02 raster graphics ver 2014
38
Basic Raster Graphics Algorithms for 2D Drawing 10/17/2022
-
Upload
independent -
Category
Documents
-
view
0 -
download
0
Transcript of 02 raster graphics ver 2014

Basic Raster Graphics Algorithms for 2D Drawing
10/17/2022

• Raster Display:Primitive element: pixel Raster: A rectangular array of points or dotsPixel: One dot or picture element of the rasterScan line: A row of pixels
Great asset: total control of the image Biggest problems: you work at a particular RESOLUTION
10/17/2022
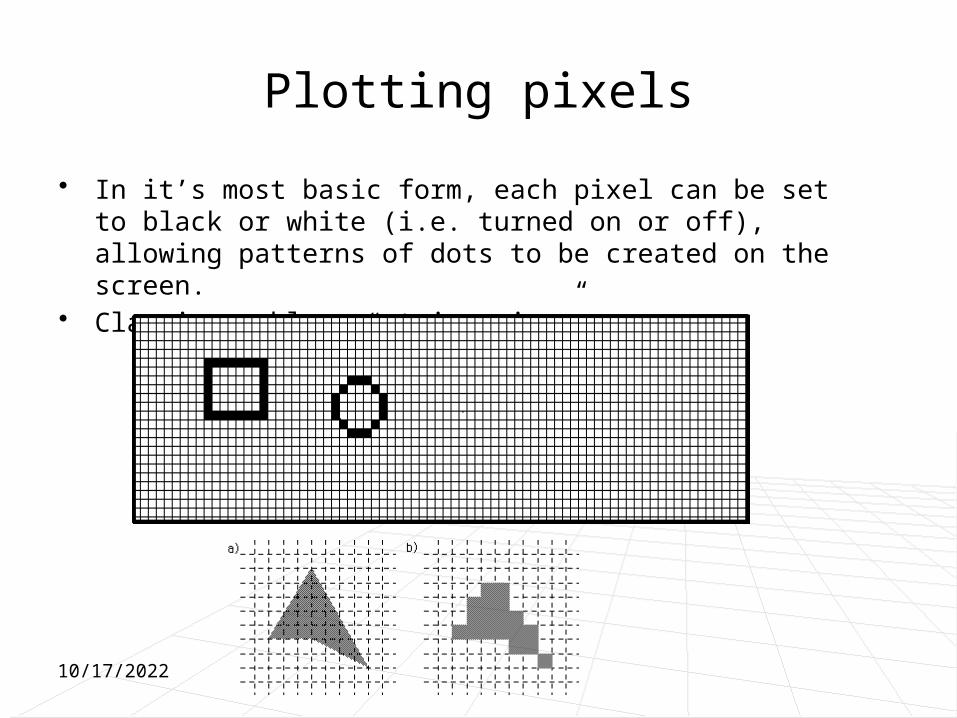
Plotting pixels• In it’s most basic form, each pixel can be set
to black or white (i.e. turned on or off), allowing patterns of dots to be created on the screen.
• Classic problem… “staircasing”.
10/17/2022
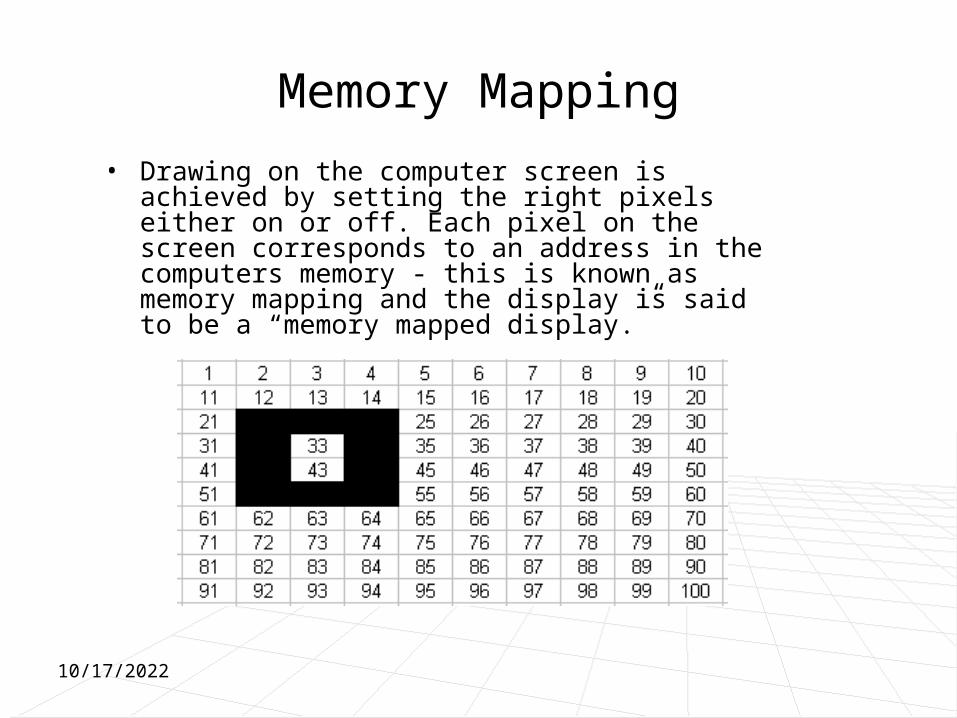
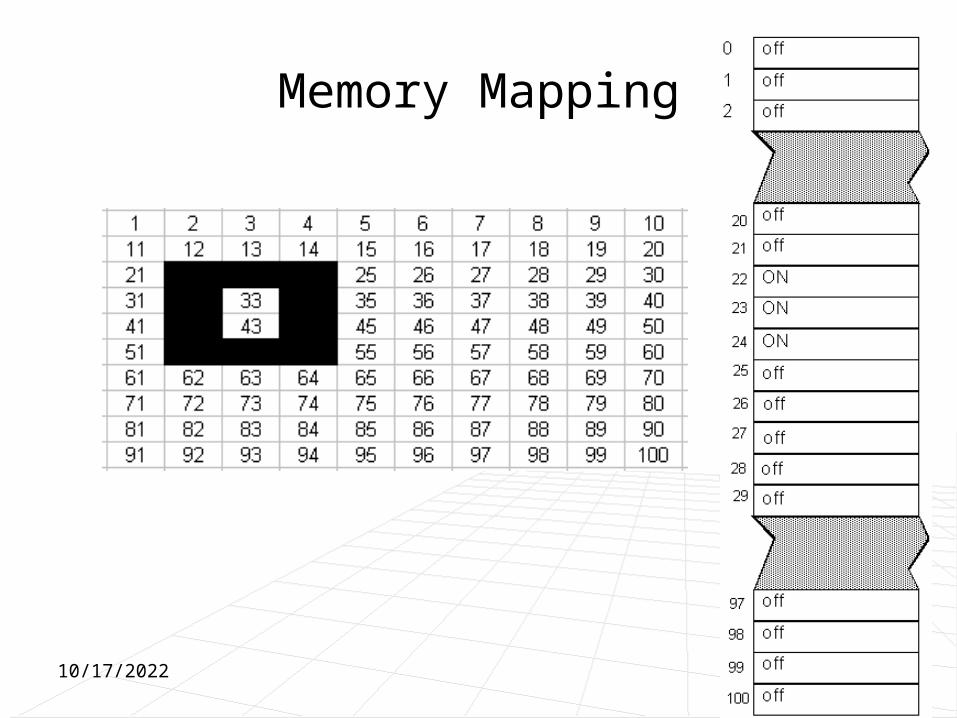
Memory Mapping• Drawing on the computer screen is
achieved by setting the right pixels either on or off. Each pixel on the screen corresponds to an address in the computers memory - this is known as memory mapping and the display is said to be a “memory mapped display.”
10/17/2022
Memory Mapping
10/17/2022
Cartesian Coordinate System• In practice, the Cartesian coordinate system is
used to define the location of pixels, leaving the computer to convert the coordinates to specific memory locations.
• The modern Cartesian coordinate system in two dimensions (also called a rectangular coordinate system) is defined by two axes, at right angles to each other, forming a plane (an xy-plane). The horizontal axis is labeled x, and the vertical axis is labeled y.
• The coordinates in a three dimensional system are of the form (x,y,z).
10/17/2022
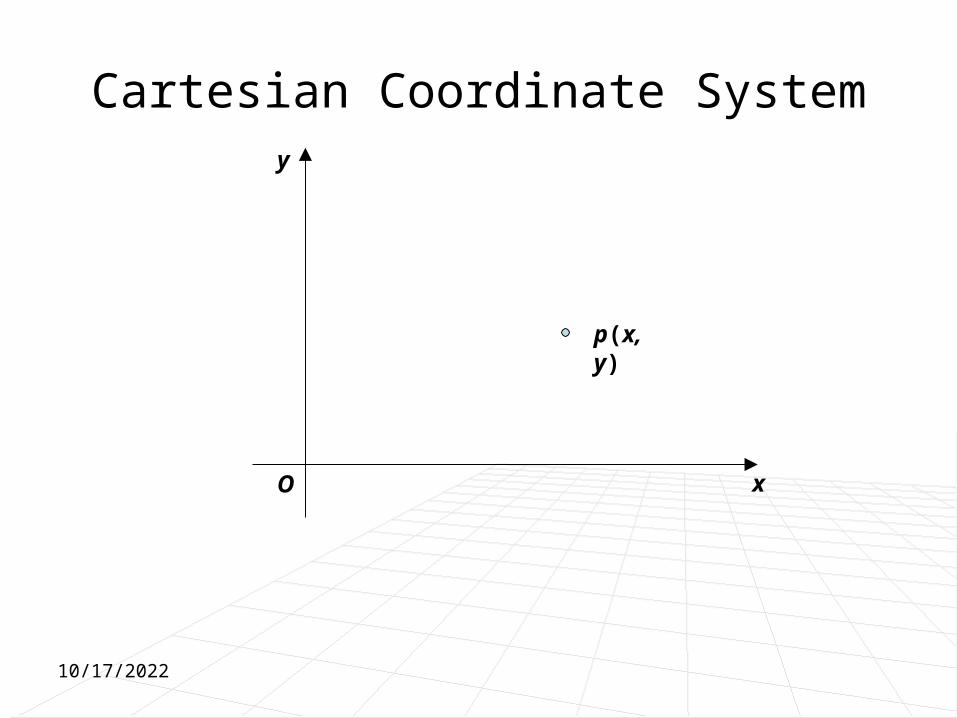
Cartesian Coordinate System
O x
y
p(x, y)
10/17/2022

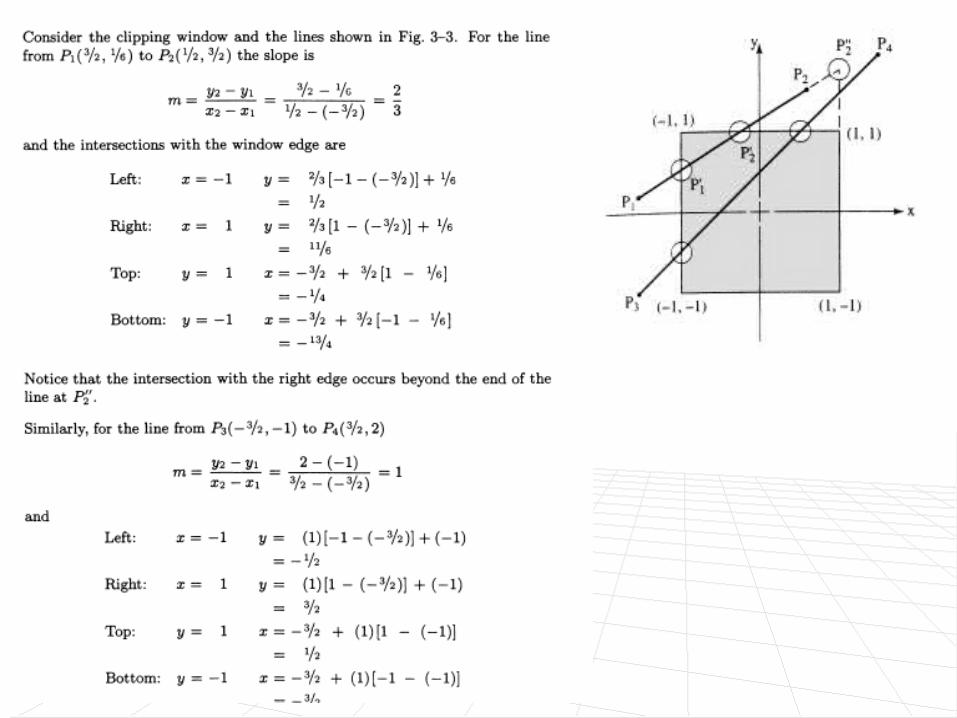
Line Drawing• A (straight) line can be mathematically defined by
its end points. To describe a line we need simply to state the coordinates of the two ends.
e.g. - (3, 8),(12, 20)
p(12, 20)
p(3, 8)
10/17/2022
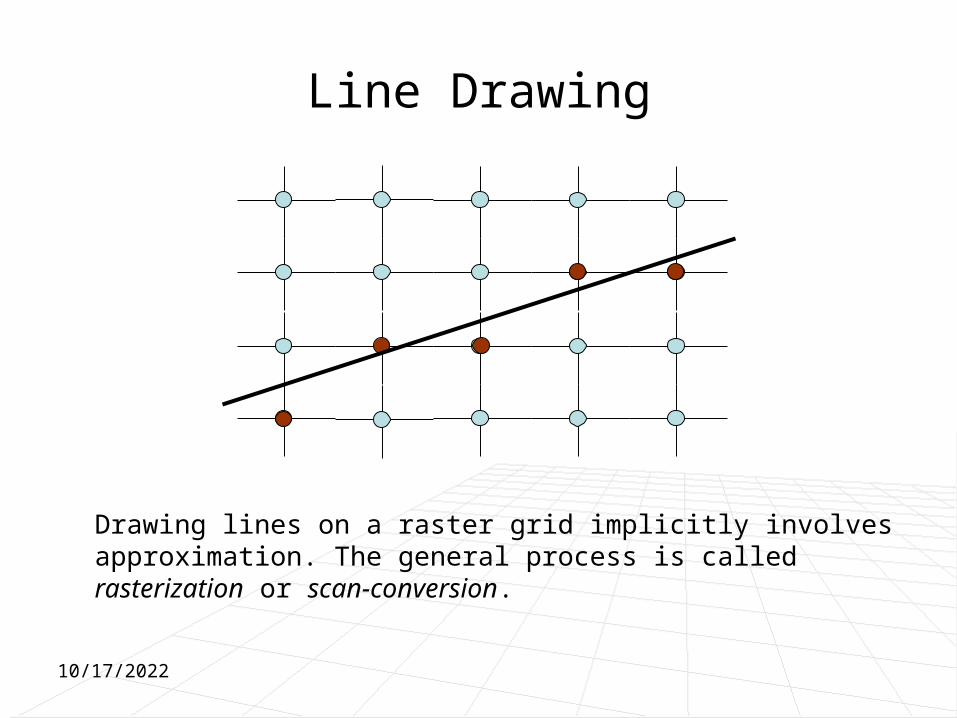
Line Drawing
Drawing lines on a raster grid implicitly involves approximation. The general process is called rasterization or scan-conversion.
10/17/2022
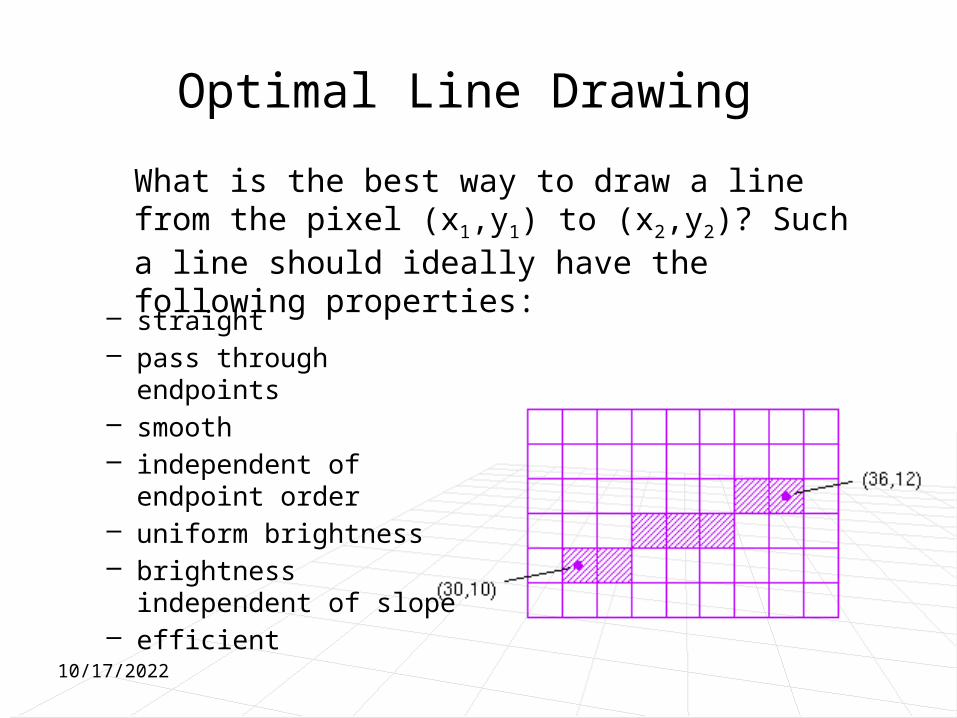
Optimal Line Drawing
– straight – pass through endpoints
– smooth – independent of endpoint order
– uniform brightness – brightness independent of slope
– efficient
What is the best way to draw a line from the pixel (x1,y1) to (x2,y2)? Such a line should ideally have the following properties:
10/17/2022
O x
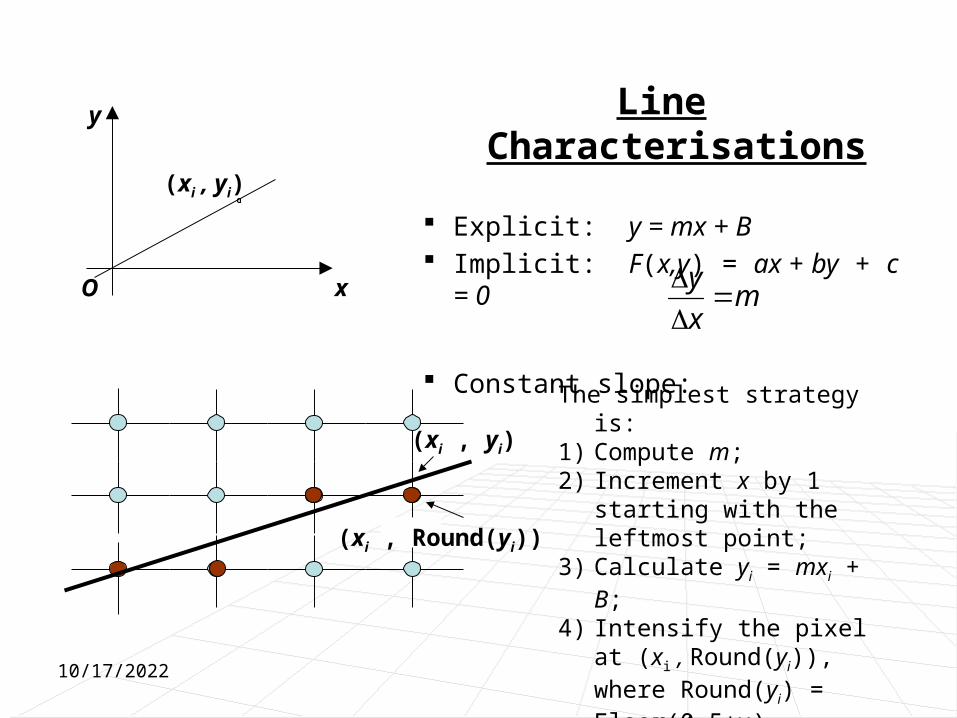
y Line Characterisations
Explicit: y = mx + B Implicit: F(x,y) = ax + by + c
= 0
Constant slope:
(xi , yi)
mxy
(xi , yi)The simplest strategy
is:1) Compute m;2) Increment x by 1
starting with the leftmost point;
3) Calculate yi = mxi + B;
4) Intensify the pixel at (xi , Round(yi)), where Round(yi) = Floor(0.5+yi)
(xi , Round(yi))
10/17/2022

The above brute-force strategy is inefficient, however, because
each iteration requires a floating-point (or binary fraction) multiply,
Addition, and invocation of Floor. We can eliminate the multiplication
by noting that:
And if x =1, then yi+1 = yi + m. Thus, a unit of change in x changes
y by m, which is the slope of the line.
xmyBxxmBmxy iiii )(11
(xi , yi)
(xi , Round(yi))(xi+1 , yi+1)
(xi +1, yi + m)
Simple Incremental Algorithm
An incremental algorithm can be defined: At each step, we make incremental calculations based on the preceding step, starting from one of the endpoints.
10/17/2022
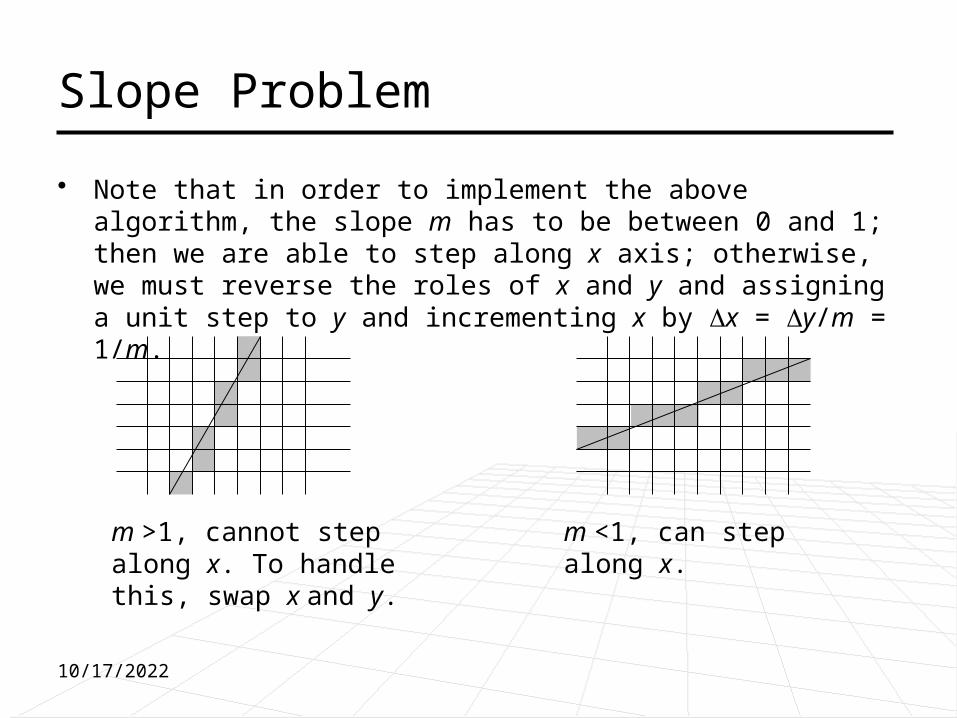
Slope Problem• Note that in order to implement the above
algorithm, the slope m has to be between 0 and 1; then we are able to step along x axis; otherwise, we must reverse the roles of x and y and assigning a unit step to y and incrementing x by x = y/m = 1/m.
m >1, cannot step along x. To handle this, swap x and y.
m <1, can step along x.
10/17/2022
Midpoint Line (Bresenham) Algorithm
• What is wrong with the incremental algorithm?– It requires floating-point operations (Round)– The time-consuming floating-point operations are unnecessary because both endpoints are integers.
– Therefore, instead of incrementing y and then rounding it at each step, we just go to the right, or to the right and up using only integer quantities.
10/17/2022
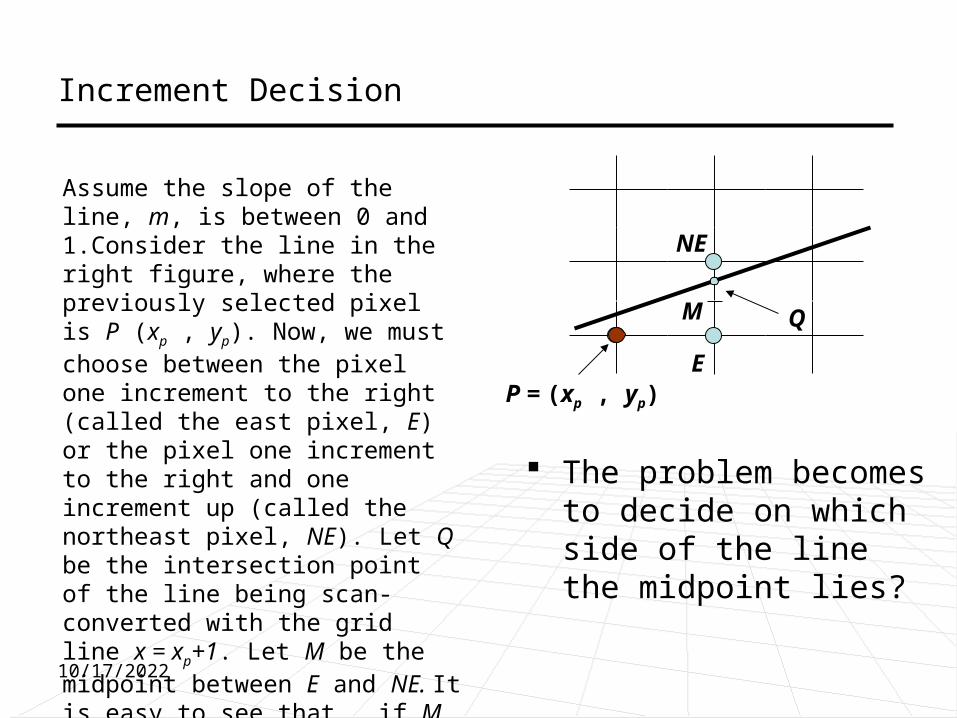
Increment Decision
The problem becomes to decide on which side of the line the midpoint lies?
Q
P = (xp , yp)
M
E
NE
Assume the slope of the line, m, is between 0 and 1.Consider the line in the right figure, where the previously selected pixel is P (xp , yp). Now, we must choose between the pixel one increment to the right (called the east pixel, E) or the pixel one increment to the right and one increment up (called the northeast pixel, NE). Let Q be the intersection point of the line being scan-converted with the grid line x = xp+1. Let M be the midpoint between E and NE. It is easy to see that , if M lies above the line, pixel E is closer to the line; if M is below the line, pixel NE is closer to the line.
10/17/2022
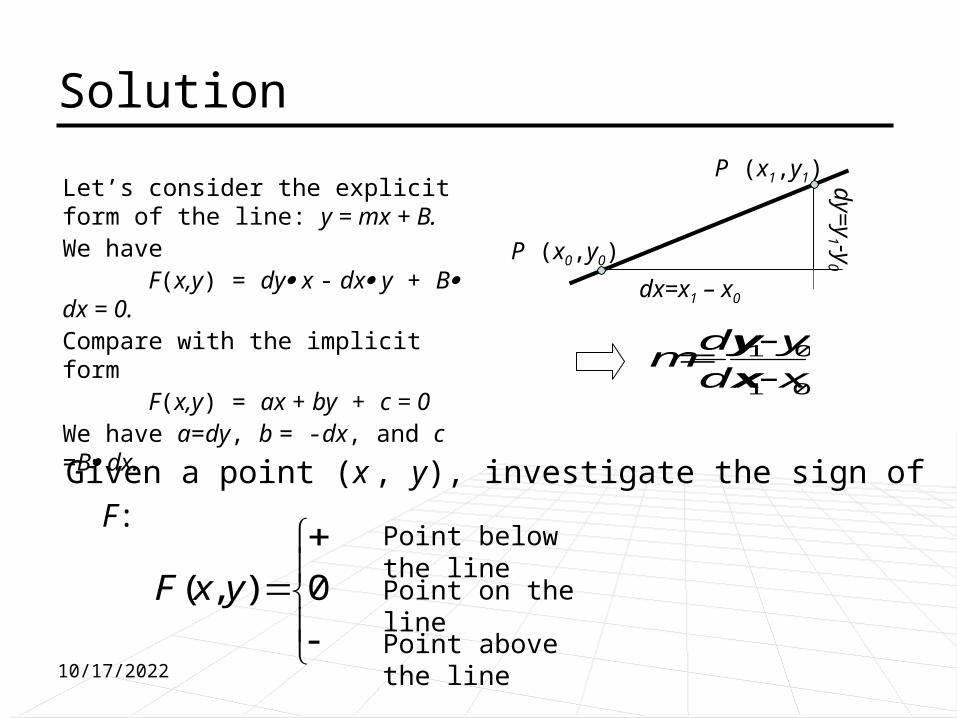
SolutionLet’s consider the explicit form of the line: y = mx + B.We have F(x,y) = dy x - dx y + B dx = 0.Compare with the implicit form F(x,y) = ax + by + c = 0We have a=dy, b = -dx, and c =B dx.
P (x0,y0)
P (x1,y1)
dx=x1 – x0
dy=y1 -y
0
01
01xxyy
dxdym
Given a point (x , y), investigate the sign of F:
0),( yxF
Point below the linePoint on the linePoint above the line10/17/2022

Decision Variable d
Since we’re trying to decide the relationship between M and the line, we need only to compute
and to test its sign.
Define a decision variable d:
)21,1()( pp yxFMF
0
)21()1()2
1,1( cybxayxFd pppp
Choose pixel NEChoose pixel EChoose pixel E
Q
(xp , yp)M
E
NE
(xp +1, yp)
)21,1( pp yx
(xp+1, yp+1)
10/17/2022

How will d be used?
Assume E is chosen, M is incremented by one step in the x direction. Then
dydad
ayxFcybaxa
cybxayxFd
oldold
pppp
ppppnew
)21,1()2
1()1(
)21()2()2
1,2(
Q
(xp , yp)M
E
NE
(xp +1, yp)(xp +2, yp)
)21,2( ppnew yxFd
(xp+1, yp+1)(xp+2, yp+1)
)21,1( ppold yxFd
10/17/2022
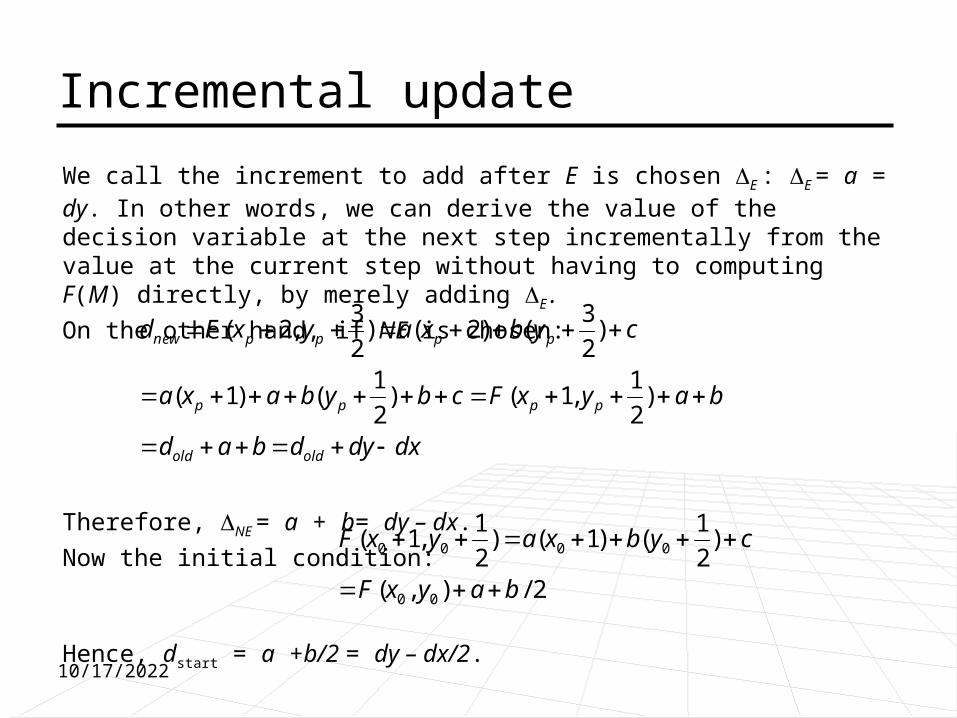
Incremental updateWe call the increment to add after E is chosen E : E = a = dy. In other words, we can derive the value of the decision variable at the next step incrementally from the value at the current step without having to computing F(M) directly, by merely adding E .On the other hand, if NE is chosen:
Therefore, NE = a + b= dy – dx.Now the initial condition:
Hence, dstart = a +b/2 = dy – dx/2.
dxdydbad
bayxFcbybaxa
cybxayxFd
oldold
pppp
ppppnew
)21,1()2
1()1(
)23()2()2
3,2(
2/),(
)21()1()2
1,1(
00
0000
bayxF
cybxayxF
10/17/2022
Summary to the midpoint technique
Let’s summarise the incremental midpoint algorithm. At each step, the algorithm chooses between two pixels based on the sign of the decision variable calculated in the previous iteration; then it updates the decision variable by adding either E or NE to the old value, depending on the choice of the pixel. The algorithm starts from the first endpoint, and the first decision variable is given by a+b/2. Using dstart, we choose the second pixel, and so on.
To eliminate the fraction in dstart, we redefine our original F by multiplying it by 2; F(x,y) = 2(ax+by+c). This multiplies each constant the decision variable (and the increments E and NE) by 2 but does not affect the sign of the decision variable, which is all that matters for the midpoint test.10/17/2022

Summary to the midpoint technique (cont.)
Initialisation: dstart = 2 a +b = 2dy – dx where dy = y1 – y0 and dx = x1 – x0 .
Incremental update: 1) if E was chosen, E = 2 dy dnew = dold + E
2) if NE was chosen, NE = 2 (dy – dx) dnew = dold + NE
Advantage: The arithmetic needed to evaluate dnew for any step is a simple integer addition. No time-consuming multiplication is involved. Further, the incremental update is quite simple, therefore, it is an efficient algorithm. Note: the given algorithm only works for those line with slope (0, 1).10/17/2022

Lines: Arbitrary Directions
Step through x, increment yStep through x, decrement y
Step through y, decrement x
Step through y, increment x
18
2
7
3
6
45
10/17/2022
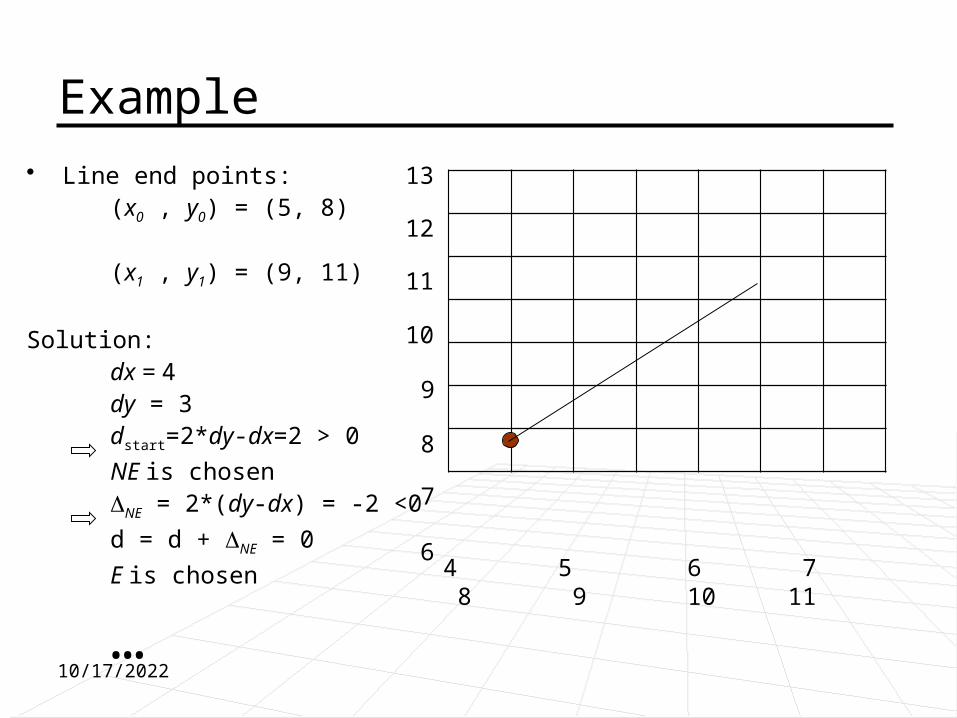
Example• Line end points:
(x0 , y0) = (5, 8)
(x1 , y1) = (9, 11)
Solution:dx = 4dy = 3dstart=2*dy-dx=2 > 0NE is chosenNE = 2*(dy-dx) = -2 <0d = d + NE = 0E is chosen
…4 5 6 7 8 9 10 11
6
7
8
9
10
11
12
13
10/17/2022

Lines: Some Remarks• Weaker Intensity of Diagonal
Lines.Consider the two scan-converted lines in the left figure. The diagonal line, B, has a slope of 1 and hence is times as long as A, the horizontal line. Yet the same number of pixels (9) is drawn to represent each line. If the intensity of each pixel is I, then the intensity per unit length of line A is I, whereas for line B it is only I/ .
2
2
10/17/2022
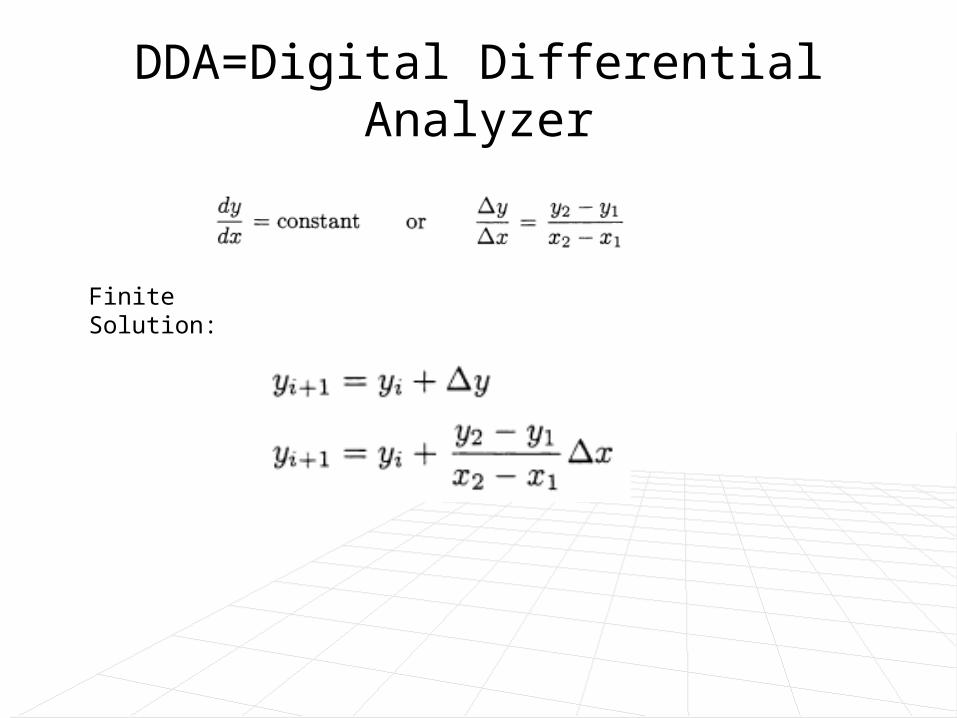
DDA=Digital Differential Analyzer
Finite Solution:

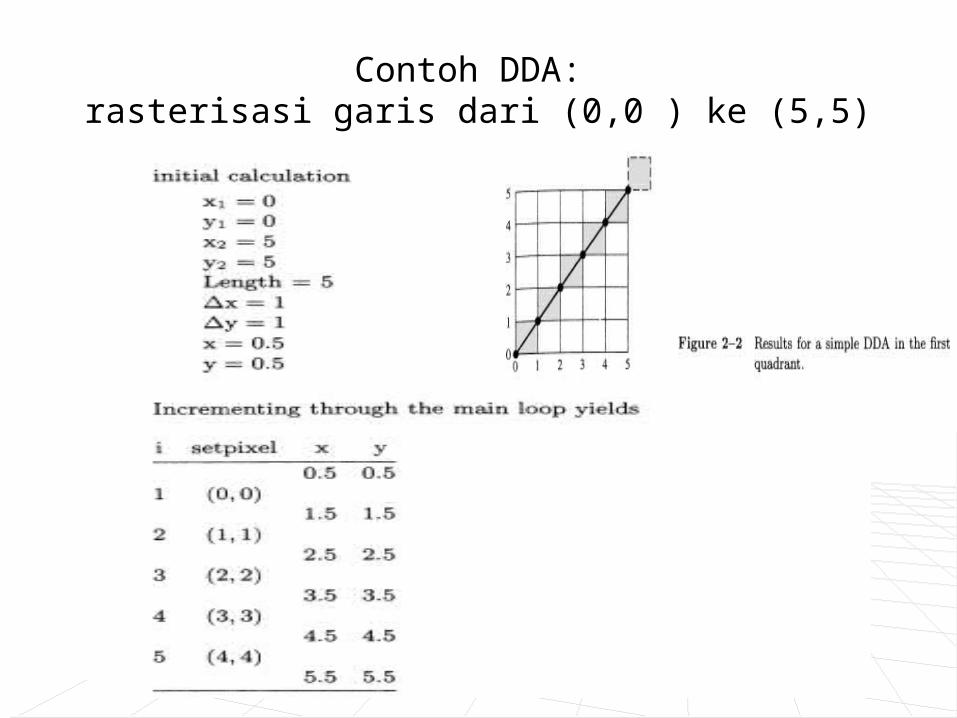
Contoh DDA: rasterisasi garis dari (0,0 ) ke (5,5)
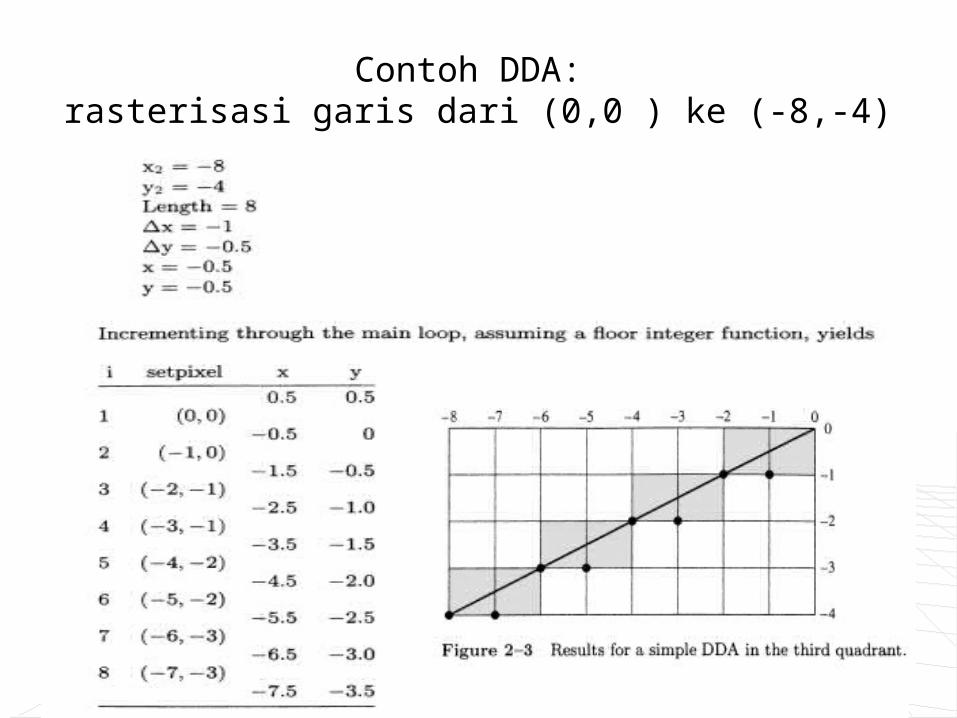
Contoh DDA: rasterisasi garis dari (0,0 ) ke (-8,-4)
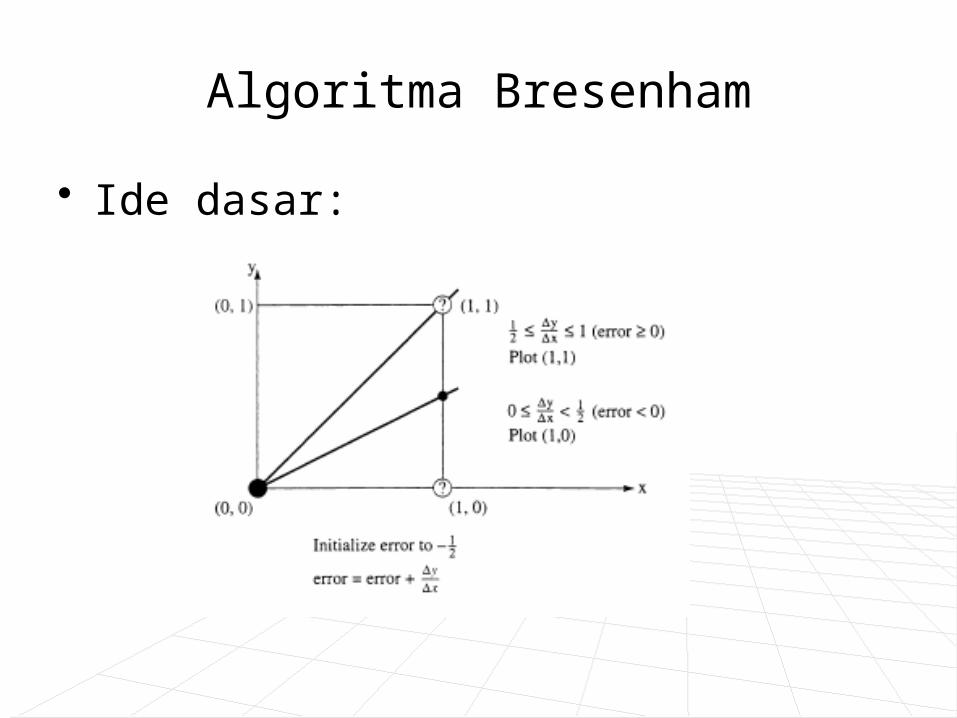
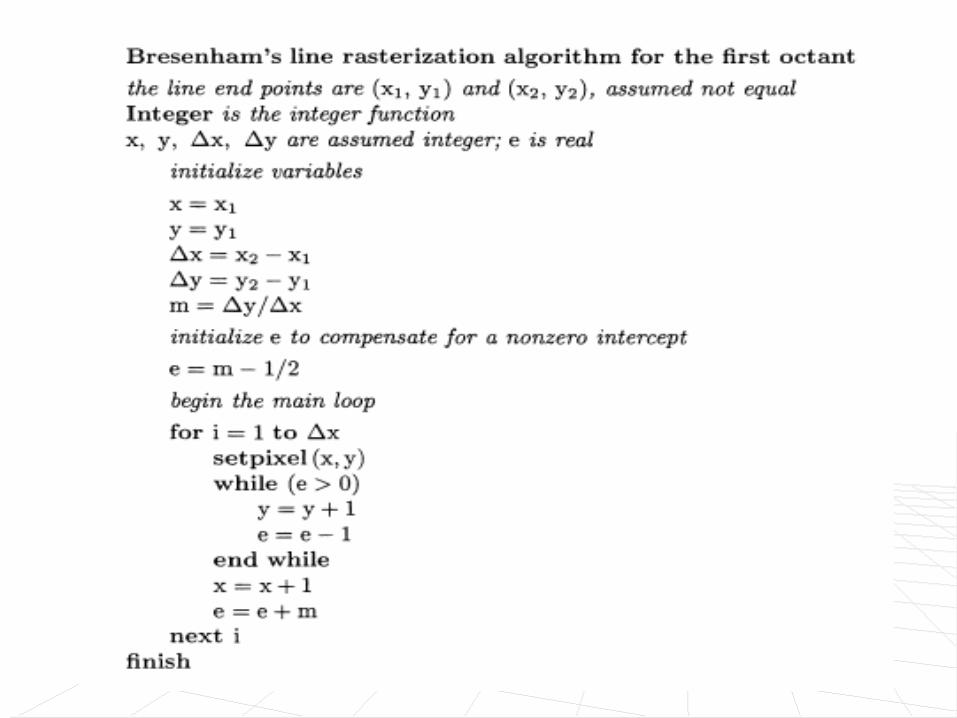
Algoritma Bresenham
• Ide dasar:
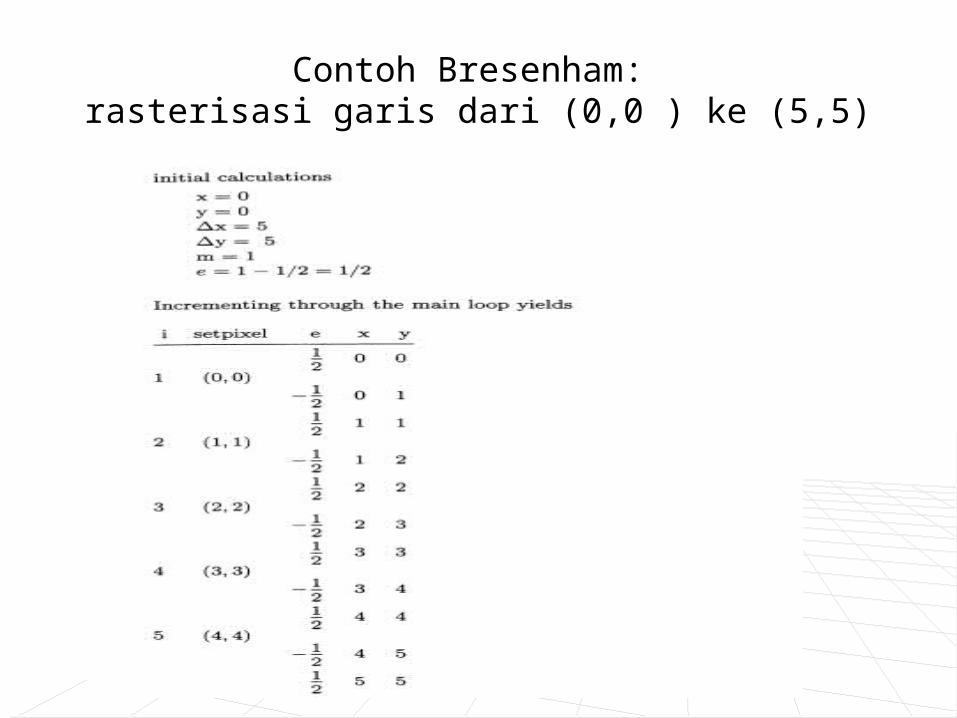
Contoh Bresenham: rasterisasi garis dari (0,0 ) ke (5,5)

Flowchart Bresenham

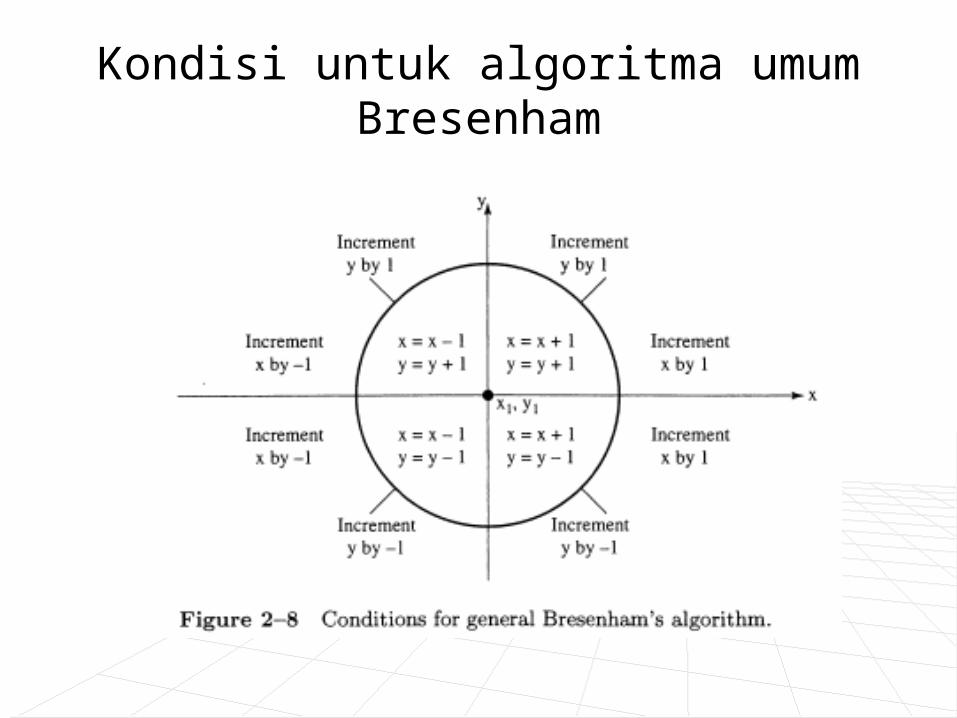
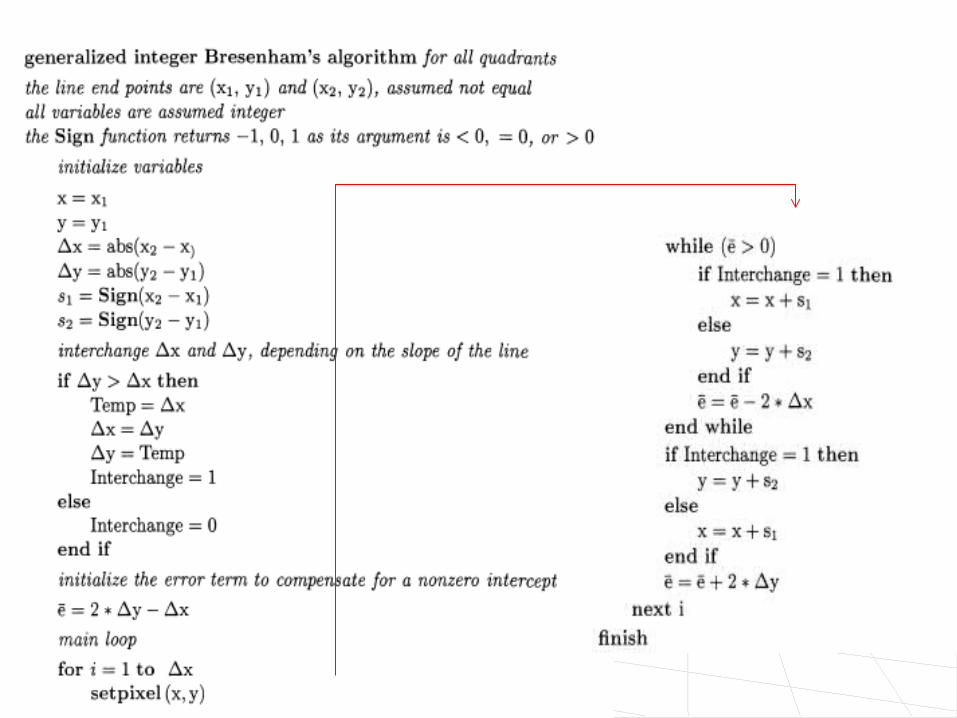
Kondisi untuk algoritma umum Bresenham

Contoh Bresenham: rasterisasi garis dari (0,0 ) ke (-8,-4)

Metoda perpotongan garis