
Creating SmartArt Graphics 7
25
KEY TERMS • assistant • demote • organization chart • promote • SmartArt diagrams • SmartArt layout • subordinates • text pane • top-level shape Creating SmartArt Graphics 7 LESSON SKILL MATRIX Skill Exam Objective Objective Number Adding SmartArt to a Slide Convert text to SmartArt. 2.5.5 Convert WordArt to SmartArt. 3.3.4 Modifying SmartArt Add and remove shapes. 3.4.1 Change SmartArt styles. 3.4.2 Change SmartArt layout. 3.4.3 Reorder shapes. 3.4.4 Make (SmartArt) shapes larger or smaller. 3.4.7 Promote bullet levels (in SmartArt). 3.4.8 Demote bullet levels (in SmartArt). 3.4.9 Converting SmartArt to Other Convert a SmartArt graphic to text. 3.4.5 Formats Convert SmartArt to shapes. 3.4.6 217
-
Upload
khangminh22 -
Category
Documents
-
view
6 -
download
0
Transcript of Creating SmartArt Graphics 7

KEY TERMS• assistant
• demote
• organization chart
• promote
• SmartArt diagrams
• SmartArt layout
• subordinates
• text pane
• top-level shape
Creating SmartArt Graphics 7LESSON SKILL MATRIX
Skill Exam Objective Objective Number
Adding SmartArt to a Slide Convert text to SmartArt. 2.5.5 Convert WordArt to SmartArt. 3.3.4
Modifying SmartArt Add and remove shapes. 3.4.1 Change SmartArt styles. 3.4.2 Change SmartArt layout. 3.4.3 Reorder shapes. 3.4.4 Make (SmartArt) shapes larger or smaller. 3.4.7 Promote bullet levels (in SmartArt). 3.4.8 Demote bullet levels (in SmartArt). 3.4.9
Converting SmartArt to Other Convert a SmartArt graphic to text. 3.4.5 Formats Convert SmartArt to shapes. 3.4.6
217
c07CreatingSmartArtGraphics.indd Page 217 8/26/11 1:41 PM user f-404 F-402
218 Lesson 7
You are the director of software development for Litware, Inc., which creates com-
puter games that help children learn to read. One of your responsibilities is orienting
new software designers who have just joined the company. You can use SmartArt
diagrams to explain your company’s organization and standard processes to the
newcomers. SmartArt diagrams provide an easy way to share complex information
in the form of sophisticated graphics that clearly show relationships and processes.
SOFTWARE ORIENTATION
Choosing a SmartArt Graphic
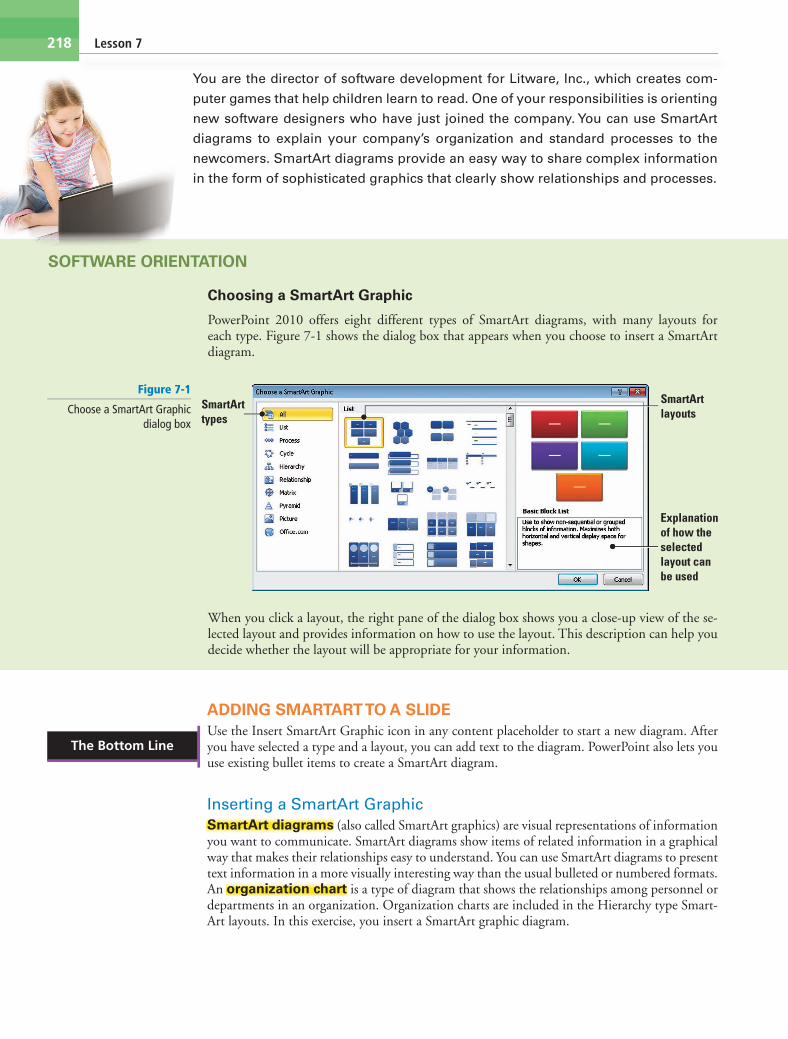
PowerPoint 2010 offers eight different types of SmartArt diagrams, with many layouts for each type. Figure 7-1 shows the dialog box that appears when you choose to insert a SmartArt diagram.
When you click a layout, the right pane of the dialog box shows you a close-up view of the se-lected layout and provides information on how to use the layout. This description can help you decide whether the layout will be appropriate for your information.
SmartArttypes
SmartArt layouts
Explanation of how the selected layout can be used
Figure 7-1
Choose a SmartArt Graphic dialog box
ADDING SMARTART TO A SLIDEUse the Insert SmartArt Graphic icon in any content placeholder to start a new diagram. After you have selected a type and a layout, you can add text to the diagram. PowerPoint also lets you use existing bullet items to create a SmartArt diagram.
Inserting a SmartArt GraphicSmartArt diagrams (also called SmartArt graphics) are visual representations of information you want to communicate. SmartArt diagrams show items of related information in a graphical way that makes their relationships easy to understand. You can use SmartArt diagrams to present text information in a more visually interesting way than the usual bulleted or numbered formats. An organization chart is a type of diagram that shows the relationships among personnel or departments in an organization. Organization charts are included in the Hierarchy type Smart-Art layouts. In this exercise, you insert a SmartArt graphic diagram.
The Bottom Line
c07CreatingSmartArtGraphics.indd Page 218 8/29/11 9:10 AM user-F393 /Users/user-F393/Desktop

Creating SmartArt Graphics 219
STEP BY STEP Insert an Organization Chart SmartArt Graphic
GET READY. Before you begin these steps, make sure that your computer is on. Log on, if necessary.
1. START PowerPoint, if the program is not already running.
2. Locate and open the Litware presentation and save it as Litware Final.
3. Go to slide 3, and click the Insert SmartArt Graphic icon in the center of the content placeholder. The Choose a SmartArt Graphic dialog box opens.
4. Click Hierarchy in the type list in the left side of the dialog box. The layouts for the Hierarchy type are displayed.
5. Click the fi rst layout in the fi rst row, the Organization Chart. Read the description of the Organization Chart layout in the right pane of the dialog box. See Figure 7-2.
WileyPLUS Extra! features an online tutorial of this task.
The Litware fi le is available on the book compan-ion website or in WileyPLUS.
Another WayTo insert a
SmartArt diagram on a slide that does not have a content placeholder, click the SmartArt button on the Insert tab.
Figure 7-2
The Hierarchy layouts in the Choose a SmartArt Graphic
dialog box
6. Click OK to insert the diagram. The diagram appears on the slide, as shown in Figure 7-3.
Figure 7-3
A new, blank organization chart diagram
Text Panebutton
7. SAVE the presentation.
PAUSE. LEAVE the presentation open to use in the next exercise.
c07CreatingSmartArtGraphics.indd Page 219 8/26/11 1:41 PM user f-404 F-402

220 Lesson 7
The Choose a SmartArt Graphic dialog box sorts its many layouts by types such as List, Process, Hierarchy, and so on. A SmartArt layout is a particular arrangement of shapes that a diagram can have. The following general descriptions of SmartArt types can help you choose a type and a specifi c layout within that type:
• List layouts display information that does not have to be in a particular order, such as a list of items to purchase.
• Process layouts show the steps in a process or timeline, such as the steps in a manufacturing process.
• Cycle layouts are useful for showing a repeating process, such as a teaching cycle of preparing for a semester, teaching a class, and submitting grades.
• Hierarchy layouts show levels of subordination, such as in an organization chart or a tournament bracket.
• Relationship layouts show connections among items, such as the relationship between supply and demand.
• Matrix layouts show how parts relate to a whole, similar to a pie chart.
• Pyramid layouts display relationships in terms of proportion, from largest at the bottom to smallest at the top.
• Picture layouts include placeholders for one or more graphics in addition to the text placeholders.
More layouts can also be found at Offi ce.com. Click the Offi ce.com category to see what’s available.
Some layouts appear in more than one type’s listing. For example, most of the Picture layouts are also categorized as other types.
Adding Text to a SmartArt DiagramA new SmartArt diagram appears on the slide with empty shapes to which you add text (and in some cases, pictures) to create the fi nal diagram. The appearance and position of these shapes are guided by the layout you chose, and shape color is controlled by the current theme. As you enter text in the diagram, PowerPoint resizes the shapes to accommodate the longest line of text in the diagram. Font size is also adjusted for the best fi t, and PowerPoint keeps the font size the same for all shapes. In this exercise, you learn how to add text to the SmartArt diagram organizational chart you have inserted in your PowerPoint slide.
An organization chart, such as the one you create in this section, has some special terminology and layout requirements. In an organization chart, there can be only one top-level shape, which is typically occupied by the name of the person or department at the head of the organization. Persons or departments who report to the top-level entity are subordinates. An assistant is a person who reports directly to a staff member and usually appears on a separate level.
STEP BY STEP Add Text to a SmartArt Diagram
USE the Litware Final presentation that is still open from the previous exercise.
1. If the text pane is not already open, click the Text Pane arrows on the left side of the SmartArt object frame (refer to Figure 7-3). This opens the Text pane.
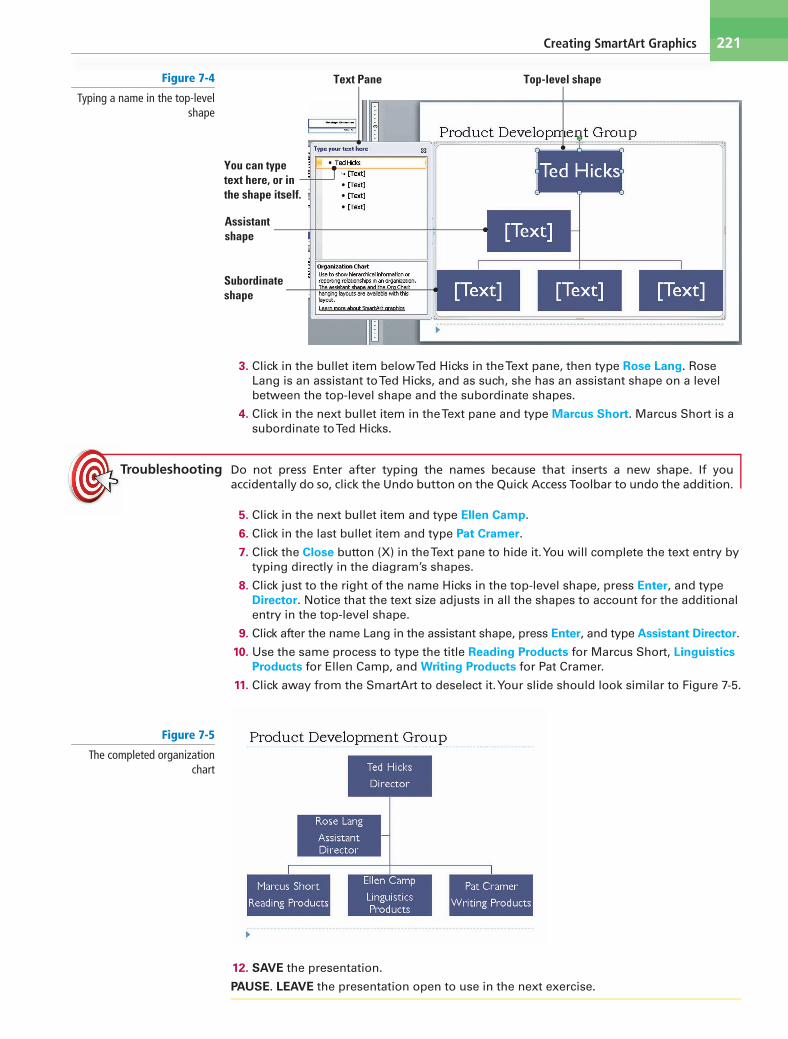
2. Click next to the bullet at the top of the Text pane to place the insertion point there. Type Ted Hicks to enter the name in the top-level shape of the diagram. Notice that as you type the text in the Text pane, it appears in the top shape of the diagram, as shown in Figure 7-4, and that the text automatically resizes to fi t in the shape.
c07CreatingSmartArtGraphics.indd Page 220 8/26/11 1:42 PM user f-404 F-402
Creating SmartArt Graphics 221
3. Click in the bullet item below Ted Hicks in the Text pane, then type Rose Lang. Rose Lang is an assistant to Ted Hicks, and as such, she has an assistant shape on a level between the top-level shape and the subordinate shapes.
4. Click in the next bullet item in the Text pane and type Marcus Short. Marcus Short is a subordinate to Ted Hicks.
Troubleshooting Do not press Enter after typing the names because that inserts a new shape. If you accidentally do so, click the Undo button on the Quick Access Toolbar to undo the addition.
5. Click in the next bullet item and type Ellen Camp.
6. Click in the last bullet item and type Pat Cramer.
7. Click the Close button (X) in the Text pane to hide it. You will complete the text entry by typing directly in the diagram’s shapes.
8. Click just to the right of the name Hicks in the top-level shape, press Enter, and type Director. Notice that the text size adjusts in all the shapes to account for the additional entry in the top-level shape.
9. Click after the name Lang in the assistant shape, press Enter, and type Assistant Director.
10. Use the same process to type the title Reading Products for Marcus Short, Linguistics Products for Ellen Camp, and Writing Products for Pat Cramer.
11. Click away from the SmartArt to deselect it. Your slide should look similar to Figure 7-5.
Figure 7-4
Typing a name in the top-level shape
Text Pane Top-level shape
Assistant shape
Subordinate shape
You can type text here, or in the shape itself.
Figure 7-5
The completed organization chart
12. SAVE the presentation.
PAUSE. LEAVE the presentation open to use in the next exercise.
c07CreatingSmartArtGraphics.indd Page 221 8/26/11 1:42 PM user f-404 F-402

222 Lesson 7
You can display or hide the Text pane, which is the panel to the left of a new diagram in which you can type diagram text. In the Text pane, shape text (that is, text that appears in shapes) ap-pears as the top-level bullet items and text that appears on the diagram in bulleted text format is indented below the shape text, similar to the way several levels of bulleted text appear in a content placeholder.
You can use the Text pane to enter text, or you can enter text directly in each shape. Click next to a bullet in the Text pane or click any [Text] placeholder and begin typing text. If you need more bullet items than are supplied in the default layout, press Enter at the end of the current bullet item to add a new one, or click the Add Bullet button in the Create Graphic group on the SmartArt Tools Design tab.
If you don’t want to use the Text pane, you can close it to get it out of the way. To redisplay it, click the Text Pane button on the left border of the SmartArt container, or click the Text Pane button in the Create Graphic group on the SmartArt Tools Design tab. You can also right-click anywhere in the diagram and then click Show Text Pane on the shortcut menu.
Take Note If you need to edit text you have entered in a diagram, you can click the text to activate it and then edit the text as necessary. You can also right-click a shape, click Edit Text on the shortcut menu, and make the necessary changes.
Converting Text or WordArt to a SmartArt DiagramAs you work with slide text, you may realize that the information would work well as a SmartArt diagram. In this situation, you do not have to retype the text in the SmartArt diagram shapes. Simply convert the bulleted list to a diagram. You can create a diagram from any bulleted list on a slide or any WordArt object. You can choose one of the common diagrams in the Convert to SmartArt gallery, or you can access the Choose a SmartArt Diagram dialog box to choose any diagram type or layout. In this exercise, you learn how to convert a list into a SmartArt Cycle diagram, and you convert WordArt text into a single SmartArt object.
Text in a diagram appears either within a shape or as a bulleted list, depending on the diagram type and layout option. In the previous exercise, you inserted text only in shapes because an organization chart does not offer the option of bulleted text. Figure 7-6 shows a list type diagram that contains both shape text and bulleted text.
Figure 7-6
Shape text and bulleted text in a diagram
c07CreatingSmartArtGraphics.indd Page 222 8/26/11 1:42 PM user f-404 F-402

Creating SmartArt Graphics 223
STEP BY STEP Convert Text or WordArt to a SmartArt Diagram
USE the Litware Final presentation that is still open from the previous exercise.
1. Go to slide 4 and select the bulleted list.
2. Click the Home tab, if necessary, and then click the Convert to SmartArt button in the Paragraph group. PowerPoint displays the gallery shown in Figure 7-7.
Another WayRight-click in a
bulleted list, and then click Convert to SmartArt on the shortcut menu.
Figure 7-7
The Convert to SmartArt Gallery
Figure 7-8
Bulleted list converted to a SmartArt diagram
3. Click More SmartArt Graphics at the bottom of the gallery. The Choose a SmartArt Graphic dialog box opens.
4. Click Cycle, then click the Block Cycle layout. Read the description of how best to use the Block Cycle layout.
5. Click OK. The bulleted list is converted to a cycle diagram, as shown in Figure 7-8.
Take Note The Text pane might appear automatically, as shown in Figure 7-8; if it does not, you can leave it hidden for now, or you can display it by clicking the Show Text Pane arrows on the left side of the SmartArt frame.
Take Note You may notice that the text in the shapes is quite small. You will learn how to modify shape and text size later in the lesson.
c07CreatingSmartArtGraphics.indd Page 223 8/26/11 1:42 PM user f-404 F-402

224 Lesson 7
8. SAVE the presentation.
PAUSE. LEAVE the presentation open to use in the next exercise.
MODIFYING SMARTARTAlthough a new SmartArt graphic makes an interesting visual statement on a slide in its default state, you will probably want to make some changes to the graphic to customize it for your use. You can apply a wide variety of formatting changes to modify appearance, and you can also change layout or orientation and add or remove shapes. You can even change the diagram type to another that better fi ts your data.
Applying a Style to a SmartArt DiagramLike other graphic objects, SmartArt diagrams can be quickly and easily formatted by applying a SmartArt style. Styles apply fi lls, borders, and effects to improve the appearance of the diagram’s shapes. In this exercise, you will apply a style to a diagram.
STEP BY STEP Apply a Style to a SmartArt Diagram
USE the Litware Final presentation that is still open from the previous exercise.
1. Go to slide 3 and click once on the diagram to select it. Take care to select the diagram itself, and not a particular shape within it.
2. Click the SmartArt Tools Design tab to activate it.
3. Click the More button in the SmartArt Styles group. The SmartArt Style gallery appears, as shown in Figure 7-10.
The Bottom Line
Figure 7-9
WordArt converted to a SmartArt diagram
6. Go to slide 1, and triple-click the Developer Orientation WordArt object to select it.
7. On the Home tab, click Convert to SmartArt, then click Vertical Bullet List (the fi rst layout in the fi rst row). The WordArt text is converted to a single-item SmartArt object. See Figure 7-9.
2.5.5
How do you convert text to SmartArt?
3.3.4
How do you convert WordArt to SmartArt?
Cartoonstyle
Figure 7-10
The SmartArt Style gallery
c07CreatingSmartArtGraphics.indd Page 224 8/26/11 1:42 PM user f-404 F-402

Creating SmartArt Graphics 225
5. Go to slide 1, click the SmartArt object, and repeat steps 2-4 to apply the same style.
6. Go to slide 4, click the SmartArt object, and repeat steps 2-4 to apply the same style.
7. SAVE the presentation and CLOSE it.
PAUSE. LEAVE the presentation open to use in the next exercise.
SmartArt styles can instantly improve a new diagram by applying visual effects to the shapes. Review the results carefully, however, after applying a SmartArt style. If your shapes contain several lines of text, some of the 3-D styles may obscure the text or cause it to run over on the edges—not a very attractive presentation.
If you do not like the formatting you have applied, you can easily revert to the original appear-ance of the diagram. Click the Reset Graphic button on the SmartArt Tools Design tab to restore the diagram to its default appearance.
Selecting a Color Theme for a SmartArt DiagramBy default, diagrams display using variants of a single theme color. Use the Change Colors gallery to apply a different theme color to a diagram. In this exercise, you will apply a different color theme to a SmartArt diagram.
STEP BY STEP Apply a Color Theme to a SmartArt Diagram
USE the Litware Final presentation that is still open from the previous exercise.
1. Go to slide 3 and click the diagram to select it. Click the SmartArt Tools Design tab.
2. Click the Change Colors button in the SmartArt Styles group. The Change Colors gallery opens.
3. Click the fourth style in the Colorful section (Colorful Range—Accent Colors 4 to 5). PowerPoint applies theme colors differentiated by level.
Take Note Differentiating levels or processes by color gives your audience further visual cues that help them understand the diagram.
4. Go to slide 4 and click the diagram to select it.
Figure 7-11
A style applied to a diagram
4. Click the Cartoon style. PowerPoint applies the style, as shown in Figure 7-11.
3.4.2
How do you change SmartArt styles?
c07CreatingSmartArtGraphics.indd Page 225 21/11/12 9:04 AM user-F408 /Users/user-F408/Desktop

226 Lesson 7
6. SAVE the presentation.
PAUSE. LEAVE the presentation open to use in the next exercise.
The Change Colors gallery provides a quick way to apply variations of theme colors to an entire diagram. If the gallery choices don’t strike your fancy, you can manually apply theme colors (or any non-theme color) by using tools on the SmartArt Tools Format tab. Click an individual shape or use the Shift or Ctrl keys to select more than one shape, and then choose a shape style from the Shape Styles gallery. You can also use the Shape Fill, Shape Outline, and Shape Effects buttons to choose new colors, outlines, or effects for the selected shapes.
If you do not like the changes you have made to a particular shape, you can reset the shape formats. Right-click the shape, then click Reset Shape on the shortcut menu.
Changing a SmartArt Diagram’s LayoutIf you decide a particular layout does not present your data as you like, you can easily choose a new layout. A different layout can dramatically change the way the data appears. Different layouts may be more or less suited to your data, so you may want to try several different layouts to fi nd the best match. In this exercise, you will change a SmartArt diagram to a different layout.
STEP BY STEP Change the Layout of a SmartArt Diagram
USE the Litware Final presentation that is still open from the previous exercise.
1. Click the diagram on slide 4 to select it, if necessary. Make sure you select the outer frame of the diagram—not an individual shape.
2. Click the More button in the Layouts group to display the Layouts gallery.
Take Note The Layouts gallery displays alternative layouts for the current diagram type.
Figure 7-12
A different color style applied to the cycle diagram
Another WayYou can also
format a shape by right-clicking the shape, selecting Format Shape, and using the options in the Format Shape dialog box.
5. Click the Change Colors button in the SmartArt Styles group, opening the Change Colors Gallery, and then click the fi rst style in the Colorful section (Colorful Accent Colors). PowerPoint uses theme colors to apply different tints to each shape (See Figure 7-12).
c07CreatingSmartArtGraphics.indd Page 226 21/11/12 9:04 AM user-F408 /Users/user-F408/Desktop

Creating SmartArt Graphics 227
4. SAVE the presentation.
PAUSE. LEAVE the presentation open to use in the next exercise.
When changing a layout, you should generally choose from among the layouts of the current diagram type. In many cases, changing a layout will not result in any additional work for you; PowerPoint simply adjusts the current text into new shapes or confi gurations, as happened in this exercise.
Take Note It is also possible to convert one type of diagram to another type. You will learn more about making this kind of change later in this lesson.
In some cases, however, your information will not convert seamlessly from one layout to another. Some layouts allow only a limited number of shapes, and if your original layout had more than the number allowed in the new layout, information that cannot be displayed in the new layout may disappear.
Adding a New Shape to a DiagramAs you work with diagrams, you may need to add shapes to accommodate your information. Use the Add Shape button to choose what kind of shape to add and where to insert it in the diagram. Adding a new shape to a diagram causes all the existing shapes to resize or reposition in the diagram to make room for the new shape.
Figure 7-13
The Layouts gallery for the Cycle type
Figure 7-14
A new layout has been applied
3. Click Continuous Cycle (see Figure 7-13). PowerPoint applies the new cycle layout to the current chart, as shown in Figure 7-14.
3.4.3
How do you change the layout of a diagram?
c07CreatingSmartArtGraphics.indd Page 227 8/26/11 1:42 PM user f-404 F-402

228 Lesson 7
STEP BY STEP Add a Shape to a Diagram
USE the Litware Final presentation that is still open from the previous exercise.
1. Go to slide 3 and click the diagram to select it. Make sure you select the diagram’s outer frame, and not a specifi c shape within it.
2. Click the SmartArt Tools Design tab.
3. Click the last shape in the last row (Pat Cramer) to select it.
4. Click the Add Shape drop-down arrow in the Create Graphic group. PowerPoint displays a menu of options for adding a shape relative to the current shape, as shown in Figure 7-15.
Figure 7-15
The Add Shape menu
5. Click Add Shape Below. PowerPoint adds a subordinate shape to the Pat Cramer shape.
Take Note Notice that the new shape, which is on a new level, has a different theme color to differentiate it from the level above.
6. Type Hannah Wong in the new shape, press Enter, and type Product Coordinator. Then click away from the diagram to deselect it. The slide should look similar to Figure 7-16.
Figure 7-16
A new shape has been added to the diagram
7. Select Hannah Wong’s shape. On the SmartArt Tools Design tab, click the Add Shape drop-down arrow, then click Add Shape Below. PowerPoint adds a subordinate shape.
8. Type Allan Morgan into the new shape, press Enter, and type Software Design.
9. With Allan Morgan’s shape still selected, click the Add Shape drop-down arrow, then click Add Shape After. PowerPoint adds a shape on the same level.
c07CreatingSmartArtGraphics.indd Page 228 8/26/11 1:42 PM user f-404 F-402
Creating SmartArt Graphics 229
12. SAVE the presentation.
PAUSE. LEAVE the presentation open to use in the next exercise.
The choices available on the Add Shape drop-down menu depend on the type of diagram you are working with. You can choose among some or all of these options:
• Add Shape After: Inserts a new shape to the right of the selected shape on the same level. (If the diagram displays shapes vertically, the new shape may appear below the selected shape.)
• Add Shape Before: Inserts a new shape to the left of the selected shape on the same level. (If the diagram displays shapes vertically, the new shape may appear above the selected shape.)
• Add Shape Above: Inserts a new shape on the level above the selected shape. The new shape is superior to the selected shape.
• Add Shape Below: Inserts a new shape in the level below the selected shape. The new shape is subordinate to the selected shape.
• Add Assistant: Inserts a new assistant shape subordinate to the selected shape. This option is available only in organization charts.
Take Note You cannot add a shape above the top-level shape in an organization chart.
Removing a Shape from a DiagramYou can easily delete shapes you don’t need. When you remove a shape from a diagram, PowerPoint resizes the other shapes to take advantage of the increased space in the diagram container. Font sizes usually increase accordingly, too. For this reason, you should not do any manual formatting of text and shape size until you have fi nalized the number of shapes in the diagram. You will learn about manually formatting the text and shapes later in this lesson.
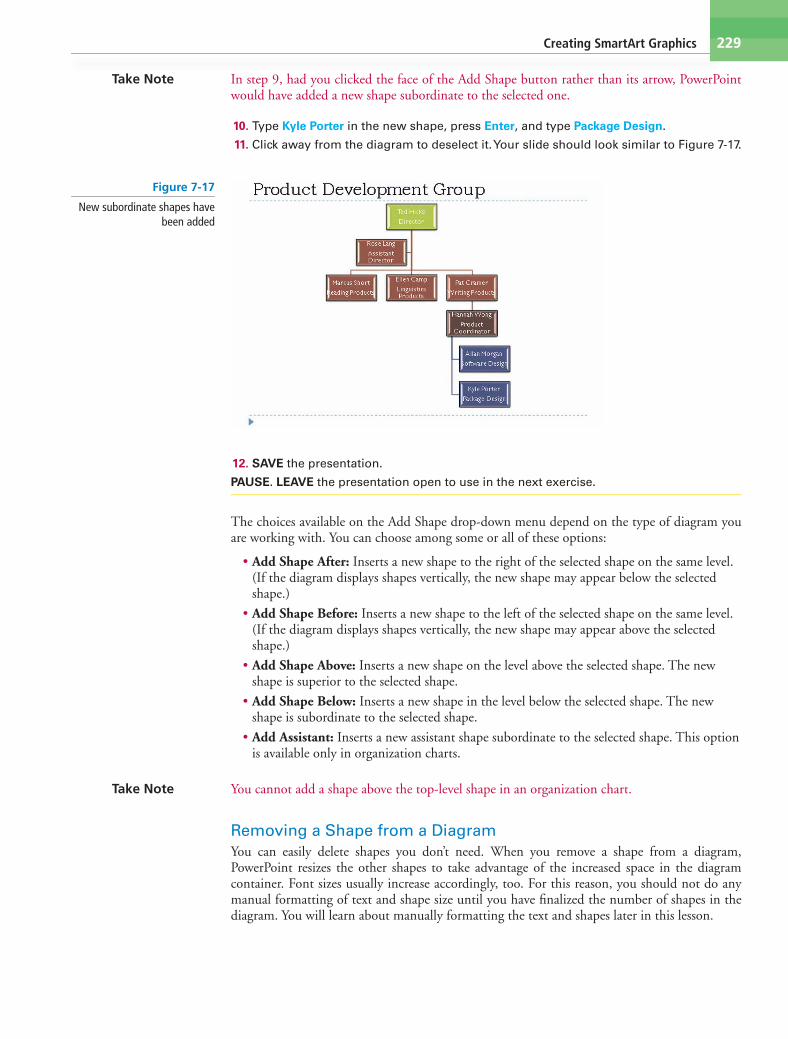
Take Note In step 9, had you clicked the face of the Add Shape button rather than its arrow, PowerPoint would have added a new shape subordinate to the selected one.
10. Type Kyle Porter in the new shape, press Enter, and type Package Design.
11. Click away from the diagram to deselect it. Your slide should look similar to Figure 7-17.
Figure 7-17
New subordinate shapes have been added
c07CreatingSmartArtGraphics.indd Page 229 8/26/11 1:42 PM user f-404 F-402

230 Lesson 7
STEP BY STEP Remove a Shape from a Diagram
USE the Litware Final presentation that is still open from the previous exercise.
1. Go to slide 4, and click the diagram to select it.
2. Click the Update shape to select it. Make sure you select the shape, and not the text within it.
3. Press Delete. PowerPoint removes the shape and reconfi gures the diagram, as shown in Figure 7-18.
4. SAVE the presentation.
PAUSE. LEAVE the presentation open to use in the next exercise.
Changing a Diagram’s OrientationYou can change the look of a diagram by modifying the way shapes are positioned in the dia-gram. You can use the Right to Left and Layout buttons to adjust diagram orientation. In this exercise, you will reverse a diagram’s orientation and change the layout of a section of an orga-nization chart.
STEP BY STEP Change a Diagram’s Orientation
USE the Litware Final presentation that is still open from the previous exercise.
1. Go to slide 3 and click the diagram to select it. Make sure you select the entire diagram.
2. Click the SmartArt Tools Design tab, if it is not already displayed.
Figure 7-18
A shape has been deleted, and the remaining shapes spread
out to take up its space
3.4.1
How do you add and remove shapes in a diagram?
c07CreatingSmartArtGraphics.indd Page 230 8/26/11 1:42 PM user f-404 F-402

Creating SmartArt Graphics 231
3. Click the Right to Left button in the Create Graphic group. PowerPoint fl ips the diagram horizontally so that shapes on the right side of the diagram are now on the left side, as shown in Figure 7-19.
4. Click in the top-level shape (Ted Hicks). Make sure you select the shape, and not the text within it.
5. Click the Layout button in the Create Graphic group. PowerPoint displays options for positioning the shapes relative to the top-level shape.
6. Click Left Hanging. The subordinate shapes are arranged vertically below the top-level shape, rather than horizontally, as shown in Figure 7-20.
7. Click the Layout button, then click Standard to restore the original layout.
Figure 7-19
Use Right to Left to switch the diagram’s orientation
Figure 7-20
The subordinate shapes appear vertically
c07CreatingSmartArtGraphics.indd Page 231 8/26/11 1:42 PM user f-404 F-402

232 Lesson 7
9. SAVE the presentation.
PAUSE. LEAVE the presentation open to use in the next exercise.
You can use the Right to Left button with any diagram that distributes shapes and information horizontally across the slide. Right to Left has no impact on diagrams that center information, such as Pyramid diagrams.
The Layout button is available only in organization charts with a shape that is superior to sub-ordinate shapes selected.
You do not have to use the default orientation and positioning of shapes if you would prefer another arrangement. You can click any shape to select it and drag it to a new location. If the shape is connected to other shapes, as in an organization chart, the connector lines shift position or change shape to maintain the connection.
Reordering ShapesIn addition to changing the diagram’s entire orientation, you can also reorder the individual shapes by using the Move Up and Move Down buttons. Be aware, however, that the directions “up” and “down” are relative and, depending on the position of the shape in the diagram, may not correspond to the actual direction being moved. In this exercise, you will move a shape to a different location in a diagram.
STEP BY STEP Move a Shape in a Diagram
USE the Litware Final presentation that is still open from the previous exercise.
1. Go to slide 4 and click the diagram to select it.
2. Click the Testing shape on the diagram.
3. On the SmartArt Tools Design tab, click Move Down. The shape moves one position in a clockwise direction. Note that in this example, Move Down actually moves the shape upward in the diagram.
4. Click Move Up. The shape moves one position in a counter-clockwise direction.
5. SAVE the presentation.
PAUSE. LEAVE the presentation open to use in the next exercise.
Figure 7-21
Layout has been changed for Hannah Wong’s subordinates
8. Click the Hannah Wong shape, click the Layout button, and then click Both. The subordinate shapes display horizontally rather than vertically, as shown in Figure 7-21.
3.4.4
How do you reorder shapes in a diagram?
c07CreatingSmartArtGraphics.indd Page 232 8/26/11 1:42 PM user f-404 F-402

Creating SmartArt Graphics 233
Promoting and Demoting ShapesYou can add, remove, or modify shapes by promoting or demoting diagram text. When you promote an item, you move it up a level. When you demote an item, you make it subordi-nate to the item above it in the hierarchy. This procedure is similar to changing the indent level of items in a bulleted list. In the following exercise, you learn how to promote a shape.
STEP BY STEP Promote a Shape
USE the Litware Final presentation that is still open from the previous exercise.
1. Click the diagram on slide 3 to select it, if necessary.
2. If the text pane is not already open, click the Text Pane button on the SmartArt Tools Design tab.
3. In the Text pane, click the Hannah Wong bulleted item. Notice in the Text pane that this item is indented below the Pat Cramer bulleted item.
4. Click the Promote button in the Create Graphic group. Hannah Wong’s shape jumps up one level, and her two subordinates are also promoted, as shown in Figure 7-22.
3.4.8
How do you promote bullet levels in SmartArt?
Figure 7-22
Promoting a shape Promote button
Hanna Wong has been promoted one level.
5. Click the Text Pane button to hide the text pane again.
6. SAVE the presentation.
PAUSE. LEAVE the presentation open to use in the next exercise.
What happens when you promote or demote an item in a diagram depends on whether you are promoting shape text or bulleted text:
• In many diagrams, you cannot promote shape text at all because shapes are already fi rst-level items by default. An exception is hierarchical charts such as organization charts. You can promote any shape except the top-level shape; when you promote a shape, it moves up to the level superior to its original position.
• If you promote a bulleted text item, it becomes a shape containing fi rst-level shape text.
• If you demote shape text, it becomes a bullet item.
• If you demote a bulleted text item, it indents further, just as when you make a bullet item subordinate on a slide.
3.4.9
How do you demote bullet levels in SmartArt?
c07CreatingSmartArtGraphics.indd Page 233 8/26/11 1:42 PM user f-404 F-402

234 Lesson 7
When you promote one bulleted item in a placeholder that contains several bulleted items, the other bulleted items may become subordinate to the new shape text. You may need to move bul-leted items back to their original shape in this case. You can use Cut and Paste in the Text pane to move bulleted items from one location to another.
Choosing a Different Type of SmartArt DiagramSometimes the hardest part about working with SmartArt is selecting the type and layout that will best display your data. Fortunately, you can easily change the diagram type even after you have created and formatted a diagram. Some diagrams will convert very well to a different type, while others will not fi t the shape layout of the new type at all. You may need to retype informa-tion to display it properly in a different diagram type. The following exercise shows how to select a different diagram type and layout.
STEP BY STEP Choose a Different SmartArt Diagram Type and Layout
USE the Litware Final presentation that is still open from the previous exercise.
1. Go to slide 4 and click the diagram to select it.
2. Click the More button in the Layouts group, then click More Layouts at the bottom of the gallery to open the Choose a SmartArt Graphic dialog box.
3. Click the Process type in the left pane, then click the Upward Arrow layout in the center pane.
4. Click OK. PowerPoint converts the diagram to the process diagram shown in Figure 7-23.
Figure 7-23
The cycle diagram is changed to a process diagram
5. SAVE the presentation.
PAUSE. LEAVE the presentation open to use in the next exercise.
Changing Shape AppearanceFinal adjustments to a SmartArt diagram include tweaking the size of shapes and modifying text formatting. PowerPoint formats shapes so that all will fi t comfortably in the diagram container. If you have only a few shapes, you might fi nd that this results in a diagram where shapes are much larger than they need to be to hold their text. Conversely, you may want to increase shape size to draw attention to one specifi c shape. These types of appearance changes can improve the look of a diagram and make it easier to read. In this exercise, you will learn how to change the size of a shape.
c07CreatingSmartArtGraphics.indd Page 234 8/26/11 1:42 PM user f-404 F-402

Creating SmartArt Graphics 235
STEP BY STEP Change Shape Size
USE the Litware Final presentation that is still open from the previous exercise.
1. Close the Text pane if it is open.
2. Select the diagram on slide 4 if it is not already selected, then click the Needs/Market Analysis circle (the circle nearest the thin end of the arrow graphic) to select it.
3. Click the SmartArt Tools Format tab.
4. Click the Larger button in the Shapes group twice to increase the size of the smallest circle.
5. Click the Design/Proof of Concept circle shape, then click the Larger button once to increase the shape’s size.
6. Click the Roll-out circle shape, then click the Smaller button in the Shapes group once to decrease the shape size. Then click away from the diagram to deselect it. Your diagram should look like Figure 7-24.
3.4.7
How do you make SmartArt shapes larger or smaller?
Troubleshooting If you select the text box rather than the shape, click outside the text box to deselect it, and then try again by clicking the left edge of the shape with the four-headed pointer.
7. SAVE the presentation.
PAUSE. LEAVE the presentation open to use in the next exercise.
Take Note You can also change shape appearance by selecting a completely new shape: right-click a shape, click Change Shape, and select the desired shape from the Shapes gallery.
Take care when enlarging or reducing shapes. You risk ending up with an inconsistent-looking diagram that is much less attractive than one in which shape sizes are identical or graduated ac-cording to an obvious pattern.
Changing Text F ormattingPowerPoint automatically adjusts font sizes to fi t in or around shapes. If you do not fi nd the size or color of text in a diagram attractive or easy to read, you can use the Home tab’s formatting op-tions to adjust font formats such as size, color, or style. You can also adjust alignment in shapes just as you would in any PowerPoint placeholder.
If you modify text formats with the diagram itself selected, all text within the diagram will display the new format. To apply a new text format to a single shape, select that shape fi rst. Text placeholders in a diagram are selected the same way as other slide placeholders are. In this exercise, you will format the text in a SmartArt diagram.
Figure 7-24
Several shapes have been resized
c07CreatingSmartArtGraphics.indd Page 235 8/26/11 1:42 PM user f-404 F-402

236 Lesson 7
STEP BY STEP Change Text Formatting
USE the Litware Final presentation that is still open from the previous exercise.
1. On slide 4, select the outer frame of the diagram (not a specifi c shape within it).
2. On the Home tab, click the Font Size drop-down arrow, then click 20. PowerPoint changes the size of all text in the diagram to 20 point, as shown in Figure 7-25.
Figure 7-25
Enlarging text size for easier reading
Figure 7-26
The completed process diagram
3. Click the Needs/Market analysis text box and drag its border to reduce its width slightly so that the word Market moves completely to the second line.
4. Click the Design/Proof of concept text box and expand its width so that the word Proof displays completely on the fi rst line.
5. Press the right arrow key on the keyboard three times to move the text box slightly to the right so its text does not overlap the circle shape.
6. Widen the Development text box so the word fi ts on a single line, and move the text box to the right slightly, as you did in steps 4 and 5. Your completed diagram should look similar to Figure 7-26.
7. Go to slide 3 and click the diagram to select it.
8. Click the outside edge of the Ted Hicks shape.
9. Click the Font Color drop-down arrow on the Home tab, then click Black, Text 1. The text in that shape is now easier to read against the light green fi ll.
c07CreatingSmartArtGraphics.indd Page 236 8/26/11 1:42 PM user f-404 F-402

Creating SmartArt Graphics 237
11. SAVE the presentation.
PAUSE. LEAVE the presentation open to use in the next exercise.
CONVERTING SMARTART TO OTHER FORMATSYou can change a SmartArt diagram to another content type in PowerPoint without losing your work. If you want to preserve the text you’ve typed in the diagram, convert it to text. If you want to preserve the look of the SmartArt, but you don’t care if it’s still editable as a diagram, convert it to shapes.
Converting SmartArtWhen you convert SmartArt to text, the text in the SmartArt object changes to a bulleted list. Top-level shape text becomes top-level bullet points, and subordinate shapes become subor-dinate bullets. When you convert SmartArt to shapes, the diagram changes to a set of drawn shapes and lines, like the ones you might draw yourself using the Shapes button on the Insert tab. In this exercise, you will convert SmartArt diagrams to text and graphics.
STEP BY STEP Convert SmartArt
USE the Litware Final presentation that is still open from the previous exercise.
1. Go to slide 4 and select the SmartArt object.
2. On the SmartArt Tools Design tab, click the Convert button, then click Convert to Text from the menu that appears. The SmartArt is converted to a bulleted list.
3. Go to slide 3 and select the SmartArt object.
4. On the SmartArt Tools Design tab, click the Convert button, then click Convert to Shapes. The diagram changes to a set of shapes.
5. Click inside the diagram to confi rm that the SmartArt tabs on the Ribbon do not appear.
6. Click one of the diagram’s shapes. Notice that the Drawing Tools Format tab becomes available, indicating it is a drawn shape object.
7. SAVE the presentation and CLOSE it.
EXIT PowerPoint.
The Bottom Line
Figure 7-27
The completed organization chart
10. Click the Bold button on the Home tab. All text in the shape is bolded. Your diagram should look like Figure 7-27.
3.4.5
How do you convert SmartArt to text?
3.4.6
How do you convert SmartArt to shapes?
c07CreatingSmartArtGraphics.indd Page 237 8/26/11 1:42 PM user f-404 F-402

238 Lesson 7
SUMMARY SKILL MATRIX
In This Lesson ObjectiveYou Learned How To: Exam Objective Number
Add SmartArt to a slide. Convert text to SmartArt. 2.5.5 Convert WordArt to SmartArt. 3.3.4
Modify SmartArt. Add and remove shapes. 3.4.1 Change SmartArt styles. 3.4.2 Change SmartArt layout. 3.4.3 Reorder shapes. 3.4.4 Make (SmartArt) shapes larger 3.4.7 or smaller. Promote bullet levels (in SmartArt). 3.4.8 Demote bullet levels (in SmartArt). 3.4.9
Convert SmartArt to other formats. Convert a SmartArt graphic to text. 3.4.5 Convert SmartArt to shapes. 3.4.6
Knowledge Assessment
Matching
Match the term in Column 1 to its description in Column 2.
Column 1 Column 2
1. Promote a. Diagram type that shows relationships among departments or personnel
2. Assistant b. Diagram type that can show steps in a timeline
3. SmartArt c. Holds the name of the person or department at the head of the organization
4. Organization chart d. Person who reports directly to a staff member
5. Process e. Panel in which you can type diagram text
6. Top-level shape f. Change shape text into a bullet item
7. Matrix g. Change a bullet item to shape text
8. Text pane h. Visual representation of information
9. Demote i. Departments that report to the head of the organization
10. Subordinates j. Diagram type that shows how parts relate to a whole
True/False
Circle T if the statement is true or F if the statement is false.
T F 1. List type diagrams show information that has to be in a particular order.
T F 2. Text in a SmartArt diagram can appear either in a shape or in a bulleted list.
T F 3. Use a Cycle type diagram if you want to show a repeating process.
T F 4. The Standard Colors gallery allows you to apply variations of theme colors to a diagram.
T F 5. You can apply a style to a SmartArt diagram from the SmartArt Tools Layout tab.
T F 6. The Add Shape Below option inserts a subordinate shape.
T F 7. The Layout button is available for all diagram types.
c07CreatingSmartArtGraphics.indd Page 238 8/26/11 1:42 PM user f-404 F-402

Creating SmartArt Graphics 239
T F 8. To remove a shape, select it and press the Delete key on the keyboard.
T F 9. You have to retype text if you change from one SmartArt layout to another.
T F 10. SmartArt can be converted to a bulleted list or to shapes.
Competency Assessment
Project 7-1: Corporate ReorganizationYou are the director of operations at Fabrikam, Inc., a company that develops fabric treatments for use in the textile industry. Your company is undergoing reorganization, and you need to prepare a presen-tation that shows how groups will be aligned in the new structure. You can use a SmartArt diagram to show the new organization.
GET READY. LAUNCH PowerPoint if it is not already running.
1. OPEN the Reorganization presentation and save it as Reorganization Final.
2. Go to slide 2 and click the Insert SmartArt Graphic icon in the content placeholder.
3. Click the Hierarchy type, click the Hierarchy layout, and then click OK.
4. Click in the top-level shape and type Operations.
5. Click in the fi rst second-level shape and type Production.
6. Click in the second second-level shape and type R & D.
7. Click in the fi rst third-level shape and type Manufacturing.
8. Delete the other third-level shape under Production.
9. Click in the remaining third-level shape (under R & D) and type Quality Assurance.
10. Click the Manufacturing shape to select it. Then click the Add Shape drop-down arrow and select Add Shape Below.
11. Type Fulfi llment in the new shape.
12. Display the SmartArt Styles gallery and click the Polished style (the fi rst style under 3D Effect).
13. Display the Change Colors gallery and click one of the Colorful gallery choices.
14. Display the Layouts gallery and click the Horizontal Hierarchy layout.
15. SAVE the presentation and CLOSE the fi le.
LEAVE PowerPoint open for use in the next project.
Project 7-2: Meeting AgendaYou work for the city manager of Center City. She has asked you to create an agenda to display at an upcoming meeting of the city’s department heads. She has supplied the bulleted text on an existing slide. You can use this text to make the agenda look more interesting.
1. OPEN the Meeting Agenda presentation.
2. Click in the content placeholder, click the Convert to SmartArt Graphic button, and then click More SmartArt Graphics.
3. Click the Vertical Box List layout, then click OK.
4. Click the fi rst shape to select it, click the Add Shape drop-down arrow, and then click Add Shape After.
5. Type Budget Cuts in the new shape.
6. Display the Layout gallery and click the Vertical Bullet List layout.
7. Display the Change Colors gallery and click the Transparent Gradient Range—Accent 5 option.
8. SAVE the presentation as Meeting Agenda Final and CLOSE the fi le.
LEAVE PowerPoint open for use in the next project.
The Reorganiza-tion fi le is available on the book companion website or in WileyPLUS.
The Meeting Agenda fi le is available on the book companion website or in WileyPLUS.
c07CreatingSmartArtGraphics.indd Page 239 8/26/11 1:42 PM user f-404 F-402

240 Lesson 7
Profi ciency Assessment
Project 7-3: Wine ListYou are the general manager of the Coho Winery, and you are about to present some new wines to your staff. You can make the information more visually exciting using a SmartArt diagram.
1. OPEN the New Wines presentation.
2. Convert the bulleted list to the Vertical Block List diagram.
3. Click the empty shape at the top of the diagram and remove it.
4. Click at the end of the one Premium bulleted item, press Enter, and type Coho Reserve Chardonnay $31.99.
5. Change the orientation of the diagram so that the shape text is at the right and the bulleted text at the left.
6. Reduce the size of the Whites, Reds, Sparkling, and Premium shapes by selecting each and clicking the Smaller button one time.
7. Apply a SmartArt Style of your choice to the diagram.
8. Apply a new color scheme of your choice to the diagram using the Change Colors button on the SmartArt Tools Design tab.
9. Change the text color to black in the shapes at the right side of the diagram.
10. SAVE the presentation as New Wines Final and CLOSE the fi le.
LEAVE PowerPoint open for use in the next project.
Project 7-4: On PaperYou are the plant manager for Northwind Paper Company. You are scheduled to give a presentation to a class of art students to explain how paper is made. You can use a diagram to make the process more visually interesting.
1. OPEN the Paper presentation.
2. Go to slide 4 and insert a new SmartArt diagram. In the Relationship type, choose the Funnel layout.
3. Display the Text pane and replace the placeholder text with the following four items:
Pulp
Stock
Press & Dry
Paper
4. Apply the Subtle Effect style to the diagram.
5. Change the diagram to the Staggered Process layout in the Process type.
6. Change the font size of all shapes in the diagram to 32 pt.
7. SAVE the presentation as Paper Final and CLOSE the fi le.
LEAVE PowerPoint open for use in the next project.
The New Wines fi le is available on the book compan-ion website or in WileyPLUS.
The Paper fi le is avail-able on the book companion website or in WileyPLUS.
The Tigers fi le is avail-able on the book companion website or in WileyPLUS.
Mastery Assessment
Project 7-5: Tiger TalesYou are the owner of a karate studio that specializes in teaching youngsters. You are working on a presentation to give at local schools and after-school care centers. You want to add a diagram to your presentation to stress the importance of having the proper attitude when learning karate.
1. OPEN the Tigers presentation.
2. Go to slide 3 and use the bulleted list to create a new SmartArt diagram using the Titled Matrix layout. Note that only the fi rst bulleted item displays in the diagram.
c07CreatingSmartArtGraphics.indd Page 240 8/26/11 1:42 PM user f-404 F-402

Creating SmartArt Graphics 241
3. Display the Text pane, if necessary, and click the Respect item, which is currently grayed out with a red X over the bullet.
4. Demote this item. It will then display in the upper-left matrix shape. However, you still can’t see it because its text is the same color as the background.
5. Change the text color for the demoted text to white.
6. Repeat steps 4 and 5 for each of the other bullet points, so they all become visible.
7. Change the orientation of the diagram to Right-to-Left.
8. Apply a SmartArt style of your choice.
9. Use the Shape Fill menu to apply a fi ll color to the Core Beliefs shape that is not a theme color but coordinates well with the other shape colors.
10. On the SmartArt Tools Design tab, click Convert, then Convert to Shapes. The diagram is converted to a graphic.
11. SAVE the presentation as Tigers Final and CLOSE the fi le.
LEAVE PowerPoint open for use in the next project.
Project 7-6: Pie TimeYou are the franchising manager for Coho Pie Safe, a chain of bakeries specializing in fresh-baked pies and other bakery treats. You are working on a presentation to help potential franchisees understand the company. Use a diagram to display information about revenue sources.
1. OPEN the Pies presentation.
2. Go to slide 3 and insert a Basic Pie diagram from the Relationship type.
3. Use the Text pane to insert the following information in the diagram:
Birthdays
Weddings
Reunions
4. Add two new shapes to the pie with the text Restaurants and Church Socials.
5. Change the diagram type to a Vertical Arrow List layout.
6. Click in the arrow shape to the right of the Birthdays shape and type All ages.
7. Add bulleted text as follows for the remaining arrows:
Weddings Both formal and informal
Reunions Per item or bulk sales
Restaurants Steady income year round
Church Socials Per item or bulk sales
8. Adjust shape size and bulleted text size as necessary to make the diagram text smaller so it looks more proportional to the slide title.
9. Apply a SmartArt style and a different color scheme of your choice.
10. Click each of the bulleted list arrow shapes and adjust the vertical text alignment to Middle. (Hint: Use the Align Text button in the Paragraph group on the Home tab.)
11. SAVE the presentation as Pies Final and CLOSE the fi le.
EXIT PowerPoint.
The Pies fi le is avail-able on the book companion website or in WileyPLUS.
diagrams in your presentation to display the guidelines. Use SmartArt diagrams for each pyramid. Create a fi nal slide that shows the current guidelines. They are displayed as bands that run from the top of the pyramid to the base, but you can convert these bands to typical pyramid slices.
INTERNET READYThe U.S. Department of Agriculture has re-
worked its Food Pyramid a few times over the past decade. Create a presentation to show how food guidelines have evolved from version to version. Use the Internet to fi nd as many previous versions as you can and create pyramid
c07CreatingSmartArtGraphics.indd Page 241 8/26/11 1:42 PM user f-404 F-402