Overview of Computer Graphics
48
1 UNIT- 1 Overview of Computer Graphics What is computer Graphics? Computer graphics is an art of drawing pictures, lines, charts, etc. using computers with the help of programming. Computer graphics image is made up of number of pixels. Pixel is the smallest addressable graphical unit represented on the computer screen. Introduction Computer is information processing machine. User needs to communicate with computer and the computer graphics is one of the most effective and commonly used ways of communication with the user. It displays the information in the form of graphical objects such as pictures, charts, diagram and graphs. Graphical objects convey more information in less time and easily understandable formats for example statically graph shown in stock exchange. In computer graphics picture or graphics objects are presented as a collection of discrete pixels. We can control intensity and color of pixel which decide how picture look like. The special procedure determines which pixel will provide the best approximation to the desired picture or graphics object this process is known as Rasterization. The process of representing continuous picture or graphics object as a collection of discrete pixels is called Scan Conversion. Advantages of computer graphics Computer graphics is one of the most effective and commonly used ways of communication with computer. It provides tools for producing picture of “real-world” as well as synthetic objects such as mathematical Surfaces in 4D and of data that have no inherent geometry such as survey result. It has ability to show moving pictures thus possible to produce animations with computer graphics. With the use of computer graphics we can control the animation by adjusting the speed, portion of picture in view the amount of detail shown and so on. It provides tools called motion dynamics. In which user can move objects as well as observes as per requirement for example walk throw made by builder to show flat interior and surrounding. It provides facility called update dynamics. With this we can change the shape color and other properties of object. Now in recent development of digital signal processing and audio synthesis chip the interactive graphics can now provide audio feedback along with the graphical feed backs. Application of computer graphics User interface: - Visual object which we observe on screen which communicates with user is one of the most useful applications of the computer graphics. Plotting of graphics and chart in industry, business, government and educational organizations drawing like bars, pie-charts, histogram’s are very useful for quick and good decision making. Office automation and desktop publishing: - It is used for creation and dissemination of information. It is used in in-house creation and printing of documents which contains text, tables, graphs and other forms of drawn or scanned images or picture.
-
Upload
khangminh22 -
Category
Documents
-
view
5 -
download
0
Transcript of Overview of Computer Graphics

1
UNIT- 1
Overview of Computer Graphics
What is computer Graphics?
Computer graphics is an art of drawing pictures, lines, charts, etc. using computers with the help of
programming. Computer graphics image is made up of number of pixels. Pixel is the smallest addressable
graphical unit represented on the computer screen.
Introduction
Computer is information processing machine. User needs to communicate with computer and the computer
graphics is one of the most effective and commonly used ways of communication with the user.
It displays the information in the form of graphical objects such as pictures, charts, diagram and graphs.
Graphical objects convey more information in less time and easily understandable formats for example statically
graph shown in stock exchange.
In computer graphics picture or graphics objects are presented as a collection of discrete pixels.
We can control intensity and color of pixel which decide how picture look like.
The special procedure determines which pixel will provide the best approximation to the desired picture or
graphics object this process is known as Rasterization.
The process of representing continuous picture or graphics object as a collection of discrete pixels is called
Scan Conversion.
Advantages of computer graphics
Computer graphics is one of the most effective and commonly used ways of communication with
computer.
It provides tools for producing picture of “real-world” as well as synthetic objects such as mathematical
Surfaces in 4D and of data that have no inherent geometry such as survey result.
It has ability to show moving pictures thus possible to produce animations with computer graphics.
With the use of computer graphics we can control the animation by adjusting the speed, portion of picture in
view the amount of detail shown and so on.
It provides tools called motion dynamics. In which user can move objects as well as observes as per
requirement for example walk throw made by builder to show flat interior and surrounding.
It provides facility called update dynamics. With this we can change the shape color and other properties of object.
Now in recent development of digital signal processing and audio synthesis chip the interactive graphics can now
provide audio feedback along with the graphical feed backs.
Application of computer graphics
User interface: - Visual object which we observe on screen which communicates with user is one of the most
useful applications of the computer graphics.
Plotting of graphics and chart in industry, business, government and educational organizations drawing like bars,
pie-charts, histogram’s are very useful for quick and good decision making.
Office automation and desktop publishing: - It is used for creation and dissemination of information. It is used in
in-house creation and printing of documents which contains text, tables, graphs and other forms of drawn or
scanned images or picture.

2
Computer aided drafting and design: - It uses graphics to design components and system such as automobile
bodies structures of building etc.
Simulation and animation: - Use of graphics in simulation makes mathematic models and mechanical systems
more realistic and easy to study.
Art and commerce: - There are many tools provided by graphics which allows used to make their picture animated
and attracted which are used in advertising.
Process control: - Now a day’s automation is used which is graphically displayed on the screen.
Cartography: - Computer graphics is also used to represent geographic maps, weather maps,
oceanographic charts etc.
Education and training: - Computer graphics can be used to generate models of physical, financial and economic
systems. These models can be used as educational aids.
Image processing: - It is used to process image by changing property of the image.
Display devices
Display devices are also known as output devices.
Most commonly used output device in a graphics system is a video monitor.
Cathode-ray-tubes
Fig. 1.1: - Cathode ray tube.
It is an evacuated glass tube.
An electron gun at the rear of the tube produce a beam of electrons which is directed towards the screen of
the tube by a high voltage typically 15000 to 20000 volts
Inner side screen is coated with phosphor substance which gives light when it is stroked bye electrons.
Control grid controls velocity of electrons before they hit the phosphor.
The control grid voltage determines how many electrons are actually in the electron beam. The negative the
control voltage is the fewer the electrons that pass through the grid.
Thus control grid controls Intensity of the spot where beam strikes the screen.
The focusing system concentrates the electron beam so it converges to small point when hits the phosphor
coating.
Deflection system directs beam which decides the point where beam strikes the screen.
Deflection system of the CRT consists of two pairs of parallel plates which are vertical and horizontal
deflection plates.
Voltage applied to vertical and horizontal deflection plates is control vertical and horizontal deflection

3
CPU
I/O Port
Keyboard Mouse
respectively.
There are two techniques used for producing images on the CRT screen:
1. Vector scan/Random scans display.
2. Raster scan display.
Vector scan/Random scan display
(Interaction
data)
(Display command)
Fig. 1.2: - Architecture of a vector display.
Vector scan display directly traces out only the desired lines on CRT.
If we want line between point p1 & p2 then we directly drive the beam deflection circuitry which focus beam
directly from point p1 to p2.
If we do not want to display line from p1 to p2 and just move then we can blank the beam as we move it.
To move the beam across the CRT, the information about both magnitude and direction is required. This
information is generated with the help of vector graphics generator.
Fig. 1.2 shows architecture of vector display. It consists of display controller, CPU, display buffer memory and
CRT.
Display controller is connected as an I/O peripheral to the CPU.
Display buffer stores computer produced display list or display program.
The Program contains point & line plotting commands with end point co-ordinates as well as character plotting
commands.
Display controller interprets command and sends digital and point co-ordinates to a vector generator.
Vector generator then converts the digital co-ordinate value to analog voltages for beam deflection circuits
that displace an electron beam which points on the CRT’s screen.
In this technique beam is deflected from end point to end point hence this techniques is also called random
scan.
We know as beam strikes phosphors coated screen it emits light but that light decays after few
milliseconds and therefore it is necessary to repeat through the display list to refresh the screen at least 30 times
per second to avoid flicker.
As display buffer is used to store display list and used to refreshing, it is also called refresh buffer.
CRT Display controller
Display
buffer
memory

4
CPU
I/O Port
00000000000000000
00000111111100000
00000000100000000
00000000100000000
00000000100000000
Mouse
Keyboard
Display controller
Raster scan display
Refresh buffer
(Interaction
data)
(Display command
Fig. 1.3: - Architecture of a raster display.
Fig. 1.3 shows the architecture of Raster display. It consists of display controller, CPU, video controller, refresh
buffer, keyboard, mouse and CRT.
The display image is stored in the form of 1’s and 0’s in the refresh buffer.
The video controller reads this refresh buffer and produces the actual image on screen.
It will scan one line at a time from top to bottom & then back to the top.
Vertical
Retrace
Horizontal
Retrace
Fig. 1.4: - Raster scan CRT.
In this method the horizontal and vertical deflection signals are generated to move the beam all over the screen in a
pattern shown in fig. 1.4.
Here beam is swept back & forth from left to the right.
When beam is moved from left to right it is ON.
CRT
T Video controller
OFF ON

5
When beam is moved from right to left it is OFF and process of moving beam from right to left after
completion of row is known as Horizontal Retrace.
When beam is reach at the bottom of the screen. It is made OFF and rapidly retraced back to the top left to start
again and process of moving back to top is known as Vertical Retrace.
The screen image is maintained by repeatedly scanning the same image. This process is known as
Refreshing of Screen.
In raster scan displays a special area of memory is dedicated to graphics only. This memory is called
Frame Buffer.
Frame buffer holds set of intensity values for all the screen points.
That intensity is retrieved from frame buffer and display on screen one row at a time.
Each screen point referred as pixel or Pel (Picture Element).
Each pixel can be specified by its row and column numbers.
It can be simply black and white system or color system.
In simple black and white system each pixel is either ON or OFF, so only one bit per pixel is needed.
Additional bits are required when color and intensity variations can be displayed up to 24-bits per pixel are
included in high quality display systems.
On a black and white system with one bit per pixel the frame buffer is commonly called a Bitmap. And for
systems with multiple bits per pixel, the frame buffer is often referred as a Pixmap.
Difference between random scan and raster scan
Base of Difference Raster Scan System Random Scan System
Electron Beam The electron beam is swept across the
screen, one row at a time, from top to
bottom.
The electron beam is directed only to the
parts of screen where a picture is to be
drawn.
Resolution Its resolution is poor because raster
system in contrast produces zigzag
lines that are plotted as discrete point
sets.
Its resolution is good because this system
produces smooth lines drawings because
CRT beam directly follows the line path.
Picture Definition Picture definition is stored as a set of
intensity values for all screen points,
called pixels in a refresh buffer area.
Picture definition is stored as a set of line
drawing instructions in a display file.
Realistic Display The capability of this system to store
intensity values for pixel makes it well
suited for the realistic display of scenes
contain shadow and color pattern.
These systems are designed for line-
drawing and can’t display realistic shaded
scenes.
Draw an Image Screen points/pixels are used to draw an
image.
Mathematical functions are used to draw an
image.

6
Color CRT monitors
A CRT monitors displays color pictures by using a combination of phosphors that emit different colored light.
It produces range of colors by combining the light emitted by different phosphors.
There are two basic techniques for color display:
1. Beam-penetration technique
2. Shadow-mask technique
Beam-penetration technique
Fig. 1.5: - Beam-penetration CRT
This technique is used with random scan monitors.
In this technique inside of CRT coated with two phosphor layers usually red and green. The outer layer of red and
inner layer of green phosphor.
The color depends on how far the electron beam penetrates into the phosphor layer.
A beam of fast electron penetrates more and excites inner green layer while slow electron excites outer red layer.
At intermediate beam speed we can produce combination of red and green lights which emit additional two
colors orange and yellow.
The beam acceleration voltage controls the speed of the electrons and hence color of pixel.
It is a low cost technique to produce color in random scan monitors.
It can display only four colors.
Quality of picture is not good compared to other techniques.
Shadow-mask technique
Fig. 1.6: - Shadow-mask CRT.

7
It produces wide range of colors as compared to beam-penetration technique.
This technique is generally used in raster scan displays. Including color TV.
In this technique CRT has three phosphor color dots at each pixel position. One dot for red, one for green and
one for blue light. This is commonly known as Dot Triangle.
Here in CRT there are three electron guns present, one for each color dot. And a shadow mask grid just behind the
phosphor coated screen.
The shadow mask grid consists of series of holes aligned with the phosphor dot pattern.
Three electron beams are deflected and focused as a group onto the shadow mask and when they pass through a
hole they excite a dot triangle.
In dot triangle three phosphor dots are arranged so that each electron beam can activate only its
corresponding color dot when it passes through the shadow mask.
A dot triangle when activated appears as a small dot on the screen which has color of combination of three
small dots in the dot triangle.
By changing the intensity of the three electron beams we can obtain different colors in the shadow mask CRT.
Direct-view storage tubes (DVST)
Fig. 1.7: - Direct-view storage tube.
In raster scan display we do refreshing of the screen to maintain a screen image.
DVST gives alternative method for maintaining the screen image.
DVST uses the storage grid which stores the picture information as a charge distribution just behind the phosphor
coated screen.
DVST consists two electron guns a primary gun and a flood gun.
A primary gun stores the picture pattern and the flood gun maintains the picture display.
A primary gun emits high speed electrons which strike on the storage grid to draw the picture pattern.
As electron beam strikes on the storage grid with high speed, it knocks out electrons from the storage grid
keeping the net positive charge.
The knocked out electrons are attracted towards the collector.
The net positive charge on the storage grid is nothing but the picture pattern.
The continuous low speed electrons from flood gun pass through the control grid and are attracted to the
positive charged area of the storage grid.

8
The low speed electrons then penetrate the storage grid and strike the phosphor coating without affecting
the positive charge pattern on the storage grid.
During this process the collector just behind the storage grid smooth out the flow of flood electrons.
Advantage of DVST
Refreshing of CRT is not required.
Very complex pictures can be displayed at very high resolution without flicker.
Flat screen.
Disadvantage of DVST
They do not display color and are available with single level of line intensity.
For erasing it is necessary to removal of charge on the storage grid so erasing and redrawing process take
several second.
Erasing selective part of the screen cannot be possible.
Cannot used for dynamic graphics application as on erasing it produce unpleasant flash over entire screen.
It has poor contrast as a result of the comparatively low accelerating potential applied to the flood
electrons.
The performance of DVST is somewhat inferior to the refresh CRT.
Flat Panel Display
The term flat panel display refers to a class of video device that have reduced volume, weight & power
requirement compared to a CRT.
As flat panel display is thinner than CRTs, we can hang them on walls or wear on our wrists.
Since we can even write on some flat panel displays they will soon be available as pocket notepads.
We can separate flat panel display in two categories:
1. Emissive displays: - the emissive display or emitters are devices that convert electrical energy into light. For
Ex. Plasma panel, thin film electroluminescent displays and light emitting diodes.
2. Non emissive displays: - non emissive display or non emitters use optical effects to convert sunlight or
light from some other source into graphics patterns. For Ex. LCD (Liquid Crystal Display).
Plasma Panels displays
Fig. 1.8: - Basic design of a plasma-panel display device.

9
This is also called gas discharge displays.
It is constructed by filling the region between two glass plates with a mixture of gases that usually includes
neon.
A series of vertical conducting ribbons is placed on one glass panel and a set of horizontal ribbon is built into the
other glass panel.
Firing voltage is applied to a pair of horizontal and vertical conductors cause the gas at the intersection of the two
conductors to break down into glowing plasma of electrons and ions.
Picture definition is stored in a refresh buffer and the firing voltages are applied to refresh the pixel
positions, 60 times per second.
Alternating current methods are used to provide faster application of firing voltages and thus brighter displays.
Separation between pixels is provided by the electric field of conductor.
One disadvantage of plasma panels is they were strictly monochromatic device that means shows only one color
other than black like black and white.
Thin Film Electroluminescent Displays.
Fig. 1.9: - Basic design of a thin-film electro luminescent display device.
It is similar to plasma panel display but region between the glass plates is filled with phosphors such as zink
sulphide doped with magnesium instead of gas.
When sufficient voltage is applied the phosphors becomes a conductor in area of intersection of the two
electrodes.
Electrical energy is then absorbed by the manganese atoms which then release the energy as a spot of light similar
to the glowing plasma effect in plasma panel.
It requires more power than plasma panel.
In this good color and gray scale difficult to achieve.
Light Emitting Diode (LED) In this display a matrix of multi-color light emitting diode is arranged to form the pixel position in the
display. And the picture definition is stored in refresh buffer.
Similar to scan line refreshing of CRT information is read from the refresh buffer and converted to voltage
levels that are applied to the diodes to produce the light pattern on the display.

10
Liquid Crystal Display (LCD)
Fig. 1.10: - Light twisting shutter effect used in design of most LCD.
It is generally used in small system such as calculator and portable laptop.
This non emissive device produce picture by passing polarized light from the surrounding or from an internal
light source through liquid crystal material that can be aligned to either block or transmit the light.
The liquid crystal refreshes to fact that these compounds have crystalline arrangement of molecules then also
flows like liquid.
It consists of two glass plates each with light polarizer at right angles to each other sandwich the liquid crystal
material between the plates.
Rows of horizontal transparent conductors are built into one glass plate, and column of vertical conductors
are put into the other plates.
The intersection of two conductors defines a pixel position.
In the ON state polarized light passing through material is twisted so that it will pass through the opposite
polarizer.
In the OFF state it will reflect back towards source.
We applied a voltage to the two intersecting conductor to align the molecules so that the light is not twisted.
This type of flat panel device is referred to as a passive matrix LCD.
In active matrix LCD transistors are used at each (x, y) grid point.

11
Transistor cause crystal to change their state quickly and also to control degree to which the state has been
changed.
Transistor can also serve as a memory for the state until it is changed.
So transistor make cell ON for all time giving brighter display then it would be if it had to be refresh
periodically
Advantages of LCD display
Low cost.
Low weight.
Small size
Low power consumption.
Hardcopy Devices
All the output devices can be categorized into two categories
Hard Copy Devices
Soft Copy Devices
Hard copy devices are those that give the output in the tangible form. Printers and Plotters are two common hard
copy devices.
Soft copy devices give output in the intangible form or the virtual form, e.g. something displayed on a screen. All
the computer monitors are covered under this category.
Printers
All the printers irrespective of the technology used can be categorized as
Impact Printers
Non Impact Printers
Impact printers are those printers in which there is a direct contact between the printing head and the paper on
which the print is produced.
they work by striking a head or a needle against an inked ribbon which leaves a mark on the paper.
These printers produce a lot of noise when printing, because of the head striking the paper.
Examples are Dot Matrix, Daisy Wheel and Line printers.
In the case of non-impact printers the printing head never comes in direct contact with the paper.
These printers work by spraying ink on the paper.
Electrostatic or electromagnetic charge is used in these printers.
Examples are Ink-Jet and Laser printers.
Dot-Matrix Printers:
Dot Matrix is an impact printer.
These printer forms characters from individual dots.
These printers have a print head which runs back and forth on a paper.
The print head has a two-dimensional array of pins called dot matrix. There may be 9 to 24 pins in the dot matrix.
From this array of pins some pins are drawn out (or driven forward) to form the shape of a character.
The drawn out pins strike an ink soaked cloth ribbon against a paper. This forms that particular character on the
paper.
Thus dot matrix printers can be used to print different fonts of characters.
Since mechanical force is used; carbon copies of documents can be taken.
40 to 250 characters can be printed per second.
Daisy Wheel Printers:

12
This is an impact printer.
Only preformed fonts of characters can be printed.
This printer contains a daisy wheel. Daisy wheel is made of plastic or metal. This holds an entire character set as
raised characters molded on each "petal".
A motor rotates the daisy wheel to position the required character between the hammer and the ribbon.
A small hammer then strikes the petal, which in turn strikes the inked ribbon to leave the character mark on the
paper.
The daisy wheel and hammer are mounted on a sliding carriage similar to that used by dot matrix printers.
Different fonts cannot be printed using this technology.
Line Printers:
The line printer is a high speed impact printer in which one line is printed at a time.
600-1200 lines can be printed per minute.
Drum printer is an example of line printers.
These printers are very expensive.
These kinds of printers were popular in the early days of computers, but the technology is still in use.
Drum Printers
In a drum printer, a fixed font character set is engraved onto a number of print wheels.
There are as many print wheels as the number of columns (letters in a line) the printer could print.
The print wheels are joined to form a large drum (cylinder),
This drum spins at high speed and paper and an inked ribbon is moved past the print position.
As the desired character for each column passes the print position; a hammer strikes the paper from the rear
and presses the paper against the ribbon and the drum, causing the desired character to be printed on the paper.
Ink-Jet Printers:
Inkjet printer is a non impact printer, Core of an inkjet printer is the print head.
The print head contains an ink cartridge which has a series of nozzles that are used to spray tiny drops of ink on to
the paper.
Ink cartridges come in various combinations, such as separate black and color cartridges, color and black in a
single cartridge or even a cartridge for each ink color.
A motor moves the print head back and forth across the paper.
Different types of inkjet printers form their droplets of ink in different ways. There are two main inkjet
technologies currently used by printer manufacturers
o Thermal bubble - This method is commonly referred to as bubble jet. In a thermal inkjet printer, tiny resistors
create heat, and this heat vaporizes ink to create a bubble. As the bubble expands, some of the ink is pushed out of
a nozzle onto the paper. When the bubble "pops" (collapses), a vacuum is created. This pulls more ink into the
print head from the cartridge. A typical bubble jet print head has 300 or 600 tiny nozzles, and all of them can fire
a droplet simultaneously.
o Piezoelectric - This technology uses piezo crystals. A crystal is located at the back of the ink reservoir of each
nozzle. The crystal receives a tiny electric charge that causes it to vibrate. When the crystal vibrates inward, it
forces a tiny amount of ink out of the nozzle. When it vibrates out, it pulls some more ink into the reservoir to
replace the ink sprayed out.
The ink droplets are subjected to an electrostatic field created by a charging electrode as they form. Charged
droplets are separated by one or more uncharged “guard droplets” to minimize electrostatic repulsion between
neighbouring droplets. The charged droplets pass through an electrostatic field and are directed (deflected) by
electrostatic deflection plates to print on the Paper.
Laser Printers:
A laser printer is a non impact printer, which produces a page of text at a time.
Laser printer uses the principle of Static Electricity to print.
This printer has revolving cylinder called Drum.
Drum is given a positive charge.
A Laser beam is used to draw the image to be printed, on the drum with negative charge. This discharges some
portion of the charge on the drum. This creates electrostatic image of the print on the drum with no charge, and
the background is left positively charged.
The drum is then exposed to toner from which positively charged toner particles mixed with carbon black are
released. Since positive charge repels positive charge, the toner particles settles on the discharged areas of the

13
Frame
Buffer
Display
Processor
Memory
Monitor Video
Controller
CPU Display
Processor
System
Memory
System Bus
drum, this is exactly the image to be printed.
The paper is then pressed against the drum; this transfers the toner particles on to the paper.
Paper is then passed through a fuser, which is a set of heated rollers; this melts the carbon black on the paper to
form the desired print.
Plotters:
Another hard copy output device is plotter. Plotter is a printing device which can draw continuous lines. This is
useful to print vector graphics rather than raster graphics unlike normal printers. Plotters are widely used in
applications like CAD.
Plotters print by moving one or more pen across the surface of a piece of paper. This means that plotters are
restricted to line art, rather than raster graphics as with other printers.
Pen plotters can draw complex line art, including text, but do so slowly because of the mechanical movement of
the pens. They are often incapable of efficiently creating a solid region of color, but can draw an area by drawing
a number of close, regular lines.
Plotters offered the fastest way to efficiently produce very large drawings or color high-resolution vector-based
artwork when computer memory was very expensive and processor power was very limited.
There are a number of different types of plotters:
A drum plotter draws on paper wrapped around a drum which turns to produce one direction of the plot,
while the pens move to provide the other direction.
A flatbed plotter draws on paper placed on a flat surface; and an electrostatic plotter draws on negatively
charged paper with positively charged toner.
Pen plotters have essentially become obsolete, and have been replaced by large-format inkjet printers and toner
based printers.
They are most frequently used for CAE (computer-aided engineering) applications, such as CAD (computer-aided
design) and CAM (computer-aided manufacturing).
Raster-graphics system with a display processor
I/O Devices
Fig. 1.17: - Architecture of a raster-graphics system with a display processor.
One way to designing raster system is having separate display coprocessor.
Purpose of display processor is to free CPU from graphics work.
Display processors have their own separate memory for fast operation.
Main work of display processor is digitalizing a picture definition given into a set of pixel intensity values for

14
store in frame buffer.
This digitalization process is scan conversion.
Display processor also performs many other functions such as generating various line styles (dashed, dotted, or
solid). Display color areas and performing some transformation for manipulating object.
It also interfaces with interactive input devices such as mouse.
For reduce memory requirements in raster scan system methods have been devised for organizing the frame
buffer as a line list and encoding the intensity information.
One way to do this is to store each scan line as a set of integer pair one number indicate number of adjacent
pixels on the scan line that are having same intensity and second stores intensity value this technique is called
run-length encoding.
A similar approach is when pixel. Intensity is changes linearly, encoded the raster as a set of rectangular areas (cell
encoding).
Disadvantages of encoding is when run length is small it requires more memory then original frame buffer.
It also difficult for display controller to process the raster when many sort runs are involved.

15
15
6
5
4
3
2
1
0
0 1 2 3 4 5 6
Output Primitives
Points and Lines
Point plotting is done by converting a single coordinate position furnished by an application program into
appropriate operations for the output device in use.
Line drawing is done by calculating intermediate positions along the line path between two specified endpoint
positions.
The output device is then directed to fill in those positions between the end points with some color.
For some device such as a pen plotter or random scan display, a straight line can be drawn smoothly from one
end point to other.
Digital devices display a straight line segment by plotting discrete points between the two endpoints.
Discrete coordinate positions along the line path are calculated from the equation of the line.
For a raster video display, the line intensity is loaded in frame buffer at the corresponding pixel positions.
Reading from the frame buffer, the video controller then plots the screen pixels.
Screen locations are referenced with integer values, so plotted positions may only approximate actual line
positions between two specified endpoints.
For example line position of (12.36, 23.87) would be converted to pixel position (12, 24).
This rounding of coordinate values to integers causes lines to be displayed with a stair step appearance
(“the jaggies”), as represented in fig 2.1.
Fig. 2.1: - Stair step effect produced when line is generated as a series of pixel positions.
The stair step shape is noticeable in low resolution system, and we can improve their appearance somewhat
by displaying them on high resolution system.
More effective techniques for smoothing raster lines are based on adjusting pixel intensities along the line
paths.
For raster graphics device-level algorithms discuss here, object positions are specified directly in integer device
coordinates.
Pixel position will referenced according to scan-line number and column number which is illustrated by
following figure.
Fig. 2.2: - Pixel positions referenced by scan-line number and column number.
To load the specified color into the frame buffer at a particular position, we will assume we have available
low-level procedure of the form 𝑠𝑒𝑡𝑝𝑖𝑥𝑒(𝑥 , 𝑦).

16
16
Y2
y1
or retrieve the current frame buffer intensity we assume to have procedure 𝑔𝑒𝑡𝑝𝑖𝑥𝑒𝑙(𝑥 , 𝑦).
Line Drawing Algorithms
The Cartesian slop-intercept equation for a straight line is “y = mx + b” with ‘m’ representing slop and ‘b’ as the
intercept.
The two endpoints of the line are given which are say (x1, y1) and (x2, y2).
X1 X2
Fig. 2.3: - Line path between endpoint positions.
We can determine values for the slope m by equation:
m= (𝑦2 − 𝑦1)/(𝑥2 − 𝑥1)
We can determine values for the intercept b by equation:
𝑏 = 𝑦1 − 𝑚 ∗ 𝑥1
For the given interval ∆𝑥 along a line, we can compute the corresponding 𝑦 interval ∆𝑦 as:
∆𝑦 = 𝑚 ∗ ∆𝑥
Similarly for ∆𝑥:
∆𝑥 = ∆𝑦/𝑚
For line with slop |𝑚 | < 1, ∆ can be set proportional to small horizontal deflection voltage and the
corresponding vertical deflection voltage is then set proportional to ∆𝑦 which is calculated from above equation.
For line with slop |𝑚 | > 1, ∆𝑦 can be set proportional to small vertical deflection voltage and the
corresponding horizontal deflection voltage is then set proportional to ∆𝑥 which is calculated from above
equation.
For line with slop 𝑚 = 1, ∆𝑥 = ∆𝑦 and the horizontal and vertical deflection voltages are equal.
DDA Algorithm
Digital differential analyzer (DDA) is scan conversion line drawing algorithm based on calculating either
∆𝑦 or ∆𝑥 using above equation.
We sample the line at unit intervals in one coordinate and find corresponding integer values nearest the line path
for the other coordinate.
Consider first a line with positive slope and slope is less than or equal to 1:
We sample at unit x interval (∆𝑥 = 1) and calculate each successive y value as follow:
𝑦 = 𝑚 ∗ 𝑥 + 𝑏
𝑦𝑘 = 𝑚 ∗ (𝑥 + 1) + 𝑏
In general 𝑦𝑘 = 𝑚 ∗ (𝑥 + 𝑘) + , &
𝑦𝑘+1 = 𝑚 ∗ (𝑥 + 𝑘 + 1) + 𝑏
Now write this equation in form:
𝑦𝑘+1 − 𝑦𝑘 = (𝑚 ∗ (𝑥 + 𝑘 + 1) + 𝑏) – (𝑚 ∗ (𝑥 + 𝑘) + 𝑏)
𝑦𝑘+1 = 𝑦𝑘 + 𝑚
So that it is computed fast in computer as addition is fast compare to multiplication.

17
17
In above equation 𝑘 takes integer values starting from 1 and increase by 1 until the final endpoint is reached.
As 𝑚 can be any real number between 0 and 1, the calculated 𝑦 values must be rounded to the nearest integer.
Consider a case for a line with a positive slope greater than 1:
We change the role of 𝑥 and 𝑦 that is sample at unit 𝑦 intervals (∆𝑦 = 1) and calculate each succeeding
𝑥 value as:
𝑥 = (𝑦 − 𝑏)/𝑚
𝑥1 = ((𝑦 + 1) − 𝑏)/𝑚
In general 𝑥 = ((𝑦 + 𝑘) − 𝑏)/𝑚, &
𝑥𝑘+1 = ((𝑦 + 𝑘 + 1) − 𝑏)/𝑚
Now write this equation in form:
𝑥𝑘+1 − 𝑥𝑘 = (((𝑦 + 𝑘 + 1) − 𝑏)/𝑚) – (((𝑦 + 𝑘) − 𝑏)/𝑚)
𝑥𝑘+1 = 𝑥𝑘 + 1/𝑚
Above both equations are based on the assumption that lines are to be processed from left endpoint to the right
endpoint.
If we processed line from right endpoint to left endpoint than: If
∆𝑥 = −1 equation become:
𝑦𝑘+1 = 𝑦𝑘 – 𝑚
If ∆𝑦 = −1 equation become:
𝑥𝑘+1 = 𝑥𝑘 − 1/𝑚
Above calculated equations also used to calculate pixel position along a line with negative slope.
Procedure for DDA line algorithm.
Void lineDDA (int xa, int ya, int xb, int yb)
{
int dx = xb – xa, dy = yb – ya, steps, k;
float xincrement, yincrement, x = xa, y = ya; if
(abs(dx)>abs(dy))
{
}
else
{
}
Steps = abs (dx);
Steps = abs (dy);
xincrement = dx/(float) steps; yincrement =
dy/(float) steps;
setpixel (ROUND (x), ROUND (y));
for(k=0;k<steps;k++)
{
x += xincrement; y += yincrement;
setpixel (ROUND (x), ROUND (y));
}
}

18
18
Advantages of DDA algorithm
It is faster algorithm.
It is simple algorithm.
Disadvantage of DDA algorithm
Floating point arithmetic is time consuming.
Poor end point accuracy.
Bresenham’s Line Algorithm
An accurate and efficient raster line-generating algorithm, developed by Bresenham which scan converts line using
only incremental integer calculations that can be modified to display circles and other curves.
Figure shows section of display screen where straight line segments are to be drawn.
1
1
1
1
Fig. 2.4: - Section of a display screen where a straight line
segment is to be plotted, starting from the pixel at column 10
on scan line 11.
Fig. 2.5: - Section of a display screen where a negative
slope line segment is to be plotted, starting from the
pixel at column 50 on scan line 50.
The vertical axes show scan-line positions and the horizontal axes identify pixel column.
Sampling at unit 𝑥 intervals in these examples, we need to decide which of two possible pixel position is closer to
the line path at each sample step.
To illustrate bresenham’s approach, we first consider the scan-conversion process for lines with positive slope less
than 1.
Pixel positions along a line path are then determined by sampling at unit 𝑥 intervals.
Starting from left endpoint (𝑥0 , 𝑦0 ) of a given line, we step to each successive column and plot the pixel whose scan-
line 𝑦 values is closest to the line path.
Assuming we have determined that the pixel at (𝑥𝑘 , 𝑦𝑘 ) is to be displayed, we next need to decide which pixel to plot
in column 𝑥𝑘 + 1.
Our choices are the pixels at positions (𝑥𝑘 + 1, 𝑦𝑘 ) and (𝑥𝑘 + 1, 𝑦𝑘 + 1).
Let’s see mathematical calculation used to decide which pixel position is light up.
We know that equation of line is:
𝑦 = 𝑚𝑥 + 𝑏
Now for position 𝑥𝑘 + 1.
= 𝑚(𝑥𝑘 + 1) + 𝑏
Now calculate distance bet actual line’s 𝑦 value and lower pixel as 𝑑1 and distance bet actual line’s 𝑦
value and upper pixel as 𝑑2.
𝑑1 = 𝑦 − 𝑦𝑘
50
49
pecified
ne path
48
47
50 51 52 53 54 55
S
li
3
Spec
line
ified
path
2
1
0
10 11
12
13
14
15

19
19
∆𝑥
d1 = m(xk + 1) + b − yk ...................................................................................................................................................................................................... (1)
𝑑2 = (𝑦𝑘 + 1) − 𝑦
𝑑2 = (𝑦𝑘 + 1) − (𝑥𝑘 + 1) − 𝑏..…………………………………………………………………………………………………………(2)
Now calculate 𝑑1 − 𝑑2 from equation (1) and (2).
𝑑1 − 𝑑2 = (𝑦 – 𝑦𝑘) – ((𝑦𝑘 + 1) – 𝑦)
𝑑1 − 𝑑2 = {(𝑥𝑘 + 1) + 𝑏 − 𝑦𝑘} − {(𝑦𝑘 + 1) − 𝑚(𝑥𝑘 + 1) − 𝑏}
𝑑1 − 𝑑2 = {𝑚𝑥𝑘 + 𝑚 + 𝑏 − 𝑦𝑘} − {𝑦𝑘 + 1 − 𝑚𝑥𝑘 − 𝑚 − 𝑏}
𝑑1 − 𝑑2 = 2(𝑥𝑘 + 1) − 2𝑦𝑘 + 2𝑏 − 1……………………………………………………………………………….……………..(3)
Now substitute 𝑚 = ∆𝑦/∆𝑥 in equation (3)
𝑑1 − 𝑑2 = 2 (∆𝑦) (𝑥𝑘 + 1) − 2𝑦𝑘 + 2𝑏 − 1 ….………………………………….………………………………………………….(4)
Now we have decision parameter 𝑝𝑘 for 𝑘𝑡ℎ step in the line algorithm is given by:
𝑝𝑘 = ∆(𝑑1 − 𝑑2)
𝑝𝑘 = ∆(2∆𝑦/∆𝑥(𝑥𝑘 + 1) – 2𝑦𝑘 + 2𝑏 – 1)
𝑝𝑘 = 2∆𝑦𝑥𝑘 + 2∆𝑦 − 2∆𝑥𝑦𝑘 + 2∆𝑥𝑏 − ∆𝑥
𝑝𝑘 = 2∆𝑦𝑥𝑘 − 2∆𝑥𝑦𝑘 + 2∆𝑦 + 2∆𝑥𝑏 − ∆𝑥 ……………………………………………………….………………………(5)
𝑝𝑘 = 2∆𝑦𝑥𝑘 − 2∆𝑥𝑦𝑘 + 𝐶 (𝑊ℎ𝑒𝑟𝑒 𝐶𝑜𝑛𝑠𝑡𝑎𝑛𝑡 𝐶 = 2∆𝑦 + 2∆𝑥𝑏 − ∆𝑥) ................................................................................... (6)
The sign of 𝑝𝑘 is the same as the sign of 𝑑1 − 𝑑2, since ∆𝑥 > 0 for our example.
Parameter 𝑐 is constant which is independent of pixel position and will eliminate in the recursive
calculation for 𝑝𝑘.
Now if 𝑝𝑘 is negative then we plot the lower pixel otherwise we plot the upper pixel.
So successive decision parameters using incremental integer calculation as:
𝑝𝑘+1 = 2∆𝑦𝑥𝑘+1 − 2∆𝑥𝑦𝑘+1 + C
Now Subtract 𝑝𝑘 from 𝑝𝑘+1
𝑝𝑘+1 − 𝑝𝑘 = 2∆(𝑥𝑘+1 − 𝑥𝑘) -2∆𝑥(𝑦𝑘+1 − 𝑦𝑘)
𝑝𝑘+1 − 𝑝𝑘 = 2∆𝑦𝑥𝑘+1 − 2∆𝑥𝑦𝑘+1 + C − 2∆𝑦𝑥𝑘 + 2∆𝑥𝑦𝑘 − C
But 𝑥𝑘+1 = 𝑥𝑘 + 1, so that (𝑥𝑘+1 − 𝑥𝑘) = 1
𝑝𝑘+1 = 𝑝𝑘 + 2∆𝑦 − 2∆(𝑦𝑘+1 − 𝑦𝑘)
Where the terms 𝑦𝑘+1 − 𝑦𝑘 is either 0 or 1, depends on the sign of parameter 𝑝𝑘.
This recursive calculation of decision parameters is performed at each integer 𝑥 position starting at the left
coordinate endpoint of the line.
The first decision parameter 𝑝0 is calculated using equation (5) as first time we need to take constant part into
account so:
𝑝𝑘 = 2∆𝑦𝑥𝑘 − 2∆𝑥𝑦𝑘 + 2∆𝑦 + 2∆𝑥𝑏 − ∆𝑥
𝑝0 = 2∆𝑦𝑥0 − 2∆𝑥𝑦0 + 2∆𝑦 + 2∆𝑥𝑏 − ∆𝑥
Now 𝑆𝑢𝑏𝑠𝑡𝑖𝑡𝑢𝑡𝑒 𝑏 = 𝑦0 – 𝑚𝑥0
𝑝0 = 2∆𝑦𝑥0 − 2∆𝑥𝑦0 + 2∆𝑦 + 2∆(𝑦0 − 𝑚𝑥0 ) − ∆x
Now Substitute 𝑚 = ∆𝑦/𝛥𝑥
𝑝0 = 2∆𝑦𝑥0 − 2∆𝑥𝑦0 + 2∆𝑦 + 2∆(𝑦0 − (∆𝑦/∆𝑥)𝑥0) − ∆x
𝑝0 = 2∆𝑦𝑥0 − 2∆𝑥𝑦0 + 2∆𝑦 + 2∆𝑥𝑦0 − 2∆𝑦𝑥0 − ∆x
𝑝0 = 2∆𝑦 − ∆x
Let’s see Bresenham’s line drawing algorithm for |𝑚| < 1
1. Input the two line endpoints and store the left endpoint in (𝑥0 , 𝑦0 ).
2. Load (𝑥0 , 𝑦0 ) into the frame buffer; that is, plot the first point.
3. Calculate constants ∆𝑥, ∆𝑦, 2∆𝑦, and 2∆𝑦 − 2∆𝑥, and obtain the starting value for the decision parameter as
20
20
𝑝0 = 2∆𝑦 − ∆𝑥
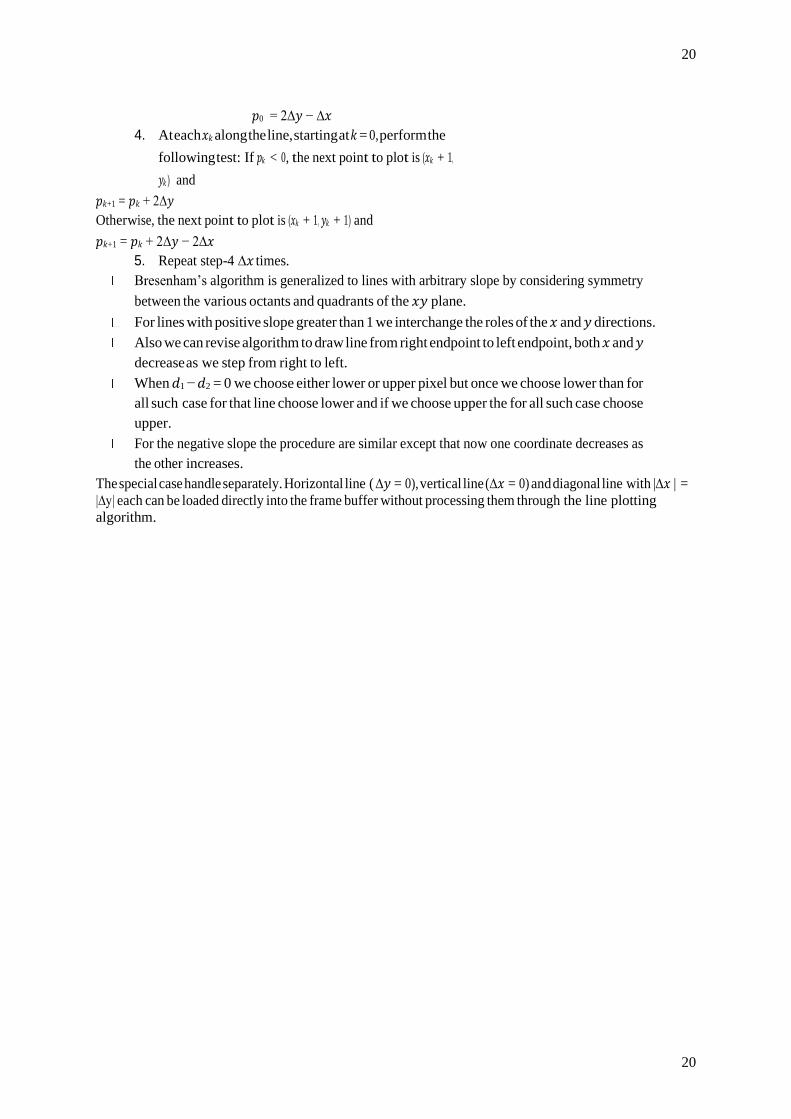
4. At each 𝑥𝑘 along the line, starting at 𝑘 = 0, perform the
following test: If 𝑝𝑘 < 0, the next point to plot is (𝑥𝑘 + 1,
𝑦𝑘 ) and
𝑝𝑘+1 = 𝑝𝑘 + 2∆𝑦
Otherwise, the next point to plot is (𝑥𝑘 + 1, 𝑦𝑘 + 1) and
𝑝𝑘+1 = 𝑝𝑘 + 2∆𝑦 − 2∆𝑥
5. Repeat step-4 ∆𝑥 times.
Bresenham’s algorithm is generalized to lines with arbitrary slope by considering symmetry
between the various octants and quadrants of the 𝑥𝑦 plane.
For lines with positive slope greater than 1 we interchange the roles of the 𝑥 and 𝑦 directions.
Also we can revise algorithm to draw line from right endpoint to left endpoint, both 𝑥 and 𝑦
decrease as we step from right to left.
When 𝑑1 − 𝑑2 = 0 we choose either lower or upper pixel but once we choose lower than for
all such case for that line choose lower and if we choose upper the for all such case choose
upper.
For the negative slope the procedure are similar except that now one coordinate decreases as
the other increases.
The special case handle separately. Horizontal line ( ∆𝑦 = 0), vertical line (∆𝑥 = 0) and diagonal line with |∆𝑥 | =
|∆y| each can be loaded directly into the frame buffer without processing them through the line plotting
algorithm.

21
21

22
22

23
23

24
24
Method
This method is suitable for producing various character.
Font size of character can be increased by increasing the size of
array.
This method uses an array of 1’s & 0’s to represent pixels.

25
25

26
26

Aine Druwing lg. a St. ne
eqn The Cavtes an slope - infercept
mz b
where, m Spe odine
b-y untetep 2 y2) - 2 end pk. e ine segmen
ine path bet. end t, at posihions
( %3 {)
hle tan. dekermine ydl. Y m b wth
m -
b m -
lgo do displaying gt.ünes based on tne ecn. 0 &cal.
gven dn
Fos any iven can conmpur the intevvat Ax oelong a dine, we
co1esponcing intervat A om
we can obtain AX Core3pondüng speayed 4y
m
* "hese eays ov uhe hsis oT determining delechion
/olages in analog deMteS
* For dines wlh slope magnkudes | m} <1 , 4 Cn be
set to a 3mat honzontal delecton voltage the coe spondin
Vestical daetion s then set o A4 calculatd om

Fos dines whose sopes have magnttudes Im , 4y can
be set to a 3mll verticcd . de voltage wth coesponding
honzontal odeh voltaqe set to 4z talculakd 4rom
Fov dines ml , Az -4y - al & lal de vodtages
equal, Ih each cage, a gmooth ine wth stope m ae
geneatd bet. dhe spetiied end pk. &9n astes 8ys., lines 3 plotled oith
pizek, & step sizes in -al 8 al divecHons
ave tonstraunecd by pixel sepaxatios hat
We must Sumple "
a he at discrek posihons &determine he heaxest pixd ts he tine a
Stuhe seament each 3aumpled po3 hon. This Scan- conveysfOn with 5 Sampin
process orst. dine3 d illustiatd un Fg. pasiticns along dhe
a hea - a dine with diserel po Sam ple pbsitions
Culong at3
Digtal dißerha lgo. (oDA qo.) anaty ze
tun e algo. based on
The DA &can On veas10n
calulaihg ether Ay / A using . We sample he
unit nteval ih oosolinak deteamine corresponding
Line path os 0fhes coosdina
calaulaihg Line at
the unteger va. nearest
Jine with t ve 8ope, Considex a
ml, we 8ample at unit interyctk (Ax ) 8 Compuk
each
starihg 0m , forptincvenes Suhseipt k dakes unteqer va
veached, m can be an Eano.
b untl thera endpt nearest int.
bet 0 &, dhe calaulaticl val. mwst be Dinded

he ole3 wth a +ve slope I, we Yeverse Fov ines
caleulat & e, we Sample at unit ntei vas (4y ) coest..
each 3LCeecuing va.
k k
Janes a 83umpbi on, thct Kon. are baked on
pIcessed tom Jet evdpt. Jo might encdpt. his PDCes3ihg
her Tever secd, So that the gtaating endpt. at nqhE, then efth
we have AT-
m
O twheen m>) we have 4y wih
-
os. thn' tan ako he ged calcutat pizd poskb along a uine uwh
ye 3lop
Tabsolu va. m 41 stat and at det, we
set Ai -I&ca. vad. uith eqn. (6
hen stant endpt. at the ight (or same slope), ue
Set A -1 0btain y 20sition rom an .
IIt when absotu val a -ve slope s 1, we use A -i 'ep. 7 we ked Ay-1&
Algoithm:
# dene PoUND (a) (Cint)Cat o.5))
voituine DDA (int a, nt ya , int zb, int yb)
int d zb-za , dy -yb -{a, steps,k; float Tn rement YInerement, 2a , }yaa

abs (da) > abs (dy)) steps : abs [dx) ee 8tep abs dy
Tncrement dz l (loat) steps, H Inerement dyl (hat) stops setpixel (RoUND (), PoUND (y}) o (K$ R< steps; kt+)
2t Jncrement;
yTnciement
setpizel (RoUND (2) , PouniD (y))
Algo esenphion:
Step 1: dcept 7lp as 2endpt. pixel poaitios.
Step 2 -al lat digerentes bet the enctpt positions are
Q33ighed o paiam eterS dx & dy (Ca. dz zb-za & dy y ya
Step 3 The derene with he gedr mag detemine s the val.
parameter 3top
Step 4 Starting wh prze posihon (Xa , ya) , determine the oset
heeded at each Step generat he next pfxe posihbn alpng dine pat,.
imes Step 5:doop he olowing pnxess or steps h.
a) se a untt eine. dec un he & direction.
a zb , the val o dnc. dn y dvecions ave I & m.
-&- m are sed 2a xb, Jhen he dee.
r3d Acd. /e DA algo
Floating pt. anth. in DDA dgo
Simplest algo. us sh time -orsuming
aster methud kor calcuaHng
Fnd pt. auurary poor. pe positid% .

Fg onsider dhe dine om (o, 0) d6 (4,6)
Xa 0, a:0&
2. d zb -xa d 8yb -ya 6-0 4- 6
3 : 0
446 (ake) 30, steps = 6
2 Jncuement d
steps 6.Cal 0.66&
6
Inrement I
8teps
6Setpized (,y) 3et pizd (o,o) tBtavrting pixel posidon)
7Tterat uhe cleulation Inuemest & yJntvement 3tepslt) ho.
dimes.
Tabulak ach itesaibon
Plotiing p. (Rounded o nteger)
k
D+0.66-o.b6 o 41
0.b6+0.6b6 = 1.32 2 (1,2)
1.32 + 0.66 1,99 2+t: 3 a,3)
(3, A 3 h,l:98 + 0.66 2.bh3 h
2.5h o.66 3.3 t:5 3,5
Result
A

(osiderthe lineom (h,6) (o,0)
b 0 yb
2. dz tb -za dy yb-ya 0-4 O 6
-6
3. X4
46 (lase) 0, Steps 6
0.66 at. xInrement dz
Steps 6
Ancrement d Steps
plxel posttion, 6.Setpirel (7,) 3etpizel (e�,5) : Stating
. Tterat dhe ca. r Jnvenent &Incvenment gossteps (4) ho. times. I7 +zInttement
+yIrament
8. Tabuat each dteration
Poting pk -66 3.34 e,5
3.34 b.b6 2.18 (, 2 2.68 6.66 2.b2 -13 2 ,3
3 2.02 b.Lb 1.3 3- -2 (1,2)
.36 6.b6 - 0.7 2 -1 (1,1
5 o.7 6 b6: 0.0l4 , D)

6
3
2
3

03-01-d0Bresenham '3 ne Jine 9enesatng go algo Cster
An &eient aceurate
veik dines using 4a gther urvE
on 4a nt developed by B, Sean
dines conveik
cirdes
Calcula tions thar aan be adapted to dusplay
Specifie Aine pah
3 SLP 2
50 51 52 3
Dt 1213 SCYeen Sec. a disp.
Sec hion ea display screen
uwhete a st. line segment i8 - ve sope ne 3gment th
pboted starting om pize at uto be plotad, Stasting
cot. 50 on 3can une 50d. the piad at col. to on gtan he li
wh ae t. áne These iusthat Sechons a dsp SCYeen
Segmenk dre to be dawn.
post tions,& honzontal ae he vertical azes ghou0 Scan lne
dentik Pize tol.
intervak dnhese e, we need b * Samplin� at unit
deide he une path
uhich 2 posgble pizel positiosi3 eloser
at each sumple 3te
Staating om d endpt. in 9uwe heed h detemine
at hett 3ample position whether Jo ptot uhe pixel dt posi tion (, D he ohe at (n, 12).
, Fig. shows a -ve slope dine path stavting m deend pt. at pixel posidion (5o, 50). in thi3 one , do e gelect
hett pizel pou tion [51, ho) (51, 4)
The3e QLestiors are anse ed wih Bresenham's dine alg0
bu testing the unteges paAameti, uwhese va. d adh
prb porttona devence bet he 3epaations 2 pixel posiao om ahua dine pah.

illwrat
process o dihes wth+ve sope 1: Pixd
Bs apprvach, we st consider he 8can Convera on po sitions
then deteumincd sampling a along. a ine pah unit ue
dintervak. Starting om t end pt. (%o o) we
8tep each utcessive col. (x position) plot he ptze whose 3 can-üne
Val close st to dine path.
mtb Bection 3Ceen md 8hong
JkA2 SCCah aptxel dh wt. k on
k Jine de. dbbe plbited along
Jhe path e ine 3 wih
Slope 0 < m <i
The above demonstsutes kh step in his prce38
przel at (. y) Agswnin have leter mined uhdt we
to be d'splayed, ue neit need d dectde which pixe o plot Jn
Co. k+) Our choiLes de athe pizek at posinions ( t )&
istances bet pize posttions
2 the une y coordanat
a samplun posi tion tl.
postion t,we dabel veical pizel At samping
Separaios om he mcuthemah'al une path as d d
ine at Pirel p03i tion +1 mouthemaial
The COordinaa on
aR catulatd
m (7 t) tb

Th en
d d +) -+1 m(t1) b - mk t) 4+b
The derence het.dhese 2 8eparahons
dd m(%k #1) +b (yk tm (L 4t) -b)
m(xk 4) +b yk - Ye -1 m (Y +1) +
2m ( 41) - 29k 2b
June alg0 A deision pacmefer Pk the k skep dn He
can be obtained. by. vecang n Eqn. so tha at dnvolves
onui integes calulaions. hle actomplish this by gubsheuting
-al al Ay /0x,whete A ehe A Ay ase he
3epaoah ons e the ed pt. positions.
PkA (d, -da)
Az 2m l 41) -2k 2h -1
Ax. 2m (k tD - 2A k 24xb - 4x
A 2 AY (1 ) - 2 Axj +2Arb -Ax A
2,4y ( +1) 2 x 24x.b Ax
2 Ay +2Ay 2A ye +24x.b -4x
247.yk 24y 24 b. -4x
Pe 2y. y -2 Ax . Hp C

Successive deusion parameter
PkA A.I 242 .j^
Subtracting PkIPk
Pkt Pk 2A kE 17-01-20
+2A 2 A 1 24y. 7 - 2 Ax. k41
PL Pk 2Ay (7k41 7 Pk
PEA Pk 2 4y (k Z) - 24x (Yk k)
(e +1)
PR Px 2Ay (z, 41 -7k) - 24 lyk+1 Sk)
PRA Pk t2424x (Y )
Tnitiat DP
Po24y 4x
B'ine Qvawing
the 2 une endpk. & 9tove the de enct pt un (X, 9) . Inpur
2oad (x0,4) into FB, de., plot the pt.
Ax, 24y &24y 24 & obtein the
Cal eulate Cont.
Stasting va or DP os
2Ay -4

starting at kC, pecm
June t each alon the
o Ubwing test
PkD, he nert p. td plb
Pk1 P 2A
thewise, he hert pt. to plot is ( tl , Yk+1)
- 24x Pke Ph 24y
s. Repeat step h A tHmes
B Line dwing
End p 0,) &30, 18).
8tope 08
30-20 13-
Tnitial decision paiameli
Po2 4y -4 2(8) -
6
pk o46 + 2(?) -2(u Poo Fake =>(21, 1)
6t 16 20
6h 2
Pi Fake = (2, 12) h41P 4 2(2) -(w
2+16 20

Pk o PM4 Pa0 Tue => 23,12) Pa4 P + 2(3)
24 l6
Pa It
3 Pao -> ahe= (24, 13) P3 + P t 2(8) -2(to)
4+ (6 -20
Ph= D
Pa 2o = Fake => (25, 14) Pa Ph *h
P5 6
Ps = Fake =>(26,15) Ps+1Ps 4 6-4
P6 2
Po 20-> Fake => (27, 16) Pe 4 Ps -4 2-h
Pr 2
P7 20> Trie => (28, 16) PT4 P7 t16 2+ 16
Pe D=> Falke =7 (29, T) P+ Ps 4-
Pa Lo
Pa o = Fake => (30, 13)

PR ( )
(21, 1t)
(22, 12)
23, 12)
24, 13)
a14
(26,15)
(07, 6)
(28,16)
(29,11)
uiC30, 1)
Aine path bet endpk 90, o) (0,1t) Pire poaitions along Jhe
ploted ith B ne algo

an umplementation B ine drauing Or 8lopes n ange
O< m < us gtven the toltowing pncedure Endpt pze p0sitiors
ine passec to ths prDedure, pizes ue plotte om JO he Ave
Jet encpt nght endpt. he tall o setpixe Joads b preset
val. into the FB at the specaed (7, y) plzed position. oloa
F inclucde device ."
Void dme Bres ane a, dnt ya , int xb , int
Ax AY int d abs (za -h), d abs( ya -yh)
tnihal decision pcua
dy -dr unt p 2*
unt tuoDy 2 *cdy tuoPyD 2 * (dy dx);
nt , y End,
I Detesmibe which pt. d se a3 stavt which Cs end
a > zb)
Stasi gb knd a,
else
End b;
3et Pizd 7,)
while ( ztnd
P tuwoDy;

else
p pt = dwo Dy Dz;
3et Pizel (7.)5
3

8- 2020 Mapt. Chcte dlgo /Bs Circa dlgo. a circle denhon
lo appymidpt. methad, we dee
Any pt. (x,y) on the bouncdary e the drde wih vadil
satisjies he eqn itle(7,9) 0.
the pt. s uin the antenior tircle, the ATcleun. -Ye
4ve. butside the ivele,
lb 8uMmaniz e , Jhe relotive position ay point (, y) can be
detemined by checking he sign ccle unchon.
(40 (7,y) side dhe ul bounda.
boundouy. -@ kurcla,y) o, (,y) on he urcle
>D, (,y) Outside dhe civde boundaq.
The ccle un. tests un are perfomedor the midposidong
at eadh sampling step. "hus he
betuween pixels neax dhe cycle pafh
ciocle une. 3 the deision paxameter uthe miclpt. ag0.
Fg.ghous he mcpt. bet the 2 cancdid atr o
Hdpt pixeb at eamping posii on 1. dssuning w
haye Hust plott ed ne ptze a (7, 9») , We
next heed to detexmine Whether the pixe) at Midpt. bet. Condidat
posihion (k tl, yk) 6 the one ak pa siti on (x,41, ya-1) pixek at sampingpOsihon 41 along
a circulau path is do ser to dhe rcle. Ou dp the tiscle
e vatucLtac the mctpt. bet. un chion O
he se 2 piaek
Pk cioecle k tl , 9
( 41)(% ) -
(3 97, *1 (9 -2 y%() (-

PAZo , h midpt irs ide he irde & he piZe o
Sean ne Close o uhe vcle boun day 0herwise, the
midpt. 3 out3ide uxcde bounday , a 9elec On dhe We
me ptxel on 3tan lîne
Suctessive dp ase cbtainecl using incsemental calculancns.
e Obtain a Tecursive erpress ion orhe het dp by evaiuahng
the uicle une. at 3aLmpling po3ition k+ t 7k 2
%+1)41] ( ) -
(44 a(#1) +I +( 2 yh() (4) -
Tka P ) 23 ti 2(3 41) 4l + (9k)41
- (e)2 -1 -Y + Yk +
Pk- Pe 2 (% 4 1) +!+ (yaa-Yk#--k) + Yk
PKa Pk
PkA P 2(x #) +9k-gJ - (he ) 41- Pk
either y r yk- depending pn the sign Pk
2 29k can ako be done ++ C Evaluahon tem
2+1 27 t 2
2yk 2Y -2

eicle une aut staut
The unttal dp i obtained y evauan
posiion o,y) (0, Y)
Pocrde (', T )
I()-
.
an simpty ound the 1adi speced as an ntege
Po to
Midpoint Circle lgo.
.Tnput adiu y &civele lentey (, y) s obtain dte ist : an
een cincumevente acrcle centerec) on dhe ongin
( (o, 1)
2. Cal. the nthat a.
Po
3. At each , positibn, staahng af k o, perom deoliseing dest
Pk o , he het pr aong the CiBcle tenteved on (o, o)
) an
Pe Pk 4 23 t1
Ofherise, dhe next pt along the ircle (7 41, yk -1) &
PkP+ 2"k4, +1 29h
wheve 2 27 12 & 2.

symmetny pk in the othe 7 octank Deter mine
uycula pah caludatd pizel posiibo(%, y)onb the 5. Move each
val . eenteec on (7e , ) & plot uhe w0cin at
6 Repeat steps 3 thro' 5 untl x 24
aiven a carcle radis v = o, ue demonstvat& she mi�point curcde algo.
by deter mtning positions along the uvcle oxtant un the quancdant
OuD 79 he úntha val. b the deis ion paiameter s
Po t-Y
y) (o, u) 27 0 20
the eirde path aue dp va. and posihion alon9
the mid pt.
Successive method caleulatd sing
PDPk1 2 k#ti 2y 2x P >oPk t 2k t-2yki k
-9t 2 t1 Pot 20 -9 ,o)
- 6 Pi
20 (2,t0) - 6
P2'
(3, to) 20 P2t -1 4b +I 2 1
P 6
(h.) Pa+ 64 841 -1 3
PA 3
3 (5,1) Pa41 3 4, t0 +1
P &
P541 + 12 41 16
T, 5 (6,8) 12
(7,7)
6 1 5
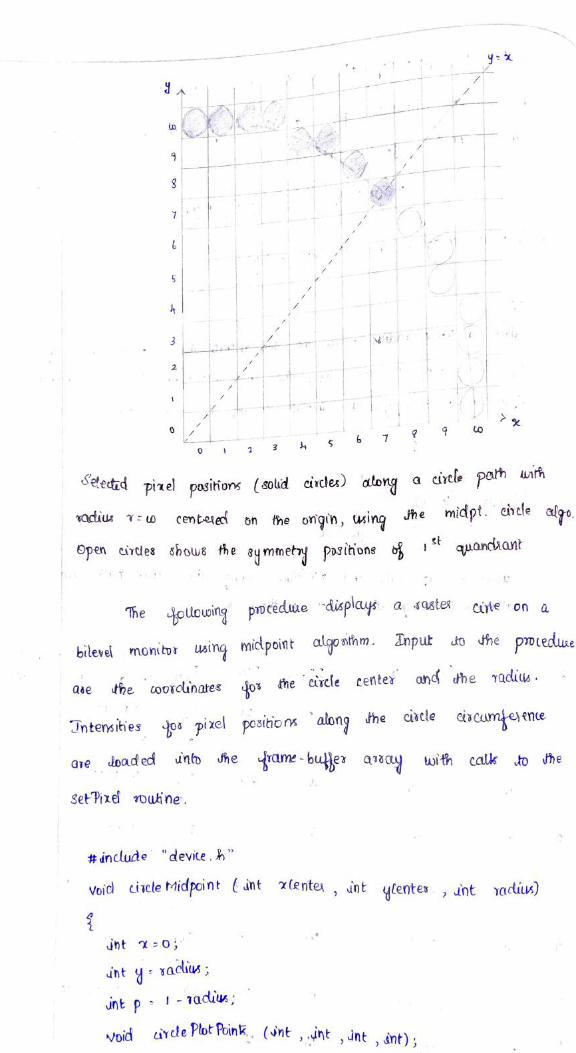
Seectnd pizel positi ons (soud circles) atong a eivcle palh h
center on he ongin, wing he midpt. cele alg
open cirdeg dhow8 he symmetn pos thons aandianr
The pD cedume displaus a s0stex olowing
bilevel mon1tor wing micdpoint algo sthm. dnpur do he pmedue
an the adius the oorounates o the curcle center
cixcle cisCumke ente Jntesies o pixel posihior along he
are oad ecd un heame-buje a7a wi th calk to he
set Pize 70ukine.
#in clude "devite. h"
Vnic cicle t4idpointint 7entes, unt ylentes, int aciuv)
uht 0
uht vaclus;
unt pI 1adius,
arcde Plot Poink (nt,nt , unt , dnt) ; Void

Plot stet o poin /
eivele Plot Poin(7 Cen ta yCentes, 7,9) while (1 <9)
p <o)
eke
p+ 2 (z-y) +
tivclePlot Poink (t (enter, ylenter , , y);
Noid Crele Plot Poini (int zlente, nt yCenter, int , JnE y
set Pixel (1(entes+7, ytentes + y
3et Pixel (zCenter 7, 4fen tex ys
3et Pixel(z (enter 7, yenter y)
set Pixd (zlenter 7 , yCente -y)
set Pix el (z(enter + entes+7)
set Pixel (z(enter -y yCenter + )
setPixel (z lenter t ylenter - )
setPizel (z(enter - enter -«);