Unmasking the Effects of Student Engagement on College Grades and Persistence
50
Unmasking the Effects of Student Engagement on College Grades and Persistence George D. Kuh Ty Cruce Rick Shoup Jillian Kinzie Robert M. Gonyea Center for Postsecondary Research Indiana University Bloomington 1900 East Tenth Street Eigenmann Hall Suite 419 Bloomington, IN 47406-7512 Phone: 812-856-5824 Paper presented at the annual meeting of the American Educational Research Association, Chicago, April 2007 1
Transcript of Unmasking the Effects of Student Engagement on College Grades and Persistence

Unmasking the Effects of Student Engagement on College Grades and Persistence
George D. Kuh Ty Cruce
Rick Shoup Jillian Kinzie
Robert M. Gonyea
Center for Postsecondary Research
Indiana University Bloomington 1900 East Tenth Street
Eigenmann Hall Suite 419 Bloomington, IN 47406-7512
Phone: 812-856-5824
Paper presented at the annual meeting of the American Educational Research Association, Chicago, April 2007
1

Abstract
Unmasking the Effects of Student Engagement on College Grades and Persistence
This study examines the relationships between student engagement, college GPA,
and persistence for 11,000 students attending 18 baccalaureate-granting institutions. Data
sources included student-level information from the National Survey of Student
Engagement, academic transcripts, merit aid, and ACT/SAT score reports. Engagement
had positive, statistically significant effects on grades and persistence between the first
and second year of study for students from different racial and ethnic backgrounds.
Equally important, engagement had compensatory effects for historically underserved
students in that they benefited more from participating in educationally purposeful
activities in terms of earning higher grades and being more likely to persist.
2

Unmasking the Effects of Student Engagement on College Grades and Persistence
A college degree has replaced the high school diploma as a mainstay for
economic self-sufficiency and responsible citizenship. In addition, earning a bachelor’s
degree is linked to long-term cognitive, social, and economic benefits to individuals,
benefits that are passed onto future generations, enhancing the quality of life of the
families of college-educated persons, the communities in which they live, and the larger
society.
Unfortunately, too many students who begin college leave before completing a
degree. Only half (51%) of students who enrolled at four-year institutions in 1995–96
completed a bachelor’s degree within six years at the institution at which they started.
Another 7% obtained a baccalaureate degree within six years after attending two or more
institutions (Berkner, He & Cataldi, 2002). Degree completion rates are considerably
lower for historically underserved students (Carey, 2004). The six-year completion rate
for African American students and Latinos is only about 46 percent (Berkner et al.,
2002). Although greater numbers of minority students are entering college than in
previous years, fewer earn degrees compared with non-minorities. Stagnant college
completion rates and unacceptable racial-ethnic gaps in college graduation rates coupled
with external pressures for institutional accountability for student learning (Bok, 2006)
have intensified the need to better understand the factors that influence student success in
college.
Students leave college for a mix of individual and institutional reasons – change
of major, lack of money, family demands, and poor psycho-social fit among others
(Astin, Korn, & Green, 1987; Bean, 1990; Cabrera, Nora, & Casteneda, 1992; Pascarella,
3

1980; Peltier, Laden, & Matranga, 1999; Tinto, 1993). Most models that examine student
success, broadly defined, include five sets of variables: (1) student background
characteristics including demographics and pre-college academic and other experiences,
(2) structural characteristics of institutions such as mission, size and selectivity, (3)
interactions with faculty and staff members and peers, (4) student perceptions of the
learning environment, and (5) the quality of effort students devote to educationally
purposeful activities.
To better understand the causes and consequences of student success in college,
more must be discovered about how these factors interact with gender, race and ethnicity,
and first generation status (Allen, 1999; Gaither, 2005; Person & Christensen, 1996).
Race and ethnicity along with family income are especially important because the nature
of the undergraduate experience of historically underserved students can differ markedly
from that of majority White students in Predominantly White Institutions (PWIs) (Allen,
1999; Gloria, Robinson Kurpius, Hamilton, & Willson, 1999).
For example, in some studies race emerges as a significant factor in persistence
(Astin, 1977; Murtaugh, Burns, Schuster, 1999; Peltier et al., 1999). High school rank,
first-year college GPA, and a self-reported measure of desire to complete college
accounted for 68% of the variance in the retention of minority students from the first to
second year of college (Allen, 1999). For non-minority students, however, high school
rank, first-year college GPA, and parental education were significant, accounting for 38%
of the variance in retention. Some research indicates that students of color perceive the
campus environment to be less supportive than their White peers (Loo & Rolison, 1986;
Pascarella, Edison, Nora, Hagedorn, & Terenzini, 1996; Schwitzer, Griffin, Ancis, &
4

Thomas, 1999) and are less likely to persist to graduation (Carey, 2004; National Center
for Education Statistics, 1995). Studies using multivariate analytical models suggest that
the impact of race or ethnicity on persistence is less consistent (Murtaugh et al., 1999; St.
John, Hu, Simmons, & Musoba, 2001), especially those that control for socioeconomic
status and pre-college experiences (Peltier et al., 1999).
Another line of inquiry is the research linking student engagement in
educationally purposeful activities to such desired outcomes as grades and persistence
and graduation rates (Astin, 1993; Kuh, 2001, 2003; Pascarella & Terenzini, 2005).
Student engagement represents both the time and energy students invest in educationally
purposeful activities and the effort institutions devote to using effective educational
practices (Kuh, 2001). However, most of the research examining the connections
between student engagement and college outcomes are based on single institution studies
that do not always control for student background characteristics or other factors or
institution-level data that can mask the effects of student-level variables. Few studies are
based on large, multi-institution data sets using student-level data. In addition, it is not
clear to what extent student engagement and other measures of effective educational
practice contribute to achievement and persistence over and above student ability.
Purpose of the Study
This study sought to determine the relationships between key student behaviors
and the institutional practices and conditions that foster student success. To do so, we
merged student-level records from different types of colleges and universities to examine
the links between student engagement and two key outcomes of college: academic
achievement and persistence. A second goal was to determine the effects of engaging in
5
educationally purposeful activities on these outcomes for students from different racial
and ethnic backgrounds. Three questions guided the study:
Does engagement during the first year of college have a significant impact on
first-year grade point average and chances of returning for a second year of
college, net of the effects of student background, pre-college experiences, prior
academic achievement, and other first-year experiences?
Does engagement during the senior year have a significant impact on senior-year
grade point average, net of the effects of student background, prior academic
achievement, and other senior-year experiences in college?
Are the effects of engagement general or conditional? That is, do the effects of
engagement on the outcomes under study differ by such student characteristics as
race and ethnicity (for GPA and persistence) and prior academic achievement (for
GPA only)?
Methods
Data Sources
The data for this study are from 18 baccalaureate degree-granting colleges and
universities that administered the National Survey of Student Engagement (NSSE) at
least once between 2000 and 2003. These institutions were selected because they met
two key criteria: an ample number of respondents to insure enough cases for the
analytical methods used to answer the research questions and reasonable racial and ethnic
diversity among the respondents. Eleven schools are Predominantly White Institutions
(PWIs), four are historically Black Colleges and Universities (HBCUs), and three are
Hispanic Serving Institutions (HSIs). Seven of the schools focus exclusively on
6
undergraduate education, seven are master’s granting universities, and four are doctoral
granting institutions.
Multiple sources of information were used in the analysis: student responses to
the NSSE, campus institutional research records including student academic and financial
aid, and information about students’ background and pre-college experiences including
academic achievement. Only those students who had complete data for the variables of
interest are included in the analysis. They include 6,193 first-year student and 5,227
seniors.
Student Engagement Data. NSSE is an annual survey of undergraduate students
at four-year institutions that measures students’ participation in educationally purposeful
activities that prior research shows are linked to desired outcomes of college (Chickering
& Gamson, 1987; Pascarella & Terenzini, 2005). The validity and reliability of the
instrument have been extensively tested (Kuh, 2002; Kuh, Kinzie, Cruce, Shoup, &
Gonyea, 2006; Pike, 2006). It is typically administered via the web or paper versions to
randomly sampled first-year and senior students. In 2006, the NSSE database
represented more than 1,000,000 students from about 1,100 colleges and universities.
Student Academic and Financial Aid Information.1 To minimize the time and
effort required of participating institutions, we asked for student information readily
available from the registrar, financial aid, and admissions offices that permitted us to
account for the potential confounding influences of financial aid and pre-college
academic achievement on the relationships between student engagement, college
academic achievement, and persistence. We also used this information to create reliable
7

measures of the two key outcome variables: academic year grade point average and
college persistence.
Student Background and Pre-College Experiences. We originally asked
institutions to provide us with ACT/SAT score reports for students who met the criteria
for inclusion in the study. These reports, provided to colleges and universities at the
applicant’s expense, contain a wealth of information students provide when they register
to take the respective college entrance exam, including background characteristics, high
school experiences, prior academic achievement, educational needs, and college
preferences. Because only a few of the participating institutions preserved complete
ACT/SAT score reports, we obtained this information with permission from the
participating institutions from ACT and the College Board.
Variable Specification
Student engagement. For this study, student engagement is represented by three
separate measures from the NSSE survey: time spent studying, time spent in co-curricular
activities, and a global measure of engagement in effective educational practices made up
of responses to 19 other NSSE items2 (Appendix A). Each of the items on the global
engagement measure contributes equally. These behaviors include asking questions in
class, working with other students on projects inside or outside of class, discussing ideas
from class or readings outside of class, among others. We chose these items because
previous research shows that all are positively related to desired outcomes of college in
studies of student development over the years (Pascarella & Terenzini, 2005). Also,
these questions represent student behaviors and activities that institutions can influence to
8

varying degrees through teaching practices and creating other conditions that foster
student engagement.
Academic and financial aid information. Academic year grade point average and
persistence from the first to second year of college were based on aggregated information
taken from detailed student course-taking records provided by the participating
institutions.3 We calculated these measures to insure that both were computed in the
same way for all students in the study. Although computing grade point average is fairly
straightforward, institutions sometime differ as to whether or how certain courses are
represented in the computation (i.e., substituting the passing grade when retaking a failed
course). Returning to the same institution for the second year of study was defined as
enrolling in one or more courses the following academic year.
Appendix B contains the operational definitions of the variables used in these
analyses. Appendices C and D provide descriptive statistics for all study variables.
Data Analyses
The data were analyzed in two stages. In the first stage, we used ordinary least
squares or logistic regression to estimate separate models for first-year and senior
students of the general effects of time on task and engagement in educationally
purposeful activities on academic year grade point average and persistence to the second
year of college (for first-year students only). For the first-year student analysis, the first
model estimated the effects of student background characteristics, high school academic
and extracurricular involvement, and prior academic performance (high school grades
and ACT score) on the students’ first-year GPA and persistence to the second year at the
same institution. In the second model, first-year experiences (including time on task and
9
the global engagement scale), and first-year grades and unmet need (in the persistence
model only) were added to the variables in the first model to examine the impact of these
experiences on GPA and persistence.
For the senior student analysis, the first model estimated the effects of
background characteristics, pre-college academic performance, and senior year
experiences (including time on task and engagement) on academic year GPA. In the
second model, junior academic year GPA was added to determine whether engagement
adds value to academic performance, over and above one’s established academic record
in college.
In the second stage of the analysis, we estimated models to test for the presence of
conditional or interaction effects. Conditional effects represent the extent to which the
influence of study time and engagement on academic year grade point average and
persistence (for first-year students only) differed by student background characteristics.
To estimate these effects, we entered a series of cross-product variables into the general
effects equation. Statistically significant increases in explained variance (R2 change) or
model fit (likelihood ratio) resulting from the addition of these cross-product terms would
indicate that the net effects of engagement or time on task differed for certain sub-groups
of students. If the R2 change or likelihood ratio was not statistically significant, we
examined the model coefficients for statistically significant effects that may have been
masked by the significance test for the R2 change or likelihood ratio. This approach
allows us to determine whether there are differences in the effects of student engagement
on college achievement and persistence by prior academic achievement and racial or
ethnic background.
10

Results
The findings yield a detailed portrait of the relationships between students’
background and pre-college characteristics, college experiences, and the two outcomes
measures. Here we focus primarily on the results that illuminate the influence of
engagement and other college experiences on outcomes, after controlling for student
characteristics and pre-college variables.
First-Year Students
General Effects. To determine the net impact of time on task and engagement
during the first year of college, we estimated two models by regressing first-year grade
point average on student background characteristics and first-year experiences. Model 1
in Table 1 includes students’ demographic characteristics, pre-college experiences, and
prior academic achievement as predictors of GPA; together, they account for 29% of the
variance in first-year grades. Prior academic achievement had the strongest influence on
first-year GPA.
Insert Table 1 about here
Adding student engagement measures to the model accounted for an additional
13% of the variance in first-year GPA, increasing the total variance explained to 42%
(Table 1, Model 2). After entering first-year experiences to the model, the effects of
demographic characteristics, pre-college experiences, and prior academic achievement
remained statistically significant, but decreased in magnitude. Also, the influence of
parents’ education essentially disappeared. The change in the influence of the pre-
college characteristics with the addition of first-year experiences in the model mirrors
findings from a steady stream of research over the past several decades (Pascarella &
11
Terenzini, 2005) suggesting that who students are when they start college – their
background characteristics and pre-college behavior – is associated to a non-trivial
degree with what they do in the first college year. At the same time, pre-college
characteristics do not explain everything that matters to student success in college (Astin,
1993; Pace, 1990; Pascarella & Terenzini, 2005).
One of the stronger predictors of first-year grade point average was the number of
credits earned during the academic year. Part-time enrollment decreased first-year GPA
by about three quarters of a grade point (.75). The lower academic performance of part-
time students in part may be because a single course grade carries more weight in their
GPA; thus poor performance in one course can have a dramatic influence on GPA.
In general, the effects of the multiple measures of time on task (hours spent
studying, participating in co-curricular activities, working off-campus, relaxing or
socializing) on first-year GPA were in the expected direction. Studying more hours per
week had a positive effect on first-year GPA. Compared with students who studied five
hours or less per week, students who studied six to 20 hours per week realized about a .04
point advantage in first-year GPA. Students who studied 21 or more hours per week
enjoyed a .12 point advantage.
Students who spent more time participating in co-curricular activities, working
off-campus, and relaxing or socializing had lower first-year grades. For example,
compared to students involved in co-curricular activities for five or fewer hours per week,
those who participated between six and 20 hours per week had a .06 point disadvantage
in their first-year GPA; students who spent 21 or more hours per week earned a GPA .11
point lower. Relative to students who worked off-campus for five hours or less, students
12

who worked off-campus a moderate number of hours per week (i.e., 6-20) had a similar
first-year GPA. But students who worked off-campus 21 hours or more had a lower GPA
(- .14 points). Finally, as the number of hours spent socializing increased, first-year GPA
decreased; for example, compared to students who relaxed or socialized only 5 or fewer
hours per week, those who spent 21 or more hours socializing had a GPA that was lower
by .13 points.
On balance, net of a host of confounding pre-college and college influences,
student engagement in educationally purposeful activities had a small, but statistically
significant effect on first-year grades. Specifically, a one-standard deviation increase in
“engagement” during the first year of college increased a student’s GPA by about .04
points.
Conditional Effects. To determine if the impact of time spent studying varied by
pre-college achievement, a set of cross-product terms representing the interaction
between study time and prior academic achievement was entered into the general effects
model. The statistically significant increase in explained variance (R2 change) indicated
that the direct effects of time spent studying differed by ACT score, which was the proxy
for student pre-college academic performance. As Figure 1 illustrates, for every category
of study time, ACT score and first-year GPA were positively related. Moreover, at any
point along the distribution of ACT scores, students who studied more hours per week
earned higher first-year GPAs.
Figure 1 shows two other subtle patterns. First, while the lines indicating the
relationship between ACT and first-year GPA for students in the ‘6 to 20’ and ‘21 or
more’ hours per week categories appear roughly parallel, the line for students in the ‘5 or
13

fewer’ hours per week category has a smaller slope. This suggests that the advantage in
first-year GPA for students who had higher high school grades is not as pronounced for
those students who only studied for five or fewer hours per week during their first year of
college. Perhaps the amount of effort sufficient to attain high grades in high school is not
enough to achieve similarly high marks during the first college year.
Insert Figure 1 about here
Second, first-year students with higher ACT scores do not seem to have to study
as many hours to earn comparable or even higher grades as do students with lower ACT
scores. For example, students with an ACT score of 28 who studied only 5 or fewer
hours per week during the first college year earned marks about one fifth of a grade point
higher compared with students with an ACT score of 20 who studied for 21 hours or
more per week. This finding helps to explain why the general effect of study time on
first-year GPA is relatively small in magnitude -- some high achievers have to study only
a few hours per week to attain relatively high grades, while some low achievers who
study many hours per week earn lower grades than their high achieving peers.
Apparently, what matters to grades is not only the amount of the time spent studying, but
also how efficiently that time is used (Hu & Kuh, 2003).
A cross-product term for the interaction between educationally purposeful
activities and pre-college academic achievement was entered into the general effects
model to determine if the impact of educationally purposeful activities on first-year GPA
differed by prior levels of academic achievement. The statistically significant increase in
explained variance (R2 change) indicated that the direct effect of educationally purposeful
activities differed by achievement. As Figure 2 suggests, student engagement in
14

educationally purposeful activities had a small, compensatory effect on first-year GPA of
students who entered college with lower levels of academic achievement. That is,
students with an ACT score of 20 realized an increase in GPA of .06 for every standard
deviation increase in their participation in educationally purposeful activities. Students
with an ACT score of 24 realized only about .04 point GPA advantage for the same
increase in engagement; students with a 28 ACT score had an advantage of only .02
points.
Insert Figures 2 and 3 about here
A set of cross-product terms representing the interaction between engagement in
educationally purposeful activities and race was entered into the general effects model to
determine if the impact of engagement on first-year GPA differed by the students’ race or
ethnicity. A statistically significant increase in explained variance (R2 change) again
indicated that the direct effect of educationally purposeful activities differed somewhat
by race and ethnicity, but only for Hispanic and White students. Figure 3 shows that, all
else being equal, a one standard deviation increase in student involvement in
educationally purposeful activities resulted in about .11 advantage in first-year GPA for
Hispanic students compared with only .03 benefit for White students.
Persistence to the Second Year of College
General Effects. To measure the net impact of time on task and engagement
during the first year of college on persistence, we estimated two models (Table 2),
regressing persistence to the second year of college on student background characteristics
and first-year experiences. Model 1 in Table 2 includes only students’ demographic
characteristics, pre-college experiences, and prior academic achievement, and correctly
15

classified 58% percent of the students. Tables 3 and 4 show the predicted probabilities of
returning for the second year of college associated with each statistically significant
variable in the model. The predicted probability associated with any particular
independent variable was calculated while holding all other variables at their mean value.
Insert Tables 2 and 3 about here
All else being equal, females had a greater probability (prob = .89) than males
(prob = .83) of returning to the same institution for the second year of college (Table 3).
Hispanic students had a lower probability of returning (prob = .82) than White students
(prob = .87). Net of other pre-college influences in the model, students with high school
grades of mostly Bs had a greater probability of returning for the second year of college
(prob = .89) than students who earned mostly A grades (prob = .86), whereas students
with mostly C or lower high school grades had roughly the same probability of persisting
as students who earned mostly A grades, suggesting a curvilinear relationship between
pre-college academic achievement and persistence (Table 3). That is, all else being
equal, students with average high school grades had the greatest odds of returning, while
students with the lowest or highest grades are less likely to return. This apparent
curvilinear relationship is corroborated in part by the statistically significant, nonlinear
effect of the students’ pre-college achievement score on persistence (Figure 4). That is,
every point increase in ACT score up to 21 (three points below the sample average of 24)
had a positive though diminishing effect on a students’ probability of returning. But for
every point increase in ACT beyond a score of 21, the students’ probability of returning
decreased exponentially.
Insert Figure 4 about here
16

Receiving a merit grant had a strong positive effect on persistence, in that merit
grant holders were about 10% more likely of returning (prob = .93) compared with non-
recipients’ (prob = .83). While gift aid may be enough of an incentive to persist at the
same institution, perhaps the recognition of one’s academic merit has a salutary
psychological effect manifested as a deepened commitment to the institution.
Model 2 in Table 2 represents what happens when students’ first year
experiences, first-year GPA, and unmet need are included to predict persistence to the
second college year at the same institution. This model correctly assigned 72% of the
students, a 25% increase over Model 1. Again, for ease of interpretation, model
coefficients were used to calculate predicted probabilities of returning for the second year
of college associated with each statistically significant variable in the model (Table 4).
The predicted probability associated with any particular independent variable was
calculated while holding all other variables at their mean value. When these variables
were added to the model, no differences were found in the probabilities of persistence for
Hispanic and White students, but the probability of returning for African Americans
(prob = .93) became greater than the probability for White students (prob = .89) (Table
4).
Insert Table 4 about here
After entering first-year experiences into the model, the curvilinear effect of ACT
on returning for the second year was no longer statistically significant. However, the
effect of first-year grades was curvilinear and statistically significant (Figure 5). That is,
first-year GPA has a positive but diminishing effect on the probability of returning for
students whose GPA is no greater than about 3.25, which is above the average first-year
17

GPA of 3.04. But for students who achieve grades above 3.25, the probability of
returning decreases exponentially.
Insert Figure 5 about here
Whether students spent their time on academic tasks such as studying or off task
such as relaxing and socializing or working off-campus did not affect their probability of
returning to the same institution for the second year (Table 4). This is not surprising,
given the off-setting effects of these experiences (positive for studying, negative for
working off campus) on first-year GPA which was also included in the model. Being
involved in co-curricular activities, however, had a strong positive impact on the
students’ probability of returning for the second year. Whereas students involved in co-
curricular activities five or fewer hours per week had a probability of returning of .88, the
probability of returning was .94 for students who were involved six to 20 hours weekly;
students who devoted 21 or more hours per week in such activities had a .95 probability
of returning. The link between extracurricular involvements and persistence is well
documented, both empirically (Astin, 1993; Feldman & Newcomb, 1969; Pascarella &
Terenzini, 2005) and theoretically (Astin, 1984, Tinto, 1993). This traditionally positive
relationship appears to hold for the current generation of students from different racial
and ethnic backgrounds attending different types of four-year colleges and universities.
Student engagement in educationally purposeful activities during the first year of
college had a positive, statistically significant effect on persistence, even after controlling
for background characteristics, other college experiences during the first college year,
academic achievement, and financial aid. To put this in perspective, students who were
engaged at a level one standard deviation below the average had a probability of returning
18

of .85, whereas students engaged at a level one standard deviation above the average had
a probability of returning of .91 (Table 4). This is another piece of evidence consistent
with the large body of research indicating that engagement matters to student success in
college.
Conditional Effects. A set of cross-product terms representing the interaction
between engagement in educationally purposeful activities and race and ethnicity were
entered into the general effects model to determine if the impact of educationally
purposeful activities varied by race or ethnicity. No differences were found. However,
the coefficient representing the differential effect of engagement for African American
and White students was statistically significant. As Figure 6 illustrates, African American
students benefited more than White students from increasing their engagement in
educationally effective activities. That is, although African American students at the
lowest levels of engagement were less likely to persist than their White counterparts, as
their engagement increased to within about one standard deviation below the mean, they
had about the same probability of returning as Whites. As African American student
engagement reached the average amount, they became more likely than White students to
return for a second year.
Insert Figure 6 about here
Senior Students
General Effects. To measure the net effects of time on task and engagement, we
estimated two models regressing senior year grade point average on student background
characteristics and senior year experiences. Model 1 in Table 5 shows that student
19
background characteristics, pre-college academic achievement, and senior year
experiences accounted for about 19% of the variance in senior year GPA.
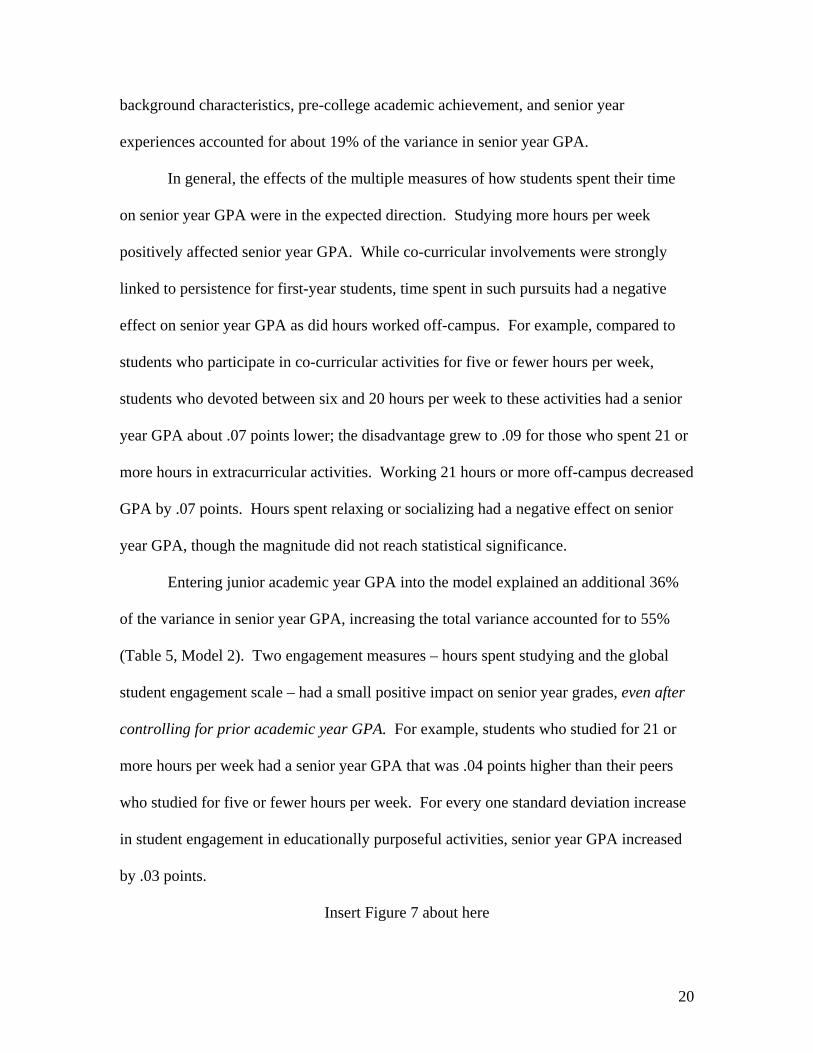
In general, the effects of the multiple measures of how students spent their time
on senior year GPA were in the expected direction. Studying more hours per week
positively affected senior year GPA. While co-curricular involvements were strongly
linked to persistence for first-year students, time spent in such pursuits had a negative
effect on senior year GPA as did hours worked off-campus. For example, compared to
students who participate in co-curricular activities for five or fewer hours per week,
students who devoted between six and 20 hours per week to these activities had a senior
year GPA about .07 points lower; the disadvantage grew to .09 for those who spent 21 or
more hours in extracurricular activities. Working 21 hours or more off-campus decreased
GPA by .07 points. Hours spent relaxing or socializing had a negative effect on senior
year GPA, though the magnitude did not reach statistical significance.
Entering junior academic year GPA into the model explained an additional 36%
of the variance in senior year GPA, increasing the total variance accounted for to 55%
(Table 5, Model 2). Two engagement measures – hours spent studying and the global
student engagement scale – had a small positive impact on senior year grades, even after
controlling for prior academic year GPA. For example, students who studied for 21 or
more hours per week had a senior year GPA that was .04 points higher than their peers
who studied for five or fewer hours per week. For every one standard deviation increase
in student engagement in educationally purposeful activities, senior year GPA increased
by .03 points.
Insert Figure 7 about here
20

Conditional Effects. The effects of engagement in educationally purposeful
activities on senior year GPA did not vary by student race or ethnicity. The effect of time
spent studying on senior year GPA was consistent for students with different prior
academic year GPAs. Unlike the compensatory effect of engagement found for first-year
students, Figure 7 shows that a greater level of engagement during the senior year
actually widens the gap between junior and senior year GPA. For example, students who
had a junior academic year GPA of 2.50 had an estimated increase in GPA of .01 for
every one standard deviation increase in their participation in educationally purposeful
activities, compared with an estimated gain of .02 for students with a junior academic
year GPA of 3.00, and an estimated gain of .03 for students with a prior GPA of 3.50.
Although these differences are small in magnitude, they suggest that the effects of
engagement and GPA may be compounding over the period of college. That is, students
who benefit from greater levels of engagement early on in their college experience may
be reinforced by their grades, and may become more selective and better practiced at the
experiences that have greater payoff academically.
Limitations
This study has some limitations that must be taken into account when interpreting
the findings. First, different institutions participated in the NSSE project in different
years. Although the results across different years of NSSE administrations are generally
consistent, if other years of data were examined the results might differ in unknown
ways. Also, the NSSE instrument is relatively short and does not measure all the relevant
aspects of engagement. In addition, this study used selected items from the survey; if
21

different aspects of engagement measured by the survey were analyzed, the results might
differ or if additional engagement behaviors were used, the findings might change. In
addition, while different types of colleges and universities were included in the study, the
patterns of results reported here may not reflect what occurs at other colleges and
universities that were not included in the study. Finally, about 85% of the students in the
study returned to the same school for the second year of college. This persistence rate
across the participating schools is so high because some unknown number of first-year
students likely left the institutions prior to the spring term when NSSE was administered.
Also, some students who may be considering transferring to another institution or
dropping out of college may not have been motivated enough to complete the survey.
The extent to which the prediction of achievement and persistence is biased by this self
selection is not known.
Conclusions, Discussion and Implications
The findings from this study point to two conclusions.
First, student engagement in educationally purposeful activities is positively
related to academic outcomes as represented by first-year and senior student grades and
by persistence between the first and second year of college. Pre-college characteristics
such as academic achievement represented by ACT or SAT score matter to first-year
grades and persistence. However, once college experiences are taken into account –
living on campus, enrollment status, working off campus and so forth -- the effects of
pre-college characteristics and experiences diminish considerably. Student engagement –
a range of behaviors that institutions can influence with teaching practices and
programmatic interventions such as first-year seminars, service-learning courses, and
22

learning communities (Zhao & Kuh, 2004) -- positively affects grades in both the first
and last year of college as well as persistence to the second year at the same institution,
even after controlling for host of pre-college characteristics and other variables linked
with these outcomes, such as merit aid and parental education. Equally important, the
effects of engagement are generally in the same positive direction for students from
different racial and ethnic backgrounds. While the positive coefficients generally are
small in magnitude, the patterns of salutary effects are consistent and appear to be
cumulative over time, as evidenced by the findings for seniors.
Second, engagement has a compensatory effect on first-year grades and
persistence to the second year of college at the same institution. That is, while exposure
to effective educational practices generally benefits all students, the effects are even
greater for lower ability students and students of color compared with White students.
The compensatory effect of engagement has also been noted by others (Cruce, Wolniak,
Seifert, & Pascarella, 2006), suggesting that institutions should seek ways to channel
student energy toward educationally effective activities, especially for those who start
college with two or more “risk” factors – being academically underprepared or first in
their families to go to college or from low income backgrounds.
Because most students benefit from early interventions and sustained attention at
key transition points, faculty and staff should clarify institutional values and expectations
early and often to prospective and matriculating students. To do this effectively, a school
must first understand who its students are, what they are prepared to do academically, and
what they expect of the institution and themselves. For example, far fewer students use
campus learning and support services than say they will when starting college (NSSE,
23

2005). To address these concerns, faculty members, advisors, and student affairs
professionals must clearly and consistently communicate to students what is expected and
provide periodic feedback as to the quality of students’ performance.
Faculty and staff must use effective educational practices throughout the
institution to help compensate for shortcomings in students’ academic preparation and
create a culture congenial to student success. How and why many of these practices work
in different institutional settings with different types of students are discussed by others
(Chickering & Gamson, 1987; Chickering & Reisser, 1993; Education Commission of
the States, 1995; Kuh, Douglas, Lund, & Ramin-Gyurnek, 1994; Kuh, Kinzie, Schuh,
Whitt & Associates, 2005; Kuh, Schuh, Whitt & Associates, 1991; Pascarella &
Terenzini, 2005). Other promising practices specific to particular groups or activities
also are available, such as working with adult learners (Cook & King, 2005),
undergraduate teaching and learning (Sorcinelli, 1991), developmental education for
underprepared students (Boyland, 2002; Grubb, 2001), and student affairs work
(Blimling & Whitt, 1999).
Students attending institutions that employ a comprehensive system of
complementary initiatives based on effective educational practices are more likely to
perform better academically, to be more satisfied, and to persist and graduate. These
practices include well-designed and implemented orientation, placement testing, first-
year seminars, learning communities, intrusive advising, early warning systems,
redundant safety nets, supplemental instruction, peer tutoring and mentoring, theme-
based campus housing, adequate financial aid including on-campus work, internships,
service learning, and demonstrably effective teaching practices (Forest, 1985, Kuh et al.,
24

2005; Wang & Grimes, 2001). However, simply offering such programs and practices
does not guarantee that they will have the intended effects on student success;
institutional programs and practices must be of high quality, customized to meet the
needs of students they are intended to reach, and firmly rooted in a student success-
oriented campus culture (Kuh et al., 2005). Institutions should insure that interconnected
learning support networks, early warning systems, and safety nets are in place and
working as intended.
The classroom is the only regular venue that most commuting and part-time
students have for interacting with other students and with faculty. Thus, using the
classroom to create communities of learning must be a high priority in terms of creating a
success-oriented campus culture. Faculty members in partnership with student affairs
professionals and other staff familiar with culture-building strategies can work together to
fashion a rich, engaging classroom experience that complements the institution’s
academic values and students’ preferred learning styles. This means that faculty
members must also be more intentional about teaching institutional values and traditions
and informing students about campus events, procedures, and deadlines such as
registration. Faculty members also could design cooperative learning activities that bring
students together to work together after class on meaningful tasks. Because peers are
very influential to student learning and values development, institutions must harness and
shape this influence to the extent possible so it is educationally purposeful and helps to
reinforce academic expectations. A well-designed first-year seminar, freshman interest
group, or learning community (where students take two or more courses together) can
serve this purpose (Kuh et al., 2005; Matthews, 1994; Muraskin, 2003; Price, 2005;
25

Tinto, 1996; Tinto, Love, & Russo, 1995). Working on campus, writing for the student
newspaper, or conducting research with a faculty member can be a life-changing
experience. When students are required to take responsibility for activities that require
daily decisions and tasks, they become invested in the activity and more committed to the
college and their studies. Advisors, counselors, and others who have routine contact with
students must persuade or otherwise induce them to get involved with one or more of
these kinds of activities or with a faculty or staff member. Academic advisors must also
encourage students to become involved with peers in campus events and organizations
and invest effort in educational activities known to promote student learning and
development (Braxton & McClendon, 2001–02; Kuh et al., 2005).
The results from this study also behoove institutions to examine whether they can
make the first year more challenging and satisfying for a group of students who
seemingly come from backgrounds that indicate they can perform well in college.
Perhaps as Heist (1968) discovered four decades ago, some of the most creative, highly
able students leave before earning a degree. This is unacceptable at a time when the
nation needs to maximize human capital to seek solutions to the challenges of the day and
maintain America’s competitive advantage and influence in the world order.
Several findings warrant additional research. For example, why are students with
high ACT or SAT scores and high first-year grades less likely to return to the same
college for a second year of study? It is also puzzling that students from the highest
income bracket are somewhat less likely to return for a second year. Even students who
appear to be well prepared and do not face financial hardships do not necessarily persist,
at least at the college at which they started. As with other studies (Kuh, Kinzie, Buckley,
26

Bridges, & Hayek, 2006; Pascarella & Terenzini, 2005), transfer status was negatively
related to persistence. We cannot tell from the results from the present study to what
extent the multiple institution-transfer-swirl phenomenon may be at work, whereby
students may be committed to earning a baccalaureate but not necessarily by doing all
their degree work at the same institution. Student tracking systems that allay privacy
concerns would help determine whether these students complete their baccalaureate
degree elsewhere.
Notes:
1The registrar’s office from each institution provided detailed student course-taking records, instructional program information, and graduation records. To accurately measure these outcomes, we requested the full, disaggregated academic transcript of each student. This included every individual course that is represented on each student’s academic record, including any withdrawals. Every academic record included the student’s identification number; academic year and term; course code and title; credit hours attempted, awarded and received; and the letter grade received. The registrar’s office also provided graduation records, including graduation date, degree code (BA, BS, etc.), and primary and secondary major. To accommodate different financial aid management systems, we developed a financial aid template based on that used for the Common Dataset Initiative which many campuses use to respond to higher education surveys. Five categories of financial aid were listed: (a) need-based grants, (b) merit-based grants, (c) subsidized loans, (d) unsubsidized loans, and (e) work-study. Each type of aid was flagged as aid awarded, accepted, and actually dispersed. Only aid dispersed was used in this study, as some participating institutions did not maintain longitudinal records of financial aid awarded and accepted. We also asked institutions provide a need value for each student, defined as total cost of attending the institution minus expected family contribution (EFC). This information was only requested for the year the student took the survey and the following academic year.
2Minor changes were made to the NSSE survey instrument every year between
2000 and 2003, including changes in response set modifications, minor wording edits, item additions or deletions, and the reordering of items on the survey. In instances where changes to response sets made items less compatible across years, response options were recoded to represent the lowest common denominator to reach a sufficient level of compatibility. Such a task accordingly compressed the amount of recorded variation in student responses, which may likely reduce the size of the effect of engagement measures on the outcomes under study. Thus, these minor year-to-year changes in the NSSE survey could affect the findings in unknown ways.
27

3The number of credit hours attempted was multiplied by quality points for a
measure of “gpa points.” To create grade point average for a particular academic term, the sum of the GPA points (credit hrs attempted x quality points) was divided by the sum of credit hours attempted). Grade point averages were calculated for each academic year. Grades for summer courses were not incorporated in GPA calculations. While grades are commonly used as an outcome measure (Pascarella & Terenzini, 2005), reasonable people disagree about whether they represent an authentic measure of learning; thus, there are limitations associated with using grades to understand the effects of engagement on student learning and personal development. We asked participating schools to provide other outcome measures such as results from standardized instruments, but none had systematically collected such information. Thus, first-year and senior grades are the only measures of academic achievement and learning available for the analysis.
28

References Allen, D. (1999). Desire to finish college: An empirical link between motivation and persistence. Research in Higher Education, 40, 461–485. Astin, A. W. (1977). Four critical years. San Francisco: Jossey-Bass.
Astin, A. W. (1984). Student involvement: A developmental theory for higher education. Journal of College Student Personnel, 25, 297–308.
Astin, A. W. (1993). What matters in college? Four critical years revisited. San Francisco: Jossey-Bass.
Astin, A. W., Korn, W., & Green, K. (1987). Retaining and satisfying students. Educational Record, 68, 36–42. Bean, J.P. (1990). Why students leave: Insights from research. In D. Hossler, J.P. Bean, and Associates (Eds.), The strategic management of college enrollments (pp. 147-169). San Francisco: Jossey-Bass. Berkner, L., He, S., & Cataldi, E.F. (2002). Descriptive summary of 1995–96 Beginning Postsecondary Students: Six years later (NCES 2003–151). Washington, DC: U.S. Department of Education. National Center for Education Statistics. Blimling, G. S., & Whitt, E. J. (1999). Identifying the principles that guide student affairs practice. In G. S. Blimling & E. J. Whitt (Eds.), Good practice in student affairs: Principles to foster student learning (pp. 1-20). San Francisco: Jossey-Bass.
Bok, D.C. (2006). Our underachieving colleges: A candid look at how much students learn and why they should be learning more. Princeton, NJ: Princeton University Press. Boyland, H. R. (2002) What works: A guide to research-based best practices in developmental education. Boone, NC: Appalachian State University, Continuous Quality Improvement Network with the National Center for Developmental Education.
Braxton, J. M., & McClendon, S. A. (2001-02). The fostering of social integration and retention through institutional practice. Journal of College Student Retention: Research, Theory & Practice, 3(1), 57-71.
Cabrera, A. F., Nora, A., & Castaneda, M. B. (1992). The role of finances in the persistence process: A structural model. Research in Higher Education, 33(5), 571–593. Carey, K. (2004, May). A matter of degrees: Improving graduation rates in four-year colleges and universities. Washington, DC: Education Trust. Chickering, A. W., & Gamson, Z. F. (1987). Seven principles for good practice in undergraduate education. AAHE Bulletin, 39, 3–7.
29

Chickering, A. W., & Reisser, L. (1993). Education and identity. San Francisco: Jossey-Bass.
Cook, B., & King, J. E. (2005). Improving lives through higher education: Campus programs and policies for low-income adults. Washington, DC: Lumina Foundation for Education and American Council on Education Center for Policy Analysis.
Cruce, T., Wolniak, G.C., Seifert, T.A., & Pascarella, E.T. (2006). Impacts of good practices on cognitive development, learning orientations, and graduate degree plans during the first year of college. Journal of College Student Development, 47, 365-383.
Education Commission of the States (ECS). (1995). Making quality count in undergraduate education. Denver, CO: ECS Distribution Center.
Feldman, K. A., & Newcomb, T. M. (1969). The impact of college on students (1st ed.). San Francisco: Jossey-Bass. Forest, A. (1985). Creating conditions for student and institutional success. In L. Noel, R. S. Levitz, D. Saluri, & Associates (Eds.), Increasing student retention: Effective programs and practices for reducing dropout rate. San Francisco: Jossey-Bass. Gaither, J. (2005). Minority retention: What works? New Directions for Institutional Research, No. 125, San Francisco: Jossey Bass. Gloria, A.M., Robinson Kurpius, S.E., Hamilton D.K., & Willson M.S. (1999). African American student persistence at a predominately white university: Influences of social support, university comfort, and self-beliefs. Journal of College Student Development, 40(3), 267-268. Grubb, W. N. (2001, February). From black box to Pandora’s box: Evaluating remedial/developmental education. New York: Columbia University, Teachers College, Community College Research Center.
Heist, P. (Ed.). (1968). The creative college student: An unmet challenge. San Francisco: Jossey-Bass. Hu, S. & Kuh, G.D. (2003). Maximizing what students get out of college: Testing a learning productivity model. Journal of College Student Development, 44(2), 185-203. Kuh, G.D. (2001). Assessing what really matters to student learning: Inside the National Survey of Student Engagement. Change, 33(3), 10-17, 66. Kuh, G.D. (2002, July). The National Survey of Student Engagement: Conceptual framework and overview of psychometric properties. Bloomington, IN: Center for Postsecondary Research and Planning, Indiana University School of Education. http://www.indiana.edu/~nsse/html/2002_NSSE_report/html/conceptual_1.htm
30

Kuh, G. D. (2003). What we're learning about student engagement from NSSE. Change, 35(2), 24–32. Kuh, G. D., Douglas, K. B., Lund, J. P., & Ramin-Gyurnek, J. (1994). Student learning outside the classroom: Transcending artificial boundaries. (ASHE-ERIC Higher Education Report No. 8). Washington, DC: The George Washington University, Graduate School of Education and Human Development.
Kuh, G.D., Kinzie, J., Buckley, J., Bridges, B., & Hayek, J.C. (2006). What matters to student success: A review of the literature. Final report for the National Postsecondary Education Cooperative and National Center for Education Statistics. Bloomington, IN: Indiana University Center for Postsecondary Research. http://nces.ed.gov/npec/papers.asp Kuh, G.D., Kinzie, J., Cruce, T., Shoup, R., & Gonyea, R.M. (2006, July). Connecting the dots: Multifaceted analyses of the relationships between student engagement results from the NSSE and the institutional policies and conditions that foster student success. Final report to Lumina Foundation for Education. Bloomington, IN: Indiana University Center for Postsecondary Research. http://nsse.iub.edu/pdf/Connecting_the_Dots_Report.pdf
Kuh, G.D., Kinzie, J., Schuh, J.H., Whitt, E.J., & Associates (2005). Student success in college: Creating conditions that matter. San Francisco: Jossey-Bass. Kuh, G. D., Schuh, J. H., Whitt, E. J., & Associates. (1991). Involving colleges: Successful approaches to fostering student learning and personal development outside the classroom. San Francisco: Jossey-Bass. Kuh, G. D., & Whitt, E. J. (1988). The invisible tapestry: Culture in American colleges and universities. ASHE-ERIC Higher Education Report, No. 1. Washington, DC: Association for the Study of Higher Education. Loo, C. M., & Rolison, G. (1986). Alienation of ethnic minority students at a predominantly white university. Journal of Higher Education 57, 58-77. Matthews, R. S. (1994). Enriching teaching and learning through learning communities. In T. O’Banion (Ed.), Teaching and learning in the community college (pp. 179-200). Washington, DC: Community College Press.
Muraskin, L. (2003). National evaluation of GEAR UP: A summary of the first two years. Washington, DC: Department of Education.
Murtaugh, P. A., Burns, L. D., & Schuster, J. (1999). Predicting the retention of university students. Research in Higher Education, 40, 355–371. National Center for Education Statistics (1995). Minority undergraduate participation in postsecondary education. Washington, DC: U.S. Department of Education, Office of Educational Research and Improvement.
31

National Survey of Student Engagement (2006). Engaged learning: Fostering success of all students. Bloomington, IN: Indiana University Center for Postsecondary Research. Pace, C. R. (1990). The undergraduates: A report of their activities and college experiences in the 1980s. Los Angeles: Center for the Study of Evaluation, UCLA Graduate School of Education. Pascarella, E. T. (1980). Student-faculty informal contact and college outcomes. Review of Educational Research, 50, 545-595 Pascarella, E. T., Edison, M., Nora, A., Hagedorn, L. S., & Terenzini, P. T. (1996). Influences on students’ openness to diversity and challenge in the first year of college. Journal of Higher Education 67, 174-195.
Pascarella, E. T., & Terenzini, P. T. (2005). How college affects students: A third decade of research (Vol. 2). San Francisco: Jossey-Bass.
Peltier, J.W., Laden, R., & Matranga, M. (1999). Student persistence in college: A review of research. Journal of College Student Retention, 1(4), 357-75. Person, D. R., & Christensen, M. C. (1996, Fall). Understanding Black student culture and Black student retention. NASPA Journal, 34 (1), 47–56. Pike, G. R. (2006). The convergent and discriminant validity of NSSE scalelet scores. Journal of College Student Development, 47, 551-564.
Price, D.V. (2005, December). Learning communities and student success in postsecondary education: A background paper. New York: MDRC.
Reyes, N. (1997). Holding on to what they’ve got. Black Issues in Higher Education, 13(26): 36-40. St. John, E. P., Hu, S., Simmons, A. B., & Musoba, G. D. (2001). Aptitude vs. merit: What matters in persistence. The Review of Higher Education, 24, 131–152. Schwitzer, A. M., Griffin, O. T., Ancis, J. R., & Thomas, C. (1999). Social adjustment experiences of African American college students. Journal of Counseling and Development 77, 189-197. Sorcinelli, M. D. (1991). Research findings on the seven principles. New Directions for Teaching and Learning, (47), 13-25. Tinto, V. (1993). Leaving college: Rethinking the causes and cures of student attrition (2nd ed.). Chicago: University of Chicago Press.
Tinto, V. (1996). Reconstructing the first year of college. Planning for Higher Education, 25(1), 1-6.
32

Tinto, V., Love, A. G, & Russo, P. (1995). Building learning communities for new students: A summary of research findings of the collaborative learning project. University Park, PA: National Center on Postsecondary Teaching, Learning, and Assessment.
Wang, H., & Grimes, J. W. (2001). A systematic approach to assessing retention programs: identifying critical points for meaningful interventions and validating outcomes assessment. Journal of College Student Retention, 2(1), 59-68. Zhao, C-M., & Kuh, G.D. (2004). Adding value: Learning communities and student engagement. Research in Higher Education, 45, 115-138.
33

Table 1. Results of OLS Regression of First-Year GPA on Student Background and First-Year Experiences
Model 1 Model 2
Variable B Sig. B Sig. Intercept 3.041 *** 3.136 *** Female 0.164 *** 0.121 *** African American/Black -0.092 *** -0.053 * Asian/Pacific Islander -0.028 -0.040 Hispanic/Latino -0.018 0.051 Other race -0.081 -0.046 Number of parents with 4-year degree 0.022 * 0.016 Parent income 30,000 or less -0.098 *** -0.062 ** Parent income 30,000 to 50,000 -0.026 -0.019 Parent income 50,000 to 80,000 -0.007 0.006 Pre-college graduate degree expectations -0.037 * -0.038 ** Number of honors courses taken in high school 0.012 * 0.009 * Number of high school extracurricular activities -0.007 * -0.007 * Pre-college GPA of B -0.308 *** -0.251 *** Pre-college GPA of C -0.494 *** -0.308 *** Pre-college achievement score (centered) 0.048 *** 0.046 *** Received merit grant 0.087 *** 0.046 *** Earned less than full-time credit hours -0.747 *** Commuting residence 0.189 *** Transfer status -0.004 6 to 20 hours per week worked off-campus -0.024 21 or more hours per week worked off-campus -0.137 *** 6 to 20 hours per week relaxing/socializing -0.048 ** 21 or more hours per week relaxing/socializing -0.128 *** 6 to 20 hours per week studying 0.044 * 21 or more hours per week studying 0.118 *** 6 to 20 hours per week co-curricular -0.058 *** 21 or more hours per week co-curricular -0.111 *** Educationally purposeful activities (standardized) 0.038 ***
R2 0.289 *** 0.421 ***
R2 Change 0.132 *** * p<.05, ** p <.01, *** p <.001
34

Table 2. Results of Logistic Regression for Persistence to the Second Year on Student Characteristics and Engagement
Model 1 Model 2 Variable B Sig. OR B Sig. OR Female 0.500 *** 1.649 0.533 *** 1.704African American/Black 0.045 0.410 ** 1.507Asian/Pacific Islander 0.168 0.431 Hispanic/Latino -0.397 * 0.672 -0.050 Other race -0.465 -0.345 Number of parents with 4-year degree -0.025 -0.063 Parent income 30,000 or less -0.184 0.358 * 1.430Parent income 30,000 to 50,000 0.062 0.412 *** 1.510Parent income 50,000 to 80,000 0.011 0.164 Pre-college graduate degree expectations 0.131 0.119 Number of honors courses taken in high school 0.012 0.003 Number of high school extracurricular activities -0.057 ** 0.944 -0.068 *** 0.934Pre-college GPA of B 0.214 * 1.239 0.399 *** 1.490Pre-college GPA of C -0.178 0.306 Pre-college achievement score (centered) -0.033 ** 0.968 -0.043 *** 0.957Pre-college achievement score (squared) -0.006 *** 0.994 0.000 Received merit grant 0.951 *** 2.589 0.731 *** 2.077Earned less than full-time credit hours -1.372 *** 0.254Commuting residence 0.132 Transfer status -0.532 ** 0.5876 to 20 hours per week worked off-campus -0.121 21 or more hours per week worked off-campus 0.210 6 to 20 hours per week relaxing/socializing -0.028 21 or more hours per week relaxing/socializing 0.231 6 to 20 hours per week studying -0.020 21 or more hours per week studying -0.122 6 to 20 hours per week co-curricular 0.731 *** 2.07721 or more hours per week co-curricular 0.927 *** 2.528Educationally purposeful activities (standardized) 0.154 *** 1.167First-year cumulative GPA (centered) 0.107 First-year cumulative GPA (squared) -0.390 *** 0.677Unmet need 10% or more of cost to attend -0.685 *** 0.504Constant 1.392 1.646
-2 Log Likelihood
5085.507 ***
4520.249 ***
Likelihood Ratio 565.258 *** Cox & Snell R2 .034 .118 Nagelkerke R2 .060 .206 Percent correct .577 .719
* p<.05, ** p <.01, *** p <.001
35

Table 3. Predicted Probability of Persisting to the Second Year of College for Model 1a
Characteristic Prob. Characteristic Prob. Gender High school grades
Female 0.887 Mostly As b 0.864 Male b 0.827 Mostly Bs 0.887
Race Pre-college achievement score c
Hispanic/Latino 0.822 1 SD above mean (approx. score 28) 0.844 White b 0.873 1 SD below mean (approx. score 20) 0.875
Number of high school co-curricular activities Merit grant
1 SD above mean (approx. 7 activities) 0.856 Received merit grant 0.925 1 SD below mean (approx. 3 activities) 0.884 Did not receive merit grant b 0.827
a Predicted probabilities are calculated with all other variables in the model held at their mean values b Reference group c Includes polynomial term
36

Table 4. Predicted Probability of Persisting to the Second Year of College for Model 2a
Characteristic Prob. Characteristic Prob. Gender Enrollment status
Female 0.913 Less than full-time credits earned 0.723 Male b 0.860 Full-time credits earned b 0.911
Race Transfer status
African American 0.927 Transfer student 0.841 White b 0.893 Non-transfer student b 0.900
Parents' income Time spent in co-curricular activities
Parent income 30,000 or less 0.912 5 hours or less per week b 0.876 Parent income 30,000 to 50,000 0.917 6 to 20 hours per week 0.936 Parent income greater than 80,000 b 0.879 21 or more hours per week 0.947
Number of high school co-curricular activities Educationally purposeful activities 1 SD above mean (approx. 7 activities) 0.885 1 SD above mean 0.912 1 SD below mean (approx. 3 activities) 0.911 1 SD below mean 0.884
High school grades First-year GPA c Mostly As b 0.886 1 SD above mean (approx. 2.5) 0.890 Mostly Bs 0.921 1 SD below mean (approx 3.5) 0.876
Pre-college achievement score c Unmet need 1 SD above mean (approx. score 28) 0.881 10% or more of cost to attend 0.849 1 SD below mean (approx. score 20) 0.913 Less than 10% of cost to attend b 0.918
Merit grant Received merit grant 0.934 Did not receive merit grant b 0.872
a Predicted probabilities are calculated with all other variables in the model held at their mean values b Reference group c Includes polynomial term
37
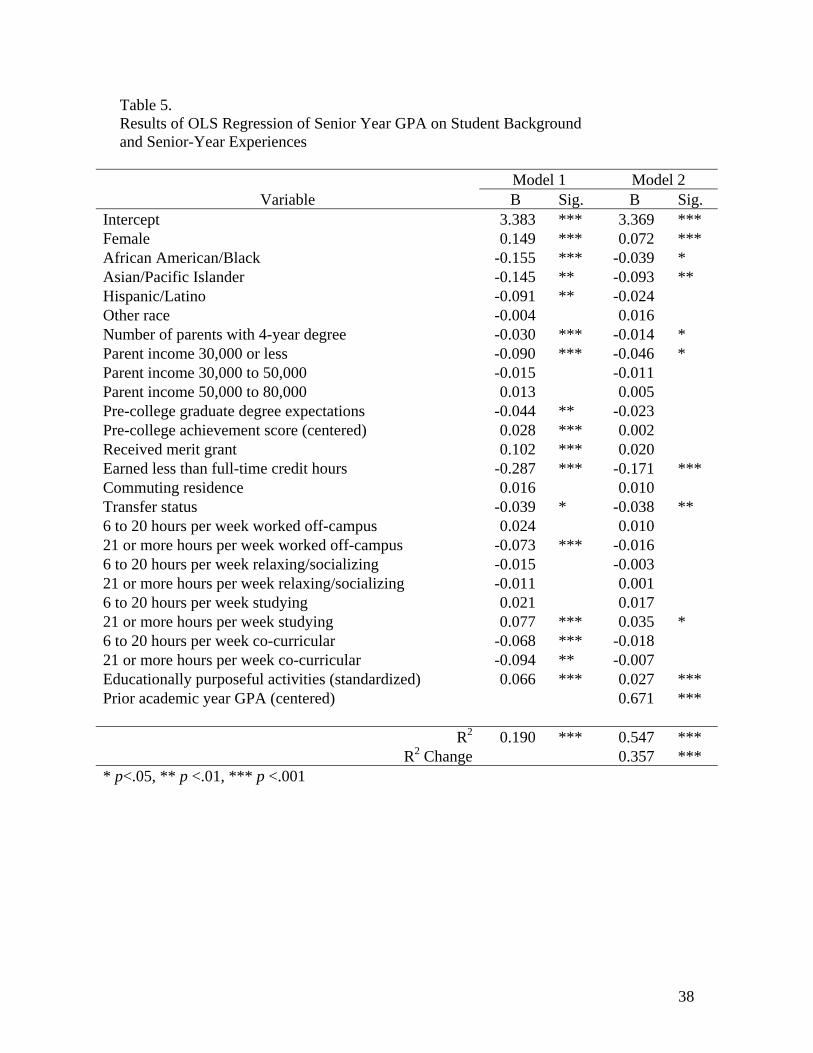
Table 5. Results of OLS Regression of Senior Year GPA on Student Background and Senior-Year Experiences
Model 1 Model 2
Variable B Sig. B Sig. Intercept 3.383 *** 3.369 *** Female 0.149 *** 0.072 *** African American/Black -0.155 *** -0.039 * Asian/Pacific Islander -0.145 ** -0.093 ** Hispanic/Latino -0.091 ** -0.024 Other race -0.004 0.016 Number of parents with 4-year degree -0.030 *** -0.014 * Parent income 30,000 or less -0.090 *** -0.046 * Parent income 30,000 to 50,000 -0.015 -0.011 Parent income 50,000 to 80,000 0.013 0.005 Pre-college graduate degree expectations -0.044 ** -0.023 Pre-college achievement score (centered) 0.028 *** 0.002 Received merit grant 0.102 *** 0.020 Earned less than full-time credit hours -0.287 *** -0.171 *** Commuting residence 0.016 0.010 Transfer status -0.039 * -0.038 ** 6 to 20 hours per week worked off-campus 0.024 0.010 21 or more hours per week worked off-campus -0.073 *** -0.016 6 to 20 hours per week relaxing/socializing -0.015 -0.003 21 or more hours per week relaxing/socializing -0.011 0.001 6 to 20 hours per week studying 0.021 0.017 21 or more hours per week studying 0.077 *** 0.035 * 6 to 20 hours per week co-curricular -0.068 *** -0.018 21 or more hours per week co-curricular -0.094 ** -0.007 Educationally purposeful activities (standardized) 0.066 *** 0.027 *** Prior academic year GPA (centered) 0.671 ***
R2 0.190 *** 0.547 ***
R2 Change 0.357 *** * p<.05, ** p <.01, *** p <.001
38

Figu
re 1
.Im
pact
of
Hou
rs P
er W
eek
Stu
dyin
g on
Fir
st-Y
ear
GP
A
By
Pre
-Col
lege
Ach
ieve
men
t Le
vel
2.00
2.25
2.50
2.75
3.00
3.25
3.50
3.75
4.00
2024
28
AC
T Sc
ore
First-year GPA
21 o
r m
ore
5 or
few
er
6 to
20
39

Figu
re 2
.Im
pact
of
Edu
cati
onal
ly P
urp
osef
ul A
ctiv
itie
s on
Fir
st A
cade
mic
Yea
r G
PA
By
Pre
-Col
lege
Ach
ieve
men
t Le
vel
2.00
2.25
2.50
2.75
3.00
3.25
3.50
3.75
4.00
-2-1
01
2
Educ
atio
nal
ly P
urp
osef
ul A
ctiv
itie
s (s
tan
dard
ized
)
First Academic Year GPA
ACT
20
ACT
28
ACT
24
40

Figu
re 3
.Im
pact
of
Edu
cati
onal
ly P
urp
osef
ul A
ctiv
itie
s on
Fir
st A
cade
mic
Yea
r G
PA
By
Rac
e/Et
hn
icit
y
2.00
2.25
2.50
2.75
3.00
3.25
3.50
3.75
4.00
-2-1
01
2
Educ
atio
nal
ly P
urp
osef
ul A
ctiv
itie
s (s
tan
dard
ized
)
First Academic Year GPA
His
pani
c
Whi
te
41

Figu
re 4
.Im
pact
of
Pre
-Col
lege
Ach
ieve
men
t Le
vel o
n P
roba
bili
ty o
f R
etur
nin
g fo
r th
e S
econ
d Y
ear
of C
olle
ge
0.50
0.55
0.60
0.65
0.70
0.75
0.80
0.85
0.90
0.95
1.00
1617
1819
2021
2223
2425
2627
2829
3031
32
AC
T S
core
Probability of Returning for the Second Year
42

Figu
re 5
.Im
pact
of
Firs
t A
cade
mic
Yea
r G
PA
on
Pro
babi
lity
of R
etu
rnin
g fo
r th
e Se
con
d Y
ear
of C
olle
ge
0.50
0.55
0.60
0.65
0.70
0.75
0.80
0.85
0.90
0.95
1.00
2.00
2.25
2.50
2.75
3.00
3.25
3.50
3.75
4.00
Firs
t-Y
ear
GP
A
Probability of Returning for the Second Year
43

Figu
re 6
.Im
pact
of
Edu
cati
onal
ly P
urp
osef
ul A
ctiv
itie
s on
th
e P
roba
bilit
y of
Ret
urn
ing
for
the
Sec
ond
Yea
r of
Col
lege
By
Rac
e
0.50
0.55
0.60
0.65
0.70
0.75
0.80
0.85
0.90
0.95
1.00
-2-1
01
2
Edu
cati
onal
ly P
urp
osef
ul A
ctiv
itie
s (s
tan
dard
ized
)
Probability of Returning for the Second Year
Afric
an A
mer
ican
Whi
te/C
auca
sian
44

Figu
re 7
.Im
pact
of
Edu
cati
onal
ly P
urp
osef
ul A
ctiv
itie
s on
Sen
ior
Aca
dem
ic Y
ear
GP
AB
y P
rior
Aca
dem
ic Y
ear
GP
A
2.00
2.25
2.50
2.75
3.00
3.25
3.50
3.75
4.00
-2-1
01
2
Edu
cati
onal
ly P
urp
osef
ul A
ctiv
itie
s (s
tan
dard
ized
)
Senior Academic Year GPA
Prio
r G
PA 3
.5
Prio
r G
PA 3
.0
Prio
r G
PA 2
.5
45

Appendix A Scale of Educationally Purposeful Activities
A summative scale of 19 NSSE items measuring student interaction with faculty, their experiences with diverse others, and their involvement in opportunities for active and collaborative learning.
• Asked questions in class or contributed to class discussions • Made a class presentation • Prepared two or more drafts of a paper or assignment before turning it in • Come to class without completing readings or assignments • Worked with other students on projects during class • Worked with classmates outside of class to prepare class assignments • Tutored or taught other students (paid or voluntary) • Participated in a community-based project as part of a regular course • Used an electronic medium (list-serv, chat group, Internet, etc.) to discuss or complete
an assignment Used e-mail to comm• unicate with an instructor
• Discussed grades or assignments with an instructor • Talked about career plans with a faculty member or advisor
embers outside of class
• ed harder than you thought you could to meet an instructor's standards or
• faculty members on activities other than coursework (committees,
• lasses with others outside of class (students,
• dents of a different race or ethnicity than your own
Cronbach’s Alpha Coefficient for Internal Consistency: First-year students = .818;
NSSE Response Set: 2000 = ‘Very often,’ ‘Often,’ ‘Occasionally,’ ‘Never;’ 2001-2003
Defined using a set of dichotomous variables
riables
• Discussed ideas from your readings or classes with faculty m• Received prompt feedback from faculty on your academic performance (written or
oral) Workexpectations Worked with orientation, student life activities, etc.) Discussed ideas from your readings or cfamily members, coworkers, etc.) Had serious conversations with stu
• Had serious conversations with students who differ from you in terms of their religiousbeliefs, political opinions, or personal values
Seniors = .836
†
= ‘Very often,’ ‘Often,’ ‘Sometimes,’ ‘Never’
a
b Reference group for the set of dichotomous vac Variables not used in senior-level analysis
46

Appendix A continued
Merit grant recipienta
• Received merit grant • Did not receive merit grantb
Unmet need
Represents 10% or more of cost to attend. A dichotomous variable that equals 1 when the difference between the student’s financial need and his or her total aid received is equal to or greater than 10% of the cost to attend the institution.
Credit hours earneda
• Earned less than full-time credit hours • Earned full-time credit hoursb
Residencea
• Commuted to campus • Lived on or near campusb
Transfer statusa
• Transferred to current institution b• Started at current institution
Time spent working off-campusa
• 5 or fewer hours per week 6 to 20 hours per week
b
a
b
ek
ime spent studyinga
urs per weekb
ek
ime spent in co-curricular activitiesa
ek
• • 21 or more hours per we ek
Time spent relaxing/socializing
• 5 or fewer hours per week • 6 to 20 hours per week • 21 or more hours per we
T• 5 or fewer ho• 6 to 20 hours per week • 21 or more hours per we
T• 5 or fewer hours per weekb • 6 to 20 hours per week • 21 or more hours per we
47

Appendix B: Operational Definitions for Study Variables
Operational Definitions for Study Variables
ection 1. Student backgrS ound variables
enderaG
• Female
ac
African American/Black
that indicates the number of parents (or legal
ar
less 0
00
Pre l a
• Graduate degree
Num r high schoolc
Number of subject areas, ranging from 0 to 5, in which a student took one or more honors, .
Num
Number of extra-curricular activities, ranging from 0 to 11, in which a student participated
Hig
• A
lower Pre l ment score
Most recent c m score, with a possible range of 1 to 36. SAT scores were sing standard conversion tables.
• Maleb
eaR• • Asian/Pacific Islander • Hispanic/Latino
b• White/Caucasian • Other race
Number of parents with 4-year degree A discrete measure, ranging from 0 to 2,guardians) with a four-year degree or more.
ent incomeaP• $30,000 or • $30,000 to $50,00• $50,000 to $80,0• $80,000 or moreb
-co lege graduate degree expectations
• Bachelor’s degree or lessb
be of honors courses taken in
Advanced Placement, or accelerated courses
ber of high school extracurricular activitiesc
during high school.
h school GPAa, c
b
• B • C or
-co lege achieveollege entrance exa
converted into ACT scores u
48
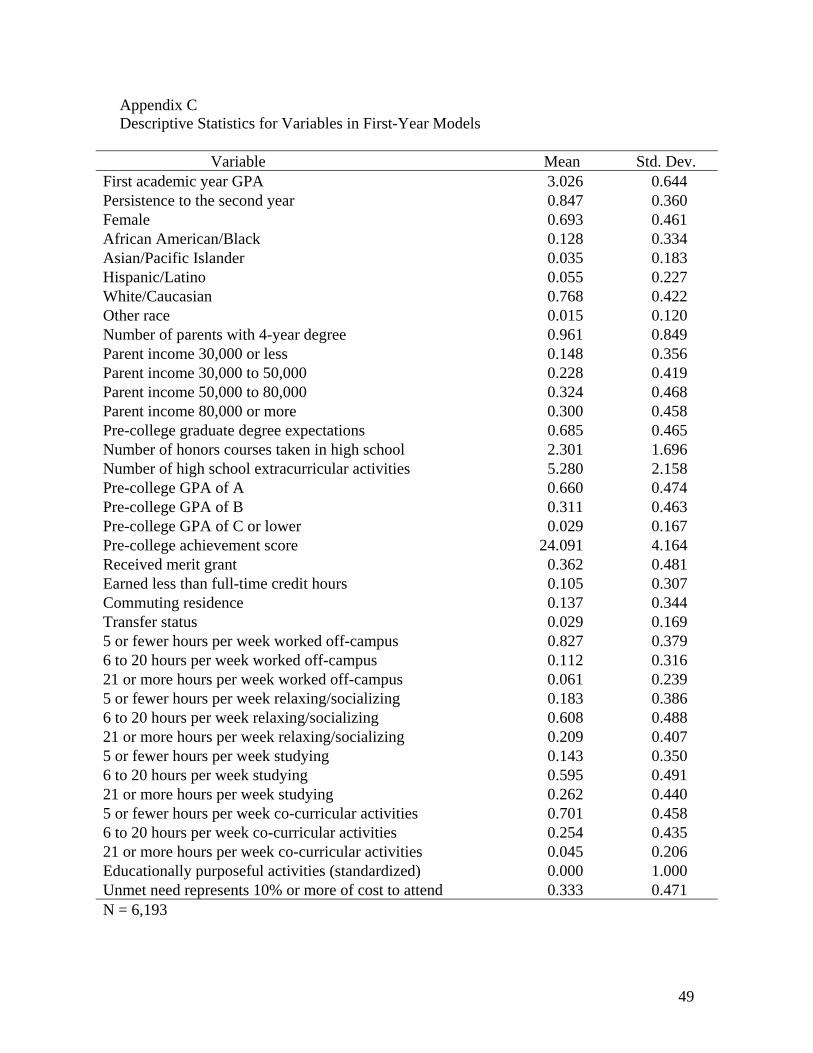
Appendix C escriptive Statistics for Variables in First-Year Models
Mean Std. Dev.
D
Variable First academic year GPA 3.026 0.644 Persistence to the second year
cific Islander
with 4-year degree e 30,000 or less
0
ctations n in high school
ivities
r lower 2
hours
ek worked off-campus r week worked off-campus
ng
ricular activities activities
d) d
0.847 0.360 Female 0.693 0.461 African American/Black 0.128 0.334 Asian/Pa 0.035 0.183 Hispanic/Latino 0.055 0.227 White/Caucasian 0.768 0.422 Other race 0.015 0.120 Number of parents 0.961 0.849 Parent incom 0.148 0.356 Parent income 30,000 to 50,000 0.228 0.419 Parent income 50,000 to 80,00 0.324 0.468 Parent income 80,000 or more 0.300 0.458 Pre-college graduate degree expe 0.685 0.465 Number of honors courses take 2.301 1.696 Number of high school extracurricular act 5.280 2.158 Pre-college GPA of A 0.660 0.474 Pre-college GPA of B 0.311 0.463 Pre-college GPA of C o 0.029 0.167 Pre-college achievement score 4.091 4.164 Received merit grant 0.362 0.481 Earned less than full-time credit 0.105 0.307 Commuting residence 0.137 0.344 Transfer status 0.029 0.169 5 or fewer hours per we 0.827 0.379 6 to 20 hours pe 0.112 0.316 21 or more hours per week worked off-campus 0.061 0.239 5 or fewer hours per week relaxing/socializi 0.183 0.386 6 to 20 hours per week relaxing/socializing 0.608 0.488 21 or more hours per week relaxing/socializing 0.209 0.407 5 or fewer hours per week studying 0.143 0.350 6 to 20 hours per week studying 0.595 0.491 21 or more hours per week studying 0.262 0.440 5 or fewer hours per week co-cur 0.701 0.458 6 to 20 hours per week co-curricular 0.254 0.435 21 or more hours per week co-curricular activities 0.045 0.206 Educationally purposeful activities (standardize 0.000 1.000 Unmet need represents 10% or more of cost to atten 0.333 0.471 N = 6,193
49

Appendix D escriptive Statistics for Variables in Senior Model
Variable Mean Std. Dev.
D
Se 3.357 0.539 nior academic year GPA Female 0.648 0.478 African American/Black
/Latino
ts with 4-year degree 000 or less
e 30,000 to 50,000
ctations
2
ampus worked off-campus
s per week worked off-campus
lar activities lar activities
lar activities
0.101 0.301 Asian/Pacific Islander 0.024 0.152 Hispanic 0.048 0.213 White/Caucasian 0.817 0.387 Other race 0.011 0.105 Number of paren 0.996 0.841 Parent income 30, 0.160 0.367 Parent incom 0.267 0.443 Parent income 50,000 to 80,000 0.336 0.472 Parent income 80,000 or more 0.236 0.425 Pre-college graduate degree expe 0.708 0.455 Pre-college achievement score 4.150 4.320 Received merit grant 0.348 0.476 Earned less than full-time credit hours 0.165 0.371 Commuting residence 0.355 0.479 Transfer status 0.177 0.382 5 or fewer hours per week worked off-c 0.549 0.498 6 to 20 hours per week 0.258 0.438 21 or more hour 0.192 0.394 5 or fewer hours per week relaxing/socializing 0.200 0.400 6 to 20 hours per week relaxing/socializing 0.629 0.483 21 or more hours per week relaxing/socializing 0.171 0.376 5 or fewer hours per week studying 0.169 0.375 6 to 20 hours per week studying 0.581 0.493 21 or more hours per week studying 0.250 0.433 5 or fewer hours per week co-curricu 0.672 0.470 6 to 20 hours per week co-curricu 0.270 0.444 21 or more hours per week co-curricu 0.059 0.235 Educationally purposeful activities (standardized) 0.000 1.000 Prior academic year GPA 3.264 0.540 N = 5,227
50