Sequencing and de novo analysis of a coral larval transcriptome using 454 GSFlx
18
BioMed Central Page 1 of 18 (page number not for citation purposes) BMC Genomics Open Access Research article Sequencing and de novo analysis of a coral larval transcriptome using 454 GSFlx Eli Meyer* 1 , Galina V Aglyamova 1 , Shi Wang 1 , Jade Buchanan-Carter 2 , David Abrego 3 , John K Colbourne 2 , Bette L Willis 3 and Mikhail V Matz 1 Address: 1 University of Texas at Austin, 1 University Station C0930, Austin, TX, 78712, USA , 2 The Center for Genomics and Bioinformatics, Indiana University, 915 East Third Street, Bloomington, IN, 47405, USA and 3 ARC Centre of Excellence for Coral Reef Studies, and School of Marine and Tropical Biology, James Cook University, Townsville, QLD, 4811, Australia Email: Eli Meyer* - [email protected]; Galina V Aglyamova - [email protected]; Shi Wang - [email protected]; Jade Buchanan-Carter - [email protected]; David Abrego - [email protected]; John K Colbourne - [email protected]; Bette L Willis - [email protected]; Mikhail V Matz - [email protected] * Corresponding author Abstract Background: New methods are needed for genomic-scale analysis of emerging model organisms that exemplify important biological questions but lack fully sequenced genomes. For example, there is an urgent need to understand the potential for corals to adapt to climate change, but few molecular resources are available for studying these processes in reef-building corals. To facilitate genomics studies in corals and other non-model systems, we describe methods for transcriptome sequencing using 454, as well as strategies for assembling a useful catalog of genes from the output. We have applied these methods to sequence the transcriptome of planulae larvae from the coral Acropora millepora. Results: More than 600,000 reads produced in a single 454 sequencing run were assembled into ~40,000 contigs with five-fold average sequencing coverage. Based on sequence similarity with known proteins, these analyses identified ~11,000 different genes expressed in a range of conditions including thermal stress and settlement induction. Assembled sequences were annotated with gene names, conserved domains, and Gene Ontology terms. Targeted searches using these annotations identified the majority of genes associated with essential metabolic pathways and conserved signaling pathways, as well as novel candidate genes for stress-related processes. Comparisons with the genome of the anemone Nematostella vectensis revealed ~8,500 pairs of orthologs and ~100 candidate coral-specific genes. More than 30,000 SNPs were detected in the coral sequences, and a subset of these validated by re-sequencing. Conclusion: The methods described here for deep sequencing of the transcriptome should be widely applicable to generate catalogs of genes and genetic markers in emerging model organisms. Our data provide the most comprehensive sequence resource currently available for reef-building corals, and include an extensive collection of potential genetic markers for association and population connectivity studies. The characterization of the larval transcriptome for this widely- studied coral will enable research into the biological processes underlying stress responses in corals and evolutionary adaptation to global climate change. Published: 12 May 2009 BMC Genomics 2009, 10:219 doi:10.1186/1471-2164-10-219 Received: 13 January 2009 Accepted: 12 May 2009 This article is available from: http://www.biomedcentral.com/1471-2164/10/219 © 2009 Meyer et al; licensee BioMed Central Ltd. This is an Open Access article distributed under the terms of the Creative Commons Attribution License (http://creativecommons.org/licenses/by/2.0 ), which permits unrestricted use, distribution, and reproduction in any medium, provided the original work is properly cited.
Transcript of Sequencing and de novo analysis of a coral larval transcriptome using 454 GSFlx

BioMed CentralBMC Genomics
ss
Open AcceResearch articleSequencing and de novo analysis of a coral larval transcriptome using 454 GSFlxEli Meyer*1, Galina V Aglyamova1, Shi Wang1, Jade Buchanan-Carter2, David Abrego3, John K Colbourne2, Bette L Willis3 and Mikhail V Matz1Address: 1University of Texas at Austin, 1 University Station C0930, Austin, TX, 78712, USA , 2The Center for Genomics and Bioinformatics, Indiana University, 915 East Third Street, Bloomington, IN, 47405, USA and 3ARC Centre of Excellence for Coral Reef Studies, and School of Marine and Tropical Biology, James Cook University, Townsville, QLD, 4811, Australia
Email: Eli Meyer* - [email protected]; Galina V Aglyamova - [email protected]; Shi Wang - [email protected]; Jade Buchanan-Carter - [email protected]; David Abrego - [email protected]; John K Colbourne - [email protected]; Bette L Willis - [email protected]; Mikhail V Matz - [email protected]
* Corresponding author
AbstractBackground: New methods are needed for genomic-scale analysis of emerging model organismsthat exemplify important biological questions but lack fully sequenced genomes. For example, thereis an urgent need to understand the potential for corals to adapt to climate change, but fewmolecular resources are available for studying these processes in reef-building corals. To facilitategenomics studies in corals and other non-model systems, we describe methods for transcriptomesequencing using 454, as well as strategies for assembling a useful catalog of genes from the output.We have applied these methods to sequence the transcriptome of planulae larvae from the coralAcropora millepora.
Results: More than 600,000 reads produced in a single 454 sequencing run were assembled into~40,000 contigs with five-fold average sequencing coverage. Based on sequence similarity withknown proteins, these analyses identified ~11,000 different genes expressed in a range ofconditions including thermal stress and settlement induction. Assembled sequences wereannotated with gene names, conserved domains, and Gene Ontology terms. Targeted searchesusing these annotations identified the majority of genes associated with essential metabolicpathways and conserved signaling pathways, as well as novel candidate genes for stress-relatedprocesses. Comparisons with the genome of the anemone Nematostella vectensis revealed ~8,500pairs of orthologs and ~100 candidate coral-specific genes. More than 30,000 SNPs were detectedin the coral sequences, and a subset of these validated by re-sequencing.
Conclusion: The methods described here for deep sequencing of the transcriptome should bewidely applicable to generate catalogs of genes and genetic markers in emerging model organisms.Our data provide the most comprehensive sequence resource currently available for reef-buildingcorals, and include an extensive collection of potential genetic markers for association andpopulation connectivity studies. The characterization of the larval transcriptome for this widely-studied coral will enable research into the biological processes underlying stress responses in coralsand evolutionary adaptation to global climate change.
Published: 12 May 2009
BMC Genomics 2009, 10:219 doi:10.1186/1471-2164-10-219
Received: 13 January 2009Accepted: 12 May 2009
This article is available from: http://www.biomedcentral.com/1471-2164/10/219
© 2009 Meyer et al; licensee BioMed Central Ltd. This is an Open Access article distributed under the terms of the Creative Commons Attribution License (http://creativecommons.org/licenses/by/2.0), which permits unrestricted use, distribution, and reproduction in any medium, provided the original work is properly cited.
Page 1 of 18(page number not for citation purposes)

BMC Genomics 2009, 10:219 http://www.biomedcentral.com/1471-2164/10/219
BackgroundReef-building corals support productive and diversemarine communities that provide important ecosystemservices [1], but are threatened throughout their globalrange by a variety of stressors that include increasing seasurface temperatures, pollution, ocean acidification anddisease [2-4]. A major focus of contemporary coral biol-ogy is to understand the factors determining stress resil-ience of corals and the potential for coral populations torecover from or adapt to these stressors [5]. The responsesof coral holobionts to heat and light stress are especiallycomplex because of the symbiotic association betweenreef-building corals and algae (zooxanthellae). The effectsof light and temperature stress on these intracellular sym-bionts have been well characterized [6], but the geneticdeterminants of stress tolerance in the coral host, and anyinteraction effects between coral and zooxanthellae phe-notypes, remain poorly understood [7,8]. Genomicresources such as genome or transcriptome sequenceswould make possible the detailed studies of gene expres-sion, genetic connectivity, and stress physiology requiredfor addressing these questions.
The genomic sequence resources currently available forcorals are limited [9]. About 11,000 to 15,000 reads frompilot shotgun sequencing projects are available at NCBIfor each of three corals (Acropora millepora, Acropora pal-mata, and Porites lobata), but no coral genomes have beencompleted and to our knowledge no genome sequencingprojects are underway for any coral species. A number ofstudies have developed EST resources for corals usingSanger sequencing [10-12]. The staghorn coral Acroporamillepora (Ehrenberg, 1834) has emerged as the mostextensively sequenced scleractinian coral, with ~10,000ESTs and ~14,000 shotgun genome sequences publiclyavailable at NCBI. Additional EST sequencing projectsusing this species are ongoing but the results are not yetpublicly available [13]. These EST sequencing efforts haveallowed development of small-scale microarrays for geneexpression analysis in the context of coral stress physiol-ogy [14], and similar studies aiming to identify stress can-didates are currently underway [13]. These studies havehighlighted the utility of cDNA sequencing for candidategene discovery in the absence of a genome sequence, buta comprehensive description of the full complement ofgenes expressed in corals remains unavailable.
The increased throughput of next-generation sequencingtechnologies such as 454 sequencing [15] shows greatpotential for expanding sequence databases of corals andother emerging model organisms (reviewed in [16]). 454sequencing of transcriptomes for organisms with com-pleted genomes has confirmed that the relatively short(100–200 bp) reads produced by current versions of thistechnology can be effectively assembled and used for gene
discovery [17,18]. These methods have not yet beenwidely applied to emerging model organisms, because ofthe lack of methods for de novo assembly and analysis inthe absence of a reference genome sequence. Neverthe-less, the few examples published to date have successfullydemonstrated the potential for discovery of genes andgenetic markers in these systems [19-23]. Despite theirobvious potential, next-generation sequencing methodshave not yet been applied to corals.
In this study, we describe improved methods for cDNAlibrary preparation and titration for de novo transcriptomesequencing of any organism using 454, as well assequence analysis and annotation procedures. The strat-egy outlined here does not require prior sequence knowl-edge, and relies exclusively on publicly available softwareand basic scripting tools. We applied these methods tosequence the larval transcriptome of the widely-studiedcoral A. millepora. The assembled, annotated sequences soproduced provide a nearly complete catalog of the genesexpressed in planulae larvae.
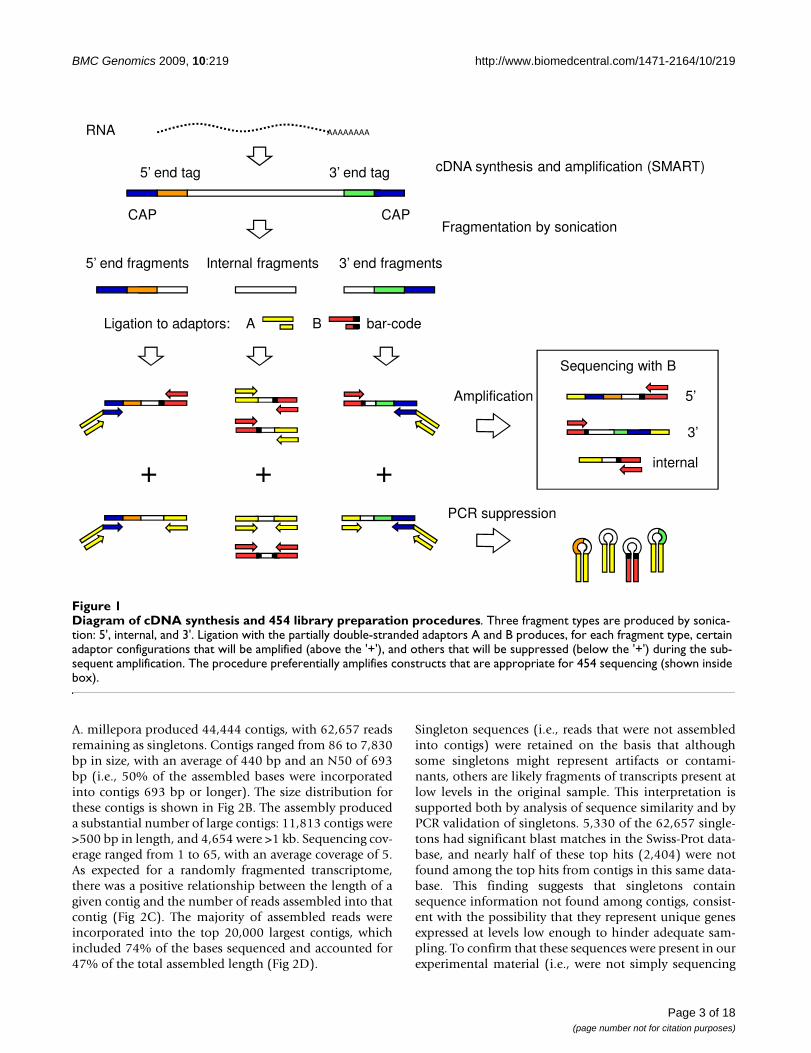
Results454 sequencing, assembly, and sequence analysisA cDNA sample was prepared from coral larvae as illus-trated in Figure 1, and sequenced using the 454 GS-Flxplatform. This single sequencing run produced 628,649reads, with an average sequence length of 232 bases (SD =55, range = 30–474). An overview of the sequencing andassembly is given in Table 1. After removal of adaptorsequences, 623,267 reads remained, with an averagelength of 216 ± 58 bases. This comparison revealed that99% of the reads produced contained useful sequencedata. A total of 146 Mb of raw sequence data were gener-ated, of which 135 Mb remained after adaptor trimming(92% of sequenced bases). Size-selection to remove out-lier reads (unusually long and unusually short) reducedthis to 134 Mb (599,248 reads; 95% of the originalnumber of reads). The size distribution for these trimmed,size-selected reads is shown in Fig 2A, revealing that 92%of trimmed reads fell between 100 and 300 bp in length.
Assembly of the trimmed, size selected reads along withthe publicly available EST sequences (NCBI's dbEST) for
Table 1: Summary of sequencing, assembly, and analysis
Sequences (n) Bases (Mb)
Raw sequencing reads 628,649 146.3Trimmed & size-selected 599,248 133.6Contigs 44,444 19.6Singletons 62,657 13.6Total 107,101 33.2Scaffolds 104,005Sequence clusters 93,466
Page 2 of 18(page number not for citation purposes)
BMC Genomics 2009, 10:219 http://www.biomedcentral.com/1471-2164/10/219
A. millepora produced 44,444 contigs, with 62,657 readsremaining as singletons. Contigs ranged from 86 to 7,830bp in size, with an average of 440 bp and an N50 of 693bp (i.e., 50% of the assembled bases were incorporatedinto contigs 693 bp or longer). The size distribution forthese contigs is shown in Fig 2B. The assembly produceda substantial number of large contigs: 11,813 contigs were>500 bp in length, and 4,654 were >1 kb. Sequencing cov-erage ranged from 1 to 65, with an average coverage of 5.As expected for a randomly fragmented transcriptome,there was a positive relationship between the length of agiven contig and the number of reads assembled into thatcontig (Fig 2C). The majority of assembled reads wereincorporated into the top 20,000 largest contigs, whichincluded 74% of the bases sequenced and accounted for47% of the total assembled length (Fig 2D).
Singleton sequences (i.e., reads that were not assembledinto contigs) were retained on the basis that althoughsome singletons might represent artifacts or contami-nants, others are likely fragments of transcripts present atlow levels in the original sample. This interpretation issupported both by analysis of sequence similarity and byPCR validation of singletons. 5,330 of the 62,657 single-tons had significant blast matches in the Swiss-Prot data-base, and nearly half of these top hits (2,404) were notfound among the top hits from contigs in this same data-base. This finding suggests that singletons containsequence information not found among contigs, consist-ent with the possibility that they represent unique genesexpressed at levels low enough to hinder adequate sam-pling. To confirm that these sequences were present in ourexperimental material (i.e., were not simply sequencing
Diagram of cDNA synthesis and 454 library preparation proceduresFigure 1Diagram of cDNA synthesis and 454 library preparation procedures. Three fragment types are produced by sonica-tion: 5', internal, and 3'. Ligation with the partially double-stranded adaptors A and B produces, for each fragment type, certain adaptor configurations that will be amplified (above the '+'), and others that will be suppressed (below the '+') during the sub-sequent amplification. The procedure preferentially amplifies constructs that are appropriate for 454 sequencing (shown inside box).
AAAAAAAA
+ + +
Internal fragments5’ end fragments 3’ end fragments
RNA
Ligation to adaptors: A B bar-code
cDNA synthesis and amplification (SMART)
Fragmentation by sonication
Sequencing with B
Amplification
PCR suppression
5’
3’
internal
5’ end tag 3’ end tag
CAP CAP
Page 3 of 18(page number not for citation purposes)

BMC Genomics 2009, 10:219 http://www.biomedcentral.com/1471-2164/10/219
Page 4 of 18(page number not for citation purposes)
Overview of A. millepora transcriptome sequencing and assemblyFigure 2Overview of A. millepora transcriptome sequencing and assembly. (A) Size distribution of 454 sequencing read sizes after removal of adaptor sequences and outliers. (B) Size distribution of assembled sequences after assembly and contig joining. Note the logarithmic y-axis. (C) Log-log plot showing the dependence of assembled sequence lengths on the number of sequences assembled into each. (D) Assembled sequences are shown ranked from largest to smallest, with the cumulative per-cent of assembled bases (dashed line) and total assembly length (solid line) calculated based on those rankings. Sequence rank is shown in units of 10,000.

BMC Genomics 2009, 10:219 http://www.biomedcentral.com/1471-2164/10/219
artifacts), we randomly selected 10 singletons for primerdesign. PCR analysis confirmed, for 8 of the 10 tested, thatthese sequences are present in the original cDNA (addi-tional file 1). These 8 primer pairs each produced a singleband of the expected molecular weight, and the othersgave either no product or multiple bands. A large numberof cycles (35–40) were required to produce detectableproducts, consistent with the possibility that thesesequences represent genes expressed at low levels. Sangersequencing of the eight successful PCR products con-firmed the identity of five, with the other three matchingpoorly to the target singletons (Table 2).
Of the 107,101 assembled sequences (contigs plus single-tons), 24,850 had significant matches in public proteinsequence databases (nr). These blast matches correspondto 17,707 different unique accession numbers, of which2,331 were each matched by multiple queries withoutoverlap. These 2,331 subject sequences correspond to5,327 different query sequences (~2.3 queries matchedeach subject, on average). For each of these proteinsequences, all queries matching that subject were joinedtogether in the appropriate order and strand (sense/anti-
sense) to produce a scaffold, a construct intended to rep-resent the collection of fragments originating from asingle transcript. Overall, the contig joining process con-densed the number of sequences from 107,101 to104,005. To validate the contig joining procedure, ten setsof sequences that had been joined in this fashion (i.e., 10scaffolds) were randomly selected for validation. Notethat because the gaps in scaffolds are of unknown length,the scaffold sequences provide minimum expectations forPCR product size. All ten scaffolds were successfullyamplified by PCR (additional file 1). Sanger sequencingof these PCR products confirmed the identity of eight scaf-folds at both ends, and the other two at only one end(Table 2). These findings confirm that the scaffolds pro-duced from our contig joining procedure successfullyrecapitulate cDNA sequences in most cases. This strategysuccessfully identified different parts of the same tran-script for >2,000 transcripts in our study, and should bewidely applicable for other transcriptome sequencingefforts in emerging model organisms.
The preceding steps, including assembly of raw reads andcontig joining, were expected to reduce redundancyamong sequences (i.e., more than one sequence per gene).To characterize any redundancy that remained, assembledsequences were clustered using two parallel proceduresbased on (1) nucleotide sequence similarity among theassembled sequences themselves, and (2) proteinsequence similarity among the query sequences' best blastmatches. The final set of 93,466 merged clusters wasobtained from the union of these protein and nucleotidesequence clusters. Excluding the large clusters matchingtransposable elements, sequence clusters ranged from 1 to64 sequences in size, with most containing only 1–2sequences and a small number of clusters containingmore than 2. The largest clusters could indicate paralogs,highly-divergent alleles, well-conserved gene families,alternative splice variants, or simply high levels of expres-sion with correspondingly high sequencing error due toincreased sampling. Regardless of the biological interpre-tation of sequence clusters, the clustering of 104,005assembled sequences into 93,466 clusters indicates thatrelatively little redundancy remained after assembly andjoining. Annotation of sequences clusters allows the rapididentification of all sequences with similarity to a particu-lar gene of interest, facilitating studies of sequence poly-morphisms and closely related genes.
Functional annotation of the transcriptomeBecause the significance of sequence similarity depends inpart on the length of the query sequence, short sequencingreads obtained from next-generation sequencing (e.g., the~216 bp average trimmed read length obtained in thisstudy) frequently cannot be matched to known genes[21]. Most of the 104,005 assembled sequences analyzed
Table 2: Validation of singleton sequences and the contig joining procedure by PCR amplification and Sanger sequencing.
Singleton ID PCR Aligned region (bp) % identity
E60BDOM01CLWZX + 127 95%E60BDOM01ALGIK +E60BDOM01BPLRZ + 154 94%E60BDOM02F1SCS + 148 99%E60BDOM01CV0LE +E60BDOM01ETTGL + 157 99%E60BDOM01BOMBA +E60BDOM01AM229E60BDOM01CMRH7E60BDOM01E1RA8 + 127 98%
Scaffold ID PCR 5' match, bp(%identity)
3' match, bp(%identity)
EZ002257 + 193 (98%)EZ000984 + 248 (99%) 123 (99%)EZ001217 + 722 (96%) 374 (98%)EZ001302 + 174 (97%) 180 (99%)EZ001324 + 361 (97%) 183 (99%)EZ002268 + 249 (99%) 186 (99%)EZ001475 + 323 (99%)EZ002219 + 715 (98%) 218 (98%)EZ000750 + 768 (96%) 212 (99%)EZ001662 + 133 (99%) 55 (98%)
Singleton sequences are identified by sequence identifiers for SRA003728, with the size (in bp) and quality (% identity) of the alignment between the 454 sequence and the Sanger sequence. Scaffolds are identified by accession numbers, with sequence identity shown for the 5'-most contig and the 3'-most contig contained in that scaffold.
Page 5 of 18(page number not for citation purposes)

BMC Genomics 2009, 10:219 http://www.biomedcentral.com/1471-2164/10/219
here are short (61% ≤ 250 bp), and correspondingly fewhave significant blast matches in NCBI's nr database(23.9%). The proportion of sequences with matches inpublic databases is greater among the longer assembledsequences, as demonstrated by applying a series ofincreasing minimum size cutoffs and recording thenumber of queries with significant matches (additionalfile 2). Among sequences ≥ 300 bp (i.e., longer than a sin-gle read), significant matches were found in nr for 62%,and among those longer than 1 kb, the proportionincreased to 88.8% (Table 3).
Assembled sequences were assigned gene names based onthe gene product and gene name annotation of the bestblast match for that sequence. This procedure successfullyassigned gene names for 15,860 sequences among theentire dataset; for 9,464 of the sequences ≥ 300 bp inlength; and for 3,889 of the sequences ≥ 1 kb in length(Table 3). Among the 15,860 annotated best hits, 11,633different gene names were assigned, providing a roughestimate of the number of different genes expressed inthese libraries. This is probably an underestimate becausemany sequences lacked matches in public sequence data-bases (Table 3) and were therefore not assigned genenames.
Analysis of protein domains revealed that 12,785 of theassembled sequences matched profiles in NCBI's con-served domains database, corresponding to 4,475 differ-ent domains. Most domains were found in only 1–2sequences, with a small number appearing more fre-quently. The top 20 most frequently detected domainsinclude conserved domains associated with transcriptionfactors, growth factors, and signaling pathways. The utilityof domain annotation is that it allows researchers toquickly select all genes sharing a common domain; forexample, selecting the 60 different sequences matchingthe domain COG5576 (homeodomain) retrieves putativehomologs of 51 different genes with known roles in devel-opment and morphogenesis (e.g., SIX4, PAX3, dll, andengrailed).
Gene Ontology terms were assigned to 17,902 assembledsequences based on sequence similarity with known pro-teins annotated with GO terms (UniProt-TrEMBL data-
base). For each sequence, the specific annotated termswere mapped to higher-level (i.e., more general) parentterms to provide a broad overview of the groups of genescataloged in this transcriptome for each of the three ontol-ogy vocabularies. The hierarchical structure of thesevocabularies allows the selection of sets of genes involvedin a specific process at the desired level of detail. For exam-ple, GO annotation revealed 320 sequences implicated ingeneral stress responses, including heat shock factor bind-ing proteins (Table 4). Within this set of general stressresponse genes, subsets of genes were associated with spe-cific stressors (i.e., higher level GO terms), including heatstress (e.g., heat shock protein 70), oxidative stress (e.g.,catalase), and response to wounding (e.g., phospholipaseA2-activating protein). These searches were based onprocesses that are the focus of ongoing research in coralbiology, and identified a number of genes that had notpreviously been investigated in the context of coral stressresponses (Table 4). These GO annotations provide a val-uable new resource for investigation of specific processes,functions, or cellular structures involved in coral stressresponses.
Pathways and complexesTo evaluate the completeness of our transcriptome libraryand the effectiveness of our annotation procedure, wesearched the annotated sequences for the genes involvedin a set of metabolic pathways and protein complexesshared among animal phyla. These simple text searcheswere based on standard gene names or synonyms. Thisconfirmed that our data include annotated sequences forall genes in the five major pathways considered here(Table 5). In a similar set of searches for components ofessential protein complexes, almost all the genes werefound (91–100%; Table 5). The presence of these essen-tial cellular process genes suggests that these annotatedsequences accounts for nearly the complete coral larvaltranscriptome.
To further evaluate the depth of coverage in this library,we searched the annotated sequences for sets of regulatorygenes known to be present in anemone Nematostella vect-ensis, the most closely related organism for which anassembled draft of the genome sequence is available. Therationale for these searches was that the presence of these
Table 3: Summary of annotation of the A. millepora larval transcriptome.
All sequences ≥ 300 bp ≥ 1000 bp
Total number of sequences 104,005 19,210 5,039Sequences with BLAST matches 24,850 11,901 4,474Sequences matching known genes 15,860 9,464 3,889Sequences assigned GO terms 17,902 8,915 3,436Sequences with conserved domains 12,785 8,144 3,573
Page 6 of 18(page number not for citation purposes)
BMC Genomics 2009, 10:219 http://www.biomedcentral.com/1471-2164/10/219
genes in anemone suggests their presence in coral, andtheir successfully identification in the coral larval tran-scriptome would support the completeness of thissequencing effort. For a set of 24 genes associated witheight major intercellular signaling pathways, 23 were suc-cessfully identified in the transcriptome sequences (Table6). Activin-like kinase was notably absent from this list,but this finding does not imply the absence of this gene inA. millepora; it could simply indicate that the gene is notexpressed, or expressed at a very low level, in the develop-mental stages sampled in this study.
A similar search was conducted for a set of transcriptionfactors known to be present in N. vectensis, based on con-served domains characteristic of each transcription factorfamily. Of the 20 families investigated, these searchesidentified annotated sequences corresponding to 18(Table 7). These text searches were based on domain iden-tifiers, domain descriptions, and gene names. No matcheswere found for two families of transcription factors: thecold-shock DNA binding domain (pfam00313), and thepaired amphipathic helix repeat (pfam02671). The lack ofdetection of these genes is not evidence that they areabsent in the coral larvae; it might indicate their lowexpression, incomplete sequencing coverage, or inade-
quate annotation. Nevertheless, the overall success inidentifying the known sets of genes associated with thesepathways and complexes indicates that the collection ofsequences established in this study provides a reasonablycomplete description of the coral larval transcriptome.
Comparisons with Nematostella vectensisSequence comparisons revealed broad similarity betweenthe coral sequences described here and the proteinsequences predicted from the anemone genome. Of the104,005 assembled coral sequences, 20,619 have signifi-cant matches among the anemone predicted proteins(blastx with adjusted e-value threshold of 10-4). These cor-respond to 11,572 different predicted proteins. Reciprocalblast searches, in which the anemone sequences were que-ried against the coral sequences, revealed that 20,976 ofthe 27,273 N. vectensis proteins had significant similaritywith coral sequences (tblastn), corresponding to 9,802different coral sequences. Comparison of the best blastmatches from these searches identified 8,515 unambigu-ous orthologs between coral and anemone, based on sig-nificant reciprocal best matches. Because the coralsequences represent partial transcripts, this is likely anunderestimate of the true number of anemone orthologsexpressed in this developmental stage.
To investigate whether the coral larval transcriptome con-tains "coral-specific" genes not found in the anemone, theassembled coral sequences were first compared with pub-lic databases. 22,158 coral sequences had significantmatches in nr with an e-value ≤ 10-4; these representsequences with reasonably strong matches to previouslyidentified proteins in other organisms. A list of all coralsequences that showed even weak similarity to anemoneproteins was compiled by searching the predicted proteins(blastx) and the genome assembly (tblastx), using a per-missive threshold of e ≤ 0.01 (n = 28,190 sequences).Comparison of these results revealed that 748 coralsequences matched known genes in other organisms buthad no significant similarity to anemone proteins fromthe draft genome. To reduce false positives stemming
Table 4: Candidate genes identified based on GO annotation of A. millepora larval transcriptome.
Process GO Term Sequences Example gene (match accession)
Response to stress 0006950 320 Heat shock factor-binding protein (Q5RDI2)Response to heat 0009408 2 70 kDa Heat shock protein (P17879)Response to oxidative stress 0006979 42 Catalase (Q9PWF7)Response to wounding 0009611 4 Phospholipase A2-activating protein (P27612)Apoptosis 0006915 38 Caspase (P70677)Exocytosis 0006887 7 Exocyst complex component 5 (P97878)Immune response 0006955 58 H-2 class II histocompatibility antigen (P04441)Nitric oxide metabolism 0046209 3 Nitric oxide synthase (O19132)Protein folding 0006457 123 60 kDa heat shock protein (P18687)Vacuolar transport and organization 0007034, 0007033 5 Vacuolar protein sorting-associated protein 26B-B (Q6DH23)
Table 5: Genes from essential metabolic pathways and macromolecular complexes annotated in larval transcriptome.
Target Genes found (n) Known genes (n)
PathwaysGlycolysis 10 10Gluconeogenesis 10 10Pentose phosphate 5 5Citrate cycle 9 9Urea cycle 5 5
Complexes26S proteosome 22 22Chaperonin (TCP1) 8 8Spliceosome 130 143Ribosome 76 79Nuclear pore complex 26 28
Page 7 of 18(page number not for citation purposes)

BMC Genomics 2009, 10:219 http://www.biomedcentral.com/1471-2164/10/219
from the fact that many assembled sequences were notcomplete cDNAs, the top blast match for each of these(i.e., a complete protein sequence for that gene, from adifferent organism) was queried against the anemone pro-teins with a permissive threshold of e ≤ 0.01. After elimi-nating the sequences with matches in this search, 207
sequences remained, corresponding to 95 different anno-tated coral genes. These analyses suggest that these coralgenes lack orthologs in the anemone. Because the draftassembly of the anemone genome is not complete [24],further experimental work would be required to verify the
Table 6: Intercellular signaling pathway genes annotated in larval transcriptome.
Pathway Gene name Sequences (n)
Hedgehog Patched 15Fused 1Hedgehog 6Smoothened 2
JAK/STAT Janus kinase 4Signal transducer and activator of transcription 1
NFKB/Toll Nuclear factor NF-kappa-B 3Toll-interacting protein 1Toll-like receptor 9
NHR Estrogen-related receptor 1Hepatocyte nuclear factor 4 1Retinoid-related orphan receptors 6
Notch Furin 8Delta 12Notch 23Presenilin 4TACE 1
RTK Receptor tyrosine kinase 5TGF-beta Activin-like kinase 0
SMAD 15TGF-beta-receptor 3
WNT Disheveled 2Frizzled 22Wnt 25
Table 7: Major transcription factor families identified by conserved domain annotation of larval transcriptome
Sequences (n) Domain ID Conserved domain description
1 pfam01722 BolA-like protein0 pfam00313 Cold-shock DNA-binding domain1 pfam01381 Helix-turn-helix2 pfam02229 Transcriptional Coactivator p150 pfam02671 Paired amphipathic helix repeat1 pfam02864 Signal transducer and activator of transcription1 pfam01167 Tub family4 pfam00046 Homeobox domain1 pfam00447 HSF-type DNA-binding2 pfam00870 P53 DNA-binding domain6 pfam02257 RFX DNA-binding domain2 pfam01422 NF-X1-type zinc finger protein3 pfam02319 E2F/DP winged-helix DNA-binding domain1 pfam00319 SRF-type transcription factor1 pfam00250 Fork head12 pfam07716, pfam00170 Basic region leucine zipper & bZIP9 pfam00010 Helix-loop-helix DNA-binding domain3 pfam00249 Myb-like DNA-binding domain12 pfam00642 Zinc finger, CCCH type5 pfam00096 Zinc finger, C2H2 type
Page 8 of 18(page number not for citation purposes)

BMC Genomics 2009, 10:219 http://www.biomedcentral.com/1471-2164/10/219
absence of these candidate coral-specific genes in theanemone.
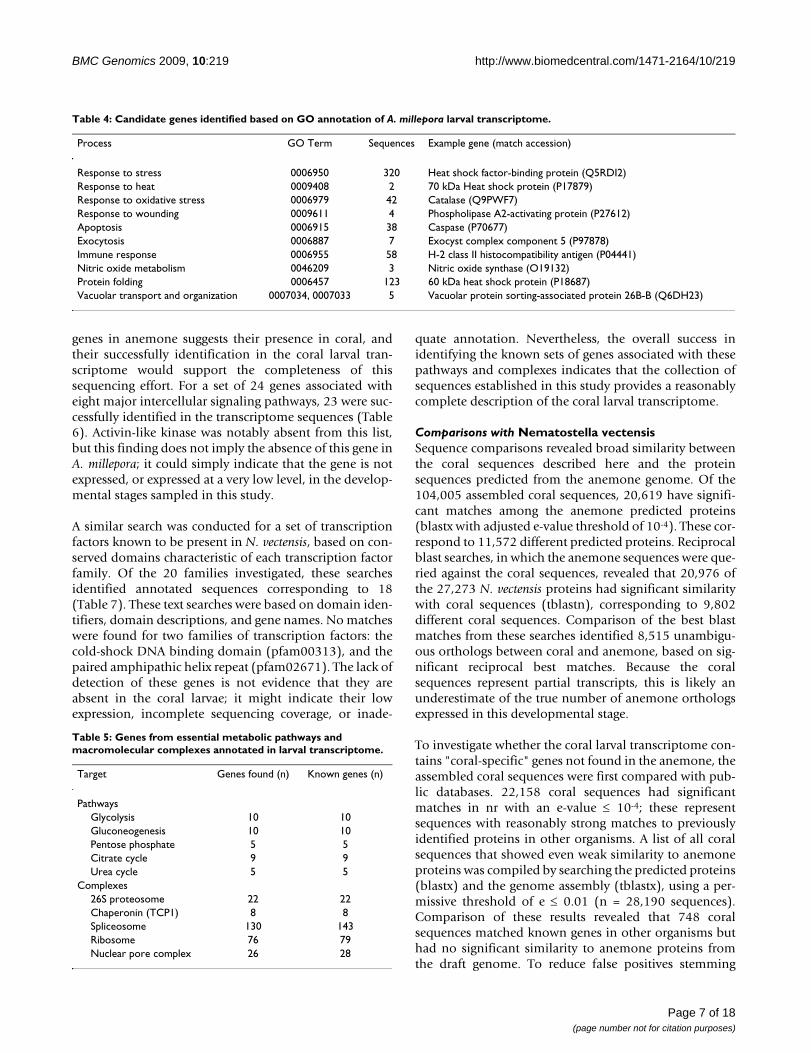
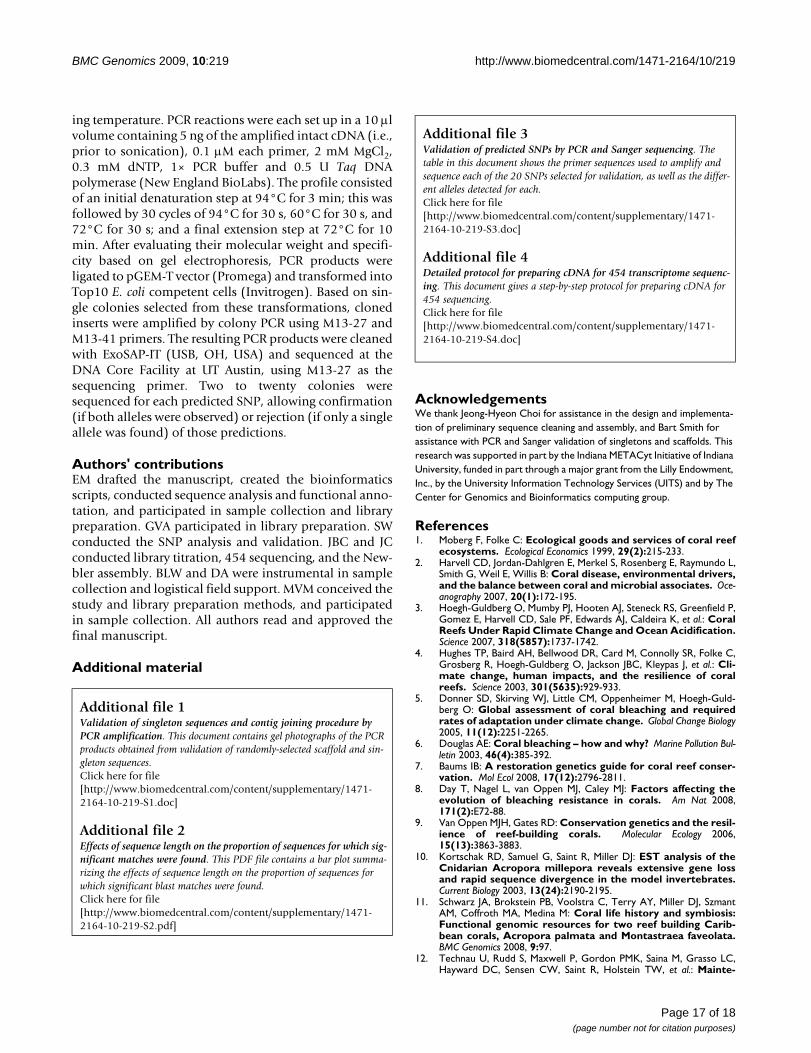
SNP detection and validationUsing the QualitySNP program, we identified 33,433 highquality SNPs and 6,820 indels within 14,613 CAP3-assembled contigs (Fig 3). These predicted SNPs included22,312 transitions and 10,823 transversions. The overallfrequency of all SNP types in the transcriptome, includingindels, was 1 per 207 bp. These predictions provide anextensive set of genetic markers for reef-building coralsthat will enable future studies of genetic connectivity andgenetic mapping at a previously unprecedented level ofdetail.
Twenty of these predicted SNPs (corresponding to 18 dif-ferent genes) were selected for validation using PCR andSanger sequencing, and 14 of these tests (70%) were suc-cessful (additional file 3). Because the genes selected forvalidation include several previously described stressresponses genes [14], the SNPs confirmed in these analy-ses may be valuable for investigating the genetic determi-nants of stress-gene expression. Overall, the successfulexperimental validation of the majority of computation-ally predicted SNPs confirms the utility of mining 454transcriptome sequences for genetic markers.
DiscussionMethodological advances for 454 sequencing of transcriptomesThe methods described here resolve several challengesassociated with 454 sequencing of transcriptomes.Because 454 sequencing does not efficiently processhomopolymer regions greater than 8 bp in length [15],the poly-A tails at the 3' ends of intact transcripts presenta problem, and would be expected to result in under-rep-resentation of the 3' ends of transcripts. In our method,this is resolved by simply interrupting the poly-T regionwith a single C. A single copy of this 'broken-T' adaptorwas found in 98,276 of the raw reads (16% of the total),slightly more than the expectation (~10%) based on aver-age read length (232 bp) and assuming an average tran-script size of 2,200 bp. This comparison suggests that the3' ends of transcripts were well-represented in our dataset,confirming the effectiveness of this solution for overcom-ing the homopolymer problem. Another difficulty in 454transcriptome sequencing is concatenation of adaptorsduring cDNA preparation, an issue that is commonlyencountered but seldom reported because concatenatedadaptor fragments either fail to sequence or are removedby adaptor trimming, decreasing the final sequencingyield. Our library preparation method resolves this diffi-culty by (1) sequencing all fragments from an internalend, so that any concatenated adaptors encountered willtend to be found at the end of the read; and (2) avoidingthe over-amplification that can contribute to adaptor con-catenation. The emPCR titration method described in thisstudy reflects an additional improvement on previousmethods that further increases the number of usable readsobtained per run.
Comparison of our results with recently published studiesthat employed 454 sequencing confirms the effectivenessof these improvements. First, 95% of the reads producedin our study passed stringent quality filters (i.e., adaptortrimming and size selection), an improvement over the85–90% that passed similar quality filters in previousstudies [17,18,23]. Our assembly incorporated 90% ofhigh-quality reads, improving on the 40–88% reportedfor assemblies in previous studies [17,21,23]. The averagecontig size, which is strongly affected by read length, was~90 bp higher in our study than in a recently publishedstudy that also used the 454 GS-Flx sequencing platformand so began with reads of comparable length [21]. Ourassembly also included a larger proportion of long contigs(27% of contigs were ≥ 500 bp) than the 8% reported in[21], despite the larger number of reads (>1 million) frommultiple sequencing runs in that study. Finally, our librarypreparation and titration procedures produce 2–5 timesmore reads per sequencing run than standard methods:~620,000 in our study versus ~130,000 to ~390,000 inprevious reports [17,21-23]. One possible caveat for these
Classification of single nucleotide polymorphisms (SNPs) identified from 454 sequencesFigure 3Classification of single nucleotide polymorphisms (SNPs) identified from 454 sequences. Overall fre-quency of these SNP types in the larval transcriptome is one per 207 bp.
Fre
quen
cy p
er k
b
0.0
0.2
0.4
0.6
0.8
1.0
1.2
C/T
A/G A/T
A/C
T/G
C/G
Inde
l
transitions transversions
Page 9 of 18(page number not for citation purposes)

BMC Genomics 2009, 10:219 http://www.biomedcentral.com/1471-2164/10/219
comparisons is that our assembly did include a smallnumber of Sanger ESTs (~11,000), and these might beexpected to improve the assembly. However, the effect ofthese Sanger ESTs on the assembly was actually negligible:a separate assembly that excluded those ESTs producedonly 0.4% more contigs, 1% more scaffolds, and 4.8%shorter contigs. Overall, these comparisons with previousstudies highlight the potential for our method to improvesequencing depth and efficiency in future transcriptomesequencing efforts.
Deep sequencing of transcriptomes with 454 sequencingtypically produces many singleton sequences that fail toassemble, representing 10% of the reads in our study and13–60% in other recent 454 transcriptome assemblies[17,19,23]. Singletons could result from sequencingerrors, artifacts of cDNA normalization, genes expressed atlow levels in the coral, or contaminants from othersources. For example, our cDNA was derived from larvaegrown in non-sterile conditions and exposed to crustosecoralline algae (CCA) collected from the reef, suggestingpotential sources of contamination. To test for differencesbetween cDNAs that remained as singletons and thosethat were assembled into contigs, a subset of 10,000 readswas randomly selected from each set. Because this com-parison was based on sequencing reads, which did not dif-fer in size between the two sets, this comparison avoidedthe confounding effect of sequence length. Contig readsand singleton reads were compared separately against nrusing blastn (e-value ≤ 10-6), and the taxonomic origin oftheir top blast matches was recorded. This confirmed thatmost sequences in both sets best matched metazoansequence records from other species, although singletonsequences contained a significantly lower proportion ofmetazoan matches (89%) than contig reads (95%)(Fisher's exact test; P < 0.01). Singletons contained a sig-nificantly higher proportion of sequences that bestmatched proteobacteria (P < 0.01) and amoebozoa (P <0.05) records than reads that assembled into contigs, sug-gesting that singletons were enriched in cDNA from bio-logical contaminants. However, the absolute numbers ofputative contaminant hits were still very low (3–4sequences for each non-metazoan group), suggesting thatthe contamination level was low overall. A notable differ-ence revealed by these comparisons is that a larger propor-tion of contig reads (10%) had significant matches thansingleton reads (2%) (Fisher's exact test; P < 0.001). Thissuggests that a substantial fraction of singletons (but notall) were artifacts of cDNA synthesis, normalization, orsequencing. Despite the potential artifacts and contami-nants detected among singletons, 5171 of the total(62,657) sequences matched annotated proteinsequences in the nr database, corresponding to 3989 dif-ferent genes (blastx, e-value ≤ 10-4). These findings sup-port the inclusion of singletons in our analysis on the
basis that many represent coding sequence and so couldbe biologically interesting despite their low expression.
Estimating the number of genes expressed in larvaeOne of the primary questions for transcriptome sequenc-ing projects is the number of genes expressed, but inorganisms lacking a fully-sequenced genome, addressingthis question is hampered by several unknowns. First,some contigs are expected to lack matches in public data-bases and therefore remain as separate sequences aftercontig-joining. Other genes present in a newly-sequencedtranscriptome might be represented by fragments thatmatch conserved regions in known genes, as well as frag-ments corresponding to poorly-conserved regions (e.g.,un-translated regions) that would be expected to lackmatches. Finally, some sequence fragments might be tooshort to allow for statistically meaningful matches, regard-less of which transcript they were derived from. At thelevel of coverage obtained in a single sequencing run (~5-fold), sequence assembly alone is not sufficient to pro-duce complete transcript sequences. Because the contigjoining procedure described here relies on proteinsequences similarity, it therefore cannot act on sequenceswithout protein matches. No obvious solutions are avail-able for assembling the sequences from a non-model sys-tem transcriptome sequencing project into a number ofcontigs that precisely matches the number of genesexpressed, although paired-end library sequencing mightimprove the situation.
To arrive at an estimate of the number of genes expressedin this library, several alternative strategies are availablethat take into account the sources of uncertainty describedabove. (1) Gene number can be estimated based on thenumber of well-supported, unique sequences in theassembly as follows. The majority of sequenced bases(>70%) assembled into sequences at least 300 bp inlength (Fig 2D), excluding essentially all singletonsequences (Fig 2A). The accuracy of these 19,210 assem-bled sequences is well supported by their high sequencingcoverage (24 reads per assembled sequence, on average).Among these high-quality sequences, 16,360 sequenceclusters (representing groups of highly similar sequences)were identified, providing one estimate of the number ofgenes expressed in these libraries. (2) Alternatively, genenumber can be estimated based on the assembledsequences that matched known genes, as follows. Amongthose contigs sufficiently long to allow good matches (≥300 bp), 11,901 showed significant similarity to recordsin the nr protein database. Gene names were assigned to9,464 of these on the basis that they matched knowngenes with annotated coding sequences, corresponding toa non-redundant list of 7,815 different gene names. Ofcourse, many cnidarian genes are expected to lack matchesin public databases; for example, 19% of predicted pro-
Page 10 of 18(page number not for citation purposes)

BMC Genomics 2009, 10:219 http://www.biomedcentral.com/1471-2164/10/219
teins from the anemone N. vectensis lack matches to otherknown genes [25]. Based on the assumption that a similarproportion of coral genes would lack matches to knowngenes, this suggests an adjusted estimate of 9,591 genesexpressed in A. millepora larvae (i.e., 7,815/0.81). (3)Finally, gene number can be estimated based on compar-isons with the anemone N. vectensis. Based on blastx com-parisons, 20,617 of the assembled coral sequencesmatched to 11,572 different predicted proteins from theanemone genome. Because more redundancy and gapsare expected among our assembled coral sequences thanin the draft anemone genome, this should approximatethe number of genes expressed in our libraries. Althoughno clear solutions are available to conclusively determinegene numbers without a fully-sequenced genome, thethree estimates described suggest that ~11,000 differentgenes are expressed in larvae of A. millepora.
This estimate matches well with previous estimates of thenumber of genes expressed during metazoan develop-ment. About 11–12,000 genes are expressed during seaurchin development based on whole-genome tiling arrays[26]. At least 6000–8000 genes are expressed during eachembryonic or larval stage of nematode development,based on SAGE libraries [27]. About 10,000 genes areexpressed in fruit fly embryos [28]. Comparison withthese previous studies that span different animal phylaand analytical techniques reveals that our estimate of11,000 genes expressed in coral larvae is within theexpected range for metazoan development.
Sequencing depth and annotation successTo evaluate whether the sequences annotated in this studyincludes all genes expressed in these treatments and devel-opmental stages, we searched for a number of genesinvolved in metabolic pathways and macromolecularcomplexes involved in essential cellular processes. Forthese searches, the lists of genes associated with metabolicpathways were based on the BioCyc database of pathways[29], and gene lists for protein complexes were based onthe CORUM database of mammalian protein complexes[30]. The rationale for these searches was that since thoseessential genes must be expressed to maintain cellularfunctions, any failure to find these sequences in the tran-scriptome would reflect either inadequate sequencingdepth or ineffective annotation. For the pathways andcomplexes considered here, essentially all genes (91–100%) were found based on these simple text searches(Table 5). A caveat for these findings is that high levels ofexpression might be expected for of some essential 'house-keeping' genes, causing them to be well represented ineven an incomplete transcriptome sequencing effort. Toaccount for this possibility, we also searched for genesassociated with intercellular signaling pathways and tran-scription factor genes. Because of their more restricted
spatial and temporal patterns of expression, these genesare not expected to be as highly expressed in whole-organ-ism libraries as the essential 'housekeeping' genes. Thequery lists for these searches were based on genes andpathways conserved among primitive metazoans and cni-darians [12,25,31]. These searches successfully identifiedgenes from nearly all of the pathways and transcriptionfactor families considered (Tables 6, 7). The few genes thatcould not be found might result from incomplete annota-tion, inadequate sampling of the transcriptome, or genesthat are truly not expressed. Regardless of the cause, theimpact appears to be minimal (i.e., almost all genes fromthese pathways were found). Overall, these searches sup-port the conclusion that the collection of annotatedsequences produced in this study represents a reasonablycomplete description of the coral larval transcriptome.
Applications for measuring gene expressionOne immediate application for the annotated sequenceresource developed in this study is the design of microar-ray probes for gene expression analysis of biological proc-esses such as heat tolerance or innate immunity. To thatend, we have selected a set of 11,000 sequences for probedesign based on the following criteria. To ensure that allsequences were sufficiently long to allow design of high-quality probes, we selected the subset of sequences ≥ 250bp in length (n = 40,686). Among these, 10,652 matchedannotated genes in public sequence databases, allowingunambiguous identification of the sense (protein-coding)strand. These included 8,523 clusters of similar sequences;within each cluster, sequences were ranked by coverage,and the most highly-covered member of each cluster wasselected. Finally, based on gene name annotation, for anycases where two sequences were annotated with the samegene name, the sequence with higher coverage wasselected. This produced a set of 7,930 well-annotatedsequences corresponding to known genes. Thesesequences have been adjusted to ensure that the sensestrand is represented, based on blast matches. To bring thetotal to 11,000, the remaining sequences ≥ 250 bp inlength without matches in public databases (n = 30,034)were ranked by coverage and the 3,070 most highly cov-ered sequences selected. For those sequences withoutblast matches, the strand information (sense/antisense) isnot known. One important practical note about the use ofthese sequences for gene expression analysis is that probesor primers designed based on these sequences should bedesigned so as not to span the junctions produced by con-tig-joining. The set of sequences selected above provides avaluable resource for designing microarray probes, andthe current widespread use of microarrays for gene expres-sion profiling of corals [32,33] suggests that this resourcewill be immediately useful.
Page 11 of 18(page number not for citation purposes)

BMC Genomics 2009, 10:219 http://www.biomedcentral.com/1471-2164/10/219
Development of genetic markersAlthough A. millepora is an emerging coral molecular biol-ogy model for molecular ecology studies, few geneticmarkers are currently available for this species [34]. Thesemarkers are obviously not enough for genome-wide asso-ciation studies of coral physiological variation, which isthe focus of ongoing projects in our laboratory addressingthe molecular and evolutionary mechanisms of coraladaptation to climate change. This study, like othersrecent published [23,35], shows a cost-effective way toproduce a large number of gene-associated SNPs fromtranscriptome data obtained by 454 sequencing. Qualit-ySNP is a newly developed program and uses a haplotype-based strategy to detect reliable SNPs without requiringsequence traces, quality scores, or genomic sequence data[36]. In our study, 70% of predicted SNPs were confirmedexperimentally. These findings clearly demonstrate theutility of SNP mining from 454 transcriptome sequences,and provide the most extensive genetic marker resourcecurrently available for A. millepora.
ConclusionIn this study, we describe methods that will facilitate tran-scriptome sequencing for organisms that present impor-tant biological questions but lack fully-sequencedgenomes. The laboratory procedures outlined here pro-vide a rapid and cost-effective method for deep transcrip-tome sequencing in a single 454 sequencing run,improving substantially on previous methods. The analyt-ical strategies we describe for adaptor trimming, assembly,joining, and annotation can all be accomplished usingpublicly available programs and basic scripting tools, andproduce useful collections of annotated sequences fromshort reads. Our findings provide a nearly completedescription of the genes expressed in coral larvae, aresource that is expected to be immediately useful formeasurements of gene expression in reef-building corals,in addition to a large number of genetic markers for stud-ies of genetic connectivity and structure. The single 454sequencing run employed in this study produced morethan 600,000 sequencing reads, allowing the identifica-tion of ~11,000 genes and ~30,000 SNPs. These findingsrepresent a substantial contribution to the existingsequence resources for reef-building corals. Application ofthese resources will greatly enhance our understanding ofthe potential for corals to adapt to increasing environ-mental stress during climate change.
MethodsLarval culture and RNA extractionBecause adult coral colonies contain algal symbionts thatcould result in contamination of extracted RNA, ourexperiments focused on a developmental stage (planulaelarvae) that, in this species, lacks those symbionts. Adultcolonies of Acropora millepora were collected at MagneticIsland (Townsville, QLD, Australia) and placed separately
into individual bins prior to spawning. Corals wereallowed to spawn naturally, following the synchronizedmass spawning schedule typical for this and many othercoral species [37], and then returned to their original loca-tions on the reef. For each colony, gamete bundles weregently sieved through a 130-μm pore-size nylon mesh toseparate sperm from eggs. Eggs from one individual col-ony were suspended in 1 l of 1-μm filtered seawater(FSW), and fertilized with sperm from a different individ-ual colony. After allowing ~5 h for fertilization, excesssperm was removed by rinsing with FSW and embryoswere stocked at 2 per ml in 2-l plastic culture vessels filledwith FSW.
To maximize the diversity of expressed genes in our exper-imental material, we exposed these larvae to a range of dif-ferent treatments expected to affect gene expression. Thesetreatments included temperature stress and known induc-ers of settlement and metamorphosis, in order to induceexpression of the genes associated with those processes.Three replicate cultures were maintained for 5 d at a stand-ard culturing temperature of ~28°C, and another threereplicates at an elevated temperature of ~32°C. Culturewater was exchange for fresh FSW regularly throughoutdevelopment.
Larvae grown at the standard (lower) temperature werepooled between culture replicates at 5 d post-fertilizationand those pooled larvae used in short-term treatmentsexpected to affect gene expression. One group was incu-bated at the higher temperature for 4 h (heat stress).Another group was not given any additional treatment, toserve as a control for any effects of handling during theseshort-term treatments. A third set of larvae from thesesame cultures was incubated with a known naturalinducer of larval settlement [38]: crustose coralline algae(CCA). Other larvae were incubated with an artificialinducer of metamorphosis, a GLW-amide peptide calledEPLPIGLW-amide [39]. Using light microscopy, we con-firmed that the CCA treatment induced behavioral andmorphological changes associated with settlement, andthe GLW-amide treatment induced metamorphosisdirectly, bypassing those subtle changes. After 4 h incuba-tions in each treatment, the larvae or recruits were pre-served in RNALater (Ambion, Austin, TX, USA). Larvaewere sampled from the different long-term culture condi-tions (28 and 32°C) on that same day and stored in thesame manner, for a total of six different samples. RNA wasextracted from these samples using the Ambion RNAque-ous-micro kit (Ambion) according to the manufacturer'sinstructions.
Preparation of cDNA samplesThe methods developed in this study for cDNA synthesis,amplification, and fragment library preparation in prepa-ration for 454 sequencing are illustrated in Fig 1. RNA
Page 12 of 18(page number not for citation purposes)

BMC Genomics 2009, 10:219 http://www.biomedcentral.com/1471-2164/10/219
preparations were purified by precipitation with lithiumchloride prior to cDNA synthesis. First-strand cDNA wasproduced using this purified RNA according to Clontech'sSMART cDNA synthesis kit, with the following modifica-tions. The primer used for first strand synthesis was amodified oligo-dT primer (AAGCAGTGGTATCAACGCA-GAGTCGCAGTCGGTACTTTTTTCTTTTTTV). The poly-Tstretch is broken by the inclusion of an internal C to min-imize the potential for 454 sequencing problems in thishomopolymer stretch. The remainder of cDNA synthesisprotocol was conducted according to the manufacturer'sinstructions.
cDNA was amplified using the "CAP" primer (AAGCAGT-GGTATCAACGCAGAGT) according to the manufacturer'sinstructions (SMART cDNA synthesis, Clontech), takingadvantage of the PCR Suppression effect to preferentiallyamplify longer molecules and thus enrich for full-lengthtranscripts [40]. Throughout these cDNA amplificationprocedures, precautions were taken to minimize distor-tions of the samples based on previously described princi-ples [41]. Following amplification, PCR products wereevaluated by gel electrophoresis to confirm that theappropriate range of molecular weights had been pro-duced (0.5–3 kb), and that the libraries were not over-amplified (i.e., more than 200 ng PCR product per 30-μlreaction), which can distort expression profiles and leadto adaptor concatenation. To maximize the amount offully double-stranded PCR product, the reactions were'chased' with additional cDNA amplification primer (1 μlof 10 μM stock) and incubated at 78°C for 1 min, 65°Cfor 1 min, then 68°C for 3.5 min. Multiple PCR reactionswere conducted for each library, then pooled and purifiedusing the Qiaquick PCR Purification kit (Qiagen, CA,USA). Finally, equal quantities of cDNA from each of thesix libraries were pooled to produce a library expected toinclude all genes expressed in the different treatments.
To minimize differences among the abundance of differ-ent transcripts (i.e., of genes expressed at different levels),2 μg of the pooled, amplified cDNA was normalized usingthe Trimmer kit (Evrogen, Moscow, Russia) according tothe manufacturer's instructions. This sample containedequal amounts of cDNA from each library (i.e., two differ-ent long term culture conditions and four different shortterm treatments). Following normalization, the cDNAwas amplified for 15 cycles as described above. 16 reac-tions (30 μl each) were amplified, then pooled and puri-fied as described above (Qiaquick PCR purification).
cDNA was sheared by sonication to produce short, ran-dom fragments appropriate for 454 sequencing. This wasaccomplished by first preparing 5 μg of amplified, nor-malized cDNA in a 100-μl volume. The pooled samplewas submerged in an icewater bath and sonicated using a
Misonix S3000 (Misonix, NY, USA) in 30 sec bursts fol-lowed by 30 sec rests, with power set at 0.5–1 (18–30 W).Fragmented cDNA samples were evaluated by gel electro-phoresis to visualize the effectiveness of the process. Arange of different sonication durations were tested, andthe 3 minute treatment selected because it produced frag-ments in the appropriate size range (ca. 300–400 bp).
Oligonucleotide adaptors were ligated to the fragmentedcDNA to facilitate 454 sequencing. First, the fragmentedcDNA was 'polished' using Klenow and T4 DNA polymer-ases (New England BioLabs, Ipswich, MA, USA) to fill insingle-strand overhangs that might remain after sonica-tion. A partially double-stranded adaptor containing thestandard 454 sequencing primer 'B' was prepared by com-bining oligonucleotides 'B+1' (GCCTTGCCAGCCCGCT-CAGACGAGCGGCCA) and its partial complement, 'anti-B+1' (TGGCCGCTCGT) at a final concentration of 10 μMeach. A second partially double-stranded adaptor contain-ing the standard 'A' sequence was prepared by combiningoligonucleotides 'A+' (GCCTCCCTCGCGCCATCAGCCGCGCAGGT) and 'anti-A+' (ACCTGCGCGG). The partiallydouble-stranded structure of these adaptors ensures thatthey are ligated in the correct orientation and minimizestandem ligations, since T4 DNA ligase requires a double-stranded DNA template. Adaptors were ligated to frag-mented cDNA using T4 DNA ligase (Promega, WI, USA)in an overnight reaction at 12°C. Following ligation, con-structs were purified using the Qiaquick PCR Purificationkit to remove excess adaptors and reagents (Qiagen, CA,USA).
Ligations were tested by PCR amplification using differentcombinations of primers to verify that the correct con-structs had been produced. Constructs were then ampli-fied through a 'step-out' PCR scheme, using primers 'A'(GCCTCCCTCGCGCCATCAG) and 'B' (GCCTT-GCCAGCCCGCTCAG), each at 0.2 μM final concentra-tion, and 'A+CAP' (GCCTCCCTCGCGCCATCAGCCGCGCAGGTAAGCAGTGGTATCAACGCAGAGT) at 0.01 μM.Amplification was carried out for 17 cycles as describedabove, including chasing with an additional aliquot ofprimers and column purification following PCR. Finally,the constructs were labeled with biotin by repeating theamplification using a 5'-biotin-labeled 'A' primer. For thisfinal labeling reaction, primers 'biotin-A' and 'B' wereeach used at 0.2 μM, and the reactions were amplified for3 cycles. The final product was again column purified, toremove unincorporated oligonucleotides and biotin, andstored at -20°C prior to sequencing. Note that because ourlibrary preparation method explicitly controls for adaptorstructure (i.e., only the correct constructs are amplified),the biotin labeling steps, which are required in typical 454library protocols, are not actually required for ourmethod.
Page 13 of 18(page number not for citation purposes)

BMC Genomics 2009, 10:219 http://www.biomedcentral.com/1471-2164/10/219
A step-by-step protocol for the library preparation methodoutlined above is provided in the additional files accom-panying this article (additional file 4). That protocolincludes minor modifications that we have recently devel-oped to reduce the number of manipulations required,improve reproducibility, and to further reduce adaptorconcatenation. The improved protocol in that file is rec-ommended for researchers interested in using our meth-ods for 454 sequencing of transcriptomes.
Library titration and 454 sequencingThe biotin-labeled library described above was furtherprocessed prior to 454 sequencing to enhance yield andsequencing quality. First, the pooled sample was purifiedusing AMPure size exclusion beads (Agencourt, MA, USA).This size-selection is essential for efficient emulsion PCR(emPCR) because small fragments would be preferentiallyamplified, causing eventual sequence loss by decreasingthe overall average read length. Next, the biotin-linkedfragments were captured onto streptavidin-coated para-magnetic beads (Invitrogen, CA, USA) and denaturedusing sodium hydroxide. This procedure was used topurify the fragments containing both adaptors (biotin-Aand B). Incorrectly ligated fragments containing B adap-tors at both ends failed to bind to beads initially, allowingtheir removal. After denaturation, those fragments withtwo biotin-A adaptors remained attached to the beads,leaving the correct constructs (with biotin-A and B) in thesupernatant. Note that, because our library was essentiallyfree of incorrect adaptor configurations (e.g., two A adap-tors, etc.), this biotin-streptavidin purification step wasnot actually necessary, but is described here for complete-ness. Finally, the size distribution of this purified, single-stranded template cDNA (sstcDNA) library was analyzedusing an Agilent Bioanalyzer, and the sample was quanti-fied using the Quant-iT OliGreen ssDNA Assay (Invitro-gen).
Following cleanup and quantification, the sample wastitrated to optimize yield and sequence quality. This pro-cedure was conducted essentially as outlined in the LongPair-End Library Preparation protocol (Roche, IN, USA)with the following modifications. First, emPCR reactionswere performed in triplicate with different amounts ofinput sstcDNA (0.5, 1, 4, and 16 copies per bead). Theemulsions were broken and the DNA Capture beads col-lected and pooled by sstcDNA concentration. Each poolwas then enriched for beads carrying sstcDNA accordingto the manufacturer's instructions (Roche). The enrichedbead samples were then counted using a Z1 CoulterCounter (Beckmann Coulter, CA, USA) to calculate thepercent enrichment (i.e., the percent of initial beads thatcontained sstcDNA). Based on a linear regression of thesepercent enrichment values against the initial sstcDNAamounts, we calculated the amount of input DNA
expected to produce 10–15% enrichment. In our experi-ence, this range of enriched bead recovery maximizes thenumber of beads containing a single amplified fragmentof sstcDNA, while minimizing the number of beads con-taining multiple fragments. This procedure is essential formaximizing the number of reads produced by 454sequencing. Based on these analyses, large-scale emPCRwas conducted based on the calculated optimum sstcDNAamount, and sequenced using the 454 GS-Flx instrumentaccording to the manufacturers' instructions (Roche).
Sequence data analysis and assemblyAll sequence analyses were conducted using publiclyavailable software and custom Perl scripts that reliedheavily upon BioPerl modules [42]. Those bioinformaticsscripts, and a detailed protocol describing their use, areavailable at the authors' website [43].
Adaptor sequences that would prevent correct assembly ofthe raw sequencing reads were removed following a simi-lar strategy to that used in NCBI's VecScreen tool, basedon the known adaptor sequences used in library prepara-tion. Known adaptor sequences were compared againstthe raw reads using standalone blast (blastn) with permis-sive settings, to allow detection of weak matches as well asperfect matches (-W 4, -F F, -e 6000). Short matches (≥ 8bp) were recorded if they fell between two other adaptormatches, or within 10 bp of either end of the read. Longer(≥ 14 bp) matches were required for internal adaptormatches. The adaptor matches so identified, and allsequence distal to those matches, were trimmed fromeach read using custom scripts.
Most of the trimmed reads (92%) were between 100 and300 bp in length, but a small proportion fell outside thisrange. On the assumption that those outlier reads mightrepresent rare sequencing artifacts, we size-selected thecleaned reads to eliminate any reads smaller than 60 bp orlarger than 340 bp. Those size thresholds were chosenbased on analysis of a preliminary assembly in which allreads within those size ranges failed to assemble, support-ing the interpretation that they might represent sequenc-ing artifacts.
The trimmed and size-selected reads were assembledusing the Newbler assembly program (Roche). To accountfor adaptor trimming and sequence quality in this assem-bly, raw sequence files (SFF format) were modified basedon the adaptor trimming information described above,and these modified SFF files processed with Newbler. Theassembly also included the publicly available EST A. mille-pora sequences from NCBI (n = 11,829), which had beencleaned based on comparisons with the UniVec databaseof vectors and adaptor sequences [44]. The overlap set-tings used for this assembly were 30 bp and 90% identity,
Page 14 of 18(page number not for citation purposes)

BMC Genomics 2009, 10:219 http://www.biomedcentral.com/1471-2164/10/219
with all other parameters set in Newbler at the default val-ues.
Singleton validationThe inclusion of singleton sequences in our dataset wassupported by bioinformatic analysis and experimentalvalidation. To evaluate whether singletons containedunique sequences not found among contigs, singletonswere compared with contigs (blastn) and both sequencesets were also compared with the Swiss-Prot database(blastx) to exclude those sequences lacking matches toknown proteins. The results from these searches werecompared to characterize the set of identifiable genesfound among singletons but not contigs. Additionalexperimental support for retaining singleton sequenceswas obtained by designing primers specific to each of tenrandomly-selected singletons using Primer3 [45]. Using 1ng of the original intact cDNA as template, each target wasamplified separately (35–40 cycles of the profilesdescribed above), and the PCR products evaluated by gelelectrophoresis to confirm the presence of each sequencein the original cDNA. Finally, the presence of these single-ton sequences in intact cDNA samples was confirmed bycloning and sequencing the resulting PCR products (DNACore Facility at UT Austin).
Contig joining and clusteringAfter assembly of short cDNA sequences, gaps can remaindue to uneven sampling across the transcript or the pres-ence of regions that are difficult for the 454 sequencingtechnique to process (e.g., homopolymer stretches: [15]).To account for any gaps remaining between contigs corre-sponding to different parts of the same transcript, assem-bled sequences were joined according to shared similaritywith known proteins. Using blastx, the assembledsequences were first compared with the well-annotatedSwiss-Prot database, and those that lacked matches weresubsequently compared to the larger nr protein database.The best match, with a significance threshold of e ≤ 10-4,was recorded for each query sequence. For each of thesetop matches (protein sequences), all queries for whichthat protein was the best match were considered. If allqueries matched to different, non-overlapping regions ofthe same protein, they were considered to represent differ-ent portions of a single transcript. In these cases, the que-ries (assembled sequences) were concatenated together inthe proper order and strand to recapitulate the originaltranscript. Gaps within these constructs, representingregions of that transcript not sampled in our libraries,were denoted by strings of 'X' characters to mark the junc-tion between each pair of joined sequences. For thosecases where two or more queries matched to overlappingregions of the same protein, all assembled sequences thatmatched that protein were considered to be possible par-alogs and were retained as individual sequences.
Validation of contig joiningThe procedure used to join contigs into scaffolds was val-idated by PCR using primers corresponding to scaffoldsequences. For each of 10 randomly-selected scaffolds, aforward primer was designed based on one of the constit-uent sequences, and a reverse primer designed based onthe other. Amplification with these primer pairs allowedus to test whether, in the intact cDNA, the two primerbinding sites were found on the same cDNA molecule,providing experimental validation of the contig joiningprocedure. PCR was carried out as described above (butfor only 20 cycles), and the products were evaluated by gelelectrophoresis then cloned and sequenced at the DNACore Facility at UT Austin.
Sequence clusteringAssembly of transcriptome sequences can produce anumber of contigs that is larger than the number ofexpressed genes, reflecting redundancy among the assem-bled sequences (i.e., more than one sequence per gene).Two complementary approaches were employed to char-acterize the redundancy remaining after assembly andcontig joining. First, the sequences with significant pro-tein sequence blast hits were clustered based on sequencesimilarity shared between those blast hits. Proteinsequences were extracted from NCBI protein sequencedatabases (Swiss-Prot and nr), based on the top hit acces-sion numbers from the blast report, and clustered usingthe Blastclust 2.2.15 program from NCBI [46]. Thisapproach assembles single-linkage clusters that includecontigs corresponding to different domains of the samegene, as well as paralogs of that gene. A disadvantage ofthis strategy is that because it depends on proteinsequence matches, the sequences lacking protein matchescannot be clustered. To reduce redundancy among thosenon-matching sequences, the complete set of assembledsequences was clustered based on nucleotide sequencesimilarity in parallel. The precluster and estcluster pro-grams from the ESTate software package were used for thisanalysis [47]. Finally, the union of these two sets of clus-ters was obtained by adding all nucleotide sequence rela-tives of each protein cluster member to that cluster.Individual sequences were annotated with cluster mem-bership information and maintained as separatesequences for further annotation.
AnnotationPutative gene names, protein domains, and Gene Ontol-ogy terms were assigned to all assembled sequences thatshared sequence similarity with previously identifiedgenes annotated with those details. Sequence compari-sons and annotation were accomplished using standaloneblast from NCBI [46], WU-Blast 2.0 (04-May-2006) [48],and custom Perl scripts. For gene name annotation, theassembled sequences were compared against Swiss-Prot
Page 15 of 18(page number not for citation purposes)

BMC Genomics 2009, 10:219 http://www.biomedcentral.com/1471-2164/10/219
and nr protein sequence databases using blastx with a sig-nificance threshold of e ≤ 10-4. Gene names were assignedto each assembled sequence based on the best blast hitannotated with a gene name, as determined by parsing theGenBank record features 'CDS' and 'Protein' for that blasthit. Blast hits annotated with uninformative terms wereencountered (e.g., 'unknown', 'uncharacterized', or 'hypo-thetical') were skipped in this analysis. For computationalspeed, the search was limited to the first 10 significant hitsfor each query.
Different genes can share certain conserved domains,reflecting a level of sequence similarity not accounted forby simple gene name annotation. To identify conservedprotein domains in our library, the assembled sequenceswere compared with the CDD database of conserveddomains [49]. These searches were based on reverse posi-tion specific blast (e-value threshold: 10-4), a blast-likealgorithm for comparing newly-identified sequences to aset of known profiles [50]. Each sequence that matched aconserved protein domain was annotated with thatdomain identifier and a description of the domain corre-sponding to the best rps-blast match for that query.
To annotate assembled sequences with Gene Ontology(GO) terms describing biological processes [51], molecu-lar functions, and cellular components, sequences werecompared against the UniProt-TrEMBL database of pro-tein sequences [52] using WU-blast. This database waschosen because it has been extensively annotated with GOterms [53]. Each query sequence was assigned GO termsbased on those associated with the top blast match forthat query, using custom Perl scripts to compare the blastresults and the table of annotations. Because the GeneOntology is hierarchical in structure, the GO terms anno-tated here can be traced back to one or more parent termsat a given level of detail. For example, inflammatoryresponse (a level 5 term) is a 'child' of the more generallevel 4 term, response to wounding. Custom scripts wereused to compare the annotated GO terms with the full setof parent-child relationships to map these annotations tovarious levels. To demonstrate the utility of these annota-tions, we used these GO mappings to search for genesassociated with processes and molecular functions knownto be involved with stress responses in corals.
Finally, the annotated sequences were compared with theRepBase database of transposable elements (TE) [54].Assembled sequences were queried against this databaseusing tblastx, and those showing significant matches toknown TE records were noted. This allows sequencesshowing similarity to TEs to be excluded from furtheranalysis when required.
The cleaned sequencing reads produced in this study havebeen deposited in NCBI's SRA database, along with the
assembly output (accession: SRA003728). The assembledand annotated sequences have been deposited in the TSAdatabase (accessions: EZ000637–EZ048765). The com-plete set of sequences is available as a flat file from theauthors' website [43], and can be searched online at Sym-BioSys, a sequence database that focuses on cnidariansand their algal symbionts [55].
Comparison with Nematostella vectensisBecause no genome sequence is available for A. milleporaor any other scleractinian coral, the sequences generatedin the current study were compared with the predictedprotein sequences from the most closely related organismwith a fully sequence genome: the anemone Nematostellavectensis [25]. The A. millepora sequences were comparedwith these protein sequences [24] using blastx with a sig-nificance threshold of e ≤ 10-4. A similar comparisonbetween the N. vectensis genome assembly and the A.millepora sequences was conducted using tblastx, to detectany coral sequences with anemone orthologs that hadbeen missed by gene prediction algorithms. Comparisonsbetween the results from these searches and the annota-tion of the A. millepora sequences as described above wereused to identify genes present in the coral but not theanemone. Reciprocal comparisons of anemone proteinsequences against assembled coral sequences (tblastn)allowed identification of orthologous genes. To correct fordifferent database sizes in these searches (~100,000 coralsequences, ~27,000 anemone sequences), e-values forreciprocal searches were adjusted to a standard databasesize (equal to the nr protein database). Pairs of ortholo-gous genes in coral and anemone were identified based onreciprocal best matches with adjusted e-values ≤ 10-4 orbetter.
SNP detection and validationPotential SNPs were detected using the QualitySNP pro-gram [36], which employs a haplotype-based strategy todetect reliable SNPs without requiring sequence traces,quality scores, or genomic sequence data. SNP identifica-tion was accomplished through a separate procedure fromthe main annotation pipeline, consisting of the followingsteps. First, all 634,070 reads were assembled using theCAP3 program [56]. Next, the contig alignments from thisassembly were evaluated to select clusters containing atleast 5 reads. Within these clusters, SNPs were identifiedbased on the filters described in [36].
Twenty predicted SNPs corresponding to 18 genes werechosen for a validation procedure involving primerdesign, PCR amplification and Sanger sequencing. The 18contigs containing these SNPs were selected based onsequence similarity with genes presumed to be involvedin stress responses in corals. Primers were designed basedon several principles as described in [41] so that all PCRamplifications could be accomplished at the same anneal-
Page 16 of 18(page number not for citation purposes)
BMC Genomics 2009, 10:219 http://www.biomedcentral.com/1471-2164/10/219
ing temperature. PCR reactions were each set up in a 10 μlvolume containing 5 ng of the amplified intact cDNA (i.e.,prior to sonication), 0.1 μM each primer, 2 mM MgCl2,0.3 mM dNTP, 1× PCR buffer and 0.5 U Taq DNApolymerase (New England BioLabs). The profile consistedof an initial denaturation step at 94°C for 3 min; this wasfollowed by 30 cycles of 94°C for 30 s, 60°C for 30 s, and72°C for 30 s; and a final extension step at 72°C for 10min. After evaluating their molecular weight and specifi-city based on gel electrophoresis, PCR products wereligated to pGEM-T vector (Promega) and transformed intoTop10 E. coli competent cells (Invitrogen). Based on sin-gle colonies selected from these transformations, clonedinserts were amplified by colony PCR using M13-27 andM13-41 primers. The resulting PCR products were cleanedwith ExoSAP-IT (USB, OH, USA) and sequenced at theDNA Core Facility at UT Austin, using M13-27 as thesequencing primer. Two to twenty colonies weresequenced for each predicted SNP, allowing confirmation(if both alleles were observed) or rejection (if only a singleallele was found) of those predictions.
Authors' contributionsEM drafted the manuscript, created the bioinformaticsscripts, conducted sequence analysis and functional anno-tation, and participated in sample collection and librarypreparation. GVA participated in library preparation. SWconducted the SNP analysis and validation. JBC and JCconducted library titration, 454 sequencing, and the New-bler assembly. BLW and DA were instrumental in samplecollection and logistical field support. MVM conceived thestudy and library preparation methods, and participatedin sample collection. All authors read and approved thefinal manuscript.
Additional material
AcknowledgementsWe thank Jeong-Hyeon Choi for assistance in the design and implementa-tion of preliminary sequence cleaning and assembly, and Bart Smith for assistance with PCR and Sanger validation of singletons and scaffolds. This research was supported in part by the Indiana METACyt Initiative of Indiana University, funded in part through a major grant from the Lilly Endowment, Inc., by the University Information Technology Services (UITS) and by The Center for Genomics and Bioinformatics computing group.
References1. Moberg F, Folke C: Ecological goods and services of coral reef
ecosystems. Ecological Economics 1999, 29(2):215-233.2. Harvell CD, Jordan-Dahlgren E, Merkel S, Rosenberg E, Raymundo L,
Smith G, Weil E, Willis B: Coral disease, environmental drivers,and the balance between coral and microbial associates. Oce-anography 2007, 20(1):172-195.
3. Hoegh-Guldberg O, Mumby PJ, Hooten AJ, Steneck RS, Greenfield P,Gomez E, Harvell CD, Sale PF, Edwards AJ, Caldeira K, et al.: CoralReefs Under Rapid Climate Change and Ocean Acidification.Science 2007, 318(5857):1737-1742.
4. Hughes TP, Baird AH, Bellwood DR, Card M, Connolly SR, Folke C,Grosberg R, Hoegh-Guldberg O, Jackson JBC, Kleypas J, et al.: Cli-mate change, human impacts, and the resilience of coralreefs. Science 2003, 301(5635):929-933.
5. Donner SD, Skirving WJ, Little CM, Oppenheimer M, Hoegh-Guld-berg O: Global assessment of coral bleaching and requiredrates of adaptation under climate change. Global Change Biology2005, 11(12):2251-2265.
6. Douglas AE: Coral bleaching – how and why? Marine Pollution Bul-letin 2003, 46(4):385-392.
7. Baums IB: A restoration genetics guide for coral reef conser-vation. Mol Ecol 2008, 17(12):2796-2811.
8. Day T, Nagel L, van Oppen MJ, Caley MJ: Factors affecting theevolution of bleaching resistance in corals. Am Nat 2008,171(2):E72-88.
9. Van Oppen MJH, Gates RD: Conservation genetics and the resil-ience of reef-building corals. Molecular Ecology 2006,15(13):3863-3883.
10. Kortschak RD, Samuel G, Saint R, Miller DJ: EST analysis of theCnidarian Acropora millepora reveals extensive gene lossand rapid sequence divergence in the model invertebrates.Current Biology 2003, 13(24):2190-2195.
11. Schwarz JA, Brokstein PB, Voolstra C, Terry AY, Miller DJ, SzmantAM, Coffroth MA, Medina M: Coral life history and symbiosis:Functional genomic resources for two reef building Carib-bean corals, Acropora palmata and Montastraea faveolata.BMC Genomics 2008, 9:97.
12. Technau U, Rudd S, Maxwell P, Gordon PMK, Saina M, Grasso LC,Hayward DC, Sensen CW, Saint R, Holstein TW, et al.: Mainte-
Additional file 1Validation of singleton sequences and contig joining procedure by PCR amplification. This document contains gel photographs of the PCR products obtained from validation of randomly-selected scaffold and sin-gleton sequences.Click here for file[http://www.biomedcentral.com/content/supplementary/1471-2164-10-219-S1.doc]
Additional file 2Effects of sequence length on the proportion of sequences for which sig-nificant matches were found. This PDF file contains a bar plot summa-rizing the effects of sequence length on the proportion of sequences for which significant blast matches were found.Click here for file[http://www.biomedcentral.com/content/supplementary/1471-2164-10-219-S2.pdf]
Additional file 3Validation of predicted SNPs by PCR and Sanger sequencing. The table in this document shows the primer sequences used to amplify and sequence each of the 20 SNPs selected for validation, as well as the differ-ent alleles detected for each.Click here for file[http://www.biomedcentral.com/content/supplementary/1471-2164-10-219-S3.doc]
Additional file 4Detailed protocol for preparing cDNA for 454 transcriptome sequenc-ing. This document gives a step-by-step protocol for preparing cDNA for 454 sequencing.Click here for file[http://www.biomedcentral.com/content/supplementary/1471-2164-10-219-S4.doc]
Page 17 of 18(page number not for citation purposes)

BMC Genomics 2009, 10:219 http://www.biomedcentral.com/1471-2164/10/219
nance of ancestral complexity and non-metazoan genes intwo basal cnidarians. Trends in Genetics 2005, 21(12):633-639.
13. Forêt S, Kassahn KS, Grasso LC, Hayward DC, Iguchi A, Ball EE, MillerDJ: Genomic and microarray approaches to coral reef con-servation biology. Coral Reefs 2007, 26(3):475-486.
14. Edge SE, Morgan MB, Gleason DF, Snell TW: Development of acoral cDNA array to examine gene expression profiles inMontastraea faveolata exposed to environmental stress.Mar Pollut Bull 2005, 51(5–7):5-7.
15. Margulies M, Egholm M, Altman WE, Attiya S, Bader JS, Bemben LA,Berka J, Braverman MS, Chen YJ, Chen Z: Genome sequencing inmicrofabricated high-density picolitre reactors. Nature 2005,437:376-380.
16. Hudson ME: Sequencing breakthroughs for genomic ecologyand evolutionary biology. Molecular Ecology Resources 2008,8(1):3-17.
17. Cheung F, Haas BJ, Goldberg SMD, May GD, Xiao YL, Town CD:Sequencing Medicago truncatula expressed sequenced tagsusing 454 Life Sciences technology. Bmc Genomics 2006, 7:272.
18. Emrich SJ, Barbazuk WB, Li L, Schnable PS: Gene discovery andannotation using LCM-454 transcriptome sequencing.Genome Research 2007, 17(1):69-73.
19. Cheung F, Win J, Lang JM, Hamilton J, Vuong H, Leach JE, Kamoun S,Levesque CA, Tisserat N, Buell CR: Analysis of the Pythium ulti-mum transcriptome using Sanger and Pyrosequencingapproaches. BMC Genomics 2008, 9(1):542.
20. Mao C, Evans C, Jensen RV, Sobral BWS: Identification of newgenes in Sinorhizobium meliloti using the GenomeSequencer FLX system. BMC Microbiology 2008, 8:72.
21. Novaes E, Drost DR, Farmerie WG, Pappas GJ, Grattapaglia D, Sed-eroff RR, Kirst M: High-throughput gene and SNP discovery inEucalyptus grandis, an uncharacterized genome. Bmc Genom-ics 2008, 9:312.
22. Toth AL, Varala K, Newman TC, Miguez FE, Hutchison SK,Willoughby DA, Simons JF, Egholm M, Hunt JH, Hudson ME, et al.:Wasp gene expression supports an evolutionary linkbetween maternal behavior and eusociality. Science 2007,318(5849):441-444.
23. Vera JC, Wheat CW, Fescemyer HW, Frilander MJ, Crawford DL,Hanski I, Marden JH: Rapid transcriptome characterization fora nonmodel organism using 454 pyrosequencing. MolecularEcology 2008, 17(7):1636-1647.
24. JGI Nematostella vectensis v1.0 [http://genome.jgi-psf.org/Nemve1/Nemve1.download.ftp.html]
25. Putnam NH, Srivastava M, Hellsten U, Dirks B, Chapman J, SalamovA, Terry A, Shapiro H, Lindquist E, Kapitonov VV, et al.: Sea anem-one genome reveals ancestral eumetazoan gene repertoireand genomic organization. Science 2007, 317(5834):86-94.
26. Samanta MP, Tongprasit W, Istrail S, Cameron RA, Tu Q, DavidsonEH, Stolc V: The transcriptome of the sea urchin embryo. Sci-ence 2006, 314(5801):960-962.
27. McKay SJ, Johnsen R, Khattra J, Asano J, Baillie DL, Chan S, Dube N,Fang L, Goszczynski B, Ha E: Gene Expression Profiling of Cells,Tissues, and Developmental Stages of the Nematode C. ele-gans. Cold Spring Harb Symp Quant Biol 2003, 68:159-69.
28. Manak JR, Dike S, Sementchenko V, Kapranov P, Biemar F, Long J,Cheng J, Bell I, Ghosh S, Piccolboni A, et al.: Biological function ofunannotated transcription during the early development ofDrosophila melanogaster. Nature Genetics 2006,38(10):1151-1158.
29. Karp PD, Ouzounis CA, Moore-Kochlacs C, Goldovsky L, Kaipa P,Ahren D, Tsoka S, Darzentas N, Kunin V, Lopez-Bigas N: Expansionof the BioCyc collection of pathway/genome databases to160 genomes. Nucleic Acids Research 2005, 33(19):6083-6089.
30. Ruepp A, Brauner B, Dunger-Kaltenbach I, Frishman G, Montrone C,Stransky M, Waegele B, Schmidt T, Doudieu ON, Mpflen VS, et al.:CORUM: the comprehensive resource of mammalian pro-tein complexes. Nucleic Acids Research 2008, 36:D646-D650.
31. Srivastava M, Begovic E, Chapman J, Putnam NH, Hellsten U,Kawashima T, Kuo A, Mitros T, Salamov A, Carpenter ML, et al.: TheTrichoplax genome and the nature of placozoans. Nature2008, 454(7207):955-U919.
32. Desalvo MK, Voolstra CR, Sunagawa S, Schwarz JA, Stillman JH, Cof-froth MA, Szmant AM, Medina M: Differential gene expressionduring thermal stress and bleaching in the Caribbean coralMontastraea faveolata. Molecular Ecology 2008, 17(17):3952.
33. Grasso LC, Maindonald J, Rudd S, Hayward DC, Saint R, Miller DJ, BallEE: Microarray analysis identifies candidate genes for keyroles in coral development. BMC Genomics 2008, 9(1):540.
34. Van Oppen MJH, Underwood J, Muirhead AN, Peplow L: Ten mic-rosatellite loci for the reef-building coral Acropora mille-pora (Cnidaria, Scleractinia) from the Great Barrier Reef,Australia. Molecular Ecology Notes 2007, 7(3):436-438.
35. Barbazuk WB, Emrich SJ, Chen HD, Li L, Schnable PS: SNP discov-ery via 454 transcriptome sequencing. Plant Journal 2007,51(5):910-918.
36. Tang JF, Vosman B, Voorrips RE, Linden CG Van der, Leunissen JAM:QualitySNP: a pipeline for detecting single nucleotide poly-morphisms and insertions/deletions in EST data from diploidand polyploid species. Bmc Bioinformatics 2006, 7:438.
37. Babcock RC, Bull GD, Harrison PL, Heyward AJ, Oliver JK, WallaceCC, Willis BL: Synchronous Spawnings of 105 ScleractinianCoral Species on the Great-Barrier-Reef. Marine Biology 1986,90(3):379-394.
38. Heyward AJ, Negri AP: Natural inducers for coral larval meta-morphosis. Coral Reefs 1999, 18(3):273-279.
39. Iwao K, Fujisawa T, Hatta M: A cnidarian neuropeptide of theGLWamide family induces metamorphosis of reef-buildingcorals in the genus Acropora. Coral Reefs 2002, 21(2):127-129.
40. Matz M, Shagin D, Bogdanova E, Britanova O, Lukyanov S, DiatchenkoL, Chenchik A: Amplification of cDNA ends based on tem-plate-switching effect and step-out PCR. Nucleic Acids Research1999, 27(6):1558-1560.
41. Matz MV: Amplification of Representative cDNA Samplesfrom Microscopic Amounts of Invertebrate Tissue to Searchfor New Genes. Methods Mol Biol 2002, 183:3-18.
42. Stajich JE, Block D, Boulez K, Brenner SE, Chervitz SA, Dagdigian C,Fuellen G, Gilbert JGR, Korf I, Lapp H, et al.: The bioperl toolkit:Perl modules for the life sciences. Genome Research 2002,12(10):1611-1618.
43. Matz Laboratory Website [http://www.bio.utexas.edu/research/matz_lab/matzlab/Welcome.html]
44. The UniVec Database [ftp://ftp.ncbi.nih.gov/pub/UniVec/]45. Primer3 [http://primer3.sourceforge.net/]46. NCBI Blast Tools [ftp://ftp.ncbi.nih.gov/blast/executables/release/
2.2.15/]47. ESTate [http://www.ebi.ac.uk/~guy/estate/]48. Washington University Blast Archives [http://blast.wustl.edu]49. NCBI Conserved Domain Database [ftp://ftp.ncbi.nih.gov/pub/
mmdb/cdd/little_endian/]50. Marchler-Bauer A, Panchenko AR, Shoemaker BA, Thiessen PA, Geer
LY, Bryant SH: CDD: a database of conserved domain align-ments with links to domain three-dimensional structure.Nucleic Acids Research 2002, 30(1):281-283.
51. Ashburner M, Ball CA, Blake JA, Botstein D, Butler H, Cherry JM,Davis AP, Dolinski K, Dwight SS, Eppig JT, et al.: Gene Ontology:tool for the unification of biology. Nature Genetics 2000,25(1):25-29.
52. UniProt-TrEMBL [http://www.ebi.ac.uk/trembl/FTP/ftp.html]53. The Gene Ontology [http://www.geneontology.org/GO.down
loads.shtml]54. RepBase [http://www.girinst.org/server/RepBase/]55. SymBioSys [http://sequoia.ucmerced.edu/SymBioSys/index.php]56. Huang XQ, Madan A: CAP3: A DNA sequence assembly pro-
gram. Genome Research 1999, 9(9):868-877.
Page 18 of 18(page number not for citation purposes)