Larval and Post-Larval Stages of Pacific Oyster (Crassostrea gigas) Are Resistant to Elevated CO2
12
Larval and Post-Larval Stages of Pacific Oyster (Crassostrea gigas) Are Resistant to Elevated CO 2 Ko W. K. Ginger 1. , Chan B. S. Vera 1. , Dineshram R 1 , Choi K. S. Dennis 1 , Li J. Adela 1 , Ziniu Yu 2 , Vengatesen Thiyagarajan 1 * 1 The Swire Institute of Marine Science and School of Biological Sciences, The University of Hong Kong, Hong Kong, SAR, 2 South China Sea Institute of Oceanology, Chinese Academy of Sciences, Guangzhou, China Abstract The average pH of surface oceans has decreased by 0.1 unit since industrialization and is expected to decrease by another 0.3–0.7 units before the year 2300 due to the absorption of anthropogenic CO 2 . This human-caused pH change is posing serious threats and challenges to the Pacific oyster (Crassostrea gigas), especially to their larval stages. Our knowledge of the effect of reduced pH on C. gigas larvae presently relies presumptively on four short-term (,4 days) survival and growth studies. Using multiple physiological measurements and life stages, the effects of long-term (40 days) exposure to pH 8.1, 7.7 and 7.4 on larval shell growth, metamorphosis, respiration and filtration rates at the time of metamorphosis, along with the juvenile shell growth and structure of the C. gigas, were examined in this study. The mean survival and growth rates were not affected by pH. The metabolic, feeding and metamorphosis rates of pediveliger larvae were similar, between pH 8.1 and 7.7. The pediveligers at pH 7.4 showed reduced weight-specific metabolic and filtration rates, yet were able to sustain a more rapid post-settlement growth rate. However, no evidence suggested that low pH treatments resulted in alterations to the shell ultrastructures (SEM images) or elemental compositions (i.e., Mg/Ca and Sr/Ca ratios). Thus, larval and post-larval forms of the C. gigas in the Yellow Sea are probably resistant to elevated CO 2 and decreased near-future pH scenarios. The pre-adapted ability to resist a wide range of decreased pH may provide C. gigas with the necessary tolerance to withstand rapid pH changes over the coming century. Citation: Ginger KWK, Vera CBS, R D, Dennis CKS, Adela LJ, et al. (2013) Larval and Post-Larval Stages of Pacific Oyster (Crassostrea gigas) Are Resistant to Elevated CO 2 . PLoS ONE 8(5): e64147. doi:10.1371/journal.pone.0064147 Editor: Sam Dupont, University of Gothenburg, Sweden Received November 27, 2012; Accepted April 9, 2013; Published May 28, 2013 Copyright: ß 2013 Ginger et al. This is an open-access article distributed under the terms of the Creative Commons Attribution License, which permits unrestricted use, distribution, and reproduction in any medium, provided the original author and source are credited. Funding: This study was supported by a three General Reserach Fund from the Research Grants Council, Hong Kong (grant numbers 778309M, 780510M and 705511P) and partially from the University of Hong Kong, grant number 201011159105. The funders had no role in study design, data collection and analysis, decision to publish, or preparation of the manuscript. Competing Interests: The authors have declared that no competing interests exist. * E-mail: [email protected] . These authors contributed equally to this work. Introduction The entry of anthropogenic CO 2 into coastal and open oceans is altering carbonate buffering systems and equilibriums and decreasing pH [1,2]. Fluctuating and decreasing pH levels are threatening oyster population and aquaculture globally and could therefore have severe effects on human welfare [3,4]. Although there is a lack of direct experimental evidence, recent oyster production declines in aquaculture farms on the North American west coast have been associated with larval exposure to environmentally fluctuating and decreased pH [5]. Such a deleterious effect is expected because larval oyster shells are made of the more soluble form of CaCO 3 , aragonite [6,7,8], and because larval developmental processes are sensitive to environ- mental factors [9,10], including decreased pH [11,12,13,14,15,16,17,18,19,20]. Oyster species with aquaculture values were notably introduced and established permanently outside their home range and ambient water quality conditions including environmental pH [21]. Microevolutionary processes can occur in a few generations within a population to progressively strengthen individual fitness towards pH fluctuation [22,23] in their non-native environments, enabling the less-sensitive traits to flourish. Such adaptive tolerance and resistance of oysters introduced to a new environ- ment may provide advantages for certain populations from novel stressors such as decreased pH [24]. For example, while the Australian population of Pacific oyster (Crassostrea gigas) has shown depressed shell growth and developmental abnormalities at pH 7.8 [17], the Japanese, American and European populations are resistant to decreased pH [11,13,16]. Although the Pacific oyster is one of the important aquacultural and favored introduced species around the world, our knowledge of its larval response to decreased pH is limited to short-term (,4 days) shell growth and survival data obtained from single early life stage (D-shaped larva) [13,16,17,25]. As most larval traits are interconnected, the pH effects on various larval characteristics should be considered together when analyzing the undesirable consequences of a stressor [26]. For an accurate prediction of the effects of multiple pH levels, long-term experiments covering the full length of the development period (i.e., the pre- and post-settlement stages) is required for C. gigas [5,13]. Larval metamorphosis in oysters is rapidly executed (within hours) while larvae switch their calcification mode from aragonite to calcite [7]. This critical life stage process is energetically PLOS ONE | www.plosone.org 1 May 2013 | Volume 8 | Issue 5 | e64147
Transcript of Larval and Post-Larval Stages of Pacific Oyster (Crassostrea gigas) Are Resistant to Elevated CO2

Larval and Post-Larval Stages of Pacific Oyster(Crassostrea gigas) Are Resistant to Elevated CO2
Ko W. K. Ginger1., Chan B. S. Vera1., Dineshram R1, Choi K. S. Dennis1, Li J. Adela1, Ziniu Yu2,
Vengatesen Thiyagarajan1*
1 The Swire Institute of Marine Science and School of Biological Sciences, The University of Hong Kong, Hong Kong, SAR, 2 South China Sea Institute of Oceanology,
Chinese Academy of Sciences, Guangzhou, China
Abstract
The average pH of surface oceans has decreased by 0.1 unit since industrialization and is expected to decrease by another0.3–0.7 units before the year 2300 due to the absorption of anthropogenic CO2. This human-caused pH change is posingserious threats and challenges to the Pacific oyster (Crassostrea gigas), especially to their larval stages. Our knowledge of theeffect of reduced pH on C. gigas larvae presently relies presumptively on four short-term (,4 days) survival and growthstudies. Using multiple physiological measurements and life stages, the effects of long-term (40 days) exposure to pH 8.1,7.7 and 7.4 on larval shell growth, metamorphosis, respiration and filtration rates at the time of metamorphosis, along withthe juvenile shell growth and structure of the C. gigas, were examined in this study. The mean survival and growth rateswere not affected by pH. The metabolic, feeding and metamorphosis rates of pediveliger larvae were similar, betweenpH 8.1 and 7.7. The pediveligers at pH 7.4 showed reduced weight-specific metabolic and filtration rates, yet were able tosustain a more rapid post-settlement growth rate. However, no evidence suggested that low pH treatments resulted inalterations to the shell ultrastructures (SEM images) or elemental compositions (i.e., Mg/Ca and Sr/Ca ratios). Thus, larval andpost-larval forms of the C. gigas in the Yellow Sea are probably resistant to elevated CO2 and decreased near-future pHscenarios. The pre-adapted ability to resist a wide range of decreased pH may provide C. gigas with the necessary toleranceto withstand rapid pH changes over the coming century.
Citation: Ginger KWK, Vera CBS, R D, Dennis CKS, Adela LJ, et al. (2013) Larval and Post-Larval Stages of Pacific Oyster (Crassostrea gigas) Are Resistant to ElevatedCO2. PLoS ONE 8(5): e64147. doi:10.1371/journal.pone.0064147
Editor: Sam Dupont, University of Gothenburg, Sweden
Received November 27, 2012; Accepted April 9, 2013; Published May 28, 2013
Copyright: � 2013 Ginger et al. This is an open-access article distributed under the terms of the Creative Commons Attribution License, which permitsunrestricted use, distribution, and reproduction in any medium, provided the original author and source are credited.
Funding: This study was supported by a three General Reserach Fund from the Research Grants Council, Hong Kong (grant numbers 778309M, 780510M and705511P) and partially from the University of Hong Kong, grant number 201011159105. The funders had no role in study design, data collection and analysis,decision to publish, or preparation of the manuscript.
Competing Interests: The authors have declared that no competing interests exist.
* E-mail: [email protected]
. These authors contributed equally to this work.
Introduction
The entry of anthropogenic CO2 into coastal and open oceans
is altering carbonate buffering systems and equilibriums and
decreasing pH [1,2]. Fluctuating and decreasing pH levels are
threatening oyster population and aquaculture globally and could
therefore have severe effects on human welfare [3,4]. Although
there is a lack of direct experimental evidence, recent oyster
production declines in aquaculture farms on the North American
west coast have been associated with larval exposure to
environmentally fluctuating and decreased pH [5]. Such a
deleterious effect is expected because larval oyster shells are made
of the more soluble form of CaCO3, aragonite [6,7,8], and
because larval developmental processes are sensitive to environ-
mental factors [9,10], including decreased pH
[11,12,13,14,15,16,17,18,19,20].
Oyster species with aquaculture values were notably introduced
and established permanently outside their home range and
ambient water quality conditions including environmental pH
[21]. Microevolutionary processes can occur in a few generations
within a population to progressively strengthen individual fitness
towards pH fluctuation [22,23] in their non-native environments,
enabling the less-sensitive traits to flourish. Such adaptive
tolerance and resistance of oysters introduced to a new environ-
ment may provide advantages for certain populations from novel
stressors such as decreased pH [24]. For example, while the
Australian population of Pacific oyster (Crassostrea gigas) has shown
depressed shell growth and developmental abnormalities at
pH 7.8 [17], the Japanese, American and European populations
are resistant to decreased pH [11,13,16]. Although the Pacific
oyster is one of the important aquacultural and favored introduced
species around the world, our knowledge of its larval response to
decreased pH is limited to short-term (,4 days) shell growth and
survival data obtained from single early life stage (D-shaped larva)
[13,16,17,25].
As most larval traits are interconnected, the pH effects on
various larval characteristics should be considered together when
analyzing the undesirable consequences of a stressor [26]. For an
accurate prediction of the effects of multiple pH levels, long-term
experiments covering the full length of the development period
(i.e., the pre- and post-settlement stages) is required for C. gigas
[5,13]. Larval metamorphosis in oysters is rapidly executed (within
hours) while larvae switch their calcification mode from aragonite
to calcite [7]. This critical life stage process is energetically
PLOS ONE | www.plosone.org 1 May 2013 | Volume 8 | Issue 5 | e64147

expensive and highly demanding and represents a bottleneck in
the form of recruitment success [27,28]. This key process and
larval physiology at the time of metamorphosis have been
overlooked in ocean acidification research [15,29]. To better
understand the consequences of decreasing pH on population
success and ecological processes, it is therefore essential to
understand what will happen to larvae physiologically at the time
of settlement and metamorphosis.
In this study, therefore, the larval response of C. gigas from a
Yellow Sea-population when exposed to decreased pH levels was
evaluated from late-veligers to juveniles using a 40 day long
exposure and large-scale (40 L) CO2 perturbation experiment.
The D-shaped larvae were reared to an early juvenile stage at
three pH levels, 8.1, 7.7 and 7.4. Comparative larval develop-
mental (shell growth and metamorphic success), physiological
(respiration and filtration rates) and calcification (shell composition
and ultrastructure) responses to the pH levels were measured to
evaluate the impact of CO2-driven decreased pH on the Chinese
oyster populations.
Materials and Methods
Statement of EthicsNo specific permits were required for the described field
sampling. No specific permissions were required for oyster sample
collection from Tsingdao (North China) in the Yellow Sea. We
also confirm that the location is not privately-owned or protected
in any way and the field studies did not involve endangered or
protected species.
Study Organism: Pacific Oysters from the Yellow SeaAdult Pacific oysters (Crassostrea gigas) were collected from the
coastal area of Tsingdao (China) in the Yellow Sea (36u 04’N, 120u22’E) during July 2012 (summer time). The Yellow Sea is a
marginal sea of the Pacific Ocean and located in the northern part
of the East China Sea. The collection site experiences minimal
freshwater influence from nearby rivers and thus have a typical
coastal oceanic conditions with mean summer water temperature
of 23uC, salinity of 30 to 31 % and pH 8.1 to 8.2 [30,31]. The
collected broodstocks were transported in emersed condition to
Hong Kong (22u 15’N, 114u 10’E) by air via Guangzhou (China).
In Hong Kong, the adults were acclimatized for 2 days at a pH of
8.1, a salinity of 24% and a temperature of 24uC. These salinity
and temperature values corresponded to recommended seawater
conditions for Pacific oyster larval culture [32]. Natural seawater
obtained from the South China Sea adjacent to Hong Kong was
used for this experiment. Sperm and eggs obtained from multiple
parents (10 male, 20 female; size 10–15 cm) were gently removed
from matured gonads and suspended in 0.22 mm filtered seawater
(FSW; with a salinity of 24%), a procedure known as ‘‘strip-
spawning’’ [14]. The fertilization of about 12 million eggs was
facilitated by gently mixing a small volume of sperm (4–7 ml dense
sperm; 1 million eggs) to avoid polyspermy [32,33]. After 2 h,
embryos were separated from the excess sperm using 20 mm nylon
mesh and placed in 40 L culture tanks with FSW (density ,20
embryos ml21). Decreased pH generally negatively affect oyster
fertilization, embryonic development and produce heterogeneous-
ly sized D- larvae with different degree of impairment
[12,16,34,35]. To avoid insufficient number of larvae reaching
eye-spot stage for subsequent analysis, therefore, we have started
our experiment with matured D-larvae without considering the
effect of pH on early larval development. The embryos developed
into D-shaped larvae within 16 h at 24uC, pH 8.1, 24% (i.e. at
ambient control condition). The D-shaped larvae with similar sizes
(,25 mm in diameter) were obtained by washing with a 20 mm
nylon mesh and were used in the following pH perturbation
experiment. This procedure allows the experiment to begin with
similarly sized and fully (without any abnormalities) developed D-
shaped larvae.
pH Perturbation: Experimental DesignThere were three pH treatments to examine the effect of pH
values that is either currently experienced by these animals due to
seasonal or daily fluctuations or expected to be experienced in
near-future due to elevated anthropogenic CO2. In the oyster
collection site, the Yellow Sea, in annual time scale, the sub-
surface seawater pH varied between 8.11 to 7.67 due to seasonal
changes in salinity and temperature [36]. For example, in winter
the pH ranged between 7.67 and 7.92 but in summer it raised to
8.06. The peak summer average pH 8.11 was however found in
late summer months (August). Notably, the carbonate system in
the oyster collection site (Yellow Sea) is substantially influenced by
globally rising anthropogenic CO2 when compared to natural
CO2 input through respiration and mineralization [36]. The
pH 8.1 is representing current global surface average as well as
average pH at the time of adult oyster collection for this study. The
two decreased pH treatments, pH 7.7 and pH 7.4, represented the
extreme carbonate system variables (such as pCO2 and carbonate
ion concentration) experienced by oysters today and the average
future projected for the year 2100 or beyond [37] [36]. These two
decreased pH levels are in fact environmentally realistic in
naturally fluctuating estuarine and coastal environments [38],
where the Pacific oyster larvae likely to develop. Each treatment
had five replicate culture tanks. In the experimental units, e.g., the
larval culture tanks, the pH was decreased by bubbling CO2-
enriched air sufficient to achieve the desired seawater pH values
[39,40]. The CO2 concentration in the tanks was adjusted using
dual variable area flow meter/controllers (Cole-Parmer Inc.). The
seawater pH was monitored as a proxy of pCO2 level, and together
with temperature both readings were recorded twice daily using a
pH meter (SG2, Mettler-Toledo), which was calibrated using
NBS/NIST standards (at pH 4, pH 7 and pH 10). Aside from the
pH and temperature, the salinity, algal food concentrations and
total dissolved oxygen levels were measured periodically with a
refractometer, haemocytometer and portable dissolved oxygen
meter (ORI-1212503 Orion 3-Star, Thermo Fisher Scientific Inc.,
U.S.), respectively. In both the larval and juvenile culture phase,
seawater from the culture tanks was changed every 3 to 4 days,
and seawater samples were collected at each time of water change
to determine the total alkalinity (TA) using an Alkalinity Titrator
(AC-A2, Apollo SciTech’s Inc., U.S.) [41]. This frequency of
seawater change was generally recommended in oyster larvae
hatcheries in China, this is not only due to practical limitation by
the common lack of flow-through facilities, it is also regarded to be
optimal duration for minimizing environmental shock and
physical damage made to oyster larvae during sieving procedure
and transportation to a different water mass, respectively. Such
frequency of seawater renewal did not cause undesirable health
consequence [42]. Immediately after collection, 50 mL water
samples were poisoned using 10 ml of 250 mM mercuric chloride,
and the whole TA measurement procedure was validated using the
certified seawater reference material, with precision of 0.009–
0.072, accuracy of 0.26–0.45 (Batch 103, A.G. Dickson, Scripps
Institution of Oceanography). The carbonate system parameters in
each experimental unit were obtained using the CO2SYS
program with the equilibrium constants K1, K2 and KSO4
[43,44], according to the measured parameters, i.e. temperature,
salinity, pH and total alkalinity.
Pacific Oyster Larvae Are Resistant to High-CO2
PLOS ONE | www.plosone.org 2 May 2013 | Volume 8 | Issue 5 | e64147

Pre- and Post-settlement CultureThe D-shaped larvae were equally divided for the 15
experimental units/tanks (3 pH treatments65 replicates). Each
cylindrical plastic culture tank contained 40 L of 0.45 mm filtered
natural seawater with 24% salinity. Tanks were randomly placed
in water baths maintained at 24uC. There were initially 20 larvae
per ml21, larval density was monitored for each tank every time
during water change. The total volume for culture was adjusted in
some tanks to maintain a consistent larval density when necessary.
This relatively large-scale (40 L) larval culture system was
appropriate to mimic aquaculture hatchery conditions as closely
as possible, to get a sufficient number of larvae for various
measurements during this relatively long-term (.45 days) exper-
iment and to minimize the considerable larval mortality often
experienced in hatchery conditions [35]. During the first 7 days,
the early veliger larvae were fed daily ad libitum with the
monoculture of live small flagellate Isochrysis galbana at the final
concentration of 56105 cells ml21 [45]. After 7 days (including the
late larval and post-settlement growth periods), animals were
cultured using similar methods, but were fed with a mixture of live
I. galbana and Chaetoceros gracilis (late veliger, 56105 cells ml21 algal
mixture I. galbana and C. gracilis in 8:2 ratio, twice daily;
pediveliger, 86105 cells ml21, 1:1 ratio, twice daily; juvenile
106105 cells ml21, 1:1 ratio, once daily). Incorporating the diet
with the bigger diatoms, C. gracilis provides higher lipid content
and maximum larval growth rates [46]. Metamorphosis was
induced by plastic plates with 7 day old natural multi-species
microbial biofilm, metamorphosed juveniles on the plates were
kept in 1 L tanks for post-metamorphic growth with similar
seawater chemistry, algal proportion and concentrations. From
these larval and juvenile cultures, samples were periodically taken
for the following measurements.
Larval Development and Shell GrowthThe effects of pH on larval survivorship, the relative proportion
of different developmental stages, mean shell growth and
frequency distribution of the different size classes were determined
on days 11 and 16 post-fertilization. During the seawater change
on days 11 and 16, all of the larvae were filtered out using a 50 mm
mesh and concentrated into 150–200 ml pH adjusted seawater.
To compare survivorship, the concentrated larvae were mixed
thoroughly and a subsample (1 ml) was taken from each replicate
culture using a wide-mouth micropipette. Samples were immedi-
ately fixed in 10% buffered formalin. Under a compound
microscope equipped with a digital camera (Leica DFC 280,
Leica, Germany), larvae were counted to calculate the percentage
of survival based on the number of empty shells (dead at the time
of fixation) and shells with larval tissue inside (alive at the time of
fixation). Since all the experimental pH level had aragonite
saturation stage, the shells of dead animals shall be well retained in
the culture tank. At the same time, the larvae were classified
according to different developmental stages and their numbers
were recorded. The developmental stages were identified using the
shell morphology and the presence of D-shaped, early umbo, late
umbo and pediveliger stages with eyespots [47]. All of the shells
were then photographed at a 636magnification. Using the picture,
projected shell areas of the right valves of randomly chosen larvae
were measured for growth analysis using a Leica QWin V3 data
processing tool [48]. The shell growth rates of the early juveniles
were measured using the following procedure. The locations of
randomly chosen post-settlement individuals on the substrates
deployed in each treatment tank were marked with permanent ink
to enable repeated records of the same individual. The area of
each juvenile’s right valve (outer shell) was measured over time
using Leica QWin V3, which was subsequently used to calculate
its growth rate. Juvenile growth rates were measured on days 5
and 12 post-settlement. For each sample, there were 25 to 100
larvae, or one to 18 individuals for the early juveniles. The
cumulative percentage abundance were plotted against shell
surface area categories in each replicates, the curves were fitted
with three parameter Gompertz asymmetric nonlinear growth
model using non-linear curve fitting option in the statistical
software Sigmaplot (version 12.0) [49]. The shell area at the
greatest slope of the curve, i.e. the inflection point, x and y (Eqn.
2), were calculated based on the statistical parameters (a, b, k)
obtained from the least squares program for the nonlinear
Gompertz equation and model (Eqn. 1). The effect of pH on
these quantitative parameters in each of the sampling dates for
larvae (day 11 and 16) and juvenile (day 5 and day 12) shell area
values were then compared using one way ANOVA. In rare
occasion observed in one of the replicates in pH 7.7 and pH 7.4
treatments for day 11 larvae did not converge to the Gompertz
model, and were excluded from the analysis. Even then, there
were four replicates or above in all sampling dates for analyses of
pH effects.
s~ke{ea{bx ð1Þ
Inflection point : x~a
b(y~k=e) ð2Þ
Larval Scope for Growth and MetamorphosisAs soon as some larvae developed into the pediveliger stage with
an eyespot and a foot (about 10%) and were competent to attach
and metamorphose into early juveniles, they were sieved out using
a 280 mm mesh. The required numbers of pediveligers (about
600 per tank) were obtained from each tank irrespective of pH
treatments and culture tanks. The similar size (about 280 mm
long), developmental stage (pediveliger stage) and age (16 days
post-fertilization) of the larval cohort permitted us to examine the
effects of pH on the larval metamorphosis, respiration and
filtration rates without interference from potential confounding
factors such as the virtual age effect or delayed (or enhanced)
growth due to pH treatments [50,51]. Nevertheless, this procedure
has a drawback, i.e. the pediveliger larvae used for the following
measurements did not represent the entire larval population and
they may have come from the fast-growing larval population
within a given treatment.
A simplified representation of the larval energy expenditure and
intake, in terms of respiration and feeding, were used to estimate
how scope for growth may be influenced by pH. Respiration
(oxygen consumption) rates were continuously measured using
polarographic oxygen sensor (POS) respirometer [52]. The six-
channel POS dissolved-oxygen measuring system (Strathkelvin
Instruments, Glasgow, U.K.) with Strathkelvin 1302 microcathode
oxygen electrodes were connected with a standard Strathkelvin
RC650 respirometer [53]. The electrodes were calibrated against
oxygen-free seawater (i.e., solution with 4% sodium sulphite) and
air-saturated FSW at each pH treatment. Exactly 200 larvae were
added into a respiration chamber (volume of 3 ml) for each
replicate (n = 3). Such a larval density had minimal effects on the
larvae’s health and allowed sensitive detection of the respiration
rate [52]. Each respiration chamber had a calibrated polaro-
graphic oxygen sensor (Model 1302, Strathkelvin), and an
adjustable air tight cap, 2 ml of FSW and a magnetic stirrer with
Pacific Oyster Larvae Are Resistant to High-CO2
PLOS ONE | www.plosone.org 3 May 2013 | Volume 8 | Issue 5 | e64147

600 rpm, air bubbles were expelled out of the respiration chamber
before the start of the measurement. The pH in each chamber was
pre-adjusted in correspondence with its larval treatment condition.
The larvae were acclimated for 1 h in respiration chambers before
measurement. The chamber temperature was maintained at the
larval culture temperature through a circulating water bath (24uC).
The oxygen consumption levels were measured for 1 h. A control
chamber corresponding pH water without larvae were used to
monitor bacteria O2 consumption, such values of O2 consumption
(about 6%) were used as the background values for the
corresponding pH measurement. Additionally, to minimize this
noise created from bacterial respiration, seawater, respiration
chamber and all apparatus were sterilized in advance. After
measurement, the larvae were removed from the chambers, rinsed
with distilled water to remove salt and seawater and grouped in
pre-weighed aluminum foil sachets to measure the ash-free dry
weight (AFDW). The foils were first dried in an oven at 50uC for
48 h and were then weighed to the nearest 0.001 mg (dry weight)
using a microbalance (R200D, Sartorius, U.S.). The foil sachets
were then placed in a muffle furnace at 550uC for 16 h and
reweighed (ash weight). The AFDW was calculated as the dry
weight (inorganic plus organic contents) minus the ash weight
(inorganic contents only). The mass specific oxygen consumption
rates of the larvae were expressed as the microliters of oxygen
consumed per milligram of AFDW per hour [52]. Only three
randomly selected replicates per pH treatment were used due to
the logistic challenges.
The effect of pH on the larval filtration (feeding) rate was
determined in a 50 ml centrifuge tube that contained 200 larvae,
30 ml of FSW and 46106 cells ml21 of I. galbana [54]. The pH and
temperature were pre-adjusted corresponding to their larval
treatment. The larvae were incubated in the centrifuge tube for
15 h, every 1–2 h, centrifuge tube were inverted to facilitate algal
mixing. From each centrifuge tube, 1 ml of seawater samples was
fixed (algal cell division and consumption quenched with 400 ml
10% buffered formalin) for the algal concentration measurement
using a Coulter counter (Coulter CounterH Multisizer II) before
and after the experiment, together with a blank chamber in the
absence of larvae [55]. After the experiment, the larval AFDW was
determined as described in the previous paragraph. The weight-
specific filtration rate was calculated from the exponential decrease
in I. galbana concentration during the 15 h feeding period ({[Vx(ln
C0-ln C1)]/t}/AFDW; V = 30 ml; t = 15 h; C0 = initial algae
concentration; C1 = final algae concentration) and expressed as
the milliliters of water filtered per hour (ml mg21h21). There were
five replicates per pH treatment. Autoclaved seawater was used
throughout the experiment.
From larval respiration and filtration rates, the energy available
for growth and development, i.e. the scope for growth (SfG), was
calculated by estimating the larval energy input and output.
Respiration rates were converted to energy equivalent using the
standard conversion value of 0.45 J mgh21 [56]. The larval
clearance rate (feeding) was converted to energy equivalent of 23 J
mgh21 per mg of particulate organic matter [57] by using the
larval food Isochrysis galbana with an estimated cell mass of 20.8 pg
cell21 [58], average cell size of 45 mm3 cell21, a carbon content of
9.37 pg C cell21, and with an estimated dry weight of 0.51 gL21.
Scope for growth was then calculated from energy intake (I) and
respiratory energy loss (R) as SfG = I2R. As excretion rates of
oyster larvae were not included in the calculation, our SfG
measurements may have been overestimated across treatments.
The percentage metamorphosis of pediveligers was determined
using the following bioassay. Under a dissection microscope, a
known amount (,200) of larvae was transferred into a 1 L plastic
bioassay vessel that contained 750 ml of FSW and a plastic sheet
covered with biofilm (i.e., 5-day-old natural microbial film
developed in an outdoor seawater aquarium). Oyster larvae are
known to be stimulated by chemical cues from biofilm-developed
surfaces, and are induced to settle and metamorphose [59]. The
pH and temperature levels for these bioassay vessels were pre-
adjusted corresponding to their larval treatment conditions. The
percentage of larvae that attached and metamorphosed on each
biofilm surface was counted after 24 h. The larvae seldom
attached on the clean wall of the bioassay container according
to observation. Measurements from all five replicate tanks were
taken in each pH treatment.
Juvenile Shell Area Ratio, Thickness, Ultrastructure andComposition
After 24 days of post-settlement growth, all juveniles were
carefully detached from the substrate and preserved in 75%
ethanol to measure their shell area ratios, thicknesses, cross-
sectional ultrastructures and compositions. Whole juvenile shell
valves (,5 individuals from each replicate tank) were mounted
onto aluminum stubs with carbon tape and were examined under
a scanning electron microscope (SEM) (Hitachi S-3400N VP
SEM), which allowed clear observation of the prodissoconch II-
dissoconch (PII-D) boundary, i.e., the boundary marking the
distinctive prodissoconch and dissoconch regions as in larval and
juvenile calcification, respectively [60]. The area ratios between
the whole juvenile shell (including both the prodissoconch and
dissoconch regions) and larval prodissoconch area were quantified
to indicate the net shell growth after metamorphosis using the
Image J program (Image J 1.45s, NIH, U.S.).
The shell thicknesses and ultrastructures were compared as
visualized from the cross-sectional specimen. The juvenile shells
were embedded in resin using silicon molds suitable for
ultramicrotomy. The excess resin was carefully trimmed away
from the embedded specimens, and a cut passing through the shell
hinge was created for each section [48,61]. The cross-sectional
surface was subsequently smoothened by ultramicrotome section-
ing, and a glass and diamond knife were then used consecutively to
remove thin (down to ,70 nm thick) sections (Ultracut S, Leica,
Germany). The shell sections were treated with 2 min of etching
using a 0.5 M EDTA solution to reveal the topographical details of
the ultrastructures. The etched surfaces were rinsed with double
distilled water and air dried, and the specimens were then
mounted onto an aluminum stub with carbon tape and
surrounded with silver paint to prevent electron charging. Finally,
the specimens were sputter coated with a gold-palladium alloy
(,50 nm) prior to imaging using a Leo 1530 FEG SEM.
The elemental ratios for magnesium/calcium (Mg/Ca) and
strontium/calcium (Sr/Ca) in the juvenile shells were determined
to evaluate the effects of pH on their shell compositions. The
relative intensities were simultaneously measured for calcium (Ca,
396.847 nm), magnesium (Mg, 285.213 nm) and strontium (Sr,
407.771 nm) using inductively coupled plasma-optical emission
spectrophotometry (ICP-OES, PE Optima 8300). The harvested
shell valves (one to five juveniles from each replicate) were
immersed with 5% bleach (NaOCl, CloroxTM) for about 30 min
to remove soft tissues. The cleaned shell valves were rinsed twice
with double-distilled water prior to acid digestion with 2% nitric
acid. All of the containers used for sample handling were acid
washed in 10% v/v HCl overnight, rinsed twice with double-
distilled water and dried at 80uC before use. Samples in different
dilutions (1-, 10- and 100-fold dilutions) were prepared to ensure
that each metal was quantified within the concentration range of
Pacific Oyster Larvae Are Resistant to High-CO2
PLOS ONE | www.plosone.org 4 May 2013 | Volume 8 | Issue 5 | e64147
the standard calibration curve [62]. Shell measurements from all
five replicate tanks were taken in each pH treatment.
Statistical AnalysisBefore analysis, data were checked for the normality and the
homogeneity of variance using the Shapiro-Wilk test and
Levene’s test, respectively. The percentage metamorphosis data
were arcsine transformed, and all of the other measurements
were square root transformed to achieve variance homogeneity.
After the transformations, all of the datasets passed the
aforementioned two assumptions and were subsequently exam-
ined using one-way ANOVA. In cases where a significant pH
effect was detected, Tukey’s multiple comparison tests were used
to differentiate between the three pH groups. Power analyses
were performed when no statistical significance was observed.
The sample size for all experimental groups was three to five,
with each sample representing the average measurement of one
to 200 oyster larvae/juveniles in a single replicate tank. The
data were presented as mean6SD. The differences were
considered significant if the probability of a Type I error was
less than 0.05.
Results
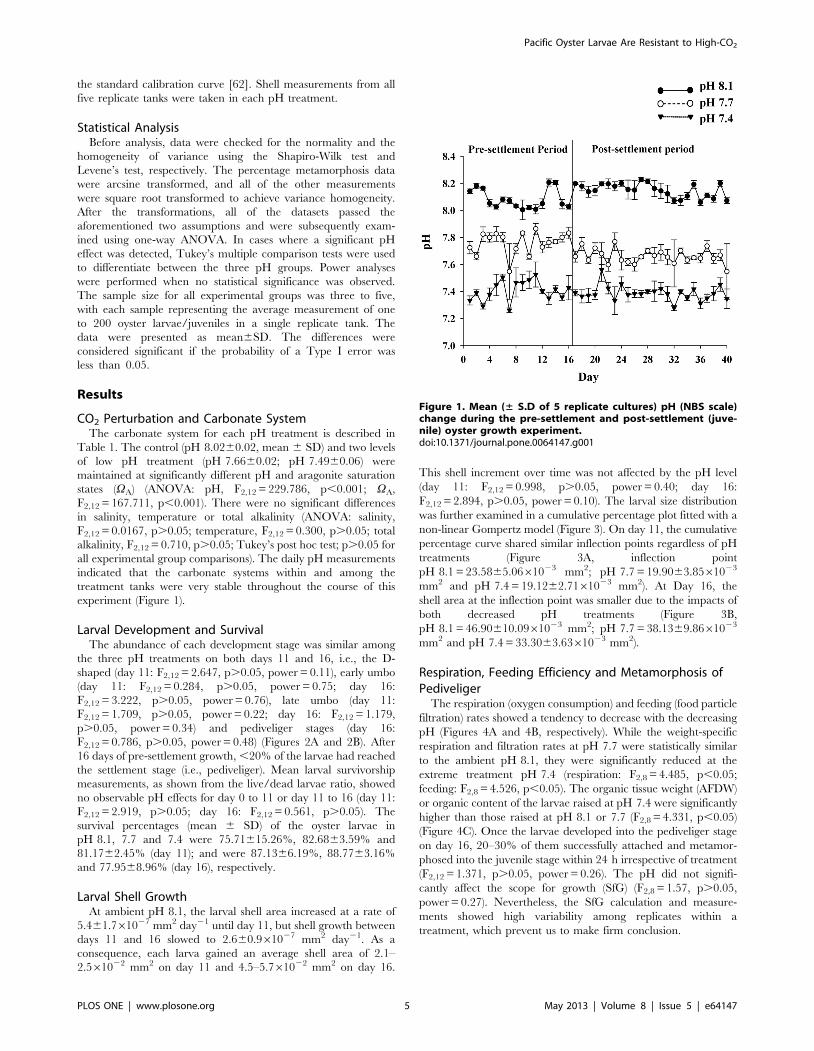
CO2 Perturbation and Carbonate SystemThe carbonate system for each pH treatment is described in
Table 1. The control (pH 8.0260.02, mean 6 SD) and two levels
of low pH treatment (pH 7.6660.02; pH 7.4960.06) were
maintained at significantly different pH and aragonite saturation
states (VA) (ANOVA: pH, F2,12 = 229.786, p,0.001; VA,
F2,12 = 167.711, p,0.001). There were no significant differences
in salinity, temperature or total alkalinity (ANOVA: salinity,
F2,12 = 0.0167, p.0.05; temperature, F2,12 = 0.300, p.0.05; total
alkalinity, F2,12 = 0.710, p.0.05; Tukey’s post hoc test; p.0.05 for
all experimental group comparisons). The daily pH measurements
indicated that the carbonate systems within and among the
treatment tanks were very stable throughout the course of this
experiment (Figure 1).
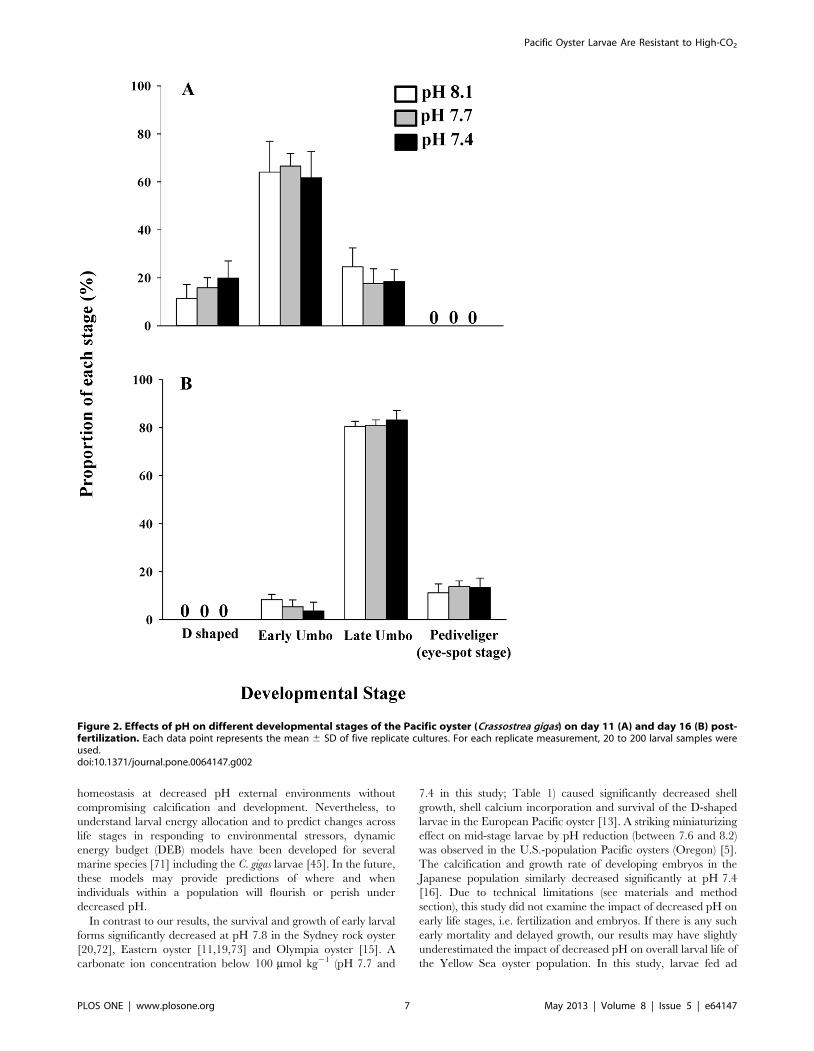
Larval Development and SurvivalThe abundance of each development stage was similar among
the three pH treatments on both days 11 and 16, i.e., the D-
shaped (day 11: F2,12 = 2.647, p.0.05, power = 0.11), early umbo
(day 11: F2,12 = 0.284, p.0.05, power = 0.75; day 16:
F2,12 = 3.222, p.0.05, power = 0.76), late umbo (day 11:
F2,12 = 1.709, p.0.05, power = 0.22; day 16: F2,12 = 1.179,
p.0.05, power = 0.34) and pediveliger stages (day 16:
F2,12 = 0.786, p.0.05, power = 0.48) (Figures 2A and 2B). After
16 days of pre-settlement growth, ,20% of the larvae had reached
the settlement stage (i.e., pediveliger). Mean larval survivorship
measurements, as shown from the live/dead larvae ratio, showed
no observable pH effects for day 0 to 11 or day 11 to 16 (day 11:
F2,12 = 2.919, p.0.05; day 16: F2,12 = 0.561, p.0.05). The
survival percentages (mean 6 SD) of the oyster larvae in
pH 8.1, 7.7 and 7.4 were 75.71615.26%, 82.6863.59% and
81.1762.45% (day 11); and were 87.1366.19%, 88.7763.16%
and 77.9568.96% (day 16), respectively.
Larval Shell GrowthAt ambient pH 8.1, the larval shell area increased at a rate of
5.461.761027 mm2 day21 until day 11, but shell growth between
days 11 and 16 slowed to 2.660.961027 mm2 day21. As a
consequence, each larva gained an average shell area of 2.1–
2.561022 mm2 on day 11 and 4.5–5.761022 mm2 on day 16.
This shell increment over time was not affected by the pH level
(day 11: F2,12 = 0.998, p.0.05, power = 0.40; day 16:
F2,12 = 2.894, p.0.05, power = 0.10). The larval size distribution
was further examined in a cumulative percentage plot fitted with a
non-linear Gompertz model (Figure 3). On day 11, the cumulative
percentage curve shared similar inflection points regardless of pH
treatments (Figure 3A, inflection point
pH 8.1 = 23.5865.0661023 mm2; pH 7.7 = 19.9063.8561023
mm2 and pH 7.4 = 19.1262.7161023 mm2). At Day 16, the
shell area at the inflection point was smaller due to the impacts of
both decreased pH treatments (Figure 3B,
pH 8.1 = 46.90610.0961023 mm2; pH 7.7 = 38.1369.8661023
mm2 and pH 7.4 = 33.3063.6361023 mm2).
Respiration, Feeding Efficiency and Metamorphosis ofPediveliger
The respiration (oxygen consumption) and feeding (food particle
filtration) rates showed a tendency to decrease with the decreasing
pH (Figures 4A and 4B, respectively). While the weight-specific
respiration and filtration rates at pH 7.7 were statistically similar
to the ambient pH 8.1, they were significantly reduced at the
extreme treatment pH 7.4 (respiration: F2,8 = 4.485, p,0.05;
feeding: F2,8 = 4.526, p,0.05). The organic tissue weight (AFDW)
or organic content of the larvae raised at pH 7.4 were significantly
higher than those raised at pH 8.1 or 7.7 (F2,8 = 4.331, p,0.05)
(Figure 4C). Once the larvae developed into the pediveliger stage
on day 16, 20–30% of them successfully attached and metamor-
phosed into the juvenile stage within 24 h irrespective of treatment
(F2,12 = 1.371, p.0.05, power = 0.26). The pH did not signifi-
cantly affect the scope for growth (SfG) (F2,8 = 1.57, p.0.05,
power = 0.27). Nevertheless, the SfG calculation and measure-
ments showed high variability among replicates within a
treatment, which prevent us to make firm conclusion.
Figure 1. Mean (± S.D of 5 replicate cultures) pH (NBS scale)change during the pre-settlement and post-settlement (juve-nile) oyster growth experiment.doi:10.1371/journal.pone.0064147.g001
Pacific Oyster Larvae Are Resistant to High-CO2
PLOS ONE | www.plosone.org 5 May 2013 | Volume 8 | Issue 5 | e64147

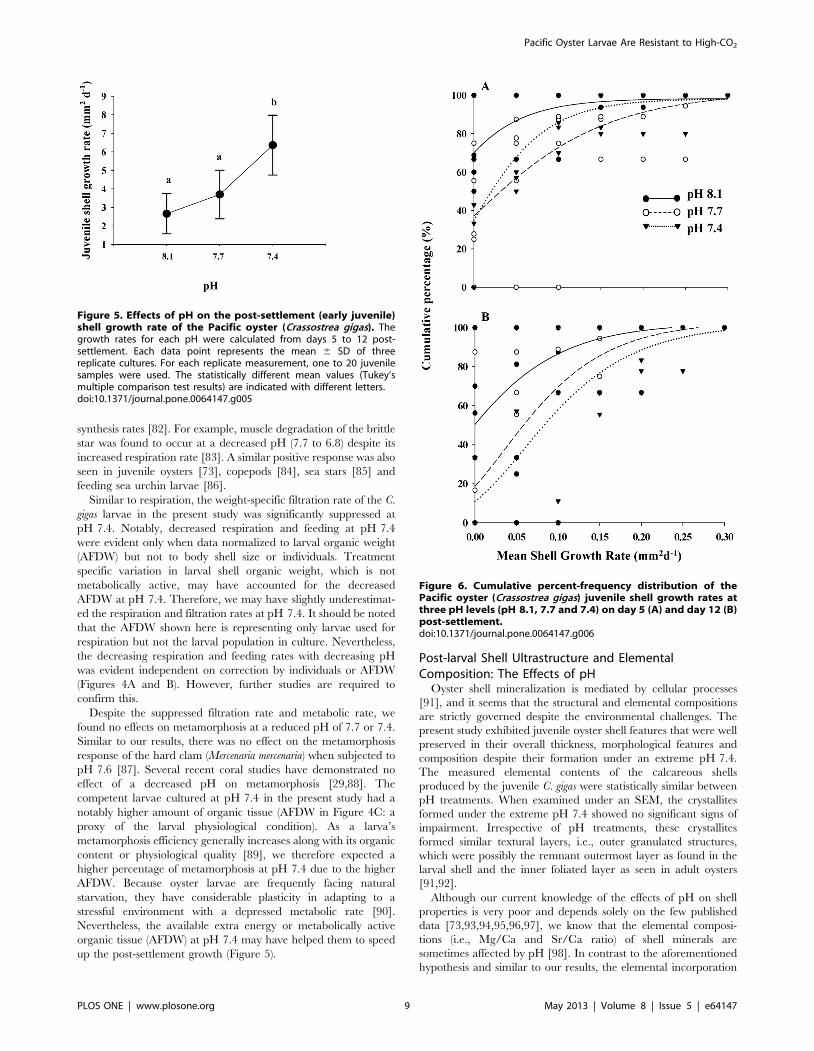
Post-settlement GrowthThe mean shell growth rate, calculated from measurements
taken at 5 and 12 days post-settlement, was ,2.6 mm2 day21 at
the ambient pH 8.1. While the juvenile growth rate in pH 7.7 was
statistically similar to pH 8.1, the juveniles in pH 7.4 grew
significantly faster (,6.3 mm2 day21) than their counterparts in
pH 8.1 (F2,11 = 1.557, p,0.05; Figure 5). Such a rapid shell
growth rate occurred only during the late juvenile growth period
from days 5 to 12 post-settlement. The juvenile size composition
was further examined in a cumulative percentage plot fitted with a
non-linear Gompertz model (Figures 6A and 6B). At Day 5, the
cumulative percentage curve shared similar inflection points
regardless of pH treatments (Figure 7A, inflection point pH 8.1
were all less valid values; pH 7.7 = 0.01660.083 mm2;
pH 7.4 = 0.00860.013 mm2). At Day 12, the shell area at the
inflection point was smaller due to the impacts of both decreased
pH treatments (Figure 6B, pH 8.1 = 0.022 mm2; pH 7.7 = 0.020
mm2; pH 7.4 = 0.038 mm2). The higher ratio between the total
shell area (i.e., larval plus juvenile shell) and the larval shell area
alone (prodissoconch) further corroborated that the low pH 7.4
induced a more rapid juvenile calcification of the calcitic
dissoconch shell. Nevertheless, the pH did not affect the juvenile
shell thickness, which had a mean thickness of 16.9464.74 mm
(F2,10 = 0.133, p.0.05, power = 0.25).
Ultrastructure and Elemental Composition of a JuvenileShell
Two textural layers were commonly observed from the SEM
images of the juvenile shells, including the outer layers of the
granular structures and the inner layers of the foliate structures.
The structure and crystal orientations appeared unaffected by low
pH treatments and shared very similar shell microstructures and
integrities (Figure 7). Further, the pH did not significantly affect
the incorporation of both Mg and Sr into the aragonite larval
shells. As a consequence, the Mg/Ca (F2,12 = 0.034, p.0.05,
power = 0.11) and Sr/Ca ratios (F2,12 = 2.554, p.0.05, pow-
er = 0.71) in the early juvenile shells were statistically similar across
the three pH treatments.
Discussion
Pre- and Post-settlement Growth: The Effects of pHA decrease in pH did not affect either the mean larval shell size
or relative composition of the different development stages on days
11 or 16 pre-settlement. The pH 7.4 treatment resulted in a more
rapid post-settlement growth, suggesting a selective pressure posed
by decreased pH on the more tolerant individuals within a
population. Pre- and post-settlement growth and survival seemed
to be resistant to the projected decrease in pH. Although the
effects of pH on fertilization success and embryonic development
were not examined, both responses have been found to be quite
unaffected by a decreased pH of 7.6 in the western Sweden
population [14]. A similar insignificant pH effect on fertilization
and embryo development has been found in the Oregon [5]and
Northwestern U.S. populations [25]. Nevertheless, oyster embryo
growth as a function of pH deserves further study. With over 45
days of pH exposure involving multiple developmental stages, this
study further suggests that the larval growth and development of
Yellow-Sea-population may be resistant and tolerant to the
detrimental effects of a decreased pH (7.4). Similar to our results,
the pH did not affect the larval growth and development of the
Suminoe oyster at pH 7.8 [11] or the Portuguese oyster at pH 7.5
[35].
Once hatched from embryos, oyster larvae feed and develop in
an estuary and coastal area where water pH naturally varies on a
daily basis, sometimes reaching pH values below 7.4 [63,64]. It
appears that oyster larvae from the Yellow Sea population have
apparently evolved a physiological tolerance to pH 7.4 through
exposure to wide ranges of natural pH variation in their estuarine
and coastal habitats. Similarly, sea urchins (Strongylocentrotus
franciscanus), corals (Acropora millepora) and red abalone (Haliotis
rufescens) have been shown to have adequate genetic diversity at
population levels to resist pH decreases [65,66,67]. Natural
selection, genetic variability, phenotypic plasticity and pre-
adaptation at the population level have similarly appeared to
protect several echinoids [68,69] and ectothermic marine inver-
tebrates [70] from pH decreases. Alternatively, during the 16 days
of exposure to deceased external pH the larvae may have
developed physiological strategies to allocate extra energy for pH
Table 1. Representative values of carbonate system parameters in the three pH treatment culture containers during larval (pre-settlement) and juvenile (post-settlement) growth period.
Measured Calculated
pH pH Temp Salinity TA pCO2 CO322
Treatments (NBS scale) (6C) (%) (mmol kg21) (matm) (mmol kg21) VCal VAg
Pre-settlement
pH 8.1 8.0260.02 24.660.3 24.860.4 2.0460.13 622 109 2.85 1.81
pH 7.7 7.6660.02 24.760.1 24.860.8 1.9760.03 1497 50 1.29 0.82
pH 7.4 7.4960.06 24.760.0 24.660.5 2.0560.14 2386 36 0.93 0.59
Post-settlement
pH 8.1 8.0560.02 24.460.2 24.560.1 1.8560.34 524 104 2.70 1.72
pH 7.7 7.6760.02 24.460.1 24.360.3 1.9260.75 1429 48 1.26 0.80
pH 7.4 7.3760.02 24.560.1 24.660.5 1.9160.27 2874 25 0.66 0.42
Samples for the pre-settlement carbonate system data were recorded at the time of larval sample collection for the metamorphosis assay, respiration and filtration ratemeasurements (the eyespot stage with a well-developed foot or pediveliger stage). Samples for the post-settlement carbonate system data were collected at the end ofexperiment. The partial pressure of carbon dioxide (pCO2), carbonate ion concentration (CO3
22), calcite saturation state (VCal) and aragonite saturation state (VAg) werecalculated using CO2SYS.doi:10.1371/journal.pone.0064147.t001
Pacific Oyster Larvae Are Resistant to High-CO2
PLOS ONE | www.plosone.org 6 May 2013 | Volume 8 | Issue 5 | e64147
homeostasis at decreased pH external environments without
compromising calcification and development. Nevertheless, to
understand larval energy allocation and to predict changes across
life stages in responding to environmental stressors, dynamic
energy budget (DEB) models have been developed for several
marine species [71] including the C. gigas larvae [45]. In the future,
these models may provide predictions of where and when
individuals within a population will flourish or perish under
decreased pH.
In contrast to our results, the survival and growth of early larval
forms significantly decreased at pH 7.8 in the Sydney rock oyster
[20,72], Eastern oyster [11,19,73] and Olympia oyster [15]. A
carbonate ion concentration below 100 mmol kg21 (pH 7.7 and
7.4 in this study; Table 1) caused significantly decreased shell
growth, shell calcium incorporation and survival of the D-shaped
larvae in the European Pacific oyster [13]. A striking miniaturizing
effect on mid-stage larvae by pH reduction (between 7.6 and 8.2)
was observed in the U.S.-population Pacific oysters (Oregon) [5].
The calcification and growth rate of developing embryos in the
Japanese population similarly decreased significantly at pH 7.4
[16]. Due to technical limitations (see materials and method
section), this study did not examine the impact of decreased pH on
early life stages, i.e. fertilization and embryos. If there is any such
early mortality and delayed growth, our results may have slightly
underestimated the impact of decreased pH on overall larval life of
the Yellow Sea oyster population. In this study, larvae fed ad
Figure 2. Effects of pH on different developmental stages of the Pacific oyster (Crassostrea gigas) on day 11 (A) and day 16 (B) post-fertilization. Each data point represents the mean 6 SD of five replicate cultures. For each replicate measurement, 20 to 200 larval samples wereused.doi:10.1371/journal.pone.0064147.g002
Pacific Oyster Larvae Are Resistant to High-CO2
PLOS ONE | www.plosone.org 7 May 2013 | Volume 8 | Issue 5 | e64147

libitum but in nature food limitation may exacerbate pH effect.
For example, mussels produce weaker shell growth under limited
food availability in decreased pH [55]. Nevertheless, the tolerance
of oyster larvae to a decreasing pH environment seems to be
species- and population-specific. Therefore, the holistic conse-
quence of this commercial species in the ecosystem and
aquaculture food production may be more unpredictable than
previously thought [18].
Larval Performance at the Time of Metamorphosis: TheEffects of pH
The decrease in the C. gigas larval respiration rate along with the
decrease in pH observed during this study correspond to results
obtained in previous studies of peanut worms, brittle stars, mussels
and coral larvae [74,75,76,77,78]. When the data were normal-
ized to the larval organic weight (AFDW), both respiration and
feeding decreased at pH 7.4. Short-term metabolic depression to a
decreased pH is a well-known natural occurrence. Metabolic
depression can be a direct result of cellular hypercapnic conditions
[78], when low intracellular pH conditions inhibit enzyme activity
[79]. Energy-demanding ion exchange processes such as the Na+/
H+ exchange and Na+-dependent Cl2/HCO32 exchange con-
tribute to a significant increase in metabolic costs in responding to
extracellular pH reduction [51]. Despite this increased energy
requirement, proton-producing metabolic processes are sup-
pressed in range of marine invertebrates in an attempt to slow
down cellular acidosis [80,81]. However, such a response is also
associated with deleterious consequences, including amino acid
catabolism, modified amino acid metabolism and reduced protein
Figure 3. Cumulative percent-frequency distribution of thePacific oyster (Crassostrea gigas) larval shell size at three pHlevels (pH 8.1, 7.7 and 7.4) on day 11 (A) and day 16 (B) post-fertilization.doi:10.1371/journal.pone.0064147.g003
Figure 4. Respiration or oxygen consumption (A), feeding orfiltration (B), and organic tissue weight or ash-free dry weight(C) of the pediveliger larvae of the Pacific oyster (Crassostreagigas) cultured at three pH levels (pH 8.1, 7.7 and 7.4).Pediveliger larvae with similar shell size (,280 mm in length) and age(16 day post-fertilization) from all three pH levels were usedsimultaneously for each measurement. Each data point represents themean 6 SD of five replicate cultures except respiration, where therewere only three randomly selected replicates. For each replicatemeasurement, 200 larval samples were used. Statistically differentmean values (Tukey’s multiple comparison test results) are indicatedwith different letters.doi:10.1371/journal.pone.0064147.g004
Pacific Oyster Larvae Are Resistant to High-CO2
PLOS ONE | www.plosone.org 8 May 2013 | Volume 8 | Issue 5 | e64147
synthesis rates [82]. For example, muscle degradation of the brittle
star was found to occur at a decreased pH (7.7 to 6.8) despite its
increased respiration rate [83]. A similar positive response was also
seen in juvenile oysters [73], copepods [84], sea stars [85] and
feeding sea urchin larvae [86].
Similar to respiration, the weight-specific filtration rate of the C.
gigas larvae in the present study was significantly suppressed at
pH 7.4. Notably, decreased respiration and feeding at pH 7.4
were evident only when data normalized to larval organic weight
(AFDW) but not to body shell size or individuals. Treatment
specific variation in larval shell organic weight, which is not
metabolically active, may have accounted for the decreased
AFDW at pH 7.4. Therefore, we may have slightly underestimat-
ed the respiration and filtration rates at pH 7.4. It should be noted
that the AFDW shown here is representing only larvae used for
respiration but not the larval population in culture. Nevertheless,
the decreasing respiration and feeding rates with decreasing pH
was evident independent on correction by individuals or AFDW
(Figures 4A and B). However, further studies are required to
confirm this.
Despite the suppressed filtration rate and metabolic rate, we
found no effects on metamorphosis at a reduced pH of 7.7 or 7.4.
Similar to our results, there was no effect on the metamorphosis
response of the hard clam (Mercenaria mercenaria) when subjected to
pH 7.6 [87]. Several recent coral studies have demonstrated no
effect of a decreased pH on metamorphosis [29,88]. The
competent larvae cultured at pH 7.4 in the present study had a
notably higher amount of organic tissue (AFDW in Figure 4C: a
proxy of the larval physiological condition). As a larva’s
metamorphosis efficiency generally increases along with its organic
content or physiological quality [89], we therefore expected a
higher percentage of metamorphosis at pH 7.4 due to the higher
AFDW. Because oyster larvae are frequently facing natural
starvation, they have considerable plasticity in adapting to a
stressful environment with a depressed metabolic rate [90].
Nevertheless, the available extra energy or metabolically active
organic tissue (AFDW) at pH 7.4 may have helped them to speed
up the post-settlement growth (Figure 5).
Post-larval Shell Ultrastructure and ElementalComposition: The Effects of pH
Oyster shell mineralization is mediated by cellular processes
[91], and it seems that the structural and elemental compositions
are strictly governed despite the environmental challenges. The
present study exhibited juvenile oyster shell features that were well
preserved in their overall thickness, morphological features and
composition despite their formation under an extreme pH 7.4.
The measured elemental contents of the calcareous shells
produced by the juvenile C. gigas were statistically similar between
pH treatments. When examined under an SEM, the crystallites
formed under the extreme pH 7.4 showed no significant signs of
impairment. Irrespective of pH treatments, these crystallites
formed similar textural layers, i.e., outer granulated structures,
which were possibly the remnant outermost layer as found in the
larval shell and the inner foliated layer as seen in adult oysters
[91,92].
Although our current knowledge of the effects of pH on shell
properties is very poor and depends solely on the few published
data [73,93,94,95,96,97], we know that the elemental composi-
tions (i.e., Mg/Ca and Sr/Ca ratio) of shell minerals are
sometimes affected by pH [98]. In contrast to the aforementioned
hypothesis and similar to our results, the elemental incorporation
Figure 5. Effects of pH on the post-settlement (early juvenile)shell growth rate of the Pacific oyster (Crassostrea gigas). Thegrowth rates for each pH were calculated from days 5 to 12 post-settlement. Each data point represents the mean 6 SD of threereplicate cultures. For each replicate measurement, one to 20 juvenilesamples were used. The statistically different mean values (Tukey’smultiple comparison test results) are indicated with different letters.doi:10.1371/journal.pone.0064147.g005
Figure 6. Cumulative percent-frequency distribution of thePacific oyster (Crassostrea gigas) juvenile shell growth rates atthree pH levels (pH 8.1, 7.7 and 7.4) on day 5 (A) and day 12 (B)post-settlement.doi:10.1371/journal.pone.0064147.g006
Pacific Oyster Larvae Are Resistant to High-CO2
PLOS ONE | www.plosone.org 9 May 2013 | Volume 8 | Issue 5 | e64147

into a coral reef was found to be unaffected by pH reduction [99].
However, the decreased pH (indicated as carbonate ion saturation)
suppressed the incorporation of both Mg and Sr into foraminifera
shells [100]. To maintain such a normal shell integrity and mineral
composition, the juvenile oyster may endure a significant energy
burden.
ConclusionsUsing a 40-day pH perturbation experiment, this study
illustrated the potential resistance, tolerance and compensatory
capacities of multiple life stages of the introduced Pacific oyster
(Crassostrea gigas) to moderate and extremely decreased pH.
Through multiple measurements of parameters including larval
development, physiology and shell composition, an integrated view
of larval response to pH exposure was achieved. The pre- and
post-settlement growth parameters clearly remained unaffected by
the today’s extreme decreased pH (pH 7.7) and the projected
future average (pH 7.4). The weight-specific respiration and
filtration rates of pediveligers decreased slightly at pH 7.4,
although these measurements were statistically similar to the
control pH (8.1) when normalized to the number of individuals.
Such similar pre-settlement growth and larval feeding histories
ensured normal metamorphosis without a significant delay.
Furthermore, juvenile oyster shell ultrastructures and elemental
compositions are the same irrespective of pH, suggesting that
juvenile oysters will have normal protective armor under near-
future decreased pH levels. Overall, our results suggest that the
larval forms of the Pacific oyster population in the Yellow Sea may
be pre-adapted to decreased pH compared with Japanese,
American, Australian and European populations.
Acknowledgments
We acknowledge the HKU-EMU facility for the SEM analysis. We also
would like to thank two anonymous reviewers and the editor (Sam Dupont)
for their highly valuable comments, suggestions and positive criticism. The
senior author (VT) is grateful to the various larval OA researchers who
attended the Larval 2012 meeting in Berkeley for their constructive
discussion on the data presented in this study. The authors wish to thank
Gianluca Sara (University of Palermo, Italy) for providing constructive
comments on the previous version of this manuscript and for his help with
our analysis of respiration and filtration data (scope of growth). Special
thanks are offered to Warren Allmon, Aileen Tan Shau, Sam Dupont,
Gray Williams and Pei Yuan Qian for their comments on this project. We
also wish to thank Richard Zeebe, Ryuji Asami, Olev Vinn, Andrew
Mount, Paul Taylor and Maggie Cusack for their constructive comments
on our biomineral work and data.
Author Contributions
Conceived and designed the experiments: KWKG CBSV VT. Performed
the experiments: KWKG DR CKSD VT. Analyzed the data: KWKG LJA
CBSV ZY. Contributed reagents/materials/analysis tools: ZY. Wrote the
paper: KWKG CBSV VT.
References
1. Sabine CL, Feely RA, Gruber N, Key RM, Lee K, et al. (2004) The oceanic sink
for anthropogenic CO2. Science 305: 367–371.2. Doney SC, Fabry VJ, Feely RA, Kleypas JA (2009) Ocean acidification: the
other CO2 problem. Ann Rev Mar Sci 1: 169–192.3. Hilmi N, Allemand D, Dupont S, Safa A, Haraldsson G, et al. (2012) Towards
improved socio-economic assessments of ocean acidification’s impacts. Mar Biol.
In press.4. Narita D, Rehdanz K, Tol RSJ (2012) Economic costs of ocean acidification: a
look into the impacts on global shellfish production. Clim Change: 1–15.5. Barton A, Hales B, Waldbusser GG, Langdon C, Feely RA (2012) The Pacific
oyster, Crassostrea gigas, shows negative correlation to naturally elevated carbondioxide levels: Implications for near-term ocean acidification effects. Limnol
Oceanogr: 698–710.
6. Kudo M, Kameda J, Saruwatari K, Ozaki N, Okano K, et al. (2010)Microtexture of larval shell of oyster, Crassostrea nippona: A FIB-TEM study.
J Struct Biol 169: 1–5.7. Medakovic D, Popovic S, Grzeta B, Plazonic M, Hrs-Brenko M (1997) X-ray
diffraction study of calcification processes in embryos and larvae of the brooding
oyster Ostrea edulis. Mar Biol 129: 615–623.
8. Stenzel H (1964) Oysters: composition of the larval shell. Science 145: 155.
9. Baker SM, Mann R (1992) Effects of hypoxia and anoxia on larval settlement,
juvenile growth, and juvenile survival of the oyster Crassostrea virginica. The
Biological Bulletin 182: 265–269.
10. Hofmann EE, Powell EN, Bochenek EA, Klinck JM (2004) A modelling study of
the influence of environment and food supply on survival of Crassostrea gigas
larvae. ICES J Mar Sci 61: 596–616.
11. Miller AW, Reynolds AC, Sobrino C, Riedel GF (2009) Shellfish face uncertain
future in high CO2 world: Influence of acidification on oyster larvae calcification
and growth in estuaries. PLoS ONE 4: 1–8.
12. Dineshram R, Lane A, Wang K, Xiao S, Yu Z, et al. (2012) Analysis of Pacific
oyster larval proteome and its response to high-CO2. Mar Pollut Bull. In Press.
13. Gazeau F, Gattuso J-P, Greaves M, Elderfield H, Peene J, et al. (2011) Effect of
carbonate chemistry alteration on the early embryonic development of the
pacific oyster Crassostrea gigas PLoS ONE 6: e23010.
14. Havenhand JN, Schlegel P (2009) Near-future levels of ocean acidification do
not affect sperm motility and fertilization kinetics in the oyster Crassostrea gigas.
Biogeosciences 6: 3009–3015.
Figure 7. SEM images showing the ultrastructure of the early juvenile shells (42 day post-settlement) of the Pacific oyster(Crassostrea gigas) cultured at three pH levels (pH 8.1, 7.7 and 7.4).doi:10.1371/journal.pone.0064147.g007
Pacific Oyster Larvae Are Resistant to High-CO2
PLOS ONE | www.plosone.org 10 May 2013 | Volume 8 | Issue 5 | e64147

15. Hettinger A, Sanford E, Hill TM, Russell AD, Sato KNS, et al. (2012) Persistentcarry-over effects of planktonic exposure to ocean acidification in the Olympia
oyster. Ecology.
16. Kurihara H, Kato S, Ishimatsu A (2007) Effects of increased seawater pCO2 onearly development of the oyster Crassostrea gigas. Aquatic Biology 1: 91–98.
17. Parker L, Ross P, O’Connor W (2010) Comparing the effect of elevated pCO2
and temperature on the fertilization and early development of two species of
oysters. Mar Biol 157: 2435–2452.
18. Parker LM, Ross PM, O’Connor WA, Borysko L, Raftos DA, et al. (2012) Adultexposure influences offspring response to ocean acidification in oysters. Global
Change Biol 18: 82–92.
19. Talmage SC, Gobler CJ (2009) The effects of elevated carbon dioxide
concentrations on the metamorphosis, size, and survival of larval hard clams
(Mercenaria mercenaria), bay scallops (Argopecten irradians), and Eastern oysters(Crassostrea virginica). Limnol Oceanogr 54: 2072–2080.
20. Watson SA, Southgate PC, Tyler PA, Peck LS (2009) Early larval developmentof the Sydney rock oyster Saccostrea glomerata under near-future predictions of
CO2-driven ocean acidification. J Shellfish Res 28: 431–437.
21. Ruesink JL, Lenihan HS, Trimble AC, Heiman KW, Micheli F, et al. (2005)Introduction of non-native oysters: ecosystem effects and restoration implica-
tions. Annu Rev Ecol Evol Syst 36: 643–689.
22. Dupont S, Dorey N, Stumpp M, Melzner F, Thorndyke M (2012) Long-termand trans-life-cycle effects of exposure to ocean acidification in the green sea
urchin, Strongylocentrotus droebachiensis. Mar Biol (In press).
23. Fabry VJ (2008) Marine calcifiers in a high-CO2 Ocean. Science 320: 1020–
1022.
24. Hendriks IE, Duarte CM, Alvarez M (2010) Vulnerability of marine biodiversityto ocean acidification: A meta-analysis. Estuar Coast Shelf Sci 86: 157–164.
25. Timmins-Schiffman E, O’Donnell MJ, Friedman CS, Roberts SB (2012)Elevated pCO2 causes developmental delay in early larval Pacific oysters,
Crassostrea gigas. Mar Biol (In press).
26. Dupont S, Thorndyke MC (2009) Impact of CO2-driven ocean acidification oninvertebrates’ early life-history: What we know, what we need to know and what
we can do. Biogeosci Disc 6: 3109–3131.
27. Crean AJ, Monro K, Marshall DJ (2011) Fitness consequences of larval traitspersist across the metamorphic boundary. Evolution 65: 3079–3089.
28. MacDonald J, Freer A, Cusack M (2010) Attachment of oysters to naturalsubstrata by biologically induced marine carbonate cement. Mar Biol 157:
2087–2095.
29. Albright R (2011) Reviewing the effects of ocean acidification on sexualreproduction and early life history stages of reef-building corals. Population 12:
15.
30. Yuan X, Yin K, Cai W, Ho A, Xu J, et al. (2011) Influence of seasonal monsoons
on net community production and CO2 in subtropical Hong Kong coastal
waters. Biogeosciences 8: 289–300.
31. Yang J, Jiang Y, Hu X (2012) The relationship between protistan community
and water quality along the coast of Qingdao. Acta Ecologica Sinica 32: 1703–1712.
32. Breese WP, Malouf RE (1975) Hatchery manual for the Pacific oyster ORESU-
H-75–002, Oregon State University Sea Grant College Program, Corvallis.
33. Rico-Villa B, Le Coz JR, Mingant C, Robert R (2006) Influence of
phytoplankton diet mixtures on microalgae consumption, larval developmentand settlement of the Pacific oyster Crassostrea gigas (Thunberg). Aquaculture 256:
377–388.
34. Barros P, Sobral P, Range P, Chıcharo L, Matias D (2013) Effects of sea-wateracidification on fertilization and larval development of the oyster Crassostrea gigas
J Exp Mar Biol Ecol 440: 200–206.
35. Thiyagarajan V, Ko GWK (2012) Larval growth response of the Portugueseoyster (Crassostrea angulata) to multiple climate change stressors. Aquaculture 370–
371: 90–95.
36. Zhai W-D, Zheng N, Huo C, Xu Y, Zhao H-D, et al. (2013) Subsurface low pH
and carbonate saturation state of aragonite on China side of the North Yellow
Sea: combined effects of global atmospheric CO2 increase, regional environ-mental changes, and local biogeochemical processes. Biogeosciences Disc 10:
3079–3120.
37. Zeebe RE, Zachos JC, Caldeira K, Tyrrell T (2008) Oceans: Carbon emissions
and acidification. Science 321: 51–52.
38. Cai WJ, Hu X, Huang WJ, Murrell MC, Lehrter JC, et al. (2011) Acidificationof subsurface coastal waters enhanced by eutrophication. Nature Geosci 4: 766–
770.
39. Lane AC, Mukherjee J, Chan VBS, Thiyagarajan V (2012) Decreased pH does
not alter metamorphosis but compromises juvenile calcification of the tube worm
Hydroides elegans. Mar Biol (In Press).
40. Riebesell U, Fabry VJ, Hansson L, Gattuso JP, editors (2010) Guide to best
practices for ocean acidification research and data reporting. Luxembourg:Publications Office of the European Union.
41. Zeebe RE, Wolf-Gladrow DA (2001) CO2 in seawater: equilibrium, kinetics,
isotopes. Amsterdam, London, New York: Elsevier Science.
42. Dineshram R, Thiyagarajan V, Lane A, Ziniu Y, Xiao S, et al. (2013) Elevated
CO2 alters larval proteome and its phosphorylation status in the commercialoyster, Crassostrea hongkongensis. Mar Biol (In Press).
43. Dickson A, Millero F (1987) A comparison of the equilibrium constants for the
dissociation of carbonic acid in seawater media. Deep Sea Res Part A 34: 1733–1743.
44. Pierrot D, Lewis E, Wallace D (2006) MS Excel program developed for CO2
system calculations. ORNL/CDIAC-105 Carbon Dioxide Information Analysis
Center, Oak Ridge National Laboratory, US Department of Energy, Oak
Ridge, Tennessee.
45. Rico-Villa B, Bernard I, Robert R, Pouvreau S (2010) A Dynamic Energy
Budget (DEB) growth model for Pacific oyster larvae,Crassostrea gigas.
Aquaculture 305: 84–94.
46. Brown M, Robert R (2002) Preparation and assessment of microalgal
concentrates as feeds for larval and juvenile Pacific oyster (Crassostrea gigas).Aquaculture 207: 289–309.
47. Christo S, Absher T, Boehs G (2010) Morphology of the larval shell of three
oyster species of the genus Crassostrea Sacco, 1897 (Bivalvia: Ostreidae).Braz J Biol 70: 645–650.
48. Gaylord B, Hill TM, Sanford E, Lenz EA, Jacobs LA, et al. (2011) Functional
impacts of ocean acidification in an ecologically critical foundation species. J ExpBiol 214: 2586–2594.
49. Mueller LD, Nusbaum TJ, Rose MR (1995) The Gompertz equation as a
predictive tool in demography. Exp Gerontol 30: 553–569.
50. Martin S, Richier S, Pedrotti ML, Dupont S, Castejon C, et al. (2011) Earlydevelopment and molecular plasticity in the Mediterranean sea urchin
Paracentrotus lividus exposed to CO2-driven acidification. J Exp Biol 214: 1357–1368.
51. Portner HO, Dupont S, Melzner F, Storch D, Thorndyke M, editors (2010)
Studies of metabolic rate and other characters across life stages: Luxembourg:Publications Office of the European Union.
52. Marsh AG, Manahan DT (1999) A method for accurate measurements of the
respiration rates of marine invertebrate embryos and larvae. Mar Ecol Prog Ser184: 1–10.
53. Hoegh-Guldberg O, Manahan D (1995) Coulometric measurement of oxygen
consumption during development of marine invertebrate embryos and larvae.J Exp Biol 198: 19–30.
54. Gerdes D (1983) The Pacific oyster Crassostrea gigas: Part I. Feeding behaviour oflarvae and adults. Aquaculture 31: 195–219.
55. Melzner F, Stange P, Trubenbach K, Thomsen J, Casties I, et al. (2011) Food
supply and seawater pCO2 impact calcification and internal shell dissolution inthe blue mussel Mytilus edulis. PLoS ONE 6: e24223.
56. Forstner H, Gnaiger E (1983) Calculation of equilibrium oxygen concentration.
Polarographic oxygen sensors: Springer. 321–333.
57. Widdows J, Johnson D (1988) Physiological energetics of Mytilus edulis: scope forgrowth. Mar Ecol Prog Ser 46: 113–121.
58. Renaud SM, Thinh L-V, Lambrinidis G, Parry DL (2002) Effect of temperatureon growth, chemical composition and fatty acid composition of tropical
Australian microalgae grown in batch cultures. Aquaculture 211: 195–214.
59. Tamburri MN, Zimmer-Faust RK, Tamplin ML (1992) Natural sources andproperties of chemical inducers mediating settlement of oyster larvae: a re-
examination. Biol Bull 183: 327–338.
60. Carriker MR (1979) Ultrastructural morphogenesis of prodissoconch and earlydissoconch valves of the oyster Crassostrea virginica. Proc Natl Shellfish Ass 69:
103–128.
61. Dykstra MJ, editor (1993) A manual of applied techniques for biological electronmicroscopy. New York: Plenum Press.
62. Andreasen DH, Sosdian S, Perron-Cashman S, Lear CH (2006) Fidelity of
radially viewed ICP-OES and magnetic-sector ICP-MS measurement of Mg/Caand Sr/Ca ratios in marine biogenic carbonates: Are they trustworthy together?
Geochem Geophys Geosyst 7: Q10P18.
63. Cao Z, Dai M, Zheng N, Wang D, Li Q, et al. (2011) Dynamics of the carbonatesystem in a large continental shelf system under the influence of both a river
plume and coastal upwelling. J Geophys Res 116: G02010.
64. Feely RA, Alin SR, Newton J, Sabine CL, Warner M, et al. (2010) Thecombined effects of ocean acidification, mixing, and respiration on pH and
carbonate saturation in an urbanized estuary. Estuar Coast Shelf Sci 88: 442–449.
65. De Wit P, Palumbi SR (2012) Transcriptome-wide polymorphisms of red
abalone (Haliotis rufescens) reveal patterns of gene flow and local adaptation. MolEcol (In Press).
66. Moya A, Huisman L, Ball EE, Hayward DC, Grasso LC, et al. (2012) Whole
transcriptome analysis of the coral Acropora millepora reveals complex responses toCO2-driven acidification during the initiation of calcification. Mol Ecol 21:
2440–2454.
67. Sunday JM, Crim RN, Harley CDG, Hart MW (2011) Quantifying rates ofevolutionary adaptation in response to ocean acidification. PLoS ONE 6:
e22881.
68. Clark D, Lamare M, Barker M (2009) Response of sea urchin pluteus larvae(Echinodermata: Echinoidea) to reduced seawater pH: a comparison among a
tropical, temperate, and a polar species. Mar Biol 156: 1125–1137.
69. Moulin L, Catarino AI, Claessens T, Dubois P (2011) Effects of seawater
acidification on early development of the intertidal sea urchin Paracentrotus lividus
(Lamarck 1816). Mar Pollut Bull 62: 48–54.
70. Melzner F, Gutowska MA, Langenbuch M, Dupont S, Lucassen M, et al. (2009)
Physiological basis for high CO2 tolerance in marine ectothermic animals: pre-
adaptation through lifestyle and ontogeny? Biogeosciences 6: 2313–2331.
71. Kooijman S, Sousa T, Pecquerie L, Van der Meer J, Jager T (2008) From food
dependent statistics to metabolic parameters, a practical guide to the use of
dynamic energy budget theory. Biol Rev 83: 533–552.
Pacific Oyster Larvae Are Resistant to High-CO2
PLOS ONE | www.plosone.org 11 May 2013 | Volume 8 | Issue 5 | e64147

72. Parker LM, Ross PM, O’Connor WA (2009) The effect of ocean acidification
and temperature on the fertilization and embryonic development of the Sydneyrock oyster Saccostrea glomerata (Gould 1850). Global Change Biol 15: 2123–2136.
73. Beniash E, Ivanina A, Lieb NS, Kurochkin I, Sokolova IM (2010) Elevated level
of carbon dioxide affects metabolism and shell formation in oysters Crassostrea
virginica. Mar Ecol Prog Ser 419: 95–108.
74. Fabry VJ, Seibel BA, Feely RA, Orr JC (2008) Impacts of ocean acidification onmarine fauna and ecosystem processes. J Mar Sci 65: 414–432.
75. Nakamura M, Ohki S, Suzuki A, Sakai K (2011) Coral larvae under ocean
acidification: survival, metabolism, and metamorphosis. PLoS ONE 6: e14521.76. Christensen AB, Nguyen HD, Byrne M (2011) Thermotolerance and the effects
of hypercapnia on the metabolic rate of the ophiuroid Ophionereis schayeri:Inferences for survivorship in a changing ocean. J Exp Mar Biol Ecol 403: 31–
38.77. Michaelidis B, Ouzounis C, Paleras A, Portner HO (2005) Effects of long-term
moderate hypercapnia on acid-base balance and growth rate in marine mussels
Mytilus galloprovincialis. Mar Ecol Prog Ser 293: 109–118.78. Reipschlager A, Portner H (1996) Metabolic depression during environmental
stress: the role of extracellular versus intracellular pH in Sipunculus nudus. J ExpBiol 199: 1801–1807.
79. Somero G (1985) Intracellular pH, buffering substances and proteins: imidazole
protonation and the conservation of protein structure and function. TransportProcesses, Iono-and Osmoregulation: 454–468.
80. Portner HO (2008) Ecosystem effects of ocean acidification in times of oceanwarming: a physiologist s view. Mar Ecol Prog Ser 373: 203–217.
81. Todgham AE, Hofmann GE (2009) Transcriptomic response of sea urchinlarvae Strongylocentrotus purpuratus to CO2-driven seawater acidification. J Exp Biol
212: 2579–2594.
82. Langenbuch M, Bock C, Leibfritz D, Portner HO (2006) Effects ofenvironmental hypercapnia on animal physiology: A 13C NMR study of
protein synthesis rates in the marine invertebrate Sipunculus nudus. CompBiochem Physiol Part A 144: 479–484.
83. Wood HL, Spicer JI, Widdicombe S (2008) Ocean acidification may increase
calcification rates, but at a cost. Proc R Soc Lond Ser B-Biol Sci 275: 1767.84. Li W, Gao K (2012) A marine secondary producer respires and feeds more in a
high CO2 ocean. Mar Pollut Bull (In Press).85. Gooding RA, Harley CDG, Tang E (2009) Elevated water temperature and
carbon dioxide concentration increase the growth of a keystone echinoderm.Proc Natl Acad Sci 106: 9316.
86. Stumpp M, Wren J, Melzner F, Thorndyke MC, Dupont ST (2011) CO2
induced seawater acidification impacts sea urchin larval development I: Elevatedmetabolic rates decrease scope for growth and induce developmental delay.
Comp Biochem Physiol Part A 160: 331–340.
87. Talmage SC, Gobler CJ (2010) Effects of past, present, and future ocean carbon
dioxide concentrations on the growth and survival of larval shellfish. Proc Natl
Acad Sci 107: 17246–17251.
88. Albright R, Mason B, Langdon C (2008) Effect of aragonite saturation state on
settlement and post-settlement growth of Porites astreoides larvae. Coral Reefs 27:
485–490.
89. Laing I, Earl NH (1998) The lipid content, spatfall and subsequent growth of
early and late settling hatchery-reared Pacific oyster, Crassostrea gigas Thunberg,
larvae. Aquacult Res 29: 19–25.
90. Garcıa-Esquivel Z, Bricelj VM, Felbeck H (2002) Metabolic depression and
whole-body response to enforced starvation by Crassostrea gigas postlarvae. Comp
Biochem Physiol Part A 133: 63–77.
91. Mount AS, Wheeler AP, Paradkar RP, Snider D (2004) Hemocyte-mediated
shell mineralization in the eastern oyster. Science 304: 297–300.
92. Lee SW, Kim GH, Choi CS (2008) Characteristic crystal orientation of folia in
oyster shell, Crassostrea gigas. Mat Sci Eng 28: 258–263.
93. Ries JB (2011) Skeletal mineralogy in a high-CO2 world. J Exp Mar Biol Ecol
403: 54–64.
94. Chan VBS, Li C, Lane AC, Wang Y, Lu X, et al. (2012) CO2-driven ocean
acidification alters and weakens integrity of the calcareous tubes produced by the
serpulid tubeworm, Hydroides elegans. PLoS ONE 7: e42718.
95. Cohen AL, McCorkle DC, De Putron S, Gaetani GA, Rose KA (2009)
Morphological and compositional changes in the skeletons of new coral recruits
reared in acidified seawater: Insights into the biomineralization response to
ocean acidification. Geochem Geophys Geosyst 19: Q07005.
96. Sokolova I, Ivanina A, Matoo O, Dickinson G, Beniash E (2012) Interactive
effects of elevated CO2, temperature and salinity on physiology and shell
properties of hard shell clams Mercenaria mercenaria. Comp Biochem Physiol Part A
163: S9.
97. Welladsen HM, Southgate PC, Heimann K (2010) The effects of exposure to
near-future levels of ocean acidification on shell characteristics of Pinctada fucata
(Bivalvia: Pteriidae). Molluscan Res 30: 125–130.
98. Diz P, Barras C, Geslin E, Reichart G-J, Metzger E, et al. (2012) Incorporation
of Mg and Sr and oxygen and carbon stable isotope fractionation in cultured
Ammonia tepida. Mar Micropaleontol 92–93: 16–28.
99. Kuffner IB, Jokiel PL, Ku’ulei SR, Andersson AJ, Mackenzie FT (2012) An
apparent ‘‘vital effect’’ of calcification rate on the Sr/Ca temperature proxy in
the reef coral Montipora capitata. Geochem Geophys Geosyst 13: Q08004.
100. Kisakurek B, Eisenhauer A, Bohm F, Garbe-Schonberg D, Erez J (2008)
Controls on shell Mg/Ca and Sr/Ca in cultured planktonic foraminiferan,
Globigerinoides ruber (white). Earth Planet Sci Lett 273: 260–269.
Pacific Oyster Larvae Are Resistant to High-CO2
PLOS ONE | www.plosone.org 12 May 2013 | Volume 8 | Issue 5 | e64147