Acceptability and nutritional evaluation of soyyam flour ...

www.sciedu.ca/jct Journal of Curriculum and Teaching Vol. 3, No. 1; 2014
Published by Sciedu Press 10 ISSN 1927-2677 E-ISSN 1927-2685
Sensory Evaluation as a Tool in Determining Acceptability of Innovative Products Developed by Undergraduate Students in Food Science and
Technology at The University of Trinidad and Tobago
Dimple Singh-Ackbarali1,* & Rohanie Maharaj1
1 Food Science and Technology Unit, The University of Trinidad and Tobago, Trinidad & Tobago
*Corresponding author: Food Science and Technology Unit, The University of Trinidad and Tobago, Caroni North Bank Road, Centeno, Via Arima, Mausica, Trinidad & Tobago, W. I. Tel: 1-868-642-8888. E-mail: [email protected]
Received: November 9, 2013 Accepted: December 27, 2013 Online Published: January 3, 2014
doi:10.5430/jct.v3n1p10 URL: http://dx.doi.org/10.5430/jct.v3n1p10
Abstract
This paper discusses the comprehensive and practical training that was delivered to students in a university classroom on how sensory evaluation can be used to determine acceptability of food products. The report presents how students used their training on sensory evaluation methods and analysis and applied it to improving and predicting acceptability of new innovative products that they developed. Students were exposed to and trained on performing some of the major sensory test methods, including discrimination, descriptive, and affective tests. They were also exposed to exercises which involved them physically setting up a test area, presenting samples that were coded and properly displayed, collating data from sensory evaluation questionnaires, statistical analysis of data collated and the use of the results of the analysis to make decisions on product acceptability and improvement. Students successfully applied their training and were able to not only get feedback on the specific food characteristics of their products that could be improved but were also able to conclude that the products they presented to the panelists were acceptable and that the panelists had a highly positive attitude towards eating the products and even purchasing if these were to become available in the market. Since appropriate statistical analysis was applied for the different sensory evaluation methods used for each of the different products, valid information and conclusions that can prove product quality and acceptability was gathered and can be presented to any product development and marketing departments in any food and beverage company that may wish to adopt and produce these products.
Keywords: sensory evaluation; product development; food; beverage industry
1. Introduction
1.1 Challenges in Ensuring Consumer Acceptability and Market Success of Products
Product developers make use of many tools in the development of a product. These tools include for example, chemical tests, microbiological procedures and the use of physical equipment to determine elasticity, hardness, viscosity, color intensity and more. It is unfortunately possible for food products to reflect similar measurements or results when these tools are applied individually, yet still result in different perceptions, acceptability or preferences on consumption of the product. Grading methods for food and beverage products, traditionally involved one or two trained “experts” assigning quality scores on the appearance, flavour and texture of the products based on the presence or absence of predetermined defects. These traditional judging methods have several shortcomings: they can’t predict consumer acceptance; their quality assessments are subjective; assigning quantitative scores is difficult; and they don’t combine analytically oriented attribute ratings with affectively oriented quality scores (Claassen & Lawless, 1992). Thus by using traditional methods of evaluation, some products with very different sensory characteristics, such as those identified by a product flavour profile, but with no product defect will obtain the same quality score.
This is where sensory evaluation becomes an invaluable tool. Users of products experience them holistically with their senses and not with equipment or tests. Many companies today are learning that only using objective tools such as chemical, physical and microbiological tests to create products can be a recipe for failure.

www.sciedu.ca/jct Journal of Curriculum and Teaching Vol. 3, No. 1; 2014
Published by Sciedu Press 11 ISSN 1927-2677 E-ISSN 1927-2685
Without sensory evaluation, development efforts reflect the personal feelings, views and choices of the product developer, product development team, marketer(s) and/or top management. Thus without sensory evaluation results which can be used to base product development trade-offs and decisions, product development successes will be few and development timelines very long. Product developers are usually left at the mercy of decision-makers (either in their company or their clients) that insist on the constant reformulation of products with no end in sight when decisions are ruled by personal judgments, preference or intuition (without facts), This does not mean that decisions cannot be made without the guidance of sensory evaluation but rather implies that the timely, successful development and launch of new products depend on the manner in which decisions are reached and new product strategies are formulated.
This is where sensory science reduces the risk of product failure. When consumer needs on the one hand and company requirements on the other, are not addressed in the development or optimisation of a product, it is unlikely that the new product will be successful if launched.
1.2 Sensory Science and Decision Making in Food Industry
The ultimate process of decision making by today’s consumers may be explained by the attitudes linked with cognitive, affective, conative and economic considerations of these consumers. These factors must be jointly analysed to assist both the Marketing and Research and Development (R&D) departments to reach a better product that will satisfy and be accepted by consumers.
Since innovation is regarded as a major source of competitive advantage, companies today integrate sensory science and methodology in both their R&D and Marketing departments, to contribute to the improvement of such innovation practices and successful business performance. Consumer tests oriented for marketing and product development play a major role in food industry. In the economic literature (Grunert & Harmsen, 1997) neither R&D nor market orientation is expected to have a direct effect on business performance, however they can both influence innovation processes, whose outcome can in turn influence business performance.
Product evaluation is typically product oriented in the R&D approach unlike the marketing approach where consumer orientation is the most basic concept. Instrumental, physiochemical and sensory analyses are used to evaluate intrinsic characteristics of the physical product, such as odour, taste, size or appearance. For food and beverage products, sensory analyses are the main concepts of integration with marketing where the priority is on people’s perceptions of sensory quality rather than the real taste evaluations. For a marketer it is more important to know what consumers think they taste, than what they really taste (Lesser, 1983).
In the process of sensory judgment usually 4 stages are recognised: physical concentration, perceived concentration, coded sensation and overt response (Van Trijp & Schifferstein, 1995). However in the laboratory situation, products are coded and the environment is far from the market place reality. Such an approach contributes to the establishment of quality assurance and quality control processes within industry (Meilgaard, Civille & Carr 1991), services to product development and product improvement as well as services to marketing research development (Sidel & Stone, 1993).
1.3 Sensory Evaluation and Quality of Food
For today’s consumers, the primary consideration for selecting and eating a food commodity is the product’s palatability or eating quality, and other quality parameters, such as nutrition and wholesomeness are secondary (Meiselman & MacFie, 1996; Lawless & Heymann, 1998). In order for players in the food and beverage industry, to have a market edge/success, they should ensure that the quality of food is appealing and appetising or more specifically that the eating quality attributes of; aroma, taste, aftertaste, tactual properties and appearance is acceptable to the consumer so that they crave for more. Thus if we accept that food quality is that “which the consumer likes best” and that the grades of quality are understood more by the degree of desirable attributes and absence of undesirable characteristics which are primarily detected by the consumer’s sensory organs, then a good method of deciding quality of a food is through sensory evaluation.
Sensory evaluation has been defined as a scientific discipline used to evoke, measure, analyse and interpret those responses to products as perceived through the senses of sight, smell, touch, taste and hearing (Sidel & Stone, 1993). Each aspect in this definition has a specific meaning, requirement or implication:
To evoke reactions, requires specific, rigorous research methods. It also requires an understanding of physiology, anatomy, biochemistry, psychology, genetics (e.g. taste or odour blindness for certain substances), the requirements for and influence of the test procedures, the test environment, and more.
www.sciedu.ca/jct Journal of Curriculum and Teaching Vol. 3, No. 1; 2014
Published by Sciedu Press 12 ISSN 1927-2677 E-ISSN 1927-2685
To measure reactions, requires measuring instruments that are qualitative or quantitative in nature to determine human reaction to one or more variables in a product or material. It requires knowledge regarding measuring instruments and their application, statistics, computer science, research methodologies/protocols, the effect of the test environment, requirements for tests, test facilities and more.
To analyse reactions, requires the application of the correct statistical software, test statistics, computer literacy, as well as knowledge of physiology, psychology, behavioral science and more to evaluate qualitative and quantitative results.
To interpret reactions, requires knowledge of statistics, food science, computer software, chemistry, biochemistry, physics, gastronomy and more. It also requires the ability to write detailed and precise executive summaries. It requires good presentation skills and the ability to advise courses of action based on the facts, without being prescriptive.
Perceived through the senses, requires knowledge about physiology and psychology in general (e.g. the effect of satiety and emotion on perception). It also requires knowledge regarding the physiology of the eyes, ears, tongue, mouth, fingers and nose.
Sensory analysis can be considered to be an interdisciplinary science that uses human panelists sensory perception related to thresholds of determination of attributes, the variance in individual sensory response experimental design to measure the sensory characteristics and the acceptability of food products, as well as many other materials. Since there is no one instrument that can replicate or replace the human psychological and emotional response, the sensory evaluation component of any food study is essential and the importance of good experimental design cannot be overemphasised in sensory experiments (Lawless & Klein, 1989; Meiselman, Mastroianni, Buller, & Edwards, 1999). Sensory analysis is applicable to a variety of areas such as; inspection of raw materials, product development, product improvement, cost reduction, quality control, selection of packaging material, shelf life/storage studies, establishing analytical/instrument/sensory relationship and process development.
For all sensory assessment methods, humans are the measuring instrument. In order for a sensory assessment to provide reliable and valid results, the sensory panel must be treated as a scientific instrument; that is, members of the panel must be screened, calibrated and validated (Meilgaard, Carr, & Civille, 1999). Tests using sensory panels must be conducted under controlled conditions, using appropriate experimental designs, test methods and statistical analyses. These procedures methods for selecting and training sensory assessors and details on how to establish the basic taste acuity of assessors have been documented by various standards organisations, such as The British Standards Institution (BSI), The International Standardisation Organisation (ISO) and The American Society for Testing Materials (ASTM). Other than the panelists, a properly designed experimental area and appropriate experimental design, test method and statistical analysis must be incorporated in the study.
There are many types of sensory analysis methods, the most popular being difference tests, descriptive analysis and consumer acceptance testing (Lawless & Heymann, 1998). Difference tests include the triangle test, where the panel member attempts to detect which one of three samples is different from the other two, and duo-trio tests, where the panel member selects which one of two samples is different from the identified standard. Difference tests estimate the magnitude of sensory differences between samples, but one limitation of these tests is that the nature of the differences is not defined. It is usually a common practice to use a combination of difference tests and descriptive sensory analysis for problem-solving. Descriptive sensory analysis uses several techniques that seek to discriminate between a range of products based on their sensory characteristics and also to determine a quantitative description of the sensory differences that can be identified, not just the defects. No judgment of “good” or “bad” is made as in traditional quality judging methods because this is not the purpose of the evaluation. Here the panel is a powerful instrument that identifies and quantifies a product’s sensory properties. Sensory profiling is as simple as having several assessors rating samples for a number of identified sensory attributes. For example, sweetness may be rated on a five-point scale, with a rating of one indicating not sweet and a rating of five meaning very sweet. External standards (such as solutions of varying concentrations of sugar) may help to define attributes and standardise the scale for each assessor. Developing and refining a vocabulary, or sensory lexicon, is an essential part of sensory profile work and is done in an objective manner. A flavour lexicon is a set of word descriptors that describe a product’s flavour. While the panel generates its own list to describe the product array under study, a lexicon provides a source of possible terms with references and definitions for clarification (Diary Industry Technical Review, 2005). Consumer acceptance, preference, and hedonic (degree of liking) tests are used to determine the degree of consumer acceptance for a product. It is also considered to be consumer tests since they should be conducted using untrained consumer panels. Although panelists can be asked to indicate their degree of liking, preference or acceptance of a product directly, hedonic tests are often
www.sciedu.ca/jct Journal of Curriculum and Teaching Vol. 3, No. 1; 2014
Published by Sciedu Press 13 ISSN 1927-2677 E-ISSN 1927-2685
used to measure preference or acceptance indirectly. Category scales, ranking tests and the paired-comparison test can all be used to assess product acceptance. Acceptance of a food product usually indicates actual use of the product (purchase and eating).
This report emphasises the importance of descriptive analysis and Hedonic tests (or combining analytically oriented attribute ratings with affectively oriented quality scores) as sensory tools for food products, and it presents a few examples of how sensory analysis was applied successfully to resolving specific challenges and preparing new and unique food products for market acceptability by students in the University’s Food Science and Technology programme. Since product flavour quality drives consumer acceptance and demand, the ability to measure sensory attributes characteristic of high-quality products is necessary for the development and production of products that meet consumer expectations. To increase the appeal of their offerings/products, food and beverage processors/manufacturers need to understand what flavour attributes affect flavour acceptance and then devise ways to control these critical flavour attributes. The material and training provided to the students were adopted from publications and training developed by the Sensory Evaluation Division of the Institute of Food Technologists, Sensory Evaluation Practices, 2nd Edition by Stone & Sidel (1993), Sensory Evaluation Techniques, 3rd Edition by Meilgaar et al. (1999), Basic Sensory Methods for Food Evaluation by Watts et al. (1989) and the text Sensory Evaluation of Food: Principles and Practices by Lawless & Heymann (1998).
2. Methods of Training Delivered To Students
2.1 Taste Identification
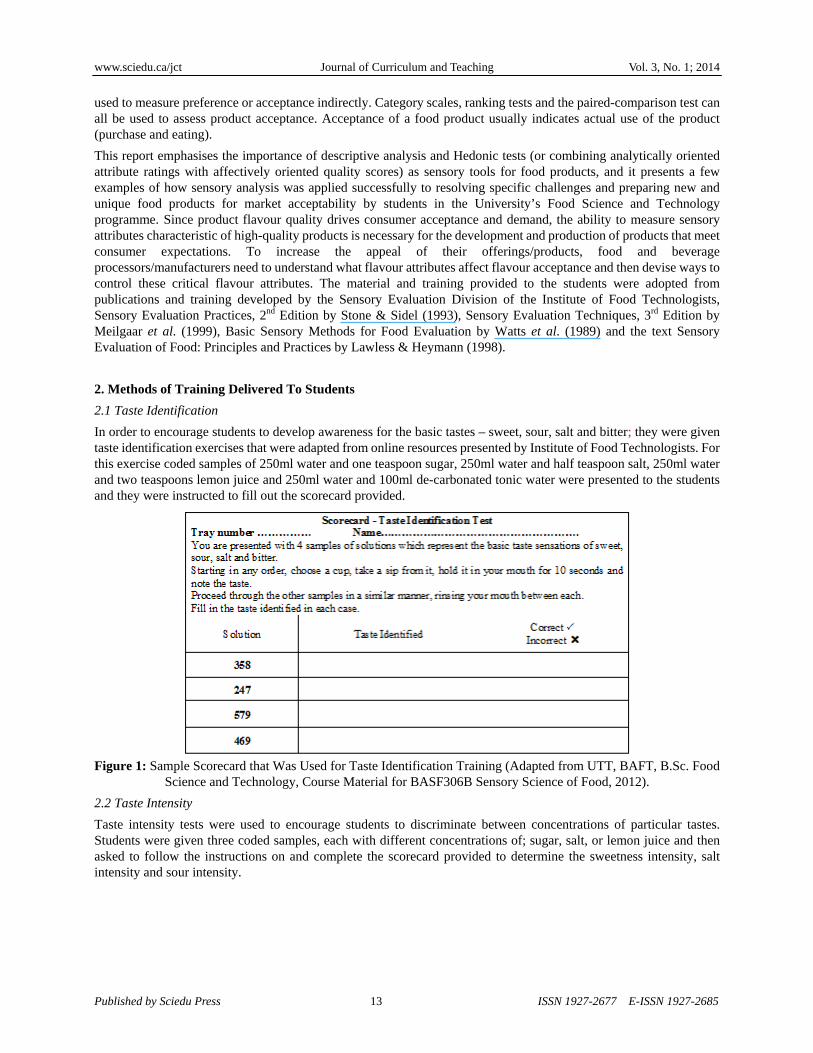
In order to encourage students to develop awareness for the basic tastes – sweet, sour, salt and bitter; they were given taste identification exercises that were adapted from online resources presented by Institute of Food Technologists. For this exercise coded samples of 250ml water and one teaspoon sugar, 250ml water and half teaspoon salt, 250ml water and two teaspoons lemon juice and 250ml water and 100ml de-carbonated tonic water were presented to the students and they were instructed to fill out the scorecard provided.
Figure 1: Sample Scorecard that Was Used for Taste Identification Training (Adapted from UTT, BAFT, B.Sc. Food
Science and Technology, Course Material for BASF306B Sensory Science of Food, 2012).
2.2 Taste Intensity
Taste intensity tests were used to encourage students to discriminate between concentrations of particular tastes. Students were given three coded samples, each with different concentrations of; sugar, salt, or lemon juice and then asked to follow the instructions on and complete the scorecard provided to determine the sweetness intensity, salt intensity and sour intensity.

www.sciedu.ca/jct Journal of Curriculum and Teaching Vol. 3, No. 1; 2014
Published by Sciedu Press 14 ISSN 1927-2677 E-ISSN 1927-2685
Figure 2: Sample Scorecard that Was Used for Taste Intensity Training (Adapted from UTT, BAFT, B.Sc. Food
Science and Technology, Course Material for BASF306B Sensory Science of Food, 2012).
2.3 Sensory Characteristics and Appropriate Vocabulary
Students were trained on which sense(s) can be used to examine which food characteristics. They were also trained on definitions of the different descriptive terms and the appropriate use of vocabulary.
Table 1: Senses, Characteristics of Each Sense and Word Back
Sense Characteristic Word Bank
Sight Appearance – colour, size, shape, transparency, dullness, gloss
Appetising, colourful, grainy, foamy, greasy, shiny, stringy, crystalline …
Smell Aroma – flavour, aromatics Aromatic, floral, rotten, acrid, musty, fragrant scented, pungent …
Taste Flavour - odour, mouth feel and taste – sweet, salt, sour, bitter
Sweet, cool, bitter, zesty, hot, tangy, sour, sharp, rich, salty …
Hearing Sound – intensity and quality Bubbling, crunchy, fizzy, sizzling …
Touch Texture, mouth feel Brittle, rubbery, gritty, bubbly, sandy, tender, soft …
Senses used for the examination of different food and beverage characteristics and some of the words from a word bank (Adapted from UTT, BAFT, B.Sc. Food Science and Technology, Course Material for BASF306B Sensory Science of Food, 2012).
2.4 Sample Preparation and Delivery
Students were given practical exercises on how to prepare and serve samples to panellist for evaluation, the material for this was adapted from the text, Sensory Evaluation of Food: Principles and Practices by Lawless & Haymann, (1998). Samples of food should be uniform in size and of the same temperature at serving. They should be coded by a random three-digit number and presented in clean odour-free containers. In cases where more than one sample is to be assessed, they need to ensure that the assessors do not receive the samples in the same order, since this will introduce a bias. Assessors are to be provided with a glass of water to rinse their mouths out with between each sample to remove all traces of the previous sample. Assessors should also be seated in a manner that they cannot communicate with each other and in a room which is free of distractions and has good lighting and ventilation.
2.5 Selection of Sensory Test and Statistical Evaluation
Training material presented to students was adapted from material from Institute of Food Technologist and a book Basic Sensory Methods for Food Evaluation by Watts et al. (1989). It is always very important to select the correct test method in sensory evaluation.
The selection of a test method depends on:
1. Test aims - Sensory evaluation provides the following types of information that pertains to the different test aims:
• Discriminative information - determination of differences between products/samples.
• Descriptive information - focus on the description of products/samples. This information can be correlated with other forms of analysis such as chemical results etc. and
• Consumer information - focus on consumer preference, acceptance, liking etc. of one product over another. Ranking of one or more products or rating of products in a range (by consumers), can also be the aim.

www.sciedu.ca/jct Journal of Curriculum and Teaching Vol. 3, No. 1; 2014
Published by Sciedu Press 15 ISSN 1927-2677 E-ISSN 1927-2685
2. The sequence of events - It is important to follow the correct procedure to identify the required method or test. A sequence of events can be used as a guideline during any phase of the product development process to prevent unnecessary and time-consuming testing:
• Perform ‘bench-top’ analysis - to determine the characteristics of the product, the necessity of testing and the test required.
• Determine whether there is a discernible difference between products
• If there is a discernible difference - determine whether the difference is significant through discriminative tests such as the paired comparison, triangle, duo trio or ranking tests.
• If the differences between products or samples are significant, determine the intensity regarding relevant attributes, through magnitude estimation, using a ratio/intensity scale with reference samples.
• Determine which product is preferred and/or liked by consumers - representative consumers evaluate the samples using paired preference tests, hedonic scaling or ranking.
• Obtain a summary of the characteristics of the sample or specific attributes and the relevant intensities - this will require trained panelists for Descriptive Analysis techniques such as Quantitative Descriptive Analysis, or Flavour profiling. Panelists with limited training can be used for Free Choice Profiling.
3. The use of a decision tree - for example the branched model proposed by Lawless and Heymann, 1998, where the answer to a pertinent question leads to the identification of the most suitable test.
Table 2 provides a summary on which type of sensory evaluation method should be used based on the questions that you are trying to answer.
Table 2: Sensory Evaluation Questions and Methods
Questions Sensory Evaluation Method
Basic Setup
Are products different?
Which sample has greater intensity of an attribute? E.g. which is sweeter?
Discrimination/
Difference Tests
20-50 panelists
Screened for acuity (keenness or sharpness of perception, i.e. can they smell and taste well?)
Analysis is done using statistical tables which compare results to chance – this analysis ensures that the difference was real and not because people chose the correct sample by luck/chance.
one-tailed binomial test, two-tailed binomial test and Chi Square test
If products are different, how are they different?
What is the magnitude of these differences?
Descriptive Analysis 8-12 panelists or 6 to 10 panelist
Screened for acuity, Trained
Asked to rate intensity for all sensory attributes
Analysis is done using a t-test or ANOVA to determine if means are statistically different.
What is the acceptability of a product? Is the product liked? Is one product preferred over another?
Affective/
Preference
Hedonic Tests
75-150 consumers per test
Min of 20 for pilot testing
Screened for product use (Do they buy the product? And how often?)
Asked degree of liking (how much do they like it) and/or preference questions
Friedman test, t-test, 2 tailed binomial, ANOVA
How to match the right Sensory Evaluation Method with the Right Question (Adapted from UTT, BAFT, B.Sc. Food Science and Technology, Course Material for BASF306B Sensory Science of Food, 2012).

www.sciedu.ca/jct Journal of Curriculum and Teaching Vol. 3, No. 1; 2014
Published by Sciedu Press 16 ISSN 1927-2677 E-ISSN 1927-2685
2.6 Selection of Panel Members
Sensory evaluation involves evaluation of products or materials by people (respondents/panel members/panelists) with/without the assistance of technology. Thus it is important that these persons be:
• Screened to eliminate for example personal prejudice, preference and acceptability to ensure an objective evaluation and differentiation between and description of product characteristics.
• Participants (panelists) be trained to perform analytical (laboratory) sensory evaluation procedures repeatedly and are audited and evaluated to ensure that their determinations are consistent.
• Selected to be representative (target market) consumers (respondents).
3. Discussion
Students enrolled in the B.Sc. Food Science and Technology Programme at the University of Trinidad and Tobago, were given an assignment to develop a unique product which mainly highlights locally grown/produced ingredients. Students were given a budget of TTD200.00 and challenged to use their technical and comprehensive knowledge in food product development, packaging and labelling and demonstrate their ability to adapt to professional situations using their creativity, analysis, synthesis, evaluation and interaction. Five unique products were created and the case studies below discusses the sensory evaluation tests they developed and conducted to assist in predicting if these products would be accepted in the market.
Students, staff and children of staff were recruited from the University with the use of fliers and class announcements to conduct sensory evaluation tests. Persons who indicated that they were interested in volunteering were then screened to determine if they were already biased to any food product, if they had any dietary restrictions, if they were allergic to any food products and also if they were free from any virus and sinus and nasal congestion. Persons who were healthy, had no allergies, no dietary restrictions and who did not have any great aversions to any specific food product were selected as panel members.
Students developed the pertinent questions they wanted answers to and used this to identify the most suitable test that should be used. This is further expanded for each of the individual case and products discussed below.
After the data was collected and collated the appropriate statistical analyses were done to make conclusions and decisions with respect to the product development.
3.1 Case Study 1
The first case study is a student’s attempt at developing a unique nutritious, delicious and fun drink for kids between the ages of 4 and 10 and also for teenagers. They called this unique drink ABC punch. The student first did their research into what type of ingredients that could be used and also the proportions and combinations of ingredients that would be complimentary. After the primary ingredients were chosen, a recipe was developed and after the first sample was made, several lab tests including viscosity and microbial testing were conducted on the product. After the finished punch was analysed and deemed suitable for consumption sensory evaluation tests were performed.
The lab analysis of the punch yielded similar results, standard deviation calculation were done on these and proved that the recipe was reproducible and that batches were identical. Students, staff and children of staff were recruited from the University with the use of fliers and class announcements to conduct sensory evaluation tests. The sensory evaluation was carried out in three phases. The first phase involved a hedonic rating test for adults and teenagers and a questionnaire. These were designed to get the test subjects acceptance on certain product attributes; appearance, aroma, taste, sweetness and mouth-feel/texture, and also to determine if they normally like the taste of apples, bananas and carrots. The questionnaire was designed to get the panelist’s comments and recommendations on how the product can be improved. The Second phase was a facial hedonic rating test for children; this test was also used to determine which of the product’s characteristics were liked the most or least and to determine which of the fruits and vegetables used in the product they liked and didn’t like. The final phase used a food action/attitude rating test to determine the attitudes of panelists to the modified punch.
Sensory tests were carried out in a sensory evaluation room, with white light, controlled ventilation, and away from distractions noise, odours and the preparation room. In all phases participants signed an informed consent form and 20 participants were chosen for the pilot testing.

www.sciedu.ca/jct Journal of Curriculum and Teaching Vol. 3, No. 1; 2014
Published by Sciedu Press 17 ISSN 1927-2677 E-ISSN 1927-2685
3.1.1 Sensory Evaluation for ABC Punch
Hedonic Rating Test and Questionnaire for First Phase, see Fig. 3 for sample of scorecard that was presented.
Figure 3: Scorecard Used for Hedonic Rating Test Given to the Adults for the Evaluation of ABC Punch (Adapted
from UTT, BAFT, B.Sc. Food Science and Technology, Student Project for PROJ2005 Capstone, 2012)
To calculate the score for each product each descriptor was assigned a score value:
like a lot = 5, like a little = 4, neither like nor dislike = 3, dislike a little = 2, dislike a lot = 1. Figure 4 below gives some of the calculations that was done using the data collected.
Figure 4: Summary of Results from Hedonic Rating Test Taken by the Adults and Teenagers for Funky ABC Punch (Adapted from UTT, BAFT, B.Sc. Food Science and Technology, Student Project for PROJ2005 Capstone, 2012).
The results from phase one, showed that the appearance, aroma and taste were accepted and well liked by the panelists, however improvements were needed to reduce the level of sweetness and to make the punch less thick and grainy. The adults who normally do not like the flavour of banana and carrots enjoyed the overall flavour of the punch.

www.sciedu.ca/jct Journal of Curriculum and Teaching Vol. 3, No. 1; 2014
Published by Sciedu Press 18 ISSN 1927-2677 E-ISSN 1927-2685
(a)
(b)
Figure 5(a) and (b): Hedonic Rating Test Given to the Children (4-10 years) for the Evaluation of Funky ABC Punch (Adapted from UTT, BAFT, B.Sc. Food Science and Technology, Student Project for PROJ2005 Capstone, 2012).
These results were similar to those from the phase one; the children loved the colour, smell, taste and sweetness of the punch. They did not like the consistency of the punch, which was too thick in their opinion. Also the children who indicated that they hated or did not like the taste of any one of the main ingredients, the apple, banana and carrots indicated that they loved or liked the taste of the punch.
For the Third Phase a Food Action/Attitude Rating test was done, see Fig. 6 for sample of scorecard that was presented, a seven point scale (ranging from I would buy this every opportunity that I had, to I would buy this only if forced to) was used to determine the attitudes of panelists to the drink. Assessors were asked to evaluate a sample of the modified punch and indicate which action best described their feelings.

www.sciedu.ca/jct Journal of Curriculum and Teaching Vol. 3, No. 1; 2014
Published by Sciedu Press 19 ISSN 1927-2677 E-ISSN 1927-2685
Figure 6: Scorecard Used for Food Action Rating Test for Funky ABC Punch (Adapted from UTT, BAFT, B.Sc. Food
Science and Technology, Student Project for PROJ2005 Capstone, 2012)
After all the scorecards were tabulated, the results showed that 55% of the assessors agreed that they would purchase the product very often, 20% said they would buy the product now and then while 25% indicated that they would hardly ever buy the product.
3.2 Case Study 2
The second case study is a student’s attempt at developing a healthy granola bar snack, TCL’s Fruity Nutritional Bar. The student first did their research on the costing of the different raw materials and ingredients that could be used in the product and also the cost of the equipment that would be needed to produce the granola bar. After the primary ingredients were chosen, a recipe was developed and after the first sample was made, several labs tests including water activity, water content, sugar content and penetration testing were conducted on the product. After the finished bar was analysed and deemed suitable for consumption sensory evaluation tests were performed.
The lab analysis of the different samples of granola bars yielded similar results, standard deviation calculation were done on these and proved that the recipe was reproducible and that batches were identical. Students, staff and children of staff were recruited from the University with the use of fliers and class announcements to conduct sensory evaluation tests. The sensory evaluation was carried out in three phases. The first phase involved a hedonic rating test and a questionnaire which were used to get the subjects acceptance on certain product attributes; appearance (colour and shape), taste/flavour, smell/odour and mouth-feel/texture, and also to get recommendations on how the granola bar can be improved. The Second phase was another hedonic rating test for the modified product. The final phase used a food action/attitude rating test to determine the attitudes of panelists to the modified granola bar.
Sensory tests were carried out in a sensory evaluation room, with white light, controlled ventilation, and away from distractions noise, odours and the preparation room. In all phases participants signed an informed consent form and 20 participants were chosen for the pilot testing.
3.2.1 Sensory Evaluation for TCL’s Fruity Granola Bar
Hedonic Rating Test and Questionnaire for First Phase, see Fig. 7 for sample of scorecard that was presented.

www.sciedu.ca/jct Journal of Curriculum and Teaching Vol. 3, No. 1; 2014
Published by Sciedu Press 20 ISSN 1927-2677 E-ISSN 1927-2685
Figure 7: Scorecard Used for Hedonic Rating Test Given to the Adults for the Evaluation of TCL’s Fruity Granola Bar
(Adapted from UTT, BAFT, B.Sc. Food Science and Technology, Student Project for PROJ2005 Capstone, 2012).
To calculate the score for each product each descriptor was assigned a score value:
Liked extremely = 9, like very much = 8, like moderately = 7, like slightly = 6, neither like nor dislike = 5, dislike slightly = 4, dislike moderately = 3, dislike very much = 2, dislike extremely = 1.
Figure 8: Summary of Results from Hedonic Rating Test Taken for TCL’s Fruity Granola Bar (Adapted from UTT,
BAFT, B.Sc. Food Science and Technology, Student Project for PROJ2005 Capstone, 2012).
The results showed that the panelists thought that the texture could be improved, they thought that it was too brittle or crumbly. Some of the suggestions on the questionnaire were to use marshmallows to help the product bind better. A few persons also recommended that the almonds be replaced with sun flower seeds so that persons who are allergic to nuts can safely consume the product.
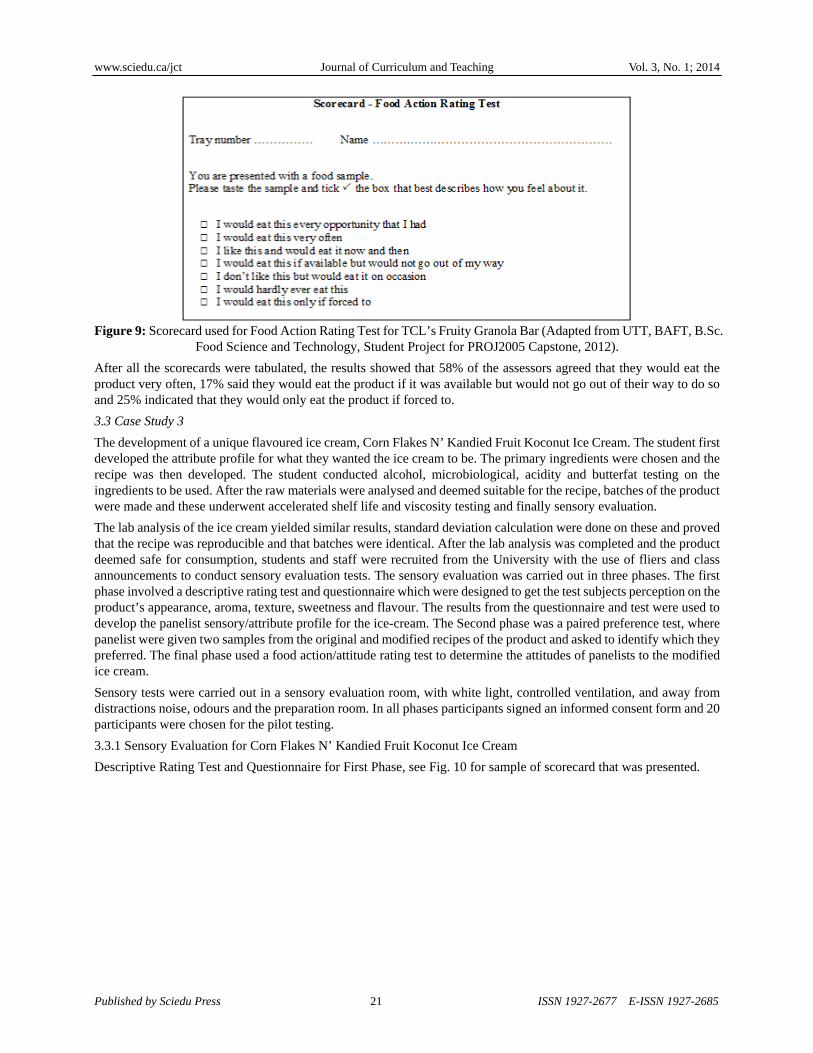
For the Second Phase a Food Action/Attitude Rating test was done, see Fig. 9 for sample of scorecard that was presented, a seven point scale (ranging from I would eat this every opportunity that I had to I would eat this only if forced to) was used to determine the attitudes of panelists to the snack. Assessors were asked to evaluate a sample of the modified granola bar and indicate which action best describes their feelings.
www.sciedu.ca/jct Journal of Curriculum and Teaching Vol. 3, No. 1; 2014
Published by Sciedu Press 21 ISSN 1927-2677 E-ISSN 1927-2685
Figure 9: Scorecard used for Food Action Rating Test for TCL’s Fruity Granola Bar (Adapted from UTT, BAFT, B.Sc.
Food Science and Technology, Student Project for PROJ2005 Capstone, 2012).
After all the scorecards were tabulated, the results showed that 58% of the assessors agreed that they would eat the product very often, 17% said they would eat the product if it was available but would not go out of their way to do so and 25% indicated that they would only eat the product if forced to.
3.3 Case Study 3
The development of a unique flavoured ice cream, Corn Flakes N’ Kandied Fruit Koconut Ice Cream. The student first developed the attribute profile for what they wanted the ice cream to be. The primary ingredients were chosen and the recipe was then developed. The student conducted alcohol, microbiological, acidity and butterfat testing on the ingredients to be used. After the raw materials were analysed and deemed suitable for the recipe, batches of the product were made and these underwent accelerated shelf life and viscosity testing and finally sensory evaluation.
The lab analysis of the ice cream yielded similar results, standard deviation calculation were done on these and proved that the recipe was reproducible and that batches were identical. After the lab analysis was completed and the product deemed safe for consumption, students and staff were recruited from the University with the use of fliers and class announcements to conduct sensory evaluation tests. The sensory evaluation was carried out in three phases. The first phase involved a descriptive rating test and questionnaire which were designed to get the test subjects perception on the product’s appearance, aroma, texture, sweetness and flavour. The results from the questionnaire and test were used to develop the panelist sensory/attribute profile for the ice-cream. The Second phase was a paired preference test, where panelist were given two samples from the original and modified recipes of the product and asked to identify which they preferred. The final phase used a food action/attitude rating test to determine the attitudes of panelists to the modified ice cream.
Sensory tests were carried out in a sensory evaluation room, with white light, controlled ventilation, and away from distractions noise, odours and the preparation room. In all phases participants signed an informed consent form and 20 participants were chosen for the pilot testing.
3.3.1 Sensory Evaluation for Corn Flakes N’ Kandied Fruit Koconut Ice Cream
Descriptive Rating Test and Questionnaire for First Phase, see Fig. 10 for sample of scorecard that was presented.

www.sciedu.ca/jct Journal of Curriculum and Teaching Vol. 3, No. 1; 2014
Published by Sciedu Press 22 ISSN 1927-2677 E-ISSN 1927-2685
Figure 10: Scorecard Used for Descriptive Rating Test for Corn Flakes N’ Kandied Fruit Koconut Ice Cream
(Adapted from UTT, BAFT, B.Sc. Food Science and Technology, Student Project for PROJ2005 Capstone, 2012).
After the average score for each attribute was calculated, the profile for the ice cream that was generated was, the ice cream had an appealing, aroma, and flavour, however the texture was just ok and the sweetness needed improvement. The results from the questionnaire showed that the texture and consistency of the ice cream base was good but panelist thought the ice cream to be too sweet, and that changes should be made to the corn flakes topping so that the natural crunchiness of this is maintained, they also suggested that the cornflakes should be incorporated within the ice cream. The results from this was used to modify the recipe by changing the topping from raisins to candied papaya and the corn flake topping was changed to one that was glazed in a fruity syrup.
Paired preference test for Second Phase, see Fig. 11 for sample of scorecard that was presented. Panelist were given two coded samples one from the original recipe (322) and one from the modified recipe (983) simultaneously and asked to identify which they preferred. 10 of the trays were prepared with sample 322 on the left and 10 of the trays were prepared with sample 983 on the left, trays were served randomly to each panelist.
Figure 11: Scorecard Used for Paired Comparison Test for Corn Flakes N’ Kandied Fruit Koconut Ice Cream (Adapted from UTT, BAFT, B.Sc. Food Science and Technology, Student Project for PROJ2005 Capstone, 2012)

www.sciedu.ca/jct Journal of Curriculum and Teaching Vol. 3, No. 1; 2014
Published by Sciedu Press 23 ISSN 1927-2677 E-ISSN 1927-2685
The results were analysed using a 2-tailed binomial test. The number of judges preferring each sample is totaled and the totals tested for significance using statistical table where X represents the number of panelists preferring a sample and n represents the total number of panelists participating in the test. The table contains decimal probabilities for certain combinations of X and n. The results was that 17 out of 20 panelists prefer sample 983, the probability from the statistical table (X = 17, n = 20) would be 0.003. Since a probability of 0.05 or less is usually required for the result to be considered significant, it would be concluded that sample 983 was significantly preferred over sample 322.
For the Third Phase a Food Action/Attitude Rating test was done, see Fig. 12 for sample of scorecard that was presented A seven point scale (ranging from I would eat this every opportunity that I had to I would eat this only if forced to) was used to determine the attitudes of panelists to this dessert. Assessors were asked to evaluate a sample of the modified ice cream and indicate which action best describes their feelings. After all the scorecards were tabulated, the results showed that 80% of the assessors agreed that they would eat the product very often.
Figure 12: Scorecard Used for Food Action Rating Test for Corn Flakes N’ Kandied Fruit Koconut Ice Cream
(Adapted from UTT, BAFT, B.Sc. Food Science and Technology, Student Project for PROJ2005 Capstone, 2012).
3.4 Case Study 4
The final case study looks at a student’s attempt at developing a unique ready to eat product that was described as a fusion of a gyro and a Jamaican patty, T-Style Patty. The student first developed the attribute profile for what they wanted the shell and the filling to be. The recipe was then developed and the primary ingredients were chosen. After the first batch of the product was made, samples underwent microbial testing, water activity testing, shelf life studies and finally sensory evaluation.
The lab analysis of the patty yielded similar results, standard deviation calculation were done on these and proved that the recipe was reproducible and that batches were identical. After the lab analysis was completed and the product deemed safe for consumption, students and staff were recruited from the University with the use of fliers and class announcements to conduct sensory evaluation tests. The sensory evaluation was carried out in three phases. The first phase involved a descriptive profile and questionnaire which were designed to get the test subjects perception on attributes of both the patty shell and the filling. The attributes that were studied were taste/flavour, smell/odour and texture/mouthfeel. The results from the questionnaire and test were used to develop the panelist sensory/attribute profile for the patty and to make alterations to the recipe. The Second phase was a hedonic rating test, which was designed to get the test subjects acceptance on certain attributes of the shell and the filling; appearance/colour, taste/flavour, aroma and mouth-feel/texture. The final phase used a food action/attitude rating test to determine the attitudes of panelists to eating the patty.
Sensory tests were carried out in a sensory evaluation room, with white light, controlled ventilation, and away from distractions noise, odours and the preparation room. In all phases participants signed an informed consent form and 20 participants were chosen for the pilot testing.
3.4.1 Sensory Evaluation for T-Style Patty
Descriptive Analysis and Questionnaire for First Phase, see Fig. 13 for sample of scorecard that was presented.

www.sciedu.ca/jct Journal of Curriculum and Teaching Vol. 3, No. 1; 2014
Published by Sciedu Press 24 ISSN 1927-2677 E-ISSN 1927-2685
Figure 13: Scorecard Used for Descriptive Test for T-Style Patty (Adapted from UTT, BAFT, B.Sc. Food Science and
Technology, Student Project for PROJ2005 Capstone, 2012).
After the information from the scorecards and questionnaires were collated, the profile description that was generated for the patty. The patty had an appetising appearance, it was tasty and savoury, the aroma of the shell was mild while that of the filling was both aromatic and savoury and it had moist filling in a soft shell. The results from the questionnaire showed that 67.5% of the panelist found the product to be fantastic with no improvements needed while the remaining percentage thought the product was in need of improvement due to personal presence in salt, but would eat again.
For the Second Phase, see Fig. 14 for sample of scorecard that was presented for the hedonic rating test. Panelist were given a coded sample and asked to how much they liked or disliked certain product attributes; appearance, taste, aroma and texture.
Figure 14: Scorecard Used for Hedonic Rating Test Given to the Panelists for the Evaluation of Both the Shell and Filling of the T-Style Patty (Adapted from UTT, BAFT, B.Sc. Food Science and Technology, Student Project for
PROJ2005 Capstone, 2012)

www.sciedu.ca/jct Journal of Curriculum and Teaching Vol. 3, No. 1; 2014
Published by Sciedu Press 25 ISSN 1927-2677 E-ISSN 1927-2685
To calculate the score for each product each descriptor was assigned a score value:
Like very much = 5, like moderately = 4, neither like nor dislike = 3, dislike moderately = 2, dislike very much = 1.
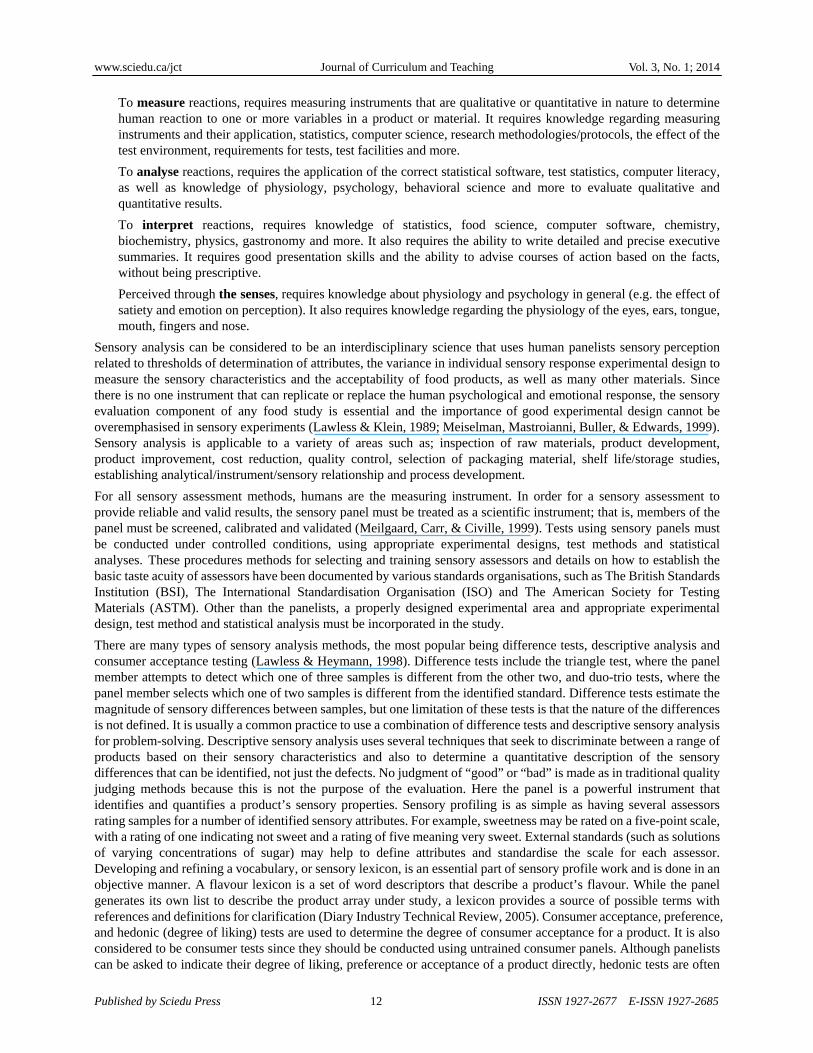
(a)
(b)
Figure 15 (a) and (b): Summary of Results from Hedonic Rating Test Taken for T-Style Patty (Adapted from UTT, BAFT, B.Sc. Food Science and Technology, Student Project for PROJ2005 Capstone, 2012).
The results showed that the taste of the entire product was very much liked but the aroma and the appearance of the filling did not have much of an impact.
For the Third Phase a Food Action/Attitude Rating test was done, see Fig. 16 for sample of scorecard that was presented A seven point scale (ranging from I would eat this every opportunity that I had to I would eat this only if forced to) was used to determine the attitudes of panelists to food product. Assessors were asked to evaluate a sample of the patty and indicate which action best describes their feelings. After all the scorecards were tabulated, the results showed that 85% of the assessors agreed that they would eat the product very often.

www.sciedu.ca/jct Journal of Curriculum and Teaching Vol. 3, No. 1; 2014
Published by Sciedu Press 26 ISSN 1927-2677 E-ISSN 1927-2685
Figure 16: Scorecard Used for Food Action Rating Test for T-Style Patty (Adapted from UTT, BAFT, B.Sc. Food Science and Technology, Student Project for PROJ2005 Capstone, 2012).
4. Conclusion
Sensory analysis is an important tool in food science and is becoming accepted as a necessary part of food quality experiments. Advances in computer technology as a means of data capture and analysis facilitates more sophisticated statistical methods to be used by sensory analysts. As new instrumental technologies are developed, for example electronic noses, the interrelationships between these techniques and sensory methods need exploring (Kerry, Kerry & Ledward, 2002). Despite all these advances the basic procedures outlined earlier, produce effective sensory results that can be used to develop and modify recipes and predict market success of a new product.
In the fast changing consumer market today the food and beverage industry will not benefit from, or require, or desire long timeframe and expensive research. Thus cost effective research and results can greatly assist in new products actually succeeding in the marketplace. The product developer, marketer and sensory scientist should always strive towards more applicable, tailor-made results, conclusions and action plans that can ensure a competitive advantage to companies in the shorter and longer term.
The success of sensory evaluation does not only lie in the application of individual tests and techniques but sensory principles can be combined with principles from other disciplines to ensure that producers stay abreast of client requirements and expectations. In the final analysis, success in product development and sensory evaluation is determined by speed to market and success in the marketplace. The most advanced procedures and methodologies only mean something when it results in the predicted sales and envisioned product success of new or optimized products.
Students adhered to using: the appropriate sensory test method (difference, descriptive, affective) and chose these to match the project objectives; the appropriate type of panelist for the type of testing and made sure that the sensory tasks were appropriate for the type of panelists employed. Consumer testing was the logical companion to sensory evaluation and was correctly applied to their project objectives which looked at product maintenance, product improvement, new product development, and shelf life testing. They made use of untrained individuals, representative of the population of end-product users, to measure such features as liking, preference, purchase intent, and consumption, using methods that help to understand product acceptance and consumer behaviour.
While the case studies discussed showed that Sensory analysis is a powerful tool in its own right, coupling sensory analysis with chemical analysis data can provide even more insights than using either technique alone. An example of this is seen in a study done by Avsar et al., 2004, where an attempt to characterise the nutty flavour of cheese was made. Specific instrumental analysis and sensory analysis was used to identify specific chemical compounds that are associated with particular flavours in cheese. The first phase in the analysis was to conduct a descriptive analysis that qualitatively and quantitatively identified all of the sensory-perceived flavours and tastes present in the cheese. Then GC techniques were applied to identify volatile compounds that contribute to flavour. Finally, model systems, similar to the actual cheese, were constructed to evaluate the role of specific compounds on sensory-perceived flavour. Using these processes, the researchers were able to successfully identify the key chemical components in cheese responsible for nutty flavour notes.

www.sciedu.ca/jct Journal of Curriculum and Teaching Vol. 3, No. 1; 2014
Published by Sciedu Press 27 ISSN 1927-2677 E-ISSN 1927-2685
Since product flavour quality drives consumer acceptance and demand, the ability to measure sensory attributes characteristic of high-quality products is necessary for the development and production of products that meet consumer expectations. The students Sensory tests were conducted under controlled conditions to reduce bias (prejudice or influence) on how panelists view the product(s). The sensory room was free from distractions (sound, odours) to not influence people’s decisions of the product. Samples were also presented in a random order and assigned three-digit product/sample code, to keep food products anonymous and to further reduce influencing the panelists’ decision. The students designed and conducted sensory tests that measured if any differences detected were truly significant by analysing the sensory data for statistical significance. After statistical analysis, the students made a meaningful interpretation from the results of the sensory data.
References
Avsar, Y.K., Karagul-Yuceer, Y., Drake, M.A., Singh, T.K., Yoon, Y., & Cadwallader, K.R. (2004). Characterization of nutty flavor in Cheddar cheese. Journal of Dairy Science, 87, 1999-2010. http://www.yumpu.com/en/document/view/6688988/characterization-of-nutty-flavor-in-cheddar-cheese-north-carolina-
Claassen, M.R., & Lawless, H.T. (1992). A comparison of descriptive terminology systems for the sensory analysis of flavor defects in milk. Journal of Food Science, 57, 596-621. http://dx.doi.org/10.1111/j.1365-2621.1992.tb08051.x
Diary Management Inc. (2005). Innovations in Diary, Diary Industry Technical Review. Rosemount, IL 60018-5616. Retrieved from http://www.innovatewithdairy.com/SiteCollectionDocuments/DMI2262SensoryBulletin.pdf
Grunert, K.G., & Harmsen, H. (1997). Determinants of Food Industry Innovation, Structural Change in the European Food Industries. In: Final Seminar Proceedings. Ed. Traill B., University of Reading.
Kerry, J., Kerry, J., & Ledward, D. (2002). Meat processing: Improving Quality (p 189). Cambridge, England: CRC Press Inc.
Lawless, H.T., & Heymann, H. (1998). Sensory Evaluation of Food: Principles and Practices. New York: Chapman & Hall.
Lawless, H.T., & Klein, B.P. (1989). Academic vs Industrial Perspective on Sensory Evaluation. Journal of Sensory Studies, 3, 205-216. http://dx.doi.org/10.1111/j.1745-459X.1989.tb00445.x
Lesser, D. (1983). Marketing and sensory quality. In: Food and Beverages: Definition, Measurement and Control. Eds. A.A. Williams & R.K. Atkins, Ellis Horwood, Chichester, pp. 448-66.
Meilegaard, M.C., Civille, G.V., & Carr, B.T. (1991). Sensory Evaluation Techniques. Ed. CRC, Boca Raton, Florida, pp. 1-23.
Meilgaard, M.C., Carr, T., & Civille, G. (1999). Sensory Evaluation Techniques (3rd ed.) New York: CRC Press Inc.
Meiselman, H. L., Mastroianni, G., Buller, M., & Edwards, J. (1999). Longitudinal measurement of three eating behavior scales during a period of change. Food Quality and Preference, 10, 1–8. http://dx.doi.org/10.1016/S0950-3293(98)00013-5
Meiselman, H.L., & Macfie, H.J.H (1996). Food Choice Acceptance and Consumption (p 239). Glasgow, UK: Backie Academic and Professional.
Sidel, J.L., & Stone, H. (1993). The role of sensory evaluation in the food industry. Food Quality & Preference, 4, 65-73. San Diego: Academic Press.
Van Trijp, H.C.M., & Schifferstein, H.N.J. (1995). Sensory analysis in marketing practice: comparison and integration. Journal of Sensory Studies, 10, 127-47.
Watts, B.M., Ylimaki, G.L., Jeffery, L.E., & Elias, L.G. (1989). Basic Sensory Methods for Food Evaluation. Ottawa, Ontario (Canada): International Development Research Centre.
Copyright © 2022 FDOKUMEN