EMPLOYER MOBILITY PLANS: ACCEPTABILITY, EFFICIENCY AND COSTS
26
THE EMPLOYER MOBILITY PLANS: BENEFITS, ACCEPTABILITY AND EFFECTIVENESS VAN MALDEREN Laurent* Louvain School of Management, FUCaM 1 , Mons Campus Centre for Operations Research and Econometrics, UCL 2 , Louvain-la-Neuve JOURQUIN Bart Louvain School of Management, FUCaM 1 , Mons Campus THOMAS Isabelle Centre for Operations Research and Econometrics, and Department of Geography, UCL 2 , Louvain-la-Neuve VAN DE VIJVER Elien Department of Transport and Regional Economics, UA 3 , Antwerp Social and Economic Geography Research Group, UG 4, Ghent VANOUTRIVE Thomas Department of Transport and Regional Economics, UA 3 , Antwerp Social and Economic Geography Research Group, UG 4 , Ghent VERHETSEL Ann Department of Transport and Regional Economics, UA 3 , Antwerp WITLOX Frank Social and Economic Geography Research Group, UG 4 , Ghent *Corresponding author: [email protected] Louvain School of Management, FUCaM, Mons Campus +32 (0)65 323 424 Chaussée de Binche, 151 7000 Mons 1 Catholic University Faculties of Mons 2 Catholic University of Louvain 3 University of Antwerp 4 University of Ghent
Transcript of EMPLOYER MOBILITY PLANS: ACCEPTABILITY, EFFICIENCY AND COSTS

THE EMPLOYER MOBILITY PLANS: BENEFITS, ACCEPTABILITY AND EFFECTIVENESS
VAN MALDEREN Laurent*Louvain School of Management, FUCaM1, Mons Campus
Centre for Operations Research and Econometrics, UCL 2, Louvain-la-Neuve
JOURQUIN BartLouvain School of Management, FUCaM1, Mons Campus
THOMAS IsabelleCentre for Operations Research and Econometrics, and Department of Geography, UCL2,
Louvain-la-Neuve
VAN DE VIJVER ElienDepartment of Transport and Regional Economics, UA3, Antwerp
Social and Economic Geography Research Group, UG4, Ghent
VANOUTRIVE ThomasDepartment of Transport and Regional Economics, UA3, Antwerp
Social and Economic Geography Research Group, UG4, Ghent
VERHETSEL AnnDepartment of Transport and Regional Economics, UA3, Antwerp
WITLOX FrankSocial and Economic Geography Research Group, UG4, Ghent
*Corresponding author:
Louvain School of Management, FUCaM, Mons Campus
+32 (0)65 323 424
Chaussée de Binche, 151
7000 Mons
1 Catholic University Faculties of Mons2 Catholic University of Louvain3 University of Antwerp4 University of Ghent
2
Abstract
Companies bring a growing attention to the home-to-work journeys of their workers. As
an important initiator of travels, they have been encouraged by the authorities to
cooperate in order to reduce the negative impacts of car traffic. Employer Mobility Plans
(EMPs) have been implemented in a growing number of companies in recent years.
These plans represent opportunities to achieve business objectives. Despite important
research on commuting traffic, only few papers cope with EMPs. With the help of a
survey among Employees Transport Co-ordinators (ETCs) of companies located in
Belgium, the aim of this paper is to evaluate the effectiveness and the acceptability of the
policy measures included in the EMPs and to assess their benefits at the company level.
The preliminary results show that the companies are particularly motivated by the
operational benefits an EMP can generate. Even companies that considered EMPs as a
constraint have found indirect operational benefits to their implementations. Among these
indirect impacts , the ETCs often cited the improvement of the mood of the employees
and of the positive image of the company. These results also show that the policy
measures are perceived as effective and well accepted by both employees and employers.
The EMPs appear thus to be useful to provide social and operational benefits to the
companies.
Keywords: commuting, employer transport plan, sustainable commuting
1. INTRODUCTION
Traffic congestion and air pollution during rush hours are nowadays a well known
characteristic of large cities. Besides environmental issues, the reduction of high traffic
volumes is required to improve the economic competitiveness. In fact, an effective
transport system, which provides a high level of accessibility, pays one’s share of
economic growth (Banister and Berechman, 2001; Vickerman, 2003). A rational
reduction of the use of private cars is therefore essential. The repeated and predictable
pattern of commuting traffic offers opportunities to achieve this objective. As an
3
important source of travelling patterns , the companies have a ringside seat to promote and
favour a more sustainable mobility (Dickinson et al.¸2003; Van Exel and Rietveld, 2009).
Conscious of the role that companies can play, and to reinforce the likelihood of
achieving public policy objectives (Weiss and Tschirhart, 1994), the employers have
been approached to cooperate as mediating institutions between governments and
citizens5 (DeHart-Davis and Guensler, 2005). Hence, the managers have increasingly paid
attention to the mobility of their employees during the recent years, being aware that
mobility also represents opportunities for them to achieve business objectives (Roby,
2009). As a consequence, an always growing number of companies implement Employer
Mobility Plans (EMPs) in order to promote sustainable mobility behaviours.
Nevertheless, and despite important research on commuter traffic, the EMPs, and
particularly their economic impacts, are poorly covered in the literature on commuting
patterns. In fact, existing research often focus on a behavioural analysis of individual
commuters (e.g. Henser and Rose, 2006) or on an analysis at the municipality level (e.g.
Rietveld and Daniel, 2004). The main objective of this paper is to evaluate the
effectiveness and acceptability of the policy measures included in the EMPs and to assess
their benefits at the company level. To achieve these objectives, EMPs of a set of
companies located in Belgium are analysed with the help of a survey conducted among
Employees Transport Co-ordinators (ETCs) or human resources staff in charge of
mobility issues.
A decisive step in the awareness-raising of employers for the mediation role the
companies can play was the implementation in 1988, in Southern California, of the Clean
Air Act, Regulation XV. This act puts the emphasis on the concept of Transportation
Demand Management (TDM), which encompasses both strategies and programmes that
encourage a more effective use of transportation resources (Litman, 2003). Many
applications have been found at the company-level and the concept of EMP emerged
5 Berger and Neuhaus (1977) define a mediating institution as an institution connecting the private lives of individuals with public policy concerns by communicating societal norms to members and providing social contexts that encourage a commitment to these norms.
4
consecutively. The Clean Air Act became mandatory in the design of the plans and the
training of ETCs (Giuliano et al., 1993).
However, the European authorities took a longer time to consider the mobility issues at
the company-level. In 1998, the United Kingdom developed a White Paper entitled A
New Deal for Transport: Better for Everyone (DETR, 1998) that promoted a voluntary
take-up of EMPs. At the same period, Italy laid down the creation of the function of ETC
in large companies. In 2001, the Netherlands have overhauled its commuting benefits
system to further promote alternative modes of transport (Enoch and Potter, 2003). Two
years later, Belgium established a census on mobility practices within large companies to
stimulate initiatives and discussions on mobility in the social dialogue (Vanoutrive et al.,
2010). Recently, the European Commission has recognised the potential of the mediating
role of the companies in its Action Plan on Urban Mobility, stating that company
mobility management can influence travel behaviours by drawing the employee’s
attention towards sustainable transport options (European Commission, 2009).
After this introduction, the second section of this paper presents a review of the literature
about mobility management in the companies and the description of the Belgian Home-
To-Work Travels (HTWT) diagnoses (Section 2). The third section is devoted to the
survey design. The results of the survey are presented in Section 4. The paper finally
draws some conclusions expressed as policy recommendations.
2. MOBILITY MANAGEMENT BY COMPANIES
The policy measures developed by companies in the framework of their EMP are various.
They affect different features of the daily work of the employees (e.g. the work hours or
wages). The designation of an ETC is one of the most conspicuous measures. In fact, the
ETC has to manage and facilitate the implementation of the EMP.

5
This section inventories the range of policy measures the companies can implement. The
role of ETCs is also discussed. Finally, the Belgian situation is sketched through the
answers found in the HTWT diagnoses.
2.1. Employer mobility plan
An EMP works out a set of actions carried out by a company to promote and favour a
more sustainable mobility. It aims at influencing the commuting behaviour of workers
through the promotion of alternative modes of transport, which are more environment-
friendly and sustainable than the use of single-occupancy vehicles (SOV) (Kingham et
al., 2001; Dickinson et al., 2003). Thereby, EMPs meet both public policy objectives
(e.g. reducing congestion, energy consumption or air pollution), and organisational ones
(e.g. solving accessibility and/or parking problems). They also represent opportunities for
managers to achieve business objectives (Roby, 2009) (e.g. promoting the image, saving
costs and/or space,or improving the satisfaction of the employees).
The policy measures included in EMPs can be gathered in 2 categories: incentive or
dissuasive measures (Banister, 2008). Both traditionally play on the 2 factors commonly
accepted as being the key criteria of commuters’ choice of a mode of transport namely
the costs, in monetary terms and travel times, and the convenience (Hagman, 2003;
Anable, 2005). Despite the lower costs of SOV’s alternatives, many workers regard the
savings as insufficient against the loss in commodity of a modal shift. Therefore, they
keep up favouring SOV use (Rodriguez and Joo, 2004).
Incentive policy measures, or “pull” measures, reward workers who have changed their
mobility behaviour. They have to offer a tangible value to the worker (Hwang and
Giuliano, 1990). It often consists on financial grants to compensate for the disadvantages
of the mode of transport given up. At the contrary, dissuasive policy measures, “push”
measures, try to discourage solo driving. Parking management, by price settings, or a
reduction of the number of car parks, is an example of a restrictive measure that appears
effective (Hole, 2004; Van Exel and Rietveld, 2009).
6
The companies can promote motorised or non-motorised modes of transport. The
promotion of motorised modes of transport consists mainly on favouring the ridesharing
or the public transport. The promotion of non-motorised mode of transport comes down
to favour cycling and walking. However, the promotion of motorised modes of transport
affects a more important number of workers. In fact, the promotion of cycling affects
only employees living close to their workplace. Journeys of less than 5 kilometres are
within cycling distance for most people, and cycling potential exists up to about 10
kilometres (Rietveld, 2001; Vandenbulcke et al., 2009). The promotion of walking
affects workers living at smaller distances.
The choice of the policy measures making up an EMP has to take into account
characteristics of the workplace. The location of the company and the type of workforce
are important factors (Rye, 1997). A limited number of car parks, long home-to-work
journeys suits better to the promotion of the train (Hwang and Giuliano, 1990; Rye,
1999a; Kingham et al., 2001; De Witte et al., 2008). At the contrary, a flat topography,
the standards of salary and of education of the workforce tend to favour the use of cycling
in the home-to-work journeys (Ortúzar et al., 2000; Rietveld, 2001; Dickinson et al.,
2003; Vanoutrive et al., 2010; Vandenbulcke et al., 2009). Nevertheless, the EMPs could
turn out to be put in place with difficulty in some companies. The car has a strong
symbolic and affective function for people (Cao and Mokhtarian, 2005; Steg, 2005).
In addition to the promotion of alternative modes of transport, the employers have the
possibility to make work hours more flexible to favour sustainable behaviours. Giving the
possibility to workers to choose their starting and departure times avoids massive
commuting journeys at the same time. As a consequence, the commuting traffic at the
peak hours is smoothed and the congestion decreases (Giuliano and Golob, 1990; Brewer,
1998). Office-type settings are well suited to such a scheme, in contrast with the
manufactures where the coordination of activities is crucial (Hung, 1996). The
compressed workweeks (CWs) go further in the flexibility of the work hours. They
shorten the traditional 5-workdays week to 4 workdays. Consequently, the employees

7
work longer days to compensate the hours lost due to the extra free day (Hung, 1996).
The demand in transport is reduced the day-off and the traffic conditions are improved
the other days as the workers commute earlier and later than usual to work their longer
hours (Sundo and Fuji, 2005).
Finally, the possibility of teleworking impacts directly in the number or the length of the
home-to-work journeys by allowing workers to work at home or at a satellite centre
closer to their home (Helminen and Ristimäki, 2007).
2.2. Employer transport co-ordinator
An ETC, or mobility manager, is a member of staff who has to manage and facilitate the
implementation of an EMP within a company. The function of ETC became more
important in 1988 with the Clean Air Act (Regulation XV) in Southern California. The
designation and the training of an ETC were mandatory (Giuliano et al., 1993). However,
the companies often just added the mobility issues to theother tasks of a member of staff.
The appointed ETC could thus only work partially on the EMP and was not necessary
interested in the mobility issues (Rye, 1999b). In the UK, only few companies have
designated an ETC. Employers do not perceive it as an acceptable and effective policy
measure despite that the designation of an ETC is as important as the management
commitment to the EMP (Rye, 1999b). In Italy, the designation of an ETC has been laid
down since 1998 in large companies.
According to Hendricks and Georggi (2007), companies should select an ETC that is at a
managerial level. An ETC should have direct communication access to top management
decision-makers and influence on the decisions related to the budget allocated to the
EMP (Hendricks and Georggi, 2007).
8
2.3. Mobility management in Belgium
The programme-law6 of April 8th 2003 has established the legal obligation for the
companies located in Belgium and employing at least a hundred workers to fill in the
HTWT questionnaire for each of their workplace employing more than 30 workers (Van
Malderen et al., 2009). The objective of this law is to stimulate initiatives and discussions
in the social dialogues about the home-to-work journeys (Vanoutrive et al., 2009). The
questionnaire is conducted every 3 years by the Federal Public Service (FPS)7 Mobility
and Transport. Two HTWT surveys have been performed to date (in 2005 and 2008), and
respectively 3,269 and 3,733 companies filled in the forms. In total, respectively 7460
and 9455 workplaces are represented, aggregating the behaviour of about one worker out
in 3 in Belgium.
The surveys contain 2 sections. The first section focuses on the commuting behaviour of
the employees. The workers have to provide information about their main mode of
transport to commute. The HTWT surveys contain therefore the percentage workers at
each workplace who used each mode of transport. In 2008, the car was mostly used by
commuters with a modal part of 68%, followed by the public transport (train bus and
metro, 13%), cycling (9%), walking (3%), carpooling (2%) and other modes of transport
(5%).
The second section refers to the characteristics of the company (e.g. economic sector) and
of their EMP. Employers have to provide information about the policy measures in force.
Four categories of measures have been designed: the measures promoting the use of
bicycles (15 measures), of carpooling (6), of public transport (6) and miscellaneous
measures (11). In 2008, the bicycle was the most promoted mode of transport by the
employers (77% of the workplaces report at least one measure promoting cycling),
followed by the public transport (40%) and carpooling (15%).
6 A programme-law is a law with a general content which has a programme value in governmental fields.7 A FPS is the equivalent of a government department in Belgium.
9
The most popular policy measures are the financial incentives for the use of alternative
modes of transport. The financial incentives for the use of public transport take the form
of additional reimbursements8 for public transport tickets. The success of such a scheme,
contrary to other countries, is explained by the benefits and income tax systems in
Belgium. Additional reimbursements are tax exempted (Vanoutrive et al, 2009) and
encouraged with a third-party payer system, where authorities step in financially9.
Providing cycling infrastructures (e.g. sheltered bicycle parks or covered bicycle
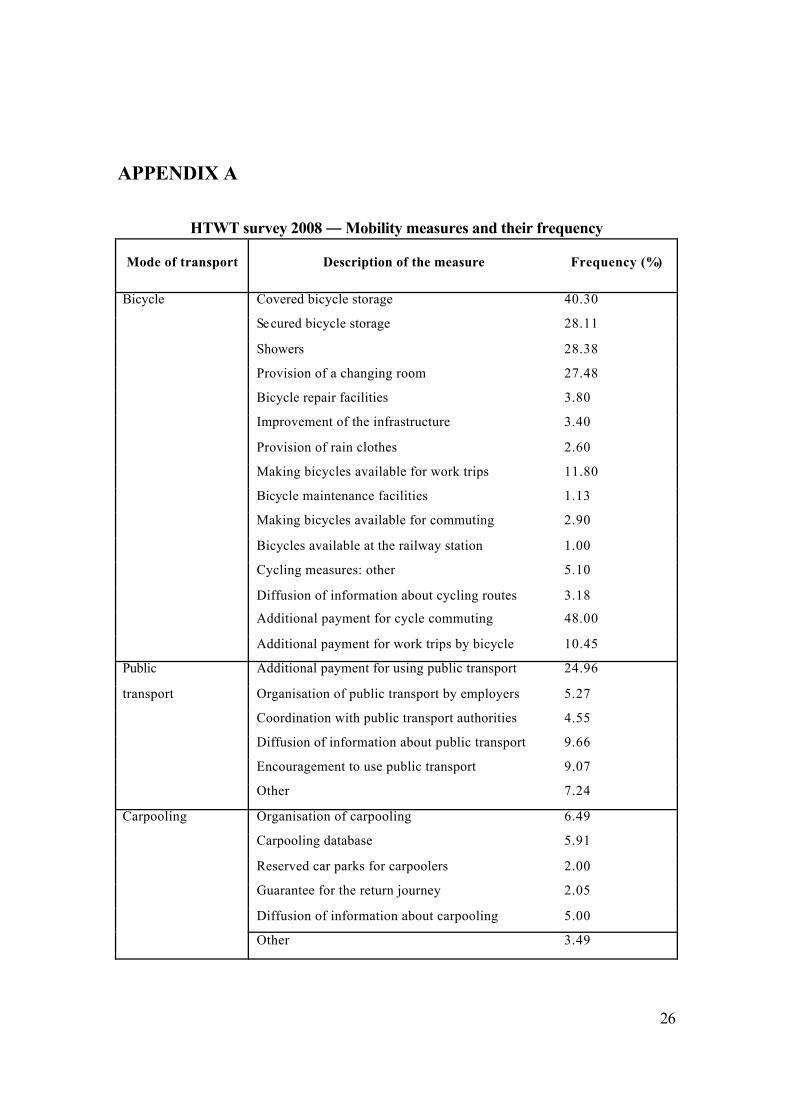
storages) is also popular among employers. Appendix A shows the frequency of the
mobility measures in Belgium.
At the same time, the Brussels -Capital Region laid down the implementation of an EMP
to companies employing at least 200 workers10. The Flemish Region has created in 2006
a Commuting Fund which subsidies project of employers to reduce SOV use. Forty-nine
projects of companies or groups of companies have been subsidized to date, for a total of
more than 15 million Euros. The Walloon Region offers support for the making up of
EMPs (Vanoutrive et al., 2009).
3. SURVEY DESIGN
The HTWT diagnoses offer opportunities to analyse the EMPs of companies (Vanoutrive
et al., 2009). Previous research showed that companies tend to implement a set of similar
measures (financial incentives, the development of facilities or the diffusion of
information) and to promote only one specific mode of transport (Van Malderen et al.,
2009; Vanoutrive et al., 2010). It also appears that the financial incentives, the provision
of facilities, the diffusion of information and the parking management all play an
important role in the promotion of alternative modes of transport (Van Malderen et al.,
2009).
8 Reimbursing a part of the public transport tickets is compulsory in Belgium. Employers are free to reimburse a more important part than the compulsory one. 9 In the third-party payer system when an employer reimburses a threshold part of the public transport tickets, authorities paid the remaining part. The employees have therefore no charge.10 Decree of February 5th 2004 of the Brussels -Capital government.
10
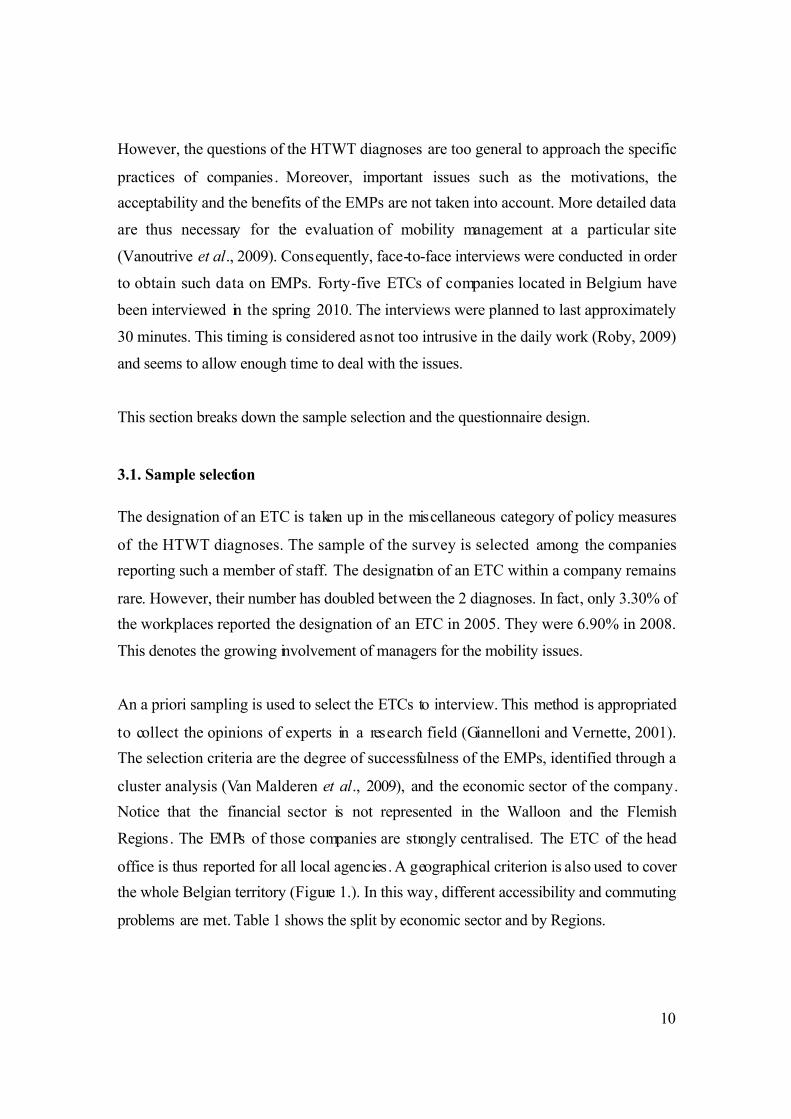
However, the questions of the HTWT diagnoses are too general to approach the specific
practices of companies. Moreover, important issues such as the motivations, the
acceptability and the benefits of the EMPs are not taken into account. More detailed data
are thus necessary for the evaluation of mobility management at a particular site
(Vanoutrive et al., 2009). Consequently, face-to-face interviews were conducted in order
to obtain such data on EMPs. Forty-five ETCs of companies located in Belgium have
been interviewed in the spring 2010. The interviews were planned to last approximately
30 minutes. This timing is considered as not too intrusive in the daily work (Roby, 2009)
and seems to allow enough time to deal with the issues.
This section breaks down the sample selection and the questionnaire design.
3.1. Sample selection
The designation of an ETC is taken up in the miscellaneous category of policy measures
of the HTWT diagnoses. The sample of the survey is selected among the companies
reporting such a member of staff. The designation of an ETC within a company remains
rare. However, their number has doubled between the 2 diagnoses. In fact, only 3.30% of
the workplaces reported the designation of an ETC in 2005. They were 6.90% in 2008.
This denotes the growing involvement of managers for the mobility issues.
An a priori sampling is used to select the ETCs to interview. This method is appropriated
to collect the opinions of experts in a research field (Giannelloni and Vernette, 2001).
The selection criteria are the degree of successfulness of the EMPs, identified through a
cluster analysis (Van Malderen et al., 2009), and the economic sector of the company.
Notice that the financial sector is not represented in the Walloon and the Flemish
Regions. The EMPs of those companies are strongly centralised. The ETC of the head
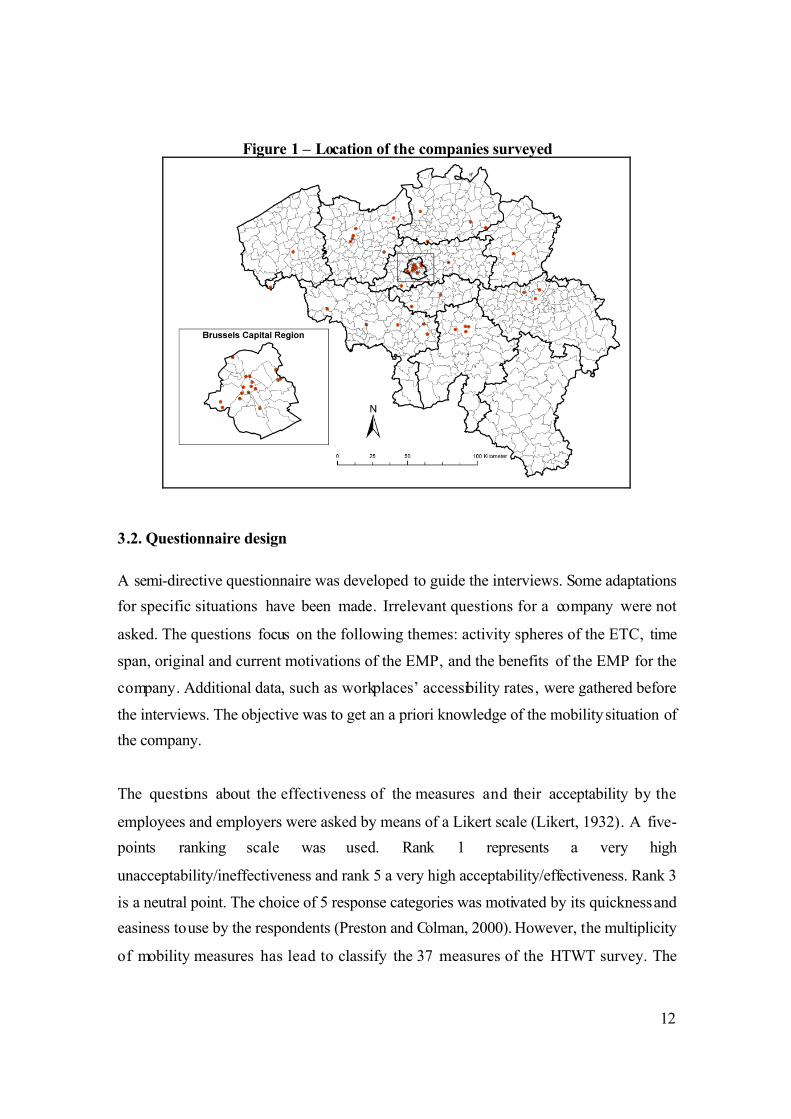
office is thus reported for all local agencies. A geographical criterion is also used to cover
the whole Belgian territory (Figure 1.). In this way, different accessibility and commuting
problems are met. Table 1 shows the split by economic sector and by Regions.
11
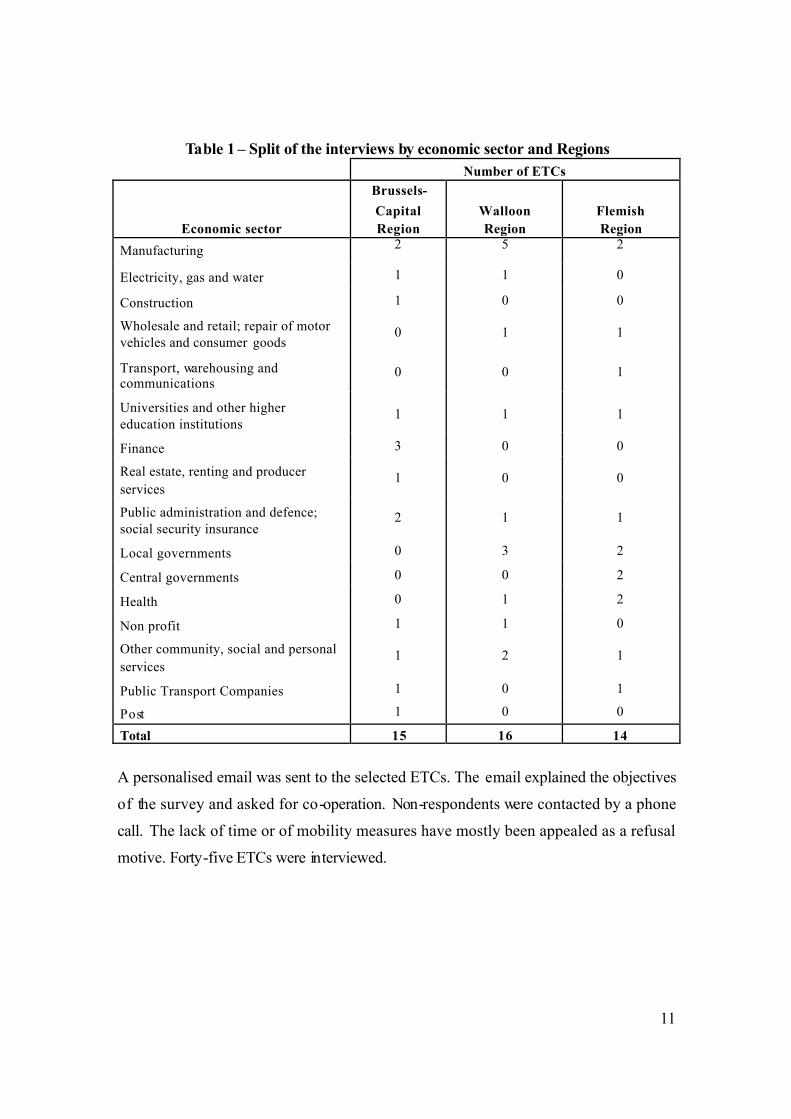
Table 1 – Split of the interviews by economic sector and Regions
Number of ETCs
Economic sector
Brussels-
Capital
Region
Walloon
Region
Flemish
Region
Manufacturing 2 5 2
Electricity, gas and water 1 1 0
Construction 1 0 0
Wholesale and retail; repair of motor vehicles and consumer goods
0 1 1
Transport, warehousing and communications
0 0 1
Universities and other higher education institutions
1 1 1
Finance 3 0 0
Real estate, renting and producer
services1 0 0
Public administration and defence; social security insurance
2 1 1
Local governments 0 3 2
Central governments 0 0 2
Health 0 1 2
Non profit 1 1 0
Other community, social and personal
services1 2 1
Public Transport Companies 1 0 1
Post 1 0 0
Total 15 16 14
A personalised email was sent to the selected ETCs. The email explained the objectives
of the survey and asked for co-operation. Non-respondents were contacted by a phone
call. The lack of time or of mobility measures have mostly been appealed as a refusal
motive. Forty-five ETCs were interviewed.
12
Figure 1 – Location of the companies surveyed
3.2. Questionnaire design
A semi-directive questionnaire was developed to guide the interviews. Some adaptations
for specific situations have been made. Irrelevant questions for a company were not
asked. The questions focus on the following themes: activity spheres of the ETC, time
span, original and current motivations of the EMP, and the benefits of the EMP for the
company. Additional data, such as workplaces’ accessibility rates, were gathered before
the interviews. The objective was to get an a priori knowledge of the mobility situation of
the company.
The questions about the effectiveness of the measures and their acceptability by the
employees and employers were asked by means of a Likert scale (Likert, 1932). A five-
points ranking scale was used. Rank 1 represents a very high
unacceptability/ineffectiveness and rank 5 a very high acceptability/effectiveness. Rank 3
is a neutral point. The choice of 5 response categories was motivated by its quickness and
easiness to use by the respondents (Preston and Colman, 2000). However, the multiplicity
of mobility measures has lead to classify the 37 measures of the HTWT survey. The
13
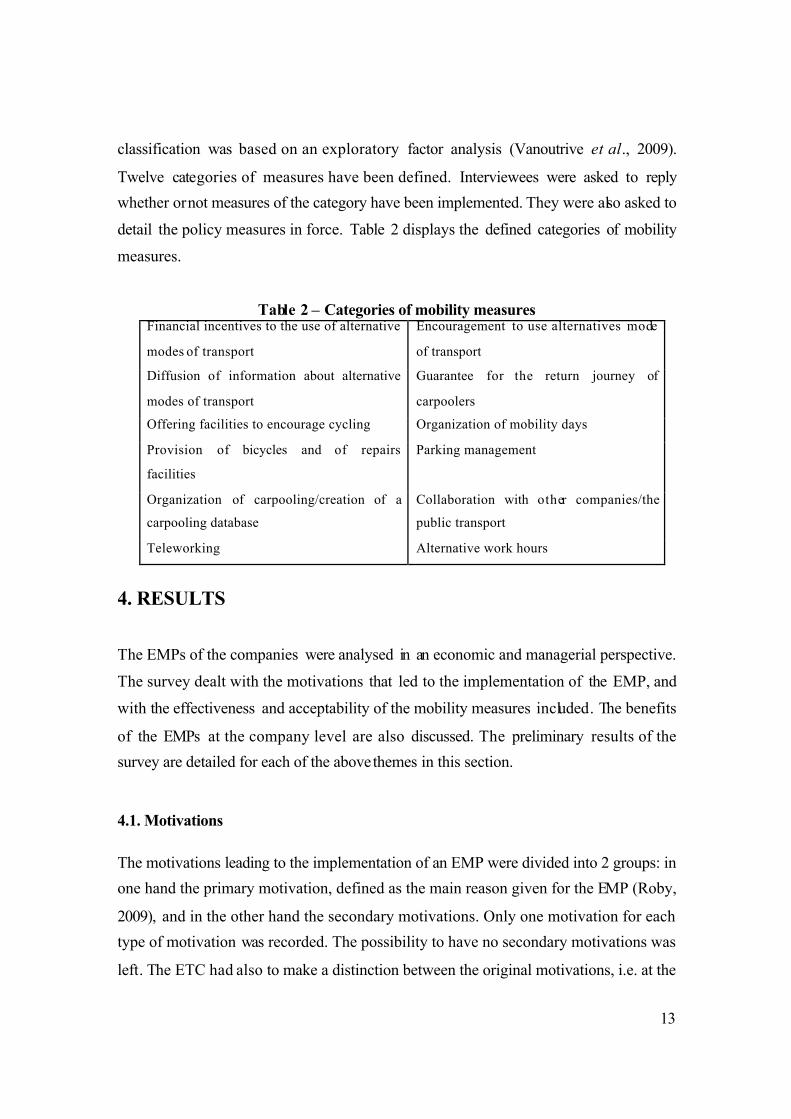
classification was based on an exploratory factor analysis (Vanoutrive et al., 2009).
Twelve categories of measures have been defined. Interviewees were asked to reply
whether or not measures of the category have been implemented. They were also asked to
detail the policy measures in force. Table 2 displays the defined categories of mobility
measures.
Table 2 – Categories of mobility measuresFinancial incentives to the use of alternative
modes of transport
Encouragement to use alternatives mode
of transport
Diffusion of information about alternative
modes of transport
Guarantee for the return journey of
carpoolers
Offering facilities to encourage cycling Organization of mobility days
Provision of bicycles and of repairs
facilities
Parking management
Organization of carpooling/creation of a
carpooling database
Collaboration with other companies/the
public transport
Teleworking Alternative work hours
4. RESULTS
The EMPs of the companies were analysed in an economic and managerial perspective.
The survey dealt with the motivations that led to the implementation of the EMP, and
with the effectiveness and acceptability of the mobility measures included. The benefits
of the EMPs at the company level are also discussed. The preliminary results of the
survey are detailed for each of the above themes in this section.
4.1. Motivations
The motivations leading to the implementation of an EMP were divided into 2 groups: in
one hand the primary motivation, defined as the main reason given for the EMP (Roby,
2009), and in the other hand the secondary motivations. Only one motivation for each
type of motivation was recorded. The possibility to have no secondary motivations was
left. The ETC had also to make a distinction between the original motivations, i.e. at the
14
time of the implementation of the EMP, and the current motivation. The objective is to
study the evolution of the motivations over time. In this way, the impact of the legal
obligation of the Brussels-Capital Region and of the HTWT surveys on the behaviours of
the companies can also be studied.
i. Primary motivations
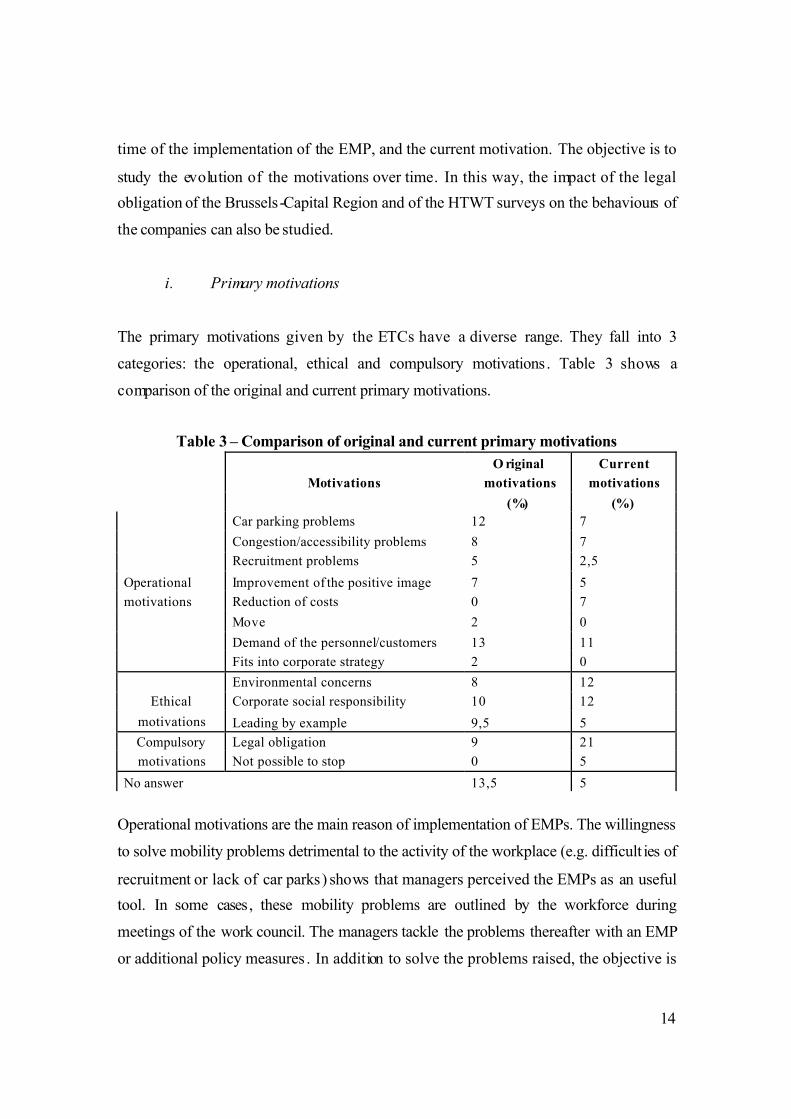
The primary motivations given by the ETCs have a diverse range. They fall into 3
categories: the operational, ethical and compulsory motivations. Table 3 shows a
comparison of the original and current primary motivations.
Table 3 – Comparison of original and current primary motivations
Motivations
O riginal
motivations
(%)
Current
motivations
(%)
Operational
motivations
Car parking problems 12 7
Congestion/accessibility problems 8 7
Recruitment problems 5 2,5
Improvement of the positive image 7 5
Reduction of costs 0 7
Move 2 0
Demand of the personnel/customers 13 11
Fits into corporate strategy 2 0
Ethical
motivations
Environmental concerns 8 12
Corporate social responsibility 10 12
Leading by example 9,5 5
Compulsory
motivations
Legal obligation 9 21
Not possible to stop 0 5
No answer 13,5 5
Operational motivations are the main reason of implementation of EMPs. The willingness
to solve mobility problems detrimental to the activity of the workplace (e.g. difficult ies of
recruitment or lack of car parks) shows that managers perceived the EMPs as an useful
tool. In some cases, these mobility problems are outlined by the workforce during
meetings of the work council. The managers tackle the problems thereafter with an EMP
or additional policy measures . In addition to solve the problems raised, the objective is
15
also to improve the satisfaction of the employees , and as a result the labour relations
climate. The EMPs are also implemented in the framework of larger plans aiming at the
improvement of the image of thecompany. The home-to-work journeys are considered as
well as other issues more customers-oriented (e.g. marketing campaigns). One can also
notice the diminution of the importance of the operational motivations over time. In fact,
a shift from operational motivations to compulsory one is observed. Notice also, that a
shift to other operational motivations than the original one is observed in some
companies. Therefore, one can assume that the original objectives of the EMP have been
achieved and new objectives planned out.
The legal obligation is a motivation that takes importance over time in Belgium. The
assumption can be made that the importance of the legal obligation goes together with the
establishment of the obligation to develop an EMP of the Brussels-Capital Region.
Nevertheless , it is mainly in the Walloon and the Flemish Regions that ETCs have cited
the legal obligation as primary current motivations for their EMP. In fact, the legal
framework does not appear as clear enough for the ETCs. The HTWT surveys have been
perceived more as an obligation to act in favour of the mobility instead of simple
diagnoses. This denotes the importance of the initiatives of the authorities in the mobility
fields and confusion of ETCs about the legal framework.
EMPs were implemented on a voluntary basis in the companies where the ETC cited the
ethical motivations as primary ones. The environmental concerns and the corporate social
responsibility are the main reasons of EMP’s implementation in those companies. The
mobility issues are also perceived as a component of larger projects , such as obtaining an
ISO certification. The achieving of such a certification can have operational motivations
but their mobility components are perceived only as environmental issues.
ii. Secondary motivations
Forty-three percents of the ETCs interviewed have not cited an original secondary
motivation for the EMP of their company. Only 20.5% of the ETCs have not cited a
16
current secondary motivation. This denotes that the ETCs have perceived the
implementation of an EMP as resulting from one specific motivation. and that other
functions have been found to the EMP with its development over time. Operational
motivations and ethical considerations take a growing importance. This shows the growth
in awareness of managers for the home-to-work journeys issues and that companies
considering an EMP as strictly utilitarian also take into account social aspects.
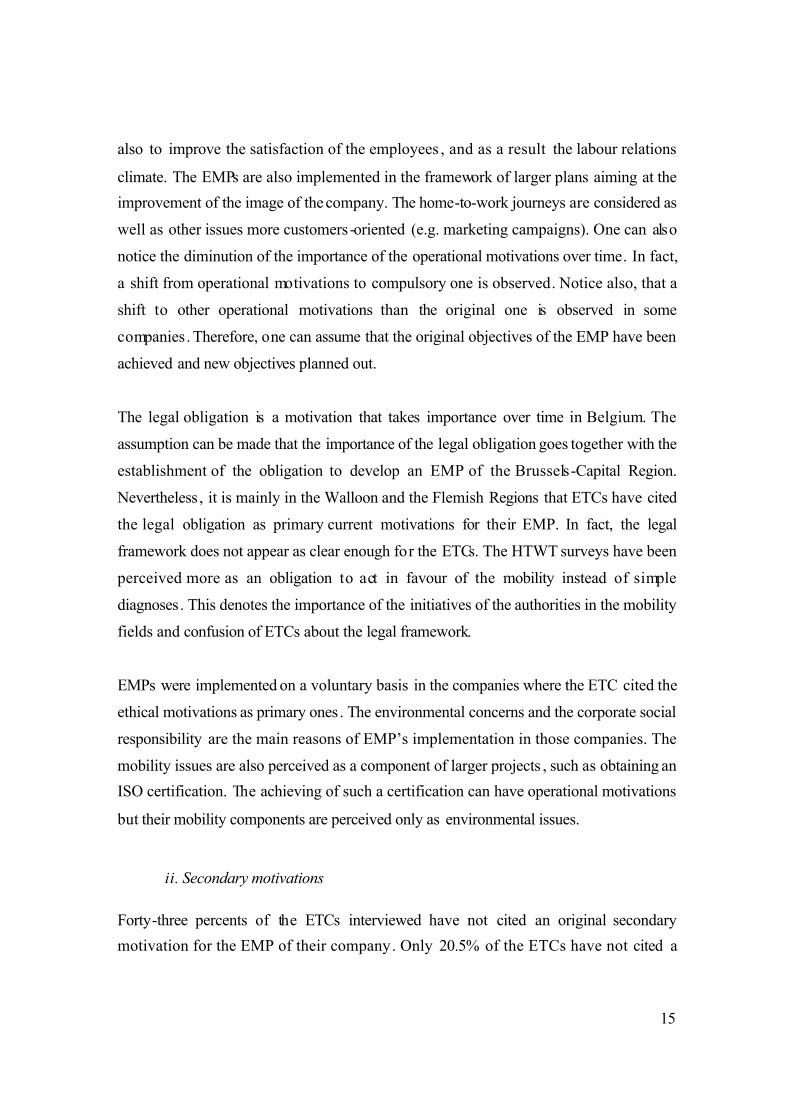
Table 4 shows the percentage ETCs selecting each original and current secondary
motivation.
Table 4. – Comparison of original and current secondary motivations
MotivationsOriginal motivations
(%)
Current motivations
(%)
Operational
motivations
Car parking problems 7 5
Congestion/accessibility
problems 0 7
Gro wth of the activity of the
company 3 3
Demand of the workforce 9 4
Recruiting problems 3 3
The arise of a new situation
around the workplace 0 2
Renewal of the parking 2 0
Ethical
motivations
Environmental concerns 5 19
Corporate social
responsibility 16 14
Leadin g by example 5 11
Compulsory
motivations
Legal obligation 4,5 7
Obligation of the head office 0 2
Not possible to stop 0 2
No secondary motivation cited 45.5 20,5
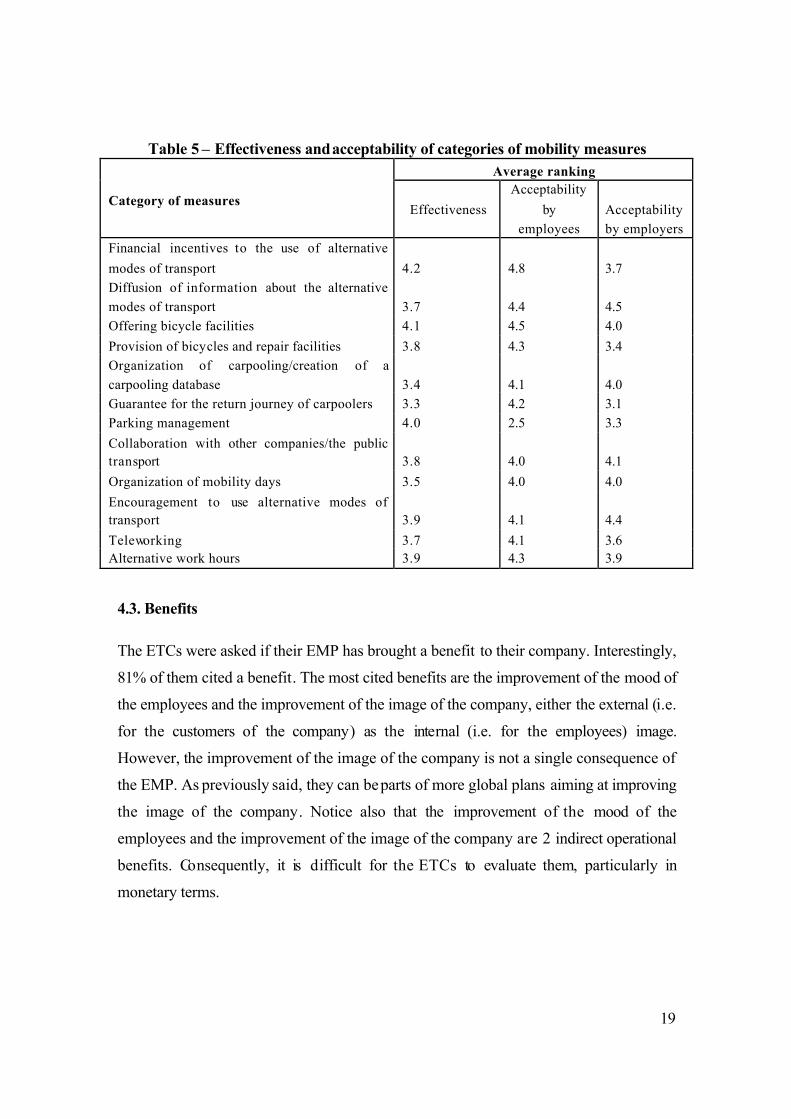
4.2. Effectiveness and acceptability
A Likert scale (Likert, 1932) was used to assess the effectiveness and the acceptability of
the categories of policy measures included in EMPs. The ETCs had to rank the
effectiveness and the acceptability of the categories of mobility measures. The

17
acceptability was considered in 2 ways: firstly the acceptability by the employees and
secondly the acceptability by the employers.
i. Effectiveness
The ranking of the effectiveness of the policy measures were on a scale of 1 (high
ineffectiveness) to 5 (high effectiveness). Rank 3 represents a neutral point. The
categories of policy measures with an average ranking of more than 3 can be considered
as perceived as effective by the ETCs. Table 5 shows the average ranking of the
categories of policy measures.
The financial incentives to the use of alternative modes of transport and the offer of
bicycle facilities are perceived as the most effective policy measures. Only the ETCs of
companies poorly served by public transport and with poor access to cycling paths are
considering this type of measures as ineffective. In the same way, offering cycling
facilities have been considered as ineffective only by the ETCs of companies located in
industrial parks or next door important railway stations. The importance of the
neighbourhood in the successfulness of a policy measure is therefore outlined. The EMP
can only be effective if the promoted modes of transport provide an alternative to the car
for the employees. Too long distances to public transport stops and unsafe cycling paths
are cited as brakes to modal shifts.
The least effective policy measures are the measures promoting the carpooling. In fact, companies have run up against the difficulty to formalize these practices and companies that adherer to carpool databases have not meet success. This is probably due to the uncertainly (about schedules, returning home, daily nature, etc.) related to the carpooling and the personal relationship that employees have to build with the partner. The employees motivated to carpool organize themselves without the help of the company.
ii. Acceptability
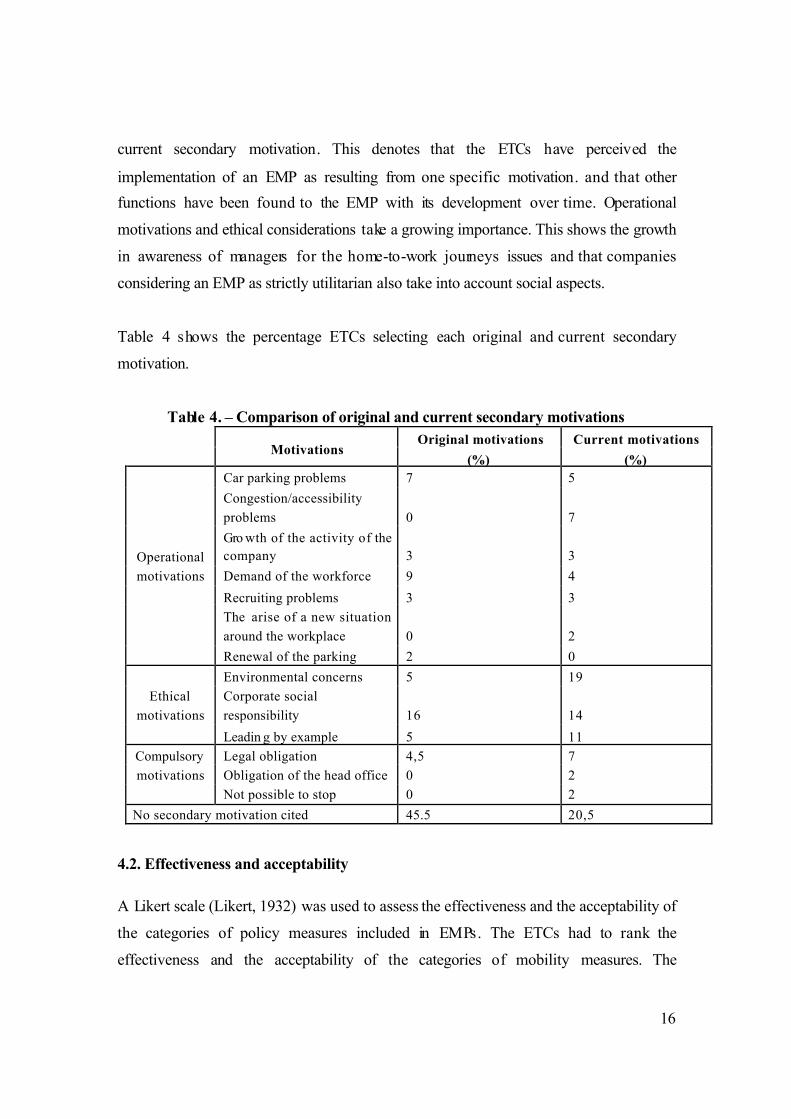
The policy measures are perceived by the ETCs as well accepted either by the employees
as the employers (Table 5). The parking management is the only measure which is not
accepted by the employees. Its average ranking is lower than 3. The car parks are
18
considered as a gain made by the employees . Parking management is perceived as a
threat for this gain. Many employers share this point of view, as employees and
employers often use the same car parks. However, parking management is perceived as
an opportunity to save costs by some employers . Decreasing the demand in car parks
reduce the costs linked to the parking. This explains the average ranking of the parking
management acceptability by the employers
The ETCs perceived the diffusion of information as a well accepted measure by the
employees. The same is true for the collaboration with other companies and especially
with the public transport providers. One can conclude that employees still consider public
transport as an insufficient alternative to the car. In addition, the employees do not look
after information in many cases. They are not aware of the existing alternatives to
commute by public transport. The companies can thus fill the gap by providing
information about public transport. It is a cheap policy measure, which is also well
accepted by the employers.
The guarantee back for the return journey of carpoolers is a measure that only one
company interviewed has implemented. The ETCs think that such a measure would be
well accepted by the employees, and would address the employees’ fear of difficulties for
their return journeys . In the opposite, they think that employers will be reluctant to accept
such a measure. This is linked to the potential high costs of such a measure, and misuses
that can be made by the employees.
Notice the preference of the employers for low-cost policy measures. The diffusion of
information and the encouragement to use alternative modes of transport are better
accepted than more expensive ones, such as the financial incentives for the use of
alternative modes of transport or as seen above the guarantee for the return journey of
carpoolers . At the contrary, the employees prefer logically measures that bring value to
them, as the financial incentives for alternative modes of transport or a more important
offer of bicycle facilities (e.g. covered bicycle storage).
19
Table 5 – Effectiveness andacceptability of categories of mobility measures
Category of measures
Average ranking
Effectiveness
Acceptability
by
employees
Acceptability
by employers
Financial incentives to the use of alternative
modes of transport 4.2 4.8 3.7
Diffusion of information about the alternative
modes of transport 3.7 4.4 4.5
Offering bicycle facilities 4.1 4.5 4.0
Provision of bicycles and repair facilities 3.8 4.3 3.4
Organization of carpooling/creation of a
carpooling database 3.4 4.1 4.0
Guarantee for the return journey of carpoolers 3.3 4.2 3.1
Parking management 4.0 2.5 3.3
Collaboration with other companies/the public
transport 3.8 4.0 4.1
Organization of mobility days 3.5 4.0 4.0
Encouragement to use alternative modes of
transport 3.9 4.1 4.4
Teleworking 3.7 4.1 3.6
Alternative work hours 3.9 4.3 3.9
4.3. Benefits
The ETCs were asked if their EMP has brought a benefit to their company. Interestingly,
81% of them cited a benefit. The most cited benefits are the improvement of the mood of
the employees and the improvement of the image of the company, either the external (i.e.
for the customers of the company) as the internal (i.e. for the employees) image.
However, the improvement of the image of the company is not a single consequence of
the EMP. As previously said, they can beparts of more global plans aiming at improving
the image of the company. Notice also that the improvement of the mood of the
employees and the improvement of the image of the company are 2 indirect operational
benefits. Consequently, it is difficult for the ETCs to evaluate them, particularly in
monetary terms.
20
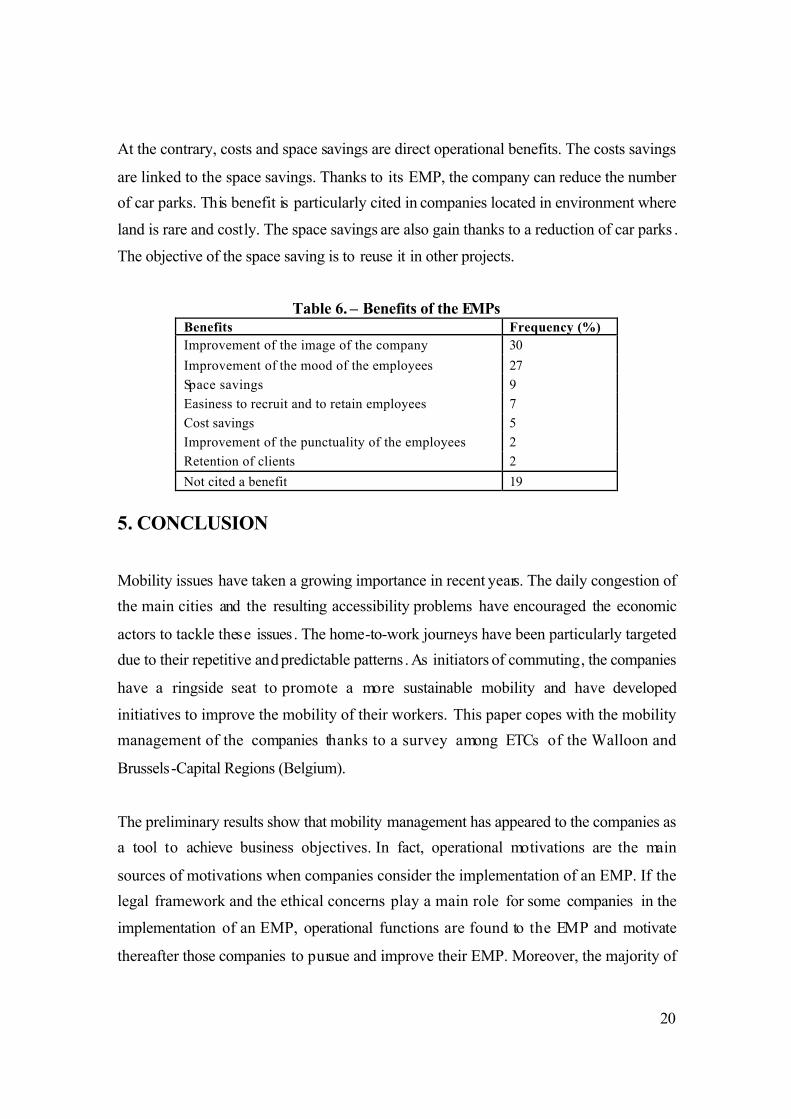
At the contrary, costs and space savings are direct operational benefits. The costs savings
are linked to the space savings. Thanks to its EMP, the company can reduce the number
of car parks. This benefit is particularly cited in companies located in environment where
land is rare and costly. The space savings are also gain thanks to a reduction of car parks .
The objective of the space saving is to reuse it in other projects.
Table 6. – Benefits of the EMPsBenefits Frequency (%)
Improvement of the image of the company 30
Improvement of the mood of the employees 27
Space savings 9
Easiness to recruit and to retain employees 7
Cost savings 5
Improvement of the punctuality of the employees 2
Retention of clients 2
Not cited a benefit 19
5. CONCLUSION
Mobility issues have taken a growing importance in recent years. The daily congestion of
the main cities and the resulting accessibility problems have encouraged the economic
actors to tackle these issues. The home-to-work journeys have been particularly targeted
due to their repetitive and predictable patterns . As initiators of commuting, the companies
have a ringside seat to promote a more sustainable mobility and have developed
initiatives to improve the mobility of their workers. This paper copes with the mobility
management of the companies thanks to a survey among ETCs of the Walloon and
Brussels-Capital Regions (Belgium).
The preliminary results show that mobility management has appeared to the companies as
a tool to achieve business objectives. In fact, operational motivations are the main
sources of motivations when companies consider the implementation of an EMP. If the
legal framework and the ethical concerns play a main role for some companies in the
implementation of an EMP, operational functions are found to the EMP and motivate
thereafter those companies to pursue and improve their EMP. Moreover, the majority of
21
the ETCs surveyed find that the EMP of their company has provided benefits to their
company. The most common benefits are the improvement of the mood of the employees
and of the image of the company. The mobility issues appear thus to be an opportunity
for employers, and not a constraint.
In addition to operational benefits , EMPs also provide social benefits. They have a real
influence on the commuting behaviours of workers. The policy measures included in the
EMPs are judged as effective by the ETCs of the companies surveyed and have
consequently a potential of modal shift. The policy measures are also judged as well
accepted by both the employees as the employers, which would make the implementation
of such measures easier.
However, companies have to adapt their EMP to their location in order to promote a more
sustainable mobility. The modes of transport promoted have to be perceived as able to
provide alternatives to the car by the employees. Companies also have to be encouraged
to pursue their efforts in the mobility field. A stronger communication on the potential
benefits an EMP can bring would probably be helpful to achieve this objective. The
EMPs appear to be useful to provide social and operational benefits to companies.
Acknowledgements
This research is conducted within the ADICCT-project (Assessing and Developing
Initiatives of Companies to control and reduce Commuter Traffic) which is financed by
Belgian Science Policy in the Science for a Sustainable Development research
programme. We are also grateful to the FPS Mobility and Transport for delivering data
and information.

22
REFERENCES
Anable, J. (2005) “Complacent car addicts” or “aspiring environmentalists”? Identifying
travel behaviour segments using attitude theory. Transport Policy 12, 65-78.
Banister, D. and Y. Berechman (2001) Transport investment and the promotion of
economic growth. Journal of Transport Geography 9, 209-218.
Banister, D. (2008) The sus tainable mobility paradigm. Transport Policy 15, 73–80.
Berger, P.L. and R.J. Neuhaus (1977) To empower people: the role of mediating
structures in public policy. Washington, DC: American Enterprise Institute for
Public Policy Research.
Brewer, A. (1998) Work design, flexible work arrangements and travel behaviour: policy
implications. Transport Policy 5, 93-101.
Cao, X. and P.L. Mokhtarian (2005) How do individuals adapt their personal travel?
Objective and subjective influences on the consideration of travel-related
strategies for San Francisco Bay Area commuters. Transport Policy 12 (4), 291–
302.
De Witte, A., C. Macharis and O. Mairesse (2008) How persuasive is “free” public
transport? A survey among commuters in the Brussels Capital Region. Transport
Policy 15, 216–224.
DeHart-Davis, L. and R. Guensler (2005) Employers as mediating institutions for public
policy: the case of commute options programs. The Policy Studies Journal 33 (4),
675-697.
DETR (1998) A New Deal for Transport: Better for Everyone. Department for the
Environment Transport and the Regions.
Dickinson, J.E., S. Kingham, S. Copsey and D.J. Pearlman (2003) Employer travel plans,
cycling and gender: will travel plan measures improve the outlook for cycling to
work in the UK? Transportation Research Part D 8 (1), 53-67.
Enoch, M. and S. Potter (2003) Encouraging the commercial sector to help employees to
change their travel behaviour. Transport Policy 10, 51-58.
23
European Commission (2009) Action plan on urban mobility. Brussels, Commission of
the European Communities, 490/5.
Giannelloni, J.L. and E. Vernette (2001) Etudes de marché. Vuibert, 239.
Giuliano, G. and T.F. Golob (1990) Staggered work hours for traffic management: a case
study. Transport Research Record 1280, 46-58.
Giuliano, G., Hwang, K. and M. Wachs (1993) Employee trip reduction in Southern
California: first years results. Transportation Research Part A 27, 125-137.
Glaister, S., J. Burnham, H. Stevens and T. Travers (1998) Transport Policy in Britain .
Macmillan, London.
Hagman, O. (2003) Mobilizing meanings of mobility: car users’ constructions of the
goods and bads of car use. Transportation Research Part D 8 (1), 1–9.
Helminen, V. and M. Ristimäki (2007) Relationships between commuting distance,
frequency and telework in Finland. Journal of Transport Geography 15, 331–342.
Hendricks, S.J. and N.L. Georggi (2007) Documented impact of transportation demand
management through the case study method . Journal of Public Transportation 10,
79-98.
Henser, D.A. and J.M. Rose (2006) Development of commuter and non-commuter mode
choice model for the assessment of new public transport infrastructure projects: a
case study. Transportation Research Part A 41 (5), 428-443.
Henry, G.T. and C.S. Gordon (2003) Driving less for better air: impacts of a public
information campaign. Journal of Policy Analysis and Management 22 (1), 45-63.
Hole, A. (2004) Forecasting the demand for an employee park-and-ride service using
commuters’ stated choices. Transport Policy 11 (4), 355–362.
Hung, R. (1996) Using compressed workweeks to reduce work commuting.
Transportation Research Part A 30 (1), 11–19.
Hwang, S. and G. Giuliano (1990) The Determinants of Ridesharing: Literature Review.
Working Paper, UCTC No. 38.
Kingham, S., Dickinson, J. and S. Copsey (2001) Travelling to work: will people move
out of their cars. Transport Policy 8, 151-160.
Likert, R. (1932) A technique for the measurement of attitudes. Archives of Psychology
140, 1-55.
24
Litman, T. (2003) The online TDM Encyclopedia: mobility management information
gateway. Transport Policy 10, 245-249.
Ortúzar, J. de D., A. Iacobelli and C. Valeze (2000) Estimating demand for a cycle-way
network transportation research. Transportation Research Part A 34, 353–373.
Preston, C.C. and A.M. Colman (2000) Optimal number of response categories in rating
scales: reliability, validity, discriminating power, and respondent preferences.
Acta Psychologica 104, 1-15.
Rietveld, P. and V. Daniel (2004) Determinants of bicycle use: do municipal policies
matter? Transportation Research Part A 38 (7), 531–550
Rietveld, P. (2001) Biking and walking: the position of non-motorised transport modes in
transport system. Tinbergen Institute Discussion paper. Paper TI 2001-111/3.
Roby, H. (2010) Workplace travel plans: past, present and future. Journal of Transport
Geography 18 (1), 23-30.
Rodriguez, D.A. and J. Joo (2004) The relationship between non-motorised mode choice
and the local physical environment. Transportation Research Part D 9 (2), 151–
173.
Rye, T. (1997) The implementation of workplace transport demand management in large
organisations. Unpublished PhD Thesis, the Nottingham Trent University.
Rye, T. (1999a) Employer attitudes to employer transport plans: a comparison of UK and
Dutch experience. Transport Policy 6, 183-196.
Rye, T. (1999b) Employer transport plans – A case for regulation? Transport Reviews 19,
13-31.
Steg, L. (2005) Car use: lust and must. Instrumental, symbolic and affective motives for
car use. Transportation Research Part A 39, 147–162.
Sundo, M. and S. Fujii (2005) The effects of compressed workweek on commuter’s daily
activity patterns. Transportation Research Part A 39 (10), 835–848.
Van Exel, N.J.A. and P. Rietveld (2009) Could you also have made this trip by another
mode? An investigation of perceived travel possibilities of car and train travellers
on the main travel corridors to the city of Amsterdam, The Netherlands.
Transportation Research Part A 43, 374-385.
25
Van Malderen, L., B., Jourquin, I., Thomas, T., Vanoutrive, A., Verhetsel and F. Witlox
(2009) Mobility policies of the companies located in Belgium: are there success
stories? In: Third Bivec-Gibet Research Day, Brussels, Belgium, 27th May 2009.
Vandenbulcke, G., I. Thomas, B. de Geus, B. Degraeuwe, R. Torfs, R. Meeusen., and L.
Int Panis (2009) Mapping bicycle use and the risk of accidents for commuters
who cycle to work in Belgium. Transport Policy 16 (2), 77–87.
Vanoutrive, T., L. Van Malderen, B. Joruquin, I. Thomas, A. Verhetsel and F. Witlox
(2009) Let the business cycle! A spatial multilevel analysis of cycling to work.
Belgeo 2009 (2), 217-231.
Vanoutrive, T., L. Van Malderen, B. Jourquin, I. Thomas, A. Verhetsel and F. Witlox
(2010) Mobility management measures by employers: overview and exploratory
analysis for Belgium. European Journal of Transport Geography 10 (2), 121-141.
Vickerman, R.W. (2003) Transport in integrating Europe: Sustainable development and
cohesion. Investigaciones Regionales 3, 163-174.
Weiss, J.A. and M. Tschirhart (1994) Public information campaigns as policy
instruments. Journal of Policy Analysis and Management 13 (1), 82-119.
26
APPENDIX A
HTWT survey 2008 ― Mobility measures and their frequency
Mode of transport Description of the measure Frequency (%)
Bicycle Covered bicycle storage 40.30
Secured bicycle storage 28.11
Showers 28.38
Provision of a changing room 27.48
Bicycle repair facilities 3.80
Improvement of the infrastructure 3.40
Provision of rain clothes 2.60
Making bicycles available for work trips 11.80
Bicycle maintenance facilities 1.13
Making bicycles available for commuting 2.90
Bicycles available at the railway station 1.00
Cycling measures: other 5.10
Diffusion of information about cycling routes 3.18
Additional payment for cycle commuting 48.00
Additional payment for work trips by bicycle 10.45
Public
transport
Additional payment for using public transport 24.96
Organisation of public transport by employers 5.27
Coordination with public transport authorities 4.55
Diffusion of information about public transport 9.66
Encouragement to use public transport 9.07
Other 7.24
Carpooling Organisation of carpooling 6.49
Carpooling database 5.91
Reserved car parks for carpoolers 2.00
Guarantee for the return journey 2.05
Diffusion of information about carpooling 5.00
Other 3.49