University of Glasgow Exploration Society Trinidad Expedition ...
60
University of Glasgow Exploration Society Trinidad Expedition Report 2007 Further information available from: Dr. Joanna Smith Biology Teaching Centre Boyd Orr Building University of Glasgow [email protected]
-
Upload
khangminh22 -
Category
Documents
-
view
0 -
download
0
Transcript of University of Glasgow Exploration Society Trinidad Expedition ...

University of Glasgow Exploration Society
Trinidad Expedition Report 2007
Further information available from:
Dr. Joanna Smith
Biology Teaching Centre
Boyd Orr Building
University of Glasgow


Contents
Acknowledgements........................................................................................................................ 4
Introduction ...................................................................................................................................... 6
Trinidad and Tobago ................................................................................................................. 6
GU Exploration Society & Trinidad ...................................................................................... 7
Expedition personnel .................................................................................................................. 10
Amphibian Conservation and Biodiversity Surveying Projects................................... 11
Investigating the influence of habitat on amphibian presence in a protected
forest reserve in Trinidad’s Northern Range. ................................................................ 11
Endemic Species Surveys on the Morne Bleu Ridge .................................................. 24
Surveying Stream Frogs: North Coast and Central Range. .................................... 25
Efficacy of digital photography in mark-recapture studies: a follow-up? .......... 28
Southern road surveys........................................................................................................... 28
Amphibian reproductive ecology projects .......................................................................... 30
The effect of Ultraviolet-B radiation on the growth and behaviour of
Phyllomedusa trinitatis tadpoles ........................................................................................ 30
The interaction between mosquito larvae and different species of tadpoles. .. 37
Entomology Projects Reports .................................................................................................. 44
Asymmetry in the praying mantis, T. roseipennis...................................................... 44
Heliconia Project Report ........................................................................................................ 53
AWNC education and outreach ............................................................................................... 58
Appendix 1: Financial report.................................................................................................... 60

Acknowledgements
Sponsorship: We would foremost like to thank everybody that contributed funds to the
expedition, without which none of this would have been possible. Special thanks go to: The
Carnegie Trust for the Universities of Scotland, the Blodwen Lloyd Binns Trust of the Glasgow
Natural History Society, Chester Zoo, The Dennis Curry Charitable Trust, The Gilchrist
Educational Trust, The Royal Scottish Geographical Society, Glasgow University Court, Hope
Homes and The Thriplow Trust.
Pre-expedition planning and advice: we would like to thank Roger Downie and Geoff
Hancock for their help and advice prior to the expedition. Thanks to all of the local businesses
and companies that provided raffle prizes, John Moffat for his help with t-shirt and hoodie
printing. Finally, many thanks to family and friends for buying cakes, t-shirts, raffle tickets etc…
In Trinidad: Thanks to all the staff at the Asa Wright Nature Centre for their help and
hospitality during, in particular Dr. Howard Nelson and Farah Gopaul-Fuller for their support
and friendship, Pamela for her poems and Ray Mendez for his fantastic stories. At Simla,
Ronnie and Linda Hernandez were invaluable as ever, thanks for your help and friendship. To
old and new friends with whom we shared Simla: Nicholas McLetchie & Chris Stieha (University
of Kentucky), your love of bryophytes is always inspiring and the loan of your binocular
microscope was incredibly generous; Doug Fraser, Alex Flecker, Mike , (FIBER): Julian Kapoor
(Berkeley University), your shoogly faces and bellbird calls are the stuff of legend. Thanks to
staff at the University of the West Indies, in particular Rabia Husein, Karen Duhn, and Savi
and Raj. We are grateful to all at the Wildlife Section, Forestry Division (MPRE), for
ensuring everything ran smoothly and for permits and access, particular thanks are due to
Nadra Nathai-Gayan, David Booodoo and Shortman. Also, Shobha Maharaj and the foresters
working with the UWI herbarium who took us on a rainy day out to Guayaguayare. We would
like to thank Econocars for all of their assistance and understanding. Special thanks are also
due to other friends in Trinidad who helped everything to run smoothly and helped us have
enormous amounts of fun. In particular we would like to thank Christo Adonis (and Rebuscar)
for parang and moonshine madness, Shobha Maharaj, Pius, Jean and Moses Hernandez of
Brasso Seco.
4

Watterson, B (1996) There’s Treasure Everywhere. Warner Books, London, UK
5

Introduction
Trinidad and Tobago
Trinidad is an island
situated in the Southern
Caribbean Sea, just off the
coast of Venezuela, and is
the most southerly member
of the Caribbean island
chain. It is an area of
extreme natural beauty and
great biological and
geographical diversity.
There are several reasons
for our continued return to
the island: Trinidad boasts a
fantastic array of
undisturbed habitats; from
the incredibly diverse
mangrove swamps in the Sou
North. Over the years we ha
welcome our research. A vast
papers have been published in
work carried out on the exp
conservation of several speci
particularly valuable in conserv
Trinidad has a tropical climate
the year and a rainy season
vacation runs from June until
out our research during this s
rainy season and is also tradit
focuses primarily on birds. Fo
particularly their reproductive
until mid July, just before the
were not possible.
Figure 1. Map of Trinidad demonstrating its proximity to mainland
South America and Highlighting the location of the Northern Range
(www.ugcs.caltech.edu)
th, to the cloud forests that cover the mountains in the
ve built up a rapport with the local community who
amount of knowledge has been accumulated, and many
peer-reviewed scientific journals as a direct result of the
editions. The work has been important in aiding the
es, ranging from frogs to turtles, and this year was
ation terms.
, with a dry season that persists during the first half of
during the second. The Glasgow University summer
September, therefore it is only possible for us to carry
hort window. This coincides with the start of Trinidad’s
ionally the low season for eco-tourism in Trinidad, which
rtunately, this is the ideal time to study amphibians -
biology. This year, however, the rains did not break
end of the expedition, so many of our proposed projects
6
One of Trinidad’s finest features is its great geographical diversity and its geographic
diversity is matched by its biological diversity. Trinidad is physically and geologically
closer to South America than to other Caribbean islands, having being connected to
the mainland as recently as 3000 years ago, and thus shares a great deal of its
biodiversity with the mainland. Some 2,300 species of flowering plants exist on the
island, including 700 orchids and 370 species of tree. The diversity of fauna on
Trinidad is no less spectacular than the flora. There are over 400 species of bird (which
makes Trinidad the most biologically diverse country in the world in terms of bird
species per km2), 108 mammal species (57 of them bats), 70 reptile species and over
30 amphibian species. Insect diversity is extremely high, too large in fact for accurate
records to be made, though as an indication, there are 620 known butterfly species
recorded.
GU Exploration Society & Trinidad
The Exploration Society is a valuable asset to the University of Glasgow. Not only does
it provide its students with invaluable experience in scientific research, it also gives
them experience in fundraising, and dramatically improves their organisation and
teamwork skills. Costs for the expeditions are typically high and the students raise all
funds through the organisation of events, sponsorship and grants.
Over the years GU Exploration Society Expeditions have built up good relations with
the Trinidad Government’s Wildlife Division, local NGOs and other conservation
organisations working on the island that welcome and support our research, and we
are very grateful for their continued help and friendship. With a new drive to attain
‘developed’ status by the year 2020 the Government has committed to ensure that “by
2020 Trinidad and Tobago should be a country in which all persons treasure the
environment and voluntarily use its resources wisely to ensure it’s protection,
conservation and restoration’ (Rakhelewan, 2006). Furthermore, as signatories to the
Convention on Biological Diversity (in 1997) Trinidad is committed to the ‘conservation
of biological diversity’, inherent in which is the necessity to catalogue what that
diversity entails. With resources for research within Trinidad limited at present, the
Wildlife Division has been keen to encourage the presence of foreign study groups,
such as expeditions from the University of Glasgow, to aid in the collection of this vital
data. Over the years, a vast amount of knowledge has been accumulated, and many
papers have been published in peer-reviewed scientific journals as a direct result of the
work carried out by the expeditions. This is of obvious benefit to the academic careers
7

of the students involved and is important for the dissemination of research to the wider
scientific community. A number of reports have been produced and circulated to local
conservation groups, the University of the West Indies and the library of the Wildlife
and Forestry Department in Trinidad and these are often used in consultation
processes to inform decisions about conservation policy.
University of Glasgow Trinidad Expedition 2007
This year was the 14th expedition to Trinidad organised by Glasgow University’s
Exploration Society. Our team of eight undergraduate students was chosen following
interviews in October 2006 and our fundraising period ran from then until May 2007.
In previous years expedition personnel were divided into teams prior to arrival in
Trinidad. This year, however, because of limited numbers of drivers, each student
worked on a number of different projects. This had the advantage of students learning
a number of valuable field techniques. A list of expedition members is shown at the
end of this introduction.
Fundraising
We carried out a range of activities in order to raise funds for the expedition and each
member participated equally in these efforts. We held several bake sales with produce
made by ourselves, held a raffle with prizes donated by a number of local shops and
companies, held a band night, a dj night, and sold expedition T-shirts and hoodies.
The expedition applied for grants and sponsorship from a number of organisations (see
financial report, Appendix 1) and the whole team was involved in applications and
letter writing. Finally, a large chunk of our funds came from the personal contribution
of £600 from each member of the expedition. For a full breakdown of income and
expenditure from 2006 see the financial section of this report (Appendix 1).
Logistics
The main party arrived in Trinidad on the 13th June 2007 and the expedition ran for a
period of eight weeks. Dr. Smith, Dr. Thornham and Rebecca Dye arrived a few days
prior to this to make final arrangements for accommodation, car hire and permits.
Accommodation and Transport
The whole expedition stayed at the William Beebee Tropical Research Station in the
Arima valley (a.k.a. Simla) for the duration. In Trinidad three cars were hired from
Econocars, each with a driver over the age of 27.
8

Insurance
Insurance for the majority of the expedition members was arranged through Essential
Travel. This was arranged online. Joanna Smith was insured through the University of
Glasgow.
Medical Arrangements
Each member of the expedition was fully vaccinated against the following: hepatitis A
and B, yellow fever, typhoid, polio, tetanus, and rabies. Malaria is extremely rare in
Trinidad so malaria tablets were not deemed necessary unless students were traveling
on to South America after the expedition. Mosquitoes were abundant across the whole
island and are known to carry dengue fever in some instances. Students were
encouraged to wear long sleeved shirts and trousers and applied insect repellant,
particularly during the day when dengue fever is most likely to be transmitted.
Mosquito nets were hung over beds to reduce insect bites at night.
Two students attended a residential expedition first aid course, run by the British Ski
Patrol, arranged through the GU Exploration Society. Two staff members also had first
aid training. Each car was equipped with a first aid kit, arranged through the GU Health
Service, and an additional first aid kit was kept at the research station.
Security
The crime rate in Trinidad is unfortunately fairly high, particularly in the towns and
cities, and past expeditions have experienced minor thefts. Fortunately Simla is
situated in a secluded area and the only access is by a single track road that runs past
the gate to a quarry. The quarry gate is manned at all times and the Asa Wright
security guards frequently patrol the area and can be contacted by phone or CB radio if
necessary. Fortunately there were no incidents of theft or disturbance during the
expedition.
After the expedition
At the end of the expedition most of the students took a very short flight over the
water to the neighbouring island of Tobago for some snorkeling, diving and relaxation.
Others remained in Trinidad to tie up loose ends and explore the country without the
pressures of research projects.
9

Expedition personnel
Stephanie Ballantyne, MSci Zoology
Gillian Carfrae, L3 Zoology
Leoni DeWert, MSci Zoology.
Rebecca Dye, MSci Zoology.
Andrew Gault, L3 Animal Biology
Geoff Hancock, Hunterian Museum.
Alison Hunter, L1 Biology
Matthew MacDonald, L4 Zoology
Amy McKellar, L4 Zoology
Fraser Murdoch, L3 Zoology
Joanna Smith, University Teacher.
Dan Thornham, Honorary Research Associate.
Figure 2: The expedition (minus Leoni, Jo & Geoff) before their ascent of Aripo, accompanied by local
expert Christo Adonis and his son Kevin. Front L to R: Fraser Murdoch, Steph Ballantyne, Becky Dye, Gill
Carfrae, Dan Thornham, Christo Adonis. Back L to R: Kevin Adonis, Amy McKellar, Ally Hunter, Matt
MacDonald, Andrew Gault.
10

Amphibian Conservation and Biodiversity Surveying Projects Reports compiled by Joanna Smith, data collected by all on expedition.
Investigating the influence of habitat on amphibian presence in a protected forest reserve in Trinidad’s Northern Range.
Introduction
The Asa Wright Nature Centre
(AWNC) is a conservation NGO
established in 1967 to
“promote the conservation of
the native ecosystems and
wildlife of the Arima Valley”.
Their main income is derived
from ecotourists, both local
and foreign, who visit the
Centre to observe a large
number of Trinidad’s bird
species. Their profits are
invested in land conservation, co
their activities promoting ecoto
Beebe Tropical Research Station
have been based three times in t
Conversations between staff an
2006 and management at the AW
together over the next four year
biodiversity and conservation in T
some localised in distribution, s
forest species, with only 4-5 en
However, from the presence of a
experimental ponds have been
where suitable habitat exists. Wi
the AWNC, the potential exist
amphibian presence to consider
Figure 3: View of the Arima Valley from the Asa Wright balcony.
Photo: J. Smith.
mmunity outreach, education and research. As well as
urism in Trinidad, the Centre manages the William
(a.k.a. Simla) where Glasgow University expeditions
he past five years.
d students of the University of Glasgow Expedition
NC resulted in plans for the two institutions to work
s to help build capacity and knowledge of amphibian
rinidad. Trinidad has about 30 species of amphibians,
ome more widespread. Only a few are truly dense
countered easily on AWNC’s main site at Springhill.
t least eight additional species at nearby Simla, where
established, it is clear that frogs do colonise areas
th a variety of habitats seen in the areas protected by
s to look at the correlation between habitat and
what qualities are specifically selected by Trinidadian
11

frog species and thus use this information to ‘improve’ habitats to promote high
amphibian diversity on the lands owned by the Nature Centre.
At present, AWNC is limited in the scope of its activities by the seasonal nature of its
main visitor base. Most Europeans and North Americans visit the Caribbean during
Trinidad’s dry season (December-May), the best time to see most birds. These non-
resident visitors make up more than 80% of AWNC clients and the high seasonality of
their arrivals limits the period during which the Centre can raise funds for its
conservation activities. The AWNC would like to be able to enhance their visitor base
by developing sites on their lands as breeding ponds for amphibians.
It is well known that amphibian populations are in steep decline around the world
(Stuart et al., 2004) and amphibian biologists have recently called for the
establishment of an Amphibian Survival Alliance to prevent their decline (Mendelson et
al., 2006). One positive strategy identified is the creation of new habitat. Although
amphibian population studies are at an early stage in Trinidad, it is clear that the rapid
economic development of the island, funded by oil and gas income, is a threat to many
amphibian habitats (JRD, JS - personal observations). The creation of new amphibian
sites in an area where strong environmental protection is already in place will help
safeguard these species, several of which are already recognised as being vulnerable
or endangered (Global Amphibian Assessment, 2006).
A team of students, in consultation with the AWNC, undertook extensive surveys of the
land protected under the management of the AWNC at Springhill to allow the
identification of suitable target areas for enhancement for amphibians. At each site the
availability of breeding sites i.e. temporary and permanent ponds, streams and
bromeliads; tree densities and vegetation structure; canopy and undergrowth cover
were measured. Concurrently, audio and visual transects were carried out, using
previously established methodologies (Smith et al. 2006), to determine amphibian
species assemblages and population densities of frogs at Springhill. These are reported
in detail here.
Similar surveys were also conducted at nearby Simla (in more disturbed habitat) and
at Morne Bleu (in less disturbed habitat) to allow comparison between a variety of
habitat types and to consider which species may benefit and colonise ‘improved’
habitat. Preliminary analysis of species densities and presence are reported here.
12

Surveying methods
Habitat
Trails were walked by day
and habitat assessments
carried out: tree density
estimates (from counts
within 1m of path on either
side); tree circumferences at
1.5m height; canopy height;
percentage of trees with
biologically significant levels
of epiphytic and vine cover
(extrapolated from first ten
trees encountered) were
noted in the field. Epiphytes
were considered to be of biolog
holding water. Photographs we
heights and percentage cover c
ImageJ). Trails were marked o
The total distance marked out f
Amphibian populations
Several 100m transects were w
dusk onwards. This time has
appropriate for the detection of
is a particular target of this
Eleutherodactylus urichi, will als
conditions. Start and stop point
time dependent effects. Tempe
frogs calling were recorded on
completed, encompassing arou
due to methodology, the densit
sex ratios were assumed, then
of information about relative nu
figures will refer to male den
Clearwater Pool were carried ou
Figure 4: Matt marks out the trails for surveying. Photo: J. Smith
ical significance to amphibians if they were capable of
re taken of the canopy and ground floor from fixed
alculated using imaging software (Adobe Photoshop &
ut in 50m stretches using ribbon markers (Figure 4).
or study stretched over a total of 2.5km.
alked on a number of occasions by two observers, from
been found, in previous studies, to be the most
Flectonotus fitzgeraldi, one of the endemic species that
study. Most other species, including the endemic
o start calling as soon as it is dark in suitable weather
s were randomised to avoid bias in any one area due to
rature, percentage humidity, species and numbers of
each audio transect. Forty-six audio transects were
nd eight hours of surveying. It should be noted that,
ies correspond to numbers of adult male frogs. If equal
densities for each species may double, but in absence
mbers of male and female frogs for these species then
sities for comparative purposes. Daytime surveys of
t to estimate numbers of Mannophryne trinitatis.
13

Springhill Trails1
Adventure Trail
06° 86.068’ N; 11° 84.915’ E (100m) 06° 86.141’ N; 11° 84.585’ E2
The Adventure Trail was walked from
the junction it makes with Bamboo
Valley. This trail is around 500m long
and is seldom, if ever, if ever walked
by guests of the Centre being labelled
on the Centre’s trail maps as being
somewhat strenuous. The path
crosses streams twice (using stepping
stones on the first occasion at 100m)
and then ascends up a steep hillside.
Trees are densely distributed in the
forest at around 4860/Ha3 (see Table
1 for summary of habitat parameters)
and the trees measured were
comparatively narrow in diameter at
around 16cm on average. 62% of the
trees have vine cover, but only 8% of
trees have significant bromeliad cover
on the main trunk. The canopy height
is around 11m with the canopy cover
dense and close, on average around
85%. Ground cover is thin, perhaps as
a consequence, at around 26%. The
temperatures at dusk were relatively low (~25°C) compared to other trails, and
relative humidities high (89%). Only the Chaconia Trail was cooler and more humid
(see Table 2 for summary of environmental parameters).
* *
E S
N W
Figure 5: Trails on the Springhill Estate (map adapted
from Asa Wright leaflet). *Potential pond sites?
It is beautiful forest and there is good habitat in several places (for Mannophryne in
particular) but is unlikely to be suitably utilised as an educational trail because of the
“difficult” terrain and thick forest. 1 The Oilbird and Heliconia trails were not surveyed for amphibian presence, due to access restrictions. 2 Map references follow Universal Transverse Mercator grid Zone 20. 3 See Table for comparative figures for all trails surveyed.
14
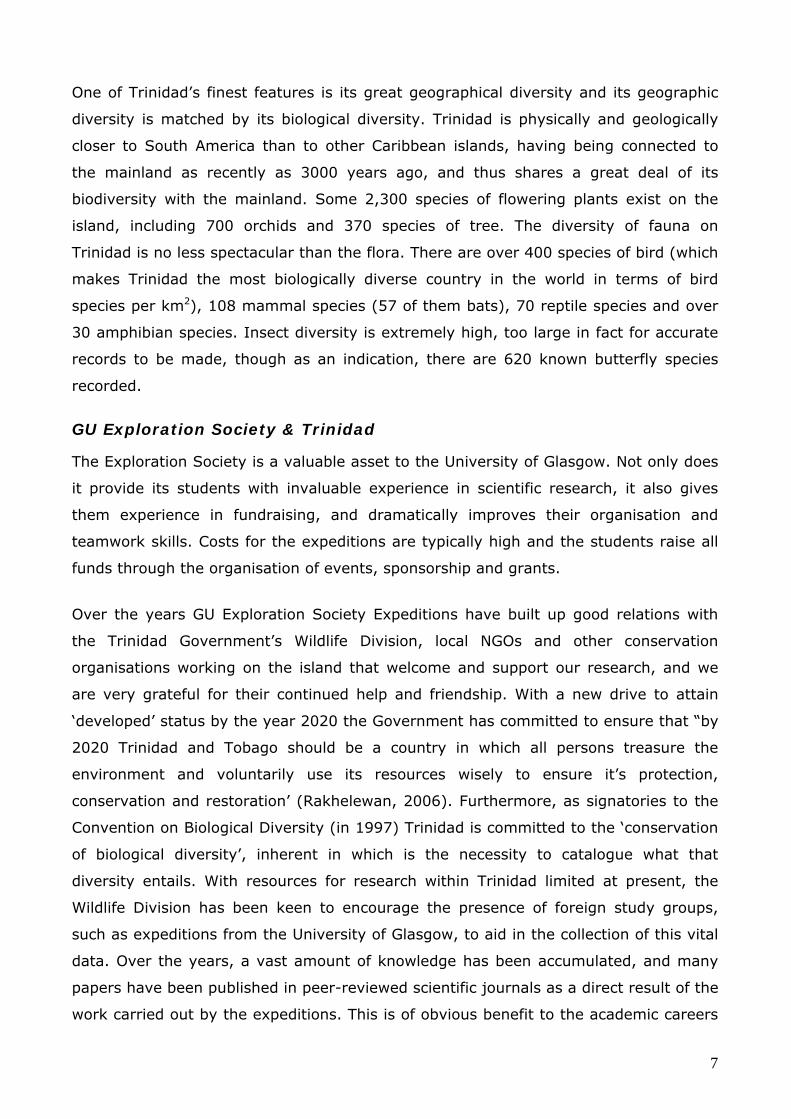
Bamboo Valley Trail
06° 86.146’ N; 11° 85.167’ E 06° 86.196’ N; 11° 85.302’ E
The Bamboo Valley Trail starts at the foot of the
stairs that lead up to the Estate house from the
Chaconia Trail. For the first 200m the trail goes
downhill towards the Arima River – to the North of
the path, the terrain is steep and there is thick leaf
litter, fallen trees and cut brush from where
numerous male Mannophryne trinitatis call. Many
visual encounters were noted of both male and
female frogs along this first stretch of the trail.
The path meets a junction with the Adventure
Trail, which leads off to the South at around
100m. The Bamboo Valley trail continues
northwards, through the buttress roots of a large
immortelle tree to a small bridge which crosses the
river at around 150m from the start of the trail. In
the early evening, along the stretch of the river on
either side of the bridge, Hypsiboas boans call. On
the far side of the bridge is a bench and some
steps which lead down to a large pool at the foot o
present these stairs are slippery and have no rails,
visitors down to the streamside to see newly emerge
also a bench and a clear area which could act as a n
for a signpost to tell the story of the Centre’s frog sp
climb upwards; here there is an abandoned hydroele
the old pump has the potential to form the base of
built and maintained to encourage the presence
Trachycephalus venulosus, Dendropsophus minut
Guppies could be maintained in the tanks and used t
fish from Darius Guppy’s original species. As the p
runs through dense stands of Heliconia where larg
heard calling at dusk. As the path continues upwar
down on the stands and see these tiny tree frogs call
path flattens out between 300-400m, having ascend
groo-groo palms, cecropia, torch ginger, cocoa an
Figure 6: Streamside habitat on the
Bamboo Valley trail ideal for the
endemic frog, Mannophryne trinitatis.
Photo: J Smith
f a small waterfall (Figure 4). At
but there is the potential to lead
nt Mannophryne froglets. There is
atural stopping place or as a site
ecies. At 200m the path starts to
ctric station. The concrete base of
a breeding pond, which could be
of charismatic species such as
us and Phyllomedusa trinitatis.
o introduce the story of aquarium
ath continues to the Northwest it
e numbers of Flectonotus can be
ds, it is possible to turn and look
ing on top of the large leaves. The
ed through secondary forest with
d hogplum amongst the species
15

present. At 350m there is a junction with the Heliconia Trail and the Bamboo Valley
Trail continues northwards and uphill again through thickening forest, with large
immortelles, Cecropia peltata (Bois canot) and tree ferns. The Trail ends at around
500m, where it meets with the metalled road of the Springhill Driveway.
The forest is not as thickly planted as elsewhere on the estate (2700 trees/Ha) with
more clearings, more diverse vegetation and mature trees (average diameter 20.96
cm). 66% of the trees have vine cover, and 24% have significant bromeliad cover on
the main trunk. The canopy height is around 11m with the canopy cover fairly
substantial, at around 83%. In spite of this, ground cover is also reasonably thick, at
around 60%. Dusk temperatures are higher here than on other trails with average
temperatures of around 27°C, though humidities are still high (~85%).
The Bamboo Valley Trail is one of the more diverse of the trails in terms of the habitat
available for amphibians and has the most potential as an educational trail; however,
beyond 200m the path can be quite steep in stretches and may not prove popular with
older clientele of the Centre.
Chaconia trail
06° 85.936’ N; 11° 85.030’ E 06° 86.146’ N; 11° 85.167’ E
The Chaconia Trail leads off to the North from the junction with the Discovery Trail. In
the first 100m, there are large crab holes under the roots of plants. Many of these are
occupied by land crabs, but male Mannophryne trinitatis were also seen calling from
these. There are a number of fallen trees along this stretch and at around 90m, an
area beneath the roots of an uprooted was being used as a calling arena by several
male Mannophryne. The large numbers of Mannophryne trinitatis that were seen along
this first 200m of this trail are linked to the proximity of a small stream, that runs
alongside the path for the second 100m. Bridges on the trail cross the stream and its
tributaries twice giving the opportunity to see these diurnally active frogs at close
quarters. After 200m, the forest becomes denser for a short distance, with mahoe,
chaconia and jacaranda trees present, but is dominated again by secondary
vegetation, including coffee plants and a large bamboo stand at around 280m. The
Chaconia Trail meets the junction with Bamboo Valley at 300m and then heads in a
Westerly direction back up towards the Estate house via several flights of stairs. This
area is dominated by ornamental planting and fruit trees but there is the occasional old
forest tree, including one very large, epiphyte-covered mountain immortelle where
16

Eleutherodactylus urichi were noted calling from the buttresses. To the North of the
path, secondary vegetation thickens gradually and this area might make a suitable site
for a breeding pond for edge species, such as Hypsiboas crepitans.
The forest that the Chaconia trail traverses is relatively densely planted (4975
trees/Ha) with many young trees (average diameter, 17cm). 68% of trees have vine
cover, though only 10% have significant bromeliad cover on the main trunk. The
canopy height is around 14m with the thickest average canopy cover, at around 88%.
Ground cover is around 45%. Dusk temperatures are lowest on this trail (~24°C) and
relative humidities highest (92%).
Discovery trail
06° 85.922’ N; 11° 85.054’ E 06° 86.141’ N; 11° 84.585’ E
The Discovery Trail starts at the Nature Centre and for the first two hundred metres
runs through gardens planted with large ornamentals and fruit trees, including many
palms, mango, ginger, tangerine, cashew, pomerac and jacaranda. The path continues
down into secondary forest4. There are commercially important trees, including
nutmeg, serette and guava planted on the former plantation land. Monkey ladder
lianas hang over the path at around 350m and a large leafcutter ant colony can be
seen on either side of the path. The path continues through densely planted secondary
forest, with occasional large emergent trees including jumbie bean and incense trees,
continuing to its end around 500m from the start, where a number of bellbirds can be
heard loudly defending their territory. There it meets with the Adventure Trail, which
goes off to the North. The Discovery Trail is the most traversed of all the trails on the
estate, though the majority of tourists only take short walks as far as the manakin lek.
In spite of the fact that the Discovery trail has 100m of ornamental garden at its start,
the density of trees is highest on this trail, at 6920 trees/Ha. However, this is largely
due to the later stretches of the path where newly planted saplings form a thick forest
and this is reflected in the high variability about the average. Surprisingly the tree
diameters in this area are not the smallest values, due to the presence of some very
large mature trees (average diameter, 19cm). Only 38% of trees have vine cover,
26% have significant bromeliad cover on the main trunk. The canopy height is high, at
around 15m, with canopy cover of around 74%. Ground cover is around 32%. Dusk
temperatures are high (~26°C) and relative humidities low (79%).
4 At around 300m there is a large active lek of bearded manakins to the South of the path.
17

Springhill Driveway
06° 86.196’ N; 11° 85.302’ E 06° 85.938’ N; 11° 85.074’ E
From where the Bamboo Valley trail
emerges on to the Driveway there is a
600m stretch of metalled road to the
Estate house. This runs through
secondary forest, alongside cultivated
christophene vine, and through gardens
planted with fruit trees (citrus,
breadfruit and nutmeg) and with
ornamental flowering shrubs (ginger,
datura, hibiscus, cigar trees) planted to
encourage hummingbirds. The
driveway crosses numerous small
streams approximately every 100m, in
many of these Mannophryne could be hea
of the path, males transporting tadpoles w
path leads off to the left to a natural swim
were many calling male Mannophryne trin
Tree densities are lowest on this trail
managed, garden-like habitat that edges
have been left are large, mature specimen
on this trail than on others (22 cm). The
bromeliad cover, so that in spite of th
percentages have vine cover (76%) and b
11m in height and gives least cover (51%
management by the estate gardeners.
relative humidities lower than elsewhere (
The trail is ideal for seeing many species
eight toucans!) because of its elevated
valley and is easily accessible and a relat
traffic are not compatible, this trail is no
tour.
5 ~200m from where Bamboo Valley Trail meets Dri
Figure 7: Calling male M. trinitatis at Clearwater Pool
Photo: L. de Wert
rd calling and in a shallow ditch to the west
ere noted on several occasions5. At 250m, a
ming pool (Clearwater Pool) and here there
itatis (Figure 7) and emergent froglets.
(2060 trees/Ha) due largely to the more
the trail. There are fewer trees but those that
s so that average tree diameters are greater
mature trees also have substantial vine and
e fact that there are fewer trees greater
romeliad cover (46%). The canopy is around
), ground cover is sparse (30%), due to strict
Dusk temperatures are high (~27%) and
80%).
of bird (including on one occasion, a family of
position which commands a view down the
ively easy walk. However, as amphibians and
t suitable for development for a frog-based
veway there is a lek of golden manakins.
18

Habitat/Environmental correlations
Correlative trends were examined between habitat parameters and environmental
parameters (see Table 3 for correlative statistics). There were lower dusk
temperatures in areas along trails where tree densities were highest and where there
was extensive canopy cover. Higher tree densities were also seen to correlate with
reduced vine and epiphytic cover and reduced ground cover. In areas with open
canopy, epiphytic cover was greater and areas with larger trees were more likely to
have higher epiphytic cover. Higher dusk temperatures (associated with open canopy)
were also seen in areas with greater ground cover.
The observation of increased epiphytic cover and increased ground cover together in
areas of low canopy cover is surprising in view of observations made at Morne Bleu in
2006 (Smith et al. 2006) where epiphytic cover was greater in closed canopy forest
and was negatively correlated with ground cover. It may be that different species of
bromeliad and epiphytes are present at the two sites, or may be that there are simply
very different conditions that lead to high percentage canopy cover in the two areas.
At Morne Bleu, which has not been subject to sustained disturbance, high percentage
canopy cover is indicative of undisturbed mature forest, which might be expected to
have greater densities of epiphytes. At Springhill, high percentage canopy cover is
indicative of recent disturbance as it is correlated with densely planted, narrow
diameter trees.
Nocturnal frog surveys
Five species were recorded on surveys at Springhill: Eleutherodactylus urichi,
Flectonotus fitzgeraldi, Hypsiboas boans, Mannophryne trinitatis and Scinax ruber.
Bufo marinus were also observed outwith survey times at the site. Dusk surveys
recorded average densities of Eleutherodactylus urichi (Eu) of 89 frogs/ Ha (± 13, n =
24) on the trails. Flectonotus fitzgeraldi (Ff) were present in lower densities, at 49
frogs/Ha (± 9, n = 24).
Eleutherodactylus urichi were found in highest densities on the Bamboo Valley trail
(Table 4). This trail has the highest ground cover (Table 2) though there is no direct
correlative relationship between the two (Table 5). Flectonotus fitzgeraldi were found
in the highest densities on the Discovery trail, due to a great extent to high numbers
recorded in the bromeliad covered fruit trees in the planted ornamental stretch at the
start of the trail. There is a positive correlative relationship between the percentage of
trees with epiphytic cover and the numbers of this species recorded along the trail.
19

Table 1: Springhill habitat parameters.
% trees with
Trail
Tree density
(no/Ha)
Diameter
(cm)
Vine
cover
Epiphyte
cover
Canopy
height
(m)
Canopy
cover
(%)
Ground
cover
(%)
N
Adventure 4860 ± 554 15.97 ± 2.95 62 ±19 8 ± 2 11 ± 2 85 ± 3 26 ± 12 5
Bamboo 2700 ± 322 20.96 ± 3.40 66 ±7 24 ± 7 11 ± 2 83 ± 7 60 ± 11 5
Chaconia 4975 ± 1238 16.86 ± 1.44 68 ±3 10 ± 0 14 ± 2 88 ± 3 45 ± 10 4
Discovery 6920 ± 1534 19.46 ± 2.87 38 ±5 26 ± 9 15 ± 2 74 ± 12 32 ± 8 5
Driveway 2060 ± 496 22.48 ± 6.88 76 ±2 46 ± 13 11 ± 1 51 ± 16 30 ± 10 5
Table 2: Springhill environmental parameters, recorded at dusk.
Trail Temperature (°C) Relative humidity (%) N
Adventure 25.0 ± 0.2 89.2 ± 1.4 5
Bamboo 26.9 ± 0.4 84.5 ± 1.0 5
Chaconia 24.1 - 92.0 - 1
Discovery 26.5 ± 0.7 79.0 ± 2.6 5
Driveway 26.7 ± 0.2 80.4 ± 0.8 5
Table 3: Springhill habitat/environmental correlations. Figures in bold are significant (p<0.05).
Temperature Humidity Tree DBH Vines Epiphytes Height Canopy
Humidity 0.81 (-) - - - - - - -
Tree density 0.47 (-) 0.18 - - - - - -
Average dbh 0.08 0.16 0.09 - - - - -
Vines 0.10 0.16 0.41 (-) 0.20 - - - -
Epiphtyes 0.61 (-) 0.60 (+) 0.43 (-) 0.37 (+) 0.18 - - -
Canopy height 0.19 0.07 0.52 (-) 0.40 (+) 0.13 0.01 - -
Canopy cover 0.43 (-) 0.43 (+) 0.25 0.09 0.23 0.64 (-) 0.09 -
Ground cover 0.51 (+) 0.26 0.34 0.25 0.08 0.02 0.34 0.16
N 21 21 24 24 24 24 24 24
Table 4: Densities of endemic species at Springhill.
Eu density (frogs/Ha) Ff density (frogs/Ha) Trail Average s.e. Average s.e. N Adventure 90 10 2 4 5 Bamboo 134 134 46 56 5 Chaconia 35 27 66 62 4 Discovery 75 14 71 39 5 Driveway 100 21 55 21 5
Table 5: R-statistics for correlative relationships and direction of correlation between frog
densities/habitat parameters. Figures in bold are significant (p<0.05).
Trees/Ha DBH %vines %epiphytes Height %canopy %ground Temp Humidity Eu 0.09 0.17 0.19 0.00 0.41 (-) 0.15 0.05 0.26 0.05 Ff 0.02 0.13 0.03 0.52 (+) 0.51 (+) 0.31 0.08 0.53 (+) 0.65 (-) N 24 24 24 24 24 24 24 21 21
20

Diurnal frog surveys
Crepuscular surveys of non-riverine habitat recorded an average density of
Mannophryne trinitatis on the Springhill estate of 13 ± 6 (n = 24) frogs/Ha. However,
given that this species is diurnal, this figure is likely to be a significant underestimate.
Furthermore, a density figure in terms of frogs/Ha is not necessarily the most
appropriate for this species, which is typically restricted in distribution to the edges of
breeding streams. A timed search and survey was undertaken at times of maximum
activity for this species (1400h-1600h) of the edges of Clearwater pool to determine
densities at breeding sites. Methodology used was identical to that described on Page
for surveys of North Coast and Central Range sites. At the beginning of the survey, the
numbers of individual males heard calling was noted. A two-minute audio transect
recorded a linear density of 17 frogs/100m. In a half-hour timed search, confined to a
metre-wide strip around the 30m perimeter of the pond, 5 males, 3 females (sex ratio
~2:1) and 10 juvenile frogs were recorded. This corresponds to a linear density of 27
frogs/100m of river bank for this species at Springhill. However, it seems likely that
some areas of streamside habitat are more suitable than others; in particular the
distribution of predators and suitability of sites for tadpole deposition is likely to affect
the distribution of breeding adults along the length of waterways. More investigation of
the factors influencing streamside distribution in this species is of key importance for
understanding the conservation needs of this fragile species and for making
recommendations for improving the habitat with its specific requirements in mind.
Recommendations
To increase the quality of habitat available for other amphibian species across the
estate, some degree of thinning out of the forest might be recommended in some
areas along the Discovery trail to allow larger trees room to increase in size and
establish epiphytic growth. The establishment of ponds in forest-edge habitat on the
Bamboo Valley or Chaconia Trail (Figure 2) might well encourage the presence of other
charismatic tree frog species such as Hyla crepitans and Phyllomedusa trinitatis, which
were once abundant at Springhill, prior to the drainage of water treatment ponds close
to the estate house (Ray Mendez, pers. comm.). The Bamboo Valley trail with its
diverse habitat availability for several species of amphibian, including three out of five
of Trinidad’s vulnerable endemics, is particularly suitable for an educational trail
focused on the diverse and interesting life histories of Trinidad’s amphibians. This could
be developed in consultation with the Centre’s educational officer, Farah Gopaul-Fuller,
who was extremely supportive of the expedition’s work around the Centre in 2007.
21

Comparisons of Springhill with two other Arima Valley sites
Two other sites in the Arima Valley were also surveyed, using the same methodologies
as used on Springhill to evaluate the densities of the endemic species (and others)
found in the area at sites with differing elevations and degrees of habitat disturbance
over the past two decades. “Simla”, The William Beebe Research Station (06° 86.914’
N; 11° 82.332’ E) is situated in a pocket of Asa Wright protected land in Verdant Vale.
The land it stands on is bordered by forest that is being regularly logged for timber,
and which has been cleared for christophene cultivation and quarrying so that there
has been a great deal of change and disturbance in the area in recent years. This has
been noted to have significant effects on the structure and diversity of the
communities of birds surveyed at the site (MacNaughton, 2001). Two trails of 500m
were marked out, one uphill through secondary forest to the edges of a large quarry,
and the other downhill, through forest protected by the Asa Wright Centre.
There were eleven species recorded on surveys at the Verdant Vale site: Bufo marinus,
Dendropsophus minutus, Eleutherodactylus urichi, Engystomops pustulosus,
Flectonotus fitzgeraldi, Hypsiboas boans, Hypsiboas crepitans, Leptodactylus fuscus,
Leptodactylus validus, Phyllomedusa trinitatis and Trachycephalus venulosus.
Mannophryne trinitatis were also recorded at the site, outwith audio transects. Dusk
surveys recorded average densities of Eleutherodactylus urichi (Eu) of 46 frogs/Ha (±
6, n = 10) and of Flectonotus fitzgeraldi (Ff) of 50 frogs/Ha (± 10, n = 10) at the site.
Morne Bleu is a high elevation ridge that bridges the two highest peaks of the Northern
Range. The forest there has been minimally exploited, with only an occasional area
given over for growth of anthuriums on a small scale for sale at the local market. A
1.5km trail was marked out and surveyed at this site in 2006 and this was re-surveyed
in 2007 for comparison between sites and years.
There were only two species recorded on surveys at the Morne Bleu site: Flectonotus
fitzgeraldi and Eleutherodactylus urichi. Bufo marinus were also recorded at the site,
outwith audio transects. Dusk surveys recorded average densities of Eleutherodactylus
urichi (Eu) of 149 frogs/Ha (± 24, n = 15) and of Flectonotus fitzgeraldi (Ff) of 75
frogs/Ha (± 23, n = 15) at the site.
22

The numbers of species recorded appears to decline in the less disturbed habitat
(Figure 8). However, the densities of both endemic species being monitored increase in
less disturbed habitat (Figure 9).
0
2
4
6
8
10
12
14
Simla Springhill Morne Bleu
Site
No o
f spe
cies
reco
rded
Figure 8: Numbers of amphibian species recorded
at three sites in the Arima Valley.
0
20
40
60
80
100
120
140
160
180
200
Simla Springhill Morne Bleu
Site
Frog
s/H
a
EuFf
Figure 9: Densities of Eleutherodactylus urichi and
Flectonotus fitzgeraldi at three sites in the Arima Valley.
However, it should be noted that it is difficult to discount the effect of increasing
elevation and differences in other environmental parameters i.e. temperature (Figure
10) when considering trends between sites. Temperature appears to be much more
variable at Simla than it is at the other two sites, though average temperatures are
comparable with Springhill. Morne Bleu is considerably cooler than the other two sites.
Data will be examined in greater detail with respect to differences between sites in the
Arima Valley in 2007, to consider the effect of specific differences in environmental and
habitat parameters on amphibian presence at the three sites.
Arima Valley sites
22Su 29Su 5Su 12Su 19SuTime (starting 18/07/2007)
19.0
20.0
21.0
22.0
23.0
24.0
25.0
26.0
27.0
28.0
29.0
30.0
Tem
pera
ture
°C
Figure 10: Data logger readings of temperature from July-August at Morne
Bleu (red), Simla (green) and Springhill (blue).
23

Endemic Species Surveys on the Morne Bleu Ridge The Morne Bleu Ridge in the Northern Range is the
‘bridge’ between the two highest mountain peaks
of Trinidad. In 2006 surveys were conducted to
determine densities of the vulnerable endemic
Eleutherodactylus urichi and the endangered
endemic Flectonotus fitzgeraldi. In 2007, we used
the same transects marked out in the 2006
surveys and carried out dusk transects to
determine numbers of frogs along the ridge. The
total distance marked out stretches for 1.5km in an easterly direction along the ridge,
from an open area cleared around a radiotransmitter station, through some secondary
forest and then into less disturbed forest and then uphill into cloud forest. Data
collected in 2007 will be compared with data collected in 2006 to consider the changes
at the same site between years and the effects that this has on frog numbers.
Figure 14: Female E. urichi on leaf
litter, Morne Bleu. Photo: J. Smith
Preliminary analyses
suggest that the densities
of both species correlate
with the distance along the
ridge from the start of the
full 1.5km transect. E.
urichi increase in density
with increased distance
from the transmitting
station (Figure 15: Open
squares, dotted line, R =
0.68, y = 0.14x + 48, p <
0.05, 14 df). This trend is opposite to that seen in 2006, and differences in habitat
parameters between years will be closely examined to consider the reasons for this,
particularly with respect to the ground cover available in the later parts of the transect.
In 2007, there were a number of large trees which had fallen in the further transects
and this may have led to increased ground cover and reduced canopy cover in these
areas, both of these habitat parameters were seen in 2006 to correlate with numbers
of Eleutherodactylus urichi.
0
50
100
150
200
250
300
350
400
0 100 200 300 400 500 600 700 800 900 1000 1100 1200 1300 1400 1500
Start of transect (m from transmitting station)
Frog
s/H
a
EuFf
Figure 15: Densities of E. urichi (Eu) and F. fitzgeraldi (Ff) vs.
transect start distance. Statistics in text.

F. fitzgeraldi densities also increase with distance from the transmitting stations
(Figure 15: Filled squares, solid line, R = 0.58, y = 0.12x – 6.11, p < 0.05, 14 df).
This is in agreement with the data from 2006 and is likely to correlate with increased
bromeliad density further along the ridge.
One notable feature of the
2007 data in comparison to
the 2006 data is that there
were significantly higher
densities of both species
recorded at Morne Bleu in 2007 than in 2006, approximately six times as many frogs
per hectare were recorded (Table 6). This is likely to be due to the larger numbers of
surveys in 2006 on which no frogs were recorded on several of the transects. In 2007,
surveys were timed to start at dusk to record maximum activity, but this time frame
was only arrived at as the most appropriate for these species as a result of the
preliminary test surveys carried out at a range of times in 2006. Data from dusk
surveys alone will be compared between the two years and it will be necessary to
continue crepuscular surveys over a number of years to determine whether this
apparent increase in numbers is a genuine observation or simply an artefact of
improved methodology for detection of these species.
Eu Ff 2006 2007 2006 2007 Density/transect (frogs/Ha) 24 149 13 75 s.e. 2 24 5 23 n 15 15 15 15
Table 6: Average densities of E. urichi (Eu) and F. fitzgeraldi (Ff)
per 100m transect at Morne Bleu in 2006 and 2007
Surveying Stream Frogs: North Coast and Central Range. The Trinidad stream frog, Mannophryne trinitatis, is Trinidad’s only dendrobatid and is
found in mountain streams in the Northern Range, with one smaller population at
Tamana Hill, in the Central Range (Jowers & Downie, 2004). Three sites on the North
Coast and one site in the Central Range were surveyed to estimate population size and
structure of this vulnerable endemic species6.
Sites on the North Coast corresponded to sites visited in previous years, known to be
variable in “reliability” for presence of transporting males in the rainy season. “Maracas
East I” in this study corresponds to a site known as “East Maracas Bay” (Royan, 2006)
or “East Maracas Bay 2” (Downie et al., 2001) around 2km East of Maracas Bay (06°
6 It should be noted that the delay in the rainy season in 2007 severely affected all of the breeding sites for this species that were visited by the expedition, with stream beds that were completely dry on several visits. This seems to have affected breeding streams in the Lopinot Valley particularly badly and for this reason, these sites were not included in the surveys this year although they are usually well populated by the species.
25

26
Surveys were conducted in two parts. On
arriving at the site, a known pre-measured
distance along the stream bank was walked
by one observer (JMS) and the numbers of
males heard calling was noted. The
streams and the adjacent habitat (no more
than a metre from the water) was then
searched thoroughly for thirty minutes by a
team of three observers and every frog
seen was noted and captured (where
possible). Frogs were placed in individual
snap-sealing see-through bags, and
returned to a central base for processing.
It should be noted that, as Dendrobatids
are known to be particularly susceptible to
chytrid fungus, and with the status of the disease unknown in Trinidad, steps were
taken to ensure that each frog was placed in a bag that had not previously been used
and SVL measurements were made through the bag. Mannophryne trinitatis are also
particularly prone to stress upon capture and processing time was kept to a minimum
as a result, photographs were only taken if the frog remained static long enough after
its release for this to be achieved.
The Central Range site at Tamana Hill is one at which GU expeditions have been
monitoring Mannophryne populations over a number of years. We wanted to see if the
seemingly decimated population at this site (Smith et al. 2006, Mike Jowers pers.
comm., 2004) has shown any signs of recovery. A stream bed running through forest
around 500m West from the mouth of Tamana Cave was sampled (06° 97.862’ N; 11°
57.630’ E).
71.723’ N; 11° 89.548’ E). “Maracas East II” is a site around 2.5km from Maracas Bay,
and is characterised by a waterfall down a very steep rock face (06° 72.089’ N; 11°
89.693’ E). “Las Cuevas West” (East Maracas Bay 1, Downie et al., 2001) is a site
around 3km from Maracas Bay, the stream there has a very large mango tree
overhanging it (06° 73.223’ N; 11° 90.476’ E).
Figure 16: M. trinitatis male and tadpoles,
Tamana 2007. Photo: J. Smith

27
North Coast sites had higher numbers of all classes of adult frog (Table 7) with an average of ~80 frogs/100m across all three
sites in comparison with 50 frogs/100m at Tamana. Detection rates by calling were 49% accurate at the North Coast (vs. visual
searches) and 56% accurate at Tamana. Male to female ratios at all sites other than Maracas East II are ~2:1. This information
could be used to supplement call detection surveying to build up a more accurate prediction of densities in this species.
Populations were more complex in terms of age structure on the North Coast, with juveniles, metamorphs and tadpoles present.
Tadpoles were recorded on 60% of the visits to the North Coast sites and 20% of the visits to Tamana. No juveniles were
recorded at Tamana, though the observation of transporting males (Figure 16) is a promising sign for the potential recovery of
the site. Very few frogs have been seen at Tamana in recent years and it is very encouraging that frogs were present in 2007,
albeit in lower numbers than at the majority of the NC sites. It is a point of interest that the calling males, transporting males and
breeding females at Tamana were all smaller in size than those at the North Coast sites (Table 8), perhaps indicative of breeding
at an earlier age in this population? Data from each individual visit to the stream frog sites will be analysed to investigate whether
changes in site occupancy by the sexes and sizes of breeding males and females are seen as the breeding season progresses.
Linear density of frogs/100m
Calling males
Silent males
Transporting males
Females
Un-ID adult
Total
Juveniles
Site Mean s.e. n Mean
s.e. n Mean
s.e. N Mean s.e. N Mean
s.e. n Mean
s.e. n
NC: Maracas East I 60 11 4 23 14 4 8 3 4 50 11 4 13 8 4 154 90 40 4 NC: Maracas East II 13 13 3 0 0 3 0 0 3 10 6 3 0 0 3 23 27 18 3 NC: Las Cuevas West 40 15 3 10 10 3 3 3 3 23 13 3 3 3 3 79 97 38 3 CR: Tamana 23 6 5 6 4 5 4 2 5 16 5 5 1 1 5 50 0 0 5
SVL (mm) Calling males Silent males
Transporting males
Females
Juveniles Site Mean ns.e. Mean s.e. n Mean s.e. n Mean s.e. n Mean s.e. N
NC: Maracas East I 21.7 0.64 13 20.3
0.40 3 22.0 0.15 2 22.7 0.17 21 18.6 0.56 16 NC: Maracas East II 20.8 - 1 - - - - - - 23.4 0.50 2 18.6 0.55 4 NC: Las Cuevas West 20.5 0.55 7 20.4 - 1 - - - 23.5 0.30 15 17.0
1.01 10
CR: Tamana 19.9 0.23 15 21.3 0.10 2 20.0 0.40 2 21.6 0.58 9 - - -
Table 7: Linear densities of Mannophryne trinitatis at four breeding sites on the North Coast (NC) and Central Range (CR).
Table 8: Average sizes of Mannophryne trinitatis at four breeding sites on the North Coast (NC) and Central Range (CR).

Efficacy of digital photography in mark-recapture studies: a follow-up?
In 2006, a roadside ditch site at the 9¾km marker on the Valencia-Matura road was
used to conduct a pilot study on the efficacy of digital photography in mark-recapture
studies. The site was chosen as it had, over several years, become a reliable site for
many of Trinidad’s forest-edge tree frogs amongst other species. Over two hundred
frogs from ten different species were photographed in 2006 and it was hoped that on
our return to Trinidad in 2007 we would be able to follow-up on the pilot study and
judge the efficacy of digital photographs as an identification tool for frog species.
Unfortunately, this ‘reliable’ site had in the intervening period been bulldozed and
developed with concrete drainage channels and on several night drives only a single
Phyllomedusa trinitatis (a re-capture) was ever found there. A large chorus of
amphibians correspondent in species make-up and size to the population from this site
was not identified along the length of the Valencia-Matura road. However, this year’s
rainy season was not the most suitable for detecting large assemblages of frogs as the
activity levels were low on all of the night-time driven transects we conducted and we
intend to identify a site at which we can continue this study on future expeditions.
Southern road surveys ‘Night-driving’ has been used as a survey technique in several instances to count the
number of amphibians crossing roads that transect habitats in which they are breeding
(Heyer et al. 1994). In 2006, routes bisecting amphibian habitats were identified and
driven and the calling activity along these routes recorded to give information about
species presence in different areas of the island. One important area for these road
surveys are the roads that bisect the Icacos swamp and the cocal plantations on the
South-Western peninsula, this being the only habitat where the endemic species
Leptodactylus nesiotus is found and the major site for several other Leptodactylids.
Southern road transects were carried out twice before the rains broke (two weeks
before the end of the expedition) and yielded very few species observations and no
records of Leptodactylus nesiotus. The week before the expedition ended, after a
heavy rain, we decided to make a last-ditch attempt to see if we could detect calling
activity by this restricted range endemic and drove down South. The result of this was
the discovery of a species of frog not previously recorded in Trinidad, the adult of a
tadpole collected on the 2006 expedition (Figure 17), suspected to belong to the
Scarthylid family. The species was present at several sites on the South-Western
28

peninsula. Detailed behavioural and morphological notes were made in the field, the
call was recorded and field notes were taken about the habitats where the frog was
found (Figure 18). Several male and female frogs were collected and set up in a
vivarium with mud and reeds taken from its collection site and their behaviour in
captivity was observed closely. We are working in collaboration with a group from the
United States on the identification and confirmation of the species as new to Trinidad
and will write up the findings together as a joint scientific paper.
Figure 17: Scarthylid species? from Southern Peninsula Figure 18: Becky goes swamping
References
Downie JR, Livingstone SR, Cormack JR (2001) Selection of tadpole deposition sites by male
Trinidadian stream frogs, Mannophryne trinitatis (Dendrobatidae): An example of anti-predator
behaviour, Herpetological Journal, 11: 91-100
Heyer WR, Donnelly MA, McDiarmid RW, Hayek LC, Foster MS (1994). Measuring and
monitoring biological diversity: standard methods for amphibians. Smithsonian Institution
Press, Washington, USA. 364pp.
Jowers MJ, Downie JR (2004) Distribution of the frog Mannophryne trinitatis (Anura-
Dendrobatidae) in Trinidad, West Indies, Living World, Journal of the Trinidad and Tobago Field
Naturalists’ Club, 2004: 17-19
MacNaughton K (2001) The effects of disturbance on rainforest birds: Arima Valley. Trinidad
Expedition Report 2001. University of Glasgow Exploration Society. 114pp.
Royan A (2006) Escape trajectory, vigilance and field studies of the Trinidadian stream frog,
Mannophryne trinitatis (Anura: Dendrobatidae). Trinidad Expedition Report 2006. University of
Glasgow Exploration Society. 105pp.
Smith J, Deas T, Gladman Z, Lupton J, McLennan D (2006) Amphibian Biodiversity Surveying
Projects. Trinidad Expedition Report 2006. University of Glasgow Exploration Society. 105pp.
Wolf JD, Konings CJF (2001) Toward the sustainable harvesting of epiphytic bromeliads: a pilot
study from the highlands of Chiapas, Mexico. Biological Conservation 101 23–31
29

Amphibian reproductive ecology projects
The effect of Ultraviolet-B radiation on the growth and behaviour of Phyllomedusa trinitatis tadpoles
Rebecca Dye
Introd
-B (UV-B) radiation may have
important consequences for the health of
c s
o ge
examined empirically the effect of UV-B radiation on different life history stages of P.
uction
Ultraviolet
frogs (Blaustein and Belden, 2003), and
therefore may be a significant factor in both
understanding global amphibian decline and
using amphibians as indicator species for
global warming and ozone depletion.
However, the picture constructed from
previous studies on the effects of UV
radiation on amphibian health is a confusing
one, with UV-B having been reported both to
be detrimental to amphibians at all life
history stages or have no determinable effect
at some or all stages (Blaustein and Belden,
2003). Furthermore, recent work has shown
that a monthly ‘UV-B boost’ may even be
beneficial to many species of frog, including
the Trinidadian monkey frog, Phyllomedusa
trinitatis (Sherriff, pers. comm.). Much of this
mall number of studies examining the effects
s other than embryonic. Most research has
concentrated on temperate regions with few considering tropical habitats (Middleton et
al., 2001, Broomhall et al. 2000) and the UV-B requirements of captive tropical
amphibians have only recently been considered and mostly only anecdotal evidence is
available (Sherriff, pers. comm). Some amphibian larvae in choice experiments have
been shown not to detect UV-B radiation (Belden et al., 2000, 2003., Pahkala et al.,
2003) while others are able to avoid it (van de Mortel & Buttemer, 1998). The only
amphibian in which UV-B detecting sensors have been discovered is the axolotl,
Abystoma mexicanum (Deutschlander & Philips, 1995). One recent study that has
onfusion can be attributed to the very
f UV radiation on amphibians at sta
Figure 19: Phyllomedusa trinitatis, Simla
2007. Photo : D. Thornham
30

lemur, discovered that there was an increase in size at metamorphosis for tadpoles
exposed to UV-B and no detrimental effect was observed (Dye, 2006).
The Trinidadian monkey frog (P. trinitatis) is a highly arboreal tree frog, and is one of
Trinidad’s most charismatic frog species. As such, a number of studies on various
spects of its life history and biology have been undertaken in the past (eg. Kenny,
P. trinitatis tadpoles. It also examined the UV-B levels to which wild frogs
re exposed during development by measuring UV-B intensity at a known P. trinitatis
eggs were collected from three different field sites: Lopinot
06° 82.698’ N, 11° 79.942’ E); Valencia (06° 05.399’ N; 11° 78.639’ E) and Simla (06°
hese were allowed to hatch and the tadpoles were left to
lm, or tinfoil filter. Filters were chosen on the basis of their ability to transmit or block
a
1966, 1969). Adults are normally around 7-10 cm long, jewel green in colour, with
large eyes that are flecked with orange. Adult males attract females by calling from the
trees and bushes that surround ponds, showing a high degree of territoriality. Female
frogs construct nests in foliage overhanging the water by folding together leaves and
gluing them together. They will then lay her eggs in this protective cocoon. The nest
remains suspended over the pool for several days while the eggs develop, protected
from aquatic predators and from arboreal predators through camouflage (as wilting
leaves). When the tadpoles hatch, they wriggle free of the leaf nest and fall into the
pool below, where they remain until they develop into froglets and leave the water.
They then quickly take to the trees and continue growing until they reach adulthood
themselves.
This study measured behavioural responses to UV-B exposure, and the effects of UV-B
on growth of
a
breeding site.
Materials and Methods
Leaf nests of P. trinitatis
(
86.914’ N; 11° 82.332’ E). T
develop for three days before separating into different treatment groups.
Growth tests were conducted on tadpoles from the three sites. 30 tadpoles from each
site were randomly assigned to round pots of 12 cm diameter covered by a glass, cling
fi
UV-B radiation. Cling film transmits UV-B, glass blocks 96% of UV-B (Gehrmann,
1987) while tin foil blocks both UV-B radiation and visible light. The transmission
properties of these materials were confirmed using a Solarmeter 6.2. Individual
tadpoles were weighed weekly to ±0.01g using electronic scales for a period of 5
weeks from 30/06/07 to 28/07/08 (Lopinot tadpoles). Tadpoles were fed tropical fish
31

flakes every second day. Change in mass over this period was analysed using Analysis
of Variance (ANOVA). Due to events unrelated to the experiments only sufficient
numbers of Lopinot tadpoles survived for analysis with 8 surviving from the cling film
(UV-B exposed), 6 from the glass (UV-B shielded), and 7 from the tinfoil (shaded)
treatments. Mortality rates were also analysed using chi-square ((χ2) tests.
Behavioural choice tests were conducted on individual tadpoles from the same batches
as the growth tests in separate polyethylene containers measuring (21cm x 14cm x
.5cm). Holes were punched in the sides of these containers and they were sunk in 8
approximately 7cm deep water. This allowed water flow and temperature buffering.
The water level was kept approximately constant by adding or removing rainwater as
required. Each container was half covered with one filter and half with another. 30
tadpoles from each site were randomly assigned to one of three different treatments
(Table 9). Each container housed a single tadpole to eliminate shoaling or repulsion
effects
Treatment Filters used UV exposure
1 Glass/Cling film UV Shielded/UV exposed
2 Tinfoil/Cling film Shaded/UV exposed
3 Tinfoil/Glass Sha ed ded/ UV shield
Table ce treatmen
The tadpoles were left to acclimate for two days before trials began and fed tropical
re performed at 10:00, 13:00, and 16:00 to
liminate diel patterns in position preference on 02/07/07 (Lopinot tadpoles), 06/07/07
re identified. Two sweep net samples of
9: Choi ts
fish flakes every second day. Trials we
e
(Simla tadpoles), and 16/07/07 (Valencia tadpoles). The location of each tadpole in its
container was recorded every 10 minutes for 1hour so 7 positions were recorded for
each tadpole each hour. If a tadpole was in the centre of the container the position of
the head was recorded. For each individual tadpole the filter under which it spent more
than 50% of its time was recorded for each hour. These experiments were designed to
record whether tadpoles exhibited any avoidance behaviour of UV-B directly by
choosing the UV shielded treatment, or indirectly by choosing the shaded treatment.
The results were analysed using chi-square (χ2) tests. UV-B levels (µWcm-²) were also
measured every 10 minutes during the trials.
Field tests were carried out at Valencia (06° 05.399’ N; 11° 78.639’ E). Adjacent areas
of high, medium, and low UV-B exposure we
32

tadpoles were obtained from each area and tadpole species and numbers were
ks tadpoles exposed to UV-B (cling film filter)
ained significantly more mass than those shielded from UV-B (glass filter) and those
m all light (tinfoil filter) (F2,18=36.73, p<0.001) (Figures 20 & 21). Mortality
recorded. UV-B readings (µWcm-²) were obtained using a handheld solarmeter 6.2,
and water temperatures (ºC) were obtained using at 5 minute intervals between
12:00 and 13:00 on 17/07/07.
Results
Growth tests showed that after 5 wee
g
shaded fro
was not significantly different in any of the treatments (χ22=0.667, p>0.05 NS).
Treatment
Chan
ge in
mas
s/g
C G T
0.00
0.05
0.10
Figure 20: Mean (±s.e) change in mass after 5 weeks
of tadpoles exposed to different UV-B treatments
e
xposed 21=0.033, p>0.05 NS). When given a choice etween Shade (tin foil) or UV-B
adpoles at natural breeding sites, and Figure 24 shows the water temperatures
Figure 21: Phyllomedusa tadpoles grown for
eight weeks in different conditions. Photo: R.
Dye
Choice tests indicated that tadpoles did not sp
filter when given the choice of UV-B e
nd significantly more time under either
(cling film) or UV-B shielded (glass)
b(χ
exposed (cling film) tadpoles spent significantly more time under tin foil (χ21=8.112,
p<0.05) When given a choice between shade (tin foil and UV-B shielded (glass)
tadpoles spent significantly more time under tin foil (χ21=15.552, p<0.05) (Figure 22).
Field tests indicated that more tadpoles, including P. trinitatis were found in areas of
high UV-B intensity (Table 10). Figure 23 shows the intensities of UV-B experienced by
t
experienced by tadpoles at the same sites during the same time period.
33

Treatment
50%
of t
ime
unde
r filte
rno
. tad
pole
s sp
endi
ng
GCTGTC
9
8
7
6
5
4
3
2
1
0
1 2 3
Figure 22: Mean (±s.e.) number of tadpoles spending more than 50% of time under different filters
Tadpole species High Exposure Medium exposure Low exposure
Scinax ruber 2.5 2 14
Dendropsophus microcephalus 3.5 10.5 1.5
Dendropsophus minutus .5 9 14 3
Phyllomedusa trinitatis 39.5 4 1
Table 10: Mean number of ta les found in high, medium and low exposure sweeps
. trinitatis tadpoles put on significantly more mass in the UV-B exposed treatment
UV-B shielded or UV-B exposed treatments (Figure 1). This is similar to
dpo
12:00 12:20 12:450
100
200
300
400
Time
UV-B
inte
nsity
/ µW
cm-²
High exposure
Medium exposure
Low exposure
12:00 12:20 12:45
31.5
32.0
32.5
33.0
Time
Wat
er T
empe
ratu
re/º
C
High exposure
Medium exposure
Low exposure
Figure 23: UV-B levels and Figure 24: Water temperatures between 12:00 and 13:00 at Valencia
Discussion
P
than either the
the findings of Pahkala et al. (2003) where tadpoles of Rana arvalis and R. temporaria
had increased growth rates when exposed to UV-B. This increased size may be due to
enhanced vitamin D3 synthesis which was suggested by Pahkala et al. (2003). In
reptiles UV-B is responsible for converting provitamin D3 into previtamin D3, which is
34

then thermally converted to vitamin D3 in the active form, and this promotes calcium
utilisation (Gehrmann, 1997). Vitamin D3 is important for bone development, growth
and the prevention of metabolic bone disease and its importance is well documented
for reptiles (e.g. Gehrmann, 1997, Ferguson et al. 2002) although little work has been
carried out on amphibians. Another possibility for the increased mass may have been
increased food availability as more algae grew in the UV-B exposed treatment. The
algae was removed at regular intervals but may still have provided a food source for
the developing tadpoles.
P. trinitatis tadpoles did not appear to be able to detect UV-B radiation as they did not
iscriminate between UV-B exposed and UV-B shielded regions of their containers.
the choice experiments where more
adpoles were found in the high exposure region of the pool than both the shaded
d
They did, however, exhibit preference for shaded regions over both UV-B exposed and
UV-B shielded suggesting indirect avoidance of UV-B (Figure 22). These are consistent
with the findings of Belden et al. (2000) who found similar behavioural reactions to
UV-B for larval long-toed salamanders (Abystoma macrodactylum). In that case,
however, negative effects of UV-B radiation on growth and survival were observed
explaining why choosing shade may confer an advantage. In the case of P. trinitatis
UV-B had no effect on survivorship and conferred a positive effect on growth. The
preferences for shaded areas observed may have been due to factors other than light
for example increased shelter from predators.
Findings in the field contradicted findings from
t
region and medium exposure region (Table 10). More variables are present in natural
conditions than the more controlled environment of the choice experiments for
example the slight temperature difference between regions (Figure 24) that may affect
growth rates. There may also be more predators present in the shaded region, or more
food available in the exposed region. The field study does indicate that tadpoles are
exposed to extremely high levels of UV-B radiation in natural conditions with a
maximum of 420 µWcm-² recorded, Belden et al. (2000) recorded a mean exposure of
14.7µWcm-², suggesting that defences against the harmful effects of UV-B radiation
are essential for these species.
35

References
Belden, L.K., Wildy, E.L. & Blaustein, A.R. (2000). Growth, survival and behaviour of larval
long-toed salamanders (Abystoma macrodactylum) exposed to ambient levels of UV-B
radiation. J. Zool., London 251: 473-479
Belden, L.K., Moore, I.T., Mason, R.T., Wingfield, J.C. & Blaustein, A.R. (2003). Survival, the
hormonal stress response and UV-B avoidance in Cascades Frog tadpoles (Rana cascadae)
exposed to UV-B radiation. Functional Ecology 17: 409-416.
Blaustein, A.R. & Belden, L.K. (2003). Amphibian defenses against ultraviolet-B radiation.
Evolution & Development 5 (1): 88-97
Broomhall, S.D., Osborne, W.S. & Cunningham, R.B. (2000). Comparative Effects of Ambient
Ultraviolet-B Radiation on Two Sympatric Species of Australian Frogs. Conservation Biology 14
(2): 420-427
Deutschlander, M.E. & Phillips, J.B. (1995). Characterization of an Ultraviolet Photoreception
Mechanism in the Retina of an Amphibian the Axolotl (Ambystoma mexicanum)
Dye, R. (2006) The effects of Ultraviolet-B radiation on different life history stages of the
lemur leaf frog Phyllomedusa lemur. Glasgow University, MSci report.
Ferguson, G.W., Gehrmann, W.H., Chen, T.C., Dierenfeld, E.S. & Holick, M.F. (2002). Effects of
Artificial Ultraviolet Light Exposure on Reproductive Success of the Female Panther Chameleon
(Furcifer pardalis) in Captivity. Zoo Biology 21: 525-537.
Gehrmann, W.H. (1987). Ultraviolet Irradiances of Various Lamps Used in Animal Husbandry.
Zoo Biology 6: 117-127
Gehrmann, W.H. (1997). Reptile Lighting a Current Perspective. The Vivarium 8 (2): 44-45, 62
Kenny, J.S. (1966) Nest building in Phyllomedusa trinitatis (Mertens). Caribbean Journal of
Science 6: 1-2.
Kenny, J.S. (1969) The Amphibia of Trinidad. Studies on the fauna of Curacao and other
Caribbean islands 103: 1-77
Middleton, E. M., Herman, J. R., Celarier, E. A., Wilkinson, J. W., Carey, C., Rusin, C.R.J (2001).
Evaluating ultraviolet radiation exposure with satellite data at sites of amphibian declines in
Central and South America. Con. Biol., 15:914–929.
Pahkala, M., Laurila, A., Merilä, J. (2003). Effects of Ultraviolet-B radiation of behaviour and
growth of three species of amphibian larvae. Chemosphere 51: 197-204.
Van de Mortel, T.F. & Buttemer, W.A. (1998). Avoidance of Ultraviolet-B Radiation in Frogs and
Tadpoles of the Species Litoria aurea, L. dentata and L. peronii. Proc. Linn. Soc. N.S.W. 119:
173-179.
36

The interaction between mosquito larvae and different species of tadpoles.
Gill Carfrae
Introduction
Tadpoles and mosquito larvae can co-exist within
the same fresh water habitat until they reach
metamorphosis, allowing them to interact. However
the nature of these interactions is unclear. A
preliminary observation carried out previously in
Trinidad (Downie, pers comm), where this
investigation was carried out, found that there were
fewer if any mosquito larvae present where tadpoles
were found. There have been a number of studies
carried out that could explain this observation. One
explanation could be that because both tadpoles and
mosquito larvae are primarily known to be
herbivorous and therefore share the same food
resources within the habitat that this could lead to
competition effects between the organisms. There is
also the possibility that because of the size
difference between tadpoles and mosquito larvae,
tadpoles could be consuming the mosquito larvae.
However it could also be the case that mosquitoes
avoid ovipositing in habitats in which tadpoles are present. These interactions may
vary between different species of tadpoles and mosquitoes.
Figure 25: Culicine mosquito larva. Photo F. Murdoch
Mosquitoes are able to act as vectors to a variety of pathogens and parasites. Some
examples of the diseases that can be transmitted by mosquitoes include Malaria,
Yellow Fever, Dengue and West Nile Virus. The main mosquito-borne disease that is
found in Trinidad is Dengue which is carried by Aedes aegypti that breed in urban
environments. In 1998 the number of cases was as high as 1372 in Trinidad and
Tobago where the population was approximately 1.25 million (http://www.carec.org/,
2007). There has also been the occasional outbreak of Yellow Fever transmitted by the
same mosquito species (Clements, 1992). Therefore the issue of mosquito control is of
vital importance to the health of populations in many countries.
37

Biological control of mosquito populations has mainly focused on the use of fish. The
use of tadpoles in controlling mosquito numbers has received very little attention.
However, the use of adult anurans for decreasing the mosquito population has been
noted and was the cause of a ban in trading in frogs’ legs from India to Europe from
1987 as the decline in frogs caused an increase in mosquitoes and therefore disease
(Jensen and Camp, 2003). There are a number of reasons why tadpoles could be used
as an effective tool in mosquito control. One of the main factors is that the
reproduction and habitat of most species coincide with the high abundance of
mosquitoes during the rainy season (Marian et al., 1983). It has been shown in a
number of studies that tadpoles are able to affect the survival of mosquito larvae as
they are on the same trophic level and therefore undergo exploitative and interference
competition (Blaustein and Margalit, 1994; Mokany and Shine, 2003; Mokany and
Shine, 2002). There is also the possibility of tadpoles consuming mosquito larvae
(Blaustein and Margalit, 1996; Speilman and Sullivan, 1974; Marian et al., 1983).
These two factors could lead to mosquitoes choosing not to oviposit in water containing
tadpoles and therefore reducing their numbers (Munga et al., 2006; Blaustein and
Kotler, 1993).
The use of tadpoles for mosquito control could also provide an economic reason for the
importance of the conservation of frogs. The substantially reducing numbers of
amphibian populations (Stuart et al. 2004) could mean the loss of an effective
biological control and could lead to an increase in mosquitoes. This could therefore
have severe consequences to human health due to mosquitoes being vectors of many
important diseases worldwide (Mokany & Shine, 2003).
The aims of this project were to study a number of species of tadpoles and determine
whether an interaction occurs between tadpoles and mosquito larvae and what general
characteristics of tadpole populations affect these interactions. The types of
interactions that could be occurring between tadpoles and mosquito larvae were also
investigated and therefore the role of various tadpole species found in Trinidad on
mosquito control and the implications for amphibian conservation were considered.
The key questions that this project focused on were:
1. What is the effect of different densities on the number of mosquito larvae present?
2. Does the stage of development of the tadpoles affect the presence of mosquitoes?
3. Is competition occurring between the tadpoles and the mosquito larvae?
4. Is predation occurring with the tadpoles consuming the mosquito larvae?
38

Experiment 1: The interaction between tadpoles and mosquito larvae
This experiment was conducted using three species of tadpoles - Leptodactylus fuscus,
Engystomops pustulosus and Phyllomedusa trinitatis. They were collected from field
sites in the Northern Range as eggs, allowing the effect of the tadpoles on mosquito
larvae to be studied throughout their development towards metamorphosis. The
tadpoles used in the experiments for each species and each replicate were from the
same nest.
Tanks were set up with a control containing no tadpoles, a tank with 4 tadpoles
present and a tank at a higher density holding 8 tadpoles. These were open and were
therefore able to be colonised by mosquito larvae. There were also however, control
tanks set up that contained 4 tadpoles or 8 tadpoles that were covered with mosquito
netting to prevent oviposition by the mosquitoes. This arrangement of tanks was set
up for each of the species at three different sites so that comparisons could be made
between them and there were two replicates for each species at each site. Sites were
chosen based on how much cover from the forest they would receive and therefore
different species of mosquito larvae that would be expected to be present.
Tadpoles were added to the tanks within a day of hatching and were measured to allow
their development to be monitored. Every second day the tadpoles were fed 0.04g
tropical fish food flakes; this was kept constant at both densities so that any effect of
competition for food could be identified.
Once mosquito larvae appeared, 10ml water sample was taken. The sample was
transferred to a petri dish and mosquito larvae were counted for each tank every two
to four days. Mosquito larvae were identified using the Identification Guide to Common
Mosquitoes of Florida (http://fmel.ifas.ufl.edu/key/index.htm, 2007) after receiving
tuition from Karen Polson from the Caribbean Epidemiology Centre (CAREC).
Results
Results from both replicates were analysed together after running a homogeneity test
that showed there was no significant difference between them. A summary of the
effect of Engystomops pustulosus, Leptodactylus fuscus and Phyllomedusa trinitatis
tadpoles on the mean number of mosquito larvae throughout the experiment can be
seen from Figure 26. There was a significant effect of species and density combined on
the number of mosquito larvae (F4,433 = 4.554, P = 0.0002). This can be seen from the
graph as the effect of the tadpoles at the two densities on the mosquito larvae differs
39

between each of the species. However there is very little difference in the number of
mosquito larvae between the species in the control (F2,149 = 1.231, P = 0.295). The
Kruskal-Wallis test used for Phyllomedusa trinitatis (H = 18.180, P = 0.0001)
demonstrates that there was a significant difference in the number of mosquito larvae
present in the control and at different densities of tadpoles. The relationship between
the two densities of tadpoles was further demonstrated by simply analysing the
number of mosquito larvae found when 4 or 8 tadpoles were present. This was also
found to be significant (H = 6.734, P = 0.009).
0 4 8
Tadpole Density
0
250
500
750
1000
Num
ber o
f mos
quito
larv
ae in
1.5
L
V
VV
V
V
V
V
V
V
Figure 26: Effects of different densities of tadpoles on mosquito numbers: Engystomops pustulosus (red)
Leptodactylus fuscus (blue) Phyllomedusa trinitatis (green).
There was no significant difference in the growth rates of any of the tadpoles in the
presence or absence of mosquito larvae (E. pustulosus: t = 0.015, P > 0.05; L. fuscus:
t = 2.27, P > 0.05; P. trinitatis: t = 1.86, P > 0.05. In both L. fuscus and E.
pustulosus, it appears that a larger percentage of tadpoles reach metamorphosis when
the mosquito larvae are absent (Table 11). However, this is not a significant effect (X2
= 0.37, P > 0.05).
%age metamorphosis Tadpole Species
Uncovered Covered
Leptodactylus fuscus 29.1 36.1
Engystomops pustulosus 36.1 48.6
Table 11: Percentage of tadpoles reaching metamorphosis in presence and absence of mosquito larvae
40

Experiment 2: Development of mosquito larvae in the presence of tadpoles:
do tadpoles feed on mosquito larvae?
Tadpoles of a late stage in development (between stages 25 and 30) were collected
using a net from various field sites in Trinidad. The tadpoles that were included were:
Leptodactylus fuscus, Phyllomedusa trinitatis, Engystomops pustulosus,
Trachycephalus venulosus, Mannophryne trinitatis, Dendropsophus minuta. Three
replicates were set up for each of the species to prevent any differences between the
containers being a confounding factor in the experiment. The containers used were
clear plastic cups of the same dimensions (10cm height and 7 cm diameter). Each of
the replicates included a control in which no tadpoles were present, a cup with one
tadpole and a cup containing 2 tadpoles so that the effect of density could again be
examined. Second instar mosquito larvae were collected from a large tub of rainwater
that had been left outside the laboratory and had over time been colonised and 8
larvae transferred into each of the experimental cups. The cups were left for one week
to allow the mosquito larvae to develop into later stages. The tadpoles were not fed
during this time period and after the week the number of mosquito larvae left in the
cups was counted to determine whether the larvae had been consumed by the
tadpoles. Fine forceps were used to remove the larvae after each of the
measurements.
Results
Figure 27 shows the effects of various species of tadpoles on mean size of mosquito
larvae. For Trachycephalus venulosus (H = 13.048, P = 0.001), Dendropsophus
minutus (F2,30 = 4.016, P = 0.028), Engystomops pustulosus (F2,32 = 11.1, P =
0.0002) there is a significant difference in the sizes of mosquito larvae in the presence
of the tadpoles. There is no effect of presence of Mannophryne trinitatis (F2,61 = 0.72, P
= 0.930), Leptodactylus fuscus (F2, 28 = 0.336, P = 0.718), Phyllomedusa trinitatis
(F2,22 = 1.769, P = 0.194).
There was a significant difference in mosquito larvae survival (Table 12) between the
control and when one tadpole is present (t = 5.94, P = 0.002). There was no
significant difference between the control and when 2 tadpoles were present (t = 2.11,
P = 0.088) and no significant difference between the two densities of tadpoles (t = -
1.62, P = 0.167).
41

0 1 2
Tadpole Density
1.00
2.00
3.00
4.00
5.00M
ean
Leng
th o
f Mos
quito
Lar
vae
(mm
)
V
V
V
0 1 2
Tadpole Density
1.00
2.00
3.00
4.00
Mea
n Le
ngth
of M
osqu
ito L
arva
e (m
m)
V
VV
0 1 2
Tadpole Density
0.00
1.00
2.00
3.00
Mea
n Le
ngth
of M
osqu
ito L
arva
e (m
m) V V
V
a b c
0 1 2
Tadpole Density
0.00
1.00
2.00
3.00
Mea
n Le
ngth
of M
osqu
ito L
arva
e (m
m) V
VV
0 1 2
Tadpole Density
0.00
1.00
2.00
3.00
Mea
n Le
ngth
of M
osqu
ito L
arva
e (m
m)
VV
V
0 1 2
Tadpole Density
0.00
1.00
2.00
3.00
Mea
n Le
ngth
of M
osqu
ito L
arva
e (m
m)
V
VV
e f d
Figure 27: Effects of different densities of tadpoles on size of mosquito larvae (a) Trachycephalus
venulosus (b) Dendrosophus minutus and (c) Mannophryne trinitatis
Table 12: The survival of the mosquito larvae in the presence of different species of tadpoles
Percentage survival of mosquito larvae in the presence of different species
No. of tadpoles T. venulosus D. minutus M. trinitatis E. pustulosus L. fuscus P. trinitatis
0 92 92 100 58 83 75 1 54 33 79 25 13 13 2 100 13 88 63 33 17
Summary
Of the three tadpole species that were mainly focused on (Engystomops pustulosus,
Leptodactylus fuscus and Phyllomedusa trinitatis), P. trinitatis was found to have the
greatest effect on mosquito larvae. Another additional species of tadpole,
Dendropsophus minutus, which was studied, had a similar effect. This is likely to be
due to predation as they caused a reduction in survival of mosquito larvae; however
oviposition behaviour of adult mosquitoes could also be a factor due to the threat of
predation. Competition was found to occur in the presence of E. pustulosus tadpoles
as they caused a reduction in the growth of the mosquito larvae but this relationship
was found to be asymmetric, as the presence of mosquito larvae did not effect the
42

growth of the tadpoles. Trachycephalus venulosus and Dendropsophus minutus, also
reduced the size of the mosquito larvae. The interaction did not increase in magnitude
when the density of tadpoles increased but this could be due to the densities used not
being representative. The results showed that Leptodactylus fuscus and Mannophryne
trinitatis tadpoles did not have any significant effect on mosquito larvae populations.
The results that demonstrate an interaction occurring could have important
implications to amphibian conservation and human health due to mosquitoes being
vectors of many important diseases.
References
Blaustein, L. & Kotler, B. P. (1993). Oviposition habitat selection by the mosquito, Culiseta
longiareolata: effects of conspecifics, food and green toad tadpoles. Ecological Entomology, 18:
104 – 108.
Blaustein, L. & Margalit, J. (1994). Mosquito larvae (Culiseta longiareolata) prey upon and
compete with toad tadpoles (Bufo viridis). Journal of Animal Ecology, 63: 841 – 850.
Blaustein, L. & Margalit, J. (1996). Priority effects in temporary pools: nature and outcome of
mosquito larva – toad tadpole interactions depend on order of entrance. Journal of Animal
Ecology, 56: 77 – 84.
Clements, A. N. (1992). The biology of mosquitoes. Vol. 1. Development, nutrition and
reproduction. Chapman and Hall, New York.
Crump, M. L. (1990). Possible Enhancement of Growth in Tadpoles through Cannibalism.
Copeia, 2: 560 – 564.
Jensen, J. B. & Camp, C. D. (2003). Human exploitation of amphibians: direct and indirect
impacts. Amphibian Conservation, Washington, DC: Smithsonian Institution, 199 – 213.
Marian, M. P., Chrisopher, M. S. M., Selvaraj, A. M. & Pandian, T. J. (1983). Studies on
predation of the mosquito Culex fatigans by Rana tigrina tadpoles. Hydrobiologia, 106: 59 – 63.
Mokany, A. & Shine, R. (2002). Pond Attributes influence competitive interactions between
tadpoles and mosquito larvae. Australian Ecology, 27: 396 – 404.
Mokany, A. & Shine, R. (2003). Competition between tadpoles and mosquito larvae. Oecologia,
135: 615 – 620.
Munga, S., Minakawa, N., Zhou, G., Barrack, O. J., Githeko, A. K. & Yan, G. (2006). Effects of
Larval Competitors and Predators on Oviposition Site Selection of Anopheles gambiae Sensu
Stricto. Journal of Medical Entomology, 43: 221 – 224.
Speilman, A. & Sullivan, J. J. (1974). Predation of predomestic mosquitoes by Hylid tadpoles on
Grand Bahama Island. American Journal of tropical Medicine and Hygiene, 23: 704 – 709.
Stuart, S. N., Chanson, J. S., Cox, N. A., Young, B. E., Rodrigues, A. S. L., Fischman, D. L. &
Waller, R. W. (2004). Status and Trends of Amphibian Declines and Extinctions Worldwide.
Science, 306(5702): 1783 – 1786.
43

Entomology Projects Reports Compiled by Dan Thornham
Asymmetry in the praying mantis, T. roseipennis.
Background & Aims
Figure 28. Tithrone roseipennis mating.
Simla, Trinidad. Photo: D. Thornham.
Tithrone roseipennis (Saussure, 1870) is a
small (20-30mm long) neotropical praying
mantis (figure 1) that is found commonly
throughout Trinidad, as well as in South and
Central America (Barabas & Hancock, 1999).
Typically, the insect is uniformly grass green
in colour. However, regardless of sex, the
mantis tends to have three red wings and one
green wing, which it folds over the three red
wings. The unusual distribution of colour
means that T. roseipennis is currently the only
known example of plastic morphological asymmetry in insects (Cuthill et al., 2006). In
spite of this, very little is known about the species.
We do know that either forewing can be green and this is the case in 90% of Trinidad’s
wild population (Barabas & Hancock, 1999). Asymmetry is unusual in nature, and
where it does occur there tend to be very strong evolutionary pressures to maintain it.
In this insect however, these pressures remain obscure. Also unknown is the
mechanism of the colour pattern.
Like many praying mantids, T. roseipennis relies on crypsis or camouflage both for
protection from predation and for concealment to allow it to approach potential prey
(Ruxton et al., 2004). Observations that T. roseipennis prefers to arrange its green
wing uppermost support this theory (Barabas & Hancock, 1996).
It is also common for such cryptic insects to possess bright, contrasting colours or
eyespots that are normally hidden from view on the hindwings. In animals with
coloured hindwings, such as in a number of moths or katydids, the colours or eyespots
can be flashed in an emergency when the insect is evading capture by a predator
(Cott, 1940; Brakefield & French, 1999). Flashing a bright colour may momentarily
distract a predator just long enough for it to hesitate or misjudge its aim. For this
44

‘tactic’ to be most successful, the flashes of colour or the eyespots should be as visible
as possible. However, theories of visual perception suggest that symmetrical patterns
are much more striking than asymmetrical ones (Cuthill et al., 2006). The asymmetry
in T. roseipennis therefore does not fall into this ‘camouflage plus distraction’
hypothesis as other insects do. It may however, be that the asymmetrical flashes
distract from the insect’s true centre of mass. As far as we know T. roseipennis would
constitute the only example of this type of flash colouration.
A similar problem arises if the unusual colouration of T. roseipennis is hypothesised to
play a role in sexual selection. There is a large body of work that indicates that
symmetry is more ‘sexy’ than asymmetry (eg. Møller & Thornhill, 1998; Thornhill &
Møller, 1998). For example, asymmetrical peacock males are less attractive to females
(Gadagkar, 2003). Furthermore, in the few examples of sexy asymmetry that exist,
the two sexes are highly dimorphic. For instance, fiddler crab males possess one
enlarged claw (cheliped) and the bigger the claw, the more sexually successful the
male (Oliviera & Custodio, 1998). Females on the other hand, possess two similarly
sized claws, much like other species of crab. However, T. roseipennis does not exhibit
any sexual dimorphism in terms of wing coloration (Barabas & Hancock, 1999); the
location of the red forewing is not linked to sex.
However, it could be possible that simply the amount of red makes T. roseipennis more
attractive, regardless of sex. To address this hypothesis and to begin to get an idea of
what the function of the red colouration might be, we aimed to observe courtship
behaviour in T. roseipennis in the laboratory. By watching and recording courtship
behaviour, we aimed to determine firstly whether the red colours are displayed at all,
secondly whether both sexes display equally, and thirdly whether the mantis display
behaviour correlated with morphology such that a mantis with two red wings on the
left side presents the left side to its potential mate. During these observational
experiments, we hoped to develop culture techniques in order to establish a breeding
colony in the laboratory. This objective would potentially allow us to begin to bring
experiments out of the field and into the laboratory, where much more control can be
exercised over the environment than in the field. Through experimental observations of
the breeding behaviour and the development of robust captive rearing protocols, we
hoped to make significant contributions to the understanding of the function of the
colour asymmetry in this intriguing praying mantis, an insect that has the potential to
test many of the established theories on animal colouration and symmetry.
45

Methods
Collection
Visual searches were made of leafy undergrowth in a number of habitats. Although
widespread, T. roseipennis appears to have a clumped distribution so that we found a
total of five individuals in seven weeks of initial searching. We then found 15
individuals at one site in 8th and 9th week in the field. The majority of the mantids (17
of 20) were collected from a population near Tamana Hill in Trinidad’s Central Range
(06° 98.303’ N; 11° 57.893’ E).
Visual searching proved the most effective and efficient search method. This was
because T. roseipennis could be found resting on the upper surfaces of the leaves of
shrubs, approximately 1m above the ground, in sunny patches alongside roads and
forest trails. We found no T. roseipennis in patches where the undergrowth reached
less than 50cm.
Tithrone roseipennis tended to attempt to evade capture by running rather than flying,
which meant that they could be shepherded into open vials or jam jars. A sweep net
was always placed below in case the mantis jumped away from the vial/jar.
Husbandry
Insects were maintained at 20-23oC and 70-95% relative humidity. Ambient light was
used to illuminate cultures both in the field and the laboratory, with supplementary
light being provided in the laboratory by a 100W daylight simulation bulb.
Adults and late instar nymphs were maintained individually in plastic vivaria (approx.
300x150x200mm), with wet cotton wool providing moisture and plastic plants
providing climbing substrate. An excess of small crickets or flies (various species) were
provided as food.
Oothecae were left where the female had laid them until hatching, when the young
mantids were moved to their own vivarium. These smaller individuals/earlier instars
were maintained together with their siblings from the same ootheca, with excess fruit
flies provided as food.
In the field, vivaria were placed in water baths from 24Jul07, when ants were found in
cultures and had destroyed the mantids.
46

Behavioural Trials
A single male was placed in a vivarium with a single female (sexual dimorphism is
described later) for a minimum of 30mins. Mantids were observed for longer if mating
attempts were made. In such cases, the trials continued until mating had finished and
the two individuals separated. Observations were made of the interactions between the
two individuals, noting and describing any visual displays or other obvious behavioural
cues exhibited during the trial period. The time of day during which the trials were
conducted was randomised to remove any effect of photoperiodism. The trials were
conducted under ambient conditions in the field, and under husbandry conditions in the
laboratory. Thirteen T. roseipennis were used in these trials. Six of these were
collected as adults from the wild, five were collected as nymphs.
Results General Morphology
Sexual dimorphism in T. roseipennis was identified very early in the study by
examining the terminal abdominal segments. Differences between the abdomens of
males and females can be seen with the naked eye (Figure 29).
A B
Figure 29. T. roseipennis abdomens. A, female, bar=2.5mm; B, male, bar=1.5mm. Photos: D. Thornham
Female abdomens are larger than males’ and posess a terminal protrusion (Figure
29A). By contrast, males’ abdomens are smaller, more slender and posess no obvious
protrusion (Figure 29B). The colours of the two abdomens shown in Figure 2 are not
indicative of sex, but vary between individuals (and with different flash exposures).
Of the thirteen adults studied, five were male and eight were female. Female body
length = 25.7mm (±0.4mm, n=8). Male body length = 21.6mm (±0.1mm, n=5). Six
47

of these adults were symmetrical. Of the six adults collected from the wild, none were
symmetrical, though one of the females became symmetrical after returning her to the
UK. 60% of those reared to adulthood in captivity were symmetrical. However, one of
the males became symmetrical two weeks after eclosing.
Six of the thirteen adults examined so far have been predominantly “left-handed”, that
is to say, when folded, their left forewing was uppermost. Half of the females were
left-handed and 2/5 males were left-handed.
Displays
52 mating opportunities (behavioural trials) have so far been observed. During the 52
trials, 103 visual displays were observed. 95% of these were by males. Of the 52
trials, 12 resulted in mating. Five of these 12 (42%) were preceded by visual displays
by the male (none were associated with female displays). The data is summarised
thus:
mating no mating totalsmale display 6 11 17no male display 7 28 35totals 13 39 52
Table 13. Chi-squared contingency table for association of male displays with successful matings.
A Χ2 test showed that mantid mating frequency was not associated with male display
occurrence (Χ2 = 0.08, df = 1, p = 0.77).
Mantids of both sexes have been observed displaying their red colouration. Male T.
roseipennis displayed during 17 of the 52 behavioural trials. Ninety-eight displays by
males were observed during these 17 trials, making the average number of displays
5.8 (±1.4).
Females displayed during only eight trials. When females displayed, they tended to
display only once per trial, the average number of displays being 1.25 (±0.2).
The visual displays of T. roseipennis appeared to follow one of two patterns. The first
was elicited only by conspecifics and involved raising the first pair of wings dorsally,
opening out/unfolding the red hind wings dorsoventrally, and curling the abdomen
towards the other mantis whilst rotating it ventro-laterally to display as much of the
red dorsal surface as possible. This category of display comprised 88% of the displays
recorded during the mating trials.
48

The second form of display was elicited by observers and occasionally by conspecifics.
This second display involved raising and opening all four wings simultaneously and
(usually) raising the abdomen dorsally whilst orienting the body to face the
observer/mantis. 12% of the displays recorded during behavioural trials were of this
second type.
Reproductive behaviour & biology
A total of twelve oothecae (egg cases) were produced during the course of the
behavioural trials. However, only 50% of the matings could be linked directly to egg
production, with an average of two oothecae produced from each of these mating
events. It could not be ascertained whether the remaining ‘successful’ matings led to
egg production because females are able to store sperm and fertilise several oothecae
from a single mating. The delay between mating and egg production averaged 14 days
(±4), ranging from 2 to 31 days. To date, the maximum number of viable oothecae
produced from a single mating is five, with the last being laid approximately three
months after copulation. The mean number of offspring hatching from an ootheca was
21 (±6).
If left for two weeks, females have been observed to engage in behaviour consistent
with pheromone release behaviour seen in other species of mantid (Kynaston et al.,
1994) a ventral curl of the abdomen, coupled with lifting the wings. In T. roseipennis
this has the side-effect of exposing the red colouration to the rear of the insect.
Other than this, mating in T. roseipennis appeared to involve minimal courtship
behaviour. Typically, the male displayed to the female when in close proximity – either
when the male approached the female, or more commonly, when the male blundered
into the female and the female reacted aggressively. Once detected, the male
approached the female very slowly and deliberately until he was within one or two
body lengths. He then leapt onto the female from which ever angle he happened to
approach (though one male was observed approaching then changing the direction of
his approach to a more rearward direction). If the male was quick enough, and the
female passive/receptive, he would settle on her abdomen and mating would
commence. This lasted between 45mins and 6hrs (typically 2½hrs). Alternatively, if
49

the female was not receptive, she treated him with aggression and attacked the male
with her forelegs7, flicking him away.
During mating the males repeatedly attempted to curl their abdomens round to
copulate with the females. When this eventually was successful, they tended to remain
locked together for at least an hour. If females were ‘uncomfortable’, they could
express themselves in two ways. The first was to reach behind their heads as though
to dislodge the males. This could be done with varying vigour. However, the males,
being on top of the females could respond either by bowing their heads out of the way,
or by retaliating and aggressively flicking their forelegs above the females’ heads.
The second method female T. roseipennis used to dislodge their males was by rubbing
their flanks on the substrate. This forced the males to move round the females’ body
to remain on top and avoid being damaged against the substrate. When females were
observed to do this, coitus ceased.
Discussion
From rearing the mantids in captivity, we are becoming aware that colour development
in T. roseipennis appears to be at least partially under some environmental influence.
We know this because 85% of the captive-reared individuals to date were symmetrical.
Asymmetry has been suggested previously to be associated with high levels of stress,
for example through overcrowding (Gibbs and Breuker, 2006). So it may be that by
placing the insects in isolation with an excess of food, we reduced the behavioural
stresses experienced by the animals. This seems unlikely however, firstly because the
captive T. roseipennis were exposed to humans on a daily basis, and secondly our low
success rate in rearing nymphs suggests that our culture environments subjected the
insects to great stresses, both behavioural (the larvae were at high density) and
environmental.
Furthermore, a number of asymmetrical individuals have been found to become
symmetrical (after being caught from the wild). When these mantids changed the
colour of their forewings, they changed from green to red. Wing colouration in other
insects is determined genetically during development and is then fixed throughout
adulthood (Monteiro et al., 2001). Polymorphisms or polyphenisms are a result of
genetic diversity and the expression of different alleles (Suzuki and Nijhout, 2008). 7 T. roseipennis appears to have two classes of aggressive attack. The first is used for feeding/predation and involves attempting to grasp the subject with the forelegs. The second is defensive and involves flicking/kicking the subject away with the forelegs.
50

Colour changes in adult T. roseipennis do not follow this pattern. All T. roseipennis
appear to possess the genetic coding for both red and green colouration (they always
express green on their thorax & red on their abdomen) but the mechanism of the
colour formation must be different. If the colour changes seen in T. roseipennis are
indeed unidirectional, always changing from green to red, it might suggest the red
coulour is a result of accumulated breakdown products of some sort. The mechanism
of this colour change and the initial formation of colour in T. roseipennis requires
further detailed investigation.
From rearing the mantids, we have also identified two uses of the red colouration. T.
roseipennis has one display to identify itself to conspecifics and another, different,
inter-species display. Visual displays were not found to be associated with courtship
behaviour (Table 13). It remains possible then that the red colour constitutes
aposematism or distraction/startle colouration. This possibility requires further
investigation because aposematic colouration should normally be symmetrical in order
to be as visible as possible to potential attackers. Colour patterns that are considered
aposematic also tend to be visible at all times; they make the animal as visible as
possible, using colours that warn of poison or distastefulness (Ruxton et al., 2004).
This is not the case in T. roseipennis, which conceals its bright red colouration under a
green forewing.
If the function of the red colour for deflection or startling of predators, it may explain
why the red is typically hidden under green forewings, only to be revealed under
specific circumstances. Could startle colouration account for the bilateral asymmetry
found in T. roseipennis? Or the plasticity of the colouration? Bilateral asymmetry might
provide an advantage if it were to distract potential predators from the mantid’s true
centre of mass, redirecting a predator’s strike to one side or the other (disruptive
colouration). If such a scenario is the case here, it may follow that plasticity in the
asymmetry could prevent predators from learning to adjust their aim.
Unfortunately, neither hypothesis alone accounts for either the reluctance of T.
roseipennis to fly to escape predation or the conspecific display behaviour we
observed. The conspecific display, being fairly slow & deliberate, might contain an
element of aposematism as it gives the observing insect ample opportunity to regard
the display and the ultimate message appears to be “don’t attack me”. However,
aposematism would conflict with the mating process, warning conspecifics away.
51

Further work exploring interactions between T. roseipennis and different species of
praying mantis species might help elucidate the true message of this display.
Ultimately, there are most likely to be a combination of theories that T. roseipennis fits
and the colouration seen in T. roseipennis will be a result of numerous trade-offs
between the need to hide from prey and predators and the need to avoid attack from
predators and conspecifics. A great deal more work is necessary to tease apart the
different functions and to determine which have had the greatest influence on the
evolution of this unique animal. Still more work is required to understand the
mechanism underlying the colouration as T. roseipennis appears to hold the title of the
only known example of plastic morphological asymmetry in insects.
References
Barabas, S.P., and Hancock, E.G. (1999) Asymmetrical colour and wing-folding in Tithrone
roseipennis (Saussure 1870) a neotropical praying mantis (Mantodea Hymenopodidae). Tropical
Zoology 12: 325-334.
Brakefield, P.M., and French, V. (1999) Butterfly wings: the evolution of development of colour
patterns. BioEssays 21: 391-401.
Cott, H.B. (1940) Adaptive coloration in animals. Methuen, London, UK.
Cuthill, I.C., Hiby, E., and Lloyd, E. (2006) The predation costs of symmetrical cryptic
coloration. Proceedings of the Royal Society B 273: 1267-1271.
Gadagkar, R. (2003) Is the peacock merely beautiful or also honest? Current Science
85(7):1012-1020.
Møller, A.P., and Thornhill, R. (1998) Bilateral symmetry and sexual selection: A meta-analysis.
American Naturalist 151: 174-192.
Oliviera, R.F., and Custodio, M.R. (1998) Claw size, waving display and female choice in the
European fiddler crab, Uca tangeri. Ethology, Ecology and Evolution 10: 241-251.
Ruxton, G.D., Sherratt, T.N., and Speed, M.P. (2004) Avoiding attack. Oxford University Press,
Oxford, UK.
Thornhill, R. and Møller, A.P. (1998) The relative importance of size and asymmetry in sexual
selection. Behavioral Ecology 9(6): 546-551.
52

Heliconia Project Report
Compiled by Dan Thornham, data collected by Fraser Murdoch
Background & Introduction
Plants of the genus Heliconia are one of the most studied non-agricultural tropical
plants, with their insect fauna being the focus of much of the work (Seifert, 1982). The
plants occur commonly throughout the neotropics, often in clusters, stands or clumps.
Heliconias typically have large, oval leaves that emerge cylindrically from a central
stem (Figure 30). The leaves are thick, waxy and often tear readily along the veins.
The plants produce flowers within bracts in large inflorescences or flower spikes (Figure
30). The bracts that enclose the flowers are often brightly coloured with reds, oranges
and yellows to attract hummingbirds, their principal pollinators (Stiles, 1979; Linhart,
1973). Other birds such as finches and bananaquits function to disperse their seeds.
Figure 30: Diagram of two typical Heliconia plants showing inflorescence structure and colour with 6 open
bracts (left) and rolled, immature leaf growing cylindrically from the stalk (right) Both structures typically
collect water and function as phytotelmata. Scale bar = 500mm. Adapted from Seifert (1982)
Both the flowers, or rather the bracts in which they sit, and the rolled emergent leaves
can collect small pools of water, known as phytotelmata. In the bracts, rainwater is
supplemented by watery secretions by the plant (Seifert & Seifert, 1976). The fluid in
the bract acts to keep developing flowers submerged and away from many of the
herbivores that would otherwise destroy them (Seifert, 1982; Skutch, 1933). However,
a number of animals have evolved to take advantage of these unusually located bodies
of water. Additionally, the secretions added by the Heliconias contain basic sugars and
amino acids that, in combination with debris that falls into the bracts, lead to the
bracts being exploited by a number of animals. These animals are well-documented
53

from different parts of the neotropics and it is clear that the community of insects
inhabiting the bracts follows a distinct successional pattern (Connell & Slayter, 1977).
This succession is linked to the sequential opening of the bracts.
Each inflorescence supports 4-25 bracts (depending on species & environmental
factors), which open one after the other over the flowering season. The delay between
one bract opening and the next delay differs between species but is typically 6-7 days.
This delay means that each bract can act as a distinct, aquatic microhabitat that is
either a week older or a week younger than its neighbours (Seifert, 1980). However, it
is part of the same plant and therefore comparable in origin, size, nutrient provision
and climate with the other bracts of the same inflorescence. This biology makes
Heliconias good model systems through which to study successional colonisation in
animal communities.
Further to their value as systems in which to study succession effects, Heliconias also
make useful systems in which to examine island biogeography (Strong, 1977). As we
mentioned earlier, the plants often occur in clusters or clumps, which can be seen as
ecological islands (Seifert, 1975). This arises because Heliconias can often reproduce
vegetatively, allowing them to take advantage of the fragmented patches of sunlight
that develop in the rainforest through falling trees. Vegetative reproduction in
Heliconias occurs by the development of new plants growing directly from rhizomes
buried beneath the soil. The consequences of this, scientifically speaking, are firstly
that there are often many clusters of varying size and shape within a geographical
area. Secondly, each cluster of Heliconia is comprised of genetically very similar plants,
or often clones. When these factors are considered in addition to the specialist nature
of the microhabitats within the clusters, it is clear that these plants make very good
model systems for examining island biogeography. Furthermore, because the number
of bracts varies between plants, even within a single cluster, there is scope to consider
island biogeography on a number of scales: at the level of the inflorescence, at the
level of the cluster, and at the scale of the wider geography of Central and South
America.
A number of studies have been published examining the insect communities
specialised to live in different Heliconia species (Fish, 1977; Seifert, 1980; Strong,
1977; Seifert & Seifert, 1976). Previous studies have examined Heliconia at different
spatial scales. However, most of the detailed studies on the successional colonisation
of bracts have been conducted in Costa Rica and Venezuela, with the Heliconias of
54

Trinidad only being considered in passing, as part of larger, biogeographical studies,
comparing the entire insect community compositions between regions and species of
Heliconia (Seifert, 1982). To our knowledge, a single attempt has been made to
examine the patterns of successional colonisation in the Heliconias of Trinidad
(Kennedy, 1999) and no studies have been done to compare the patterns to those of
other regions or those in Heliconia patches of different sizes.
Our aim was firstly to identify patterns of successional insect colonisation in the bracts
of H. bihai growing in the Arima Valley, Trinidad – a location from which Heliconias
have been sampled in the past. We then intended to compare the patterns we
identified to those published from other areas of the Neotropics, and to those from
clusters of different sizes.
Methods
This project was conducted by one of the undergraduate students on the expedition,
who will analyse the data collected on his return from a placement year in New
Zealand. Therefore only an outline of the project can be given here, along with the
most basic analysis of the results.
The position of every Heliconia in a ≈1ha area at Simla Research Station (06° 86.914’
N; 11° 82.332’ E) was mapped (Figure 31). Clumps or clusters of individual plants
were identified using the methods of Seifert (1975). For a sub-set of the clumps, the
total number of bracts in the clump was recorded. Then inflorescences were sampled
from these clumps and individual bracts were numbered sequentially, starting with that
most recently opened. Each bract was then dissected and the insect fauna within was
identified. Identifications were made tentatively in the field as morphospecies. More
reliable identifications are being made by the student on the samples brought back to
Glasgow. In order to allow fellow expedition members to assist on the project, a simple
dichotomous key was devised in the field to identify the morphospecies encountered.
55

Figure 31. Map showing distribution and size of Heliconia clumps sampled from a ≈1ha area in the Arima
Valley, Trinidad. The relative size of the circles indicates the relative size of the clump in terms of the
number of bracts. Distances are in metres.
Results
In total 214 bracts were dissected from 21 inflorescences. The mean number of bracts
per inflorescence was therefore 10.2 ± 0.5. When the bracts were dissected, a total
1135 animals were encountered. These were identified to 49 morphospecies. The
major taxa encountered are summarised in table 1. This means the average (mean)
number of species per bract was 4.95 ± 0.14. Dividing the number of animals
encountered by the number of inflorescences suggests there were ≈54
animals/inflorescence.
Table 14. Summary of major orders of animals encountered in Heliconia bracts.
Class Sub-Class/Order Common Name MorphospeciesInsecta Coleoptera Beetles 11
Diptera Flies 24Hemiptera Bugs 1Hymenoptera Wasp/Ants/Bees 3Lepidoptera Butterflies/Moths 1
Annelida Oligochaeta Earthworms 7Arachnida Acaria Mites 1
Aranea Spiders 1
56

Conclusions
On the basis of this cursory examination of the results, the data appear to fit well with
previous findings from the Arima Valley (cf. Seifert, 1982) and support the findings
that the insect fauna in this location fall into Seifert’s Type 1 category, characterised
by large bracts with little water (Seifert, 1980). As stated earlier, the analysis of the
data from this project is ongoing and this document can present only a preliminary
outline of the work that was conducted during the 2007 Trinidad Expedition.
References
Connell, H., and Slayter, R.O. (1977). Mechanisms of succession in natural communities and
their role in community stability and organization. American Naturalist, 111: 1119-1144.
Fish, D. (1977). An aquatic spittle bug (Homoptera: Cercopidae) from a Heliconia flower bract
in southern Costa Rica. Entomological News, 88: 10-12.
Kennedy, S. (1999) The ecology of Diptera larvae inhabiting the flower bracts of Heliconia bihai
in Trinidad. In: Livingstone S. (ed.) Glasgow University Exploration Society Report: Trinidad
Expedition 1999. Glasgow University, Glasgow, UK.
Linhart, Y.B. (1973) Ecological and behavioural determinants of pollen dispersal in hummingbird
pollinated Heliconia. American Naturalist 107: 511-523.
Seifert R.P. (1975). Clumps of Heliconia inflorescences as ecological islands. Ecology, 56: 1416-
1422.
Seifert, R.P. (1980). Mosquito fauna of Heliconia aurea. Journal of Animal Ecology, 49: 687-
697.
Seifert, R.P. (1982). Neotropical Heliconia insect communities. Quarterly Review of Biology, 57:
1-28.
Seifert, R.P., and Seifert, F.H. (1976) Natural history of insects living in inflorescences of two
species of Heliconia. Journal of the New York Entomological Society, 84: 233-242.
Skutch, A.F. (1933). The aquatic flowers of a terrestrial plant, Heliconia bihai L. American
Journal of Botany 20: 535-544.
Stiles, F.G. (1979). Notes on the natural history of Heliconia (Musaceae) in Costa Rica.
Brenesia, 15: 151-180.
Strong, D.R.Jr. (1977). Insect species richness: hispine beetles of Heliconia latispatha. Ecology,
58: 573-582.
57

AWNC education and outreach In 2007, as part of a move to increase their activities
with the local communities surrounding the land
protected by the Centre, the AWNC appointed a new
Education Officer, Ms Farah Gopaul, to work with Mr Ken
Fournillier, their experienced Community Outreach
Officer. The team hope to develop more educational
packages and encourage stronger links between local
community schools and the AWNC in years to come.
Much of the work planned will be focused on teaching
biodiversity with respect to avian fauna, as this is the
current area of expertise of the trained guides at the
Centre, but discussions between Farah and members of
the expedition team suggested that the additional “studentpower” available could help
to implement further environmentally-based
games being developed. As part of the
programme of celebration of the AWNC’s 50th
Anniversary, a community food fete had been
organised in nearby Blanchisseuse, and Farah
wanted to use this as a launch
platform/testing ground for some of the
educational games she was developing. Under
the enthusiastic leadership of MC Jason, and
with the help (and occasional participation) of
the students the day’s games ended up being great fun and a very useful exercise for
developing the ideas involved. We also took the
opportunity to take along a particularly docile
species of frog for the kids to meet. An old hand
at meeting children, “George” is a male
Phyllomedusa trinitatis that has held territory at
Simla for several years. Our first record of this
frog is from 2001 and so many of the children
were amazed to learn that “George” was older
than some of them! After (a lot) of initial
reservations, he became a great hit and children
Figure 12: Amy, Dan and Jason discuss
game tactics with the kids. Photo: J.Smith
Figure 13: Introducing children to
“George”. Photo: D. Thornham
were so
Figure 11: Farah takes frogs to
hat. Photo: J.Smith
on clamouring to hold him.
58

The Fete itself was a big success, the food was fantastic and we were thrilled to be
asked to be involved.
59

Appendix 1: Financial report
DescriptionAmount In
(£) DescriptionAmount Out (£)
Bake sale 203.11 1st aid courses 170.00Band Night 651.70 1st aid kits & Healthcare 226.34Other Fundraising Events 505.18 Accommodation 5025.00Personal Contributions 5400.00 Band Night 630.00Raffle 696.22 Car Maintenance 42.15Sponsored Leg Wax 255.00 Car rental 2154.60T-shirts 1425.00 Equipment (T&T) 233.00Carnegie Trust for the Universities of Scotland 2000.00 Equipment (UK) 178.00Chester Zoo 1000.00 Flights 4617.00Dennis Curry Trust 1500.00 Food 2295.00Gilchrist Educational Trust 500.00 Insurance 751.00
Glasgow Natural History Society (Blodwyn Lloyd Binns Fund) 1000.00 Petrol 558.84Glasgow University Court 2300.00 Phone 116.07Hope Homes 100.00Royal Scottish Geographical Society 200.00 Report production (approx.) 500.00Thriplow Charitable Trust 1000.00TOTAL 18736.21 TOTAL 17497.00Total (Ingoing-Outgoings) 1239.21
60