title 18 zoning regulations table of contents chapter section page
Upload
khangminh22Category
view
1download
0
Glasgow Theses Service http://theses.gla.ac.uk/
Ballantine, Lucy (2011) Transcriptomic analysis of peripheral blood monocytes and synovial macrophages in inflammatory arthritis. PhD thesis. http://theses.gla.ac.uk/2825/ Copyright and moral rights for this thesis are retained by the Author A copy can be downloaded for personal non-commercial research or study, without prior permission or charge This thesis cannot be reproduced or quoted extensively from without first obtaining permission in writing from the Author The content must not be changed in any way or sold commercially in any format or medium without the formal permission of the Author When referring to this work, full bibliographic details including the author, title, awarding institution and date of the thesis must be given

Transcriptomic analysis of peripheral blood monocytes
and synovial macrophages in inflammatory arthritis
Lucy Elizabeth Ballantine
A thesis submitted to the College of Medicine, Veterinary and Life Sciences,
University of Glasgow in fulfilment of the requirements for the degree of
Doctor of Philosophy
Institute of Infection, Immunity and Inflammation University of Glasgow 120 University Place Glasgow G12 8TA
2
Abstract
Background: Rheumatoid arthritis (RA) and psoriatic arthritis (PsA) are two
distinct forms of chronic auto-immunity; understanding the transcriptomic
profiles of key leukocyte subsets implicated in these arthritides could improve
the diagnosis and treatment of patients. Current microarray analyses of samples
derived from RA and PsA patients have examined the genetic profiles of whole
blood or diseased tissue which, although informative, can mask the genetic
contributions of individual cell types. Monocytes and macrophages are a cellular
subset known to play a major role in PsA and RA through the production of pro-
inflammatory chemokines, cytokines and destructive proteinases.
Aim: To define the transcriptome in CD14+ cells separated from the blood and
synovial fluid of PsA and RA patients, and to then compare and contrast that
signature in health and disease. Thereafter to define the relevant activities of
selected novel moieties described in the foregoing analysis.
Methods & Results: The transcriptomic profiles of healthy, RA and PsA CD14+
blood cells were remarkably similar - few genes could distinguish diseased from
healthy CD14+ cells. Comparison of the genetic signature of the RA and PsA
synovial fluid CD14+ cells revealed that just over 50% of the differentially
expressed genes were shared between the two disease groups. Furthermore,
analysing the canonical pathways in the synovial fluid cells compared to the
matched peripheral blood of both patient groups surprisingly revealed Liver X
receptor (LXR) activation pathway as the most significantly upregulated
pathway: this pathway has been previously shown by our group to play a pro-
inflammatory role in arthritis.
Examination of specific upregulated mRNAs in the synovial fluid CD14+ cells from
both disease types revealed two novel genes that had not previously been
associated with arthritis, the lysosomal enzyme legumain and the cell surface
molecule plexin A1. Legumain was demonstrated to be present in RA and PsA
CD14+ cells by RNA and protein analysis and was physiologically active.
Incubation of CD14+ cells with patient synovial fluid under hypoxic conditions
also potentiated legumain expression. Plexin A1 was confirmed to be expressed
at the mRNA level within RA synovium. siRNA knockdown of plexin A1 suggested

3
that it may play a pro-inflammatory role within macrophages since subsequent
treatment of these macrophages with LPS resulted in decreased TNFα
production. However, investigations into the identity of the specific ligands for
plexin A1 in arthritis, known as semaphorins, were inconclusive.
I finally generated microarray data to evaluate the transcriptome of
macrophages activated via cel contact with activated T cells. Such cells shared
only a small percentage of genes with those dysregulated in the RA and PsA
synovial fluid derived CD14+ cells suggesting that this model at the time points
chosen may not be an appropriate in vitro representation of articular
macrophages. An imaging system of this in vitro model was also established to
visualise the dynamic nature of the T cell – macrophage interactions and
demonstrated that variables such as duration or method of T cell activation
could alter the number and duration of interactions between the two cell types.
Conclusions: These studies demonstrate that the CD14+ cells isolated from the
blood are similar transcriptomically between healthy controls and RA and PsA
patients. The synovial fluid CD14+ cells from RA and PsA patients exhibit
substantial overlap in terms of their genetic profile. Two novel molecules
expressed by diseased patients namely plexin A1 and legumain have been
identified and their preliminary characteristics in the context of synovitis have
been defined.

4
Table of contents
Abstract ................................................................................................................. 2 Table of contents .................................................................................................. 4 List of Tables ......................................................................................................... 8 List of Figures ....................................................................................................... 9 List of Accompanying Material .......................................................................... 11
Acknowledgements ............................................................................................ 12 Author’s Declaration ........................................................................................... 14 Abbreviations ...................................................................................................... 15 Chapter 1 Introduction ....................................................................................... 17
1.1 Inflammatory Arthritis: Rheumatoid Arthritis and Psoriatic Arthritis ......... 18
1.1.1 Definition and Classification ............................................................ 18 1.1.2 Epidemiology ................................................................................... 20 1.1.3 Clinical Features .............................................................................. 21
1.1.4 Risk Factors .................................................................................... 22 1.1.5 Histopathology ................................................................................. 28 1.1.6 Immunopathology ............................................................................ 30
1.1.7 Mechanisms of inflammation ........................................................... 36 1.1.8 Current therapies in RA and PsA..................................................... 41
1.2 Monocytes and Macrophages ................................................................. 45
1.2.1 Monocyte and macrophage origin ................................................... 45 1.2.2 Monocytes ....................................................................................... 46
1.2.3 Macrophages ................................................................................... 51
1.2.4 Monocytes and macrophages in inflammatory arthritis .................... 62
1.2.5 Macrophages in RA and PsA .......................................................... 65 1.3 Gene expression analyses in inflammatory arthritis ............................... 80
Chapter 2 Materials and Methods ...................................................................... 93 2.1 Patients and controls .............................................................................. 94 2.2 Cell Culture ............................................................................................. 94
2.2.1 Primary Human Cell Culture ............................................................ 94
2.2.2 Purification of mononuclear cells from buffy coats and peripheral blood ........................................................................................................ 94 2.2.3 Purification of mononuclear cells from synovial fluid ....................... 94 2.2.4 Isolation of CD3+ T cells and CD14+ monocytes .............................. 95 2.2.5 CD3+ T cell and CD14+ monocyte stimulation ................................. 95
2.2.6 T cell / macrophage cell contact ...................................................... 95 2.3 Flow cytometry ....................................................................................... 96
2.3.1 Assessment of cell purity ................................................................. 96 2.3.2 Semaphorin 6D staining .................................................................. 96
2.4 Enzyme-linked-immunosorbent assay (ELISA) ...................................... 98 2.5 Microarray ............................................................................................... 99
2.5.1 Collecting and preparing samples for microarray ............................ 99
2.5.2 Isolating cells using the FACS ARIA ................................................ 99 2.5.3 Manual RNA Isolation from Trizol .................................................. 100
2.5.4 Single strand cDNA amplification .................................................. 101 2.5.5 SPIA™ amplification ...................................................................... 103
2.5.6 Purification of amplified cDNA ....................................................... 104 2.5.7 Fragmenting and biotin labelling of the amplified cDNA ................ 105 2.5.8 Array hybridization ......................................................................... 106
2.5.9 Staining and Scanning ................................................................... 107
5
2.5.10 Scanning ....................................................................................... 109 2.6 PCR and SYBR green .......................................................................... 109
2.6.1 cDNA preparation .......................................................................... 110 2.6.2 PCR ............................................................................................... 110
2.6.3 SYBR green .................................................................................. 110 2.7 Immunohistochemical methods ............................................................ 111
2.7.1 Antibodies ...................................................................................... 111 2.7.2 Single immunohistochemical staining ............................................ 112
2.8 Western blotting .................................................................................... 113
2.8.1 Whole cell lysates .......................................................................... 113 2.8.2 BCA Assay .................................................................................... 113 2.8.3 SDS-PAGE gel electrophoresis ..................................................... 113 2.8.4 Western blotting............................................................................. 113
2.9 Legumain activity assay ........................................................................ 114
2.9.1 Collecting samples for activity assay ............................................. 114 2.9.2 Setting up activity assay ................................................................ 114
2.10 siRNA ................................................................................................... 115
2.11 Real time cell imaging ........................................................................... 116 2.11.1 Preparing macrophages for imaging .............................................. 117 2.11.2 Staining macrophages for imaging ................................................ 117
2.11.3 Staining T cells for imaging ........................................................... 117 2.11.4 Imaging cell contact on microscope ............................................... 117 2.11.5 Analysis of real time images .......................................................... 118
2.12 Statistical analysis ................................................................................ 118 Chapter 3 Transcriptomic analyses of psoriatic and rheumatoid arthritis blood and synovial fluid CD14+ cells .............................................................. 119
3.1 Introduction and Aims ........................................................................... 120
3.2 Patients and normal donors .................................................................. 122 3.3 Collecting patient samples .................................................................... 123
3.3.1 Purity of monocyte samples .......................................................... 125 3.3.2 RNA quality of patient samples...................................................... 125
3.4 Summary of samples analysed on microarray ...................................... 128
3.5 Analysis of microarray results ............................................................... 129
3.5.1 Background correction of the Affymetrix chips .............................. 130 3.5.2 Signal histogram of normalised data ............................................. 131 3.5.3 Principle component analysis ........................................................ 132
3.6 Comparing samples .............................................................................. 135
3.6.1 Comparison 1: Patient blood compared to normal blood ............... 135 3.6.2 Comparison 2: Analysis of microarray results comparing psoriatic and rheumatoid patient blood CD14+ cells to synovial fluid CD14+ cells ...... 149
3.7 Discussion ............................................................................................ 181 3.7.1 Comparison 1: Healthy blood versus diseased blood .................... 182 3.7.2 Comparison 2: RA and PsA blood versus matched synovial fluid . 201
Chapter 4 Investigation into the expression and function of the novel gene plexin A1 in rheumatoid and psoriatic arthritis patients ............................... 224
4.1 Introduction ........................................................................................... 225 4.2 Validation of plexin A1 in microarray samples ...................................... 230 4.3 Expression of plexin A1 in other patient samples ................................. 231 4.4 Immunohistochemistry of plexin A1 ...................................................... 234
4.5 siRNA knockdown of plexin A1 in M-CSF derived macrophages ......... 236 4.5.1 Expression of plexin A1 in macrophages after 6 days of M-CSF differentiation ............................................................................................... 236
4.5.2 Transfection efficiency of N-TER reagent ...................................... 237

6
4.5.3 Testing siRNA 1-4 at 3 concentrations .......................................... 240 4.5.4 Effect of plexin A1 knockdown in M-CSF derived macrophages stimulated with LPS or Tck .......................................................................... 243
4.6 Investigation into the expression of the Plexin A1 ligand semaphorin 6D on T cells ......................................................................................................... 246
4.6.1 Semaphorin 6D FACS analysis ..................................................... 247 4.6.2 Investigation into the level of semaphorin 6D mRNA in T cell samples ...................................................................................................... 251
4.7 Investigation into the expression of other plexin A1 ligands semaphorin 3A, 3F, 6D on RA synovial membrane ............................................................ 254
4.7.1 qRT-PCR on RA synovial membrane ............................................ 254 4.7.2 SYBR green of RA synovial fibroblasts ......................................... 255
4.8 Discussion ............................................................................................ 257 Chapter 5 Investigation into the expression and function of the novel gene legumain in rheumatoid and psoriatic arthritis patients ............................... 263
5.1 Introduction ........................................................................................... 264 5.2 Validation of legumain expression in microarray samples .................... 269
5.3 Expression of legumain in other patient samples ................................. 270 5.4 Immunohistochemistry .......................................................................... 273 5.5 Western blot for legumain ..................................................................... 275
5.5.1 Legumain in M-CSF derived macrophages by RT-PCR ................ 275 5.5.2 Legumain in M-CSF macrophages by western blot ....................... 276 5.5.3 Legumain in patient CD14+ samples by western blot .................... 277
5.6 Legumain activity assay ........................................................................ 278 5.6.1 Legumain activity assay of M-CSF derived macrophages ............. 279
5.6.2 Legumain activity assay of patient CD14+ samples ....................... 281 5.7 Analysing legumain expression under normoxic and hypoxic conditions ... ............................................................................................................. 283 5.8 Discussion ............................................................................................ 285
Chapter 6 Microarray analysis of cell contact activated macrophages ....... 291 6.1 Introduction ........................................................................................... 292 6.2 Patients and normal donors .................................................................. 292
6.3 Separating macrophages from the cell contact ..................................... 293
6.3.1 Live cell contact ............................................................................. 293 6.3.2 FACS ARIA sorting of macrophages ............................................. 295
6.4 Analysing cell contact RNA yield and quality ........................................ 298 6.4.1 Cell contact activated macrophages have variable RNA quality after 24 hours ...................................................................................................... 298 6.4.2 Cell contact activated macrophage RNA quality over time ............ 300 6.4.3 RNA yield decreases after prolonged cell contact activation ......... 301
6.5 Collecting patient samples .................................................................... 303 6.6 Microarray analysis ............................................................................... 304
6.6.1 Signal histogram of normalised data ............................................. 304 6.6.2 Principle component analysis ........................................................ 305
6.7 Cell contact activated macrophages compared to synovial fluid activated macrophages ................................................................................................... 307 6.8 Discussion ............................................................................................ 314
Chapter 7 Validation of an in vitro live cell imaging system ......................... 321 7.1 Introduction ........................................................................................... 322
7.2 Real-time imaging ................................................................................. 325 7.2.1 Imaging on the microscope ........................................................... 327 7.2.2 Quantitative measurements of imaging ......................................... 328
7.3 Comparison of cytokine activated T cells to unstimulated T cells ......... 331

7
7.3.1 Comparison of Tcks and T cells after 2 hours of co-culture with macrophages ............................................................................................... 335
7.4 Comparison of fixed and live Tcks after 2 hours co-culture with macrophages ................................................................................................... 340
7.5 Discussion ............................................................................................ 344 Chapter 8: General Discussion ........................................................................ 350 References......................................................................................................... 355

8
List of Tables
Table 1.1 ACR classification criteria for rheumatoid arthritis ................................. 19 Table 1.2 Classification criteria for psoriatic arthritis (CASPAR) ........................... 20 Table 1.3 Comparison of clinical features of RA and PsA ..................................... 22 Table 1.4 Major cytokines with a role in inflammatory arthritis .............................. 38 Table 1.5 Chemokines with a role in inflammatory arthritis ................................... 40
Table 1.6 Characteristics of human monocyte subsets ......................................... 49 Table 1.7 Depending on T cell stimulus, various products are induced in the monocyes/macrophages upon direct cell contact ................................................. 75 Table 1.8 Genomic studies in RA and PsA ........................................................... 89 Table 2.1 Cytokine analysis by ELISA .................................................................. 99
Table 2.2 Primer sequences used for RT-PCR ................................................... 109
Table 2.3 Antibody source and concentration used for IHC ................................ 111
Table 3.1 Patient characteristics ......................................................................... 122 Table 3.2 Patient and normal donor samples collected ...................................... 124 Table 3.3 Summary of microarray samples ........................................................ 128 Table 3.4 A list of the 12 upregulated genes in RA PB CD14+ cells compared to PsA PB CD14+ cells ............................................................................................ 139
Table 3.5 A list of the 12 upregulated genes in PsA blood CD14+ cells compared to RA blood CD14+ cells ......................................................................................... 142
Table 3.6 The top 5 canonical pathways associated with the RA PB vs RA SF CD14+ comparision ............................................................................................ 158
Table 3.7 The top 5 diseases and disorders associated with the RA PB vs RA SF CD14+ comparison .............................................................................................. 158
Table 3.8 Top 5 molecular and cellular functions associated with the RA PB vs RA SF CD14+ comparison ........................................................................................ 158
Table 3.9 Canonical pathways associated with the PsA PB vs PsA SF CD14+ comparison ......................................................................................................... 162 Table 3.10 Diseases and disorders associated with the PsA PB vs PsA SF CD14+ comparison ......................................................................................................... 163 Table 3.11 Molecular and cellular functions associated with the PsA PB vs PsA SF CD14+ comparison .............................................................................................. 163 Table 3.12 Canonical pathways associated with the differentially expressed genes in BOTH RA and PsA synovial fluid .................................................................... 170
Table 3.13 Molecular and cellular functions associated with the differentially expressed genes in BOTH RA and PsA synovial fluid ........................................ 170
Table 3.14 Canonical pathways associated with the differentially expressed genes in PsA only .......................................................................................................... 171
Table 3.15 Molecular and cellular functions associated with the differentially expressed genes in PsA only .............................................................................. 172 Table 3.16 Canonical pathways associated with the differentially expressed genes in RA only ........................................................................................................... 173 Table 3.17 Molecular and cellular functions associated with the differentially expressed genes in RA only ............................................................................... 175 Table 3.18 Gene upregulated in BOTH RA and PsA synovial fluid CD14+ cells 177 Table 6.1 Patient and normal donor samples collected ...................................... 304

9
List of Figures
Figure 1.1 Comparison of a normal and arthritic synovium ................................... 30 Figure 1.2 Inflammatrory cell types within the synovium ....................................... 36 Figure 1.3 Differentiation of the macrophage/DC progenitor and origin of macrophage and DC subsets ............................................................................... 46 Figure 1.4 Innate and acquired immune activation of macrophages ..................... 61
Figure 1.5 Phenotypic overview of RA and PsA monocytes and macrophages .... 73 Figure 3.1 Purity of CD14+ cells isolated from PsA and RA patient blood and synovial fluid samples ......................................................................................... 126 Figure 3.2 RNA quality of the CD14+ samples from two patients ....................... 127 Figure 3.3 Signal histogram of normalised data .................................................. 132
Figure 3.4 Principle component analysis of all microarray samples .................... 134
Figure 3.5 Profile plot of entities that passed the quality control filter. ................ 136
Figure 3.6 Up and downregulated groups of genes in RA blood compared to healthy blood....................................................................................................... 147 Figure 3.7 Up and downregulated groups of genes in PsA PB compared to healthy PB ....................................................................................................................... 148 Figure 3.8 PCA analysis of PB and SF from RA and PsA patients ..................... 151
Figure 3.9 Profile plots of entities that are significantly changed between PB and SF in RA and PsA ............................................................................................... 152
Figure 3.10 Heatmap of significantly changed genes with a fold change cut off of 4 between the PB and SF of PsA and RA patients ................................................ 155
Figure 3.11 LXR/RXR activation canonical pathway associated with the RA PB vs SF comparison .................................................................................................... 159
Figure 3.12 Pathogenesis of multiple sclerosis canonical pathway associated with the PsA PB vs PsA SF CD14+ cell comparison. ................................................. 162
Figure 3.13 Venn diagram of the differentially expressed genes between RA PB and SF and between PsA PB and SF ................................................................. 165 Figure 3.14 B cell development canonical pathway associated with the genes expressed in PsA synovial fluid only ................................................................... 172 Figure 3.15 ERK5 signalling canonical pathway associated with the genes expressed in RA synovial fluid only ..................................................................... 174 Figure 4.1 Semaphorin ligands for type A plexin family members ...................... 226 Figure 4.2 Plexin A1 expression in microarray samples ..................................... 231
Figure 4.3 Plexin A1 expression in CD14+ cells from arthritic patients ................ 233
Figure 4.4 Plexin A1 staining in RA synovial membrane ..................................... 235
Figure 4.5 Plexin A1 in M-CSF differentiated macrophages ............................... 237 Figure 4.6 siRNA transfection efficiency by imaging fluorescence on the microscope.......................................................................................................... 238 Figure 4.7 FACS analysis siRNA transfected macrophages ............................... 239 Figure 4.8 Testing siRNA PLX 1-4 in M-CSF differentiated macrophages .......... 242 Figure 4.9 Testing PLX 1 and PLX 4 siRNA in macrophages ............................. 243 Figure 4.10 RT-PCR of plexin A1 knockdown in activated macrophages ........... 245 Figure 4.11 TNFα ELISA of siRNA treated macrophages ................................... 246 Figure 4.12 Surface and intracellular semaphorin 6D staining of CD3/CD28 stimulated T cells ................................................................................................ 249 Figure 4.13 Surface and intracellular semaphorin 6D staining of Tcks ............... 250
Figure 4.14 qRT-PCR of semaphorin 6D expression in T cell samples and patient CD3+ samples ..................................................................................................... 253 Figure 4.15 Semaphorin 3A, 3F, 6D expression in RA synovial membrane ....... 255
Figure 4.16 Semaphorin 3A, 3F and 6D expression in RA synovial fibroblasts .. 256

10
Figure 5.1 Legumain expression in microarray samples ..................................... 270 Figure 5.2 Legumain expression in CD14+ cells from arthritic patients ............... 272
Figure 5.3 Immunohistochemistry staining of legumain in RA synovial membrane ............................................................................................................................ 274
Figure 5.4 Legumain expression in M-CSF treated macrophages for 6 days ..... 275 Figure 5.5 Legumain western blot of M-CSF treated macrophages .................... 277 Figure 5.6 Legumain western blot of patient CD14+ cells ................................... 278 Figure 5.7 Legumain activity assay in M-CSF derived macrophages ................. 281 Figure 5.8 Legumain activity assay in CD14+ patient samples ........................... 282
Figure 5.9 Legumain expression in the presence of synovial fluid under hypoxic and normoxic conditions ..................................................................................... 284 Figure 5.10 Overview of legumain's expression and proposed role in arthritis ... 290 Figure 6.1 Separation of cells from a live cell contact ......................................... 294 Figure 6.2 Separating the macrophages and Tcks from cell contact using the FACS ARIA ......................................................................................................... 297 Figure 6.3 RNA integrity of macrophages and Tcks after 24 hours of cell contact ............................................................................................................................ 299
Figure 6.4 Macrophage RNA quality after different durations of cell contact ...... 301 Figure 6.5 Total RNA yield from macrophages after increasing duration of cell contact activation by Tcks ................................................................................... 302
Figure 6.6 Principle component analysis of all microarray samples .................... 306 Figure 6.7 Venn diagram of the significantly differentially expressed genes within the cell contact activated macrophages, RA synovial fluid macrophages and PsA synovial fluid macrophages ................................................................................. 309 Figure 6.8 Up- and downregulated biological processes in cell contact, RA SF and PsA SF macrophages ......................................................................................... 312 Figure 6.9 Up- and downregulated biological processes in cell contact and RA SF macrophages ...................................................................................................... 313 Figure 7.1 Outline of in vitro real time imaging experimental setup..................... 326
Figure 7.2 Example of the images taken by the inverted microscope for the real time imaging........................................................................................................ 327 Figure 7.3 Volocity software method for determining the macrophage-T cell interactions.......................................................................................................... 330
Figure 7.4 Imaging Tcks or non-activated T cells incubated with macrophages for 24 hours .............................................................................................................. 334 Figure 7.5 Imaging Tcks or non-activated T cells incubated with macrophages for 2 hours ................................................................................................................ 339
Figure 7.6 Imaging fixed or live Tcks incubated with macrophages for 2 hours .. 343

11
List of Accompanying Material
A DVD disc containing the real time movies referenced in Chapter 7 accompanies
this thesis and can be visualised using Apple QuickTime software.

12
Acknowledgements
I would like to begin by thanking my two supervisors Prof Iain McInnes and Dr
Alastair Gracie who have provided much encouragement and believed in both me
and my project. Their support enabled me to become a more independent
scientist. I would also like to thank my funding bodies, Oliver Bird Rheumatism
Programme and GSK, for allowing me to embark on my PhD project. The OBRP in
particular has been very supportive of my progress.
A special thank you must go to all the patients who donated synovial fluid and
blood for my study and to all the Doctors and nurses who consented patients and
took the samples. My research depended entirely on these samples and I am very
grateful for the willingness of the patients to take part.
The CRD lab group has been friendly and collaborative group within which to
perform my research as well as a sociable one resulting in many Friday nights in
the pub! I would like to thank Anne Crilley, Alasdair Fraser and Jim Reilly for
showing me the ropes when I first started and making me feel welcome. Ashley
Gilmour, Shauna Kerr and Neal Millar have also been very helpful in guiding me
through techniques in the lab. Additionally, I would like to thank Darren and
Axel for being brilliant bench buddies and good friends, I miss our chats and
Welsh lessons and even the Lucy Lou songs! I also must thank the scientists at
GSK, especially Sabina, who helped me to set up and perform my microarray
experiment which formed a major part of my project.
There are so many other dear friends that I made during my PhD; too many to
mention but you know who you all are. I am so grateful to have met you all and
thank you for putting a smile on my face during my time at Glasgow and getting
me through the bad science days. Thank you to my other friends especially
Vicky, Josie and Chris for your words of encouragement.
A big thank you to my wonderful family who have been behind me every step of
the way and are so proud of my achievements. My oldest brother Andrew was
the inspiration behind me doing an arthritis-related PhD after watching him
suffer with Ankylosing Spondylitis from a young age and my little sister Lowri
was always at the other end of the phone when I needed her. Thank you to my

13
beautiful nieces and nephews who always put a smile on my face and cheer me
up. Eden, Ruby, Liam, Charlie, Oliver and Finley, I love you all. Baby Lloyd I
think of you all the time, rest in peace little one xx
I would also like to mention Craig‘s mum Christine whose courageous strength
throughout her battle with breast cancer showed me the importance of being
positive in the face of adversity.
A very special thank you to my amazing mum for being so encouraging with her
unwavering support throughout my life. She gave up a lot and worked very hard
to enable me and my siblings to have a good life and for that I will be eternally
grateful. I can never thank you enough mum, you are my inspiration. Remember
those people who told us that kids from single parent families never do well? We
proved them wrong!
And last but by no means least I would like to thank my fantastic boyfriend Craig
for his firm belief in me and my ability from the day I received the email saying I
had my PhD place until now. You have been there through the highs, lows, tears
and laughter of the past four years with your love, support and brilliant sense of
humour. You even bought a new laptop for me to use when mine broke whilst
writing up! Thank you for being there and for being my rock. I dedicate this
thesis to you xxx

14
Author’s Declaration
I declare that, except where explicit reference is made to the contribution of
others, that this thesis is the result of my own work and has not been submitted
for any other degree at the University of Glasgow or any other institution.
Signature…………………………………………………………..
Printed name……………………………………………………

15
Abbreviations
ACPA Anti-citrullinated protein antibodies AEP Asparagine endopeptidase APC Allophycocyanin APC Antigen presenting cell APO Apoplipoprotein AS Ankylosing Spondylitis C.C Cell contact CCP Cyclic citrullinated protein CD Cluster of differentiation CIA Collagen induced arthritis CLU Clusterin CRP C-reactive protein DAVID Database for annotation, visualisation and integrated Discovery DC Dendritic cell ERK Extracellular signal-related kinase ESR Erythrocyte Sedimentation Rate FACS Fluorescence activated cell sorting FCS Foetal calf serum FITC Fluorescein isothiocyanate FLS Fibroblast-like synoviocyte FOXP1/3 Forkhead box P1/3 FPR1/2 Formyl peptide receptor 1/2 FZ Frizzled receptor GM-CSF Granulocyte macrophage colony-stimulating factor GSTM1/2 Glutathione S-transferase M1/2 HDL High density lipoprotein HLA Human leukocyte antigen ICAM Inter-cellular adhesion molecule IFN Interferon IL Interleukin IPA Ingenuity pathway analysis ITAM Immunoreceptor tyrosine-based activation motif JAK Janus kinase KLF Krupple-like factor LAMC1 Laminin gamma 1 LPS Lipopolysaccharide LXR Liver X receptor MAC membrance attack complex MAPK Mitogen-activated protein kinase MCP-3/4 Monocyte-specific chemokine 3/4 M-CSF Macrophage colony-stimulating factor MHC Major histocompatibility complex MICA MHC class I chain-related gene A MIP-1α/β Macrophage inflammatory protein 1 alpha/beta MM Mis-match MMP Matrix metalloproteinase Mo Monocyte MФ Macrophage MTC Multiple testing correction

16
NK Natural killer NO Nitric oxide OA Osteoarthritis PAMP Pathogen associated molecular pattern PB Peripheral blood PBMC Peripheral blood mononuclear cells PCA Principle component analysis PDGFA/B Platelet-derived growth factor alpha/beta polypeptide PLX Plexin PM Perfect match PPBP Pro-platelet basic protein PsA Psoriatic arthritis RA Rheumatoid arthritis RANKL Receptor-activator-of-nuclear-factor-κB ligand RANTES Regulated upon activation, normal T-cell expressed,
and secreted RF Rheumatoid factor RNI Reactive nitrogen intermediates ROS Reactive oxygen species RXR Retinoid X Receptor SEMA Semaphorin SF Synovial fluid SLE Systemic lupus erythematosus SNP Single nucleotide polymorphism SOCS Suppressor of cytokine signalling SpA Spondylarthritis STAT Signal transducer and activator of transcription TACE TNFα-converting enzyme T1D Type 1 diabetes Tck Cytokine activated T cell Th1 T helper 1 cell Th2 T helper 2 cell TIEG TGFβ early gene-1 TIMP Tissue inhibitor of MMPs TNFα Tumor necrosis factor α TLR Toll-like receptor TRAF TNF receptor associated factor Treg T regulatory cell TTCF Tetanus toxin C fragment UPR Unfolded protein response VASH1 Vasohibin 1 VEGF Vascular endothelial growth factor ZIA Zymogen induced arthritis

Chapter 1 Introduction

18
1.1 Inflammatory Arthritis: Rheumatoid Arthritis and Psoriatic Arthritis
The inflammatory arthritides compose a heterogeneous group of chronic
inflammatory rheumatic diseases. The progressive joint inflammation and
immune cell infiltration typically seen in these diseases leads to progressive and
irreversible destruction of the cartilage and bone. Arthritis affects 1-3% of the
general population and is projected to affect 67 million people by 2020 in the
United States alone [1]. This disease is not only associated with significant
healthcare costs but also severe physical limitations and disability within the
individual [2]. Rheumatoid arthritis affects 0.5-1.1% of the population [3].
Psoriatic arthritis is another common inflammatory arthritis affecting 2-3% of the
general population and occurring in 7-26% of psoriasis sufferers [4].
1.1.1 Definition and Classification
Rheumatoid arthritis (RA) is a chronic symmetric polyarticular arthritis which
primarily affects the small joints of the hands and feet [5]. It is characterised by
inflammation of the joint lining and cellular infiltration into the joint, which
subsequently causes damage and destruction of bone and cartilage. RA sufferers
have a life expectancy decrease of 3 to 10 years compared to the general
population [3]. The current accepted criteria for the classification of RA have
been defined by the 1987 American College of Rheumatology (ACR) criteria
outlined in Table 1.1 [6].

19
Table 1.1 ACR classification criteria for rheumatoid arthritis
A patient is diagnosed as having RA if they present with at least 4 of the 7
criteria with the first four criteria being present for at least 6 weeks:
1. Morning stiffness
2. Soft tissue swelling in 3 or more joint areas
3. Arthritic swelling of the hand joints
4. Symmetrical presentation of arthritis
5. Rheumatoid nodules
6. Serum rheumatoid factor (RF) positive
7. Radiographic changes including erosions or bony decalcifications.
Psoriatic arthritis (PsA) is a (predominantly) seronegative inflammatory disease
of joints, entheses and periarticular connective tissue in association with
psoriasis [7]. Rheumatoid factor and anti-cyclic citrullinated proteins (anti-CCP)
antibodies are seen in 4.7% and 7.6% of cases respectively [8]. PsA constitutes a
subset within the spondyloarthropathy (SpA) group due to it sharing common
clinical features with the other SpA diseases. Clinical, radiologic and familial
evidence has indicated PsA as a distinct disease entity however basic research
within this disease has been confounded by the absence of widely agreed-upon,
validated disease criteria. Several classification criteria have been proposed by
Moll and Wright [9], Vasey and Espinoza [10] and the European
Spondyloarthropathy Study Group (ESSG) [11]. A large international study group
identified as the classification criteria for psoriatic arthritis or CASPAR study
group has since been used to construct new classification criteria [8] (see Table
1.2).

20
Table 1.2 Classification criteria for psoriatic arthritis (CASPAR)
To meet the CASPAR criteria a patient must have inflammatory articular disease
(joint, spine or entheseal) with ≥ 3 points from the following categories (1 point
each):
1. Psoriasis (skin, scalp)
2. Psoriasis in patient‘s history
3. Psoriasis in family history
4. Psoriatic nail involvement (now)
5. Rheumatoid factor negative (determined by ELISA)
6. Dactylitis (inflammation of an entire digit) (now)
7. Dactylitis in patient‘s history
8. Radiological signs of new bone formation adjacent to the joints
1.1.2 Epidemiology
Numerous population based studies have been performed on the incidence and
prevalence of RA and indicate large differences between various communities.
Studies performed in North America and Northern Europe have found the
prevalence of RA to be 0.5-1.1% with an annual incidence of 29-38 per 100,000
whereas lower prevalence of 0.3-0.7% were demonstrated in Southern Europe
which had an annual incidence of 16.5 per 100,000 inhabitants [3]. In the UK the
prevalence of RA is estimated to be 0.8% [12] with an incidence of 36 per
100,000 in women and 14 per 100,000 in men [13]. There have been few
prevalence studies in developing countries but those that have taken place
suggest a significantly lower prevalence of RA than in North America and
Northern Europe, of 0.1-0.5% [14].
In comparison, fewer epidemiological studies have been performed on PsA
possibly due to a previous lack of a widely accepted classification or diagnostic
criteria. Prevalence is estimated at 0.1-1% [15] which increases in patients with
psoriasis to 7-26% [4] but has been reported up to 30% in a Swedish study [16].
Few population based incidence studies have been undertaken on PsA however,
the various incidence rates have been reported as 6 in 100,000 individuals in
Finland [17], 6.59 in 100,000 in the USA [18] and 8 in 100,000 in Sweden [19]. In
a study performed in Minnesota the age- and sex-adjusted incidence increased

21
from 3.6 (1970-1979) to 9.8 (1990-2000), reasons for this increased are unknown
but may be due to better classification and diagnosis of the disease [20].
1.1.3 Clinical Features
RA and PsA often present similar overlapping features of disease, as outlined in
Table 1.3, such as the presence of rheumatoid factor which occurs in 80% of RA
patients but also 4.7% of PsA patients [8]. Secondly, although PsA classically
presents with an asymmetric distribution, symmetry has been detected in up to
33% of patients with polyarticular disease [21]. The pattern of joint involvement
is not fixed and in a 2 year follow up study of early PsA patients initially
classified as polyarticular, 49% were subsequently classified as oligoarticular
[22]. In addition psoriasis, which is a defining feature of PsA, develops after the
rheumatological manifestations in 20% of patients or does not develop at all
[23]. However, there are several differential features between the two diseases
that aid in differential diagnosis: PsA shares features in common with the
spondyloarthropathies such as HLA-B27 association which are not observed in RA
[24-26]; also the involvement of the distal joints, spine involvement and the
presence of enthesis are all typical clinical features specific to PsA [15].
Consequently, several factors must therefore be taken into account when
distinguishing PsA from RA.

22
Table 1.3 Comparison of clinical features of RA and PsA
Finding RA PsA
Morning stiffness >1 hour +++ +
Standard mortality ratio 1.27 [27] 1.62 [28]
Rheumatoid Factor ++ (80%) [6] +/- (4.7%) [8]
Articular Features
Symmetrical Arthritis +++ +/- [21]
Dactlylitis - +++
New bone formation near joints - +++
Affection of distal finger/toe joints - +++
Extra-articular features
Rheumatoid arthritis:
Skin (Rheumatoid nodules, Vasculitis); Cardiac (ischemic heart disease) [29];
Respiratory (interstitial lung disease) [30]; Haematological (anaemia) [31]
Psoriatic Arthritis:
Skin (psoriasis, nail lesions 87% [32]); Ocular (uveitis [33]); Back pain [21].
1.1.4 Risk Factors
The precise cause of RA or PsA is currently unknown, but it is believed to be a
combination of numerous risk factors as well as disregulated inflammatory
processes.
1.1.4.1 Genetic Factors
There is overwhelming evidence that the risk of developing RA or PsA is
associated with genetic factors.
1.1.4.1.1 First-degree relatives and twin studies
A well established approach to assess and quantify the possible role of genetic
factors and disease risk is to measure the concordance of diseases between
related individuals. A highly heritable disease will have an increased prevalence
in individuals related to the arthritis sufferer compared to the general
population. A parameter used to measure this is the λR which is the ratio of the
23
prevalence of a disease among first-degree relatives compared to the general
population. The λR for RA is 2-17 [34] which is a modest value compared to a
highly penetrant diseases such as cystic fibrosis which can have a λR value of 500
[35]. A recent study in Sweden demonstrated an increased relative risk (the
probability of the disease occurring) of RA in siblings of affected individuals as
4.6 and in children as 3.0 [36]. The λR for PsA was determined to be 30.8 in a
first-degree relative study of 100 PsA patients in Canada [37] and 47 in a similar
study conducted in the UK [38]. A 2009 Icelandic study also demonstrated that
first-degree relatives had a 40-fold increased risk of developing PsA whilst
second-degree relatives had a 12-fold increased risk [39]. Overall these studies
indicate that PsA a more heritable disease in first- and second-degree relatives
compared to RA.
Twin studies are a powerful tool to understand the genetics of a disease. An
increased incidence of disease amongst monozygotic (identical) twins compared
to dizygotic twins offers evidence that inherited factors predispose to disease
[35]. In RA two major twin studies have been undertaken using a Finnish [40]
cohort and a British cohort [41] and the combined data from these studies
suggests that RA is approximately 65% heritable [42]. Unlike RA there are no
large twin cohorts available for PsA and the one twin study reported could not
demonstrate a genetic effect on PsA as it was underpowered [43] however the
results from the first-degree relative studies have demonstrated that PsA is a
highly heritable disease.
1.1.4.1.2 HLA associations
The largest genetic contribution to RA susceptibility is a combination of a group
of alleles within the HLA-DRB1 gene found within the major histocompatibility
complex (MHC) region in chromosome 6p21. These alleles are collectively known
as the shared epitope since they encompass a conserved sequence of amino
acids in the third hypervariable region of the class II DRβ1 chain (70Q/R-K/R-R-A-
A74) [44]. Many studies have demonstrated that HLA-DRB1 alleles are consistently
linked and associated with RA in every population [45, 46] and have been shown
to interact with environmental factors such as smoking [47]. Despite being the
largest genetic contribution to RA a large UK based study found no PsA
susceptibility association with the HLA-DRB1 alleles [48].

24
There have been far fewer genetic mapping studies performed on PsA compared
to psoriasis which was first found to be associated with HLA class 1 antigens in
the 1970s [49], however subsequent studies have since identified the same
psoriasis risk alleles to be associated with PsA. For example, the HLA-Cw*0602
which comprises the largest genetic contribution to psoriasis is also associated
with PsA patients who have psoriasis [48]. HLA-B27 is another molecule
containing PsA associated variants [24-26], it is considered indicative of the
association of PsA to the spondyloarthropathies and could also be a predictive
marker for clinical features such as joint deformity [50]. PsA has also been
associated with polymorphisms in the MHC class 1 chain-related gene A (MICA),
which was not associated with psoriasis alone [51]. MICA molecules are
considered markers of stress and are expressed by epithelial cells [52], they are
recognised by the receptor NKG2D found on CD8 αβ T cells, γδ T cells and
natural killer (NK) cells and therefore polymorphisms within this molecule may
subsequently affect the innate immune response.
1.1.4.1.3 Other genetic associations
Despite the MHC locus contributing the single strongest genetic risk to RA, it is
estimated to explain only 30% of total genetic component of susceptibility
indicating that other genes may also be involved in disease predisposition.
Genome wide linkage scans have subsequently identified a number of non-HLA
genes associated with disease risk.
PTPN22
A variant within the PTPN22 gene is the second largest genetic risk to the
development of RA after the shared epitope. This variant has been associated
with RA in numerous studies [53, 54] but has been found to be very rare in Asian
populations and is not associated with RA in these populations [55]. PTPN22
codes for a lymphoid-specific phosphatase (Lyp), which is an intracellular
protein tyrosine phosphatase (PTP) involved in T cell receptor (TCR) signalling.
Following engagement of the TCR complex, protein tyrosine kinases become
activated and then phosphorylate immunoreceptor tyrosine-based activation
motifs (ITAMs) in the cytoplasmic tail of the TCR-CD3 chains. Phosphatases
dampen this response thereby providing a means of turning the signalling on and
off. The genetic variant within the PTPN22 gene associated with RA is a
nucleotide change causing an amino acid substitution. This results in a gain of
25
function for Lyp by increasing its enzymatic activity and causes an overall defect
in T cell response to antigen stimulation. It has been proposed that this variant
could predispose to RA by suppressing T cell receptor signalling during thymic
development resulting in the survival of autoreactive T cells [56].
Despite the PTPN22 variant predisposing to RA and many other autoimmune
diseases such as systemic lupus erythematosus (SLE) [54] and systemic sclerosis
(SSc) [57] there has been no consistent evidence for an association with PsA [58,
59]. However, different variants within the same gene locus have been
associated with psoriasis [60, 61].
STAT4
Signal transducer and activator of transcription 4 (STAT4) is an important
transcription factor in the regulation of the immune response. STAT4 is involved
in the signalling pathways of IL-12, IL-23 and type 1 interferons in T cells and
monocytes leading to a T helper type 1 (Th1) and Th17 differentiation and
monocyte activation [62]. A fine-mapping study first identified an RA
susceptibility locus within the STAT4 gene in a US population [63] and this
association has since been confirmed in other populations of European and Asian
descent [64, 65]. Analysis of STAT4 deficient mice have underlined the
importance of this transcription factor in RA since these mice lack Th1 responses
and do not develop experimental arthritis [66]. However, further studies are
required to determine the role of the susceptibility variants in RA. There has
been no reported PsA susceptibility locus in STAT4 however, as has been found
with PTPN22, a gene polymorphism in STAT4 is associated with psoriasis [67].
IL12B and IL23R
IL12B and IL23R are both proteins which are known to be important in T cell
development. Genetic variants within these genes have been identified as
psoriasis genetic susceptibility loci and subsequent studies have also identified
association with PsA but not RA [68].
1.1.4.2 Gender
Despite PsA showing no gender bias, RA is far more common in women than men
with the female to male ratio being 3:1 [3]. Gender differences may also play a
role in the disease activity as women with RA have been found to have worse

26
disease activity compared to men with RA [69]. The higher incidence of RA in
women had led many studies to analyse whether or not there is a hormonal
influence on disease risk. Studies on hormone levels are often difficult as
treatment for the disease or often the disease itself can affect hormone levels
and reports on pre-disease hormone levels are not often available. One study
found that serum testosterone levels were lower in males with RA compared to
healthy controls which is supportive of the hypothesis that male sex hormones
could protect against RA [70]. RA frequently goes into remission in women during
pregnancy [71] but will flare up again during breastfeeding [72] which is thought
to be due to the major hormonal fluctuations taking place. Further studies into
the use of the oral contraceptive pill (OCP) in women has found that current or
ever-use of OCP has a protective effect against RA development although it has
not been determined whether OCP postpones rather than prevents the onset of
RA [73].
1.1.4.3 Environmental and lifestyle factors
Both environmental and lifestyle factors are influences that have long been
considered as potential triggers for the pathogenesis of RA and PsA.
1.1.4.3.1 Infectious agents
A potential involvement of infectious agents in the occurrence of RA and PsA has
been speculated as it is thought that such agents could trigger the development
of disease in a genetically susceptible host. The identification of bacterial DNA
in the RA synovium has fuelled this hypothesis as investigations have
demonstrated the presence of Mycobacterium [74] and mycoplasma [75] DNA.
However, the bacterial species identified frequently have an equal occurrence in
control populations therefore the pathogenic role for these bacteria remain to
be identified.
Bacterial infections have also been suggested to have a pathogenic role in PsA as
there have been reports of increased immunoreactivity in the sera of PsA
patients to some streptococcal antigens which is not seen in RA patients or
psoriasis patients without arthritis [76]. However, it is difficult to prove a solely
pathogenic role for such antigens since secondary infections of psoriatic plaques
are common. Anti-enterobacterial antibodies have also been detected in the

27
sera of PsA patients at a significantly higher level compared to psoriatic patients
or healthy controls [77] although the significance of this is yet to be established.
Interest into the role of viral infection in the initiation and propagation of
inflammation in inflammatory arthritis has been stimulated through several
observations such as acute viral infections are occasionally followed by the
development of an acute polyarthritis similar to early RA. Proposed viral triggers
associated with RA include parovirus B19, retroviruses, and herpes viruses
including Epstein-Barr virus (EBV) [78]. EBV was initially proposed as a potential
factor involved in arthritis by the presence of anti-EBV antibodies in the sera of
affected patients [78]. Subsequent research has since aimed to address the
possible role of EBV in RA, Takeda et al found evidence of EBV infection in 47%
of RA synovial samples but none of the 30 OA controls [79]. However, two
following studies by Blaschke et al [80] and Niedobitek et al [81] did not find
such a high proportion of EBV within the RA synovium (8% and 18% respectively).
Consequently, since its expression is highly variable in RA synovium it is unlikely
that EBV plays a primary role in this disease. Hepatitis C infection has been put
forward as a trigger for PsA since levels of the virus are found at significantly
higher levels in the sera of PsA patients compared to that of healthy controls
[82] but once again the role of this virus within disease pathogenesis is unknown.
Consequently, there has been no conclusive evidence to date which has clearly
defined the role of any infectious agent in RA or PsA. The persistent expression
in joint tissue of any one particular pathogen has not been demonstrated but
interestingly a study analysing the synovial tissue of a variety of inflammatory
arthritis patients demonstrated that several samples were positive for two or
more viral species at the same time [83]. Therefore, multiple different
infections may be needed in order to drive arthritis pathogenesis.
1.1.4.3.2 Smoking
Cigarette smoking has been demonstrated to significantly increase the risk,
severity and outcome of RA in men and women [84, 85]. Smoking is associated
with a thirteen fold increase in the incidence of the disease and can induce long
term susceptibility as individuals who have ceased smoking for greater than ten
years remain twice as likely to develop RA as the general population [86].

28
Cigarette smoking supports the process of citrullination which is the post-
translational modification of the amino acid arginine within a protein to the
amino acid citrulline. This process is catalysed by the enzyme peptidylarginine
deaminase 4 (PADI4). Citrullinated proteins such as fibronectin, fibrin, α-
enolase, fibronectin and type-II collagen have been detected in the RA synovium
and have been demonstrated to be targets of the autoantibody response [87,
88]. These anti-citrullinated protein antibodies (ACPAs) have been identified in
over 90% of RA patients and correlate with disease activity [89]. Citrullinated
proteins have been suggested to play a pathogenic role by modifying self peptide
which may then drive an immune response [90]. There is a strong association
between smoking and the generation of ACPAs in patients with HLA-DRB1 alleles
demonstrating how genetic and environmental factors may interact to drive RA
pathology [47].
1.1.5 Histopathology
The normal synovium covers the inner surface of the joints and is relatively
acellular consisting of 0.5-5 mm thickness. It comprises of a thin intimal layer of
predominantly fibroblasts and macrophages and a thicker sublining layer
connective tissue layer. Within the joint, a protective smooth layer of cartilage
acts as a shock absorber and provides a low friction surface to allow the bones to
gently move over each other. This is lubricated by synovial fluid which within a
non-diseased joint is relatively acellular with mean counts of 35 cells/μl [91].
The synovial fluid also provides nutrients to the chrondrocyte cells within the
joint cartilage as the cartilage lacks blood vessels.
During the progression of chronic arthritis, the synovium evolves from a
protective structure to an invasive tissue that is characterised by inflammatory
cell infiltration into the synovial membrane (synovitis) which drives the typical
symptoms of joint pain and stiffness. In RA, the intimal lining layer thickens to
over 8 cells deep and in PsA this thickening is 2-3 cells deep [92]. In addition,
the synovial fluid expands abnormally acquiring between 10-1000 cell/µl [93]
consisting of polymorphonuclear cells as well as monocytes, T cells, DCs, B cells
and NK cells.

29
Radiographic examinations reveal a loss of joint space and the destruction of
underlying cartilage and bone which is caused, in part, by the release of
proteolytic enzymes from macrophages and fibroblasts. MMP-1, MMP-3 and TIMP-
1 mRNA have been detected at similar levels in the synovium of both RA and PsA
[94]. Moreover, the activation of bone-resorbing osteoclasts by M-CSF and RANK-
L, both of which are up-regulated by IL-1 and TNFα, is a critical event for
progression of bone damage in RA and PsA and levels of both osteoclast
activating factors are found in both the synovium and peripheral blood of RA and
PsA patients [95, 96]. In PsA, bony erosions are less common and often appear at
a slower rate than in RA and consistent with these findings the levels of
aggrecans, which are components of the cartilage structure and an indicator of
damage, are lower in PsA synovial fluid compared to RA synovial fluid [97].
This articular destruction is accompanied by pannus formation (intrusion of the
bone and cartilage by the proliferating synovial membrane) and the infiltration
of inflammatory cells. The influx of these cells can promote synovial
inflammation and damage through the production of chemokines, cytokines and
proteases which can in turn promote a state of hypoxia and hence pronounced
angiogenesis. Angiogenesis is a prominent feature of synovitis and is
fundamental to disease pathology by transmitting oxygen and nutrients to the
synovium in addition to being a means through which inflammatory cells are
recruited to different areas of the diseased tissue. In both RA and PsA pro-
angiogenic factors, such as angiopoetin-1 and -2 and VEGF, are detectable at
early stages of disease [98, 99] however levels have been found to be higher in
PsA than RA which may be explained by the significantly increased number of
blood vessels found in PsA compared to RA [92]. See Figure 1.1 for a comparision
of an arthritic and normal synovium.

30
Figure 1.1 Comparison of a normal and arthritic synovium This illustration demonstrates the presence of inflammatory cell infiltrates characterised by macrophages, B cells, T cells and DCs; synovial membrane hyperplasia and cartilage and bone destruction.
1.1.6 Immunopathology
RA and PsA are both characterised by an inflammatory cell influx into the
diseased joints which drives tissue destruction and inflammation. Consequently,
in order to elucidate the mechanisms which drive synovitis it is important to
identify which cells are present within the synovium and how they may be
contributing to the perpetual inflammatory response.
See Figure 1.2 for a summary of the interactions between the inflammatory cells
found within the arthritic joint.

31
1.1.6.1 The monocyte/macrophage lineage
Monocytes and macrophages are found at high levels within the synovium of both
RA and PsA. Circulating monocytes of the peripheral blood also demonstrate an
increased level of activation compared to healthy controls. The variety of
cytokines, chemokines, growth factors and enzymes that are secreted by this
cell type ensure that they play a central role in the pathogenesis of arthritis.
Due to this cell type being the focus of this thesis; a full and detailed discussion
of monocytes and macrophages will take place in section 1.2 of this
introduction.
1.1.6.2 Dendritic cells
Dendritic cells (DCs) arise from myeloid progenitor cells and are a highly
phagocytic cell type. DCs are professional antigen presenting cells (APCs) that
are critical to the cross talk between the innate and adaptive immune response.
DCs are found in tissues in a inactive form and upon immune activation by TLR
ligation or antigen uptake they downregulate their phagocytic activity and
upregluate their ability to process and present antigen and are subsequently
directed to lymph nodes via a CCR7 dependent pathway in order to induce to T
cell activation [100]. There have been two major subsets of DCs identified,
myeloid DCs (mDC) and plasmacytoid DCs (pDC). mDCs have a primary function
of antigen capture and presentation and are capable of producing a wide variety
of cytokines such as IL-23, IL-18, IL-12p70, IL-15 and TNFα and therefore are
able to polarise T helper cells depending on the cytokines they secrete. pDCs
tend to be present in the circulation at a lower frequency than mDCs and upon
viral infection are a major source of type I interferon synthesis. In RA and PsA
the levels of circulating pDCs are significantly reduced compared to healthy
controls and the levels of mDCs are significantly reduced in RA patients however
both mDCs and pDCs are found to be present in the SF of both RA and PsA
patients [101]. Depletion of pDCs in a murine model of arthritis has been shown
to enhance the severity of articular pathology suggesting that they may mediate
an anti-inflammatory function [102] whereas mDC numbers have been
demonstrated in RA patients to inversely correlate with disease activity
suggesting that they may contribute to RA activity [103].

32
1.1.6.3 T cells
T cells can be divided into two subgroups, CD4+ and CD8+. CD4+ effector T cells
can be divided into distinct subgroups depending on their cytokine secretion
profile. Th1 cells are classified according to the secretion of the cytokines IL-2
and IFNγ whilst Th2 cells are known to secrete the cytokines IL-4, IL-5 and IL-13.
In addition another subset of T cells designated Th17 has recently been
described due to their secretion of IL-17A in addition to IL-17F and IL-22. There
is strong evidence which implicates a role for T cells within the pathogenesis of
RA and PsA, first CD4+ T cells contribute a large proportion of infiltrating cells
into the synovium and synovial fluid of RA and PsA. The number of T cells within
the synovial fluid are similar in both groups of patients [92]. Secondly, the strong
association of HLA genes to aggressive pathology in RA and PsA may reveal the
presentation of arthritogenic peptide to autoreactive T cell clones especially
since T cells can be detected co-localised to MHC II expressing APCs in RA and
PsA synovium. In addition, T cells have been demonstrated to play a primary role
in several murine models of arthritis including CIA [104].
RA and PsA were thought to be Th1 mediated diseases due to the predominance
of Th1 cytokines such as IFNγ and IL-12 within the synovium and the detection of
Th1 CD4+ IFNγ+ cells at an elevated ratio compared to Th2 cells [105]. However,
more recently, studies in animal models have favoured a mechanism which
implicates Th17 cells. IL-6 is known to induce the differentiation of Th17 cells
and studies have demonstrated that IL6-/- mice are resistant to the development
of CIA [106]. In addition, the inhibition or overexpression of IL-17 within the
murine joints suppresses or increases joint inflammation respectively [104, 105].
At present it is not known how well these murine models represent human
disease as although IL-17 is detected within RA synovial fluid [106] Th17 cells are
present in low numbers within the RA synovium and may only be induced to
produce IL-17 following cell contact with activated macrophages [107]. Other
studies have also demonstrated that the frequency of Th17 within the synovium
is low compared to the frequency in patient blood and Th1 cells are the
predominant T cell subtype within the diseased joint [108]. Additionally, IL-17 is
now known to be secreted by non-CD4+ T cells such as γδ T cells, NK cells, CD8
cells, macrophages, neutrophils and most recently mast cells [109-112] therefore
it is unlikely that the observed phenotype upon IL-17 deletion is solely

33
attributable to Th17 cells but may be a combination of different cellular
sources. IL-17 can induce the secretion of numerous effector molecules,
including TNFα, IL-23, IL-6, MCP-1 and RANKL from macrophages, fibroblasts and
chrondrocytes indicating that blockade of IL-17 may be a beneficial therapeutic
target for RA and PsA [113].
CD4+,CD25+ regulatory T cells (Tregs) have become a focus of arthritis research
due to their participation in controlling effector CD4+ cell function and their
ability to regulate the autoimmune response through the production of IL-10 and
TGFβ [114] and via direct cell contact. Treg cells have been identified within the
peripheral blood and synovial tissue of RA patients but they have been found to
have a decreased ability to suppress TNFα and IFNγ from effector CD4+ cells or
monocytes [115]. Interestingly, this ability to suppress cytokine secretion from
effector CD4+ cells was demonstrated to be mediated through TNFα, since
treatment with the anti-TNFα antibody infliximab was able to restore the Treg
suppressive capacity.
In contrast to CD4+ T cells, CD8+ T cells or cytotoxic T cells mediate effector
function by MHC I directed antigen specific killing of target cells and through
cytokine production, in particular IFNγ and TNFα. Populations of CD8+ T cells
have been identified in both RA and PsA synovium [116, 117]. Of interest,
studies have reported a greater CD8+ T cell enrichment in PsA synovial fluid
compared to RA synovial fluid which may be reflecting a more important role for
CD8+ T cells in the former compared to the latter [118] however the role of CD8+
T cells in either disease are at present unclear.
1.1.6.4 B cells
B cells mediate adaptive immunity through the secretion of antigen-specific
antibodies which promote pathogen elimination, but are also able to present
antigen. Upon activation by antigen presentation, B cells will migrate to the
lymph nodes or spleen where they will differentiate into antibody secreting
plasma cells. The production of auto-antibodies can subsequently induce
inflammatory cell activation through the binding of the antibodies to the Fc
receptors expressed on leukocytes.

34
There is a wealth of evidence which points to a key role of B cells within
arthritis pathology including the presence of germinal centres within the
synovium of both RA and PsA [119, 120]. These germinal centres are in an
environment surrounded by pro-inflammatory cytokines and self antigens and
therefore provide an ideal location for antigen presentation, plasma cell
differentiation and auto-antibody production. In addition, the use of the anti-
CD20 monoclonal antibody therapy rituximab has shown clinical benefits in both
RA and PsA [121, 122]. Of particular importance, it is recognised that B cells may
be critical in the initiation of RA since autoantibodies against self citrullinated
proteins, type II collagen and rheumatoid factor are present in the serum of
patients up to 10 years before the clinical manifestation of disease [123]. A
similar finding has yet to be shown in PsA.
1.1.6.5 Other inflammatory cell types
Neutrophils and Mast cells
Neutrophils are found at a high concentration within the synovial fluid and
synovium of RA and PsA with an increased number being detected in the latter
disease [124]. At present their primary role within disease pathogenesis is not
known. However, neutrophils are activated by complement components and
cytokines to release a variety of proinflammatory cytokines such as TNFα, BAFF,
IL-6 and IL-18 and therefore may generally contribute to the pro-inflammatory
milieu found within the synovium. Mast cells are also detected in the synovial
fluid of both RA and PsA [125, 126]. Animal models of arthritis have been
contradictory in determining the role that mast cells play within the disease
[127, 128]. However, as mentioned above, a recent study has demonstrated that
mast cells within the synovium of RA patients express the proinflammatory
cytokine IL-17A [109] and therefore may be playing a pathogenic role within the
disease by secreting cytokines into the synovium which will activate other
inflammatory cells resulting in a positive feedback loop of inflammation.
Fibroblasts
Synovial fibroblasts together with synovial macrophages are the two leading cell
types within the hyperplastic synovial tissue that invades and degrades adjacent

35
cartilage and bone. Fibroblasts are well established effectors of inflammation
within arthritis as they are known to produce a wide variety of inflammatory
mediators such as IL-1, IL-6, TNFα, MCP-1, IL-8 and M-CSF which in turn can
potentiate the influx, survival and activation of several leukocyte subtypes
[129]. Synovial fibroblasts are also an important source of MMPs and cathepsins
which are enzymes that drive the destruction of articular cartilage and bone. In
addition, these cells produce high levels of RANKL in both RA and PsA and
therefore can drive articular destruction indirectly through the induction of
osteoclasts and hence osteoclastogenesis [130, 131].
Osteoclasts and Chrondrocytes
The articular structure in healthy individuals is maintained in stable equilibrium
through maintaining a balance of both bone resorption and deposition and
collagen deposition. Within the diseased synovium this balance is skewed in
favour of bone resorption and collagen removal which leads to articular
degradation, furthermore in PsA patients aberrant bone formation may also
occur. Osteoclasts are multinucleated cells which mediate bone resorption
through the secretion of acid and MMPs, and are differentiated from monocyte
precursors in the presence of RANKL and M-CSF [132]. Other cytokines within the
inflammatory milieu can drive osteoclast formation such as TNFα, IL-1β and IL-17
which induce RANKL expression.
Chrondrocytes are cells which, under normal conditions, maintain a stable
equilibrium between the synthesis and degradation of matrix components such
as collagen. However, in arthritis the chrondrocyte cell participates in the
destruction of its own matrix by releasing a variety of MMPs in response to the
proinflammatory cytokines present within the synovium such as IL-1 and TNFα.
The chrondroytes themselves can also release pro-inflammatory mediators in
response to cytokine activation which can further perpetuate the chronic
cartilage destruction in a paracrine and autocrine fashion [133]. Consequently, it
is evident that the synovial environment within RA and PsA can promote
articular destruction through several mechanisms.

36
Figure 1.2 Inflammatrory cell types within the synovium An overview of the cellular communication between immune cells within the RA and PsA inflamed joint. Adapted from [132].
1.1.7 Mechanisms of inflammation
The numerous inflammatory cells infiltrating the synovial compartment release
soluble factors including cytokines, chemokines and MMPs that are directly
responsible for the disease pathology by activating and promoting recruitment of
further inflammatory cells. A full explanation of the cytokines and chemokines
expressed by monocytes and macrophages in RA and PsA are discussed fully in
section 1.2.4 and 1.2.5.
1.1.7.1 Cytokines
Cytokines are small (5 to 50 kDa) proteins or glycoproteins that serve as
chemical messengers between cells and thus are of significant importance in
almost all aspects of innate and adaptive immunity. Cytokine levels are
significantly upregulated in RA and PsA where they regulate the chronic

37
inflammatory response. Within the synovium cytokines can work in an autocrine
fashion and due to the close proximity of cells they can also work in a paracrine
(neighbouring cell activation) and juxtacrine (cell-to-cell contact) manner.
In both RA and PsA numerous pro-inflammatory cytokines including TNFα IL-6, IL-
1α/β, IL-17, IL-18, BAFF and IL-23 are elevated in the serum, synovial fluid and
synovium [132] (see Table 1.4). The critical role of cytokines within the
pathogenesis of both RA and PsA is exemplified by the success of specific
cytokine targeted therapies such as anti-TNFα and anti-IL-6R [134, 135]. Of note,
anti-inflammatory cytokines such as IL-10, IL-1Ra and soluble TNF-receptor
(sTNFR) are also detectable in the inflamed synovial compartment. However, the
levels of these are thought to be too low to be biologically active thus providing
a disequilibrium of pro- and anti-inflammatory cytokines.

38
Table 1.4 Major cytokines with a role in inflammatory arthritis
Cytokine Principle Source Primary Biological Activity TNFα Monocytes, macrophages activates macrophages and Fibroblasts, T cells, DC, endothelial cells; induces Neutrophils neutrophil apoptosis; increases ICAM-1, VCAM-1 and E selectin expression IL-1α/β Monocytes, macrophages induces cytokine secretion from DC, B cell, fibroblasts monocytes and fibroblasts; increase endothelial adhesion molecule expression; osteoclast activation IL-1Ra Monocytes antagonize effects of IL-1α and IL-1β IL-18 Monocytes, DC, neutrophils T cell differentiation; NK cell
activation; activation of monocytes and macrophages
IL-6 Fibroblasts, monocytes, B cell proliferation and antibody macrophages, T cells, production; T cell proliferation;
B cells acute phase response; thrombopoiesis
IL-10 Monocytes, T cells, decrease DC activation and B cells, DC, epithelial cytokine release; decrease cells synovial fibroblast cytokine and MMP release Type I IFN Widespread antiviral response; macrophage activation; lymphocyte activation and survival IL-17 T cells, macrophages, induces proinflammatory cytokine DC and γδ T cells release from macrophages; fibroblasts and endothelial cells IL-15 T cells, monocytes, increased T cell and NK cell macrophages, DC recruitment, B cell
differentiation, synovial fibroblast and macrophage activation
IL-23 monocytes, DC, Th17 cell proliferation macrophages RANKL stromal cells, osteoblasts, stimulates osteoclast mediated T cells bone resorption

39
Table 1.4 continued
APRIL monocytes, macrophages, promotes T and B cell survival lymphocytes and proliferation BAFF T cells, monocytes, Promotes B cell survival and macrophages, DC maturation GM-CSF Monocytes, fibroblasts, Stimulates the differentiation T cells, osteoclasts and survival of macrophages and neutrophils M-CSF Lymphocytes, fibroblasts, regulator of monocyte monocytes and osteoclasts differentiation and proliferation and of macrophage survival
1.1.7.2 Chemokines
The influx of inflammatory cells into the synovium is mediated by chemokines
which are small molecular weight (8-12 kDa) chemoattractant proteins that
primarily promote leukocyte recruitment and activation. Over 50 distinct
chemokines have been identified and can be classified into four sub-families: 1)
CXC which can promote angiogenesis, 2) CC which act primarily on monocytes
and T cells, 3) C and 4) CX3C which consists of the chemokine fractalkine
(CX3CL1) [136]. A number of pro-inflammatory chemokines have been detected
at elevated levels in both RA and PsA (see Table 1.5).

40
Table 1.5 Chemokines with a role in inflammatory arthritis
Chemokine ligand Receptor (s) Primary source Physiological Feature
CC Family CCL2 (MCP-1) CCR2 Fibroblasts, macrophages, Inflammation,
Osteoclasts osteoclast differentiation
CCL3 (MIP-1α) CCR1, CCR5 Macrophages, fibroblasts Inflammation CCL4 (MIP-1β) CCR5 Monocytes, DCs Inflammation CCL5 (RANTES) CCR3, CCR5 T cells, macrophages, Inflammation CCR1 Fibroblasts CCL19 (ECL) CCR7 Macrophages, Homeostatic, neutrophils Inflammatory CCL20 (MIP-3-α) CCR6 macrophages, Inflammation, Fibroblasts bone resorption CCL21 (SLC) CCR7 endothelial cells Inflammation, Lymphoid neogenesis C Family XCL1 (lymphotactin) XCR1 mast cells, activated Inflammation, CD8+, NK cells stimulates T cell
Accumulation CXC Family CXCL1 (gro-alpha) CXC2R, Fibroblasts Inflammation,
CXCR1 synovial angiogenesis CXCL5 (ENA-78) CXCR2 Fibroblasts Inflammation CXCL8 (IL-8) CXCR1, Macrophages, Inflammation, CXCR2 fibroblasts, epithelial synovial angiogenesis cells CXCL9 (Mig) CXCR3 macrophages, Inflammation, Neutrophils angiostatic CXCL10 (IP-10) CXCR3 Fibroblasts, monocytes, Inflammation, DCs, epithelial cells, agiostatic Endothelial cells CX3C Family CXC3CL1 (fractalkine) CXC3CR1 Monocytes, fibroblasts, Inflammation Macrophages, DC Endothelial cells MCP, monocyte chemoattractant protein; MIP, macrophage inflammatory protein; RANTES, regulated on activation normal T cell expressed and secreted; ECL, Epstein-Barr virus-induced receptor ligand; SLC, secondary lymphoid tissue chemokine; ENA, epithelial-derived neutrophil-activating peptide; MIG, monokine induced by gamma interferon; IP-10, interferon gamma-induced protein 10kDa.

41
1.1.8 Current therapies in RA and PsA
Advances in the knowledge of the mechanisms driving RA and PsA pathology have
enabled the discovery of new therapeutics. In recent years the purpose of new
therapeutics has altered from that of simply inhibiting disease progression to the
ability to prevent the initial onset of disease.
1.1.8.1 DMARDS
Disease modifying anti-rheumatic drugs (DMARDs) particularly methotrexate
have been widely used for the treatment of RA and PsA for decades. Despite
reports of methotrexate treatment reducing the synovial sublining layer within
PsA patients [137] it has been increasingly recognised that methotrexate only
partially inhibits the progression of structural damage in RA [138]. In addition, a
2-year retrospective study of matched PsA patients either on or off
methotrexate therapy did not show any difference in radiologic progression
scores between the two groups [139]. Furthermore, up to 60% of RA patients
have reported adverse reactions to methotrexate including nausea, diarrhoea,
headaches, hepatitis and leukopenia which have only resolved with
discontinuation of therapy [140]. As a result methotrexate does not exert
therapeutic benefits in a large proportion of patients and may only delay the
progression of disease. Other DMARDs in use are sulfasalazine, cyclosporine,
leflunomide and hydroxychloroquine which all demonstrate some clinical benefit
in a percentage of patients but as with methotrexate are often associated with
toxicitiy and restricted duration of effectiveness.
1.1.8.2 Anti-TNFα
TNFα is a potent pro-inflammatory cytokine that is known to play a critical role
in chronic inflammatory diseases such as RA and PsA [141]. Soluble TNFα is
produced as a precursor form called transmembrane TNFα (tmTNFα) which is a
cell surface protein found on activated macrophages and lymphocytes [142]. This
tmTNFα is cleaved and processed by TNFα-converting enzyme (TACE) to release
a soluble 17 kDa molecule. The combination of three of these 17 kDa molecules
as a homotrimer forms soluble TNFα, which mediates its pro-inflammatory
properties through type 1 and 2 TNF receptors (TNFR1 and TNFR2) [143].
Numerous studies have indicated that both soluble TNFα and its precursor form

42
tmTNFα are involved in the inflammatory response through binding to TNFR1 or
TNFR2. Soluble TNFα can act at sites distant from the TNFα-producing cells
whereas tmTNFα can exert its function on other cells through direct cell contact
[144].
At present there are three anti-TNFα agents, infliximab, etanercept and
adalimumab, which are approved worldwide for the treatment of various
inflammatory conditions including RA, PsA, psoriasis, Crohn‘s disease and AS
[135]. In addition, other anti-TNFα agents, certolizumab pegol and golimumab,
have just been approved for clinical use. Infliximab, adalimumab and golimumab
are monoclonal antibodies against human TNFα and etanercept is engineered
from human TNF receptors. Adalimumab, infliximab and entanercept all bind to
soluble or tmTNFα with a similar affinity [145].
Adalimumab has been demonstrated to have a high level of tissue penetration in
RA patients as radioscintography demonstrated that labelled adalimumab rapidly
(within minutes) localised to the inflamed joints after intravenous administration
[146] and tissue concentrations of the antibody in the synovial fluid range from
31% to 96% of those in the serum [147]. Greater than two thirds of RA patients
respond favourably to TNFα inhibitors and administration of adalimumab to RA
patients has been shown to significantly slow the radiological progression after
one year [148]. PsA patients treated with adalimumab over 48 weeks show
reduced radiographic progression, reduced disability and improved skin and joint
manifestations [149] therefore this anti-TNFα treatment have proved to be a
highly effective treatment for the management of inflammatory arthritis. The
antibody‘s mechanisms of action within the diseased patients include binding
and hence neutralising soluble TNFα.
Infliximab is a similar therapy to adalimumab as it is a monoclonal antibody
against human TNFα. A phase III study of infliximab in 200 PsA patients showed
significant benefit since at week 14, 58% of patients achieved an ACR20
response. The presence of dactylitis and enthesitis decreased significantly and
quality of life measures also significantly improved [150]. Within RA patients
infliximab has proven to be highly efficacious with ACR20 and ACR50 responses
of up to 80% and 60% respectively [151]. Etanercept is a soluble receptor for
TNFα and has been demonstrated to be successful in the treatment of PsA and

43
RA. In a phase III trial of 205 PsA patients an ACR20 response was achieved by
59% of etanercept treated patients and psoriatic skin involvement significantly
decreased after 24 weeks of treatment [152]. Furthermore, the successful
response of patients to treatment from any of these three anti-TNFα therapies
are significantly increased when administered in combination with methotrexate
with which it has synergistic benefits [151, 153, 154].
Since TNFα can act independently, additively or synergistically within the
arthritic joint its neutralisation can reduce the production of other pro-
inflammatory molecules such as IL-6, IL-1β and MCP-1 from immune cells as well
as reducing the expression of ICAM-1 and VCAM-1 adhesion molecules which can
prevent cell trafficking into the joint and is the reason for the reduced
cellularity seen the inflamed tissue after anti-TNFα therapy [135].
1.1.8.3 Rituximab and B cell targeted therapies
Rituximab is a chimeric human/mouse monoclonal antibody directed at the CD20
antigen expressed by mature B cells and pre-B cells but not on other cells
including plasma cells. It was first used as a treatment for non-Hodgkin‘s
lymphoma but has since been approved for treatment of RA. Although several
studies have suggested that CD20 may function as a calcium channel or a cell
surface signalling receptor, its function and the mechanisms of action in RA
remains unclear [155]. In the phase III REFLEX trial rituximab was administered
to 309 RA patients whilst 209 patients received placebo, and it was found that
rituximab efficacy versus placebo was evident from 8 weeks onwards and the
retardation of joint damage was significantly different from placebo after 56
weeks [122]. Rituximab therapy has also been successful in the treatment of PsA
[121].
Several mechanisms for the observed improvements have been suggested such as
reduced antibody production; reduced secretion of B cell derived pro-
inflammatory cytokines or reduced antigen presentation. Due to the success of
rituximab considerable effort has been expended into developing biologics
against BLyS (B-lymphocyte stimulator) also known as BAFF (B-cell-activating
factor of the TNF family) and APRIL (a proliferation induced ligand) which are
TNF superfamily members and promote B cell survival, differentiation and

44
activation. Belimumab is a fully human monoclonal antibody that specifically
targets BLyS, the reports of a phase II study of this antibody in RA demonstrated
a reduction in B cells and rheumatoid factor however the ACR responses were
low in comparison to those seen with rituximab as only 29% of patients achieved
an ACR20 response [156].
1.1.8.4 Anti IL-6 receptor
Since anti-TNFα therapy is ineffective in a proportion of patients, other
therapies are required to treat such non-responder patients. Tocilizumab, a
human monoclonal antibody against the IL-6 receptor, has provided encouraging
results in patients who have previously failed anti-TNFα therapy [134]. In
addition, as has been observed with anti-TNFα therapy, the optimal clinical
responses are seen when tocilizumab is administered in combination with
methotrexate [157]. At present there have been no trials investigating the
efficacy of tocilizumab in psoriatic arthritis.
1.1.8.5 Abatacept
Abatacept is a recombinant human fusion protein of the extracellular domain of
the cytotoxic T lymphocyte-associated antigen 4 (CTLA4) linked to the Fc portion
of human IgG1. Abatacept functions to block T cell activation by binding to the
CD80/86 receptor on an antigen presenting cell thus blocking the second signal
activation of the CD28 receptor on the T cell. During clinical trials of RA patients
abatacept treatment resulted in a high ACR response and it is now approved in
Europe for treatment of RA [158]. A recent trial has also found that abatacept is
an efficacious therapy for PsA resulting in significant improvements in patients
compared to placebo controls [159].
1.1.8.6 Other therapies
Ustekinumab is an IL12/23 inhibitor and its administration has demonstrated
significant efficacy in psoriasis since IL-12 and IL-23 are over expressed in
psoriasis plaques. This inhibitor has also shown efficacy in preliminary PsA
studies by reducing the signs and symptoms of arthritis [160].

45
1.2 Monocytes and Macrophages
1.2.1 Monocyte and macrophage origin
Leukocytes are a diverse group of cells types which mediate the body‘s immune
response. They have a shared origin of hematopoietic stem cells (HSC) and
develop along divergent differentiation pathways in response to internal and
external cues. The mononuclear phagocyte system represents a population of
leukocytes originating as bone marrow derived myeloid cells [161] and comprises
of bone marrow monoblasts and promonocytes, peripheral blood monocytes,
tissue macrophages and dendritic cells (DCs).
Current models propose that blood monocytes originate in vivo from HSC derived
progenitors with myeloid restricted differentiation potential. Successive
commitment steps include common myeloid progenitors (CMPs) and
macrophage/DC progenitors (MDPs). Each of these differentiation steps involves
cell fate decisions which subsequently restrict cell development potential [162].
MDPs are a subset of proliferating cells in the bone marrow that differentiate
into both monocytes, which give rise to the macrophage subsets, and common
DC precursors (CDPs), which give rise to the DC subsets [161]. See Figure 1.3 for
an overview of monocyte and macrophage differentiation.

46
Figure 1.3 Differentiation of the macrophage/DC progenitor and origin of macrophage and DC subsets Differentiation of monocytes and macrophages in humans. Hematopetic stem cells (HSC) give rise to common myeloid progenitors (CMPs) which can differentiate into macrophage/DC progenitors (MDPs) within the bone marrow. The MDPs will then give rise to monocytes which will then differentiate into tissue macrophages, alternatively the MDPs will differentiate into common DC precursors (CDPs) within the blood. The CDPs will then differentiate into classical DCs (cDC) or plasmacytoid DCs (pDC).
1.2.2 Monocytes
Circulating blood monocytes supply peripheral tissues with macrophage and DC
precursors and within the setting of infection contribute to immune defense
against microbial pathogens. Newly formed monocytes are thought to remain in
the bone marrow for less than 24 hours before entering into the peripheral
blood. In humans and mice, monocytes contribute 4-10% of all circulating
leukocytes [163] and share some typical morphological features such as irregular
cell shape, cytoplasmic vesicles and high cytoplasm to nucleus ratio.

47
1.2.2.1 Monocyte subsets
In humans, circulating monocytes are not a homeogenous population and can be
divided into two distinct subsets on the basis of the expression of CD14, a
component of the LPS receptor complex, and CD16 the FcγRIII immunoglobulin
receptor [164]. These subsets are designated CD14+CD16-, otherwise known as
CD14+ monocytes, and CD14lowCD16+, otherwise called CD16+ cells [165]. These
two monocyte subsets express distinct chemokine, immunoglobulin, adhesion
and scavenger receptors and have varying levels of cytokine production, antigen
presentation and transendothelial migration [166]. See Table 1.6 for the
characteristics of these two monocyte subtypes.
CD14+ monocytes are large ~18 μm in diameter and represent 80-90% of
circulating monocytes, in contrast CD16+ monocytes are smaller ~14 μm in
diameter and constitute ~10% of circulating monocytes [166]. CD14+ cells express
high levels of the chemokine CCR2 and low levels of CX3CR1; consequently, their
phenotype resembles that of mouse Ly6c+ (Gr1+) monocytes [161, 165] whereas
CD16+ cells resemble the phenotype of mouse Ly6clo(Gr1lo) monocytes. TLR4
stimulation of both CD14+ and CD16+ monocytes with LPS induced similar levels
of TNFα mRNA within the two cell types whilst the IL-10 mRNA was low to absent
in CD16+ monocytes [167]. In addition, intracellular cytokine staining of CD14+
and CD16+ monocytes demonstrated a higher level of TNF protein within the
CD16+ in response to TLR4 and TLR2 stimulation [168]. This combination of low
IL-10 levels and high TNF levels meant that CD16+ monocytes became known as
pro-inflammatory monocytes.
Despite monocytes being far less efficient than DCs at MHC class II antigen
presentation to CD4+ T cells [169], both CD14+ and CD16+ monocytes
demonstrated the ability to present tetanus toxin antigen to T cells [170].
However, CD16+ monocytes have demonstrated a higher level of HLA-DR
expression compared to CD14+ monocytes [164] and have been shown to
preferentially develop into DCs with high antigen presentation capacity in
response to TLR stimulation [171] suggesting that this monocyte subset and their
DC progeny may be superior antigen presenting cells.

48
A third human monocyte subset has been recently reported that is defined by
the expression of CD14+ CD16+ and CD64+ (FcγR-I) [172]. These cells combine
characteristics of macrophages and DCs as they have high expression of CD68
and HLA-DR and high T cell stimulatory activity. In comparison to CD14+
monocytes, CD14+CD16+CD64+ monocytes have a similarly high phagocytic
activity and produce large amounts of cytokines such as TNFα and IL-6. But they
also share characteristics with CD16+ monocytes such as a greater stimulatory
activity in mixed leukocyte reactions (MLR) compared to CD14+ cells [173]. At
present the origins of this subset are not know but they are speculated to be an
intermediate phenotype between monocytes and DCs [172].

49
Table 1.6 Characteristics of human monocyte subsets
CD14+ (CD14+CD16-) CD16+ (CD14lowCD16+) Monocyte markers CD14 ++ +/— CD16 — + CD11b + + Chemokine receptors CCR1 + — CCR2 + — CCR4 +/— — CX3CR1 +/— ++ CXCR4 +/— + Adhesion molecule CD62L + —
1.2.2.2 Monocyte diapedesis
A central component of monocyte trafficking is the continuous transition from
the blood circulation into the tissue and vice versa, as this process enables the
monocyte cells to differentiate and develop into functional macrophages. The
endothelium within the vasculature represents the interface between these two
compartments and acts as a barrier to leukocyte trafficking whilst also
instructing leukocyte adhesion and transmigration. Egress of the monocytes from
the bone marrow into the circulation or from the circulation into the tissue
requires migration across the monolayer of endothelial cells which line the
vascular circulatory system, known as diapedesis.
Extravasation of monocytes can be divided into several steps and the process
begins when monocytes accumulate on the luminal side of the endothelium and
undergo transient rolling interactions mediated by selectins [163], which
facilitates sensing of chemokines presented on the endothelial surface and
enables the monocytes to respond to them. This triggers the interaction of
monocyte integrin receptors with their endothelial ligands which results in cell
arrest, these molecules include junctional adhesion molecule-like (JAML) which
has been demonstrated to contribute to monocyte adhesion and transmigration
in vitro [174]. Once the cells have arrested on the endothelium they undergo
actin polarisation and integrin-dependent lateral migration. This process is to
allow the monocytes to search for sites permissive for endothelial barrier

50
penetration [175] and once a site has been found the monocytes breach and
transmigrate across the endothelium. The movement across the endothelium
may either be paracellular where the monocytes move in between two
endothelial cells or transcellular where the monocytes pass directly through an
individual endothelial cell through the formation of a transcellular pore [176].
As mentioned previously, CD14+ cells preferentially express the chemokine CCR2
which allows monocyte intravasation into the circulation from the bone marrow
through interaction with its ligands CCL2 (otherwise known as MCP-1) and CCL7
[177]. This finding is further exemplified in CCR2-/- mice which express a
diminished number of Ly6C+ mouse monocytes in the circulation under
homeostatic conditions [178] demonstrating that the exit of CD14+ or Ly6C+
monocytes from the bone marrow is mediated in part by CCR2. Inflammation is
associated with an increase in CCL2 within the circulation therefore in the
presence of a local inflammatory stimulus, circulating CD14+ monocytes
extravasate into the affected non-lymphoid areas in a CCR2-CCL2 dependent
manner where they differentiate into macrophage or DC subsets [179]. These
and many other studies has resulted in the human CD14+ cells and the equivalent
mouse Ly6C+ cells becoming known as the ―inflammatory‖ subset.
In contrast, CD16+ monocytes lack CCR2 expression and undergo transendothelial
migration through the expression of CX3CR1, which is the fractalkine receptor,
and CCR5 which is the receptor for CCL3 (otherwise known as MIP1α) [163].
Studies performed by Auffray et al have demonstrated that the Ly6C- subset of
murine monocytes, which are equivalent to the CD16+ human monocytes,
continuously migrate over the luminal surface of dermal and mesenteric
microvascular endothelium where they are thought to be patrolling for signs of
infection or tissue damage [180]. This patrolling behaviour was dependent on the
integrin ICAM-1 and the chemokine receptor CX3XR1 and is responsible for this
cell subset becoming known as ―resident‖ monocytes. Upon tissue damage such
as exposure to irritants, aseptic wounding or peritoneal infection these
patrolling resident monocytes extravasated rapidly within 1 hour and invaded
the surrounding tissue where they were the main producers of the pro-
inflammatory cytokines TNFα and IL-1 and were shown to differentiate into
macrophages. The Ly6C+ cells were shown to enter the immune site at a later
time and differentiated into inflammatory DCs. These results elegantly

51
demonstrated the functions of the two monocyte subsets within an immune
response [180]. Since human CD16+ monocytes share a phenotype similar to the
resident Ly6C- mouse monocytes these cells could have a similar patrolling
function within human immune system surveillance.
1.2.2.3 Monocyte function in immune defense
Monocytes were previously considered to be merely a developmental
intermediate between bone marrow precursors and tissue macrophages.
However, it is now clear that monocytes can carry out specific effector functions
during inflammation. Monocytes have been demonstrated to be crucial for host
defense again a wide variety of pathogens such as Listeria monocytogenes,
Mycobacterium tuberculosis, toxoplasma gondii and various fungi. CCR2-/- mice
are susceptible to infections caused by all of the above bacteria/fungi indicating
that CCR2 mediated recruitment of Ly6C+ monocytes is crucial for host immune
defense [166]. This result is verified by experiments performed in MCP-1-/- mice
which are also more susceptible to bacterial infections such as L. monocytogens
infection, MCP-1 is a ligand for CCR2 and is released during infection [181] and
therefore plays a role in monocyte trafficking. Once at the site of infection it
has been shown that monocytes produce reactive nitrogen intermediates (RNIs)
and reactive oxygen intermediates (ROIs) and increase the production of
phagolysosomal enzymes in order to destroy the bacteria and bring the infection
to an end [182].
1.2.3 Macrophages
The term ―macrophage‖ was first used over 100 years ago by Elie Metchnikoff to
describe the large mononuclear phagocytic cells he observed in tissues [183].
Since this first observation an enormous amount of research to establish the
function and importance of this cell type has taken place. It is now known that
macrophages, along with DCs, form networks of phagocytic cells throughout
most tissues where they play major roles in host development, inflammation,
scavenging and antipathogen defences. Most macrophages in the tissue of an
adult are derived from circulating monocytes which replenish these populations
and there is substantial debate about whether specific monocyte populations
develop into specific tissue macrophage subsets [184]. In addition, some
macrophages such as those found within the lung and brain, undergo self-

52
renewal and proliferation and do not need circulating precursor monocytes to
maintain their population [185].
1.2.3.1 Macrophage heterogeneity
Macrophages are distributed constitutively throughout the body and known to
have a very high degree of heterogeneity which reflects the specialized
functions adopted by these cells in different tissue localisations. Apart from the
inflammatory monocyte derived macrophages which will be discussed in detail in
section 1.2.3.3 there are several other macrophage types that have been
identified. Examples of these cell types include: Langerhan cells which are a
self-renewing subset found within the epidermis [186]; the bone re-modelling
osteoclasts which require M-CSF and RANKL for development [187, 188];
microglia and choroid-plexus macrophages which reside within the CNS; and
Kupffer cells which are the resident macrophages of the liver and are involved in
the clearance of particulate and soluble substances.
1.2.3.2 Macrophage function
The heterogeneous nature of the macrophage, its diverse distribution and
numerous cell subsets indicate that it has several physiological functions.
However, there are two main function shared by most macrophage subsets;
phagocytosis and antigen presentation.
1.2.3.2.1 Phagocytosis
Macrophages represent a major defense against invasion of the host by a wide
variety of microorganisms including bacteria, viruses, fungi and protozoa.
Macrophages also play a role in the clearance of apoptotic cells and the process
by which they carry out these two important functions is phagocytosis. Apoptosis
is a feature that is conserved through all eukaryotic cells and constitutes a series
of cellular events through which the cells orchestrate their own demise. A
critical feature of apoptosis is the ability of the apoptotic cell to be recognised
by the innate immune system and phagocytes. One of the most studied apoptotic
signals is the change in the plasma membrane phospholipid distribution on the
apoptotic cell, especially the exposure of the phospholipid phosphatidylserine
(PS). PS is normally found in the inner leaflet of the plasma membrane of viable
cells. However during apoptosis PS is exposed on the outer membrane of the cell
53
and is a marking of an apoptotic cell. It has been proposed that PS exposure is a
sufficient signal for macrophage-mediated phagocytosis [189]. Macrophages
appear to use several receptors in the recognition and phagocytosis of apoptotic
cells such as PS-R, CD36 and CD14 [190] which is thought to maintain the
efficient clearance of apoptotic bodies as different receptors may engage with
different phases of apoptosis. CD14-dependent clearance of apoptotic cells by
macrophages has been demonstrated in both murine and human systems [190,
191] and it has been shown to interact specifically with ICAM-3, a glycosylated
leukocyte protein, during the clearance of apoptotic leukocytes [192].
Macrophages also have specialised surface receptors that detect the presence of
microorganisms before phagocytosis takes place. These receptors can directly
interact with the microorganism through the recognition of pathogen associated
molecules such as surface carbohydrates, peptidoglycans or lipoproteins. The
macrophage can also recognise the pathogen through opsonins. Opsonins are
host factors such as IgG and components of the complement cascade that attach
to the pathogen surface. These opsonins are then recognised by receptors on the
macrophage such as Fcγ receptors (FcγR) and complement receptor 3 (CR3)
[193].
Once the macrophage has recognised the apoptotic cell or the microorganism it
will engulf the cell or pathogen by advancing pseudopodia over the regions of
the cell/microorganism that are linked to the cell surface receptors. This
internalisation requires reorganisation of the macrophage cyotoskeleton as well
as delivery of membrane to accompany the increased surface area of the
phagocytic cup which engulfs and surrounds the apoptotic cell/microorganism. A
process called phagosome maturation then takes place inside the phagocytic
macrophage by which the phagosome undergoes sequential fusion with early
endosomes, late endosomes and lysosomes which are increasingly acidified
membrane bound structures [194]. The fusion of these structures to the
phagosome eventually leads to degradation of the phagocytosed pathogens or
cells. Although most pathogens are phagocytosed and destroyed with ease by the
macrophages, certain pathogens have developed mechanisms through which they
avoid phagocytosis such as M. Tuberculosis which inhibits phagosomal
maturation and L.pneumophila which can redirect the phagosomal maturation
pathway in order to allow bacterial replication [193].

54
1.2.3.2.2 Antigen processing and presentation
Macrophages are one of several antigen presenting cells (APCs) which present
antigen to T cells or to B cells within follicles of the lymph node [195]. Indeed
one of the important functions of the macrophage is to assist in initiating and
facilitating cell-mediated immune responses against pathogens through the
processes of secreting cytokines and inflammatory mediators as well as antigen
presentation. As professional phagocytes, macrophages express a variety of
receptors that participate in the phagocytic uptake of antigens including those
which recognise complement activation products or Ig Fc fragments.
Macrophages express both MHC class I and class II molecules and therefore are
able to present antigen derived from cytosolic or extracellular proteins for
recognition by the appropriate CD8+ (MHC class II expressing) or CD4+ (MHC class
I expressing) restricted antigen specific T cells. In addition macrophages can
deliver the second co-stimulation signal required by the T cell to enhance
cellular adhesion and signalling and promote maximal cross-talk between the
macrophage and the T cell. These signals include CD80/86 and CD40 which
interact with CD28 and CD154 respectively on the T cells [196]. The process of
antigen presentation amplifies the inflammatory signal through subsequent T
cell cytokine production and clonal expansion.
1.2.3.3 Macrophage activation
Macrophages are an extremely heterogenous cell type and as a result have
demonstrated remarkable plasticity which allows them to respond to
environmental cues and change their phenotype. These stimuli can be exogenous
or endogenous and can be produced by innate immune cells, antigen-specific
cells or the macrophages themselves. This extensive network of potential stimuli
can give rise to diverse populations of macrophages with distinct physiology and
much work has been devoted to phenotyping and understanding these
macrophage populations.
One of the first populations of activated macrophages to be described were the
classically activated macrophages which designates the effector macrophage
population that are produced during the process of cell-mediated immune
responses [197]. The first description of a classically activated macrophage was
the result of research performed in the 1960s by Mackaness et al which

55
demonstrated that the infection of mice with Mycobacterium bovis bacillus
Calmette-Guerin (BCG) or Listeria monocytogenes enhanced the antimicrobial
ability of macrophages in a stimulus dependent but antigen independent manner
[198]. Since this first observation, several studies have shown that classical
macrophage activation depends on the pro-inflammatory cytokines produced by
T helper 1 (Th1) cells and NK cells, in particular TNFα and IFNγ, and microbial
products [199]. The combination of these two signals resulted in a macrophage
population which had enhanced microbicidal activity and secreted high levels of
pro-inflammatory cytokines [200].
IFNγ can be produced by both innate and adaptive immune cells. NK cells are an
early source of this cytokine as they produce IFNγ in response to stress and
infection. This cytokine can prime macrophages to secrete pro-inflammatory
cytokines and produce oxygen and nitrogen radicals to increase their killing
ability [201]. However this production of IFNγ by NK cells is transient and cannot
maintain a population of macrophages. Therefore an adaptive immune response
is normally needed to sustain the activated macrophages and sustain host
defense against intracellular pathogens. In this situation IFNγ can also be
provided by Th1 cells which are antigen specific however the microbicidal
macrophages that the IFNγ induces can kill and phagocytose randomly.
Other mechanisms of classical macrophage activation include TLR ligation by
bacterial pathogens which, acting in a MyD88-dependent manner, induces the
transcription of TNFα which will then assist IFNγ and activate the macrophage
population in an autocrine manner. In addition to this mechanism of activation,
TLR ligands can also activate TIR-domain-containing adaptor protein inducing
IFNβ (TRIF)-dependent pathways, which signal through IRN-regulatory factor 3
(IRF3) and result in IFNβ production [202], this IFNβ can induce classical
macrophage activation in place of IFNγ indicating that TLR agonists can
overcome the IFNγ dependent classical macrophage activation.
The role of classically activated macrophages in the host defense to intracellular
pathogens has been well established. Studies have shown that mice lacking in
IFNγ expression are more susceptible to various bacterial or viral infections and
treating macrophages with IFNγ and TNFα before infection with Leishmania
parasites results in a population of macrophages which can kill the parasite.

56
However the complex combination of genes and cytokines that are expressed
and produced as a result of classical activation require both the IFNγ receptor
ligation and either TNFα receptor ligation or TLR ligation. Since stimulation of
macrophages with IFNγ alone resulted in macrophages that could not clear the
Leishmania parasite effectively but exogenous treatment with TNFα or a TLR
ligand restored the macrophage ability to clear the parasite completely [197].
In conclusion, classically activated macrophages can be produced by innate
stimuli following a pathogenic infection and cell-mediated immune response.
This activation usually requires two stimuli consisting of IFNγ and TNF or TLR
ligation but this can be overcome by certain TLR agonists that can induce TNF
and IFNβ production from the macrophages which acts in an autocrine manner.
The resultant macrophages have increased microbicidal activity and can produce
high levels of pro-inflammatory cytokines. The pro-inflammatory cytokines
produced by classically activated macrophages, such as IL-1, IL-6 and IL-23, are
known to induce the development and expansion of Th17 cells [197, 203] which
can contribute to numerous inflammatory autoimmune pathologies. Therefore
although classically activated macrophages are a fundamental constituent of
host defense, their regulation must be tightly controlled to avoid extensive host
damage.
Since the identification of classically activated macrophages numerous
investigations have demonstrated that macrophages can also be activated by
other stimuli which results in the upregulation of cell surface markers and
phenotypic changes that are distinct from those induced by IFNγ. These studies
analysing different subset of activated macrophages came after reports of the
macrophage mannose receptor, which is expressed on resident macrophages,
being specifically downregulated by IFNγ but upregulated by the cytokine IL-4
[204, 205]. It was proposed that IL-4 induced an ―alternative‖ form of
macrophage activation compared to the classical activation and subsequently
other workers introduced the term M1 and M2 for classically and alternatively
activated macrophages respectively to emulate the T helper cell polarisation
literature [206]. Further work has demonstrated that IL-13 can also induce
alternative macrophage activation [207] by upregulating the mannose receptor
which is dependent on IL4Rα1 which is the common IL-4 and IL-13 receptor alpha
chain [208].

57
Alternatively activated macrophages are similar to classically activated
macrophages as they can develop in response to innate or adaptive signals. IL-4
is thought to be one of the first cytokines released during tissue injury [209]
where one of the main sources of this cytokine are basophils and mast cells.
However, as has been demonstrated with classically activated macrophages, the
transient secretion of activating cytokines by innate cells is not sufficient to
maintain the sustained macrophage activation therefore the adaptive immune
response is necessary to develop and maintain an alternatively activated
macrophage population. In contrast to the classically activated macrophages
which require a Th1 immune response to produce the cytokines needed for
activation the alternatively activated macrophages require a Th2 immune
response. Th2 immune responses are primarily induced in response to
disturbance at mucosal surfaces such as the intestine or the lung but can also be
induced at non-mucosal surfaces such as in response to helmith infections [210].
The main cytokines which are produced by Th2 cells are IL-4 and IL-13 which
directly induce the alternative activation of macrophages, however other
cytokines have also been demonstrated to indirectly induce alternative
macrophage activation through Th2 cells. IL-33 is one such cytokine and binds to
it receptor ST2 on Th2 cells which therefore amplifies Th2 cytokine production
and hence alternative macrophage activation [211].
Alternatively activated macrophages act upon inflammatory and immune
processes and their main role is to counteract pro-inflammatory and cellular
immune mechanisms through regulatory and inhibitory functions. Treating
macrophages in vitro with IL-4 and IL-13 induces macrophages that fail to
present antigen to T cells, produce minimal levels of pro-inflammatory cytokines
and are much less efficient at producing oxygen and nitrogen radicals and killing
intracellular pathogens compared to classically activated macrophages [212]. IL-
4 can also stimulate arginase activity in these macrophages which allows them to
convert arginine to ornithine, since ornithine is a precursor of collagen these
cells can therefore contribute to the production of extracellular matrix.
Consequently, alternatively activated macrophages are often referred to as
wound healing macrophages [197].
Alternatively activated macrophages also have a role in parasitic infections
where they contribute to the clearance of helmiths by aiding in the expulsion of
58
the worms in an arginase-dependent manner [213]. Recent reports have
suggested that this protective effect mediated by alternatively activated
macrophages may be due to these macrophages controlling the underlying Th-1
responses during the helmith infections which if left unregulated would
contribute to pathogenesis of the infection [210]. Alternatively activated
macrophages can also secrete the chemokine CCL22 which induces the
recruitment of Th2 cells into affected tissue to aid in the removal of parasitic
infection [214]. This macrophage subgroup has also been identified in the lungs
of mice with experimental asthma and also in those of humans with asthma
where they are thought to play a role in the recruitment of inflammatory cells
into the lung through their secretion of the chemokines CCL24 and CCL17. These
chemokines recruit several cell types into the lung including basophils,
eosinophils, mast cells and Th2 cells which may lead to excessive type 2
inflammation and airway hyperreactivity and therefore contribute to the clinical
disease pathogenesis [211, 215].
Previously, during the investigations into the phenotypes and subsets of
macrophages the term ―alternative activation‖ was used to describe all forms of
non-classical activation of macrophages. This loose definition obscured the
phenotypic differences observed in macrophages which were activated by
cytokines or factors other than IFNγ in a non-classical manner. Consequently,
three subsets of the M2 alternative activation were proposed: M2a are
macrophages activated by IL-4 and IL-13; M2b are macrophages that are induced
by agonists of TLRs or IL-1 receptors; and M2c macrophages are induced by IL-10
and glucocorticoid hormones [216]. However, a recent review by David Mosser
and Justin Edwards proposed a different grouping of macrophage subsets and
propositioned a new population of macrophages called regulatory macrophages
[197]. These regulatory macrophages would appear to be most like the M2c
subset as they are induced by glucocorticoids, IL-10, apoptotic cells and immune
complexes and have anti-inflammatory activity. Glucocorticoids are naturally
produced hormones which are released by the adrenal gland in response to stress
and can inhibit macrophage mediated host defense by preventing the
transcription of genes coding for pro-inflammatory cytokines such as IL-1β and
TNFα [217]. Glucocorticoids can exert both direct and indirect effects on
immune responses as glucocorticoid treated APCs either fail to present antigen

59
to T cells or induce the development of regulatory T cells which can inhibit
immune responses [218] therefore the macrophages induced by glucocorticoids
are primarily anti-inflammatory.
The first report of regulatory macrophages was by Gerber and Mosser in 2001
who demonstrated that following in vitro stimulation with immune complexes
and the TLR4 agonist LPS, the subsequent macrophage population produced high
levels of the anti-inflammatory cytokine IL-10 [219]. Following studies
demonstrated that the same IL-10 producing regulatory macrophages could be
obtained by activating macrophages with various stimuli including IL-10 and
apoptotic cells [197, 220]. Similar to the induction of classically activated
macrophages, regulatory macrophages require two signals to induce their anti-
inflammatory activity. The first signal of glutocorticoids, immune complexes or
apoptotic cells for example will generally have little stimulatory function on the
macrophage however when combined with a second signal, such as a TLR ligand,
these two signals will induce the macrophages to produce IL-10 which is the
most reliable characteristic of regulatory macrophages. In addition, regulatory
macrophages also downregulate IL-12 production [219] therefore the ratio of IL-
10 to IL-12 can be used to define regulatory macrophage populations. Due to the
ability of IL-10 to downregulate the production of pro-inflammatory, regulatory
macrophages are effective inhibitors of inflammation although they do maintain
their ability to produce pro-inflammatory cytokines [197]. Regulatory
macrophages are unable to contribute to the extracellular matrix which is seen
in alternatively activated macrophages however they do express high levels of
the co-stimulatory molecules CD80 and CD86 and as a result can still present
antigens to T cells [212].
In summary, the regulatory macrophages represent a newly defined subset of
activated macrophages that have a predominantly anti-inflammatory function
through the production of IL-10. However several studies have demonstrated
that incorrect regulation of these macrophage can have deleterious effects on
the host and regulatory macrophages have been found to play a role in the
neoplastic growth of tumours [197]. Tumour associated macrophages have been
found to have a regulatory phenotype and produce high levels of IL-10 and can
also contribute to angiogenesis and tumour growth [221]. However, the function

60
and exact role that these regulatory macrophages play in tumour progression is
still to be elucidated.
To conclude, the plasticity of macrophages has made classification of activated
populations very difficult and there is controversy regarding the phenotype of
these populations as research groups denote different identifications of the
macrophage subsets. As demonstrated above the classification of macrophages is
more complex that an M1 or M2 macrophage because unlike T cells, which
undergo major epigenetic modifications during differentiation, macrophages will
maintain their plasticity and continue to respond to environmental cues [222].
Therefore rather than being strict phenotypic characteristics the three subsets
of macrophages discussed here represent a spectrum of activation and these
macrophages will have the ability to change from one subset to another and may
even display attributes of two subsets depending on the host environment. See
Figure 1.4 for a cartoon representation of the three macrophage population
which arise as a result of different mechanisms of activation.

61
Figure 1.4 Innate and acquired immune activation of macrophages Classically activated macrophages develop in response to the cytokines IFNγ, which can be produced during an adaptive immune response by Th1 cells or during an innate immune response by NK cells, and TNFα which can be produced by NK cells, Th1 cells or APCs. Alternatively, classical macrophage activation can develop as a result of TLR ligation by microbial products. Alternatively activated macrophages arise in response to IL-4 and IL-13 which are produced during a Th2 adaptive response or during a granulocyte innate response. IL-33 can activate Th2 cells and amplify their cytokine production and therefore alternative macrophage activation. Regulatory macrophages develop in response to various stimuli including IL-10, apoptotic cells, immune complexes and glucocorticoids. Each of these macrophage populations has a different phenotype and role within host defense, classically activated macrophages have microbicidal activity whereas alternatively activated macrophages have a role in tissue repair and parasite expulsion and regulatory macrophages produce high levels of IL-10 to dampen the immune response. The development of the macrophage populations shown here are not permanent changes to the cells and due to remarkable plasticity of macrophage cells they retain the ability to change from one subset to another depending on the environmental stimuli. Adapted from [197].

62
1.2.4 Monocytes and macrophages in inflammatory arthritis
Autoimmune disorders such as PsA and RA are characterised by the obliteration
of self-tolerance and the appearance of self-reactive lymphocytes. Monocytes
and macrophages are one of the cell types implicated in the perpetuation of
arthritic disease and are found in dense populations within the diseased synovial
membrane.
1.2.4.1 Blood monocytes in RA and PsA
Within healthy individuals the circulating blood monocyte population will consist
of approximately 90% CD14+CD16- cells and 10% CD14lowCD16+ cells [166]. In
comparison to the CD14+CD16- monocytes, CD14+CD16- (CD16+) monocytes have
shown distinct patterns of additional surface molecules such as MHC class II,
ICAM-1 and LFA-1 [164, 223] and are thought to bear resemblance to tissue
macrophages. CD16+ monocytes are thought to be of pathological significance
since they are expanded in inflammatory conditions such as asthma [224] and
sepsis [225] and have been discovered to be at a higher ratio in the blood of RA
patients. The percentage of CD16+ monocytes is significantly increased in RA
blood (11-15%) compared to healthy blood (9-9.5%) [226-229] and the RA
diseased blood monocytes also had increased levels of surface TLR2 compared to
the healthy controls [227]. CD16+ cells produce larger amounts of TNFα in
response to TLR2-specific ligands compared to CD16- cells [168] suggesting that
the RA blood monocytes may be more proinflammatory and have higher levels of
activation compared to those of the healthy controls.
The expression of CD16 on blood monocytes in RA patients has also been shown
to be correlated to the disease activity of the patients which also substantiates
the hypothesis that CD14+CD16+ monocytes in RA contribute to the disease
pathogenesis [226, 228, 229]. In addition, the plasma concentrations of
cytokines which are known to induce CD16+ expression such as M-CSF, TGFβ1 and
IL-10 are increased in RA patients. In addition, to being at an increased level in
the blood of RA patients, CD16+ monocytes are also overrepresented in the
synovium of patients where they again correlate with disease activity and the
degree of joint destruction [229]. Moreover, circulating CD16+ monocytes as well
as the lining layer in the synovial tissue of RA patients show increased expression
of CX3CR1 which is the receptor for fractalkine (CX3CL1). CX3CR1 is capable of

63
mediating leukocyte migration and firm adhesion, and high levels of fractalkine
have been detected in the serum and synovial fluid of RA patients indicating that
this receptor – ligand complex may be mediating the migration and recruitment
of CD16+ monocytes from the blood into the synovium [230].
In addition to the work performed on CD16+ overexpression within the blood of
RA patients other studies investigating the function of monocytes in RA have
further demonstrated their pathogenic role within the disease. For example, RA
CD14+ monocytes have been shown to inhibit synovial T cell glucocorticoid –
mediated apoptosis though the release of soluble factors rather than via direct
cell contact. Therefore RA monocytes could provide a mechanism for the
increased survival of synovial T cells within the disease and may be a mechanism
for the differences in response to glucocorticoid treatment for RA [231].
In comparison to the RA literature there has been little research into the
presence of an elevated CD16+ monocyte population in PsA patients. However, a
very recent study by Chiu et al noted that there was an increased frequency of
circulating CD14+CD16+ monocytes in PsA patients compared to healthy controls
(0.91% versus 0.46% respectively) [232]. It had been previously demonstrated
that circulating monocytes in PsA were able to mature into osteoclasts, which
are cells that directly absorb bone, without any exogenous stimuli [233]. The
results of the current study demonstrate that the osteoclast cells were mainly
derived from the CD14+CD16+ cells in PsA and increased CD16 expression was
associated with increased bone erosion in PsA [232]. However, this result is in
direct contrast to those of Komano et al who isolated monocytes from the blood
of RA patients and illustrated that the CD16- monocyte subset but not the CD16+
population were able to differentiate into osteoclasts by stimulation of the cells
with RANKL in combination with M-CSF. In contrast, the CD16+ monocytes
expressed larger amounts of TNFα and IL-6 which were enhanced by RANKL
stimulation therefore this would suggest that the RA blood monocytes consist of
two functionally distinct subsets which respond in alternative ways to RANKL
stimulation [234]. The difference demonstrated between the ability of CD16+
cells to form osteoclasts in PsA but not in RA is at present inexplicable but may
be due to differences in the monocyte subsets between the two diseases.

64
1.2.4.1.1 Chemokine receptor expression on diseased monocytes
The majority of cells which form the infiltrate in RA and PsA synovial tissue are
derived from the circulation and the synovial inflammation seen in both diseases
is dependent on the infiltration and retention of these inflammatory cells within
the joint. Chemokines and their receptors play a crucial role within these
processes as they allow the immune cells to chemotax from the blood to the
synovium and the upregulated expression of chemokine receptors is a
characteristic of diseased monocytes. The chemokine network represents a large
group of chemotatic proteins which are structurally related. To date there are
around 50 chemokines signalling through 20 different receptors which can be
constitutively expressed on cells or be up- or down-regulated dependent on cell
activation.
Arthritic blood monocytes have previously been demonstrated to express
chemokine receptors at a significantly increased level compared to normal blood
monocytes. As mentioned previously fractalkine (CX3CL1) is expressed at a
higher level on RA CD16+ monocytes which is thought to mediate the migration
of these cells into the diseased joint [230]. An additional study has also found
that RA PB monocytes express both CCR1, which will bind a variety of ligands
including CCL3 and CCL5, and CCR2, which binds with CCL2, while RA SF
macrophages have upregulated levels of CCR5 and CCR3. This differential
chemokine receptor expression would suggest that CCR1 and CCR2 may be
involved in monocyte recruitment from the blood and CCR3 and CCR5 may be
involved in retention of the monocytes within the synovium [235]. In addition, a
recent paper had revealed the expression of the chemokine receptor CCR9 on RA
PB monocytes as well as RA synovia, the expression of CCR9‘s only known ligand
CCL25 was also detected in RA synovia co-localised with CD14+ monocytes and
CD68+ macrophages. CCL25 induced strong chemotaxis of PB monocytes and also
the differentiation of monocytes into macrophages and therefore this receptor-
ligand complex may play a dual role in the pathogenesis of monocytes in RA by
inducing their movement into the synovium and promoting their differentiation
into a destructive macrophage phenotype [236].
The RA and PsA synovium also contains high levels of monocyte chemotactic
chemokines including the ligands for the chemokines receptors mentioned above
which are expressed on PB monocytes such as CCL5 and CCL3 [237, 238] which

65
will enable the migration of blood monocytes into the synovium in order to
differentiate into pathogenic macrophages and maintain their continual
pathogenic secretion of pro-inflammatory cytokines and chemokines.
A recent interesting imaging study which investigated the migration of RA
monocytes, isolated CD14+ monocytes from patients and labelled them with a
radioactive tracer before re-infusing these monocytes back into the patients.
The patients were imaged and the results determined that a small number of the
monocytes had migrated into the diseased joints after 1 hour and had a
continuous movement into the joint [239]. These results demonstrate the short
migration time of monocytes from the blood into the synovial compartment and
reveal the strong migratory potential of these monocytes possibly led in part by
the high levels of chemotactic proteins expressed within both the patient
synovium and serum and the upregulation of adhesion molecules on the surface
of the cells [230, 240].
The proinflammatory milieu within the serum of arthritis patients can also
induce blood monocytes to produce chemokines and pro-inflammatory cytokines
therefore the blood monocytes are not only the precursors for the inflammatory
macrophages seen in the synovium but can also contribute to the inflammatory
environment themselves. For example, a recent study demonstrated that the
pro-inflammatory molecule osteopontin which is found at increased levels in the
serum of RA patients induced the expression of the chemokines CCL2 and CCL4
in CD14+ monocytes [241]. Monocytes have also been shown to secrete TNFα in
response to immune complexes found in the serum of arthritis patients [242]
indicating that these cells play a role in the elevated serum chemokine and
cytokine levels observed in RA and PsA.
1.2.5 Macrophages in RA and PsA
Once the peripheral blood monocytes have entered the arthritic synovium they
will mature and develop into macrophages which express broad pro-
inflammatory, remodelling and destructive potential and contribute significantly
to the inflammation and joint destruction observed in RA and PsA. Similar
numbers of CD68+ macrophage populations are found within the lining and
sublining of the synovium in RA and PsA [243] and upregulated levels of

66
monocytes and macrophages have been found in the synovial fluid of RA and PsA
patients [244]. The importance of macrophages for the pathogenesis of
inflammatory arthritis has been demonstrated by several studies such as those
performed by Tak et al who illustrated that the number of synovial macrophages
correlate with the scores for knee pain and also the levels of TNFα and IL-6
expression [245]. In addition, the radiographic progression of joint destruction in
RA has been found to correlate with the degree of synovial macrophage
infiltration [246] which underscores the important role the macrophage plays in
synovial inflammation. Furthermore, an ex vivo cellular model of rheumatoid
arthritis which was set up using cultures of synovial tissue from RA patients
revealed that the spontaneous reconstruction of inflammatory tissue which was
visualised after 4 weeks of culture could be inhibited by depleting CD14+ cells
from the synovial tissue. They suggested that these results imply a critical role
of CD14+ monocytes and macrophages in the development of the destructive
pannus tissue observed in RA [247]. Studies in animal models have also revealed
the importance of macrophages in arthritis as op/op mice which are deficient in
the macrophage differentiation cytokine M-CSF fail to develop collagen induced
arthritis [248].
1.2.5.1 Stimulation of macrophage activation in RA and PsA
The differentiation and activation of infiltrating monocytes into pathogenic
macrophages underlies the systemic inflammation observed in both RA and PsA
and is a complex interaction of paracrine mechanisms through cell-cell
interaction as well as the result of soluble stimuli and autocrine mechanisms.
1.2.5.1.1 Cell-cell interaction
A considerable part of macrophage effector responses is mediated by cell
contact dependent signalling with different inflammatory or mesenchymal cells.
Due to the large numbers of fibroblasts and macrophages within synovial tissue
the interaction of these cell types is essential for the resulting tissue damage
and inflammation. The direct cell contact of these two cell types elicits the
production of IL-6, GM-CSF and IL-8 which can be enhanced by the addition of
other pro-inflammatory cytokines or inhibited by the addition of regulatory
cytokines or by neutralising CD14 [249].

67
The interaction between monocytes and endothelial cells in arthritis is necessary
for the sustained influx of cells into the synovium through the interaction of
selectin/intergrin pairs on the surface of the two cell types. The synovial
cytokine environment upregulates the expression of these ligand pairs and leads
to the further influx and activation of peripheral blood monocytes [250]. In
addition, cell contact between macrophages and monokine-activated NK cells
induces TNFα production from the macrophages demonstrating a further
mechanism for macrophage activation [251].
A substantial amount of work has been dedicated to analysing the cell contact
dependent activation of macrophages by T cells which will be discussed in detail
in section 1.2.5.3. This cell contact activation occurs in the absence of antigen
but there have also been reports of macrophages acting as APCs within the joint
and presenting autoantigens such as collagen to T cells [252].
1.2.5.1.2 Soluble stimuli
There are numerous soluble stimuli present in the arthritic joint which are able
to activate macrophages of these the most notable stimuli are cytokines. Many
of the cytokines present have a pro-inflammatory effect on the macrophages and
several of them, such as TNFα, IL-1 and IL-15, are produced by macrophages
themselves and therefore will activate the macrophages in an autocrine fashion
and result in a subset of perpetually activated macrophages. T cells within the
joint can also produce inflammatory cytokines that will affect the macrophage
population such as IL-17 which has pro-inflammatory and amplifying effects on
macrophages in RA [113]. In addition to their inflammatory effects, there are
also cytokine stimuli within the joint which have a regulatory effect on the
synovial macrophages such as IL-4 and IL-13 which are produced by T cells and
are involved in the alternative activation of macrophages as discussed previously
and also IL-10 which is produced by macrophages themselves and may be a
mechanism of autocrine regulation in order to try and reduce the chronic
inflammation taking place.
An interesting study undertaken by Vandooren et al demonstrated that the
synovial fluid from SpA patients which included a subset of PsA patients was able
to induce the preferential expression of the M2 (alternative activation) markers
CD163 and CD200R on peripheral blood monocytes in comparison to synovial fluid

68
from RA patients [253]. Previous studies had also shown an increased number of
CD163 expressing macrophages in the synovium of SpA patients [254, 255], these
studies demonstrate that the local inflammatory synovial environment is
different in SpA compared to RA and could be preferentially inducing a more
wound healing alternative macrophage phenotype which may be contributing
towards maintaining tissue integrity although at present no differences in the
subsequent destructive processes in SpA and RA have been identified.
1.2.5.2 Macrophage effector molecules in RA and PsA
Once the blood monocytes have been differentiated and fully activated into
synovial macrophages they start to produce a number of pro-inflammatory
effector molecules that contribute to the continual inflammation and joint
destruction seen within the arthritic joint. Subsets of these molecules are
outlined below.
1.2.5.2.1 Chemokines
As discussed previously chemokine receptor expression play a significant role in
the infiltration of blood monocytes into the synovium. Once in the arthritic joint
the differentiated macrophage will upregulate a different profile of chemokine
receptors such as CCR3 and CCR5 which may be involved in their retention
within the synovium [235] and in addition will also secrete chemokines in
response to the pro-inflammatory environment. Synovial macrophages have been
shown to produce a range of CXC and CC chemokines and will often produce the
ligands for the chemokine receptors expressed on the diseased blood monocytes
in order to increase the number of infiltrating monocytes entering the synovium.
One such chemokine is CXCL16 which is the sole ligand for CXCR6 and is found in
the RA synovial tissue lining and interstitial macrophage cells. CXCL16 is involved
in monocyte recruitment into the RA synovial tissue [256].
In addition to secreting monocyte chemotactic chemokines synovial macrophages
also produce chemokines such as CXCL8 (IL-8), CXCL1 (Groα), CXCL7 (CTAP-III)
and CCL18 (PARC) which are chemotactic for other inflammatory cells such as
neutrophils and T cells [257, 258]. CCL22 is also secreted by macrophages in RA
and PsA synovium and is thought to be involved in the migration of CCR4
expressing memory T cells to the joint [259]. These secreted chemokines can

69
become part of autocrine loops of macrophage activation as their cognate
receptors are often found on the surface of the macrophages themselves.
Furthermore, some of the macrophage-expressed chemokines such as IL-8 are
powerful promoters of angiogenesis and thus provide a link between macrophage
activation and the prominent neo-vascularisation of the RA and PsA synovium
[136].
1.2.5.2.2 Cytokines, proteinases and growth factors
TNFα In RA and PsA, TNFα is mostly produced by macrophages at the cartilage pannus
junction and in the synovial membrane [250], this cytokine can induce the
production of adhesion molecules, collagenase and collagen from synovial cells
and can also act on macrophages in an autocrine manner to produce numerous
products including IL-6, IL-8, MCP-1 and MIP-1α [258]. Due to its significant pro-
inflammatory capabilities TNFα is of critical importance in the pathogenesis of
RA and PsA and neutralisation of the cytokine through the use of anti-TNFα
antibodies is now used as a therapy for both diseases [135, 148, 149].
IL-1 IL-1 is another pro-inflammatory cytokine found within the synovial joint that is
predominantly secreted by CD14+ macrophages [260], and synovial fluid levels of
this cytokine have been found to correlate with joint inflammation [261]. IL-1
influences proteoglycan synthesis and degradation and hence articular damage
underscoring the pathogenic effect macrophages and their products can have on
the chronic nature of arthritis. In addition, the IL-1 type 1 receptor (IL-1R1),
which mediates IL-1-induced cell activation, is found on numerous cells within
the synovium of RA patients [262] indicating the pro-inflammatory capacity of IL-
1 within the synovium. The type II receptor (IL-1R2) which does not induce
cellular activation and is therefore anti-inflammatory is found at low levels in
the arthritic synovium [263]. However, IL-1 receptor antagonist (IL-1RA) which
blocks the action of IL-1 by binding to IL-1R1 is constitutively expressed by
differentiated macrophages and is produced at increased levels by the
mononuclear cells of RA patients compared to healthy controls [264]. In
addition, IL-1RA levels in the sera of PsA patients correlate with the number of
swollen joints [265]. These findings may help to explain why therapeutic
application of IL-1RA (anakinra) appears to be only modestly effective in RA
70
[266] and PsA [267] despite being an effective therapeutic for several hereditary
autoimmune diseases.
IL-15 IL-15 is an IL-2 family member cytokine that has chemoattractant properties for
memory T cells, it is produced by lining layer cells including macrophages and is
increased in the synovial fluid of RA patients [268]. Peripheral or synovial T cells
stimulated with this cytokine can induce macrophages to produce IL-1β, TNFα,
MCP-1 and IL-8 but not the anti-inflammatory IL-10 [269]. Since IL-15 is produced
by the macrophages themselves, this may re-stimulate the T cells and result in a
self-perpetuating pro-inflammatory loop [268].
IL-6 IL-6 has also been shown to be produced by synovial macrophages in addition to
synovial fibroblasts, it is elevated in the synovial fluid of RA and inflammatory
arthritis during the acute phase of disease and has been shown to have phase
dependent effects as it protects the cartilage in acute disease but promotes
excessive bone formation during chronic disease [250]. However, despite these
opposing effects of IL-6 within the disease setting clinical trials of an anti-IL-6
receptor antibody suggest it may be used as an effective treatment for RA [134,
157] although at present no trials have investigated the use of such antibodies in
PsA.
IL-18 IL-18 is a member of the IL-1 family of cytokines and its expression is up-
regulated within the synovial membrane as well as the serum and synovial fluids
of RA and PsA patients [270, 271]. It is expressed by CD68+ macrophages
contained within lymphoid aggregates as well as by fibroblast-like synoviocytes
and RA synovial fluid CD14+ macrophages also express the IL-18 receptor (IL-18R)
[272]. Several lines of investigation have demonstrated the pro-inflammatory
role of IL-18 in arthritis: (a) IL-18 deficient mice exhibit reduced incidence and
severity of disease in the CIA and ZIA mouse models of arthritis [273-275] (b)
anti-IL-18 antibodies can effectively reduce development and established
arthritis in both streptococcal cell wall induced arthritis (a strongly macrophage-
dependent model) and CIA [276, 277] (c) treatment with low doses of IL-18 prior
to induction of CIA was able to increase the severity and incidence of disease
[278] and (d) IL-18 is selectively overexpressed in the bone marrow of patients

71
with juvenile idiopathic arthritis and macrophage activation syndrome [279]. IL-
18 has also been demonstrated to correlate with CRP levels in arthritis patients
and their levels decrease in parallel in synovial tissue and serum following
effective treatment with DMARDs [271]. A recent study performed by Ruth et al
engrafted human synovial tissue into SCID mice and investigated whether the
injection of IL-18 into these grafts could induce the migration of human PB
monocytes which were administered to the mice. They found that IL-18 could
indeed induce monocyte recruitment to the synovial tissue and in addition IL-18
gene knockout mice showed pronounced reductions in joint inflammation during
ZIA model of arthritis once again indicating the dominant role of IL-18 within
arthritis and its ability to act in an autocrine manner and induce monocyte
migration to sites of inflammation [275].
MIF Macrophage migration inhibitory factor (MIF) is an early-response cytokine
abundantly released by macrophages. This cytokine can stimulate macrophage
functions in an autocrine manner such as the release of TNF-α and phagocytosis.
MIF can also confer resistance to apoptosis in both macrophages and synovial
fibroblasts within the synovial joint [250]. In RA, MIF is overexpressed in the
serum and synovial fluid of patients and correlates with disease activity and
arthritis severity is significantly reduced in MIF-/- mice in comparison to wild
type mice and is associated with reduced T cell activation [280].
Proteinases Matrix metalloproteinases (MMPs) are enzymes involved in extracellular matrix
degradation that is a central part of the joint destruction seen in arthritis. There
are around 30 known MMPs and of these mainly MMP-1 (collagenase), MMP-2
(gelatinase A) and MMP-9 (gelatinase B) are released by RA synovial macrophages
[258, 281]. MMP-1 and MMP-3 (stromelysin) mRNA has also been detected in the
synovium of PsA patients [94]. Synovial macrophages also produce tissue
inhibitors of MMPs such as TIMP-1 and TIMP-2 that anatagonise the effects of
MMPs.
Growth factors Growth factors are involved in the synovial angiogenesis, inflammation and
fibrosis occurring in the arthritic joint. Synovial macrophages are known to
secrete several such factors including platelet-derived growth factor (PDGF) and

72
vascular endothelial growth factor (VEGF) [258]. PDGF-C and PDGF-D are the two
isoforms expressed by synovial tissue macrophages and the latter isoform has
been previously shown to increase the production of the enzyme MMP-1 within
the synovium [282]. VEGF levels are significantly increased in the sera of PsA and
RA patients and correlate with disease activity [98, 283]. The VEGF receptor
(VEGFR-1/Flt-1) has previously been implicated in macrophage activation and
angiogenesis in RA [284]. VEGFR-1 deficient mice were shown to obtain
diminished clinical symptoms of induced arthritis compared to wild type mice
and this VEGFR-1 deficiency was associated with reduced macrophage
differentiation and function including a decrease in the secretion of pro-
inflammatory mediators [284].
1.2.5.2.3 Anti-inflammatory cytokines
In addition to producing a large variety of pro-inflammatory mediators in the
synovial joint macrophages also produce anti-inflammatory cytokines, namely IL-
1RA as mentioned previously and IL-10. IL-10 is a macrophage and Th2 derived
cytokine which reduces antigen presentation by macrophages and prevents the
production of pro-inflammatory cytokines by synovial macrophages [250]. The ex
vivo production of IL-10 by RA PBMCs is negatively correlated with radiographic
joint damage suggesting that IL-10 is protective however several studies have
found a deficiency of IL-10 in the synovial compartments [285] which proposes
that the synovial macrophages may be reducing their regulatory cytokine output
in favour of a highly pro-inflammatory profile.
An outline of the characteristics and pro-inflammatory potential of inflammatory
arthritis monocytes and macrophages are shown in Figure 1.5.

73
Figure 1.5 Phenotypic overview of RA and PsA monocytes and macrophages
An overview of the functional differences between healthy monocytes and RA or PsA diseased monocytes in the blood (A) and the arthritic joint (B). This figure demonstrates the inflammatory phenotype of these cellular subtypes and the mechanisms of their activation in RA and PsA.
1.2.5.3 In vitro model of inflammatory arthritis
The use of in vitro model systems within the investigation of chronic arthritis is
valuable for the detailed analysis of patient cells to fully understand how they
activate and interact with other cells. One such in vitro model has been
established to investigate the contact-dependent, antigen independent
interactions occurring in the synovial joint between macrophages and stimulated
T cells. Since histologically, T cells are often found within close contact with
macrophages within RA synovial tissue [286]. In addition, T cell cytokines such as
IL-4, IL-10, TGF-β and IL-13 have predominantly anti-inflammatory effects and

74
IFN-γ alone displays weak activation capacity in terms of IL-1β and TNF-α
induction which suggests that the soluble factors produced by T cells are not
pathological mediators. Therefore it was hypothesised that within the synovium,
one method through which T cells could exert a pathological effect would be
through direct cellular contact with macrophages to induce cytokine and
chemokine secretion from the latter cell type.
The history of contact mediated activation of macrophages by stimulated T cells
began in the mid-eighties when it was observed that the expression of
membrane- associated IL-1 (IL-1α) in mouse macrophages was mediated by both
soluble mediators and direct cell contact with T cells [287]. The same group
subsequently demonstrated that this T cell contact mediated IL-1 induction in
monocytes took place with both Th1 and Th2 cells in the absence of lymphokine
release [288]. Following this result a similar experiment was setup with human
cells and it was demonstrated that the production of IL-1β by human monocytes
also required direct cell contact with anti-CD3 stimulated cells [289].
Accordingly, other investigators have shown that the induction of macrophage
effector functions mediated through T lymphocytes in living cell co-cultures
involved signals from cell-cell contact in addition to IFNγ [290]. Furthermore, by
using isolated plasma membranes from T cells stimulated with PHA/PMA Vey et
al demonstrated that this contact activation was sufficient for the activation of
the human monocytic cell line THP-1 and their subsequent secretion of IL-6,
TNFα and IL-1β in the absence of T cell derived cytokines. This cytokine release
did not occur when the cells were physically separated by a permeable
membrane [291].
Antigen independent, direct contact mediated activation of monocytes and
macrophages by stimulated T cells was found to be as potent as LPS in inducing
cytokine production in monocytes and monocytic cell lines [291-293]. However,
besides PHA/PMA various stimuli for the T cells were found to activate
monocytes by direct cellular contact such as cross-linking CD3 by anti-CD3 mAb
and the addition of cytokines to the T cells. In addition, depending on the T cell
type and the stimulus, direct cell-cell contact between stimulated T cells and
monocytes/macrophages induced different patterns of products secreted from
the latter cell type (see Table 1.7).

75
Table 1.7 Depending on T cell stimulus, various products are induced in the monocyes/macrophages upon direct cell contact
Stimulus T cell Monocyte Products PHA/PMA PB T cells, PB mo, THP-1 TNFα, IL-1β, IL-6, Synovial, Jurkat, IL-8, IL-1α, MMP-1, Th1 and Th2, MMP-9, TIMP-1
HUT-78 [291, 293-295] PdBu/ionomycine PB T cells PB mo IL-10, TNFα [296] Anti-CD3 PB and synovial PB mo, THP-1 IL-10, IL-1β, TNFα, T cells MMP-1 [296-299] Anti-CD3 PB T cells PMA/IFNγ treated IL-10, IL-12, TNFα, U937 IL-4 [300] IL-15 or IL-2 PB T cells, U937, PB mo, TNFα, IL-1β, IL-10 Synovial T cells, THP-1, synovial [301, 302] Th1 and Th2 mo IL-2, IL-6, TNFα PB T cells, PB mo TNFα, MCP-1, Synovial T cells MCP-1, MIP-1α,
MIP-1β, RANTES, IL-8, GROα, IP-10, IL-1β [269, 298]
The observations outlined in Table 1.7 suggested that multiple ligands and
counter-ligands are involved in the contact mediated activation. It was
hypothesised that membrane associated cytokines or soluble cytokines may play
a role however the Dayer group consistently demonstrated that neither soluble
TNFα receptors or IL-1Ra blocked T cell mediated signalling of the monocyte.
Additionally neutralisation of TNFα, IL-1, IL-2, GM-CSF and IFNγ all failed to
affect monocyte activation by membranes from stimulated T cells [291, 293,
297]. In addition to membrane-associated cytokines other surface molecules
were investigated for their ability to activate macrophages upon contact with
stimulated T cells. The CD40/CD40L interaction was shown to be involved in the
contact activation of both human and mouse macrophages by T cells stimulated
for 6 hours [303] but T cells isolated from a CD40L knockout mouse were also
able to trigger macrophage activation although this activation was less than that
seen from wild type murine T cells [304]. Furthermore, blocking antibodies to
CD40L or soluble CD40 failed to inhibit contact-induced activation of

76
macrophages by 48 hour activated T cells. HUT-78 cells, which are able to
induce cytokine production from macrophages, do not express CD40L mRNA in
the resting or activated state [305]. Finally, Th1 but not Th2 clones stimulated
with IL-15 were able to induce IL-1β production from monocytes, in the former
system blockade of the CD40/CD40L interaction resulted in inhibition of IL-1β
production despite similar levels of CD40L expression in the Th1 and Th2 cells
indicating the selective requirement of CD40 engagement upon monocyte
activation by Th1 clones [301]. Other groups have also demonstrated the
presence of surface molecules such as CD69, LFA-1 and ICAM-1 on simulated T
cells play a role in macrophage activation through the use of blocking antibodies
which effectively inhibited macrophage activation [291, 302, 306].
Histological studies of the RA synovium have indicated that this tissue is very
cellular and that several different cell types including macrophages and T cells
are in close proximity [286]. This could therefore suggest that direct contact
between macrophages and T cells could be important in vivo in modulating
synovial macrophage function. It was first reported in 1994 that a cocktail of
cytokines, namely IL-2, IL-6 and TNFα, could activated T cells in the absence of
antigen which in turn stimulated B cells [307]. Since the RA synovial joint is a
highly pro-inflammatory environment containing a milieu of pro-inflammatory
cytokines it was hypothesised that these cytokines could activate the T cells
contained within the joint which would subsequently activate the synovial
macrophages by direct cell contact and be a mechanism for the increased
production of pro-inflammatory mediators.
In 1997, McInnes et al demonstrated that IL-15 alone, which is a cytokine found
within RA synovium [268], could activate T cells isolated from the PB or SF of RA
patients; these fixed T cells were then able to activate U937 cells or matched RA
PB or SF monocytes to produce TNFα. This monocyte activation was cell contact
dependent since the TNFα production was abrogated in the presence of a semi
permeable membrane. Furthermore, it was demonstrated that the T cell surface
molecules CD69, LFA-1 and ICAM-1 were involved in this activation since
antibodies against these molecules prevented the secretion of TNFα from the
monocyte [302]. In the same year Brennan and Feldmann used the cytokine
cocktail IL-2, IL-6 and TNFα to stimulate PB T cells and demonstrated that the
manner in which the T cells were activated influenced the profile of cytokines

77
secreted by the monocytes. Thus, if blood T cells were activated with cross-
linked anti-CD3 this induced the production of TNFα and IL-10 from monocytes
[296]. However, if the T cells were stimulated with the cocktail of cytokines for
8 days, the monocytes produced TNFα production but not IL-10 [269]. Such
observations suggested that these cytokine stimulated T cells, designated Tcks,
could be similar to the T cells found in the synovial tissue of RA patients since
they induce an unbalanced pro-inflammatory cytokine response from monocytes.
Consequently, further work performed by the Brennan and Feldmann group set
out to investigate fully these Tck cells and their relevance to RA. This group
demonstrated that the TNFα production in RA synovium was T cell dependent as
the removal of CD3-positive T cells from RA synovial mononuclear cells resulted
in the significant reduction of macrophage TNFα, in addition this TNFα output
was abrogated if physical contact between the two cell types was blocked [298].
It was also shown that Tck cells but not T cell receptor dependent stimulated T
cells induced TNFα production in monocytes in an NF-κB dependent manner.
Conversely, phosphatidylinositol 3-kinase (PI3K) inhibitors were found to block T
cell receptor stimulated T cell activation of monocytes but did not affect Tck
mediated monocyte activation indicating the different signalling mechanisms
employed by the two differentially activated T cells [298]. Interestingly, RA
synovial T cells were also found to employ the same signalling mechanisms as
Tcks since the induction of TNFα in resting PB monocytes by synovial T cells was
NF-κB dependent and were superinduced if PI3K was blocked [298]. These
results provided evidence that the IL-2, IL-6, TNFα activated Tcks were similar
to the synovial T cells found in RA and provided a basis for an in vitro model of
inflammatory arthritis.
Subsequent investigations have also substantiated this finding and provided
evidence for the Tck cell contact activated macrophages as a model of arthritis.
For example, the chemokines produced by M-CSF differentiated macrophages
after contact with fixed Tck cells have been analysed and it was revealed that
they produce several CC and CXC chemokines such as MCP-1, MIP-1α, MIP-1β,
RANTES, IL-8, GROα and IP-10. Interestingly, blockade of NF-κB signalling
through IκBα overexpression inhibits Tck and synovial T cell induced macrophage
secretion of CXC but not CC chemokines, suggesting that RA synovial T cells
share similarities in their effector function to Tck cells [308]. Subsequent

78
phenotyping of this Tck cell subset has revealed that they are a
CD4+CD45RO+CCR7- CD49dhigh population of T cells. After IL-2, IL-6 and TNFα
stimulation in culture these Tcks acquire an activated phenotype that resembles
the phenotype of RA synovial T cells including the selective upregulation of
adhesion molecules and integrins such as very late antigen 4(VLA-4) [309]. In
summary, these investigations established the functional and phenotypic
similarities between in vitro cytokine activated T cells (Tck) and RA synovial T
cells and demonstrated the importance of the cell contact mediated activation
of monocytes/macrophages as a surrogate model of RA.
The modulation of T cell induced signalling in monocytes may be an important
concept as it would maintain a low level of monocyte activation within the blood
stream. Apolipoprotein (apo) A-I has been identified as a specific inhibitor of
contact-mediated activation of monocytes [310]. Apo A-I is known as a negative
acute phase protein and is one of the main proteins of high density lipoprotein
(HDL). There have been several reports of variations of apo A-I concentration in
inflammatory diseases [311] and in RA the levels of circulating apo A-I and HDL-
cholesterol in untreated patients were lower than in healthy controls [312].
Conversely, apo A-I levels were enhanced in the synovial fluid of RA patients
[313].
This possible regulatory mechanism within the synovium may be overcome by a
positive acute-phase protein which can displace apo A-I from HDL, known as
serum amyloid A (SAA) [314]. SAA is produced in the liver but has also been
detected in the RA synovium, HDL-associated SAA is a pro-inflammatory
molecule and the expression of SAA can be increased by cytokines such as TNFα
and IL-1β. This could therefore lead to a positive feedback loop of inflammation
within the synovium as the cell contact dependent activation of synovial
macrophages will induce the production of pro-inflammatory cytokines which
will therefore increase the levels of SAA and consequently decrease the levels of
Apo A-I. The decreased level of Apo A-I, which is an inhibitor of contact
mediated monocyte activation, will thereby result in higher levels of monocyte
activation and increased levels of pro-inflammatory molecules thus increasing
the chronic synovial inflammation [314]. To try to further understand the role of
HDL within T cell contact activation of monocytes Gruaz et al performed a
microarray analysis of monocytes activated by the plasma membranes of fixed

79
PHA/PMA stimulated T cells in the presence or absence of HDL. The results of
this study demonstrated that T cell activation of monocytes induced the
upregluation of 437 probe sets in the monocytes including genes associated with
the inflammatory response and inflammatory diseases. It was also shown that
the addition of HDL to the monocytes at the time of T cell membrane activation
was able to inhibit the expression of 164 (38%) of these probe sets which
included probe sets specific for TNFα, IL-6, IL-1β, CCL4 and CCL3. Consequently
this study substantiated the previous reports of the pro-inflammatory nature of T
cell contact activation of human monocytes and the subsequent anti-
inflammatory capacity of HDL upon this cell contact model [315].
In summary, these studies have demonstrated that stimulated T cells have the
ability to active monocytes and macrophages in an antigen independent but cell
contact dependent manner. The method through which the T cells are
stimulated can vary (see Table 1.7) and this variation can affect the products
secreted by the monocytic cell. However it has been demonstrated that a
particular stimulus consisting of a cocktail of cytokines can induce a T cell
phenotype and activation pattern similar to that of RA synovial T cells. Due to
the close proximity of T cells and macrophages within the RA synovium and the
predominantly anti-inflammatory effect of T cell secreted cytokines the T cell –
macrophage cell contact activation has been postulated to be a mechanism of
increasing the pro-inflammatory cytokine and chemokine levels within the
synovium. Therefore the cytokine cocktail method of T cell stimulation within
the cell contact model has become an established in vitro method of
investigating the role T cell – macrophage activation within arthritis.

80
1.3 Gene expression analyses in inflammatory arthritis
As described in 1.1.1, the rheumatic diseases are a heterogenous group of
disorders with a wide clinical spectrum and considerable variability in secondary
organ involvement. Every aspect of this heterogenous disease phenotype should
be represented in the pattern of genes and proteins which are expressed by the
patient. This molecular signature will represent the contribution of the
interactions between specific molecules and the individual cell types that are
associated with disease characteristics and subtypes and thus will determine the
samples‘ unique molecular biology. A powerful way to gain insight into the
molecular signature contained within the cells and tissues of rheumatic diseases
has arisen with the advent of DNA microarray technology, which can
comprehensively identify the subset of genes which are differentially expressed
among patients with clinically defined disease. There were initially several
problems in the use of such technology, which requires highly standardised
conditions, such as the lack of consistent methods for blood and tissue handling
or preparation or the use of different platforms and standardisation procedures.
However, after a decade of technical improvement the technology and
standardisation procedures have been shown to be robust and allow comparison
between properly designed and controlled experiments [316] thereby helping to
unravel information that may aid in allowing clinicians to optimise treatment for
and understanding further the complexity of rheumatic diseases.
The resultant findings of microarray analyses performed in RA and PsA are
summarised in Table 1.8.
1.3.1.1 Rheumatoid arthritis
1.3.1.1.1 Genetic analysis of affected tissues
One of the first gene expression profiling studies for RA was conducted on biopsy
tissue using high density cDNA arrays [317]. This report identified an increased
expression of inflammation associated genes, such as HLA-DR, in the RA
synovium compared to normal synovium. However, due to the investigators using
pooled samples from three patients with RA and three healthy controls it was
impossible to study the individual genetic profiles of the patients or the
heterogeneity between samples. In contrast, a study set up by van der Pouw

81
Kraan analysing the genetic expression of the synovial tissue from RA (n=21) and
OA (n=9) patients found the RA patients to be highly heterogenous in their
genetic signatures [318, 319]. Interestingly, they identified two molecularly
distinct forms of RA; the synovial tissue from one group of patients had an
abundant expression of clusters of genes indicative of ongoing inflammation and
involvement in the adaptive immune response. This subgroup was referred to as
the RA high inflammation group. The second group, known as the low
inflammation subgroup, contained expression profiles of tissue remodelling
genes such as increased expression of MMP-11 and MMP-13 and low levels of
inflammatory genes which was similar to the patterns seen in the OA tissue
[318]. Analysis of the genes in the RA high inflammation subgroup indicated a
prominent role of genes involved in activated IFN and the signal transducer and
activator of transcription (STAT)-1 pathway [318]. It was determined by
histological analysis that the difference obtained in the two subgroups of RA
patients were related to differences in cell distribution, as tissues which
contained germinal centre-like structures were those found in the high
inflammation subgroup.
A further study performed by Devauchelle et al analysed the differences in gene
expression between the synovial tissue of RA (n=5) and OA (n=10) patients [320].
A set of 63 genes were identified based on their over- or under-expression in RA
tissue compared to the OA tissue, 15 of these genes had unknown function but
the expression of the remaining 48 genes allowed the correct classification of
additional RA or OA patients therefore the authors proposed that such
information could aid in the diagnosis of RA. Of interest, 16 genes from this
study overlapped between the microarray performed by van der Pouw Krann and
seven of these genes including the type I IFN regulated GBP1 and CTSL had
comparable gene expression profiles indicating the ability to reproduce genetic
results between different patient samples and different groups of investigators.
Additional studies have also demonstrated that RA patients have significant
tissue heterogeneity both between and within patient samples. A study
performed by Tsubaki and colleagues [321] showed that early RA patients were a
heterogenous group in comparison to patients with longstanding RA as the early
RA patients could be subdivided into at least two different subgroups depending
on their gene expression profiles. A similar study was performed in 2009 [322],

82
the synovium from 4 early RA patients, 4 treated longstanding RA patients and 7
controls was analysed by microarray and it was found that distinct molecular
signatures were expressed during early or longstanding RA suggesting that
increased understanding regarding the main biological processes and pathways
involved at each stage of the disease may help to decide the most appropriate
therapy for the patients. An interesting study by Lindberg et al [323]
investigated the variability in synovial gene expression at the biopsy site,
between different sites and between patients. Multiple biopsy samples were
taken from 13 patients; 7 by orthopaedic surgery and 6 by rheumatic arthroscopy
and it was found that the number of differentially expressed genes between
pairs of biopsies from the same knee ranged from 6 to 2,133 indicating the
considerable level of heterogeneity between biopsy samples. The methods by
which these samples were taken had a significant effect on the results since the
number of differentially expressed genes between biopsies from the same
patient was three times higher when the biopsies were taken by the orthopaedic
method compared to the arthroscopic method which was thought to be due to
sampling of non-inflamed tissue. Upon removal of biopsies which contained non-
inflamed tissue the remaining gene expression signatures were found to be
unique to each patient but also contained groups of genes which belonged to
gene ontology categories such as cell communication and immune response.
Since the arrival of microarray studies which have analysed the diseased
synovium of RA patients there has also been an increase in the number of studies
which analyse the gene expression changes of the synovium in response to
patient treatment. Lindberg and colleagues recently investigated the
transcriptional profile of the synovium of RA patients treated with the anti-TNFα
therapy infliximab in order to determine biomarkers which could be predictive
of response to treatment [324]. This study found that within the 62 patients
analysed no significant differences in genes expression could be detected
between responders and non-responders to the infliximab treatment which
therefore does not support the idea that microarray analysis of whole synovium
biopsy specimens can be used to identify non-responders before the initiation of
treatment.

83
1.3.1.1.2 Genetic analysis of blood derived cells
Although the gene expression analysis of tissue samples of affected target organs
offer insight into the genes principally involved in disease progression and
activity, it may not be viable to use this approach to study all patients especially
large cohorts. Consequently, several groups began to analyse the gene
expression profiles of whole blood or peripheral blood mononuclear cells (PBMCs)
to obtain disease related gene expression profiles since the systemic nature of
RA allows the communication between systemic and organ specific
compartments within the disease. In addition, understanding the gene
expression of blood cells may allow the use of such profiles for biomarker studies
and could also improve diagnosis and personalised therapy.
One of the first microarrays analysing RA PBMCs took place in 2004 by Bovin and
colleagues who examined the PBMCs from eight RF-positive RA patients, six RF-
negative patients and seven healthy controls [325]. No significant differences
between RF-positive and RF-negative patients were detected. However,
comparison of the gene expression pattern from all fourteen patients and the
healthy controls identified a subset of 25 discriminative genes which included
genes associated with the inflammatory response such as defensin alpha and
CD14 antigen as well as the calcium binding proteins S100A8 and S100A12.
Batliwalla and colleagues investigated the gene expression differences between
PBMCs from RA patients (n=29) and those from healthy donors (n=21) [326].
Using cluster analysis they identified a significant alteration in the expression of
81 genes in the PBMCs of RA patients compared to controls. A large number of
these genes correlated with differences in the monocyte counts between the
two study populations as many of the genes were known to be expressed at high
levels in monocytes such as CD14 antigen. A logistic regression analysis revealed
that of the remaining genes IL-1RA, S100A12, glutaminyl cyclase and Grb2-
associated binding protein (GAB2) were the top discriminator genes in
categorising RA patients from controls.
A further study performed by Edwards and colleagues analysing the RNA from
the PBMCs of nine RA patients and thirteen healthy controls found 330 genes
differentially expressed in RA [327]. These differentially expressed genes
belonged to diverse functional classes and included genes involved in several
biological groups such as transcription, signal transduction, extracellular matrix,

84
cytokines, enzymes and proteases. Interestingly, ten genes which had an
increased expression in RA PBMCs compared to healthy controls mapped to an RA
susceptibility locus, 6p21.3 which the investigators hypothesised could be a
mechanism contributing to the etiology of the disease through the coordinated
transcription of specific regions of a chromosome in response to stress or
inflammation. A study performed by Junta et al evaluated the differential gene
expression profile of PBMCs of RA patients and their association with the HLA
shared epitope (HLA-SE), anti-CCP antibody levels, DAS-28 score and disease
treatment [328]. This research demonstrated that thirteen genes were
exclusively associated with the presence of HLA-SE alleles whose major functions
were related signal transduction, apoptosis and signal transduction. One hundred
and one genes were associated with the presence of anti-CCP antibodies, 91
genes were associated with disease activity including genes involved in DNA
damage, signal transduction and response to stress and finally 28 genes were
associated with TNF blockade treatment which included genes involved in
protein transport and intracellular signalling.
In 2007, van der Pouw Krann and colleagues published a paper investigating the
gene expression profiles of whole blood from RA patients (n=35) and healthy
controls (n=15) [329]. The microarray data confirmed previous observations of
increased expression of genes such as the S100A8 and S100A12 calcium-binding
proteins. Pathway analysis software identified the increased expression within
RA patients of immune defense genes including the type I IFN response genes
indicating that this pathway is activated systemically in RA. A separate study
comparing RA PBMCs to those of controls identified a spectrum of genes involved
in immunity and defense to be upregulated in the RA patients once again
demonstrating that such immune pathways are upregulated systemically in RA
[330].
In addition to microarray analyses being performed on synovial biopsies from
patients before and after therapeutic intervention there have also been a
number of recent studies evaluating the effect of different treatments on the
gene profile of PBMCs. Since a significant percentage of patients fail to show a
clinical response to treatment, designated non-responders, the main focus of
such microarray studies has been to determine molecular discriminators of
response in patients. One study which obtained blood from patients before

85
starting the TNFα blockade therapy infliximab identified an eight-gene
expression profile that was able to predict the patient response to the treatment
as either a responder or non-responder [331]. This profile, which included the
genes HLA-DRB3 and TLR5, was able to predict response of an independent
validation set of RA patients with 85.7% accuracy. Another study looking at
molecular discriminators of response to the anti-TNFα therapy etanercept found
certain genes which when expressed in groups of two or three could have 89-95%
prediction accuracy [332]. Finally, a microarray analysis of PBMCs taken from
patients before the commencement of the IL-1Ra therapy anakinra identified 52
genes which were expressed as a response to treatment [333]. Seven of these
transcripts, as assessed by quantitative RT-PCR, were able to predict 15 of 18
independent responder and non-responder patients with an accuracy of 87.5%. In
conclusion, the emergence of such modelling systems could aid the clinician in
the selection of the optimal treatment strategy for RA patients and has strong
application potential within the clinical setting.
1.3.1.1.3 Gene analysis within cell subsets
The analysis of synovial biopsies and PBMCs from RA patients has been extremely
useful in identifying patterns of gene expression within the disease and the
response of patient tissues to treatment. However, it has been suggested that
some of the genetic signatures identified in such studies may be attributable to
differences in the relative abundance of individual cell populations within the
sample. In addition cell-specific changes may be missed when analysing a mixed
population of cells. Consequently, several groups set out to investigate the
genetic signatures of individual cell populations within RA patients.
Fibroblast-like synoviocytes (FLS) are considered to play a major role in joint
destruction in RA and also contribute to leukocyte migration into the joint. One
of the first gene expression profiles of RA FLS revealed the over-expression of
genes responsible for tumour like growth of rheumatoid synovium [334]. This
study used a cDNA array containing 588 cDNA-fragments of known cancer related
genes to compare the gene expression of FLS from five RA patients and five
traumatic control patients and found the increased expression of such cancer-
related genes in the RA FLS. An additional study analysing the genetic expression
of 19 RA FLS samples correlated the genetic data to that of paired synovial
tissue samples and found that the heterogeneity at the synovial tissue level was

86
associated with a specific FLS phenotype [335]. The high inflammation tissues
were associated with an FLS subtype that exhibits similarity with a fibroblast cell
called myofibroblasts. The myofibroblast cells are specialised cells that have a
key role in connective tissue remodelling and cell infiltration. Addition studies in
oncology have demonstrated that these cells play a crucial role in angiogenesis
through the production of growth factors and extracellular matrix proteins.
Therefore these myofibroblast-like FLS in RA synovium are thought to contribute
to the tissue destruction and angiogenesis which is often seen in this disease.
Szodoray and colleagues used a genome scale microarray to identify
differentially regulated genes in peripheral blood B cells from eight RA patients
with early disease compared to eight healthy controls [336]. They discovered
that 305 genes were overexpressed in RA B cells and 231 genes were
underexpressed compared to controls. Clusters of functionally associated
networks were analysed and five biological classes were defined: autoimmunity;
cytokines; cell activation and apoptosis; neuro-immune regulation and
angiogenesis. A microarray analysis has also been performed on isolated CD4+ T
cells, the study by Li et al analysed the microRNA (miRNA) profile of CD4+ T cells
isolated from the synovial fluid of RA patients compared to CD4+ T cells isolated
from healthy controls [337]. Analysis of the results demonstrated that miR-146a
was upregulated in SF CD4+ T cells whilst miR-363 and miR-498 were
downregulated. Subsequent studies indicated that miR-146a overexpression
suppressed T cell apoptosis since one of the genes it regulated was Fas
associated factor 1 (FAF1) and therefore the upregulation of this miR could
promote the long-term survival of the pathogenic T cells.
There is also one microarray gene expression study that has been performed
specifically on monocytes from RA patients, Stuhlmüller et al compared
monocytes from the first leukapheresis pool (activated cells) and third
leukapheresis pool (nonactivated cells) of 26 RA patients undergoing
leukapheresis treatment to identify known and novel genes in the activated
monocytes [338]. This analysis identified 482 differentially expressed genes
between the first and third pools, the activated monocytes were found to
express inflammatory genes such as IL-1β, IL-6 and TNFα whilst the nonactivated
monocytes expressed differentiation and transcription genes such as PU.1.

87
Despite the enormous advances in the field of transcriptomics and microarray
analyses there appears to be very few studies investigating the genetic signature
of individual cell types within arthritis which could be masked in a full scale
microarray of whole blood or synovium. Since individual cell types are known to
play diverse roles in the pathogenesis of arthritis understanding the genetic
signal of the different activated cell types may aid in unravelling the causes and
different treatment mechanisms of this disease.
1.3.1.2 Psoriatic arthritis
In comparison to the vast amount of microarray analysis that has been
performed on RA patients there has been a paucity of research into the genetic
signature of PsA. In addition, there has been a great deal of progress into
identifying the genetic phenotype of psoriasis but very few studies analysing the
arthritis that will often accompany or follow this condition have been
performed. One of the few microarray studies analysing PsA took place in 2002,
Gu and colleagues investigated the genetic profiles of PBMCs from RA patients
(n=6), spondyloarthropathy (SpA) patients (n=7) and PsA patients (n=6) compared
to healthy controls (n=7). They established an upregulation of several genes in
the three types of arthritis in comparison to healthy controls including those
coding for chemokine receptors (CCR1 and CXCR4), cytokines (IL-1β) and the
signalling molecules JAK3 and MAP kinase p38 [339]. They also found an
upregluation of the chemokine receptor CXCR4 in the three arthritis groups, the
ligand for CXCR4 is SDF-1 and levels of this chemokine were detected in the SF
of the SpA and RA patients. Since SDF-1 is a chemokine for lymphocytes and
monocytes it was suggested to be potentially important pro-inflammatory
mediator within the pathogenesis of RA, SpA and PsA.
Despite the interesting observations of the above study, due to the method by
which they grouped the microarray results together for all three different
arthritis subsets it proved difficult to discriminate the specific gene profile of
the PsA patients. However, two subsequent studies used microarray technology
to compare the PBMCs of PsA patients to those of healthy controls. The first
study performed by Batliwalla and colleagues analysed the gene expression
signature of peripheral blood cells from 19 PsA patients compared to that of age
and sex matched healthy donors [340]. They found that 257 genes were

88
expressed at a lower level in PsA patients and 56 genes were expressed at a
higher level in comparison to controls. The genes that were downregulated in
the PsA patients were found to be involved in the suppression of innate and
acquired immune mechanisms suggesting that these cells favoured a pro-
inflammatory response. Pro-inflammatory genes such as S100A8 and S100A12
demonstrated increased expression in the PsA samples. In addition, using a
dataset of RA samples for comparison it was found that the combination of two
genes MAP3K3 and CACNA1S could correctly classify the RA patients and PsA
patients. Therefore this gene expression profiling was able to differentiate PsA
from control subjects and PsA from RA patients indicating that PsA has a
distinctive blood cell gene expression pattern. Stoeckman et al also performed a
similar microarray analysis comparing the PBMCs of PsA patients to those of age
and sex matched healthy controls and discovered that 310 genes were
differentially expressed with the majority being upregulated in PsA [341]. It was
also found that this differential gene expression profile did not overlap with
those of RA or SLE patients and that individual genes, such as ZNF395, had high
discriminatory potential for disease diagnosis indicating that PsA patients had a
unique gene expression profile which could reveal novel disease markers.
At present these three microarray analyses are the only studies to be performed
investigating the gene expression pattern of PsA. There have been no studies
into the gene expression of synovial tissue or individual cell subsets and the
effect of different drug therapies on the genetic signatures of diseased cells,
which has been very informative in the field of RA, have not been performed. As
a result very little is known about the transcriptomics of PsA and therefore more
investigation is required in this field in order to gain more information into the
pathogenesis of this disease and to aid clinicians in deciding the optimal therapy
for the patients.
See Table 1.8 for a summary of the gene expression studies performed in RA and
PsA.

89
Table 1.8 Genomic studies in RA and PsA
Disease Tissue Number of Approx number Comparison Results Ref. samples of genes on array RA Synovium 21 RA and 9 OA 11,500 and 18,000 Within RA and versus Evidence for the existence of [318, 319] OA multiple pathways for tissue destruction RA Synovium 5 RA and 10 OA 5,760 RA versus OA Differentially expressed genes [320] between RA and OA RA Synovium 12 early and 4 late 23,040 Early versus longstanding Early RA fell into two groups [321] RA dependent on the expression of genes critical for proliferate inflammation RA Synovium 4 early untreated, 10,000 Early RA versus LS RA, Early and LS RA have separate [322] 4 treated early RA versus healthy, molecular signatures with distinct longstanding, 7 LS RA versus healthy biological processes participating controls during the course of disease RA Synovium 13 RA. 7 biopsies 46,000 Biopsies from the same There is a substantial level of [323] obtained by patient compared, heterogeneity between pairs of orthopaedic sampling, orthopaedic versus patient samples. Orthopaedic 6 by arthroscopy arthroscopy biopsies are unsuitable for gene
expression analysis
RA Synovium 62 patients before 17,927 Treatment responders No difference between responders [324] infliximab treatment versus non-responders and non-responders was detected therefore
synovial biopsy samples may not be appropriate to identify non-responders to infliximab treatment

Chapter 1 90
Table 1.8 continued
RA PBMCs 8 RF+, 6 RF-, 7 10,000 RF+ versus RF- and No differentially expressed genes [325] healthy controls versus healthy control between RF+ and RF- patients. Increased expression of
immunoinflammatory response genes in RA RA PBMCs 29 RA and 21 12,626 RA versus HC Monocyte associated gene [326] healthy controls signature increased in RA RA PBMCs 9 RA and 13 6937 RA versus HC Diverse functional subsets of [327] healthy controls genes were differentially expressed between RA and HC samples. Ten genes with increased expression in
RA PBMCs mapped to RA susceptibility locus 6p21.3
RA PBMCs 23 RA 4500 Comparison between Different numbers of genes were [328] patients according to exclusively associated with each anti-CCP level, DAS-28, disease variable HLA-shared epitope presence and treatment type RA Whole blood 35 RA and 12 18,000 within RA and versus HC Assignment of a type I IFN [329] healthy controls signature in a subpopulation of patients RA PBMCs 18 RA and 15 48,701 RA versus HC Elevated expression of genes [330] healthy controls associated with immunity and defense in RA patients

Chapter 1 91
Table 1.8 continued
RA Whole blood 44 RA before 47,000 treatment responders An 8-gene expression profile [331] infliximab treatment versus non-responders was able to predict treatment response
RA PBMCs 19 RA 18,500 Before versus 72 hours Gene pairs and triplets predictive [332] after etanercept for response to treatment at an early stage of treatment RA PBMCs 32 RA before 12,000 treatment responders A 52-gene expression profile [333] anakinra treatment versus non-responders was demonstrated to predict treatment response RA FLS 5 RA and 5 HC 588 RA versus HC Increased expression of genes [334] responsible for tumour-like growth in RA FLS RA FLS 19 RA 18,000 Within RA The heterogeneity between [335] synovial tissue is reflected in the FLS RA B cells 8 RA and 8 HC 21,329 RA versus HC B cell biology in RA is disregulated [336] due to the differential expression of multiple biological pathways RA CD4 T cells 2 RA and 1 HC 47,000 RA SF versus RA CD4+ cells overexpress [337] HC PB CD4+ cells micro-RNA‘s which help promote the long term survival of the T cells RA Monocytes 29 RA 482 Monocytes from first Activated monocytes from first [338] leukapheresis compared leukapheresis pool had and increased to monocytes from third expression of pro-inflammatory genes leukapheresis pool

Chapter 1 92
Table 1.8 continued
PsA PBMCs 6 RA, 7 SpA, 588 Three forms of arthritis The three forms of arthritis similarly [339] 6 PsA, 7 HC versus HC upregulate pro-inflammatory molecules in comparsion to HC
PsA PBCs 19 PsA, 19 HC 22,215 PsA versus healthy Downregulated genes in PsA [340] compared to HC consisted of genes
associated with suppression of immune mechanisms PsA PBMCs 16 PsA, 15 HC 54,000 PsA versus healthy PsA genetic profiles showed no [341] overlap with RA or SLE profiles and were distinct from control profiles

93
Chapter 2 Materials and Methods

94
2.1 Patients and controls
RA and PsA patients who fulfilled the American College of Rheumatology criteria
for RA [6] or met diagnostic criteria for PsA [8] were identified from the
Rheumatology Clinics in Glasgow Royal Infirmary (GRI) and Glasgow Gartnavel
Hospital (GGH) and were invited to take part in the study. All patients and
healthy donors gave informed consent and the study protocol was approved by
the Ethical Committee, Glasgow Royal Infirmary, Scotland.
2.2 Cell Culture
2.2.1 Primary Human Cell Culture
All tissue culture work was performed in laminar flow hoods and all cells were
cultured at 37oC, 5% CO2 in RPMI-1640 medium (Invitrogen) containing L-
glutamine (2 mM), penicillin (100 IU/ml), streptomycin (100 μg/ml) and 10%
foetal calf serum (complete medium).
2.2.2 Purification of mononuclear cells from buffy coats and peripheral blood
Peripheral blood mononuclear cells (PBMC) were purified by standard density
gradient centrifugation. Briefly, blood was obtained from either single donor
plateletpheresis residues donated by Gartnavel blood bank or from healthy
donors. The blood was then diluted 1:1 in phosphate buffered saline (PBS)
(Invitrogen) and 10 mls were overlaid on 4 mls Histopaque®-1077 (Sigma) in 15
ml centrifuge tubes. Tubes were centrifuged at 350 g for 20 minutes at room
temperature. The mononuclear cells were then harvested from each tube and
washed three times at 200 g for 5 minutes in ice cold PBS containing 2 mM
ethylene diamine tetra-acetic acid (EDTA) and 0.5% human serum albumin, (PEA)
before cell purification.
2.2.3 Purification of mononuclear cells from synovial fluid
Before the mononuclear cells were isolated from patient synovial fluid (SF) the
fluid was centrifuged for at 350 g for 20 minutes in order to pellet the cells. The
cell free synovial fluid was collected and stored at -700C. The pellet of cells
from the synovial fluid was resuspended in PEA before being overlaid on 4 mls
Histopaque®-1077 and centrifuged at 350 g for 20 minutes. The mononuclear

95
cells were then harvested and washed three times in PEA before cell
purification.
2.2.4 Isolation of CD3+ T cells and CD14+ monocytes
CD3+ T cells and CD14+ monocytes were purified by positive selection from
mononuclear cell suspension by autoMACS, according to the manufacturer‘s
instructions. Briefly, mononuclear cells were incubated in 90 μl/107 cells PBS/2
mM EDTA/0.5% human serum albumin (PEA) containing 10 μl/107 cells anti-CD3-
conjugated magnetic microbeads (Miltenyi Biotec), or 10 μl/107 cells anti-CD14-
conjugated magnetic microbeads (Miltenyi Biotec) for 15 minutes at 4oC. After
washing in ice cold PEA by centrifugation at 200 g for 5 minutes CD3+ T cells or
CD14+ monocytes were isolated by positive selection using the possel programme
on the autoMACS machine. The positive cell fraction was put through the
machine twice on possel programme to ensure a higher purity. Purity was
assessed by flow cytometry and routinely >95%.
2.2.5 CD3+ T cell and CD14+ monocyte stimulation
CD3+ T cells were purified by positive selection from peripheral blood and
activated for 6 days in complete medium containing IL-2 (25 ng/ml), IL-6 (100
ng/ml) and TNF-α (25 ng/ml) (all from Biosource), in order to produce an
activated phenotype similar to that displayed in the synovium [309]. CD14+ cells
were purified by positive selection from the same peripheral blood and cultured
in 96, 24 or 12 well plates depending on the experiment at 5x10⁵ cells/ml in
complete medium supplemented with 50 ng/ml M-CSF (Biosource). These cells
were then incubated for 6 days at 370C.
2.2.6 T cell / macrophage cell contact
After 6 days in culture the cytokine activated T cells (Tcks) were washed three
times in PEA and either fixed in PBS/2% paraformaldehyde on ice for 2 hours, or
not (as indicated), and added back to the macrophage culture at a ratio of 4:1.
This culture was incubated at 370C for between 1 to 24 hours depending on the
experiment.

96
2.3 Flow cytometry
2.3.1 Assessment of cell purity
All samples which were isolated on the autoMACS were analysed for purity by
Flow cytometry. After positive selection cells were washed in PEA and
resuspended at a concentration of 1 x 10⁶ cells/ml. 100 μl of cells was added to
two clean FACS tubes, one for the isotype control and one for the antibody
staining. For purity checks the following antibodies were used (all from BD
biosciences):
Tube 1. Isotype IgG FITC, IgG APC
Tube 2. CD14 FITC, CD3 APC
5 μl of each antibody was added to the tube and the cells were incubated at
room temperature for 15 minutes in the dark. The cells were then washed with
PEA and the supernatant discarded. If the cells were to be analysed immediately
they were resuspended in 200 μl PEA or if they were to be analysed the following
day they were resuspended in 200 μl FACS FIX (2% paraformaldehyde in PBS). The
cells were analysed on a FACS Calibur (BD Biosciences) using Cell Quest
software™. When assessing the purity of the samples, an analysis gate was set to
ensure that within the isotype control sample <2.5% of the cells were positive
for FITC or APC staining.
2.3.2 Semaphorin 6D staining
Surface and intracellular semaphorin 6D staining was assessed on Tck cells and
CD3/CD28 activated cells after 0, 3 and 6 days of activation.
T cells were obtained from donor blood packs as described in 2.2.4 and half of
the T cells were stimulated with IL-2, IL-6 and TNF-α as described in 2.2.5 for 3
and 6 days to produce Tcks. The remainder of the T cells were stimulated with T
cell activation expansion kit cytostim beads (Miltenyi Biotec) according to the
protocol. Briefly, the MACSibead particles were loaded by pipetting 100 μl each
of CD2-biotin, CD3-biotin and CD28-Biotin into a 1.5 ml eppindorf and mixing.
500 μl of Anti-biotin MACSibead particles (1 x 10⁸ Anti-biotin MACSibead
Particles) were added to the antibody mix with 200 μl of PEA and the mixture

97
was incubated for 2 hours at 40C under constant, gentle rotation. Once the Anti-
Biotin MACSibead particles were loaded they were stored at 40C until required.
To activate the T cells with the Anti-Biotin MACSibead particles 25 μl of beads
per 5 x 10⁶ T cells were resuspended in 100 μl complete culture medium and
centrifuged at 300 g for 5 minutes after which time the beads were resuspended
in 100 μl complete medium. The T cells were resuspended at a density of 5 x 10⁶
cells per 900 μl of complete medium and the 100 μl of beads were added. The
cells were cultured in 24 well plates at a concentration of 2.5 x 10⁶ cells per
well for 3 and 6 days. In order to remove the beads before the FACS staining
commenced the T cells were extracted from the plate and washed before being
resuspended in PEA and vortexed thoroughly. The cells were then placed in an
easystep magnet (Stemcell) for 2 minutes and the supernatant containing the
activated T cells was removed and the process was repeated again. Once all the
beads had been removed from the cells they were washed twice in PEA buffer
and stained for semaphorin 6D.
The following protocol for intracellular and surface staining of semaphorin 6D
was used to stain unactivated T cells at day 0 and the Tcks and CD3/CD28 Anti-
biotin MACSibead after 3 and 6 days of activation.
2.3.2.1 Surface staining Semaphorin 6D
T cells were washed and approximately 1 x 10⁶ cells were put into each FACS
tube. 10 μl of Fc block (Miltenyi Biotec) was added to each tube and the cells
incubated for 5 minutes at 40C. The cells were washed in PEA at 200 g for 5
minutes and 5 μg of semaphorin 6D antibody (MAB2095, R&D) or 5 μg of
irrelevant antibody (CD68 mouse anti human DAKO) was added to the tubes
before being incubated for 20 minutes at 40C. The cells were washed in PEA and
6 μl of goat F(ab‘)2 anti-mouse IgG APC secondary antibody (F0101B, R&D) was
added to the cells for 10 minutes at 40C before being washed again. CD4 FITC or
isotype FITC (BD bioscences) was added to the relevant FACS tubes for 15
minutes at 40C and the cells were washed a final time before being resuspended
in 300 μl PEA and analysed on the FACS Calibur.
2.3.2.2 Intracellular staining of semaphorin 6D
T cells were washed and approximately 1 x 10⁶ cells were put into each FACS
tube. 10 μl of Fc block (Miltenyi Biotec) was added to each tube and the cells

98
incubated for 5 minutes at 40C. The cells were washed in PEA at 200 g and 100 μl
of cytoperm (BD biosciences) was added for 20 minutes at 40C, after this time 50
μl of permwash (BD Biosciences) was added to the cells which were then spun at
200 g for 5 minutes. The cells were then resuspended in 100 μl of 2% goat
serum/perm wash and incubated at 40C for 20 minutes; 5 μg of semaphorin 6D,
CD68 or mouse IgG1 was added directly to the cells in 2% goat serum/perm wash
and incubated at 40C for 20 minutes. After this time 500 μl of permwash was
added to the cells which were then spun at 200 g for 5 minutes. The cells were
resuspended in 100 μl of permwash and 5 μl of goat anti-mouse APC (Invitrogen)
was added before the cells were incubated at 40C for 10 minutes. For the final
step the cells were washed in permwash and resuspended in 200 μl permwash
before being analysed on the FACS Calibur.
2.4 Enzyme-linked-immunosorbent assay (ELISA)
ELISA was used to measure concentration of human IL-6 and TNFα in cell culture
supernatants. The concentrations of antibodies and buffers used for each ELISA
are shown in Table 2.1.
96 well plates (Thermo Labsystems) were coated with detection antibody in PBS
and incubated overnight at 40C. The plates were then washed with 0.05%
PBS/Tween followed by the addition of blocking buffer (0.5% BSA/PBS) to block
non-specific binding and incubated at 370C for 1 hour. An eight point standard
curve was made using recombinant human cytokine dissolved in complete media
at a top standard of 2000 pg/ml and serially diluted 1:2. 100 μl of each standard
was added in duplicate to the plate along with two wells containing only
complete media. Samples were then diluted 1:2-4 with complete media (donor
dependant) and 100 μl transferred to each well. The plates were covered and
incubated for 2 hours at room temperature. The plates were washed several
times in 0.05% PBS/Tween followed by addition of secondary antibody and
incubated at 370C for 1 hour. After incubation the plates were washed and 100 μl
TMB chromagen (Biosource) was added to each well. The reaction was stopped
by addition of 100 μl stop solution (Biosource) and the intensity of the signal was
read at 450 nm on a microplate reader (Dynex Technology).

99
Cytokine Concentration
of primary antibody
Concentration of secondary antibody
Streptavidin HRP dilution
Kit supplier
TNFα
IL-6
2 μg/ml (100
μl/well)
2 μg/ml (100
μl/well)
1.5 μg/ml
(100 μl/well)
1.5 μg/ml
(100 μl/well)
1:1250
1:1250
Invitrogen
Invitrogen
Table 2.1 Cytokine analysis by ELISA
2.5 Microarray
2.5.1 Collecting and preparing samples for microarray
All CD14+ blood and synovial fluid samples were collected by density gradient
centrifugation and magnetic bead positive selection as described in 2.2.2 and
2.2.3. An aliquot of each sample was taken to check for cell purity and the
sample was lysed in trizol (Invitrogen) (2x10⁶ cells/ml trizol) and stored at -700C.
2.5.2 Isolating cells using the FACS ARIA
For the cell contact activated macrophages the following protocol was used.
Cytokine activated T cells (Tcks) were washed three times in PEA, CFSE
(Invitrogen) dye was made up in Hank‘s buffered salt solution (HBSS) media
(Invitrogen) at a concentration of 10 μM and 1 ml was added to the Tcks before
incubating for 10 minutes at 370C. Tcks were washed three times in PEA and
then fixed in PBS/2% paraformaldehyde on ice for two hours. After washing
three times in PEA the fixed CFSE stained Tcks were added to macrophages in a
24 well plate at a 4:1 ratio and left in cell contact for 2 hours. Following the 2
hour cell contact the supernatant was collected and retained for cytokine
analysis by ELISA and 0.5 ml cell dissociation solution (Sigma) was added to each
well. The plate was incubated for 15 minutes at 370C to remove the adherent
macrophage cells. Any remaining cells that were seen to be still adhering to the
plate on inspection under a brightfield microscope were incubated with
additional cell dissociation solution. All of the cell suspensions were washed in

100
PEA and pooled together for isolating on the FACS ARIA. The two cell fractions of
macrophages and fixed CFSE stained Tcks were separated on the basis of FITC
positive and FITC negative therefore all the FITC negative cells were believed to
be macrophages. Cells were counted as they were being separated on the FACS
ARIA and cell fractions were lysed in Trizol (2 x 10⁶ cells/ml Trizol) and stored at
-700C.
A small aliquot of each cell fraction was taken for cytospins to ensure we had
collected the correct cell type in each fraction.
2.5.2.1 Cytospins
An aliquot of cells isolated from the FACS ARIA were resuspended at a
concentration of 0.5 x 10⁶ cell/ml in PEA. Glass slides were labelled and placed
into the metal holders with a piece of filter paper and a cuvette, 200 μl of the
cell suspension was loaded into the cuvette and the cells were spun at 350 rpm
for 6 minutes. The slides were then removed and the cuvette was carefully
detached to avoid damaging the smear of cells. The cells were immediately
stained with RAPI-DIFF reagents (Ready reagents). The slides were placed in a
Coplin jar containing solution A for 15 seconds and then placed in a Coplin jar
containing solution B for 15 seconds finally the slides were washed twice in
Phosphate buffer pH 6.8 for 10 seconds and then left to dry before being imaged
on a light microscope.
2.5.3 Manual RNA Isolation from Trizol
The cells isolated from the cell contact experiments and patient samples were
stored in Trizol and transferred to GlaxoSmithKline (GSK) in Stevenage for mRNA
extraction. QIAgen mini columns were used for the RNA clean-up with an
incorporated on column DNAse step. Briefly, 200 μl of chloroform was added to
each epindorff of cells containing 1 ml of Trizol and centrifuged at 12,000 g for 3
minutes. The aqueous supernatant was removed to a clean epindorff and an
equal volume of 70% ethanol added. This solution was applied to a QIAgen
RNeasy mini-column and the protocol supplied with the QIAgen kit was followed
to extract the RNA. Briefly, the RNeasy column was centrifuged at 13,000 g for
30 seconds at room temperature and the flow through discarded. The sample
was then washed by adding 700 µl of solution RWT and the column was spun at

101
13,000 g for 1 minute at room temperature and the flow through was discarded.
A DNase-1 stock solution (Qiagen) was prepared in 550 µl RNase-free water and
10 µl of this solution was added to 70 µl buffer RDD. 80 µl of DNase-1/RDD buffer
was pipetted onto each column and incubated at room temperature for 15
minutes. Following this step 500 µl of buffer RW1 was added to each column
which was subsequently spun at 12,000 g for 1 minute. The sample was then
washed twice by adding 500 µl of solution RPE and spinning the column at 13,000
g for 1 minute. The column was then transferred to an RNase-free microfuge
tube and 35 µl of RNase-free water was added to the column making sure the
liquid was centred on the membrane. The sample was allowed to stand for 1
minute to allow the RNA to dissolve into the water and the microfige tube was
spun for 1 minute at 13,000 g. The RNA sample was then re-pipetted onto the
column membrane and allowed to stand for 1 minute in order to increase RNA
yield before being centrifuged at 13,000 g for 1 minute. All RNA samples were
subsequently stored at -70ºC.
The concentration of each RNA sample was measured on a nanodrop
spectrophotometer and the quality of the RNA was analysed on an Agilent 2100
bioanlyser using the agilent RNA 6000 pico kit (Agilent Technologies). When using
the Agilent bioanalyser the sample RNA was diluted to 5 ng/ml in deionised
water before being put on the pico chip for analysis.
RNA was then diluted to 10 ng/μl using water on a Beckman Coulter Biomek FX
machine. 5 μl of this RNA was transferred to a 96 well cone plate (Greiner) for
amplification.
2.5.4 Single strand cDNA amplification
Single strand amplification was performed using NuGEN RNA amplification
system V2.
2.5.4.1 First strand cDNA synthesis
For the primer annealing stage 2.5 μl of A1 primer was added to each 5 μl RNA
sample and the 96 well plate was placed in a thermal cycler for 5 minutes at 65
ºC. After this time the samples were removed and snapcooled by placing them
on ice.

102
The first strand master mix was prepared as follows (volumes listed are for a
single sample)
First strand buffer mix 12 μl First strand enzyme mix 1 μl Total Volume 13 μl
13 μl of the first stand master mix was added to each sample and the samples
placed in a thermal cycler programmed to run as follows:
Incubate at 48ºC for 60 minutes
Heat at 70ºC for 15 minutes
Cool to 4ºC
Once the temperature had reached 4ºC the plate was removed from the thermal
cycler and spun in a centrifuge to collect condensation before being placed on
ice.
2.5.4.2 Second strand cDNA synthesis
The second strand mastermix was prepared as follows (volumes listed are for a
single sample)
Second strand buffer mix (B1) 18 μl Second strand enzyme mix (B2) 2 μl Total Volume 20 μl
A multichannel pipette was used to add 20 μl of second strand master mix to
each well containing the first strand reaction mixture in the 96 well plate. The
plate was briefly centrifuged for 2 seconds to remove air bubbles before being
placed in a pre-warmed thermal cycler set to the following programme:
Incubate at 37ºC for 30 minutes
Continue heating at 75ºC for 15 minutes

103
Cool to 4ºC
Once the programme had completed the plate was removed from the thermal
cycler and spun briefly before being placed on ice.
2.5.5 SPIA™ amplification
The SPIA mastermix was prepared as follows (volumes are listed for a single
sample):
SPIA buffer mix (C2) 72 μl SPIA primer mix (C1) 2 μl Water 4 μl SPIA enzyme mix (C3) 40 μl Total Volume 118 μl
A multichannel pipette was used to add 118 μl of the SPIA mastermix to each
well of the 96 well plate containing the second strand reaction mixture. The
plate was briefly centrifuged before being placed in a thermal cycler
programmed to incubate the samples at 48ºC for 30 minutes. After this time a
further 6 μl of SPIA primer mix (C1) was added to each well of the 96 well plate
containing the SPIA reaction mixture. The 96 well plate was centrifuged for 2
seconds and placed back into the thermal cycler to run on the following
programme:
Incubate 48ºC for 30 minutes
Continue heating at 95ºC for 5 minutes
Cool to 4ºC
The plate was removed from the thermal cycler and centrifuged for 2 seconds
before being placed on ice.

104
2.5.6 Purification of amplified cDNA
Purification of the amplified cDNA is required if it is intended for fragmentation,
labelling and GeneChip array analysis. All amplified cDNA was purified according
to the Agencourt RNAClean magnetic beads protocol.
The magnetic beads were resuspended by gently agitating the RNAClean bottle
before being dispensed into a clean reagent reservoir. 288 μl of beads were
added to one matrix tube per sample. The amplified cDNA sample (160 μl) was
then pipetted into a matrix tube and incubated at room temperature for 10
minutes to allow the cDNA to bind to the magnetic beads.
A round bottomed 96 well plate was placed onto the plate magnet and for each
sample half of the bead/cDNA mixture (220 μl) was added into each well and
incubated for 10 minutes at room temperature. After this time the supernatant
was carefully removed and discarded using a multichannel pipette.
The remaining 220 μl of bead/cDNA mixture was added to the same wells and
again the plate was incubated for 10 minutes at room temperature before
removing the supernatant from the wells.
Each sample was washed by dispensing 200 μl of 80% ethanol to each well for 30
seconds after which time the ethanol was removed and discarded. This step was
repeated ensuring that all ethanol was removed before leaving the samples to
air dry for 2 minutes.
34 μl of water was added to each sample on the plate and the plate was left
undisturbed for 5 minutes, after this time the plate was tapped gently to mix
and left for another 5 minutes. The plate was then placed onto the magnet and
incubated for 10 minutes.
The cDNA concentration of each sample was measured on a nanodrop
spectrophotometer and the quality of the cDNA was analysed on an Agilent 2100
bioanlyser using the agilent RNA 6000 pico kit. When using the Agilent
bioanalyser the sample cDNA was diluted to 5 ng/ml in deionised water before
being put on the pico chip for analysis.

105
2.5.7 Fragmenting and biotin labelling of the amplified cDNA
For fragmenting and labelling, 5 μg of cDNA in a total volume of 25 μl was used.
Fragmenting and labelling was performed using the FL-Ovation™ cDNA Biotin
Module V2 kit from Nugen.
2.5.7.1 Fragmentation
The fragmentation master mix was prepared as follows (volumes listed are for a
single sample)
FL1 5 μl FL2 2 μl Total Volume 7 μl
7 μl of master mix was added to each cDNA sample in a 96 well plate and mixed
by pipetting the sample several times. The plate was centrifuged briefly to
remove any air bubbles and then was placed into a thermal cycler set to the
following programme:
Incubate 370C for 30 minutes
Incubate 950C for 2 minutes
Cool to 40C.
The plate was centrifuged briefly and placed on ice before proceeding with the
labelling step.
2.5.7.2 Labelling
The labelling buffer mix (FL3), labelling reagent (FL4) and labelling enzyme
(FL5) were obtained from the product box stored at -200C 15 minutes prior to
completion of the fragmentation reaction to allow the products to thaw to room
temperature.
The labelling master mix was prepared as follows (volumes listed are for a single
sample):

106
FL3 15 μl FL4 1.5 μl FL5 1.5 μl Total Volume 18 μl
18 μl of master mix was added to each cDNA sample in a 96 well plate and mixed
by pipetting the sample several times. The plate was centrifuged briefly to
remove any air bubbles and was then placed into a thermal cycler set to the
following programme:
Incubate 370C for 60 minutes
Incubate 700C for 10 minutes
Cool to 40C
After completion of the programme the plate was removed from the thermal
cycler and centrifuged briefly before continuing with the hybridization step.
2.5.8 Array hybridization
Array hybridization was performed using the GeneChip Hybridization Control Kit
(Affymetrix). The biotin-labelled cDNA was hybridized onto Human genome U133
Plus 2.0 array cartridges (Affymetrix).
The Affymetrix cartridges were removed from the refrigerator one hour before
use to allow them to equilibrate to room temperature.
The hybridization cocktail was prepared as follows (volumes listed are for a
single sample):
2x hybridization buffer 110 μl Affymetrix B2 3.7 μl Affymetrix 20X controls 11 μl Invitrogen BSA 2.2 μl Invitrogen herring sperm DNA 2.2 μl DMSO 22 μl Water 19 μl Total volume 170.1 μl

107
170 μl of hybridization cocktail was added to a 96 well plate (one well per
sample) into which 50 μl of fragmented and labelled cDNA was added. After
pipetting several times to mix the sample the 96 well plate was placed in a
thermal cycler set to the following programme:
Incubate 950C for 3 minutes
Incubate 450C for 5 minutes
Cool to 40C
The plate was removed from the thermal cycler and centrifuged at 350 g for 5
minutes.
For each sample 200 μl of sample/hybridization cocktail was removed from the
96 well plate and dispensed into an Affymetrix chip. The chips were secured in a
450C hybridization oven and spun at 60 rpm for 16 hours.
2.5.9 Staining and Scanning
Genechip fluidic station 450 (Affymetrix) was used to wash and stain the probe
chips.
Wash buffers were made up the day prior to staining and scanning the chips.
Wash buffer A was prepared as follows:
20% SSPE 300 ml 10% Tween 1 ml Water 699 ml Total volume 1000 ml
150 ml of wash A was aliquoted into wash station bottles (one bottle per one
Affymetrix chip).
Wash buffer B was prepared as follows:
MES buffer 83.2 ml NaCl 5.3 ml

108
10% Tween 1 ml Water 910.5 ml Total Volume 1000 ml
150 ml of wash buffer B was aliquoted into wash station bottles (one bottle per
Affymetrix chip).
The fluidics stations were primed and for each fluidic station three bottles
containing wash A buffer, wash B buffer and water were placed in the fluidic
stations.
The staining solutions to stain the chips were prepared as follows.
Streptavidin Phycoerythrin (SAPE) solution (volumes listed are for a single
sample, 600 μl each for the first and third stain):
2x stain buffer 600 μl BSA 48 μl SAPE 12 μl Water 540 μl Total Volume 1200 μl
Antibody solution (volumes listed are for a single sample):
2x stain buffer 300 μl BSA 24 μl Goat IgG 6 μl Antibody 3.6 μl Water 266.4 μl Total Volume 600 μl
The empty vials on the fluidics station were replaced with 600 μl each of SAPE
(first and third stain) and antibody (second stain).
The Affymetrix chips were removed from the hybridization oven and the
hybridization mix was extracted from the chip. Each chip was inserted into a
fluidics station where they were washed and stained, after this time the chips
were removed and checked for air bubbles. If air bubbles were found the chips

109
were put back on the fluidic station to be re-filled with wash buffer, if no air
bubbles were found the chips were then scanned.
2.5.10 Scanning
Tough-spot (Cole-Parmer) labels were used to cover the two septa on the
affymetrix chip to prevent leakage of wash buffer. Smudges and dust were
removed from the glass front of the chip and the chips were loaded into the chip
carousel. The chips were scanned using GeneChip® Scanner 3000 and analysed
using Affymetrix GeneChip Command Console software.
2.6 PCR and SYBR green
The primer sequences used for SYBR green are shown in Table 2.2.
Table 2.2 Primer sequences used for RT-PCR
Primer name
Forward sequence
Reverse sequence
GAPDH
β-actin
Legumain
Plexin A1
Sema 3A
Sema 3F
Sema 6D
TCG ACA GTC AGC CGC ATC TTC TTT
AAT GTG GCC GAG GAC TTT GAT TGC
CGC ACA CCA ACA CCA GCC AC
AGG GAG AAC GGC TGC CTG GT
TGG GGT TGC CCA GCT CCC TT
GGA CAC AGC ATC GGC CCT CA
GCC GTT CCA CCC ATT GCC GA
ACC AAA TCC GTT GAC TCC GAC CTT
AGG ATG GCA AGG GAC TTC CTG TAA
AGG GGG ACG GGA GAA CTG GC
AGC AGG GAG CGC ACG TTG TC
TGT GCG TCT CTT TGC AGT GGG
GAC GGG TCG TTC AGC CAC CG
ACC ATG CCA GCT TCA GAG CCA
RNA isolation was performed on samples as described in 2.5.3.

110
2.6.1 cDNA preparation
cDNA was prepared from RNA samples according to AffinityScript™ multiple
temperature cDNA synthesis kit. Briefly 100-500 ng of RNA, depending on
experiment, was mixed with 3 μl random primers and RNase-free water to a
total volume of 15.7 μl. The reaction was incubated at 650C for 5 minutes before
being cooled to room temperature for 10 minutes to allow the primers to anneal
to the RNA. The following components were then added to each sample for a
total volume of 20 μl.
2.0 μl of 10x AffinityScript RT buffer
0.8 μl of dNTP mix
0.5 μl of RNase Block Ribonuclease Inhibitor (40 U/μl)
1 μl of AffinityScript Multiple Temperature Reverse Transcriptase (RT)
A minus RT (-RT) control was also set up with each set of samples along with a
water control. In the case of the -RT control 1 μl of RNase free water was added
instead of the AffinityScript Multiple Temperature RT.
The reaction was then incubated for 10 minutes at 250C to extend the primers
prior to increasing the reaction temperature to 420C for 60 minutes for cDNA
synthesis. The reaction was then terminated by incubating it at 700C for 15
minutes.
2.6.2 PCR
2.6.3 SYBR green
SYBR green was performed using SYBR green mastermix (Applied Biosystems).
Prior to setting up the SYBR green the cDNA was diluted 1 in 5 using RNase-free
water. The reaction mix was prepared as follows (volumes listed are for a single
sample):
Mastermix 10 μl Primer mix 0.8 μl Water 8 μl

111
Total volume 18.8 μl
Each sample was measured in triplicate therefore 3 lots of reaction mix were
prepared for each cDNA sample. For the triplicate samples 54.5 μl reaction mix
was mixed with 6 μl cDNA and 19.8 μl of this total mixture was added to each of
the three wells of a MicroAmp fast optical 96 well reaction plate (Applied
Biosystems). A non template control was added to the plate where 6 μl of water
was mixed with the 56.4 μl reaction mix and a minus RT was also included in the
plate using the –RT control cDNA.
Once the plate had been loaded with the cDNA samples it was covered using a
MicroAmp optical adhesive cover (Applied Biosystems) and spun at 200 g for 5
minutes. The plate was then transferred to an ABI 7900 H7 Fast-real-time PCR
machine (Applied Bioststems) where it was read on the following cycle:
Incubate 48ºC for 30 minutes
Incubate 95ºC for 10 minutes
40 cycles of 95ºC for 15 seconds followed by 60ºC for 1 minute
A dissociation curve was subsequently measures on the following cycle:
Incubate 95ºC for 15 seconds
Incubate 60ºC for 15 seconds
Incubate 95ºC for 15 seconds
Using the results of this analysis, the expression of target genes relative to the
housekeeping gene was then quantified.
2.7 Immunohistochemical methods
2.7.1 Antibodies
Table 2.3 Antibody source and concentration used for IHC

112
Antibody Manufacturer Source Working concentration
Legumain
Plexin A1
Prestige Antibodies
Cell Signalling
Rabbit
Rabbit
0.5 μg/ml
1.02 μg/ml
Table 2.3 shows the antibodies that were used for single immunohistochemical
staining for light microscopy and the concentration of the antibody used.
2.7.2 Single immunohistochemical staining
Sections containing sections of RA synovial membrane were initially heated to
650C for 35 minutes after which time they were de-waxed in xylene and
rehydrated through an ethanol gradient to water/TBS Tween (TBST). To reduce
non-specific background staining endogenous peroxidase activity was blocked
using hydrogen peroxide (H202) and methanol. Fixation of tissue specimens forms
cross-links that mask the antigenic sites, thereby giving weak or false negative
staining for immunohistochemical (IHC) detection of proteins. Antigen retrieval
using citrate buffer is designed to break the cross-links thereby unmasking the
antigens and epitopes in the tissue. Antigen retrieval was performed in 0.01 M
citrate buffer pH 6.0, the buffer was heated in a microwave for 5 minutes then
the sections were added to the buffer and were heated for 8 minutes before
being left to cool for 15 minutes. The sections were then blocked for 1 hour at
room temperature in 2.5% serum of the species in which the secondary antibody
was raised. The relevant primary antibody or isotype antibody was applied to the
sections which were left overnight at 40C.
The following day the species specific reagent from the ImmPRESS kit (Vector)
was added to the sections for 30 minutes before being washed in TBST and
developed with ImmPACT DAB (Vector) for up to 2 minutes until a brown
reaction product appeared. Sections were then washed in water and
counterstained using hematoxylin. Finally sections were dehydrated in ethanol,
cleared in xylene to remove fats and oils and then mounted in DPX (Cellpath Ltd)
before being imaged on a light microscope.

113
2.8 Western blotting
2.8.1 Whole cell lysates
CD14+ monocytes from the peripheral blood or synovial fluid of patients and
CD14+ monocytes and M-CSF matured macrophages from normal donors were
washed in PBS. Subsequently, 100 μl of M-PER (Thermo Scientific) with the
addition of 1 μl Halt Protease Inhibitor Cocktail (Thermo Scientific) was added to
the cells. The cells were solubilised for 30 minutes on ice before centrifugation
of the lysates at 16,000 g for 15 minutes. The resulting whole cell lysate
supernatants were removed from the cell debris pellet and were stored at -200C
before being used for Western blot anaylsis.
2.8.2 BCA Assay
To determine the protein concentration of the cell lysates a BCA assay (Thermo
Scientific) was performed. For each sample 2.5 μl was added to 72.5 μl of BCA
reagent in triplicate on a 96 well plate and left at room temperature for 30
minutes. A standard curve was also set up on the plate using known
concentrations (2000 µg/ml – 25 µg/ml) of the protein bovine serum albumin
(BSA). The plate was read on a plate reader at 502 nm. The amount of total
protein in each sample was determined by comparing the OD value of each
sample to a standard curve of values.
2.8.3 SDS-PAGE gel electrophoresis
5µg of protein from the whole cell lysates were incubated with the appropriate
volume of 4x NuPAGE LDS sample buffer (Invitrogen) and 10 x NuPAGE reducing
agent (Invitrogen) at 700C for 10 minutes. Samples and seeblue plus2 protein
standard (Invitrogen) were run on NuPAGE Bis-Tris gels (4-12%) (Invitrogen) with
NuPAGE MES running buffer (Invitrogen) at 100 V for 1 hour. The gel was then
transferred onto a nitrocellulose membrane using the i-blot transfer system
(Invitrogen).
2.8.4 Western blotting
Following transfer, nitrocellulose membranes were washed in TBS/Tween (0.5 M
NaCl and 20 mM Tris pH 7.0 with 0.1% (v/v) Tween-20) and blocked for 1 hour in
TBS/Tween containing 5% non-fat milk protein. Membranes were then incubated

114
with 0.2 μg/ml legumain primary antibody (R&D, AF2199) diluted in TBS/Tween
containing 5% non-fat milk protein overnight at 4ºC. Following the incubation
with the primary antibody the nitrocellulose membranes were washed (5 x
5mins) with TBS/Tween and incubated in the an anti-goat HRP-conjugated
antibody (abcam, ab6741) containing 5% non-fat milk containing protein for 1
hour at room temperature. The membranes were then washed in TBS/Tween (5
x 5 mins) and protein bands were visualised using the ECL detection system (GE
Life Sciences). Nitrocellulose membranes were incubated in a mixture of equal
volumes of ECL solution A (2.5 mM luminol, 0.4 mM p-coumaric acid and 100 mM
Tris pH 8.5) and ECL solution B (0.002% hydrogen peroxide and 100 mM Tris pH
8.5) for 1 minute before exposing the membranes to Kodak X-Ray film.
Nitrocellulose membranes were then stripped and re-probed with a β-actin
primary antibody (1/1000 dilution ab8229 Abcam). Membranes were stripped at
room temperature for 1 hour with stripping buffer (100 mM 2-mercaptoethanol,
2% SDS and 62.5 mM Tris pH 7). Nitrocellulose membranes were washed
thoroughly in PBS/Tween and checked for residual signal before re-starting the
western blotting protocol.
2.9 Legumain activity assay
To measure the activity of the enzyme legumain in our samples an activity assay
was performed. The activity of legumain was measured on its ability to cleave a
substrate Z-Ala-Ala-Asn-AMC (AnaSpec). Cleavage of this substrate releases the
AMC (7-amino-4-methylcoumarin) flurophore which can be detected at 441 nm
upon excitation at 342 nm.
2.9.1 Collecting samples for activity assay
M-CSF differentiated samples were washed in PEA prior to lysis. Patient synovial
and blood CD14+ cells were isolated by magnetic bead separation and washed in
PEA before lysis. All samples were lysed in lysis buffer containing 50 mM citrate,
0.1% CHAPS (pH 5.5), 5 mM of DTT and 0.5% Triton-X 100 [342]. Cell lysates were
collected and frozen at -700C.
2.9.2 Setting up activity assay
Human recombinant legumain (rhLGM) (R&D, 2199-CY-010) was used as a
positive control and is supplied as the pro form of the enzyme. To activate the

115
rhLGM it was diluted to 100 μg/ml in activation buffer containing 50 mM sodium
acetate and 100 mM NaCl, pH 4.0 and incubated for 2 hours at 370C. After this
time the rhLGM was diluted to 1 ng/μl in assay buffer containing 20 mM citric
acid, 60 mM Na2HPO4, 0.1% CHAPS (pH 5.5), 1 mM EDTA, and 1 mM DTT. 50 μl of
the rhLGM was loaded into a well of a black welled 96 well plate.
Cell lysate samples were freeze thawed three times before being centrifuged at
10,000 g for 5 minutes, 50 μl of each sample was loaded into a black welled 96
well plate.
The substrate Z-Ala-Ala-Asn-AMC was diluted to 200 μM in assay buffer and the
reaction was started by adding 50 μl of substrate to all wells containing sample
and rhLGM. A blank well containing 50 μl assay buffer and 50 μl substrate was
also put on the plate.
The plate was read on a fluorescent plate reader programmed to take readings
at times 0, 5, 10, 15, 20, 25, 30, 60, 90, 120, 150, 180, 210 minutes, the plate
was incubated at 370C for the duration of the readings.
2.10 siRNA
N-TER Nanoparticle siRNA transfection system (Sigma) was used to knockdown
the plexin A1 gene in M-CSF derived macrophages using 4 Flexitube plexin A1
siRNA‘s (Qiagen). To check the transfection system was working in the
macrophage cells an Allstars negative control with an Alexa Fluro 555
modification (Qiagen) was used to visualise the cells after transfection. If the
nanoparticle transfection system had worked and the siRNA negative control had
entered the cells then the cells were seen to be fluorescing orange by light
microscope or by FACS analysis. The Allstars negative control siRNA is a
nonsilencing siRNA which has no known homology to any known mammalian
gene; therefore it is used to check whether the transfection of the cells has any
effect on the expression of the gene being investigated.
To set up the siRNA transfection the target (plexin A1) and negative control
(Allstars negative control) siRNA were prepared as follows:
5 μM target/control siRNA 13 μl

116
siRNA dilution buffer 37 μl Total volume 50 μl
The N-TER peptide was then prepared as follows (volumes listed are for each
siRNA being tested)
N-TER peptide 8 μl Water 42 μl Total Volume 50 μl
The 50 μl of N-TER peptide was added to each 50 μl siRNA preparation and
incubated at room temperature for 20 minutes; the concentration of siRNA at
this point was 650 nM.
To transfect the M-CSF differentiated macrophages the siRNA was diluted to a
concentration of 5 – 30 nM in complete medium depending on the experiment.
The culture medium was then removed from the macrophages and 500 μl of
diluted siRNA was added to macrophages. The cells were incubated for 24 hours
at 370C and after this duration the supernatants were collected for cytokine
analysis and the cells were put in 0.5 ml trizol. Alternatively after siRNA
treatment, the macrophages were stimulated with Tcks at 4:1 ratio or were
stimulated with 10 ng/ml LPS for 24 hours at 370C. After this period of
stimulation the supernatants were collected for cytokine analysis and the cells
were put into 0.5 ml trizol.
All 4 siRNA‘s were tested individually on the macrophages for knockdown of the
plexin A1 gene, however in some experiments a mixture of 2 siRNA‘s were used
to see their combined effect. In this case when preparing the siRNA 7.5 μl of
each siRNA was added to the siRNA dilution buffer.
2.11 Real time cell imaging
Macrophages and T cells used for cell imaging were autoMACS purified as
described in section 2.2.4.

117
2.11.1 Preparing macrophages for imaging
AutoMACS purified CD14+ monocytes were cultured in 24 well plates in complete
medium supplemented with 50 ng/ml M-CSF (Biosource) for 5 days. To remove
the macrophages 0.5 ml of cell dissociation solution (Sigma) was added to each
well and the plate was placed into a 370C incubator for 10 minutes. The wells
were then washed with PEA and scraped to remove any remaining macrophages
still adhering to the wells. Macrophages were washed, counted and resuspended
in complete medium at concentrations between 2x10⁵ and 6x10⁵ depending on
the experiment and plated out on either a 2-well or 4-well chamberslide (VWR).
The macrophages were left to adhere overnight in a 370C incubator.
2.11.2 Staining macrophages for imaging
A red fluorochrome called CMTPX (Invitrogen) was used to stain the
macrophages, the dye was diluted to a concentration of 2.5 μM in HBSS media
(Invitrogen) and 1 ml was added to each chamberslide well of macrophages. The
chamberslides were placed in a 370C incubator for 20 minutes. After this time
the media was removed from each well and 1 ml of complete medium added,
the chamberslides were then incubated for a further 30 minutes in a 370C
incubator to allow any excess CMTPX dye to be secreted from the cells.
2.11.3 Staining T cells for imaging
Depending on the experiment, either T cell purified from the blood of a healthy
donor on the day of the imaging or Tcks that had been activated in a cytokine
cocktail for 6 days were used. If Tcks were to be used they were washed
thoroughly three times in PEA before being stained. The T cells/Tcks were dyed
green with 1 ml of 10 μM CFSE (Invitrogen) which had been diluted in HBSS
medium. The cells were incubated for 10 minutes at 370C, after this period the
cells were washed three times in PEA to remove any excess CFSE. Tcks were
either fixed in PBS/2% paraformaldehyde on ice for two hours, or not (as
indicated) and the cells were added to the macrophages at a ratio of 1:1 or 4:1.
2.11.4 Imaging cell contact on microscope
The T cell - macrophage cell contact was left for varying amounts of time
depending on the experiment but was usually imaged after 2 hours on a Carl

118
Zeiss Axiovert S100 inverted microscope. An automated sequence of events using
Openlab software was setup in order to record time lapse images of the cell
contact. The sequence of events consisted of an image taken in green, followed
by a brightfield image followed by a red image. This series of pictures was taken
every 12 seconds for up to 1 hour and recorded the movement of the T
cells/Tcks along with their interactions with the macrophages.
2.11.5 Analysis of real time images
Analysis of the movies produced from the time lapse images was done on
Volocity software (PerkinElmer). Two different types of analysis were carried
out measuring the number and duration of interactions and the co-localisation
coefficient of interactions.
2.12 Statistical analysis
All microarray results were background corrected by the GC-RMA algorithm and
analysed by paired T test or 1-way ANOVA unequal variance (Welsh ANOVA) using
Genespring GX 11 software. In addition for specific comparisions both DAVID and
IPA software, which use a modified version of Fisher‘s exact test, were
employed. The remaining results are displayed as mean ± standard deviation and
statistical analysis was done by students T test or 1-way ANOVA test, as
indicated in figure legends, using the GraphPad Prism 4 software. A p value of <
0.05 was considered statistically significant.

119
Chapter 3 Transcriptomic analyses of psoriatic and rheumatoid arthritis blood and synovial fluid CD14
+
cells

120
3.1 Introduction and Aims
Rheumatoid arthritis (RA) and Psoriatic arthritis (PsA) are both chronic,
autoimmune arthritides. The cause of neither disease is, at present, known with
both genetic and environmental factors thought to play a role in disease
susceptibility and progression thereafter. The synovial tissue in both RA and PsA
is characterised by marked cellular infiltration, pronounced angiogenesis and
increased cytokine and protease expression [132, 343]. Therapies used clinically
in both RA and PsA induce significant improvement in disease activity status but
many patients do not respond to existing standard of care [132], consistent with
the heterogeneous nature of the diseases: this in turn underlines the need for
further research and better therapies specifically targeted at patients who are
non-responders to current treatments.
In order to address this gap in the knowledge and understanding of RA and PsA
many genome-wide gene expression studies have been undertaken in both
diseases comparing the genetic profiles of patients to those of healthy controls
in order to acquire a genetic signature unique to each disease [325-327, 329,
330, 340, 341]. Gene expression studies have also been performed on patients
undergoing various forms of therapy to identify discriminatory genetic markers
which could predict the patient response to therapy [332]. Many of these genetic
studies have been performed on peripheral blood mononuclear cells (PBMCs) or
whole synovial tissue, which provides interesting information on the genetic
expression status of the diseased state as a whole but cellular heterogeneity
contained therein may be masking the contribution of individual cell types.
Recently a small number of RA gene expression studies have specifically
examined B cells [336], CD4+ T cells [337] and fibroblasts [334] from diseased
patients in order to obtain an understanding of how these individual cell types
are contributing to disease.
There is also one microarray gene expression study that has been performed
specifically on monocytes from RA patients, Stuhlmüller et al compared
monocytes from the first leukapheresis pool (activated cells) and third
leukapheresis pool (nonactivated cells) of 26 RA patients undergoing
leukapheresis treatment to identify known and novel genes in the activated
monocytes [338]. However, at present there are no gene expression studies
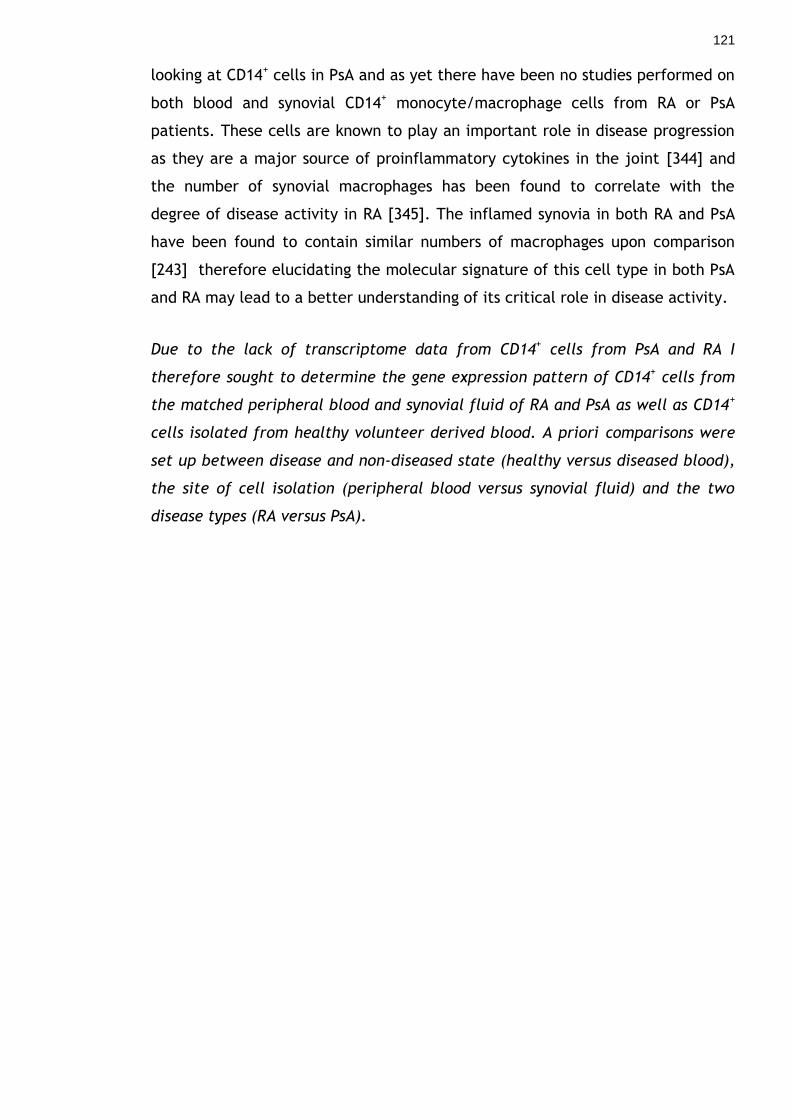
121
looking at CD14+ cells in PsA and as yet there have been no studies performed on
both blood and synovial CD14+ monocyte/macrophage cells from RA or PsA
patients. These cells are known to play an important role in disease progression
as they are a major source of proinflammatory cytokines in the joint [344] and
the number of synovial macrophages has been found to correlate with the
degree of disease activity in RA [345]. The inflamed synovia in both RA and PsA
have been found to contain similar numbers of macrophages upon comparison
[243] therefore elucidating the molecular signature of this cell type in both PsA
and RA may lead to a better understanding of its critical role in disease activity.
Due to the lack of transcriptome data from CD14+ cells from PsA and RA I
therefore sought to determine the gene expression pattern of CD14+ cells from
the matched peripheral blood and synovial fluid of RA and PsA as well as CD14+
cells isolated from healthy volunteer derived blood. A priori comparisons were
set up between disease and non-diseased state (healthy versus diseased blood),
the site of cell isolation (peripheral blood versus synovial fluid) and the two
disease types (RA versus PsA).

122
3.2 Patients and normal donors
Inflammatory arthritis patients attending Gartnavel General Hospital (GGH) or
Glasgow Royal Infirmary (GRI) fulfilled the American college of Rheumatology
criteria for RA [6], or met diagnostic criteria for PsA [346]. Information regarding
patient characteristics is shown in Table 3.1.
Age-matched normal donors were recruited from the Glasgow Biomedical
Research Centre (GBRC) building and all blood samples were taken with
informed consent.
Table 3.1 Patient characteristics
Characteristic RA patients PsA patients
Mean age (years)
Female:Male
Mean Disease duration (years)
ESR mm/hr (mean)
CRP (mean)
RF positive (%)
% of patients using DMARDS
Anti-TNF therapy (number of patients)
68
5:3
12.2
86
107
87.5
62.5
1*
51
4:4
1.8
37
115
0
37.5
1*
*Anti-TNF therapy was stopped due to patients becoming anti-TNF resistant
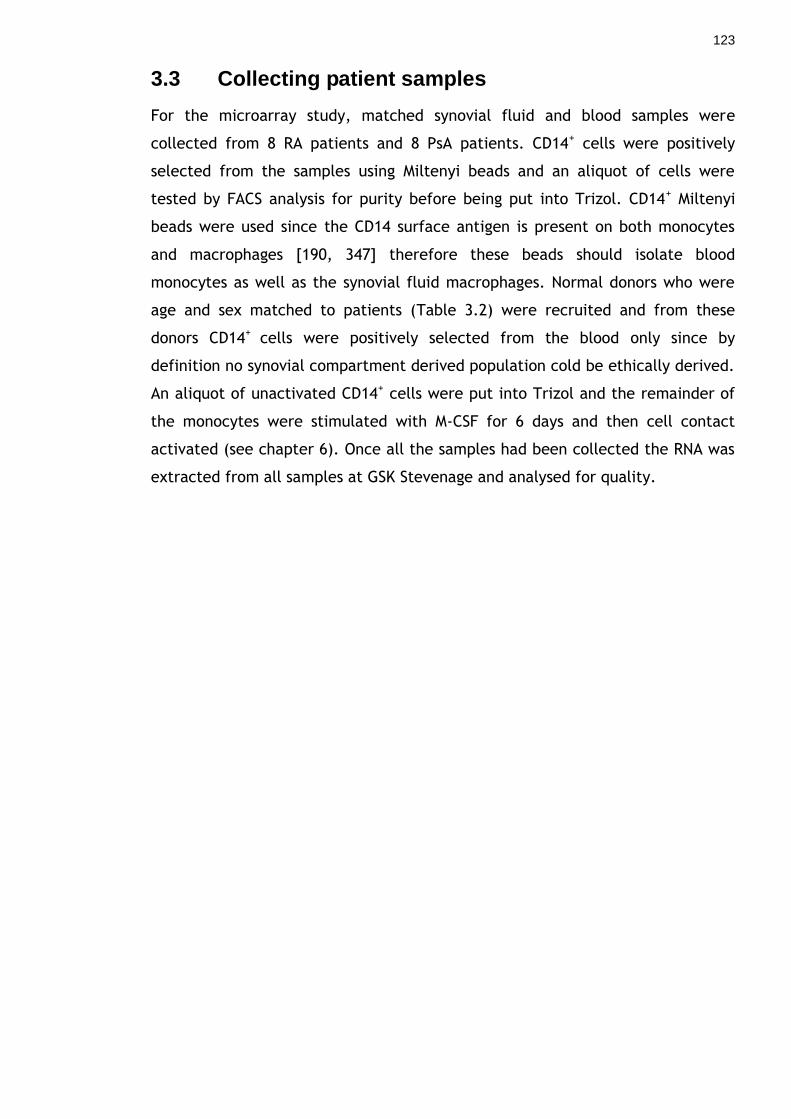
123
3.3 Collecting patient samples
For the microarray study, matched synovial fluid and blood samples were
collected from 8 RA patients and 8 PsA patients. CD14+ cells were positively
selected from the samples using Miltenyi beads and an aliquot of cells were
tested by FACS analysis for purity before being put into Trizol. CD14+ Miltenyi
beads were used since the CD14 surface antigen is present on both monocytes
and macrophages [190, 347] therefore these beads should isolate blood
monocytes as well as the synovial fluid macrophages. Normal donors who were
age and sex matched to patients (Table 3.2) were recruited and from these
donors CD14+ cells were positively selected from the blood only since by
definition no synovial compartment derived population cold be ethically derived.
An aliquot of unactivated CD14+ cells were put into Trizol and the remainder of
the monocytes were stimulated with M-CSF for 6 days and then cell contact
activated (see chapter 6). Once all the samples had been collected the RNA was
extracted from all samples at GSK Stevenage and analysed for quality.

124
Table 3.2 Patient and normal donor samples collected
Patient
Gender
Age
Age and sex
matched normal
donor
PsA 1
PsA 2
PsA 3
PsA 4
PsA 5
PsA 6
PsA 7
PsA 8
RA 1
RA 2
RA 3
RA 4
RA 5
RA 6
RA 7
RA 8
Female
Female
Male
Male
Male
Female
Male
Female
Female
Male
Female
Male
Female
Male
Female
Female
53
40
34
34
80
58
54
58
71
56
62
69
78
69
69
77
Yes
Yes
Yes
No
No
Yes
Yes
No
No
Yes
No
No
No
No
No
No

125
3.3.1 Purity of monocyte samples
The CD14+ cells isolated from each patient blood and synovial fluid sample were
analysed on a FACS Calibur to check that there were no other contaminating cell
types that would affect the transcriptomic profile obtained. Figure 3.1 shows a
purity check from one representative PsA patient (A) and one RA patient (B).
3.3.2 RNA quality of patient samples
The RNA quality of the samples was analysed on an Agilent 2100 Bioanalyser
which is a microfluidics based platform that analyses RNA qualitatively; RNA
samples and a standard (ladder) are loaded into wells on a specifically designed
chip containing a fluorescent dye. The dye molecules become incorporated into
the RNA and a voltage gradient is applied to the chip allowing the RNA to
become separated by size. By comparing the separation of the RNA to that of
the ladder, which contains components of known size, a standard curve of
migration time versus fluorescence units is plotted called an electropherogram.
Viewing the electropherogram can give an indication of the integrity of the RNA
sample.
Figure 3.2 (A) is an electropherogram showing an example of good quality RNA.
It is characterised by three clear peaks, a peak for the RNA marker (1) and a
peak for the 18 S (2) and 28 S (3) ribosomal RNA subunits. There should be a
relatively flat baseline between the two rRNA peaks and minimal low molecular
weight noise adjacent to the RNA marker peak. Figure 3.2 also shows the RNA
quality from the blood and synovial fluid CD14+ cells of a representative PsA
patient (B) and RA patient (C). All four of the samples show good quality RNA
evident by the two clear peaks and no low molecular weight noise. After
checking the RNA from each sample was of good quality, cDNA was generated
from each RNA sample before being purified, fragmented and labelled. The
labelled cDNA was then hybridised onto an Affymetrix GeneChip.

126
Figure 3.1 Purity of CD14+ cells isolated from PsA and RA patient blood and synovial fluid samples These graphs are a representative of the CD14+ cells isolated from the 8 PsA and the 8 RA patients that were analysed on the microarray
127
Figure 3.2 RNA quality of the CD14+ samples from two patients RNA was extracted and analysed for quality using an Agilent 2100 Bioanalyser. Figure (A) represents an example of good quality RNA. It is characterised by three clear peaks: a peak for the RNA marker (1) and a peak for the 18 S (2) and 28 S (3) ribosomal RNA subunits. The quality of representative PsA patient samples (B) and RA patient samples (C) are shown here and both demonstrate good quality RNA.
(C)
(B)
PsA PB mo PsA SF mo
(A)
1
2 3
RA PB mo RA SF mo

128
3.4 Summary of samples analysed on microarray
The samples that were examined using the microarray GeneChips are
summarised in Table 3.3. Eight matched PsA and RA blood and synovial fluid
samples were obtained along with 6 age and sex matched healthy controls,
unactivated blood CD14+ cells were not collected from one control but
macrophage cells before and after Tck cell contact activation were collected for
all 6 healthy controls. These latter samples will be discussed and analysed in
chapter 6.
Table 3.3 Summary of microarray samples
Monocyte/macrophage sample analysed Number of samples PsA PB CD14+ 8 PsA SF CD14+ 8 RA PB CD14+ 8 RA SF CD14+ 8 Healthy control PB CD14+ 5 Healthy control M-CSF activated Mø 6 Tck cell contact activated Mø 6

129
3.5 Analysis of microarray results
Affymetrix GeneChip microarrays are one of the most popular high-density
oligonucleotide (oligo) gene expression arrays currently available and have been
widely validated for the purposes of the present study – this was therefore our
selected methodology of choice. Each gene on an Affymetrix GeneChip is
represented by a probe set consisting of 11 pairs of 25-bp oligos covering the
transcribed region of the gene. Each probe set pair consists of a perfect match
(PM) and a mismatch (MM) oligonucleotide. The PM probe matches exactly the
sequence of the gene while the MM probe differs in a single substitution in the
central 13th base, the MM probe is designed to distinguish noise caused by non-
specific hybridisation from the actual specific hybridisation signal [348].
Affymetrix GeneChips have many sources of variation, for example non-
biological variation can arise due to: differences in sample preparation, unequal
quantities of starting RNA, differences between chips or differences in
hybridisation between chips [349], therefore pre-processing must take place to
adjust for these sources of non-biological variation.
Affymetrix microarrays are pre-processed in three steps:
Background correction – this is to adjust for hybridisation effects that are not
related to the interaction between probes and target DNA
Normalisation – this is to remove systematic errors and bias, it is necessary as it
allows multiple chips to be compared to each other and analysed together. It is
performed under the assumption that all chips have approximately the same
distribution of PM values.
Summarisation – This is performed using the 11 individual probe intensities from
a probe set, combined to yield a single value for each gene that best represents
the expression level of the sample RNA transcript.
There are many different algorithm tools that can be applied to the background
correction step of Affymetrix data pre-processing: an appropriate choice is
dependent upon the experimental design and dataset. Each phase will now be
described.

130
3.5.1 Background correction of the Affymetrix chips
At present there are several different algorithm tools that are used to
background correct Affymetrix chips such as MAS5 [350], RMA [351], GC-RMA
[352] and PLIER. Upon careful consideration it was decided to use GC-RMA,
which is a modified version of RMA, as the background correction for my
experiment design and dataset. As mentioned above each gene is represented on
the GeneChip by 11 probe pairs made up of a MM and a PM probe, the MM probe
is designed to distinguish noise and non-specific background signal from the
specific hybridisation signal. However a problem arises when using MM data
because in approximately 1/3 of probes the MM intensity levels are higher than
the PM intensity levels. This suggests that the MM probes are detecting real
signal. In these cases subtracting the MM signal from the PM signal results in a
negative signal value and the loss of interesting signal value for those probes.
Due to this problem several pre-processing algorithms were designed which only
took into account the PM values, an example of which is RMA. RMA excludes MM
data completely which reduces noise but also loses information therefore GC-
RMA was designed which takes into account non-specific hybridisation using the
signal intensity of representative MM probes possessing the same GC nucleotide
content as the PM probe of interest.
The background correction in GC-RMA consists of three sequential steps:
1. Optical background correction, this is an important step as the scanner
measuring the hybridisation strength of each GeneChip will introduce
optical noise
2. Probe intensity adjustment through non-specific binding (NSB) using the
optical noise adjusted representative MM probe intensities
3. Probe intensity adjustment through gene-specific binding where the NSB
adjusted PM intensities are corrected for the effect of PM probe affinities.
GC-RMA is currently considered to be one of the best methods for estimating
expression values of genes. A recent study comparing several pre-processing
algorithms found GC-RMA to be the algorithm of choice for detecting differential
expression of genes and also the algorithm which produced gene expression data

131
that was highly correlated to qRT-PCR validation data [353]. Hence, GC-RMA was
chosen for pre-processing the Affymetrix GeneChips data produced in the
current study.
3.5.2 Signal histogram of normalised data
Once the data normalisation had been performed and prior to formal data
analysis, all the GeneChips must be analysed to check for outliers that may
affect or skew the results interpretation. One method is to examine the signal
histogram of the normalised data which plots a line for each of the GeneChips
with the intensity of the probes contained on the chip on the x-axis and the
frequency of the probe intensity on the y-axis. This then allows the visualisation
of the distribution of the signal intensity to identify any outliers. Figure 3.3
illustrates the signal histogram of all the samples that were tested, each line
represents one GeneChip and they are coloured by condition with blue
representing the cell contact activated macrophage samples, red the M-CSF
treated macrophages, purple the healthy donor blood CD14+, green the patient
blood CD14+ and gold represents the synovial fluid CD14+ cells. It can clearly
been seen on the histogram that all the samples have a similar signal intensity
expression apart from one sample which is a GeneChip containing a cell contact
activated macrophage sample. The reasons for this outlying sample are unknown
but since it is only one sample and the signal intensities of the other samples are
relatively similar to each other it is unlikely to represent a problem with the
hybridisation, washing or staining of the chips. As a result it is most likely to be
due to a problem with the individual sample or the labelling of that particular
sample. Since this sample is an outlier and may potentially skew the data
interpretation it was removed from further data analysis.

132
Figure 3.3 Signal histogram of normalised data This graph represents the signal intensity of all the GeneChips that were analysed in this experiment. It is used to identify outliers in the samples. Each line represents one GeneChip and the lines are coloured according to the monocyte sample that was loaded onto each GeneChip. A blue line represents a cell contact activated macrophage, green is CD14
+ cells from the patients,
purple is healthy donor blood CD14+, red is M-CSF activated macrophages and gold is synovial
fluid CD14+ cells.
3.5.3 Principle component analysis
Phenotypes of diseases or experimental conditions can be classified using
Principle Components Analysis (PCA) [354]. This is an analytical method that
identifies distinct patterns in the observed transcriptomic differences of
samples. It transforms multidimensional data into a lower dimensional space
using as few variables as possible. The resultant PCA graph can be used to look
for trends in the data and also identify samples which may be outliers as samples
clustered within the same area of the PCA graph are considered to be
genetically similar.
All the samples from the microarray were analysed by PCA based on conditions
applied (Figure 3.4). Each circle on the graph represents a sample and each
colour represents a condition. Figure (A) shows the PCA plot of all samples
including the outlier sample that was identified in the signal histogram to
illustrate how different the genetic profile of that sample was compared to all
the other samples. This is visualised on the PCA plot by the one blue circle

133
representing the outlier sample being isolated on the left hand side of the graph
while all the remaining samples are clustered on the right hand side of the
graph. This graph provides further support for the removal of this one sample
from the analysis as its genetic profile and signal intensity vary widely from the
other samples.
Figure 3.4 (B) demonstrates the PCA plot of the samples once the outlier had
been removes. It can clearly been seen that SF CD14+ cells (gold circles) from
both disease types cluster tightly together indicating that CD14+ cells from RA
and PsA SF share a similar expression transcriptomic profile. This same pattern
can also been seen for the patient blood CD14+ cells (green circles); both
diseases have similar genetic profiles as indicated by the clustering of the green
circles. This cluster of patient blood samples is distinct from the synovial fluid
cluster of samples and more ‗transcriptomically similar‘ to the healthy donor
CD14+ blood cells (purple circles) due to the healthy donor CD14+ samples being
located in the same area of the PCA graph as the diseased blood CD14+ cells. The
red circles and blue circles represent M-CSF activated macrophages and cell
contact activated macrophages respectively and will be fully discussed in
chapter 6.
This PCA analysis helped to visualise the trends in the data and these trends
were used to determine further comparisons to be performed. These were:
comparing patient blood to normal blood
comparing diseased blood CD14+ cells to synovial fluid CD14+ cells of both
RA and PsA to see if there are genes that are similar in both diseases and
conversely if each disease also has a unique distinguishing genetic subset.

134
Figure 3.4 Principle component analysis of all microarray samples PCA was performed on the microarray samples to try and identify trends in the data. Graph (A) indicates the normalised samples before the outlier was removed. The blue circle on the left hand side of the graph represents the outlying sample and it can been seen that all the other samples are clustered away from that area of the graph indicating that general genetic profile of the outlying sample does not match those of the remaining samples. Figure (B) shows PCA graph once the outlying cell contact sample had been removed. Each circle represents a sample and samples clustered in the same area of the graph are considered to be genetically similar. Each colour represents a sample condition; red is M-CSF treated macrophages, blue is cell contact activated macrophages, gold is synovial fluid derived CD14+ cells, green is patient blood CD14+ cells and purple is healthy blood CD14+ cells.

135
3.6 Comparing samples
3.6.1 Comparison 1: Patient blood compared to normal blood
Analysing the PCA graph indicated that the CD14+ cells from both the 8 RA and 8
PsA patients have a similar gene expression to the 5 healthy control CD14+ cells.
It was decided to analyse the genetic profiles of these samples further to see
how similar they were and to determine if there were any disease-specific genes
not detected in the healthy controls as has been found by many previous studies
[325-327, 329, 330, 340, 341].
All samples were pre-processed by the GC-RMA algorithm and quality control on
the entities was performed. To pass the quality control analysis each entity had
to have a signal value between 20 and 100% in order to remove any background
signal and each entity had to be expressed in all 21 samples (8 RA PB, 8 PsA PB
and 5 healthy PB). This is due to the considerable heterogeneity in the patient
samples with regards to treatment and disease duration; we were only
interested in genes that had changed in all disease samples rather than genes
that changed for example, only in response to a certain treatment type.
41424 entities passed the quality control analysis that can be visualised as shown
in Figure 3.5. The y value is the normalised signal intensity of the entity where
the signal is normalised to the median value of that entity across all the
samples. It is a visualisation tool that allows entities with very high or very low
signal values to be visualised on the same graph. The graph indicates that whilst
there are many entities that do not change their signal expression levels
between non-diseased and diseased states there are some outliers that have
varying levels of intensity in each of the three conditions.
136
Figure 3.5 Profile plot of entities that passed the quality control filter. Each line represents an entity and this graph shows the change in the signal intensity value of each entity in all healthy samples (left hand side of the graph), PsA PB samples (middle of the graph) and RA PB samples (right had side of the graph). The colour of the line denotes the signal intensity of the entity in healthy peripheral blood; blue represents a signal intensity of -6 to -1, yellow -1 to 1 and red 1 to 6.
3.6.1.1 Statistical analysis of healthy and diseased blood CD14+ cells
During microarray data analysis, multiple testing corrections (MTC) should be
applied where possible to decrease the number of false positives. Any statistical
tests (e.g. T test, ANOVA) that are performed on microarray data perform one
test per gene therefore the number of false positives increases proportionally to
the number of tests performed. For example analysing 10000 genes with a cut-
off p value of 0.05 will mean performing 10000 individual statistical tests and as
a result 500 genes (0.05 x 10000) are likely to appear significant by chance
alone. The Benjamini and Hochberg (false discovery rate) MTC gives a corrected
p value for each gene depending on the number of genes being tested [355].
A one-way ANOVA unequal variance (Welch ANOVA) with a Student-Newman-
Keuls (SNK) post Hoc test was used to analyse the 3 microarray conditions of

137
healthy blood, RA blood and PsA blood. A MTC was unable to be used in this
instance as when the Benjamini and Hochberg MTC was used there were no
significantly changed genes between the three groups. Since a p value cut off of
0.05 was used this means that 5% of the differentially expressed genes may be
false positives and appearing by chance alone, a way to overcome this is to look
at the p values of each gene as the higher the p value of the gene the less
chance of it being a false positive.
The one-way ANOVA with a p value cut off of 0.05 gave the following results:
494 genes significantly changed between RA and PsA PB cells
1457 genes significantly changed between healthy blood and RA blood
1384 genes significantly changed between healthy blood and PsA blood
These results indicate that although the PCA graph showed all of the blood CD14+
samples to be genetically similar, there are groups of genes that are significantly
changed between samples indicating that there are likely to be disease-specific
genes being expressed.
3.6.1.2 Fold change cut off analysis of healthy and diseased blood derived CD14+ cells
Since there were many genes that had significantly changed between groups a
fold change analysis was performed to look at differential expression. A cut off
value of 2 was chosen, consequently if a gene had a fold change difference in
expression between two conditions that was ≥ 2 then it would be considered
differentially expressed. The fold change cut off gave the following results:
43 genes changed between RA and PsA blood CD14+ cells (22 genes up-regulated
in RA compared to PsA PB and 21 genes up-regulated in PsA compared to RA PB)
239 genes changed between healthy blood and RA blood (158 genes up-regulated
in RA compared to healthy PB and 81 genes down-regulated in RA compared to
healthy PB)

138
281 genes changed between healthy blood and PsA blood (153 genes up-
regulated in PsA blood compared to healthy and 128 genes downregulated in PsA
blood compared to healthy)
These results demonstrate that of the 54,000 probe sets on the Affymetrix
GeneChips there are very few of these (43 probes/genes) that are differentially
expressed between RA blood and PsA blood. This result reinforces the PCA
results which showed the RA and PsA blood samples to be grouped together
therefore implying these samples were transciptionally similar. Hence from our
data it appears that the blood monocytes from RA and PsA have similar
transcriptomic profiles and there are very few genes that are expressed by these
monocytes that could distinguish them as belonging to either disease.
Nevertheless there are 43 genes that were distinguished by this analysis as being
differentially expressed between RA and PsA PB CD14+ cells with a fold change
difference of ≥2. Of these 43 gene hits there were only 24 individual genes that
had changed. This is because on the affymetrix GeneChips each gene can be
represented by more than one probe set and one gene can be appear several
times in the differentially changed gene list, also the gene lists often contain
transcribed loci that have no known function or gene name and therefore cannot
be analysed further. Of the 24 genes that were differentially expressed between
RA and PsA blood CD14+ cells 12 were upregulated in RA blood compared to PsA
and 12 were upregulated in PsA blood compared to RA.
Table 3.4 outlines the functions of the 12 genes upregulated in RA PB CD14+ cells
compared to PsA PB CD14+ cells.
Table 3.5 outlines the functions of the 12 genes upregulated in PsA PB CD14+
cells compared to RA PB CD14+ cells.

139
Table 3.4 A list of the 12 upregulated genes in RA PB CD14+ cells compared to PsA PB CD14
+ cells
Symbol Gene Name Fold change upregulation Description of Gene in RA PB compared to
PsA PB (p value) NRP1 Neuropilin 1 5.1 (5.72 X 10⁻⁵) A single pass transmembrane protein which has various ligands including semaphorins and VEGF family members. They have principle functions
in cell motility, including neural growth cone collapse mediated by semaphorins, and vascular and lymphatic sprouting triggered by VEGFs [356]. NRP-1 is the major VEGF 165 receptor in fibroblast like synoviocytes in RA. It is also expressed in the lining layer, endothelial cells and infiltrating leukocytes in RA [357].
NCAM1 Neural cell adhesion molecule 1 3.8 (0.017) A cell surface glycoprotein which mediates homotypic and heterotypic cell-cell adhesion through a homophilic binding mechanism. It is present in the nervous system where it participates in neural outgrowth and cell migration [358]. NCAM may also play a role in blood vessel stability as NCAM deficiency results in unstable endothelial cell – pericyte
interaction and hence vessel stability [359]. CYB5R2 Cytochrome b5 reductase 2 3.5 (0.021) Cytochrome b5 is an electron transfer component in oxidative reactions
such as anabolic metabolism of fats and steroids [360]. The CYB5R2 isoform is a membrane bound form of cytochrome b5 reductase which partakes in fatty acid elongation and desaturation [361] and cholesterol biosynthesis. It may also play a role in mitochondrial respiration [362].
GPR34 G protein-coupled receptor 34 2.8 (0.048) G protein-coupled receptors are the largest family of receptor proteins
in mammals and are known to bind to a variety of extracellular ligands such as chemokines, enzymes and hormones [363]. GPR34 is highly abundant in mast cells where it acts as the functional receptor for lysophosphatidylserine which enhances mast cell degranulation [364].
HPGD hydroxyprostaglandin dehydrogenase 2.4 (0.0062) An enzyme responsible for the inactivation of prostaglandins and
15-(NAD) lipoxins by catalysing the oxidation of 15(S)-Hydroxyl group resulting

140
in metabolites with reduced biological activity [365]. It is downregulated in human epithelial tumours and shows tumour suppressor activity [366].
PKP2 Plakophilin 2 2.3 (0.046) A protein found co-localised to desmosomes, which are adhesive
junctions linking intermediate filament networks to sites of strong intercellular adhesion. These junctions provide strength to tissue undergoing mechanical stress such as cardiac and epidermal tissue [367]. Plakophilin 2 has been detected in the adherens junctions of cardiomyocytes [368] and can co-localise with β-catenin at adherens junctions in epithelial cells [369].
CA5B carbonic anhydrase VB, mitochondrial 2.2 (0.045) A metalloenzyme expressed in mitochondria which is involved in several biosynthetic processes and plays a key role in fatty acid biosynthesis [370]. IL7 Interleukin 7 2.1 (0.011) A member of the IL-2 family expressed by epithelial cells in
lymphopoietic tissues, epithelial cells, keratinocytes, DCs and monocytes [371]. IL-7 plays an important role in T cell homeostasis such as naïve T cell survival but has also been found to induce bone loss by inducing osteoclast formation from human monocytes in a T cell dependent manner [372]. Serum levels of IL-7 are higher in RA patients compared to healthy controls and correlate with markers of inflammation [371]. IL-7+ cells correlate with the number of CD68+ cells in RA synovial lining and sub-lining layers and double staining demonstrates that CD68+ cells are a major producer of IL-7 [373].
LAMC1 Laminin, gamma 1 2.1 (0.016) Laminins are extracellular matrix components and are a major
constituent of basement membranes. Laminin and collagen provide the basic scaffold to which other basement membrane proteins, such as proteoglycan, integrate [374]. Laminin is also expressed in the cerebal cortex and laminin γ1 has been shown to play a critical role in neuronal morphogenesis and migration [375]. Laminin γ1 is also required for the deposition of matrix molecules in cardiomyocytes [376].

141
LYCAT Lysocardiolipin acyltransferase 2.1 (0.011) In embryonic stem cells (ESC) differentiation lysocardiolipin acyltransferase plays an essential role in hematopoietic and endothelial lineage development [377]. It is also involved in the remodelling of the phospholipid cardiolipin. Cardiolipin is sensitive to oxidative damage by reactive oxygen species and lysocardiolipin acyltransferase plays a regulatory role in remodelling cardiolipin in response to stress [378].
LRP11 Low density lipoprotein receptor-related 2.1 (0.0077) The LDL receptor related protein (LRP) is a heterodimeric endocytic
protein 11 cell surface receptor which transports a variety of macromolecules into cells through a process called receptor mediated endocytosis. LRP11 is expressed mainly in the brain and it has been shown to play a role in cell-cell adhesion in neurons however it has also been shown to be present in vascular smooth muscle cells and can induce enhanced migration and invasion activities [379]. LRP11 may play a role in Alzheimer disease (AD) as its expression is significantly reduced in the brains of AD patients, in this setting LRP11 is thought to be a sorting protein that protects β-amyloid precursor protein (APP) processing into amyloid-β (Aβ) which is the peptide found accumulated within the brains of AD patients [380].
RNF34 Ring finger protein 34 2.0 (0.049) Otherwise known as human ring finger homologous to inhibitor of apoptosis (hRFI). hRFI is an apoptosis regulator protein. Transfection of hRFI into HeLa cells resulted in an increase in cell survival after TNFα treatment [381] and transfection of hRFI into human colorectal cancer cells significantly inhibited death receptor mediated apoptosis with decreased caspase activity [382]. Thus indicating that hRFI has anti-apoptotic activity.

142
Table 3.5 A list of the 12 upregulated genes in PsA blood CD14+ cells compared to RA blood CD14
+ cells
Symbol Gene Name Fold change upregulation Description of Gene in PsA PB compared to
RA PB (p value) GSTM2 glutathione S-transferase M2 3.0 (0.040) Glutathione S-transferases (GSTs) are a broadly expressed family
of enzymes which protect against endogenous oxidative stress as well as exogenous toxins. They detoxify a variety of electrophilic compounds including oxidised lipids and DNA products generated by reactive oxygen species damage to intracellular molecules [383]. Glutathione S-transferase M2 is a muscle specific enzyme.
GSTM1 Gluthathione S-transferase M1 2.9 (0.035) (See above for a description of GSTs). Allelic variant within the
GSTM1 gene are associated with differences in detoxification efficiency, the GSTM1 gene has a non-functioning allele termed GSTM1-null. RA patients who carry this GSTM1-null polymorphism and are smokers are associated with worse disease severity [384]. A further study in a Korean population indicated that the GSTM1-null polymorphism is associated with increased susceptibility to RA [385].
PPP1R16B protein phosphatase 1, 2.9 (0.036) Protein phosphatase 1 (PP1) is a eukaryotic serine/threonine
regulatory (inhibitor) subunit 16B phosphatase which regulates a large variety of cellular functions through the interaction of its catalytic subunit with over 50 different regulatory subunits [386]. The PPP1R16B gene encodes a protein called TGF-β-inhibited membrane-associated protein (TIMAP). TIMAP is expressed at high levels in endothelial cells, phosphorylation of TIMAP controls its association with PP1 which in turn regulates extension of filapodia within the endothelial cells [387].
VASH1 Vasohibin 1 2.9 (0.0088) An angiogenesis inhibitor upregulated in endothelial cells [388].

143
Vasohibin-1 has also been detected in RA synovium in synovial lining cells, synovial fibroblast and endothelial cells. In vitro stimulation of RA synovial fibroblasts with inflammatory cytokines induced vasohibin-1 mRNA expression in hypoxic conditions [388].
CHST13 Carbohydrate (chondroitin 4) 2.8 (0.013) Chondroitin sulfotransferases synthesize the diverse sulphated
sulfotransferase 13 structures found in the glycosaminoglycans (GAGs) chondroitin sulphate [389]. As present there is no defining information on the specific role of carbohydrate sulfotransferase 13.
FOXP1 forkhead box P1 2.7 (0.017) A member of the FOX family of transcription factors. FOXP1 has a
role in B cell development [390], thymocyte development [391] and monocyte differentiation as downregulation of FOXP1 is necessary for monocyte differentiation and hence macrophage function [392].
KLF9 Kruppel-like factor 9 2.3 (0.011) The kruppel-like factor family are zinc finger transcription
factors. KLF9 regulates estrogen and progesterone action by modulating the activity of the progesterone receptor (PGR). It directly interacts with PGR to mediate progesterone responsive genes [393] and acts as a transcriptional repressor of estrogen receptor signalling [394].
KIF1B Kinesin family member 1B 2.3 (0.031) The kinesin superfamily of proteins play a role in organelle
transport in cells such as neurons and epithelial cells [395]. KIF1B is a plus end directed motor that transports synaptic vesicle precursors in the axon from the cell body to the synapse [396], it has also been shown to transport mitochondria in nerve cells [397].
BIN1 Bridging integrator 1 2.3 (0.035) BIN1 contains a BAR domain that allows it to interact with
cellular membranes and induce membrane curvature [398]. BIN1 is a muscle specific isoform of BAR domain containing proteins. It is highly expressed during muscle development and helps

144
generate the membrane curvature needed to form T-tubules [399].
MED26 Mediator complex subunit 26 2.1 (8.6 X 10⁻⁴) Once of several subunits that comprise the Mediator complex. The Mediator complex forms a crucial part of the RNA polymerase II transcriptional machinery that is essential for the transcription of almost all protein coding genes [400].
ACSL3 Acyl-CoA synthetase long-chain 2.1 (0.039) An enzyme isoform involved in lipid synthesis, fatty acid
family member 3 catabolism and membrane remodelling [401]. EIF2AK3 Eukaryotic translation initiation factor 2.1 (0.022) An ER transmembrane protein kinase which functions during
2-alpha kinase 3 cellular stress as an unfolded protein response (UPR) sensor. It is activated by accumulated misfolded proteins in the ER and reduces cellular translation to allow the cell to correct for the misfolded proteins causing the ER stress before synthesising additional proteins [402].
145
3.6.1.3 Database for annotation, visualisation and integrated discovery (DAVID) analysis of genes changed between healthy and patient CD14+ cells
Following on from the statistical and fold change analysis of the blood CD14+
samples an analysis of the groups of genes which were changed between healthy
and patient samples took place. This analysis will identify the function of the
expressed genes and subsequently group them according to their function. This
may be more informative rather than studying each individual gene and could
indicate the phenotype of the diseased CD14+ cells.
The database for annotation, visualisation and integrated discovery (DAVID)
analysis was used to investigate the gene lists to see if there was a significant
enrichment of group of genes required for a specific biological function. DAVID is
a publicly available software that can systematically map a large number of
genes to their associated biological annotation and then statistically highlight
the most overrepresented enriched biological processes [403].
DAVID analyses gene lists in regard to the reference background, which in this
analysis is all of the genes expressed on the Affymetrix GeneChip. To decide the
degree of biological enrichment within the input gene list DAVID compares it to
the reference background for example, if 10% of the gene list are kinases versus
1% of the genes on the Affymetrix GeneChip then kinases would be classed as
overrepresented within the gene list. The DAVID software uses a modified
Fisher‘s exact test to measure the gene-enrichment in the biological process
groups and groups with a p value <0.05 were considered to be specifically
associated with the gene list. Each gene is represented by more than one probe
on the Affymetrix GeneChip and therefore there may be several entities in the
gene list which correspond to the same gene, DAVID analysis takes this into
account and will only analyse each gene once irrespective of how many times it
appears in the gene list.
The gene lists which were analysed using DAVID were the up- and down-
regulated genes in RA blood CD14+ compared to healthy blood CD14+ and the up-
and down-regulated genes in PsA blood CD14+ compared to healthy blood.
Related groups of genes with a p value <0.05 were considered to be significantly
enriched within the gene list, if there were several gene groups associated with

146
the gene list only the top 10 most significantly associated groups were analysed.
Figure 3.6 shows the biological process gene groups which were expressed at a
higher level in RA blood compared to healthy blood CD14+ (A) and those that
were expressed at a lower level in RA blood (B). The upregulated groups of
genes include genes associated with chemotaxis, which could be in preparation
of the monocytes extravasating from the blood into the diseased joints, and
genes associated with response to external stimulus. This latter gene group may
be due to the proinflammatory stimuli found within the serum of arthritis
patients but not healthy controls to which the RA blood monocytes are exposed
[404, 405]. The downregulated groups of genes in RA PB monocytes include those
that regulate intracellular protein complex localisation and negative regulation
of cell migration which reinforces the results shown in graph (A) suggesting that
RA blood monocytes are upregulating groups of genes which will enable the cell
to migrate and respond to chemotaxis.
Figure 3.7 indicates the biological process groups which were upregulated in PsA
PB CD14+ compared to healthy controls (A) and downregulated in PsA PB
compared to healthy control blood (B). The results of this analysis indicate that
in comparison to healthy control monocytes the PsA blood monocytes have an
increased expression of genes involved in DNA packaging, chromatin assembly
and nucleosome assembly suggesting an overall reduction of DNA transcription
and translation within these cells. The PsA blood monocytes are also
upregulating genes involved in chemotaxis, which was also shown in the RA
blood monocytes in the previous figure, and may be due to an increase in
chemokines within the serum of PsA patients in comparison to healthy controls
[265, 406]. The downregulated genes in the PsA blood samples are mainly
involved in cell projection, morphogenesis, differentiation and metabolic
processes which all involve a large amount of energy expenditure therefore the
cells could be trying to conserve energy and resources.
In summary, the purpose of this healthy blood and diseased blood comparison
was to determine if there were any disease-specific genes not detected in the
healthy controls as the PCA analysis had demonstrated that the blood CD14+
samples in healthy and diseased patients had similar genetic profiles. Despite
the possibility that 5% of the genes within the gene lists generated are false
positives due to not being able to apply a multiple testing correction (MTC) to

147
the data there were a considerable number of differentially expressed genes
between the healthy blood samples and diseased samples. This indicates that
there are disease specific genes being expressed in the monocytes which in the
case of both RA and PsA included groups of genes required for chemotaxis and
cell movement. This analysis also generated the surprising result that there are
only 24 individual genes that are differentially expressed between RA and PsA
blood monocytes, this would suggest that the blood monocytes are remarkably
similar in the two forms of arthritis and may suggest that they play similar roles
within the diseases.
Figure 3.6 Up and downregulated groups of genes in RA blood compared to healthy blood DAVID analysis was used to discover the significantly up- and downregulated biological process gene groups as identified by gene ontology (GO). The 10 most significant biological process groups are shown which all have a p value <0.05 which is equivalent to a –log p value >1.30.

148
Figure 3.7 Up and downregulated groups of genes in PsA PB compared to healthy PB DAVID analysis was used to discover the significantly up- and downregulated biological process gene groups as identified by gene ontology (GO). The 10 most significant biological process groups are shown which all have a p value <0.05 which is equivalent to a –log p value >1.30.

149
3.6.2 Comparison 2: Analysis of microarray results comparing psoriatic and rheumatoid patient blood CD14+ cells to synovial fluid CD14+ cells
My major questions concerned changes occuring in the genetic profile as the
CD14+ cells of PsA and RA patients move from the blood into the synovial
compartment. The principle component analysis (PCA) plot of the RA and PsA PB
and SF CD14+ (Figure 3.8) illustrates that there are numerous genetic differences
between the PB and SF of both diseases indicated by the PB samples (blue and
red circles) occupying a separate area of the PCA graph as the SF samples (green
and purple circles). However this graph also shows that the PB CD14+ cells of
both diseases and the SF CD14+ of the two diseases are transcriptionally similar
to each other. This observation indicates that there are large genetic differences
between the site from which the CD14+ were isolated (i.e. blood and synovial
fluid) however the genetic differences between diseases at these sites is small
(i.e. RA and PsA SF CD14+ cells are transcriptomically similar).
3.6.2.1 Statistical analysis of peripheral blood CD14+ compared to synovial fluid CD14+
All samples were pre-processed with the GC-RMA algorithm and quality control
was performed on the 16 matched RA samples (8 PB and 8 SF) and then
performed on the 16 matched PsA samples (8 PB and 8 SF). In order to pass the
quality control filter each gene had to have a signal value between 20 and 100%
and be expressed in all 16 samples. Again, this was selected due to the high
heterogeneity of the 8 RA and 8 PsA patients with regard to disease duration and
patient treatment. Ensuring that each gene was present in all of the 16 RA or
PsA samples being tested meant that the analysis was only looking at genes
changed in the disease condition as a whole and was not affected by an
individual treatment type.
Once the quality control had been performed a paired T test was undertaken for
each disease comparing the matched PB and SF samples of each patient. The p
value cut off was 0.05 and the Benjamini and Hochberg multiple testing
correction was applied to the data which gives the genes a corrected p value.

150
Following this analysis there were:
10763 significantly changed genes between RA PB CD14+ cells and RA SF CD14+
cells
9533 significantly changed genes between PsA PB CD14+ cells and PsA SF CD14+
cells
Figure 3.9 shows the profile plots of the significantly changed genes between RA
PB and SF (A) and between PsA PB and SF (B). The profile plot is a visualisation
tool similar to a heatmap to allow trends in genetic expression data to be
identified, however its benefit over a heatmap is that it allows thousands of
genes to be analysed simultaneously. On these graphs each line represents one
gene and the colour of the line denotes the median GeneChip intensity value of
that gene from the 8 blood samples; with blue signifying a low intensity value,
yellow denotes an intermediate value and red denotes a high level of intensity.
The profile plots indicate that there are a large number of genes in both
diseases which are upregulated in the SF CD14+ cells compared to PB CD14+ cells;
there are also a smaller number of genes which a downregulated in the SF cells
compared to the PB CD14+ cells.

151
Figure 3.8 PCA analysis of PB and SF from RA and PsA patients PCA analysis was performed on the 32 samples to try and discover trends in the data as samples in the same area of the graph are considered to be genetically similar. Each circle represents an individual sample and all samples are colour coded per condition, red corresponds to RA PB, blue to PsA PB, purple to RA SF and green to PsA SF.

152
Figure 3.9 Profile plots of entities that are significantly changed between PB and SF in RA and PsA Each line on the profile plot represents one gene and the graphs indicate how the normalised signal intensities of the gene change between the PB samples and the SF samples. The colour of the line represents the median signal intensity of each gene in the PB samples. A blue line indicates the gene was expressed at a low level in the PB, a yellow line indicates an intermediate level and a red line a high level of signal intensity.

153
3.6.2.2 Fold change analysis and Ingenuity pathway analysis (IPA) of RA PB vs RA SF and PsA PB vs PsA SF
The two gene lists which had been generated from the paired T test analysis
were subjected to fold change analysis. Due to the substantial number of
significantly expressed genes in both diseases a fold change cut off of ≥ 4 was
applied to the data. In microarray data analysis the fold change cut off value is
arbitrary and we were interested in genes with a high fold change difference
between PB and SF.
The fold change analysis gave the following results:
1686 genes significantly changed between RA PB and RA SF with a fold
change ≥ 4
1149 genes significantly changed between PsA PB and PsA SF with a fold
change ≥ 4
The varying expression levels of these genes is depicted in Figure 3.10 which is a
heatmap of all the significantly changed genes between the PB and SF samples
of RA and PsA with a fold change cut off of 4. The heatmap displays the
normalised signal intensity of each gene within the blood and synovial fluid
samples of each patient. The range in colour represents the relative expression
levels of the genes in each sample with green representing a low level of
expression and red representing a high level of relative expression. Heatmaps
are used as a visualisation tool and this figure is demonstrating the there appear
to be many genes which are upregulated in the synovial fluid of the patients in
comparison to the peripheral blood as demonstrated by the large number of
genes which are green (low level of expression) in the peripheral blood cell but
are red (high level of expression) in the synovial fluid cells.
The two gene lists were then subjected to ingenuity pathway analysis (IPA)
which may be used to analyse complicated gene sets and identify genes that are
part of a common regulatory network. This software has advantages over DAVID
analysis in addition to identifying the overrepresented molecular and cellular
functions within the gene list IPA can also identify the canonical pathways as
well as the diseases and disorders associated with the genes. IPA is similar to

154
DAVID analysis as it uses Fisher‘s exact test to determine whether an association
of a biological process or a pathway with the dataset is due to random chance.
The smaller the p value of the process or pathway the less likely that the
association is random and the more significant the association, in this analysis p
values less than 0.05 indicate a statistically significant non-random association.
IPA determines the association of processes and pathways within the gene list by
comparing it to a reference gene set, which in this case are all the genes
expressed on the Affymetrix GeneChips, and calculating whether the pathways
or processes are overrepresented in the gene list and whether this association is
statistically significant using Fisher‘s exact test.

155
Figure 3.10 Heatmap of significantly changed genes with a fold change cut off of 4 between the PB and SF of PsA and RA patients The normalised signal intensity of each differentially expressed gene with a fold change cut off of 4 or above is shown. The degree of colour represent the relative level of expression for each gene in each sample ranging from green - low relative expression, to red - high relative expression (see legend). It can be visualised that there are genes which are expressed at a low level in the blood and therefore a high level in the synovial fluid and vice versa.

156
3.6.2.3 IPA of RA blood vs RA synovial fluid CD14+
The 1686 differentially expressed genes between the RA PB and RA SF CD14+
samples with a fold change cut off of 4 were analysed using IPA. This analysis
generated three sets of results associated with the gene lists; the top 5
canonical pathways, the top 5 diseases and disorders and the top 5 molecular
and cellular functions.
Table 3.6 indicates the top 5 canonical pathways associated with the up- and
downregulated genes observed in the RA synovial fluid samples. This analysis
includes pathways which have previously been associated with RA such as the
coagulation system and the role of macrophages in RA but also includes other
pathways such as LXR/RXR activation.
Figure 3.11 outlines the canonical pathway of LXR/RXR activation which was the
most significant pathway associated with the RA PB vs SF gene list. All of the
genes highlighted in the pathway are the 17 genes from the gene list associated
with the RA comparison; all of these genes are highlighted in red which indicates
that these genes were upregulated in the synovial fluid CD14+ cells compared to
the PB CD14+ cells. These genes range from pro-inflammatory chemokines such
as MCP-1 to the cholesterol efflux genes ApoE and ApoC1. The relevance of these
genes to RA pathogenesis will be analysed in detail in the discussion section of
this chapter.
Table 3.7 outlines the diseases and disorders associated with the up- and down-
regulated genes expressed in RA SF CD14+ compared to RA PB CD14+. As would be
expected all the diseases and disorders are related to or involve RA. The range
of p values shown determines the significance of the gene list to different terms
encompassed by the diseases and disorders. For example the term inflammatory
disease includes more specific terms such as inflammatory disorder of the joint,
arthritis or multiple sclerosis so depending on the association of the gene list
with each term tested an individual p value is given. Due to the large number of
terms that can be significant within one category a range of p values is outlined
in the table.

157
Table 3.8 outlines the top 5 cellular functions associated with the gene list. The
gene list comprises genes that are differentially expressed within the RA synovial
fluid CD14+ cells and the cellular functions significantly overrepresented in this
gene list are those which we would expect to be upregulated within the RA SF
cells in comparison to the PB cells. Two of the cellular functions are cellular
movement and immune cell trafficking which could be upregulated as a result of
the CD14+ transendothelial migration from the blood vessels into the synovium
[258, 407]. Since macrophages within the synovial compartment are known to
participate in cellular interactions with several cell types such as fibroblasts
[249], T cells [269, 314, 408], endothelial cells [407] and natural killer (NK) cells
[251] it is no surprise that one of the top cellular functions associated with the
RA SF CD14+ cells is cell-to-cell signalling and interaction. The final two cellular
functions associated with RA SF CD14+ compared to PB cells are cellular growth
and proliferation and cellular development which is logical due to the
maturation that the CD14+ cells undergo into fully activated macrophages once
they are within the synovium and exposed to the pro-inflammatory and hypoxic
environment [409, 410].

158
Table 3.6 The top 5 canonical pathways associated with the RA PB vs RA SF CD14+
comparision
Canonical pathway
p value (number of associated
genes/total number of genes in pathway)
LXR/RXR activation
Hepatic fibrosis/ hepatic stellate cell activation
Role of mø, fibroblasts and endothelial cells in RA
LPS/IL-1 mediated inhibition of RXR function
Coagulation system
3.96 x 10⁻⁷ (17/86)
2.27 x 10⁻⁵ (21/131)
7.20 x 10⁻⁵ (36/366)
1.07 x 10⁻⁴ (25/205)
1.98 x 10⁻⁴ (9/37)
Table 3.7 The top 5 diseases and disorders associated with the RA PB vs RA SF CD14+
comparison
Diseases and Disorders
p value
Connective Tissue Disorders
Inflammatory Diseases
Skeletal and Muscular Disorders
Immunological Diseases
Inflammatory Response
4.68x10⁻¹⁵ – 4.77x10⁻⁴
4.68x10⁻¹⁵ – 5.90 x 10⁻⁴
4.68x10⁻¹⁵ – 4.77x10⁻⁴
9.70x10⁻¹⁴ – 4.43x10⁻⁵
2.79x10⁻¹³ – 7.03x10⁻⁴
Table 3.8 Top 5 molecular and cellular functions associated with the RA PB vs RA SF CD14+
comparison
Molecular and Cellular Functions
p value
Cellular movement
Cell-to-cell signalling and interaction
Cellular growth and proliferation
Immune cell trafficking
Cellular development
1.00x10⁻²³ – 5.90x10⁻⁴
1.40x10⁻¹⁷ – 7.03x10⁻⁴
9.08x10⁻¹⁷ – 7.05x10⁻⁴
1.72x10⁻¹⁵ – 1.35x10⁻⁴
7.08x10⁻¹³ – 6.89x10⁻⁴

159
Figure 3.11 LXR/RXR activation canonical pathway associated with the RA PB vs SF comparison This diagram outlines the genes involved in LXR and RXR activation which were differentially expressed in the RA PB vs RA SF comparison. The genes which are coloured red are those which were expressed at a higher level in the RA SF cells and therefore are genes which are upregulated once the blood CD14
+ cells enter the synovial environment.

160
3.6.2.4 IPA analysis of PsA blood vs PsA synovial fluid CD14+
The 1149 genes differentially expressed with a fold change ≥ 4 in the PsA
synovial fluid compared to the PsA blood CD14+ were analysed using IPA. As with
the RA blood vs synovial fluid investigation this analysis yielded three sets of
results associated with the gene list: the top 5 canonical pathways, the top 5
diseases and disorders and the top 5 molecular and cellular functions.
Table 3.9 demonstrates the top 5 canonical pathways associated with the
differentially expressed genes in the PsA SF CD14+ samples compared to the PsA
CD14+ blood samples. Three of the pathways overlap with the results of RA SF
associated pathways once again emphasizing the similarities between the
synovial fluid macrophages of both RA and PsA. The PsA SF specific canonical
pathways included the complement system and intriguingly the pathogenesis of
multiple sclerosis. The elements of this canonical pathway along with the PsA
genes associated with it can be visualised in Figure 3.12. This diagram
demonstrates that the PsA SF differentially expressed genes associated with the
pathogenesis of multiple sclerosis pathway are all chemokines and emphasises
the overlap in inflammatory gene expression between immune mediated
diseases.

161
Table 3.10 outlines the diseases and disorders associated with the differentially
expressed genes in PsA SF CD14+ cells compared to PsA PB CD14+ cells. As was
observed with the RA SF gene set in Table 3.7 all of the diseases and disorders
associated with immunological disease and the inflammatory response.
Table 3.11 outlines the cellular functions associated with PsA SF CD14+ cell gene
expression. There is considerable overlap between the cellular functions
associated with PsA SF and RA SF CD14+ cells as four of the top five functions
associated with RA are also associated with PsA. All of the five cellular functions
would be expected to be differentially expressed in PsA SF CD14+ cells compared
to the matched peripheral blood cells. In PsA, monocytes are known to migrate
from the blood into the inflamed joint [254, 411] (demonstrated by the functions
cellular movement and immune cell trafficking) where they interact with other
cell types and illicit an immune response [412] (demonstrated by the functions
cell-to-cell signalling and interactions and cell mediated immune response), the
pro-inflammatory environment also enables the differentiation of these cells
into activated macrophages (demonstrated by the function cellular growth and
proliferation). Hence, the cellular functions being undertaken by the PsA SF
CD14+ cells as they move from the blood into the synovium are the functions
needed to transform them into an activated, pro-inflammatory immune cell
capable of sustaining the chronic inflammation seen in psoriatic arthritis.

162
Table 3.9 Canonical pathways associated with the PsA PB vs PsA SF CD14+ comparison
Canonical pathway p value (number of
associated genes/total
genes in pathway)
LXR/RXR activation
Complement system
LPS/IL-1 mediated inhibition of RXR function
Pathogenesis of multiple sclerosis
Hepatic fibrosis/hepatic stellate cell activation
8.52 x 10⁻⁶ (13/86)
7.12 x 10⁻⁵ (8/35)
2.09 x 10⁻⁴ (20/205)
4.50 x 10⁻⁴ (4/9)
1.67 x 10⁻³ (14/131)
Figure 3.12 Pathogenesis of multiple sclerosis canonical pathway associated with the PsA PB vs PsA SF CD14+ cell comparison.
Component of the pathway coloured red are genes that are upregulated in the PsA SF CD14+ cells. Four of the nine pathway components are upregulated in PsA SF macrophages.

163
Table 3.10 Diseases and disorders associated with the PsA PB vs PsA SF CD14+
comparison
Diseases and Disorders
p value
Inflammatory Disease
Connective Tissue Disorder
Skeletal and Muscular Disorders
Immunological Disease
Inflammatory Response
2.58x10⁻¹⁵ – 2.21x10⁻³
2.76x10⁻¹⁵ – 2.08x10⁻³
2.76x10⁻¹⁵ – 1.70x10⁻³
6.64x10⁻¹⁴ – 2.08x10⁻³
4.83x10⁻¹⁰ – 2.21x10⁻³
Table 3.11 Molecular and cellular functions associated with the PsA PB vs PsA SF CD14+
comparison
Molecular and Cellular Function
p value
Cellular Movement
Cell-to-cell signalling and interaction
Cellular Growth and Proliferation
Immune Cell Trafficking
Cell Mediated Immune Response
2.98x10⁻²⁰ – 2.31x10⁻³
1.51x10⁻¹⁶ – 2.15x10⁻³
3.41x10⁻¹³ – 2.21x10⁻³
1.18x10⁻¹³ – 1.14x10⁻³
7.86x10⁻⁹ – 2.15x10⁻³

164
3.6.2.5 Depicting RA and PsA differentially expressed genes
Analysis of the foregoing results identified the interesting observation that the
synovial fluid CD14+ cells of both the RA and PsA patients shared substantial
similarity in gene expression. This observation was first identified by examining
the PCA plot (Figure 3.8) depicting the SF samples of both diseases were co-
localised indicating a similarity in the overall transcriptomes of the two diseases.
The subsequent IPA analysis then identified that many of the same canonical
pathways and cellular functions appeared in both diseases therefore signifying a
similarity in gene expression. Consequently, it was decided to further analyse
the genes that had changed in the RA and PsA PB and SF samples as we
hypothesized that there would be a subset of genes that changed in both
diseases as well as subsets of genes that had only changed in RA or PsA. To
answer this hypothesis a Venn diagram was constructed (Figure 3.13) using the
following gene lists:
All entities (shown in blue), which is the list of genes that had a positive signal
on the GeneChip in any of the samples. This is the starting list of genes before
any quality control analysis has been done.
PsA PB vs PsA SF (shown in green), these are the differentially expressed genes
between PsA PB and PsA SF. According to a paired T test and Benjamini and
Hochberg MTC each gene has a corrected p value ≤ 0.05.
RA PB vs RA SF (shown in red), this list represents the differentially expressed
genes between RA PB and RA SF. The p values were calculated in the same
manner as those for the PsA comparsion.
Figure 3.13 indicates the Venn diagram, analysing the results proved our
hypothesis to be correct as the diagram produced three gene lists:
1. Genes that are specifically changed in only the RA PB vs RA SF analysis
(5158 genes)
2. Genes that are specifically changed only in the PsA PB vs PsA SF analysis
(3928 genes)

165
3. Genes that are changed in both diseases (5605 genes)
These gene lists also demonstrate that 58% (5605 of 9533 total genes) of the PsA
SF CD14+ differentially expressed genes and 52% (5605 of 10763 total genes) of
the RA SF CD14+ differentially expressed genes are present in both of the
diseases. This indicates that there is a significant and substantial amount of
overlap between the transcriptomes of the synovial fluid CD14+ cells of the two
diseases.
Figure 3.13 Venn diagram of the differentially expressed genes between RA PB and SF and between PsA PB and SF Gene lists were applied to the Venn diagram in order to distinguish genes that were changed in both RA and PsA and genes that were changed in only one of the diseases. The blue circle represents all of the genes which were expressed on the Affymetrix GeneChips. The red circle represents differentially expressed genes between RA PB and RA SF which had a p value ≤ 0.05. The green circle represents the differentially expressed genes between the PsA PB and PsA SF which had a p value ≤ 0.05. The regions where these three circles overlap represent genes which are expressed in both RA and PsA (5605 genes), in RA only (5158 genes) and in PsA only (3928 genes).

166
Prior to any further analysis a fold change cut off of 4 was applied to the data.
Since the fold change cut off in microarray data analysis is arbitrary we decided
a high fold change cut off to specifically focus on the genes that were
differentially expressed to a large extent. The fold change cut off gave the
following three gene lists:
1. Up- and downregulated genes that are changed in both diseases (873
genes)
2. Up- and downregulated genes that are changed in the PsA PB vs PsA SF
analysis only (154 genes)
3. Up- and downregulated genes that are changed in the RA PB vs RA SF
analysis only (348 genes)
IPA analysis was subsequently performed on these three gene lists to determine
the canonical pathways associated with both diseases and each disease
individually. Specifically the genes that were up- and down-regulated in the
synovial fluid compared to the peripheral blood CD14+ cells of the diseases were
analysed to try to determine what pathways were activated within the synovial
fluid macrophages once they were exposed to the proinflammatory environment
of the joint. The diseases and disorders analyses in the previous IPA comparisons
were not very informative as they highlighted that the diseases associated with
our gene lists were related to arthritic and inflammatory disorders. Therefore in
this IPA analysis only the canonical pathways and molecular functions associated
with the genes lists were investigated.

167
Table 3.12 shows the canonical pathways associated with the differentially
expressed genes that were similarly expressed in both RA and PsA synovial fluid.
These pathways are the same as those that were identified in the IPA analysis of
the RA PB vs SF and PsA PB vs SF comparison (Table 3.6 and Table 3.9
respectively). Table 3.13 demonstrates the molecular and cellular functions
associated with the gene list which was differentially expressed in both RA and
PsA synovial macrophages. These functions have previously been identified in
the RA PB vs SF and the PsA PB vs SF comparisons and demonstrate the shared
macrophage functions between the two diseases.

168
Table 3.14 identified the canonical pathways that are significantly associated
with the subset of genes which are differentially expressed specifically in the
synovial fluid CD14+ cells of the PsA patients but not the RA patients. It outlines
pathways that would not usually be associated with macrophages such as B cell
development and altered B and T cell signalling in RA. Investigating the
differentially expressed genes from the gene list which are associated with these
pathways identifies genes that are expressed in both macrophages and B cells/T
cells such as CD40, MHC II and TLR3. This result is highlighted in Figure 3.14
which demonstrates that the two genes within B cell development canonical
pathway associated with the PsA only gene list, are MHC II and CD40 which are
two genes that are known to be expressed in both B cell and macrophages.
Table 3.15 outlines the molecular and cellular functions associated with the
differentially expressed genes found specifically in the PsA SF CD14+ cells
compared to the PsA PB CD14+ cells. Two of these functions, cellular movement
and cell-to-cell signalling and interaction, were previously associated with the
broad PsA PB vs SF CD14+ comparison, however the other three functions which
consist of DNA replication, cell cycle and cell death are unique to the PsA SF
CD14+ expressed genes and demonstrate the disease specific cellular functions.
Table 3.16 outlines the canonical pathways significantly associated with the
subset of genes differentially expressed specifically within the RA synovial fluid
CD14+ cells. The top two pathways were previously associated with the
differentially expressed genes in RA PB vs SF (see Table 3.6) however this
analysis of the unique genes expressed in RA SF cells identifies three other
pathways involving intracellular signalling within the macrophages including
atherosclerotic, p38 and ERK5 signalling. Figure 3.15 demonstrates the ERK5
canonical pathway and outlines the five genes from the RA gene list which were
associated with the pathway. In this figure, genes highlighted in green were
expressed at a higher level in the RA PB CD14+ cells compared to the SF cells
whereas genes highlighted in red denote the genes which were expressed at a
higher level in the RA SF CD14+ cells compared to RA PB CD14+ cells. Table 3.17
outlines the molecular and cellular functions associated with the gene list
expressed by RA SF CD14+ cells only. All of these functions were previously
associated with the broad analysis of RA PB vs SF CD14+ apart from the function

169
of cell morphology. Hence cell morphology is a disease specific function and is
only associated with RA SF CD14+ cells.

170
Table 3.12 Canonical pathways associated with the differentially expressed genes in BOTH RA and PsA synovial fluid
Canonical Pathways expressed in BOTH RA and PsA synovial fluid CD14+
P value (number of associated genes/total number of genes in pathway)
LXR/RXR activation
LPS/IL-1 mediated inhibition of RXR function
Complement system
Hepatic fibrosis/Hepatic stellate cell activation
Pathogenesis of Multiple Sclerosis
3.28x10⁻⁶ (12/76)
7.07x10⁻⁵ (18/197)
1.00x10⁻⁴ (7/34)
1.52x10⁻³ (12/128)
3.11x10⁻³ (3/9)
Table 3.13 Molecular and cellular functions associated with the differentially expressed genes in BOTH RA and PsA synovial fluid
Molecular and cellular functions associated with BOTH RA and PsA synovial fluid CD14+
P value
Cellular movement
Cellular growth and proliferation
Cell-to-cell signalling and interaction
Cellular development
Cellular function and maintenance
9.80x10⁻¹⁷ – 1.15x10⁻²
3.51x10⁻¹² – 1.15x10⁻²
1.09x10⁻¹¹ – 1.15x10⁻²
3.96x10⁻⁷ – 1.15x10⁻²
5.32x10⁻⁷ – 1.15x10⁻²

171
Table 3.14 Canonical pathways associated with the differentially expressed genes in PsA only
Canonical pathways expressed in PsA synovial fluid
CD14+ only
P Value (number of associated genes/total
number of genes in pathway)
B cell development
Allograft rejection signalling
Pathogenesis of Multiple Sclerosis
Autoimmune Thyroid disease signalling
Altered T and B cell signalling in Rheumatoid Arthritis
8.08x10⁻⁴ (3/30)
1.53x10⁻³ (3/51)
1.75x10⁻³ (2/9)
1.79x10⁻³ (3/53)
2x10⁻³ (4/85)

172
Figure 3.14 B cell development canonical pathway associated with the genes expressed in PsA synovial fluid only The two genes highlighted within this pathway (MHC II, CD40) are expressed in the PsA only gene list and are associated with this pathway. These genes are highlighted in red which indicates that they were upregulated in the PsA SF compared to PsA PB.
Table 3.15 Molecular and cellular functions associated with the differentially expressed genes in PsA only
Molecular and cellular functions associated with PsA synovial fluid CD14+ only
P value
Cellular movement
DNA replication, recombination and repair
Cell-to-cell signalling and interaction
Cell cycle
Cell death
3.34x10⁻⁷ – 2.16x10⁻²
1.08x10⁻⁵ – 1.91x10⁻²
1.74x10⁻⁵ – 2.16x10⁻²
2.46x10⁻⁵ – 2.16x10⁻²
3.47x10⁻⁵ – 2.16x10⁻²

173
Table 3.16 Canonical pathways associated with the differentially expressed genes in RA only
Canonical pathways expressed in RA synovial fluid CD14+ only
p value (number of associated genes/total
number of genes in pathway)
Heptatic fibrosis/hepatic stellate cell activation
Role of mø/fibroblasts and endothelial cells in RA
Atherosclerosis signalling
p38 MAPK signalling
ERK5 signalling
5.27x10⁻⁵ (9/128)
2.19x10⁻⁴ (13/329)
2.95x10⁻⁴ (7/107)
1.52x10⁻³ (6/96)
1.54x10⁻³ (5/69)

174
Figure 3.15 ERK5 signalling canonical pathway associated with the genes expressed in RA synovial fluid only The highlighted genes are those that were differentially expressed only in the RA PB vs RA SF comparison. Genes highlighted in green indicate genes which were downregulated in RA SF CD14
+ cells and therefore were expressed at a higher level in RA PB CD14
+ cells. Genes which
are highlighted in red demonstrate genes which were expressed at a higher level in RA SF CD14+
cells compared to the RA PB CD14+ cells.

175
Table 3.17 Molecular and cellular functions associated with the differentially expressed genes in RA only
Molecular and cellular functions associated with RA synovial fluid CD14+ only
P value
Cellular movement
Cellular growth and proliferation
Cellular development
Cell-to-cell signalling and interaction
Cell morphology
1.09x10⁻¹⁴ – 4.09x10⁻³
3.19x10⁻¹¹ – 3.75x10⁻³
1.38x10⁻⁹ – 4.12x10⁻³
4.87x10⁻⁹ – 3.57x10⁻³
9.64x10⁻⁸ – 4.90x10⁻³

176
3.6.2.6 Table of genes highly upregulated in both RA and PsA SF samples
The IPA analysis was very informative in defining the groups of genes and the
pathways involved in the RA and PsA synovial CD14+ cells however we also
wanted to study individual genes and their expression within each disease to try
and identify novel pathways of arthritis pathogenesis. The aim of the subsequent
analysis therefore was to locate novel genes that were increased in the CD14+ SF
samples of both diseases. The list of genes upregulated in both RA and PsA SF
cells compared to their matched blood cells was obtained from the Venn
diagram analysis and analysed in order of descending fold change. Starting from
the most highly expressed genes in both RA and PsA synovial fluid literature
searches were performed on genes to determine their function and expression.
Unsurprisingly, many genes had been previously associated with or found to be
highly expressed in either RA or PsA; however some novel genes were also found.
Table 3.18 lists several of the genes that were analysed.

177
Table 3.18 Gene upregulated in BOTH RA and PsA synovial fluid CD14+ cells Symbol Gene Name Fold change Fold change Description of Gene upregulation upregulation
in RA SF (p value) in PsA SF (p value) SPP1 Secreted phosphoprotein 1 1762 (3.8x10⁻⁴) 484 (3.2x10⁻⁴) An extracellular matrix glycoprotein expressed
(osteopontin) by many inflammatory cells. It is up-regulated in response to injury and inflammation [413]. Thrombin cleaved OPN is found in RA SF at a
30 times higher concentration compared to OA SF [414]. CCL18 Chemokine ligand 18 326 (6.4x10⁻⁵) 375 (2.7x10⁻⁴) A T cell attracting chemokine expressed by monocytes/macrophages and DCs [415]. Levels
of CCL18 in RA were higher than in OA in serum, synovial fluid, cartilage and synovial tissue. These levels were positively correlated with disease activity and rheumatoid factor levels [416, 417].
APOCI Apolipoprotein C-I 482 (3.3x10⁻⁴) 344 (5.4x10⁻⁴) Apo C-I along with Apo C-II are constituents of
high-density lipoprotein (HDL) that slows the clearance of triglyceride-rich lipoproteins [418].
PLTP Phospholipid transfer protein 98 (8.9x10⁻⁴) 246 (2.7x10⁻⁴) PLTP facilitates the transfer of phospholipids
from triglyceride-rich lipoproteins to HDL via an enzyme lipoprotein lipase (LPL) [419]. PLTP may play a role in atherosclerosis depending on its expression. Systemic over-expression of PLTP is associated with increased atherosclerosis susceptibility [420] whereas in an LDLr-
/- mouse model, which is susceptible to atherosclerosis, macrophage derived PTLP was found to be atheroprotective [421].
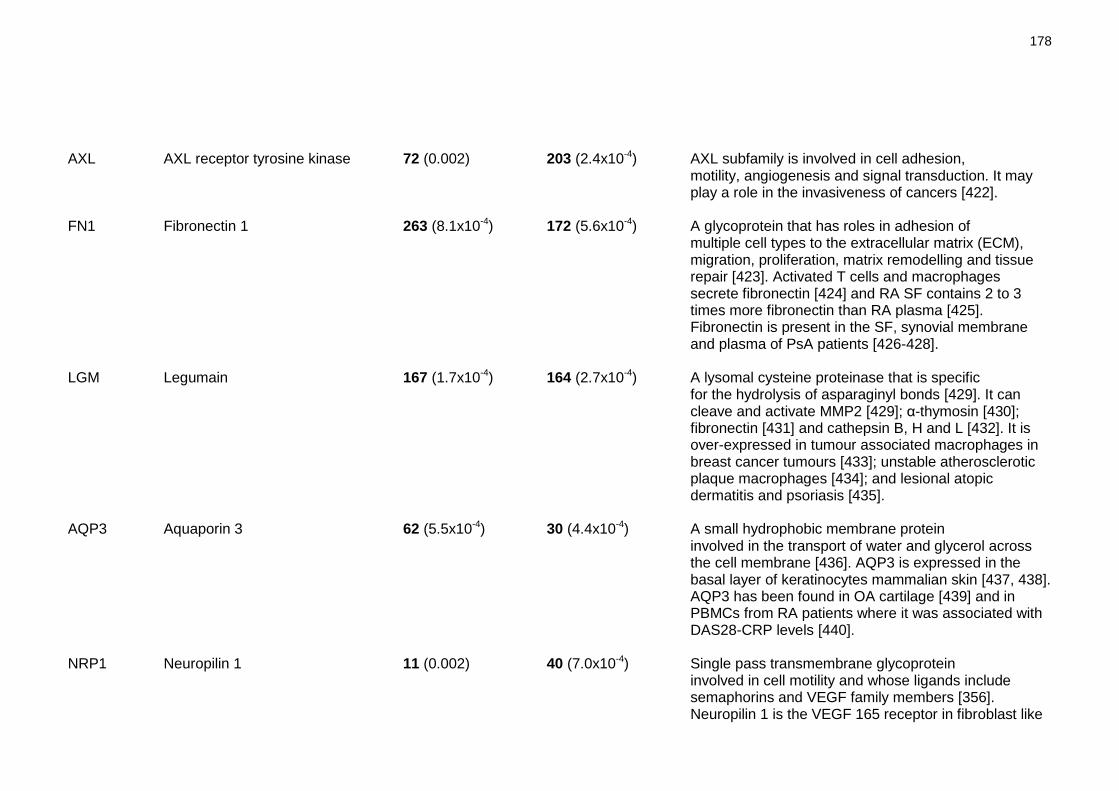
178
AXL AXL receptor tyrosine kinase 72 (0.002) 203 (2.4x10⁻⁴) AXL subfamily is involved in cell adhesion, motility, angiogenesis and signal transduction. It may play a role in the invasiveness of cancers [422].
FN1 Fibronectin 1 263 (8.1x10⁻⁴) 172 (5.6x10⁻⁴) A glycoprotein that has roles in adhesion of
multiple cell types to the extracellular matrix (ECM), migration, proliferation, matrix remodelling and tissue repair [423]. Activated T cells and macrophages secrete fibronectin [424] and RA SF contains 2 to 3 times more fibronectin than RA plasma [425]. Fibronectin is present in the SF, synovial membrane and plasma of PsA patients [426-428].
LGM Legumain 167 (1.7x10⁻⁴) 164 (2.7x10⁻⁴) A lysomal cysteine proteinase that is specific for the hydrolysis of asparaginyl bonds [429]. It can cleave and activate MMP2 [429]; α-thymosin [430]; fibronectin [431] and cathepsin B, H and L [432]. It is over-expressed in tumour associated macrophages in breast cancer tumours [433]; unstable atherosclerotic plaque macrophages [434]; and lesional atopic dermatitis and psoriasis [435].
AQP3 Aquaporin 3 62 (5.5x10⁻⁴) 30 (4.4x10⁻⁴) A small hydrophobic membrane protein involved in the transport of water and glycerol across the cell membrane [436]. AQP3 is expressed in the basal layer of keratinocytes mammalian skin [437, 438]. AQP3 has been found in OA cartilage [439] and in PBMCs from RA patients where it was associated with DAS28-CRP levels [440].
NRP1 Neuropilin 1 11 (0.002) 40 (7.0x10⁻⁴) Single pass transmembrane glycoprotein
involved in cell motility and whose ligands include semaphorins and VEGF family members [356]. Neuropilin 1 is the VEGF 165 receptor in fibroblast like

179
synoviocytes in RA and is also expressed on infiltrating leukocytes [357]. Neuropilin 1 mRNA has also been detected in OA but not healthy cartilage samples [441].
PLXNA1 Plexin A1 26 (4.9x10⁻⁴) 27 (9.9x10⁻⁴) Single membrane spanning proteins which,
along with neuropilins, are receptors for semaphorins [442]. Plexin A1 expression is increased during M-CSF differentiation [443] and it is thought to be important for T cell – DC interactions as plexin A1 deficient DCs Induced 50% less T cell proliferation than control DCs [444].
PDPN Podoplanin 6 (0.02) 22 (0.001) A mucin-type transmembrane glycoprotein that
is involved in lymphatic vessel formation. It is a specific marker for lymphatic endothelium and is not expressed in blood vessels [445]. TNFα blockade therapy promotes the proliferation of lymphatic vessels, the inflamed synovium of RA and SpA patients receiving TNF blockade therapy stained for podoplanin [446].

180
Table 3.18 demonstrates the subset of genes that were explored in silico in
depth from the list of genes upregulated in SF CD14+ cells of both diseases. They
were analysed based on their large fold change increased in the SF; this analysis
was set up to try and discover novel genes that as yet had not been analysed in
the context of RA and PsA arthritis. Several novel genes were found but after
performing comprehensive literature searches two of these genes, an enzyme
called legumain and a surface receptor called plexin A1, appeared to be
candidate genes which may have particular relevance to the pathogenesis of the
synovial macrophage in both PsA and RA. It was decided to concentrate further
research on these two genes to try and discover why they were highly
upregulated in the SF CD14+ cells of both RA and PsA. The following two chapters
demonstrate the experimental work performed to try and understand the role of
these genes within the synovial environment.

181
3.7 Discussion
Microarrays have become a standard method to investigate differential disease
states on the basis of genome-wide expression. Previously, there have been
numerous microarray studies analysing the two diseases RA and PsA. However,
these studies mainly focused on the gene expression of PBMCs or whole synovial
tissue and as yet very few studies have measured the gene expression within
individual immune cell types. Macrophages are an essential component of the
inflammatory cell influx into the joint, being one of the major cell types
producing the pro-inflammatory cytokines, chemokines and extracellular matrix
components which all contribute to the destruction and degradation of the
arthritic joint [258]. Since very little is known about the transcriptomic profile
of this cell type within RA or PsA we decided to microarray chip analyse several
different samples to try and elucidate which genes were being expressed in (1)
diseased blood monocytes compared to healthy controls, and (2) synovial fluid
macrophages compared to blood monocytes.
Once all the patient and normal samples had been collected, prepared and
individually hybridized onto Affymetrix GeneChips the results were subjected to
quality control to detect any outliers. Quality control must take place during
microarray analysis to ensure that: i) the data is suitable to answer the
experimenter‘s question and ii) the data is suitable for subsequent analysis
[447]. For the current analysis quality control consisted of examining the signal
intensity of the GeneChips on a signal histogram which resulted in the detection
of a GeneChip which had an abnormal signal intensity. This outlier was further
confirmed by analysing the principle component analysis (PCA) plot which graphs
the overall transcriptomic signature of each sample. Quality control problems
can come from several sources; for example the hybridisation step can cause
uneven fluorescence on the chip and differences in RNA quality can produce
variable signal intensity and reports have shown that removing outlier GeneChips
can improve the detection of differentially expressed genes [447], therefore the
outlier sample identified in this study was removed from further analysis.
Once the outlier was removed a PCA plot of the samples was setup to identify
trends in the data since samples clustered within the same area of the PCA
graph are considered to be genetically similar [354]. This analysis identified that

182
the blood CD14+ cells from both RA and PsA were genetically similar and also the
synovial fluid CD14+ cells from both diseases had similar genetic profiles, which
was a surprising result as previous studies had identified differential subsets of
macrophages in RA compared to PsA [253, 255]. On the basis of the PCA plot and
the original hypotheses we decided to perform two main comparisons: i) the
differentially expressed genes in the patient blood CD14+ cells compared to
those of the healthy blood CD14+ cells, and ii) the differentially expressed genes
in the patient synovial fluid CD14+ compared to the matched blood CD14+ cells.
3.7.1 Comparison 1: Healthy blood versus diseased blood
The first data comparison to take place was analysing CD14+ cells isolated from
the blood of diseased patients and healthy controls. Previously there have been
several microarray analyses comparing peripheral blood mononuclear cells
(PBMCs) or peripheral blood cells (PBCs) of healthy donors to those of patients
with rheumatic diseases such as RA, PsA and JIA [325-327, 329, 330, 340, 341].
These studies have been very informative in distinguishing disease specific
expression profiles such as the microarray analysis work by van der Pouw Krann
et al which discovered a type I IFN subpopulation of RA patients who had a
higher expression of type I IFN specific genes and a distinct biomolecular
phenotype compared to healthy controls [329]. Batliwalla et al performed a
similar microarray analysis comparing the PBCs of PsA patients to those of
healthy controls and identified specific genes that could discriminate healthy
controls from PsA patients, which they suggested could act as diagnostic
biomarkers for PsA [340]. Consequently, microarray analysis comparing healthy
and diseased peripheral blood cells have provided a wealth of information for
rheumatic disease and identified many disease specific genes and biological
processes.
However, this type of analysis is not without problems and several analyses have
reported skewing of the overall data and gene expression due to differing
numbers of cell subtypes within the whole blood. Batliwalla et al came across
this problem when examining the gene expression profiles of PBCs from RA
patients to those isolated from healthy controls. They found 40% of the genes
differentially upregulated in the RA cells were classed as ―monocyte enriched‖
which they later discovered was due to significantly higher numbers of

183
monocytes in the RA patient PBCs compared to those of healthy controls [326].
Thus whilst microarray analysis on whole blood cells is informative, difficulties
can arise when trying to account for differences in the number of cell subtypes
which can cause complications when trying to compare and verify work between
groups.
Whole blood microarray profiling may also be masking the individual contribution
of cell subtypes to the disease therefore microarray analysis of individual cell
types from diseased patients may be a useful strategy in understanding the
genetic makeup of these cells. Recently, a small number of studies have been
performed looking at the gene expression profiles of specific cell types in RA
such as B cells [336], CD4+ T cells [337] and fibroblasts [334]. One study
performed by Stuhlmuller et al has also analysed the gene expression of RA
blood monocytes isolated during the course of leukapheresis treatment [338].
However, at present there have been no studies analysing the blood monocytes
of RA and PsA compared to healthy donor blood monocytes. Given the
importance of the monocyte/macrophage in the pathogenesis of RA and PsA we
hypothesised that analysing the gene expression profile of this cell subset in
comparison to healthy controls may elucidate disease specific genes and also
discriminate differences in gene expression between the two diseases.
Peripheral blood isolated CD14+ cells were analysed from 8 RA patients, 8 PsA
patients and 5 healthy controls. When these samples were analysed on the PCA
plot (Figure 3.4) we discovered the intriguing result that all of the peripheral
blood samples were clustered together indicating a similar gene expression
profile expressed by the healthy and diseased sample conditions. Since most of
the previous microarray experiments of healthy vs diseased PBMCs have
demonstrated a significant difference in the genetic profiles of the two
conditions this result may suggest that the large genetic differences seen in
these experiments are not the result of differences in the monocytes but may be
due to large genetic differences between other cell subtypes.
Of the 12 genes which are upregulated in RA blood monocytes compared to PsA
monocytes three (NCAM1, PKP2 and LAMC1) are associated with cell adhesion
and interaction. Neural cell adhesion molecule 1 (NCAM1) otherwise known as
CD56 is usually expressed on cytotoxic cells such as natural killer (NK) cells and

184
NK-T cells. However, a small population of CD56+ monocytes have been
identified in healthy individuals which can present antigen and produce a variety
of monocyte cytokines in response to LPS stimulation [448]. CD56+ NK cells are
enriched at the inflammatory sites in RA where they have been found to interact
with monocytes and induce TNFα expression in a cell contact dependent manner
[251, 449]. Conversely, CD56+ CD8+ CD28- T cells displayed strong anti-
inflammatory properties in a SCID mouse chimera model of human RA by
interacting with APCs and causing the subsequent down-regulation of CD80 and
CD86 [450]. NCAM1 is known to mediate cell-cell adhesion and the data above
suggests that it plays a role in cell adhesion and interaction therefore we can
hypothesise that NCAM1 expression in RA blood monocytes may be playing a role
in cell-cell interaction.
PKP2 and LAMC1 are two novel genes not previously associated with RA.
Plakophilin 2 (PKP2) is normally found co-localised with adhesive junctions in
cardiomyocytes and epithelial cells [368, 369] therefore its possible role in RA
blood monocytes is unclear at present. LAMC1 (laminin gamma 1) is a subunit of
all laminin molecules which are major constituents of basement membranes and,
along with collagen, provide the basic scaffold to which other basement
membrane proteins, such as proteoglycan, integrate [374]. Laminins have
structural, adhesive and cell signalling functions and are able to modulate cell
signalling behaviour and migration by interacting with cell surface integrin
receptors [451]. Laminin has also previously been found to affect monocyte
phagocytosis, and play a role in monocyte migration by inhibiting their adhesion
to basement membranes thereby assisting their migration across the membrane
and also by inducing spontaneous migration within the cells [452-455]. LAMC1
has previously been detected in healthy blood monocytes, which was used to
produce the molecule laminin-8, monocyte adhesion to laminin-8 also produced
spontaneous and chemokines-induced migration [455]. Hence, the upregulation
of LAMC1 in RA blood monocytes could help play a role in the migration of these
cells across the basement membrane of the blood vessels thereby assisting their
infiltration into the joint.
Two genes which were upregulated in RA PB compared to PsA PB have previously
been shown to be associated with RA. These genes are NRP1 (neuropilin-1) and
IL7 (Interleukin 7). Neuropilin-1 is a receptor for vascular endothelial growth

185
factor (VEGF) and is expressed in the synovium of RA patients where it was
specifically associated with the lining layer, infiltrating leukocytes and
endothelial cells [357]. Recent work has shown that the interaction of
neuropilin-1 with VEGF prevented apoptosis and was therefore crucial to
rheumatoid synovial cell survival [357]. VEGF is detected in the serum of RA
patients [456] and has been found to correlate with the development of
radiographic damage and CRP level [457]. Since neuropilin-1 interaction with
VEGF has been shown to prevent apoptosis in synoviocytes we hypothesis that
neuropilin-1 is playing the same role in the blood monocytes and the
upregulation of NRP1 in the RA monocytes could be a mechanism to prolong their
survival.
IL-7 has also previously been described in RA, serum levels of the cytokine are
higher in RA patients compared to healthy controls and correlate with markers
of inflammation [371]. IL-7+ cells correlate with the numbers of CD68+ cells in RA
synovial lining and double staining has demonstrated that CD68+ cells are the
major producer of IL-7 [371]. In RA blood and synovial fluid IL-7R is primarily
expressed on T cells, with the highest expression on CD4+ cells. Numerous
studies have focused on the role of IL-7 in RA, synovial fluid isolated CD4+ T cells
are hyperresponsive to IL-7 and IL-7 enhanced cell-contact dependent activation
of T cells and macrophages resulting in TNFα production [373]. IL-7 also
enhances IFNγ and TNFα production from T cells [458]. Hence, the RA blood
monocytes positive for the IL7 mRNA in this present study may be a source of the
increased RA serum IL-7 levels and due to the cytokine‘s pro-inflammatory
properties could be contributing to increased inflammation seen in these
patients.
Analysing the group of 12 genes that are upregulated in PsA PB monocytes
compared to RA PB monocytes two groups of genes emerge, genes that are
associated with response to stress and toxins (GSTM1, GSTM2 and EIF2AK3) and
genes involved in transcription and its initiation (FOXP1, KLF9 and MED26).
Glutathione S-transferase M1 and M2 (GSTM1 and GSTM2 respectively) are part of
a broadly expressed family of enzymes which catalyse the conjugation of
glutathione and are involved in the detoxification of cytotoxic carcinogens and
metabolites. Glutathione is an intracellular antioxidant and is a prominent
defence against reactive oxygen species, it acts as a radical quencher in cells by
186
removing superoxide anions and hydrogen peroxide and works to maintain the
equilibrium between free radical production and antioxidant defence thereby
reducing oxidative stress damage [383]. Oxidative stress has previously been
shown to be implicated in the pathogenesis of RA and PsA where an excess of
free radicals causes oxidation and subsequent damage to cartilage, extracellular
matrix and DNA [459] and markers of oxidation have been found in the serum
and synovial fluid of patients [460, 461]. Hassan et al measured the level of the
antioxidant glutathione in RA serum compared to healthy controls and found it
to be decreased whereas the levels of the enzyme glutathione S-transferase
(GST) were increased, which the authors suggested could be a compensatory
mechanism in the absence of its substrate glutathione [462]. Since our data has
shown an increase in the levels of two GST proteins, GSTM1 and GSTM2, in PsA
blood monocytes compared to RA blood monocytes these PsA patients may also
be increasing their levels of these enzymes to due to the increased oxidative
stress associated with this disease and the decrease in antioxidant glutathione.
Of interest, polymorphisms in GST genes have been associated with RA
susceptibility, these genes include GST Theta (GSTT1), GST Pi (GSTP1) and in
particular one of our genes of interest GST Mu (GSTM1) [385]. Some of the
polymorphisms also show an additive effect with smoking and patients carrying
the polymorphisms who also smoke were found to be at an increased risk of
disease with higher disease severity [463]. Despite no susceptibility being
reported for PsA these findings highlight the potential importance of GST
enzymes within the pathogenesis of psoriatic arthritis.
Eukaryotic translation initiation factor 2-alpha kinase 3 (EIF2AK3) otherwise
known as PERK is an endoplasmic reticulum (ER) transmembrane protein kinase.
The function of the ER is to correctly fold and process proteins which are
intended for the secretory pathway before they are transported to the Golgi
apparatus. If the secretory demand exceeds the folding capacity of the ER, the
accumulated mis- or unfolded proteins, often called ER stress, activates the
unfolded protein response (UPR). The UPR aims to enhance the processing,
assembly and transport of secretory proteins. PERK is a UPR sensor, its role is to
reduce global translation thereby allowing the cell to correct for the impaired
protein folding resulting from the ER stress before allowing additional secretory
proteins to be synthesised [402]. PERK does this by phosphorylating eIF2 which

187
prevents the release of the translation factor from the ribosomal machinery and
thus reduces translation [464]. At present there have been no studies performed
on the role of the UPR in psoriatic arthritis, however another
spondyloarthropathy ankylosing spondylitis (AS) has shown associations between
the molecule HLA-B27, which is present in up to 96% of patients [465], and the
UPR. Research into AS in HLA-B27 transgenic rats has shown that HLA-B27 has
the propensity to mis-fold resulting in ER stress and the activation of the UPR
[466]. Consequently, the upregulation of the UPR sensor PERK in PsA compared
to RA blood monocytes may be an indication that the PsA monocytes are more
exposed to mediators of ER stress such as metabolic stress or mutant/over
expression of secreted proteins as is seen in the spondyloarthropathy AS which
shares some clinical features with PsA.
As mentioned above there are also a group of genes upregulated in PsA blood
monocytes which are associated with transcription initiation namely FOXP1,
KFL9 and MED26. Forkhead box P1 (FOXP1) is a member of the FOX family of
transcription factors and is involved in B cell development [390], thymocyte
development [391] and monocyte differentiation in vitro and in vivo [392, 467].
FOXP1 must be downregulated by the monocyte in order for it to fully
differentiate into a macrophage, because mice which are transgenic for FOXP1
have reduced M-CSF receptor expression, impaired migratory capacity and
diminished macrophage function such as cytokine production [392]. Since PsA
monocytes expressed FOXP1 as 2.7 fold change increase compared to RA
monocytes this could suggest that at the time of the samples being taken the RA
monocytes were more differentiated towards a macrophage phenotype
compared to the PsA monocytes.
Kruppel-like factor 9 (KLF9) is a member of the Kruppel-like family (KLF) of zinc
finger transcription factors. There are 25 KLFs proteins known at present, which
bind to GC/GT boxes found in promoter regions and enhancer/silencer regions of
multiple chromosomal genes [468]. KLF9 has been identified as having a
stimulatory role in neuronal cell process formation and differentiation [469] and
endometrial cell proliferation [470]. A recent study has also shown that mice
lacking KLF9 have disregulated intestinal crypt cell proliferation and villus cell
migration [471]. The exact role of KLF9 within PsA blood monocytes is unclear at
present but it could play a role in monocyte migration into the diseased joint.

188
Mediator complex subunit 26 (MED26) is one of at least 30 subunits that make up
the mediator complex. The mediator complex is a required part of
transcriptional activation and serves as an adaptor between the transcription
factors bound at the regulatory elements on the DNA and both RNA polymerase II
and the general transcription factors [472]. At present the exact role of MED26
within the mediator complex is unknown therefore it is difficult to speculate on
the role of MED26 on PsA blood monocytes however it could indicate an increase
in the amount of general transcription taking place within the monocytes.
Database for annotation, visualisation and integrated discovery (DAVID) software
was used in this analysis to determine if there is a significant enrichment of
different biological processes within the two remaining gene lists: (1)
differentially expressed genes between RA PB monocytes and healthy blood
monocytes (2) differentially expressed genes between PsA PB monocytes and
healthy blood monocytes.
The DAVID analysis of the genes which were expressed at a higher level in RA
blood compared to healthy blood monocytes (Figure 3.6) demonstrated two
distinct groups of genes, response to stimulus (indicated by the three biological
processes response to external stimulus, response to chemical stimulus and
response to wounding) and cellular movement (indicated by the three biological
processes chemotaxis, taxis and locomotion). The other biological processes
associated with this RA gene list were negative regulation of cellular process and
positive regulation of cellular process, which both contain many of the same
genes. Since these biological processes conflict highly with each other they were
not analysed further.
The RA blood monocytes may be up-regulating genes associated with response to
stimulus function due to the pro-inflammatory stimuli present in the serum of RA
patients which are not found in healthy controls. The three biological process
groups: response to stimulus, response to chemical stimulus and response to
wounding contain many of the same genes including; TSP1 (thrombospondin-1),
SOCS3 (suppressor of cytokine signalling 3) and CLU (clusterin). Thrombospondin-
1 has previously been associated with RA [473] and a recent study indicated that
serum thrombospondin-1 levels were increased in RA patients compared to
healthy controls and correlated with increased serum levels of pro-inflammatory

189
cytokines [474]. This study validates the data found in this experiment which
indicates thrombospondin-1 is expressed at a higher level in RA PB monocytes
compared to healthy controls and is significantly associated with biological
processes involving response to environmental stimuli.
Another gene associated with all three response to stimuli related biological
processes is suppressor of cytokine signalling 3 (SOCS3). The SOCS family consists
of SOCS1–SOCS7 and cytokine-inducible SH2 (CIS) and their role is to tightly
regulate the activity of the JAK-STAT pathway [475]. They are not constitutively
expressed in cells but their expression is induced by a range of cytokines via
activated STATs [476]. Once expressed they inhibit the JAK-STAT pathway by
several mechanisms such as prevention of STAT recruitment to activated
cytokine receptors, induction of substrate degradation and suppression of JAK
catalytic activity [477]. SOCS3 levels are significantly higher in RA PBMCs
compared to healthy controls, which was found to be due to the upregulation of
SOCS3 specifically in the RA blood monocytes [478]. SOCS3 overexpression is
effective in preventing the development of murine collagen induced arthritis
(CIA) [479] and SOCS3 knockout mice, which have a constitutive lack of SOCS3 in
hematopoetic and endothelial cells, developed a more severe form of acute IL-1
dependent inflammatory arthritis [480]. Taken together these results suggest
that SOCS3 is a critical negative regulator in inflammatory arthritis. Our data
indicate that SOCS3 is upregulated in RA PB compared to healthy control
monocytes which was also found by Isomaki et al [478]. This upregulation is no
doubt caused by the increased pro-inflammatory environment to which the RA
monocytes are exposed to within the blood and may be a regulatory mechanism
of the cells to try and reduce the overactive inflammatory response. However,
SOCS expression is known to alter cellular responsiveness to cytokines therefore
up-regulation of SOCS3 may be involved in disease progression by causing
unresponsiveness to anti-inflammatory genes.
Clusterin (CLU) was another gene associated with the response to stimulus
processes outlined in the DAVID analysis. It was the most differentially expressed
genes in the RA PB vs healthy blood monocyte comparison with a fold change
increase in RA PB of 40 it also had the second highest p value of 1.80 x10⁻⁴. Since
a multiple testing correction was unable to be used in the analysis a high p value
indicates that this change is more likely to be a true result and not a false

190
positive. CLU is a secreted heterodimeric protein which was initially described as
a complement inhibitor protein, where its role is to protect cells from the
membrane attack complex (MAC) by binding to the MAC and rendering it
physiologically inactive [481]. It has since been found to interact with a variety
of molecules including lipids, amyloid proteins, and Igs. However, unravelling
the function of CLU is complicated by its ability to interact with several
molecules and its differential expression in many diseased states such as
neurodegenerative disease and cancer [482, 483]. Recently it became apparent
that different functions of CLU might depend on its final maturation and
localisation, and whilst its predominant form is a secreted 80 kDa heterodimeric
protein (sCLU) a nuclear form of the protein (nCLU) has also been reported
which is thought to be responsible for its functions involving NF-κB and apoptosis
[484]. This suggests that CLU can have different functions depending on whether
it is expressed inside or outside of the cell.
Santilli et al reported that the intracellular level of nCLU could be essential for
regulation of NF-κB activity through its ability to stabilise inhibitors of NF-κB
(IκB) [485]. Consequently, Devauchelle et al further demonstrated that nCLU
interacts with phosphorylated IκB and prevented it from being degraded by the
E3 ubiquitin ligase βTrCP and therefore blocking NF-κB activation [486]. This
latter study was based on the result of a previous microarray experiment which
demonstrated significantly lower amounts of CLU in the synovial membrane of
RA patients compared to OA [320]. Subsequently it was concluded that the lack
of CLU within the RA synovium would result in enhanced IκB degradation and
therefore a greater activation status of NF-κB enabling pro-inflammatory gene
expression. This finding was also supported by their observation that siRNA
induced knockdown of CLU in cultured fibroblast-like synoviocytes (FLS) resulted
in increased production of IL-8 and IL-6 cytokines which are regulated by NF-κB
[486].
Numerous studies have analysed the role of CLU in the apoptosis of cancer cells
but once again the function of CLU may depend on its form and localisation.
sCLU inhibits apoptosis in human cancer cells by interfering with Bax activation
in mitochondria [487] however, nCLU has been found to be pro-apoptotic as
overexpression of nCLU resulted in cell death in both the presence or absence of
ionizing radiation [488]. It is now accepted that a shift from the cell producing

191
sCLU to nCLU would result in cell death as nCLU has been found to induce cell
death in many experimental conditions [489].
The finding that RA blood monocytes highly upregulate CLU compared to healthy
blood monocytes is a significant one and has not been demonstrated previously.
Of note the same pattern of upregulated CLU expression is also seen in PsA blood
monocytes compared to healthy controls. Many reports conclude that CLU is an
anti-inflammatory molecule in arthritis as CLU has been found at a reduced level
in RA synovium compared to OA synovium [320] and CLU knockout mice induced
with the K/BN model of arthritis developed arthritis faster which also lasted for
longer compared to the control mice [490]. Hence the reasons for the large
upregulation of CLU in RA PB (40 fold change increase) and PsA PB (20 fold
change increase) compared to healthy controls are unknown. Since most reports
demonstrate that CLU is anti-inflammatory the monocytes may be upregulating
CLU as a counteractive mechanism as a result of the pro-inflammatory
environment. Two of the most studied functions of CLU are inhibition of the NF-
κB pathway and induction of apoptosis. However, since several of the NF-κB
target genes, such as IL-6, are consistently upregulated in the serum of RA
patients and there have been no reports of increased apoptosis levels in PsA or
RA PB monocytes, to the contrary the antiapoptotic molecule Mcl-1 has been
found to be increased in CD14+ cells isolated from RA SF [491], this may suggest
that CLU may have a different function within arthritic blood monocytes. CLU is
a heterogenous molecule with many differing, often conflicting, functions and
further work into the expression of this molecule within the cells and serum of
RA and PsA patients is necessary.
The second group of biological processes upregulated in RA PB monocytes
compared to healthy controls were associated with cellular movement, indicated
by the three biological processes chemotaxis, taxis and locomotion. This group
of biological processes in significant for the pathogenesis of RA as one of the
earliest events in RA is the ingress of leukocytes into the inflamed synovial
tissue. In order for the cells to enter the synovium from the blood they must
adhere to the endothelial cells and then migrate into the interstitial matrix
which is aided by the upregulation of chemokines and chemokines receptor on
the leukocytes and the endothelial cells [136]. Once again due to the
heterogeneous nature of genes and their various functions many of the same

192
genes were significantly associated with all three chemotaxis associated
biological processes which indicate the importance of cellular movement to the
RA PB monocytes. Some of the genes associated with these biological processes
are LAMC1, FPR1, FPR2 and PPBP.
Laminin gamma 1 (LAMC1) has been described earlier on in this discussion as it
was significantly upregulated in RA PB compared to PsA PB. It is a basement
membrane molecule and may be helping the RA monocytes migration across the
basement membrane of the blood vessels thereby allowing their subsequent
infiltration into the joint. The two genes formyl peptide receptor 1 (FPR1) and
formyl peptide receptor 2 (FPR2) were also both included in the chemotaxis,
taxis and locomotion biological process groups. The protein product of FPR1 is
known as formyl peptide receptor (FPR) and the protein product of FPR2 is
denoted as formyl peptide receptor-like 1 (FPRL-1) which both belong to the
seven transmembrane domain Gi-protein-coupled receptor (GPCR) family. Two
of the main sources of ligands for this family of receptors are bacterial [492] and
mitochondrial proteins [493] therefore the main function of these receptors is
thought to be to mediate trafficking of phagocytes to sites of bacterial invasion,
tissue damage or cell necrosis, although anti-inflammatory functions of some
ligands has also been proposed [494]. FPR and FPRL-1 are detected on
phagocytic leukocytes especially monocytes and neutrophils and activation of
these receptors by their agonists results in Ca2+ mobilisation and cellular
migration [495].
There are numerous ligands for FPR and FPRL-1 and several of them have been
previously found in the serum and synovial fluid of RA, one such ligand is soluble
form of the urokinase-type plasminogen activator receptor (suPAR). suPAR is a
ligand for FPRL-1 and has been demonstrated to be released by neutrophils
isolated from the PB and SF of RA patients. Cell lines expressing FPRL-1 migrated
towards the supernatants harvested from RA neutrophils thereby suggesting that
neutrophils may be involved in the recruitment of FPRL-1 expressing cells into
the diseased synovium [496]. Consequently, the upregulation of FPR and FPRL-1
in RA blood monocytes in comparison to healthy control blood may be due to
pro-inflammatory environment that the RA blood monocytes are exposed to
which has been shown to contain the ligands for these receptors. Activation of
FPR and FPRL-1 has been demonstrated to induce monocyte migration therefore

193
the upregulation of these genes may be a mechanism to induce monocyte
recruitment into the synovial joint.
Pro-platelet basic protein (PPBP) otherwise known as CXCL7 is the third gene
associated with the cell migration group of biological processes upregulated in
RA monocytes. It is translated as a 14 kDa propeptide called PPBP or leukocyte
derived growth factor (LDGF) which can then be cleaved into several smaller
forms called platelet basic protein (PBP), β-thromboglobulin (β-TG) connective
tissue activating protein-3 (CTAP-III) and neutrophil activating peptide-2 (NAP-2)
[497]. Peptidases such as cathepsin G, are known to play a role in the post-
transcriptional modifications of PPBP [498]. The derivatives of PPBP have
amazing functional diversity: NAP-2 is a potent neutrophil chemoattractant
[497]; PBP and CTAP-III have antimicrobial activity and LDGF itself is a fibroblast
mitogen [497]. PBP was originally thought to be expressed only by cells of the
megakaryocyte lineage but it has since been shown to be expressed by
monocytes in response to various stimuli such as exposure to microbial
components LPS or zymosan [499]. CTAP-III has previously been found in the
blood circulation of RA patients, deposition of CTAP-III was found in the
synovium and is associated with a partial processing to NAP-2 isoforms [500]. It is
difficult to speculate on the importance of the upregulation of PPBP in RA blood
monocytes due to its ability to be cleaved into several smaller forms which all
have differing functions especially since cathepsin G, which can cleave PPBP, is
present in RA serum [501]. Its main function may be to act as a neutrophil
chemoattractant however further investigations are needed.
The biological processes downregulated in RA PB compared to healthy control PB
monocytes display three main functions: protein complex localisation
(demonstrated by the two biological processes cellular protein complex
localisation and protein complex localisation), selenocysteine incorporation
(translational readthrough and selenocysteine incorporation) and negative
regulation of cell movement (demonstrated by the three biological processes
negative regulation of cell migration, locomotion and cell motion). A
downregulation in protein complex localisation was indicated by the decrease in
expression of SMAD7 (SMAD family member 7) and TMEM48 (transmembrane
protein 48). SMAD7 is an inhibitor of TGF-β signalling, TGF-β is a multifunctional
cytokine which regulates cell growth, adhesion and differentiation in a variety of

194
cell types and it is also a potent immunosuppressor. Therefore the RA PB
monocytes downregulating SMAD7, the inhibitor of TGF-β, may be an
autoregulatory mechanism to compensate for the increased inflammatory
processes taking place. However SMAD7 had also been demonstrated to
negatively regulate signalling intermediaries in pro-inflammatory signalling
pathways such as NF-κB, in this pathway SMAD7 plays a role in increasing IκB
expression [502]. Consequently the downregulation of SMAD7 by the RA PB
monocytes may conversely enable NF-κB signalling and increase the production
of pro-inflammatory cytokines therefore contributing to the increased pro-
inflammatory cytokines detected within RA serum. The other gene associated
with protein complex localisation is TMEM48 that codes for the protein
nucleoporin NDC1. This protein is required for nuclear pore complex assembly
which are large multiprotein complexes that span the nuclear envelope forming
a selective channel between the cytoplasm and the nucleus. There is very little
information regarding nucleoporin NDC1 therefore at present the relevance of
the downregulation of this gene in RA blood monocytes is unclear.
Selenocysteine incorporation was also process downregulated by the RA PB
monocytes indicated by the downregulation of the genes SEPSECS (Sep (O-
phosphoserine) tRNA:Sec (selenocysteine) tRNA synthase) and TRSPAP1 (tRNA
selenocyteine associated protein 1). Selenocysteine incorporation it is an
essential process required for the production of at least 25 selenoproteins.
Selenocysteine is comprised of the trace element selenium which is an
antioxidant, deficiency of this element results in increase reactive oxygen
species (ROS) [503]. Selenium levels are reduced in the serum and synovial fluid
of RA patients compared to controls and this reduced selenium is associated with
increased risk of the disease [504]. Hence, a reduction in the selenium levels in
the serum of the RA patients could be the reason for the downregulation of
genes associated with selenocysteine incorporation in RA PB monocytes. Of note,
selenium deficiency in RAW 264.7 macrophages had significantly increased
inducible nitric oxide synthase activity (iNOS) and subsequent nitric oxide (NO)
production after stimulation with LPS [505] therefore a reduction in selenium
and selenocysteine incorporation in RA PB monocytes may be one mechanism
causing the increased iNOS and NO seen in RA [506].

195
The third group of biological processes downregulated in RA PB monocytes was
negative regulation of cell movement which again emphasises the importance of
the process of chemotaxis and extravasation for the diseased monocytes. The
downregulated RA genes associated with this biological process are SMAD7,
which has been previously discussed, and VASH1 (vasohibin 1). Vasohibin 1 is a
negative feedback regulator of angiogenesis which was originally identified in a
microarray analysis designed to analyse the upregulated genes induced by
vascular endothelial growth factor (VEGF) stimulation in endothelial cells [388].
Subsequent immunohistochemistry analysis has identified vasohibin 1 in the
synovium of RA patients associated with synovial lining cells, endothelial cells
and synovial fibroblasts [507]. At present there has been no vasohibin 1
identified specifically in monocytes therefore our observation may represents a
novel one. Inflammatory cytokines were shown to induce vasohibin 1 expression
in RA synovial fibroblasts [507] and its expression is thought to help co-ordinate
the formation of blood vessels and angiogenesis in the synovium. Consequently,
the downregulation of vasohibin 1 in RA blood monocytes could be due to it not
being required by the blood cells and may be upregulated again once the
monocytes enter the inflamed synovium. Analysing the RA SF macrophage
samples (which will be discussed thoroughly in the next comparison of this
chapter) this hypothesis is correct. The RA PB CD14+ express a low level of
vasohibin 1 compared to healthy controls and this expression is increased by a
fold change of 13 in the patient matched RA SF macrophages. This result
indicates that the monocytic cells downregulate their vasohibin 1 expression
until they migrate into the synovial fluid of RA patients where its anti-angiogenic
properties are needed to regulate and co-ordinate the formation of blood
vessels.
DAVID analysis was also performed on the differentially expressed genes
between PsA PB monocytes and healthy blood monocytes. After removal of gene
repeats in the list and genes with no designated function the list of 154 genes
upregulated in PsA blood monocytes was reduced to 92 and the list of 129 genes
downregulated in PsA blood monocytes was reduced to 66 genes. The two
biological processes associated with the 92 upregulated genes in PsA were DNA
packaging (demonstrated by the groups nucelosome assembly, chromatin
assembly, protein-DNA complex assembly, DNA packaging and chromatin

196
assembly and disassembly) and chemotaxis (demonstrated by the groups
chemotaxis and taxis). Again because genes can be part of several biological
process groups each of the six biological process groups which had the shared
general function of DNA packaging all had the same six genes from the PsA gene
list associated with them. These genes were HIST1H2BK (histone cluster 1,
H2bk), TSPYL5 (TSPY-like 5), HIST1H2AC (histone cluster 1, H2ac), HIST3H2A
(histone cluster 3, H2a), NAP1L5 (nucleosome assembly protein 1-like 5) and a
probe on the Affymetrix GeneChip which targets six histone cluster 1 genes.
Surprisingly there is very little to no information on the function or role of any of
these genes particularly the histone genes. The function of NAP1L5 is also
unknown but its shows homology to nucleosome assembly protein 1 which is
involved in the translocation of histones from the cytoplasm into the nucleus
[508]. Given that the role of histones is to provide a core around which DNA is
packaged to form a nucleosome, the basic unit of chromatin, it could be
suggested that the PsA blood monocytes upregulating genes responsible for DNA
packaging would therefore prevent any further gene transcription. However, the
importance of this observation cannot be fully understood until the roles of the
upregulated genes are discovered.
The second group of biological processes associated with the genes upregulated
in PsA PB monocytes had the general function of chemotaxis. This result is the
same as that seen in the upregulated genes in RA PB monocytes, and the same
genes such as FRP1, FRP2 and PPBP are upregulated in both cell subsets. Once
again this highlights importance of chemotaxis to the arthritic blood monocyte
as it is via chemotaxis that the cell will move into the diseased joint. The
increased levels of chemokines and pro-inflammatory mediators detected in the
serum of PsA patients compared to healthy controls may be one of the triggers
causing the upregulation of chemotaxis related genes in the PsA monocytes [406,
509].
The two main biological processes associated with the downregulated genes in
the PsA blood monocytes have the main functions of cell morphogenesis
(demonstrated by the biological processes cell projection morphogenesis, cell
part morphogenesis, cell morphogenesis, cell projection organisation and
cellular component organisation) and osteoclast differentiation (demonstrated
by the biological processes regulation of osteoclast differentiation, regulation of

197
myeloid leukocyte differentiation and positive regulation of osteoclast
differentiation). Downregulated PsA genes associated with the cell
morphogenesis biological processes include DYNC1I2 (dynein, cytoplasmic 1,
intermediate chain 2) and DST (dystonin). Dynein is an energy dependent motor
protein found to be associated with microtubules which moves cellular cargo,
such as organelles, vesicles and RNA, towards the minus end of the
microtubules. DYNC1I2 is one of two intermediate chains which are involved in
intracelluar dynein cargo transport by binding to specific cargo although the
mechanisms of this are not fully understood [510]. Dystonin is a cytoskeletal
interacting protein which is known to play important roles in maintaining
cytoarchitecture integrity in skin and in the neuromuscular system, it is thought
to act as a ―linker‖ protein linking elements of the cytoskeleton to each other or
to subcellular components such as adhesion structures [511]. Since there are no
reports of disregulated cytoskeletal or microtubule transport in PsA the
importance of these downregulated genes in PsA is yet to be understood.
Downregulated genes associated with the osteoclast differentiation include GNAS
(GNAS complex locus) and KLF10 (Kruppel-like factor 10). GNAS codes for the
protein Gs α-subunit (Gsα) which is a subunit of G proteins. G proteins are
membrane associated complexes that are primarily involved in signalling at the
plasma membrane. Gsα plays a central role in receptor mediated signal
transduction, coupling receptor activation with the production of cAMP [512]. It
is well known that G-protein coupled receptors play a substantial role in arthritis
as the signal transducing receptors for many molecules such as MMPs and
chemokines [513, 514]. However, the GNAS complex locus has recently been
identified as an incredibly complex gene which encodes multiple gene products
through the use of alternative promoters and first exons [515] such as extra-
large isoform Gsα, which is thought to be localised to the Golgi apparatus, and
NESP55 amongst others [512]. Consequently, this multiple gene product
complexity renders it impossible to try and understand the significance of the
down-regulation of this gene in PsA blood monocytes since we do not know
which end product of the gene the PsA and healthy monocytes are translating
and producing.
KLF10 otherwise known as TGFβ early gene-1 (TIEG) is a zinc finger transcription
factor which plays an important role in mediating the TGFβ Smad signalling

198
pathway. TIEG overexpression enhances Smad 4 activity and the induction of
TGFβ target genes [516]. Overexpression of TIEG in an epithelial cell line
induced apoptosis [517] and reduced cell proliferation in a human osteosarcoma
cell line which was also seen in control cells stimulated with TGFβ [518]. Hence
the PsA monocytes may be downregulating the TIEG gene in order to avoid TGFβ
mediated apoptosis and suppression of cellular activation and proliferation. Of
note, this mechanism is seen in cancer cells which are known to downregulate
their TIEG expression at the protein and mRNA level in order to avoid cell death
and reduced proliferation [519].
In conclusion the diseased and healthy blood comparison has been very
informative in defining the biological functions of the groups of genes up- or
downregulated by each monocyte subset as well and allowing the investigation
of individual genes. The PCA analysis performed on the entire set of microarray
samples indicated the surprising result that the peripheral blood monocytes from
healthy donors, RA patients and PsA patients all had a very similar genetic
profile. In addition, performing statistical and fold change analyses on the data
did result in the identification of just 24 genes which were differentially
expressed between the RA and PsA blood monocytes. This low result
demonstrates that within the blood the monocyte may not a cell type
responsible for the differing clinical features seen in both diseases since this cell
subset is showing a similar genetic profile in both diseases.
The 12 genes which were upregulated in RA blood compared to PsA blood
monocytes contained a group of genes which had roles in cell adhesion and
interaction, such as the laminin subunit LAMC1, as well as genes that had been
previously associated with RA including the IL-7 gene. This latter result is
encouraging as the presence of differential expression in genes previously
associated with RA validates this dataset. The 12 genes which were upregulated
in PsA blood compared to RA blood monocytes contained two groups of genes,
one group had functions involved in the response to stress and toxins such as
EIF2AK3/PERK and the other group of genes were involved in transcription and
its initiation. It would be interesting to perform validation experiments on some
of these genes especially those which have not been previously associated with
monocytes in inflammatory disease. Laminin and its receptor expression has
previously been associated with synovial fibroblasts in RA [520] but we believe

199
this is the first time the expression of a laminin subunit (LAMC1) has been found
in RA blood monocytes and further experiments are needed in order to elucidate
the function of LAMC1 in particular whether the monocyte is producing and
releasing laminin molecules. The upregulated expression of EIF2AK3/PERK in PsA
monocytes is another novel and interesting finding since this molecule is
involved in the ER stress induced unfolded protein response (UPR). The UPR has
not previously been implicated in the pathogenesis of PsA but has been well
researched in another spondyloarthropathy ankylosing spondylitis (AS) [466, 521]
which shares some clinical features with PsA. Unfortunately time restrictions
meant that no further experimental or validation assays were able to be
performed on these genes.
The RA PB vs healthy PB monocyte comparison was also very revealing in
illustrating the overall functions of the differentially expressed genes. In
comparison to healthy blood monocytes the RA PB cells showed an upregulation
of genes involved in response to stimulus such as CLU and genes involved in
cellular movement such as CXCL7. These two groups of genes are not surprising
given that it is well known that the RA serum contains many pro-inflammatory
mediators compared to healthy control serum which will be partly responsible
for the upregulation of the response to stimulus genes. It is also known that the
monocyte cells in RA need to undergo chemotaxis and migration in order to
transmigrate from the blood vessels into the synovial joint where they
accumulate and play a role in the damage and destruction of the joint.
The downregulated genes in RA PB had functions in complex localisation,
selanocysteine incorporation and negative regulation of cell movement. The
down-regulation of two genes involved in selanocysteine incorporation was
interesting as selenium, the main component of selanocysteine, is decreased in
the serum and synovial fluid of RA patients but also selenium deficiency has
been shown to induce increased iNOS and subsequent nitric oxide (NO)
production in RAW 264.7 macrophages. Therefore a lack of serum selenium may
directly be contributing to the increased NO and NO-induced damage seen in RA.
Down-regulation of genes associated with the negative regulation of cell
movement also reinforces the importance of the ability of the RA monocytes to
undergo chemotaxis and cell migration.

200
The upregulated genes in PsA blood monocytes compared to healthy blood
monocytes had roles in DNA packaging and chemotaxis. An upregulation of genes
associated with DNA packaging could suggest that the PsA monocytes are
reducing their overall transcription levels by packing their DNA into nucleosomes
and chromatin. However, since there is little to no information on any of the six
upregulated genes associated with the DNA packaging function it is difficult to
speculate further on the reasons for their increased expression compared to
healthy controls. The upregulated genes associated with chemotaxis are the
same genes upregulated in RA PB monocytes such as CXCL7, FPR1 and FPR2. The
increased expression of these genes in PsA blood compared to healthy control
demonstrates the importance of the arthritis specific requirement for the
monocyte to migrate out of the blood and into the diseased joint. The
downregulated genes in PsA monocytes identified an interesting transcription
factor TIEG which is known to induce apoptosis; therefore the PsA monocytes
may be down-regulating molecules like TIEG in order to maintain and prolong
cell survival as has been seen in cancer cells.
Due to time restrictions only 5 healthy control blood monocyte samples were
obtained which mainly were age- and sex-matched to the PsA patients. It is
recognised that obtaining additional healthy donor samples which were age-
matched to the RA patients would have been advantageous and allowed us to
investigate the age specific genes that may have changed in the monocytes.
Nevertheless, the analysis performed with the 5 healthy donors has been very
informative in identifying the differentially regulated genes in the monocytes
including novel genes not previously associated with inflammatory arthritis. This
analysis has also identified that the blood monocytes in RA and PsA have very
similar genetic profiles which was also previously unknown.

201
3.7.2 Comparison 2: RA and PsA blood versus matched synovial fluid
Given the important role of synovial macrophages in the pathogenesis of both RA
and PsA one important question to be answered by this microarray analysis was
what changes occur in the arthritic monocyte as it exits the blood and enters the
synovium? This is an important question as it aims to identify not only the
monocyte differentiation markers as it changes from a monocyte into an
inflammatory macrophage but it will also identify the inflammatory genes that
are upregulated once the monocyte is exposed to the pro-inflammatory synovial
environment.
In order to answer this question paired T tests were performed between the
matched RA blood and synovial fluid samples and a separate set of paired T tests
were performed between the matched PsA blood and synovial fluid samples in
order to determine the up- and down-regulated genes in the synovial
macrophages compared to the blood monocytes. Due to the substantial amount
of differentially expressed genes between the PB and SF of each disease (10763
in RA and 9533 in PsA) we applied a fold change cut off of 4 to the data since
fold change values in microarray analysis are arbitrary and we were interested in
genes with a high fold change difference between the blood and the SF.
Ingenuity pathway analysis (IPA) was then used to determine the canonical
pathways and molecular functions significantly associated with the differentially
expressed genes in the RA SF compared RA PB CD14+ cells and those significantly
associated with the differentially expressed gene in the PsA SF compared to the
PB CD14+.
3.7.2.1 RA PB CD14+ versus RA SF CD14+
Table 3.6 shows the top 5 canonical pathways significantly associated with the
differentially expressed genes in the RA SF macrophages compared to the RA PB
monocytes. The most significantly associated pathway is LXR/RXR activation
pathway. LXR is a nuclear receptor ligand-activated transcription factor, it forms
heterodimers with RXR before binding to the DNA sequences of target genes
[522]. Analysing the list of RA SF differentially expressed genes associated with
this pathway demonstrates the novel finding that one of the LXR isoforms LXRα
which has been previously been shown to be expressed in
202
monocytes/macrophages [523] is upregulated in RA SF macrophages compared to
RA PB. Other RA SF upregulated genes associated with this pathway include the
a range of LXR target genes such as ABCA1, ABCG1, lipoprotein lipase (LPL),
ApoE, ApoC1 and ApoC2 which are all involved in reverse cholesterol transport
and cholesterol efflux [524, 525]. This process ensures the efflux of cholesterol
from peripheral cells and its transport to the liver for metabolism and biliary
excretion hence the LXR activation pathway is considered to be central in
maintaining cholesterol homeostasis and is considered protective against
atheroscleosis.
However, LXR agonism has also been considered pro-inflammatory since LPS-
stimulated human macrophages treated with two synthetic LXR agonists
increased TNFα expression though the ability of LXRs to increase Toll-like
receptor 4 (TLR4) expression; this agonism also increased reactive oxygen
species generation from the macrophages [526]. LXR agonism has also been
demonstrated by our group to exacerbate articular damage in a murine model of
arthritis suggesting LXRs have a pro-inflammatory role in arthritis [527]. In this
study, LXR agonism induced a dose-dependent enhancement of the prevalence,
incidence and severity of the collagen induced arthritis (CIA) mouse model. Ex
vivo culture of RA PB derived monocytes which were LPS stimulated and treated
with two LXR agonists showed an increase in IL-6 and TNFα production.
Macrophages stimulated in the in vitro inflammatory model of arthritis by direct
cell contact with Tcks also demonstrated an increase in pro-inflammatory
cytokine and chemokine production in response to LXR agonism. Low density
lipoprotein (LDL) is a natural agonists for LXR activation and has been found in
the synovial fluid of RA patients [528] therefore the up-regulation of the LXR
pathway in RA SF macrophages compared to PB monocytes along with the
presence of its agonist in the synovial fluid indicates that this pathway may be
promoting articular destruction through inducing the increased production of
pro-inflammatory cytokines and chemokines from the synovial macrophages.
However more work on the role of LXR activation in RA SF macrophages is
required to test this hypothesis.
The hepatic stellate cell activation canonical pathway is the second most
significant pathway differentially expressed in RA SF CD14+ cells. This is due to
the overlap of several MMPs, chemokines, cytokines and growth factors that are

203
implicated in both hepatic stellate activation and synovial macrophage
activation. For example platelet-derived growth factor alpha polypeptide
(PDGFA) and PDGFB were both upregulated in the RA SF macrophages and these
genes have also been implicated in hepatic stellate cell induced hepatic fibrosis
[529, 530]. PDGF is a potent mitogen, chemoattractant and angiogenesis
promoter [531] and the level of this growth factor is increased in RA synovial
tissue and fluid [532, 533]. PDGF has been implicated in RA through its function
as a growth factor for fibroblast-like synoviocytes (FLS) [532, 533]. It has
recently been shown that in combination with TGF-β, PDGF augmented TNFα or
IL-1β induced MMP3, IL-6, IL-8 and macrophage inflammatory protein 1 alpha
(MIP1α) secretion by FLS suggesting PDGF induces a more pro-inflammatory,
aggressive phenotype in the FLS in response to TNFα [534]. Consequently, the
increased expression and possible secretion of PDGFA and PDGFB by RA SF
macrophages may be contributing to articular damage by activating synovial FLS.
The remaining genes differentially expressed in RA SF macrophages which were
associated with the hepatic stellate cell activation canonical pathway consist of
many inflammatory cytokines, chemokines and growth factors which have
previously been connected with RA. These genes include FN1 (fibronectin) which
is detected in the synovial fluid of RA and can induce MMP expression from
fibroblasts [425]; the gelatinases MMP2 and MM9 (matrix metalloproteinase 2 and
9) which are both upregulated in the synovium of RA patients [535] and their
levels are associated with increased joint erosions [536]; CCL2 (monocyte
chemoattractant protein 1, MCP1) is also increased in the synovium and is a
potent chemoattractant for immune cells [537]; and CSF1 (macrophage colony
stimulation factor, M-CSF). M-CSF is a growth factor which controls the
proliferation, survival and differentiation of mononuclear phagocytes, it is
normally expressed by the tissue environment however macrophages can also
produce and secrete M-CSF if the tissue cells are unable to supply large amounts
of the growth factor [538]. In conclusion, the association of the hepatic stellate
cell activation pathway with the genes differentially expressed in the RA SF
macrophages compared to RA PB monocytes has highlighted the upregulation of
several important inflammatory genes discussed above. However not only do the
SF macrophages up-regulate genes which will contribute to the pro-inflammatory
environment but they also demonstrate increased expression of the macrophage

204
differentiation and survival factor M-CSF which could help differentiate
monocytes infiltrating into the joint into pro-inflammatory macrophages.
The third canonical pathway is defined as the role of macrophages, fibroblasts
and endothelial cells in RA. The association of this canonical pathway validates
the genes that are differentially expressed by the RA SF macrophages as many of
these genes are known to be expressed in the RA synovium. This pathway
contains many of the upregulated genes which were associated with the hepatic
stellate cell activation pathway such as fibronectin, MMP2, MMP9 and the two
PDGFs as well as other genes such as TRAF5 (TNF receptor-associated factor 5),
WNT5A (wingless type MMTV integration site family member 5A) and FZD7
(frizzled homolg 7).
TRAFs are cytoplasmic adaptor proteins for the TNF/IL-1/TLR receptor
superfamily, they are responsible for transducing extracellular signals from cell
surface receptors and activating intracellular signalling cascades such as the NF-
κB and the JNK signalling pathways [539]. The RA SF macrophages demonstrated
a 5 fold increase in TRAF5 expression compared to matched blood monocytes
and interestingly a SNP upstream of TRAF5 has been identified as an RA
susceptibility gene [540]. TRAF5 interacts with lymphotoxin β receptor (LTβR)
and CD40 and has shown functional redundancy with TRAF2 [541]. Both TRAF2
and TRAF5 can mediate TNF-induced NF-κB activation and protection from cell
death [539]. Hence, an upregulation of TRAF5 in the RA SF macrophage may
imply that it plays a proinflammatory role such as increased cellular activation
and transcription of other proinflammatory cytokines. However, a recent study
into the role of macrophage TRAF5 in atherosclerosis found it to be anti-
inflammatory as murine monocytes deficient for TRAF5 demonstrated an
upregulation of cell adhesion molecules implicated in cell adhesion and rolling
and also enhanced migration and chemokine production [542]. Since macrophage
TRAF5 has not been examined in RA at present further studies are required to
distinguish whether TRAF5 plays a pro- or anti-inflammatory role in this disease.
WNT5A was also upregulated in the RA SF macrophages compared to the blood
monocytes, Wnt-5a is one of 19 Wnt proteins which are a family of secreted
lipid-modified glycoproteins that display a highly regulated pattern of expression
and have distinct roles during development and tissue homeostasis. The

205
importance of Wnt-5a in various developmental pathways is demonstrated in
Wnt-5a knockout mice which die at birth and display many defective features
such as facial abnormalities, truncated bodies and shortened limbs [543]. Wnt
signalling pathways are activated by the binding of secreted Wnt to the cystolic
domain of a family of transmembrane receptors called the Frizzled receptor
proteins (Fz) [544]. The binding of Wnts to their receptors determines the type
of downstream signalling pathway either canonical, which involves the
transcriptional activation of β-catenin, or non-canonical which does not involve
β-catenin. Wnt-5a is classed as a non-canoical Wnt which are generally
considered to control morphogenic movement. In RA Wnt-5a has been shown to
be upregulated in synovial fibroblasts where it binds to frizzled 5 (Fz5), and the
downregulation of Wnt-5A or Fz5 both resulted in inhibition of synovial fibroblast
activation [545].
Wnt-5a has also been demonstrated to be upregulated in human macrophages
stimulated with bacterial pathogens in vitro as it was demonstrated that
activation of TLR4 signalling cascade induced Wnt-5a expression. These
macrophages also expressed Fz5 and it was demonstrated that Wnt-5a and Fz5
regulated the microbially induced IL-12 release from these cells [546]. Wnt-5a
has been demonstrated to be expressed in macrophages of murine and human
atherosclerotic plaques associated with TLR4 [547] and has also been
demonstrated to be critical for invasion and MMP7 and TNFα release from
tumour associated macrophages which were found to be positive for Wnt-5a
[548]. Consequently the upregulation of Wnt-5a in the RA SF macrophages may
be as a result of increased TLR4 signalling since TLR4 ligands are present in the
RA synovium [549]. Both synovial fibroblasts and macrophages have been
demonstrated to express a Wnt-5a receptor Fz5 therefore the secretion of Wnt-
5a by synovial macrophages could be acting in an autocrine or paracrine manner
by stimulating surrounding cells. This activation by Wnt-5a could cause
inflammatory cytokine and proteinase secretion by synovial fibroblasts or
macrophages thereby contributing to the synovial joint damage.
FZD7 (frizzled homolog 7) was another gene upregulated by the RA SF
macrophages which was associated with role of macrophages and fibroblasts in
RA canonical pathway. As mentioned above frizzled molecules are the cell
surface receptors for Wnt proteins and the subsequent binding of these two

206
molecules activates the Wnt signalling pathways. Frizzled 7 (Fz7) has previously
been detected in RA synovial tissue [550] and a recent paper has demonstrated
the Fz7 can associate with Ror2 to form a receptor complex to mediate Wnt-5a
signalling and activation of the JNK signalling pathway [551]. Put together this
novel data demonstrates the upregulation of a Wnt protein (Wnt-5a) and part of
its receptor complex (Fz7) specifically in RA synovial macrophages, further work
is required to elucidate the importance of these molecules in RA pathogenesis
however they could play a role in the invasive potential, inflammatory mediator
secretion and sustained activation of these cells.
The differentially associated genes with the role of macrophages and fibroblasts
in RA canonical pathway was also associated with genes that were
downregulated in RA SF macrophages compared to their matched PB monocytes.
Two of these downregulated RA SF macrophage genes were TLR5 and TLR7. The
activation of TLRs by pathogen-associated molecular patterns (PAMPs) alters the
host to presence of infection and triggers a variety of defense mechanisms, such
as the production of pro-inflammatory cytokines and chemokines, depending on
the receptor and cell type. Several TLRs have been detected in RA synovium as
well as candidate endogenous TLR ligands [552] therefore the perpetual
activation of TLR signalling has been identified as a potential mechanism for the
maintenance of the chronic inflammation seen in RA. TLR5 has not previously
been identified in the synovium of RA however stimulation of FLS from RA and
JIA patients with the TLR5 ligand flagellin did induce IL-6, MMP1 and MMP3
production suggesting that these FLS expressed TLR5 [553].
TLR7 has been demonstrated to be expressed within the RA synovium [554].
However, when DCs isolated from RA patients were stimulated with TLR7 ligands
the level of cytokine production was similar between DCs from RA and those
from healthy patients. This was in marked contrast to TLR2 or TLR4 stimulation
which induces a much higher production of inflammatory mediators for RA DCs
compared to healthy controls [554]. This result suggests that TLR7 may not as
essential to the perpetuation of arthritis as TLR2 and TLR4, which is further
verified by the observation that TLR2 and TLR4 deficient mice do not develop
serum transfer or streptococcal cell wall-induced arthritis [555, 556].
Consequently, the downregulation of TLR5 and TLR7 by the RA SF macrophages

207
may be due to these receptors not being as vital in the pathogenesis of RA as
some of the other Toll-like receptor members such as TLR2/TLR4.
The LPS/IL-1 mediated inhibition of RXR was the fourth most significant
canonical pathway associated with the RA SF differentially expressed genes. The
associated genes include many of the same genes which were included in the
LXR activation pathway such as APOC1, APOC2 and APOE. All three of these
apolipoprotein molecules are constituents of the anti-inflammatory and athero-
protective high density lipoprotein (HDL) [418]. ApoE and another apolipoprotein
ApoA1 have been detected at an increased level in the synovial fluid of RA
patients compared to serum levels and total cholesterol was also at an increased
level in the synovial fluid [557]. Accumulation of HDL particles in the inflamed
joint has anti-inflammatory effects since HDL can block the pro-inflammatory
cytokine production from monocytes induced by T cell contact through binding
to the T cell surface activating factors [558]. However, it has also been proposed
that the accumulation of HDL within the synovium of RA patients and thereby
reducing the amount of circulating HDL may contribute to the increased
cardiovascular risk seen in these patients [559]. Consequently, the upregulation
of these genes in the RA SF macrophages as well as the lipid transporter ABCA1
needed to assemble the HDL particles may be as a result of the activation of the
LXR/RXR pathway, as indicated by the canonical pathway analysis, or it may be
as a result of the macrophage trying to dampen down the immune response by
producing anti-inflammatory HDL particles which will inhibit the local production
of inflammatory cytokines.
The presence of the LPS/IL-1 mediated inhibition of RXR canonical pathway also
indicates that the LPS pathway may play a role in the RA SF CD14+. LPS is one of
the ligands for TLR4 which is a protein expressed on the surface of immune cells
such as monocytes and its activation triggers signalling pathways which in turn
lead to the induction of inflammatory cytokines such as TNF-α [560]. TLR4 has
been detected in the RA synovium [549] and a TLR4 agonist has shown
therapeutic effect in two murine models of arthritis [561] indicating that it may
play a role in pathogenesis. Therefore the association of this canonical pathway
with RA SF CD14+ is unsurprising since many TLR4 agonists such as hyaluronan,
fibrinogen and heat shock proteins have been detected in the RA synovium.

208
The coagulation system is the fifth canonical pathway that is significantly
associated with the differentially expressed genes in the RA SF CD14+ cells due
to the upregulation of genes such as coagulation factors and plasminogen
activators such as UPA (plasminogen activator, urokinase). UPA can convert
plasminogen into the less specific plasmin which has various substrates including
fibrin, cytokines and proMMPs, and also has a role in matrix degradation [562]. It
has been demonstrated that systemic inflammation in arthritis can activate the
coagulation cascade [563]. Levels of UPA are increased in RA [564] and induction
of CIA in UPA-/- mice resulted in a mild disease indicating a pro-inflammatory
role for UPA in RA [565]. Therefore these results indicate that RA synovial fluid
macrophages are expressing genes which are contributing to the increased
coagulation cascade seen in RA as well as the increased matrix degradation and
inflammation.
The diseases and disorders associated with the differentially expressed genes in
RA SF macrophages compared to their matched PB monocytes are all related to
rheumatoid arthritis such as inflammatory disease and skeletal and muscular
disorders. The presence of these diseases significantly associated with the
differentially expressed gene list validates this dataset as they are all related to
our disease of interest.
The top 5 cellular functions significantly overrepresented in the RA SF gene list
comprise functions which we would expect to upregulated in the monocytes
once they move from the blood into the synovium. This is exemplified by two of
the cellular functions being cellular movement and immune cell trafficking
which would be expected to be upregulated as a result of the CD14+
transendothelial migration from the blood vessels into the synovium [258, 407].
Transendothelial migration is the mechanism via which leukocytes infiltrate into
the RA joint and several adhesion molecules which assist in this process have
been identified in RA [179]. Another cellular functions significantly associated
with the up- and down-regulated genes in the RA SF gene list was cell-to-cell
signalling and interaction which is unsurprising since it has been well
documented that macrophages within the synovial compartment are known to
participate in cellular interactions with several cell types such as fibroblasts
[249], T cells [269, 314, 408], endothelial cells [407] and natural killer (NK) cells
[251]. The final two cellular functions associated with RA SF CD14+ compared to

209
PB cells are cellular growth and proliferation and cellular development which is
logical due to the maturation that the CD14+ cells undergo into fully activated
macrophages once they are within the synovium and exposed to the pro-
inflammatory and hypoxic environment [409, 410]. An upregulation of genes such
as CSF1 (M-CSF) which was previously discussed will be contributing to the
maturation of the blood monocytes into synovial macrophages.
In conclusion the RA PB versus RA SF analysis to determine the effect of the
migration of the monocytes from the blood into the synovial fluid has been very
informative. The IPA analysis demonstrated the association of the differentially
expressed genes with several pathways such as the LXR/RXR activation pathway.
This pathway could be contributing towards an anti-inflammatory effect, though
the production of HDL, or a pro-inflammatory effect since research by our group
has demonstrated LXR activation is pro-inflammatory in a murine arthritis model
[527]. Further analysis of the IPA canonical pathways also demonstrated the
upregulation of novel receptor ligand complexes in the RA SF macrophages such
as Fz7 and Wnt-5a which warrant further investigation. The cellular and
molecular functions associated with the RA SF gene list consisted of cellular
migration, cell-to-cell interaction and cellular development. This result
demonstrates that once the RA PB monocytes migrate into the synovial
compartment they are expressing transcripts of genes involved in cellular
interactions, which are know to promote the production of pro-inflammatory
mediators, and also genes associated with monocyte maturation into a fully
functional synovial macrophage.

210
3.7.2.2 PsA PB CD14+ versus PsA SF CD14+
The IPA analysis of the differentially expressed genes in the PsA SF CD14+ cells
compared to the PB CD14+ cells resulted in remarkably similar results to those
obtained from the IPA analysis of the RA SF gene list. Three of the five
significantly associated canonical pathways were the same pathways found
associated with RA SF macrophages: LXR/RXR activation, LPS/IL-1 mediated
inhibition of RXR function and hepatic stellate cell activation. Many of the
individual genes associated with these pathways were the same in the PsA and
RA gene lists indicating similarities between the two types of arthritic synovial
macrophages. LXR activation has not previously been demonstrated to be
associated with PsA therefore this finding is a novel one. The LXR activation
pathway could be playing one of two roles; it could be an anti-inflammatory
pathway in PsA by producing components of HDL which prevents cytokine
secretion from monocytes [558] or it is more likely to be playing a pro-
inflammatory role in PsA. As discussed in the previous section LXR agonism in
LPS-stimulated monocytes resulted in increased TNFα production and LXR
agonism also exacerbates a murine model of arthritis possibly through the
increased cytokine and chemokine production [526, 527]. A natural agonist of
the LXR activation pathway is LDL, which has been detected in the plasma of PsA
patients therefore indicating a mechanism for the LXR activation [566]. The
association of the LPS/IL-1 mediated inhibition of RXR pathway with the
differentially expressed PsA SF macrophage genes is due to the upregulation of
the same apoplipoproteins and lipid transporter genes which were upregulated
in the RA SF macrophages including APOE, APOC1, APOC2, ABCA1 and ABCG1. As
discussed for the RA SF CD14+ cells the upregulation of these genes would result
in an increase in HDL which prevents monocyte cytokine secretion and therefore
mediate an anti-inflammatory effect from the PsA SF macrophage.
The association of the hepatic stellate cell activation canonical pathway with
the PsA gene list is due the upregulation of growth factors, MMPs and
chemokines which are also involved in hepatic stellate cell activation. It includes
genes which have been previously associated with PsA such as MMP2, MMP9
[567], fibronectin [426] and CCL2 [509] but also novel genes such as SMAD7 and
TGFB2 (transforming growth factor beta 2). TGFβ exists in three isoforms TGFβ1,
TGFβ2 and TGFβ3, it is a multifunctional cytokine which regulates cell growth,

211
adhesion and differentiation in a variety of cell types, it is a potent
immunosuppressor but also helps to drive the differentiation of Th17 which can
promote inflammation and augment autoimmune conditions [568]. Of note there
are increased levels of circulating Th17 cells in the blood of PsA patients [569].
TGFβ has not previously been associated with PsA but one of its isoforms TGFβ1
is present in the epidermis and serum of psoriasis patients and correlates with
the psoriasis area and severity index (PASI), although the same study found no
correlation between PASI and our TGF isoform of interest TGFβ2 [570].
Overexpression studies of TGFβ1 in keratinocytes of mice induces a psoriasis-like
skin inflammation suggesting TGFβ is pro-inflammatory [571] however the
mechanisms for this are not understood. In addition to an upregulation of
TGFβ2, the PsA SF macrophages also upregulated SMAD7 which paradoxically is a
negative regulator of TGFβ2 [572]. SMAD7 had also been demonstrated to
negatively regulate signalling intermediaries in pro-inflammatory signalling
pathways such as NF-κB, in this pathway SMAD7 plays a role in increasing IκB
expression [502]. Therefore the upregulation of SMAD7 in the PsA macrophages
may be as an auto-regulatory anti-inflammatory mechanism in order to decrease
the amount of NF-κB pro-inflammatory gene transcription. TGFβ2 and SMAD7
expression have not been analysed in PsA previously therefore our observation is
an interesting one. It is difficult to determine the overall net effect of the
upregulation of the potential pro- and anti-inflammatory molecule TGFβ2 along
with its intracellular inhibitor SMAD7 therefore further expressional and
functional studies would be required.
The two canonical pathways which are specifically associated with the PsA SF
macrophage differentially expressed gene list are pathogenesis of multiple
sclerosis and the complement system. Numerous studies have implicated the
complement system within rheumatoid arthritis; elevated levels of complement
activation products have been detected within RA synovial fluid [573] and
several animals models have provided evidence for the involvement of
complement in arthritis such as C5-/- and C3-/- mice being resistant to CIA [574,
575]. In comparison there are very few studies implicating the complement
system in PsA, one study has found the presence of terminal complement
complex in PsA serum [576] and another study indicated that erythrocytes from
psoriatic patients had reduced expression of surface CD59 compared to healthy

212
controls and it was hypothesised that this may be an indicator of low tissue CD59
expression [577]. CD59 (protectin) is an inhibitor of the membrane attack
complex (MAC) therefore a reduction in its expression could result in the
perpetual activation of the complement system and increased lysis of
erythrocytes and synovial cells through the MAC. Contrary to this observation the
data generated by our microarray indicates that the PsA SF actually have an
increased level of CD59 expression compared to PB monocytes which may due to
the macrophage trying to regulate the amount of complement activation taking
place in order to prevent perpetual activation. Brought together these data
suggest that the complement system may be involved in PsA as well as RA and
the synovial macrophage could be a key cell type producing complement system
components.
The pathogenesis of multiple sclerosis canonical pathway is significantly
associated with the differentially expressed genes in PsA SF CD14+ due to four
chemokines which play a role in this small nine component pathway being
present in the gene list (see Figure 3.12). The four chemokines involved in this
pathway are CCL4, CCR5, CXCL9 and CXCL11. CCL4 otherwise known as
macrophage-inflammatory protein-1 beta (MIP-1β) is produced by activated
macrophages [578]. CCL4 has been identified as one of the chemokines
significantly upregulated in the serum of PsA patients compared to healthy
controls and it is significantly associated with cellular synovial tissue markers in
PsA [237]. Studies performed in RA have demonstrated that mediators found
within RA synovial fluid, such as osteopontin, can induce CCL4 production from
monocytes [241] and there is also evidence that the interaction between CCL4
and its receptor CCR5 plays a crucial role for trafficking Th1 and other immune
cells into the RA joint [235, 579]. Apart from the identification of CCL4 within
PsA serum and synovial fluid there is little known about the role of CCL4 within
PsA; however it could be hypothesised that this chemokine plays a similar role in
inflammatory cell recruitment that has been described for RA.
CCR5 otherwise known as CC-CKR5 is a receptor found on macrophages and T
cells which binds RANTES, MIP-1α and MIP-1β (CCL4) with high affinity [580]. As
has been illustrated above it has been implicated in Th1 cell trafficking into the
RA joint and its expression has been determined within the RA synovial tissue
and on synovial fluid monocytes and T cells [581]. At present there is no

213
evidence for the presence of CCR5 within the PsA synovial compartment apart
from the data presented here, however since its high affinity ligand CCL4 has
been demonstrated to be present in the synovial fluid we can hypothesise that
CCR5 is also present also and contributing to the inflammatory cell influx into
the diseased joint.
The third gene upregulated in PsA SF CD14+ cells and associated with pathogensis
of MS pathway was CXCL9 otherwise known as monokine induced by IFN-γ (Mig).
CXCL9 is produced by activated monocytes [582] and mRNA levels of this
chemokines have previously been detected in the synovium of PsA [238] where it
is thought to help regulate the influx of inflammatory cells. CXCL11 otherwise
known as IFN-inducible T-cell alpha chemoattractant (I-TAC) was the fourth
chemokine upregulated in PsA SF CD14+ cells, this chemokines is upregulated by
LPS stimulated macrophages [583] and had been detected in PsA synovial fluid
[584]. Consequently, from this result it is not assumed that the pathogenesis of
multiple sclerosis (MS) plays a role in PsA only that several of the chemokines
which are involved in the pathogenesis of MS are also upregulated in PsA synovial
fluid macrophages.
The diseases and disorders correlated with the PsA SF macrophage differentially
expressed genes are the same as those found associated with the RA SF
macrophage genes and are all related to arthritic disease such as inflammatory
diseases and inflammatory response. Again the significant association of these
disorders with the gene list validates our PsA dataset.
The molecular and cellular functions associated with the up- and down-regulated
PsA SF macrophages are highly similar to those correlated with the RA SF
macrophage genes as 4 of the 5 associated functions are the same in RA and PsA.
This data further substantiates the finding that the RA and PsA macrophages
have very similar genetic profiles and upregulate analogous genes once the
monocytes migrate out of the blood and into the synovial fluid. The molecular
and cellular functions which were significantly associated with the PsA genes
included cell movement and immune cell trafficking which will be due to the
presence of up- and downregulated genes involved in transendothelial migration
and movement of the cells into the synovial joint. The synovium of PsA patients
is characterised by an inflammatory cell influx [7] and monocytes isolated from

214
PsA patients have been demonstrated to interact with cultured endothelial cells
whilst down-regulating adhesion molecules which is thought to aid in their
migration [411]. PBMCs from PsA patients are also have a significant increase in
their adhesion to endothelial cells compared to healthy PBMCs [585] and the
level of chemokines is significantly increased in the serum and synovium of PsA
patients [259, 406, 509]. These data emphasize the importance of
transendothelial migration in the pathogenesis of PsA and also emphasises why
the PsA SF have a significant change in their migratory associated genes
compared to PB monocytes.
Another molecular and cellular function associated with the PsA SF macrophage
expressed genes was cell-to-cell signalling and interaction. In comparison to RA
there have been only two studies into the role of macrophage direct cell contact
in PsA. These studies demonstrated that direct cell contact between PsA
monocytes and NK cells was able to differentiate the monocytes into DCs [586]
and direct interaction of PsA monocytes with endothelial cells aided in their
transendothelial migration [411]. Despite the lack of information regarding the
role of direct macrophage cell contact in PsA, due to the close proximity of
macrophages to other immune cells in the synovium [124] we can hypothesise
that direct cell interaction is one method through which macrophages exert
their pro-inflammatory potential as has been extensively demonstrated in RA.
The two other molecular and cellular functions associated with the PsA SF
macrophage gene list are cellular growth and proliferation and cell mediated
immune response. A reason for genes associated with both of these functions
being differentially expressed in the synovial macrophages could be due the pro-
inflammatory environment into which the cells migrate. Previous studies have
demonstrated the PsA synovium to be a hypoxic environment [587] containing
many cytokines, chemokines and inflammatory mediators [237, 259] which would
in turn cause the monocytes to differentiate into macrophages and illicit an
immune response.
In summary the PsA PB versus PsA SF microarray comparison to establish the
effect of the PB monocyte migration into the synovium has identified the
activation of novel pathways in the macrophages such as LXR/RXR activation as
well as the identification of novel genes which have not previously been
associated with PsA such as TGFβ2 and its inhibitor SMAD7. Nevertheless, the

215
most interesting observation to come out of this analysis is the similarity
between the transcriptomes of the RA and PsA synovial macrophages which is
investigated further in the following comparison.
3.7.2.3 Identification of genes expressed in: both RA and PsA synovial fluid macrophages, only in RA macrophages or only in PsA macrophages
The similarity between the transcriptomes of the RA and PsA samples first
became apparent during the PCA comparison which indicated that the synovial
fluid samples of both PsA and RA were clustered in the same area of the graph
indicating that these samples had similar genetic expression. Investigating the
two diseases individually during IPA analysis then demonstrated that the synovial
macrophages in both RA and PsA shared many of the same canonical pathways
and molecular functions. These results let us to hypothesise that the synovial
fluid macrophages of PsA and RA shared many of the same genes. To investigate
this hypothesis the differentially expressed genes from both disease PB versus SF
comparison were subjected to a Venn diagram comparison to determine genes
which were expressed in both diseases and also genes which were specific to the
synovial fluid macrophages of each disease.
Interestingly the Venn diagram demonstrated that 58% of the PsA differentially
expressed genes and 52% of the RA differentially expressed genes were present
in both diseases indicating that just under half of the genes expressed in the RA
or PsA synovial fluid cell were disease specific. This result is in contrast to those
of Dominique Baeten and his group who have previously described a differential
macrophage phenotype in SpA (including PsA) compared to RA patients through
revealing an increased number of CD163+ cells in the synovium of SpA patients
[255] and demonstrating that the synovial fluid of SpA but not RA was able to
polarise blood monocytes to express CD163 [253]. CD163 is a cell surface
glycoprotein which is classed as a marker of alternatively activated macrophages
(M2), M2 macrophages have been implicated in tissue remodelling and immune
regulation and are in stark contrast to classically activated macrophages (M1)
which are thought to be the main source of pro-inflammatory cytokines which
are associated with tissue damage [185]. Consequently, Baeten et al suggest that
the macrophage phenotype in RA and SpA are significantly different due to the
presence of different markers of macrophage polarisation and the ability of the
216
diseased synovial fluid to induce these macrophage phenotypes. Our venn
diagram data illustrates that in contrast to results of Baeten et al the genetic
profile and therefore the phenotype of both RA and PsA macrophages are very
similar and over 50% of the genes expressed by each diseased macrophage are
shared between the diseases. This observation is further exemplified by
analysing for the presence of genes associated with M1 and M2 phenotypes in the
macrophage gene lists from both diseases. As although CD163 is not present in
either the PsA or RA SF macrophages, possibly due to the strict inclusion criteria
for the microarray analysis, other markers of M2 phenotype such as the mannose
receptor (MRC1 and MRC2) and macrophage scavenger receptor (CD204) are
upregulated by a similar fold change in both RA and PsA. MRC1 has a fold change
(FC) increase of 73 in PsA and 61 in RA, MRC2 (FC 32 PsA, 32 RA) and CD204 (FC
10 PsA, 8 RA). However, analysis of markers of M1 polarisation demonstrates
that these markers are also upregulated to similar levels of magnitude in both
RA and PsA SF macrophages such as CD86 (FC 11 PsA, 15 RA) and MHC class II
molecules HLA-DOA (FC 7 PsA, 4 RA). Our results would suggest that rather than
the RA and PsA SF macrophages being two separate phenotypes, as implicated by
work of Beaten et al, they are both similar cell types and at the RNA transcript
level appear to have no preferential expression of an M1 or M2 phenotype. This
could be an indication of the high level of plasticity of macrophage cells and
their ability to constantly change their phenotype in response to their
environment. Despite there being very little differences in the expression of
several M1 and M2 macrophage markers the results of the venn diagram did also
demonstrate that both the RA and PsA have a subset of genes that were disease
specific which could account for some of the differences in seen in the
pathogenesis and cytokine profiles of the two diseases.
The results of the Venn diagram were saved as three individual datasets; i) genes
which were differentially expressed in both diseases, ii) genes which were
expressed only in PsA and iii) genes which were expressed only in RA. These
gene lists were then analysed by IPA to identify the canonical pathways and the
molecular and cellular functions which were significantly associated with them.
The canonical pathways associated with the gene list expressed by both PsA and
RA consisted of pathways which had already been discovered from the previous
IPA analyses of RA PB vs RA SF and PsA PB vs PsA SF. These five pathways were:

217
LXR activation which has been previously been described as being a potential
pathogenic pathway in RA [527] but as yet no association has been demonstrated
for PsA; LPS/IL-1 inhibition of RXR function is also associated with the gene list
due to an upregulation of HDL constituents in both RA and PsA macrophages, the
significance of this pathway is not fully understood but since HDL had been
demonstrated to prevent monocytes from releasing pro-inflammatory mediators
[315, 558] this pathway may be an anti-inflammatory mechanism through which
the macrophages counter-balance their disproportionate pro-inflammatory
response. The complement system was the third pathway associated with the
genes expressed in both diseases, complement components have been detected
in the serum and synovial fluid of RA and PsA patients [573, 576] and several
animals models have already provided evidence for the involvement of
complement in arthritis such as C5-/- and C3-/- mice being resistant to CIA [574,
575]. Therefore the combination of this data with our microarray data indicate
that synovial macrophages may be a specific cell type in both RA and PsA to be
involved in the activation of the complement pathway.
The hepatic stellate cell activation was the fourth associated canonical pathway,
as described previously the presence of this pathway is due to the occurrence of
pro-inflammatory chemokines, cytokines and growth factors that are expressed
in both hepatic stellate cells and synovial macrophages during cellular
activation. The final canonical pathway was the pathogenesis of multiple
sclerosis, the association of this pathway to the gene list is due to the presence
of three chemokines which play a role in both multiple sclerosis as well as RA
and PsA pathogenesis. The three chemokines were CCL4 (MIP-1β) and its
receptor CCR5 which are both associated with macrophages and play a role in
trafficking immune cells into the arthritic joint [235, 579], and CXCL11 which
has been previously detected in RA synovium [588] and PsA synovial fluid [584].
The molecular and cellular functions associated with the gene list expressed in
both RA and PsA SF CD14+ cells had all previously been associated with the SF
macrophages such as cell-to-cell signalling and interaction, cellular development
and cellular movement. The one function which had not previously been
correlated to the SF macrophages was cellular function and maintenance which
may be due to genes associated with cellular homeostasis being expressed by the
RA and PsA macrophages.

218
The canonical pathways associated with the genes specifically expressed in PsA
SF macrophages were: B cell development, pathogenesis of multiple sclerosis,
autoimmune thyroid disease signalling, altered T and B cell signalling in
rheumatoid arthritis, and allograph rejection signalling. The pathogenesis of
multiple sclerosis was previously associated with the PsA PB vs SF comparison
but the four other canonical pathways are unique to the PsA SF macrophage
gene list. All four of these novel canonical pathways appear to be specifically T
and B cell related, however they are associated with the PsA SF specific gene list
due to the presence of three genes within the gene list. These genes are CD40,
HLA-DQA1 and HLA-DOA which were all upregulated in PsA SF macrophages
compared to PB monocytes and these genes are found in all four canonical
pathways.
CD40 is a cell surface receptor found on macrophages/monocytes, B cells and
myeloid DCs and it is activated by ligation with CD154 found on CD4+ T cells,
platelets, mast cells and basophils [589]. Ligation of CD40 on monocytes and
macrophages results in the induction of pro-inflammatory cytokine and
chemokine synthesis such as IL-1α, TNFα, IL-6, IL-8, CCL2 and CCL4 [589]. CD40
ligation on monocytes or macrophages also upregulates the expression of MHC
class II and co-stimulatory molecules CD80 and CD86, as well as CD40 itself
[590]. CD40 has previously been demonstrated to play a role in arthritis as
blockade of the CD40:CD154 interaction inhibited the onset of collagen induced
arthritis (CIA) [591]. Once again, in comparison to RA there have been few
studies analysing the role of CD40 in PsA. However, soluble CD40 ligand (sCD40L)
is present in the serum of PsA patients [592] and interestingly Stoeckman et al
discovered that CD40 and its signalling intermediates were downregulated in PsA
PBMCs compared to healthy controls which they suggested could be due to the
migration of CD40-expressing cells out of the blood and into the synovium. Our
data agrees with this hypothesis as we demonstrate that in comparison to PsA PB
CD14+ cells there is an upregulation of CD40 gene expression in PsA SF CD14+
cells. The presence of CD40 on PsA synovial macrophages will be contributing to
the inflammatory milieu within the synovium through its ligation with CD154
present on the synovial T cells and sCD40L present within PsA patients.
The remaining two genes associated with the four canonical pathways specific to
the PsA macrophage differentially expressed genes are HLA-DQA1 and HLA-DOA.

219
Human leukocyte antigen (HLA) is coded for by the major histocompatibility
complex (MHC) gene region and HLA molecules are critical for distinguishing self
from non-self. Cell-surface HLA molecules function to present processed
antigenic peptide, which is held within a groove in the HLA molecule, to T cell
receptor molecules expressed on the surface of T cells. HLA class II DR, DQ and
DP molecules are found on B cells and professional antigen presenting cells and
present processed peptides derived from exogenous antigens to CD4+ T cells
[593]. An increased expression of HLA genes within the PsA SF macrophage could
indicate an increase in the amount of antigen presentation taking place within
the synovium and is also a marker of increased cellular activation. HLA-DQA1
alleles have been associated with susceptibility to a wide variety of
inflammatory conditions such as multiple sclerosis [594] and coeliac disease
[595]. The expression of this molecule has also been upregulated in
oligoarticular JIA [596] and different alleles have been demonstrated to be a risk
factor for susceptibility to RA [597] and susceptibility to psoriasis [598]. These
results indicate that HLA-DQA1 has a role in immune disease and arthritis
pathogenesis and despite there being no direct link to PsA increased levels of
HLA-DQA1 in PsA macrophages may be playing a role in disease susceptibility and
antigen presentation. The other gene associated with the PsA specific canonical
pathways is HLA-DOA which is another HLA molecule involved in antigen
presentation and is upregulated at the RNA and protein level in monocytes
treated with GM-CSF [599]. A single nucleotide polymorphism (SNP) in HLA-DOA
which is significantly associated with RA susceptibility has recently been
identified [600] again emphasising the importance of antigen presentation in the
pathogenesis of arthritic disease.
The cellular and molecular functions specifically associated with PsA SF
macrophages included two functions, cellular movement and cell-to-cell
signalling and interaction, which have been previously discussed. However, the
other three pathways: DNA replication, recombination and repair; cell cycle and
cell death represent functions which are specific to PsA SF macrophages. Despite
there being no direct link of DNA replication, recombination and repair to PsA
pathogenesis this molecular function is associated with the PsA macrophages due
to an increase in the expression of genes such as TOP2A (topoisomerase (DNA) II
alpha 170kDa). TOP2A is an enzyme which transiently breaks and rejoins double

220
stranded DNA in order to resolve topological problems which arise as a result of
supercoiling or knotting which can occur naturally in the DNA [601].
The molecular function of cell cycle is associated with the PsA gene list due to
the upregulation of genes such as TOP2A (described above) and CDK1 (cyclin-
dependent kinase 1) which regulates cell division and controls cell-cycle
transitions by associating with different cell-cycle stage specific cyclins [602].
The association of the cell death function with the PsA gene list is due to the
differential expression of apoptosis related genes including the down-regulation
of clusterin (CLU) in SF macrophages. Clusterin was discussed previously in this
chapter as a protein which was highly upregulated in RA PB monocytes compared
to healthy controls. Clusterin‘s cellular functions are context dependent and
nuclear associated clusterin (nCLU) is a pro-apoptotic factor [489]. Hence the
down-regulation of this gene within the SF macrophages may be a mechanism
through which these cells evade apoptosis. This data demonstrates that as well
as the proinflammatory pathways which are being upregulated in the synovial
macrophages, as demonstrates by the pathways correlated with the genes
expressed in both RA and PsA SF macrophages, the PsA macrophages are also up-
regulating cellular functions associated with the maintenance of homeostasis
such as cell cycle and DNA replication as well as pro-survival factors.
The canonical pathways associated with the gene list expressed specifically in RA
SF macrophages compared to the PB monocytes consisted of two pathways,
hepatic stellate cell activation and the role of macrophages, endothelial cells
and fibroblasts in RA, which were previously associated with the primary RA PB
vs RA SF comparison. This is due to the differential expression of genes such as
CSF1 (M-CSF) and VEGFA which play a role in these pathways and the
pathogenesis of RA. However, the IPA analysis of the genes expressed only in RA
SF macrophages also revealed three RA specific pathways: atherosclerosis
signalling, ERK5 signalling and p38 MAPK signalling. The presence of the
atherosclerosis signalling pathway within the IPA analysis of the RA SF specific
genes is interesting as inflammatory pathways have been implicated in both
atherosclerosis and RA and this result emphasises the overlap in immune
disregulation which exists in both diseases. RA patients also have a 30-60% higher
risk of cardiovascular events compared to osteoarthritis patients or patients
without arthritis [603]. This phenomenon is thought to be due to RA patients

221
being exposed to chronic inflammation which is known to be a driver of
atherosclerosis.
One of the RA SF macrophage genes correlated to this atherosclerosis signalling
pathway was TNFRSF12A (tumour necrosis factor receptor superfamily, member
12A) which codes for the TWEAK (TNF-like weak inducer of apoptosis) receptor
otherwise known as fibroblast growth factor inducible 14 (Fn14). TWEAK has
been demonstrated to induce proliferation as well as cell adhesion molecule and
cytokine expression in human umbilical vein endothelial cells (HUVECs) [604] and
has also been implicated in angiogenesis in vivo. Recently, studies using an anti-
human Fn14 monoclonal antibody have demonstrated that TWEAK-induced
proliferation and migration is solely mediated by its Fn14 receptor [604]. The
TWEAK/Fn14 interaction has been implicated in the pathogenesis of arthritis as
serum levels of TWEAK were elevated in murine CIA and neutralising TWEAK in
this model significantly reduced the clinical severity, paw swelling and
infiltration of inflammatory cells [605, 606]. Recently, Fn14 has been detected
in the RA synovium and on synovial fibroblasts where its ligation with TWEAK
induced the production of pro-inflammatory cytokines and the expression of
intracellular adhesion molecule (ICAM-1) [607]. This pro-inflammatory cytokine
release has since been demonstrated to be mediated through the activation of
the NF-κB pathway [608]. Fn14 is detected within the synovium of both RA and
PsA where it has been demonstrated to be specifically expressed on
macrophages and fibroblasts [609] and its ligand TWEAK is present in the serum
of RA patients and correlates with disease activity [610]. Consequently, the
upregulation of the Fn14 gene TNFRSF12A by the RA SF macrophages in our study
demonstrates a mechanism through which these macrophages can contribute to
the inflammatory environment in RA synovium. The TWEAK/Fn14 has been shown
to play a role in the pathogenesis of atherosclerosis and cardiac dysfunction due
to its ability to induce angiogenesis, exacerbate vascular damage and mediate
lipid uptake by macrophages [611-613] and therefore may be a pathway causing
the increased risk of cardiovascular events seen in RA.
The remaining two canonical pathways associated with the RA specific gene list
were ERK5 signalling pathway and p38 MAPK pathway, both of these pathways
are members of the MAPK signalling family and their association with RA SF
macrophages is due to the up- and down-regulation of genes coding for signalling

222
intermediates and transcription factors involved in these pathways. ERK5
signalling pathway has not previously been associated with RA pathogenesis but
some of its signalling components which were differentially expressed in the RA
SF macrophages have been demonstrated to play a role. For example, FOSL1 is
upregulated in the RA SF macrophages and this gene codes for the Fra-1 protein
which dimerises with c-Jun to form the AP-1 transcription factor. AP-1 has been
demonstrated to be constitutively active in rheumatoid synovium [614] and
treatment of rheumatoid synoviocytes with TNFα and IL-1β induced the nuclear
translocation of Fra-1 and induction of AP-1 transcription [615]. Consequently,
despite no evidence for the ERK5 pathway being implicated in RA the
components of this pathway have been demonstrated to play a role in the
pathogenic phenotype of synovial cells.
The p38 MAPK pathway is also correlated to the RA SF macrophages which is due
to the upregulation of genes coding for IL-1 receptor type I, IL-1 receptor type II,
IL-1 receptor-associated kinase 2 (IRAK2) and the anti-inflammatory molecule IL-
1 receptor antagonist. The ligation of IL-1α or IL-1β to the IL-1 receptor type I
on the cell surface activates IRAK and commences the activation of the p38
MAPK signalling pathway and the subsequent translation of genes coding for pro-
inflammatory mediators such as IL-6, IL-8, CCL2 (MCP-1), IL-1α and IL-1β [616].
Interestingly the RA SF macrophages have also upregulated levels of IL-1
receptor antagonist (IL-RA) and the decoy receptor IL-1 receptor II (IL-1R2)
which are inducible negative regulators of IL-1 signalling and can terminate or
limit IL-1 effects. Hence the RA SF macrophages are not only up-regulating
activator components of the p38 MAPK pathway but also negative regulators of
this pathway, the net effect of this gene expression is not known since IL-1RA
binds IL-1R1 with a similar specificity and affinity as IL-1α and IL-1β [616]. Of
interest, a recombinant version of human IL-1RA designated anakinra is used as a
therapy for RA demonstrating the significant anti-inflammatory properties of IL-
1RA [266].
The molecular and cellular functions of the RA SF specific gene list highlight the
same group of functions which were associated with the previous RA PB vs RA SF
comparison such as cellular movement, cell-to-cell signalling and cellular
growth. As discussed previously the differential expression of genes associated
with these functions demonstrates the increased cellular migration undertaken

223
by the macrophages as well as the physiological growth and development which
the PB monocytes undergo to mature into the synovial macrophages.
In summary, the analysis of the genes similarly expressed in both RA and PsA SF
macrophages as well as the genes expressed specifically in PsA SF macrophages
or RA SF macrophages has been crucial in defining groups of genes specifically
expressed in each disease. The Venn diagram analysis also revealed the
significant similarity in gene expression in both RA and PsA macrophages
compared to their matched disease blood monocytes with over 50% of the genes
being shared in each disease.
Apart from the identification of the shared expression of the LXR activation
pathway which was an interesting finding this analysis unfortunately did not
reveal any novel genes which change in expression as the RA monocytes move
from the blood into the synovial fluid. For that reason it was decided to analyse
the differentially expressed genes that changed in both RA and PsA SF
macrophages to try and detect novel genes that had not previously been
associated with arthritis. This was in the hope of finding novel pathways
regulating the pathogenesis of the arthritic synovial macrophage. The genes
which had been upregulated in the synovial macrophages compared to the blood
monocytes were analysed starting with those that had the largest fold change
difference. Analysing the genes using this method unsurprisingly resulted in the
identification of genes coding for molecules which have previously been
associated with arthritis such as FN1 (fibronectin), SPP1 (osteopontin) and
CCL18. However, through this analysis we also discovered two novel genes; LGM
which codes for the enzyme legumain and PLXA1 which codes for the cell surface
receptor plexin A1. These two candidate genes were subsequently validated and
further analysis was performed to determine their function within the arthritic
synovium. These results are discussed in full detail in the following chapters.

224
Chapter 4 Investigation into the expression and function of the novel gene plexin A1 in rheumatoid and psoriatic arthritis patients

225
4.1 Introduction
Plexin A1 is one of the genes found to be upregulated in RA and PsA SF CD14+
cells in the preceding microarray experiment; it has not been previously
associated with arthritis and is one of the two genes that I selected for intensive
investigation in the context of rheumatoid and psoriatic arthritis pathogenesis.
Plexins are a homogenous family of proteins, which when first identified were
shown to be neuronal cell surface molecules with a function in cell adhesion
[442]. They are grouped into four categories (A-D) based on their overall
homology, there are 4 type-A, three type-B, one type-C and one type D found in
vertebrates and two plexins found in invertebrates (A and B) [617].
Plexins are the receptors for semaphorins, which are both secreted and
membrane associated proteins named for their properties which are analogous
to the system of flags and lights used in rail and maritime communication for the
direction of movement. Semaphorins were originally characterised in the
developing nervous system as chemorepellent molecules which acted to initiate
axonal collapse in areas where they were found in high concentration, thus
resulting in axonal guidance [618, 619]. However, more recently they have been
shown to have diverse functions in several physiological processes such as
angiogenesis [620], tumor metastasis [621, 622], osteoclastogenesis [623] and
immune regulation [624]. More than 20 types of semaphorins have been
identified and are grouped into eight classes on the basis of their structural
elements and amino acid sequence similarity [619]. The semaphorins found in
invertebrates are grouped into classes 1 and 2, classes 3-7 are vertebrate
semaphorins and the final group, group V, are viral semaphorins. Proteins in the
semaphorin classes 1, 4, 5, 6 and 7 are membrane associated whereas those in
classes 2, 3 and the viral semaphorins are secreted [617]. All semaphorins
contain a conserved ~500 amino acid extracellular domain termed a sema
(semaphorin) domain and a class specific C terminus.
Plexins are single membrane spanning proteins that have an extracellular domain
consisting of a ~500 amino acid sema domain, that is conserved among all
semaphorin family members, followed by a cysteine-rich motif and several
glycine-proline rich motifs [442]. Most plexin-semaphorin interactions are
mediated through the sema domains of both proteins except for class 3

226
semaphorins, which, with the exception of sema 3E, bind to neuropillin-1 or
neuropilin-2 along with plexin in a co-receptor complex [625-627]. Neuropilins
have a very short cytoplasmic domain that cannot transduce intracellular signals,
therefore the plexin receptor must act as the signal transducing components of
the semaphorin-neuropilin-plexin complex [628]. Plexin A family members are
the main receptors for the secreted class 3 semaphorins as shown in Figure 4.1,
semaphorin 3A will only bind neuropilin-1 (NRP-1) in the plexin-neuropilin
receptor complex whereas semaphorin 3C and 3F bind both NRP-1 and NRP-2
[443].
Figure 4.1 Semaphorin ligands for type A plexin family members There are four members of the plexin A family which interact primarily with two classes of semaphorins, class 3 and class 6. Both plexins and semaphorins are characterised by a sema domain shown in red for the plexins and blue for the semaphorins. Arrows indicate binding interactions detected between semaphorins and plexins. Labels on the arrows indicate which specific semaphorins have been shown to interact with which plexin [443, 444, 617, 629-632]. Blue labels of semaphorin names indicate the necessity for neuropilin-1 (dark blue) or neuropilin-1/neuropilin-2 (green).

227
Plexin A1 is the only receptor in the type A family of plexins that interacts with
two different classes of semaphorins, class 3 and class 6 (Figure 4.1). It is our
gene of interest based on the results of the microarray and it is one of the
semaphorin receptors whose function has been widely investigated. It is known
to be expressed in the heart, liver, brain, kidney, spleen and lung of 4 week old
mice [623] and is specifically expressed on plasmacytoid DCs [633], mature
dendritic cells [444] and at low levels on T and B cells [623]. Recently plexin A1
has also been shown to increase in expression during M-CSF differentiation of
human monocytes into macrophages [443], the same group also showed LPS
stimulation suppressed plexin A1 expression in macrophages. Toyofuku et al first
identified semaphorin 6D (sema 6D) as one of plexin A1‘s ligands during chick
cardiac development. Plexin A1 was found to form site specific receptor
complex with vascular endothelial receptor type 2 (VEGFR2) in the conotruncal
segment or with Off-track in the ventricle segment. These specific complexes
bound to sema 6D and were responsible for its specific effects in these regions
[631]. It is thought that semaphorin binding relieves plexin autoinhibition, as
plexin A1 lacking its sema domain is constitutively active [634].
Plexin A1 has been previously shown to play a role in axonal guidance in the
developing nervous system by acting as a co-receptor with neuropilin-1 to bind
sema 3A resulting in a chemorepulsive signal [635]. It also has a role in
chemotaxis of carcinoma cells as expression of constitutively active plexin A1 in
breast carcinoma cells impaired their ability to chemotax [636]. However, the
first report of plexin A1 in immune cell function came as a result of a microarray
that identified plexin A1 as a gene down regulated in CIITA-deficient DCs to 5%
of that found in wild type cells [444]. CIITA (class II transactivator) is a
transcription factor that controls MHC class II expression [637], it functions as a
transcriptional scaffold to coordinate NF-Y and RFX5 transcription factors in
binding the conserved promoter regions found in MHC class II promoters. The
same group found plexin A1 to be highly expressed in mature DCs from wild type
mice and it was established that depletion of plexin A1 in mature DCs by RNA
interference led to a 50% reduction in T cell stimulation in vitro and in vivo
indicating that plexin A1 expression is important for T cell-DC interactions. This
reduced proliferation could not be attributed to decreased antigen processing,
MHC expression or peptide loading; however a suggested function for plexin A1

228
on the DCs was to serve as a co-stimulatory marker that binds its partner ligand
on the T cells therefore enhancing the T cell-DC interaction.
A further study, [623], into plexin A1‘s role in immune responses found that
plexin A1-/- DCs had an impaired ability to stimulate antigen-specific T cells as
they had reduced proliferative responses and cytokine production, consistent
with the previous work performed by Wong et al. The plexin A1-/- mice had
reduced cellularity in their long bones compared to wild type litter mates and it
was revealed that plexin A1 deficiency resulted in increased bone mass and the
development of osteopetrosis. It was also shown that plexin A1-/- mice had
decreased osteoclast numbers, lower osteoclast surface to bone ratio and
reduced osteoclast bone turnover therefore implicating a role for plexin A1 in
bone homeostasis. This group had previously identified sema 6D as the ligand for
plexin A1 in chick cardiac development [631] and found sema 6D to be highly
expressed in T cells, therefore they incubated DCs with soluble recombinant
sema 6D and showed that it induced IL-12 production and upregulation of MHC
class II suggesting that sema 6D is the ligand for plexin A1 in T cell- DC cellular
interactions. Sema 6D was also found to be expressed on osteoclasts and soluble
recombinant sema 6D promoted osteoclast differentiation again suggesting that
sema 6D is the ligand for plexin A1 in bone homeostasis. To try and further
understand the plexin receptor complex, the group screened molecules
associated with plexin A1 in DCs and osteoclasts and identified TREM-2. Previous
studies have indicated that TREM-2 forms a receptor complex with DAP12, an
ITAM-bearing activating adaptor protein, through a positively charged amino acid
in its transmembrane domain [638]. Several experiments using RNA interference
and DAP12-/- cells suggested that plexin A1, DAP-12 and TREM-2 are the sema 6D
functional receptor components on DCs and osteoclasts [623]. Interestingly,
genetic mutations in TREM-2 or DAP12 result in a bone fracture syndrome called
Nasu-Hakola disease further underscoring the importance of the association of
plexin A1 with DAP12 and TREM-2 in bone homology [639].
Further studies into the localisation of plexin A1 in DCs found it to be associated
with the DC-T cell immune synapse in approximately 70% of T cell- DC cellular
conjugates where it was found to regulate actin polarisation in the DCs via
activation of the small GTPase Rho [640]. Plexin A1 has also been found to
associate with DAP12 and another TREM family member found specifically on

229
pDCs designated PDC-TREM. Sema 6D binding to the plexin A1-DAP12-PDC-TREM
complex on pDCs induced the production of type I IFN [633].
Plexin A1 has recently been shown to play a crucial role in allowing murine DCs
to enter the lymphatic system and track to the lymph node. This migration is
dependent on the presence of semaphorin 3A (sema 3A), one of plexin A1‘s
ligands, in the lymphatic system. Sema 3A is thought to promote DC
transmigration by inducing actomyosin contraction, which allows the cells to
pass through constricted areas, by regulating myosin II activity and
phosphorylation. This was demonstrated by treating the DCs with the myosin II
inhibitor blebbistatin or the Rho kinase ROCK inhibitor Y-27632 which abolished
sema 3A induced transmigration across lymphatic endothelial cell monolayers
[632].
Due to the identification of a novel gene, plexin A1, expressed in RA and PsA SF
CD14+ cells, and its plausible biologic profile, I therefore sought to validate this
expression by RT-PCR in the microarray samples and samples from other
patients. I then sought to identify its potential function in macrophage cells by
siRNA and to investigate the expression of its semaphorin ligands on stimulated
T cells and synovial membrane.

230
4.2 Validation of plexin A1 in microarray samples
Plexin A1 was one of the genes identified when the group of genes upregulated
in both RA and PsA SF were analysed. It had a fold change increase from the PB
to the SF of 26 in RA patients and 27 in PsA patients. Figure 4.2 (A) demonstrates
the raw fluorescent data signals of plexin A1 obtained from the Affymetrix
GeneChips. The PB samples from both disease groups have very low levels of
signal intensity indicating that these samples had low levels of plexin A1 mRNA.
In contrast the patient synovial fluid samples have much higher levels of signal
intensity and therefore contained higher levels of plexin A1 mRNA. The reason
for the variable levels of the mRNA expression may be due to different disease
duration in the patients or differences in disease therapy. To verify and validate
this expression qRT-PCR was used to analyse the expression of plexin A1 in the 8
RA and 8 PsA matched PB and SF CD14+ samples. All of the samples were able to
be analysed apart from one RA PB sample which consistently produced unusual
results which could not be included in the analysis. This may have been due to a
problem with the RNA sample therefore that PB sample and its matched SF were
not analysed. Figure 4.2 (B) shows the results of qRT-PCR, the fold change values
were calculated by comparing the level of plexin A1 expression in the synovial
fluid compared to the PB. Each circle represents one patient and the line is the
mean fold change, the RA samples had a mean fold change increase of 8 from
the PB to the SF and the PsA samples had a mean fold change increase of 13.
The results demonstrate that there was an increase in plexin A1 expression in all
of the synovial fluid samples compared to their matched peripheral blood
samples which agree with the results obtained from the microarray.

231
Figure 4.2 Plexin A1 expression in microarray samples (A) Demonstrates the raw signal intensities of the plexin A1 gene locus on the Affymetrix GeneChips. Each circle represents one patient sample which was hybridised to one genechip and the line represents the mean signal intensity. Plexin A1 mRNA levels were then measured in the RA and PsA paired PB and SF microarray samples by qRT-PCR. (B) The fold change of plexin expression in the SF samples was normalised to the matched patient PB sample, each circle represents one patient and the line the mean fold change
4.3 Expression of plexin A1 in other patient samples
Once the expression of plexin A1 had been validated in the microarray patient
samples we then analysed the expression of plexin A1 in CD14+ of other arthritic
patients to check that the increase in plexin A1 expression was generalizable.
Figure 4.3 shows the results of this analysis, graph (A) indicated all the CD14+
cells that were obtained and tested for relative expression plexin A1 which was
normalised to the housekeeping gene GAPDH. PsA SF cells have varying
PsA PB PsA SF RA PB RA SF0
50
100
150
200
250
300
350
400
450
500
550
Monocyte type
Aff
ymetr
ix s
ignal
RA patients PsA patients0
5
10
15
20
25
30
35
40
45
50
55
plex
in A
1 fo
ld c
hang
e fr
om P
B t
o S
F
(A)
(B)

232
expressions of plexin A1 depending on the individual patient but the mean
relative expression is higher than the mean relative expression of the PsA PB
samples. The RA SF samples also have variable amount of plexin A1 but the mean
expression is similar to that seen in PsA SF. An inflammatory polyarthritis and a
juvenile idiopathic arthritis (JIA) SF sample were also obtained for this analysis
and both samples contain plexin A1 RNA, unfortunately no matched peripheral
blood CD14+ cells were acquired for either patient so we cannot determine
whether the plexin A1 expression increases in the SF cells compared to the PB
cells as is seen with RA and PsA patients. However, matched PB and SF CD14+
cells from a patient with osteoarthritis (OA) were also analysed and shows that,
as with the RA and PsA from the microarray, plexin A1 expression is higher in the
SF compared to the PB. This indicates that expression of plexin A1 on CD14+ cells
is not confined to PsA and RA SF and could also be expressed in other arthritic
diseases. These analyses should however be considered anecdotal and are
included here for completeness at this stage. Five of the PsA patients analysed
had matched SF and PB CD14+ cells therefore the fold change increase of plexin
A1 from the PB samples to the SF samples was determined (graph B). In
summary, these data indicate that in the majority, but not all, PsA patients
plexin A1 RNA levels are higher in the SF compared to the PB CD14+ cells as was
seen in the microarray experiment.

233
Figure 4.3 Plexin A1 expression in CD14+ cells from arthritic patients
To verify the microarray results plexin A1 RNA levels were measured in CD14+ cells from several
other arthritic patients (A). Five of the PsA patients analysed in (A) had matched PB and SF samples therefore the fold change increase of plexin A1 expression from the PB sample to the SF sample was measured for each of these patients and is shown in (B) each square represents one patient. Lines on each graph indicate the mean.
(A)
(B)

234
4.4 Immunohistochemistry of plexin A1
Once plexin A1 expression had been validated as being present in the microarray
samples and other patient samples by RT-PCR, immunohistochemistry (IHC) was
used to investigate the presence of plexin A1 protein in RA synovial membrane
tissue. Five RA membranes stained positively for plexin A1; Figure 4.4 shows the
pattern of staining seen in a representative membrane. Panel (B) shows an area
of the membrane at x10 magnification on the left and x40 magnification on the
right. The synovial membrane can be seen to be positively stained (indicated by
brown staining) around vascular structures and within cells in the area
surrounding the vasculature possibly indicative of infiltrating cells (indicated by
black arrows). Panel (C) indicates two more images taken from the same
membrane and again demonstrates that the areas staining positively for plexin
A1 are those surrounding blood vessels and in cells around vasculature area but
there are also cells within the synovial membrane structure that have stained for
plexin A1. The staining appears to be present in both the cytoplasm and the
nucleus of the cells. The positive staining surrounding the vasculature could be
indicative of endothelial cells but the identity of the positive cells within the
membrane require double staining of plexin A1 and other cellular markers. Such
experiments would be the focus of future analysis in order to confirm the extent
of plexin A1 expression.

235
Figure 4.4 Plexin A1 staining in RA synovial membrane Five RA synovial membrane tissues were stained for the presence of plexin A1. This figure indicates the staining pattern seen in one of these membranes. Panel (A) indicates the isotype control at x 10 and x 40 magnification. Panel (B) and (C) show the positive plexin A1 staining (shown in brown) of two areas within the membrane (arrows identify infiltrating cells), the staining is shown at x 10 magnification on the left and x 40 magnification on the right.

236
4.5 siRNA knockdown of plexin A1 in M-CSF derived macrophages
I next decided to establish the role of plexin A1 in macrophage biology using RNA
interference (RNAi). RNAi is a pathway in eukaryotic cells by which sequence
specific small interfering RNA (siRNA) is able to find and cleave complementary
mRNA [641]. An enzyme known as Dicer can cleave double stranded RNA into
siRNA fragments [642]. Once siRNA is present in the cell it is incorporated into a
protein complex called the RNA induced silencing complex (RISC) [643] where
argonaute-2 unwinds the siRNA. The activated RISC complex containing the
antisense strand of siRNA will then find and degrade mRNA that is
complementary to this strand resulting in specific gene silencing. Synthetic
siRNA specific to a gene can be directly introduced into a cell allowing gene
silencing of almost any mammalian gene thereby allowing analysis of specific
gene function.
So far most experimental work on plexin A1 has looked at plexin A1 expression
and function in DCs, since our results showed that plexin A1 is upregulated in
monocytes/macrophages in the arthritic synovial fluid we wanted to determine
the role of plexin A1 in this cell type with the use of siRNA. M-CSF differentiated
macrophages were used to work up the siRNA experiments as these are a
relatively accessible cell source compared to the limited number of synovial
fluid patient samples we obtain in the lab.
4.5.1 Expression of plexin A1 in macrophages after 6 days of M-CSF differentiation
A preliminary experiment before starting the siRNA knockdown of plexin A1 was
to first determine that macrophages expressed plexin A1 mRNA. A previous study
had demonstrated that plexin A1 was upregulated in macrophages differentiated
in M-CSF for 2 days [443]. In our experimental setup monocytes were
differentiated with 50 ng/ml M-CSF for 6 days and analysed at day 0 and 6 for
plexin A1 expression. Figure 4.5 shows the fold change in plexin A1 expression in
day 6 differentiated macrophages compared to day 0. Once the presence of
plexin A1 had been determined in these cells we could then set up the siRNA
experiments.

237
Figure 4.5 Plexin A1 in M-CSF differentiated macrophages Monocytes were differentiated with 50 ng/ml M-CSF for 6 days. Fold change in plexin A1 mRNA expression was measured by qPCR.
4.5.2 Transfection efficiency of N-TER reagent
An N-TER nanoparticle transfection system was used to knockdown the plexin A1
gene. In this transfection system the N-TER peptide binds siRNA non-covalently
forming a nanoparticle. The nanoparticle then interacts with the lipids on the
surface of the plasma membrane thus allowing the nanoparticle to diffuse across
the cell membrane and delivering the siRNA to the cytoplasm.
To test the efficiency of this transfection system a negative control siRNA with
an Alexa Fluro 555 modification was used. The negative control siRNA will not
knockdown any genes in the cell since it is a non-silencing siRNA with no known
homology to any known mammalian gene. Since it is modified with a fluorescent
tag it can be used to measure the transfection efficiency of the N-TER peptide as
any cell that has been successfully transfected will fluoresce. To determine the
concentration at which the N-TER peptide worked most effectively, cells were
transfected with the negative control siRNA and analysed on a fluorescent
microscope and by FACS.
4.5.2.1 Inverted microscope images
Day 6 M-CSF differentiated macrophages were transfected with varying
concentrations of negative control siRNA for 24 hours in the presence or absence
of fetal calf serum (FCS) as FCS can sometimes affect siRNA transfection. The

238
cells were then imaged on a fluorescent inverted microscope as seen in Figure
4.6. In the cells transfected in medium plus FCS all concentrations of siRNA have
resulted in positively transfected cells as shown by the orange fluorescence.
However, the cells did not transfect as well at the 5 nM concentration of siRNA
indicated by the less intense fluorescent staining of those macrophages. A
similar staining pattern can be seen in the cells which were transfected without
serum in the medium as all the concentrations of siRNA show positive
transfection and fluorescent cells but some cells in the 10 nM and 5 nM
concentrations are not stained as brightly as the cells in the 30 nM and 20 nM
concentrations. The cells that were incubated without serum contained lots of
cellular debris as can be seen in the 30 nM image indicating that this could be
detrimental to the cells. Therefore, siRNA transfection was performed in the
presence of FCS.
Figure 4.6 siRNA transfection efficiency by imaging fluorescence on the microscope Macrophages were treated with M-CSF for 6 days and transfected with varying concentrations (30 - 5 nM) of negative control siRNA for 24 hours in the presence or absence of fetal calf serum (FCS). The negative control siRNA has a fluorescent tag therefore cells that been successfully transfected cells will fluoresce.

239
4.5.2.2 FACS plots
To quantify the amount of positive transfection with the N-TER transfection
system macrophages were treated with the negative control siRNA for 24 hours
in serum-containing media, the cells were then collected and analysed on the
FACS for Alexa Fluro-555 fluorescence compared to untransfected cells. Figure
4.7 shows the results of this FACS analysis and demonstrates that at least 93% of
macrophages were positive for negative control siRNA in all of the
concentrations tested. This indicates that the N-TER transfection system allows
siRNA to successfully enter the macrophage cells even at 5 nM
concentration.
Figure 4.7 FACS analysis siRNA transfected macrophages Monocytes were differentiated with M-CSF for 6 days and transfected with varying concentrations of a fluorescent tagged negative control siRNA for 24 hours in complete medium. Cells were then
Sid
e s
catt
er
Alexa fluro 555
Untransfected cells Transfected cells
5 nM
10 nM
20 nM
30 nM
240
collected and analysed by FACS for fluorescence which was indicative of positive siRNA transfection.
4.5.3 Testing siRNA 1-4 at 3 concentrations
Once the transfection system had been validated in macrophage cells the plexin
A1 siRNA was tested in the macrophage cells to see if it changed the expression
of plexin A1. The plexin A1 siRNA received from Qiagen consisted of four
individual siRNA‘s designated 1-4. Each individual siRNA was tested on the
macrophages at three concentrations 10, 20 and 30 nM. It was decided not to
test the siRNA at 5 nM as from the fluorescent microscope experiment the
macrophages did not appear to be as intensely stained at the 5 nM concentration
as they did at the other concentrations.
4.5.3.1 PLX1- 4 at 30, 20, 10 nM
Macrophages were M-CSF treated for 6 days and then treated with negative
control siRNA (designated control) and the four plexin siRNA (designated PLX 1-
4) at 10, 20 and 30 nM concentrations for 24 hours. After this time the cells were
collected and put into trizol and the qRT-PCR was performed on the samples to
determine whether the siRNA had decreased the amount of plexin A1 siRNA
being expressed by the cells. Since the negative control siRNA is a non-silencing
siRNA it should not affect the amount of plexin A1 expression and therefore the
plexin A1 mRNA levels in the samples treated with siRNA PLX 1-4 were compared
back to the negative control siRNA to look for a relative increase or decrease in
expression. Figure 4.8 shows the results of this experiment; graph (A)
demonstrates the expression of plexin A1 as a result of siRNA treatment. The
values of the negative control siRNA are 1 and the line drawn on the graph is set
at 1. It can be seen that at 30 nM concentration PLX 1, -2 and -3 siRNAs are
causing an increase in Plexin A1 expression rather than knocking it down and at
the 10 nM concentration PLX 2 and 3 siRNA are also causing an increase in plexin
A1 expression in the cells compared to the control.
Figure 4.8 (B) shows the percentage inhibition of plexin A1 as a result of adding
the 4 different siRNAs. The percentage inhibition was calculated relative to the
negative control and a negative value indicates an increase in plexin A1
expression whereas a positive value indicates a decrease in plexin A1 expression.
At the 30 nM concentration PLX 1, PLX 2 and PLX 3 siRNA induced an increase in

241
plexin A1 expression of 89, 83 and 84% respectively. Also at the 10 nM
concentration PLX 2 and PLX 3 siRNA increased the amount of plexin A1 mRNA by
100 and 67% respectively. The reason for these siRNAs increasing the amount of
expression is unknown. A recent study has shown when an siRNA sequence is
complementary to the promoter region of a gene it can increase transcription of
that gene [644]. However, the siRNAs used in this study are unlikely to target
the promoter region of plexin A1 as the phenomenon of the PLX siRNA inducing
expression of plexin A1 does not occur at all of the concentrations tested and
only occurs at 30 nM and 10 nM concentrations.
Due to the PLX 2 and PLX 3 siRNA producing an increase in plexin A1 levels at 30
and 10 nM concentrations they were omitted from further experiments. PLX 1
siRNA induced an increase of plexin A1 at the 30 nM concentration but otherwise
induced a high amount (75%) of inhibition at the 20 nM concentration and also
decreased plexin A1 levels at the 10 nM concentration. PLX 4 siRNA was the only
siRNA to consistently decrease the level of plexin A1 mRNA. Consequently only
PLX 1 and 4 were used in additional experiments.

242
Figure 4.8 Testing siRNA PLX 1-4 in M-CSF differentiated macrophages M-CSF differentiated macrophages were treated with 4 siRNAs PLX 1-4 and a negative control siRNA that should not affect the expression of plexin A1 at 3 different concentrations 10, 20 and 30 nM for 24 hours. Using qRT-PCR the amount of expression of plexin A1 in the cells relative to the negative control, which is set at 1, was determined in graph (A). The line on the graph is set at 1 therefore any bars above the line are showing an increase in plexin A1 expression and any lines below are a decrease in plexin A1 expression. The percentage inhibition of plexin A1 was also determined for this experiment as can be seen in graph (B). Positive values for the percentage inhibition indicate that there was a decease in plexin A1 expression compared to the negative control.
4.5.3.2 PLX 1 and 4 at 30, 20, 10 nM
To check the level of plexin A1 inhibition by the two siRNAs PLX 1 and PLX 4, M-
CSF derived macrophages were treated with 10, 20 and 30 nM siRNA for 24
hours. Figure 4.9 (A) indicates that both PLX 1 and PLX 4 decreased the amount
of plexin A1 mRNA expression in the macrophages compared to the negative
control in all of the three conditions. The percentage inhibition of plexin A1,
graph (B), ranged from 14% to 54%. The concentration at which the percentage
inhibition was greatest was 20 nM, at this concentration PLX 1 and PLX 4 induced
49 and 54% inhibition respectively compared to the negative control. Hence the
20 nM concentration of PLX 1 and PLX 4 was used in the further experiments, a
mixture of both siRNAs was also used to determine if combining the two siRNAs
results in a greater amount of gene silencing.
(A)
(B)
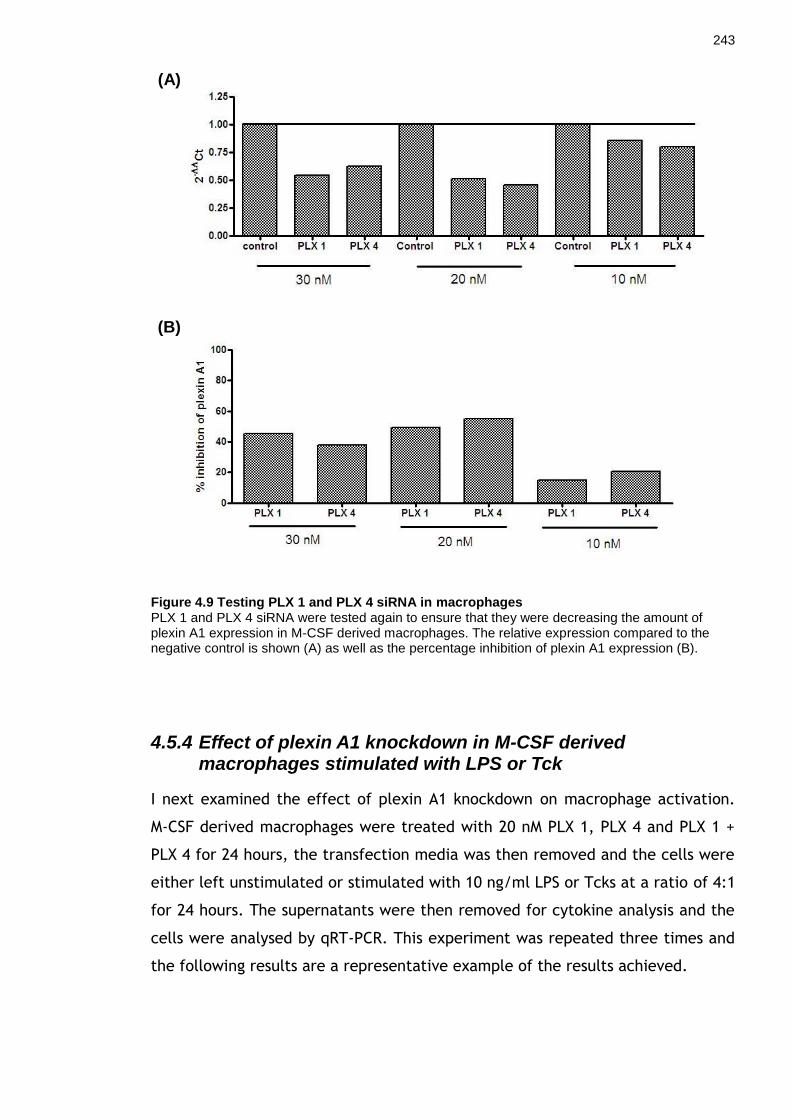
243
Figure 4.9 Testing PLX 1 and PLX 4 siRNA in macrophages PLX 1 and PLX 4 siRNA were tested again to ensure that they were decreasing the amount of plexin A1 expression in M-CSF derived macrophages. The relative expression compared to the negative control is shown (A) as well as the percentage inhibition of plexin A1 expression (B).
4.5.4 Effect of plexin A1 knockdown in M-CSF derived macrophages stimulated with LPS or Tck
I next examined the effect of plexin A1 knockdown on macrophage activation.
M-CSF derived macrophages were treated with 20 nM PLX 1, PLX 4 and PLX 1 +
PLX 4 for 24 hours, the transfection media was then removed and the cells were
either left unstimulated or stimulated with 10 ng/ml LPS or Tcks at a ratio of 4:1
for 24 hours. The supernatants were then removed for cytokine analysis and the
cells were analysed by qRT-PCR. This experiment was repeated three times and
the following results are a representative example of the results achieved.
(A)
(B)

244
4.5.4.1 qRT-PCR data
Prior to analysing the TNF ELISA data it was necessary to check that the plexin
A1 expression had decreased as a result of treating the cells with siRNA. Figure
4.10 shows the relative expression of plexin A1 in the macrophage samples
relative to the negative control. In the unstimulated macrophages which were
incubated with media after the siRNA treatment there is a decrease in the
amount of plexin A1 being expressed by the cells which were treated with PLX 1
siRNA. The amount of plexin A1 expression in macrophages treated with PLX 4
siRNA is also decreased compared to control but the siRNA treatment producing
the highest amount of gene silencing is the combined treatment of PLX 1+4. This
same pattern is seen with the macrophages which were stimulated with LPS,
where the greatest level of gene silencing is seen when the combination of
PLX1+4 were used. The percentage inhibition of plexin A1 in the macrophages
treated with PLX 1+4 siRNA was 43% and 55% for the macrophage samples which
were subsequently incubated with media or LPS respectively. Despite this being
a large percentage inhibition in the context of the experiment it indicates that
there is still over 50% or just under 50% of the total amount of plexin A1 being
expressed in the macrophages, which will therefore bias the results when trying
to determine effect of silencing the plexin A1 gene in macrophages. It also
indicates that there is a discrepancy of over 10% in the amount of gene
knockdown obtained each time the macrophages are treated with PLX siRNA;
this variability will also bias the results of the siRNA experiment.
In Figure 4.10 the results from the macrophages which were subsequently
stimulated with Tcks in a cell contact (c.c) indicate that there was very little
gene silencing of plexin A1 in these cells since the level of plexin A1 relative
expression in the cells treated with siRNA is similar to the level of plexin A1 in
the cells treated with the negative control siRNA. This may be due to
contaminating Tcks in the sample with the macrophages as although every effort
was made to remove the Tcks before putting the cells in trizol some may have
remained. T cells have been shown to express plexin A1 [623] and the presence
of contaminating Tcks in the macrophage sample could have diluted out the
effect of the siRNA gene silencing therefore producing the result of little or no
plexin A1 gene knockdown in these samples.

245
Once the result of 43% and 55% gene knockdown in the macrophage samples had
been determined, the pro-inflammatory output from these stimulated
macrophages could be analysed.
Figure 4.10 RT-PCR of plexin A1 knockdown in activated macrophages PLX 1, 4 or 1+4 siRNA were used to silence the plexin A1 gene in macrophages that were subsequently stimulated with LPS or Tcks.
4.5.4.2 TNFα ELISA data
To establish whether the plexin A1 knockdown had any effect on the pro-
inflammatory output of the macrophages stimulated with LPS or Tcks a TNFα
ELISA was performed on the cell supernatants. Figure 4.11 shows the results of
the ELISA, while there were small amounts of TNFα produced by the
macrophages incubated for 24 hours in media alone the stimulated macrophages
both produced elevated quantities of TNFα. The LPS stimulated macrophages
produced less TNFα in the samples which had been treated with PLX siRNA
compared to the samples which had been treated with the negative control
siRNA. The lowest amount of TNFα produced is from the macrophage sample
that was treated with PLX 4 which from the previous figure induced 31%
inhibition of plexin A1 therefore inhibiting a relatively small percentage of
plexin A1 in macrophages may be enough to change its pro-inflammatory profile.
This decrease in TNFα using PLX 4 siRNA compared to the negative control
sample is statistically significant using a 1 way ANOVA and a Turky‘s multiple
comparison test.

246
The Tck cell contact activated macrophages do not appear to have changed their
proinflammatory output as a result of siRNA silencing of plexin A1 since the
amount of TNF produced by the cells treated with PLX siRNA is not significantly
different to the TNF production from the negative control treated macrophages.
This could indicate that plexin A1 may not be involved in the cellular cross talk
between macrophages and T cells however plexin A1 was not fully silenced with
the PLX siRNA and it is possible that in order to elucidate the role plexin A1
plays in the cellular contact between macrophages and T cells the plexin A1
gene must be fully knocked down.
Figure 4.11 TNFα ELISA of siRNA treated macrophages A TNFα ELISA was performed on macrophages that had been treated with various siRNAs before being incubated with media alone, 10 ng/ml LPS or Tcks (c.c). Error bars are mean ±SEM. This is a representative of three individual experiments. Using a 1 way ANOVA with Tukey’s multiple comparison test on the LPS treated group there is a statistically significant difference between the –ve control LPS group and the PLX 4 LPS group in addition to a statistically significant difference between –ve control LPS and PLX1+4 LPS group (p<0.05).
4.6 Investigation into the expression of the Plexin A1 ligand semaphorin 6D on T cells
Plexin A1 is known to have several semaphorin ligands including semaphorin 6D.
In the context of the immune system semaphorin 6D is the most well studied
plexin A1 ligand to date and several studies have indicated that plexin A1
expressed on DCs may interact with T cells expressing semaphorin 6D [623]. A
recent study investigated the regulation of semaphorin 6D expression on T cells
and found that in vitro activation of murine CD4+ T cells using plate-bound anti-
CD3 and anti–CD28 antibody increased mRNA levels of sema 6D by 24 hours and

247
after 5 days induced 71% surface expression of sema 6D compared to control
during the late phase of activation [645].
Since plexin A1 is upregulated in RA and PsA synovial fluid CD14+ cells and
macrophages are known to interact with T cells in the arthritic joint [408] we
hypothesised that semaphorin 6D, one of plexin A1‘s specific ligands, is
expressed on arthritic T cells and is one of the receptor-ligand interactions
taking place within the synovium of diseased patients. It was decided to first
test for the presence of sema 6D on cytokine activated T cells (Tcks) since these
are an in vitro model of activated synovial T cells [298, 309]. As a positive
control human T cells were also activated with anti-CD3 and anti-CD28
antibodies as a previous study had shown 71% of murine cells stimulated in this
manner were found to express semaphorin 6D after 5 days [645].
4.6.1 Semaphorin 6D FACS analysis
T cells were isolated from normal donors and stimulated for 6 days with a
cytokine cocktail to produce Tcks or CD3/CD28 microbeads to produce activated
T cells. T cells were analysed for semaphorin 6D expression at day 0
(unactivated T cells), day 3 and day 6. Since the semaphorin 6D antibody was
unconjugated a secondary APC antibody was incubated with the cells to detect
whether sema 6D had bound to the cells. As a control, an irrelevant antibody
(CD68) that should not have bound to the T cells was incubated with the cells
before adding the secondary antibody in order to detect any non-specific
staining of the secondary antibody.
4.6.1.1 Semaphorin 6D expression on CD3/CD28 stimulated T cells
Figure 4.12 demonstrates representative results of the FACS staining for the T
cells stimulated for 0, 3 and 6 day with anti-CD3, anti-CD28 microbeads. Isotype
control is shown as the grey histogram, semaphorin 6D surface and intracellular
staining is shown in blue on the left hand histograms. Irrelevant antibody
staining is shown in red on the right hand panel of histograms.
Unstimulated T cells on day 0 appear to have approximately 3.5% semaphorin 6D
surface staining however upon comparison to the irrelevant antibody, which has

248
3.16% positive staining, it appears that the majority of the staining seen at day
0 is non-specific secondary antibody staining. The same pattern is seen at day 3
where there is 3.5% positive surface staining from the irrelevant antibody which
indicates that the 4.39% positive semaphorin 6D staining is unlikely to be a valid
observation. The same observation is seen within the day 6 activated T cells..
The intracellular staining at day 6 is also negative for both semaphorin 6D and
irrelevant antibody. However, the intracellular staining in the T cells at day 3
appears to show a small increase in semaphorin 6D expression compared to
isotype control as 9% of cells are positive for semaphorin 6D. The irrelevant
antibody staining at this timepoint is 1.9% indicating that the semaphorin 6D
expression could be valid observation.
Consequently, day 3 intracellular staining is the only timepoint which shows
expression of semaphorin 6D, the intracellular levels are negative at day 6 and
there is no surface expression of semaphorin 6D at any of the three timepoints
examined. These observations conflict with the results shown by O‘Connor et al
[645] who demonstrated that over 70% of murine CD4+ T cells express
semaphorin 6D on the surface after 5 days of stimulation with anti-CD3 and anti–
CD28 antibodies.

249
Figure 4.12 Surface and intracellular semaphorin 6D staining of CD3/CD28 stimulated T cells T cells were analysed at day 0, day 3 and day 6 after stimulation for surface and intracellular staining of semaphorin 6D (blue lines). The semaphorin 6D was not a directly conjugated FACS antibody therefore a secondary APC conjugated antibody was incubated with the cells after semaphorin 6D staining to detect the presence of the surface ligand. As a control an irrelevant antibody (CD68) was incubated with the cells before adding the secondary antibody in order to check for non-specific staining of the secondary antibody (red lines). Isotype control is shown as the grey histograms. The surface staining is a representative of n=6 experiments and the intracellular staining is a representative of n=2 experiments.
4.6.1.2 Semaphorin 6D expression in cytokine stimulated T cell (Tcks)
Tcks were also analysed for semaphorin 6D expression after 0, 3 and 6 days of
activation (Figure 4.13). Semaphorin 6D staining is shown by the blue lines on
the left hand panel of histograms and irrelevant antibody staining is shown by
the red lines on the right hand panel of histograms. Since the same unactivated
T cells were used as a control for both CD3/CD28 and Tck activated T cells
before the cells were activated with either stimulus, day 0 T cells show the
same results as in the previous figure. There is no surface semaphorin 6D
expression due to a similar percentage of positive staining for the irrelevant
antibody, indicating that the secondary antibody is binding non-specifically.
There was no induction of surface semaphorin 6D expression after 3 and 6 days
of cytokine activation (2.1% and 2.5% positive respectively) considering that the

250
secondary antibody was also positive (0.68% and 1.7% respectively) indicating
non-specific staining. There was also no intracellular semaphorin 6D expression
at day 6 since the percentage of positive cells for semaphorin 6D and irrelevant
antibody were almost identical (3.93% and 3.75%). However, as was seen with
the CD3/CD28 activated T cells the intracellular expression of semaphorin 6D in
Tcks was increased at day 3, 17.1% of Tcks were positive for semaphorin 6D. The
irrelevant antibody had a considerably lower expression at this timepoint (3.97%)
suggesting that the semaphorin 6D staining was specific.
As was seen with the CD3/CD28 activated T cells semaphorin 6D is only
expressed in Tcks intracellularly after 3 days of activation but is not expressed
on the surface of the cells during the 6 days of activation.
Figure 4.13 Surface and intracellular semaphorin 6D staining of Tcks T cells were analysed at day 0, 3 and 6 after cytokine stimulation for surface and intracellular expression of semaphorin 6D (blue lines). Since the semaphorin 6D was not a conjugated FACS antibody a secondary APC conjugated antibody was incubated with the cells after semaphorin 6D staining to detect the presence of the ligand. As a control an irrelevant antibody (CD68) was incubated with the cells before adding the secondary antibody in order to check for non-specific staining of the secondary antibody (red lines). Isotype control is shown as the grey histograms. The surface staining is a representative of n=6 experiments and the intracellular staining is a representative of n=2 experiments.

251
4.6.2 Investigation into the level of semaphorin 6D mRNA in T cell samples
Due to problems with repeated non-specific staining of the secondary antibody
during the FACS analysis we therefore went on to analyse the levels of
semaphorin 6D mRNA in cytokine- and CD3/CD28-activated T cells. A PCR was
set up with these samples and no detectable bands could be observed (data not
shown) therefore to verify this result the samples were analysed by qRT-PCR.
4.6.2.1 qRT-PCR of T cell samples
T cells were isolated from 2 donors and activated with cytokines or CD3/CD28
for 6 days. CD3+ cells were also isolated from 3 PsA synovial fluids. The relative
expression of semaphorin 6D compared to the GADPH of each sample is shown in
graph (A) of Figure 4.14. All Tck and CD3/CD28 samples have very low relative
expression values indicating that semaphorin 6D is almost certainly not being
expressed. The Tck day 6 sample of one of the donors has a much higher relative
expression compared to all of the other samples which could suggest semaphorin
6D mRNA is being expressed. The three PsA synovial fluid CD3+ samples have
varying levels of semaphorin 6D relative expression but the levels are still
relatively low, again indicating that semaphorin 6D is unlikely to be expressed in
these cells.
The fold change of semaphorin 6D expression in the Tck and CD3/CD28 activated
cells can be determined by comparing the semaphorin 6D expression of the
activated samples to that of the corresponding inactivated day 0 T cell sample.
Graph (B) of Figure 4.14 illustrates the fold change in semaphorin 6D in the
activated T cell samples compared to inactivated T cells. The Tcks and
CD3/CD28 T cells activated after 3 days in both donors demonstrated a decrease
in the amount of semaphorin 6D compared to inactivated T cells. The day 6 Tcks
and CD3/CD28 T cells had a decrease in the amount of semaphorin 6D (fold
change of -141 and -28 respectively) in donor 1 and a slight increase in donor 2
(fold change 11 and 1.9 respectively).
The combined FACS and qRT-PCR data suggest that in the activated T cells there
are donor specific variances in the mRNA level of semaphorin 6D, however these
expression levels are very low and on the whole demonstrate a decrease in the

252
amount of semaphorin 6D mRNA compared to inactivated T cells. The levels of
semaphorin 6D expression within CD3+ cells from PsA synovial fluid are also very
low. Semaphorin 6D protein appears to be transiently expressed within the T cell
during activation. Plexin A1 is a receptor for semaphorin 6D and can only form
an interaction if its ligand is present on the cell surface. During the FACS
analysis surface semaphorin 6D could not be detected in the Tck samples that
have been previously demonstrated to be an in vitro model of synovial T cells
[298, 309]. This data combined with the very low levels of semaphorin 6D mRNA
in the CD3+ synovial fluid samples suggests that T cells within the arthritic joint
may not be the source of plexin A1‘s ligand semaphorin 6D.

253
Figure 4.14 qRT-PCR of semaphorin 6D expression in T cell samples and patient CD3+
samples T cells from two donors were stimulated for 3 and 6 days with cytokines (Tcks) or CD3/CD28 microbeads. These activated T cells and inactivated T cell were then analysed for semaphorin 6D expression by qRT-PCR. T cells were also isolated from 3 PsA synovial fluids and analysed for semaphorin 6D. Graph (A) shows the relative expression of semaphorin 6D compared to the GAPDH levels in each sample. Graph (B) shows the fold change in expression in the Tck or CD3/CD28 activated T cells compared to the inactivated T cells (T cells d=0).

254
4.7 Investigation into the expression of other plexin A1 ligands semaphorin 3A, 3F, 6D on RA synovial membrane
The previous results suggested that semaphorin 6D is unlikely to be expressed on
the T cells in the arthritic joint therefore it was decided to analyse the synovial
membrane of RA patients for semaphorin 6D. If the membrane was positive for
semaphorin 6D expression, this would imply that plexin A1‘s ligand is being
expressed by other cell types rather than T cells.
Plexin A1 is also known to interact with class 3 semaphorins namely semaphorin
3A and semaphorin 3F [617]. As mentioned in the introduction class 3
semaphorins will only bind plexin A1 if neuropilin is present as a co-receptor,
semaphorin 3A will specifically bind neuropilin-1 (NRP-1) and semaphorin 3F will
bind NRP-1 and NRP-2 [443]. Analysing the microarray data (presented in chapter
4) for genes that are upregulated in addition to plexin A1 in the RA and PsA SF
CD14+ cells reveals that these cells have upregulated NRP-1 with a fold change
increase of 40 in PsA SF and 11 in RA SF and NRP-2 with a fold change increase of
24 in PsA SF and 31 in RA SF. Since these cells had upregulated plexin A1 and the
two co-receptors needed for semaphorin 3A and 3F signalling it was possible that
plexin A1 could be binding to either of these ligands hence the presence of
semaphorin 3A and 3F were also analysed in the RA synovial membrane.
4.7.1 qRT-PCR on RA synovial membrane
SYBR green analysis was performed on 10 RA synovial membranes to investigate
the presence of three plexin A1 ligands. The results are shown in Figure 4.15 and
indicate that all three semaphorins are expressed in the RA membranes however
semaphorin 3A has the greatest relative expression in the samples compared to
its housekeeping gene. Semaphorin 6D is also expressed in the RA membranes
indicating that although we could not detect it on T cells it may be present on
other cell types within the membrane. Consequently the level of these
semaphorins on another cell type known to be present in the RA synovium was
investigated.

255
Figure 4.15 Semaphorin 3A, 3F, 6D expression in RA synovial membrane qRT-PCR was used to determine the relative expression of 3 of plexin A1’s ligands in 10 RA synovial membranes. Each dot represents one patient sample and the line indicates the mean expression.
4.7.2 SYBR green of RA synovial fibroblasts
Given that it had been determined that three of the plexin A1 ligands were
expressed in the RA synovial membrane it was hypothesised that fibroblasts may
be a cell type expressing these semaphorins since macrophages and fibroblasts
are known to interact in the inflamed synovial joint [646]. Consequently, the
relative expression of semaphorin 3A, 3F and 6D compared to GAPDH was
determined for RA synovial fibroblasts from 5 patients. Figure 4.16 outlines the
results and reveals that semaphorin 3F was the most highly expressed
semaphorin and all five samples expressed it at a similar level. Semaphorin 3A
was also expressed but the levels varied between samples with 3 samples having
a high level of expression comparable to semaphorin 3F samples whereas the
remaining 2 samples having a low level of expression. The five RA fibroblast
samples expressed semaphorin 6D but at a lower level compared to the other
semaphorin‘s examined. The overall expression of the three semaphorin
molecules is very low with all of the relative expression values being lower than
0.02. Further analysis with more samples would need to be performed to
determine whether synovial fibroblasts could be expressing the plexin A1
ligands.

256
Figure 4.16 Semaphorin 3A, 3F and 6D expression in RA synovial fibroblasts Synovial fibroblasts from 5 RA patients were analysed for semaphorin (sema) 3A, 3F and 6D. qRT-PCR was used to determine the relative expression of the semaphorins which were then normalised to GAPDH levels of each sample. The line represents the mean value.

257
4.8 Discussion
Plexin A1 is a semaphorin receptor known to participate in axonal guidance
[635], chick cardiac development [631], bone homeostasis [623], T cell-DC
interactions [444, 623] and DC trafficking to the lymph node [632]. Plexin A1 had
been previously shown to be expressed on human M-CSF differentiated
macrophages [443] but has not been shown to be present or play a role in PsA or
RA. After discovering plexin A1 to be a highly upregulated gene in RA and PsA
CD14+ cells, showing a fold change increase of 26 and 27 respectively, we were
interested in its previously identified role in T cell-DC interactions. In this
setting plexin A1 is expressed on the DCs and is thought to act as a co-
stimulatory marker for a T cell ligand because plexin A1-/- DCs have a reduced
ability to stimulate T cells [623] and plexin A1 has been shown to be localised at
the T cell-DC interface [640]. Since macrophages have been demonstrated to
interact with many cellular subtypes within the synovium of arthritis patients
[249, 408, 646] we hypothesized that the increased levels of plexin A1 on
synovial fluid CD14+ cells may play a role in enhancing cellular interactions
within the diseased joint. In order to investigate this hypothesis we needed to
demonstrate that plexin A1 was present within the synovial fluid cells and the
synovium of arthritis patients, determine which plexin A1 ligands were present
within the joint and investigate the effects of silencing plexin A1 on the pro-
inflammatory cytokine level obtained from activated macrophages.
Plexin A1 was expressed at the mRNA level in all of the CD14+ cells isolated from
the synovial fluid of RA and PsA examined which included the samples that had
been analysed on the microarray and other patient samples. Plexin A1 mRNA was
also detected in the CD14+ synovial fluid cells of a JIA, an inflammatory
polyarthritis and an OA patient indicating that this cell surface molecule may
also be playing a role in other arthritic diseases, although more patients would
have to be analysed to verify this. In the patients where a matched synovial fluid
and blood sample were available the mRNA level of plexin A1 was consistently
increased in the synovial fluid CD14+ cells compared to the blood CD14+ cells
verifying the microarray results and suggesting the pro-inflammatory
environment within the diseased joint causes the CD14+ cells to upregulate
plexin A1 once they exit the blood and enter the synovium.

258
We observed the presence of plexin A1 in five RA synovial membranes where it
was mainly located in cells outlining vascular structures, possibly indicative of
endothelial cells, and within cells surrounding the vasculature structures which
could represent cells infiltrating into the membrane via the blood vessels.
However, due to a lack of PsA synovial membrane this disease was unable to be
analysed for plexin A1 staining.
Plexin A1 is a receptor molecule for semaphorin ligands and previous work has
indicated that the specific ligands which interact with plexin A1 are semaphorin
3A, 3F and 6D [624]. The main focus of research involving plexin A1‘s role in the
immune response has been its interaction with semaphorin 6D on T cells [623,
640]. O‘Connor et al demonstrated that CD3/CD28 activation of murine CD4+
cells induced the surface expression of semaphorin 6D [645] therefore we
investigated whether an in vitro system of cytokine activation previously shown
to induce a T cell phenotype similar to that of synovial T cells [298, 309] could
induce the expression of semaphorin 6D. The interaction of macrophages and T
cells in the arthritic joint has been well documented [314, 408] therefore a
plexin A1 – semaphorin 6D receptor ligand complex could be one of the
interactions taking place. We observed no surface semaphorin 6D expression on
the cytokine activated or CD3/CD28 activated T cells and no mRNA expression of
semaphorin 6D in these cells or synovial fluid CD3+ T cells. The lack of surface
semaphorin 6D on CD3/CD28 activated T cells conflicted with the results of the
O‘Connor paper which demonstrated CD3/CD28 antibody stimulation induced
semaphorin 6D expression in 70% of T cells after 5 day [645]. However, this
discrepancy may be explained by a species specific response as the O‘Connor
paper analysed murine T cells whereas we investigated semaphorin 6D in human
T cells.
Despite semaphorin 6D being undetected in cytokine activated and synovial T
cells there was a possibility that semaphorin 6D was being expressed in the
synovium on other cell types. There was also the prospect of the macrophage
plexin A1 interacting with one of its other ligands in the synovium such as
semaphorin 3A or 3F. However, both of these semaphorins only interact with
plexin A1 in the presence of neuropilin-1 or -2 acting as a co-receptor [647].
Analysis of the microarray study data indicated that compared to blood CD14+
cells RA and PsA SF CD14+ had increased levels of neuropilin-1 and -2 as well as

259
plexin A1 indicating that binding of semaphorin 3A or 3F would be possible in
these synovial macrophages. We observed that 10 RA synovial membranes
expressed semaphorin 3A mRNA at a higher level than that of semaphorin 3F or
6D and so it appeared that semaphorin 3A could be the main receptor for plexin
A1 in the synovial compartment. To try and elucidate which cell type expressed
the plexin A1 ligands we investigated five RA synovial fibroblasts samples since
synovial macrophages have been demonstrated to interact with synovial
fibroblasts [249]. In these cells semaphorin 3F mRNA was expressed at a higher
level compared to semaphorin 3A and 6D. However, the relative expression of
these semaphorins were very low and further studies to analyse protein levels of
expression should be conducted before a definitive conclusion can be made
about the presence of semaphorins on synovial cell types.
Despite being unable to define which cells were expressing the plexin A1 ligands
we had shown that these ligands were present in the synovium of RA patients
and therefore could hypothesize that the upregulation of plexin A1 in synovial
macrophages was significant and may be playing a role in the progression of
disease in RA and PsA. To try and elucidate the function of plexin A1, small
interfering (siRNA) was used to silence the plexin A1 gene in M-CSF derived
macrophages which had been shown to upregulate plexin A1 mRNA during their
differentiation. The transfection efficiency was over 90% indicating that the
siRNA was effectively entering the cells using the nanoparticle transfection
system. Unexpectedly, two of the four siRNA induced an increase in plexin A1
expression rather than knocking it down. siRNA‘s are known to have off-target
effects as a result of a lack of specificity and can therefore silence other genes
within the cell if the siRNA imperfectly pairs with sequence motifs residing in
the 3‘ UTR of cellular mRNA [648]. There has been one report of siRNA
treatment resulting in the upregulation of mRNA within cells. This was thought
to be due to competition between the transfected siRNA and the cell‘s own
endogenous miRNA. Hence the mRNAs targeted by the endogenous miRNA are
not degraded and the cell demonstrates an upreglulation of these mRNA‘s [649].
However, despite this report of upregulation of mRNA levels occurring as a result
of siRNA treatment there has been no report of upregulation of the siRNA target
gene which is what occurred during the plexin A1 knockdown experiments. The
reason for the observed upregulation of plexin A1 mRNA is unknown but could

260
have been due to badly designed siRNA which did not target the plexin A1 mRNA
for degradation. As a result the two PLX siRNA which demonstrated increased
plexin A1 expression were not used in further experiments.
The TNFα cytokine profile of siRNA treated macrophages subsequently
stimulated with 10 ng/ml of LPS or cell contact activated with Tcks for 24 hours
were analysed. It was thought that these two treatments may mimic the pro-
inflammatory environment to which synovial macrophages may be exposed as
TLR signalling may play a role in arthritis [650] and cellular contact with
activated T cells is known to take place within the joint.
In the experiment shown, treating macrophages with 20 nM PLX 1+PLX 4 resulted
in a 43% inhibition of plexin A1 in the cells which were subsequently cultured
with media alone and 55% inhibition in the macrophages which were
subsequently stimulated with LPS. This discrepancy of over 10% in the amount
gene silencing demonstrated the large variability of the siRNA treatment which
was seen throughout all three siRNA experiments. The small amount of gene
silencing also indicated that potentially there could be as much as 50% of the
total amount of plexin A1 mRNA still present in the macrophage cells before
activation which could therefore bias the results of the cytokine analysis. In the
siRNA treated macrophages which were activated with Tcks there appeared to
be little to no gene silencing with the maximal amount of inhibition being 10%
with PLX 4 treatment. This observation could be the result of contaminating Tcks
remaining in the culture wells as T cells have been shown to express plexin A1
[623]. Consequently, contaminating T cells in the macrophage sample may have
diluted out any effect of the siRNA treatment which resulted in the appearance
of no plexin A1 knockdown. Due to this discrepancy we must assume that the
level of gene silencing in the Tck-stimulated was at a similar level to the gene
silencing seen in the other macrophage samples i.e. around 43 – 55% inhibition.
The subsequent TNFα analysis of the macrophage samples demonstrated that the
cytokine level did not change in the macrophages incubated in media alone,
indicating that the siRNA treatment did not adversely activate the macrophages.
The LPS stimulated macrophages produced less TNFα in the samples which had
been treated with siRNA compared to the negative control. The sample
producing the lowest amount of TNFα was the sample which had a 31%
261
knockdown of the plexin A1 gene suggesting that even a small decrease in the
amount of plexin A1 may be enough to change the pro-inflammatory cytokine
profile of the macrophage. This result would imply that plexin A1 is playing a
pro-inflammatory role within the macrophage as a decrease in plexin A1
expression causes less TNFα to be released by the cell as a result of TLR4
stimulation. This observation is in contrast to that of Ji et al [443] who
previously demonstrated that LPS stimulation of human monocytes alongside M-
CSF stimulation for 24 hours resulted in the inhibition of plexin A1 mRNA
expression. The inconsistency could be due to the stage of monocyte activation
as the Ji et al paper investigated day 0 monocytes which were M-CSF and LPS
stimulated at the same time for 24 hours while our investigation analysed the
effect of plexin A1 silencing in macrophages that had been treated with M-CSF
for 6 days and therefore would have a more activated phenotype. It must also be
noted that the plexin A1 inhibition in the macrophages of this experiment was
55% therefore there is still 45% of the total plexin A1 mRNA level being
expressed within these cells. Subsequently, it is difficult to draw definitive
conclusions about the role of plexin A1 with regards to TLR-4 stimulation until
complete knockdown of the plexin A1 gene is established.
The TNFα levels measured in the siRNA treated macrophage activated with Tcks
did not appear to have changed significantly in comparison to siRNA negative
control macrophages. This result could indicate plexin A1 on the macrophages is
not involved in the cellular cross talk which occurs between Tcks and
macrophages since its knockdown did not affect the pro-inflammatory output of
the macrophages. This conclusion is supported by our finding that semaphorin
6D, one of plexin A1‘s most studied ligands, is not present on Tcks or synovial
CD3+ cells at the surface protein or mRNA level. However, as with the siRNA-
treated LPS stimulated macrophages it is difficult to draw conclusions about the
role of plexin A1 within the macrophage - Tck cell contact when the plexin A1
gene is incompletely silenced. The true function of plexin A1 may only become
apparent once macrophage cells with 100% knockdown of plexin A1 are studied.
In conclusion, the plexin A1 investigation has demonstrated that plexin A1 mRNA
is highly upregulated in synovial fluid macrophage cells of PsA and RA and is also
upregulated in synovial CD14+ cells of other arthritic conditions such as OA, JIA
and inflammatory polyarthritis. It is present within the synovial membrane of all

262
5 RA patients examined although double staining is necessary to determine if the
plexin A1 positive cells are predominantly macrophages. One of plexin A1‘s
ligands semaphorin 6D could not be measured on cytokine activated T cells
(Tcks) or CD3/CD28 activated T cells as had been previously described [645] and
its mRNA levels could not be determined in the above cell types or synovial fluid
CD3+ cells suggesting that macrophage plexin A1 was not interacting with T cells
in the synovium. However, another of plexin A1‘s ligands, semaphorin 3A, was
found to be highly expressed at the mRNA level in 10 RA synovial membranes
indicating that this could be plexin A1‘s main ligand within the arthritic joint. At
present the cell type expressing this semaphorin has not been discovered and
analysis of RA synovial fibroblasts indicated that they expressed low levels of
semaphorin. Investigation into the function of plexin A1 using siRNA has hinted
at a possible pro-inflammatory role in macrophages as LPS induced TNFα
secretion decreased in siRNA treated cells. However further investigations are
needed to fully confirm this observation.

263
Chapter 5 Investigation into the expression and function of the novel gene legumain in rheumatoid and psoriatic arthritis patients

264
5.1 Introduction
The second ‗novel articular‘ gene to be discovered during the analysis of the
upregulated genes in RA and PsA SF CD14+ cells was legumain. Legumain,
otherwise known as asparagine endopeptidase (AEP), is a lysosomal cysteine
protease that specifically cleaves protein substrates on the C-terminal side of
asparagine [651]. The mammalian form was cloned and sequenced in 1997 [651]
after being described in leguminous plants [652] and the blood fluke Schistosoma
mansoni [653]. There are four families of cysteine endopeptidases found in
mammals, the most numerous of those belong to the papain family (C1), which
are predominantly lysosomal enzymes and include cathepsin S, L, F, B, K and C
[654]. These enzymes are responsible for proteolysis in the lysosomal/endosomal
system and can also be secreted to act extracellularly. The other families of
cysteine endopeptidases consist of calpain (family C2), caspase and legumain
(family C13) [655].
Legumain is produced as an inactive zymogen that requires proteolytic cleavage
to gain activity. Legumain activates itself autocatalytically which requires the
sequential cleavage of a C-terminal 110-residue propeptide and then a shorter
N-terminal 8-residue propeptide, this activation is pH dependent occurring
optimally between pH 4.0-4.5 [656]. Initial studies of legumain found it to have
the highest activity in the kidney of rat, rabbit and pig [651]. However, further
studies of mouse legumain found it be expressed in all samples examined
including placenta, spleen, kidney, heart, lung, liver, testis and thymus but the
active legumain was particularly abundant in the kidney and placenta [657].
Legumain deficient mice have enlarged proximal renal tubule cells suggesting
that material to be degraded is accumulating in the lysosomes; previous
hypotheses proposed that legumain has a role in the biosynthesis of lysosomal
enzymes [432]. Legumain has since been shown to be ubiquitously expressed in a
large panel of human tissue at mRNA level [435] and is constitutively expressed
in most cells types including macrophages and DCs [658].
Legumain is known to cleave and activate several substrates such as MMP-2
[429]; fibronectin [431]; α-thymosin [430]; cathepsin B, H and L [432]; TLR9 in
DCs [658] and it also processes microbial tetanus toxin antigen [659]. Due to this
wide variety of substrates, the functional role of legumain is cell and tissue

265
context dependent. Manoury et al [659] first described a role for legumain as the
enzyme which processes microbial tetanus toxin antigen (TTCF) for antigen
presentation; legumain was isolated from disrupted lysosomes of the human B
cell line EDR and exposed to TTCF in vitro. Peptide inhibitors to legumain slowed
TTCF presentation to T cells while pre-processing of the peptide with legumain
accelerated its presentation. The same group later showed that T cell responses
to TTCF were still mounted in legumain-deficient mice but the in vivo kinetics of
TTCF presentation was slower. Boosting legumain levels in the primary APCs
accelerated TTCF processing and presentation in vitro indicating that legumain
is the most efficient protease for TTCF processing but in its absence other
enzymes can substitute to enable a slower immune response [660]. Recently,
Sepulveda et al [658] showed that legumain plays a role in the processing of
TLR9 in DCs as legumain deficiency resulted in decreased secretion of
proinflammatory cytokines in response to umCpG DNA. They also showed that
transfection of TLR9 deficient DCs with a mutant TLR9 lacking a legumain
cleavage site did not restore TLR9 signalling, suggesting that TLR9 is a direct
substrate for legumain.
As well as its roles in antigen processing and TLR9 cleavage, legumain has also
been shown to directly degrade fibronectin in vitro and in cultured mouse renal
proximal tubular cells [431]. The processing of fibronectin was abrogated by
chloroquine, an inhibitor of lysosomal degradation, and was enhanced by the
overexpression of legumain revealing that fibronectin degradation occurs in the
presence of legumain in the lysosomes of renal proximal tubular cells. Similarly,
legumain-deficient mice exhibit renal injury induced protein accumulation of
fibronectin and enhanced renal interstitial fibrosis which led to the hypothesis
that renal proximal tubular cells take up and degrade fibronectin intracellularly
thereby linking legumain to extracellular matrix remodelling. Legumain may also
play an indirect role in matrix remodelling as it can cleave pro-MMP-2 into active
MMP-2 [429]. MMP-2 is known to degrade the extracellular matrix due its wide
variety of substrates including fibronectin, several MMPs and collagen types
[661].
Despite playing an important role in extracellular matrix turnover and antigen
processing legumain is also linked to various pathological conditions such as
cancer, atherosclerosis and skin barrier function. Legumain was first

266
demonstrated to be involved in cancer when Liu et al showed that it was
overexpressed in a panel of human solid tumours including breast, colon, lung,
prostate and ovarian carcinoma [662]. The same study used fluorescent
microscopy in tumour cells to show legumain expression associated with
intracellular membranous vesicles, consistent with its function as a lysosomal
protease, as well as on the cell surface and in membranous vesicles
concentrated at the invadopodia of the tumour cell. HEK 293 cells stably
expressing legumain were found to have increased migration and invasion in
vitro and legumain expression was correlated with tumour invasion and
metastasis in vivo [662]. Legumain was also found to be expressed specifically in
tissue sections of a mouse tumour line CT26 where it was detected in vascular
endothelial cells, macrophages and in the extracellular matrix associated with
collagen I [663]. Cystatin E/M is a cysteine protease inhibitor and its relationship
with legumain was investigated in human melanoma, legumain was expressed
and active in most of the cell lines but was absent or at low levels in cell lines
secreting cystatin E/M. When melanoma lines lacking cystatin E/M secretion
were transfected with a plasmid containing full length cystatin E/M their
intracellular legumain activity was inhibited, suggesting that it regulates
legumain activity and hence its invasive potential [664].
Legumain was first associated with atherosclerosis when a microarray study
comparing stable and unstable atherosclerotic plaques found legumain to be one
of the genes upregulated in the unstable areas of plaques [434]. The same group
demonstrated legumain mRNA to be co-localised with CD68 macrophages in the
shoulder region of the plaque by in situ hybridisation and IHC. Another group
followed on from this initial observation by using a microarray to study the aorta
of aging Apolipoprotein E deficient mice with developed atherosclerosis, they
found that legumain mRNA expression increased with the development of
atherosclerosis while its expression remained at low unchanged levels in aged
matched C57BL/6 control mice [665]. In both Apolipoprotein E deficient mouse
arteries and human advanced atherosclerotic plaques legumain was
predominantly expressed in macrophages. It was also shown to induce
chemotaxis of primary human monocytes and human umbilical vein endothelial
cells (HUVECs). The macrophage-specific expression of legumain in vivo as well
as the ability of legumain to induce chemotaxis of cells in vitro suggests

267
legumain could play a functional role in atherogenesis. It has also subsequently
been shown that human unstable plaques express twice the amount of legumain
as stable plaques [666].
Cystatin C and cystatin E/M both bind to legumain with high affinity in vitro
thereby inhibiting its activation [667]. Since cystatin E/M plays a regulatory role
in epidermal differentiation, misregulation of this pathway leads to abnormal
stratum corneum and hair follicle formation as well as severe disturbances of
skin barrier formation [668]. Legumain is found in the epidermis and hair
follicles of wild type and Cystatin E/M null mice (ichq mouse) but active
legumain is only found in the epidermis of the ichq mouse suggesting that a role
for cystatin E/M in vivo is to regulate legumain activity [669]. Regulation of
legumain activity is important as it cleaves and activates cathepsin L which in
turn activates transglutaminase 3 (TGM3). Active TGM3 was detected in skin
extracts of cystatin E/M null mice at a time where skin lesions developed and
caused abnormal cornification [669], therefore unrestricted legumain activation
could play a role in irregular skin barrier formation. Ichq mice are a model of the
human disorder type 2 harlequin ichthyosis which is a severe type of skin disease
and as yet the presence of legumain in this disorder has not been determined.
However, legumain mRNA has been detected in atopic dermatitis and psoriasis
suggesting it may be contributing to the abnormal skin barrier seen in these
conditions [435].
Since legumain was expressed at high levels in the SF of RA and PsA in my
microarray samples and it is has been demonstrated to cleave and activate
several substrates found in the arthritic joint, such as fibronectin [425-428],
MMP-2 [670] and cathepsin B and L [671-673], it was decided to analyse legumain
and its expression and activity in RA and PsA samples.
Due to identification of a novel gene legumain which was highly upregulated in
RA and PsA CD14+ SF cells I therefore sought to validate this expression in the
microarray samples and samples from other patients. I also sought to determine
the level of protein expression of legumain in the synovial membrane of
diseased patients and in the CD14+ cells of diseased patients by IHC and western
blot. Once the presence of legumain had been verified I sought to determine

268
whether the legumain that was present was active and still able to cleave
substrates.

269
5.2 Validation of legumain expression in microarray samples
Legumain had a fold change increase from PB CD14+ samples to the matched SF
CD14+ samples of 167 in RA and 164 in PsA. However, since microarray results
require validation and verification by an alternative and complementary gene
expression profiling method qRT-PCR was used to determine the expression of
legumain in the 8 RA and 8 PsA pairs of samples that had been used for the
microarray study. Figure 5.1 (A) shows the raw data signals of legumain on the
affymetrix GeneChips for each patient sample. The signal values of legumain in
the synovial fluid of both sets are considerably higher than those of the blood
samples however the signal intensity varies between the synovial fluid samples
of each patient indicating that the levels of legumain in the synovial fluid CD14+
cells are not consistent possibly due to differences in disease duration and
treatment type of the patients.
To validate these results qRT-PCR was used to determine the fold change in
legumain expression in the SF samples compared to the PB samples. One RA
patient was unable to be analysed due to a problem with the peripheral blood
sample, as repeated measurements gave unusual results which could not be
analysed. This could have been due to a problem with the RNA for that sample
therefore the matched PB and SF samples from that particular patient were not
analysed. Figure 5.1 (B) shows the results of the qRT-PCR and clearly
demonstrates that legumain expression increases from the PB to the SF of each
patient which reflects the results obtained from the microarray.
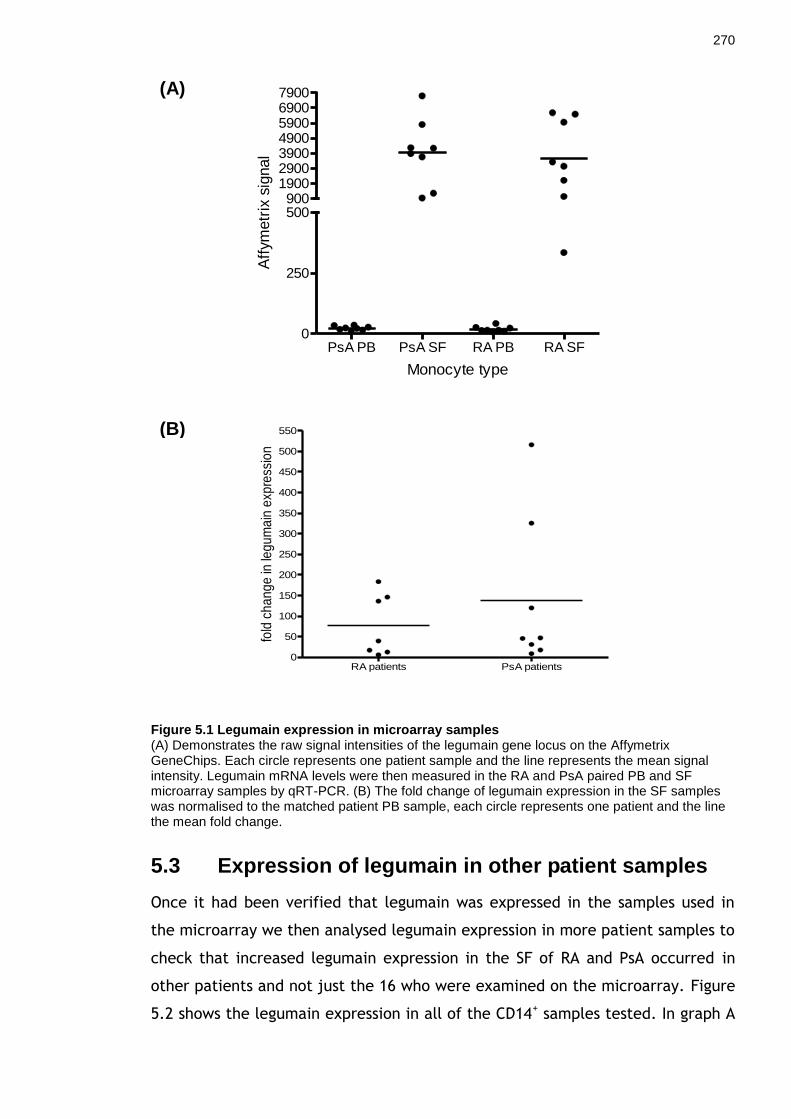
270
Figure 5.1 Legumain expression in microarray samples (A) Demonstrates the raw signal intensities of the legumain gene locus on the Affymetrix GeneChips. Each circle represents one patient sample and the line represents the mean signal intensity. Legumain mRNA levels were then measured in the RA and PsA paired PB and SF microarray samples by qRT-PCR. (B) The fold change of legumain expression in the SF samples was normalised to the matched patient PB sample, each circle represents one patient and the line the mean fold change.
5.3 Expression of legumain in other patient samples
Once it had been verified that legumain was expressed in the samples used in
the microarray we then analysed legumain expression in more patient samples to
check that increased legumain expression in the SF of RA and PsA occurred in
other patients and not just the 16 who were examined on the microarray. Figure
5.2 shows the legumain expression in all of the CD14+ samples tested. In graph A
PsA PB PsA SF RA PB RA SF0
250
500900
1900290039004900590069007900
Monocyte type
Aff
ym
etr
ix s
ignal
RA patients PsA patients0
50
100
150
200
250
300
350
400
450
500
550
fold
ch
an
ge
in le
gu
ma
in e
xpre
ssio
n
(B)
(A)

271
it can been seen that there are varying levels of legumain in the PsA CD14+ SF
samples but the mean level of expression is higher than that seen in PsA PB
CD14+. Five of these PsA patients tested had matched PB and SF CD14+ cells and
therefore the fold change increase in legumain expression from the PB to the SF
was able to be measured as seen in Figure 5.2 (B). As was observed in the
microarray samples some of the patients had a substantial fold change
differences but the mean fold change difference in legumain expression was 133
which is similar to the mean fold difference of 138 seen from the microarray
samples. We were unable to obtain matched PB samples for the RA patients
analysed however, in part (A) of Figure 5.2 the RA SF CD14+ and PsA SF CD14+
samples both have a similar mean relative expression of legumain which concurs
with the results observed in the microarray samples.
Graph (A) of Figure 5.2 also demonstrates the other arthritic patient samples
from which we obtained CD14+ cells to analyse for legumain expression. The
inflammatory arthritis and JIA CD14+ samples both appear to have lower levels of
legumain expression compared to the RA and PsA SF samples however legumain
is present in the samples. Unfortunately we were not able to obtain PB CD14+
samples from each patient to distinguish whether the legumain expression level
increased from PB to SF CD14+ as has been seen with the RA and PsA patients.
Matched OA PB and SF CD14+ cells from the same patient were measured for
legumain expression and as with the RA and PsA microarray samples the level of
mRNA expression increased from the PB to the SF. These data demonstrate that
legumain is not specific to RA and PsA but is also expressed in other arthritic
diseases.

272
Figure 5.2 Legumain expression in CD14+ cells from arthritic patients
Legumain RNA expression was measured in the CD14+ cells from the PB or SF of arthritic patients. (A) Expression was measured relative to GAPDH. Five of the PsA patients had matched PB and SF samples, in these patients the fold change increase of legumain expression was measured and plotted in graph (B).
(A)
(B)

273
5.4 Immunohistochemistry
Next immunohistochemistry (IHC) was performed to detect the enzyme in RA
synovial membrane. The antibody staining was first optimised on tonsil sections
before the RA synovial membranes were stained for legumain (data not shown).
Five individual RA membranes were stained and they all displayed specific
positive staining of legumain. Figure 5.3 shows representative staining from one
of the RA synovial membranes. The x10 and x40 magnification isotype controls
are shown in panel (A). Positive legumain staining at x10 and x40 magnification
from two different areas of the same RA synovial membrane are shown in panel
(B) and (C). The isotype controls show no non-specific staining indicating the
antibody is specific for legumain. In panel (B) legumain staining is seen to be
constitutively expressed throughout the membrane and analysing the x40
magnification the staining is cytoplasmic with no nuclear staining and within
some cells the staining is granular indicative of lysosomal staining.
Panel (C) shows staining from the same tissue and demonstrates that positive
legumain staining is seen on the edge of the membrane where it is contained
within the cytoplasm of cells. Positive staining can also been seen in cells within
follicular regions of the tissue (indicated by arrows). The staining appears to be
present in macrophage-like cells but this cannot be verified until the membrane
is double stained for legumain and CD68.

274
Figure 5.3 Immunohistochemistry staining of legumain in RA synovial membrane Five individual membranes were stained for legumain; this figure shows the results from one membrane that represents the staining pattern of legumain seen in the membranes. The isotype controls are shown in (A) at the x10 and x40 magnification. Images (B) and (C) define the positive legumain staining (shown in brown) seen in the RA membrane. Arrows in panel C denote positive follicular staining. The x10 magnification is shown on the left and the x40 magnification of an area of the x10 image defined by the box is shown on the right.

275
5.5 Western blot for legumain
Since we had determined that legumain RNA was expressed in synovial CD14+
cells and IHC had indicated that legumain was present in RA synovial membrane
we wanted to determine if arthritic synovial CD14+ cells were expressing the
legumain enzyme at the protein level. Legumain has already been demonstrated
to be upregulated in M-CSF macrophages [665, 674] therefore M-CSF treated
macrophages were also analysed as a positive control.
5.5.1 Legumain in M-CSF derived macrophages by RT-PCR
To determine whether the presence of legumain increased as a result of M-CSF
treatment, day 6 M-CSF treated macrophages from 5 individual donors were
analysed by RT-PCR. As can be seen from Figure 5.4, M-CSF treatment induced
legumain mRNA production in all 5 donors. The fold change difference between
untreated monocytes and treated macrophages is donor dependent and varies
between the lowest fold change of 26 and the highest fold change of 3567.
Figure 5.4 Legumain expression in M-CSF treated macrophages for 6 days Monocytes were obtained from 5 healthy donors and treated with M-CSF for 6 days. Monocyte samples were taken at day 0 and compared to the M-CSF treated macrophages for legumain expression by RT-PCR. The graph shows the relative fold change in legumain expression from day 0 monocytes to day 6 treated macrophages.

276
5.5.2 Legumain in M-CSF macrophages by western blot
Once we had shown that legumain is present in M-CSF derived macrophages at
the mRNA level we next wanted to verify expression at the protein level.
Monocytes were isolated from three individual donors and analysed at day 0, 3
and 6 days after M-CSF treatment for legumain and also for β-actin as a loading
control (Figure 5.5). As described in the introduction legumain can exist in two
forms, a pro form and an active form, to convert to the active form legumain
must autocatalytically cleave itself in a pH dependent process [656]. In Figure
5.5 the upper panel indicates the presence or absence of legumain in each
sample. There appears to be no legumain in any of the day 0 - monocyte samples
however day 3 M-CSF treated monocytes exhibit two bands representing pro-
legumain at 52 kDa and active legumain at 36 kDa. At day 6 in all three donors
the amount of pro-legumain is reduced as well as the amount of active
legumain. The lower panel of Figure 5.5 demonstrates the β-actin loading
control of each macrophage sample. Despite the samples being analysed by BCA
for protein concentration and 5 μg of protein being loaded to each well, the β-
actin blot indicates that the amount of protein loaded into each well varies due
to the different intensity of the β-actin band in each sample. Also, there appears
to be very little sample in day 0 monocytes of donor 1 due to a lack of a band for
the β-actin control. However, regardless of the loading control we have
demonstrated that macrophages express the pro- and active form of legumain
when induced via M-CSF differentiation of monocytes.

277
Figure 5.5 Legumain western blot of M-CSF treated macrophages Three donors were analysed after day 0, 3 and 6 of M-CSF treatment for the presence of legumain (top blot) or β-actin as a loading control (bottom blot). Both pro- and active legumain were present at day 3 in all three donors whereas by day 6 the pro-legumain levels had decreased.
5.5.3 Legumain in patient CD14+ samples by western blot
We next wished to detect legumain by western blotting in RA synovial CD14
cells. The western blot assay had already been optimised for the detection of
legumain using M-CSF derived macrophages as a control. CD14+ cells were
isolated from five individual RA bloods, one PsA blood, two PsA synovial fluids
and one RA synovial fluid and run on a western blot to detect legumain and the
loading control β-actin.
The upper panel in Figure 5.6 illustrates the presence of active legumain in 4 of
the 5 RA bloods and in the PsA blood CD14+ cells which was not seen in the CD14+
cells at day 0 of the normal donors in Figure 5.5. Large amounts of pro- and
active legumain were present in both of the PsA synovial fluid macrophage

278
samples however, there does not appear to be any legumain in the RA synovial
fluid CD14+ cells. The lower panel of Figure 5.6 demonstrates the β-actin loading
control of the samples as observed in the M-CSF macrophage western blot
despite 5 μg of protein being added to each well there appears to be varying
levels of protein in each well as indicated by the difference in intensity of the β-
actin bands. Also the two samples which appeared to contain no legumain in the
upper panel, the RA PB sample and the RA SF sample, do not have a β-actin band
suggesting that not enough of sample was loaded into these wells. These
samples would have to be repeated to determine if they do contain the enzyme
legumain. We have therefore demonstrated that active legumain is present in
the peripheral blood CD14+ cells of arthritic patients which was not seen in
normal donors day 0 CD14+ cells (Figure 5.5). We have also demonstrated that
pro- and active legumain is expressed in the PsA synovial fluid CD14+ cells.
Figure 5.6 Legumain western blot of patient CD14+ cells
CD14+ cells from five RA bloods, one PsA blood, two PsA synovial fluids and one RA synovial fluid
were analysed by western blot for the presence of legumain (upper panel) and β-actin control (lower panel).
5.6 Legumain activity assay
Legumain is a lysosomal enzyme that in its active form specifically cleaves
protein substrates after an asparagine residue [651], despite showing that M-CSF
derived macrophages and synovial fluid derived CD14+ cell express the active

279
form of legumain it was necessary to establish that this enzyme was still
physiologically active and could still cleave its substrates. A legumain activity
assay was therefore employed which uses a substrate Z-Ala-Ala-Asn-AMC.
Incubating active legumain with this substrate results in its cleavage after the
asparagine residue (Asn) thereby releasing the AMC (7-amino-4-methylcoumarin)
flurophore. The amount of flurophore released can be detected on a
luminescence reader.
To determine the presence of active legumain in M-CSF derived macrophages
and patient derived CD14+ samples, cells were resuspended in lysis buffer and
then freeze thawed three times to disrupt the lysosomes where legumain is
thought to reside [432].
5.6.1 Legumain activity assay of M-CSF derived macrophages
Given that large amounts of the active form of legumain were visualised in the
M-CSF derived macrophages by western blot it was decided to analyse these
samples to determine if the legumain in these samples was physiologically active
and still able to cleave its substrate. Clerin et al [665] previously demonstrated
that legumain is more active and can cleave its substrate in day 3 M-CSF
differentiated macrophages compared to monocytes however a timecourse of
day 0, 3 and 6 activated macrophages has not been reported to my knowledge.
Day 0, 3 and 6 M-CSF treated macrophages from two donors were analysed using
the activity assay; the same number of cells (1 x 10⁶) were examined per
condition. Recombinant human (rh) legumain was also analysed on the assay as a
positive control. Figure 5.7 illustrates the results of the activity assay; the rh
legumain (black line) shows an increase in fluorescence units (FU) over time
indicating that the legumain is active. The two donors tested are shown by the
red line for donor 1 and blue line for donor 2 with the triangle symbol indicating
day 0 monocytes, the square symbol indicating macrophages treated with M-CSF
for 3 days and the diamond symbol indicates day 6 M-CSF treated macrophages.
In both donors a similar pattern in legumain activity can be observed. The day 0
monocytes have little or no legumain activity for the duration of the assay as the
FU detected were less than the background fluorescence of the assay. This
corroborates the legumain western blot of M-CSF macrophages (Figure 5.5) as

280
there was no legumain detected in the day 0 monocytes. The fluorescence units
of day 3 M-CSF activated macrophages in both donors is high and increases over
time to a maximum of 670 FU and 592 FU in donors 1 and 2 respectively
indicating a high level of legumain activity. This discrepancy in the amount of
legumain activity in these samples despite having the same number of
macrophages may be due to donor specific variability or it is possible that the
macrophages from donor 1 contain more legumain.
In both day 6 activated macrophage samples the amount of fluorescence and
therefore legumain activity is lower compared to the day 3 activated
macrophages. The FU from donor one decreases by almost two thirds from 670
to 177 FU at the 210 minute timepoint and the FU from donor two decreases
from 592 to 346. This indicates that there could be less legumain present in
these cells and therefore legumain may undergo a cyclic form of expression with
no active legumain present in day 0 monocytes, a high level of activity and
expression in 3 day differentiated macrophages which then decreases to a lower
level at day 6. This observation agrees with the western blot of the M-CSF
differentiated macrophages as there was a greater amount of active legumain
expressed in the day 3 macrophages compared to the day 6 macrophages.
Overall it has been demonstrated that legumain is expressed at varying levels in
M-CSF activated macrophages depending on the duration of activation, this
legumain is the active form of the enzyme and as a result is able to fulfil its
physiological role and cleave its endogenous substrate.

281
Figure 5.7 Legumain activity assay in M-CSF derived macrophages M-CSF activated macrophages for 0, 3 and 6 days from two separate donors were analysed using a legumain activity assay to determine whether the legumain detected in these samples was active could cleave a substrate. Once the substrate is cleaved it releases a fluorophore which can be detected on a luminescence plate reader. The assay is incubated at 37ºC for 3.5 hours and the amount of fluorescence (measured in fluorescent units) is measured at set time points. Human recombinant legumain was used as a positive control and is indicated by the black line. Cells from donor 1 are shown by the red line and cells from donor 2 are shown by the blue line with the triangle symbol indicating day 0 monocytes, square symbol indicating M-CSF treated macrophages for 3 days and diamond symbol indicating M-CSF macrophages treated for 6 days. Each donor sample contained 1 x 10
6 cells.
5.6.2 Legumain activity assay of patient CD14+ samples
Once we had determined that legumain was present and active in the M-CSF
macrophage samples we then went on to establish whether the large amounts of
legumain present in the CD14+ patient samples as seen on the western blot was
active and able to cleave its substrate. Two RA synovial fluid samples, one with
a matched blood, were obtained and CD14+ cells were isolated from each. Due
to differences in the amount of synovial fluid obtained and donor variation there
were slight differences in the total number of cells, analysed, RA patient 1 had
7.2 x 10⁵ SF CD14+ cells whereas RA patient 2 had 8.8 x 10⁵ SF CD14+ cells.
The results for the patient legumain activity assay are shown in Figure 5.8. As in
the previous experiment rh legumain was used as a positive control. Despite
having the lowest total cell number RA patient 1 SF (red line) exhibited the
largest amount of legumain activity shown by the steady increase over time of

282
FU up to a maximum of 830 FU. However, the PB sample (red line) from the
same patient contained a much lower amount of legumain; the fluorescence
level of this sample was very low and did not increase above the background
level of fluorescence indicated by the negative FU values. Nevertheless, it
appears that this sample did contain a small amount of legumain as the FU can
be seen to slowly increase towards the baseline which would suggest that
legumain is present but there is not enough enzyme to create a strong
fluorescent signal. This same pattern of activity can be visualised in the patient
2 RA SF sample (blue line) where the fluorescence unit increase from -30 to -1
FU over the duration of the assay indicating that active legumain is present in
this sample but in small amounts.
Synovial fluid from several patients including six RA, six PsA, one OA, one JIA
and one inflammatory polyarthritis were analysed using the activity assay to
investigate whether these samples contained active legumain that may have
been excreted from the synovial cells. However, no activity was determined for
any of the samples (data not shown).
Figure 5.8 Legumain activity assay in CD14+ patient samples
CD14+ cells isolated from patient blood or synovial fluid samples were analysed using a legumain
activity assay to determine whether the legumain that was present in these cells was active and able to cleave a fluorescent substrate. The assay is incubated at 37ºC and the amount of fluorescence measured in fluorescence units (FU) is quantified at set time points. Human recombinant legumain (black line) was also assayed as a positive control. RA patient 1 is shown in red with the upwards facing triangle indicating blood CD14
+ cells and the downwards facing triangle
indicating synovial fluid CD14+ cells. RA patient 2 is shown by the blue line indicating synovial fluid
CD14+ cells.

283
5.7 Analysing legumain expression under normoxic and hypoxic conditions
Once we had established that legumain was present in RA synovial fluid
macrophages and was physiologically active we decided to try and determine
what potential factors could be inducing legumain expression. To do this we
cultured healthy donor M-CSF differentiated macrophages in complete media or
in complete media supplemented with 10% RA or PsA synovial fluid for 24 hours
under normoxic (24% oxygen) or hypoxic (1% oxygen) conditions. This was in
order to represent the conditions that the arthritic macrophages may be exposed
to once they exit blood and enter the synovial compartment. The synovium has
been shown to be a hypoxic environment [409] and the synovial fluid of arthritic
patients contains many cytokines, chemokines, antibodies and extracellular
matrix proteins [410, 537] which could interact with and induce differential gene
expression in the macrophages. Therefore, we hypothesized that exposing
macrophages to patient synovial fluid under hypoxic conditions may induce the
expression of legumain within these cells. Three RA and three PsA synovial fluids
were tested on the macrophages and the experiment was repeated three times.
Figure 5.9 shows the fold change in legumain mRNA expression relative to the
macrophage in complete media alone control. Graph (A) demonstrates those
cells which were incubated with the six synovial fluids for 24 hours under
normoxic conditions. The fold change in legumain expression increases with 2 of
the RA synovial fluids but the addition of RA SF 2 seems to decrease the amount
of legumain expression resulting in a negative fold change. In contrast, only one
PsA SF appeared to increase the amount of legumain expression under normoxic
conditions while PsA SF 1 and PsA SF 3 decreased the amount of legumain
expression.
On the other hand, culturing macrophages with synovial fluid under hypoxic
condition increased legumain expression in all synovial fluid conditions relative
to the macrophages incubated with media alone. The hypoxic conditions are
shown in graph (B) of Figure 5.9; the three RA synovial fluids and three PsA
synovial fluids all induced an increase in legumain expression compared to
control indicated by the positive fold change values.

284
These results suggest that the combination of both synovial fluid and hypoxia are
needed in order to induce legumain expression in macrophages. As the addition
of synovial fluid under normoxic conditions induces both up and down regulation
of legumain expression compared to control whilst the macrophages cultured
under hypoxic conditions show an increase in legumain expression with all of the
six synovial fluids examined.
Figure 5.9 Legumain expression in the presence of synovial fluid under hypoxic and normoxic conditions M-CSF differentiated macrophages were cultured individually with three different RA synovial fluids or three PsA synovial fluids for 24 hours under normoxic (24% oxygen) (A) or hypoxic (1% oxygen) (B) conditions. The fold change in legumain expression is shown relative to the mo alone control for either the hypoxic or normoxic condition. This is a representative of three independent experiments.

285
5.8 Discussion
The second gene identified from the microarray experiment as being highly
expressed in both RA and PsA synovial macrophages was the enzyme legumain. It
is an enzyme that specifically cleaves its substrates after an asparagine residue
and has a role in the cleavage and activation of several substrates as well as in
the processing of microbial antigen for MHC II presentation [659]. Legumain is
known to be disregulated in several inflammatory conditions and diseased states
such as breast cancer where it is specifically overexpressed on tumour
associated macrophages [433]; atherosclerosis where it is upregulated in
macrophages in unstable areas of plaques [434] and in inflamed skin where it is
highly upregulated in lesional atopic dermatitis and psoriasis compared to
normal skin [435].
Legumain has not been previously associated with inflammatory arthritis
however several of its substrates that it can cleave and activate are present
within the synovium of arthritis patients. These substrates include fibronectin
[431] a glycoprotein that has been found in the synovia of RA and PsA patients
[426] whose cleaved fragments acquire catalytic activities which can stimulate
cartilage chrondrolysis [675]; legumain can activate gelatinase A (MMP2) [429]
which has been found a higher levels in RA patient blood compared to controls
[670] and is also upregulated in the RA and PsA SF CD14+ cells in my microarray
experiment (see chapter 3). Legumain has also been demonstrated to cleave
several cathepsins including cathepsin B and L which are upregulated in RA
synovial fluid [671]. Since active fibronectin, gelatinase A, cathepsin B and L are
all known to degrade collagen and other components of the extracellular matrix
we hypothesised that legumain is upregulated by synovial fluid macrophages as a
result of the pro-inflammatory environment to function as an extracellular
matrix degradation enzyme and therefore may be contributing to the cartilage
and bone degradation that is often seen in these two diseases.
These are the first data to investigate legumain expression in RA and PsA and
using qRT-PCR we observed that all of the RA and PsA synovial fluid samples
analysed were expressing legumain at varying levels and the amount of synovial
fluid CD14+ legumain was always elevated in comparison to the CD14+ blood
cells. We also demonstrated that legumain was expressed in the synovial fluid

286
CD14+ cells of an OA patient, a JIA patient and an inflammatory polyarthritis
patient indicating that this enzyme was not exclusively expressed in RA and PsA
and appeared to be a marker of other arthritic synovial macrophages. Research
into the control of mRNA expression has uncovered small non-coding RNAs
termed microRNAs (miRNA) that target and degrade mRNA thereby suppressing
proteins synthesis [676] therefore observing mRNA expression of a gene such as
legumain does not imply that it will be expressed at the protein level.
Consequently, further studies took place to investigate the expression of
legumain. Immunohistochemistry revealed a novel observation that legumain
was consitutively expressed in five RA synovial membranes. At a higher
magnification legumain was observed specifically in the cytoplasm of the cells in
a granular pattern which is indicative of its role as a lysomomal enzyme [432]
and cell surface staining was also observed. Legumain has previously been shown
to be expressed on the cell surface and along the invadapodia of invading
tumour cells where it correlated with increased tumour invasion and metastasis
[662]. Further double staining of legumain and the plasma membrane would
need to be carried out to verify legumain cell surface expression on synovial
arthritic cells but a role for this surface expression could be to help invading
synovial cells to further degrade the cartilage and extracellular matrix. Positive
staining was also observed within follicular regions of the membrane and within
cells on the outside edge of the synovium. We propose that the legumain
positive cells on the outside of the membrane are well positioned to uptake
substrates from the synovial fluid, such as fibronectin, in order to cleave them
intracellularly. To establish whether this synovial legumain was present mainly
in macrophages double staining would need to be performed but time
restrictions meant this could not be performed.
It had been observed that synovial fluid CD14+ macrophages expressed legumain
at the mRNA level and arthritic synovial membrane expressed legumain at the
protein level therefore we wanted to determine whether synovial fluid
macrophages expressed legumain at the protein level by western blot. Legumain
has been previously shown to be upregulated in M-CSF differentiated
macrophages [665, 674] therefore these cells were used as a positive control for
the western blot. We confirmed that M-CSF differentiated monocytes had
increased legumain mRNA expression, the fold change increase in legumain

287
ranged from 26 to 3573 indicative of donor specific variability. A western blot
was performed on 3 donors consisting of monocyte samples which were treated
for 0, 3 and 6 days with M-CSF. We observed no legumain in the day 0 CD14+
monocytes but pro- and active legumain were visible at day 3 and 6 of all three
donors analysed. There appeared to be more active legumain in all of the day 3
samples but it is difficult to remark on levels of the enzyme since the β-actin
loading control was not consistent among all samples despite the same amount
of protein (5 μg) being loaded onto the assay. Repetition of these experiments
would be helpful to formally define this issue – time precluded this analysis.
Once we had validated the western blot assay, we analysed CD14+ cells from the
blood and synovial fluid of RA and PsA patients. There has been no previous work
illustrating legumain‘s presence in PB monocytes, however it has been
demonstrated that other cysteine proteases are upregulated in monocytes in
response to pro-inflammatory cytokines [677, 678]. The serum of PsA and RA
patients is known to contain pro-inflammatory cytokines, growth factors, MMPs
and adhesion molecules [679-681] which could be inducing active legumain in
diseased blood monocytes, a phenomenon that is not seen in healthy donor
blood monocytes. The two PsA synovial fluid CD14+ samples tested on the
western blot were positive for high levels of pro- and active legumain but the RA
SF CD14+ tested did not develop any protein bands. This result indicates that the
legumain positive cells detected by IHC in the synovium are likely to be
macrophages however the possibility that other cells express legumain cannot be
discounted. The two RA PB and SF samples which did not develop a legumain
band were also negative for a β-actin loading control band indicating either a
problem with the samples or that perhaps not enough sample was loaded onto
the western blot. Further analysis of the presence of legumain within RA SF
CD14+ samples would be useful to verify that these cells express legumain at the
protein level but time restrictions meant this was not possible.
An activity assay was set-up to determine if the legumain protein detected in
the samples was active. Clerin et al [665] had previously demonstrated that
monocytes treated with M-CSF for 3 days contained physiologically active
legumain however a timecourse of M-CSF treated monocytes had not been
examined. The results of the western blot were replicated in the activity assay
as day 0 monocytes showed no activity on the assay and no protein on the

288
western blot. Day 3 activated monocytes had high levels of active legumain
which decreased in the day 6 activated macrophages. These observations
demonstrate that legumain may undergo a cyclic form of expression with no
active legumain present in day 0 monocytes, a high level of activity and
expression in 3 day differentiated macrophages which then decreases to a lower
level at day 6. At present there have been no other reports of legumain
undergoing cyclic expression dependent on macrophage maturation as all other
studies have analysed legumain levels at one timepoint. Further studies are
required to understand the significance of this observation.
Patient derived CD14+ cells were analysed on the activity assay to ascertain
whether these cells contained physiologically active legumain. We examined
matched RA PB and SF CD14+ samples and a RA SF CD14+ sample due to the
variation in isolated cell numbers in patient samples the number of cells
analysed in each sample was slightly different. Nevertheless, the SF patient
sample containing the least number of cells had the highest amount of active
legumain illustrating that individual macrophage cells may contain varying levels
of legumain. The matched PB sample from this patient showed a low level of
active legumain as did the other RA SF sample analysed again indicating that the
level of legumain varies between patients. It would be interesting to determine
if treatment type or disease duration was a factor determining how much active
legumain was present within the synovial macrophages of arthritic patients.
Unfortunately we did not receive any PsA patient samples to assay and time
restrictions meant we could not continue collecting samples.
The inflammatory synovium is known to be a hypoxic environment [409] and the
synovial fluid of RA patients contains many cytokines, chemokines, antibodies
and extracellular matrix proteins [410, 537, 682-685] which could interact with
and induce differential gene expression in the cells entering the synovium.
Establishing what factors could be causing the upregulation of active legumain in
macrophages once they have transmigrated from the blood system into the
diseased joint is vital in understanding legumain‘s role in disease pathology.
Proinflammatory cytokines have been previously shown to induce expression of
other cysteine proteases in monocytes [677, 678] therefore we hypothesised that
the proinflammatory mediators and environmental stresses within the synovial
environment may be inducing the large upregulation of legumain once the

289
macrophages entered the synovial compartment. To address this question we
differentiated healthy monocytes with M-CSF for 6 days and cultured them in the
presence of three RA synovial fluids and three PsA synovial fluids for 24 hours in
hypoxic or normoxic conditions. We observed that under normoxic conditions
macrophages had increased legumain mRNA expression when incubated with two
of the three RA synovial fluids and one of the three PsA synovial fluids compared
to macrophages incubated alone. However, under hypoxic conditions legumain
mRNA expression increased in all of the macrophages incubated with the six
synovial fluids indicating that a combination of the hypoxic environment with
the proinflammatory mediators contained within the synovial fluid is necessary
to induce upregulation of legumain.
In summary, legumain is an enzyme which plays a physiological role in the
biosynthesis of lysosomal enzymes in the proximal tubule cells of the kidney
[431] and is expressed in macrophages and DCs where it is thought to play a role
in cleaving peptides for antigen presentation [658, 659]. However it has now
become apparent that legumain is involved in many inflammatory diseases and
conditions including arthritis. We propose that legumain is a marker for cell
activation demonstrated by its upregulation in macrophages but it is also an
inflammatory enzyme induced and deregulated during inflammation. The
perpetual inflammation that occurs during arthritis causes the upregulation of
this enzyme. Legumain is induced in the arthritic blood monocytes by the pro-
inflammatory mediators contained within the serum and is also induced within
the synovial fluid macrophages by the hypoxic inflammatory milieu found within
the joint. Once upregulated within the synovial macrophages legumain is
expressed on the cell surface and may be assisting the cells to invade and
degrade the surrounding joint cartilage and extracellular matrix. Pro- legumain
has recently been found to be excreted from macrophages and has been shown
to induce chemotaxis of primary monocytes [665], therefore if the legumain
positive macrophages visualised within the synovium were also excreting
legumain this could be playing a role in increasing the number of infiltrating
monocytes into the arthritic joint.
Legumain is also expressed within the lysosomal compartment of the cells where
it may cleave and active glycoproteins such as fibronectin either being produced
by the cell or which have been taken up by the cell. One of legumain‘s primary
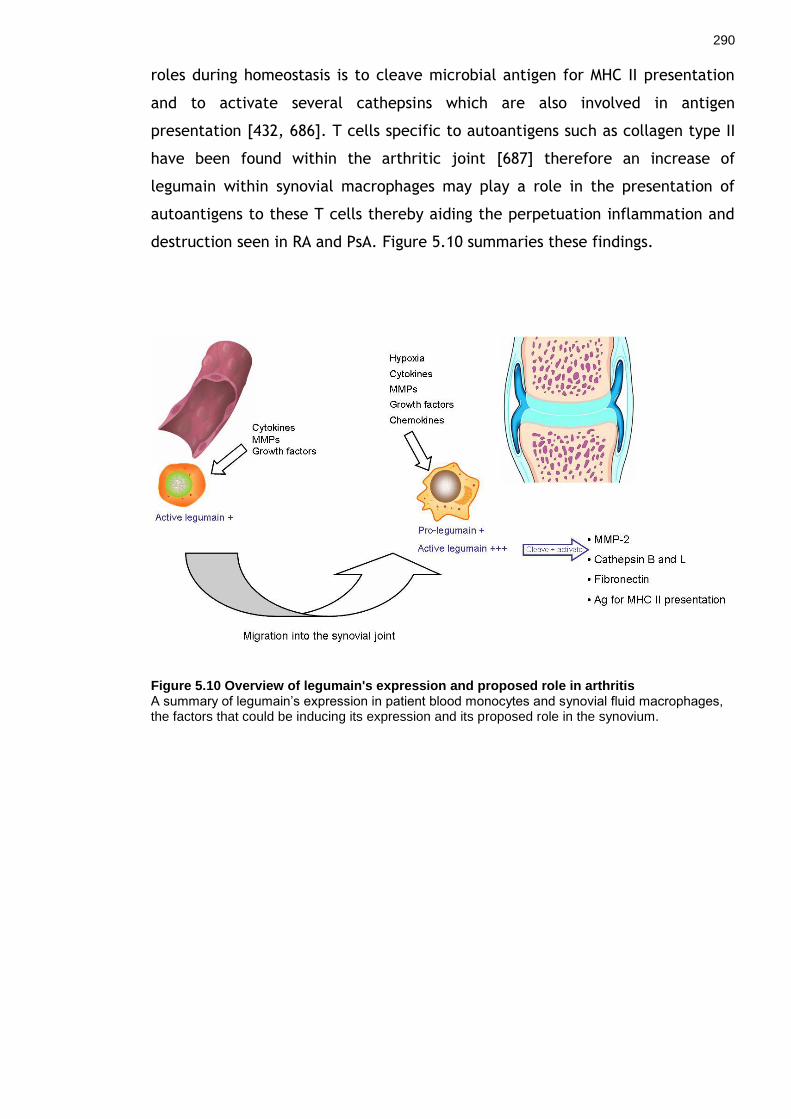
290
roles during homeostasis is to cleave microbial antigen for MHC II presentation
and to activate several cathepsins which are also involved in antigen
presentation [432, 686]. T cells specific to autoantigens such as collagen type II
have been found within the arthritic joint [687] therefore an increase of
legumain within synovial macrophages may play a role in the presentation of
autoantigens to these T cells thereby aiding the perpetuation inflammation and
destruction seen in RA and PsA. Figure 5.10 summaries these findings.
Figure 5.10 Overview of legumain's expression and proposed role in arthritis A summary of legumain’s expression in patient blood monocytes and synovial fluid macrophages, the factors that could be inducing its expression and its proposed role in the synovium.

291
Chapter 6 Microarray analysis of cell contact activated macrophages

292
6.1 Introduction
One critical mechanism whereby macrophages are thought exert their
proinflammatory potential in the synovium is by direct cell-cell interaction with
T cells. We and other groups have investigated this interaction in an in vitro
model system of inflammatory arthritis. In order to set up this model monocytes
and T cells are isolated from normal donors before activating T cells with a
cytokine cocktail (IL-2, IL-6, TNFα) and maturing the monocytes into
macrophages with M-CSF for 6 days each. After this time the two cells types are
put into direct contact for a period of 24 hours after which the supernatants are
collected and analysed for cytokine release. Several groups have investigated
this in vitro system and found it to be a robust model of inflammatory arthritis
since both cytokine activated T cells (Tcks) and RA synovial T cells can induce
production of TNFα and several CC and CXC chemokines in resting M-CSF treated
macrophages in a cell contact dependent manner [269, 298, 308]. Also Brennan
et al found that after 8 days of stimulation Tcks acquire an activated phenotype
resembling RA synovial T cells, such as upregulation of adhesion molecules and
activation markers. Neutralising these markers in both T cell types abolished the
cell contact dependent TNFα production from resting macrophages [309].
However, apart from cytokine and chemokine production little is known about
the effects of Tck direct cellular contact activation on the macrophages.
Due to the lack of transcriptomic information of the cell contact activated
macrophages it was decided to collect normal donor samples, which were age
and sex matched to the RA and PsA patient samples collected for the
microarray, and activate these using the cell contact model of inflammatory
arthritis. These macrophages were then analysed on the microarray and the
results were compared to the synovial CD14+ cell samples to determine how
similar these Tck activated macrophages were to the synovial macrophages. The
results should inform us how comparable the macrophages from the in vitro
model of inflammatory arthritis are to synovial macrophages from RA and PsA
patients.
6.2 Patients and normal donors
As described previously, inflammatory arthritis patients attending Gartnavel
General Hospital (GGH) or Glasgow Royal Infirmary (GRI) fulfilled the American

293
college of Rheumatology criteria for RA [6], or met diagnostic criteria for PsA
[346].
Age-matched normal donors were recruited from the Glasgow Biomedical
Research Centre (GBRC) building and all blood samples were taken with
informed consent.
6.3 Separating macrophages from the cell contact
In order to analyse the transcriptomic profile of the activated macrophages after
they had been in contact with the Tcks we had to first gain a pure population of
macrophages that did not have any contaminating Tcks which would affect the
results of the microarray.
6.3.1 Live cell contact
The in vitro cell contact model of inflammatory arthritis can be set up in a
number of ways including using T cell membranes [294], fixed Tcks or live Tcks
to activate the macrophages. For the microarray experiment we wanted to
compare cell contact activated macrophages with patient derived SF CD14+ cells
and therefore decided to set up the cell contact experiment with live Tcks. This
would allow us to see the effects of direct cellular contact along with the
soluble mediators that the Tcks released upon the activation of macrophages.
The cell contact was set up at a ratio of 4 Tcks to 1 macrophage for 24 hours,
the cells were separated by washing off the non-adherent Tcks (Tck fraction)
and scraping the adherent macrophages from the wells (macrophage fraction).
However, when the two cell fractions were analysed on the FACS for cell purity
(Figure 6.1) the macrophage fraction (A) was 91% positive for CD3 cells and had
no CD14 positive cells but a very small percentage (3.7%) of CD3 negative cells.
This experiment was repeated n=5 times with the same or similar results
occurring each time. The same experiment was set up with fixed Tcks as it was
thought that fixed cells may be less likely to stick to the macrophages, however
we obtained similar Tck contamination in the macrophage fraction in these
experiments (data not shown).

294
Figure 6.1 Separation of cells from a live cell contact Cells were separated by washing the non-adherent Tcks from the wells designated Tck fraction (B) and scraping the adherent macrophages from the wells designated macrophage fraction (A). This is a representative FACS plot from n=5 experiments
(A) Macrophage Fraction
Iso
type
AP
C
Isotype FITC CD14 FITC
CD
3 A
PC
(B) Tck fraction
Isotype FITC CD14 FITC
Iso
type
AP
C
CD
3 A
PC

295
6.3.2 FACS ARIA sorting of macrophages
Due to the problem of being unable to fully separate the macrophages from the
Tcks using the method of washing and scraping the wells, it was decided to try
and separate the two cell fractions from the cell contact using the FACS ARIA.
The Tcks were stained with carboxyfluorescein succinimidyl ester (CFSE) and
fixed before being put into cell contact with the macrophages. After incubating
the cell contact all the cells were collected and put through the FACS ARIA
machine, separating the cells based on FITC-positive cells (Tcks) and FITC-
negative cells (presumably macrophages). Figure 6.2 shows the plots from one
FACS ARIA experiment; figure A shows all the cells that were isolated from the
cell contact experiment and the histogram shows the counts of cells that were
FITC positive and FITC negative. On the histogram the gates p1 and p2 indicate
the gates that were used to differentiate and collect FITC-negative (macrophage
cells) and FITC-positive (Tck cells) respectively. The two gates did not overlap
and a substantial gap was left between them, cells included in this area were
not collected as it was important for the purpose of the microarray to be able to
collect a pure population of macrophages with no contaminating Tcks. Figure B
and C show the plots and histograms of the two separated cell fractions, Tcks
and macrophages respectively. The cells collected in the Tck fraction (B) were
all FITC-positive, as indicated by the histogram, and the forward and side scatter
plot indicates the cells collected in this fraction are of the correct size and
granularity for activated T lymphocytes. As expected all cells collected in the
macrophage fraction (C) were FITC-negative and on the forward and side scatter
plots show the cellular size and granularity of macrophage like cells. However, it
must be noted from panel (C) that a large proportion of the events on the
forward side scatter graph are in the bottom left hand corner which is indicative
of cellular debris. This debris may be as a result of the removal of the
macrophages from the culture wells after cell contact activation and the
presence of this debris may ultimately affect the purity of the macrophages used
for the microarray.
Subsequently an aliquot of the FACS ARIA separated cells was used for cytospins
which were stained with RAPI-DIFF reagents to check for cell purity and
morphology. As can been seen in figure (D) the cells from the macrophage
fraction had the correct shape and morphology of macrophage cells with no

296
visible contaminating Tck cells whereas the cells from the Tck fraction (E) were
the morphology and size of T lymphocytes.
It was decided therefore that using the FACS ARIA to gain a pure population of
cell contact activated macrophages was the optimal method of separation for
the normal donor samples that would be age and sex matched to the patient
samples.

297
Figure 6.2 Separating the macrophages and Tcks from cell contact using the FACS ARIA The FACS ARIA was used to separate fixed CFSE stained Tcks from the macrophages after cell contact. (A) All cells from the cell contact experiment showing the forward and side scatter plot of the cells and the histogram plot with the gates used to separate the cells, gate p1 (FITC negative cells) and gate p2 (FITC positive cells). (B) Tck cell fraction after separation and (C) macrophage cell fraction. An aliquot of the two cell fractions from the macrophage fraction (D) and the Tck fraction (E) was stained with RAPI-DIFF to check for cell morphology.
298
6.4 Analysing cell contact RNA yield and quality
Microarray experiments demand a high quality of RNA in order for correct
interpretation of results and the amount of RNA obtained from the cells should
be consistent between samples. Therefore before the cell contact activated
cells are analysed on a microarray the RNA quality and yield from the
macrophage cells must be examined (described in detail in chapter 3).
6.4.1 Cell contact activated macrophages have variable RNA quality after 24 hours
Fixing the Tcks before putting them into cell contact was found to help recover
a more pure population of macrophages after FACS ARIA separation thus it was
decided that fixed Tcks should be used in all cell contact experiments. Three
independent macrophage – Tck cell contact experiments were set up at a 4:1
ratio of fixed Tcks to macrophages, after 24 hours the Tcks and macrophages
were separated and both cell types were put into Trizol reagent. The RNA was
isolated from the cells and the quality was analysed on an Agilent 2100
Bioanalyser. The principles of the agilent 2100 bioanalyser are described in
section 3.3.2 of chapter 3, but briefly this equipment is used to ascertain the
quality of the RNA and allows the user to obtain a plot indicating the RNA
integrity. Figure 6.3 (A) shows an example of good quality RNA. It is
characterised by three clear peaks, a peak for the RNA marker (1) and a peak for
the 18 S (2) and 28 S (3) ribosomal RNA subunits. There should be a relatively
flat baseline between the two rRNA peaks and minimal low molecular weight
noise adjacent to the RNA marker peak.
Figure 6.3 (B) shows the electropherogram of the three fixed Tck and
macrophage samples after 24 hours of cell contact. The Tcks in all three
experiments had degraded RNA indicated by the low molecular weight noise and
the absence of 18 S and 28 S peaks. The degraded RNA for the Tcks was thought
to be a consequence of fixing the Tcks with paraformaldehyde. However, the
RNA from the macrophages was of poor quality in two of the three experiments.
The macrophage RNA from experiment 2 shows good quality RNA with two sharp
rRNA peaks and no low molecular weight noise but the RNA from experiment 1
and 3 is of poor integrity with the complete absence of rRNA peaks. Due to the

299
large variability in quality of the macrophages RNA it was decided that a
timepoint cell contact should be set up to try and discover why the macrophage
RNA is degraded after 24 hours of cell contact.
Figure 6.3 RNA integrity of macrophages and Tcks after 24 hours of cell contact An Agilent 2100 Bioanalyser was used to analyse the quality of the RNA from 3 macrophage and 3 Tck samples after 24 hours of cell contact. (A) an example of good quality RNA (B) the agilent profile electropherograms of the three cell contact experiments.

300
6.4.2 Cell contact activated macrophage RNA quality over time
A timecourse cell contact was set up three times and the macrophages were
activated with Tcks for between 1 and 48 hours. Figure 6.4 shows the results of
one timecourse experiment and consist of RNA electropherograms for the fixed
Tcks, unactivated macrophages (Mø) and macrophages that have been cell
contact activated for varying amounts of time. The fixed Tck RNA is once again
badly degraded due to the paraformaldehye fixation process. The RNA from the
macrophages that had not been cell contact activated (Mø) was of good integrity
as indicated by the two sharp rRNA peaks and the absence of low molecular
weight noise. The RNA from the macrophages that had been in cell contact for 1
hour up until 8 hours is also of good quality showing similar electropherogram
plots to the one for the inactivated macrophages. With the exception of 28 hr
cell contact activated macrophages (t=28hrs) the plots for RNA isolated from
macrophages after 8 hours of cell contact all showed blank electrophreogram
plots, apart from the RNA marker peak, indicating that the RNA was either
degraded or in such low concentration that the Agilent machine could not detect
it. t=28 hrs RNA was the only exception to this observation as that sample was of
high quality with no degradation.

301
Figure 6.4 Macrophage RNA quality after different durations of cell contact Macrophages were exposed to direct cellular contact with fixed Tcks for between 1 and 48 hours. The Tcks were removed from the macrophages and the quality of the Tck and macrophage RNA were analysed on an Agilent 2100 Bioanalyser
6.4.3 RNA yield decreases after prolonged cell contact activation
The total amount of RNA that was being recovered from the macrophages during
the timecourse cell contact experiments was also investigated and measured on
a nanodrop. Figure 6.5 shows a representative experiment from the three
experiments that were set up, for comparison the amount of RNA from the fixed
Tcks and macrophages alone (t=0) was also measured. It can be seen that
compared to the unstimulated macrophages, designated t=0, the total amount of
RNA decreases with increasing duration of cell contact activation. This trend
continues until 26 hours of cell contact where the total amount of RNA increases
Fixed Tck
Tcks
t= 4hrs t= 3hrs
Mø alone
t=2hrs
c.c t=1 hr
t= 7hrs t= 6hrs t= 8hrs
t= 20hrs t= 22hrs t= 24hrs
t= 48hrs t= 28hrs t= 26hrs

302
from 202 ng at cell contact t=26 hrs to 608 ng at cell contact t=28 hrs, however
after this one timepoint cell contact the amount of RNA recovered from the
sample decreases to 252 ng at t=48hrs. This trend of decreasing total yield of
RNA from cell contact activated macrophages compared to the unstimulated
macrophages was seen in the two other timecourse experiments set up (data not
shown). Based upon the preceding results it was decided to analyse macrophages
which had been cell contact activated for 2 hours on the microarray as well as
unactivated macrophages from the same donor. The reasons for this were due to
the large variability in the yield and quality of macrophage RNA after 8 hours
and also because we were interesting in the early response genes that changed
in a macrophage after Tck contact.
Fixe
d Tc
kt=
0 t=1
t=2
t=3
t=4
t=6
t=7
t=8
t=20
t=22
t=24
t=26
t=28
t=48
0100200300400500600700800900
100011001200
Duration of cell contact (hours)
To
tal R
NA
yie
ld (
ng
)
Figure 6.5 Total RNA yield from macrophages after increasing duration of cell contact activation by Tcks A fixed 4:1 cell contact between Tcks and macrophages was set up for varying amounts of time between 1 and 48 hours. Each cell contact was set up in an individual well of a culture plate. After the specified time the macrophages and Tcks were separated and the macrophages placed into Trizol reagent. RNA was extracted from all samples and the total yield measured. RNA was also extracted from Tcks (fixed Tcks) and macrophages alone (t=0). This graph is a representative of n=3 experiments.
303
6.5 Collecting patient samples
Normal donors who were age and sex matched to patients (Table 3.2) were
recruited and from these donors CD14+ cells were positively selected from the
blood. An aliquot of unactivated CD14+ cells were put into trizol and the rest of
the cells were differentiated with M-CSF for 6 days. After this duration the
macrophages were cell contact activated for 2 hours with fixed Tcks that had
been obtained from the same donor. The cell contact activated macrophages
were isolated using the FACS ARIA and put into trizol as well as unactivated M-
CSF derived macrophages from the same donor. Once all the samples had been
collected the RNA was extracted from all samples at GSK Stevenage and
analysed for quality. The samples which were analysed by the microarray are
summarised in table 3.3 of chapter 3. Six age and sex matched healthy controls
were recruited and macrophage cells before and after Tck cell contact activated
were collected from all of these controls.

304
Patient Gender Age Age and sex matched
normal donor
PsA 1
PsA 2
PsA 3
PsA 4
PsA 5
PsA 6
PsA 7
PsA 8
RA 1
RA 2
RA 3
RA 4
RA 5
RA 6
RA 7
RA 8
Female
Female
Male
Male
Male
Female
Male
Female
Female
Male
Female
Male
Female
Male
Female
Female
53
40
34
34
80
58
54
58
71
56
62
69
78
69
69
77
Yes
Yes
Yes
Yes
No
Yes
No
No
No
Yes
No
No
No
No
No
No
Table 6.1 Patient and normal donor samples collected
6.6 Microarray analysis
6.6.1 Signal histogram of normalised data
The signal histogram of all the samples which were analysed by the microarray is
shown in figure 3.3 of chapter 3. Upon inspection of the histogram it was
discovered that one of the cell contact activated samples was an outlier as it
clearly had a distinct signal intensity compared to the other samples which were
analysed. The reasons for this sample being an outlier are unknown but since the
other samples have similar signal intensities it is most likely to be due to a
problem with the individual sample or the labelling of that particular sample.
Due to this sample being an outlier it may potentially skew the data
interpretation and therefore was removed from further data analysis.

305
6.6.2 Principle component analysis
The PCA plot shown in Figure 6.6 has previously been shown in chapter 3 but it is
represented in this chapter to demonstrate the outlier cell contact activated
macrophage sample indicated by the blue circle on the left hand side of the
graph in (A). Once this sample had been removed the PCA analysis graph was
analysed to look for trends in the data since samples represented in the same
area of the graph are considered to be genetically similar. Each circle on the
graph represents a sample and each colour represents a condition.
Figure 6.6 (B) demonstrates the PCA plot of the samples once the cell contact
outlier sample had been removed. This plot demonstrates that the cell contact
activated macrophages (blue circles) are genetically distinct from the M-CSF
activated macrophages (red circles) indicating that transcriptional changes take
place once the macrophages are put into cell contact with Tcks for 2 hours.
However, it can also been seen that the cell contact activated samples (blue
circles) appear to be genetically distinct from the synovial fluid activated
macrophage samples (yellow circles) which could argue against the cell contact
macrophages not having a similar genetic profile to the synovial fluid. This will
be explored further in the following sections.

306
Figure 6.6 Principle component analysis of all microarray samples PCA was performed on the microarray samples to try and identify trends in the data. Graph (A) indicates the normalised samples before the outlier was removed. The blue circle on the left hand side of the graph represents the outlying sample and it can been seen that it is distinct from all the other samples indicating that its genetic profile is dissimilar to that of the remaining microarray samples. Figure (B) shows PCA graph once the outlying cell contact sample had been removed. Each circle represents a sample and samples clustered in the same area of the graph are considered to be genetically similar. Each colour represents a sample condition; red is M-CSF treated macrophages, blue is cell contact activated macrophages, gold is synovial fluid derived CD14+ cells, green is patient blood CD14+ cells and purple is healthy blood CD14+ cells. This graph was previously shown in chapter 3.

307
6.7 Cell contact activated macrophages compared to synovial fluid activated macrophages
Cell contact dependent activation of macrophages by synovial T cells has
previously been shown to play a role in arthritis and as a result an in vitro model
of inflammatory arthritis has been developed by our group and others to mimic
the cellular interactions taking place within the diseased joint. Investigations
into the proinflammatory cytokines and chemokines released by the
macrophages as a result of T cell interactions have taken place [269, 298, 308]
as well as analysing the activated T cells [309]. One study by Gruaz et al [315]
has also analysed the genetic profile of the macrophages after being stimulated
by the isolated membranes of the human T cell line HUT-78. However there has
been no comparative analysis of the in vitro cell contact stimulated
macrophages and macrophages isolated from the arthritic joint.
The cell contact activated macrophages were stimulated with fixed cytokine
activated T cells (Tcks) for 2 hours as we were interested in the early response
genes that were differentially expressed in the macrophages. Previous analyses
indicated that one of the cell contact activated macrophage samples was an
outlier due to its abnormal signal intensity. Therefore this sample and its
matched unactivated macrophage sample was removed from further analysis.
6.7.1.1 Statistical analysis of genes and elucidating similarly expressed genes between conditions using a Venn diagram
All samples were pre-processed using the GC-RMA algorithm and quality control
was performed on the three macrophage conditions i.e. cell contact, RA or PsA.
In order to pass the quality control filter each gene had to have a signal value
between 20 and 100% and be expressed in all of the samples of each condition.
To establish the presence of differentially expressed genes in the three
activated macrophage conditions paired T Tests were first performed with a p
value cut off of 0.05 followed by the Benjamini and Hochberg multiple testing
correction (MTC). However an MTC was unable to be used in the cell contact
comparison as there were no significantly changed genes between the
unactivated macrophages and cell contact activated macrophages. Since a p
value cut off of 0.05 was used this means that 5% of the differentially expressed

308
genes may be false positives and appearing by chance alone, a way to overcome
this is to look at the p values of each gene as the higher the p value of the gene
the less chance of it being a false positive. This statistical analysis gave the
following results:
Unactivated M-CSF macrophages vs cell contact activated macrophages
(n=5 matched samples) 3902 significantly expressed gene entities
RA PB vs RA SF (n=8 matched samples) 10879 significantly expressed gene
entities
PsA PB vs PsA SF (n=8 matched samples) 7401 significantly expressed gene
entities
The up- and downregulated genes with a p value <0.05 from each of the three
comparisons were then inputted into a Venn diagram to distinguish if there were
similar genes being expressed by the activated macrophages conditions.

309
Figure 6.7 Venn diagram of the significantly differentially expressed genes within the cell contact activated macrophages, RA synovial fluid macrophages and PsA synovial fluid macrophages Paired T Tests were performed between the unactivated and cell contact activated macrophages, RA blood and RA synovial fluid macrophages and between PsA blood and PsA synovial fluid macrophages. The up and downregulated genes in the activated macrophage samples were then put into a Venn diagram, blue represents the differentially expressed genes in the RA condition, green represents the PsA condition and red represents the cell contact activated macrophages. The genes that were expressed by cell contact macrophage samples and PsA or RA or by all three conditions were analysed further.
Figure 6.7 shows differentially expressed genes in all three conditions, blue
represents the significantly expressed genes between RA PB and RA SF CD14+
samples, green represents the significantly changed genes between PsA PB and
PsA SF while red represents the significantly expressed genes between
unactivated M-CSF macrophages and cell contact activated macrophages.
Analysing the Venn diagram it can be seen that there are three groups of genes
being expressed in cell contact activated and synovial fluid macrophages:
Genes expressed in all conditions (cell contact, RA SF and PsA SF
macrophages). 590 genes
Genes expressed in cell contact macrophages and PsA SF macrophages.
221 genes
Genes expressed in cell contact macrophages and RA SF macrophages. 664
genes

310
The Venn diagram also indicates that only a small proportion of the genes
expressed by the RA or the PsA synovial fluid are expressed within the cell
contact activated macrophages. 10% (811 of 7401 genes) of PsA genes and 11%
(1254 of 10879) of RA genes are expressed in the cell contact activated
macrophages.
The three gene groups listed above were then subjected to fold change analysis
where the cut off threshold was set at a fold change ≥ 2. This analysis gave the
following results:
149 genes expressed in all three conditions (c.c, RA SF, PsA SF)
40 genes expressed in both cell contact macrophages and PsA SF
146 genes expressed in both cell contact macrophages and RA SF
Since the basis of this investigation was to determine how similar the cell
contact activated macrophages were to the synovial fluid macrophages, the gene
lists generated from the fold change analysis were scrutinised further to only
include genes that were up or downregulated in both the cell contact samples
and the synovial fluid samples. This is due to the discovery that many genes
were being expressed in different directions, for example a gene that was
upregulated in the cell contact activated samples was downregulated in the
synovial fluid samples. As a result the number of similar genes from cell contact
and synovial fluid macrophages decreased further:
110 genes expressed in all three conditions (72 downregulated genes and
38 upregulated genes)
18 genes expressed in cell contact macrophages and PsA SF (6
downregulated genes and 12 upregulated genes)
128 genes expressed in cell contact macrophages and RA SF (88
downregulated genes and 40 upregulated genes)

311
6.7.1.2 DAVID analysis of the differentially expressed genes in cell contact activated macrophages and synovial fluid macrophages
DAVID software was used to analyse the up- and downregulated genes that were
changed in the cell contact macrophages and the synovial fluid macrophages to
determine the overall biological functions of these genes. DAVID analysis did not
find any significantly overrepresented processes within the gene list expressed in
both the cell contact and PsA SF macrophage samples, which was likely to be
due to the small number of genes within the list. Figure 6.8 demonstrates the
top ten overrepresented biological processes associated with the upregulated
genes found in all 3 macrophage conditions (A) and the downregulated genes
found in all 3 macrophage conditions (B). The results of this analysis indicate
that the macrophage samples are upregulating genes associated with immune
response and response to stimulus and stress. The same macrophage samples are
also downregulating genes associated with intracellular signalling cascade and
regulation of myeloid cell differentiation. Figure 6.9 shows the biological
processes associated with the upregulated genes found in both the cell contact
and RA SF macrophages conditions (A) and the biological processes associated
with the downregulated genes in both the cell contact and RA SF macrophage
conditions (B). The upregulated genes are involved in processes such as
intracellular signal transduction and phosphorylation. The downregulated genes
are involved in processes such as cellular metabolism and T cell differentiation.

312
Figure 6.8 Up- and downregulated biological processes in cell contact, RA SF and PsA SF macrophages DAVID software was used to analyse the genes which were differentially expressed in all three macrophage conditions to determine overrepresented biological processes associated with the genes. The top ten significantly overrepresented processes are shown here with a p value <0.05 which is equivalent to a –log p value > 1.30

313
Figure 6.9 Up- and downregulated biological processes in cell contact and RA SF macrophages DAVID software was used to analyse the genes which were differentially expressed in cell contact and RA SF macrophage conditions to determine overrepresented biological processes associated with the genes. The top significantly overrepresented processes are shown here with a p value <0.05 which is equivalent to a –log p value > 1.30

314
6.8 Discussion
The in vitro model of inflammatory arthritis consists of direct cell contact
activating M-CSF differentiated macrophages with cytokine activated T cells.
Microarray analysis of one cell type requires a pure cell population as
contaminating cells would have an effect on the genetic profiles obtained.
Therefore we devised a method of isolating the activated macrophages from the
T cells by CFSE staining the T cells and using the FACS ARIA to separate the cells
based on their fluorescence. This method ensured that no antibody or CFSE
staining of the macrophages took place as any manipulation of these cells may
have altered their genetic profile. However, the FACS ARIA plots indicated that a
large amount of cellular debris had been collected in the macrophage cell
fraction which may have ultimately affected the macrophage purity and
subsequently the transcriptomic profile of the cell contact activated
macrophages.
A 2 hour timepoint was demonstrated to be the appropriate duration of cell
contact activation for the macrophages due to variability in the quality and yield
of RNA after this time. It is difficult to fully explain these variable findings.
However, the low quality RNA in the cell contact activated macrophages, as
visualised by the empty electropherogram plots seen after t = 8hours in Figure
6.4, may be due to very low amounts of RNA being run through the Agilent
Bioanalyser The sequential decrease in the yield of macrophage RNA over the
duration of the cell contact activation was also an unusual finding but may be
due to increased apoptosis and cell loss which would therefore decrease the
yield of RNA from the cells. As a result of these findings, we decided to analyse
the macrophages after they had been cell contact activated for 2 hours, it was
also decided that this timepoint was more appropriate for analysing the early
response genes that would be differentially expressed within the macrophages.
Crucially however this may not represent the gene profile present in a
chronically activated macrophage derived from within the synovial compartment
and in this sense the outcome was perhaps predictable.
After completion of the microarray experiment and removal of the outlier cell
contact macrophage sample from further analysis a PCA plot of the samples was
setup to identify trends in the data since samples clustered within the same area

315
of the PCA graph are considered to be genetically similar [354]. This analysis
identified that the M-CSF differentiated macrophages were genetically distinct
from the Tck activated macrophages which suggests that being in cell contact
with the Tcks for 2 hours induced a transcriptional change in the macrophages.
However, the PCA analysis also demonstrated that the cell contact macrophages
were genetically distinct from the synovial fluid macrophages.
Previous work has demonstrated that the cytokine activated T cells (Tcks) used
in this in vitro system are similar to RA synovial T cells, as they up-regulate the
same cell surface activation markers and adhesion molecules and also induce the
production of various cytokines and chemokines from macrophages in a cell
contact dependent manner [298, 308, 309]. Recently, a microarray analysis of
monocytes activated for 24 hours by PMA and PHA stimulated T cell membrane
fragments was performed by Gruaz et al who analysed the anti-inflammatory
effects of high-density lipoproteins (HDL) on the transcriptome of the activated
monocytes. They discovered that 666 probe sets were altered in the activated
monocytes compared to unactivated monocytes indicating that T cell contact
activation of monocytes does have an effect on the transcriptome of the cells
[315]. Hence, for our study it was hypothesised that cell contact activation of
macrophages by fixed Tcks for 2 hours should indicate the early response genes
upregulated by the macrophages. Given that the Tcks have been demonstrated
to be similar to synovial T cells, the genes upregulated in these macrophages
should be similar to those expressed in the synovial fluid CD14+ cells.
The three macrophage conditions of cell contact, PsA synovial fluid and RA
synovial fluid were compared to their matched unactivated or baseline samples,
which in this comparison were unactivated M-CSF macrophages, RA PB CD14+
cells and PsA CD14+ cells. After determining the differentially up- and down-
regulated genes in these activated conditions a Venn diagram was used to
discover if any genes overlapped with those of the other conditions. The initial
results of the Venn diagram were disappointing as it demonstrated that only 10%
of the total significantly expressed genes in the PsA SF condition and 11% of the
total expressed genes in the RA SF condition were expressed in the cell contact
macrophages indicating that these conditions were not significantly similar. A 2-
fold change analysis was subsequently performed on the gene lists which were
then examined further to ensure that they were all differentially expressed in

316
the same direction. For example, if a gene was differentially expressed in both
the cell contact activated and PsA synovial fluid conditions it had to be either
up-regulated or down-regulated in both conditions but could not be up-regulated
in one condition and down-regulated in the other since we were investigating
the similarities between the conditions. This resulted in further decreasing the
size of the gene lists and of the 54,675 probe sets on the Affymetrix GeneChips
less than 130 were expressed in each of the three gene lists of i) expressed in
cell contact, RA SF and PsA SF conditions, ii) expressed in cell contact and RA
SF, iii) expressed in cell contact and PsA SF.
DAVID analysis was performed on the up- and down-regulated genes in each of
the three comparisons to determine the biological function of the similarly
expressed genes. DAVID analysis of the genes present in all conditions indicated
that all three macrophage types were up-regulating genes involved in response
to stimuli. In the cell contact macrophages this would be as a result of Tck
contact and in the synovial fluid macrophages this would be as a result of direct
cell contact as well as the pro-inflammatory environment. All three cell
conditions are also up-regulating genes associated with the immune response
and its regulation, this would be expected in the synovial fluid macrophages
since it has been well documented that the cellular influx into the joint is
exposed to many pro-inflammatory mediators [537, 682-685] which would result
in the up-regulation of these genes. However, it is reassuring to observe that the
cell contact activated macrophages also up-regulate genes involved in immune
system regulation since these cells are used as an in vitro model of arthritis.
This also reflects the observations seen in the Gruaz et al microarray analysis of
monocytes activated with PMA and PHA stimulated T cells which demonstrated
an up-regulation of cytokines and mediators involved in the immune system
[315]. The biological processes of the down-regulated genes in all three
conditions include intracellular signalling cascade, RNA polymerase II
transcription, and regulation of myeloid cell differentiation suggesting that the
macrophages could be trying to regulate the increased transcription and
signalling observed in cell contact activated and synovial cells as a result of
extracellular stimuli.
DAVID analysis of the genes up- and down-regulated in the cell contact
macrophages and the RA synovial fluid macrophages demonstrated that the up-

317
regulated genes were involved in processes such as signal transduction and
intracellular signalling cascade. Signal transduction pathways provide an
intracellular mechanism by which cells can respond and adapt to their
environment. Proinflammatory stimuli found within the synovial environment
can activate signalling cascades within a cell to alter gene transcription and
protein expression. Several signal transduction pathways have been implicated in
RA such as mitogen-activated protein kinase (MAPK) and NF-κB as well as the
transcription factors janus kinase (JAK) and signal transducer and activator of
transcription (STAT) [688, 689]. Signal transduction pathways, specifically NF-κB
but not PI-3 kinase, have also previously been shown to play a role in the
production and secretion of pro-inflammatory cytokines within the cell contact
activated macrophages [298]. The results from this DAVID analysis highlight the
importance of signal transduction and intracellular signalling in allowing the
synovial macrophage to contribute to the pro-inflammatory milieu found in the
synovium and also emphasises the ability of the cell contact model of arthritis to
replicate this biological process found in the synovial macrophage.
The biological processes of the down-regulated genes in RA synovial fluid and
cell contact activated macrophages were metabolic process, T cell
differentiation and regulation of IFN-α production. IFN-α is a proinflammatory
cytokine that is present within the synovial fluid of RA patients and the
macrophage cells may be down-regulating genes associated with its production
as an anti-inflammatory regulatory mechanism [690]. The T cell differentiation
process is a misleading title as two of the three genes associated with this
function (the transcription factor Ikaros and the phosphatase PTPN22/Lyp) have
been demonstrated to be expressed in macrophages as well as T cells [691, 692]
and the third gene, ZNF278, a zinc finger repressor of gene expression has not
been previously demonstrated to be present in T cells. This result highlights the
point that the genes associated with each biological process may need to be
analysed further to understand why the process is associated with the gene list
since genes can appear in several biological process pathways and each gene can
be expressed by more than one cell type.
DAVID analysis could not be performed on the shared PsA synovial fluid and cell
contact activated macrophages due to the small number of genes within this
gene list. However, analysis of the gene list demonstrates that both PsA

318
macrophages and cell contact activated macrophages are upregulating
inflammatory genes such as the cytokine TNFα which has a pronounced role in
the pathogenesis of arthritis. These two macrophage types are also upregulating
genes such as NRP2 (neuropilin 2) which is a surface receptor originally
identified as a factor involved in nerve fibre repulsion during neuronal growth
[693]. Neuropilin 2 positive nerve fibres have been detected in the synovium of
rheumatoid arthritis patients and soluble neuropilin 2 has also been detected in
the synovial fluid of these patients where it was hypothesised to aggrevate the
loss of sympathetic nerve fibres which is observed in RA [694]. Consequently
despite the low numbers of genes that are the same in the PsA and cell contact
macrophages, the genes that are shared between the subgroups are of an
inflammatory phenotype and have been demonstrated to be involved in the
destructive phenotype of arthritis.
The common genes between all three conditions and between cell contact
activated macrophages and RA synovial fluid macrophages were revealed to
share biological processes such as immune system regulation, which
demonstrates that after just 2 hours the Tck contact activation is eliciting an
immune response in the M-CSF macrophages similar to that seen in synovial fluid
derived macrophages. Nevertheless, this study has also demonstrated that of all
the genes differentially expressed between RA PB and RA SF CD14+ and between
PsA PB and PsA SF CD14+ only 11% and 10%, respectively, of those genes are also
differentially expressed between the M-CSF and cell contact activated
macrophages. This result would indicate that the cell contact model of
inflammatory arthritis may not be a suitable in vitro model for arthritis since the
cell contact activation does not appear to effectively replicate the same level of
transcriptional expression within the M-CSF macrophage compared to a synovial
fluid macrophage isolated from a patient.
Nonetheless, there are several possible reasons for this discrepancy. Firstly, the
FACS ARIA separation suggested that a large proportion of collected events for
the macrophage cell fraction was celluar debris which may have been created
during the removal of the macrophages from the culture wells after cell contact
activation. The presence of this debris would affect the overall purity of the
macrophage cells and may have contained cellular components and nuclear
material which could have affected the transcriptomic measurement and

319
analysis. In addition, due to time restrictions only 6 normal donors were able to
be recruited for the cell contact activation samples and since one of these
samples was the outlier identified at the start of the microarray analysis its
removal meant that only 5 matched cell contact samples were compared to 8
matched RA and 8 matched PsA samples. Therefore the full spectrum of the cell
contact transcriptome may not have been analysed. The cell contact donors
were also only age and sex matched to the PsA patients who had a smaller mean
age compared to the RA patients. Many papers have described the effect of
aging on epigenetics such as altered DNA methylation and histone modification
which in turn impact on chromatin folding [695], women are also more
predisposed to rheumatic diseases due to hormonal as well as genetic
differences between males and females [696]. Hence not including age and sex
matched donors to the RA patients may have automatically discarded genes
associated with these two factors.
As noted at the outset of my discussion, the final and most important variable
which may have affected the gene expression of the cell contact activated
macrophages was the duration of activation. During the cell contact model the
macrophages are usually stimulated for 24 hours with the Tcks before analysis,
however due to our interest in the early response genes expressed in the
macrophages and the variability in the macrophage quality and yield it was
decided to analyse the cells after a shorter duration. Consequently trying to
compare macrophages which have been activated for 2 hours to macrophages
from the synovial fluid which have been activated for an unknown duration
presents problems. A recent paper which analysed the stability and temporal
changes in inflammatory gene expression in TNFα stimulated murine fibroblasts
found three groups of mRNA expression: group 1 genes had a peak mRNA
expression at 0.5 hours after stimulation but their expression was unstable and it
fell to baseline after 1 hour; group 2 genes had a peak expression at 2 hours
however upon the removal of the TNFα stimulus their expression fell to baseline;
group 3 genes had peak expression 12 hours after the stimulus, these genes were
transcribed at a slow rate but the resulting mRNA was very stable [697].
Subsequently if the same pattern of mRNA expression was occurring within the
cell contact activated macrophages then analysing these cells after 2 hours
would only detect the group 2 genes as mRNA from the group 1 genes would

320
probably already be in the process of degradation and the group 3 genes would
not be expressed at a detectable level.
In summary, despite the cell contact activated macrophages only sharing 10-11%
of the genes expressed in RA or PsA synovial fluid macrophages those genes
involve a high proportion of immune system regulation genes indicating that this
system is upregulating the types of genes thought to be involved in the perpetual
immune activation seen in macrophages of the arthritic joint. However, to fully
elucidate the appropriateness of this cell contact system as a model of
inflammatory arthritis an extended microarray experiment would have to be set
up in which each RA and PsA patient had an age- and sex-matched donor for the
cell contact activation and particular care was taken when isolating the
macrophage cells from the cell contact to ensure a high cell purity. The cell
contact activated cells would ideally be activated over a timecourse of 1-24
hours to determine the different groups of genes being expressed within these
cells over time.

321
Chapter 7 Validation of an in vitro live cell imaging system

322
7.1 Introduction
The macrophage – T cell co-culture experiment is a well established in vitro
model of inflammatory arthritis. The method of cytokine activation of the T cells
for this in vitro model confers a pro-inflammatory synovial phenotype which can
induce the release of several cytokines and chemokine from the macrophages via
direct cellular contact as has previously demonstrated by the vast amount of
research performed by our group and several others [298, 308, 309, 408]. Whilst
we have obtained a wealth of information regarding several aspects of the in
vitro model such as the signalling pathways involved in the cytokine and
chemokine release from the macrophages as well as the adhesion molecules
upregulated by the cytokine activation of the T cells, there are still important
facets of this model which have not been explored. One important question
which we addressed in the previous chapter is how similar is the transcriptome
of the Tck cell contact activated macrophage compared to the synovial
macrophage. However, another important aspect of the cell contact model is
determining how the macrophages and Tcks in this model interact and how long
these interactions last for; this information can be determined using in vitro live
cell imaging.
Live cell imaging is a widely used technique which has become more sensitive
and efficient in recent years with the introduction of new imaging techniques
and machines such as two-photon laser scanning microscopy. A large amount of
the current work using live cell imaging has focused on the in vivo interactions
between DCs and T cells within the lymph node [698]. These studies have been
very informative in determining the behaviour of the T cell – DC interactions
during antigen presentation. Such studies have revealed that when T cells are
moving around the lymph node they follow a chaotic trajectory with random
movements and are not directed by chemotatic gradients over large distances as
was previously thought [699]. Live cell imaging has also demonstrated that T cell
may make several contacts of a short duration with antigen loaded DCs before
forming a stable cell-cell immunological synapse contact with one DC. The use of
live cell imaging has made it possible to visualise the movement of the T cells
towards the DCs during antigen presentation and several papers have proposed
models for the type of movements and behaviours observed by the T cells before
they form stable, long-lived interactions such as ―drive by‖ which is a situation

323
where the T cell will have a short interaction with the DC but will then move
away from the DC and carry on migrating [700].
Despite the wealth of knowledge about the interactions of T cells and DCs
gained from live cell imaging there has been far fewer investigation into the
interactions between T cells and macrophages either in vivo or in vitro. One
study performed by Underhill et al imaged such interactions using OVA specific
murine T cells containing a reporter construct which caused the cell to express
green fluorescent protein (GFP) upon productive engagement with OVA
presenting macrophages. Using in vitro live cell imaging this group demonstrated
that 90% of the T cells appeared to move around the surface of individual
macrophages and 50% of T cells migrated from one macrophage to another
during 3 hours of time lapse imaging. Underhill et al also determined that the T
cell — macrophage interactions had to be sustained for 2 hours for the T cell to
become fully activated and express GFP however due to the behaviour of the T
cells this activation may be the summing up of multiple activatory signals during
the numerous interactions with the macrophages [701]. This study was analysing
the T cell — macrophage interactions in the presence of antigen and at present
there are no studies analysing such in vitro interactions in an antigen
independent environment.
Histological analysis of the inflamed synovium has shown that macrophages are
found in close contact with T cells [286] indicating that direct cell contact may
be a mechanism causing the production of pro-inflammatory cytokines.
Subsequent studies using the in vitro cell contact model have demonstrated this
observation to be correct since the incubation of synovial-like Tcks with
macrophages induces the production of pro-inflammatory cytokines and
chemokines as well as anti-inflammatory cytokines such as IL-10 [269, 308].
Despite the large amount of experimental work on the cell contact model of
arthritis there are still gaps in our knowledge regarding the mechanisms of the
cell—cell interactions and the behaviour of the cells during the co-culture.
Therefore we set out to use an inverted microscope to image these antigen
independent interactions in real time. We aimed to determine the number and
duration of Tck—macrophage interactions and the overall area of these
interactions. Different variables such as using inactivated T cells or fixed Tcks
were analysed to visualise their effects on the interaction measurements. Once

324
the behaviour and movement of the cells during the cell contact model have
been fully understood, the live cell in vitro imaging system could then be used
to analyse the impact that blocking molecules or proteins may have on the Tck—
macrophage interaction. It was our intention to bring this imaging system
together with the preceding microarray data to visualise the effect of altering
key genes, which had identified as being differentially expressed in the synovial
macrophages, on the cellular interactions taking place and also whether this
may be affecting the cytokine/chemokine profile of the cell contact.

325
7.2 Real-time imaging
Figure 7.1 demonstrates the experimental set up to allow real time imaging of
the cell contact events. The conditions being compared may differ from those in
the figure however the general experimental set up was the same. Macrophages
were isolated from a healthy donor and stimulated for 5 days with M-CSF before
being stained with the red fluorescent dye CMTPX and plated out onto a
specialised imaging culture chamber for 24 hours to allow the cells to adhere. T
cells isolated from the same donor which were treated under differing conditions
were stained with the green fluorescent dye CFSE and cultured with the
macrophages. The cultures were incubated for 2 or 24 hours (as indicated in the
text) and then imaged on an inverted microscope. Each condition was imaged for
varying lengths of time therefore each co-culture set up was often staggered for
each condition to maintain a constant incubation time before being imaged.

326
Figure 7.1 Outline of in vitro real time imaging experimental setup An example of the experimental set up for real time imaging demonstrating how a comparative analysis between a macrophage (Mø) and Tck culture compared to a macrophage and unstimulated T cell culture would be set up. For this experiment macrophages and T cells are isolated from the donor, T cells are stimulated for 6 day with cytokines to generate cytokine activated T cells (Tcks) and the monocytes are stimulated for 5 days with M-CSF before being stained red with a CMTPX dye and plated out onto two imaging chamber for 24 hours to allow them to adhere to the chamber. On day 6 T cells are isolated from the same donor and stained green with CFSE and the Tcks are also stained green. Each of the two T cell conditions are then incubated with macrophages and the two cell contacts are incubated for a specified duration before being imaged on the microscope.

327
7.2.1 Imaging on the microscope
Once the cell contact experiments had been cultured for the specified duration
the co-cultures were imaged on an inverted microscope which had a heated
stage to maintain the cultures at 37ºC. For each imaging condition three movies
were taken of three separate areas of the co-culture chamber. Once the area to
be visualised had been chosen the microscope was set up to take three images
every 12 seconds. The three images consisted of a green fluorescent image, a
brightfield image and a red fluorescent image as shown in Figure 7.2. The
brightfield image was taken to ensure that the camera remained aligned while
the green and red fluorescent images were merged to obtain a single timepoint
image. When all of the merged imaged were played in sequence they produced a
real time movie of the in vitro cell contact model of inflammatory arthritis.
Figure 7.2 Example of the images taken by the inverted microscope for the real time imaging During the real time imaging the inverted microscope takes three consecutive images. An image of the green fluorescence, a brightfield image and an image in red fluorescence (top three images of panel). The red and the green fluorescent images are then merged to make the single timepoint image (bottom image of panel). The brightfield image is not used in the final timepoint image but is taken to ensure that the microscope remains aligned.

328
7.2.2 Quantitative measurements of imaging
Once generated, the real-time images and movies were analysed to determine if
there is a difference in the interactions between experimental conditions.
Volocity is specific imaging software which allows factors such as the number
and duration of T cell-macrophage interactions to be examined as well as the
colocalization coefficient between the two cell types.
7.2.2.1 Number and duration of interactions
The number and duration of each macrophage-T cell interaction during the
course of the real time movies were calculated using the Volocity software. This
software has specific functions that can detect red fluorescence (representing
the macrophage cells) and green fluorescence (representing the T cells) and
then determine where these two fluorescence signals intersect i.e. where the
two cell types are interacting. The software measures the interactions taking
place in the field of view for the first time frame of the movie and then
calculates how long these interactions last for the duration of the imaging. It
also measures any new interactions and their duration taking place during the
co-culture therefore enabling the user to determine exactly how many
interactions took place between the two cell types and how long these
interactions last for. The basis for how the software identifies these cell-cell
interactions is shown in Figure 7.3.
7.2.2.2 Colocalization coefficient
The Volocity software can also be used to measure the colocalization coefficient
of the macrophage-T cell interactions. In the context of digital fluorescence
imaging, colocalization can be described as the detection of signal at the same
pixel localisation in each of two channels. The two channels are made up of
images of two different fluorochromes taken from the same sample area. The
Volocity software therefore detects how many yellow pixels are in each time
frame image as the yellow pixels are representing the position where the two
fluorescent colours (green and red) are overlapping and hence where the two
different cell types are interacting. The colocalization coefficient therefore
analyses the area of interaction between the two cell types, it has an advantage
over the number and duration analysis as statistical analyses can be made on the

329
colocalization coefficient values between two different experimental conditions
to determine if there is a significant difference between the areas of
colocalization. In summary there are two different methods of analysis for the
real time movies generated of the in vitro model of inflammatory arthritis. They
are both constructive methods of analysis and enable the amount and duration
of interactions as well as the overall areas of interactions to be measured.

330
Figure 7.3 Volocity software method for determining the macrophage-T cell interactions Each macrophage-T cell culture movie is made up of individual frames taken by the microscope which, when played in sequence, produces the real time movie. To determine the number and duration of interactions taking place during each movie Volocity begins by analyses the first time frame of the movie. In this image Volocity identifies objects which are fluorescing green (T cells) and identifies objects which are fluorescing red (macrophages). It highlights each new object it identifies in a different colour. The software then identifies the areas of intersection between the red and green objects and each area is classed as an interaction between the two cell types. The software will then track these interactions and any new interactions which form during the movie and determine how long each interaction lasted for. The cartoons on the right hand side of the figure depict how the software views the cells and locates the areas of interaction.

331
7.3 Comparison of cytokine activated T cells to unstimulated T cells
In the cell contact model of inflammatory arthritis the T cells are stimulated
with a specific cytokine cocktail for 6 days, this stimulation induces an activated
T cell (Tck) phenotype which resembles T cells isolated from an RA synovial
joint. Not only do these Tcks express a similar cell surface ligand and activatory
marker phenotype as the synovial T cells they also induce a similar pro-
inflammatory cytokine and chemokine profile in macrophages by direct cell
contact [269, 298, 308, 309]. To establish whether the cytokine activation of the
T cells induced more interactions with the macrophages or a larger area of
interactions a comparative analysis of Tcks and inactivated T cells took place.
Figure 7.4 is a representative of three independent experiments performed.
Since each co-culture condition was imaged three times in separate areas of the
culture chamber panel, Figure 7.4 (A) shows individual time frames of a
representative movie for each culture condition taken at t=0, t=60 seconds and
t=120 seconds for the macrophage—T cell co-culture (top panel) and the
macrophage—Tck co-culture (bottom panel). The white arrows on the
macrophage—Tck co-culture images indicate Tck cell movement during the
course of the movie. Upon comparison of the two sets of images it can be seen
that many Tcks are clustered around the macrophages which is not visualised in
the non activated T cells images. Consequently, the cytokine stimulation of the
T cells would appear to induce a higher rate of clustering and interaction with
the macrophages compared to T cells from the same donor which have not been
stimulated.
This pattern of interaction can also been seen in the two real time movies
represented by the panel of images in part (A) of Figure 7.4. The supplementary
file designated movie 1 demonstrates the inactive T cell — macrophage
interactions. It can be seen that there is little T cell movement within the field
of view. There are also only a small number of interactions taking place between
the T cells and the macrophages which appear to be stable. The movie for the
Tck—macrophage co-culture is supplementary file movie 2 and from this short
movie it can be seen that the majority of interactions are stable long-lived
interactions where many Tcks have clustered around one macrophage indicating

332
their increased activation status compared to the inactivate T cells. There are
only a small number of Tcks which have not formed stable interactions moving
though the field of view therefore it is difficult to comment on the migration
pattern of the Tcks. It is likely that in the 24 hours prior to the imaging of the
co-culture the majority of the Tcks have already formed and established stable
interactions with the macrophages therefore a shorter imaging timepoint may be
necessary in order to visualise the how the Tcks migrate and behave. I note also
that the experiment is not performed under formal flow conditions which might
alter the adhesive activities of cells.
Volocity analysis was used to analyse the movies in order to determine the
number and duration of interactions which are shown in Figure 7.4 (B). These
graphs show the number of interactions on the y axis and the duration of
interactions in time frames on the x axis. One time frame is equivalent to a
duration of 12 seconds since this is the unit of time between each image being
taken on the microscope. The graphs represent the average number and duration
of interactions throughout the three movies taken of each co-culture condition.
The graph on the left hand side demonstrates that the Tcks (red line) have more
sustained interactions with the macrophages. These interaction last for a longer
duration which is identified by the peak of interactions just before time frame
200 and at time frame 250 which is not seen in the T cell co-culture (black line).
Due to the difficulty in visualising the difference in the number of short duration
interactions between the two co-culture conditions all interactions which lasted
up to 10 minutes, equivalent to 50 time frames, were plotted on a separate
graph (demonstrated by the right hand side graph). Analysing this graph
illustrates that as well as having more sustained interactions with the
macrophages the Tcks also have a higher number of shorter duration
macrophage interactions compared to the T cells. This can be most easily seen
at time frames 5 to 10 where the Tcks consistently exhibit a higher number of
interactions compared to the T cells. Volocity analysis of the colocalization
coefficient in Figure 7.4 (C) reveals that the average area of interaction was
significantly higher in the three movies of the Tck co-culture compared to the
three movies of the T cell co-culture (p<0.0001).
Hence these results demonstrate that cytokine activation of the T cells does
induce more interactions with the macrophages, these interactions are more

333
sustained and have a significantly larger area. However, analysis of the movies
demonstrates that there is little Tck movement towards the macrophages as
most of the Tcks have migrated towards and maintained their interactions with
the macrophages in the 24 hour period prior to microscope imaging. Since we
are also interested in visualising how the Tcks migrate towards and interact with
the macrophages it was decided to analyse the co-culture experiments after a
shorter 2 hour duration of incubation.

334
Figure 7.4 Imaging Tcks or non-activated T cells incubated with macrophages for 24 hours The two co-culture experiments were analysed after 24 hours of incubation, three fields of view were imaged from each condition. Figure (A) shows single images from the real time movie taken at t=0, t=60 seconds and t=120 seconds from the cell contact containing macrophages and non activated T cells (top panel) and the cell contact containing macrophages and Tcks (bottom panel). The white arrows on the bottom panel of images indicate Tck cell movement during the course of the imaging. These images are a representative of the three movies which were taken of each condition. Figure (B) indicates the number and duration of macrophage-T cell interactions throughout the course of the movies. The duration of interactions is represented in time frames

335
where one time frame is equivalent to 12 seconds. The data points represent the average value taken from the three movies of the macrophage-T cell co-culture (black line) and the macrophage-Tck co-culture (red line). The graph on the left indicates all the interactions which occur for the duration of the movies. Since the number of short interactions is difficult to visualise on this graph the short duration interactions lasting no longer than 10 minutes (50 time frames) have been plotted on the right hand side graph. Figure (C) demonstrates the average colocalization coefficient of the two co-cultures (mean plus standard deviation). Colocalization coefficient is a measure of the area of interaction between the macrophages and T cells and this result demonstrates that there is a significantly higher amount of interaction taking place in the Tck co-culture compared to the T cell co-culture (p<0.0001).
7.3.1 Comparison of Tcks and T cells after 2 hours of co-culture with macrophages
I next examined cellular contacts between macrophages and T cells/Tcks after a
2 hour duration of incubation. Since we also planned to use this model system to
analyse the effect of different proteins/molecules identified from the
microarray on this inflammatory model of arthritis, analysing the co-culture
system after 2 hours would also allow us to identify early effects of targeting or
manipulating these proteins.
Figure 7.5 is a representative of three independent experiments that measured
the interactions between macrophages and non-activated T cells or Tcks after 2
hours of co-culture. Figure (A) is displaying screen shots taken from the movie of
the macrophages incubated with non-activated T cells (upper panel) or
incubated with Tcks (lower panel). Examination of the two image panels
revealed that even after 2 hours of incubation the macrophages and T cells are
already in contact with one another. This demonstrates that the T cells require
only a short duration of time in which to establish their interactions with the
macrophages. Upon comparison of the two panels of screenshots, the
macrophage-Tck co-culture appear to have substantial clustering of the T cells
around the macrophages compared to the non-activated T cell –macrophage co-
culture. This clustering of the Tcks around the macrophages is not distributed
evenly throughout the field of view and is localised to a subgroup of
macrophages. The reason for this is unclear at present but it may be due to an
increased activation of the macrophage subset causing increased expression of
cell surface activatory markers or increased chemokine or cytokine expression
from these cells which could be causing the Tcks to cluster around them.

336
The representative movie for the macrophage—T cell 2 hour co-culture is
designated movie 3 in the supplementary files. Upon observing this real time
movie it is clear, especially at the start of the movie, that all of the T cells are
moving in the same direction and they all change their direction of movement at
the same time. This would indicate that rather than undergoing independent
random movement the T cells are all moving throughout the field of view as a
result of an external variable which could possibly be the external airflow.
Despite this variable, several of the inactive T cells have formed stable contacts
with the macrophages indicating that the two cell types can establish stable
interactions after just 2 hours of co-culture. Analysing the migrating T cells in
the movie demonstrates that these T cells appear to only briefly interact with
the macrophages before moving away. These short interactions may be due to
the T cells being inactivate and therefore are not expressing the high level of
adhesion molecules needed to form strong interactions upon the first encounter
of the macrophages. In addition the external air flow could be playing a role in
moving the T cells away from the macrophages before the establishment of the
stable interactions. This is in contrast to the small number of stable interactions
which have formed between the two cell types which may have formed during
the 2 hour co-culture in a 37ºC incubator without the influence of external air
flow.
The representative movie for the macrophage—Tck 2 hour co-culture is
designated movie 4 in the supplementary files. Analysis of this movie indicates
that the Tcks have formed stable interactions emphasising the observation that
the Tcks only need a few hours to form stable cell contacts with the
macrophages. In the middle of the field of view in the movie there is a
macrophage dense region around which many Tcks have clustered. This
clustering of T cells was not seen in the inactive T cell movie indicating that the
Tcks have a greater capacity for macrophage cell contact. As was visualised in
the previous movie, the external air flow appears to be influencing the
movement of the Tcks as all of the Tcks are moving in the same direction though
the field of view, making it difficult to distinguish the migration pattern of the
Tcks. However, although their movement appears to be influenced by the air
flow the Tcks are demonstrating more short duration interactions with the
macrophages compared to the inactive T cells. This observation is not due to the

337
selection of the field of view as three areas were selected at random for this
analysis and the same pattern of airflow was visualised in all three fields of
view. In addition, the Tcks appear to interact for longer with the macrophages
before moving away in comparison to the inactive T cells which appear to only
interact briefly.
Panel (B) of Figure 7.5 is showing the number and duration of interactions
occurring between the macrophages and the non-activated T cell or the Tcks.
The left hand graph indicates the average number and duration of the
macrophage-T cell interaction which took place during the two conditions. The
interactions between the macrophages and Tcks are indicated by the red line
and the interactions between the macrophages and the non-activated T cells are
indicated by the black line. On the left hand graph it is difficult to visualise the
number of interactions lasting for a short duration however both the Tcks and
the non-activated T cells appear to have a similar number of interactions lasting
for the maximal duration of 265 time frames (53 minutes). Due to the difficulty
in viewing the number of interactions lasting for a short duration, this data was
re-graphed specifically analysing interactions which lasted for up to 10 minutes
in duration. This graph can be seen on the right hand side of panel (B) and
demonstrates that the Tcks (red line) had an increased number of short
interactions with the macrophages compared to the non-activated T cells (black
line). Volocity analysis of the area of interaction (colocalization coefficient)
within each of the movies was also calculated and the results are shown in panel
(C). The colocalization coefficient is significantly higher (p<0.0001) when the
Tcks are co-cultured with the macrophages compared to the non-activated T
cells indicating a higher area of interaction. These results correspond with those
that were observed during comparison of the images in panel (A) and
supplementary movies 3 and 4 where it was observed that more Tcks appeared
to be in contact and clustered around the macrophages compared to the non-
activated T cells.
In summary, this 2 hour imaging condition has verified the results of the
Tck/non-activated T cell imaging performed after 24 hours of co-culture as it
has demonstrated at this timepoint that cytokine activated T cells have a higher
number of interactions with the macrophages and these interactions have a
larger area. The results of the 2 hour co-culture imaging also inform us that the

338
T cells interact with the macrophages after a relatively short duration of
incubation and it is not necessary to incubate the co-culture for 24 hours before
imaging. Performing imaging after such a short incubation has its advantages as
the initial movement and interactions of the T cells with the macrophages can
be visualised along with the early effects of adding inhibitory molecules or
targeting specific genes within the co-culture system.

339
Figure 7.5 Imaging Tcks or non-activated T cells incubated with macrophages for 2 hours The two co-culture experiments were analysed after 2 hours of incubation. Figure (A) shows single images from the real time movie taken at t=0, t=60 seconds and t=120 seconds from the cell contact containing macrophages and non activated T cells (top panel) and the cell contact containing macrophages and Tcks (bottom panel). Figure (B) indicates the number and duration of macrophage-T cell interactions throughout the course of the movies. The data points represent the values taken from the macrophage-T cell co-culture (black line) and the macrophage-Tck co-culture (red line). The graph on the left indicates all the interactions which occur during the movies. Since the number of short interactions is difficult to visualise on this graph the short duration interactions lasting for up to 10 minutes (50 time frames) have been plotted on the right hand side graph. Figure (C) demonstrates the average colocalization coefficient of the two co-cultures. Colocalization coefficient is a measure of the area of interaction between the macrophages and T cells and this result demonstrates that there is a significantly higher amount of interaction taking place in the Tck co-culture compared to the T cell co-culture (p<0.0001).

340
7.4 Comparison of fixed and live Tcks after 2 hours co-culture with macrophages
Once it had been established that the Tcks, which have a phenotype similar to
RA synovial T cells, have more interactions compared to non-activated T cells we
decided to develop and validate the in vitro imaging system further by
comparing fixed Tcks to live Tcks. We hypothesised that the live Tcks would be
able to actively migrate towards the macrophages and therefore would have a
larger number of interactions with the macrophages compared to fixed Tcks.
Figure 7.6 is a representative of five experiments which took place to image the
fixed and live Tck co-culture conditions with live macrophages. For the fixation
process 2% paraformaldehyde was used which fixes the cells through cross linking
the proteins. Consequently, the fixed Tcks will still have the cell surface
markers and adhesion molecules needed to interact with the macrophages but
they will not be able to actively migrate or chemotax towards the macrophages
or produce cytokines or chemokines which could activate the macrophages.
Panel (A) of Figure 7.6 is showing the screen shots from one of the three fields
of view taken for each imaging condition for this experiment. The screen shots
are taken at 0, 60 and 120 seconds after the commencement of imaging.
Comparison of the two sets of screenshots demonstrates that there are very few
interactions taking place between the macrophages and fixed Tcks however the
live Tcks have clustered around the macrophages and are interacting with them.
This can also be visualised in the real time movies taken of these conditions.
Supplementary file movie 5 is the representative field of view taken of the fixed
Tcks—macrophages after 2 hours of co-culture. Upon analysis of this movie it is
clear that there are very few interactions taking place between the fixed Tcks
and the macrophages. Furthermore, there appears to be a very small number of
stable interactions between the fixed Tcks and the macrophages, the Tcks which
are moving around the field of view are seen to very briefly interact with the
macrophages before moving away. The supplementary file movie 6 represents
the live Tcks from the same donor imaged after 2 hours of co-culture. This movie
demonstrates that the live Tcks are highly activated and have clustered around
and acquired stable interactions with the macrophages. Some of the Tcks are
interacting with two macrophages at the same time and can be visualised
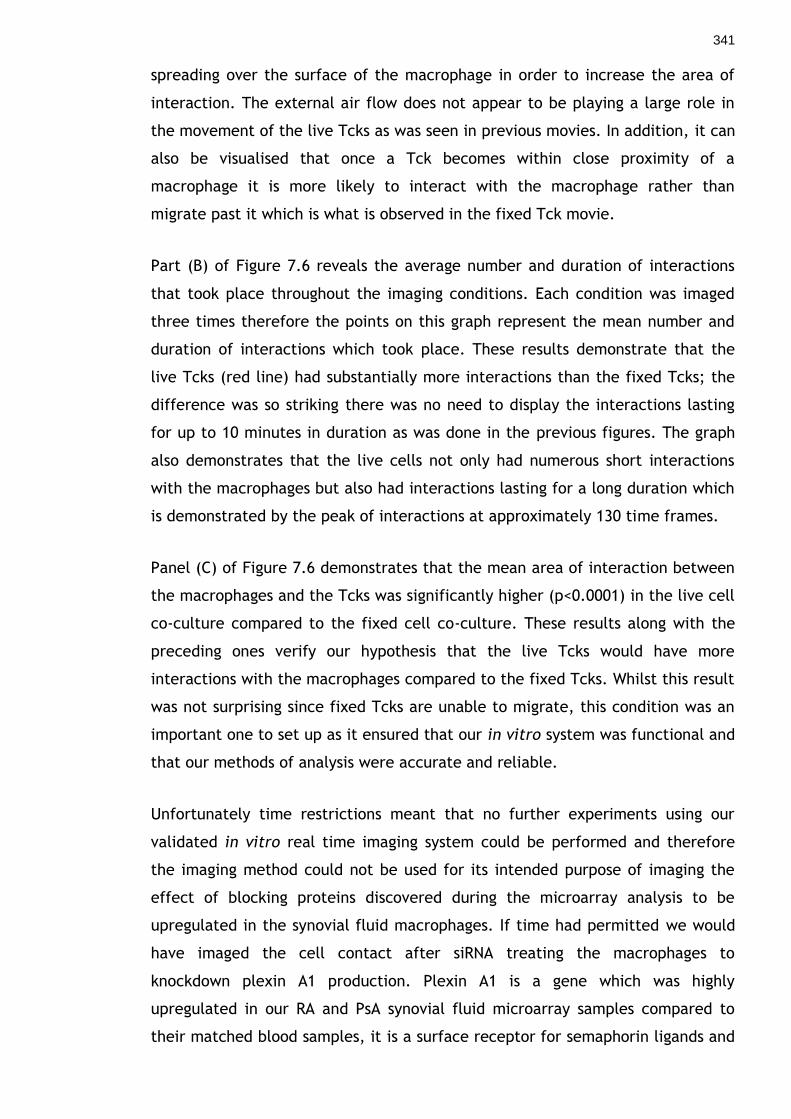
341
spreading over the surface of the macrophage in order to increase the area of
interaction. The external air flow does not appear to be playing a large role in
the movement of the live Tcks as was seen in previous movies. In addition, it can
also be visualised that once a Tck becomes within close proximity of a
macrophage it is more likely to interact with the macrophage rather than
migrate past it which is what is observed in the fixed Tck movie.
Part (B) of Figure 7.6 reveals the average number and duration of interactions
that took place throughout the imaging conditions. Each condition was imaged
three times therefore the points on this graph represent the mean number and
duration of interactions which took place. These results demonstrate that the
live Tcks (red line) had substantially more interactions than the fixed Tcks; the
difference was so striking there was no need to display the interactions lasting
for up to 10 minutes in duration as was done in the previous figures. The graph
also demonstrates that the live cells not only had numerous short interactions
with the macrophages but also had interactions lasting for a long duration which
is demonstrated by the peak of interactions at approximately 130 time frames.
Panel (C) of Figure 7.6 demonstrates that the mean area of interaction between
the macrophages and the Tcks was significantly higher (p<0.0001) in the live cell
co-culture compared to the fixed cell co-culture. These results along with the
preceding ones verify our hypothesis that the live Tcks would have more
interactions with the macrophages compared to the fixed Tcks. Whilst this result
was not surprising since fixed Tcks are unable to migrate, this condition was an
important one to set up as it ensured that our in vitro system was functional and
that our methods of analysis were accurate and reliable.
Unfortunately time restrictions meant that no further experiments using our
validated in vitro real time imaging system could be performed and therefore
the imaging method could not be used for its intended purpose of imaging the
effect of blocking proteins discovered during the microarray analysis to be
upregulated in the synovial fluid macrophages. If time had permitted we would
have imaged the cell contact after siRNA treating the macrophages to
knockdown plexin A1 production. Plexin A1 is a gene which was highly
upregulated in our RA and PsA synovial fluid microarray samples compared to
their matched blood samples, it is a surface receptor for semaphorin ligands and

342
has been demonstrated to have a role in immune regulation and axonal guidance
[444, 618]. Hence imaging the effect of siRNA knockdown of plexin A1 could
have demonstrated if it played a role in Tck—macrophage interaction and
whether silencing plexin A1 in the macrophage had an impact on the number,
duration or area of cellular interactions.

343
Figure 7.6 Imaging fixed or live Tcks incubated with macrophages for 2 hours The two co-culture experiments were analysed after 2 hours of incubation. Figure (A) shows single images from the real time movie taken at t=0, t=60 seconds and t=120 seconds from the cell contact containing macrophages and fixed Tcks (top panel) and the cell contact containing macrophages and live Tcks (bottom panel). These images are a representative of the three movies which were taken of each condition. Figure (B) indicates the number and duration of macrophage-T cell interactions throughout the course of the movies. The data points represent the average value taken from the three movies of the macrophage- fixed Tck co-culture (black line) and the macrophage-live Tck co-culture (red line). Figure (C) demonstrates the average colocalization coefficient of the two co-cultures (mean plus standard deviation). Colocalization coefficient is a measure of the area of interaction between the macrophages and T cells and this result demonstrates that there is a significantly higher amount of interaction taking place in the live Tck co-culture compared to the fixed Tck co-culture (p<0.0001).
344
7.5 Discussion
This project has demonstrated the validation work required to verify an in vitro
imaging model of inflammatory arthritis, and we have illustrated the effects of
changes to the model through fixing the Tcks or by adding unstimulated T cells
to the culture. In addition, this work has allowed the visualisation of the
dynamic nature of the interactions between the cytokine activated Tcks and
macrophages. The inflammatory cell contact model has previously been
demonstrated to be a robust model of arthritis since the cytokine activation of
the T cells induces a phenotype similar to T cells found in the RA synovium [269,
298, 308, 309]. However, previous work has only analysed the
cytokine/chemokine profiles of the macrophage—Tck co-culture, the activatory
markers present on the Tcks or the inflammatory signalling pathways which are
activated in the macrophage as a result of co-culture. Hence, we set out to
visualise and measure the interactions that take place within this co-culture
model with the eventual aim of imaging the effect of blocking specific proteins
shown to be upregulated in the synovial macrophage by combining this work with
the microarray results of the preceding chapters.
The first set of experiments which were performed compared the interactions
between a macrophage—Tck to a macrophage —T cell co-culture that had been
incubated for the standard duration of 24 hours. The results of these
experiments revealed that on average the Tcks engaged in a higher number of
interactions with macrophages compared to the unstimulated donor matched T
cells. These Tck interactions also lasted for a longer duration and had a
significantly higher surface area compared to the T cell interactions. Recently,
Brennan et al showed that the cytokine activation of T cells results in the
upregulation of T cell activation markers such as CD25, CD69 and HLA-DR as well
as adhesion molecules such as L-selectin, integrin β-1 (CD29), integrin β-2 (CD18)
and CD49d an integrin alpha subunit that in combination with CD29 make up the
integrin very late antigen-4 (VLA-4) [309]. These adhesion molecules are known
to interact with receptors which are present on the surface of macrophages,
such as VCAM-1 which interacts with Tck VLA-4 and ICAM-1 which interacts with
Tcks CD18. Consequently, the observations of increased interactions between
Tcks and macrophages with a higher surface area compared to those between
inactivated T cells and macrophages is unsurprising since the Tcks have

345
previously been shown to express adhesion molecules which will aid in their
establishment and maintenance of interactions with the macrophages. Analysis
of the numerous movies taken of the two co-culture conditions demonstrated
that while many stable interactions had formed between the Tcks/T cells and
the macrophages there were very few Tcks or T cells which were actively
migrating or moving throughout the field of view. This result indicated that most
of the Tcks/T cells had already established and maintained their stable
interactions with the macrophages in the 24 hours prior to the commencement
of the real time imaging.
Since part of this investigation was to visualise the movement of the T cells
within the cell contact system and visualise the establishment of these
interactions it was decided to analyse the co-culture system after a shorter
duration of incubation. An incubation period of 2 hours was decided upon before
the commencement of the real time imaging. This short incubation period should
allow the T cell movement to be observed and the establishment of short and
stable interactions as a previous study analysing murine T cell macrophage
interactions demonstrated that the T cells move from one macrophage to
another after 2 hours of real time imaging [701]. In addition, using a 2 hour
incubation period before imaging the co-culture would coordinate well with
using this in vitro imaging system alongside the microarray results to visualise
the function of particular genes. The microarray analysis took place after 2
hours of co-culture to analyse the early response genes that are changed in the
macrophages therefore imaging this co-culture system after 2 hours will allow
the visualisation of the effect these early response genes have on the
interactions between the Tcks and macrophages.
Imaging the Tck—macrophage co-culture in comparison to the T cell—
macrophage co-culture after 2 hours of incubation correlated well with the
previous analyses of the co-culture after 24 hours. The number of short duration
interactions and the colocalization coefficient was higher in the Tck co-culture
compared to the T cell co-culture however both co-culture systems had a similar
average number of long-duration stable interactions. Hence not only are the
Tcks having more short duration interactions with the macrophages but the area
of these interactions is also significantly larger, this observation may be caused
by the increased expression of adhesion molecules on the surface of the Tcks

346
after cytokine activation as previously described [309]. Analysis of the movies
from these co-culture experiments unfortunately did not reveal a large amount
of information regarding the independent movement of the T cells/Tcks due to
external factors influencing their movement. In each movie the Tcks/T cells can
be observed to all move in a single direction before changing their direction of
movement simultaneously which leads to the conclusion that external air flow
may be causing the movement of the T cells.
Despite the external air flow, which was not consistent throughout the
experiements, patterns of interaction can still be noted from these movies.
During the numerous Tck—macrophage co-cultures which were set up the Tcks
were seen to cluster around specific macrophages and were not evenly
distributed throughout the field of view. Studies analysing murine T cell—DC
interactions in the absence of antigen have demonstrated that the rate of
contacts is not solely the result of random collision events. Chemokines, such as
CCL3 and CCL4, produced at the site of T cell-DC conjugates increases the
chance of migrating CCR5-expressing CD8+ T cells to contact DCs by a factor of 2
to 4 [702]. In addition in vitro observations have revealed that T cell movement
and behaviour can be influenced by the presence of surface bound chemokines
on the DC. Friedman et al demonstrated that when T cells encounter APCs which
have been pulsed with CCR7 ligands in the absence of antigen they remain
attached to the APCs for several minutes by a uropodal tether. It was also
demonstrated that this attachment was reduced by 62% in the presence of a
blocking antibody to ICAM-1 [703]. In the human in vitro model of inflammatory
arthritis Tcks have been demonstrated to express the chemokine receptor CCR5
and to a lesser extent CCR7 [309] therefore the movement and cellular
interaction of these Tcks could be influenced by the expression of chemokines
from the macrophages. Since the CCR5 ligands CCL3 and CCL4, otherwise known
as MIP-1α and MIP-1β, are expressed by activated macrophages [578] the
clustering of Tcks around certain macrophages may the result of these subsets of
macrophages expressing a higher level of chemokine ligands which causes the
specific migration and interaction of Tcks to these cells. Once these Tcks are in
close contact with the macrophages their cellular contacts and maintenance of
stable interactions will be mediated by adhesion molecules previously associated
with Tcks and macrophages such as L-selectin and ICAM-1. There is no clustering

347
pattern of inactive T cells around the macrophages seen in the T cell movies
which is most likely due to the lack of chemokine receptors expressed on the T
cells that ensures these T cells are not moving by a chemotactic gradient
towards the macrophages and only interact with the macrophages by random
chance.
In conclusion imaging the co-culture after 2 hours of incubation rather than 24
hours showed a similar pattern of colocalization coefficient but the advantage of
imaging after such a short incubation allows the movement and brief
interactions of the Tcks/T cells with the macrophages to be observed whereas
the was very little T cell movement when the co-culture was analysed after 24
hours. However, it must be noted that the Tck/T cell movement may not be
entirely random during the real time imaging as the behaviour and motion of
these cells may be influenced by the external air flow outside of the imaging
chamber.
Once it had been established that the Tcks, which have a phenotype similar to
RA synovial T cells, partake in more cellular interactions with the macrophages
compared to non-activated T cells it was decided to validate the in vitro imaging
system further by comparing fixed Tcks to live Tcks after 2 hours of co-culture.
Fixation of the Tcks before incubating them with the macrophages results in T
cells which express all the surface bound chemokine receptors or adhesion
molecules which are known to be upregulated on Tcks [309] but are unable to
actively migrate towards the macrophages. Analysis of the graphs in Figure 7.6
which represent one of five experiments clearly indicates that live Tcks have
more interactions with the macrophages compared to fixed Tcks and these
interactions last for a longer duration and have a significantly higher surface
area. These results validated our hypothesis that the live Tcks are able to move
towards the macrophages and respond to the chemokines and adhesion
molecules present on the surface of the macrophages. Analysis of the
representative movies demonstrated that fixed Tcks do form stable interactions
with the macrophages, since these cells cannot actively migrate towards the
macrophages this would indicate that these interactions are the result of random
movement of the fixed Tcks possibly influenced by the external air flow aiding
the cells in their movement. Combining these results would indicate that the
formation of stable interactions between Tcks and macrophages are the result of
348
random movement as well as chemotaxis through the production of chemokines
from the macrophages. Analysis of the fixed and live Tck co-cultures enabled the
validation of the in vitro imaging system and ensured that this inflammatory
arthritis model produced reliable and reproducible results.
This imaging system had provided us with interesting results regarding the
movement and interaction of cells within the cell contact model of arthritis but
there are several areas of improvement for future experiments. One such area
would be to reduce the influence of the external airflow on the T cell movement
through the use of a heated chamber which surrounds the in vitro system. This
modification would subsequently allow the observation of the independent T cell
movement and migration rather than the cell movement being influenced by the
air flow. The use of z stacks to take images at different focal depths of the field
of view should also be considered as this would enable a 3D image of the cells
within the field of view to be acquired. The z stack information would reveal the
3D area of interaction between the Tcks and macrophages, which would be more
informative than the current 2D area measured in the preceding experiments.
Such z stack information would also enable a more accurate colocalization
coefficient to be measured between the Tcks and the macrophages. Also the use
of a 3D collagen matrix would make the movement of the cells more
physiological and would be representative of the environment within the
synovial joint. Several experiments were set up using a collage matrix (data not
shown) but the inability to focus on the cells made it impossible to image their
interaction. However, such imaging capacity is available using a confocal
microscope which is more advanced than the inverted microscope used for the
current study. In summary, the use of a collagen matrix in addition to measuring
z stacks on more advanced confocal microscope would greatly enhance the
amount of information gained from this in vitro imaging system.
In addition, time restrictions meant that this imaging model could not be used
for its intended purpose of imaging the effect of blocking genes identified from
the microarray analysis performed in this project (see chapter 4) to ascertain
whether the interactions between the macrophages and synovial-like Tcks were
affected. For example imaging the effect of silencing the plexin A1 gene would
be of interest as these experiments may determine whether this cell surface

349
associated protein, which was found to be highly upregulated in RA and PsA
synovial macrophages, has a role in the synovial T cell—macrophage interaction.

350
Chapter 8: General Discussion
At the outset of my studies many microarray investigations had been performed
to analyse the trancriptomic signature of RA and PsA either by whole blood or
whole tissue profiling [318-320, 325-327, 329, 330, 340, 341] but very few had
analysed the individual cell subsets which drive the pathogenesis of disease. I
therefore sought to determine the expressed genetic profiles of matched blood
and synovial fluid CD14+ monocytes and macrophages from RA and PsA patients
to determine how the macrophages change their transcriptome once they
migrate from the blood into the inflamed synovial joint. I also sought to compare
these profiles to those of healthy blood CD14+ monocytes and to cell-contact
activated macrophages, representing an in vitro model of inflammatory arthritis.
Analysis of the microarray data comparing i) healthy blood, ii) RA blood and iii)
PsA blood CD14+ cells revealed the unexpected result that the overall genetic
profiles of these three monocyte types were remarkably similar and there were
very few genes that could distinguish one monocyte subset from another. This
result was in contrast to previous microarray analyses which have found a
distinct disease signature in RA and PsA blood compared to healthy control blood
[326, 329, 330, 340, 341]. The discrepancy between microarray results may be
due to differences in sample numbers as my study only included 5 healthy donors
and were age- and sex-matched to the PsA patients only. Despite this, my results
suggested that the monocytes within RA and PsA are not responsible for the gene
expression differences seen in other PBMC microarray studies between healthy
and arthritic patients indicating that other cells within the peripheral blood may
be causing the diseased genetic signature. Numerous microarray studies have
proposed the use of genetic data from patient PBMCs to discover molecular
discriminators indicating a response to treatment or disease progression.
However, since my data suggest that the RA and PsA blood monocytes do not
have a differentiating disease signature compared to healthy controls it may not
be appropriate to use this cell subset as a marker of disease or treatment
response.
Comparison of matched blood and synovial fluid CD14+ cells from the RA and PsA
patients also revealed some novel findings. Unsurprisingly, the synovial fluid
genetic signature was vastly different to that of the matched blood samples

351
therefore demonstrating that the monocytes only develop a disease specific
signature once they exit the blood and enter the diseased joint. In addition,
upon comparison of the differentially expressed genes it was discovered that
over 50% of the expressed genes in the synovial fluid CD14+ cells compared to
the blood cells were the same in both RA and PsA. This result was unexpected
given previous analyses by Baeten et al who suggested that the macrophages in
SpA and RA were different since they found SpA (including PsA) macrophages
expressed higher levels of markers of alternative activation compared to RA
macrophages [255] and SpA synovial fluid but not RA was able to polarise blood
monocytes to express the alternative activation marker CD163 [253]. However,
analysis of the genetic transcriptome generated by my study demonstrated a
similar level of alternative activation markers, such as CD204 or mannose
receptor, expressed in the PsA CD14+ and RA CD14+ SF cells. Indeed, I also found
similar levels of classical activation markers such as CD86 expressed in both RA
and PsA SF cells demonstrating that within this study the RA and PsA
macrophages do not have a preferential activation phenotype which contradicts
the previous findings. The reasons for this may be due to the Baeten et al study
analysing the effects of SF on healthy blood monocytes rather than analysing the
diseased macrophages isolated from the source of inflammation as was
performed in our study as the effect of the cell-cell contact that takes place
within the synovium in addition to the SF environment may play a role in the
expression of activation markers and macrophage polarization. However, further
studies on the phenotype of the macrophages and protein expression of
activation markers are required to test this hypothesis.
Due to the same genes being differentially expressed in the RA and PsA SF
macrophages compared to their matched blood monocytes many of the same
canonical pathways were significantly associated with these genes lists.
Interestingly, the top pathway was LXR activation which has previously been
associated with RA but is a novel finding for PsA. Work performed by our
research group prior to this observation had demonstrated that LXR agonism
exacerbated articular damage in CIA a murine model of arthritis. In addition, ex
vivo culture of RA PB derived monocytes which were LPS stimulated and treated
with two LXR agonists showed an increase in IL-6 and TNFα production,
suggesting LXRs have a pro-inflammatory role in arthritis [527]. However in the

352
present investigation several of the RA and PsA SF macrophage genes associated
with this LXR canonical pathway are constituents of the anti-inflammatory
lipoptotein HDL. HDL has been previously shown to mediate anti-inflammatory
effects within RA since HDL can block the pro-inflammatory cytokine production
from monocytes induced by T cell contact through binding to the T cell surface
activating factors [558]. Consequently, the net inflammatory effect of the
upregulated LXR pathway in the RA and PsA SF macrophages is yet to be defined
and should be the focus of further investigations.
Analysis of the highly upregulated genes in both of the RA and PsA SF
macrophage subsets compared to the PB monocytes resulted in the identification
of two novels genes that had not been previously associated with arthritis. One
of these genes was legumain which is a lysosomal cysteine protease that
specifically cleaves protein substrates such as MMP2, cathepsins and fibronectin
[429, 431] which are all found within the synovium of arthritis patients. My work
revealed that legumain was found at the mRNA and protein level in RA and PsA
SF CD14+ cells and was physiologically active; in addition M-CSF matured
macrophages could be induced to express legumain when cultured in RA or PsA
SF under hypoxic conditions. Therefore, I hypothesise that legumain is highly
upregulated by macrophages once they enter the hypoxic pro-inflammatory
environment of the synovium and is required by the cell to activate
glycoproteins or enzymes being produced or taken up by the cell which therefore
contribute to the destructive inflammation seen in the synovium. Legumain was
also seen to be expressed on the cell surface of the synovial macrophages and
has also been shown to be excreted from cells [665] and therefore could be
activating destructive enzymes such as MMPs within the synovial fluid milieu.
Plexin A1 was the second novel gene discovered by the microarray analysis to be
highly upregulated in the RA and PsA SF macrophages compared to the blood
monocytes. Plexin A1 is a cell surface receptor which binds to semaphorin
ligands and has previously been shown to be important for T cell-DC interactions
and subsequent T cell activation [444, 623]. Due to the large body of literature
describing macrophage interactions with other cell types in the arthritic
synovium causing subsequent activation and pro-inflammatory mediator release I
hypothesised that plexin A1 expression on the synovial macrophages may be
playing a role in the cellular contacts taking place between these and other

353
synovial cells. In our study, plexin A1 was shown to be expressed at the protein
and RNA level and knocking down the gene using siRNA demonstrated that it may
be playing a potential pro-inflammatory role. Nevertheless our studies were
hampered by the inability to discover the presence of the most widely know
plexin A1 ligand, semaphorin 6D, on activated or synovial T cells despite it
previously being detected on activated murine T cells [645]. However, plexin A1
is known to have several semaphorin ligands and whilst our initial studies
suggested these may be expressed at the RNA level in synovial membrane and
synovial fibroblasts more investigation is required to elucidate what role plexin
A1 and its ligands could be playing in arthritic disease.
Analysis of the expressed genetic signature of the Tck activated macrophages,
(postulated to represent an in vitro model of inflammatory arthritis [298, 309,
314]), in comparison to synovial fluid derived macrophages demonstrated that
only 10% of the expressed genes in the cell contact activated macrophages were
expressed in RA or PsA synovial fluid macrophages. This would imply that this in
vitro system may not be a suitable model of arthritis; however my analysis was
confounded by several variables particularly the duration of macrophage
activation by the Tcks which was restricted to 2 hours. Therefore further
investigation especially involving a more extensive timecourse of macrophage
activation is required to fully elucidate the relevance of this in vitro model to an
in vivo disease process.
The real time imaging performed on the in vitro cell contact model of arthritis
provided some interesting observations on the variables influencing the
interactions between the T cells and macrophages. It was discovered that the
number of individual interactions between the macrophages and T cells was high
at 2 hours of co-culture due to the Tcks moving around the field of view and
interacting with several macrophages. This observation may help to explain why
there were so few genes in the 2 hour cell contact activated macrophages that
were shared with the SF macrophages as stable interactions with the Tcks, which
would activate the macrophages, were not fully formed after 2 hours of co-
culture. Unfortunately time restrictions meant that this imaging system could
not be used for its intended purpose which was imaging the effect of blocking
genes identified in the microarray analysis. These experiments may have allowed
us to visualise whether these genes, i.e. plexin A1, played a role in the

354
interaction of macrophages with other cell types such as the synovial T cell like
Tck.
While this new evidence of the genetic signatures of RA and PsA synovial fluid
macrophages has been informative, several avenues of investigation remain to
be explored. Future studies must identify the role of plexin A1 within the
synovial fluid macrophages and the semaphorin ligand it is potentially
interacting with. In addition, understanding the consequences of high levels of
active legumain within the RA and PsA synovium through the use of legumain
knockout mice and further functional analyses is of paramount importance as it
represents an entirely novel enzyme with arthritic disease relevant functions.

355
References
1. Hootman, J.M. and C.G. Helmick, Projections of US prevalence of arthritis and associated activity
limitations. Arthritis Rheum, 2006. 54(1): p. 226-9.
2. Brent, L.H., Inflammatory arthritis: an overview for primary care physicians. Postgrad Med, 2009.
121(2): p. 148-62.
3. Tobon, G.J., P. Youinou, and A. Saraux, The environment, geo-epidemiology, and autoimmune disease:
Rheumatoid arthritis. J Autoimmun, 2010. 35(1): p. 10-4.
4. Prey, S., et al., Assessment of risk of psoriatic arthritis in patients with plaque psoriasis: a systematic
review of the literature. J Eur Acad Dermatol Venereol, 2010. 24 Suppl 2: p. 31-5.
5. Firestein, G.S., Evolving concepts of rheumatoid arthritis. Nature, 2003. 423(6937): p. 356-61.
6. Arnett, F.C., et al., The American Rheumatism Association 1987 revised criteria for the classification of
rheumatoid arthritis. Arthritis Rheum, 1988. 31(3): p. 315-24.
7. Wollina, U., et al., Psoriatic arthritis. Dermatol Ther, 2010. 23(2): p. 123-36.
8. Taylor, W., et al., Classification criteria for psoriatic arthritis: development of new criteria from a large
international study. Arthritis Rheum, 2006. 54(8): p. 2665-73.
9. Moll, J.M. and V. Wright, Psoriatic arthritis. Semin Arthritis Rheum, 1973. 3(1): p. 55-78.
10. Vasey F, E., LR, Psoriatic Arthropathy. Spondyloarthropathies, ed. C. A. 1984, Orlando: Grune & Stratton.
151-185.
11. Dougados, M., et al., The European Spondylarthropathy Study Group preliminary criteria for the
classification of spondylarthropathy. Arthritis Rheum, 1991. 34(10): p. 1218-27.
12. Symmons, D., et al., The prevalence of rheumatoid arthritis in the United Kingdom: new estimates for a
new century. Rheumatology (Oxford), 2002. 41(7): p. 793-800.
13. Symmons, D.P., et al., The incidence of rheumatoid arthritis in the United Kingdom: results from the
Norfolk Arthritis Register. Br J Rheumatol, 1994. 33(8): p. 735-9.
14. Anaya, J.M., et al., Rheumatoid arthritis in African Colombians from Quibdo. Semin Arthritis Rheum,
2001. 31(3): p. 191-8.
15. Gladman, D.D., et al., Psoriatic arthritis: epidemiology, clinical features, course, and outcome. Ann
Rheum Dis, 2005. 64 Suppl 2: p. ii14-7.
16. Zachariae, H., Prevalence of joint disease in patients with psoriasis: implications for therapy. Am J Clin
Dermatol, 2003. 4(7): p. 441-7.
17. Kaipiainen-Seppanen, O. and K. Aho, Incidence of chronic inflammatory joint diseases in Finland in 1995.
J Rheumatol, 2000. 27(1): p. 94-100.
18. Shbeeb, M., et al., The epidemiology of psoriatic arthritis in Olmsted County, Minnesota, USA, 1982-
1991. J Rheumatol, 2000. 27(5): p. 1247-50.
19. Soderlin, M.K., et al., Annual incidence of inflammatory joint diseases in a population based study in
southern Sweden. Ann Rheum Dis, 2002. 61(10): p. 911-5.
20. Wilson, F.C., et al., Time trends in epidemiology and characteristics of psoriatic arthritis over 3
decades: a population-based study. J Rheumatol, 2009. 36(2): p. 361-7.
21. Veale, D., S. Rogers, and O. Fitzgerald, Classification of clinical subsets in psoriatic arthritis. Br J
Rheumatol, 1994. 33(2): p. 133-8.

356
22. Kane, D., et al., A prospective, clinical and radiological study of early psoriatic arthritis: an early
synovitis clinic experience. Rheumatology (Oxford), 2003. 42(12): p. 1460-8.
23. Olivieri, I., et al., Psoriatic arthritis sine psoriasis. J Rheumatol Suppl, 2009. 83: p. 28-9.
24. Liao, H.T., et al., Human leukocyte antigen and clinical and demographic characteristics in psoriatic
arthritis and psoriasis in Chinese patients. J Rheumatol, 2008. 35(5): p. 891-5.
25. Bonfiglioli, R., et al., Frequency of HLA-B27 alleles in Brazilian patients with psoriatic arthritis. Clin
Rheumatol, 2008. 27(6): p. 709-12.
26. Gladman, D.D., et al., HLA markers and progression in psoriatic arthritis. J Rheumatol, 1998. 25(4): p.
730-3.
27. Young, A., et al., Mortality in rheumatoid arthritis. Increased in the early course of disease, in ischaemic
heart disease and in pulmonary fibrosis. Rheumatology (Oxford), 2007. 46(2): p. 350-7.
28. Wong, K., et al., Mortality studies in psoriatic arthritis: results from a single outpatient clinic. I. Causes
and risk of death. Arthritis Rheum, 1997. 40(10): p. 1868-72.
29. Turesson, C., A. Jarenros, and L. Jacobsson, Increased incidence of cardiovascular disease in patients
with rheumatoid arthritis: results from a community based study. Ann Rheum Dis, 2004. 63(8): p. 952-5.
30. Gabbay, E., et al., Interstitial lung disease in recent onset rheumatoid arthritis. Am J Respir Crit Care
Med, 1997. 156(2 Pt 1): p. 528-35.
31. Wolfe, F. and K. Michaud, Anemia and renal function in patients with rheumatoid arthritis. J Rheumatol,
2006. 33(8): p. 1516-22.
32. Eastmond, C.J. and V. Wright, The nail dystrophy of psoriatic arthritis. Ann Rheum Dis, 1979. 38(3): p.
226-8.
33. Queiro, R., et al., Clinical features and predictive factors in psoriatic arthritis-related uveitis. Semin
Arthritis Rheum, 2002. 31(4): p. 264-70.
34. Seldin, M.F., et al., The genetics revolution and the assault on rheumatoid arthritis. Arthritis Rheum,
1999. 42(6): p. 1071-9.
35. Raychaudhuri, S., Recent advances in the genetics of rheumatoid arthritis. Curr Opin Rheumatol, 2010.
22(2): p. 109-18.
36. Hemminki, K., et al., Familial associations of rheumatoid arthritis with autoimmune diseases and related
conditions. Arthritis Rheum, 2009. 60(3): p. 661-8.
37. Chandran, V., et al., Familial aggregation of psoriatic arthritis. Ann Rheum Dis, 2009. 68(5): p. 664-7.
38. Myers, A., et al., Recurrence risk for psoriasis and psoriatic arthritis within sibships. Rheumatology
(Oxford), 2005. 44(6): p. 773-6.
39. Karason, A., T.J. Love, and B. Gudbjornsson, A strong heritability of psoriatic arthritis over four
generations--the Reykjavik Psoriatic Arthritis Study. Rheumatology (Oxford), 2009. 48(11): p. 1424-8.
40. Aho, K., et al., Occurrence of rheumatoid arthritis in a nationwide series of twins. J Rheumatol, 1986.
13(5): p. 899-902.
41. Silman, A.J., et al., Twin concordance rates for rheumatoid arthritis: results from a nationwide study. Br
J Rheumatol, 1993. 32(10): p. 903-7.
42. MacGregor, A.J., et al., Characterizing the quantitative genetic contribution to rheumatoid arthritis
using data from twins. Arthritis Rheum, 2000. 43(1): p. 30-7.
43. Pedersen, O.B., et al., On the heritability of psoriatic arthritis. Disease concordance among monozygotic
and dizygotic twins. Ann Rheum Dis, 2008. 67(10): p. 1417-21.

357
44. Gregersen, P.K., J. Silver, and R.J. Winchester, The shared epitope hypothesis. An approach to
understanding the molecular genetics of susceptibility to rheumatoid arthritis. Arthritis Rheum, 1987.
30(11): p. 1205-13.
45. Orozco, G. and A. Barton, Update on the genetic risk factors for rheumatoid arthritis. Expert Rev Clin
Immunol. 6(1): p. 61-75.
46. Fernando, M.M., et al., Defining the role of the MHC in autoimmunity: a review and pooled analysis. PLoS
Genet, 2008. 4(4): p. e1000024.
47. Lundstrom, E., et al., Gene-environment interaction between the DRB1 shared epitope and smoking in the
risk of anti-citrullinated protein antibody-positive rheumatoid arthritis: all alleles are important.
Arthritis Rheum, 2009. 60(6): p. 1597-603.
48. Ho, P.Y., et al., Investigating the role of the HLA-Cw*06 and HLA-DRB1 genes in susceptibility to psoriatic
arthritis: comparison with psoriasis and undifferentiated inflammatory arthritis. Ann Rheum Dis, 2008.
67(5): p. 677-82.
49. Chandran, V. and S.P. Raychaudhuri, Geoepidemiology and environmental factors of psoriasis and
psoriatic arthritis. J Autoimmun, 2010. 34(3): p. J314-21.
50. Tsai, Y.G., et al., Relationship between human lymphocyte antigen-B27 and clinical features of psoriatic
arthritis. J Microbiol Immunol Infect, 2003. 36(2): p. 101-4.
51. Gonzalez, S., et al., MICA rather than MICB, TNFA, or HLA-DRB1 is associated with susceptibility to
psoriatic arthritis. J Rheumatol, 2002. 29(5): p. 973-8.
52. Stephens, H.A., MICA and MICB genes: can the enigma of their polymorphism be resolved? Trends
Immunol, 2001. 22(7): p. 378-85.
53. Hinks, A., et al., Association between the PTPN22 gene and rheumatoid arthritis and juvenile idiopathic
arthritis in a UK population: further support that PTPN22 is an autoimmunity gene. Arthritis Rheum,
2005. 52(6): p. 1694-9.
54. Orozco, G., et al., Association of a functional single-nucleotide polymorphism of PTPN22, encoding
lymphoid protein phosphatase, with rheumatoid arthritis and systemic lupus erythematosus. Arthritis
Rheum, 2005. 52(1): p. 219-24.
55. Kochi, Y., et al., Genetics of rheumatoid arthritis: underlying evidence of ethnic differences. J
Autoimmun, 2009. 32(3-4): p. 158-62.
56. Xavier, R.J. and J.D. Rioux, Genome-wide association studies: a new window into immune-mediated
diseases. Nat Rev Immunol, 2008. 8(8): p. 631-43.
57. Dieude, P., et al., The PTPN22 620W allele confers susceptibility to systemic sclerosis: findings of a
large case-control study of European Caucasians and a meta-analysis. Arthritis Rheum, 2008. 58(7): p.
2183-8.
58. Butt, C., et al., Association of functional variants of PTPN22 and tp53 in psoriatic arthritis: a case-
control study. Arthritis Res Ther, 2006. 8(1): p. R27.
59. Huffmeier, U., et al., Male restricted genetic association of variant R620W in PTPN22 with psoriatic
arthritis. J Invest Dermatol, 2006. 126(4): p. 932-5.
60. Smith, R.L., et al., Polymorphisms in the PTPN22 region are associated with psoriasis of early onset. Br J
Dermatol, 2008. 158(5): p. 962-8.
61. Li, Y., et al., Further genetic evidence for three psoriasis-risk genes: ADAM33, CDKAL1, and PTPN22. J
Invest Dermatol, 2009. 129(3): p. 629-34.
62. Korman, B.D., et al., STAT4: genetics, mechanisms, and implications for autoimmunity. Curr Allergy
Asthma Rep, 2008. 8(5): p. 398-403.

358
63. Remmers, E.F., et al., STAT4 and the risk of rheumatoid arthritis and systemic lupus erythematosus. N
Engl J Med, 2007. 357(10): p. 977-86.
64. Orozco, G., et al., Association of STAT4 with rheumatoid arthritis: a replication study in three European
populations. Arthritis Rheum, 2008. 58(7): p. 1974-80.
65. Kobayashi, S., et al., Association of STAT4 with susceptibility to rheumatoid arthritis and systemic lupus
erythematosus in the Japanese population. Arthritis Rheum, 2008. 58(7): p. 1940-6.
66. Kaplan, M.H., et al., Impaired IL-12 responses and enhanced development of Th2 cells in Stat4-deficient
mice. Nature, 1996. 382(6587): p. 174-7.
67. Zervou, M.I., et al., STAT4 gene polymorphism is associated with psoriasis in the genetically
homogeneous population of Crete, Greece. Hum Immunol, 2009. 70(9): p. 738-41.
68. Filer, C., et al., Investigation of association of the IL12B and IL23R genes with psoriatic arthritis.
Arthritis Rheum, 2008. 58(12): p. 3705-9.
69. Sokka, T., et al., Women, men, and rheumatoid arthritis: analyses of disease activity, disease
characteristics, and treatments in the QUEST-RA study. Arthritis Res Ther, 2009. 11(1): p. R7.
70. Spector, T.D., et al., Free and serum testosterone levels in 276 males: a comparative study of
rheumatoid arthritis, ankylosing spondylitis and healthy controls. Clin Rheumatol, 1989. 8(1): p. 37-41.
71. de Man, Y.A., et al., Disease activity of rheumatoid arthritis during pregnancy: results from a nationwide
prospective study. Arthritis Rheum, 2008. 59(9): p. 1241-8.
72. Barrett, J.H., et al., Breast-feeding and postpartum relapse in women with rheumatoid and inflammatory
arthritis. Arthritis Rheum, 2000. 43(5): p. 1010-5.
73. Hannaford, P.C., C.R. Kay, and S. Hirsch, Oral contraceptives and rheumatoid arthritis: new data from
the Royal College of General Practitioners' oral contraception study. Ann Rheum Dis, 1990. 49(10): p.
744-6.
74. van der Heijden, I.M., et al., Detection of mycobacteria in joint samples from patients with arthritis
using a genus-specific polymerase chain reaction and sequence analysis. Rheumatology (Oxford), 1999.
38(6): p. 547-53.
75. Johnson, S., et al., Identification of Mycoplasma fermentans in synovial fluid samples from arthritis
patients with inflammatory disease. J Clin Microbiol, 2000. 38(1): p. 90-3.
76. Vasey, F.B., et al., Possible involvement of group A streptococci in the pathogenesis of psoriatic
arthritis. J Rheumatol, 1982. 9(5): p. 719-22.
77. Lapadula, G., et al., Anti-enterobacteria antibodies in psoriatic arthritis. Clin Exp Rheumatol, 1992.
10(5): p. 461-6.
78. Hyrich, K.L. and R.D. Inman, Infectious agents in chronic rheumatic diseases. Curr Opin Rheumatol, 2001.
13(4): p. 300-4.
79. Takeda, T., et al., Lytic Epstein-Barr virus infection in the synovial tissue of patients with rheumatoid
arthritis. Arthritis Rheum, 2000. 43(6): p. 1218-25.
80. Blaschke, S., et al., Epstein-Barr virus infection in peripheral blood mononuclear cells, synovial fluid
cells, and synovial membranes of patients with rheumatoid arthritis. J Rheumatol, 2000. 27(4): p. 866-
73.
81. Niedobitek, G., et al., Lack of evidence for an involvement of Epstein-Barr virus infection of synovial
membranes in the pathogenesis of rheumatoid arthritis. Arthritis Rheum, 2000. 43(1): p. 151-4.
82. Taglione, E., et al., Hepatitis C virus infection: prevalence in psoriasis and psoriatic arthritis. J
Rheumatol, 1999. 26(2): p. 370-2.

359
83. Stahl, H.D., et al., Detection of multiple viral DNA species in synovial tissue and fluid of patients with
early arthritis. Ann Rheum Dis, 2000. 59(5): p. 342-6.
84. Harty, L.C. and D.J. Veale, Irish smokers with rheumatoid arthritis suffer more than their nonsmoking
counterparts. J Rheumatol, 2010. 37(5): p. 1062; author reply 1063.
85. Harrison, B.J., Influence of cigarette smoking on disease outcome in rheumatoid arthritis. Curr Opin
Rheumatol, 2002. 14(2): p. 93-7.
86. Stolt, P., et al., Quantification of the influence of cigarette smoking on rheumatoid arthritis: results from
a population based case-control study, using incident cases. Ann Rheum Dis, 2003. 62(9): p. 835-41.
87. Somers, K., et al., Novel autoantibody markers for early and seronegative rheumatoid arthritis. J
Autoimmun, 2010.
88. Wegner, N., et al., Autoimmunity to specific citrullinated proteins gives the first clues to the etiology of
rheumatoid arthritis. Immunol Rev, 2010. 233(1): p. 34-54.
89. Predeteanu, D., et al., Anti-cyclic citrullinated peptide antibodies--activity markers in rheumatoid
arthritis. J Med Life, 2009. 2(1): p. 36-41.
90. Holers, V.M., Antibodies to citrullinated proteins: pathogenic and diagnostic significance. Curr Rheumatol
Rep, 2007. 9(5): p. 396-400.
91. Fawthrop, F., et al., A comparison of normal and pathological synovial fluid. Br J Rheumatol, 1985.
24(1): p. 61-9.
92. Veale, D., et al., Reduced synovial membrane macrophage numbers, ELAM-1 expression, and lining layer
hyperplasia in psoriatic arthritis as compared with rheumatoid arthritis. Arthritis Rheum, 1993. 36(7):
p. 893-900.
93. Pascual, E. and V. Jovani, Synovial fluid analysis. Best Pract Res Clin Rheumatol, 2005. 19(3): p. 371-86.
94. Kane, D., et al., Quantitation of metalloproteinase gene expression in rheumatoid and psoriatic arthritis
synovial tissue distal and proximal to the cartilage-pannus junction. J Rheumatol, 2004. 31(7): p. 1274-
80.
95. Dalbeth, N., et al., Circulating mediators of bone remodeling in psoriatic arthritis: implications for
disordered osteoclastogenesis and bone erosion. Arthritis Res Ther, 2010. 12(4): p. R164.
96. Kaplan, C. and A. Finnegan, Osteoclasts, pro-inflammatory cytokines, RANK-L and bone remodeling in
rheumatoid arthritis. Front Biosci, 2003. 8: p. d1018-29.
97. Mansson, B., et al., Release of cartilage and bone macromolecules into synovial fluid: differences
between psoriatic arthritis and rheumatoid arthritis. Ann Rheum Dis, 2001. 60(1): p. 27-31.
98. Fink, A.M., et al., Vascular endothelial growth factor in patients with psoriatic arthritis. Clin Exp
Rheumatol, 2007. 25(2): p. 305-8.
99. Szekanecz, Z., et al., Angiogenesis and vasculogenesis in rheumatoid arthritis. Curr Opin Rheumatol,
2010. 22(3): p. 299-306.
100. Hirao, M., et al., CC chemokine receptor-7 on dendritic cells is induced after interaction with apoptotic
tumor cells: critical role in migration from the tumor site to draining lymph nodes. Cancer Res, 2000.
60(8): p. 2209-17.
101. Jongbloed, S.L., et al., Enumeration and phenotypical analysis of distinct dendritic cell subsets in
psoriatic arthritis and rheumatoid arthritis. Arthritis Res Ther, 2006. 8(1): p. R15.
102. Jongbloed, S.L., et al., Plasmacytoid dendritic cells regulate breach of self-tolerance in autoimmune
arthritis. J Immunol, 2009. 182(2): p. 963-8.

360
103. Richez, C., et al., Myeloid dendritic cells correlate with clinical response whereas plasmacytoid dendritic
cells impact autoantibody development in rheumatoid arthritis patients treated with infliximab.
Arthritis Res Ther, 2009. 11(3): p. R100.
104. Lubberts, E., et al., Treatment with a neutralizing anti-murine interleukin-17 antibody after the onset of
collagen-induced arthritis reduces joint inflammation, cartilage destruction, and bone erosion. Arthritis
Rheum, 2004. 50(2): p. 650-9.
105. Nakae, S., et al., Suppression of immune induction of collagen-induced arthritis in IL-17-deficient mice. J
Immunol, 2003. 171(11): p. 6173-7.
106. Kotake, S., et al., IL-17 in synovial fluids from patients with rheumatoid arthritis is a potent stimulator
of osteoclastogenesis. J Clin Invest, 1999. 103(9): p. 1345-52.
107. Evans, H.G., et al., In vivo activated monocytes from the site of inflammation in humans specifically
promote Th17 responses. Proc Natl Acad Sci U S A, 2009. 106(15): p. 6232-7.
108. Yamada, H., et al., Th1 but not Th17 cells predominate in the joints of patients with rheumatoid
arthritis. Ann Rheum Dis, 2008. 67(9): p. 1299-304.
109. Hueber, A.J., et al., Mast cells express IL-17A in rheumatoid arthritis synovium. J Immunol, 2010.
184(7): p. 3336-40.
110. Lockhart, E., A.M. Green, and J.L. Flynn, IL-17 production is dominated by gammadelta T cells rather
than CD4 T cells during Mycobacterium tuberculosis infection. J Immunol, 2006. 177(7): p. 4662-9.
111. Michel, M.L., et al., Identification of an IL-17-producing NK1.1(neg) iNKT cell population involved in
airway neutrophilia. J Exp Med, 2007. 204(5): p. 995-1001.
112. Song, C., et al., IL-17-producing alveolar macrophages mediate allergic lung inflammation related to
asthma. J Immunol, 2008. 181(9): p. 6117-24.
113. Lundy, S.K., et al., Cells of the synovium in rheumatoid arthritis. T lymphocytes. Arthritis Res Ther,
2007. 9(1): p. 202.
114. Bluestone, J.A. and Q. Tang, How do CD4+CD25+ regulatory T cells control autoimmunity? Curr Opin
Immunol, 2005. 17(6): p. 638-42.
115. Ehrenstein, M.R., et al., Compromised function of regulatory T cells in rheumatoid arthritis and reversal
by anti-TNFalpha therapy. J Exp Med, 2004. 200(3): p. 277-85.
116. Costello, P.J., et al., Psoriatic arthritis joint fluids are characterized by CD8 and CD4 T cell clonal
expansions appear antigen driven. J Immunol, 2001. 166(4): p. 2878-86.
117. Wang, E.C., et al., CD8high+ (CD57+) T cells in patients with rheumatoid arthritis. Arthritis Rheum, 1997.
40(2): p. 237-48.
118. Costello, P., et al., Predominance of CD8+ T lymphocytes in psoriatic arthritis. J Rheumatol, 1999. 26(5):
p. 1117-24.
119. Canete, J.D., et al., Ectopic lymphoid neogenesis in psoriatic arthritis. Ann Rheum Dis, 2007. 66(6): p.
720-6.
120. Takemura, S., et al., Lymphoid neogenesis in rheumatoid synovitis. J Immunol, 2001. 167(2): p. 1072-80.
121. Cohen, J.D., Successful treatment of psoriatic arthritis with rituximab. Ann Rheum Dis, 2008. 67(11): p.
1647-8.
122. Cohen, S.B., et al., Rituximab for rheumatoid arthritis refractory to anti-tumor necrosis factor therapy:
Results of a multicenter, randomized, double-blind, placebo-controlled, phase III trial evaluating primary
efficacy and safety at twenty-four weeks. Arthritis Rheum, 2006. 54(9): p. 2793-806.
123. Rantapaa-Dahlqvist, S., et al., Antibodies against cyclic citrullinated peptide and IgA rheumatoid factor
predict the development of rheumatoid arthritis. Arthritis Rheum, 2003. 48(10): p. 2741-9.

361
124. Kruithof, E., et al., Synovial histopathology of psoriatic arthritis, both oligo- and polyarticular,
resembles spondyloarthropathy more than it does rheumatoid arthritis. Arthritis Res Ther, 2005. 7(3): p.
R569-80.
125. Freemont, A.J. and J. Denton, Disease distribution of synovial fluid mast cells and cytophagocytic
mononuclear cells in inflammatory arthritis. Ann Rheum Dis, 1985. 44(5): p. 312-5.
126. Tetlow, L.C. and D.E. Woolley, Mast cells, cytokines, and metalloproteinases at the rheumatoid lesion:
dual immunolocalisation studies. Ann Rheum Dis, 1995. 54(11): p. 896-903.
127. Nigrovic, P.A., et al., Mast cells contribute to initiation of autoantibody-mediated arthritis via IL-1. Proc
Natl Acad Sci U S A, 2007. 104(7): p. 2325-30.
128. Zhou, J.S., et al., Mast cell deficiency in Kit(W-sh) mice does not impair antibody-mediated arthritis. J
Exp Med, 2007. 204(12): p. 2797-802.
129. Muller-Ladner, U., et al., Cells of the synovium in rheumatoid arthritis. Synovial fibroblasts. Arthritis Res
Ther, 2007. 9(6): p. 223.
130. Mori, G., et al., Synovial fluid fibroblasts and lymphocytes support the osteoclastogenesis in human
psoriatic arthritis. Ann N Y Acad Sci, 2007. 1117: p. 159-64.
131. Lee, H.Y., et al., CD40 ligation of rheumatoid synovial fibroblasts regulates RANKL-mediated
osteoclastogenesis: evidence of NF-kappaB-dependent, CD40-mediated bone destruction in rheumatoid
arthritis. Arthritis Rheum, 2006. 54(6): p. 1747-58.
132. McInnes, I.B. and G. Schett, Cytokines in the pathogenesis of rheumatoid arthritis. Nat Rev Immunol,
2007. 7(6): p. 429-42.
133. Otero, M. and M.B. Goldring, Cells of the synovium in rheumatoid arthritis. Chondrocytes. Arthritis Res
Ther, 2007. 9(5): p. 220.
134. Emery, P., et al., IL-6 receptor inhibition with tocilizumab improves treatment outcomes in patients with
rheumatoid arthritis refractory to anti-tumour necrosis factor biologicals: results from a 24-week
multicentre randomised placebo-controlled trial. Ann Rheum Dis, 2008. 67(11): p. 1516-23.
135. Tracey, D., et al., Tumor necrosis factor antagonist mechanisms of action: a comprehensive review.
Pharmacol Ther, 2008. 117(2): p. 244-79.
136. Szekanecz, Z., et al., Chemokines and chemokine receptors in arthritis. Front Biosci (Schol Ed), 2010. 2:
p. 153-67.
137. Kane, D., et al., Reduction of synovial sublining layer inflammation and proinflammatory cytokine
expression in psoriatic arthritis treated with methotrexate. Arthritis Rheum, 2004. 50(10): p. 3286-95.
138. van der Heijde, D., et al., Comparison of etanercept and methotrexate, alone and combined, in the
treatment of rheumatoid arthritis: two-year clinical and radiographic results from the TEMPO study, a
double-blind, randomized trial. Arthritis Rheum, 2006. 54(4): p. 1063-74.
139. Abu-Shakra, M., et al., Longterm methotrexate therapy in psoriatic arthritis: clinical and radiological
outcome. J Rheumatol, 1995. 22(2): p. 241-5.
140. Weinblatt, M.E., et al., Long-term prospective trial of low-dose methotrexate in rheumatoid arthritis.
Arthritis Rheum, 1988. 31(2): p. 167-75.
141. Bradley, J.R., TNF-mediated inflammatory disease. J Pathol, 2008. 214(2): p. 149-60.
142. Luettig, B., T. Decker, and M.L. Lohmann-Matthes, Evidence for the existence of two forms of membrane
tumor necrosis factor: an integral protein and a molecule attached to its receptor. J Immunol, 1989.
143(12): p. 4034-8.
143. Vandenabeele, P., et al., Two tumour necrosis factor receptors: structure and function. Trends Cell Biol,
1995. 5(10): p. 392-9.

362
144. Horiuchi, T., et al., Transmembrane TNF-alpha: structure, function and interaction with anti-TNF
agents. Rheumatology (Oxford), 2010. 49(7): p. 1215-28.
145. Kaymakcalan, Z., et al., Comparisons of affinities, avidities, and complement activation of adalimumab,
infliximab, and etanercept in binding to soluble and membrane tumor necrosis factor. Clin Immunol,
2009. 131(2): p. 308-16.
146. Barrera, P., et al., Scintigraphic detection of tumour necrosis factor in patients with rheumatoid
arthritis. Ann Rheum Dis, 2003. 62(9): p. 825-8.
147. Humira (adalimumab) prescribing information Abbott Laboratories, 2007.
148. Navarro-Sarabia, F., et al., Adalimumab for treating rheumatoid arthritis. J Rheumatol, 2006. 33(6): p.
1075-81.
149. Gladman, D.D., et al., Adalimumab for long-term treatment of psoriatic arthritis: forty-eight week data
from the adalimumab effectiveness in psoriatic arthritis trial. Arthritis Rheum, 2007. 56(2): p. 476-88.
150. Antoni, C.E., et al., Sustained benefits of infliximab therapy for dermatologic and articular
manifestations of psoriatic arthritis: results from the infliximab multinational psoriatic arthritis
controlled trial (IMPACT). Arthritis Rheum, 2005. 52(4): p. 1227-36.
151. St Clair, E.W., et al., Combination of infliximab and methotrexate therapy for early rheumatoid arthritis:
a randomized, controlled trial. Arthritis Rheum, 2004. 50(11): p. 3432-43.
152. Mease, P.J., et al., Etanercept treatment of psoriatic arthritis: safety, efficacy, and effect on disease
progression. Arthritis Rheum, 2004. 50(7): p. 2264-72.
153. Klareskog, L., et al., Therapeutic effect of the combination of etanercept and methotrexate compared
with each treatment alone in patients with rheumatoid arthritis: double-blind randomised controlled
trial. Lancet, 2004. 363(9410): p. 675-81.
154. Breedveld, F.C., et al., The PREMIER study: A multicenter, randomized, double-blind clinical trial of
combination therapy with adalimumab plus methotrexate versus methotrexate alone or adalimumab
alone in patients with early, aggressive rheumatoid arthritis who had not had previous methotrexate
treatment. Arthritis Rheum, 2006. 54(1): p. 26-37.
155. Jazirehi, A.R. and B. Bonavida, Cellular and molecular signal transduction pathways modulated by
rituximab (rituxan, anti-CD20 mAb) in non-Hodgkin's lymphoma: implications in chemosensitization and
therapeutic intervention. Oncogene, 2005. 24(13): p. 2121-43.
156. Bingham, C.O., 3rd, Emerging therapeutics for rheumatoid arthritis. Bull NYU Hosp Jt Dis, 2008. 66(3): p.
210-5.
157. Maini, R.N., et al., Double-blind randomized controlled clinical trial of the interleukin-6 receptor
antagonist, tocilizumab, in European patients with rheumatoid arthritis who had an incomplete response
to methotrexate. Arthritis Rheum, 2006. 54(9): p. 2817-29.
158. Buch, M.H., E.M. Vital, and P. Emery, Abatacept in the treatment of rheumatoid arthritis. Arthritis Res
Ther, 2008. 10 Suppl 1: p. S5.
159. Mease, P., et al., Abatacept in the treatment of patients with psoriatic arthritis: Results of a double-
blind, randomized, placebo-controlled phase 2 trial. Arthritis Rheum, 2010.
160. Gottlieb, A., et al., Ustekinumab, a human interleukin 12/23 monoclonal antibody, for psoriatic arthritis:
randomised, double-blind, placebo-controlled, crossover trial. Lancet, 2009. 373(9664): p. 633-40.
161. Geissmann, F., et al., Development of monocytes, macrophages, and dendritic cells. Science, 2010.
327(5966): p. 656-61.
162. Auffray, C., M.H. Sieweke, and F. Geissmann, Blood monocytes: development, heterogeneity, and
relationship with dendritic cells. Annu Rev Immunol, 2009. 27: p. 669-92.

363
163. Kamei, M. and C.V. Carman, New observations on the trafficking and diapedesis of monocytes. Curr Opin
Hematol, 2010. 17(1): p. 43-52.
164. Passlick, B., D. Flieger, and H.W. Ziegler-Heitbrock, Identification and characterization of a novel
monocyte subpopulation in human peripheral blood. Blood, 1989. 74(7): p. 2527-34.
165. Geissmann, F., S. Jung, and D.R. Littman, Blood monocytes consist of two principal subsets with distinct
migratory properties. Immunity, 2003. 19(1): p. 71-82.
166. Serbina, N.V., et al., Monocyte-mediated defense against microbial pathogens. Annu Rev Immunol, 2008.
26: p. 421-52.
167. Frankenberger, M., et al., Differential cytokine expression in human blood monocyte subpopulations: a
polymerase chain reaction analysis. Blood, 1996. 87(1): p. 373-7.
168. Belge, K.U., et al., The proinflammatory CD14+CD16+DR++ monocytes are a major source of TNF. J
Immunol, 2002. 168(7): p. 3536-42.
169. Banchereau, J. and R.M. Steinman, Dendritic cells and the control of immunity. Nature, 1998. 392(6673):
p. 245-52.
170. Thomas, R. and P.E. Lipsky, Human peripheral blood dendritic cell subsets. Isolation and characterization
of precursor and mature antigen-presenting cells. J Immunol, 1994. 153(9): p. 4016-28.
171. Krutzik, S.R., et al., TLR activation triggers the rapid differentiation of monocytes into macrophages and
dendritic cells. Nat Med, 2005. 11(6): p. 653-60.
172. Grage-Griebenow, E., et al., Identification of a novel dendritic cell-like subset of CD64(+) / CD16(+) blood
monocytes. Eur J Immunol, 2001. 31(1): p. 48-56.
173. Grage-Griebenow, E., H.D. Flad, and M. Ernst, Heterogeneity of human peripheral blood monocyte
subsets. J Leukoc Biol, 2001. 69(1): p. 11-20.
174. Guo, Y.L., et al., Role of junctional adhesion molecule-like protein in mediating monocyte
transendothelial migration. Arterioscler Thromb Vasc Biol, 2009. 29(1): p. 75-83.
175. Schenkel, A.R., Z. Mamdouh, and W.A. Muller, Locomotion of monocytes on endothelium is a critical step
during extravasation. Nat Immunol, 2004. 5(4): p. 393-400.
176. Carman, C.V., Mechanisms for transcellular diapedesis: probing and pathfinding by 'invadosome-like
protrusions'. J Cell Sci, 2009. 122(Pt 17): p. 3025-35.
177. Serbina, N.V. and E.G. Pamer, Monocyte emigration from bone marrow during bacterial infection requires
signals mediated by chemokine receptor CCR2. Nat Immunol, 2006. 7(3): p. 311-7.
178. Tsou, C.L., et al., Critical roles for CCR2 and MCP-3 in monocyte mobilization from bone marrow and
recruitment to inflammatory sites. J Clin Invest, 2007. 117(4): p. 902-9.
179. Rabquer, B.J., et al., Junctional adhesion molecule C mediates leukocyte adhesion to rheumatoid
arthritis synovium. Arthritis Rheum, 2008. 58(10): p. 3020-9.
180. Auffray, C., et al., Monitoring of blood vessels and tissues by a population of monocytes with patrolling
behavior. Science, 2007. 317(5838): p. 666-70.
181. Serbina, N.V., et al., Sequential MyD88-independent and -dependent activation of innate immune
responses to intracellular bacterial infection. Immunity, 2003. 19(6): p. 891-901.
182. Seki, E., et al., Critical roles of myeloid differentiation factor 88-dependent proinflammatory cytokine
release in early phase clearance of Listeria monocytogenes in mice. J Immunol, 2002. 169(7): p. 3863-8.
183. Karnovsky, M.L., Metchnikoff in Messina: a century of studies on phagocytosis. N Engl J Med, 1981.
304(19): p. 1178-80.
184. Nahrendorf, M., et al., The healing myocardium sequentially mobilizes two monocyte subsets with
divergent and complementary functions. J Exp Med, 2007. 204(12): p. 3037-47.

364
185. Gordon, S. and P.R. Taylor, Monocyte and macrophage heterogeneity. Nat Rev Immunol, 2005. 5(12): p.
953-64.
186. Merad, M., et al., Langerhans cells renew in the skin throughout life under steady-state conditions. Nat
Immunol, 2002. 3(12): p. 1135-41.
187. Yoshida, H., et al., The murine mutation osteopetrosis is in the coding region of the macrophage colony
stimulating factor gene. Nature, 1990. 345(6274): p. 442-4.
188. Kong, Y.Y., et al., OPGL is a key regulator of osteoclastogenesis, lymphocyte development and lymph-
node organogenesis. Nature, 1999. 397(6717): p. 315-23.
189. Krahling, S., et al., Exposure of phosphatidylserine is a general feature in the phagocytosis of apoptotic
lymphocytes by macrophages. Cell Death Differ, 1999. 6(2): p. 183-9.
190. Gregory, C.D., CD14-dependent clearance of apoptotic cells: relevance to the immune system. Curr Opin
Immunol, 2000. 12(1): p. 27-34.
191. Schlegel, R.A., et al., CD14 is a component of multiple recognition systems used by macrophages to
phagocytose apoptotic lymphocytes. Cell Death Differ, 1999. 6(6): p. 583-92.
192. Moffatt, O.D., et al., Macrophage recognition of ICAM-3 on apoptotic leukocytes. J Immunol, 1999.
162(11): p. 6800-10.
193. Flannagan, R.S., G. Cosio, and S. Grinstein, Antimicrobial mechanisms of phagocytes and bacterial
evasion strategies. Nat Rev Microbiol, 2009. 7(5): p. 355-66.
194. Desjardins, M., et al., Biogenesis of phagolysosomes proceeds through a sequential series of interactions
with the endocytic apparatus. J Cell Biol, 1994. 124(5): p. 677-88.
195. Martinez-Pomares, L. and S. Gordon, Antigen presentation the macrophage way. Cell, 2007. 131(4): p.
641-3.
196. Mackey, M.F., R.J. Barth, Jr., and R.J. Noelle, The role of CD40/CD154 interactions in the priming,
differentiation, and effector function of helper and cytotoxic T cells. J Leukoc Biol, 1998. 63(4): p. 418-
28.
197. Mosser, D.M. and J.P. Edwards, Exploring the full spectrum of macrophage activation. Nat Rev Immunol,
2008. 8(12): p. 958-69.
198. Mackaness, G.B., The Immunological Basis of Acquired Cellular Resistance. J Exp Med, 1964. 120: p. 105-
20.
199. Gordon, S., Alternative activation of macrophages. Nat Rev Immunol, 2003. 3(1): p. 23-35.
200. Mackaness, G.B., Cellular immunity and the parasite. Adv Exp Med Biol, 1977. 93: p. 65-73.
201. Dale, D.C., L. Boxer, and W.C. Liles, The phagocytes: neutrophils and monocytes. Blood, 2008. 112(4): p.
935-45.
202. Yamamoto, M., et al., Role of adaptor TRIF in the MyD88-independent toll-like receptor signaling
pathway. Science, 2003. 301(5633): p. 640-3.
203. Langrish, C.L., et al., IL-23 drives a pathogenic T cell population that induces autoimmune inflammation.
J Exp Med, 2005. 201(2): p. 233-40.
204. Mokoena, T. and S. Gordon, Human macrophage activation. Modulation of mannosyl, fucosyl receptor
activity in vitro by lymphokines, gamma and alpha interferons, and dexamethasone. J Clin Invest, 1985.
75(2): p. 624-31.
205. Stein, M., et al., Interleukin 4 potently enhances murine macrophage mannose receptor activity: a
marker of alternative immunologic macrophage activation. J Exp Med, 1992. 176(1): p. 287-92.
206. Gordon, S. and F.O. Martinez, Alternative activation of macrophages: mechanism and functions.
Immunity, 2010. 32(5): p. 593-604.

365
207. Doyle, A.G., et al., Interleukin-13 alters the activation state of murine macrophages in vitro: comparison
with interleukin-4 and interferon-gamma. Eur J Immunol, 1994. 24(6): p. 1441-5.
208. Linehan, S.A., et al., IL-4 receptor signaling is required for mannose receptor expression by macrophages
recruited to granulomata but not resident cells in mice infected with Schistosoma mansoni. Lab Invest,
2003. 83(8): p. 1223-31.
209. Loke, P., et al., Alternative activation is an innate response to injury that requires CD4+ T cells to be
sustained during chronic infection. J Immunol, 2007. 179(6): p. 3926-36.
210. Kreider, T., et al., Alternatively activated macrophages in helminth infections. Curr Opin Immunol, 2007.
19(4): p. 448-53.
211. Kurowska-Stolarska, M., et al., IL-33 amplifies the polarization of alternatively activated macrophages
that contribute to airway inflammation. J Immunol, 2009. 183(10): p. 6469-77.
212. Edwards, J.P., et al., Biochemical and functional characterization of three activated macrophage
populations. J Leukoc Biol, 2006. 80(6): p. 1298-307.
213. Anthony, R.M., et al., Memory T(H)2 cells induce alternatively activated macrophages to mediate
protection against nematode parasites. Nat Med, 2006. 12(8): p. 955-60.
214. Sironi, M., et al., Differential regulation of chemokine production by Fcgamma receptor engagement in
human monocytes: association of CCL1 with a distinct form of M2 monocyte activation (M2b, Type 2). J
Leukoc Biol, 2006. 80(2): p. 342-9.
215. Munitz, A., et al., Distinct roles for IL-13 and IL-4 via IL-13 receptor alpha1 and the type II IL-4 receptor
in asthma pathogenesis. Proc Natl Acad Sci U S A, 2008. 105(20): p. 7240-5.
216. Benoit, M., B. Desnues, and J.L. Mege, Macrophage polarization in bacterial infections. J Immunol, 2008.
181(6): p. 3733-9.
217. Sternberg, E.M., Neural regulation of innate immunity: a coordinated nonspecific host response to
pathogens. Nat Rev Immunol, 2006. 6(4): p. 318-28.
218. Franchimont, D., Overview of the actions of glucocorticoids on the immune response: a good model to
characterize new pathways of immunosuppression for new treatment strategies. Ann N Y Acad Sci, 2004.
1024: p. 124-37.
219. Gerber, J.S. and D.M. Mosser, Reversing lipopolysaccharide toxicity by ligating the macrophage Fc
gamma receptors. J Immunol, 2001. 166(11): p. 6861-8.
220. Erwig, L.P. and P.M. Henson, Immunological consequences of apoptotic cell phagocytosis. Am J Pathol,
2007. 171(1): p. 2-8.
221. Lin, E.Y., et al., Macrophages regulate the angiogenic switch in a mouse model of breast cancer. Cancer
Res, 2006. 66(23): p. 11238-46.
222. Stout, R.D., et al., Macrophages sequentially change their functional phenotype in response to changes in
microenvironmental influences. J Immunol, 2005. 175(1): p. 342-9.
223. Ziegler-Heitbrock, H.W., et al., The novel subset of CD14+/CD16+ blood monocytes exhibits features of
tissue macrophages. Eur J Immunol, 1993. 23(9): p. 2053-8.
224. Rivier, A., et al., Blood monocytes of untreated asthmatics exhibit some features of tissue macrophages.
Clin Exp Immunol, 1995. 100(2): p. 314-8.
225. Fingerle, G., et al., The novel subset of CD14+/CD16+ blood monocytes is expanded in sepsis patients.
Blood, 1993. 82(10): p. 3170-6.
226. Kawanaka, N., et al., CD14+,CD16+ blood monocytes and joint inflammation in rheumatoid arthritis.
Arthritis Rheum, 2002. 46(10): p. 2578-86.

366
227. Iwahashi, M., et al., Expression of Toll-like receptor 2 on CD16+ blood monocytes and synovial tissue
macrophages in rheumatoid arthritis. Arthritis Rheum, 2004. 50(5): p. 1457-67.
228. Hepburn, A.L., J.C. Mason, and K.A. Davies, Expression of Fcgamma and complement receptors on
peripheral blood monocytes in systemic lupus erythematosus and rheumatoid arthritis. Rheumatology
(Oxford), 2004. 43(5): p. 547-54.
229. Baeten, D., et al., Human cartilage gp-39+,CD16+ monocytes in peripheral blood and synovium:
correlation with joint destruction in rheumatoid arthritis. Arthritis Rheum, 2000. 43(6): p. 1233-43.
230. Yano, R., et al., Recruitment of CD16+ monocytes into synovial tissues is mediated by fractalkine and
CX3CR1 in rheumatoid arthritis patients. Acta Med Okayama, 2007. 61(2): p. 89-98.
231. Makrygiannakis, D., et al., Monocytes are essential for inhibition of synovial T-cell glucocorticoid-
mediated apoptosis in rheumatoid arthritis. Arthritis Res Ther, 2008. 10(6): p. R147.
232. Chiu, Y.G., et al., CD16 (FcRgammaIII) as a potential marker of osteoclast precursors in psoriatic
arthritis. Arthritis Res Ther, 2010. 12(1): p. R14.
233. Ritchlin, C.T., et al., Mechanisms of TNF-alpha- and RANKL-mediated osteoclastogenesis and bone
resorption in psoriatic arthritis. J Clin Invest, 2003. 111(6): p. 821-31.
234. Komano, Y., et al., Identification of a human peripheral blood monocyte subset that differentiates into
osteoclasts. Arthritis Res Ther, 2006. 8(5): p. R152.
235. Katschke, K.J., Jr., et al., Differential expression of chemokine receptors on peripheral blood, synovial
fluid, and synovial tissue monocytes/macrophages in rheumatoid arthritis. Arthritis Rheum, 2001. 44(5):
p. 1022-32.
236. Schmutz, C., et al., Monocytes/macrophages express chemokine receptor CCR9 in rheumatoid arthritis
and CCL25 stimulates their differentiation. Arthritis Res Ther, 2010. 12(4): p. R161.
237. Fiocco, U., et al., Synovial effusion and synovial fluid biomarkers in psoriatic arthritis to assess
intraarticular tumor necrosis factor-alpha blockade in the knee joint. Arthritis Res Ther, 2010. 12(4): p.
R148.
238. Konig, A., et al., Mig, GRO alpha and RANTES messenger RNA expression in lining layer, infiltrates and
different leucocyte populations of synovial tissue from patients with rheumatoid arthritis, psoriatic
arthritis and osteoarthritis. Virchows Arch, 2000. 436(5): p. 449-58.
239. Thurlings, R.M., et al., Monocyte scintigraphy in rheumatoid arthritis: the dynamics of monocyte
migration in immune-mediated inflammatory disease. PLoS One, 2009. 4(11): p. e7865.
240. Koller, M., et al., Expression of adhesion molecules on synovial fluid and peripheral blood monocytes in
patients with inflammatory joint disease and osteoarthritis. Ann Rheum Dis, 1999. 58(11): p. 709-12.
241. Zheng, W., et al., Role of osteopontin in induction of monocyte chemoattractant protein 1 and
macrophage inflammatory protein 1beta through the NF-kappaB and MAPK pathways in rheumatoid
arthritis. Arthritis Rheum, 2009. 60(7): p. 1957-65.
242. Mathsson, L., et al., Immune complexes from rheumatoid arthritis synovial fluid induce FcgammaRIIa
dependent and rheumatoid factor correlated production of tumour necrosis factor-alpha by peripheral
blood mononuclear cells. Arthritis Res Ther, 2006. 8(3): p. R64.
243. van Kuijk, A.W., et al., Detailed analysis of the cell infiltrate and the expression of mediators of synovial
inflammation and joint destruction in the synovium of patients with psoriatic arthritis: implications for
treatment. Ann Rheum Dis, 2006. 65(12): p. 1551-7.
244. Hart, P.H., et al., Synovial fluid macrophages and blood monocytes differ in their response to IL-4. J
Immunol, 1993. 151(6): p. 3370-80.
245. Tak, P.P., et al., Analysis of the synovial cell infiltrate in early rheumatoid synovial tissue in relation to
local disease activity. Arthritis Rheum, 1997. 40(2): p. 217-25.

367
246. Mulherin, D., O. Fitzgerald, and B. Bresnihan, Synovial tissue macrophage populations and articular
damage in rheumatoid arthritis. Arthritis Rheum, 1996. 39(1): p. 115-24.
247. Nozaki, T., et al., Development of an ex vivo cellular model of rheumatoid arthritis: critical role of CD14-
positive monocyte/macrophages in the development of pannus tissue. Arthritis Rheum, 2007. 56(9): p.
2875-85.
248. Campbell, I.K., et al., The colony-stimulating factors and collagen-induced arthritis: exacerbation of
disease by M-CSF and G-CSF and requirement for endogenous M-CSF. J Leukoc Biol, 2000. 68(1): p. 144-
50.
249. Chomarat, P., et al., Contribution of IL-1, CD14, and CD13 in the increased IL-6 production induced by in
vitro monocyte-synoviocyte interactions. J Immunol, 1995. 155(7): p. 3645-52.
250. Kinne, R.W., B. Stuhlmuller, and G.R. Burmester, Cells of the synovium in rheumatoid arthritis.
Macrophages. Arthritis Res Ther, 2007. 9(6): p. 224.
251. Dalbeth, N., et al., CD56bright NK cells are enriched at inflammatory sites and can engage with
monocytes in a reciprocal program of activation. J Immunol, 2004. 173(10): p. 6418-26.
252. Tsark, E.C., et al., Differential MHC class II-mediated presentation of rheumatoid arthritis autoantigens
by human dendritic cells and macrophages. J Immunol, 2002. 169(11): p. 6625-33.
253. Vandooren, B., et al., Absence of a classically activated macrophage cytokine signature in peripheral
spondylarthritis, including psoriatic arthritis. Arthritis Rheum, 2009. 60(4): p. 966-75.
254. Baeten, D., et al., Infiltration of the synovial membrane with macrophage subsets and
polymorphonuclear cells reflects global disease activity in spondyloarthropathy. Arthritis Res Ther,
2005. 7(2): p. R359-69.
255. Baeten, D., et al., Association of CD163+ macrophages and local production of soluble CD163 with
decreased lymphocyte activation in spondylarthropathy synovitis. Arthritis Rheum, 2004. 50(5): p. 1611-
23.
256. Ruth, J.H., et al., CXCL16-mediated cell recruitment to rheumatoid arthritis synovial tissue and murine
lymph nodes is dependent upon the MAPK pathway. Arthritis Rheum, 2006. 54(3): p. 765-78.
257. van Lieshout, A.W., et al., Novel insights in the regulation of CCL18 secretion by monocytes and dendritic
cells via cytokines, toll-like receptors and rheumatoid synovial fluid. BMC Immunol, 2006. 7: p. 23.
258. Szekanecz, Z. and A.E. Koch, Macrophages and their products in rheumatoid arthritis. Curr Opin
Rheumatol, 2007. 19(3): p. 289-95.
259. Flytlie, H.A., et al., Expression of MDC/CCL22 and its receptor CCR4 in rheumatoid arthritis, psoriatic
arthritis and osteoarthritis. Cytokine, 2010. 49(1): p. 24-9.
260. Wood, N.C., et al., In situ hybridization of interleukin-1 in CD14-positive cells in rheumatoid arthritis.
Clin Immunol Immunopathol, 1992. 62(3): p. 295-300.
261. Arend, W.P., et al., Interleukin-1 receptor antagonist: role in biology. Annu Rev Immunol, 1998. 16: p.
27-55.
262. Deleuran, B.W., et al., Localization of interleukin-1 alpha, type 1 interleukin-1 receptor and interleukin-
1 receptor antagonist in the synovial membrane and cartilage/pannus junction in rheumatoid arthritis.
Br J Rheumatol, 1992. 31(12): p. 801-9.
263. Silvestri, T., et al., In vivo expression of inflammatory cytokine receptors in the joint compartments of
patients with arthritis. Rheumatol Int, 2006. 26(4): p. 360-8.
264. Shingu, M., et al., Increased IL-1 receptor antagonist (IL-1ra) production and decreased IL-1 beta/IL-1ra
ratio in mononuclear cells from rheumatoid arthritis patients. Br J Rheumatol, 1995. 34(1): p. 24-30.

368
265. Elkayam, O., et al., Serum levels of IL-10, IL-6, IL-1ra, and sIL-2R in patients with psoriatic arthritis.
Rheumatol Int, 2000. 19(3): p. 101-5.
266. Geyer, M. and U. Muller-Ladner, Actual status of antiinterleukin-1 therapies in rheumatic diseases. Curr
Opin Rheumatol, 2010. 22(3): p. 246-51.
267. Jung, N., et al., An open-label pilot study of the efficacy and safety of anakinra in patients with
psoriatic arthritis refractory to or intolerant of methotrexate (MTX). Clin Rheumatol, 2010. 29(10): p.
1169-73.
268. McInnes, I.B. and J.A. Gracie, Interleukin-15: a new cytokine target for the treatment of inflammatory
diseases. Curr Opin Pharmacol, 2004. 4(4): p. 392-7.
269. Sebbag, M., et al., Cytokine stimulation of T lymphocytes regulates their capacity to induce monocyte
production of tumor necrosis factor-alpha, but not interleukin-10: possible relevance to pathophysiology
of rheumatoid arthritis. Eur J Immunol, 1997. 27(3): p. 624-32.
270. Gracie, J.A., et al., A proinflammatory role for IL-18 in rheumatoid arthritis. J Clin Invest, 1999. 104(10):
p. 1393-401.
271. Rooney, T., et al., Synovial tissue interleukin-18 expression and the response to treatment in patients
with inflammatory arthritis. Ann Rheum Dis, 2004. 63(11): p. 1393-8.
272. Gracie, J.A., S.E. Robertson, and I.B. McInnes, Interleukin-18. J Leukoc Biol, 2003. 73(2): p. 213-24.
273. Wei, X.Q., et al., Reduced incidence and severity of collagen-induced arthritis in mice lacking IL-18. J
Immunol, 2001. 166(1): p. 517-21.
274. Leung, B.P., et al., Combined effects of IL-12 and IL-18 on the induction of collagen-induced arthritis. J
Immunol, 2000. 164(12): p. 6495-502.
275. Ruth, J.H., et al., Interleukin-18 as an in vivo mediator of monocyte recruitment in rodent models of
rheumatoid arthritis. Arthritis Res Ther, 2010. 12(3): p. R118.
276. Plater-Zyberk, C., et al., Therapeutic effect of neutralizing endogenous IL-18 activity in the collagen-
induced model of arthritis. J Clin Invest, 2001. 108(12): p. 1825-32.
277. Smeets, R.L., et al., Adenoviral delivery of IL-18 binding protein C ameliorates collagen-induced arthritis
in mice. Gene Ther, 2003. 10(12): p. 1004-11.
278. Ye, X.J., et al., The roles of interleukin-18 in collagen-induced arthritis in the BB rat. Clin Exp Immunol,
2004. 136(3): p. 440-7.
279. Maeno, N., et al., Increased interleukin-18 expression in bone marrow of a patient with systemic juvenile
idiopathic arthritis and unrecognized macrophage-activation syndrome. Arthritis Rheum, 2004. 50(6): p.
1935-8.
280. Santos, L.L., et al., Reduced arthritis in MIF deficient mice is associated with reduced T cell activation:
down-regulation of ERK MAP kinase phosphorylation. Clin Exp Immunol, 2008. 152(2): p. 372-80.
281. Pakozdi, A., et al., Macrophage migration inhibitory factor: a mediator of matrix metalloproteinase-2
production in rheumatoid arthritis. Arthritis Res Ther, 2006. 8(4): p. R132.
282. Pohlers, D., et al., Expression of platelet-derived growth factors C and D in the synovial membrane of
patients with rheumatoid arthritis and osteoarthritis. Arthritis Rheum, 2006. 54(3): p. 788-94.
283. Ozgonenel, L., et al., The relation of serum vascular endothelial growth factor level with disease
duration and activity in patients with rheumatoid arthritis. Clin Rheumatol, 2010. 29(5): p. 473-7.
284. Murakami, M., et al., Signaling of vascular endothelial growth factor receptor-1 tyrosine kinase promotes
rheumatoid arthritis through activation of monocytes/macrophages. Blood, 2006. 108(6): p. 1849-56.
285. Katsikis, P.D., et al., Immunoregulatory role of interleukin 10 in rheumatoid arthritis. J Exp Med, 1994.
179(5): p. 1517-27.

369
286. Duke, O., et al., An immunohistological analysis of lymphocyte subpopulations and their
microenvironment in the synovial membranes of patients with rheumatoid arthritis using monoclonal
antibodies. Clin Exp Immunol, 1982. 49(1): p. 22-30.
287. Weaver, C.T. and E.R. Unanue, T cell induction of membrane IL 1 on macrophages. J Immunol, 1986.
137(12): p. 3868-73.
288. Weaver, C.T., L.M. Duncan, and E.R. Unanue, T cell induction of macrophage IL-1 during antigen
presentation. Characterization of a lymphokine mediator and comparison of TH1 and TH2 subsets. J
Immunol, 1989. 142(10): p. 3469-76.
289. Landis, R.C., et al., Induction of human monocyte IL-1 mRNA and secretion during anti-CD3 mitogenesis
requires two distinct T cell-derived signals. J Immunol, 1991. 146(1): p. 128-35.
290. Stout, R.D. and K. Bottomly, Antigen-specific activation of effector macrophages by IFN-gamma producing
(TH1) T cell clones. Failure of IL-4-producing (TH2) T cell clones to activate effector function in
macrophages. J Immunol, 1989. 142(3): p. 760-5.
291. Vey, E., J.H. Zhang, and J.M. Dayer, IFN-gamma and 1,25(OH)2D3 induce on THP-1 cells distinct patterns
of cell surface antigen expression, cytokine production, and responsiveness to contact with activated T
cells. J Immunol, 1992. 149(6): p. 2040-6.
292. Burger, D., Cell contact-mediated signaling of monocytes by stimulated T cells: a major pathway for
cytokine induction. Eur Cytokine Netw, 2000. 11(3): p. 346-53.
293. Isler, P., et al., Cell surface glycoproteins expressed on activated human T cells induce production of
interleukin-1 beta by monocytic cells: a possible role of CD69. Eur Cytokine Netw, 1993. 4(1): p. 15-23.
294. Vey, E., J.M. Dayer, and D. Burger, Direct contact with stimulated T cells induces the expression of IL-
1beta and IL-1 receptor antagonist in human monocytes. Involvement of serine/threonine phosphatases in
differential regulation. Cytokine, 1997. 9(7): p. 480-7.
295. Li, J.M., et al., Contact-dependent stimulation of monocytic cells and neutrophils by stimulated human T-
cell clones. Immunology, 1995. 84(4): p. 571-6.
296. Parry, S.L., et al., Contact with T cells modulates monocyte IL-10 production: role of T cell membrane
TNF-alpha. J Immunol, 1997. 158(8): p. 3673-81.
297. Lacraz, S., et al., Direct contact between T lymphocytes and monocytes is a major pathway for induction
of metalloproteinase expression. J Biol Chem, 1994. 269(35): p. 22027-33.
298. Brennan, F.M., et al., Evidence that rheumatoid arthritis synovial T cells are similar to cytokine-
activated T cells: involvement of phosphatidylinositol 3-kinase and nuclear factor kappaB pathways in
tumor necrosis factor alpha production in rheumatoid arthritis. Arthritis Rheum, 2002. 46(1): p. 31-41.
299. Miltenburg, A.M., et al., Immobilized anti-CD3 antibody activates T cell clones to induce the production
of interstitial collagenase, but not tissue inhibitor of metalloproteinases, in monocytic THP-1 cells and
dermal fibroblasts. J Immunol, 1995. 154(6): p. 2655-67.
300. Chabot, S., et al., Cytokine production consequent to T cell--microglia interaction: the PMA/IFN gamma-
treated U937 cells display similarities to human microglia. J Neurosci Methods, 2001. 105(2): p. 111-20.
301. Ribbens, C., J.M. Dayer, and C. Chizzolini, CD40-CD40 ligand (CD154) engagement is required but may not
be sufficient for human T helper 1 cell induction of interleukin-2- or interleukin-15-driven, contact-
dependent, interleukin-1beta production by monocytes. Immunology, 2000. 99(2): p. 279-86.
302. McInnes, I.B., et al., Interleukin-15 mediates T cell-dependent regulation of tumor necrosis factor-alpha
production in rheumatoid arthritis. Nat Med, 1997. 3(2): p. 189-95.
303. Wagner, D.H., Jr., R.D. Stout, and J. Suttles, Role of the CD40-CD40 ligand interaction in CD4+ T cell
contact-dependent activation of monocyte interleukin-1 synthesis. Eur J Immunol, 1994. 24(12): p. 3148-
54.

370
304. Stout, R.D., et al., Impaired T cell-mediated macrophage activation in CD40 ligand-deficient mice. J
Immunol, 1996. 156(1): p. 8-11.
305. Gauchat, J.F., et al., Human CD40-ligand: molecular cloning, cellular distribution and regulation of
expression by factors controlling IgE production. FEBS Lett, 1993. 315(3): p. 259-66.
306. Manie, S., et al., CD3-stimulated Jurkat T cells mediate IL-1 beta production in monocytic THP-1 cells.
Role of LFA-1 molecule and participation of CD69 T cell antigen. Eur Cytokine Netw, 1993. 4(1): p. 7-13.
307. Unutmaz, D., P. Pileri, and S. Abrignani, Antigen-independent activation of naive and memory resting T
cells by a cytokine combination. J Exp Med, 1994. 180(3): p. 1159-64.
308. Beech, J.T., et al., T-cell contact-dependent regulation of CC and CXC chemokine production in
monocytes through differential involvement of NFkappaB: implications for rheumatoid arthritis. Arthritis
Res Ther, 2006. 8(6): p. R168.
309. Brennan, F.M., et al., Resting CD4+ effector memory T cells are precursors of bystander-activated
effectors: a surrogate model of rheumatoid arthritis synovial T-cell function. Arthritis Res Ther, 2008.
10(2): p. R36.
310. Hyka, N., et al., Apolipoprotein A-I inhibits the production of interleukin-1beta and tumor necrosis
factor-alpha by blocking contact-mediated activation of monocytes by T lymphocytes. Blood, 2001.
97(8): p. 2381-9.
311. Burger, D. and J.M. Dayer, High-density lipoprotein-associated apolipoprotein A-I: the missing link
between infection and chronic inflammation? Autoimmun Rev, 2002. 1(1-2): p. 111-7.
312. Park, Y.B., et al., Lipid profiles in untreated patients with rheumatoid arthritis. J Rheumatol, 1999.
26(8): p. 1701-4.
313. Ananth, L., P.E. Prete, and M.L. Kashyap, Apolipoproteins A-I and B and cholesterol in synovial fluid of
patients with rheumatoid arthritis. Metabolism, 1993. 42(7): p. 803-6.
314. Burger, D. and J.M. Dayer, The role of human T-lymphocyte-monocyte contact in inflammation and tissue
destruction. Arthritis Res, 2002. 4 Suppl 3: p. S169-76.
315. Gruaz, L., et al., Blockade of T cell contact-activation of human monocytes by high-density lipoproteins
reveals a new pattern of cytokine and inflammatory genes. PLoS One, 2010. 5(2): p. e9418.
316. van Baarsen, L.G., et al., Transcription profiling of rheumatic diseases. Arthritis Res Ther, 2009. 11(1):
p. 207.
317. Zanders, E.D., et al., Analysis of immune system gene expression in small rheumatoid arthritis biopsies
using a combination of subtractive hybridization and high-density cDNA arrays. J Immunol Methods,
2000. 233(1-2): p. 131-40.
318. van der Pouw Kraan, T.C., et al., Rheumatoid arthritis is a heterogeneous disease: evidence for
differences in the activation of the STAT-1 pathway between rheumatoid tissues. Arthritis Rheum, 2003.
48(8): p. 2132-45.
319. van der Pouw Kraan, T.C., et al., Discovery of distinctive gene expression profiles in rheumatoid
synovium using cDNA microarray technology: evidence for the existence of multiple pathways of tissue
destruction and repair. Genes Immun, 2003. 4(3): p. 187-96.
320. Devauchelle, V., et al., DNA microarray allows molecular profiling of rheumatoid arthritis and
identification of pathophysiological targets. Genes Immun, 2004. 5(8): p. 597-608.
321. Tsubaki, T., et al., Characterization of histopathology and gene-expression profiles of synovitis in early
rheumatoid arthritis using targeted biopsy specimens. Arthritis Res Ther, 2005. 7(4): p. R825-36.
322. Lequerre, T., et al., Early and long-standing rheumatoid arthritis: distinct molecular signatures
identified by gene-expression profiling in synovia. Arthritis Res Ther, 2009. 11(3): p. R99.

371
323. Lindberg, J., et al., Variability in synovial inflammation in rheumatoid arthritis investigated by
microarray technology. Arthritis Res Ther, 2006. 8(2): p. R47.
324. Lindberg, J., et al., The gene expression profile in the synovium as a predictor of the clinical response to
infliximab treatment in rheumatoid arthritis. PLoS One, 2010. 5(6): p. e11310.
325. Bovin, L.F., et al., Blood cell gene expression profiling in rheumatoid arthritis. Discriminative genes and
effect of rheumatoid factor. Immunol Lett, 2004. 93(2-3): p. 217-26.
326. Batliwalla, F.M., et al., Peripheral blood gene expression profiling in rheumatoid arthritis. Genes Immun,
2005. 6(5): p. 388-97.
327. Edwards, C.J., et al., Molecular profile of peripheral blood mononuclear cells from patients with
rheumatoid arthritis. Mol Med, 2007. 13(1-2): p. 40-58.
328. Junta, C.M., et al., Differential gene expression of peripheral blood mononuclear cells from rheumatoid
arthritis patients may discriminate immunogenetic, pathogenic and treatment features. Immunology,
2009. 127(3): p. 365-72.
329. van der Pouw Kraan, T.C., et al., Rheumatoid arthritis subtypes identified by genomic profiling of
peripheral blood cells: assignment of a type I interferon signature in a subpopulation of patients. Ann
Rheum Dis, 2007. 66(8): p. 1008-14.
330. Teixeira, V.H., et al., Transcriptome analysis describing new immunity and defense genes in peripheral
blood mononuclear cells of rheumatoid arthritis patients. PLoS One, 2009. 4(8): p. e6803.
331. Julia, A., et al., An eight-gene blood expression profile predicts the response to infliximab in rheumatoid
arthritis. PLoS One, 2009. 4(10): p. e7556.
332. Koczan, D., et al., Molecular discrimination of responders and nonresponders to anti-TNF alpha therapy
in rheumatoid arthritis by etanercept. Arthritis Res Ther, 2008. 10(3): p. R50.
333. Bansard, C., et al., Gene profiling predicts rheumatoid arthritis responsiveness to IL-1Ra (anakinra).
Rheumatology (Oxford), 2011. 50(2): p. 283-92.
334. Watanabe, N., et al., Gene expression profile analysis of rheumatoid synovial fibroblast cultures
revealing the overexpression of genes responsible for tumor-like growth of rheumatoid synovium.
Biochem Biophys Res Commun, 2002. 294(5): p. 1121-9.
335. Kasperkovitz, P.V., et al., Fibroblast-like synoviocytes derived from patients with rheumatoid arthritis
show the imprint of synovial tissue heterogeneity: evidence of a link between an increased
myofibroblast-like phenotype and high-inflammation synovitis. Arthritis Rheum, 2005. 52(2): p. 430-41.
336. Szodoray, P., et al., A genome-scale assessment of peripheral blood B-cell molecular homeostasis in
patients with rheumatoid arthritis. Rheumatology (Oxford), 2006. 45(12): p. 1466-76.
337. Li, J., et al., Altered microRNA expression profile with miR-146a upregulation in CD4+ T cells from
patients with rheumatoid arthritis. Arthritis Res Ther, 2010. 12(3): p. R81.
338. Stuhlmuller, B., et al., Identification of known and novel genes in activated monocytes from patients
with rheumatoid arthritis. Arthritis Rheum, 2000. 43(4): p. 775-90.
339. Gu, J., et al., A 588-gene microarray analysis of the peripheral blood mononuclear cells of
spondyloarthropathy patients. Rheumatology (Oxford), 2002. 41(7): p. 759-66.
340. Batliwalla, F.M., et al., Microarray analyses of peripheral blood cells identifies unique gene expression
signature in psoriatic arthritis. Mol Med, 2005. 11(1-12): p. 21-9.
341. Stoeckman, A.K., et al., A distinct inflammatory gene expression profile in patients with psoriatic
arthritis. Genes Immun, 2006. 7(7): p. 583-91.
342. Costantino, C.M., et al., Lysosomal cysteine and aspartic proteases are heterogeneously expressed and
act redundantly to initiate human invariant chain degradation. J Immunol, 2008. 180(5): p. 2876-85.

372
343. Ritchlin, C.T., Pathogenesis of psoriatic arthritis. Curr Opin Rheumatol, 2005. 17(4): p. 406-12.
344. Feldmann, M., F.M. Brennan, and R.N. Maini, Role of cytokines in rheumatoid arthritis. Annu Rev
Immunol, 1996. 14: p. 397-440.
345. Haringman, J.J., et al., Synovial tissue macrophages: a sensitive biomarker for response to treatment in
patients with rheumatoid arthritis. Ann Rheum Dis, 2005. 64(6): p. 834-8.
346. Helliwell, P.S. and W.J. Taylor, Classification and diagnostic criteria for psoriatic arthritis. Ann Rheum
Dis, 2005. 64 Suppl 2: p. ii3-8.
347. Devitt, A., et al., Human CD14 mediates recognition and phagocytosis of apoptotic cells. Nature, 1998.
392(6675): p. 505-9.
348. Jiang, N., et al., Methods for evaluating gene expression from Affymetrix microarray datasets. BMC
Bioinformatics, 2008. 9: p. 284.
349. Millenaar, F.F., et al., How to decide? Different methods of calculating gene expression from short
oligonucleotide array data will give different results. BMC Bioinformatics, 2006. 7: p. 137.
350. Affymetrix, Affymetix Microarray Suite 5.0 in "User Guide". 2001, Affymetrix Inc, Santa Clara, CA.
351. Irizarry, R.A., et al., Summaries of Affymetrix GeneChip probe level data. Nucleic Acids Res, 2003. 31(4):
p. e15.
352. Wu, Z. and R.A. Irizarry, Preprocessing of oligonucleotide array data. Nat Biotechnol, 2004. 22(6): p.
656-8; author reply 658.
353. Mieczkowski, J., et al., Probe set filtering increases correlation between Affymetrix GeneChip and qRT-
PCR expression measurements. BMC Bioinformatics, 2010. 11: p. 104.
354. Raychaudhuri, S., J.M. Stuart, and R.B. Altman, Principal components analysis to summarize microarray
experiments: application to sporulation time series. Pac Symp Biocomput, 2000: p. 455-66.
355. Hochberg, Y. and Y. Benjamini, More powerful procedures for multiple significance testing. Stat Med,
1990. 9(7): p. 811-8.
356. Bagri, A., M. Tessier-Lavigne, and R.J. Watts, Neuropilins in tumor biology. Clin Cancer Res, 2009. 15(6):
p. 1860-4.
357. Kim, W.U., et al., Interaction of vascular endothelial growth factor 165 with neuropilin-1 protects
rheumatoid synoviocytes from apoptotic death by regulating Bcl-2 expression and Bax translocation. J
Immunol, 2006. 177(8): p. 5727-35.
358. Paratcha, G., F. Ledda, and C.F. Ibanez, The neural cell adhesion molecule NCAM is an alternative
signaling receptor for GDNF family ligands. Cell, 2003. 113(7): p. 867-79.
359. Perl, A.K., et al., Reduced expression of neural cell adhesion molecule induces metastatic dissemination
of pancreatic beta tumor cells. Nat Med, 1999. 5(3): p. 286-91.
360. Schenkman, J.B. and I. Jansson, The many roles of cytochrome b5. Pharmacol Ther, 2003. 97(2): p. 139-
52.
361. Keyes, S.R. and D.L. Cinti, Biochemical properties of cytochrome b5-dependent microsomal fatty acid
elongation and identification of products. J Biol Chem, 1980. 255(23): p. 11357-64.
362. de Cabo, R., et al., CYB5R3: a key player in aerobic metabolism and aging? Aging (Albany NY). 2(1): p. 63-
8.
363. Kawasawa, Y., et al., G protein-coupled receptor genes in the FANTOM2 database. Genome Res, 2003.
13(6B): p. 1466-77.
364. Sugo, T., et al., Identification of a lysophosphatidylserine receptor on mast cells. Biochem Biophys Res
Commun, 2006. 341(4): p. 1078-87.

373
365. Tai, H.H., et al., NAD+-linked 15-hydroxyprostaglandin dehydrogenase: structure and biological
functions. Curr Pharm Des, 2006. 12(8): p. 955-62.
366. Myung, S.J., et al., 15-Hydroxyprostaglandin dehydrogenase is an in vivo suppressor of colon
tumorigenesis. Proc Natl Acad Sci U S A, 2006. 103(32): p. 12098-102.
367. Hatzfeld, M., Plakophilins: Multifunctional proteins or just regulators of desmosomal adhesion? Biochim
Biophys Acta, 2007. 1773(1): p. 69-77.
368. Franke, W.W., et al., The area composita of adhering junctions connecting heart muscle cells of
vertebrates. I. Molecular definition in intercalated disks of cardiomyocytes by immunoelectron
microscopy of desmosomal proteins. Eur J Cell Biol, 2006. 85(2): p. 69-82.
369. Chen, X., et al., Protein binding and functional characterization of plakophilin 2. Evidence for its diverse
roles in desmosomes and beta -catenin signaling. J Biol Chem, 2002. 277(12): p. 10512-22.
370. Guzel, O., et al., Carbonic anhydrase inhibitors. Aromatic/heterocyclic sulfonamides incorporating
phenacetyl, pyridylacetyl and thienylacetyl tails act as potent inhibitors of human mitochondrial
isoforms VA and VB. Bioorg Med Chem, 2009. 17(14): p. 4894-9.
371. Hartgring, S.A., et al., Interleukin-7 induced immunopathology in arthritis. Ann Rheum Dis, 2006. 65
Suppl 3: p. iii69-74.
372. Weitzmann, M.N., et al., Interleukin-7 stimulates osteoclast formation by up-regulating the T-cell
production of soluble osteoclastogenic cytokines. Blood, 2000. 96(5): p. 1873-8.
373. van Roon, J.A., et al., Increased intraarticular interleukin-7 in rheumatoid arthritis patients stimulates
cell contact-dependent activation of CD4(+) T cells and macrophages. Arthritis Rheum, 2005. 52(6): p.
1700-10.
374. Mayer, U., E. Kohfeldt, and R. Timpl, Structural and genetic analysis of laminin-nidogen interaction. Ann
N Y Acad Sci, 1998. 857: p. 130-42.
375. Chen, Z.L., et al., Cortical deficiency of laminin gamma1 impairs the AKT/GSK-3beta signaling pathway
and leads to defects in neurite outgrowth and neuronal migration. Dev Biol, 2009. 327(1): p. 158-68.
376. Malan, D., et al., Lack of laminin gamma1 in embryonic stem cell-derived cardiomyocytes causes
inhomogeneous electrical spreading despite intact differentiation and function. Stem Cells, 2009. 27(1):
p. 88-99.
377. Wang, C., et al., Mouse lysocardiolipin acyltransferase controls the development of hematopoietic and
endothelial lineages during in vitro embryonic stem-cell differentiation. Blood, 2007. 110(10): p. 3601-9.
378. Cao, J., et al., ALCAT1 is a polyglycerophospholipid acyltransferase potently regulated by adenine
nucleotide and thyroid status. Am J Physiol Endocrinol Metab, 2009. 296(4): p. E647-53.
379. Chung, N.S. and K.M. Wasan, Potential role of the low-density lipoprotein receptor family as mediators
of cellular drug uptake. Adv Drug Deliv Rev, 2004. 56(9): p. 1315-34.
380. Marzolo, M.P. and G. Bu, Lipoprotein receptors and cholesterol in APP trafficking and proteolytic
processing, implications for Alzheimer's disease. Semin Cell Dev Biol, 2009. 20(2): p. 191-200.
381. Sasaki, S., et al., Isolation and characterization of a novel gene, hRFI, preferentially expressed in
esophageal cancer. Oncogene, 2002. 21(32): p. 5024-30.
382. Konishi, T., et al., Overexpression of hRFI (human ring finger homologous to inhibitor of apoptosis
protein type) inhibits death receptor-mediated apoptosis in colorectal cancer cells. Mol Cancer Ther,
2005. 4(5): p. 743-50.
383. Hayes, J.D., J.U. Flanagan, and I.R. Jowsey, Glutathione transferases. Annu Rev Pharmacol Toxicol, 2005.
45: p. 51-88.

374
384. Mattey, D.L., et al., Smoking and disease severity in rheumatoid arthritis: association with polymorphism
at the glutathione S-transferase M1 locus. Arthritis Rheum, 2002. 46(3): p. 640-6.
385. Yun, B.R., et al., Glutathione S-transferase M1, T1, and P1 genotypes and rheumatoid arthritis. J
Rheumatol, 2005. 32(6): p. 992-7.
386. Cohen, P.T., Protein phosphatase 1--targeted in many directions. J Cell Sci, 2002. 115(Pt 2): p. 241-56.
387. Li, L., et al., Phosphorylation of TIMAP by glycogen synthase kinase-3beta activates its associated
protein phosphatase 1. J Biol Chem, 2007. 282(35): p. 25960-9.
388. Watanabe, K., et al., Vasohibin as an endothelium-derived negative feedback regulator of angiogenesis. J
Clin Invest, 2004. 114(7): p. 898-907.
389. Akita, K., et al., Expression of multiple chondroitin/dermatan sulfotransferases in the neurogenic regions
of the embryonic and adult central nervous system implies that complex chondroitin sulfates have a role
in neural stem cell maintenance. Stem Cells, 2008. 26(3): p. 798-809.
390. Hu, H., et al., Foxp1 is an essential transcriptional regulator of B cell development. Nat Immunol, 2006.
7(8): p. 819-26.
391. Feng, X., et al., Foxp1 is an essential transcriptional regulator for the generation of quiescent naive T
cells during thymocyte development. Blood, 2010. 115(3): p. 510-8.
392. Shi, C., et al., Down-regulation of the forkhead transcription factor Foxp1 is required for monocyte
differentiation and macrophage function. Blood, 2008. 112(12): p. 4699-711.
393. Zhang, D., et al., Direct interaction of the Kruppel-like family (KLF) member, BTEB1, and PR mediates
progesterone-responsive gene expression in endometrial epithelial cells. Endocrinology, 2002. 143(1): p.
62-73.
394. Velarde, M.C., et al., Kruppel-like factor 9 is a negative regulator of ligand-dependent estrogen receptor
alpha signaling in Ishikawa endometrial adenocarcinoma cells. Mol Endocrinol, 2007. 21(12): p. 2988-
3001.
395. Hirokawa, N., Kinesin and dynein superfamily proteins and the mechanism of organelle transport.
Science, 1998. 279(5350): p. 519-26.
396. Hirokawa, N. and R. Takemura, Biochemical and molecular characterization of diseases linked to motor
proteins. Trends Biochem Sci, 2003. 28(10): p. 558-65.
397. Nangaku, M., et al., KIF1B, a novel microtubule plus end-directed monomeric motor protein for transport
of mitochondria. Cell, 1994. 79(7): p. 1209-20.
398. Ren, G., et al., The BAR domain proteins: molding membranes in fission, fusion, and phagy. Microbiol Mol
Biol Rev, 2006. 70(1): p. 37-120.
399. Lee, E., et al., Amphiphysin 2 (Bin1) and T-tubule biogenesis in muscle. Science, 2002. 297(5584): p.
1193-6.
400. Conaway, R.C., et al., The mammalian Mediator complex and its role in transcriptional regulation.
Trends Biochem Sci, 2005. 30(5): p. 250-5.
401. Cao, A., et al., Long chain acyl-CoA synthetase-3 is a molecular target for peroxisome proliferator-
activated receptor delta in HepG2 hepatoma cells. J Biol Chem. 285(22): p. 16664-74.
402. Wek, R.C. and D.R. Cavener, Translational control and the unfolded protein response. Antioxid Redox
Signal, 2007. 9(12): p. 2357-71.
403. Dennis, G., Jr., et al., DAVID: Database for Annotation, Visualization, and Integrated Discovery. Genome
Biol, 2003. 4(5): p. P3.

375
404. Foster, W., et al., Inflammatory cytokines, endothelial markers and adhesion molecules in rheumatoid
arthritis: effect of intensive anti-inflammatory treatment. J Thromb Thrombolysis, 2010. 29(4): p. 437-
42.
405. Yang, M.H., et al., Expression of CC chemokine ligand 5 in patients with rheumatoid arthritis and its
correlation with disease activity and medication. Chin Med Sci J, 2009. 24(1): p. 50-4.
406. Szodoray, P., et al., Circulating cytokines in Norwegian patients with psoriatic arthritis determined by a
multiplex cytokine array system. Rheumatology (Oxford), 2007. 46(3): p. 417-25.
407. Szekanecz, Z. and A.E. Koch, Vascular involvement in rheumatic diseases: 'vascular rheumatology'.
Arthritis Res Ther, 2008. 10(5): p. 224.
408. Brennan, F. and A. Foey, Cytokine regulation in RA synovial tissue: role of T cell/macrophage contact-
dependent interactions. Arthritis Res, 2002. 4 Suppl 3: p. S177-82.
409. Muz, B., et al., Hypoxia. The role of hypoxia and HIF-dependent signalling events in rheumatoid
arthritis. Arthritis Res Ther, 2009. 11(1): p. 201.
410. De Benedetti, F., et al., Differences in synovial fluid cytokine levels between juvenile and adult
rheumatoid arthritis. J Rheumatol, 1997. 24(7): p. 1403-9.
411. Neumuller, J., et al., Interaction of monocytes from patients with psoriatic arthritis with cultured
microvascular endothelial cells. Clin Immunol, 2001. 98(1): p. 143-52.
412. Kraan, M.C., et al., Alefacept treatment in psoriatic arthritis: reduction of the effector T cell population
in peripheral blood and synovial tissue is associated with improvement of clinical signs of arthritis.
Arthritis Rheum, 2002. 46(10): p. 2776-84.
413. Wang, K.X. and D.T. Denhardt, Osteopontin: role in immune regulation and stress responses. Cytokine
Growth Factor Rev, 2008. 19(5-6): p. 333-45.
414. Hasegawa, M., et al., Thrombin-cleaved osteopontin in synovial fluid of subjects with rheumatoid
arthritis. J Rheumatol, 2009. 36(2): p. 240-5.
415. Schutyser, E., A. Richmond, and J. Van Damme, Involvement of CC chemokine ligand 18 (CCL18) in normal
and pathological processes. J Leukoc Biol, 2005. 78(1): p. 14-26.
416. van Lieshout, A.W., et al., Circulating levels of the chemokine CCL18 but not CXCL16 are elevated and
correlate with disease activity in rheumatoid arthritis. Ann Rheum Dis, 2007. 66(10): p. 1334-8.
417. Momohara, S., et al., High CCL18/PARC expression in articular cartilage and synovial tissue of patients
with rheumatoid arthritis. J Rheumatol, 2007. 34(2): p. 266-71.
418. Shachter, N.S., Apolipoproteins C-I and C-III as important modulators of lipoprotein metabolism. Curr
Opin Lipidol, 2001. 12(3): p. 297-304.
419. Ohashi, R., et al., Reverse cholesterol transport and cholesterol efflux in atherosclerosis. Qjm, 2005.
98(12): p. 845-56.
420. Yang, X.P., et al., Increased atherosclerotic lesions in apoE mice with plasma phospholipid transfer
protein overexpression. Arterioscler Thromb Vasc Biol, 2003. 23(9): p. 1601-7.
421. Valenta, D.T., et al., Macrophage PLTP is atheroprotective in LDLr-deficient mice with systemic PLTP
deficiency. J Lipid Res, 2008. 49(1): p. 24-32.
422. Lay, J.D., et al., Sulfasalazine suppresses drug resistance and invasiveness of lung adenocarcinoma cells
expressing AXL. Cancer Res, 2007. 67(8): p. 3878-87.
423. Przybysz, M., et al., Synovial fibronectin fragmentation and domain expressions in relation to
rheumatoid arthritis progression. Rheumatology (Oxford), 2007. 46(7): p. 1071-5.
424. Hershkoviz, R., et al., Activated T lymphocytes and macrophages secrete fibronectin which strongly
supports cell adhesion. Cell Immunol, 1992. 141(2): p. 352-61.

376
425. Barilla, M.L. and S.E. Carsons, Fibronectin fragments and their role in inflammatory arthritis. Semin
Arthritis Rheum, 2000. 29(4): p. 252-65.
426. Mayston, V., et al., Fibronectin in the synovium of chronic inflammatory joint disease. Rheumatol Int,
1984. 4(3): p. 129-33.
427. Beaulieu, A.D., et al., Protein biosynthetic activity of polymorphonuclear leukocytes in inflammatory
arthropathies. Increased synthesis and release of fibronectin. J Rheumatol, 1987. 14(4): p. 656-61.
428. Cutolo, M., et al., Plasma fibronectin in psoriatic arthritis subgroups. Clin Rheumatol, 1984. 3(2): p. 129-
36.
429. Chen, J.M., et al., Activation of progelatinase A by mammalian legumain, a recently discovered cysteine
proteinase. Biol Chem, 2001. 382(5): p. 777-83.
430. Sarandeses, C.S., et al., Prothymosin alpha is processed to thymosin alpha 1 and thymosin alpha 11 by a
lysosomal asparaginyl endopeptidase. J Biol Chem, 2003. 278(15): p. 13286-93.
431. Morita, Y., et al., Legumain/asparaginyl endopeptidase controls extracellular matrix remodeling through
the degradation of fibronectin in mouse renal proximal tubular cells. FEBS Lett, 2007. 581(7): p. 1417-
24.
432. Shirahama-Noda, K., et al., Biosynthetic processing of cathepsins and lysosomal degradation are
abolished in asparaginyl endopeptidase-deficient mice. J Biol Chem, 2003. 278(35): p. 33194-9.
433. Luo, Y., et al., Targeting tumor-associated macrophages as a novel strategy against breast cancer. J Clin
Invest, 2006. 116(8): p. 2132-2141.
434. Papaspyridonos, M., et al., Novel candidate genes in unstable areas of human atherosclerotic plaques.
Arterioscler Thromb Vasc Biol, 2006. 26(8): p. 1837-44.
435. Cheng, T., et al., The cystatin M/E-controlled pathway of skin barrier formation: expression of its key
components in psoriasis and atopic dermatitis. Br J Dermatol, 2009. 161(2): p. 253-64.
436. Verkman, A.S., More than just water channels: unexpected cellular roles of aquaporins. J Cell Sci, 2005.
118(Pt 15): p. 3225-32.
437. Sugiyama, Y., et al., Osmotic stress up-regulates aquaporin-3 gene expression in cultured human
keratinocytes. Biochim Biophys Acta, 2001. 1522(2): p. 82-8.
438. Ma, T., et al., Impaired stratum corneum hydration in mice lacking epidermal water channel aquaporin-3.
J Biol Chem, 2002. 277(19): p. 17147-53.
439. Meng, J.H., et al., Aquaporin-1 and aquaporin-3 expressions in the temporo-mandibular joint condylar
cartilage after an experimentally induced osteoarthritis. Chin Med J (Engl), 2007. 120(24): p. 2191-4.
440. Parker, A., et al., Peripheral blood expression of nuclear factor-kappab-regulated genes is associated
with rheumatoid arthritis disease activity and responds differentially to anti-tumor necrosis factor-
alpha versus methotrexate. J Rheumatol, 2007. 34(9): p. 1817-22.
441. Enomoto, H., et al., Vascular endothelial growth factor isoforms and their receptors are expressed in
human osteoarthritic cartilage. Am J Pathol, 2003. 162(1): p. 171-81.
442. Ohta, K., et al., Plexin: a novel neuronal cell surface molecule that mediates cell adhesion via a
homophilic binding mechanism in the presence of calcium ions. Neuron, 1995. 14(6): p. 1189-99.
443. Ji, J.D., K.H. Park-Min, and L.B. Ivashkiv, Expression and Function of Semaphorin 3A and Its Receptors in
Human Monocyte-derived Macrophages. Hum Immunol, 2009.
444. Wong, A.W., et al., CIITA-regulated plexin-A1 affects T-cell-dendritic cell interactions. Nat Immunol,
2003. 4(9): p. 891-8.
445. Schacht, V., et al., T1alpha/podoplanin deficiency disrupts normal lymphatic vasculature formation and
causes lymphedema. Embo J, 2003. 22(14): p. 3546-56.

377
446. Polzer, K., et al., Tumour necrosis factor blockade increases lymphangiogenesis in murine and human
arthritic joints. Ann Rheum Dis, 2008. 67(11): p. 1610-6.
447. Kauffmann, A. and W. Huber, Microarray data quality control improves the detection of differentially
expressed genes. Genomics, 2010. 95(3): p. 138-42.
448. Sconocchia, G., et al., Phenotype and function of a CD56+ peripheral blood monocyte. Leukemia, 2005.
19(1): p. 69-76.
449. Dalbeth, N. and M.F. Callan, A subset of natural killer cells is greatly expanded within inflamed joints.
Arthritis Rheum, 2002. 46(7): p. 1763-72.
450. Davila, E., et al., Cell-based immunotherapy with suppressor CD8+ T cells in rheumatoid arthritis. J
Immunol, 2005. 174(11): p. 7292-301.
451. Colognato, H. and P.D. Yurchenco, Form and function: the laminin family of heterotrimers. Dev Dyn,
2000. 218(2): p. 213-34.
452. Giavazzi, R. and I.R. Hart, Mononuclear phagocyte adherence in the presence of laminin. A possible
marker of cellular differentiation. Exp Cell Res, 1983. 146(2): p. 391-9.
453. Bohnsack, J.F., et al., Connective tissue proteins and phagocytic cell function. Laminin enhances
complement and Fc-mediated phagocytosis by cultured human macrophages. J Exp Med, 1985. 161(5): p.
912-23.
454. Penberthy, T.W., et al., MCP-1-stimulated monocytes preferentially utilize beta 2-integrins to migrate on
laminin and fibronectin. Am J Physiol, 1995. 269(1 Pt 1): p. C60-8.
455. Pedraza, C., et al., Monocytic cells synthesize, adhere to, and migrate on laminin-8 (alpha 4 beta 1
gamma 1). J Immunol, 2000. 165(10): p. 5831-8.
456. Lee, S.S., et al., Vascular endothelial growth factor levels in the serum and synovial fluid of patients
with rheumatoid arthritis. Clin Exp Rheumatol, 2001. 19(3): p. 321-4.
457. Kurosaka, D., et al., Clinical significance of serum levels of vascular endothelial growth factor,
angiopoietin-1, and angiopoietin-2 in patients with rheumatoid arthritis. J Rheumatol, 2010. 37(6): p.
1121-8.
458. van Roon, J.A., et al., Interleukin 7 stimulates tumour necrosis factor alpha and Th1 cytokine production
in joints of patients with rheumatoid arthritis. Ann Rheum Dis, 2003. 62(2): p. 113-9.
459. Filippin, L.I., et al., Redox signalling and the inflammatory response in rheumatoid arthritis. Clin Exp
Immunol, 2008. 152(3): p. 415-22.
460. Maurice, M.M., et al., Evidence for the role of an altered redox state in hyporesponsiveness of synovial T
cells in rheumatoid arthritis. J Immunol, 1997. 158(3): p. 1458-65.
461. Firuzi, O., et al., Oxidative stress parameters in different systemic rheumatic diseases. J Pharm
Pharmacol, 2006. 58(7): p. 951-7.
462. Hassan, M.Q., et al., The glutathione defense system in the pathogenesis of rheumatoid arthritis. J Appl
Toxicol, 2001. 21(1): p. 69-73.
463. Keenan, B.T., et al., Effect of glutathione S-transferase T1, M1, P1 and heme oxygenase-1
polymorphisms interactionswith heavy smoking on the risk of rheumatoid arthritis. Arthritis Rheum,
2010.
464. Harding, H.P., Y. Zhang, and D. Ron, Protein translation and folding are coupled by an endoplasmic-
reticulum-resident kinase. Nature, 1999. 397(6716): p. 271-4.
465. Caffrey, M.F. and D.C. James, Human lymphocyte antigen association in ankylosing spondylitis. Nature,
1973. 242(5393): p. 121.

378
466. Turner, M.J., et al., HLA-B27 misfolding in transgenic rats is associated with activation of the unfolded
protein response. J Immunol, 2005. 175(4): p. 2438-48.
467. Shi, C., et al., Integrin engagement regulates monocyte differentiation through the forkhead
transcription factor Foxp1. J Clin Invest, 2004. 114(3): p. 408-18.
468. Suske, G., E. Bruford, and S. Philipsen, Mammalian SP/KLF transcription factors: bring in the family.
Genomics, 2005. 85(5): p. 551-6.
469. Denver, R.J., et al., Basic transcription element-binding protein (BTEB) is a thyroid hormone-regulated
gene in the developing central nervous system. Evidence for a role in neurite outgrowth. J Biol Chem,
1999. 274(33): p. 23128-34.
470. Zhang, X.L., et al., Increased expression of the Zn-finger transcription factor BTEB1 in human
endometrial cells is correlated with distinct cell phenotype, gene expression patterns, and proliferative
responsiveness to serum and TGF-beta1. Mol Cell Endocrinol, 2001. 181(1-2): p. 81-96.
471. Simmen, F.A., et al., Dysregulation of intestinal crypt cell proliferation and villus cell migration in mice
lacking Kruppel-like factor 9. Am J Physiol Gastrointest Liver Physiol, 2007. 292(6): p. G1757-69.
472. Casamassimi, A. and C. Napoli, Mediator complexes and eukaryotic transcription regulation: an overview.
Biochimie, 2007. 89(12): p. 1439-46.
473. Koch, A.E., et al., Effects of thrombospondin-1 on disease course and angiogenesis in rat adjuvant-
induced arthritis. Clin Immunol Immunopathol, 1998. 86(2): p. 199-208.
474. Rico, M.C., et al., Thrombospondin-1 and transforming growth factor beta are pro-inflammatory
molecules in rheumatoid arthritis. Transl Res, 2008. 152(2): p. 95-8.
475. Starr, R., et al., A family of cytokine-inducible inhibitors of signalling. Nature, 1997. 387(6636): p. 917-
21.
476. Naka, T., et al., Structure and function of a new STAT-induced STAT inhibitor. Nature, 1997. 387(6636):
p. 924-9.
477. Kubo, M., T. Hanada, and A. Yoshimura, Suppressors of cytokine signaling and immunity. Nat Immunol,
2003. 4(12): p. 1169-76.
478. Isomaki, P., et al., The expression of SOCS is altered in rheumatoid arthritis. Rheumatology (Oxford),
2007. 46(10): p. 1538-46.
479. Veenbergen, S., et al., Splenic suppressor of cytokine signaling 3 transgene expression affects T cell
responses and prevents development of collagen-induced arthritis. Arthritis Rheum, 2008. 58(12): p.
3742-52.
480. Wong, P.K., et al., SOCS-3 negatively regulates innate and adaptive immune mechanisms in acute IL-1-
dependent inflammatory arthritis. J Clin Invest, 2006. 116(6): p. 1571-81.
481. Choi, N.H., T. Mazda, and M. Tomita, A serum protein SP40,40 modulates the formation of membrane
attack complex of complement on erythrocytes. Mol Immunol, 1989. 26(9): p. 835-40.
482. Jones, S.E. and C. Jomary, Clusterin. Int J Biochem Cell Biol, 2002. 34(5): p. 427-31.
483. Falgarone, G. and G. Chiocchia, Chapter 8: Clusterin: A multifacet protein at the crossroad of
inflammation and autoimmunity. Adv Cancer Res, 2009. 104: p. 139-70.
484. Leskov, K.S., et al., Synthesis and functional analyses of nuclear clusterin, a cell death protein. J Biol
Chem, 2003. 278(13): p. 11590-600.
485. Santilli, G., B.J. Aronow, and A. Sala, Essential requirement of apolipoprotein J (clusterin) signaling for
IkappaB expression and regulation of NF-kappaB activity. J Biol Chem, 2003. 278(40): p. 38214-9.
486. Devauchelle, V., et al., Characterization and functional consequences of underexpression of clusterin in
rheumatoid arthritis. J Immunol, 2006. 177(9): p. 6471-9.

379
487. Zhang, H., et al., Clusterin inhibits apoptosis by interacting with activated Bax. Nat Cell Biol, 2005. 7(9):
p. 909-15.
488. Leskov, K.S., et al., When X-ray-inducible proteins meet DNA double strand break repair. Semin Radiat
Oncol, 2001. 11(4): p. 352-72.
489. Bettuzzi, S. and F. Rizzi, Chapter 5: Nuclear CLU (nCLU) and the fate of the cell. Adv Cancer Res, 2009.
104: p. 59-88.
490. McLaughlin, L., et al., Apolipoprotein J/clusterin limits the severity of murine autoimmune myocarditis. J
Clin Invest, 2000. 106(9): p. 1105-13.
491. Liu, H., et al., Regulation of Mcl-1 expression in rheumatoid arthritis synovial macrophages. Arthritis
Rheum, 2006. 54(10): p. 3174-81.
492. Marasco, W.A., et al., Purification and identification of formyl-methionyl-leucyl-phenylalanine as the
major peptide neutrophil chemotactic factor produced by Escherichia coli. J Biol Chem, 1984. 259(9): p.
5430-9.
493. Carp, H., Mitochondrial N-formylmethionyl proteins as chemoattractants for neutrophils. J Exp Med,
1982. 155(1): p. 264-75.
494. Le, Y., J.J. Oppenheim, and J.M. Wang, Pleiotropic roles of formyl peptide receptors. Cytokine Growth
Factor Rev, 2001. 12(1): p. 91-105.
495. Le, Y., et al., Receptors for chemotactic formyl peptides as pharmacological targets. Int
Immunopharmacol, 2002. 2(1): p. 1-13.
496. Pliyev, B.K. and M.Y. Menshikov, Release of the soluble urokinase-type plasminogen activator receptor
(suPAR) by activated neutrophils in rheumatoid arthritis. Inflammation, 2010. 33(1): p. 1-9.
497. Iida, N., et al., Leukocyte-derived growth factor links the PDGF and CXC chemokine families of peptides.
Faseb J, 1996. 10(11): p. 1336-45.
498. Cohen, A.B., et al., Generation of the neutrophil-activating peptide-2 by cathepsin G and cathepsin G-
treated human platelets. Am J Physiol, 1992. 263(2 Pt 1): p. L249-56.
499. Schaffner, A., et al., Induction and antimicrobial activity of platelet basic protein derivatives in human
monocytes. J Leukoc Biol, 2004. 76(5): p. 1010-8.
500. Castor, C.W., et al., Connective tissue activation. XXXVI. The origin, variety, distribution, and biologic
fate of connective tissue activating peptide-III isoforms: characteristics in patients with rheumatic,
renal, and arterial disease. Arthritis Rheum, 1993. 36(8): p. 1142-53.
501. Locht, H., T. Skogh, and A. Wiik, Characterisation of autoantibodies to neutrophil granule constituents
among patients with reactive arthritis, rheumatoid arthritis, and ulcerative colitis. Ann Rheum Dis,
2000. 59(11): p. 898-903.
502. Wang, W., et al., Signaling mechanism of TGF-beta1 in prevention of renal inflammation: role of Smad7.
J Am Soc Nephrol, 2005. 16(5): p. 1371-83.
503. Holben, D.H. and A.M. Smith, The diverse role of selenium within selenoproteins: a review. J Am Diet
Assoc, 1999. 99(7): p. 836-43.
504. Knekt, P., et al., Serum selenium, serum alpha-tocopherol, and the risk of rheumatoid arthritis.
Epidemiology, 2000. 11(4): p. 402-5.
505. Prabhu, K.S., et al., Selenium deficiency increases the expression of inducible nitric oxide synthase in
RAW 264.7 macrophages: role of nuclear factor-kappaB in up-regulation. Biochem J, 2002. 366(Pt 1): p.
203-9.

380
506. Pham, T.N., et al., Elevated serum nitric oxide levels in patients with inflammatory arthritis associated
with co-expression of inducible nitric oxide synthase and protein kinase C-eta in peripheral blood
monocyte-derived macrophages. J Rheumatol, 2003. 30(12): p. 2529-34.
507. Miyake, K., et al., Inflammatory cytokine-induced expression of vasohibin-1 by rheumatoid synovial
fibroblasts. Acta Med Okayama, 2009. 63(6): p. 349-58.
508. Loyola, A. and G. Almouzni, Histone chaperones, a supporting role in the limelight. Biochim Biophys Acta,
2004. 1677(1-3): p. 3-11.
509. Antonelli, A., et al., High values of Th1 (CXCL10) and Th2 (CCL2) chemokines in patients with psoriatic
arthtritis. Clin Exp Rheumatol, 2009. 27(1): p. 22-7.
510. Kuta, A., et al., Mouse cytoplasmic dynein intermediate chains: identification of new isoforms,
alternative splicing and tissue distribution of transcripts. PLoS One, 2010. 5(7): p. e11682.
511. Young, K.G. and R. Kothary, Dystonin/Bpag1--a link to what? Cell Motil Cytoskeleton, 2007. 64(12): p.
897-905.
512. Weinstein, L.S., et al., Studies of the regulation and function of the Gs alpha gene Gnas using gene
targeting technology. Pharmacol Ther, 2007. 115(2): p. 271-91.
513. Eck, S.M., et al., Matrix metalloproteinase and G protein coupled receptors: co-conspirators in the
pathogenesis of autoimmune disease and cancer. J Autoimmun, 2009. 33(3-4): p. 214-21.
514. Penela, P., et al., G protein-coupled receptor kinase 2 (GRK2) in migration and inflammation. Arch
Physiol Biochem, 2008. 114(3): p. 195-200.
515. Weinstein, L.S., The stimulatory G protein alpha-subunit gene: mutations and imprinting lead to complex
phenotypes. J Clin Endocrinol Metab, 2001. 86(10): p. 4622-6.
516. Johnsen, S.A., et al., TGFbeta inducible early gene enhances TGFbeta/Smad-dependent transcriptional
responses. Oncogene, 2002. 21(37): p. 5783-90.
517. Ribeiro, A., et al., The transforming growth factor beta(1)-inducible transcription factor TIEG1,
mediates apoptosis through oxidative stress. Hepatology, 1999. 30(6): p. 1490-7.
518. Hefferan, T.E., et al., Overexpression of a nuclear protein, TIEG, mimics transforming growth factor-beta
action in human osteoblast cells. J Biol Chem, 2000. 275(27): p. 20255-9.
519. Reinholz, M.M., et al., Differential gene expression of TGF beta inducible early gene (TIEG), Smad7,
Smad2 and Bard1 in normal and malignant breast tissue. Breast Cancer Res Treat, 2004. 86(1): p. 75-88.
520. Rinaldi, N., et al., Loss of laminin and of the laminin receptor integrin subunit alpha 6 in situ correlates
with cytokine induced down regulation of alpha 6 on fibroblast-like synoviocytes from rheumatoid
arthritis. Ann Rheum Dis, 1998. 57(9): p. 559-65.
521. Tran, T.M., et al., HLA-B27 in transgenic rats forms disulfide-linked heavy chain oligomers and multimers
that bind to the chaperone BiP. J Immunol, 2004. 172(8): p. 5110-9.
522. Zhao, C. and K. Dahlman-Wright, Liver X receptor in cholesterol metabolism. J Endocrinol. 204(3): p. 233-
40.
523. Geyeregger, R., et al., Liver X receptors regulate dendritic cell phenotype and function through blocked
induction of the actin-bundling protein fascin. Blood, 2007. 109(10): p. 4288-95.
524. Chawla, A., et al., A PPAR gamma-LXR-ABCA1 pathway in macrophages is involved in cholesterol efflux
and atherogenesis. Mol Cell, 2001. 7(1): p. 161-71.
525. Mak, P.A., et al., Regulated expression of the apolipoprotein E/C-I/C-IV/C-II gene cluster in murine and
human macrophages. A critical role for nuclear liver X receptors alpha and beta. J Biol Chem, 2002.
277(35): p. 31900-8.

381
526. Fontaine, C., et al., Liver X receptor activation potentiates the lipopolysaccharide response in human
macrophages. Circ Res, 2007. 101(1): p. 40-9.
527. Asquith, D.L., et al., Liver X receptor agonism promotes articular inflammation in murine collagen-
induced arthritis. Arthritis Rheum, 2009. 60(9): p. 2655-65.
528. Dai, L., et al., Evidence for oxidised low density lipoprotein in synovial fluid from rheumatoid arthritis
patients. Free Radic Res, 2000. 32(6): p. 479-86.
529. Thieringer, F., et al., Spontaneous hepatic fibrosis in transgenic mice overexpressing PDGF-A. Gene,
2008. 423(1): p. 23-8.
530. Czochra, P., et al., Liver fibrosis induced by hepatic overexpression of PDGF-B in transgenic mice. J
Hepatol, 2006. 45(3): p. 419-28.
531. Hollinger, J.O., et al., Recombinant human platelet-derived growth factor: biology and clinical
applications. J Bone Joint Surg Am, 2008. 90 Suppl 1: p. 48-54.
532. Remmers, E.F., H. Sano, and R.L. Wilder, Platelet-derived growth factors and heparin-binding
(fibroblast) growth factors in the synovial tissue pathology of rheumatoid arthritis. Semin Arthritis
Rheum, 1991. 21(3): p. 191-9.
533. Thornton, S.C., et al., Identification of the major fibroblast growth factors released spontaneously in
inflammatory arthritis as platelet derived growth factor and tumour necrosis factor-alpha. Clin Exp
Immunol, 1991. 86(1): p. 79-86.
534. Rosengren, S., M. Corr, and D.L. Boyle, Platelet-derived growth factor and transforming growth factor
beta synergistically potentiate inflammatory mediator synthesis by fibroblast-like synoviocytes.
Arthritis Res Ther, 2010. 12(2): p. R65.
535. Konttinen, Y.T., et al., Analysis of 16 different matrix metalloproteinases (MMP-1 to MMP-20) in the
synovial membrane: different profiles in trauma and rheumatoid arthritis. Ann Rheum Dis, 1999. 58(11):
p. 691-7.
536. Goldbach-Mansky, R., et al., Active synovial matrix metalloproteinase-2 is associated with radiographic
erosions in patients with early synovitis. Arthritis Res, 2000. 2(2): p. 145-53.
537. Stankovic, A., et al., Serum and synovial fluid concentrations of CCL2 (MCP-1) chemokine in patients
suffering rheumatoid arthritis and osteoarthritis reflect disease activity. Bratisl Lek Listy, 2009.
110(10): p. 641-6.
538. Popova, A., et al., Pro- and anti-inflammatory control of M-CSF-mediated macrophage differentiation.
Immunobiology, 2010.
539. Tada, K., et al., Critical roles of TRAF2 and TRAF5 in tumor necrosis factor-induced NF-kappa B
activation and protection from cell death. J Biol Chem, 2001. 276(39): p. 36530-4.
540. Potter, C., et al., Investigation of association between the TRAF family genes and RA susceptibility. Ann
Rheum Dis, 2007. 66(10): p. 1322-6.
541. Nakano, H., et al., TRAF5, an activator of NF-kappaB and putative signal transducer for the
lymphotoxin-beta receptor. J Biol Chem, 1996. 271(25): p. 14661-4.
542. Missiou, A., et al., TRAF5 Deficiency Accelerates Atherogenesis in Mice by Increasing Inflammatory Cell
Recruitment and Foam Cell Formation. Circ Res, 2010.
543. Oishi, I., et al., The receptor tyrosine kinase Ror2 is involved in non-canonical Wnt5a/JNK signalling
pathway. Genes Cells, 2003. 8(7): p. 645-54.
544. McDonald, S.L. and A. Silver, The opposing roles of Wnt-5a in cancer. Br J Cancer, 2009. 101(2): p. 209-
14.

382
545. Sen, M., et al., Blockade of Wnt-5A/frizzled 5 signaling inhibits rheumatoid synoviocyte activation.
Arthritis Rheum, 2001. 44(4): p. 772-81.
546. Blumenthal, A., et al., The Wingless homolog WNT5A and its receptor Frizzled-5 regulate inflammatory
responses of human mononuclear cells induced by microbial stimulation. Blood, 2006. 108(3): p. 965-73.
547. Christman, M.A., 2nd, et al., Wnt5a is expressed in murine and human atherosclerotic lesions. Am J
Physiol Heart Circ Physiol, 2008. 294(6): p. H2864-70.
548. Pukrop, T., et al., Wnt 5a signaling is critical for macrophage-induced invasion of breast cancer cell
lines. Proc Natl Acad Sci U S A, 2006. 103(14): p. 5454-9.
549. Radstake, T.R., et al., Expression of toll-like receptors 2 and 4 in rheumatoid synovial tissue and
regulation by proinflammatory cytokines interleukin-12 and interleukin-18 via interferon-gamma.
Arthritis Rheum, 2004. 50(12): p. 3856-65.
550. Sen, M., et al., Expression and function of wingless and frizzled homologs in rheumatoid arthritis. Proc
Natl Acad Sci U S A, 2000. 97(6): p. 2791-6.
551. Nishita, M., et al., Ror2/Frizzled complex mediates Wnt5a-induced AP-1 activation by regulating
Dishevelled polymerization. Mol Cell Biol, 2010. 30(14): p. 3610-9.
552. Foell, D., H. Wittkowski, and J. Roth, Mechanisms of disease: a 'DAMP' view of inflammatory arthritis.
Nat Clin Pract Rheumatol, 2007. 3(7): p. 382-90.
553. Agarwal, S., R. Misra, and A. Aggarwal, Induction of metalloproteinases expression by TLR ligands in
human fibroblast like synoviocytes from juvenile idiopathic arthritis patients. Indian J Med Res, 2010.
131: p. 771-9.
554. Roelofs, M.F., et al., The expression of toll-like receptors 3 and 7 in rheumatoid arthritis synovium is
increased and costimulation of toll-like receptors 3, 4, and 7/8 results in synergistic cytokine production
by dendritic cells. Arthritis Rheum, 2005. 52(8): p. 2313-22.
555. Choe, J.Y., et al., Interleukin 1 receptor dependence of serum transferred arthritis can be circumvented
by toll-like receptor 4 signaling. J Exp Med, 2003. 197(4): p. 537-42.
556. Joosten, L.A., et al., Toll-like receptor 2 pathway drives streptococcal cell wall-induced joint
inflammation: critical role of myeloid differentiation factor 88. J Immunol, 2003. 171(11): p. 6145-53.
557. Oliviero, F., et al., Apolipoprotein A-I and cholesterol in synovial fluid of patients with rheumatoid
arthritis, psoriatic arthritis and osteoarthritis. Clin Exp Rheumatol, 2009. 27(1): p. 79-83.
558. Carpintero, R., et al., HDL interfere with the binding of T cell microparticles to human monocytes to
inhibit pro-inflammatory cytokine production. PLoS One, 2010. 5(7): p. e11869.
559. Tanasescu, C., et al., Vascular disease in rheumatoid arthritis: from subclinical lesions to cardiovascular
risk. Eur J Intern Med, 2009. 20(4): p. 348-54.
560. O'Neill, L.A., C.E. Bryant, and S.L. Doyle, Therapeutic targeting of Toll-like receptors for infectious and
inflammatory diseases and cancer. Pharmacol Rev, 2009. 61(2): p. 177-97.
561. Abdollahi-Roodsaz, S., et al., Inhibition of Toll-like receptor 4 breaks the inflammatory loop in
autoimmune destructive arthritis. Arthritis Rheum, 2007. 56(9): p. 2957-67.
562. Busso, N. and J.A. Hamilton, Extravascular coagulation and the plasminogen activator/plasmin system in
rheumatoid arthritis. Arthritis Rheum, 2002. 46(9): p. 2268-79.
563. So, A.K., et al., Arthritis is linked to local and systemic activation of coagulation and fibrinolysis
pathways. J Thromb Haemost, 2003. 1(12): p. 2510-5.
564. Busso, N., et al., Plasminogen activation in synovial tissues: differences between normal, osteoarthritis,
and rheumatoid arthritis joints. Ann Rheum Dis, 1997. 56(9): p. 550-7.
383
565. Cook, A.D., et al., Differing roles for urokinase and tissue-type plasminogen activator in collagen-induced
arthritis. Am J Pathol, 2002. 160(3): p. 917-26.
566. Cauza, E., et al., Intravenous anti TNF-alpha antibody therapy leads to elevated triglyceride and
reduced HDL-cholesterol levels in patients with rheumatoid and psoriatic arthritis. Wien Klin
Wochenschr, 2002. 114(23-24): p. 1004-7.
567. Hitchon, C.A., et al., Gelatinase expression and activity in the synovium and skin of patients with erosive
psoriatic arthritis. J Rheumatol, 2002. 29(1): p. 107-17.
568. Korn, T., et al., IL-17 and Th17 Cells. Annu Rev Immunol, 2009. 27: p. 485-517.
569. Jandus, C., et al., Increased numbers of circulating polyfunctional Th17 memory cells in patients with
seronegative spondylarthritides. Arthritis Rheum, 2008. 58(8): p. 2307-17.
570. Flisiak, I., et al., Association between psoriasis severity and transforming growth factor beta(1) and beta
(2) in plasma and scales from psoriatic lesions. Cytokine, 2002. 19(3): p. 121-5.
571. Michaelis, K., et al., Modulating T cell functions does not alleviate chronic inflammatory skin lesions in
K5.TGF beta 1 transgenic mice. Exp Dermatol, 2010. 19(5): p. 406-15.
572. Fuchshofer, R., et al., Gene expression profiling of TGFbeta2- and/or BMP7-treated trabecular meshwork
cells: Identification of Smad7 as a critical inhibitor of TGF-beta2 signaling. Exp Eye Res, 2009. 88(6): p.
1020-32.
573. Swaak, A.J., et al., An analysis of the levels of complement components in the synovial fluid in rheumatic
diseases. Clin Rheumatol, 1987. 6(3): p. 350-7.
574. Hietala, M.A., et al., Complement deficiency ameliorates collagen-induced arthritis in mice. J Immunol,
2002. 169(1): p. 454-9.
575. Wang, Y., et al., A role for complement in antibody-mediated inflammation: C5-deficient DBA/1 mice are
resistant to collagen-induced arthritis. J Immunol, 2000. 164(8): p. 4340-7.
576. Oleesky, D.A., et al., Terminal complement complexes and C1/C1 inhibitor complexes in rheumatoid
arthritis and other arthritic conditions. Clin Exp Immunol, 1991. 84(2): p. 250-5.
577. Triolo, G., et al., Impaired expression of erythrocyte glycosyl-phosphatidylinositol-anchored membrane
CD59 in patients with psoriatic arthritis. Relation to terminal complement pathway activation. Clin Exp
Rheumatol, 2003. 21(2): p. 225-8.
578. Flesch, I.E., J. Barsig, and S.H. Kaufmann, Differential chemokine response of murine macrophages
stimulated with cytokines and infected with Listeria monocytogenes. Int Immunol, 1998. 10(6): p. 757-
65.
579. Mack, M., et al., Predominance of mononuclear cells expressing the chemokine receptor CCR5 in synovial
effusions of patients with different forms of arthritis. Arthritis Rheum, 1999. 42(5): p. 981-8.
580. Raport, C.J., et al., Molecular cloning and functional characterization of a novel human CC chemokine
receptor (CCR5) for RANTES, MIP-1beta, and MIP-1alpha. J Biol Chem, 1996. 271(29): p. 17161-6.
581. Nissinen, R., et al., CCR3, CCR5, interleukin 4, and interferon-gamma expression on synovial and
peripheral T cells and monocytes in patients with rheumatoid arthritis. J Rheumatol, 2003. 30(9): p.
1928-34.
582. Wang, Z.M., C. Liu, and R. Dziarski, Chemokines are the main proinflammatory mediators in human
monocytes activated by Staphylococcus aureus, peptidoglycan, and endotoxin. J Biol Chem, 2000.
275(27): p. 20260-7.
583. Okamoto, Y., et al., Adiponectin inhibits the production of CXC receptor 3 chemokine ligands in
macrophages and reduces T-lymphocyte recruitment in atherogenesis. Circ Res, 2008. 102(2): p. 218-25.

384
584. Lande, R., et al., Characterization and recruitment of plasmacytoid dendritic cells in synovial fluid and
tissue of patients with chronic inflammatory arthritis. J Immunol, 2004. 173(4): p. 2815-24.
585. Watabe, D., et al., Adhesion of peripheral blood mononuclear cells and CD4+ T cells from patients with
psoriasis to cultured endothelial cells via the interaction between lymphocyte function-associated
antigen type 1 and intercellular adhesion molecule 1. Br J Dermatol, 2007. 157(2): p. 259-65.
586. Zhang, A.L., et al., Natural killer cells trigger differentiation of monocytes into dendritic cells. Blood,
2007. 110(7): p. 2484-93.
587. Ng, C.T., et al., Synovial tissue hypoxia and inflammation in vivo. Ann Rheum Dis, 2010. 69(7): p. 1389-
95.
588. Badot, V., et al., Gene expression profiling in the synovium identifies a predictive signature of absence of
response to adalimumab therapy in rheumatoid arthritis. Arthritis Res Ther, 2009. 11(2): p. R57.
589. Suttles, J. and R.D. Stout, Macrophage CD40 signaling: a pivotal regulator of disease protection and
pathogenesis. Semin Immunol, 2009. 21(5): p. 257-64.
590. Kiener, P.A., et al., Stimulation of CD40 with purified soluble gp39 induces proinflammatory responses in
human monocytes. J Immunol, 1995. 155(10): p. 4917-25.
591. Durie, F.H., et al., Prevention of collagen-induced arthritis with an antibody to gp39, the ligand for
CD40. Science, 1993. 261(5126): p. 1328-30.
592. Pamuk, G.E., et al., Elevated platelet-monocyte complexes in patients with psoriatic arthritis. Platelets,
2009. 20(7): p. 493-7.
593. Howell, W.M., P.C. Calder, and R.F. Grimble, Gene polymorphisms, inflammatory diseases and cancer.
Proc Nutr Soc, 2002. 61(4): p. 447-56.
594. Lincoln, M.R., et al., Epistasis among HLA-DRB1, HLA-DQA1, and HLA-DQB1 loci determines multiple
sclerosis susceptibility. Proc Natl Acad Sci U S A, 2009. 106(18): p. 7542-7.
595. Pietzak, M.M., et al., Stratifying risk for celiac disease in a large at-risk United States population by
using HLA alleles. Clin Gastroenterol Hepatol, 2009. 7(9): p. 966-71.
596. Haas, J.P., et al., HLA-DQA1 gene expression profiling in oligoarticular JIA. Autoimmunity, 2009. 42(4): p.
389-91.
597. Yen, J.H., et al., HLA-DQA1 genotyping in patients with rheumatoid arthritis in Taiwan. Kaohsiung J Med
Sci, 2001. 17(4): p. 183-9.
598. Zhang, X., et al., HLA-DQA1 and DQB1 alleles are associated with genetic susceptibility to psoriasis
vulgaris in Chinese Han. Int J Dermatol, 2004. 43(3): p. 181-7.
599. Hornell, T.M., et al., Regulation of the class II MHC pathway in primary human monocytes by granulocyte-
macrophage colony-stimulating factor. J Immunol, 2003. 171(5): p. 2374-83.
600. Reynolds, R.J., et al., Genetic association of htSNPs across the major histocompatibility complex with
rheumatoid arthritis in an African-American population. Genes Immun, 2010. 11(1): p. 94-7.
601. Bates, A.D. and A. Maxwell, The role of ATP in the reactions of type II DNA topoisomerases. Biochem Soc
Trans, 2010. 38(2): p. 438-42.
602. Satyanarayana, A. and P. Kaldis, Mammalian cell-cycle regulation: several Cdks, numerous cyclins and
diverse compensatory mechanisms. Oncogene, 2009. 28(33): p. 2925-39.
603. Watson, D.J., T. Rhodes, and H.A. Guess, All-cause mortality and vascular events among patients with
rheumatoid arthritis, osteoarthritis, or no arthritis in the UK General Practice Research Database. J
Rheumatol, 2003. 30(6): p. 1196-202.
604. Harada, N., et al., Pro-inflammatory effect of TWEAK/Fn14 interaction on human umbilical vein
endothelial cells. Biochem Biophys Res Commun, 2002. 299(3): p. 488-93.

385
605. Kamata, K., et al., Involvement of TNF-like weak inducer of apoptosis in the pathogenesis of collagen-
induced arthritis. J Immunol, 2006. 177(9): p. 6433-9.
606. Perper, S.J., et al., TWEAK is a novel arthritogenic mediator. J Immunol, 2006. 177(4): p. 2610-20.
607. Kamijo, S., et al., Involvement of TWEAK/Fn14 interaction in the synovial inflammation of RA.
Rheumatology (Oxford), 2008. 47(4): p. 442-50.
608. Roos, C., et al., Soluble and transmembrane TNF-like weak inducer of apoptosis differentially activate
the classical and noncanonical NF-kappaB pathway. J Immunol, 2010. 185(3): p. 1593-605.
609. van Kuijk, A.W., et al., TWEAK and its receptor Fn14 in the synovium of patients with rheumatoid
arthritis compared to psoriatic arthritis and its response to tumour necrosis factor blockade. Ann Rheum
Dis, 2010. 69(1): p. 301-4.
610. Park, M.C., et al., Relationship of serum TWEAK level to cytokine level, disease activity, and response to
anti-TNF treatment in patients with rheumatoid arthritis. Scand J Rheumatol, 2008. 37(3): p. 173-8.
611. Jain, M., et al., A novel role for tumor necrosis factor-like weak inducer of apoptosis (TWEAK) in the
development of cardiac dysfunction and failure. Circulation, 2009. 119(15): p. 2058-68.
612. Munoz-Garcia, B., et al., Tumor necrosis factor-like weak inducer of apoptosis (TWEAK) enhances
vascular and renal damage induced by hyperlipidemic diet in ApoE-knockout mice. Arterioscler Thromb
Vasc Biol, 2009. 29(12): p. 2061-8.
613. Schapira, K., et al., Fn14-Fc fusion protein regulates atherosclerosis in ApoE-/- mice and inhibits
macrophage lipid uptake in vitro. Arterioscler Thromb Vasc Biol, 2009. 29(12): p. 2021-7.
614. Asahara, H., et al., Direct evidence of high DNA binding activity of transcription factor AP-1 in
rheumatoid arthritis synovium. Arthritis Rheum, 1997. 40(5): p. 912-8.
615. Granet, C., W. Maslinski, and P. Miossec, Increased AP-1 and NF-kappaB activation and recruitment with
the combination of the proinflammatory cytokines IL-1beta, tumor necrosis factor alpha and IL-17 in
rheumatoid synoviocytes. Arthritis Res Ther, 2004. 6(3): p. R190-8.
616. Weber, A., P. Wasiliew, and M. Kracht, Interleukin-1 (IL-1) pathway. Sci Signal, 2010. 3(105): p. cm1.
617. Kruger, R.P., J. Aurandt, and K.L. Guan, Semaphorins command cells to move. Nat Rev Mol Cell Biol, 2005.
6(10): p. 789-800.
618. Kolodkin, A.L., D.J. Matthes, and C.S. Goodman, The semaphorin genes encode a family of
transmembrane and secreted growth cone guidance molecules. Cell, 1993. 75(7): p. 1389-99.
619. Unified nomenclature for the semaphorins/collapsins. Semaphorin Nomenclature Committee. Cell, 1999.
97(5): p. 551-2.
620. Toyofuku, T., et al., Semaphorin-4A, an activator for T-cell-mediated immunity, suppresses angiogenesis
via Plexin-D1. Embo J, 2007. 26(5): p. 1373-84.
621. Giordano, S., et al., The semaphorin 4D receptor controls invasive growth by coupling with Met. Nat Cell
Biol, 2002. 4(9): p. 720-4.
622. Capparuccia, L. and L. Tamagnone, Semaphorin signaling in cancer cells and in cells of the tumor
microenvironment--two sides of a coin. J Cell Sci, 2009. 122(Pt 11): p. 1723-36.
623. Takegahara, N., et al., Plexin-A1 and its interaction with DAP12 in immune responses and bone
homeostasis. Nat Cell Biol, 2006. 8(6): p. 615-22.
624. Suzuki, K., A. Kumanogoh, and H. Kikutani, Semaphorins and their receptors in immune cell interactions.
Nat Immunol, 2008. 9(1): p. 17-23.
625. Kolodkin, A.L., et al., Neuropilin is a semaphorin III receptor. Cell, 1997. 90(4): p. 753-62.
626. He, Z. and M. Tessier-Lavigne, Neuropilin is a receptor for the axonal chemorepellent Semaphorin III. Cell,
1997. 90(4): p. 739-51.

386
627. Gu, C., et al., Semaphorin 3E and plexin-D1 control vascular pattern independently of neuropilins.
Science, 2005. 307(5707): p. 265-8.
628. Takahashi, T., et al., Plexin-neuropilin-1 complexes form functional semaphorin-3A receptors. Cell, 1999.
99(1): p. 59-69.
629. Brown, C.B., et al., PlexinA2 and semaphorin signaling during cardiac neural crest development.
Development, 2001. 128(16): p. 3071-80.
630. Montolio, M., et al., A semaphorin 3A inhibitor blocks axonal chemorepulsion and enhances axon
regeneration. Chem Biol, 2009. 16(7): p. 691-701.
631. Toyofuku, T., et al., Dual roles of Sema6D in cardiac morphogenesis through region-specific association
of its receptor, Plexin-A1, with off-track and vascular endothelial growth factor receptor type 2. Genes
Dev, 2004. 18(4): p. 435-47.
632. Takamatsu, H., et al., Semaphorins guide the entry of dendritic cells into the lymphatics by activating
myosin II. Nat Immunol.
633. Watarai, H., et al., PDC-TREM, a plasmacytoid dendritic cell-specific receptor, is responsible for
augmented production of type I interferon. Proc Natl Acad Sci U S A, 2008. 105(8): p. 2993-8.
634. Takahashi, T. and S.M. Strittmatter, Plexina1 autoinhibition by the plexin sema domain. Neuron, 2001.
29(2): p. 429-39.
635. Rohm, B., et al., Plexin/neuropilin complexes mediate repulsion by the axonal guidance signal
semaphorin 3A. Mech Dev, 2000. 93(1-2): p. 95-104.
636. Bachelder, R.E., et al., Competing autocrine pathways involving alternative neuropilin-1 ligands regulate
chemotaxis of carcinoma cells. Cancer Res, 2003. 63(17): p. 5230-3.
637. Ting, J.P. and J. Trowsdale, Genetic control of MHC class II expression. Cell, 2002. 109 Suppl: p. S21-33.
638. Lanier, L.L. and A.B. Bakker, The ITAM-bearing transmembrane adaptor DAP12 in lymphoid and myeloid
cell function. Immunol Today, 2000. 21(12): p. 611-4.
639. Kaneko, M., et al., Nasu-Hakola disease: The first case reported by Nasu and review. Neuropathology.
640. Eun, S.Y., et al., Cutting edge: rho activation and actin polarization are dependent on plexin-A1 in
dendritic cells. J Immunol, 2006. 177(7): p. 4271-5.
641. Elbashir, S.M., et al., Duplexes of 21-nucleotide RNAs mediate RNA interference in cultured mammalian
cells. Nature, 2001. 411(6836): p. 494-8.
642. Whitehead, K.A., R. Langer, and D.G. Anderson, Knocking down barriers: advances in siRNA delivery. Nat
Rev Drug Discov, 2009. 8(2): p. 129-38.
643. Rand, T.A., et al., Biochemical identification of Argonaute 2 as the sole protein required for RNA-induced
silencing complex activity. Proc Natl Acad Sci U S A, 2004. 101(40): p. 14385-9.
644. Li, L.C., et al., Small dsRNAs induce transcriptional activation in human cells. Proc Natl Acad Sci U S A,
2006. 103(46): p. 17337-42.
645. O'Connor, B.P., et al., Semaphorin 6D regulates the late phase of CD4+ T cell primary immune responses.
Proc Natl Acad Sci U S A, 2008. 105(35): p. 13015-20.
646. Hoek, R.M., et al., Deletion of either CD55 or CD97 ameliorates arthritis in mouse models. Arthritis
Rheum. 62(4): p. 1036-42.
647. Takamatsu, H., T. Okuno, and A. Kumanogoh, Regulation of immune cell responses by semaphorins and
their receptors. Cell Mol Immunol. 7(2): p. 83-8.
648. Jackson, A.L. and P.S. Linsley, Recognizing and avoiding siRNA off-target effects for target identification
and therapeutic application. Nat Rev Drug Discov, 2010. 9(1): p. 57-67.

387
649. Khan, A.A., et al., Transfection of small RNAs globally perturbs gene regulation by endogenous
microRNAs. Nat Biotechnol, 2009. 27(6): p. 549-55.
650. Brentano, F., et al., The role of Toll-like receptor signalling in the pathogenesis of arthritis. Cell
Immunol, 2005. 233(2): p. 90-6.
651. Chen, J.M., et al., Cloning, isolation, and characterization of mammalian legumain, an asparaginyl
endopeptidase. J Biol Chem, 1997. 272(12): p. 8090-8.
652. Kembhavi, A.A., et al., The two cysteine endopeptidases of legume seeds: purification and
characterization by use of specific fluorometric assays. Arch Biochem Biophys, 1993. 303(2): p. 208-13.
653. Dalton, J.P., L. Hola-Jamriska, and P.J. Brindley, Asparaginyl endopeptidase activity in adult
Schistosoma mansoni. Parasitology, 1995. 111 ( Pt 5): p. 575-80.
654. Brix, K., et al., Cysteine cathepsins: cellular roadmap to different functions. Biochimie, 2008. 90(2): p.
194-207.
655. Dickinson, D.P., Cysteine peptidases of mammals: their biological roles and potential effects in the oral
cavity and other tissues in health and disease. Crit Rev Oral Biol Med, 2002. 13(3): p. 238-75.
656. Li, D.N., et al., Multistep autoactivation of asparaginyl endopeptidase in vitro and in vivo. J Biol Chem,
2003. 278(40): p. 38980-90.
657. Chen, J.M., et al., Cloning and expression of mouse legumain, a lysosomal endopeptidase. Biochem J,
1998. 335 ( Pt 1): p. 111-7.
658. Sepulveda, F.E., et al., Critical role for asparagine endopeptidase in endocytic Toll-like receptor
signaling in dendritic cells. Immunity, 2009. 31(5): p. 737-48.
659. Manoury, B., et al., An asparaginyl endopeptidase processes a microbial antigen for class II MHC
presentation. Nature, 1998. 396(6712): p. 695-9.
660. Matthews, S.P., et al., Distinct protease requirements for antigen presentation in vitro and in vivo. J
Immunol, 2010. 184(5): p. 2423-31.
661. Jezierska, A. and T. Motyl, Matrix metalloproteinase-2 involvement in breast cancer progression: a mini-
review. Med Sci Monit, 2009. 15(2): p. RA32-40.
662. Liu, C., et al., Overexpression of legumain in tumors is significant for invasion/metastasis and a
candidate enzymatic target for prodrug therapy. Cancer Res, 2003. 63(11): p. 2957-64.
663. Wu, W., et al., Targeting cell-impermeable prodrug activation to tumor microenvironment eradicates
multiple drug-resistant neoplasms. Cancer Res, 2006. 66(2): p. 970-80.
664. Briggs, J.J., et al., Cystatin E/M suppresses legumain activity and invasion of human melanoma. BMC
Cancer, 2010. 10: p. 17.
665. Clerin, V., et al., Expression of the cysteine protease legumain in vascular lesions and functional
implications in atherogenesis. Atherosclerosis, 2008.
666. Mattock, K.L., et al., Legumain and cathepsin-L expression in human unstable carotid plaque.
Atherosclerosis, 2009.
667. Alvarez-Fernandez, M., et al., Inhibition of mammalian legumain by some cystatins is due to a novel
second reactive site. J Biol Chem, 1999. 274(27): p. 19195-203.
668. Zeeuwen, P.L., T. Cheng, and J. Schalkwijk, The biology of cystatin M/E and its cognate target
proteases. J Invest Dermatol, 2009. 129(6): p. 1327-38.
669. Zeeuwen, P.L., et al., Evidence that unrestricted legumain activity is involved in disturbed epidermal
cornification in cystatin M/E deficient mice. Hum Mol Genet, 2004. 13(10): p. 1069-79.
670. Chang, Y.H., et al., Elevated circulatory MMP-2 and MMP-9 levels and activities in patients with
rheumatoid arthritis and systemic lupus erythematosus. Clin Biochem, 2008. 41(12): p. 955-9.

388
671. Ikeda, Y., et al., Cathepsins B and L in synovial fluids from patients with rheumatoid arthritis and the
effect of cathepsin B on the activation of pro-urokinase. J Med Invest, 2000. 47(1-2): p. 61-75.
672. Maciewicz, R.A., et al., Mode of activation of the precursor to cathepsin L: implication for matrix
degradation in arthritis. Biol Chem Hoppe Seyler, 1990. 371 Suppl: p. 223-8.
673. Lemaire, R., et al., Selective induction of the secretion of cathepsins B and L by cytokines in synovial
fibroblast-like cells. Br J Rheumatol, 1997. 36(7): p. 735-43.
674. Hashimoto, S., et al., Serial analysis of gene expression in human monocytes and macrophages. Blood,
1999. 94(3): p. 837-44.
675. Xie, D. and G.A. Homandberg, Fibronectin fragments bind to and penetrate cartilage tissue resulting in
proteinase expression and cartilage damage. Biochim Biophys Acta, 1993. 1182(2): p. 189-96.
676. Fabian, M.R., N. Sonenberg, and W. Filipowicz, Regulation of mRNA translation and stability by
microRNAs. Annu Rev Biochem. 79: p. 351-79.
677. Liu, J., et al., Cathepsin L expression and regulation in human abdominal aortic aneurysm,
atherosclerosis, and vascular cells. Atherosclerosis, 2006. 184(2): p. 302-11.
678. Sukhova, G.K., et al., Expression of the elastolytic cathepsins S and K in human atheroma and regulation
of their production in smooth muscle cells. J Clin Invest, 1998. 102(3): p. 576-83.
679. Prince, H.E., Biomarkers for diagnosing and monitoring autoimmune diseases. Biomarkers, 2005. 10 Suppl
1: p. S44-9.
680. Ebrahimi, A.A., et al., Serum levels of TNF-alpha, TNF-alphaRI, TNF-alphaRII and IL-12 in treated
rheumatoid arthritis patients. Iran J Immunol, 2009. 6(3): p. 147-53.
681. Mastroianni, A., et al., Cytokine profiles during infliximab monotherapy in psoriatic arthritis. Br J
Dermatol, 2005. 153(3): p. 531-6.
682. Shao, X.T., et al., Expression of interleukin-18, IL-18BP, and IL-18R in serum, synovial fluid, and synovial
tissue in patients with rheumatoid arthritis. Clin Exp Med, 2009. 9(3): p. 215-21.
683. Partsch, G., et al., Highly increased levels of tumor necrosis factor-alpha and other proinflammatory
cytokines in psoriatic arthritis synovial fluid. J Rheumatol, 1997. 24(3): p. 518-23.
684. Schuerwegh, A.J., et al., Synovial fluid and peripheral blood immune complexes of patients with
rheumatoid arthritis induce apoptosis in cytokine-activated chondrocytes. Rheumatol Int, 2007. 27(10):
p. 901-9.
685. Peters, J.H., et al., Electrophoretic characterization of species of fibronectin bearing sequences from the
N-terminal heparin-binding domain in synovial fluid samples from patients with osteoarthritis and
rheumatoid arthritis. Arthritis Res Ther, 2003. 5(6): p. R329-39.
686. Turk, V., et al., Lysosomal cathepsins: structure, role in antigen processing and presentation, and
cancer. Adv Enzyme Regul, 2002. 42: p. 285-303.
687. He, X., A.H. Kang, and J.M. Stuart, Accumulation of T cells reactive to type II collagen in synovial fluid of
patients with rheumatoid arthritis. J Rheumatol, 2000. 27(3): p. 589-93.
688. Sweeney, S.E. and G.S. Firestein, Signal transduction in rheumatoid arthritis. Curr Opin Rheumatol, 2004.
16(3): p. 231-7.
689. Thalhamer, T., M.A. McGrath, and M.M. Harnett, MAPKs and their relevance to arthritis and
inflammation. Rheumatology (Oxford), 2008. 47(4): p. 409-14.
690. Sozzani, S., et al., Type I interferons in systemic autoimmunity. Autoimmunity, 2010. 43(3): p. 196-203.
691. Cho, S.J., et al., Ikaros negatively regulates inducible nitric oxide synthase expression in macrophages:
involvement of Ikaros phosphorylation by casein kinase 2. Cell Mol Life Sci, 2008. 65(20): p. 3290-303.
389
692. Chien, W., et al., Characterization of a myeloid tyrosine phosphatase, Lyp, and its role in the Bcr-Abl
signal transduction pathway. J Biol Chem, 2003. 278(30): p. 27413-20.
693. Castellani, V. and G. Rougon, Control of semaphorin signaling. Curr Opin Neurobiol, 2002. 12(5): p. 532-
41.
694. Fassold, A., et al., Soluble neuropilin-2, a nerve repellent receptor, is increased in rheumatoid arthritis
synovium and aggravates sympathetic fiber repulsion and arthritis. Arthritis Rheum, 2009. 60(10): p.
2892-901.
695. Gravina, S. and J. Vijg, Epigenetic factors in aging and longevity. Pflugers Arch, 2010. 459(2): p. 247-58.
696. Oliver, J.E. and A.J. Silman, Why are women predisposed to autoimmune rheumatic diseases? Arthritis
Res Ther, 2009. 11(5): p. 252.
697. Hao, S. and D. Baltimore, The stability of mRNA influences the temporal order of the induction of genes
encoding inflammatory molecules. Nat Immunol, 2009. 10(3): p. 281-8.
698. Bousso, P., T-cell activation by dendritic cells in the lymph node: lessons from the movies. Nat Rev
Immunol, 2008. 8(9): p. 675-84.
699. Beauchemin, C., N.M. Dixit, and A.S. Perelson, Characterizing T cell movement within lymph nodes in the
absence of antigen. J Immunol, 2007. 178(9): p. 5505-12.
700. Friedman, R.S., J. Jacobelli, and M.F. Krummel, Mechanisms of T cell motility and arrest: deciphering the
relationship between intra- and extracellular determinants. Semin Immunol, 2005. 17(6): p. 387-99.
701. Underhill, D.M., et al., Dynamic interactions of macrophages with T cells during antigen presentation. J
Exp Med, 1999. 190(12): p. 1909-14.
702. Castellino, F., et al., Chemokines enhance immunity by guiding naive CD8+ T cells to sites of CD4+ T cell-
dendritic cell interaction. Nature, 2006. 440(7086): p. 890-5.
703. Friedman, R.S., J. Jacobelli, and M.F. Krummel, Surface-bound chemokines capture and prime T cells for
synapse formation. Nat Immunol, 2006. 7(10): p. 1101-8.
Copyright © 2022 FDOKUMEN