2015RobertsonPhD.pdf - University of Glasgow
271
Glasgow Theses Service http://theses.gla.ac.uk/ [email protected] Robertson, Duncan (2015) Implicit cognition and the social evaluation of speech. PhD thesis. http://theses.gla.ac.uk/7176/ Copyright and moral rights for this thesis are retained by the author A copy can be downloaded for personal non-commercial research or study This thesis cannot be reproduced or quoted extensively from without first obtaining permission in writing from the Author The content must not be changed in any way or sold commercially in any format or medium without the formal permission of the Author When referring to this work, full bibliographic details including the author, title, awarding institution and date of the thesis must be given
-
Upload
khangminh22 -
Category
Documents
-
view
0 -
download
0
Transcript of 2015RobertsonPhD.pdf - University of Glasgow

Glasgow Theses Service http://theses.gla.ac.uk/
Robertson, Duncan (2015) Implicit cognition and the social evaluation of speech. PhD thesis. http://theses.gla.ac.uk/7176/ Copyright and moral rights for this thesis are retained by the author A copy can be downloaded for personal non-commercial research or study This thesis cannot be reproduced or quoted extensively from without first obtaining permission in writing from the Author The content must not be changed in any way or sold commercially in any format or medium without the formal permission of the Author When referring to this work, full bibliographic details including the author, title, awarding institution and date of the thesis must be given

Implicit Cognition and the Social
Evaluation of Speech
A thesis submitted in partial fulfilment of the degree of
Doctor of Philosophy
at
The University of Glasgow
Duncan Robertson
14th September 2015

Abstract
For the past three decades, psychological research has repeatedly shown that
it is not always necessary for us to be conscious of events in order to perceive
them, a phenomenon referred to as implicit cognition (Underwood & Bright
1996). Although this has been the subject of much research in the disciplines
of psychology and social psychology, sociolinguists have only recently begun
to examine how implicit cognition functions with regards to how we perceive
speech (Campbell-Kibler 2012). Consistent with social psychology research
on implicit responses to visually-derived social information (Greenwald et al
1998; Karpinski & Hilton 2001), recent sociolinguistic research suggests that
listeners make differing conscious and unconscious social evaluations upon
hearing different regional and foreign-accented speech varieties (Kristiansen
2009; Pantos & Perkins 2013), and that this is at least partly driven by
socially-marked phonetic variation (Campbell-Kibler 2012, 2013).
While previous research has investigated this phenomenon in relation to
different regional or international varieties of English, the current study in-
vestigates the conscious and unconscious associations listeners make towards
different social accents in Glasgow. This was achieved over three experi-
ments by adapting an established psycholinguistic eye tracking methodology
for sociolinguistic research. The first experiment (N=32) was conducted
without eye tracking, relying on pencil and paper responses. Participants
were tasked with choosing between on-screen ‘working-class’ and ‘middle-
class’ target images (determined via a separate norming task) of brand logos
and objects while recordings of different speakers uttering words semanti-
cally related to both images were heard. Non-significant trends were found
in the data, with participants more likely to choose ‘working-class’ brand
logos when a working-class speaker was heard and ‘middle-class’ logos when
a middle-class speaker was heard. A second experiment (N=42) recorded
listener eye movements in real time towards the same experimental stim-
uli, finding listeners to have been significantly (p<.05) more likely to fixate

upon ‘working-class’ brand logos when hearing a working-class speaker than
when hearing a middle-class speaker. Listeners’ verbal choices of brand logos
showed no significant effect of speaker heard, showing a divergence between
the on-line and off-line responses made towards speakers. Conversely, the
speaker heard was found to have had a significant (p<.05) effect on the
images of objects verbally chosen by listeners, but no effect on fixations
made towards objects. A third experiment (N=54) investigated listener fix-
ations towards brand logos while hearing words containing different socially-
marked phonetic variants. Socially-marked phonetic realisations of CAT,
post-vocalic/post-consonantal /l/, and non-prevocalic /r/ were all found to
have elicited significant (p<.05) effects on listener fixation behaviour, with
response times ranging from 300-700ms. A supplemental subjective reaction
test (N=60) found participants to have evaluated middle-class Glaswegian
speakers significantly (p<.05) more favourably in terms of Zahn & Hopper’s
(1985) status attributes than working-class Glaswegian speakers, in line with
the findings of previous language attitude studies (Preston 1999; Zahn &
Hopper 1985; Kristiansen 2001).
Overall, the results indicate that speech varieties with varying levels of
perceived social status elicit differing conscious and unconscious social eval-
uations in listeners, and that socially-marked phonetic variation plays a role
in this.
2

Dedication
This thesis is dedicated to my parents, who can’t read it, my wife, who
won’t read it, and my infant son, who can’t read.

Acknowledgements
For making this research possible and guiding me throughout my Masters
and Doctoral studies, I would like to thank my supervisors — Prof. Jane
Stuart-Smith, Dr. Rachel Smith, and Dr. Christoph Scheepers — each
of whom have been unbelievably helpful, knowledgeable, and approachable
over the last four years, and have worked tirelessly to tackle the many, many
problems I encountered along the way!
I would also like to thank Dr. Kathryn Campbell-Kibler at the Ohio
State University, whose presentation at ExAPP 2010 was responsible for
sparking my interest in the subject matter, Dr. Andrew MacFarlane at the
University of York, who assisted greatly with the social psychology aspect of
this research by selecting and providing me with a host of relevant papers
to read, Dr. Christophe Veaux at the University of Edinburgh for supplying
synthetic speech samples, Prof. Catherine Best at the University of Western
Sydney for providing invaluable advice on phonological processing, and Prof.
Jennifer Smith at the University of Glasgow and Dr. Bronwen Evans at
University College London for serving as reviewers for this thesis, providing
insightful feedback and identifying areas of improvement.
Finally, I would like to thank all at the Glasgow University Laboratory
of Phonetics, particularly Farhana Alam, Vijay Solanki, and Robert Lennon,
who have continuously provided me with help and support during the writing
of this thesis.

Declaration
This thesis is a presentation of my original research work. Wherever con-
tributions of others were involved, every effort is made to indicate this clearly
with due reference to the literature. This research was carried out under the
guidance of Prof. Jane Stuart-Smith, Dr. Rachel Smith, and Dr. Christoph
Scheepers at the University of Glasgow, UK.
Duncan Robertson
24/02/16

Contents
1 Introduction 12
2 Background 15
2.1 Attitudes . . . . . . . . . . . . . . . . . . . . . . . . . . . . . 16
2.2 Language Attitudes . . . . . . . . . . . . . . . . . . . . . . . . 23
2.3 Sociolinguistic Perception . . . . . . . . . . . . . . . . . . . . 30
2.4 Linguistic Context . . . . . . . . . . . . . . . . . . . . . . . . 37
2.5 Summary . . . . . . . . . . . . . . . . . . . . . . . . . . . . . 41
3 Pilot Study (MLitt) 43
3.1 Introduction . . . . . . . . . . . . . . . . . . . . . . . . . . . . 43
3.2 Method . . . . . . . . . . . . . . . . . . . . . . . . . . . . . . 44
3.2.1 Participants . . . . . . . . . . . . . . . . . . . . . . . . 44
3.2.2 Materials . . . . . . . . . . . . . . . . . . . . . . . . . 45
3.2.3 Stimuli Norming . . . . . . . . . . . . . . . . . . . . . 48
3.2.4 Procedure . . . . . . . . . . . . . . . . . . . . . . . . . 49
3.3 Results . . . . . . . . . . . . . . . . . . . . . . . . . . . . . . . 50
3.4 Discussion . . . . . . . . . . . . . . . . . . . . . . . . . . . . . 53
4 Experiment 1 - Off-line Semantic Association Task 56
4.1 Introduction . . . . . . . . . . . . . . . . . . . . . . . . . . . . 56
4.2 Method . . . . . . . . . . . . . . . . . . . . . . . . . . . . . . 57
4.2.1 Participants . . . . . . . . . . . . . . . . . . . . . . . . 57
4.2.2 Materials . . . . . . . . . . . . . . . . . . . . . . . . . 57
4.2.3 Procedure . . . . . . . . . . . . . . . . . . . . . . . . . 61
1

CONTENTS
4.3 Results . . . . . . . . . . . . . . . . . . . . . . . . . . . . . . . 62
4.4 Discussion . . . . . . . . . . . . . . . . . . . . . . . . . . . . . 64
5 Background II 66
5.1 Implicit Cognition . . . . . . . . . . . . . . . . . . . . . . . . 66
5.2 Implicit Social Cognition . . . . . . . . . . . . . . . . . . . . . 72
5.2.1 Social Priming . . . . . . . . . . . . . . . . . . . . . . 72
5.2.2 Replication Issues . . . . . . . . . . . . . . . . . . . . . 79
5.2.3 The Implicit Association Test . . . . . . . . . . . . . . 83
5.3 Implicit Sociolinguistic Cognition . . . . . . . . . . . . . . . . 87
5.4 Implicit vs. Explicit Cognition . . . . . . . . . . . . . . . . . . 95
5.4.1 Evolutionary Basis . . . . . . . . . . . . . . . . . . . . 95
5.4.2 Dual Systems vs. Iterative Processing Models . . . . . 96
5.5 The Visual World Paradigm . . . . . . . . . . . . . . . . . . . 99
5.6 Summary . . . . . . . . . . . . . . . . . . . . . . . . . . . . . 107
6 Experiment 2 - Listener Fixations Upon Hearing Different
Social Accents 109
6.1 Introduction . . . . . . . . . . . . . . . . . . . . . . . . . . . . 109
6.2 Method . . . . . . . . . . . . . . . . . . . . . . . . . . . . . . 110
6.2.1 Participants . . . . . . . . . . . . . . . . . . . . . . . . 110
6.2.2 Materials . . . . . . . . . . . . . . . . . . . . . . . . . 111
6.2.3 Procedure . . . . . . . . . . . . . . . . . . . . . . . . . 112
6.2.4 Data Conversion . . . . . . . . . . . . . . . . . . . . . 114
6.3 Results . . . . . . . . . . . . . . . . . . . . . . . . . . . . . . . 116
6.3.1 Generalised Estimating Equations . . . . . . . . . . . . 116
6.3.2 Objects . . . . . . . . . . . . . . . . . . . . . . . . . . 117
6.3.3 Brand Logos . . . . . . . . . . . . . . . . . . . . . . . . 121
6.4 Discussion . . . . . . . . . . . . . . . . . . . . . . . . . . . . . 123
7 Experiment 3 - Listener Fixations Upon Hearing Different
Socially-Marked Phonetic Variants 126
7.1 Introduction . . . . . . . . . . . . . . . . . . . . . . . . . . . . 126
7.2 Method . . . . . . . . . . . . . . . . . . . . . . . . . . . . . . 127
2

CONTENTS
7.2.1 Participants . . . . . . . . . . . . . . . . . . . . . . . . 127
7.2.2 Materials . . . . . . . . . . . . . . . . . . . . . . . . . 127
7.2.3 Procedure . . . . . . . . . . . . . . . . . . . . . . . . . 141
7.3 Results . . . . . . . . . . . . . . . . . . . . . . . . . . . . . . . 144
7.3.1 CAT Vowel Realisations . . . . . . . . . . . . . . . . . 144
7.3.2 Post-Vocalic/Post-Consonantal /l/ Realisations . . . . 148
7.3.3 Non-Prevocalic /r/ Realisations . . . . . . . . . . . . . 152
7.4 Discussion . . . . . . . . . . . . . . . . . . . . . . . . . . . . . 156
8 Experiment 4 - Subjective Reaction Test 159
8.1 Introduction . . . . . . . . . . . . . . . . . . . . . . . . . . . . 159
8.2 Method . . . . . . . . . . . . . . . . . . . . . . . . . . . . . . 161
8.2.1 Participants . . . . . . . . . . . . . . . . . . . . . . . . 161
8.2.2 Materials . . . . . . . . . . . . . . . . . . . . . . . . . 161
8.2.3 Procedure . . . . . . . . . . . . . . . . . . . . . . . . . 166
8.3 Results . . . . . . . . . . . . . . . . . . . . . . . . . . . . . . . 167
8.3.1 Principal Component Analysis . . . . . . . . . . . . . . 167
8.3.2 Phonetic Variables . . . . . . . . . . . . . . . . . . . . 169
8.4 Discussion . . . . . . . . . . . . . . . . . . . . . . . . . . . . . 176
9 Discussion 178
9.0.1 Summary of Main Findings . . . . . . . . . . . . . . . 178
9.0.2 Research Questions . . . . . . . . . . . . . . . . . . . . 183
9.0.3 Theoretical Implications . . . . . . . . . . . . . . . . . 186
10 Conclusion 192
Bibliography 193
10.1 References . . . . . . . . . . . . . . . . . . . . . . . . . . . . . 194
Appendices 211
10.2 Appendices . . . . . . . . . . . . . . . . . . . . . . . . . . . . 212
3

CONTENTS
.1
Social Evaluation Questionnaire
Pilot Study, Experiments 1 and 2 (Unrandomised) . . . . . . . 212
.2
Visual Stimuli
Pilot Study, Experiments 1 and 2 . . . . . . . . . . . . . . . . 226
.3
Word Association Task
Experiment 3 . . . . . . . . . . . . . . . . . . . . . . . . . . . 234
.4
Brand Evaluation Questionnaire
Experiment 3 (Unrandomised) . . . . . . . . . . . . . . . . . . 238
.5
Brand Evaluation Ratings
Experiment 3 . . . . . . . . . . . . . . . . . . . . . . . . . . . 244
.6
Visual Stimuli
Experiment 3 . . . . . . . . . . . . . . . . . . . . . . . . . . . 248
.7
Subjective Reaction Test Form
Experiment 3 . . . . . . . . . . . . . . . . . . . . . . . . . . . 262
4

List of Figures
2.1 Illustration of visual display in Koops et al (2008: 95) . . . . . 34
2.2 Question and semantic differential scale used by Labov et al
(2011: 438) . . . . . . . . . . . . . . . . . . . . . . . . . . . . 35
2.3 Mean subject ratings of newscaster in Experiment 3 with log-
arithmic progression, from Labov et al (2011: 445) . . . . . . 36
2.4 Comment on Mhairi Black’s speech, from The Mail Online . . 40
3.1 Image set displaying brand logos with working-class (Ford)
and middle-class (BMW) target images, paired with the audi-
tory target word car (pilot study) . . . . . . . . . . . . . . . . 47
3.2 Image set displaying objects with working-class (hairnet) and
middle-class (mortar board) target images, paired with the
auditory target word job (pilot study) . . . . . . . . . . . . . . 48
3.3 Mean ratings of reported written word-image associations in
norming task, pilot study (z-scores) . . . . . . . . . . . . . . . 49
3.4 Mean ratings of associations between spoken words and target
images across all image sets, by speaker (pilot study) . . . . . 51
3.5 Mean ratings of associations between spoken words and target
images in image sets depicting objects, by speaker (z-scores) . 52
3.6 Mean ratings of associations between spoken words and target
images in image sets depicting brand logos, by speaker (z-scores) 53
5

LIST OF FIGURES
4.1 An image set depicting objects, showing images hypothesized
to carry ‘working-class’ (the gun) and ‘middle-class’ (the spoon)
connotations, based on ratings from a norming task (Experi-
ment 1) . . . . . . . . . . . . . . . . . . . . . . . . . . . . . . 59
4.2 An image set containing brand logos, showing images hypoth-
esized to carry ‘working-class’ (The Scottish Football Associa-
tion) and ‘middle-class’ (Scottish Rugby) connotations, based
on ratings from a norming task (Experiment 1) . . . . . . . . 60
4.3 Listener choices of brand logos by speaker heard, Experiment
1 (95% C.I.) . . . . . . . . . . . . . . . . . . . . . . . . . . . . 63
4.4 Listener choices of objects by speaker heard, Experiment 1
(95% C.I.) . . . . . . . . . . . . . . . . . . . . . . . . . . . . . 63
5.1 A research participant viewing images on a tachistoscope . . . 67
5.2 Participant view of a typical IAT. Participants are tasked with
categorising visual stimuli according to attributes on either
side of the screen, with attributes changing positions through-
out successive blocks of trials. . . . . . . . . . . . . . . . . . . 84
5.3 Visual representation of an iterative processing model (from
Van Bavel et al 2012: 444). Under this model, a perceiver’s
initial attitudes towards a stimulus are re-evaluated over the
course of continuing ‘evaluation cycles’. . . . . . . . . . . . . . 100
5.4 Visual scene used by Altmann & Kamide (1999: 250) . . . . . 103
6.1 An image set depicting objects hypothesized to carry ‘working-
class’ (the gun) and ‘middle-class’ connotation, determined by
ratings in a norming task (Experiment 2) . . . . . . . . . . . . 110
6.2 An image set containing brand logos hypothesized to carry
‘working-class’ (Fiat) and ‘middle-class’ (Mercedes-Benz ) con-
notations, determined via a norming task (Experiment 2) . . . 113
6.3 Images verbally chosen while viewing image sets containing
objects, by speaker (95% C.I.) (Experiment 2) . . . . . . . . . 119
6

LIST OF FIGURES
6.4 Time course of participant gazes towards ‘working-class’ ob-
jects in comparison to ‘middle-class’ objects, by speaker heard
(by subject analysis, Experiment 2) . . . . . . . . . . . . . . . 120
6.5 Time course of participant gazes towards ‘working-class’ ob-
jects in comparison to ‘middle-class’ objects, by speaker heard
(by image set analysis, Experiment 2) . . . . . . . . . . . . . . 121
6.6 Images chosen while viewing image sets containing brand lo-
gos, by speaker (95% C.I.) (Experiment 2) . . . . . . . . . . . 122
6.7 Time course of participant gazes towards ‘working-class’ ob-
jects in comparison to ‘middle-class’ objects, by speaker heard
(by subject analysis, Experiment 2) . . . . . . . . . . . . . . . 122
6.8 Time course of participant gazes towards ‘working-class’ ob-
jects in comparison to ‘middle-class’ objects, by speaker heard
(by image set analysis, Experiment 2) . . . . . . . . . . . . . . 123
7.1 Formant plot of stressed /a/ in speaker productions of pack to-
kens only. Working-class realisations are red triangles, middle-
class speaker realisations are blue squares, the token from the
synthesized voice is a purple circle (Experiment 3) . . . . . . . 132
7.2 Image set showing a working-class brand (Aldi) and middle-
class brand (Marks & Spencer), paired with the auditory token
store (Experiment 3) . . . . . . . . . . . . . . . . . . . . . . . 138
7.3 Image set paired with target word beer in the drink category
(Experiment 3) . . . . . . . . . . . . . . . . . . . . . . . . . . 142
7.4 Fixations made towards target images while hearing retracted
CAT vowel tokens (Experiment 3). Fixations towards working-
class target brands shown in red, middle-class target brands
shown in blue, distractor brands shown in green. . . . . . . . . 145
7.5 Fixations made towards target images while hearing neutral
CAT vowel tokens (Experiment 3). Fixations towards working-
class target brands shown in red, middle-class target brands
shown in blue, distractor brands shown in green. . . . . . . . . 146
7

LIST OF FIGURES
7.6 Fixations made toward target images while hearing fronted
CAT vowel tokens (Experiment 3). Fixations towards working-
class target brands shown in red, middle-class target brands
shown in blue, distractor brands shown in green. . . . . . . . . 147
7.7 Post-vocalic /l/ onset in till, speaker MC2 (Experiment 3) . . 148
7.8 Fixations made towards target images while hearing strongly-
vocalised /l/ tokens (Experiment 3). Fixations towards working-
class target brands shown in red, middle-class target brands
shown in blue, distractor brands shown in green. . . . . . . . . 149
7.9 Fixations made towards target images while hearing weakly-
vocalised /l/ tokens (Experiment 3). Fixations towards working-
class target brands shown in red, middle-class target brands
shown in blue, distractor brands shown in green. . . . . . . . . 149
7.10 Fixations made towards target images while hearing dark /l/
tokens (Experiment 3). Fixations towards distractor images
shown in green. . . . . . . . . . . . . . . . . . . . . . . . . . . 151
7.11 Fixations made towards target images while hearing clear /l/
tokens (Experiment 3). Fixations towards working-class target
brands shown in red, middle-class target brands shown in blue,
distractor brands shown in green. . . . . . . . . . . . . . . . . 151
7.12 Non-prevocalic /r/ onset in fork, speaker WC4 (Experiment 3) 152
7.13 Fixations made while hearing derhoticised /r/ tokens (Experi-
ment 3). Fixations towards working-class target brands shown
in red, middle-class target brands shown in blue, distractor
brands shown in green. . . . . . . . . . . . . . . . . . . . . . . 153
7.14 Fixations made while hearing weak /r/ tokens (Experiment 3).
Fixations towards working-class target brands shown in red,
middle-class target brands shown in blue, distractor brands
shown in green. . . . . . . . . . . . . . . . . . . . . . . . . . . 154
7.15 Fixations made while hearing tap/approximant /r/ tokens (Ex-
periment 3). Fixations towards working-class target brands
shown in red, middle-class target brands shown in blue, dis-
tractor brands shown in green. . . . . . . . . . . . . . . . . . . 154
8

LIST OF FIGURES
7.16 Fixations made while hearing bunched /r/ tokens (Experi-
ment 3). Fixations towards working-class target brands shown
in red, middle-class target brands shown in blue, distractor
brands shown in green. . . . . . . . . . . . . . . . . . . . . . . 156
8.1 Semantic differentials for perceived speaker personality traits
in Subjective Reaction Test (Experiment 4) . . . . . . . . . . 165
8.2 Social attractiveness traits in Zahn & Hopper (1985) and Kris-
tiansen (2001) . . . . . . . . . . . . . . . . . . . . . . . . . . . 166
8.3 Mean participant ratings of speaker personality trait compo-
nents, by social class (95% C.I.) (Experiment 4) . . . . . . . . 167
8.4 Mean participant ratings of speaker personality trait compo-
nents, by speaker (95% C.I.) (Experiment 4) . . . . . . . . . . 168
9
List of Tables
2.1 Participant ratings of UK regional accents, BBC Voices project
(from Coupland 2007: 98) . . . . . . . . . . . . . . . . . . . . 26
2.2 Differences in listener personality trait assessments of Scottish
and English voices (from Cheyne 1970: 78) . . . . . . . . . . . 28
5.1 Attributes frequently associated with Type 1 and Type 2 pro-
cesses in dual process models (from Evans & Stanovich 2013:
225). . . . . . . . . . . . . . . . . . . . . . . . . . . . . . . . . 97
6.1 GEE by subject model effects, showing a highly significant
(<.001) effect of image set type (Igroup) and a significant
(p=.024) interaction of speaker and image set type on the
verbal image choices reported by listeners (Experiment 2) . . . 117
6.2 GEE pairwise comparisons by subject, showing a significant
(p=.008) effect of speaker heard on image choices while view-
ing image sets depicting objects (Experiment 2) . . . . . . . . 118
6.3 GEE by image set model effects, showing a highly signifi-
cant (p=.004) interaction between image set type (Igroup) and
speaker heard on the images verbally chosen by listeners (Ex-
periment 2) . . . . . . . . . . . . . . . . . . . . . . . . . . . . 118
6.4 GEE pairwise comparisons by image set, showing a highly sig-
nificant (p=004) effect of speaker heard on the images verbally
chosen by listeners while viewing image sets depicting objects
(Experiment 2) . . . . . . . . . . . . . . . . . . . . . . . . . . 119
10

LIST OF TABLES
7.1 Target words in auditory stimuli, by phonetic variable (Exper-
iment 3) . . . . . . . . . . . . . . . . . . . . . . . . . . . . . . 128
7.2 Speakers used as auditory stimuli in eye tracking task (Exper-
iment 3) . . . . . . . . . . . . . . . . . . . . . . . . . . . . . . 130
7.3 CAT vowel realisations by speaker (Experiment 3) . . . . . . . 133
7.4 Post-vocalic/post-consonantal /l/ realisations by speaker (Ex-
periment 3) . . . . . . . . . . . . . . . . . . . . . . . . . . . . 134
7.5 Non-prevocalic /r/ realisations by speaker, (Experiment 3) . . 136
7.6 Participant ‘poshness’ ratings of brands used in visual stim-
uli (Experiment 3) ‘Working-class’ brands are in red/pink,
‘middle-class’ brands are in blue . . . . . . . . . . . . . . . . . 139
7.7 Image set/auditory target stimuli pairings (Experiment 3) ‘Working-
class’ brands are in red/pink, ‘middle-class’ brands are in blue 140
8.1 Speakers heard in auditory stimuli during Subjective Reaction
Test (Experiment 4) . . . . . . . . . . . . . . . . . . . . . . . 163
8.2 Rotated component matrix identifying principal components
of speaker personality trait ratings (Experiment 4) . . . . . . . 165
8.3 Class-typical realisations produced by each speaker in Subjec-
tive Reaction Test stimuli (Experiment 4) . . . . . . . . . . . 169
8.4 Aggregated class-typical realisations produced by each speaker
in Subjective Reaction Test stimuli (Experiment 4) . . . . . . 170
8.5 Speaker voice qualities heard during Subjective Reaction Test
(Experiment 4) . . . . . . . . . . . . . . . . . . . . . . . . . . 171
9.1 Two-tailed unpaired t-test table of male and female listener
ratings of personality traits of working and middle-class speak-
ers, displaying p-values (Experiment 4). . . . . . . . . . . . . . 189
9.2 Correlation of listener age with ratings of speaker personal-
ity traits in the subject reaction test, by speaker social class
(Experiment 4). . . . . . . . . . . . . . . . . . . . . . . . . . . 190
11

Chapter 1
Introduction
This thesis presents an experimental investigation of implicit sociolinguis-
tic cognition — the notion that language can trigger, within listeners, varying
automatic and unconscious social evaluations of speakers. Although there has
been relatively little research on this phenomenon to date, recent studies sug-
gest that listeners make differing conscious and unconscious evaluations of
speakers based upon both regional and foreign accent features (Kristiansen
2009; Pantos & Perkins 2013; Campbell-Kibler 2012, 2013). The purpose
of this doctoral research was to investigate whether or not the same holds
true when people encounter speakers of different social accents and, if so,
the specific sociolinguistic features related to the formation of unconscious
associations upon hearing speech.
The city of Glasgow provides an ideal linguistic background for studying
listener evaluations of socially divergent speech varieties, being home to
both heavily stigmatised working-class vernacular and relatively prestigious
middle-class accents of English (Macaulay 1977; Macafee 1983, 1988; Men-
zies 1991; Torrance 2003). Furthermore, previous research has shown that
Glaswegian listeners are able to categorise working and middle-class Glaswe-
gian accents based solely on the presence of class-typical phonetic variants
(MacFarlane & Stuart-Smith 2012).
In a departure from previous investigations of implicit sociolinguistic cogni-
tion, which have favoured Greenwald et al ’s (1998) Implicit Association Test,
12

1. INTRODUCTION
this study utilises the Visual World Paradigm — an established psycholin-
guistic research paradigm which involves the real-time tracking of listener eye
movements in response to spoken language. To date, Visual World experi-
ments have primarily been used to study the cognitive processing of semantic
and pragmatic information, but have also been implemented in a small num-
ber of sociolinguistic studies (cf. Koops et al 2008; Dahan et al 2008). Here,
the methodology was adapted specifically to investigate unconscious social
class evaluations, with Visual World studies devised to investigate the effect
of differing social accents and socially-marked phonetic variation on the au-
tomatic associations made by listeners upon hearing speech.
The current research represents a continuation of a short masters disserta-
tion, which served as a tentative first step, and is briefly summarized here
by way of providing necessary background for the development of the exper-
imental paradigm (Ch. 3). Following on from the initial pilot study (N=40),
this thesis presents the findings of an off-line speaker evaluation task (N=32)
which tested elements of the methodology prior to implementing eye track-
ing, a Visual World experiment (N=42) investigating listener associations
made upon hearing two speakers of socially contrasting Glaswegian accents,
another eye tracking experiment (N=54) investigating the role of socially
marked phonetic variation on listener associations, and a subjective reaction
test (N=60) investigating listeners’ explicit evaluations of those speakers.
The specific research questions which the study aimed to answer were
formulated as follows:
1. Does social information encoded within the speech signal im-
pact upon the implicit associations made by listeners?
2. Does socially-marked phonetic variation impact upon the im-
plicit associations made by listeners?
3. What is the time-course of implicit sociolinguistic cognition?
To briefly address these questions (which are answered in detail in section
13

1. INTRODUCTION
9.0.2), the Visual World experiments revealed different social accents and
socially-marked phonetic realisations to have triggered differing associations
in listeners, with significant differences in fixation behaviour observed from
300ms after the onset of socially-marked phonetic realisations, indicating
that such associations were made unconsciously. Furthermore, the results
were largely in line with previous research on the topic, adding to a growing
body of evidence for implicit sociolinguistic cognition.
14

Chapter 2
Background
Research on implicit sociolinguistic cognition is a truly interdisciplinary
area of investigation, existing primarily at the intersection of sociolinguistics
and social psychology — disciplines which, although sharing many common-
alities, have traditionally been considered to be largely unrelated fields —
while also drawing upon techniques and theoretical frameworks from psy-
cholinguistics, phonetics, and cognitive psychology. While in no means an
exhaustive account of these subject areas, this literature review attempts to
give a brief overview of some of the most relevant research in each discipline to
the specific thesis topic, while also outlining methodological developments in
key areas. This includes the development of attitudinal research and charac-
teristics of attitudes in social psychology (p.16), the subsequent development
of the study of language attitudes in sociolinguistics (p.23), and the effect of
fine phonetic variation on social evaluations of speech (p.30). This section
then outlines why Glasgow provides an ideal linguistic background for this
research (p.37), before summarising the key points from each section (p.41).
After chapters outlining 2 preliminary experiments, the literature review
is continued in a second part (Chapter 5) which outlines early psychological
research on implicit cognition (p.66) via subsequent investigations on implicit
social evaluations in social psychology (p.72), and to the specific thesis topic
of implicit sociolinguistic cognition (p.87). The review then touches upon the
15

2.1. ATTITUDES
theoretical basis of implicit cognitive processing (p.95), before discussing the
development and key points of the research methodology used to examine
implicit associations in this study (p.99).
2.1 Attitudes
Attitudes are of central importance both in the fields of social psychology,
a discipline which was originally defined as ‘the scientific study of attitudes’
(Ajzen & Fishbein 2005: 174), and in sociolinguistics, a discipline which ‘has
always shared overlapping concerns and involvement [with social psychology]’
(Garrett 2001: 626). Furthermore, prominent social psychologists, such as
Allport (1954: 43), have long considered attitudes to be ‘the most distinctive
and indispensable concept’ in the field.
Despite the notion of attitudes being fundamental to both disciplines, the
term has been given many varying definitions over time. Thurstone (1931),
for example, defined an attitude as ‘affect for or against a psychological
object’, Allport (1935: 810) as ‘a mental and neural state of readiness, orga-
nized through experience, exerting a directive and dynamic influence upon
the individual’s response to all objects and situations with which it is re-
lated’, and Krech & Crutchfield (1948: 152) as ‘an enduring organisation of
motivational, emotional, perceptual, and cognitive processes with respect to
some aspect of the individual’s world’. Over two decades later, Sarnoff (1970:
279) defined attitudes as ‘a disposition to react favourably or unfavourably
to a class of objects’, Bem (1970: 14) simply as ‘likes and dislikes’, and
Eagly & Chaiken (1993: 1) as ‘a psychological tendency that is expressed
by evaluating a particular entity with some degree of favor or disfavor’ —
with the unifying feature that they all ‘describe some way in which positiv-
ity or negativity is linked to some attitude object.’ (Olson & Fazio 2009: 20).
Attitudes were originally thought to have a degree of permanence, with
Allport (1935: 814) noting that attitudes ‘often persist throughout life in the
way in which they were fixed in childhood or in youth’, Sherif & Cantril (1947:
7) stating that ‘attitudes, once formed, are more or less enduring states of
16

2.1. ATTITUDES
readiness’, and Petty & Cacioppo (1981: 7) defining attitudes as ‘an enduring
positive or negative feeling about some person, object, or issue.’ Furthemore,
Garrett (2010: 20) defines an attitude as ‘an evaluative orientation to a social
object of some sort, whether it is a language, or a new government policy,
etc.’, with the characteristic that such evaluations have ‘a degree of stability
that allows it to be identified.’
Early attitudinal surveys which relied on self-reports appear to confirm
that attitudes can, indeed, persist over time. Brown (1970), for example,
had students recruit two friends — one knowledgeable about and interested
in politics and the other comparitively disinterested in politics (or ‘artic-
ulates’ and ‘inarticulates’, as defined by Brown) — to complete attitudinal
questionnaires (N=36) which tasked them with indicating their level of agree-
ment with various political statments. Twelve participants (consisting of six
‘articulates’ and six ‘inarticulates’) were then contacted every two weeks to
resit the experiment until, after six weeks, each participant had completed
the questionnaire twice. The attitudes of both ‘articulate’ and ‘inarticulate’
participants were found to have remained stable across both tests, and at all
time points (p<.01).
A decade later, Bishop et al (1980) conducted surveys (N=115) among
two groups of middle-aged men and women, 56 of whom had attended college,
to determine their attitudes towards seven different political issues. Each
participant was given the same survey twice, with the second survey given
between nine and eleven months after the first. The results found a high
degree of correlation between the answers given in the first and second surveys
of participants who had attended college, but little correlation in the answers
of participants who had not. While the results demonstrate that the attitudes
of individuals can either remain constant or change over time, they also
highlight the problem with generalising the results of attitudinal research
conducted on college students to the wider populace — a consideration which
is still very much relevant in social science research today.
In another study, Marwell et al (1987: 364) conducted attitudinal surveys
(N=145) of white US civil rights activists in both 1965 and 1985, using Likert
scales which prompted participants to state their level of agreement with
17

2.1. ATTITUDES
questions such as:
We hear a lot of talk these days about liberals and conservatives.
Here is a seven-point scale on which the political views that peo-
ple might hold are arranged from extremely liberal to extremely
conservative. Where would you place yourself on this scale, or
haven’t you thought about it much?
The study found the political attitudes of the activists to have remained
consistently liberal over the 20 year period, with the responses to most ques-
tions indicating ‘a remarkable level of stability regarding a very wide range
of issues.’ (Marwell et al 1987: 373). While all three studies investigated
only political attitudes, Erber et al (1995: 433) note that ‘Other kinds of
attitudes are also notorious for their resistance to change, such as prejudiced
and racist opinions.’
Other studies, however, have found attitudes to be highly dependent on
context — such as question order or question wording (Schwarz & Bohner
2001: 436). Hippler & Schwarz (1986), for example, performed a face-to-face
survey (N=88) in which forty eight subjects were asked if peep shows should
be allowed and the remaining forty asked if they should be forbidden. In a
replication (N=146), seventy two subjects were asked if the showing of X-
rated movies in public cinemas should be allowed and seventy four asked if
it should be forbidden (Hippler & Schwarz 1986: 90). The results showed
respondents to have been 23.3% more likely to state that peep shows should
not be allowed than state that they should be forbidden, and 14% more
likely to state that X-rated movies in public cinemas should not be allowed
than state that they should be forbidden, a finding which Hippler & Schwarz
(1986: 91) claim arose ‘as a function of question wording’.
In Bickart’s (1992) telephone survey (N=181) about running shoes among
81 runners and 100 non-runners, the order in which participants were asked
questions was found to have had a significant (p<.05) effect on participant
ratings of different shoe brands. Similarly, Billiet et al (1992) conducted
a questionnaire (N=370) among married women in Ghent, Belgium, which
contained attitudinal questions that differed slightly in wording or sequence.
18

2.1. ATTITUDES
For example, one version of the questionnaire (given to 179 participants)
contained a ‘specific’ question followed by a ‘general’ question, as follows
(Billiet et al 1992: 134):
Do you think it should be possible for a pregnant woman to obtain
a legal abortion if there is a strong chance of serious defect in the
baby? (Birth defect item: specific)
Do you think it should be possible for a pregnant woman to obtain
a legal abortion if she is married and does not want any more
children? (Woman’s right item: general)
In another version of the questionnaire, given to 191 participants, the same
questions appeared in reverse order. Respondents were found to have an-
swered yes to the ‘general’ question significantly (p=<.001) more often when
it appeared before the ‘specific’ question (56.1%) than when the sequence
was reversed (39%). The order in which questions appeared had virtually
no effect, however, on participant responses to the ‘specific’ question (89.1%
vs. 93.1%). A similar effect of question order was found in participant
responses to questions on increasing taxes on European vs. American prod-
ucts, with participants significantly (p=<.001) more likely to support higher
taxes on American goods if they had answered yes to increasing taxes on
European goods beforehand (37%, compared to 14.2% when asked about
American goods first). This appears to affirm the postulation previously
made by Feldman & Lynch (1988: 422), that ‘cognitions activated in the
process of making the first judgment may suppress the retrieval of cognitions
that would have influenced the second judgment or behavior in the absence
of prior measurement.’
While some researchers agree that the problem of such attitudinal in-
stability is a methodological one (Schuman & Presser 1981), others opine
that it reflects evaluative judgements being made ‘based primarily on the
information that comes to mind most easily’ at any given time (Schwarz &
Strack 1991: 46). Another view is that attitudes are, indeed, based upon
the most easily accessible information that comes to mind while evaluative
judgements are made, but that this information is stored in relatively stable
19

2.1. ATTITUDES
memory structures (cf. Tourangeau 1992; Lord & Lepper 1999), while yet
another view is that ‘individuals may hold multiple attitudes about an ob-
ject, accessing different ones at different points in time.’ (Schwarz & Bohner
2001: 3).
Other researchers, however, posit that the stability of a given attitude is
primarily related to the strength of the attitude (Erber et al 1995). It should
be noted, however, that attitudes can be strong in a number of different ways,
as Krosnick & Smith (1994: 283) outline:
If stronger attitudes are indeed more resistant to change, they
should show higher levels of stability. Consistent with this expec-
tation, a number of studies have found more stability for attitudes
higher in importance, extremity, evaluative-cognitive consistency,
interest, and direct experience. Highly ambivalent attitudes have
also been shown to be less stable over time.
Krosnick & Smith (1994: 280) identify ten different dimensions of attitude
strength — extremity, intensity, certainty, importance, interest in attitude-
relevant information, knowledge, accessibility, direct experience, latitudes of
rejection and non-commitment, and evaluative-cognitive consistency. Under
this framework, it is argued that these dimensions have implications for the
stability of the attitudes which individuals hold in the following ways:
Extremity:
Attitudes which are extremely favourable or unfavourable towards ob-
jects are more resistant to change than more neutral attitudes.
Intensity:
Attitudes that evoke strong emotional responses are more resistant to
change than attitudes that evoke little or no emotional response.
Certainty:
Attitudes which are considered by an individual to be certain are less
likely to change than attitudes of which an individual is uncertain.
20

2.1. ATTITUDES
Importance:
Attitudes which an individual considers to be of great importance are
more resistant to change than attitudes which are of less importance.
Interest:
Attitudes towards objects which an individual shows interest in are less
likely to change than attitudes towards objects in which the individual
has little or no interest.
Knowledge:
Attitudes related to subjects in which an individual has a greater degree
of knowledge are more resistant to change than attitudes related to
subjects in which an individual has a lesser degree of knowledge.
Accessibility:
Attitudes which come to an individual’s mind easily are more resistant
to change than attitudes which do not (most often measured by the
time the individual takes to report an attitude towards an object).
Direct Experience:
Attitudes towards objects which an individual has direct experience
of, or has participated in acitvities relating to, are more resistant to
change than attitudes towards objects which an individual has no direct
experience of.
Latitudes of Rejection and Non-commitment:
Attitudes which an individual considers to be unacceptable are more
resistant to becoming adopted than attitudes which an individual finds
neither acceptable nor unacceptable.
Evaluative-Cognitive Consistency:
Attitudes which are consistent with an individual’s wider set of beliefs
are more resistant to change than attitudes which are inconsistent with
those beliefs.
These dimensions have been found to factor in peoples’ attitudes in vary-
ing degrees across different studies. Pomerantz et al (1995), for example,
21

2.1. ATTITUDES
conducted a selective judgement experiment (N=153) in which participants
were first subject to an attitudinal questionnaire which tasked them with self-
reporting the strengths of their attitudes towards a range of issues including
capital punishment, legalized abortion, and environmental preservation. The
questionnaire consisted of statements intended to assess aspects of attitude
certainty, importance, and ego involvement (evaluative-cognitive consistency
under Krosick & Smith’s framework), with participants indicating their levels
of agreement on 9-point Likert scales. Participants also indicated their overall
attitudes towards each issue on a 17-point scale, the value of which was used
as a measure of extremity, and asked to indicate how knowledgeable they
were about each topic. In a second session, participants were split into two
groups — with half being tasked with evaluating fabricated research reports
on capital punishment and half tasked with evaluating actual newspaper
editorials on the same topic. Participants were then informed that the re-
searchers were interested in individuals’ judgements of research/editorials on
social issues, and tasked with assessing the quality of the materials presented
before their attitudes towards capital punishment and attitudinal strength
measures were reassessed. Participant attitudes were found to have correlated
significantly (p<.05) with two distinct groups of attitude strength dimensions
— those relating to the individual’s self-concept, value system, and knowl-
edge structure (termed the ‘Embeddedness factor’), and those relating to
one’s commitment to a particular position, labelled the ‘Commitment factor’
(Pomerantz et al 1995: 416). Pomerantz et al (1995: 416) note that ‘both
heightened Embededdness and Commitment were associated with increased
intentions to act on one’s attitude’. Heightened Commitment was also found
to have correlated with measures of selective judgment and attitude polariza-
tion (with participants who reported greater Commitment-related attitudes
found to have been more likely to argue against attitude-incongruent mate-
rial), whereas heightened Embeddedness correlated with ‘greater self-reports
of information seeking and decreased selective elaboration’.
In common with these findings, the attitudes which people hold towards
different speech varieties have also been shown to cluster around common
22

2.2. LANGUAGE ATTITUDES
factors of attributes.
2.2 Language Attitudes
Since the 1970s, language attitudes have been a major focus of sociolin-
guistic research, largely kept separate from the wider body of attitudinal
research carried out in social psychology (Garrett 2001). Conversely, lan-
guage attitudes have been largely ignored in the domain of social psychology,
despite speech offering ‘some of the most socially rich stimuli in our environ-
ment’ (MacFarlane 2014: 15). It seems reasonable to assume, however, that
the attitudes which individuals hold towards language are comparable to
attitudes held towards other attitude objects, and that the large body of
attitudinal research carried out in social psychology can be of use in un-
derstanding attitudes towards language. As Fasold (1987: 148) explains,
however, the term ‘language attitudes’ has come to encompass more than
simply ‘attitudes towards language’:
Language attitudes are distinguished from other attitudes by the
fact that they are precisely about language. Some language-
attitude studies are strictly limited to attitudes towards language
itself [...] Most often, however, the definition of language attitude
is broadened to include attitudes towards speakers of a particular
language or dialect. An even further broadening of the definition
allows all sorts of behavior concerning language to be treated,
including attitudes toward language maintenance and planning
efforts.
As in social psychology, attitudes towards speakers and speech varieties
have frequently been examined by directly questioning informants about their
beliefs and feelings towards attitude objects via interviews or surveys. Pre-
ston (1999), for example, reported on over a decade’s worth of investigation
into language attitudes in the United States, using a range of methodolo-
gies including attitudinal surveys and open interviews, as well as a map
23

2.2. LANGUAGE ATTITUDES
task (which had participants identify areas where regional accents are spo-
ken on hand-drawn maps). The survey (N=147), which tasked participants
in Michigan with rating their impressions of different regional accents on
six-point semantic differential scales (containing attribute-dimensions such
as ugly-beautiful), found participants to have rated Southern states almost
universally lower in terms of ‘correctness’ than Northern states, suggesting a
perception of Southern accents as non-standard and, subsequently, not ‘cor-
rect’. This pattern continued over two broad sets of attributes, with accents
which had been rated lowly in terms of ‘correctness’ also being rated poorly
on a host of other traits. Preston (1999: 135) reduced these to two factor
groups, one with attributes relating to status (such as ‘smart, educated, nor-
mal, good English’, and ‘no drawl’) and group solidarity (such as ‘polite,
casual, friendly’, and ’down-to-Earth’). With the exception of the ‘nasal’
and ‘polite’ attributes, participant were found to have rated Northern states
significantly (p<.05) higher in terms of status attributes than accents from
Southern states. Conversely, with the exception of the ‘polite’ attribute,
participants were found to have rated accents from Southern states signif-
icantly (p<.05) higher in terms of group solidarity attributes than accents
from Northern states. This dichotomy, between ‘standard’ language varieties
perceived as having high status and low group solidarity attributes, and ‘non-
standard’ accents perceived as having low status and higher group solidarity
attributes, is a recurring finding in language attitude research.
This was also evident in a large-scale attitudinal survey carried out as
part of the BBC Voices1 project. The study gathered participant responses
towards different questions (such as How much prestige do you think is asso-
ciated with this accent? and How pleasant do you think this accent sounds? )
on 7-point scales, collating responses to 34 different regional UK English ac-
cents from 5,010 participants (Coupland & Bishop 2007: 77). Participants
were found to have rated ‘Standard English’ as the most socially attractive
and second most prestigious variety, and ‘Queen’s English’ as the most pres-
tigious and seventh most socially attractive variety (table 2.1). Respondents
1http://www.bbc.co.uk/voices/ [accessed 10/09/2014]
24
2.2. LANGUAGE ATTITUDES
were also found to have rated an ‘accent identical to [their] own’ as the second
highest variety in terms of social attractiveness and third highest in terms of
prestige. Considering responses were gathered UK-wide, this suggests that
people tend to rate their own speech varieties highly in terms of both social
attractiveness and social prestige, even when those accents are non-standard
regional accents. At the other end of the scale, participants rated Birming-
ham accents as being least socially attractive and least prestigious of the 34
varieties, along with the Black Country accents (rated 33 and 32 for social
attractiveness and prestige, respectively), Asian accents (31, 33), Liverpool
accents (30, 31), and Glaswegian accents (29, 29). In general, the most neg-
atively rated accents in terms of both social attractiveness and prestige were
those found in former industrial centers (such as Birmingham, the Black
Country, Liverpool, and Glasgow). While the survey made no differentiation
between the different social accents spoken in each region, relying only on
respondents’ own stereotypical ideas of the accents spoken in each region, it
seems probable that they would have had the vernacular accents spoken in
those regions in mind during the task.
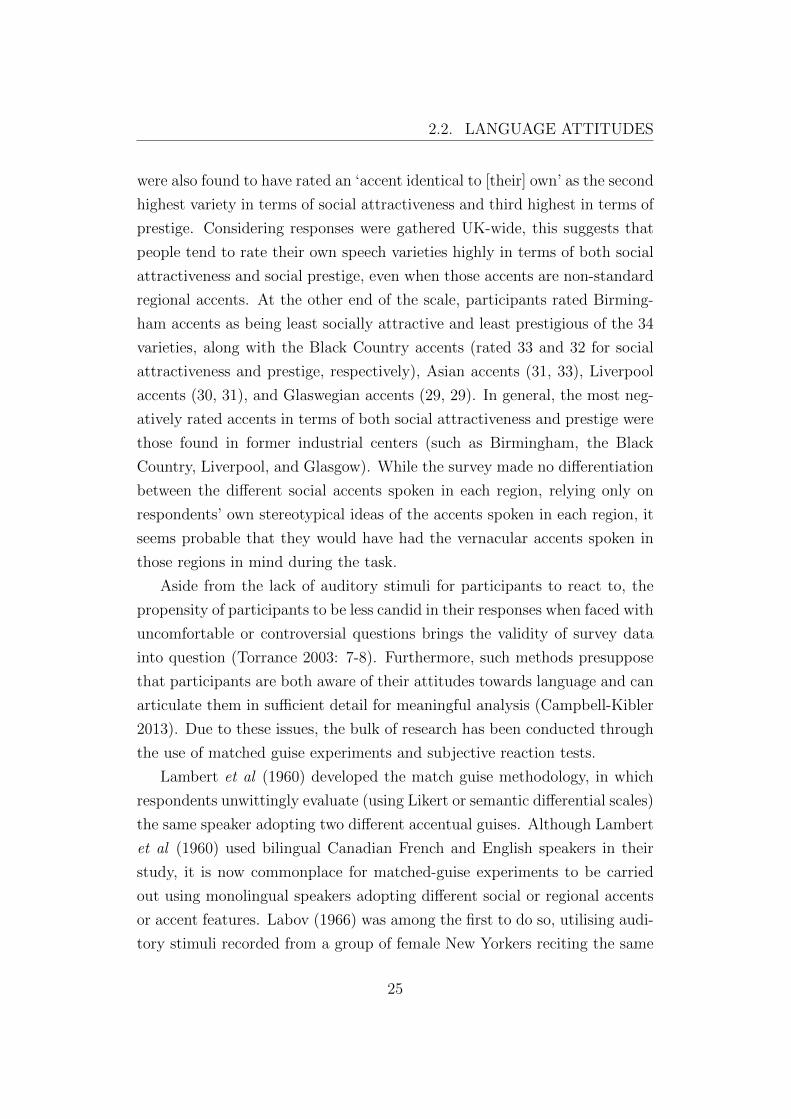
Aside from the lack of auditory stimuli for participants to react to, the
propensity of participants to be less candid in their responses when faced with
uncomfortable or controversial questions brings the validity of survey data
into question (Torrance 2003: 7-8). Furthermore, such methods presuppose
that participants are both aware of their attitudes towards language and can
articulate them in sufficient detail for meaningful analysis (Campbell-Kibler
2013). Due to these issues, the bulk of research has been conducted through
the use of matched guise experiments and subjective reaction tests.
Lambert et al (1960) developed the match guise methodology, in which
respondents unwittingly evaluate (using Likert or semantic differential scales)
the same speaker adopting two different accentual guises. Although Lambert
et al (1960) used bilingual Canadian French and English speakers in their
study, it is now commonplace for matched-guise experiments to be carried
out using monolingual speakers adopting different social or regional accents
or accent features. Labov (1966) was among the first to do so, utilising audi-
tory stimuli recorded from a group of female New Yorkers reciting the same
25

2.2. LANGUAGE ATTITUDES
Table 2.1: Participant ratings of UK regional accents, BBC Voices project(from Coupland 2007: 98)
26

2.2. LANGUAGE ATTITUDES
set of passages both with and without word-final post vocalic /r/ — a socially
marked phonetic variable in New York English. These stimuli were presented
to participants (N=102) who were then asked to indicate which occupations
they perceived the recorded speakers to have from a choice of seven (includ-
ing TV personality, Factory worker, and Receptionist), unaware that they
were hearing each speaker twice – once with and once without post-vocalic
/r/ realisations. The study found that listeners consistently associated the
recordings featuring /r/ realisations with higher prestige occupations than
the recordings featuring /r/ deletion.
Cheyne (1970) conducted another matched guise experiment (N=169)
among different groups of Scottish participants in Glasgow, and English par-
ticipants in London. Auditory stimuli consisted of read passages in both
Standard English and regional Scottish guises recorded from four drama stu-
dents, and single passages recorded from other speakers with Scottish and
English accents. Participants were tasked with judging speaker attributes on
six-point scales for 21 different attributes, consisting of 20 used by Lambert et
al (1965) plus ‘occupational status’. Cheyne (1970) reported both groups of
listeners to have rated English voices significantly (p<.01) higher than Scot-
tish voices in terms of perceived wealth, prestige, intelligence, and height, and
Scottish voices higher than English voices in terms of friendliness. Both sets
of speakers also rated English male voices significantly (p<.01) higher than
Scottish male voices in terms of perceived ambition, leadership, cleanliness,
good looks, and self-confidence. Scottish listeners, however, rated Scottish
male voices significantly (p<.01) higher than English male speakers in terms
of sense of humour, generosity, goodheartedness, likeability, and nervousness,
and rated Scottish female voices significantly (p<.01) higher than English fe-
male voices in terms of ‘entertainingness’ and sense of humour, as table 2.2
(overleaf) illiustrates.
Similar evaluations have repeatedly found standard prestige language va-
rieties (such as RP) to be rated higher in terms of ‘prestige’ features such as
wealth, intelligence, and social status than non-standard regional language
varieties. Giles et al (1975), for example, conducted another matched guise
experiment which involved sending a university lecturer to present a talk
27

2.2. LANGUAGE ATTITUDES
Table 2.2: Differences in listener personality trait assessments of Scottishand English voices (from Cheyne 1970: 78)
to two groups of schoolchildren (aged 16-18 years), delivering the talk with
an RP accent to one group, and with a Birmingham accent to the other.
Both groups were subsequently asked to evaluate the lecturer after the talk,
with the group who had heard him deliver the talk in RP rating him as
significantly more intelligent than the group who had heard him deliver the
talk in a Birmingham accent. Subjective reaction tests have also been used,
in which participants responses to different speakers are evaluated, rather
than the same speakers using different guises. Smith (1979), for example,
conducted a subjective reaction test which tasked secondary school children
in Newham (East London) with rating recordings of speakers of Cockney
and speakers of RP accents. The children were found to have rated Cock-
ney accents — their own speech variety — more negatively than RP accents
across a range of personality traits, including friendliness, intelligence, kind-
28

2.2. LANGUAGE ATTITUDES
ness, ‘hard-workingness’, good looks, cleanliness, and honesty (Hudson 1996:
62). This is in line with subsequent accent studies, such as Coupland (2007),
which showed people to rate standardised speech varieties (such as ‘Standard
English’) more favourably than their own speech varieties in term of both
social attractiveness and prestige attributes.
In attempt to make the findings of sociolinguistic attitude studies more
comparable, Zahn & Hopper (1985) devised a measurement of language at-
titudes called the Speech Evaluation Instrument. Using a large-scale sub-
jective reaction test (N=572), participants were presented with recordings
of interviews and job interviews conducted with a range of speakers from
different regional background across the US. Participants were tasked with
rating speakers on 56 different personality traits according to semantic dif-
ferential scales. Through factor analyses (considering a variable to be part
of a factor if its loading was >.50 and all of its other loadings were <.30),
Zahn & Hopper (1985) were able to reduce the personality traits to three
factors which explained 64.5% of the variance in subject ratings. These
factors were labelled superiority (encompassing traits such as intelligent,
educated, upper-class, advantaged, wealthy, organised, and fluent), attrac-
tiveness (encompassing traits such as good natured, kind, warm, likeable,
friendly, honest, and pleasant), and dynamism (encompassing traits such as
active, talkative, aggressive, enthusiastic, strong, confident, and energetic).
As a whole, attitudinal research in sociolinguistics shows ‘standardised’
speech varieties to be evaluated more favourably in terms of attributes re-
lating to social status than non-standard regional speech varieties, and non-
standard regional speech varieties to be evaluated more favourably in terms of
social attractiveness attributes than ‘standardised’ language varieties (Cheyne
1970; Giles 1975; Smith 1979; Zahn & Hopper 1985; Preston 1999; Coupland
& Bishop 2007). It would also appear that such evaluations are driven, at
least in part, by socially-marked phonetic variation (Labov et al 2011).
29

2.3. SOCIOLINGUISTIC PERCEPTION
2.3 Sociolinguistic Perception
Evidence from various sociophonetic studies suggest that listeners both
infer social information from fine phonetic variation, and use social infor-
mation when processing speech (Strand & Johnson 1996; Niedzielksi 1999;
Hayet al 2006; Campbell-Kibler 2009; Koops et al 2008; Labov et al 2011).
Strand & Johnson (1996) suggest that social information encoded within
the speech signal, as well as visually-derived social information, can alter
listener perceptions of phonetic variables. In the first of two experiments
(N=28), listeners were given a lexical decision task involving four different
stimuli voices. Stimuli voices had been chosen from 37 previously-rated voices
in a separate task, with one selected on the basis of being ‘the most proto-
typically male’, another as being ‘the most prototypically female’, one as ‘the
most non-prototypically male’, and the final as ‘the most non-prototypically
female’ voice (Strand 1999: 89) . Stimuli were altered prior to testing, by
concatenating synthesized fricatives on a nine-step continuum from /S/ to
/s/ with recorded utterances of codas from the words sod and shod for each
speaker. Participants were tasked with deciding whether each word heard was
sod or shod over 72 trials, with each participant hearing each iteration of the
stimuli (9 synthetic fricatives applied to 2 words, for each of 4 speakers).
Participants were found to have reliably identified more synthesized tokens
as sod while hearing a male speaker than while hearing a female speaker.
Strand & Johnson (1996: 20) reason that listeners’ perceptual boundaries
were conditioned by the perceived gender of the speaker heard, explaining
that:
longer vocal tracts generally produce lower-frequency resonances,
and men generally have longer vocal tracts than women. So the
fricatives produced by men will generally exhibit lower frequen-
cies. Thus, the boundary between [S] and [s] is generally at a lower
frequency for men since lower formants are expected in their [s]
compared with the same fricatives as produced by women. (...)
30

2.3. SOCIOLINGUISTIC PERCEPTION
In a second experiment (N=24), participants were shown video recordings
of either male or female faces while hearing synthesised-fricative tokens of
sod and shod. Visual stimuli were drawn from 37 video recordings on the
basis of masculinity/femininity ratings determined in a previous norming
task (N=58), with the three ‘Most male-appearing’ and three ‘Most female-
appearing’ faces selected (Johnson & Strand 1996: 21). These recordings
were then overdubbed with the auditory stimuli used in the previous experi-
ment, with the jaw opening motions seen in each video aligned with the vowel
onsets of the auditory tokens. Testing was conducted over 4 blocks of 108
trials, with each stimulus item being presented once per block. Here, Strand
& Johnson (1996: 21) found a significant (p<.05) main effect of ‘face’, with
auditory tokens paired with male faces being identified as sod more often
than auditory tokens paired with female faces. This suggests that, as in the
McGurk effect2, visual information can change our perception of phonetic
variants. Moreover, it would appear that this effect also applies to visually-
derived social information, such as speaker gender.
It was also established by Niedzielski (1999) that social information can
impact upon listener processing of phonological space. For this study, Detroit-
area residents were given perceptual tests (N=41) consisting of sets of resyn-
thesised vowels along with accompanying questionnaires which asked them
to choose the tokens that they felt best matched their own speech (Niedziel-
ski 1999: 64). Participants were played around 50 sentences from the same
speaker (a Detroit resident), being asked to focus on a particular vowel in
each sentence before matching it with one of six computer resynthesised vow-
els (Niedzielski 1999: 64). Half of the respondents, however, were told that
the speaker was from Michigan, while the other half were told that they
were hearing a Canadian speaker, from a town directly across the Detroit
2The McGurk Effect demonstrates that speech perception is a multi-modal phe-nomenon. McGurk & McDonald (1970) discovered the effect by dubbing a videotapeof a woman uttering /ga/ with the auditory syllable /ba/. Upon watching the tape back,they found that they perceived /da/. It was later discovered that hearing /ga/ and seeingsomeone produce /ba/ also causes listeners to perceive /da/, and that hearing /pa/ andseeing /ka/ causes perceptions of /ta/.
31

2.3. SOCIOLINGUISTIC PERCEPTION
River (Niedzielski 1999: 64). As the perceived nationality of the speaker was
the only aspect that varied between the two sets of respondents, it can be
surmised that this factor alone caused the discrepancy between the results
presented by the groups. The study found that those ‘given the Canadian
label chose raised-diphthong tokens as those present in the dialect of the
speaker, whereas those given the Michigan label did not’ (Niedzielski 1999:
62). The results point towards raised /aw/ being a Canadian stereotype
among Detroit residents, who do not appear to be consciously aware that it
is also a prominent feature of their own dialect.
Hay et al (2006) found that social information from visual stimuli can
impact upon listener evaluations of speakers. In this study participants were
given perceptual tests consisting of recordings of minimal pairs containing
vowels in the NEAR/SQUARE merger-in-progress in New Zealand English.
These tokens were played to most of the respondents alongside gender and age
appropriate photographs of individuals presented as being the speakers (Hay
et al 2006: 462). For some participants, visual stimuli consisted of ‘two pho-
tographs of each of four individuals, and in each photograph the individual
was dressed differently’ (Hay et al 462). Here, each individual was pictured
in attire and locations intended to portray them as being working-class in one
photograph, and middle-class in the other. Participant responses were col-
lected via questionnaires, with listeners being asked to identify and rate each
token according to how they perceived its speaker in terms of age, level of ed-
ucation, and personality traits such as reliability, ambition, and friendliness
(Hay et al 2006: 465). The content of the photographs was found to signifi-
cantly (p=.003) affect listener accuracy, as the error rate for tokens with the
greatest distinction between the NEAR/SQUARE vowels increased when they
were accompanied by photographs portraying working-class speakers (Hay et
al 2006: 478). Conversely, error rates were found to decrease when tokens
were accompanied by pictures which portrayed the speaker as middle-class.
Furthermore, participants who reported minimal pairs as being less merged
were found to have made significantly (p=.02) more errors when shown pic-
tures of older people.
32

2.3. SOCIOLINGUISTIC PERCEPTION
Using a Visual World methodology, Koops et al (2008) examined the ef-
fect of speaker age on listener perception of vowels (specifically the PIN and
PEN vowels in Houston, Texas), via means of a forced choice word identifica-
tion task. Participants (N=24) were tasked with choosing between on-screen
words containing different vowels while pictures of speakers (Anglo females
of various ages) were displayed (as figure 2.1 overleaf, illustrates). Auditory
stimuli, consisting of target words containing unmerged vowels, were simulta-
neously presented via loudspeaker. These consisted of tokens recorded from
one ‘younger’ (32 year old) and one ‘older’ (49 year old) female speaker. Lis-
tener fixations were recorded throughout the experiment via a head-mounted
eye tracker. Participants were given two seconds per trial to choose the word,
via mouse click, containing the vowel which they thought most closely resem-
bled the vowel in the target word played auditorily. The experiment found a
significant (p=.024) effect of perceived speaker age in the ‘older guise’ (being
presented pictures and recordings of an older speaker), with listeners fixating
longer upon the ‘competitor word’ (displayed word containing the opposite
vowel in the Houston PEN/PIN merger from the intended target word) than
when the ‘younger’ or ‘middle-aged’ guises were presented (Koops et al 2010:
99). That the participants appeared to associate the merged pronunciation
more with the older guises than with other age groups shows a clear ef-
fect of speaker age on listener vowel perception in this instance, an effect
which Koops et al (2010: 100) attribute to a higher proportion of young and
middle-aged Houstonians having emigrated from non-merged dialect areas
than older Houstonians. From this, it appears that listeners draw upon their
experience of their linguistic environment when processing familiar accents.
Furthermore, Campbell-Kibler (2009) found that the effect of fine pho-
netic variation on sociolinguistic evaluation is dependent on other social in-
formation which listeners deduce from the speech signal. The study ex-
amined listener perceptions of ING variation via qualitative data collected
from open-ended group interviews (N=55) and quantitative data obtained
from a matched-guise experiment (N=124). Auditory stimuli consisted of
33

2.3. SOCIOLINGUISTIC PERCEPTION
Figure 2.1: Illustration of visual display in Koops et al (2008: 95)
thirty two excerpts of spontaneous speech from eight different speakers (var-
ied by gender and region) which were digitally altered to vary only in tokens
of ING (/IN/ versus /In/). Digital editing of the auditory stimuli allowed
for close researcher control over the elements which were altered, serving
to minimise other variables from impacting on listener responses. The re-
sults of the matched-guise experiment show a significant (p=.033) positive
correlation between realisations of /IN/ and listener perceptions of speaker
education and intelligence, but only in cases where speakers were perceived as
being from ‘working-class backgrounds’ (Campbell-Kibler 2009: 148). These
findings were not reflected in the group discussions, which ‘usually involved
an observation that all of the speakers sounded educated and middle-class’
(Campbell-Kibler 2009: 144). This may be attributable to social class be-
ing, as Campbell-Kibler (2009: 144) observes, ‘a relatively uncomfortable
topic for interview participants’, noting that ‘regional differences emerged as
the dominant theme for the interviews’. Listener perceptions of the regional
origins of speakers were also found to impact on ING variation and percep-
tions of speaker intelligence and education – but only when those speakers
were believed to be working-class (Campbell-Kibler 2009: 148). From this,
Campbell-Kibler (2009: 148) extrapolates that ‘This double of layer of inter-
actions demonstrates ING’s contextual dependence even with respect to one
of its most central meanings.’
Labov et al (2011) conducted a series of matched guise experiments in
34

2.3. SOCIOLINGUISTIC PERCEPTION
Pennsylvania investigating listener responses to differing frequencies of ING
variation. In their first experiment (N=23), speakers evaluated a recording of
a passage from a newscast containing different frequencies of /IN/ and /In/
in ING contexts. Audio was recorded from a female speaker of a ‘conser-
vative Northern’ US dialect, with stimuli tokens spliced together from two
recordings — one with consistent /IN/ realisations in ING contexts, and the
other with consistent /In/ realisations in ING contexts. Participants were
then played different stimuli tokens and asked to evaluate how well suited
the speaker was for a job as a newsreader in each case (figure 2.2). Lis-
teners rated the speaker as significantly (p<.001) more professional after
hearing recordings containing between 0-30% /In/ realisations, and signifi-
cantly (p=.02) less professional after hearing recordings containing between
30-50% /In/ realisations. After hearing stimuli containing 50% /In/ reali-
sations, participants also rated the speaker as significantly (p=.033) more
professional when the first ING context was realised as /IN/ than when it
was realised as /In/. Higher proportions of /In/ realisations (70% and 100%)
were rated as increasingly less professional, but in smaller, non-significant
(p>.068) increments.
Figure 2.2: Question and semantic differential scale used by Labov et al(2011: 438)
A second experiment (N=36) was conducted as a replication, with the
only major methodological change being the addition of stimuli items con-
taining 10% and 20% /In/ realisations, and the inclusion of only one passage
containing 50% /In/ realisation. Participants were found to have responded
35

2.3. SOCIOLINGUISTIC PERCEPTION
in a similar manner, following a logarithmic curve with an r2 of .96 and slope
of 1.52. A third experiment (N=54) altered the design to gather participant
responses to stimuli via an on-screen slider controlled by computer mouse,
rather than a 7-point semantic differential, allowing for more fine-grained
evaluations. A different speaker, an African-American linguist from Philadel-
phia, was also recording reading the same stimuli materials, both with 100%
/IN/ realisations and no /IN/ realisations in ING contexts, from which stimuli
containing various /In/ frequencies were produced. Participants were found
to have rated the stimuli in similar proportions to the previous two experi-
ments, with ratings versus /In/ frequency fitting a logarithmic curve with an
r2 of .97 (figure 2.3).
Figure 2.3: Mean subject ratings of newscaster in Experiment 3 with log-arithmic progression, from Labov et al (2011: 445)
Labov et al (2011) also performed replications of the same experiment
with the addition of stimuli recorded from a Southern speaker, both in South
Carolina (N=55), in the South, and New Hampshire (N=51), in the North.
Participants in both locations were found to have rated stimuli from the
Southern speaker on a similar logarithmic curve as found previously, with r2
of .96 and .98, respectively. Participants in South Carolina were also found
to have rated stimuli from the conservative Northern speaker in on a similar
curve (r2=.96), but with a lower slope indicating that higher frequencies of
36

2.4. LINGUISTIC CONTEXT
/In/ are viewed as less unprofessional in the South. Participants ratings of
the conservative Northern speaker in New Hampshire were found to have
patterned differently, with stimuli being rated as least professional at 50%
/In/ frequency, increasing in professionalism ratings at 70% and 100% /In/
frequencies. Another replication (N=42), however, found participant ratings
to have patterned according to the logarithmic curve (r2=.91) found previ-
ously.
Taken as a whole, the logarithmic curve found by Labov et al ’s (2011) sug-
gests that listener evaluations were affected more by the stigmatised phonetic
variant (/In/) than the non-stigmatised one (/IN/). It is not clear, however,
if this is generalisable to other variables (cf. Levon & Fox 2014). Further-
more, the findings suggest that listener evaluations of phonetic variants are
conditioned by the frequency of those variants in speech.
Nevertheless, these studies illustrate how visually-derived information,
pre-conceived notions of speaker attributes, and the frequency of socially-
marked phonetic variants can all have measurable effects on how listeners
socially evaluate speech.
2.4 Linguistic Context
A city historically divided by social class, Glasgow retains a high level of
social segregation to this day, with its large working-class population effec-
tively kept separate from smaller middle-class groups (Pacione 1995; Maver
2000). As a result, the city continues to host two systematically varying social
accents, existing on a bipolar sociolinguistic continuum between vernacular
Glaswegian and Scottish Standard English (SSE; Aitken 1984; Macafee 1983,
1994; Stuart-Smith 2003). Although existing on a continuum, the primary
Glaswegian speech varieties are generally recognisable as either working-class
(Glaswegian vernacular) or middle-class (SSE) accents – and are readily cat-
egorisable as such by native listeners based solely on a group of socially
marked phonetic features (MacFarlane & Stuart-Smith 2012).
37

2.4. LINGUISTIC CONTEXT
In the past, explicit attitude studies have repeatedly shown working-class
varieties of Glaswegian to be socially stigmatized in comparison to more pres-
tigious, middle-class Glaswegian accents. The stigmatized view of Glaswe-
gian vernacular speech has been documented at least as far back as 1930s,
with elocution manuals such as McAllister (1938) making it clear that the
vernacular was stigmatised (Macafee 1983). Macaulay (1977) carried out an
study of language attitudes which included analyses of vowels and t-glottaling
used among different social classes in Glasgow, finding clear social stratifi-
cation in the pronunciations of Glaswegian speech and a range of negative
attitudes towards the vernacular. These are perhaps best illustrated in the
following quotation, collected in another section of the study, from a univer-
sity lecturer: ‘The accent of the lowest state of Glaswegian is the ugliest one
can encounter, but that is partly because it is associated with the unwashed
and the violent’ (Macaulay 1975: 94). In response, Macafee (1983: 23)
notes that the lecturer’s statement ‘simply reflects the very bad reputation
of Glasgow generally. This stereotype has a blighting effect on working-class
adolescents.’
A similarly derisory view of working-class Glaswegian was reported in
qualitative sociolinguistic interviews (N=75) conducted by Macafee (1988:
5), which found young working-class speakers to have been perceived as ‘foul
mouthed’ by adults, and who were thought to have considered their own
speech as slang. This is line with Macualay’s (1977: 132) assertion that
‘the comments of employers, university lecturers and training college lectur-
ers show that the main criticism of [working-class Glaswegian] school-leavers
is their lack of confidence in speaking.’ These comments were supported
by Menzies (1991), who made use of a subjective reaction test and open-
ended questionnaire in her investigation of the language attitudes of Glas-
gow schoolchildren towards Scots, ‘Standard English’, and the Glaswegian
dialect. The children were found to have held ‘underlying negative attitudes
to their spoken vernacular’, with girls being ‘much more likely than boys to
have prejudiced attitudes towards Scots and to incline their speech towards
the standard; and this phenomenon increases with age’ (Menzies 1991: 45).
38

2.4. LINGUISTIC CONTEXT
Nevertheless, working-class varieties of Glaswegian have also been demon-
strated to hold a measure of covert prestige among native speakers that
self-identify as Glaswegian (Braber 2009), rating highly in terms of social at-
tractiveness traits (Torrance 2003: 43). Torrance (2003), for example, made
use of a hybrid matched-guise experiment/subjective reaction test (N=16)
with auditory stimuli consisting of 7 male and 7 female speakers, each of
whom were recorded reading the stimuli in guises containing different con-
centrations of the phonetic variables /û/, /ë/, /r/, and /T/. Stimuli guises
were intended to be broadly representative of several speech varieties spoken
across the UK, including working-class Glaswegian and middle-class Glaswe-
gian, Received Pronunciation (RP), as well as accents found in Edinburgh,
Newcastle, Manchester, and London. All listeners were working-class Glaswe-
gians who had spent most of their lives in Glasgow, and who were divided
into older (over 30 years old) and younger (under 25 years old) age groups.
Participants rated each speaker in terms of fourteen different traits falling
under the broader categories of ‘competence’, ‘integrity’, and ‘social attrac-
tiveness’ (Torrance 2003: 42). The study found the RP guises to have been
evaluated most favourably in terms of the competence traits among both the
older and younger groups of listeners. The RP and Newcastle guises were
also found to have been evaluated most favourably in terms of integrity traits
among the older listeners (with the younger listeners showing no clear pref-
erence here). The Glaswegian speakers, however, were found to have been
rated highest in terms of the social attractiveness traits among both groups
of speakers. These results demonstrate that attitudes towards dialects are
far more complex than can be accounted for simply by measuring on a simple
positive versus negative bipolar continuum, as listeners can associate a host
of different attributes, both positive and negative, with any given dialect.
Negative attitudes towards working-class Glaswegian appear to persist
today, however, as indicated by a comment found on a news story3 on Mhairi
3http://www.dailymail.co.uk/news/article-3073108/SNP-Mhairi-Black-youngest-MP-1667.html [accessed 15/06/15]
39

2.4. LINGUISTIC CONTEXT
Figure 2.4: Comment on Mhairi Black’s speech, from The Mail Online
Black, who had just given a speech after becoming the UK’s youngest MP in
348 years (Figure 2.4). That the commenter ‘knew she was a lout’ as soon
as they heard her speak strongly suggests that this opinion was formulated
solely on her working-class Glaswegian accent. Certainly, the content of her
acceptance speech appears to carry no such connotations, as the following
excerpt demonstrates:
I would like to thank all the other candidates for their participa-
tion and, in particular, whilst I appreciate that this is a blow for
Douglas Alexander, I truly hope he will remain to see his future
in politics once he has recovered from this result. I would like to
thank my mum, my dad, my brother, my close friends for their
continued support and all the help they’ve given me throughout
this campaign. I want to thank the people of this constituency, for
placing their faith in me, and for faith within the SNP. Whether
you voted for the SNP or not, and whatever your views are on
Scotland’s future, I will seek to represent you and everyone in
this constituency to the very best of my ability. This election
is about making the voice of this constituency and the whole of
Scotland heard more effectively at Westminster than ever before.
I pledge to use this voice not just to improve Scotland, but to
pursue progressive politics for the benefit of people across the
UK.4
While anonymous internet comments cannot be taken as any measure of
conclusive evidence, the popularity of the comment (with 30 Mail Online
4Mhairi Black’s election victory speech: https://www.youtube.com/watch?v=iwz7uXl9OYU[accessed 15/06/15]
40

2.5. SUMMARY
account holders having clicked the ‘up arrow’ in agreement, compared to 11
having clicked the ‘down arrow’ in disagreement) would appear to indicate
that such opinions are not uncommon, or even unpopular, today. Further-
more, the informants in the numerous studies to have reported a stigmatized
view of working-class Glaswegian speech range from middle-class university
professors to working-class schoolchildren – suggesting that such views are
pervasive throughout all levels of society (Macauley 1977; Menzies 1991).
In a more recent study, MacFarlane & Stuart-Smith (2012) utilized a
matched-guise experiment (N=31) which tasked listeners with assigning both
a working-class and middle-class guise (each containing phonetic variants
typical of such varieties) to different researcher-created ‘personas’, consisting
of separate groupings of working and middle-class associated brands. The
study found that listeners were able to place both the working-class and
middle-class guises into their corresponding ‘personas’ solely on the strength
of the phonetic variants (/l/, /r/, and coda <er >) (MacFarlane & Stuart-
Smith 2012: 11). This shows that both middle and working-class varieties
of Glaswegian can be easily distinguished by native Glaswegian listeners to
a highly significant degree (p<.001). This result is especially important for
the current research as evidence of the implicit associations which people
make towards both working-class and middle-class varieties of Glaswegian is
dependent on the ability of native listeners to distinguish them.
2.5 Summary
Attitudes are affects for or against mentally-represented objects (Thur-
stone 1931). Self-reported attitudes can be unreliable, as they are affected
by multiple factors such as the context of preceding information/questions,
or question wording (Hippler & Schwarz 1986; Bickart 1992). The stability
of an attitude is related to its strength (Krosnick & Smith 1994), which has a
variety of dimensions that can be generalised to broad factors relating to how
individuals view themselves and their level of commitment to the attitude
(Pomerantz et al 1995).
41

2.5. SUMMARY
With regards to language, ‘standardised’ speech varieties, such as RP,
tend to be evaluated more favourably in terms of attributes relating to so-
cial status than non-standard regional speech varieties, whilst non-standard
regional speech varieties tend to be evaluated more favourably in terms of so-
cial attractiveness attributes than ‘standardised’ language varieties (Cheyne
1970; Giles 1975; Smith 1979; Zahn & Hopper 1985; Preston 1999; Coup-
land & Bishop 2007). It would also appear that such evaluations are driven,
at least in part, by socially-marked phonetic variation (Labov et al 2011).
Listener perceptions of fine phonetic variation can be affected by visually-
derived social information or prior conceptions of speakers (Strand & Johnson
1996; Niedzielksi 1999; Hayet al 2006; Koops et al 2008; Campbell-Kibler
2009). The social evaluation of speech may also be affected by the frequency
of socially-marked phonetic variants in speech (Labov et al 2011).
With this in mind, a pilot sociolinguistic perception study was con-
ducted in order to determine whether hearing speakers of different social
accents would cause listeners to choose brand logos conveying differing socio-
economic connotations.
42

Chapter 3
Pilot Study (MLitt)
3.1 Introduction
The current study developed from an initial pilot study carried out as
part of a Master’s dissertation (Robertson 2011) in which a first attempt was
made to develop a methodology to investigate automatic social evaluations
with regards to social accent. The rationale, design, method and results are
repeated here in brief, by way of context for the research which was subse-
quently carried out in this PhD project.
The study centered around an experiment in which listeners were pre-
sented with various sets of images (with four images in each set, displayed in
quadrants of a computer display) while pre-recorded instructions requested
them to rate each image on accompanying (pencil and paper) questionnaires
in terms of how strongly they associated them with a selection of target
words. Image sets were compiled to include one ‘working-class’ image and
one ‘middle-class’ image, each bearing semantic relationships to a correspond-
ing target word in the auditory stimuli, and two semantically unrelated dis-
tractor images. ‘Working class’ and ‘middle-class’ categories for images were
determined by hypothesis, taking class-stereotypical and socio-economic con-
siderations into account. The experiment was carried out using a between
subjects design, with twenty participants hearing instructions recorded from
43

3.2. METHOD
a working-class Glaswegian male, and the remaining half hearing the same
instructions recorded from a middle-class Glaswegian male. As this was the
only experimental condition to change, it was hypothesized that sufficiently
varying responses between the two groups would indicate that speaker voice
and accent had an effect on the implicit associations formed by listeners be-
tween the images shown and the target words heard. Conversely, a lack of
variance between the responses made between the groups was thought to
represent the null hypothesis that speaker accent did not impact upon the
implicit associations made. Participant responses were not found to have
varied by speaker heard, either descriptively or from statistical analysis. It
seems likely that this was due to aspects of the experimental design, which
were addressed over the course of the PhD study.
3.2 Method
3.2.1 Participants
The experiment was conducted with a total of 40 participants, 24 of which
were male (60%), with 19 subjects living in Glasgow (47.5%) and the remain-
ing 21 living in West Lothian. An opportunistic sample was taken, as a rela-
tively large number of time consuming experiments (each lasting around 20
minutes in total) were required within a relatively short period of time, which
also necessitated the recruitment of participants from both Glasgow and the
neighbouring council district of West Lothian. The experiment was carried
out between subjects, with half of the participants hearing a middle-class
speaker and the remainder hearing a working-class speaker throughout. For
each condition, three separate randomized orders of the visual and auditory
stimuli were presented in order to control for fatigue effects.
The ages of the participants ranged between 18 and 67 years old (M=37.5,
SD=10.8). The mean age of those who heard the middle-class speaker was
slightly over 39 and a half years, with the mean age of those who had heard
the working-class speaker being just under 36 years. While participant age
was not controlled for, due to the need for a relatively large number of par-
44

3.2. METHOD
ticipants in a limited timeframe, care was taken to ensure subjects had no
significant sight or hearing impairments. With regards to participant gender,
9 females and 11 males performed the experiment hearing the middle-class
speaker, as opposed to the 7 females and 13 males who heard the working-
class speaker. Of the participants who heard the middle-class speaker, 8
participants lived in Glasgow, as opposed to 12 living in West Lothian. The
experiment containing audio taken from the working-class speaker, on the
other hand, was completed by 11 Glasgow residents, and 9 people from West
Lothian.
3.2.2 Materials
Auditory stimuli were recorded from one middle-class and one working-
class Glaswegian male, who were both in their late 20s (29 and 26, respec-
tively) and native to Glasgow. The middle-class speaker was a university lec-
turer known to the researcher, whereas the working-class speaker responded
to an email requesting native, working-class Glaswegians, and was considered
by the researcher to speak with an identifiably working-class accent. Each
speaker was recorded reading the carrier sentence ‘Please rate these images
in accordance to how strongly you associate them with the word ’, followed by
each of the eleven priming words used in the experiment (car, clothes, drink,
food, game, job, knife, plant, ring, shop, and show). The carrier sentence was
intended to be semantically neutral, with no consideration given to phonetic
features.
Each speaker was recorded reciting the carrier sentence in whole for each
priming word. This was carried out to prevent the possibility of any incon-
sistencies which could have resulted from splicing the priming words with the
carrier sentence from factoring in listener responses. While that the prox-
imity of the priming words could have had an effect on listener associations
(providing linguistic cues before the target word), this was not evident from
participant responses (see 3.3). Each speaker was also recorded reading the
phrase ‘Where one is no association, and four is a strong association’ sepa-
rately, which were later appended to each of their eleven sentences containing
45

3.2. METHOD
priming words, leaving a 500ms pause between the sentences in order to have
them follow each other in a naturalistic sounding manner. Carrier sentences,
and the appended instructional phrase, were deliberately chosen over single
words in order to ensure that listeners had the opportunity to derive so-
ciolinguistic information from each speaker’s voice by providing numerous
linguistic cues as to their sociolinguistic backgrounds.
Recording took place within the recording booth in the English Language
department at the University of Glasgow, using a Sennheiser MKH40P8 pres-
sure gradient condenser microphone connected to a Digital Audio Worksta-
tion, which comprised a desktop PC running the program Audacity. All audio
was recorded in mono at a sample rate of 44,100Hz. The recorded audio was
then equalized in terms of overall amplitude using Audacity, with a peak of
-12dB. Sections of many of the utterances recorded from the working-class
speaker were also separately adjusted in terms of amplitude across certain
words and phrases, as the speaker’s voice tended to trail off over the course
of each sentence. This had the effect of obscuring the priming words in many
of his sentences in their unedited forms, but was compensated for by raising
the amplitude in the latter sections of each utterance in proportion with the
overall waveform. Care was taken not to increase the amplitudes of such
sections over the -12dB peak, thus ensuring the edited utterances sounded
as naturalistic as possible. Aside from the adjustment of amplitude, and the
timing of the onsets of the two separate phrases in each utterance (which were
preceded by silence in each case), no other manipulation was carried out on
the audio samples. These alterations were made solely in the interests of pre-
senting equivalent stimuli to participants throughout the experiments, and
in attempting to ensure the utterances would be intelligible to participants.
Visual stimuli consisted of 48 sets of 4 images (displayed in quadrants), with
each set containing a ‘working-class’ and ‘middle-class’ target, both of which
were semantically related to the priming word in the accompanying auditory
stimuli for the set. These labels were applied as it was hypothesized that the
‘working-class’ target would be chosen more often when the working-class
speaker was heard, with the reverse proving true for the ‘middle-class’ target
and speaker. In each set, two semantically unrelated distractor images were
46

3.2. METHOD
Figure 3.1: Image set displaying brand logos with working-class (Ford) andmiddle-class (BMW) target images, paired with the auditory target word car(pilot study)
also presented in randomized quadrants. Figure 3.1 illustrates one such set,
with a brand logo hypothesized to be carry more middle-class connotations
(BMW) and one hypothesized to carry more ‘working-class’ connotations
(Ford) paired with auditory target word of car. Figure 3.2 shows a similar
image set composed of depictions of objects. Here, it was hypothesized that
participants would associate the image of the mortar board with academia
(a more middle-class occupation) and the hairnet with a food-service job
(a more stereotypically working-class occupation), giving target images with
socially disparate connotations which are both semantically related to the
auditory target word job. A total of 96 images were used, with each indi-
vidual image appearing once as a target image and once as a distractor in
order to control for salience effects, as exposing participants to some images
more often than others may have affected responses (cf. Schneider & Shiffrin
1977). The visual stimuli for the experiment were divided into 24 sets con-
taining brand logos, and 24 sets containing images of objects, as depicted in
figures 3.1 and 3.2 (overleaf).
47
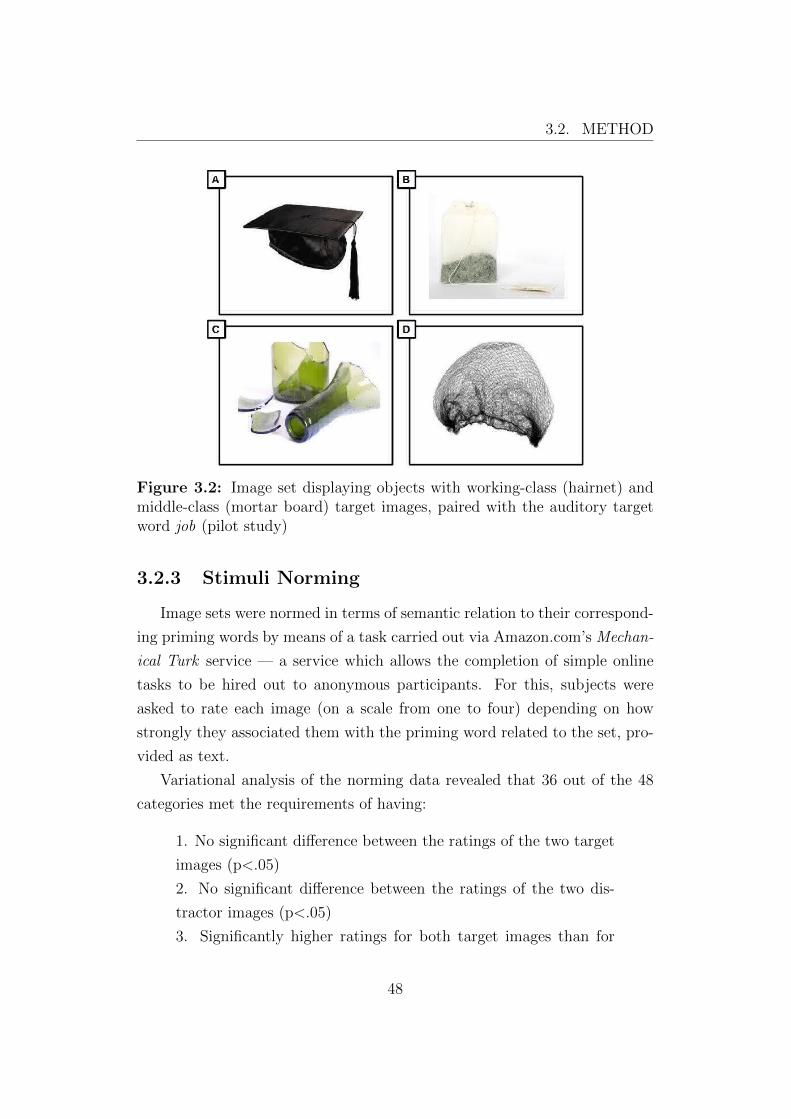
3.2. METHOD
Figure 3.2: Image set displaying objects with working-class (hairnet) andmiddle-class (mortar board) target images, paired with the auditory targetword job (pilot study)
3.2.3 Stimuli Norming
Image sets were normed in terms of semantic relation to their correspond-
ing priming words by means of a task carried out via Amazon.com’s Mechan-
ical Turk service — a service which allows the completion of simple online
tasks to be hired out to anonymous participants. For this, subjects were
asked to rate each image (on a scale from one to four) depending on how
strongly they associated them with the priming word related to the set, pro-
vided as text.
Variational analysis of the norming data revealed that 36 out of the 48
categories met the requirements of having:
1. No significant difference between the ratings of the two target
images (p<.05)
2. No significant difference between the ratings of the two dis-
tractor images (p<.05)
3. Significantly higher ratings for both target images than for
48

3.2. METHOD
Figure 3.3: Mean ratings of reported written word-image associations innorming task, pilot study (z-scores)
both distractor images (p<.05)
As participants reported strong associations between the target images and
priming words, and weak associations between the distractor images and
priming words (figure 3.3), these 36 image sets were assumed to be seman-
tically balanced. From this, it was also assumed that participants were able
to readily identify the images in these image sets, reliably associating them
with their corresponding target words. As a result of this, the remaining 12
image sets were excluded from analysis, but left in the main experiment as
distractors.
3.2.4 Procedure
Participants were told they were being given a ‘semantic association task’
which would involve rating sets of images according to how strongly they
associated each image with spoken words.
The task was then presented in the form of a Microsoft Powerpoint presen-
tation, running on a laptop using Microsoft Windows XP. With the exception
of the first and last slides of the presentation, which consisted of an intro-
duction and a slide thanking participants, respectively, each slide displayed
a different set of four images. Each image set was paired with an auditory
49

3.3. RESULTS
token containing a recording of a word bearing semantic relationships with
two of the images.
Auditory stimuli were presented via a pair of Sennheiser HD 518 head-
phones, with stimuli programmed to trigger upon slide progression. It was
originally intended that image sets be displayed for a total of 30 seconds be-
fore automatically progressing to the next slide, but it was discovered when
the first participant was completing the experiment that this did not provide
enough time for participants to mark their responses on the supplemental
questionnaire. Due to this, automatic slide progressions were removed from
the experiment, with each new slide instead being manually triggered by the
researcher when subjects had rated all of the images in the preceding set.
Experimental stimuli were presented in 8 different randomised orders (4 of
which contained auditory stimuli recorded from the working-class speaker,
and 4 containing audio recorded from the middle-class speaker) in order to
control for possible fatigue effects. This gave a total of experimental 8 config-
urations in total, with each completed by 5 participants – 20 of whom heard
only the middle-class speaker and 20 hearing only the working-class speaker
throughout the task.
Participant responses were recorded in the form of pen-and-paper ques-
tionnaires, with subjects asked to rate each image in each set according to
how strongly they associated them with the words heard in the auditory
stimuli. It was initially hypothesised that comparing the responses gathered
from these two groups of participants would reveal the implicit associations
triggered by each speaker, with significant differences providing a preliminary
indication of implicit sociolinguistic cognition.
3.3 Results
Statistical analyses were conducted upon the raw data with supervisory
assistance. Analyses were conducted using linear mixed effects models (bino-
mial distribution, logit link function) with raw image ratings and participant-
specific z-scores as dependent variables. Speaker condition (middle-class vs.
working-class), object (the middle-class, working-class, and distractor images
50

3.3. RESULTS
Figure 3.4: Mean ratings of associations between spoken words and targetimages across all image sets, by speaker (pilot study)
in each set), and the speaker condition x object interaction were utlized as
fixed effects. Participant, image set, participant x object, and image set x
object were included as crossed random effects (the latter two random in-
teractions were important for generalization purposes, as they controlled for
the fact that different participants and/or image sets might have produced
slightly different object preferences). From these models, 95% confidence
intervals around the means were derived.
The first set of analyses were carried out utilizing all 48 image sets, the
second took only the ‘best 36’ (as identified by the norming task) into ac-
count, while an additional set of analyses examined image sets containing
brand logos against those containing objects. Taking all 48 categories into ac-
count, including the 24 sets of brand logo images and 24 sets of object images,
figure 3.4 shows a perfect replication of the results found from the norming
task, in that the target images each received significantly stronger associ-
ational ratings than the distractor images. The social class of the speaker
which participants heard, however, was found to have had virtually no effect
on participant ratings here. This was also found to have been the case over
the 36 categories which were determined to have been semantically balanced
in the norming experiment (figure 3.3, p.49).
Finally, the categories containing brand logos and the categories com-
51

3.3. RESULTS
Figure 3.5: Mean ratings of associations between spoken words and targetimages in image sets depicting objects, by speaker (z-scores)
prised of images of objects were analysed separately in order to determine
whether or not participants had reacted towards these in the same manner.
Figure 3.5 and 3.6 show similar patterns to the previous analyses, in which
the social class of the speaker heard by participants appears to have had
virtually no effect on participant ratings of the visual stimuli.
When viewing image sets depicting objects, 2-tailed independent samples
t-tests revealed no significant (p>.6) gender variance in listener ratings of ei-
ther ‘working-class’ or ‘middle-class’ objects, regardless of which speaker lis-
teners had heard. Listeners from Glasgow and those from West Lothian were
also found not to have varied significantly (p>.07) in their reported associa-
tions between objects and target words, regardless of speaker heard. Listener
associations between target words and ‘middle-class’ objects were found to
positively correlate (p=.03) with listener age when hearing the working-class
speaker, but no other significant (p>.1) effects of listener age were apparent.
When viewing image sets composed of brand logos, female listeners were
found to have reported significantly (p=.02) stronger associations between
target words and ‘working-class’ brand logos than male listeners while hear-
ing the working-class speaker. Listener associations between target words
and ‘middle-class’ brand logos while hearing the working-class speaker, how-
ever, were not found to vary significantly (p=.1). Similarly, while hearing
52

3.4. DISCUSSION
Figure 3.6: Mean ratings of associations between spoken words and targetimages in image sets depicting brand logos, by speaker (z-scores)
the middle-class speaker, male and female listener ratings of ‘working-class’
brands (p=.7) and ‘middle-class’ brands (p=.7) did not vary significantly
under 2-tailed independent samples t-tests. Furthermore, the associations
between target words and brand logos reported by listeners from Glasgow
were not found to have differed significantly (p>.3) from those reported by
listeners from West Lothian. No significant (p>.06) correlations between lis-
tener age and associative ratings of brand logos emerged, regardless of which
speaker listeners heard.
3.4 Discussion
Although the results appear to show little to no effect of the social ac-
cent heard on the associations made by listeners, potential issues with the
methodology were assumed to have prevented firm conclusions from being
drawn from the experiment.
In line with Labov et al ’s (2011: 457) theory of the sociolinguistic mon-
itor, which posits that ‘women generally show more negative reactions to
deviations from overt linguistic norms’, female listeners were found to have re-
ported significantly (p=.02) stronger associations than male listeners between
target words and ‘working-class’ brand logos while hearing the working-
53

3.4. DISCUSSION
class speaker. Older listeners were also found to have reported significantly
(p=.03) stronger associations between target words and ‘middle-class’ objects
than younger listeners, but only while hearing the working-class speaker.
While this may suggest that females and older listeners were more sensi-
tive to the social information encoded in the working-class speaker’s voice,
these effects were not found elsewhere and no specific linguistic features were
examined, making further inferences problematic.
It was evident from the completed questionnaires submitted by 4 partic-
ipants that the instructions for rating image associations had been misin-
terpreted, in that they had assigned each image in each set a unique rank
from 1 to 4 — rather than rating the strength of the associations made with
each image on an individual basis. Incidentally, this was originally intended
to be part of the experimental design, with images being ranked in relation
to the other images in their respective sets. Due to difficulties encountered
when attempting to program a rankings interface into HTML code for the
online norming task, however, this method was abandoned in favour of the
ratings scales utilised here. The receipt of four such surveys, each completed
independently of the others, would appear to suggest that such a rankings
system would have been more intuitive for participants, given that this hap-
pened in spite of instructions being given to rate (rather than rank) each
image, both on the experimental questionnaire and repeated throughout the
auditory stimuli. Using a ranking system to denote comparative associations
between images and auditory priming words may also have been beneficial in
that it would most likely have yielded greater differences between associative
ratings throughout the experiment, as subjects would have been unable to
apportion the same associative valence to any two images in a set.
Perhaps the most notable issue with the experiment, however, was that it
was conducted ‘offline’, with no apparatus used to record real-time data on
participant responses towards stimuli. Due to the pencil and paper format in
which participant responses were subsequently recorded, it is impossible to
determine whether the data collected reflect implicit associations, with estab-
lished thresholds of implicit cognition ranging from 200-300ms (cf. Greenwald
et al 1998; Payne 2001). Given that it took participants considerably longer
54

3.4. DISCUSSION
than this to listen to the auditory stimuli and mark their responses on the
scales provided, it is unlikely that this was the case.
Another potential issue was identified in participants hearing a single
speaker throughout the experiment, which may have led listeners to focus
solely on the semantic information presented in the auditory stimuli, making
them to be less receptive to the social information encoded within the speech
signal. In order to control for this potential effect, it was decided that future
experiments should be designed to expose listeners to speakers with differing
social accents.
Despite these methodological issues, the experiment served as an invalu-
able pilot study, identifying areas to address in the current thesis. That
participants reported strong associations between the priming words and se-
mantically related target images, and weak associations with the distractor
images, suggested that the categories used in the visual stimuli were suffi-
ciently balanced for use in future experiments. As the data show little effect
of speaker voice on the (ostensibly explicit) associations reported by listen-
ers throughout the course of the experiment, these results provide a valuable
comparison to the real-time eye tracking data subsequently carried out.
55

Chapter 4
Experiment 1 - Off-line
Semantic Association Task
4.1 Introduction
As a precursor to working with eye tracking data, it was decided that
another off-line pilot study should be carried out in order to test whether
different speaker accents could influence listener associations between words
and images. In contrast with the previous experiment, listeners were in-
stead tasked with choosing an image in each set rather than rating them
individually (abandoning considerations of a ranking system in favour of a
simpler design), according to the target words heard in the auditory stim-
uli. As this required a different set of instructions from the previous exper-
iment, new auditory stimuli were recorded from both a working-class and
a middle-class Glaswegian male, and distractor tokens recorded from two
Glaswegian females. In keeping with the new forced-choice design, the au-
ditory instructions for the task were changed to ‘Please choose the picture
you most strongly associate with the word [target word]’. It was hypothesised
that hearing speakers of differing social accents would elicit differing image
choices in listeners.
56

4.2. METHOD
4.2 Method
4.2.1 Participants
The experiment was conducted with 32 participants, comprising 21 males
(65.6%) and 11 females, with ages ranging from 18 to 63 years old (M=28,
SD=13.3). Participation was open only to native Glaswegians, who had been
born and lived all of their lives in the Greater Glasgow area, in order to avoid
potential regional biases and ensure that listeners were able to recognise the
social accents in the auditory stimuli. Due to the difficulty in obtaining a
sufficient number of participants with the regional/native restriction in place,
participant age and gender were not controlled for.
4.2.2 Materials
Auditory Stimuli
Auditory stimuli were recorded from different speakers than the pilot study,
consisting of a 27 year old working-class Glaswegian male and a 25 year old
middle-class Glaswegian male. This was necessary due to the change in ex-
perimental design, with the auditory stimuli used in the previous experiment
containing instructions to rate, rather than choose, images. Distractor stim-
uli was recorded from a 22 year old working-class Glaswegian female and a 24
year old working-class Glaswegian Asian female. Recording took place within
a sound-attenuated recording booth within the English Language department
at the University of Glasgow, using a Sennheiser MKH40P8 pressure gradi-
ent condenser microphone connected to a Digital Audio Workstation, which
comprised a desktop PC running Audacity. All audio was recorded in mono
at a sample rate of 44,100Hz, and normalized to +10dB in order to remove
changes in amplitude across stimuli items. As the purpose of the experi-
ment was to investigate the effects of social accents on listener associations,
it was decided to only analyse the associations participants made upon being
presented with image sets accompanied by the male speakers, and include
the female speakers as distractor voices (in order to control for the effects
57

4.2. METHOD
of gender and ethnicity on listener perceptions). Each speaker was recorded
uttering the semantically neutral carrier sentence ‘Please choose the picture
you associate most with the word...’, followed by each of the target words –
car, clothes, drink, food, game, job, knife, plant, ring, shop, and show. These
were presented to participants via headphones, alongside corresponding vi-
sual stimuli.
Visual Stimuli
Visual stimuli were comprised of the same image sets composed and normed
for the pilot study, with an additional 48 image sets serving as distractors. As
before, each image set was comprised of four images (with an image displayed
in each quadrant of a computer screen), with two of those images bearing
different semantic relations to the corresponding priming word for each set,
and two semantically unrelated distractor images (figure 4.1). These target
images were placed in pseudo-randomised locations across trials. Target im-
ages were chosen on the basis that one would be more readily associated with
working-class speakers, while the other would be more readily associated with
middle-class speakers. This hypothesis was formulated with consideration to
differing socio-economic associations with working and middle-class speakers
in Glasgow, with images chosen to depict class-typical items of clothing, for
example, and objects with varying associations with violent behaviour and
‘toughness’ (cf. Lawson 2011).
Visual stimuli were split between 24 image sets containing pictures of ob-
jects (as in figure 4.1), and 24 image sets containing brand logos (as in figure
4,2). For example, one of the image sets containing objects was comprised
of pictures of a gun, a spoon, a teapot, and a pair of trainers.
When this image set was displayed to participants, listeners heard a
speaker utter the sentence ‘Please choose the picture you most strongly as-
sociate with the word knife’. Following the design of Payne (2001), it was
calculated that choosing the image of the gun would indicate that listeners
associated the word ‘knife’ with its sense as a weapon, whereas choosing the
image of the spoon would indicate that listeners associated the target word
more with its sense as a utensil. This led to the hypothesis that listeners
58

4.2. METHOD
Figure 4.1: An image set depicting objects, showing images hypothesized tocarry ‘working-class’ (the gun) and ‘middle-class’ (the spoon) connotations,based on ratings from a norming task (Experiment 1)
hearing the working-class speaker would associate the priming word more
often with the gun than the spoon when this image set was displayed, with
the reverse being the case for those hearing the middle-class speaker.
Here, it was thought that the logo for the Scottish Football Association
(paired with the target word game) would be more readily associated with
the working-class speaker, as the sport has a predominantly working-class
following in Britain (Cashmore 2010: 236). Conversely, it was thought that
the logo for Scottish Rugby would be more readily associated with the middle-
class speaker as, with the notable exception of Wales, the sport has tradi-
tionally been associated with middle-class, public-school educated men in
Britain (Cashmore 2010: 225). Similar reasoning was applied when generat-
ing the 23 other image sets containing objects, and 23 other sets comprised of
brand logos, before the visual stimuli were tested both for the strength of the
associations which people felt between the target images and target words
(achieved via a separate norming task, conducted using Amazon’s Mechan-
ical Turk service (p.50), and for any inherent social connotations which the
59

4.2. METHOD
Figure 4.2: An image set containing brand logos, showing images hypothe-sized to carry ‘working-class’ (The Scottish Football Association) and ‘middle-class’ (Scottish Rugby) connotations, based on ratings from a norming task(Experiment 1)
images used held, determined through the responses collected from a social
evaluation questionnaire (N=32).
Stimuli Norming : A social evaluation questionnaire was conducted prior
to the experiment among a separate group of 32 native Glaswegians, who pro-
vided associative ratings of each image used in the experimental stimuli on
5-point semantic differential scales, with ‘neddy’ (a Glaswegian colloquialism
relating to Glasgow’s socio-economic underclass, cf. Lawson 2011) at one
end and ‘posh’ on the other (Appendix 1, p.212). These informal terms,
locally-relevant terms were chosen in order to reflect a sharp contrast in so-
cial class that may not have been apparent with standard ‘working-class’ and
‘middle-class’ labels, and to avoid using social-science specific terms such as
‘underclass’ which are not in use among the general public.
The results from the image norming task were converted to numerical
data and z-transformed, before it was decided that only sets where the tar-
60

4.2. METHOD
get images were 2 measures of relative distance apart should be considered
as having sufficiently varying social connotations. Of the 48 original (non-
distractor) image sets, 28 image sets passed this criteria.
4.2.3 Procedure
The experiment was presented to participants via a Microsoft Powerpoint
presentation, running on desktop computers supplied with sets of Sennheiser
HD 518 headphones outputting audio through M-Audio USB Fasttrack ex-
ternal soundcards. Two computers with identical setups were used in order
to run the experiment with multiple participants at once, with all testing
conducted in University of Glasgow’s Experimental Phonetics Laboratory.
Each presentation consisted of slides containing the visual stimuli, with the
corresponding auditory stimuli for each image set embedded and cued to
play upon slide progression. Four different presentations, showing the same
stimuli in different randomized orders, were utilized in order to control for
possible fatigue effects. Unlike the previous experiment, participants were
asked to choose only one image in each set. Although each listener was pre-
sented with auditory stimuli from all four speakers recorded, the experiment
was carried out between subjects. Half of the subjects were presented with
certain image sets accompanied by audio from the working-class male and
other image sets while hearing the middle-class male, while the other partici-
pants saw the same image sets with the order of the speakers heard reversed.1.
Participants were also presented with distractor image sets paired with au-
ditory tokens recorded from the female speakers. Responses were recorded
via questionnaires, which were completed during the experiment. Listeners
were given a total of seven seconds to indicate which image in each set they
most strongly associated with the corresponding target words, hearing one
instance of auditory stimuli with each image set.
1For example, where one group of participants were presented with image sets 1, 3, and5 while hearing the middle-class speaker, a second group were given image sets 1, 3, and5 while hearing the working-class speaker. Conversely, the first group were given imagesets 2, 4, and 6 while hearing the working-class speaker, whereas the second group heardthe middle-class speaker during these image sets
61

4.3. RESULTS
4.3 Results
Instances in which listeners had selected distractor images were excluded
from analyses, as these were found to have occurred in negligible proportions
(3.9% of total trials).
Participant responses to the image sets containing brand logos were anal-
ysed both together with and separately from the image sets containing ob-
jects. The results here show the separate analyses of brand logo and object
images sets, as these were found to have patterned in opposing directions.
This may have been due to differences in semantic associations made towards
objects and brand logos — for example, when viewing image sets contain-
ing objects, participants were tasked with selecting an object semantically
related by function to the target word, whereas the brand logos were hy-
ponymously related to the target words (e.g. a gun or a spoon can be used
for similar purposes as a ‘knife’, whereas Waitrose and Tesco are both types
of ‘shop’). The data collected from participant responses to the brand logos
showed that listeners were marginally more likely to choose the image of the
brand hypothesised to be more associated with working-class speakers when
the target words were heard from either the middle-class speaker (52%) or
the working-class speaker (52%), indicating a slight trend in favour of the
‘working-class images’ regardless of the speaker heard (Figure 4.3).
With regards to the image sets containing objects, the reverse was found
with listeners found to have chosen the ‘middle-class objects’ more often than
the ‘working-class’ objects regardless of speaker heard (Figure 4.4).
Nevertheless, these results were not found to be statistically significant
(p>.4 in each case) under linear mixed effects model (binomial distribution,
logit link function), including speaker condition (middle-class vs. working-
class), object (the middle-class, working-class, and distractor images in each
set), and the speaker condition x object interactions as fixed effects. Partic-
ipant, image set, participant x object, and image set x object were included
as crossed random effects.
Under 2-tailed independent samples t-tests, female listeners were found
to have selected marginally more working-class brand logos when hearing
62

4.3. RESULTS
Figure 4.3: Listener choices of brand logos by speaker heard, Experiment1 (95% C.I.)
Figure 4.4: Listener choices of objects by speaker heard, Experiment 1(95% C.I.)
63

4.4. DISCUSSION
a middle-class speaker and more middle-class brand logos while hearing a
working-class speaker (showing a class-incongruent trend). Male listeners
were found to have selected marginally more working-class brand logos while
hearing a working-class speaker and more middle-class targets while hearing a
middle-class speaker (class-congruent trend). All gender variances, however,
were non-significant (p>.05). Similarly, no significant (p>.25) correlations
were found between listener ages and choices of either objects or brand logos,
regardless of speaker heard.2
4.4 Discussion
While statistical analyses did not reveal a significant impact of speaker
voice on the images chosen by listeners, the results of this experiment show
clear trends in the directions hypothesized – with listeners more likely to
choose a ‘middle-class’ image when the middle-class speaker was heard, and a
‘working-class’ image when the working-class speaker was heard. The exper-
iment also revealed that people were more likely to choose the ‘working-class’
brand logos and ‘middle-class’ objects regardless of speaker heard. This may
be due to the more ubiquitous nature of brand logos considered working-
class, and the less commonly used nature of some of the objects used as
‘working-class’ examples here. For example, Tesco has a far larger mar-
ket share and number of stores that Waitrose (with which it was paired in
the experiment), so would presumably be far more likely to trigger associa-
tions. Likewise, it may have been the case that some of the objects chosen
for the ‘working-class’ images, such as nuchakus and knuckledusters for the
word ‘knife’, are less commonly encountered than their ‘middle-class’ coun-
terparts, such as scissors and cake slices. As participants were exposed to
the same stimuli in both speaker conditions, however, such salience effects
are not of primary concern. While the trends in listener image choices ap-
pear unusual, the non-significant variance in listener image choices indicates
that any effect of speaker voice was minimal. Furthermore, no significant
22-tailed Pearson correlations
64

4.4. DISCUSSION
(p>.05) differences were found between male and female listeners’ choices of
either brand logos or objects, and little correlation (p>.25) was found be-
tween participant choices of brands and objects, regardless of speaker heard.
This methodology, however, did not record real-time data so cannot be used
to infer implicit associations. In order to investigate this, a near-replication
of this experiment was formulated, monitoring listener fixation behaviour in
real-time via an eye tracking headset (Ch. 6)
65

Chapter 5
Background II
5.1 Implicit Cognition
For the past three decades, psychological research has repeatedly shown
that it is not always necessary for us to be conscious of events in order to
perceive them, with the evidence suggesting that ‘the recognition of sim-
ple stimuli can be achieved without attention, and even without awareness’
(Underwood & Bright 1996: 1). This phenomenon is referred to as implicit
cognition, and operates on the basis that ‘Awareness of an event is neither a
necessary consequence of cognition nor a necessary condition for cognition’
(Underwood & Bright 1996: 3).
Implicit cognition experiments in psychology have traditionally utilised
methods such as semantic priming, in which stimuli are presented to par-
ticipants under subliminal conditions, below what is considered to be the
threshold of conscious awareness. This, for example, may involve words or
images being displayed for tens of milliseconds before being replaced by a
backwards (or pattern) mask in the form of a second stimulus, often consist-
ing of a random display of letter-like features, dots, or other non-linguistic
features (Underwood & Bright 1996: 3).
Early semantic priming experiments involved first determining the criti-
cal stimulus-onset-asynchrony (SOA)1 levels at which participants could not
1SOA: The amount of time between the onset of one stimulus item and the onset of
66

5.1. IMPLICIT COGNITION
Figure 5.1: A research participant viewing images on a tachistoscope
explicitly identify stimulus items, before presenting stimulus items at a lower
SOA. Fowler et al (1981) utilised the semantic priming method in a series
of experiments which tasked participants with identifying words presented
to both eyes on a tachistoscope (figure 5.1)2, across trials which consisted
of cards (with 50% blank and 50% containing words) flashing momentarily
inside the tachistoscope before being replaced by a pattern mask. Two such
experiments (N=20 and N=10) found masked words to have facilitated ‘lex-
ical decisions concerning subsequently presented semantically related words’
as effectively as unmasked words (Fowler et al 1981: 341).
Similarly, Balota (1983) conducted an experiment (N=24) investigating
the influence of a masked prime on subjects’ lexical decisions. After determin-
ing each subject’s critical SOA threshold in identifying whether words were
present on tachistoscope-displayed cards or not, participants were subject to
64 trials involving priming words and 64 trials containing non-words. Primes
were momentarily displayed to participants’ non-dominant eyes before disap-
pearing, with a pattern mask being simultaneously presented to their domi-
another, with the second stimulus item ordinarily being a pattern mask.2Image taken from the York University (Canada) website:
http://www.yorku.ca/yul/gazette/past/archive/2000/022300/issue.htm [26/06/15]
67

5.1. IMPLICIT COGNITION
nant eyes. Participants were then given a choice between two target words in
a lexical decision task, where ‘primes were either related (GRAPE), neutral
(XXXXX), or unrelated (BOX) to the targets (JAM)’ (Balota 1983: 88). The
experiment found subjects to have responded faster to targets which followed
semantically related primes than to targets which followed semantically un-
related primes, with ‘subjects being unable to reliably report the presence of
the prime’ (Balota 1983: 88).
Also using a tachistoscope, Marcel (1983) utilised a similar methodology
to Balota (1983), presenting participants with a priming stimulus in their
non-dominant eye, followed by a patterned mask in their dominant eye. In
his first experiment (N=24) cards were momentarily shown to participants,
with 50% being blank and 50% containing words. Over 480 trials, partici-
pants were tasked with deciding if a word was present and, if so, choosing a
semantically similar term from a choice of two target words, then a graphi-
cally similar word from a choice of another two target words, each pre-tested
for similarity using pre-existing norms (Bousfield et al 1960; Postman &
Keppel 1970; Weber 1970). SOA was lowered for each participant as the
experiment continued, with participants found to have first reached chance
performance level (making correct decisions in 50% of trials) first in detecting
words, then in choosing graphically similar words, and finally in choosing se-
mantically similar words, suggesting that unconscious processing time varies
for different types of information.
It should be noted, however, that the semantic priming method as utilised
by Fowler et al (1981), Balota (1983), and Marcel (1983) has been criticized
for relying on verbal participant reports to determine whether stimuli are
subliminal or not. As Underwood & Bright (1996: 4) state: ‘this objective
measure does not necessarily match with subjective impressions. The per-
ceiver may be unable to identify a word well enough for verbal report while
still knowing something of the presentation.’
Other studies, such as Cheesman & Merikle (1984), addressed this by
examining implicit cognition using objective thresholds, determined by par-
ticipant ability in ‘making discriminative responses regardless of their verbal
reports of discriminability.’ (Underwood & Bright 1996: 4). In their experi-
68

5.1. IMPLICIT COGNITION
ment (N=8), Cheesman & Merikle (1984: 388) performed a series of stroop
test3 variants, in which participants were tasked with fixating on colour
patches within a tachistoscope and naming the colour as quickly as possi-
ble. Colour patches were accompanied by either one of four congruent colour
words (e.g. blue when viewing a blue colour patch), an incongruent colour
word (e.g. yellow when viewing a blue colour patch), or a control letter string
(e.g. XXXXX when viewing a blue colour patch) appearing either above or
below the patch. The colour patch and stimulus were then obscured by a
pattern mask, and participants were then tasked with identifying the colour
of the patch seen during the trial from a choice of four colours.
Cheesman & Merikle (1984) then determined each participant’s objective
SOA threshold in identifying priming words during a preliminary block of tri-
als in which SOA was reduced until participants reached 25% accuracy levels.
In a subsequent block of trials, participants were instructed to identify colour
blocks but ‘to avoid naming any letter strings that might appear above or
below the colour patch’ (Cheesman & Merikle 1984: 389). The experiment
found stimulus words presented at the objective SOA thresholds to have
had no effect on participant performance in identifying the colour of simul-
taneously presented colour patches. Furthermore, all participants ‘claimed
they could not see anything at durations that were 30 to 50ms above their
objective thresholds’ (Cheesman & Merikle 1984: 390).
In a second experiment (N=10), both the objective and subjective thresh-
olds for each participant were established before priming trials were carried
out. As before, participants were given a four-option forced-choice colour
word naming task. Objective thresholds were determined by finding the SOA
for each participant at which priming words could only be correctly identi-
fied at chance (25%) accuracy levels, whereas subjective thresholds were de-
fined as ‘the actual observed performance when subjects initially estimated
3Stroop tests task participants with reading aloud or categorising the written namesof colours while the text itself is displayed in non-matching colours (e.g. red, blue,or yellow), and in naming the colours of solidly-coloured blocks in a control condition.Interference is expressed as the total difference in participant response times betweencorrectly naming the colours represented by the text and in naming the colours of thecontrol blocks (MacLeod 1991).
69

5.1. IMPLICIT COGNITION
that their detection performance was less than 30% correct.’ (Cheesman
& Merikle 1984: 392). For this experiment, stimuli were presented over
computer display, rather than via tachistoscope, using a hood to physically
divide the screen into two separate (left eye and right eye) sections. Partic-
ipants entered choices via a connected button box, which was also used to
initiate trials. All subjects were found to have identified colour words with
high accuracy levels (between 53% and 75%) at the subjective threshold, at
SOAs where they claimed not to be able to determine colour words with bet-
ter than chance accuracy. At the objective threshold, however, participants
were found to only have correctly identified primes with a mean accuracy of
27%. Cheesman & Merikle (1984: 394) argue that the absence of a prim-
ing effect in the objective threshold condition and presence of a pronounced
effect in the subjective threshold condition demonstrates the need for both
thresholds in implicit cognition research, in order to distinguish between ‘per-
ceptual sensitivity’ and ‘a lack of confidence that a particular stimulus has
been presented’, but conclude that:
The results thus support Eriksen’s (1960) position that verbal
reports are an accurate indicator of perceptual processing and
contradict recent claims that masked primes presented below the
awareness threshold are nevertheless perceived.
(Cheesman & Merikle 1984: 395)
Building upon this, a further study by Reingold & Merikle (1988) pro-
posed an approach involving a comparison between direct measures (explicit
responses, such as verbal reports) and indirect measures (implicit perfor-
mance, or changes in discrimination performance unavailable for report),
reasoning that a discrepancy between explicit and implicit reactions within
subjects would provide proof of the unconscious processing of subliminal
primes. In an experiment (N=40) conducted to test this approach, partici-
pants were simultaneously presented with words and non-words over two sets
of 144 trials. Stimuli were presented to both eyes via computer display, with
a hood physically dividing the left-eye and right-eye fields, and participant
responses gathered via touch-sensitive plates positioned before the display
70

5.1. IMPLICIT COGNITION
screen. In one set of trials, participants were tasked with deciding which of
the two display fields (left or right) contained a word (with the other con-
taining a non-word). In a second set of trials, participants were tasked with
deciding which stimulus item (left or right) was displayed for a longer dura-
tion than the other. Participants were found to have performed significantly
(p<.01) better than chance in identifying words from non-words. In the other
set of trials, the presence of words versus non-words was not found to have
significantly (p>.05) influenced participant judgements of stimuli durations.
Furthermore, a cross-condition 2x2 analysis of variance found a significant
(p<.05) effect of task, showing participants to have performed significantly
better during the lexical decision task than during the duration judgement
task — a finding which Reingold & Merikle (1988: 571) claim ‘provide[s]
strong support for the conclusion that the direct measure of lexical status
has greater absolute sensitivity than the comparable indirect duration judg-
ment measure.’
In a further experiment (N=20) conducted under similar experimental
conditions, Reingold & Merikle (1988: 572) informed participants that they
would see two ‘flashes’, tasking participants with deciding ‘which flash con-
tained a string of letters’ or, in a separate condition, ‘which flash was longer
in duration’. Stimuli in each condition consisted of a randomly selected word
or non-word presented to one eye while a blank field was simultaneously pre-
sented to the other. Subjects were found to have performed at significantly
better than chance levels both in detecting words and non-words (p<.001)
and in determining which stimuli had the greater duration (p<.01). An ad-
ditional analysis of variance found a significant (p<.001) main effect between
conditions, supporting the findings of the previous experiment — that direct
measures, such as the perceived presence of letter strings, provide ‘a more
sensitive index of perception than does a comparable indirect measure’, such
as the perceived duration of stimuli (Reingold & Merikle 1988: 572).
It is Reingold & Merikle’s (1988) approach of comparing direct and in-
direct responses that has been largely adopted across the domain of social
psychology, where implicit cognition has been under research for over twenty
71

5.2. IMPLICIT SOCIAL COGNITION
years, repeatedly showing individuals to make automatic evaluations upon
encountering ‘attitude objects’ (Castelli et al 2004: 373).
5.2 Implicit Social Cognition
The enormity of the social implications of automatic evaluations is per-
haps best outlined by Payne & Gawronski (2010: 1), who assert that ‘Within
the space of the last two decades, virtually every intellectual question in so-
cial psychology, and many outside of it, has been shaped by the theories
and methods of implicit social cognition.’ Numerous studies have examined
implicit evaluations with regards to a range of different social groups, using
measures such as the affective priming procedure (Fazio et al 1986; Klauer
& Wegener 1998) and the Implicit Association Test (Greenwald et al 1998),
with results consistently showing that people are quicker to associate nega-
tive traits with members of socially stigmatised groups than with members
of groups which are less stigmatised (Greenwald et al 1998; Payne 2001).
Such research has shown that associations can occur below the level of con-
scious awareness, with unconscious associations believed to be triggered via
automatic attitude activation. Fazio (2001: 115) explains this process in the
following terms: ‘presentation of an attitude object has been shown to auto-
matically activate from memory the evaluation that an individual associates
with the object.’
5.2.1 Social Priming
Research on implicit social cognition draws upon early priming studies,
such as those carried out by Schneider & Shiffrin (1977), who conducted
a series of experiments which involved tasking participants with identifying
target letters in rapidly-displayed letter strings presented via tachistocope,
across blocks of trials with changing targets between trials. The study found
participants to have identified target letters faster (with participants report-
ing the target letters ‘popping out’) when those letters had not been previ-
ously seen as distractors in other trials. From this, and similar experiments,
72
5.2. IMPLICIT SOCIAL COGNITION
Schneider & Shiffrin (1977) formulated a theory of automatic detection versus
controlled search processes.
Later priming experiments, such as Fazio et al (1986), used the affective
priming procedure. In the first such experiment (N=22), subjects were po-
sitioned in front of an Apple II+ computer and tasked with categorising a
series of on-screen ‘attitude objects’ (words including the names of individ-
uals, animals, foods, social groups, nations, activities, and physical objects)
as either good or bad, using labelled keys on a keyboard. Participants were
instructed to perform this task as quickly and as accurately as possible, with
responses and response times recorded. From their performance, words were
selected on the basis of participants having responded to them quickest in
categorising them as good, quickest in categorising them as bad, slowest in
categorising them as good, and slowest in categorising them in bad — or,
as Fazio et al (1986: 231) termed these categories, ‘strong good, strong bad,
weak good, and weak bad.’ Participants were given a series of trials in which
they were shown primes consisting of the selected words (or a string of iden-
tical letters) for 200ms, followed by a 100ms interval, before being shown
an adjective (with either positive or negative connotations) and tasked with
categorising the adjective as either good or bad, while also being asked to re-
cite the on-screen primes, or ‘memory words’, which they saw. Compared to
other conditions, participants were found to have been significantly (p<.001)
quicker in categorising positive adjectives as good when shown a priming
word they had previously been quick to rate as good (or a strong good word),
and significantly (p<.001) quicker in categorising negative adjectives as bad
when shown a priming word they had previously been quick to categorise as
bad (or a strong bad word). Weak primes (weak good and weak bad words),
on the other hand, were found not to have facilitated faster adjective cate-
gorisations. Valence incongruent (i.e. a strong good prime presented before
a negatively valenced adjective) trials were found to have produced an in-
hibitory effect, with participants slower in categorising the adjectives in these.
As Fazio et al (1986: 233) state, the results show that ‘at least some atti-
tudes may be activated from memory automatically upon mere presentation
of the attitude object.’
73

5.2. IMPLICIT SOCIAL COGNITION
In a later study, Fazio et al (1995) made use of the affective priming proce-
dure to briefly show (N=53) participants on-screen photographs of people of
different races (for a duration of 315ms, followed by a 135ms interval), before
displaying either positively or negatively valenced adjectives. Participants
were tasked with categorising the adjectives as either positive or negative,
with input recorded via keyboard. Among white participants (N=45), pic-
tures of white faces were found to have facilitated quicker positive categorisa-
tions, and pictures of black faces faster negative categorisations. Conversely,
among black participants (N=8), pictures of white faces were found to have
facilitated quicker negative categorisations, and pictures of black faces faster
positive categorisations.
Priming effects were also demonstrated in two experiments conducted by
Bargh et al (1996), the first of which (N=34) found participants who had
been exposed to scrambled sentences containing words semantically related
to the concept of ‘rudeness’ (such as aggressively, bother, disturb, and in-
terrupt) to have interrupted the experimenter significantly (p=.008) quicker
than participants who had either been exposed to scrambled sentences con-
taining words semantically related to the concept of ‘politeness’ (such as re-
spect, patiently, polite, and unobtrusively), or scrambled sentences containing
words intended to be semantically neutral (such as normally, optimistically,
clears, and prepares). The second such experiment (N=30) presented partici-
pants with scrambled sentences containing either words related to an ‘elderly
stereotype’ (such as old, grey, wise, and retired) or a neutral stereotype which
contained ‘age-non-specific words in the place of elderly stereotyped words.’
(Bargh et al 1996: 237), before a second experimenter recorded the amount
of time they took to walk down a corridor after exiting the laboratory. The
study was then replicated with a further 30 participants. In both cases,
those who were subjected to the scrambled ‘elderly stereotype’ words took
significantly (p<.01 and p<.05, respectively) longer to walk down the hall
than participants that were not, suggesting that the passive activation of the
elderly stereotype was responsible for their slower walking pace.
Dijksterhuis & van Knippenberg (1998: 865) conducted four experiments
investigating the performance of college students in general knowledge tests
74

5.2. IMPLICIT SOCIAL COGNITION
after being primed with either ‘intelligent’ or ‘stupid’ stereotypes. In the first
such experiment (N=60), undergraduate students were first told to imagine
and list the traits of either a typical university professor (in one condition),
or a typical secretary (in a control condition). Another group of partici-
pants were given no prime, with participants being randomly assigned to one
of the three experimental conditions. These occupations were chosen after
a prior norming task (N=40), which had participants rate various occupa-
tions in terms of 56 traits on 9-point scales, with professors found to have
been perceived as intelligent (with a mean rating of 7.78) and knowledge-
able (7.56), and secretaries found to have been rated near the mid point for
these attributes (5.05 and 4.83, respectively). Participants were then given
a general knowledge test consisting of 42 multiple-choice questions (drawn
from the game Trivial Pursuit), each with four choice options, and told that
‘the Personality Department was currently developing a ”general knowledge”
scale’ with subscales ranging from very easy(1) to very difficult (5), and that
the experiment was ‘testing the differences in difficulty between each scale’
(Dijksterhuis & van Knippenberg 1998: 869). Participants in the ‘professor’
condition were found to have performed significantly better in the test than
those in the ‘secretary’ (p<.003) or no-prime (p<.02) conditions.
A second experiment (N=58) attempted to replicate the first, varying
the length of time participants were exposed to both primes and questions
(shown on an Apple Macintosh LCIII computer display). Primed subjects
were shown a ‘professor’ prime, with some given a 2 minute prime condition
and others a 9 minute prime condition. One third of the subjects were
apportioned to a no-prime control group. Subjects were subsequently given
the same instructions and general knowledge test as in the first experiment,
with the addition of 18 new questions. A time limit was also introduced,
with each question displayed on screen for 15 seconds. Participants who had
been primed for 9 minutes were found to have performed significantly better
in the test than those primed for 2 minutes (p<.05) and those not primed
at all (p<.001). Participants who had been primed for 2 minutes were also
found to have performed significantly (p<.04) than those in the no-prime
condition.
75

5.2. IMPLICIT SOCIAL COGNITION
In a third experiment (N=95), Dijksterhuis & van Knippenberg (1998)
replicated the second experiment, but replaced the ‘professor’ prime condi-
tion with a ‘soccer hooligan’ prime condition — in which participants were
asked to imagine and list the attributes of a typical football hooligan, a group
which participants in a prior norming task (N=40) had rated low in terms of
intelligence and knowledgeability (with mean ratings of 2.12 and 1.98 out of
9, respectively). Participants given a 9 minute ‘soccer hooligan’ priming task
were found to have performed significantly worse in the general knowledge
test than those given a 2 minute ‘soccer hooligan’ priming task (p<.05) and
those in a no-prime control condition (p<.003). In a fourth and final experi-
ment (N=43), participants were primed either with a stereotype (‘professor’
or ‘soccer hooligan’) or with an associated trait (‘intelligent’ or ‘stupid’), with
those in the trait conditions being instructed to think about the concept of
that trait. Participants primed with either the ‘professor’ or ‘intelligent’
traits were found to have peformed significantly (p<.02) than those in the
‘soccer hooligan’ and ‘stupid’ conditions. These findings, however, and those
of Bargh et al (1996), are not without controversy (see section 2.4.2).
Payne (2001) utilised an affective priming procedure in two experiments,
the first of which (N=31) consisted of a series of trials which involved ex-
posing white subjects to an image of a human face (a black face on some
trials, a white face on others), which flashed on-screen before momentarily
being replaced with either a gun or a ‘harmless’ hand tool, which in turn was
replaced with an irregularly patterned black and white visual mask. Partici-
pants were then tasked with ignoring the faces while categorising the objects
as either guns or tools, with their reaction times being recorded in each case.
Response time comparisons across conditions revealed participants to have
been significantly (p<.001) quicker to identify guns when primed by a black
face than when a whte face was shown, and significantly (p<.02) quicker in
identifying tools when primed by a white face than when a black face was
shown. A second experiment (N=32) was conducted as a direct replication
of the first with a new set of participants (all white college students), with
the only methodological change being an instruction that participants must
respond to stimuli as quickly as possible. Participants were found to have
76

5.2. IMPLICIT SOCIAL COGNITION
responded with considerably higher error rates, falsely identifying tools as
guns in significantly (p<.003) higher proportions when primed with a black
face than when a white face was shown.
More recently, Miller et al (2012: 728) conducted a series of experiments
which found white college students to have been quicker in performing ‘avoid-
ance behavior’ actions after being exposed to images of black faces than after
being exposed to images of white or Asian faces. In their first experiment
(N=82), participants were first primed with video intended to provoke avoid-
ance behaviour. In one condition, this included a scene from The Silence of
the Lambs in which ‘a White female is stalked by a White male murderer’,
intended to elicit a self-protective, fearful state, while another condition in-
cluded a scene from Pink Flamingos, in which an actor eats dog faeces,
intended to ‘produce a desire to avoid potential sources of pathogens and
elicit emotion (disgust) consistent with that desire’ (Miller et al 2012: 728).
Participants were then tasked with categorizing faces according to their race
by moving a joystick towards or away from themselves (with this varying
by condition). Participants who had been primed with The Silence of the
Lambs (the ‘self-protection’ condition) were found to have been significantly
(p=.013) quicker in pushing the joystick away from themselves (an ‘avoid-
ance behavior’) in response to black faces than white faces. No effect of race,
however, was found among participants who had been primed with the scene
from Pink Flamingos (the ‘pathogen avoidance’ condition). This result was
in line with Miller et al ’s (2012: 728) hypothesis that:
Given that Black men are stereotypically associated with phys-
ical safety threat more than pathogen threat, we predicted that
self-protective motivation (relative to pathogen avoidance moti-
vation) would facilitate greater avoidance behaviors when encoun-
tering Black men as compared to White men.
In a second experiment (N=139), a group of participants were exposed to the
same ‘self-protection’ condition as before (viewing the scene from The Silence
of the Lambs) while others were shown a ‘time-lapsed videography of urban
living from the film Koyaanisqatsi ’, intended as a neutral condition (Miller
77

5.2. IMPLICIT SOCIAL COGNITION
et al 2012: 730). Participants were then tasked with pushing a joystick away
from themselves as quickly as possible in response to either white, black, or
Asian faces displayed in different blocks of trials. Participants in both con-
ditions were found to have responded significantly (p<.001) faster towards
black faces than either white or Asian faces. This effect was significantly
(p=.034) greater, however, in the ‘self-protection’ condition than in the neu-
tral condition. These results were in line with a preliminary questionnaire
(N=30) carried out as part of the same study which found a much higher per-
centage of college students to have listed danger associated concepts (such as
violence, aggression, and hostility) as stereotypes of black men (93.3%) than
white (3.3%) or Asian men (0%), suggesting that the differences in avoidance
behaviour resulted from stereotype activation.
A meta-analysis of 167 priming studies conducted by Cameron et al
(2012) found correlations between sequential priming tasks and both be-
havioural measures (r=.28) and explicit attitude measures (r=.20). The
meta-analysis, which included a wide range of experimental designs, included
only sequential priming studies (in which the stimulus onset asynchrony be-
tween priming stimuli and target stimuli was zero) which examined the re-
lationship between sequential priming and behaviours or sequential priming
and explicit attitudes (Cameron et al 2013: 333). To examine publication
bias, as social science studies reporting statistically significant (p<.05) re-
sults are approximately 41% more likely to be published than studies which
report null results (Franco et al 2014), the meta-analysis was carried out
after plotting the effect size in each study against its sample size then ex-
amining the mean effect size estimates, and included ‘enough unpublished
studies that we could examine publication status as a moderator of conver-
gent validity’, finding no significant (p=.94) difference in the effect sizes of
published versus unpublished studies (Cameron et al 2013: 338).
This area of research is not without controversy, however, with the ro-
bustness of social priming findings called into question after attempted repli-
cations of high-profile studies such as Bargh et al (1996) and Dijksterhuis &
van Knippenberg (1998) failed to be yield confirmatory results (cf. Doyen et
al 2011; Shanks et al 2013).
78

5.2. IMPLICIT SOCIAL COGNITION
5.2.2 Replication Issues
The need for more rigorous replication in social psychology was recently
brought to the fore after a study (Bem 2011) published in the Journal of
Personality and Social Psychology claimed to show evidence of psychic phe-
nomena (or ‘pre-cognition’) in 8 of 9 experiments. The most widely replicated
of these, Bem’s (2011) eighth and ninth experiments (N=100; N=50), each
presented participants with a word recall task then later had them rehearse
those words, with the published results suggesting that post-hoc rehearsal
had significant (p=.029; p=.002) effects on participant performance on the
prior tasks. Bem (2011: 42) claimed that the results ‘show that practicing
a set of words after the recall test does, in fact, reach back in time to facili-
tate the recall of those words’. These findings were, perhaps unsurprisingly,
not confirmed by subsequent replication studies, with Ritchie et al (2012)
finding no effect of after-task priming in 3 direct replications conducted in-
dependently at 3 different universities, and Galak et al (2012) failing to find
significant effects in 7 replication attempts (total N=3,289). Furthermore,
Galek et al (2012: 933) conducted a meta-analysis of 10 published and un-
published replications of Bem’s (2011) eighth and ninth experiments, as well
as Bem’s (2011) original findings, concluding that ‘the average effect size
(d=.04) is no different from zero.’
The validity of somewhat less controversial studies, such as Bargh et al
(1996) and Dijksterhuis & van Knippenberg (1998), have also been called
into question due to poor replicability. Doyen et al (2012) attempted a repli-
cation of 2 of Bargh’s (1996) experiments (N=34; N=30), which had found
significant (p<.01; p<.05) effects of viewing scrambled sentences contain-
ing words related to ‘elderly stereotypes’ on subsequent participant walking
speeds, with those who had viewed the ‘elderly stereotype’ words (such as
old, grey, wise, and retired) measured to have significantly slower walking
speeds immediately following the task than those who had viewed sentences
containing ‘age-non-specific words’ (Bargh et al 1996: 237). While a previous
replication (N=77) conducted by Cesario et al (2006) appeared to confirm
the elderly-stereotype priming effect found by Bargh et al (1996), Doyen et al
79

5.2. IMPLICIT SOCIAL COGNITION
(2012: 1) claim that both studies ‘can be questioned based on imprecise tim-
ing methods’, as each had relied on secondary researchers (who were unaware
which priming condition participants had been exposed to) using hand-held
stopwatches to record participant walking times over a set distance. Sub-
sequently, Doyen et al (2012) aimed to measure participant speeds more
accurately by using hidden infrared sensors to record participant walking
times over the same distance. Doyen et al (2012: 2) also ensured that the
experimenters administering the priming stimuli were unaware of the prim-
ing condition given to each participant, and had ‘neither prior expectations
toward participants behavior nor knowledge of the original experiment.’ In
a first replication (N=120), no significant difference was found between the
walking speeds of those who had been primed with ‘elderly words’ versus
those who had been primed with ‘neutral words’.
A second replication (N=50) was then conducted, in which half of the
experimenters were told during an hour long briefing that the primed par-
ticipants would walk slower as a result of the prime, and half told that the
participants would walk faster. Participants, however, were instead randomly
assigned to conditions during the experiment. In addition, the first partici-
pant tested by each experimenter ‘was a confederate who had been covertly
instructed to act in the manner expected by the experimenter.’ (Doyen et
al 2012: 3). Furthermore, experimenters were instructed to measure par-
ticipant walking times via hand-held stopwatches, as in the original study,
giving a measure of subjective timing against which the objective timings
recorded by the infrared sensors could be compared. When timed by stop-
watch, participants were found to have walked significantly (p<.002) slower
after being primed with ‘elderly stereotype words’ than those primed with
‘neutral words’ when tested by an experimenter who expected the primed
participants to walk slower. Participants who had been primed with ‘el-
derly stereotype’ words, however, were found to have walked significantly
(p=.012) faster than those primed with ‘neutral’ words when tested by an
experimenter who expected them to walk faster, suggesting that experimenter
bias was responsible for producing this effect. Furthermore, the infrared sen-
sors revealed participants to have walked significantly (p=.014) slower in the
80

5.2. IMPLICIT SOCIAL COGNITION
‘elderly stereotype’ condition that in the ‘neutral words’ condition when ex-
perimenters expected participants to walk slowly, replicating Bargh et al ’s
(1996) effect between these conditions. When the experimenter expected
participants to walk quicker, however, no significant effect of priming con-
dition was observed. The study also revealed walking speeds to have been
significantly (p<.001) slower when experimenters believed participants were
being primed to walk slowly than when they believed the prime would make
them walk faster. Overall, the results suggest that some element of exper-
imenter behaviour was responsible for the variance in participant walking
speeds throughout the task, and bring Bargh et al ’s (1996: 242) findings
into question.
Similarly, Shanks et al (2013) conducted a series of experiments attempt-
ing to replicate Dijksterhuis & van Knippenberg (1998), which claimed that
participant performance in general knowledge tests had been influenced by
first imagining ‘professor’ or ‘soccer hooligan’ stereotypes. In their first 2
experiments, Shanks et al (2013) showed participants 8 minute-long video
clips of either professors discussing cosmology or a documentary about soc-
cer hooliganism, then had participants spend 5 minutes listing the attributes
of a typical professor or soccer hooligan before taking a test consisting of
Raven’s Advanced Progressive Matrices.4 The decision to change the test
from a general knowledge test to one which involves matching geometric
patterns was justified by Shanks et al (2013: 2) as follows:
If the effects of priming are thought to be due to changes in
motivation or strategy, then examining performance in a general
knowledge test seems less than ideal given the binary nature of
such knowledge (known/unknown). Instead, employing a test of
analytical thinking and problem solving should be better suited
to detecting priming effects.
The first such experiment (N=40) found a statistically insignificant (p=.14)
difference between participant test scores in the ‘professor’ condition versus
4Raven’s Progressive Matrices is an intelligence test which infers a measure of IQ (bycorrelation with percentile score on the test) solely from participant ability to completelogical sequences expressed through geometric symbols (cf. Raven 1938)
81

5.2. IMPLICIT SOCIAL COGNITION
the ‘soccer hooligan’ condition. Incongruously, those in the ‘soccer hooligan’
condition were found to have performed better than those in the ‘professor’
condition. A second experiment (N=16) repeated the methodology of the
first, but removed the video clips from the pre-test conditions. Again, those
in the ‘soccer hooligan’ condition were found to have performed better in the
test than those in the ‘professor’ condition, but not to a significant (p=.43)
degree. A third experiment (N=44) repeated the methodology of the second
experiment, but replaced the Raven’s Progressive Matrices test with general
knowledge questions and extended the priming procedure from 5 minutes
to 9 minutes. No significant (p=.33) difference in participant test scores
between the ‘professor’ and ‘soccer hooligan’ conditions was observed. In a
fourth experiment (N=100), Shanks et al (2013) conducted a close replication
of Dijksterhuis & van Knippenberg’s (1998) original study, with a priming
phase of 5 minutes followed by a general knowledge test. Once again, no
significant (p=.28) divergence was found between participant scores by con-
dition, suggesting little to no effect of stereotype priming on participant test
performance.
Overall, it would seem wise to avoid generalising from the results of any
individual priming study until further replications have been carried out,
especially when methodologies allow for factors other than primes to influ-
ence subsequent participant behaviour. Replication is somewhat more dif-
ficult with regards to sociolinguistic perception studies, however, as direct
replications must necessarily involve both equivalent auditory stimuli and
listeners drawn from the same speech communities as utilised in original
studies. This is made increasingly impractical by the ever-changing nature
of language, with speech varieties and perceptions of sociolinguistic variables
within speech communities prone to change over time, necessitating that a
direct replication be carried out not only within the same linguistic envi-
ronment but in a relatively short timespan after an original study. Failed
replications of Niedzielski’s (1999) Detroit vowel priming study (Lawrence
2015), or Labov et al ’s (2011) newsreader experiment (Levon & Fox 2014),
for example, were conducted in different countries and examined different
sociophonetic variables than the original studies, making direct comparisons
82

5.2. IMPLICIT SOCIAL COGNITION
problematic. It would seem, then, that a rigorous meta-analysis of soci-
olinguistic perception studies is needed in order to determine whether the
effects found in previous studies are generalisable to other variables in other
locations.
5.2.3 The Implicit Association Test
Perhaps the most common method of examining unconscious biases, how-
ever, is Greenwald et al ’s (1998) Implicit Association Test (IAT). The IAT
works by measuring participant response times in categorising stimuli accord-
ing to both positive and negative attributes. Participants are presented with
stimuli (generally visual, via computer display), which must be rapidly cat-
egorised using computer interfaces (ordinarily different keys on a keyboard)
assigned to each hand. Greenwald et al (1998) refer to this visual stimuli
as the ‘target-concept discrimination’, consisting of words or images which
represent the different concepts under study, and which must be categorised
according to opposing values referred to as the ‘attribute dimension’. In order
to determine the subjects’ underlying attitudes towards the target stimuli,
participant response times in apportioning the visual stimuli to different at-
tributes are compared, with responses measuring less than 300ms or more
than 3,000ms being excluded from analyses. For example, in the IAT shown
in figure 5.2 (overleaf), which can be taken on Harvard University’s Project
Implicit website1, participants are tasked with categorising black faces as
being African American and white faces as being European American. Par-
ticipants are then tasked with categorising positively valenced words (such
as joy, happy, and love) as ‘good’ and negatively valenced words (such as
failure, hurt, and evil) as ‘bad’, with categorical labels in opposing corners
at the top of the screen. In following trials, the African American and Euro-
pean American labels appear alongside the ‘good’ and ‘bad’ category labels,
and participants are tasked with categorising both black faces and negatively
valenced words to the left side of the screen (using the e key, in this example)
and European American faces and positively valenced words to the right of
1https://implicit.harvard.edu/implicit/takeatest.html [27/06/15]
83

5.2. IMPLICIT SOCIAL COGNITION
the screen (using the i key). A subsequent trial then sees the ‘good’ and
‘bad’ labels switch position, with participants tasked with categorising the
European American faces and negatively valenced words as to one side of
the screen, and African American faces and positively valenced words to the
other. The order of trials containing both target stimuli labels (e.g. African
American and European American labels) and valence labels (‘good’ and
‘bad’) are ordinarily reversed across participants or in subsequent trials in
order to control for fatigue effects. By comparing participant reaction times
in categorising black faces and the differently valenced attributes with white
faces and the differently valenced attributes, a measure of the subjects’ rel-
ative implicit associations towards the two racial groups can be inferred. If,
for example, a participant was much quicker in categorising black faces than
white faces along with positively valenced attributes, then this would indi-
cate an implicit preference for black faces over white faces and, from this,
implicit racial bias could be inferred.
Figure 5.2: Participant view of a typical IAT. Participants are tasked withcategorising visual stimuli according to attributes on either side of the screen,with attributes changing positions throughout successive blocks of trials.
84
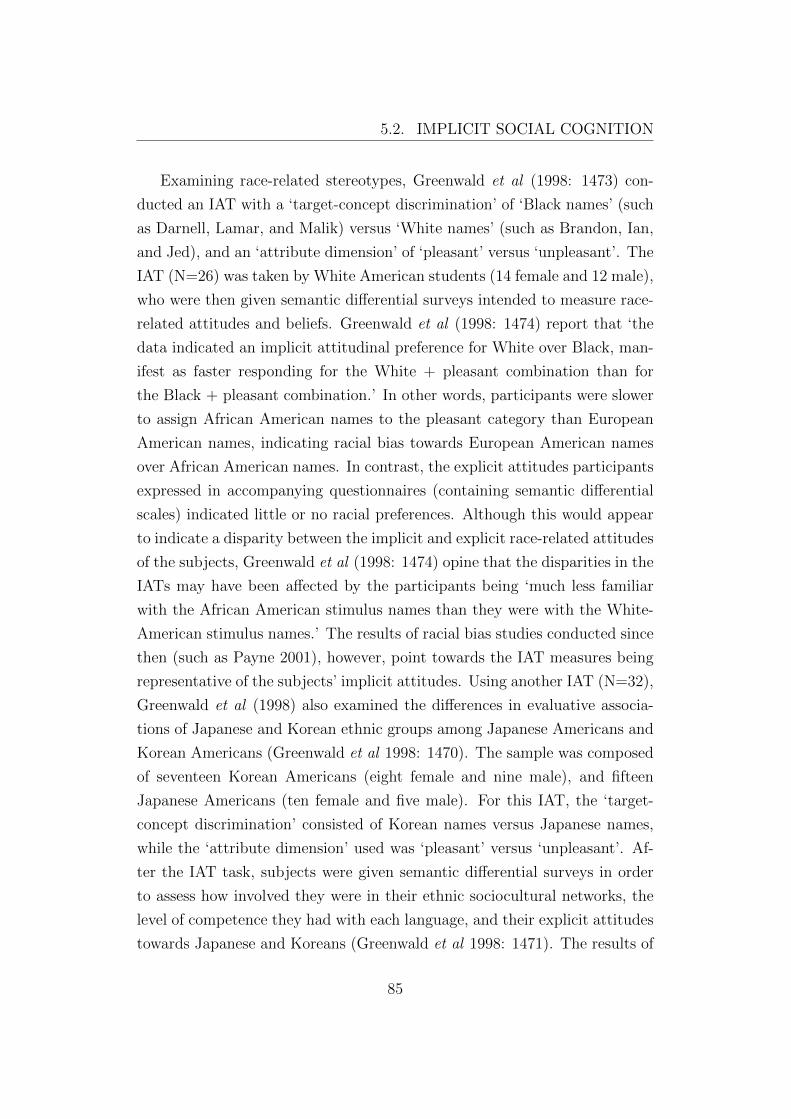
5.2. IMPLICIT SOCIAL COGNITION
Examining race-related stereotypes, Greenwald et al (1998: 1473) con-
ducted an IAT with a ‘target-concept discrimination’ of ‘Black names’ (such
as Darnell, Lamar, and Malik) versus ‘White names’ (such as Brandon, Ian,
and Jed), and an ‘attribute dimension’ of ‘pleasant’ versus ‘unpleasant’. The
IAT (N=26) was taken by White American students (14 female and 12 male),
who were then given semantic differential surveys intended to measure race-
related attitudes and beliefs. Greenwald et al (1998: 1474) report that ‘the
data indicated an implicit attitudinal preference for White over Black, man-
ifest as faster responding for the White + pleasant combination than for
the Black + pleasant combination.’ In other words, participants were slower
to assign African American names to the pleasant category than European
American names, indicating racial bias towards European American names
over African American names. In contrast, the explicit attitudes participants
expressed in accompanying questionnaires (containing semantic differential
scales) indicated little or no racial preferences. Although this would appear
to indicate a disparity between the implicit and explicit race-related attitudes
of the subjects, Greenwald et al (1998: 1474) opine that the disparities in the
IATs may have been affected by the participants being ‘much less familiar
with the African American stimulus names than they were with the White-
American stimulus names.’ The results of racial bias studies conducted since
then (such as Payne 2001), however, point towards the IAT measures being
representative of the subjects’ implicit attitudes. Using another IAT (N=32),
Greenwald et al (1998) also examined the differences in evaluative associa-
tions of Japanese and Korean ethnic groups among Japanese Americans and
Korean Americans (Greenwald et al 1998: 1470). The sample was composed
of seventeen Korean Americans (eight female and nine male), and fifteen
Japanese Americans (ten female and five male). For this IAT, the ‘target-
concept discrimination’ consisted of Korean names versus Japanese names,
while the ‘attribute dimension’ used was ‘pleasant’ versus ‘unpleasant’. Af-
ter the IAT task, subjects were given semantic differential surveys in order
to assess how involved they were in their ethnic sociocultural networks, the
level of competence they had with each language, and their explicit attitudes
towards Japanese and Koreans (Greenwald et al 1998: 1471). The results of
85

5.2. IMPLICIT SOCIAL COGNITION
the IAT patterned as expected, with Korean subjects finding it more diffi-
cult to perform ‘Japanese+pleasant’ categorisations than ‘Korean+pleasant’
ones, and the reverse proving true for the Japanese subjects (Greenwald et
al 1998: 1471-2). IAT differentiations were also found to correlate positively
with the level of immersion subjects had in their respective cultures, deter-
mined via responses to several survey questions. No correlation, however,
was found between the explicit attitudes towards Japanese and Koreans ex-
pressed in the semantic differential surveys and the implicit attitudes implied
by the IATs, which Greenwald et al (1998: 1472) claim ‘strongly suggests
that the semantic differential and the IAT measured different constructs.’
Also utilizing an IAT (N=172), Rudman & Glick (2001) tasked 105 female
and 67 male participants with categorizing ‘agentic-meaning’ words (such as
independent, competitive, autonomous, individual, and self-sufficient) and
‘communal-meaning’ words (such as communal, attached, cooperative, to-
gether, kinship, and commitment) into either male or female categories. The
study found that participants who conformed most to gender stereotyping
during the IAT, being quicker in categorizing agentic-meaning words as male
and communal-meaning words as female, ‘were also likely to view agentic fe-
males as interpersonally deficient’ (Rudman & Glick 2001: 756). A separate
explicit task, however, which involved choosing candidates for a proposed
employment role based on application forms, uncovered no significant effect
of gender bias.
Another IAT (N=82) conducted by Inbar et al (2009) tasked participants
with categorising ‘gay images’ (such as a photograph of two men kissing)
and ‘straight images’ (such as a photograph of a man and a woman kissing)
according to an attribute dimensions consisting of either ‘gay’ or ‘straight’
labels in combination with either positively or negatively valenced words
(such as pleasant and unpleasant). Participant reaction times revealed a
highly significant (p<.0001) effect, with participants faster in categorising
straight images as pleasant and gay images as unpleasant. This was despite
73% of participants in a separate task explicitly reporting that there was
‘nothing wrong with gay men French kissing in public’ — exceeding the 55%
of participants who reported that there was ‘nothing wrong with straight
86

5.3. IMPLICIT SOCIOLINGUISTIC COGNITION
couples French kissing in public’ (Inbar et al 2009: 436).
Nosek et al (2007) examined 10 different IAT studies which had partici-
pants sit the same IATs at different times, finding a strong correlation (r=.54)
between participant results in their first and second IATs, suggesting a high
degree of test-retest reliability. This was followed by a meta-analysis of 122
IAT studies carried by Greenwald et al (2009), containing 184 IATs and to-
talling 14,900 participants, which found IAT measures to correlate (r=.274)
with behavioural, judgement, and physiological measures. The analysis also
found IAT and self-report measures to correlate strongly in investigations
of consumer preferences (r=.319) and political preferences (r=.537). An op-
posite effect, however, was found between IATs and self-report measures
examining responses towards different racial (r=.198) or ‘other intergroup’
(r=.207) attributes, which included ‘behavior toward groups defined by eth-
nicity, age, or weight’ (Greenwald et al 2009: 24). The findings suggest that
IATs provide a more sensitive metric of participant associations when dealing
with socially sensitive stimuli, as Greenwald et al (2009: 32) state:
In the studies examined in this review, high social sensitivity of
topics was most characteristic of studies of racial and other inter-
group behavior. In these topic domains, the predictive validity
of IAT measures significantly exceeded the predictive validity of
self-report measures.
It would seem, then, that the IAT is a reliable means of inferring latent
attitudes towards social stimuli, demonstrating perceivers to automatically
make unconscious social evaluations on processing visually-derived social in-
formation. As such, it has recently been adopted as the primary means of
examining the unconscious processing of linguistically-derived social infor-
mation, an area of research which is still very much in its infancy.
5.3 Implicit Sociolinguistic Cognition
Sociolinguists have speculated that language evaluation may be carried
out without conscious awareness since the discipline’s inception, with Labov
87

5.3. IMPLICIT SOCIOLINGUISTIC COGNITION
(1972) noting that his informants ‘documented a socially rich system of mean-
ing for two vocalic variables which, he reports, his informants could not name
or describe explicitly.’ (Campbell-Kibler 2013: 310). Milroy & McClenaghan
(1977: 8) also speculated that unconscious processes may explain the ten-
dency of evaluations of RP, Scottish, Southern Irish, and Ulster Scots accents
to remain consistent even when misidentified by those judging them:
It has been widely assumed that an accent acts as a cue identi-
fying a speaker’s group membership. Perhaps this identification
takes place below the level of conscious awareness. [...] Presum-
ably by hearing similar accents very frequently [one] has learnt
to associate them with their reference groups. In other words,
accents with which people are familiar may directly evoke stereo-
typed responses without the listener first consciously assigning
the speaker to a particular reference group.
While a wealth of research has been carried out on automatic evaluative
responses in the domain of social psychology, repeatedly showing people to
make automatic and unconscious negative evaluations of out-group members
(cf. Fazio et al 1986; Wilson & Brekke 1994; Greenwald et al 1998; Payne
2001), these have never had a sociolinguistic focus, or even utilised speech as
stimuli. In recent years, however, there have been a small number of notable
studies examining implicit attitudes in relation to sociolinguistics (cf. Babel
2009; Redinger 2010; Campbell-Kibler 2012, 2013; Pantos & Perkins 2013),
with the most widely-used method of investigation being the Implicit Asso-
ciation Test.
Kristiansen (2009) examined both conscious and unconscious attitudes
towards various dialects among adolescents throughout Denmark. The study
was conducted by means of subjective reaction tests, evaluating samples of
young speakers thought to have accentual features characteristic of either the
conservative, modern, or regional forms of Danish (Kristiansen 2009: 173).
The stimuli for the experiment was collected through informal interviews
with groups of young people, which were then edited into 30 second samples
88

5.3. IMPLICIT SOCIOLINGUISTIC COGNITION
before being presented to listeners with an accompanying semantic differen-
tial survey. Respondents were asked to grade speakers on various personality
traits (such as intelligence and ‘niceness’) via differential scales, with a sup-
plementary open-ended question: ‘what is your impression of this person?’.
In order to facilitate subconscious ‘below the line’ responses from listeners,
the exact purpose of the experiment was not revealed to participants until
after the surveys had been completed and they had been asked what they
thought that the experiment was about. That none of the subjects were able
to correctly identify the focus of the research as being related to ‘attitudes
towards dialects’, indicates that the methodology was wholly successful in
this respect (Kristiansen 2009: 178). Participants were then told the rea-
son for the experiment before being played the data once more, while being
asked to indicate which speakers they perceived to be from Copenhagen,
and whether the speech was rigdansk (Standard Danish) or not. The re-
sults for the part of the experiment concerned with subconscious evaluation
found that speakers with conservative accents received the most favourable
ratings in what Kristiansen (2009: 187) terms ‘superiority values’ (which
include intelligence, conscientiousness, or trustworthiness), whereas speakers
with accents considered modern received the most favourable ratings on ‘dy-
namism values’ (such as being self-assured, fascinating, or nice). Speakers
with accents perceived as being ‘local’ (from regions other than Copenhagen)
were found to have received less favourable ratings throughout all traits than
speakers with either conservative or modern dialects. The latter part of the
experiment found that speakers with more conservative features were con-
sidered to be closest to rigsdansk, a non-regional prestige variety of Danish,
whereas speakers with more modern forms were generally thought to be from
Copenhagen. Kristiansen (2009: 187) concludes that young Danish speakers
‘operate with two systems for valuation of language differences’ one which
is put to use when social evaluation is consciously carried out, and another
when it is processed below the level of conscious awareness.
Babel (2009) conducted a ‘shadowing task’ and accompanying IAT (N=150)
among white college students in order to investigate the relationship between
implicit racial bias and speech behaviour. The ‘shadowing task’ included
89

5.3. IMPLICIT SOCIOLINGUISTIC COGNITION
auditory stimili consisting of 50 different words containing /i/, /æ/, /A/,
/o/, and /u/, which were recorded from a white male and a black male in
their early 30s. Participants were charged with repeating auditory tokens,
heard over headphones, which was recorded for later analysis to determine
the level of phonetic distance they displayed for each variable under exam-
ination. Participants were then given an IAT which had them categorise
both African American names (such as Aaliyah and Jamal) and Caucasian
American names (such as Emily and Cody), as well as ‘good words’ (such as
caress and cheer) and ‘bad words’ (such as abuse and agony), according to
BLACK and WHITE target dimensions displayed either side of the screen.
The experiment found participants who had been quickest in categorising
the African American names with positive attributes, indicating lower levels
of implicit racial bias, to have shown the greatest levels of accommodation
in their productions of /æ/ and /A/ when repeating stimuli tokens recorded
from the black speaker. This suggests that measures of implicit bias can, in
certain circumstances, serve as a predictor of speech behaviour.
Redinger (2010) also conducted an IAT, modeled on Borton et al ’s (2007)
IAT measuring self-esteem. Redinger’s IAT focused on ‘the measurement
of implicit language attitudes towards Luxembourgish and French among
secondary school students in Luxembourg’ (Redinger 2010: 123). Compar-
ing participant reaction times when assigning positive and negative stimulus
words to both Luxembourgish and French, Redinger (2010: 189) found sub-
jects to have reacted faster when associating Luxembourgish with positive
traits than when assigning positive traits to French – by a mean difference
of 140ms, suggesting that the participants implicitly viewed their ‘own’ lan-
guage (Luxembourgish) in a more positive light than they did French. Due
to the small sample size utilized in Redinger’s (2010: 189) IAT, however, this
result could not be tested for statistical significance.
Reporting on an experiment conducted in 2010, Pantos & Perkins (2013)
appear to have been the first to use auditory stimuli in an IAT (N=165), find-
ing listeners to have reacted significantly (p<.001) faster when categorizing
positive personality traits with recordings of an American English speaker
90
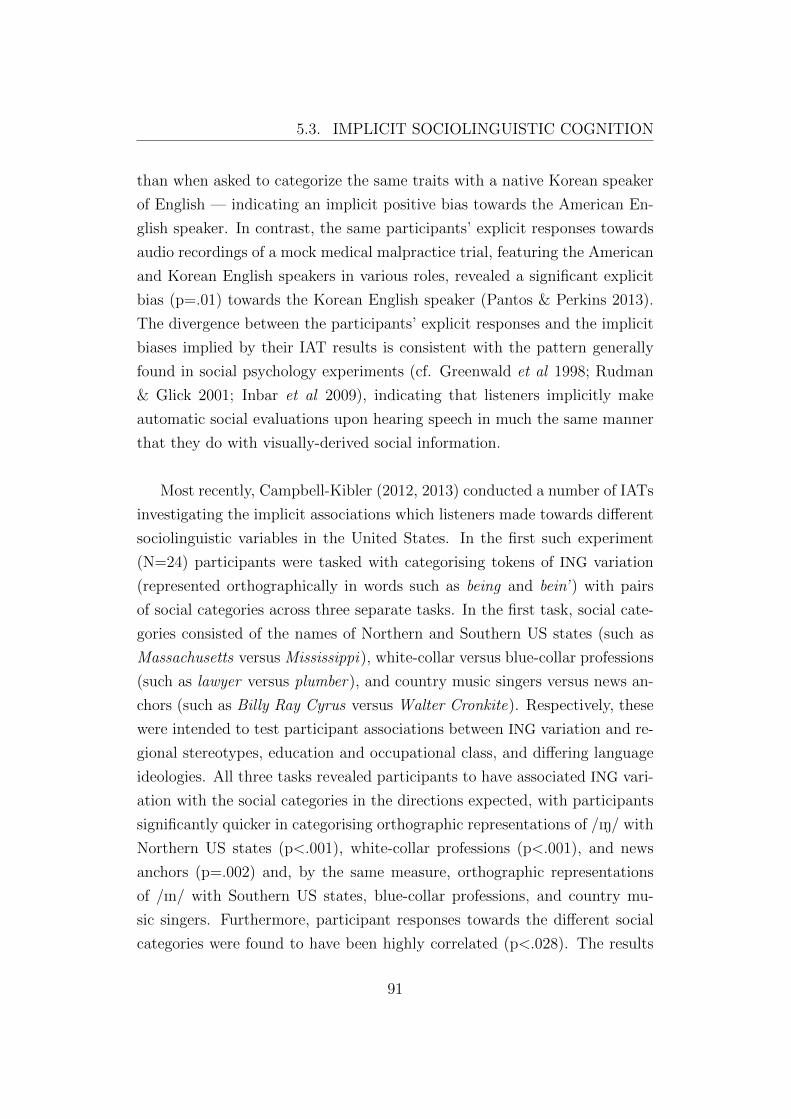
5.3. IMPLICIT SOCIOLINGUISTIC COGNITION
than when asked to categorize the same traits with a native Korean speaker
of English — indicating an implicit positive bias towards the American En-
glish speaker. In contrast, the same participants’ explicit responses towards
audio recordings of a mock medical malpractice trial, featuring the American
and Korean English speakers in various roles, revealed a significant explicit
bias (p=.01) towards the Korean English speaker (Pantos & Perkins 2013).
The divergence between the participants’ explicit responses and the implicit
biases implied by their IAT results is consistent with the pattern generally
found in social psychology experiments (cf. Greenwald et al 1998; Rudman
& Glick 2001; Inbar et al 2009), indicating that listeners implicitly make
automatic social evaluations upon hearing speech in much the same manner
that they do with visually-derived social information.
Most recently, Campbell-Kibler (2012, 2013) conducted a number of IATs
investigating the implicit associations which listeners made towards different
sociolinguistic variables in the United States. In the first such experiment
(N=24) participants were tasked with categorising tokens of ING variation
(represented orthographically in words such as being and bein’ ) with pairs
of social categories across three separate tasks. In the first task, social cate-
gories consisted of the names of Northern and Southern US states (such as
Massachusetts versus Mississippi), white-collar versus blue-collar professions
(such as lawyer versus plumber), and country music singers versus news an-
chors (such as Billy Ray Cyrus versus Walter Cronkite). Respectively, these
were intended to test participant associations between ING variation and re-
gional stereotypes, education and occupational class, and differing language
ideologies. All three tasks revealed participants to have associated ING vari-
ation with the social categories in the directions expected, with participants
significantly quicker in categorising orthographic representations of /IN/ with
Northern US states (p<.001), white-collar professions (p<.001), and news
anchors (p=.002) and, by the same measure, orthographic representations
of /In/ with Southern US states, blue-collar professions, and country mu-
sic singers. Furthermore, participant responses towards the different social
categories were found to have been highly correlated (p<.028). The results
91

5.3. IMPLICIT SOCIOLINGUISTIC COGNITION
suggest that participants, who were primarily college students from Ohio,
implicitly associate orthographic representations of /In/ with less socially
prestigious dialect areas, lower levels of education and occupational class,
and less overtly prestigious language ideologies than they do representations
of /IN/. Problematically, however, participants may have been responding
to perceived spelling errors in the orthographically represented /In/ words,
rather than the underlying phonetic forms which they were intended to rep-
resent.
In a second experiment (N=15), Campbell-Kibler (2012) addressed this
by adapting the IAT to present auditory stimuli tokens recorded by the study
author in place of the orthographic representations utilised previously. In
the first task, auditory stimuli consisted of ING tokens, produced with both
/IN/ and /In/ realisations, with social categories consisting solely of North-
ern versus Southern US states (with the assumption that comparable results
between experiments would translate to the other social categories previ-
ously tested). A second task introduced auditory tokens with and without
/ay/ monophthongisation (in words such as my, eye, and pie), a linguistic
feature associated with Southern US dialects. A third task replaced /ay/
monophthongised tokens with auditory tokens featuring /t/ release variation
(in words such as cat, bat, and mat), a linguistic feature associated with
level of education and articulateness. As in the previous experiment, partic-
ipants were found to have been significantly quicker (p=.002) in categorising
/IN/ with Northern US states and /In/ with Southern US states. The sec-
ond task revealed participants responses towards /In/ realisations to have
correlated significantly (p=.004) with participant responses towards /ay/
monophthongised realisations, suggesting that listeners hold similar associ-
ations towards the Southern accent variants versus the ‘standard’ Northern
realisations (/IN/ and /aI/). A similar effect, however, was not found with
regards to participant responses towards /t/ released variation in the third
task.
92
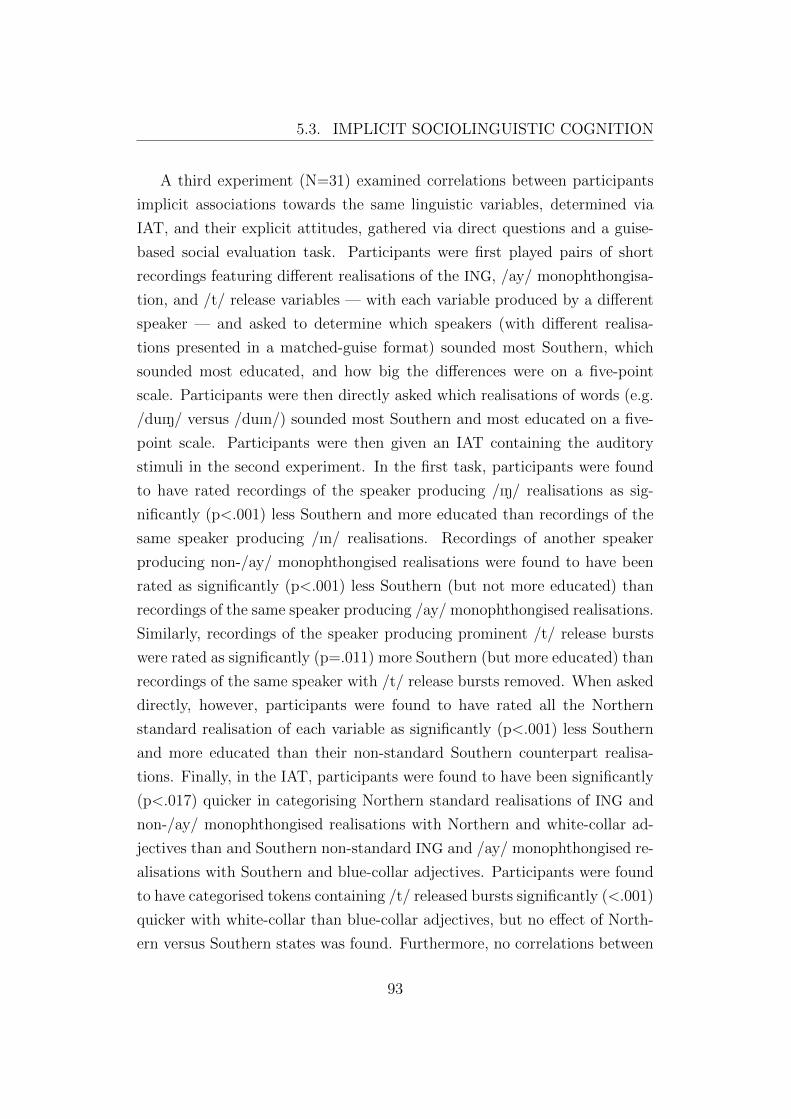
5.3. IMPLICIT SOCIOLINGUISTIC COGNITION
A third experiment (N=31) examined correlations between participants
implicit associations towards the same linguistic variables, determined via
IAT, and their explicit attitudes, gathered via direct questions and a guise-
based social evaluation task. Participants were first played pairs of short
recordings featuring different realisations of the ING, /ay/ monophthongisa-
tion, and /t/ release variables — with each variable produced by a different
speaker — and asked to determine which speakers (with different realisa-
tions presented in a matched-guise format) sounded most Southern, which
sounded most educated, and how big the differences were on a five-point
scale. Participants were then directly asked which realisations of words (e.g.
/duIN/ versus /duIn/) sounded most Southern and most educated on a five-
point scale. Participants were then given an IAT containing the auditory
stimuli in the second experiment. In the first task, participants were found
to have rated recordings of the speaker producing /IN/ realisations as sig-
nificantly (p<.001) less Southern and more educated than recordings of the
same speaker producing /In/ realisations. Recordings of another speaker
producing non-/ay/ monophthongised realisations were found to have been
rated as significantly (p<.001) less Southern (but not more educated) than
recordings of the same speaker producing /ay/ monophthongised realisations.
Similarly, recordings of the speaker producing prominent /t/ release bursts
were rated as significantly (p=.011) more Southern (but more educated) than
recordings of the same speaker with /t/ release bursts removed. When asked
directly, however, participants were found to have rated all the Northern
standard realisation of each variable as significantly (p<.001) less Southern
and more educated than their non-standard Southern counterpart realisa-
tions. Finally, in the IAT, participants were found to have been significantly
(p<.017) quicker in categorising Northern standard realisations of ING and
non-/ay/ monophthongised realisations with Northern and white-collar ad-
jectives than and Southern non-standard ING and /ay/ monophthongised re-
alisations with Southern and blue-collar adjectives. Participants were found
to have categorised tokens containing /t/ released bursts significantly (<.001)
quicker with white-collar than blue-collar adjectives, but no effect of North-
ern versus Southern states was found. Furthermore, no correlations between
93

5.3. IMPLICIT SOCIOLINGUISTIC COGNITION
measures (IAT, direct questions, and the social evaluation task) were found.
Overall, the IAT results (Campbell-Kibler 2012) show that people are faster
to associate more socially stigmatized phonetic variants (/In/ and monoph-
thongised /ay/) with Southern US states and blue-collar occupations than
Northern US states and white-collar occupations, and that listeners explicitly
consider speakers with more-standardised (/IN/ and released /t/) phonetic
variants to sound more Northern and more educated than speakers heard to
produce non-standard realisations.
In another series of IATs (N=28), Campbell-Kibler (2013) discovered par-
ticipants to have made similar implicit associations towards another Southern
accent feature, derhoticity or ‘r-lessness’. As in the previous study, monoph-
thongal /ay/ was also included as a variable. Auditory stimuli consisted
of single-word tokens containing differing realisations of the variables under
examination recorded from 16 speakers. Speakers were grouped into pairs
uttering the same five target words, with one speaker in each pair producing
a Southern realisation and the other producing a Northern realisation (lower
TRAP, retracted LOT, rhoticity, and diphthongal /ay/). As in the previous
experiment, Southern features (derhotic and /ay/ monophthongised tokens)
were found to have affected participant response times in categorising stim-
uli, with a significant (p=<.001) effect of /ay/ monophthongised tokens and
a significant (r=.40) correlation between associations made towards /ay/
monophthongised tokens and derhotic tokens. A similar effect, however, was
not found in participant responses to tokens containing differing TRAP/LOT
tokens.
Taken as a whole, the studies strongly suggest that socially-marked pho-
netic variation can trigger differing implicit associations in listeners, par-
ticularly when such variants belong to a heavily stereotyped speech variety
(such as Southern dialects of American English) in comparison to a more
overtly prestigious ‘standard’ speech variety (such as Northern dialects of
American English). Presumably, this would hold true for other negatively
stereotyped speech varieties, such as working-class Glaswegian, versus more
94
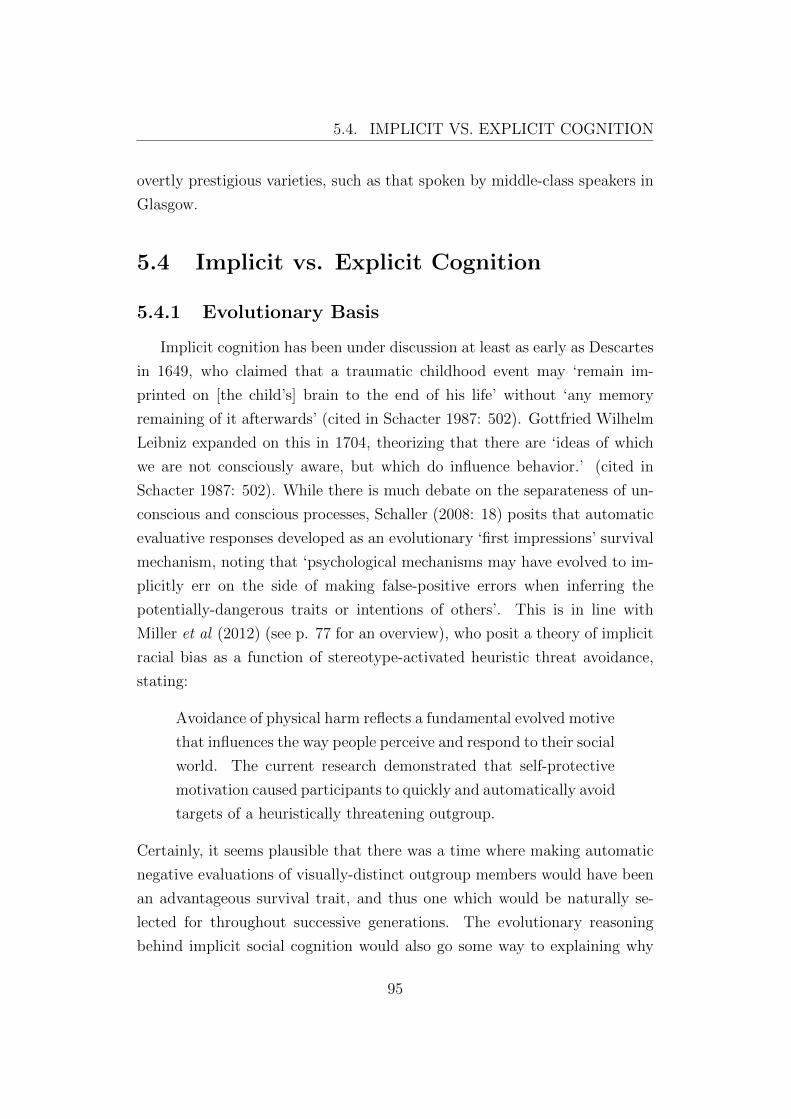
5.4. IMPLICIT VS. EXPLICIT COGNITION
overtly prestigious varieties, such as that spoken by middle-class speakers in
Glasgow.
5.4 Implicit vs. Explicit Cognition
5.4.1 Evolutionary Basis
Implicit cognition has been under discussion at least as early as Descartes
in 1649, who claimed that a traumatic childhood event may ‘remain im-
printed on [the child’s] brain to the end of his life’ without ‘any memory
remaining of it afterwards’ (cited in Schacter 1987: 502). Gottfried Wilhelm
Leibniz expanded on this in 1704, theorizing that there are ‘ideas of which
we are not consciously aware, but which do influence behavior.’ (cited in
Schacter 1987: 502). While there is much debate on the separateness of un-
conscious and conscious processes, Schaller (2008: 18) posits that automatic
evaluative responses developed as an evolutionary ‘first impressions’ survival
mechanism, noting that ‘psychological mechanisms may have evolved to im-
plicitly err on the side of making false-positive errors when inferring the
potentially-dangerous traits or intentions of others’. This is in line with
Miller et al (2012) (see p. 77 for an overview), who posit a theory of implicit
racial bias as a function of stereotype-activated heuristic threat avoidance,
stating:
Avoidance of physical harm reflects a fundamental evolved motive
that influences the way people perceive and respond to their social
world. The current research demonstrated that self-protective
motivation caused participants to quickly and automatically avoid
targets of a heuristically threatening outgroup.
Certainly, it seems plausible that there was a time where making automatic
negative evaluations of visually-distinct outgroup members would have been
an advantageous survival trait, and thus one which would be naturally se-
lected for throughout successive generations. The evolutionary reasoning
behind implicit social cognition would also go some way to explaining why
95

5.4. IMPLICIT VS. EXPLICIT COGNITION
implicit gender biases appear to be more nuanced than implicit biases to-
wards other outgroups (Davison & Burke 2000; Rudman & Glick 2001), as
the formation of automatic negative associations towards members of the
opposite gender would not be an evolutionary advantageous trait. Following
this line of thinking, it seems probable that the same would hold true for as-
sociations made upon auditorily identifying outgroup members, such as upon
hearing different regional and, presumably, social accents. While speakers of
non-standard speech varieties are generally found to make positive explicit
evaluations of more prestigious, standardised speech varieties (cf. Coupland
2007), it is not yet known whether such positive evaluations happen on an
unconscious level, and further investigation is required in this regard.
5.4.2 Dual Systems vs. Iterative Processing Models
While there is wealth of evidence for cognitive processing below the level
of conscious awareness (p.66), there remains debate as to exactly how this
differs cognitively from conscious processing. Dual process models have been
largely adopted in social cognition research to account for the divergence
between conscious and unconscious responses to stimuli (Chaiken & Trope
1999; Epstein 1994; Smith & DeCoster 2000; Kruglanski & Orehek 2007).
Such models draw a distinction between Type 1 and Type 2 cognitive pro-
cesses (Evans & Stanovich 2013). The attributes ascribed to these processes
(shown in table 5.1) are drawn from multiple dual systems models, with no
single model currently able to account for all of these features.
It is also worth noting that the two types of processes may not be mu-
tually exclusive, as it is ‘perfectly possible’ that explicit cognition includes
a combination of Type 1 and Type 2 processes (Evans 2008: 271). Further-
more, Evans (2008: 271) argues that tasks which are carried out explicitly
can become implicit with sufficient repetition, stating that ‘We have habitual
and automated behavior patterns that once required conscious type 2 effort
but seem to have become type 1 with practice and experience.’ Evans &
Stanovich (2013: 236) also argue that explicit, Type 2 processing is unique
to human beings:
96

5.4. IMPLICIT VS. EXPLICIT COGNITION
Table 5.1: Attributes frequently associated with Type 1 and Type 2 pro-cesses in dual process models (from Evans & Stanovich 2013: 225).
Although rudimentary forms of higher order control can be ob-
served in mammals and other animals, the controlled processing
in which they can engage is very limited by comparison with hu-
mans, who have unique facilities for language and meta-representation
as well as greatly enhanced frontal lobes.
While Evans (2008: 259) also states that Type 2 processes are ‘thought to be
associated with language, reflective consciousness, and higher-order control
with the capacity to think hypothetically about future and counterfactual
possibilities’, it would seem that the reference to language solely as an explicit
Type 2 process is a false one, as people have been repeatedly shown to respond
97

5.4. IMPLICIT VS. EXPLICIT COGNITION
to speech and accommodate towards the speech of others below the level of
conscious awareness (cf. Babel 2009; Campbell-Kibler 2012; 2013).
Although speech is considered to be a uniquely human trait, speech per-
ception is not, as evidenced by the ability of dogs to process speech in
much the same manner as humans do, comprehending words rather than
merely affective components from suprasegmental information. Heimbauer
et al (2011) note that ‘It is a commonplace [sic] that most dogs recognize
their name and a few special words, like ‘walk or ‘dinner. In extraordinary
cases, dogs learn to recognize hundreds of words. Ratcliffe & Reby (2014)
played human speech through speakers positioned either side of dogs, and
inferred hemispheric processing depending on which speaker the dogs turned
towards. When hearing commands which had been manipulated to remove
intonational cues, dogs turned to the right, indicating a left-hemispheric bias.
When the command was in a foreign language (from the dogs owner) or when
the phonemes were arranged to create nonsense phrases, dogs turned to the
left, indicating a right-hemispheric bias. This mirrors human speech per-
ception, where the left hemisphere is mainly used to process verbal content
and the right hemisphere to process speaker characteristics and emotional
content. Furthermore, it has been found that chimpanzees can recognise
synthetic speech, even with reduced acoustic cues to phonetic context. He-
imbauer et al (2011) found a chimpanzee with knowledge of 128 spoken words
to respond above chance level in selecting visual symbols (in a four-alternative
choice task) when played corresponding words synthesized as three-tone sine-
waves. The notion of speech perception as a Type 1 (although not necessarily
exclusively so) process is central to any theory of implicit sociolinguistic cog-
nition, and one that appears to be supported by the relatively few studies
carried out in the field so far (p.87).
While Evans & Stanovich (2013) attribute the lack of a single agreed
dual process model to the existence of multiple kinds of implicit processing
erroneously grouped together as a single system, others dispute the idea that
there are two distinct cognitive systems, instead arguing for iterative models
of cognitive processing (Cunningham & Zelazo 2007; Van Bavel et al 2012).
98

5.5. THE VISUAL WORLD PARADIGM
Iterative models, such as that proposed by Cunningham & Zelazo (2007)
put forward the idea that evaluations are dynamic, and subject to subsequent
iterative re-evaluations, rather than implicit and explicit. Under such models,
the rapid processing evident in previous research on unconscious processing
is explained as resulting from fewer ‘evaluation cycles’, as Cunningham &
Zelano (2007: 97) outline:
Whereas evaluations that are based on few iterations of the eval-
uative cycle are relatively automatic, in that they are obligatory
and might occur without conscious monitoring, evaluations based
on additional iterations and computations are relatively reflective.
Cunningham & Zelano (2007: 98) hypothesise that such ‘lower-order’ evalu-
ative processes provide affective information on valence (whether an attitude
object is ‘good’ or ‘bad’), with ‘higher-order’ processes recruited during sub-
sequent iterations. While this would seem in line with dual process theories
of cognition, iterative processing models argue that information is repeat-
edly ‘passed back’ to lower-order processes for re-evaluation in a recursive
feedback loop, with subsequent iterations serving to provide more carefully
considered evaluations (Cunningham & Zelano 2007: 98).
While such models are certainly worthy of consideration with regards to
implicit sociolinguistic cognition, an in-depth investigation would require a
review of the background literature in neuroscience, which is outwith the
scope of this thesis. Increasingly, it appears it may not be possible to dis-
tinguish dual processing from iterative processing via behavioural studies, as
effects ascribed to implicit and explicit evaluations may instead result from
varying evaluative iterations, with ‘implicit’ responses analogous to fewer
evaluative iterations and ‘explicit’ responses analogous to a greater number
of evaluative iterations.
5.5 The Visual World Paradigm
Rather than using an Implicit Association Test, as in other investigations
of implicit sociolinguistic cognition, this study has focussed on adapting the
99

5.5. THE VISUAL WORLD PARADIGM
Figure 5.3: Visual representation of an iterative processing model (fromVan Bavel et al 2012: 444). Under this model, a perceiver’s initial attitudestowards a stimulus are re-evaluated over the course of continuing ‘evaluationcycles’.
Visual World methodology — an established psycholinguistic eye tracking
technique — for sociolinguistic enquiry. The Visual World Paradigm was de-
vised after an experiment by Cooper (1974), who discovered that individuals
spontaneously fixate upon the visual referents of words being heard. Cooper
(1974) also discovered participants to have fixated on semantically related
visual referents of words (such as an image of a camera while hearing the
phrase, while on a photographic safari), with ‘over 90% of the fixations to
the critical objects being triggered either while the corresponding word was
spoken or within 200ms of word offset.’ (Huettig et al 2011: 151). Cooper
(1974: 84) reported that he had discovered ‘a practical new research tool for
the real-time investigation of perceptual and cognitive processes and, in par-
ticular, for the detailed study of speech perception, memory, and language
processing.’
100

5.5. THE VISUAL WORLD PARADIGM
The discovery, however, was largely forgotten until Tanenhaus et al (1995)
adopted the technique to investigate the manner in which listeners make use
of visual information to interpret sentences. In their study, Tanenhaus et
al (1995) instructed participants to move in-room objects while their eye
movements were recorded by a head-mounted eye tracker. Instructions took
the form of sentences, such as Put the apple that’s on the towel in the box.
As in Cooper (1974), participants were found to have fixated on objects
immediately after hearing them named. When hearing instructions such as
Touch the starred yellow square, participants were found to have fixated upon
in-room objects possessing the described properties in turn (e.g. first fixating
upon a star-shaped object, followed by a yellow object, and finally a square
object) whenever such objects were present. Fixations were recorded to have
occurred at an average of 250ms after the end of words when only one related
object was present (e.g. at the end of ‘yellow’ when the room contained only
one yellow object). When presented with a grid containing playing cards and
given more complex instructions (such as Put the five of hearts that is below
the eight of clubs above the three of diamonds), participants were found to
have made use of referential cues, such as fixating on cards above the five
of hearts immediately after hearing ‘below’ (Tanenhaus et al 1995: 1632).
When instructed to move objects with initially similar names (such as ‘the
candy’ and ‘the candle’) while one of those objects were present, participants
were found to have fixated upon the object at an average of 145ms from the
end of the target word (compared with 230ms when both named items were
present). As it takes around 200ms for a saccadic eye movement to occur,
Tanenhaus et al (1995) found that participants had fixated on objects before
hearing the end of the word when no competitor objects were present.
Next, Tanenhaus et al (1995) tested syntactic ambiguities, presenting
listeners with the instructions Put the apple on the towel in the box (am-
biguous) and Put the apple that’s on the towel in the box (unambiguous).
In one condition, participants were presented with a towel with an apple on
top, another towel (without an apple), a box, and a pencil. In a second con-
dition, the pencil was replaced with a second apple on a napkin. Different
fixation behaviours were observed between the two conditions, with partici-
101

5.5. THE VISUAL WORLD PARADIGM
pants given the ambiguous instruction in the first condition fixating on the
sole apple 500ms after hearing ‘apple’, then fixating on the towel without
the apple (the incorrect referent) in 55% of cases, indicating a tendency to
interpret ‘on the towel’ as specifying the destination (Tanenhaus et al 1995:
1633). Participants given the unambiguous instruction in this condition were
found to have looked at the correct referent (the towel with the apple on it)
in 100% of cases. In the second condition, where two apples were present,
participants were found to have reacted to the ambiguous instruction by fix-
ating upon the incorrect referent (the napkin) in 61% of cases (compared to
42% while hearing the unambiguous instruction), indicating that the modi-
fier ‘on the towel’ was interpreted as a modifier, rather than a destination,
in this condition.
As a whole, Tanenhaus et al (1995: 1634) showed that ‘people seek to
establish reference with respect to their behavioral goals during the earliest
moments of linguistic processing’ , while demonstrating the validity of eye
tracking methodologies for observing the mental processes that occur during
spoken language comprehension. Experiments using this type of methodol-
ogy have subsequently come to be referred to as ‘Visual World’ experiments.
Speech has also been shown to trigger listener fixations towards on-
screen images. Altmann & Kamide (1999: 250) conducted a similar ex-
periment (N=24), presenting participants with stimuli consisting of ‘semi-
realistic scenes’, each paired with two different semantically-related sen-
tences. Figure 5.4 (overleaf), for example, shows one such scene — depicting
a ball, a boy, a cake, a toy car, and a toy train set. This image set was
paired with the auditory sentences The boy will move the cake and The boy
will eat the cake. For this stimuli, participants were found to have fixated
upon the cake significantly (p<.007) earlier in the ‘eat’ condition than in the
‘move’ condition, suggesting that hearing verbs facilitates fixations towards
semantically related visual referents.
In order to investigate if the effect applied to words other than verbs,
Kamide et al (2003) conducted an experiment (N=64) in which similar scenes
were presented to participants, with auditory stimuli containing semantically
102

5.5. THE VISUAL WORLD PARADIGM
Figure 5.4: Visual scene used by Altmann & Kamide (1999: 250)
relevant sentences varying in initial and final nouns, such as The man will
ride the motorbike versus The girl will ride the carousel. For this stimuli,
participants were found to have produced significantly (p=.04) more looks
to an image of a motorbike upon hearing ‘the man’ than hearing ‘the girl’.
This is particularly notable, as it not only shows an effect of nouns on listener
fixations, but suggests that automatically activated attitudes (as described
on p.73 by Fazio et al 1986) trigger fixations towards semantically related
visual referents.
The visual referents focussed on by listeners have also been found to be
affected by prosodic information. Dahan et al (2002), for example, presented
participants (N=16) with image sets containing two images which contained
phonetically-similar onsets (such as an image of a ‘candy’ and an image of
a ‘candle’) alongside two distractor images. Each image set was then paired
with auditory stimuli consisting of a series of recorded sentences instructing
processes relating to the on-screen visual stimuli. For example, in the image
set depicting a candy and a candle, the utterance was follows, with pitch-
accented phrases shown in bold text (Dahan et al 2002: 297):
Put the candle above the triangle; now put the candle above the
103

5.5. THE VISUAL WORLD PARADIGM
square.
Put the book below the triangle; now put the candle above
the square
Put the candy below the triangle; now put the book above
the square.
Participants were found to have fixated significantly (p<.01) more often
on competitor images (i.e. an image of a candle when the word ‘candy’
was heard) when the critical phrases were pitch-accented, rather than de-
accented. This indicates that pitch-accented phrases triggered participants
to expect a change in visual referent from those previously heard in the au-
ditory stimuli (e.g having heard the word ‘candy’ and looked towards the
candy, a change in speaker pitch prompted fixations towards the candle).
This demonstrates that suprasegmental cues play a role in the processing of
semantic information.
Another Visual World study conducted by Salverda et al (2003) found
fixations to have been influenced by fine phonetic variation. Here, partici-
pants (N=30) were presented with image sets containing two paired target
images and two distractor images, with target images bearing direct semantic
relations to accompanying auditory tokens. For example, one set depicted an
image of a ham and an image of a hamster as target images, with auditory
tokens of /"ham/ and /ham"st@/ (with ‘ham’ being stressed, and the initial
syllable in ‘hamster’ unstressed). Distractor images represented phonolog-
ically dissimilar terms. The initial syllables of auditory tokens were also
cross-spliced to create new stimuli tokens, with a token of ‘ham’ contain-
ing the first syllable of /ham"st@/, and a token of ‘hamster’ containing the
first syllable of /"ham/. Here, the lexical items remained identical, with the
only audible differences between tokens being the stess of the initial syllables.
Participants were found to have fixated on the image of the ham significantly
(p<.05) more often than the hamster when hearing the token of ‘hamster’
which had been spliced with the first syllable of /"ham/. This demonstrates
an effect of lexical stess on the fixations made by listeners and, more gen-
104

5.5. THE VISUAL WORLD PARADIGM
erally, indicates that fine phonetic variation has a marked effect on listener
processing of speech.
Taken as a whole, these studies demonstrate the efficacy of Visual World
experiments for examinations of listener associations made while hearing
speech, and show that fine phonetic information can influence listener fix-
ation behaviour.
Also key to the methodology behind the current research are studies con-
ducted by Huettig & Altmann (2005) and Dunabeitia et al (2009). Huettig
& Altmann (2005) investigated a secondary observation made by Cooper
(1974), who found that 53% of listeners fixated on a picture of a sailboat
while hearing the word ‘lake’. Their Visual World study presented partic-
ipants (N=60) with visual stimuli consisting of thirty sets of four images
(with images displayed in each quadrant of a computer monitor) while audi-
tory stimuli, consisting of sentences containing embedded target words, were
presented simultaneously. Three conditions were presented, with one image
in each set of visual stimuli being a direct referent of the target word in the
first condition, one image in each set bearing a partial semantic relationship
to the target word in the second condition, and one image bearing a direct and
one image bearing a partial semantic relationship to target words in the third
condition. The other images in each set consisted of semantically unrelated
distractors. For example, in one set in the third condition, listeners heard
the word ‘piano’ while a picture of a piano was depicted alongside a picture
of a trumpet and two semantically unrelated distractor images. Auditory
stimuli were ‘recorded at a normal speaking rate by a male native speaker
of British English [from the Greater Manchester area]’ (Huettig & Altmann
2005: 25). Participants were told to ‘look at whatever they wanted’ during
the task, without being given any further explicit instructions (Huettig &
Altmann 2005: 26). The study found listeners to have produced significantly
(p=.005) more fixations upon each of the visual targets throughout the first
two conditions than towards distractor images. When both the direct referent
(piano) and weakly related image (trumpet) were displayed simultaneously
105

5.5. THE VISUAL WORLD PARADIGM
during the third condition, listeners produced signifcantly (p<.0001) more
fixations towards the direct referent but, most notably, significantly (p<.002)
fewer looks away from the other target image than from the distractor items.
This demonstrates that listener fixations towards images are triggered by
words which bear only partial semantic relationships to those images.
Also relevant to this study is research carried out by Dunabeitia et al
(2009) who investigates the different ways in which abstract concepts and
concrete objects are represented conceptually. In their Visual World study,
participants (N=30) were presented with auditory stimuli consisting of carrier
sentences containing target words which either referred to concrete objects
or abstract concepts.5 These were accompanied by visual stimuli compris-
ing an image in each quadrant of a display depicting various items, one of
which was semantically related to the target word heard. For example, one
set in the abstract condition contained the target word ‘faith’ with images
including a depiction of a cross6, whereas one set in the concrete condition
featured a target word of ‘crib’ with visual stimuli containing an image of
a baby. For each image set, participants were tasked with pointing to the
picture corresponding to the target word heard. Although the study found
that listeners were quick to focus on the semantically related images regard-
less of whether the target words represented concrete or abstract concepts,
participant fixations were significantly (p<.05) more often and faster when
target words related to abstract concepts than concrete referents. In their
discussion of these findings, Dunabeitia et al (2009: 290) opine that:
The most straightforward interpretation of these results is that
abstract and concrete words differ in the way that they are repre-
sented in semantic memory: associated concepts are more readily
5Concrete objects being items with a physical referent, and abstract concepts beingideas without physical referents. For the purposes of the current thesis, brand logos wereconsidered to be abstract concepts as, although there are physical objects with logosprinted on them, the brand images used as experimental stimuli have no physical referents(in contrast with images depicting physical objects).
6While a cross, in this case, was a concrete referent associated with the word ‘faith’,there is no direct referent for ‘faith’.
106

5.6. SUMMARY
available for abstract than for concrete words.
This is of particular interest here as the visual stimuli for the experiments
carried out in experiments 2 and 3 contained depictions of ‘concrete’ ob-
jects, as well as sets containing brand logos – which can be said to represent
abstract concepts (corporate identity rather a concrete referent). Although
Dunabeitia et al (2009) found this effect by comparing differences in concrete
and abstract terms in their auditory stimuli, rather than visual stimuli, their
findings appear to suggest that listeners may process abstract associations
differently from concrete associations. This notion is revisited in later exper-
imental chapters.
While Visual World studies have, to date, been used primarily to inves-
tigate semantic and pragmatic linguistic processing, so far the methodology
appears to have been used a handful of time to investigate sociolinguistic phe-
nomena (cf. Koops et al 2008; Dahan et al 2008), and does not appear to
have been previously used to examine social class associations. Fortunately,
the city of Glasgow provides an ideal linguistic background for investigations
of this type.
5.6 Summary
With regards to implicit cognition, people can respond to visual stimuli
without being able to explicitly report that they have seen it (Fowler et al
1981; Balota 1983; Marcel 1983). Commonly, studies investigating this phe-
nomenon have done so by comparing direct and indirect responses to stimuili
(Cheesman & Merikle 1984; Reingold & Merikle 1988). This paradigm has
been adopted in social psychology, where stimuli presented below the level
of conscious awareness have repeatedly been shown to affect subsequent be-
haviour (Cameron et al 2012).
People have also been shown to make unconscious social evaluations upon
encountering attitude objects (Fazio et al 2001). There appears to be an
evolutionary basis behind this, with automatic negative associations serving
107

5.6. SUMMARY
to facilitate faster threat avoidance behaviours (Schaller 2008; Miller et al
2012). Debate exists as to whether such automatic processes function under
a separate cognitive system from conscious thought (Chaiken & Trope 1999;
Epstein 1994; Smith & DeCoster 2000; Kruglanski & Orehek 2007; Evans &
Stanovich 2013) or result from lesser or fewer iterations of repeated processes
in a single cognitive system (Cunningham & Zelazo 2007; Van Bavel et al
2012).
The most common methods for investigating automatic evaluations are
the affective priming procedure and the Implicit Association Test (cf. Fazio
et al 1986; Greenwald et al 1998). Both methods demonstrate people to show
implicit biases against members of socially-stigmatised out-groups, such as
people of different races (Fazio et al 1995; Greenwald et al 1998; Payne 2001;
Miller et al 2012; ), nationalities (Greenwald et al 1998), and sexualities
(Inbar et al 2009), even in the absence of reports of explicit bias (Greenwald
et al 1998; Karpinski & Hilton 2001). Similar automatic social evaluations
have been observed in listener responses to different regional accents (Pantos
& Perkins 2013), with such evaluations linked to realisations of different
socially-marked phonetic variants (Campbell-Kibler 2012,2013).
Listeners automatically fixate on the visual referents of words being heard
(Cooper 1974), even when those words bear only partial semantic relation-
ships to visual referents (Huettig & Altmann 2005). Listeners have also been
shown to fixate on referents which have stereotypical associations with words
heard in speech (Kamide et al 2003). Fixation behaviour is also affected by
pitch accent and lexical stress (Dahan et al 2002; Salverda et al 2003).
With this in mind, the Visual World Paradigm seems well-suited to exam-
ining the automatic associations which listeners make towards different social
accents and socially-marked phonetic variants. Glasgow provides an ideal lin-
guistic background for this, being home to documented social working-class
and middle-class speech varieties with varying levels of perceived social pres-
tige (Macaulay 1975, 1977; Macafee 1983; Menzies 1991; Torrance 2003), and
which native listeners can readily distinguish from socially-marked phonetic
variation (MacFarlane & Stuart-Smith 2012).
108

Chapter 6
Experiment 2 - Listener
Fixations Upon Hearing
Different Social Accents
6.1 Introduction
In order to investigate whether speaker accent has an impact on the im-
plicit associations formed by listeners, it is necessary to obtain ‘on-line’, or
real-time, data. To achieve this, an experiment was conducted utilizing an
SR Research Eyelink II eye tracking headset, which measured participant eye
movements in relation to on-screen images while auditory stimuli consisting
of instructions read by speakers with differing accents were played. In con-
trast with the previously conducted experiments which provided only off-line
data as to the explicit associations participants made, it was hypothesized
that the this experiment would reveal divergent effects of speaker voice, re-
flecting less conscious associations indicated by eye movements. Conversely,
the null hypothesis was that no such effects would be found.
109

6.2. METHOD
Figure 6.1: An image set depicting objects hypothesized to carry ‘working-class’ (the gun) and ‘middle-class’ connotation, determined by ratings in anorming task (Experiment 2)
6.2 Method
6.2.1 Participants
The experiment was conducted among 42 native Glaswegian speakers,
consisting of 25 females and 17 males (59.5% and 40.5%, respectively), with
ages ranging from 18 to 60 years old (M=25.3, SD=8.25). Listeners were
recruited on the basis of having been born and lived their whole lives in
Glasgow, and if having no significant sight or hearing impairments. Of the
42 participants, 19 (59.5%) were perceived (subjectively) by the researcher
as possessing a middle-class accent, and 23 (54.8%) as having a working-class
accent. Recruitment was conducted via the Psychology department’s online
subject pool, from which respondents were directed to an online Doodle poll
to book an available date and time. Each participant took roughly 25 minutes
to complete the task, including an introductory briefing. Participants were
each paid £3 for their time at the experiment’s conclusion.
110

6.2. METHOD
The first group of subjects was comprised of 16 females and 5 males
(76.2% and 23.8%, respectively), with 9 (42.9%) perceived as possessing
middle-class accents, and 12 (57.1%) perceived as possessing working-class
accents. Participant ages in this group ranged from 19 to 60 years old, with
a mean age of 27.2 years. Due to the opportunistic nature of the sampling,
it was not discovered that the gender makeup of this group was unbalanced
until the data were collated, which is a factor to consider for future research.
Other than this, however, no significant differences between the groups were
evident. The second group of subjects consisted of 9 females and 12 males
(42.9% and 57.1%, respectively), with 10 (47.6%) perceived as possessing
middle-class accents and 11 (52.4%) perceived as possessing working-class
accents. Participant ages in this group ranged from 18 to 41 years old, with
a mean age of 23.4 years. Age variances between the groups were examined,
but were found to be non-significant (p>.05).
6.2.2 Materials
It was decided to re-use the visual and auditory stimuli from the previ-
ous experiment (Ch.5) in order to make findings comparable. The auditory
stimuli consisted of four speakers a working-class Glaswegian male, a middle-
class Glaswegian male, a working-class Glaswegian female, and a Glaswegian
Asian female. As in Experiment 1, the male speakers were paired with vi-
sual stimuli containing the target images for analysis, and the female speakers
were paired with distractor image sets, using the same 96 image sets (consist-
ing of 24 image sets containing objects, and 24 image sets containing brand
logos, and 48 image sets comprised of distractor images – with 24 of these
containing objects, and 24 consisting of brand logos). In order to control for
fatigue effects, 6 different randomized stimuli orders were distributed evenly
among the subjects. The first three image sets in each experiment consisted
of distractor images, in order to familiarize participants with the format of
the experiment prior to collecting data.
Participants were tested for eye-dominance before being fitted with an SR
111

6.2. METHOD
Research Eyelink II eye tracking headset. Visual stimuli were displayed to
participants via a 21 Dell CRT monitor running SR Research’s Experiment
Builder software, and auditory stimuli relayed via a Dell 5650 5.1 surround
sound system with each speaker directed towards the participant. Audio was
played at 25% of the system’s maximum volume in each case, in order to
ensure that stimuli was presented at consistent amplitudes throughout. A
secondary linked PC running SR Research’s Eyelink software was operated
by the researcher throughout the experiment in order to set and monitor
eye calibrations in relation to the visual stimuli. It was originally intended
to record participants’ explicit associations via a portable audio recorder,
with subjects being fitted with lapel microphones. This would have had the
added benefit of providing auditory recordings of the participants’ own social
accents. When the recorder’s SD card was full and the data were uploaded
to a PC, however, it was discovered that the equipment had failed (with
recordings containing only white noise). Fortunately, participants’ verbal
confirmations of on-screen associations were also recorded by the researcher
on pencil and paper forms, with perceptual impressions of their social accents
noted for later analysis.
6.2.3 Procedure
Participants were taken to a dedicated eye tracking suite within the Uni-
versity of Glasgow’s Psychology department on an individual basis, where
they were briefed and given consent forms. Participants were then tested
for eye dominance using a variant of the Miles (1930) test, in which they
were instructed to form a small triangle-shaped gap between their thumbs
and index fingers before outstretching their arms and fixating upon the re-
searcher through the gap. The researcher was then able to observe which
eye participants aligned with the gap, indicating eye dominance. Subjects
were then sat in a chair directly in front of Dell 21” CRT monitor and fitted
with the eye tracking headset, with an eye tracking camera placed under the
dominant eye and focussed using SR Research’s Eyelink software on the sec-
ondary PC. Participants then underwent a calibration process, in which they
112

6.2. METHOD
Figure 6.2: An image set containing brand logos hypothesized to carry‘working-class’ (Fiat) and ‘middle-class’ (Mercedes-Benz ) connotations, de-termined via a norming task (Experiment 2)
were requested to focus upon a series of dots appearing on-screen. Once the
apparatus had been successfully calibrated, the first image set was triggered
by the researcher, with the subject being presented with the visual and cor-
responding auditory stimuli.
Auditory stimuli were composed of 11 complete sentences. In order to make
the stimuli sound more naturalistic, it was decided not to splice target words
into their carrier sentences, but to record each sentence separately. As these
were recorded from two different speakers, it was found necessary to align
the dataset both from the onset of the trials, and from the mean onset of
the target words. This gave two separate sets of results for both objects and
brands – one which showed listener bias towards the targets from the start of
the trial (including the first 1,000ms before the onset of speaker voice), and
one which showed listener bias slightly before and after the mean onset of the
target words. Target words were monosyllablic, with an average duration of
approximately 500ms. Auditory stimuli were presented in a between-subjects
design in order to prevent participants from being exposed to any given image
113

6.2. METHOD
set more than once, controlling for potential salience effects. Each group was
presented with the same image sets, but with opposing auditory data. For
example, the first group was shown the image set containing the spoon and
the gun (figure 6.1) while hearing auditory data recorded from the working-
class male, while the second group was shown the same image set while a
recording of the middle-class male was played. In order to ensure that each
participant was exposed to multiple voices, however, the first group were
also shown image sets while recordings of the middle-class speaker were pre-
sented. In these cases, the second group were presented with the same image
sets while hearing the working-class speaker. Six different randomized orders
were utilized in order to control for fatigue effects, as it was anticipated that
participant responses could differ depending on whether an image set was
encountered earlier or later in the experiment.
Participants were tasked with verbally indicating which of the four images
in each set they most strongly associated with the target words heard in
the auditory stimuli. Each image set was displayed for a total of 7,000ms,
with auditory stimuli commencing from 1,000ms. Between image sets, par-
ticipants were tasked with focusing upon a dot which appeared in the centre
of the screen, with which the researcher could confirm that calibration re-
mained accurate, make corrections if necessary via the secondary console,
before triggering the next image set. At the halfway point of the experiment
(after 48 image sets had been displayed), another full calibration process uti-
lizing a series of on-screen dots was carried out. At this point, participants
were asked if they were comfortable, wanted to take a break, and were happy
to continue, before the latter half of the experiment commenced. The exper-
iment lasted around 25 minutes, in total. Upon completion, subjects were
thanked for their time and contribution before being paid a £3 participation
fee.
6.2.4 Data Conversion
The raw fixation data (containing the time course of each participant’s
eye movements in relation to the 96 image sets) were outputted from SR
114

6.2. METHOD
Research’s Eyelink software, before being converted, collated, and filtered
using a custom Perl script and Java filter created by Dr. Christoph Scheep-
ers. This allowed the relevant fixation data and metadata to be extracted in a
format suitable for analysis. During this process, trials were paired with 8-bit
colour-coded image templates corresponding to the visual stimuli, which al-
lowed the Java filtering program to assign participant fixation coordinates to
the positions in which ‘working-class’, ‘middle-class’, and distractor images
appeared during each trial.
Distractor images were found to have been explicitly chosen in negligi-
ble proportions (2.4% of all responses, or in 68 instances across 2,016 trials)
as they bore little or no semantic relationship with the target words in the
auditory stimuli. For this reason, it was decided to exclude them from the
analyses of both the verbal choices and eye tracking data. This allowed for a
logarithmic ratio of looks towards working-class images versus looks towards
middle-class images to be calculated, in which a positive value represented
visual bias towards a working-class image and a negative value represented
visual bias towards a middle-class image (with a zero value representing no
visual bias). This ratio, indicating participant bias towards either working or
middle-class images across image sets containing either objects or brand lo-
gos, was then calculated across 50ms time bins, before the data were collated
and restructured for statistical analysis.
For the eye tracking data, statistical bootstrapping provided the most ro-
bust analysis of the sample population. Statistical bootstrapping, introduced
by Efron (1979), provides a viable compromise to sampling an entire pop-
ulation by means of drawing repeated samples from a given dataset, which
gives a ‘surrogate population for the purpose of approximating the sampling
distribution of a statistic’ (Singh & Xie 2010: 46). As this type of analysis
is non-parametric in nature, it can better handle non-normally distributed
data (such as fixation coordinates over time) as it does not rely on assump-
tions about the characteristics or structure of the sample population. In this
case, 5,000 random resamples were drawn from the original dataset. This al-
lowed for the calculation of robust 95% confidence intervals for the difference
of the means, providing a visual measure of statistical significance. Fixa-
115

6.3. RESULTS
tion behaviour was visualised via line graphs, with datapoints representing
aggregated fixations towards/away from working-class target images versus
middle-class target images in each 50ms time bin. Responses were aligned to
the mean onset of target words in the auditory stimuli.
Participants’ verbal choices of image sets were analysed using Generalized
Estimating Equations (GEE). As distractors were excluded from the analysis,
listener responses were narrowed down to a binary choice between ‘working-
class’ and ‘middle-class’ images for each trial, making GEE a suitable choice
of statistical model. GEEs are also semi-parametric, making them more
suitable for dealing with non-normally distributed data, such as the verbal
responses given by listeners in relation to the stimuli used here.
One weakness of both GEE and statistical bootstrapping is that neither
technique allows for the inclusion of random factors. In order to compensate
for this, each technique was run on their respective datasets using both sub-
jects and image sets as the independent variable. This provided two sets of
analyses for both the on-line and off-line data – a by subjects analysis and by
image sets analysis for the verbally recorded data, and a by subjects analysis
and by image sets analysis for the eye tracking data.
6.3 Results
6.3.1 Generalised Estimating Equations
GEEs were used to analyse listeners’ verbal choices of images during the
experiment. A by subjects GEE analysis (table 6.1) revealed a non-significant
(p=.073) main effect of speaker on the images chosen by participants across
all image sets (brands and objects). This was in addition, however, to a
highly significant (p <.001) effect of brands vs. objects (Igroup). Finally, a
significant interaction between speaker and image set type (p=.024) reflects
the differences in listener choices of images while viewing image sets contain-
ing brand logos and those depicting objects. Pairwise comparisons under
this model (table 6.2) revealed a non-significant (p=.247) effect of speaker
heard on image chosen while viewing image sets containing brand logos, but
116

6.3. RESULTS
Table 6.1: GEE by subject model effects, showing a highly significant(<.001) effect of image set type (Igroup) and a significant (p=.024) inter-action of speaker and image set type on the verbal image choices reportedby listeners (Experiment 2)
a significant effect (p=.008) of speaker heard on image chosen while viewing
image sets containing objects.
A GEE carried out by image set (table 6.3, p.118), rather than by subject,
revealed a non-significant effect of speaker (p=.097) on the images chosen by
participants. The effect of image set type (brands vs objects) was also non-
significant (p=.073). There was a highly significant (p=.004) interaction of
speaker and image set type, however, indicating a disparity between speaker
effects while viewing image sets depicting objects and speaker effects while
viewing image sets containing brand logos. Pairwise comparisons revealed
non-significant (p=.097, p=.073) effects of images chosen by speaker and by
image set type, respectively. A highly significant (p=.004) effect, however,
was found on listener choices when both speaker and image set type were
taken into account, again illustrating the difference in listener responses to
working-class and middle-class speakers while viewing image sets containing
objects and those containing brand logos (illustrated in figures 6.3 and 6.6).
6.3.2 Objects
Figure 6.3 (p.119) shows participants’ verbal responses in response to im-
age sets containing objects, with 95% confidence intervals providing a visual
measure of statistical significance. Here, speaker voice was found to have had
117

6.3. RESULTS
Table 6.2: GEE pairwise comparisons by subject, showing a significant(p=.008) effect of speaker heard on image choices while viewing image setsdepicting objects (Experiment 2)
Table 6.3: GEE by image set model effects, showing a highly significant(p=.004) interaction between image set type (Igroup) and speaker heard onthe images verbally chosen by listeners (Experiment 2)
118

6.3. RESULTS
Table 6.4: GEE pairwise comparisons by image set, showing a highly sig-nificant (p=004) effect of speaker heard on the images verbally chosen bylisteners while viewing image sets depicting objects (Experiment 2)
Figure 6.3: Images verbally chosen while viewing image sets containingobjects, by speaker (95% C.I.) (Experiment 2)
119

6.3. RESULTS
Figure 6.4: Time course of participant gazes towards ‘working-class’ objectsin comparison to ‘middle-class’ objects, by speaker heard (by subject analysis,Experiment 2)
marked effects on the images verbally chosen by listeners. This, however, oc-
curred in a class-incongruent direction – with listeners being significantly
more likely to choose a ‘middle-class’ object when the working-class speaker
was heard (p<.05), and significantly more likely to choose a ‘working-class’
object when the middle-class speaker was heard (p<.05). With regards to the
eye tracking data, however, no significant effect was found. Figure 6.4 shows
participant fixation bias towards/against ‘working-class’ images in trials con-
taining depictions of objects. This bias was determined by excluding fixations
towards distractors, which were found to have occurred in negligible propor-
tions, before calculating a logarithmic ratio of looks towards working-class
target images versus looks towards middle-class target images. This is repre-
sented here by the y-axis scale — with looks above the zero point indicating
proportionately more looks towards working-class images and looks below
the zero point indicating proportionately more looks towards the middle-
class images. The x axis depicts the time course of fixations made across
trials, sorted into 100ms time bins. Here, trials were synchronised to the
onset of the target words, with the zero point on the x axis indicating the
‘mean onset time of the target words heard during the experiment.
Here, we can see that listeners were immediately more inclined to look
towards working-class images at the beginning of the trial, before any audi-
tory stimuli was heard, although not significantly so (p>.05). Furthermore,
analysis of listener fixations towards working-class target images upon hear-
ing the auditory target words also revealed no significant (p>.05) effect of
120

6.3. RESULTS
Figure 6.5: Time course of participant gazes towards ‘working-class’ ob-jects in comparison to ‘middle-class’ objects, by speaker heard (by image setanalysis, Experiment 2)
speaker heard. Furthermore, a virtually identical pattern was revealed in the
‘by image set’ analysis (figure 6.5).
From this, we can determine that hearing different speakers did not signifi-
cantly (p>.05) impact upon the fixations made by listeners towards on-screen
objects while hearing semantically related target words.
6.3.3 Brand Logos
Figure 6.6 shows the verbal choices of images participants made while
viewing image sets containing brand logos. Here, clear trends emerge in the
directions hypothesised – with listeners more inclined to choose ‘middle-class’
brand logos when the middle-class speaker was heard, and ‘working-class’
logos when the working-class speaker was heard. These trends, however,
were not found to be statistically significant (p>.05).
Figure 6.7 shows participant fixation bias towards/against ‘working-class’
images in trials containing brand logos. As before, bias was determined by
calculating a logarithmic ratio of looks towards working-class target images
versus looks towards middle-class target images. This is represented here by
the y-axis scale — with looks above the zero point indicating proportionately
more looks towards working-class images and looks below the zero point in-
dicating proportionately more looks towards the middle-class images. Trials
were synchronised to the onset of the target words, with the zero point on
the x axis indicating the ‘ mean onset time of target words heard during the
121

6.3. RESULTS
Figure 6.6: Images chosen while viewing image sets containing brand logos,by speaker (95% C.I.) (Experiment 2)
experiment.
Here we can see a significant (p<.05) effect of speaker voice emerge at
two consecutive time-points — 1,100ms and 1,150ms after the mean on-
set of target words. Although listeners were more inclined to show bias
towards ‘working-class’ brand logos regardless of speaker heard, they were
significantly more biased towards ‘working-class’ brand logos when hearing a
working-class speaker than when hearing a middle-class speaker. When the
Figure 6.7: Time course of participant gazes towards ‘working-class’ objectsin comparison to ‘middle-class’ objects, by speaker heard (by subject analysis,Experiment 2)
122

6.4. DISCUSSION
Figure 6.8: Time course of participant gazes towards ‘working-class’ ob-jects in comparison to ‘middle-class’ objects, by speaker heard (by image setanalysis, Experiment 2)
dataset was analysed by image set (figure 6.8), significance (p<.05) emerged
in the very same time bins, showing marked effects of speaker voice not found
elsewhere in the time course of the experiment.
These figures (6.7 and 6.8) show conclusively that the speaker heard had
a significant (p<.05) effect on the images fixated upon by listeners, with
listeners more likely to fixate upon a ‘working-class’ brand when a working-
class speaker was heard than when a middle-class speaker was heard. Such
divergence emerges at 1,100ms after the mean onset of the target words,
continuing across the following time bin at 1,150ms. No such divergence was
evident from 1,200ms onwards.
6.4 Discussion
The experiment found a significant (p<.05) effect of speaker voice on the
explicit associations verbally reported by listeners when presented with image
sets containing objects, but no such effect was found in participant eye move-
ments across the same trials. While it is not known for certain why partici-
pants’ explicit responses patterned in the opposite direction than was hypoth-
esised — with listeners being significantly more inclined to choose ‘working-
class’ objects when the middle-class speaker was heard, and ‘middle-class’
objects when the working-class speaker was heard — it is possible that lis-
teners deliberately avoided negatively stereotyping the working-class speaker
in choosing ‘working-class’ objects (such as a gun as opposed to a spoon, or a
123

6.4. DISCUSSION
beer glass as opposed to a coffee mug), overcompensating by choosing more
‘middle-class’ targets when the working-class speaker was heard. Conversely,
this may also have led them to choose more ‘working-class’ targets when the
middle-class speaker was heard. This type of hypercorrection is outlined by
Pantos and Perkins (2013: 13), who assert that:
Listeners can hypercorrect their explicit attitude reporting if they
suspect their implicit attitudes might reveal a socially unaccept-
able bias. Such hypercorrection in attitude reporting has been
shown to occur when participants are concerned about percep-
tions of their self-presentation.
As these results were ostensibly explicit, conscious choices, deliberated over
the course of several seconds, this explanation would seem applicable here.
Although the implicit reactions indicated by the eye tracking data towards
image sets containing objects revealed no significant effect of speaker voice,
the difference in listeners’ explicit choices on hearing different speakers sug-
gests differences in the implicit and explicit associations made in response to
the social information in the speech signal.
With regards to the brand logos, the explicit responses revealed slight
trends in the directions hypothesised, with listeners more likely to choose
‘middle-class’ logos when the middle-class speaker was heard, and more likely
to choose ‘working-class’ logos when the working-class speaker was heard.
Although these trends were not found to be statistically significant (p>.05),
the explicit results here mirror those obtained from the Experiment 1. Par-
ticipant fixations towards image sets containing brand logos, however, show
a significant (p<.05) effect of speaker voice, as hypothesised. This appears
to indicate that social information in the speech signal is, indeed, evaluated
implicitly, and that such implicit evaluation is separate from explicit evalua-
tion. Furthermore, the effect first appears at 1,100ms after the average onset
of the target words. Given that the average duration of the monosyllabic
target words heard was around 500ms, and that it takes around 200ms for a
saccade to be processed (cf. Arnold & Tinker 1939; Salthouse & Ellis 1980;
Salthouse textitet al 1981; Vaughan 1983), this would suggest that listeners
124

6.4. DISCUSSION
implicitly reacted to the semantic associations between the visual stimuli and
the auditory target words with a delay of around 400ms. This result may
imply that the time course of implicit cognition is longer (or slower) for social
information derived from the speech signal than for visually-derived social
information, where responses have been recorded occurring between 200 and
300ms (cf. Payne 2001; Greenwald et al 1998).
While it is not known exactly why there is an implicit effect of speaker
voice in response to image sets containing brand logos but not in response to
image sets containing objects, the findings from Dunabeitia et al (2009) may
go some way to explaining these results. If, as Dunabeitia et al (2009: 209)
suggest, ‘abstract and concrete words differ in the way that they are repre-
sented in semantic memory: associated concepts are more readily available
for abstract than for concrete words.’, it may be that listeners are quicker to
associate the target words with visual representations of abstract concepts
(brand logos) than with visual representations of concrete items (objects) –
resulting in an implicit effect for the former, but not the latter. It may also
be possible that brand logos trigger more immediate responses due to their
abstractness, as abstract concepts are open to a variety of interpretations
(e.g. a Ford logo might cause people to think of a transit van or a rally car,
depending on the perceiver, whereas an image depicting a transit van is open
to less varied interpretations). Nevertheless, aggregated participant ratings
in a subsequent norming task (Table 7.6, p.139) demonstrate a degree of con-
sistency in the socio-economic connotations which people infer from different
brand logos.
125
Chapter 7
Experiment 3 - Listener
Fixations Upon Hearing
Different Socially-Marked
Phonetic Variants
7.1 Introduction
While the results of Experiment 2 indicate that social accents trigger dif-
fering fixation behaviours and verbal responses in listeners, the small number
of speakers used in the auditory stimuli (one working-class and one middle-
class Glaswegian male, along with two female distractor voices) provide lim-
ited evidence for this effect. Furthermore, the previous experiment examined
only responses to a holistic notion of ‘accent’, with no examination of the spe-
cific components which listeners responded to. With this in mind, a new eye
tracking experiment was devised in order to investigate the effect of socially-
marked phonetic variation on the socio-economic associations which listeners
make towards different social accents. For this experiment, auditory stimuli
were recorded from 8 Glaswegian speakers (4 working-class and 4 middle-
class males), consisting of mono-trisyllabic single word tokens containing
socially-marked CAT, post-vocalic/post-consonantal /l/, and non-prevocalic
126

7.2. METHOD
/r/ variation. New visual stimuli were composed of 36 image sets depict-
ing brand logos (omitting depictions of objects, based on the findings of the
previous experiment), each containing a ‘working-class’ and a ‘middle-class’
brand semantically paired with target words in the auditory stimuli.
7.2 Method
7.2.1 Participants
54 native Glaswegian participants were selected for inclusion in the anal-
ysis from a total of 60 participants tested, recruited via the University of
Glasgow’s psychology department subject pool, as well as through emails
circulated by departmental secretaries and posters placed in and around
campus. Participants were primarily students from a range of subject ar-
eas, although no record was taken of the subjects each participant studied
and which were non-students (a point to bear in mind for future research).
The 6 participants not selected (the last 6 tested) were excluded for the pur-
poses of keeping the experimental design balanced in a Latin square1, with
54 participants ensuring that responses to each of the 8 stimuli voices (and 1
distractor voice) could be recorded in relation to each image set a total of 6
times. Among participants included in the analysis, 28 were female (51.8%),
with ages ranging from 18 to 61 years old (M=25.8, SD=9.9).
7.2.2 Materials
Auditory Stimuli: Target words (table 7.1) for the auditory stimuli were
selected on the basis of containing both semantic relationships with the cat-
egories represented by target images in the visual stimuli, and possessing the
potential for socially-marked phonetic variation in post-vocalic realisations
1A Latin square can be described as a grid filled with different symbols, each occurringonly once in each row and once in each column. In experimental design, a Latin squarecan be used to balance stimuli across experimental conditions. In this case, it was usedto ensure that each participant was exposed to each of the 9 speakers an equal numberof times over the course of 36 image sets, and that the distribution of possible speakerutterance/image set combinations was split evenly between participants.
127

7.2. METHOD
Table 7.1: Target words in auditory stimuli, by phonetic variable (Experi-ment 3)
of /l/, /r/, and the CAT vowel. Each token was categorised according to the
perceived articulations which speakers made while producing the variables
under study (post-vocalic/post-consonantal /l/, non-prevocalic /r/, and the
CAT vowel). Post-vocalic/post-consonantal /l/ and non-prevocalic /r/ to-
kens were coded auditorily, with the experimenter classifying each realisation
according to four point scales, while CAT vowel realisations were categorised
in terms of frontness/retractedness according to relative F2 measurements.
The preceding and following phonetic environments of each variable were also
coded for inclusion in later analyses.
Target words were chosen on the basis of being semantically linked to one
of four categories (cars, restaurants, shops, and drink), and for their inclusion
of phonetic contexts where the socially-marked phonetic realisations under
examination were possible. While a metric of the strength of the seman-
tic associations between the target words and their corresponding categories
would have been useful, with perhaps the only method to obtain this being
a preliminary norming task, this was not found to be practical as there is
a limit to how many words containing non-prevocalic /r/ contexts, for ex-
ample, that can realistically be semantically linked to brand logos conveying
differing socio-economic contexts. Auditory tokens from a synthesized voice
was obtained from Dr. Christophe Veaux of the University of Edinburgh’s
128

7.2. METHOD
Institute of Language, Cognition and Computation.
To provide greater ecological validity, it was originally intended that au-
ditory stimuli from Glaswegian speakers be collected via a pictogram task,
recording two speakers at a time as they participated in a spot-the-difference
activity and extracting the required tokens from their recorded conversations,
but this was found to be impractical due to the number of speakers required
to provide useful stimuli for the experiment. Furthermore, as the list of target
words was drawn up with consideration to both semantic relationships with
categories in the visual stimuli and potential for socially-stratified phonetic
variation, some were perhaps too abstract for a pictogram task (words such
as hunger, mile, and scan, for example, being particularly tricky to elicit with
images). With this in mind, a word association task was devised in which
single participants were tasked with guessing words, with the first letter of
each word and semantically related clues given to elicit the desired responses.
Participants were instructed to repeat each target word 3 times, as it was
found that they would often produce the first instance of words with a rising
intonation (being unsure if they had guessed the word correctly). Partic-
ipants were informed when guesses were incorrect and asked to try again.
If this failed to produce the intended target, speakers were given additional
letters for the missing word until a successful utterance was elicited. A to-
tal of nineteen male speakers were recorded, from which four self-reported
working-class and four self-reported middle-class speakers, with ages ranging
from 18-29 years old (Table 7.2), were selected on the basis of sounding most
prototypically working or middle-class.
Female speakers were not recorded as the experimental design was al-
ready complex, and time constraints were such that the addition of another
variable (speaker gender) would have been impractical. The task was found
to have been successful in reliably eliciting the socially-marked phonetic vari-
ants under examination from self-reported middle-class speakers, and from
some of the self-reported working-class speakers. Several of the self-reported
working-class speakers were found to have produced variants thought to be
typical of middle-class, or more standard, speech. While this may have re-
sulted from the word association task itself, and its resemblance to a word list
129

7.2. METHOD
Table 7.2: Speakers used as auditory stimuli in eye tracking task (Experi-ment 3)
designed to elicit read speech, the recording environment (a formal task con-
ducted in a sound-proofed recording booth) and the level of higher education
which the speakers possessed (being primarily undergraduate students at the
University of Glasgow) may have contributed to speakers adopting a register
closer to the prestige norm of Scottish Standard English. The task, however,
was found to have elicited the expected variants from other working-class
speakers, so can be said to have been successful in this regard.
All speakers were native to Glasgow, with the exception of the synthetic
stimuli voice —which had been resynthesized from a 23 year old male speaker
from Edinburgh. Of the Glaswegian speakers selected for inclusion as stimuli,
the 4 who self-identified as working-class had a mean age of 23 years, and the
4 who self-identified as middle-class a mean age of 25.5 years. Tokens from
the synthetic voice were included in the experiment as distractors, with the
purpose of disguising the task as investigating differences in listener reactions
while hearing both real and synthetic voices. It was thought that not explic-
itly mentioning the synthetic voice would lead participants to believe that it
was an important part of the experiment. This, however, proved not to be
the case, as although some participants (11.6%) commented that the syn-
thetic voice was either computer generated or had been manipulated during
the following Subjective Reaction Test, no participant explicitly mentioned
the synthetic voice when asked to state the purpose of the experiment once
130

7.2. METHOD
testing had concluded. In hindsight, it may have been more effective to have
falsely advised participants that the experiment was focussed on synthetic
speech before testing began.
No working-class speakers were found to have produced the working-class-
typical variants for every token and some middle-class speakers produced
some working-class prototypical variants. This is in line with previous so-
ciolinguistic research, which shows that phonological variation according to
sociolect is rarely categorical (Macafee 1994), and allows for a comparison of
the effect which the realisations themselves had on listener associations inde-
pendently from the self-reported social classes of the speakers heard. If, for
example, it was found that working-class speakers trigger certain reactions in
listeners which middle-class speakers do not, and that this happens regardless
of whether the speech heard contains typical working-class phonetic variants
or not, then this would indicate that implicit associations are triggered by
other socially encoded linguistic information (such as voice quality). In order
to investigate this, the most prominent voice qualities of each speaker were
also auditorily coded for later analysis.
CAT Vowel Realisations: Socially stratified productions of the CAT vowel
in Scottish English have been noted at least as early as Macualey (1977), who
found working-class speakers to generally produce more retracted variants
than middle-class speakers, with such productions for all speakers retracted
before approximants such as /r/. In a study of different Communities of Prac-
tice (CofP) in a Glasgow secondary school, Lawson (2011: 244) found clear
social stratification of the CAT vowel based on peer-group, with members of
the ‘Ned’ CofP producing more fronted and lowered realisations, and mem-
bers of the ‘Schoolie’ CofP more raised realisations, than other peer-groups
in the school. This is in line with Stuart-Smith (1999), who suggests that
middle-class realisations of CAT tend to be more raised than working-class
realisations.
Acoustic analysis was conducted on CAT productions in the auditory
stimuli, with F1 and F2 measurements taken from static mid-points on each
vowel in Praat, using the program’s ‘track formants’ feature before visu-
131

7.2. METHOD
Figure 7.1: Formant plot of stressed /a/ in speaker productions of packtokens only. Working-class realisations are red triangles, middle-class speakerrealisations are blue squares, the token from the synthesized voice is a purplecircle (Experiment 3)
ally verifying the formant tracks in each spectrogram. In order to examine
fixations made upon hearing different CAT realisations, it was found neces-
sary to convert speaker vowel productions into discrete categories. For this,
speaker CAT vowel productions were sorted into fronter (stereotypically more
working-class) and more retracted (stereotypically more middle-class) cate-
gories based on the F2 values of all stressed /a/ realisations in the auditory
stimuli. The mean F2 frequency of all CAT vowel realisations was found
to be 1,356Hz, with a median F2 of 1,412Hz among middle-class speakers
and 1,290Hz among working-class speakers. With this in mind, realisations
were sorted into fronter (1,400Hz or higher) and more retracted (1,300Hz or
lower) categories, with an intermediate ‘neutral’ category (1,300Hz-1,400Hz)
serving as a buffer between the two.
Various methods of vowel normalisations were considered, but were re-
jected due to the similarity of speakers in the auditory stimuli (all adult
males) and due to there being only one vowel under examination. While
there were invariably differences in the vocal tract sizes of different speakers,
it was felt that the raw F2 frequency data were sufficient for preliminary
132

7.2. METHOD
Table 7.3: CAT vowel realisations by speaker (Experiment 3)
analysis.
Post-Vocalic/Post-Consonantal /l/ Realisations: While varieties of
Scots have long contained dialectal forms of /l/ vocalisation, primarily fol-
lowing /O/ in words such as ball and fall and following /0/ in words such
as shoulder (Macafee 1983), a relatively recent innovation has arisen among
Glaswegian vernacular speakers which is more akin to the type of /l/ vo-
calisation found in working-class Cockney and South-East London English
(Stuart-Smith et al 2006). This newer type of /l/ vocalisation in Glasgow
appears post-vocalically following front vowels in both word-final and pre-
consonantal positions (in words such as well and milk), as well as post-
consonantly (in words such as people), and has been shown to occur much
more frequently among younger working-class speakers than older working-
class speakers or middle-class speakers of any age, making the variant a clear
marker of both age and social class (Stuart-Smith et al 2006). Acousti-
cally, laterals are generally characterised by a low F1 and dark F2, with a
raised F1 and lowered F2 when dark, and a higher F3 when ‘strongly dark
and/or denti-alveolar’ (Stuart-Smith et al 2015). In vernacular Glaswegian,
/l/ is typically denti-alveolar and very dark, while another variant which has
been observed from the 1980s vocalises to ‘a high back (un)rounded vowel in
syllable-final position’ (Stuart-Smith et al 2015: 1).
Coding /l/ tokens according to these categories was carried out auditorily
according to strongly vocalised, weakly vocalised, dark, and clear /l/ realisa-
133

7.2. METHOD
tions. Some vocalised tokens were found to be perceptually ‘stronger’ than
others, and were coded accordingly. This may have been due to differences
in duration, and future analyses are planned to account for this. A range
of perceptually-different dark /l/ pronunciations were also discovered, with
dark /l/ being the most commonplace post-vocalic/post-consonantal reali-
sation in Glaswegian speech (Stuart-Smith et al 2015). In order to ensure
that coding was consistent, 10% of all categorised /l/ tokens were verified by
two additional phoneticians (Jane Stuart-Smith and Robert Lennon at the
Glasgow University Laboratory of Phonetics).
Table 7.4: Post-vocalic/post-consonantal /l/ realisations by speaker (Ex-periment 3)
Hall-Lew & Fix (2012: 794) note that vocalised /l/ is ‘a challenging vari-
able to measure consistently’, finding categorisations to vary markedly by
rater after a task in which 53 linguists coded /l/ tokens according to degree
of vocalisation on a four-point scale. While Hall-Lew & Fix (2012) focussed
on ratings of the degree of /l/ vocalisation in spontaneous speech, this is
mitigated to an extent in the current study as auditory stimuli were com-
posed of single-word tokens which, as Stuart-Smith et al (2006) note, are
more conducive to discriminating vocalised /l/ than casual speech. Further-
more, as the speakers’ intended choice of words were known to the researcher,
this removed potential ambiguities which may have arisen in distinguishing
intentional back vowels from vocalised /l/ tokens, for example. The cate-
gorisation of vocalised versus non-vocalised /l/ tokens was also made simpler
by coding vocalised tokens as either strongly or weakly vocalised, and other
134

7.2. METHOD
/l/ tokens as either clear or dark. As can be seen from table 7.4 (above),
most speakers produced dark /l/ realisations for each token. These included
a range of dissimilar-sounding articulations, presenting an area for further
investigation in future research.
Non-Prevocalic /r/ Realisations: From the turn of the century, stud-
ies have shown coda /r/ to have been weakened to a pharyngealised vowel
among many working-class Glaswegian speakers (Romaine 1979; Macafee
1983; Johnston 1997). Conversely, a shift towards rhoticity was noted among
middle-class speakers around the same time, with Lawson et al (2008: 102)
noting that this may have been due to ‘Ridicule of MC Anglo-Scottish accents
in popular culture and an increase in nationalism’, whereas the working-
class ‘loss of /r/ appeared to be a slow-moving, system-internal change, un-
connected with Anglo nonrhoticity’. The trend towards nonrhoticity among
young working-class Glaswegians has been observed to have increased greatly
in recent years (Stuart-Smith 2003; Stuart-Smith et al 2007). In contrast,
speakers of middle-class varieties of Glaswegian now tend to produce schwar
and bunched-/r/ articulations in post-vocalic postitions (Stuart-Smith et al
2007; Lawson et al 2011; Lennon 2013). Acoustically, middle-class Glaswe-
gian post-vocalic /r/ realisations, including retroflex and bunched realisa-
tions, show lowered F3, while uvular and dental trills show raised F3 (Stuart-
Smith et al 2015). Working class realisations tend to show auditory weaken-
ing of non-prevocalic /r/, especially in utterance final position and unstressed
syllables — for which little acoustic evidence exists. A small-scale study by
Stuart-Smith (2007), however, suggests that these may be characterised by
a high/rising F3. Although completely derhotic realisations present no au-
dible cues to rhoticity, Lawson et al (2014) note that covert /r/ articulatory
gestures are often common during their production. For stimuli tokens con-
taining non-prevocalic /r/, coding was carried out auditorily, categorising
realisations into derhotic, weakly rhotic, approximant/tap, and bunched /r/
categories (Table 7.5). As the /l/ realisations, 10% of all /r/ tokens were
verified by two additional phoneticians.
135

7.2. METHOD
Table 7.5: Non-prevocalic /r/ realisations by speaker, (Experiment 3)
Combined Tokens: Three stimuli tokens contained two socially-marked
phonetic variants — bar, car, and cashier, all of which contain stressed /a/
and non-prevocalic rhoticity. It’s worth noting, however, that productions of
cashier varied between the working-class and middle-class speakers, with all
but one of the middle-class speakers (MC1, MC2, MC3, and WC1) producing
the token with a stressed /a/, and all but one of the working-class speakers
(WC2, WC3, WC4, and MC4) producing the token with an unstressed ini-
tial vowel. This indicates that this type of variation is also socially marked
in Glasgow. The analysis of combined tokens was also confounded by the
co-articulatory effect of /ar/ realisations, with /a/ productions for all speak-
ers retracted before approximants such as /r/. As such, these tokens were
omitted from analysis. The omission of combined tokens left analysable
auditory stimuli comprising 12 words containing CAT, 12 words containing
post-vocalic/post-consonantal /l/ realisations, and 9 words containing non-
prevocalic /r/ per speaker.
Voice Quality: Voice quality has also been found to generally be a differen-
tiating factor between working and middle-class varieties of Glaswegian, with
working-class Glaswegians being noted to utilise more whispery phonation
and open jaw settings than their middle-class counterparts (Stuart-Smith
1999). Voice quality has also found to vary between different ages and gen-
ders of Glaswegian speakers, with males tending to utilise more creaky phona-
136

7.2. METHOD
tion than females, and younger speakers tending to have more lax settings
than older speakers (Stuart-Smith 1999). Furthermore, Stuart-Smith (2003:
115) also found that there are ‘a specific constellation of settings typical of
working-class speakers (more open jaw, raised and retracted tongue body
with possible retracted tongue root, whispery voice), which tended to be ab-
sent in middle-class speakers.’
Visual Stimuli: New sets of visual stimuli were compiled and normed for
the experiment, comprising image sets containing brand logos relating to
four different categories — cars, restaurants, shops, and alcohol. These cat-
egories were selected as they were thought to be strongly associated with
socio-economic status, for which divergent connotations could be conveyed
by different brand logos. Brands were pre-selected via a Google Docs feature
which provided semantically generated lists from an initial input, with gen-
erated brands not found in Glasgow being manually replaced with brands
local to the area. Logos corresponding to each of the resulting brands gen-
erated/selected were then obtained online, via the Brands of the World2
website, as well as from Google image searches where logos were otherwise
unavailable. Vector images were obtained where possible, as these can be
scaled up or down indefinitely without loss of image quality. High quality
bitmap and jpeg images were obtained when vector graphic logos could not
be found. All logos were normed via a social evaluation questionnaire (N=39)
which consisted of brand logos above accompanying Likert scales on which
raters were tasked with indicating ‘how posh’ they thought each brand was
on a scale of one to six (Appendix 4, p.238). Norming was conducted primar-
ily on students from the University of Glasgow. While this may have affected
ratings, the sample for the norming task was drawn from a similar population
as the sample for its corresponding eye tracking task. Ratings were gathered
for 96 brand logos, with questionnaires presented in five different randomised
orders in order to control for possible fatigue effects. Participant ratings for
each brand were collated and converted to participant-specific z-scores, which
2www.brandsoftheworld.com [accessed 08/04/14]
137

7.2. METHOD
Figure 7.2: Image set showing a working-class brand (Aldi) and middle-class brand (Marks & Spencer), paired with the auditory token store (Ex-periment 3)
were then used to determine whether a brand had been classified as more
‘working-class’, ‘middle-class’, or neither, depending on whether or not the
brand z-score was greater than 0.1 (for ‘middle-class’ brands) or less than
-0.1 (for ‘working-class’ brands) above zero. This produced a total of 41
‘working-class’ brands, 44 ‘middle-class’ brands, and 11 brands with z-scores
close to 0, as detailed in table 7.6 (overleaf).
Image sets were compiled based on the difference between the z-scores of
the rated logos, with middle-class brands which were rated as the most ‘posh’
in the norming task being paired with brands which scored in the upper-end
of the ‘working-class’ category. This allowed for image sets containing a clear
‘working-class’ and ‘middle-class’ brand for each set, for example in figure
7.2. While there may have been disparities in the ratings given to different
brands by individual participants, the aggregated ratings collected for the
norming task (Appendix 5) demonstrate a degree of consistency in the socio-
economic associations which subjects derived from different brand logos.
Equipment
138

7.2. METHOD
Table 7.6: Participant ‘poshness’ ratings of brands used in visual stimuli(Experiment 3)‘Working-class’ brands are in red/pink, ‘middle-class’ brands are in blue
139

7.2. METHOD
Table 7.7: Image set/auditory target stimuli pairings (Experiment 3)‘Working-class’ brands are in red/pink, ‘middle-class’ brands are in blue
140

7.2. METHOD
Stimuli speakers were recorded in a soundproofed recording booth using a
Sennheiser MKH40-P48 pressure gradient condenser microphone connected
to a desktop PC running Audacity. All auditory stimuli were recorded in
mono at a sample rate of 44,100Hz, and normalized to +10dB. Eye tracking
was conducted using an SR Research Eyelink II headset connected to two
desktop computers one running SR Research’s Eyelink software, which the
experimenter used as a control console to calibrate and monitor the eye track-
ing equipment, and the other used to run SR Research’s Experiment Builder
software, which cued and displayed stimuli to participants and recorded fix-
ation data. Visual stimuli were presented via a 21” Dell CRT display screen
with attached sensors to detect participant head movement, while auditory
stimuli were relayed via a Dell 5650 5.1 surround sound system. Only two
(left and right) speakers were utilized during the experiment, placed either
side of the display screen (at a fixed distance from the chair where partici-
pants were sat during the experiment), with volume kept at a constant 25%
of the maximum system volume in order to ensure that each participant was
subjected to comparable volume levels throughout testing.
7.2.3 Procedure
For the Visual World experiment, participants were first told that the
purpose of the experiment was to investigate the associations that people
make between spoken words and images. Participants were then tested for
eye dominance using a variant of the Miles test (outlined on p.112) and
asked to sit in front of the computer monitor with speakers positioned at
either side. Following this, participants were fitted with an Eyelink II eye
tracking headset, with an eye tracking camera positioned under each partic-
ipant’s dominant eye. The camera was then focussed, and an eye tracking
calibration process carried out using SR Research’s Eyelink software. After
the calibration process was successfully completed, participants were tasked
with fixating upon a dot which appeared in the middle of the display mon-
itor to begin the experiment. Participants were also instructed that they
should select (with a mouse) the image in each set which they most strongly
141

7.2. METHOD
Figure 7.3: Image set paired with target word beer in the drink category(Experiment 3)
associated with the target word heard in the corresponding auditory stimuli,
and that this should be done as quickly as possible. Each image set was
displayed for 1,000ms before category-relevant auditory tokens were played.
Participants were given a total of 7,000ms to manually select a brand logo in
each set, with image sets advancing after the 7 seconds had elapsed or when
a mouse click was made (whichever came first). Mouse clicks were disabled
until 3,000ms had elapsed, in order to prevent participants from advancing
image sets before auditory tokens were heard and fixation behaviour towards
them could be recorded. Stimuli tokens were manually paired with specific
image sets, in order to ensure that equivalent semantic relationships were
maintained — care was taken, for example, to pair the target word beer with
an image set containing two brands of beer (figure 7.3) rather than a set
containing a brand of beer and a brand of wine, or one containing a brand of
vodka and a brand of cider (cider bearing more semantic similarity to beer
than to vodka).
Nine different playlists containing the same image set/target word pair-
ings were compiled, with target words uttered by different speakers in each
playlist. Consecutive participants were presented with different playlists in
142

7.2. METHOD
a repeating pattern (e.g. the first participant was shown playlist one, the
second shown playlist two, the ninth shown playlist nine, with the pattern
repeating on the tenth participant until all 54 participants were tested). The
order of image sets displayed was completely randomised for each participant,
using Experiment Builder ’s randomise function, in order to control for fatigue
effects. Listener fixations were recorded via the Eyelink software. Following
the experiment, participants were given a Subjective Reaction Test (Ch.8)
before being briefed and payed a £6 participation fee.
Data Interpretation
As with the previous Visual World experiment, it was decided to aggregate
participant fixation data into 100ms time bins across trials, whereupon the
images primarily fixated upon by listeners during each timeslot could be
determined.
The eye tracking output files were put through a filter program where fix-
ation coordinates and trial information were extracted, saccades and fixations
shorter than 80ms were excluded, blinks were added to previously occuring
fixations, and the fixation data were paired with colour-coded image tem-
plates to encode the positions of the visual stimuli items in the dataset. The
subsequent filtered files were then collated into a single dataset, before trial-
specific information (speaker information, variants produced in each trial)
was added for analysis.
Statistical analysis was conducted for fixations towards each image upon
hearing each realisation of each variable, bootstrapping the data with 10,000
random resamples in each case. This allowed for the calculation of robust
95% confidence intervals, providing a visual measure of statistical significance
corresponding to a p-value of .05.
143

7.3. RESULTS
7.3 Results
7.3.1 CAT Vowel Realisations
Examining responses to realisations of phonetic variables required a dif-
ferent approach from that used in the previous experiment — basing ob-
servations on time points corresponding to word onset, variable onset, and
word end (marking the point where semantic information could definitely be
processed), while also factoring in the time needed for fixations to have taken
place (200ms for saccadic eye movement). This was adapted from a method
utilised by Reinisch et al (2010), examining differences in fixation behaviour
in order to determine the time-points in spoken words where stress (but not
segmental information) could lead listeners to visually prefer semantically
related on-screen words over semantically unrelated on-screen words. As
the current experiment utilised two images — one target (class-congruent)
brand logo and one competitor (class-incongruent) brand logo — which bore
semantic relationships to a target word heard during each trial, as well as
two semantically-unrelated distractor images, a level of adaptation was re-
quired. Here, fixations towards both working and middle-class target brands
and distractor images were examined from the onset of auditory stimuli, with
time points marked for the onset of the phonetic variables under examina-
tion and the mean duration of the target words containing those variables.
This allowed for the examination of fixations immediately following different
socially-marked realisations of the variables, as well fixations triggered by se-
mantic information upon hearing target words. For example, the mean onset
for stressed /a/ realisations was 195ms after the onset of target words, with
a mean duration of tokens containing the CAT vowel of 532ms. Taking CAT
onsets and word durations into account, critical time windows were calcu-
lated from 400ms to 700ms after the target word onset (the mean vowel onset
plus 200ms saccade time through to the end of the average word duration
plus saccade time) and from 700ms onwards (the mean duration of target
words plus a 200ms saccade, where listeners should have visually preferred a
brand logo semantically related to the target word).
144

7.3. RESULTS
Figure 7.4: Fixations made towards target images while hearing retractedCAT vowel tokens (Experiment 3). Fixations towards working-class targetbrands shown in red, middle-class target brands shown in blue, distractorbrands shown in green.
Figure 7.4 shows participant fixations towards both working and middle-
class brand logos and distractor logos while hearing ‘retracted’ CAT vowel
tokens — that is, tokens with a measured F2 of between 1,300Hz and 1,400Hz.
On the x-axis, PHON marks the onset of stressed /a/ plus 200ms for a saccade
to take place (the first point where an effect of /a/ realisation could appear in
the fixation data), and WORD marks the average word duration plus 200ms
for a saccade to take place (where we can reasonably expect to see semantic
information affect listener fixations). 95% confidence intervals are centered
around fixations towards working-class and middle-class brands. Retracted
CAT realisations were produced 10 times by middle-class speakers and 20
times by working-class speakers in the auditory stimuli.
The graph shows no significant differences in looks towards working-class
brands versus middle-class brands. Listeners can be seen to react to the
semantic information in the target words from around 1,000ms after the onset
of auditory stimuli onwards, visually preferring both working and middle-
class target brands over semantically unrelated distractor images (shown in
green). From this, we can surmise that retracted CAT vowel realisations had
145
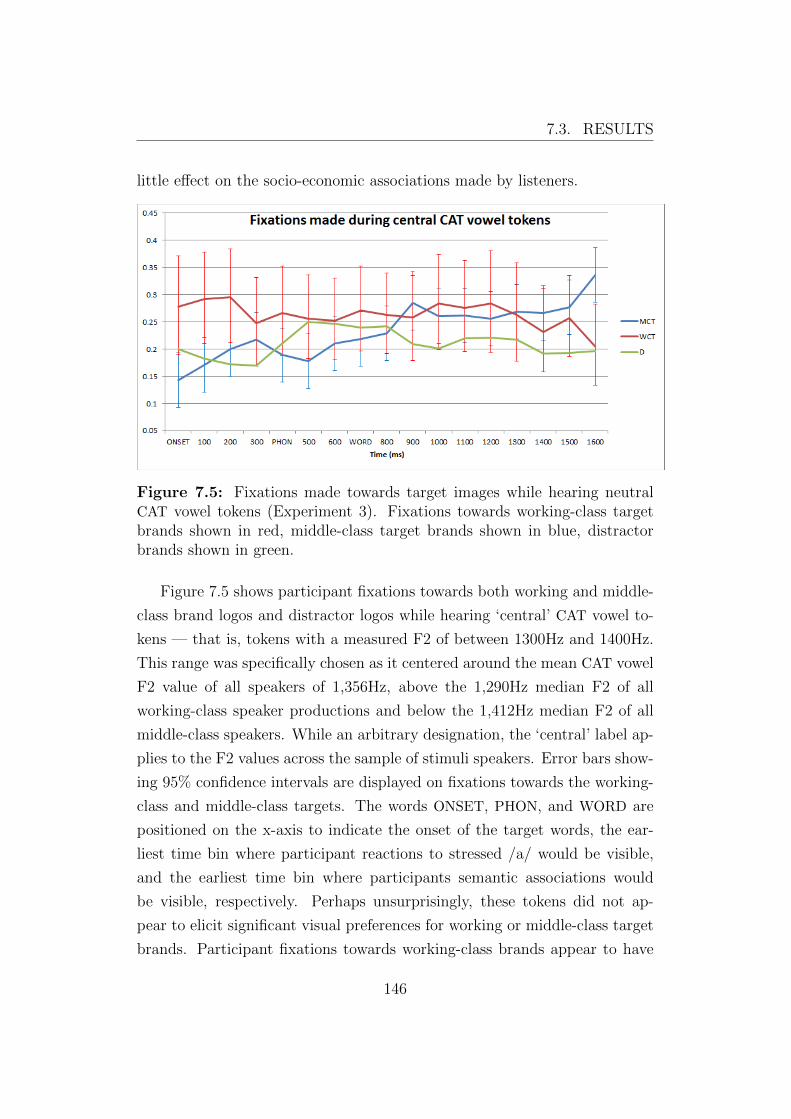
7.3. RESULTS
little effect on the socio-economic associations made by listeners.
Figure 7.5: Fixations made towards target images while hearing neutralCAT vowel tokens (Experiment 3). Fixations towards working-class targetbrands shown in red, middle-class target brands shown in blue, distractorbrands shown in green.
Figure 7.5 shows participant fixations towards both working and middle-
class brand logos and distractor logos while hearing ‘central’ CAT vowel to-
kens — that is, tokens with a measured F2 of between 1300Hz and 1400Hz.
This range was specifically chosen as it centered around the mean CAT vowel
F2 value of all speakers of 1,356Hz, above the 1,290Hz median F2 of all
working-class speaker productions and below the 1,412Hz median F2 of all
middle-class speakers. While an arbitrary designation, the ‘central’ label ap-
plies to the F2 values across the sample of stimuli speakers. Error bars show-
ing 95% confidence intervals are displayed on fixations towards the working-
class and middle-class targets. The words ONSET, PHON, and WORD are
positioned on the x-axis to indicate the onset of the target words, the ear-
liest time bin where participant reactions to stressed /a/ would be visible,
and the earliest time bin where participants semantic associations would
be visible, respectively. Perhaps unsurprisingly, these tokens did not ap-
pear to elicit significant visual preferences for working or middle-class target
brands. Participant fixations towards working-class brands appear to have
146

7.3. RESULTS
remained relatively stable throughout these tokens, while fixations towards
middle-class brands steadily increased until becoming significantly (p<.05)
more likely than fixations towards working-class brands at 1,600ms after the
target word onset, although this is a late effect.
Figure 7.6: Fixations made toward target images while hearing frontedCAT vowel tokens (Experiment 3). Fixations towards working-class targetbrands shown in red, middle-class target brands shown in blue, distractorbrands shown in green.
Figure 7.6 shows participant fixations made during fronted CAT tokens,
with error bars generated on 95% confidence intervals for the mean difference
around fixations towards middle-class brands (fronted realisations being more
commonplace among the middle-class speakers in the auditory stimuli). Here
we can see significant divergence (p<.05) between fixations towards working-
class brands and middle-class brands from the onset of auditory stimuli, con-
tinuing across the following 100ms time bin. This divergence then disappears
until the mean onset of CAT realisations, 400ms after the onset of auditory
stimuli. A significant divergence in listener fixation behaviour re-emerges at
300ms following mean onset of CAT realisations. Listeners were also found to
have fixated upon working-class brands in significantly (p<.05) greater pro-
portions at 1,600ms following the onset of auditory stimuli (1,200ms following
the mean onset of CAT), although this is a late effect.
147

7.3. RESULTS
7.3.2 Post-Vocalic/Post-Consonantal /l/ Realisations
Time (s)
0 0.46310
5000
Fre
qu
ency
(H
z)
0.137407116
TillMC2
Figure 7.7: Post-vocalic /l/ onset in till, speaker MC2 (Experiment 3)
The durations of words containing post-vocalic/post-consonantal /l/ re-
alisations and onset times of /l/ realisations were measured in Praat, using
F2 and F3 transitions as a visual guide to /l/ realisation onset (as in figure
7.7) and auditory analysis when no transitions were evident. For vocalised
/l/ tokens, /l/ realisation onset was measured at the beginning of the vowel.
This gave an average target word duration of 376ms, and an average /l/ re-
alisation onset time of 217ms, giving slightly different critical time periods
to examine than for CAT vowel realisations. Rounding up/down and adding
200ms for a saccade to take place in each instance, gives time bins of 400ms
onwards for an effect of /l/ realisations, and 600ms onwards for where we
can expect semantic information to show an effect on fixation behaviour.
Figure 7.8 shows listener fixations made while hearing tokens containing
strongly-vocalised /l/ realisations, a typically working-class Glaswegian di-
alect feature, with error bars based on 95% confidence intervals centered on
fixations towards working-class target brands. No significant (p>.05) differ-
ences emerged between fixations towards working-class brands and fixations
towards middle-class brands. Listeners were found to have visually preferred
148

7.3. RESULTS
Figure 7.8: Fixations made towards target images while hearing strongly-vocalised /l/ tokens (Experiment 3). Fixations towards working-class targetbrands shown in red, middle-class target brands shown in blue, distractorbrands shown in green.
Figure 7.9: Fixations made towards target images while hearing weakly-vocalised /l/ tokens (Experiment 3). Fixations towards working-class targetbrands shown in red, middle-class target brands shown in blue, distractorbrands shown in green.
149

7.3. RESULTS
both targets over the semantically-unrelated distractor images.
Figure 7.9 shows listener fixations made while hearing tokens contain-
ing weakly-vocalised /l/ realisations, a typically working-class Glaswegian
dialect feature, with error bars based on 95% confidence intervals centered
on fixations towards working and middle-class target brands. A significant
(p<.05) visual preference for working-class brands over middle-class brands
can be seen at 1,100ms following the target word onset (700ms following
the mean onset of /l/ realisaitons). While it is not known for certain why
weakly-vocalised /l/ realisations produced a marked effect whereas strongly-
vocalised /l/ realisations did not, the answer may lie in the social class of
the speakers which listeners heard producing the variants. Table 7.4 shows
strongly-vocalised /l/ to have been produced 4 times by self-reported middle-
class speakers, as opposed to 14 times by self-reported working-class speakers.
Conversely, weakly-vocalised /l/ was found to have been produced 12 times
by self-reported middle-class speakers, and only 7 times by working-class
speakers. The disparity in fixations made between the two variants may sug-
gest a greater effect of /l/ vocalisation when the realisation is produced by a
class-incongruent (middle-class) speaker than by a class-congruent (working-
class) speaker. Furthermore, the late effect seen in listener responses to
weakly-vocalised /l/ may be indicative of additional cognitive processing
in resolving class-incongruence between social information derived from the
speaker (bearing in mind that listeners heard each speaker multiple times
throughout the experiment) and from socially-marked phonetic variation.
Figure 7.10 shows listener fixations made while hearing tokens contain-
ing dark /l/ realisations, with error bars based on 95% confidence intervals
centered around fixations towards middle-class target brands. As the most
commonplace /l/ realisation in both working-class and middle-class Glaswe-
gian speech, it is perhaps unsurprising that little variation in listener fixa-
tions towards working-class brands and middle-class brands is evident. It was
noticed during the auditory coding of dark /l/ tokens, however, that such
realisations exist in a perceptually diverse range, making a case for further
sub-categorisation of this variable in future research.
Figure 7.11 shows listener fixations made while hearing tokens contain-
150

7.3. RESULTS
Figure 7.10: Fixations made towards target images while hearing dark /l/tokens (Experiment 3). Fixations towards distractor images shown in green.
Figure 7.11: Fixations made towards target images while hearing clear /l/tokens (Experiment 3). Fixations towards working-class target brands shownin red, middle-class target brands shown in blue, distractor brands shown ingreen.
151

7.3. RESULTS
ing clear /l/ realisations, a typical middle-class Glaswegian dialect feature,
with error bars based on 95% confidence intervals centered on fixations to-
wards middle-class target brands. While no significant divergence in listener
fixation behaviour was observed, listeners showed a marginally significant
preference for middle-class brands at 400ms following the mean onset of /l/
realisations, a class-congruent pattern for this variable.
7.3.3 Non-Prevocalic /r/ Realisations
Time (s)
0 0.60080
5000
Fre
qu
ency
(H
z)
0.240961799
ForkWC4
Figure 7.12: Non-prevocalic /r/ onset in fork, speaker WC4 (Experiment3)
Measurement of the durations of target words containing non-prevocalic
/r/ realisations and the onset times of /r/ realisations were recorded for
each stimuli token in Praat, using F2 and F3 formant transitions as a visual
guide to /r/ onset (as in figure 7.12) and auditory analysis where no formant
transitions were evident. For completely derhotic tokens, /r/ onset was either
recorded as occurring upon an audible change in vowel quality, or as the start
point of the vowel in cases where no change in vowel quality was audible.
From this, the mean target word duration of 417ms and mean /r/ realisation
onset of 226ms were calculated, giving critical time periods of 400ms onwards
for an effect of non-prevocalic /r/ realisation to become visible and 600ms
152

7.3. RESULTS
onwards for a visible effect of semantic information from the target words
heard.
Figure 7.13: Fixations made while hearing derhoticised /r/ tokens (Ex-periment 3). Fixations towards working-class target brands shown in red,middle-class target brands shown in blue, distractor brands shown in green.
Figure 7.13 shows listener fixations during derhoticised /r/ tokens (com-
plete derhoticity), a typically working-class Glaswegian feature, with error
bars based on 95% confidence intervals centered on fixations towards working
and middle-class target brands. Listeners were found to have visually pre-
ferred middle-class brands over working-class and distractor brands from the
onset of auditory stimuli until the mean onset of /r/ realisations. Following
the mean /r/ onset, the proportion of fixations towards middle-class brands
is shown to visibly decrease until a listener preference towards working-class
and distractor brands over middle-class brands emerges at 200ms following
the mean /r/ onset. This effect is particularly pronounced at 400ms follow-
ing the mean onset of /r/ realisations, but differences in fixations towards
middle-class versus working-class brands do not exceed marginal significance.
Figure 7.14 (p.154) shows listener fixation behaviour while hearing to-
kens containing weak rhoticity (realisations such as pharyngealised /r/ and
rhoticised vowels), a typically working-class Glaswegian dialect feature, with
error bars based on 95% confidence intervals centered around fixations to-
153

7.3. RESULTS
Figure 7.14: Fixations made while hearing weak /r/ tokens (Experiment3). Fixations towards working-class target brands shown in red, middle-classtarget brands shown in blue, distractor brands shown in green.
Figure 7.15: Fixations made while hearing tap/approximant /r/ tokens(Experiment 3). Fixations towards working-class target brands shown inred, middle-class target brands shown in blue, distractor brands shown ingreen.
154

7.3. RESULTS
wards working and middle-class target brands. Weakly rhotic tokens were
heard to have been produced 11 times by middle-class speakers and 15 times
by working-class speakers. Listeners were significantly (p<.05) more likely
to fixate upon middle-class target brands than any other images from the
mean onset of /r/ realisations and for 100ms following, although this trend
was observed as beginning shortly after the onset of auditory stimuli, reach-
ing marginal significance 100ms before the mean /r/ onset, suggesting that
this effect was unlikely to have been triggered by the variant. Listeners can
then be seen producing proportionately more fixations towards working-class
brands, with listeners significantly more likely to fixate upon working-class
brands than middle-class brands from 500-600ms following the mean onset
of /r/ realisations.
Figure 7.15 (overleaf) shows listener fixations during tokens containing
approximant and tap /r/ realisations, with error bars based on 95% con-
fidence intervals centered on fixations towards middle-class target brands.
These realisations were found to have been produced 14 times by the middle-
class speakers in the auditory stimuli and 17 times by the working-class
speakers, demonstrating that these realisations are fairly common among in
both varieties of Glaswegian. These tokens appear to have elicited a visi-
ble trend of fixations towards working-class brands over middle-class brands
from 200-400ms following the mean /r/ onset, with the effect particularly
pronounced at the 400ms mark. This effects, however, was not statistically
significant.
Figure 7.16 (above) shows listener fixations during tokens containing
bunched /r/, a typically middle-class Glaswegian dialect feature, with er-
ror bars based on 95% confidence intervals centered on fixations towards
working and middle-class target brands. Bunched /r/ realisations were pro-
duced 10 times by middle-class speakers and once by the synthetic voice. No
working-class speakers produced bunched /r/ realisations. It is perhaps sur-
prising, then, to see listeners significantly (p<.05) more likely to fixate upon
working-class target brands than middle-class target brands across four con-
secutive time bins — from 300-600ms following the mean /r/ onset. Listeners
can then be seen to have shifted their visual preference of brands towards
155

7.4. DISCUSSION
Figure 7.16: Fixations made while hearing bunched /r/ tokens (Experiment3). Fixations towards working-class target brands shown in red, middle-classtarget brands shown in blue, distractor brands shown in green.
middle-class targets, with a marginally significant preference of middle-class
brands over working-class brands visible at 900ms following the mean onset
of /r/ realisations.
7.4 Discussion
Effects of socially-marked phonetic variation appear to be evident in lis-
tener fixation behaviour during certain realisations of all three variables un-
der examination. Significant (p<.05) differences in listener fixations towards
target brands were observed as having occurred during fronted CAT vowel
realisations (300ms following mean /a/ onset), weakly vocalised /l/ (700ms
following mean /l/ onset), weakly rhotic /r/ (500ms following mean /r/ on-
set), and bunched /r/ (300ms following mean /r/ onset), with differences
in listener fixation behaviour towards target brands approaching significance
elsewhere.
Listeners were found to have made proportionately more fixations to-
wards working-class brands than middle-class brands following the more-
156

7.4. DISCUSSION
fronted CAT vowel realisations, despite the majority of these variants having
been produced by self-reported middle-class speakers (29 fronted realisations,
versus 12 produced by self-reported working-class speakers). Fronted CAT
realisations, however, are commonly said to be a feature of working-class
Glaswegian speech, with Lawson (2011: 244), for example, finding high school
children belonging to the socially-stigmatised and typically underclass ‘Ned’
social group to have produced more fronted and lowered CAT realisations
than children belonging to other social groups. This appears to indicate that
it was the realisation of CAT, rather than socially-encoded suprasegmental
information, which drove listener fixations towards working-class brands in
this instance.
Where significant (p<.05) differences in listener fixation behaviour emerged
elsewhere, these also patterned in class-congruent directions, with weakly-
vocalised /l/ and weakly-rhotic /r/ realisations (primarily found in working-
class speech) eliciting significantly higher proportions of fixations towards
working-class target brands. It is not immediately obvious, however, why lis-
tener fixations towards target brands showed a diverging effect during these
variants and not during tokens containing complete derhoticity or perceptu-
ally stronger /l/ vocalisation. One possible explanation is that this resulted
from listener hypercorrection, as is thought to have been the case with the
explicit choices of objects which listeners reported in Experiment 2 (p.117),
with listeners reluctant to associate brands carrying connotations of lower
socio-economic status with more stigmatized phonetic realisations. Given
the short time window for listener responses, however, this would seem im-
probable here. While no appreciable differences in listener fixation behaviour
were evident upon hearing the more strongly vocalised /l/ variant, this may
reflect the manner in which these tokens were perceptually coded, and future
acoustic analysis is planned to investigate this. The lack of significant differ-
ences in listener fixations towards target brands during derhotic /r/ tokens
may also be explained by the small number of derhotic /r/ productions heard
during the experiment, with completely derhotic /r/ accounting for only 5
of the 81 /r/ realisations heard throughout the experiment. Despite the low
number of realisations, the time-course of listener fixations towards middle-
157

7.4. DISCUSSION
class brands upon hearing this variant suggests that this variant elicited an
effect, albeit a non-significant one.
Bunched /r/ realisations, a stereotypically middle-class feature (MacFar-
lane & Stuart-Smith 2012), appear to have produced a class-incongruent
effect — with listeners fixating upon working-class brands in significantly
(p<.05) greater proportions from 300-600ms following the mean /r/ onset.
The subsequent trends in fixation behaviour following these tokens, however,
with fixations towards working-class brands decreasing and fixations towards
middle-class brands increasing, suggests that listeners took longer to derive
class-congruent social information for this variant.
While the earliest significant divergences in listener fixation behaviour
appear to have occurred some 300ms following the onset of two separate
variables (fronted CAT and bunched /r/), on the cusp of previously estab-
lished thresholds of implicit cognition in social psychology (cf. Greenwald et
al 1998), this is somewhat misleading due to the formatting of the fixation
data, with time bins representing averaged fixations for the previous 100ms.
It seems likely, then, that notable divergences in fixations towards targets
would have occurred at some point in the 200-300ms following the onset
of the phonetic realisations in question, and a more fine-grained analysis is
planned to investigate this.
Despite this, the differences in listener response times upon hearing dif-
ferent socially-marked phonetic realisations suggests that the associations
triggered by some variants are less conscious than the associations triggered
by others — indicating that some socially-marked phonetic variants carry a
greater cognitive processing cost than others.
158
Chapter 8
Experiment 4 - Subjective
Reaction Test
8.1 Introduction
In order to examine the participants’ explicit attitudes, enabling compar-
isons with the implicit associations indicated in the eye tracking data, a sub-
jective reaction test (N=60) was administered immediately following the eye
tracking experiment, collecting explicit attitudinal responses towards each
speaker heard in the Visual World task. Here, it was hypothesized that the
explicit attitudes recorded from participants would diverge from the implicit
associations indicated by their fixations during the eye tracking task – as
is generally found in social psychology experiments which have utilised only
visual stimuli (cf. Greenwald et al 1998; Karpinski & Hilton 2001). A result
in line with this hypothesis would be in keeping with the findings of previous
social psychology experiments that used only visual stimuli, indicating that
people undergo similar conscious and unconscious processes when deriving
social information from speech as when visually-deriving social information.
It was decided to give participants the subjective reaction test immedi-
ately following the eye tracking task in Experiment 3 (in order to better hide
the purpose of the eye tracking task), as the test included a form which con-
tained sections for participants to indicate their social class, and it was felt
159

8.1. INTRODUCTION
that the purpose of the experiment (explicitly rating different speaker per-
sonality traits) was more obvious than that of the eye tracking task. Testing
participants in the same day was also convenient from a practicality stand-
point — as having to call participants back for further tests at a later date
would have made attaining a sufficient number of participants considerably
more difficult.
Taking Kristiansen (2009) into account, who found that Danish speakers
from Copenhagen thought to have more ‘conservative’ accents were rated
highest by listeners in terms of superiority values, whereas those with more
‘modern’ Copenhagen accents were rated highest by listeners in terms of
dynamism values, it was hypothesized that a similar distinction would be
found in listener ratings of working-class and middle-class Glaswegian speak-
ers. While the linguistic context in Copenhagen differs from that in Glasgow
in many respects, with the former largely divided between ‘conservative’ and
‘modern’ socially accented speakers and the latter primarily divided between
working-class and middle-class speakers, it is thought that there may be par-
allels to be found between them – with Danish listener evaluations of ‘con-
servative’ Copenhagen accents likely to correlate with Glaswegian listener
ratings of middle-class Glaswegian speakers. Similarly, given the negative
evaluations repeatedly found of working-class Glaswegian speech (Macauley
1977; Menzies 1991; Macafee 1994; Torrance 2003), it might be expected that
Glaswegian listener ratings of Glaswegian speech would resemble the negative
evaluations made by listeners from Copenhagen towards non-Copenhagen re-
gional Danish accents (termed ‘local’ accents by Kristiansen 2009: 187). Pre-
vious studies, however, have found working-class Glaswegian speech to have
been positively evaluated in terms of ‘solidarity’ values (Macafee 1983) and
‘social attractiveness traits’ (Torrance 2003: 43), suggesting that Glaswegian
listener evaluations of working-class Glaswegian speakers may be more in
line with Copenhagen listener evaluations of ‘modern’ Copenhagen accents,
which were rated highest in terms of Kristiansen’s (2001) dynamism values.
160

8.2. METHOD
8.2 Method
8.2.1 Participants
60 native Glaswegian participants were recruited via the University of
Glasgow Psychology Department’s subject pool, as well as through emails
circulated by departmental secretaries and posters placed in and around cam-
pus. These included the 54 participants who took part in the eye tracking
experiment, as well as 6 others who took part in the eye tracking task but
whose fixation data were excluded from analysis in order to balance the de-
sign of that experiment (p.127). Of the 60 participants, 33 (55%) were female,
28 (46.7%) self-identified as either working-class or upper working-class, and
32 (53.3%) self-identified as either lower middle-class or middle-class. Par-
ticipant ages ranged from 18 to 61 years old (M=25.5, SD=9.6).
In addition to their age and self-reported social class, participants were
also asked for their region of residence, region of birth, high school attended,
parents’ regions of birth, and parents’ occupations. It was intended that this
information would allow for a more objective measure of each participant’s
social class to be calculated. This, however, proved not to be possible, as
the variety of home regions, high schools, and parents’ birthplaces and oc-
cupations were too wide to allow meaningful comparisions to be made. 45
different high schools were reported, for example, with no more than 3 par-
ticipants having attended any one school. With similar frequencies found in
the other class-related fields, this method was abandoned in favour of using
participants’ self-reported social class.
8.2.2 Materials
The test comprised separate audio recordings of each speaker heard during
the eye tracking experiment, with subjects tasked with rating each speaker
in terms of different social attractiveness values presented in an accompany-
ing questionnaire. The values chosen to be assessed were chosen from the
status and attractiveness values outlined by Zahn & Hopper (1985), and cat-
161

8.2. METHOD
egorized under the superiority and dynamism schema utilized by Kristiansen
(2001). For example, the values ‘intelligent’ and ‘ambitious’ fall under Zahn
& Hopper’s (1985) status dimension, while the values ‘pleasant’ and ‘trust-
worthy’ were categorized under their attractiveness dimension, with all four
being labeled as superiority values by Kristiansen (2001). Likewise, the val-
ues ‘efficient’ and ‘independent’ fall under Zahn & Hopper’s (1985) status
dimension, and the values ‘interesting’ and ‘straightforward’ fall under their
attractiveness dimension, with all four being labeled as dynamism values by
Kristiansen (2001). Figure 8.1 shows the semantic differential scales used in
the experiment, with 7-point scales being chosen to provide listeners with
a neutral option for each value, and also to enable easier comparisons with
Kristiansen (2001: 15), who also utilized 7-point scales.
Auditory Stimuli
Auditory stimuli were drawn from the same eight Glaswegian speakers and
one synthetic voice heard in the Visual World experiment, with the table
reproduced here (table 8.1) for ease of reference. For each speaker, the words
can, mile, drinker, steer, tags, and double were concatenated in Audacity and
normalized to +10dB to ensure that amplitudes remained consistent across
tokens and voices. These specific tokens were selected to give two instances
where socially marked variation could occur in each variable under exami-
nation (the CAT vowel in can and tags, non-prevocalic /r/ in drinker and
steer, and post-vocalic/post-consonantal /l/ realisations in mile and dou-
ble). Furthermore, these tokens were not included in the eye tracking ex-
periment, so participants had not encountered them prior to the subjective
reaction test. In order to prepare the stimuli for analysis, instances of post-
vocalic/post-consonantal /l/ and /r/ were coded auditorily according to 4
point scales. This entailed categorising post-vocalic/post-consonantal /l/
realisations as either clear /l/, dark /l/, weakly-vocalised /l/, or strongly-
vocalised /l/. Similarly, post-vocalic /r/ productions were categorised as
either bunched /r/, tap or approximant /r/, weakly rhotic (such as pharyn-
gealised /r/ realisations), or completely derhotic, as in the accompanying
eye tracking study. The most prominent voice qualities were also audito-
162

8.2. METHOD
Table 8.1: Speakers heard in auditory stimuli during Subjective ReactionTest (Experiment 4)
rily coded for each speaker, by perceptual analysis. Speaker voice qualities
were auditorily analysed by an additional two trained phoneticians (Jane
Stuart-Smith and Robert Lennon, of the Glasgow University Laboratory of
Phonetics) in order to determine the most prominent voice qualities for each
speaker. Other speaker qualities were determined via acoustic analyses in
Praat] — namely, the fundamental frequency (F0) of each speaker’s voice
(calculated by dividing a period in the mid-point of their productions of pack
by 1 second) and the F1 and F2 values of /a/ in can. Formant values were
determined using Praat’s ‘track formants’ function, taking readings from the
temporal mid-point of the vowel after visually checking the formant track
against the formant patterns in the spectrogram. From this, the total num-
ber of instances of ‘working-class’ prototypical productions of /l/, /r/, and
/a/ were tallied for each speaker across the combined six-word utterances
heard by participants during the subjective reaction test.
Equipment
Participants were sat in front of a desktop PC running Goldwave. Audio was
relayed via a Dell 5650 5.1 surround sound system. Only two (left and right)
speakers were utilized during the experiment, placed either side of the display
screen, with volume kept at a constant 25% of the maximum system volume
in order to ensure that participants were subjected to consistent amplitudes
163

8.2. METHOD
throughout. Responses were collected via pen-and-paper questionnaires con-
taining semantic differential scales (Figure 8.1).
Analysis
A principle component analysis was conducted on participant ratings of
speaker personality traits in SPSS using the Anderson-Rubin (1958) method.
The analysis revealed participant ratings to be reductible to three factors
which accounted for most (62.3%) of the variance in the observed variables.
Considering a factor loading of >.6 to be strong, table 8.2 (p.165) shows par-
ticipants to have given the ‘ambitious’, ‘efficient’, and ‘interesting’ personal-
ity traits similar ratings (Component 1), the ‘intelligent’, ‘independent’, and
‘poshness’ traits similar ratings (Component 2), and the ‘pleasant’, ‘trustwor-
thy’, and ‘straightforward’ traits similar ratings (Component 3), accounting
for all nine variables in the subjective reaction test. Taking Zahn & Hop-
per’s (1985) status and attractiveness dimensions into account, it might be
expected that participants would give working-class speakers higher Com-
ponent 3 ratings (as the factor consists entirely of attractiveness traits) and
middle-class speakers higher Component 2 ratings (as the factor consists en-
tirely of status traits with the addition of ‘poshness’ — a trait overtly related
to status). Under these dimensions, participants might also be expected to
have given higher Component 1 ratings to middle-class speakers, as the factor
consists of two status traits (‘ambitious’ and ‘efficient’) and one attractiveness
trait (‘interesting’). Under Kristiansen’s (2001) superiority and dynamism
dimensions, however, participants might be expected to have given higher
Component 1 ratings to working-class speakers, as the factor contains two
dynamism traits (‘efficient’ and ‘interesting’) and one superiority trait (‘ambi-
tious’). Similarly, Kristiansen’s (2001) dimensions suggest that participants
might have rated Component 2 traits higher for middle-class speakers (two
superiority traits and one dynamism trait, with ‘poshness’ assumed to be a
superiority trait), and also given higher Component 3 ratings to middle-class
speakers (two superiority traits and one dynamism traits).
In order to control for any possible tendencies of listeners for rating speak-
ers towards a specific end of the scale throughout the experiment, the position
164

8.2. METHOD
Table 8.2: Rotated component matrix identifying principal components ofspeaker personality trait ratings (Experiment 4)
Figure 8.1: Semantic differentials for perceived speaker personality traitsin Subjective Reaction Test (Experiment 4)
165

8.2. METHOD
Figure 8.2: Social attractiveness traits in Zahn & Hopper (1985) and Kris-tiansen (2001)
of the positive and negative values on each scale were switched on alternating
traits. In addition, antonyms were placed at opposing ends of each semantic
differential scale for the values used by Zahn & Hopper (1985) and Kris-
tiansen (2001), and participants were also asked to indicate ‘how posh’ they
felt each participant was on a scale of one to six. This was carried out in order
to draw a direct comparison with the ‘poshness’ ratings in the brand norming
task but, in hindsight, may have been better implemented as a seven-point
semantic differential appearing alongside the other personality traits.
8.2.3 Procedure
Participants were sat in front of a pair of speakers (the front speakers of a
Dolby 5650 surround sound system), a computer keyboard, and a question-
naire containing semantic differential scales representing different personality
traits (Appendix 7, p.262). Subjects were then instructed to indicate their
initial impression of each speaker’s personality traits and how ‘posh’ they felt
each speaker was on the scales (using a pen), and advised that they could
offer additional comments for each speaker.
The experimenter cued sound files for each stimuli speaker in Goldwave,
with participants informed that they could listen to each speaker as many
times as they wanted by pressing the space bar on the keyboard positioned
in front of them. When participants had finished rating a speaker, the ex-
166

8.3. RESULTS
Figure 8.3: Mean participant ratings of speaker personality trait compo-nents, by social class (95% C.I.) (Experiment 4)
perimenter cued the next stimuli speaker. Stimuli were presented to each
participant in one of three randomised orders in order to control for fatigue
effects. No time limit was set for the experiment. After the task, subjects
were de-briefed and payed £6 for their participation in this and the previous
(Experiment 3) eye tracking task. The subjective reaction test was carried
out immediately following Experiment 3 in order to better hide the purpose
of the eye tracking task.
8.3 Results
8.3.1 Principal Component Analysis
Figure 8.3 shows averaged listener ratings of speakers across the three
principal components by self-reported speaker class, with error bars gener-
ated from 95% confidence intervals. Here, participants were not found to have
rated working-class speakers significantly (p>.05) differently from middle-
class speakers or the synthetic speaker on Component 1 traits (ambitious,
interesting, and efficient). Participants, however, rated middle-class speak-
ers significantly (p<.05) more favourably in terms of Component 2 traits
167

8.3. RESULTS
Figure 8.4: Mean participant ratings of speaker personality trait compo-nents, by speaker (95% C.I.) (Experiment 4)
(intelligent, independent, and ‘more posh’) than working-class speakers. Fi-
nally, participants were found to have rated both working and middle-class
speakers significantly (p<.05) higher in terms of Component 3 traits (pleas-
ant, trustworthy, and straightforward) than the synthetic speaker. This is
despite the comparatively large confidence intervals generated for the syn-
thetic speaker, due to there being only one synthetic speaker as opposed to
four working-class and four middle-class speakers.
Figure 8.4 shows mean participant ratings of individual speakers, broken
down by principal components and with 95% confidence intervals giving a
visual indication of statistical signifance. Here we can see that the self-
reported social class given by speakers is not a particularly reliable measure
of listener perceptions.
168

8.3. RESULTS
Table 8.3: Class-typical realisations produced by each speaker in SubjectiveReaction Test stimuli (Experiment 4)
8.3.2 Phonetic Variables
Tables 8.3 and 8.4 (p.169-170) show the number of typically working-class
and typically middle-class socially-marked phonetic realisations produced by
each speaker, using the same classification criteria as was used for the eye
tracking analysis. Here, ‘working-class’ realisations consist of retracted CAT
realisations (with F2 values of less than 1,300Hz), derhotic and weakly rhotic
non-prevocalic /r/ realisations, and vocalised (whether weakly or strongly)
post-consonantal/post-vocalic /l/ realisations. Conversely, ‘middle-class’ re-
alisations consist of fronted CAT vowel tokens (with F2 values of greater
than 1,400Hz), tap, approximant, or bunched non-prevocalic /r/ realisations,
and clear post-vocalic/post-consonantal /l/ realisations. ‘Central’ CAT vowel
productions (with F2 values between 1,300Hz and 1,400Hz) and dark /l/ re-
alisations were excluded from analysis, as these are frequent in both speech
varieties.
Notable comparisons can be made between figure 8.4 (p.168) and table
8.4 (p.170), with the former showing the speaker (MC2) that produced most
typically middle-class realisations to have been rated signifcantly (p<.05)
higher in terms of both Component 1 traits (corresponding primarily to
status/dynamism values) and Component 2 traits (corresponding to sta-
tus/superiority values) than any other speaker. Likewise, the speaker with
169

8.3. RESULTS
Table 8.4: Aggregated class-typical realisations produced by each speakerin Subjective Reaction Test stimuli (Experiment 4)
the greatest frequency of ‘working-class’ realisations (WC2) is shown to have
been rated significantly (<.05) higher in terms of Component 3 traits (cor-
responding to Zahn & Hopper’s attractiveness dimension) than every other
speaker with the exception of speaker MC3. It is also notable that speaker
MC3, the second most highly rated speaker in terms of Component 3 traits,
self-reported as middle-class but was found to have produced two vocalised
/l/ tokens and two derhotic/weakly rhotic /r/ tokens in the auditory stim-
uli. This suggests that self-reports of speaker class are not a reliable met-
ric for sociolinguistic analyses. It also indicates, however, that listeners as-
sociated working-class typical phonetic realisations with Component 3 ‘at-
tractiveness’ traits, and middle-class typical realisations with Component 2
‘status/superiority’ traits. Also of note are listener principal component rat-
ings towards speaker WC4, who participants rated significantly (p<.05) less
favourably than any other speaker in terms of Component 2 (status/superiority)
traits, and less than any other speaker (with the exception of the synthetic
voice) in terms of Component 1 and Component 3 traits. Along with speaker
MC3 and speaker WC2, speaker WC4 was found to have produced two typi-
cally working-class non-prevocalic /r/ realisations and two typically working-
class post-consonantal/post-vocalic /l/ realisations, suggesting that the pho-
netic realisations of these variables do not account for the differences in lis-
170

8.3. RESULTS
tener ratings of this speaker. Furthermore, speaker WC2 shares the voice
qualities of slight creak and laxness with speaker WC4 (table 8.5), suggesting
that some other factor caused listeners to rate WC4 less favourably than any
other speaker.
Table 8.5: Speaker voice qualities heard during Subjective Reaction Test(Experiment 4)
Table 8.5 shows speaker voice qualities and F0 frequencies, the latter of
which was measured from single periods at the stable mid-point of speaker
realisations of /a/ in can. While the table provides too few data points
for statistical analysis, little correlation with listener principal component
ratings is evident with regards to either voice qualities or the fundamental
frequencies of speakers’ voices. While there is no statistical analysis available,
the optional comments participants made regarding each speaker may go
some way to explaining their ratings here:
Speaker MC1 Comments:
Middle class, student-like, nervous and uptight.
Quite commanding voice.
Quickly spoken, makes him sounds very untrustworthy.
Prefer voice 1 (WC4) but this is v. Scottish too. Business like.
The way he says ‘drinker’ lessens how much it grates on me. Def-
initely not as much as voice 2 (MC2).
Clear speech and sounds confident.
171

8.3. RESULTS
Speaker MC2 Comments:
Very rich voice, sounds professional, voice suggests warm person-
ality.
Sounds well educated but still approachable.
Sounds quite posh, upper class, good articulation.
Tough voice to read.
Sets my teeth on edge. Gut instinct is I don’t like him, but he
could turn out to be decent.
Voice feels almost like some sarcasm in it, so pleasantness is down.
Sounds more intelligent (than WC4) due to clarity of speaking.
Speaker MC3 Comments:
Curious?
Student.
Fairly posh, slowness of voice suggests laid-back personality.
Dull.
Sounded odd.
Sounded similar to my father.
More soothing style of imparting information.
Pleasant but quite unintelligent.
Very simple, sounds very normal.
Gentle. Makes me smile but in a ’aw bless’ way. Pronunciation
of ‘drinker’ makes a huge impact.
Voice sounds demotivated, but a pleasant person.
Sounds a bit friendly but not that interested.
Speaker MC4 Comments:
Good diction, less approachable perhaps or just younger.
Neutral reaction, sounds slightly nasal or odd? Not necessarily
posh. Sounds SAD. If he spoke I would listen.
Person sounds not confident, not assertive.
Seems unsure.
172
8.3. RESULTS
Sounded electronically produced.
Sounds foreign.
Sounds halfway between extreme traits from working-class and
middle-class accents.
Sounds like a methodical person.
Sounds shy and scared.
Speaker WC1 Comments:
Apathetic.
Pronunciation of ‘drinker’ makes me smile. Could be friends with
this guy. Wouldn’t be as annoying as voice 2 (MC2).
Sounds bored but is clear in speech.
Sounds like a doctor in training, short, to the point, good enun-
ciation.
Sounds very normal.
Speaks slowly.
Younger speaker, good articulation.
Speaker WC2 Comments:
Best so far (previous voices were MC3, WC4, and MC4).
inflection on ’drinker’, otherwise non-commital.
Makes me smile. Definitely Scottish but softer. The way he says
’drinker’ makes me trust him.
More scottish (than WC4 and MC2).
Sounds a bit timid but speaks clearly and does not sound bored.
Sounds focussed.
Sounds middle-class and educated.
Sounds quite innocent.
Sounds straightforward and to-the-point but somebody not to be
messed with.
Sounds very straightforward and independent in speech.
Working class but not uneducated, upbeat and enthusiastic.
173

8.3. RESULTS
Speaker WC3 Comments:
Bland, boring voice.
For some reason I dislike this voice.
Middle class GU student.
Person sounds a bit dull.
Sounded altered.
Sounds bored and uninterested. Also sounds quite forced.
Sounds David Tennanty (Dr Who 10). Scottish but softer accent.
The association may have affected my impressions :)
Sounds older and educated.
Sounds quite interested.
Steady, monotone, almost little inflection at all, each word was
just a word with no real commitment/context.
Sure of himself.
Tired sounding.
Speaker WC4 Comments:
Boring.
Difficult to judge some of the variables, 8 (Straightforward) in
particular, from voice.
Dull.
Mechanic.
More neddy Glasgow accent (than WC3 and WC2).
Not the neddiest accent, sounds like Glasgow (home), makes me
smile.
Rough voice.
Sounds a bit rough.
Sounds assertive, strong willed.
Sounds like a ned/hooligan.
Sounds rather brash.
Sounds unenthusiastic.
174
8.3. RESULTS
Speaker S1 (Synthetic Voice) Comments:
Boring, monotonous.
Computer.
Computer generated.
Difficult to judge due to slight distortion.
Monotone, getting nothing.
Odd audio recording, not sure if it has been manipulated? More
difficult to gauge when selecting the areas/scales.
Quite hard to tell personality traits from this voice.
Seems to get clearer/more human towards the end. Hard to judge
from voice as it seems like it may not be their own.
Sounds like a computer animated voice clip!
Sounds like it’s being manipulated, almost robotic, therefore less
human and not empathetic.
Sounds very posh.
Speaks quickly.
Very clipped and abrupt way of speaking.
Very difficult to make out what was said, it was a mumbled and
not clear and confident.
Voice sounds computer generated.
Taking participant comments into account, then, it would seem that some
quality of speaker WC4’s voice was not taken into account which influenced
listener ratings in the Subjective Reaction Test. These appear to correspond
to the ‘ned’/‘neddy’ underclass stereotype (including two separate mentions
of sounding ‘rough’), and the sole mention among participants of a working-
class-associated blue-collar occupation (‘mechanic’). Clearly, there is some
tangible quality to the tokens produced by speaker WC4 which elicited such
responses from listeners, and a future acoustic analysis is planned to account
for this, and other, aspects of variation in the data.
175

8.4. DISCUSSION
8.4 Discussion
Preliminary analyses of the Subjective Reaction Test results (figure 8.3)
revealed listeners to have rated middle-class speakers significantly (p<.05)
higher than working-class speakers in terms of principal Component 2 traits
(intelligent, independent, and ‘more posh’), corresponding to Kristiansen’s
(2001) superiority dimension and Zahn & Hopper’s (1985) status dimen-
sion. In this respect, both models were good predictors of listener attitudes
towards middle-class speech in comparison to working-class speech. Other
components, however, did not vary significantly by social class, making other
aspects of each model untestable. Participant ratings of individual speakers
(figure 8.4), however, show that self-reported social class is not necessarily a
reliable predictor of participants’ explicit associations of speakers. Despite
this, the principal Component 2 ratings of the speaker who produced the
highest ratio of typically middle-class realisations (MC2) offer an indication
that greater concentrations of fronted CAT vowel, /bunched /r/, and clear /l/
elicit more favourable listener evaluations of personality traits correspond-
ing to Zahn & Hopper’s (1985) status dimension. Conversely, the principal
Component 3 ratings of the speaker who produced the highest ratio of typi-
cally working-class realisations (WC2) indicate that greater concentrations of
retracted CAT, weak/derhotic /r/, and vocalised /l/ elicit more favourable
evaluations of personality traits corresponding to Zahn & Hopper’s (1985)
attractiveness dimension. This is in line with previous attitudinal research
on working and middle-class Glaswegian speech varieties (Torrance 2003).
If it is, indeed, higher frequencies of working and middle-class typical real-
isations of socially-marked phonetic variants which trigger differing explicit
responses in listeners, then this would support Labov et al ’s (2011) theory
of the sociolinguistic monitor. The design of the subjective reaction test did
not allow for a sufficient number of differing phonetic realisations to allow for
any meaningful statistical analysis of this. The subjective reaction test did,
however, provided evidence for listener evaluations of individual speakers,
grouped together in terms of self-reported social class, and future by-speaker
and by-social class analyses of Experiment 3 are planned in order to deter-
176

8.4. DISCUSSION
mine how these compare with the more implicit associations indicated by
fixation behaviour.
177

Chapter 9
Discussion
This intent behind this research was to investigate the implicit social
evaluations which listeners make upon hearing speakers of two different social
accents in Glasgow. This was achieved via the use of a real-time eye tracking
research methodology, recording the fixations which listeners made towards
different sets of images (containing both working and middle-class associated
targets) while hearing speakers of different social accents and socially-marked
phonetic realisations. On the whole, the results show the different speech
varieties and phonetic realisations to have elicited differing conscious and
unconscious associations in listeners, as outlined below.
9.0.1 Summary of Main Findings
Pilot Experiment
Method:
The pilot study (N=40) was conducted off-line, recording participant re-
sponses via pencil and paper questionnaires. Participants rated the strength
of associations they felt between target words in the auditory stimuli and
images in the visual stimuli. Visual stimuli comprised image sets depicting
objects and image sets composed of brand logos. Stimuli were recorded from
one working-class and one middlle class Glaswegian male. Auditory stimuli
comprised recordings of target words semantically related to target images
in the visual stimuli. Target words were heard as the last word in a carrier
178

9. DISCUSSION
sentence (Please rate these images according to how strongly you associate
them with the word [...]). The semantic associations between the images in
the visual stimuli and target words were normed on community outsiders
(via a web-based Mechanical Turk task).
Results:
• No significant differences were found in listeners’ reported associations
depending on speaker heard
• No trends in listeners’ reported associations were evident
• Participant associations were assumed to have been explicit (no re-
sponse time measured)
Experiment 1
Method:
Experiment 1 (N=32) was conducted off-line, recording participant responses
via pencil and paper questionnaires. Participants made forced choices of the
images in the visual stimuli which they most strongly associated the target
words in the auditory stimuli. Visual stimuli comprised image sets depict-
ing objects and image sets composed of brand logos. Auditory stimuli was
recorded from one working-class and one middlle class Glaswegian male, and
two female distractor voices. Auditory stimuli comprised recordings of tar-
get words semantically related to target images in the visual stimuli. Target
words in the auditory stimuli were heard as the last word in a carrier sen-
tence (Please choose the picture you most strongly associate with the word
[...]), The social class associations of the images in the visual stimuli were
normed on community insiders, using locally relevant terminology (via pencil
and paper norming questionnaire, N=32).
Results:
• No significant differences were found in listeners’ reported associations
depending on speaker heard
179

9. DISCUSSION
• Separate trends were observed in participant responses to image sets
containing objects and those containing brand logos
• Participant associations were assumed to have been explicit (no re-
sponse time measured)
Experiment 2
Method:
The experiment (N=42) was conducted on-line, recording participant eye
movement in real-time. Participants made forced choices of the images in
the visual stimuli which they most strongly associated the target words in
the auditory stimuli (providing verbal reports of choices). Visual stimuli com-
prised image sets depicting objects and image sets composed of brand logos.
Auditory stimuli were recorded from one working-class and one middle-class
Glaswegian male, and two female distractor voices. Auditory stimuli com-
prised recordings of target words semantically related to target images in
the visual stimuli. Target words in the auditory stimuli were heard as the
last word in a carrier sentence (Please choose the picture you most strongly
associate with the word [...]), The social class associations of the images in
the visual stimuli were normed on community insiders, using locally relevant
terminology (via pencil and paper norming questionnaire, N=32).
Results:
• Significant (p<.05) effects of speaker voice on participants’ verbal choices
of objects were observed, with listeners significantly more likely to ver-
bally choose a middle-class object when the working-class speaker was
heard and a working-class object when a middle-class speaker was heard
• Class-congruent trends were observed in participants’ verbal choices of
brand logos
• A significant (p<.05) effect of speaker voice on participants’ fixations
towards brand logos were observed, with participants fixating on working-
class brands in significantly higher proportions when the working-class
speaker was heard than when the middle-class speaker was heard
180

9. DISCUSSION
• The disparity between participants’ fixations and their verbal reports
suggests an implicit/explicit distinction, in line with previous social
psychology research
Experiment 3
Method:
The eye tracking task (N=54) was conducted on-line, recording participant
eye movement in real-time. Participants made forced choices of the images
in the visual stimuli which they most strongly associated the target words
in the auditory stimuli (via mouse clicks). Visual stimuli comprised image
sets composed of brand logos. Auditory stimuli were recorded from four
working-class and four middlle class Glaswegian males, with tokens from a
synthesized voice used as distractor. Auditory stimuli comprised recordings
of target words semantically related to target images in the visual stimuli.
Target words were single word mono-tryllabic tokens. The social class associ-
ations of the images in the visual stimuli were normed on community insiders
(via pencil and paper norming questionnaire, N=39). The subjective reac-
tion test (N=60) gathered listener attribute ratings of stimuli speakers via
pencil and paper questionnaires.
Results:
• Fronted CAT realisations — Significantly (p<.05) greater fixations to-
wards working-class brands than middle-class brands at 300ms after
the mean onset of /a/ realisations.
• Weakly-vocalised /l/ realisations — Significantly (p<.05) greater fixa-
tions towards working-class brands than middle-class brands at 700ms
after the mean onset of /l/ realisations.
• Weakly-rhotic /r/ realisations — Significantly (p<.05) greater fixations
towards working-class brands than middle-class brands from 500-600ms
after the mean onset of /r/ realisations.
• Bunched /r/ realisations — Significantly (p<.05) greater fixations to-
wards working-class brands than middle-class brands from 300-600ms
181

9. DISCUSSION
after /r/ onset. Greater fixations towards middle-class brands at 900ms
after the mean onset of /r/ realisations (marginally significant).
• Participant responses were observed from 300-700ms after the mean
onset of socially-marked phonetic realisations, with some variants trig-
gering faster associations than others.
Experiment 4
Method:
The subjective reaction test (N=60) gathered listener attribute ratings of
speakers heard in the previous eye tracking experiment (Experiment 3) via
pencil and paper questionnaires. Auditory stimuli consisted of recordings of
each speaker reciting the words can, mile, drinker, steer, tags, and double.
Participant ratings of 9 personality traits were aggregated via a principal
component analysis which accounted for 62.3% of the variation in the data.
Results:
• No significant difference between ratings of working and middle-class
speakers in terms of Component 1 traits (ambitious, interesting, and
efficient)
• Middle class speakers were rated significantly (p<.05) more favourably
than working-class speakers in terms of Component 2 traits (intelligent,
independent, and ‘more posh’)
• Working and middle-class speakers were rated significantly (p<.05)
more favourably in terms of Component 3 traits (pleasant, trustworthy,
and straightforward) than the synthetic speech stimuli.
• The speaker with the highest frequency of middle-class-typical realisa-
tions (MC2) was rated significantly (p<.05) more favourably in terms
of both Component 1 and Component 2 traits than any other speaker.
• With the exception of the synthetic voice, speaker WC4 was rated sig-
nificantly (p<.05) less favourably than every other speaker in all com-
ponent categories.
182

9. DISCUSSION
• Participant attribute ratings of speakers with the highest and lowest
frequencies of middle-class-typical phonetic realisations suggest that
the frequency of phonetic realisations had a cumulative effect on listener
perceptions of status-related speaker traits.
• Female listeners found to have rated middle-class speakers significantly
(p=.003) more favourably than male listeners in terms of perceived
intelligence.1
• Female listeners found to have rated working-class speakers significantly
more favourably than male listeners in terms of perceived intelligence
(p=.01), trustworthiness (p=.016), efficiency (p=.049), and straight-
forwardness (p=.0029).
9.0.2 Research Questions
Overall, the findings appear to converge with previous research on im-
plicit sociolinguistic cognition, with working-class and middle-class Glaswe-
gian speakers and different socially-marked phonetic realisations eliciting dif-
fering implicit associations in listeners. While the pilot study and Experiment
1 did not reveal significant effects of speaker voice on listener associations,
these served to trial the methodology before implementing eye tracking. They
also allowed for the identification of methodological issues, which were ad-
dressed in subsequent experiments. Experiments 2 and 3 were then able to
tackle the research questions formulated for this study, which can now be
addressed as follows:
1. Does social information encoded within the speech signal im-
pact upon the implicit associations made by listeners?
Experiment 2 (Ch.6) revealed participants to have been significantly (p<.05)
more likely to fixate upon ‘working-class’ brand logos while hearing a working-
class speaker than while hearing a middle-class speaker, suggesting an effect
1See p.189 for a discussion of gender effects.
183
9. DISCUSSION
of speaker social class on the implicit associations made by listeners. Con-
versely, participants’ verbal choices of brand logos did not differ significantly
depending on the speaker heard, suggesting that listeners make differing con-
scious and unconscious associations upon hearing speech. This is in line with
Pantos & Perkins (2013), who found thathearing a speaker with an Amer-
ican English accent facilitated faster positive categorisations in an Implicit
Association Test than hearing a Korean English speaker (indicating an im-
plicit bias towards the American English speaker), but found participants to
have favoured the Korean English speaker in an explicit task. The results
also mirror previous research in social psychology, which found subjects to
show implicit biases towards visual stimuli in the absence of explicit bias
(Greenwald et al 1998; Karpinski & Hilton 2001; Inbar et al 2009). This
appears to indicate that the social information which listeners derive from
speech is implicitly evaluated in a similar manner to visually-derived social
information.
2. Does socially-marked phonetic variation impact upon the im-
plicit associations made by listeners?
Experiment 3 revealed different socially-marked realisations of the CAT
vowel and post-vocalic/post-consonantal /l/ to have had significant (p<.05)
effects on the brand logos fixated on by listeners, indicating that socially-
marked phonetic variation triggers differing implicit associations in listeners.
This effect was most prominent in listener fixations during fronted CAT and
weakly-vocalised /l/ realisations, eliciting significantly (p<.05) greater fixa-
tions towards ‘working-class’ associated brand logos across multiple time-bins
(for 400ms and 300ms, respectively), but was also observed at single time-
points during retracted CAT vowel, clear /l/, and dark /l/ realisations (at
1,000ms after the onset of auditory stimuli in each case), with clear and
dark /l/ realisations each eliciting significantly (p<.05) greater fixations to-
wards ‘middle-class’ brand logs. This is in line with MacFarlane & Stuart-
Smith (2012), who found different vocalised and clear /l/ realisations to have
184

9. DISCUSSION
elicited different categorisations of speakers into working-class and middle-
class guises, respectively.
Derhotic /r/ was found to have elicited significantly (p<.05) fewer fix-
ations towards middle-class brand logos than any other image (including
semantically unrelated distractor images) across two consecutive time bins
(800-900ms after auditory onset). This suggests a strong affective response
in the absence of a response to semantic information, indicating that this re-
alisation was strongly dissociated from middle-class brands. The subjective
reaction test found participants to have rated middle-class speakers signifi-
cantly (p<.05) more favourably in terms of attributes on Zahn & Hopper’s
(1985) status dimension, with the speaker heard to have produced the high-
est number of typically-middle-class phonetic realisations being rated sig-
nificantly (p<.05) more favourably in terms of these attributes than any
other speaker. This patterns with Campbell-Kibler’s (2012, 2013) findings
on listener IAT response times towards speakers with Northern US /IN/ and
/ay/ dipthongised realisations versus speakers with Southern US /In/ and
/ay/ monophthongised realisations. While the speech varieties investigated
by Campbell-Kibler (2012, 2013) were regionally marked, they were also
diverse in terms of social status — with Northern US speech varieties per-
ceived as ‘standard’ compared to ‘non-standard’ Southern US speech va-
rieties. Campbell-Kibler (2009) also found that /In/ realisations elicited
less favourable participant evaluations of status-associated attributes such as
socio-economic status, education, and articulateness. This suggests a direct
link between the perceived social status of speech varieties and, by extension,
phonetic realisations linked to those varieties, and the implicit associations
which listeners make towards speech.
3. What is the time-course of implicit sociolinguistic cognition?
Experiment 2 (Ch.6) provided a measure of the time course of implicit
sociolinguistic cognition in relation to two speakers with differing social ac-
cents, with effects of speaker voice emerging at 1,150ms after the mean onset
of the monosyllabic target words heard. Taking the mean duration of those
target words into account, at 500ms, and factoring 200ms for a saccade to
185

9. DISCUSSION
take place (as per Arnold & Tinker 1939; Salthouse & Ellis 1980; Salthouse
textitet al 1981; Vaughan 1983), this gives a reaction time of 450ms from
hearing an entire word to making a social evaluation between that word and
an image. Using the duration of target words as a measure is problematic,
however, as listeners are often able to make lexical decisions before hearing
the end of words (Tanenhaus et al 1995).
Experiment 3 (Ch.7) provided a more precise measure, repeatedly show-
ing listeners to respond to socially-marked phonetic variants with response
times ranging from 300-700ms. Participants were found to have made sig-
nificant shifts in fixation behaviour from 300ms following the mean onsets
of fronted CAT and bunched /r/ realisation, from 500ms following the mean
onset of weakly rhotic /r/ realisations, and from 700ms following the mean
onset of weakly vocalised /l/ realisations. The response times while hear-
ing some realisations (fronted CAT and bunched /r/) appear to suggest that
listeners can react with similar reaction times towards linguistically-derived
social information and visually-derived social information, with 300ms used
as a benchmark for implicit responses in previous social psychological re-
search on automatic evaluative responses (e.g. Greenwald et al 1998). Other
response times appear to indicate that the processing of social information
from speech can be more complex, and further investigation is required in
this regard.
9.0.3 Theoretical Implications
In order to describe the mental processing, tracking, and storage of lin-
guistic variation, Labov et al (2011) formulated the theory of the sociolinguis-
tic monitor. This was proposed following a series of experiments (see p.34-37
for an overview) in which participants were asked to rate a newsreader’s level
of professionalism based upon an auditory recording of a passage which varied
in concentrations of /In/ and /IN/ realisations. The study found listener per-
ceptions of the newsreader’s professionalism to vary on a logarithmic curve
according to the frequency of socially-marked phonetic variants, with audio
186

9. DISCUSSION
samples containing more /IN/ realisations being consistently rated as more
professional than those containing more /In/ realisations. Drawing primar-
ily from their experimental findings, Labov et al (2011: 457) ascribed the
following properties to the sociolinguistic monitor:
Temporal Range:
Extrapolating from their experiments, the temporal window of the
monitor is reasonably wide: operating continuously across the 57-second
time frame of their experiment trials.
Sensitivity:
Adult subjects are consistent in their evaluation of sociolinguistic vari-
ables, sensitive to differences in frequency as small as 10 percent. Fol-
lowing the logarithmic curve found, speakers who follow this progres-
sion will react sharply to small percentage differences at low frequen-
cies of a marked variable, but not for the same percentage differences
at the high end. To the extent that the logarithmic relation governs
subjective reactions, we cannot expect to obtain significant differences
at increasingly high percentages of the marked variant.
Attenuation:
The response of the monitor is not linear, but proportional to the in-
crease in the number of marked forms observed.
Asymmetry:
Listeners sensitivity to frequencies is radically different for the marked
variant of a sociolinguistic variable that is unexpected in a given social
situation. Sociolinguistic anomalies appear to be processed in the same
way as semantic anomalies.
Gender:
In the speech communities examined, women generally show more neg-
ative reactions to deviations from overt linguistic norms, a difference
more evident at moderate rather than extreme frequencies.
187

9. DISCUSSION
Age of Acquisition:
As with other aspects of sociolinguistic variation, sensitivity to fre-
quency develops through adolescence. The logarithmic function ap-
pears to be fully defined among young adults. Responses of younger
populations with lesser degrees of social consensus fit this function less
precisely, but may display a significant linear response to the variable.
(edited from Labov et al 2011: 457)
Of particular relevance to this thesis are the areas relating to the temporal
window of the sociolinguistic monitor and the effects of listener age and
gender on sociolinguistic perception.
While the examination of gender effects was not initially a primary focus
of this research, a preliminary by-gender analysis of participant ratings of
speaker personality traits in the subjective reaction test (table 9.1) shows
female listeners to have rated ‘middle-class’ speakers significantly (p=.003)
higher in terms of perceived intelligence than male listeners. While hearing
‘working-class’ speakers, female listeners were also found to have rated speak-
ers significantly (p=.01) more favourably in terms of perceived intelligence
than male listeners, but also rated speakers significantly higher in terms of
how trustworthy (p=.016), efficient (p=.049), and straightforward (p=.0029)
they perceived them to be. While a broad analysis based on self-reported
speaker social class (which, as discussed in 8.3.1, is not a reliable predictor
of listener perceptions), these results suggest that listener gender was very
much a factor in the explicit speaker ratings made during the subjective re-
action test. Due to time constraints, it was not possible to examine gender
differences in fixation behaviour during the eye tracking experiments. Future
analyses, however, are planned in order to determine the extent to which gen-
der impacted on the less-conscious associations made upon hearing different
socially-marked phonetic variants during Experiment 3, with the 50% par-
ticipant gender split conducive to this. It may be expected here, in line with
Labov et al (2011), that female listeners would have shown greater sensitiv-
ity than male listeners to the socially-marked variants heard during this task.
188

9. DISCUSSION
Table 9.1: Two-tailed unpaired t-test table of male and female listenerratings of personality traits of working and middle-class speakers, displayingp-values (Experiment 4).
Table 9.2 (p.190) shows a correlational analysis of listener age with ratings
of speaker personality traits during the subjective reaction test. This was car-
ried out taking all participant ratings into account, with 60 participants each
rating 4 working-class and 4 middle-class speakers in terms of 9 personality
traits — with the exception of ‘poshness’ ratings which, due in part to the
layout of the subjective reaction test form (appendix 7, p.262), were omitted
by three listeners. The analysis shows positive correlations between listener
age and ratings of how intelligent (r=.132), ambitous (r=.139), trustworthy
(r=.131), and efficient (r=.170) they perceived middle-class speakers to be.
Similarly, listener age was found to positively correlate with listener ratings
of how intelligent (r=.176), pleasant (r=.144), trustworthy (r=.219), efficent
(r=.159), and straightforward (r=.157) they perceived working-class speak-
ers to be. While these correlations appear to suggest that participant age
had a marked effect on speaker personality trait ratings, with older listeners
showing more favourable perceptions of speakers of both social classes, it is
worth noting that the majority of subjects were drawn from the student pop-
ulation at the University of Glasgow. This resulted in an unbalanced sample
in terms of participant age (M=25.5, SD=9.6), with only 20% (12/60) of
participants aged 30 or over, and 11.6% (7/60) aged 40 or over, preventing
firm conclusions from being drawn.
189

9. DISCUSSION
Table 9.2: Correlation of listener age with ratings of speaker personalitytraits in the subject reaction test, by speaker social class (Experiment 4).
Labov et al (2011: 455) also examined ‘real time’ responses to socially-
marked phonetic variation, through an experiment which tasked participants
with moving an on-screen slider during a 100s audio passage in order to
indicate the level of professionalism they perceived the stimuli speaker to
have. The results are discussed in terms of the slider movements of a single
participant, which are said to display a ‘characteristic pattern’, with slider
movements shown to ‘strongly correlate’ with instances of /In/ in the au-
ditory stimuli (Labov et al 2011: 455). Debriefing questionnaires following
the experiment also ‘did not show a high level of conscious awareness of
(ING)’. While Labov et al (2011) primarily focussed on frequency effects
of a single socially-marked phonetic variable on listeners’ social perceptions
over an extended time window, the third experiment in this thesis exam-
ined aggregated effects of multiple realisations of three different phonetic
variables over a short (1,600ms) temporal window, using an ‘on-line’ eye
tracking methodology. The experiment revealed listeners to have reacted
to different variants with response times ranging from 300-700ms following
the mean onset of different socially-marked phonetic variants. Responses to
some variants (fronted CAT and bunched /r/) were found to have occurred
on the cusp of established thresholds of conscious awareness in social psy-
190

9. DISCUSSION
chology (cf. Greenwald et al 1998) whereas responses to other variants did
not (weakly rhotic /r/ and weakly vocalised /l/). Speculatively, the diver-
gence in response time between variants may be indicative of varying levels of
social-salience, with more socially-salient variants triggering socio-economic
associations faster than variants which are less socially-salient. Given that
‘there is no appreciable lag between what is fixated and what is processed’
(Just and Carpenter 1980: 331), the findings suggest that the associations
triggered by some variants are less conscious than the associations triggered
by others — indicating that some socially-marked phonetic variants carry a
greater cognitive processing cost than others.
191
Chapter 10
Conclusion
This thesis represents a preliminary investigation of implicit sociolinguis-
tic cognition towards two socially-divergent speech varieties in Glasgow, pro-
viding evidence that different social accents elicit differing conscious and
unconscious associations in listeners. Findings also indicate that different re-
alisations of socially-marked phonetic variants trigger differing unconscious
associations in listeners. This is in line with previous implicit sociolinguis-
tic cognition research carried out on different regional and foreign accent
varieties (Pantos & Perkins 2013; Campbell-Kibler 2012, 2013), suggesting
that linguistically encoded markers of regional background and social class
elicit automatic evaluative responses in listeners in much the same manner.
This may be due to commonalities in listener evaluations of non-standard
regional and working-class speech varieties versus standard ‘prestige’ and
middle-class speech varieties — which provoke equivalent disparities in lis-
tener evaluations of speaker status and social attractiveness related attributes
(Giles el atl 1975; Macaulay 1977; Preston 1999; Coupland & Bishop 2007;
Campbell-Kibler 2009). This appears to suggest that such attitude dimen-
sions are strongly tied to the automatic social evaluations which listeners
make towards speech, presenting further avenues of investigation. Further-
more, the time course of listener responses to different socially-marked pho-
netic realisations, which were observed as occurring as early as 300ms in
separate instances, is in line with the time course of automatic evaluative
192

10. CONCLUSION
responses in social psychology research (Greenwald et al 1998; Payne 2001),
suggesting that listeners automatically evaluate linguistically-derived social
information in much the same manner as they evaluate visually-derived social
information.
This thesis also serves as a test of a novel Visual World eye tracking
methodology for investigating sociolinguistic perception, showing different
social accents and socially-marked phonetic realisations to trigger fixations
towards images carrying differing socio-economic connotations. The findings
are encouraging for future investigations of sociolinguistic perception under
this research paradigm.
193

10.1. REFERENCES
10.1 References
Aitken, A. (1994). Scots and English in Scotland. In: P. Trudgill, ed.,
Language in the British Isles, 1st ed. Cambridge: Cambridge University
Press, pp.517-532.
Ajzen, I. and Fishbein, M. (2005). The influence of attitudes on behav-
ior. In: D. Albarracan, B. Johnson and M. Zanna, ed., The Handbook of
Attitudes, 1st ed. Mahwah: Erlbaum, pp.173-221.
Allport, G. (1935). Attitudes. In: C. Murchison, ed., Handbook of Social
Psychology, 1st ed. Worcester: Clark University Press, pp.798-844.
Allport, G. (1954). The nature of prejudice. Cambridge, Mass.: Addison-
Wesley Pub. Co.
Altmann, G. and Kamide, Y. (1999). Incremental interpretation at verbs:
restricting the domain of subsequent reference. Cognition, 73(3), pp.247-264.
Arnold, D. and Tinker, M. (1939). The fixational pause of the eyes. Jour-
nal of Experimental Psychology, 25(3), pp.271-280.
Babel, M. (2009). Phonetic and Social Selectivity in Phonetic Accommo-
dation. PhD. University of California.
Balota, D. (1983). Automatic semantic activation and episodic memory
encoding. Journal of Verbal Learning and Verbal Behavior, 22(1), pp.88-104.
Bargh, J., Chaiken, S., Raymond, P. and Hymes, C. (1996). The Auto-
matic Evaluation Effect: Unconditional Automatic Attitude Activation with
a Pronunciation Task. Journal of Experimental Social Psychology, 32(1),
pp.104-128.
194

10.1. REFERENCES
Bem, S. (1970). The role of comprehension in children’s problem solving.
Developmental Psychology, 2(3), pp.351-358.
Bem, D.J. (2011b). Feeling the future: Experimental evidence for anoma-
lous retroactive influences on cognition and affect. Journal of Personality and
Social Psychology, 100(3), 407425.
Bickart, B. (1992). Question-order effects and brand evaluations: The
moderating role of consumer knowledge. In: N. Schwarz and S. Sudman,
ed., Context Effects in Social Psychological Research, 1st ed. New York:
Springer-Verlag, pp.63-79.
Bishop, G., Hamilton, D. and McConahay, J. (1980). Attitudes and
Nonattitudes in the Belief Systems of Mass Publics. The Journal of Social
Psychology, 110(1), pp.53-64.
Bousfield, W., Whitmarsh, G. and Berkowitz, H. (1960). Partial Re-
sponse Identities in Associative Clustering. The Journal of General Psychol-
ogy, 63(2), pp.233-238.
Braber, N. (2009). I’m Not a Fanatic Scot, But I Love Glasgow: Con-
cepts of Local and National Identity in Glasgow. Identity, 9(4), pp.307-322.
Brown, R. (1970). Psycholinguistics. New York: Free Press.
Cameron, C. D., Brown-Iannuzzi, J. L., Payne, K. B. (2012). Sequential
Priming Measures of Implicit Social Cognition: A Meta-Analysis of Associa-
tions With Behavior and Explicit Attitudes. Personality and Social Psychol-
ogy Review, 16(4), pp.330-350.
Campbell-Kibler, K. (2009). The nature of sociolinguistic perception.
Lang. Var. Change, 21(01), p.135.
195
10.1. REFERENCES
Campbell-Kibler, K. (2012). The Implicit Association Test and sociolin-
guistic meaning. Lingua, 122(7), pp.753-763.
Campbell-Kibler, K. (2013). Connecting attitudes and language behavior
via implicit sociolinguistic cognition. In: S. Grondelaers and T. Kristiansen,
ed., Experimental studies of changing language standards in contemporary
Europe, 1st ed. pp.307-329.
Castelli, L., Zogmaister, C., Smith, E. and Arcuri, L. (2004). On the Au-
tomatic Evaluation of Social Exemplars. Journal of Personality and Social
Psychology, 86(3), pp.373-387.
Cesario, J., Plaks, J. E., Higgins, E. T. (2006). Automatic Social Behav-
ior as Motivated Preparation to Interact. Journal of Personality and Social
Psychology, 90(6), pp.893-910.
Chaiken, S. and Trope, Y. (1999). Dual-process theories in social psy-
chology. New York: Guilford Press.
Cheesman, J. and Merikle, P. (1984). Priming with and without aware-
ness. Perception and Psychophysics, 36(4), pp.387-395.
Cheyne, W. (1970). Stereotyped Reactions to Speakers with Scottish and
English Regional Accents. British Journal of Social and Clinical Psychology,
9(1), pp.77-79.
Cooper, R. (1974). The control of eye fixation by the meaning of spoken
language. Cognitive Psychology, 6(1), pp.84-107.
Corey, S. (1937). Professed attitudes and actual behavior. Journal of
Educational Psychology, 28(4), pp.271-280.
Coupland, N. and Bishop, H. (2007). Ideologised values for British ac-
196

10.1. REFERENCES
cents. Journal of Sociolinguistics, 11(1), pp.74-93.
Cunningham, W. and Zelazo, P. (2007). Attitudes and evaluations: a so-
cial cognitive neuroscience perspective. Trends in Cognitive Sciences, 11(3),
pp.97-104.
Dahan, D., Tanenhaus, M., Chambers, C. (2002). Accent and reference
resolution in spoken-language comprehension. Journal of Memory and Lan-
guage, 47(2), pp.292-314.
Davison, H. and Burke, M. (2000). Sex Discrimination in Simulated Em-
ployment Contexts: A Meta-analytic Investigation. Journal of Vocational
Behavior, 56(2), pp.225-248.
Dijksterhuis, A. and van Knippenberg, A. (1998). The Relation Between
Perception and Behavior, or How to Win a Game of Trivial Pursuit. Journal
of Personality and Social Psychology, 74 (4), pp.865-877.
Doyen S, Klein O, Pichon C-L, Cleeremans A (2012). Behavioral Prim-
ing: Its all in the Mind, but Whose Mind? PLoS ONE 7(1): e29081
Drager, K. and Hay, J. (2010). Stuffed toys and speech perception. Lin-
guistics 48(4), pp.865-892.
Dunabeitia, J., Aviles, A., Afonso, O., Scheepers, C. and Carreiras, M.
(2009). Qualitative differences in the representation of abstract versus con-
crete words: Evidence from the visual-world paradigm. Cognition, 110(2),
pp.284-292.
Eagly, A. and Chaiken, S. (1993). The psychology of attitudes. Fort
Worth, TX: Harcourt Brace Jovanovich College Publishers.
Efron, B. (1979). Bootstrap Methods: Another Look at the Jackknife.
197

10.1. REFERENCES
Ann. Statist., 7(1), pp.1-26.
Epstein, S. (1994). Integration of the cognitive and the psychodynamic
unconscious. American Psychologist, 49(8), pp.709-724.
Erber, M., Hodges, S. and Wilson, T. (1995). Attitude strength and
attitude stability. In: R. Petty and J. Krosnick, ed., Attitude strength: An-
tecedents and consequences, 1st ed. Hillsdale: Erlbaum.
Evans, J. (2008). Dual-Processing Accounts of Reasoning, Judgment, and
Social Cognition. Annual Review of Psychology, 59(1), pp.255-278.
Evans, J. and Stanovich, K. (2013). Dual-Process Theories of Higher
Cognition: Advancing the Debate. Perspectives on Psychological Science,
8(3), pp.223-241.
Fasold, R. (1987). The sociolinguistics of society. 2nd ed. Oxford, Eng-
land: B. Blackwell.
Fazio, R. (2001). On the automatic activation of associated evaluations:
An overview. Cognition and Emotion, 15(2), pp.115-141.
Fazio, R., Jackson, J., Dunton, B. and Williams, C. (1995). Variability in
automatic activation as an unobtrusive measure of racial attitudes: A bona
fide pipeline?. Journal of Personality and Social Psychology, 69(6), pp.1013-
1027.
Fazio, R., Sanbonmatsu, D., Powell, M. and Kardes, F. (1986). On the
automatic activation of attitudes. Journal of Personality and Social Psychol-
ogy, 50(2), pp.229-238.
Fowler, C., Wolford, G., Slade, R. and Tassinary, L. (1981). Lexical access
with and without awareness. Journal of Experimental Psychology: General,
198

10.1. REFERENCES
110(3), pp.341-362.
Franco, A., Mahotra, N., Simonovits, G. (2014). Publication bias in the
social sciences: Unlocking the file drawer. Science, 6203(345), pp.1502-1505.
Galak, J., LeBouef, R. A., Nelson, L. D., Simmons, J. P. (2012). Cor-
recting the Past: Failures to Replicate Psi. Journal of Personality and Social
Psychology, 103(6), pp.933-948.
Garrett, P. (2001). Language attitudes and sociolinguistics. Journal of
Sociolinguistics, 5(4), pp.626-631.
Garrett, P. (2010). Attitudes to language. Cambridge, UK: Cambridge
University Press.
Gawronski, B. and Payne, B. (2010). Handbook of implicit social cogni-
tion. New York: Guilford Press.
Giles, H. and Powesland, P. (1975). Speech style and social evaluation.
London: Published in cooperation with the European Association of Exper-
imental Social Psychology by Academic Press.
Greenwald, A. G., McGhee, D. and Schwartz, J. (1998). Measuring indi-
vidual differences in implicit cognition: The implicit association test. Journal
of Personality and Social Psychology, 74(6), pp.1464-1480.
Greenwald, A. G., Poehlman, T. A., Uhlmann, E. L., and Banaji, M. R.
(2009). Understanding and Using the Implicit Association Test: III. Meta-
Analysis of Predictive Validity. Journal of Personality and Social Psychology,
1(97), pp.17-41.
Hall-Lew, L. and Fix, S. (2012). Perceptual coding reliability of (L)-
vocalization in casual speech data. Lingua, 122(7), pp.794-809.
199

10.1. REFERENCES
Hay, J., Warren, P. and Drager, K. (2006). Factors influencing speech per-
ception in the context of a merger-in-progress. Journal of Phonetics, 34(4),
pp.458-484.
Heimbauer, L., Beran, M. and Owren, M. (2011). A Chimpanzee Recog-
nizes Synthetic Speech with Significantly Reduced Acoustic Cues to Phonetic
Content. Current Biology, 21(14), pp.1210-1214.
Hippler, H. and Schwarz, N. (1986). Not Forbidding Isn’t Allowing: The
Cognitive Basis of the Forbid-Allow Asymmetry. Public Opinion Quarterly,
50(1), p.87.
Huettig, F. and Altmann, G. (2005). Word meaning and the control
of eye fixation: semantic competitor effects and the visual world paradigm.
Cognition, 96(1), pp.B23-B32.
Huettig, F., Rommers, J. and Meyer, A. (2011). Using the visual world
paradigm to study language processing: A review and critical evaluation.
Acta Psychologica, 137(2), pp.151-171.
Inbar, Y., Pizarro, D., Knobe, J. and Bloom, P. (2009). Disgust sensitiv-
ity predicts intuitive disapproval of gays. Emotion, 9(3), pp.435-439.
Johnston, P. (1997). The Language Ecology of Contemporary Scotland.
In: C. Jones, ed., The Edinburgh History of the Scots Language, 1st ed.
Edinburgh: Edinburgh University Press, pp.47-111.
Just, M. A. and Carpenter, P. A. (1980). A theory of reading: From eye
fixations to comprehension. Psychological Review, 87(4), pp.329-354.
Kamide, Y., Altmann, G. and Haywood, S. (2003). The time-course of
prediction in incremental sentence processing: Evidence from anticipatory
200

10.1. REFERENCES
eye movements. Journal of Memory and Language, 49(1), pp.133-156.
Karpinski, A. and Hilton, J. (2001). Attitudes and the Implicit Associa-
tion Test. Journal of Personality and Social Psychology, 81(5), pp.774-788.
Kawakami, K., Dunn, E., Karmali, F. and Dovidio, J. (2009). Mispre-
dicting Affective and Behavioral Responses to Racism. Science, 323(5911),
pp.276-278.
Klauer, K. and Wegener, I. (1998). Unraveling social categorization in
the ”Who said what?” paradigm. Journal of Personality and Social Psychol-
ogy, 75(5), pp.1155-1178.
Koops, C., Gentry, E. and Pantos, A. (2008). The effect of perceived
speaker age on the perception of PIN and PEN vowels in Houston, Texas.
niversity of Pennsylvania Working Papers in Linguistics: Selected papers
from NWAV, 36(14), pp.91-101.
Krech, D. and Crutchfield, R. (1948). Theory and problems of social psy-
chology. New York: McGraw-Hill Book Co.
Kristiansen, T. (2001). Two Standards: One for the Media and One for
the School. Language Awareness, 10(1), pp.9-24.
Kristiansen, T. (2009). The macro-level social meanings of late-modern
Danish accents. Acta Linguistica Hafniensia, 41(1), pp.167-192.
Krosnick, J. and Smith, W. (1994). Attitude strength. In: V. Ramachan-
dran, ed., Encyclopedia of human behavior, 1st ed. San Diego: Academic
Press.
Kruglanski, A. and Orehek, E. (2007). Partitioning the Domain of Social
Inference: Dual Mode and Systems Models and Their Alternatives. Annual
201

10.1. REFERENCES
Review of Psychology, 58(1), pp.291-316.
Labov, W. (1966). The social stratification of English in New York City.
[Washington]: Center for Applied Linguistics.
Labov, W. (1972). Sociolinguistic patterns. Philadelphia, PA: University
of Pennsylvania Press.
Labov, W., Ash, S., Ravindranath, M., Weldon, T., Baranowski, M. and
Nagy, N. (2011). Properties of the sociolinguistic monitor1. Journal of Soci-
olinguistics, 15(4), pp.431-463.
Lambert, W., Hodgson, R., Gardner, R. and Fillenbaum, S. (1960). Eval-
uational reactions to spoken languages. The Journal of Abnormal and Social
Psychology, 60(1), pp.44-51.
LaPiere, R. (1934). Attitudes vs. Actions. Social Forces, 13(2), pp.230-
237.
Lawrence, D. (2015). Limited Evidence for Social Priming in the Per-
ception of the BATH and STRUT Vowels. In The Scottish Consortium for
ICPhS 2015 (Ed.), Proceedings of the 18th International Congress of Pho-
netic Sciences. Glasgow, UK: the University of Glasgow. Retrieved from
http://www.icphs2015.info/pdfs/Papers/ICPHS0244.pdf [accessed 01/02/16]
Lawson, E., Stuart-Smith, J. and Scobbie, J. (2015). Articulatory In-
sights into Language Variation and Change: Preliminary Findings from an
Ultrasound Study of Derhoticization in Scottish English. University of Penn-
sylvania Working Papers in Linguistics, 14(2), pp.101-110.
Lawson, R. (2011). Patterns of linguistic variation among Glaswegian
adolescent males 1. Journal of Sociolinguistics, 15(2), pp.226-255.
202

10.1. REFERENCES
Lennon, R. (2013). The effect of experience in cross-dialect perception:
Parsing /r/ in Glaswegian. MSc. The University of Glasgow.
Levon, E. and Fox, S. (2014). Social Salience and the Sociolinguistic
Monitor: A Case Study of ING and TH-fronting in Britain. Journal of En-
glish Linguistics, 42(3), pp.185-217.
Lord, C. and Lepper, M. (1999). Attitude representation theory. In: M.
Zanna, ed., Advances in experimental psychology, 1st ed. New York: Aca-
demic Press, pp.265-343.
Macafee, C. (1983). Glasgow. Amsterdam: Benjamins.
Macafee, C. (1988). Qualitative Insights into Working-Class Language
Attitudes. York Papers in Linguistics, 13.
Macafee, C. (1994). Traditional dialect in the modern world. Frankfurt
am Main: P. Lang.
Macaulay, R. (1975). Negative prestige, linguistic insecurity, and linguis-
tic self-hatred. Lingua, 36(2-3), pp.147-161.
Macaulay, R. (1977). Language, social class and education: A Glasgow
Study. Edinburgh: Edinburgh University Press.
Macaulay, R. (1977). Language, Social Class, and Education. A Glasgow
Study. Edinburgh: Edinburgh University Press.
MacFarlane, A. (2014). Voice Activated: Exploring the effects of voices
on behaviours. Ph. D. the University of Canterbury.
MacFarlane, A. and Stuart-Smith, J. (2012). One of them sounds sort of
Glasgow Uni-ish. Social judgements and fine phonetic variation in Glasgow.
203

10.1. REFERENCES
Lingua, 122(7), pp.764-778.
Marcel, A. (1983). Conscious and unconscious perception: Experiments
on visual masking and word recognition. Cognitive Psychology, 15(2), pp.197-
237.
Marwell, G., Aiken, M. and III, N. (1987). The Persistence of Political
Attitudes Among 1960s Civil Rights Activists. Public Opinion Quarterly,
51(3), p.359.
Maver, I. (2000). Glasgow. Edinburgh: Edinburgh University Press.
McAllister, A. (1938). A Year’s Course in Speech Training. London:
University of London Press.
McGurk, H. and Macdonald, J. (1976). Hearing lips and seeing voices.
Nature, 264(5588), pp.746-748.
Menzies, J. (1991). An Investigation of Attitudes to Scots and Glasgow
Dialect Among Secondary School Pupils. [online]
http://www.arts.gla.ac.uk/STELLA/STARN/lang/MENZIES/menzie1.htm
[Accessed 13 Sep. 2015].
Miles, W. R. (1930). Ocular dominance in human adults. Journal of
General Psychology, 3, pp.412-430.
Miller, S., Zielaskowski, K., Maner, J. and Plant, E. (2012). Self-protective
motivation and avoidance of heuristically threatening outgroups. Evolution
and Human Behavior, 33(6), pp.726-735.
Niedzielski, N. (1999). The Effect of Social Information on the Perception
of Sociolinguistic Variables. Journal of Language and Social Psychology, 18,
pp.62-85.
204
10.1. REFERENCES
Nosek, B. A., Greenwald, A. G., and Banaji, M. R. (2007). The Implicit
Association Test at age 7: A methodological and conceptual review. In J.
A. Bargh (Ed.), Automatic Processes in Social Thinking and Behavior. Psy-
chology Press, pp.265-292.
Olson, M., Fazio, R. and Han, H. (2009). Conceptualizing Personal and
Extrapersonal Associations. Social and Personality Psychology Compass,
3(2), pp.152-170.
Pacione, M. (1995). Glasgow. Chichester: J. Wiley.
Pantos, A. and Perkins, A. (2012). Measuring Implicit and Explicit At-
titudes Toward Foreign Accented Speech. Journal of Language and Social
Psychology, 32(1), pp.3-20.
Payne, B. (2001). Prejudice and perception: The role of automatic and
controlled processes in misperceiving a weapon. Journal of Personality Social
Psychology, 81, pp.181-192.
Petty, R. and Cacioppo, J. (1981). Attitudes and persuasion–classic and
contemporary approaches. Dubuque, Iowa: W.C. Brown Co. Publishers.
Petty, R. and Krosnick, J. (1995). Attitude strength. Mahwah, N.J.:
Lawrence Erlbaum Associates.
Petty, R., Fazio, R. and Brinol, P. (2009). Attitudes. New York: Psy-
chology Press.
Pomerantz, E., Chaiken, S. and Tordesillas, R. (1995). Attitude strength
and resistance processes. Journal of Personality and Social Psychology, 69(3),
pp.408-419.
205
10.1. REFERENCES
Postman, L. and Keppel, G. (1970). Norms of word associations. New
York: Academic Press.
Preston, D. (1999). A Language Attitude Analysis of Regional US Speech:
Is Northern US English Not Friendly Enough?. Cuadernos de Filologia In-
glesa, 8, pp.129-146.
Ratcliffe, V. and Reby, D. (2014). Orienting Asymmetries in Dogs Re-
sponses to Different Communicatory Components of Human Speech. Current
Biology, 24(24), pp.2908-2912.
Raven, J. C. (1938). Progressive Matrices. London: H. K. Lewis and Co.
Ltd.
Redinger, D. (2010). Language Attitudes and Code-switching Behaviour
in a Multilingual Educational Context: The Case of Luxembourg. PhD. Uni-
versity of York.
Reingold, E. and Merikle, P. (1988). Using direct and indirect measures
to study perception without awareness. Perception and Psychophysics, 44(6),
pp.563-575.
Reinisch, E., Jesse, A. and McQueen, J. (2010). Early use of phonetic
information in spoken word recognition: Lexical stress drives eye movements
immediately. The Quarterly Journal of Experimental Psychology, 63(4),
pp.772-783.
Ritchie, S.J., Wiseman, R., and French, C.C. (2012). Failing the future:
Three unsuccessful replications of Bems retroactive facilitation of recall ef-
fect. PLoS ONE, 7(3)
Robertson, D. (2011). Accent and Implicit Cognition. MLitt. The Uni-
versity of Glasgow.
206

10.1. REFERENCES
Romaine, S. (1979). Postvocalic /r/ in Scottish English: Sound change
in progress?. In: P. Trudgill, ed., Sociolinguistic Patterns in British English,
1st ed. London: Edward Arnold.
Rudman, L. and Glick, P. (2001). Prescriptive Gender Stereotypes and
Backlash Toward Agentic Women. Journal of Social Issues, 57(4), pp.743-
762.
Salthouse, T. and Ellis, C. (1980). Determinants of Eye-Fixation Dura-
tion. The American Journal of Psychology, 93(2), p.207.
Salthouse, T., Ellis, C., Diener, D. and Somberg, B. (1981). Stimulus
processing during eye fixations. Journal of Experimental Psychology: Hu-
man Perception and Performance, 7(3), pp.611-623.
Salverda, A., Dahan, D. and McQueen, J. (2003). The role of prosodic
boundaries in the resolution of lexical embedding in speech comprehension.
Cognition, 90(1), pp.51-89.
Sarnoff, I. (1970). Social Attitudes and the Resolution of Motivational
Conflict. Harmondsworth: Penguin.
Schacter, D. (1987). Implicit memory: History and current status. Jour-
nal of Experimental Psychology: Learning, Memory, and Cognition, 13(3),
pp.501-518.
Schaller, M. (2008). Evolutionary bases of first impressions. In: N. Am-
bady and J. Skowronski, ed., First Impressions, 1st ed. New York: Guildford
Press, pp.15-34.
Schneider, W. and Shiffrin, R. (1977). Controlled and automatic human
information processing: I. Detection, search, and attention. Psychological
207

10.1. REFERENCES
Review, 84(1), pp.1-66.
Schuman, H. and Presser, S. (1981). The Attitude-Action Connection
and the Issue of Gun Control. The ANNALS of the American Academy of
Political and Social Science, 455(1), pp.40-47.
Schwarz, N. and Bohner, G. (2001). The Construction of Attitudes. In:
A. Tesser and N. Schwarz, ed., Intrapersonal Processes, 1st ed. Oxford:
Blackwell, pp.436-457.
Schwarz, N. and Strack, F. (1991). Context Effects in Attitude Surveys:
Applying Cognitive Theory to Social Research. European Review of Social
Psychology, 2(1), pp.31-50.
Shanks, D. R., Newell, B. R., Lee, E. H., Balakrishnan, D., Ekelund, L.,
Cenac, Z., Fragkiski, K., Moore, C. (2013). Priming Intelligent Behavior:
An Elusive Phenomenon. PLoS ONE 8(4): e56515.
Sherif, M. and Cantril, H. The psychology of ego-involvements. New
York: Wiley, 1947, pp. 527. (1948). Journal of Clinical Psychology, 4(3),
pp.314-315.
Singh, K. and Xie, M. (2010). Bootstrap: a statistical method. In: Pe-
terson, Baker and McGaw, ed., International Encyclopedia of Education, 1st
ed. Oxford: Elsevier, pp.46-51.
Smith, E. and DeCoster, J. (2000). Dual-Process Models in Social and
Cognitive Psychology: Conceptual Integration and Links to Underlying Mem-
ory Systems. Personality and Social Psychology Review, 4(2), pp.108-131.
Smith, G. (1979). Language and Racial Attitudes in East. MPhil. Uni-
versity College London.
208

10.1. REFERENCES
Smith, H. (1932). A scale for measuring attitudes about prohibition. The
Journal of Abnormal and Social Psychology, 26(4), pp.429-437.
Spira, J. (2002). Attitude Strength and Resistance to Persuasion. Ad-
vances in Consumer Research, 29, pp.180-181.
Stagner, R. (1942). Some Factors Related to Attitude toward War, 1938.
The Journal of Social Psychology, 16(1), pp.131-142.
Strand, E. and Johnson, K. (1996). Gradient and visual speaker normal-
ization in the perception of fricatives. In: D. Gibbon, ed., Natural Language
Processing and Speech Technology: Results of the 3rd KOVENS Conference,
1st ed. Berlin: Bielefeld, pp.14-26.
Stuart-Smith, J. (1999). Glasgow: Accent and voice quality. In: P.
Foulkes and G. Docherty, ed., Urban Voices: Variation and Change in British
Accents, 1st ed. London: Arnold, pp.203-222.
Stuart-Smith, J. (2003). The phonology of Modern Urban Scots. In: J.
Corbett, ed., The Edinburgh Companion to Scots, 1st ed. Edinburgh: Edin-
burgh University Press, pp.110-137.
Stuart-Smith, J., Lennon, R., Macdonald, R., Robertson, D., Soskuthy,
M., Jose, B. and Evers, B. (2015). A dynamic view of real-time change in
word-final liquids in spontaneous Glaswegian. In: Proceedings of the 18th
International Congress of Phonetic Sciences. [online] Glasgow: The Univer-
sity of Glasgow.
http://www.icphs2015.info/pdfs/Papers/ICPHS1028.pdf [Accessed 22 Aug.
2015].
Stuart-Smith, J., Timmins, C. and Tweedie, F. (2006). Conservation
and innovation in a traditional dialect: Lvocalization in Glaswegian. English
World-Wide, 27(1), pp.71-87.
209

10.1. REFERENCES
Tanenhaus, M., Spivey-Knowlton, M., Eberhard, K. and Sedivy, J. (1995).
Integration of visual and linguistic information in spoken language compre-
hension. Science, 268(5217), pp.1632-1634.
Thurstone, L. (1931). The Measurement of Change in Social Attitude.
The Journal of Social Psychology, 2(2), pp.230-235.
Thurstone, L. and Chave, E. (1929). The measurement of attitude.
Chicago, Ill.: The University of Chicago Press.
Torrance, K. (2003). Language Attitudes and Language Change in Glaswe-
gian Speech. MPhil. The University of Glasgow.
Tourangeau, R. (1992). Attitudes as memory structures: Belief sampling
and context effects. In: N. Schwarz and S. Sudman, ed., Context Effects in
Social Psychological Research, 1st ed. New York: Springer-Verlag.
Underwood, G. (1996). Implicit cognition. Oxford: Oxford University
Press.
Van Bavel, J., Jenny Xiao, Y. and Cunningham, W. (2012). Evaluation
is a Dynamic Process: Moving Beyond Dual System Models. Social and Per-
sonality Psychology Compass, 6(6), pp.438-454.
Vaughan, J. (1983). Saccadic reaction time in visual search. In: K.
Rayner, ed., Eye Movements in Reading, 1st ed. New York: Academic Press,
pp.397-411.
Weber, R. (1970). First graders’ use of grammatical context in reading.
In: H. Levin and J. Williams, ed., Basic studies on reading, 1st ed. New
York: Basic Books.
210

10.1. REFERENCES
Weigel, R. and Newman, L. (1976). Increasing attitude-behavior corre-
spondence by broadening the scope of the behavioral measure. Journal of
Personality and Social Psychology, 33(6), pp.793-802.
Wilson, T. and Brekke, N. (1994). Mental contamination and mental cor-
rection: Unwanted influences on judgments and evaluations. Psychological
Bulletin, 116(1), pp.117-142.
Wilson, T. and et al, (1984). Effects of analyzing reasons on attitude-
behavior consistency. Journal of Personality and Social Psychology, 47(1),
pp.5-16.
Wilson, T., Dunn, D., Kraft, D. and Lisle, D. (1989). Introspection,
attitude change, and attitude-behavior consistency. In: L. Berkowitz, ed.,
Advances in experimental social psychology, 1st ed. Orlando: Academic
Press, pp.123-205.
Zahn, C. and Hopper, R. (1985). Measuring Language Attitudes: The
Speech Evaluation Instrument. Journal of Language and Social Psychology,
4(2), pp.113-123.
211

10.2. APPENDICES
10.2 Appendices
.1
Social Evaluation Questionnaire
Pilot Study, Experiments 1 and 2 (Unran-
domised)
212

.1.SOCIAL EVALUATION QUESTIONNAIRE
PILOT STUDY, EXPERIMENTS 1 AND 2 (UNRANDOMISED)
213

(2 / 12)
'Neddy'
Posh1 2 3 4 5
'Neddy'
Posh1 2 3 4 5
'Neddy'
Posh1 2 3 4 5
'Neddy'
Posh1 2 3 4 5
'Neddy'
Posh1 2 3 4 5
'Neddy'
Posh1 2 3 4 5
'Neddy'
Posh1 2 3 4 5
'Neddy'
Posh1 2 3 4 5
'Neddy'
Posh1 2 3 4 5

(3 / 12)
'Neddy'
Posh1 2 3 4 5
'Neddy'
Posh1 2 3 4 5
'Neddy'
Posh1 2 3 4 5
'Neddy'
Posh1 2 3 4 5
'Neddy'
Posh1 2 3 4 5
'Neddy'
Posh1 2 3 4 5
'Neddy'
Posh1 2 3 4 5
'Neddy'
Posh1 2 3 4 5
'Neddy'
Posh1 2 3 4 5

(4 / 12)
'Neddy'
Posh1 2 3 4 5
'Neddy'
Posh1 2 3 4 5
'Neddy'
Posh1 2 3 4 5
'Neddy'
Posh1 2 3 4 5
'Neddy'
Posh1 2 3 4 5
'Neddy'
Posh1 2 3 4 5
'Neddy'
Posh1 2 3 4 5
'Neddy'
Posh1 2 3 4 5
'Neddy'
Posh1 2 3 4 5

(5 / 12)
'Neddy'
Posh1 2 3 4 5
'Neddy'
Posh1 2 3 4 5
'Neddy'
Posh1 2 3 4 5
'Neddy'
Posh1 2 3 4 5
'Neddy'
Posh1 2 3 4 5
'Neddy'
Posh1 2 3 4 5
'Neddy'
Posh1 2 3 4 5
'Neddy'
Posh1 2 3 4 5
'Neddy'
Posh1 2 3 4 5

(6 / 12)
'Neddy'
Posh1 2 3 4 5
'Neddy'
Posh1 2 3 4 5
'Neddy'
Posh1 2 3 4 5
'Neddy'
Posh1 2 3 4 5
'Neddy'
Posh1 2 3 4 5
'Neddy'
Posh1 2 3 4 5
'Neddy'
Posh1 2 3 4 5
'Neddy'
Posh1 2 3 4 5
'Neddy'
Posh1 2 3 4 5

(7 / 12)
'Neddy'
Posh1 2 3 4 5
'Neddy'
Posh1 2 3 4 5
'Neddy'
Posh1 2 3 4 5
'Neddy'
Posh1 2 3 4 5
'Neddy'
Posh1 2 3 4 5
'Neddy'
Posh1 2 3 4 5
'Neddy'
Posh1 2 3 4 5
'Neddy'
Posh1 2 3 4 5
'Neddy'
Posh1 2 3 4 5

(8 / 12)
'Neddy'
Posh1 2 3 4 5
'Neddy'
Posh1 2 3 4 5
'Neddy'
Posh1 2 3 4 5
'Neddy'
Posh1 2 3 4 5
'Neddy'
Posh1 2 3 4 5
'Neddy'
Posh1 2 3 4 5
'Neddy'
Posh1 2 3 4 5
'Neddy'
Posh1 2 3 4 5
'Neddy'
Posh1 2 3 4 5

(9 / 12)
'Neddy'
Posh1 2 3 4 5
'Neddy'
Posh1 2 3 4 5
'Neddy'
Posh1 2 3 4 5
'Neddy'
Posh1 2 3 4 5
'Neddy'
Posh1 2 3 4 5
'Neddy'
Posh1 2 3 4 5
'Neddy'
Posh1 2 3 4 5
'Neddy'
Posh1 2 3 4 5
'Neddy'
Posh1 2 3 4 5

(10 / 12)
'Neddy'
Posh1 2 3 4 5
'Neddy'
Posh1 2 3 4 5
'Neddy'
Posh1 2 3 4 5
'Neddy'
Posh1 2 3 4 5
'Neddy'
Posh1 2 3 4 5
'Neddy'
Posh1 2 3 4 5
'Neddy'
Posh1 2 3 4 5
'Neddy'
Posh1 2 3 4 5
'Neddy'
Posh1 2 3 4 5

(11 / 12)
'Neddy'
Posh1 2 3 4 5
'Neddy'
Posh1 2 3 4 5
'Neddy'
Posh1 2 3 4 5
'Neddy'
Posh1 2 3 4 5
'Neddy'
Posh1 2 3 4 5
'Neddy'
Posh1 2 3 4 5
'Neddy'
Posh1 2 3 4 5
'Neddy'
Posh1 2 3 4 5
'Neddy'
Posh1 2 3 4 5
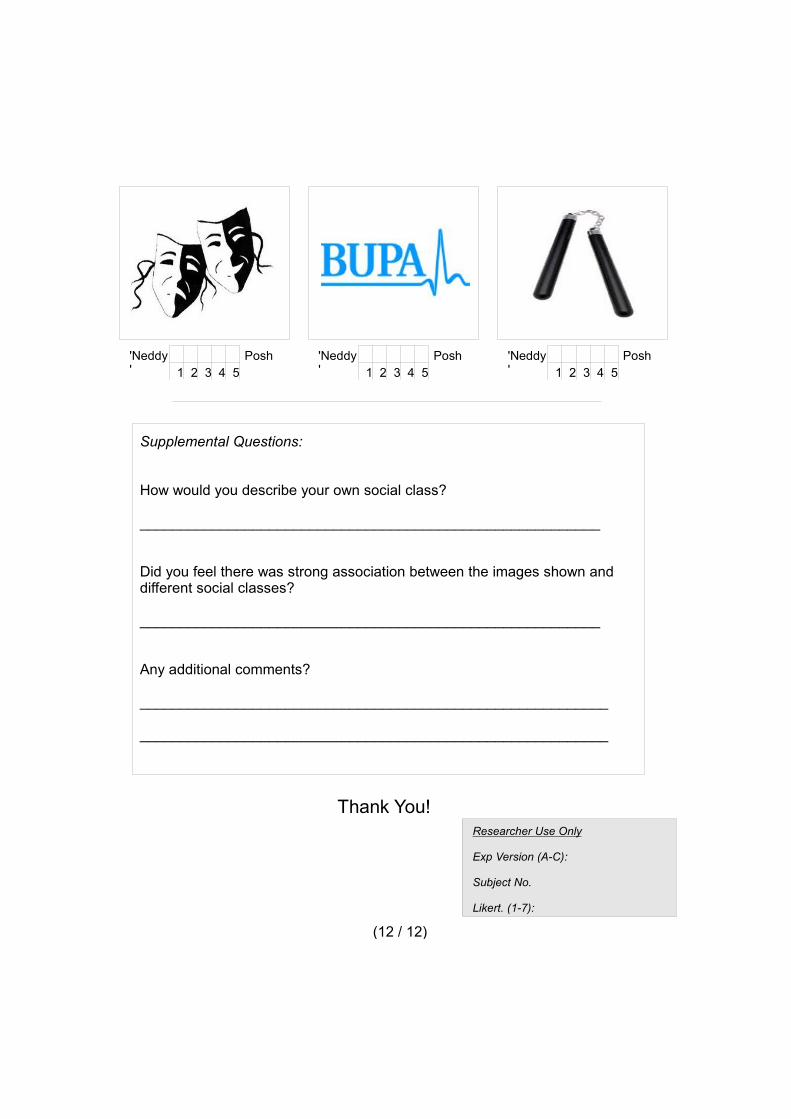
(12 / 12)
'Neddy'
Posh1 2 3 4 5
'Neddy'
Posh1 2 3 4 5
'Neddy'
Posh1 2 3 4 5
Thank You!Researcher Use Only
Exp Version (A-C):
Subject No. Likert. (1-7):
Supplemental Questions:
How would you describe your own social class?
_________________________________________________________
Did you feel there was strong association between the images shown and different social classes?
_________________________________________________________
Any additional comments?
__________________________________________________________
__________________________________________________________

.1.SOCIAL EVALUATION QUESTIONNAIRE
PILOT STUDY, EXPERIMENTS 1 AND 2 (UNRANDOMISED)
225

.2.VISUAL STIMULI
PILOT STUDY, EXPERIMENTS 1 AND 2
.2
Visual Stimuli
Pilot Study, Experiments 1 and 2
226

.2.VISUAL STIMULI
PILOT STUDY, EXPERIMENTS 1 AND 2
227


.3.WORD ASSOCIATION TASK
EXPERIMENT 3
.3
Word Association Task
Experiment 3
234

WORD ASSOCIATION TASK
Please read aloud the semantically related missing terms on each row, the first letter of each are provided for you. If you get stuck, please ask the experimenter for more letters.
Alcoholic One who drinks D _ _ _ _ _ _Ask for Demand O _ _ _ _Bags Wolf P _ _ _ Barbecue Toast G _ _ _ _Bin Carrier B _ _Bite Chew N _ _ _ _ _Bread Filling S _ _ _ _ _ _ _ Car Bus V _ _ _ _ _ _Car Garage M _ _ _ _ _ _ _Checkout Cashier T _ _ _ Consumer Customer S _ _ _ _ _ _ Dinner Food M _ _ _Dram Drink of choice T _ _ _ _ _Drink Swig G _ _ _Drink Container Metal H _ _ F _ _ _ _Eatable Food E _ _ _ _ _Food Light Meal S _ _ _ _ January Half-price S _ _ _Kilometer Yard M _ _ _Knife Spoon F _ _ _Labels Price T _ _ _ Lager Ale B _ _ _ Lettuce Caesar S _ _ _ _ Meal Food D _ _ _ _ _ Merit Medal B _ _ _ _Motor Cooking O _ _ Petrol Stove G _ _Pub Tavern B _ _Run Sprint D _ _ _Serviette Paper N _ _ _ _ _Shop Grocery S _ _ _ _Shopping Park R _ _ _ _ _Single Triple D _ _ _ _ _Sink Faucet T _ _Stacking Book S _ _ _ _Starve Famish H _ _ _ _ _Steering Tire W _ _ _ _Stick Shift G _ _ _Thanks To your health C _ _ _ _ _

Tie Collar S _ _ _ _Till Checkout C _ _ _ _ _ _Tin Soda C _ _Top-up Have Another R _ _ _ _ _Drive Guide S _ _ _ _Ultrasound X-Ray S _ _ _Vehicle Automobile C _ _ Wheel Rubber T _ _ _Window Pane G _ _ _ _

.3.WORD ASSOCIATION TASK
EXPERIMENT 3
237

.4.BRAND EVALUATION QUESTIONNAIRE
EXPERIMENT 3 (UNRANDOMISED)
.4
Brand Evaluation Questionnaire
Experiment 3 (Unrandomised)
238

more posh more posh more posh more posh
more posh more posh more posh more posh
more posh more posh more posh more posh
more posh more posh more posh more posh
more posh more posh more posh more posh

more posh more posh more posh more posh
more posh more posh more posh more posh
more posh more posh more posh more posh
more posh more posh more posh more posh
more posh more posh more posh more posh

more posh more posh more posh more posh
more posh more posh more posh more posh
more posh more posh more posh more posh
more posh more posh more posh more posh
more posh more posh more posh more posh

more posh more posh more posh more posh
more posh more posh more posh more posh
more posh more posh more posh more posh
more posh more posh more posh more posh
more posh more posh more posh more posh

.4.BRAND EVALUATION QUESTIONNAIRE
EXPERIMENT 3 (UNRANDOMISED)
243
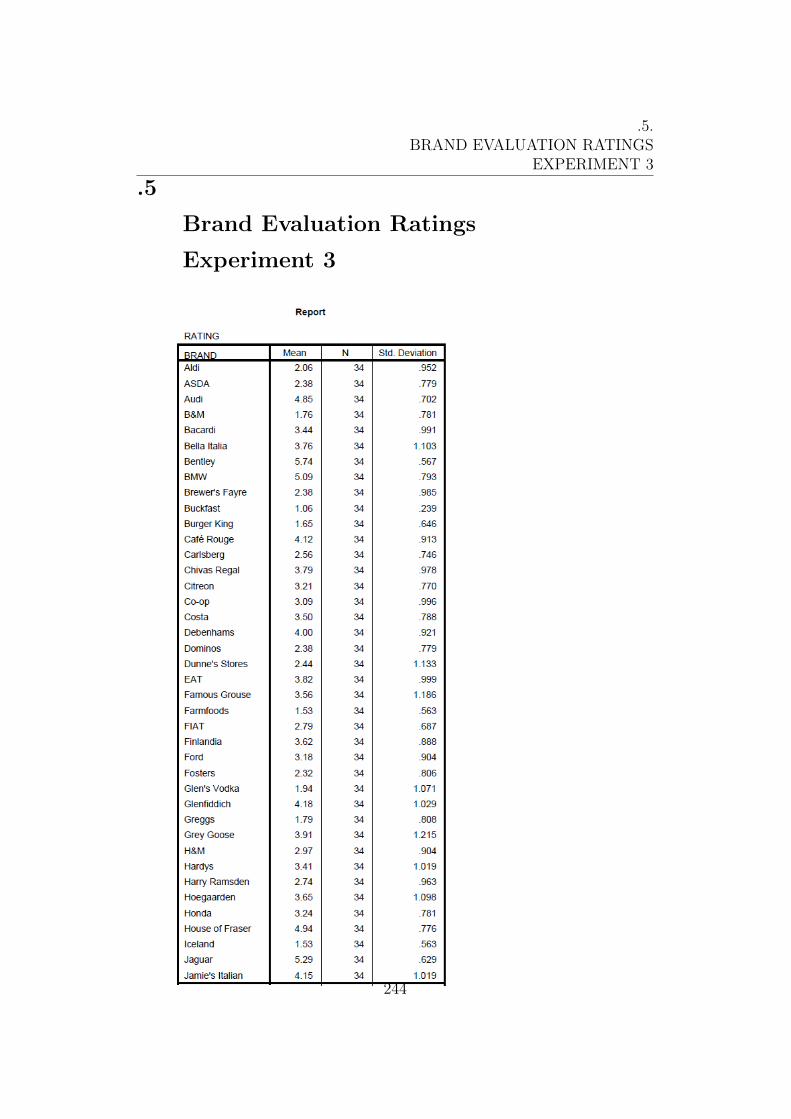
.5.BRAND EVALUATION RATINGS
EXPERIMENT 3
.5
Brand Evaluation Ratings
Experiment 3
244

Report
RATINGRATINGRATING
BRAND
RATING
Mean N Std. Deviation
Jim Beam
John Lewis
KFC
Kia
La Tasca
Laphroaig
Leffe
LIDL
Magners
Marks & Spencers
Matalan
Mazda
McDonalds
Mercedes Benz
Mitsubishi
Morrisons
Nandos
New Look
Nissan
Peckhams
Peugeot
Pizza Express
Pizza Hut
Porsche
Poundland
Pret a Manger
Primark
Punk IPA
Renault
River Island
Rolls Royce
Russian Standard
Sainsburys
SEAT
Skoda
Smart
Smirnoff
Starbucks
Stolichnaya
Strongbow
3.09 34 .900
4.65 34 .734
1.76 34 .654
2.79 34 .845
3.79 34 .914
4.79 34 1.008
3.88 34 1.200
1.62 34 .551
2.85 34 .892
4.29 34 .871
2.38 34 .985
3.38 34 .985
1.50 34 .663
5.15 34 .925
3.71 34 .871
2.59 34 .821
2.94 34 .886
2.74 34 .864
3.12 34 .844
4.59 34 1.131
3.24 34 .855
3.74 34 .864
2.38 34 .697
5.65 34 .544
1.09 34 .288
4.35 34 .884
1.56 34 .660
3.47 34 1.261
3.12 34 .808
3.62 34 1.074
5.88 34 .327
3.79 34 1.175
3.71 34 .938
3.24 34 .855
2.68 34 1.065
3.44 34 1.160
3.09 34 .965
3.59 34 .892
3.09 34 1.215
1.82 34 .869
3.03 34 .937
RATINGRATING
Page 2

Report
RATINGRATINGRATING
BRAND
RATING
Mean N Std. Deviation
Subara
Subway
Tennants
Tesco
TGI Fridays
TK Maxx
Toby Carvery
Toyota
Vladivar
Volkswagen
Volvo
Wagamama
Waitrose
Wetherspoons
Whyte & Mackay
Yo! Sushi
3.03 34 .937
2.38 34 .779
1.82 34 .716
2.79 34 .946
3.24 34 1.046
2.44 34 .786
2.21 34 .946
3.38 34 .779
3.24 34 .923
3.85 34 .821
3.53 34 .861
3.65 34 1.041
5.03 34 .904
2.32 34 .806
3.29 34 1.115
3.32 34 .878
RATINGRATING
Page 3

.5.BRAND EVALUATION RATINGS
EXPERIMENT 3
247

.6.VISUAL STIMULI
EXPERIMENT 3
.6
Visual Stimuli
Experiment 3
248

.6.VISUAL STIMULI
EXPERIMENT 3
249
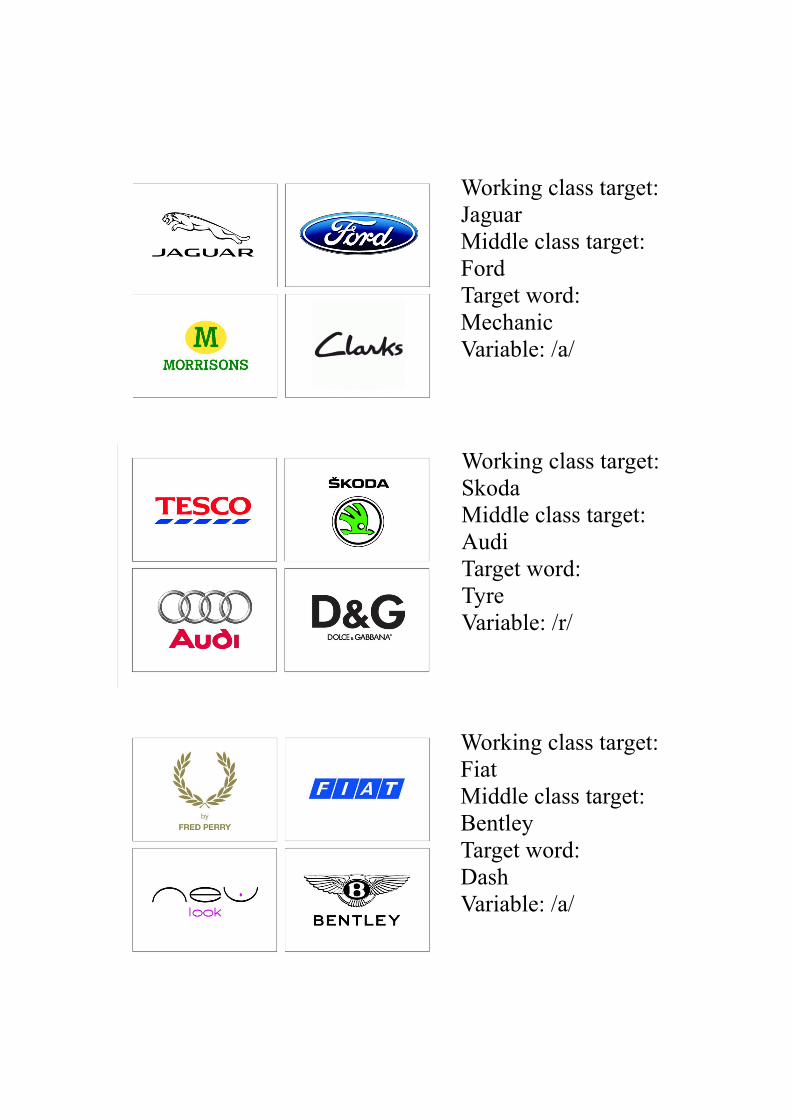
Working class target:
Jaguar
Middle class target:
Ford
Target word:
Mechanic
Variable: /a/
Working class target:
Skoda
Middle class target:
Audi
Target word:
Tyre
Variable: /r/
Working class target:
Fiat
Middle class target:
Bentley
Target word:
Dash
Variable: /a/

Working class target:
Kia
Middle class target:
Rolls Royce
Target word:
Car
Variable: /a/+/r/ (excluded from analysis)
Working class target:
Magners
Middle class target:
Glenfiddich
Target word:
Tipple
Variable: /l/
Working class target:
Strongbow
Middle class target:
Hardys
Target word:
Bar
Variable: /a/+/r/ (excluded from analysis)

Working class target:
Glen’s Vodka
Middle class target:
Whyte & Mackay
Target word:
HipFlask
Variable: /a/
Working class target:
Carlsberg
Middle class target:
Grey Goose
Target word:
Gulp
Variable: /l/
Working class target:
Foster
Middle class target:
Leffe
Target word:
Beer
Variable: /r/

Working class target:
Buckfast
Middle class target:
Jim Beam
Target word:
Glass
Variable: /a/
Working class target:
Tennants
Middle class target:
Laphroaig
Target word:
Refill
Variable: /l/
Working class target:
Toby Carvery
Middle class target:
Pizza Express
Target word:
Dinner
Variable: /r/

Working class target:
Wetherspoon
Middle class target:
Wagamama
Target word:
Snack
Variable: /a/
Working class target:
Brewer’s Fayre
Middle class target:
Bella Italia
Target word:
Grill
Variable: /l/
Working class target:
Subway
Middle class target:
La Tasca
Target word:
Hunger
Variable: /r/
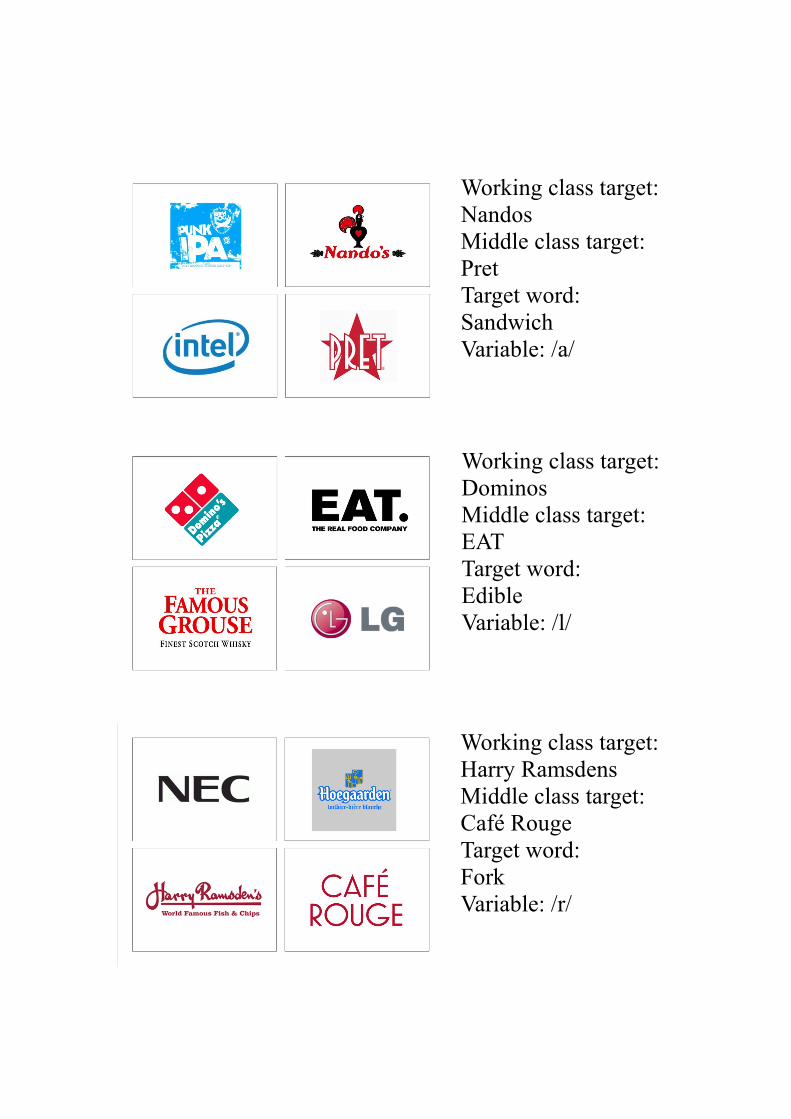
Working class target:
Nandos
Middle class target:
Pret
Target word:
Sandwich
Variable: /a/
Working class target:
Dominos
Middle class target:
EAT
Target word:
Edible
Variable: /l/
Working class target:
Harry Ramsdens
Middle class target:
Café Rouge
Target word:
Fork
Variable: /r/

Working class target:
McDonald’s
Middle class target:
TGI Fridays
Target word:
Salad
Variable: /a/
Working class target:
Pizza Hut
Middle class target:
Jamie’s Italian
Target word:
Meal
Variable: /l/
Working class target:
Burger King
Middle class target:
Yo Sushi
Target word:
Order
Variable: /r/

Working class target:
KFC
Middle class target:
Costa Coffee
Target word:
Napkin
Variable: /a/
Working class target:
Greggs
Middle class target:
Starbucks
Target word:
Nibble
Variable: /l/
Working class target:
Matalan
Middle class target:
Debenhams
Target word:
Shirt
Variable: /r/

Working class target:
Primark
Middle class target:
River Island
Target word:
Bag
Variable: /a/
Working class target:
LIDL
Middle class target:
Sainsbury’s
Target word:
Shelf
Variable: /l/
Working class target:
ALDI
Middle class target:
Marks & Spencer
Target word:
Store
Variable: /r/

Working class target:
ASDA
Middle class target:
Waitrose
Target word:
Pack
Variable: /a/
Working class target:
TK Maxx
Middle class target:
House of Fraser
Target word:
Till
Variable: /l/
Working class target:
B&M
Middle class target:
John Lewis
Target word:
Cashier
Variable: /a/+/r/ (excluded from analysis)

Working class target:
Poundland
Middle class target:
Peckham’s
Target word:
Scan
Variable: /a/
Working class target:
Farmfoods
Middle class target:
The Co-operative
Target word:
Retail
Variable: /l/
Working class target:
Iceland
Middle class target:
H&M
Target word:
Sale
Variable: /l/

.6.VISUAL STIMULI
EXPERIMENT 3
261

.7.SUBJECTIVE REACTION TEST FORM
EXPERIMENT 3
.7
Subjective Reaction Test Form
Experiment 3
262

.7.SUBJECTIVE REACTION TEST FORM
EXPERIMENT 3
263

.7.SUBJECTIVE REACTION TEST FORM
EXPERIMENT 3
264