
Geothermal district heating networks - University of Glasgow
Upload
khangminh22Category
view
2download
0
Glasgow Theses Service http://theses.gla.ac.uk/
Salaheldin, Salaheldin Ismail (1998) The implementation of material requirements planning (MRP) systems in Egyptian manufacturing companies: an empirical study. PhD thesis. http://theses.gla.ac.uk/6886/ Copyright and moral rights for this thesis are retained by the author A copy can be downloaded for personal non-commercial research or study, without prior permission or charge This thesis cannot be reproduced or quoted extensively from without first obtaining permission in writing from the Author The content must not be changed in any way or sold commercially in any format or medium without the formal permission of the Author When referring to this work, full bibliographic details including the author, title, awarding institution and date of the thesis must be given.

THE IMPLEMENTATION OF MATERIAL REQUIREMENTS
PLANNING (MRP) SYSTEMS IN EGYPTIAN MANUFACTURING
COMPANIES: AN EMPIRICAL STUDY
BY
SALAHELDIN ISMAIL SALAHELDIN
A THESIS SUBMITTED FOR THE DEGREE OF DOCTOR OF PHILOSOPHY (Ph. D. )
TO
THE DEPARTMENT OF MANAGEMENT STUDIES
UNIVERSITY OF GLASGOW BUSINESS SCHOOL
UNIVERSITY OF GLASGOW
GLASGOW, SCOTLAND UK.
JANUARY 1998

DEDICATION
TO
THE GREATEST LOVE IN MY LIFE
MY PARENTS
ABSTRACT
The new world economic conditions and increasing global competition have
changed the way in which manufacturing companies view production/operations
management and their role in achieving greater productivity, lower costs, operational
efficiency and better customer service. Several manufacturing planning and control
systems have been developed in order to enable manufacturers to meet these new
challenges. Material Requirements Planning System-MRP I and its extension
Manufacturing Resources Planning System-MRP II, the much proclaimed systems, have
gained wide acceptance from both academics and practitioners. The research presented here concentrates on the key issues of MRP practices and
the effectiveness of MRP systems. Evidence from the literature shows that over 60
percent of MRP I/MRP II users have failed to achieve the expected benefits. Also, a
review of the literature reveals that very little work has been done to provide
mathematical models to relate these benefits to their determinants. Furthermore, it reveals
that much was written about MRP practices based on case studies, but very few studies
survey-based have been conducted to investigate MRP implementation. None of these
studies was conducted in less developed countries. The researcher has attempted to fill some of these gaps in this study by posing
three key questions, namely: how have MRP systems been implemented in Egyptian
manufacturing companies?, what are the benefits obtained from these which have been
implemented?, and what are the explanatory variables of MRP systems effectiveness?. Accordingly, the objectives of the current study are threefold:
" To investigate MRP practices in Egyptian manufacturing companies.
" To assess the effectiveness of MRP practices measured by the benefits obtained from
MRP implementation based on the expectations and perceptions of MRP users in
Egyptian manufacturing companies.
" To explore and examine the explanatory variables of MRP systems effectiveness. This study has drawn on an extensive review of the literature and previous
empirical studies in western industrialised countries and in newly industrialised countries. The strategy used to achieve the research objectives involved quantitative analysis
of questionnaire data. Data for the study were collected by a postal questionnaire. One
questionnaire was sent out to each company within the Egyptian industrial ex-public
111

sector. Companies were asked if an MRP user in their organisations could respond (production manager or materials manager or inventory control manager or master
scheduler or management information systems manager). Of 200 questionnaires sent out,
123 replies were received, giving a response rate of 61.5%. Of the 123 replies, 93
respondents were usable giving a usable response rate of 46.5%: some unusable
responses were the result of a high proportion of missing values. The final usable sample
was broken-down into respondents from companies which had implemented MRP
systems and respondents from non-MRP companies (52: 41).
Extensive quantitative methods to analyse questionnaire data were used i. e. Frequency Analysis, Mean Value, Standard Deviation, Mann-Whitney test, T-test,
Kruskal Wallis, One Way Analysis of Variance (ANOVA), Paired T-test, Spearman's
Correlation Coefficient, Bartlett's test, K-M-O technique, Principal Component of Factor
Analysis, Eigenvalue criterion, Varimax Rotation technique, Skewness method, Cook's
Distance measure, Scatterplots method, Adjusted R2, OLS technique, Forward and Backward Stepwise strategies and ACE model (Alternating Conditional Expectation
technique). This study has provided important insights into the current situation and practices
related to rvRP users in Egypt. The main findings of this study indicated that MRP
practices in Egypt are relatively similar to those in the newly industrialised countries and in the west.
The findings of this research indicated that Egyptian users believe that the
expected benefits from MRP implementation have been obtained, though most of the
companies which have installed MRP are relative beginners. However, not all MRP users attained the same degree of MRP benefits.
Our findings indicated that the MRP benefit-determinant relationships take a non- linear form for several relationships. Knowledge of this non-linearity may be
advantageous for both MRP managers and users in order to manage these relationships
effectively for achieving the effectiveness of MRP practices. Finally, valuable implications have been drawn for managers and practitioners to
achieve more successful implementation of MRP systems.
iv

ACKNOWLEDGEMENTS
First of all, all praise to the Almighty God for enabling me to complete this work. I would like to extend my gratitude to a number of people for the help and
encouragement I received while undertaking this research. I am extremely grateful for the assistance I received from my supervisor,
Professor Arthur Francis head of Department of Management Studies and director of
research of University of Glasgow Business School whose constructive criticisms, advise
and support, constant encouragement, generosity with time and inspiring discussions. His
suggestions, comments and recommendations have been strongly effectual in giving this
thesis the shape it has acquired. From him, I have learned much about persistence that is
required of a researcher. To you Arthur I owe a debt of gratitude. I would like to extend my deepest gratitude to Dr Robert MacIntosh who has
been so helpful and friendly and has never hesitated in helping me in any way with my
research. Also my heartfelt thanks to all the staff of Department of Management Studies
who have been so friendly and for showing willingness to assist at all times.
No person gives me as much support as my sister "Nota". She deserves my
appreciation and unconditional love for being invisible force behind my hard work. Many friends are entitled to be mentioned a sign of acknowledgement of their help
support and good company over the years in Glasgow. They are: Dr Zakaria Saad and his
family and all of my colleagues in the Department of Management Studies. Many thanks, too, go to the Egyptian Government and my employer Faculty of
Commerce and Business Administration for the financial support provided to enable me to undertake this research.
To my wife Fooz, I must extend my deepest gratitude and appreciation for her
help, understanding, encouragement and forbearance during our stay in the United
Kingdom. In particular, in times of frustration it was indeed her cajoling, coaxing and
stimulating help that enabled me to keep working so hard in order to complete this
research. To you my wife all my heartfelt thanks.
Finally, many thanks go to my children Omar, Shaimaa, Zaharaa and Nada who
provided me with a warm and joyful atmosphere. Thank you very much my lovely
children.
V

TABLE OF CONTENTS
PRELIMINARIES PAGE
DEDICATION .................................................................................................... ii
ABSTRACT ...................................................................................................... iii
ACKNOWLEDGEMENTS ................................................................................. v
TABLE OF CONTENTS ................................................................................... vi
LIST OF FIGURES .......................................................................................... xiii
LIST OF TABLES ............................................................................................ xv
CHAPTER ONE: Introduction to the Study .................................................. 1 1.1 Introduction
.................................................................................................. 1 1.2 Rationale of the study ................................................................................... 1 1.3 Statement of research problems .....................................................................
5 1.4 Tasks of the study .........................................................................................
7 1.4.1 A conceptual model ............................................................................. 7 1.4.2 The state of MRP practices ..................................................................
7 1.4.3 MRP systems effectiveness ..................................................................
7 1.5 Significance of the study ............................................................................... 8
1.5.1 Personal level ...................................................................................... 8
1.5.2 Theoretical level .................................................................................. 8
1.5.3 Empirical level ..................................................................................... 9
1.5.4 National level ............................................ 9 .......................................... 1.5.5 Methodological level
........................................................................... 9 1.6 Contribution to current knowledge
............................................................... 10 1.7 Scope of the study ....................................................... 10 ................................. 1.7.1 Empirical
.............................................................. 11 ............................... 1.7.2 Descriptive ........................................................... 11 ............................... 1.7.3 Analytical-interpretative
....................................................................... 11 1.8 Organisation of the dissertation
..................................................................... 11 1.9 Summary ...................................................................................................... 13
CHAPTER TWO: MRP Systems Implementation Review of Related Literature and Research ..................... 14
2.1 Introduction .................................................................................................. 14
2.2 The new environment challenges for manufacturing ....................................... 15 2.3 Manufacturing planning & control system (MPC)
.......................................... 17 2.3.1 The significance of MPC system .......................................................... 17
vi

2.3.2 MPC system framework ...................................................................... 18
2.3.3 The role of MPC system ...................................................................... 20
2.3.4 MPC system responses to forces for change ......................................... 23 2.3.4.1 Requirements and Resources Planning Systems
(MW UMRP II) ........................................................................... 25
2.3.4.2 Just-in-time (JIT) system ............................................................. 30
2.3.4.3 Optimised Production Technology (OPT) .................................... 34
2.3.4.4 Comparison of MRP, JIT, and OPT .............................................
37
2.4 Why MRP systems? ...................................................................................... 39
2.5 Evolution of MRP systems ............................................................................ 42
2.5.1 Reorder Point Systems (ROP) .............................................................
43 2.5.1.1 Two-Bin System
.......................................................................... 44
2.5.1.2 The ABC Inventory System ......................................................... 44
2.5.2 Material Requirements Planning I ..... 46 2.5.3 Closed-Loop MRP
.............................................................................. 50
2.5.4 Manufacturing Resources Planning (MRP II) ....................................... 52
2.6 The state of practice of MRPIMRP II systems ............................................... 56
2.6.1 Promoting areas for MRP implementation ............................................
56 2.6.2 Factors that may impede Non-users to implement MRP systems.......... 58
2.7 The Effectiveness of MRP practices .............................................................. 59
2.7.1 MRP implementation benefits ..............................................................
60 2.7.1.1 Tangible benefits
.......................................................................... 60
2.7.2.2 Subjective benefits ....................................................................... 64
2.7.2 The key failings of MRP systems ......................................................... 74
2.8 Factors that influence MRP suitability and success of MRP implementation... 76 2.8.1 Uncertainty factors
.............................................................................. 77
2.8.1.1 Product characteristics diversity ...................................................
77 2.8.1.2 Amount of aggregate product demand
......................................... 78
2.8.1.3 Machine down time ..................................................................... 78
2.8.1.4 The standards of raw material .............................. '........................ 79
2.8.. 1.5. Behaviour of people within the factory .......................................
79 2.8.1.6 Reliability of plant within the factory walls ..................................
80 2.8.1.7 Capacity constraints .................................................................... 80
2.8.2 Organisational factors ......................................................................... 81
2.8.2.1 Company's age ............................................................................ 81 2.8.2.2 Company's size ........................................................................... 81 2.8.2.3 Type of products ......................................................................... 83 2.8.2.4 Type of manufacturing ................................................................
85 2.8.2.5 Company complexity ...................................................................
86 2.8.2.6 Organisational arrangements ........................................................ 87 2.8.2.7 Type of process (layout) ..............................................................
88 2.8.2.8 Organisational willingness ............................................................
90 2.8.3 Implementational factors
...................................................................... 90
vii

2.8.3.1 Length of time in implementation ................................................. 91 2.8.3.2 Implementation strategy ............................................................... 91 2.8.3.3 Initiator of MRP effort .................................................................
92 2.8.3.4 Data accuracy ..............................................................................
94 2.8.3.5 Vendor support ...........................................................................
96 2.8.3.6 Implementation problems .............................................................
97 4 Technological factors
........................................................................... 8 2 99 . . 2.8.4.1 Degree of integration between MRP modules .............................
99 2.8.4.2 Source of MRP system ................................................................
103 2.8.4.3 System installation costs ..............................................................
105 2.8.4.4 User Class
................................................................................... 106
2.8.4.5 MRP system features ...................................................................
107 2.8.5 Human factors
..................................................................................... 111
2.8.5.1 The previous experience with CAPM systems .............................. 112
2.8.5.2 Education and training ................................................................ 112
2.8.5.3 User involvement .........................................................................
114 2.8.5.4 User support ................................................................................
115 2.8.5.5 Degree of utilising NW outputs ..................................................
116 2.9 Summary
...................................................................................................... 116
CHAPTER THREE: The Manufacturing Sector of Egypt ............................ 123
3.1 Introduction .................................................................................................. 123
.............. 123 3.2 An overview of the manufacturing sector in Egypt........ ...................
3.2.1 The main subsectors within the Egyptian manufacturing sector............ 124 3.2.2 Manufacturing sector objectives ....................................... 3.2.3 The significance of the Egyptian manufacturing sector .........................
128 3.2.4 Trade in manufacturers ............................................................ _...........
129 3.2.5 The main production problems in the Egyptian manufacturing sector... 131
3.3 Computerisation in the Egyptian manufacturing sector .................................. 132
3.4 Summary and Conclusions ..................................................... 134 .......................
CHAPTER FOUR: Research Methodology ..................................................... 135 4.1 Introduction .................................................................................................. 135 4.2 Types of research design and research methods ............................................. 136
4.2.1 Types of research design ...................................................................... 136
4.2.1.1 Experimental design ..................................................................... 137
4.2.1.2 Case study design ........................................................................
137 4.2.1.3 Survey design
.............................................................................. 138
4.2.2 Research methods ................................................................................ 139
4.2.2.1 Questionnaire method .................................................................. 139 4.2.2.2 Interview method .........................................................................
140
VII'

4.2.2.3 Observation method ..................................................................... 141 4.2.2.4 Archival records method .............................................................. 141
4.3 Research design for the present study ............................................................ 142 4.3.1 Research questions and objectives ........................................................ 144
4.3.1.1 Research question ........................................................................ 144 4.3.1.2 Research objectives ..................................................................... 145
4.3.2 Determination of the research variables ................................................ 146
4.3.3 Formulation of the research hypotheses ................................................
148 4.3.3.1 Benefits obtained from MRP implementation
............................... 148
4.3.3.2 The MRP benefit-determinant relationships .................................. 148
4.3.4 Identification of the population for this study ....................................... 149
4.3.5 Development of the questionnaire ........................................................ 150
4.3.5.1 The type of questions ................................................................... 150
4.3.5.2 The validity of questionnaire ........................................................ 151
4.3.5.3 Identification of appropriate respondents ..................................... 153
4.3.5.4 The questionnaire ........................................................................ 153
4.3.6 Identification of the appropriate method for data collection .................. 156
4.3.6.1 Telephone survey ......................................................................... 157
4.3.6.2 Personal interview .......................................................................
157 4.3.6.3 Mail survey .................................................................................
157 4.3.7 Response rate ......................................................................................
158 4.3.7.1 Increasing response rate .......................... 4.3.7.2 Problems and limitations ..............................................................
161 4.3.8 Data analysis methods ..........................................................................
161 4 4 Summary 164
. ......................................................................................................
CHAPTER FIVE: Data Analysis- Current MRP Practices in Egypt ............. 166
5.1 Introduction ........................................................... 166 ....................................... 5.2 Company profile ........................................................................................... 168
5.2.1 Type of industry .................................................................................. 168
5.2.2 Company characteristics ...................................................................... 168 5.2.3 Company size ...................................................................................... 171 5.2.4 Product complexity .............................................................................. 172
5.3 Obstacles that impede MRP implementation in Egypt .................................... 173
5.4 Factors promoting MRP systems ................................................................... 174 5.5 Reasons for implementing MRP systems ..................... .................................. 175 5.6 Organisational arrangements for MRP implementation
.................................. 176 5.7 MRP implementation process ........................................................................ 178
5.7.1 Years in implementation ...................................................................... 178
5.7.2 Initiator of MRP effort ........................................................................ 179 5.7.3 Degree of data accuracy ...................................................................... 180
ix

5.7.4 Degree of vendor support .................................................................... 182 5.7.5 MRP implementation strategy .............................................................. 183 5.7.6 MRP implementation problems ....................................:....................... 183
5.8 MRP system characteristics ........................................................................... 185
5.8.1 Definition of MRP ............................................................................... 185
5.8.2 MRP system features ...........................................................................
186 5.8.3 Hardware and software ........................................................................
188 5.8.4 Degree of computerisation of MRP modules ........................................
189 5.8.5 Degree of integration
........................................................................... 190
5.9 MRP users profile ......................................................................................... 191
5.9.1 Previous experience ............................................................................. 191
5.9.2 MRP users support .............................................................................. 192
5.9.3 The degree of utilising the outputs of MRP systems ............................. 193
5.9.4 User involvement .................................................................................
194 5.10 The stage of MRP implementation
.............................................................. 195
5.11 Summary and conclusions ........................................................................... 198
CHAPTER SIX: Data Analysis- MRP Implementation Benefits ................... 201
6.1 Introduction ..................................................................................................
201
..................... 6 2 NW implementation benefits 204 . ................................................... 6.2.1 The objective benefits obtained from NW implementation ..................
205 6.2.1.1 The objective benefits obtained from NW implementation
of the total sample ....................................................................... 206
6.2.1.2 The extent of the improvements achieved from NW implementation in the individual industries
................................... 208
6.2.1.3 The variation between industries concerning NW performance measures scored by NW users ...............................
210 6.2.1.4 The progress achieved from NP implementation for
each of the five performance measures of the total sample.......... 212 6.2.1.5 Comparison with the previous studies .......................................... 213
6.2.2 The subjective benefits attained from NW implementation ..................
216 6.2.2.1 The subjective benefits perceived by NW users ...........................
217 6.2.2.2 The variation among NW users concerning the subjective
benefits perceived ........................................................................ 219 6.2.2.3 The degree of improvements on all subjective benefit measures
of NW implementation from points of view of NW users.......... 220 6.2.2.4 The extent of the subjective benefit perceived versus reasons
for implementing NW systems by manufacturing companies....... 221 6.2.2.5 Comparing the present research findings with the previous
studies ....................................................................................... 223
X
6.3 MRP implementation costs ............................................................................ 225 6.3.1 The analysis of the cost of MRP installation and the expected
substantial additional investment over the next three years ................... 225 6.3.2 The relationship between company size factors and MRP installation
costs .................................................................................................... 228 6.3.3 Comparison with previous studies ........................................................ 229
6.4 Summary and conclusions ............................................................................. 230
CHAPTER SEVEN: Data Analysis- The MRP Benefit-Determinant Relationships
.................................................................. 233 7.1 Introduction .................................................................................................. 233 7.2 A suggested model framework
..................................................................... 234 7.3 Factor Analysis (FA)
..................................................................................... 235 7.3.1 The appropriateness of running a Factor Analysis .................................
236 7.3.2 The number of common factors to be extracted .................................... 237
7.3.2.1 The number of factors to be extracted for MRP benefits .............. 238
7.3.2.2 The number of factors to be extracted for determinant variables... 239 7.3.3 The criteria for the significance of factors to be loaded
......................... 240
7.3.4 The constructed factors .......................................................................
240 7.3.5 Results of the Principal Components
.................................................... 243
7.4 Testing hypothesis using ACE technique ....................................................... 246
7.4.1 To decide whether a transformation is necessary .................................. 249
7.4.1.1 Theoretical consideration ............................................................. 249 7.4.1.2 Probabilistic reasons .................................................................... 249 7.4.1.3 Examining plots ............................ ............................................... 255
7.4.2 Evaluating an ACE's model capability ................ ........ 257
.......................... 7.4.3 Selecting the final models for MRP benefits ......................................... 258
7.4.4 The interpretation of ACE models for MRP benefits ............................
261 7.4.4.1 Inventory Turnover ..................................... 263 ................................ 7.4.4.2 Delivery Lead Time
................................. 266 .................................... 7.4.4.3 Percent of Time Meeting Delivery Promises ............................. 269
7.4.4.4 Percent of Split Orders .............................. 272 .................................. 7.4.4.5 Number of Expediters
................................. 275 ................................. 7 4 4 6O erational Effici . . . p ency ................................................................. 278 7.4.4.7 Co-ordination
.............................................................................. 281 7.4.4.8 Manufacturing Planning and Control
............................................ 283 7.4.4.9 Formal System
............................................................................. 286 7.4.4.10 Inventory Costs
......................................................................... 289 7.5 Summary and conclusions ............................................................................. 289
CHAPTER EIGHT: Conclusion and Recommendations ............................... 294 8.1 Introduction
............................................................................................ 294
xi

8.2 Main findings of the study ....................................................................... 297 8.2.1 Findings regarding the state of practice of MRP systems in Egyptian
manufacturing companies .................................................................... 298 8.2.2 Findings relating to the benefits obtained from MRP implementation
by Egyptian manufacturing companies ................................................. 301 8.2.3 Findings related to determinants of MRP benefits ................................. 301
8.3 Implications of the stud 305 8.4 Contributions of the study .............................................................................
310 8.4.1 Theoretical contributions .....................................................................
310 8.4.2 Practical contributions .........................................................................
312 8.5 Limitations of the study .................................................................................
313 8.6 Recommendations for further research ..........................................................
315 8.7 Summary ...................................................................................................... 317
BIBLIOGRAPHY 318 ........................... .................................................................. APPENDICES 338 :. ............................... .....:.................................................... ...... Appendix A: ................ ................................................. ...... 339
Appendix B: ....................................... ....................................................................... 349
Appendix C: 354 . ....................................... ............... ........................................................ Appendix D: ....................................... ....................................................................... 358
Appendix E .............................................................................................................. 370
X11

LIST OF FIGURES
Figure No. PAGE
Figure 2.1 Manufacturing Planning and Control system .................................... 20 Figure 2.2 The core system ..............................................................................
21 Figure 2.3 Evolutionary responses to forces for change .................................... 23 Figure 2.4 MRP system within MPC system ....................................................
30 Figure 2.5 Basic MRP I structure .....................................................................
49 Figure 2.6 Basic Closed-loop MRP
................................................................... 51
Figure 2.7 MRP II: integration of planning functions within the Closed- Loop ...............................................................................................
55 Figure 2.8 The old and new diamond of expectations from MRP systems.......... 69 Figure 2.9 Stock driven production ...................................................................
83
.......................................... Figure 2.10 Customer driven production .................
83 Figure 2.11 Conceptual model of MRP implementation
.................................... 119
Figure 2.12 A suggested model framework of the explanatory variables of MRP implementation benefits
.................................................... 121
Figure 3.1 Structure of GDP by sector of origin, 1975 and . 1992 ..................... 125
Figure 3.2 Structure of manufacturing Value Added (MVA), 1970 and 1992
........................................................................................ 125
Figure 3.3 Structure of manufacturing employment, 1990 ................................ 127
Figure 4.1 Study variables ............................................................................... 147
Figure 5.1 1995 Gross sales ............................................................................. 171
Figure 5.2 Organisational willingness to implement MRP systems reported by MRP users .............................................................................................. Figure 5.3 The growth of MRP users in Egypt
.................................................
177 178
Figure 5.4 The degree of integration among the MRP system modules rating's MRP users .............................................................................................. 190
Figure 5.5 The extent to which MRP users utilise the outputs of an MRP system .............................................................................. 193
Figure 5.6 People involvement in the implementation of MRP systems. 194 Figure 6.1 The current MRP investment (hardware, software and personnel
costs). Investment (L. E. 000) ........................................................ 226
Figure 6.2 An additional investment over the next 3 years (L. E. 000) .............. 227
Figure 7.1 The standard subjective benefit measures for MRP implementation. 244 Figure 7.2 The determinant variables affecting MRP implementation benefits... 244 Figure 7.3 Investigating the relationship between operational efficiency and
data accuracy factors with matrix Scatterplots ................................. 255 Figure 7.4 Investigating the relationship coordination and people support
factors with matrix Scatterplots ....................................................... 255
Figure 7.5 Transformations for Inventory Turnover ......................................... 262 Figure 7.6 Transformations for Delivery Lead Time ......................................... 265 Figure 7.7 Transformations for Percent of Delivery Promises ........................... 268 Figure 7.8 Transformations for Percent of Split Orders
.................................... 271
xiii

Figure 7.9 Transformations for Number of Expediters ..................................... 274
Figure 7.10 Transformations for Operational Efficiency ................................... 277
Figure 7.11 Transformations for Co-ordination ................................................ 280
Figure 7.12 Transformations for Manufacturing Planning & Control ................ 282
Figure 7.13 Transformations for Formal System .............................................. 285 Figure 7.14 Transformations for Inventory Costs
............................................. 288 Figure 8.1 A suggested model framework of determinant variables of MRP
implementation benefits .................................................................. 296
Figure 8.2 The relationship between vendor support and MRP user needs over time ........................................................................................ 303
xiv

LIST OF TABLES
Table No. PAGE
Table 2.1 Comparison of MRP, JIT, and OPT .................................................
38
Table 2.2 Increasing inventory turnover as a result of MRP implementation(sales/inventory) ........................................................
62 Table 2.3 Better delivery lead time as a result of MRP implementation
(days) ............................................................................................... 62
Table 2.4 Increasing percent of time meeting delivery promises as a result of MRP implementation (%)
............................................................. 63
Table 2.5 Reducing percent of orders requiring "splits" because of unavailable material as a result of MRP implementation % 63
Table 2.6 Reducing number of expediters as a result of MRP implementation (number of people) .............................
64 Table 3.1 Distribution of total employment among the Egyptian economic
sectors in 1992 (million) ................................................................... 126
Table 3.2 The main imports (E. L'000) .............................................................. 129
Table 3.3 The main exports (E. L'000) ............................................................. 130
Table 3.4 Public and private sector investment expenditure, 1982/1983-1991/1992-1996/1997 (Million L. E)
............................... 131
Table 4.1 Characteristics of Measurement Scales ............................................. 152
Table 4.2 Companies classified according to type of industry ........................... 159
Table 4.3 Distribution of responses achieved from MRP users by MRP users ................................................................................................
160
Table 4.4 Distribution of responses achieved from non-MRP companies ........................................................................................
160 Table 5.1 Company characteristics reported by the total sample .......................
170 Table 5.2 Number of employees and production & inventory control
employees in different contexts ......................................................... 171
Table 5.3 Number of Bill of Materials levels in different contexts ..................... 172
Table 5.4 The main obstacles that impede MRP implementation reported by non-MRP companies .......................................................................
173 Table 5.5 Factors promoting MRP in Egypt
..................................................... 174 Table 5.6 The reasons for implementing an MRP system in different contexts.. 175 Table 5.7 Organisational arrangements for implementing MRP systems
reported by MRP users .................................................................... 176
Table 5.8 Initiator of MRP effort in different contexts (% of companies).......... 179 Table 5.9 The importance of the degree of data accuracy reported by MRP
users in different contexts ................................................................. 180
Table 5.10 Vendor support reported by MRP users in different contexts.......... 182 Table 5.11 The implementation strategy used by the Egyptian manufacturing
companies ...................................................................................... 183
Table 5.12 MRP implementation problems reported by MRP users in different
contexts ......................................................................................... 184
xv

Table 5.13 Definition of term "MRP" reported by MRP users in different contexts (% of companies) ............................................................. 186
Table 5.14 NW system features in different contexts ...................................... 186 Table 5.15 Hardware and software of NW systems reported by NW
users of the total sample ................................................................. 189
Table 5.16 Degree of computerisation of MRP modules in different contexts... 189 Table 5.17 The previous experience with CAPM systems reported by NW
users of the total sample ................................................................. 191
Table 5.18 The formal training associated with NW implementation ............... 192 Table 5.19 Level of support of NW implementation by NW users in
different contexts ............................................................................ 193
Table 5.20 Industry and NW use classification profile .................................... 195
Table 5.21 NW Classification percentages of the sample firms in different contexts ............................................................................
197 Table 6.1 MRP performance measures reported by NW users of the
total sample ...................................................................................... 207
Table 6.2 Levels of MRP performance measures on average reported by industrial sector scored by MRP users ..............................................
208 Table 6.3 The extent of improvements achieved by industrial sectors scored by
NW users ....................................................................................... 209
Table 6.4 The achieved improvement versus the expected progress for each of the five performance measures for all NW companies .......................
213 Table 6.5 The comparison of the tangible benefits of NW systems
implementation in different contexts ..............................................:... 214
Table 6.6 The subjective benefits obtained from NW implementation reported by NW users of the total sample.. ......................................
218 Table 6.7 The major benefits attained versus reasons for implementing an
NW system ..................................................................................... 222
Table 6.8 The comparison of the subjective benefits of NW systems implementation in different contexts ................................................. 223
Table 6.9 Spearman's Correlation Coefficient between NW cost and the company size factors ........................................................................ .
228 Table 6.10 The comparison of the costs of NW systems installation in
different contexts (in $ 000) ............................................................ 229
Table 7.1 The framework of determinant variables of NW implementation benefits ............................................................................................ 234
Table 7.2 Number of factors extracted and the percentage of variance explained for subjective benefits ......................................................... 238
Table 7.3 Number of factors extracted and the percentage of variance explained for determinant variables ................................................... 239
Table 7.4 Subjective benefit measures factor loadings ...................................... 241
Table 7.5 Determinant variables factor loadings ............................................... 242
Table 7.6 Statistics to depict the significance of Skewness ............................... 251 Table 7.7 Influence measures (Cook's Distance) .............................................. 254 Table 7.8 The ACE models for NW benefits ................................................... 260
xvi

CHAPTER ONE
Introduction to the Study
1.1 Introduction
This research aims to investigate the state of practice of MRP' systems in
Egyptian manufacturing companies, to assess the effectiveness of MRP practices
measured by the benefits obtained from MRP implementation, and to explore & examine
a set of the explanatory variables of MRP systems effectiveness i. e. uncertainty,
organisational, implementational, technological, and human determinant variables in
Egyptian manufacturing companies.
To do that, a model framework including both the explanatory variables and MRP
benefits is suggested, current MRP practices in Egypt are investigated, testing if
significant differences exist among MRP users regarding the benefits obtained from MRP
implementation, then regression models to relate the key determinant variables
(independent) to MRP implementation benefits (dependent variables) are developed.
The main objective of this chapter is to acquaint the reader with the general
outlook of the study. So, the second section identifies the rationale of the study, the third
section states the problems of this study, the fourth section delineates the major tasks of
the current study, the fifth section states its significance, the sixth section provides the
1 The term "MRP" is used in this study to include all versions of MRP systems (i. e. Material Requirements Planning (MRP I), Closed-loop MRP, and Manufacturing Resource Planning (MRP II)) because the only concern here is with the implementational issues in terms of the state of practice of M RP systems and its effectiveness as in Schroeder et al. (1981); Duchessi et al. (1988); Cooper and Zmud (1989; 1990); Turbide (1990); Ptak (1991); Sandeep (1992); Vollmann et al. (1992); Dilworth (1993); Sum and Yang (1993); Sum et al. (1995) and Browne et al. (1996).

main contribution of the study, the seventh section specifies its scope, the eighth section
states the structure of the thesis and the last section provides a summary of this chapter.
1.2 Rationale of the study
Many factors characterise today's manufacturing environment such as: increased
product variety, intensifying global competition, changing social expectations and rapid
advancement of manufacturing technology (Ang et al., 1995; Browne et al., 1996; Carrie
et al., 1997).
Accordingly, manufacturing companies find themselves in a totally changed
environment, so they must improve both their products and their productivity, and which
means making their manufacturing processes more efficient and effective to remain
competitive.
An important factor for improving these processes is production control (Cooper
and Zmud, 1989). A variety of information systems to support production control such as
Material Requirements Planning (MRP I) & Manufacturing Resources Planning (MRP
II), Just -in-Time (JIT) and Optimised Production Technology (OPT) have been
developed to replace the traditional reorder point-based information systems.
Materials Requirements Planning (MRP I) and its extension Manufacturing
Resources Planning (MRP II), have both gained the acceptance from academics and
practitioners as important factors for improving manufacturing processes (Goh, 1984;
Aggarwal, 1985; Cooper and Zmud, 1989; Sandeep, 1992; Newman & Sridharan, 1992;
Turbide, 1995; Browne et al., 1996; Robertson et al., 1996; Lunn, 1996; John and
Charlotte, 1996; Carrie et al., 1997).
2

However, there is a reported dissatisfaction with MRP/MRP II use by the
implementers. Duchessi et al. (1989) reported that there have been numerous failures in
implementing MRP/MRP II, with consequent financial loses and disruption of operations.
Furthermore, Aggarwal (1985); Fintech (1989); Sandeep (1992) and Hill (1993),
reported that despite the huge investments in MRP systems, over 60 percent of
MRP/MRP II users have failed to achieve the expected benefits. In the same way,
Browne et al. stated:
"Only a very small percentage of users of MRP consider themselves to be
successfully operating their MRP systems. Many systems are installed, as
opposed to implemented, i. e. the formal system is not the real system" (1996, P. 188).
Also, the literature review reveals that there are numerous studies that have dealt
with various aspects of MRP implementation. However, very few studies have been done
to assess the effectiveness of MRP practices measured by the benefits obtained from the
implementation of MRP systems within manufacturing companies (Schroeder et al.,
1981; White et al., 1984; Anderson and Schroeder, 1984; Sum and Yang, 1993). Besides,
very little work has been done to specify and measure all possible explanatory variables
of MRP systems effectiveness (Duchessi et al., 1988; Sum et al., 1995).
However, most of these studies are based upon case studies or personal
experience, namely empirical studies on MRP practices have been limited (Duchessi et
al., 1989; Sum and Yang, 1993; Ang et al., 1995). The problem with case studies is that
the failures are rarely documented because the authors are typically employees of (or
3

consultants to) the companies described in the cases (Bums et al., 1991), as such the
lessons may not be applicable in other cases (Ang et al., 1995).
The literature review reveals that previous studies were conducted either in
developed countries such as the US (Schroeder et al, 1981; White et al., 1984; Anderson
and Schroeder, 1984; Duchessi et al., 1988; 1989) or in the newly industrialised countries
such as Singapore (Sum and Yang, 1993; Ang et al., 1995; Sum et al., 1995).
A new era of transformation process in Egypt is the core for its economic reform-
transformation from losing to winning companies. This transformation increases the
importance of the function of production management, where the future holds enormous
opportunities and challenges for production management. Furthermore, at national level,
Egypt faces increasing regional and international competition, while at operational level,
in most manufacturing companies the following statements sound familiar: "we have got
too much inventory... we are not as a competitive as we used to be... we are losing
market share". In most cases this stems from manufacturing companies not making the
right things at the right time. In response, manufacturing companies should make their
processes more efficient and effective. To do so, many manufacturing companies in
Egypt have implemented, are implementing or are considering the implementation of
MRP systems.
However, as pointed out by Per-lind (1991), Egyptian manufacturing companies
which have decided to acquire new technology such as MRP systems have had limited
success in implementing it. For instance, he mentioned that 70% of all installed
computers can be regarded as not optimally utilised. Also, he claimed that it is not
4

unusual to have an effective utilisation of 5-10 percent and it has even happened that
computers are unused for two and three years.
Accordingly, this study aims to fill some of the gap relating to the scarcity of
empirical studies concerning MRP practices; the effectiveness of MRP implementation
measured by the benefits obtained from MRP practices is assessed, and also the MRP
benefit-determinant relationships are explored and examined. This is based upon the data
collected from MRP users within the manufacturing sector of Egypt.
1.3 Statement of research problems
Taking into account the above discussion, the main conclusion has been that in
spite of the fact that empirical studies regarding the state of practice of MRP systems
permit managers, current users, potential users, and vendors of MRP systems to obtain a
better understanding of the implementation of MRP systems and allow researchers to
proceed with the task of developing and testing theories of MRP implementation, the
literature review reveals that studies which have been done to investigate MRP practices
based upon survey are relatively few compared to those conducted on a case study base
whether in developed countries such as the US or in the newly industrialising countries
such as Singapore.
In spite of the growing popularity of MRP systems, no study has been conducted
which provides empirical evidence to monitor the state of MRP practices in Egypt.
Despite the fact that a very small percentage of users of MRP consider themselves
to be successfully operating their MRP systems, there is a scarcity of empirical evidence
5

that assesses the effectiveness of MRP practices measured by the benefits obtained from
the implementation of MRP systems within manufacturing companies.
In spite of the fact that studies concerned with specification and measurement of
all the possible explanatory variables of MRP systems effectiveness may help both MRP
managers and users to focus on key areas to achieve the expected potential benefits that
match their companies goals and to improve the efficiency of MRP implementation and
allow researchers to examine certain hypotheses regarding MRP practices, no study has
been conducted which provides empirical evidence about the correlation of all of the
following factors (i. e. uncertainty, organisational, implementational, technological, and
human factors) with the benefits obtained from MRP implementation.
Even though there is a growing volume of literature on the implementation of
MRP systems in developed countries and the newly industrialising countries, no
comprehensive and systematic research has been done to investigate the state of practice
of MRP systems, its effectiveness measured by the benefits attained, and to specify and
measure all the possible explanatory variables of such effectiveness in one study.
Accordingly, there are three questions that need to be investigated concerning
MRP implementation in Egyptian manufacturing companies:
" How have MRP systems been implemented?,
. what are the benefits obtained from these which have been implemented, and
" What are the explanatory variables of MRP systems effectiveness?.
6

1.4 Tasks of the study
Correspondingly, to reply to the previous mentioned questions the tasks of this
study were evolved as follows:
1.4.1 A conceptual model
To suggest a conceptual model which provides a greater understanding of the
issue under investigation and to develop a theoretical model framework concerning the
key determinant variables of MRP benefits.
1.4.2 The state of MRP practices
To detect and outline the state of practice of MRP implementation which can be
accomplished by covering several key issues, such as: MRP company profile (i. e. size and
age, type of manufacturing system, type of manufacturing process and layout), MRP
systems characteristics (i. e. hardware and software, degree of computerisation, degree of
integration, system features, MRP definitions), the stage of MRP implementation (i. e.
user class), initiators of MRP (i. e. those who introduce MRP to the company e. g., top
management, production managers, vendors etc. ), MRP implementation problems, MRP
systems growth, factors that may impede non-users to implement _ MRP systems and
finally the main areas for promoting MRP systems based on points of view of MRP users
within the Egyptian manufacturing companies.
1.4.3 MRP systems effectiveness
To assess the effectiveness of MRP practices measured by the benefits obtained
from MRP implementation based on the expectations and perceptions of MRP users and
7

to explore and examine the MRP benefit-determinant relationships in Egyptian
manufacturing companies.
1.5 Significance of the study
Accordingly, the importance of this research was drawn at various levels as we
will mention below:
1.5.1 Personal level
(1) To the best of the researcher's knowledge, this is the first study to address the issue of
MRP practices and its effectiveness measured by the benefits obtained from MRP
implementation in a less developed country. It adds to this issue by investigating the
impact of a set of uncertainty, organisational, implementational, technological, and
human factors on the effectiveness of MRP implementation measured by the benefits
obtained by the Egyptian users, and this can be claimed to be one of its main aims of
significance.
1.5.2 Theoretical level
(1) A conceptual model was developed in this study to outline the successive stages
should be taken into account for investigating the state of NW practices and its
effectiveness. The study considered the extent to which uncertainty, organisational,
implementational, technological, and human factors affect this effectiveness.
(2) It is hoped that the body of the literature will contribute in providing useful
information which may help in filling the gap of the literature review relating to the
critical factors that influence MRP implementation.
8

1.5.3 Empirical level
(1) Even though the empirical results concerning the MRP benefit-determinant
relationships developed by Sum et al. (1995) are encouraging, the authors still call for a
great deal of further research to be done. Replications of their work are needed to
corroborate the results. This research attempts to do that. While the previous study only
investigated the relationships between a set of organisational, technological and
implementational variables and MRP benefits, this research has extended these variables
to include the uncertainty and human variables.
(2) It is the first empirical study that tests to what extent the implementation of N1RP
systems is affected by the uncertainty factors.
1.5.4 National level
(1) As far as the researcher is aware, this research reports on the first extensive study on
the state of practice of MRP systems in less developed countries in general, and in Egypt
in particular.
(2) It is expected that the government policy makers and other MRP promoters in
Egyptian industrial sector can take advantage of the empirical results of this study to
formulate the relevant strategies and programs to sustain the Egyptian manufacturing
sector to increase their use of MRP systems.
1.5.5 Methodological level
(1) It develops a series of mathematical models using the Alternating Conditional
Expectation (ACE) method as an advanced statistical technique that increases the model
fit by approximating the optimal transformations for the dependent variables (MRP
9

benefits) and independent variables (uncertainty, organisational, implementational,
technological and human factors).
1.6 Contribution to current knowledge
This study contributes to what is currently a very limited amount of empirical
research (survey) on MRP implementation. And also, it contributes to what is currently a
limited amount of empirical evidence to explore and investigate all the possible
explanatory variables for MRP systems effectiveness. As a contribution to the academic
work, the current study develops a conceptual model which may help to investigate these
issues.
Furthermore, this study uses a novel method (ACE technique) to investigate the
benefit-determinant relationships in implementing MRP, providing valuable insights. for
managers and practitioners hoping to achieve successful implementation of MRP
systems.
1.7 Scope of the study
The current study based upon points of view of MRP users (i. e. the production
managers, materials managers, inventory control managers, master scheduler and
management information system managers) has attempted to provide better understanding
of the state of practice of MRP systems and which may help to judge its effectiveness in
less developed countries. Within this prospective the scope of this research is empirical,
descriptive and an analytical interpretative as shown in detail below:
10

1.7.1 Empirical
The empirical characteristic of this study is derived from its main objectives, that
is the methodical and systematic investigation to detect and outline the state of MRP
practices, to assess its effectiveness and to explore and examine the possible explanatory
variables of MRP systems effectiveness in Egyptian manufacturing companies.
1.7.2 Descriptive
Also, this study is descriptive because it has relied on an extensive literature
review for developing a model framework with respect to the determinant variables of
the benefits obtained from MRP implementation.
1.7.3 Analytical-interpretative
Finally, it is an analytical-interpretative study for making a comparison between
the preceding studies which were applied in developed countries or the newly
industrialised countries concerning the implementation of MRP systems and the data
which are generated by this study.
1.8 Organisation of the dissertation
Following this introduction, # Chapter two (Literature review) investigates the
appropriate literature, discusses the new environment challenges for manufacturing, the
role of manufacturing planning and control system for helping manufacturing companies
to face these challenges, highlighting its responses to forces for change reflected in
providing new production management systems such as MRP, JIT and OPT systems, and
the nature of the implementation of MRP systems (concepts, motivations, and evolution).
It presents a major emphasis on the benefits obtained from MRP implementation, a set of
11

uncertainty, organisational, implementational, technological, and human determinant
variables affecting MRP implementation and the benefits obtained from such
implementation and finally shows a suggested conceptual model which has been
employed to fulfil the objectives of the study.
# Chapter three (The manufacturing sector of Egypt) is designed to acquaint the
reader about the main features and performance of the Egyptian industrial sector.
# Chapter four (Research methodology) provides the research methodology
designed to investigate the major objectives of the current research through describing
the steps that are used in carrying it out. These steps are designed as a bridge between
the theoretical framework and the empirical findings.
# Chapter five (Data analysis: Current MRP practices in Egypt) is devoted to
presenting a discussion of the field research findings related to investigating the state of
practice of MRP systems.
# Chapter six (Data analysis: The benefits obtained from MRP implementation
and the costs spent on MRP installation) is devoted to presenting a discussion of the field
research findings related to investigating the tangible and subjective benefits obtained
from MRP implementation, in addition to the costs spent on MRP installation.
# Chapter seven (Data analysis: The MRP benefit-determinant relationships) is
devoted to presenting a discussion of the field research findings related to investigating
the relationship between the uncertainty, organisational, implementational, technological,
and human determinant variables and the benefits obtained from MRP implementation.
12

# Chapter eight (Conclusions and recommendations for further research) gives a
summary of the main findings of the study, shows main implications of the study, presents
the theoretical contributions to the literature in general and the empirical contributions to
MRP managers and users in the Egyptian industrial sector in particular, states limitations
of the study and finally suggests a number of proposals are as a springboard for further
research.
1.9 Summary
Having conducted a thorough search in the literature, areas lacking research
efforts are identified. The current study proposes a model framework and mathematical
models to relate the benefits obtained from MRP implementation and the determinant
variables that influence them. Moreover, it presents a useful comparative data for
academics. In addition, as a contribution to the practitioners, the study provides summary
statistics of the state of practice of MRP systems in Egypt, and also highlights the
determinant variables of MRP implementation benefits.
13

CHAPTER TWO
MRP Systems Implementation
Review of Related Literature and Research
2.1 Introduction
The aim of this chap-'er is threefold. It aims first to outline the main characteristics
of the new business environment facing industrial companies. Second, it briefly presents
the significance of manufacturing planning and control system within manufacturing
companies. Lastly, it provides information on the state of practice of an MRP system and
its effectiveness highlighting the expected potential benefits and the actual benefits
obtained from MRP and the critical factors that influence MRP suitability and success of
MRP implementation as in Duchessi et al. (1988); Sum and Yang (1993) and Sum et al.
(1995).
The second section of this chapter presents an introduction to the subject of the
new environment challenges for manufacturing. The third section begins with the
significance of manufacturing planning and control system, the general framework of it,
its role, and concludes with MPC responses to forces for change highlighting the most
popular new production management systems that have been implemented by
manufacturing companies in order to satisfy the new needs of business. The fourth
section shows how MRP systems are still number one regarding their widespread
implementation. The fifth section presents the evolution of MRP systems. The sixth
section gives a general notion about the MRP systems in such a manner that clarifies the
state of practice of MRP systems, presenting the main barriers that impede the
14

implementation of MRP systems by non-users and the main areas for promoting MRP
systems. The seventh section shows the effectiveness of &W practices highlighting the
expected potential benefits and the actual benefits obtained from MRP implementation
(tangible benefits -improved performance and intangible benefits-users satisfaction), and
concludes with indicating the key failings of MRP systems. The eighth section. presents
the critical factors that influence MRP suitability and success of MRP implementation.
The last section presents an extensive summary of the issue under investigation followed
by presenting the gaps need to be empirically investigated by undertaking the current
study, then illustrating a conceptual model framework which might provide a greater
understanding of the subject matter and a suggested model framework of the explanatory
variables of MRP effectiveness.
2.2 The new environment challenges for manufacturing
There are many factors that may have a fundamental impact on today's
manufacturing environment these include: improved IT capabilities, new production
management approaches, increased product variety, changing manufacturing costs
patterns, changing social expectations, rapid growth of processes and materials and
increasing the need to respond rapidly to customer requirements (Maly, 1988;
Chamberlain and Thomas, 1995; Ang et al., 1995; Strzelczak, 1995; Browne et al., 1996;
Titone, 1996; Carrie et al., 1997).
Jewitt (1995) has pointed out that throughout the 90s, manufacturing industry
will be asked to reply to an augmenting set of threats and opportunities, for instance, the
need to prove that products and processes are environmentally-friendly will be derived
15
from customer and demand, the advance of technology will continue to affect products
and the manufacturing process, relationships with supplier will be very significant, and
the competition will increase.
This dramatic change in the business environment led to increasing
"manufacturing dilemma" and which has been reflected in two main problems: the first, is
the variety and great complexity of products, materials, technology, machines, and people
skills (Plossl, 1995), and the second, is increasing the uncertainty as a result of
unpredictable behaviour of customers and suppliers outside the business and unreliability
of behaviour of people and plant within the company (Puttick, 1987).
Accordingly, manufacturing companies struggle to cope with this changed
environment, through improving both their products and their productivity or optimise
their uses of tools and resources. This means making their processes more efficient and
effective to remain competitive as a matter of survival.
Putterill et al. (1996) concluded that manufacturing companies need to improve
their manufacturing operations in order to achieve the required improvements in business
performance. This has been frequently attained through adopting Computer Aided
Production Management - CAPM such as MRP systems (Corke, 1985; Sandeep, 1992;
Carrie et al., 1997) which hold the promise for significant improvements in everything
from quality to cost, quantity, delivery, speed and accuracy. One of the most important
functional areas of the application of CAPM is manufacturing planning and control area
(Paul and Suresh, 1991; Gerwin and Kolodny, 1992).
16

Hence, the next section (2.3) is devoted to discuss briefly the importance of
manufacturing planning and control systems that may enable manufacturing companies to
match changes of their business, followed by the discussion and the presentation of the
most popular manufacturing planning and control systems in last three decades.
2.3 Manufacturing planning & control system (MPC)
The previous section revealed that there are several changes and needs
challenging manufacturing companies. Under modern manufacturing pressures,
manufacturing planning and control systems are required together with clearly defined
objectives, rules, and the like in order to enable manufacturing companies to achieve their
goals quickly and comprehensively or to trace the developments in business environment
(Paul and Suresh, 1991). Therefore, it is interesting to determine the importance of MPC,
its functions, its activities, and to present its developments in order to confront changes
of business from time to time. These are viewed below:
2.3.1 The significance of MPC system
Vollmann et al. (1992) defined manufacturing planning and control system as a
source of information to effectively manage the flow of materials, effectively utilise
people and equipment, co-ordinate internal activities with those of suppliers, and
communicate with customers about market requirements.
Likewise, Hill stated that production planning and control is "the development of
schedules to achieve timely delivery of finished products. It requires a knowledge of each
component, of time estimates for each process, and the capacity (usually in hours) of
each machine or work centre. This knowledge is essential since schedules list when each
17

component should be processed on each work centre so that the product can be
assembled and delivered on time, and meet sales and distribution targets" (1994, p. 127).
More significantly, Vollmann et al. (1992) pointed out that several management
activities are supported by MPC system, some of them are: plan capacity requirements
and readiness to meet marketplace needs, plan to assure that the required materials will
arrive on time in the right quantities, maintain appropriate inventories of raw materials,
work in process, and finished goods in the right locations, schedule production activities
so people and equipment are working on the correct things, track material, people,
customers' orders, equipment, and other resources in the factory, meet customer
requirements in a dynamic environment, and provide information to other functions on
the physical and financial implications of the manufacturing activities.
In the broadest sense, the goal of MPC system is to support the strategy and
tactics pursued by the company in which they are implemented.
2.3.2 MPC system framework
If manufacturing companies aim to carry out MPC system activities in accordance
with their marketplace's requirements (and this may be different from one company to
another or from time to time for the same company) it is both interesting and helpful to
show a general framework model of manufacturing planning and control (MPC) system
which has been suggested by Vollmann et al. (1992). They classified the activities of the
MPC system framework into three groups of activities namely, the front, the engine and
backend activities.
18

(1) The front activities represent the planning and preparation activities. Demand
management represents forecasting, order promising and other activities that place
demand requirements on manufacturing capacities. These demand requirements are
evaluated for resources and translated into workable Master Production Schedule. The
MPS is the disaggregated version of the production plan, which provides the production
input to the company game plan and determines the manufacturing role in this agreed-
upon strategic plan. Resource planning provides the basis for managing the match
between manufacturing plans and capacity.
(2) The engine activities are the central mechanism for MPC. It is concerned with the
detailed material planning which directly depends upon the master production schedule.
This material plan can be utilised in the detailed capacity planning to compute labour or
machine centre capacity required to manufacture all the component parts. These plans are
the specific guides for implementation in the backend- the supplier and the production
line.
(3) The backend activities represent the execution activities which often end with the
measurement of actual results. These three phases for manufacturing planning and control
are depicted in Figure 2.1 below:
19

Resource ýI Production Demand planning planning Management
Ater Production Front end Scheduling
___________________________t_-___________-__________
Detailed capacity planning
Shop-floor systems
Detailed planning
Material and capacity plans Engine
------ ------------------------
Vendor Back end systems
Figure 2.1 Manufacturing Planning and Control system (Quoted from Vollmann et al.,
1992: P. 5).
It is worth mentioning here that it is not necessarily that all of these activities
must accomplished in any manufacturing company, but there must be at least front-end,
engine, and back-end activities.
2.3.3 The role of MPC system
Plossl (1995) has confirmed the above significant role of MPC by saying that
there are three functions of manufacturing planning and control:
" Developing a sound game plan. This requires two sets of numbers: first, a Production
Plan (long term) and, second, Master Production Schedules (short term).
20

" Offering an adequate capacity needed to support the game plan.
" Helping to correct priorities by producing the right things at the right time in the
required quantities.
Furthermore, he said that there are six questions representing a universal logic
that underlies all manufacturing, they are: What is to be made?, How many, and when are
they needed?, What resources are required to do this?, Which are already available?,
Which others will be available in time?, and What more will be needed, and when?.
The first two questions are answered by business and marketing strategies. But
the answers for last four questions are provided by manufacturing planning control
systems. More specifically, the significant relationship between manufacturing planning
and control system and strategic and business planning is illustrated in Figure 2.2 below:
Business Planning
Production Planning
Master Rough-Cut Production Capac. Reqt Scheduling Planning
Material Capacity Requirements Requirements
Planning Planning
Priority ----------I
Capacity Control Control
Figure 2.2 The core system (Adopted from Plossl, 1995: P. 2).
21

Figure 2.2 reveals the core system linking strategic, business and production
planning. Strategic plans cover long horizons and include strategies for type of products
and the marketplaces entered. Business plans have a shorter horizon concentrate on
product families to meet strategic goals, and define the market the company serves (Goh,
1984). Production plans are more detailed than strategic and business plans and cover
manufacturing facilities needed to support both strategic and business plans and they
specify the quantities of products and amounts of resources which include capital,
employment and skills, plant and equipment. Plossl added the structure of the core
planning system integrates five basic elements utilising techniques common to all
manufacturing:
1. Master production schedule (MPS)- which is used to develop the data showing which
products must be produced, how many, and when. These data are restricted by the
strategic, business, and production plans and drive all detailed operating plans.
2. Material requirements planning (NW)- which determines the quantities of materials
needed to support the MPS and when they should be scheduled.
3. Capacity requirements planning (CRP), which helps evaluate the resources (people,
machines, etc. ) needed to support the MPS and Rough-Cut- Capacity Planning (RCCP)
which involves a quick check on a few key resources required to implement the MPS in
order to ensure that it is feasible from a capacity viewpoint (Browne et al., 1996).
4. Production activity control (PAC)- which is used to evaluate the performance in the
material/priority execution phase, by comparing it to plans.
22

5. Input and output capacity control (I/O)- whereas the actual capacities are compared to
plans and signals sent for actions needed.
2.3.4 MPC system responses to forces for change
As pointed out in section 2.2 the business environment is continuously changing.
Therefore, manufacturing companies should adjust their strategies as a reaction to these
developing needs. In response to these changes and needs, the development of new
paradigms, principles and expectations for industrial management was originated on an
equal footing (Strzelczak, 1995). Consequently, several approaches to production
planning and control such as Material Requirements Planning and Manufacturing
Resources Planning(MRP I/ NW II), Just-in-Time (JIT), and Optimised Production
Technology (OPT) systems have been developed and publicised over the past three
decades. Figure 2.3 shows typical MPC responses to forces for change below:
Forces for Change
Technology Products Processes Systems Techniques
Marketplace dictates
Company strategy
Manufacturing strategy
Manufacturing processes
MPC System
Typical Responses
Shorter product life cycle Time-based competition
Quality requirements
Flexibility/responsiveness Reduced overhead costs
Automation Production cells Simplification
MRP JIT OPT
Figure 2.3 Evolutionary responses to forces for change (Adopted from Vollmann et al., 1992: P. 10).
23

Figure 2.3 indicates that manufacturing companies should change their strategies
to respond changes in marketplace, which in turn often call for changes in manufacturing
strategy, manufacturing processes, and MPC systems. The main implication can be
extracted from Figure 2.3 that MPC system should be evolved to meet changing
requirements in the market, products and manufacturing processes in harmony with the
company's game plan.
This confirms that MPC is a dynamic field that will continue to evolve from time
to time in order to fulfil manufacturing companies needs for instance offering advanced
and quality products, fulfilment of customer needs and faster delivery times (Manthou et
al., 1996). Therefore, the next subsections are intended to shed some light on new
developments for manufacturing planning and control (MPC) systems that comes from
nearly all of the field studies, to understand the difference among them, and to present to
what extent manufacturing company may find itself in trouble for deciding in which
system it will select in order to match its business needs.
In summary, there is some consensus among researchers within the operations
management area such as Aggarwal (1985); Ptak (1991); Giauque & Sawaya (1992);
Newman & Sridharan (1992); Vollman et al. (1992) and Browne et al. (1996), that
Requirements Planning Systems (Materials Requirements Planning-MRP I and
Manufacturing Resources Planning-NW II), Just-in-time (JIT) and Optimised
Production Technology (OPT) have been considered as the most common systems that
have invaded operations planning and control in quick succession one after the other.
24

These systems can ease the work-load of planning and control, enable new
schedules to be quickly calculated, and Work-In-Process to be decreased (Hill, 1994).
2.3.4.1 Requirements and Resources Planning Systems (MRP I/MRP 11)
MRP originated in the early 1960s in the United States as a computerised
approach to the planning of materials and production by manufacturing "gurus" such as
Orlicky, Plossl and Wight. This system was based on some insights into production
planning that were different from prevailing thought at that time. MRP developed the
concept of dependent demand for components and subassemblies to plan production and
reduce inventories, while the accepted concepts were on the Economic Order Quantities
(EOQ) and other mathematical tools (Wight, 1981).
In studying MRP systems, one can discern easily that there are three levels for
MRP definitions. MRP can be defined generally as primarily computerised
materials/production planning and control systems integrated with other business areas to
achieve a total business system. It can be defined in narrow sense as a computerised
materials/production planning and control system for production only (Sum and Yang,
1993).
In general terms, MRP is essentially a "push system" or "order launching system"
which is designed to push materials and work in progress (WIP) according to master plan
by work orders (Dibono, 1997) or which transforms a master schedule of end products
into parts requirements (Sandeep, 1992). But it has to be supplemented by "pull" systems
or expediting in order to get orders completed when they are needed (Plossl, 1995).
25

2.3.4.1.1 Goals and significance of MRP systems
The overall objectives of MRP system are the reduction of inventory investments,
the improvement of work flow, the reduction of shortages of materials and components,
and the achievement of more reliable delivery schedules.
According to Aggarwal (1985) the goal of materials requirements planning
(MRP) is to raise service and response to customers while reducing inventory investment.
This system helps purchasing and production departments to move the right amount of
materials at the right time to production-distribution stages and enables managers to
track orders through the whole manufacturing process.
Sum and Yang (1993) reported in their study regarding MRP practices on 128
companies in Singapore that the main reasons for the implementation of MRP system
were: inventory control, production control, improved productivity, lower inventory cost,
improved competitive position, improved quality of products, increased throughput, and
to meet delivery dates better.
All in all, Lockyer et al. (1989); Schroeder (1993); Dilworth (1993) and
Krajewski & Ritzman (1996), argue that Material Requirements Planning - MRP I is still
one of the popular methods of production control used by manufacturing companies.
In direct contrast, Burbidge (1989) believed that MRP was fundamentally a poor
solution to the production control problem. By adopting Group Technology -GT i. e. the
analysis and comparison of items to group them together and standardise them into
families with similar design characteristics and requiring similar machine operations,
organisations could divide one large production control problem into a series of similar,
26

more manageable problems with each group becoming almost independent of the others.
He therefore advocated a combination of GT and period batch control (PBC). The key to
using GT successfully is the ability to identify readily items within the same family
(Lockyer et al., 1989).
A review of the literature reveals that the benefits usually claimed for GT are
reduction in the production planning time for jobs, a reduction in materials handling and
in- process inventory because most of the families goes through a common sequence of
nearby work stations, an increase in coordination of jobs because many of the operations
can be followed visually, and also a reduction in setup time and the investment needed for
holding fixtures and other tooling (Burbidge, 1989; Lockyer et al., 1989; Dilworth,
1993).
2.3.4.1.2 Assumptions and requirements of MRP systems
Ptak (1991) has pointed out that Mite requires that individual lead times are fixed
and known, processes independence of manufactured items, and all components of an
assembly are needed at the time of the assembly order release.
Related to the MRP prerequisites Plossl (1995) added that MRP needs support
from other subsystems, including: customer order processing, process information, open
manufacturing order tracking, open purchase order tracking, inventory transaction
handling, and production reporting.
MRP assumes that every worker, whether operator, quality inspector, planner,
salesman, analyst, or purchasing agent is strictly trained about feeding up dates into the
system. Without such adherence, the memory of MRP system starts to accumulate errors
27

concerning inventory in stock, quantities needed, and when items are needed. And also,
everyone dealing with the MRP system have to make all their decisions based on the data
offered by the system at every step (Aggarwal, 1985). Furthermore, it assumes that the
lead time is determined in advance of the schedule and is independent of the batch size
(Browne et al., 1996).
Guide and Ghiselli (1995) reported that before implementing any MPC such as
MRP, JIT, and OPT, three basic elements must be in place: an inventory control system,
bills of material, and accurate routings for parts/components.
Sandeep stated that MRP systems are based on three main assumptions to derive
orders:
" "The master production schedule is realistic and stable. Unrealistic and unstable
schedules will lead to a mismatch between demand and production.
9 The lead time for each part number is usually fixed and independent of the lot size and
any external influences such as shop load, production route etc..
9 The manufacturing capacity is infinite during the order generation process.
Consequently, it ignores the total work load on individual work centres i. e. it assumes
that what is scheduled will be produced on time" (1992, p. 26).
In general terms, there are several assumptions made in NW- based planning and
control programs. Some of them are explicit and the others are implicit. They are: every
inventory should move into and out of stock, all components of an assembly are required
at the time at which an assembly order is released, components are disbursed and used in
28

different lots, and each manufactured item can be processed independently of any other
(Plossl, 1995).
2.3.4.1.3 MRP in an MPC system framework
According to Vollmann et al. (1992) MRP represents a central issue when
companies start to develop their MPC systems. Figure 2.4 shows that MRP system can
work in all three areas in the general MPC system namely, the front end, the engine and
the back end.
In the front end of the MPC system, MRP plays a vital role for offering the
detailed planning process for components to support the MPS which represents the core
of this phase of the general MPC system. In the engine section, MRP system is vital to all
activities in this portion of the general MPC framework. It provides a detailed material
planning, also it helps for the anticipated time-phased set of master production schedule
requirements which means that the requirements will be stated on a unique period-by-
period basis, rather than aggregated or averaged, and the previous data can be used as
input for developing capacity plans.
Moreover, the back end section deals with shop-floor scheduling of the company
and with managing materials coming from vendor and which depend to a great degree on
the outputs of MRP systems.
29
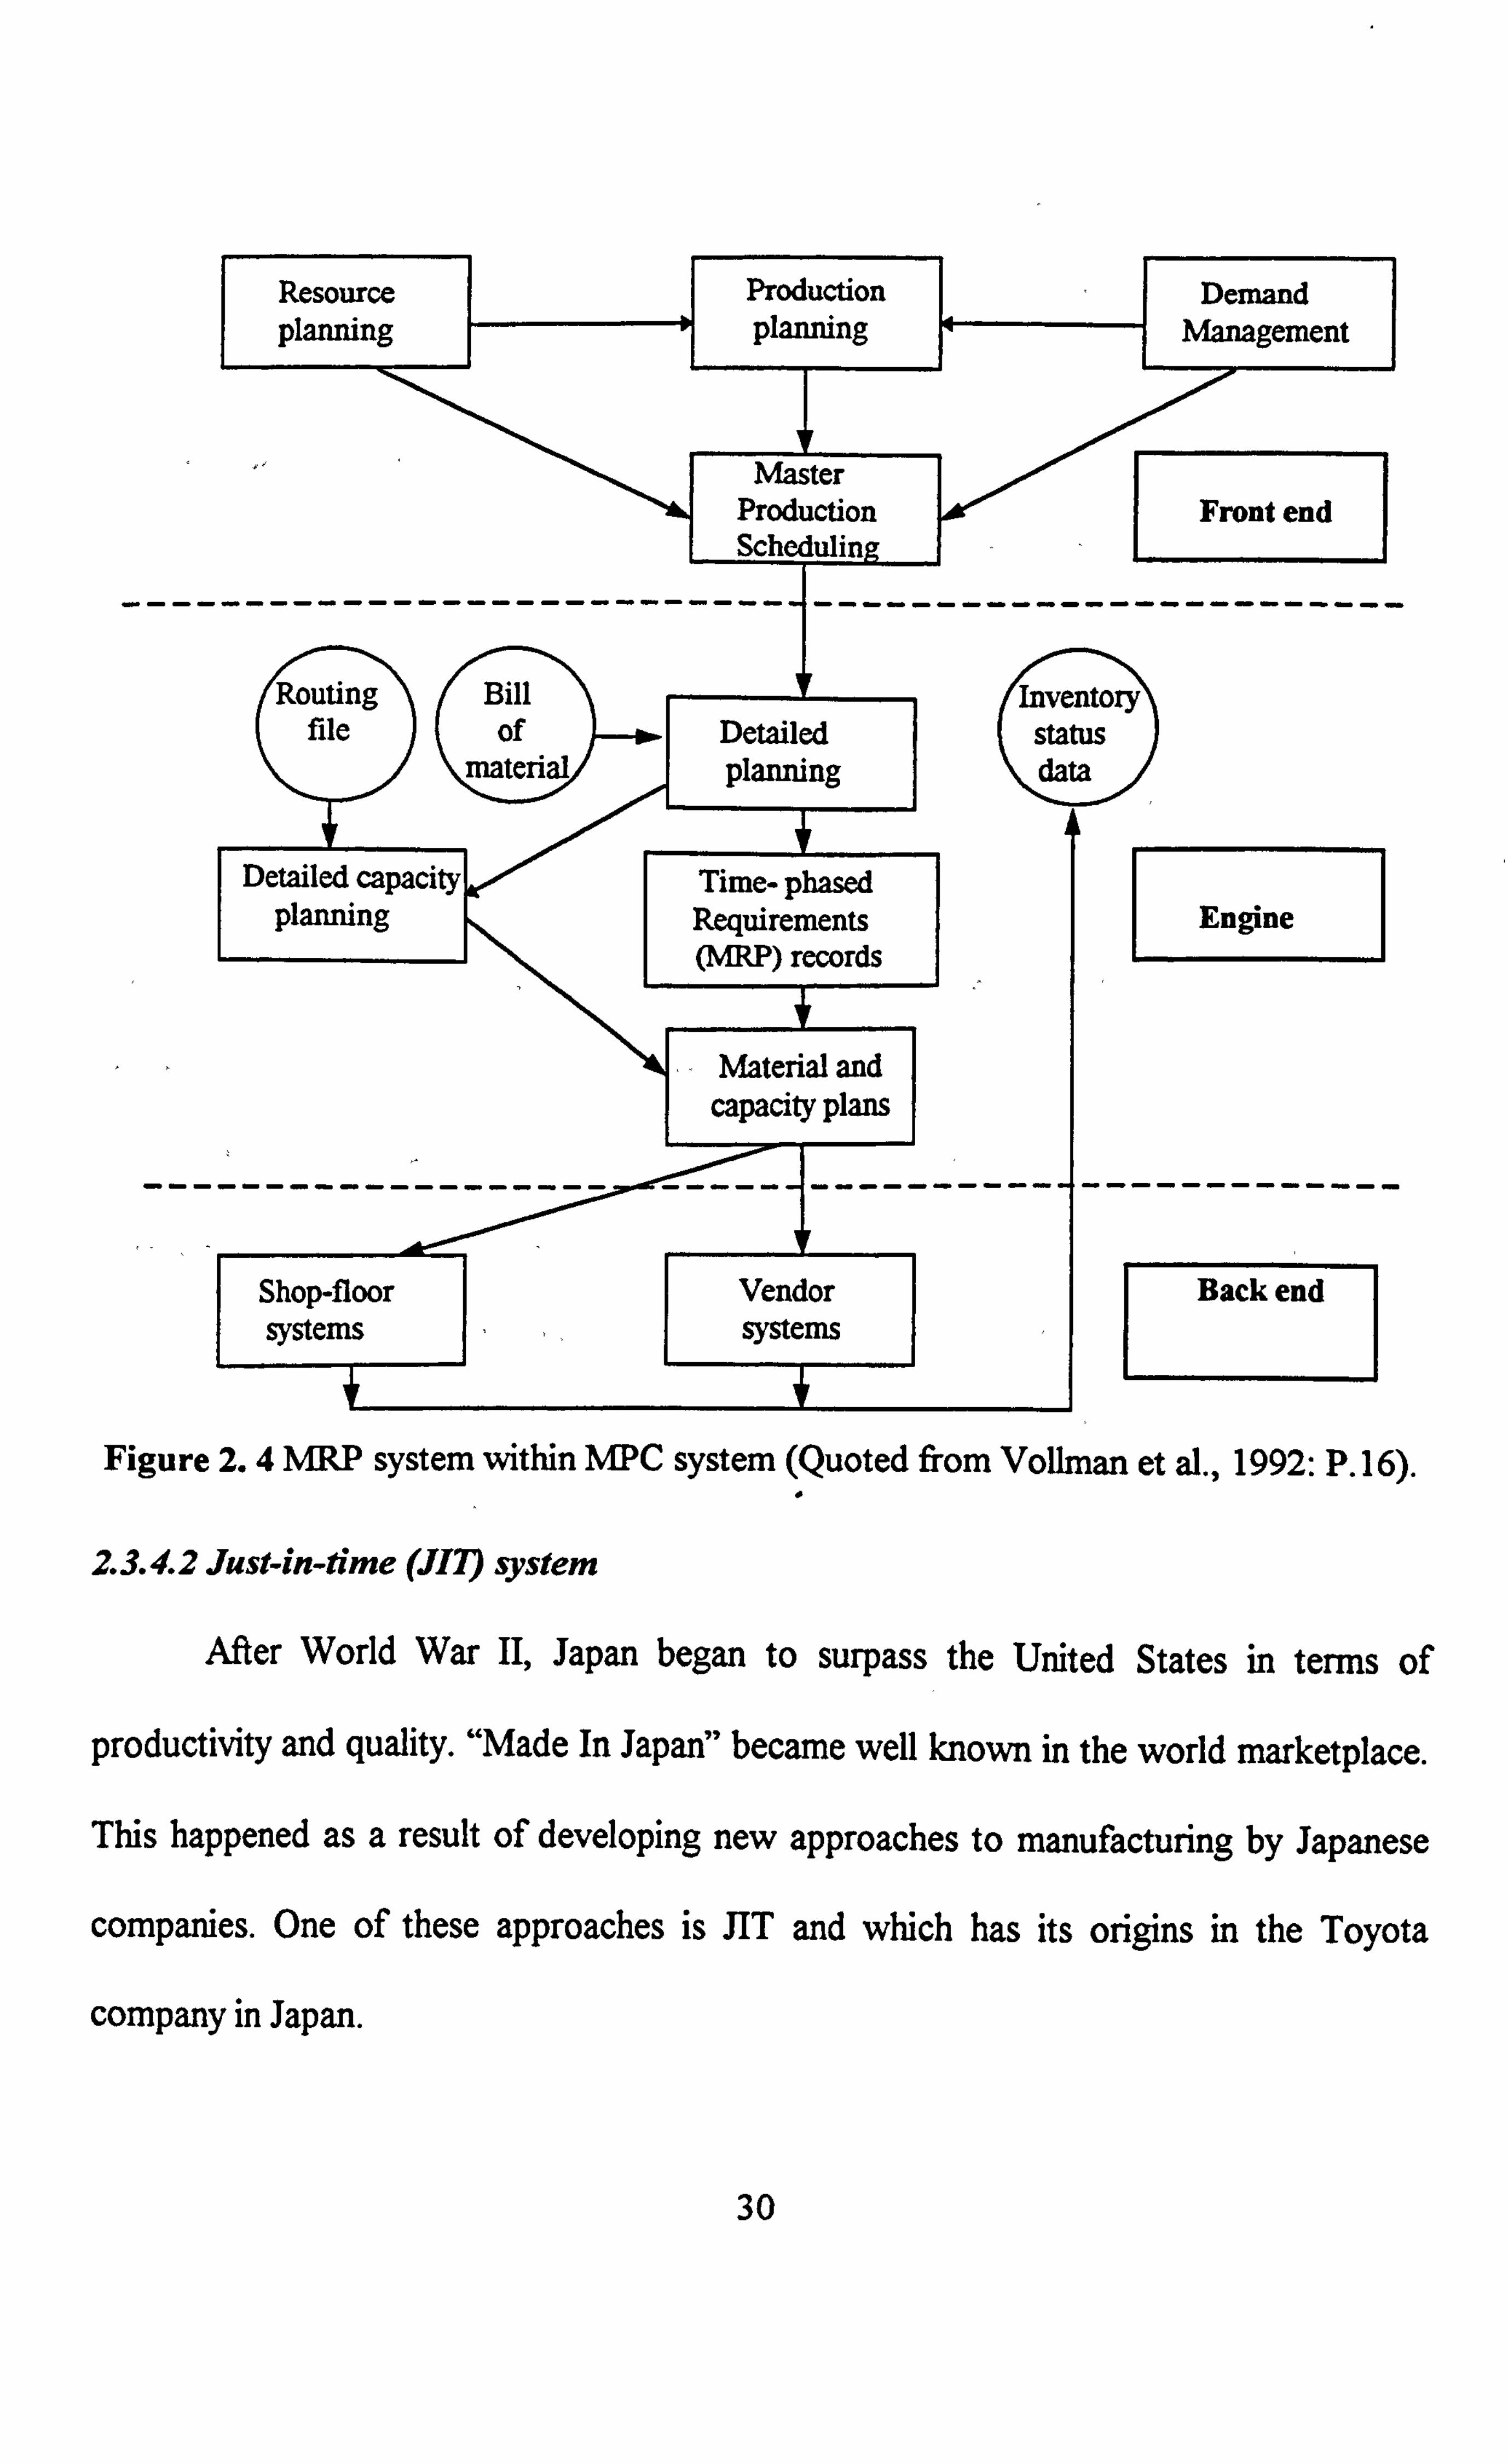
Resource Production Demand planning planning 14 -ý Management
Master Production Front end Scheduling
Routing Bill Inventory file of Detailed status
material planning data
Detailed capacity Time- phased planning Requirements Engine
(MRP) records
Material and capacity plans
------------------- ----- ------------------------
Shop-floor Vendor Back end systems systems
Figure 2.4 MRP system within MPC system (Quoted from Vollman et al., 1992: P. 16).
2.3.4.2 Just-in-time (JIT) system
After World War II, Japan began to surpass the United States in terms of
productivity and quality. "Made In Japan" became well known in the world marketplace.
This happened as a result of developing new approaches to manufacturing by Japanese
companies. One of these approaches is JIT and which has its origins in the Toyota
company in Japan.
30

In the 60s, Toyota worked on developing new approaches to manufacturing
stimulated by the "oil crisis" of the 60s. By 1972 this new approach had begun to attract
wide attention in Japan and in the mid 70s other Japanese companies began to experiment
with and adopt them. But the approach was called the "Toyota Manufacturing System",
and for some time later it was known as JIT. By the end of the 70s this system had begun
to attract attention in the west.
Therefore, an attempt was conducted by several writers to clear up the term "JIT"
whether in a narrow sense or in a broad sense. Matsuura et al. (1995) pointed out that
JIT in a narrow sense, means an operations management system (Toyota Production
System) which is featured as a mixed model assembly line fed with parts using Kanban
system (sign boards) in shop floor control. In a wide sense, JIT means a manufacturing
philosophy toward improving efficiency in manufacturing system through the absolute
elimination of waste along with continuous improvement and workers's involvement.
Golhar et al. (1990) and Jewitt (1995), reported that the major barriers that may
impede the successful implementation of JIT system may stem back from: poor
knowledge about 7IT, unreliable delivery schedule, failure to appreciate the importance of
people for the successful implementation, lack of vendor involvement, poor training and
communications, inability to manage change, changes in layout of machinery and
operations, and lack of top management commitment.
2.3.4.2.1 Goals and significance of JIT
A major objective of JIT implementation is to have the right item at the right
place at the right time (Dilworth, 1993), and which is same for all MPC systems. As
31

pointed out by several writers such as Crawford and Cox (1991) and Wild (1996), the
significance of JIT implementation stems back into: improving delivery and quality
performance, reducing inventories and WIP, reducing space requirement, shorter
throughput times, smoother work flows, improving customer service, achieving on-time
delivery of a quality product therefore, market share and profit will be increased,
achieving greater productivity and the reduction in process variation.
Golhar et al. (1990) reported in their study about JIT implementation in 32 small
manufacturing firms (less than 500 employees) located in the Midwest of the US, that the
implementation of JIT led to a reduction in raw materials, work-in-process, and finished
goods inventory were 80%, 58%, and 56%, respectively. Also, they reported an
improvement in the quality of finished product and a decrease in the number of
complaints concerning quality and delivery.
Furthermore, Sohal and Naylor (1992) have conducted a case study concerning
the implementation of JIT in a small manufacturing firm in the US. The results indicate
that the implementation of JIT led to achieving several benefits. Some of them are:
reducing the throughput time from ten days to three days and which was reflected in
better customer service, both sales and profits increased approximately 30%, inventory
level was reduced by at least 60%, and WIP was reduced substantially.
More specifically, Browne et al. stated that JIT seeks to achieve the following
objectives "1) zero defects, 2) zero inventories, 3) zero handling, 4) zero set-up time, 5)
zero breakdowns, 6) zero lead time, and lot size of one" (1996, p. 218).
32
2.3.4.2.2 Requirements and assumptions of JIT
Helms (1990); Vora et al. (1990) and Jewitt (1995), have pointed out several
requirements for the successful implementation of JIT system, they are:
" Understanding what JIT is really about and what is not
" Getting top management commitment
" Preparing people through training to accept ongoing programme of continuos
improvements
" Using a pilot project before implementing JIT system
Furthermore, Wild (1996) has summed up the requirements for effective JIT in:
demand stability, vendor reliability (to ensure reliable supply), good communications,
preventive maintenance, total quality control, management commitment, employees
involvement, worker flexibility and low variety of items being processed.
2.3.4.2.3 JIT in MPC system framework
According to Vollmann et al. (1992) the JIT system relates to the three areas in
MPC framework (front end, engine, and back end). In the back end area, JIT makes
major improvements such as reducing costs of detailed shop scheduling, a significant
reduction in work in process and lead times, and achieving better vendor scheduling. In
the engine area, it plays a vital role in reducing the number of parts planned and the
number of levels in the bill of materials (BOM) and which is reflected in reduction in the
complexity of detailed materials planning. Also, in the front end, JIT has some impacts.
The implementation of JIT system requires production plans and master
production schedules that provide degree of level capacity loading which is necessary for
33
1Q
smooth shop operations. This will lead to stable schedules and a reduction in lead times.
Within JIT environment companies follow marketing strategy make to order or assemble
to order instead of make to stock which may enable them to respond customers orders.
This in turn can impact on demand management activities in the front end area.
2.3.4.3 Optimised Production Technology (OPT)
OPT has its origins in Israel from the very beginning of the 80s, when Israeli
physicist Eliyahu Goldratt was examining the goals and procedures in manufacturing
organisations. His recommendations for action were presented in easily understood book
(The Goal). This book introduced a new philosophy termed OPT (Optimised Production
Technology), which emphasised on the main goal of a manufacturing companies -How
To Make Money (Ptak, 1991).
Matsuura et al. (1995) had concluded in their study that OPT is understood by
Japanese users as technique which utilises the OPT software package in scheduling. It is
connected with finite loading which makes clear the relationship between scheduling and
capacity availability. It starts with a specified capacity level for each work centre or
resource grouping, this capacity is then allocated to work orders. Therefore, it can be
considered as method for scheduling work orders (Vollmann et al., 1992).
On the other hand, it is understood as developing the capacity to prevent
bottlenecks and controlling the capacity and materials flow for increasing the capacity
utilisation of bottlenecks by Finnish users (Matsuura et al., 1995). In the aggregate, can
be considered from two points of view, first, the OPT approach to manufacturing and
planning control and second, the OPT software product.
34

2.3.4.3.1 Goals and significance of OPT
According to Aggarwal (1985) and Dilworth (1993), an objectives of OPT
system are to maximise the use of critical resources namely, maximise utilisation of the
bottlenecks and minimise WIP inventories and lead times through synchronising the flow
of items through a factory. It helps manufacturing companies to determine priorities for
each operation using a weighted function involving a number of important criteria such
as: due dates, necessary safety stock and use of bottleneck machines.
Furthermore, it determines the duration of the fixed period and the optimal batch
sizes for each component or subassembly in process at each machine or resource, and
also use of the nonbottleneck resource beyond the quantity required to match the
bottleneck-produced items will produce needless WIP. Ptak (1991) argues that OPT
system helps manufacturing companies to build what is required from the market when it
is required. Browne et al. (1996) have indicated that the main goal of OPT system by
manufacturing companies is to make money. This goal can be represented by three
financial measurements as follows: a) net profit, b) return on investment, and c) cash
flow.
In sum, OPT is intended to determine the bottlenecks, ensuring that these
resources are fully utilised, then scheduling use of nonbottlenecks in concurrent with the
bottlenecks (Dilworth, 1993).
35

As cited in Browne et al. (1996, p. 306), the bottleneck is defined by Bylinsky
(1983) as:
"a point or storage in the manufacturing process that holds down the
amount of product that a factory can produce. It is where the flow
of materials being worked on, narrows to a thin stream. "
2.3.4.3.2 Requirements and assumptions of OPT
Browne et al. (1996) reported that there are important requirements of the
implementation of OPT system: a) the need for shop floor supervisors and others to have
confidence in the schedule presented to them by the computer, b) it requires a large and
complex production database, c) it requires determining a product network which
requests that the process and product (BOM) data be brought together.
In general terms Dilworth (1993) and Browne et al. (1996) have pointed out that
the main assumptions of OPT are: the enormous data not required compared to the
others MPCs such as MRP systems, the accurate data on the bottlenecks resources and
the products which visit those resources are needed, the plant assembled products instead
of or in addition to selling individual components, the demand exceeds the capacity of the
plant, and there is a bottleneck (s) that limits the production rate of some components of
the products.
2.3.4.3.3 OPT in MPC system framework
It is both interesting and helpful to determine where OPT can be put in the
general MPC system. According to Vollmann et al. (1992) OPT system works in all three
areas in the general MPC system namely, the front end, the engine and the back end as
36

illustrated in Figure 2.1. However, it is better seen as encompassing much of what's in
the engine and end back, whereas it combines them in a way what that allows
manufacturing companies to plan both materials and capacity simultaneously.
Furthermore OPT can accomplish some functions in the MPC framework. The
OPT system depends upon the bottleneck resource and which plays a vital role for
determining the production outputs, increasing throughput through better capacity
utilisation of the bottleneck facilities. It helps to determine a lot size by distinguishing
between a transfer batch ( the quantity that moves from operation to operation) and a
process batch ( the total lot size released to the shop). Any differences between the two
will be held as WIP inventories in the shop. In essence, a transfer batch should be built up
behind any operation before its start.
Also, the work centre only produces a transfer batch whatever the build-up
behind it, unless the finite scheduling calls for several batches. The lot size is relating to a
scheduling approach in OPT which calls Drum-Buffer-Rope. This works as follows: the
material is moved as possible through nonbottleneck operations until it reachs the
bottleneck (the rope). Then, the work is scheduled for maximising efficiency (large
batches) i. e. the drum. Thereafter, the work again moves as fast as it can to the finished
goods (buffer).
2.3.4.4 Comparison of MRP, JIT, and OPT
In the aggregate, based on the literature review all three new production
management systems have certain limitations and strengths which are summarised in
Table 2.1 below:
37

Table 2.1 Comparison of MRP, JIT, and OPT.
Item MRP- JIT - OPT
Development era 1960s Mid 1960 to 1970s 1980s
Reasons for development Eliminate the need to forecast Eliminate all waste forms Maximise utilisation of capacity at the bottlenecks
Early gurus Oliver Wight Dr Cho Eliyahu Goldratt George Plossl Shigeo Shingo Joseph Orlicky
Approach MPC system MPC system MPC system
General assumptions Stable and deterministic MPS Stable and level MPS The enormous data is required Safety stock not required Total quality compared to the others MPCs The lead times is fixed Short lead time The accurate data on the Infinite capacity No supply variability bottlenecks is needed Dependent requirement The plant assembled products calculated from BOM The demand exceeds the explosion capacity of the plant
There is a bottleneck (s)
Application areas Assembly and fabrication Repetitive Batch production
The scope Influence the when the product is Influence the what, the how Influence the when the product is manufactured and the when of manufactured
manufacturing
Key failing Capacity requirements planning It only useful when use in It does not provide a sense of has a relatively low utilisation by repetitive industry hierarchical planning MRP users It is not useful when It seems to focus on a technical Using the average of lead time as company's supplier are local solutions an actual lead time for planning and captive
Basic elements An inventory control system An inventory control An inventory control system BOM system BOM Accurate routings for parts / BOM Accurate routings for parts / components Accurate routings for parts / components
components
Planning Planned inventory No Planned inventory Capacity planning No Capacity planning Projected cash flow No Projected cash flow
Early users Black and Decker Toyota M&M/ Mars candy company
Control - Detailed sequence and schedule Detailed sequence and Detailed sequence and schedule Priority control & rescheduling schedule Priority control & rescheduling Data collection Priority control & Data collection
rescheduling Data collection
Implementation Difficult, Complex, & Difficult, Simple, & Difficult, Complex, & Expensive Expensive Expensive
Benefits to people High for management High for management High for management Low for shop floor employees High for shop floor employees Moderate for shop floor employees Maintenance Difficult, Complex, & Easy and Cheap Difficult, Complex, &
Expensive Expensive
38
2.4 Why MRP systems?
The previous argument reveals that manufacturing companies may confront the
problem of which solution to adopt -MRP, JIT, or OPT. The response is difficult because
the solution for one industry is not necessarily the answer for all industries or even all
companies within one industry (Ptak, 1991), also each system is sound in its own way
and may be able to achieve the required improvements such as low cost, high-quality, on
time production (Aggarwal, 1985). Furthermore, each system can be considered as a
panacea for achieving the required improvements (Carrie et al., 1994).
Within this perspective, Greenhalgh (1991) asserts that manufacturing
management may face some difficulties in the selection of the best manufacturing
planning and control systems in order to meet current and future needs. These difficulties
may stem from, firstly, that manufacturing companies must understand what each
approach does well and not so well and the type of problems which might arise during
implementation, secondly, they must realise that any new technologies related to
manufacturing will continue to develop, namely, these new systems must not be seen as a
final solution. Lastly, they should remember that any change has to be related to true
business needs. However, Greenhalgh does suggest three key factors that may help
manufacturing company to select the right system or systems. They relate to the degree
of impact of the expected system on a) product performance, b) delivery reliability, and
c) price.
In same direction Steele et al. (1995) has pointed out that the production
environment such as the stability and simplicity of schedule procedure, lot-sizing rule,
39

capacity constraints, demand (Lin et al., 1993) and the predictability of lead time can be
considered as major factors in system choice.
Moreover, three operating factors have a great impact on system choice, they are:
Master Production Schedule (MPS) volume variation, MPS mix variation, and set-up
time/lot sizes. Plossl (1995) has argued that there is no single best MPC system for
manufacturing planning and control, because the tool of planning and control, like the
weapons of war, namely, include many techniques usable in many ways. All in all, the
future success of manufacturing cannot depend on only one of the new MPCs,
manufacturing company has to draw from the entire series of these systems what can
enable it to achieve its goals (Ptak, 1991).
However, a review of the literature reveals that there is some consensus among
researchers and practitioners concerning the widespread implementation of MRP systems
compared to the other MPCs. Goh (1984); Cooper and Zmud (1989) and Sandeep
(1992), pointed out that of the many 'Computer Aided Production Management' (CAPM)
systems, MRP I/MRP II systems are still number one concerning their widespread
implementation compared to the other new manufacturing planning systems such as JIT
and OPT.
Browne et al. (1996) argue that MRP systems have almost certainly, been the
popular implemented large scale production management systems since the early 1970s.
Several thousands systems of MRP systems (MRP I, Closed-Loop MRP I, MRP II) are
in use within manufacturing companies around the world.
40

Newman & Sridharan, (1992) found in their study about the selection of the best
manufacturing planning and control system by manufacturing companies in the US, that
103 out of 185 manufacturing companies surveyed had implemented MRP systems, while
14 companies had implemented JIT system, only 9 companies had implemented OPT
system, and the rest of the companies still implemented the traditional systems (Reorder
Point Systems- ROP). Also, they had concluded that MRP systems appear to be most
versatile and are able to cope with increased complexity in manufacturing. In this regard
Robertson et al. (1996) stated that one particular form of computer aided production
management (CAPM) which has been heavily promoted by technology suppliers as best
practice is MW/MW II.
Furthermore, Lunn (1996) suggested that NW systems are still considered as
one of the best methods to reduce inventory which has been viewed by business and
industry as a necessary evil, because too little of it may cause the interruptions in the
operation, and too much of it will affect negatively on the achieved profits (Taha, 1992).
Again, Turbide (1995) showed that despite the fact that the idea of MRP dates
back more than thirty years, and its software package has been around since the 1970s,
MRP is still number one for application software structure for today's manufacturing
management. John and Charlotte (1996) reported that MRP II is considered the most
popular production scheduling package in the UK.
41

In this connection, Carrie et al. (1997) suggest that:
"MRP II continues to grow in popularity despite persistent problems
with its implementation ....... Surveys continue to show increased
adoption rates significant implementation problems and research from
as early as the 1970s suggests that these problems have not changed
much over the years" (1997, p. 2).
Consequently, one can say that Materials Requirements Planning (MRP I) and its
extension Manufacturing Resources Planning (MRP II), the much proclaimed systems,
have gained the acceptance from both academics and practitioners as an important factor
for improving manufacturing processes.
2.5 Evolution of MRP systems
Though Mite concepts have been and are still extensively used in 66
management of manufacturing companies, it is not an easy concept to define. It would be
both interesting and challenging to trace the development of the MRP system in order to
minimise the confusion concerning these three separate but related aspects of MPCs i. e.
MRP I, Closed-Loop MRP, and MRP II. However, no endeavour will be made in
explaining the technical details of the system.
MRP I was expanded to include capacity requirements planning, with provision of
feedback to adjust the capacity to meet the production requirements. Therefore the term
closed loop MRP system was used to represent this matter of development of MRP
system.
In the 1980s another development of MRP was evolved to convert the schedule
information into useful corporate-wide game planning information. This helped in that the
42

change of priorities and order due dates within the Master Production Schedule (MPS)
can be reflected in both materials plan and capacity requirement plan. This development
refers to Manufacturing Resources Planring system -MRP II (Spreadbury, 1994).
However, the original idea of MRP has continued to support materials planning, and
launching of shop and purchase orders (Sandeep, 1992).
Therefore, the next subsection is intended to discuss the details of the evolution
of MRP systems. A review of the literature reveals that there are two major approaches
to materials control: Reorder Point (ROP) and Material Requirements Planning (MRP).
However, the assumption of independent demand is violated if the reorder point
approach is used to calculate assembly products with dependent demand. This caused the
development of MRP which serves to deal with dependent demand (Mady, 1992;
Dilworth, 1993; Wild, 1996). Therefore, this section begins with an introduction of
Reorder Point Systems (ROP), followed by the development of MRP systems.
2.5.1 Reorder Point Systems (ROP)
A reorder point system is used for inventory control in two successive steps: the
first, to determine when to order, and the second, to identify how much to order. The
answer to the two questions is as follows: when the inventory level, including existing
orders on suppliers, reaches a predetermined reorder point, a new order is placed on the
supplier (or production). A reorder point is usually specified by the inventory level at
which a new order must be placed. Having decided to place an order point (when the
reorder point is reached), the next decision is to determine how much to order. The order
size is often calculated using the "Economic Order Quantity" (EOQ).
43

2.5.1.1 Two-Bin System
One of many approaches in ROP systems is Two-Bin system which was widely
used before MRP. It places a quantity (equal to the order point quantity) in a separate
storage bin, not to be touched until the working stock is used up. When accessed, a
replenishment order is placed (Plossl, 1995).
The major advantage of this method is the obvious reduction of clerical work
because it does not need a continual inventory record. On the other hand the major
disadvantages of this system are: in some cases is difficult to keep the stock in the two
bins properly separated, in turn will be there high inventory (Dobler and Burt, 1996), and
also the items are ordered because of the rule instead of need (Sandeep, 1992).
Z5.1.2 The ABC Inventory System
Another inventory system was widely used before MRP system, is known as ABC
Inventory Classification or Pareto Analysis. The ABC technique is identified as a simple
procedure that can be used to isolate the items that require special attention in terms of
inventory control.
According to Taha (1992); Dilworth (1993) and Elkhouly (1994), the idea, of the
procedure is that the total cost of materials which will be used over a specific period is
computed first. This amount is determined by multiplying the unit cost of each item by
the estimated total usage for the period. Once total usage costs for every item is
computed, they are listed in descending order, the highest first and lowest last. Two
percentages are then computed: the percentage of each item's cost to total cost and the
44

percentage of each item's units to total units. The items are divided into three
classifications as follows:
Class A. High value items: The 15 to 20 percent of the items that account for 75 to 80
percent of the total annual inventory value.
Class B. Medium value items. The 30 to 40 percent of the items that account for
approximately 15 percent of the total annual inventory value.
Class C. Low value items. The 40 to 50 percent of the items that account for 10 to 15
percent of the annual inventory value.
Many advantages can be achieved of the ABC technique for instance, it is a very
valuable management tool for identifying and controlling important inventory items
(Dobler and Burt, 1996) and it is first step in improving inventory control performance
(Vollmann et al., 1992).
The major operational problems associated with the implementation of the Pareto
analysis are summarised by Sandeep (1992) as follows: how many groups or categories
must be used?, where should the class boundaries be?, what should the ordering
frequency be for each category?, and how much protection should be used in each class
initially?.
All in all, one can conclude that the ROP systems are not effective in the case of
dependent demand "for instance, a car door is a dependent demand item in the
production of a car". This may stem from the following:
1. The demand for the required items is lumpy due to "the dependency of component
demand on the demand for their parents gives rise to a phenomenon of discontinuous
45

demand at the component level" (Browne et al., 1996, p. 97). This will lead to slack
inventory, if manufacturing company had decided to use EOQ for inventory control.
2. When the production line is long, the distance between an item and the final
assembling station becomes far, the lumpy and uncertain demand likely to be increased.
In such matter, if manufacturing companies had decided to use EOQ systems, they should
keep a high level of inventory as a safety stock in order to ensure that the production
processes will continue without halting.
3. The ordering technique is capacity-insensitive i. e. no consideration is given as to
whether there is sufficient capacity and components to meet the schedule.
Consequently, the MRP system was created as a new manufacturing planning and control
system to help manufacturing companies to overcome the above mentioned problems.
However, it is necessary to contend here that the need for the traditional
inventory control techniques for other types of production systems will continue to be in
demand for a long time to come (Taha, 1992).
2.5.2 Material Requirements Planning (MRP 1)
Material Requirements Planning (MRP) is a technique used to determine what
requirements of materials used in the manufacturing operation are needed, how many are
needed, when they are needed, and when they should be ordered in order to they likely to
be available when needed.
In many manufacturing organisations, MRP has been considered as a
computerised information system for managing dependent demand inventory and
46

scheduling stock replishment orders (Duchessi et al., 1989; Manthou et al., 1996;
Roberston et al., 1996).
Matsuura et al. (1995) have pointed out that MRP in a narrow sense means a
technique which explodes and calculates material requirements based on master .
production schedule, using bill of material and inventory status data. It is concerned
essentially with the scheduling of activities and the management of inventories.
Specifically, it is useful where there is need to produce components, items or sub-
assemblies which themselves are later used in the production of a final product (Wild,
1996).
Within this perspective, MRP has been considered as a dynamic economic order
quantity model which may help to review the inventory level periodically so as to provide
a timely delivery of required materials for different stages of the production process-
(Taha, 1992). Furthermore, MRP system appears to work best for companies with mass
production assembly lines (Aggarwal, 1985) and in batch manufacture (Wild, 1996).
Overall, it assumes unequal demand, attempts to achieve zero stock-outs, and focuses on
setting priorities (Aggarwal, 1985).
The main inputs of MRP are: a) the master production schedule (MPS) which
shows how much of each end item is wanted and when the items are wanted. In general
terms, Spreadbury (1994) argues that Master Production Scheduling (MPS) plays a vital
role as a balance between manufacturing demands factors (customer orders, forecasts,
safety stocks, inter-plant requirements, and export requirements) and manufacturing,
resources- supply factors (material, inside capacity, and outside capacity), b) the bill of
47

materials computer file (BOM) which identifies the components parts of a final output
product at each level, and c) the inventory master computer file which shows the
available inventories of all materials, subassemblies, components, etc.. required for the
manufacture of the end product. This will enable a company to determine requirements
for timing individual products and work schedules (Elkhouly, 1994; Wermus and Pope,
1995; Wild, 1996).
There are a variety of reports that can be constructed from the information
obtained from an MRP system. They are the following: current orders release to
purchasing the quantity of each item with due date requirements, planned orders
indicating the quantity and timing of orders to be released in future time periods if the
current master schedule is to be accomplished, current and planned order releases for in-
house production, with achievement date requirements, reschedule notices indicating
which order due dates need to be changed and dates to which they must be changed, and
finally an MRP system may replan and schedule the material requirements in light of the
notices extracted from the MPS (Elkhouly, 1994; Dobler and Burt, 1996). The previous
reports can be used to determine time-phased gross and net requirements for
manufacturing inventory. And also, can be used to determine feasible delivery dates for
customer orders.
In sum, as shown in Figure 2.5 the processing logic of MRP centres on the
development of a materials planning record for each item. MRP takes the data contained
in the master production schedule, bill of materials, and inventory record file shown at the
top. This presents the gross requirements or the anticipated usage of the item projected
48
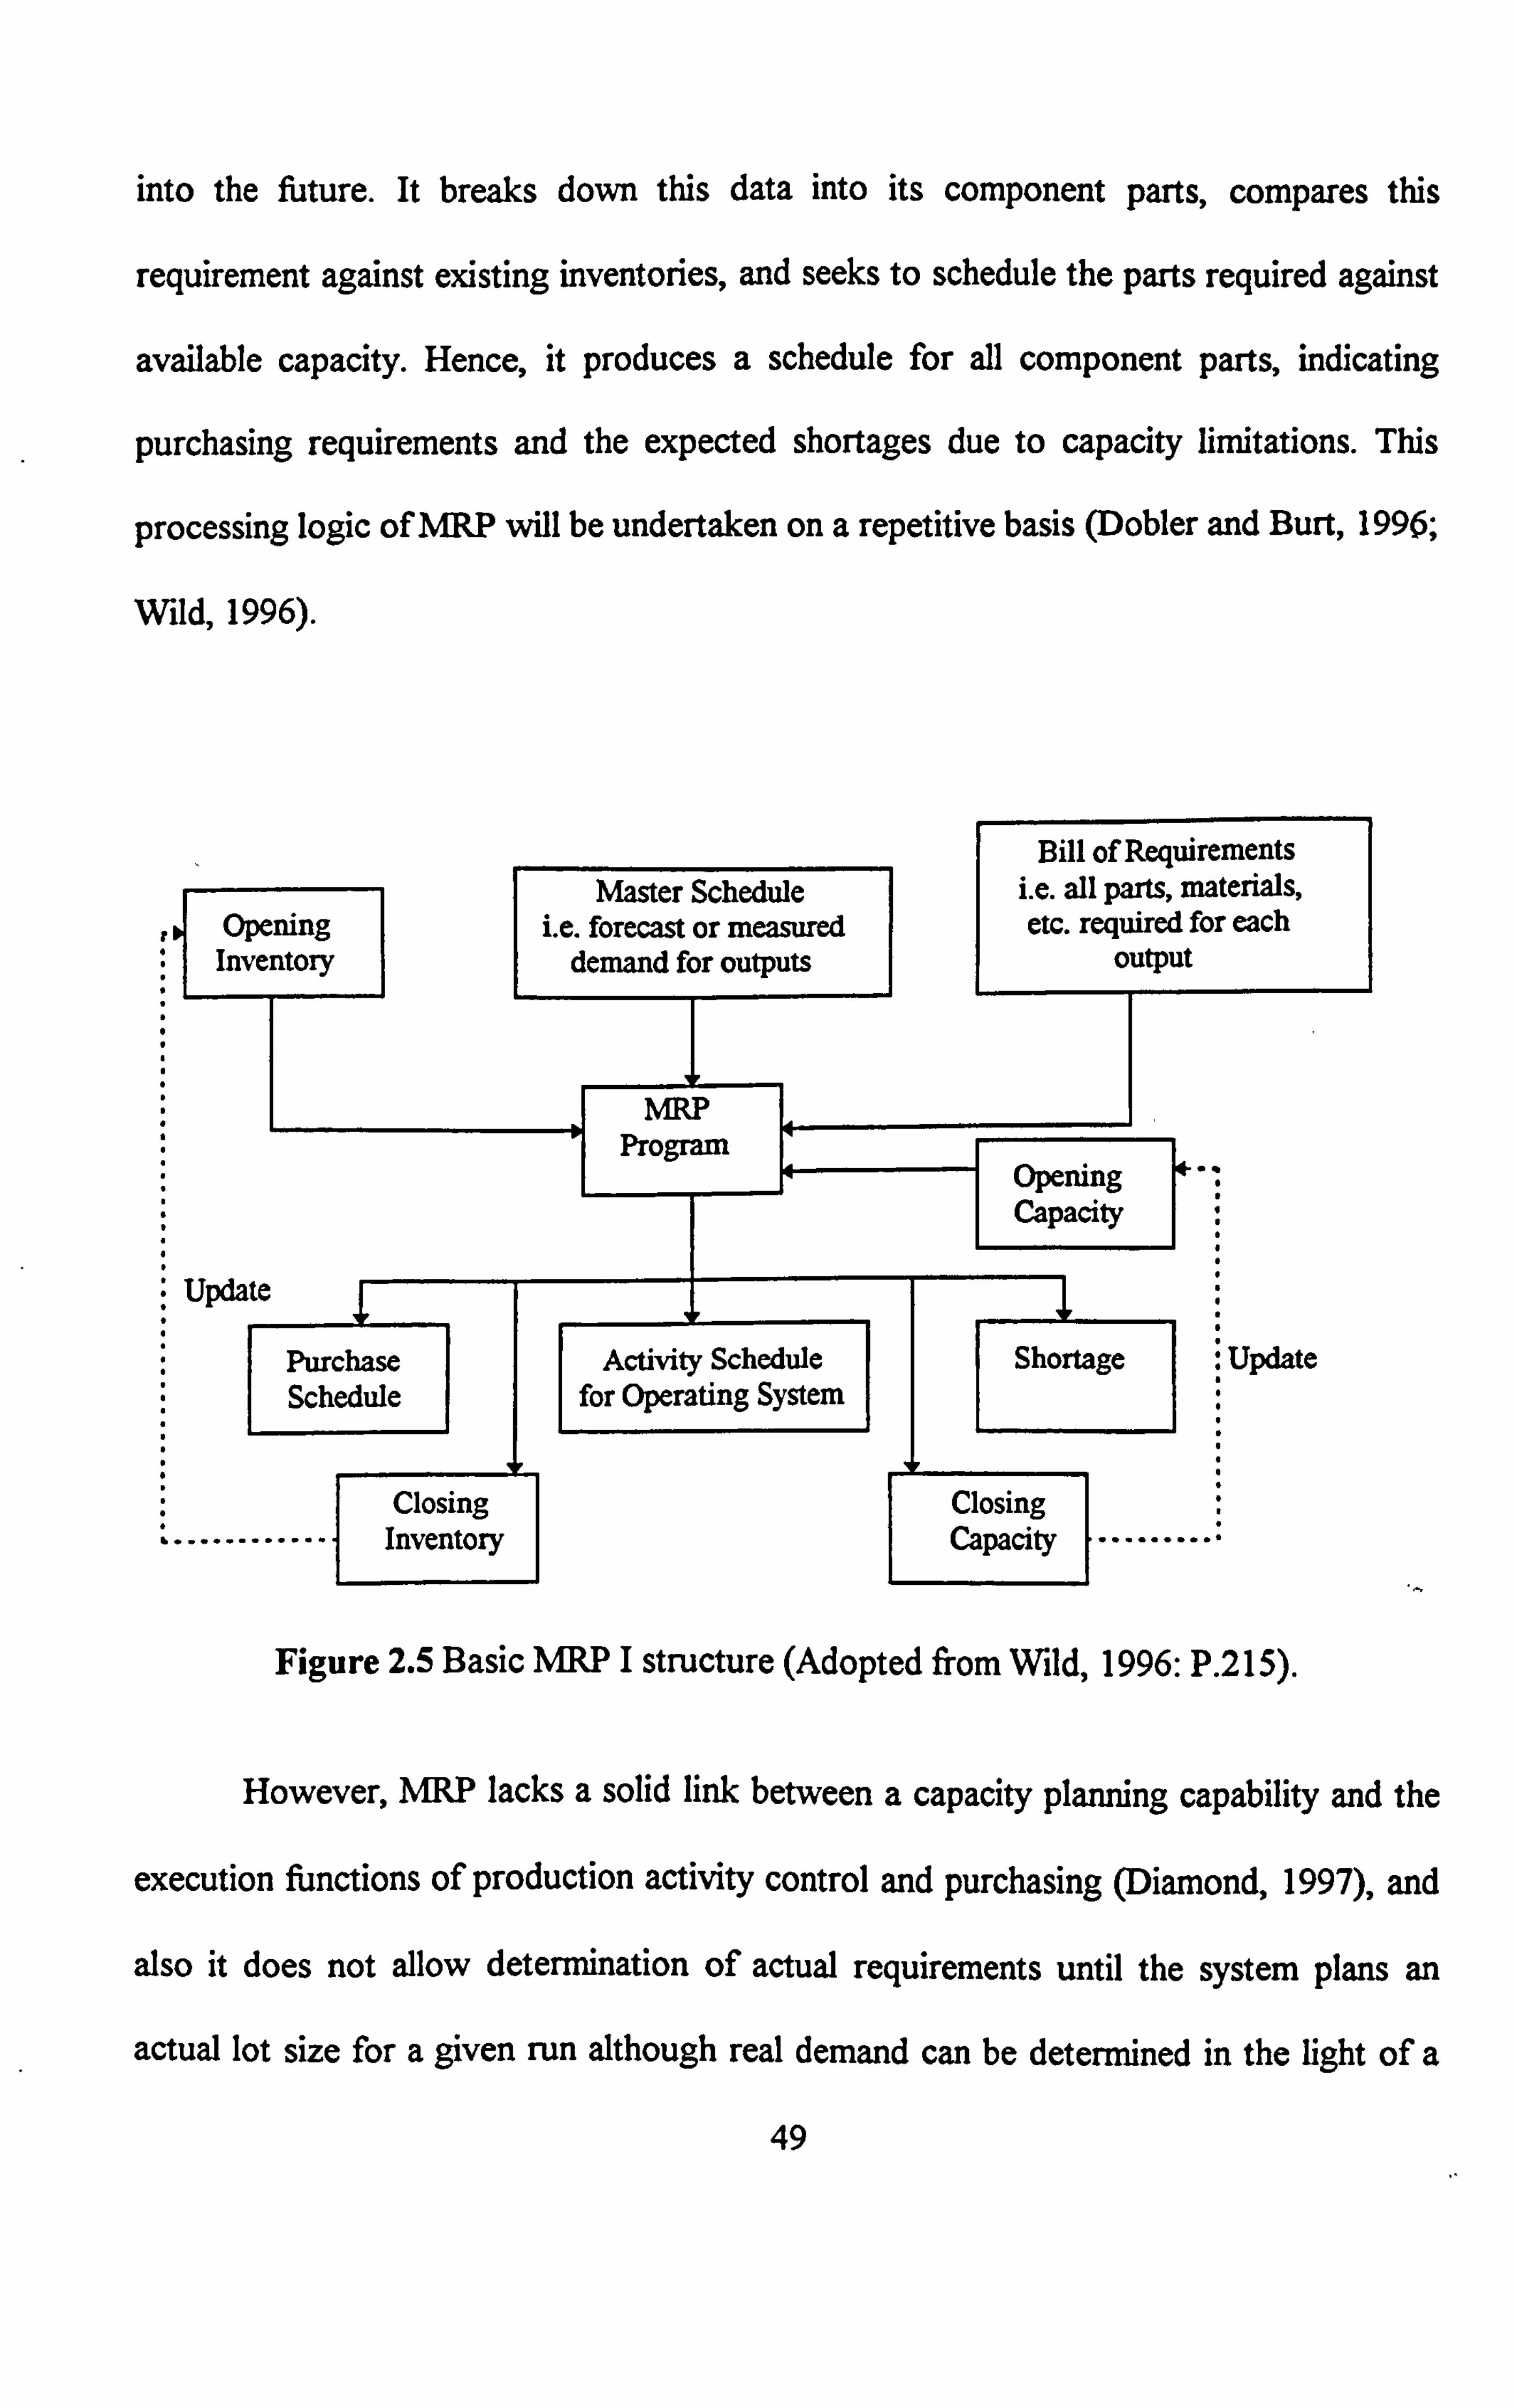
into the future. It breaks down this data into its component parts, compares this
requirement against existing inventories, and seeks to schedule the parts required against
available capacity. Hence, it produces a schedule for all component parts, indicating
purchasing requirements and the expected shortages due to capacity limitations. This
processing logic of MRP will be undertaken on a repetitive basis (Dobler and Burt, 1996;
Wild, 1996).
Bill of Requirements Master Schedule i. e. all parts, materials,
Opening i. e. forecast or measured etc. required for each Inventory demand for outputs output
I NW J Program
Opening Capacity
Update
Purchase Activity Schedule Shortage Update Schedule for Operating System
Closing Closing ............ Inventory Capacity ........
Figure 2.5 Basic MRP I structure (Adopted from Wild, 1996: P. 215).
However, MRP lacks a solid link between a capacity planning capability and the
execution functions of production activity control and purchasing (Diamond, 1997), and
also it does not allow determination of actual requirements until the system plans an
actual lot size for a given run although real demand can be determined in the light of a
49

combination of existing customer orders and additional forecasted demand (Chamberlain
and Thomas, 1995). Thus, the development of the MRP system that occurred in order to
fill this gap was identified as the closed-loop system.
2 S. 3 Closed-Loop MRP
A Closed-loop MRP incorporates MRP in a narrow sense (expanding and
calculating material requirements) as a core, in which functions such as master
production scheduling, capacity requirements planning, and shop floor control, are
attached (Matsuura et al., 1995). It provides feedback to scheduling from the inventory
control system. This feedback links between capacity planning and MRP system.
Therefore, it is a system that provides the means for determining feasibility of the
company's production plan (i. e. does the company meet the production requirements? ).
Furthermore, the main objective of developing the MRP closed loop concept is to help
manufacturing companies to cope with the complexities of production planning (Wermus
and Pope, 1995).
While the closed loop system extends the capabilities of MRP I system by
including capacity planning functionality and feedback system that monitors and reports
on the progress of open shop orders and purchase orders, Manufacturing Resources
planning- MRP II system integrates the closed-loop MRP I with other modules, including
forecasting, general ledger, accounts receivable, accounts payable, finished good
inventory and order entry (Duchessi et al., 1988), and creates a complete closed-loop
management facility that touches all of the major functional areas of the business in order
to monitor all of the resources of a manufacturing firm.
50

Figure 2.6 shows the processing logic of the closed loop system. It denotes a link
between capacity requirements planning and master scheduling, MRP, and the execution
functions of production activity control and purchasing which include input/output
measurement, detailed scheduling and dispatching on the shop floor, and delay reports
from both shop floor and vendors. It also indicates that the feedback from execution
functions (i. e. questions and output data) are looped backed up the system for
verification and, if necessary, modification (Chase et al., 1998). All in all, the system
sums up all the needs created by an explosion of product requirements in the master
schedule. If adequate capacity does not exist at a work centre, the feedback results in a
revision of the master schedule or actions taken such as overtime, increasing workforce
etc.
Production Plannin%!
Master Production Scheduling
Material requirements Capacity Requirements Planning Planning
Realistic Plans
Yes
Purchasing Production Activity Control
Feedback from execution
Figure 2.6 Basic Closed-loop NW (Quoted from Browne et at., 1996: P. 131).
51

Thus, the closed loop system can effectively help manufacturing companies to
replace the existing system (informal- does not work very well) with a formal system
(that works). Feedback is a self correcting process (Fisher, 1981). However, it lacks a
link to strategic planning as the manufacturing plans are not strategically estimated and
lacks an input from the other departments- marketing, finance, engineering which may
result in conflicting goals. Consequently, the last step, to date, in this evolutionary
process is known as Manufacturing Resource Planning -MRP II ( Dobler and Burt,
1996). In this connection, Browne et al. (1996) have pointed out that Manufacturing
Resources Planning (MRP II) represents` an extension of the features of the MRP I
system through Closed loop MRP in order to support many other manufacturing
functions beyond material planning, inventory control, and bill of materials control.
Accordingly, MRP II was evolved from MRP I by a gradual series of extensions to MRP
system functionality.
Z S. 4 Manufacturing Resources Planning (MRP II)
MRP II is a company-wide system which involves every facet of the business.
"What if " questions can be asked to determine the effects of changes in situations/plans
on the organisation and its profitability facts. The simulation capability of such system
allows decision makers to compare alternative strategies based on actual manufacturing
constrains and conditions. This facilitates the formulation of effective business plans with
inputs from all departments.
While MRP I only deals with material ordering aspects of operations control,
MRP II takes the concept further by considering the resources available. MRP II
52

recognises when a material requirements plan is infeasible (e. g., when production
schedules generated are greater than capacity) and can suggest measures to remedy this.
MRP II integrates computer control of materials with other areas of
computerisation within the business including finance, marketing, sales design and
engineering. MRP II is often seen as closing the control feedback loop by the constant
monitoring and upgrading of the computer-based systems of the business, so it can be
seen as ensuring the effective operation and control of the wider manufacturing systems
(Forrester et al., 1995).
MRP II can be considered as an extension or a development of MRP, but is very
much broader in concept and application (LaPlante, 1994; Wild, 1996) or as a step
beyond the closed loop system. It might allow a company to use work orders to track
labour and material utilisation where they vary from job to job, but to diminish
transactions by removing work orders where machine or labour utilisation is standard
(Parker, 1995).
Moreover, MRP system looks ahead to see when company need, then backs up to
see when company ought to release it. The significant feature of the MRP system that
gives its powerful capabilities is its rescheduling features (Goh, 1984).
In the aggregate, Browne et al. provide the main characteristics of MRP systems as
illustrated below:
9 "NW is product oriented in that it operates on a BOM to calculate the component
and assembly requirements to manufacture and assemble a final product.
53

" MRP is future oriented in that it uses planning information from the master production
schedule to calculate future component requirements instead of forecasting based on
historical data.
" MRP involves time phased requirements in that during MRP processing, the
requirements for individual components are calculated and offset by their expected
lead times to determine the correct requirement date.
" MRP involves priority planning in that it establishes what needs to be done to meet the
master schedule, as opposed to what can be done, given capacity and material
constraints.
" MRP promotes control by focusing on orders, whether purchase orders or orders for
the manufacturing plant. "(1996, pp. 100-101).
Figure 2.7 shows the processing logic of Manufacturing Resource Planning (MRP
II). Spreadbury stated that MRP II "mechanics comprise a variety of functions each
linked together. There are business planning, sales and operations planning, master
production scheduling, MRP, capacity requirements planning and associated shop floor
execution systems. It illustrates how these functions are integrated. In order to close the
loops and provide true business integration, financial management is also included within
MRP II, and this helps the business and sales and operations planning functions to
operate efficiently, through incorporation of "what if' and financial forecasting based on
one set of numbers" (1994, p. 153).
54

Yearly I Business Planning
Monthly I Sales and Operations Planning
Master Production Scheduling
Weekly
Materials Requirement Planning
Capacity Requirements Planning
Execute Shop Daily
I Schedule
Figure 2.7 MRP II: integration of planning functions within the Closed-Loop (Straight
copy from Spreadbury, 1994: P. 153).
In the aggregate, MRP II can provide production schedules, purchase orders and
material requirements on specific jobs. Therefore, one can conclude that the accurate
database constructed by implementing MRP II system helps for both controlling and
planning functions, and simulation capability. Therefore, MRP II opens up a new
manufacturing era.
However, it is worth mentioning to present the main factors that may impede the
practice of MRP system by manufacturing companies and also the main areas for
promoting' NW practices. This before investigating the critical factor affecting MRP
implementation and the benefits obtained from the implementation of MRP system.
55

2.6 The state of practice of MRP/MRP II systems
As pointed out by several writers such as Anderson et al. (1982); Laforge and
Sturr (1986) and Sum et al. (1993), investigation of the practice of MRP system can be
accomplished by covering several key issues, such as: MRP company profile (i. e. size and
age, type of manufacturing system, type of manufacturing process and layout), MRP
system characteristics (i. e. hardware and software, degree of computerisation, degree of
integration, and system features), the stage of MRP implementation (i. e. user class),
implementation process (i. e. initiator of MRP and implementation problems), MRP
system growth, factors that may impede non-users to implement MRP systems and finally
the main areas for promoting MRP system.
For the purpose of this thesis, all of these issues will be covered in detail in
section (2.8) in discussing factors affecting MRP suitability and success of MRP
implementation except for the last two issues which will be discussed in the following
subsections:
2.6.1 Promoting areas for MRP implementation
As pointed out by Sum and Yang (1993) and Ang et al. (1995) several areas can
help to promote MRP systems, they are: government support (e. g., grants, incentives),
education/ training provided by government/professional bodies, education! training
provided by software/ hardware vendors, information sharing among users, and low cost
consultancy. They had concluded from their studies about the implementation of NW
systems on 128 Singaporean companies, that the Singaporean government support (e. g.,
56

grants, incentives) and education/ training provided by government/professional represent
the main areas for promoting MRP in Singapore.
Related to the above mentioned results, the literature reveals that governments
still play a vital role with regard to encouraging manufacturing companies to adopt
advanced manufacturing technology (AMT) such as MRP systems whether in developed
countries such as the UK or in less developed countries such as Egypt or in the newly
industrialising countries such as China.
In the UK, DTI (1991) has published a report comprising the government
response to the Advisory Council On Science And Technology (ACOST) concerning the
implementation of advanced manufacturing technology within manufacturing companies
in the UK. This revealed that the British government still plays a significant role in the
promotion of advanced manufacturing technology within British companies. For example
the DTI conducted a programme concerning advanced information technology which
seeks to develop techniques for improved usability of IT systems. The government is
doing all it can to fill the gap of the shortage of the supply of engineering graduates
through increasing the number of students applying for technological courses in the 90's.
Likewise, other related work was conducted by the Organisation for Economic Co-
operation and Development -OECD (1991) which includes the western countries
including the USA, in addition to Turkey, and concluded that most OECD governments
have encouraged firms to implement AMT with a range of incentives and infrastructural
support such as: training initiatives, financial incentives to invest in new equipment,
develop new products and software.
57

Per-lind (1991) pointed out in his study about computerisation in less developed
countries, with special reference to NASCO company as a biggest automobile company
in Egypt, that the Egyptian government plays a vital role in encouraging manufacturing
companies to implement new production technology such as MRP system in order to
improve its productivity.
In China, Davis (1995) reported that the Chinese government seeks to encourage
efficiencies in the industrial sector by implementing MRP II system to achieve global
competitiveness.
Roberston et al. (1996) have pointed out that the vendors of Computer Aided
Production Management -CAPM play a vital role for promoting both MRP I and MRP II
in the UK as a best practice of CAPM systems. Subsequently, they may have recognised
the potential significance of users knowledge and application of software in order to
infusion occurs.
2.6.2 Factors that may impede Non-users to implement MRP systems
A review of the literature reveals that there are several obstacles impeding
manufacturing companies to implement any new manufacturing technology such as MRP
systems. Ang et al. (1995) found in their study about the critical success factors in
implementing MRP and government assistance on 128 companies within Singapore that
the main reason for Non-NW companies not implementing MRP system is a lack of
company expertise in MRP in Singaporean companies.
Another obstacle that may impede the implementation of MRP systems is that
some manufacturing companies do not feel it achieves big enough benefits. This may go
58

back to the fact that the most of implementers reported a dissatisfaction with MRP use
(Aggarwal, 1985; Fintech, 1989; Hill, 1993; Browne et al., 1996; Carrie et al., 1997).
Newman & Sridharan (1992) found in their study about the selection of the best
manufacturing planning and control system by manufacturing companies in the US, that
ROP users had obtained the best performance among MPC systems implemented by
American companies. This means that some Non-MW companies may be successful
without implementing MRP systems.
In fact the implementation of any new manufacturing technology by
manufacturing companies is not an easy task. Drayson et al. (1986) have reported in their
study with regard to the implementation of robotics in a food manufacturing company in
UK that the problems associated with implementation of A. M. T such as MRP systems
are due to these technologies being too far ahead of the company's abilities to manage.
Furthermore, Beatty and Gordon (1988) reported that people within manufacturing
companies may resist the implementation of a new manufacturing technology such as an
MRP system for fear that they will lose their power and status.
Duchessi et al. (1989) argue that companies implementing or considering
implementation of MRP system should receive advice on how to manage effectively the
implementation process. Therefore, the next section is devoted to investigate
effectiveness of the state of practice of MRP system.
2.7 The Effectiveness of MRP practices
Browne et al. (1996) suggested that the investigation of the state of practice of
MRP systems relates primarily to understanding the effectiveness of such systems for the
59

companies that use them. As a system is effective if it achieves its objectives or if it does
what we need it to do (Johnson et al., 1974; Fisher, 1981; Browne et al., 1996).
Therefore, the effectiveness of MRP practices is measured by the benefits
obtained from MRP implementation. Consequently, the next section is devoted to present
the expected potential benefits and the real benefits obtained from MRP implementation,
then the key failings of MRP systems.
2.7.1 MRP implementation benefits
A review of the literature reveals that MRP benefits have been measured in three
ways as follows: firstly, MRP implementation studies have measured MRP benefits by
attitudes, intentions or behaviour of users (subjective or intangible benefits or user
satisfaction) such as Duchessi et al. (1988); Sum and Yang (1993) and Sum et al. (1995).
Secondly studies such as Anderson et at. (1982); Anderson and Schroeder (1984);
Laforge and Sturr (1986) and Cerveny & Scott (1989) have measured MRP benefits by
actual use or improved performance measures. Thirdly studies such as White et al. (1982)
and Schroeder et al. (1981) have measured benefits by both improved performance and
subjective benefits.
2.7.1.1 Tangible benefits
MRP benefits can be measured by improvement in tangible measures of
manufacturing performance. These are inventory turnover, delivery lead time, percent of
time meeting delivery promises, percent of order requiring "splits" because of unavailable
material, and number of expediters. However, there is a difficulty in obtaining measures
of actual use (White et al., 1982), because, often, companies cannot to keep track of the
60

performance measures over time (Sum et al., 1995). Therefore, to assess improved
performance the respondents (MRP users) are often asked to provide the experience that
they would expect operating in today's economic environment with their pre-NW
production system, then to state the current experience given their stage of MRP
development, and finally, state the future experience that they anticipate given total
completion of their MRP development plans as in Anderson et al. (1982) and Laforge &
Stun (1986).
2.7.1.1.1 Increasing inventory turnover
Inventory turnover is basically the ratio of sales to the average inventory level.
Therefore, it can be increased whether increasing sales or reducing inventory level. With
MRP system, the company can increase its sales through improving the company's ability
to react to changes in customer needs (Dilworth, 1993; Strzelczak, 1995); improving
customer service by on-time delivery, and better quality (Cox and Clark, 1984; Sum et
al., 1995). The company can reduce inventory level through balanced inventory,
reduction in work in process inventories, and reduction in finished goods inventories
(Smith et al., 1980; Cox and Clark, 1984). Several empirical studies reported that
inventory turnover was increased as a result of the implementation of an MRP system
such as Anderson et al. (1982) in their study about the state of the art of MRP practices
on 679 companies in the US, and Laforge & Sturr (1986) in their study regarding MRP
practices in a random sample of manufacturing companies consists of 107 companies in
the US, and Cerveny and Scott (1989) in their study concerning MRP implementation on
433 companies in the US. This is shown in Table 2.2 below:
61

Table 2.2 Increasing inventory turnover as a result of MRP implementation
(sales/inventory%).
Author Country Pre-NW After-MRP Improvement Anderson et aL (1982) USA 3.2 4.3 +1.1 Laforge and Sturr (1986) USA 4.5 7.9 +3.4 Cerveny and Scott (1989) USA 4.6 5.5 +, 9
2.7.1.1.2 Better delivery lead time (days)
Delivery lead time is the time that a customer waits between placing an order and
receiving shipment (Bartezzaghi et al., 1994). Dilworth (1993) argues that the
implementation of an MRP system helps manufacturing company to cut delivery lead
time by keeping components on schedule and minimising parts shortages and which will
be reflected in helping production meet assembly dates. Anonymous (1996) reported that
lead times have been reduced from six weeks to less than one week at Bimba
Manufacturing of Monee Illinois after implementing MRP system. Furthermore, this
benefit was achieved empirically by the American users as shown in Table 2.3 below:
Table 2.3 Better delivery lead time as a result of MRP implementation (number of days).
Author Country Pre-NW After-NW Improvement Anderson et al. (1982) USA 71.4 58.9 -12.5 Laforge and Sturr (1986) USA 55.6 41.7 -13.9 Cerveny and Scott (1989) USA 17.5 13.5 -4.0
2.7.1.1.3 Increasing percent of time meeting delivery promises (%)
With an MRP system, Singaporean companies could obtain a better meeting of
delivery dates (Sum and Yang, 1993). MRP systems enable managers to calculate the
requirements of each part or every subassembly week by week and helps to identify in
62

advance possible delays or shortages. This will enable people in inventory control to
reschedule dates for the released orders as an attempt to meet the promised deliveries
(Aggarwal, 1985). Furthermore, the implementation of an MRP system will improve the
percentages of promised deliveries because work orders are released based upon MRP
need dates and are rescheduled based upon its output (Duchessi et al., 1989). It has
helped Bimba Manufacturing of Monee at Illinois to achieve 95% on-time delivery
(Anonymous, 1996). As pointed out several writers report increasing percent of time
meeting delivery promises after implementing MRP system as shown in Table 2.4 below:
Table 2.4 Increasing percent of time meeting delivery promises as a result of MRP implementation (%).
Author Country Pre-MRP After-MRP Improvement Anderson et aL (1982) Laforge and Stuff (1986)
USA USA
61.4 73.9
76.6 88.6
+15.2 +14.7
2.7.1.1.4 Reducing percent of split orders (%)
Table 2.5 indicates that the implementation of MRP systems leads to the
reduction of percent of orders requiring "splits" because of unavailable material. This is
because the implementation of an MRP system requires that each part or every
subassembly's bill of materials (BOM) is accurate (Aggarwal, 1985).
Table 2.5 Reducing percent of orders requiring "splits" because of unavailable material as a result of MRP implementation (%).
Author Co Pre-MRP After-MRP Improvement Anderson et aL (1982) Laforge and Sturr (1986)
USA USA
32.4 29
19.4 13.5
-13 -15.5
63

2.7.1.1.5 Reducing number of expediters (number of people)
According to Plossl (1995) MRP systems can sustain priority control by
attempting to make two dates coincide, the first is the due date which is allocated to open
orders either put on the orders when released or revised by planners later, the second is
need date which shows when orders are actually needed. These two dates are often
unlike. If so, there is a need to move the need date either forward or backward by
rescheduling in time from due date. MRP systems can signal either "expedite" or "de-
expedite" order in order to reduce the divergence of the two dates. That is, MRP systems
recommend changes (expedite or deexpedite) in due dates for orders (Dilworth, 1993).
Table 2.6 verifies the previous mentioned benefit as follows:
Table 2.6 Reducing number of expediters as a result of MRP implementation (number of people).
Author Country Pre-NW After-NW Improvement: Anderson et al. (1982) Laforge and Sturr (1986)
USA USA
10.1 10.8
6.5 5.1
-3.6 -5.7
2.7.2.2 Subjective benefits
Due to the difficulties in obtaining improved performance measures several
studies have decided to measure MRP benefits using user satisfaction only. The data are
interpreted as expressing user perceptions of the successful implementation of MRP
systems as in Duchessi et al. (1988); Sum and Yang (1993) and Sum et al. (1995).
2.7.2.2.1 Improved competitive position
As pointed out by several writers such as Leng (1987); White and Wharton
(1990); Lummus and Wilson (1992) and Sum and Yang (1993), manufacturing
64

companies may adopt new production management systems such as MRP and JIT, as a
response to regional and international competition pressures. These systems may enable
manufacturing companies to " ease these pressures through the continuous pursuit of
greater productivity, lower costs and better customer service and which are reflected in
improving competitive position.
Strzelczak (1995) argues that an MRP system can be considered as one of the
basic tools which enables manufacturing companies to achieve better responsiveness to
changing market demand. Furthermore, Duchessi et al. (1989) reported that Flo-Co
systems, which is a leading manufacturer of steel teeming systems (control devices for
regulating the flow of steel) at Illinois in the US, chose to implement MRP II as a part of
an overall business strategy to be more competitive.
2.7.2.2.2 Reduced inventory costs
Anonymous (1996) reported that the biggest benefit obtained from MRP II
implementation, by the company James, Coney, was a 20% to 25% reduction in
inventories, plus lower costs for holding stocks of obsolete inventory. Moreover, with
implementation of an MRP system, the company can improve vendor relations (Dilworth,
1993) because it will be able to provide vendors with valid schedules of purchase orders.
With that, the vendors can produce the items demanded more efficiently and at lower
costs. This will be reflected in a reduction in purchase costs. Smith et'al. (1980) reported
that the company's Smith Valve has achieved inventory reduction of 16% after
implementing an MRP system.
65

2.7.2.2.3 Increased throughput
Browne et al. (1996) defined throughput as the rate at which finished units are
sold. With MRP systems companies can increase throughput whether through better
capacity utilisation (Dilworth, 1993) or through reducing throughput times (i. e. the
reductions in the inventory level) by providing the right components and parts at the right
time and which is reflected in increasing manufacturing productivity (Duimering et al.,
1993).
Furthermore, companies with high throughput efficiencies will easily out compete
companies with low throughput efficiencies because they have the ability to shorten
production lead times more than the others (Best, 1997).
Furthermore, increased throughput is reported by Sum and Yang (1993) as one of the
major benefits obtained from MRP implementation in Singaporean companies.
2.7.2.2.4 Improved product quality
According to Sheldon (1991) quality cannot to be separated from MRP II. It is
required as an attitude. The quality can be achieved if all data files such as bills, item
master records are measured and clearly defined. Cox and Clark (1984) argue that the
implementation of an MRP system will help companies to achieve better quality and this
is reflected in obtaining better customer service. Virtually every company that uses an
NW system can enhance the improvement in the quality of life in manufacturing because
the system provides the company with immense flexibility to reply to market demand
(White et al., 1982; Wight, 1983). Furthermore, an MRP system provides the company
with the ability to make products which show maximum value through attempting to
66

make cost correspond to customers wants and resources in a given situation, namely
making the production and marketing functions work closely together (Gordon and
Marino, 1992).
2.7.2.2.5 Improved productivity
Several researchers have reported an improvement in the company's productivity
as a result of MRP implementation (Sum and Yang , 1993; Sheldon, 1994; Sum et al.
1995). Sohal and Naylor (1992) highlight the company's productivity can be increased
dramatically in consequence of reduction in throughput time and reduction in inventory.
This can be achieved from MRP implementation (Dilworth, 1993). Furthermore, with an
MRP system productivity of direct labour can be improved because the production will
be planned in advance. With this knowledge, production orders can be scheduled to
better utilise the available labour time.
2.7.2.2.6 Increased information on which to base decisions
One of the significant reasons for adopting MRP as the production management
technique by manufacturing companies is because it makes use of the computer's ability
to store data centrally and provide access to the large body of information that seemed
necessary to run a company, and also, it helps to achieve coordination among various
aspects of production such as engineering, production and materials (Sum et al., 1995;
Browne et al., 1996).
According to Kneppelt (1981) an MRP II system can be used for the decision-
making process in areas such as accounts payable, payroll etc. With an MRP system
operations managers can make decisions concerning the rescheduling of orders and the
67

cancellation or suspension of orders on the master schedule as the firm's priorities
changes (Elkhouly, 1994). The firm can also monitor results, and when necessary, change
direction, because the system provides data quickly, before time works its permutations
(Kull, 1983) . In addition, the MRP data base allows managers to obtain reports on
projected inventory levels, vendor delivery performance, lead time, the master parts, bill
of materials, the manufacturing routing, and work centres (Browne et al., 1996).
It is worth mentioning that MRP is not an automatic decision system, it is a
decision support system (DSS) which provides timely and valuable information to people
who make the decisions and who make a company run such as sales order processing,
forecasting, aggregate production scheduling, material requirements planning, master
production scheduling, bill of materials, capacity requirements planning (Plenert, 1992;
Dilworth, 1993). Furthermore, Duchessi et al. (1989) found that successful companies in
MRP implementation rely on the system for day-to-day decisions.
2.7.2.2.7 Better ability to meet volume/product change
According to Sum and Yang (1993) and Sum et al. (1995), a better ability to
meet changes of the products and the required volumes is one of the benefits obtained
from MRP implementation. In this connection, Strzelczak (1995) argues that the most
important quality for the MRP users is its flexibility which enables fast, smooth, and
effective reaction to dynamic changes of the market demand. Figure 2.8 shows the old
and the new expectations from MRP systems:
68

Was Expected Less ock
MRP Better control productivity I Growth
Less workforce
Is Expected Short lead times
MRP Bette control Flexibility Growth
Reliability Growth
Figure 2.8 The old and new diamond of expectations from MRP systems (Quoted from
Strzelczak, 1995: P. 13 8).
2.7.2.2.8 Better production scheduling
According to Donk and Dam (1994) there are two possibilities for improving
scheduling. The first is to implement one the large number of software packages available
to support scheduling such as MRP software, and the second is to solve the scheduling
problem by mathematically-oriented scientists. With an MRP system, the company can
obtain a better production scheduling because it can generate a valid schedule to ensure
making products on schedule and shipping on time (Schroeder et al., 1981; White et al.,
1982; Duchessi et al., 1989; Sum and Yang, 1993; Sum et al., 1995). In other words,
with an MRP system a company can achieve actual production schedules (Callarman and
Heyl, 1986).
69

2.7.2.2.9 Reduced safety stock
According to Dilworth (1993) companies maintain safety stock for end items
because they experience independent demand, which is subject to uncertainties. But one
of the main outputs of an MRP system is manufacturing activity schedules indicating
which items are to be manufactured, in what quantity and by what date (Wild, 1996).
This will reduce finished goods and work-in-process inventories and maintain safety
stocks at lower level. Moreover, Buzacott and Shanthikumar (1994) have concluded in
their study about safety stock versus safety time in MRP controlled production systems
that safety time is preferable to safety stock if there is a good forecast of required
shipments, while safety stock is preferable to safety time if the master schedule is poor
because customers change their required shipments dates or companies cannot predict the
mean level of demand.
2.7.2.2.10 Better cost estimation
Traditionally, cost of production consists of material costs, wages,
depreciationfinterest, and overheads (Per-lind, 1991, Browne et al., 1996). The MRP
system can have a significant profitable effect on the cost structure of a firm as evidenced
by the internal measures such as the reduction in the amount of inventory on hand and
which results in increased inventory turnover ratios (Callarman and Heyl, 1986; Plossl,
1995), and also through planning the required work force (Dilworth, 1993).
2.7.2.2.11 Improved co-ordination with marketing and finance
MRP systems have planning techniques that improve communication both inside
and outside the manufacturing companies. Co-ordination here refers to the integration
70

between functions and sub-systems in order to constitute a unified information system
within the organisation (Per-lind, 1991). Manufacturing companies that have
implemented MRP systems have made major improvements in co-ordination of cross-
functional activities to produce the right material in the right quantity at the right time
(Martin, 1995).
Ho stated that "MRP generates the information required to co-ordinate various
activities in departments: telling people what to do and when to do it. Detailed
instructions are conveyed to the factory floor indicating how people should respond
under every eventuality" (1996, p. 93).
Furthermore, Westbrook (1995) reported that lack of communication (the failure
to involve other functions such as: marketing and purchasing), and poor
training/education on MRP have been considered some of reasons behind the failure of
computers such as MRP systems in manufacturing operations management.
2.7.2.2.12 Improved ability of iob performance
Turnipseed et al. (1992) reported that 80% replied that their job would be more
difficult or much more difficult without MRP and 81% of respondents reported that an
MRP system has improved or significantly improved their ability to perform their job.
Moreover, MRP systems provide a massive amount of information which may enable
people in many departments within the company to plan and operate with greater
coordination and effectiveness (Dilworth, 1993). For instance, purchasing can achieve
improved vendor relations and better utilisation of time; the marketing department can
71

achieve better customer relations through more reliable delivery; and the finance
department can improve planning control (Elkhouly, 1994).
2.7.2.2.13 Reduced informal systems
With the implementation of an MRP system the amount of formalization is
increased (Callarman and Heyl, 1986), whereby management must re-evaluate its method
of conducting business through developing and instituting formal policies which describe
how to perform business functions (e. g., forecasting, master scheduling purchasing etc. ),
procedures which describe how to enter and confirm associated system transactions, and
responsibilities which should be distributed across functional areas (Duchessi et al.,
1989). On the other hand, after MRP implementation a new formal structure breeds a
new informal system. The success or failure of MRP depends considerably on how the
new informal system responds to the needs of its members (Safizadeh and Raafat, 1986).
In this connection, Jacobi (1994, p. 13) states:
"NIRP is a formal and disciplined management process to plan and
control the total resources of a manufacturing business to effectively
allocate limited resources to the most profitable opportunities and
produce predictable performance. "
Moreover, Sandeep (1992) argues that the implementation of an MRP system
leads to the birth of a so called "formal system" because lot sizes and order points are
determined precisely using formal rules such as lead time off-set, and ordering rules etc.
In the aggregate, Duchessi et al. (1989) reported that the successful companies with
MRP implementation had - developed formal controls, distributed responsibilities, and
72

assured accountabilities i. e. defining what is expected from the organisation or people
part (Sheldon, 1994) more than less successful companies.
2.7.2.2.14 Increased BONI/inventory/MPS accuracy
There are two opinions regarding BO)nventory/MPS files accuracy: first, it is a
critical factor affecting the implementation of MRP systems, second, it is one of the main
benefits obtained from MRP implementation (Anderson and Schroeder, 1984; Callarman
and Heyl, 1986; Sum and Yang, 1993). However, one can say that MRP is intentionally
designed to bring accurate and timely information into the production operations
(Safizadeh and Raafat, 1986). Many researchers have reported in their studies that data
accuracy was increased as a result of MRP implementation. For instance Duchessi et al.
(1988) report that the successful companies with MRP implementation had higher levels
of data accuracy after implementation Smith et al., (1980) report that MRP
implementation increased inventory accuracy from 75% to 90% in the company's Smith
Valve. Also Sheldon (1994) reports that data accuracy in the stockroom was increased
from 66% to 95+ percent in about 16 months after implementing MRP system at
Raymond Corporation in upstate New York.
2.7.2.2.15 Improved morale in production
As pointed out by several writers such as White et al. (1982) and Sum et al.
(1995), improved morale in production can be regarded as one of benefits obtained from
MRP implementation. According to Cox and Clark (1984) as the implementation of MRP
system increases, management's confidence in the system increases, and better co-
ordination among departments is approved. Moreover, it ensures that all people are
73

focused on the same final objective and are working toward common goals (Sheldon,
1994), "everyone knows the steps that they must perform and they can see the forest for
the trees" (Hollander and Mirlocca, 1994), hence conflicts are few and can be resolved.
This is reflecting in improved morale in production. Again, Schroeder et al. (1981)
reported that improved morale in production is one of benefits obtained from MRP
system by the American users.
2.7.2 The key failings of MRP systems
Despite MRP systems can be seen as an adequate successful venture, there are
several qualifications to that success (Browne et al., 1996). They reported that MRP
systems still have many faults such as a) MRP did not attempt to address the design of
the manufacturing process. This leads to a situation where activities take place unnoticed
(which are counterproductive to good manufacturing practice and hence to
manufacturing system performance). For example, the BOM concept tended to
encourage the development of many process stages, each with buffers separating them
from the next stage. Now, this is not required because MRP structures seem to guide
users in this direction, b) in the development towards MRP II, MRP I has perhaps sought
sophistication but achieved complexity instead, c) the idea of leaving the capacity
management to the user has never worked very well. Therefore, even today, the master
planning level of MRP II is never really adequate on this account, d) MRP II has grown
too large. It has tried to address too many problems in too many domains with the same
basic approach. Fore example, now the shop floor control module of MRP II is not a
viable alternative for complex manufacturing environments. The BOM concept may have
74
had too much influence on the design of shop floor routings, and the result is the lack of
clarity in representing manufacturing process routings, e) although the fact that lead times
cannot be predicted, this does not necessarily imply that the average lead times cannot be
used for planning purposes. MRP II companies use the average actual lead time for the
planning lead time, through the application of the rough cut capacity what if analysis
(RCCP). As a result, mistakes may happen if the user tried to drive operational control or
production activity control with planned lead times, and f) the MRP approach to lot
sizing is criticised. It seems that the MRP always favored simplicity in lot sizing or,
indeed, no real lot sizing, by matching planned orders exactly with net requirements.
Sheridan (1995) adds that although MRP II systems have long played a role in
integrating such corporate functions as sales and marketing, manufacturing, finance, and
purchasing, the scope of user access tended to be rather limited, particularly in
Management Information Systems- MIS controlled mainframe environments.
In practical terms, Greenhalph (1991); Zhao and Lee (1993) and Browne et al.
(1996), discussed that there are several problems associated with MRP systems such'as:
a) the issue of schedule instability of MRP systems (i. e. significant changes in master
production schedule including changes in quantity or timing of planned orders or
schedules receipts) has been considered as a major concern for MRP practitioners, b)
master production scheduling and production activity control are not computerised by
MRP users as far as expected, c) capacity requirements planning has a relatively low
utilisation by MRP users, d) it is assumed that the required materials for the master
production schedule are either currently available or are not able to be supplied on time.
75

This may lead to excessive raw materials, namely increasing inventory depending
on the procurement lead-time and the actual sales and production, e) several items within
MRP system (such as lead times, safety stocks, and lot sizes) are supposed to be fixed
when they are variable, f) if load exceeds capacity, MRP does not adjust schedules
(Gupta, 1997), g) most of today's MRP and MRP II fail to allow any employee from any
department to connect with the computer and get a picture of the status of any customer
order (LaPlante, 1994), and h) MRP system can't tackle the problems encountered on
the shop floor because they lack the responsiveness needed to coordinate the many
simultaneous events occurring in a manufacturing environment (Gumaer, 1996).
However, applications of MRP II will continue to get richer, adding more
functionality and more areas of the business. Therefore, recent attempts to re-name it (i. e.
enterprise resource planning - ERP or customer- oriented manufacturing management
systems - COMMS) without really changing its nature have received little acceptance
(Turbide, 1995).
2.8 Factors that influence MRP suitability and success of MRP
implementation
The previous section dealt with the expected potential and the real benefits
obtained from MRP implementation. This section is intended to review the literature and
the previous studies concerning factors affecting a) MRP suitability and b) success of
MRP implementation.
76

2.8.1 Uncertainty factors
A review of the literature reveals that only one article, by Puttick (1987), has
dealt, with the impact of the degree of uncertainty on MRP implementation. He adds
when the degree of uncertainty is high that direction is required to manage the
uncertainty and control the whole operations by systems such as MRP. This will help it to
keep track of all components and batches manufactured at different locations within a
factory. Furthermore, he suggested that the uncertainty may arise from the unpredictable
behaviour of customers and suppliers outside the business- the uncertainty of the
marketplace (i. e. product variety, sales volume, and quality) and also it arises from
unpredictable behaviour' of people and unreliable plant within the company walls (i. e.
plant availability, and absenteeism). The previous mentioned is discussed in detail as
follows:
Z 8.1.1 Product characteristics diversity
According to Puttick (1987) and Wild (1990), when product variety increases,
the degree of uncertainty will increase. A company can meet that by modifying the
production lines (Gerwin and Kolodny, 1992). The implementation of an MRP system
can be seen as a way to manage the uncertainty, because it can perform the massive data
processing required to plan every component in hundreds of products to be produced
over a lengthy horizon. Consequently it improves the company's ability to react to
changes in diversified customer orders (Dilworth, 1993).
77

2.8.1.2 Amount of aggregate product demand
According to Gerwin and Kolodny (1992) the amount of aggregate product
demand can be regarded as source of uncertainty and which is reflected in changes in
company's market share. They added that manufacturing companies can reduce this
uncertainty by having the flexibility of volume. Therefore, it was thought that the
implementation of an MRP system can be seen as a way to help company in order to
reduce market share uncertainty or the volume uncertainty because its implementation
may increase the company's ability to react to changes in customer orders, namely
improving fitness to meet changes in market need (Dilworth, 1993).
In general terms, the uncertain demand works out in two cases- the first when the
actual demand is higher than that forecast, on-hand inventory is lower than that
projected, in turn an open order may be rescheduled to an earlier date during replanning,
and the second when the actual demand is lower than that forecast, on-hand inventory is
higher than that projected, in turn an open order may be rescheduled to a later date
during replanning (Kadipasaoglu, 1995).
Moreover, Sandeep (1992) pointed out that in practice a mismatch between
planned demands and actual customer orders causes order reschedules. Consequently,
MRP system is required to match planned demands and actual customer orders and
which makes the MPS realistic and stable.
2.8.1.3 Machine down time
It was suggested by Gerwin and Kolodny (1992) that machine downtime
represents one of the sources of uncertainty in process operations. Per-lind (1991) found
78

that the main reason for production stops within the biggest automobile company in
Egypt (NASCO) is machine breakdown. This will be reflected in the company's inability
to meet customer due dates. Therefore, the implementation of MRP system is necessary
in order to achieve better delivery performance, namely cut delivery lead times in turn
making promises kept (Callarman and Heyl, 1986; Dilworth, 1993).
2.8.1.4 The standards of raw material
Gerwin and Kolodny (1992) reported that meeting the required standards of raw
materials can be regarded as source of uncertainty, and this is reflected in product quality.
Therefore, the implementation of MRP system can be seen as a way to reduce uncertainty
through providing just sufficient material just-in-time for subsequent operations to
proceed, to provide a powerful capability for production review as much detail as
possible, and to provide valid day-to-day schedules (Leng, 1987). This may be reflected
in improving quality through increasing the production capability to produce items
without defects (Dilworth, 1993).
2&1. S. Behaviour of people within the factory
One of the measurements of the uncertainty is that behaviour of people within the
factory is unpredictable (Puttick, 1987). He suggests that when the rate of absenteeism is
unpredictable the implementation of MRP system is required to control the operations, as
the system provides a picture of work force planning, and can also achieve better
utilisation of human and capital resources (capacity). For instance information from it will
show the need to delay on some components if other wanted components are not at hand
(Dilworth, 1993).
79

2.8.1.6 Reliability of plant within the factory walls
Puttick (1987) suggests that when the plant within the factory wall is unreliable
the degree of uncertainty increases, in turn the implementation of MRP system may be
required in order to translate the overall plans for production into individual steps
necessary to accomplish those plans (Vollmann et al., 1992). In other words MRP system
determines the quantity of materials need to support the MPS which determines how
many products should be produced and when, depending upon the data derived- from
strategic, business and production plans. Therefore, when these data are reliable the
degree of uncertainty concerning the MPS outputs is decreased. In this connection, Earl
(1996) reports that business plans should be analysed to recognise where information
systems such as MRP systems are most required.
Z 8.1.7 Capacity constraints
Though the planning of production assumes that sufficient production capacity is
available, the uncertainty in production capacity can be regarded as one of the difficulties
in planning and control of production (Per-lind, 1991). Production planning and control
system such as MRP system may can be seen as a way to reduce uncertainty through
identification of actual capacity constraints (Dilworth, 1993), and working to fit between
planned and actual capacity (Per-lind, 1991). Therefore, MRP I system assumes that no
capacity constraints on the production of the master scheduled item and its components;
all purchased materials are available (Lin et al., 1994), namely it assumes unlimited
capacity in all work centres (Aggarwal, 1985).
80

2.8.2 Organisational factors
As pointed out by several writers such as Duchessi et al. (1988) and Sum et al.
(1995) the organisational factors such as company's age; company's size; type of
manufacturing system (Make to stock or make to order or both); manufacturing process;
company's complexity; organisational arrangements; organisational willingness; and type
of industrial process (layout) can be not only seen as determinants of MRP
implementation but also as determinants of MRP benefits.
2.8.2.1 Company's age
According to Sum and Yang (1993), when the company becomes more aged and
more established, it is more willing to invest in longer term enhancement projects like
MRP systems. Other empirical explanations for the association between the company age
and the implementation of MW system have been offered by Duchessi et al. (1988) who
conducted a survey regarding determinants of success in implementing material
requirements planning (MRP) on 272 MRP companies in the US. They found that the
average age of companies that have implemented MRP I/MRP II systems in the US is
37 years. In direct contrast, Sum et al. (1995) found in their study that there is no
significant relationship between company age and the benefits obtained from MRP
implementation.
2.8.2.2 Company's size
It is general believed that the company size has a great impact on the
implementation of MRP systems. Anderson et al. (1982) and Sum & Yang (1993),
indicated that as companies increase in size as measured by gross sales, they have a
81

greater inclination to implement MRP systems. Sum et al. (1995) in their study about the
analysis of the MRP benefit-determinant relationships for 128 companies in Singapore
found that there is a positive (+) followed by negative (-) relationship (using ACE
technique) between company size (measured by gross sales, number of employees,
current and additional investment over next 3 years in MRP) and operational efficiency
(measured by improved productivity, improved quality, increased throughput and
reduced inventory costs). Cerveny and Scott (1989) reported in their study regarding
MRP implementation in 433 companies in the US, that there are significantly more MRP
systems in large companies (measured by number of employees, sales and number of
product lines).
Moreover, White et al. (1982) employed multiple discriminate analysis to examine
the impact of several variables such as company size, management support, etc. as a
predictors of the successful implementation of MRP system within 357 companies in the
US. Though they found that company size did not show significant discriminatory power,
there is an impact of company size on the successful implementation. This is embedded in
another two variables which are highly correlated with company size, namely the length
of time of implementation and the degree of computerisation. The analysis revealed that
the two variables have a great impact on the successful implementation. Again, Burns et
al. (1991) in their study regarding critical success factors in manufacturing resource
planning implementation on 502 companies in the US, found that MRP companies have
been characterised by more employees, greater annual sales and more end items than
companies who did not use MRP II. Schroeder et al. (1981) found in their study
82

regarding MRP benefits and costs in 679 MRP companies in the US, that there is a
positive (+3.8)2 relationship between company size and the number of expediters. They
reported that large MRP companies had more expediters.
2.8.2.3 Type of products
As pointed out by several writers such as Anderson et al. (1982); Duchessi et al.
(1988); Cerveny and Scott (1989); Cooper and Zmud (1990); Sum and Yang (1993) and
Parker (1995), the implementation of MRP system is affected by the type of products
that company offers to serve its customer.
According to Dilworth (1993) and Browne et al. (1996), there are four types of
products or marketing strategies based on a distinction between stock driven or customer
driven systems. Customer driven production system can meet customer needs quicker
than the other or can respond faster to changes due to a direct interaction between
customer and manufacturer is very high (see Figures 2.9; 2.10 below).
Products Products Manufacturer -) ( Stock l Customer
Orders Orders Figure 2.9 Stock driven production (Quoted from Browne et al., 1996, p. 16)
Products
Manufacturer Customer Orders
Figure 2.10 Customer driven production (Ibid. )
2 Using T-test.
83

These types of products are as follows: a) Make -To- Order (MTO) describes a
manufacturing system where the products are selected by customers in advance (e. g.,
based on a catalogue), and then the company completes the end item required after
receiving the customer order for the item, b) Make -To- Stock (MTS) describes a
manufacturing system where the demand for clearly defined product is very well known
and predictable. The company makes items that are completed and placed in stock before
receiving the customer order, then the end items are shipped "off the shelf' from finished
goods inventory after receiving customer order. In general, direct interaction between the
manufacturer and the customer tends to be very low, c) Assemble-To- Order (ATO)
describes a manufacturing system where products are configured or assembled to
customer order from a set of assemblies and components such as an automobile factory,
d) Engineer-To-Order (ETO), describes a manufacturing system where the customer
order requires that a new engineering design be developed because the item is unique. In
general, the product is designed to a customer specifications (custom-designed item).
In sum, many companies are now moving towards using a hybrid strategy in order
to achieve a higher degree of customer satisfaction. And also, it is notable that moving
from MTS to ETO depends on what the literature called Customer Order Decoupling
Point (CODP) which defines the parts of the process that are driven by customer orders
and the parts that are driven by forecasts (Browne et al., 1996).
According to Anderson et al. (1982); Cooper and Zmud (1989); Cerveny and
Scott (1989) and Sum & Yang (1993), MRP systems are more frequently adopted by
manufacturing companies that follow a combination of make to order and make to stock
84
products strategy. Burns et al. (1991) reported that two-thirds of 502 MRP companies in
the US produce products both to order and stock.
Sum et al. (1995) found that both types of manufacturing systems, namely Make -
To- Order (MTO) or Make -To- Stock (MTS) impact on the benefits obtained from
MRP regarding customer service, but it is being in Make -To- Order (MTO) environment
more than Make -To- Stock (MTS) environment.
Schroeder et al. (1981) reported that the type of products had some impact on
two performance measures. The inventory turnover was more frequent in make-to-order
companies than make-to-stock companies, while the later one had lower delivery lead
times than the former.
2.8.2.4 Type of manufacturing
According to Lockyer et al. (1989); Dilworth (1993); Kim and Lee (1993) and
Browne et al. (1996), there are several types of manufacturing (sometimes called the
production systems) such as: project manufacturing, job shop manufacturing, repetitive
manufacturing, batch manufacturing, and continuous manufacturing.
Plossl stated that:
"It is clear that the application of MRP is generally better in
discrete order as contrasted to continuous processing and
repetitive manufacturing, where specific batch orders may not
exist, and for complex rather than simple, even one-piece,
products" (1995, p. 54).
Anderson et al. (1982) reported in their study about Material Requirements
Planning Systems (MRP I): the state of the art in 679 manufacturing companies in the
US, that 83.2% of companies that have implemented MRP system are working in
85

assembly and fabrication operations environment. In the same way, Sum and Yang
(1993) found that MRP systems have been implemented by Singaporean manufacturing
companies that work more in assembly and fabrication operations environment than
companies that work in assembly only or continuous/process flow environments
(33.9: 28.8: 13.6).
2.8.2.5 Company complexity
The company becomes complex when its products are with many components
that must be identified and controlled, there is a large number of workcentres, the number
of levels in bill of materials is large (Puttick, 1987), the number of products is large, there
are dependencies between different production lines and the company has to produce a
combination of make to order and make to stock (Donk and Dam, 1994). If so, the
implementation of MRP system is required to control the entire operations and to keep
track of all components.
Sum and Yang (1993) reported MRP systems are more often adopted by
manufacturing companies with a complex product structure and which is measured by
number of items (it indicates the size of the product structure), number of levels in bill of
materials (it indicates the depth of the product structure) and the degree of commonality
of parts (it measures the average number of the present of parent items for each
component item). Furthermore, Burns et al. (1991) found that MRP companies have
been characterised by more components, and more level of bill of material than
companies did not use MRP II.
86

Schroeder et al. (1981) found that there is a relationship between the complexity
of the product structure (measured by number of parts & components, and level in the
BOM) and the successful implementation of MRP systems measured by the five
performance measures (i. e. increased inventory turnover, decreased delivery lead time,
increased delivery promises percent, decreased split ordered, and decreased number of
expediters). They reported that companies with more parts and components were poorer
in their performance, whine companies with more levels in the BOM had better
performance.
2.8.2.6 Organisational arrangements
Top management has to control and steer the MRP project by influencing its
progress. To do this, a steering committee should comprise the company president, and
vice president of the various department such as executive vice president operations, vice
president finance, director, sales and marketing (Iemmolo, 1994). Furthermore, as
pointed out by several writers such as Forster and Hsu (1976); Brenizer (1981); Savage
and Schuette (1982); Pendelton (1982); Huther (1983) and Anderson & Schroeder
(1984) the successful implementation of MRP system depends upon the organisational
arrangements accompanied the implementation. These arrangements include the forming
of a steering committee and project team, and having these committee meet regularly on
weekly or monthly basis, having someone with authority on the steering committee.
These reflect organisational and managerial support which is necessary to generate
acceptance of MRP within the organisation and foster user involvement.
87

Duchessi et al. (1988) found that nearly two-thirds of both successful and less
successful companies reported forming a steering committee, that the steering committee
met at least once a month, and the project team met weekly. They add that the successful
companies were much more likely to agree that someone with full authority attended
steering committee meetings.
According to Burns et al. (1991), the data collected from 238 MRP companies
responding to the survey indicate that a steering committee was formed from
manufacturing materials, production and inventory control, and data processing
departments in 83% of companies. The project managers had full-time responsibility for
managing the project in 40% of MRP companies.
Furthermore, they found that 83% of MRP companies used a project team which
consisted of eight members from manufacturing materials, production and inventory
control, and data processing departments and which often met on a weekly basis. In
addition, they reported that the use of a project team was strongly linked with the stage
of MRP II implementation achieved, and also found that the more time devoted by
project manager to the effort of implementation, the more advanced stage of MRP
implementation.
2.8.2.7 Type of process (layout)
As mentioned earlier there are several types of production systems within
manufacturing environment. Each production system describes something about its
manner of operation, (i. e. the facility, the equipment, and operations methods that
company uses based on the type of products that it provide to its customer). This reflects
88

the way that company arranges departments, machines, storage areas, and so forth,
within the confines of some physical structure such as a factory, a warehouse, a retail
store, or an office (Johnson et al., 1974). In this connection, Wild (1996) defined the
layout by the arrangement of facilities in a given space. The need for layout is a) to
facilitate the movement of materials, components, the finished products, and labour and
which is reflected in a reduction of the distance moved by items and in the time
consumed, and hence in the cost, b) to achieve a reduction in work in progress and hence
reduce throughput time and c) to utilise of space, facilities of operation, maintenance,
supervision and labour.
In general, there are three types of layout; firstly, layout by product which is used
when the entire production process is devoted to a single product or activity. It is also
called a layout by continuous process or by assembly line. Secondly is layout by process
where activity areas are arranged to group all work stations of a given type together. It is
also called a layout by job shop, and thirdly is layout by a combination between product
and process (Johnson et al., 1974; Dilworth, 1993).
Anderson et al. (1982) and Sum & Yang (1993), reported that MRP systems are
more adopted by manufacturing companies with the complicated processes (layout).
They have been implemented in assembly line and job shop more than continuous process
environments. While, Bums et al. (1991) found that 32% of manufacturing companies
with job shop manufacturing have implemented MRP systems, followed by 29% of MRP
companies with repetitive production and 10% of MRP companies utilised a continuous
process. Moreover, Cerveny and Scott (1989) found in their study that MRP users are
89

more likely to be assembly line or combination of process types than nonusers.
Furthermore, Duchessi et al. (1988) reported that 51% of MRP companies in their
sample are discreterobshop, followed by 29% of companies working within repetitive
manufacturing environment.
Z. 8.2.8 Organisational willingness
According to Kneppelt (1981) the major problem that impedes the
implementation of MRP II is the need for a higher degree of efficient integration of the
human element. Wacker et al. (1977), argue that the success of MRP implementation lies
in its acceptance by the people of the organisation. This acceptance is subject to
resistance from those people partly because they may expect that the implementation of
MRP system will formalise many decisions that were left to the individual's discretion,
will cause the informal system to be more accountable, will cause changes in duties and
job descriptions, will create perceptual problems over what its purpose is, will require
learning new methods or because it is a complicated dynamic system.
Burns et al. (1991) found that 49% of MRP users may resist change and go along
with changes only if forced to comply, and only 21% of MRP companies may actively
seek change. Also, they found the organisation's willingness to change was associated
with the stage of implementation and the more willing an organisation is to change, the
more successful implementation.
2.8.3 Implementational factors
As was mentioned in an earlier part in this chapter MRP has been the most widely
implemented system over the last 'three decades. A review of the literature reveals that
90

there are several factors affecting the implementation process of T RW system itself such
as length of time since implementation; implementation strategy; initiator of MRP effort;
vendor support; and implementation problems.
Z 8.3.1 Length of time in implementation
The length of time since MRP implementation has been found to be a reliable
discriminator of successful and unsuccessful implementation (White et al., 1982). Thus,
according to Sum et al. (1995) companies with matured systems tend to offer higher
customer service benefits (i. e. better meeting of delivery promises, shorter delivery lead
time, better production scheduling, and better ability to meet volume/product change).
The positive impact of a matured system on MR? benefits could be explained by
it taking time to achieve effective coordination among different departments such as
marketing and production, and also by greater user acceptance of the system as a result
of prolonged usage.
2.8.3.2 Implementation strategy
The conversion to an MRP system can be defined as a change from one situation
to the other. It has been seen as a bridge which takes form, length, width, supporting
structure, materials... depending how wide the river, the anticipated traffic and so on
(Forster and Hsu, 1976).
In general terms Badiru and Schlegel (1994) present four strategies can be used
for technology conversion:
" Parallel conversion: both technologies (new and old) operate concurrently until there
is confidence that the new technology is satisfactory.
91
" Direct conversion: the old technology is removed totally and the new technology is
implemented. This can be used in case of the two technologies cannot be kept
operational for incompatibility or cost considerations.
" Phased conversion: the modules of new technology are gradually introduced at a time
using either direct or parallel conversion.
" Pilot conversion: the new technology is fully implemented on a pilot basis in a selected
department within the company.
Croke (1985) and Bessant (1991), advocate that phased conversion can be
regarded as the right way of implementing a new technology such as CAPM technologies
within manufacturing companies, where users become more experienced with the process
of time.
Burns et al. (1991) found that 80% of NW implementation was based upon a
phased approach, with an average of four phases required to complete the
implementation.
Plossl (1995) and Browne et al. (1996) argue that one of the problems of MRP
implementation is that MRP users involved in the implementation process do not have a
clear understanding of the approach to implementation.
2.8.3.3 Initiator of MRP effort
According to Sum and Yang (1993), "initiator of MRP" means that person or
department which can effect the extent and rate of acceptance of the system in a
company. White et al. (1982) report that there are several initiators of MRP systems such
as top management, production and inventory control management, both top
92

management and production and inventory control management, data processing
personnel, and software/hardware vendors. Sum and Yang (1993) found that top
management were committed to introducing MRP systems in 67.8% of MRP companies
in Singapore. In contrast, White et al. (1982) found that 31% of MRP system were
introduced by production and inventory control (p&ic) management, and also, both top
management and p&ic management were committed to introduce MRP system in 31% of
XW users in the US.
In general terms, it has been found to be a critical factor for the successful
implementation of new manufacturing technology (Chen and Small, 1994). As pointed
out by several writers such as Wight (1981); Donovan (1982); Beddick (1983), Dilworth
(1993); Sum et al. (1993); Ang et al. (1995) and Browne et al. (1996), top management
commitment is regarded as a prerequisite for a successful MRP implementation.
To reap the benefits of MRP system, top management has to be committed to
work out and maintain a new set of values in the organisation so that it can operate
effectively. Furthermore, with top management support the people tend to accept
changes (Blackstone and Cox, 1984). Thus, to increase the opportunity of success in
implementing MRP system, top management has to effectively support and be involved in
planning, implementing and monitoring of the systems (Cox et al., 1981). Despite this,
getting top management support is not an easy task (Ishman, 1995). The question is how
top management are committed. The answer is they must become involved in the
implementation, set clear goals for the implementation, use formal planning and control
functions of MRP/MRP II to run the business and measure results, distribute
93

responsibilities across functional areas, allocate resources to training during the
modernisation phase, and hold people accountable, namely that they know what is
expected from them (Duchessi et al., 1989; Sheldon, 1991; 1994; Chen and Small, 1994).
Furthermore, Schroeder et al. (1981) found in their study that top management support
affected percentage of delivery promises that were met and percentage of split orders.
2.8.3.4 Data accuracy
According to Anderson et al. data accuracy means "the accuracy of information
with which management deals" (1982, p. 62). Macbeth and Ferguson (1994) consider that
both MRP I and MRP II are so dependent on accurate data that extensive shop floor
recording equipment's need to be installed to automate the stock and material
information movement. Duchessi et al. (1988; 1989) had concluded that data accuracy is a
major determinant of MRP implementation success. In the same way Sum et at. (1995)
found that the degree of data accuracy, whether it was planning data such as inventory
records data or execution data such as shop floor data, impacts on all benefits to be
obtained from MRP implementation (i. e. operational efficiency, customer service, and
coordination benefits).
Ang et al. (1995) found in their study that data accuracy represents the most
important factor affecting the successful implementation of MRP systems in Singapore.
They found that the accuracy of BOM records, inventory records, manufacturing lead
times, and master production schedules were rated as especially significant. Moreover,
Wight (1983; 1989) and Blackstone & Cox (1985) reported that 98%-100% of the bill of
94

materials, 95%-100% of the inventory records, and 95%-100% of the routing file should
be accurate before MRP implementation.
On the other hand, it is generally believed that inaccurate data will undermine
management decision making ability which has a negative effect on all organisational
aspects. And also inaccurate data records such as BOM file and inventory records may
cause great confusion and uncertainty about MRP system output necessary for the
effective manufacturing management (Westbrook, 1995). This will reduce productivity
contrary to the initial objective of MRP implementation.
Other theoretical explanations for an association between data accuracy and the
successful implementation of MRP system have been offered by several writers such as
Vollmann et al. (1992); Dilworth (1993) and Browne et al. (1996). They consider the
successful implementation of MRP system depends upon the degree of data accuracy of
the basic data files such as inventory records which are established and maintained for
inventory item (Plossl, 1995). Its inaccuracy will lead to the generation of wrong net
requirements. With the use of MRP system these requirements will be rapidly exploded
through lower levels of components (i. e. BOM) to generate production and purchase
orders that are of the wrong quantities. Bill of material records which show the structure
of products (i. e. it includes data regarding component part numbers required to make
each individual part, number of each required, units of measure and engineering change
numbers) will result in similar outcome if it is inaccurate (Vollmann et al., 1992).
95

The failure of an MRP system may be due to the bad data in use e. g., BOM/
Inventory/ lead times data, because the value of MRP depends on the quality of data it
uses (Plossl, 1995).
Moreover, Schroeder et al. (1981) found in their study that data accuracy has a
positive effect on the percent of delivery promises that met.
2.8.3.5 Vendor support
According to White (1980) and Keen (1981), outside assistance such as vendor
support is critical to the successful implementation of any major organisational change
such as an MRP system. Management must assure that continuous support throughout
the implementation is provided by the software vendor (Duchessi et al., 1989).
Cerveny and Scott (1989) reported in their study that 61% of 261 MRP
companies received help from their system vendor. Also, they found that there is a
positive relationship between the amount of outside help and some benefits obtained from
MRP implementation for instance, inventory turnover ratio (sales/inventory) increase
(+. 50) and lead time decrease (+. 24).
Ang et al. (1995) reported in their study that vendor support has been considered
as a significant factor affecting the successful implementation of MRP system in
Singapore.
Duchessi et al. (1989) reported in their study about implementing a manufacturing
planning and control information system on 272 manufacturing companies with MRP
I/MRP II software in the US that successful companies reported fewer problems with
vendor support, greater understanding of the instructions of software product, lack of
96

vendor software support, vendor provision of the conversion of data into the new system,
and were more likely to agree that vendor personnel efficiently resolved software
problems. In sum, Duchessi et al. (1988) cite having software and hardware vendor
support as a significant element of the successful implementation of an MRP system.
2.8.3.6 Implementation problems
A review of the literature reveals that there several factors which may cause
obstacles or problems which manufacturing companies may encounter during the
implementation of MRP systems.
Duchessi et al. (1988; 1989); Groves (1990); Sum and Yang (1993) and Browne
et al. (1996), consider lack of'support of people or departments, such as lack of support
from top management, lack of support from production, lack of support from
supervisor/foreman, lack of support from marketing, and lack of support from finance.
These are very significant barriers encountered in the implementation of MRP system.
Ang et al. (1995) concluded in their study that the most common problem
encountered in the implementation of MRP systems in Singapore is that an MRP system
is expensive. 25 out of 52 companies that have implemented MRP systems in Singapore
have invested more than S$ 500.000 into the system. Leng (1987); Plossl (1995) and
Browne et al. (1996) argue that lack of clear goals for MRP effort represents one of the
barriers to MRP implementation because MRP users do not comprehend the main goals
for MRP implementation such as meeting of delivery dates and a reduction in inventory.
Duchessi et al. (1988) reported that less successful companies reported a lack of
involvement from vendor. While Sum et al. (1995) consider that lack of vendor
97

knowledge on MKP one of the problems which are encountered in implementing MRP
systems.
Beatty and Gordon (1988) reported that one of the barriers to implementation of
A. M. T such as computer aided design and computer aided manufacturing is in
compatibility of systems and which stems from purchasing a variety of hardware and
software. While White et al. (1982) reported that the problem with lack of suitability of
hardware and software has a negative impact on the successful implementation of MRP
systems. Hollander and Mirlocca (1994) reported that management must choose software
that most closely fits its requirements and leads to an easy installation. Duchessi et al.
(1989) add that companies with successful MRP implementation reported that there is no
problem with the suitability of hardware and software. Moreover, it is interesting to
mention here that implementing an MRP system is totally different from installing a TV
set. To implement an MRP system three areas should be understood: functionality (i. e.
financial planning, using operating numbers, scheduling etc. ), modifications (i. e. need for
customised reports, monitor screen display etc. ), and bugs which means that people have
to learn that software operation is more of a hope than a reality (Leng, 1987).
Sum and Yang (1993) reported that lack of company expertise in MRP represents
the biggest barriers to MRP implementation in Singaporean companies.
One of the barriers to MRP implementation is that manufacturing companies need
long time to learn how to implement MRP systems. This time is ranged from two years
(Smith, 1993) to 10 years (Voss, 1986).
98

Sum and Yang (1993) and Sum et al. (1995) consider lack of information
technology expertise one of the obstacles that impedes the implementation of MRS'
systems by manufacturing companies.
In the aggregate, Covin (1981) reported that there are five categories for
problems that may impede the successful implementation of MRP systems: a) computer
system not technically sound, b) poor inventory records, c) poor bills of material and
routing records, d) unrealistic master schedule, and e) personnel attitudes.
2.8.4 Technological factors
In simple terms "technological factors" is the label for those factors which relate
to the source of the MRP system; the system's installation, its features and its
development.
Z84.1 Degree of integration between MRP modules
Despite computerisation being the essence of the implementation of the MRP
system process, the operational effectiveness of MRP implementation is measured not
only by what MRP modules have been computerised and what is the degree of
computerisation of them, but also what is the degree of integration among the
computerised modules (Sum and Yang, 1993; Sum et al., 1995). In turn, the next
subsections are devoted to shed some light on the two related issues, namely degree of
computerisation and degree of integration among MRP modules.
2.8.4.1.1 Degree of computerisation
White et al. (1982) reported that degree of computerisation of MRP modules can
be regarded as a significant discriminator of successful and unsuccessful implementation
99

of MRP systems. The implication is that the higher the level of computerisation the
greater appears to be the successful implementation of the MRP systems (Sum and Yang,
1993). They add that there are a wide array of MRP modules, but companies only install
those that meet their requirements.
As put forth in numerous studies (Duchessi et al., 1988; 1989; Sum and Yang,
1993; Browne et al., 1996), the basic MRP modules that must be implemented and
integrated by manufacturing companies in order to ensure the successful implementation
of MRP system include: a) the Bills Of Materials module which essentially is used in
order to translate the master production schedule into subordinate components
requirements (Vollmann et al., 1992); b) the Master Production Schedule module which "
takes into account the sales forecast as well as considerations such as the backlog,
availability of material, availability of capacity, management policy, and company goals,
etc. in determining the best manufacturing strategy" (Browne et al., 1996, p132); and c)
the Inventory Control module which is used to state every item to be controlled by NW
system (Dilworth, 1993), and which serves as an input to the master schedule.
In this connection Cerveny and Scott (1989) found that 235 of 261 MRP
companies in the US had installed BOM and Inventory Control modules, and over 70%
of them had installed Master Production Schedule module which is different from the
MRP procedure whereas the demand will only generate from the scheduled MPS and not
from the projected requirements. Consequently, the MPS will not influence
manufacturing or purchasing orders without the intervention of the master planner
(Browne et al., 1996).
100

To become more effective at manufacturing planning and control system,
company requires to install a) a Forecasting module which is used in order to help the
company to get a better handle on expected demand and inventory required to meet
customer service objectives. It should account for the level (rate of demand per period),
trend (rate of increase or decrease), and seasonability i. e. period fluctuations around the
trend line (Duchessi et al., 1988; John, 1996); b) a Shop Floor Control module which can
help manufacturing companies "to accommodate special order requests quickly and meet
production demands proactively by allowing manufacturers to prioritise and manipulate
day-to-day production activity" (Ross, 1997, p. 90). It also, provides current status to the
capacity requirements planning system as well as activity tracking to support input/output
control (Kneppelt, 1981) and to "support dispatching and detailed scheduling control and
allow line management to report current progress of open shop orders" (Duchessi et al.,
1989, p. 76), c) an Explosion of requirements module which explodes the requirements in
MRP system from master production schedule down through component levels in
accordance with the logical linkage of inventory records from top to bottom of bill of
material structure (Plossl, 1995), d) Purchasing and receiving module which determines
when and what parts should be ordered from vendors (Duchessi et al., 1989).
Furthermore, there is a wide array of sophisticated MRP modules would be
required to make links to other major MRP modules (Frazer and Nakhal, 1992) such as:
Capacity Requirements Planning, Rough-cut capacity planning, Financial analysis,
Customer order service, Routing/work centres, Cost accounting, Sales order processing,
Operations scheduling, Inventory Control module and Payroll/human resources.
101

2.8.4.1.2 Degree of integration
According to Carrie and Maclntosh (1993), the term "integration" is considered
in many contexts and at many levels. However, there are two points of view concerning
its accomplishment. The first the narrow view, relates to the coherence and coordination
of elements within the computer systems and the second the wider view, is concerned
with the coordination of activities and the suitability of the current systems in the
organisation to achieve its objectives (Carrie and MacIntosh, 1992). They added that:
"integration is achieved by the communication of, and adherence to,
corporate strategic objectives throughout an enterprise, thereby
allowing these objectives to dictate the real time operational activities
of the enterprise" (1992, p. 162).
In general terms, MacIntosh (1994) define a hierarchy of integration, three type
of integration, containing four levels:
" Technical: The use of compatible hardware and software data
" Information: The use of common data definitions and status information expressed in
common currency
" Strategy: The existence of common aims at all levels within the organisation
" Functional: The merging of business functions
Sum and Yang (1993) and Sum et al. (1995), attempted to measure the degree of
integration among MRP modules by use a simple scale (discrete scale)3. Sum and Yang
(1993) reported a degree of integration of at least 60% in 65% of Singaporean users.
3 Their methodology has been used in the study (see Q. 28 in Appendix. A).
102

Moreover, Sum et al. (1995) found in their study that higher efficiency is
accompanied by a higher degree of integration between MRP modules and also they
concluded that high integration is needed to achieve effective coordination among
subsystems and departments.
Furthermore, Miller and Sprague (1975) highlight the importance of coordination
and integration between MRP modules in order to ensure the successful implementation
of an MRP system. In the same way, Safizadeh and Raafat (1986) argue that the
fiustration with MRP hardware may stem back from a lack of integration of the MRP
software modules.
2.8.4.2 Source of MRP system
As put forth in numerous studies (Duchessi et al., 1988; 1989; Sum and Yang,
1993) there are several sources of MRP software package, a) developing the entire
software package in-house, b) all bought-in as turn-key systems or off the shelf or
customised, and c) bought-in and customised in-house.
Burns et al. (1991) reported that 59% of MRP users purchased software with
some modification while only 29% had developed the software package for MRP in
house. They found that the source of MRP II software was linked to MRP II success and
positively associated with the stage of MRP achieved (i. e. D or C or B or A stage).
And also, Sum and Yang (1993) reported that 71.1% of MRP companies in
Singapore source their software from vendors and only 13.6% developed the entire
software in-house. They add that companies prefer to buy turn-key systems in order to
103

shorten the MRP implementation time and also to take advantage of the consultancy
offered by vendors.
The source of the MRP system has been considered as a technological factor
affecting the implementation of such systems (Sum et al., 1995). White et al. (1982)
found that there is a relationship between MRP implementation and the outside source of
MRP system such as whether it comes from software or from hardware vendors.
Schroeder et al. (1981) found that there is an adverse relationship between the
source of MRP software (software vendor) and the performance measures. They
reported that where vendor supplied software with no or little or high modifications MRP
companies had the poorer performance. Therefore, they suggest the best approach is to
use vendor supplied software with some modifications not too much and not too little.
The computer hardware in MRP systems can run on microcomputers, mainframes
or minicomputers. According to Diamond (1997) MRP I and MRP II were associated
exclusively with mainframes and microcomputers. This trend has been changing,
however, since the mid-1980s with the introduction of PC-based manufacturing
applications. Moreover, Sum et al. (1993) found that about 49.2% of the MRP systems
in Singaporean companies run on minicomputers while an equal percentage each (20.3%)
run on microcomputers and mainframes. Finally, the maintenance of IMP can be done
whether in-house or by software vendor or by IT specialists. In this connection, Duchessi
et al. (1989) reported that the maintenance of MRP was completed by software vendor at
a successful company with MQRP implementation (Flo-Con company).
104

2.8.4.3 System installation costs
In general terms, Vollmann et al. (1992) argue that too many managers ask "
How much does Manufacturing Planning Control system such as an MRP system cost? "
because it can run from a few thousand dollars to millions. They add that the problem not
with the cost of hardware and software of MPC system because it is decreasing
dramatically and will continue to do so, but it is concerned with preparing people for
operating a new system. They suggest that the cost of any MPC such as MRP system
includes several categories of costs as follows: training cost (e. g., training trainers and
system users, cleaning up the data base (e. g., developing the correct data), personnel
expenses (e. g., full time and part time project members), support of people (e. g., revised
pay schemes), relayout of facilities (e. g., factory floor changes), software (e. g., package
purchase cost), and hardware cost (e. g., network in equipment).
As reported by White et al. (1982) and Ang et al. (1995) the cost of an MRP
system can be regarded as one of the major problems that may encounter the
implementation of MRP system. Fisher (1981) considers the cost of MRP system as an
important factor for Mi11 implementation. This cost includes purchase price and
operation & maintenance costs.
Sum and Yang (1993) reported that all MRP companies in Singapore were
prepared to make further investment whether in order to extend or to change the current
MRP system. Moreover, the cost of MRP system including the current cost and the
further investment was regarded as a determinant variable of operational efficiency (Sum
et al., 1995).
105

2.8.4.4 User Class
"User class" is a term used by Anderson and Schroeder (1982) to represent the
stage of development of the MRP systems within manufacturing companies or the extent
of MRP infusion within manufacturing companies based on A through D classification
scheme suggested by Wight (1984; 1989). Whereas Class D indicates that MRP
companies have not achieved even the lower advanced stage of MRP implementation,
they had only passed the adoption stage, while Class A indicates that MRP companies
have achieved the higher advanced stage of MRP implementation. These classes are
illustrated below:
Class A: A closed -loop system used for both priority planning and capacity planning.
MPS is levelled and used by top management to the business. Most deliveries are on time
inventory is under control, and little or no expediting is done.
Class B: A closed-loop system with capability for both priority planning and capacity
planning. In this case, the MPS is somewhat inflated, top management does not give full
support, and some inventory reductions have been obtained, but capacity is sometimes
exceeded, and some expediting is needed.
Class C: An order launching system with priority planning only. Capacity planning done
informally, typically with an inflated MPS. Expediting is used to control the flow of work
and a modest reduction in inventory is achieved.
Class D: The MRP system is exists mainly in data processing. Many records are
inaccurate. The informal system is largely used to run the company. Little benefit is
obtained from the MRP system.
106

Cooper and Zmud (1989) reported in their study about material requirements
planning infusion on the random sample of 62 manufacturing companies in the US, that
MRP is infused (D through A) when manufacturing method is more continuous than
intermittent, and when production is more complex (measured by average number of
parts and BOM levels).
Sum et al. (1995) found that MRP companies with more aged system (closer to
class A) tend to provide higher customer service benefits (delivery promising, lead times,
responsiveness to changing market demand, etc. ).
Moreover, Schroeder et al. (1981) reported that user class had a very strong
affect on all five types of performance. For instance, they found that MRP company with
class A had achieved the best inventory turnover.
2 8.4.5 MRP system features
According to White et al. (1982); Anderson et al. (1984); Vollmann et al. (1992);
Sum et al. (1993); Dilworth (1993) and Browne et al. (1996), the common technical
characteristics of MRP system are:
a) Update method: There are two methods which can be used to update an MRP system,
firstly regenerative MRP programs construct new data each time (usually each week). It
views the MPS as a document, new editions of which are released on a periodic basis.
The second is the net change MRP program which revises only the data of ected by
transactions that are put into it or by a new master schedule. These transactions may be
entered into a net change program frequently to reflect conditions as they change. It
views the MPS as a document in a manner of continuous change (Dilworth, 1993;
107

Browne et al., 1996). Furthermore, a combination between the two methods is possible.
It was found in practice Regenerative programs may borrow some net change features
and conversely, net change programs are used periodically just like regeneration
programs (Plossl, 1995).
b) Use of cycle counting: It can be regarded as a necessity to achieve and maintain
inventory accuracy. For doing that companies must learn that the purposes of doing cycle
accounts are to find the cause of errors and not just to correct the inaccurate count, to
maintain a high level of inventory record accuracy, and to correct statements of assets
(Covin, 1981; Correll, 1995).
c) Use of pegging. This is a special feature of MRP systems which allows MRP users to
trace an item's gross requirements to parent sources in the master schedule or identify the
sources of demand for a particular component's gross requirements. If each individual
requirement for a planned item is identified in the BOM this is termed single level
pegging, while if it is identified against a master production scheduled item and for
customer order this is termed Full Pegging (Browne et al., 1996).
d) MPS update frequency: The frequency of updating and revision of master production
scheduling is linked to the forecasting cycle in order to respond to changes in the
customer orders and to serious unplanned developments in procurement. It is often
weekly when computer forecasting models are used, but it may be monthly when
management review the data (Plossl, 1995).
e) Allocation of inventory: This refers to the quantity of an item earmarked for a parent
order released for production. Allocated parts belong to the parent orders but are still
108

physically on hand in the stockroom because there is a gap between order release and
issuing material from stockroom (Plossl, 1995). This a step before order launching that
involves an availability check for the necessary component or components. It means that
this amount of component part is mortgaged to the particular shop order and is,
therefore, not available for any other shop order. If sufficient quantities of each
component are available, the shop order can be created. If the order is created, then the
system allocates the necessary quantities to the particular shop order (Vollmann et al.,
1992).
f) Use of an automatic lot sizing: This has been considered as "the particular technique to
determine order quantities for a given inventory item and to determine the requirements
for its components" (Plossl, 1995, p. 50). Several techniques can be used in order to help
determine the appropriate lot size in MRP systems (Dilworth, 1993; Plossl, 1995;
Browne et al., 1996). Some of these techniques are: The lot for lot (L4L) method, fixed
order quantity (FOQ) method, the economic order quantity (EOQ) method, period order
quantity (POQ) method, the wagner within algorithm (WWA) method, and least total
cost (LTC) method. However, there is a problem related to selecting the proper
technique for each item needed in the computer program that controls the requirements
computation. But according to Browne et al. (1996) the user can choose the lot sizing
technique which is easy to use in practice, easy for production people to understand, and
efficient in terms of computing time.
g) Time bucket size: According to Browne et al. (1996) the time bucket refers to the
units of time into which the planning horizon (i. e. the span of time the MPS covers) is
109

divided. The data structures used to represent time in an MRP system can be bucketed or
non-bucketed. In the bucketed approach, a predetermined number of data cells are
reserved to accumulate quantity information by period. This is depicted by the matrix
structure used in the calculations of requirements. These data cells are called "time
buckets". A weekly time bucket which contains all of the relevant planning data for a
whole week is considered to be necessary for immediate and medium period planning by
MRP system, where monthly buckets are considered too rough.
A bucketless MRP system specifies the exact release and due dates for each requirement,
using scheduled receipt (i. e. which represents a commitment, whereas the planned order
is only a plan) and planned orders (Vollmann et al., 1992).
h) Average number of weeks in MPS: Plossl states "time periods of MPS must be
identical to those of MRP; typically they are one-week periods" (1995, p. 49).
Anderson et al. (1984); Laforge and Sturr (1986) and Sum & Yang (1993), report in
their studies that typical MRP uses operate a regenerative rather than a net change update
method, employing cycle counting, higher percentage of pegging, updating MPS on a
weekly basis, employing allocation of inventory, an automatic lot sizing unused, planning
in weekly time bucket and the MPS planning horizon averaged ranged from 20 to 40
weeks.
Furthermore, it is believed that the selection of features can help to "fine tune" an
MRP system, resulting in achieving the highest benefits. However White et al. (1982)
found that there are no a significant discriminatory powers regarding the relationship
110

between system features and MRP implementation, namely success or failure of the
implementation effort does not appear to rely on any particular feature of MRP system.
Schroeder et al. (1981) found in their study that the only one of the technical
characteristics of MRP system that had a significant effect on performance was time
bucket size. They added that weekly time buckets are the best for obtaining high levels of
performance. This seems to be because weekly time buckets provide about the right level
of detail.
2.8.5 Human factors
As pointed out by several writers such as White et al. (1982); Wight (1983) and
Callarman and Heyl (1986), that the problems with MRP implementation relate to
people, and are not technical in nature. Vollmann et al. (1992) argue that the
implementation of any manufacturing planning and control system such as MRP requires
a large number of professionals. They added that MPC system tasks involve the largest
number of indirect persons that may be working in the entire company. Goh (1984)
considers that the critical elements in the implementation of MRP system are sorted into
three categories (i. e. the people, data and computer). Related to the importance of people
for implementing MRP system Turnipseed et al. (1992) conducted a survey regarding an
implementation analysis of MRP systems: focusing on the human variable on 72
companies in the US, they found that the previous experience with CAPM systems, level
of formal training, degree of user involvement, degree of user support and degree of
utilising MRP outputs have been considered as the critical human factors affecting the
implementation of MRP system by manufacturing companies.
111

2.8.5.1 The previous experience with CAPMsystems
Burns et al. (1991) suggest that one of the problems with MRP implementation is
that operations/production managers involved in the implementation have not had
previous experience in the implementation of complex information systems. In contrast,
despite MRP systems requiring advanced knowledge of computers and information
systems, Turnipseed et al. (1992) found in their study that there is a low relationship
between the outcome variables of MRP implementation such as increased job
satisfaction, improved job performance, improved the quality of information etc. and
prior experience with technically advanced information systems.
2.8.5.2 Education and training
According to Hall and Vollmann (1978); Maertz (1979); Cox and Clark (1984);
Dilworth (1993); Lunn (1994); Plossl (1995) and Browne et al. (1996), the people in
MRP companies should understand what MRP is all about for successful implementation
and learn to use MRP as an effective tool for it to be successful. Safizadeh and Raafat
(1986) and Cruz (1997) add that education and formal training can be regarded as one of
the fundamental issues that determines the successful implementation of an MRP system.
Moreover, although the technology is generally adequate with regard to computer
hardware and software, and associated machinery, the prime problem is that people who
are presumed to operate the system such as MRP may be ill prepared (Shaw and
Regentz, 1980).
As stated by Safizadeh and Raafat "Education refers to the process of providing
the management and employees with a rationale for change to the MRP system and
112

making them familiar with the technical and nontechnical aspects of the system" (1986,
p. 116). The educational effort should be conducted in a cross-functional/facility
environment in order to build up skills necessary for effective implementation such as
communications, influence, conflict resolution and effective meetings (lemmolo, 1994).
Moreover, it is thought that education will increase management's understanding
of MRP I/MRP II concepts and then it will help for understanding the need for the MRP
system such as developing formal policies and procedures and distributing responsibilities
(Duchessi et al., 1989). The education effort may be conducted outside the company at
other companies working towards the same objective. This can be considered as a good
opportunity to hearing what problems other companies are having and to show
management what are the common problems (Correll, 1994).
While training deals with the actual tasks and procedures which are necessary to
ensure operating personnel to effectively perform their duties and use the new
technology. Each person in the organisation must have to attend at MRP training sessions
(Maertz, 1979; Sheldon, 1991). MRP training can be divided into three types of training
as follows: a) generic training which describes the MRP process and provides basic
understanding of the various modules that comprise an MRP system, b) software
orientation which describes how the unmodified software will function when installed, c)
application training which describes how the MRP system will function in the company
environment (Millard, 1989).
113

With education and training confidence among MRP users will be increased and
should enhance their performance on the job and then the greater efficiency can be
obtained.
Duchessi et al. (1989) found that nearly two thirds of both successful and less
successful companies had senior management attending an MRP overview session and
project team members educated in MRP, therefore education has become recognised as a
critical implementation step (Sheldon, 1994).
Anderson and Schroeder (1984) found in their study regarding getting results
from MRP systems by the American companies that education of personnel represent the
major problem that face companies in implementing MRP system.
Turnipseed et al. (1992) found that 73% of respondents are college graduates.
They also found a strong positive correlation between the higher the level of formal
education and training and the ability of MRP users to perform their job.
2.8.5.3 User involvement
One of the main prerequisites for the successful implementation of an MRP
system is that all people and all managers are involved in its implementation (Turbide,
1990; Dugger, 1996). According to Hoyt (1977) the necessity of user involvement is to
protect the users from "data processing mentality", because data processing people often
think they must be calling the shots. They cannot understand what users need because
they think too much in terms of efficiencies through computer use. He adds that there are
several ways in order to get user involvement such as meeting with users in order to
inform them what the MRP project is and in order to get an idea about what they want
114

the project to be, training people in order to be familiar with the system, and finally
documenting what goes into the system. Moreover, Dilworth (1993) argues that
participation of users of the system in its development will make them more familiarised
with it, and then more involved.
Turnipseed et al. (1992) found that 50% of MRP users were involved in
implementing MRP system whether by leading the implementation or being active with
the implementation on at least a weekly basis. They demonstrated that user involvement
is positively correlated with some positive outcomes obtained from MRP implementation
such as simplifying the performance on the job. Dugger (1996) reported that the
involvement of business managers with MRP users within the MRP implementation
context such as attending their weekly project meeting at the SEQUUS Pharmaceutical
Company led to accelerating the development and helped users to take their role more
seriously. In this sense, Leng (1987) suggests that the successful implementation of MRP
system not only requires a great deal of time and effort on the part of many people
throughout the company, but also virtually all departments in the company must be
involved in MRP implementation.
2.8. S. 4 User support
As a whole, the level of user support has often been identified as one of major
implementation prerequisites (Callarman and Heyl, 1986; Dilworth, 1993). Desmond and
Wilson (1989) in their study regarding the implementation of CAPM system such as
MRP system on four companies in the UK highlight the importance of user support as a
major factor affecting the implementation of MRP systems, specifically from middle
115
management. Turnipseed et al. (1992) found that 89% of MRP users in the US were at
least supportive implementing MRP systems. They found that there is a strong
relationship between level of user support provided for MRP implementation and most of
outcome variables of such implementation, for instance improved ability of the user to
perform his/her job.
Moreover, Sum et al. (1995) reported that at the outset of the implementation of
the formal MRP system there will be data inaccuracy, mishandling, increasing resistance
etc.. This makes the people lose confidence in the formal system and rely on informal
systems to accomplish their work. However, with process of time they will start to realise
the importance of the formal system. In turn they will be oriented to rely on it to
accomplish their work which may lead to increased operational efficiency. And also, they
found that higher people support is needed for higher coordination among subsystems
and departments within the MRP context.
2.8.5.5 Degree of utilising MRP outputs
Turnipseed et at. (1992) reported that forty four percent of respondents indicated
that they are using the MRP system daily to perform their job. They demonstrated that
the outputs obtained from MRP implementation such as increased information, improved
information quality etc. led to an increase of the degree of utilising MRP system.
2.9 Summary
This chapter of the study has shown that the new manufacturing environment
imposes some challenges on manufacturing companies, for instance to offer more
advanced and quality products, fulfilment of customer needs and faster delivery times.
116

The effective development of new manufacturing planning and control systems
has enabled manufacturing companies to meet these dramatic changes. Consequently,
MRP, JIT and OPT systems have been developed as new systems for manufacturing
planning & control so as to ensure that productivity is maintained, stocks are minimised
and resources are optimised, in turn achieving manufacturing efficiency and effectiveness.
Also, it was shown that MRP systems still number one concerning the widespread
implementation among the latest MPCs, namely MRP, JIT and OPT. MRP in and of itself
does not achieve the expected commercial results within manufacturing companies unless
it is carefully applied. Successful applications on these where such systems are married
with a range of others activities, factors and strategies. Successively, after identifying and
determining the role and the significance and the developments of MRP systems, comes
their role in successful implementation. We discussed the activities and factors which are
related to the implementation of MRP systems by manufacturing companies.
In sum, a review of the literature and previous empirical studies reveals that there
are several gaps that need to be empirically investigated. These are:
(1) Much has been written about how to implement MRP UMRP II based upon case
studies or personnel experience. Very little is written about understanding the state of
MRP practices based on an empirical survey analysis of multiple companies.
(2) No previous empirical study has tried to investigate MRP implementation in less
developed countries, such as Egypt.
117

(3) There is only a handful of studies dealing with the benefits obtained from MRP
implementation by manufacturing companies (Schroeder et al., 1981; White et al., 1984;
Anderson and Schroeder, 1984; Sum and Yang, 1993).
(4) Only two studies have attempted to investigate the stage of MRP implementation by
MRP users (Cooper and Zrrud, 1989; 1990).
(5) Only one study has been conducted to explore and examine the explanatory variables
of MRP system effectiveness, the so called MRP benefit-determinant relationships (Sum
et al., 1995).
(6) There is a scarcity of studies relating to the impact of the human aspects on MRP
implementation.
(7) There are no empirical studies that have attempted to explore and examine the
relationship between the uncertainty factors and MRP implementation.
(8) There is a lack of studies conducted to analyse the cost spent on MIZP
implementation by manufacturing companies.
The current research aims to fill empirically the previous mentioned gaps.
Therefore, a conceptual model has been established to provide a greater understanding of
the subject matter. This serves to outline the major inputs which have been employed to
accomplish the objectives of the study. Figure 2.11 shows a conceptual model for
conducting this study.
118

New Business Needs
Uncertainty Variables
Manufacturing Improvements
Implementing New Manufacturing P&C Systems
MRP Practices
Implementational Variables
Technological Variables
Organisational Variables
MRP Implementation Benefits
Evaluate MRP
Improved Performance
Human Variables
Users Satisfaction
Figure 2.11 Conceptual model of MRP implementation (Constructed by the researcher).
119

More specifically, a suggested model framework of the explanatory variables of
MRP benefits has been established to outline the effectiveness of MRP implementation
measured by the expected potential and the actual benefits obtained from MRP
implementation and to state the explanatory variables of such effectiveness. This is shown
in Figure 2.12 below:
120

Figure 2.12 A suggested model framework of the explanatory variables of MRP
implementation benefits
Determinant Variables MRP Implementation Benefits Uncertainty Determinants Tangible Benefits Product characteristics diversity Inventory turnover Amount of aggregate product demand Delivery lead time (days) Machine downtime Percent of time meeting delivery promises (%) The standard of raw material Percent of orders requiring "splits" Behaviour of people within the factory because of unavailable material (%) Reliability of plant within the factory walls Number of expediters (number of People) Capacity constraints Subjective Benefits Organisational Determinants Improved competitive position Company age Reduced inventory costs Company size Increased throughput Type of products Improved product quality Type of Manufacturing Improved productivity Layout Better ability to meet volume/ product change Company complexity Better production scheduling Organisational arrangements Reduced safety stocks Organisational willingness Better cost estimation Implementational Determinants Improved co-ordination with marketing and finance Years in implementation Improved your ability to perform in your job Implementation strategy Reduced informal systems for materials management/ Degree of data accuracy inventory/ production control Initiator of MRP effort Increased BOM/inventory/MPS accuracy Software/hardware vendors support Increased information on which to base decisions since Implementation problems MRP has been implemented Technological Determinants Degree of integration among MRP modules Source of system System cost Additional investment over next 3 years User class (stage of MRP implementation) MRP system features Human Determinants The previous experience with CAPM Systems Education and formal training User involvement User support Degree of utilising the a Tats of MRP
To investigate conceptual model framework of MRP implementation and a
suggested model framework of the explanatory variables of MRP effectiveness, the
current study seeks to investigate the state of practice of MRP systems in Egypt as a less
121

developed country (Chapter 5), to assess the effectiveness of MRP practices measured by
the benefits obtained from MRP implementation, and to explore and examine the
explanatory variables of MRP system effectiveness (Chapters 6&7). To do that, firstly an
overview of the manufacturing sector of Egypt will be presented in order to acquaint the
reader about the main features of the manufacturing sector under investigation (Chapter
3), then secondly the methodology for achieving the objectives of the current study is
developed as shown in (Chapter 4).
122

CHAPTER THREE
The Manufacturing Sector of Egypt
3.1 Introduction
The overall objective of the present chapter is to acquaint the reader with the
main features of the Egyptian manufacturing industry sector. To achieve this end, this
chapter is divided into the following: The first section provides an overview of the
manufacturing sector in Egypt starting with its main subsectors, its objectives, its
significance, trade in manufacturers (imports and exports) and the main problems facing
the manufacturing sector in Egypt. The second section deals with computerisation in the
Egyptian industrial sector. The final section states the summary and conclusions of this
chapter.
3.2 An overview of the manufacturing sector in Egypt
As pointed out by several writers such as Per-lind (1991) and UNIDO (1994), the
manufacturing sector in Egypt is one of the most important sectors in accomplishing
Egypt's development goals which are: raising production and productivity, and overall
living standards, and establishing its market leadership in the face of global competition
and protectionism. It has expanded very quickly since the mid-1980s. Improving
manufacturing labour productivity has increased along with overall manufacturing
efficiency and effectiveness.
In general terms, the Egyptian industrial sector is characterised by a) labour
intensive industries like textiles, food and assembling, b) substantial geographical
dispersion-for instance, there is manufacturing industry in Cairo, Alexandria, Helwan,
123

Tenth of Ramadhan City, and Sixth of October City, c) a low proportion of private sector
industry-despite the era of transformation from public to private sector, there is an only
40 out of 314 companies exposed to be privatised (Album, 1997), moreover of the 40
companies which have been privatised a majority of their equities are still held by the
Egyptian government in order to give the investors more confidence in the protection of
their rights. This means that one of the main characteristics of the Egyptian industrial
sector is a large share of government-owned enterprises
3.2.1 The main subsectors within the Egyptian manufacturing sector
The manufacturing sector in Egypt is broken down into two main subsectors
according to ownership. The public sector consists of approximately 200 state-owned
companies and the private sector consists of approximately 15,000 private-owned
establishments.
According to UNIDO (1994) and DTI (1996), the Egyptian industrial sector
consists of a limited range of industries. These are: Textiles, Mining and petroleum
industries, Drink and tobacco, Engineering, Garments, Chemicals, Leather, Wood, Food
industries, Paper, Printing, and Plastics industries.
The manufacturing sector of Egypt plays an important role in the Egyptian
economy. Figure 3.1 shows that it has expanded at very rapid rates since the mid-1970s,
with the share of MVA in total GDP estimated to have risen from about 16 per cent in
1975 to almost 23 per cent by 1992.
124

Figure 3.1 Structure of GDP by sector of origin, 1975 and 1992.
70 so 50
40
30
20
10
0
® Agriculture Manufacturing 13 Others
Source: Constructed by the researcher on the basis of UNIDO, 1994.
However, four subsectors, i. e. foods, engineering, textile, and chemicals, form the
main industrial structure in Egypt in terms of Manufacturing Value Added (MVA) and
industrial employment. Figure 3.2 shows the Manufacturing Value Added of the Egyptian
industrial sector, 1970 and 1992.
Figure 3.2 Structure of manufacturing value added (MVA), 1970 and 1992.
Source: Al Ahram International, March 1996, p. 14.
125
1975 1992
0 10 20 30 40 $0

Despite the Manufacturing Value Added (MVA's) for the four subsectors was
declined from 1970 to 1990, they still form more than 50% of the MVA of the Egyptian
industrial sector.
Data on employment in Egypt are difficult to obtain, particularly for the
manufacturing sector (UNIDO, 1994). However, Table 3.1 shows that total employment
in the fiscal year reached an estimated 13.9 million, of 4.6 were employed in agriculture,
2.9 million in industry, mining and petroleum products sector, 2.5 million in government
services and social insurance, 1.5 million in trade, finance & insurance and 911,000 in
construction. The remainder are employed in tourism, hotels and restaurants and
electricity.
Table 3.1 Distribution of total employment among the Egyptian economic sectors in
1992 (million).
Sectors N
Agriculture 4.6 33.1
Manufacturing 2.9 21.0
Government services 5 2.5 17.7
Trade and finance 1.5 10.5
Social services 1.4 10.1
Construction . 911 7.0
Other . 89 .6 Total 13.9 100%
Source: Constructed by the researcher on the basis of UNIDO, 1994 and Europa Publications Limited, 1996.
On the other hand as reported by UNIDO (1994) textile production, food
processing, machinery, chemical industries remain the most important sources of
126

manufacturing employment. Figure 3.3 states that the share of total manufacturing
employment held by the foods, machinery, textile, and chemicals industries is 67% of
total manufacturing employment in the Egyptian industrial sector.
Figure 3.3 Structure of manufacturing employment, 1990.
Source: Constructed by the researcher on the basis of UNIDO, 1994
3.2.2 Manufacturing sector objectives
Manufacturing industry in Egypt basically aims to achieve the following:
(1) Exploiting the available economic resources such as. raw materials, and human
resources.
(2) Improving the technical methods of existing industries through modern techniques
and automation for increasing quality.
(3) Diversifying the material economic base in order to create new sources of income,
which at the same time avoiding dependency on any one sector as the main income
resource.
(4) Developing other sectors through using their outputs as inputs to other industries.
127

(5) Satisfying the needs of domestic markets through providing goods instead of
importing them from outside, and potentially exporting the surplus.
(6) Creating productive employment.
3.2.3 The significance of the Egyptian manufacturing sector
The manufacturing sector plays a significant role in the Egyptian economy for
several reasons as shown below:
(1) In the 90s the manufacturing sector is responsible for 16% of Gross Domestic
Product (GDP) and 21% of employed labour in Egypt (Europa Publications Limited,
1996).
(2) The manufacturing sector is responsible for 22% of Gross National Product (GNP)
(Al- Gebaly, 1996).
(3) It was the fastest growing sector in the last five-year Plan from 1987/1988 to
1991/1992, with an annual growth rate of 8.4% (Fiani and Partners, 1992).
(4) The share of value added in the gross output of manufacturing sector in Egypt has
risen significantly since the mid-1970s, from 26.6% in 1975 to 31.4% by 1990 (UNIDO,
1994).
(5) The total investment expenditure in the industry and mining sector is 22.8% of the
total investment expenditure in the Egyptian economic sectors in last two five-year plans,
covering the period from 1982/1983 to 1991/1992 (Ibid. ).
(6) Data for the manufacturing sector in Egypt are more readily available than in other
sectors such as agriculture, services etc.
128

3.2.4 Trade in manufacturers
(1) Imports: Although Egypt has increased its industrial production considerably since
the 1920s, the country is still a major importer of capital and manufactured goods,
particularly from Europe. Table 3.2 states the main imports by the Egyptian economic
sectors in 1994.
Table 3.2 The main imports (E. L*'000).
Commodity 1994 Wheat
.. 2,501,168
Wheat flour 235,381 Maize 892,463 Chilled/frozen meat 534,744 Dairy products 509,404 Refined sugar 52,305 Trucks 259,796 Automobiles 746,461 Vehicle & tractor parts 762,050 Iron rods and bars 90.781 Excavating machinery 322,704 Chemicals 1,107,298 Cement 51,744
*$1=L. E. 3.39. Source: Financial Times, May 1996.
Table 3.2 indicates that the total imports by industrial subsectors such as
chemicals, engineering and assembling, excavating machinery etc. represents
approximately 41.4% of the total imports by the Egyptian economic sectors.
(2) Exports: Table 3.3 indicates that chemical products and textiles products are the most
important categories of the main exports of the Egyptian economic sectors in 1994.
129

Table 3.3 The main exports (E. L*'000)
Commodity 1994 Crude oil 2,684,977 Rawcotton
:. -.: . .... 791,081
Cotton yarn 1,279,541 Cotton fabrics 409,030 Clothing 780,342 Non-crude, shale oils 742,075 Unwrought aluminium 94,433 Refined sugar cane 295 Oranges .. 27,841 Rice 267,875 Potatoes 98,205 Aluminium rods & sections 405,438
* $1 = L. E. 3.39. Source: Ibid.
From these figures one can see the important role played by imports and exports
by of Egyptian industrial sector in the Egyptian economy. For this reason the Egyptian
government has been encouraging manufacturing companies to adopt new technologies
such as MRP systems, in order to raise production and productivity, in turn establishing
their market leadership and protectionism. As a result, the Egyptian government
continues to make current incentives available for manufacturing companies such as tax
relief, financial assistance, grants, subsidies, free training and consultancy services.
Moreover, there has been increased the investment in this sector. Table 3.4 shows
that public and private investment in industry grew from LE 13.4 billion during the first
Five Year Plan ending in June 1987 to LE 25.7 billion during the second Five Year Plan
ending in June 1992. This represents 22.9 per cent of total investment. For the current
plan period, 1992/1993 to 1996/1997, the government is expecting total investment in
industry to reach LE 28 billion. This would represent about 18.2 per cent of the total
overall investment - LE 154 billion _
targeted for the five - year period.
130
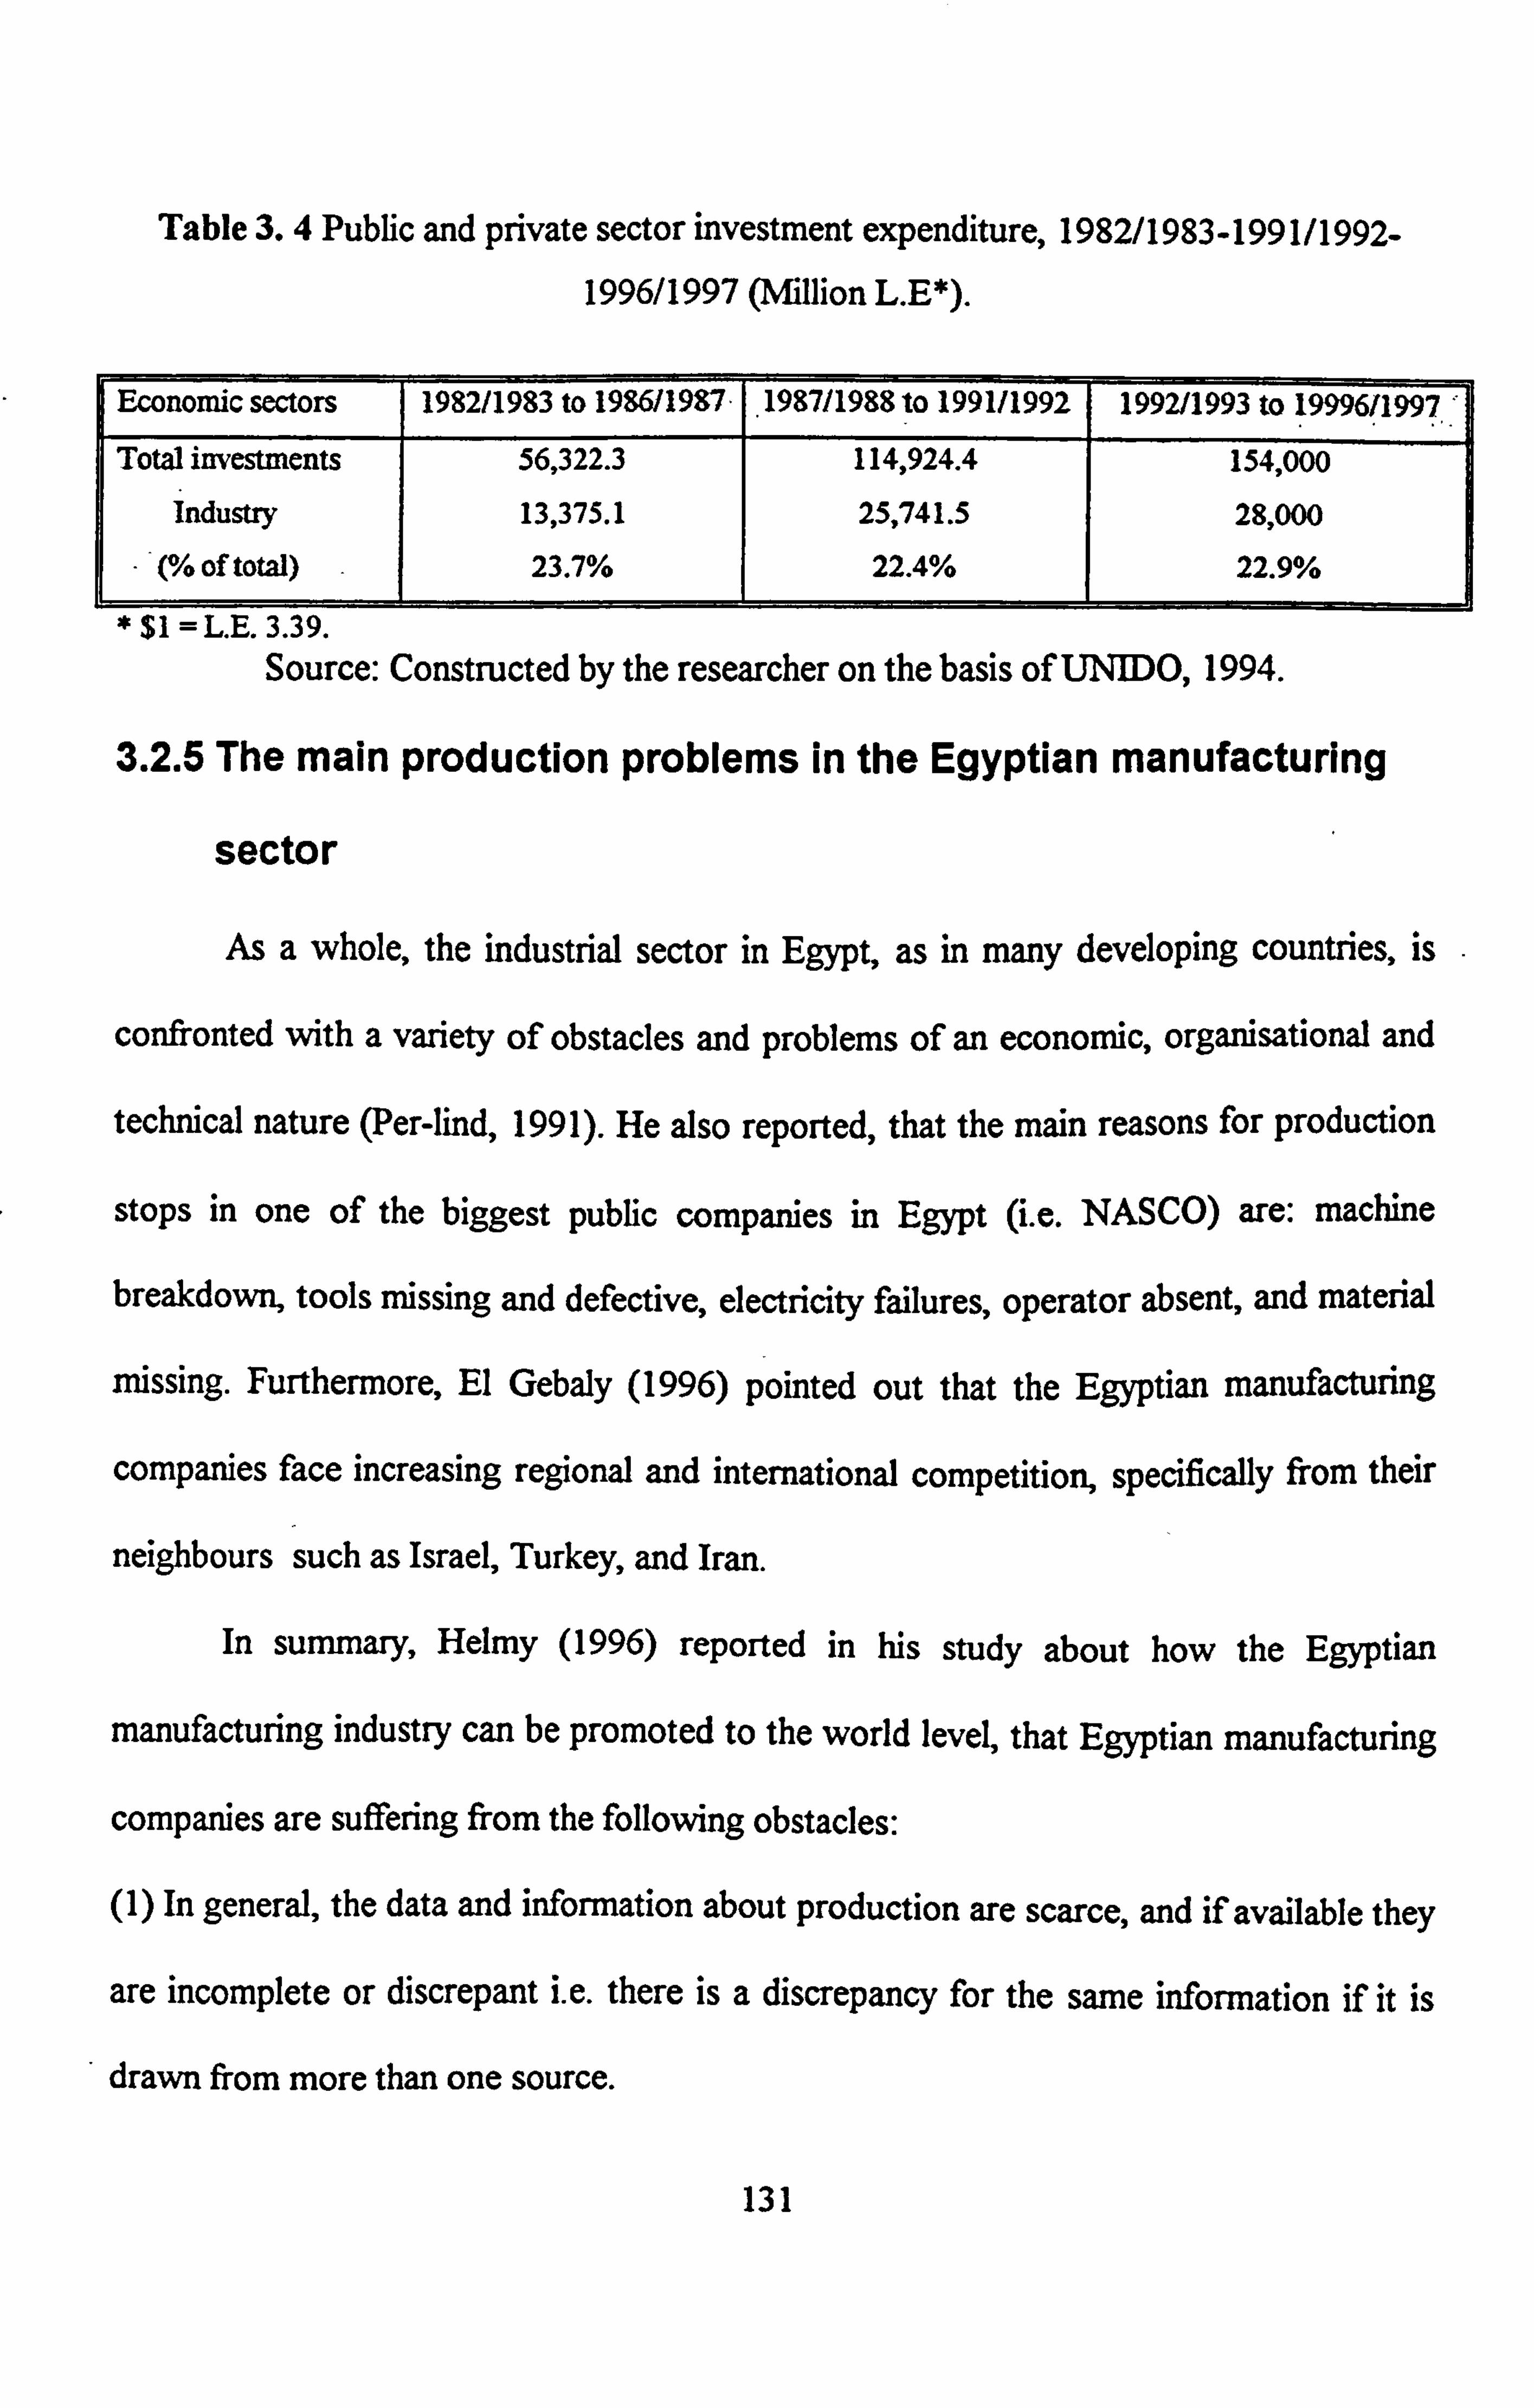
Table 3.4 Public and private sector investment expenditure, 1982/1983-1991/1992-
1996/1997 (Million L. E*).
Economic sectors 1982/1983 to 1986/1987 1987/1988 to 1991/1992 1992/1993 to 19996/1997
Total investments 56,322.3 114,924.4 154,000
Industry 13,375.1 25,741.5 28,000
- (% of total) - 23.7% 22.4% 22.9%
Source: Constructed by the researcher on the basis of UNIDO, 1994.
3.2.5 The main production problems in the Egyptian manufacturing
sector
As a whole, the industrial sector in Egypt, as in many developing countries, is
confronted with a variety of obstacles and problems of an economic, organisational and
technical nature (Per-lind, 1991). He also reported, that the main reasons for production
stops in one of the biggest public companies in Egypt (i. e. NASCO) are: machine
breakdown, tools missing and defective, electricity failures, operator absent, and material
missing. Furthermore, El Gebaly (1996) pointed out that the Egyptian manufacturing
companies face increasing regional and international competition, specifically from their
neighbours such as Israel, Turkey, and Iran.
In summary, Helmy (1996) reported in his study about how the Egyptian
manufacturing industry can be promoted to the world level, that Egyptian manufacturing
companies are suffering from the following obstacles:
(1) In general, the data and information about production are scarce, and if available they
are incomplete or discrepant i. e. there is a discrepancy for the same information if it is
drawn from more than one source.
131

(2) Effective co-ordination among departments is not likely to occur, because there is
discrepancy in complaints raised by marketing, finance, purchasing, and production
departments.
(3) Lack of automation expertise, and also training and education can be identified as
major problems facing manufacturing companies in the Egyptian industrial sector.
(4) Increases in all types of inventory such as raw materials, parts, components, finished
goods and spares.
(5) Decreasing product quality level compared to its peers in the international markets
and increasing disorder in production scheduling and loading.
(6) Despite the continuous expansion of the industrial sector in Egypt since the 1920s,
there is no substantial impact on the import substitution or exports of manufactured
goods as in other sample countries (Per-lind, 1991).
Since MRP systems can help manufacturing companies to overcome the problems
mentioned above, or the majority of them, many manufacturing companies in Egypt have
implemented, are implementing, or are considering the implementation of MRP systems.
3.3 Computerisation in the Egyptian manufacturing sector
Per-lind (1991) pointed out that attempts are continually made by the Egyptian
government to improve industrial efficiency - they are encouraging the use Of computers
for specific support functions such as materials requirements planning.
The first computers were introduced into Egypt in 1962, and after approximately
two decades the number of computers had reached 120 in the government public sector.
132

The first computers to be installed at a university was at the University of Alexandria in
1964, followed by Cairo University and Ain Shams University in 1968-9.
With the beginning of the open door policy in 1974-5, a number of computer vendors
were attracted by the opening Egyptian market. They are approximately thirty vendors,
through ICL, IBM and NCR together represent nearly 60 per cent of all installed
computers. According to Per-lind about 10 percent of all installed computers can be
characterised as well utilised, efficient and achieving their objectives, whereas 90 per cent
are regarded as (inefficient) in one way or another. Nonetheless, the growing number of
installations is obvious. Public manufacturing companies like textiles, automobiles, iron
and steel and chemical have implemented computer systems but the major applications
areas have been: payroll, accounting, costing and inventory accounting, on-line
maintenance management, process control, and materials management.
Per-lind gave in his book a very short description about the Material
Requirements Planning system that has been implemented by El Nasr Company, the
biggest company producing vehicles in the Egyptian manufacturing sector.
The MRP system at NASCO adheres to a formal technique that is common to all
computer-based MRP. The system is regarded as necessary by the production planning
management for all material acquisition activities, for external as well as for internal
supply. Its outputs form the basis for initiating purchase and manufacturing orders.
133

3.4 Summary and Conclusions
The main purpose of this chapter was to review the current characteristics of the
Egyptian industrial sector and its associated problems. Examining these issues had led to
developing the following conclusions:
(1) Despite an era of transformation from public to private sector, a large public sector
still dominates control structures over industry is still a major characteristic in Egypt.
(2) In spite of the Government's radical economic reform programme for the Egyptian
industrial sector, it still suffering from several problems such as: decreasing market share
and too much inventory confirming that new production technologies are needed. MRP
systems are one such example.
(3) The Egyptian industrial sector in particular has shown the growing appreciation of the
acquisition of new production technology (e. g., MRP systems) as a suitable path for
improving manufacturing efficiency and effectiveness.
For achieving the objectives of this study a proper design of the methodology is
developed as shown in next chapter (Chapter 4).
134

CHAPTER FOUR
Research Methodology
4.1 Introduction
The main purpose of the current study is to investigate the state of practice of
MRP systems in Egyptian manufacturing companies, to assess their effectiveness (i. e. the
tangible & subjective benefits obtained from MRP implementation based upon the
expectations and perceptions of MRP users), and to explore and examine the
relationships between a set of uncertainty, organisational, implementational, technological
and human determinant variables and the tangible and subjective benefits attained by
Egyptian users. Without proper design of methodology, a study cannot achieve its
objectives. Therefore, the overall aim of this chapter is to describe the procedures, steps,
and methods used in the study in order to achieve the research objectives.
To do this the chapter is divided into two main parts. The first part sheds some
light on the major types of research design and research methods that are available to
social scientists (this is briefly covered in sections 4.2.1 & 4.2.2). The second part
presents the design or strategy adopted for this study and which has passed through eight
successive stages (from section 4.3.1 to section 4.3.8). These are: the first section
presents research questions and objectives, the second section describes how the study
variables were determined, the third section deals with formulation of the study
hypotheses, the fourth section identifies the population for this study, the fifth section
shows development of the questionnaire, the sixth section deals with identification of the
135

appropriate data collection method, the seventh section displays response rate, the eighth
section presents data analysis methods.
4.2 Types of research design and research methods
4.2.1 Types of research design
According to Emory (1985) several definitions of "research design" have been
developed, but no one definition tells the full range of substantial aspects. Kerlinger
(1986, p: 279) defines research design as "the plan which is overall scheme or program of
research. It includes an outline of what the investigator will do from writing the
hypotheses and their operational implications to the final analysis of the data". And also,
research design can be regarded as the overall strategy that includes total planning for the
investigation (Nachmias and Nachmias, 1992), or the overall structure of the plans used
for collecting data. Kerlinger (1973) states that "strategy implies how the research
objectives will be reached and how the problems encountered in the research will be
tackled" as cited in (Emory, 1985, p. 59).
Oppenheim (1992) offered a more general definition which emphasises that
research design refers to the basic plan or strategy of research and which enables the
investigator to draw general conclusions from it or which enables him/her to obtain
answers to research questions (Kerlinger, 1986).
Accordingly, these definitions can give the essentials of a good research design.
"First, the design is a plan that specifies the sources and types of information relevant to
the research question. Second, it is a strategy or blueprint specifying the approaches to be
used for gathering and analysing data" (Emory, 1985, p. 59).
136

According to Kerlinger (1986); Nachmias & Nachmias (1992) and Brownell
(1995), research design can be classified into three major types as follows:
4.2.1.1 Experimental design
The experimental research design occurs "when the subjects (people or social
systems) and conditions (events or situations) to be studied are manipulated by the
investigator. The key to experimental design is that the investigator assigns subjects to
conditions rather than observing them in naturally occurring situations" (Spector, 1993,
p. 1-2). This type of research design is best illustrated by the laboratory experiment.
Therefore, it is mainly used by researchers in the biological and physical sciences
(Nachmias and Nachmias, 1992).
The major advantage of the experimental design is that it allows us to determine
causality (Spector, 1993; Whitley, 1996). However, this type of research design has its
own drawbacks since it is often difficult to control all external factors and therefore
difficult to establishing causality (Spector, 1993), as well as it can only be used to study
independent variables that can be manipulated (Whitley, 1996).
4.2.1.2 Case study design
This type of research design can be defined as a classic way of obtaining detailed
information about a single individual (Elmes et al., 1992), or it is intended to provide in-
depth information on the details of a single instance of a phenomena for either descriptive
or hypothesis-testing purposes (Whitley, 1996; Nation, 1997). However, the researchers
often tend to think of the case as a tool for description rather than hypotheses testing
(Whitley, 1996).
137

The main advantages of the case study design are summarised as follows
(Brownell, 1995; Whitley, 1996; Nation, 1997): It allows the researcher to investigate
rarely occurring phenomena, compared to the experimental strategy which is based on
the use of the large numbers of cases. It can to be used to study phenomenon that occurs
infrequently. It allows the researcher to gain a new point of view on a situation and also,
it is useful for developing materials for teaching purposes. However, three significant
disadvantages of the case study approach are: the impossibility of drawing conclusions
about causality, its limited generalizability, and its vulnerability to researcher bias (Al-
Shauaibi, 1991; Whitley, 1996; Nation, 1997).
4.2.1.3 Survey design
As stated by Whitley (1996, p. 417) the survey design can be defined as: "the
process of collecting data by asking questions and recording people's answers". He adds
that there are two purposes for using survey design: First, is to estimate the
characteristics of a population such as to determine the percentage of people who
perform certain behaviours (e. g., smoking cigarettes) or the demographic characteristics
of the population (e. g., age and sex), second is to test hypotheses.
The major advantages of the survey design (Stone, 1978; Kerlinger, 1986;
Brownell, 1995) are: results allow for generalisation because the sample is representative
of the population, a great deal of information can be obtained, its information can be
accurate because of large sample sizes and low sampling errors and also it is a powerful
tool in analytic studies undertaken to test specific hypotheses. However, the survey
design also has its own disadvantages such as survey information does not penetrate very
138

deeply below the surface, it requires time and money, and also requires a good deal of
research knowledge.
4.2.2 Research methods
The previous subsection has covered the three types of research design. In this
subsection, research methods will be introduced as techniques for collecting primary data.
There are several choices concerning the means of collecting primary data. Normally
these include questionnaires, interviews, observations, and archival records.
4.2.2.1 Questionnaire method
Questionnaires are simply lists of questions that research respondents are asked to
answer. It can be either self- administrated in which case respondents read printed
questions and answer in writing, or interviewer administrated, in which case a researcher
asks the questions and records the respondent's answers (Whitley, 1996).
The principal advantages of the questionnaire are summarised by Al-Shauaibi (1991);
Oppenheim (1992) and Fife-Schaw (1995) as follows: it appears to be simple, it is
versatile, its cost is low for data gathering, it provides a good enough quality of the
required data for testing hypotheses or making decisions, it is a well understood
technique, it provides a level of anonymity to the respondents, and also it can cover many
more people than an interview method which allows the researcher who is limited in
terms of time and effort to meet a little number of interviewees or respondents.
However, it has its disadvantages such as it requires a great experience concerning
how to design a good questionnaire because the perfect questionnaire is impossible, the
response rate is often poor, it often needs follow-up of non-respondents, and this is
139

problematic where anonymity of the respondents is guaranteed (Brownell, 1995; Fife-
Schaw, 1995).
4.2.2.2 Interview method
The interview is another technique for collecting data. According to Whitley
(1996) in an interview the researcher asks questions of a research respondent, who then
responds. Interviews can take place in person, in a face to face meeting between the
interviewer and interviewee or over the telephone, and respondents can participate either
in groups or individually. Breakwell (1995) adds that an interview can be designed as
unstructured, semi-structured, or structured based on the extent to which the questions
and the order they are asked are planned in advance of data collection.
Using interviews, many advantages could be gained such as motivating the
respondent to supply accurate and complete information immediately, guiding the
respondent in his/her interpretation of the questions, giving a greater flexibility in
questioning the respondent, allowing a greater control over the interview situation
because: a) the respondent deals with questions in a certain sequence, b) the respondent
will not consult others in giving his/her answers, and evaluating the variability of
information by observing the respondent's non-verbal manifestations of his/her attitude
toward supplying the information (Churchill, 1991; Ghauri, 1995).
However, the interview method has its own drawbacks in that it is costly, the risk
of interviewer bias is expected (Brownell, 1995), and the waste of time for the
interviewer- for instance the interviewer may spend some time for preparing the interview
in terms of booking an appointment with the interviewee, and also he/she may spend
140

some time to make the interviewee in a relaxed and friendly manner before conducting
the interview (Whitley, 1996).
4.2.2.3 Observation method
Observation means that the investigator keeps watching a case very carefully
(people or subjects) as it occurs in natural settings in response to natural events to record
what can be observed (AI-Shauaibi, 1991).
There are several advantages to be gained in using this method for data collection,
it allows the researcher to oversee natural behaviour in its natural context (Whitley
(1996), observations can be regarded as a good source of ideas for further research
(Elmes et al., 1992), furthermore Nation (1997) states it allows the researcher to count
and record behaviours that may occur infrequently over a long time span.
In contrast, the disadvantages of observation method include: observer bias,
observers often need considerable training otherwise he/she can make incorrect
inferences from observation, people under the observation may change their behaviour
when they are aware that they are part of research to show themselves in a favourable
light, and also it is costly because it requires the observer to be present all times (Stone,
1978; Kerlinger, 1986; Nachmias and Nachmias, 1992; Whitley, 1996).
4.2.2.4 Archival records method
The final method for collecting data is through archival records method. As
pointed out by Whitley (1996) archives are records or documents that describe the
characteristics of individuals, groups or organisations. There are three types of archives:
First, statistical archives which store data in summary form such as public health records,
141

second survey archives which include the people's responses to national surveys of public
opinion, and finally written and electronic records which include the speeches and
writings in the public domain which reflect attitudes, beliefs, and motivations.
The major advantages of this method are summarised by Al-Shauaibi (1991) and
Nachmias & Nachmias (1992) as follows: the low costs and the accessibility to the data
in most cases (e. g., national health records, demographic data such as age, sex, etc. ).
However it has its own drawbacks such as the problem of accessibility (e. g., the
individuals might not want to release private documents such as diaries and letters), and
the problem with the validity of information in archival records (Whitley, 1996).
4.3 Research design for the present study
In the previous section research designs and methods were covered along with
their advantages and disadvantages for each type and method. In this section, the
research design for the current study and the data collecting technique will be covered.
However, it is worth stressing that a review of the literature of research methodology
reveals that no single design is better than another (A1-Shauaibi, 1991; Nation, 1997).
However, there is some consensus among researchers in the research
methodology domain that the appropriate design for any research must answer the
research question and meet the research objectives (Hakim, 1987; Robson, 1993). On the
other hand, the methodological options are restricted by the subject or the problem under
investigation (Kerlinger, 1986; Easterby-Smith et al., 1991).
As a consequence, the survey design is considered to be the best method to meet
the purpose of the current study because it provides the data required whether it was
142

qualitative or quantitative or both (Kinnear, 1987). A decision has been made to use (the
survey design (i. e. the empirical study) for the following considerations:
1. A Survey can investigate a large number of cases (companies in our research). It has
been considered the appropriate method for the current study which attempts to
investigate the state of practice of MRP implementation in the Egyptian industrial public
sector which consists of 200 manufacturing companies.
2. A Survey can provide the required data for testing hypotheses or decision making. It
has been considered the proper methodology for the current study which seeks to explore
and examine the relationships between large numbers of independent variables
(uncertainty, organisational, implementational, technological and human determinant
variables) and dependent variables (MRP benefits measures).
3. Using the survey approach can help to compare the results of the current study with
the handful of previous studies regarding MRP implementation which are based on
survey design, such as Anderson et al. (1982); Duchessi et al. (1988; 1989); Sum and
Yang (1993); Sum et al. (1995) and Ang et al. (1995).
Despite the main constraint affecting the survey design being the extent to which
respondents are willing and able to provide the required data, a carefully designed data
collection instrument can help minimise this constrain. Therefore, a questionnaire is used
to collect the data in this study. The main considerations in using the questionnaire were:
1. First of all a questionnaire has been regarded as the most common method for
collecting data in surveys because it assures the confidentiality of data collected and the
anonymity of participants (Al-Shauaibi, 1991).
143

2. The objectives of the current study, to test the hypothesised relationships will be
accomplished by using several statistical techniques. Therefore the questionnaire is a
proper tool for collecting the needed data.
3. It is suitable for an individual researcher who is limited in terms of time, effort, and
money (Al-Shauaibi, 1991).
4. Building up the questionnaire from previous research (such as in our study) means that
some items will have been well tested in other studies.
All in all, the research design of the current study (i. e. the survey design) and the
data collection instrument (i. e. the questionnaire) are used to meet the objectives and to
provide answers to the current study questions.
The design of the current research has passed through eight successive stages
(from section 4.3.1 to section 4.3.8) as illustrated below.
4.3.1 Research questions and objectives
4.3.1.1 Research question
Taking into account the study background, it was decided that the first research
question should be:
" Have MRP systems been implemented as effectively in Egyptian manufacturing
companies as in manufacturing companies in developed countries?,
Once this research question had been selected, the thinking moved toward
developing the main investigative questions which the researcher wished to answer.
Three investigative questions represent the guide for gathering the data needed from
144

individual Egyptian manufacturing companies and developing the research direction;
these are:
" Has your organisation implemented an MRP system?,
" What have been the benefits obtained from this MRP implementation, and
" What factors determined the extent to which MRP benefited your organisation, the
so-called benefit-determinant relationships?.
Once the investigative questions had been developed, the thinking moved on to
determine the measurement questions. Those are what we actually asked MRP users and
non MRP companies in Egyptian manufacturing companies. They appear on the
questionnaire which contains thirty three questions seeking information that provide
answers to the investigative questions.
4.3.1.2 Research objectives
The previous mentioned was the overall questions to be answered by the current
study. To achieve that, there were three objectives representing the central concern of
this study. These were:
" To investigate the state of practice of MRP in Egyptian manufacturing companies.
" To assess the effectiveness of MRP practices measured by the benefits obtained from
MRP implementation based on the expectations and perceptions of MRP users in
Egyptian manufacturing companies.
" To explore and measure the possible explanatory variables of MRP systems
effectiveness in Egyptian manufacturing companies.
145

4.3.2 Determination of the research variables'
Taking into account the study purposes, and in order to place the present study in
a proper perspective, it may be useful to outline a suggested model framework which
states the overall variables underlying the structure, domain and the main approach of the
present study and provides a foundation for the development of mathematical models for
two kinds of MRP benefits measures (improved performances and user satisfaction). The
content consists of both the identification of determinant variables affecting MRP
implementation and also the benefits obtained from MRP implementation based on the
expectations and perceptions of MRP users. The suggested model framework has been
established based on an extensive review of the literature and previous empirical studies
to select the uncertainty, organisational, implementational, technological, and human
determinant variables and to identfy the tangible and subjective benefits obtained from
MRP implementation (i. e. the effectiveness measures) from points of view of academics
and practitioners. It will be operationalized and serves as inputs for the development of a
research method (questionnaire). Figure 4.1 shows determinant variables of MRP
implementation benefits:
I It is interesting to remind the reader that those variables i. e. independent variables (determinant
variables) and dependent variables (MRP benefits) have been covered in details in Chapter two of the
current study.
146

Figure 4.1 A suggested model framework of determinant variables of MRP
implementation benefits (study variables).
Determinant Variables MRP Tm lementation Benefits' *. ' :: Uncertainty Determinants Tangible Benefits Product characteristics diversity Inventory turnover Amount of aggregate product demand Delivery lead time (days) Machine downtime Percent of time meeting delivery promises (%) The standard of raw material Percent of orders requiring "splits" Behaviour of people within the factory because of unavailable material (%) Reliability of plant within the factory walls Number of expediters (number of people) Capacity constraints Subjective Benefits Or'anisational Determinants Improved competitive position Company age Reduced inventory costs Company size Increased throughput Type of products Improved product quality Type of Manufacturing Improved productivity Layout Better ability to meet volume/ product change Company complexity Better production scheduling Organisational arrangements Reduced safety stocks Organisational willingness Better cost estimation Imnlementational Determinants Improved co-ordination with marketing and finance Years in implementation Improved your ability to perform in your Job Implementation strategy Reduced informal systems for materials management/ Degree of data accuracy inventory/ production control Initiator of MRP effort Increased BOMlinventory/MPS accuracy Softwarehardware vendors support Increased information on which to base decisions since Implementation problems MRP has been implemented Technoloeical Determinants Degree of integration among MRP modules Source of system System cost Additional investment over next 3 years User class (stage of MRP implementation) MRP system features Human Determinants The previous experience with CAPM Systems Education and formal training User involvement User support Degree of utilising the 22 Tuts of MRP
For analytical purposes, it should be noted that one variable in this study (i. e.
degree of data accuracy) has been treated once as an independent variable, and again as a
dependent variables. It can be a benefit that can be obtained from MRP implementation
147

as suggested by Callarman and Heyl (1986) and Sum & Yang (1993), and as an
implementational determinant variable of MRP benefits as in Sum et al. (1995).
4.3.3 Formulation of the research hypotheses
In pursuit of the objectives of the research, the following hypotheses have been
formulated, forming the basis for the primary data collection and have been devised to
guide the direction of the research and organise the survey. These hypotheses are taken
from the literature sources and are presented in two levels as follows:
4.3.3.1 Benefits obtained from MRP implementation
Hypothesis # (1) "Not all MRP users in Egyptian industrial sector attain the same
benefits from MRP implementation".
This hypothesis seeks to explore that there are significant differences concerning
the benefits obtained from MRP implementation based on the expectations and
perceptions of MRP users in Egyptian manufacturing companies. This was taken from
Anderson and Schroeder (1984); and Duchessi et al. (1989).
4.3.3.2 The MRP benefit-determinant relationships 2
Hypothesis # (2) "The explanatory variables (i. e. uncertainty, organisational,
implementational, technological and human variables) do not necessarily correlate with
MRP implementation benefits in a linear manner".
2 Since the main aim of this hypothesis is to explore and examine the relationships between uncertainty,
organisational, implementational, technological & human variables and the benefits obtained from MRP
implementation, these relationships form 608 sub-hypotheses (32 independent variables X 19 dependent
variables) each one reflects one of the relationships under investigation, it was decided to develop one
main hypothesis to reflect the expected relationships instead. This will be measured using ACE model as illustrated in detail in Chapter seven.
148

This hypothesis attempts to test the assumption that there exist underlying non-
linear relationships among determinant variables such as execution data accuracy, degree
of integration among MRP modules, planning data accuracy, technical problems,
company size and people support problems and the benefits obtained from MRP
implementation. This hypothesis was taken from (Sum et al., 1995).
4.3.4 Identification of the population for this study
The survey population of this study was defined as all state-owned companies
working in the manufacturing industry in Egypt. The sample frame used in identifying
manufacturing companies for this study was taken from industrial data held by the
Egyptian Industrial Chambers and the Industrialisation General Organisation. In these
databases, data available includes the name of company, its address, total capital, and
type of products. As a consequence, 200 companies were identified as a public
manufacturing companies. Those companies constituted the total population which was
targeted to be surveyed as a whole.
The main reasons for limiting the study to the industrial public sector were as
follows:
a) The Egyptian manufacturing public sector contributes 75% of all industrial output
within the Egyptian industrial sector, and includes all medium-to large-scale industries
(Per- lind, 1991).
b) In the 80s Egyptian's manufacturing public sector generated two-thirds of the value
added in industry and provides 50% of industrial employment (Kurian, 1992).
149

c) The examination of the literature indicates that most MRP companies'are assembling
and engineering manufacturing while the industrial private sector in Egypt has been
limited primarily to textile manufacturing, leather products, the processing of wood
products, and food processing. Therefore this sector was excluded from the study.
Moreover, most of the manufacturing companies in the industrial private sector comprise
individuals or small establishments rather than companies. Most of these establishments
employ less than 50 people (Per-lind, 1991) and are therefore unlikely to use MRP
systems.
d) Since the Egyptian government has a good database, the data required was available
for research purposes, providing name and address manufacturing companies of public
sector in Egypt and which represents the population of the current study.
4.3.5 Development of the questionnaire
As we mentioned in the previous section the field research was carried out by
using mail questionnaire. The following steps were carried out in the development of the
questionnaire:
4.3.5.1 The type of questions
Essentially, a combination of closed and open-ended types of questions was used
in the current study for the following reasons:
1. Most MRP users in Egypt are relative beginners. Closed-ended questions were used
whenever possible to reduce the number of ambiguous answers that might be given.
150

2. Since the key issue under investigation is the state of practice of MRP systems in
Egyptian manufacturing companies, some opened-ended questions were used in order to
make the respondents write down what they have seen fit.
Multiple-choice questions offer a number of advantages over open-ended questions. They
are generally easier for the respondent and they also tend to reduce respondent bias (Tull,
1987)
A space also for additional information and documentary data was provided where
relevant to be completed by the respondent.
4.3.5.2 The validity of questionnaire
The validity of a measure refers to the extent to which it measures what it was
intended to measure. One of the related approaches for establishing validity for the
current study is called "content validity" (Al-Shauaibi, 1991; Whitley, 1996; Nation,
1997). This approach refers to the extent to which it provides adequate coverage of the
topic under investigation. There are two main methods can be used to determine "content
validity".
(1) The determination of the topic under investigation and the items to be scaled. To do
that, the author's selection of questionnaire items was based on an extensive review of
the literature and the previous empirical studies. Then, the items in the questionnaire
were scaled, on a variety of Nominal, Ordinal and Ratio scales (see the questionnaire
version in Appendix A).
Table 4.1 which is adopted from Emory (1985, p. 87) shows the differences
between these types of scales as follows:
151

Table 4.1 Characteristics of Measurement Scales.
Type of Scale Characteristics of Scale Nominal No order, distance, or origin Ordinal Order but no distance or origin Interval Both order and distance but no origin Ratio .
Order, distance, or on in
An important issue that should be flagged up here relates to utilisation of both odd and
even- numbered scales. An even-numbered scale such as four or six point, has the
advantage of forcing the respondents to either agree or disagree to some extent with a
particular issue. An odd scale, on the other hand allows for indifferent responses (Moser
and Kalton, 1971).
The second issue taken into account here related to utilising a numerical code3 for the
Ordinal and Interval data which can help to transform the responses to data values that
can be directly subjected to statistical analysis (Nation, 1997).
(2) To use people to judge how well the questionnaire meets the standard. This was done
as far as possible. To do that, a pilot questionnaire document was produced and pre-
tested by academics and on a small number of companies, well-known to the researcher.
All questionnaire items were pre-tested by Prof. Arthur Francis the supervisor of the
research and some staff members of the Department of Management Studies at
University of Glasgow Business School. It was also tested by 24 managers (the
production manager, materials manager, inventory control manager, master scheduler,
and management information system manager) of the Egyptian manufacturing public
3A numerical code means that the responses are data values that can be directly subjected to statistical
analysis.
152

sector in order to ensure that each question was clear and easily understandable.
Furthermore, the validity is enhanced because the data were collected from subjects in a
natural setting and the sample represented a known population.
4.3.5.3 Identification of appropriate respondents
In the current study, the basic criterion for the choice of the respondents was the
capability of the respondents to provide the necessary information (i. e. information to
help to display the state of practice of MRP system and its effectiveness) on the basis of
his/her participation in using an MRP system. Consequently, the target respondent in
each company was the production manager or materials manager or inventory control
manager or master scheduler or management information system manager as in Sum and
Yang (1993); Ang et al. (1995) and Sum et at. (1995).
4.3.5.4 The questionnaire
In order to ensure that the questionnaire was reliable for the current study a
number of steps were taken in the construction of the questionnaire. These included the
replication of questions from the pioneer studies previously conducted in related fields of
the study such as Duchessi et at. (1988); Sum and Yang (1993) and Sum et at. (1995),
and translation of the questionnaire was another factor of reliability in this study. Because
this study was conducted in Egypt where Arabic is the main language, it was necessary to
translate the questionnaire into an identical version of Arabic language. To do that, the
questionnaire was translated by the researcher and revised by four Arab Professors of the
Department of Linguistics at the Faculty of Linguistics and Translation- Al Azhar
University in Egypt.
153

The user questionnaire collected data on six sets of issues.
First part: General information and organisational determinant variables
This part of the survey instrument comprised fifteen questions designed to be
responded to by both MRP users and non-users. The first three questions seek responses
regarding the title of respondent, then the type of industry, and company's ownership
(based on nominal scales). The next five questions seek responses regarding type of
products, type of manufacturing, type of processes (based on nominal scales), years in
operations, company size measures, the parameters of product structure complexity, and
the significance of main areas used for promoting MRP systems (based on ordinal scales).
Six of the first fifteen questions apply only to MRP users as they relate to MRP
definitions, organisational arrangements for implementing MRP systems, the
responsibility for managing the MRP project, the main reasons for implementing MRP
systems, the degree of computerisation of MRP modules (based on ordinal scales), and
the company's organisational willingness to change (based on a nominal scale).
Finally, the last question in this part is for non users in order to provide responses
regarding the current system used and the main obstacles that impede NW
implementation (based on ordinal scales).
Second part: Uncertainty determinant variables
This part of the survey instrument is intended for MRP users in order to provide
responses concerning uncertainty determinant variables that influence the benefits
obtained from MRP implementation. These are: product characteristics diversity, amount
of aggregate product demand, machine downtime, product quality, behaviour of people
154

within the company, reliability of plant within the factory, and capacity constraints (based
on ordinal scales).
Third part: Implementational determinant variables
This part of the survey instrument is intended to obtain responses regarding
implementational determinant variables that influence MRP benefits. These are: initiator
of MRP (based nominal scales), years in implementation (based on an ordinal scale),
implementation strategy (based on a nominal scale), the degree of data accuracy, vendor
support, and problems that impede the successful implementation of MRP systems (based
on ordinal scales).
Forth part: Technological determinant variables
This part of the survey instrument seeks the responses concerning the
technological determinant variables that impact on the benefits obtained from MRP
implementation. These are: the features of MRP systems, the source of MRP system,
user class (based on nominal scales), the costs of MRP installation, how much the
company is prepared to invest further (based on ordinal scales), and finally the degree of
integration among MRP modules (based on a ratio scale).
Fifth part: Human determinant variables
This part of the survey instrument is intended to provide responses regarding the
human factor that influence MRP benefits. These are: the degree of involvement in the
implementation, the extent of utilising the outputs of MRP system, level of support of
MRP implementation, level of formal training (based on nominal scales), and the previous
experiences with the automated complex information systems (based on ordinal scale).
155

Sixth part: MRP benefits measures
This part of the survey instrument is intended to provide responses concerning the
benefits obtained from MRP implementation. Some concern tangible benefits [i. e.
inventory turnover (sales/inventory ratio), delivery lead time (days), percent of time
meeting delivery promises (%), percent of orders requiring "splits" because of unavailable
material (%), and number of expediters (number of people)] and these are based upon the
estimates of MRP users of what levels of performance were on the five measures prior to
MRP implementation, after MRP implementation and in the future. Others concern
subjective benefits (i. e. improved competitive position, reduced inventory costs,
increased throughput, improved product quality, improved productivity, better ability to
meet volume/ product change, better production scheduling, reduced safety stocks,
better cost estimation, improved co-ordination with marketing and finance, improved
user ability to perform in his/her job, reduced informal systems for materials management/
inventory/ production control, increased BOM accuracy, and increased information on
which to base decisions since MRP has been implemented) based upon user's perceptions
using an ordinal scale.
4.3.6 Identification of the appropriate method for data collection
For primary data collection by questionnaire, there are three methods that can be
used, and these are Telephone survey, Mail survey, and Personal interview. Each of them
has its own merits and demerits as illustrated below:
156

4.3.6.1 Telephone survey
This stands out as the best method for gathering information quickly. It permits
the interviewer to clarify questions if they are not understood. The main drawback of
telephone interview is that it is usually short because people are unwilling to talk for very
long periods on the telephone (Breakwell, 1995).
4.3.6.2 Personal interview
It has been considered the most versatile of the three methods. In this method
many advantages can be obtained. The personal interviewer can ask more questions, it
can be long; and a high level response rate can be achieved (Kerlinger, 1986; Whitley,
1996). However, it is the most expensive method and requires more trained people for
conducting the interviews (Brownell, 1995).
4.3.6.3 Mail survey
This may be the best way to reach persons who would not give personal
interviews or where there might be interviewer bias. The main drawback of the mail
questionnaire is its low response rate (Whitley, 1996).
However, since the exact number of companies having at least basic MRP modules such
as inventory control in Egypt was not known, the primary intention of the current study
was to collect data from as many companies as possible. Therefore, mail survey was
chosen in preference to other two kinds of survey methods for the following reasons:
a) Since the Egyptian manufacturing companies are geographically dispersed the mail
questionnaire is the appropriate technique for data collection in this study. A list of valid
addressees for 200 companies representing the public manufacturing companies was
157

identified from two main sources (Egyptian Industrial Chambers and Industrialisation
General Organisation).
b) Due to one of the objectives of the current study being the investigation of the real
state of practice of MRP systems in Egypt, the decision was made to use a mail survey in
order to avoid any response that might be biased by the interviewers.
c) Since the respondents of the current survey are managers, making appointments with
them for personal interview or talking with them via a telephone survey would be
difficult. Therefore the decision was made to use mail survey method.
Only one survey questionnaire was sent to each company, to be completed whether by
the production manager or materials manager or inventory control manager or master
scheduler or management information system manager.
4.3.7 Response rate
Of 200 questionnaires sent out, 123 replies were received, giving a response rate
of 61.5% which was regarded as a good response to mail survey. Nachmias and
Nachmias stated "that the sample size must be a certain proportion (often put at 5
percent) of the population" (1992, p. 185). Furthermore, Roscoe (1975) argues that
sample sizes between 30 size and less than 500 are appropriate for most research. Of the
123 replies, 93 respondents were usable: the unusable responses being because they are
with a high proportion of missing values. The final usable sample (93 respondents, giving
a response rate of 46.5%) was broken down into two categories of MRP users and Non
users (52: 41).
158

Table 4.2 shows the various industries represented in the responses as it is illustrated
below:
Table 4.2 Companies classified according to type of industry.
Description MRP Companies
No % Non-MRP Companies No. % No.
Overall %
Textiles 8 15.38 11 26.83 19 20.43 Mining and petroleum industries 3 5.77 3 7.32 6 6.5 Drink and tobacco 0 0.0 3 7.32 3 3.3
Engineering & electronic 26 50.0 4 9.7 30 32.2 Garments 0 0.0 0 0.0 0 0.0
Chemicals 11 1.16 9 21.9 20 21.5 Leather 0 0.0 0 0.0 0 0.0 Wood 0 0.0 0 0.0 0 0.0 Food industries 4 7.69 6 14.6 10 10.7 Paper 0 0.0 3 7.32 3 3.3
Printing 0 0.0 0 0.0 0 0.0 Plastics 0 0.0 2 4.8 2 2.2 Total 52 100.0 41 100.0 93 100.0
It appears from Table 4.2 that some industries were more involved in
implementing MRP systems than the others, e. g., engineering industries were more
involved (50.0% of MRP companies). In contrast, there are several industries where no
firms in the sample have implemented MRP systems, so far, such as the drink and
tobacco industries and the paper industries.
On the other hand, participating respondents came from all MRP users as
illustrated in Table 4.3 below:
159

Table 4.3 Distribution of responses achieved from MRP users by MRP users. Tý of company PMs* MMs* ICMs* MSs* MISMs* Total Engineering 15 1 3 3 4 26 Textile 2 3 0 0 3 8 Chemical 2 2 3 1 3 11 Food 1 2 0 1 0 4 Mining 1 0 1 0 1 3 Total 21 8 7 5 11 52 Rate 404 15.4 13.4 9.6 21.2 100. % * PMs refers to production managers, MMs refers to materials managers, ICMs refers to inventory control managers. MSs refers to master schedulers, and MISMs management information system managers.
Table 4.3 reveals that the higher response rate came from production managers
rather than others. And also, for non users Table 4.4 indicates that the high response rate
came from production managers.
Table 4.4 Distribution of responses achieved from non-MRP companies.
Ty of company PMs MMs ICMs MSs MISMs Total Engineering 1 0 0 2 1 4 Textile 4 2 4 0 1 11 Chemical 2 1 1 3 2 9 Food 2 2 0 2 0 6 Mining 1 0 1 1 0 3 Plastics and Metals 1 0 0 0 1 2 Paper 1 2 0 0 0 3 Drink and Tobacco 2 0 0 0 1 3 Total 14 7 6 8 6 41 Rate 34.1 17.1 14.6 19.5 14.6 100%
4.3.7.1 Increasing response rate
In seeking to increase the response rate, several ways were followed by the
researcher. These were. a) personalised cover letters were used, in this case three cover
letters were issued- one from the researcher's supervisor, the second one was issued by
the Department of Mission- Ministry of Education in Egypt and the third one included
permission to the conduct survey and was from the so-called Central Agency for Public
160

Mobilisation and Statistics in Egypt. These letters briefly explained the purpose of the
study and its importance and requested the co-operation of the respondents,
b) using stamped rather than business reply return envelope was used. To do that, each
company received one questionnaire in a sealed envelope and which contained a
questionnaire and a stamped return envelope, and
c) all companies were promised strict confidentiality regarding the identity and
participation in the current study.
4.3.7 .2 Problems and limitations
First of all, as might the expected, not all companies whose co-operation was
sought were willing to cooperate despite the personalised letters, using stamped envelope
and the researcher's promise of strict confidentiality (i. e. response rate was 38.4%). In
some cases a large period of time passed before the questionnaires were received (two
months after). The high rate of uncompleted questionnaire (i. e. 30 out of 123
questionnaire received were unusable because they are with a high proportion of missing
values).
4.3.8 Data analysis methods
Finally, for drawing the conclusion, the survey responses were coded, and then
analysed by using two statistical packages that were expected to be well suited for the
analysis of survey results. These were:
First, the Statistical Package for the Social Sciences (SPSS for Windows). SPSS is an
integrated system of computer programs designed for the analysis of social science data.
The programme provides a combined and comprehensive package which enabled us to
161

perform different types of data analysis such as frequency, Mann-Whitney U-test,
Kruskal-Wallis, 1-Way Anova and Factor Analysis.
Second, the Dbank package which can be defined as a network-ready, tree-structured
filing system for data that runs under Microsoft Windows. It provides numerous
commands for managing, manipulating, viewing and plotting data in a user-friendly
environment. One of the main techniques for data analysis in Dbank is the Alternating
Conditional Expectation (ACE) model.
The following statistical techniques were used in the current study:
" Frequency Analysis was used to show a count of the number of occurrences that fall
into each of several categories, when the categories are based on two or more
variables considered simultaneously such as initiator of NW systems and level of
formal training.
" Mean Value was used to provide differences between items.
9 Standard Deviation was used in order to state the degree of consistency in responses
among the sample companies i. e. when the Standard Deviation is low the degree of
consistency is high and vice versa.
" The Mann-Whitney test and the T-test were used to find out if significant differences
exist between MRP companies and Non-NW companies.
" The Kruskal Wallis and One Way Analysis of Variance (ANOVA) were employed to
find out if significant differences exist among MRP users.
" The Paired T-Test technique was used to find if significant differences exist between
results of the current study and the previous studies.
162

" Spearman's Correlation Coefficient used to find out the strength of the relationship
between company size factors and MRP installation costs.
" The Bartlett's Test of Sphericity tests if there is a large or small correlation between
variables.
" The Kaiser-Meyer-Olkin (K-M-O) measure of sampling adequacy which indicates
whether the overall approach of Factor Analysis is likely to be worthwhile and
whether each variable is worth including.
" Principal Component of Factor Analysis was used to reduce a large number of
independent variables (determinant variables affecting MRP benefits) and dependent
variables (the subjective benefits obtained from MRP implementation).
" Eigenvalue criterion was used to determine the number of factors needed to represent
the data.
" The Varimax rotation technique was employed to magnify the factor loadings by
maximising the variance.
" Matrix Scatterplots method was used for identifying the form of the relationships
between variables (i. e. there is a non-linearity or not).
9 The adjusted R2 is used as a benchmark for comparing the quality of the regression of
b on d (before transformation) to the regression of tb on td (after transformation),
where b is the benefit obtained from MRP implementation and d is the determinant
variable.
" OLS technique was used in order to evaluate an ACE's model capability.
163

" Forward and Backward Stepwise strategies were used for selecting the final models
for MRP benefits.
" The Skewness method was used to determine which data departed from normality.
" The Cook's Distance measure was used as an easier and more accurate way of
detecting multivariate outliers.
" ACE model was used as the best overall way to represent the dependence of the
dependent variable on the independent variables.
4.4 Summary
The main purpose of this chapter was to describe the design of the appropriate
methodology for achieving the major objectives and answering the questions of the
current research through describing the steps which are used to carrying it out. Three
types of research designs (i. e. experiment, case study, and nonexperiment- survey)
followed by the most common methods in the social sciences for collecting data (i. e.
observation, questionnaire, interview and archival records) are presented with their own
merits and demerits. The survey design was used as the most suitable approach to fulfil
the objectives of the current study.
It is stressed in this chapter that there is never a single or standard perfect design
or method for research because each type has its merits and demerits. However, one can
conclude that the suitable design or method is one which enables the investigator to meet
the research objectives.
As a consequence, the design of the current study has passed through eight
successive stages. It starts with recapitulating the research questions and its objectives,
164
outlines the overall variables underlying the structure and the main approach of the
current study, presents the hypotheses have advised to guide the direction of the research
and organise the survey, identifies companies among which the survey has been
conducted, develops the questionnaire, determines the appropriate method for data
collection, identifies sample size, and determines the appropriate data analysis methods.
The findings of the survey and analysis of the results are given in the next three chapters
(Chapters 5,6 & 7).
165

CHAPTER FIVE
Data Analysis
Current MRP Practices in Egypt
5.1 Introduction
Since MRP implementation is relatively new in less developed countries such as
Egypt, there is no research that considers MRP implementation in Egypt or in any
developing country. This may stem from a lack of knowledge about MRP systems in less
developed countries in general, and in Egypt in particular. This chapter of the study is
intended to:
1. Investigate MRP practices in Egyptian manufacturing companies which may be
educational and informative for manufacturing companies which have implemented,
are implementing, or are considering MRP implementation.
2. Identify the similarities and dissimilarities of the nature of MRP implementation in
Egypt compared to other contexts.
In pursuit of these objectives, this chapter presents the analysis of the field study
findings concerning the survey of both MRP-companies and non NW-companies.
Ninety-three responses were received, of which fifty-two were from MRP companies
which operated in quite different business environments within the Egyptian industrial
sector. Data from these were investigated and compared with findings from previous
studies elsewhere such as: Sum and Yang (1993) in Singapore as a newly industrialising
country, and Anderson et al. (1982) and Laforge & Sturr (1986) in the US as a
developed country.
166

Statistical techniques used in analysing the data collected from the field study are
arranged as follows:
" The presentation of the basic distributional characteristics of the variables through
frequencies and percentages.
" To find out if significant differences exist between MRP companies and Non-NW
companies the Mann-Whitney test and the T-test were used (for double accuracy).
" To find out if significant differences exist among MRP users the Kruskal Wallis and
One Way Analysis of Variance (ANOVA) were employed.
9 The Paired T test was used to find out if significant differences exist between results
of the current study and the previous studies.
To ascertain the state of practice of MRP implementation in Egypt, the data
collected in the survey of Egyptian manufacturing companies are presented and discussed
in nine sections as follows: the second section shows company profile; the third section
states the main obstacles that impede non-NW companies to implement MRP systems in
Egypt; the fourth section presents the importance of various factors in promoting MRP in
Egypt; the fifth section presents the main reasons for implementing MRP systems from
the point of view of MRP users; the sixth section shows the organisational arrangements
for implementing MRP systems; the seventh section states MRP implementation process;
the eighth section deals with MRP systems characteristics; the ninth section shows MRP
user's profile; the tenth section deals with the stage of MRP implementation which
includes the type of industry and uses an MRP classification profile.
167

Finally, this chapter of the research is concluded by providing an assessment of
the state of practice of MRP systems within Egyptian manufacturing companies.
5.2 Company profile
This section is intended to present the main features of the companies sampled in
this survey. These will be compared with the previous studies whenever possible and
meaningful.
5.2.1 Type of industry
As mentioned earlier in Chapter 4 (see section 4.3.7), some industries
implemented MRP systems more than others, e. g., engineering industries accounted for
50.0% of the MRP companies. In contrast, there are several industries which have not
implemented MRP systems, so far, such as the drink & tobacco industries and the paper
industries.
Similar studies by Anderson et al. (1982) concluded that electric and electronic
industries had achieved the highest proportion of MRP implementation in the US, while
Sum and Yang (1993) reported that 47.5% of MRP companies in Singapore were located
within the electronic and transport equipment industries. These sectoral differences may
be influenced by the fact that Singapore and USA have very different industrial profiles.
5.2.2 Company characteristics
The findings in Table 5.1 indicate that the majority of MRP companies are
governmental owned in contrast to Sum & Yang (1993) study which indicates that
59.3% of MRP companies in Singapore are multinational corporations. This reflects a
feature of the Egyptian economic structure where a large public sector has been
168

dominating control over the industry (Per-lind, 1991; DTI, 1996). Respondents indicated
that MRP systems are more likely to be found in older companies. The interpretation of
this finding is that when the company becomes mature and more established, it is more
willing to invest in longer term enhancement projects such as MRP systems (Sum and
Yang, 1993).
The majority of MRP companies embraced a marketing strategy combination of
make to order and make to stock products. This is a similar trend in relation to marketing
strategy which MRP companies used in the US and Singapore as demonstrated by
Anderson et al. (1982) and Sum & Yang (1993) respectively.
MRP systems are also more often adopted by manufacturing companies that work
in complicated manufacturing processes (assembly and fabrication operations) than in
companies with continuous/process flow. To a large extent, this result is similar to those
of Anderson et al. (1982) and Sum and Yang (1993) concerning the type of
manufacturing associated with the implementation of MRP systems by American and
Singaporean manufacturing companies, successively.
Furthermore, our findings concur with the findings of Cerveny and Scott (1989)
study, Burns et al. (1991) study and Sum and Yang (1993) study, concerning the type of
process (layout) associated with MRP implementation by the American and Singaporean
users. It indicates that MRP users are likely to be assembly line (i. e. layout by product)
and job shop (i. e. layout by process) more than non-users.
169

Table 5.1 Company characteristics reported by the total sample.
Characteristic MRP Companies Non- MRP Companies Overall (N) (%) (N) (%) (N) (%)
Ownership * Government 48 92.3 39 95.1 87 93.5 Private 0 0.0 0 0.0 0 0.0 Multinational corporation 4 7.7 2 4.9 6 6.5
Total 52 100.0 41 100.0 93 100.0
Age** Less than 3 years 0 0.0 0 0.0 0 0.0 4-5 years 2 4.0 3 7.3 5 5.5 6-10 years 1 2.0 8 19.5 9 9.9 11-15 years 8 16.0 11 26.8 19 20.8
More than 15 years 39 78.0 19 46.3 58 63.7 Total 50 100.0 41 100.0 91 100.0
Type of products** Make-to-order only 11 22.4 15 36.6 26 28.8
Make-to-stock only 11 22.4 8 19.5 19 21.1
Make-to-order and make-to-stock 27 55.2 18 43.9 45 50.0 Total 49 100.0 41 100.0 90 100.0
Manufacturing process** Assembly only 4 7.6 3 7.7 7 7.7
Fabrication only 1 1.9 2 5.1 3 3.3 Assembly and fabrication 29 55.8 19 48.7 48 52.7 Continuos/process flow' 18 34.6 15 38.5 33 36.3 Others 0 0.0 0 0.0 0 0.0
Total 52 100.0 39 100.0 91 100.0
Layout(type of process) **
Job shop 14 27.5 5 13.9 19 21.8 Continuos process` 6 11.8 18 50.0 24 27.6
Assembly line 31 60.8 13 36.1 44 50.6 Combination 0 0.0 0 0.0 0 0.0
Total 51 100.0 36 100.0 87 100.0
*Q3 of the questionnaire ** Q4 of the questionnaire
' As on assemb1 lines. production follows a predetermined sequence of steps, but the continuos/process flow is continuos rather than discrete as in petroleum and chemicals industries. Such structures are
usually highly automated and constitute one integrated "machine" that must be operated 24 hours a day
to avoid expensive shutdowns and start-ups (Chase et al.. 1998).
2 Continuos process means layout by product for companies have machines that must be operated 24
hours a day such as petroleum and chemicals companies.
170

5.2.3 Company size
Figure 5.1 1995 Gross sales*.
*Q5 of the questionnaire
It seems from Figure 5.1 that MRP implementation is inclined to increase as one
moves from small companies with gross sales less than L. E. 10 millions to big companies
with gross sales greater than L. E 50 millions. This result supports the results ofAnderson
et al. (1982) study, and Sum and Yang (1993) study, which concluded that as companies
increase in size as measured by gross sales, they have a greater inclination to implement
MRP systems (i. e. to computerised systems).
Furthermore, Table 5.2 indicates that MRP systems as measured by number of
employees and number of production and inventory control employees are more adopted
by large companies in both the Egyptian and American companies.
Table 5.2 Number of employees and production & inventory control employees (Mean values) in different contexts.
Study Number of employees in MRP companies Non-NW companies
Number of P&IC employees in NW companies Non-MRP companies
The Current study* 2.100 1,011 48 26 Anderson et al., stud-v 1.064 578 19 12.5 *Q5 of the questionnaire
171

5.2.4 Product complexity
Table 5.3 suggests that MRP systems are more often adopted by manufacturing
companies with a complex product structure (number of levels in the bill of materials -
BOM). This result supports Puttick's grid (1987) concerning key manufacturing
techniques. This supposes that when manufacturing companies engage in complicated
manufacturing processes, the need and opportunity of implementation of MRP systems is
increased to manage and control the whole operations
In general terms, Table 5.3 indicates that the product complexity as measured by
BOM levels in Egypt is smaller than those in the US whether in MRP companies or Non-
MRP companies. This is consistent with our results (see section 5.2.1) in relation to the
fact that MRP companies in the US have very different industrial profiles.
Table 5.3 Number of Bill of Materials levels (Mean values) in different contexts.
Stud} BOM levels in MRP companies BOM levels in Non-NW
companies The Current studv* 4.4 2.3 Anderson et al.. study 6.9 5.8
*Q6 of the questionnaire
Furthermore, our findings indicate that the majority of MRP companies (51.0%)
reported that number of ite-ns per product are over 100 items. This result supports the
findings of Anderson et al. (1982), who found that the MRP systems have been
implemented by companies with a complex product structure measured by the number of
the parts and components per product. In the same trend, this finding concurs with Sum
et al. (1993) study, who reported that as the number of parts per product increases (more
than a 40- part), the product structure becomes bigger and more complex.
172

5.3 Obstacles that impede MRP implementation in Egypt
Our findings indicate that about 44.1% of companies participating in the empirical
study had not implemented the MRP systems. They reported that the traditional systems
(Reorder Point Systems- ROP) have been used for manufacturing planning and control
for more than 5 years. To some extent, this result concurs with the findings of Newman
& Sridharan (1992), who found that 59 out of 185 manufacturing companies surveyed in
the US still implemented the Reorder Point Systems- ROP- computer based or manual.
Lack of knowledge about MRP was reported as the biggest obstacle impeding
MRP implementation for non-adopters (Table 5.4), with a high level of agreement
between respondents about this (SD . 27). To a large extent this result is similar to Ang et
al. (1995), where they found that the main reason for not implementing MRP systems is a
lack of company expertise in MRP in Singaporean companies.
Table 5.4 The main obstacles that impede NIP implementation reported by non-MRP
companies*.
Item Mean score** SD*** Limited knowledge about MRP 2.92 .
27 Successful without MRP implementation 2.50
. 73
Not applicable 1.82 . 39
Not felt to achieve big enough benefits 1.69 . 47
Cost too high 1.21 . 41
Potential staff attitude problems 1.08 . 37
*Q 15 of the questionnaire ** Based on a 3-point scale "1" for of no significance and -3- for very significant. *** The standard deviation presents an adverse measure of agreement among the respondents which means that a high standard deviation refers to a low level of agreement while a low standard deviation indicates a high level of agreement (as in White and Wharton, 1990).
To find out if there were significant differences between industrial sectors in the
reasons given by non-MRP companies, for non-adoption, the Kruskal Wallis and One
Way Analysis of Variance (ANOVA) were used. These techniques indicate that there is
173
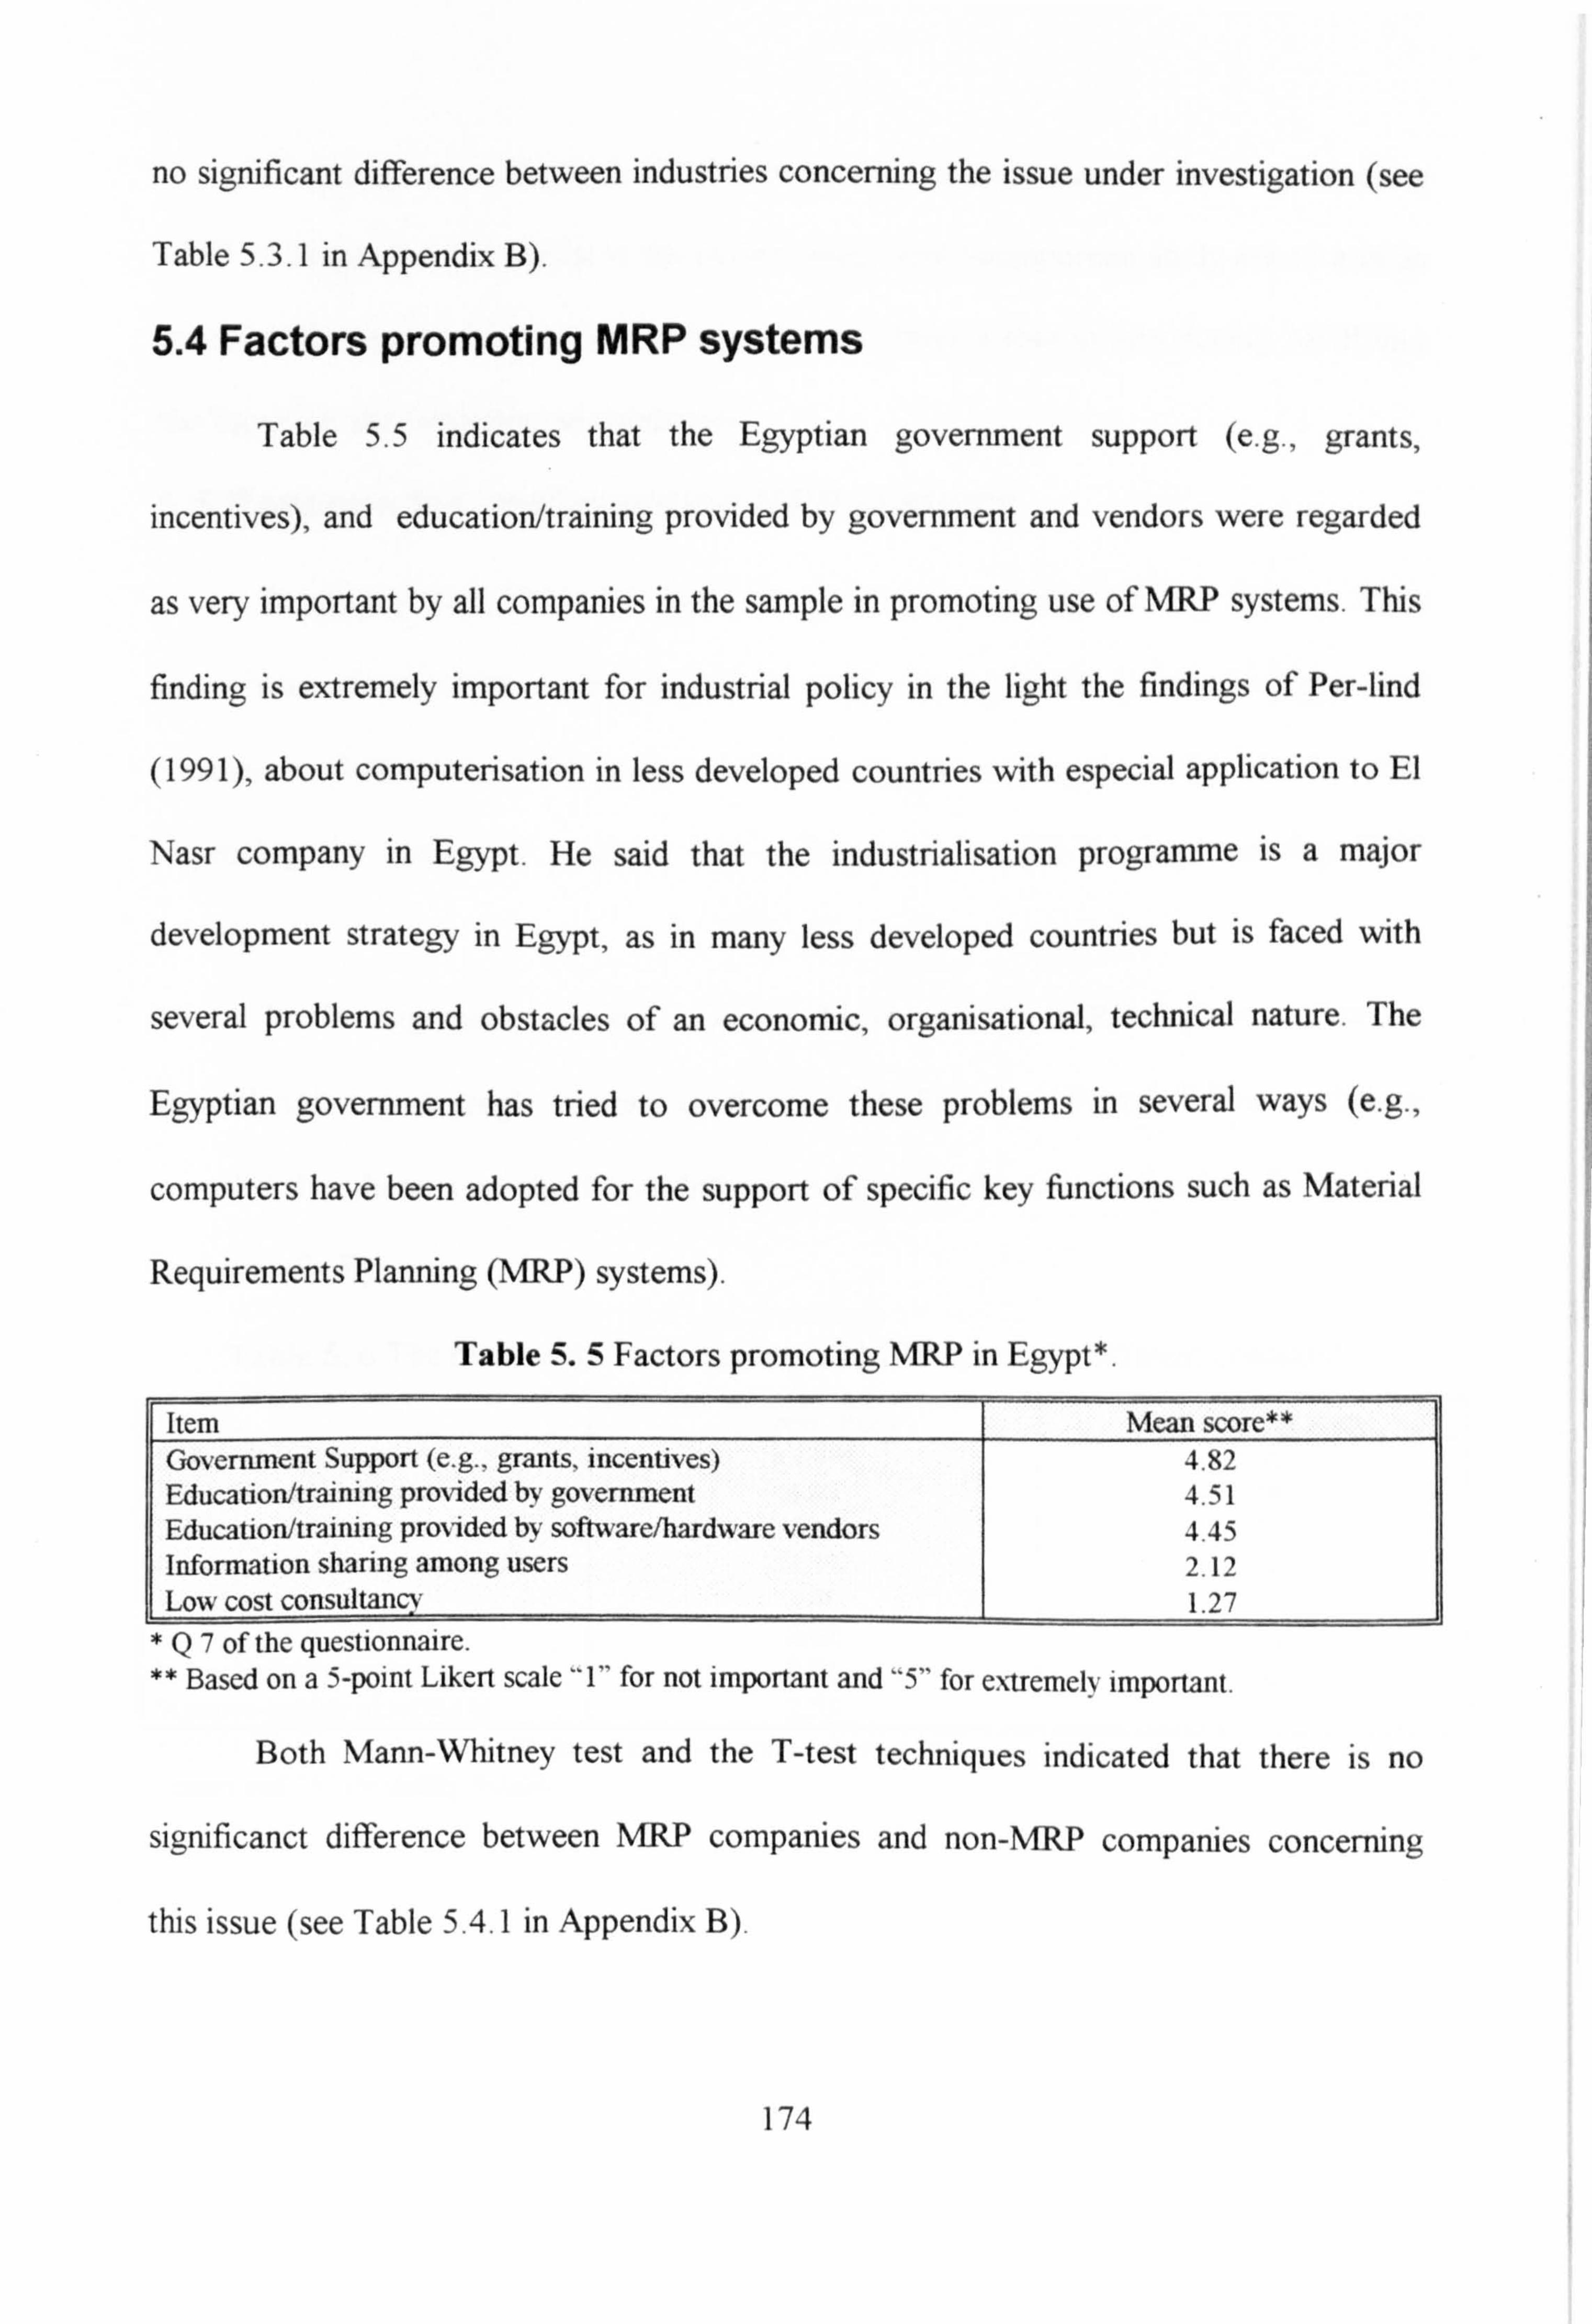
no significant difference between industries concerning the issue under investigation (see
Table 5.3.1 in Appendix B).
5.4 Factors promoting MRP systems
Table 5.5 indicates that the Egyptian government support (e. g., grants,
incentives), and education/training provided by government and vendors were regarded
as very important by all companies in the sample in promoting use of MRP systems. This
finding is extremely important for industrial policy in the light the findings of Per-lind
(1991), about computerisation in less developed countries with especial application to El
Nasr company in Egypt. He said that the industrialisation programme is a major
development strategy in Egypt, as in many less developed countries but is faced with
several problems and obstacles of an economic, organisational, technical nature. The
Egyptian government has tried to overcome these problems in several ways (e. g.,
computers have been adopted for the support of specific key functions such as Material
Requirements Planning (MRP) systems).
Table 5.5 Factors promoting MRP in Egypt*.
Item Mean score** Government Support (e. g., grants, incentives) 4.82 Education/training provided by government 4.51 Educationhraining provided by soft ware/hardware vendors 4.45 Information sharing among users 2.12 Low cost consultanev 1.27
*Q7 of the questionnaire. ** Based on a 5-point Liken scale "1" for not important and -5- for extremely important.
Both Mann-Whitney test and the T-test techniques indicated that there is no
significanct difference between MRP companies and non-MRP companies concerning
this issue (see Table 5.4.1 in Appendix B).
174

Compared with Ang et al. (1995) concerning the importance of factors promoting
MRP in Singapore, the results in the current study and Singaporean study are to a large
extent similar concerning the importance of government's role in introducing MRP into
the Egyptian and Singaporean companies.
5.5 Reasons for implementing MRP systems
It appears from Table 5.6 that lower inventory cost and meeting delivery dates
better were the most important reasons for implementing MRP systems in Egypt and
Singapore. Apparently, MRP users whether in Egypt or Singapore did not feel that
improving the quality of products was an important reason for implementing MRP
systems.
In the aggregate, one can say that the reasons for MRP implementation are
tactical and not strategic reasons in the two studies. The Paired T-Test technique
revealed that there is no significant differences between the two studies (see Table 5.5.1
in Appendix B).
Table 5.6 The reasons for implementing an MRP system in different contexts*.
Reason Current study Sum & Yang y Lower inventory cost 4.69** 4.06 Meet delivery dates better 4.63 4.25 Inventory control 4.10 3.74 Improve competitive position 3.39 3.74 Production control 2.88 3.91 Improve productivity 2.62 3.98 Increase throughput 2.61 3.60 improve quality of products 2.53 2.77 *Q 12 of the questionnaire ** based on a six-point Likert scale, score "0" for not at all, "1" for weak reason and "5" for strong reason.
175

5.6 Organisational arrangements for MRP implementation
It appears from Table 5.7 that two-thirds of MRP companies set up a formal
steering committee to oversee the implementation of MRP system, and in half the cases it
met at least once a month and a project team met weekly. MRP companies in Egypt set
up a formal steering committee to oversee the implementation of MRP systems more
than their peers in Singapore { 68.8% in Egypt against 47.4% in Singapore as in (Ang et
al., 1995)) but these arrangements were less formal than those made by MRP companies
in the US (69.35% as in (Duchessi et al., 1988).
Table 5.7 Organisational arrangements for implementing MRP systems reported by
MRP users*. Item Yes No Total A steering committee was formed N 33 15 48
% 68.8 31.2 100.0 A steering committee met at least once a month N 27 23 50
54.0 46.0 100.0
The project team generally met weekly N 26 23 49 % 53.1 46.9 100.0
*Q 11 of the questionnaire
MRP users were asked to evaluate whether the MRP project manager's only
responsibility was for managing the project or not based on Five-point Likert scale with
strongly disagree =1 and strongly agree = 5. They reported that there is a strong
inclination within the MRP companies in Egypt that the project manager is responsible
only for managing the project whereas the mean value is (4.14). This result concurs with
the findings of Burns et al. (1991), who found that 95 out of 238 manufacturing
companies in the US have appointed project manager's whose only responsible for
managing the Ni" project.
176

Duchessi et al. (1989) reported that successful and less successful companies had
a moderate inclination towards having the MRP project manager with a full responsibility
for managing the project (the mean of their responses based on the same scale was 2.71).
Furthermore, a review of the literature revealed that the organisation's willingness to
change has been considered as a critical factor for implementing MRP systems by
manufacturing companies (Wacker et al., 1977, Kneppelt, 1981). The respondents were
also asked to indicate the organisation's willingness to implement the MRP systems. This
is illustrated in Figure 5.2 below
Figure 5.2 Organisational willingness to implement MRP systems reported by MRP users*
*Q 14 of the questionnaire
This shows that the majority of MRP companies (83.0%) were suggesting and
actively seeking to implement an MRP system within the Egyptian manufacturing sector.
This finding supports the findings of Burns et al. (1991), who reported that the majority
of MRP companies in the US were also suggesting and actively seeking to implement the
177

MRP systems. They added that when the organisation's willingness to change increases,
the opportunity for the successful implementation of MRP systems appears to increase.
5.7 MRP implementation process
5.7.1 Years in implementation
Figure 5.3 The growth of MRP users in Egypt*.
50
40 40
30 33
a 20
Cl- 17 5
10 10
0
y e
*Q 18 of the questionnaire
This shows a sharply growing trend in the implementation of MRP systems by
Egyptian manufacturing companies in the last decade. Implementation has been relatively
recent- 57% within last five years. There has been increasing Egyptian government
support for implementing new production technology within the Egyptian industrial
sector, such as grants, and education provided. To a large extent, the previous result is
similar to Sum & Yang (1993), concerning the degree of growth of MRP systems, and
the government's role in introducing MRP systems in Singapore.
178

5.7.2 Initiator of MRP effort
For comparative purposes, the findings in our study are compared with White et
al. (1982) and Sum & Yang (1993) studies concerning the initiator of MRP systems in
the US and Singapore respectively, as shown in Table 5.8 below:
Table 5.8 Initiator of MRP effort in different contexts (°%ö of companies)*.
Initiator Egypt (present study)
Singapore United States'
a) Top management 78.8 67.8 18.0
b) Production and inventory control (P&IC) management 5.8 6.8 31.0
c) Both top management and P&IC management 9.6 18.6 31.0
d) Data processing personnel 0.0 3.4 10.0
e) Software/hardware vendors 3.8 5.1 NAb
f) Others 0.0 0.0 10.0
Total 100.0% 101.7`% 100.0%
a Results extracted from White et al., (1982). ° "NA" means response is not available because option was
not reported in White et al., (1982). ` Percentages do not add up to 100 because several companies gave
multiple answers. * Q 17 of the questionnaire.
The Egyptian and Singaporean top management are more involved in introducing
MRP systems into their companies than their peers in the US companies. This result can
be interpreted in the light of the fact that MRP users in Egypt and Singapore are
relatively beginners compared with the US users. In turn, this may mean that the top
managers are more informed about implementing MRP systems in Egypt and Singapore
than their peers in US companies. On the other hand, the findings indicate that
software/hardware vendors do not take any particular initiatives to promote their
products though this type of application is general requires substantial support before and
after its installation. This result validates Per-lind (1991) findings concerning the missing
role of the computer suppliers and software vendors to promote their industry products
in Egypt.
179

5.7.3 Degree of data accuracy
A review of the literature reveals that the company must have accurate records in
the supporting files, such as BOM and inventory records, to implement MRP systems
(Dilworth, 1993). Table 5.9 exhibits the findings in Anderson and Schroeder, study
(1982) alongside our responses concerning the importance of the degree of data accuracy
of the supporting files associated with the implementation of MRP systems.
Table 5.9 The importance of the degree of data accuracy reported by MRP users in
different contexts*.
MRP System Element Egypt* current study)
United States
Master production schedule 3.14** 2.7 Bill of material records 3.00 3.2 Inventory records 2.86 2.7 Vendor lead times 2.85 2.5 Production lead times 2.80 2.6 Market forecasts 2.78 2.0 Shop floor control data 2.76 2.0 Capacity data 2.75 2.0 Routin workcentre data 2.65 NA'
'NA. means response is not available because option was not reported in Anderson and Schroeder study, (1982). * Q 20 of the questionnaire. ** Based on Four-point scale, score "I" for little. -4- for very much. `The higher the mean, the greater the importance of the item.
It appears from Table 5.9 that the Egyptian companies with MRP systems
reported the significance of data accuracy for MRP implementation, especially the three
main inputs of MRP systems and which must be very accurate for sufficient application of
MRP systems, namely, master production schedule, bill of material (BOM) records and
the inventory master computer record respectively. This finding may mean that MRP
companies in Egypt have perceived the importance of data accuracy as a critical variable
for operational use as in (Anderson et al., 1982, Duchessi et al., 1989, and Sum et al.,
1995).
180

The Kruskal Wallis Test and One Way of Variance (ANOVA) indicate that there
is no significant differences among MRP users in Egypt concerning the importance of the
accurate data of MRP system elements as a main pre-implementation prerequisite (see
Table 5.7.1 in Appendix B).
It seems from Table 5.9 that the accuracy of BOM record element was more
important in US companies with MRP systems than the Egyptian users. This result can be
interpreted in light of the fact that the US users are more mature users of MRP systems
(Etienne, 1983).
The pattern of responses for the other MRP elements between Egyptian and US
users indicate that the accuracy of all MRP systems elements in Egypt are generally felt
to be more important than in US. This result can be interpreted in light of the fact that
the MRP companies in Egypt are still within a "crusade" or diffusion era of the
implementation of MRP. Managers are particularly interested to get the accurate
information for all MRP systems elements. This is consistent with our findings in section
5.7.1 which indicates that there is a sharply growing trend in MRP implementation by
Egyptian manufacturing companies.
The Paired T-Test technique (see Table 5.7.2 in Appendix B) reveals that the
difference between the two studies is statistically significant, where MRP users in Egypt
have perceived the importance of data accuracy as a major prerequisite for implementing
MRP systems more than their peers in the US.
181

5.7.4 Degree of vendor support
For comparative purposes our findings were compared with the Duchessi et al,
study (1988) concerning the role of vendor support in implementing MRP systems by
manufacturing companies, as it is depicted in Table 5.10 below:
Table 5.10 Vendor support reported by MRP users in different contexts*.
Vendor Support Egypt United States'
We expected more extensive vendor support 4.89** 3.15 Vendor instructions understand their software product 4.80 3.41 The vendor provided conversion of our data into the new system 4.18 2.3 We experienced a vendor software support discontinuation problem 4.13 2.40 Vendor personnel efficiently resolved software problems 4.07 3.11
Results extracted from Duchessi et al, study (1988). ([Mean of successful responaent + mean of successful respondent]/2). * Q 21 of the questionnaire** Based on a five-point Likert scale, score "1" strongly disagree, "5" for strongly agree.
Table 5.10 indicates that the Egyptian users depend upon vendor support for
implementing MRP systems more than US users. This result can be interpreted in light of
the fact that many Egyptian users are relatively beginners while the most of the US users
have implemented MRP systems since 19705. Consequently, they expect less support and
rely on internal experience to solve many of the problems that they encounter during
MRP implementation.
The Kruskal Wallis Test and One Way of Variance (ANOVA) techniques
revealed that the differences among the five industries concerning the importance of
software/hardware vendor support for implementing MRP systems are not statistically
significant(see Table 5.7.3 in Appendix B).
Using the Paired T-Test technique reveals that the differences between the
current study and Duchessi et al study are statistically significant in favour of the US
182
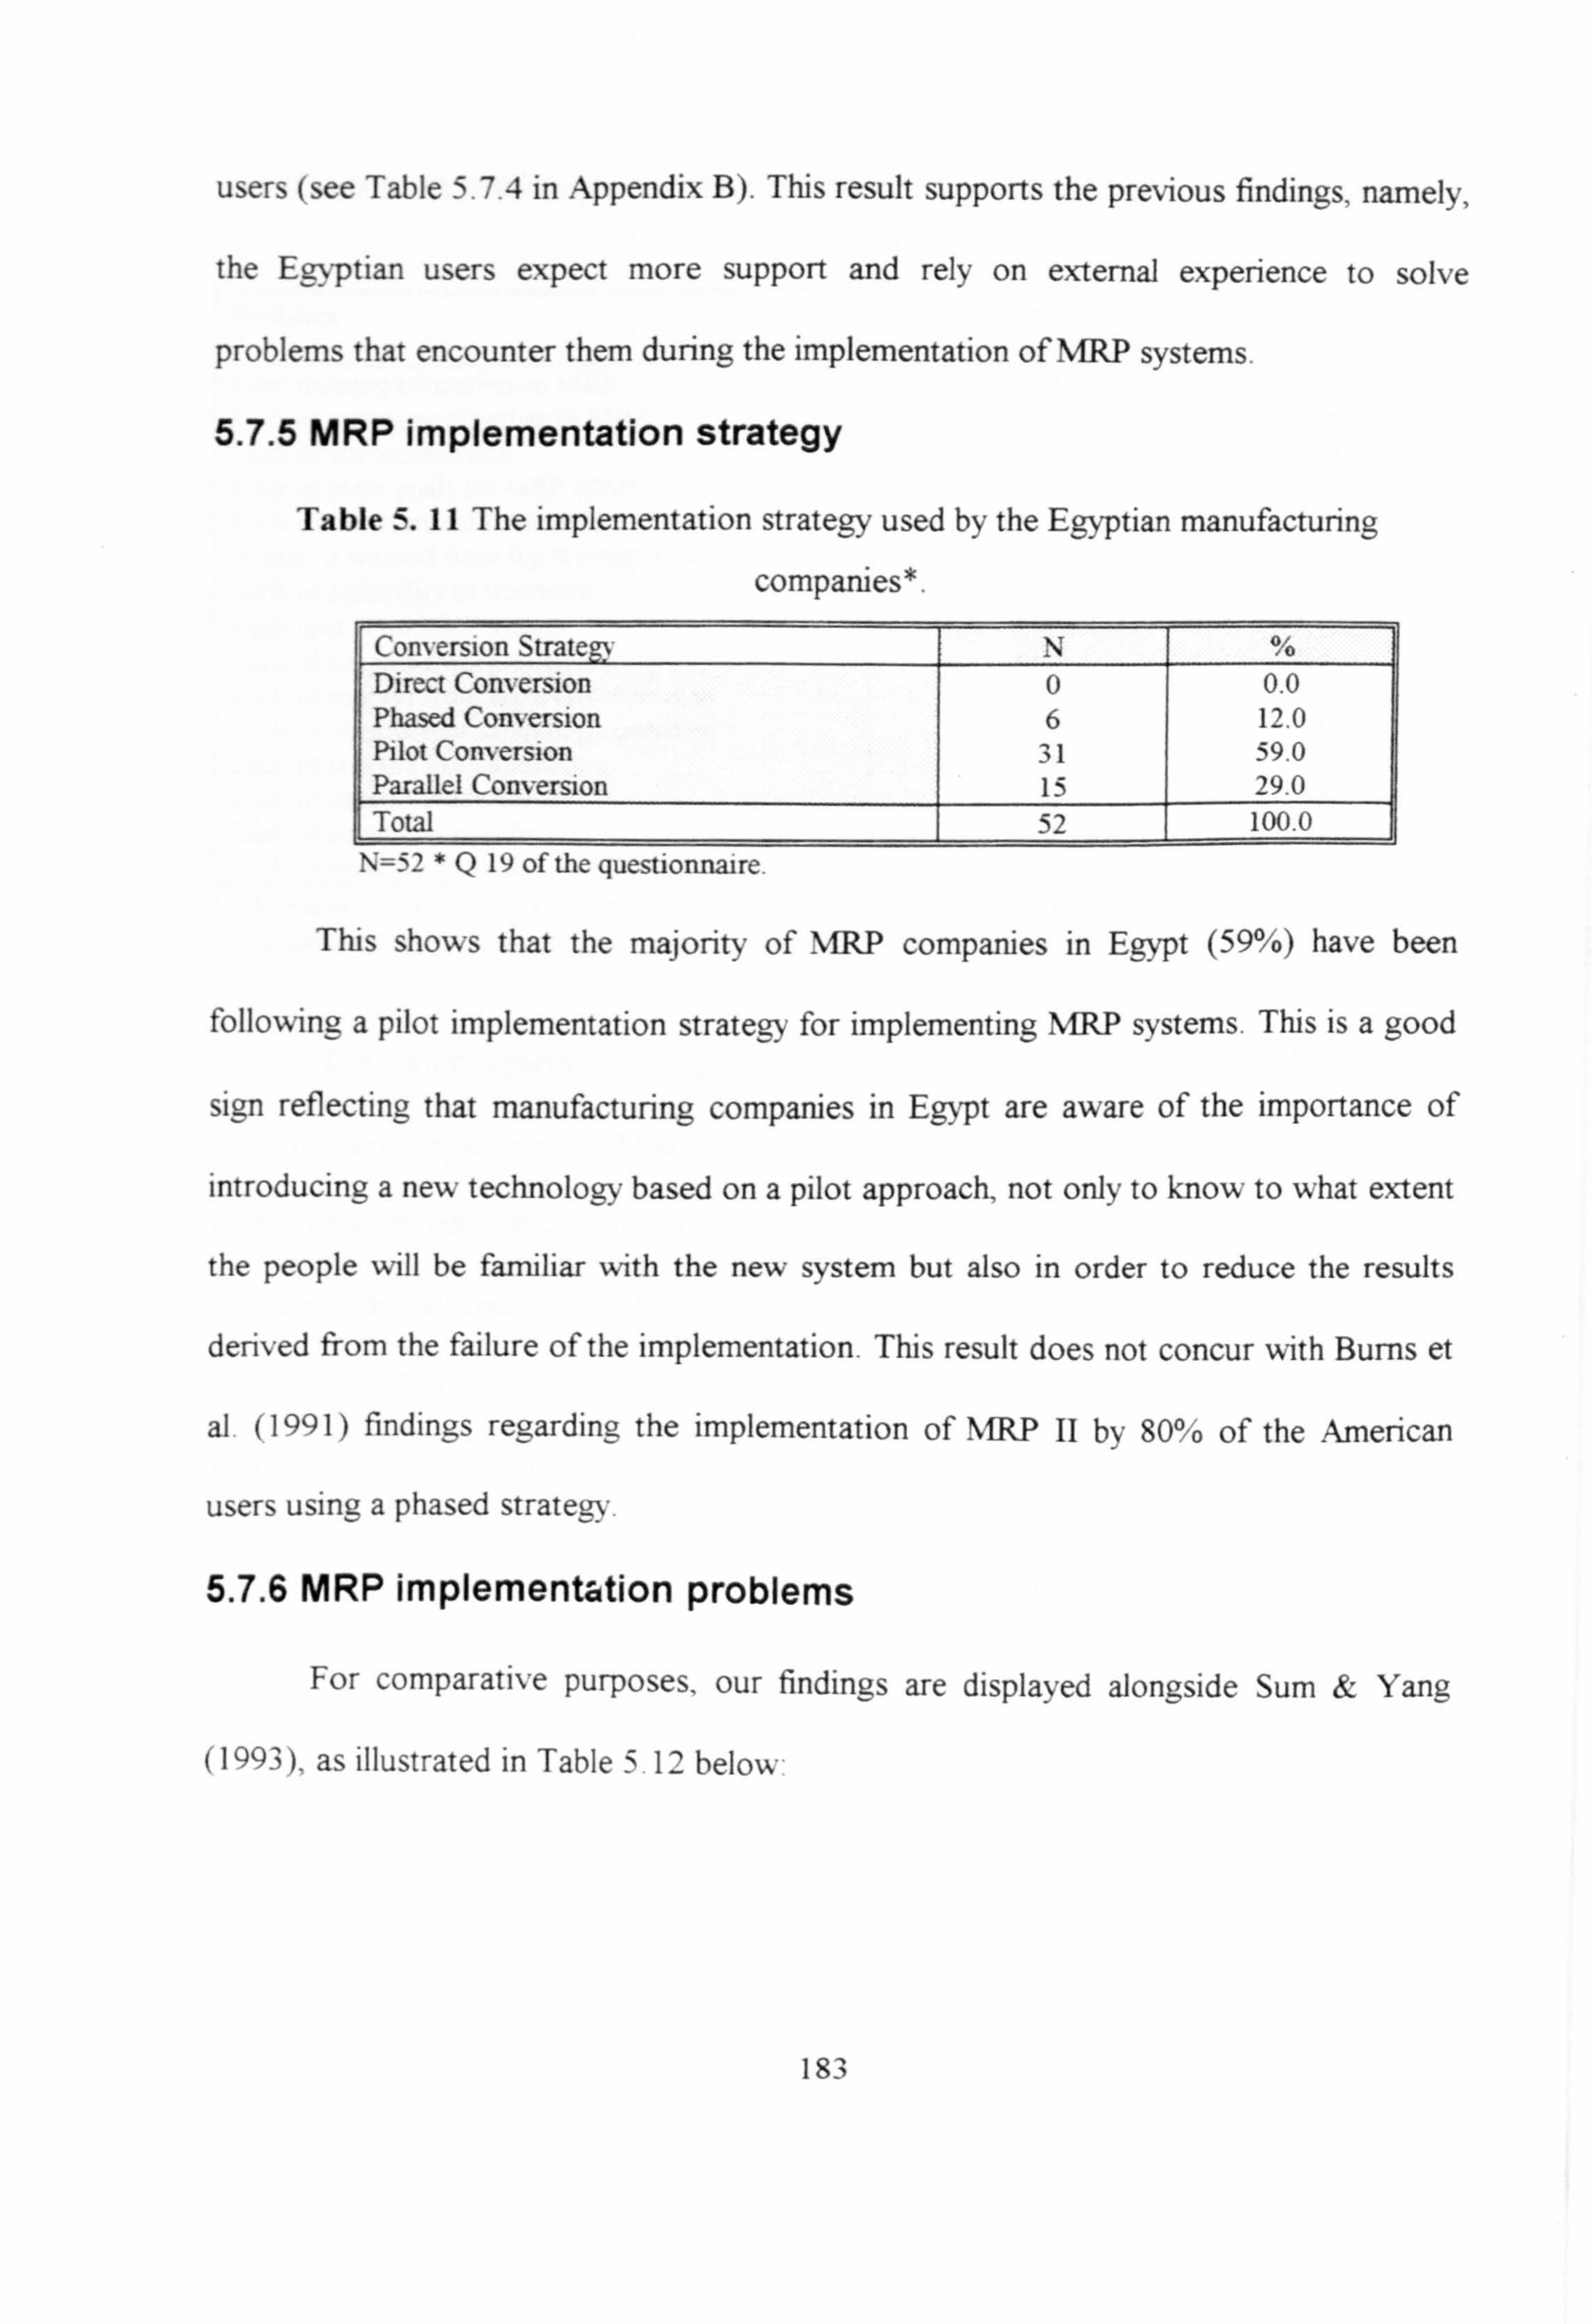
users (see Table 5.7.4 in Appendix B). This result supports the previous findings, namely,
the Egyptian users expect more support and rely on external experience to solve
problems that encounter them during the implementation of MRP systems.
5.7.5 MRP implementation strategy
Table 5.11 The implementation strategy used by the Egyptian manufacturing
companies*
Conversion Strate N % Direct Conversion 0 0.0 Phased Conversion 6 12.0 Pilot Conversion 31 59.0 Parallel Conversion 15 29.0 Total 52 100.0
N=52 *Q 19 of the questionnaire
This shows that the majority of MRP companies in Egypt (59%) have been
following a pilot implementation strategy for implementing MRP systems. This is a good
sign reflecting that manufacturing companies in Egypt are aware of the importance of
introducing a new technology based on a pilot approach, not only to know to what extent
the people will be familiar with the new system but also in order to reduce the results
derived from the failure of the implementation. This result does not concur with Burns et
al. (1991) findings regarding the implementation of NW II by 80% of the American
users using a phased strate-.
5.7.6 MRP implementation problems
For comparative purposes, our findings are displayed alongside Sum & Yang
(1993)), as illustrated in Table 5 12 below
183

Table 5.12 TARP implementation problems' reported by MRP users in different
contexts*.
Problem Egypt Current Study)
Singapore
Poor training/education on IMP 4.92** 3.02 Lack of company expertise in MRP 4.84 3.00 Lack of communication 4.75 2.86 Lack of clear goals for MRP effort 4.58 NA Lack of involvement from vendor 4.57 2.53 A lack of support from top management 4.52 NAa Lack of suitability of hardware 3.98 NA
High cost of an MRP system 3.69 2.49 Lack of support from production 3.69 NA Lack of support from supervisor/foreman 3.67 NA Lack of information technology expertise 3.53 2.52 Lack of support from marketing 1.92 NA Lack of support from finance 1.90 NA
Lack of suitability of software 1.70 2.62 Lack of vendor knowledge on MRP 1.63 NA
a NA. means response is not available because option was not reported in Sum and Yang study. * Q 22 of the questionnaire ** Based on a five-point Likert scale, score "1" weak problem. "5" for strong problem.
The major implementation problems are poor training/education on NW and lack
of company expertise in MRP, respectively. This supports the literature review
concerning the need to design MRP education and training programmes and which reflect
the important ingredients of MRP implementation (Plossi, 1995; Correll, 1994). Both
studies revealed that the cost of MRP systems and the lack of support from top
management were not cited as major obstacles for MRP implementation.
Using Kruskal Wallis Test and One Way of Variance (ANOVA) reveal that the
differences among the five industries concerning the critical factors cause obstacles or
To main implementation problems N%ere excluded (i. e. poor data accuracy and poor user discipline).
Because the% have been discussed in another subsections in this chapter (see sections 5.7.3 and 5.9.1
respectiveh ).
184

problems during the implementation of MRP systems are not statistically significant (see
Table 5.7.5 in Appendix B).
The Paired T-Test technique indicates that there is a significant difference
between the two studies in support of the Singaporean users (see Table 5.7.6 in
Appendix B).
Table 5.12 illustrates that all but one of the critical factors causing obstacles or
problems during the implementation of MRP systems for the Egyptian manufacturing
companies are more serious than those which Singaporean users encountered. This may
be because most of Singaporean users are multinational companies (Sum & Yang, 1993)
which means that there is in - company expertise to help them to overcome the
implementation problems.
5.8 MRP system characteristics
5.8.1 Definition of MRP
The majority of the Egyptian users indicate that the MRP system is regarded as a
tool for planning and control for production (Table 5.13). In contrast, Sum and Yang
(1993) reported in their study about MRP practices in Singapore that the majority of
MRP companies had apprehended the extensive scope of MRP systems. This result
suggests that MRP users in Egypt do not understand the extensive scope of MRP
systems and which may stem back to the fact that about two-thirds of MRP companies
had implemented MRP I, while only 34.7% had implemented MRP II (Q 9 of the
questionnaire).
185

Table 5.13 Definition of term "MRP" reported by MRP users in different contexts*
(% of companies).
Definition N
Egypt % N
Singapore %
(a) Computerised materials/production planning and control system for production only 30 58.0 10 17.2
(b) Primarily computerised materials/production planning and control system integrated with other business area to achieve a total business system 14 26.0 40 67.2
(c) General system for computerising any business function 8 16.0 7 12.1
(d) Others 0 0.0 2 3.5
Total 52 100.0 59 100.0
*Q 10 of the questionnaire
5.8.2 MRP system features
For comparative purposes. the findings in Sum and Yang (1993) and Anderson et
al. (1982), are displayed alongside our findings, as illustrated in Table 5.14 below:
Table 5.14 MRP system features in different contexts*.
Feature Descnption Egypt (resent study)
Singapore United States
a) Update method Net change 54.0% 32.0% 30.3%
Regenerative 30.0% 24.0% 69.7% Both 16.0% 44.0% NAa
b) Use of cycle counting Yes 68.6% 75.5% 61.4% No 31.4% 24.5% 38.6%
c) Use of pegging Yes 74.5% 80.9% 55.1% No 25.5% 19.1% 44.9%
d) NIPS update frequency Weekh 51.0% 41.5% 56.7% Daily 15.7% 28.3% 16.4% Others 33.3% 30.2% 27.0%
e) Allocation of inventory Yes 58.0% NA 71.3% No 42.0% NA 28.7%
f) Use of automatic lot sizing Yes 5.9°% 0.0 44.5% No 94.1% 100.0% 55.5%
g) Time bucket size Daily 33.3% 30.3% NA WeeklN 51.0% 55.4% 70.4% Monthly 3.9% NA 12.5% Others 11.8% 14.3% 27.0%
h) Average number of weeks in MPS 29.8 22.8 40 'NA. means response is not available because option was not reported in Singapore and US studies. *Q 2' of the questionnaire
186

Table 5.14 illustrates that most Egyptian users update their systems on a weekly
basis using Net change method, while most MRP companies in Singapore update their
systems on a weekly basis but using Net change and regenerative methods together. On
the other hand, most US users update their systems on a weekly basis using regenerative
method. This may stem from the fact that most manufacturing companies update their
systems on basis of their product lead time which is likely to be different from one user to
other.
Also, this is a healthy sign as it suggests that most Egyptian users understand the
two methods for coping with nervousness, because, often, MRP users start with
regeneration, because it is easier to understand and implement than net change (Plossl,
1995).
To a great extent, the features of the MRP systems in the three studies are similar
whereas the update method is regenerative rather than Net change, employing cycle
counting, higher percentage of pegging, updating MPS on a weekly basis, employing
allocation of inventory, an automatic lot sizing unused, planning in weekly time bucket
and the MPS planning horizon averaged ranged from 22.8 to 40 weeks.
The finding that MRP companies are extensively using cycle counting as in
McCormick and Martino study (1981); Duchessi et al. (1989) and the current study,
indicate that formal physical controls were used to achieve and maintain high levels of
data accuracy of an inventory store. In addition, the finding that MRP companies highly
emphasise the pegging feature in the three studies indicate that the MRP users have the
187

ability to trace an item from record to another i. e. the planner can trace the demands to
their ultimate sources (Plossl, 1995).
The Paired T-Test technique was employed to find out if statistically significant
differences exist between the current study and the previous two studies (see Table 5.8.1
in Appendix B). The results indicate that there is no significant differences whether
between the current study and the US study, or between the current study and Singapore
study, or between the US study and Singapore study concerning the common features of
MRP systems.
5.8.3 Hardware and software
The findings in Table 5.15 indicate that 70.6% of the MRP systems run on
microcomputers and mainframes while 29.4% of MRP users run their systems on
minicomputers. 84.3% of MRP companies in Egypt prefer to buy turn-key systems
against 15.7% of MRP companies who did some in-house development of the bought
software package. Furthermore, a majority of companies (88.2% %) indicate that the
maintenance of MRP software is done by the software vendors. This result may stem
from the Egyptian users seeking to take advantage of the services offered by vendors and
to shorten the implementation time.
This result to a large extent is similar to the findings of the Sum & Yang (1993)
study, which found that 49.2% of the MRP systems in Singapore run on minicomputers,
71.1% of MRP companies source their MRP software from vendors, and only 13.6%
develop the entire software in house.
188

Table 5.15 Hardware and software of MRP systems reported by MRP users of the total
sample*.
Item Egypt (present study) N** %
Computer hardware Microcomputers and mainframes 38 70.6 Minicomputers 14 29.4 Source of MRP software package Developing the entire software package in-house 8 15.7 Butiin turn-key systems 44 84.3 The maintenance of MRP software a. Done in-house 6 11.8 b. Done by software vendor 46 88.2 c. Done by IT specialists 0 0.0
*Q 24 of the questionnaire ** N= 52
5.8.4 Degree of computerisation of MRP modules
The findings in Sum and Yang (1993) are displayed alongside our findings in
Table 5.16 below:
Table 5.16 Degree of computerisation of MRP modules in different contexts*.
Module Egypt (Current study) Sum & Yang Study Inventory control 4.29** 4.26 Purchasing and receiving 4.22 3.74 Bills of materials 4.06 4.18 Material requirements planning (parts explosion) 4.02 3.57 Customer order service 3.06 NAd Routing/uork centres 2.06 2.98 Sales order processing 2.06 3.18 Cost accounting 2.04 3.20 Master production scheduler 1.87 2.56 Shop floor control 1.82 2.12 Financial analysis 1.80 2.73 Payroll/human resources 1.72 2.61 Rough-cut capacity planning
. 96 1.27
Forecasting . 92 1.31
Operations scheduling . 88 1.79
Capacity requirements planning . 83 1.53
y i-) of nie quesuonnaire ** Based on a six-point Likert scale, score "0" for "not at all", "1" for 1-20%; "5" for "81-100%".
On the whole, Table 5.16 illustrates that the degree of computerisation of MRP
modules associated with the MRP implementation in Egypt and Singapore extends only
189

to basic MRP modules such as an inventory control, purchasing and receiving, bill of
materials, and material requirements planning (parts explosion).
The sophisticated modules such as capacity requirements planning and rough-cut
capacity planning were little used. This result can be interpreted in light of the fact that
both the Egyptian and Singaporean users (Ang et al. 1995) are still relatively beginners
with the implementation of MRP systems. Consequently, this degree of computerisation
meets their requirements for the current period.
Using Kruskal Wallis Test and One Way of Variance (ANOVA) reveal that the
differences among the five industries concerning the degree of computerisation of MRP
modules in the Egyptian industrial sector are not statistically significant (see Table 5.8.2
in Appendix B).
The Paired T-Test technique indicate that there is no significant differences
whether between the current study and Singapore study, concerning the degree of
computerisation of MRP modules (see Table 5.8.3 in Appendix B).
5.8.5 Degree of integration
Figure 5.4 The degree of integration among the MRP system modules rating's MRP users*.
Q28 of the questionnaire.
190

Figure 5.4 shows the extent to which companies had integrated of the elements of
the MRP system listed in Table 5.16. This shows that the majority of MRP companies in
Egypt (51.0%) reported a degree of communication among MRP modulesranged from
41.0-60.0%. Only 6.0% of MRP companies indicated that 80.0% or more of their
computerised modules are fully integrated. This is similar to the findings of the Sum &
Yang study (1993) which found that 65.0% of 59 companies had integrated at least
60.0% of these modules.
This indicates that the degree of integration among the MRP modules concurs
with the length of time of MRP implementation, because of our findings indicate that
MRP companies in Egypt are still relatively beginners and also, Ang et al. (1995)
indicated that MRP implementation is new in Singapore.
5.9 MRP users profile
5.9.1 Previous experience
The respondents were asked to indicate their previous experience with automated
complex information systems based on a 5-point Likert scale, with 1= very little and 5=
very high (Q 30 of the questionnaire). Table 5.17 exhibits the responses of that question
in terms of mean and standard deviation as it is illustrated below:
Table 5.17 The previous experience with automated, technically complex information
systems reported by MRP users of the total sample. Item Mean* SD The previous experience 2.92
. 56
iv= Dº- tsasea on a D-point Likert scale, with 1= very little and 5= very high.
Our findings indicate that the MRP users in Egypt had received a moderate
experience with automated complex information systems before implementing an MRP
191

system. This result is consistent with our findings which suggest that 15.7% of MRP
companies in Egypt did some in-house software development and 11.8% of MRP
companies maintain their system in-house.
This result also concurs with the claim that operations/production managers
responsible for the implementation of NW systems in US companies have not had
previous experience in the implementation of complex information systems (Burns et al.,
1991). Both Kruskal Wallis Test and One Way of Variance (ANOVA) techniques
showed no significant difference among MRP users concerning the issue under
investigation (see Table 5.9.1 in Appendix B).
Furthermore, the MRP users in Egyptian manufacturing companies were asked to
indicate their formal training associated with MRP implementation. Table 5.18 shows
level of formal training that MRP users got.
Table 5.18 The formal training associated with MRP implementation*.
Item N %
a) College graduate 42 82.4 b) Some college education 3 5.9 c) Techrccal school graduate 6 11.8 d) High school graduate 0 0.0 e) Less than hi school 0 0.0 Total 51 100.0
Ty su of the questionnaire.
Table 5.18 reveals that about 82.4% of MRP users in Egypt were a college
graduate against 44.0% of the Turnipseed et al, sample. (1992).
5.9.2 MRP users support
Table 5.19 shows that 88.5% of MRP users were at least supportive to the
decision to implement an MRP system. This result to a large extent is similar to the
findings of the Turnipseed et al. (1992) study which found that 90.0% of MRP users in
192

the US were at least supportive for implementing MRP systems. This is a good sign as
the level of users support has often been identified as one of major implementation
prerequisites (Callarman and Heyl, 1986; Dilworth, 1993).
Table 5.19 Level of support of MRP implementation by MRP users in different
contexts*.
Item N
Egypt % N
US %
a) Total support 7 13.5 28 38.0 b) Very supportive 26 50.0 18 24.0 C) Supportive 13 25.0 19 27.0 d) Neutral 6 11.5 7 10.0
e) Opposed implementation 0 0.0 0 0.0 Total 52 100.0 72 100.0
*Q 32 of the questionnaire.
5.9.3 The degree of utilising the outputs of MRP systems
The MRP users were asked about the extent to which they utilised the outputs of
MRP systems.
Figure 5.5 The extent to which MRP users utilise the outputs of an MRP system*.
*Q 29 of the questionnaire.
193
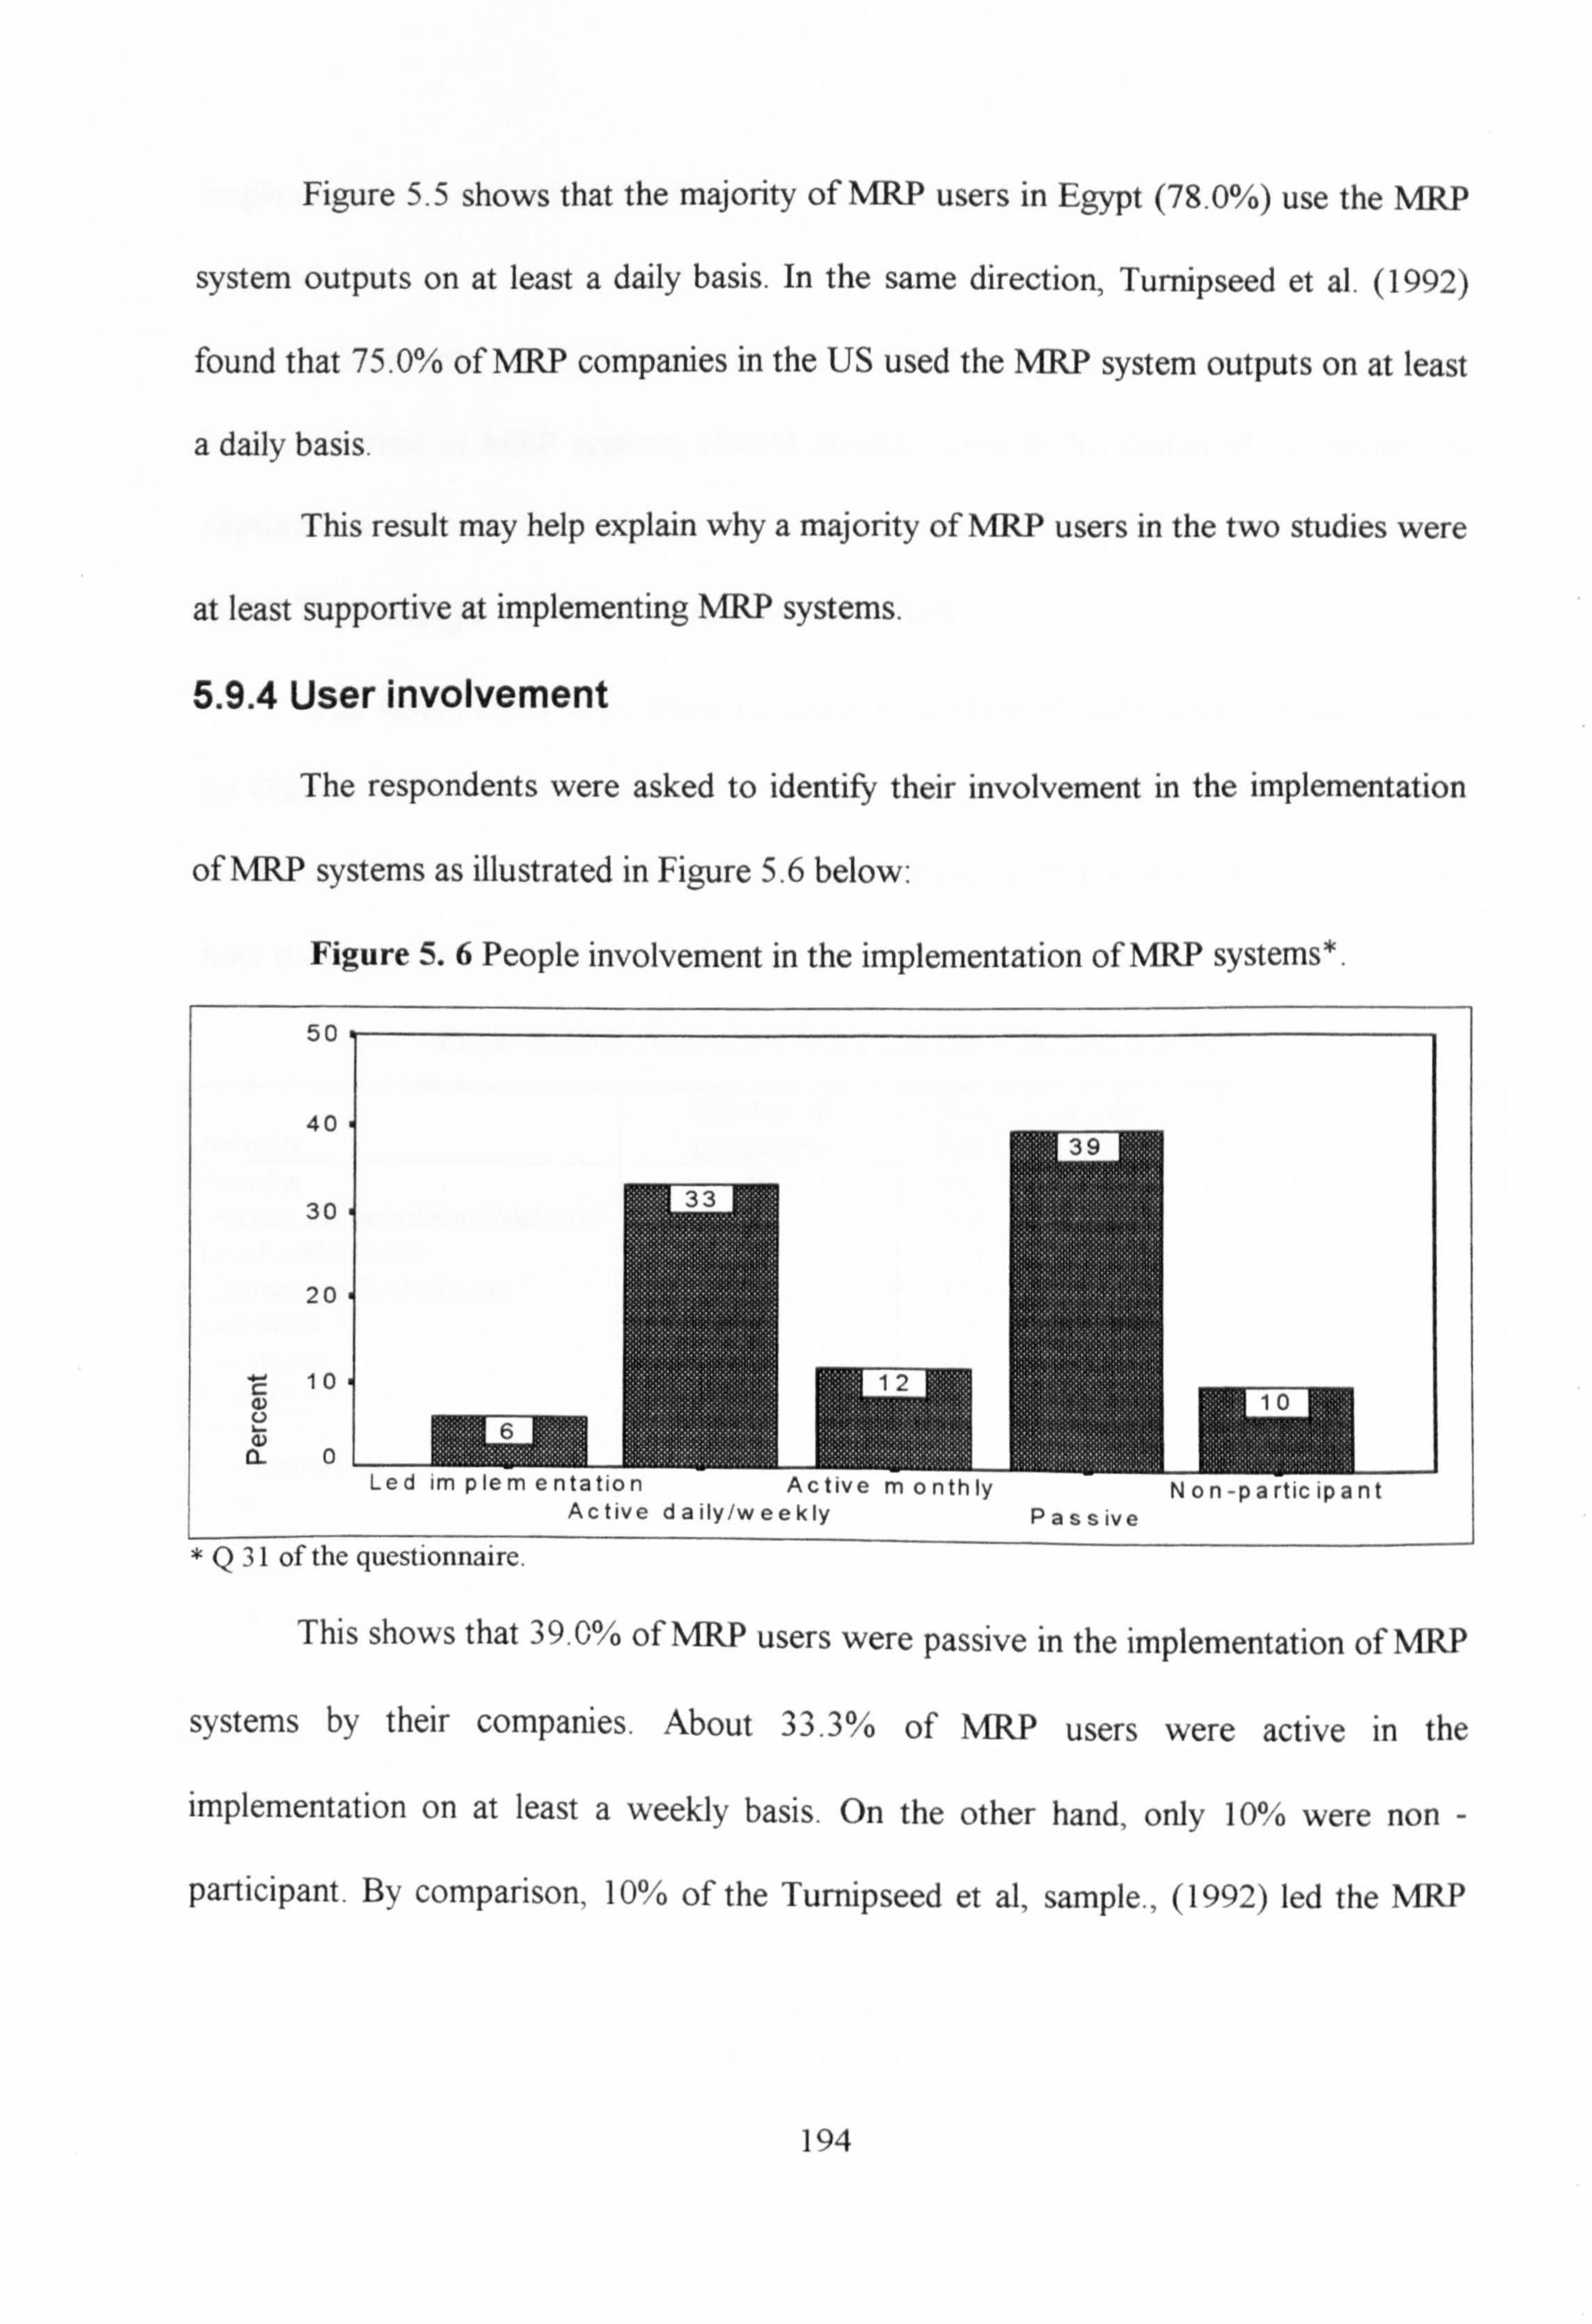
Figure 5.5 shows that the majority of MRP users in Egypt (78.0%) use the MRP
system outputs on at least a daily basis. In the same direction, Turnipseed et al. (1992)
found that 75.0% of MRP companies in the US used the MRP system outputs on at least
a daily basis.
This result may help explain why a majority of MRP users in the two studies were
at least supportive at implementing MRP systems.
5.9.4 User involvement
The respondents were asked to identify their involvement in the implementation
of MRP systems as illustrated in Figure 5.6 below:
Figure 5.6 People involvement in the implementation of MRP systems*.
*Q 31 01 the questionnaire.
This shows that 39.0% of MRP users were passive in the implementation of MRP
systems by their companies. About 33.3% of MRP users were active in the
implementation on at least a weekly basis. On the other hand, only 10% were non -
participant. By comparison, 10% of the Turnipseed et al, sample., (1992) led the MRP
194

implementation, and about 40.0% were active with the implementation on at least a
weekly basis.
Westbrook (1995) recommends that MRP companies, to achieve successful
implementation of MRP systems, should involve users in the design of the system, to
capture their commitment and to avoid their misunderstanding of the current procedures.
5.10 The stage of MRP implementation
The respondents were asked to assess their state of MRP implementation based
on Class D-C-B-A system suggested by Wight (1984)4, where Class D refers to the least
advanced MRP, and Class A refers to the most advanced MRP system. Table 5.20 shows
how the Egyptian users classified themselves.
Table 5.20 Industry and MRP use classification profile*.
Number of % of Reorder MRP Classification
Industr%, Companies Total Point DCBA
Textiles 19 20.7 11 1 5 2 0 Mining and petroleum industries 6 6.5 3 0 2 1 0 Drink and tobacco 3 3.3 3 0 0 0 0
Engineering & electronic 29 31.9 4 1 11 13 0
Garments 0 0.0 0 0 0 0 0 Chemicals 20 21.9 9 1 7 3 0
Leather 0 0.0 0 0 0 0 0 Wood 0 0.0 0 0 0 0 0 Food industries 10 10.9 6 1 0 3 0 Paper 3 3.3 3 0 0 0 0 Printing 0 0.0 0 0 0 0 0 Plastics 2 2.1 2 0 0 0 0
Total 92 100.0 41 4 25 22 0 Percent of Total 44.6 4.3 27.2 23.9 0.0
Percent Considering 7.8 49.0 43.2 0.0 onl y MRP
*Q 25 of the questionnaire.
It is interesting to remind the reader that term user class and the stage of MRP implementation are used
interchangeably in this thesis, and this has been discussed in section 2.8.4.4 (Chapter. 2).
195

Based upon Table 5.20 several observations can be made:
a) 49.0% of MRP companies claimed to be Class C user which means that they use MRP
system as an order launching system and to manage inventory, but they do not include
the use of feedback for the readjustment of orders in response to actual performance.
43.2% of MRP companies reporting MRP usage identify themselves as Class B users,
namely, they use MRP system as a Closed-loop MRP system for production operations
control, for vendor follow-up system, and for detailed capacity requirements planning
(Dilworth., 1993). This result is consistent to a great degree with Table 5.13 which
suggests that about 58.0% of MRP users defined MRP system as a tool for planning and
control for production only.
b) Table 5.20 indicates that no MRP companies in Egypt claimed to be Class A user. This
result can be interpreted as follows:
9 That manufacturing company needs to have longer experience with MRP
implementation in order to be Class A user, while the Egyptian users are still relatively
beginners. Our findings indicate that 73% of MRP companies had installed their
systems for 3 to 10 years and which can be seen to be synchronised with the current
stages of implementation. Voss (1986) has said that manufacturing companies need
ten years to learn how to implement MRP systems.
" That Class A users have more sophisticated MRP modules such as RCCP and CRP
modules, while our findings indicate that the Egyptian users had implemented the basic
modules such as BOM and MPS modules.
196

9 That Class A users have more integrated systems, while our findings indicate that the
majority of MRP modules are not fully integrated so far.
c) Table 5.20 indicates that 82.8% of engineering & electronic industries are at stages B
&C and had achieved the highest stage of MRP implementation among the Egyptian
industries. This result is consistent with Cooper & Zmud's studies (1989; 1990)
concerning MRP infusion within the US companies. The first study found that 12 out of
37 MRP users with Classes C&B are electronic companies, and in the second study,
found that 14 out of 32 MRP users with Classes C&B are also electronic companies.
The foregoing analysis provides strong evidence that MRP systems are more developed
in the engineering & electronics industries than the other industries.
For comparative purposes, our findings are displayed alongside Cooper & Zmud
(1989) and Laforge & Stun (1986) findings concerning the stage of MRP
implementation in the US companies, as it is illustrated in Table 5.21 below:
Table 5.21 MRP Classification percentages of the sample firms in different contexts.
Current Study Cooper & Zmud Study Laforge & Sturr Study User class N % N % N %
Class A 0 0.0 1 2.4 25 25.0 Class B 22 43.8 12 28.5 31 31.0 Class C 25 47.9 24 57.0 41 41.0 Class D Total
4 51
8.3 100.0
5 42
12.0 100.0
3 100
3.0 100.0
Table 5.21 indicates that a majority of MRP companies classified themselves as
either Class B or Class C MRP users in the three studies. Of the MRP companies in the
current study, 91.7% classified their system as either Class B or C. By comparison,
85.5% of the Cooper & Zmud sample claimed to be Class B or Class C MRP users, in
197

contrast, 72.0% of MRP companies of the Laforge & Sturr sample reported themselves
to be Class B or Class C MRP users. This result clarifies that MRP companies in Egypt
and the US are to some extent similar in relation to the stage of MRP implementation.
5.11 Summary and conclusions
The main purpose of the this chapter has been to present and discuss the state of
practice of MRP systems in Egyptian manufacturing companies, and to compare our
results with the results of related previous studies in order to identify the similarities and
dissimilarities in the nature of MRP implementation in Egypt compared to different
contexts. Having discussed that, the following is a summary of findings:
(1) The results of the current study suggest that the implementation of MRP systems in
Egypt is relatively similar to that, in Singapore, as reported by Sum & Yang (1993), as a
newly industrialising country; Anderson et al. (1982) and Laforge and Sturr (1986) in the
US as a developed country.
(2) The survey findings suggested that MRP implementation is more likely to be in
engineering and electronic industries and less likely to be in other industries whether in
Egypt or Singapore or the US. The need for implementing MRP systems is likely to be
greater when companies are larger, older, complex, and their marketing strategy is a
combination of make to order and make to stock products in the three countries.
(3) The survey findings suggest that limited knowledge about MRP systems can be
considered as the most important obstacle that impedes MRP implementation by the
Egyptian and Singaporean users, while lack of MRP training, education and expertise
198

were identified as a critical problems encountered in the implementation process either in
Egypt or Singapore.
(4) In contrast, the interesting differences that emerged can be summarised as follows: a)
the current study reveals that the most MRP companies in Egypt are state owned. In
contrast the majority of MRP companies in Singapore and in the US are multinational
owned, and this reflects that the. public sector still dominates industry in Egypt, b) from
the empirical evidence, the study indicates that the organisational arrangements for
implementing MRP systems incline to be more formal for the US users than their peers in
Egypt and Singapore, c) our study reveals that top management support in Egypt has a
great impact on the extent and rate of the acceptance of MRP systems more than their
peers in Singapore and the US. The reason behind that may be that the MRP companies
in Egypt are still in an early implementation stage (57.0% of companies under
investigation had implemented MRP systems for 5 or less than 5 years) so top
management are highly involved in MRP implementation, and d) in addition, the findings
indicated that software/hardware vendors play a vital role in the implementation of MRP
systems. In contrast, their role in US companies is less. The reason for this may be that
US users had more expertise in the implementation of MRP systems than the Egyptian
users.
(5) In general terms, the study reveals that the current usage of MRP systems is not very
widespread in Egypt. Despite the Egyptian government support (e. g., grants, incentives)
in promoting use of MRP systems, 52 of 93 companies participated in the empirical
analysis. had implemented MRP systems and 41 had not yet implemented.
199

In summary, in this chapter an attempt was made to investigate the state of MRP
practices in Egyptian manufacturing companies.
In order to investigate the extent to which MRP implementation is effective by
the Egyptian users, the next chapter (i. e. Chap. 6) is intended to assess the effectiveness
of MRP practices measured by the benefits obtained from MRP implementation by MRP
users in Egypt.
200

CHAPTER SIX
Data Analysis
MRP Implementation Benefits
6.1 Introduction
The purpose of this chapter is three fold, first to assess empirically the
effectiveness of MRP practices measured by the benefits obtained from MRP
implementation in Egyptian manufacturing companies, second to report the costs of MRP
installation by the Egyptian users, and third to test hypothesis relating to the benefits
obtained from MRP implementation. It was suggested earlier in Hypothesis # (1) that
"Not all MRP users in Egyptian industrial sector attain the same benefits from MRP
implementation" (see Chapter 4 section 4.3.3).
To achieve these objectives, the data collected in the survey of fifty-two MRP
companies concerning the benefits obtained from MRP implementation and the costs
spent on MRP installation by Egyptian manufacturing companies are presented and
discussed in three main sections, as follows.
Section 6.2 presents a preliminary analysis of the benefits obtained from MRP
implementation by the Egyptian manufacturing companies. This is divided into two
subsections.
The first presents the objective benefits obtained from MRP implementation by
the Egyptian manufacturing companies. This is done by investigating the objective
benefits obtained from MRP implementation from the point of view of MRP users.
Statistical analysis of the data collected from MRP companies was used in two cases.
201

The first case is analysis of the data collected in terms of means and standard deviations
and which covers the objective benefits obtained from MRP implementation by MRP
companies. Then an attempt is made to determine the extent of the improvements
achieved from MRP implementation for each of the Egyptian manufacturing industries,
and to find out if significant differences exist between individual industries using Kruskal
Wallis Test (K-W) and One Way of Variance (ANOVA) (to test hypothesis # 1).
The second case is analysis of how much progress towards the final target has been made
for each of the five performance measures (i. e. inventory turnover, delivery lead time,
percent of time meeting delivery promises, percent of orders requiring "splits" because of
unavailable material, and number of expediters) of MRP implementation of the total
sample. This subsection concludes by presenting how this is different from previous
studies through comparing the result of this study and those obtained by previous studies.
In this case, the Paired T-Test technique was employed to find out if significant
differences exist between the current study findings and the findings of each of the
previous studies.
The second subsection of section 6.2 presents the subjective benefits obtained
from MRP implementation by the Egyptian manufacturing companies. These are
investigated from the point of view of MRP users. Means and standard deviations of
responses about the subjective benefits obtained from MRP implementation of the total
sample were calculated and the Kruskal Wallis Test (K-W) and One Way of Variance
1 Because some companies cannot meet delivery dates, a number of expediters have been used (i. e. a
number of people who are appointed) to help companies make two days (i. e. due date and need date)
have been coincided.
202

(ANOVA) techniques were used to find out if significant differences exist amongst MRP
users perceptions, concerning the degree of improvement on all subjective benefit
measures of MRP implementation (again testing hypothesis # 1), and finding out the
extent of the perceived subjective benefits versus reasons for implementing MRP
systems. The result is then reported of using a Paired T-Test technique to find out if
significant differences exist between the current study findings versus the findings of each
of the previous studies.
Section 6.3 deals with the costs spent on MRP implementation by Egyptian
manufacturing companies. It reports what has happened in the Egyptian manufacturing
companies concerning the costs of MRP installation and the expected substantial
additional investment over the next three years.
Statistical analysis of the data collected from MRP companies were used in two
cases. The first is analysis of the results of the two questions relating to MRP installation
costs and the expected substantial additional investment over the next three years in
terms of means and standard deviations. The second is analysis of the strength of the
relationship between company size and MRP installation costs using Spearman's
Correlation Coefficient. These results are compared with those obtained from previous
studies.
Section 6.4 is intended to summarise the research findings regarding the benefits
obtained from MRP implementation and its installation costs from points of view MRP
users within the Egyptian manufacturing companies.
203
6.2 MRP implementation benefits
As it was stated in the literature survey (see section 2.7 in Chapter Two) that the
effectiveness of MRP practices is measured by the benefits obtained from MRP
implementation. Previous studies concerning MRP implementation benefits can be sorted
into two types: the first provides only a listing of the benefits of MRP implementation
success such as Sum and Yang (1993); Ang et al. (1995) and Sum et al. (1995), and the
second attempts to develop or validate a standard measure concerning the expected
potential benefits of MRP implementation (Duchessi et al., 1988). There are fewer
studies of this second type.
With this in mind, the present study attempts to support the latter type. To do
this, the effectiveness of MRP implementation is measured by (1) tangible benefits or
improved performance measures, and (2) subjective benefits or user satisfaction as in
(White et al., 1982; Anderson and Schroeder, 1984; Duchessi et al., 1988).
Accordingly, the respondents were asked to outline the benefits obtained from MRP
implementation and which were measured in two ways in the research survey, firstly by
improvements in the objective benefit measures and secondly by the subjective ratings of
benefits.
This section is intended to determine the degree to which the Egyptian
manufacturing companies achieved the expected potential benefits of MRP
implementation. The field study findings on this one issue are discussed below:
204

6.2.1 The objective benefits obtained from MRP Implementation
Anderson and Schroeder (1984) collected five objective performance estimates
(i. e. inventory turnover, delivery lead time, percent of time meeting delivery promises,
percent of orders requiring "splits" because of unavailable material, and number of
expediters) and those were used to judge the extent that manufacturing companies
achieved improvements in performance as a result of MRP implementation.
It is worth mentioning here that the literature review reveals that there are some
difficulties in obtaining measures for tangible benefits such as the respondents do not
keep track of the required data for performance measures over time (White et al., 1982;
Sum and Yang, 1993; Sum et al., 1995). Surprisingly, most of the respondents in this
study gave the required data for using performance measures.
To determine to what extent the Egyptian manufacturing companies are reaping
tangible benefits of MRP implementation, the findings in this sub-section are divided into
five headings:
" The objective benefits obtained from MRP implementation of the total sample.
" The extent of the improvements achieved from MRP implementation in the individual
industries scored by MRP users.
" The variation between industries for each of the five MRP performance measures (i. e.
the tangible benefits achieved) (testing hypothesis # 1).
" The progress achieved in MRP implementation for each of the five MRP performance
measures of the total sample.
205
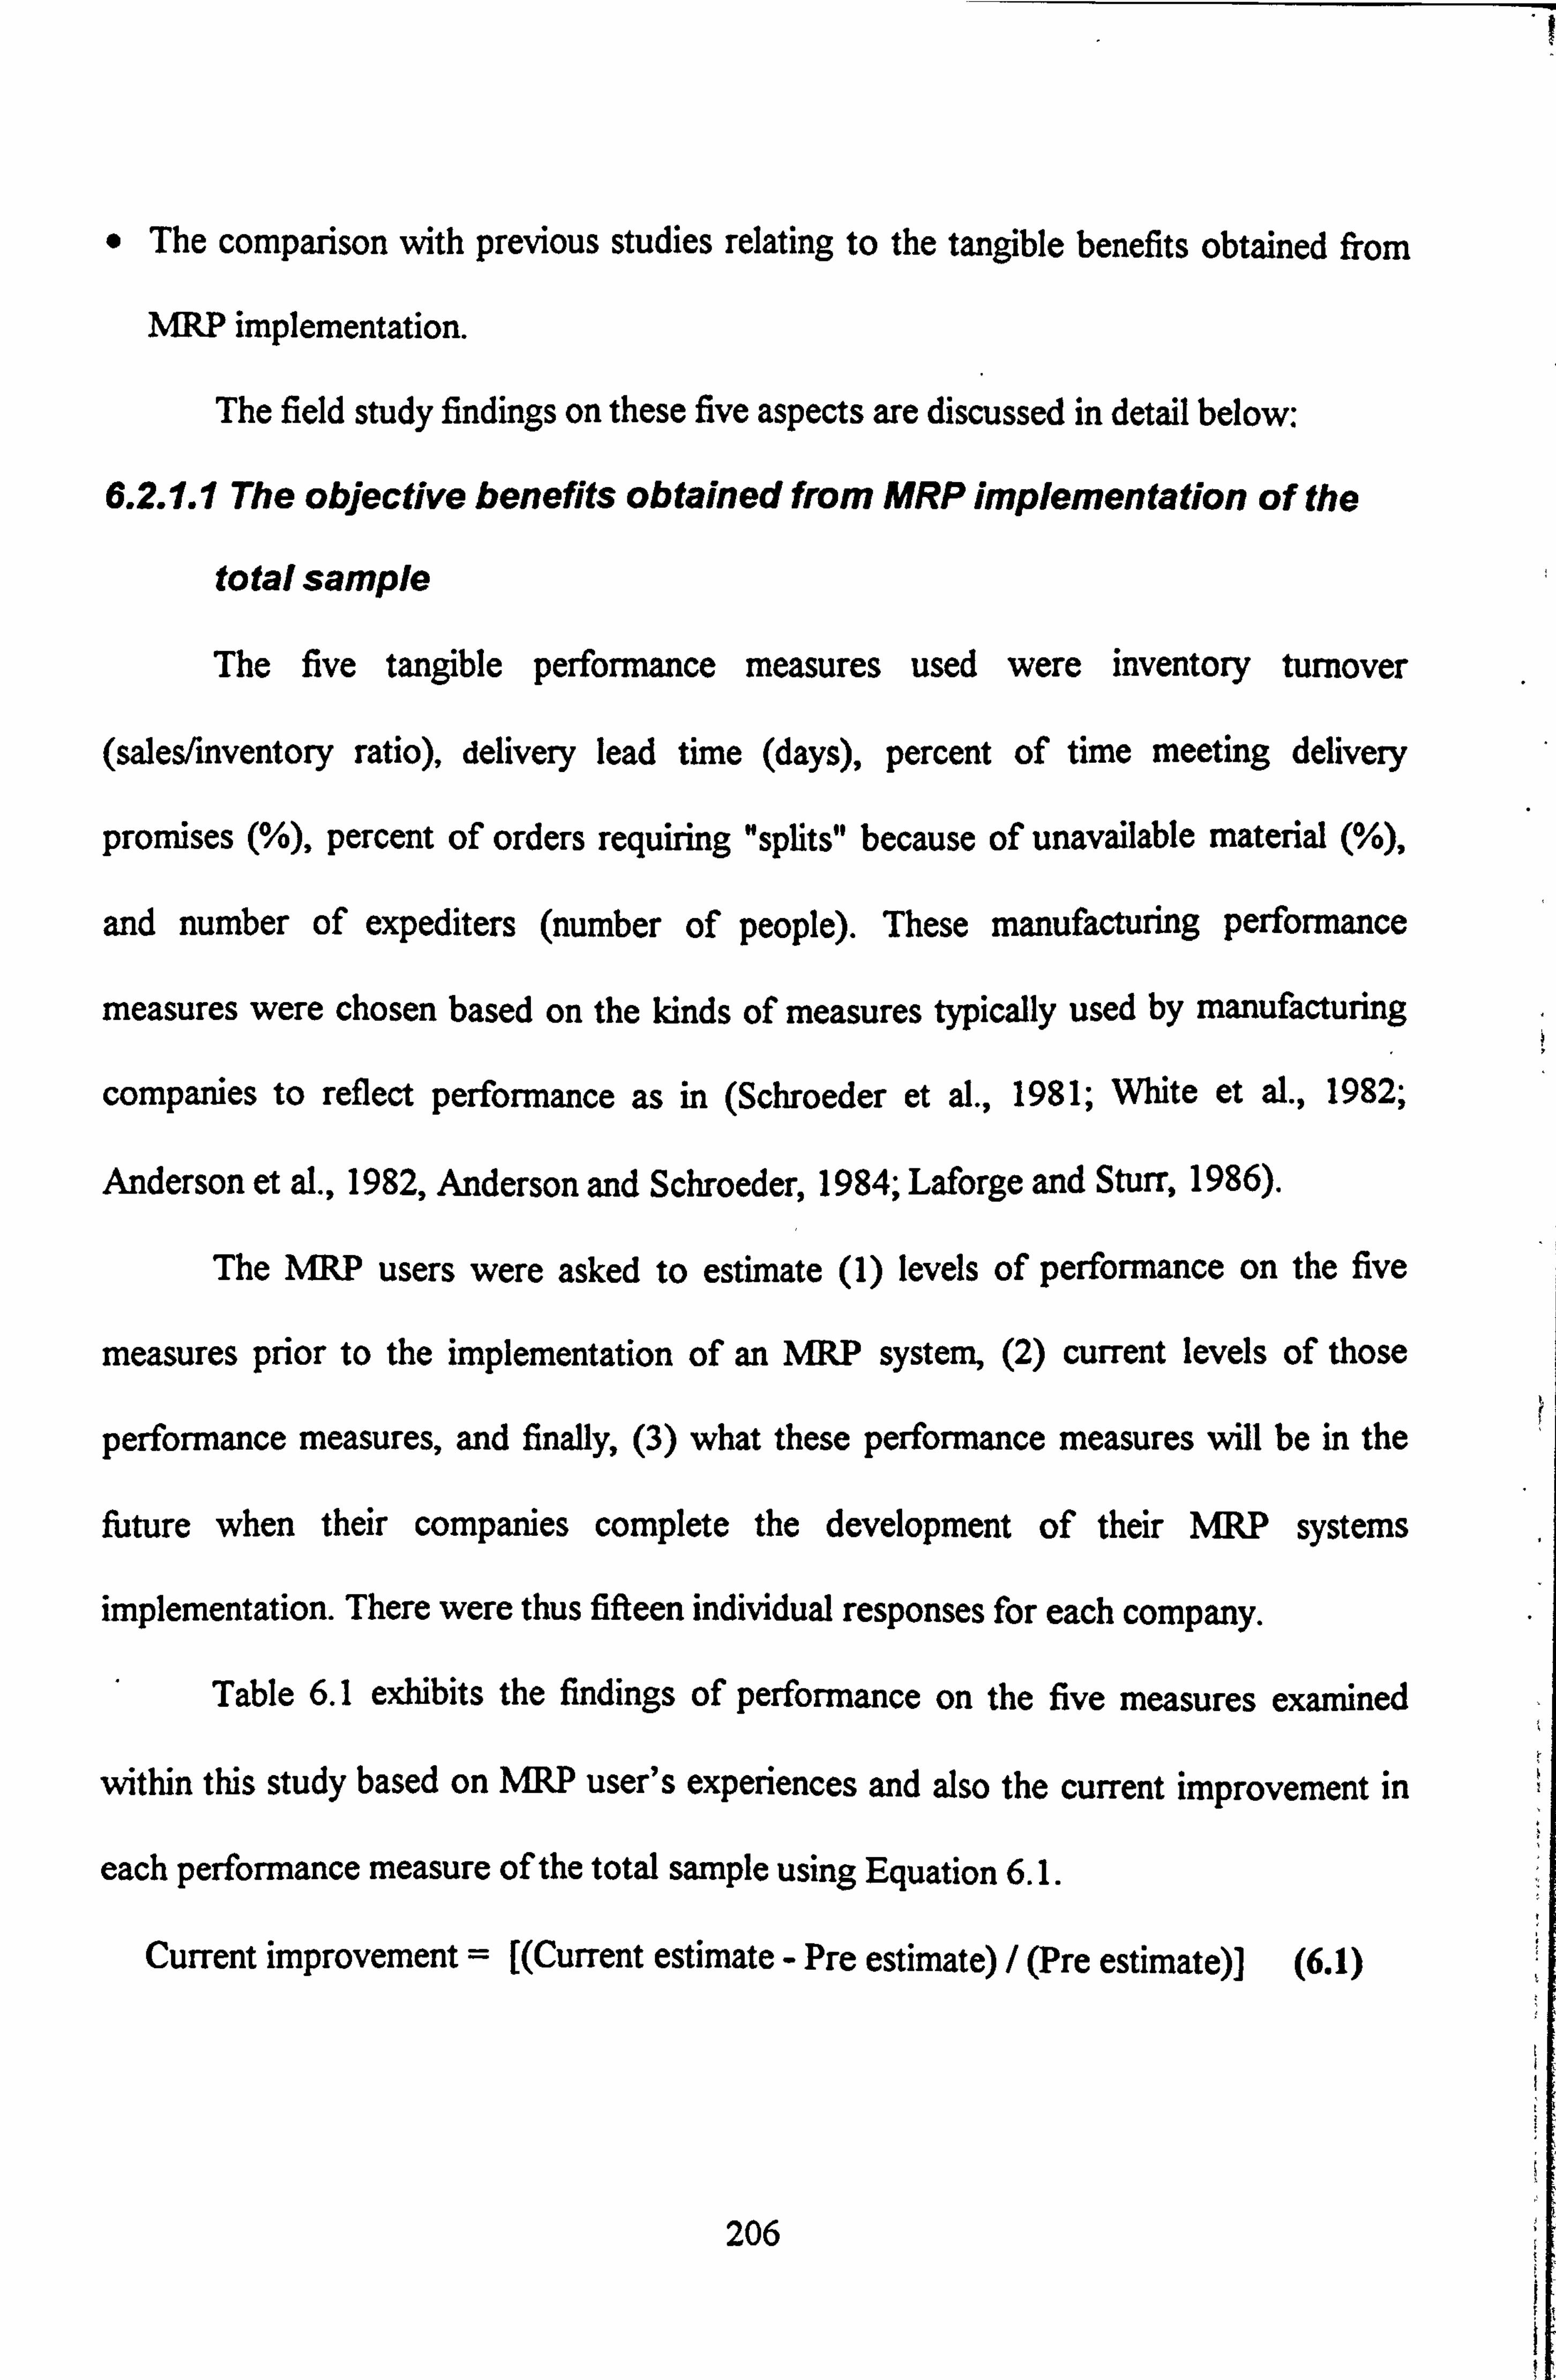
" The comparison with previous studies relating to the tangible benefits obtained from
MRP implementation.
The field study findings on these five aspects are discussed in detail below:
6.2.1.1 The objective benefits obtained from MRP implementation of the
total sample
The five tangible performance measures used were inventory turnover
(sales/inventory ratio), delivery lead time (days), percent of time meeting delivery
promises (%), percent of orders requiring "splits" because of unavailable material (%),
and number of expediters (number of people). These manufacturing performance
measures were chosen based on the kinds of measures typically used by manufacturing
companies to reflect performance as in (Schroeder et al., 1981; White et al., 1982;
Anderson et al., 1982, Anderson and Schroeder, 1984; Laforge and Sturr, 1986).
The MRP users were asked to estimate (1) levels of performance on the five
measures prior to the implementation of an MRP system, (2) current levels of those
performance measures, and finally, (3) what these performance measures will be in the
future when their companies complete the development of their MRP systems
implementation. There were thus fifteen individual responses for each company.
Table 6.1 exhibits the findings of performance on the five measures examined
within this study based on MRP user's experiences and also the current improvement in
each performance measure of the total sample using Equation 6.1.
Current improvement = [(Current estimate - Pre estimate) / (Pre estimate)] (6.1)
206

Table 6.1 MRP performance measures reported by MRP users of the total sample (average value* and standard deviation below in parenthesis)***
Performance Measures Pre-MRP Estimate
Current Estimate
Future Estimate
Current im rovement**
a) Inventory turnover (ratio) 2.8 3.9 6.1 39.3% ( 1.1) (. 90) (. 76)
b) Delivery lead time (days) 71.3 53.5 39.9 25.0% (11.1) (10.4) (8.0)
c) Percent of time meeting delivery promises 56.3 80.1 91.2 42.3% (%) (6.7) ( 10.4) (5.0) d) Percent of orders requiring "splits" 33.7 17.4 7.5 48.4%
because of unavailable material (%) (8.0) (6.1) (3.0) e) Number of expediters (number of people) 12.8 6.7 6.6 47.7%
(2.1) (2.0) (1.4) *N=52 ** Using Equation 6.1 *** Q 33 of the questionnaire.
........... Based on Table 6.1 three observations can be made as follows:
a) The increase of percent of time meeting delivery promises, the reduction of the percent
of split orders and the average number of expediters had achieved the highest level of
improvements of MRP implementation in proportions to (42.3%), (48.4%) and (47.7%)
successively.
b) In contrast, both delivery lead time and inventory turnover had received the lowest
level of improvement of MRP implementation by Egyptian manufacturing companies in
proportions to (25%) and (39.3%) respectively.
c) The analysis indicates that MRP companies reported substantial improvement in all
five performance measures and this provides strong evidence that MRP companies under
investigation are experiencing the improvement expected by the mean performance
measures.
207
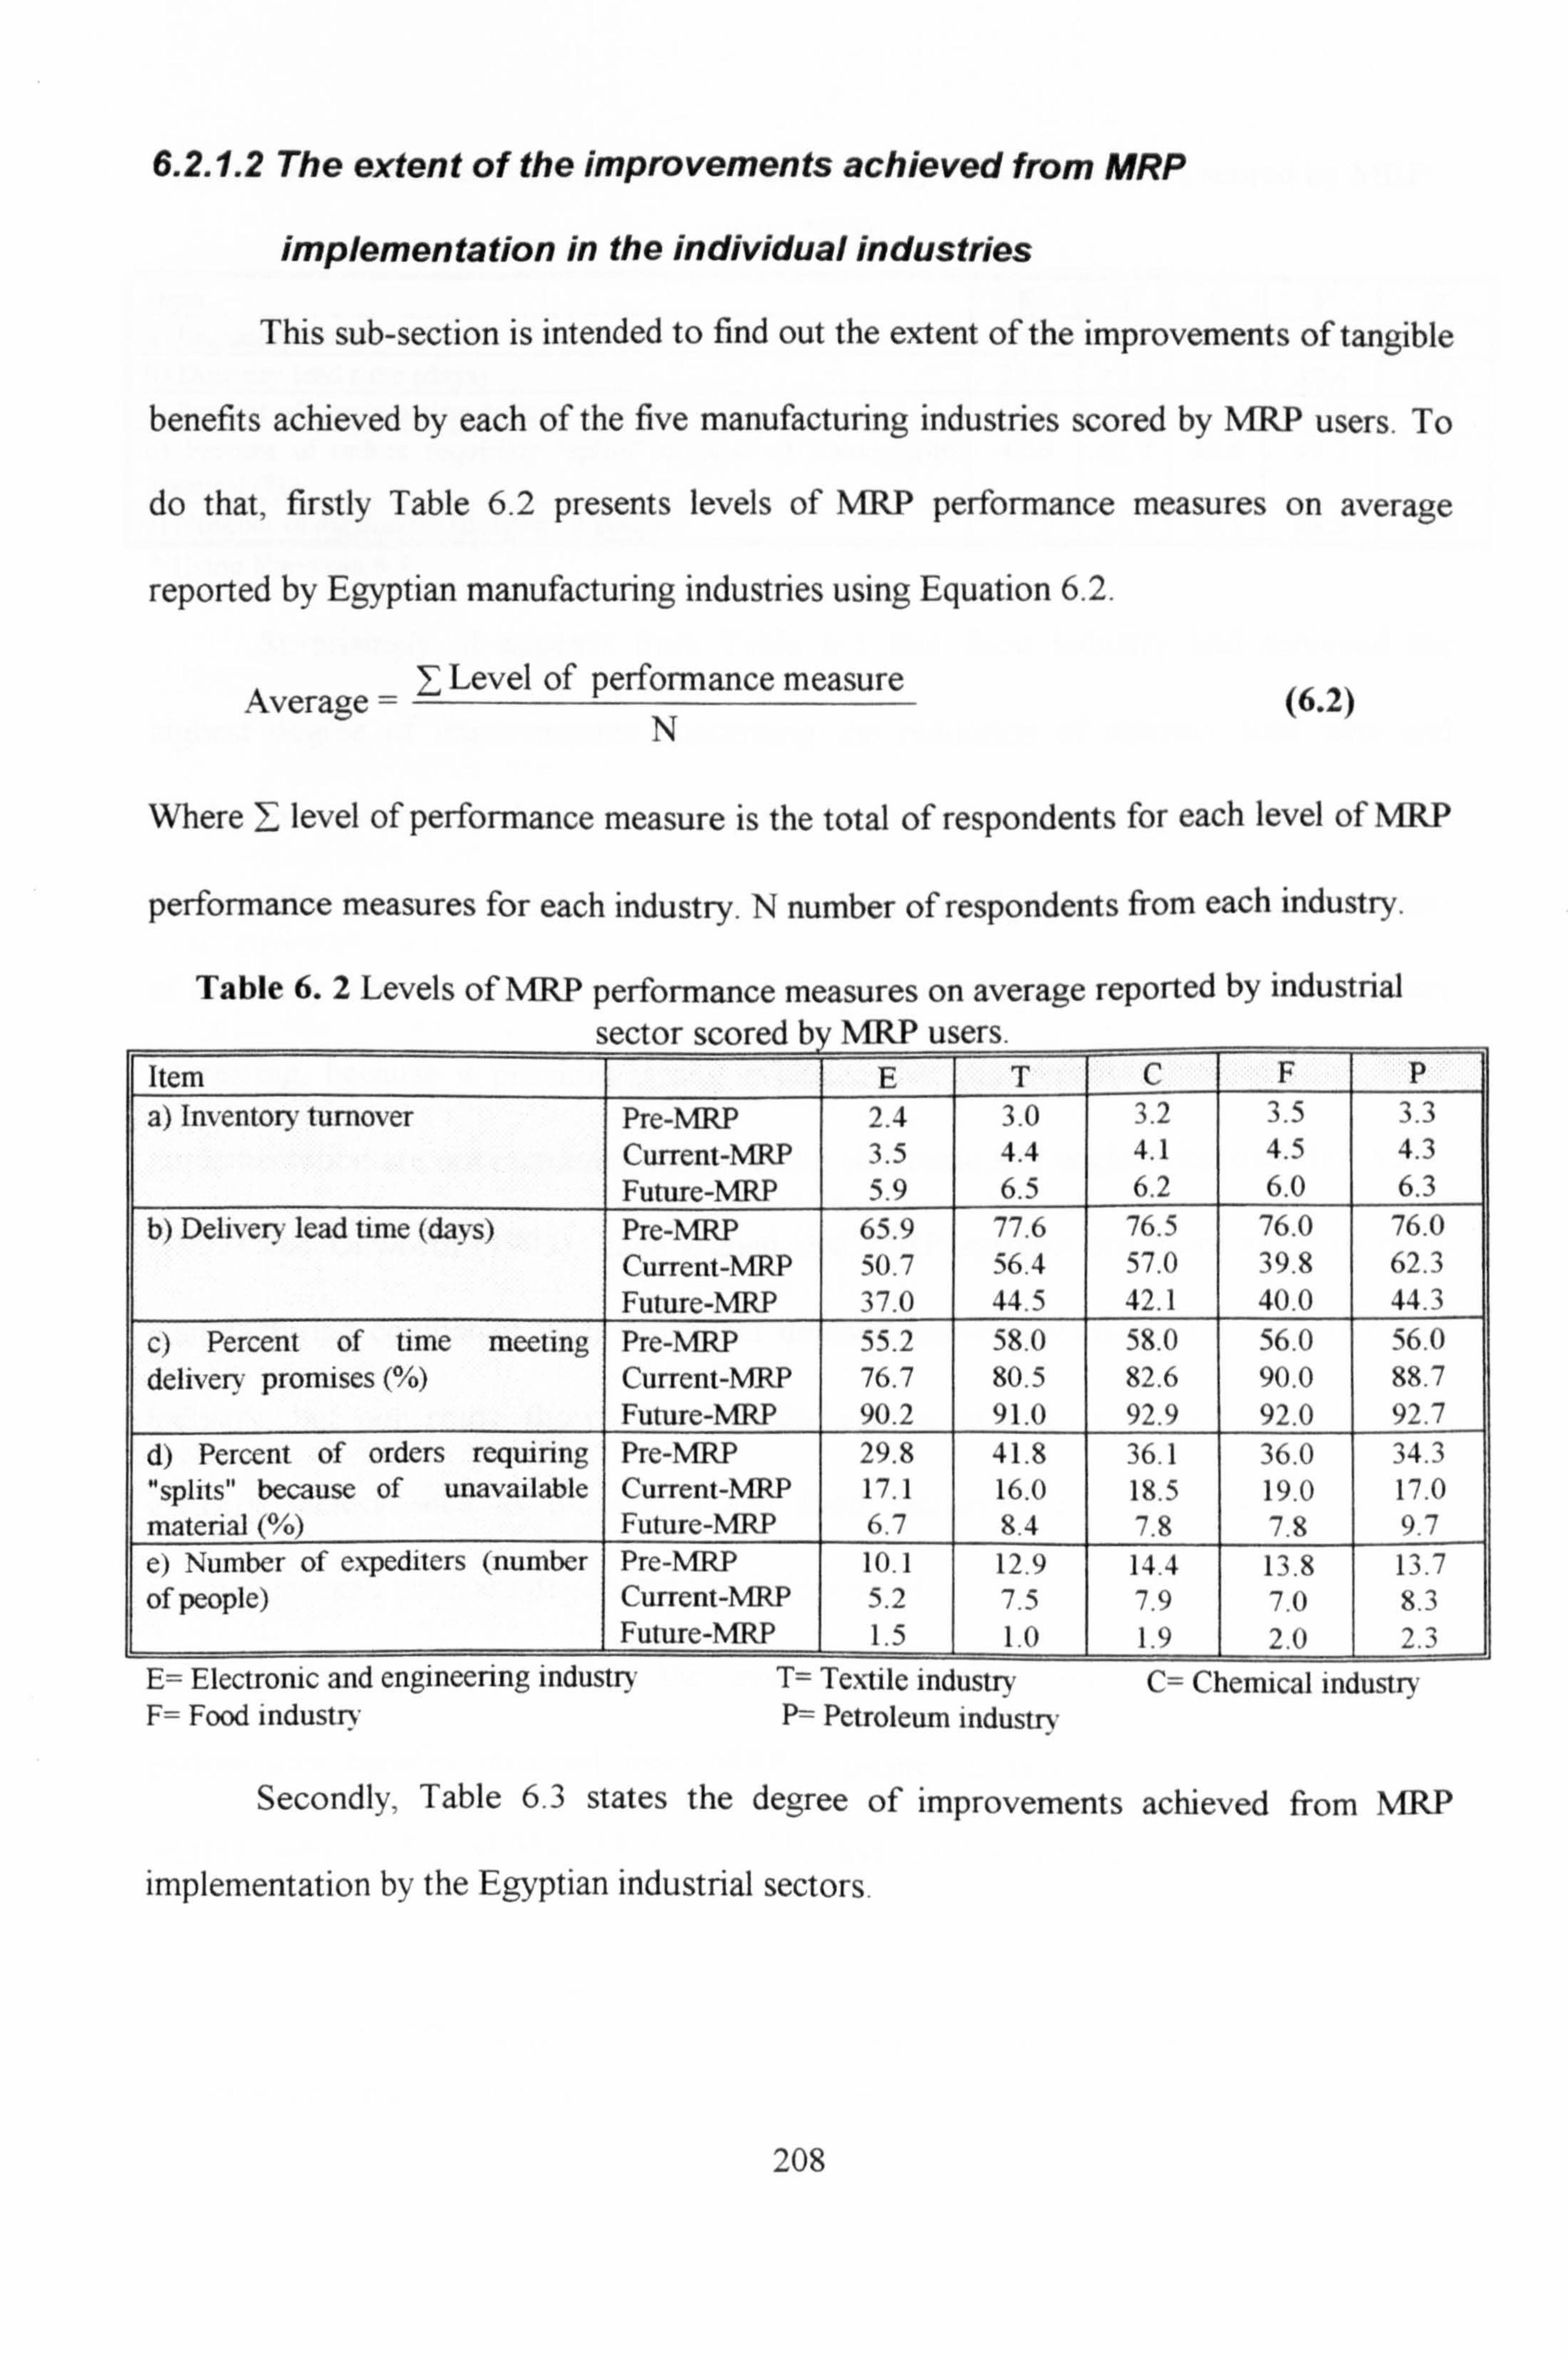
6.2.1.2 The extent of the improvements achieved from MRP
implementation in the individual industries
This sub-section is intended to find out the extent of the improvements of tangible
benefits achieved by each of the five manufacturing industries scored by MRP users. To
do that, firstly Table 6.2 presents levels of MRP performance measures on average
reported by Egyptian manufacturing industries using Equation 6.2.
Level of performance measure Average = N
(6.2)
Where T_ level of performance measure is the total of respondents for each level of MRP
performance measures for each industry. N number of respondents from each industry.
Table 6.2 Levels of MRP performance measures on average reported by industrial
cectnr ccnreri by MR Pii-, er,, Item E T C F P
a) Inventory turnover Pre-N1RP 2.4 3.0 3.2 3.5 3.3 Current-NW 3.5 4.4 4.1 4.5 4.3
Future-MRP 5.9 6.5 6.2 6.0 6.3 b) Deliver} lead time (days) Pre-MRP 65.9 77.6 76.5 76.0 76.0
Current-MRP 50.7 56.4 57.0 39.8 62.3 Future-MRP 37.0 44.5 42.1 40.0 44.3
C) Percent of time meeting Pre-MRP 55.2 58.0 58.0 56.0 56.0 delivery promises (%) Current-MRP 76.7 80.5 82.6 90.0 88.7
Future-MRP 90.2 91.0 92.9 92.0 92.7
d) Percent of orders requiring Pre-MRP 29.8 41.8 36.1 36.0 34.3 "splits" because of unavailable Current-MRP 17.1 16.0 18.5 19.0 17.0 material (%) Future-MRP 6.7 8.4 7.8 7.8 9.7
e) Number of expediters (number Pre-MRP 10.1 12.9 14.4 13.8 13.7 of people) Current-MRP 5.2 7.5 7.9 7.0 8.3
Future-MRP 1.5 1.0 1.9 2.0 2.3 E= Electronic and engineenng industry T= Textile industry C= Chemical industry F= Food industry P= Petroleum industry
Secondly, Table 6.3 states the degree of improvements achieved from MRP
implementation by the Egyptian industrial sectors.
208

Table 6.3 The extent of improvements achieved by industrial sectors scored by MRP
users *(%).
Item E T C F P a) Inventory turnover 45.8 46.7 28.1 28.6 30.3 b) Delivery lead time (days) 23.1 27.3 25.5 47.6 18.0 c) Percent of time meeting delivery promises (%) 38.9 38.8 42.4 60.7 58.4 d) Percent of orders requiring "splits" because of unavailable material (%)
42.6 61.7 48.8 47.2 50.4
e) Number of expediters (number of people) 48.5 41.9 45.1 49.3 39.4 * Using Equation 6.1
Surprisingly, it appears from Table 6.3 that food industry had achieved the
highest degree of improvements concerning the reduction of delivery lead time and
number of expediters and also increasing the percent of time meeting delivery promises.
On the other hand, the textile industry had achieved the highest degree of improvements
of inventory turnover and the reduction of the percent of split orders. This result is very
interesting, because it provides strong evidence that the benefits obtained from MRP
implementation are not restricted mainly to the electronic and engineering industry. Mady
(1992) and Dilworth (1993), have argued that MRP systems are more likely to be in
manufacturing companies with dependent demand between products such as electronic
industry, but our study shows that benefits can be attained by other manufacturing
industry sectors such as the textile and food industries in which the demand for
components and parts are dependent and independent.
Furthermore, calculating the averages2 of the improvements of the five
performance benefits obtained from MRP implementation by the Egyptian industrial
sectors were 31. %, 43.3%, 38.0%, 50.3% and 39.3% for the engineering, textile,
Improvements 2. Average = -- N where ' improvements is the total of improvements in each industry, for the five performance measure. N number of performance measures.
209

chemical, food and petroleum industries respectively. This indicates that the electronics
and engineering industry had achieved the lowest average for all the five tangible
measures. In contrast, the results indicate that the food industry had achieved the highest
average. But a word of caution must be made, with regard to the interpretation of these
results. The food industry more than the others because it represents 8% of the total
sample while the electronics and engineering industry represent 50% of the total sample.
6.2.1.3 The variation between industries concerning MRP
performance measures scored by MRP users
It appears from Table 6.2 that there are real differences exist between individual
industries with respect to MRP performance measures scored by MRP users. Using
Kruskal Wallis and One Way Analysis of Variance (ANOVA) to find out if these
differences are statistically significant or not, show the following findings:
a) Pre-NW estimate: both techniques showed statistically significant differences exist
between industries in two tangible measures-"the percent of split orders" and " number of
expediters" because the calculated Ps (i. e. calculated values based upon statistical
technique used) were less than the accepted significance level (. 05) whether using
Kruskal Wallis or One Way Analysis of Variance (ANOVA), (see Table 6.2.1 in
Appendix Q. An examination of Table 6.2 (sub-section 6.2.1.2), reveals that there is a
difference between the textile industry on one hand and the rest of the industries on the
other hand concerning "the percent of split orders" whereas it has achieved the highest
percent of split orders because of unavailable material prior to MRP implementation, this
result can be interpreted in light of the fact that the Egyptian textile sector was importing
210

most textile products such as raw cotton, raw silk, nylon, threads, and polyester from
various foreign suppliers in the last two decades, which has led to increasing the percent
of orders requiring "splits" because of unavailable materials.
On the other hand, there is a difference in "number of expediters" between the chemical
industry on one hand and the rest of the industries on the other, whereby it had the
highest number of expediters prior to the implementation of MRP. This difference may be
due the chemical industry processes being subject to product customisation while the
other industries processes are highly standardised.
b) Current- MRP estimate: both techniques showed statistically significant differences
amongst the five industries in one tangible measure " number of expediters" because the
calculated Ps were less than the accepted significance level (. 05), whether using Kruskal
Wallis or One Way Analysis of Variance (ANOVA) (see Table 6.2.1 in Appendix Q. An
examination of Table 6.2 (sub-section 6.2.1.2), reveals that there is a difference in means
for "number of expediters" between the petroleum refinery industry on one hand and the
rest of the industries on the other hand, whereby it returns the highest number of
expediters which may be due to having faced many difficulties in coinciding due date and
need date for the required orders.
On the other hand, the results in Table 6.2.1 (Appendix C), indicate that there is no
significant difference amongst the five industries concerning the percent of split orders.
This means that the implementation of MRP systems led to a significantly greater
reduction of the percent of split orders for the production needs in the textile industry.
211

c) Future- MRP estimate, both techniques showed no statistically significant differences
amongst the five industries concerning the expected progress of each of the five objective
measures of MRP implementation.
In the aggregate, the results mentioned above partly support the suggested
hypothesis, which is that not all MRP users in Egyptian industrial sector attain the same
benefits from MRP implementation.
6.2.1.4 The progress achieved from MRP implementation for each of the
five performance measures of the total sample
This sub-section is devoted to the level of progress for each of the five
performance measures by taking account of users estimates of future-MRP performance.
The degree of progress in each performance measures was computed as in White et al.
(1982), who provided a measure of progress which can be used in each area of
manufacturing performance. They constructed a measure of progress towards expected
performance which measured each company's current progress against its own expected
future performance using Equation 6.3.
Progress = CurrentEstimate-" Pr e- MRP" Estimate
(6.3) FutureEstimate-" Pre - MAP" Estimate
Table 6.4 illustrates progress for each of the five performance measures for all
MRP companies from points of view of MRP users.
212

Table 6.4 The achieved improvement versus the expected progress for each of the five
performance measures for all MRP companies.
Item The achieved
improvement Progress (%)**
a) Inventory turnover (ratio) 39.3 33.3 b) Delivery lead time (days) 25.0 56.7 c) Percent of time meeting delivery promises (%) 42.3 68.2 d) Percent of split orders (%)
L 48.4 62.2
e) Number of expediters (number of o le) 47.7 54.5 * Using Equation 6.1 ** Using Equation 6.3
Taking account of the future MRP estimate, it appears from Table 6.4 that:
a) the MRP users feel that more improvement can be achieved in the future when their
MRP systems are fully installed.
b) MRP users feel that most improvement is yet to be made in increasing inventory
turnover (39.3% made so far). This may be due to a reduction of delivery lead time and
an increase of time meeting delivery promises obtained from MRP implementation. On
the other hand they expect a lower progress in inventory turnover because most of the
electronic and engineering companies (50% of the total sample), have big inventories of
components and parts as a result of their implementation of the agreements with foreign
suppliers. At the same time, they are facing strong competition from foreign competitors
which may result in a decrease of their sales, and in turn decreasing their inventory
turnover (sales/inventory).
6.2.1.5 Comparison with the previous studies
As far as researcher is aware, there are no publications concerning the benefits of
MRP systems implementation in less developed countries. However, it is of interest to
compare our findings with studies of MRP implementation in developed countries. Our
213

findings can be compared with two previous studies concerning the tangible benefits of
MRP practices in USA (Anderson et al., 1982; Laforge and Sturr, 1986).
To do this, the findings in the two previous studies are displayed alongside our
responses. Table 6.5 shows the comparison of the tangible benefits of MRP systems
implementation between the current study and the two previous studies.
Table 6.5 The comparison of the tangible benefits of MRP systems implementation in
different contexts (standard deviation* below in parenthesis). Pre-MRP Current Future The Progress
Estimate Estimate Estimate . 'hexed
Item improvement' Current 2.8 3.9 6.1 39.3 33.3
a) Inventory turnover Anderson (1.1)
3.2 (. 90)
4.3 (. 76
5. .3
34.4 52.4
(2.4) (3.1) (3.8) Laforge 4.5 7.9 11.2 75.6 50.7
(4.3) (6.5) (7.3) Current 71.3 53.5 39.9 25.0 56.7
b) Delivery lead time Anderson (11.1 >
71.4 ( 10.4)
58.9 (8-0) 44.5 17.5 46.7
(days) (65.8) (59.6) (43.3) Laforge 55.6 41.7 31.8 25.0 58.4
(31.2) (23.6) (20.5) Current 56.3 80.1 91.2 42.3 68.2
c) Percent of time meeting Anderson (6.7) 61.4
(10.4) 76.6
(5.0) 88.7 24.8 55.7
delivery promises (%) (21.4) (18.2) (13.8) Laforge 73.9 88.6 94.6 19.9 71.0
(17.8) (7.1) (5.9)
d) Percent of orders Current 33.7 17.4 7.5 48.4 62.2
"slits" requiring p Anderson (8.0) 32.4
(6.1) 19.4
(3.0) 9.1 40.1 55.8
because of unavailable (22.0) (17.3) (8.8)
material (%) Laforge 29.0 13.5 5.5 53.4 65.9 (27.4) (15.0) (5.6)
Current 12.8 6.7 1.6 47.7 54.5
e) Number of expediters (2.1) (2.0) (1.4)
Anderson 10.1 6.5 4.6 35.6 65.5
(number of people) (16.0) (9.2) (6.0) Laforge 10.8 5.1 2.1 52.8 65.5
(20.7) (9.7) 2.0
*The standard deviations are used in order to state the degree of consistency in improved performance. a Using Equation 6.1 bUsing Equation 6.3
Based on Table 6.5 there are several observations that can be made.
a) It appears from the pre-MRP estimate column that firms in this study performed
worse, compared to the US firms, on all but one performance measure (only delivery lead
214
time being longer in two US studies which is dependent on the firms in the survey), but
with the exception of inventory turnover, the results are relatively similar in Egypt and
the US.
b) But after MRP implementation firms in the current study had achieved a greater
improvements on all five performance measures than the firms in Anderson's study. On
the other hand, the results of current study are similar to those of Laforge concerning the
degree of improvement in meeting delivery lead times; are better than the Laforge study
regarding the degree of improvement in meeting delivery promises; but are worse than
the Laforge study concerning the rest of the five performance measures.
c) The progress made on the five performance measures by the Egyptian firms is worse
than their peers in the Laforge study, but is better than those in the Anderson study on
these measures- that of their delivery lead time, meeting delivery promises and percent of
split orders.
d) In contrast with previous studies showing that MRP users are dissatisfied with its
implementation such as Aggarwal (1985); Fintech (1989); Sandeep (1992); Hill (1993);
Browne et al. (1996) and Carrie et al. (1997), the results of the three studies, as a group,
strongly provide further evidence that MRP companies experience significant
improvements in manufacturing performance of MRP implementation.
e) With the exception of the standard deviations for inventory turnover measure in the
other two studies and percent of time meeting delivery promises measure in the current
study, the research findings indicate that the standard deviations are inclined to decrease
as one moves from pre-NW estimate to the current estimate to the future estimate
215

which may indicate that there is a confluence of the MRP companies under investigation
toward this improved performance. The standard deviations are used in order to state the
degree of consistency in improved performance.
To find out if the differences mentioned above between the current study and
each one of the previous two studies are statistically significant or not, the Paired T-Test
technique was used to reveal that there is no significant differences amongst the three
studies concerning the tangible benefits achieved from MRP implementation by
manufacturing companies in Egypt and their peers in the US (see Table 6.2.2 in Appendix
C).
6.2.2 The subjective benefits attained from MRP Implementation
This section has highlighted the subjective benefits of MRP implementation which
has been discerned by manufacturing companies surveyed. MRP users were asked to give
their attitudes and intentions toward the subjective benefits obtained from MRP
implementation, which means that intended use rather than actual use is often selected as
a good measure of MRP implementation success because of many difficulties of actual
use as in all previous studies, such as White et al. (1982); Sum and Yang (1993) and Sum
et al. (1995).
Taking account of the above, a word of caution should be considered here
because two main problems that may arise from using benefits which are self reported,
the first, benefits can be overestimated due to the halo effect of MRP, and the second,
benefits can be underestimated due to estimation errors (Schroeder et al., 1981).
However, we have tried to reduce these problems to some extent through getting these
216 i ;: ý_ t
t
f

estimates from MRP users who have involved in MRP implementation (i. e. production
managers, inventory managers, materials managers, master schedulers and management
information systems managers) as a relevant source for the required data as used in
previous studies such as Sum and Yang (1993); Ang et al. (1995) and Sum et al. (1995).
This section of the research is intended to explore to what extent MRP users had
perceived the subjective benefits of MRP implementation in the Egyptian manufacturing
companies.
To do this, the issues under investigation are presented as follows:
" The subjective benefits perceived by MRP users.
" The variation among MRP users concerning the subjective benefits perceived (testing
hypothesis #1).
" The degree of improvements on all subjective benefit measures of MRP
implementation from points of view of MRP users.
" The extent of the subjective benefits perceived versus reasons for implementing MRP
systems.
9 The comparison with previous studies relating to the subjective benefits obtained from
MRP implementation.
Below are the survey findings relating to these issues.
6.2.2.1 The subjective benefits perceived by MRP users
The subjective benefits of MRP implementation were measured by asking users
their perceptions about a) improved competitive position, b) reduced inventory costs, c)
increased throughput, d) improved product quality, e) improved productivity, f) better
217

ability to meet volume/ product change, g) better production scheduling, h) reduced
safety stocks, i) better cost estimation, j) co-ordination with marketing and finance, k)
improvements in their ability to perform in their job, 1) reduced informal systems for
materials management/ inventory/ production control, m) increased BOM accuracy, and
n) increased information on which to base decisions since MRP has been implemented
(see section 2.7 in Chapter Two). Each respondent answered on a four -point scale
ranging from little benefits to very much benefits.
A measure of user satisfaction was obtained by calculating the average of user
perceptions of the success of MRP implementation. Table 6.6 summarises the subjective
benefits obtained from MRP implementation of the total sample rated by MRP users in
the Egyptian manufacturing companies. A higher rating indicates high subjective benefit
obtained and a lower rating indicates low subjective benefit achieved.
Table 6.6 The subjective benefits obtained from MRP implementation reported by MRP
users of the total sample*. Item Mean** SD Reduced inventory costs 3.63*** .
82 Better production scheduling 3.62 . 66 Increased BOM accuracy 3.31 .
96 Increased throughput 3.23 .
67 Better cost estimation 2.85 1.06 Improved co-ordination with marketing and finance 2.75
. 74
Reduced informal systems for materials management/inventorv/production control 2.58 . 89
Reduced safety stocks Improved productivity 2.40 72 Better ability to meet volume/product change 2.37 .
63 Improved product quality 2.19 .
84 Improved your ability to perform in your job 2.15 .
36 Improved competitive position 1.92 . 27 Increased information on which to base decisions since MRP has been implemented 1.83
. 38
1.81 . 40
*Q 33 of the questionnaire, ** Based upon a four- point scale, score ' l" for little benefit, "4" for very much benefit. (N=52) *** The higher the mean, the greater the user satisfaction of item.
218

Based on Table 6.6 a number of observations can be made as follows:
a) It appears from Table 6.6, that reduced inventory costs received the highest rating by
MRP users. This supports the claim that a common phrase in most manufacturing
companies in Egypt is "We have got too much inventory" and we are ready to implement
any technique to help us to overcome this problem.
b) It becomes clear that improved competitive position was a less commonly recognised
outcome of implementing an MRP system, receiving the next to lowest rating's by MRP
users. This means improved competitive position was not one of the major reasons for
MRP implementation by the Egyptian manufacturing companies.
c) It is very clear that standard deviation of better cost estimation measure is the highest
one which means that there is a big deviation among companies concerning this measure.
6.2.2.2 The variation among MRP users concerning the subjective
benefits perceived
To find out if the differences amongst MRP users concerning their perception of
the intangible benefits obtained from MRP implementation are statistically significant or
not, the Kruskal Wallis and One Way Analysis of Variance (ANOVA) were performed.
Both techniques showed a' significant difference amongst MRP companies in three
subjective benefit measures "improved product quality", "better ability to meet volume/
product change" and "improved ability to perform a job" respectively (see Table 6.2.3 in
appendix Q. Calculated Ps are less than the accepted significance level (. 05). An
examination of Table 6.2.4 in (Appendix C) shows differences in means for the three
measures as explained below:
219

a) There is a difference in means between production and inventory control managers on
one hand and the rest of the MRP users on the other. Whereas both of them had received
the lowest level of satisfaction compared with the others users concerning improving
product quality.
b) Table 6.2.4 indicates that master scheduler users were more satisfied than the others
regarding achieving better ability to meet volume/ product change. Perhaps because its
their biggest concern i. e. a problem which is theirs to solve.
c) The findings in Table 6.2.4 show that inventory control managers had perceived the
lowest degree of satisfaction with MRP implementation concerning improving their
ability to perform in their job.
In the aggregate, the results mentioned above partly support hypothesis # I.
6.2.2.3 The degree of improvements on all subjective benefit measures
of MRP implementation from points of view of MRP users
For calculating the degree of improvement aims all subjective benefit measures of
MRP implementation, two steps were performed as illustrated below:
(1) A measure of user satisfaction for the whole 14 subjective benefit measures was
calculated using Equation 6.4.
SAT� =E SAT/ N (6.4)
Where, SAT� is the average of user satisfaction for the whole 14 subjective benefits
measures.. SAT is user satisfaction for each subjective benefit measure. N number of
respondents (N=52).
220

(2) Then, we located the value obtained from Equation 6.4 on the scale range for the
whole subjective benefit measures. The satisfaction for all subjective benefit measures
was ranged from 14 "lowest score" to 56 "highest score" (i. e. score 14 means that MRP
company with score 1 "little benefit" for all the fourteen subjective benefits and on the
other hand score 56 means that MRP company with score 4 "very much benefit" for all
the fourteen subjective benefits).
Using the above mentioned, the users satisfaction for the whole 14 subjective benefit
measures of MRP implementation was 36.64 score and which indicates that user
satisfaction is approximately 65% for the whole 14 subjective benefit measures of the
total sample.
All in all, the above result provides some indication of the degree of satisfaction
with MRP implementation in the Egyptian manufacturing companies. Again, this result
does not concur with past literature which indicates that over 60% of MRP users are not
satisfied with the benefits obtained from MRP implementation (Fintech, 1989; Sandeep,
1992; Hill, 1993).
6.2.2.4 The extent of the subjective benefit perceived versus reasons for
implementing MRP systems by manufacturing companies
This sub-section is intended to find out the extent of the subjective benefits
perceived versus reasons for implementing MRP systems. This analysis may help
manufacturing companies to know if are they on the right track in considering MRP
implementation or not. Therefore, we have presented the major subjective benefits
perceived versus reasons for implementing an MRP system as shown in Table 6.7 below.
221

Table 6.7 The major benefits attained versus reasons for implementing an MRP system. Major Benefits Mean
Score Major Reasons Mean
Score Reduced inventory costs 3.63 Lower inventory cost 4.69 Better production scheduling 3.62 Meet delivery dates better 4.63 Increased BOM accuracy 3.31 Inventory control 4.10 Increased throughput 3.23 Increase throughput 3.39 Better cost estimation 2.85 Production control 2.88 Improved co-ordination with marketing and finance 2.75 Improve productivity 2.62 Reduced informal systems for materials 2.58 Improve competitive position 2.61
management/inventory/production control Improve quality of products 2.53
Reduced safety stocks 2.40 Improved productivity 2.37 Better ability, to meet volume/product changes 2.19 Improved product quality 2.15 Improved your ability to perform in your job 1.92 Improved competitive position 1.83 Increased information on which to base decisions 1.81
since MRP has been implemented
Based on Table 6.7 three observations can be made as follows:
a) It appears from the Table 6.7, that "lower inventory cost" is the important reason for
implementing MRP systems, and at the same time is the most important subjective benefit
obtained from MRP implementation.
b) In general terms we can say that most of the benefits obtained from MRP
implementation match the implementation reasons except for improved competitive
position measure. Only a few companies reported some significant satisfaction about
improvement on this measure.
c) It appears from Table 6.7 that MRP companies in the Egyptian industrial sector are
intending to use MRP system as a tool for achieving manufacturing efficiency measured
by reduced inventory costs, better production scheduling, increased BOM accuracy, etc.
rather than as a means for improved their competitive position. These findings are similar
to those reported in Sum & Yang (1993).
222

6.2.2.5 Comparing the present research findings with the previous studies
This sub-section compares the findings of the current study with those of previous
studies concerning the subjective benefits achieved by MItP implementation.
For comparative purposes, the findings of two previous studies, one of them concerning
the subjective benefits achieved for MRP practices in Singapore (Sum & Yang, 1993)
and the other relating to the subjective benefits obtained from MRP practices in US
(Schroeder et al., 1981), are displayed alongside our responses. Table 6.8 illustrates that
MRP users in Egyptian manufacturing companies believe that the expected subjective
benefits from MRP implementation have been attained.
Table 6.8 The comparison of the subjective benefits of MRP systems implementation in
different contexts. (mean value*).
Item Current Study
Sum and Yangstudy
Schroeder Study
Reduced inventory costs 3.63 3.65 N/A** Better production scheduling 3.62 3.87 2.7 Increased BOM accuracy 3.31 N/A N/A Increased throughput 3.23 3.48 N/A Better cost estimation 2.85 3.69 2.2 Improved co-ordination with marketing and finance 2.75 N/A 2.4 Reduced informal svstems for
materials management/inventorv/production control 2.58 N/A N/A Reduced safety stocks 2.40 3.46 2.4 Improved productivity 2.37 3.66 N/A Better ability to meet volume/product changes 2.19 3.83 N/A Improved product quality 2.15 N/A N/A Improved your ability to perform in your job 1.92 N/A N/A Improved competitive position 1.83 3.40 2.1 Increased information on which to base decisions since 1.81 N/A N/A MRP has been implemented * The comparison was built on the mean score tor each subjective benefit measure in the three studies. ** N/A. means response is not available because option was not reported in the other two studies.
The analysis of Table 6.8 provides us with the following observations:
a) To a large extent, our findings are similar to Sum & Yang findings (1993). This is true
specially with regard to reduction of inventory costs. This result concurs with the findings
223

of Anonymous (1996), who reported that the biggest benefit obtained from MRP II
implementation, by the company James Coney, was lower costs for holding stocks of
obsolete inventory.
b) MRP companies in the current study, Sum & Yang study, and the Schroeder study are
achieving operational benefits more than a strategic benefits. This result is contrary to
that of Leng (1987); White and Wharton (1990); Lummus and Wilson (1992) and
Strzelczak (1995), who argue that manufacturing companies may adopt new production
management systems such as MRP and JIT, as a response to regional and international
competition pressures.
To find out if significant differences exist between the current study and each one
of the previous two studies, the Paired T-Test technique was used. This reveals that there
is significant difference between Sum and Yang study and the current study and
C), Schroeder et al. study. An examination the results in Table 6.2.5 (see Appendix
indicate that MRP users in Singaporean companies had perceived the higher degree of
satisfaction with MRP implementation than their peers in Egypt and US. In contrast,
there is no significant difference between the current study and Schroeder et al. study,
which means that MRP users in the Egyptian and the US companies had not perceived
dissimilar degrees of satisfaction with MRP implementation.
All in all, although the literature survey demonstrated that the extent of the
variance is high, or not all companies attain such benefits. ( Anderson & Schroeder, 1984;
Duchessi et al., 1989), the findings of the present study partly support this claim. Our
224

findings indicate that there is significant difference amongst MRP users in some and not
all tangible and intangible benefits obtained from the implementation of MRP systems.
To this end, we have completed an in depth analysis of the benefits obtained from
MRP implementation by Egyptian manufacturing companies, but have not taken account
of how much was invested in order to take advantage of the expected potential benefits
and changes from MRP implementation. Therefore, the next section will be intended to
discuss and analyse the costs of MRP installation in the Egyptian manufacturing
companies.
6.3 MRP implementation costs
The findings in this section are divided into three headings:
" The costs of MRP installation and the expected substantial additional investment over
the next three years.
" The relationship between company size factors and MRP installation costs.
" Comparison of the results of the current study with those obtained by previous
studies.
6.3.1 The analysis of the costs of MRP installation and the expected
substantial additional investment over the next three years
Since it is generally believed that MRP implementation benefits are not without
considerable costs (Schroeder et al., 1981; Laforge and Sturr, 1986; Sum and Yang,
1993; Ang et al., 1995), two of the questions in the survey were related to MRP
implementation costs. One of them was:
225

How much has your company spent to install MRP in your facility?, the other question
was: is an additional investment intended in MRP systems (hardware/software) over the
next 3 years?, if yes, why and how much. Accordingly, the following discussion presents
with in-depth analysis the responses for the previous two questions, respectively.
Figure 6.1 The current MRP investment (hardware, software and personnel costs).
Investment (L. E. `000)*.
*Q 26 of the questionnaire.
According to Figure 6.1 we can categorise MRP users into three groups in terms
of the range of how much is spent on MRP system installation. The smaller group,
companies who had spent less than L. E. 600,000 (15.4% of firms), the medium group of
25.0% who had spent between L. E. 600,000 and L. E 1,500,000, and the larger group,
59.9% of the total, who had spent more than L. E 1,500,000.
226
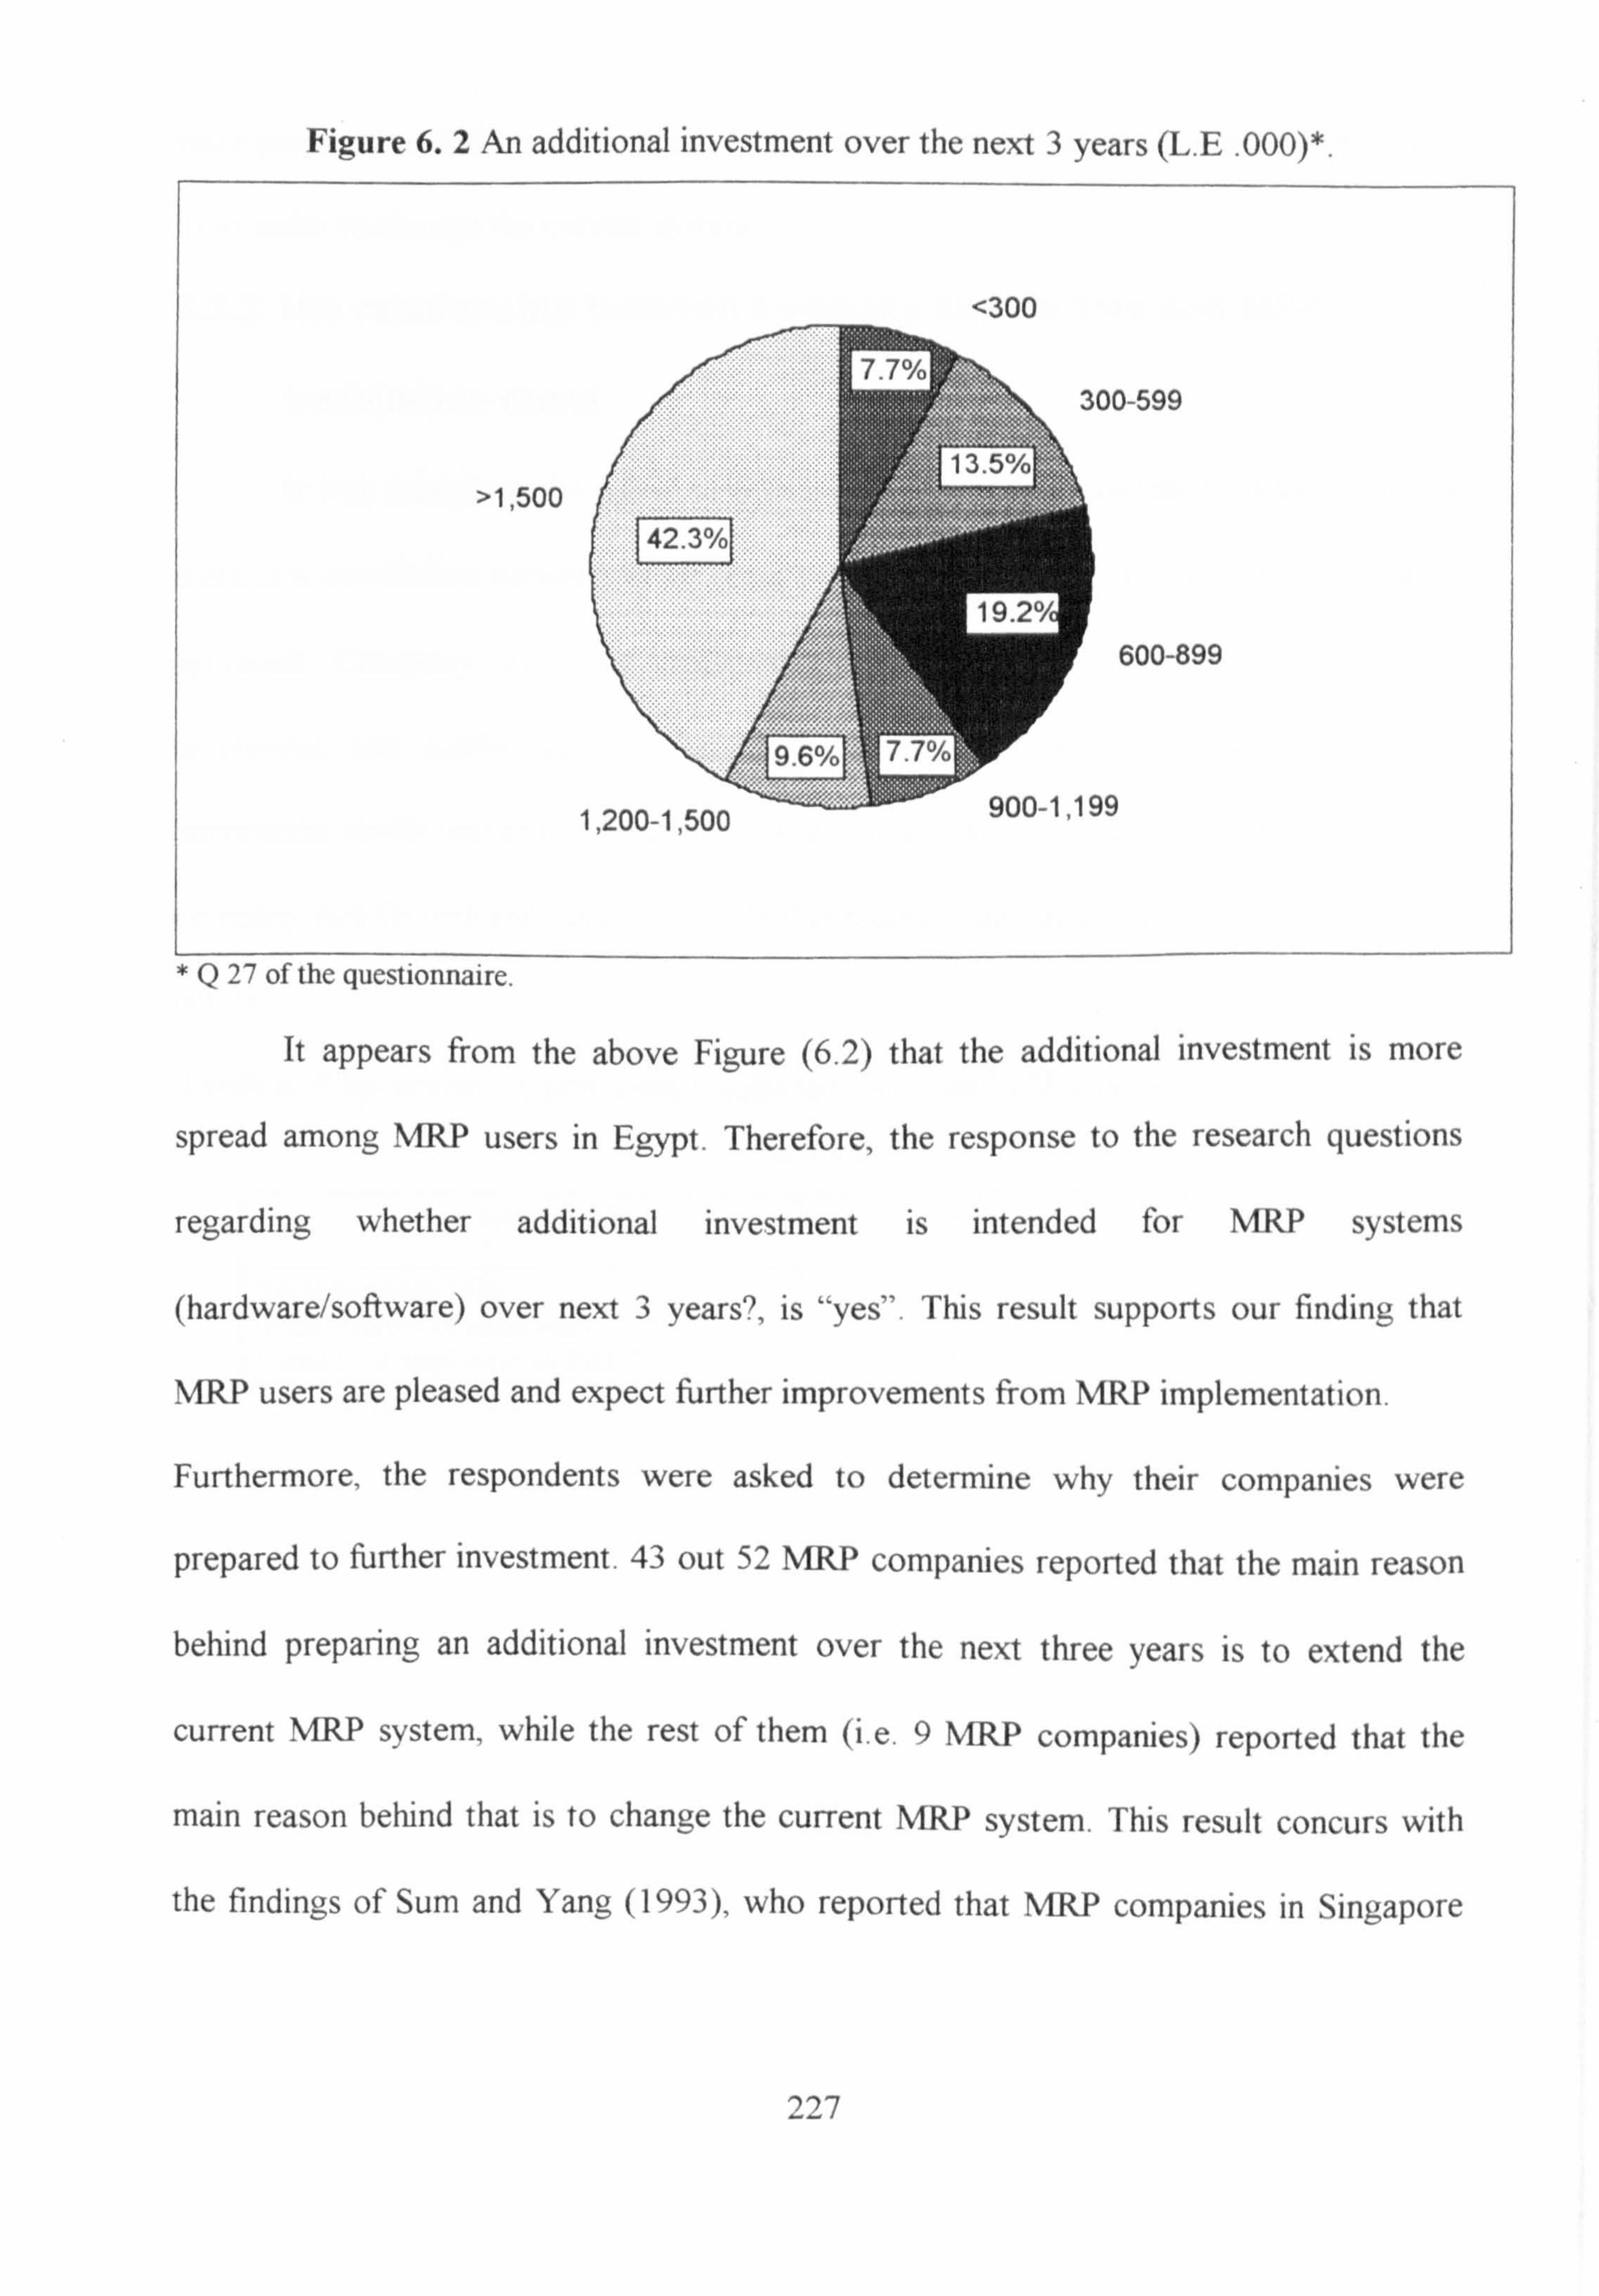
Figure 6.2 An additional investment over the next 3 years (L. E . 000)*.
*Q 27 of the questionnaire.
It appears from the above Figure (6.2) that the additional investment is more
spread among MRP users in Egypt. Therefore, the response to the research questions
regarding whether additional investment is intended for MRP systems
(hardware/software) over next 3 years?, is "yes". This result supports our finding that
MRP users are pleased and expect further improvements from MRP implementation.
Furthermore, the respondents were asked to determine why their companies were
prepared to further investment. 43 out 52 MRP companies reported that the main reason
behind preparing an additional investment over the next three years is to extend the
current MRP system, while the rest of them (i. e. 9 MRP companies) reported that the
main reason behind that is to change the current MRP system. This result concurs with
the findings of Sum and Yang (1993), who reported that MRP companies in Singapore
227

were prepared to further investment whether in order to extend the current MRP system
or in order to change the current system.
6.3.2 The relationship between company size factors and MRP
installation costs
It was thought to be useful to take a further step and investigate whether or not
there is a correlation between MRP costs and the company size in the MRP companies
surveyed. Company size was measured by total company sales, total number of
employees, and number of employees in production and inventory control. Therefore
correlation coefficient analysis was employed to state the association between each of the
company size factors and the costs of MRP implementation as it is illustrated in Table 6.9
below.
Table 6.9 Spearman's Correlation Coefficient between MRP cost and the company size
factors.
Item relationship r Significant Level
Total company sales . 03 N. S.
Total number of employees -. 05 N. S. Number of employees in P&I C
. 003 N. S.
N. S.: Not Significant at . 05 level.
It can be seen from Table 6.9, that the relationships between the costs of the
MRP system (MRP installation cost + the additional investment) and the company size
factors are low (r = . 03, -. 05 and .
003, P>. 05). Manufacturing companies do not
necessarily have to be big in order to spend more on implementing MRP systems.
Company size does not seem to predict the costs related to implementing MRP. This may
stem from the fact that all companies in the survey are state-owned, with the Egyptian
government providing thern with grants, incentives etc. in implementation of new
228

technologies. As such, these companies can freely fund their MRP implementation costs
without much restriction.
This result is contrary to that of Sum and Yang study, (1993). Their results show a
strong relationship between the company size and the costs of MRP implementation by
the Singaporean manufacturing companies.
6.3.3 Comparison with previous studies
For comparative purposes, the findings in two previous studies concerning the
costs of MRP implementation in the US (Schroeder et al., 1981, Laforge and Sturr,
1986) are displayed alongside our findings. Table 6.10 illustrates the comparison of costs
of MRP installation in the Egyptian and the US companies.
Table 6.10 The comparison of the costs of MRP systems installation in different
contexts (in $ 000).
Egypt (Present study)
US Schroeder Lafor e
Mean__ 354* 375 623
* The average investment in $= (The average investment in Egyptian pound L. E 1,200.000/ 3.39 3)
Table 6.10 shows the current average investment of MRP system of the three
studies. It indicates that Egyptian companies spent less than their peers in the US. This
result is consistent with our findings in Chapter 5 (see section 5.10) which indicate that
the Egyptian users are still relatively beginners. The Egyptian investment in MRP is less
than their peers in the US where an advanced stage of MRP system has already been
3 For comparative purposes the cost of MRP implementation in Egypt was calculated by $ currency. $1=L. E. 3.39 (The average investment in Egyptian pound = L. E 1,200,000)
229

implemented. This is reflected in an expensive hardware and software and an extensive
training as well.
6.4 Summary and conclusions
The aim of this chapter was to assess the effectiveness of MRP implementation in
Egyptian manufacturing companies. In this connection, two main issues were investigated
from the point of view of MRP users:
" Estimating the real benefits obtained from MRP implementation and the costs spent on
MRP installation by Egyptian manufacturing companies.
" Testing hypothesis concerning the benefits obtained from MRP implementation.
To investigate the above issues, statistical techniques were extensively performed
more than the previous studies to provide the highest statistical significance of the results
of the issues under investigation. Having discussed the statistical results of the previous
two issues, the following is a summary explaining the importance of findings:
1. The study partly demonstrates that not all MRP users attain same benefits, and also
there is no relationship between company size and the costs spent on MRP installation.
2. Compared with the previous studies our study is the first large-scale study to
concentrate on specific MRP benefits (nineteen measures of the benefits of MRP
implementation) using extensive statistical techniques. In addition, it is as an attempt to
fill the gap relating to the scarcity of benefits studies in the literature.
3. The study demonstrates that the effectiveness of MRP practices does not seem to be
restricted to manufacturing companies in developed countries. The results indicate that
the Egyptian manufacturing companies had received some success, at least up to the
230
present, and expect to achieve more improvements in their business performance because
of MRP implementation in the future.
4. Our findings provide strong evidence that NiRP users in Egypt, Singapore and USA
are not only pleased with the improvements which were derived from MRP
implementation, but also, optimistic concerning further improvements.
5. The analysis of the relationship between MRP cost and company size provides
evidence that it is not necessary for the company to be too big in order to spend more on
MRP implementation.
6. The findings show that although inventory control was the factor that received the
highest satisfaction ratings cverall, nevertheless inventory control managers perceived the
lowest level of satisfaction with MRP implementation concerning improving their ability
to perform in their job. Master scheduler users recorded the highest level of satisfaction
regarding achieving better ability to meet volume/ product change.
7. Our findings indicate that production and inventory control managers are not satisfied
with the role of MRP implementation for improving product quality measure.
8. The study provides strong evidence that MRP benefits seem to be not restricted to the
electronic and engineering industry as it was generally believed but those benefits can be
attained by the other manufacturing industry sectors such as the textile and food
industries.
Finally, taking account of the results of data analysis of this chapter one can
conclude that the implementation of MRP systems by Egyptian users seems to be
effective because our survey indicates that users believe that the expected benefits have
231

been obtained. However, it is both interesting and relevant to explore and examine the
explanatory variables of MRP system effectiveness. Consequently, the next chapter
(Chapter 7) explores and examines the relationships between a set of uncertainty,
organisational, implementational, technological, and human variables and the benefits
obtained from MRP implementation.
232

CHAPTER SEVEN
Data Analysis
The MRP Benefit- Determinant Relationships
7.1 Introduction
This chapter is intended to test empirically the key hypothesis that the uncertainty,
organisational, implementational, technological, and human variables do not correlate
with the benefits obtained from MRP implementation in a linear manner (hypothesis #2-
- see section 4.3.3 in Chapter 4). This is done by constructing a series of mathematical
models for both MRP benefits measures (tangible and subjective benefits) using
Alternating Conditional Expectation (ACE) technique as an advanced statistical
modelling technique that may increase the model fit to the data by approximating the
optimal transformations for the independent and dependent variables in contrast with the
other regression techniques that try to satisfy the model assumptions only (Sum et al.,
1995). Four specific objectives were pursued using this approach:
" to reduce statistically the number of independent variables (determinant variables) and
dependent variables (MRP benefits) prior to the regression analysis using ACE,
" to generate ACE models for the benefits obtained from MRP implementation,
" to explore and examine the MRP benefit-determinant relationships, and
" to compare our findings with the relevant previous studies.
In summary, this chapter of the research has attempted to explore and examine
the MRP benefit-determinant relationships by using the ACE technique and this may help
233

to find out new insights concerning the relationship between the benefits and their
determinants within Egyptian manufacturing companies.
7.2 A suggested model framework
It is interesting to recapitulate the suggested model framework of determinant
variables of MRP implementation benefits prior to using the ACE technique for testing
the relationships among MRP benefits and their determinants. Table 7.1 shows the
determinant variables and the MRP benefits:
Table 7.1 The framework of determinant variables of MRP implementation benefits.
Determinant Variables Type* MRP Implementation Benefits TvLw. Uncertainty Determinants Tangible Bene& Product characteristics diversity 0 Inventory turnover N Amount of aggregate product demand 0 Delivery lead time (days) N Machine downtime U Percent of time meeting The standard of raw material (quality) 0 delivery promises (: ro) N Behaviour of people within the factory 0 Percent of orders requiring "splits" Reliability of plant within the factor walls 0 because of unavailable material (° o) N Capacity constraints 0 Number of expediters (number of people) ti ()rpanisarional Determinants Vubiective Benefits Company age 0 Improved competitive position t) Company size 0 Reduced inventory costs t) Type of products C Increased throughput t) Type of Manufacturing C Improved product quality 0 Layout C Improved productivity 0) Company complexity 0 Better ability to meet volume product Organisational arrangements C change 0 Organisational willingness C Better production scheduling 0 Implementalional Determinants Reduced safety stocks () Years in implementation 0 Better cost estimation t) Implementation strateg} C Improved co-ordination with Degree of data accuracy 0 marketing and finance t) Initiator of MRP effort C Improved your ability to perform in Software hardware vendors support 0 your job t) Implementation problems t) Reduced informal systems for Technological Determinants materials managemertt' inventorvl Degree of integration among MRP modules 1) production control t) Source of system C Increased BOMqnventory MPS System cost 0 accuracy () Additional investment over next 3 years 0 Increased information on which to User class C base decisions since MRP has been MRP system features C implemented 0 Human Determinants The previous experience with the automated information systems t) I ser involvement Degree of utilising the outputs of MRP C Education and formal training C User su ort C
-%.. v refers to oramai vanaoie L. revers to categoncai vananie v rerers to alscrete variable ,A reters to numencal capable
234

7.3 Factor Analysis (FA)
The preceding sub-section shows that there are a large number of determinant
variables and MRP benefit measures (as shown in Table 7.1). Therefore, a series of
Factor Analyses (FA) was carried out as in (Schroeder et al., 1981; White et al., 1982;
Duchessi et at., 1988; Sum et at., 1995), to reduce statistically the large number of
determinant variables and MRP benefits to some smaller numbers by determining which
relate to each other and which appears to measure the same thing (Emory, 1985), and to
facilitate the interpretation process of the relationships under the investigation (Hair et
al., 1992). This was done prior to the regression analysis by ACE technique'. In general
terms, Factor Analysis has been used to determine the number of factors required for a
data set and to rotate them to facilitate the interpretation of factors (Everitt and Dunn,
1991), and this was done in the current study. It was carried out separately for the
subjective benefits, uncertainty, data accuracy, implementation problems, vendor support,
and organisational, technological & human variables. To do this, five steps were carried
out respectively as illustrated below:
" the appropriateness of running a Factor Analysis (FA),
" the number of factors to be extracted,
" the criteria of the significance of factors to be loaded,
" the constructed factors, and
I There is no widely accepted technique for dealing with incomplete data (Johnson and Wichern, 1992).
However, as a part of this study involves comparing the Egyptian survey with previous studies such as Schroeder et al. (1981); White et al. (1982) and Sum et al. (1995). I have chosen to adopt the same
strategy as used by them i. e. replacing missing values with the mean value from other respondents.
235

" results of the Principal Components of Factor Analysis.
7.3.1 The appropriateness of running a Factor Analysis
As pointed out by several writers such as Kim & Muller (1994) and Hutcheson
(1997), the first step in Factor Analysis should be testing the appropriateness of the data
collected. They mentioned that a number of statistical indicators can be used to provide
evidence of the overall appropriateness of the model and also which variables should be
included or excluded from the analysis. The Bartlett's Test of Sphericity tests if there is a
large or small correlation between variables. When the value of Bartlett's statistic is not
significant there is little correlation between the variables and vice versa (Hutcheson,
1997).
The Kaiser-Meyer-Olkin (K-M-O) measure of sampling adequacy is another one
of these statistical indicators which indicates whether the overall approach of Factor
Analysis is likely to be worthwhile and whether each variable is worth including. It is
characterised by providing an indication of the appropriateness of the data set as whole
and each variable, where the overall values of the K-M-O scores which are less than 0.50
indicate that a Factor Analysis (FA) is not worth pursuing the data. A variable with a K-
M-O value of less than 0.50 should be excluded from the analysis. The K-M-O scores for
individual variables are provided on the diagonals of the Anti-image correlation matrix
(see Appendix D).
By computing the Bartlett's Test and the K- M- 0 technique separately for the
subjective benefits, uncertainty, data accuracy, implementation problems, vendor support,
and organisational, technological and human variables, the results indicate that all the
236

values of Bartlett's statistic are significant and also all the K-M-Os are z 0.60 for each
data set and are z 0.50 for each variable (see Appendix D), which means that all
variables are likely to be worthwhile for running Factor Analysis.
7.3.2 The number of common factors to be extracted
The second step in Factor Analysis is to determine the factors needed to represent
the data. To do this, the Principal Component (PC) method of Factor Analysis is the
most frequently approach. By this method, a given set of variables is transformed into a
new set of composite variables or (principal components) that are not correlated with
each other (Emory, 1985), in other words, to transform a set of correlated variables into
a set of uncorrelated variables (Flury and Riedwyl, 1988). The first Principal Component,
PC (1), is the combination of variables accounting for the variance2 in the data set as a
whole. PC (2), is the linear combination of the variables that are uncorrelated with PC
(1), and accounts for the maximum amount of the remaining variation not accounted for
by PC (1), and so on. (Hutcheson, 1997)
In order to determine the number of factors needed to represent the data, there
are two criteria are employed (Emory, 1985; Hair et al., 1992). The first criterion is the
percentage of total variance which is explained by each, this is labelled Eigenvalue. The
factors will be considered significant on the basis that they account for variances equal to
or greater than one, and the second one is the percentage of variance which is attributable
2 Variance of a given variable is a measure of its variation in the data. The variance accounted for by the
new variable is greater than the variance accounted for by any other variable. Therefore, it accounts for
the maximum of the total variance (Sharma, 1996).
237

to each factor, when the last factor accounts for less than 5 percent of variance we arrive
at the end of factoring procedure. The last column in the initial statistics indicates the
commutative percentage of variance attributable to that factor and those that precede it.
On this occasion, Hair et al. (1992) said that the analyst can consider as
satisfactory a solution that accounts for 60 per cent of the total variance (and in some
instances even less) in the social science, where information is often less precise. This will
be displayed in tables 7.2 and 7.3 consecutively below:
7.3.2.1 The number of factors to be extracted for MRP benefits
Since the data on tangible benefits measures is numerical, Factor Analysis
technique was used only for the subjective benefits measures where the data is ordinal.
Table 7.2 indicates that five factors out of fourteen subjective benefits variables were
extracted with Eigenvalue of one, or more than one for each. The commutative
percentages of variance accounted by the extracted factors are 60.6 per cent for factors
relating to the subjective benefits.
Table 7.2 Number of factors extracted and the percentage of variance explained for subjective benefits.
Factor* Eigenvalue % of variance Cum. % 1 2.53 18.1 18.1 2 1.97 14.1 32.2 3 1.40 10.0 42.2 4 1.37 9.8 52.1 5 1.18 8.5 60.6 * The five extracted factors represent the factors needed to represent the data relat ed to the subjective benefits based on both the Eigenvalue which estimates the amount of total variance explained by the factor) and the percentage of variance which estimates the amount of variable variation in the data. Those factors are discussed in detail in Appendix D.
238

-ý f
7.3.2.2 The number of factors to be extracted for determinant variables
Table 7.3 indicates that three factors out of seven uncertainty variables, four out
of nine data accuracy variables, three out of five vendor support variables, five out of
fourteen MRP problems variables and five out of thirteen organisational and
technological and human variables were extracted with Eigenvalues of one or more than
one for each. The commutative percentages of variance accounted by the extracted
factors are z 60% for factors relating to the determinant variables as shown in Table 7.3
below
Table 7.3 Number of factors extracted and the percentage of variance explained for determinant variables.
Factor* Eigenvalue % of variance 0 Cum. % Uncertainty_
._ 1.89 27.0 27.0
2 1.33 19.1 46.0 3 1.02 14.6 60.7 Data accuracy 1 2.18 24.3 24.3 2 1.59 17.7 42.0 3 1.06 11.8 53.9 4 1.03 11.5 65.4 Vendor support 1- 2.14 35.8 35.8 2 1.30 21.7 57.5 3 1.00 16.7 74.2 1VIRP Implementation Problems 1 2.60 18.6 18.6 2 2.04 14.6 33.2 3 1.80 12.9 46.0 4 1.63 11.7 57.7 5 1.06 7.6 65.3 Organisational & Technological & Human 1 2.76 21.2 21.2 2 1.93 14.9 36.1 3 1.39 10.7 46.8 4 1.09 8.4 55.2 5 1.03 7.9 63.1 " The twenty extracted factors are discussed in detail in Appendix D.
.
239

7.3.3 The criteria for the significance of factors to be loaded
In this stage, the researcher has to decide on which factor loadings are to be
considered to represent variables in each factor. Factor loadings indicate how much
weight is assigned to each factor based on the coefficients used to express a standardised
variable in terms of the factors, where factors with large coefficients for variable are
closely related to that variables (Hutcheson, 1997). Several writers such as Hair et al.
(1992); Kim and Mueller (1994) and Lascu and Giese (1995), indicated that factor
loading with coefficients equal to or greater than ± 50 are considered very significant.
Accordingly, the considered factor loadings in this research are ± 50 or above. On this
occasion, Hair et al. (1992) mentioned that variables with higher loading may have a
great impact on the name of the label for the representative factor.
7.3.4 The constructed factors
At this stage we could pick the factor matrix to state the factors that may be
correlated with many variables. But the factor matrix is not easy to assign any description
to the factors. So, the technique of rotation can be used which can help us to select the
variables for each factor and to transform the factors to make them more easily
interpretable (Hutcheson, 1997). The Varimax rotation technique was employed to
magnify the factor loadings by maximising the variance (i. e. a measure of dispersion of a
variable) (Hair et al., (1992); or to minimise the number of variables which have a high
loading on a factor, and to facilitate the interpretation of the identified factors
(Hutcheson, 1997). ). The rotated factor matrix provides a much clearer interpretation of
240

the results as can be seen in Tables 7.4 and 7.5 consecutively, for both the subjective
benefit measures and the determinant variables.
Table 7.4 Subjective benefit measures factor loadings.
Factors* Coºnmunality*
MRP Success Measures 1 2 3 4 5 Increased throughput .
75 . 60
Improved product quality . 67
. 49 Better cost estimation .
70 . 58
Improved co-ordination with marketing and finance . 78 . 70
Better production scheduling . 70
. 60
Reduced safety stocks . 68 . 74
Reduced informal systems for materials management/ inventory/ production control .
74 . 69
Increased BOM/inventorv/MPS accuracy . 65
. 58
Reduced inventory costs . 79
. 70
* The values underneath each factor are correlation coefficients between the factor and the variables. These correlation coefficients are called loadings. The keys of the five factors are as follows: operational efficiency. co-ordination, manufacturing planning and control, formal system and inventory costs, successively. This is depicted in detail in Figure 7.1. ** Communalities mean estimates of the variance in each variable which is explained the five factors
e. g.. with variable (increased throughput) the communality is . 60 indicating that 60 percent of the
variance in this variable is statistically explained in terms of factors 1,2.3.4 and 5.
241

Table 7.5 Determinant variables factor loadings Factors' Communali '
Determinant Variables 1 2 3 4 5 6 7 8 Uncertainty Product characteristics diversity
. 72
. 64
Amount of aggregate product demand . 73
. 62
The standard of raw material . 71
. 53
Machine downtime . 65
. 56
Capacity constraints . 80
. 68
Behaviour of people within the factory . 70
. 57
Reliability of plant within the factory . 74
. 68 MRP Implementation Problems Poor training/education on MRP
. 82
. 72
Lack of suitability of hardware . 63 .
53 Lack of suitability of software .
77 . 73
A lack of support from top management . 75
. 73
Lack of support from production . 78 . 68
Lack of support from marketing . 63 . 65 Lack of communication . 73 . 60 Lack of information technology expertise .
75 . 77 Lack of support from supervisor/foreman .
76 . 69
Lack of company expertise in MRP 66 . 67
Lack of involvement from vendor . 77
. 71
9 10 11 12 13 14 15 16
Organisational &Technological & Human Sales
. 62 . 52
Number of P&IC employees . 85 . 81
Number of items per product . 69 .63
User class** . 65 . 54
Degree of integration . 70 .
57 Previous experience .
84 . 73
Number of BOM levels . 75
. 63
Years in operation . 75
. 61
Vendor Support We expected more extensive vendor support .
76 . 68
We experienced a vendor software support discontinuance problem
. 73
. 63
Vendor instructions interpret their software product
. 77
. 74
Vendor personnel efficiently resolved software problems . 90 .
84 The vendor provided conversion of our data
into the new system . 93 . 88
* The keys of the sixteen factors are as follows: the required products. capacity uncertainty-, reliability uncertainty, technical problems, management support problems. MRP expertise problems, people support problems. active vendor involvement problems. company size, stage of development, experience. BOM level, company maturity. vendor support availability, active vendor proficiency and vendor experience. successively. This is depicted in detail in Figure 7.2. ** For analytical purposes user class was entered to the analysis as an ordinal variable as in Duchessi et al. (1989) and Sum et al. (1995).
242

Table 7.5 : (Continuedl Factors* Communafi
Determinant Variables 17 18 19 20 Data Accuracy Capacity data . 79
. 64 Vendor lead times .
76 . 61
Production lead times . 63
. 50
Bill of material records . 69
. 58
Inventory records . 68
. 76
Market forecasts . 75
. 77
Master production schedule . 87 . 79
Routing/Work centre data . 63
. 56
Shop floor control data . 84
. 74 * The keys of the four factors are as follows: supply planning data, demand planning data, schedule execution data and operating execution data, successively. This is illustrated in detail in Figure 7.2.
7.3.5 Results of the Principal Components
The last stage of running Factor Analysis is to get the interpreting factors. By
matching the subjective benefit measures and the determinant variables of each factor in
Tables 7.4 and 7.5 to their description, Figures 7.1 and 7.2 show that nine subjective
benefit measures were collapsed into five dependent measures and forty determinant
variables were collapsed into twenty independent determinant variables. These factors
will be used in a consecutive analysis (ACE analysis).
243

Figure 7.1 The standard subjective benefit measures for MRP implementation3
Factor 1: Operational Efficiency 518.1%) Increased throughput Improved product quality Factor 2: Co-ordination 114.1%) Better cost estimation Improved co-ordination with marketing and finance Factor 3: Manufacturing Planning & Control (Predictability) (10.0%) Better production scheduling Reduced safety stocks Factor 4: Formal System (9.8%) Reduced informal systems for materials management/ inventory/
production control Increased BOM/inventory/MPS data accuracy Factor 5: Inventory Costs 18.5%) Reduced inventory costs
* (%) Refers to the percent of variance explained by the factor
Figure 7.2 The determinant variables affecting MRP implementation benefits4
Uncertainty Factors Factor 1: The Required Products (27.0%) Product characteristics diversity Amount of aggregate product demand The standard of raw material Factor 2: Capacity (19.1%) Machine downtime Capacity constraints Factor 3: Reliability (14.6%) Behaviour of people within the factory Reliability of plant within the factory Implementation Problems Factors Factor 4: Technical (18.6%) Lack of suitability of hardware Lack of suitability of software Poor training/education on MRP Factor 5: Management Support (14.6%) A lack of support from top management Lack of support from production Lack of support from marketing Factor 6: MRP Expertise (12.9%) Lack of communication Lack of information technology expertise Factor 7: People Support (11.7%) Lack of support from supervisor/foreman Lack of company expertise in MRP
3 The five factors are discussed in detail in Appendix D. 4 The twenty factors are discussed in detail in Appendix D.
244

7.2: Factor 8: Active Vendor Involvement (7.6%) Lack of involvement from vendor Organisational & Technological & Human Factors Factor 9: Size (21.2%) Sales Number of P&IC employees Number of items per product Factor 10: Stage of Development (14.9%) User class Degree of integration Factor 11: Experience (10.7%) Previous experience with automated information systems Factor 12: BOM Level (8.4%) Number of BOM levels Factor 13: Company Maturity (7.9%) Years in operation Vendor Support Factors Factor 14: Vendor Support Availability (35.8%) We expected more extensive vendor support We experienced a vendor software support discontinuance problem Factor 15: Active Vendor proficiency (21.7%) Vendor instructions interpret their software product Vendor personnel efficiently resolved software problems Factor 16: Vendor Experience (16.7%) The vendor provided conversion of our data into the new system Data Accuracy Factors Factor 17: Supply Planning Data (24.3%) Capacity data Vendor lead times Production lead times Factor 18: Demand Planning Data (17.7%) Bill of material records Inventory records Market forecasts Factor 19: Schedule Execution Data (11.8%) Master production schedule Routing/Work centre data Factor 20: Operating Execution Data (11.5%) Shop floor control data
* (%) Refers to the percent of variance explained by the factor
From figures 7.1 and 7.2 we can notice that some subjective benefit measures
such as "improved competitive position"; "better ability to meet volume/ product
change"; "increased information on which to base decisions since MRP has been
implemented"; and "improved productivity" and some determinant variables such as
245

"lack of support from finance"; "lack of clear goals for MRP effort"; "lack of vendor
knowledge on MRP" "the project manager responsibility" did not load in any of the
subjective benefits factors or determinant factors, namely these variables are either
uncorrelated with the extracted factors or have weak correlation coefficients with them.
This may mean that these benefits or determinant variables are not important from point
of views MRP users in Egyptian manufacturing companies. Then, the loadings of the
factors were saved as new variables for further analysis (Hutcheson, 1997), such as
regression models (ACE) in our case. As a whole, after the Factor Analysis, we had five
dependent benefits (tangible benefits), five constructed factors (subjective benefits), and
fourteen independent variables, in addition to twenty constructed factors. In turn,
regression models were then developed for each benefit separately using ACE technique
as illustrated in the next sections below:
7.4 Testing hypothesis using ACE technique
It has been suggested (in Hypothesis -2) that the determinant variables such as
execution data accuracy, degree of integration, planning data accuracy, technical
problems, company size and people support problems do not necessarily correlate with
MRP implementation benefits in a linear manner. For instance, when data accuracy
deteriorates to a threshold level such that MRP users refuse to follow the
recommendations produced by the system anymore, a further decrease in accuracy may
not produce the same marginal or proportionate impact on benefits as before the
threshold level was reached (Sum et al., 1995). Another example informed by learning
246
ý} i

theory, states that the time taken to perform a task on the ith occasion (Ti) is non-
linear(Chatterjee and Price, 1991; Wild, 1996): as illustrated in Equation 7.1 below:
T, = a, 6' ,a>0,0<13<1 (7.1)
Therefore, the organisational and labour learning occurring during the implementation of
MRP system and its effect on benefits is likely to exhibit non-linear characteristics.
By formulating the foregoing hypothesis, the significance of the relationships can be
tested with the ACE regression model as in Sum et al. (1995), who used this technique to
analyse the MRP benefit-determinant relationships on 52 NW users in Singapore.
As pointed out by several writers such as Brillinger and Preisler (1984); Pregibon
and Vardi (1985); Fox and Long (1990) and Sum et al. (1995)5 Alternating Conditional
Expectation (ACE) estimation can be defined as an automatic tool for finding
transformations from non-linear relationships into linear ones of both the response
(dependent variables) and the predictors (independent variables) that maximises the
multiple correlation, R2, to achieve increased linear associations between Y (dependent)
and set Xl ......, X� (independent). Furthermore, it can be distinguished by the following
characteristics:
" unlike other empirical methods, the ACE transformations have a much better model
fit compared to models produced by previous studies produced by standard
techniques such as Ordinary Least Squares and Discriminate Analysis because it is
concerned with enhancing the model fit to the data rather than satisfying the model
assumptions,
8ý
4
w1
5A whole example that illustrates the key advantages of ACE over standard regression techniques and rt addresses the interpretation of an ACE model is presented in detail in (Appendix E).
247
fý ýý
i

" it may suggest new ways of modelling the dependence of the response (1) on the
predictors (X1......, X. ), indicating the adjusted R2 which can be used as a benchmark
to ensure that the analytic functions represent the graphical ACE adequately, and also
indicating the imputed P-value which is very helpful for comparisons between
models,
" it provides the best transformations unambiguously, on the basis of both the
quantitative evidence provided by comparison R2 s and the subjective evidence
provided by comparison of the scatterplots.
" its outputs include estimates of the optimal functions such as 0, O, V at each data
point and which may be used graphically for prediction,
" it is a powerful tool for finding transformations in multiple regression when
relationships among dependent and independent variables are complex; it provides
several options that can enhance understanding of complex relationships. One of
these options is to force some or all the transformations to be monotonic,
" it has superior modelling capability compared to the other modelling methodologies
such as multiple regression analysis and multiple analysis of variance in terms of
highest R2 and smallest P-value, and
" the best transformations are estimated without use of ad hoc heuristics. Furthermore,
its outputs can be interpreted using transformation plots which are considered easier
to conceptualise compared to mathematical expressions of the transformations. These
plots may lead the investigator to improve an empirical model or to give him a sense
of how much improvement is possible by taking more extreme steps. t f}
248
a

To create ACE models for MRP benefits, four steps should be executed
consequently as follows:
7.4.1 To decide whether a transformation is necessary
Box and Cox (1964); Wetherill et al. (1986); Carroll and Ruppert (1988); Fox
and Long (1990); Sen and Srivastava (1990); Chatterjee & Price (1991) and Hutcheson
(1997), indicated that the need for transforming the data arises when the original variable
or the model in terms of the original variable violates one or more of the assumptions of
the standard regression model. These are: normality of distributions, linearity (the
relationships between variables is well approximated by a,. straight line) and
homoscedasticity (the constancy of the error variance) or the non-linear relationship
between variables is theoretically hypothesised (Chatterjee & Price, 1991). If so,
transformation to normality and homoscedasticity data is necessary in order to enable us
to use the standard regression techniques and allows the parameter vector ß to be
estimated efficiently (Carroll & Ruppert; 1988; Chatterjee & Price, 1991; Hutcheson,
1997). Therefore, the following subsections are intended to detect the previous problems
as follow:
7.4.1.1 Theoretical consideration
It was hypothesised that there were underlying, non-linear relationships between
determinant variables and benefits obtained from MRP implementation (see section 7.4).
7.4.1.2 Probabilistic reasons
If the original data is non-normally distributed and the variance of error is non-
constant, the linear model will be distorted and the analysis will be degraded. The
249

Skewness method can be used to determine which data can depart from normality. It
refers to the degree to which a distribution is not symmetric and which may lead to
misleading results (Ratkowsky, 1983). If the ratio of the skewness to the standard error
of the skew is less than -2 or greater than +2, the data can be considered to be
significantly skewed and they are candidate to be transformed and vice versa. Equation
7.2 shows the significance of Skewness:
Significantly Skewed Data = Skewness
s. e. skew (7.2)
where s. e (standard error) denotes the square root of the variance of a sample i. e. the
mean square deviation of the values of a sample from their own mean.
A positive value indicates a longer right tail to the distribution and a negative value a left
tail (Hutcheson, 1997). Table 7.6 depicts the skewness statistics calculated for 44
variables represent MRP benefits and determinant variables (10: 34).
250

Table 7.6 Statistics to depict the significance of Skewness.
Variables Skewness S. E. Skew The significance of Skewed Data
Vendor experience 1.24 . 33 3.76
Co-ordination -. 60 . 33 -1.82
Active vendor proficiency 2.94 . 33 8.91
Inventory costs -. 58 . 33 -1.76
Vendor support availability 1.45 . 33 4.39
Organisational willingness . 13
. 33
. 39
Manufacturing P&C -. 73 . 33 -2.21
Supply planning data . 68
. 33 2.06
Demand planning data . 59
. 33 1.79
Company size . 82
. 33 2.48
Levels in BOM . 31
. 33 . 94
Company maturity -2.60 . 33 -7.88
Stage of development . 19
. 33 .
58 Formal system .
04 . 33 .
12 Technical problems -1.08 . 33 -3.27 Schedule execution data
. 11 33 . 33
Uncertain capacity . 87
. 33 2.64
Uncertain required products . 10
. 33 .
30 Management support problems -1.44 .
33 4.36 Active vendor involvement
. 02
. 33 .
06 Layout
. 28
. 33 .
85
Uncertain reliability . 35 . 33 1.06
People support problems . 74 . 33 2.24
Operational efficiency . 28 . 33 .
85 MRP expertise problem .
25 . 33 .
76 Experience with automated Systems -. 25
. 33 -. 76
Operating execution data 1.83 . 33 5.55
Organisational arrangements . 96
. 33 2.91
Initiator of MRP effort 2.86 .33
8.67 Implementation strategy .
91 . 33 2.76
Meeting deliver- promises . 30
. 33
. 91
Marketing strategy . 08 . 33
. 24
The number of expediters -84. . 33 -2.43 The percent of split orders -. 14
. 33 -. 42
Source of system . 25
. 33
. 76
Inventory turnover -. 33 . 33 -1.00
Delivery lead times . 25 . 33
. 76 Utilising outputs 1.33
. 33 4.03
User involvement . 11
. 33 33
Manufacturing process 1.25 .3; 3.79
Years in implementation . 13
. 33 ;9
MlRP system features . 91
_3 ; 2 67/
User Support . 30
. 33
. 91
Education and Training . 25 .3; .
76
251

The results in the last column in Table 7.6 indicate that 19 out of 44 variables are
significantly skewed and are candidates for transformation to reduce the Skewness.
Furthermore, one of the assumptions that should be made of the data for General Linear
Model (GLM) is that the response variables are independent with having an equal
variance or homoscedasticity (Wetherill et a1., 1986).
One of the common methods used for determining whether the variance of error
is constant or non- constant (heteroscedastic) is to check for outliers in the data. (Flury
and Riedwyl, 1988; Sen and Srivastava, 1990; Everitt and Dunn, 1991). The outliers
mean that some individual data points are quite different from the rest of the observations
(Chatterjee & Price, 1991). These outlier points may arise from coding error or unusual
data points (Hutcheson, 1997). Regression analysis literature suggests that graphical
methods of detecting outliers are quite time consuming and can only really be used if
there are two or three variables. The Cook's Distance measure has been considered an
easier and more accurate way of detecting multivariate outliers. It indicates the effect of
having the particular data point in the model or not. It is calculated by first running the
regression model procedure and saving Cook's Distance as a new variable using
Equation 7.3 below:
(ý
i
c? _Z ps (7.3)
Where, C, Cook's Distance represents a measure of how much the results of all cases
would change if a particular case were excluded from the calculation of the regression
analysis. Pst denotes the P matrix of the residual mean square s2. y; y; represents the
252

predicted values of j which represents the variables which result from deleting the i th
observations (i = 1,2......... n). It has been suggested that points with Cr values greater
than the 1 can be classified as influential point, namely, it will be outlier point (Chatterjee
& Price, 1991). Table 7.7 depicts the Coo-xl,.... lo where x represents the number of
Cook's measures that we had calculated as shown below:
253

Table 7.7 Influence measures (Cook's Distance). Row Coop Cool Coq Coo4 Coos Co06 Coo%' '.: Coos. Coop Coom 1 . 01380 . 00723 . 02793 . 04625 . 04625 . 04480 . 14118 . 10445 . 00080 . 06040 2 . 00686 . 00146 . 00080 . 02107 . 02107 . 00507 . 04703 . 00395 . 01355 . 10711 3 . 01010 . 01371 . 00844 . 04029 . 04029 . 10837 . 06306 . 00160 . 07591 . 01660 4 . 00199
. 06487 . 00157 . 00502 . 00502
. 00407
. 02666 . 02077
. 03576 . 05440
5 . 06009 . 00688 . 00261 . 00885 . 00885 . 03129 . 00024 . 12132 . 01408 . 01159 6 . 08663 . 04452 . 01595 . 00520 . 00520 . 03853 . 07483 . 00036 . 11886 . 08289 7 . 00111 . 04939 . 00014 . 06056 . 06056 . 00033 . 01647 . 06555 . 04781 . 07363 8
. 02320 . 00248
. 00000
. 09509
. 09509 . 00235
. 01411 .
07235 . 08178
. 00877 9 . 00299
. 09860
. 02232
. 03938
. 03938 . 00000 . 00012 . 00266 . 03859
. 00438 10 . 00457 . 01805 . 02004 . 00566 . 00566 . 00069 . 00841 . 00546 . 07434 . 00898 11 . 04600 1.0159 . 01256 . 07910 . 07910 . 02449 . 02462 . 09167 . 03566 . 05398 12 . 01146 . 00614 . 00014
. 02366 . 02366 . 00860 . 10514 . 07617 . 00005 . 10103 13 . 00734 . 04997 . 06969 . 14936 . 14936 . 00000 . 00149 . 16935 . 07250 . 18423 14
. 09682 . 05055" . 06694
. 19452 . 19452 . 09644 . 08949 . 20260 . 02360 . 00870
15 . 02859 . 03639 . 01585 . 02339 . 02339 . 00359 . 00637 . 01169 . 00670 . 00248 16 . 19743 . 10685 . 01751
. 12535 . 12535 . 01612 . 37165 . 22900 1.2667 . 01285 17 . 07995 . 00460 . 01687
. 09012 . 09012 . 10557 . 00401 . 02798 . 00108 . 16476 18 . 00536 . 02676 . 01606
. 03628 . 03628 . 07318 . 01350 . 03577 . 00940 . 00193 19 . 05284 . 09218 . 01129
. 01155 . 01155 . 00703 . 00003 . 00026 . 00277 . 03221 20 . 07216 . 01912 . 09753
. 05900 . 05900 . 07525 . 19551 . 00105 . 12516 . 09700 21 . 00071 . 00756
. 05678 . 03811 . 03811 . 02429 . 00345 . 00103 . 00049 . 05756
22 . 01480 . 08332 . 02559 . 08313 . 08313 . 01685 . 21129 . 02195 . 00100 . 00237
23 . 36849 . 11884 . 00154 . 07842 . 07842 . 12684 . 06395 . 24313 . 17391 . 00557 24 . 02152 . 01726 1.4587
. 07708 . 07708 . 00146 . 16875 . 00069 . 00287 . 06798 25 . 16428 . 08492 . 38035 . 00321 . 00321 . 11414 . 00150 . 04346 . 33009 . 00122 26 . 08984 . 25727
. 00008 . 02857 . 02857 . 00270 . 01897 . 00074 . 05281 . 00217 27 . 11726 . 01835
. 07126 . 05699 . 05699 . 00640 . 00277 . 00133 . 00137 . 02240 28 1.0468 . 00525 . 45505 . 05608 . 05608 . 06304 . 04322 . 04129 1.1852 . 05796 29 . 02611
. 08175 . 00949 . 00778 . 00778 . 01571 . 06797 . 01189 . 00227 . 04592
30 . 08992 . 00167 . 04703 . 02660 . 02660 . 03425 . 02594 . 02081 . 00714 . 04617 31 . 00023 . 00044
. 19917 . 03036 . 03036 . 00442 . 02247 . 01099 . 03817 . 03461 32 . 16758
. 00191
. 00002 . 06290 . 06290 . 04618 .
01987 . 00639
. 00210 .
01129
33 . 01847 . 01105 . 00364 . 00142 . 00142 . 01807 . 11636 . 00958 . 00105 . 11207
34 . 01137 . 00034 . 06382 . 05625 . 05625 . 01865 . 03617 . 00281 . 13978 . 00064
35 . 04877 . 02528 . 00422 . 17029 . 17029 . 03830 . 00069 . 06449 . 10621 . 09947
36 . 22867 . 17823 . 57840 1.1180 . 57180 . 24850 . 17933 . 02916 . 15878 . 13786 37 . 08469 . 00268
. 20095 . 00219 . 00219 . 01951 . 00283 . 18447 . 10536 . 01318 38 . 11039 . 05640 . 00645 . 00028 . 00028 . 03047 . 15639 . 00360 . 14535 . 09254 39 . 00017 . 00245
. 00526 . 00267 . 00267 . 00170 . 00919 . 01803 . 00286 . 01148 40 . 00000 . 00388 . 24914 . 08422 . 08422 . 08592 . 09056 . 00055 . 11508 . 05068 41 . 00042 . 00388 . 09987 . 08415 . 08415 . 09844 . 02510 . 04244 . 40579 . 04412 42 . 01320 . 07453 . 01004 . 07684 . 07684 . 15207 . 00148 . 02396 . 03359 . 01705 43 . 00159 . 01336 . 01497 . 00163 . 00163 . 04330 . 02053 . 00080 . 00099 . 00141 44 . 01698 . 08280 . 01078 . 08328 . 08328 . 07339 . 00083 . 02235 . 01141 . 00404 45 . 00003 . 21602 . 08155 . 02423 . 02423 . 00016
. 00657 . 17081 . 00000 . 00638 46 .
07020 . 15439 . 00193
. 00088 . 00088
. 02094 . 00011
. 00734
. 01914 . 06378
47 . 00000 . 02171 . 03901 . 06475 . 06475 . 06300 . 01009 . 03185 . 01374 . 05105 48 . 00011 . 00048
. 00029 . 01942 . 01942
. 03533 . 00880 . 05904
. 00060 . 00787 49 . 05424 . 09739 . 03906 . 00981 . 00981
. 01678 . 09474 . 00420
. 00935 . 00721 50 . 04476 . 00305
. 01886 . 00556
. 00556 . 06342
. 00714 . 01119 . 00010 . 00429
51 . 01525 . 00030 . 03458 . 00541 . 00541 . 07557 . 04202 . 01657 . 02013 . 04385
52 . 00679 . 00236 . 00930 . 01547 . 01547
. 06140 . 01677 . 08793
. 03789 . 00776
The conclusion that can be drawn from Table 7.7 is that there are several
observations such as (16 with Coo9 and 28 with Coop ) which are clearly outliers.
Therefore, transforming data is needed.
254

7.4.1.3 Examining plots
A useful method for identifying non-linearity is to use Matrix Scatterplots which
identify the form of the relationships between variables (Hutcheson, 1997). The matrices
scatterplots indicate that some of the relationships among benefits and the determinant
variables appear to be non-linear. For example, there appears to be a non-linear
relationship between operational efficiency and data accuracy factors and between
coordination and people support as shown in Figures 7.3 & 7.4 below:
Figure 7.3 Investigating the relationship between operational efficiency and data
accuracy factors with matrix scatterplots
ý " Data Fl "* "..... ý r
at. {
' .. '
st . v. " ý iß: 1 . "i
' "ý r Data F2 "" . ý". . ýý
. ti " .. ý
"' Data F3 " fäi"
" : ý. "; _
Data F4 1 .
' ýý +P O/E F do . =4 . i
Figure 7.4 Investigating the relationship coordination and people support factors with matrix scatterplots
People Support ": '-,
.. S
Coordination
255

The foregoing relationships can be mathematically described in a non-linear form
(the parameter (31 does not enter the model linearly). So, a regression model is non-linear
as shown in Equations 7.4 below:
B=a+eßiD+E (7.4)
where B is the value of operational efficiency benefit (dependent variable). D is the value
of company. size (independent variable). a is the value of B when explanatory variable
(D) = 0. c indicates the variability in the response variable (B) which cannot be
appropriated to any of the explanatory variables in the equation. ß represents the
elasticity of change in B (dependent) which is expected to result from a change of one
unit in D (independent) when all other independent variables are held constant. e is an
analytical function (exponential).
On the other hand, the relationship between response and predictor variable can
be described in a linear manner where the parameters ß`s enter in the model linearly. This
can be represented by one of the following equations (Chatterjee & Price, 1991):
B=a+OD +E (7.5)
B=a+ß1D+(32D2+E (7.6)
B =a+ 01 logD+E (7.7)
B=a+Pob+c (7.8)
In summary, we conclude that the data of some of the variables under
investigation can described in a linear manner. On the other hand, the rest of the data
have the major three problems (non-normality, non-linearity and non-constant variance or
heteroscedasticity), so, transformation is necessary to approximate the data to the normal
256

distribution, to achieve linearity related to variable another and to stabilise the variance
using ACE technique as in Sum et al. (1995). Therefore, the decision was made to test
the relationships between benefits and the determinant variables using multiple regression
analysis as in Schroeder et al. (1981) namely, before transforming data, followed by
testing these relationships using ACE technique (models after variable transformation) as
in Sum et al. (1995), then checking the statistical significance of comparing between the
best linear models and the best ACE' models by evaluating modelling capability of the
type of models using adjusted R2 and P-values, then finally selecting the final models for
NW benefits.
7.4.2 Evaluating an ACE's model capability
The ACE model should not be blindly trusted as the best overall way to represent
the dependence of the dependent variable on the independent variables. Also, it is not
intended to replace the standard regression tools in the data analysis (Fox and Long,
1991). The need to evaluate the capability of ACE's modelling is required before
selecting the final models for MRP benefits. To do that, we followed Schroeder et al.
(1981) and Sum et al. (1995). We identified the best linear models by running all possible
regression analysis models and selecting the top few models with highest adjusted
multiple correlation of the response with the predictors, R. Then we ran ACE using the
same variables determined in the best linear models. Then we compared the results of the
two techniques in the light of the extracted R2 which provides how well the model fits the
population. It is a much more useful statistic for multiple regression, and can be
calculated using Equation 7.9:
257

- Adjusted R2 = RZ -P
(1 R2) (7.9)
N-P-1
Where R2 is the coefficient of multiple regression which provides how well the model fits
the sample or represents the amount of the variance in one variable which can be
accounted for by the other, P is the number of explanatory variables in the model, and N
is the number of cases. The adjusted R2 is used as a benchmark for comparing the quality
of the regression of b on d (before transformation) to the regression of tb on td (after
transformation), where b is the benefit obtained from MRP implementation and d is the
determinant variable. The results indicate that the highest adjusted R2 s extracted by
running regression analysis were 0.28 and 0.446 in cases of the relationships between
delivery lead time benefit and all independent variables and between operational
efficiency benefit with all independent variables respectively.
By running ACE using the same variables identified in the best linear models (i. e.
models without transformations), the ACE models improved the adjusted R2 as much as
0.63 (0.91 - 0.28) and 0.42 (0.86 - 0.44) percentage points respectively. These results
confirm the superior modelling capability of ACE technique.
7.4.3 Selecting the final models for MRP benefits
Several writers such as Wetherill et al. (1986); Sen and Srivastava (1990) and
Chatterjee & Price (1991), pointed out that it is important to recognise strategies should
be taken to select candidate models in a regression analysis. The ACE technique depends
upon two strategies to generate the final ACE models for MRP benefits. The first
6 These results were extracted using OLS technique in order to get R2 for the two dependent variables with all the forty independent variables before transformations.
258
strategy is forward stepwise which starts with no determinant variables in the model and
first selects that y which has the highest adjusted R2 with Y and so on until there is no
substantial increase in model adjusted R2 . The second is backward stepwise elimination
which starts with all determinant variables in the model and deletes the less important
ones one by one.
Ten final ACE models were selected by running the previous strategies
consequently as depicted in Table 7.8. The parameter's coefficients for determinant
variables in the ACE models and small p-values in Table 7.8 indicate that all ACE models
and all determinant variables are very significant. It is interesting to note that all
parameters coefficients for the determinant variables (independent) are positive because
we regressed the transformed benefit measure (dependent variable) on all the transformed
determinant variables (independent) as in Sum et al. (1995). Surprisingly, the adjusted R2
`s and P-values are better than Cooper and Zmud (1989; 1990) and Sum et al. (1995).
For analytical purposes, we used a Dummy variable coding to recode
Manufacturing Process and Marketing Strategy into a number of dichotomous variables
showing the presence or absence of each category. The first was coded 0 for continuous
(includes continuous production and assembly line) and 1 for intermittent (includes batch
operation and job shop), the second was coded 0 for make to stock and 1 for make to
order (in relation to intermediate levels for marketing strategy making to order and to
stock are presented by fractional numbers).
259

Table 7.8 The ACE models for MRP benefits.
Determinant Variable B B . -' B4 Bs`` " B6 B -' B ': B Uncertainty
. The required products' Capacity' ' . 0026 . 0351 Reliability' ' . 0045 Org. & Tech. & Hum. ̀ ' Source of MRP system" Manufacturing process
continuos . 0088
intermittent . 0136 Layout Manufacturing strategy
Make to oreder . 0525° . 0001 Make to stock . 0741 . 0651
User involvement Utilizing MRP outputs Levels in BOM ' .
0007 . 0001 . 0005 . 2e4
Company maturity User support ... Company size'
. 0884 . 5e-4
Stage of development' . 3e-5 . 0003 . 0049 Years in implementation . 0035 MRP system features Education and training Experience . 0036 Vendor support availability' . 0048 Active vendor proficiency' Vendor experience Organizational willingness Implementational Year in implementation Data accuracy
Supply planning data' . 0001 . 0013
Demand planning data' . 0003 . 0534 Schedule execution data' . 0019 Operating execution data' . le-4
Implementatinal problems Technical' " .
3e-4 Management support' . 0250
. 2e-
MRP expertise' People support' . 0034
. 0002 Vendor involvement'
Implementation strategy Initiator of MRP effort Modelp-value . le-6 . 7e-5 . le-3 . 4e-9 . 2e-5 . le-5 . le-6 . 4e-5 . 2e-6 . le-6 Model adjusted Rt 0.51 0.43 0.35 0.74 0.45 0.47 0.50 0.39 0.47 0.55 Model RZ 0.56 0.48 0.41 0.78 0.50 0.52 0.53 0.43 0.50 0.61 rT 52 52 52 52 52 52 52 52 52 52
' Constructed factor. ° Parameter p-value. All parameter coefficients are positive. Bi refers to inventory turnover B2 refers to delivery lead time B3 refers to percent of time meeting delivery promises B. refers to split orders B5 refers to number of expediters B6 refers to operational coefficient B7 refers to co-ordination Bs refers to manufacturing planning and control B, refers to formal system Boo refers to inventory costs. * Organizational & Technological & Human. '" Blanks in the table indicate parameter coefficients are not statistically significant (determinant variables not included in the models extracted by ACE technique).
260

7.4.4 The interpretation of ACE models for MRP benefits
The analytic transformations extracted from the ACE technique for determinant
variables in the ten MRP benefits models are illustrated in Figures 7.5-7.14 respectively.
As a whole, these figures provide us with valuable information which support our
hypothesis that the benefits obtained from MRP implementation do not necessarily
correlate with the determinant variables in a linear manner.
To interpret the output of the ACE models, we should look at the plots of tb vs.
b and tdv vs. d, for each v=1,......, n variables. It is interesting to note that the
transformed scores of the determinant variables in Figures 7.5-7.14 are positively
correlated with their corresponding observed benefit scores. This is because of all the
transformations for the benefit variables are increasing functions as shown in Figures 7.5.
- 7.14, and also all parameters coefficients for the determinant variables are positive as
depicted in Table 7.8 Therefore, we will interpret the transformed scores axis (y-axis) of
a determinant transformation plot as if it is the corresponding "observed benefit variable"
axis as in Sum et al. (1995). All in all, we only concentrate on the individual
transformation plots of the independent variables (determinant variables) in order to
explore and examine their effects on the dependent variables (MRP benefits) as in
Schroeder et al. (1981) and Sum et al. (1995).
261

Figure 7.5 Transformations for Inventory Turnover
T ran sform ed High I
1. ow
Transformed High I"
Low
T ran sform ed High j.
1. ow
Low
.
Low High 0 bserved
(c) Mianufacturins SlrJtc-e% Dummy V. 2
Transformed
High j
Low
I) bserted O b%erved
(d) Levels in RIM tei Vendor $uppsi t AYail. 11-ilirv
0 bserved
(a) inventory Turnover
Transformed
High I
262
Low High
I. uw High Observed
(b) Manufacturing Stritety Dummy V.!
Low 11 izh 1.46wt High

7.4.4.1 Inventory Turnover
As shown in Table 7.8 the inventory turnover benefit measure is affected by
manufacturing strategy, levels in BOM and vendor support availability. The results of the
inventory turnover model are statistically significant, with 51.0% of the variance in
inventory turnover accounted for (i. e. that manufacturing strategy, levels in BOM and
vendor support availability variables had explained approximately 51.0% of changes of
inventory turnover benefit measure among the Egyptian users). Figure 7.5 displays the
variable transformations.
7.4.4.1.1 Manufacturing strategy
The difference in the parameter estimates between make to order and make to
stock variables (Table 7.8) is . 0216 in favour of make to order strategy, suggesting that
more inventory turnover are obtained in make to order than make to stock environments.
Logically, make to stock companies should operate with safety stocks of the end item for
protection from stockout until components become available if the company happens to
get off schedule, while make to order companies would not be able to have safety stocks
of components because they do not know what end items they will be producing and
when. As usual, make to order companies are achieving higher inventory turnover ( the
ratio of sales to the average of inventory level measured at the cost or retailed price) than
make to stock companies (Dilworth, 1993). Our results concurs with Schroeder et al. `s
(Schroeder et al., 1981) finding that inventory turnover is significantly better in make to
order environments.
263

7.4.4.1.2 Levels in BOM
The levels in BOM transformation is displayed in Fig. 7.5d. This indicates that an
increasing level in bill of materials has a negative impact on inventory turnover. The
interpretation for the previous result may be related to the fact that more levels in the
BOM means more subassemblies, more intermediates, more parts and more raw materials
(Browne et al., 1996), namely more inventory investment and which may lead to less
inventory turnover. This finding supports Schroeder et al. `s (Schroeder et a1., 1981)
finding that the complexity product structure which includes parts & components and
levels in BOM has an opposite effect on inventory turnover.
7.4.4.1.3 Vendor support availability
The non-linear transformation of the independent variable, vendor support
availability, presents a very interesting insight (Fig. 7.5e). It suggests that as the vendor
support increases, the inventory turnover would decrease, then increase, and then
decrease again. The explanation of this result is likely to be related to the fact that as a
manufacturing company is a beginner in MRP implementation, it expects high support
from MRP vendors to overcome the implementation problems and which may be
reflected in reducing its performance such as reducing inventory turnover. In process of
time, the MRP company becomes more familiar and more successful with MRP
implementation so they expect less support from the vendor. But, the company may
decide to upgrade or develop its MRP system later and their reliance on the vendor
support will increase again. Duchessi et al. (1986; 1989) also found that the successful
companies expect less support from MRP vendors.
264

Figure 7.6 Transformations for Delivery Lead Time Transformed "
II 12 h
Law
Transformed High I
Low
0 bserved
(b) Capacity
Transformed High
Loa
O bserved
(a) Deliver7 Lead Timt
Transformed High I.
265
Low
Transformed High
Low
O bserved
(e) . supply Plinnin: 1139. s
Low High
Low High Observed
(c) Mlanufacturin_ Prfwe. s Dumm)' V. 1
Luw High
Low 11 igh Luw High O bservrd
(dOlanufacturin; 1'rD re . I)tunm% V. 2

7.4.4.2 Delivery Lead Time
Table 7.8 shows that capacity constraints uncertainty, manufacturing process and
supply planning data accuracy are important determinant variables of delivery lead time.
The ACE model of delivery lead time indicate that the previous factors are statistically
significant and explained approximately 43.0% of the change in delivery lead time among
the Egyptian MRP users.
7.4.4.2.1 The uncertainty of the capacity
The uncertainty of the capacity is a constructed factor comprising capacity
constraints and machine downtime (see Figure 7.2). Figure 7.6b suggests that the
uncertainty of the capacity leads to the higher delivery lead times. The transformation can
be explained as follows: When the capacity constraints and machine downtime are
unpredictable, the company's ability to use an MRP system to cut delivery lead times is
decreased. This may be because the uncertainty of the capacity may lead to the
nervousness in the Master Production Schedule i. e. the MPSs are not held firm by MRP
companies, in turn the production can not to meet delivery dates.
7.4.4.2.2 Manufacturing process
In contrast with Schroeder et al. 's (Schroeder et al., 1981) finding that
manufacturing processes do not affect the performance measures, our findings suggest
that the continuous industries had lower delivery lead times than the intermittent
industries because the nature of this industry helps manufacturing companies to make the
customer lead time from order to delivery very low. The investigation of the difference in
266

the parameter estimates between continuous and intermittent industries variables (Table
7.8) is . 0048 in support of the continuous industry.
7.4.4.2.3 Supply planning data
The non-linear transformation in Figure 7.6e indicates that there is a turning point
for the impact of supply planning data which comprises capacity data, vendor lead times
and production lead times on the delivery lead time. This shows that the increase of
supply data planning led to a decrease followed by an increase in delivery lead time. Our
insight into this is built upcn the fact that the data extracted from the system does not
continue to be accurate all times, but it may become inaccurate when users refuse to
follow the recommendations produced by the system anymore (Sum et al., 1995).
Subsequently any decision or process built upon these data such as determining delivery
lead time is improper.
267

Figure 7.7 Transformations for Percent of Delivery Promises
Transformed High I
Low
Transformed High I-
Low
U bserved
(b) Reliability
Transformed 11 igh
1.4N
O bserved
(a) DNivM Pronºi. C%
Transformed H igh I
Low
O bservtd
id) People Aupp""rt 1'rnblcm
268
O bserved
(C) Schedule E%ecution Data
Low High
Lo%% High Low High
1. ow 11 igh

7.4.4.3 Percent of Time Meeting Delivery Promises
The company's ability to meet delivery promises is affected by the degree of
uncertainty of the reliability, schedule execution data and people support problems (Table
7.8). The variable transformations are depicted in Figure 7.7.
7.4.4.3.1 The uncertainty of the reliability
Reliability is a constructed factor comprising behaviour of people and reliability of
plant within the factory (Figure 7.2). Figure 7.7b suggests that manufacturing companies
with more unreliable behaviour of people and plant within the factory wall had lower
percent of time meeting delivery promises. This result concurs with the notion that in
order to achieve the successful implementation (the higher performance) the company
must integrate the system with daily operations (Duchessi et al., 1989) and which, often,
are based on work force planning and master production scheduling.
7.4.4.3.2 Schedule execution data
As mentioned in Dilworth (1993); ElKhouly (1994) and Browne et al. (1996),
data accuracy has a positive effect on MRP implementation. Figure 7.7c shows that
schedule execution data accuracy has a positive impact on meeting delivery promises.
This could be explained by the realistic master schedule as a result of data accuracy
usage. This result supports Schroeder et al. 's (Schroeder et al., 1981) and Sum et al. 's
(Sum et al., 1995) findings that data accuracy affects delivery promises.
7.4.4.3.3 People support problem
The descent trend in Figure 7.7d indicated that people support problem reduces
the percent of meeting delivery promises. This supports the notion that higher
269

performance such as higher meeting delivery promises is accompanied by higher people
support (Turnipseed et al., 1992; Dilworth, 1993). This result concurs with Schroeder et
al. 's (Schroeder et al., 1981) finding that delivery promises is affected by people support.
270

Figure 7.8 Transformations for Percent of Split Orders Transformed
I 11 high
Transformed High I
Low
I. ow
O bserved
(b) Levels in BONI
Transformed il igh
1.4)"
Observed
(a) Split Orders
Transformed
H igh I
Low
0 bserved
id) %lanaeentrnt Supp. trt Problem
271
0 bserved
(c) Stare of De,. eIopment
Low High
Low High Low High
1. ow High

7.4.4.4 Percent of Split Orders
Table 7.8 shows that three independent variables have a significant impact on the
percent of spilt orders, they are levels in BOM, stage of development and management
support problem respectively.
7.4.4.4.1 Levels in BOM
The levels in BOM transformation displayed in Figure 7.8b indicates that
increasing levels in bill of materials has a positive impact on the percent of spilt orders.
The explanation can be offered for that effect is derived from the fact that a complex
BOM is a potential source of inefficiency for a production planning and control system
(Etienne, 1983; Sum et al., 1995). This may be reflected in increasing the percent of split
orders because of unavailable material as was demonstrated by (Schroeder et al., 1981).
7.4.4.4.2 Stage of development
As shown in Figure 7.8c there is a negative relationship between the stage of
MRP implementation and the percent of split orders. As the stage of MRP
implementation increases, the percent of split orders decreases because of unavailable
material. This concurs with the notion that when companies adopt an advanced stage of
MRP system (i. e. Classes B& A) the accuracy and stability of master production
schedule will increase. As a consequence, the degree of accuracy of BOM also will be
increased. This result supports Schroeder et al. 's (Schroeder et al., 1981) finding that the
percent of split orders is adversely affected by the stage of MRP implementation.
272

7.4.4.4.3 Management support problem
The upward trend in Figure 7.8d supports the notion that higher performance is
accompanied by higher top management support. The transformation for top
management support problem in Figure 7.8d suggests that where little problem with
management support was encountered, companies had a lower percent of split orders.
This result affirms the importance of top management support for improving the
operational use and improving performance (Duchessi et al., 1989) and also, conforms
with the findings of Schroeder et al. (1981).
273

Figure 7.9 Transformations for Number of Expediters T ran srorm ed
II igh I
Transformed High
Low
1,0 N
Transformrd High j
Low
L ii.
Low
Low
Observed
(b) Capacity
Observed
(d) Size
H igh O bserved
(a) Number of E%peüter%
Transformed High I
Low
High
Transformed
High I
Low
11 igh
O bserved
(c) Levels in BO\I
274
Low High
Lo% 11 ich O bser%-ed
(e) Star ut' I)r%r1.. piurnt

7.4.4.5 Number of Expediters
The ACE model for number of expediters (Table 7.8) indicates that the
uncertainty of the capacity, levels in BOM, company size and stage of MRP
implementation variables had explained approximately 45.0% of changes of the number
of expediters among the Egyptian users.
7.4.4.5.1 The uncertainty of the capacity
The transformation for the uncertainty of the capacity in Figure 7.9b suggests that
as the capacity is unpredictable the number of expediters increases and then decreases.
When little unpredictable of capacity is encountered, companies had lower number of
expediters because there is little falling behind with schedules, but at the turning point the
position is totally different where the increase of the uncertainty of the capacity is
adversely related to the number of expediters. This could be due to the company
depending on ad hoc solutions, such as supply from an alternative source (Per-lind,
1991).
7.4.4.5.2 Levels in BOM
The number of expediters is adversely affected by the number of levels in BOM.
Figure 7.9c suggests that as the levels of bill of materials increase the number of
expediters is likely to be increased. This is expected because increasing levels in BOM
may lead to an increase in materials, subassemblies, and parts behind schedule. This
means that a company may need to increase the number of expediters in order to meet
customers needs in the due dates.
275

7.4.4.5.3 Company size
Figure 7.9d suggests that increasing company size has a positive impact on the
number of expediters. Since company size is related to the scale and scope of the
manufacturing operations (Sum et al., 1995), therefore the large companies are likely to
have more hot jobs and more behind schedule, which may lead to the need to more
expediters in order to reduce the deviations between two dates (due date and need date),
namely making the two dates coincided (Plossl, 1995). This supports the findings of
Schroeder et al. (1981).
7.4.4.5.4 Stage of development
Table 7.8 affirms the importance of the stage of development in increasing
performance. Figure 7.9e suggests that as the stage of development increases, the
growing computerisation in all MRP modules such as inventory control, bill of materials
and master production schedule increases, and this will be reflected in minimising behind
schedule (Mady, 1992), namely, minimising the number of expediters. This result
supports Schroeder et al. `s (Schroeder et al., 1981) finding that the number of expediters
is adversely affected by the stage of MRP implementation.
276

Figure 7.10 Transformations for Operational Efficiency T ransform ed
High I
Transformed High I
Low
Low
1
Observed
(b) Size
Transformed If igh I
I. 11 N
O bserved
(a) Operational EtTkienc?
Transformed
H igh I
Low
0 bserved
(d' Operrtin_ Exrculiun '): na
0 bserved
(c) state or I)e%cI. ipmcnt
277
Low High
i, o% High Low 11 UEh
Low 11 i! h

7.4.4.6 Operational Efficiency
Table 7.8 shows that operational efficiency (increased throughput and improved
product quality) is affected by company size, the stage of development and operating
execution data accuracy.
7.4.4.6.1 Company size
The size transformation displayed in Figure 7.10b indicates that increasing
company size has a positive followed by "plateau" then positive impact' again on
efficiency. The first part of the curve indicates that as company size increases the growing
ability to increase throughput and improve product quality tends to be increased. The
plateau stage can be explained in the light of the fact that as size gets too big, the
conflicting technologies, objectives, processes, and procedures might set in (Sum et al.,
1995). Consequently, further benefits have not been reaped, in turn companies try to
keep on the existing level of benefits achieved. But this is inconsistent with Sum et al. 's
(Sum et al., 1995) finding that increasing size has a positive followed by a negative
impact on efficiency. They stated that as size increases, diseconomies and inefficiencies
due to conflicting technologies, objectives, processes and procedures might set in.
7.4.4.6.2 Stage of MRP implementation
Figure 7.1Oc reveals that increasing stage of development has a positive followed
by a negative impact on efficiency. Our insight into the turning point phenomena in
Figure 7.1 Oc is derived from the fact that increasing stage of MRP implementation means
that company tends to develop the formal system of planning and control by increasing
278

formal policies, procedures and responsibilities (Duchessi et al., 1989), and which may
lead to more resistance or more conflict from people part within a factory.
7.4.4.6.3 Operating execution data
The transformation for the operating execution data accuracy in Figure 7.1Od is
similar to Figure 7.7c in that high data accuracy is needed to achieve both the tangible
and subjective benefits. An explanation could be that operational efficiency requires
accurate data about planning data (capacity, vendor lead times, production lead times)
and execution data (shop floor control). Thus, data accuracy can be considered as a
major determinant variable of the successful implementation (Duchessi et al., 1989).
279

Figure 7.11 Transformations for Co-ordination T rjnsform ed
II i^h
º. ow
O bserved
(a) Co-ordination
Transformed High
Low
Observed
(b) Demand Plannin; Data
Transform ed H igh
Low
Transformed High I
Low
Observed
(d) People Support I'rubkm
Observed
(c) Management Support Pn. blem
280
Low High
Low High Low High
Low High

7.4.4.7 Co-ordination
The ACE model for co-ordination benefit reveals that demand planning data,
management support problem and people support problem are statistically significant
independent variables affecting co-ordination among operations, marketing and finance.
The variable transformations are displayed in Figure 7.11.
7.4.4.7.1 Demand planning data
The upward trend in Figure 7.11b supports the fact that the higher co-ordination
among functions and sub-systems within the organisation is accompanied by higher
quality of data flow across them (Sum et at., 1995). Figure 7.1 lb suggests data accuracy
is important for effective co-ordination.
7.4.4.7.2 Management support problem
Figure 7.11c suggests that increasing management support problem has a
negative impact on co-ordination. An explanation could be that effective co-ordination
requires management support to set clear goals for the implementation and to distribute
responsibilities across functional areas (Duchessi et al., 1989).
7.4.4.7.3 People support problem
The transformation in Figure 7.11 d reveals that people support problems such as
lack of support from supervisor/foreman and lack of company expertise in MRP reduce
co-ordination. This is expected since the implementation of any new formal systems is
accompanied with resistance or lack of knowledge about it across departments. This
result to a great degree concurs with Sum et al. 's (Sum et al., 1995) finding that
increasing people support problems reduce co-ordination.
281

Figure 7.12 Transformations for Manufacturing Planning & Control Transform ed
11 igh
Transform ed High I
Low
Low
observed
(b)1'earin Implementation
T ransform ed 11 ich 1
1. low
Low
Observed
(c) supply Planning Data
1. ow H i_h 0 bser%ed
td) Demand I'lrnnm_ I)ar. r
O bserved
(a) MIanufacturin_ P d: C
Transformed High
282
Low High
Low Iii; h Lop it High

7.4.4.8 Manufacturing Planning and Control
Table 7.8 shows that three independent variables are statistically significant and
explained approximately 50.0% of the change in manufacturing planning and control
among the Egyptian users. The variable transformations are displayed in Figure 7.12.
7.4.4.8.1 Year in implementation
Figure 7.12b suggests that increasing years in implementation has a positive,
followed by a negative, then a positive impact on manufacturing planning and control.
The positive impact of older system on manufacturing planning and control can be
explained by user acceptance of the system as a result of prolonged usage (Sum et at.,
1995). On the other hand, the negative impact may be as a result of the systems
becoming conventional and the company needing to upgrade it to improve its business.
7.4.4.8.2 Supply planning data
The transformation for supply planning data in Figure 7.12c exhibits a positive
impact on manufacturing planning and control. An explanation could be that supply
planning data such as capacity data, vendor lead times and production lead times data
may allow managers to obtain reports on the material flow, the right parts at the right
place at the right time. This may be reflected in the efficiency of MPC system.
7.4.4.8.3 Demand planning data
The importance of demand planning data such as BOM, inventory and market
forecasts data is reflected in Figure 7.12c which shows that as demand planning data
increases, there is better manufacturing planning and control increases. This result
283

supports the Schroeder et al. (1981); White et al. (1982) and Sum et al. (1995) findings
concerning the importance of data accuracy for improving performance.
284

Figure 7.13 Transformations for Formal System Transformed
H Ifh
Low
Observed
(a) Furnud SPxtrm
Transformed H igh I
Low
Observed
(b) Experience
Transformed H igh
LUN
0 bserved
(c) Technical Prahlern
285
Low High
Lowy II i=h
1, ow 11 ich

7.4.4.9 Formal System
As shown in Table 7.8 the formal system benefit measure is affected by the degree
of experience and technical problems. The results of the formal system model are
statistically significant, with 47.0% of the variance in formal system accounted for. Figure
7.13 displays the variable transformations.
7.4.4.9.1 Experience with CAPM
Figure 7.13b suggests that increasing previous experience with CAPM systems
has a positive impact on formal systems. This is expected, because increasing experience
with automated information systems is likely to increase people's ability to understand
and accept any prerequisites for a new formal systems such as the policies which describe
how to perform business functions (e. g., forecasting, master production purchasing, cost
accounting), procedures which describe how to enter and verify associated system
transactions, and the distribution of responsibilities. The acceptance of these formal
issues permit using the system, conducting business, and achieving data accuracy
(Duchessi et al., 1989).
7.4.4.9.2 Technical problem
Figure 7.13c indicates that when few technical problems are encountered, low
formal system benefits are reported. As the technical problems increase, the need for
formal system increase in order to reduce informal systems for material
management/inventory/production control and to increase BOM/inventory/MPS data
accuracy. This result concurs with Sum et al. 's (Sum et al., 1995) finding that increasing
technical problems have a positive followed by a negative impact on co-ordination among
286

departments and sub-systems, and which may demonstrate the need for increasing formal
systems to formalise policies, procedures and distribute responsibilities.
287

Figure 7.14 Transformations for Inventory Costs Transformed
H igh I
Low
Transformed High I
Low
Observed
(b) Manufacturing Str4teo_y Wnuny V. 1
Transformed H izh
1. ow
0 bserved
(a) Inventory Cots
Transformed High I-
Low
0 bser""ed
(d) Le%els in BONI
288
Observed
(c) Manufacturing Sfrrle* 1)umm% V. 2
Low High
Low High Low High
Low High

7.4.4.10 Inventory Costs
The ACE model of inventory cost benefit (Table 7.8) shows that inventory cost is
affected by type of product and levels in bill of materials. Figure 7.14 displays the
variable transformations.
7.4.4.10.1 Manufacturing strategy
The difference in the parameter estimates between make to order and make to
stock variables concerning inventory costs benefit (Table 7.8) is . 0650 (. 0651 make to
stock- . 0001 make to order) in favour of make to order, namely make to order is highly
statistically significant more than make to stock. This suggests that more reduction in
inventory costs is obtained in make to order than make to stock where the last strategy
has a higher inventory costs (Browne et al., 1996).
7.4.4.10.2 Levels in BOM
The upward trend in Figure 7.14c supports the notion that higher levels in BOM
is accompanied by higher inventory costs. This result concurs with the fact that more
levels in bill of materials means more inventory investment (ElKhouly, 1994; Plossl,
1995).
7.5 Summary and conclusions
The main purpose of the analysis in this chapter has been to test that uncertainty,
organisational, implementational, technological, and human variables do not necessarily
correlate with the benefits obtained from MRP implementation in a linear manner.
The hypothesis was tested using Alternating Conditional Expectation (ACE). It
was partly supported. In so doing, Factor Analysis (FA) was employed to reduce the
289

number of the subjective benefits measures to some smaller number by determining which
relate each other and which appear to measure the same thing. Five out of fourteen
subjective benefits measures were extracted. These are operational efficiency, co-
ordination, manufacturing planning & control (predictability), formal system, and
inventory costs. The subjective benefits measures within each factor were related to each
other. In contrast, this technique was not for the tangible benefits measures because the
data is numerical. In addition, 20 out of 40 uncertainty, organisational, implementational,
technological and human determinant variables were extracted.
As the second MRP study to use the advanced ACE technique, our ACE models
cover several interesting insights into the relationships between benefits obtained from
MRP implementation and determinant variables beyond these from the first study
conducted by Sum et al. (1995). This concerned an analysis of determinant variables of
MRP benefits on 52 MRP companies in Singapore, such as uncertainty, vendor support
and user profile factors in addition to measuring improvements in performance.
Having discussed the mathematical results of the relationships between
uncertainty, organisational, implementational, technological and human determinant
variables and the benefits obtained from MRP implementation, the following is a
summary of findings:
1. In general terms, similar to the findings of the Sum et al. study there are surprising new
insights regarding the relationship between determinant variables and the benefits
obtained from MRP implementation as a result of using ACE transformations.
290

2. The level in bills of materials (BOM) appears to be a critical determinant variable in
affecting inventory turnover, percent of split orders, number of expediters and inventory
costs. This is expected because levels in BOM identifies the components parts of a final
output product at each level and indicate the complexity of detailed material planning.
Therefore, high levels in BOM increases the probability of increasing inventory. In turn
inventory costs tends to increase and inventory turnover tends to decrease. Moreover,
the percentage of split orders because of unavailable materials tends to increase as does
the number of expediters.
3. Our results concerning the importance of data accuracy as an important factor for
MRP implementation are consistent with past literature, which confirmed that degree of
data accuracy, whether it was planning data such as inventory records data or execution
data such as shop floor data, impacts on all benefits that can be obtained from MRP
implementation. This study reveals that high data accuracy leads to shortened delivery
lead time, increased percent of delivery promises achieved, increased operational
efficiency, and increased coordination among departments within the company. This will
be reflected in increasing the user's level of confidence in and acceptance of the system.
4. The literature review revealed that an adequate capacity enables a company to meet its
customer needs. Our findings are consistent with past literature, where capacity
uncertainty increases delivery lead time and the number of expediters increases in order
to meet due dates.
291

5. Consistent with past literature, manufacturing companies implementing a make to
order strategy attained increased inventory turnover and decreased inventory costs more
than companies implementing a make to stock strategy.
6. Our findings show that management support and people support are critical to
decreasing the percent of split orders, to increasing the percent of delivery promises, to
improving coordination and to achieving operational efficiency. This suggests that
management should understand the significance of informal systems alongside formal
systems (MRP systems) in order to make users perform better.
7. Our findings indicate that stage of the MRP implementation can have a negative
impact on both percent of split orders and number of expediters. This is consistent with
past literature where a high stage of MRP implementation is associated with capability
for both priority planning and capacity planning, and reductions in inventory and number
of expediters needed.
8. Our findings indicate that company size can have a positive impact on operational
efficiency. This may be because big companies may have the capability to successfully
operate MRP systems in terms of having experts in automated information systems and
increasing investment in advanced systems etc.
9. It is very interesting to note that there are no significant relationships between source
of MRP system, MRP system features, company maturity, implementation strategy, user
involvement, education and training, the required products, initiator of MRP effort,
vendor involvement and vendor experience and the tangible and subjective benefits
obtained from MRP implementation based on the points of view of the Egyptian users.
292

All in all, an analysis of the relationships between uncertainty, organisational,
implementational, technological, and human determinant variables and the benefits
obtained from MRP implementation using ACE technique created new insights into these
relationships and which may help MRP users and managers to derive MRP practices
which enhance its effectiveness.
293

CHAPTER EIGHT
Conclusion and Recommendations
8.1 Introduction
Having finished the presentation and analysis of the results of this study in the
previous chapters, it is time now to present the concluding chapter which is composed of
five main sections. The first section attempts to acquaint the reader the main conclusions
based on a review of the literature and the survey undertaken by the researcher, the
second section presents both theoretical and empirical implications of the study; the third
section illustrates the main contribution of the study; the fourth section offers the
limitations of the study and the final section provides suggested recommendations for
further research.
While considerable efforts have been directed towards investigating the
implementation of MRP systems based on case study analysis, only a handful of studies
have been devoted to examine MRP practices based on empirical studies. Some of these
studies were conducted in developed countries such as the US and others in newly
industrialising countries such as Singapore, but none of them was conducted in less
developed countries such as Egypt. Even though much is reported about the user's
dissatisfaction concerning the benefits obtained from MRP practices, very little work has
been done to assess the benefits obtained from MRP implementation. Besides, most of
previous studies have attempted to establish the facts concerning the factors that
influence MRP systems effectiveness without attempting to specify and measure all
possible explanatory variables of such effectiveness.
294

Therefore, the main task of this study was to fill some of this gap, and three
objectives represent the central concern of this study: a) to investigate the state of
practice of MRP in Egyptian manufacturing companies, b) to assess the effectiveness of
MRP practices measured by the real benefits obtained from MRP implementation in
Egyptian manufacturing companies, and c) to explore and measure the MRP benefit-
determinant relationships in Egyptian manufacturing companies.
The sample for the present study was 93 Egyptian manufacturing companies in
the public industrial sector (population size = 200). It was broken down into MRP
companies and Non-NW companies (52: 41). The data for this study were collected by a
nine page questionnaire mail survey because the population of study is geographically
dispersed.
The major findings of this research suggest that MRP implementation in Egypt is
relatively similar to implementation in manufacturing companies in the newly
industrialised countries and in the west. We conclude that the average company installing
MRP has achieved significant benefits. The relationships between MRP benefits and
determinant variables that influence them do not take a linear manner for several
relationships and this may be advantageous for both MRP managers and users in
managing these relationships effectively for achieving the effectiveness of MRP practices.
When we tested a suggested model framework of determinant variables of MRP
implementation benefits in this study in the light of the basic data analysis, we found that
the conclusions generally tended to support the model in some relations but not in others
- see Figure 8.1 below:
295

Figure 8.1 A suggested model framework of determinant variables of MRP
implementation benefits.
Determinant Variables MRP Implementation Benefits Uncertainty Determinants Tangible Benefits Product characteristics diversity Inventor turnover Amount of aggregate product demand Delivery lead time (days) Machine downtime Percent of time meeting delivery promises (%) The standard of raw material Percent of orders requiring "splits" Behaviour of people within the factory because of unavailable material (%) Reliability of plant within the factory walls Number of expediters (number of people) Capacity constraints Subjective Benefits Organisational Determinants Improved competitive position Company age Reduced inventory costs Company size Increased throughput Type of products Improved product quality Type of Manufacturing Improved productivity Layout Better ability to meet volume/ product change Company complexity Better production scheduling Organisational arrangements Reduced safety stocks Organisational willingness Better cost estimation Implementational Determinants Improved co-ordination with marketing and finance Years in implementation Improved your ability to perform in your job Implementation strategy Reduced informal systems for materials management/ Degree of data accuracy inventory/ production control Initiator of MRP effort Increased BOM/inventory/MPS accuracy Software/hardware vendors support Increased information on which to base decisions since Implementation problems MRP has been implemented Technological Determinants Degree of integration among MRP modules Source of system System installation cost Additional investment over next 3 years User class (stage of MRP implementation) NW system features Human Determinants The previous experience with CAPM Systems Education and formal training User involvement User support De ree of utilising the outputs of MRP
Statistical analysis regarding reported benefits by the Egyptian users demonstrate
that not all MRP users attain same NIRP benefits because there are significant differences
among MRP companies concerning one of the tangible benefits i. e. "a reduction in
number of expediters" and three of the subjective benefits i. e. "improved product
296

quality"; "better ability to meet volume/product change"; and "improved ability to
perform a job" obtained from MRP implementation.
Non-linear relationships were discovered between certain determinant variables
and MRP benefits (e. g., uncertain capacity and number of expediters; people support
problems and co-ordination among internal departments). The next section summarises
the main findings of the current study.
8.2 Main findings of the study
As a whole, the findings in the current study suggest that MRP practices in Egypt
are relatively similar to those in Sum & Yang (1993) and Ang et al. (1995) in Singapore
as a newly industrialising country; and Anderson et al. (1982) and Laforge & Sturr
(1986) in the US as a developed country. Also, the study reveals that the implementation
of MRP systems by Egyptian users is satisfactory because our survey indicates that MRP
users believe that the expected benefits have been obtained. This is particularly striking
because most of the companies who have installed MRP have done so only recently.
Furthermore, the findings in the current study show that there is a relationship
between some uncertainty, organisational, implementational, technological and human
determinant variables and the benefits obtained from MRP implementation. As a
consequence, the empirical findings of the study can be summarised and concentrated in
the following points which attempt to link them to the literature:
297

8.2.1 Findings regarding the state of practice of MRP systems in
Egyptian manufacturing companies
The empirical findings indicate that the current usage of MRP system in Egypt is
not very widespread, considering that out of the 123 respondents (usable and unusable),
only 52 (42.3%) companies have implemented at least the basic modules of MRP system.
However, this implies that the Egyptian companies are striving to improve their
manufacturing efficiency and effectiveness with a better manufacturing planning and
control system. On the other hand, a review of the literature indicates that the usage
levels of MRP systems in other countries are approximately similar e. g., in Singapore 59
(46.1%) out of 128 companies surveyed by Sum and Yang (1993); Ang et al. (1995) and
Sum et al. (1995), had implemented MRP systems, also in the US 433 (64%) out of 679
companies and 33 (31%) out of 107 companies surveyed by Anderson et a1. (1982) and
Laforge & Sturr (1986) respectively, had implemented MRP systems.
Consistent with past literature, the survey findings suggest that MRP
implementation is more likely to be in engineering and electronic industries and less likely
to be in other industries either in Egypt or Singapore or the US.
Companies are more likely to implement MRP systems when they are larger,
older, complex, and their marketing strategy is a combination of make to order and make
to stock products in the three countries. These findings also are consistent with past
literature in related studies such as Anderson et al. (1982) in the US and Sum & Yang
(1993) in Singapore.
298

The survey findings suggested that limited knowledge about MRP systems can be
considered as the most important obstacle that impedes MRP implementation by the
Egyptian and Singaporeian Non-users, while lack of MRP training, education and
expertise were identified as critical problems encountered in the implementation process
both in Egypt and in Singapore.
The current study reveals that most of MRP companies in Egypt are state owned;
in contrast the majority of MRP companies in Singapore and the US are multi-national
owned.
From the empirical evidence, the study indicates that the organisational
arrangements for implementing MRP systems incline to be more formal by the US users
(oldest users) than their peers in Egypt and Singapore.
Our study reveals that top management support in Egypt has a great impact on
the extent and rate of the acceptance of MRP system more than their peers in Singapore
and the US. The reason behind that may be because MRP companies in Egypt are still in
an early phase of implementation (57.0% of companies under investigation had
implemented MRP systems for 5 or less than 5 years) so top management are highly
involved in MRP implementation or it may be a cultural difference.
The empirical findings indicated that there is a high reliance among Egyptian users
on the vendors to provide the necessary assistance. The reason behind that may be that
fact that local companies lack the necessary expertise in automated manufacturing
systems in general and in MRP system in particular. In contrast, the vendor's role in the
299

US companies is less, perhaps the reason being that US users have had more expertise in
the implementation of MRP systems than Egyptian users.
The empirical findings indicate that the Egyptian users are at the earlier stage of
MRP implementation. Twenty five out of 52 MRP companies in Egypt claimed to be
class C users which means that they use MRP system as an order launching system for
managing inventory.
Consistent with past literature, the research findings revealed that the
government is still a major player in the development of the manufacturing sector
whether in Egypt or in Singapore. It promotes the implementation of MRP systems by
manufacturing companies whether through providing support such as financial assistance,
tax reliefs, and grants, or by providing education and training from the governmental
institutions.
Our findings indicate that the majority of MRP systems run on mainframes and
minicomputers rather than PCs in Egypt. Also, the majority of MRP companies in Egypt
prefer to buy turn-key systems. This may stem from the Egyptian users seeking to take
advantage of the services offered by vendors and to shorten the implementation time.
This is consistent with the results of the Sum and Yang study (1995) concerning MRP
practices in Singapore.
Consistent with past literature, the human aspects were found to be crucial in
affecting the implementation of MRP systems in the local context. MRP users reported
that they regarded education and training, top management commitment and users
involvement as necessary requirements for implementing MRP systems.
300

8.2.2 Findings relating to the benefits obtained from MRP
implementation by Egyptian manufacturing companies
The survey findings demonstrate the benefits from MRP already documented in
developed countries such as the US and the newly industrialising countries such as
Singapore, were also obtained by Egyptian users.
The research findings indicated that MRP users in Egypt, Singapore and USA are
not only pleased with the improvements which were derived from MRP implementation,
but also optimistic concerning further improvements when their MRP systems are fully
installed.
The findings of the study indicate that the costs of MRP installation by the
Egyptian users are less than their peers in the US. The reason seems to be that local
companies are at earlier stage of MRP implementation i. e. the majority of MRP users are
implementing MRP I, while the most of American users have implemented a complete
Manufacturing Resources Planning (MRP II) system which is considered more
sophisticated than MRP I and is more expensive and needs more training expenses.
In direct contrast to past literature, the findings found no relationship between the
costs spent on MRP installation and company size suggesting that it is not only the large
firms can implement in these expensive systems.
With the exception of a difference in the number of expediters among MRP
companies, our findings provide strong evidence that there are no significant differences
amongst the Egyptian users concerning the improvements and changes achieved and the
expected progress from MRP implementation. This is partly inconsistent with past
301

literature (Anderson and Schroeder, 1984; Duchessi et al., 1989) which suggests that not
all MRP users attain the same benefits.
The study reveals that MRP benefits are not only restricted to the electronic and
engineering industry as was generally believed in past studies but also those benefits can
be obtained by the other manufacturing industry sectors such as: textile industry and food
industry, though a smaller proportion of firms in these latter industries have adopted
MRP.
8.2.3 Findings related to determinants of MRP benefits
Consistent with past literature, the benefits obtained from NW implementation
are significantly better in "make-to-order" than "make-to-stock" environments. Our
findings suggest that MRP companies working in make to order environments obtained
better inventory turnover and lower inventory costs than those companies working in
make to stock environments.
In direct contrast to previous studies, our findings indicate that there is a non-
linear relationship between vendor support and inventory turnover. This suggests that
when a manufacturing company is a beginner in MRP implementation it has a lot of
problems concerning the implementation of MRP system problems which may be
reflected in reduced performance in areas such as inventory levels and inventory turnover.
Therefore, it has a high reliance on the vendor to provide the necessary technical
assistance. In process of time, MRP user becomes more familiar and more successful
with MRP implementation, so, it expects less support from the vendor. But the company
may decide to upgrade or develop its MRP system afterwards so its reliance on vendor
302

support will increase again. This relationship can be depicted as shown in Figure 8.2
below:
Figure S. 2 The relationship between vendor support and MRP user needs over time.
Vendor Support
Years in implementation
Levels in bills of materials (BOM) appear to be critical determinant variables in
affecting several MRP benefits such as inventory turnover, percent of split orders,
number of expediters and inventory costs. This is expected because high levels in BOM
increases the probability of increasing inventory and in turn inventory costs tends to
increase and inventory turnover tends to decrease. Moreover, the percentage of split
orders because of unavailable materials and the number of expediters tend to increase.
Consistent with past literature, experience with CAPM systems was found to be
crucial to increasing "formality" benefits such as developing new policies which describe
how to perform business functions (e. g., forecasting, master production purchasing, cost
accounting), new procedures which describe how to enter and verify associated system
transactions, and the distribution of responsibilities.
Our findings indicate that as the technical problem increase, the need for formal
system increase in order to reduce the use of informal systems for material
303

management/inventory/production control and to increase BOM/mventory/MPS data
accuracy. This result is consistent with previous studies concerning the impact of
technical problem on the need for increasing formal systems to formalise policies,
procedures and distribute responsibilities.
Consistent with past literature, data accuracy, whether planning data such as
inventory records data or execution data such as shop floor data, was found to be crucial
in affecting all the benefits that can be obtained from MRP implementation. This study
reveals that high data accuracy leads to shortened delivery lead time, increased percent of
achieved delivery promises, increased operational efficiency, and increased co-ordination
among departments within the company. This should be reflected in increasing the user's
level of confidence in and acceptance of the system.
Our findings indicate that adequate capacity enables a company to meet its
customer needs. Where capacity uncertainty increases, delivery lead time and number of
expediters increase in order to meet due dates.
Consistent with past literature, manufacturing companies have implemented
make-to-order strategies attained increased inventory turnover, and decreased inventory
costs more than those who have implemented make to stock strategies.
Our findings show that management support and people support are critical in
decreasing the percent of split orders, increasing the percent of delivery promises,
improving co-ordination and achieving operational efficiency. This suggests that
management should understand the significance of the informal system alongside the
formal system (MRP system) in order to make users perform better.
304

Our findings indicate'that the stage of MRP implementation can have a negative
impact on both percent of split orders and number of expediters. This is consistent with
past literature where it is in later stages of MRP implementation that there is capability
for both priority planning and capacity planning, reductions in inventory take place and
more expediters are needed.
Our findings indicate that company size can have a positive impact on operational
efficiency. This may be because big companies may have greater capability to successfully
operate MRP systems in terms of having experts in automated information system and
bigger investment in advanced systems etc.
Inconsistent with past literature, our findings indicate that there is no significant
impact of several determinant variables, such as source of MRP system, MRP system
features, company maturity, implementation strategy, user involvement, education and
training, the required products, initiator of MRP effort, vendor involvement and vendor
experience on the benefits obtained from MRP implementation by the Egyptian users.
8.3 Implications of the study
The study findings appear to have theoretical and practical implications for both
MRP managers and users in Egyptian manufacturing companies and for researchers.
Therefore, the following theoretical and practical implications can be drawn:
(1) One of the main implications of the current study is that it has shown that competitive
position was not one of the major reasons for MRP implementation by the Egyptian
manufacturing companies. A majority of MRP companies in Egypt indicated that the
most important reasons for implementing MRP systems were operational and not
305
strategic reasons. Lowering inventory cost and meeting delivery dates better were the
kinds of reasons given, suggesting that MRP systems were not viewed as a competitive
strategy weapon.
(2) Another implication of this empirical study is that the governmental role represents a
highly salient factor for developing the industrial sector in Egypt. Manufacturing
companies indicated that they rely on the government not only to promote MRP systems
but also to provide support (e. g., grants, incentives), and to run the relevant
education/training programmes for achieving successful implementation. This reflects the
extent to which the public sector still dominates control structures over industry in Egypt.
(3) A very significant implication is that user's involvement was found to be crucial to
implementing MRP systems. In this regard, manufacturing companies can encourage
MRP users to be more involved in the implementation process whether by taking account
of their comments and recommendations or by increasing incentives such as rewards.
Also, they can run the appropriate training courses whether on site, at the educational
institutions or at private and government training agencies.
(4) Managers in manufacturing companies within Egyptian industrial sector can use the
instrument used in this study to evaluate the expectations and perceptions of MRP users
concerning the tangible and intangible benefits obtained from MRP implementation in
their organisations. These measures can help top management to know how MRP is
being used, to concentrate on key areas to maximise MRP benefits that match their
company goals and to identify those areas of MRP practices where improvements should
be made.
306

(5) Western managers can get a better understanding of the MRP practices in Egypt
based on the empirical findings provided. In today's global economic environment,
companies are often looking for business partners all over the world. Understanding of
how manufacturing companies in other countries such as Egypt are exploiting a powerful
technology such as MRP systems for gaining competitive advantage is very important for
decision makers in Western corporations.
(6) Another implication for software and hardware MRP vendors (e. g., ICL company
which is seeking nowadays to distribute its product of Manufacturing Control System -
MAX in Egypt) is that they can get a better understanding of the state of practice of
MRP systems in Egypt. In turn they can formulate the relevant strategies which enable
them to meet the current and expected user needs.
(7) The empirical findings of this research are educational and informative for non-users
and potential users of MRP. They can take advantage of the experiences of the current
users which provide a preview of what they can expect to face and the traps that they can
avoid when they acquire MRP.
(8) Poor training/education on MRP and lack of company expertise in MRP were viewed
as the major implementation problems. Therefore, the need for MRP education and
training is highly stressed. In turn, MRP vendors, educational institutions and government
training agencies can meet this need through preparing appropriate programmes and
courses for MRP users.
(9) As the cost of MRP installation by the Egyptian users has not been considered as a
major barrier to adopt MRP systems and also is less than their peers in the US, this can
307

be considered as a good incentive for the decision makers in non-NW companies to plan
and promote MRP implementation in their organisations.
(10) With the empirical findings of the effectiveness of MRP systems measured by the
benefits obtained from MRP implementation, greater attention should be paid by current
and potential MRP users to MRP practices. Greater MRP systems effectiveness will
place the Egyptian manufacturing sector in a competitive position in the international
arena.
(11) As the empirical results indicate that data accuracy appears to be critical in affecting
the benefits obtained from MRP implementation, managers and users must devote more
effort to maintain data accuracy at a high level if they want to obtain significant benefits
from their MRP systems.
(12) The linear and non-linear relationships between uncertain capacity and the benefits
obtained from MRP implementation suggest that MRP managers must expend extra
effort to estimate the right capacity (usually in hours) of each machine or work centre in
order to maintain the efficiency of their production planning and control system.
(13) The negative impact of increased levels in bill of materials (BOM) on the benefits
obtained from MRP implementation addressed by the current study suggests that
managers in the production departments in non-NW companies with low levels in BOM
such as food and textile industries can be shown that the implementation of MRP systems
is not restricted to complex companies (i. e. companies with high levels in BOM), but
could be applicable in their companies.
308

(14) Our empirical results indicate that as company size increases the need for more
expediters increases, also as size gets too big the operational efficiency increases. This
provides a new insight into management which means that an extended size is not
necessary to achieving the full effectiveness of MRP systems. On the other hand, this is a
good sign for decision makers in small size companies who are hesitating to adopt MRP
system due to size considerations indicating that they might be able to implement and
operate an MRP systems effectively.
(15) A very significant implication is that the stage of NW implementation was found to
be crucial to the benefits obtained from MRP implementation. This suggests that
management commitment must be extended for implementing an advanced stage of MRP
system if they want to realise more benefits from their MRP system.
(16) Our findings suggest that there is a positive impact of "people support" on the
benefits obtained from MRP implementation. The main implication is that people
problems should be monitored very closely by managers and also they have to understand
that informal systems should exist and be sustained alongside the formal system if they
want to attain significant benefits from their MRP system.
(17) The non-linear relationship between people support problems and co-ordination
among departments may suggest that top management should monitor MRP usage
among different departments such as production, finance, and marketing departments, if
they want to achieve the effectiveness of MRP implementation.
(18) Our findings indicate that MRP companies set up formal steering committees to
oversee the implementation of MRP systems, have these committees meet regularly, and
309

have someone with full responsibility for the MRP project. This suggests that top
management support should be provided and also organisational support across functions
and levels in the company should be generated, if MRP users want to achieve successful
implementation of their MRP system.
8.4 Contributions of the study
It is hoped that this study will make several contributions, mainly in the following
areas:
8.4.1 Theoretical contributions
(1) This study contributes to the development of the body of the literature showing the
role of developments in manufacturing planning and control systems such as MRP, JIT
and OPT systems in increasing the ability of a company to face dramatic changes in the
business environment.
(2) A very significant contribution of this study is its extensive comparison with results
obtained by previous studies elsewhere. Comparison is made between preceding studies
of MRP implementation in developed countries and in the newly industrialising countries,
and MRP implementation in a less developed country, namely Egypt.
(3) There is a large body of earlier work on MRP practices to which this study relates but
most are exploratory, and have been conducted based upon case studies. This study is not
only exploratory, it is empirical, descriptive and quantitative.
(4) This study has also a wider coverage in terms of the scope of the key issues about
MRP practices. It investigated MRP company profile (i. e. size, age, type of
manufacturing systems, type of manufacturing processes), MRP system characteristics
310

(i. e. hardware and software, degree of computerisation, degree of integration, system
features, MRP definitions), the stage of MRP implementation (i. e. user class), MRP
implementation (i. e. initiator of MRP, implementation problems), MRP systems growth,
factors that may impede non-users to implement MRP systems and finally the main areas
for promoting MRP systems based on the point of view of MRP users within Egyptian
manufacturing companies.
(5) Compared with the previous studies our study is the first large-scale study
concentrating on specific MRP benefits, namely nineteen measures of the benefits of
NW implementation which are broken down into two groups a) the tangible benefits
which comprise five performance measures, and b) the subjective benefits which consist
of fourteen intangible benefit measures. On the other hand, Sum and Yang (1993)
investigated ten subjective benefit measures in order to assess the benefits obtained from
NW implementation in Singapore, Anderson and Schroeder (1984) investigated five
tangible benefits in their study regarding the results obtained from NW implementation
by the American companies, while Sum et al. (1995) investigated thirteen subjective
benefits in their study concerning the MRP benefit-determinant relationships in the
Singaporean context.
(6) Regarding the NW benefit-determinant relationships, the current study has a wider
coverage in scope of the explanatory variables of NW systems effectiveness measured
by both tangible and subjective benefits obtained from MRP implementation, more than
Sum et al. (1995), who found that there are linear and non-linear relationships between a
set of organisational, implementational, and technological determinant variables and the
311

subjective benefits obtained from MRP implementation by the Singaporean users. This
study investigated the relationships between a set of uncertainty, organisational,
implementational, technological, and human determinant variables and the tangible and
subjective benefits obtained from MRP implementation by the Egyptian users. In the
same direction the results show that there are linear and non-linear relationships between
MRP benefits and their determinant variables.
8.4.2 Practical contributions
(1) This study contributes to what is currently a very limited amount of empirical
research on MRP practices. Therefore, its conclusions are less biased by limitations of
personal experience than most of the previous studies.
(2) No study has been done concerning MRP practices whether in developed countries or
in the newly industrialising countries providing the large number of empirical implications
for both MRP managers and users like the current study.
(3) Since only one previous study examined the MRP benefit-determinant relationships
using Alternating Conditional Expectations (ACE transformation) technique, the current
study is only the second study to explore and examine the MRP benefit-determinant
relationships using the ACE transformation. This novel technique gives surprising new
insights regarding the relationship between dependent and independent variables. For
instance the relationship between people support problems and co-ordination among
departments does not take a linear form - the ACE transformation shows that people
support problems decrease then increase along with co-ordination among departments.
312

(4) This study contributes in blending the literature from various disciplines, especially
production management, organisation behaviour, and information systems, to explain the
findings from the data analysis.
(5) Another contribution achieved by undertaking the current study is to provide useful
comparative data for academics as it is the first attempt to investigate the state of MRP
practices in a less developed country, namely Egypt.
(6) This study contributes to what is currently a very limited amount of empirical
research on the costs of MRP installation and the benefits obtained from MRP
implementation in one study.
(7) This study contributes to what is currently a very limited amount of empirical
research on measuring the level of for each of the five performance measures by taking
account of the future-NW benefit estimate based upon the expectations of MRP users.
(8) This study invites the researchers in less developed countries in general and in Egypt
in particular to give more attention to MRP implementation studies on the basis that this
study is the first concerning the state of practice of MRP systems in developing countries
as far as the researcher is aware.
8.5 Limitations of the study
During the carrying out of this study and also in interpreting the results several
limitations were encountered.
(1) The scarcity of literature in respect of MRP practices within manufacturing
companies in developing countries in general and in Egypt in particular. Therefore,
comparison was made with the most notable studies on MRP practices whether in
313

developed countries or in the newly industrialised countries such as Anderson et al.
(1982) in the US; Sum and Yang (1993) and Sum et al. (1995) in Singapore.
(2) The generalisation of the findings of this study are limited to the Egyptian industrial
public sector, not including the Egyptian industrial private sector.
(3) The decision was made to ask respondents to state their expectations based on their
experience and not to provide the raw data regarding performance measures in three
cases a) the pre-NW estimate, b) current estimate, and c) future estimate for three main
reasons: a) as part of this study involves comparing the Egyptian survey with the
previous surveys i. e. Schroeder et al. (1981); Anderson et al. (1984); Anderson and
Schroeder (1984) and Laforge & Sturr (1986), we have chosen to adopt the same
strategy as used by them i. e. asking respondents to state their expectations based on their
experience, b) it was felt that the responding companies were unlikely to be able to keep
track of performance measures such as inventory turnover, number of expediters etc.
over time, because of the lack of records in the companies or the confidentiality of the
data, and also c) the fact that the companies are at an early stage of MRP implementation
(57% of the companies having implemented the system for 5 or less than 5 years), and
limited formed assessment of effectiveness based on performance measures would have
been made.
(4) The ABCD checklist suggested by Wight (1981) to measure MRP systems
effectiveness in the US, is not adopted by the current study because a different situation
existed in the US and Egypt concerning the stage of MRP implementation. Furthermore,
because the ABCD checklist is intended to measure companies that have implemented a
314

complete Manufacturing Resources Planning (MRP II) system, it is not applicable in the
local context because the Egyptian users were still relatively beginners, namely they have
implemented MRP I and have not achieved the status of MRP II users. Therefore, the
tangible and intangible benefits obtained from MRP implementation were claimed to
measure MRP system effectiveness, on the basis that a system is effective if it achieves its
objectives.
(5) The term "implementation" is used as a broad term to include pre-implementation,
implementation, and post- implementation stages as in Duchessi et al. (1988); Sum and
Yang (1993) and Sum et al. (1995).
Despite these inherent limitations, the findings of this research should be useful in
contributing to the local pool of knowledge to explore the state of practice of MR. P
system in Egyptian manufacturing companies as well as providing groundwork for further
research.
8.6 Recommendations for further research
Since this study is considered as the first attempt to investigate the state of
practice of MRP implementation in less developed countries in general, and in Egypt in
particular, directions for further research are suggested:
(1) Further research should be undertaken to monitor the progress and status of MRP
usage in Egypt over time. This may provide useful insights into the current trend and
development in the implementation of MRP systems by the Egyptian users.
315

(2) The recommendation is made for further comparative studies with other less
developed countries which could find out the similarities and dissimilarities concerning
MRP implementation.
(3) Case studies need to be conducted to present more details concerning MRP
implementation processes.
(4) Investigation is needed about MRP implementation in the private sector in
comparison with the public sector.
(5) The major findings of this research indicate that the critical factors affecting the
successful implementation of (MRP) systems within manufacturing companies are varied
and interrelated together. This implies that an in-depth analysis of each factor or each
group of factors at the most is required.
(6) Empirical research should be conducted to explore and examine the critical factors
influencing the stage of MRP implementation in Egypt which may help to determine the
progress of MRP usage.
(7) As noted, there is a trend towards a hybrid MRP with the other new production
management systems such as JIT and OPT systems within the CIM context. Future
studies can be based on the evaluation of such a hybrid system and identifying the unique
set of critical success factors.
(8) As the current study has been considered the second attempt to explore and examine
the MRP benefit-determinant relationships using the Alternating Conditional
Expectations (ACE), future studies could be conducted to validate the findings presented
in this study.
316

(9) The model of determinant variables of MRP benefits in this study adds new groups of
determinant variables i. e. uncertainty and human variables in addition to new variables,
e. g., vendor support. Therefore, it will be very useful to assess the relevance of this
model in other contexts.
8.7 Summary
As presented, the research has been based on a comprehensive review of related
literature and a thorough examination of the state of practice of I RW systems. As
observed, investigating the MRP benefit-determinant relationships was offered as one of
the solutions for achieving the effectiveness of MRP implementation. Effectiveness is the
main indicator which can help to present the state of practice of MRP systems.
In contributing to this debate this thesis represents the largest survey on MRP
practices in terms of coverage in scope, and offers added factors to be taken into
consideration, particularly examining the effects, and relationship of, uncertainty factors
on the benefits obtained from MRP implementation.
It is hoped that Egyptian manufacturing companies will pay attention to the
results and note its proposals. It is hoped, too, that the study will open new dimensions
for other researchers to execute more research in the field of the state of practice of MRP
systems and to merge with other related disciplines such as information systems, finance
and marketing, which can contribute to a better understanding, and to the enhancement,
of MRP practices whether in developed countries or in less developed countries.
317

BIBLIOGRAPHY
Aggarwal, S. (1985), "MRP, JIT, OPT, FMS? ", Harvard Business Review, September-
October, pp. 8-16.
Album, A. (1997), "Egypt: economic reforms bear fruit", The Middle East, July/August,
No. 269, pp. 24-25.
Al-Gebaly, A. (1996), "The Egyptian economy in a competitive environment", Al Ahram
International, February, p. 14.
Al-Shuaibi, K. (1991), "Manufacturing strategy: an analysis of the Saudi manufacturing
private sector", Ph. D. Dissertation, Glasgow University, UK.
Allen, R. (1996), "Untried promises", Financial Times Business Information, May, p. III.
Anderson, J. and Schroeder, R. (1984), "Getting results from your MRP system",
Business Horizons, May-June, pp. 57-64.
Anderson, J., Schroeder, R.; Tupy, S. and White, E. (1982), "Material Requirements
Planning systems: the state of the art", Production and Inventory Management,
Fourth Quarter, pp. 51-67.
Ang, J.; Sum, C. and Chung, W. (1995), "Critical success factors in implementing MRP
and government assistance: a Singapore context", Information Management, No. 29,
pp. 63-70.
Anonymous, (1996), "MRP II system trims inventories 20-25%", Modern Materials
Handling (MMH), No. 51, p. 45.
Anonymous, (1996), "MRP II implementation improves customer service", IIE Solutions
August, pp. 50-51.
318

Badiru, A. and Schlegel, R. (1994), "Project management in computer-integrated manufacturing implementation", in Karwowski, W. and Salvendy, G. (Ed. ), Organisation and Management of Advanced Manufacturing, John Wiley & Sons, USA, pp. 255-279.
Bartezzaghi, E., Spina, G. and Verganti, R. (1994), "Lead time models of business
processes" International Journal of Operations and Production Management, Vol. 14 No. 5, pp. 5-20.
Beatty, C. and Gordon, J. (1988), "Barriers to the implementation of CAD and CAM
systems", Sloan Management Review Summer, pp. 25-33.
Beddick, J. (1983), "Elements of success-NW implementation", Production and Inventory Management, Vol. 24 No. 2, pp. 26-32.
Berger, G. (1983), "The untold secrets of successful MRP", Conference Proceedings, American Production and Inventory Control Society, pp. 309-313.
Bessant, J. (1991), Managing Advanced Manufacturing Technology: The Challenge of
the Fifth Wave, NCC Blackwell, UK.
Best, M. (1997), "Production principles, organisational capabilities and technology
management", Proceedings of Conference on Innovation, Cooperation and Growth, Cambridge university, June.
Billesbatch, T. (1991), "A study of the implementation of Just-in-Time in the United States", Production and Inventory Management Journal, Third Quarter, pp. 1-4.
Blackstone, J. and Cox, J. (1985), "MRP design and implementation issues for small manufacturers", Production and Inventory Management, Vol. 26 No. 3, pp. 65-76.
Blasingame, W. and Weeks, J. (1981), `Behavioural dimensions of MRP change: assessing your organisation's strengths and weaknesses", Production and Inventory Management, Vol. 22 No. 1, pp. 81-96.
319

Box, G and Cox, D. (1964), "An analysis of transformations", The Royal Statistical Society, No. 26, pp. 211-252.
Breakwell, G. (1995), "Interviewing", in Breakwell, G.; Hammond, S. and Fife-Schaw, C. (Ed. ), Research Methods in Psychology, Sage Publications, London, pp. 230-242.
Brenizer, N. (1981), "The odyssey of inventory management", American Production and Inventory Control Society, Vol. 22, pp. 23-35.
Brillinger, D. and Preisler, H. (1984), "An exploratory analysis of the joyner-boore
attenuation data", Bulletin of the Seismological Society of America, No. 74, pp. 1441-1450.
Browne, J., Harhen, J. and Shivnan, J. (1996), Production Management Systems: An Integrated Perspective, Addison-Wesley Publishing Company, Harlow, England.
Brownell, P. (1995), Research Methods in Management Accounting, Coopers and Lybrand, Australia.
Burbidge, J. (1989), Production Flow Analysis for Planning Group Technology, Clarendon Press, Oxford.
Burnham, J. (1987), "Some conclusions about JIT manufacturing", Production and Inventory Management, Third Quarter, pp. 7-10.
Burns, O. and Turnipseed, D. (1991), "Critical success factors in Manufacturing Resource Planning implementation", International Journal of Operations Management, Vol. 11, pp. 5-19.
Buzacott, J. and Shanthikumar, J. (1994), "Safety stock versus safety time in MRP
controlled production systems" Management Science, Vol. 40 No. 12, December, pp. 1678-1689.
Callarman, T. and Heyl, J. (1986), "A model for Material Requirements Planning implementation", in Voss, C. (Ed. ), Managing AdvancedManufacturing Technology, IFS Ltd, UK, pp. 31- 43.
320
Carrie, A. and MacIntosh, R. (1992), "UK research in manufacturing systems integration", in Pels, H. and Wortmann, J. (Eds. ), Integration in Production
Management Systems, Elsevier Science Publishers B. V. North Holland, pp. 323- 336.
Carrie, A. and MacIntosh, R. (1993), "Improving integration in manufacturing systems", in Pappas, I. and Tatsiopoulos, I. (Eds. ), IFIP Transactions on Advances in
Production Management Systems, North Holland, pp. 161- 168.
Carrie, A., MacIntosh, R., Scott, A. and Peoples, G. (1994), "Linking strategy to
production management structures and systems", International Journal of Production Economics, Vol. 34, pp. 293-304.
Carrie, A., Pandya, K., Buchanan, J., MacIntosh, R. and Francis, A. (1997), "The future
of CAPM systems), A Research Proposal to EPRSC, London, UK.
Carroll, R and Ruppert D. (1988), "Transformation and Weighting in Regression",
Chapman and Hall, New York.
Cerveny, R and Scott, L. (1989), "A survey of MRP implementation", Production and
Inventory Management, Third Quarter, pp. 31-34.
Chamberlain, W. and Thomas, G. (1995), "The future of MRP: headed for the scrap
heap or rising from the ashes? ", IIE Solutions, July, pp. 7-10.
Chase, R., Aquilano, N. and Jacobs, F. (1998), "Production and Operations
Management: Manufacturing and Services", Eighth ed. Irwin/McGraw-Hill, USA.
Chatterjee, S. and Price, B. (1991), "Regression Analysis by Example", Second ed. John
Wiley & Sons, New York.
Chen, I. and Small, M. (1994), "Implementing advanced manufacturing technology: an integrated planning model", International Journal of Management Science, Vol. 22 No. 1, pp. 91-103.
Churcill, G. (1991), "Marketing Research: Methodological Foundations", Dryden Press, Chicago.
321

Cooper, R. and Zmud, R. (1989), "Material Requirements Planning system infusion", International Journal of Management Science (OMEGA), Vol. 17, pp. 471-481.
Cooper, R. and Zmud, R. (1990), "Information technology implementation research: a technological diffusion approach", Management Science, Vol. 36, pp. 123-139.
Corke, D. (1985), "A Guide to CAPM', The Institution of Production Engineers, London.
Correll, J. (1994), "How to get top management support for MRP Ir', Hospital Material Management Quarterly, Vol. 15 No. 4, pp. 23-28.
Correll, J. (1995), "Reengineering the MRP II environment: the key is successfully implementing change", IIE Solutions, July, pp. 24-27.
Covin, S. (1981), "Inventory accuracy: one of your first hurdles", Production and Inventory Management, Second Quarter, pp. 13-22.
Cox, F. and Clark, S. (1984), "Problems in implementing and operating a Manufacturing Resource Planning information system", Journal of Management Information Systems, Vol. 1 No. 1, pp. 81-101.
Cox, J., Zmud, R. and Clark, S. (1985), "Auditing an MRP system" Academy of Management Journal, Vol. 24, pp. 386-402.
Cruz, C. (1997), "Employers are expecting more skills from each applicant", Purchasing, Vol. 13, p. 98.
Davis, D. (1995), "MRP II's new frontier", Manufacturing Systems, August, pp. 36-46.
Department of Trade and Industry, (1991), "Advanced Manufacturing Technology", HMSO Publications Centre, London.
Department of Trade and Industry, (1996), "Doing Business in Egypt", Egyptian Desk, London.
322

Desmond, J. and Wilson, F. (1989), "The implementation of CAPM system: process framework and cognitive view operations management", Proceedings of Conference
on Advanced Manufactures and Services, Scotland, 5-6 January, pp. 153-166.
Diamond, J. (1997), "Production and inventory control: the move to the PC", IIE
Solutions, Vol. 29 No. 1, pp. 8-22.
Dibono, P. (1997), "Flow manufacturing improves efficiency and customer
responsiveness", IIE Solutions, March, pp. 25-29.
Dilworth, J. (1993), Production and Operations Management: Manufacturing and Services, McGraw-Hill, International Editions, New York.
Dobler, D. and Burt, D. (1996), Purchasing and Supply Management: Text and Cases,
McGraw-Hill, USA.
Donk, D. and Dam, P. (1994), "Structuring complexity in scheduling: a study in a food
processing industry", International Journal of Operations and Production
Management, Vol. 16 No. 5, pp. 54-63.
Donovan, M. (1982), "Are you ready for MRP? ", Management Focus, pp. 31-33.
Drayson, P., Fleck, J. and Foster, K. (1986), "The implementation of robotics in a food
manufacturing company", IMechE, pp. 1-5.
Duchessi, P.; Schaninger, C. and Hobbs, D. (1989), "Implementing a Manufacturing
Planning and Control information system", California Management Review Spring,
pp. 75-90.
Duchessi, P., Schaninger, C., Hobbs, D. and Pentak, L. (1988), "Determinants of success in implementing Material Requirements Planning (MRP)", Manufacturing and Operations Management, Vol. 1, pp. 263-304.
Dugger, R. (1996), "Managing users: don't write off business managers", Datamation
December, p. 29.
323

Duimering, P., Safayeni, F. and Purdy, L. (1993), "Integrated manufacturing: redesign the organisation before implementing flexible technology", Sloan Management Review, Summer, pp. 47-56.
Earl, M. (1996), "An organisational approach to IS strategy-making", in Earl, M (Ed. ),
Information Management: the Organisational Dimension, Oxford University Press,
UK, pp. 136-170.
Easterby-Smith, M., Thorpe, R. and Lowe, A. (1991), Management Research, Sage
Publication Ltd, London.
Elkhouly, S. (1994), Advanced Concepts of Management, Ain Shams Library, Cairo.
Elmes, D., Kantowitz, B. and Roediger, H. (1992), Research Methods in Psychology,
West Publishing Company, USA.
Emory, C. (1985), Business Research Methods, Irwin, USA.
Everitt, B. and Dunn, G. (1991), Applied Multivariate Data Analysis, Edward Arnold,
London.
Fiani & Partners, (1992), Egypt Investment and Business Directory, Cairo.
Fife-Schaw, C. (1995), "Questionnaire design" in Breakwell, G., Hammond, S. and Fife-
Schaw, C. (Eds. ), Research Methods in Psychology, Sage Publications, London, pp. 174-193.
Fintech, U. (1989), "Academic offers World Class Manufacturing", Financial Times
Business Information, pp. 134/2-134/4.
Fisher, K. (1981), "How to implement NW- successfully", Production and Inventory Management, Fourth Quarter, pp. 36-54.
Flury, B. and Riedwyl, H. (1988), Multivariate Statistics: a Practical Approach,
Chapman and Hall, New York.
324

Flynn, B., Sakaldbara, S., Schroeder, R, Bates, K. and Flynn, E. (1990), "Empirical
research methods in operations management", Operations Management, No. 9, pp. 250-274.
Forrester, P., Tang, N. and Hawksley, C. (1995), "A computer integrated manufacturing programmed learning environment", Integrated Manufacturing Systems, No. 6, pp. 24-29.
Forster, A. and Hsu, E. (1976), "Material Requirements planning the fine line between
success and failure", Conference Proceedings, American Production and Inventory Control Society, pp. 421-446.
Frazer, J. and Nakhal, B. (1992), "The problems with MRP on microcomputer spreadsheets", Production and Inventory Management Journal, Third Quarter, pp. 1- 5.
Gaither, N. (1990), Production and Operations Management: a Problem-Solving and Decision MakingApproach, The Dryden Press, USA.
Gerwin, D. and Kolodny, H. (1992), Management of Advanced Manufacturing Technology: Strategy, Organisation and Innovation, John Wiley & Sons, USA.
Ghauri, P. (1995), Research Methods in Business Studies: a Practical Guide, Pritice Hall, New Jersey, USA.
Giauque, W. and Sawaya, W. (1992), "Strategies for production control", Production
and Inventory Management Journal, Third Quarter, pp. 36-39.
Gilberto, P. (1995), "The road to business process improvement-can you get there from here", Hospital Materiel Management Quarterly, November, pp. 12-20.
Goh, P. (1984), "Manufacturing Resource Planning (MRP II)", Engineering Technician, June, pp. 19-26.
325
Golhar, D., Stamm, C. and Smith, W. (1990), "JIT implementation in small
manufacturing firms", Production and Inventory Management Journal, Second
Quarter, pp. 44-47.
Gordon, G. and Marino, P. (1991), "The use of production information in test market decisions", Production and Inventory Management Journal, Second Quarter, pp. 27-
31.
Greenhalgh, G. (1991), Manufacturing Strategy: Formulation and Implementation,
Addison-Wesley Publishing Company, Sydney, Australia.
Guide, V. and Ghisell, G. (1995), "Implementation of drum-buffer-rope at a military rework depot engine works", Production and Inventory Management Journal, Third
Quarter, pp. 79-83.
Gumaer, R (1996), "Beyond ERP and MRP II optimised planning and synchronised
manufacturing", IIE Solutions, September, pp. 32-35.
Gupta, S. (1997), "Supply chain management in complex manufacturing", IIE Solutions,
March, pp. 18-21.
Hair, J., Anderson, R., Tatham, R. and Black, W. (1992), Multivariate Data Analysis
with Readings, Macmillan Publishing Co., USA.
Hall W. and Vollmann, E. (1978), "Planning your materials requirements", Harvard
Business Review, Vol. 56 No. 2, pp. 105-112.
Helms X. (1990), "Communication: the key to JIT success", Production and Inventory Management Journal, Second Quarter, pp. 18-21.
Helmy, H. (1996), "How to elevate our products to the international level? ", Alnasr Automobile, No. 280-286, pp. 28-46.
Hill, M. (1994), "Computer-Integrated Manufacturing: elements and totality", in Storey, J. (Ed. ), New Wave Manufacturing Strategies: Organisational and Human Resource Management Dimensions, Paul Chapman Publishing Ltd, London, pp. 122-150.
326

Hill, T. (1993), Manufacturing Strategy: the Strategic Management of the Manufacturing function, MacMillan Press, UK.
Ho, C. (1996), "Information technology implementation strategies for manufacturing organisations: a strategic alignment approach", International Journal of Operations
and Production Management, Vol. 16, pp. 77-99.
Hollander, N. and Mirlocca, N. (1994), "The path to successful MRP package selection", Hospital Materiel Management Quarterly, Vol. 15 No. 4, pp. 29-32.
Hoyt, G. (1977), "Successes and failures in MRP user involvement", Conference Proceedings, American Production and Inventory Control Society, pp. 204-209.
Hutcheson, G. (1997), "Factor Analysis", Faculty of Social Science, Glasgow University, Scotland; Unpublished Paper.
Huther, W. (1983), "A management guide to MRP II: Manufacturing Resources Planning", Management Review, No. 72, pp. 43-48.
Iemmolo, G. (1994), "MRP education: a team- building experience", Hospital Materiel Management Quarterly, Vol. 14 No. 4, pp. 33-39.
Ishman, M. (1995), "Commitment-compliance: counter-forces in implementing
production and inventory control systems", Production and Inventory Management, First Quarter, pp. 33-37.
Jacobi, M. (1994), "How to unlock the benefits of MRP II and Just-in-Time", Hospital Materiel Management Quarterly, Vol. 15 No. 4, pp. 12-22.
Jewitt, R. (1995), Just-in-Time, Department of Trade and Industry, London.
John, D. and Charlotte, M. (1996), "MRP rest in peace", Management Accounting- London, No. 74, pp. 14-20.
John, E. (1996), "Tailoring your MRP system to meet your needs", IIE Solutions, Vol. 28 No. 9, pp. 36-39.
327

Johnson, R., Newell, W. and Vergin, R. (1974), Production and Operations Management: a System Concept, Houghton Mifflin Company, USA.
Johnson, R. and Wichern, D. (1992), Applied multivariate statistical analysis, Prentice- Hall International, Inc., USA.
Kadipasaoglu, S. (1995), "The effect of freezing-the master production scheduling on cost in multilevel MRP systems", Production and Inventory Management Journal, Third Quarter, pp. 30-36.
Keen, P. (1981), "Information systems and organisational change", Communications of the ACM, Vol. 24 No. 1, pp. 24-33.
Kerlinger, F. (1986), Foundations of behavioural research, Holt, Rinehart and Winston, New York.
Kim, J. and Mueller, C. (1994), "Introduction to Factor Analysis", in Uslaner, E. (Ed. ), Quantitative Applications in the Social Sciences, Sage Publications, USA.
Kim, Y. and Lee, J. (1993), "Manufacturing strategy and production systems: an integrated framework", Journal of Operations Management, Vol. 11, pp. 3-15.
Kinnear, T, C. and Taylor, J, R (1987), Marketing Research: an Applied Approach, McGraw Hill, New York.
Kneppelt, L. (1981), "Implementing manufacturing planning/difficulty of the task", Production and Inventory Management, Second Quarter, pp. 59-77.
Krajewski, L. and Ritzman, L. (1996), Operations Management: Strategy and Analysis, Addison-Wesley Publishing Company, Inc, New York.
Kull, D. (1983), "MRP II: the industrial revolution meets the information age", Computer Decisions, October, pp. 120-133.
Kurian, G. (1992), Encyclopaedia of the Third World, Facts on File, New York.
328

Laforge, R and Sturr, V. (1986), "NW practices in a random sample of manufacturing firms", Production and Inventory Management, Third Quarter, pp. 129-137.
LaPlante, A. (1994), "Faster factories", Forbs ASAP, October, pp. 37-41.
Lascu, D. and Giese, T. (1995), "Exploring country bias in a relating environment: implications of retailer country of origin", Journal of Global Marketing, Vol. 9 No.
112, pp. 41-58.
Leng, L. (1987), "MRP II - the competitive edge", Journal of Institution of Engineers,
Vol. 27 No. 3 September, pp. 58-63.
Lin, N., Krajewski, L., Leong, G. and Benton, W. (1993), "The effects of environmental factors on the design of master production scheduling systems", Journal of Operations Management, Vol. 11, pp. 3 67-3 84.
Lockyer, K., Muhlemann, A. and Oakland, John. (1989), Production and Operations
Management, Pitman, Singapore.
Lummus, R and Wilson, L. (1992), "When JIT is not Hr, Production and Inventory
Management Journal, Second Quarter, pp. 61-65.
Lunn, T. (1994), "The people side of MRP", Hospital Materiel Management Quarterly,
Vol. 15 No. 4, pp. 56-61.
Lunn, T. (1996), "Six ways to reduce inventory", Hospital Materiel Management
Quarterly, Vol. 17, pp. 54-61.
Macbeth D. and Ferguson, N. (1994), Partnership Souring: an Integrated Supply Chain
Management Approach, Pitman Publishing, UK.
MacIntosh, R. (1994), "A modelling technique for studying the integration of material
and information flow in manufacturing organisations", Ph. D. Dissertation, Strathclyde University, UK.
329

Mady, M. (1992), Production Planning and Control, The Modern Arabian Library, Alexandria, Egypt.
Maetrz W. (1979), "MRP's fourth requirement", Production and Inventory Management, Third Quarter, pp. 81-84.
Maly, M. (1988), Strategic, "Organisation and social issues of CIM: international
comparative analysis", September, IIASA.
Markham, I. and McCart, C. (1995), "The road to successful implementation of Just-in- Time systems", Production and Inventory Management Journal, Third Quarter, pp. 67-70.
Matsuura, H., Kurosu, S. and Lehtimaki, A. (1995), "Concepts, practices and expectations of MRP, JIT and OPT in Finland and Japan", International Journal of Production Economics, No. 41, pp. 267-272.
McCormick, R and Martino, P. (1981), "Case study of an MRP II implementation in an industrial pump division", Conference Proceedings, American Production and Control Society, pp. 114-118.
Millard, R (1989), "Is MRP training aimed in the right direction", Production and Inventory Management Journal, Second Quarter, pp. 22-26.
Miller, J. and Sprague, L. (1975), "Behind the growth in Materials Requirements Planning", Harvard Business Review, September/October, pp. 83-91.
Moser, C. and Kalton, G. (1971), Survey Methods in Social Investigation, Heineman Educational Books, London.
Nachmias, C. and Nachmias, D. (1992), Research Methods in Social Sciences, Edward Arnold, London.
Nation, J. (1997), Research Methods, Prentice Hall, USA.
330

Newman, W. and Sridharan, V. (1992), "Manufacturing planning and control: is there
one definitive answer? ", Production and Inventory Management, First Quarter, pp. 50-54.
Oppenheim, A. (1992), Questionnaire Design, Interviewing and Attitude Measurement,
Printer Publishers, London.
OECD, (1991), Managing Manpower for Advanced Manufacturing Technology,
Organisation for Economic Co-operation and Development, France.
Parker, K. (1995), "The next gen: time and yields greater sophistication", Manufacturing
Systems, July, pp. 30-34.
Paul, H. and Suresh, B. (1991), "Manufacturing strategy through planning and control
techniques of advanced manufacturing technology", International Journal of Technology Management, Vol. 6, pp. 23 3 -242.
Pendelton, W. (1982), "Managing conflict during MRP implementation", Conference
Proceedings, American Production and Inventory Control Society, pp. 254-258.
Per-lind, (1991), Computerisation in Developing Countries, Routledge, London.
Plenert, G. (1992), "What does a decision support system (DSS) do from
manufacturing", Production and Inventory Management Journal, First Quarter, pp. 17-19.
Plossl, G. (1995), Orlicky's Material Requirements Planning, McGraw-Hill, New York.
Porter, J., Little, P., Laakmann, J., Hannen, C. and Schotten, M. (1996), "Production
planning and control system developments in Germany", International Journal of Operations and Production Management, Vol. 16, pp. 27-39.
Pregibon, D. and Vardi, Y. (1985), "Estimating Optimal Transformations for Multiple
Regression and Correlation (comment)", The American Statistical Association,
September, pp. 598-601.
331

Ptak, C. (1991), "MRP, MRP II, OPT, JIT, and CIM- succession, evolution, or
necessary combination", Production and Inventory Management Journal, Second
Quarter, pp. 7-11.
Publications Limited British Library, (1996), The Middle East and North Africa, British
Library, England.
Putterill, M., Maguire, W. and Sohal, A. (1996), "Advanced manufacturing technology
investment: criteria for organisational choice and appraisal", Integrated
Manufacturing Systems, No. 7/5, pp. 12-24.
Puttick, J. (1987), "Manufacturing Pull- Manufacturing Push" Springboard for
Competitive Advantage", in Toone, R. and Jackson, D. (Ed. ), The Management of Manufacturing: the Competitive Edge, IFS Publications Ltd, London, pp. 12-27.
Ratkowsky, D. (1983), Nonlinear Regression Modelling: a Unified Practical Approach,
Marcel Dekker, New York.
Ray, M. (1995), "Turbocharging MRP II systems with enterprise synchronisation", IIE
Solutions, No. 27, pp. 32-34.
Render, H. (1993), Production and operations management, Allyn and Bacon, USA.
Robertson, M., Swan, J. and Newell, S. (1996), "The role of networks in the diffusion of
technological innovation", Journal of Management Studies, No. 33: 3 (May), pp. 333-359.
Robson, C. (1993), "Can H. R. respond to corporate strategy? ", Journal of Business
Strategy, Vol. 9 No. 2, pp. 57-58.
Roscoe, J. (1975), Fundamental Research Statistics for the Behavioural Sciences, Holt,
Rinehart and Winston, New York.
Ross, J. (1997), "Control your client's shop, control your profits", Reseller Management
Vol. 1 No. 1, pp. 90-94.
332
Safizadeh, M. and Raaft, F. (1986), "Formatinformal systems and MRP implementation", Production and Inventory Management, Vol. 27 No. 1, pp. 115- 120.
Sanchez, A. (1991), "Advanced manufacturing technologies: an integrated model of diffusion", International Journal of Operations and Production Management, No. 11, pp. 48-63.
Sandeep, S. (1992), "Setting parameters in MRP for the effective management of bought-out inventory in a JIT assembly environment", Ph. D. Dissertation, Aston
University, UK.
Savage, W. and Schuette, K (1982), "Successful implementation is emphasising people, not technology-a case study history at Oster", Conference Proceedings, American Production and Inventory Control Society, pp. 502-506.
Schroeder, R, Anderson, J., Tupy, S. and White, E. (1981), "A study of MRP benefits
and costs", Operations Management, No. 2, pp. 1-9.
Schroeder, R. (1993), Operations Management: Decision Making in the Operations Function, McGraw-Hill, Inc, Singapore.
Sen, A. and Srivastava, M. (1990), Regression Analysis: Theory, Methods, and Applications, Springer-Verlag, New York.
Sharma, S. (1996), Applied multivariate techniques, john Wiley & Sons, Inc., New York.
Shaw, R. and Regentz, M. (1980), "How to prepare users for a new system", Management Focus, March/April, pp. 33-36.
Sheldon, D. (1991), "MRP II- what it really is", Production and Inventory Management Journal, Third Quarter, pp. 12-15.
Sheldon, D. (1994), "MRP implementation: a case study", Hospital Materiel Management Quarterly, Vol. 15 No. 4, pp. 48-52.
333

Sheridan, J. (1995), "Which path to follow? ", IW Electronics and Technology, July, pp. 41-45.
Smith, A., Abair, R. and Parr, R. (1980), "Smith valve corporation MRP systems "if you don't, your competition will", American Production and Inventory Control Society,
pp. 182-183.
Smith, D. (1993), "It's the implementation, not the software", Manufacturing Systems, October, pp. 46-52.
Sohal, A. and Naylor, D. (1992), "Implementation of JIT in a small manufacturing firm", Production and Inventory Management Journal, First Quarter, pp. 20-25.
Spector, P. (1993), "Research designs", in Lewis-Beck, M. (Ed. ), Experimental Design
and Methods, Sage Publications, UK, pp. 1-72.
Spreadbury, A. (1994), "Manufacturing Resource Planning", in Storey, J. (Ed. ), New
Wave: Manufacturing Strategies: Organisational and Human Resource Management Dimensions, Paul Chapman Publishing LTD, London, pp. 151-174.
Steele, D., Berry, W. and Chapman, S. (1995), "Planning and control in multi-cell manufacturing", Decision Sciences, No. 26, pp. 1-33.
Stone, E. (1978), Research Methods in Organisational Behaviour, Good Year Publications Co., Santa Monica.
Strzelczak, S. (1995), "Flexibility of MRP II systems", in IMechE. (Ed. ), Computer- Aided Production Engineering, Mechanical Engineering Publications Ltd, London,
pp. 137-142.
Sum, C., Prig, D. and Yang, K. (1993), "Effects of product structure complexity on multi-level lot sizing", Decision Sciences, Vol. 24 No. 6, pp. 1135-1155.
334

Sum, C. and Yang, K. (1993), "A study of Material Resource Planning (MRP II)
practices in Singapore", International Journal of Management Science (OMEGA), No. 21, pp. 187-197.
Sum, C., Yang, K., Ang, J. and Quek, S. (1995), "An analysis of Material Requirements Planning (MRP) benefits using Alternating Conditional Expectation (ACE)", Operations Management, Vol. 13, pp. 35-58.
Taha, H. (1992), Operations Research, an Introduction, MacMillan Publishing Company, New York.
Titone, R. (1996), "Moving beyond JIT to logistics planning", IIE Solutions, February,
pp. 22-24.
Tull, D, S. (1987), Marketing Research: Measurement and Method: a Text with Cases, MacMillan Publications Company, New York.
Turbide, D. (1990), "What every manager needs to know about MRP", Manufacturing
Systems, January, pp. 46-48.
Turbide, D. (1995), "MRP II still number one! ", IIE Solutions, July, pp. 28-31.
Turnipseed, D. and Burns, 0. (1992), "An implementation analysis of MRP systems: a focus on the human variable", Production and Inventory Management, First Quarter,
pp. 1-5.
Unido, (1994), Egypt: Industrial development review, The Economist Intelligent Unit, London, UK.
Veaux, R. (1990), "Finding transformations for regression using the ACE algorithm", in
Fox, J. and Long, J. (Ed. ), Modern Methods of Data Analysis, Sage Publications, Newbury Park, London, pp. 177-208.
Vollman, T., Berry, W. and Whybark, D. (1992), Manufacturing Planning and Control Systems, Irwin, USA.
335

Vollmann, T. (1986), OPT as an enhancement to MRP II, Production and Inventory
Management, Vol. 27, pp. 38-46.
Vollmann, T., Berry, W. and Whybark, D. (1992), Manufacturing Planning and Control Systems, Irwin, USA.
Vonderembse, M. and White, G. (1988), Operations Management: Concepts, Methods,
and Strategies, West Publishing Company, New York, USA.
Vora, J., Saraph, J. and Petersen, D. (1990), "JIT implementation practices", Production
and Inventory Management Journal, Third Quarter, pp. 57-59.
Voss, C. (1986), "Implementing manufacturing technology- a manufacturing strategy perspective", in Voss, C (Ed. ), Managing Advanced Manufacturing Technology, IFS, UK, pp. 95-107.
Wacker, J. and Hills, F. (1977), "The key to successes or failures of MRP: overcoming human resistance", Production and Inventory Management, Vol. 18 No. 4, pp. 7-16.
Wermus, M. and Pope, J. (1995), "Students planning in an MRP framework", Production and Inventory Management Journal, Second Quarter, pp. 51-55.
Westbrook, R. (1994), "Priority management: new theory for operations management", Operations and Production Management, No. 14, pp. 4-24.
Wetherill, G., Duncombe, P., Kenwaed, M., Paul, S. and Vowden, B. (1986), Regression Analysis with Applications, Chapman and Hall, New York.
White, E. (1980), "Implementing an MRP system using the lewin-schein theory of change", Production and Inventory Management, Vol. 21 No. 1, pp. 1-12.
White, E., Anderson, J., Schroeder, R and Tupy, S. (1982), "A study of MRP implementation process", Operations Management, Vol. 2, pp. 145-153.
336

White, E. and Wharton, T. (1990), "Current manufacturing approaches: opinion and practice", Production and Inventory Management Journal, Fourth Quarter, pp. 38- 43.
Whitley, B. (1996), Principles of Research in Behavioural Science, Mayfield Publishing Company, California.
Wight, 0. (1984), MRP II: Unlocking America's Productivity Potential, Oliver Wight Limited Publications, USA.
Wight, O. (1989), The ABCD Checklist, Oliver Wight Co., Essex Junction, Vermont.
Wild, K (1996), Essentials of Production and Operations Management: Text and Cases, Cassell, UK.
Zhao, X. and Lee, T. (1993), "Freezing the master production schedule for material requirements planning systems under demand uncertainty", Journal of Operations Management, Vol. 11, pp. 185-205.
337

APPENDICES
338

Appendix A
Questionnaire
339
11 17
DUES DIT121E
QUESTIONNAIRE ON MRP
SYSTEMS IMPLEMENTATION
To be completed by the production managers or materials managers or inventory
control managers or master schedulers or management information system
managers in the Egyptian public manufacturing companies.
340

PURPOSE OF THE STUDY
The main task of this study is to explore and examine the MRP benefit-determinant relationships to
permit MRP managers and users to obtain a better understanding of MRP systems practices and
which enable them to concentrate on key areas to achieve benefits that match their company goals in the Egyptian public manufacturing companies.
GENERAL INFORMATION FOR COMPLETION
When answering the questions please keep the following in mind: (1) This study is addressed to the Egyptian public manufacturing companies. (2) The questionnaire should be answered by the production managers or materials managers or
inventory control managers or master schedulers or management information system managers within a
factory.
(3) The questionnaire has been designed with the aim of minimising the time required for completion.
consequently, alternative answers are provided for most questions so you simply has to tick the response (s) which most accurately describe your opinion or the company's practice.
(4) The survey applies to MRP companies and Non-MRP companies in the sectors under investigation.
(5) The term (MRP) systems is used as a general term to include all versions of MRP systems, namely,
MRPI (i. e. materials planning for order launching), Closed-Loop MRP (i. e. MRPI with capacity
planning and shop floor control), MRPII (i. e. Closed-Loop MRP integrated with finance, marketing,
accounting, etc., and with simulation capabilities).
(6) The term of others is provided at the end of most of responses for any response (s) you have opined
that it or them should be considered but the questionnaire ignore it or them.
(7) If any information is requested which is not routinely available, reasonable estimates will suffice.
Please be assured that response based on informed judgement is infinitely more valuable than no
response at all.
(8) All the information collected will be treated confidentially. Only the researcher will have access to
your responses.
(9) Space is provided at the end of questionnaire for any comments you may wish to make about it. You
are also asked to provide your name, your job title and the company's name so that a report surnmarising
the results of this study will be made available to you later. Thank you for your support, and if you have
any problems in completing the questionnaire, do not hesitate to contact me:
Mr. Salah Eldin Ismail Tel. (047) 801043 & (047) 801162
341
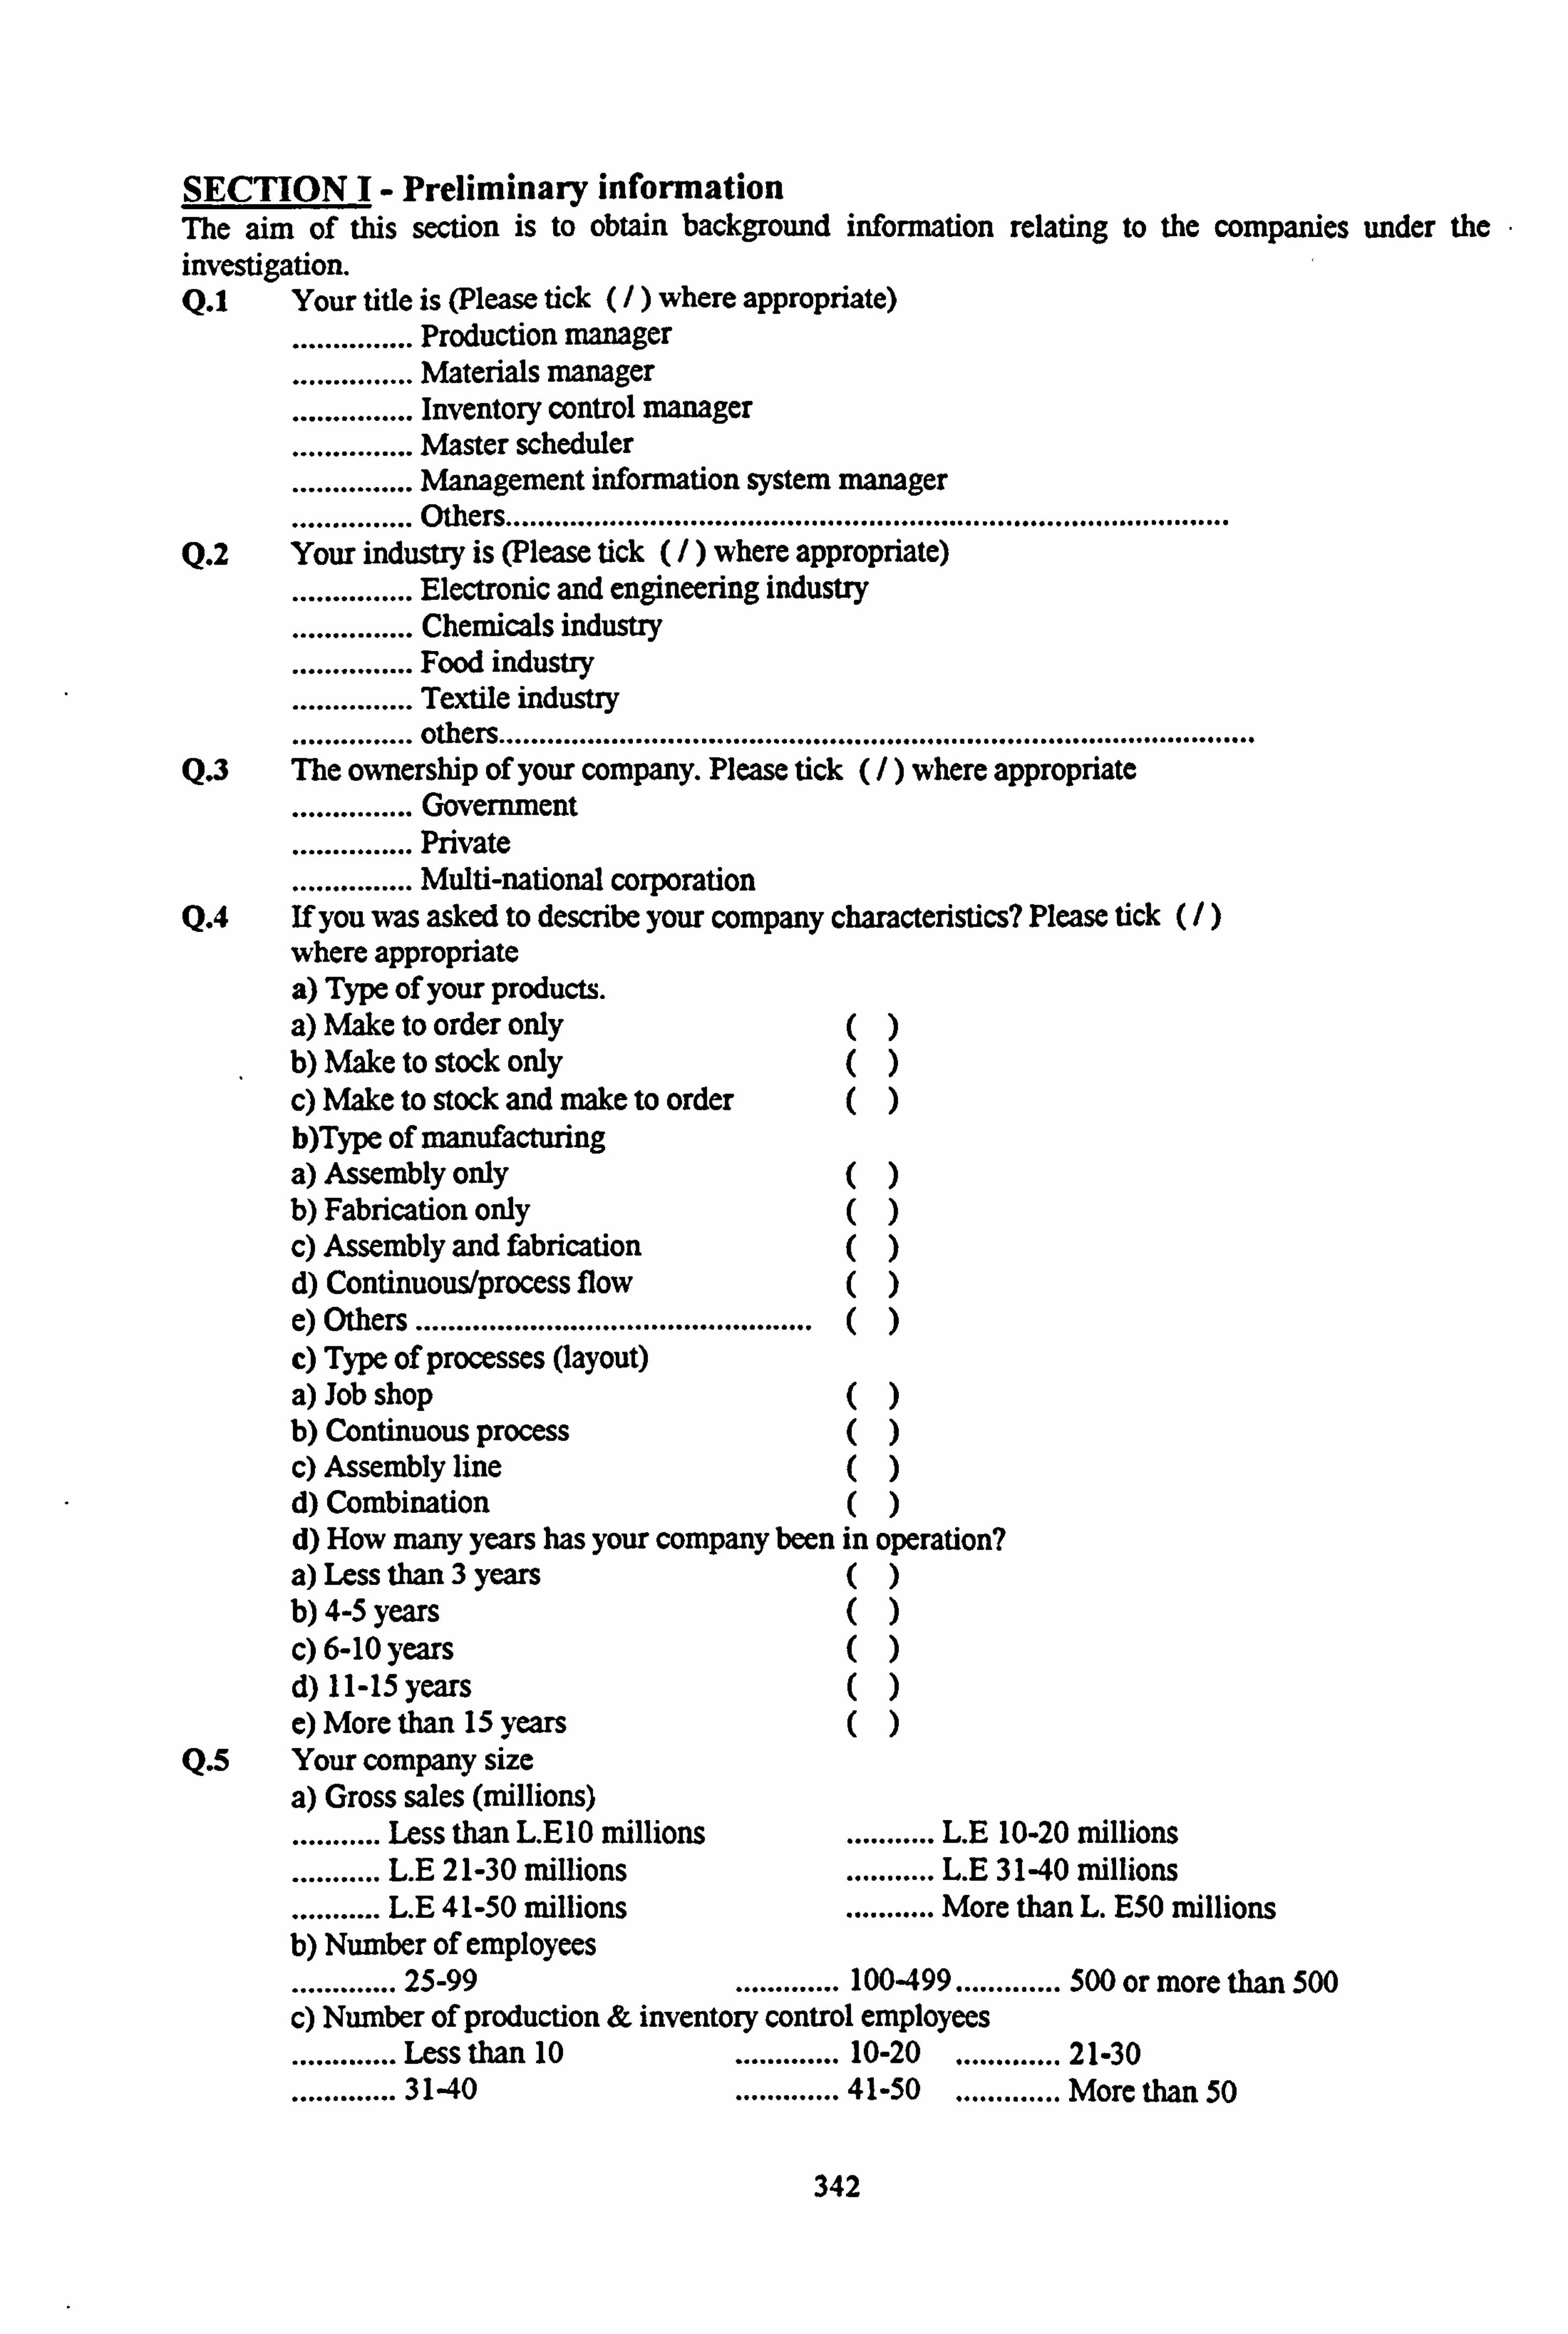
SECTION I- Preliminary information The aim of this section is to obtain background information relating to the companies under the investigation. Q. 1 Your title is (Please tick (/) where appropriate)
............... Production manager
............... Materials manager
............... Inventory control manager
............... Master scheduler
............... Management information system manager
............... Others.......................................................................................... Q. 2 Your industry is (Please tick (/) where appropriate)
............... Electronic and engineering industry
............... Chemicals industry
............... Food industry
............... Textile industry
............... others.............................................................................................. Q. 3 The ownership of your company. Please tick (/) where appropriate
............... Government
............... Private
............... Multi-national corporation
Q. 4 If you was asked to describe your company characteristics? Please tick (/ ) where appropriate a) Type of your products. a) Make to order only () b) Make to stock only () c) Make to stock and make to order () b)Type of manufacturing a) Assembly only () b) Fabrication only () c) Assembly and fabrication () d) Continuous/process flow () e) Others ................................................. () c) Type of processes (layout) a) Job shop () b) Continuous process () c) Assembly line () d) Combination () d) How many years has your company been in operation? a) Less than 3 years () b) 4-5 years () c) 6-10 years () d) 11-15 years () e) More than 15 years ()
Q. 5 Your company size a) Gross sales (millions)
........... Less than L. E10 millions ........... L. E 10-20 millions
........... L. E 21-30 millions ........... L. E 31-40 millions
........... L. E 41-50 millions ........... More than L. E50 millions b) Number of employees .............
25-99 ............. 100-499............. 500 or more than 500
c) Number of production & inventory control employees
............. Less than 10 ............. 10-20 ............. 21-30
............. 31-40 ............. 41-50 ............. More than 50
342

Q. 6 Listed below the parameters for characterising product structure complexity. Please tick (/) one box for each parameter listed
a) Number of items per product up to 32 32-64 64-100 Over 100 [l[][l[l
b) Number of levels in the bill of materials up to 3 3-5 5 5-7 over 7 [][l[l[l[]
Q. 7 Listed below are several areas that could be used for promoting MRP systems in an industry. Please indicate the level of importance for each area of them currently. Please tick (/) one score for each area listed. 1=Not important at all 5=Extremely important a) Government support
(e. g. grants, incentives) 12345 b) Education/ training provided by government/
professional bodies 12345 c) Education/ training provided by software/
hardware vendors 12345 d) Information sharing among users 12345 e) Low cost consultancy 12345 f) Others
..................................................... 12345 Q. 8 Has your company implemented (MRP) systems? Please tick (/) the appropriate box.
Yes [] No [] If yes, please go to Q. 9 If no, please go to Q. 15
Q. 9 Which version of the following MRP systems versions has implemented in your company? a. Material requirements planning MRPI () b. Closed-Loop MRP () c. Manufacturing resources planning MRPII ()
Q. 10 Listed below some common MRP systems definitions. According to your opinion, please tick (/) where appropriate. (a) Computerized materials/production planning and control
system for production only () (b) Primarily computerized materials/production planning and
control system integrated with other business area to achieve a total business system ()
(c) General system for computerizing any business function () (d) Others ()
Q. 11 a) If you was asked to describe your company organizational arrangements for implementing MRP systems. Please check all statements that apply. a) A steering committee was formed Yes () No () b) A steering committee met at least once a month. Yes () No () c) The project team generally met weekly. Yes () No () b) The project manager's only responsibility was managing the project. Strongly disagree Strongly agree
12 3 4 5 Q. 12 What was your major reasons for implementing an MRP system? Please tick (I )
one score for each reason listed: 0 =Not at all 1= Weak reason 5- Strong reason a) Inventory control 0 1 2 3 4 5 b) Production control 0 1 2 3 4 5 c) Improve productivity 0 1 2 3 4 5 d) Lower inventory cost 0 1 2 3 4 5 e) Improve competitive position 0 1 2 3 4 5 f) Improve quality of products 0 1 2 3 4 5 g) Increase throughput 0 1 2 3 4 5 h) Meet delivery dates better 0 1 2 3 4 5 i) Others
........................................ 0 1 2 3 4 5
343

Q. 13 Please indicate the degree of computerization of MRP modules. 0 for not at all, 1 for 1-20%, 2for 21-40%, 3 for 41-60%, 4 for 61-80%, 5 for 81-100%. Please tick (/) one score for each MRP modules listed. MRP modules a) Bills of materials 0123 4 5 b) Inventory control 0123 4 5 c). Master production Schedule 0123 4 5 d) Capacity requirements planning 0123 4 5 e) Forecasting 0123 4 5 f) Purchasing and recei, ring 0123 4 5 g) Shop floor control 0123 4 5 H) Rough-cut capacity planning 012 3' 4 5 I) Customer order service 0123 4 5 j) Routing/work centres 0123 4 5 k) Cost accounting 0123 4 5 1) Financial analysis 0123 4 5 m) Sales order processing 0123 4 5 n) Operations scheduling 0123 4 5 o) Material requirements planning
(parts explosion) 0123 4 5 p) Payroll/human resources 0123 4 5
Q. 14 Please indicate your company's organizational willingness to change: ........... Oppose change........... Resist change........... Suggest change........... Actively Seeks change
Q. 15 If there are not any (MRP) systems has implemented in your company plan, please indicate: a) The current system which is used ............................................................... b) How long this system has been used?. Please tick (/) where appropriate a. Less than 3 years ()b. 3-5 years ()c. More than 5 years () c) In your experience how significant are the following factors in influencing the company to favor the current system rather than the acquisition of MRP systems? Please tick (/) one box for each factor listed. Of no Of some Very
significant significant significant 1. Limited knowledge of MRP [][] [] 2. Not felt to achieve enough benefits [][] [] 3. Successful without using MRP [][] [] 4. Potential staff attitude problems [][] [] 5. Cost too high [][] [] 6. Not applicable [][] [] 7. Others: .................................... [l[l [l Please, stop here and return the questionnaire.
SECTION II - Uncertainty determinants of MRP implementation. The aim of this section is to explore the existing critical environmental uncertainty factors affecting MRP systems implementation in the Egyptian manufacturing industry. Q. 16 How important is each of the following uncertainty factors that might influence the
implementation of MRP systems in your company. Please tick (/ ) one score for each factor listed. 1=Not important at all 5=Extremely important
a) Product characteristics diversity 123 4 5 b) Amount of aggregate product demand 123 4 5 c) Machine downtime 123 4 5 d) The standard of raw material (quality) 123 4 5 e) Behaviour of people within the
factory ( e. g., absenteeism rate) 123 4 5 f) Reliability of plant within the factory walls 123 4 5 g) Capacity constraints 123 4 5
344
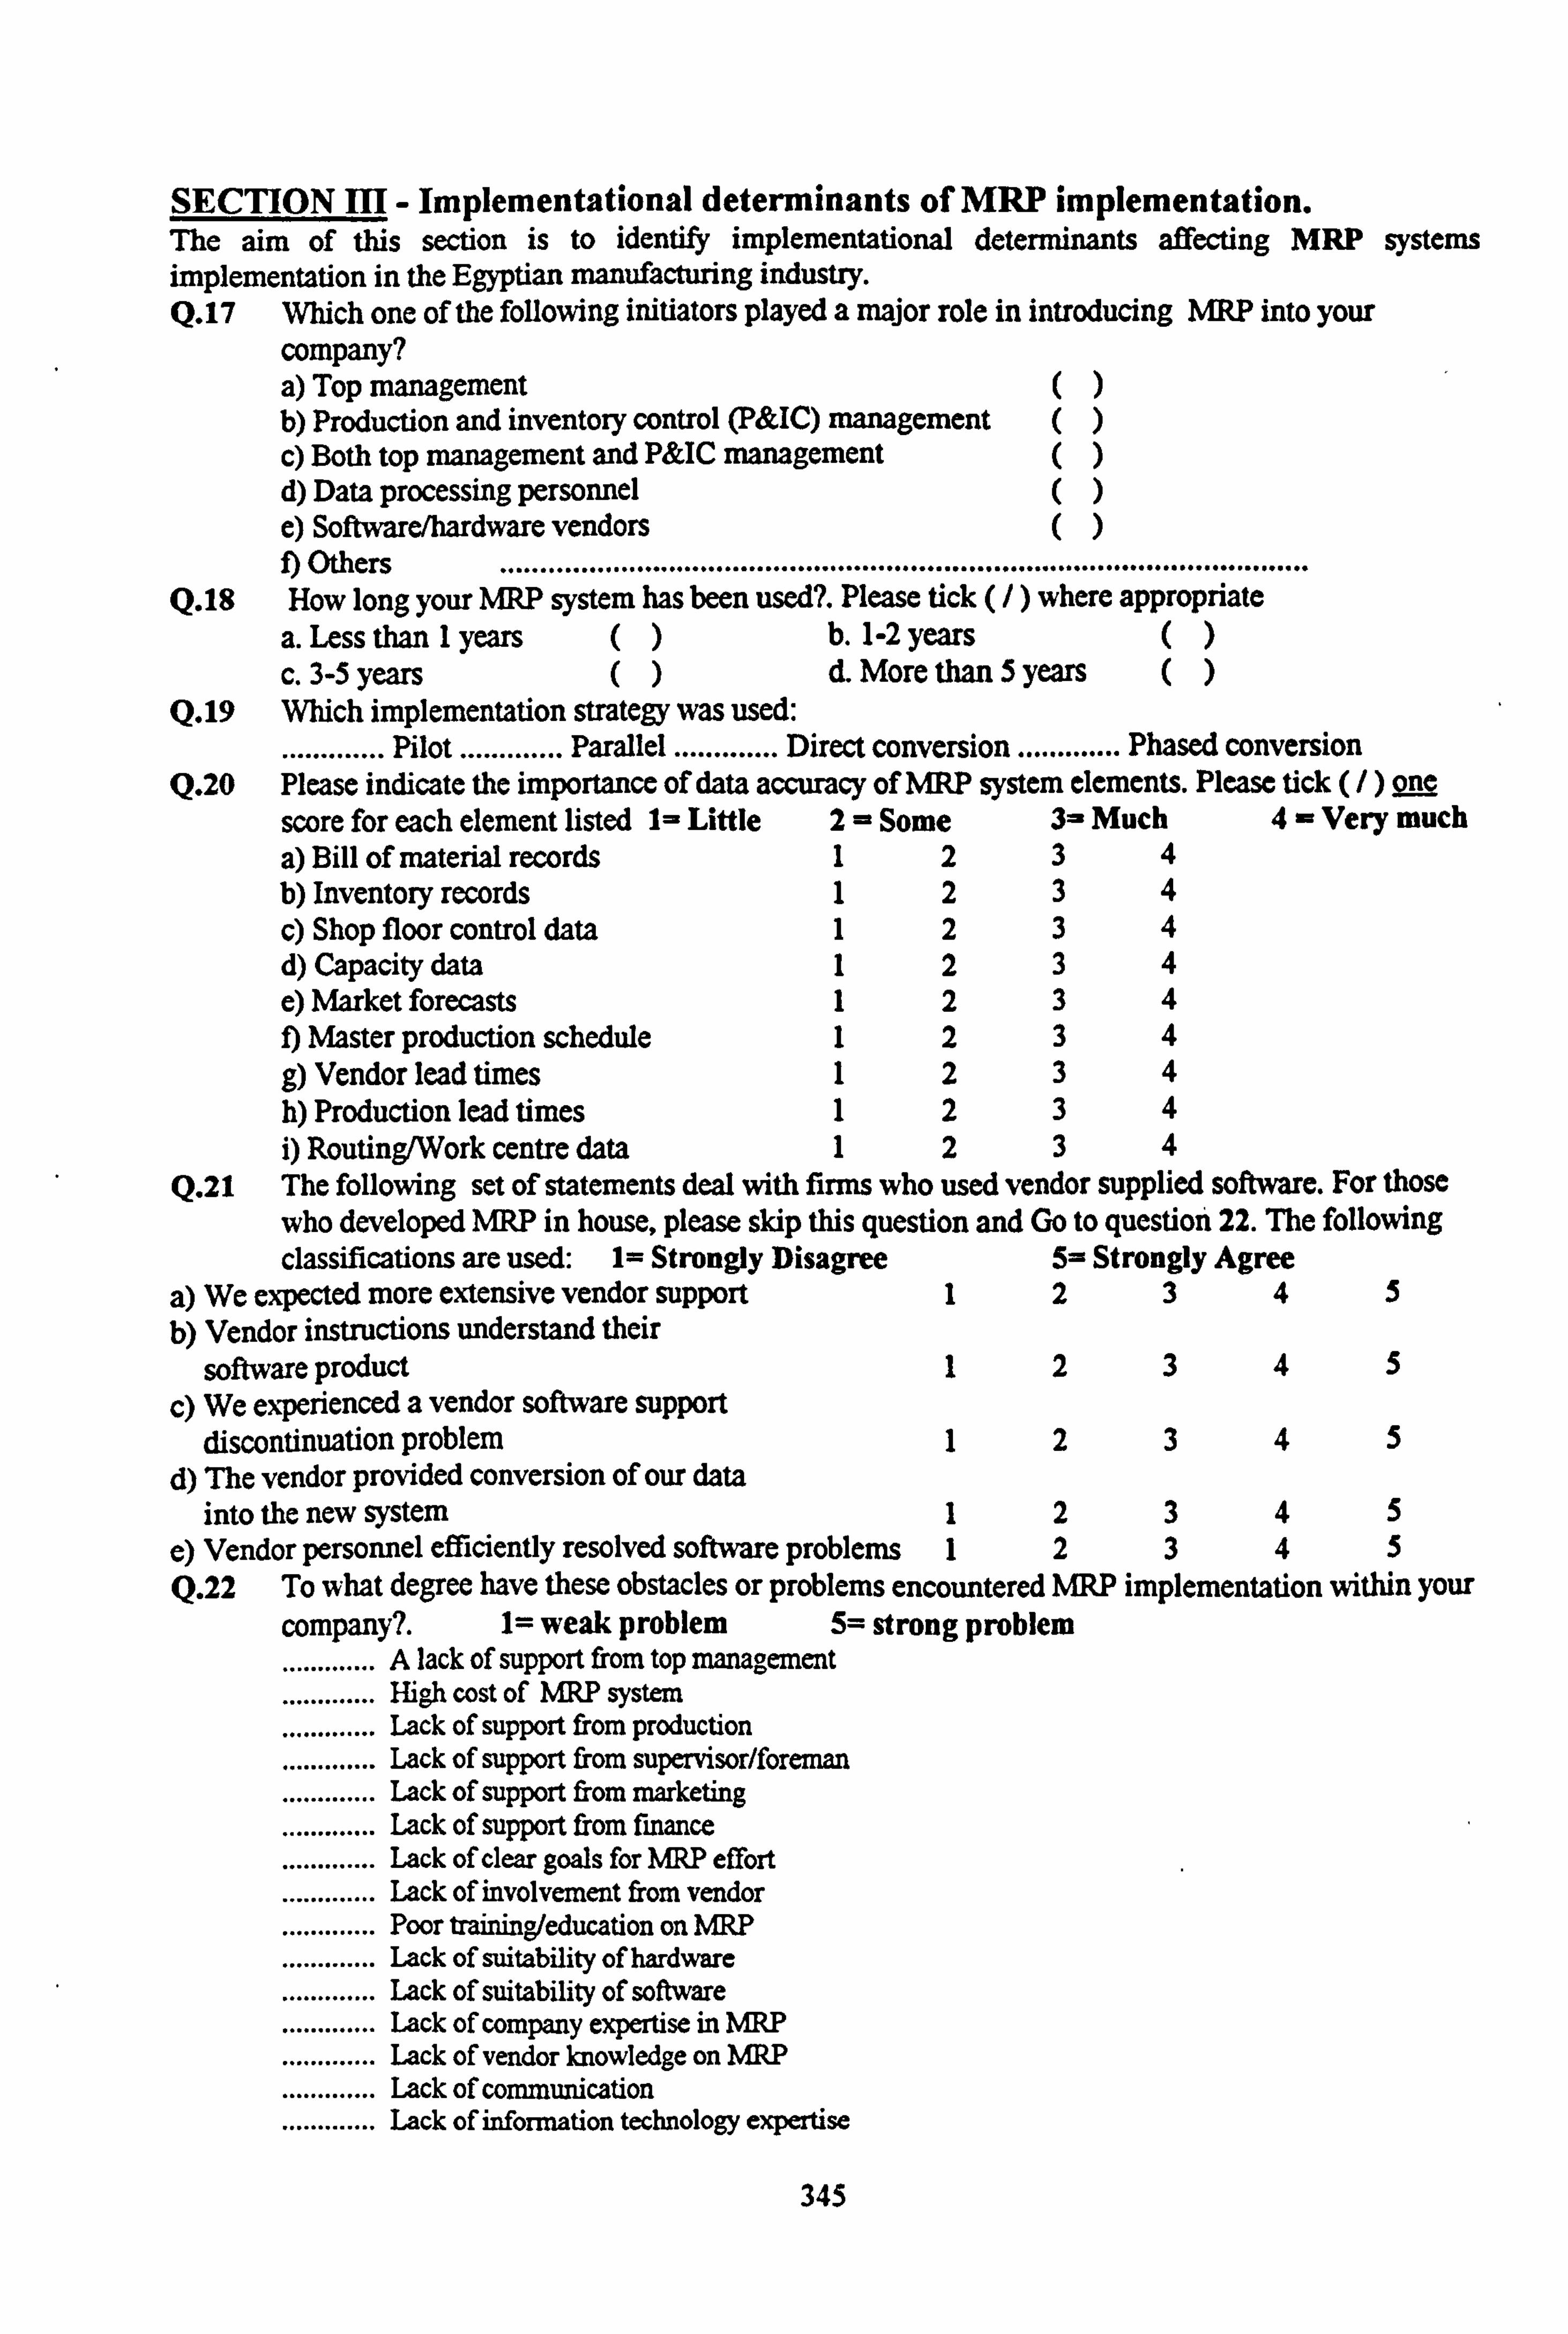
SECTION III - Implementational determinants of MRP implementation. The aim of this section is to identify implementational determinants affecting MRP systems implementation in the Egyptian manufacturing industry. Q. 17 Which one of the following initiators played a major role in introducing MRP into your
company? a) Top management () b) Production and inventory control (P&IC) management () c) Both top management and P&IC management () d) Data processing personnel () e) Softwarehardware vendors () f) Others ................................................................ ....................................
Q. 18 How long your MRP system has been used?. Please tick (/ ) where appropriate a. Less than 1 years ()b. 1-2 years ()
c. 3-5 years ()d. More than 5 years () Q. 19 Which implementation strategy was used:
............. Pilot ............. Parallel ............. Direct conversion .............
Phased conversion Q. 20 Please indicate the importance of data accuracy of MRP system elements. Please tick (/ ) one
score for each element listed 1- Little 2= Some 3- Much 4= Very much a) Bill of material records 12 34 b) Inventory records 12 34 c) Shop floor control data 12 34 d) Capacity data 12 34 e) Market forecasts 12 34 f) Master production schedule 12 34 g) Vendor lead times 12 34 h) Production lead times 12 34 i) Routing/Work centre data 12 34
Q. 21 The following set of statements deal with firms who used vendor supplied software. For those
who developed MRP in house, please skip this question and Go to question 22. The following classifications are used: 1= Strongly Disagree 5= Strongly Agree
a) We expected more extensive vendor support 1 2345 b) Vendor instructions understand their
software product 1 2345 c) We experienced a vendor software support
discontinuation problem 1 2345 d) The vendor provided conversion of our data
into the new system 1 2345 e) Vendor personnel efficiently resolved software problems 1 2345 Q. 22 To what degree have these obstacles or problems encountered MRP implementation within your
company?. 1= weak problem 5= strong problem ............. A lack of support from top management .............
High cost of MRP system
............. Lack of support from production
............. Lack of support from supervisor/foreman
............. Lack of support from marketing
............. Lack of support from finance
............. Lack of clear goals for MRP effort
............. Lack of involvement from vendor
............. Poor training/education on MRP
............. Lack of suitability of hardware
............. Lack of suitability of software
............. Lack of company expertise in MRP
............. Lack of vendor knowledge on MRP
............. Lack of communication
............. Lack of information technology expertise
345

SECTION IV - Technological determinants of MRP implementation. The aim of this section is to discover the main technological determinants of MRP systems implementation in the Egyptian manufacturing industry. Q. 23 Listed below are the most common features of MRP systems.
Please tick (/) one box for each feature listed. a) Update method ............... Net change ............... Regenerative........ Both b) Use of cycle counting ............... Yes ...............
No c) Use of pegging ...............
Yes ...............
No d) MPS update frequency ............... Weekly ...............
Daily ........ Others
e) Allocation of inventory ............... Yes ............... No f) Use of automatic lot sizing ............... Yes ...............
No g) Time bucket size ...............
Weekly ...............
Monthly........ Others h) Average number of weeks in MPS ...............
Q. 24 a) Please indicate in which your company got IMP system ........... Developing the entire system in-house ............... Buying turn-key system b) Please indicate what computer hardware is your, MRP system run on:
............... Microcomputers and mainframes ............... Minicomputers
c) Where the maintenance of MRP is done? Please tick )where appropriate. a. Done in-house () b. Done by software vendor () c. Done by IT specialists ()
Q. 25 The following categories are based on Oliver Wight's Class A, B, C or D companies. Which of these best describes the status of MRP in your facility? Please tick (/) where appropriate:
. Class A: A closed -loop system used for both priority planning and capacity planning. MPS is
leveled and used by top management to the business. Most deliveries are on time, inventory is
under control, and little or no expediting is done. Class B: A closed-loop system with capability for both priority planning and capacity
planning. In this case, the MPS is somewhat inflated, top management does not give full support, and some inventory reductions have been obtained, but capacity is sometimes exceeded, and some expediting is needed. Class C: An order launching system with priority planning only. Capacity planning done
informally, typically with an inflated MPS. Expediting is used to control the flow of work and a modest reduction in inventory is achieved. Class D: The MRP system is exists mainly in data processing. Many records are inaccurate.
The informal system is largely used to run the company. Little benefit is obtained from the MRP system.
Q. 26 Please estimate how much your company had spent for the acquisition of an MRP system? Please tick (/) where appropriate a) Less than L. E. 300,000 b) L. E. 300,000-599,999 c) L. E. 600,000-899,999 d) L. E. 900,000-1,199,999
e) L. E. 1,200,000-1,499,999 f) L. E. 1,500,000 or more than L. E. 1,500,000 Q. 27 a) Does there is an additional investment intended for MRP systems (hardwarelsoftware) over
the next 3 years? ............. Yes ............. No If Yes go to B If No, Please specify, Why?
............................................................. b) Please specify Why your company was prepared to further investment? In order to extend the current MRP system () In order to change the current system () Others ..................................................... () c) How much your company is prepared to further invest? Please tick (/) where appropriate a) Less than L. E. 300,000 b) L. E. 300,000-599,999 c) L. E. 600,000-899,999 d) L. E. 900,000-1,199,999 e) L. E. 1,200,000-1,499,999 f) L. E. 1,500,000 or more than L. E. 1,500,000
346

Q. 28 In this scale, 100 points means full integration among MRP modules. On the same scale, circle
the number which indicates your actual degree of system integration:
10 20 ' 30 40 50 60 70 80 90 100
SECTION V- Human determinants of MRP systems implementation. The aim of this section is to explore the critical human determinants of MRP systems implementation in Egyptian manufacturing industry. Q. 29 To what extent do you utilize the outputs of an MRP system? Please tick (/) where appropriate.
a) Use daily [] b) Use weekly [] c) Use monthly [] Q. 30 a) What is your previous experience with automated, technically complex information systems
before implementing an MRP system? Very Very little Somewhat Moderate High High
12345 b) What is your level of formal training? Please tick (/) where appropriate. a) College graduate [] b) Some college education [] c) Technical school graduate [] d) High school graduate [] e) Less than high school []
Q. 31 What is your involvement in the implementation of an MRP system in your facility? Please tick (/) where appropriate a) Led Implementation [] b) Active daily/weekly [] c) Active monthly [] d) Passive [] e) Non-participant []
Q. 32 What level of support did you give to the decision Please tick (/) where appropriate
to implement an MRP system?
[] a) Total support b) Very supportive [] c) Supportive [] d) Neutral [] e) Opposed implementation []
SECTION VI - MRP systems implementation success measures. The aim of this section is to investigate the expected potential benefits of the MRP systems to explore the most appropriate criteria for measuring the performance of MRP systems in the Egyptian manufacturing companies. Q. 33 a) For each of the characteristics below (a-e) state (in column II) the current experience given your stage of MRP development. Then state (in column I) the experience that you would expect operating in today's economic environment with your pre-NW production system. Finally, state (in column III) the future experience that you anticipate given total completion of your MRP development plans.
I II III Pre-NW Current Future Estimate Estimate Estimate
a) Inventory turnover b) Delivery lead time (days) c) Percent of time meeting delivery promises (%) d) Percent of orders requiring "splits" because
of unavailable material (%) e) Number of expediters (number of people)
347

b) To what degree have the following benefits been achieved from your MRP system? Degree of improvement
Very Little Some Much Much
a) Improved competitive position 1 2 3 4 b) Reduced inventory costs 1 2 3 4 c) Increased throughput 1 2 3 4 d) Improved product quality 1 2 3 4 e) Improved productivity 1 2 3 4 f) Better ability to meet volume! product change 1 2 3 4 g) Better production scheduling 1 2 3 4 h) Reduced safety stocks 1 2 3 4 i) Better cost estimation 1 2 3 4 j) Improved co-ordination with marketing and finance
1 2 3 4 k) Improved your ability to perform in your job 1 2 3 4 1) Reduced informal systemsfor materials management/
inventory/ production control 1 2 3 4 m) Increased BOMlinventory/1v1PS accuracy 1 2 3 4 n) Increased information on which to base 1 2 3 4 decisions since MRP has been implemented 1 2 3 4
Please if there are any factors influencing the implementation of MRP systems which you think are important and which have not been covered by the questionnaire, please use the space below to describe them. Any other comments about the questionnaire are most welcome. Comments:
THANK YOU VERY MUCH FOR YOUR CO-OPERATION WHEN FINISHED, PLEASE REFOLD WITH THE PRE-PAID POSTAGE FACING OUT AND MAIL PROMPTLY
348

Appendix B
349
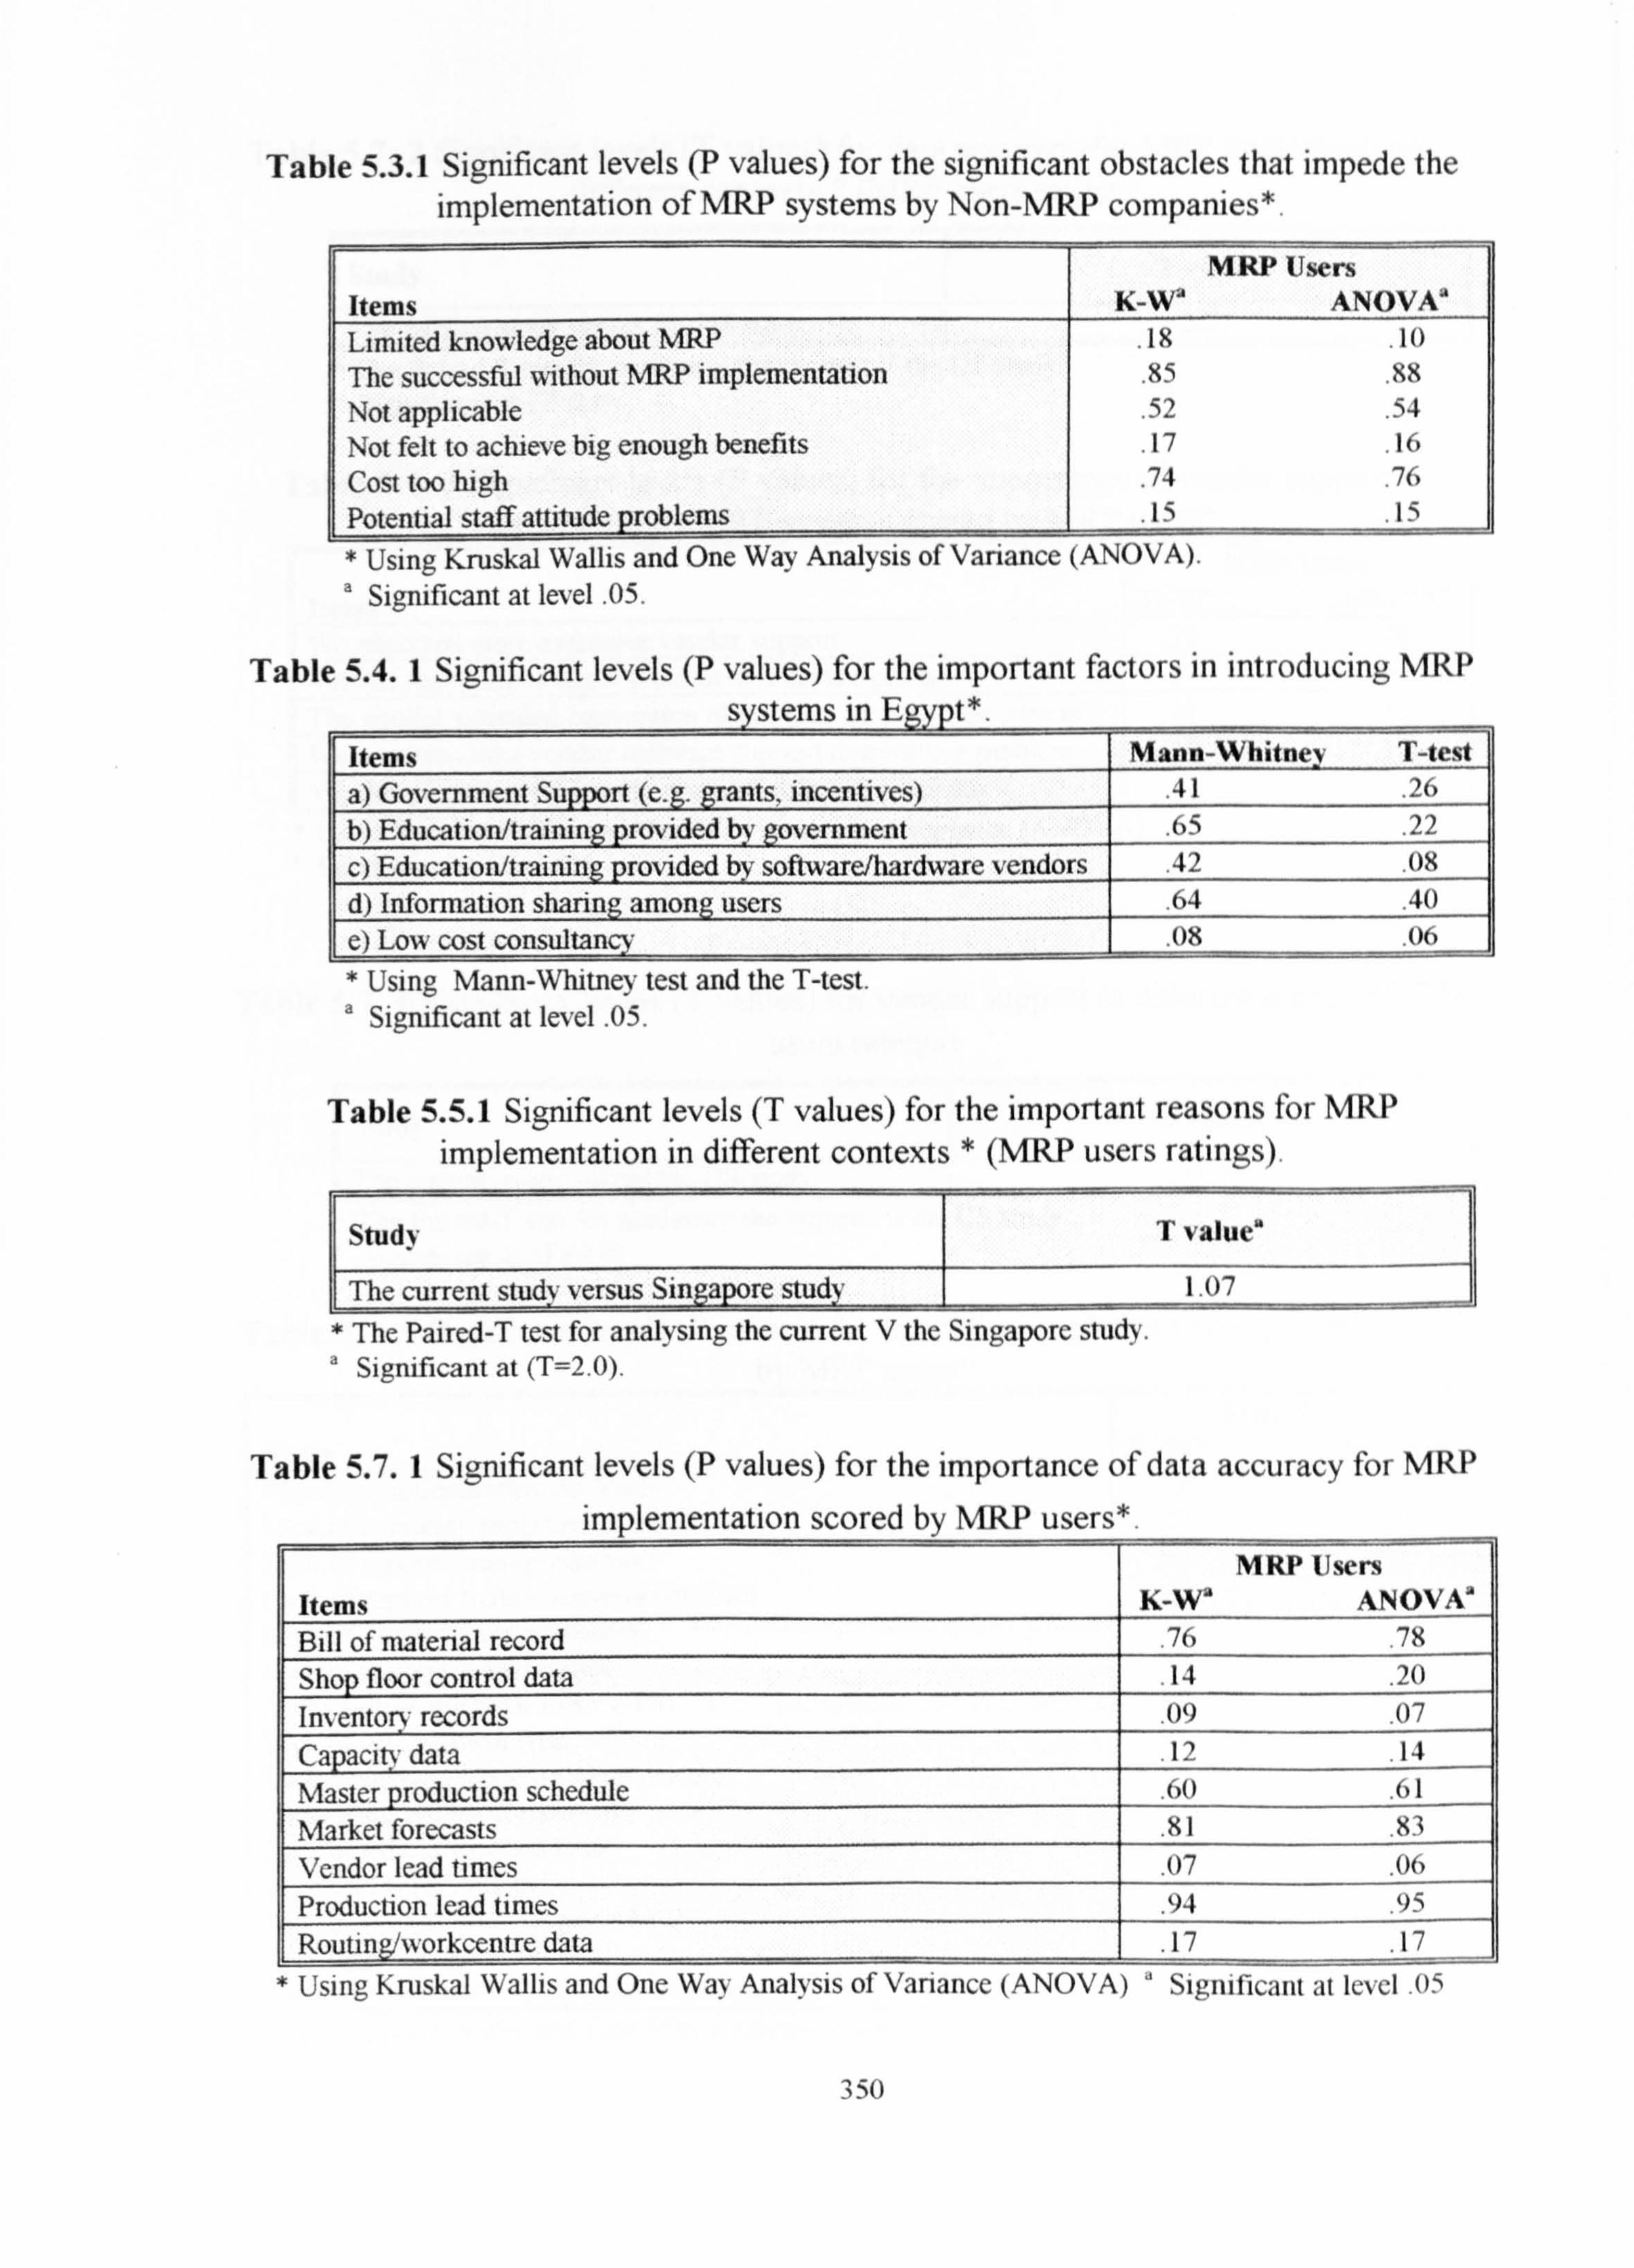
Table 5.3.1 Significant levels (P values) for the significant obstacles that impede the implementation of MRP systems by Non-MRP companies*.
Items K-W' MRP Users
ANOVA' Limited knowledge about MRP
. 18
. 111
The successful without MRP implementation . 85 . 88
Not applicable . 52 . 54 Not felt to achieve big enough benefits . 17 . 16 Cost too high . 74 . 76 Potential staff attitude problems . 15 . 15
* Using Kruskal Wallis and One Way Analysis of Variance (ANOVA). a Significant at level .
05.
Table 5.4.1 Significant levels (P values) for the important factors in introducing MRP
systems in Egypt*.
Items Mann-Whitney T-test
a) Government Support (e. grants, incentives) . 41 . 26 b) Educationhrainin provided by govemment . 65 .
22 c) Education/training provided by software/hardware vendors .
42 . 08
d) Information sharing among users . 64
. 40
11 e) Low cost consultancy . 08
. 06
* Using Mann-Whitney test and the T-test. a Significant at level .
05.
Table 5.5.1 Significant levels (T values) for the important reasons for MRP implementation in different contexts * (MRP users ratings).
Study T value"
The current study versus Singapore study 1.07
* The Paired-T test for analysing the current V the Singapore study. Significant at (T=2.0).
Table 5.7.1 Significant levels (P values) for the importance of data accuracy for MRP
implementation scored by MRP users*.
Items K-W' MRP Users
ANOVA" Bill of material record .
76 . 78
Shop floor control data 14 . 20
Inventory records 09 . 07
Capacity data . 12
. 14
Master production schedule . 60 . 61 Market forecasts .
81 . 83
Vendor lead times . 07 . 06
Production lead times . 94
. 95
Routin ww, orkcentre data . 17
. 17
* Using Kruskal Wallis and One Way Analysis of Variance (ANOVA) ' Significant at level . 05
350

Table 5.7.2 Significant levels (T values) for data accuracy for MRP implementation in different contexts * (MRP users ratings).
Study T value"
The current study versus the US study 2.27
* The Paired-T test for analysing the current V the US study. a Significant at (T=2.0).
Table 5.7.3 Significant levels (P values) for the importance of vendor support for implementing MRP systems scored by MRP users*.
Items K-W" MRP Users
ANOVA* We expected more extensive vendor support .
76 . 78
Vendor instructions understand their software product . 07
. 07
The vendor provided conversion of our data into the new system . 31
. 31
We experienced a vendor software support discontinue problem . 16
. 15
Vendor personnel efficiently resolved software problems . 10
. 09
* Using Kruskal Wallis and One Way Analysis of Variance (ANOVA). a Significant at level
. 05.
Table 5.7.4 Significant levels (T values) for vendor support in different contexts* (MRP
users ratings).
Study T value'
The current study versus the US study 11.23
* The Paired-T test for analysing the current V the US study. a Significant at (T=2.0).
Table 5.7.5 Significant levels (P values) for the critical implementation problems scored by MRP users*.
Items K-We MRP users
ANOVA" Poor training/education on MRP
. 32 1, Lack of company expertise in MRP
. 47 . 48
Lack of support from production . 92 . 93
Lack of support from supervisor/foreman . 27
. 27 Lack of support from marketing .
40 . 41
Lack of support from finance . 78
. 79
Lack of clear goals for MRP effort . 20 . 18
Lack of involvement from vendor . 88 . 81)
Lack of support from top management . 83 . 84
Lack of suitability of hardware . 17 . 16
Lack of suitability of softvýare 22; . 29
High cost MRP system . 69 . 70
Lack of vendor knowledge on MRP . 61
. (,
Lack of communication . 46 47
Lack of information technology evne_ rtise . 21 21
* Using Kruskal Wallis and One Way Analysis of Variance (ANOVA) ' Significant at Ie\cl. 05
351

Table 5.7.6 Significant levels (T values) for critical implementation problems in different contexts* (NIRP users ratings).
Study T value'
The current study versus Singapore study 4.89 * The Paired-T test for analysing the current V the Singapore study. a Significant at (T=2.0)
Table 5.8.1 Significant levels (T values) for MRP system features in different contexts* (MRP users ratings).
Study T value'
The current study versus Singapore study 1.27 The current study versus the US study --27 Sin re study versus the US study -. 95
* The Paired-T test for analysing the current V the US studies and the the Singapore stud'. a Significant at (T=2.0)
Table 5.8.2 Significant levels (P values) for the degree of computerisation of MRP modules in the individual industries * (MRP users ratings).
Items K-W' MRP Users
ANOVA'
a) Bills of materials . 87
. 88
b) Inventory control . 08
. 06
c). Master production Schedule . 19
. 21
d) Capacity requirements planning . 59
. 60 e) Forecasting
. 19
. 21
f) Purchasing and receiving . 59 . 60 g) Shop floor control .
15 . 14
H) Rough-cut capacity planning . 26
. 26
I) Customer order service . 58
. 59
j) Routing/work centres . 13
. 06
k) Cost accounting . 11
. 10
1) Financial analysis . 62
. 78
m) Sales order processing . 71
. 76
n) Operations scheduling . 10 . 11 o) Material requirements planning (parts explosion) . 91
. 91
Pavroll/human resources . 21
. 12 Using Kruskal Wallis and One Way Analysis of Variance (ANOVA).
a Significant at level . 05.
352

Table 5.8.3 Significant levels (T values) for the degree of computerisation of MRP modules in different contexts* (MRP users ratings).
Study T value'
The current study versus Singapore study -1.08 * The Paired-T test for analysing the current the Singapore study. a Significant at (T=2.0).
Table 5.9.1 Significant levels (P values) for the previous experience with automated, technology complex information systems scored by MRP users*.
Items MRP Users
K-W' ANOVA" The previous experience .
75 . 74
* Using Kruskal Wallis and One Way Analysis of Variance (ANOVA) a Significant at level . 05
353

Appendix C
354

Table 6.2.1 Significant levels (P values*) for the improved performance in individual industries (MRP users ratings).
Item Pre-M RP Current-M RP Future-MRP
a) Inventory turnover K-W .II . tºc, 33
ANOVA II (u, Ute
b) Delivery lead time (days) K-W to .II .II
ANOVA 10 17 Ioº
c) Percent of time meeting delivery K-W . 77 07 74
promises (%) ANOVA 74 09 0)
d) Percent of orders requiring "splits" K-W 00** 48 Ix
because of unavailable material (%, ) ANOVA O(1** ')0 40
e) Number of expediters (number of people) K-W o2** (11 ** 45
ANOVA . 01** OO** 49
* Using Kruskal Wallis and One Way Analysis of Variance (ANOVA) ** Highly significant differences
Table 6.2.2 Significant levels (P values *) for the improved performance in the current study versus previous two studies (MRP users ratings).
Study Pre- MRP estimate
('urrent-MRP
estimate Future- MRP
estimate
Current versus Anderson -. 23 - So 92
Current versus Laforge . 12 28 10
Laforge versus Anderson . 21 37 40
* Significant at . 05 level (T=2.00)
355

Table 6.2.3 Significant levels (P values*) for the subjective benefits in MRP companies (MRP users ratings).
Item K-W ANOVA
a) Improved competitive position . 21
. 21
b) Reduced inventory costs . 79
. 80
c) Increased throughput . 93
. 85
d) Improved product quality . 00**
. 00**
e) Improved productivity . 62
. 41
f) Better ability to meet volume/ product change . 00** . 00**
g) Better production scheduling . 82 . 87
h) Reduced safety stocks . 06 . 08
i) Better cost estimation . 34
. 34
j) Improved co-ordination with marketing and finance . 53 . 57
k) Improved your ability to perform in your job (ý(ý** (>(>**
1) Reduced informal systems for materials management/ inventory/ . 16 . 22
production control
m) Increased BOM accuracy . 13
. 09
n) Increased information on which to base decisions since MRP . 64 . 66
has been implemented
* Using Kruskal Wallis and One Way Analysis of Variance (ANOVA) ** Highly significant differences
Table 6.2.4 Distribution of the subjective benefits by industrial sector scored by MRP
users.
Means Item PM s MM s ICMs MSs MISS Improved product quality 2.0 2.3 2.0 2.4 2.4 Better ability to meet volume/ product change 2.0 1.9 2.1 3.2 2.2 Improved your ability to rform in your job 2.0 2.0 1.2 2.0 2.2
356
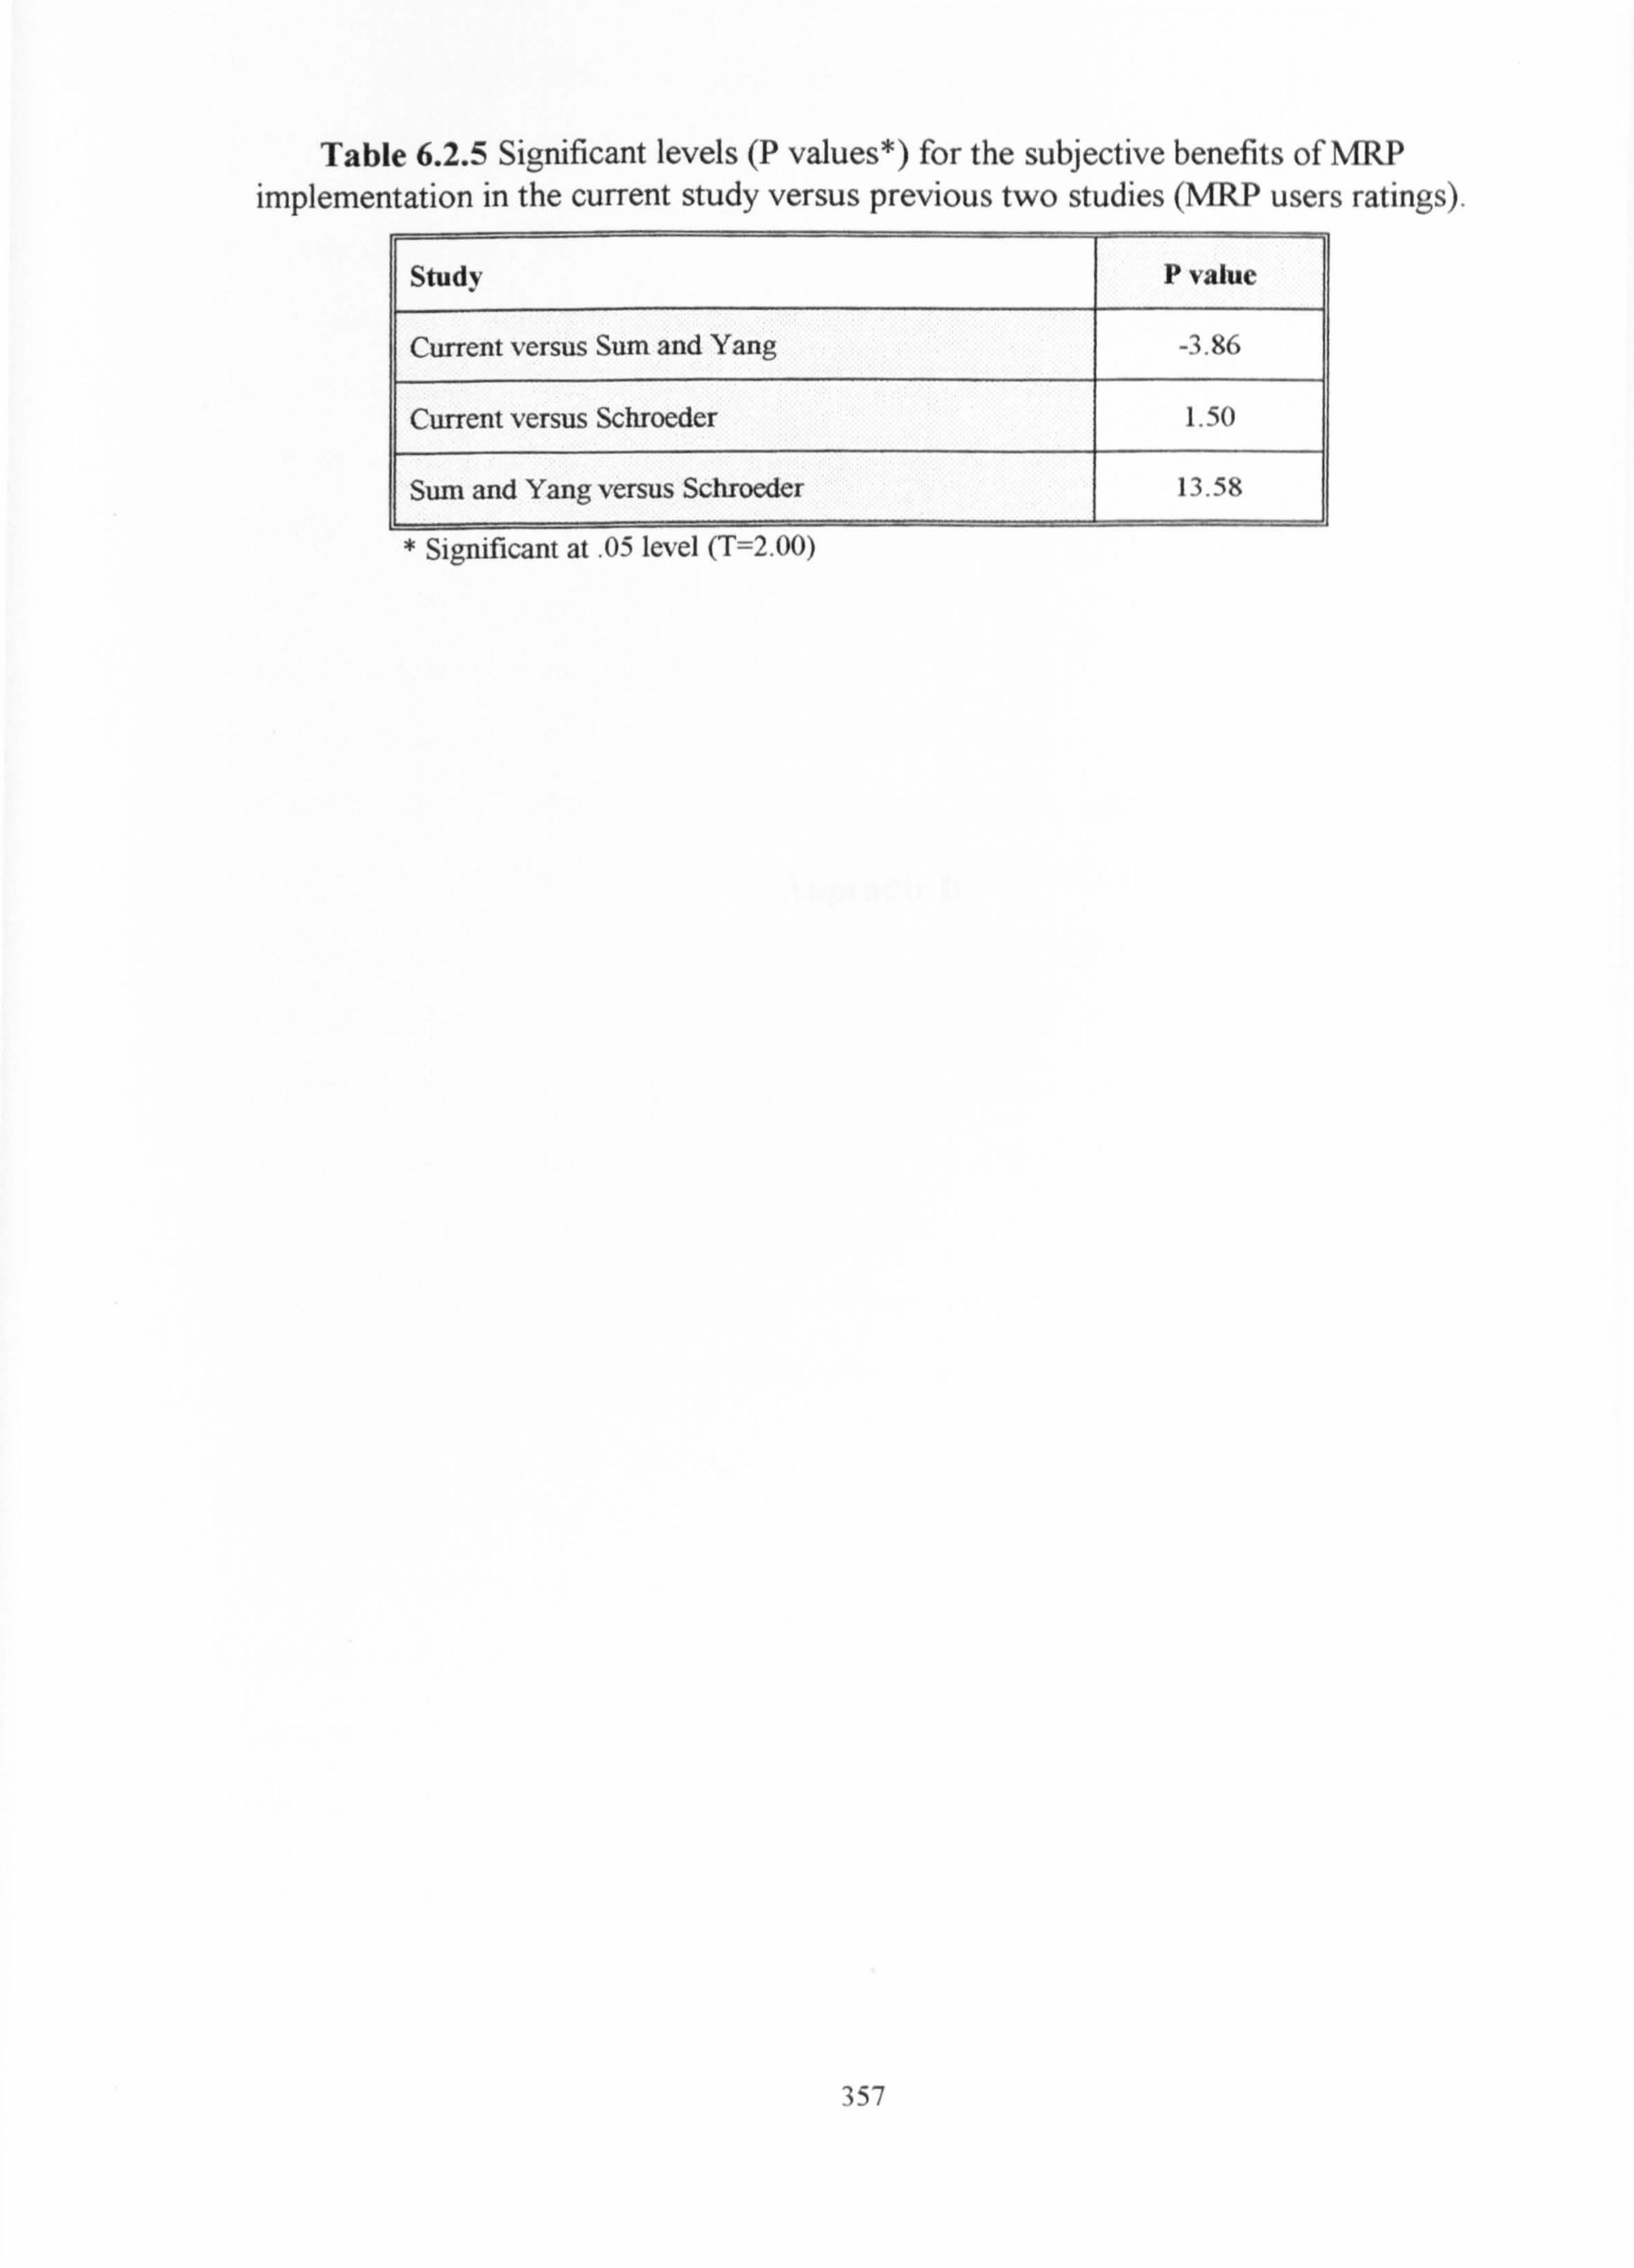
Table 6.2.5 Significant levels (P values*) for the subjective benefits of MRP implementation in the current study versus previous two studies (MRP users ratings).
Study P value
Current versus Sum and Yang -3.86
Current versus Schroeder 1.50
Sum and Yang versus Schroeder 13.58
* Significant at . 05 level (T=2.00)
357

Appendix D
358
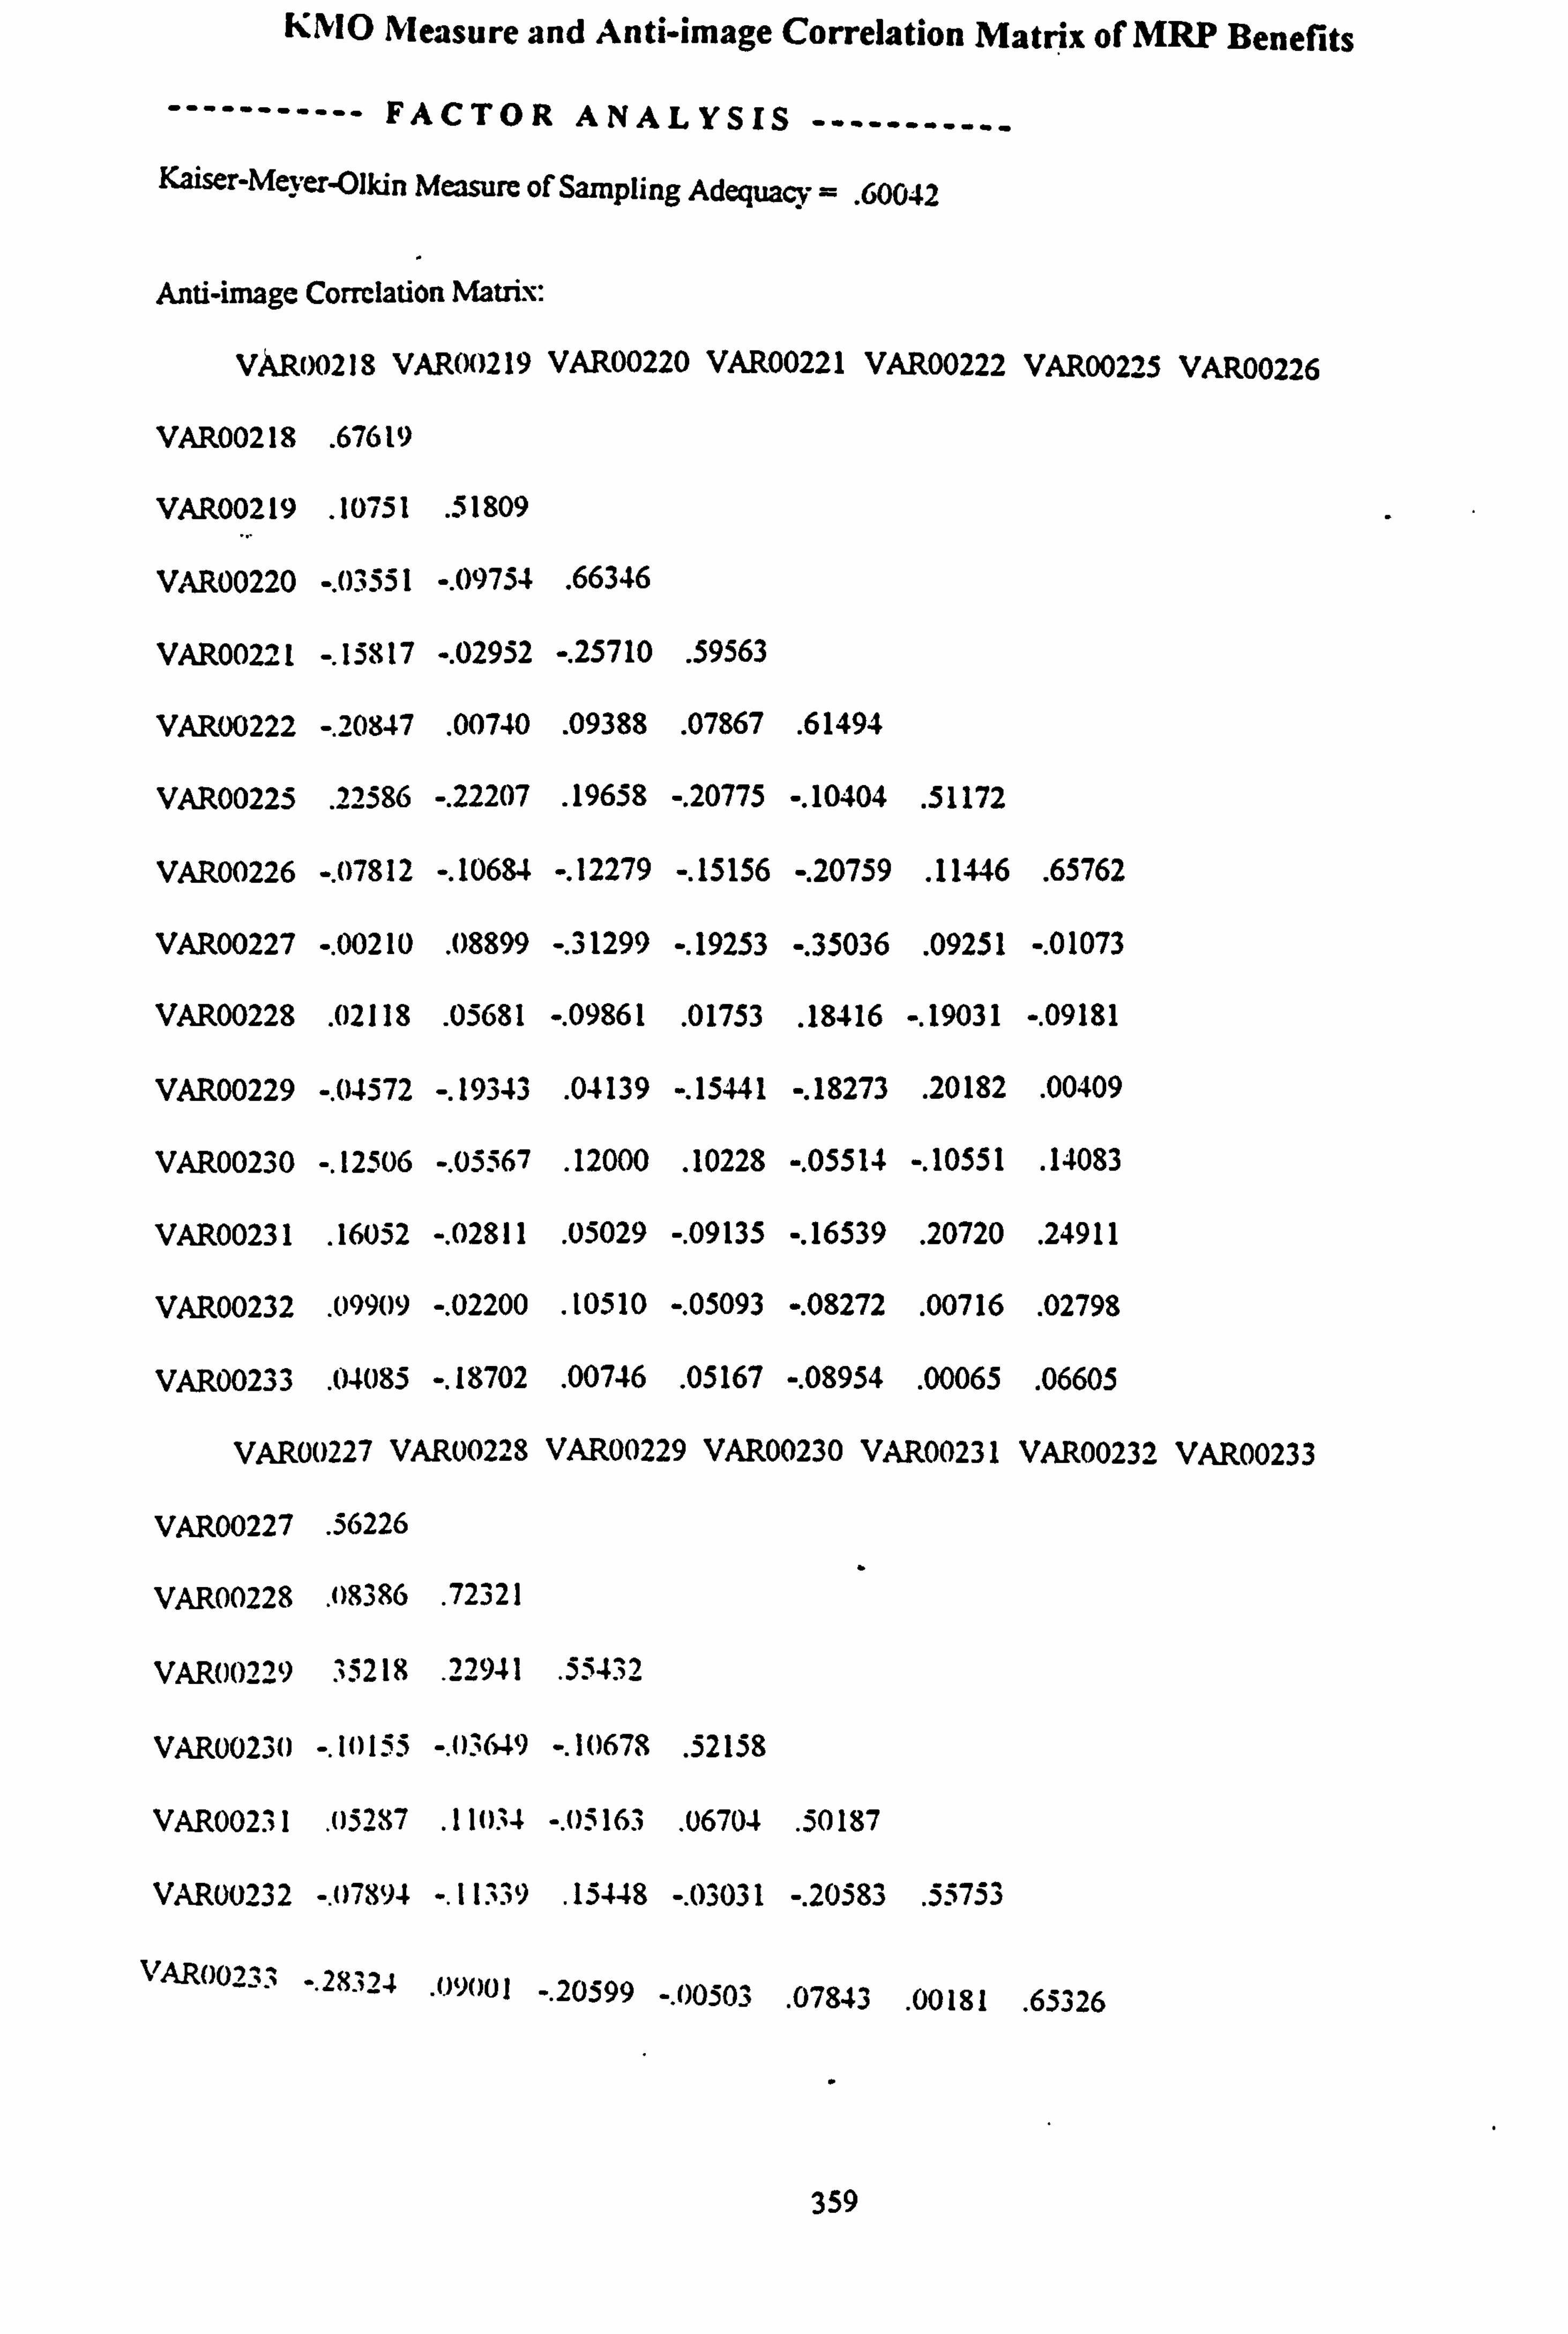
KNIO Measure and Anti-image Correlation Matrix of MRP Benefits
----------- FACTOR ANALYSIS ----------- Kaiser-Meier-Olkin Measure of Sampling Adequacy = . 60042
Anti-image Correlation Matrix:
VAR00218 VAR00219 VAR00220 VAR00221 VAR00222 VAR00225 VAR00226
VAR00218 . 67619
VAR00219 . 10751 . 51809
VAR00220 -. 03551 -. 09754 . 66346
0221 -. 15817 -. 02952 -. 25710 . 59563 VAR0
VAR00222 -. 20847 . 00740 . 09388 . 07867 . 61494
VAR00225 . 22586 -. 22207 . 19658 -. 20775 -. 10404 . 51172
VAR00226
VAR00227
VAR00228
VAR00229
VAR00230
VAR00231
VAR00232
VAR00233
VAR,
-. 07812
-. 00210
. 02118
-. 04572
-. 12506
. 16052
. 09909
. 04085
)0227 VV
-. 10684 -. 12279
. 08899 -. 31299
. 05681 -. 09861
-. 19343 . 04139
-. 05567 . 12000
-. 02811 . 05029
-. 02200 . 10510
-. 18702 . 00746
. RU0228 VAR002
-. 15156 -. 20759 . 11446 . 65762
-. 19253 -. 35036 . 09251 -. 01073
. 01753 . 18416 -. 19031 -. 09181
-. 15441 -. 18273 . 20182 . 00409
. 10228 -. 05514 -. 10551 . 14083
-. 09135 -. 16539 . 20720 . 24911
-. 05093 -. 08272 . 00716 . 02798
. 05167 -. 08954
. 00065
. 06605
29 VAR00230 VAR00231 VAR00232 VAR00233
VAR00227 . 56226
VAR00228 . 08386 . 72321
VAR00229 35218 . 22941 .
55432
VAR00230 -. 10155 -. 01649 -. 10678 . 52158
VAR002 31 . 05287 . 110,4 -. 05163 . 06704 . 50187
VAR00232 -. 07894 -. 11339 . 15448 -. 03031 -. 20583 .
55753
VAR0023 ̀ -. 28324 . 09001 -. 20599 -. 1)0503
. 07843 . 00181
. 65326
359

KMO Measure and Anti-image Correlation Matrix of Uncertainty Factors
................................................... FACTOR ANALYSIS.............................................
Kaiser-Meyer-Olkin Measure of Sampling Adequacy =. 60823
Anti-image Correlation Matrix:
VAR00029 VAR00030 VAR00031 VAR00032 VAR00033 VAR00034 VAR00035
VAR00029 . 60105
VAR00030 -. 11932 . 5-3164
VAR00031 -. 21731 . 13542 . 64385
. 15853 -. 08511 . 20160 . 68629 VAR00032
VAR00033 -. 01274 -. 07738 -. 18935 . 07195
. 61643
VAR00034 . 13450 . 18418 -. 02902 . 12192 . 10124 . 51434
VAR00035 -. 05672 . 24117 . 00789 . 13647 -. 25206 . 06923 . 59686
360

KMO Measure and Anti-image Correlation Matrix of Data Accuracy Factors
................................................... FACTOR ANALYSIS.............................................
Kaiser-Meyer-Olkin Measure of Sampling Adequacy =. 60547
Anti-image Correlation Matrix:
VAR00103 VAR00109 VAROOIIO VAR00111 VAR00112 VAR00113 VAR00114
VAR00108 . 60123
VAR00109 -. 12662 . 55116
VAROO IIO-. 02598 . 17847 . 51074
VAROOIII -. 01933 -. 10476 -. 06135 . 60947
VAR00112 -. 27925 -. 28998 -. 23271 . 04428 . 55738
VAR00113 . 04941 -. 03501 -. 04981 . 17020 -. 03002 . 52544
VAR00114 -. 17310 . 08327 . 07846 -. 35210 . 00078 -. 19087 . 64548
VAR00115 -. 00172 . 09267 . 13807 -. 24698 .
04478 -. 14539 -. 13765
VAR00116 . 0U935 . 15144 -. 00342 . 19898 -. 22118 . 24992 .
00435
115 VAROO116
VAROO 115 . 74007
VAR00116 . 12240 . 65470
361

KMO Measure and Anti-image Correlation Matrix of Vendor Support Factors
................................................... FACTOR ANALYSIS.............................................
Kaiser-Meyer-Olkin Measure of Sampling Adequacy =. 60122
Anti-image Correlation Matrix:
VAR00121 VAR00123 VAR00124 VAR00125 VAR00128 VAR00130
VAROO121 . 66820
VAR00123 -. 10358 . 58183
VAR00124 -. 40228 -. 21309 . 61550
VAR00125 . 24098 . 08742 . 16225 . 74492
VAR00128 -. 21604 -. 14949 . 01195 -. 10545 . 53760
VAR00130 -. 04762 -. 49261 . 24168 . 04604 . 12137 . 52396
362
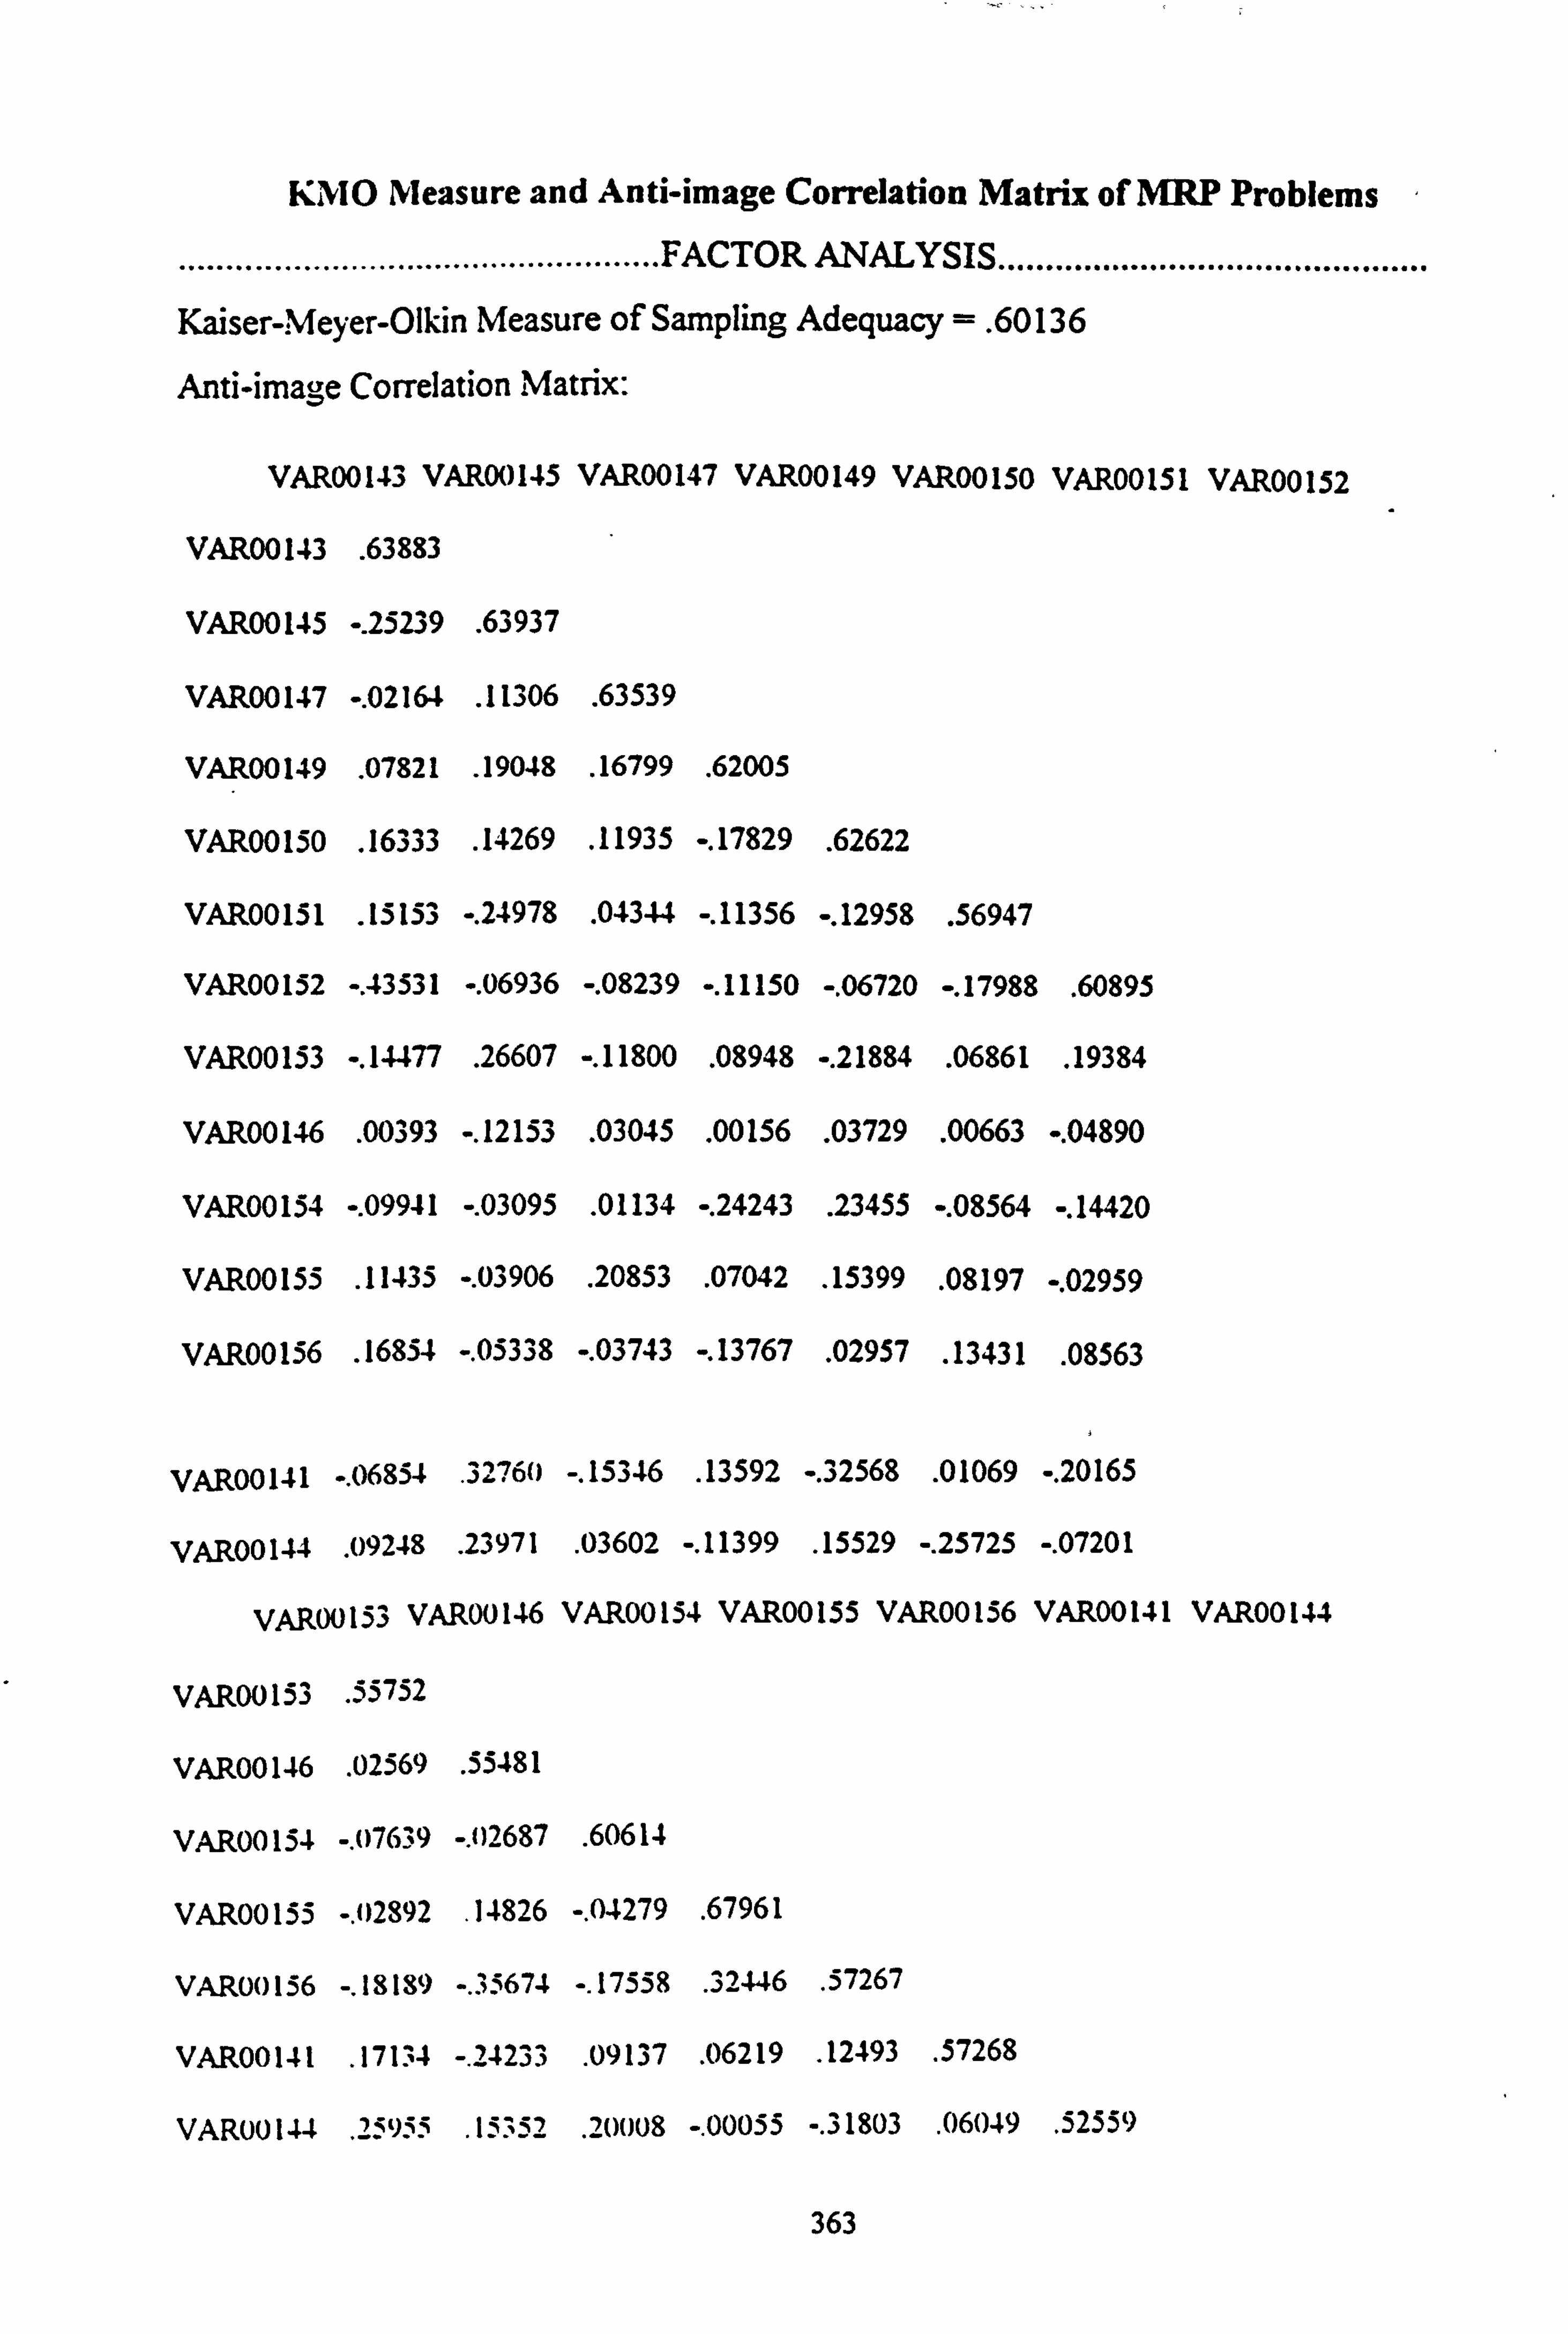
KMO Measure and Anti-image Correlation Matrix of MRP Problems
FACTOR ANALYSIS .............................................
Kaiser-Meyer-Olkin Measure of Sampling Adequacy = . 60136
Anti-image Correlation Matrix:
VAR00143 VAR00145 VAR00147 VAR00149 VAR00150 VAR00151 VAR00152
VAR00143 . 63883
VAR00145 -. 25239 . 63937
VAR00147 -. 02164
VAR00149 . 07821
VAR00150 . 16333
VAR00151 . 15153
VAR00152 -. 43531
VAR00153 -. 14477
. 11306
. 19048
. 14269
-. 24978
-. 06936
. 26607
. 63539
. 16799 . 62005
. 11935 -. 17829 . 62622
. 04344 -. 11356 -. 12958 . 56947
-. 08239 -. 11150 -. 06720 -. 17988 . 60895
-. 11800 . 08948 -. 21884 . 06861 . 19384
VAR00146 . 00393 -. 12153 . 03045 . 00156
. 03729 . 00663 -. 04890
VAR00154 -. 09941 -. 03095 . 01134 -. 24243 . 23455 -. 08564 -. 14420
VAR00155 . 11435 -. 03906 . 20853 . 07042 . 15399 . 08197 -. 02959
VAR00156 . 16854 -. 05338 -. 03743 -. 13767 . 02957
. 13431 . 08563
VAR00141 -. 06854 . 32760 -. 15346 . 13592 -. 32568 . 01069 -. 20165
VAR00144 . 09248 . 23971 . 03602 -. 11399 . 15529 -. 25725 -. 07201
VAR00153 VAR00146 VAR00154 VAR00155 VAR00156 VAR00141 VAR00144
VAROO 153 . 55752
VAR00146 . 02569 . 55481
VAR00154 -. 07639 -. 02687 . 60614
VAROO 155 -. 02892 . 14826 -. 04279 .
67961
VAROO156 -. 18189 -. 35674 -. 17558 . 32446 . 57267
VAR00141 . 17134 -. 24233 . 09137 . 06219 . 12493 . 57268
VAR00144 . 25955 . 15352 . 20008 -. 00055 -. 31803 . 06049 . 52559
363
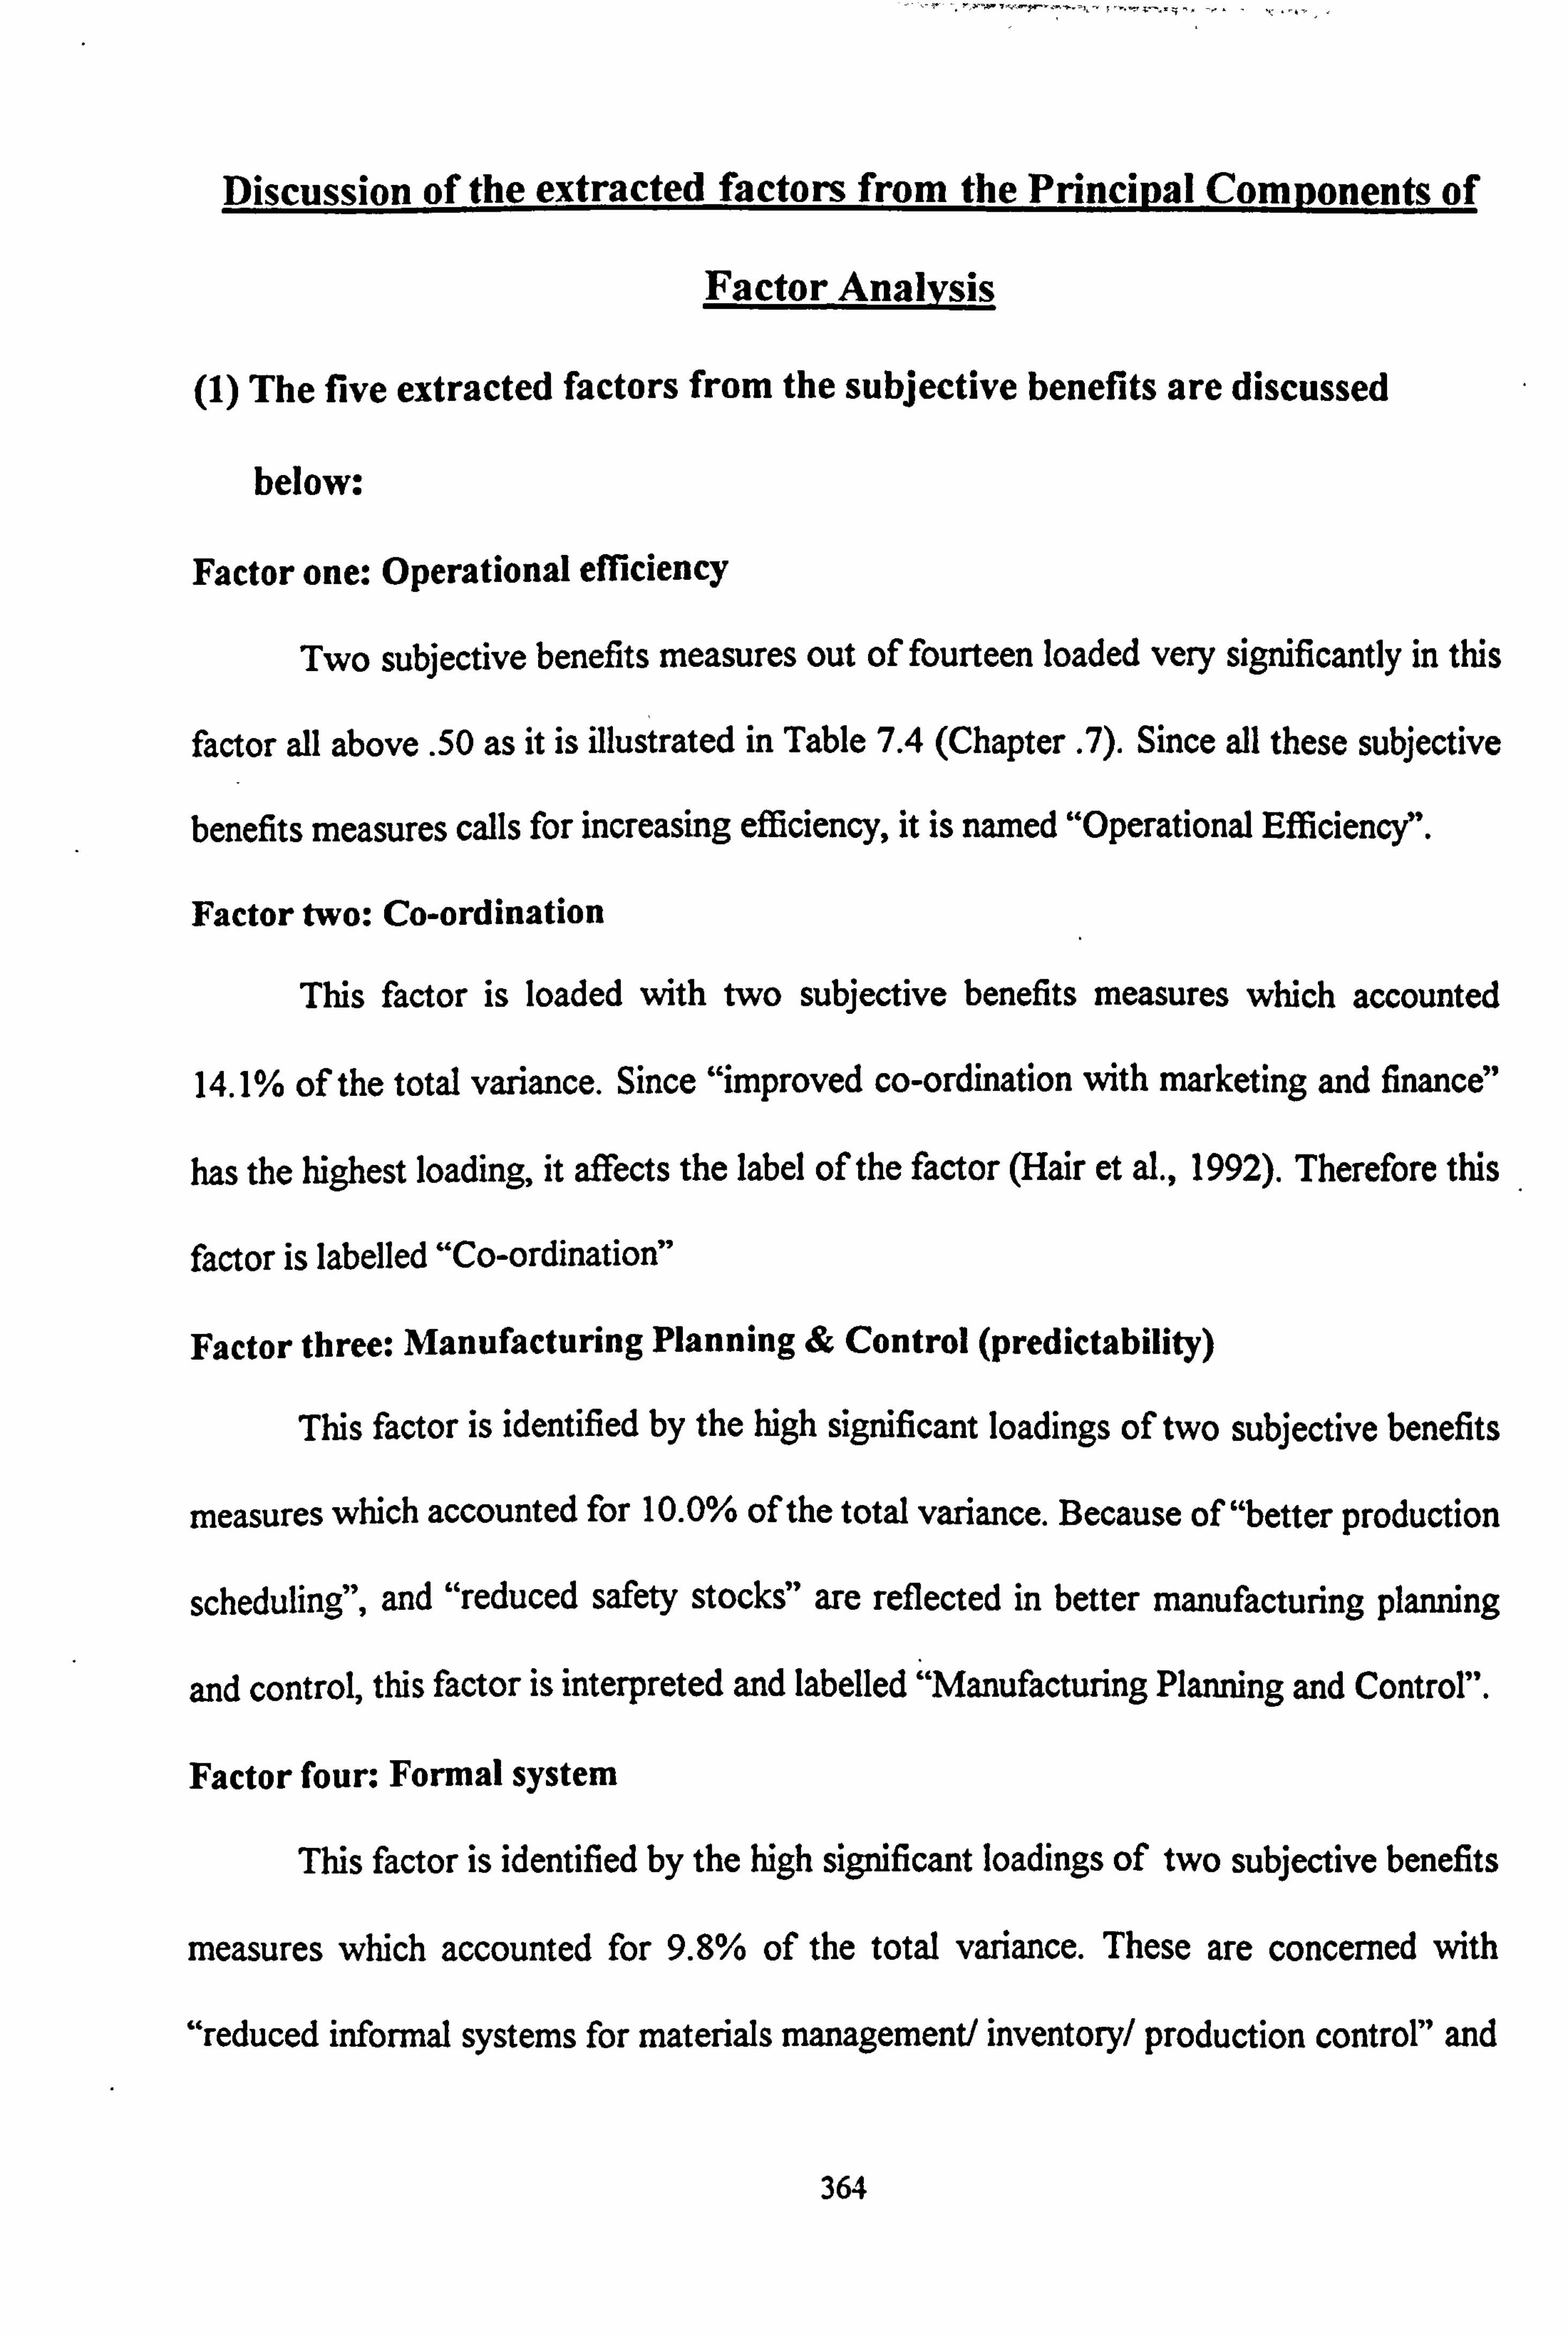
Discussion of the extracted factors from the Principal Components of
Factor Analysis
(1) The five extracted factors from the subjective benefits are discussed
below:
Factor one: Operational efficiency
Two subjective benefits measures out of fourteen loaded very significantly in this
factor all above . 50 as it is illustrated in Table 7.4 (Chapter . 7). Since all these subjective
benefits measures calls for increasing efficiency, it is named "Operational Efficiency".
Factor two: Co-ordination
This factor is loaded with two subjective benefits measures which accounted
14.1% of the total variance. Since "improved co-ordination with marketing and finance"
has the highest loading, it affects the label of the factor (Hair et al., 1992). Therefore this
factor is labelled "Co-ordination"
Factor three: Manufacturing Planning & Control (predictability)
This factor is identified by the high significant loadings of two subjective benefits
measures which accounted for 10.0% of the total variance. Because of "better production
scheduling", and "reduced safety stocks" are reflected in better manufacturing planning
and control, this factor is interpreted and labelled "Manufacturing Planning and Control".
Factor four: Formal system
This factor is identified by the high significant loadings of two subjective benefits
measures which accounted for 9.8% of the total variance. These are concerned with
"reduced informal systems for materials management/ inventory/ production control" and
364
"increased BOMnventory/MPS data accuracy". Therefore, this factor is interpreted and
labelled "Business Results".
Factor five: Inventory costs
This factor is identified by the high significant loadings of one subjective benefits
measure which accounted for 8.5% of the total variance. Since this benefit measure deals
with "reduced inventory costs", this factor is named "Inventory Costs".
(2) The twenty extracted factors from determinant variables are discussed
below:
Uncertainty constructed factors:
Factor one: The required products
Three variables out of seven loaded significantly in this factor all above . 70 as it is
illustrated in Table 7.5 (Chapter . 7). Since all these uncertainty variables relating to
products, it is named "The Required Products".
Factor two: Capacity
This factor is loaded with two uncertainty variables which accounted 19.1% of
the total variance. Since "capacity constraints" and "machine downtime" are concerned
with production capacity. Therefore, this factor is labelled " Capacity".
Factor three: Reliability
This factor is identified by high significant loadings of two uncertainty variables
which accounted for 14.6% of the total variance. Since "reliability of plant within the
factory" has the highest loading, the label of this factor is "Reliability".
365

Implementation problems constructed factors:
Factor four. Technical
Three implementation problems are loaded highly in this factor and accounted
18.6% of the total variance. These problems call for technical issues. Thus, this factor is
interpreted and labelled "Technical".
Factor five: Management support
This factor includes three implementation problems which accounted for 14.6%
of the total variance. These are concerned with lack of support from top management,
production management and marketing management. Therefore, this factor is interpreted
and labelled "Management Support".
Factor six: MRP expertise
Two implementation problems included in this factor which accounted for 12.9%
of the total variance. Since the second variable has the highest loading, it influence the
label of the factor (Hair et al., 1992). Thus, this factor is interpreted and labelled "MRP
Expertise".
Factor seven: People support
This factor is identified by two implementation problems which accounted for
11.7% of the total variance. Because of the high loading of the lack of support from
supervisor/ foreman, this factor is interpreted and labelled " People Support".
Factor eight: Active vendor support
Only one implementation problem is loaded in this factor. It is accounted for
7.6% of the total variance. Since this calls for the vendors involvement where they are
regularly going to the companies to know how does system work, what are the
366

implementation problems and to provide the advice through meeting or training
programmes, it is named "Active Vendor Support".
Organizational & Technological & Human constructed factors:
Factor nine: Company size
This factor is identified by three organisational variables which accounted for
21.2% of the total variance. These are "gross sales"; "number of P&IC employees";
and "number of items per product". Since all of them call for determining company size,
this factor is named "Company Size".
Factor ten: Stage of development
This factor includes two technological variables which accounted for 14.9% of
the total variance. These are concerned with the development of MRP implementation
achieved by MRP users. Therefore, this factor is labelled " Stage of Development".
Factor eleven: Experience
This factor is identified by one human variable which accounted for 10.7% of the
total variance. Since this variable calls for the degree of previous experience with the
automated information systems, it is named "Experience".
Factor twelve: BOM level
Only one organisational variable is loaded in this factor. It is accounted for 8.4%
of the total variance. Since this variable calls for the number of bill of materials, it is
labelled "BOM Levels".
367

Factor thirteen: Company maturity
This factor is identified by one organisational variable which accounted for 7.9%
of the total variance. Since company age is a constructed factor identified by the length of
company in operation, it is named " Company Maturity"
Vendor support constructed factors:
Factor fourteen: Vendor support availability
Two variables are loaded in this factor and accounted for 35.8% of the total
variance. Since these variables indicate the degree to which the vendors are available to
call them to turn up to solve the implementation problems, this factor is named "Vendor
Support Availability".
Factor fifteen: Active vendor proficiency
This factor includes two variables which explained 21.7% of the total variance,
making the cumulative percentage of variance over 70.0%. Vendor support variables in
this factor indicate into the degree of proficiency to offer the instructions of their
software product which is easy understood by the user, and also indicate the vendor
proficiency to solve software problems. Therefore, this factor is labelled " Active Vendor
Proficiency".
Factor sixteen: Vendor experience
This factor is loaded with only one variable which accounted for 16.7% of the
total variance. Since this variable calls for the vendor experience to help MRP user to
convert their data to be available with MRP systems such as coding data, using
spreadsheets ... etc. Thus, this factor is interpreted and called "Vendor Experience".
368

Data accuracy constructed factors:
Factor seventeen: Supply planning data
Three data accuracy elements are loaded in this factor and accounted for 24.3%
of the total variance. These elements deal with the issue of planning based on supply data
such as capacity data, vendor lead times and production lead times. Therefore, this factor
is interpreted and labelled "Supply Planning Data".
Factor eighteen: Demand planning data
This factor includes three data accuracy elements which accounted for 17.7% of
the total variance. These are concerned with planning based demand data such as BOM
records, inventory records and market forecasts. Thus, this factor is named "Demand
Planning Data".
Factor nineteen: Schedule execution data
This factor is identified by two data accuracy elements which accounted for
11.8% of the total variance. These are concerned with scheduling and routing/ work
centre data. Since the first element has the highest loading, it influences the label of the
factor. Thus, this factor is labelled "Schedule Execution Data".
Factor twenty: Operating execution data
Only one element of data accuracy elements is loaded in this factor. It is
accounted for 11.5% of the total variance. Since this element calls for increasing the
accuracy of the required data to perform job, it is named " Operating Execution Data".
369

Appendix E
370

ACE Example
The example below illustrates the key advantage of ACE over standard regression
techniques. This example also address the interpretation of an ACE model. It
demonstrates the effectiveness of ACE by attempting to recover the transformations for
individual variables in the following equation used to construct Y:
Y =1og[3 sin(13A) + abs(B) + C2 +(D3 / 9) +E+ 10] -8 (1)
where A, B, C, D and E are independent samples of 100 observations drawn from the
Normal distribution with mean 0 and variance 1. Note that relationship (1) above can be
re-expressed as:
e=exp(fl=3sin(1.3A)+abs(B)+C2 +(D3 /9)+E+10 (2)
Thus, if we are simply given the data values for Y, A, B, C, D and E, without
knowledge of functional relationship (1), we might try to plot Y individually against the
independent variables A, B, C, D and E so as to gain some insights on the pair-wise
relationships, yielding the graphs in Figure 1.
Note that the plots in Figure 1 do not suggest any obvious transformation for
either the dependent or independent variables.
371

a(. 4866) b(. 0022)
' ,. ý
'f ,
"".. ýýý
ýýýý,
rýý "ý1 �"
c(. 0066) d(. 0247) e(. 0983)
Y vs. X's Figure 1
Ordinary Regression:
If we then regress Y on A, B, C, D and E using Ordinary Least Squares (OLS),
we will obtain an R2 of 0.637. We might plot the residuals from the regression first
A against the fit }', then separately against the independent variables to see if there might
be patterns to suggest possible transformations for the independent variables. The plots
are shown in Figure 2. Perhaps only the plots of the residuals versus A and C gives any
hint that some non-linear component of A or C might help to explain the variation in Y.
y(. 0083) i(O3 b(O) c(O) d(O) MO1
Residuals Plots Figure 2
ACE Regression:
If we now invoke ACE on the given data set, ACE will provide an output of
individual transformations for the variables as shown in Figure 3. ACE's suggested
graphical transformations for the variables are shaped like exponential for Y, sine for A,
absolute-value for B, square for C, cubic for D, and linear for E, which are exactly the
corresponding functions in relationship (1).
372

V. 9975. £750e-118) a(. 6825. . 2756e-114) b(. 0099.. 8908e-58) c(. 2289. . 4090e-83)
It ACE Transformations
Figure 3
f r 1
d(A533.. 8401e-62) : e(. 092,. 1653. -80)
Note that the transformations do not provide any information on the scales of the
transformed variables (e. g., 3 for sin(1.3A)) or any shift in the origins for the transformed
variables (which would affect the intercept +10). This is because the scaling of an
independent variable does not affect the fit of the corresponding regression model, and .
any translational shift in the origins will be absorbed into the constant term in a
regression. We therefore need not be concerned with the markings on the scale for the
ordinate (y-) axis in a plot of the suggested ACE transformation for a variable. That is,
the origin for the y-axis can be fixed anywhere and the unit of measurement for the y-axis.,
is arbitrary. In addition, the suggested ACE transformations are constructed such that a
larger transformed value for an independent variable will be associated, everything else
being equal, with a larger value of the transformed dependent variable. In other words, if
we regress the transformed dependent variable on all the transformed independent
variables, all parameter coefficients for the independent variables will be positive. Since ,
we are fitting a model to the data and because ACE's suggested transformations (Figure
3) are in graphical form, we would, at this point, need to look for analytic functions that.
approximate the suggested ACE transformations for transforming the original data. In
this example, we would arrive quite easily at analytic functions such as exponential for Y,
sine for 1.3A (the 1.3 would be estimated from the observed x-values at the turning
373

points on the transformation plot for A), absolute-value for B. square for C, cubic for D,
and no transformation for E (Figure 4). After we have applied these analytic functions to
transform the original data, a regression of the transformed Y on the transformed
independent variables will obviously produce an R2 of 1, an intercept of 10e s, and
parameter coefficients of 3e-8, e $, e-, e'$ /9 and e$ for the corresponding independent
variables. The functional relationship of the model in Figure 4 is thus:
E[exp(Y)] = 3e-` sin(1.3A) + e-' abs(B) + e-= C2 +e-'(D' I 9) + e'E + 10e"' ý3)
1"" ýt
% "5 i V.: "".. J .. ,
yy(. 9748) a: a(. 696) bb(. 0168) c: c(. 037) A: d(. 3859) e: e(1)
Analytic Transformations Figure 4
In actuality, the ACE model has an R2 of 0.997 which is short of 1.0 because
ACE, being a numerical procedure, is not perfect even on an analytic model. However,
note that the R2 of 0.997 is considerably better than 0.637 as obtained using OLS. It is
important to note that in theory ACE can not fit worse than ordinary regression, because
if no transformation is indeed necessary (i. e., the ordinary regression model is exactly
true), then ACE would simply suggest nearly linear transformations for all variables
(much like the transformation for E in Figure 3).
Naturally, ACE will generally not do as well as the example here when (1) some
independent variables are highly correlated, (2) there is an error term, (3) some
independent variables are omitted or (4) some extra independent variables are present,
374

although this last situation is partially taken care of by a built-in stepwise variables
selection procedure.
Interpreting ACE Transformation Plots:
To study the effects of the independent variables (A, B, C, D, E) on the
dependent variable (Y), we can refer to relationship (3) or the analytic ACE
transformation plots (Figure 4). In general, it is easier to interpret the ACE model from
the transformation plots because the plots are easier to conceptualise compared to the
mathematical expressions of the transformations which can be quite cumbersome. If we
choose to interpret using transformation plots, then a very useful observation to note is
that when the transformation for the dependent variable is an increasing function, then the
transformed scores (y-axis) of the individual transformation plots of the independent
variables are positive correlates of the observed (i. e. pre-transformed) score for the
dependent variable. This observation is true because a higher transformed score for an
independent variable has a larger contribution to the transformed score of the dependent
variable (because the corresponding parameter estimate for the independent variable is
always positive), which in turn maps back onto a higher observed score for the dependent
variable (because its transformation is an increasing function).
Similarly, a lower transformed score for an independent variable has a smaller
contribution to the transformed score for the dependent variable, which in turn maps
inversely onto a lower observed score for the dependent variable. In this example, the
transformation for Y is an increasing function (i. e., exponential) (Figure 4) and the
parameter estimates for A, B, C, D, and E are positive (see relationship (3)), hence a
higher transformed score for B, say, will result, everything else being equal, in a higher
375

transformed Y score, which in turn translates back into a higher observed Y score. In
short, a higher transformed B score will map onto a higher observed Y score, and vice
versa. Therefore, when we want to relate the independent variables (A, B, C, D, ' E) to
the dependent variable, Y, we can bypass the mapping onto the Y transformation plot,
and simply regard the transformed scores of the independent variable plots as positive
correlates of the observed Y scores. In other words, we can, for interpretation purposes,
treat a transformed axis (y-axis) of an X-variable transformation plot as if it were the
observed (pre-transformed) axis (x-axis) of Y, provided the ACE transformation for Y is
an increasing function.
So we only need to focus on the individual transformation plots of the
independent variables in order to study their effects on the dependent variable, Y. For
instance, if we look at the transformation plot for A (Figure 4), we know that the ACE
model suggests that, as the observed A score increases, the observed Y score would
decrease, then increase, and then decrease again. As for B, its absolute-value
transformation suggests that as B increases, Y would decrease and then increase (Figure
4).
Generating an ACE Model:
The ACE module produces an output of graphical transformations for the
dependent and independent variables. ACE will also indicate the adjusted and imputed p-
value of the model based on these graphical transformations (all p-values are really only
the computational counterparts of the p-values in a standard regression model, but they
are useful for between-model comparisons as well as for variables selection). As the
transformations for this preliminary ACE model are presented in graphical rather than
376

analytic form, analytic functions will then have to be constructed to replace the ACE
transformations for transforming the original data (see De Veaux ("Finding
Transformations for Regression Using the ACE Algorithm. " Sociological Methods &
Research, vol 18,1989) for examples of analytic function construction). Ordinary Least
Squares regression can then be applied to the transformed data to arrive at the final ACE
model.
To ensure that the analytic functions represent the graphical ACE transformations
adequately, the adjusted in the preliminary and the final ACE models must be checked for
a close match. The statistical significance of the variables in the final model are then
ascertained, and the model assumptions of constant variance and normality checked.
tS1 CQNý y1°i4
11ýý
377
Copyright © 2022 FDOKUMEN