
University of Glasgow Exploration Society Trinidad Expedition ...
Upload
khangminh22Category
view
0download
0
UNIVERSITY Of
GLASGOW
An Examination of Factors Influencing the Formation of the Consideration Set and Consumer Purchase
Intention in the Context, of Non-deceptive Counterfeiting
By
XUEMEI BIAN
A Dissertation Submitted According to the Regulations for the
Degree of Doctor of Philosophy
Management and Business School University of Glasgow
October 2006
y 81t

Abstract
The substantial growth of the appearance of counterfeits in the worldwide market has
aroused significant levels of concern, interest and attention among practitioners, policy
makers, and academic researchers. However, existing research on this phenomenon
remains to date incomplete, with considerable confusion and fragmentation. Consumers'
perceptions towards counterfeits as well as the effect of consumers' perceptions on
consumer purchase behaviour remain unclear. On the other hand, the study of
determinants of the consideration set has recently become attractive to researchers due to
its importance in relation to the study of consumer choice processes. Nevertheless,
previous research appears to be arbitrary and few researchers have examined the
influence of consumer perceptions of branded products on the formation of the
consideration set despite the fact that a number of academics have called for research in
this area.
Recognising the deficiency in these two research areas, this thesis attempts an
investigation of the determinants of the two crucial stages - consideration set and
purchase intention of the consumer choice process in the context of non-deceptive
counterfeiting. To achieve this aim, the present research adopted a combination of
qualitative research (focus group) and quantitative research (individual interview survey)
and provides a detailed examination of consumers' perceptions of both the counterfeit
and original branded products studied, as well as their explanatory power on the selected
consumer choice processes.
This research suggests that there are certain differences in the kinds of determinants of
the same stage of the consumer choice process across different versions of a brand.
There also exist some differences in the kinds and numbers of determinants of the
consideration set and the purchase intention towards one brand. Nevertheless, the brand
personality appears to be significant across all regression models. Generally, it plays the
dominant role in the formation of the consideration set and consumer purchase intention.
Consumers are more likely to evaluate more criteria in the process of consideration than
at the purchase intention stage. This research contributes a more comprehensive
understanding of determinants of the consumer choice processes in a more complex
context than was previously available, enriches the branding theory, suggests a more
sophisticated use of Aaker's (1997) brand personality scale, develops a new
measurement scale for use in the study of multiple brands, recommends a more
comprehensive data analysis process and proposes possible directions for further research.
I

Contents
Abstract ..............................................................................................
I Contents
...................................................................................... II-VII
List of Tables .............................................................................. VIII-XI
List of Figures ............................................................................. XII-XIII
Acknowledgements ..................................................................... XIV -XV I
Chapter 1 Introduction .................................................................. 1-17
1.1 Introduction .............. .................................................................
1 1.2 Literature Review in Study of Counterfeiting and Research Gap .................. 2 1.3 Literature Review of Consumer Choice Processes, and Identification
of the Research Gap ..................................................................... .. 4 1.4 The Research Aim and Objectives ......................................................
6 1.5 Assumptions of This Study and Research Scope .................................... .. 7 1.6 Research Methodology ..................................................................
7 1.7 Significance of This Research .......................................................... .. 8
1.7.1 Academic Contributions .............................................................. 9
1.7.2 Implications ........................................................................... 10 1.8 Structure of the Study ................................................................... 11 1.9 Summary ................................................................................... 17
Chapter 2 Counterfeiting and Related Studies ................................... 18-42
2.1 Introduction ............................................................................... 18 2.2 The Counterfeiting Phenomenon: Development, Scope, Impact, Producers and
Recipients ................................................................................. 19 2.3 Counterfeiting in the UK ............... 21 ................................................ 2.4 Counterfeiting/Counterfeit Product, Imitation, and Piracy ........................
22 2.4.1 The Overall Situation .................................................................. 22 2.4.2 Analysis of Definitions of Investigated Terminologies
........................... 23
2.5 Definition of Counterfeiting Used in This Study .................................... 28 2.6 Anti-Counterfeiting, Anti-Counterfeiting Outcomes and Proposed Reasons... 29 2.7 Types of Counterfeiting and Choice of Non-deceptive Counterfeiting
Context ..................................................................................... 31
2.8 Past Research on Counterfeiting ........................................................ 32
2.8.1 Overview of Past Studies .............................................................. 32 2.8.2 Consumers and Counterfeits
......................................................... 33 2.9 Identified Research Problem
............................................................ 39 2.10 Summary
................................................................................. 41
Chapter 3 Literature Relative to Consumer Choice Processes ................ 43-69
3.1 Introduction ............................................................................... 43
3.2 Models Related to Consumer Choice Process ........................................ 43 3.2.1 The Model of Consumer Evaluation and Choice .................................. 44 3.2.2 The Model of Individual Choice ................................................... 46
3.3 The Characteristics of the Consideration Set ........................................ 48 3.3.1 The Definition of the Consideration Set .......................................... 48 3.3.2 The Dynamic Nature of the Consideration Set .................................... 50
II
3.3.3 Types of Consideration Set ..................................................... 51 3.3.4 The Rationale for the Consideration Set ............................................ 52 3.3.4. 1 Empirical Evidences .................................................................
52 3.3.4. 2 Theoretical Support from Other Disciplines ....................................
54 3.4 Significant Roles Played by the Consideration Set .................................
55 3.5 Previous Research Related to the Consideration Set and Findings ...............
56 3.5.1 The Consideration Set and Consumer Choice Models ...........................
56 3.5.2 Research Related to the Characteristics of the Consideration Set ............. 57 3.5.3 Research Related to the Formation of the Consideration Set ....................
58 3.5.4 Attitude, Attitude Strength and the Consideration Set Formation ............... 59 3.5.5 Critiques of the A2SC2 Model ....................................................... 60
3.6 Identified Research Problem ............................................................ 62 3.7 Research Aim .............................................................................
63 3.8 Research Scope ..........................................................................
64 3.9 Decision on Inclusion of Purchase Intention vs. Choice .............................
64 3.10 Summary ...................................................................................
66
Chapter 4 Analysed Constructs and Research Hypotheses .................. 70-113
4.1 Introduction ..... 70 ... . .................................................................... 4.2 Involvement
.......................................................................... . 71 4.2.1 Product Involvement ................................................................... 72 4.2.1.1 Product Involvement Definition ............................................. 73 4.2.1.2 Enduring Involvement vs. Situational Involvement ......................
74 4.2.1.3 Enduring Involvement - Focus of the Present Study ...................... 75 4.2.2 Product Involvement Hypotheses ................................................... 76
4.3 Product Knowledge .................................................................... 79 4.3.1 Definition and Types of Product Knowledge .................................... .. 80 4.3.2 Self-assessed Product Knowledge Is to Be Examined .......................... .. 80 4.3.3 Self-assessed Product Knowledge Hypotheses
................................. .. 81 4.4 D emographic Variables ................................................................ .. 83
4.4.1 Age ..................................................................................... .. 83 4.4.2 Household Income .................................................................... .. 85 4.4.3 Gender .................................................................................. 85 4.4.4 Education .............................................................................. 86
4.5 B rand, Brand Identity and Brand Image ............................................ 87 4.5.1 Relationship between Brand, Brand Image and Brand Identity ............... .. 89 4.5.2 Brand Image Trap and Proposed Reasons for This Trap ..................... .. 91 4.5.2.1 How Brand Image was Defined Historically .............................. .. 91 4.5.2.2 Components of Brand Image and Brand Identity ........................ .. 93 4.5.2.3 Debriefings and Suggestions ................................................ .. 95 4.5.2.4 Significance of Brand Image ................................................ 95 4.5.2.5 Brand Image - Focus of This Study ..................................... .. .. 96 4.5.3 .. Brand Personality ................................................................... .. 97 4.5.3.1 Definition of Brand Personality ............................................. .. 98 4.5.3.2 Human Personality vs. Brand Personality .................................. .. 98 4.5.3.3 Significance of Brand Personality Study ................................. 100 4.5.3.4 Two Facets of Brand Personality .......................................... 100 4.5.3.5 Brand Personality Hypotheses ............................................. 101 4.5.3.6 Brand Consequences - Perceived Risk Hypotheses .....................
102 4.5.3.7 Products' Physical Attributes and Perceived Benefits ................... 104
4.6 S ummary ................................................................................. 108
III

Chapter 5 Research Methodology ................................................ 114-166
5.1 Introduction ............................................................................
114 5.2 Choice of the Studied Brands ........................................................ 114
5.2.1 Specific Brands or Product Categories? -A Review of Previous Work...... 114 5.2.2 Choice of Product Categories Based on Availability of the Counterfeit
Version, Consumer Awareness and Acceptability ..............................
115 5.2.3 Choice of Four Brands from the Two Identified Product Categories......... 117 5.2.4 Selected Brands .................................................................... 118
5.3 The Overall Research Design ......................................................... 118 5.3.1 Types of Research Design .......................................................... 118 5.3.2 Choosing a Research Approach for the Current Study ......................... 119 5.3.3 Stimulus- vs. Memory-based Approach .......................................... 120 5.3.4 Section Overview .................................................................... 121
5.4 Sample Design .......................................................................... 121 5.4.1 Define the Population ............................................................... 122 5.4.2 Specify the Sampling Frame ........................................................ 123 5.4.3 Select a Sampling Procedure ....................................................... 124 5.4.3.1 Specify Sampling Method .................................................... 124 5.4.3.1.1 Probability vs. Nonprobability ............................................... 124 5.4.3.1.2 Multi-cluster Two-stage Area Sampling ...................................
125 5.4.3.1.3 Select Socio-economic Clusters ............................................. 125 5.4.3.2 Specify Sampling Plan ...................................................... 128 5.4.4 Determine the Sample Size ....................................................... 132 5.4.5 Specify the Sampling Unit ........................................................ 133 5.4.6 Section Overview .................................................................. 134
5.5 Questionnaire Design and Instrument Piloting and Results ..................... 134 5.5.1 Questionnaire Design Process ................................................... 134 5.5.1.1 Step 1: Information Needed ................................................ 135 5.5.1.2 Step 2: Closed-ended Questions vs. Open-ended Questions........... 136 5.5.1.3 Step 2: Determine Method of Data Collection .......................... 136 5.5.1.4 Step 3: The Content of the Questionnaire and Content of the Individual
Questions ........................................................................ 137 5.5.1.4.1 Justification of Measure of Involvement ................................... 138 5.5.1.4.2 Justification of Measure of Product Knowledge .......................... 139 5.5.1.4.3 Measure of Brand Image ..................................................... 142 5.5.1.4.3.1 Measure of Brand Personality ............................................. 143 5.5.1.4.3.2 Measure of Purchase Benefit and Product Attributes .................. 145 5.5.1.4.4 Justification of Measures of Consideration Set ........................... 145 5.5.1.4.5 Justification of Measures of Consumer Purchase Intention... 146 5.5.1.4.6 Methods Adopted to Increase Response Rate ........................... 147 5.5.1.5 Step 4: Response to Questions .............................................. 149 5.5.1.5.1 Exclusion of `Don't know', `No opinion' and ̀ Not applicable'......... 149 5.5.1.5.2 Number of Categories ....................................................... 150 5.5.1.6 Step 5: Wording ............................................................... 150 5.5.1.7 Step 6,7, and 8: Physical Characteristics of Questionnaire and
Revisions ....................................................................... 152 5.5.1.8 Newly Developed Technique to Reduce the Length of the
Questionnaire ......................................................................................... 152 5.5.2 Step 9: Piloting Questionnaire and Verification ........................... 154 5.5.2.1 Two-stage Pre-test and the Respondents' Profile .......................... 154
IV
5.5.2.2 Shortcomings Identified by the Three Experts and Solutions...... 156 5.5.2.3 Comments from the Ordinary Consumers (Second stage piloting) and
Actions Taken by the Researcher. ' ...................................... 158
5.5.2.4 The Researcher's Observations and Solutions .............................
158 5.5.2.5 The Final Version of the Questionnaire
.................................... 159
5.6 Fieldwork Administration .......................................................... 160 5.7 Summary
................................................................................. 162
Chapter 6 Preliminary Qualitative Study and Results ......................... 167-203
6.1 Introduction .............................................................................. 167
6.2 The Preliminary Study Methodology ................................................ 167 6.2.1 Rationale for the Use of Focus Group ............................................. 167 6.2.2 Number of Focus Groups ............................................................ 168 6.2.3 Length of Each Focus Group ...................................................... 168 6.2.4 Recruiting and Assigning Participants to Each Focus Group................ 169 6.2.5 Focus Group Size ..................................................................... 170 6.2.6 Preparation for the Preliminary Study
............................................. 170 6.2.6.1 The Information Letter and the Appointment Card .....................
171 6.2.6.2 Confirmation from Local Police and Full Support from
Trading Standards ........................................................ 172 6.2.7 The Facilitator and the Observer ................................................... 172 6.2.8 The Entire Process
.................................................................. 173 6.2.9 Lessons Learnt from the First Focus Group and
the Necessary Improvements ....................................................... 175
6.2.9.1 Problem Caused by Academic Jargon and, Introduction of Alternative Dimension of the Brand Personality and Proposed Solutions............ 175
6.2.9.2 Problems Caused by Incorrect Probe Questions ........................... 178
6.2.9.3 First Focus Group as a Lesson ............................................... 179
6.2.10 Number and the Profile of the Recruited Participants ........................ 179
6.2.11 Transcribing Focus Group Data .................................................... 180 6.2.12 Adopted Data Analysis Techniques ............................................... 181
6.3 Data Analysis Results of the Preliminary Study ................................... 182 6.3.1 Results of the Structured Discussion ............................................. 183 6.3.1.1 Brand Personality
............................................................. 184 6.3.1.1.1 Criteria in Relation to Personality Traits ................................... 184 6.3.1.1.2 Justification for the above Pre-set Criteria in Relation to
Reducing Items ............................................................... 186 6.3.1.1.3 Personality Traits Results.........
........................................... 187 6.3.1.2 Product Attributes............
................................................. 189 6.3.1.2.1 Product Attributes Results
.................................................... 189 6.3.1.2.2 Criteria in Relation to Product Attributes ................................... 191 6.3.1.2.3 Dropping Warranty and Logo .............................................. 191 6.3.1.3 Benefits and Consequences
................................................... 192 6.3.1.3.1 Criteria in Relation to Benefits and Consequences ........................ 192 6.3.1.3.2 Product Benefits and Consequences Results ............................... 193 6.3.2 Open Discussion Results and Factors Finally Qualified to Remain........... 197
6.4 Summary ................................................................................. 201
Chapter 7 Data Preparation, Examination of the Samples and Factor Analysis Results ...................................................... 204-257
V
7.1 Introduction .............................................................................. 204
7.2 Survey Response ....................................................................... 204
7.2.1 Usable Response Rate and Preparing the Data for Analysis .................. 205
7.2.2 Data Cleaning and Reverse Items Recoding .................................... 209
7.2.3 Response Rate ...................................................................... 209
7.2.4 The Researcher's Observation ...................................................... 212
7.2.5 Evaluation of the Incentive Approach ............................................ 212
7.3 Descriptive Statistics .................................................................. 213
7.4 Characteristics of the Samples ....................................................... 214
7.4.1 Age Group Analysis ............................................................... 214 7.4.2 Gender Analysis ................................................................... 215 7.4.3 Household Income Analysis ......................................................
216 7.4.4 Education Analysis .................................................................
217 7.5 Reliability and validity ...............................................................
218 7.5.1 Validity ..............................................................................
218 7.5.2 Reliability ............................................................................
219 7.5.3 Applied Techniques to Validate Scales Validity and Reliability ............. 221 7.5.3.1 Factor Analysis ................................................................
221 7.5.3.1.1 Assessment of the Suitability of the Data for Factor Analysis......... 221 7.5.3.1.2 Objectives for Using Factor Analysis ......................................
223 7.5.3.1.3 Principal Components Analysis v. s. Principal Factor Analysis....... . 223 7.5.3.1.4 Factor Extraction and Loading ............................................. 224 7.5.3.2 Brand Image Results .......................................................... . 224 7.5.3.2.1 Original Rolex and Counterfeit Rolex ................................... . 224 7.5.3.2.2 Original Gucci and Counterfeit Gucci ...................................... . 229 7.5.3.2.3 Original Burberry and Counterfeit Burberry ............................ . 234 7.5.3.2.4 Original Louis Vuitton and Counterfeit Louis Vuitton ................ . 239 7.5.3.2.5 Key Findings Related to Brand Image ..................................... . 244 7.5.3.3 Reliability and Validity Analysis Results of Product Involvement,
Product Knowledge, Consideration and Purchase Intention Scales..... 245 7.5.3.3.1 Evaluation Results Using Cronbach Alpha,
Pearson inter-correlation, and Item-total Correlation ................. . 245 7.5.3.3.2 Evaluation results using PFA ............................................ . 249
7.6 Final Stage Data Preparation for the Principal Analysis ........................ . 252 7.7 Summary .............................................................................. . 254
Chapter 8 GLM Analysis and Results ............................................ 258-313
8.1 Introduction ............................................................................ 258
8.2 Information about the Analysed Variables ........................................ 258 8.2.1 Categories of Demographic Variables ............................................. 258 8.2.2 Interaction between Product Knowledge and Product Involvement.......... 260 8.2.3 Other Variables Involved ........................................................... 260
8.3 Choice of Statistical Analysis Techniques ....................................... 260 8.3.1 Consideration of OLS ............................................................... 261 8.3.2 Consideration of Loglinear and Logistic Regression ......................... 267 8.3.3 Justification of Transformation of Data and Use of R Commander.......... 269
8.4 OLS Regression Using SPSS ....................................................... 270 8.4.1 Constant Variance Test .............................................................. 271 8.4.2 Casewise Diagnostics ............................................................... 271 8.4.3 OLS Regression Results ........................................................... 273 8.4.3.1 Choice of Appropriate Models ............................................. 273
VI
8.4.3,2 Overall Results of Consideration of the Original Brands ............... 277 8.4.3.3 Original Rolex Consideration Model ...................................... 281 8.4.3.4 Original Gucci Consideration Model ...................................... 282 8.4.3.5 Original Burberry Consideration Model .................................. 284 8.4.3.6 Original Louis Vuitton Consideration Model
............................ 284 8.5 Regression Results Using R Commander
......................................... 285 8.5.1 Choice of More Appropriate Models
.............................................. 285 8.5.2 Overall Results Using R Commander ........................................... 286 8.5.3 Original Rolex Purchase Intention ............................................... 290 8.5.4 Counterfeit Rolex Purchase Intention
.............................................. 292 8.5.5 Counterfeit Rolex Likelihood of Consideration ............................... 295 8.5.6 Original Gucci Purchase Intention .............................................. 296 8.5.7 Counterfeit Gucci Purchase Intention .............................................. 298 8.5.8 Counterfeit Gucci Likelihood of Consideration ................................ 300 8.5.9 Original Burberry Purchase Intention ........................................... 302 8.5.10 Counterfeit Burberry Purchase Intention ........................................ 302 8.5.11 Counterfeit Burberry Likelihood of Consideration ............................ 305 8.5.12 Original Louis Vuitton Purchase Intention .................................. 306 8.5.13 Counterfeit Louis Vuitton Purchase Intention
.................................. 307 8.5.14 Counterfeit Louis Vuitton Likelihood of Consideration ...................... 308 8.5.15 Model Diagnostics
......................... 309 8.6 S ....................................... ummary 311 ...............................................................................
Chapter 9 Conclusion ................................................................ 314-340 9.1 Introduction
.............................................................................. 314 9.2 Summary of Research Findings ...................................................... 315 9.3 Research Contributions
................................................................ 323 9.3.1 Theoretical Contributions
.......................................................... 323 9.3.2 Methodological Contributions
...................................................... 326 9.4 Implications
............................................................................. 329 9.5 Limitations
.............................................................................. 333 9.6 Further Research
........................................................................ 337
Appendices ................................................................................. 341-369 Appendix 1 Letter to Supermarkets
..................... 341 Appendix 2 ................................... Rejection Letter from Supermarket
.......................................... 342 Appendix 3 Rejection Email from Supermarket
............................. 343 Appendix 4 ............. Research Instrument
........................................................... 344 Appendix 5 Cove Letter ..................................................................... 353 Appendix 6 Letter to Potential Focus Group Participants ........................... .. 354 Appendix 7 . . Appointment Card and Researcher Contact Card
.......................... 356 Appendix 8 Descriptive Statistics of Involvement, Knowledge, Consideration
Set, and Purchase Intention .............................. 357 Appendix 9 .................. Descriptive Statistics of Brand Image ....................................... 359 Appendix 10 Scale Reliability Test Results (product knowledge, consideration set,
and purchase intention) .............................. 364
Appendix 11 .......................... Bivariate Correlation ...................... 367 Appendix 12 ..................................... Histogram of Residues and qq-plot after Transformation
................ 370 Appendix 13 Residuals versus the Fitted Values
........................................... 374
References .................................................................................. 376-419
VII

List of Tables
Table No. Topic Page
Table 2.1 Definitions of counterfeiting and counterfeit products .................... 24
Table 2.2 Definitions of imitation .................................................... ..... 25
Table 2.3 Definitions of piracy ....................................................... ..... 26
Table 2.4 Consumer and counterfeiting/counterfeits studies .......................... 33
Table 2.5 Counterfeit-prone consumer profile ...................................... ..... 37
Table 4.1 Components of brand image (generalised based on Dobni and
Zinkhan 1990) ............................................................ ..... 93
Table 4.2 Components of brand image and brand identity ............................. 94
Table 4.3 Research hypotheses ....................................................... .... 111
Table 5.1 Product classifications and product categories studied by
prior studies .................................................................. 116
Table 5.2 Comparison of basic research designs ................................. .... 119
Table 5.3 The target population ................................................... .... 123
Table 5.4' Sample size and accuracy level .......................................... .... 133
Table 5.5 Research objectives and information required ........................ .... 136
Table 5.6 Comparison of three consumer involvement measures ........ .... 140
Table 5.7 Example of the newly developed technique ........................ .... 153
Table 6.1 The profiles of the participants four focus groups used in
data analysis ..................................................................... 180
Table 6.2 Tested personality traits and related data ................................... 185
Table 6.3 Personality traits satisfied the pre-set up criteria ...................... ..... 187
Table 6.4 Personality traits qualified to stay at this stage ............................. 189
Table 6.5 Product attributes examined in focus group discussion and results ..... 191
Table 6.6 Product attributes qualified for further investigation ..................... 192
Table 6.7 Detailed research data in relation to benefits/consequences ............. 193
Table 6.8 Benefits/consequences left for further consideration ..................... 197
Table 6.9 Product attributes considered as important by the participants.......... 198
Table 6.10 Benefits/consequences of the original BP ................................. 198
Table 6.11 Benefits/consequences finally qualified to remain ........................ 200
Table 6.12 Product attributes finally qualified for inclusion in the draft
Questionnaire ........................................................... .... 201
VIII

List of Tables
Table No. Topic Page
Table 6.13 Number of items to be tested related to consumer perception toward
studied brands .................................................................. 203
Table 7.1 Response rate for mall intercept surveys ................................... 211
Table 7.2 Age profile of the respondents and Glasgow Census data ............. 215
Table 7.3 Gender profile of the respondents ........................................... 216
Table 7.4 One-sample statistics .......................................................... 216
Table 7.5 Education analysis ............................................................. 217
Table 7.6 KMO ............................................................................. 222
Table 7.7 Comparison of original Rolex personality factors and counterfeit
Rolex personality factors .............................................................. 225
Table 7.8 Original Rolex scale validation .......................................... 227
Table 7.9 Counterfeit Rolex scale validation ....................................... 228
Table 7.10 Comparison of original Gucci image factors and counterfeit Gucci image factors
...................................................... 230
Table 7.11 Original Gucci brand image scale validation .......................... . 232
Table 7.12 Counterfeit Gucci brand image scale validation ..................... 233
Table 7.13 Comparison of original Burberry images factors and
counterfeit Burberry image factors ......................................... . 235
Table 7.14 Original Burberry brand image scale validation .................... . 237
Table 7.15 Counterfeit Burberry brand image scale validation ................. . 238
Table 7.16 Comparison of original LV brand image factors and counterfeit LV brand image factors ....................................................... . 240
Table 7.17 Original LV brand image scale validation .............................. . 242
Table 7.18 Counterfeit LV brand image scale validation ........................... . 243
Table 7.19 Reliability analysis ............................................................ . 245
Table 7.20 Reliability analysis of knowledge ....................................... . 246
Table 7.21 Involvement reliability test results (including boredness)........ . 247
Table 7.22 Involvement reliability test results (after dropping off boredness).. . 248
Table 7.23 Factor solutions of product involvement and product knowledge
across product class ....................................................... . 250
Table 7.24 Factor solutions of consideration set and purchase intention........ 251
Ix
List of Tables
Table No. Topic Page
Table 7.25 Test of Multi collinearity ................................................. 255
Table 8.1 Percentage breakdown of demographic variables ..................... 259
Table 8.2 Frequency and percent of consideration and intention ............... 268
Table 8.3 Identified outliers .............................................. ............. 272
Table 8.4 Cases with undue influence .............................................. 273
Table 8.5 Multiple regression analysis of likelihood of consideration of original branded watches ................................................. 274
Table 8.6 Multiple regression analysis of likelihood of consideration of
original branded handbags ................................................ 275
Table 8.7 Multiple regression analysis of likelihood of consideration of
original branded watches final model .................::................... . 283
Table 8.8 Multiple regression analysis of likelihood of consideration of
original branded handbags final model ................................ 285
Table 8.9 The difference in the parameters of the regression model when
unduly influenced cases are excluded (Rolex) .......................... . 276 Table 8.10 The difference in the parameters of the regression model when
undue influential cases are excluded (Gucci) .......................... . 276 Table 8.11 The difference in the parameters of the regression model when
undue influential cases are excluded (Burberry) ....................... . 276
Table 8.12 The difference in the parameters of the regression model when
undue influential cases are excluded (4 factor) ......................... . 277 Table 8.13 Subjects with primary school education and cases with leverage
value greater than three times of average value ......................... . 277 Table 8.14 Comparison of the initial generalised linear model and the
generalised linear model after transformation ......................... . 291
Table 8.15 Comparison of the initial generalised linear model and the
generalised linear model after transformation ......................... . 293 Table 8.16 Comparison of the initial generalised linear model and the
generalised linear model after transformation ........................ . 295
Table 8.17 Comparison of the initial generalised linear model and the
generalised linear model after transformation ........................ . 297
X

List of Tables
Table No. Topic Page
Table 8.18 Comparison of the initial generalised linear model and the
generalised linear model after transformation ................... ........ 299
Table 8.19 Comparison of the initial generalised linear model and the
generalised linear model after transformation ................... ........ 301
Table 8.20 Comparison of the initial generalised linear model and the
generalised linear model after transformation ................... ........ 303
Table 8.21 Comparison of the initial generalised linear model and the
generalised linear model after Transformation ................... ........ 304
Table 8.22 Comparison of the initial generalised linear model and the
generalised linear model after Transformation ................... ........ 305
Table 8.23 Comparison of the initial generalised linear model and the
generalised linear model after transformation ............................ 306
Table 8.24 Comparison of the initial generalised linear model and the
generalised linear model after transformation ............................ 307
Table 8.25 Comparison of the initial generalised linear model and the
generalised linear model after transformation ............................ 309
Table 8.26 Collinearity statistics Rolex and Gucci ..................................... 310 Table 8.27 Collinearity statistics Burberry and Louis Vuitton ........................
310
Table 8.28 Cases with undue influence ......................................... ......... 312
Table 9.1 Number of determinants ...................................................... 321
Table 9.2 Hypotheses test results ................................................ ......... 322
XI
List of Figures
Figure No Topic Pages
Figure 1.1 Overall structure of the thesis ............................................... . 13
Figure 3.1 Model of consumer evaluation and choice ................................. 45
Figure 3.2 Model of individual choice ............................................... . 46
Figure 4.1 Influential factors and interrelationships between situational product involvement, enduring product involvement and product involvement... .. 75
Figure 4.2 Relationship between brand, brand image and brand identity.......... 91
Figure 4.3 The Proposed conceptual model .......................................... 112
Figure 5.1 Six-step procedure for drawing a sample ..................................... 121
Figure 5.2 Sample size and level of accuracy ............................................. 133
Figure 5.3 Procedures for developing a questionnaire ................................... 135
Figure 5.4 Pre-test scope ....................................... ....... ....................... 155
Figure 8.1 Distribution of likelihood of consideration of original Rolex............ 262
Figure 8.2 Distribution of purchase intention of original Rolex ....................... 262
Figure 8.3 Distribution of likelihood of consideration of counterfeit Rolex......... 262
Figure 8.4 Distribution of purchase intention of counterfeit Rolex .................... 262
Figure 8.5 Distribution of likelihood of consideration of original Gucci .............. 263 Figure 8.6 Distribution of purchase intention of original Gucci ....................... 263
Figure 8.7 Distribution of likelihood of consideration of counterfeit Gucci.......... 263 Figure 8.8 Distribution of purchase intention of counterfeit Gucci .................... 263
Figure 8.9 Distribution of likelihood of consideration of original Burberry .......... 263
Figure 8.10 Distribution of purchase intention of original Burberry .................... 263
Figure 8.11 Distribution of likelihood of consideration of counterfeit Burberry..... 263
Figure 8.12 Distribution of purchase intention of counterfeit Burberry ............... 263
Figure 8.13 Distribution of likelihood of consideration of original Louis Vuitton ... 264
Figure 8.14 Distribution of purchase intention of original Louis Vuitton ............. 264
Figure 8.15 Distribution of likelihood of consideration of counterfeit Louis Vuitton ................................................................... 264
Figure 8.16 Distribution of purchase intention of counterfeiting Louis Vuitton ................................................................... 264
Figure 8.17 Residual histogram (original Rolex consideration) ........................ 265
Figure 8.18 Residual histogram (original Rolex intention) ............................. 265
XII
List of Figures
Figure No Topic Pages
Figure 8.19 Residual histogram (counterfeit Rolex consideration) ..................... 266
Figure 8.20 Residual histogram (counterfeit Rolex intention) ...........................
266
Figure 8.21 Residual histogram (original Gucci consideration) .......................... 266
Figure 8.22 Residual histogram (original Gucci intention) ............................... 266
Figure 8.23 Residual histogram (counterfeit Gucci consideration) ...................... 266
Figure 8.24 Residual histogram (counterfeit Gucci intention) ........................... 266
Figure 8.25 Residual histogram (original Burberry consideration) ..................... 266
Figure 8.26 Residual histogram (original Burberry intention) ........................... 266
Figure 8.27 Residual histogram (counterfeit Burberry consideration) .................. 267
Figure 8.28 Residual histogram (counterfeit Burberry intention) ........................ 267
Figure 8.29 Residual histogram (original LV consideration) ............................. 267
Figure 8.30 Residual histogram (original LV intention) ................................. . 267
Figure 8.31 Residual histogram (counterfeit LV consideration) ........................ 267
Figure 8.32 Residual histogram (counterfeit LV intention) ............................ . 267
Figure 8.33 Residual versus fitted value (original Rolex) .............................. . 271
Figure 8.34 Residual versus fitted value (original Gucci) .............................. . 271
Figure 8.35 Residual versus fitted value (original Burberry) ........................... . 271
Figure 8.36 Residual versus fitted value (original Louis Vuitton) ..................... . 271
XIII

ACKNOWLEDGEMENTS
'PhD has never been an easy journey. If it is easy, it is not a PhD. ' If anyone asks me
who said this, I can provide a list of Doctors who made almost this identical statement
while I was complaining about the struggles, loneliness, hopelessness and stress I
encountered in the journey in pursuit of a PhD. Frankly speaking, as a person who is
seeing the light at the end of the tunnel, I cannot agree more with this apparently very
plain and simple, but actually very meaningful, claim. Put more bluntly, it might be the
case that only people who have gone through the entire journey know what this simple
sentence means. It is constant hard work. By hard work, I really mean that it is more
than a full-time job which requires a person like me (not very bright anyway) to work
more than six days a week the whole year round, with no holiday, no social life, no time
for cooking, no... for three years. You will be put off by even thinking of it.
Doing a PhD is hard, for sure. In my case, believe it or not, I see it (the last three years)
as the hardest time in my life. As such, without full support from people around me, I
would not have been able to succeed. I have been too busy to acknowledge people's
support and assistance over the last three years. Now, coming to the final stage of the
whole PhD process, I am really ready to express my sincere gratitude to these kindest of
people.
First and foremost, I would like to thank my two supervisors, Professor Luiz Moutinho
and Professor Angus Laing, for guiding, motivating, giving emotional support and more. Without these, it would have been impossible for me to complete this thesis on time. I
recall that on one occasion I gave a piece of my written work to Professor Moutinho in
the morning (8.30am) and left for other commitments for the day. His secretary told me later that Professor Moutinho had been looking for me in the afternoon of same day to
give me his comments on my work. In fact, that is what we did over last one and a half
years, since he became my supervisor in March 2005. Normally, I handed in my work
the first thing in the morning, and Professor Moutinho would let me have his comments in the afternoon (4.30 pm) of the same day while my writing was still fresh in my mind. Professor Moutinho's efficient working style contributed enormously to my fast
working pace in the second half of my PhD journey.
XIV

When he learned that this research might be restricted by limited budget, Professor
Laing told me to go ahead and buy the products I needed for the fieldwork and he would
bear the cost himself. I am still not quite sure how many PhD supervisors would be
prepared to do this for their PhD students. One thing I am completely convinced of is
that my supervisors would give me whatever they possibly could. These are only two
examples of my two supervisors' contributions to my PhD project. There are many
more examples I could give. All in all, I would like to say that I have been extremely
fortunate to have had the opportunity to work with these two highly-respected scholars
in the last eighteen months.
I would like to express my deep appreciation and thanks to RTO for supporting this
project financially. Without the financial support, this research could not have been
conducted. The company was in deep financial difficulty in 2004 for unforeseen
reasons and was forced to carry out redundancies. Regardless of the financial difficulty,
the board of the company decided to continue supporting this PhD research project until it was completed.
My thanks and deep appreciation are due to all the staff of the Business and
Management School, especially the ex-head of School, Professor Robert Paton, other
academic staff such as Professor Phillip Beaumont, Dr. Marian Jones, and Dr. Moira
Fischbacher, to name but a few, as well as all the secretaries and clerical staff of the
School, and the IT staff of the Faculty of Social Sciences, for all the help they have
given me towards making the completion of the thesis possible and in helping to
provide a conducive environment for me as a doctoral student at the School.
Outwith'the academic resources of the Business and Management School, this research
also received academic assistance from Professor John Fox (McMaster University in
Hamilton, Canada) on implication data transformation using R Commander, Dr.
Graeme Hutcheson (The University of Manchester) on the application of R Commander,
and Professor Christopher Moore (Caledonian Business School) on UK consumer
shopping patterns. My special and appreciative thanks must be given to these people I
personally hardly knew before I took up this project. In fact, I not only gained the most
advanced knowledge from these scholars, but more importantly I was also influenced by
xv
their dedication to and inspiration in their work. I believe that the interpersonal skills I
learnt from them will benefit me for ever.
I would also like to express my appreciation and thanks to the Glasgow Trading
Standards who provided me with all the counterfeit examples to assist with the research. The counterfeit examples were extremely valuable in assisting with the minimization of the data bias. My thanks and appreciation should also go to the supermarkets that gave
me permission to conduct this research in the supermarkets, as well as providing the
facilities required by this research.
I am very grateful to the fieldworkers, who were so dedicated in the whole data
collection process. None of them on any occasion was late for their shifts. They were
cheerful, enthusiastic, patient and responsible, which helped to a great extent to secure high quality data.
Last but not least, I owe my appreciation and thanks to my parents-in-law, who took on the full responsibility for taking care of my deeply-loved daughter while I was pursuing
my PhD. Their contribution made it possible for me to devote myself entirely to my
research. Also, I am grateful to my husband, who has always been the motivating factor
for me to continue to work hard in completing the thesis, as well as being my life's
inspiration.
xv'

Chapter 1 Introduction

Chapter 1 Introduction
Chapter 1 Introduction
1.1 Introduction
The purpose of the present chapter is to provide an introduction and overview of the
current study as a whole. In so doing, it will make clear both the imperative and
rationale for the study, and introduce the means by which this research will be
prosecuted.
To achieve this aim, the chapter has six main objectives: a full description of the
identified research problems based on an intensive research literature review; an outline
of the overall aims and objectives of the study; an outline of the research assumptions
and research scope; a brief description of the main research methodology; a brief
discussion of the significance of this research; and the overall structure of this thesis.
The organisation of this chapter closely follows the objectives of the chapter. The first
two sections focus on reporting the core literature in the study of counterfeiting and
consumer choice process related issues, with the identified research gaps being reported
at the end of each section. Based on the identified research problems, the research aim,
as well as research objectives, are then generalised and reported in a brief format.
Following this, the key issues related to research methodology are reported. This part focuses on a discussion of the justification for the use of a combination of qualitative
and quantitative research methods. Next the main theoretical and methodological
contributions of the current research are presented. This section highlights the
significance of the present study.
The last objective of this chapter is to be achieved by signalling the purpose and form of
each of the following chapters in turn, and providing an indication of the chronology,
content and structure of the study. Key issues covered by each chapter are discussed
briefly with the aim of providing the reader with the key content of each individual
chapter, as well as demonstrating the connections and logic of this organisation. In
offering this brief overview, the present chapter is chiefly concerned with putting forward an introduction to the study and making some preliminary considerations. The
chapter finishes with a brief summary.
1
Chapter 1 Introduction
1.2 Literature Review of Counterfeiting and Identification of the Research Gap
Counterfeiting has existed for a long time, yet it mushroomed only in the 1970s (Harvey
and Ronkainen 1985). Counterfeiting is regarded as a civil offence, and is also
considered as a criminal offence in some countries (Bush et al. 1989; Hopkins et al.
2003), for example, the U. S. and the U. K. As counterfeiting practice is illegal, explicit
data on the volume of such trade is not available. However, it is estimated that the
value of counterfeit goods in the world market grew by 1100% between 1984 and 1994
(Blatt 1993; Carty 1994), whilst the International Chamber of Commerce states that it
accounts for 8 per cent of world trade (Freedman 1999). No product categories are left
unscathed (Shultz II and Saporito 1996). It is clear that counterfeiting has become a
significant economic phenomenon.
In general, counterfeiting is regarded as a serious economic, social, and political
problem. It affects consumers' confidence in legitimate products, destroys brand equity
and companies' reputations (Wilke and Zaichkowsky 1999), causes loss of revenues
(Grossman and Shapirol988a, b; Bush et al. 1989), increases costs associated with
trying to contain infringement, impacts on hundreds of thousand of jobs (Bamossy and
Scammon 1985), and threatens consumer health and safety (Grossman and Shapiro
1988a; Chakraborty et al. 1996; Cordell et al. 1996; Tom et al. 1998). Counterfeiting
has emerged as a major headache for global marketers (Blatt 1993; Sweeney et al.
1994).
In contrast to this general view, however, Givon et al. (1995) and Prasad and Mahajan
(2003) suggest that the diffusion of the legitimate software can benefit from the
`shadow diffusion' of the counterfeit version. Furthermore, Grossman and Shapiro
(1988a) argue that whilst on one hand counterfeits of status goods impose a negative impact on consumers' evaluation of genuine items, as counterfeits degrade the status
associated with a given label, while on the other hand counterfeits allow consumers to
unbundle the status and quality attributes of brand-name products, and alter the
competition among oligopolistic trademark owners. Grossman and Shapiro (1988b)
report that counterfeits may raise or lower national and global welfare, depending on the
trading circumstances of the home country. They suggest that in the case of a fixed
number of domestic firms, the existence of counterfeits would cause both national and
global welfare to rise, since it is likely that brand-name producers would be forced to
2

Chapter 1 Introduction
raise their quality in an effort to battle counterfeiters. However, the existence of
counterfeits will lower national and global welfare if the country allows free entry to
domestic firms. These analyses once again highlight the complexity of counterfeiting
and the caution people should have in view of the effects of counterfeits.
During the last couple of decades, counterfeiting has attracted more and more research
interest from academics. A closer look reveals that most of the discussions have focused
on the general situation of counterfeiting and legal issues related to counterfeits (e. g.
Bikoff 1983; Harvey 1987; Roberts 1985; Bamossy and Scammon 1985; Globerman
1988; Chaudhry and Walsh 1996; Nill and Schultz 11 1996; Wilke and Zaichkowsky
1999; Lai and Zaichkowsky 1999; Chow 2000; Stone 2001), and looked into strategies
for curbing counterfeiting (e. g. Harvey 1987; Bush et al. 1989; Olsen and Granzin 1992;
Shultz II and Saporito 1996; Delener 2000; Green and Smith 2002). Some studies
examined impacts of counterfeit products (e. g. Givon et al. 1995; Prasad and Mahajan
2003; Grossman and Shapiro 1988a, b), whilst others investigated consumer-related
issues (e. g. Bloch et al. 1993). It is appreciated that there is a need to examine
counterfeiting from the consumers' perspective. A few academics (e. g. Bloch et al.
1993; Wee et al. 1995; Penz and Stöttinger 2003) called for further investigation of
consumer behaviour and counterfeits.
Previous research into the study of consumer behaviour and counterfeiting has tried to
search for answers to questions such as what consumers' views about counterfeits are
(e. g. Bamossy and Scammon 1983; Nia and Zaichkowsky 2000), do consumers
purchase counterfeits or not (e. g. Bloch et al. 1993; Tom et al. 1998; Wee et al. 1995;
Phau et al 2001), who buys counterfeits (e. g. Phau et al. 2001) and why consumers
purchase counterfeits (e. g. Bloch et al. 1993; Wee et al. 1995; Albers-Miller 1999). In
addition, most recently, cross-cultural study has begun to attract some attention from
researchers (e. g. Bian and Veloutsou 2006; Gentry et al. 2006; Harvey and Walls 2003).
Despite all the aforementioned works, it appears that the study of counterfeits from
brand level is almost untouched; consumers' perceptions of counterfeit branded
products (CBP) as opposed to original branded products (BP) is unknown; and
modelling consumer behaviour from a brand perspective in the context of non-deceptive
counterfeiting is unexplored.
3
Chapter 1 Introduction
Counterfeiting has been defined in many ways by both researchers and practitioners.
This research demonstrates that misuse and misunderstanding of this terminology
appears to be common in previous research. Although, by definition, counterfeiting,
imitation and piracy are distinct practices, some researchers tend not to differentiate
these terms in their works. This author argues that not only are these three terminologies
defined differently literally, but also that they possess distinguishable legal
responsibility. Thus, it is necessary to have a clear boundary to the concept of
counterfeiting before any investigation is carried out by researchers (Phau et al. 2001;
Hoe et al. 2003). In this study, counterfeit products are considered to be "those bearing
a trademark that is identical to, or indistinguishable from, a trademark registered to
another party and infringes on the rights of the holder of the trademark" (Scrivener
Regulation). This definition is consistent with the views of both practitioners and
researchers, is widely adopted by previous researchers (e. g. Bamossy and Scammon
1985; Grossman and Shapiro 1988a, b; Kapferer 1995a; Chaudhry and Walsh 1996;
Bian and Veloutsou 2004,2006; Veloutsou and Bian 2005), and fits the studied branded
products of this research well.
Consumers are not always deceived when they are involved in counterfeiting
transactions. Accordingly, Grossman and Shapiro (1988a) classify the practice whereby
consumers knowingly purchasing counterfeit products as non-deceptive, whilst
unwitting purchases are classified as deceptive. This research believes that Grossman
and Shapiro's (1988a) classification of counterfeiting is not exhaustive. The scenario,
where consumers are not quite sure whether what they purchase is counterfeit or a
genuine branded product is not included in either non-deceptive counterfeiting or
deceptive counterfeiting. The current research labels this scenario as `blur
counterfeiting'. In this study, the focus is on non-deceptive counterfeiting, since only
under these circumstances can consumers make conscious purchase decisions on
counterfeits.
1.3 Literature Review of Consumer Choice Processes and Identification of the
Research Gap
According to the dynamic choice process model (Shoker et al. 1991), consumer decision-making concerning brand choice is a two-step process. These two steps are the
4

Chapter 1 Introduction
formation of a consideration set and the final choice. Consumers tend to consider a
subset of the alternatives from the awareness set during the formation of the
consideration set (Wu and Rangaswamy 2003; Lawrence and Garber Jr. 1995), either by
selected memory or stimulus cues or both (Bettman 1979; Lynch Jr. and Scrull 1982).
The consideration set helps simplify purchasing decisions, and has significant
implications for the marketing strategy and the allocation of marketing resources (Krieger et al. 2003).
Consumers typically evaluate brands that pass into their consideration sets because they
expect that the products will perform well (Nedungadi 1990). Research has shown that
consideration effects have an important influence on consumer choice (Roberts and
Lattin 1991; Hauser and Wernerfelt 1990; Nedungadi 1990). Hauser and Wernerfelt
(1990) argue that 70% of the variance accounted for in choice is explained by
consideration. Since inclusion of a product in a consideration set is often a necessary
precondition for choice (Howard and Sheth 1969), unless a product is included in the
consideration set, it will not be chosen (Nedungadi 1990).
Aspects related to the formation of a consideration set have attracted attention; for
example, how consumers narrow down the alternatives. Previous research findings
suggest that in the context of a stimulus-based choice situation, advertising (Mitra 1995;
Baker et al. 1986), pioneering products (Kardes et al. 1993; Shapiro et al. 1997),
packaging (Garber Jr. 1995), brand familiarity (Baker et al. 1986), in-store display
activities and features advertising (Mehta et al. 2003), goal-conflict and goal-ambiguity (Ratneshwar et al. 1996), strength of association between the brand and the choice
category (Posavac et al. 2001), involvement and consumer sensitivity of type II error (Chakravarti and Janiszewski 2003), and incidental exposure to an advertisement (Shapiro et al. 1997), all influence the formation of the consideration set. Nedungadi
(1990) focuses on memory-based choice situations and suggests that brand accessibility (ease of retrieval) and external cues (e. g. brand organization in memory and brand
primes) are two potentially important factors in the formation of the consideration set. Desai and Hoyer (2000) also investigate memory-based choice situations and reveal that
the familiarity of usage occasion and usage location both have an impact on
consideration set stability, size and marginal variety.
5
Chapter 1 Introduction
As can be clearly seen, study in this area is still very much arbitrary and there is no
obvious pattern in terms of research findings on perspectives from which the previous
research was conducted. Roberts and Lattin (1997) call for research to study the nature
of the relationship between product attributes and consideration. Interestingly, it
appears that this area has been largely ignored to date. In particular, little attention has
been devoted to an investigation of the effects of consumers' perceptions of
product/brand related characteristics on the formation of a consideration set, leaving
unanswered the question as to how difficult it might be for a brand/product to enter or
remain in a consideration set (Desai and Hoyer 2000; Roberts and Lattin 1991).
Furthermore, what the determinants of the formation of a consideration set and purchase
intention in the context of non-deceptive counterfeiting are, is something that has not
yet attracted the attention it deserves.
1.4 The Research Aim and Objectives
Building on the identified research problems that limited research has been undertaken
into consumers' perceptions of counterfeit products and their effects on consumer
choice from the brand level (Bloch et al 1993; Wee et al. 1995; Penz and Stöttinger
2003) and how consumers narrow down alternatives to form a consideration set (Chiang
et al. 1999; Robert and Lattin 1997) which thereafter leads to purchase behaviour, this
study aims to achieve an in-depth understanding of consumers' perceptions towards
non-deceptive CBP as opposed to BP, and its impact alongside other selected factors
(product involvement, self-assessed product knowledge, and four demographic
variables) on consumer choice processes in the context of non-deceptive counterfeiting.
In order to achieve the research aim, this study will be carried out with the follow
objectives (in the context of non-deceptive counterfeiting).
" To explore the influences of variables related to consumer characteristics and self-
assessed consumer product knowledge, product involvement of the studied product
categories, and consumer perceptions of CBP on the likelihood of consideration of CBP.
" To explore the influences of variables related to consumer characteristics and self-
assessed consumer product knowledge, product involvement of the studied product
categories, and consumer perceptions of BP on the likelihood of consideration of BP.
6
Chapter 1 Introduction
" To explore the influences of variables related to consumer characteristics and self-
assessed consumer product knowledge, product involvement of the studied product
categories, and consumer perceptions of CBP purchase tendency of CBP.
" To explore the influences of variables related to consumer characteristics and self-
assessed consumer product knowledge, product involvement of the studied product
categories, and consumer perceptions of BP on purchase tendency of BP.
1.5 Assumptions of This Study and Research Scope
" This research assumes that consumers do form a consideration set in the process of decision making.
" This research only examines consumer behaviour in the context of non-deceptive
counterfeiting, but is cognizant that there are other kinds of counterfeit practice (e. g., deceptive counterfeiting and blur counterfeiting).
" This research only investigates consumers' perceptions of luxury branded products but not generic products, even though, researchers claim that to some extent generic
products can also be counterfeited.
" This research is conducted in the UK.
" This research only investigates the influence of consumers' perceptions of the
studied CBP and BP on choice processes in general, but does not put them into a specific usage situation. However, the researcher is fully aware that the usage
situation may have a great impact on consumer consideration and purchase intention.
" This research uses a stimulus based approach. Examples of the counterfeit branded
products and pictures of the genuine branded counterparts are presented to
participants.
1.6 Research Methodology
The present research uses both qualitative and quantitative research methods in order to
enhance the robustness of the current research design and to improve the level of
reliability of the research findings. More specifically, the qualitative research method (focus group discussion) is adopted in order to generate the most important and relevant items related to brand image and the language that consumers use to describe their
perceptions of the investigated luxury brands. It serves construction of the research instrument. The interview survey is used to collect data for the principal study.
7

Chapter 1 Introduction
The research instrument used in this study is developed by the researcher. Apart from
the brand image measure, the other measures are all adopted from previous research
with necessary adaptation. The research instrument goes through three phases before it
reaches the survey respondents. These phases are the qualitative study (five focus group
discussions), the stage one piloting (testing of the research instrument using three
experts) and the stage two piloting (testing of the research instrument on 40 typical
respondents). All of these efforts assist in achieving an accurate and practical
questionnaire.
Driven by the research objectives, an intensive literature review is conducted. A set of
hypotheses developed based on previous literature. The research hypotheses are tested
through examination of first-hand data collected by trained fieldworkers using an
individual interview survey method in four randomly selected supermarkets in Glasgow.
In total, 430 questionnaires were collected. Out of the 430 collected questionnaires, 321
are usable, giving a usable rate of 76.5 percent.
The collected data is analysed using SPSS and R statistical analysis software (R-
Commander package only). The use of R-Commander is required due to the severely
skewed distribution' nature of the response variables related to certain brands or certain
versions of a brand. Specifically, R-Commander is used to transform skewed data.
Before beginning the testing of the hypotheses, reliability and validity of all utilised
measures are carried out. Appropriate actions are taken to clean the raw data when it is
necessary in order to secure an acceptable level of reliability. A series of tests on the
basic regression assumptions are carried out before running the regressions. These tests
include detection of multicollinearity, non-constant variance and break of normality. The main statistical techniques employed in this research are content analysis, descriptive statistics, frequency statistics, factor analysis, regression analysis, and Box-
Cox and Box-Tidwell for data transformation.
1.7 Significance of This Research "
This piece of research is designed to contribute to both theory and practice, as required for the degree of Doctor of Philosophy. Some of the contributions that are offered by
this study are outlined briefly as follows.
8
Chapter 1 Introduction
1.7.1 Academic Contributions
It is argued that this research will contribute to both the literature of consumer choice
process and the study of counterfeiting in several ways. Firstly, this research
contributes to the consumer choice process literature and the literature in the study of
counterfeiting phenomenon by establishing the determinants of the formation of a
consideration set and purchase intention in the context of non-deceptive counterfeiting. Consumers do knowingly purchase counterfeits, as has frequently been reported, and
consumer demand for counterfeits is regarded as one of the main reasons why
counterfeiting is booming despite all the anti-counterfeiting efforts by the parties involved. Reasons as to why consumers knowingly purchase counterfeits remain
unclear. There is limited work exploring this issue from an individual brand perspective.
Meanwhile, the study on determinants of the formation of the consideration set is also
scarce. The current research fills these two identified literature gaps
Secondly, this research provides empirical support to Plummer's (1985,2000) brand
image composition proposition. Brand image is regarded as a multi-dimensional
construct. Plummer (1985,2000) proposes that product attributes, perceived purchase benefit/consequence, and brand personality compose the brand image. This notion
remained theoretical. No empirical support for this has been in existence until the
present research. In addition, this research also suggests that Plummer's (1985,2000)
brand benefit notion might be too conservative as it only takes into account functional
benefits. The research results reveal that in addition to the functional benefits,
consumers also perceive image benefit (a combination of experiential benefits and
symbolic benefits). These findings undoubtedly enrich the brand image theory.
Thirdly, this research challenges the traditional view, which claims that attitude influences consumer decision making. This research argues that consumers'
perceptions of branded products have a significant role to play in terms of influencing
consumer decision making. This is supported by the research findings. This research indicates that any research into counterfeiting and consumers should never ignore brand
effects on consumer behaviour.
Fourthly, this study investigates the universal applicability of Aaker's (1997) brand
personality scale. The finding from the preliminary study reveals that the universal
9
Chapter 1 Introduction
applicability of the tested scale should be viewed with caution. The majority of the
items included in Aaker's scale appear to be irrelevant to the studied brands. This
finding is consistent across two versions of all four selected brands. Some items
included in Aaker's (1997) scale appear to be difficult to understand for participants in
Glasgow.
Fifthly, in terms of methodology, in order to shorten the research instrument, the
researcher developed a new measure technique. The newly-developed scale combines
the Liker Scale with the repertory-grid technique. This new technique retains all
advantages of both. In addition, it helps to avoid the occurrence of respondents
"haloing" their response toward brands that they like. The practicality and reliability of
this new scale has been tested and supported by this research. By using the new scale,
the length of the research instrument is reduced almost by half. This newly developed
measure scale can be applied in study of multiple products or brands.
Sixthly, in terms of data analysis, this research goes beyond the conventional logistic
regression and loglinear techniques commonly used by previous researchers when
facing the broken normality problem. R-Commander's Box-Cox and Box-Tidwell data
transformation functions are applied for the first time in analysing counterfeiting related
data. In the same vein as Cordell et al. (1996), this research addresses the point that
conventional OLS and logistic regression statistics should be used with caution, in
particular when researchers are analysing behavioural data related to the study of
counterfeits.
1.7.2 Implications
The research findings not only fill the identified gaps relating to both consumer choice
process literature and that of counterfeiting literature, but also provide practitioners and
policy-makers with a base from which they can begin to work out an effective way to
curb counterfeits. The discussions regarding the managerial implications are based
closely on the research findings. The main implications are generalised and presented
using bullet points, as follows:
" Owners of original luxury brands should highlight the difference between the brand
personality of the original branded products and the counterfeit versions.
10

Chapter 1 Introduction
" Owners of original luxury brands could emphasise the distinctive image benefits
that the original branded luxury goods can bring to their consumers, while at the
same time stressing the negative image benefits related to counterfeits.
" To emphasise the functional benefits of the original function-oriented luxury
branded products will increase sales of these products, but not necessarily contribute
to anti-counterfeiting. Efforts should not be made to highlight the functional
benefits related to fashion-oriented luxury brand products.
" Owners of original luxury brands should take on the task of directing consumption
by emphasising the importance of consuming genuine products and being genuine
and stressing the benefits and good sense related to going for one which is really
good, rather than for 10 crappy ones.
" Policy makers could help to curb counterfeits by educating the public about the
environmental concerns related to massive amounts of disposable goods.
" The marketers of the original luxury brands could consider carrying out differentiated marketing to target several market segments. The market should be
segmented according to usage situations rather than consumer demographic profile. This device might only be worth implementing if counterfeits are taking a
noticeable percentage of market-share and if consumers with higher levels of
product knowledge and involvement appear to purchase counterfeits.
" Marketers of original luxury brands should be fully aware of both the determinants
of the consideration set and purchase intention, and ensure that their marketing
strategies fit in well with these determinants and monitor the change of the
determinants on a regular basis.
1.8 Structure of the study This study is presented in nine chapters, as illustrated in Figure 1.1. After identifying
the research problems, outlining the research aim and objectives, reporting the research
assumptions and research scope, presenting the research methods utilised to achieve the
research objectives, and justifying the significance of the study in the introductory
chapter, this thesis will proceed with a review of the relevant literature in the study of
counterfeit phenomena (Chapter 2) and consumer decision making processes (Chapter
3). This is to establish the significance of this study as well as to provide its theoretical
foundation. Consequently, it justifies the theoretical contributions that this study can
11
Chapter 1 Introduction
provide to the literature gaps of consumer choice process and counterfeiting study, in
particular in the context of non-deceptive counterfeiting.
Chapter 2 provides the research context for the present research, an intensive literature
review on the study of counterfeiting, and detailed discussion about the identified
research gap. This chapter is organised around four arguments. First, it is argued that
counterfeiting, imitation and piracy are different literally and practically as well as
bearing distinguishable legal responsibilities. Therefore, researchers should draw a
clear boundary between them before they carry out any research in related areas.
Second, this research challenges Grossman and Shapiro's (1988a) counterfeiting
categorisation. It is suggested that the two categories (non-deceptive and deceptive
counterfeiting) proposed by these authors are not exhaustive. Based on a live scenario
which appears to be ignored by Grossman and Shapiro (1988a), this study proposes the
third category of counterfeiting practice, namely `blur counterfeiting'. Third, in line
with previous works, the current study argues that consumer demand for'counterfeiting
is one of the main reasons for the spectacular spread of counterfeits. Fourth, it is
claimed that little work has investigated counterfeiting from a brand perspective,
consumers' perceptions of CBP and BP are unexplored, and there are few works which
have modelled how consumers' brand perceptions influence consumer choice processes.
The fourth argument is developed based on a thorough review of the literature in the
study of consumers and counterfeits, and represents the identified research gap in the
study of counterfeiting. It also implies the theoretical significance of the current
research.
Chapter 3 provides the theoretical foundation of this research, an extensive review of
the literature in the study of the consideration set concept, and the research problem in
relation to the study of consumer choice process. This study first differentiates the
consumer decision making process from the consumer choice process by arguing that
each of the process possesses distinguishable subjects. It is claimed that consumers are
the subjects of the consumer decision making process, whereas brands/products are the
subjects of the consumer choice process. Research related to the first process examines the process undertaken by consumer before they come to an end choice. Research
related to the consumer choice process investigates the process that brands/products go through before they are chosen by consumers. The distinction this research discovered
12
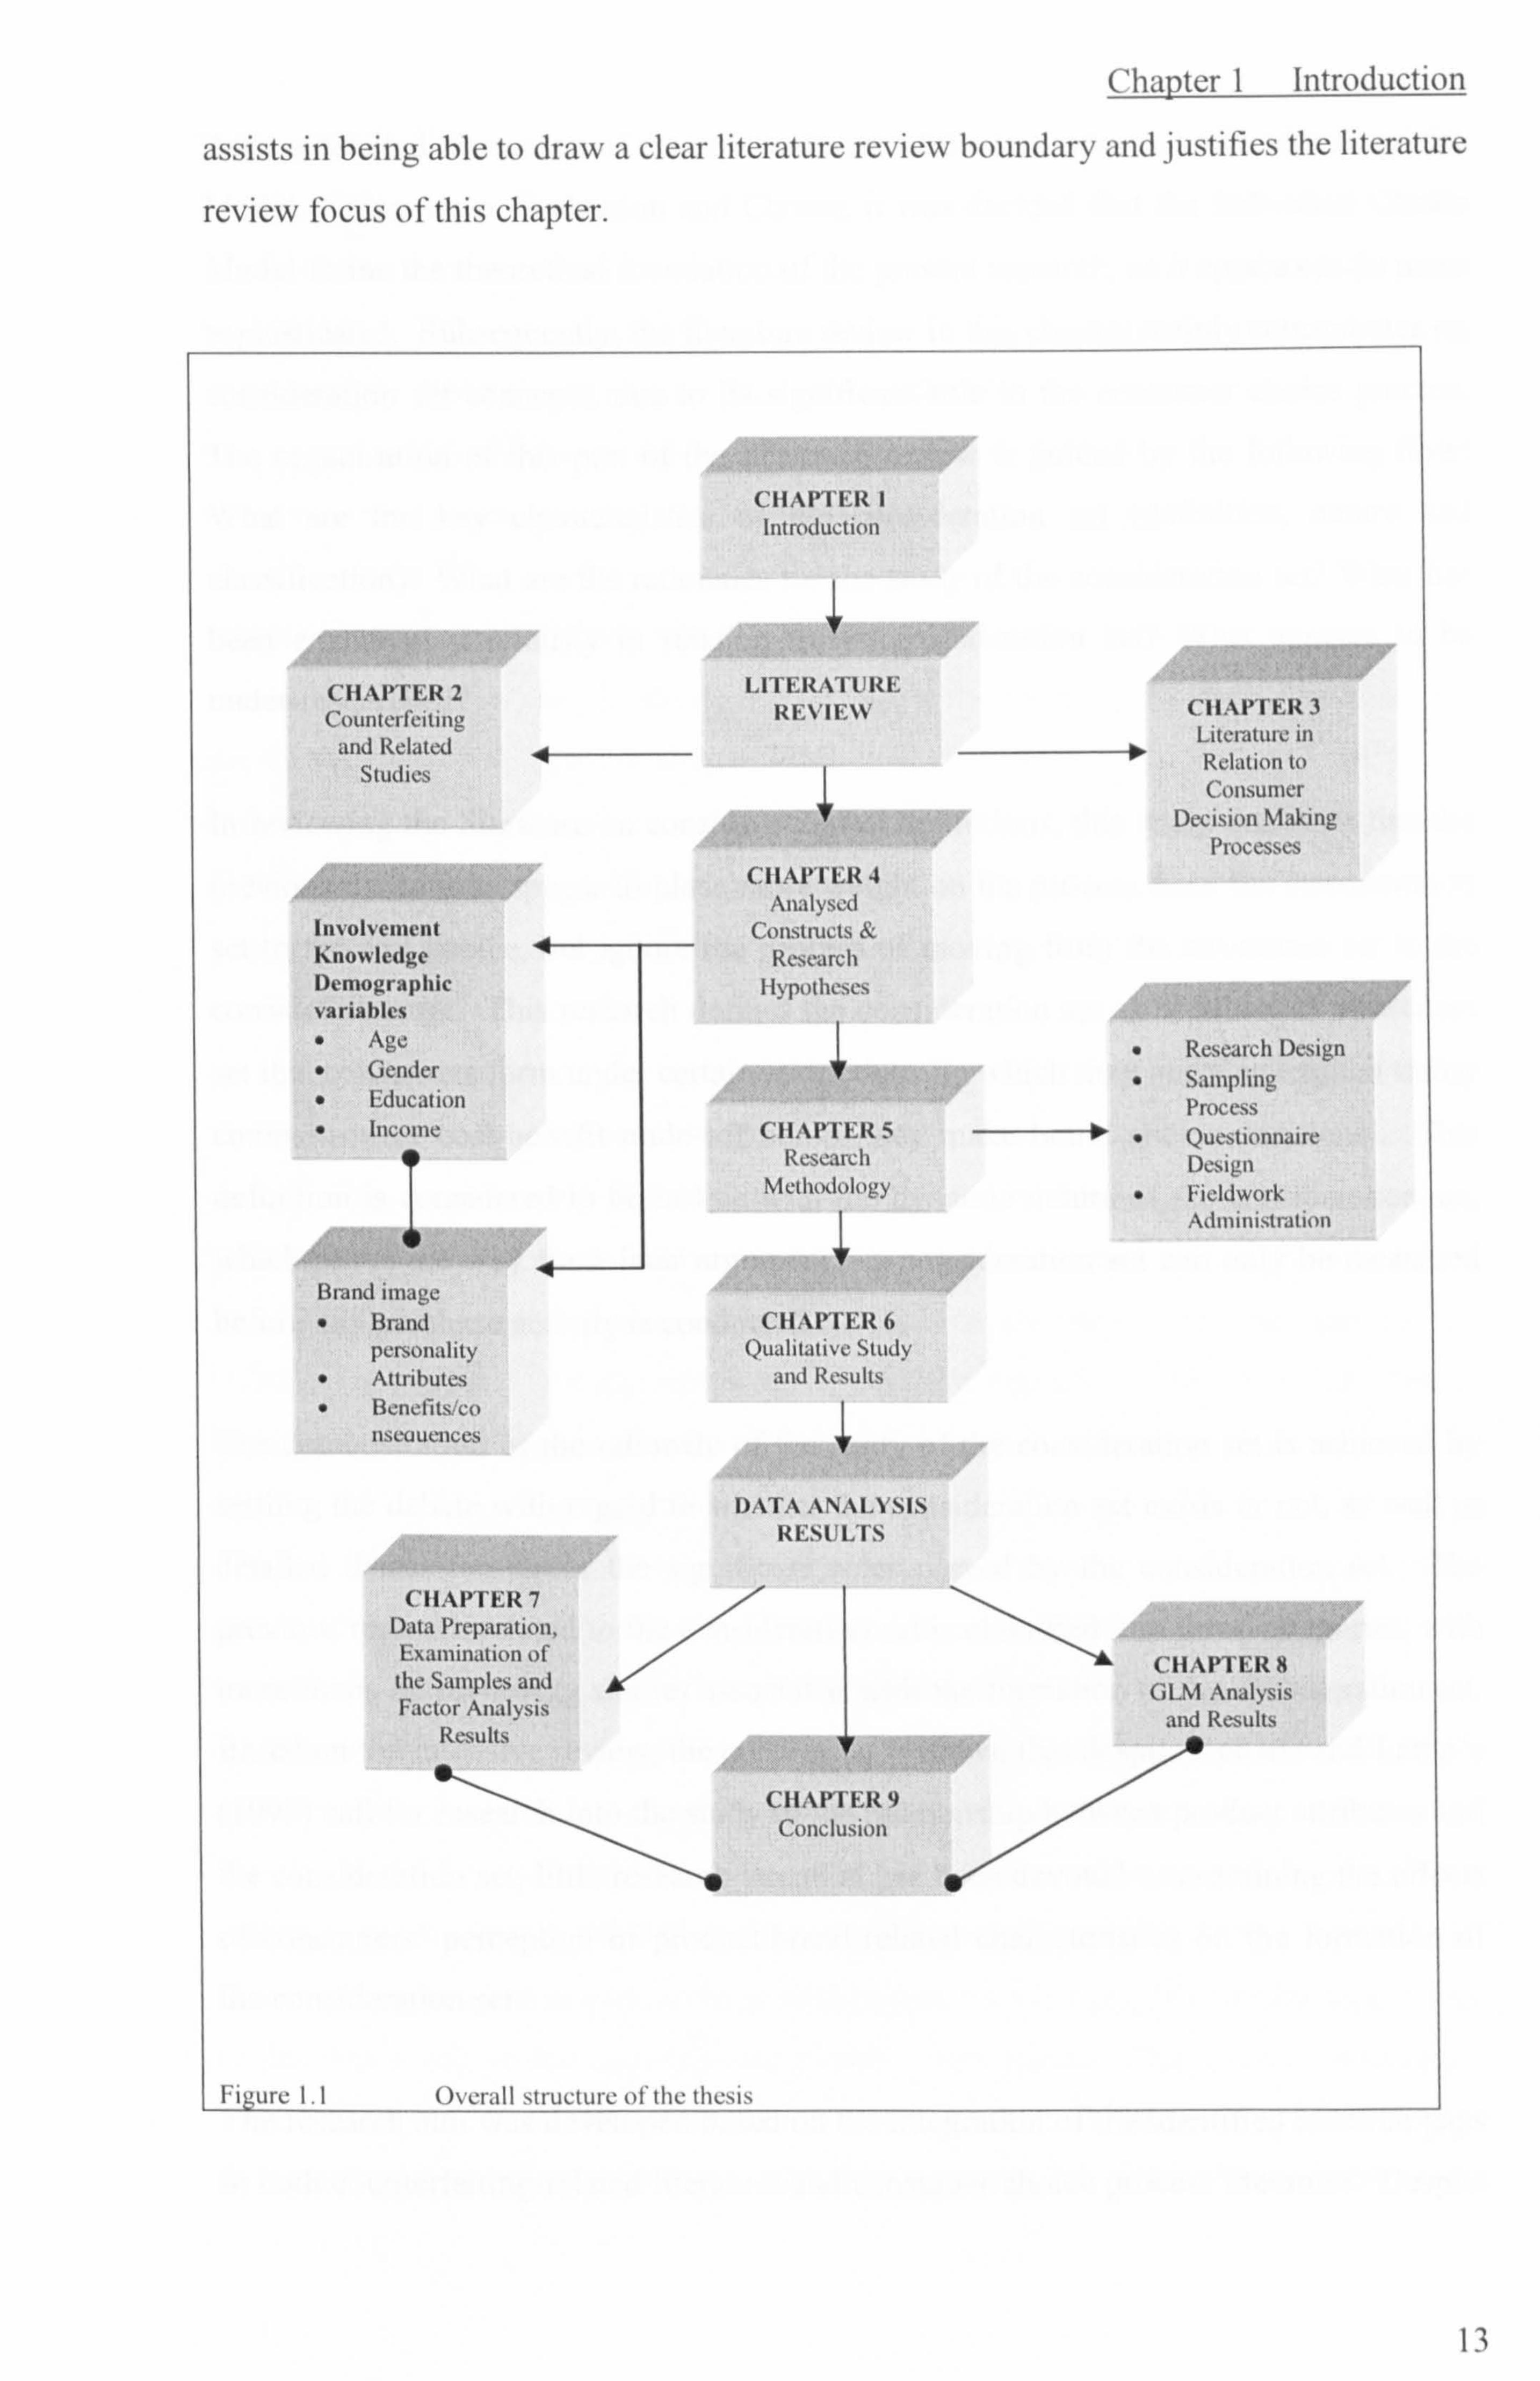
Chapter 1 Introduction
assists in being able to draw a clear literature review boundary and justifies the literature
review focus of this chapter.
CHAPTER 2 Countci fciting
and Related Studies
1 Involvement Knowledge Demographic variables " Age
" Gender
" Education Income
Rt: uk11 ini. i"L. " Bland
S
Fi
personality Attributes Bcncfitslco n, cuuences
Process Questionnaire Design Fieldwork Administn Lion
the Samples and -Ilk CHAPTER 8
GLM Factor Analysis
Analysis
Results and d Results
CHAP I FR 9 Conclusion
01-
CI I APTER 4 Analysed
Constwcts Research
Hypotheses
1
Ch APTr R3 Literature in Relation to Consumer
Decision Making Processes
Research Design Samnline
CHAPTER 5 Research
Methodology "
1 CHAPTER 6
Qualitative Study and Results
DATA ANALYSIS RESULTS
Data PrepataEKtirn /I\7
n,
Overall structure of the thesis
13
Chapter 1 Introduction
After a detailed discussion of the pros and cons of the Individual Choice Model and the
Model of Consumer Evaluation and Choice, it was decided that the Individual Choice
Model forms the theoretical foundation of the present research, as it appears to be more
sophisticated. Subsequently, the literature review in this chapter mainly concentrates on
consideration set concepts, due to its significant role in the consumer choice process.
The organisation of this part of the literature review is guided by the following flow:
What are the key characteristics of the consideration set (definition, nature and
classification)? What are the rationales for the study of the consideration set? What has
been examined previously in relation to the consideration set? What appears to be
under-researched?
In reviewing the literature on consideration set definitions, this study discovers that the
previous definitions appear to place more weight on the process from the consideration
set to the end choice, but ignore the process of moving from the awareness set to the
consideration set. This research defines the consideration set as ̀ a subset of awareness
set that consumers form under certain restrictions, in which they make an explicit utility
comparison or cost-benefit trade-off before they make brand choice decisions'. This
definition is considered to be in line with the dynamic nature of the consideration set,
which paves the way for a later argument -a consideration set can only be measured before any purchase activity is conducted.
The demonstration of the rationale of the study of the consideration set is achieved by
settling the debate with regard to whether the consideration set exists or not, as well as
detailed discussion about the significant roles played by the consideration set. The
previous research related to the consideration set is classified into three categories, with
more focus on reviewing studies associated with the formation of the consideration set. Based on the intensive review, the conclusion is drawn that despite Roberts and Lattin's
(1997) call for research into the study of the relationship between product attributes and
the consideration set, little research attention has been devoted to examining the effects
of consumers' perception of product/brand-related characteristics on the formation of
the consideration set.
The research aim was developed based on the integration of the identified research gaps in both counterfeiting-related literature and consumer choice process literature. Despite
14
Chapter 1 Introduction
the fact that choice is the final stage in the consumer choice process, it has been decided
to replace the final choice with purchase intention in the research conceptual model. The justifications of this action are as follows. First, data on actual behaviour are
unavailable. This is particularly true in study of consumer behaviour in relation to
counterfeits. Second, in general, the relationship between purchase intention and
purchase is positive and significant. Third, the concept of consumer purchase intention
is the most widely used connotive measure in marketing effectiveness research.
Chapter 4 proceeds with a review of a wide range of literature related to determinants of
consumer choice process. Based on this review of the literature, the factors influencing
the formation of the consideration set and consumer purchase intention are identified
and expounded. The identified factors are: product involvement, self-accessed product knowledge, demographic variables (age, gender, education, and household income) and
consumers' perceptions of a certain brand. It is at this stage that the conceptual research
model is formed.
Another focus of chapter 4 is on hypotheses development. Based on previous research,
a set of hypotheses are developed at this stage, which suggest that consumers
perceptions of CBP and BP are influenced by consumer self-assessed product knowledge and level of product involvement, and that likelihood of consideration and tendency of purchase of both counterfeit and original version of a brand is a function of these analysed variables.
Chapter 5 describes the research methodology in detail. The study relies principally on the quantitative method with the complement of a piece of qualitative research (presented in Chapter 6), which is used to assist in the construction of the research instrument used in the principal research. Therefore, the methodology used for the data
collection for the principal research adheres to the quantitative method requirement. The choice of the studied brands and products is justified through reviewing relevant literature and discussion of available sources. The overall research design is illustrated, followed by a detailed discussion of sample design. In addition, this chapter endeavours to develop a robust and user-friendly research instrument. The research instrument development processes, problems identified through two piloting tests, and solutions to the listed problems are reported in detail. In order to reduce the length of the
15
Chapter 1 Introduction
questionnaire, a new scale has been developed by the researcher based on the well-
known Likert scale and the Repertory-grid technique. Application of this new scale
assists in reducing the research instrument almost by half, which can be considered a
remarkable achievement.
Finally, issues concerning fieldwork administration are presented at the end of this
chapter. Specifically, this research employed eight fieldworkers to conduct data
collection. The eight fieldworkers were recruited by the researcher personally. They all
received proper training before they were sent into the field. Justification for the use of
touch and gaze techniques, appealing statements and incentives in data collection
process are provided.
Chapter 6 is an extension of Chapter 5. Given its importance to the construction of the
research instrument of this research, as well as the rich nature of this part of the research,
it is reported separately as an individual chapter. More specifically, Chapter 6 focuses
on the qualitative research organisation and presenting the focus group discussion
results. This chapter serves to illustrate the robust and user-friendly requirements of the
research instrument. The objectives of the qualitative study are to identify the criteria
used by consumers to evaluate the studied brands, as well as to establish plain
language/vocabulary that can be adopted in the research instrument. Four focus group
discussions were used to collect data. The data collected is then analysed using the
content analysis technique. Detailed results are presented.
Chapters 7 and 8 deal with data analysis issues and research results. Chapter 7 handles
the issues related to the survey response, validity and reliability of the collected data,
respondents' profile analysis, validity and reliability of measurements and computing
values for new variables and generating factor scores. The statistical techniques
adopted at this stage include descriptive statistics, binominal tests, one-sample statistics, factor analysis, Pearson correlation analysis, item-total correlation, Cronbach's
coefficient alpha, and collinearity statistics.
Chapter 8 focuses on regression analysis and presenting regression results. A series of
tests were conducted before running regression. These include tests of multicollinearity,
normality, consistent variance and casewise diagnostics. To test the hypotheses
16

Chapter 1 Introduction
developed in Chapter 4, the method of generalised linear model is used to estimate
regression equations across 4 brands and 2 versions of each brand incorporating the
variables of product involvement, product knowledge, perceived brand image, and
demographic variables (age, gender, education attainment, and household income). In
the cases where the normality distribution assumption is severely broken, R
Commander's super data transformation functions (Box-Cox and Box-Tidwell) are
utilised. Both before and after data transformation regression results are reported, a
decision is made on which equations are to remain for further interpretation and discussion. Interpretations of results and discussions are presented in detail in this
chapter.
Finally, chapter 9 summarises the research results and provides a detailed discussion of the overall research findings. The research limitations and suggested areas for further
research are presented. It also highlights the original contributions to theory and
methodology that this study has made, as well as managerial implications for both
marketers and policy makers.
1.9 Summary
This introductory chapter has sought to provide a description and brief explanation of
the chronology and substance of the present study. It has conveyed the initial research
problem, provided a rationale for the study, outlined the aim and objectives of the thesis,
and provided an overview and chronological outline of the chapters through indication
of the structure and sequence of the thesis. In so doing, the chapter has provided an
account of the purpose, aim and objectives of the study, as well as how the objectives will be achieved.
17

Chapter 2 Counterfeiting and Related Studies

Chapter 2 Counterfeiting and Related Studies
Chapter 2 Counterfeiting and Related Studies
2.1 Introduction
Counterfeiting is not a new business practice. However, it has expanded rapidly over
the last few decades. Following the introduction section, the main body of this chapter
starts off by drawing an overall picture of the counterfeiting phenomenon in relation to
its development, scope, impact, producers and recipients. The counterfeiting situation
in the UK is presented in detail in the third section, as this research is to be conducted in
the UK. Section four provides a detailed discussion of a number of terminologies
(counterfeiting/counterfeit product, imitation, and piracy). This research argues that
misuse, misunderstanding and interchange of these terms appear to be common in
previous studies, which has caused difficulties in terms of comparison of previous
research findings. This section points out that under some circumstances, imitation,
counterfeiting, and piracy were defined differently, whilst in some cases they were
perceived as the same kind of practice. Therefore, to define the term counterfeiting is
crucial for any study concerning counterfeits in order to avoid causing unnecessary
confusion.
Based on the detailed discussion of the definitions of counterfeiting/counterfeit product,
the definition adopted in this study is decided upon and reasons for the choice are
provided in section five. In a response to the wide spread of counterfeits, anti-
counterfeiting campaigns are on the agendas of supranational organizations, national
governments and manufacturers. Issues related to anti-counterfeiting are reviewed in
section six. Section seven discusses how counterfeits are classified and which
categorisation this research focuses upon. Past research on the study of counterfeiting is
reviewed in section eight. The review mainly focuses on studies investigating
consumers and counterfeits. Principal research streams are illustrated in detail. The
research problem is identified based on the detailed literature review and presented in
section nine. The chapter ends with a brief summary.
The purpose of this chapter is to draw a full picture of counterfeiting from the
perspectives of both counterfeiting as an economic phenomenon, and previous related
18
Chapter 2 Counterfeiting and Related Studies
research. Thereafter, an obvious research problem is identified and a clear research
scope drawn for the current study - non-deceptive counterfeiting in the UK.
2.2 The Counterfeiting Phenomenon: Development, Scope, Impact, Producers and
Recipients
Although counterfeiting is currently a topic of keen global interest, it is hard to trace
when it first began. Certainly, this phenomenon is not new. For example, counterfeit
painting became so common in the late Ming Dynasty (1368-1644) in China that it was
recorded that only one in ten paintings was estimated to be genuine (Clunas 1991).
Counterfeiting was listed in an English statute of 1352 as one of the "seven heads of
treason", a crime punishable by hanging or burning at the stake. Reports of women
being sent to the stake for counterfeiting coins can be found until the mid-1790s.
American law extended the concept to product counterfeiting in the 1800s, but it had
always been strict with currency counterfeiting. Comprehensive trademark legislation
(the Trademark Act of 1870) was enacted in the United States in 1870. All this is
evidence that counterfeiting has existed for several hundred years at least.
Although counterfeiting is not new, it had never been such a serious concern to national
governments, supranational organizations and legitimate manufacturers until the 1970s.
Harvey and Ronkainen (1985) state that counterfeiting has been a problem for a long
time, yet it was only in the 1970s that it mushroomed. Indeed, it is estimated that the
value of counterfeit goods in the world market has grown by 1100% since 1984 (Blatt
1993; Carty 1994). The International Anti-Counterfeiting Coalition estimates that
counterfeit products accounted for $200 billion in lost sales for United States companies
in 1994, up from $60 billion seven years previously (Chaudhry and Walsh 1996;
Freedman 1999). Globally, the sales of counterfeit products are estimated to be about
$300 billion (Gentry et al. 2001; Chaudhry and Walsh 1996). The International
Chamber of Commerce estimates that counterfeit products account for 8 per cent of
world trade (Freedman 1999). It should be noted that, accurate records of the growth
and magnitude of product counterfeiting are unavailable, since companies must estimate
volumes on the basis of seizures made and sudden unexplained drops in their market.
The same is true for industry organizations and regulatory authorities, who can only
estimate the impact on total trade and the economy generally. However, these statistics,
19

Chapter 2 Counterfeiting and Related Studies
despite their wide-ranging differences, imply that counterfeiting is growing rapidly and
that the growth will continue.
The preferred targets of counterfeiters are products which carry a high brand image and
require a relatively simple production technology, such as clothing, consumer
electronics, media, cigarettes, watches and toys (International Anti-Counterfeiting
Coalition 2003). However, counterfeiting no longer involves just currency (Anti-
Counterfeiting Group Survey Report 2004) and highly visible branded consumer goods;
the scale of counterfeiting has spread beyond this. Large scale counterfeiting has
emerged in a variety of industries, including medical equipment, prescription drugs
(Granzin 1992; Bikoff 1983; Diamond 1981; Schwartzman 1976), agricultural
implements (Harvey 1988), auto parts (Bikoff 1983; Fletcher and Wald 1987), sports
equipment (Gentry et al. 2001), high-technology consumer electronic products
(Grossman and Shapiro 1988a) and even aeronautical instruments and military parts.
Counterfeit transistors have been discovered among parts destined for use in U. S. space
shuttle tests (Bikoff 1983; Roberts 1985). Indeed, no product categories are left
unscathed (Shultz II and Saporito 1996). The spectrum of goods being counterfeited is
limited only by the outer bounds of the human imagination.
Counterfeiting has an effect on four involved communities, consumers, legitimate
manufacturers, brand owners and society as a whole. In general, it is regarded as a
serious economic, social, and political problem. It affects consumers' confidence in
legitimate products, destroys brand equity and companies' reputations (Wilke and
Zaichkowsky 1999), causes loss of revenues (Grossman and Shapiro 1988a, b; Bush et
al. 1989), increases costs associated with trying to contain infringement, impacts on
hundreds of thousand of jobs (Bamossy and Scammon 1985), and threatens consumer
health and safety (Grossman and Shapiro 1988a; Chakraborty et al. 1996; Cordell et al.
1996; Tom et al. 1998). Moreover, in some cases the financial benefit generated from
counterfeits might be used as financial support to terrorism (Playle 2003).
Counterfeiting has emerged as a major headache for global marketers (Blatt 1993;
Sweeney et al. 1994).
In the Far East, product counterfeiting takes place on a wide scale in China, Taiwan,
South Korea, Singapore, Indonesia and Malaysia, but it is by no means restricted to the
20
Chapter 2 Counterfeiting and Related Studies
Far East. About 50% of counterfeit products come from the Far East, 25% from New
York and the remainder from other countries (Delener 2000). The U. S. is not only a
main recipient of counterfeits, but also a significant counterfeit generator. US industries
estimated that they suffered losses of US$5.53 billion - more than one-third of global losses - as a result of piracy of copyrighted products in Asia (Ang et al. 2001), whereas
Asia accounts for more than one-third of the losses arising from counterfeiting (Asian
Wall Street Journal 1999).
2.3 Counterfeiting in the UK
Unlike the U. S. which has proven to be not only a major victim of IPR infringement,
but also a major source of counterfeit merchandise (Nill and Shultz 11 1996), the UK is
low on the list of producers of counterfeits; however, it is perceived to be one of the
main recipients of counterfeits in the world (Kay 1990). In 2001, the Anti-
Counterfeiting Group (ACG) estimated that the cost to the UK economy alone of
counterfeit goods was at least £2.8 billion in 2001; this figure had increased to about £10 billion in 2003 (ACG Survey Report 2004). It is no longer just luxury brands that
are at stake, but also a wide array of consumer goods including such products as soap
powder, spirits, food, pharmaceutical products (Stewart 2003), prints (Key 1990) and
software (Chaudhry and Walsh 1996).
In the UK there is evidence that the consequences of counterfeiting to the legitimate
producer include not only lost revenues, but also the high cost of combating infringement. For example, Marks and Spencer's invested in a `smart tag' in order to
make it easier to separate the genuine from the counterfeit (Stewart 2003).
Counterfeiting also causes about 4100 job losses per annum in the UK (ACG Survey
report 2004). It is reported that a Scottish woman died after drinking fake vodka in 2003
(ACG Survey Report 2004). Furthermore, recent investigations initiated by UK
customs officials seem to confirm that counterfeiting and piracy are linked to drugs and terrorist networks (Playle 2003).
A stricter IPR law against counterfeiting is now enforced in the UK, based on the 2002
Act that came into force in November 2002. The 2002 Act (which amends the
Copyright, Designs and Patents Act of 1988 and the Trade Marks Act of 1994)
tightened up the regulation of copyright and trademark infringement in an effort to
21

Chapter 2 Counterfeiting and Related Studies
reduce the losses being sustained by British businesses as a consequence of
counterfeiting and piracy. The new maximum penalty for these offences for conviction
on indictment is an unlimited fine and/or up to 10 years in prison to reflect the
seriousness of these crimes (The Patent Office 2002).
Regardless of the damage caused by counterfeiting and the strengthening of law
enforcement, a survey commissioned by the Anti-Counterfeiting Group demonstrated
that in 2003, about one-third of consumers would knowingly purchase counterfeit goods
if the price and quality of the goods were right, and 29% of subjects saw no harm in
product counterfeiting so long as the products did not put the purchaser at risk (ACG
Survey Report 2004). These results are in line with previous research findings (Bloch et
al. 1993; Wee et al. 1995; Tom et al. 1998; Phau et al. 2001).
2.4 Counterfeiting/Counterfeit Product, Imitation, and Piracy
This section deals with issues related to counterfeit definition. The current situation and
the problems caused by lack of a fixed definition are discussed. A number of
terminologies (counterfeit, imitation, and piracy) used by previous researchers in studies
of the counterfeiting phenomena are analysed, with the aim to differentiating them
literally, as well as demonstrating that misunderstanding and misuse of these terms have
occurred in previous research. Finally, a definition that is considered suitable and is
commonly accepted by prior researchers is chosen for the current research.
2.4.1 The Overall Situation
As noted above, counterfeiting has been a concern for national governments and
legitimate manufacturers for a long time. Nevertheless, there is no commonly accepted
definition of this phenomenon. Consequently, researchers have been using
counterfeiting, counterfeit product, imitation, and piracy interchangeably. A generally
acceptable generic definition and a number of characteristics are proposed by the
General Agreement on Tariffs and Trade (GATT): The intent to wrongfully benefit
through deceit from the efforts of a firm to establish and maintain a product or corporate
image with the consumer or the public at large. This statement indicates that
counterfeiting is driven by profit, and that the practice is regarded as deceitful, and is
wrong. The GATT definition of counterfeiting is however far too general, which raises
the following questions: a) What are the relationships between trademark, copyright and
22
Chapter 2 Counterfeiting and Related Studies
patent? b) What are the differences between counterfeiting, imitation, piracy and
passing off? Unfortunately, no fixed answers to these questions have been found so far.
Therefore, it is not surprising that researchers have different understandings of the
nature of counterfeiting.
2.4.2 Analysis of Definitions of Investigated Terminologies
The majority of definitions/understandings of counterfeiting, imitation, and piracy
which have appeared in previous studies of counterfeiting will be listed. In order to
draw a clear picture, they are presented in three tables. These three tables have the same
format, with each of them containing five major components: terminology, definition,
original source, cited by and defined by. "Terminology" refers to the phrase used in the
original source, either articles or law dictionaries. In order to avoid any possible
misinterpretation from editing, the expression(s) was (were) copied directly from the
original works of previous researchers and pasted into the three tables. The "original
source" represents the source of the definition. The "cited by" and "defined by" refer to
whether the definition is defined by the author or cited from other sources. One point
for clarification is that it is assumed that the definition is given by the author(s) so long
as the author(s) did not state where it is originally from. As it is the intention to argue
that people hold different understandings with regard to "counterfeiting" and
"counterfeit products", but do not searching for correct answers to these definitions,
therefore, some expressions that are displayed in the three tables might not necessarily be held as proper definitions. The principle, insofar as it represents the author's
understanding of the relevant terminology, is displayed in the table.
Table 2.1 is a review of the definition/understanding of counterfeiting/counterfeit
product adopted by previous researchers. Counterfeiting is categorised into commercial
counterfeiting and monetary counterfeiting. Commercial counterfeiting is the
counterfeiting of a brand name or trademarked merchandise. A counterfeit is a spurious
mark that is identical with or is substantially indistinguishable from a registered mark (Bamossy and Scammon 1985). Monetary counterfeiting refers to forged money (see
Black's Law Dictionary, 5`h Edition). In fact, this usage can be traced back to 1650
(Scott 1953). Generally speaking, before commercial counterfeiting burgeoned in the
1970s, counterfeiting was mainly used to refer to the production of fraudulent money.
23

Chapter 2 Counterfeiting and Related Studies
Table 2.1 Definitions of counterfeiting counterfeit products Terminology Definition Original Source Cited by Defined by
I CP CPs are those bearing a trademark that is identical to, Scrivener Regulation Chaudhry or indistinguishable from, a trademark registered to and Walsh another party and infringes the rights of the holder of 1996 the trademark.
2 C'ing The unauthorized use of a registered trademark on a US International trade Grossman product that is identical or similar to the product for Commission 1984 and Shapiro which the trademark is registered and used 1988a
3 C'ing The intent to "wrongfully benefit through deceit from General Agreement of Grossman the efforts of a firm to establish and maintain a product Trade and Tariff and Shapiro or corporate image with the consumer or the public at 1988b large.
4 CP A CP is designed to "be like" the original and provides Consumer Evaluations of d'Astous and consumers with a less expensive copy Brand Imitations Gargouri 2001
5 C'ing I C'ing refers to the mere reproduction of a trademark. French law Kapferer 1995a
6 CP A CP is one which the manufacturer produces with the Brand Imitation: do the Lai and intention of deceiving the consumer by leading buyers Chinese Have Different Zaichkowsky to believe that they are purchasing the genuine article. Views? 1999
7 C'ing C'ing refers to the unauthorized copying of the content Enforcement against Chow 2000 of a fixed medium of expression, such as films, Counterfeiting in the musical recordings, and computer software, People's Republic of
China C'ing C'ing refers to a "direct" copy. Wilke and
Zaichkowsky 1999
9 C'ing C'ing is by definition: theft. Nia and Zaichowsky 2000, Green and Nill and Schultz 1996 Smith 2002
I0 C'ing C'ing - the production of copies that are identically Kay, 1990 Wee et al packaged including trademarks and labelling, copied so 1995 as to seem to a consumer the genuine article.
tt C'ing C'ing is the unauthorized production of goods that are Protecting Intellectual Shultz II and legally protected by trademarks, copyrights or patents. Property: Strategies and Saporito 1996
Recommendations to Deter Counterfeiting and Brand Piracy in global Markets
12 C'ing C'ing can be described as the fraudulent practice of Product Counterfeiting: Bamossy and affixing a false trademark to a product. Consumers and Scammon
Manufacturers Beware 1985 13 C'ing/ Commercial counterfeiting is the counterfeiting of The Lanham Act, Section Bamossy
CP brand name, trademarked merchandise... A counterfeit 1127 and is a spurious mark which is identical with or is Scammon substantially indistinguishable from a registered mark. 1985
14 C'ing Counterfeit: to forge: to copy or imitate, without Black's Law Dictionary S authority or right, and with a view to deceive or Edition defraud, by passing the copy or thing forged for that which is original or genuine. Most commonly applied to the fraudulent and criminal imitation of money or securities.
15 CP There are four types of counterfeits: Assessment of the Impact Chaudhry and " True CPs that look as much like the original as of Counterfeiting in Walsh 1996
possible and use the same brand name International Markets: the " Look-alikes that duplicate the original and bear a Piracy Paradox Persists
different name, but not a private label of a - branded industrial product " Reproductions that are not exact copies " Unconvincing imitations (Harvey, 1987)
16 CP There are two kinds of counterfeits: deceptive and non- Foreign Counterfeiting of Grossman and deceptive counterfeiting. Status Goods Shapiro 1988a
17 C'ing Product counterfeiting, commonly defined as the Consumer "Accomplices" Bloch, Bush unauthorized copying of trademark or copyrighted in Product Counterfeiting and Campbell goods, harms legitimate producers through lost sales. 1993
is CP Product designed to imitate a genuine product, Pricing Strategy and Papadopoulos typically those associated with a particular trademark Practice: Pricing and Pirate 2004 or brand name. It is made to resemble, as closely as Product Market Formation possible, the authentic product, with the objective of deceiving the consumer and defrauding the producer.
19 CP CPs are those bearing a trademark that is identical to, Scrivener Regulation Bian and or indistinguishable from, a trademark registered to Veloutsou another party and infringe the rights of the holder of 2004,2005, the trademark. 2006
Note: C'ing - Counterfeiting; CP - Counterfeit
24

Chapter 2 Counterfeiting and Related Studies
Some researchers believe that commercial counterfeiting, by its nature, is theft with an
aim to deceive consumer (e. g. Green and Smith 2002), and is therefore illegal, whereas
other consider that commercial counterfeiting to be more complicated than is thought.
These researchers classify counterfeiting into different categories (e. g. Chaudhry and
Walsh 1996; Grossman and Shapiro 1988a). According to these authors, some
categories are illegal, but some are legal. Table 2.1 also shows that in some cases,
researchers do not distinguish between counterfeiting, imitation and copyright
infringement (e. g. Papadopoulos 2004; Chow 2000; Chaudhry and Walsh 1996; Bloch
et al. 1993).
Table 2.2 Definitions of imitation
Terminology Definition )riginal Source Cited Defined by by
1 Imitation Brand imitation is designed so as to "be like" and make Consumer Evaluations of D'Astous consumers "think of' the original brand. Brand Imitations and
Gargouri, 1999
2 Imitation Imitation is akin to a certain degree of resemblance. Brand Confusion: Kapferer Empirical Study of a Legal 1995 Concept Psychology & Marketing
3 Imitation In using the word "imitate", what is typically meant is Consumer "Confusion" of Loken, Ross an effort to reproduce the major ingredients or Origin and Brand and Hinkle functional properties of the product, perhaps to emulate Similarity Perceptions 1986 promotional them, advertising/promotional strategy, distribution, price and other components of the marketing mix; not to "copy" those distinctive and stylistic (non-functional) aspects of the product which have become trademarks
4 Imitation The making of one thing in the similitude or likeness of Black's Law Dictionary 5 another. as a counterfeit coin is said to be made "in Edition imitation" of the genuine. An imitation of a trademark is that which so far resembles the genuine trademark as the be likely to induce the belief that it is genuine, whether by the use of words or letters similar in appearance or in sound, or by any sign, device, or other means.
5 Imitation Brand imitation - or "passing off', in legal language - Brand Imitation and Its Wilke and is based on similarities. Effects on Innovation Zaichkowsky
Competition, and Brand 1999 Equity
6 Imitation Imitators need not copy directly; they need only Brand Imitation and Its Wilke and borrow or copy some aspects or attributes of the Effects on Innovation Zaichkowsky original. Competition, and Brand 1999
Equity 7 Imitation In merchandising jargon, an imitation is a copy of an Product Counterfeiting: Bamossy and
original that is not sufficiently similar to constitute a Consumers and Scammon counterfeit. Manufacturers Beware 1985
8 Imitation Imitation is legal manufacturing of look-alikes Brand imitation: do the Gentry Lai and (including many generics) or'knock-offs', while Chinese have different et al. Zaichkowsky overruns are associated with outsourced manufacturers views? 2006 1999 who produce more than the contracted amount and distribute the extras through unauthorized channels.
Table 2.2 displays the interpretations of imitation that have appeared in previous
academic articles. As mentioned previously, the term `imitation' was used to refer to
25

Chapter 2 Counterfeiting and Related Studies
counterfeiting in some counterfeiting studies. Nevertheless, in no case does the
literature reviewed here show that counterfeiting was used to refer to imitation. It
seems therefore that researchers who investigated imitation-related issues have a clear
understanding of imitation practice. Researchers seem to agree that the aim of imitation
is to `be like', but not to `be' (e. g. d'Astous and Gargouri 1999; Wilke and Zaichkowsky 1999; Bamossy and Scammon 1985)
Compared with piracy and counterfeiting, imitation is a more general and neutral term.
Researchers studying imitation are fully aware of the differences between counterfeiting
and imitation. Counterfeiting is direct copy, whereas imitation means `indirect copy'
(e. g. Bamossy and Scammon 1985). As Kapferer (1995b) states: "The imitation is
subtle, often based on partial differences: the imitator recreates an overall similarity,
even if the details of the packaging differ between the national brand and the copying
own-label product. " The researchers in the study of imitation appear to be fully aware
of these differences. From a legal perspective, imitation also defers to both piracy and
counterfeiting as both piracy and counterfeiting are illegal according to legislation;
whereas, imitation does not necessarily break the law unless it is proven that it has
caused confusion to consumers (Bamossy and Scammon 1985).
Table 2.3 Definitions of piracy Terminology Definition Original Source Cited by Defined by 1 Piracy Pirated goods are goods that are copies made without Scrivener Regulation Chaudhry
the consent of the holder of the copyright or related and Walsh rights. 1996
2 Piracy Piracy is counterfeiting. The intention is not always to Product piracy: The McDonald and deceive the consumer. The consumer is aware that the problem that will not go Roberts 1994 product he is buying is an unauthorized copy of the away original product.
3 Piracy Piracy is the unauthorized use of copyright or patented Protecting Intellectual Shultz 11 and goods or ideas. Pirates are engaged in all processes of Property: Strategies and Saporito 1996 IPR theft including, for example, the distribution and Recommendations to Deter sale of counterfeit products or the theft of technology Counterfeiting and Brand that enables production capability. Piracy in Global Markets
4 Piracy When a counterfeit is sold at a fraction of the usual Product Counterfeiting: Bamossy and selling price, this is said to be a signal to consumers Consumers and Scammon 1985 that the goods are counterfeit. Such a case is usually Manufacturers Beware referred to as piracy, since the manufacturer's intention is not to deceive the consumer as to the true origin of the goods.
5 Piracy The term pirated brand refers to products that are also Understanding Consumer Prendergast, copies of items, but they are produced in the Demand for Non-deceptive Chuen and knowledge that the customer will be aware that the Pirated Brands Pharr 2002 item is a fake, so it is usually sold at a fraction of the copied goods.
6 Piracy Piracy, like counterfeiting, involves the unauthorised Pricing Strategy and Papadopoulos duplication or reproduction of a copyright or patented Practice: Pricing and Pirate 2004 product. Piracy, while defrauding right holders in the Product Market Formation same way as counterfeit products, does not include the act of der tion.
9 Piracy Piracy is usually limited to the copying of software, Brand imitation: do the Gentry et Lai and music, or videos. Chinese have different al. 2006 Zaichkowsky
views? 1999
26

Chapter 2 Counterfeiting and Related Studies
Table 2.3 represents a summary of the diverse definition/understandings of piracy held
by previous researchers. It is commonly accepted that piracy involves unauthorised
duplication and reproduction of copyright or patented products (Chaudhry and Walsh
1996; Papadopoulos 2004; Predergast et al. 2002). Both pirated goods and counterfeits
are infringements of intellectual property rights (copyright, patent and trademark).
Some previous researchers believe that piracy is counterfeiting, with the only difference
being that piracy does not tend to deceive the consumer (e. g. McDonald and Roberts
1994). The consumer is aware that the product he is buying is an unauthorised copy of
the original product (McDonald and Roberts 1994; Bamossy and Scammon 1985;
Predergast et al. 2002). Nevertheless, some researchers seem to differentiate literally
between piracy and counterfeiting. They believe that piracy is like counterfeiting, but is
not counterfeiting. Piracy infringes copyright and patent, whereas counterfeiting is an
offence against trademark (e. g. Chaudhry and Walsh 1996; Papadopoulos 2004).
Table 2.1, Table 2.2 and Table 2.3 represent summaries of definitions/understanding of
counterfeiting and counterfeit products, imitation, and piracy which have appeared in
academic works over the last few decades. The tables clearly show that some of the
definitions of counterfeiting noted above reflect only part of the picture, and it is also
clear that people hold different understandings of the same terminology.
Misunderstandings and even misuse of the terms do exist. Quite often imitation and
piracy are used to refer to counterfeiting rather than the other way around. Furthermore,
some articles have adopted different terms to refer to the same practice, for example Ang et al. (2001), Kapferer (1995a), Foxman et al. (1990) and Gentry et al. (2001). To
judge which definition/understanding is correct is beyond the scope of this study. What
is stressed here is that it is necessary to distinguish brand imitation from counterfeit
products (Kay 1990), and that counterfeiting should be distinguished from copyright
piracy, which refers to the unauthorized copying of the content of a fixed medium of
expression, such as films, musical recordings, and computer software (Chow 2000).
From the tables in section 2.4 it can also be seen that, in some cases, the authors did
intend to distinguish the differences between these terminologies. However, one
problem in developing countries is the absence of a uniform definition of the practice
27
Chapter 2 Counterfeiting and Related Studies
(Russel 1983). Furthermore, the problems with laws is that (1) they can change over
time, (2) they vary from country to country, (3) they can vary within a country, such as
the United States, (4) each case is dealt with separately, and (5) the interpretation of the
laws as they apply to each case is made by different people with different experiences,
beliefs, and values (Wilke and Zaichkowsky 1999). Usually, the courts side with the
manufacturer, and see no difference between pirated and counterfeit goods either. All
these could be triggers of the misunderstandings and mixed use of different terms.
Having said all of the above, generally speaking these three terms refer to different
practices. Although it is very true that people hold distinctive views on whether these
practices are good or bad, it is clear that to some degree all of these three practices can
create similar problems for original brands because under certain circumstances they all
infringe the original's image and profits.
2.5 Definition of Counterfeiting Used in This Study
As revealed earlier, counterfeiting has been defined in many ways by both researchers
and practitioners. It can be easily confused with imitation and piracy by both
researchers and readers. Therefore, in line with Phau et al. (2001) and Hoe et al. (2003),
it is suggested that it is necessary to have a clear demarcation of counterfeiting before
researchers carry out any investigation. This would be helpful for the researchers in
identifying relevant literature, and to have clear guidance on their overall research plan;
it would also be helpful for readers in interpreting the research findings.
The definition of a counterfeit product used in this study is taken from Chaudhry and Walsh (1996): counterfeit products are those bearing a trademark that is identical to, or indistinguishable from, a trademark registered to another party and infringes on the
rights of the holder of the trademark (Scrivener Regulation). This definition is
consistent with the views of both practitioners and researchers, has been widely adopted by previous researchers (e. g. Bamossy and Scammon 1985; Grossman and Shapiro
1988a, b; Kapferer 1995a; Chaudhry and Walsh 1996; Bian and Veloutsou 2004,2006;
Veloutsou and Bian 2005), and it fits the studied products of this research well. In order to achieve a common understanding of counterfeit products between the research
participants, the definition adopted is displayed on the cover page of the self-
administered questionnaire.
28
Chapter 2 Counterfeiting and Related Studies
2.6 Anti-Counterfeiting, Anti-Counterfeiting Outcomes and Proposed Reasons
The negative impacts caused by counterfeit practices have drawn a great deal of
attention from supranational organizations, national governments, legitimate
manufacturers and brand holders (Green and Smith 2002). In response to the fast-
expanding counterfeiting phenomenon, national anti-counterfeiting legislations have
been strengthened (e. g. US Trade Mark Counterfeiting Act 1984, UK The IPR 2002
ACT), international legal anti-counterfeiting measures have been developed (e. g., the
General Agreement on Tariffs and Trade, Trade-Related Intellectual Property Rights),
various supranational anti-counterfeiting organisations (e. g. the International Anti-
counterfeit Coalition, Anti-counterfeiting Group) have been set up with the same
purpose - to eliminate counterfeiting. Moreover, individual firms have been dedicated
themselves to curb counterfeiting. For example, Louis Vuitton employs sixty full-time
people at various levels of responsibility to work with teams of investigators and lawyers in order to protect its brand from counterfeiters (LVMH 2006). Due to both
the time and wordage restrictions on this research, as well as the fact it is beyond the
scope of this study, the detailed legal framework is not reported here.
Despite the increased efforts of national governments, supranational organizations and
also individual manufacturers, the loss figure caused by counterfeiting continues to
climb. For example, as noted earlier, the value of counterfeit goods in the world market has grown by 1100% since 1984; within seven years the estimated value of counterfeit
products increased by $140 billion (Chaudhry and Walsh 1996; Freedman, 1999) The
estimated figure reached £10 billion in 2003 in the UK, which is almost 3 times more than in 2001 (ACG 2004), and the International Chamber of Commerce (ICC) projected that the counterfeit market would soon exceed $500 billion per year (ICC 2003).
Clearly, the reality is business as usual for most IPR pirates (Gentry et al. 2006).
Overall, the success of governments has been limited. Even within the U. S.,
governmental policing efforts have met with limited success (Olsen and Granzin 1992).
Several factors have contributed to the growth of this phenomenon. Apart from the
obvious financial incentive (Ang et al. 2001; Shultz II and Saporito 1996; Nill and Shultz II 1996; Harvey and Ronkainen 1985), the increase may stem from
decentralization of political power in many regions, as regions become more concerned
29
Chapter 2 Counterfeiting and Related Studies
about the immediate welfare of local companies, employees of those companies and
other regional stakeholders. This is especially true in transitional economies such as
China, Vietnam and Russia (Shultz II and Le 1993; Shultz II and Ardrey 1995). Further
more Harvey (1988) and Roberts (1985) state that counterfeiting is regarded as an
industrial development strategy for some developing countries. According to Harvey,
some producers in developing countries have not mastered the ability to develop
products of their own, however, they have progressed enough to produce replica
products. Since they have not gained a reputation that would help their products to
stand on their own, it is more likely that they adopt a counterfeiting strategy.
At a more basic level, some countries and many IPR pirates refuse to accept the ideas
and concepts espoused by the WTO and pressure from developed countries; indeed,
they may even acknowledge that they engage in or support counterfeiting (Chow 2000).
Bush et al. (1989) claim that counterfeiting continues to flourish because multinational
marketing has created high worldwide demand for well-known brands. In addition,
technological advances enable counterfeiters to produce brand name products easily
(Gentry et al. 2001; Delener 2000) and the removal of trade barriers makes it likely that
counterfeiting will continue to abound (Cottman 1992; Harvey 1988; Kay 1990).
Inadequate penalties for commerce in counterfeiting and weak enforcement of the
respective laws and regulations have also been blamed for the growth in counterfeit
trade (Bush et al. 1989; Kay 1990; Harvey 1987; Roberts 1985). Irrespective of these
issues which are considered responsible for the wide spread of counterfeiting, a number
of researchers claim that counterfeit will always exist and grow so long as the demand
for them is still strong (Robert 1985; Bloch et al. 1993; Chakraborty et al. 1996). This
statement is in the same vein as the economic theory which suggests that if there is little
or no demand for a product, supply will also decrease.
It would be naive to claim that the demand for counterfeit products should take full
responsibility for the boom in counterfeiting, but it is certainly one of the main reasons
why anti-counterfeiting campaigns appear to achieve little success despite the efforts by
countries to improve and enforce relevant legislation (Bamossy and Scammon, 1985).
It is also well-recognized that counterfeiting activities can be It is argued that it is
crucial to understand why consumers are accomplices to counterfeiting, before victims
of counterfeiting can make any successful achievements in curbing the practice.
30

Chapter 2 Counterfeiting and Related Studies
Therefore, the study of counterfeiting from the consumers' perspective will be very
valuable.
2.7 Types of Counterfeiting and Choice of Non-deceptive Counterfeiting Context
Consumers are not always deceived when involved in counterfeiting transactions.
Grossman and Shapiro (1988a) classify the practice of consumers knowingly
purchasing counterfeit products as non-deceptive, and classify unwitting purchase as
deceptive. Despite the fact that Grossman and Shapiro's (1988a) classification of
counterfeiting is widely accepted, the way that they classify counterfeiting by drawing a
clear line between deceptive and non-deceptive may be somewhat stringent. It is not
always the case that either consumers do not know or are fully aware that what they are
buying is the genuine branded product or its counterfeit counterpart. For example,
consumers might be suspicious about goods, but may assume they are stolen
merchandise, or they may think that the seller has obtained the goods through parallel
import arrangements (Wilke and Zaichkowsky 1999). This study extends Grossman
and Shapiro's (1988a) counterfeiting categorization by introducing a third notion. Here,
in the scenario which consumers are fully aware that they are buying non-genuine
brands is named as non-deceptive counterfeiting. In contrast, if goods are counterfeit
products but the consumers are given clear indication that the goods are genuine when
they are purchased, this scenario is labelled deceptive counterfeiting. The third
category is named blur counterfeiting, as it refers to the reality that, in some cases,
consumers are not sure whether products are counterfeit versions, genuine versions,
genuine versions but from parallel import arrangement, genuine versions which are on
sale, or even stolen merchandise, when they pursue purchases.
Green and Smith (2002) suggest that non-deceptive and deceptive counterfeiting have
different characteristics. Non-deceptive counterfeits are considered to pose little or no
health or safety risk to the public, have little demonstrable impact on brands being
counterfeited, can even provide some demonstrable benefit (e. g. employment) to the
nation, and consumers can be viewed as accomplices in the activities. In contrast, deceptive counterfeits are believed to bring potential health and safety risks to
consumers, lead to calculable losses to governments, damage brand equity and cause loss of sales. Therefore, in comparison to non-deceptive counterfeits, deceptive
31
Chapter 2 Counterfeiting and Related Studies
counterfeits are likely to receive a more enthusiastic response from local authorities for
requests for intellectual property protection (Green and Smith 2002).
This study only focuses on the non-deceptive counterfeit. The choice of the non-
deceptive counterfeit context is considered important, because only under these
circumstances is it possible to investigate consumers' true perceptions of counterfeit
branded products. Moreover, only under these circumstances will consumers'
perceptions of counterfeit products reflect their demand for counterfeit products, and
thereafter influence their choice processes.
2.8 Past Research on Counterfeiting
This section consists of two sub-sections. The first sub-section aims to review the
relevant works on the study of counterfeiting. The second sub-section focuses on
reviewing literature in the study of consumer and counterfeiting, and points out that the
study of the influence of consumers' perceptions of counterfeits on consumer choice is
overlooked and more work is required.
2.8.1 Overview of Past Studies
As noted earlier in this chapter, counterfeiting has emerged as a major problem for
global marketers since it started spreading globally in the 1970s. It has been more than
three decades since counterfeiting first drew the attention of researchers; however, it
appears that the study on this phenomenon is still very limited. In reviewing the limited
literature, the research works can be categorised into four broad categories: general
study; normative impact study; anti-counterfeiting strategy study and consumer study.
The general study covers literature published in journals, which look at general issues
regarding counterfeiting. Most of these articles cover a wide range of the aspects of
counterfeiting. These articles are by Wilke and Zaichkowsky (1999), Roberts (1985),
Chaudhry and Walsh (1996), Nill and Schultz II (1996), Harvey and Ronkainen (1985),
Chow (2000), Bikoff (1983), Lai and Zaichkowsky (1999), Globerman (1988) and
Stone (2001). The normative impact study group consists of Pepall and Richards
(1994), Grossman and Shapiro (1988a, 1988b), and Yao (2005) who have examined the
impact of counterfeiting on innovation, social welfare, status goods, trade and
monopolists. The anti-counterfeiting strategy study category includes Green and Smith
32
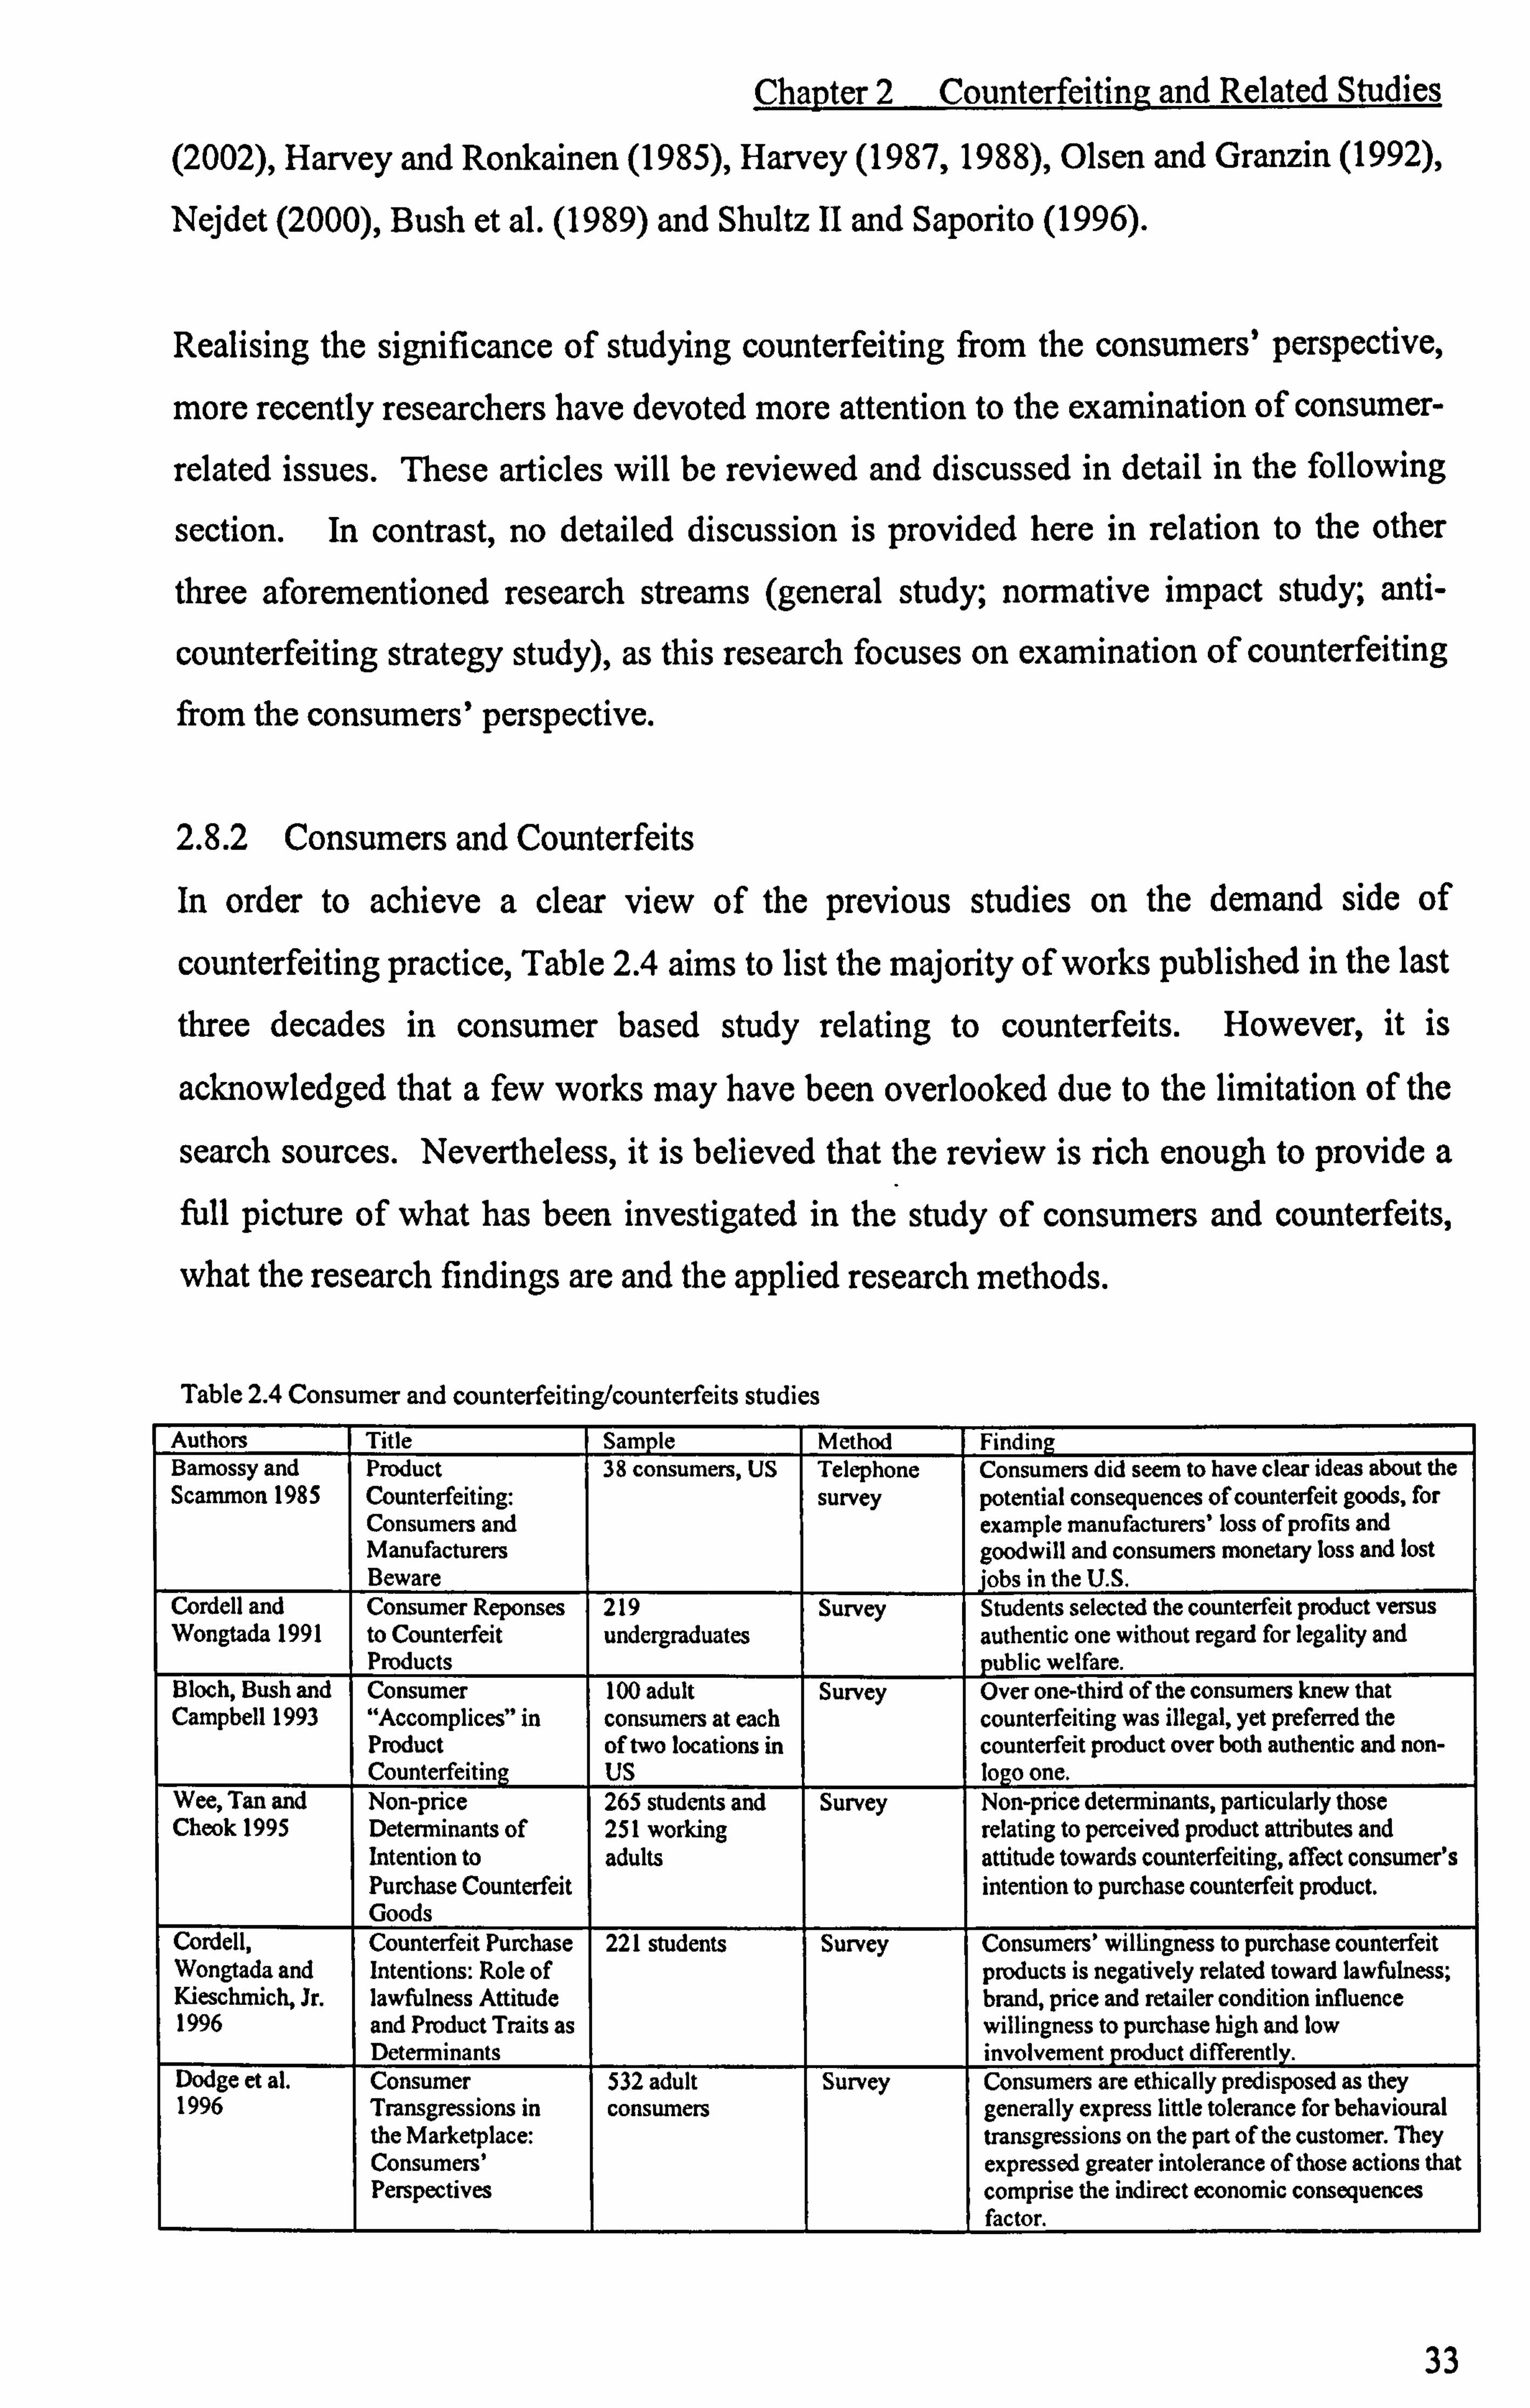
Chapter 2 Counterfeiting and Related Studies
(2002), Harvey and Ronkainen (1985), Harvey (1987,1988), Olsen and Granzin (1992),
Nejdet (2000), Bush et al. (1989) and Shultz II and Saporito (1996).
Realising the significance of studying counterfeiting from the consumers' perspective,
more recently researchers have devoted more attention to the examination of consumer-
related issues. These articles will be reviewed and discussed in detail in the following
section. In contrast, no detailed discussion is provided here in relation to the other
three aforementioned research streams (general study; normative impact study; anti-
counterfeiting strategy study), as this research focuses on examination of counterfeiting from the consumers' perspective.
2.8.2 Consumers and Counterfeits
In order to achieve a clear view of the previous studies on the demand side of
counterfeiting practice, Table 2.4 aims to list the majority of works published in the last
three decades in consumer based study relating to counterfeits. However, it is
acknowledged that a few works may have been overlooked due to the limitation of the
search sources. Nevertheless, it is believed that the review is rich enough to provide a full picture of what has been investigated in the study of consumers and counterfeits,
what the research findings are and the applied research methods.
Table 2.4 Consumer and counterfeiting/counterfeits studies Authors Title Sample Method Finding Bamossy and Product 38 consumers, US Telephone Consumers did seem to have clear ideas about the Scammon 1985 Counterfeiting: survey potential consequences of counterfeit goods, for
Consumers and example manufacturers' loss of profits and Manufacturers goodwill and consumers monetary loss and lost Beware 'obs in the U. S.
Cordell and Consumer Reponses 219 Survey Students selected the counterfeit product versus Wongtada 1991 to Counterfeit undergraduates authentic one without regard for legality and
Products public welfare. Bloch, Bush and Consumer 100 adult Survey Over one-third of the consumers knew that Campbell 1993 "Accomplices" in consumers at each counterfeiting was illegal, yet preferred the
Product of two locations in counterfeit product over both authentic and non-
_Counterfeiting US logo one.
Wee, Tan and Non-price 265 students and Survey Non-price determinants, particularly those Cheok 1995 Determinants of 251 working relating to perceived product attributes and
Intention to adults attitude towards counterfeiting, affect consumer's Purchase Counterfeit intention to purchase counterfeit product. Goods
Cordell, Counterfeit Purchase 221 students Survey Consumers' willingness to purchase counterfeit Wongtada and Intentions: Role of products is negatively related toward lawfulness; Kieschmich, Jr. lawfulness Attitude brand, price and retailer condition influence 1996 and Product Traits as willingness to purchase high and low
Determinants involvement product differently. Dodge et at. Consumer 532 adult Survey Consumers are ethically predisposed as they 1996 Transgressions in consumers generally express little tolerance for behavioural
the Marketplace: transgressions on the part of the customer. They Consumers' expressed greater intolerance of those actions that Perspectives comprise the indirect economic consequences
factor.
33
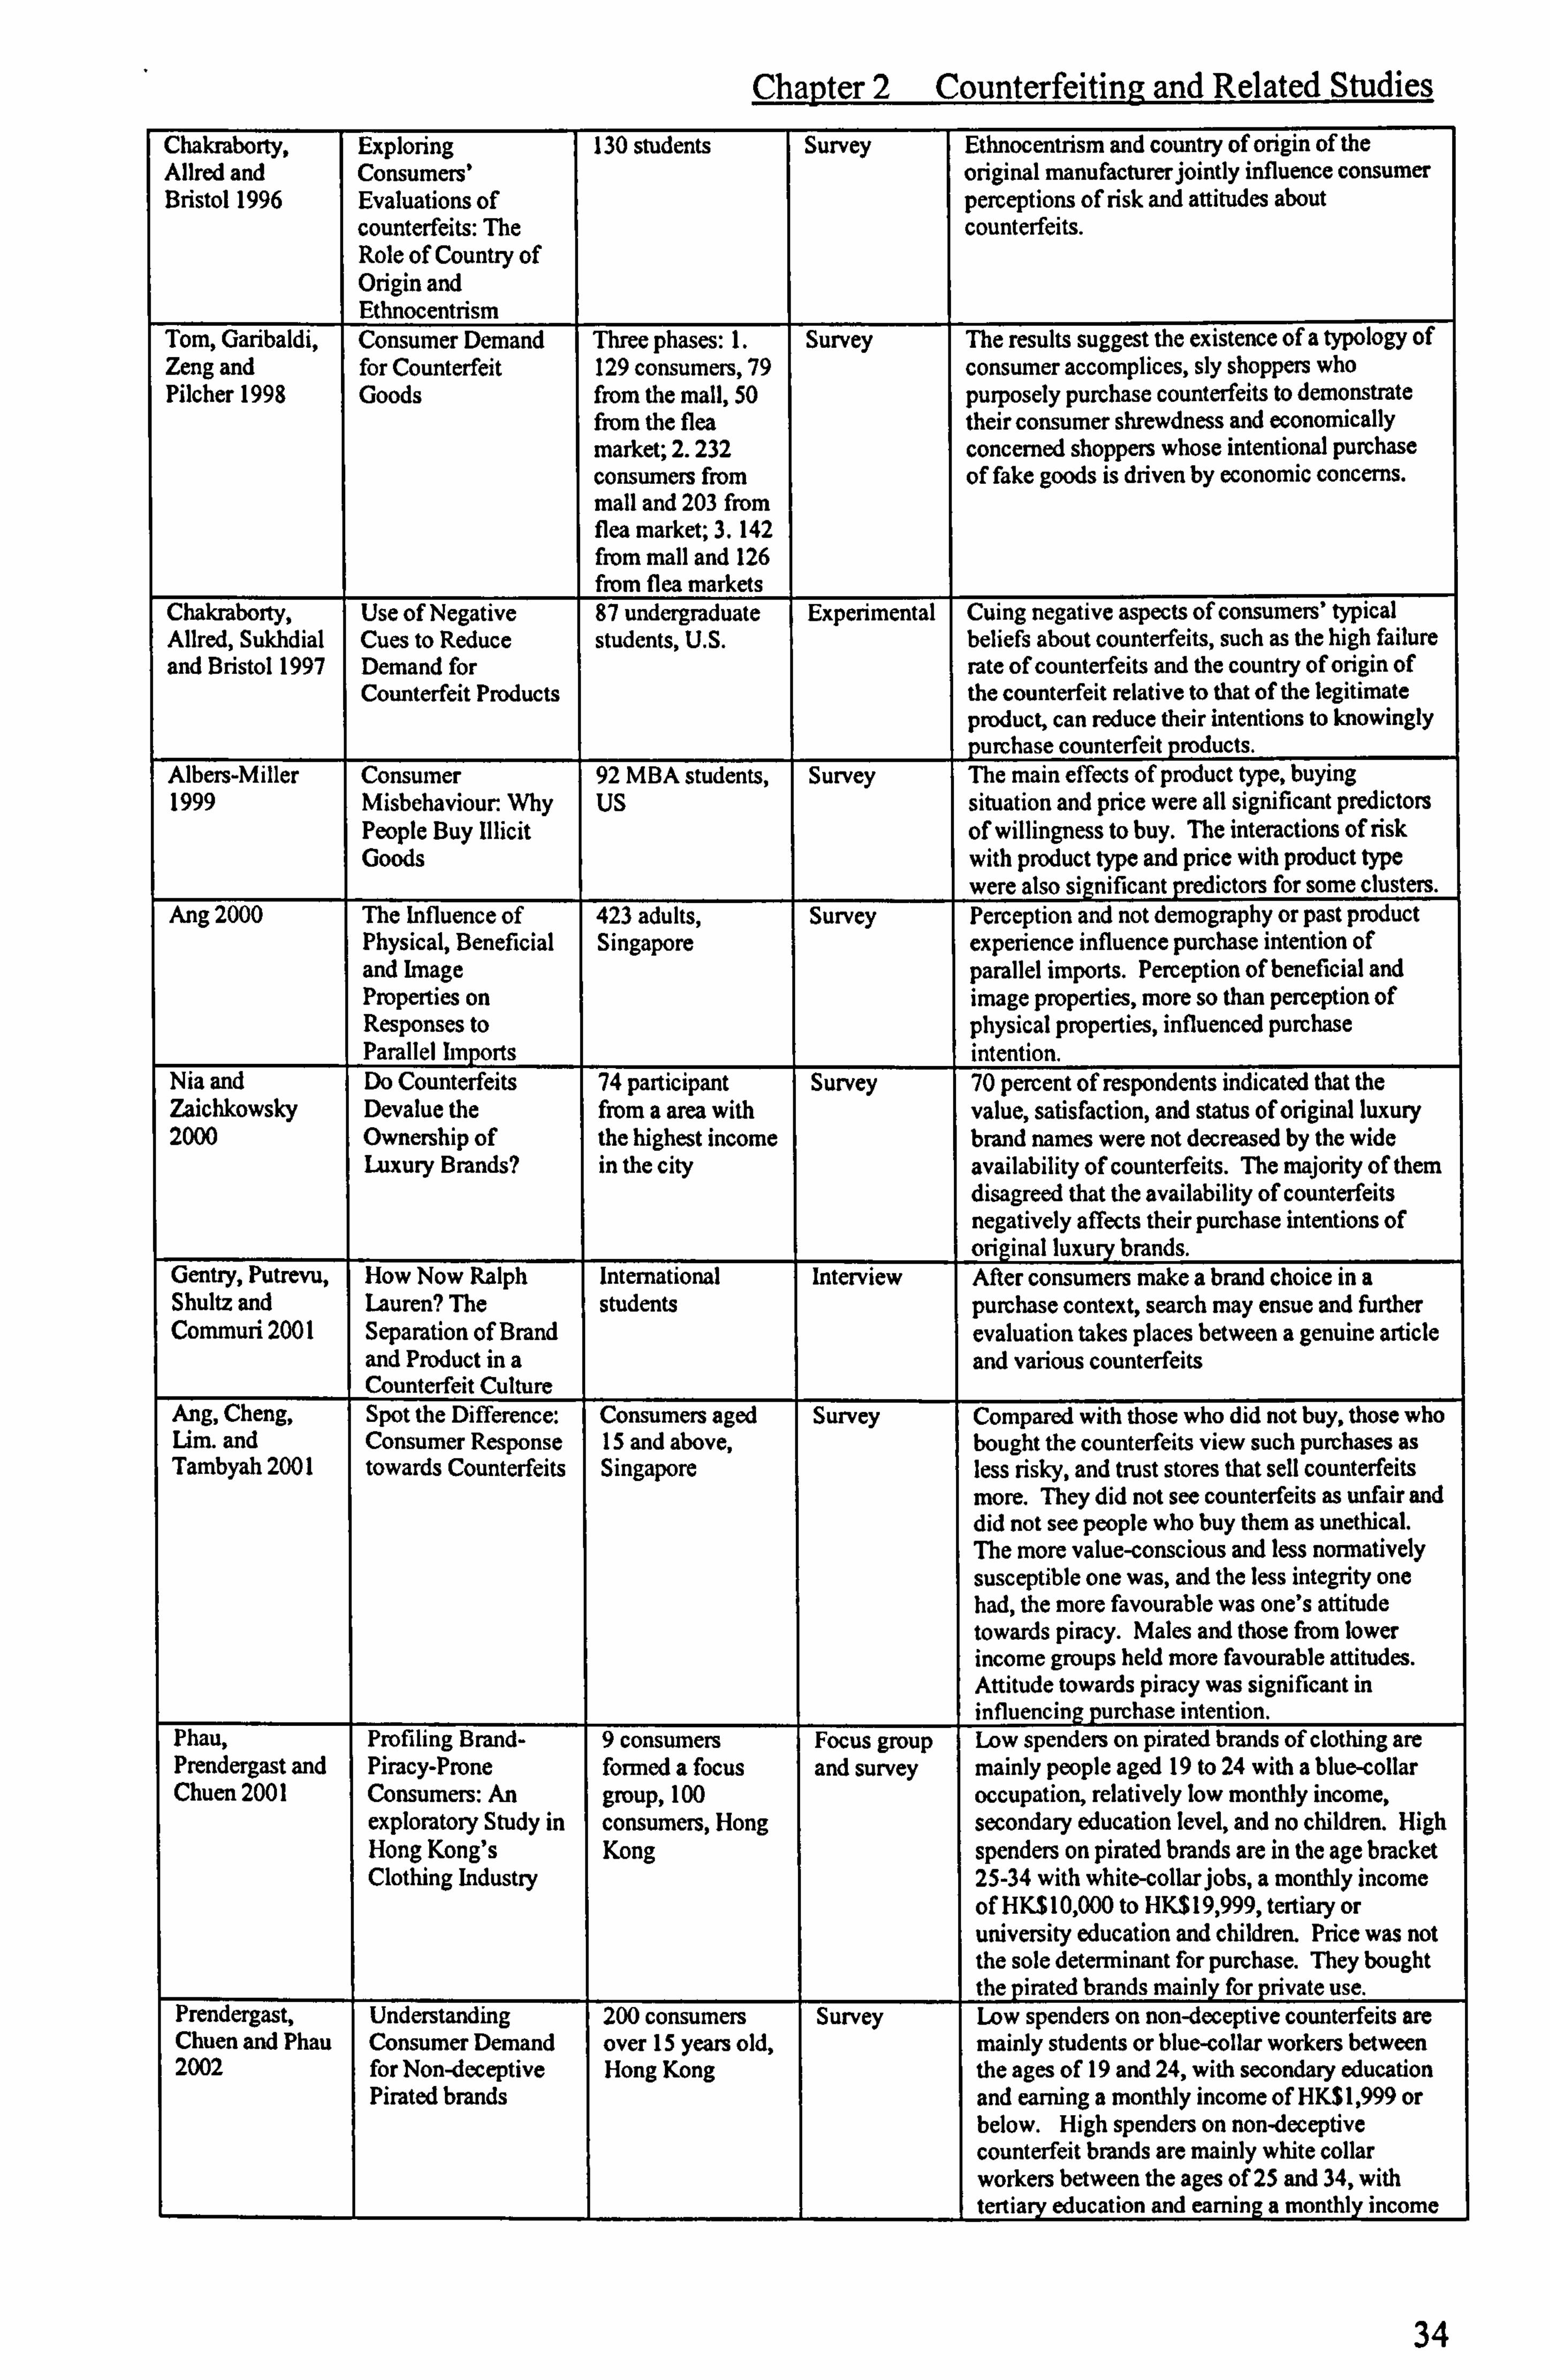
Chapter 2 Counterfeiting and Related Studies Chakraborty, Exploring 130 students Survey Ethnocentrism and country of origin of the Allred and Consumers' original manufacturer jointly influence consumer Bristol 1996 Evaluations of perceptions of risk and attitudes about
counterfeits: The counterfeits. Role of Country of Origin and Ethnocentrism
Tom, Garibaldi, Consumer Demand Three phases: 1. Survey The results suggest the existence of a typology of Zeng and for Counterfeit 129 consumers, 79 consumer accomplices, sly shoppers who Pitcher 1998 Goods from the mall, 50 purposely purchase counterfeits to demonstrate
from the flea their consumer shrewdness and economically market; 2.232 concerned shoppers whose intentional purchase consumers from of fake goods is driven by economic concerns. mall and 203 from flea market; 3.142 from mall and 126 from flea markets
Chakraborty, Use of Negative 87 undergraduate Experimental Cuing negative aspects of consumers' typical Allred, Sukhdial Cues to Reduce students, U. S. beliefs about counterfeits, such as the high failure and Bristol 1997 Demand for rate of counterfeits and the country of origin of
Counterfeit Products the counterfeit relative to that of the legitimate product, can reduce their intentions to knowingly purr-base counterfeit roducts.
Albers-Miller Consumer 92 MBA students, Survey The main effects of product type, buying 1999 Misbehaviour. Why US situation and price were all significant predictors
People Buy Illicit of willingness to buy. The interactions of risk Goods with product type and price with product type
were also si nificant predictors for some clusters. Ang 2000 The Influence of 423 adults, Survey Perception and not demography or past product
Physical, Beneficial Singapore experience influence purchase intention of and Image parallel imports. Perception of beneficial and Properties on image properties, more so than perception of Responses to physical properties, influenced purchase Parallel Imports intention.
Nia and Do Counterfeits 74 participant Survey 70 percent of respondents indicated that the Zaichkowsky Devalue the from a area with value, satisfaction, and status of original luxury 2000 Ownership of the highest income brand names were not decreased by the wide
Luxury Brands? in the city availability of counterfeits. The majority of them disagreed that the availability of counterfeits negatively affects their purchase intentions of original luxubrands.
Gentry, Putrevu, How Now Ralph International Interview After consumers make a brand choice in a Shultz and Lauren? The students purchase context, search may ensue and further Commuri 2001 Separation of Brand evaluation takes places between a genuine article
and Product in a and various counterfeits Counterfeit Culture
Ang, Cheng, Spot the Difference: Consumers aged Survey Compared with those who did not buy, those who Lim. and Consumer Response 15 and above, bought the counterfeits view such purchases as Tambyah 2001 towards Counterfeits Singapore less risky, and trust stores that sell counterfeits
more. They did not see counterfeits as unfair and did not see people who buy them as unethical. The more value-conscious and less normatively susceptible one was, and the less integrity one had, the more favourable was one's attitude towards piracy. Males and those from lower income groups held more favourable attitudes. Attitude towards piracy was significant in influencing purchase intention.
Phau, Profiling Brand- 9 consumers Focus group Low spenders on pirated brands of clothing are Prendergast and Piracy-Prone formed a focus and survey mainly people aged 19 to 24 with a blue-collar Chuen 2001 Consumers: An group, 100 occupation, relatively low monthly income,
exploratory Study in consumers, Hong secondary education level, and no children. High Hong Kong's Kong spenders on pirated brands are in the age bracket Clothing Industry 25-34 with white-collar jobs, a monthly income
of HKS 10,000 to HK$19,999, tertiary or university education and children. Price was not the sole determinant for purchase. They bought the pirated brands mainly for private use.
Prendergast, Understanding 200 consumers Survey Low spenders on non-deceptive counterfeits are Chuen and Phau Consumer Demand over 15 years old, mainly students or blue-collar workers between 2002 for Non-deceptive Hong Kong the ages of 19 and 24, with secondary education
Pirated brands and earning a monthly income of HKS1,999 or below. High spenders on non-deceptive counterfeit brands are mainly white collar workers between the ages of 25 and 34, with tertiary education and eamin a monthly income
34

Chapter 2 Counterfeiting and Related Studies
of HK$10,000 to HK$19,999.
Penz and Brands and Adults Combined Consumers have a very clear picture of the Stöttinger 2003 Counterfeits - What approach benefits of brands over counterfeits.
Do They Have in (survey and Common? interview)
Harvey and Laboratory Markets Undergraduates, Experimental Subjects in Hong Kong are more likely to Walls 2003 in Counterfeit 20x3 both in Hong purchase the counterfeit good than are subjects in
Goods: Hong Kong Kong and Las Las Vegas; the price and penalty elasticities are versus Las Vegas Vegas substantially larger in Las Vegas than in Hong
Kong; and that in both locations the price effects of legitimate and counterfeit goods are asymmetrical in the monetary price and expected penalty cost. An equal increase in the price of authentic goods and the expected penalty cost of counterfeit goods increase the probability that a consumer will purchase the authentic goods.
Hoe, Hogg and Faking it: 20 interviewees, Interview Consumers are willing to buy and wear the fakes Hart 2003 Counterfeiting and UK but condemn the duplicity of those who do.
Consumer Contradictions
Bian and Perceived Risk 165 consumers Survey The constants of perceived risk are Veloutsou 2004 When Purchasing aged 18 and interdependent and the six risk dimensions
Non-deceptive above, UK account for a high percentage of the total Counterfeit Products variance in the overall risk measure. Financial
risk appears to be the most powerful explanatory component.
Pens and Forget the "Real" 1040 subjects Survey The fewer the obstacles to purchase counterfeits Stöttinger, 2005 thing-Take the (quota sample), in terms of time needed to find them, geographic
Copy! An Austria barriers, etc., the more likely consumers will Explanatory Model intend to buy them. At a price level which is for the Volitional only slightly cheaper than the original, the Purchase of embarrassment potential did not affect the Counterfeit Products intention to purchase, while the subjective norm
did. At a very small discount, the financial risk of making the wrong decision by buying a fake product and not the slightly more expensive original is rather high. If the price discount is high, the financial is reduced, while the social risk increases. Self identity, price consciousness and the access to fake products displayed very little to no effect on the intentions to purchase counterfeits.
Veloutsou and Consumer's 230 consumers Survey All respondents do not have a very high opinion Bian 2005 Attitudes Towards aged 18 and above of counterfeit brands, while Chinese value them
Non-Deceptive in the UK and 296 even less. Consumers find it difficult to Counterfeit Brands in China distinguish between the genuine and the in the UK and China counterfeit brands, and when they are compared
with the genuine, the British believe that counterfeits are even less trustworthy.
Bian and Consumer's 230 consumers Survey Not all respondents have a very high opinion Veloutsou 2006 Attitudes Regarding aged 18 and above regarding counterfeit brands, while Chinese value
Non-Deceptive in the UK and 296 them even less. Consumers find it difficult to Counterfeit Brands in China distinguish between the genuine and the in the UK and China counterfeit brands, when they are compared with
the genuine, the British believe that counterfeits are even less trustworthy.
Veloutsou and A Cross-National 525 responses Survey The interrelationships between the dimensions of Bian (waiting Examination of aged 18 and above perceived risk are supported. The psychological for the authors' Consumer Perceived risk is the only dimension of risk that with no verification) Risk in the Context doubt contributes to the formation of the overall
of Non-Deceptive risk in both contexts. Social risk did not appear Counterfeit Brands to be an issue. The British seem to have a higher
performance and psychological risk and lower social, time and physical risk than the Chinese. The financial, physical and the performance risk are generally ranked higher than the other types of risks. Physical risk is significantly higher than most of the other types of risk, but it is viewed in a similar manner with the performance risk from the British. Financial risk is the third most important type of risk.
35

Chapter 2 Counterfeiting and Related Studies
According to Table 2.4, it is clear that later researchers showed a greater interest in the
study of counterfeiting from consumers' perspectives since Cordell and Wongtada's
(1991) exploratory study found that students, when faced with a paper and pencil choice
of a counterfeit 'versus legitimate goods, selected the counterfeit without regard for
legality or public welfare. It has been argued that counterfeits allow consumers to
unbundle the status and quality attributes of the branded products (Grossman - and
Shapiro 1988a) and that counterfeiting can damage the reputation of the genuine brand
(Wilke and Zaichkowsky 1999). Therefore, examination of the final purchasers' views
and attitudes towards counterfeiting is important.
That said, the academic research examining consumers and counterfeits is still relatively limited and some of the output very descriptive. For example, researchers attempted to
profile the consumers who buy counterfeits. Previous research findings suggest that
demographic characteristics do not have a consistent relationship with the purchasing or
the intention to purchase of counterfeit brands (Table 2.5). Bloch et al. (1993) reported
that age and household income were not effective criteria for distinguishing between
counterfeit accomplices and consumers who would choose genuine brand clothing. These findings were contradictory to the findings of a number of other studies. Tom et
al. (1998) claimed that the brand-counterfeit-prone consumers were younger and earned less than consumers who preferred genuine products in all stages of purchase behaviour
(pre-purchase, purchase, and post-purchase). Phau et al. (2001) suggested that low
spenders on counterfeit branded clothing were young, with a blue-collar occupation,
relatively low monthly income, lower education level, and no children; high spenders
on counterfeit branded clothing were in the 25-34 age bracket with white-collar jobs, a higher income, higher education level, and children. Other studies provided inconclusive results. Wee et al. (1995) found that although educational level and household income affected consumer purchase intention, age did not seem to have any
power in terms of explaining consumers' intentions of purchasing counterfeits. In
addition to demographic variables, past research discover that counterfeit accomplices
are more likely to perceive purchase of counterfeits as less risky and less unfair to legitimate brand owners than people who do not buy (Ang et al. 2001).
In the past, some researchers have suggested that consumers have clear ideas about the
potential consequences of counterfeit goods in the marketplace and are aware of the
36

Chapter 2 Counterfeiting and Related Studies
manufacturers' loss of profits and goodwill, and loss of jobs in the country of
production (Bamossy and Scammon 1985; Bloch et al. 1993). Moreover, it seems that
the ethical issue is clear enough to consumers (Nia and Zaichkowsky 2000; Nill and
Schultz 11 1996). Counterfeiting is, by definition, theft (Green and Smith 2002).
Consumers have a very clear picture of the benefits of brands over counterfeits (Penz
and Stöttinger 2003). Thus, on one hand, consumers condemn the duplicity of those
who buy counterfeits (Hoe et al. 2003), while on the other hand however, it seems that
they are willing to buy counterfeit goods when they are available (Hoe et al. 2003).
Previous studies suggested that 17 to 38% of the respondents claimed that they would
purchase counterfeit brands for products such as clothing, CD's, software, purses,
perfumes, videos, and watches (Bloch et al. 1993; Wee et al. 1995; Tom et al. 1998;
Phau et al. 2001). However, counterfeit-prone consumers differ by product types (Wee
et al. 1995; Tom et al. 1998). Surprisingly for some, a number of consumers may even
select counterfeits without considering legal or public welfare issues (Cordell and Wongtada's 1991; Bloch et al. 1993).
Table 2.5 Counterfeit-nrnne cnncumer nrnfile
Age Household Education Studied Income products
Bloch et al No explanatory power No explanatory
'-'-'- Clothes 1993 power
Wee et al. Negative relationship Functional products: positive
Literature Software
1995 No explanatory power with fashionable relationship items Fashionable items: negative relationship es Watches
CDs, Software T-shirts Purses
Tom 998 Negative relationship Negative relationship
------- Clothing Perfume Perfumes Videos Watches
apes Phau et al. Lower spender. 19-24 No straight-line No straight-line relationship Clothes 2001 Higher spender 25-34 relationship
Although anecdotal evidence suggests that price could be the main factor driving the
buyer's intention to purchase counterfeit brands (Dodge et al. 1996; Bloch et al. 1993),
researchers have challenged this view. Non-price factors, such as attitude, brand status,
educational level, household income, appearance, image, perceived fashion content,
purpose and quality, and retailer . conditions, have been proven to have a significant
impact on consumers' intention of purchasing counterfeits (Wee et al. 1995; Cordell et
al. 1996; Albers-Miller 1999; Phau et al. 2001). The customer's ethnocentrism and the
genuine manufacturer's country of origin jointly influence consumer perception of risk
and attitudes on counterfeits and are therefore mediating factors in the formation of
37

Chapter 2 Counterfeiting and Related Studies
consumers' evaluations, feelings towards, and intention to purchase counterfeit brands
(Chakraborty et al. 1996). Furthermore, negative views and experiences from
counterfeits, such as the high failure rate of counterfeits and the country of origin of the
counterfeit could reduce consumers' purchase intention (Chabraborty et al. 1997).
Researchers claimed that increases in the expected cost, such as the cost of penalties,
could decrease consumers' willingness to buy counterfeits (Harvey and Walls 2003).
Most recently, research findings reveal that the influential power of a variable may vary
along the change of price difference between the counterfeit product and its counterpart
original version. For example, at a very small discount, the financial risk of making the
wrong decision by buying a counterfeit and not the slightly more expensive original is
rather high. If the price discount is high, the financial risk is reduced, while the social
risk increases (Penz and Stöttinger 2005). These authors also claimed that consumer
self- identity, price consciousness and access to counterfeits displayed very little to no
effect on the intention to purchase counterfeits.
The effect of counterfeits on genuine brands is unclear. The majority of genuine brand
owners agree with the view that the value, the satisfaction provided from, and the status
of the genuine luxury brand names are decreased by the availability of counterfeits. However, consumers do not believe that the availability of the counterfeits negatively
affects the purchase intentions of the original luxury brands (Nia and Zaichkowsky
2000). Consumers also consider that both counterfeits and the original branded products
are fun and worth the money they paid for them (Nia and Zaichkowsky 2000). Finally,
consumers believe that counterfeits are less trustworthy (Bian and Veloutsou 2006);
they regard counterfeits as low-grade versions that offer less value for less cost, but
consider that this is an acceptable compromise (Gentry et al. 2001).
The most recent cross-cultural studies have discovered that consumers from different
countries may have varying perceptions of counterfeits. Despite the fact of the wider spread (accounting for 10 percent of products in the retail market) of counterfeits in China (Hung 2003), Chinese have even lower attitude toward counterfeit brands than the British (Bian and Veloustou 2006). The British are concerned more about
performance and psychological risk than the Chinese, whereas, it seems that the Chinese are more worried about social risk and physical risk than the British (Veloustou
and Bian, forthcoming). The cross-cultural studies also reveal that Hong Kong
38
Chapter 2 Counterfeiting and Related Studies
consumers appear to be more counterfeit-prone than Las Vegas consumers. The price
elasticities are substantially larger in Las Vegas than in Hong Kong, and Hong Kong
consumers are more likely to purchase the counterfeit version (Harvey and Walls 2003).
2.9 Identified Research Problem As can be seen from the last section, the existing studies on consumer behaviour related
to counterfeits mainly focus on finding answers to questions such as "whether or not
consumers purchase counterfeits", "who buys counterfeits? ", "what factors influence
consumers' intentions to purchase counterfeits? ", and " what are consumers' attitudes
towards counterfeits? ". Studies on consumers' perceptions of counterfeits are scarce. Moreover, few works have examined counterfeits from a brand perspective. This is
demonstrated by the majority of past studies which investigated a single product class or
multiple product classes rather than specific brand(s). More detailed discussion
regarding this point is provided in Chapter 5.
Penz and Stöttinger (2003) state that when look into consumers' motives for buying
counterfeits, this cannot be effective without investigating their notion of brands.
Brands are powerful entities to organisation and customers, because they blend
functional, performance-based values that are rationally evaluated, with emotional
values that are affectively evaluated (de Chernatony 2001). There are three types of
assets that provide the sources of earnings for brand owners. They are tangible assets, brands and other intangible assets. Depending on the market, up to 70 percent of
earnings can be attributed to the brand (Perrier 1997). The most valuable assets that
many companies possess are intangible ones, namely, the brands they own (Green and Smith 2002; Keller 1991; Meters-Levy et al. 1994). For example, in 2005 Sony was
estimated to be worth US$10.75 billion, Levi's at US$2.26 billion, and Hewlett-Packard
US$ 18.87 billion (Berner and Kiley 2005).
The objective of investing in brand development is to create an identity around which products and services come to be recognized and valued by customers, and from which customer loyalty is built (Levy and Rook 1981). A successful brand is an identifiable
product, service, person or place, augmented in such a way that the buyer or user perceives relevant, unique, sustainable added values which match their needs most closely (de Chernatony and McDonld 1998). Given that the consumer has come to
39
Chapter 2 Counterfeiting and Related Studies
realize that a particular brand represents better quality, unique features, style and/or
excellent service, successful brand goods usually demand a higher price in the
marketplace. Global or national brands are the main creators of wealth (Hopkins et al. 2003; Perrier 1997).
Brands and concepts associated with them are the prerequisites for counterfeiting. A
counterfeit must copy a trademarked brand (Cordell et al. 1996). It is more than likely
that if branded products did not attract consumers, they would not be counterfeited (Bloch et al. 1993; Cordell et al. 1996). According to Harvey and Ronkainen (1985),
successful branded products have the highest attractiveness level to counterfeiters. In
fact, it is the most successful brands like Chanel, Rolex and Gucci which are the
primary targets of counterfeiters.
A number of researchers have devoted their efforts to investigating the forces driving
the growth of counterfeiting (e. g. Harvey and Ronkainen 1985; Grossman and Shapiro 1988a; Cordell et al. 1996). It is commonly agreed that the consumer plays a crucial role in counterfeit trade and willing consumer participation is in evidence worldwide (Cordell et al. 1996). If consumers did not buy counterfeit products, counterfeiting would not be an issue (Roberts 1985; Charkraborty et al. 1996). In other words, consumer demand for counterfeits is one of the reason why counterfeiting is spreading.
Counterfeit activities can be reduced by attacking either the supply of counterfeits or the demand for counterfeits. Although companies and governments have managed to
restrict the supply of counterfeits, counterfeiters have consistently demonstrated their
abilities to find new ways to serve consumers. As long as the demand is still thriving, it
will continue to impel the supply. Given that the counterfeit business is booming, and that a large portion of losses can be attributed to consumers who wilfully purchase
counterfeit goods, it is believed that before companies design, implement and sponsor
marketing and advertising campaigns that can reduce the demand for counterfeit, a better understanding of their consumers is a key to their success with their campaigns.
As Lewin (1936) points out that people respond on the basis of their perception of reality, not a reality per se. Porter (1976) confirms that perceptions are important to
study, even if they are misconceptions of actual events. Therefore, study of counterfeits
40
Chapter 2 Counterfeiting and Related Studies
from the consumers' perspective at brand level is crucial. Specifically, a study of
consumers' perceptions of the original brands as opposed to the counterfeits, and how
these perceptions toward these two versions of one brand might thereafter influence
individual consumer choice processes should be the starting point for any company to
achieve a true understanding of their consumers, due to very little work having
modelled consumer choice processes from brand perspective in the literature,
particularly in the context of non-deceptive counterfeiting.
2.10 Summary
This chapter outlines the current overall situation of counterfeiting both worldwide and
in the UK. In general, counterfeiting is booming and this trend will continue.
Therefore, it has become a concern to all involved communities. Supranational
organisations, national governments and legitimate manufactures have been putting
great effort and financial input into trying to curb counterfeiting. Nevertheless, the
outcome does not meet expectation. Counterfeiting is growing rather than shrinking,
and there has been a tremendous growth of counterfeiting in the last two decades
worldwide. The UK is not listed as one of the main counterfeit producers; nevertheless, it is one of the main recipients of counterfeits. The counterfeit situation in the UK is not
much different to the general situation worldwide - counterfeiting is expanding. It is
believed that as long as the demand exists, counterfeiters will always find ways to serve
this demand.
Although counterfeiting is not a new to concept, it appears that some researchers have
difficulties in differentiating it from imitation and piracy. Misunderstanding, misuse,
and using two or more terminologies interchangeably in one piece of research is not a
matter of unique. Therefore, this chapter provides a thorough review of the definitions
and understandings of these terms. In addition, similarities and differences between
them are also discussed. This research strongly suggests that it is necessary to set up a
clear boundary for the counterfeit concept before any research is carried out.
Counterfeit product in this research is defined as: those bearing a trademark that is
identical to, or indistinguishable from, a trade mark registered to another party and infringes on the rights of the holder of the trademark (Chaudhry and Walsh 1996).
41
Chapter 2 Counterfeiting and Related Studies
Research in study of counterfeiting can be categorised into four main streams (general
study, normative impact study, anti-counterfeiting strategy study and consumer study).
Consumer study is attracting more and more research interest recently. Past research in
this area mainly try to answer questions such as "Do consumers buy counterfeits? ",
"Who buys counterfeit? ", "Why do consumers purchase counterfeit? " and "What are
consumers attitude toward counterfeits? " with most recently cross culture study of
counterfeiting has begun to gain some attention. In general, previous research findings
in relation to "Who buys counterfeits" are not consistent. However, a number of studies
reveal that consumers are aware of the negative effects and ethical issues related to
counterfeits, nevertheless, they are still willing to buy them when they are available.
The percentage of counterfeit prone consumers differs by product types and ranges 17
to 38 percent of the respondents.
Previous work almost all investigated product class or classes, leaving examination of
specific brand(s) under-researched. In addition, it appears that there is little work which investigated consumers' perceptions of counterfeits as opposed to their counterpart
original branded products from a brand perspective, and no research has modelled how
consumers' perceptions of brands could influence different consumer choice processes.
This chapter further looked at categorisation of counterfeits and challenged Grossman
and Shapiro's (1988a) two types of counterfeits notion. It is argued that to classify
counterfeits into either deceptive or non-deceptive might have overlooked the reality
that in some cases consumers are not sure whether products are counterfeits or not when
they are purchased. This scenario should not be ignored and is labelled as `blur
counterfeiting' in the current study. This research is to investigate non-deceptive
counterfeiting in the context of the UK market.
Following the identified research gap in the study of counterfeits from consumers'
perspective, the next chapter will explore the literature in relation to the consumer
choice process. This will be followed by a clarification of the research aim based on the
defined research gaps in two bodies of literature - counterfeiting and consumer choice
process.
42
Chapter '3 " Literature Relative 'to Consumer Choice Processes

Chapter 3 Literature Relative to Consumer Choice Processes
Chapter 3t M4,
Literature Relative to Consumer Choice Processes
3.1 Introduction
The overall context of this research was outlined in the last chapter. In addition, the last
chapter also reported the identified research gap in the study of counterfeiting related
issues in literature. After the intensive review of the literature on counterfeiting, it is
now necessary to look at consumer choice process theory in order to understand how
consumers come to a choice decision.
Hence, this chapter reviews the literature related to consumer choice process. The main body of this chapter starts with a general discussion of two choice process related
models, highlighting the focus of the literature review of this chapter. Following this, a detailed picture of the consideration concept is drawn and its significant role in
consumer choice process is discussed. Thereafter, an outline of the literature in relation to consideration sets is presented. Based on the review, the research problem in relation to consumer choice process is defined. Finally, the research aim and objectives are defined, followed by the establishment of a clear research scope. The reasons for the
choice of purchase intention as a response variable other than the choice set or even the final choice concepts are given. The chapter ends with a chapter summary.
3.2 Models Related to Consumer Choice Process
Following the boom of the economy worldwide after World War II, the constraints
shifted from supply to demand in the market place. As a result, the study of consumer behaviour began to attract increasing research attention. Numerous researchers in the
past have focused on the investigation of the consumer decision-making processes and
consumer choice processes. Given that consumers are facing more and more choices for one single demand, it is crucial to ensure that a brand or a product which might finally lead to a purchase is considered. This section discusses two choice models
which have a great impact on the study of consumer choice process. They are Srinivasan's (1987) consumer evaluation and choice model and Shocker et al's (1991)
individual choice model.
43
Chapter 3 Literature Relative to Consumer Choice Processes
One thing worth noting here is that this research distinguishes the consumer decision-
making process and the consumer choice process, despite the fact that some researchers
may believe that there is no difference between these two concepts. The reason for this
approach is that these two concepts have distinguishable subjects. Consumer choice
process focuses on the processes that an individual brand/product goes through before a
consumer comes to a purchase decision. The subject is a brand or a product. In
contrast, the consumer decision-making process investigates the processes that a
consumer goes through before he/she makes up his/her mind to purchase. In this case,
the consumer is the subject. This distinction allows us the establishment of a clear
boundary for the literature review. It makes it unnecessary to review the massive
amount of previous work related to the consumer decision-making process. As a result,
it makes the literature review more focused and ensures that the literature directly serves
the research aim.
3.2.1 The Model of Consumer Evaluation and Choice
Historically, the cognitive-rational and hedonic aspects of choice have been treated as
two mutually exclusive elements by the modellers of these two schools. The cognitive-
rational school believes that consumers solve their consumption problems in a `rational'
and `analytical' way. These consumers' behaviour is goal-directed, calculated and
predicated on some knowledge of costs and benefits of alternative choices (Peter and
Tarpey 1975). The consumers are assumed to be benefit-driven and risk-averse, but are
constrained by the complexity of the task itself, their own ability to cope with the
complexity of the task, and limited time, information sources and even monetary
resources. On the other hand, the hedonic school argues that consumers purchase
products for certain abstract, intangible, aesthetic, symbolic, and hedonic benefits
through a process very different from the one used in the cognitive-rational model
(Srinivasan 1987), but not only for the utilitarian and functional benefits. They view the
process as emotional in comparison to rational (Hirschman 1982).
It is still debatable whether or not the cognitive-rational and the hedonic aspects should be laid on the two ends of a continuum. For example, Hirschman (1982) asserts that "a
growing body of evidence suggests that sensory-emotive stimulation seeking and
cognitive information seeking are two independent dimensions". On the contrary, Holbrook (1981) suggests that all consumer behaviour does contain some symbolic
44

Chapter 3 Literature Relative to Consumer Choice Processes
components. Therefore, it should make sense to regard cognitive-rational and hedonic
aspects as mutually inclusive in the consumer choice process. In line with this view,
Srinivasan (1987) developed the consumer evaluation and choice model, which is an
integrative approach of both cognitive-rational and hedonic thoughts.
This model (Srinivasan 1987) consists of four processes (Figure 3.1). According to the
author, the evoked set is a subset of the awareness set which meets the criteria such as
functional (salience on a major performance variable), social (peer group
recommendation), personal (intuitive appeal), or risk reduction (well-known brand); the
choice set is a subset of the evoked set consisting of few brands (often two). He asserts
that the choice set is arrived at from the evoked set using a cognitive-rational
eliminative process (Denoted I), whereas the final choice is made from the choice set by
a hedonic process (Denoted II), primarily involving personal and psychological
variables. The author further advanced the view that in business-to-business buying
situations, the second stage can be a cognitive-rational one, indicated by II-A. In
impulse-buying situations, the cognitive-rational process may be entirely skipped and
the process may involve only the hedonic element (indicated by I-A). In situations with
very high perceived risk, the exogenous risk reduction pathway is taken when the
consumers opt for a well-known brand, the brand owned by friends, or from a reputable
dealer (indicated by III).
r------------------------------ I-A -------------------------. Ii II i
Awareness 1, Evoked Set , Choice Set > Choice Set 1 11
-------- II-A ........ .
------------------------------ III -------------------------=
Figure 3.1: Model of consumer evaluation and choice (adopted from Srinivasan, 1987)
As noted earlier, Srinivansan's (1987) consumer evaluation and choice model is an integration of cognitive-rational and hedonic thoughts. The author advanced this model, but did not provide any empirical backup. In addition, Srinivasan did not explain what he meant by awareness set, neither did he provide any background information or
sources for any of the processes that he included in the model. However, the model
45

Chapter 3 Literature Relative to Consumer Choice Processes
does share some common features with the model of individual choice, developed by
Shocker et al. (1991).
3.2.2 The Model of Individual Choice
Focusing on the individual decision maker, Shocker et al. (1991) developed the
individual sequential choice model which the authors claim as a stylized "process" by
which this individual arrives at a choice (Figure 3.2). The model of individual choice
involves a series of hierarchical or nested sets of alternatives. Shocker et al. (1991)
suggest that the universal set refers to the totality of all alternatives that could be
obtained or purchased by any consumer under any circumstance. The awareness set is
defined as the subset of items in the universal set of which, for whatever reason, a given
consumer is "aware of' and which are believed appropriate for the consumer's goal or
objective. The consideration set is viewed as consisting of those goal-satisfying
alternatives salient and accessible on a particular occasion. Because consumers may not
be exposed to all brands and because consumers may not encode all brands to which
they have been exposed, the consideration set is usually much smaller than the universal
set and even the awareness set (Alba and Chattopadhyay 1985). Finally, the choice set
is defined as the final consideration set. More specifically, the choice set contains the
set of alternatives considered immediately prior to choice.
I. __.
Figure 3.2 Model of individual choice (adopted from Shocker et at. 1991)
46

Chapter 3 Literature Relative to Consumer Choice Processes
The model is hierarchical or nested in nature. - However, this it not to say that the
process of nesting from a bigger to a smaller set implies sequencing, since certain set
formations may occur simultaneously (Shocker et al. 1991). This model allows the
influence of post-purchase evaluation (dotted line) and purchase situation. In contrast to
the model of consumer evaluation and choice (Srinivasan 1987), Shocker et al. (1991)
do not give their own view as to how the consideration set is formed and the end choice
is made. However, these authors did acknowledge the fact that previous researchers had
proposed that different processes may be involved in moving from awareness to
consideration and from consideration to choice (Nedungadi 1990), and that some even
postulated non-compensatory models for determining the composition of the choice set
and compensatory models for evaluating options in the set in order to make a choice
(Wright and Barbour 1977; Bettman 1979; Gensch 1987).
The Model of Individual Choice (Shocker et al. 1991) appears to have been developed
without acknowledging Srinivasan (1987) (judgement based on the citation references).
Nevertheless, these two models show a great deal of similarity. The most noteworthy
points are, first of all, that both models emphasise that consumer choice processes are
separate and discrete, and are assumed to have well-defined boundaries. Second, they
both focus on decisions made by choosing from alternatives which are actively
processed or considered at or near the time of decision. Third, they give a great deal of
attention to the two processes of moving from consideration to choice set and choice set
to final choice. Fourth, both believe that the consumer is thought to first screen
alternatives using relatively simple criteria before making a thorough analysis and
choice from the reduced set of brands. Finally, neither of them pays sufficient attention
to the process of moving from awareness to consideration.
In comparison to the Model of Consumer Evaluation and Choice (Srinivasan 1987), the
Individual Choice Model (Shocker et al. 1991) is more simplified in that it focuses only
on the individual choice process. However, inclusion of the universal set and the clear description of the awareness set provide the model with solid background logic. The
acknowledgement of previous relevant work illustrates the theoretical backup for the
newly-developed model. The acceptance of the impact of the post-purchase evaluation implies that experience can teach and thus affect those alternatives considered, as well
as those chosen at later times, which is consistent with research findings on the
47
Chapter 3 Literature Relative to Consumer Choice Processes
influence of the post-purchase evaluation on consumer decision-making (e. g. Mukhopadhyay 2005).
Considering all of the pros and cons, the Individual Choice Model (Shocker et al. 1991)
is can be seen as more sophisticated, and is where this current research begins. After
careful consideration of both views, the Individual Choice Model has been adopted as
the theoretical foundation of this research. However, in comparison to both Shocker et
al. (1991) and Srinivasan (1987) who place more weight on addressing the processes of
moving from the consideration set to the choice set and from the choice set to the final
choice, the process of moving from the awareness set to the consideration set is the
focus of concern in this present study. The following sections will provide a detailed
review relative to the consideration set concept.
3.3 The Characteristics of the Consideration Set
While Shocker and his co-authors used the term `consideration set' in the Model of Individual Choice, Srinivasan (1987) adopted the term `evoked set' in his Consumer
Evaluation and Choice Model. Issues relating to either evoked set or consideration set
concepts were not discussed in last section; these are discussed in this section. The
discussion will concentrate on consideration set characteristics. These include
consideration set definitions, the dynamic nature of consideration sets, types of
consideration set, the rationale for consideration sets and the importance of
consideration sets.
3.3.1 The Definition of the Consideration Set The study of the consideration set was pursued initially under the rubric of evoked set
analysis, first used by Howard (1963). Since the introduction of the term by Howard
(1963), the concept of "evoked set" has gained considerable attention from researchers (Mehta et al. 2003). However, "evoked set" has been used with several different
meanings, from "brands the consumer would consider" to "brands acceptable to the
consumer. " Wright and Barbour (1977) first used the term "consideration set" to
replace "evoked set" to describe "brands that a consumer will consider. " A review of
previous literature reveals that the terminologies used by authors are not only restricted to "consideration set" and "evoked set" (Shocker et al. 1991). For example, some
authors use "evoked set" (e. g. Howard 1977; Bettman 1979; Turley and LeBlanc 1995),
48

Chapter 3 Literature Relative to Consumer Choice Processes
some use "relevant set" (e. g. Silk and Urban 1978), some use "choice set" (e. g.
Nedungadi 1990; Manrai and Andrews 1998; Bronnenberg and Vanhonacker 1996),
while other researchers use "consideration set" (e. g. Shocker et al. 1991; Mehta et al.
2003). It appears that "consideration set" is more widely adopted than the other
equivalent terms. In addition, it is not clouded by the ambiguity surrounding "evoked
set". Therefore, "consideration set" is used in this study.
A number of researchers have proposed definitions for "consideration set" (e. g Reilly
and Parkinson 1985; Roberts and Lattin 1991; Wright and Barbour 1977; Shocker et al.
1991). Most recently, "consideration set" was defined as "the set of brands (a subset of
all the brands in the product category) over which a consumer makes an explicit utility
comparison or cost-benefit trade-off before she makes her brand choice decision"
(Mehta et al. 2003, p. 58). This definition is in a similar vein to that of Lleiser et al.
(1999), who claim the consideration set is the collection of brands that have been
examined by the consumer. Generally speaking, a consideration set is perceived to
consist of the brands or products that a consumer would consider purchasing to achieve
a purchase goal by previous research (e. g. Reilly and Parkinson 1985; Roberts and
Lattin 1991; Wright and Barbour 1977).
Despite their wide acceptance, this work argues that these previous definitions appear to
be problematic. For instance, they only focus on the process from consideration set to
choice of consumer decision-making, but ignore the process moving from the awareness
set to the consideration set, i. e. the formation of consideration set. Therefore, the
consideration set description is not a complete explanation of the marketing situation.
Acknowledging the handicap of the previous definitions, this research defines
consideration set as `a subset of awareness set consumers formed under some
restrictions, over which consumers make an explicit utility comparison or cost-benefit
trade-off before they make brand choice decisions'. This definition clarifies the
relationship between the awareness set and the consideration set, reveals the processes
that a brand/product goes through from the awareness set to the consideration set, and
from the consideration set to the final choice, and illustrates the dynamic nature of the
consideration set.
49

Chapter 3 Literature Relative to Consumer Choice Processes
If it is acceptable to say that to some extent the evoked set and the consideration set are
conceptually similar, then the introduction of the process from the awareness set to the
consideration set and the definition of the consideration set proposed in the present
study are supported by previous research. For example, Narayana and Markin (1975)
argued that there were three subsets within the awareness set: evoked set, inert set and
inept set. The evoked set consists of the selected brands that the consumer considers
while making a purchase as a result of having given them a positive evaluation. The
inert set refers to those brands in the product category for which the consumer has
neither a positive nor a negative evaluation; the inept set consists of those brands the
consumer has rejected from his purchase consideration. The authors suggest that the
change in the consumer's perception is caused by a dynamic marketing environment,
for example, the introduction of new brands can result in changes to the awareness set.
Consequently, the change in the awareness set will lead to changes in the evoked set,
inert set, or inept set. Similarly, the brands in the evoked set may move to either the
inert set or the inept set, or vice versa. This implies a dynamic process related to the
formation of the evoked set. This is consistent with Nedungadi (1990), who suggests
that different processes may be involved in moving from awareness to consideration
and from consideration to choice, which also indicates the existence of the formation
process of the consideration set.
3.3.2 The Dynamic Nature of the Consideration Set
Early work proposes that the consideration set is relatively static (e. g. Howard and
Sheth 1969; Silk and Urban 1978). Hoyer (1984) points Out that this is because much of
the research on consumer behaviour examines isolated, discrete events. Rather than
considering the consideration set as a static construct, later researchers argue that the
consideration set is dynamic (e. g. Hauser and Wernerfelt 1990; Punj and Srinivasan
1989; Ratneshwar and Shocker 1991; and Nedungadi 1990). Punj and Srinivasan
(1989) take another step forward by asserting that the consideration set (evoked set)
should include an "initial evoked set" (a set of brands the consumer considered soon
after the problem recognition) and "final evoked set" (a set of brands the consumer
considered just prior to purchase). Shocker et al. (1991) state that the consideration set is dynamic both within and across usage occasions. For example, in the case of cross-
usage occasions, a consumer includes a less luxurious brand in the consideration set for
50

Chapter 3 Literature Relative to Consumer Choice Processes
private usage occasions; in contrast he/she might exclude it from the consideration set for public usage occasions. This is because the content of the consideration set can
evolve as costs and benefits over time; hence this might possibly lead to items being
removed from the set (Hauser and Wernerfelt 1990). In the case of a specific usage
occasion, the content of the consideration set might change subject to different purchase
situations and different stimuli.
In studies of industrial buyers, later researchers distinguish between static and dynamic
considerations sets. The static consideration set is also called a `closed set', implying
that consumers only consider previously used suppliers, whereas the dynamic
consideration set, also labelled an `open set', where consumers also consider other
alternatives, not only previous suppliers (Gensch and Soofi 1995). This study argues
that a `closed set' only exists for a certain period of time. It cannot possibly be static
forever, given the fast-changing marketing environment. Therefore, the consideration
set is dynamic in nature. This is also true even in the case of industrial purchases.
To acknowledge the dynamic nature of the consideration set is important in the process
of the research design. Basically, it suggests that consideration should be measured before purchase activity and the formation of the choice set. The composition of the
consideration sets might differ between before-purchase and after-purchase behaviour.
Moreover, the dynamic nature of the consideration set also cautions researchers to be
aware of the influence of purchase and usage situations on the consideration set and to
take them into account in their research planning process. It also provides guidance on the interpretation of research findings.
3.3.3 Types of Consideration Set
Previous research suggests that consideration sets can be either memory-based or
stimulus-based (e. g. Shapiro et al. 1997; Nedungadi 1990). When brands/products are
not available for consideration and must be retrieved from memory, the consideration
set is entirely memory-based (Alba and Chattopadhyay 1985; Nedungadi 1990; Desai
and Hoyer 2000). In the case of brands/products being available and in view in a
purchase environment, the consideration set might be entirely stimulus-based (e. g. Parkinson and Reilly 1979; Reilly and Parkinson 1985; Nowlis and Simonson 2000).
Here `might be entirely stimulus-based' is used rather than `entirely stimulus-based'
51

Chapter 3 Literature Relative to Consumer Choice Processes
because `entirely stimulus-based' only appears where the whole range of
brands/products included in the awareness set is available and in view. In addition, the
consumer has no purchase experience, and has not obtained any information about any
brand or product of this product sector before. This rarely happens in real life. More
rigorously, in most cases ̀ stimulus-based' is used to represent `memory-stimulus-based
consideration set', which implies that consumers not only respond to stimulus cues but
also actively evoke previously-obtained memory. In this research, because pictures of
the original branded products as well as counterfeit examples are presented to
participants, the `stimulus-based' consideration set is examined. More detailed reasons
as to why a `stimulus-based' approach is used in this study are given in Chapter 5.
3.3.4 The Rationale for the Consideration Set
Since the concept was first used in marketing in the 1960s, the consideration set has
gained considerable acceptance by researchers and practitioners, even though it is not
directly observable. A large body of research on consideration sets has evolved within
the past three decades. Despite the assumption that individuals navigate through a series
of sets of alternatives (e. g. universal set, awareness set, consideration set, and choice
set) in order to arrive at a choice being commonly accepted (e. g. Shocker et al. 1991;
Priester et al. 2004), the fundamental issue in terms of whether consideration set exists
or not has not been settled. Notably, Horowistz and Louviere (1995) question the
conventional view regarding the existence of the consideration set and conclude that
beyond information that enables modellers to specify the preference function more
precisely, the measurement of consideration sets offers no improvement in the
predictive performance of choice models. This section provides both empirical and
theoretical back up to the rationale for the consideration set with the aim of justifying
the significance of the current study.
3.3.4.1 Empirical Evidences
Shocker et al. (1991), and Hauser and Wernerfelt (1990) reviewed previous research findings. Based on the previous research, these authors assert that consideration sets
exist, they are dynamic, they change with time and occasion, and they are affected by
consumer contexts and purposes. The support for the notion of the existence of the
consideration set suggested by previous researchers is as follows:
52

Chapter 3 Literature Relative to Consumer Choice Processes
A number of researchers report that the size of the consideration set is relatively small
(e. g. Hauser et al. 1983; Gronhaug 1973). Most studies suggest that the consideration
set size is in the range of 3 to 6, and in extreme cases with a minimum size of 2 and a
maximum size of 8, whereas the size of the awareness set is between 6 to 47 (Hauser
and Wernerfelt 1990). The empirical results indicate that the category of considered
brands is more likely to account for a limited percentage of the awareness set. In other
words, the fact that the consideration set is only a subset of the awareness set is
empirically evidenced. For a summary of the consideration set size-related studies,
refer to Hauser and Wernerfelt (1990).
Nedungadi (1990) reports that changing the probability of brand consideration does
have an effect on probability of choice, but it does not affect brand evaluation. These
results imply that inclusion in the consideration set is crucial for any brand if it is to be
chosen in the final choice process; brands are considered to have more chance of being
selected for purchase. Therefore, a conclusion can be drawn that a consideration set formation is a process consumers go through before they come to a final choice stage.
Ratneshwar and Shocker (1991) found that different goals would result in different
productsibrands being included in the consideration set. If this research finding can be
explained as purchase consideration being goal-driven, then it might also be safe to
conclude that a brand/product will go though the consideration set before it can be
chosen. This was supported by Srivastava et al. (1984) who found that different usage
situations could result in different brand inclusions of the consideration set.
Most notably, Hauser and Wernerfelt (1989) suggest that 70 percent of the variance
accounted for in choice is explained by consideration. Hauser (1978) reports that the
consideration set accounts for 78 percent of the explainable uncertainty in choice data,
while a heterogeneous/multinomial logit model based upon consumer preference
accounts for only 22 percent. Obviously, these research findings suggest that
consideration sets have remarkable explanatory powers over the final choice; the
prediction accuracy of consumer choice can be improved more than two-fold with the
inclusion of the consideration set in the choice process. Hence, these results are strong
and sufficient back-up to the rationale for the consideration set.
53
Chapter 3 Literature Relative to Consumer Choice Processes
3.3.4.2 Theoretical Supports from Other Disciplines
Apart from the empirical supports, the consideration set also has solid theoretical
support. Consumers' motivations to simplify the choice process and optimise the
choice outcome are the two main rationales for the formation of the consideration set
(Chakravarti and Janiszewski 2003). The psychological literature asserts that
consumers have limited cognitive ability (e. g. Miller 1956). Hence, when they
encounter a large set of alternative brands, they normally use screening criteria to
reduce the number of alternatives and form a consideration set, which will simplify the
choice process (Mehta et al. 2003; Troye 1984; Urban et al. 1993), because they cannot
make explicit comparisons across all the brands. In stimulus-based situations, the
consumer may be exposed to various brands but fail to recognize some of them even
though they are appropriate to requirements. In a memory-based choice situation, the
consumer may fail to recall all brands or options that are available to them (Hutchinson
et al. 1994). Inability to recall or recognise all brands they are aware of results in an
actual consideration set that is smaller than the awareness set (Manrai and Andrews
1998).
The idea behind the second rationale is that a consumer is uncertain about the attributes
and consequences of their purchase behaviour and therefore must actively search for
information about the alternative brands. Because information acquisition is a costly
and time-consuming process, there is a strong tradition in economics of questioning the
cost-effectiveness of consumers' processing information on all the brands of which they
are aware (Stigler 1961). Information searching stops when the benefits are traded off by the total cost (Robberts and Lattin 1991,1997; Hauser and Wernerfelt 1990; Roberts
1989). Consequently, consumers can only seek information for a limited number of
brands/products given the cost restriction. To summarise, despite the reality not being
directly observable, the existence of consideration sets is a logical outcome of theories
of economics and psychology (Shocker et al. 1991).
Although Horowistz and Louviere's (1995) concern about the existence of the
consideration set is not the mainstream of the research related to consideration sets, it
does however caution later researchers against the blind use of the consideration set. Based on the rationales of existence of the consideration set noted above, this research,
54

Chapter 3 Literature Relative to Consumer Choice Processes
in line with the conventional view, assumes that consumers create a downsized
consideration set in the process of decision-making.
3.4 Significant Roles Played by the Consideration Set
Despite the debate about the rationale for the consideration set noted above, the notion
of consideration has become a fundamental principle of research associated with
decision-making processes (Alba et al. 1991; Hauser and Wernerfelt 1990; Kardes
1994; Roberts and Lattin 1991; Shocker et al. 1991). It is believed that inclusion of a
brand/product in a consideration set is often necessary for eventual choice (e. g. Howard
and Sheth 1969). Research results have shown that consideration effects have an
important influence on consumer choice (e. g. Roberts and Lattin 1991; Hauser and
Wernerfelt 1990; Nedungadi 1990). The consideration set helps simplify purchasing
decisions (Krieger et al. 2003). More specifically, consumers only evaluate brands that
pass into their consideration sets because they expect that the products will perform well
(Nedungadi 1990).
The importance of the consideration set and its remarkable power to predict the
consumer's final choice has been explored by empirical research. As noted earlier,
Hauser and Wernerfelt (1989) suggest that 70% of the variance accounted for in choice
is explained by consideration, and Hauser (1978) argues that the consideration set
accounts for 78% of the explainable uncertainty in choice data while a
heterogeneous/multinomial logit model based upon consumer preference accounts for
only 22%. Moreover, research findings also show that, when four different unobserved
effects are simultaneously present (i. e. choice set effects, heterogeneity in preference
and market response, state dependence, and serial correlation), a two-stage logit model
with consideration sets produces the most valid parameter estimates. Therefore, it is
concluded that the two-stage models tend to give more accurate predictions then a one-
stage multinominal logit model (Manrai and Andrews 1998).
To summarize, the consideration set helps to simplify consumer purchasing decisions,
and has significant implications for marketing strategy (Nowlis and Simonson 2000)
and allocation of marketing resources (Krieger et al. 2003; Desai and Hoyer 2000).
Since inclusion of a product in a consideration set is often a necessary precondition for
choice (Howard and Sheth 1969; Alba et al. 1991; Hauser and Wernerfelt 1990; Kardes
55
Chapter 3 Literature Relative to Consumer Choice Processes
1994; Roberts and Lattin 1991; Shocke et al. 1991), unless a product is included in the
consideration set, it will not be chosen (Nedungadi 1990). It is one of the important
barriers that a new brand must be able to overcome (Kardes et al. 1993). All of these
imply the importance of achieving a better understanding of the consideration set.
3.5 Previous Research Related to the Consideration Set and Findings
The focus of this section is a review of literature related to the consideration set. Three
broad categories of literature are identified. The first subsection outlines the literature
relative to consumer choice modelling. The second section discusses literature in the
study of consideration set characteristics (size and composition). The third subsection
concentrates on literature concerning consideration set formation. The fourth section
reviews one particular work that investigates the influence of attitude and attitude
strength on consideration set formation. This is followed by constructive comments on
this work and a challenge to its research findings.
3.5.1 The Consideration Set and Consumer Choice Models
The introduction of the consideration set evoked a great shift in relation to modelling
consumer decision-making. Recognisably, this construct has been commonly used in
terms of modelling consumer choice behaviour since the late 1980s (e. g. Roberts 1989;
Hauser and Wernerfelt 1990; Roberts and Lattin 1991; Shocker et al. 1991; Ratneshwar
and Shocker 1991; Andrews and Srinivasan 1995; Turley and LeBlanc 1995; Chiang et
al. 1999; Wu and Rangaswamy 2003; Vroomen et al. 2004). Models which take the
consideration set as a separate stage are named two-stage logit models, as opposed to
the heterogeneous/multinomial logit model which supposes that consumer choice is
made directly from the awareness set. The inclusion of the consideration set in the two-
stage models helps to relax certain restrictive assumptions (e. g. consumers choose from
the full set of available brands/products in the market place on each purchase occasion) inherent in Luce-based discrete choice models, such as multinomial logit models (Vroomen et al. 2004; Manrai and Andrews 1998). The two-stage models assume that
consumers form a consideration set due to limited cognitive capability and cost
restriction involved in information searching (e. g. Miller 1956; Mehta et al. 2003; Troye
1984; Urban et al. 1993; Stigler 1961; Robberts and Lattin 1997), from which the final
choice will be made.
56

Chapter 3 Literature Relative to Consumer Choice Processes
Compared to the conventional one-stage discrete choice models (see Manrai 1995 for a
review), the two-stage models are considered to represent better the underlying process
which consumers are believed to use in selecting a brand or a product from a set of
alternatives of awareness (Shocker et al. 1991; Gensch 1987) and to perform better than
basic logit models (Manrai and Andrews 1998; Vroomen et al. 2004). Given that the
objective is not to develop another consumer choice model, and a relatively thorough
review has been conducted by previous researchers, a detailed review of two-stage
discrete choice models is not provided in this research in order to avoid replication. For
those who are interested, see Manrai and Andrews (1998) for a review of the two-stage
discrete choice models.
3.5.2 Research Related to the Characteristics of the Consideration Set
A few aspects of the consideration set have attracted attention. Nevertheless, the
primary orientations of empirical work have been toward investigation of consideration
set size and issues associated with composition of the consideration set. Previous studies
of the consideration set size have been largely descriptive, reporting the
consideration/evoked set size and searching for correlations between consideration set
size and involvement (e. g. Lapersonne et al. 1995; Brisoux and Cheron 1990; Elliot and Warfield 1993), information search (e. g. Belonax and Mittelstaedt 1978), advertising (e. g. Mitra and Lynch 1995), variety seeking (e. g. Sivakumaran and Kannan 2002),
knowledge (e. g. Aurier et al. 2000; Punj and Srinivasan 1989), experience (e. g. Johnson
and Lehmann 1997), familiarity (e. g. Aurier et al. 2000; Alba and Hutchinson 1987),
brand preference (e. g. Mitra and Lynch 1995), and socio-demographic characteristics (e. g. Gronhaug 1973). Please see Hauser and Wernerfelt (1990) and Shocker et al. (1991) for a detailed review.
Since Roberts and Lattin (1991) developed a cost-benefit model intended to describe the
composition of a consumer's consideration set at a certain point in time, quite a few
studies have examined consideration set composition related issues (e. g. Desai and Hoyer 2000; Bronnenberg and Vanhonacker 1996; Andrews and Srinivasan 1995;
Hutchinson et al. 1994; Kardes et al. 1993; Troye 1984). These studies attempt to
identify the descriptive characteristics of the consideration set and what kinds of
products are included in the consideration set.
57

Chapter 3 Literature Relative to Consumer Choice Processes
3.5.3 Research Related to the Formation of the Consideration Set
The aspects related to the formation of the consideration set have also attracted
attention; for example what the factors are that influence the formation of the
consideration set are has attracted research interest. This has been particularly true in the
last twenty years. Broadly speaking, the past research can be classified into two
categories, according to the research context-stimulus-based approach and memory- based approach.
Previous research findings suggest that in the context of stimulus-based choice
situations, advertising (Mitra 1995), pioneering products (Kardes et al. 1993),
packaging (Garber Jr. 1995), brand familiarity (Baker et al. 1986), in-store display
activities and feature ads (Mehta et al. 2003), goal-conflict and goal-ambiguity
(Ratneshwar et al. 1996), strength of association between the brand and the choice
category (Posavac et al. 2001), involvement and consumer sensitivity of type II error (Chakravarti and Janiszewski 2003), influence of incidental exposure to an
advertisement (Shapiro et al. 1997) and influence of implicit memory for familiar brand
names (Coates et al. 2004) all have an impact on the formation of the consideration set.
Mitra (1995) found that when subjects exposed to differentiating advertising are compared to subjects who are not exposed to advertising, the consideration set
composition of the former group is more stable. Kardes et al. (1993) reveal that a
pioneering brand is more likely to be retrieved and considered compared with followers.
Garber Jr. (1995) suggests that a sufficiency of the visual attributes' typicality and
novelty will indicate a greater likelihood of attention, and that the appropriateness of a
visually novel brand will indicate a greater likelihood of consideration. Baker et al. (1986) suggest that brand familiarity is unlikely to exert a robust effect on consumers' brand attitudes and consideration when extensive product knowledge is available or when involvement is high. Mehta et al. (2003) explore the idea that although in-store
display activities and feature advertising do not influence quality perceptions, they do
reduce consumer search cost for a brand, thereby significantly increasing the probability of the brand being considered. Ratneshwar et al. (1996) find that cross-category consideration is high when there is either goal conflict or goal ambiguity. Posavac et al. (2001) find that a brand is more likely to be included in the consideration set, and indicated as an intended choice, if the association between the brand and the choice
58
Chapter 3 Literature Relative to Consumer Choice Processes
category is strengthened as opposed to not strengthened. Chakravarti and Janiszewski
(2003) look at the influence of macro-level motives on the consideration set
composition in novel purchase situations. They find that priming different macro-level
motives predisposes consumers to employ different types of screening strategies. The
screening strategies interact with characteristics of the stimuli, consumption goals, and
situational variables to determine the content of consideration sets. Shapiro et al. (1997)
examine the effects of incidental advertising exposure on the formation of the
consideration set. They find that the incidental advertising exposure effect is fairly
robust, occurring across a variety of occasions (both memory- and stimulus-based
choice situations, both familiar and unfamiliar purchase situations, and across different
product classes).
A brand name must be represented in a consumer's consideration set in memory if it is
to be chosen (Hauser and Wernerfelt 1990). Nedungadi (1990) focuses on the memory- based choice situation and suggests that brand accessibility (ease of retrieval) and
external cues (e. g. brand organization in memory and brand primes) are two potentially important factors in the formation of the consideration set. Desai and Hoyer (2000) also investigate the memory-based choice situation and reveal that familiarity of usage
occasion and usage location has impacts on consideration set stability, size and marginal
variety. It can clearly be seen that study in this area is still very arbitrary and there is no
real pattern appearing in terms of research finding and perspective from which the
research was conducted.
3.5.4 Attitude, Attitude Strength and the Consideration Set Formation Based on the well-developed attitude strength and choice theory, Priester et al. (2004)
propose that attitude and attitude strength toward the alternative is a fundamental
antecedent of consideration. This is the only work found that investigates the formation
of consideration set from consumers' perspective. Specifically, the authors examine the
influence of consumers' preference, attitude and attitude strength toward
brands/products on the consideration set formation. The research findings of two
experimental studies (the product studied is toothpaste) support these authors'
arguments and suggest that attitude together with attitude strength influence the formation of the consideration set, and the influence of attitude strength on behaviour is
mediated by consideration. These authors conducted a third piece of experimental
59

Chapter 3 Literature Relative to Consumer Choice Processes
research using a different product (candy bars) in order to examine the reliability and
convergent validity of their conceptualization of attitude strength. Research findings
from the third study provided further support to the authors' research hypothesis.
Priester et al. (2004) do raise concerns in relation to generalisability and reliability of
their research findings. One of the concerns is related to the studied product. The
authors recognise that the apparently consistent research results across two experimental
studies might be caused by the specific studied product category - toothpaste. As noted
earlier, these authors conducted a third study to re-test their previous finding and came
out with supportive findings. As a result, the authors do not suggest further concerns
for applying the proposed `Attitudes, Attitude Strength and Consideration and Choice'
(A2SC2) model on other product classes.
3.5.5 Critiques of the A2SC2 Model
This research would argue that the A2SC2 model proposed by Priester et al. (2004) may
not apply to all alternative product categories universally. The first question raised
concerns the stability of Priester et al. 's (2004) research results. Although it appears
that the research findings are consistent across three studies and two product categories, it is also true that the authors only examined low-price product categories. Moreover,
past studies indicate that the link between attitude toward the object and behaviour is
not always clear (Spears and Singh 2004; Cobb-Walgren et al. 1995). In some cases,
attitudes appear to have a direct effect on behaviour (e. g. Bagozzi and Warshaw 1992;
Bagozi and Yi 1988), while in others they do not (e. g. Bagozzi 1981,1992). Therefore,
it makes sense to ask whether or not the apparently consistent results are generated by
chance.
The second question is related to the attitude strength measurement that Priester et al.
(2004) developed. The concept of attitude strength holds that attitudes that possess
equivalent extremity can differ as to their underlying strength. Strong attitudes possess
the following properties: they come to mind faster, persist over time, resist
counterpersuasive attempts, and guide behaviour more than weak attitudes (Fazio 1995;
Petty and Cacioppo 1986; Petty et al. 1995). Thereby, previous research suggests that a
theoretically meaningful indicator of attitude strength is the speed with which an
attitude comes to mind (Priester and Petty 2003). A number of researchers used this
60

Chapter 3 Literature Relative to Consumer Choice Processes
indicator to guide their measure of attitude strength (e. g. Fazio et al. 1989; Priester and
Petty 2003). Priester et al. (2004) used four item, 11-point scales to measure this
concept. One scale is anchored with "not at all important" and "extremely important",
the second with "not at all self-relevant" and "extremely' self-relevant", the third with
"not certain at all" and "extremely certain", and the fourth scale with "have not thought
about it at all" and "have though about it a great deal". Although the authors claim that
the reasons for choosing these measures is to reflect the antecedents of elaboration and
consequences associated with attitude strength, it could be argued that three out of the
four scales seem to be very similar in involvement measures, the exception being the
third one. Therefore, there is a strong chance that the score generated from using this
proposed measure actually measured the involvement rather than attitude strength. One
more reason to question the viability of using the Priester et al. (2004) proposed scale to
measure attitude strength lies on the measurement validity. It is beyond the research
scope to delve into scale construction. However, one very obvious shortcoming of this
scale is that it measures the antecedents and consequences of the attitude strength but
not the concept itself, according to the authors' own claim.
A further question relates to whether Priester et al. (2004) should have designed their
research in the first place. This might seem to be a very strong statement. However, the
argument is based on the following. Firstly, it is well-documented that attitudes are
generally a poor predictor of marketplace behaviour, therefore any more attempt to test
their explanatory power on consumer behaviour will only add one more example to
either the `yes' category (the `yes' attitude appears to have a significant effect on
consumer behaviour) or the `no' category (the `no' attitude appears not to have
significant explanatory power on consumer behaviour). Secondly, the authors
examined the influence of consumers' attitudes toward individual brands on
consideration and choice. It appears that the research design was developed from the
Fishbein and Ajzen (1975) reasoned action theory or Ajzen's (1991) planned action
theory. Nevertheless, both reasoned action theory and planned action theory are about
attitude toward behaviours, not objects. In fact, based on a number of empirical
research findings, Fishbein and Ajzen (1975) made it very clear that reasoned action theory should not be applied to objects, as did the authors of the planned action theory.
For those who are interested in this point, please refer to these two benchmark works.
61
Chapter 3 Literature Relative to Consumer Choice Processes
Given the above, it can be proposed that to apply the A2SC2 model to luxury branded
products would be problematic. Moreover, this research further argues that it is not
necessarily consumer attitude, or even attitude strength, which guides formation of
consideration set. One simple example offered here is that a consumer may have a very
positive attitude and high attitude strength towards a Rolex watch, however s/he may
never consider buying one, due to a shortage of money.
3.6 Identified Research Problem
The review of literature on consumer choice process reveals that the study of
determinants of the consideration set has become attractive to researchers recently due
to its importance. Studies related to the consideration set can be categorised into three
very broad streams. The first stream of previous studies investigates contributions of
the consideration set to consumer choice models. The second stream focuses on
exploring the characteristics of the consideration set. Most recently, researchers'
interests shifted to issues concerning the formation of the consideration set. The past
research is categorised as the third research stream in the study of the consideration set.
However, research in this area still appears to be very much arbitrary, with no clear
pattern emerging from it.
Roberts and Lattin (1997) called for research into the nature of the relationship between
product attributes and consideration. Interestingly, it appears that this area has not
received the attention it deserves. The effects of consumer attitude and attitude strength
toward low-involvement brands (objects) on the formation of the consideration set have
been investigated (e. g. Priester et al. 2004). According to the authors, the research
results are convincing. However, the theoretical logic of the research and the validity of
the measure they adopted are questioned. The influence of attitude toward brands in the
consumer choice process is challenged considering that both the reasoned and planned
action theories are about attitude toward behaviours not objects. This research proposes
that the research findings of Priester et al. (2004) should be viewed with caution and
might not be applicable to luxury brands. Apparently, little research attention has been
devoted to the investigation of the effects of consumers' perceptions of product/brand
related characteristics on the formation of a consideration set, leaving unanswered the
question of what inherent characteristics of a brand/product determine its entry into the
consumer consideration set.
62
Chapter 3 Literature Relative to Consumer Choice Processes
The study of the impact of consumer perception of a brand/product on the formation of
a consideration set is considered important and valuable. First of all, consumer
behaviour is, at root, driven by perceptions of a brand. Perceptions are in the hearts and
minds of consumers, and are actually driving brand equity (Biel 1992). It is perceptions
that provide the grounds for purchasing decisions (Friedman and Zimmer 1988; Borgers
and Timmermans 1987). Secondly, attitude is a "summary evaluation" of an object or
behaviour (Giner-Sorolla 1999), whereas consumer perceptions are defined as the
selection, organisation and interpretation of marketing and environmental stimuli into a
coherent picture (Assael 2004). Therefore, the study of perceptions can provide
marketers with a more detailed picture about how their brand is perceived by consumers
compared with the investigation of attitude. Thirdly, modelling influence of consumers'
perceptions towards a brand on consumer brand choice process will help to reveal the
significantly influential factors related to the brand. Based on this, marketers will be in
a position to work out more effective marketing strategies.
Some researchers argue that the reason for the lack of research into determinants of the
formation of the consideration sets is that this construct is not usually directly
observable; hence a researcher has to estimate it from observed purchase data (Roberts
and Lattin 1997; Vroomen et al. 2004). Some argue that the size of the consideration
set is easier to measure than its composition (Punj and Srinivasan 1989). These authors
further argue that it might be the conventional view that strongly favours non-
compensatory process at the consideration phase and compensatory process at the
choice phase (e. g. Gensch 1987) which deters researchers. Roberts (1989) challenges
the widely-accepted conventional view and argues that both compensatory and non-
compensatory processes are appropriate on the basis of Narayana and Markin's (1975)
classification of non-considered alternatives into inept and inert brands. Later
researchers (e. g. Roberts and Lattin 1991; Desarbo and Jedidi 1995) choose to model
consideration as a compensatory process, given its apparent robustness (see Johnson
and Meyer 1984). This research has decided not to take any side on this but rather to
let the research results speak for themselves at the end.
3.7 Research Aim
To integrate the research problems identified in the two bodies of literature, studies on
counterfeiting and consumer choice process, this research aims to investigate
63
Chapter 3 Literature Relative to Consumer Choice Processes
consumers' perceptions of counterfeit branded products as opposed to genuine branded
products, as well as to uncover the underlying determinants of the formation of the
consideration set and purchase intention in the context of non-deceptive counterfeiting.
More specifically, it examines the influence of consumers' perceptions of these two
versions of a brand together with some other exploratory variables on the formation of
the consideration set and the tendency of consumer choice. Accordingly, this research
seeks to fill the identified research gaps: consumers' perceptions of counterfeit branded
products as opposed to their original counterparts have not received the research
attention they deserve; the majority of research the in study of counterfeits has used
either qualitative or quantitative research methods; few research has examined
counterfeiting from brand level; and what brand characteristics might influence
consumer decision processes appears to be unknown.
3.8 Research Scope
Luxury branded products (both original and counterfeit versions) are chosen as the
centre of this study, with consumers as the subjects. The research focuses on modelling
the influence of consumer perceived brand image (the subjective/perceptual judgements
of the brands rather than the objective physical attributes), the perceived product
involvement, the self-assessed knowledge and consumer demographic variables on
formation of consideration set and purchase intention. This research does not deny that
other factors could significantly influence the consumer choice process, for example
self-image (e. g. O'Cass and Lim 2002; Quester et al. 2000) and perceived similarity
(e. g. Baker et al. 2002; Dhar et al. 1999) are found to be significantly influential to
consumer purchase choice and consumer purchase intention. Nevertheless, due to the
time restriction for this project, it was decided that other than the above noted, no other
factors are to be considered.
3.9 Decision on Inclusion of Purchase Intention vs. Choice
According to the model of individual choice (Shocker et al. 1991), the final response
variable is the `choice'. However, many investigations designed to study the
determinants of behaviour have not actually observed behaviour, as data on actual behaviour are normally unavailable, but have instead used measures of behavioural
intentions as their criteria. Due to its not being easy to set up a selling scenario for both
counterfeit and original branded products, the actual purchase behaviours are difficult to
64
Chapter 3 Literature Relative to Consumer Choice Processes
measure properly in this study. As a result, examining purchase intention seems more
appropriate, since the tested branded products are not actually purchased by research
participants. Therefore, in this research, purchase intention is the final outcome
variable.
Purchase intention originally evolved from the psychological construct of behavioural
intention. Behavioural intention is the subjective probability of performing overt
behaviour (Ajzen and Fishbein 1973), which suggests that with little variation, people do what they say that they are going to do. Marketing researchers define purchase intention as the personal action tendencies or likelihood to make an effort to purchase a brand (Spear and Singh 2004; Grewal et al. 1998; Bagozzi and Burrkrant 1979; Ostrom
1969). Based on the intention-behaviour model (e. g. Ajzen and Fishbein 1973),
researchers propose that purchase intention approximates purchase behaviour.
Supporting evidence suggests that the relationship between intentions and purchase is
generally positive and significant (e. g. McNeil 1974; Taylor et al. 1975; Tauber 1975),
however the strength of the relationship varies from study to study. Some research
reveals relatively poor correlations. For example, Bonfield (1974) calculated a total
sample r=0.44 between intentions and fruit drink choices, and Harrell and Bennett
(1974) obtained r=0.37 when intentions and physician prescribing behaviour were
compared.
Despite the debate over the exploratory power of purchase intention over purchase behaviour between early researchers, the concept of consumer purchase intention is
commonly used in measuring marketing effectiveness (Andrews et al. 1992; Beerli and Santana 1999). Moreover, it has attracted extensive interest from marketing
researchers. Recent research has suggested that attitude (Laroche & Brisouz 1989;
Laroche et al. 1996; Prendergast and Hwa 2003), knowledge (familiarity and
experience) (Anand et al. 1988; Brucks 1985; Heath 1990; Laroche et al 1996; Zajonc
and Markus 1982; Pope and Voges 2000; Chang 2004), and demographic variables (Prendergast and Hwa 2003) have a great impact on consumer purchase intentions.
Moreover, the consumer's intention to buy a specific brand is also determined by
attitudes toward other competing brands in the choice set (Simonson and Tversky 1992;
Jaccard 1981; Malhotra 1986; Nantel 1986).
65

Chapter 3 Literature Relative to Consumer Choice Processes
All in all, the use of purchase intention to replace the choice is considered appropriate for the present research. In line with Spears and Singh (2004, p. 56), the purchase intention in the present research refers to `an individual's conscious plan to make an
effort to purchase a brand'.
3.10 Summary
This chapter provides the theoretical foundation of this research. Although some
researchers do not differentiate between consumer decision-making process from
consumer choice process, this research argues, judged on having investigated different
objects, that they are distinguished concepts. Consumers are the studied objects for the
consumer decision-making process, whereas for the consumer choice process, brands or
products are examined. The effort this research puts into distinguishing these two
concepts assists in drawing a clear literature review boundary for the current study. More specifically, this chapter only reviews literature related to consumer choice
process, as to gain an understanding of the reasons why a brand is considered and
eventually purchased is of interest to this research.
The Model of Consumer Evaluation and Choice (Scrinivasan 1987) and the Model of Individual Choice (Shocker et al. 1991) are discussed in detail. It is revealed that both
models acknowledge the process from awareness set to consideration/evoked set. Nevertheless, neither of them focuses on this critical process. - Compared to the earlier
model, the later model is individually focused and provided with abundant theoretical backup, and is thus considered better suited to this research.
A number of terminologies have been used by previous researchers to refer to the
consideration set. Given that it appears to be the most widely adopted term and that the
use of this term can avoid the ambiguity surrounding "evoked set", it was decided to use "consideration set" in the current study. This research defines the consideration set as `a subset of an awareness set consumers formed under some restrictions, through which
consumers make an explicit utility comparison ' or cost-benefit trade-off before they
make brand choice decisions. ' Building on previous commonly-accepted definitions,
the definition proposed by this research further highlights the process from awareness to
consideration and also the dynamic nature of the consideration set.
66
Chapter 3 Literature Relative to Consumer Choice Processes
The dynamic nature of the consideration set is discussed in a number of past studies. It
is believed that the composition of the consideration set varies with time and in different
situations (Hoyer 1984; Shocker et al. 1991; Hauser and Wenerfelt 1990). The
acknowledgement of this dynamic nature is crucial at the research planning stage.
Simply, it determines that it will not make any logical sense if the consideration set is
explored after purchase behaviour. Moreover it also provides guidance on research
result interpretation.
Despite Horowistz and Louviere's (1995) questioning the existence of the consideration
set, in line with a number of other researchers (e. g. Shocker et al. 1991; Priester et al.
2004), this research argues that the consideration set does exist, although it might not
be directly observable. Both empirical and theoretical supports to this argument are
presented and discussed, based on past research. This further assists in justifying
indirectly that the study of consideration set related issues is worthwhile. The direct
support is provided by the important role it plays - unless a brand/product is included in
the consideration set, it will not be chosen (Nedungadi 1990).
Research on the study of the consideration set can be classified into the consideration
set and consumer choice models category, research related to characteristics of the
consideration set (consideration set size and composition) category, and research related
to the formation of the consideration set category. The review focus is placed on the
last category due to its direct relevance to this research., The review discovers that study
of the consideration set formation has not received the attention that it deserves; the
existing research appears to be arbitrary, and research findings do not show any pattern.
Most recently, the influence of attitude and attitude strength on the formation of the
consideration set was examined by Priester and his colleagues. Despite the consistent
results across three separate studies, the generalisability of Priester et al's (2004) results
is challenged. First, considering the fact that the link between attitude toward the object
and behaviour is debatable, it is questioned whether or not the results of Priester et al.
(2004) were generated by chance. Second, it is argued that the scale Priester et al.
(2004) used to measure the attitude strength lacks content validity, since they measured
the antecedents and consequences of this concept according to the authors. On close
examination of the statements they adopted in their research instrument, it is believed
67
Chapter 3 Literature Relative to Consumer Choice Processes
that to a great extent they measured the product involvement notion but not the attitude
strength concept. Third, it is suggested that as the attitude concept having been well
documented as a poor predictor of marketplace behaviour, Priester et al. (2004) may
have not added anything new to knowledge at all. Moreover, Priester et al. (2004)
might also face the possibility of having misunderstood the well-established reasoned
action theory and planned action theory if the authors claim that their research stems
from these two benchmark works, as both of these works make it very clear that one
should not apply these two theories to objects.
Based on the literature review, it is concluded that the formation of the consideration set
deserves more research attention. Little research begins from the study of the influence
of the inherent characteristics of the objects (brand or product) on the consumer choice
processes. Consumer attitude toward a brand or product might not provide a good
prediction as to the inclusion of a brand or product in the consideration set or eventual
choice. In contrast, perceptions toward a brand or product are the real drivers of
consumer behaviour (Biel 1992; Friedman and Zimmer 1988; Assael 2004).
It is at this stage that a clear research aim is established by integrating the identified
research gaps in two bodies of literature. In fact, the research aim is two-fold. This
research attempts to investigate consumers' perception of counterfeit branded products
as opposed to the original branded products, as well as to discover the determinants of
the formation of consideration set and purchase intention in the context of non-
deceptive counterfeiting. Research which focuses on the interplay between consumers'
perceptions of a particular brand or product is thus likely to enhance understanding of
how a brand (counterfeit or original) or product enters and is retained in the
consideration set, and is probably eventually selected. To achieve this goal, the
influence of brand image, product involvement, self-assessed product knowledge and
four selected demographic variables are examined in the stimulus-based situation.
According to the model of Individual Choice (Shocker et al. 1991), the final response
variable should be `choice'. This research has decided to replace `choice' with
`purchase intention', since to set up a selling scenario for both counterfeit and original
branded products is considered practically unachievable.
68

Chanter 3 Literature Relative to Consumer Choice Processes
Chapter 2 and 3 have reviewed literature on the study of counterfeiting as well as
relevant literature on the study of consumer choice process. Based on the intensive
literature review, research problems are identified, the research aim is sharpened, and a
clear research boundary has also been established. The following chapter will focus on
reviewing literature related to the above noted concepts (brand image, product involvement, product knowledge and selected demographic variables) and presenting
the research hypothesis and the research conceptual model.
69
Chapter 4 ,;.,,
Analysed _Constructs
and Research
,. } Hypotheses,,

Chapter 4 Analysed Constructs and Research Hypotheses
Chapter 4 Analysed Constructs and Research Hypotheses L, '. iil
4.1 Introduction
Chapter 2 provided detailed information of the research context as well as the identified
research problem in relation to the study of counterfeiting. Guided by the identified
research problem in Chapter 2, Chapter 3 discussed literature concerning consumer
choice processes. The literature review further discovered that the determinants of the
formation of the consideration set and the choice from product/brand level appears to be
under-researched, despite the significant role played by the consideration set in
consumer choice process. To integrate the research problems identified in Chapter 2
and Chapter 3, it is acknowledged that little research has examined this issue in the
context of non-deceptive counterfeiting. Thereby, the two-fold research aim of the
present research is to investigate consumers' perceptions of counterfeit branded product
as opposed to genuine branded product, as well as to uncover the underlying
determinants of the formation of the consideration set and purchase intention from the
brand level in the context of non-deceptive counterfeiting.
A review of the consumer behaviour literature helped to identify four main constructs
which influence consumer choice processes. They are discussed as product
involvement, self-assessed product knowledge, demographics (gender, age, education,
and household income), and brand image variables (product attributes, benefits, brand
personality and perceived consequences). The discussion about brand image variables
mainly focuses on the brand image concept itself and brand personality. The detailed
discussion about brand image is to clarify relationships between the three closely
associated and easily misunderstood constructs - brand, brand identity and brand image,
and to illustrate the rationale of investigation of brand image in the current study. The
effort devoted to analysing brand personality is drawn by its abstract and complex
nature.
The purpose of this chapter is to provide a theoretical background of the variables
affecting the consumer choice processes, more specifically, the formation of
consideration set and purchase intention, and hence to provide a foundation for the
research conceptual model and develop the research hypotheses. Following the analysis
70
Chapter 4 Analysed Constructs and Research Hypotheses
of the investigated explanatory variables, the research hypotheses are proposed. This
chapter finishes with a brief chapter summary. The research conceptual model is
reported in this section. It is here that it can be clearly seen that the organisation of this
chapter is led by the flow of the research conceptual model.
4.2 Involvement
Like most marketing concepts, the involvement construct originates from the discipline
of psychology. Involvement was pioneered by Sherif and Cantril (1947). These authors
describe involvement as the state of an organism when presented with any stimulus
which is ego-central, or when any stimulus is either consciously or subconsciously
related to the ego. In marketing, the concept appears to be more complex. Cohen
(1983, p. 325) states that there may well be `1000 great ideas' on the concept of
involvement. Not surprisingly, there is no commonly accepted definition of this
hypothetical construct., Involvement is used to refer to: personal relevance to message
and product (Petty and Cacioppo 1981; Petty et al. 1983; Engel and Blackwell 1982;
Greenwald and Leavitt 1984; Richins and Bloch 1986; Zaichkowsky 1985; Celsi and
Olson 1988); arousal, interest, or drive evoked by a specific stimulus (Park and Mittal
1985); a person's activation level (Cohen 1983); goal-directed arousal capacity (Park
and Mittal 1985; Park and Young 1986); an individual's subjective feeling of the
importance of the judgement process or importance of the object about which judgement is being made (Mantel and Kardes 1999); the familiarity or attachment to the
product and the congruency between the product and the values of the individual
(Lastovicka and Gardner 1978).
In addition, involvement is a complex construct that can be viewed from different
aspects such as involvement with advertising (Krugmen 1962,1965,1967,1977), with
a product or product category (De Wulf 2001; Mittal 1995; Howard and Sheth 1969;
Hupfer and Gardner 1971; Zaichkowsky 1985), with a purchase decision (Ganesh et al. 2000; Clarke and Belk 1978; Zaichkowsky 1985; Slama and Tashchian 1985; Mittal
and Lee 1989), with shopping (Josiam et al. 2005), with consequences of the product on
the individual in terms of his/her cognitive response (Richins et al. 1992), with
responses to involvement (Laaksonen 1994), and more recently. with purchase channel (Lueg 2006). The list of different aspects of the involvement concept given here is far
from exhaustive.
71
Chapter 4 Analysed Constructs and Research Hypotheses
Given what has been noted earlier, one should not be surprised by the complex nature of
the involvement construct. As early as 1947, Sherif and Cantril alerted researchers to
the fact that people can develop many different types of involvement. Slama and
Tashchian (1985) further claim that involvement can derive from activities, objects,
ideas, social issues, and so on. Rothchild (1984, p. 217) proposes: `It is driven by
current external variables (the situation; the product; the communication) and past
internal variables (enduring; ego; central values)'. In a similar vein, Chung and Zhao
(2003) note that the characteristics of the person, the physical characteristics of the
stimulus, and the situation are the three antecedents of the involvement. The
involvement exists in a process. The complexity of this concept is determined by its
nature. In line with the complex nature of the involvement construct, there is no single
direction that involvement research is taking. Sometimes these concepts are discussed
in the context of a rather broad domain, while at other times they are used to describe
more specifically a particular aspect of the involvement construct (Meuhling et al.
1993).
Following the awareness of the complexity of the involvement construct, Cohen (1983)
suggests that relationships among overly broad constructs are necessarily imprecise, and
this impairs our ability to refute propositions and reformulate theories. Previous
researchers have concluded that involvement is best dealt with when it is conceptualised
within a particular domain (e. g. Dholakia 1997; Meuhling et al. 1993; Batra and Ray
1985; Lutz 1985). Consistent with this, product involvement is considered to be
appropriate here because this research is to examine perceived involvement of product level. More specifically, it is interested in the influence of product involvement of two
specific product classes (watches and handbags) and consumers' perceptions, and on
consumer choice processes (possibility of being considered, possibility of being chosen)
of two versions (counterfeit version and original version) of each brand (four luxury
brands are examined in the current study).
4.2.1 Product Involvement
Since it was first introduced to marketing, the concept of involvement has been a major
centre of interest in consumer research literature (Brisoux and Cheron 1990). A
substantial amount of research attention has been given to the study of the influence of
72

Chapter 4 Analysed Constructs and Research Hypotheses
product involvement on consumer information searching, processing and purchasing behaviour (Rothschild 1984). Product involvement has been extensively used as a
moderating or explanatory variable in consumer behaviour (Dholakia 1997; 1998). The
level of involvement has been shown to determine the depth, complexity and
extensiveness of cognitive and behavioural processes during the consumer choice
process (e. g. Houston and Rothchild 1978; Laurent and Kapferer 1985; Kleiser and
Wagner 1999; Kokkinaki 1999; Chakravarti and Janiszewski 2003). It is regarded as a
central framework, vital to understanding consumer decision-making behaviour and
associated communications (Fill 1999). Purchase decisions made by consumers vary
considerably, and one of the factors thought to be the keys to brand choice decisions is
the level of involvement (in terms of importance and relevance) a consumer has with
either the product or the purchase process.
4.2.1.1 Product Involvement Definition
The meaning and definitions of product involvement differ across researchers (Chung
and Zhao 2003). De Wulf et al. (2001) and Mittal (1995) conceptualise product involvement as a consumer's enduring perceptions of the importance of the product
category based on the consumer's inherent needs, values, and interests. Ratchford
(1987) underlines the risk incurred, or the importance of the decision. Laurent and
Kapferer (1985) propose a multidimensional concept distinguishing five facets: interest,
pleasure, value of the sign, risk importance, and the likelihood of making the wrong
choice. Dholakia (2000) defines product involvement as an internal state variable that
indicates the amount of arousal, interest or drive evoked by a product class. For this
study, the definition of product involvement is taken from Zaichkowsky (1985, p. 342):
`A person's perceived relevance of the object based on inherent needs, values and interests'.
Zaichkowsky's (1985) definition contains the general viewpoints of several researchers (e. g. Krugman 1967; Clarke and Belk 1978; Mitchell 1979; Greenwald and Leavitt
1984; Rothschild 1984; Dholakia 2000), and it has been commonly adopted by recent
researchers (e. g. Kokkinaki 1999; Kleiser and Wagner 1999; McGrath and Mahood
2004). It also responds to Laurent and Kapferer (1985) who claim that `product
involvement' is often used interchangeably with `perceived product involvement' in
marketing literature. More specifically, this definition falls within the domain of
73
Chapter 4 Analysed Constructs and Research Hypotheses
cognitive approaches to defining involvement (Laaksonen 1994); it is subject-centred.
In addition, adoption of this definition also secures the legitimacy of using the Revised
Personal Involvement Inventory (RPII) to measure product involvement in this research,
simply because the RPII is a verified version of the Personal Involvement Inventory
(PII), developed by Zaichkowsky (1985) based on this definition (see Chapter 5 for
details).
4.2.1.2 Enduring Involvement vs. Situational Involvement
Houston and Rothschild (1978) first make a distinction between enduring involvement
and situational involvement. According to these authors, situational involvement refers
to the degree of involvement evoked by a particular purchase situation and is essentially
context-dependent and temporary, whilst enduring involvement reflects a general and
permanent concern with the product class, and is long-lived (Houston and Rothschild
1978). It is believed that enduring involvement derives from the perception that the
product is related to centrally-held values (Arora 1982).
Despite the fact that some theorists generally accept Houston and Rothschild's (1978)
view and believe that involvement comprises enduring and situational involvement
(Bloch et al. 1989; Richins and Bloch 1986), it is still debatable whether product involvement is an enduring or a situational concept. The main stream of researchers believes that product involvement consists of the enduring involvement and situational involvement. For example, Baker and Scribner (2002) suggest that to consider product involvement to be perceived, personal relevance allows for products to have different
levels of involvement associated with them for different persons and in different
situations. In the same vein, Dholakia (1998) claims that enduring involvement and
situational involvement are two types of involvement associated with a product class. In contrast, some researchers propose that product involvement is long-lived,
determined by the stable elements of the individual's identity, and therefore should be
labelled enduring involvement (Laaksonen 1994; Lee 2000). Some researchers (e. g.
Chung and Zhao, 2003) claim that enduring involvement and situational involvement
are two distinct types.
In line with Baker and Scribener (2002) and Dholakia (1998), this research would argue that enduring involvement and situational involvement should be regarded as two sub-
74

Chapter 4 Analysed Constructs and Research Hypotheses
constructs of the product involvement. These two sub-constructs are labelled `enduring
product involvement' and `situational product involvement' in order to distinguish them
from enduring and situational involvement. Figure 4.1 represents the influential factors
of situational product involvement and enduring product involvement, as well as the
proposed interrelationship between these two concepts and product involvement. This
research proposes that situational product involvement and enduring product
involvement coexist in most cases. It is a matter of who is playing a dominant role
rather than what kind of involvement product involvement should be labelled as. For
example, an individual will perceive a car as having a high level of product involvement
in their daily life. This kind of product involvement should be classified as enduring
involvement, as a car is a durable product and normally it is an expensive product,
therefore the involvement is long-lived. However, the perceived product involvement
will increase if the individual is going to drive his/her car to a job interview for a very
senior position. Under these circumstances, the situational involvement is highlighted
particularly, and it may take the lead. When this happens, that is not necessarily to say
that the enduring involvement diminishes completely.
Immediate 0 0, Situational environment product
involvement Product Involvement
Personal 0 1 Enduring needs, goals product and values invulvrn, rnl
Figure 4.1 Influential factors and interrelationships between situational product involvement, enduring product involvement and product involvement
4.2.1.3 Enduring Involvement - Focus of the Present Study
This study sets out to measure enduring product involvement. In reality, it is more
likely that enduring involvement would be measured unless a particular situation at a
particular point of time is highlighted. This is because the situational involvement is
transitory and is largely a function of short-term changes in the consumer's immediate
environment (Rothschild 1979), and therefore the level of situational involvement is not
only product specified, but also varies according to different situations. A few
researchers examined the effects of situational involvement in laboratory experiments
75
Chapter 4 Analysed Constructs and Research Hypotheses
(e. g. Petty et al. 1983) as it can be manipulated more easily. Nevertheless, measuring
enduring involvement might appear to be more practically valuable due to its being
subject-centred (Broderick and Mueller 1999), relatively long-lived and stable
(Laaksonne 1994). It is also true that more measures developed by previous researchers
are designed to measure enduring involvement specifically, with very few exceptions
(e. g. Laurent and Kapferer 1985) which propose a measure of both enduring and
situational involvement (Havitz and Howard 1995).
4.2.2 Product Involvement Hypotheses
Petty and Cacioppo (1981) propose the Elaboration Likelihood Model (ELM). The
ELM suggests that persuasion can occur via two routes - the central and peripheral
routes. According to the authors the central routes refer to the elaborate processing, the
peripheral routes represent the non-elaborate processing. The tenet of the ELM is that
different methods of inducing persuasion may work best depending on whether the
elaboration likelihood of the communication situation is high or low. According to the
ELM, consumers' processing information differs with their level of involvement. More
specifically, when the level of involvement is high the central routes apply, which
means that consumers are more motivated to devote cognitive effort to evaluate the true
merits of a product. In contrast, less involved consumers are less motivated to process
information, leading to non-elaborate processing. Therefore, consumers are less
affected by argument quality in low involvement situations.
The ELM has achieved considerable recognition. For example, Browne and
Kaldenberg (1997) note that under high involvement conditions, buyer decision
processes are thought to proceed through extended decision-making, a series of
sequential stages involving information search and evaluation of criteria; Celsi and
Olson (1988) report that the extent to which a product is viewed as personally relevant,
in that it is perceived in some way to be instrumental in achieving their personal goals
and values, makes the consumer likely to be more motivated to process information
about it; in contrast, consumers neither wish nor are able to exert a lot of effort to
process information in a low involvement situation (Chung and Zhao 2003).
Based on the above, it is rational to assume that if the level of product involvement is
high, consumers are more likely to put more effort into evaluating two versions of one
76
Chapter 4 Analysed Constructs and Research Hypotheses
brand in the context of non-deceptive counterfeiting. Deliberative information
processing involves the scrutiny of available information and an analysis of positive and
negative features, of costs and benefits (Fazio 1990). Given that CBP are considered as
a low grade of BP in the context of non-deceptive counterfeiting (Nia and Zaichkowsky
2000; Penz and Stöttinger 2003), there is more chance that consumers would be able to
distinguish the difference between CBP and BP in relation to product attributes, costs
and benefits, and hence develop different perceptions of CBP versus BP and show more
preference for the BP than CBP.
On the other hand, the differences between CBP and BP in relation to product attributes,
benefits and consequences might not be recognised easily, if the level of product
involvement is low, due to lack of motivation, effort and even capability in relation to
processing information. Therefore, consequently consumers' perceptions of CBP and
BP might not differ significantly under these circumstances, which will lead to more
favourable perceptions of CBP.
Given that consumers in a higher product involvement situation are more likely to be
able to define the difference between CBP and BP related to the quality argument in the
context of non-deceptive counterfeiting, thus they may regard CBP as a lower grade of
BP, with low price and low quality. Consumers look for more personal, experimental
and symbolic gain other than maximising product functionality in a high involvement
situation than low (Solomon et al. 1985). Low price and low quality products, CBP in
this case, will not pay off the personal treat, excitement, status desired by the
consumers. Therefore, it is less likely that CBP will be included in the consumers'
consideration set, if the product class is perceived as high involvement to the
consumers.
In addition, Petty and Cacioppo (1981) find that consumers accept fewer alternatives
when they have high level of product involvement. This is consistent with Lapersonne
et al's (1995) research finding. Nevertheless, Brisoux and Cheron (1990) show that
product involvement does not appear to affect consideration set size significantly. Although these findings are not identical, however, they indicate that it is unlikely that
consumers will form a larger consideration set in a high product involvement situation. As a result, there is less chance of CBP being included in the consideration set as a late
77
Chapter 4 Analysed Constructs and Research Hypotheses
invader. This notion is also supported by the social judgement theory. According to
the social judgement theory (Sherif et al. 1965), a high level of involvement leads to
more negative evaluations of a communication because a high level of involvement is
associated with extended "latitude of rejection. " Thus, - CBP is thought to have a high
possibility of being rejected as an invader and late entrant compared with BP, because
their negative traits are enhanced, and they are more likely fall within the unacceptable
range of products in the situation of high involvement.
The ELM suggests that a low level of product involvement would probably create low
consumer motivation to process information, which leads to a greater possibility of the
peripheral route of persuasion. In the context of non-deceptive counterfeiting, the
counterfeit brand name and logo may serve the peripheral route of persuasion. Hence,
CBP is more likely to be included in the consideration set in the low product involvement situation due to consumers tending to purchase impulsively. In contrast, for products with a higher consumer involvement, consumers would spend more energy
on consumption-related activities, and hence make more rational decisions. In such
situations, consumers who have a high level of involvement will generate more positive
perception toward BP due to its being commonly recognised as a superior version as
opposed to CBP. As a result, the BP is more likely to be included in the consideration
set.
The consideration set as shaped by the consumer's involvement with the product
category, has significant implications for choice. Following from Kardes et al. (1993),
only considered brands can be chosen. Then, as explained earlier, the CBP is more likely to be considered as a low involvement product, and it has more chance of being
purchased than BP. On the other hand, the original BP is more likely to be chosen when the involvement is high. As a result, the following hypotheses are proposed.
H invo vemen� : The level of product involvement has a positive relationship with the
likelihood of consideration and the purchase intention of BP.
H involvement 2: The level of product involvement has a negative relationship with the
likelihood of consideration and the purchase intention of CBP.
78
Chapter 4 Analysed Constructs and Research Hypotheses
4.3 Product Knowledge
Traditionally, product knowledge has been treated as a mono-dimensional construct
(e. g. Hutchinson 1983), and most often referred to as product familiarity or prior
product knowledge. It is normally considered that consumers have some experience
with or information about a particular product category (Alba and Hutchinson 1987).
Later researchers note that the product knowledge is a bi-dimensional construct. Some
researchers propose that consumer product knowledge has two major components:
familiarity and expertise (e. g. Jacoby et al. 1986; Alba and Hutchinson 1987; Mishra et
al. 1993). Familiarity is defined as the number of product-related experiences that have
been accumulated by the consumer. Expertise represents a consumer's ability to
perform product-related tasks successfully (Alba and Hutchinson 1987). Laroche et al.
(2003) note that the knowledge is conceptualised with two related dimensions:
experience and expertise. These authors argue that experience and expertise are
different dimensions of product knowledge. More specifically, they consider that
experience is concrete, operational, and actualised by the consumer. Expertise is
potential, latent and virtually realisable by the consumer. A close study reveals that
Laroche et al's (2003) concept is in line with the above reported "familiarity and
expertise" thought and brings in nothing new. Scribner and Weun (2001) propose that
product knowledge consists of three dimensions: brand knowledge, attribute knowledge,
and experience knowledge. They further claim that these dimensions are likely to have
different effects on consumer behaviour. Scribner and Weun's (2001) statement moves
one step forward by taking the brand dimension into the product knowledge construct.
In the past, some research has used the terms familiarity, expertise, and experience
interchangeably when referring to product knowledge (e. g Punj and Srinivasan 1989;
Jacoby et al. 1986; Laroche et al. 1996). Part of the reason is that these three concepts
overlap with each other. For example, a consumer's purchase experience contributes to
the degree of his/her product familiarity as well as expertise. In general, product
experience is a necessary but insufficient condition for consumer expertise and
familiarity (Rao and Monroe 1988). This stand is particularly important for this
research, because it is one of the reasons why measures of consumers' experience are
not used in this research. More details are reported in the measures of knowledge
section of Chapter 5.
4.3.1 Definition and Types of Product Knowledge
79
Chapter 4 Analysed Constructs and Research Hypotheses
In general, product knowledge refers to the information stored within memory (e. g.
Engel et al. 1993; Alba and Hutchinson 1987; Park et al. 1994). Brucks (1985) and
Park and Lessig (1981) distinguish objective knowledge and self-assessed knowledge
(also named as subjective knowledge, e. g. Brucks 1985; Berger et al. 1994). Objective
knowledge is accurate information about the product class stored in long-term memory.
Self-assessed knowledge is consumers' perceptions of what or how much they know
about a product class, which indicates self-confidence levels as well as knowledge level
(Brucks 1985). Based on research in subjective probability assessment (Fischohoff et
al. 1977) and feeling-of-knowing (Schacter 1983), Park et al. (1994) further suggest that
another reason for a need to distinguish objective and subjective knowledge is that what
people think they know and what they actually know often do not correspond. Research
findings support this assertion and suggest that the mechanisms through which
subjective knowledge and objective knowledge affect information search (Bettman and
Park 1980; Brucks 1985; Park and Lessig 1981) and information processing (Park et al.
1988) may be different.
Based on previous studies, Rao and Monroe (1988, p. 255) propose that prior product knowledge is defined as knowledge which can "encompass the amount of accurate information held in memory about product alternatives as well as buyers' self-
perceptions of this product knowledge". `The amount of accurate information' refers to
the objective knowledge; `the buyers' self-perceptions of product' represents the self-
assessed knowledge. Clearly, what Rao and Monroe (1988) suggest is that product knowledge is a combination of objective knowledge and subjective knowledge.
Research findings show that subjective knowledge and objective knowledge are highly
correlated (e. g. Rao and Monroe 1988). This raises questions as to how product knowledge should be measured and whether Rao and Monroe's (1988) definition of knowledge is better than the others. To judge the appropriateness of Rao and Monroe's
(1988) product knowledge definition is beyond the scope of the current study. The
question as to how product knowledge should be measured in the present study will be
dealt with in further detail in Chapter 5.
4.3.2 Self-assessed Product Knowledge Is to Be Examined
It was decided that self-assessed product knowledge is to be examined in this research. The discussion about the choice of the appropriate knowledge measures in Chapter 5
also presents detailed reasons for the investigation of the self-assessed knowledge in
80

Chapter 4 Analysed Constructs and Research Hypotheses
this study. The self-assessed knowledge definition suggested by Brucks (1985) is
adopted (see section 4.3.1 for detail). In order to avoid repetition, no more discussion is
provided here. For those who are interested, please refer to the noted chapter.
4.3.3 Self-assessed Product Knowledge Hypotheses
Consumer product knowledge has been studied in a variety of different ways in recent
years (e. g. Baker et al. 2002; Alba and Hutchinson 2000; Brucks 1986; Park et al. 1994;
Raju et al. 1995; Rao and Monroe 1988). It has been recognised as a characteristic in
consumer research that influences all phases in the decision process (Bettman and Park
1980).
Consumers with various levels of product knowledge are different in their perceptions
of product attributes (Laroche et al. 2003; Baker et al. 2002; Blair and Innis 1996).
Marks and Olson (1981) propose that consumers with higher levels of product knowledge have better developed and more complex schemata, with well-formulated decision criteria. Therefore, it is rational to suggest that when they process information,
less cognitive effort is required and relevant knowledge structures can be activated automatically; this allows consumers with higher level of product knowledge to be able to process more information (Alba and Hutchinson 1987).
This research argues that, given better-developed and more complex schemata,
consumers with higher levels of product knowledge have better cognitive capacity to
evaluate comparative alternatives. In this study, the comparative alternatives refer to CBP and BP. Kempf and Smith (1998) further suggest that consumers with higher
levels of product knowledge are more diagnostic and informative than those who have
lower levels of product knowledge. Therefore, the higher the level of product knowledge a consumer possesses, the less chance he/she will generate evaluation bias.
In the context of non-deceptive counterfeiting, when consumers are exposed to CBP and BP, consumers with higher levels of product knowledge are more likely to be able to distinguish the CBP and BP, due to higher cognitive capacity. As a result, differences
between consumers' perceptions toward CBP and BP become clearer when consumers'
product knowledge increases, whereas these differences become less identifiable when consumer's product knowledge level decreases. Given that CBP are considered to be a
81

Chapter 4 Analysed Constructs and Research Hypotheses
low grade of BP (Nia and Zaichkowsky 2000; Penz and Stöttinger 2003), consumers
become more favourable to CBP when the level of product knowledge is low. In
contrast, consumers are more favourable to BP when the level of the product knowledge
is high.
In terms of knowledge within the product category, greater knowledge might lead the
consumer to know and try more products. Conover (1982), and Alba and Hutchinson
(1987) suggest that consumer product knowledge is linked to the existence of a more
complex cognitive structure that leads to wider consideration sets. Johnson and
Lehmann (1997) have shown that the consideration set size increases as the consumer
becomes more experienced, when this set is constructed in terms of products or brands.
But, conversely, the development of procedural knowledge associated with more
familiarity would lead the individual to restrict his/her consideration set for efficiency
motives. Thus, a higher level of product knowledge would enable the consumer to
remove unsatisfactory products, so as to reduce his/her set size, particularly when it is
constructed in terms of brands (Raju and Reilly 1980; van Tripj et al. 1996). Due to the
conflicting research results, it is interesting to explore the influence of self-assessed knowledge on the consideration set of the original branded products as well as the
counterfeit version. Past research results also show that self-perceived knowledge
operates as a direct influencer of purchase intentions for original branded durable
products (Berger et al. 1994). In the context of non-deceptive counterfeiting, the
present study has established that consumers with a higher level of product knowledge
are more able to distinguish the CBP and BP. As a result, they should give greater
acknowledgement to the superior grade of BP against CBP. Therefore, despite the
contradictory research findings related to the influence of product knowledge on the
consideration set, the following hypotheses that summarize the interpretation of the
literature of this research are to be tested:
H kno,,, edge, : The level of consumers' self-assessed product knowledge has a positive
relationship with the likelihood of consideration and the purchase tendency of the BP.
H knowledge2 : The level of consumers' self-assessed product knowledge has a negative
relationship with the likelihood of consideration and the purchase tendency of the CBP.
82

Chapter 4 Analysed Constructs and Research Hypotheses
4.4 Demographic Variables
Demographic changes affect marketplace opportunities and threats, through changes in
consumers' purchase behaviour, so it is advisable for firms to consider the individual
differences of prospective buyers of counterfeit goods when designing anti-
counterfeiting campaigns (Nill and Schultz 11 1996). This research argues that it is also
important to understand the individual difference of prospective buyers of original BP.
To see if effects on the purchase intention of CBP and BP also stem from other
differences across subjects, the research identified four commonly used and important
demographic elements as covariates for this study: age, gender, educational attainment,
and household income.
There are two main reasons for selecting these demographic variables for this study.
Firstly, they are believed to have significant impact on consumers' choice processes.
For instance, consumers' age, household income, gender and education are very closely
related to their spending behaviour (Wilkes 1995; Engel et al. 1990; Schaninger and
Danko 1993; Solomon and O'Brien 1991). Moreover, maturity which comes with age,
discernment which comes with more education, and purchasing power which comes
with higher household income, and purchase patterns which might be influenced by
gender may covariate with other determinants in influencing the consumer's intention to
purchase counterfeit products (Wee et al. 1995). Secondly, these demographic variables
are also chosen because their measurements can be treated as categorical variables (dummy coding techniques can be applied), fulfilling one of the requirements for
multiple regression analysis, the main analytical statistics used in this study.
4.4.1 Age
Age is considered as an important variable because it is one of the most helpful proxy
variables for the determination of motivation and interest of consumers (Engel et al. 1990). Consumers from the same age group usually share common requirements of
products and indicate a common interest in particular fashions or trends of products in
the market. It is recognised that every time consumers pass through age stages, their
product requirements change accordingly. For example, younger consumers are more likely to show more interest in fashionable and trendy products than their older
counterparts. In addition, Beatty and Smith (1987) suggest that as people become older,
they tend to limit the amount of information they obtain about products prior to a brand
83
Chapter 4 Analysed Constructs and Research Hypotheses
choice decision. Cole and Balasubramanian (1993) state that age may impose natural
constraints on how effectively a consumer searches for information.
In contrast to earlier research findings, recent studies show that consumers from the
older age category may behave similarly to other consumers from younger categories.
For instance, Gunter (1998) finds that some of the older consumers can be as fashion-
conscious as younger consumers. There appears some degree of heterogeneity in the
older category, such as some of them being confused by too much choice, while at the
same time some of them do cope well with overwhelming choice. This notion is further
supported by Gunter and Furnham (1998), who report that the market segment for
children is also found to be a heterogeneous one in terms of demographic and
psychological character, and respect to purchase patterns.
Past research in the study of counterfeiting reveal that age is an influential factor in the
intention and the actual purchasing frequency of counterfeit products for British
consumers. Older consumers are less likely to want to buy counterfeit brands (Bian and Veloutsou 2006). Consumers who indicated previous purchases of counterfeit products
are significantly younger (mean age 29 years) than consumers who indicated that they have never purchased counterfeits (mean age 39 years) (Wee et al. 1998). Consumers
who stated a preference for the counterfeits tend to be younger (mean age 28.4 years) than consumers who stated a preference for the legitimate goods (mean age 35.4 years),
and consumers who admit to purchasing counterfeit goods are younger (mean age 28.1
years versus a mean age of 34.3 years) (Wee et al. 1995). On the other hand, Phau et al. (2001) report that lower spenders on counterfeits are mainly people aged 19 to 24 with a blue-collar occupation; higher spenders on counterfeits are people in the age bracket 25
to 34. Given that the main stream of research findings suggest that older consumers are
more likely to prefer BP, and younger consumers are more likely to show a preference for CBP the following hypotheses are proposed:
H agel : Age of a consumer has a positive relationship with the likelihood of
consideration and the purchase intention of BP.
H age2 : Age of a consumer has a negative relationship with the likelihood of
consideration and the purchase intention of CBP.
84

Chapter 4 Analysed Constructs and Research Hypotheses
4.4.2 Household Income
Consumers' purchase behaviour is heavily influenced by their economic resources
(Engel et al. 1990). It takes money to become a consumer. To most consumers, income
provides the main economic resource. Therefore, it is rational to say that the level of
consumers' income to a great extent determines the categories of product they seek and
what brand they buy. This is particularly true in relation to luxury products. This notion
is supported by Maslow's well-established Hierarchy of Needs Theory (Maslow 1954).
We are aware that disposable income might be the best measure of income for this
study. Nevertheless, the household income is measured for the present research. This is
because consumers might have a clearer idea about the household income than the
disposable income and therefore, more accurate data can be obtained.
Peter and Olson (1994) maintain that people with similar incomes tend to have similar
purchase behaviours and lifestyles. Therefore, one can expect that the consumers of
different levels of household income will have different purchase behaviours. High
income consumers are more likely to purchase luxury brands compared to low income
consumers. Consumers who state a preference for the counterfeits tend to earn less
income, while, consumers who admit to purchasing counterfeit goods earn less income
(Wee et al. 1995). The interpretations and understanding of the above noted literature
can be summarised as the following hypothesis:
H Incomel : Consumer income has a positive relationship with the likelihood of
consideration and the purchase tendency of BP.
H ; ncome2 : Consumer income has a negative relationship with the likelihood of
consideration and the purchase tendency of BP.
4.4.3 Gender
Although there is a general agreement that the gap between traditional male and female
roles is becoming increasingly blurred, researchers do differentiate between male appeal
and female appeal (Chisnall 1995). This argument is further supported by Peter and
Olson (1994), who state that despite the modem tendency to downplay differences
85
Chapter 4 Analysed Constructs and Research Hypotheses
between men and women, there is ample evidence that men and women differ in many
respects besides physical characteristics.
Past research demonstrate that gender difference exists in the information processing
styles and emotion involved at the time of judgement in consumption (Fisher and Dube
2005; Dube and Morgan 1996), as well as in the processing strategy involving memory
in the advertising contexts (Meyers-Levy and Maheswaran 1991). Gender seems to
influence the degree to which British consumers admit that they are willing to buy or
that they actually do buy counterfeit brands. Men in the UK confessed that they were
willing to buy counterfeits for their own use and as presents and that they did actually
buy them, more than did women (Bian and Veloutsou 2006). As such, the following are
proposed:
H gender : Gender will have a significant effect on CBP consumption, with males being
more likely to consider CBP and intending to purchase CBP in the context of non-
deceptive counterfeiting.
4.4.4 Education
It seems that more educated respondents are more willing to admit that they are willing
to purchase counterfeit brands (Bian and Veloutsou 2006). This is in line with Phau and
Lau (2001) who claim that low spenders on counterfeits have relatively lower education
level, whereas, high spenders appear to have higher education level (e. g. tertiary or
university education). Apparently, previous research findings related to impact of
education on purchase behaviour of CBP are not consistent. For example, Wee et al.
(1995) find that consumers who stated a preference for the counterfeits have less
education. Despite the clear relationship reported in the aforementioned research,
Bloch et al. (1993) found that demographic variables (gender, household income, and
age) were not effective in distinguishing between counterfeit purchasers and non-
purchasers. Accordingly, one can conclude that previous research findings suggest that
the demographic characteristics do not appear to have a consistent relationship with the
purchasing or the intention to purchase counterfeit brands. For those who are interested,
please refer to Chapter 2 for further details.
Nevertheless, this research believes that level of education negatively influences
consumer choice of CBP; this is in line with Bian and Veloutsou (2006) and Phau et al.
86

Chapter 4 Analysed Constructs and Research Hypotheses
(2001). The reason for choosing this stand is because the study of Bian and Veloutsou
(2006) was conducted in the UK, whereas Phau et al's (2001) was conducted in Hong
Kong. Consumers from these two regions are heavily influenced by British culture. In
contrast, "Wee et al's study (1995) was conducted in Singapore, and Bloch et al. 's (1993)
data was collected in the United States, where the culture is different to that of the UK.
Consumers with a higher level of educational background are more likely to have better
paid jobs, and are more capable of differentiating BP and CBP. Consequently, they
might appear to prefer BP. Hence, the following propositions are to be examined.
H ed�«, t; onl :
The level of educational attainment has a positive relationship with the
likelihood of consideration and purchase tendency of BP.
H educalion2 : The level of educational attainment has a negative relationship with the
likelihood of consideration and purchase tendency of CBP.
4.5 Brand, Brand Identity and Brand Image
According to Thorsten Nilson, the term "brand" comes from a Scandinavian word for
burning (branna). "Brand" is the Swedish word for fire. Originally, this often meant burning a mark on a product, much as the cowboys of the early West began branding
their cattle for identification purposes (Nilson 1996). The marketing practice of
branding products dates at least to ancient Rome, when caps on wine amphorae revealed
the maker's mark (Abalos 1985). Thus, branding originated from the act of putting
your identifiable mark on something you had produced.
Since `brand' was first used in marketing, there have been various interpretations of this
concept (de Chematony and Dall'Olmo Riley 1998). For example, brand was defined
as a legal statement of ownership (Crainer 1995), and as a risk reducer (Kapfererb
1995). One of the more established definitions of a brand was proposed by the
American Marketing Association (AMA) in 1960:
A name, term sign, symbol or design, or a combination of them, intended to
identify the goods or services of one seller or group of sellers and to
differentiate them from those of competitors (de Chernatony 2001, p. 21).
87
Chapter 4 Analysed Constructs and Research Hypotheses
This definition stresses the importance of the brand's logo and visual signifiers
primarily as a basis for differentiation purposes (de Chernatony 2001) and was widely
accepted by marketing researchers either with slight verification (e. g. Koch 1994) or
without verification (e. g. Kotler et al. 1996; Aaker 1991). This definition was criticised
for being too preoccupied with the product (e. g. Crainer 1995) and too mechanical (e. g.
Arnold 1992) as well as very restrictive, since it neglects the other brand identity
elements which bring brand differentiations (de Chernatony and Dall'Olmo Riley
1998).
Brands are complicated entities which involve branded products themselves, consumers,
distributors, marketers, corporations, competitors (de Chernatony 2001). Although
previous research has put a great deal of effort into describing them, nevertheless, no
consensus has been achieved, as it appears that different researchers tried to describe
them from different perspectives. For example, Seguela (1982) suggests that all brands
should be described through three facets: the physical characteristics (product
attributes), the character (brand personality facet) and the style (executional elements
for advertising and communication). Plummer (2000) recommends that brands can be
described in terms of three different classes of characteristics: physical attributes
(product attributes), functional/consequences characteristics, and characteristics (brand
personality facet). It is more likely that Seguela's claim is in the same vein as Aaker's
(1996) brand identity benchmark work (to be reported in a later section), which is a
view of brands from the marketer/strategist's perspective. In contrast, Plummer's
(2000) description is drawn from the consumers' perspective. More specifically,
consumers see brands as products, as persons, which can bring functional and emotional
benefits.
Very recently, researchers realised that it was necessary to develop a theory for the
brand (e. g. Singh 1991; de Chernatony and Dall'Olmo Riley 1998), since it appeared
that lack of precision in the terminology of brands caused problems to both practitioners
and academics (Mintzberg and Waters 1982; Kollat et al. 1970). Following this view,
de Chernatony and Dall'Olmo Riley (1998) reviewed more than one hundred articles
(more than 80% of them were published in the 1980s and 1990s) from trade as well as
from academic journals, providing a broad and rich perspective of the range of
definitions used. Using content analysis, the authors identified twelve main themes of
88

Chapter 4 Analysed Constructs and Research Hypotheses
brand definitions (de Chernatony and Dall'Olmo Riley 1998). Strictly adhering to
Singh's (1991) recommendation, the authors applied the redundancy analysis to this
research and laid the foundations for a theory for the brand. The authors suggest that
`the brand is a complex multidimensional construct whereby managers augment
products and services with values and this facilitates the process by which consumers
confidently recognise and appreciate these values' (de Chernatony and Dall'Olmo Riley
1998, p. 436). This definition notes that both firms and consumers are the two main
stakeholders of a brand. Moreover, the authors assert that `by incorporating knowledge
about consumers' interpretations of brands, the virtuous cyclical process should enable
firms to build powerful brands' (de Chernatony & Dall'Olmo Riley 1998, p. 436).
De Chernatony and Dall'Olmo Riley's (1998) study first attempted to draw two themes
of descriptions of brand characteristics, brand identity and brand image, together in
consideration of the formation of brand theory. The proposed brand definition stresses
the importance of understanding consumers' perception of a brand in terms of building
a strong brand and brand management. Even though de Chernatony and Dall'Olmo
Riley (1998) did not address the differentiation between brand identity and brand image,
the definition of brand they suggested gives a strong indication that brand identity and brand image are two broad dimensions of brand and they serve different functions in the
establishment of a brand.
4.5.1 Relationship between Brand, Brand Image and Brand Identity
`Brand identity is a unique set of brand associations that the brand strategist aspires to
create or maintain. These associations represent what the brand stands for and imply a
promise to customers from the organisation members' (Aaker 1996, pp. 68).
Accordingly, one can argue that brand identity provides a long-term direction to
marketers and corporations as a whole. It only stresses what marketers want their
brands to be, and what they want their brands to be to consumers, but ignores the impact
of consumers' perception on brand identity. Technically, there is no problem in terms
of brand identity definition if one only focuses on what the marketers want their brand
to be. Nevertheless, the problem appears when the attention is shifted to brand identity
establishment. In reality, to create a brand identity is not one directional task; it
involves interactions between consumers and marketers (Johar et al. 2005). In other
89
Chapter 4 Analysed Constructs and Research Hypotheses
words, marketers are in control of brand identity design, but certainly not of how
consumers perceive their brands.
It was believed conventionally that managers could exert a fairly high degree of control
over brand image through careful strategic choices (e. g. Aaker and Joachimsthaler
2000; Keller 1998). This view was challenged by later researchers. Wee (2004) asserts
that marketers only have limited control of the fate of their brands. Holt's (2002,2003)
and Muniz and O'Guinn Jr. 's (2001) research findings imply that marketing managers
exert far less direct control over brand meaning than was commonly supposed in the
previous brand management literature. Although there exists little consensus
concerning to what extent marketers have control over brand image, it is very widely
accepted that marketers' knowledge of consumers' perception of their brands provides
useful and necessary background information when developing a brand identity (Aaker
1996; de Chernatony and Dall' Olmo Rileyl 998; Holt, 2002,2003; Muniz and O'Guinn
Jr. 2001; Johar et al. 2005).
Marketers choose a brand to convey the identify they want to establish. In this sense,
the brand itself is not a memory target but a cue that might facilitate recall or inference
of previously learned brand association (Warlop et al. 2005). Therefore, the consumer's
perception of a brand is actually the perceived brand identity, which is termed brand
image. Given that what the consumer perceives might not reflect what the brand is, the
consumer perceived brand image might or might not be identical to the brand identity
that the marketers intend to establish. Thus, marketers have to have a good knowledge
of consumers' perceptions of their brand before they take any action to reposition their
brand and strength their intended brand identity. This indicates the important influential
role played by the brand image in the process of brand identity establishment. Figure
4.2 generalises the relationship of brand, brand image, brand identity and the related
subjects involved, as suggested by previous research. The dotted arrows indicate that
what marketers want their consumers perceive is not passed on from marketers to
consumers directly, whereas the solid arrows represent the actual message flow.
4.5.2 Brand Image Trap and Proposed Reasons for This Trap
Aaker (1996) cautioned against `brand image trap' in brand identity and brand
management literature and indicated that `the use of the brand image as an identity
statement often goes unchallenged' (p. 69). Apparently the situation is far broader than
90

Chapter 4 Analysed Constructs and Research Hypotheses
Aaker (1996) recognised. A close look at the relevant literature reveals that researchers
used brand image, brand identity, brand personality as well as brand attitude
interchangeably. For example, Chang (2002) and Bird et al. (1970) used brand image to
refer to brand attitude; Graeff (1997) and Dennis et al. (2002) used brand image to
replace brand personality; brand image also was used as brand identity (e. g. Bhat and
Reddy 1998; Park et al. 1986; Madden et al. 2000). Roth (1995) used brand image,
brand personality and brand identity interchangeably in his work.
Brand
Firm's input - brand identity Marketers/strategists
Influence
------------- Intended identify
Consumers' Perception -brand image Consumers
Figure 4.2 Relationship between brand, brand image and brand identity Adapted from de Chernatony & Dall'Olmo Riley (1998)
Aaker (1996) claims that brand image, brand identity and brand position are different
concepts. Brand image is `how a brand is perceived by consumers, ' while brand
identity reflects `how strategists want a brand to be perceived' (Aaker 1996, p. 71).
Aaker's work has made a great contribution to the understanding of brand image and
brand identity, the two main concepts related to brand notion. However, this study did
not make any effort to investigate questions concerning why these two concepts
together with other constructs were used interchangeably among researchers. The
current research extends Aaker's (1996) work by exploring why brand image, brand
identity were used interchangeably. It is proposed that one needs to look at how brand
image was defined historically and the dimensions of both brand image and brand
identity.
4.5.2.1 How Brand Image was Defined Historically
Since it was first introduced formally into the marketing discipline by Gardner and Levy
(1955), to communicate a brand image to a target segment has been regarded as an
important marketing activity (Gardner and Levy 1955; Grubb and Grathwhol 1967;
Reynolds and Gutman 1984; White 1959). Particularly, it has become a commonplace
in consumer behaviour research (Dobni an Zinkhan 1990). However, like some other
91
Chapter 4 Analysed Constructs and Research Hypotheses
concepts (e. g. involvement and perceived risk), until very recently there was no
commonly accepted understanding of brand image. Recent researchers claim that brand
image refers to the role of brand names and other aspects of a brand's trade dress as
cues that retrieve or signal product attributes, benefits, effects, or overall quality (e. g.
Erdem and Swait 1998; Kirmani and Rao 2000; Henderson et al. 2003). Nevertheless,
conventionally, brand image was defined differently according to different research
focus (Reynolds and Gutman 1984), due to lack of a firm base or foundation on which
the concept can be built (Dobni an Zinkhan 1990).
Reynolds and Gutman (1984) reveal that considerable variation exists among
definitions of brand image. These authors further suggest five categories of definitions
used by previous researchers. These include (1) general characteristics, feelings, or
impressions (Jain and Etgar 1976), (2) perceptions of products (Lindquist 1974; Marks
1976), (3) beliefs and attitudes (May 1974; James et al. 1976; Hirschman et al. 1978),
(4) brand personality (Arons 1961; Martineau 1958), (5) linkages between
characteristics and feelings/emotions (Oxenfeldt 1974). More recently, Dobni and
Zinkhan (1990) analysed 28 previous studies and asserted that brand image has not
remained stable over a period of 35 years. The authors argue that there existed little
consensus concerning how the construct should be operationalised (Dobni and Zinkhan
1990), and suggested that previous definitions could be grouped into five broad
categories. These five categories are `blanket definition' (e. g. Herzog 1963; Newman
1957), `emphasis on symbolism' (e. g. Levy 1958; Frazer 1983; Noth 1988), `emphasis
on meanings and messages (e. g. Durgee and Stuart 1987; Swartz 1983; Friedmann and
Lessig 1987; Reynolds and Gutman 1984), `emphasis on personalification' (e. g.
Debevec and Iyer 1986; Bettinger et al. 1979; Levy 1958), `emphasis on cognitive or
psychological elements' (e. g. Reynolds and Gutman 1984).
Not surprisingly, to a great extent there exist similarities between the brand image
definition categories suggested by Reynolds and Gutman's (1984) and the broad
categories recommended by Dobni and Zinkhan (1990). More importantly, both of
these works revealed that brand image has been assigned different meanings from the
day it was introduced into the marketing discipline and there no consensus has been
achieved concerning the definition of brand image. As such, this could be one of the
92
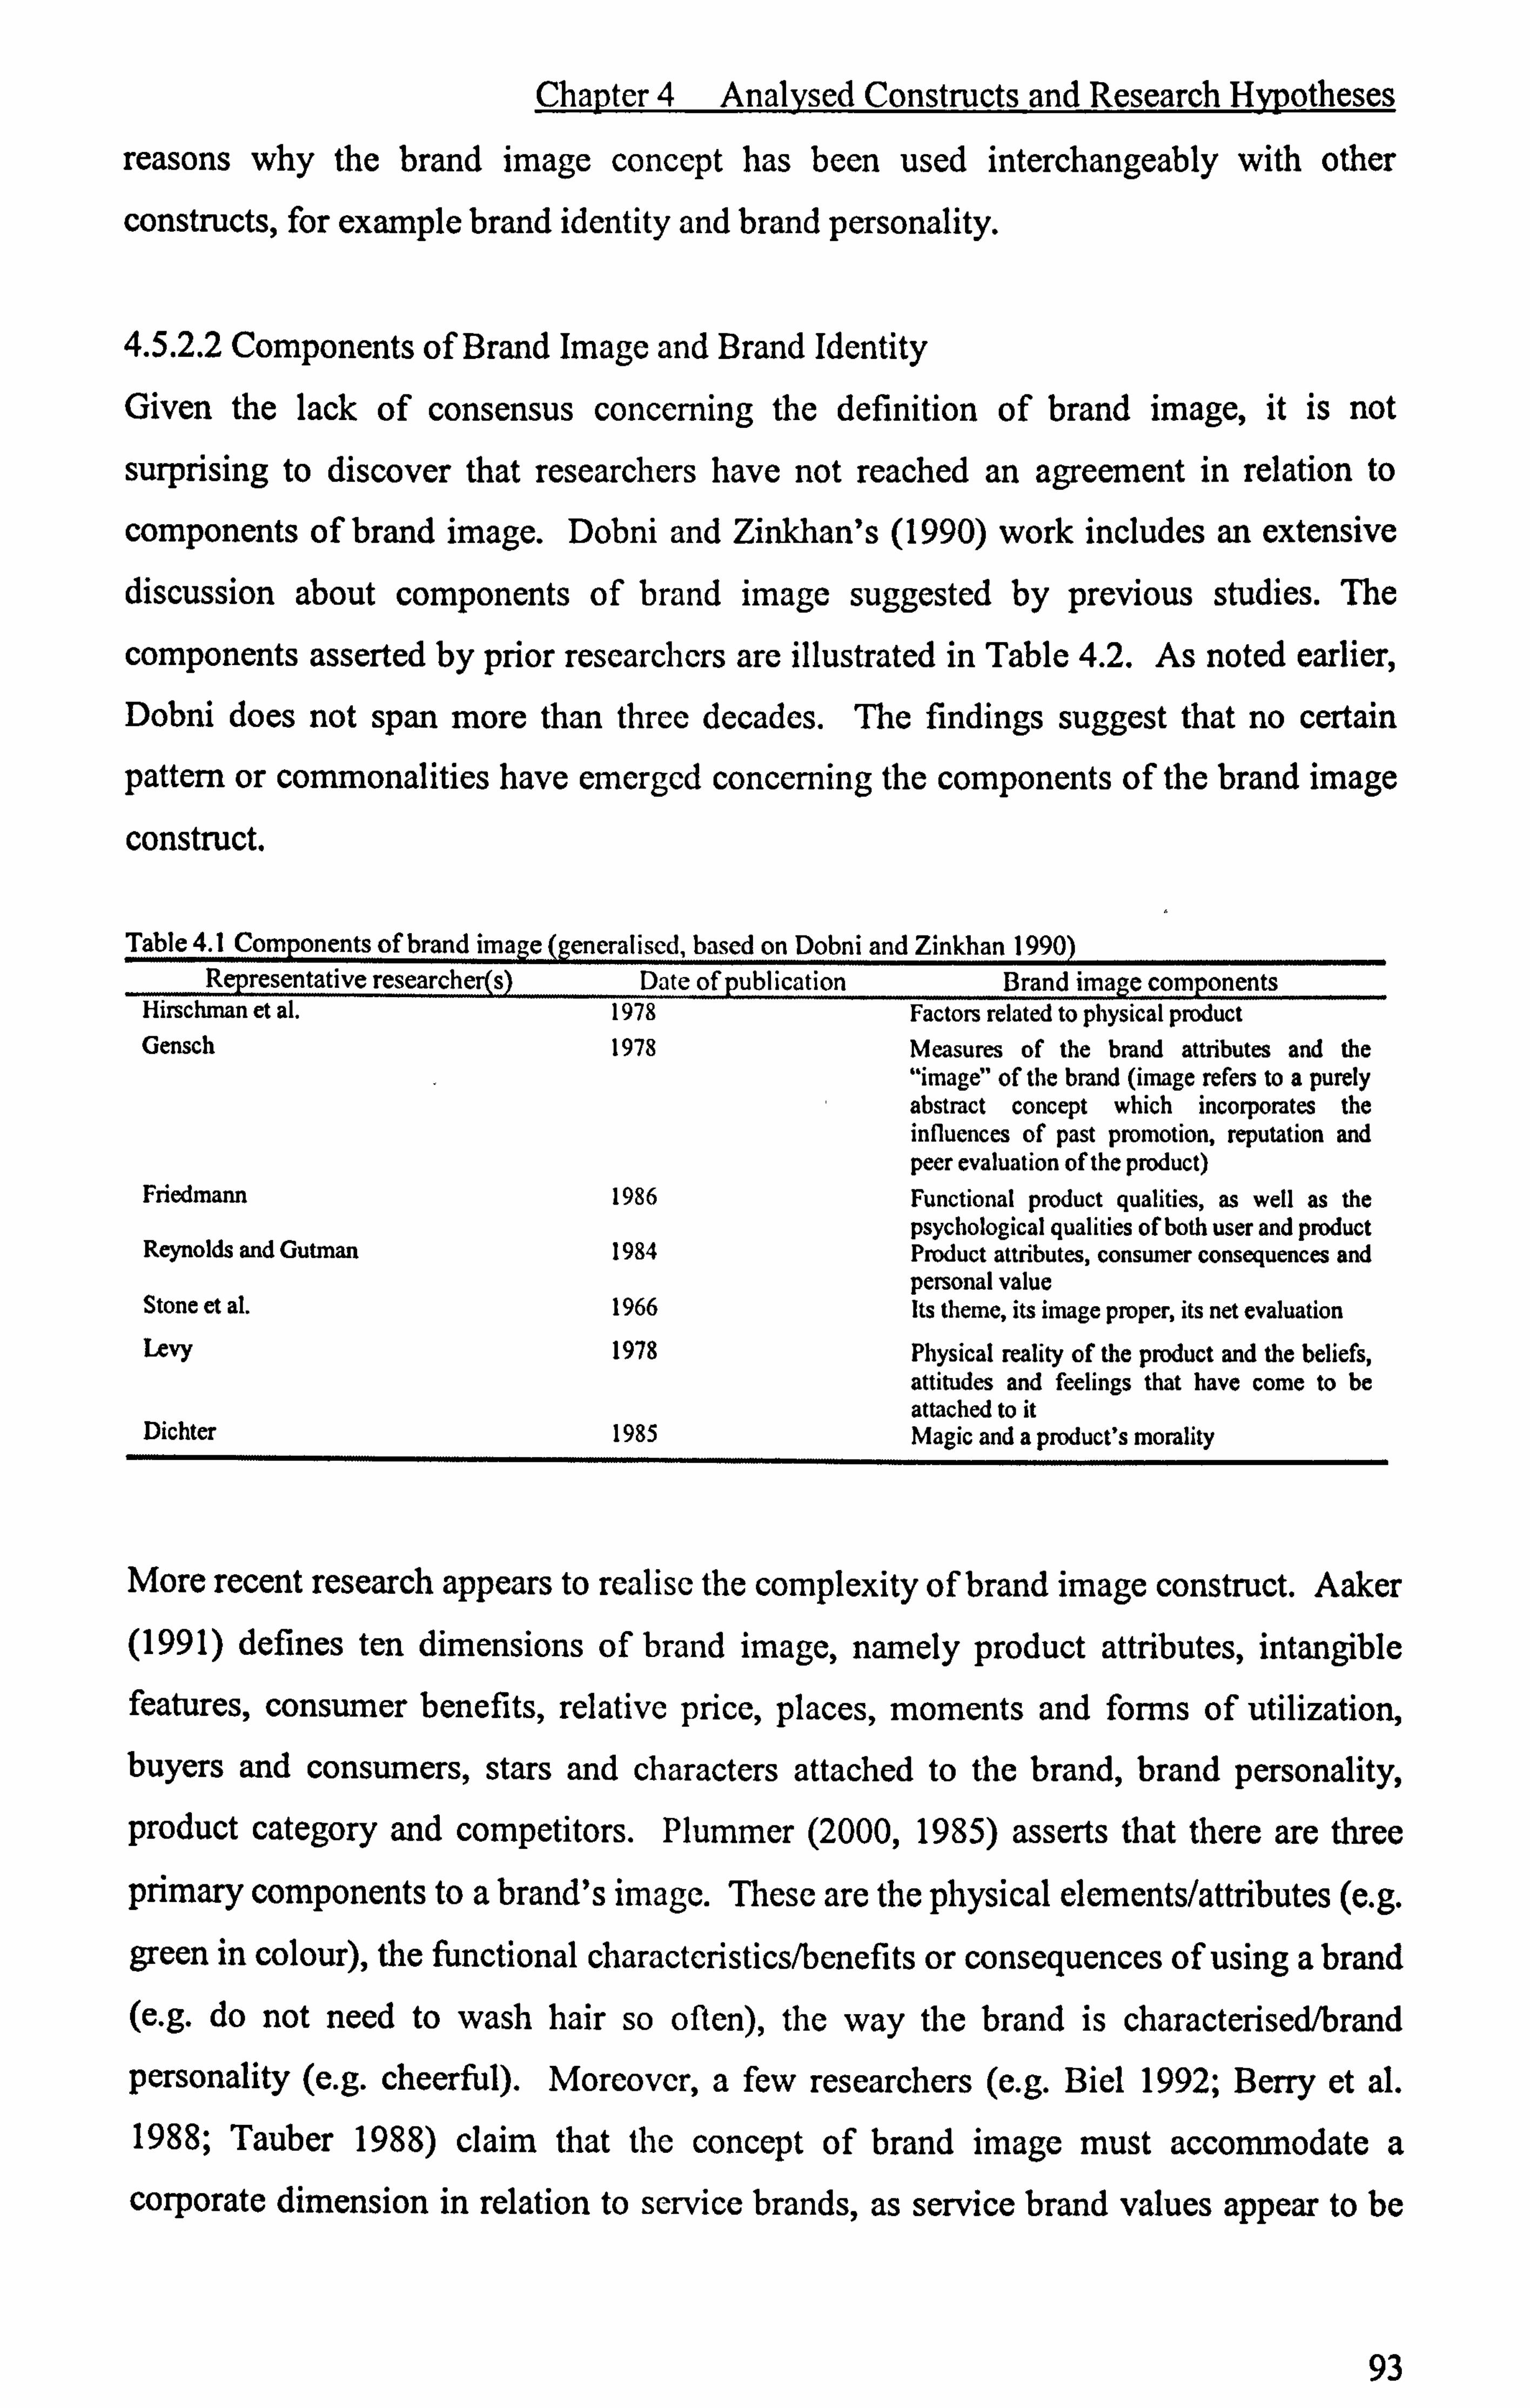
Chapter 4 Analysed Constructs and Research Hypotheses
reasons why the brand image concept has been used interchangeably with other
constructs, for example brand identity and brand personality.
4.5.2.2 Components of Brand Image and Brand Identity Given the lack of consensus concerning the definition of brand image, it is not
surprising to discover that researchers have not reached an agreement in relation to
components of brand image. Dobni and Zinkhan's (1990) work includes an extensive discussion about components of brand image suggested by previous studies. The
components asserted by prior researchers are illustrated in Table 4.2. As noted earlier,
Dobni does not span more than three decades. The findings suggest that no certain
pattern or commonalities have emerged concerning the components of the brand image
construct.
Table 4.1 Components of brand image (generalised, based on Dobni and Zinkhan 1990 Representative researcher(s) Date of publication Brand image components
Hirschman et at. 1978 Factors related to physical product Gensch 1978 Measures of the brand attributes and the
"image" of the brand (image refers to a purely abstract concept which incorporates the influences of past promotion, reputation and peer evaluation of the product)
Friedmann 1986 Functional product qualities, as well as the psychological qualities of both user and product
Reynolds and Gutman 1984 Product attributes, consumer consequences and personal value
Stone et at. 1966 Its theme, its image proper, its net evaluation Levy 1978 Physical reality of the product and the beliefs,
attitudes and feelings that have come to be attached to it
Dichter 1985 Magic and a product's morality
More recent research appears to realise the complexity of brand image construct. Aaker
(1991) defines ten dimensions of brand image, namely product attributes, intangible
features, consumer benefits, relative price, places, moments and forms of utilization, buyers and consumers, stars and characters attached to the brand, brand personality,
product category and competitors. Plummer (2000,1985) asserts that there are three
primary components to a brand's image. These are the physical elements/attributes (e. g.
green in colour), the functional characteristics/benefits or consequences of using a brand (e. g. do not need to wash hair so often), the way the brand is characterised/brand personality (e. g. cheerful). Moreover, a few researchers (e. g. Biel 1992; Berry et al. 1988; Tauber 1988) claim that the concept of brand image must accommodate a corporate dimension in relation to service brands, as service brand values appear to be
93

Chapter 4 Analysed Constructs and Research Hypotheses
most salient to consumers at the corporate level. This assertion enriches Plummer's
theory by adding an alternative dimension - the `brand as a company'.
It seems that components of brand identity did not attract as much attention from
researchers as brand image did. One of the two notable works is Kapferer's (1998)
`brand identity prism'. According to the brand identity prism, brand identity has six dimensions (the brand personality, brand inner values, the brand relationship facet, the
brand-reflected consumer facet, and the brand physical facet). Setting off from brand
management, Aaker (1996) suggested that brand identity consists of four perspectives
with twelve dimensions: brand as product (product scope, product attributes,
quality/value, uses, users, country of origin), brand as organisation (organizational
attributes, local versus global), brand as person (brand personality, brand customer
relationships), and brand as symbol (visual imagery/metaphors and brand heritage).
After close study of components of brand image (e. g. Plummer 2000,1985) and brand
identity (e. g. Aaker 1996), one can comfortably claim that to a great extent the brand
image and the brand identity consist of almost identical facets. This finding is
interesting, but certainly not surprising, since it is along the same lines as the nature of brand image and brand identity, which claims that brand image is the concept of a brand
that is held by consumers, while brand identity is what marketers/strategists want their
brand to be and what they want their brand to be to consumers (Aaker 1996). Table 4.3
represents the generalised components of brand image (Plummer 2000,1985; Biel
1992; Berry et al. 1988; Tauber 1988) and the dimensions of brand identity (Aaker
1996).
Table 4.2 Components of brand image (Plummer 2000,1985) and brand identity (Aaker 1996)
Constructs Brand image Brand identity
Components Physical attributes Plummer (2000,1985 Functional characteristics/benefits or
Brand as product (product
consequences of using a brand Plummer (2000, attributes, product scope, 1985) quality/value, uses, users,
country of origin (Aaker 1996)
Characterisation/brand personality (Plummer Brand as a person (Aaker 1996) 2000,1985
Brand as a symbol (Aaker 1996)
Brand as a company (Biel 1992; Berry, Brand as a company (Aaker Lepkowith and Clark 1988; Tauber 1988) 1996
94
Chapter 4 Analysed Constructs and Research Hypotheses
4.5.2.3 Debriefings and Suggestions
The various brand image definitions as well as components of both brand image and
brand identity in the two sub-sections above have been analysed with the aim of
identifying the reasons for the so-called `brand image trap'. The reasons discovered
through the review can be summarised as follows. First, historically there was lack of a
firm base or foundation on which the brand image concept can be built. Consequently,
brand image was defined differently to serve different research focuses, and there was
no consensus concerning the definition of brand image until more recently (e. g.
Plummer 2000). Second, previously proposed brand image components did not show
any clear pattern, nor did any commonality appear. Third, more recent research
suggests that brand image and brand identity consist of almost identical components. It
is believed that all these reasons are responsible for the interchanging use of the brand
image and the brand identity.
Considering all of the above, it is necessary for any researcher to clarify what the
research is examining, brand image or brand identity, at the outset before embarking on
any research. Researchers should have a clear mind that brand identity and brand image
are distinguishable constructs, although broadly speaking, these two concepts have
almost identical dimensions. Misuse of any one of these constructs would certainly
cause confusion for readers and would also make comparison and generalization of
research findings difficult (Dobni and Zinkhan 1990). To have a good understanding of the difference between brand identity and brand image is also a necessity for marketers,
as brand image is the most important component of brand equity (Warlop et al. 2005;
Cobb-Walgren et al. 1995), while brand identity is not.
4.5.2.4 Significances of Brand Image
In their benchmark work, Gardner and Levy (1955) suggest that the long-term success
of a brand depends on marketers' ability to select a brand meaning (image) prior to
market entry, operationalize the meaning in the form of an image, and maintain the
image over time. At root, brand image is important because it contributes to the
consumer's deciding whether or not the brand is the one for him/her (Dolich 1969) and it influences consumers' subsequent buying behaviour (Fishbein 1967; Johnson and
95
Chapter 4 Analysed Constructs and Research Hypotheses
Puto 1987). Managing brand image has been seen as a vital part of an organisation's
marketing management strategies (Hsieh 2002).
It has been established earlier that the perceived brand image is in fact consumers'
perceptions of a branded product. The perception process has long been recognised as
the most significant barrier to effective communication. It is important that marketers
understand the whole notion of perception so that they can determine more readily what influences consumers to buy (Schiffman and Kanuk 1991). A well-communicated brand image should help to establish a brand's position, insulate the brand from
competition (Oxenfeldt and Swann 1964), enhance the brand's market performance (Shocker and Srinivasan 1979; Wind 1973), and therefore plays an integral role in
building long-term brand equity (Aaker and Keller 1990; Keller 1993; Park et al. 1991;
Feldwick 1996; Park and Srinivasan 1994). All in all, a favourable brand image is the
key to success of a brand.
4.5.2.5 Brand Image - Focus of This Study
As noted earlier the brand identity is what the marketers want their brand to be to
consumers, while the brand image is about how the brand is perceived by the consumers (Aaker 1996). It is not necessary to say that the information from the sender (marketer)
will definitely get through to the receiver (consumer) (Aaker and Myers 1987), since
correct decoding of marketing information hinges on the consumer's perception of the
communication content (Koekmoer 1991). Therefore, perceptions of brand/product are
of crucial importance to the marketer, since people respond on the basis of their
perceptions of reality, not reality per se (Lewin 1936; Puth et al. 1999). A number of
research confirms that perceptions are important to study (e. g. Schiffman and Kanuk
1991), even if they are misconceptions of actual events (Porter and Claycomb 1997).
Analysis of consumer perceptions and decision-making processes is therefore extremely important in order to understand consumer behaviour, since it can help marketers to
determine more readily what influences consumers to buy (Schiffman and Kanuk 1991),
and draft better positioning strategies. In the case of the presence of counterfeit
products, a better understanding of consumers' perceptions of both CBP and BP, as well
as their effects on consumer behaviour will assist marketers and policy makers to develop more effective campaigns against counterfeits.
96
Chapter 4 Analysed Constructs and Research Hypotheses
This research attempts to investigate consumers' perceptions and their effects on
consumer choice processes. Therefore, the brand image theory is adopted. More
specifically, consumers' perceived brand image and its influence on the formation of
consideration set and purchase intention are to be examined. Many academic
researchers have investigated the concept of brand image from different perspectives
(e. g. Aaker 1997; Gabbott and de Chernatony 2005). Recently, there has been renewed
interest in the subjective and emotive aspects of consumption (Fournier 1995). It is
commonly accepted that products are often purchased based not only on functional or
utilitarian attributes, but also on symbolic reasons. This is more likely to be the case
with `Hi-Visible' products and luxury brands, where some personal or social meaning is
to be attached to the branded product. As the present research is to examine luxury
brands, product attributes, brand benefit/consequences and brand personality are the
investigated dimensions related to brand image in this research. The brand personality
tends to serve a symbolic or self-expressive function and, in contrast, product-related
attributes tend to serve a utilitarian function for consumers (Wee 2004). In non-service
brands, quite often consumers have no direct contact with companies; therefore `brand
as a company' is not examined here, even though this is considered as a component of
brand image in general. This decision is supported by the findings of the focus group
discussion. The focus group findings reveal that consumers are more likely to be
concerned about factors related to the branded products rather than factors related to the
company which own the selected brands.
4.5.3 Brand Personality
Brand related benefits/consequences and product attributes are fairly straightforward
concepts; therefore it has been decided that no more effort will be put into reviewing the
relevant literature. The most salient and relevant benefits/consequences and product
attributes related to the studied brands are generated from focus group discussions.
Details are reported in Chapter 6 with regard to how they are chosen and which are
chosen. The focus of this section is on reviewing brand personality literature. This
effort is considered necessary for a research like this as by its very nature the brand
personality concept is abstract and complex. Indeed, focus group participants appeared
to have great difficulties in understanding this concept, which supports the necessity of
this review.
97

Chapter 4 Analysed Constructs and Research Hypotheses
4.5.3.1 Definition of Brand Personality
Like most marketing concepts, brand personality was first created by practitioners who
were not marketing academics (Azoulay and Kapferer 2003), by frequently using
celebrities to endorse branded products. At the very earlier stage when brand personality
was first adopted by academics, it was used to refer to the non-material dimensions that
a store special (Martineau 1958). Since then a few researchers have offered their
definitions of brand personality (e. g. Aaker et al. 1995; Aaker 1997; Azoulay and
Kapferer 2003).
Aaker's (1997) definition is widely accepted by later researchers; this suggests that
brand personality is "the set of human characteristics associated with a brand" (p. 347),
which includes such characteristics as gender, age, and socio-economic class as well as
classic human personality traits such as warmth, concern, and sentimentality. This
definition was criticised by Azoulay and Kapferer (2003), who claim that Aaker's
(1997) definition is too loose, and almost covers everything related to a human being
(e. g. gender and age). Azoulay and Kapferer (2003) note that definition of brand
personality should closely follow the way human personality is defined and suggest that
intellectual abilities, gender and social class should not be included in brand personality. They propose that `brand personality is the set of human personality traits that are both
applicable to and relevant for brands' (Azoulay and Kapferer 2003). The root of
Azoulay and Kapferer's (2003) brand personality definition is the well-explored human
personality in psychology. In fact, how the brand personality should be defined is still debatable. However, researchers generally agree that the brand personality originated as
a non-product-based definition of the brand (e. g. Azoulay and Kapferer 2003; Aaker
1997). Despite the criticism, the present research adopts Aaker's (1997) definition, as
we believe that age and gender should be included as brand characteristics. This is in
line with other research, such as that of Plummer (2000,1985).
4.5.3.2 Human Personality vs. Brand Personality
Human personality is defined as `the set of relatively stable and generally dynamic,
emotional and affective characteristics of an individual's way of being, in his/her way to
react to the situations in which s/he is in' (Bloch et al. 1997). According to this definition, intellectual abilities, gender and social class are excluded. Human
personality deals with the affective, emotional and dynamic aspect (Azoulay and
98

Chapter 4 Analysed Constructs and Research Hypotheses
Kaplerer 2003). It has been commonly accepted that brands, like people, can be
described with adjectives (Berry et al. 1988; Plummer 1985,2000; Poiesz 1989).
Actually, much of the work in the area of brand personality was based on translated
theories of human personalities (Wee 2004), and also most personality scales were
closely related to the use of measures of human personality (e. g. Aaker 1997; Caprara et
al. 2001). In comparison to the well-developed human personality theory, studies of
brand personality have a very short history (Aaker 1995,1997; Aaker and Fournier
1995; Caprara et al. 2001; Chung et al. 2001).
Although brand personality developed from human personality, there appear to be some
obvious distinctions between these two constructs. First of all, the means through
which they are perceived by consumers is different. Human personality is perceived
through a human being's behaviour, physical characteristics, attitudes and beliefs, and
demographic characteristics (Azoulay and Kapferer 2003; Park et al. 1986); brand
personality can be transmitted to consumers both directly and indirectly (Supphellen
and Gronhaug 2003; Helgeson and Supphellen 2004). The `direct' sources of brand
personality are person-based, and include human characteristics associated with a
typical brand user, company employees, the CEO of the company, and brand endorsers (Aaker 1997); the `indirect' sources involve all the decisions made by the manager
relative to the brand, such as price, advertising style, packaging (Phau and Lau 2001;
Batra et al. 1993; Levy 1958; Plummer 1985). Secondly, the contents of these two
constructs are different. The human personality "Big Five Model" consists of
personality traits of Extroversion, Agreeableness, Conscientiousness, Emotional
Stability and Openness (Goldberg 1990); Aaker's (1997) five dimensions of brand
personality refers to Sincerity, Excitement, Competence, Sophistication and
Ruggedness. Lastly, although three out of five brand personality dimensions of Aaker's
(1997) five dimension brand personality theory relate to three of the "Big Five Model"
of human personality dimensions, two dimensions (sophistication and ruggedness)
differ from any of the "Big Five" of human personality (Briggs 1992). This indicates
that `brand personality dimensions might operate in different ways or influence
consumer preference for different reasons' (Aaker 1997, p. 353). This assumption was
examined by Caprara et al. (2001). In line with Aaker's (1997) claim, the research findings suggested that `while the psycholexical approach remains a suitable procedure
99

Chapter 4 Analysed Constructs and Research Hypotheses
to identify brand descriptors, the factors used to describe human personalities appear to
be inappropriate for describing the brand studied (Caprara et al. 2001).
4.5.3.3 Significances of Brand Personality Study
As products have moved from a utilitarian perspective to a perspective of consumer and
brand relationship, brand personality seems to play a very important role for all involved societies related to branded products. From the marketers' perspective, brand
personality is the key element to understanding consumer brand choice (Plummer
2000); it provides some direction with regards to the brands' marketing plans (Wee
2004), and it also serves as the foundation for meaningful differentiation, especially in
contexts where brands are similar with respect to product attributes (Halliday 1996;
Aaker 1996; de Chernatony and McDonald 1998).
From a managerial perspective, brand personality enables firms to communicate with
their consumers about the brand more effectively (Plummer 1985; Aaker 1996), it is a
contemporary tool for marketing strategies to use to build and enhance stronger
emotional ties of consumers to a brand, to obtain greater consumer trust and loyalty
(e. g. Siguaw et al. 1999; Johnson et al. 2000), and, as a result, to sustain and increase
brand equity (Phau and Lau 2001; Johnson et al 2000; Keller 1993; Batra et al. 1993).
Brand personality should be seen as a key determinant of brand equity and it offers
differentiation from other brands/products (Biel 1993; Aaker 1991). As such,
examination of brand personality is crucial to marketers from the managerial
perspective.
4.5.3.4 Two Facets of Brand Personality
Plummer (2000) suggested that brand personality is a two-facet concept. The input
facet refers to what marketers/strategists want consumers to think and feel about their
brand (brand personality statement). In other words, the input facet refers to brand
personality from the brand identification perspective. The output facet is what
consumers actually do think and feel about the brand (consumer perceptions of the
brand). The output facet represents brand personality from the brand image perspective.
Accordingly, this research only investigates the output facet of brand personality of both
CBP and BP. More specifically, it looks at consumers' perceptions of the brand
personality of the studied brand products.
100

Chapter 4 Analysed Constructs and Research Hypotheses
4.5.3.5 Brand Personality Hypotheses
Brand personality factor enables a consumer to express his or her own self (Belk 1988;
Hem and Iversen 2002; Aaker 1999) or specific dimensions of the self (Kleine et al.
1993); it serves as a symbolic or self-expressive function, it helps consumers
differ/integrate themselves with others (Keller 1993), or to make a statement of
themselves (de Chernatony and McDonald 1998). Brand personality also projects the
brands' values and creates an image of the brand's typical user (Johar and Sirgy 1991),
which might be the ideal image of the consumer. This brand information may actually
encourage the use of a given brand as a self-expressive device by consumers who hold a
similar position and want to present a like image or ideal self (Malhotra 1988).
Brand personality elicits an emotional rather than intellectual response that arouses
passion and incites an affinity without rationale for the brand (Carr 1996). Such
feelings about brand personality may make the brand seem more relevant to consumers
(Keller 1998). As such, it assists in creating a meaningful relationship between the
consumer and the brand, encourages the consumer to invest in the relationship with the
brand (Fournier 1998), and instils brand loyalty (Biel 1992).
Consumers seem to prefer brands that possess a strong, favourable brand personality
(Freling and Forbes 2005). Previous research suggest that favourable brand personality
is a central driver of consumer preference and usage (Biel 1993; Batra et al. 1993; Sirgy
1982), as consumers are more likely to associate them with a desired group, or self-
image (Aaker 1997; Lefkoff-Hagius and Mason 1993). Hence, when the perceived
brand personality of the original branded products is more favourable, the more likely it
is that these products will be considered and purchased. In the same vein, if the
counterfeit branded products are perceived to project a positive and favourable brand
personality, they are more likely to be included in the consideration set and lead to the
opportunity of being purchased. Based on our understanding of the literature, we
propose that:
H pe sonartyl : The level of consumers' favourableness of the brand personality has a
positive relationship with the likelihood of consideration and the purchase intention of
the BP.
101
Chapter 4 Analysed Constructs and Research Hypotheses
H personarry2 : The level of consumers' favourableness of the brand personality has a
positive relationship with the likelihood of consideration and the purchase intention of
the CBP.
4.5.3.6 Brand Consequences - Perceived Risk Hypotheses
Since it was first introduced by Bauer (1960), this concept has continued to receive
attention from both practitioners and academics (Mitchell 1999), and perceived risk has
been regarded as one of the major explanatory variables in consumer behaviour
(Brooker 1984; Gabbott 1991; Mitchell and Boustani 1993; Mitchell 1999). Perceived
risk has for a long time been acknowledged in the marketing literature as an important
issue during buying decisions. It is a central construct in marketing, suggesting that
consumers seek to reduce uncertainty and unfavourable consequences of purchase
decisions (Bauer 1960; Cox 1967).
A number of studies suggest that the evidence that consumers perceive risk in choice
situations is extensive (i. e. Cox and Rich 1964; Hisrich et al. 1972; Stem et al. 1977;
Shimp and Bearden 1982; Mitchell and Greatorex 1989). Consumers are often
imperfectly informed about product attributes (Erdem 1998), and they can only deal
with limited information even when all information is available (Gabbott 1991).
Hence, the outcome of a choice is more likely to be known only in the future.
Consequently, consumers are forced to deal with uncertainty and the uncertainty can
create consumer perceived risk (Anand 1993).
Consumer researchers define perceived risk in terms of uncertainty and consequences
(Bauer 1960; Taylor 1974; Dowling 1986; Campbell and Goodstein 2001) which can
lead to frustration (Cox and Rich 1964). Perceived risk comprises multidimensional
constructs, possessing financial, performance, physical, psychological, social and time
elements (Jacoby and Kaplan 1972; Arndt 1967; Perry and Hamm 1969; Mandel 2003;
Cox 1967; Roselius 1971; Mitchell and Baustani 1993; Cunningham 1967; Campbell
and Goodstein 2001).
The focus group data revealed that in the context of non-deceptive counterfeiting,
consumers are mainly concerned about social risk, financial risk and performance risk.
102

Chapter 4 Analysed Constructs and Research Hypotheses
Of interest to this study, only these three risk dimensions are discussed in detail. In the
literature, the sources of social risk, financial risk and performance risk have been
identified as follows:
" Social risk. Social risk is one in which a negative risk would result in
embarrassment, disapproval and disesteem among one's family or peers (Arndt
1967; Perry and Hamm 1969; Mandel 2003).
" Financial risk. Financial risk refers to when some products fail, the loss to the
consumers of the money spent on the products, or the money it takes to make the
product work properly, or replace it with a satisfactory product. (Roselius 1971;
Mitchell and Boustani 1993).
" Performance risk. Performance risk means that some products generalise poor
performance and lack of reliability (Cunningham 1967).
Prior studies show that in general higher value, more complicated and more involving
products are more risky than lower value, low-involvement simpler convenience
products (Mitchell 1999). Moreover, Derbaix (1983) finds that for goods characterised
by highly visible attributes, social risk is more important than others. These findings
indicate that consumers might perceive reasonably high levels of financial and social, as
well as performance, risk in relation to the branded products to be examined (Rolex
watches, Gucci watches, Burberry handbags and Louis Vuitton handbags) in the current
study due to the luxurious and symbolic nature of these brands.
There is some inherent performance risk in buying a counterfeit instead of the legitimate
product, since the former may not perform as well as the original. It is also rational to
assume that consumers may face financial risk while buying counterfeit products versus
legitimate products, due to the high uncertainty of their performance and unlikelihood
of consumer redress (Bamossy and Scammon 1985; Cordell et al. 1996). Moreover,
consumers are concerned about being found out by their peers or people whom they
esteem for buying and using counterfeit branded products (Wee et al. 1995), which
suggests that perceived social risk of purchasing counterfeits might be a concern to
consumers.
In general, it is assumed that decision makers prefer smaller risks to larger ones,
provided that other factors (e. g. expected value) are constant (Arrow 1965). Marketing
103
Chapter 4 Analysed Constructs and Research Hypotheses
literature suggests perceived risk is more powerful in explaining consumers' behaviour
since consumers are more often motivated to avoid mistakes rather than to maximise
utility in purchasing (Mitchell 1999). Thus we expect that the greater risk should
reduce consumers' likelihood of consideration and intentions to purchase the counterfeit (Charkraboty et al. 1996), as well as reduce the possibility of consideration and
purchase intention of the original branded products. Based on our understanding of the
literature we formulate the following hypothesis.
H risk, :
The level of consumer perceived risk has a negative relationship with the
likelihood of consideration and the purchase intention of BP.
H risk2 : The level of consumer perceived risk has a negative relationship with the
likelihood of consideration and the purchase intention of CBP.
4.5.3.7 Products' Physical Attributes and Perceived Benefits
Product attributes can be categorized in a variety of ways (Myers and Shocker 1981).
Keller (1993) suggests that attributes are those descriptive features that characterize a
product or service - what a consumer thinks the product or service is or has and what is
involved with its purchase or consumption. Keller further distinguishes product
attributes into two product-related attributes and non-product-related attributes. The
product-related attributes are defined as the ingredients necessary for the performance
of the product or related to a product's physical composition, whereas non-product-
related attributes are defined as external aspects of the product that relate to its purchase
or consumption. The non-product-related attributes are further categorised as price information, packaging or product appearance information, user imagery and usage imagery.
Stokmans (1991) notes that a product can be viewed as a bundle of intrinsic and
extrinsic attributes, or as a bundle of perceived attributes. The intrinsic attributes of the
product are information cues directly linked to the product such as design, taste, and
performance, and those extrinsic attributes are information cues which are indirectly
connected to the product such as price, brand name, packaging, and warranties. This is
consistent with a number of previous studies (e. g. Romaniuk 2003; Holden 1993).
104

Chapter 4 Analysed Constructs and Research Hypotheses
Keller's (1993) attribute notion represents a broader view of product attributes which
covers not only Stokmans (1991) product attribute concept but also brand personality
attributes and benefit attributes. The author believes that the user and usage imagery are
the antecedents of the brand personality component of Plummer (1985,2000) brand
image. Accordingly, Romaniuk (2003) labels Keller's (1993) attribute notion as ̀ brand
attribute'. It seems that to a great extent Stokmans' (1991) product attribute concept is
in line with the attribute component of Plummer's brand image concept, even though
Plummer (1985,2000) did not provide specific information regarding what he means by
product attribute. As brand personality has been covered in a previous section, there is
no need to reanalyse it. Thus, this research takes the narrower view of product
attributes suggested by Stokmans (1991).
The description of a product in terms of intrinsic and extrinsic attributes is usually based
on a marketer's perspective. The consumer, on the other hand, uses perceived attributes in the decision-making process (Puth et al. 1999), which is what has been named
consumers' perception of product attributes. Consumers brand perceptions are formed
through a transformation from objective, of physical attribute dimensions (e. g. size of a TV set in inches), to subjective or perceptual dimensions (e. g. largeness of the set). The
transformation is established through a comparison of brands or similar products in the
market place. For example, an ordinary TV might have been scored `good' on picture
quality. However, when high-digital TV sets enter the market, the ordinary TV will
score poorly on picture quality in comparison to the high-digital one, which will
certainly have a great impact on consumer purchase behaviour. Product attributes
represent what a specific branded product can offer to a consumer, whereas the
perceived product attributes are what the consumer believes he/she will gain from a
purchase. A positive relationship between linkage of the brand and perceived product
attributes and brand choice/preference has been found by multiple researchers since the
1960s (Cohen 1966; Axelrod 1968; Nedungadi 1990), which indicates that the more
positive the consumers' perceptions of the product attributes of a specific brand the
more chance the branded product is considered and purchased. As such, we propose the
followings.
H.,, ib. gel : Consumers' perceptions of product attributes have a positive influence on
likelihood of consideration of products and purchase intention of BP.
105
Chapter 4 Analysed Constructs and Research Hypotheses
H at: ribute2 : Consumers' perceptions of product attributes have a positive influence on
likelihood of consideration of products and purchase intention of CBP.
Perceived benefits are directly associated with perception of product attributes and
brand personality, which are the personal values consumers attach to the product. More
specifically, perceived benefit is what consumers think the product or service can do for
them (Keller 1993). In the context of non-deceptive counterfeiting, benefits are what
consumers believe the original branded products or the counterfeit branded product can
bring them.
Traditionally, benefits are classified into three categories (e. g. Park et al. 1986):
functional benefits, experiential benefits and symbolic benefits. Functional benefits are
the more intrinsic advantages of product or service consumption and usually correspond
to the product-related attributes. These benefits are often linked to fairly basic demands,
such as better product performance and long product life etc. Experiential benefits
relate to what it feels like to use the product and usually correspond to the product-
related attributes. These benefits satisfy experiential needs such as sensory pleasure (e. g. fun and value for money), variety and cognitive stimulation. Symbolic benefits are the
more extrinsic advantages of product or service consumption. They usually correspond
to non-product-related attributes and relate to underlying needs for social approval or
personal expression and outer-directed self-esteem. Therefore, the symbolic benefits
are related to prestige, exclusivity, fashionable appearance etc.
Regardless of the type of benefits suggested by previous research, the factor analysis
results of the present research extracted two factors related to consumer perceived benefits. These two factors are labelled `image benefit' and `functional benefit' (see
Chapter 7 for details). One can clearly see that in most cases the `image benefit' factor
comprises the `symbolic and experiential benefits', whereas the `functional benefit'
corresponds to `disposability' and `product life' (for handbags only) or `performance'
(for watches only).
Consumers use product attributes as the basis for evaluating a product, and product
attributes promise benefits consumers seek when purchasing a product/brand (Puth et al.
106
Chapter 4 Analysed Constructs and Research Hypotheses
1999). These benefits lead to certain end states or values that consumers wish to
achieve (Aaker et al. 1992; Belch and Belch 1995; Kotler 1999; Mowen 1993; Peter and
Olson 1994); they are what consumers want to buy (Kotler 1999). Perception of
product attributes and benefit are the choice criteria a consumer uses when evaluating
products and services. They provide the grounds for deciding to purchase one brand or
another (Jobber 2004). Numerous previous studies have demonstrated the positive
relationship between perceived benefit and consumer decision-making (e. g. Bove and
Johnson 2000; Mai and Ness 1997; Cho et al. 2002). For example, past research has
found that direct economic benefits such as paying a lower price influence the tolerance
of questionable behaviour by consumers (Dodge et al. 1996). Prior researches in the
study of counterfeiting reveal that the consumer who wilfully buys counterfeit benefits
from getting the prestige (e. g. Ang et al. 2001; Bloch et al. 1993; Tom et al. 1998) and
quality (Grossman and Shapiro 1988a) of the original branded product for a fraction of
its price. People buy counterfeits because they believe that they are getting prestige
without paying for it (Bloch et al. 1993). Past research also show that consumers
purchase counterfeit products because they believe that counterfeits are comparable to
originals in terms of brand, quality, and performance, but are superior as far as price is
concerned (Tom et al. 1998). Ang et al. (2001) suggests that people who buy
counterfeits feel that legitimate products are unfairly priced. According to the
understanding of the literature, it would seem reasonable to suggest that the greater the
perceived benefit from a purchase behaviour the more likely the products are going to
be considered and thereafter purchased. This should be applicable to both original and
counterfeit branded products. Thus, the proposed hypothesis is as follows:
Hbeneft(image®fimctional): Consumers' perceptions of benefits have a positive influence on
likelihood of consideration of products and purchase intention of both counterfeit and
original branded products.
Consumer behaviour is complex in nature. Numerous factors can have a significant
effect on consumer choice. The current research selected four constructs and is to
examine their influence on the formation of the consideration set and purchase intention. The four constructs were chosen because previous research has provided
substantial empirical evidence of their significant influence on consumer behaviour. In
addition, the influences of three out of four of these constructs on consumer behaviour
107

Chapter 4 Analysed Constructs and Research Hypotheses
have never been tested in the context of non-deceptive counterfeiting. The only
construct which has been investigated in relation to the study of counterfeiting is the demographic construct. In addition to the reason given above, this construct is to be re-
examined in the present study as the research context is different to previous ones, and
previous research findings do not appear to be consistent.
4.6 Summary
Drawing on the previous research, this chapter developed a model of determinants of
consumer choices processes. This study proposes that the decision to purchase a branded product (both counterfeit and original branded versions) can be explained by a
combination of variables drawn from the study of branding and consumer behaviour.
The examined variables are product involvement, self-assessed product knowledge,
demographic variables (age, gender, education and household income). More
specifically, the likelihood of consideration and purchase tendency of a branded product is predictable based on these variables when other conditions hold unchanged.
Analysis of the involvement construct begins by demonstrating the complexity of this
notion. Considering the complex nature of the involvement construct, as well as following Cohen (1983) who suggests that study based on imprecisely defined
involvement can lead to the impairment of our ability to refute propositions and
reformulate theories, this research determined to focus on involvement from product level and nothing else. Disregarding the various different meanings allocated to this
concept by previous researchers, by product involvement we mean: "A person's
perceived relevance of the object based on inherent needs, values and interests"
(Zaichkowsky 1985, p. 342). This definition is considered appropriate for the present
research because it indicates that generation of product involvement involves a
cognitive process; it has obtained common recognition among previous researchers,
and, more importantly, the scale used to measure this concept was developed based on
acceptance of this definition.
Acknowledging the distinctions between enduring and situational involvement, this
research challenges previous researchers' view that product involvement should be
labelled as enduring involvement. Using perceived product involvement of a car in two different situations as an example, we demonstrate that enduring involvement and
108
Chapter 4 Analysed Constructs and Research Hypotheses
situation involvement should be considered as two sub-constructs of product
involvement. It is a matter of who plays the dominant role under certain circumstances
rather than what label (enduring or situational) should be given to product involvement.
To differentiate enduring and situational involvement, this research suggests that these
two sub-constructs should be labelled as enduring and situational product involvement
at the product level. The research focus is to examine enduring product involvement, as
it is more practically valuable and because of the existence of the well-developed
measuring scale.
To start with an analysis of dimensions of the product knowledge construct, this
research reveals that the three major components of product knowledge (familiarity,
expertise and experience) have been used interchangeably by a number of researchers to
refer to this concept. This research takes the stand of Rao and Monroe (1988), who
claim that product experience is a necessary but insufficient condition for consumer
expertise and familiarity. This paves the way for the decision for not measuring
consumers' product experiences in the current study. Objective knowledge and self-
assessed knowledge are the two types of commonly accepted product knowledge.
However, the relationship between these two concepts remains ambiguous. Rao and Monroe (1988) assert that product knowledge is the sum of objective knowledge and
self-assessed knowledge. To study the relationship between objective knowledge and
subjective knowledge is beyond the scope of this study. Nevertheless, we do believe
that it is inappropriate to take the added value of the objective knowledge score and the
self-assessed knowledge score as the final score of the product knowledge. This
research investigates only self-assessed knowledge, and detailed reasons are provided in
Chapter 5 (Justification of measure of product knowledge section).
Four demographic variables are discussed in detail in this chapter. They are age,
gender, educational attainment and household income. The choice of these four
variables are determined by reports of their influential power on consumer purchase behaviour in past research, as well as their all being capable of being treated as
categorical variables, which satisfies the fundamental requirement for conduction of
multiple regression analysis. Another thing we addressed particularly is that we are fully aware that disposable income is a better measure than household income.
Nevertheless, a trade-off is made in consideration of the possibility of gathering more
109
Chapter 4 Analysed Constructs and Research Hypotheses
biased data related to disposable income due to the limited cognitive ability of
consumers. As a result, we decided to measure household income instead.
Great efforts were made in analysing brand and its related concepts. This was driven by
the complex nature of these constructs and the fact that they can be easily
misunderstood. The discussion about brand construct followed the chronological
sequence. The topics covered included what brand means historically, how brand is
interpreted conventionally in the marketing discipline, and the pros and cons of
conventional brand definitions. Then we introduced de Chernatony and Dall'Olmo
Riley's (1998) brand definition, which suggests that `brand is a complex
multidimensional construct whereby managers augment products and services with
values and this facilitates the process by which consumers confidently recognise and
appreciate these values' (p. 436). We consider that de Chernatony and Dall'Olmo
Riley's (1998) brand definition is more sophisticated than others, given that it takes into
account both brand managers' as well as consumers' contributions to the establishment
of a brand.
This research further analysed the relationship between brand, brand image and brand
identity. In line with the more recent research (Holt 2002,2003; Muniz and O'Guinn
2001), the conventional claim that managers could exert a fairly high degree of control
over brand image through careful strategic choices was challenged. The present
research argues that marketers have only limited control over brand image, given that it
is not accurate to say that what marketers want the brand to convey (brand identity) is
exactly what the consumers perceive (brand image).
The `brand image trap' caution raised by Aaker (1996) was re-examined with the
current focus on investigation of underlying causes of the misuse and misunderstanding
of brand image and brand identity. The investigation was carried out from definition
level and component level of brand image and brand identity. It was summarised that
lack of a firm base or foundation which the brand image concept can build on, as well as
these two concepts possessing almost identical components are the two proposed causes for the misuse and misunderstanding of these two theoretically distinguishing concepts by researchers. This work has no intention of claiming that the proposed reasons are
exhaustive, as to investigate this issue is not the main focus of the current research.
110

Chapter 4 Analysed Constructs and Research Hypotheses
Consequently only limited time was devoted to investigating this issue. Nevertheless,
this attempt opened a door to further research. In the same vein as Dobin and Zinkhan
(1990), this research further argues that any misuse and misunderstanding of these
related concepts might cause confusion for readers and would also make comparison
and generalization of research findings difficult.
This research was set up to examine consumers' perceptions of branded products.
Therefore, brand image, rather than brand identity, is the theoretical foundation of this
research. Plummer's (2000,1985) brand image theory is the guidance of the literature
review. Specifically, the four brand image dimensions (brand personality, benefits,
consequences, and product attributes) are analysed separately, with more effort devoted
to a discussion of the brand personality concept, given its complex nature and its being
difficult to understand.
Table 4.3 Research hypotheses
Investigated Code Hypothesis Content
Construct
Product The level of product involvement has positive relationship with the likelihood of Involvement H involvement! consideration and the purchase intention of original branded products.
The level of product involvement has negative relationship with the likelihood of H involvement2 consideration and the purchase intention of counterfeit branded products. Self- The level of consumers' self-assessed product knowledge has positive relationship accessed
H knowledgel with the likelihood of consideration and the purchase tendency of the BP. Product
H The level of consumers' self-assessed product knowledge has negative Knowledge knowledge2 relationship with the likelihood of consideration and the purchase tendency of the
CBP. Age Age of consumer has positive relationship with the likelihood of consideration and H
agel the purchase intention of BP.
Age of consumer has positive relationship with the likelihood of consideration and H age2 the purchase intention of CBP.
Income H
Consumer income has positive relationship with the likelihood of consideration income! and the purchase tendency of BP.
Consumer income has negative relationship with the likelihood of consideration H income2 and the purchase tendency of BP. Gender Gender will have a significant effect on CBP consumption, with male being more H
gender likely to consider CBP and intend to purchase CBP in the context of non- deceptive counterfeiting.
Education The level of education attainment has positive relationship with the likelihood of H education! consideration and purchase tendency of BP.
The level of education attainment has positive relationship with the likelihood of H education 2 consideration and purchase tendency of CBP.
Brand The level of consumers' favourableness to the brand personality has positive H personalityl relationship with the likelihood of consideration and the purchase intention of the
Personality BP. The level of consumers' favourableness to the brand personality has positive H
personality2 relationship with the likelihood of consideration and the purchase intention of the CBP.
Perceived The level of consumer perceived risk has negative relationship with the likelihood
i k H
risk! of consideration and the purchase intention of BP. R s The level of consumer perceived risk has negative relationship with the likelihood
H risk2 of consideration and the purchase intention of CBP.
Product Consumers' perceptions of product attributes have a positive influence on
i H
attribute! likelihood of consideration of products and purchase intention of BP. Attr bute Consumers' perceptions of product attributes have a positive influence on H
attribute 2 likelihood of consideration of products and purchase intention of CBP. Image and Consumers' perceptions of benefits have positive influence on likelihood of functional H benefr(image®fhncriona! ) consideration of products and purchase intention of both counterfeit and original benefit branded products.
111

Chapter 4 Analysed Constructs and Research Hypotheses
Research hypotheses were proposed directly after each section of the discussion of each
individual construct. These hypotheses are well supported by previous research
findings. As detailed discussions are provided in each section, there is no need to
describe again here how they are established. For the purpose of recapping, all the
proposed hypotheses are gathered together and presented in Table 4.4.
Based on the above, Figure 4.3 presents the research conceptual model. The overall
discussion sequences in this chapter strictly followed the proposed model. No more
detailed explanations concerning this model and interrelationships between variables are
provided here, due to their having been fully reflected on and analysed in the discussion
of related variables and proposed hypotheses.
Background
Variables
Consumer brand perception Consumer Purchase
Consideration Intention
Consumer attitudes towards product categories of the background variables refers to the
product involvement variable and self-assessed product knowledge variable, whereas
the consumer characteristics refer to age, gender, educational attainment and household
income. By perception of CBP and BP we mean consumers' perception of brand image
of CBP and BP. We are fully aware that there are some other factors which may have a
great impact on consumer choice processes of CBP and BP. Nevertheless, we decided
to focus on the above noted variables, due to their substantial role in consumer decision
112
Figure 4.3 The proposed conceptual model Note: both the solid line and dashed line refer only to influence and do not indicate whether the relationship is positive or negative.
Chapter 4 Analysed Constructs and Research Hypotheses
making. One more thing which must be clarified here is that we decided not to
investigate the relationship between consumers' perceptions of CBP and BP (the
vertical double arrows). This is because, first of all, this research is determined to focus
on regression modelling, and secondly because the time and word constraints of this
research restricted us from conducting such broad analyses. We would like to leave it
for future research. Our decision is considered rational, since we believe that research
should identify the most influential factors of the consumer choice process first in the
context of non-deceptive counterfeiting, and then follow with examinations of
consumers' perception differences of CBP and BP on these identified factors. In other
words, we can see little point in conducting any investigation on factors which might have no significant impact on consumer product consideration and tendency to
purchase.
Chapter 2 draws a full picture of the overall research context and reveals that the study
of consumer perceptions of CBP has not received the research attention it deserves.
Following this discovery, Chapter 3 provides a substantial and intensive literature
review on consumer choice processes. It is in Chapter 3 that the research problem is
identified and the research aim defined. The current chapter mainly concentrates on
analysis of identified exploratory variables. Based on the detailed analysis, research
hypotheses are proposed. In general, we attempt to take a fresh look at the demand side
of CBP and BP. Specifically, this study aims to develop a comprehensive, yet
economical model of the determinants of brand consideration and purchase tendency of both CBP and BP. Up to now it has been believed that the following questions have
been answered: What are we going to do? Why are we doing it? Is this research
worthwhile? The next chapter will demonstrate how this research is going to be
conducted in order to achieve the research aim. More specifically, the research
methodology will be the focus of the Chapter 5.
113

Chapter, 5 ,;, ý=r., i {,, s .ý
Research Methodology
Chapter 5 Research Methodology
Chapter 5 Research Methodology
5.1 Introduction
Previous chapters have dealt with the literature review, reported the identified research
problems and the objectives of this work, and presented the conceptual research model.
This chapter focuses on research methodology issues, which are to be utilised to achieve
the research objectives set out in Chapter 1.
This chapter begins with the choice of studied brands, then proceeds to cover the overall
research design, the sampling design, the research instrument, the research instrument
piloting and results, and ends with the fieldwork administration. Logically, the issues
related to the preliminary qualitative research and results should be included in the
research instrument section of this chapter. However, the preliminary research and
results are reported in a separate chapter, Chapter 6, due to the important role they play
in this research and their complex, rich nature.
5.2 Choice of the Studied Brands
This study goes through several stages in relation to the selection of the investigated
brands. At the first stage, an extensive literature review on study of counterfeiting
related issues is conducted. The review uncovers that previous research has mainly
focused on examining product categories; few researchers have investigated individual
brands. At the second stage, based on the Anti-counterfeiting Group's (ACG) Survey
Report (2004) five product categories are identified as the most commonly counterfeited
products; two product categories the UK consumers would knowingly purchase are also
identified. The third stage attempts to determine the brands studied in this research with
the help of the Trading Standards Officers. Four brands appear to fit in well with this
research. All these four brands are chosen for further investigation in this study.
5.2.1 Specific Brands or Product Categories? -A Review of Previous Work
A review of previous work on study of consumer demand side of counterfeiting
phenomena (Table 5.1) shows that few researchers have investigated product categories in their studies (e. g. Cordell and Wongtada 1991; Bloch et al. 1993; Wee et al. 1995;
Cordell et al. 1996; Chakraborty et al. 1996; Chakraborty et al. 1997; Tom et al. 1998;
114
Chapter 5 Research Methodology
Albers-Miller 1999; Nia and Zaichkowsky 2000; Phau et al. 2001; Bian and Veloutsou
2004; Harvey and Walls 2003; Hoe et al. 2003). Few studies examine specific brands,
with the exception of that of Cordell and Wongtada (1991), which examines the impact
of specified brands on consumers' judgement of whether or not a product is counterfeit.
This can be interpreted as some researchers being led by the reality that certain product
categories are more commonly counterfeited than others (Bamossy and Scammon 1985)
and information about counterfeited product categories is more accessible than
information about the counterfeiting situation of individual brands. Worrying that the
brand equity might be damaged, brand owners are reluctant to release detailed
information related to the counterfeiting situation of their brands (Shultz II and Saporito
1996). The brand owners' concern is shown by Kessler (1998) who argues that 72
percent of consumers indicate that they would avoid purchasing a company's products if those products had a reputation for being counterfeited. The erosion of brand equity
could occur if consumers were aware that some portion of the available stock of a brand
is actually counterfeit (Wilke 1999), because this situation could potentially erode
confidence in the brand and reduce the status value that is sometimes associated with brand ownership of luxury goods (Green and Smith 2002).
Given that consumer behaviour is pretty much brand and product specified, it is rational
to ask whether previous research findings based on investigation of product categories
can be applied to individual brands or not. The study of individual brands in the context
of non-deceptive counterfeits has not attracted the research attendance it deserves.
Hence, for this research, the specific brands are examined because using specific brands
can help subjects to achieve a better understanding of the studied objects, and can also fill the identified literature gap, i. e. lack of research in the study of counterfeit
phenomena related to the investigation of specific brands.
5.2.2 Choice of Product Categories Based on Availability of the Counterfeit
Version, Consumer Awareness and Acceptability
Given that the information about the current counterfeiting situation of individual brands is not publicly available, it is necessary to determine the product categories first
before the studied brands are identified. This is due to information about counterfeiting
situation of product categories in the UK being relatively accessible (e. g. the ACG
Survey Report 2004) in comparison to that of individual brands. Five product
115

Chapter 5 Research Methodology
categories (perfumes/fragrances; clothing/footwear; watches; alcohol; electrical goods)
were selected for further study based on the ACG Survey Report (2004), as the report
suggests that these selected product categories are identified much more with
counterfeits and perceived a higher degree of consumer awareness of counterfeit
versions than other product categories such as pharmaceuticals, food and pesticides. Moreover, the ACG Survey Report (2004) also reveals that consumers appear to
knowingly purchase counterfeit versions of clothing/footwear and watches when price
and quality are acceptable. Therefore, it has been decided that brands in these two
product categories are to be investigated in this study due to their relatively high
accessibility, consumer awareness and acceptability. It is considered to be essential to
ensure that the studied brands (counterfeit version) are accessible and acceptable to the
target population to some extent, and have a high degree of consumer awareness. If any
one of the conditions does not hold, then there is no chance that consumers will knowingly purchase them. Thereafter, the research aim will appear pointless both
theoretically and practically.
Tnhle 51 Prnrlnet daccifirntinne and nrMiit-t entranriea chidietl by nrinr chtdies
Author Product studied Methodology Sample Cordell and Wongtada 1991 No detailed information Undergraduate student, Survey Convenience sample
available, 'a specified watch (students) and pair of shoes (prestige brand); a kite shirt and a camera
Bloch et al. 1993 Knit sports shirts Shopping mall, flea market Normal consumers experimental research (USA)
Wee et al. 1995 Literature, computer Survey (South-east Asia) Convenience sample software, leather (students) wallets/ purses and watches
Chakraborty et at. 1996 Auto parts Experimental research (USA) Convenience sample (students)
Cordell et al. 1996 A knit shirt and 35-mm Experimental research (USA) Convenience sample camera (students)
Chakraborty et al. 1997 Auto parts Experimental research (USA) Convenience sample (students)
Tom et al. 1998 CDs and software (functional Shopping mall and flea market, Normal consumers products); t-shirt and purses Survey (USA) (symbolic products)
Albers-Miller 1999 Color television Survey (USA) Survey, convenience sample student
Nia and Zaichkowsky 2000 Luxury goods (25 kinds of Shopping centre survey Normal consumers luxury brands were (Canada) examined)
Phau et al. 2001 Branded clothing Face-to-face interview survey at Normal consumers railway station (Hong Kong)
Harvey and Walls 2003 Authentic and counterfeit god Experimental research (Hong Convenience sample Kong) (underground students)
Hoe et at. 2003 Clothing Interview, snowball technique Self-selecting group (UK) (consumers under 30
years old) Bian and Veloutsou 2004 Sunglasses Shopping mall, flea market, a Normal consumers
university Survey (UK)
Bian and Veloutsou 2006 Sunglasses Shopping mall, flea market, a Normal consumers university Survey UK
116
Chapter 5 Research Methodology
5.2.3 Choice of Four Brands from the Two Identified Product Categories
As noted earlier, information about the current counterfeiting situation in the UK of the
individual brands is not publicly available. The researcher decided to consult anti-
counterfeiting enforcement officers. The officials of Trading Standards are regarded as
the appropriate people for advice, because they are one of the three anti-counterfeiting
enforcement forces in the UK, and they are the only ones who deal directly with
consumer and trading related issues. In addition, Trading Standards plays a leading role
in relation to anti-counterfeiting in the UK. The other two anti-counterfeiting
enforcement forces are Police and Customs, but these two forces do not become directly
involved in consumer related matters.
The Trading Standards officials confirmed that counterfeit clothing/footwear and
watches were more common in the marketplace than other product categories. This is
consistent with the ACG Survey Report (2004). Furthermore, they also revealed that it
appears Burberry, Rolex, Gucci, Louis Vuitton, Timberland, Adidas, and Nike are the
most commonly counterfeited brands, although some other brands also run a risk of
being counterfeited (Wee et al. 1995). According to Trading Standards, the counterfeit
versions of these brands account for around 50 percent of the CBP confiscated by
Trading Standards. Although Trading Standards cannot provide more statistically
sophisticated figures in relation to the percentages, nevertheless, the statements they
made are in line with Green and Smith (2002), who claim that luxury brands appear to
be more likely to be counterfeited than other generic brands.
Burberry, Rolex, Gucci and Louis Vuitton were eventually chosen because, firstly, they
are well-known and long-established brands, and thus familiar to the respondents;
secondly these brands are the most counterfeited brands, with Burberry taking the lead
over Gucci, Louis Vuitton and Rolex (Poulter 2006); thirdly the counterfeit versions of
these brands are available. Responding to the two determined product categories,
Burberry handbags, Louis Vuitton handbags, Rolex watches, and Gucci watches were
selected for further investigation in this research. The four brands selected are expected
to induce a wide range of involvement levels and knowledge levels across individuals
and thus to provide an appropriate research opportunity.
The Trading Standards gave their full support to this research. They provided the
researcher with four identical samples (counterfeit versions) of each chosen brand from
117

Chapter 5 Research Methodology
the products they confiscated. The principal survey was conducted with the help of
eight trained interviewers; therefore it was crucial to ensure that each of the research
assistants had identical example sets to show research participants. This helped to
ensure the information passed on to the respondents is consistent. The Trading
Standards officials also confirmed that all the examples are available in the marketplace
in Glasgow, and they are the CBP which consumers will normally knowingly purchase.
5.2.4 Selected Brands
To summarise, due to much work having been done on the study of product categories
in counterfeiting related literature, but the study of specific brands having been left
almost untouched, this research attempts to fill this literature gap by investigating the
specific brands in the context of non-deceptive counterfeiting. Four different brands
(Burberry handbags, Louis Vuitton handbags, Rolex watches, and Gucci watches) were
selected for study. They were chosen because they satisfy certain criteria. Firstly, these
brands (both CBP and BP) are familiar and commonly available to the subjects in the
study. Secondly, the counterfeit versions of these brands appear to be more acceptable
to general consumers than other CBP. Thirdly, examples of the counterfeit version of
these brands are available. Finally, another goal of this study is to obtain results that
can be generalised from findings of this study. To this end, four brands that belong to
two product categories (clothing and watches) are examined. This allows cross-
category comparison as well as inter-product category comparison. Moreover, the
findings from this study will be compared to findings of the earlier studies that
examined product categories.
5.3 The Overall Research Design
A research design is simply the framework or plan for a study, used as a guide in
collecting and analyzing data (Churchill 1999). It is also regarded as a framework or
blueprint for conducting a marketing research project (Aaker et al. 1997; Malhotra
1996). According to Churchill (1999), a research design ensures that the study will be
relevant to the problems and will use economical procedures. Therefore, a well-defined
research design is prerequisite to a successful research.
5.3.1 Types of Research Design
According to distinguishing fundamental objectives of different researches, research designs are classified as exploratory, descriptive and causal (e. g. Churchill 1999; Aaker
118

Chapter 5 Research Methodology
et al. 1997). Malhotra (1996) views the descriptive and causal research as sub-
constructs of the conclusive research design. The major emphasis in exploratory
research is on the discovery of ideas and insights (Churchill 1999; Aaker et al. 1997),
seeking the possible decision alternatives, and relevant variables that need to be
considered (Aaker et al. 1997). The purpose of descriptive research is to provide ' an
accurate snapshot of some aspect of the market environment (Aaker et al. 1997).
When it is necessary to show that one variable causes or determines the values of other
variables, a causal research approach should be used (Churchill 1999; Aaker et al.
1997). Despite the usefulness of the classification of design types for gaining insight
into the research process, it is argued that the distinctions are not absolute (Churchill
1999). More specifically, on one hand, certain types of research designs are better
suited to some purposes than others; on the other hand, there might be more than one
type of research design which can be used to serve one purpose. It is suggested that `the
design of the investigation should stem from the problem' (Churchill 1999, p. 99).
Malhotra (1996) and Aaker et al. (1997) provide a summary of uses and types of
studies, which are more appropriate for each research design, as illustrated in Table 5.2.
Table 5.2 Comparison of basic research designs (Developed from Malhotra 1996, p. 89 and Aaker et al. 1997, p. 78 Exploratory Descriptive Causal
Objective Discovery of ideas and Describe market Determine cause and effect insights characteristics or relationships
functions
Characteristics Flexible, versatile Marked by the Manipulation of one or formulation of specific more independent variables hypotheses
Often the front end of Preplanned and structured Control of other mediating total research design design variables
Methods Expert surveys Secondary Experiments Pilot surveys Surveys Surveys
Secondary data Panels
Qualitative research Observational and other data
5.3.2 Choosing a Research Approach for the Current Study
To reiterate, the main purposes of this research are to investigate consumers'
perceptions of CBP as opposed to BP, as well as relationships between the demographic
variables, product involvement, product knowledge, consumers' perceptions and stages (consideration set and purchase intention) of consumer choice process. Referring to
Table 5.2, the descriptive research design is applicable to serve the first purpose,
119
Chapter 5 Research Methodology
whereas the causal research design might be more suitable to the second purpose, given
that the study of relationships is relevant to the element of cause and effect. Therefore,
a survey is considered an appropriate approach.
One critical task that must be completed before embarking on the principal research is
to generate the criteria consumers used to evaluate the studied brands. There is little
prior knowledge on which to build. This is because, first of all, brand image is very
much brand specific. Secondly, there is little work investigating brand image in the
context of non-deceptive counterfeiting. According to recommendations from previous
works (e. g. Aaker et al. 1997; Malhotra 1996; Churchill 1999), the exploratory research design is applicable to this study at this stage. Focus group discussions are utilised to
fulfil this task and form the preliminary study (for details, see Chapter 6).
5.3.3 Stimulus- vs. Memory-based Approach
The fact is that one quarter of British people are not aware of the sale of counterfeit
products (ACG Survey Report 2004). People who are aware of the existence of CBP
may not have experience of the counterfeit versions of the selected brands of this study.
It is likely that these people will consider that they are not eligible for participating in
this study, which will bring down the response rate by at least 25 per cent. Moreover,
the literature in consumer choice process study suggests that a lack of sufficient
information about certain brands may be one of the reasons that these brands are
included in the inert sets of many consumers. If the appropriate information were
supplied, some of these brands might move into the evoked set and thus enjoy consumer
acceptance and market success (Narayana et al. 1975). This research aims to investigate
perceptions towards CBP of ordinary consumers and how their perceptions influence
the formation of a consideration set and purchase intention, but not people who favour
CBP only. Therefore, there is no sense in excluding people who lack awareness of CBP
in the research sample. The solution is to use the stimulus-based approach. More
specifically, CBP examples and pictures of the BP are used as stimuli and are presented
to research participants before each research phase starts. The researcher acknowledges
that the use of the real branded products as opposed to the pictures might achieve better
results. However, due to the studied brands all being costly products, buying the
genuine products is restrained by the limited research budget. Moreover, it is also
considered that to present the real original products to research participants in the field
120

Chapter 5 Research Methodology
might cause security concerns. Therefore, the use of pictures of the original branded
products is considered acceptable.
5.3.4 Section Overview
Echoing Aaker et al. (1997) who claim `seldom is a data collection method perfectly
suited to a research objective (aim). A successful choice (... ) is achieved by combining
several methods to take advantage of their best features and minimize their limitations
(p. 78)', the nature of the preliminary study of this research is exploratory, whereas the
principal research is a combination of descriptive and causal research. The fieldwork of
this research is conducted in three phases - preliminary qualitative research, piloting
test of questionnaire, and interview survey. The details related to each stage (including
rational, process, results and solutions) are reported in following sections, with the
exception of the preliminary research and results, which are reported in Chapter 6.
5.4 Sample Design
The sample design according to which the principal study is conducted will be
discussed in detail in this section. The discussion follows the sampling procedures
suggested by Churchill (1999) as outlined in Figure 5.1. It starts with defining the
population and ends with collecting the data from the designated element.
Step 11 Define the Population
Step 21 Identify the Sampling Frame
Step 31 Select a Sampling Procedure
Step 41 Determine the Sample Size
Step 51 Specify the Sample Unit
Step 6I Collect the Data from the Desianated Elements
Figure 5.1 Six-step procedure for drawing a sample (adopted from Churchill 1999, pp. 498)
121
Chapter 5 Research Methodology
5.4.1 Define the Population
A population is defined as the entire group under study as specified by the objectives of
the research product (Burns and Bush 2000). To identify the population properly and
accurately is critical at the outset, since sampling is intended to gain information about
the population (Aaker et al. 1997). A properly defined population is the foundation of a
research. If the population is defined improperly, the research results cannot be reliable; in some cases the respondents are unlikely to be able to provide the information
requested (Aaker et al. 1997).
For the present research, the target population comprises ordinary consumers aged 18
years old and above who reside in the city of Glasgow. Glasgow was chosen for two
reasons. First of all, the researcher is based in Glasgow. This makes data collection
more cost-effective. Secondly, according to the Trading Standards official, the Glasgow
Barras Market is one of the best-known markets in Europe for selling counterfeit goods.
The counterfeit samples provided by the Trading Standards, Glasgow were confiscated from the Barras Market. Therefore, it is rational to assume that these counterfeit brands
have obtained some market share regionally, which indicates that the counterfeit version
of the studied branded products might not be beyond the awareness of the ordinary
consumer in Glasgow.
The choice of age groups is restricted first of all by the Approval of the Ethical
Research Committee. It is a requirement that the respondents should be aged 18 years
old and over. In addition, it is assumed that most people who are under 18 might have
very limited purchasing power compared with other age groups. This is because people
tend to leave home to live independently at age around 17 to 18 in the UK. Most of
them do not earn any money before they leave home. It is more likely they are financially dependent. Therefore, they are excluded from the target population.
In sum, the guidelines suggested by Aaker et al. (1997) were considered in the process
of defining the target population. The guidelines considered include: serve the research
objective, consider alternatives, know the market, consider the appropriate sampling
unit, specify clearly what is excluded, do not over-define, should be reproducible, and consider convenience. Table 5.3 represents the defined population for the present research.
122

Chapter 5 Research Methodology
Table 5.3 The tareet nonulation Population Criteria Target Population of This Study
Element Ordinary consumers
Sampling unit The individual residents of the city of Glasgow
Extent People aged 18 and over
Time November and December 2005
5.4.2 Specify the Sampling Frame
A sampling frame is a master list of the sample units in the population (Burns and Bush
2000). In other words, the sampling frame is the instrument in which the elements of
the population from which the study samples are to be drawn are listed (Churchill
1999). For this research, the available physical sampling frames include the Glasgow
Registry of Electors (2005), the Yellow Pages; BT on line 118 500 Directory Enquiries
(www. bt. com), the BT residential telephone book, and Royal Mail online
(www. royalmail. com).
In general, questionnaires can be administered in person, by telephone and by mail
survey (Churchill 1999). The use of personal survey in this study is justified in Section
5.5.1.3. Given that the personal survey is more suitable to this research, telephone
surveys and mail surveys are not discussed here. The use of any sampling frames
mentioned above requires either paying a personal visit to individual households, or
alternatively inviting individuals to a site arranged by the researcher. Personal visits to
an individual household is not at all cost-effective and is also extremely time-
consuming. If it costs two pounds on transportation for one questionnaire, for 384
questionnaires (requested sample size) the cost involved is £768. On top of that,
according to DTI Employment Relations-National Minimum Wage (DTI 2005), UK
minimum wage for workers aged 22 and over is £5.05 an hour, which brings the cost of labour to £1939 for 384 questionnaires (calculated based on one field worker collecting
one usable questionnaire per hour). Furthermore, the use of this means might also put
the field workers in a situation where they could face potential security problems,
particularly when female field workers are employed. The insecurity problem can be
reduced by using more than one field worker for each single household visit. However,
the direct effect will be a doubled cost, at least. It would be impossible for the very
tight research budget to cope with the massive expenses involved in the use of this
method.
123
Chapter 5 Research Methodology
On the other hand, the means of gathering individual consumers to a site identified by
the researcher is problematic as well. This is because individuals are reluctant to come
to a place they do not know well, which will reduce the response rate dramatically. This
was experienced in the process of organising the focus groups. In addition, it will put
off individuals who are far from the site, have no transportation, or are housebound.
Consequently, none of the sample frames noted above is applicable to this research.
Therefore, it is decided that the samples should be drawn from randomly selected
supermarkets in Glasgow. The rationale for the choice of the supermarkets is detailed
in the following section.
5.4.3 Select a Sampling Procedure
Selecting a sampling procedure is inextricably intertwined with the identification of the
sampling frame, because the choice of sampling method depends largely on what the
research can develop from a sampling frame (Churchill 1999). Sampling procedure
consists of two steps: specify sampling method and specify sampling plan (Tull and
Hawkins 1993). The sampling method is the way the sample units are to be selected.
The sampling plan refers to the operational procedures for selection of the sampling
units (Tull and Hawkins 1993). These two steps are discussed in details in this section.
5.4.3.1 Specify Sampling Method
5.4.3.1.1 Probability vs. Non-probability
Sampling techniques can be divided into the two broad categories of probability and
non-probability samples (e. g. Churchill 1999). Probability samples are ones in which
members of the population have a known chance of being selected into the sample. On
the other hand, non-probability samples are instances in which the chances of selecting
members from the population into the sample are unknown (Burns and Bush 2000). For
the current study, due to the absence of usable sampling frames, supermarkets are
chosen as the sites for data collection. One may argue that this is not probability
sampling. This research does not deny the limitations it might bring to this research.
Nevertheless, Malhotra (1996) claims that non-probability sampling can be used if the
research interests centres on the proportion of the sample that gives various responses or
expresses various attitudes. In order to achieve a certain level of advantages provided by the probability sampling, this research introduces in probability elements. It is
124
Chapter 5 Research Methodology
expected that the drawbacks caused by the use of supermarkets can be compensated for
by the use of probability techniques. The probability techniques utilised in this study include multi-cluster two-stage area sampling and systematic sampling.
5.4.3.1.2 Multi-cluster Two-stage Area Sampling
All probability sampling plans (e. g. sample random sampling, stratified sampling and
systematic sampling) require a list of population in order to draw the sample, but not
area sampling (Burns and Bush 2000). Burns and Bush (2000) suggest that there are
two kinds of area sampling plans: one-stage area sampling and two-stage area sampling.
This research uses the two-stage area sampling plan, given that there are still too many
units to be included in the sample, as well the possibility that samples of one cluster are
similar to each other rather than heterogeneous (Burns and Bush 2000). The advantage
of the two-stage area sampling is that it is not necessary to employ all units in a selected
cluster, which can help to reduce the sample size to a desired level. The use of multi-
cluster two-stage area sampling will also increase heterogeneity of the sample,
consequently reduce sampling error (Burns and Bush 2000; Aaker et al. 1997). Clusters
are selected using a random sampling method at the first stage. At the second stage,
respondents are chosen using a systematic sampling approach.
5.4.3.1.3 Select Socio-economic Clusters
In this study, twenty supermarkets are selected randomly from the list of supermarkets located in Glasgow. The list of supermarkets located in Glasgow is generated from the
Yellow Pages online service. There is no official report as to how precisely the
Glasgow Yellow Pages covers the supermarkets overall. However, Yellow Pages staff in Glasgow believe that it has a wider coverage than any directory provided by
telephone companies. This is because the Yellow Pages is a combination of directories
of all telephone companies in the UK. In addition, it also covers businesses that are not listed in directories provided by telephone companies. Individual businesses have the
right to choose whether they want to be included in the Yellow Pages or not. Because it
has free entry, there is no reason why businesses would choose not to be listed,
particularly supermarkets in this case. Therefore, one is on solid ground in assuming
that the list of supermarkets generated from the Yellow Pages website represents almost the full list of supermarkets in Glasgow.
125
Chapter 5 Research Methodology
Letters asking for assistance from supermarkets are sent off to the selected 20
supermarkets addressed to the General Manager of each individual store. The letter
consists of the brief information about this piece of research, and appealing statements
stressing the importance of any help they can provide, requirements of the researcher to
the supermarkets, guarantee of no problem caused by this research as well as manners
used to prevent these things happen, an offer for buying incentive (chocolate) used in
data collection from the supportive supermarket and an offer of an executive summary
of the research finding on request. The letter was triple-signed by the researcher, her
two supervisors and printed on the university letterhead (Appendix 1). The rationale for
choice of 20 supermarkets is based on an assumption that 25 percent positive feedback
will be received. The researcher plans to conduct data collection from 4 different sites.
To collect data from multi-sites is considered as vital to this research, because samples
of one site might be similar to each other. The use of multi-sites will assist in
increasing heterogeneous. The number of 4 sites is determined by the very limited
research budget. The more sites are chosen the more cost will be in relation to
transport, labour as well as the project administration.
Two written rejections were received within one week after the letter was sent off. One
was by e-mail and claimed that all research related requests and charity collections etc.
have to go through their Head Office; another one was a letter that claimed they were
unable to accommodate the researcher's requirements due to the lack of space and also
the time of the year (see Appendix 2,3). A letter did not reach the Store/General
Manager of one selected store and returned, as the store moved to somewhere else.
After ten days, the researcher phoned each selected store from which the researcher had
not received any response. The researcher asked to speak to the Store Manager or the
General Manager directly. All stores said that they had received the letter, with the
exception of one store manager claimed that they never received anything from
University of Glasgow. The letter was faxed through to the store on request. An e-mail
was received soon after the fax went through, rejecting the request. No explanation was
given for this rejection. Twelve out of sixteen stores who acknowledged receipt of the
letter decided not to support this research as requested. The main reasons given by
these stores included it being company policy or that they had a lack of space in their
store, particularly at that time of the year. One store promised support after Christmas.
126
Chapter 5 Research Methodology
Interestingly enough, just as expected, four stores said that they would like to support
this research and asked the researcher to go to see them and talk about further details.
After meeting the researcher, all four stores decided to support this research. Two
stores are relatively small and located in residential areas. They are convenience stores.
The other two are medium-sized stores with minimum daily sales of over £35,000. One
of them is located in a shopping centre in Glasgow and perceived as a relatively
expensive supermarket, with another one, located at the edge of the city, being well
known for its low price strategy. The two small stores were not able to provide table
and two chairs as requested due to lack of space in the stores, while the two bigger ones did not have any difficulty in meeting the researcher's requirements. Actually, both of
them provided the researcher with more than she expected originally, not only in terms
of facility support but also valuable access (one store allowed the researcher and the
fieldworkers access to their staff dining room), financial support (one store gave the
researcher `staff discount' for the incentives the researcher bought from them).
Regardless of the size of the stores, all stores allocated the fieldworkers to inside the
stores, more specifically right in front of the store exit, as requested by the researcher in
the letter (see Appendix 1). These locations secured a pleasant, warm and comfortable
place for conducting data collection. This is very important for any data collection
conducted in winter in Glasgow. Firstly, a comfortable fixed work place makes the
tough data collection process more pleasant for the fieldworkers. Secondly, it attracts
more people to participate in this research. Thirdly, it makes the fieldwork
administration and supervision much easier. Therefore, full support from the stores to
some extent secured a better quality of data, a higher response rate and lowered the cost involved in data collection.
It is acknowledged that a shopping mall is often chosen for consumer related surveys (Aaker et al. 1997). The reasons for choosing supermarkets for this study are as follows. First of all, consumers go to supermarkets more often than to shopping malls.
There is little precise information about Glasgow consumer shopping patterns by way of
academic research. According to the Target Group Index (TGI) Survey (2002), 72.5 per
cent of adults did their regular major shopping at least once a week, and more than 81
percent of adults did so two or three times a month, and around 90 percent of them
shopped at least once a month. In addition, there appears to be a reinforcement of
127
Chapter 5 Research Methodology
weekly shopping as the norm (TGI Survey 2002). Given that the data collection is
conducted every day, across two weeks, to a great extent it is rational to assume that all
adults have a non-zero (but not equal) probability of being found in a supermarket.
Secondly, people need food regardless of whether he/she likes shopping or not.
Supermarkets provide a wide range of food products; some even have a variety of non-
food products on their shelves (for example, Tesco Extra and ASDA). As a result,
supermarkets attract a wide range and variety of shoppers. A key assumption is that
residents go to the nearest supermarket. Obviously, this assumption is unrealistic.
However, it is believed that the multi-cluster method to some extent will be of help in
reducing this bias. With regard to the non-equal probability for being chosen caused by
different shopping frequencies (Sudman 1980), whether or not it leads to a biased
sample is still debatable. For example, previous research finding suggest that there
seems to be no basis to conclude that leaving frequency of shopping uncontrolled would
lead to a biased sample (Dupont 1987). In sum, the use of supermarkets as sites for data
collection is considered acceptable.
5.4.3.2 Specify Sampling Plan
Numerous research books show great preference to probability samples over non-
probability samples, due to probability samples allowing an assessment of the amount
of "sampling error' likely to occur because a sample rather than a census was employed
when gathering the data (e. g. Churchill 1999). This research argues that both
probability sampling and non-probability sampling are two-stage processes. The first
stage is sampling design, in which the researcher normally has full control in terms of
who to choose and how to choose. The second stage is the actual sampling practice in
the field, which starts when the field work begins. At this stage the researcher can only influence, but has very limited control in relation to who is going to take part in this
research. Probability sampling only secures the first half of data collection. The
assumption that as far as each unit of the population has the same chance of being
selected, the respondents should represent the entire population well is not always
correct. Therefore, it will be less confusing to rename `sampling error' as `planned
sampling error'. Whatever sampling method is chosen, the effort should be put on
minimizing the both the `planned sampling error' and the `actual sampling error',
minimize the gap between the `actual sampling error' and the `planned sampling error'.
128

Chapter 5 Research Methodology
In the current research great effort is placed on minimizing the actual sampling error.
The selection of the supermarkets intercept sample is based on the first three steps
(select sampling areas and sampling points, station interviewers, sample days of the
week and times of day proportionate to supermarket traffic) of the sampling procedures
recommended by Sudman (1980). The interviewers are located at the supermarket
entrances (all selected supermarkets have only one entrance) rather than in the
supermarkets to avoid the length-biased sampling (Nowell and Stanley 1991). The
opening hours of each supermarket is split into two halves. Interviewers work on two
shifts. Each shift varies from six to seven hours, depending on which supermarket the
interviewers are situated in. To control interviewers' fatigue, it is ensured that no extra
working hours are requested. This assists in avoiding unintentional interviewer error
pertaining to fatigue-related mistakes (Burns and Bush 2000).
Special efforts were made to ensure the sample selection is not based on the
interviewers' judgements. The interviewers are instructed to draw a systematic sample
from the shoppers at the entrance. Every nth person is selected. The number of people
to be skipped is set according to a predetermined measure of shopping traffic at each location. Initially the design was that in case the people approached refused to
participate, the following person is intercepted as a replacement. However, this
approach proved to be unsuccessful in the field. Three reasons are offered here. First of
all, in most cases the following person is very close to the person the fieldworker has
just approached. Practically, it is very difficult to intercept him/her. Secondly, the
fieldworker felt awkward to intercept the following person right after having been
rejected. Thirdly, the following person appeared to be influenced by the person who just refused to participate into the research, given the short distance between these two
people. As a solution, the fieldworkers are instructed to approach the fifth person after
the rejection. This rule is kept unchanged across all locations. Personal interviews are
conducted over two weeks and all way through opening hours of the chosen
supermarket. These procedures cannot ensure `full' protection against interviewer
selection bias, but they help greatly to reduce it (Sudman 1980). Despite the call for
weighing for shopping frequency, influence of shopping frequency is not taken into
account in this study, as it would probably not affect the demographic profile of the
resulting sample or the substantive results of the survey (Dupont 1987).
129

Chapter 5 Research Methodology
Low cost, greater control and flexibility are the major reasons for the popularity of the
mall survey method (Hornik and Ellis 1988). Although this research is conducted in
supermarkets, the characteristics are considered as being the same as the mall survey
method. Nevertheless, apart from the advantages it shares with the mall survey method,
it also possesses the weakness the mall survey has: vulnerability to haphazard sampling
procedures and high non-response rates (Murry et at. 1989; Gates and Solomon 1982).
The first shortcoming has been dealt with in previous section. The next section
demonstrates devices adopted to reduce non-response rates.
Non-response error is caused by a difference between those who respond to a survey
and those who do not (Tull and Hawkins 1993). It can be a serious problem (Aaker et
al. 1997; Tull and Hawkins 1993). Compared with other data collection methods, mall-
intercept interviews appear to have even higher refusal rates (Gates and Soloman 1982).
In order to improve response rate, the gaze and touch method recommended by Hornik
and Ellis (1988), the appealing verbal method suggested by Hornik (1982), in addition
to the traditional incentive method (Aaker et al. 1997; Wiseman et al. 1983) are
adopted. As a shopper enters the supermarket, he/she is met by an interviewer who
wishes the individual good morning (afternoon, evening) and asks whether the subject is
a Glasgow resident. The Glasgow resident is offered a box of chocolates (worth about
£2.50) embossed with the name and logo of the university. The interviewer then
introduces him/herself as a student working on a university research project and asks the
shopper to participate in a 15 to 25 minute interview and ensures confidentiality.
It is expected that the use of the university logo will give the respondents an impression
of seriousness of this research. The general finding from the literature is that the use of
incentives is effective in increasing response rate in postal, telephone and face-to face
surveys (e. g. Singer et al. 1999; Church 1993; McConaghy and Beerten 2003;
Willimack et al. 1995). In addition, it will also help to reduce falsehoods, because the
respondent may feel morally obligated to tell the truth considering he or she has
received compensation. In other words, he or she may feel guilty at receiving an
incentive and then not answering truthfully (Burns and Bush 2000). Moreover, many
studies point out that incentives can improve data quality in terms of greater response
completeness and greater accuracy, reduce item non-response and elicit more comments
130
Chapter 5 Research Methodology
to open-ended questions (James and Bolstein 1990; Brennan 1992; Willimack et al.
1995; Shettle and Mooney 1999).
Despite the monetary and non-monetary forms of incentive both having been found to
increase response rate, the effectiveness of the monetary method is still debatable. It
appears that a large monetary incentive is more effective in generating a high response
rate (Goetz et al. 1984). On the contrary, a small monetary incentive might lower the
response rate (Harmon and Resnik 1983). Harmon and Resnik (1983) did not offer any
explanation as to this unexpected result. This research believes that there might be two
reasons. First of all, a small amount of money might not be attractive to people. Secondly, it might put people who would like to contribute off if they think that is how
their contribution is valued. It is decided that chocolate is to be used an incentive in this
research. Chocolate can be interpreted as a monetary attraction by some people, at the
same time it can also be regarded as an appreciation from the researcher by some others
who are not only attracted by the incentive. Therefore, it might be a better incentive
than monetary payment.
Pre-paid incentives and conditional incentives are the two methods used by previous
researchers. The conditional incentives tend to be used in surveys that are more burdensome for respondents, for example involving diary keeping (Lynn and Sturgis
1997; Lynn et al. 1998). Compared with the conditional incentives, previous research findings show that the pre-paid incentive is more effective in terms of increasing the
response rate (e. g. Church 1993; Hopkins and Gullickson 1992; Goyder 1994). This
research is designed to use the pre-paid incentive method.
It is a concern that incentives could increase response bias, as their motivational effect is greater in some groups of the population than others. Incentives have been found to
increase co-operation rates among certain groups (e. g. James 1997; Mack et al. 1998;
Tzamourani and Lynn 2000). However, it can be argued that as the groups who are
more motivated by incentives tend to be those who are usually under-represented in
surveys, incentives can actually reduce response bias. This is evidenced by Stratford et
al. (2003), who report when incentives were used in the National Travel Survey 2002,
the sample composition improved compared with population figures derived from the
2001 Census.
131
Chapter 5 Research Methodology
During the request, the interviewer either touches or gazes (if the interviewer does not
feel comfortable to touch the subject) at the subject and is at all times pleasant and
friendly. The following appealing expression is used: "We are earnestly asking for your
generous help in answering a few questions about counterfeit branded products and
branded products". This expression is chosen is because it is the most effective in
generating responses (Hornik 1982). The interviewers offer to read the questions for
the respondents if they cannot read or have difficulty reading for any reason.
5.4.4 Determining the Sample Size
The size of the sample depends on the basic characteristics of the population, the type of
information required from the survey and the cost involved (Chisnall 1986). The
sample size has nothing to do with how representative that sample is of the population,
but directly affects the accuracy of results (Burns and Bush 2000). More specifically, it
determines how close the sample's statistic is to the true population value it represents
(Bums and Bush 2000; Tull and Hawkins 1993).
A survey cannot be planned or implemented properly without knowing the sample size
(Aaker et al. 1997). There are several method used to decide on a sample's size. The
commonly recommended methods are the confidence interval approach and the
percentage approach (e. g. Bums and Bush 2000; Churchill 1999; Aaker et al. 1997). To
compute a sample size using the mean requires a researcher to have some knowledge of
or at least a good guess at how much variability there is in the population. In the current
study, the researcher is incapable of estimating the standard deviation of the population. Given this reason, the percentage approach is utilised to calculate the sample size. The
formula used is as follows:
n= z2 (p4)
Z e
where n= the sample size z= standard error associated with the chosen level of confidence p= estimated variability in the population q= (100-p) e= acceptable sampling error
132
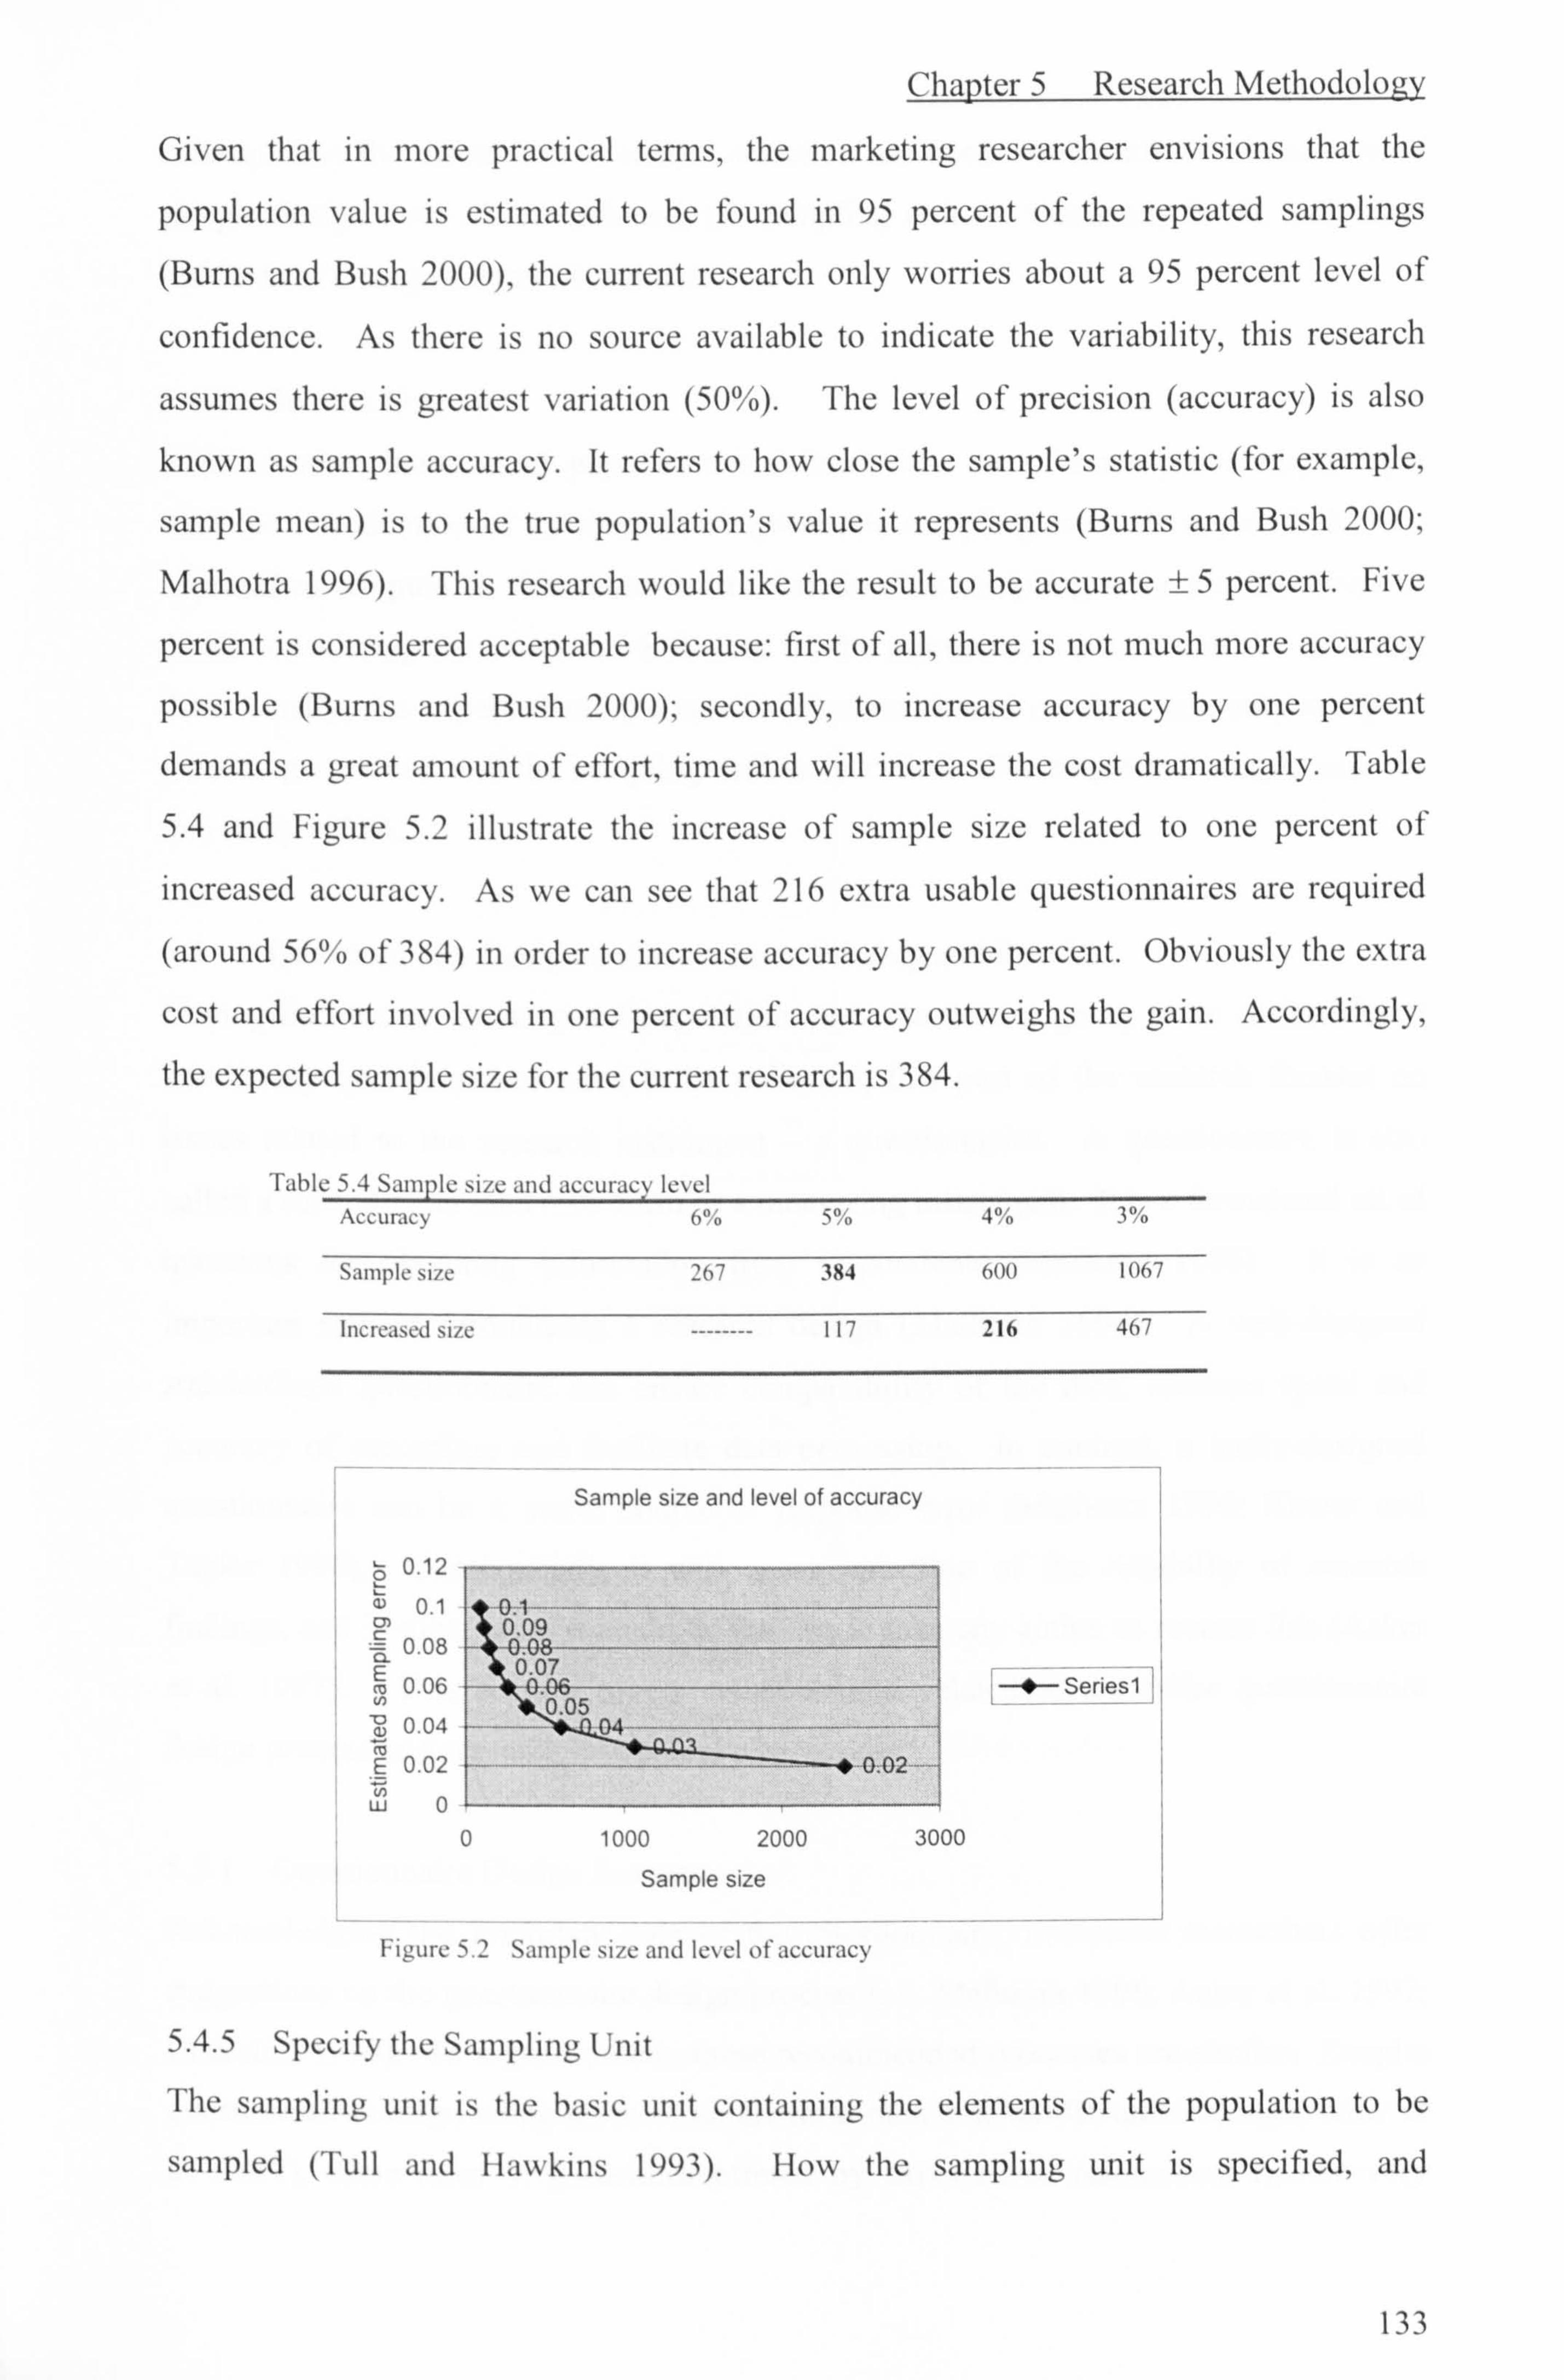
Chapter 5 Research Methodology
Given that in more practical terms, the marketing researcher envisions that the
population value is estimated to be found in 95 percent of the repeated samplings
(Burns and Bush 2000), the current research only worries about a 95 percent level of
confidence. As there is no source available to indicate the variability, this research
assumes there is greatest variation (50%). The level of precision (accuracy) is also
known as sample accuracy. It refers to how close the sample's statistic (for example,
sample mean) is to the true population's value it represents (Bums and Bush 2000;
Malhotra 1996). This research would like the result to be accurate ±5 percent. Five
percent is considered acceptable because: first of all, there is not much more accuracy
possible (Burns and Bush 2000); secondly, to increase accuracy by one percent
demands a great amount of effort, time and will increase the cost dramatically. Table
5.4 and Figure 5.2 illustrate the increase of sample size related to one percent of increased accuracy. As we can see that 216 extra usable questionnaires are required
(around 56% of 384) in order to increase accuracy by one percent. Obviously the extra
cost and effort involved in one percent of accuracy outweighs the gain. Accordingly,
the expected sample size for the current research is 384.
Table 5.4 Sample size and accuracy level Accuracy 6% 5% 4% 3%
size 267 384 600 1067
Increased site -------- 117 216 467
Sample size and level of accuracy
ö 0.12
a) 01 0) n 0.08 N 0.06
0.04 E 0.02 w0
E! -Series1
0 1000 2000 3000
Sample size
Figure 5.2 Sample size and level of accuracy
5.4.5 Specify the Sampling Unit
The sampling unit is the basic unit containing the elements of the population to be
sampled (Tull and Hawkins 1993). How the sampling unit is specified, and
133
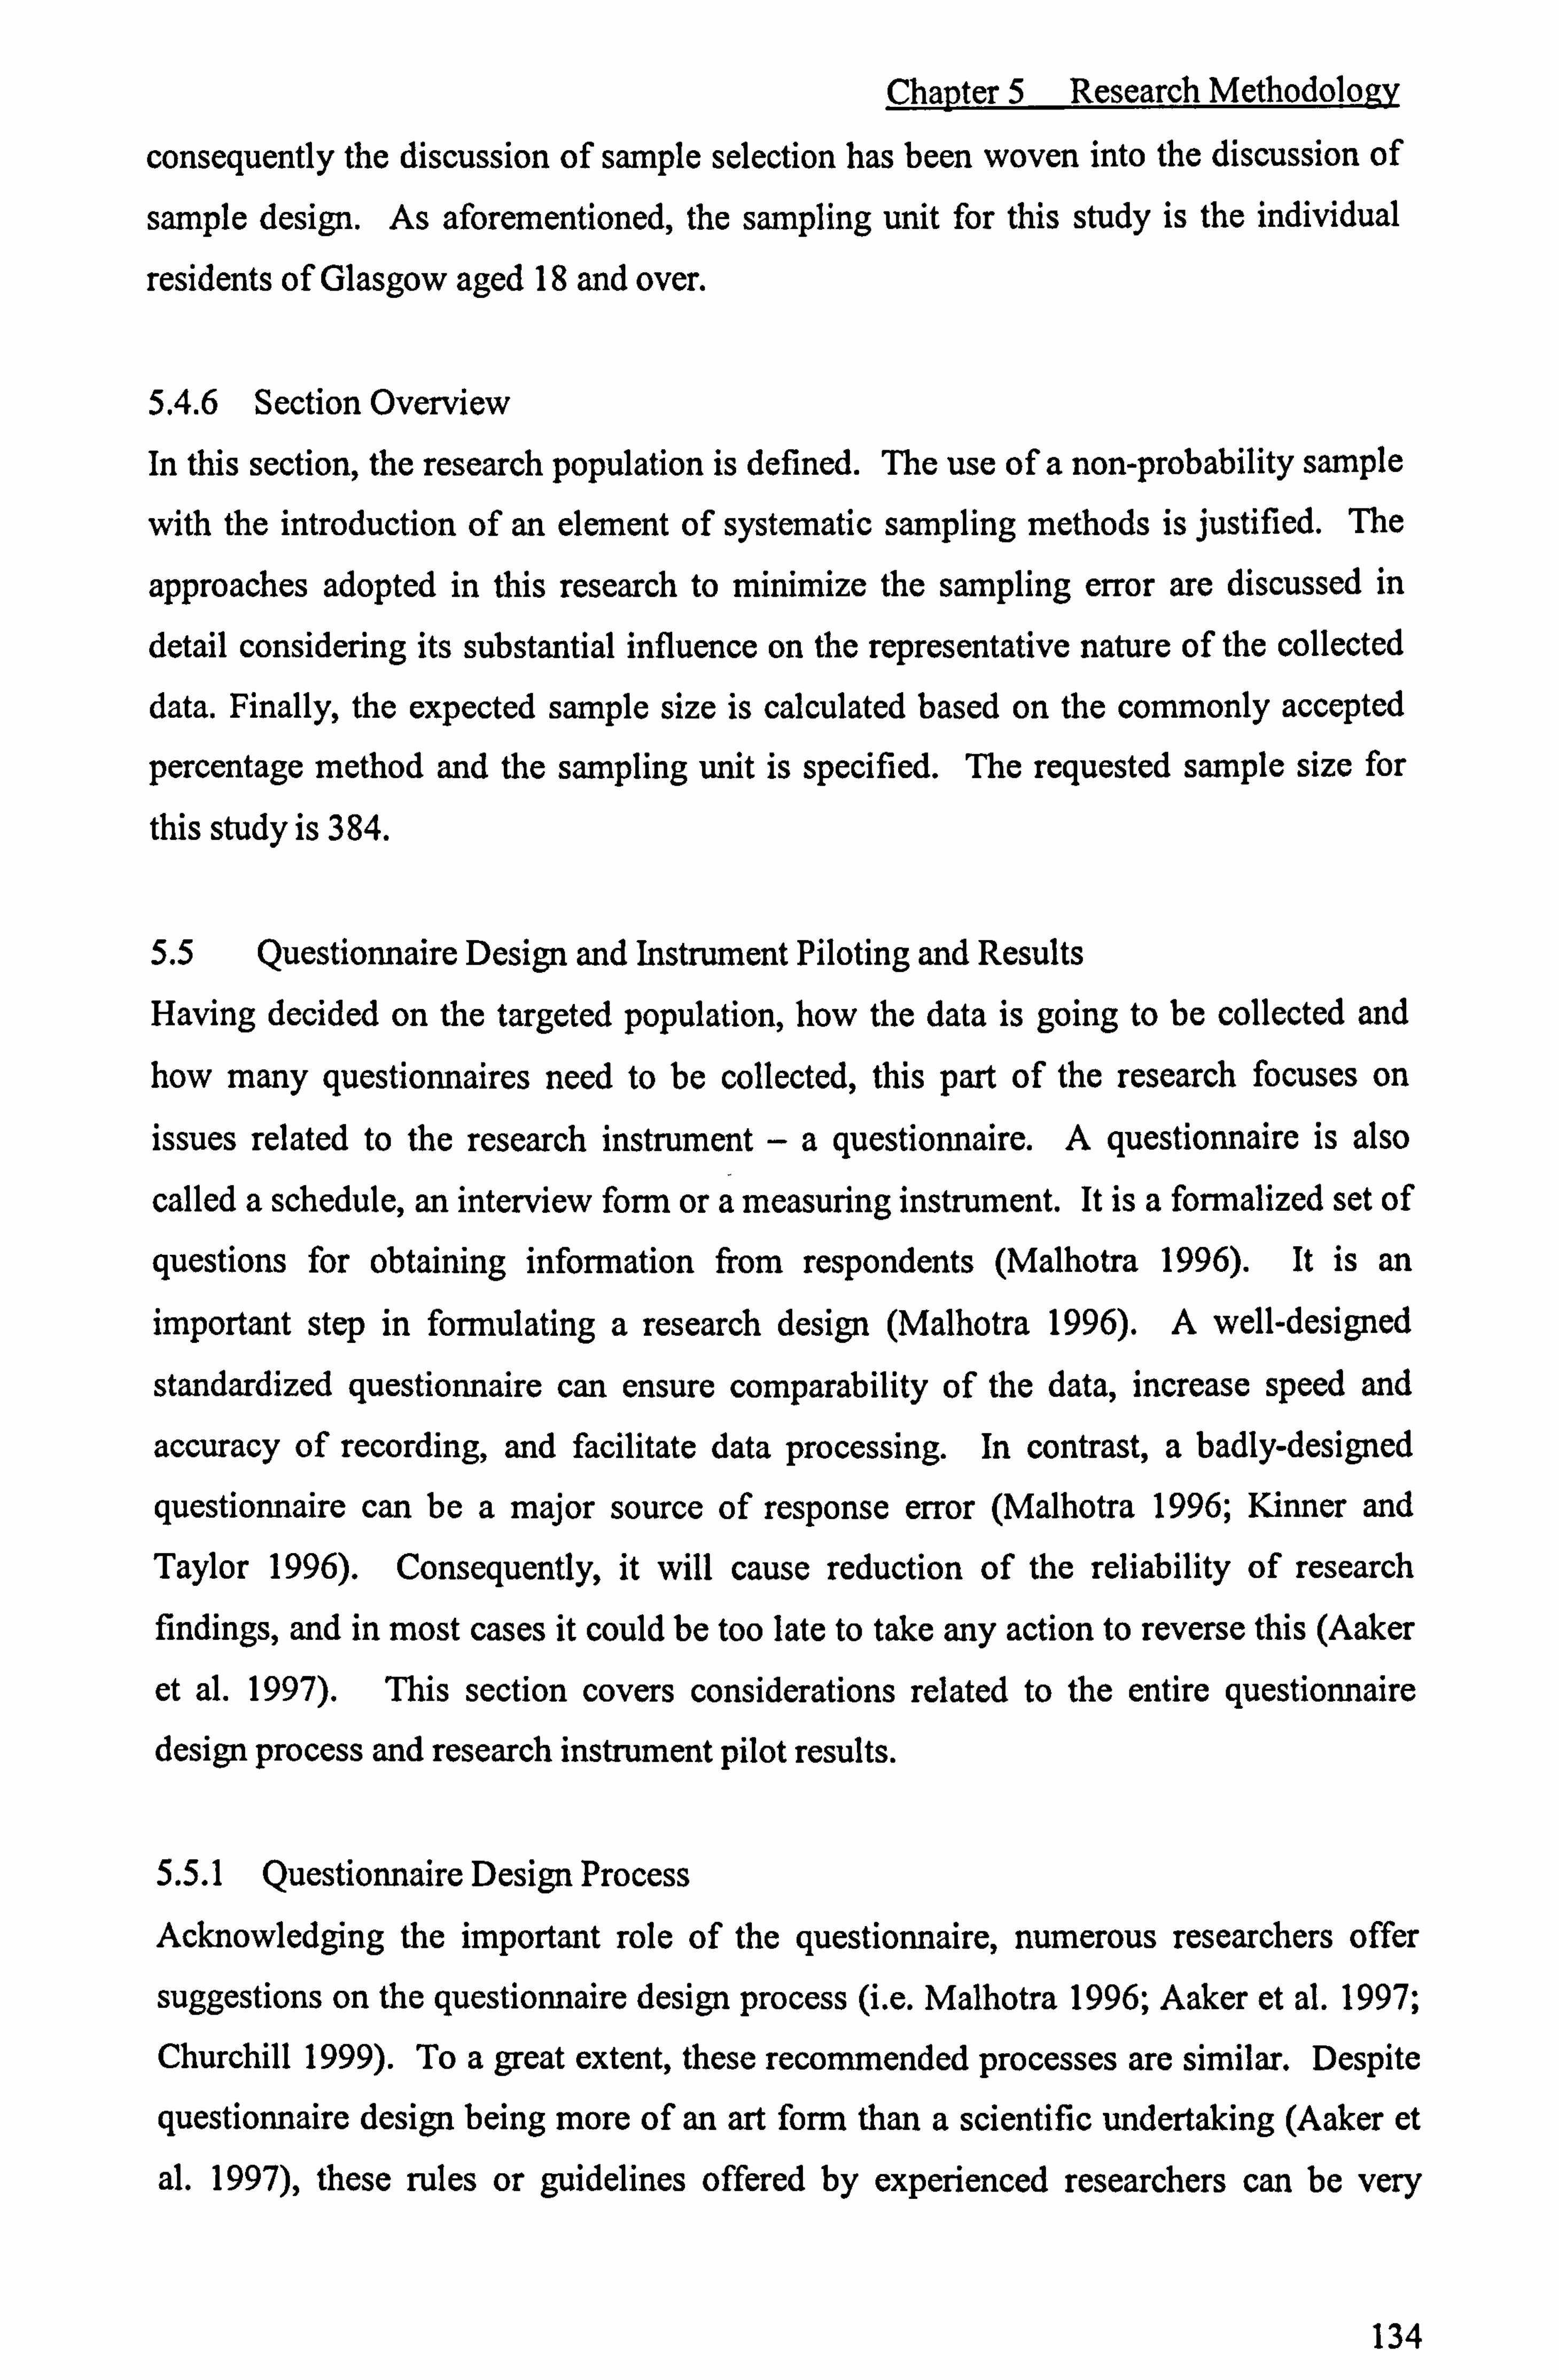
Chapter 5 Research Methodology
consequently the discussion of sample selection has been woven into the discussion of
sample design. As aforementioned, the sampling unit for this study is the individual
residents of Glasgow aged 18 and over.
5.4.6 Section Overview
In this section, the research population is defined. The use of a non-probability sample
with the introduction of an element of systematic sampling methods is justified. The
approaches adopted in this research to minimize the sampling error are discussed in
detail considering its substantial influence on the representative nature of the collected
data. Finally, the expected sample size is calculated based on the commonly accepted
percentage method and the sampling unit is specified. The requested sample size for
this study is 384.
5.5 Questionnaire Design and Instrument Piloting and Results
Having decided on the targeted population, how the data is going to be collected and
how many questionnaires need to be collected, this part of the research focuses on
issues related to the research instrument -a questionnaire. A questionnaire is also
called a schedule, an interview form or a measuring instrument. It is a formalized set of
questions for obtaining information from respondents (Malhotra 1996). It is an
important step in formulating a research design (Malhotra 1996). A well-designed
standardized questionnaire can ensure comparability of the data, increase speed and
accuracy of recording, and facilitate data processing. In contrast, a badly-designed
questionnaire can be a major source of response error (Malhotra 1996; Kinner and
Taylor 1996). Consequently, it will cause reduction of the reliability of research
findings, and in most cases it could be too late to take any action to reverse this (Aaker
et al. 1997). This section covers considerations related to the entire questionnaire design process and research instrument pilot results.
5.5.1 Questionnaire Design Process
Acknowledging the important role of the questionnaire, numerous researchers offer
suggestions on the questionnaire design process (i. e. Malhotra 1996; Aaker et al. 1997;
Churchill 1999). To a great extent, these recommended processes are similar. Despite
questionnaire design being more of an art form than a scientific undertaking (Aaker et
al. 1997), these rules or guidelines offered by experienced researchers can be very
134
Chapter 5 Research Methodology
helpful to inexperienced researchers. They are particularly useful in avoiding serious
errors (Kinner and Taylor 1996). Figure 5.3 presents the Procedure for Developing a
Questionnaire suggested by Churchill (1999). This research is guided, but not
restricted, by the procedure recommended by Churchill. Furthermore, the two rounds of
pre-test which followed provided further assistance in obtaining an effective and
efficient questionnaire.
Ste 1 Specify What Information will be p Sought
Step 2 Determine Type of Questionnaire and Method of Administration
Step 3I Determine Content of Individual Questions
Ste 4 Determine Form of Response to P Each Question
Step 5I Determine Wording of Each Question
Determine Physical Ste 6 Step Characteristics of Questionnaire
Ste 7 p Re-examine Physical L
i Characteristics of Questionna re
Step 8 Re-examine Steps 1-7 and Revise if Necessary
Step 9I Pre-test Questionnaire and Revise if Necessary
Figure 5.3: Procedures for developing a questionnaire (Churchill 1999, pp. 329)
5.5.1.1 Step 1: Information Needed
The information sought for this research is determined by the research objectives and
the finalised research conceptual model. A great amount of effort was put into on
reviewing relevant literature in order to avoid the possibility of the results being
irrelevant to the research purpose or incomplete. Following the suggestion of Aaker et
al. (1997), the research objectives were translated into specific information requirements
135

Chapter 5 Research Methodology
in order to ensure that the data collected through the research instrument serves the
overall research purpose. Table 5.5 presents the research objectives and information
requirements matched to the research objectives.
Table 5.5 Research objectives and information required Research objectives Information requirements Do consumers perceive CBP and BP differently? Consumers' perception of image (attributes,
benefits/consequences and personality) of CBP and BP. Do product knowledge, product involvement and Consumers' self-assessed product knowledge; product consumer characteristics influence how the consumers involvement; and personal detail of consumers. perceive CBP and BP? Do how consumers perceive CBP and BP, consumer Likelihood of consideration of CBP and BP; level of purchase product knowledge, product involvement and consumer intention. characteristics influence consumer decision-making?
5.5.1.2 Step 2: Closed-ended Questions vs. Open-ended Questions
Broadly speaking, a question may be unstructured or structured (Malhotra 1996).
Unstructured questions are also known as open-ended questions, which are not followed
by any kind of choice; whereas structured questions are closed-ended, with the
respondents being offered a choice of alternative replies (Oppenheim 2000; Aaker et al.
1997). Each has its advantages and disadvantages (Oppenheim 2000). It is difficult to
say which is better in general. However, it is commonly accepted that open-ended
questions are useful in exploratory research. The disadvantages of open-ended questions
outweigh the advantages in a large survey (Malhotra 1996; Churchill 1999). The
closed-ended questionnaire is utilised in this part of the study, because it is more
suitable for a large survey (Churchill 1999). The closed questions are easier and
quicker to answer, require no extended writing, are easy to process, are low cost, and
make group comparisons easy (Oppenheim 2000). In addition, all the referenced
measures adopted in this research utilise closed-ended questions in the original research,
which provides more support for using the fixed-choice questions in this study.
5.5.1.3 Step 2: Determine Method of Data Collection
In general, questionnaires can be administered in person, by telephone and by mail
survey (Churchill 1999; Aaker et al. 1997). The type of questions (open versus closed)
and the type of data requested have important effects on the choice of data collection
method (Churchill 1999). In cases where questions are simple and detailed instructions
are provided in the questionnaire, mail administration can be an alternative to the
personal interview. Compared to personal interviews, mail administration requires less
effort and can be time-saving and less expensive than using interviewers (Oppenheim
136

Chapter 5 Research Methodology
2000). Moreover, the researcher can work on something else, for example writing up
the literature review, while waiting for delivered questionnaires coming back.
Regardless of the above advantages, the mailing method is not suitable for this research,
given that counterfeit samples are used as stimuli in this research, which determines the
complexity of the administration work. Furthermore, the limited number of the
counterfeit samples provided by Trading Standards precludes the use of the mailing
method. Telephone interviews limit the types of questions that can be asked to short
and simple ones (Churchill 1999; Aaker et al. 1997), and thus are not considered
applicable to this study.
In personal interviews, respondents see the questionnaire and interact face to face with the interviewer. Therefore, lengthy, complex, and varied questions can be asked (Malhotra 1996). Moreover, personal interviews often achieve a higher response rate;
they offer opportunity to correct misunderstandings and control for incompleteness; and interviewers can succeed with respondents who have reading or language difficulties
(Oppenheim 2000). After balancing the advantages and disadvantages of mail survey,
telephone survey, and personal interview, it is decided that the personal survey is more
appropriate to this study. Due to the very tight schedule for this research, eight interviewers (four groups with two fieldworkers each group) are trained by the
researcher to conduct data collection. In doing so, time needed for the data collection is
shortened by three-quarters, subject to the assumption that on average the capacity of
each group of trained interviewers is equivalent to the researcher's capacity. In
addition, the researcher is not tied up by data collection, which allows her to devote
more time to getting administrative work organised properly.
5.5.1.4 Step 3: The Content of the Questionnaire and Content of the Individual
Questions
The content of the questionnaire covers measures of all constructs embraced in the
research conceptual model, including product involvement, product knowledge,
demographic variables, consumers' perceptions of brand image, consideration set and
purchase intention. In addition to the essential questions in relation to measures of these
construct, three additional questions were asked at the very beginning of the
questionnaire in order to establish involvement and rapport. These questions are not directly related to the needed information and are not analysed. The information
137

Chapter 5 Research Methodology
requested and the methods used to administer the questions largely control the decisions
regarding individual question content (Churchill 1999). The content of the individual
questions are adapted from established measures developed by previous researchers,
with the perceptions of brand image as an exception (see Chapter 6 for details). The
justification for using and adapting these measures are as follows.
5.5.1.4.1 Justification of Measure of Involvement
Because of the complexity of the involvement construct, many ways have been
proposed to measure this concept according to different research focuses (e. g. Wright
1973,1974; Sheth and Venkatesen 1968; Traylor 1981). Before Zaichkowsky's (1985)
benchmark work, administering Likert scale items was widely used to explore the
underlying concept of product involvement (e. g. Lastovicka and Gardner 1978; Traylor
1981). Laurent and Kapferer's Consumer Involvement Profile (CIP) scale was developed to measure five dimensions: (a) the importance of the product class to the
individual, (b) the pleasure or hedonic value derived from the product, (c) the sign or
symbolic. value attributed to the product, (d) the risk probability associated with a
potential mispurchase, and (e) the risk consequences associated with a mispurchase.
In line with prior research (e. g. Rothschild 1984; Laurent and Kapferer 1985), Hsu and
Lee (2003) consider involvement as a continuous variable and suggest that the fuzzy
mathematics method could be used to investigate the involvement. With the use of the
fuzzy mathematics method the exact measurement of consumer involvement can be
found; however, the advantage of this measure does not match the objective of this
research. This research attempts to examine effects of product involvement on consumer
choice processes rather than investigate the level of product involvement precisely.
Zaichkowsky (1985) developed the Personal Involvement Inventory (PII) with the aim
of selecting items so that the same scale might be applied to product, advertisements
and purchase decisions. The 20-item scale uses a 7-point semantic differential scale
with bipolar adjectives as anchors and was used widely by later researchers (e. g. Baker
et al. 2002; Kokkinaki 1999), due to its wider range of applicability, reported reliability
and validity. However, it was criticised by later researchers for `utilising polysyllabic
vocabulary and being very lengthy; having a problem with discriminant validity; as well
138

Chapter 5 Research Methodology
as a problem with the adequacy of the behavioural criteria and construct validity' (McQuarrie and Munson 1992, p. 108).
McQuarrie and Munson (1992) verified Zaichkowsky's (1985) PH scales and suggested
the Revised Product Involvement Inventory (RPII). Compared with PII, the RPII is
only half as long (10 items), remains very reliable, uses mostly short and simple words,
is strongly predictive of information search and processing, and is effective at
discrimination felt involvement across situations (McQuarrie and Munson 1992). The
RPII scale contains ten seven-point items, each labelled with bipolar adjectives, such as
important/unimportant, essential/nonessential, and relevant/irrelevant. Subjects'
responses to these items were summed, producing a minimum score of 10 and
maximum score of 70. The RPII was adopted by recent research (e. g. Koufaris 2002).
In the current study, the Revised Personal Involvement Inventory (RPII) proposed by
McQuarrie and Munson (1992) was used to measure product involvement due to its
widely tested validity, with necessary verification conducted. Table 5.6 presents a
comparison of three consumer involvement measures that have been reviewed in detail
in this study.
5.5.1.4.2 Justification of Measure of Product Knowledge
Measures of consumer product knowledge used in previous studies fall into several
categories. The first category refers to the usage of a surrogate scale to measure the
knowledge concept, for example consumers' actual experience with purchasing/using a
product (e. g. Monroe 1976; Anderson et al. 1979; Bettman and Park 1980; Kiel and
Layton 1981; Newman and Staelin 1973; Park and Lessig 1981; Marks and Olson
1981), experience of formal training (e. g. Bettman and Park 1980; Hutchinson 1983,
Hutchinson and Farrand 1982; Johnson and Russo 1984; Moore and Hutchinson 1985;
Srull 1983) and consumers' self-assessed knowledge (e. g. Gardner 1985; Park and
Lessig 1981; Cole et al. 1986; Punj and Srinivasan 1989). The second category
measures the amount, type, and organisation of what an consumer actually has stored in
memory associated with a product (also named `objective knowledge') (e. g. Olson and
Muderrisoglu 1979; Marks and Olson 1981; Kanwar et al. 1981; Russo and Johnson
1980; Staelin 1978; Brucks 1985; Jacoby et al. 1977; Sujan 1985). The third category
combines the aforementioned scales and measures consumers' experience and objective knowledge (e. g. Rao and Monroe 1988), consumers' experience and self-assessed
139
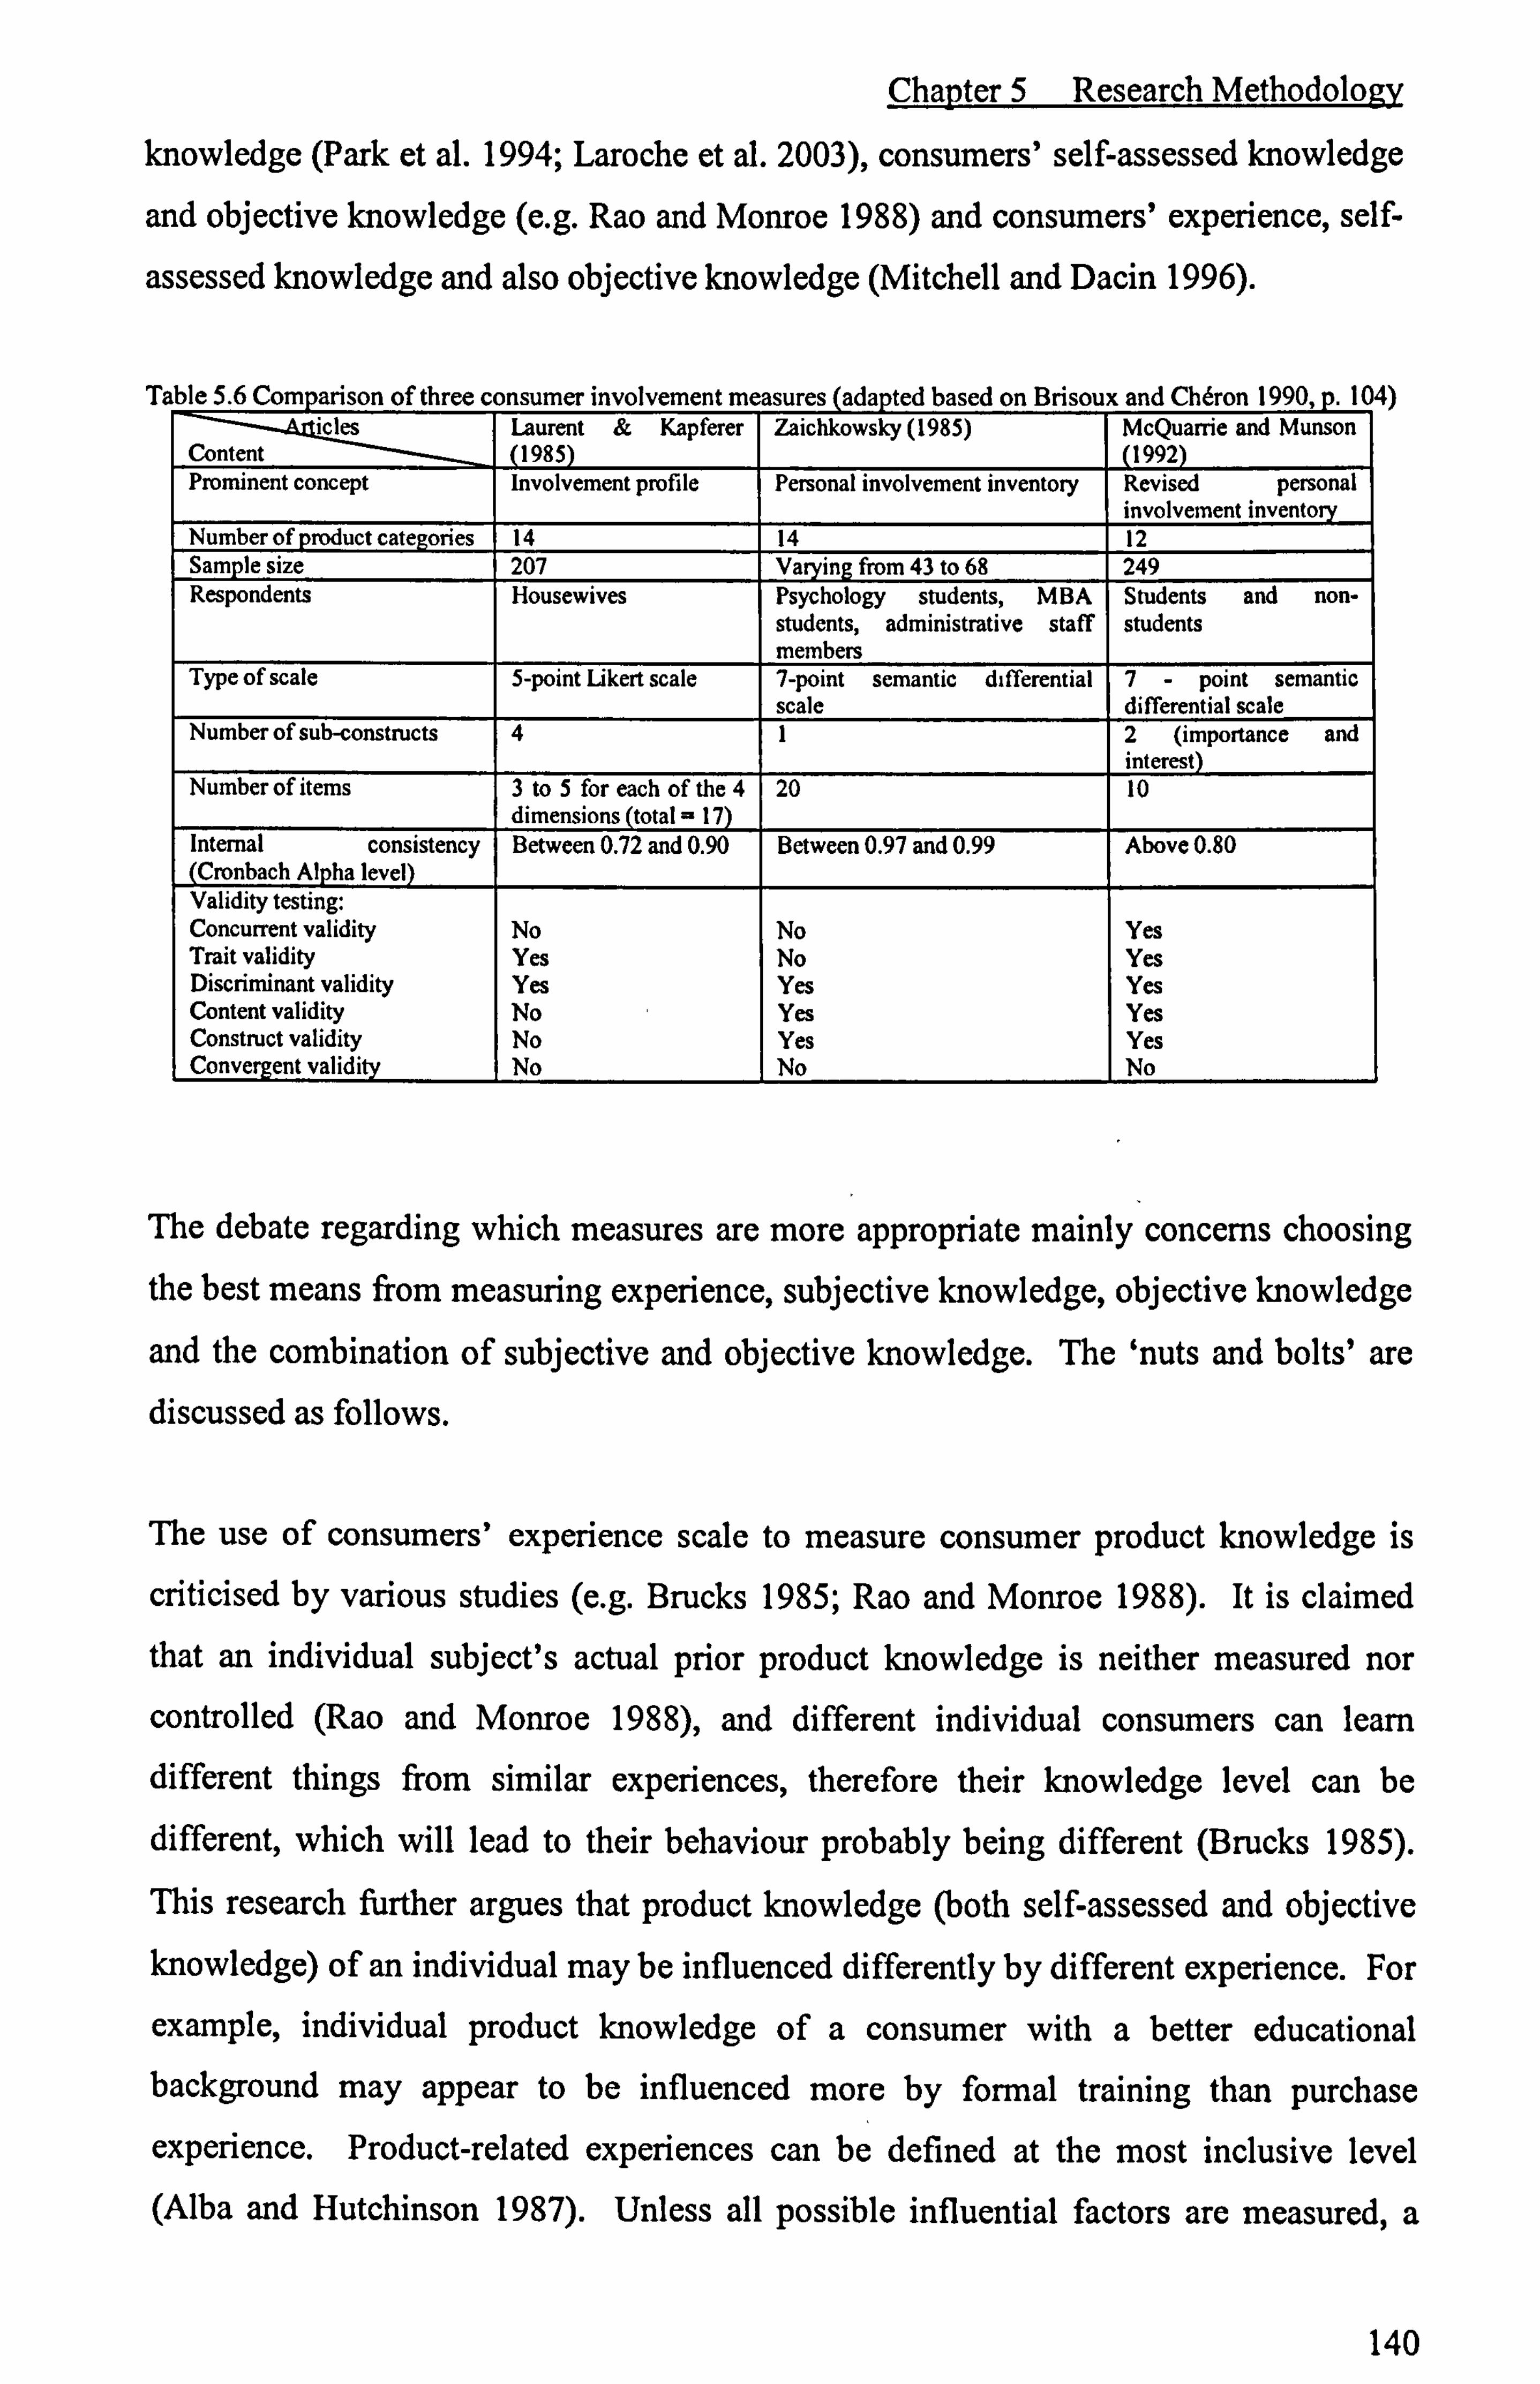
Chapter 5 Research Methodology
knowledge (Park et al. 1994; Laroche et al. 2003), consumers' self-assessed knowledge
and objective knowledge (e. g. Rao and Monroe 1988) and consumers' experience, self-
assessed knowledge and also objective knowledge (Mitchell and Dacin 1996).
Table 5.6 Comparison of three consumer involvement measures (adapted based on Brisoux and Cheron 1990, p. 104) icles Laurent & Kapferer Zaichkowsky (1985) McQuarrie and Munson
Content (1985) (1992) Prominent concept Involvement profile Personal involvement inventory Revised personal
involvement inventory Number of product categories 14 14 12 Sample size 207 Varying from 43 to 68 249 Respondents Housewives Psychology students, MBA Students and non-
students, administrative staff students members
Type of scale 5-point Likert scale 7-point semantic differential 7- point semantic scale differential scale
Number of sub-constructs 4 1 2 (importance and interest)
Number of items 3 to 5 for each of the 4 20 10 dimensions (total - 17)
Internal consistency Between 0.72 and 0.90 Between 0.97 and 0.99 Above 0.80 (Cronbach Alpha level) Validity testing: Concurrent validity No No Yes Trait validity Yes No Yes Discriminant validity Yes Yes Yes Content validity No Yes Yes Construct validity No Yes Yes Convergent validity No No No
The debate regarding which measures are more appropriate mainly concerns choosing
the best means from measuring experience, subjective knowledge, objective knowledge
and the combination of subjective and objective knowledge. The `nuts and bolts' are discussed as follows.
The use of consumers' experience scale to measure consumer product knowledge is
criticised by various studies (e. g. Brucks 1985; Rao and Monroe 1988). It is claimed
that an individual subject's actual prior product knowledge is neither measured nor
controlled (Rao and Monroe 1988), and different individual consumers can learn
different things from similar experiences, therefore their knowledge level can be
different, which will lead to their behaviour probably being different (Brucks 1985).
This research further argues that product knowledge (both self-assessed and objective knowledge) of an individual may be influenced differently by different experience. For
example, individual product knowledge of a consumer with a better educational background may appear to be influenced more by formal training than purchase experience. Product-related experiences can be defined at the most inclusive level (Alba and Hutchinson 1987). Unless all possible influential factors are measured, a
140
Chapter 5 Research Methodology
biased result is unavoidable. Therefore, in line with Rao and Monroe (1988), this
research recommends that the experience scale should be used with caution, as the use
of experience scales makes it hard to ensure that an individual subject's actual product
knowledge is measured and controlled properly (Rao and Monroe 1988).
In response to Brucks (1985), who suggests that a measure of knowledge/familiarity
should include eight dimensions that help in discriminating between peoples'
knowledge structures,. Rao and Monroe (1988) developed a scale to measure consumer
knowledge of womens' blazers. This scale comprises 13 objective and subjective
knowledge-based questions with an attempt to combine objective and subjective
measures together. However, these authors fail to report reliability and validity of this
scale in their work. It seems that the background idea of this combined measure is that
both subjective knowledge and objective knowledge have their own advantages and
shortcomings, hence, a combined measure which covers a wider range of consumers'
knowledge structures will balance the shortcomings of each individual scale.
The current study argues that it is not necessary to say that a combined measure will
serve better than any individual measures in all cases. For example, if marketers or
researchers want to know consumers' true knowledge about a certain brand, the
objective measure should be utilised. In contrast, if they want to investigate how
consumers' knowledge influences their information searching and purchase behaviour,
subjective knowledge should be measured, because only subjective knowledge drives
the information search and has a direct influence on behaviour (Bettman and Park 1988;
Park and Lessig 1981). Our argument is supported by Meeds (2004), who finds that
self-assessed knowledge is a better predictor of participants' cognitive responses and
general attitudinal evaluation, whereas objective knowledge is a better predictor of
ratings for specific product attributes. Practically, to measure both objective and
subjective knowledge puts extra pressure on both researcher and respondents; this is
particularly true if the research instrument is already very lengthy. Moreover, previous
research reveals that subjective knowledge and objective knowledge are highly
correlated empirically (Rao and Monroe 1988; Park et al. 1994), and subjective
knowledge depends on the level of objective knowledge (Rao and Monroe 1988). If
this claim holds, one can safely say that objective knowledge is the antecedent of
141

Chapter 5 Research Methodology
subjective knowledge. It then does not make any statistical sense to calculate the
average of subjective knowledge and objective knowledge.
Measures of objective knowledge are conceptually and operationally distinct from
measures of subjective knowledge (Brucks 1985). Objective knowledge to a great
extent reflects consumers' true product knowledge, it ignores the impact of consumers'
confidence levels on the selection of information search strategies (Brucks 1985), and
consumers' receptivity to new information (Park et al. 1988). Compared with objective
knowledge, subjective knowledge may not reflect true consumer product knowledge
(Brucks 1985). However, it provides a better understanding of decision-makers'
systematic biases and heuristics (Park and Lessig 1981). Another advantage of using
measures of subjective knowledge is that this can bring in the self-confidence
dimension, as well as consumer perceived knowledge (Brucks 1985). Perceived self-
confidence may affect decision strategies and tactics (Park and Lessig 1981).
Moreover, it tends to drive information search and the type of decision heuristics
consumers use (Bettman and Park 1980; Park and Lessig 1981), both of which are
central to the theory underlying many of the research hypotheses and fit in with the
theoretical conceptual model of the current research.
Along the same lines as certain previous research (e. g. Chang 2004; Smith and Park
1992; Li et al. 2002; and Park et al. 1994), this research uses a "self-assessed
knowledge" scale rather than an "objective knowledge" scale. Likert scales (e. g. Smith
and Park 1992) and semantic differential scales (Brucks 1985) are utilised in the
previous studies. In this study the measures are taken from Smith and Park (1992) with
slight adaptation. The reason for choosing this scale is because these measures have
been commonly adopted and also have a satisfactory reliability (e. g. Li et al. 2002;
Biocca et al. 2001). Smith and Park (1992) report that Cronbach's Alpha is satisfied at
. 80. In the current research, respondents are asked to indicate on a 5-point scale
(strongly agree/strongly disagree) the extent to which they agree with four statements
about their knowledge of the studied product class (see Appendix 4).
5.5.1.4.3 Measure of Brand Image
As noted earlier (see Chapter 4), the brand image consists of three sub-constructs. They
are brand personality, purchase benefits/consequences and product attributes (Plummer
142

Chapter 5 Research Methodology
2000). By its nature, brand image is brand/product specific. Therefore, it is likely that
there is no universally applicable measure. This section will discuss the measures of the
three sub-constructs of the brand image in detail.
5.5.1.4.3.1 Measure of Brand Personality
Before Aaker's (1997) brand personality scale, two types of brand personality scales
were used in marketing research. First, idiographic brand personality measures were
often used (e. g. Helgeson and Supphellen 2004; Birdwell 1968). These measures are
still more common than other scales (Helgeson and Supphellen 2004), since they ensure
that only salient and relevant personality characteristics are included. Idiographic scales
are based on qualitative pre-study in which relevant personality traits for the brand are
elected. These measures are useful, but it appears that they were often developed for
the purpose of a specific research study, and the traits were chosen arbitrarily.
Therefore, very frequently these scales cannot be applied to other studies, and their
validity and reliability are also questionable (Aaker 1997; Helgeson and Supphellen
2004). The second type of scales are those that are based on human personality scales
(e. g. Bellenger et al. 1976; Dolich 1969). However, the validity of such scales in the
context of brands has not been validated (Aaker 1997; Helgeson and Supphellen 2004;
Sirgy 1982; Kassarjian 1971). Furthermore, a direct adoption of human personality
scales to study of brand personality should be problematic, since the factors used to
describe human personalities have been proved to be inappropriate for describing
brands (Caprara et al. 2001).
Recognising the handicaps of all previous scales of brand personality and realising the
need for further empirical research, Aaker (1997) developed a scale which attempted to
achieve a generalisability, validity and reliability across diverse categories. Following
the scale development process suggested by Malhotra (1981), Aaker generated a pool of
traits related to brand on the basis of three sources: personality scales from psychology,
personality scales used by marketers, and original qualitative research of personality
traits associated with 37 different brands. After sorting a number of descriptors of brand personality by using exploratory and confirmatory factors analysis, as well as
replicability analysis, five major personality dimensions appeared. The final scale
contained 5 dimensions, 15 facets and 42 personality traits.
143

Chapter 5 Research Methodology
Aaker's (1997) brand personality scale has been examined across various cultural
contexts, product categories and also across profit and non-profit organisations (e. g.
Aaker 2000; Aaker et al. 2001; Ferrandi et al. 2000). These studies have established
that there are consistencies in brand personality dimensions in different contexts,
concurring with Aaker (1997), who claimed that the brand personality scale is reliable,
valid and can be generalised. In other studies, Aaker's (1997) brand personality scale
appears problematic. Venable et al. (2003) reported that a five-factor structure of non-
profit brand personality emerged that included four of the five dimensions identified by
Aaker (1997) when they tested Aaker's (1997) brand personality scale on non-profit
organizations. Koebel and Ladwein (1999) found that it was difficult to apply Aaker's
(1997) scales to a French context. Davies and Roper (2001), when they applied Aaker's
(1997) scales to the UK context, recognised that the items `Western', `Small town' and
`Feminine' accounted for many of the low reliability scores of their study; the item
`Western' caused confusion between subjects, and items are culturally specific.
Furthermore, it is still debatable whether items like `age' and `gender' should be
included in brand personality scales (Azoulay and Kapferer 2003). In contrast to
Azoulay and Kapferer (2003), who suggested that brand personality should not include
gender, age and social class related dimensions, Plummer's (2000) findings are in line
with those of Aaker (1997), which noted that age did help to discriminate brands.
Aaker's (1997) scale was developed based on the measurement theory. After close
study of the development of Aaker's (1997) scales, one can argue that idiographic
measures can be regarded as the results of the first phase of this development. In other
words, Aaker's (1997) scales are more advanced compared to idiographic measures, having been tested and supported as being valid and reliable. Despite some researchers
claiming that idiographic measures are still more commonly used than other scales (Helgeson and Supphellen 2004), this research decided to adopt Aaker's (1997) scales
as the foundation of the instrument to measure brand personality of studied brand(s),
both genuine branded products and the related counterfeit versions.
It was necessary to conduct a preliminary study in this research. First of all, this
research investigated brand personalities of different versions of a same brand. Although Aaker's (1997) scales were developed from a study of a wide range of brands,
and it was suggested that they can be used to compare personalities of brands across
144

Chapter 5 Research Methodology
product categories (Austin et al. 2003; Aaker 1997), no research has proved that
applying Aaker's (1997) scales to a specific brand will be problem free. In fact,
researchers did appear to question whether same traits can be applied to all brands (e. g.
Caprara et al. 2001). Secondly, Aaker's (1997) scales were developed in the U. S.
context. To some extent, they appeared to be problematic when applied to the UK
context (Davis and Roper 2001). Thirdly, the use of the original Aaker brand
personality scale will give a very lengthy questionnaire, since it consists of 42 items. A
simple calculation indicates that the total number of questions related to the brand
personality only will be 336, as we are investigating 4 brands and 2 versions of each
brand. That said, Aaker's (1997) scale is regarded as the foundation of a master list of
traits to be tested in the preliminary study due to its proven high reliability and validity.
More details are reported in the preliminary study chapter.
5.5.1.4.3.2 Measure of Purchase Benefits/Consequences and Product Attributes
By their nature, purchase benefits and product attributes are product specific. Therefore, it is essential to identify the most salient and relevant benefits and product
attributes before measuring them. The preliminary study is designed to achieve this
goal. Details are reported in Chapter 6.
5.5.1.4.4 Justification of Measures of the Consideration Set
The consideration set is a concept that is both intuitively appealing and practically
useful, and it has attracted more and more research interest. One thing which must be
addressed here is that few adoptable measures of the formation of a consideration set have been reported. Previous researchers conclude that the reason why more research has been done on the study of the size of the consideration set and even the descriptive
characteristics of the consideration set is because the consideration set is a construct that
is difficult to measure (Punj and Srinivasan 1989). Asking respondents to list what
they would consider purchasing or choosing from a list of brands/products provided by
researchers is commonly used by researchers to measure both memory-based
consideration sets and stimulus-based consideration sets (e. g. Shapiro et al. 1997; Reilly
and Parkinson 1985; Parkinson and Reilly 1979; Johnson and Lehmann 1997;
Nedungadi 1990). In these studies, brands/products are treated as either `considered' or `not considered'.
145

Chapter 5 Research Methodology
Troye (1983) used a 5-item scale to measure the consideration set when investigating
the impact of similarity of choice alternatives, number of available alternatives and
purpose of information processing on this construct. However, the author did not report the scale reliability, or the scale validity. Troye's (1983) 5-item scale is adopted, as this
is the only multi-item scale we could find. The scale reliability and validity are tested
and the test results are reported in later chapter (Chapter 7).
5.5.1.4.5 Justification of Measure of Consumer Purchase Intention
Previous researchers have used a variety of scales to measure consumer purchase intentions. For instance, a single-item scale (e. g. Whitlark et al. 1993; Cronin and Taylor 1992; Woodside et al. 1989), a 2-item scale (e. g. Boulding et al. 1993), 3-item
scale (e. g. Mackenzie et al. 1986; Chang 2004), a 4-item scale (e. g. Prendergast and
Hwa 2003; Li et al. 2002), a 6-item scale (e. g. Boulding et al. 1993), an 11-item scale (e. g. Martin and Bush 2000), and a 13-item scale with four categories (word-of-mouth
communications, purchase intentions, price sensitivity, and complaining behaviour)
(e. g. Zeithaml et al. 1996). Some researchers (e. g. Zeithaml et al. 1996) argue that
previous research has not captured the full range of potential consumer behaviour by
using scales such as single-item, 2-item, and even 6-item scales. However, research findings suggest that the single-item scale is not necessarily unusable. Using a single- item Likert scale, Whitlark et al. (1993) found that 75 percent of those who stated a
purchase intention did purchase within 3 months, with a slightly higher percentage
purchasing within 6 months. These findings apply over a range of products with different levels of involvement, including printers, milk, and meals.
Apart from the above noted single- or multi-item scales, some other methods are also
used to measure purchase intention. For instance, binary question is used to assess this
construct (e. g. Daneshvary and Keith 2000); counting future purchase times in the next ten purchase occasions is also utilised by researchers (e. g. Laroche et al. 1996; Juster
1966; Howard and Ostlund 1973). It seems that just about every study measuring this
construct has utilised a different set of items. Given this, anyone who wishes to
measure these constructs is faced with a bewildering array of choices.
Spears and Singh (2004) further note that despite the reported support in relation to the
reliability of the measures, none of the previous research examines the psychometrical
146
Chapter 5 Research Methodology
validity of the measure of purchase intention and there is no standard scale available. Moreover, it seems that practically every study measuring this construct has utilised a different set of items. Responding to the call for better measures (e. g. Bagozzi 1992;
Churchill 1979), on the basis of measures reported in prior research, Spears and Singh
(2004) developed measures of purchase intention and further replicated and validated it
using another empirical study. This five-item scale which includes never/definitely
purchase intention, definitely do not intend to buy/definitely intend, very low/high
purchase interest, definitely not buy it/definitely buy it, probably not/probably buy it is
recommended (Spears and Singh 2004). The Spears and Singh (2004) scale is adopted for this research due to its tested reliability and validity. Necessary verifications are
conducted according to the studied brands and format of the current research instrument. Thus, an established five-item, five-point Likert scale is used to measure
the likelihood that participants would purchase the evaluated CBP and BP.
5.5.1.4.6 Methods Adopted to Increase Response Rate
Contents of the questionnaire and possible methods related to the research instrument
that can help to increase response rate are considered at this stage. Previous researchers (e. g. Oppenheim 2000) have suggested a number of methods to increase response rate. This research utilises the following approaches in order to improve response rate.
Explanation of selection: The preliminary study indicates that some ordinary consumers
will think that they are not qualified to participate in this study because they have never
consumed or bought CBP. As reported earlier, about a quarter of ordinary consumers
are not aware of the existence of CBP. Therefore, it is more likely that these people will
refuse to take part in this research if no sound explanation is given. As a result, the
response rate is reduced by one quarter before even the research starts. Moreover, it brings in bias to this study, given that these consumers might possess different
perceptions of CBP and BP to other consumers. To overcome this potential problem, a thorough explanation is given in relation to the method of sampling used in this
research, how the respondent comes to be chosen in the cover letter, and who is eligible for participation (see Appendix 5).
Use of egoistic appeal: It is suggested that use of egoistic appeal can improve the
response rate (Bums and Bush 2000). In this research, the egoistic appeal used is:
"Your participation is crucial in completing this research. "
147

Chanter 5 Research Methodology
Use of counter-biasing statements: A statement indicating that consumers do
knowingly purchase CBP is illustrated in both the cover letter and at the very beginning
of the questionnaire. It is believed that the use of this technique can make it easier for
the respondent to admit potentially embarrassing behaviour (Churchill 1999), for
example, purchase intention of the CBP in this study.
Confidentiality: The respondents are promised that all data they provide are treated as
confidential. More specifically, only the researcher will have access to them. The
following statement appears both in the cover letter and on the front page of the
questionnaire with the core words highlighted: Any information you provide will be
kept absolutely confidential. Information identifying the respondent will not be
disclosed under any circumstances.
Definition of CBP: The definition statement of CBP is placed at the very beginning of
the questionnaire. Considering people may have different understandings with regard to
the terminology of counterfeiting (Phau et al. 2001; Hoe et al. 2003), this manner is
regarded important to ensure that all respondents will achieve a common understanding
of what we mean by CBP in the current research.
Appearance: There have been many experiments with general layout, type face, colour
and quality of paper etc. It is best to aim at a relatively `conservative' but pleasant
appearance. A relatively `conservative' appearance is adopted in this study, because it is
considered as more professional (Oppenheim 2000).
Length: The complexity of this research determines the lengthy nature of the research
instrument. Being fully aware of the impact of the length of a questionnaire on the
response rate, the researcher tried all possible approaches in order to keep the
questionnaire as short as possible, while trying to ensure at the same time no important
information is missed. For example, a suitable format of questionnaire was developed
which combined the advantages of the Likert scale and the repertory-grid technique.
This new technique saves the respondents from reading a statement several times in
different locations. Rather, the respondents only read the statement once but consider it
several times against different brands before locating their answers. This approach
148

Chapter 5 Research Methodology
makes the questionnaire look much shorter than it would be using the conventional Likert scale, while at the same time ensuring no loss of information. For more details,
please refer to section 5.5.1.8.
Sequence of questions: The questionnaire starts with easy questions. This helps to
establish a rapport and builds the confidence of the respondent in his or her ability to
answer (Kahn and Cannell 1957). The questionnaire follows the logic of the consumer
decision-making process, which is also in line with the research conceptual model. The
classification questions in relation to personal details tend to be very off-putting to
respondents (Oppenheim 2000), therefore, they are put right at the end of the
questionnaire, by which time we hope to have convinced the respondent that the inquiry
is genuine and this is a piece of serious academic work.
Introductory phase: Whenever a new topic is introduced, a transition statement is
provided to tell the respondent what information is requested in this part of the
questionnaire. In addition, precise instructions are provided to guide the respondent to
provide standard answers.
5.5.1.5 Step 4: Response to Questions
5.5.1.5.1 Exclusion of `Don't know', `No opinion' and ̀ Not applicable' Whether response categories of a questionnaire should include `Don't know', `No
opinion' and `Not applicable' still remains debatable (e. g. Oppenheim 2000; Churchill
1999). This research would argue that the inclusion or exclusion of these categories
should be decided by the nature of the questions and the likelihood of these answers being provided by respondents. It was decided that the respondents would not be
provided with these response categories in this research. This is mainly because the
research is testing consumers' own evaluation of their knowledge, involvement of
studied product classes, consumers' evaluation of their perceptions of CBP and BP, the
likelihood of their consideration and their purchase intention. `Don't know', `Not
applicable' and `No opinion' do not apply to the questions related to self-assessment,
simply because that there are no reasons why respondents do not know the answer or believe the questions do not apply to them. In the preliminary data analysis stage the
items for which the participants claimed "Don't know" or "Irrelevant" are excluded
149
Chapter 5 Research Methodology
from the questionnaire. Therefore, there is no sense in including these statements in the
response categories in relation to consumers' perceptions.
This research suggests that `No opinion' is different from `Neutral'. `No opinion' could be an indication that the respondent does not understand or the respondent is reluctant to
give any answer. `Neutral' means that the respondent has an opinion. His/her opinion
represents the midpoint of a scale. Thus, `Neutral' is included in the response
categories. Furthermore, this research assumes that all respondents are fully aware of
their own stage of life cycle as well as their demographically related situation.
5.5.1.5.2 Number of Categories
Although the number of categories can range from a 2-point scale all the way to a 100-
point scale, as a general rule, the range of opinion on most issues can best be captured
with five or seven categories (Aaker et al. 1997). Despite the fact that seven categories
might generate more precise results, this research utilises a five-point Likert scale to
measure the majority of constructs involved in this research. This is because it is
typical of a Likert scale that each scale item has five response categories, ranging from
"strongly disagree" to "strongly agree" (Malhotra 1996). More complex scoring
methods have been shown to possess no advantage (Oppenheim 2000). In addition,
compared with a seven-point scale, a five-point scale is more manageable and less off-
putting to respondents. In the case where a semantic differential scale was used when the reference measures were developed, the semantic differential scale was adapted to
the Likert scale, with the positive polar chosen as the content of the individual question. The reason for choosing a positive polar is to avoid double negative wording. Numbers
are assigned to the response categories, since the researcher believes the respondents' judgments can be treated as interval data. This is consistent with the referenced
previous research. The numbers used are 1,2,3,4, and 5. A low score on the scale
means an unfavourable attitude. More specifically, unfavourable statements are scored 1 for `strongly disagree', up to 5 for `strongly agree'.
5.5.1.6 Step 5: Wording Question wording is considered as the most critical and difficult task in developing a
questionnaire (Malhotra 1996; Churchill 1999). It involves translating the desired
question content and structure into words that respondents can clearly and easily
150
Chapter 5 Research Methodology
understand (Malhotra 1996). The two main problems caused by poor wording are
known as `item non-response' and `response error' (Malhotra 1996). More specifically,
poor phrasing of a question can cause respondents to refuse to answer or to answer
incorrectly, either because of misunderstanding or on purpose (Churchill 1999), either
of which can lead to biased results (Fred 1990).
Given that the importance and difficulties related to question wording is well
recognised, a number of works provide suggestions as to how to develop good phrasing
of questions (e. g. Malhotra 1996; Churchill 1999; Oppenheim 2000; Aaker et al. 1997).
Based on previous works, this research generated a list of rules-of-thumb that can be
applied to the current research. This list serves as a checklist of wording. Each
question appearing in the draft of questionnaire is checked against this list by the
researcher. The researcher is fully aware that the `rule-of-thumb' is easier to state than
to practice. Therefore, it is decided that two pre-tests are needed in order to ensure a high level of wording accuracy. The list of rules-of-thumb includes: avoid double-
barrelled questions; avoid double negatives; use simple words; avoid acronyms,
abbreviations, jargon and technical terms; beware the dangers of alternative usage; beware ̀ leading' questions; beware loaded words, and avoid overlapping categories.
One of the valuable contributions of the preliminary study to this part of the research is
to help to understand the impact of contexts on respondents' interpretation of phases.
For example, `western' and `sentimental' could be interpreted differently in different
contexts. For further details, please refer to Chapter 6. This finding suggests that to
ensure data collected from two contexts are comparable, different interpretations of one
phase should be measured.
Apart from the aforementioned contribution, the preliminary study plays a very important role in helping to achieve a better question wording in relation to examination
of the participants' perception of brand image. This assistance includes its being the
source of the plain language used by consumers and providing the indication of
potential loaded words. For example, the focus group discussion revealed that in
general the participants use `style' to refer to the product `design' and their answers are
affected by the emotionally coloured word `legitimate', which suggests an automatic
151

Chapter 5 Research Methodology
feeling of approval and disapproval. Therefore, ̀ design' and `legitimate' are replaced by `style' and ̀ original'.
5.5.1.7 Step 6,7, and 8: Physical Characteristics of Questionnaire and Revisions
The physical appearance of the questionnaire can affect the accuracy of the replies that
are obtained (Mayer and Piper 1982; Sanchez 1992), as well as how respondents react
to it and the ease with which the replies can be processed (Churchill 1999; Aaker et al.
1997). The questionnaire package includes a cover letter and the questionnaire. The
cover letter was printed on the University letterhead, and the University logo and the
title of the project appear on the first page of the questionnaire, which should lend
credibility to the study (Churchill 1999). Good quality A3 paper was used in this
research. All questionnaires are printed, but not photocopied, in order to achieve clarity
of reproduction. The questionnaire was intended to be made into a booklet. The
questions are numbered, with particular attention being paid to ensuring that the
questionnaire does not look crowded. All the efforts made here were aimed at
influencing respondents' cooperation, increasing the accuracy of the data obtained, and
facilitating handling and control. The questionnaire was re-edited carefully, followed
by an overall re-examination of Step 1 to 7. Necessary revisions were implemented
before conducting the pre-test.
5.5.1.8 Newly Developed Technique to Reduce the Length of the Questionnaire
Following the conventional Likert scale technique, the research questionnaire is more
than 14 pages long. There is no doubt that the lengthy nature of the research instrument
will put potential respondents off. Moreover, due to this research examining two
versions of four brands from two product categories, the majority of the questions are
repeated two or even eight times. Repetition of a question will make respondents feel
bored (McLauchlan 1987). In order to solve the problem, a new technique is developed
based on the repertory-grid technique and the Likert scale.
Kelly (1955) proposed the repertory-grid technique. The most important aspects of the
repertory-grid technique are the constructs (attributes) and the objects. It can be used to
study which things are seen as similar, to find out how the meaning of different
constructs hang together, and to study the individual's `construct map' (Oppenheim
2000). This technique allows studies at the personal level as well as at the group level.
152

Chapter 5 Research Methodology
It has been used in conjunction with the development of a set of semantic differential
scales (Fransella and Bannister 1977). There is no report of the repertory-grid technique
being used in conjunction with the Likert scale.
The Likert scale was first proposed by Rensis Likert. The Likert method of summated
ratings overcomes previous criticisms about scoring and allows an expression of
intensity of feeling (Likert 1932). A Likert scale usually consists of two parts, the item
part and the evaluative part. The item part is essentially a statement about a certain
product, event, or attitude. The evaluative part is a list of response categories ranging
from "strongly agree" to "strongly disagree. " Subjects are asked to indicate their degree
of agreement or disagreement with each and every statement in a series by checking the
appropriate response.
This research is the first to use a Likert scale in conjunction with the repertory-grid
technique. The combination of two techniques consists of three parts, the item part
remaining unchanged, with the evaluative part (response categories) being replaced by
objects. The evaluative part becomes a component of the introductory phase. The
subjects are asked to indicate their degree of agreement or disagreement with every
statement in relation to each object by tilling in the appropriate number that reflects
their level of agreement or disagreement. This newly developed technique retains all
advantages of the repertory-grid technique and the Likert scales. More importantly, the
length of the questionnaire is reduced remarkably through the application of this
technique and avoids repetition of questions (See Table 5.7 for an example). Beckwith
and Lehmann (1975) suggested that respondents tend to "halo" their responses toward
brands by rating the brands they like high on all attributes. Application of the newly-
developed technique helps the respondent to avoid only thinking of the alternative and
not about the attributes by making the attributes the focus of attention. The applicability
of this technique is to be tested in the process of piloting.
Table 5.7 Example of the newly developed technique (part of the research questionnaire) Watches Original Gucci Counterfeit Gucci
Strongly Strongly Strongly Strongly disagree agree disagree agree
II can get the size I want. 1234 5 I23 4 5
2 It is expensive. I234 5 I23 4 5
3 The materials are good. I234 5 I23 4 5
4 They have the style I like. I234 5 I23 4 5
5 The product is practical. 1234 5 123 4 5
153

Chapter 5 Research Methodology
5.5.2 Step 9: Piloting Questionnaire and Verification
It is widely accepted that pre-testing a questionnaire is an integral part of the
questionnaire development process (Reynolds and Diamantopoulos 1998; Churchill
1999). Pre-testing a questionnaire is the stage in questionnaire design that occurs after
the research has completed the initial questionnaire, before the questionnaire is used for
the main survey. Given that neither professional judgement nor intellectual exercise are
perfect substitutes for pre-testing (Backtrom and Hursch 1963) and non-sampling error
(i. e., response and non-response error) is the major contributor to total survey error
(Assael and Keon 1982), pre-testing a questionnaire is regarded as vital to the survey
design process (Bolton 1991). Churchill (1999) suggested that data collection should
never begin without an adequate pre-test of the instrument.
5.5.2.1 Two-stage Pre-test and the Respondent's Profile
The measures for most constructs in the study (i. e. brand personality, product
knowledge, product involvement, consideration set and purchase intention) are drawn
from previous research with necessary amendments. Following advice from the
methodological literature (Diamantopoulos et al. 1994), the questionnaire is subject to
two separate pre-tests. First, three academic researchers not involved directly with the
design of the questionnaire, but who are familiar with questionnaire design principles
and have knowledge of the subjects are interviewed by the researcher with the aim of detecting technical errors. To use "experts" as pre-test respondents is suggested by a
number of previous researchers (e. g. Hague 1987; Green et al. 1988), and is tested by
Diamantopoulos et al. (1994). Diamantopoulos et al. (1994) report that knowledge of
the subjects appears to be particularly useful for detection of problems not contained in
the questions themselves. The expert respondents are briefed on the topic of this survey
as well as samples and population of the principal research.
The "expert" test is followed by a second pre-test comprised of forty "ordinary"
consumers. There is no set answer to the question about how many respondents should be used (Tull and Hawkins 1987). The sample size can range anywhere from half a dozen to one hundred cases or even more (Tull and Hawkind 1987). It is recommended that the pre-test sample size be small, varying from fifteen to thirty respondents for the initial testing, but the sample size can increase substantially if the pre-testing involves
154
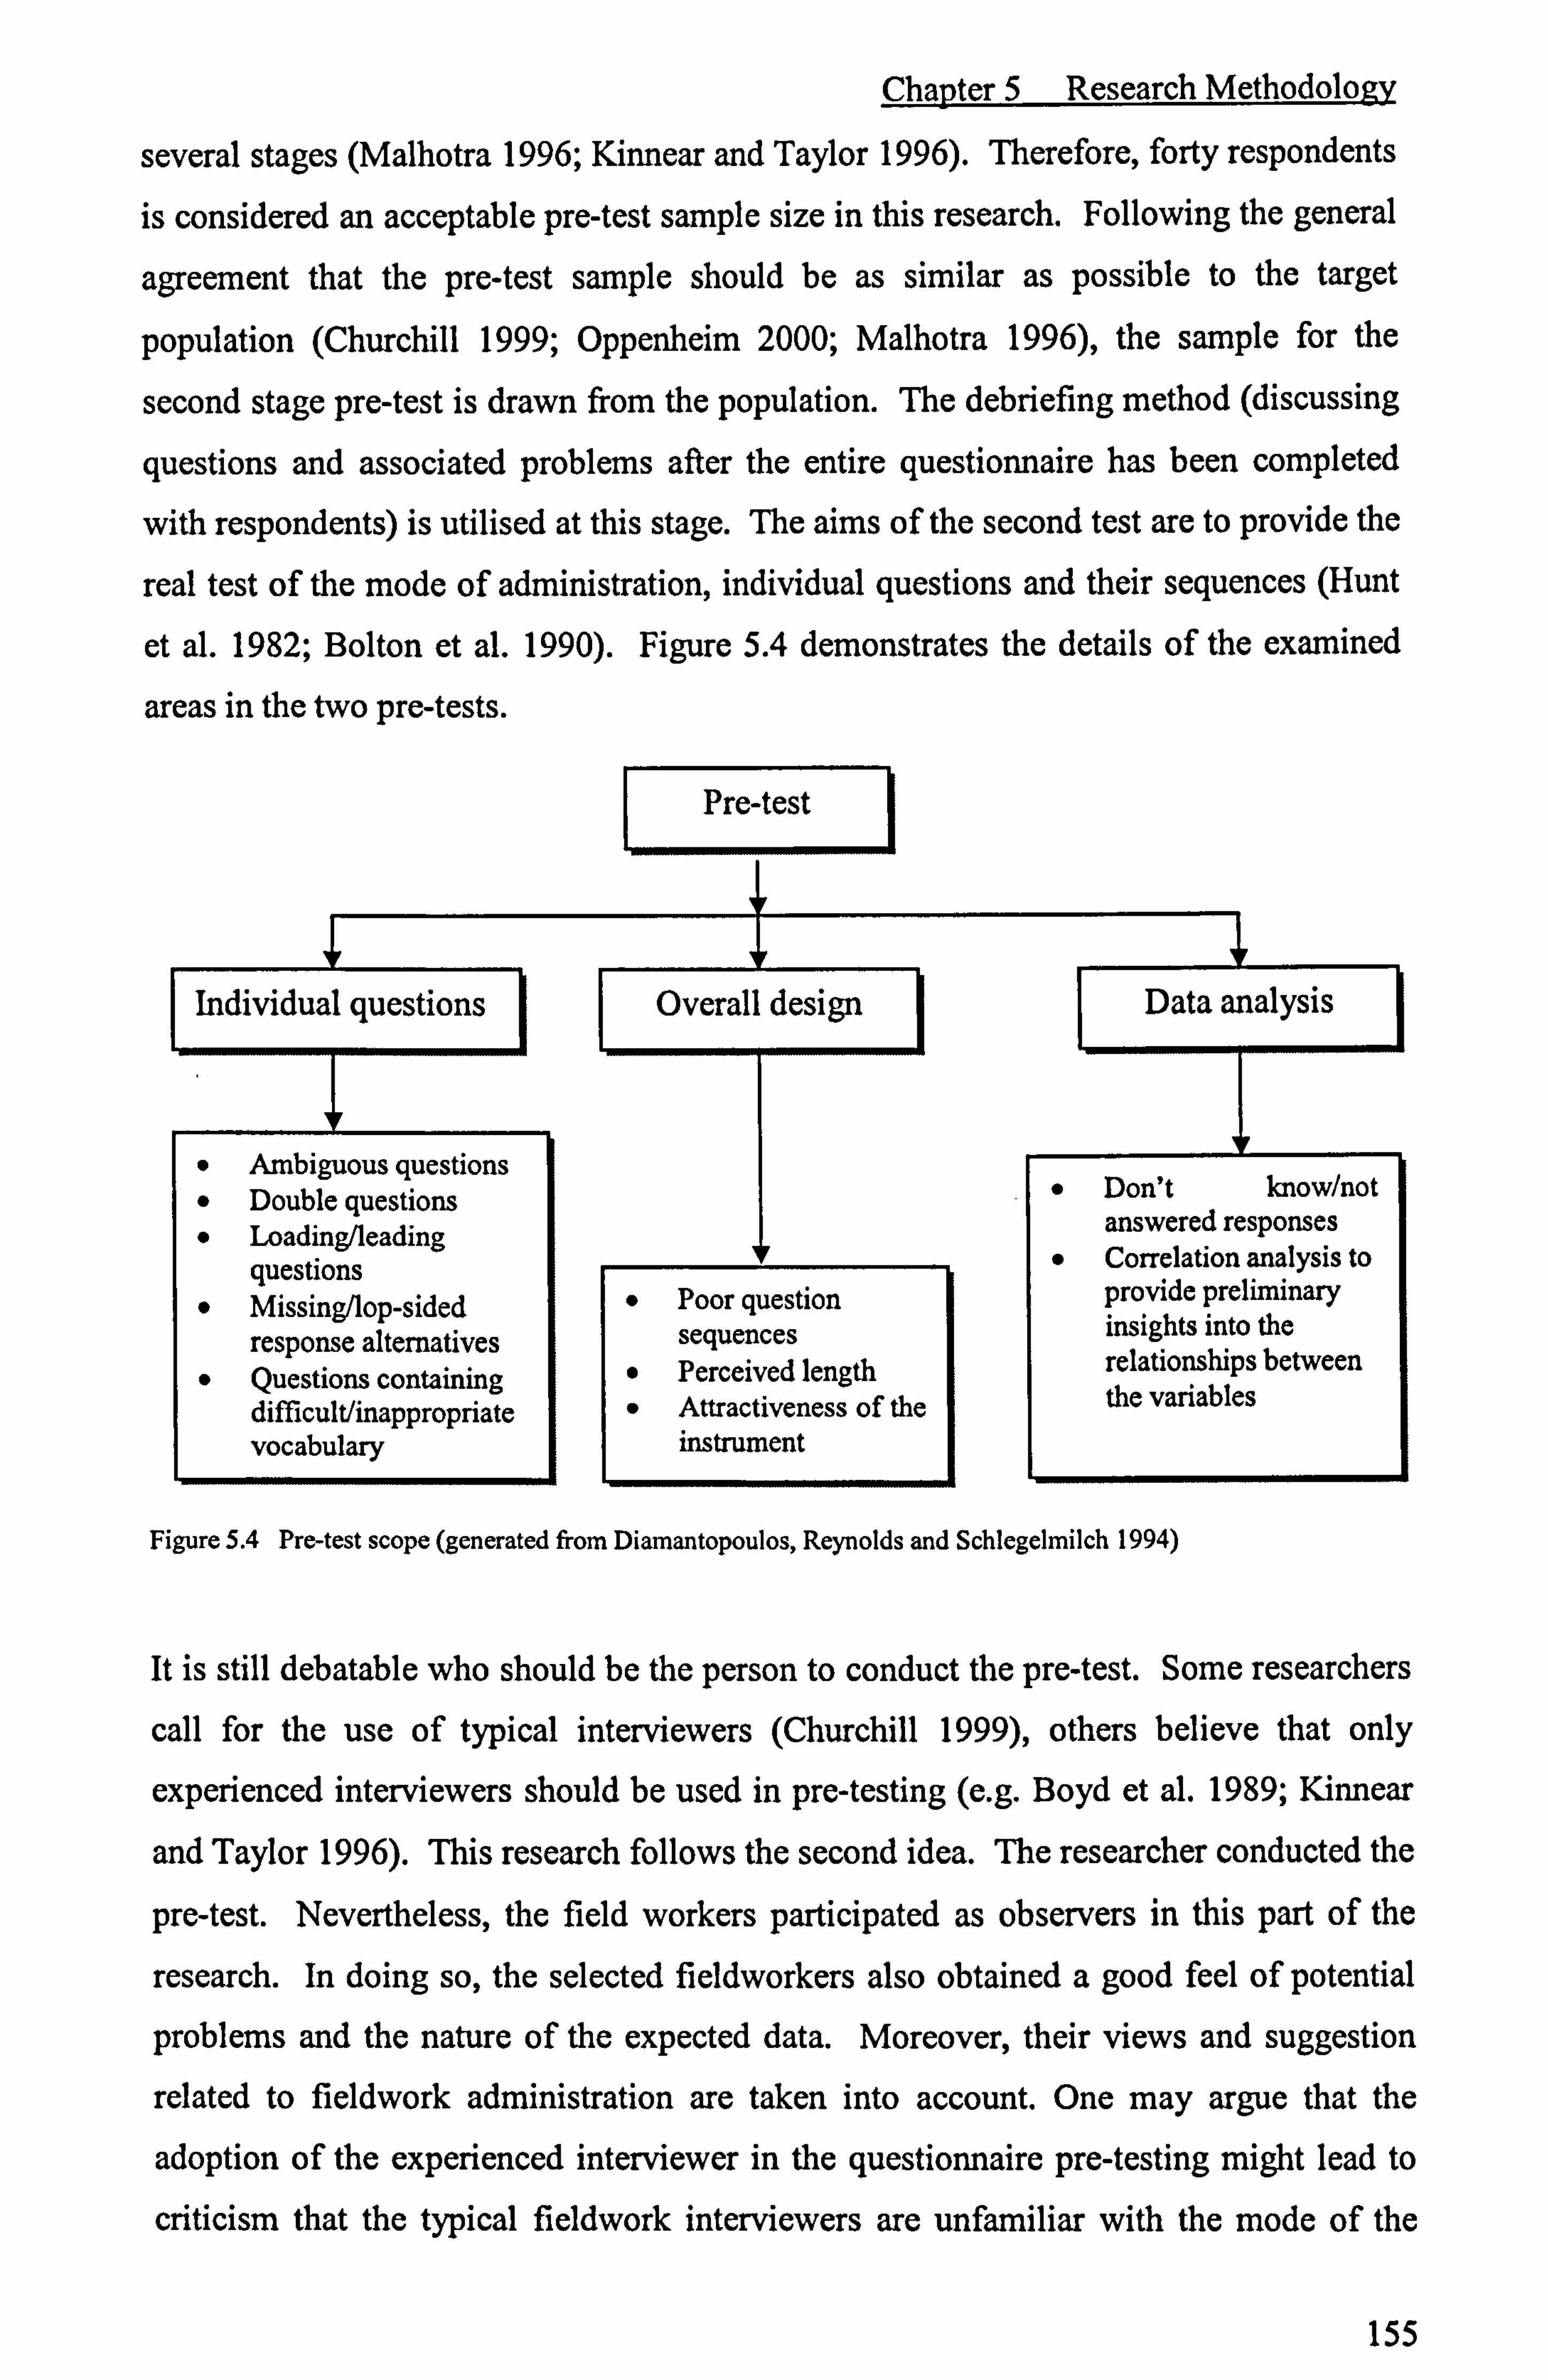
Chapter 5 Research Methodology
several stages (Malhotra 1996; Kinnear and Taylor 1996). Therefore, forty respondents
is considered an acceptable pre-test sample size in this research. Following the general
agreement that the pre-test sample should be as similar as possible to the target
population (Churchill 1999; Oppenheim 2000; Malhotra 1996), the sample for the
second stage pre-test is drawn from the population. The debriefing method (discussing
questions and associated problems after the entire questionnaire has been completed
with respondents) is utilised at this stage. The aims of the second test are to provide the
real test of the mode of administration, individual questions and their sequences (Hunt
et al. 1982; Bolton et al. 1990). Figure 5.4 demonstrates the details of the examined
areas in the two pre-tests.
Individual questions
Pre-test
Overall design Data analysis
" Ambiguous questions " Double questions " Loading/leading
questions " Missing/lop-sided
response alternatives " Questions containing
difficultlinappropriate vocabulary
" Poor question sequences
" Perceived length " Attractiveness of the
instrument
" Don't know/not answered responses
" Correlation analysis to provide preliminary insights into the relationships between the variables
Figure 5.4 Pre-test scope (generated from Diamantopoulos, Reynolds and Schlegelmilch 1994)
It is still debatable who should be the person to conduct the pre-test. Some researchers
call for the use of typical interviewers (Churchill 1999), others believe that only
experienced interviewers should be used in pre-testing (e. g. Boyd et al. 1989; Kinnear
and Taylor 1996). This research follows the second idea. The researcher conducted the
pre-test. Nevertheless, the field workers participated as observers in this part of the
research. In doing so, the selected fieldworkers also obtained a good feel of potential
problems and the nature of the expected data. Moreover, their views and suggestion
related to fieldwork administration are taken into account. One may argue that the
adoption of the experienced interviewer in the questionnaire pre-testing might lead to
criticism that the typical fieldwork interviewers are unfamiliar with the mode of the
155

Chapter 5 Research Methodology
fieldwork administration and unclear about the potential problems they might confront.
Consequently, the quality of the data could be affected. The researcher is fully aware of
the drawbacks of using an experienced interviewer, more specifically the researcher
herself in this research. In order to overcome the potential problem, necessary means
are utilised, in addition to placing the typical interviewers at the piloting sites to be the
observers. Please refer to the Fieldwork Administration (section 5.6) for further details.
5.5.2.2 Shortcomings Identified by the Three Experts and Solutions
The first pre-test revealed some minor problems with the individual questions, and some
shortcomings of the overall design. The almost satisfactory results related to individual
questions should devote its success to the focus group discussion. The shortcomings identified by the three experts and suggestions from them are classified into three
categories and are discussed below in detail.
a. Length of the questionnaire: The first draft of the questionnaire is perceived as too long. The experts suggested the following:
1. Change the title statement of each section into question (for example: "Product
involvement" is replaced by "How interested are you in watches and handbags? ").
These changes make the task of each section is more obvious to the respondents; they also help to shorten the introductory part of each section, which makes the
questionnaire much shorter than the first draft.
2. The introductory part of section F appears too long. Responding to this suggestion,
unnecessary information is cut out.
3. Should make the most use of the cover page, therefore, definitions, the appealing statement and background information are moved to the cover page.
b. Shortcomings and suggestions concerning language:
1. "Watches/handbags are very neat products" appeared problematic, and should
change to "I like watches/handbags". This is because that Glasgow people do not
use "neat" to refer to "preference". "Neat" is perceived as "clean" and "tidy" in
Glasgow. This is different to America, where, when people say something is neat,
they express a kind of "preference" or "liking".
156
Chapter 5 Research MethodoloQy
2. "Watches/handbags are of my concern" is problematic grammatically, and should be
replaced by "I care about watches/handbags".
3. "Brand personality" and "product attribute" are considered to be more academic,
and difficult for ordinary consumers to understand, and therefore should be changed
to "characteristics of brands" and "design feature" which are regarded as plain language.
4. Item "leader" (tested personality trait) is not an adjective, and is replaced by "for
leaders".
5. Item "relevant" used to measure product involvement appears ambiguous, therefore
the statement "Watches/handbags are relevant to me" is replaced by "I get bored
when people talk to me about watches/handbags". This measure is used by Beatty
and Talpade (1994) and Glynn et al. (1996).
c. Suggestions concerning technical problems:
1. Change "tick" to "circle" (instruction statement of section B, C, D, E, F, G, H),
which helps to avoid confusion caused in the case that the respondent did not place
the "tick" in the appropriate place. For example, a "tick" placed in the middle of
two numbers might be confusing.
2. Apart from the instruction of each section, an example should be given to illustrate
how to answer the questions.
3. In each sub-section, in addition to the product class, a picture of the related product
class is also used. The use of pictures makes the questionnaire more user-friendly,
and is expected to help reduce errors of misunderstanding.
4. It is suggested that the categories in relation to age and income should be cut down
in order to simplify and shorten the questionnaire.
157
Chapter 5 Research Methodology
5. The cover letter should be cut shorter than in the first draft. It is not necessary that information appearing in the questionnaire appear in the covering letter, too. More
stress is put on asking for assistance in the completion of this research and the
importance of the respondents' help in this project.
All of the above comments from the three experts are considered valuable in terms of
assisting in the improvement of the questionnaire. Necessary action was taken in
response to the observations and suggestions from the experts before the questionnaire
was tested on the ordinary consumers. Compared with the first draft, the verified
version (second draft) is two pages shorter, and is more user-friendly.
5.5.2.3 Comments from the Ordinary Consumers (Second stage piloting) and Actions
Taken by the Researcher
1. The questionnaire is still regarded as very long. It is recommended that the
questionnaire should be split into two and two separate studies conducted. This
suggestion was not taken because it did not fit in well with the overall research design.
2. The use of `-' and `+' to replace `Strongly disagree' and `Strongly agree' on page 4
caused confusion in some respondents. In order to solve this issue, "strongly
disagree and strongly agree" as well as ̀ -' and `+' are used in order to provide a
clear indication at the beginning of page 4.
3. The statement "This product may do not last long. " appeared grammatically
problematic and should be changed to "This product may not last long. " This
suggestion was taken.
5.5.2.4 The Researcher's Observations and Solutions
1. The booklet format of the questionnaire is not user-friendly in this research. The
respondents had to turn the questionnaire over and fold it when they came to even
pages. This really caused inconvenience to the respondents and appeared to be
time- consuming. Even though they were provided with seats and a desk, most of them had to put the clipboard on their knees when they were filling out the
questionnaires, since they only had very limited space in which to fill out the
158
Chapter 5 Research Methodology
questionnaires at the entrance of the supermarkets. Therefore, it is decided that the
normal notebook format should replace the booklet format in this research, with the
research questions printed on one side rather than both sides of the paper. Doing so
simplifies the administration process for the respondents. One might argue that the
booklet format might look more formal than the notebook format. The researcher
believes that the use of the badge with the university logo on, as well as the
cooperation from the supermarkets (providing chairs and tables inside the
supermarkets) is enough to convince the respondents of the seriousness of this
research. The most important thing is to simplify administration of the
questionnaire for the respondents.
2. Sequences of questions in section A did not follow any logic. Question 2 and
question 3 were reversed. The respondents are asked whether they have bought any
counterfeit goods or not first, followed by "what are they? " rather than the other
way round.
3. The mode of the administration in relation to intercepting the following person after
rejection by an individual approached by the fieldworker appeared problematic. This is changed to approach the 5`h person after a rejection. Please refer to section
5.4.3.2.
5.5.2.5 The Final Version of the Questionnaire
The research instrument went through two drafts and two separate pilotings before
reaching the final version (Appendix 4). This final version of the questionnaire is seven
full A4 pages long (excluding the cover page and the contact information page) with
354 questions in total (including the warming-up questions). To put 354 questions into
a 7-page research instrument is no easy task. This is achieved by applying the newly
developed scale technique, which is a combination of the Likert scale and the repertory-
grid technique. This technique also helps to avoid repetition of questions two or even
four times. The final version of the research instrument is user-friendly and uses plain
language. The researcher is aware that the length of the questionnaire might still be a
shortcoming of this research. However, it is determined by the nature of this research.
As can be clearly seen, great effort has been put into reducing the length of the research
159
Chapter 5 Research Methodoloay
instrument. In fact, there is not much else the researcher can do but proceed at this
stage.
In addition to the main body of the questionnaire, the research instrument also includes
an extra page which requests the respondents to provide contact information (Appendix
4). The contact information page was designed for monitoring the process of data
collection and securing the accuracy of the data collected. This is required for the use of
fieldwork monitoring, as trained fieldworkers are used for collecting data. This device
also proved to be useful in terms of increasing the rate of useable questionnaires, and
hence lowering the total cost of data collection. For example, some questionnaires
disqualified for inclusion in the data set became usable after missing information was
provided by the respondents when the researcher contacted them using the
correspondence number or addresses they provided.
5.6 Fieldwork Administration
This study is conducted in the City of Glasgow. As noted previously, due to the time
limitation for the completion of this study, field workers are employed to collect data
with the aim of speeding up the progress. Despite the recommendations of previous
research which suggests that the typical interviewer is a married woman aged 35-54
(Barker 1987), the field workers employed in this research are honours and masters
students aged between 20-30 years old. This research is a piece of academic work
under the banner of the University of Glasgow; therefore, the use of students is more
convincing to respondents in relation to its seriousness and non-commercial purpose.
Moreover, students are easy to recruit. The researcher knows them personally, which
enables her to select the right people for this research.
Eight fieldworkers are recruited, four men and four women. Following Collins and
Butcher's (1983) recommendations, all fieldworkers are Glasgow residents, native
English speakers, healthy, outgoing, communicative, with a pleasant appearance, and
well-educated. The fieldworkers are paid an hourly rate rather than on a per completed
questionnaire basis, to avoiding their falsifying part of or even the entire questionnaire.
Previous researchers suggest that in some circumstances, the interviewer will usually
struggle to comply with the researcher's wishes, or may fail to do so to some degree or
160
Chapter 5 Research Methodology
another (e. g. Burns and Bush 2000). In order to avoid any biases resulting from the
fieldworkers' manner, appearance, different levels of understanding of the current
research and so forth, as well as to ensure that all interviewers administer the
questionnaire in the same manner so that the data can be collected uniformly, proper
training is provided to all recruited interviewers. Training covers an introduction to the
survey and questionnaire administration requirements, making the initial contact, handling objections and refusals, reading out the questions for respondents (if
necessary), answering questions from the respondents, and terminating the interview.
Following the training session, interviewers engage in role-play as a means of becoming
familiar with the questionnaire's administration requirements. They play the roles both
of interviewers and respondents. In addition, as reported earlier, they also participate as
observers in the second stage research questionnaire piloting test.
To make sure that the interviewers are comfortable with and fully follow the pre-set up
procedures and techniques in which they are trained, the researcher accompanies each individual in the field until she is satisfied with the interviewer's work. This manner
secures the consistency of the mode of administration across all fieldworkers. The
interviewers are told that fieldwork validation will be conducted on a daily basis. More
specifically, a certain percentage of respondents will be contacted using the
correspondence addresses they provided at the end of the questionnaire. It is expected that all these effort will help to minimize interviewer cheating and improve the quality
of the fieldwork (Tull and Richards 1980; Bums and Bush 2000).
The researcher received all data she needed for this piece of research within a two week
period. This remarkable result was due to the very good pre-fieldwork preparation, as
well as full support from the supermarkets. First of all, the fieldworkers are provided fixed, pleasant places to work. Secondly, they are well looked after by the researcher. Besides the fixed pay the fieldworkers received from the researcher, costs related to food and drinks in the workplaces are also covered by the researcher. Whenever (in 2
out of 4 supermarkets) hot food and drinks are available, the fieldworkers are told to feel free avail themselves of them, with all costs involved reimbursed by the researcher. This became affordable because the fieldworkers were treated as members of the
supermarket staff in one supermarket and had access to their staff dining room; the
161

Chapter 5 Research Methodology
researcher was given staff discount for buying chocolate from the supermarket. All this
helped to bring down the total costs associated with the fieldwork.
The fieldwork validation was conducted on a daily basis. One hundred and fifty eight
respondents out of 420 participants provided their correspondence address or contact
number. Around 20 percent of respondents who provided a correspondence address or
contact number were contacted by the researcher. The daily fieldwork validation did
not show any sign of interviewer cheating. The respondents who did not provide
correspondence addresses are not approachable. Therefore, it is impossible to validate
fieldwork related to these respondents. However, it is assumed that the fixed, pleasant
workplaces, and relatively easy administration could have helped to reduce the
possibility of interviewer cheating.
5.7 Summary
This chapter is organised around seeking answers to the following questions: What is to
be investigated in this research? How is this research to be conducted? What is the
target population? How to ensure that the selected samples will present the targeted
population? What is the logic of the determined sample size? How is the research instrument constructed?
It was decided that the present research is to investigate four brands from two product
categories. The studied branded products are both original and counterfeit branded
Rolex and Gucci watches, Burberry and Louis Vuitton handbags. The choice of these
branded products went through several stages. The first stage involves an examination
of literature in the study of counterfeiting. This review shows that the study of specific
brands is valuable in terms of helping to achieve a better understanding of consumer behaviour in the context of non-deceptive counterfeiting. Nevertheless, research in the
study of specific brands appears to be scarce, as previous research mainly examined
product category in relation to counterfeits. As such, previous research findings based
on investigation of the product category might not be applicable to individual brand(s),
as consumer behaviour is to a great extent product as well as brand specific. This
justifies the decision of study of the four specific brands in the current research. The
choice of the four selected brands is driven by the reality that these four brands appear
to be heavily counterfeited and widely available in the UK markets. In addition, the
162
Chapter 5 Research Methodology
counterfeit examples requested by the research design are available from the Trading
Standards Glasgow.
By its nature, the current research is a combination of exploratory, descriptive and
causal research approaches. The focus group is to be used to fulfil the exploratory part,
to generate the vocabulary and traits consumers use to evaluate the selected brands. To
investigate consumers' perceptions of CBP as opposed to BP requires the use of a
descriptive approach, whereas modelling consumer choice processes demands the
causal research design. The causal research design carries more weight than the other
approaches due to its being required by the principal research of the current study. The
survey method is considered as appropriate.
Taking into the consideration the fact that not every consumer has experience of
counterfeits, it is decided that the stimulus-based approach will be adopted rather than
the memory-based method. This method extends the pool of eligible potential
respondents and ensures that the eligible respondent group is equivalent to the target
population. Moreover, it also assists in increasing the response rate. As a result, it
helps to minimize research bias.
The current research is to be conducted in Glasgow. Glasgow is chosen because
Glasgow residents have access to the selected counterfeit branded products. In addition,
the researcher is based in Glasgow, so to conduct the research in Glasgow will reduce
costs. The target population for the current study is Glasgow residents aged 18 and
over. The defined age group is restricted by the Approval of the Ethical Research
Committee, but it is also held by the researcher that people underl 8 might not have very
strong purchasing power due to their being unlikely to be financially independent.
The use of a probability sampling method is mainly constrained by the costs involved
and security issues concerning the fieldworkers. As such, a non-probability sampling
method is adopted. More specifically, this research will use the multi-cluster two stage
area sampling method. Twenty Glasgow supermarkets are randomly selected using Yellow Pages online services. Four out of twenty supermarkets kindly agree to support this research by providing space and facilities requested by the researcher. Data
collection is conducted at the exit of each supermarket. One desk and two chairs are
163

Chapter 5 Research Methodology
allocated at the exit of the supermarkets, which to a great extent provides both
fieldworkers and respondents with a pleasant working situation. It is believed that this
somewhat unexpected support from the supermarkets improves the response rate and
the quality of the data in general. Following this, the samples are selected using a
systematic sample method. Every nth customer is approached by the fieldworker. In
order to minimize sampling error a number of devices are used; these include a pre-paid
incentive (to appeal to passive respondents to participate in the survey), a touch and
gaze approach, an appealing expression, and the appearance of university logo on the
cover letter, the front page of the research instrument and the badge the fieldworkers
wear (to indicate the seriousness of this research).
The sample size requested for this research is 384, which is calculated using the
percentage approach with a desired result of ±5 percent accuracy. Obviously, the more
accurate the collected data, the more desirable it is. Nevertheless, it is considered that 5
percent is acceptable, as this leaves little room for improvement. In addition, once
again this is limited by the tight budget as well as the time constraint for this research.
It is reported that an improvement in accuracy of one percent will result in an almost 75
percent increase in samples, which will lead to a demand for 75 percent more time and financial resources as a direct result. This is simply not achievable under current
circumstances.
The development of the research instrument went through three processes - the
qualitative study, first round questionnaire testing, and second round questionnaire
testing. All the measures used in this research are adopted (with slight changes if
necessary) from previous studies with the exception of brand image. Closed-ended
questions are used in this study, as they are more suitable for a large survey like this,
and they are easier and quicker to answer. The 5-point Likert scale is adopted all way
through the questionnaire regardless of the fact that some previous researchers did use
semantic differential scales. Considering that this research is principally testing
consumers' perceptions towards publicly approachable branded products, `Don't
know', `No opinion' and `Not applicable' are not included in the response categories, as
there is not much point if consumers claim that they are not sure about their opinions.
The questionnaire adopts a `pleasant' and `conservative' appearance. It is deemed that
the front page of the questionnaire contains most of the relevant information about this
164

Chapter 5 Research Methodology
research (explanation of selection, appealing statement, counter-biasing statement and
assurance of confidentiality) and leaves the main body of the questionnaire only focusing on the collection of the data required. The sequence of the questions follows
the flow of the consumer choice processes, which it is also in line with the research
conceptual model.
The main objectives of the qualitative study are to generate the criteria consumers
utilised to evaluate the studied brands and to extract the plain language used by
consumers (details about the qualitative study as well as results are reported in Chapter
6). The first stage piloting is to detect technical errors. Three experts who are familiar
with questionnaire design are interviewed by the researcher. The second stage piloting
aims to provide the real test of the mode of administration, individual questions and
their sequences. Forty consumers are approached by the researcher in the supportive
supermarkets. A number of problems are identified and necessary actions are taken. In
fact, after the first round of testing and verifying according to the experts' suggestions,
the questionnaire was improved dramatically. The second round testing did not show
any serious problems apart from some minus errors. In total, the main body of the
questionnaire is seven pages long, uses plain language and has a pleasant appearance.
This chapter finishes with a discussion of the fieldwork administration. Eight
fieldworkers (postgraduate students) are recruited, four men and four women. They are
all Glasgow residents, native English speakers, healthy, outgoing, communicative, and
with a pleasant appearance. Proper training is provided by the researcher before the
fieldworkers are sent out to the field to collect data. The researcher accompanied every
fieldworker to collect data in the field until she felt that the fieldworkers were 100
percent capable of working on his/her own. This effort assists in ensuring that the data
collection is administered in the same manner. Fieldwork validation was conducted on
a daily basis. The fieldwork validation did not show any sign of fieldworkers cheating.
This chapter dealt with research methodology related issues. The great challenge this
research faced was how to cut down the length of the research questionnaire. To
achieve this, a new technique was developed based on the widely adopted Likert scale
and the repertory-grid technique. Appliance of this technique avoids the repetition of
the same statement when a trait is to be tested more than once on different brands or
165

Chapter 5 Research Methodology
different versions of one brand. Consequently, the research instrument is shortened
without compromising the richness of data.
The qualitative research conducted should be included in this chapter. Nevertheless,
considering its richness and critical role it played in relation to construction of the
robust research instrument, this part of the research together with the research results,
are reported in a separate chapter. This is what the Chapter 6 is concerned with.
166

Chapter 6 Preliminary Qualitative Study and Results
sE
Chapter 6 Preliminary Qualitative Study and Results
Chapter 6 Preliminary Qualitative Study and Results
6.1 Introduction
This chapter focuses on the preliminary study related issues. As noted in Chapter 5, the
main purpose of this part of the research mainly serves the construction of the research instrument of the principal survey research - define the criteria consumers used (based
on product attributes and brand personality and benefits/consequences) to evaluate the
counterfeit branded products and the counterpart genuine branded version. In addition, it also aims to establish the vocabulary and language used by the target population.
The main body of this chapter consists of two main sections. This first section deals
with issues concerning the preliminary study methodology, choice of an appropriate
method, a series of decisions related to the focus groups (number of focus groups, length of focus groups, size of focus groups, participant recruitment, pre-focus group
preparation, roles played by facilitator and observer), the whole process of data
collection (protocol of focus group discussion and identified shortcomings and
solutions, improved focus group discussions), data transcription and data analysis
method. The second section reports the preliminary study results. The results are
presented into two subsections, with the structured discussion results are reported first
followed by the open discussion results. The final results are a combination of the
structure discussion results and the open discussion results. This chapter ends with a brief summary.
6.2 The Preliminary Study Methodology
The focus group is considered an appropriate method to serve the research objectives of
this part of the research. This section reports the issues related to focus group discussion. It starts with the rationale of the use of focus groups and ends with discussion of data analysis method adopted to analyse focus group data.
6.2.1 Rationale for the Use of the Focus Group
The focus group is chosen in preference to an individual interview. Focus groups are
considered to be appropriate for completion of the preliminary study, because of the following: focus groups are appropriate approaches for exploratory purposes prior to the
167
Chapter 6 Preliminary Qualitative Study and Results
drafting of the survey instrument itself, they are superior to other methods for the study
of group understandings (Bloor et al. 2001), using focus groups for preliminary
exploration of certain topic areas is most useful in those fields where survey planning is
most difficult because relatively little is known (Vaughn et al. 1996), focus groups can
be used to access the everyday language of research subjects (Bloor et al. 2001; Fern
2001). Furthermore, they can help to elicit a more interacted response from the
participants, who might feel lost for words during a one-to-one interview. The
interaction between the participants might eliminate something unknown. All the noted
advantages of focus group technique fit in well with the predefined objectives of the
preliminary study.
6.2.2 Number of Focus Groups
There is no a clear-cut point regarding how many focus groups are sufficient for a piece
of research (Bloor et al. 2001). The number of groups required may range anywhere from one to thirty or even more depending on the research purpose (Fern 2001).
However, researchers argue that most focus group research requires somewhere between four and six groups (Fern 2001). Considering that here in this research, focus
groups are only used for the completion of the preliminary study but not the principal
study, as well as the time limitation and the very tight budget for this study, four focus
groups are considered acceptable and can fulfil the pre-identified research objectives of
the preliminary study. Each individual focus group is allocated different tasks. The
main task of the first focus group is to discover criteria consumers use to examine the
counterfeit and genuine Rolex watches. The second focus group aims to develop
criteria consumers utilise to evaluate the counterfeit and genuine Burberry handbags.
The third focus group serves to construct the criteria that consumers use to examine the
counterfeit and genuine Gucci watches. The fourth focus group is used to generate the
criteria consumers use to evaluate the counterfeit and genuine Louis Vuitton handbags.
In addition to the above tasks, vocabulary used by ordinary consumers in relation to
evaluation of the studied brands is generated during the focus group discussions. This
effort will assist in ensuring a user-friendly research instrument.
6.2.3 Length of Each Focus Group
Bloor et al. (2001) suggest that the focus group facilitator should wind things up after 90 minutes in order to avoid the premature departure of some group members. This
research follows this rule. Each focus group lasted between one and one-and-a-half
168
Chapter 6 Preliminary Qualitative Study and Results
hours. This timeslot excludes the completion of the pre-group Consent Form and the
post-group personal information form and debriefing.
6.2.4 Recruiting Participants and Assigning Participants to Each Focus Group
The snow-balling technique is used to recruit focus group participants. More
specifically, the researcher utilizes her existing social networks to recruit participants.
The advantages of this manner are firstly, it greatly decreases the demand for labour
input of the research, and secondly, it saves time. The shortcomings of this approach
are loss of control of the researcher and the possibility that the intermediary may act as
an unwanted `screening device' selecting out certain members of the group from
participation (Bloor et al. 2001). In order to overcome these pitfalls, the contact persons
are asked to give each potential participant an information package pre-prepared by the
researcher, with the aim of ensuring that every potential participant receives identical
and accurate information about this study. This also enables them to contact the
researcher with any queries or give notice in advance if their circumstances have
changed and they become unable to attend the group. This information package
includes an information letter (Appendix 6), two appointment cards (one is returned to
the researcher, the other one is kept by the respondent for reference after the respondent has filled the required information in) and a contact card of the researcher (Appendix 7).
More details of the information package are reported in a later section in this chapter.
Because one of the main objectives of this part of this study is to develop the survey instrument, according to Bloor et al. (2001), participants of the focus groups should
reflect the respondents of the survey. In order to achieve this goal, the initial contact
persons are restricted to residents of the city where the study is conducted, and are
selected from the target population. As such, the initial contact persons are told that
respondents they recruit should be residents of the city from which the sample of this
research is drawn. It is assumed that there is a good chance that the respondents
recruited by a specific contact person might have similar characteristics to the recruiter, because it is likely that the contact person would find that it is easier to recruit from the
society that he/she belongs to, alternatively they simply choose friends and peers (Michell 1999). Therefore, particular attention is placed on achieving a sample which
represents the research population. Balance of gender, age group, income, and social
class are considered and taken into account. Here, as information about income and
169
Chapter 6 Preliminary Qualitative Study and Results
social class are difficult to obtain, occupation and education are used as surrogates as
suggested by Fern (2001).
The recruited participants are assigned by the researcher to four focus groups. In order
to make sure that the participants of each focus group to a reasonable extent reflect the
respondents of the survey, a great effort is placed on maximizing group differences
within groups (heterogeneity) and minimizing differences across groups
(heterogeneity). This is consistent with Fern (2001), who notes that if the researcher's
interest is in generating potential items for a survey, within-group heterogeneity may be
best. The focus groups comprise a mix of age, gender, education, and occupation.
Participants recruited by the same contact person are allocated to different groups in
order to achieve compatibility of the focus group and avoid cohesiveness. This is
particularly important because cohesiveness may encourage participants to conform to
reference group pressures and alter the reports of their individual notions to meet the
expectations of others in the group (Fein 2001).
6.2.5 Focus Group Size
The size of a focus group can range from three participants to fourteen (Pugsley 1996).
However, it is argued that between six and eight participants is the optimum size for
focus group discussion (Bloor et al. 2001). Accordingly, this research proposes to keep
the size of the groups to between six to eight participants. English is not the facilitator's
(researcher's) native language. As a doctoral researcher, the facilitator is not greatly
experienced in terms of facilitating focus groups. In addition, there are two main tasks
which must be achieved (see p. 167) at this stage of the research. All these are the
restrictions which come from using a larger size of focus group. Balancing all the
above, relatively small size is considered more appropriate for this research, since it
helps the researcher to achieve a considerable control of the discussion. In addition,
smaller groups increase participants' opportunity to fully express ideas without interruption (Morgan and Scannel 1998; Krueger 1994).
6.2.6 Preparation for the Preliminary Study
The preparation of preliminary qualitative research consists of three phases. The first
phase involves the development of a preliminary list of descriptive product attributes, brand personality and benefit/consequence statements of the counterfeit and original
170
Chapter 6 Preliminary Qualitative Study and Results
versions of the selected brands. The list of product attributes and benefit/consequence
related statements of both CBP and BP of the four studied brands are generated from a
combination of sources, including previous research on study of counterfeiting and
branded products, product packages, advertisings, and Consumer Reports. To
operationalise brand personality, the Aaker (1997) personality scale is adopted to form
the main part of the list of items for testing. In addition, the adjectival expressions in
relation to personality, which are generated from product packages, advertising, as well
as consumer reports, are also included in the list. During the second phase, an
information letter, appointment cards, and the researcher's contact card are produced.
The third phase involves designing a form for participants to complete to provide their
social-demographic information and consulting local police and Trading Standards.
6.2.6.1 The Information Letter and the Appointment Card
The content of the information letter covers an brief explanation of the research aims,
the objectives of the focus groups, the contribution of this research, a call for
participation, the site where the focus groups will be conducted, the time demanded for
this task (one to one and a half hours), four suggested time scales [week day lunch time
(12.30 to 2.30); week day evening (5.30 to 7.30); weekend afternoon (3.00 to 5.00);
weekend evening (5.00 to 7.00)] in order to make sure that potential participants are not
restricted by times given by the researcher, and the instructions as to how to complete
the appointment card and the need for returning one back to the contact person, keeping
one for their own reference. Great attention was placed on using neutral words in the
information letter, in order to avoid leading participants' perception. The letter went
through several drafts and was checked by two native English speakers and one English
language expert before it was sent off to the researcher's contacts to recruit participants.
The appointment card and the researcher's contact card are identical in size but different
colours. The appointment card is two-sided. The front displays all four suggested time
scales; the back illustrates the site of the focus group, the respondent's correspondence information requested by the researcher and also the researcher's contact number. The
contact card provides more correspondence information of the researcher, including full
contact address, e-mail address, fax number as well as mobile number. This maximises the approachability of the researcher to all potential participants.
171
Chapter 6 Preliminary Qualitative Study and Results
6.2.6.2 Confirmation from Local Police and Full Support from Trading Standards
As originally planned, this research uses stimuli-based approach. More specifically, the
counterfeit branded products are shown to focus group participants, as well as survey
participants by the researcher or the research assistants. Hence, there is a possibility
that some people might mistake them as the researcher or the research assistants are
dealing with counterfeit products. This is a concern of the researcher particularly in the
case of the market-place interview survey. According to the 2002 Act (see The Patent
Office 2002), manufacturing and selling counterfeit products is regarded as criminal in
the UK. In order to avoid unnecessary frustration, the researcher had been in touch with
the local police and the Trading Standards. Both of these government clients confirmed
that they did not see any problem with this piece of research. Particularly, the Trading
Standards gave their full support to this research by providing all counterfeit examples
from the goods they confiscated. They believe that this research will help them to
achieve a better understanding about why consumers knowingly purchase counterfeit
product and require a specific report assessing the residents' perceptions of the studied
counterfeit branded products and the genuine branded products, as well as the
implications at the end of the research project. It was suggested that a letter should be
sent to the Divisional Commander of the local police before the principal survey starts.
The contents of the letter should cover the nature of the research, where and when the
research is going to take place, who is going to undertake the research, as well as what kind of ID the researcher/research assistants will carry with them. The local police also
confirm that this requirement applies to any research conducted in public places.
6.2.7 The Facilitator and the Observer
The doctoral researcher is the group leader, conducting the interview, facilitating
discussion, and debriefing members at the conclusion of each session. An academic
researcher, who is a native English speaker, and also familiar with the Glasgow accent,
accompanies the researcher as the observer during the focus group discussions. It is
considered to be necessary to have a native English speaker and who is also familiar
with the local accent to be the observer, since English is not the native language of the
researcher. Moreover, some of Glasgow people have very strong accent. It is
commonly known that some native English speakers do have difficulties in
understanding the Glasgow accent. The role the observer plays mainly is to observe the
172
Chapter 6 Preliminary Qualitative Study and Results
group, take a reasonable amount of notes on the context and group dynamics, help to
identify speakers, as well as being a language backup to the researcher. It is considered
important to be able to identify individual voices from within the group for data
analysis, because it allows changing points of view to be followed through the
transcription (Bloor et al. 2001). An intensive discussion between the interviewer and
the observer is conducted soon after each focus group, which allows the facilitator to
recognise shortcomings of the techniques utilized and improve them in the following
groups, and also allows a process of qualification and deepening of findings of earlier
groups through the feedback of the observer.
6.2.8 The Entire Process
The Principles of Ethical Research and the Consent Form are delivered to the
participants before the discussion starts. The participants are informed that the
discussion will be audio recorded in order to ensure less loss of richness of data, and are
reminded of the voluntary nature of participation as well as confidentiality of the
information gathered. Then, the participants are given time to read the Principles of
Ethical Research and are asked to complete the standard departmental Consent Form
and return the form to the researcher.
When the discussion starts, the researcher first introduces herself and the observer to the
participants, then follows with a brief introduction to this research and the objectives of
the focus group discussion. Thereafter, each member of the group is asked to tell their
names and then to say a few sentences about themselves and to write down their name
on a piece of cardboard paper prepared by the researcher and display it in front of them.
Subjects are also told that there are no right or wrong answers and they should consider
only their personal perception.
The researcher asks several general questions about shopping (e. g., Have you ever bought any counterfeit products before? If so, what were they? Where did you buy
them? Were you happy with them? Why do you buy/do not buy counterfeit products? What is a counterfeit product? ) This is with an aim to warming up the participants. This
method ensures that the participants can ask questions about the current research and
allows the researcher to explain what counterfeit branded products mean in this study. It is also believed that the general discussion helps participants to become familiar with
173
Chapter 6 Preliminary Qualitative Study and Results
the research project, it helps release tension, and it also assists in generating initial
research data.
The focus group sessions are built around two key questions: What are the criteria
consumers used to evaluate CBP? What are the criteria consumers used to evaluate BP?
These questions are intended to raise for discussion those matters alluded to in focus
groups.
To establish broadly:
1. Product attributes consumer used when evaluating BP.
2. Product attributes consumer used when evaluating CBP.
3. Consumer perceived product benefit/consequence of BP.
4. Consumer perceived product benefit/consequence of CBP.
5. Consumer perceived brand personality of BP.
6. Consumer perceived brand personality of CBP.
Probes for each question are also developed before each focus group discussion.
The main body of the focus group discussions consisted of two stages. The first stage
was the open discussion about both counterfeit and original versions of the studied
brand. The participants were encouraged to speak out on their perceptions of examined
brand (both counterfeit and original branded versions). At this stage, the researcher
attempted to generate consumers' understanding about benefits and consequences of
CBP and BP, and identify criteria consumers consider as important when they come to
purchase. The questions were mostly open form, the participants were able to expand
on any answers that needed clarification or qualification and allowed to give their
rationalisation of their answer. The second stage aimed to test consumers'
understanding and relevance of pre-generated items associated with the brand image of
the studied four brands. This part of discussion was guided by the pre-generated items.
For details as to how these items were derived, please refer to section 6.2.6. The
respondents were given the item first, thereafter they were asked to say whether they
had any difficulty in understanding it, whether it was relevant to the studied specific
version of the brand. If the participants could not understand the item being tested, or
did not think it was `relevant', then the items were dropped and no further questions put forward. In the case where the answer was `relevant' and the participants did not
encounter any difficulties in terms of understanding, the respondents were asked to
174

Chapter 6 Preliminary Qualitative Study and Results
identify the items which they considered as `important' product attributes to them when
they were facing purchase decisions, to give a `yes' or `no' answer to
benefit/consequences and brand personality related questions. For example, the
respondents were asked `Do you think the counterfeit Rolex watch has a "high failure
rate"? `Do you think the personality of the counterfeit Rolex watch is "down to earth"?
Moreover, the respondents were given time to explain why they thought the answer to
the given question should be as it was. This method brought in very rich data.
Following this, a debriefing was conducted after the researcher closed the focus group discussion. Then, the participants were asked to complete the personal information
form. The researcher expressed her thanks to all the participants for their contribution
to this research and a summary of the focus group discussion would be sent to them for
validation subject to their willingness for further participation.
6.2.9 Lessons Learnt from the First Focus Group and the Necessary Improvements
Despite the time and effort the researcher spent on the focus group preparation, the
outcome of the first focus group discussion does not satisfy the researcher's expectation.
The following problems are identified by the researcher during the discussion and further proved by some participants and the observer of this session.
6.2.9.1 Problems Caused by Academic Jargon and Introduction of Alternative
Dimensions of the Brand Personality and Proposed Solutions
The first problem is caused by academic jargon. This has been addressed in detail by a
number of previous researchers. Nevertheless, the researcher who is completely new to
focus group technique did not really understand the seriousness of the problem that
academic jargon might bring to the research. The researcher automatically used some
academic expressions in the discussion, given that she has been working in this
particular area for quite a while. As a non-native English speaker, she is more familiar
with the academic jargon than the plain language used by members of the public. This
problem is obvious in relation to two constructs. They are "brand personality" and "product attribute". Most participants to a great extent did not understand what do these
terms mean. All participants showed good understanding of "product attribute" after the researcher's explanation. However, the researcher's explanation of "brand
personality" did not achieve the same result. In contrast, the participants appeared to be
more confused.
175
Chapter 6 Preliminary Qualitative Study and Results
To communicate the brand personality concept to subjects better, Aaker's (1997)
definition of brand personality is first introduced. The participants were then asked to
think of the brand as a person, what human characteristics the person has. This
approach is in line with the approach utilised by a few previous researchers (e. g. Aaker
1997; de Chernatony and McDonald 1998). The brand personalities generated are
considered as associated with the indirect source of personality. In addition, the
participants were also asked to think out loud about the human characteristics associated
with a typical brand user and brand endorsers (if there are any). The second dimension
originates from the `direct' sources of brand personality noted by Aaker (1997). Aaker
(1997) suggests that there are four direct sources of brand personality. These include
typical brand users, brand endorsers, company employees and CEO of the company.
Considering that consumers normally do not have direct contact with company
employees and the CEO of the company, they were not recommended to the participants
of this focus group. The introduction of the second dimension appeared to be
problematic. This is the source of confusions caused to the participants. This is
particularly obvious when the researcher threw brand personality traits on the master list
one by one into discussion. The participants were instructed to indicate which of the
adjectives they would use to describe the brand personality of the examined brand. The
confusions are broadly categorized into the following two entities:
1) Some tested items are considered to be relevant to the examined branded product, but
it is not necessary to say that they reflect both the true brand personality of the brand, as
well as the personality of the typical brand purchaser or endorsers. These items only fitted in well with one dimension introduced by the researcher, but not the other, hence,
the participants were unsure whether they should count them as descriptive of the
"brand personality" or not. This kind of problem is illustrated by the following example
statements:
Tested trait: leader (original Gucci watch) Yes, the brand could be a leader.
I don't see that. No, I think they (typical users) follow a trend.
OK, but the product (branded product) is leading everybody towards it.
176

Chapter 6 Preliminary Qualitative Study and Results
Tested trait: Upper class (Original Gucci watch)
Yes, I would say the (original branded) product is upper class.
Celebrities(typical users) wear; it they're not upper class. I don't think it's
traditional enough for upper class to wear it. I don't think it's upper class. My
definition is they (upper class) have money, they don't have to demonstrate it as
well.
What we're talking about here is like the brand everybody wants to follow for
fashion, that's not an upper class thing.
2) Participants shifted to personality of designers or producer of the product when "intelligent" is tested. Nevertheless, participant appears to have difficulty to link
`intelligent' directly to the tested branded product. This is evidenced by the following
interchange.
Intelligent, yes, like people who make it or design it would be. People buy
it... see themselves as being intelligent. ... No what I mean its designers and
producer, people who associate with the product, they (should be) perceived as
intelligent.
But it is not necessary to say that the (branded) product is intelligent.
In order to solve this problem, the research went back to the brand personality literature
once again and to investigate how the brand personality scales were developed by
previous research. This time the focus was on the scale development process rather
than the scale itself. The scrupulous study reveals that few researchers resorted to the
alternative sources (typical user, brand endorsers, company employees and the CEO) of brand personality noted by Aaker (1997). Interestingly, this includes Aaker herself.
The commonly adopted approach in communicating the brand personality is to ask
participants to think of the brand as a person and then think of human characteristics
associated with investigated brand(s) (e. g. Aaker 1997; Helgeson and Supphellen 2004).
This approach is also used to evaluate descriptiveness of brand personality traits (e. g. Siguaw et al. 1999; Aaker et al. 2001; Plummer 1985). This observation raises a
question about the accuracy of Aaker's (1997) sources of brand personality claim. This
177
Chapter 6 Preliminary Qualitative Study and Results
research would suggest that it might be more precise and make more sense if "typical
user, brand endorsers, company employees and the CEO of the company" are labelled
as influential factors to brand personality rather than the direct sources of brand
personality. The real source of perceived brand personality should be the products
under the brand. Consumers' perceived brand personality can be influenced by "typical
user, brand endorsers, company employees and the CEO". Actually, this is similar to
perceived human personality. The individual is the object of his/her personality. External factors might have great impact on an individual personality. Nevertheless, it is
not legitimate to say that external factors are the source of the individual personality.
Having understood the above, it is clear that to introduce so-called "direct source of brand personality" (Aaker 1997) will not help the participants achieve a better
understanding of brand personality at all. Therefore, the researcher decides to improve
the process as follows:
1) The academic definition of brand personality, an example of a branded product
and a selected representative of brand personalities are written on a board and displayed in front of the participants. Mercedes Benz is chosen, and the selected brand personalities are smart, successful, and prestigious.
2) The participants are asked to think of the examined branded product as if it was
a person and to comment on all the human characteristics of the branded product that come to mind.
3) The predefined brand personality traits are thrown into the discussion one by
one. The participants are asked to indicate which of the traits they would use to
describe the brand.
6.2.9.2 Problems Caused by Incorrect Probe Questions
The second problem is caused by the questions the researcher asked in relation to the
product attributes. The participants were asked to think of product features associated
with the investigated branded products. This question did not serve the research
objectives of this part of this research. Actually, what the researcher attempted to work
out is what product features (both intrinsic and extrinsic) consumers consider as important to them when they are considering buying a product from the studied branded
products. (Gucci watches in this case). The answers from the participants did not reflect
the true pictures of the features considered to be important. Therefore, they cannot be
178
Chapter 6 Preliminary Qualitative Study and Results
used for further study. In order to overcome this problem, the questions were rephrased
to ensure the researcher would obtain the answers what she was looking for.
Furthermore, they were pre-tested with a non-academic colleague in advance.
6.2.9.3 First Focus Group as a Lesson
In sum, the first focus group discussion is treated as a protocol focus group, due to its
unsatisfying outcome. One more focus group is organised, which brings the total of
focus groups up to five. Considering that some counterfeit related practices (e. g.
manufacturing and selling) are regarded as unethical or even illegal, the research places
great attention on avoiding any leading language during the focus group discussion. For
example, "genuine branded product" is replaced by "ordinary branded product".
6.2.10 Number and the Profile of the Recruited Participants
In total, thirty-five ordinary consumers were generated by the researcher's contacts.
Twenty-eight of them actually turned up for focus group discussions. Table 6.1
provides the age and gender information about the participants (excluding the protocol
focus group). The size of the protocol focus group is five. The sizes of the focus
groups used in data analysis are: 6,6,5, and 6. Despite two reminder phone calls the
researchers made (one was made one week before each focus group discussion, and the
other one was made the day before the focus group was held), the turn-out rate was not
satisfactory. One focus group was smaller than the initially planned minimum six
subjects. The Wimbledon semi-final and final are considered to be the reasons for the
relatively low turn-out rate for groups held in the afternoons. The researcher also
realised that some potential participants were reluctant to come to a new place they had
never been to before (in this case, the site arranged by the researcher is a seminar room
at the Business School). The low turn-out rate of the smallest focus group was caused
by unpredictable incidents happening to two potential participants. These two people
notified the researcher of their reasons for absence by phone on the date the focus group
was held. It was too late for the researcher to find replacements. It is acknowledged
that the smaller size of one focus group introduces some limitations to this part of the
research. Nevertheless, the preliminary nature of the focus group discussion and
actually the size is only one participant less than initially planned six subjects (e. g. some
researchers used even smaller sizes) justify the acceptability of the relatively smaller
group size. Furthermore, the disadvantages of the limited participation are counteracted
179
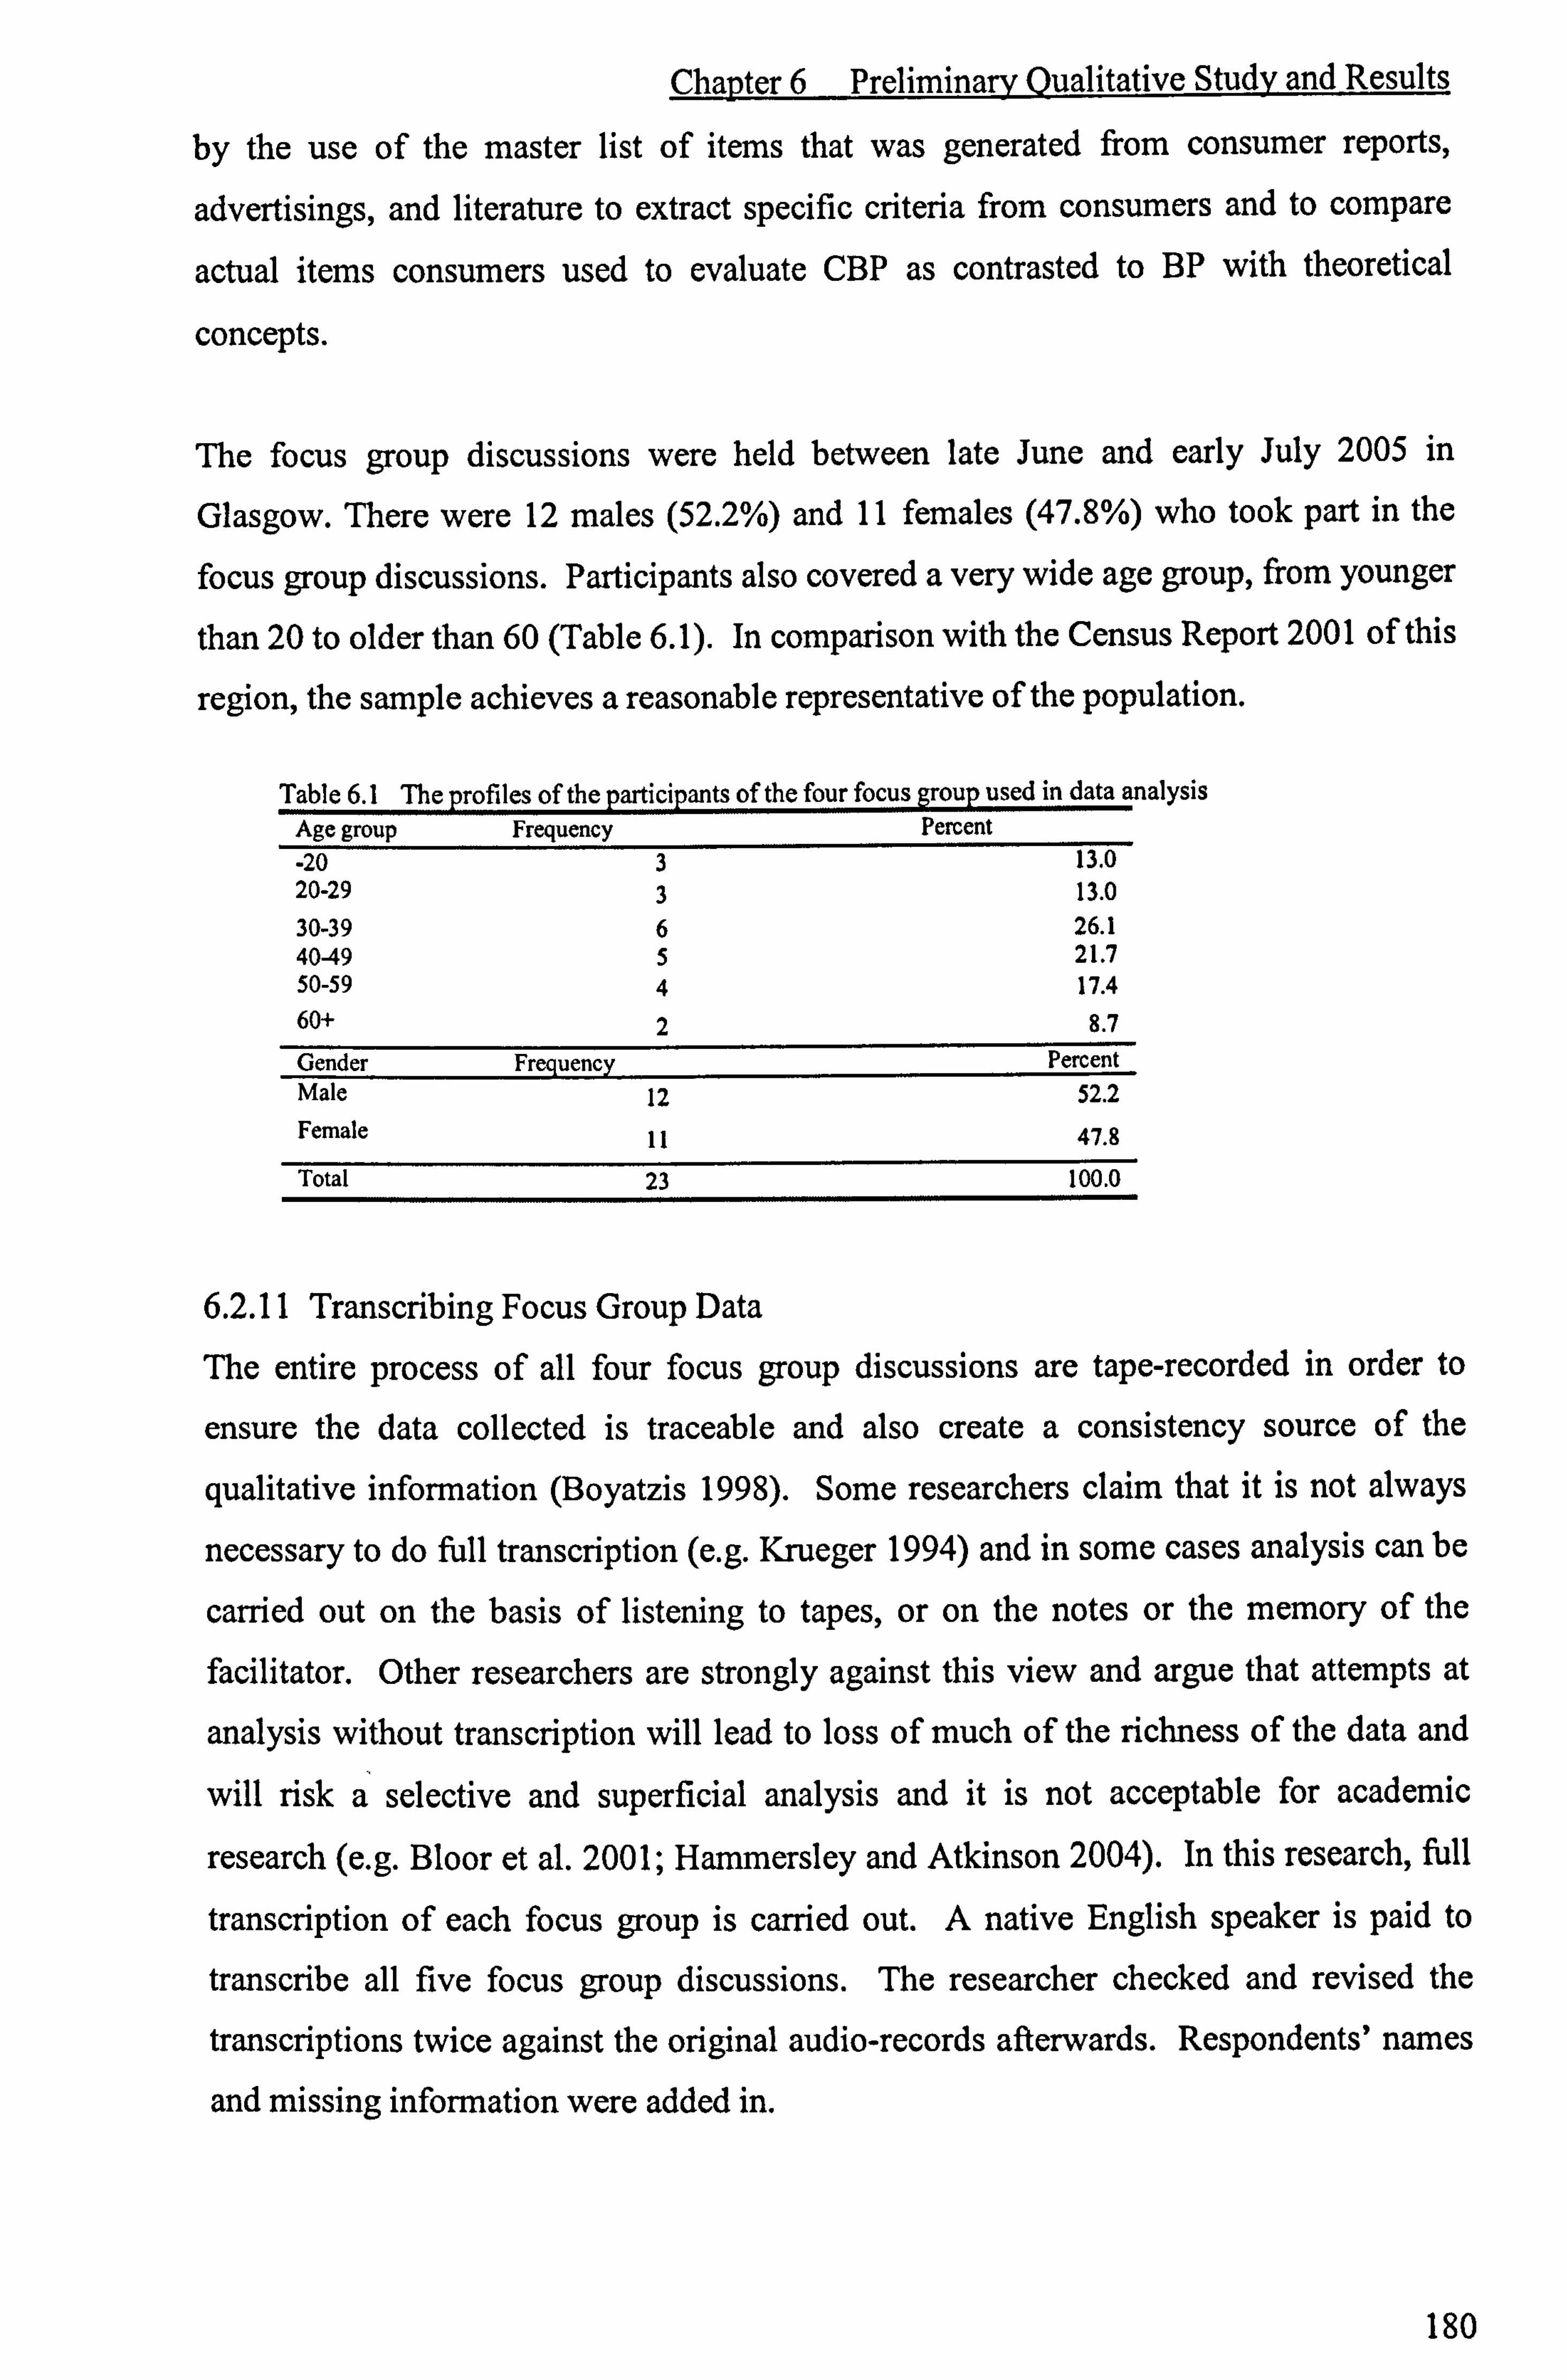
Chapter 6 Preliminary Qualitative Study and Results
by the use of the master list of items that was generated from consumer reports,
advertisings, and literature to extract specific criteria from consumers and to compare
actual items consumers used to evaluate CBP as contrasted to BP with theoretical
concepts.
The focus group discussions were held between late June and early July 2005 in
Glasgow. There were 12 males (52.2%) and 11 females (47.8%) who took part in the
focus group discussions. Participants also covered a very wide age group, from younger
than 20 to older than 60 (Table 6.1). In comparison with the Census Report 2001 of this
region, the sample achieves a reasonable representative of the population.
Table 6.1 The profiles of the participants of the four focus group used in data analysis Age group Frequency Percent
-20 3 13.0 20-29 3 13.0 30-39 6 26.1 40-49 5 21.7 50-59 4 17.4 60+ 2 8.7
Gender Frequency Percent Male 12 52.2 Female 11 47.8
Total 23 100.0
6.2.11 Transcribing Focus Group Data
The entire process of all four focus group discussions are tape-recorded in order to
ensure the data collected is traceable and also create a consistency source of the
qualitative information (Boyatzis 1998). Some researchers claim that it is not always
necessary to do full transcription (e. g. Krueger 1994) and in some cases analysis can be
carried out on the basis of listening to tapes, or on the notes or the memory of the
facilitator. Other researchers are strongly against this view and argue that attempts at
analysis without transcription will lead to loss of much of the richness of the data and
will risk a selective and superficial analysis and it is not acceptable for academic
research (e. g. Bloor et al. 2001; Hammersley and Atkinson 2004). In this research, full
transcription of each focus group is carried out. A native English speaker is paid to
transcribe all five focus group discussions. The researcher checked and revised the
transcriptions twice against the original audio-records afterwards. Respondents' names
and missing information were added in.
180
Chapter 6 Preliminary Qualitative Study and Results
6.2.12 Adopted Data Analysis Techniques
This part of the research is not trying to work out any causal relationship. The main
objective of this part of the research is to generalise the criteria consumers used to
evaluate CBP and BP. Therefore, the data collected need to be quantified. Content
analysis technique is chosen for data analysis, because it is deemed best at giving
objective, systematic, quantitative description of communications content (Kassarjian
1977; Berelson 1952), it can serve the predefined requirement of the quantified result.
The focus group discussion data was coded and analysed manually. The data collected in the warming up section was excluded from coding and analysing process, because
they did not serve the research questions directly (the role played by phase one has been
reported earlier). This rule was consistently applied across all four focus groups' data.
The aim of the coding is to bring together all extracts of data that are pertinent to a
particular theme and/or topic (Coffey and Atkinson 1996).
The categories were derived from Plummer (2000), which contained product attributes,
benefits/consequences and brand personality. Plummer (2000) does not include security
concepts. However, the security concern emerged as one stream of worries to the
participant. One might argue that the security concern might be considered as a dimension of purchase consequences. Therefore, for the time being the `security
concern theme' is combined with the `purchase consequence theme'. Nevertheless, due
to this being something never reported before, the legality of inclusion of security
concept in the benefit/consequences theme is to be tested in the principal study.
Only the elements in the content which fitted the analyst's themes, were selected in
order to avoid partial or biased analysis. More specifically, elements irrelevant to the
product attributes, the benefits/consequences and the brand personality were eliminated from analysis. The definitions of the categories emerged from previous research. The
product attributes are physical elements related to a product (Plummer 2000). The
benefits/consequences refer to what consumers think the product can do for them (Keller 1993). Brand personality is the set of human characteristics related to a brand (Aaker 1997).
To avoid the problems of bias by the researcher, the observer of the focus group discussions was selected and trained by the researcher to be the alternative coder of
181
Chapter 6 Preliminary Qualitative Study and Results
double coding. The double coding means was adopted because it was regarded as the
most commonly used technique and also which can produce sufficient reliability (Miles
and Huberman 1984). The reasons for choosing the observer as the coder were first she
was familiar with this research; secondly she had a similar background to the researcher.
These criteria were considered important by previous researchers (e. g. Peter and Lauf
2002; Krippendorff 2004). The researcher and the recruited coder coded the data
independently. Percentage of agreement was used to calculate intercoder reliability, because it was one of the commonly used measures (Perreault and Leigh 1989;
Kassarjian 1977). The overall reliability is 0.87, a level higher than that described for
acceptance (0.85) (Kassarjian 1977). Coding discrepancies were resolved through
discussion before analysis continued. The criteria considered to be `important product
attributes' and `yes' answers to benefit/consequence and brand personality related
questions by participants when they evaluated the investigated brands (both counterfeit
and original versions) were organised into four narrative summaries. The narrative
summaries were sent to several participants of focus groups for validation and
correction of any misconceptions.
6.3 Data Analysis Results of the Preliminary Study The data collected from the open discussion and the structured discussion parts were
analysed separately, with the research results were reported in the following two
sections. The stage one and the stage two data are compensatory to each other. However, the structured discussion of the stage two represents the core part of each focus group discussion. Items generated from these two sections were cross-checked
against each other and combined to form a list of items, which were used as input
variables of the draft research instrument.
In order to save space, common results across groups were combined and reported
synthetically and were presented mainly using tables. This is considered as feasible,
because in most cases the emerged factors from the stage one data across all four
groups, as well as the tested factors of the stage two were somewhat similar. This is
particularly true for the structured discussion section. For example, mainly the
personality traits suggested by Aaker (1997) were tested across all four focus groups in
relation to brand personality. To report the research results synthetically also helped to
reduce the chance of repetition and unnecessary effort involved in reporting similar
182

Chapter 6 Preliminary Qualitative Study and Results
results repeatedly. All distinguishable results were reported individually with the
source of the data marked clearly.
As reported earlier, the master list of items was generated with the aim of achieving
maximum exhaustion. By doing so, to a great extent it established that few important
items were left unexamined in the preliminary study. For methodological constraints
(the length of the questionnaire could limit the number of respondents), this part of the
research attempted to drop unimportant factors in relation to brand image, reduce the
number of items to be tested at the principal research stage, and therefore identify the
most important and appropriate items for inclusion in this study. Accordingly, the stage
two data was analysed and reported first, thereafter the stage one results. The logic
behind this is to work out what can be qualified to stay from the stage two data, then
check the qualified items against the stage one results. Missed items were added in and
repeated items were dropped off.
To reduce the number of variables to a manageable level at this stage is absolutely
crucial to this research because this study examines two versions of four brands
simultaneously, which makes the questionnaire unnecessarily long if this situation is not
dealt with carefully. Thus, any effort that can reduce even one single item might have a
multiple effect on the length of the questionnaire. For example, if one item can be
removed without reducing the accuracy of measurement of the dimension, then
effectively the length of the research instrument can be reduced at least by two
statements. This is because each statement will be repeated twice for the reason that
two versions of one brand are examined in this study. In some cases, due to three
dimensions of one variable requiring (e. g. risk) separate tests, each statement will be
repeated six times.
6.3.1 Results of the Structured Discussion
Given the complex and rich nature of this part of the data, fixed criteria are needed before setting out for each step of data reduction. These criteria should clearly indicate
what items are qualified to be dropped off for further investigation. The pre-set up
criteria are considered important because the researcher will have to resort to them in
the process of reduction of unnecessary items in order to achieve accuracy. These
criteria also assist to achieve a consistency across studied brands and product classes. The pre-set up criteria are reported in detail in the following sections.
183
Chapter 6 Preliminary Qualitative Study and Results
6.3.1.1 Brand Personality
6.3.1.1.1 Criteria in Relation to Personality Traits
" Personality traits the participants had difficulties to understand None of the participants across all four focus groups admitted that he/she had
difficulties in understanding the personality traits given by the researcher. Interestingly,
they appeared to have difficulties in qualifying some of the personality traits when they
were asked whether studied brands had these brand personalities or not, and failed to
give a "yes" or "no" answer to the questions they were asked. These answers are
categorised into "hard to say", "too difficult to qualify", "I am not sure" and "ask
further explanation from the researcher". These answers indicate that the participants did not understand the personality traits provided by the researcher or at least could not
connect them with the studied brands. Nevertheless, they were reluctant to admit it in
front of other people. This is consistent with Mitchell (1999) who addresses that lack of
public disclosure of individuals might be a pitfall of focus group discussion. Thus,
these personality traits are treated as hard to understand and formulate the first criterion
that should be met by the items that are not qualified for further consideration. These
items are presented in Table 6.2 marked with "NK".
" Personality traits the participants considered as irrelevant
Not surprisingly, the participants stated that some of the personality traits could not be
used to depict the brand personality of the studied brands. This responses to Aaker
(1997) and Davies and Roper (2001), who suggest that brand personality was
productibrand specific. These personality traits are dropped off for further test. So the
second criterion is personality traits considered as irrelevant to the studied brands. They
are reported in Table 6.2 marked with "I".
" Personality traits the participants believed the studied brands did not have or might
not have
The research revealed that although some personality traits were confirmed by the
participants that they could be used to describe the brand personality of the studied brands, however it is not necessary to say that the participants would perceive that the brands had these personalities. Therefore, the personality traits were left out for further
consideration in the case that neither the original BP (all the respondents) nor the CBP
184
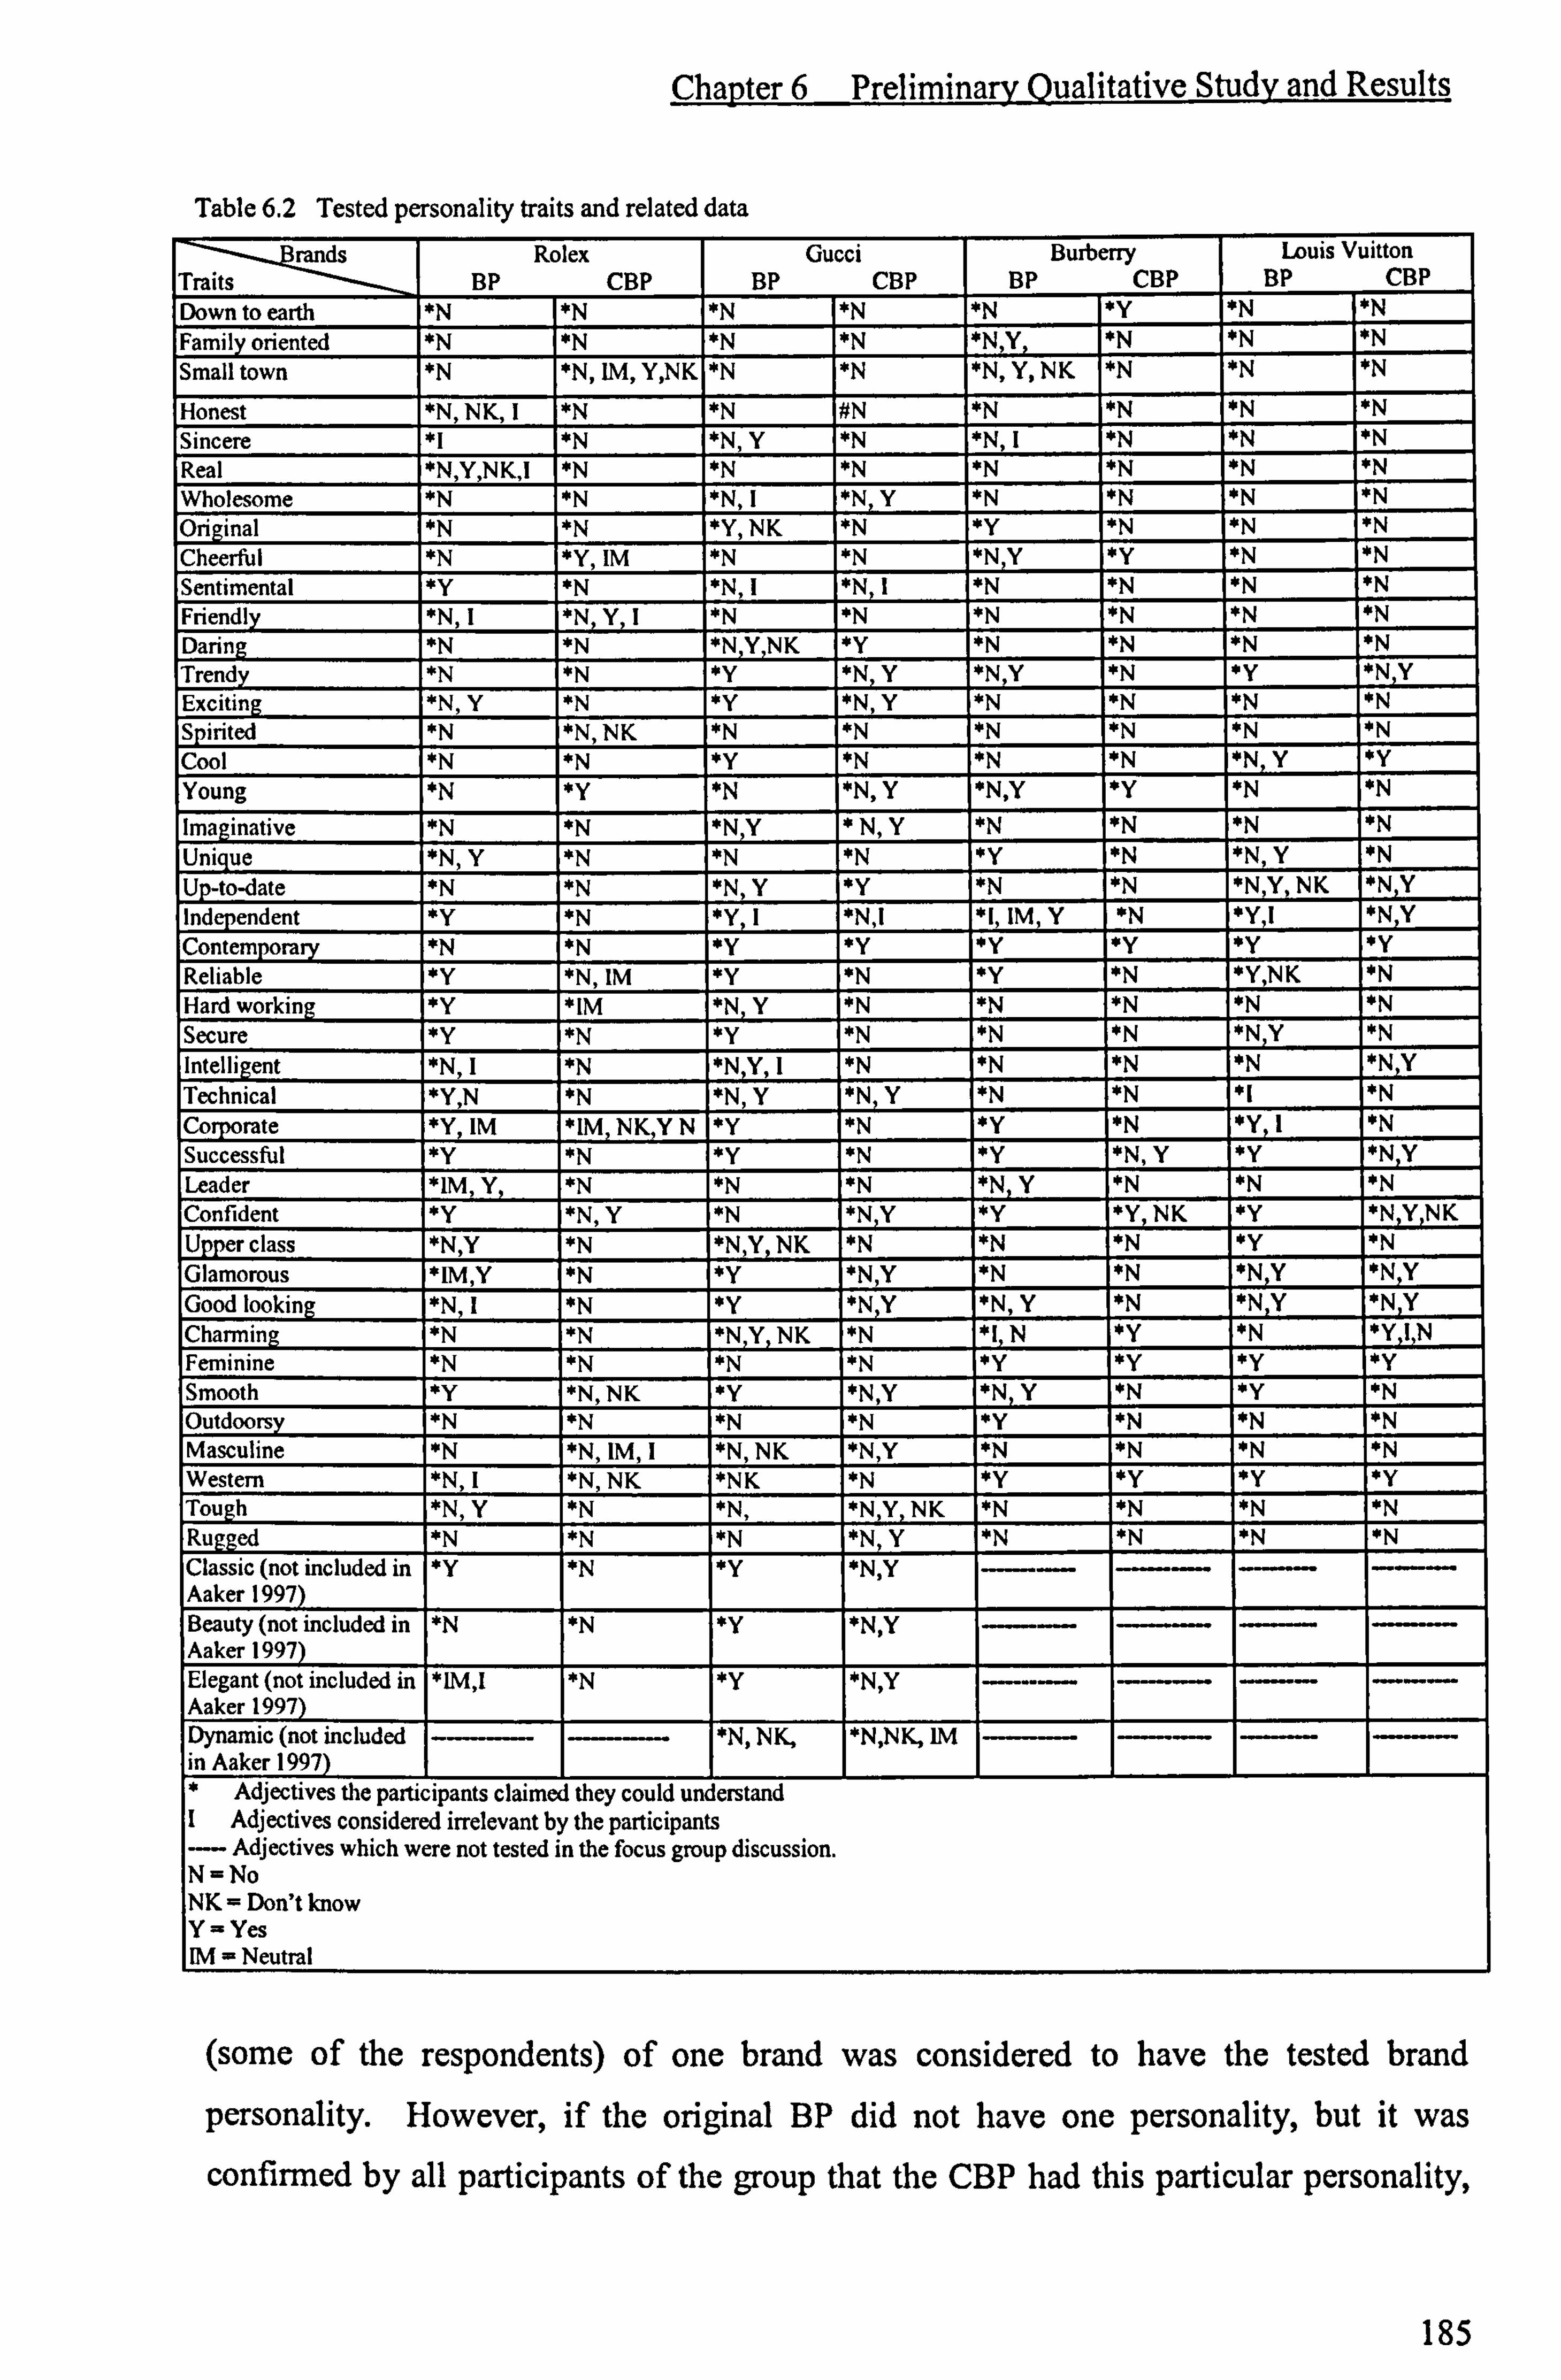
Chapter 6 Preliminary Qualitative Study and Results
Table 6.2 Tested personality traits and related data
rands Traits
Rolex BP CBP
Gucci BP CBP
Burberry BP CBP
Louis Vuitton BP CBP
Down to earth *N *N *N *N *N *Y 'N 'N Family oriented *N 'N 'N *N *N, Y 'N *N 'N
Small town *N *N, IM, Y, NK *N 'N *N, Y, NK *N 'N *N
Honest *N, NK, I *N *N #N 'N *N 'N 'N Sincere *1 *N *N, Y *N *N, I *N 'N 'N Real *N, Y, NK, 1 'N *N 'N *N *N 'N Wholesome *N
M
'N, 1 *N Y 'N *N 'N *N Oriinal *N 'Y, NK 'N 'Y *N *N *N Cheerful *N *N *N *N Y 'Y *N 'N Sentimental *Y 'N, I *N I 'N *N 'N *N Friendly *N, I *N Y, I *N 'N *N *N 'N *N Daring *N *N *N Y NK *Y 'N *N 'N 'N 'Trendy *N *N 'Y 'N Y *N Y *N 'Y *N Y Exciting *N, Y *N 'Y *N, Y *N 'N *N *N Spirited *N *N, NK *N *N *N 'N 'N 'N
Cool *N *N 'Y *N 'N *N 'N Y 'Y Young 'N *Y *N *N, Y 'N, Y 'Y *N 'N
Imaginative *N 'N 'N Y ' N, Y *N *N *N 'N Unique 'N, Y 'N 'N *N *Y 'N *N, Y 'N Up-to-date *N *N 'N, Y 'Y *N 'N *N, Y, NK *N ,Y Independent 'Y *N *Y I 'N, l 'I, IM, Y 'N *Y ,l
*N ,Y Contemporary *N 'N *Y *Y *Y *Y 'Y *Y Reliable *Y *N, IM *Y 'N *Y 'N *Y, NK 'N Hard working *Y *IM *N Y *N *N *N 'N 'N
Secure *Y 'N 'Y *N *N *N *N ,Y *N Intelligent *N, I *N I *NY= LLL *N *N *N 'N *N ,Y Technical *Y, N *N . - *N, Y *N Y *N 'N *1 'N Corporate 'Y IM *IM NK, Y N 'Y *N *Y *N *Y I 'N Successful *Y *N *Y 'N 'Y *N, Y *Y *N Y Leader *1M, Y, 'N *N 'N *N Y *N 'N 'N Confident *Y *N, Y *N *N ,Y *Y 'Y NK 'Y 'N Y NK Upper class *N, Y *N *N, Y NK *N *N *N 'Y 'N Glamorous 'IM, Y 'N *Y *N, Y *N *N *N ,Y 'N Y Good looking *N I 'N 'Y *NY 'N, Y 'N *N ,Y 'N Y Charming *N *N 'N Y NK *N *1 N *Y *N 'Y IN Feminine 'N *N *N *N 'Y *Y *Y 'Y Smooth *Y *N, NK 'Y *N, Y *N Y 'N 'Y 'N Outdoorsy *N *N *N *N *Y *N *N *N
- Masculine 'N *N, IM, I *N, NK *N, Y 'N 'N 'N *N Western 'N, I 'N, NK *NK 'N *Y 'Y *Y *Y Tough *N, Y *N *N, 'N, Y NK *N *N *N *N Rugged *N *N *N *N, Y *N *N 'N 'N Classic (not included in Aaker1997
*Y *N *Y *N, Y ---- ----
Beauty (not included in Aaker 1997)
*N 'N 'Y *N, Y
Elegant (not included in Aaker 1997)
*IM, I *N *Y *N, Y ------- - -------
Dynamic (not included in Aaker 1997)
- 'N, NK, 'N, NK, IM -----
* Adjectives the participants claimed they could understand I Adjectives considered irrelevant by the participants ---- Adjectives which were not tested in the focus group discussion. N=No NK = Don't know Y=Yes IM = Neutral
(some of the respondents) of one brand was considered to have the tested brand
personality. However, if the original BP did not have one personality, but it was confirmed by all participants of the group that the CBP had this particular personality,
185

Chapter 6 Preliminary Qualitative Study and Results
this personality trait was remained. The reason for this is that these results might be an
indication that consumers might perceive brand personality of CBP different to BP. It
will be interesting to see what new brand personalities the counterfeit version can bring
in. Moreover, these perceived brand personalities of the CBP over the BP might have
great influence on consumer decision making process and purchase choice. The third
criterion is described as: personality traits which all the participants perceived that the
BP did not have and at least some of the participants considered the CBP did not have.
Finally, in the case that the participants could not reach an agreement in relation to
whether the original BP had a tested personality or not, this personality trait was
regarded as unqualified. This formulates the last criterion. Table 6.2 reports the tested
personality traits across four brands and related data collected from focus group
discussions.
6.3.1.1.2 Justification for the above Pre-set Criteria in Relation to Reducing Items
One might argue that the general criteria set up by the researcher in order to reduce items are very harsh and may lead to some limitation to this research. This research
acknowledges this limitation. However, dropping unnecessary items is regarded as a better approach compared with ending up with a very lengthy research questionnaire, as
a very length research instrument requires a very large sample size, will increase the
possibility of a obtaining lower response rate, and leads to more missing data.
Furthermore, considering the one of the main objectives of this research is to compare
consumers' perceptions of the CBP as opposed to BP, thus only the very obvious brand
personalities are considered important for this research and worth investigation. With
regard to the rationale in relation to dropping off the items which the participants had
difficulties to understand, this research would argue that if the subjects could not even
understand what they were asked about, how can it be possible to ensure the answers
elicited from them are not ambiguous? The researcher believes that people would
agree that there is no sense to keep the items that are perceived as "irrelevant".
Likewise, it is pointless to keep personality traits that the participants considered the
likelihood of these being personalities of these studied brands as low or even none for
both CBP and BP (justification for the third criteria). To drop all the items that the
participants could not reach an agreement on the tested brand personality of the original BP is also because of the reason that this research only investigates the most obvious brand personality perceived by consumers due to the time limitation for this research
186

Chapter 6 Preliminary Qualitative Study and Results
but not all possible personality possessed by an individual brand. This means also
makes a more focused research. The above noted arguments justify the acceptability of
the criteria pre-set up by the researcher. Table 6.3 presents the personality traits that
went through the criteria and left for further investigation.
T., l. le I De.. ý...... l: f.. f....: fý ... 1.:.. L. ýýf: ýF. eA +k �. u_cnf ., � rrif o
s Traits
Rolex BP CBP
Gucci BP CBP
Burberry BP CBP
Luise Vuitton BP CBP
Down to earth I *N *Y Original 2 *Y *N
Cheerful I *N *Y, IM Sentimental *#Y *#N Trendy I *Y *N, Y I *Y *N, Y Exciting 2 *Y *N, Y Cool 3 *Y *N Young 2 *N *Y Unique 3 *Y *N Independent 3 *Y *N Contemporary 4 *Y *Y 4 *Y *Y 2 *Y *Y Reliable 4 *Y *N, IM 5 *Y *N 5 *Y *N Hard working 5 *Y *IM Secure 6 *Y *N 6 *Y *N Corporate 7 *Y *N 6 *Y *N Successful 7 *Y *N 8 *Y *N 7 *Y *N ,Y 3 *Y *N, Y Leader 8 *IM, Y, *N Confident 9 *Y *N, Y Upper class 4 *Y *N Glamorous 10 *IM, Y *N 9 *Y *N, Y
Good looking 10 *Y *N Y Feminine 8 *Y *Y 5 *Y *Y Smooth 11 *Y *N, Y 6 *Y *N Outdoorsy 9 * * N Western # *#Y *#Y Classic not included in Aaker 1997 1l *Y *N 12 *Y *N, Y
W
Beau not included in Aaker 1997 13 *Y *N Y Eleant not included in Aaker 1997 -- 14 *Y *N, Y * Adjectives the participants claimed could understand. # Adjectives are considered irrelevant and inappropriate after discussion.
-- Adjectives which were not tested in the focus group discussion. N=No Y=Yes IM = Neutral
6.3.1.1.3 Personality Traits Results
Responding to our earlier argument which suggests that brand endorsers, company's
employees or CEO might be regarded to have direct impact on consumer perceived brand personalities, personality traits associated to these characteristics are considered
as acceptable in order to achieve an exhaustive list. The rationale for keeping these
personality traits is because that it is clear that the consumer perceived brand
personalities are in line with their perceptions of these related characteristics. We
would argue that in the case that consumers' perceived brand personalities do not fit in
well with their perceived human personality of the influential parties, the perceived
human personalities should not be considered as presenting brand personality.
187

Chapter 6 Preliminary Qualitative Study and Results
The participants of the Gucci group and the Rolex group expressed that original Gucci
and Rolex watches were "sentimental". More specifically, the original Rolex and Gucci
watches were considered as "sentimental" if they were received as presents. Due to the
"usage situation" not being considered as an antecedent of brand personality by Aaker
(1997), "sentimental" is dropped for further consideration from Rolex and Gucci. By so
doing, this research is not suggesting that previous research is flawless and one should
not challenge them, but because to introduce more dimensions will end up with more
variables to be tested later on. Moreover, the research focus is not on redefining
dimensions of brand personality. Whereas, the time scale of this research does not
allow fulfilling this task either. Therefore, it is decided that no further effort to be put
into justifying the legitimacy of the newly discovered dimension. However this
research acknowledges that this discovery might have shed some light on a new
research area for later researchers.
Two focus groups' (Burberry and Louis Vuitton) participants believed that both
Burberry and Louis Vuitton handbags had "western" brand personality, because only
western people wore these brands and both of these brands were western brands as
opposite to Asian brands. Aaker (1997) did not give detailed interpretations to each
individual item she included in the brand personality dimensions. There is a great
chance that the participants' understanding of "western" brand personality in this
research is different to Aaker's (1997). Aaker's (1997) dimensions were developed in
the context of American culture, in which "western" is more likely connected to life in
the western part of the US in the times of the wars with the American Indians, or one
with cowboys, rustlers, and sheriffs. If this holds true, the participants' interpretation of
"western" of this research differs to the original meaning of "western" recommended by
Aaker (1997). Given that "western" appeared difficult to understand (Rolex and Gucci
groups) and were more likely to be misinterpreted (Burberry and Louis Vuitton), it was
decided that this personality trait is eliminated, despite they were qualified to remain in
to groups according to the pre-set up criteria. This is consistent with Diamantopoulos et
al. (2004) and Davies and Roper (2001) who also report that `western' is highly
ambiguous in the UK context. Table 6.4 reports all items associated to brand personality
that finally qualified for inclusion in this study.
188

Chapter 6 Preliminary Qualitative Study and Results
Tah1 fd Percnnality traite nna1ifieri to ctav at this ctaor
ands Traits
r Rolex BP
CBP
Gucci BP CBP
Burberry BP CBP
Louis Vuitton BP CBP
Down to earth -- - ---- I *N *Y Original -- - --- 2 *Y *N Cheerful I *N *Y, IM -- - Trendy 1 *Y *N, Y - 1 'Y *N Y Exciting --- - 2 *Y *N, Y - --- -.. _ý. Cool - - 3 *Y *N Young 2 *N *Y - - Unique 3 'Y 'N Independent 3 *Y *N Contemporary -- - 4 *Y *Y 4 'Y *Y 2 'Y *Y Reliable 4 'Y *N, IM 5 *Y *N 5 *Y *N Hard working 5 *Y 'IM Secure 6 *Y *N 6 *Y *N Corporate ---- 7 *Y 'N 6 'Y *N Successful 7 'Y *N 8 'Y 'N 7 *Y *N, Y 3 *Y 'N, Y Leader 8 *IM, Y *N -- - Confident 9 *Y *N, Y Upper class - ----- -- ---- 4 *Y *N Glamorous 10 *IM, Y *N 9 *Y *N, Y - Good lookin --- -- 10 'Y *N ,Y Feminine ---- - ----- 8 'Y *Y 5 *Y 'Y Smooth ---- --- 11 *Y 'N, Y ---- 6 'Y *N Outdoorsy 9 'Y *N Classic (not included in Aaker 1997) 11 'Y *N 12 'Y *NY ---- Beau not included in Aaker 1997) 13 *Y 'N, Y Elegant (not included in Aaker 1997) ----- - 14 *Y *N, Y ' Adjectives the participants claimed could understand. --- Adjectives which were not tested in the focus group discussion N=No Y= Yes MI = Neutral
6.3.1.2 Product Attributes
6.3.1.2.1 Product Attributes Results
Style, price, logo, size, and material were considered as important factors for both CBP
and BP across almost all four studied brands, with the exception of the respondents of
the Rolex focus group all agreed that material of the counterfeit Rolex watches did not a
matter to them, and some of Louis Vuitton respondents claimed that the size of the
counterfeit handbag was not an issue.
All the participants of the Rolex and Gucci groups confirmed that warranty was
important to the original branded products. Some respondents of Burberry and Louis
Vuitton claimed that warranty was important; some thought it was not an issue in
relation to the original BP. None of the participants across all four focus groups
considered warranty was a factor to them when faced with CBP. It appears that
warranty is considered more important for functional brands than for fashionable
brands. This might because consumers concern more performance risk when they buy
189

Chapter 6 Preliminary Qualitative Study and Results
functional products then fashionable products. Thus "warranty" as a kind of back up to
any failure performance appears to be critical.
Packaging was not considered as a matter at all to all respondents of all four focus
groups under CBP circumstances. It was not regarded as important in relation to the
original Gucci watches and Burberry handbags. All the participants of the Rolex group
and some of the Louis Vuitton participants of claimed that packaging was important to
Rolex watches and Louis Vuitton, with some of Louis Vuitton respondents asserting
that packaging never came to their mind. The reason for this result is not clear.
Possible reasons the researcher can offer are, first Rolex watches and Louis Vuitton
handbags are priced much higher then Gucci watches and Burberry handbags, therefore
the participants would expect more personal treatment; secondly it is well known that
Rolex watches and Louis Vuitton handbags normally come with very high quality
packaging.
The participants of the Rolex group believed that country of origin was very important
for the original Rolex watches. More specifically, the original Rolex watches had to be
Swiss made. The other three focus groups respondents did not achieve an agreement
with regard to the importance of the country of origin to the original BP. Some
respondents thought it was important, some disagreed. These distinctions might have
something to do with the fact that Switzerland is perceived as the origin of the best
mechanical watch manufacturers. Thus, consumers would certainly expect Switzerland
to be the country of origin of a watch brand like Rolex. A clear pattern appears in the
case of CBP; all respondents across four focus groups did not think country of origin of CBP mattered to people.
Waterproof was considered as very important to the genuine Rolex watch, but not to the
counterfeit version. Some participants believed that waterproof was important to both
the original and counterfeit Gucci watches, some had opposite opinions. This can be
explained by the fact that "waterproof' is one of the key functions of Rolex watches and
serves special needs. For example, each Oyster Rolex watch is waterproof to
minimum100 meters. Therefore, it bound to be considered as vital to this brand. In
comparison with Rolex, Gucci is more likely to be perceived as a fashionable brand.
Considering the price they pay for a Gucci watch, consumers would expect that the
190

Chapter 6 Preliminary Qualitative Study and Results
watch is waterproof to some extent. It appeared that some subjects did not fully
understand what the `Red cherry equestrian' and ̀ Check' attributes related to Burberry
mean. These two terms are discarded. Table 6.5 presents the detailed data gathered in
relation to product attributes.
Table 6.5 Product attributes examined in focus eroun discussion and results ds
Traits Rolex
BP CBP Gucci
BP CBP Burberry
BP CBP Louis Vuitton
BP CBP Size Y Y Y Y Y Y Y N, Y Price Y Y Y Y Y Y Y Y Packaging Y N N N N N N, Y N Warranty Y N Y N Y, N N N, Y N Waterproof Y N NY YN Count of origin Y N N, Y N N, Y N NY N Material Y N Y Y Y Y Y Y Logo Y Y Y Y Y Y Y Y Style Y Y Y Y Y Y Y Y Red cherry equestrian - --- -- - NK Y NK Check -- --- -- - Y NK INK
--- Not relevant to studied branded products N= NO, For example: It does not bother me. I don't think it would be a big concern Y= YES, For example: I think you expect..., NK = NOT KNOW, For example: I don't know why they should think about that, what do you mean?
6.3.1.2.2 Criteria in Relation to Product Attributes
This part of the research aimed to elicit the product attributes that the participants
considered as important in relation to the studied brands. Any attributes the participants
showed any difficulty in understanding, in addition to the attributes that either all or part
of the group participants regarded as unimportant to the original BP were treated as inoperative for a study investigating the distinguishable consumers' perceptions of BP
and CBP. It is true that different consumers might perceive different product attributes
as important according to their personal situation. However, this is not what this
research sets out for. This research focuses on examining the product attributes that are
perceived as important to consumers in general. The reasons are similar to the one given in personality traits section, the only difference is that this part of the research is looking
at product attribute other than brand personality. The logic behind it is identical. This
approach results the research focuses on the most important product attributes. Furthermore, consumers might have different perceptions of product attributes of the
CBP and BP; however, due to these attributes not being considered as important, it was
more likely that they did not have much exploratory power in the formation of
consideration set and final choice. Therefore they are not kept for further consideration.
6.3.1.2.3 Dropping Warranty and Logo
As reported earlier in this section, all the participants of the Rolex and the Gucci groups
confirmed that warranty is important to the original branded products, but not to the
191

Chapter 6 Preliminary Qualitative Study and Results
counterfeit versions. According to the pre-set up criteria, "warranty" is qualified to
stay. Nevertheless, given that CBP does not provide warranty in the context of non-
deceptive counterfeiting is an obvious reality, there is no sense in testing it again.
Furthermore, this was evidenced by the focus group data, which showed that none of
participants across all four focus groups considered warranty was a factor to them when
faced with CBP. Accordingly, "warranty" is dropped off. The idea of counterfeiting is
to adopt the logo of the original branded. The counterfeit branded products have
identical logos to the original branded products. There is no point in examining them.
As such, `logo' is discarded. Table 6.6 presents the products attributes left for cross-
checking against open discussion stage results.
Table 6.6 Product attributes qualified for further investigation ds
Traits Rolex
BP CBP Gucci
BP CBP Burberry
BP CBP Louis Vuitton
BP CBP Size y Y Y Y Y Y Y N, Y Price y Y Y Y Y Y Y Y Packaging Y N -- - Waterproof Y N - -- -- Count of origin y N -- - - ---- ---- Material Y N Y Y Y Y Y Y Logo y Y Y Y Y Y Y Y Style y Y Y Y Y Y Y Y
---- Not qualified product attributes Na NO, For example: It does not bother me. I don't think it would be a big concern Y -YES, For example: I think ou ex ect ...
6.3.1.3 Benefits and Consequences
6.3.1.3.1 Criteria in Relation to Benefits and Consequences
The tested items are dropped if the participants considered them as "irrelevant" or
claimed "do not understand" in either case of the original BP or the CBP. This is
because for either of these, the data associated to BP and CBP would be ambiguous and
incomparable. Furthermore, in the case that the participants could not reach an
agreement in relation to the suggested benefit or consequence of the BP, the related item
is treated as disqualified for further investigation. This research assumed that these
items did not indicate very obvious benefits or consequences of the tested original BP
compared with other items, which all the participants either determined "yes" or "no" to
the given questions. We are aware that this means might cause some bias to this
research, due to the size of the focus group being relatively small. However, a trade off has to be made between a possibility of reasonable level of bias and ending up with a
very lengthy questionnaire. For the same reason which has been addressed in the
"personality traits" section and the "product attribute section", this research believes the
192
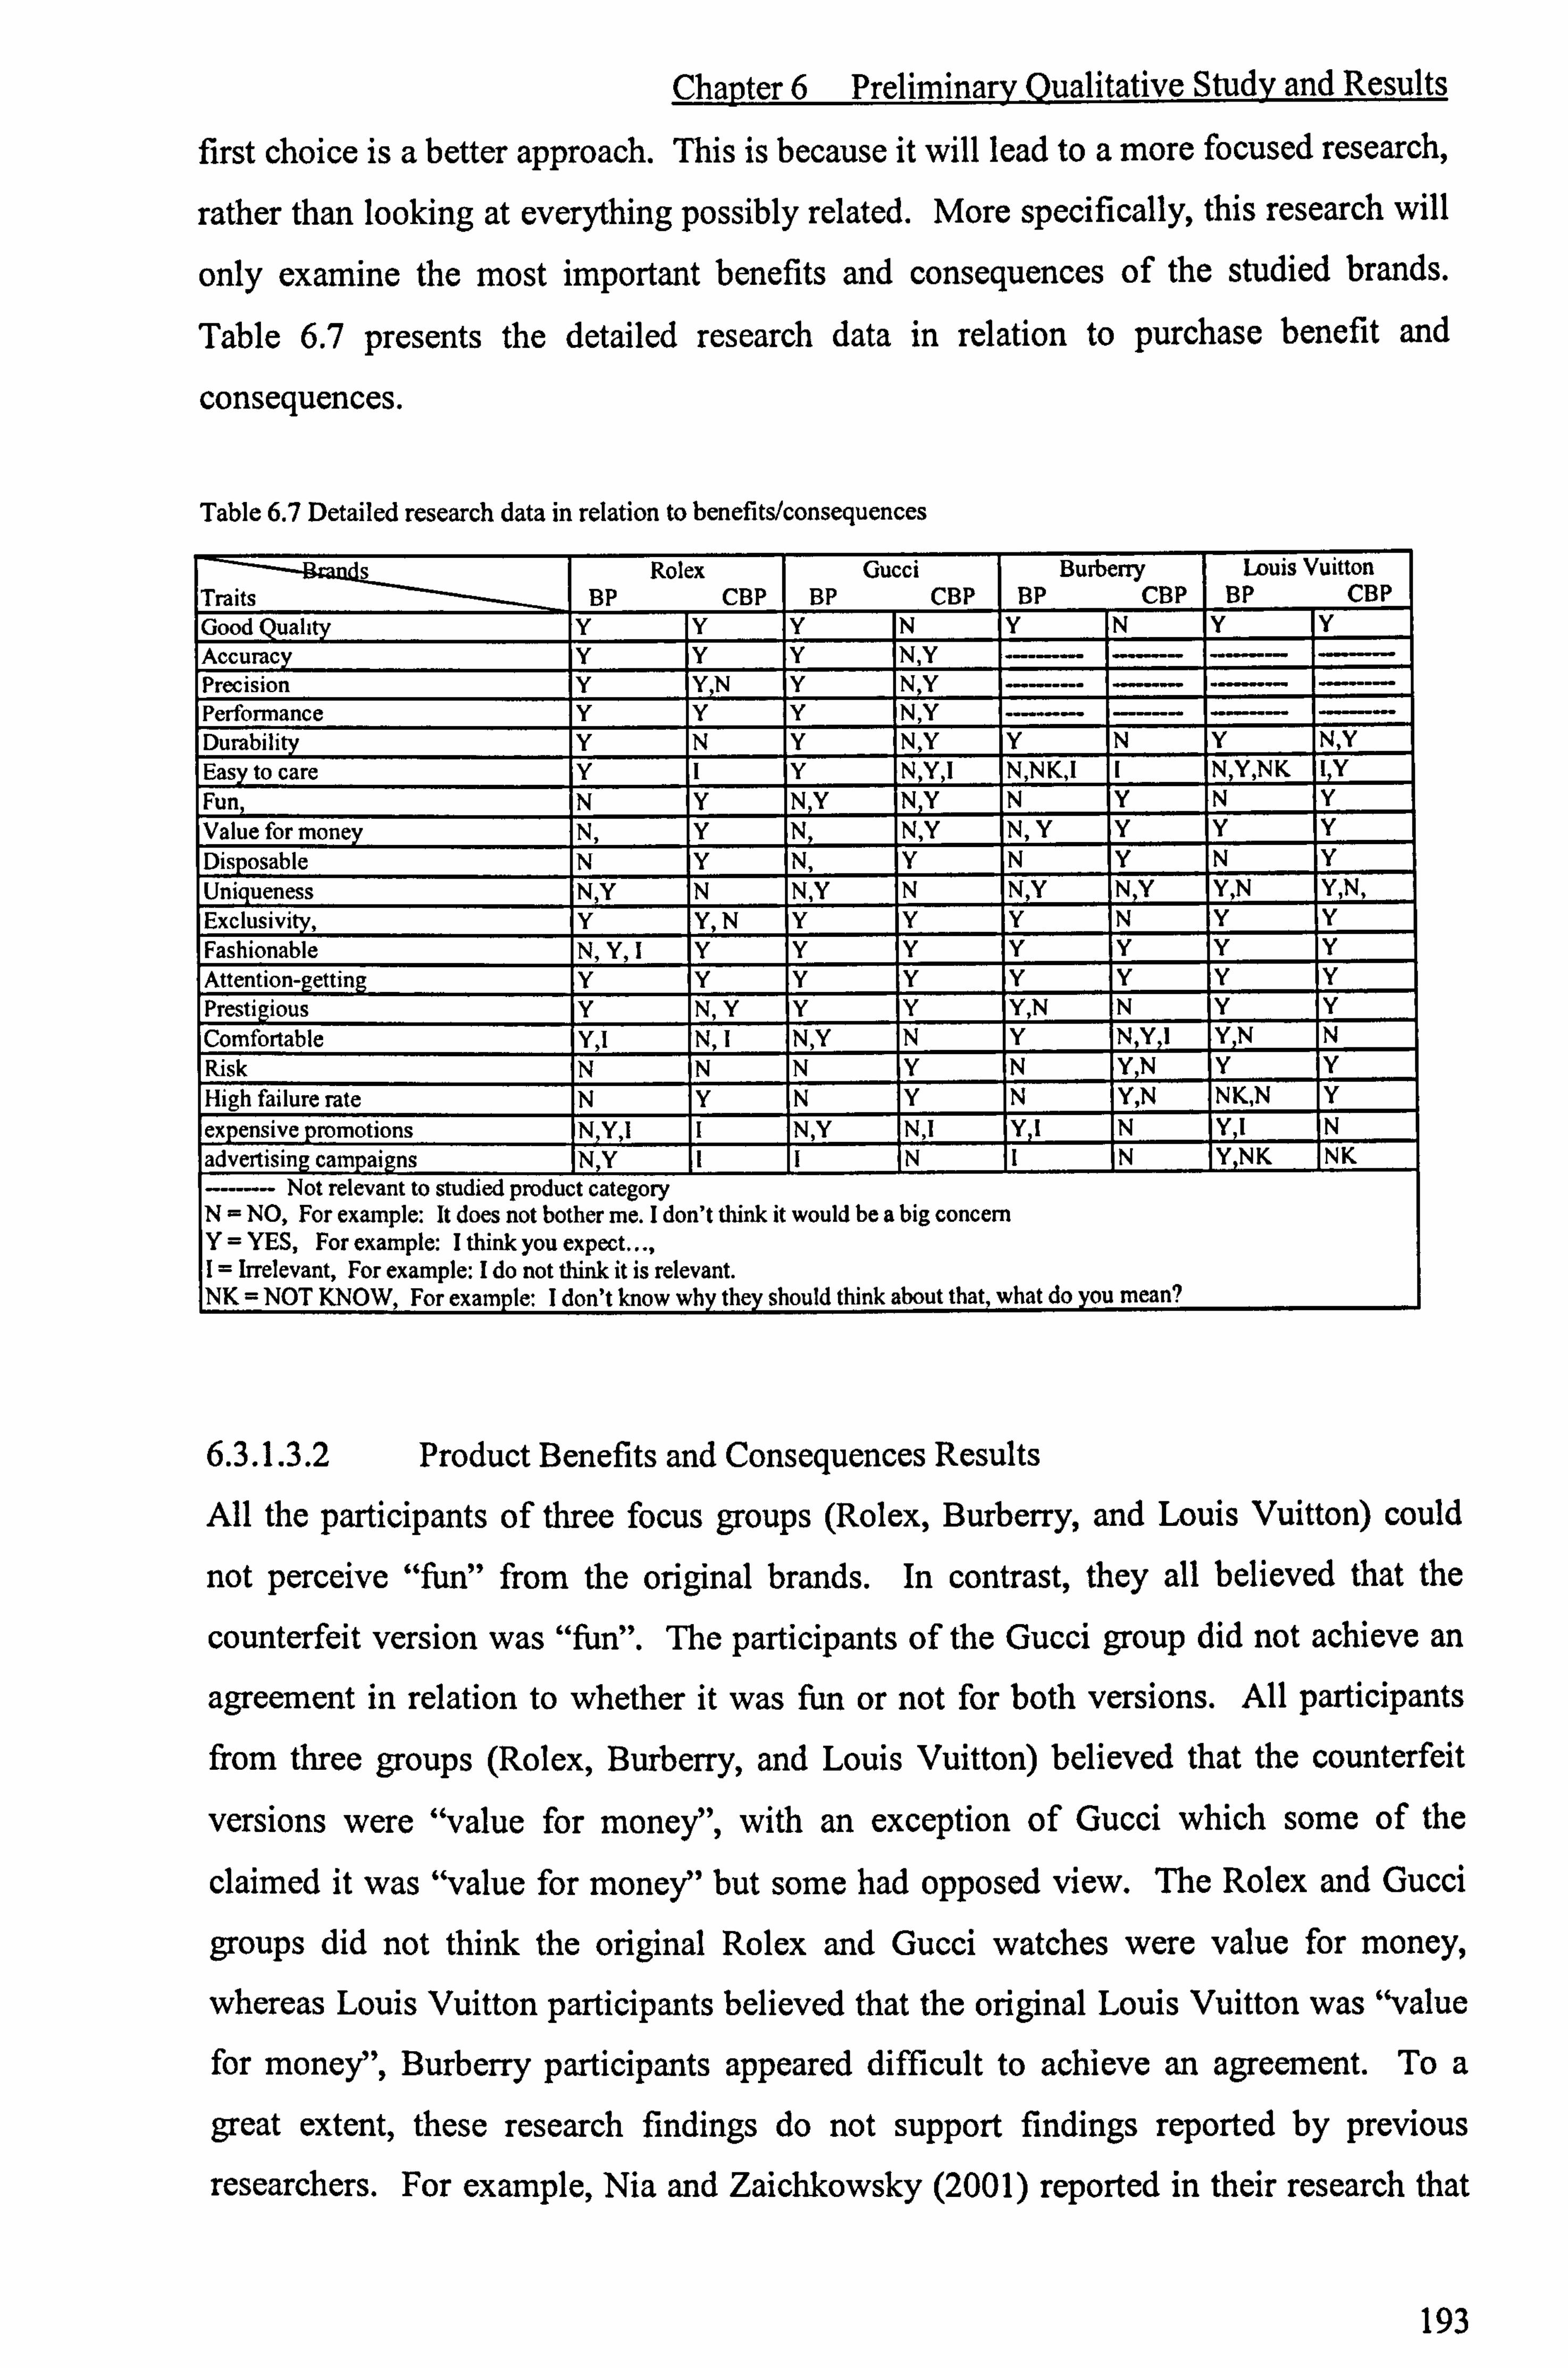
Chapter 6 Preliminary Qualitative Study and Results
first choice is a better approach. This is because it will lead to a more focused research,
rather than looking at everything possibly related. More specifically, this research will
only examine the most important benefits and consequences of the studied brands.
Table 6.7 presents the detailed research data in relation to purchase benefit and
consequences.
Table 6.7 Detailed research data in relation to benefits/consequences
s Traits
Rolex BP CBP
Gucci BP CBP
Burberry BP CBP
Louis Vuitton BP CBP
Good Quality Y Y Y N Y N Y Y Accuracy Y Y Y N, Y ---- Precision Y YN Y N, Y - - Performance Y Y Y N, Y Durability Y N Y N, Y Y N Y N, Y Easy to care Y I Y N Y, l N, NK, I I N, Y, NK I, Y Fun, N Y N, Y NY N Y N Y Value for money N, Y N, N, Y N, Y Y Y Y Disposable N Y N, Y N Y N Y Uniqueness N, Y N N, Y N N, Y N, Y Y, N Y, N, Exclusivity, Y Y, N Y Y Y N Y Y Fashionable N, Y, I Y Y Y Y Y Y Y Attention-getting Y Y Y Y Y Y Y Y Prestigious Y IN, Y Y Y Y, N N Y Y Comfortable Y, l IN, I N, Y N Y N, Y 1 Y, N N Risk N N N Y N YN Y Y High failure rate N Y N Y N Y, N NK, N Y
expensive promotions N, Y, l I N, Y N, I Y11 N Yj N advertising campaigns NY I I N I N Y NK NK
------ Not relevant to studied product category N= NO, For example: It does not bother me. I don't think it would be a big concern Y= YES, For example: I think you expect..., I= Irrelevant, For example: I do not think it is relevant. NK = NOT KNOW, For example: I don't know why they should think about that, what do you mean?
6.3.1.3.2 Product Benefits and Consequences Results
All the participants of three focus groups (Rolex, Burberry, and Louis Vuitton) could
not perceive "fun" from the original brands. In contrast, they all believed that the
counterfeit version was "fun". The participants of the Gucci group did not achieve an
agreement in relation to whether it was fun or not for both versions. All participants from three groups (Rolex, Burberry, and Louis Vuitton) believed that the counterfeit
versions were "value for money", with an exception of Gucci which some of the
claimed it was "value for money" but some had opposed view. The Rolex and Gucci
groups did not think the original Rolex and Gucci watches were value for money,
whereas Louis Vuitton participants believed that the original Louis Vuitton was "value
for money", Burberry participants appeared difficult to achieve an agreement. To a
great extent, these research findings do not support findings reported by previous
researchers. For example, Nia and Zaichkowsky (2001) reported in their research that
193
Chapter 6 Preliminary Qualitative Study and Results
the subjects found that luxury products are "fun" and "worth the price they paid for",
whether they were original or counterfeit. The reasons the researcher can offer here for
the distinguishable results is might be something to do with the subjects elected for
these two studies. Nia and Zaichkowsky's (2001) subjects were people from a very rich
area, the participants of this study were ordinary consumers of Glasgow, a city with
average household income lower than national average household income (Wealth of
the Nation 2006). People with different income levels are more likely to have different
perceptions of luxury products. Furthermore, Nia and Zaichkowsky's (2001) study was
conducted in Canada, this work was undertaken in the UK.
Moving one step beyond Nia and Zaichkowsky (2001), this research revealed that
"value for money" was interpreted in two distinguishable ways. It is more likely that
the participants were concerned more about quality when judging whether CBP was "value for money" or not, some participants used quality as the only criterion in relation to judge of value of BP, some brought in alternative criterion, for example brand image.
This was evidenced by the following:
Yes (it is value for money). Because if you are buying it you might not for
quality of the product, it isn't what you are putting across, so it may be value for
money in that respect. People see you with that sort of brand; (they) talk to you because of what you wear, what you do. So it could be construed, maybe not
actual physical material properties... The value you can see is something else. (Original Burberry)
You are not buying (original Burberry) for value for money.
Possibly (it is value for money), depending on the quality. (Counterfeit Louis
Vuitton)
The above statements indicate that "value for money" might be a two-dimensional
construct in the context of non-deceptive counterfeiting. One dimension is derived from
the connection of the perceived physical material properties and the price of the product. The second dimension can be obtained from the linkage of the price of the product and its intangible properties, for example statement of status. It is very important to be
aware of the two-dimensional nature of this concept and it should be taken into account
194

Chapter 6 Preliminary Qualitative Study and Results
in the principal study. This finding extends Bradburn and Sudman's (1991) statement
who argue that `language is basically ambiguous, words can have different meanings to
the person who says them and to those who hear them (p. 32)' by suggesting that words
can have different meanings to different people, they also can mean different things to
the same people in different contexts.
Given the above very interesting findings, both "fun" and "value for money" were
considered as the most dominant dimensions of image (Grossman and Shapiro 1988a;
Dubois and Paternault 1995; Nia and Zaichkowsky 2001), they remain for further
consideration despite in some cases they satisfied the criteria for dropping off.
Choice of "high failure rate" or "risk"
The focus group data revealed that the participants differentiated risk and noted
performance risk, financial risk and social risk (possibility of being found out by a third
party if they buy CBP) in relation to CBP. These were evidenced by:
If it lasts a year and costs £5, that is not much risk (counterfeit Rolex watch).
Well I mean you are taking a risk and you're paying money for something that's
very shoddy (Counterfeit Louis Vuitton).
You are making a risk statement. Although I'm paying for this £10, can I afford to waste this £10 as opposed to £20 (Counterfeit Burberry)?
You're always calculating that risk. Because you're thinking this is a forgery, is
it going to do its purpose (Counterfeit Burberry)?
(It's)a risk if you get found out (Counterfeit Louis Vuitton).
They will not feel very comfortable with G8 going on (Original Louis Vuitton).
There are some pubs do not allow people who wear Burberry products in
(Burberry).
On the contrary, none of respondent expressed any concern about performance and financial risk related to purchase of the BP. To explain the reason, a claim of one group
might shed some light, if it is not sufficient:
195

Chapter 6 Preliminary Qualitative Study and Results
I don't think (to buy original Rolex watch) it's risky. Because it's under
warranty.
I think you expect a warranty with whatever you buy. If it breaks you take it
back, or claim on your credit card insurance or whatever (Burberry handbag).
It is likely that "warranty" of BP might be the source of peace in mind for the
participants. Although the financial risk was noted as a dimension of the risk in
literature, there is no agreement reached between participants with regard to possibility
of financial risk in relation to CBP. The data also revealed that both original brands and
counterfeit versions might bring social risk to the participants. However the social risk
is caused by different reasons. The participants believed that people might be
concerned about being found out for using CBP, they might worry about being
considered as anti-socialist in the case of consuming luxury brands (Original Louis
Vuitton group) or being singled out by society (Original Burberry group). Surprisingly,
the respondents of the Rolex group did not see much risk at all in relation to both the
counterfeit version and original version. No sound interpretation can be provided at this
stage. An assumption was made that the surprising finding might be caused by the
small number of the participants, alternatively the complexity of the risk construct.
Therefore, it is interesting to see whether this research finding will hold in the case of a
larger sample size. In order to ensure the comparability of data across two version, it is
rational to include all the antecedents of risk emerged from the focus group discussions.
Therefore, financial risk, performance risk as well as social risk will be tested across all four brands in the principal research. Two dimensions of social risk are measured in
relation to Burberry and Louis Vuitton handbags. Worries for being singled out or becoming a target of anti-capitalists is not tested in relation to Rolex and Gucci watches, because watches do not attract as much attention as handbags. Therefore, people who
wear Rolex and Gucci are less likely to be targeted by the anti-capitalists.
Given that this research assumed that the "high failure rate" is identical to the
performance risk of the overall risk, therefore, in order to avoid repeated measuring
only one should remain. Considering the participants of one focus group showed difficulties in terms of understanding "high failure rate", on the other hand performance
196
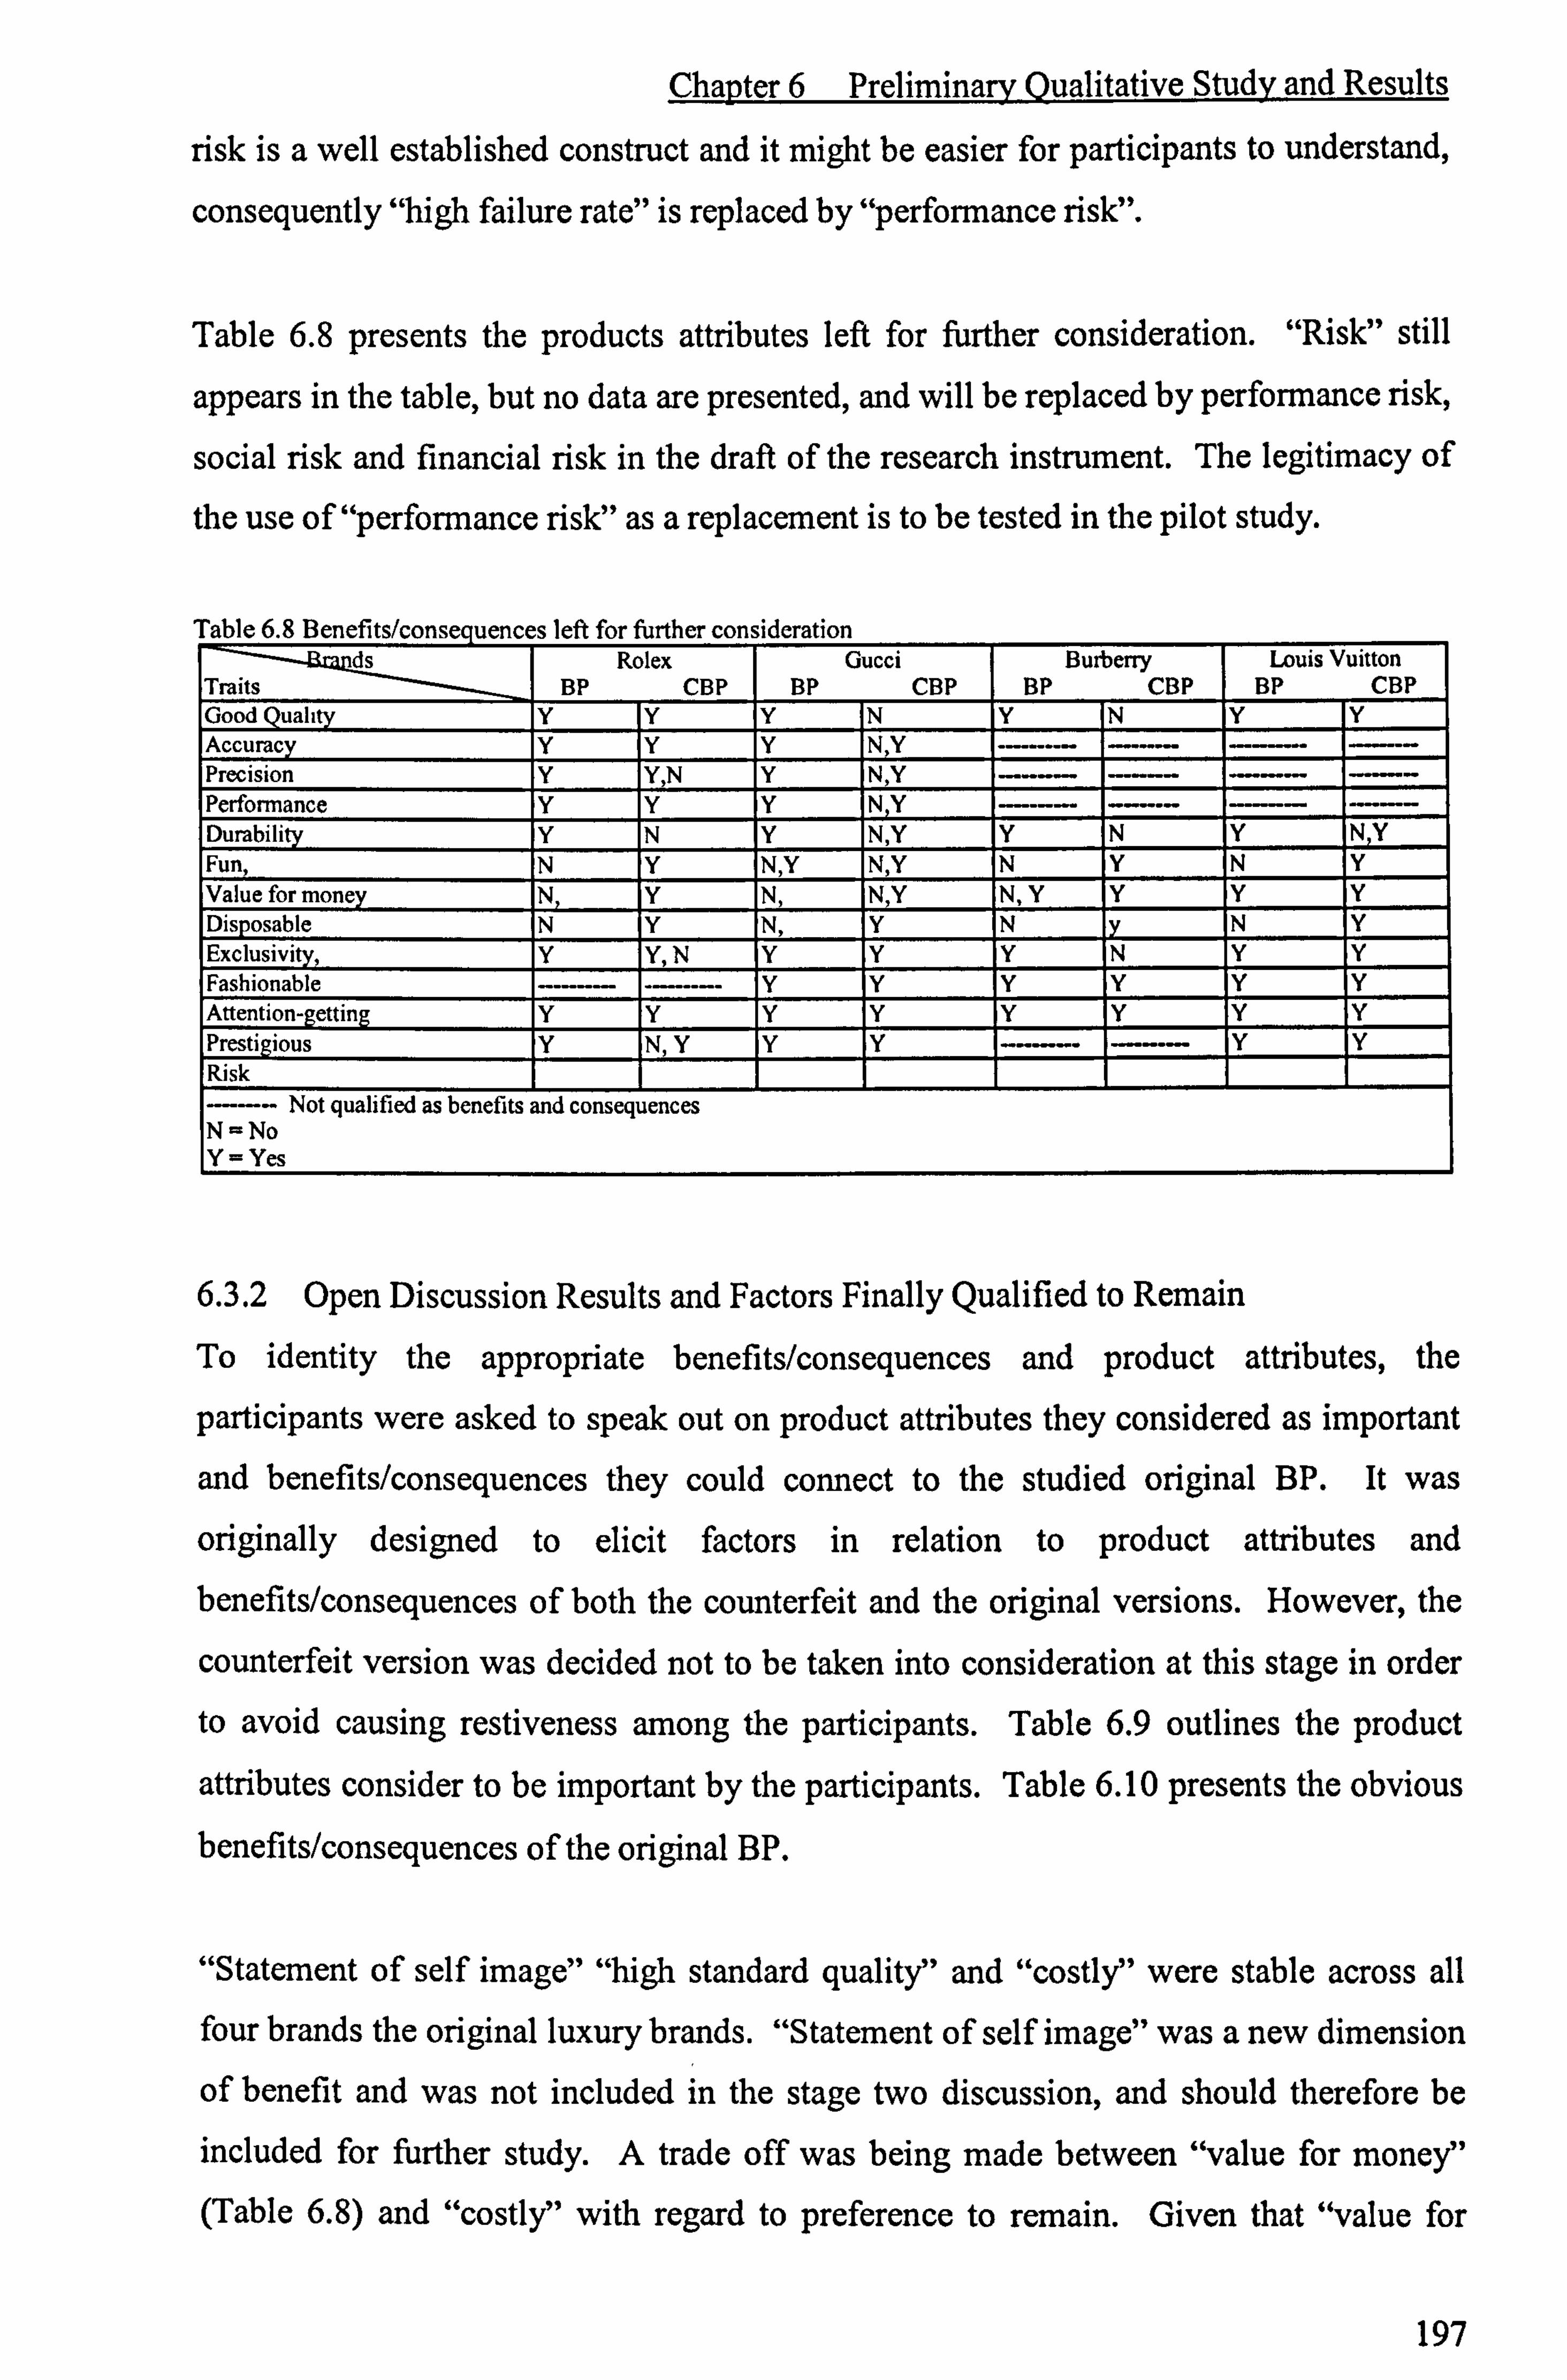
Chapter 6 Preliminary Qualitative Study and Results
risk is a well established construct and it might be easier for participants to understand,
consequently "high failure rate" is replaced by "performance risk".
Table 6.8 presents the products attributes left for further consideration. "Risk" still
appears in the table, but no data are presented, and will be replaced by performance risk,
social risk and financial risk in the draft of the research instrument. The legitimacy of
the use of "performance risk" as a replacement is to be tested in the pilot study.
Tahle 6R Renefitc/nnncernienrec left fnr fiirther enncideratinn
ds Traits
Rolex BP CBP
Gucci BP CBP
Burberry BP CBP
Louis Vuitton BP CBP
Good Quality y Y Y N Y N Y Y Accuracy y Y Y N, Y ----- - Precision Y Y, N Y N, Y --- Performance y Y Y NY Dur-ability Y N Y N, Y Y N Y NY Fun, N Y N, Y N, Y N Y N Y Value for money N, Y N, N, Y I N, Y Y Y Y Disposable N Y N, Y N N Y Exclusivity, Y Y, N Y Y Y N Y Y Fashionable y y y y y y Attention-getting y Y Y Y Y Y Y Y Prestigious Y N, Y Y Y ----- -- Y Y Risk
--- Not qualified as benefits and consequences N=No Y=Yes
6.3.2 Open Discussion Results and Factors Finally Qualified to Remain
To identity the appropriate benefits/consequences and product attributes, the
participants were asked to speak out on product attributes they considered as important
and benefits/consequences they could connect to the studied original BP. It was
originally designed to elicit factors in relation to product attributes and benefits/consequences of both the counterfeit and the original versions. However, the
counterfeit version was decided not to be taken into consideration at this stage in order
to avoid causing restiveness among the participants. Table 6.9 outlines the product
attributes consider to be important by the participants. Table 6.10 presents the obvious
benefits/consequences of the original BP.
"Statement of self image" "high standard quality" and "costly" were stable across all four brands the original luxury brands. "Statement of self image" was a new dimension
of benefit and was not included in the stage two discussion, and should therefore be
included for further study. A trade off was being made between "value for money" (Table 6.8) and "costly" with regard to preference to remain. Given that "value for
197

Chapter 6 Preliminary Qualitative Study and Results
money" was considered as one of the most influential variables to consumer decision
making (Zeithaml 1988), it was decided that "value for money" remained to stay,
"costly" was excluded from the study. The exclusion of "costly" is considered
legitimate and does not have great impact on the rigorous of this study. This is because
"costly" has a very similar meaning to "very high price" which was regarded as a very important product attribute and was to be tested in this study.
Table 6.9 Product attributes considered as imnortant by the narticinants Rolex Gucci BurberTy Louis Vuitton
Price #* #* #* # Waterproof #* Quality * * * Style #* #* * #* Material # #* #* #* Logo # # #* #* Colour #* * Size # # #* #* Quality mark Practicality * * * * * Product attributes considered as important at this stage # Product attributes considered as important in stage two, but were not mentioned at this stage
Tah1e h 10 RPnefite/cnncrmienrec of the nrioinal RP
Rolex Gucci Butberry Louis Vuitton High standard quality #* #* #* #* Statement of self image * * * * Good feeling Social risk Security Costly * * * * Attention getting #* #* # #
Exclusivity # # # Fashionable # # #* * Benefits/consequences in relation to original BP
Product attributes considered as important in stage two, but were not mentioned at this stage
The participants of all four groups claimed that "high standard quality" was an obvious
benefit of the original brands. Interestingly enough, few participants noted any precise
quality benefit. It appeared that the participants utilised the general view about quality in preference over providing more precise judgement of quality based on product
physical features under the stimulus situations. This might because it is difficult for
consumers to give more precise quality evaluation before they actually have used the
product (Lefkoff-Hagius and Mason 1993). Accordingly, "high standard quality" is
kept, whereas other items (accuracy, performance, precision, and durability) related to
more detailed quality that were qualified to remain in stage two (Table 6.8) were
excluded from further investigation.
198
Chapter 6 Preliminary Qualitative Study and Results
"Security concern" was another new dimension which emerged from the open
discussion associated with consequences of the original BP. It appeared that it only
linked to the Rolex watches and Louis Vuitton handbags, but not the other two original
BPs. This can be explained by the differentiation of the market segments of these
brands. All the respondents of these two groups believed that original Rolex watch and
Louis Vuitton handbags might bring insecure consequences to the purchaser. This is
evidenced by the following quotations.
(Expensive) is one reason. Plus the fact I don't want to get held up one night
going in the casino. Getting jumped in the middle of the road and getting my
watch taken off me. And when you see the watch, they obviously think he has a
load of money as well. Your wallet and all the rest of it, where do you stay, (as
well as) your bank cards. (Rolex)
It is a liability. (Rolex)
Yeah, that's alright for David Beckham with security going... (Rolex)
As he was saying, you couldn't go down the pub with that watch on because you
would be nervous all the time. (Rolex)
You become a bit of a target for muggers. (Louis Vuitton)
One might argue that the above noted could be counted as a kind of financial risk. On a
closer examination of literature in relation to risk reveals that they do not fit in well with
the definition of the financial risk, which refers to when some products fail, the loss to
the consumers of the money spent on the products, or the money it takes to make the
product work properly, or replace it with a satisfactory product (Roselius 1971; Mitchell
and Baustani 1993). Accordingly, "security concern" is included for Rolex and Louis
Vuitton. The security concept is a well developed area. Nevertheless, there is no literature which has made any effort to clarify whether security concern should be
included in the purchase consequences or not. For the time being, it is categorised
under purchase benefit/consequence theme and will be tested in the principal research.
"Good feeling" was considered as a kind of benefit the original Burberry and Louis Vuitton handbags could bring to the participants. However, considering they were more
199

Chapter 6 Preliminary Qualitative Study and Results
likely caused by feelings of "exclusivity" and being "fashionable", "good feeling" was
excluded in the study. Other factors related to benefits/consequences emerged in this
part of the discussion had been covered in stage two and all qualified to remain. Table
6.11 reports the benefits/consequences finally qualified for further investigation.
Table 6.1 1 Benefits/ennserniencee finally niialifierl to rrrnain
Rolex Gucci Burbetry Louis Vuitton High standard quality * 1 * 1 * I * 1 Statement of self image * 2 * 2 * 2 * 2 Security 3 * 3 Fun 4 * 3 " 3 * 4 Value for money 5 * 4 * 4 * 5 Disposable * 6 * 5 * 5 * 6 Exclusivity * 7 * 6 * 6 * 7 Fashionable * 7 * 7 * 8 Attention getting " 8 8 * 8 * 9 Prestigious * 9 * 9 " 10 Performance risk " 10 * 10 " 9 " 11 Financial risk III 1 11 10 * 12 Social risk " 12 " 12 * 11 two dimensions 13 two dimensions * Benefits/consequences qualified for remain in the study --- N/A
"Price", "style" and "practicality" appeared to be consistent across all four brands and believed to be the important product attributes. "Price" and "style" were qualified for inclusion in previous section, with "practicality" emerging as a new factor and
considered as legitimate for further investigation. The participants of the Louis Vuitton
group noted that "quality mark" was important feature needing to be checked in the
process of purchase; moreover, the participants of the two handbag groups claimed that
"colour" was important to the original branded handbags. Accordingly, "colour" was
added in the study in relation to handbags. It was decided that "quality mark" was
excluded in relation to Louis Vuitton, due to that being what counterfeit is about. Given
that "quality" was chosen for inclusion in relation to benefits/consequence, it was
excluded in this part in order to avoid repetition. The rest of product attributes which
suggested as important by the participant at this stage were also qualified at the
structured open discussion stage. At this stage, it was decided to exclude "logo",
although it was considered as an important product attribute by almost all participants
across four focus groups. The reason lies in the nature of counterfeit products, as
counterfeiting mainly directly copies the logo (Papadopoulos 2004). Therefore, logo as
a symbol of a brand is dropped. Table 6.12 outlines the qualified product attributes in
the study.
200
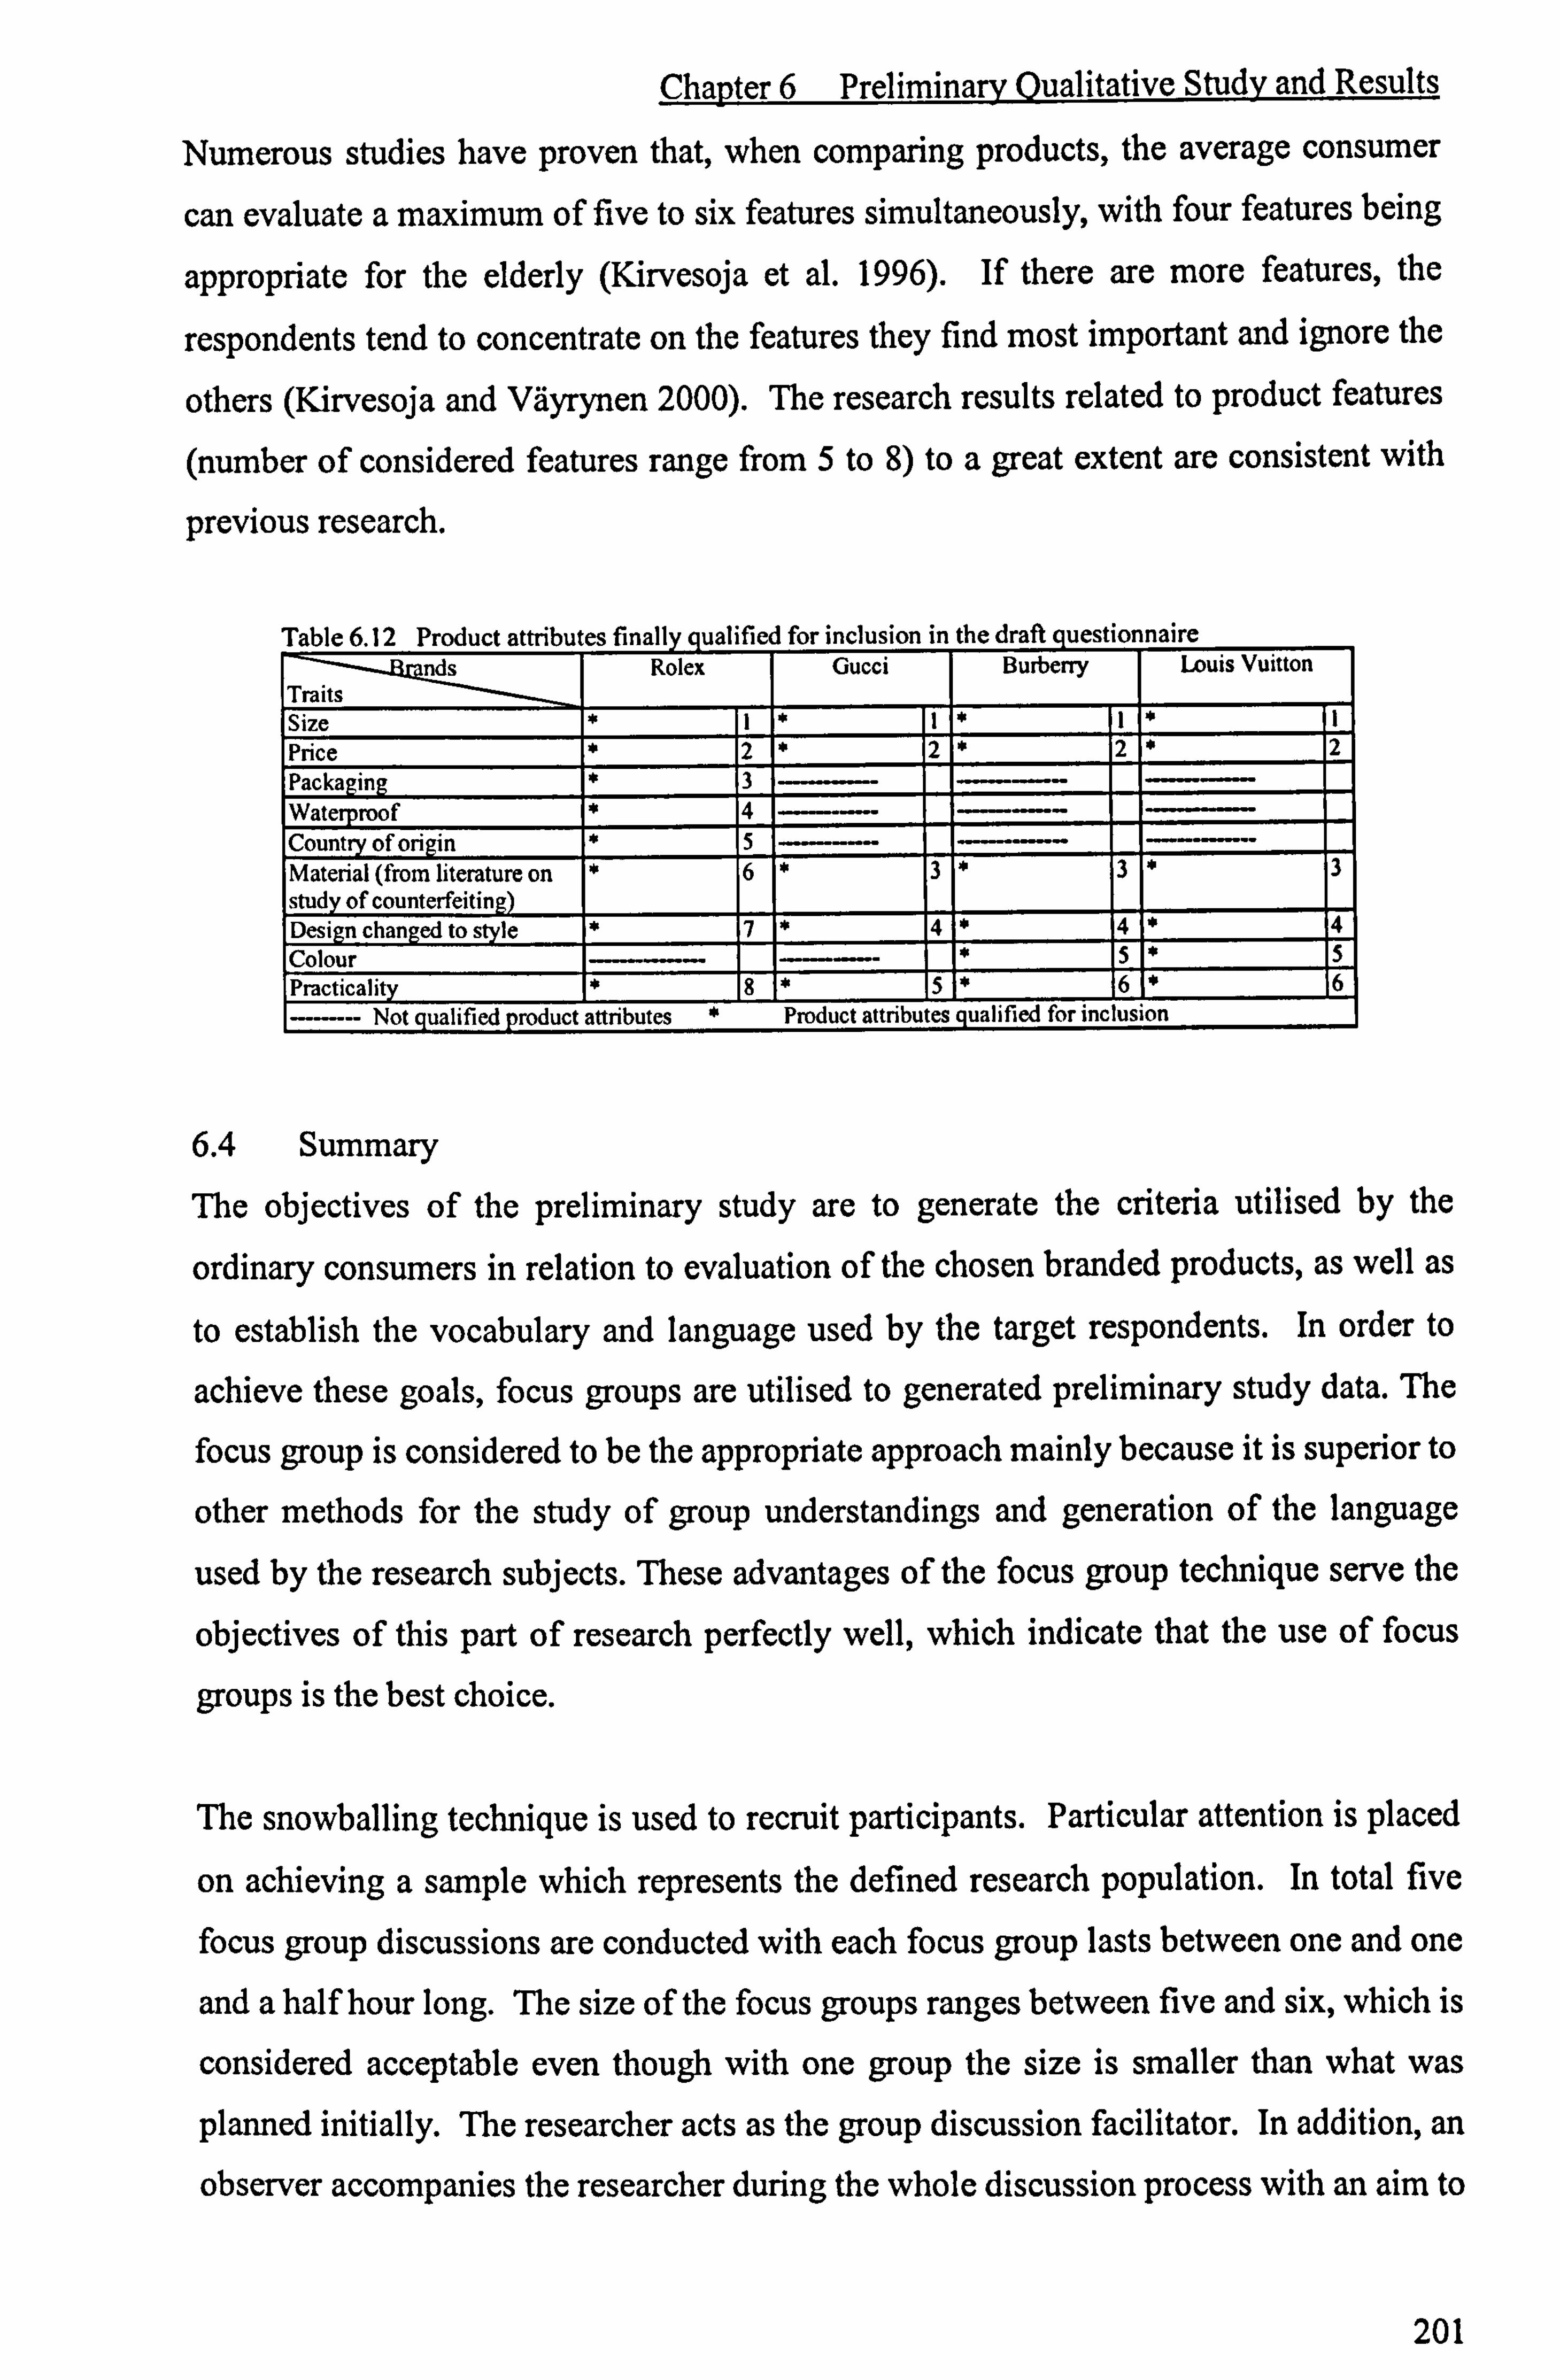
Chapter 6 Preliminary Qualitative Study and Results
Numerous studies have proven that, when comparing products, the average consumer
can evaluate a maximum of five to six features simultaneously, with four features being
appropriate for the elderly (Kirvesoja et al. 1996). If there are more features, the
respondents tend to concentrate on the features they find most important and ignore the
others (Kirvesoja and Väyrynen 2000). The research results related to product features
(number of considered features range from 5 to 8) to a great extent are consistent with
previous research.
T. 1,1a A 17 P, nA. , 't tn; h.. t.. 4; nolly niinliC A fnr inrhicinn in the Arif miestinnnnire
rids Traits
Rolex Gucci Burberry Louis Vuitton
Size * 1 * I * 1 * 1 Price * 2 2 * 2 * 2 Packaging * 3 Waterproof * 4 ----- Count of origin * 5 ----- -------- Material (from literature on study of counterfeiting)
* 6 * 3 * 3 * 3
Design changed to sle * 7 * 4 * 4 * 4 Colour 5 * 5 Practicalit * 8 * 5 * 6 * 6
--- Not qualified product attributes * Product attributes qualified for inclusion
6.4 Summary
The objectives of the preliminary study are to generate the criteria utilised by the
ordinary consumers in relation to evaluation of the chosen branded products, as well as
to establish the vocabulary and language used by the target respondents. In order to
achieve these goals, focus groups are utilised to generated preliminary study data. The
focus group is considered to be the appropriate approach mainly because it is superior to
other methods for the study of group understandings and generation of the language
used by the research subjects. These advantages of the focus group technique serve the
objectives of this part of research perfectly well, which indicate that the use of focus
groups is the best choice.
The snowballing technique is used to recruit participants. Particular attention is placed
on achieving a sample which represents the defined research population. In total five
focus group discussions are conducted with each focus group lasts between one and one
and a half hour long. The size of the focus groups ranges between five and six, which is
considered acceptable even though with one group the size is smaller than what was
planned initially. The researcher acts as the group discussion facilitator. In addition, an
observer accompanies the researcher during the whole discussion process with an aim to
201

Chapter 6 Preliminary Qualitative Study and Results
providing language support to the researcher when it is necessary as well as taking some
notes.
Given that the outcomes of the first focus group were not what the researcher expected,
the researcher decided to regard it as the protocol discussion. Data collected from the
first focus group as well as the involved administrative process were analysed by the
researcher with the assistance of the observer. Shortcomings and problems which
appeared in the first focus group discussion were identified and reported in detail.
Following this, the proposed solutions are discussed.
The entire process of all five focus group discussions are tape recorded. A professional is employed to transcribe all collected data. The employment of the professional
guarantees a high level of data transcription accuracy, meanwhile it also releases the
researcher from the labour-intensive work at a very low cost.
Content analysis is use to analyse focus group data, due to this part of the research only
searching for quantified information rather than seeking any causal relationships. The
researcher and the observer double coded the focus group data. The intercoder
reliability is relative high (87 percent), which is higher than the recommended
acceptance level by Kassarjian (1987). Coding discrepancies were resolved before the
data analysis is conducted.
The data collected from the open discussion (stage one) and the structure discussion
(stage two) parts were analysed separately, with the structured discussion being the core
and analysed and reported before the open discussion part. Nevertheless, the stage one
and stage two data are compensatory to each other. The most important criteria
perceived by the respondents are picked out and remain for further investigation. Table
6.13 illustrates the number of items to be examined in the principal research. As one
can see, the total number has been reduced to a manageable level. For example, the
number of personality traits has been reduced by about three-quarters compared with
Aaker's (1997) original brand personality scale.
To keep and examine the important criteria is considered as crucial for this research. First of all, it makes the research more focused on the most influential factors.
202

Chapter 6 Preliminary Qualitative Study and Results
Secondly, it helps to reduce the number of factors, which decreases the length of the
questionnaire, and allows the possibility of investigation of four brands across two
product categories. Thirdly, the exclusion of irrelevant or less important criteria to a
great extent simplifies data analysis.
Total 6.13 Number of items to be tested related to consumer perception toward studied brands
nds Image dimension
Rolex Gucci Burberry Louis Vuitton
Personality traits 11 14 9 6 Benefits/consequences 12 12 12 14 Product attributes 8 5 6 6 Total 31 31 26 25 Number of questions in total 1113x2=226
The language used by the target respondents is also reported as integrated with the
detailed data analysis. Up to now, the two objectives of this part of the research are
fully implemented. On top of these, the focus group data reveals that Aaker's (1997)
direct and indirect brand personality sources might be questionable. This research
argues that it might be more accurate if the indirect brand personality sources are
labelled as `influential factors'. Moreover, this research discovers that `usage situation'
appears to be influential on the consumers' perceived brand personality. This discovery
is not considered by Aaker (1997), which raises a question about the exhaustiveness of
Aaker's (1997) indirect brand personality sources notion.
In addition, the research findings of this part of the research provides further empirical
evidence to previous researchers' claims that Aaker's (1997) brand personality scale can
not be adopted universally, as brand personality by its nature is brand-specific and
culture-specific. Aaker's (1997) brand personality scale is too long to be adopted
practically. Most of the personality traits included in this scale might not be perceived
as relevant or important to a specific brand. Lastly, this research raises questions about
whether the `security concern' associated with purchase luxury brands should be
considered as a dimension of perceived consequence related to branded products or not.
Due to this not being what the current research is designed for, it is left to other
researchers who might be interested.
203

Chapter 7y Data `Preparation, Exainination of Results the Samples and, Factor,
Chapter 7 Data Preparation, Examination of the Samples and Factor Analysis Results
Chapter 7 Data Preparation, Examination of the Samples and Factor Analysis
Results
7.1 Introduction
The discussion on the research methodology required to pursue this study was reported in Chapter 5. This was then followed by a thorough discussion about the development
of the research instrument in the second half of Chapter 5 and all of Chapter 6. Chapter
6 serves a critical role in terms of the construction of a robust and practical research
questionnaire. In this chapter, this study will proceed with an examination of the survey
response. In total, 430 questionnaires were collected within two weeks in 2005.
In this chapter, the data collected is to be looked at first in terms of the usable response
rate and the issues related to data preparation for analysis, as well as the response rate
and evaluation of the incentive approach. Next, a detailed analysis of the characteristics
of the samples is presented to justify the representative nature of the sample. The third
section presents the descriptive statistics on data related to the two tested product
classes. The fourth section of this chapter focuses on preliminary analysis. Reliability
and validity of measures used in this study are evaluated at this point. Lastly, new
variables are computed whenever necessary, the objective of which is to convert the
original data into a more manageable form and to prepare for the multiple regression
analysis. This chapter finishes with a summary of the tasks conducted at this stage of
the research.
7.2 Survey Response
A total of 430 questionnaires were collected from four supermarkets in Glasgow using the interview survey method over a period of two weeks. This included the 40
questionnaires collected for the second stage research instrument piloting. These data
are considered to be acceptable for inclusion in the principal data set, due to there no
major changes being made in relation to the content of the questionnaire after the
second stage piloting (see Chapter 5). These questionnaires were collected from the
same places where the principal survey was conducted, and the respondents were
systematically selected from the same target population. Moreover, none of the changes
204
Chapter 7 Data Preparation, Examination of the Samples and Factor Analysis Results
made to the questionnaire after the second stage piloting had a great impact on the
respondents' understanding of the questions.
7.2.1 Usable Response Rate and Preparing the Data for Analysis
Out of the total number of questionnaires collected, 321 were considered to be usable
after careful questionnaire checking, editing and data cleaning, resulting in a 74.7
percent usable questionnaire rate. Following Malhotra's (1996) suggestions, the
questionnaire checking mainly detects incompletion of questionnaires,
misunderstanding of respondents, little variance of responses, and missing page(s);
editing focuses on identifying incomplete, inconsistent, or ambiguous responses; data
cleaning mainly handles missing responses. Despite the time demanded for the
completion of these tasks, the questionnaire checking, editing and data cleaning were
conducted by the researcher in order to ensure consistency of treatment.
In the case of inconsistent or ambiguous responses, missing values, missing pages
concerning `self-assessed product knowledge', `product involvement' or `demographic
variables', the researcher contacted the respondents to improve the unsatisfactory
responses wherever possible. At this stage the correspondence addresses or contact
numbers provided by the respondents proved to be valuable in terms of assistance in up-
grading the data. The respondents were not approached by the researcher if the
inconsistent or ambiguous responses, missing values or missing page(s) related to the
`respondents' perceptions of CBP and BP', `purchase consideration' and `purchase
intention' despite some of the respondents' correspondence addresses being available. This is because that the researcher was concerned that the data obtained the second time
may be different from those obtained during the original survey. According to Malhotra
(1996), these differences may be attributed to changes over time or differences in the
mode of questionnaire administration. In this study, the changes would have been in the
mode of questionnaire administration if the second survey conducted had included
telephone or e-mail as opposed to a person-to-person interview survey, and the
approach would have been memory-based rather than stimulus-based. In addition, the
consideration set is dynamic (Hauser and Wernerfelt 1990; Punj and Srinivasan 1989;
Ratneshwar and Shocker 1991; Nedungadi 1990), which indicates that components of the consideration set might change with time and consumption situation. The
questionnaires showing little variance of response were considered as invalid data and
205
Chapter 7 Data Preparation, Examination of the Samples and Factor Analysis Results
discarded, as it might be the case that the respondents were lacking in cooperation.
Therefore, there was not a great deal of point in putting more effort into re-approaching
these respondents. Eight questionnaires became usable after this effort.
Some male respondents regarded handbags as a female product and did not answer the
questions related to handbags, claiming either that these products were irrelevant to
them or that they lacked knowledge of handbags. Some male respondents ticked/circled
the same responses in the list of questions associated with handbags. These
questionnaires were treated as usable, as long as no other major problems were identified. However, although all questions relating to handbags in these questionnaires
were thrown out, the balance of the questions were retained.
Similarly, some respondents bypassed the questions relating to income, but cooperated fully with the other questions. These questionnaires were considered as usable. No
value is assigned to missing income in this research, although a neutral value can be
substituted for the missing value (Malhotra 1996). The reasons are: first of all, a very limited number of questionnaires have the income value missing; secondly, the sample
size is reasonably large; thirdly the logic of substituting a mean value is not a problem- free method (Malhotra 1996). In the parts of the analysis involving income and handbags, only those respondents who provided usable answers to these questions are included (list-wise deletion), but in the rest of the analysis all respondents are included.
One questionnaire was discarded as the respondent claimed to be "Intersexed". This
particular respondent not only ticked both boxes referring to male and female, but also
wrote "Intersexed" in capitals right after the answers to the question provided in the
questionnaire. This questionnaire was excluded from the data set because of its
absolute uniqueness. This could give rise to a need for caution concerning how gender issues should be addressed in research instruments.
The inconsistent responses occurred more often when the reverse statements were used The reverse statements used in the research instruments include `I get bored when people talk to me about watches/handbags (boredom)'; `You can throw it away after a
while (disposability)'; `This product may not function well (functionality)'; and `This
product may not last long (functionality)'. It was observed that some respondents
206

Chapter 7 Data Preparation, Examination of the Samples and Factor Analysis Results
could not work their way around the reverse statements (e. g. boredom), some
respondents provided inconsistent responses across brands and different versions of a brand (e. g. disposability, functionality). It was decided that no correction was to be
made in relation to boredom, since there was no evidence to prove the misjudgement of
the specific respondents apart from the researcher's instinct. On the other hand,
necessary corrections were made in relation to functionality and disposability if there
was clear evidence. For example, in the case of the respondent disagreeing that the
original Rolex watch may not function well and agreeing that the counterfeit Rolex
watch may not function well, but agreeing that the original Gucci watch may not function well while disagreeing that the counterfeit Gucci watch may not function well, the answers in relation to the questions about Gucci were corrected to the same direction
of those about the Rolex watch. The corrections were made following the rules: 1 was
replaced by 5,2 replaced by 4,3 remained unchanged, 4 was replaced by 2, and 5 was
replaced by 1. The same rules applied to questions related to disposability, as well as handbags.
In addition to the questionnaire which was marked "intersexed", 108 questionnaires
were discarded: 53 for being incomplete, 10 due to respondents' misunderstanding, 42 because of little variance of responses and 5 because of missing page(s), bringing the
total number of discarded questionnaires to 109. Here, incomplete questionnaires refer to the questionnaires that contain untraceable missing values (7), missing sections (22),
and questionnaires where more than one page at the back was not touched by the
respondent (26). The incomplete questionnaires where the questions relating to the
original branded products were completed but the questions associated with the
counterfeit branded products not completed were categorised in the missing section. As
one can see, that the number considered as missing sections are relatively high. The
explanation the researcher can offer is that some respondents were not used to the idea
of one question applying to two versions of one brand or even two brands. They
planned to finish all the questions concerned with one version and come back to work on the other(s). However, in some cases they simply forgot. This is one of the
shortcomings of the newly-developed technique, and there should be caution whenever it is applied. This research suggests that it might help to some extent to overcome this
shortcoming if the interviewer explains the multiple uses of one statement to potential
respondents before they start filling out the questionnaire. For example, a statement can
207
Chapter 7 Data Preparation, Examination of the Samples and Factor Analysis Results
be made saying `one statement should be treated as several questions according to the
specific circumstances'. All the fieldworkers confirmed that the incomplete
questionnaires containing more than one page at the back untouched by the respondents
were caused by the unusual length of the questionnaire. Some of these respondents lost
their patience, while some of them simply did not have time to complete it.
Ten questionnaires were considered unusable due to the respondents appearing to have
misunderstood. The questionnaires classified in the misunderstanding category included
those where the respondents did not appear to have understood the completion
requirements, (for example, they had circled more than one answer to a question, or
only provided one answer to the whole section), and also included the ones where
respondents claimed that some questions were not relevant to them. Seven out of these
ten respondents provided their full correspondence addresses, which is an indication of
the seriousness of their participation. Eight of them were over 50 (accounting for 80
percent), with one aged 20-30, and the other one aged 31-40. The relatively high
percentage of elderly respondents in this section certainly has some negative effect on
the representativeness of people in this age group in the sample. The response quality
of these respondents could have been improved if more care and patience had been
shown by the fieldworkers in the field.
As suggested by previous works (e. g. Aaker et al. 1997; Malhatro 1996), this research
regarded the questionnaires containing little variance of responses as an indication of a lack of respondents' cooperation. It is more likely neither the fieldworkers nor the
researcher could have done more to improve the respondents' degree of cooperation. Despite the fact that the fieldworkers were trained to check the missing pages before
they were sent out to the field, there were still five collected questionnaires containing
missing page(s). Three out of five had one page missed out. Interestingly, the missing
page in all three of these questionnaires is page 4, which is the middle page of the
research instrument. The other two questionnaires each have two pages not filled out. As the questionnaires containing missing page (s) only account for about 1 percent of the total sample size, this is considered acceptable. The low missing page ratio also indicates that the fieldworkers fulfilled their responsibility reasonably well in this
respect. Nevertheless, one is aware that this is still an area that could have been
improved.
208
Chapter 7 Data Preparation, Examination of the Samples and Factor Analysis Results
The decision to discard the 109 questionnaires was based on the consideration that the
sample size was sufficiently large. It is obvious that the number of discarded
questionnaires is relatively large. However, returning to the field was not feasible due
to the nature of the research (stimulus-based approach), some of the respondents not
being traceable because they had not given a correspondence address or contact number
provided, and also because of the research budget constraint. Hence, the researcher has
to accept the relatively high rate of unusable questionnaires (109/430). On careful
examination, it is safe to say that more than half of the unusable questionnaires were due to the length of the questionnaire or to lack of cooperation on the part of the
respondents, which the researcher could not possibly have done more to improve due to
the nature of this research. Therefore, the relatively high unusable rate is considered
acceptable. The researcher is aware that several disadvantages may be associated with
this drawback. These include the reduction of the representativeness of the sample, and
the possibility of losing important information. This is one of the major limitations of
this research.
7.2.2 Data Cleaning and Reverse Items Recoding
After the data was transferred into SPSS, the frequency distribution was used to identify
out-of-range values. Moreover, 70 selected cases (70/321, about 22 percent) were double checked against the original collected data for data entering errors. Most of the
information was obtained using 5-point scales, so responses of 0, and figures above 5
were considered out of range. At this stage, the reverse items were recoded using SPSS
to ensure that agreement was indicative of the same direction.
7.2.3 Response Rate
The nature of the supermarket survey determines that it is more likely that the research
will not establish a clear target with regard to how many subjects they will approach. Even in some cases where the target is established, the fieidworkers will normally fail to
fulfil the task of keeping an accurate record of how many potential respondents they
intercepted, because the fieldwork itself is already difficult to handle. It was planned initially to keep an accurate report of the number of consumers approached, the number
of ineligible respondents, the number of uncooperative respondents, the number of
respondents willing to participate, the number of respondents who stopped half way
209
Chapter 7 Data Preparation, Examination of the Samples and Factor Analysis Results
through, and the number of respondents who completed the questionnaire. The reality
was that it was very difficult for the fieldworkers to fulfil this task. It would be unfair to
say that this was because of lack of cooperation on the part of the fieldworkers.
Working with the fieldworkers in the field all the way through the data collection
process, the researcher observed the difficulties confronting them, and realised that it
was unfeasible to keep a proper record of how many people they approached. This was
particularly difficult during the peak shopping time, given the fast-moving shopper
stream, as well as the extremely high rejection rate. The record keeping would have
been improved by employing an extra fieldworker on each site. Nevertheless, this was
not allowed by the very tight research budget.
Given that no concrete information as to the number of consumers approached was
collected, the calculation of a precise response rate is not feasible. However, according
to the report from the fieldworkers the average response rate of this research could lie
between 25 to 40 percent. These figures vary across different supermarkets, across
different time periods in a day, and across different days of the week. According to the
fieldworkers, the response rate could be as high as 60 percent in the slow shopping
periods, for example in the early morning and late in the evening, whereas the response
rate could be as low as 10 percent during the peak shopping time (between 11.3Oam and
2.30pm) on week days. This is because a very high percentage of people shopping at
lunch time tend to be taking a lunch break. Thus, they simply do not have time to
participate in a survey which takes them at least 20 minutes to complete. This scenario
appeared to be worst in the supermarket located in the Shopping Centre. The
fieldworkers reported that they hardly stopped any people during lunch time. All the
fieldworkers believed that if the questionnaire had been only a couple of pages long, the
response rate could have been much higher. The high rate of incompletion is evidence
of this. Most of them finished fewer than four pages. This result is in line with
Billesbach et al. (1991), Aaker et al. (1997) and Smith et al. (2003) who suggested that
the perceived amount of work required in a survey has a negative impact on the
response rate. The response rate appeared to be higher during the weekend. This is
because people tend to be more relaxed during weekends than on weekdays.
Compared with shopping mall surveys, it seems that the non-response rate of this
research is higher than those of previous research. For example, Gates and Solomon
210
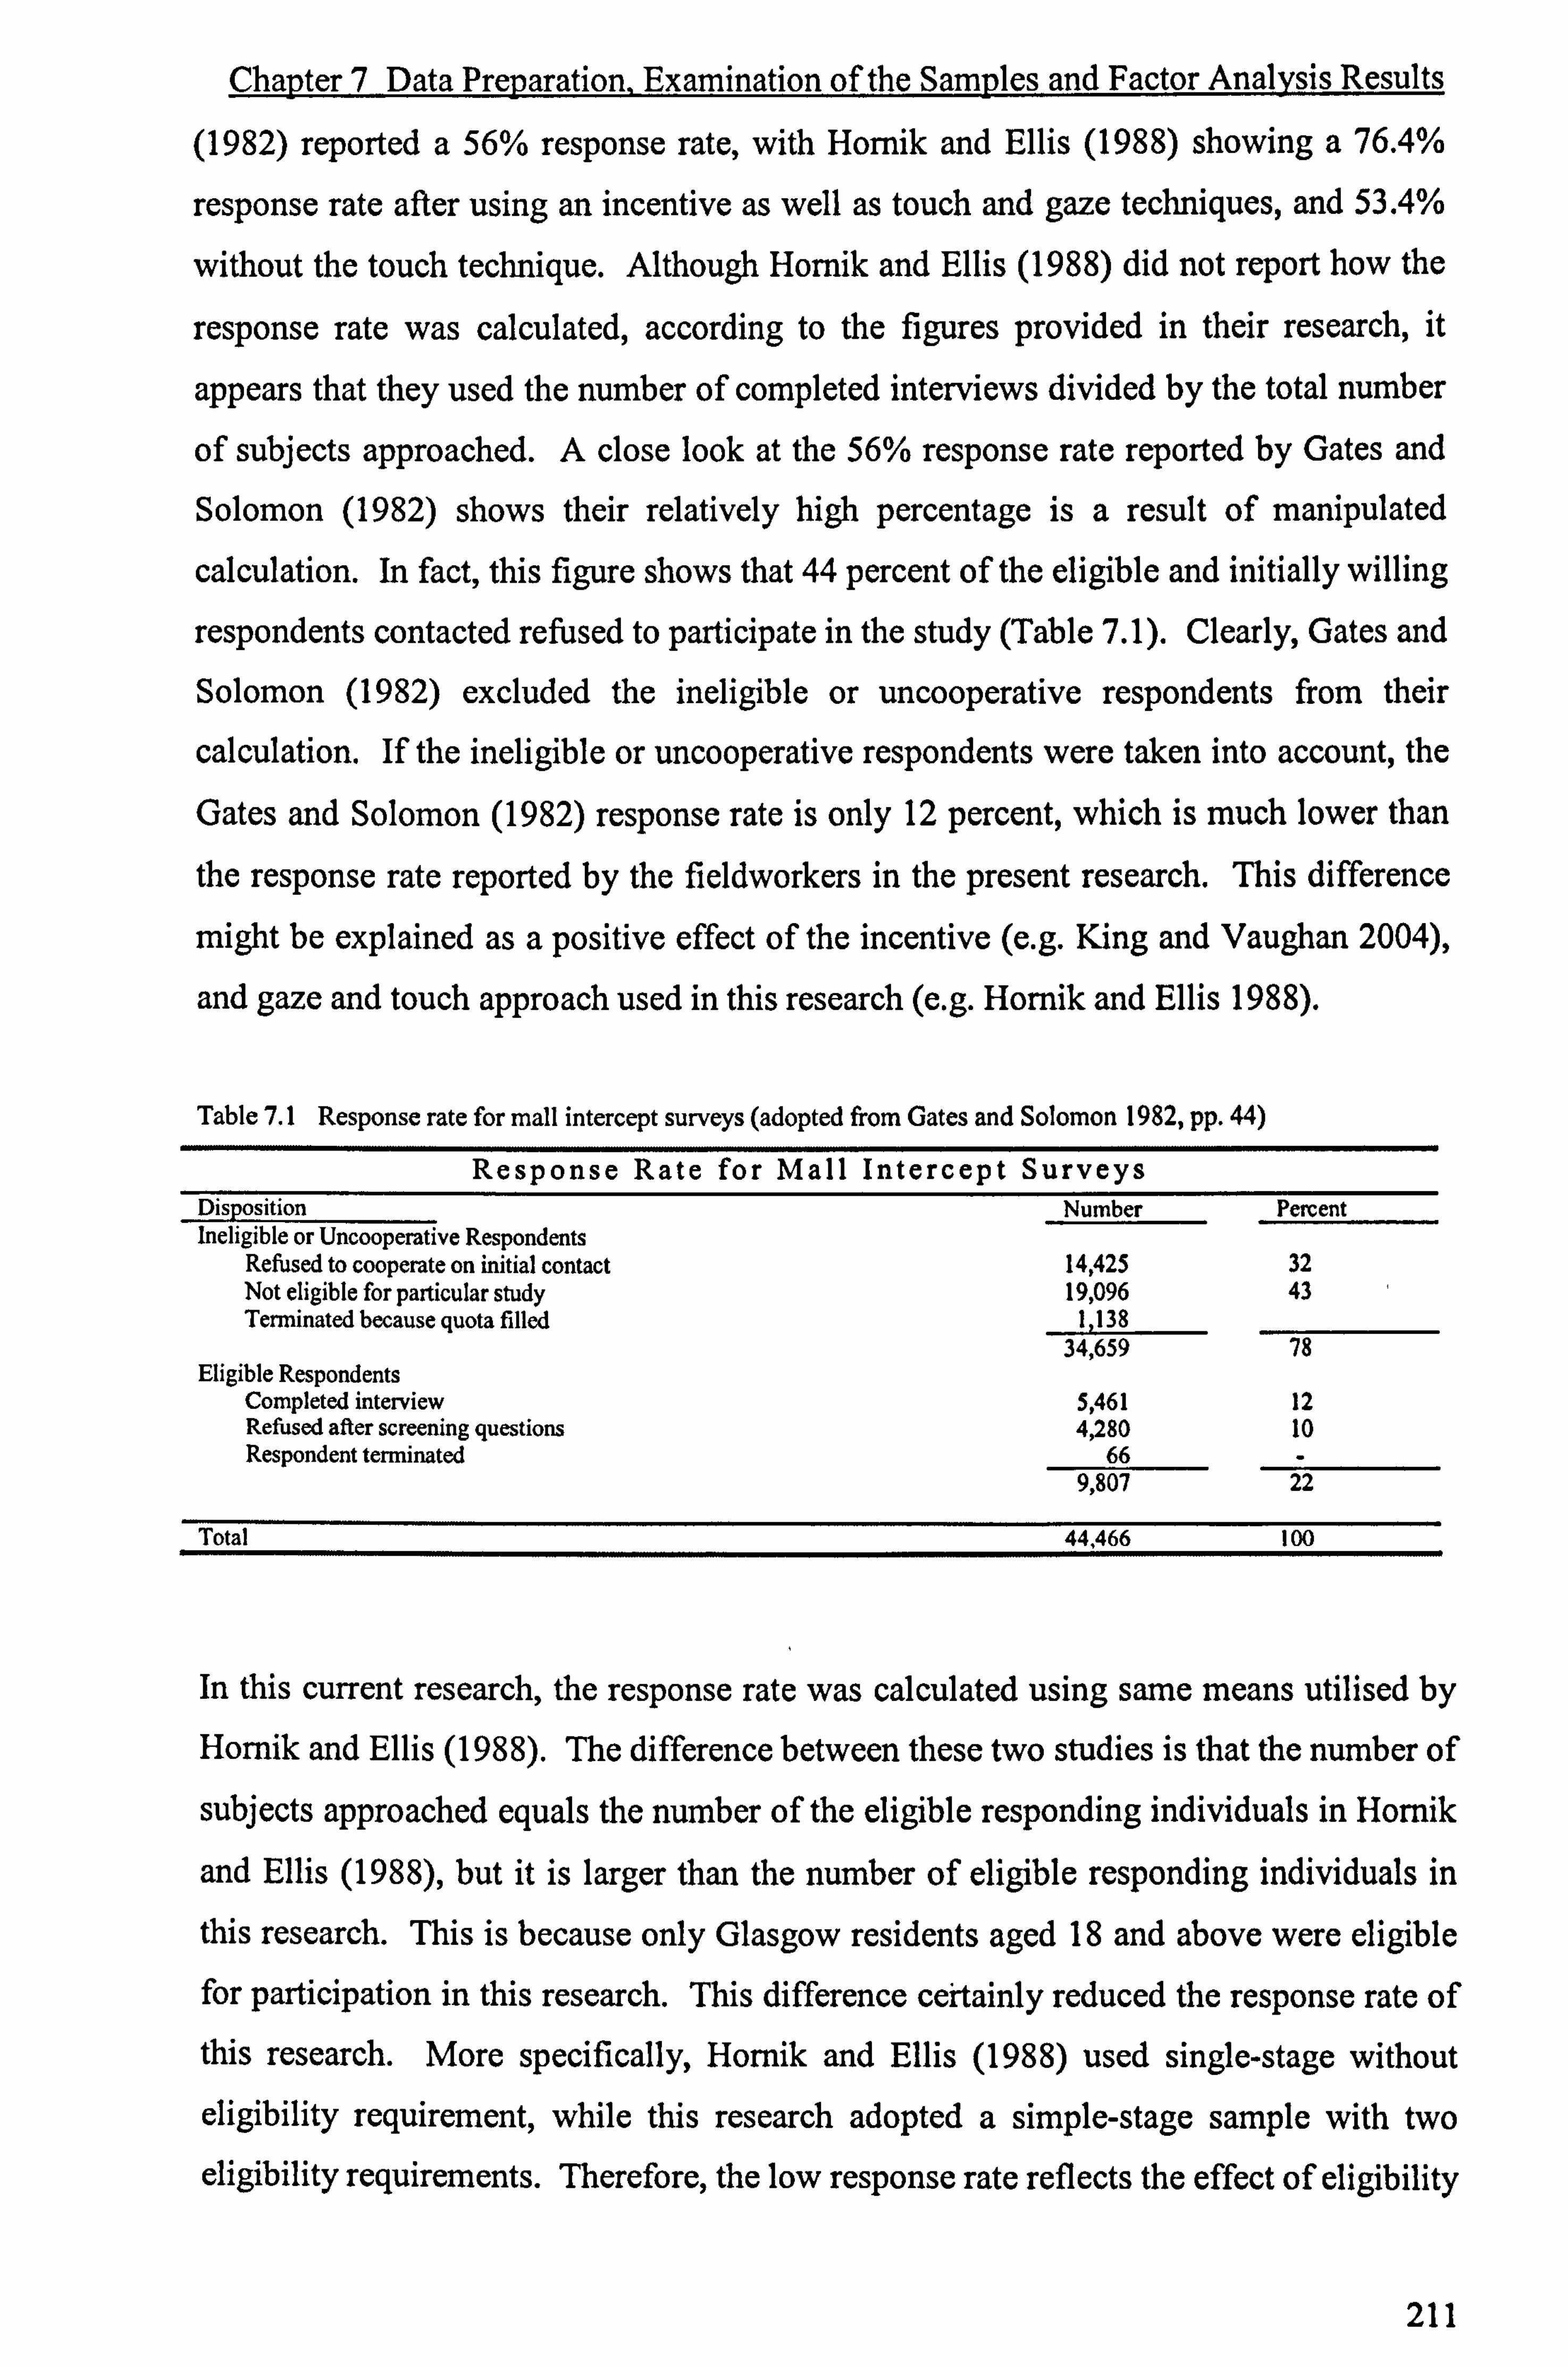
Chapter 7 Data Preparation, Examination of the Samples and Factor Analysis Results
(1982) reported a 56% response rate, with Hornik and Ellis (1988) showing a 76.4%
response rate after using an incentive as well as touch and gaze techniques, and 53.4%
without the touch technique. Although Hornik and Ellis (1988) did not report how the
response rate was calculated, according to the figures provided in their research, it
appears that they used the number of completed interviews divided by the total number
of subjects approached. A close look at the 56% response rate reported by Gates and
Solomon (1982) shows their relatively high percentage is a result of manipulated
calculation. In fact, this figure shows that 44 percent of the eligible and initially willing
respondents contacted refused to participate in the study (Table 7.1). Clearly, Gates and
Solomon (1982) excluded the ineligible or uncooperative respondents from their
calculation. If the ineligible or uncooperative respondents were taken into account, the
Gates and Solomon (1982) response rate is only 12 percent, which is much lower than
the response rate reported by the fieldworkers in the present research. This difference
might be explained as a positive effect of the incentive (e. g. King and Vaughan 2004),
and gaze and touch approach used in this research (e. g. Hornik and Ellis 1988).
Table 7.1 Response rate for mall intercept surveys (adopted from Gates and Solomon 1982, pp. 44)
Response Rate for Mall Intercept Surveys Disposition Number Percent Ineligible or Uncooperative Respondents
Refused to cooperate on initial contact 14,425 32 Not eligible for particular study 19,096 43 Terminated because quota filled 1,138
34,659 78 Eligible Respondents
Completed interview Refused after screening questions Respondent terminated
5,461 12 4,280 10
66 9,807 22
Total 44,466 100
In this current research, the response rate was calculated using same means utilised by
Hornik and Ellis (1988). The difference between these two studies is that the number of
subjects approached equals the number of the eligible responding individuals in Hornik
and Ellis (1988), but it is larger than the number of eligible responding individuals in
this research. This is because only Glasgow residents aged 18 and above were eligible for participation in this research. This difference certainly reduced the response rate of this research. More specifically, Hornik and Ellis (1988) used single-stage without
eligibility requirement, while this research adopted a simple-stage sample with two
eligibility requirements. Therefore, the low response rate reflects the effect of eligibility
211
Chapter 7 Data Preparation, Examination of the Samples and Factor Analysis Results
requirements. Moreover, the relatively low response rate reported might also reflect the
fact that British people are more reluctant to participate in survey research compared
with those in the US.
7.2.4 The Researcher's Observation
Working with the fieldworkers all the way through the data collection period in the
field, the researcher observed that the high rejection rate during lunch time on weekdays
had a great impact on the fieldworkers' mood, which decreased the response rate still
further. Based on her own experience, the researcher believed that it might work better
if a short break was allowed. The fieldworkers were told to take a5 to 10 minutes break
if they were constantly rejected. In general, all the fieldworkers reported that they felt
more productive after a short break.
7.2.5 Evaluation of the Incentive Approach
In total, 365 boxes of chocolate were distributed to the respondents. Sixty-five
respondents (25 percent of the total number of collected questionnaires) did not take the
incentive. These respondents claimed that they only wanted to be of some help to this
research. The number of these respondents almost balanced off 60 percent of the
unusable questionnaires. This outcome is not what was expected by the researcher,
given that very few studies reported the possibility of respondents not taking the
incentive.
As reported earlier, there are forty-two questionnaires with little variance of response
and uncompleted pages. If it is rational to assume that the majority of these respondents lacked cooperation, and it might be safe to say that there is a good chance that some of
these respondents were attracted purely by the incentive. Although many studies point
out that incentives improve data quality in terms of greater response completeness,
greater accuracy, reduced item non-response (Jame and Bolstein 1990; Brennan 1992;
Willimack et al. 1995), and improving individual co-operation in providing information
(Shettle and Mooney 1999), the result of this research indicates that previous findings
should be viewed with caution. With all due respect to previous research findings, this
researcher would argue that the effectiveness of an incentive is likely to depend on the
type of incentive on offer, the target group and nature of the survey, and research instrument. In the case of the current study, if the questionnaire had been two to three
pages long, the effectiveness of the incentive could have been much higher.
212

Chapter 7 Data Preparation, Examination of the Samples and Factor Analysis Results
To combine the current research results with previous research findings, the summary
that this research would offer is that the questionnaire respondents consist of three kinds
of people. The first group are people who are willing to participate in research, known
as research affiliation. Research affiliations are not affected by incentives. Whether
there is any incentive on offer or not does not affect their intention to help. The second
group are people who are neutral to the idea of participating in research. If they are
pushed in a certain way, they can be very cooperative. The last group are people who
think the research is of little relevance or interest to them, but are only attracted by the
incentive. These people can be further classified according to whether the respondents
attracted by the incentive are cooperative or uncooperative. As reported earlier, some
people are more likely to lack cooperation. There is a strong chance of these
respondents checking the same response in a long list of questions, or leaving the
questionnaire incomplete. Great attention should be paid to the second group and to the
first sub-group respondents of the third group, if the objective of using an incentive is to
increase co-operation rates.
7.3 Descriptive Statistics
The purpose of descriptive analysis is to provide an initial examination of the data.
Specifically, to provide preliminary insights as to the nature of the response obtained as
reflected in the distribution of values of each variable of interest in this study. The
descriptive analysis covers central tendency (mean) and measures of dispersion
(standard deviation, range). The results are reported in two separate tables (see
Appendix 8 and Appendix 9). Items related to the scales of involvement, knowledge,
consideration set and intention are to be found in Appendix 8, while statistics of brand
image items are demonstrated in Appendix 9. The descriptive analysis results
concerning demographic variables are not presented here, as they are covered in later
analysis.
As can be seen from the two tables, all values range from 1 (strongly disagree) to 5
(strongly agree), which correspond to the 5-point Likert scale adopted in this research,
with the exception of one item testing consumers' perception of quality of the original Rolex watches ("In buying this version, you get a high standard of quality"). The
values fall between 2 to 5. This is not a surprising result and can be explained by the
213
Chapter 7 Data Preparation, Examination of the Samples and Factor Analysis Results
fact that consumers perceive Rolex watches as very high quality. In addition, all
measures present reasonable variance.
7.4 Characteristics of the Samples '. Before going any further in analysing the data provided by the samples, it is important
to analyse the demographic characteristics of the samples obtained from the survey.
This assists in justifying the degree of representativeness of the samples to the target
population. To obtain a representative sample is crucial, as it ensures that the findings
of the research can be applied to the target population. The analysis looks at the
distribution of the samples according to age, gender, total household income, and
education. As the 2005 Glasgow Census is still not publicly accessible, demographic
profiles (age and gender) of the sample are compared to the 2001 Glasgow Census
statistics. Household income profiles are compared to the National Statistics 2005
Annual Abstract of Statistics, and educational attainment profiles are analysed against
the Scottish Household Survey 2005.
7.4.1 Age Group Analysis
The comparison of the age profile of the respondents with age groups of the Glasgow
Census (2001) is presented in Table 7.2. The population covered in this study is all the
people aged 18 years old or over in 2005. The age profile of the respondents is
compared to the age profiles of the 2001 Glasgow Census age statistics. People aged
over 80 are not counted in this research due to most of them lacking mobility or not being very active in terms of shopping. The total population aged between 18 and 79 is
423,871 in Glasgow.
The difference between the percentage of age profiles of the respondents in this study
and the percentage of the 2001 Glasgow Census lies between -56.4 to 49.7. The Chi-
square is 168.75, which is significant at 5% level of significance and with a degree of
freedom of 6. According to the result, the age group of the population is not well
represented by the samples used in this study. People aged under 20 are over-
represented in general, with people aged 50 and over under-represented.
This result, although not what the researcher expected, is not surprising. It can be
explained first of all by the fact that people aged over 50 are more reluctant to
214
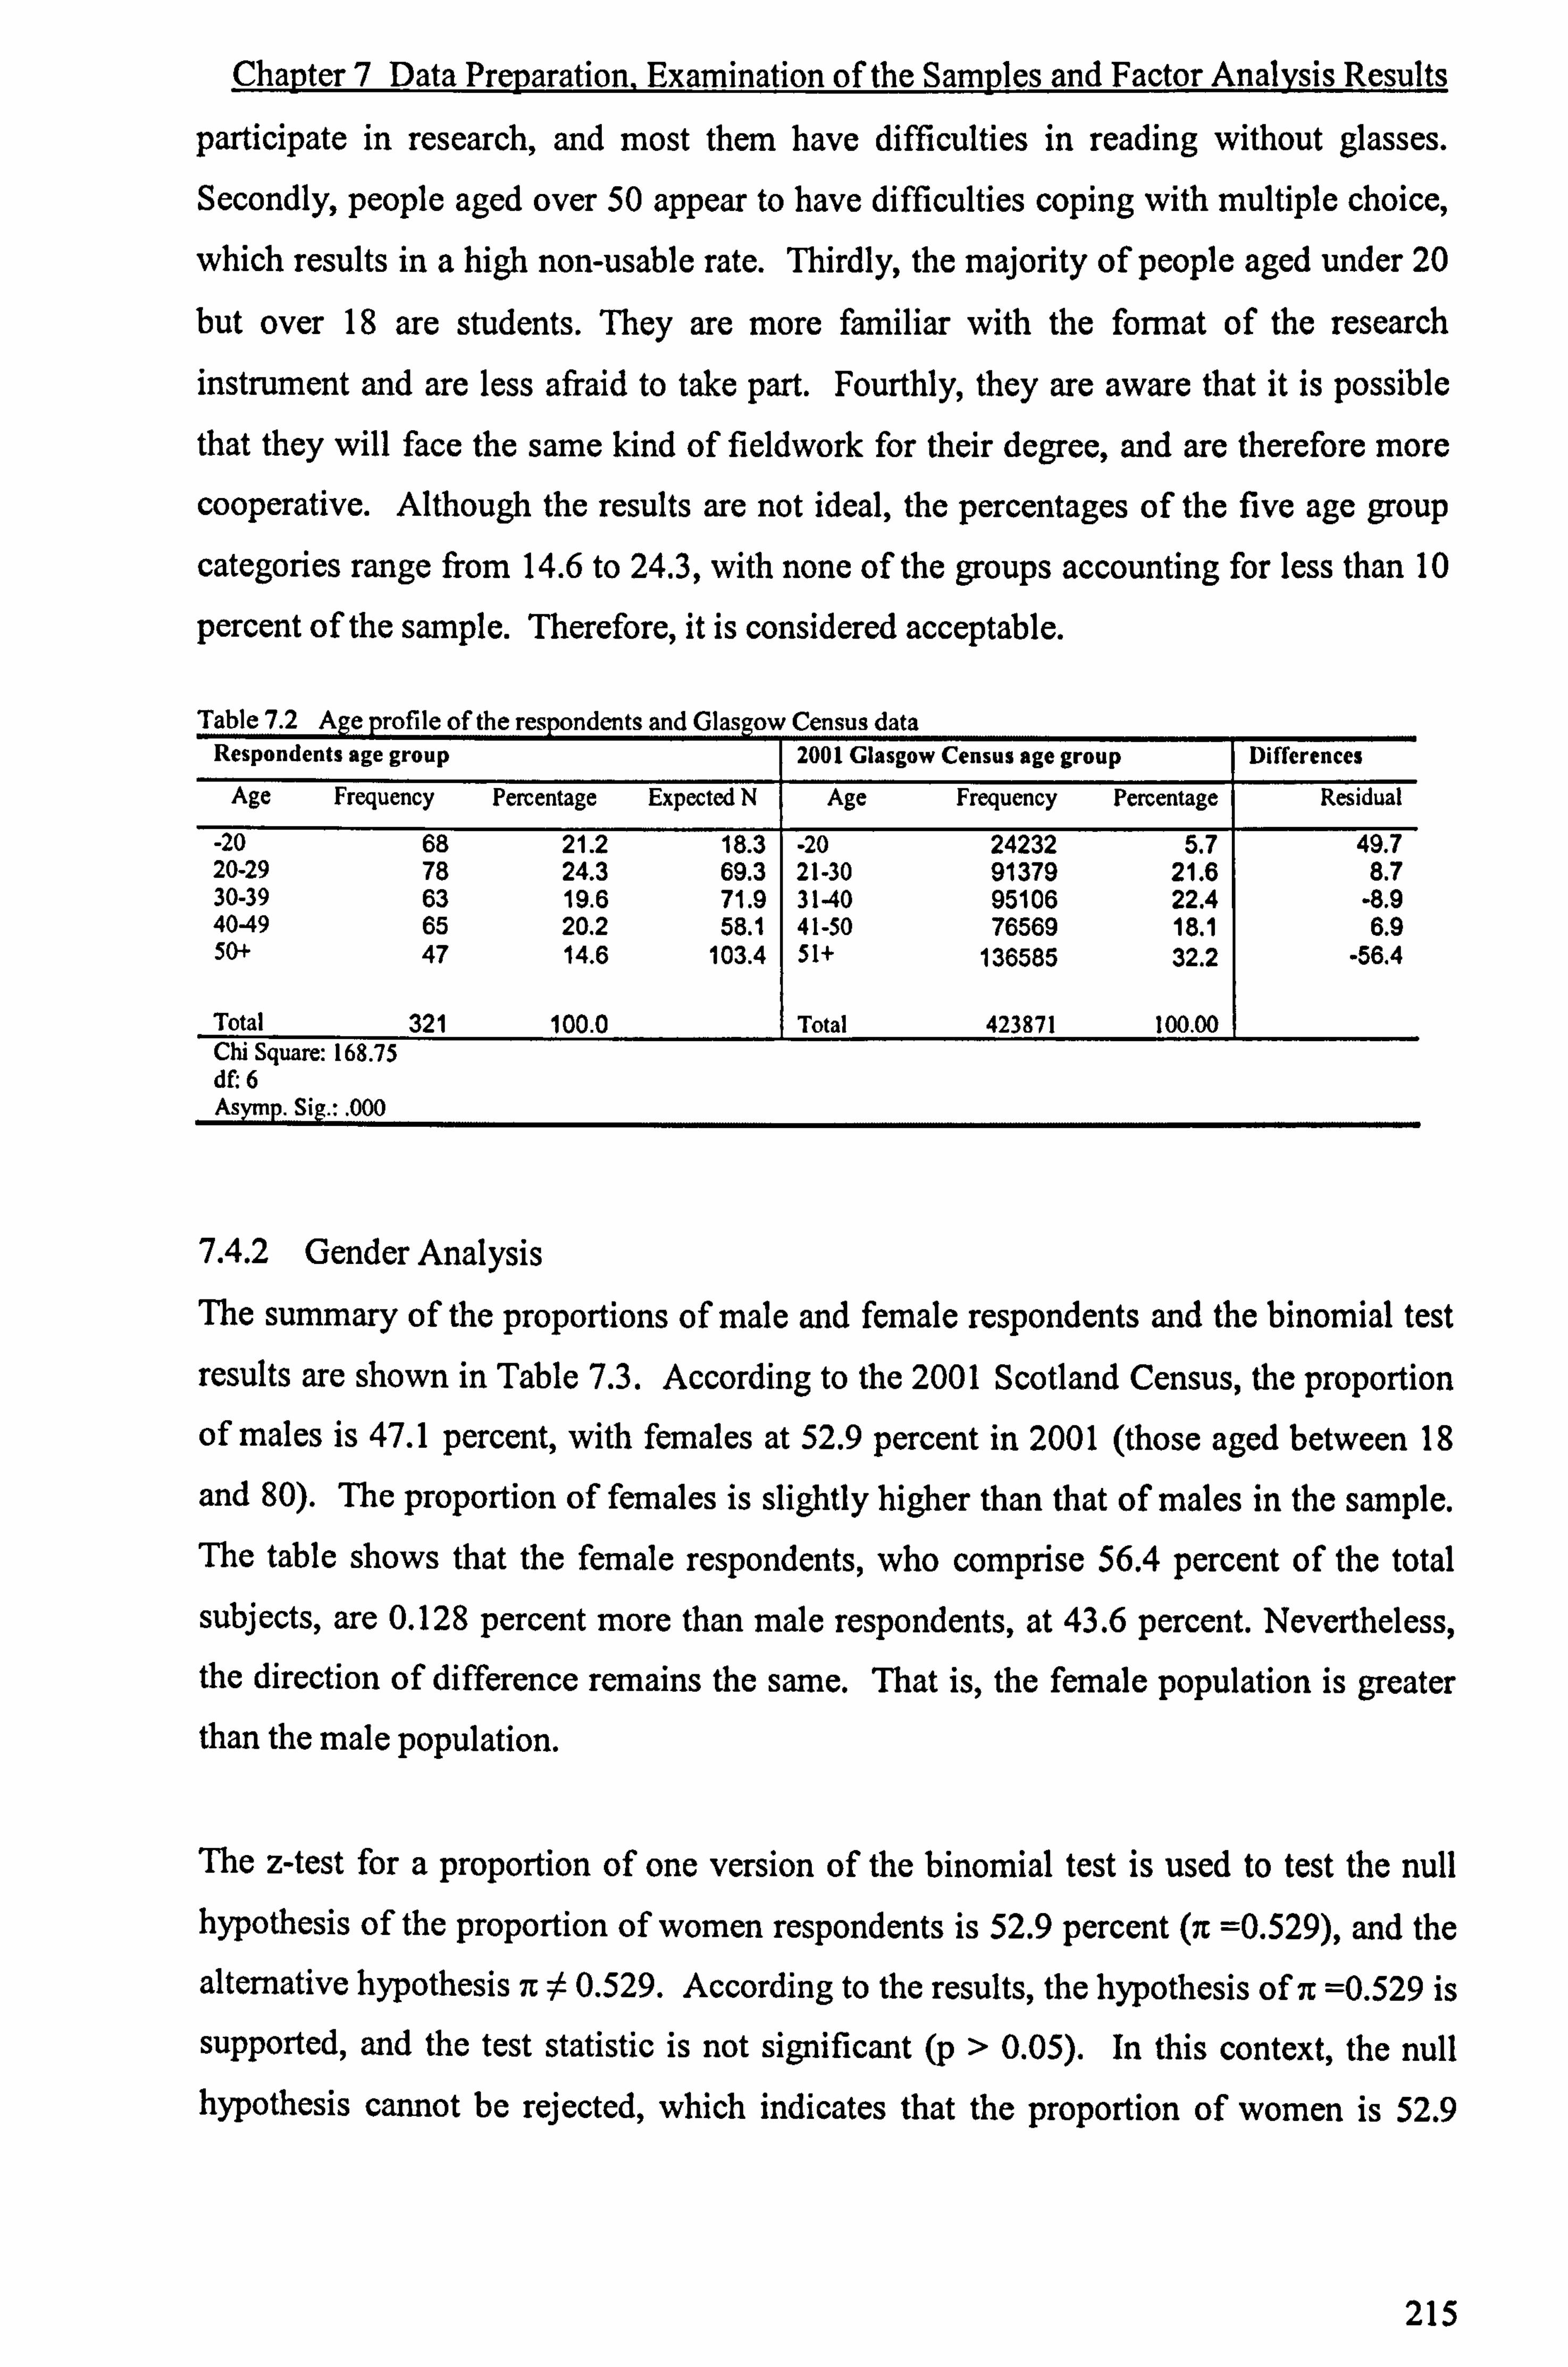
Chapter 7 Data Preparation, Examination of the Samples and Factor Analysis Results
participate in research, and most them have difficulties in reading without glasses.
Secondly, people aged over 50 appear to have difficulties coping with multiple choice,
which results in a high non-usable rate. Thirdly, the majority of people aged under 20
but over 18 are students. They are more familiar with the format of the research
instrument and are less afraid to take part. Fourthly, they are aware that it is possible
that they will face the same kind of fieldwork for their degree, and are therefore more
cooperative. Although the results are not ideal, the percentages of the five age group
categories range from 14.6 to 24.3, with none of the groups accounting for less than 10
percent of the sample. Therefore, it is considered acceptable.
Table 7.2 Age profile of the respondents and Glasgow Census data Respondents age group 2001 Glasgow Census age group Differences
Age Frequency Percentage Expected N Age Frequency Percentage Residual
-20 68 21.2 18.3 -20 24232 5.7 49.7 20-29 78 24.3 69.3 21-30 91379 21.6 8.7 30-39 63 19.6 71.9 31-40 95106 22.4 -8.9 40-49 65 20.2 58.1 41-50 76569 18.1 6.9 50+ 47 14.6 103.4 51+ 136585 32.2 -56.4
Total 321 100.0 Total 423871 100.00 Chi Square: 168.75 df: 6 Asymp. Sig.:. 000
7.4.2 Gender Analysis
The summary of the proportions of male and female respondents and the binomial test
results are shown in Table 7.3. According to the 2001 Scotland Census, the proportion
of males is 47.1 percent, with females at 52.9 percent in 2001 (those aged between 18
and 80). The proportion of females is slightly higher than that of males in the sample. The table shows that the female respondents, who comprise 56.4 percent of the total
subjects, are 0.128 percent more than male respondents, at 43.6 percent. Nevertheless,
the direction of difference remains the same. That is, the female population is greater than the male population.
The z-test for a proportion of one version of the binomial test is used to test the null hypothesis of the proportion of women respondents is 52.9 percent (n =0.529), and the
alternative hypothesis it :A0.529. According to the results, the hypothesis of i =0.529 is
supported, and the test statistic is not significant (p > 0.05). In this context, the null hypothesis cannot be rejected, which indicates that the proportion of women is 52.9
215
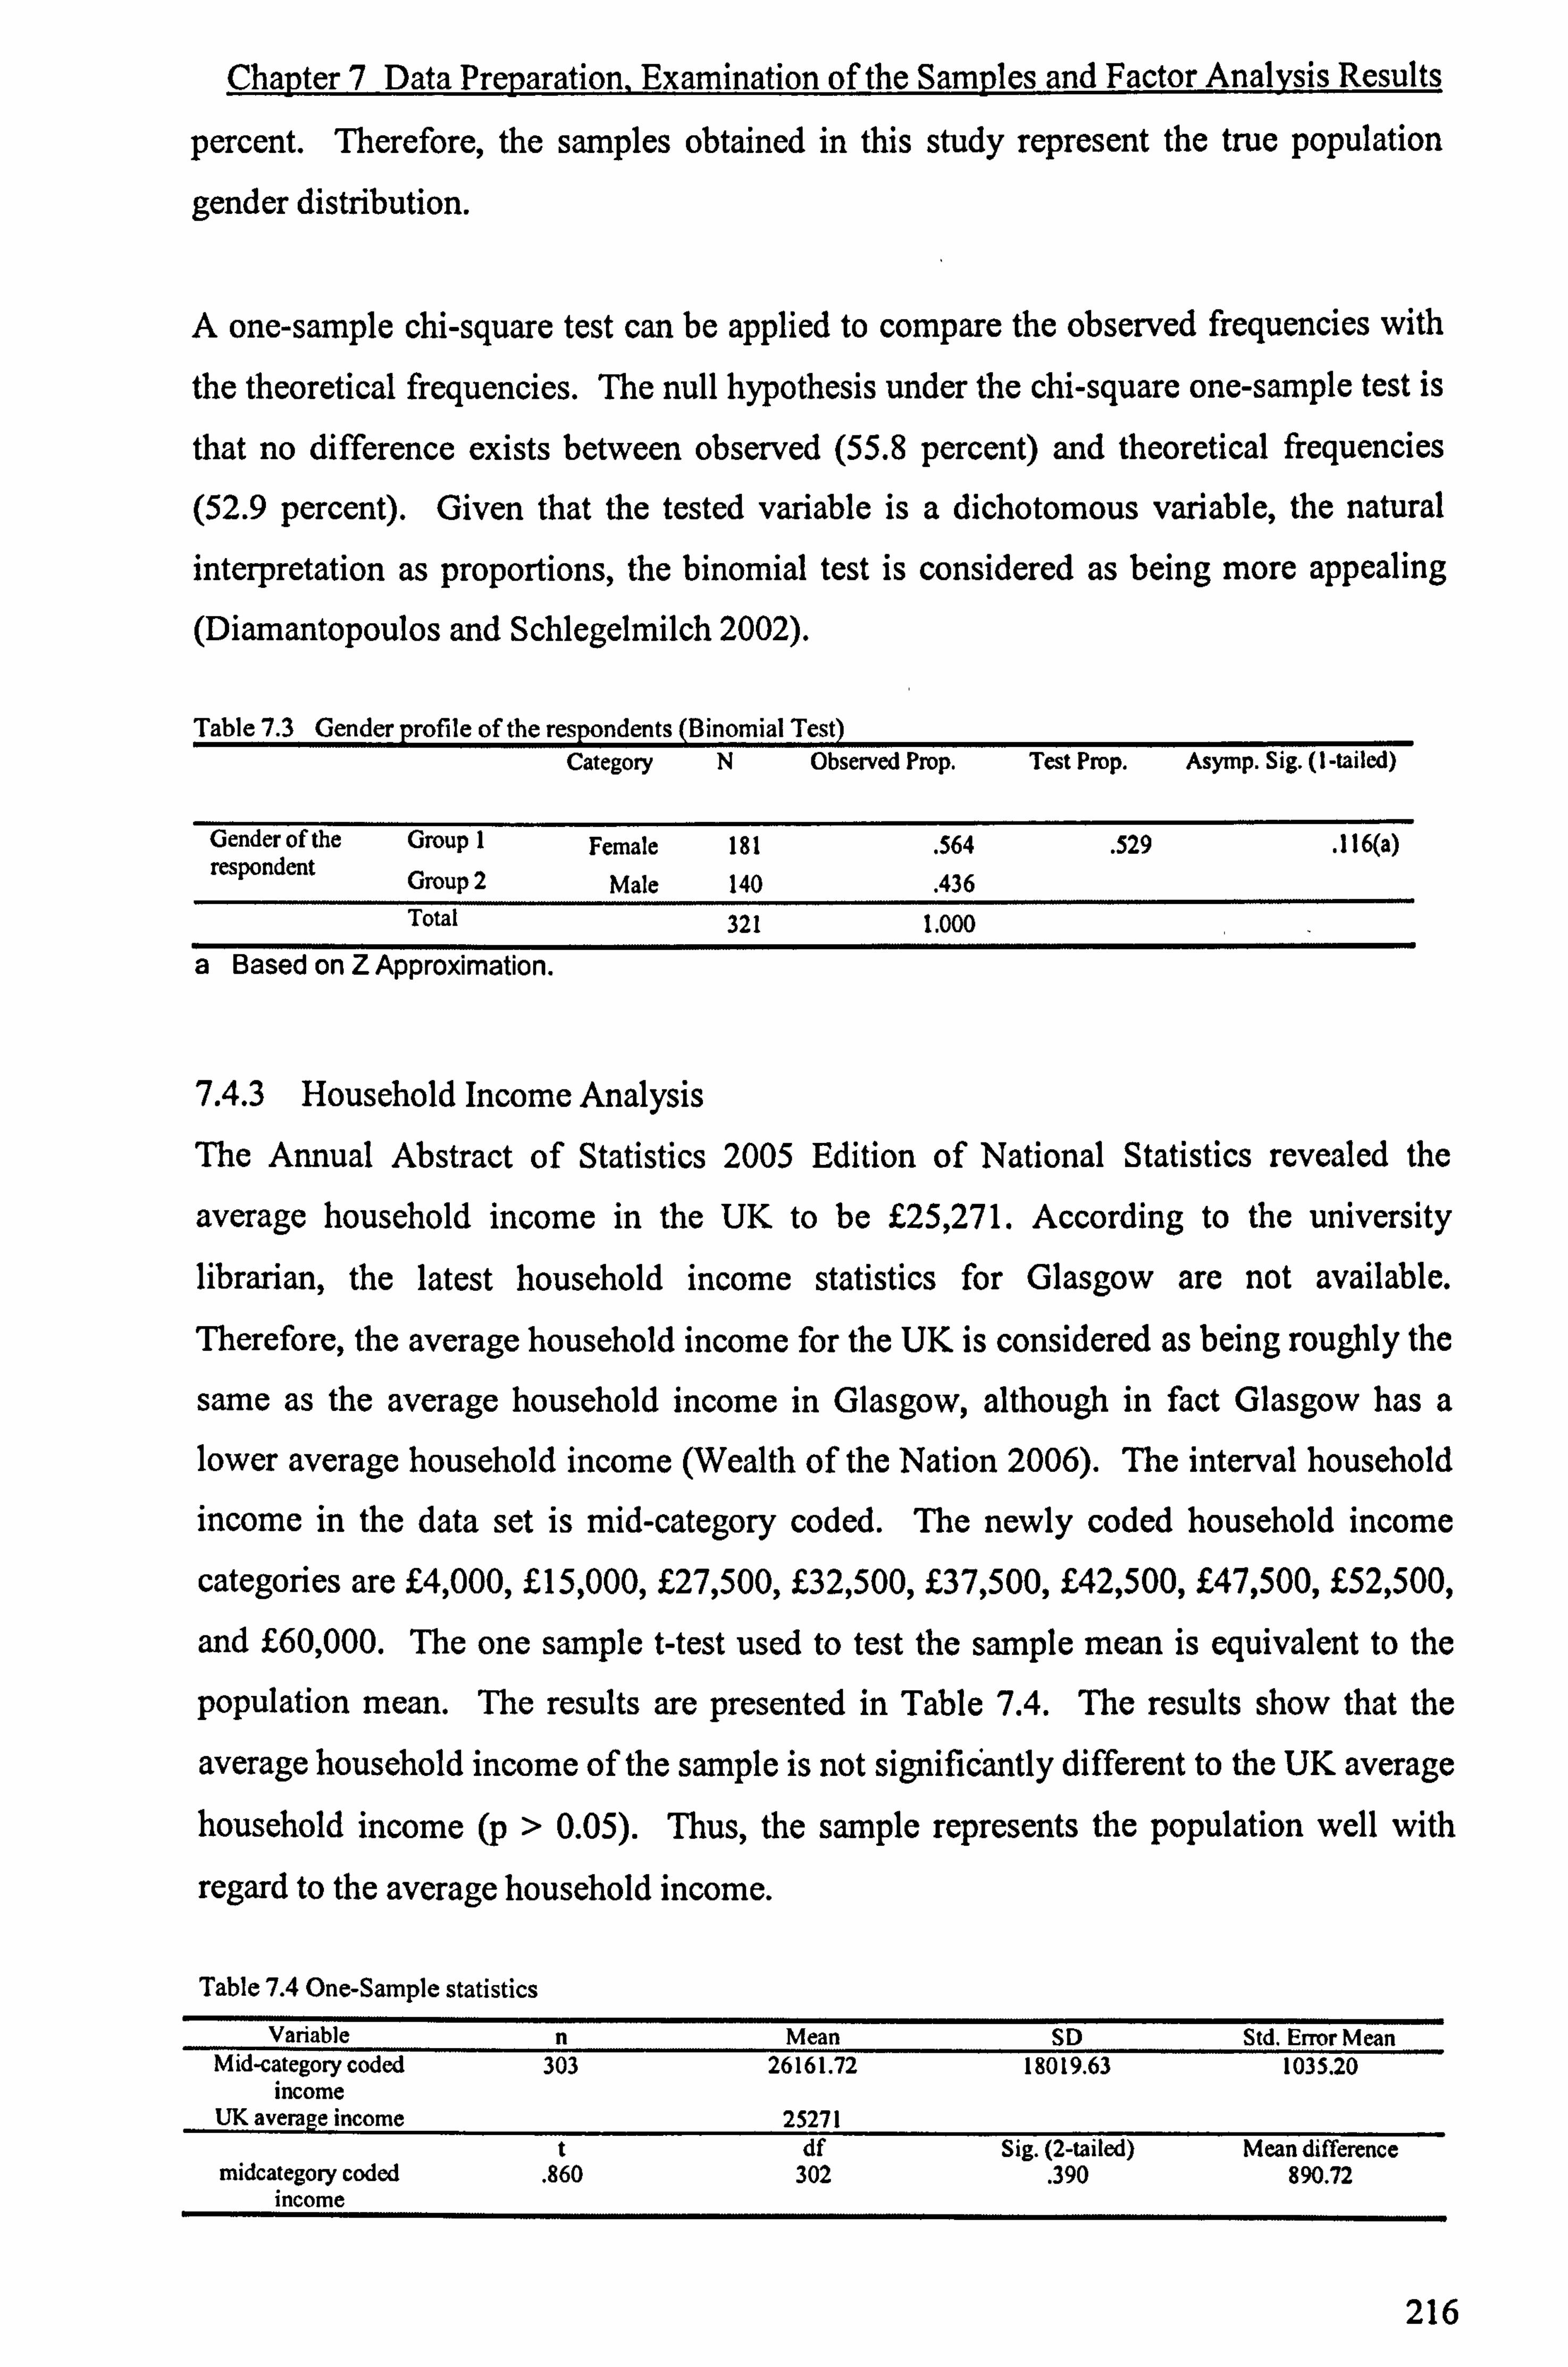
Chapter 7 Data Preparation, Examination of the Samples and Factor Analysis Results
percent. Therefore, the samples obtained in this study represent the true population
gender distribution.
A one-sample chi-square test can be applied to compare the observed frequencies with
the theoretical frequencies. The null hypothesis under the chi-square one-sample test is
that no difference exists between observed (55.8 percent) and theoretical frequencies
(52.9 percent). Given that the tested variable is a dichotomous variable, the natural interpretation as proportions, the binomial test is considered as being more appealing (Diamantopoulos and Schlegelmilch 2002).
Table 7.3 Gender profile of the respondents (Binomial Test) Category N Observed Prop. Test Prop. Asymp. Sig. (I-tailed)
Gender of the Group 1 Female 181 . 564 . 529 . 116(a) respondent Group 2 Male 140 . 436
Total 321 1.000
a Based on Z Approximation.
7.4.3 Household Income Analysis
The Annual Abstract of Statistics 2005 Edition of National Statistics revealed the
average household income in the UK to be £25,271. According to the university
librarian, the latest household income statistics for Glasgow are not available.
Therefore, the average household income for the UK is considered as being roughly the
same as the average household income in Glasgow, although in fact Glasgow has a lower average household income (Wealth of the Nation 2006). The interval household
income in the data set is mid-category coded. The newly coded household income
categories are £4,000, £15,000, £27,500, £32,500, £37,500, £42,500, £47,500, £52,500,
and £60,000. The one sample t-test used to test the sample mean is equivalent to the
population mean. The results are presented in Table 7.4. The results show that the
average household income of the sample is not significantly different to the UK average household income (p > 0.05). Thus, the sample represents the population well with
regard to the average household income.
Table 7.4 One-Sample statistics Variable n Mean SD Std. Error Mean
Mid-category coded 303 26161.72 18019.63 1035.20 income
UK average income 25271 t df Sig. (2-tailed) Mean difference
midcategory coded . 860 302 . 390 890.72 income
216

Chapter 7 Data Preparation, Examination of the Samples and Factor Analysis Results
7.4.4 Education Analysis
The comparison of the educational attainments of the respondents with the educational breakdown of Scotland residents is presented in the Table 7.5. Glasgow residents'
educational attainments should be utilised as references. Nevertheless, according to the
university librarian, the educational attainment data for the city of Glasgow is not
available. Therefore, the use of the educational data for Scotland (Scottish Household
Survey 2005) is considered acceptable.
The difference between the percentages of educational attainments of the respondents in
this study and the percentages of the Scottish Household Survey lies between -33.1 and
43.9. The Chi-square is 77.04, which is significant at 5% level of significance and with
a degree of freedom of 3. According to the result, the educational attainment of the
population is not well represented by the samples used in this study. People with `High
School' and `Other' educational attainments are under-represented in general, while
people with HND/HNC and BA/MA achievement are over-represented.
This result, although not as expected, is not surprising. First of all, it is because people
with higher education are more likely to participate in research, whereas people with lower educational achievements are reluctant to take part in survey research, or even if
they do participate, some of them might have difficulties in completing the
questionnaire due to problems with reading or comprehension. In addition, people with high school education are under-represented as some of them are excluded from the
targeted population for being under 18 years old. Although the results are not ideal, the
percentages of the four educational attainment categories range from 16.3 to 32.8, with
none of the groups accounting for less than 10 percent of the sample. Therefore, it is
considered acceptable.
Table 75 Fdncatinn annlvcic
Sample Scottish Household Survey 2005 difference Frequency Percent Percent Residual
Valid High School 105 32.8 40.5 -22.7 HND/HNC 77 24.1 10.5 43.9 BA/MA 86 26.9 23.5 11.9 Others 52 16.3 25.5 -33.1 Total 320 100.0 100.0
Total 321 100.0 100.0 Chi Square: 77.04 df 3 As . Sig.: . 000
217

Chapter 7 Data Preparation. Examination of the Samples and Factor Analysis Results
7.5 Reliability and Validity
Before any research embarks on data analysis, perhaps one should first of all examine
whether the measurement devices used in the research are robust, reliable and valid or
not (Oppenheim 2000). The value a research obtains using a certain measurement is not
the true value of the characteristic of interest but rather an observation of it (Malhotra
1996). The difference between the true value and the observed value is caused by
measurement error. There are a variety of factors which can cause measurement error. Malhora (1996) presents the true score model as follows, which provides a framework
for an understanding of the reliability and validity of measurement.
xo = xT + Xs+ xR where
xo = the observed score or measurement
XT = the true score of the characteristic Xs = systematic error
X, = random error
Random error is not constant. It is the source of inconsistency and has a direct effect on
reliability. Systematic error affects the measurement in a constant way. Therefore,
sources of systematic error do not have an adverse impact on reliability. On the other
hand, perfect validity demands that there be no systematic error, nor random error
(Malhotra 1996). Reliability is necessary, but not a sufficient condition for validity
(Churchill 1999). The focus of this section is on testing the reliability and validity of the
measurements utilised in this research.
7.5.1 Validity
A measuring instrument is valid to the extent that differences in scores among objects
reflect the objects' true differences on the characteristic that the instrument tries to
measure (Churchill 1999). In simple words, the measure has validity if it measures
what it is supposed to measure (Aaker et al. 1997). If this is the case, then differences
in attitude scores will reflect differences among the objects or individuals on the
characteristic being measured. The most common types of validity are content validity,
construct validity and criteria validity (Lehmann et al. 1998).
Content validity, also called face validity, is a subjective but systematic evaluation of how well the content of a scale represents that measurement task at hand (Malhotra
218
Chapter 7 Data Preparation Examination of the Samples and Factor Analysis Results
1996). It requires the researcher to examine whether the scale items adequately cover
the entire domain of the construct being measured. More often, the content validity is
supported by little more than common sense (Aaker et al. 1997).
Criterion validity reflects whether a scale performs as expected in relation to other
variables selected as meaningful criteria (Malhotra 1996); it is based on empirical
evidence that the attitude measure correlates with other "criterion" variables (Aaker et
al. 1997). Based on the time period involved, criterion validity can take two forms,
concurrent validity and predictive validity. If the two variables, are measured at the
same time, concurrent validity is established; if the two variables are measured at
different periods, then the predictive validity can be examined.
Construct validity addresses the question of what construct of characteristic the scale is,
in fact, measuring. Thus, construct validity requires a sound theory of the nature of the
construct being measured and how it relates to other constructs. Construct validity is
the most sophisticated and difficult type of validity to establish. It includes convergent,
discriminant, and nomological validity (Churchill 1999; Malhotra 1996). Convergent
validity requires that a measure should be highly correlated with other measures which
are used to measure the same construct (Churchill 1999). It is not necessary that all
these measures be obtained by using conventional scaling techniques (Malhotra 1996).
The two possible approaches are to employ different questionnaire research instruments
or to use different methods (Bryman and Cramer 1999). Discriminant validity is the
extent to which a measure does not correlate with other constructs from which it is
supposed to differ. The investigation of discriminant validity implies that one should
also search for low levels of correspondence between a measure and other measures
which are supposed to represent other concepts (Bryman and Cramer 1999; Malhotra
1996; Aaker et al. 1997). Nomological validity is the extent to which the scale
correlates in theoretically predicted ways with measures of different but related
constructs (Malhotra 1996). Little construct validation is attempted in marketing, as
there is a lack of well-established measures that can be used in a variety of
circumstances (Aaker et al. 1997).
7.5.2 Reliability
The reliability of a measure means its consistency. More specifically, it refers to the
extent to which a scale produces consistent results if repeated measurements are made
219

Chapter 7 Data Preparation, Examination of the Samples and Factor Analysis Results
(William et al. 1989). In other words, a reliable measure will yield the same finding on
repeated occasions if the phenomenon has not changed (Burns and Harrison 1979).
This notion is often taken to entail two separate aspects - external and internal
reliability (Bryman and Cramer 1999).
External reliability refers to the degree of consistency of a measure over time. The test-
retest reliability is one of the main approaches to checking external reliability. The
problems with test-retest reliability are that intervening events between the test and the
retest may lead to a discrepancy between the two sets of results, or if the test and retest
are too close in time, participants may provide earlier answers, so that an artificial
consistency between the two tests is created. Other researchers have suggested an
alternative-forms reliability test (e. g. Andrews 1984; Jaffe and Nebenzahl 1984), which
means that two equivalent forms of the scale are constructed. The same respondents are
measured at two different times. The scores from the administrations of the alternative
scale forms are correlated to assess reliability. Similar to the test and pre-test reliability,
this method is time-consuming, more costly, and it is difficult to construct two
equivalent forms of a scale (Malhotra 1996). In this research, the external reliability is
not tested, as the time constraint does not allow this to be done.
Internal consistency is used to assess the reliability of a summated scale where several
items are summed to form a total score (Malhotra 1996). It answers the question of
whether each scale is measuring a single idea, and hence whether the items which make
up the scale are internally consistent (Bryman and Cramer 1999). The split-half
reliability and Cronbach's Alpha are the two most commonly-used procedures for
estimating internal reliability (Bryman and Cramer 1999; Aaker et al. 1997). The
problem with the split-half reliability is that the results will depend on how the scale
items are split (Malhotra 1996). Luckily, Cronbach's Alpha can be used to overcome
this problem, as Cronbach's Alpha, currently widely-used, essentially calculates the
average of all possible split-half reliability coefficients (Bryman and Cramer 1999;
Aaker et al. 1997). Therefore, Cronbach's Alpha is used to examine the internal
consistency of the multiple-item scales - product involvement, product knowledge,
brand image, consideration set, and purchase intention. The rule of thumb is that the
correlation coefficient should be 0.8 or above (Bryman and Cramer 1999), a less
restrictive rule has an acceptable level of at least 0.70 (Hinkin 1995). The rule of
220

Chanter 7 Data Preparation, Examination of the Samples and Factor Analysis Results
thumb is applied to product knowledge scale, product involvement scale, consideration
set scale, and purchase intention scale. The less restrictive 0.70 level is applied to the
testing of internal reliability of brand image factors. In the case of the correlation
coefficient being lower than 0.8, it is suggested that the items that reduce the reliability be deleted from the scale (Kaplan and Saccuzzo 1997). This dropping item means is
used in order to improve scale reliability. The same rule is adopted when the Cronbach
Alpha falls below 0.70 in relation to brand image factors. Prior to conducting the
reliability analysis, the scores of the negative statements are reversed to make sure that
all scores are absolute values of those items. This is because `failing to reverse-score items that have been phrased oppositely to other items on the scale will mess up your
reliability analysis' (Field 2005, p. 674). In addition, the item-total correlations or the
inter-correlations (Pearson's correlation) of the items are also reported. Items are deleted if the item-total correlation is below
. 50 according to the recommendation of
Bearden and Netemeyer (1999).
7.5.3 Applied Techniques to Validate Scales Validity and Reliability
Being aware of the importance of validity and reliability, this study uses Factor
Analysis, Pearson Correlation Analysis, Item-Total Correlation and Cronbach's
Coefficient Alpha to validate adopted scales. Before these techniques are applied, a detailed assessment of the suitability of the data for factor analysis, the difference
between PCA (Principal Component Analysis) and PFA (Principal Factor Analysis), as
well as objectives expected to be achieved are reported, followed by reports of validity
and reliability of the brand image construct. This section ends with evaluation of scale
reliability and validity of product involvement, product knowledge, consideration set
and purchase involvement.
7.5.3.1 Factor Analysis
7.5.3.1.1 Assessment of the Suitability of the Data for Factor Analysis
Much has been written about the necessary sample size for factor analysis. Despite Hulin et al. (2001) calling for 15: 1 ratio of respondents to number of items, some
researchers recommend much lower ratio and more specific sample size -300 samples. For example, Kass & Tinsley (1979) suggest having between 5 and 10 subjects per
variable up to a total of 300 (beyond which test parameters tend to be stable regardless
of the subject to variable ratio). This claim is further supported by Tabachnick & Fidell
221
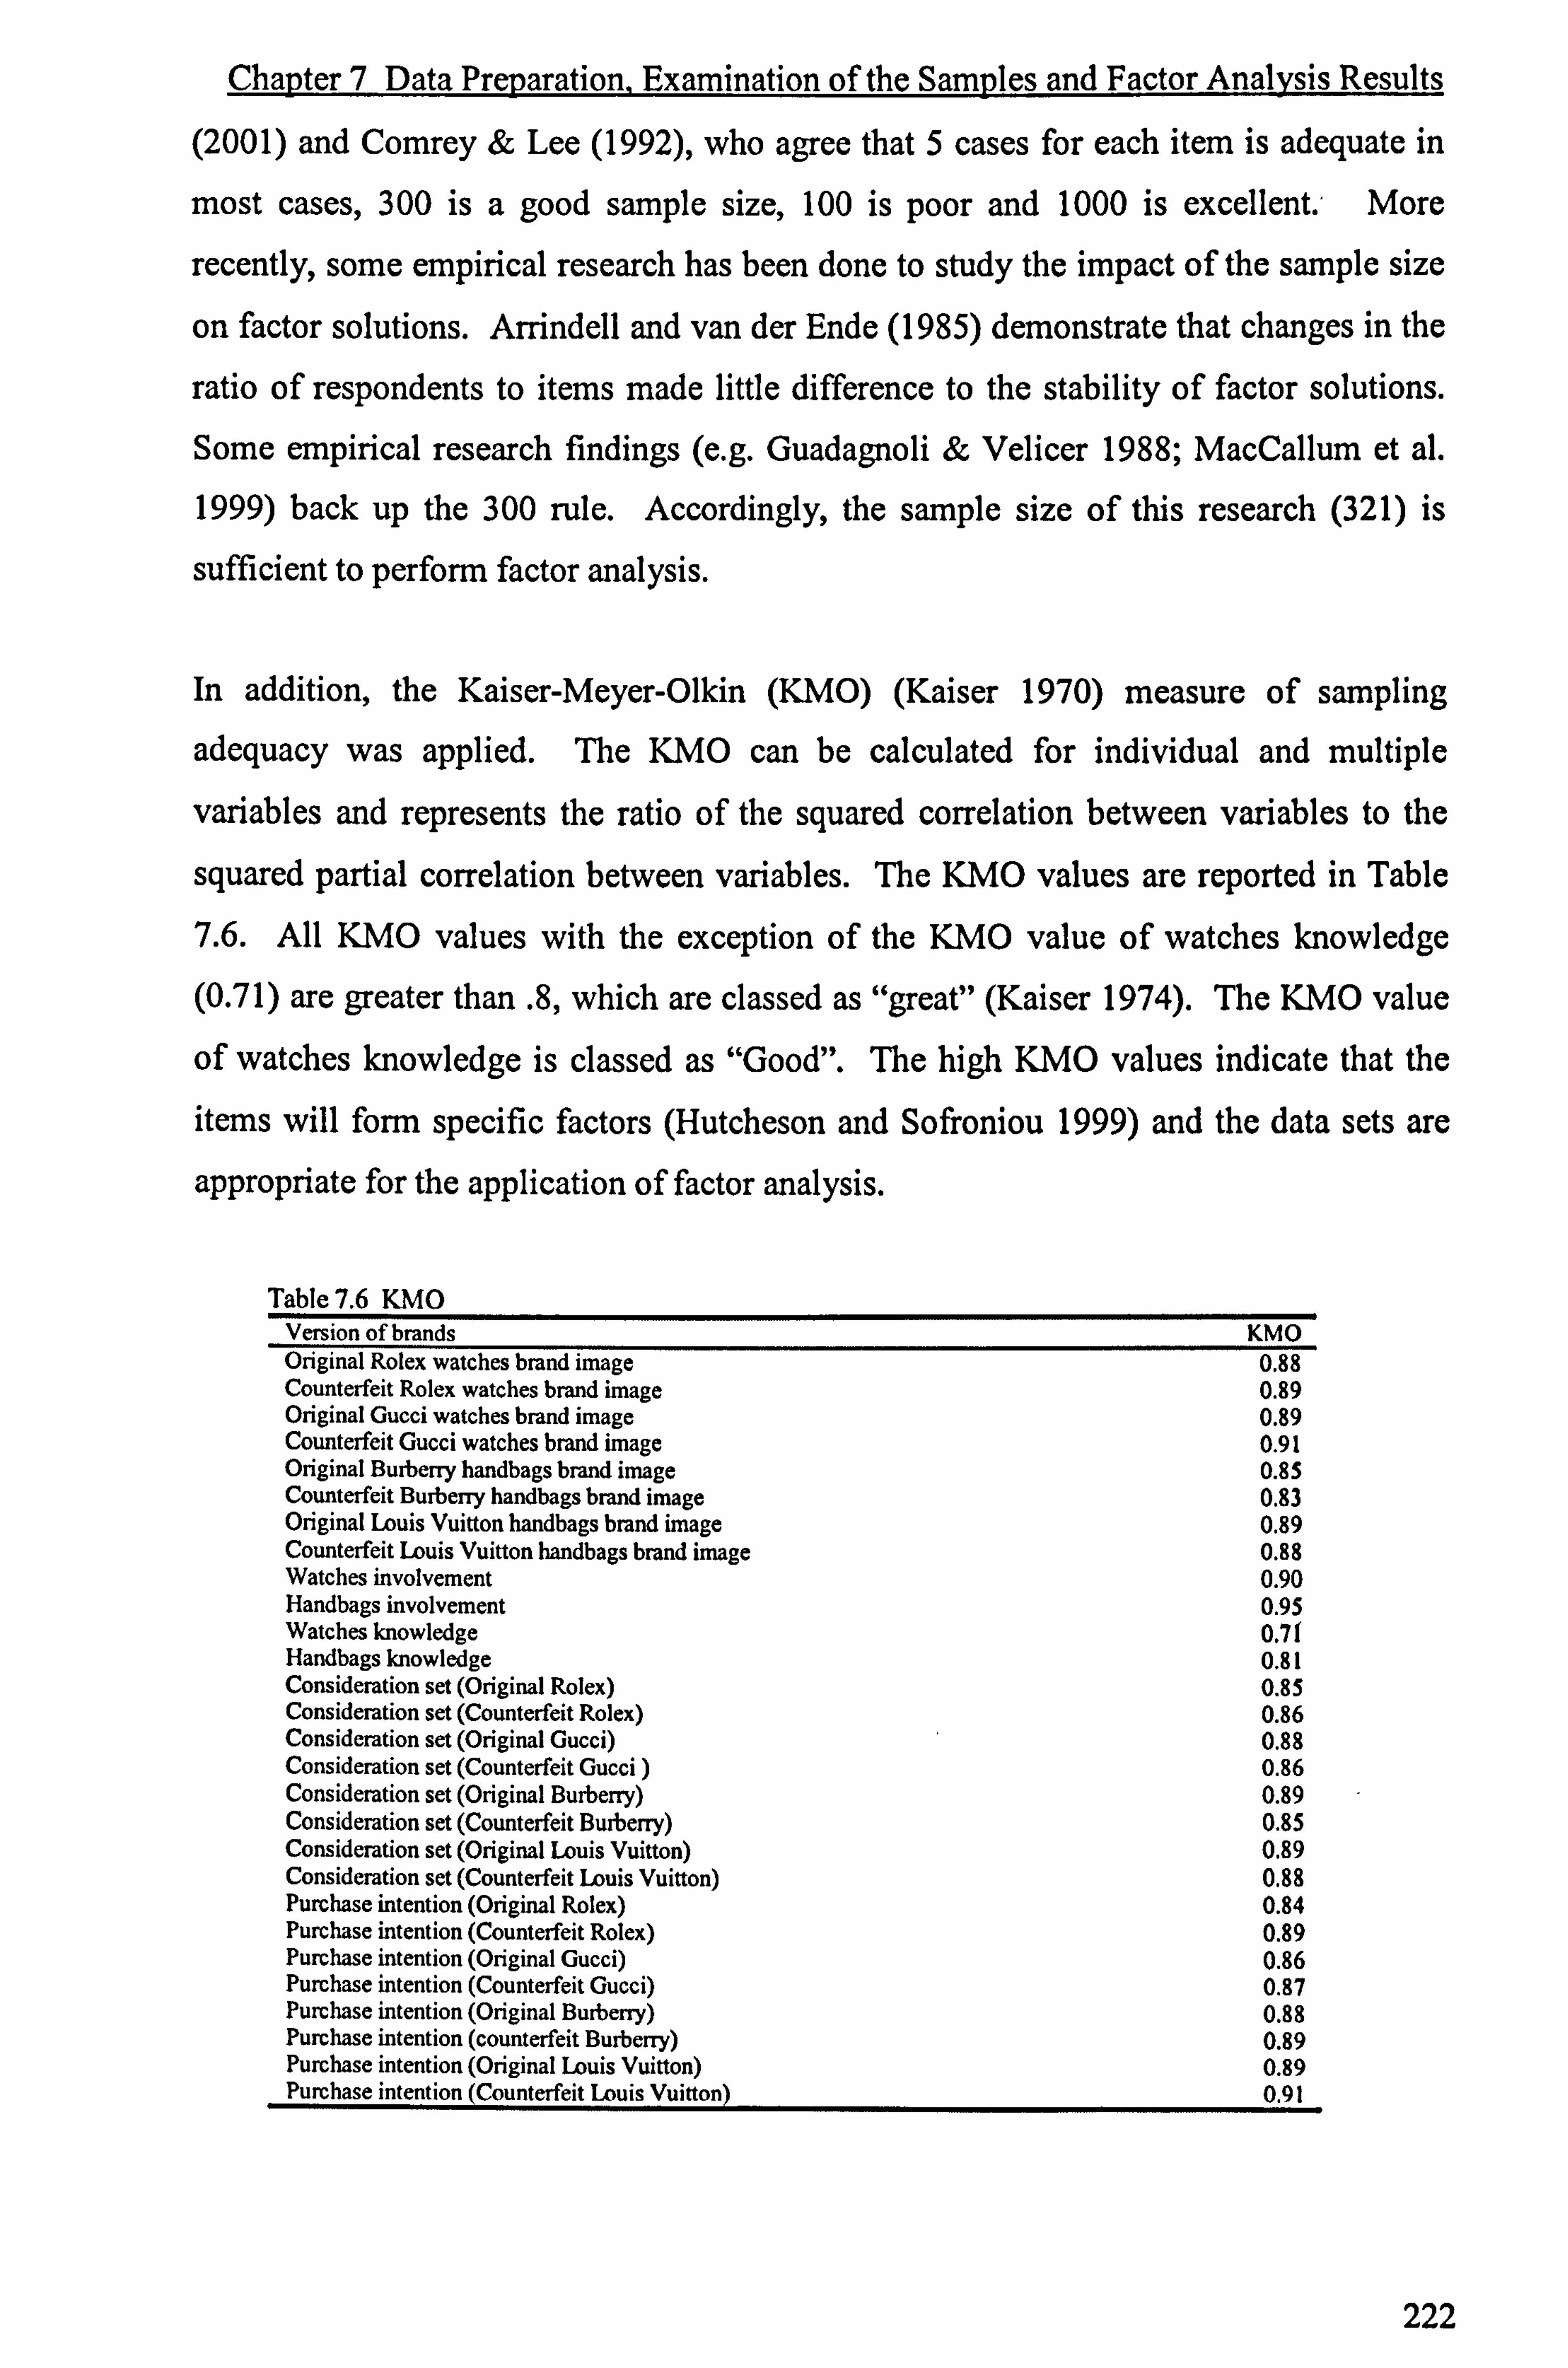
Chapter 7 Data Preparation, Examination of the Samples and Factor Analysis Results
(2001) and Comrey & Lee (1992), who agree that 5 cases for each item is adequate in
most cases, 300 is a good sample size, 100 is poor and 1000 is excellent. ' More
recently, some empirical research has been done to study the impact of the sample size
on factor solutions. Arrindell and van der Ende (1985) demonstrate that changes in the
ratio of respondents to items made little difference to the stability of factor solutions.
Some empirical research findings (e. g. Guadagnoli & Velicer 1988; MacCallum et al.
1999) back up the 300 rule. Accordingly, the sample size of this research (321) is
sufficient to perform factor analysis.
In addition, the Kaiser-Meyer-Olkin (KMO) (Kaiser 1970) measure of sampling
adequacy was applied. The KMO can be calculated for individual and multiple
variables and represents the ratio of the squared correlation between variables to the
squared partial correlation between variables. The KMO values are reported in Table
7.6. All KMO values with the exception of the KMO value of watches knowledge
(0.71) are greater than . 8, which are classed as "great" (Kaiser 1974). The KMO value
of watches knowledge is classed as "Good". The high KMO values indicate that the
items will form specific factors (Hutcheson and Sofroniou 1999) and the data sets are
appropriate for the application of factor analysis.
Table 7.6 KMO Version of brands KMO Original Rolex watches brand image 0.88 Counterfeit Rolex watches brand image 0.89 Original Gucci watches brand image 0.89 Counterfeit Gucci watches brand image 0.91 Original Burberry handbags brand image 0.85 Counterfeit Burbeny handbags brand image 0.83 Original Louis Vuitton handbags brand image 0.89 Counterfeit Louis Vuitton handbags brand image 0.88 Watches involvement 0.90 Handbags involvement 0.95 Watches knowledge 0.7 f Handbags knowledge 0.81 Consideration set (Original Rolex) 0.85 Consideration set (Counterfeit Rolex) 0.86 Consideration set (Original Gucci) 0.88 Consideration set (Counterfeit Gucci) 0.86 Consideration set (Original Burberry) 0.89 Consideration set (Counterfeit Burberry) 0.85 Consideration set (Original Louis Vuitton) 0.89 Consideration set (Counterfeit Louis Vuitton) 0.88 Purchase intention (Original Rolex) 0.84 Purchase intention (Counterfeit Rolex) 0.89 Purchase intention (Original Gucci) 0.86 Purchase intention (Counterfeit Gucci) 0.87 Purchase intention (Original Burberry) 0.88 Purchase intention (counterfeit Burberry) 0.89 Purchase intention (Original Louis Vuitton) 0.89 Purchase intention (Counterfeit Louis Vuitton) 0.91
222

Chapter 7 Data Preparation, Examination of the Samples and Factor Analysis Results
7.5.3.1.2 Objectives for Using Factor Analysis
The use of factor analysis attempts to achieve two objectives. Firstly, to condense the
information obtained in relation to brand personality, product attribute and benefit/consequence into a small set of new composite dimensions which makes the
data more manageable. Secondly, to examine whether the measures used to measure
the constructs across two versions of the four tested brands and the two product classes fall into the same factor(s). If scale items load on the same factor(s), and they have
similar factor loading (s), then content validity can be assumed (Bryman and Cramer
1999). This method has been widely used in previous cross-cultural research to test if
groups of items comprising a dimension in one culture also load in similar fashion on the same construct in another (e. g. Veloutsou et al. 2005; Poortinga 1989; Singh 1995).
In this research factor analysis is used to test if items comprising a dimension of the
construct of the original brand also load similarly on the same construct of the
counterfeit brand.
7.5.3.1.3 Principal Components Analysis vs. Principal Factor Analysis
The method used to achieve the first objective is principal components analysis (PCA).
PCA is used is because we are only interested in data reduction, and it is often preferred
as a method for data reduction over PFA (Preacher and MacCallum 2003). Despite the
fact that there are no strong grounds to believe that the underlying factors should be
unrelated (Field 2005), the factor solution in this research was rotated using the
Varimax method, as the orthogonal rotation algorithm Varimax is the one most frequently reported in the management literature for scale construction (Hinkin 1995).
Moreover, due to the objective of this part of analysis being to utilize the factor results in regression models, the orthogonal rotation procedure is appropriate (Hair et al. 1987)
Principal Factor Analysis (PFA) is used to achieve the second objective. PFA is
appropriate here because this research is only interested in identifying factors that
account for correlations among the multiple items (Preacher and MacCallum 2003) used
to measure the constructs in our research model. In addition, PCA is often preferred as
a method for data reduction, while PFA is often preferred when the goal of the analysis is to detect structure (Cliff and Caruso 1998). Varimax rotation is used and reported if
more than one factor is extracted.
223
Chapter 7 Data Preparation, Examination of the Samples and Factor Analysis Results
7.5.3.1.4 Factor Extraction and Loadings
Following Kaiser's (1960) recommendation, all factors with eigenvalues greater than
1.0 are reported. The eigenvalues represent the amount of variation explained by a
factor. The Kaiser (1960) criterion, although commonly used, has met with criticism.
Jolliffe (1973,1986) reports that Kaiser's criterion is too strict and suggests retaining all
factors with eigenvalues more than . 70. Later research advises to use a scree plot
provided the sample size is greater than 200 (Stevens 1992). Preacher and MacCallum
(2003) recommend the use of the Kaiser criterion in conjunction with other means.
Accordingly, both scree plot and eigenvalues are considered in this research in relation
to factor extraction, but with only the eigenvalues reported. In addition, the reasons for
doing factor analysis are also taken into account. For example, in order to overcome
multicollinearity problems in regression, it is intended to retain more factors. In
contrast, in relation to scale validity testing, there is no need to keep as many factors as
possible, therefore Kaiser's (1960) criterion is principally considered.
Items with a factor loading of at least . 40, and which are not split loaded on another factor above . 40 were perceived as components of one factor. This is in line with Stevens' (1992) recommendation to interpret only factor loadings with an absolute
value greater than . 40. Items split loaded on two factors with more than one factor
loading being above . 40 are to be dropped.
7.5.3.2 Brand Image Results
7.5.3.2.1 Original Rolex and Counterfeit Rolex
All the factors with eigenvalues greater than 1.0 are extracted (Table 7.7). For the both
original Rolex and counterfeit Rolex data, 7 factors are extracted. To a great extent, the
contents of the extracted factors are similar across these two versions. Both product
attribute related items and brand personality items of two versions of this brand group into two factors. It appears that the product benefit/consequence related items load on
three factors for both versions. For the original Rolex, "This product can bring you fun
(fun)" cross load on two factors. Due to the factor loading on both factors are higher
than . 40, this item is discarded. Therefore, it is likely that the subjects do not perceive Rolex watches are related to "fun". In contrast, the item "fun" nicely grouped in one factor with the other benefit related two items in the context of counterfeit Rolex. This
indicates that the subjects do consider "fun" as a kind of benefit the counterfeit Rolex
224

W) N N
to 4Y M %0
ö -1
Ooo 2 009 "M»
r-
Nooet .: v
O . ßi 0NOn
O
d 0C 0N
00 Mb
4ý ýO ýD ýO pý .+ vi Ö
N 00 \O -. Mhn
NN it nÖNrbn
ýO ýO l- 00 ýD fV O, Ö
W N
oo S 00 r- _
Opt ý--ýO MCOB
.m výNo00oOo0. t''. ON odNcN cd
0p .ng 00
1-4
p. w Ö ýO TuNO W1 ýQ ý'
NNÖ
r "UyO ~ON
Cr O. M.
o0"II< El eq km ý' ooooýD pý.. ed
'v
tp 00 M M
yf {£ ON
lO OMO aO ce Q
4+
O
U 41.1 MO - tN O, --t e
110 ä- NMMO, '. O
O FI( \O MMONN
10 N -11 11 . OR N ýO lýtýhlý tý NON
U
WN
wO E) 2, Oyy
ü'w NJ y
rh
ßi WOdNN td
"ý "ý
QN a0
'7 ucýwUeUUä. ä,. 0 CO
ä.
ö3U ? rß;
1- 9 -ý id 7ý v° Nm to ' U ao a ai wy5.. ý°
Cd .0m aua 1: 6 K N
v"itou. y E Y.. öan ai 3ovVC CO
U 'äi 'cýq aw ýye? v, v ýi Q `, ý c
yý+ 00v 0. VDE ääai a .
ä, c y aar°d w° y . 3ýy ' ýi ý4e o yy uo stc
E , may�
N !)yNNNN lVý yNNH CL N Vl Fi ÜVl
ip ý7ý'
>0äoG fxtlvýiviw°ÜüÜýeoa'ý c
z o.. "ý . nevi '. onooo'. o N'nvIn'. 0N u
OOOe Qo9 E"ý Z . --ý NMý v'1 %O too O, -++ ýýý. -+ý. +NNNNNNNNNOO UW ýUý
Chapter 7 Data Preparation, Examination of the Samples and Factor Analysis Results
can bring. This finding is contradictory to Nia and Zaikowsky's (2001) finding, which
suggest that both luxury original brands and counterfeit luxury brands bring people
"fun". However, the finding is not supervising considering the extremely high price of
the original Rolex watches, and the original Rolex is not projected as "fun" product to i
consumers. The item "The quality of the product merits the price" does not group with
any other items for the original Rolex; rather it stands out as a factor on its own.
Interestingly, this item combines with the items "This product can bring you fun" and
"You get value for money for the status it brings you" for counterfeit Rolex.
Comparison of this result with results of other brands shows that this unique result may be due to the nature of the Rolex watches. People are more likely to associate the price
of Rolex watches with their extremely high quality. As such, even though there is only
one item in this factor, it is considered important and retained for further analysis. The
item "independent" combined well with the items "young" and "cheerful" for original
Rolex, whereas, it cross loads on both extracted brand personality factors for counterfeit Rolex. As it has one factor loading of almost 0.60, and another one just above 0.40 the
threshold level, this item is remained in the heavily related factor, but is excluded from
the less related factor. The cross loading of the "independent" item for counterfeit
Rolex can be explained in that the respondents might have difficulties in associating "independent" with the counterfeit Rolex brand personality. The extracted factors
account for 64.33 percent of the overall variance for the original Rolex, with 64.71
percent for the counterfeit Rolex.
Due to the personality items being mostly generated from the Aaker's (1997)
personality scale, Aaker (1997)'s interpretations are closely consulted in relation to the
extracted personality factors. One factor is strongly related to items such as `reliable',
`hardworking', `secure', `successful', `for leader', `confident', `glamorous', and `classic". Most of these items load in Aaker's (1997) `competence' factor. Therefore,
this factor is described as `competence'. The other personality related factor is strongly
related to variables, `cheerful', `young' and `independent (the original Rolex only)',
which suggests an `excitement' factor. The factor which is strongly related to
`expensive', `package', `waterproof, `country of origin', `material' is interpreted as `general product attribute', while the factor related to `style' and `practicality' is
explained as `functional attribute'. The item `product size' is grouped under the `general product attributes factor' for the original Rolex, but included in the `functional
226

r- C14 N
" O' ORoN gvý; Onr
J. V1 M .$
övýv Q OO ;Öo r- o r0 ?
3 O> r 00 MM viýq�c r-:
V V
? Vm
GG
t-e u r Oý r ýO ý 00 00 nrr
M Mr -e j "' h ýO
9 O c> 0rr0 Iý 1ý r b o0 r[ ßýýrr ýO rb o0 ["
2) ý ý 1ý y a? o0 00 00 00 0o a? a
09 ÜÜÜ
h
C O
"ä
d L I. O V C O N L A
d D.
a
Mn yj 'R M
N 4- r NM
-' it .M . 111: - nÖ
'D NV
N yMj N ýp e} V
M1 V1 M
C) C4 Me
NQMf1MN vW `i,
v` !v NV, c
'O M CO n r- ON MOMM O1 f N ti fn M- VY Vl "? 't Ne IQ:
N N
00
41 .. 5Z
._ eO ü
w ýýtýiüq w 9 vo v oýi8
q .. + CC@C y ä5 b4
e
CVY 19
d
'. ý
vCe 2
O v)mm<w QJY2X w U<rnow o. 3 LL)xxv,, d(Z(.
z NNIzN N MMM I1
ac 00
00
Hh
C: "
C
ö
U C1 O
.ö y
C
0. P.
NV F T Ld
ý
w .. ýg
d ýu
aý 2 3
sy= Ü
c aTi d
ýý ýi Nc a
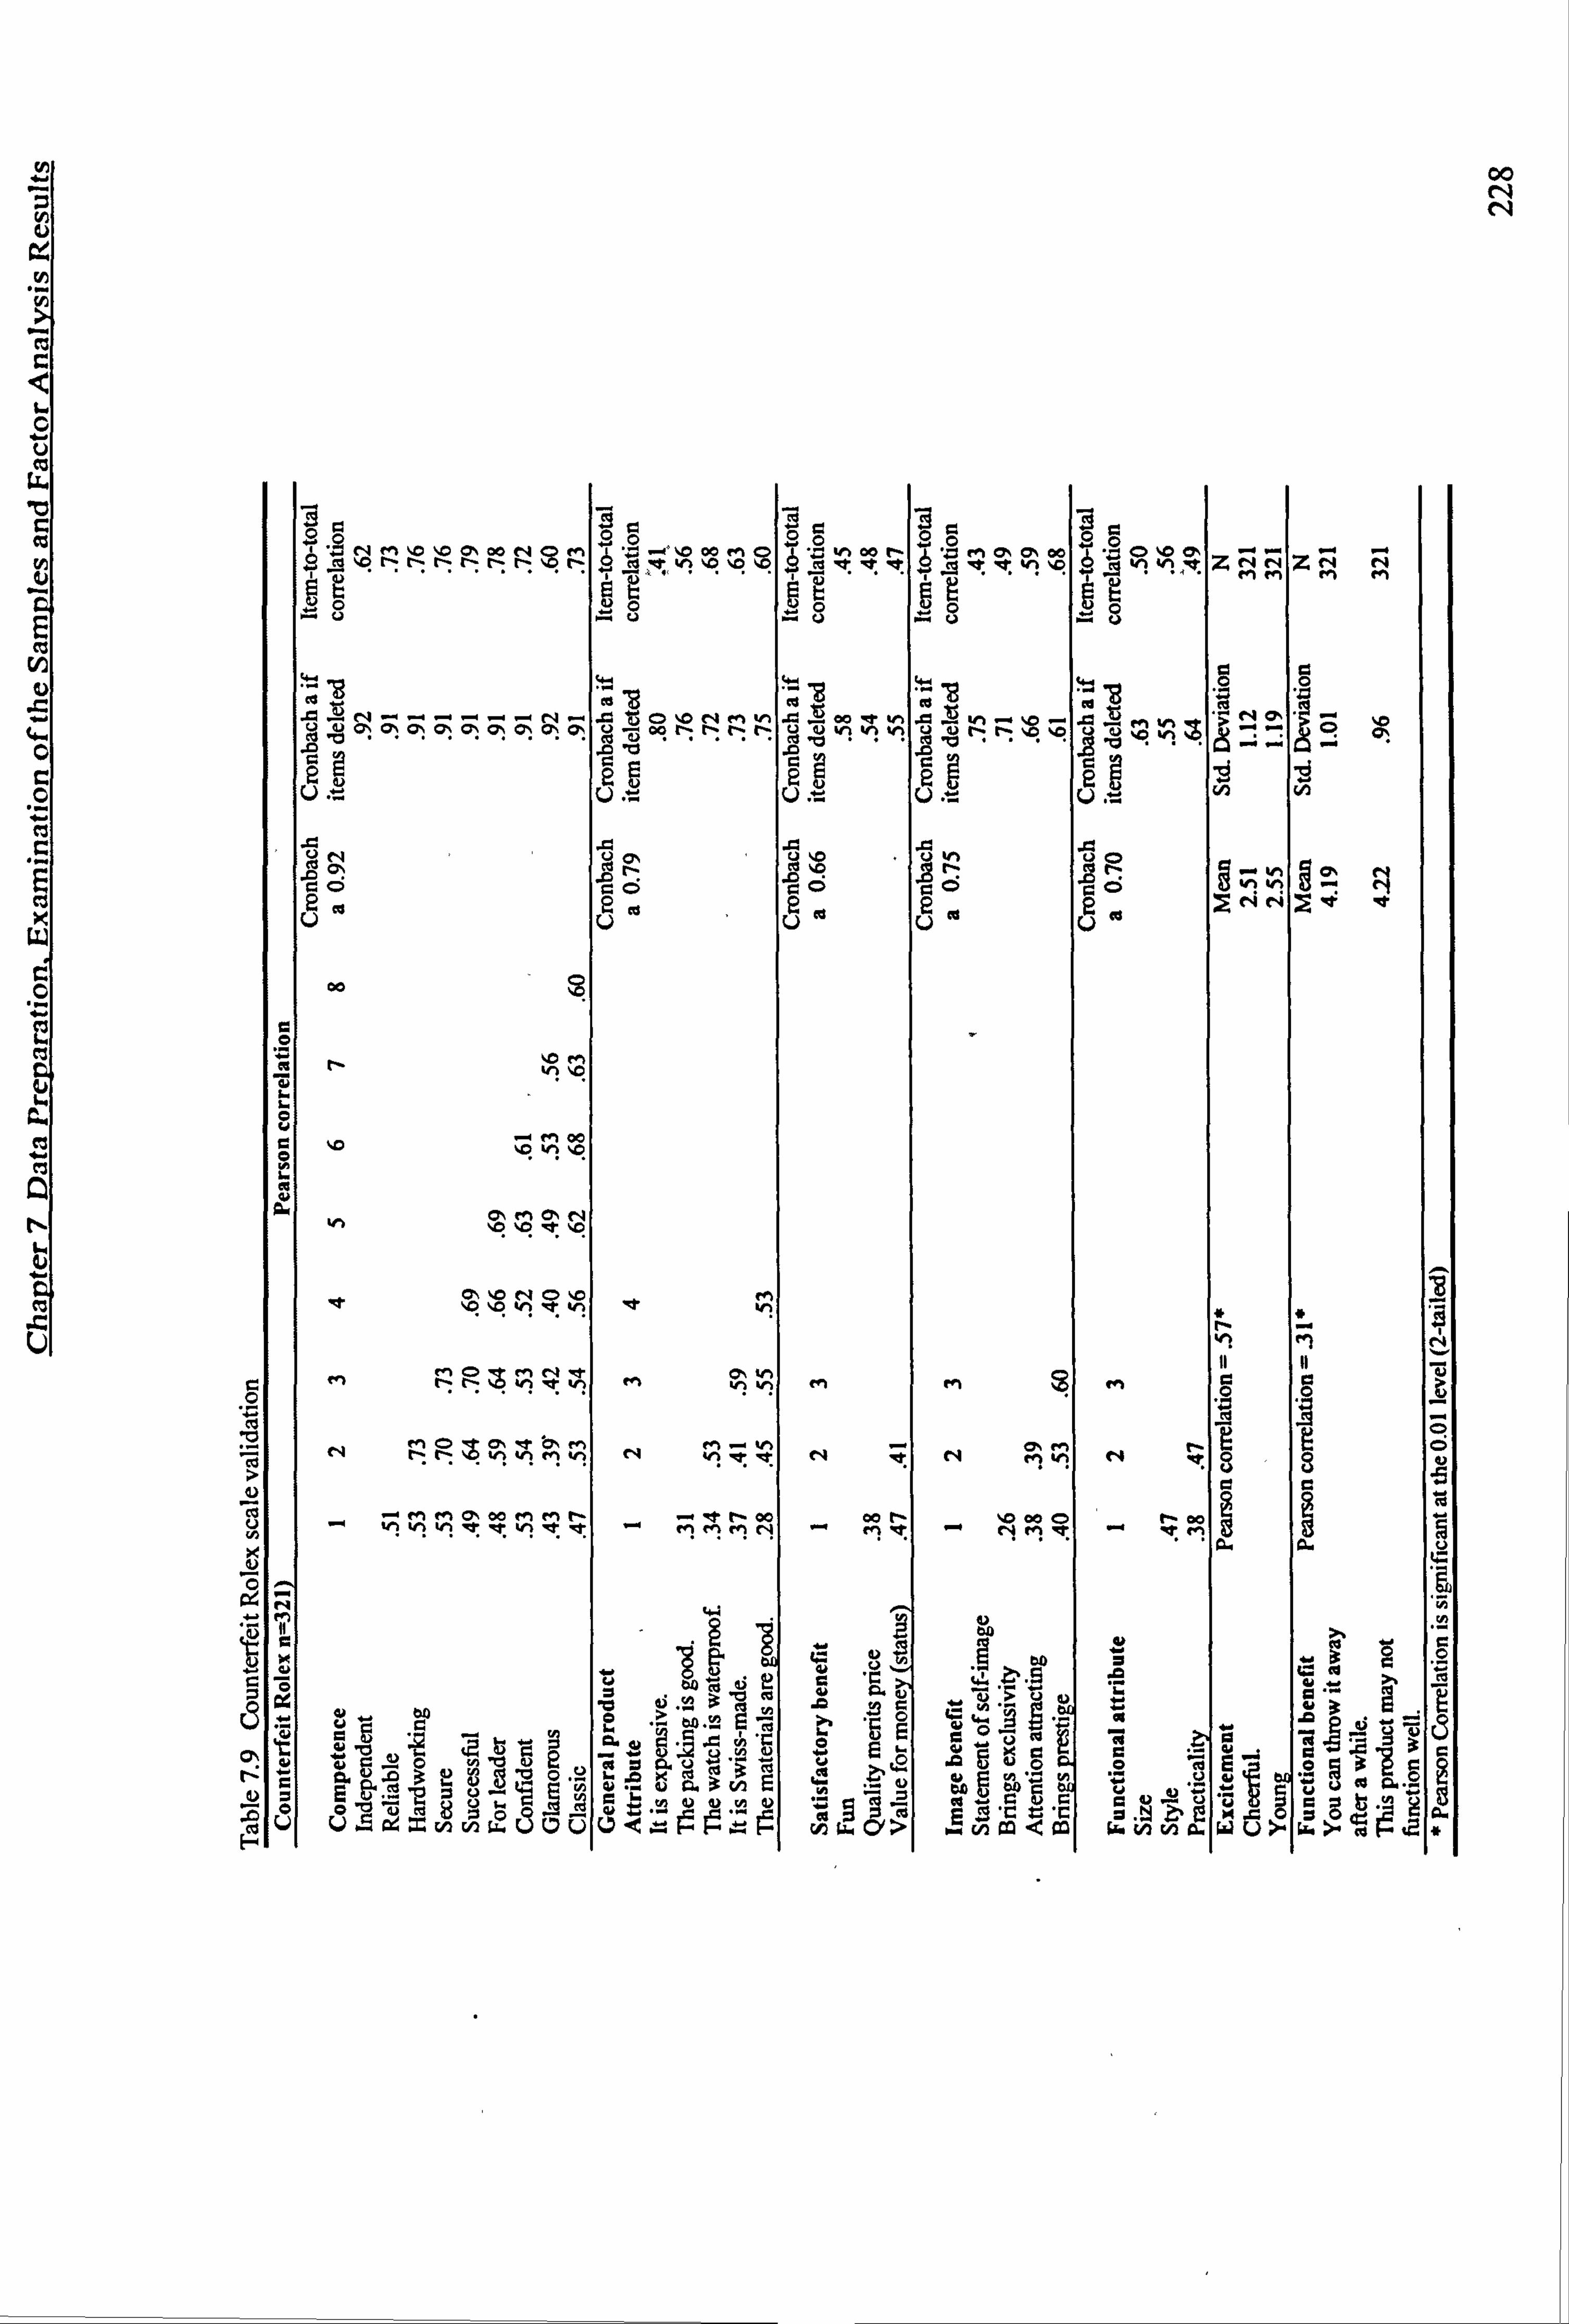
00 N N
ý'. 07N MAO ýc ON eO NMO. OO MC 9
ý9 CNNNcýcýcýýý ö ev, vý oýoý
.CNN Yu OONMv
-2bOýO; OýOýOýOýtT tT Oý ÄIcioo lýlýlýC
-x
.ö °`
aö ad ÜýVo
00 s
ßNIb d
O
;Z en 00
CAM O,
d' ýO VN1 'V' hV
MMOM r4 e. Q1 Y ö lý fý
ý hý hM V1 V
CO
Co
10 NN1 v0'1h
Mh N
hRe
d
o "'ý V1 V1 fA V 0r V1 M "'ý MMM r- 0
l'
G ýäýs ad° >""s
aý o Eýi. ý oo cu 42 LGn ýUU. 5axvýirnw°ÜCýÜüd : ýý: Fý
ýa 0 ; nootq lcý vve
00 " -0 lu Ü
..
co
lu
4.5 ä
N+ a o, oo o ýo a "" "" ý of Y1 NR b. V1 Z. NNZNN ü en MMM
öö
N lý n \D 1yMh ýO
2 ti
äcc S3 v,
výi ý°; `cý
ÜÜ fV N4a
v M
p M ýp M
u n q ý,
O
NZ N ei Vi N �t
8 8
lu b C 'ý ý i 00 R M ý
a a
y Üý
ate, ä; ro E
V ý4
Hý4
y9 V1
f ar 11
4: b Ei ° d
1d ý3 a, cu m
_ ö 'ýa dý E ög 9 2
£C 'C M .Öäy ý
.. výWQ0.1 O
Cy ß "

Chapter 7 Data Preparation, Examination of the Samples and Factor Analysis Results
attribute' in the case of counterfeit Rolex. The factor related to `disposability' and
`functionality' suggests a relation to product life cycle and performance and is therefore
named as a `functional benefit'. The rest of the product benefit related items gathered
under one factor for the original Rolex is labelled `image benefit'. The single item
factor is named as `value for money (quality and price)' for the original Rolex. In the
context of the counterfeit Rolex, the factor related to `fun', `quality and price' and
`status and value' suggest the `satisfactory benefit', while the factor associated with
`attention attracting', `prestige' and `exclusivity' can be interpreted as ̀ image benefit'.
For both the original Rolex and the counterfeit Rolex, the extracted factors are
considered to be reliable and adequately capture single construct, since they all have a Cronbach Alpha above 0.70 or Pearson correlation higher than 0.25 which is significant
at the 0.01 level, with the exception of the satisfactory factor which has a Cronbach
Alpha of 0.66. However, the lower value of the Alpha might caused by the small
number of items involved (3 items). Therefore, it is considered as acceptable. The item-
total correlation for all items is very close or higher than the suggested 0.50 benchmark
(Bearden and Netemeyer 1999) for both versions of this brand (Table 7.8,7.9).
Therefore, the results suggest that the scale adopted to measure Rolex brand image is
both valid and reliable for both versions of Rolex.
7.5.3.2.2 Original Gucci and Counterfeit Gucci
All the factors with eigenvalues greater than 1.0 are extracted for both original and
counterfeit Gucci (Table 7.10). Four factors are extracted from the original Gucci data,
with 6 components from the counterfeit Gucci data. Unlike the Rolex, all product
attribute items fell into one factor for both original Gucci and counterfeit Gucci, and brand benefit/consequence items load on two factors in each case. The content of these
factors have no difference across the two versions. For the original Gucci data, the
majority of brand personality items load on one factor, with the exception of `corporate'
and `reliable' are singled out. `Reliable' and `corporate' are discarded as they split load
on two factors and with both factor loadings higher than 0.40. Different to factor
extractions of the original Gucci data, the personality items of the counterfeit Gucci load
nicely on three factors, with each factor consisting of 4 or more than 4 items. The
`trendy', `exciting', `cool' and `successful' items split load on two factors. However,
due to all of them having the factor loadings on one factor as high as around 0.70, and
229
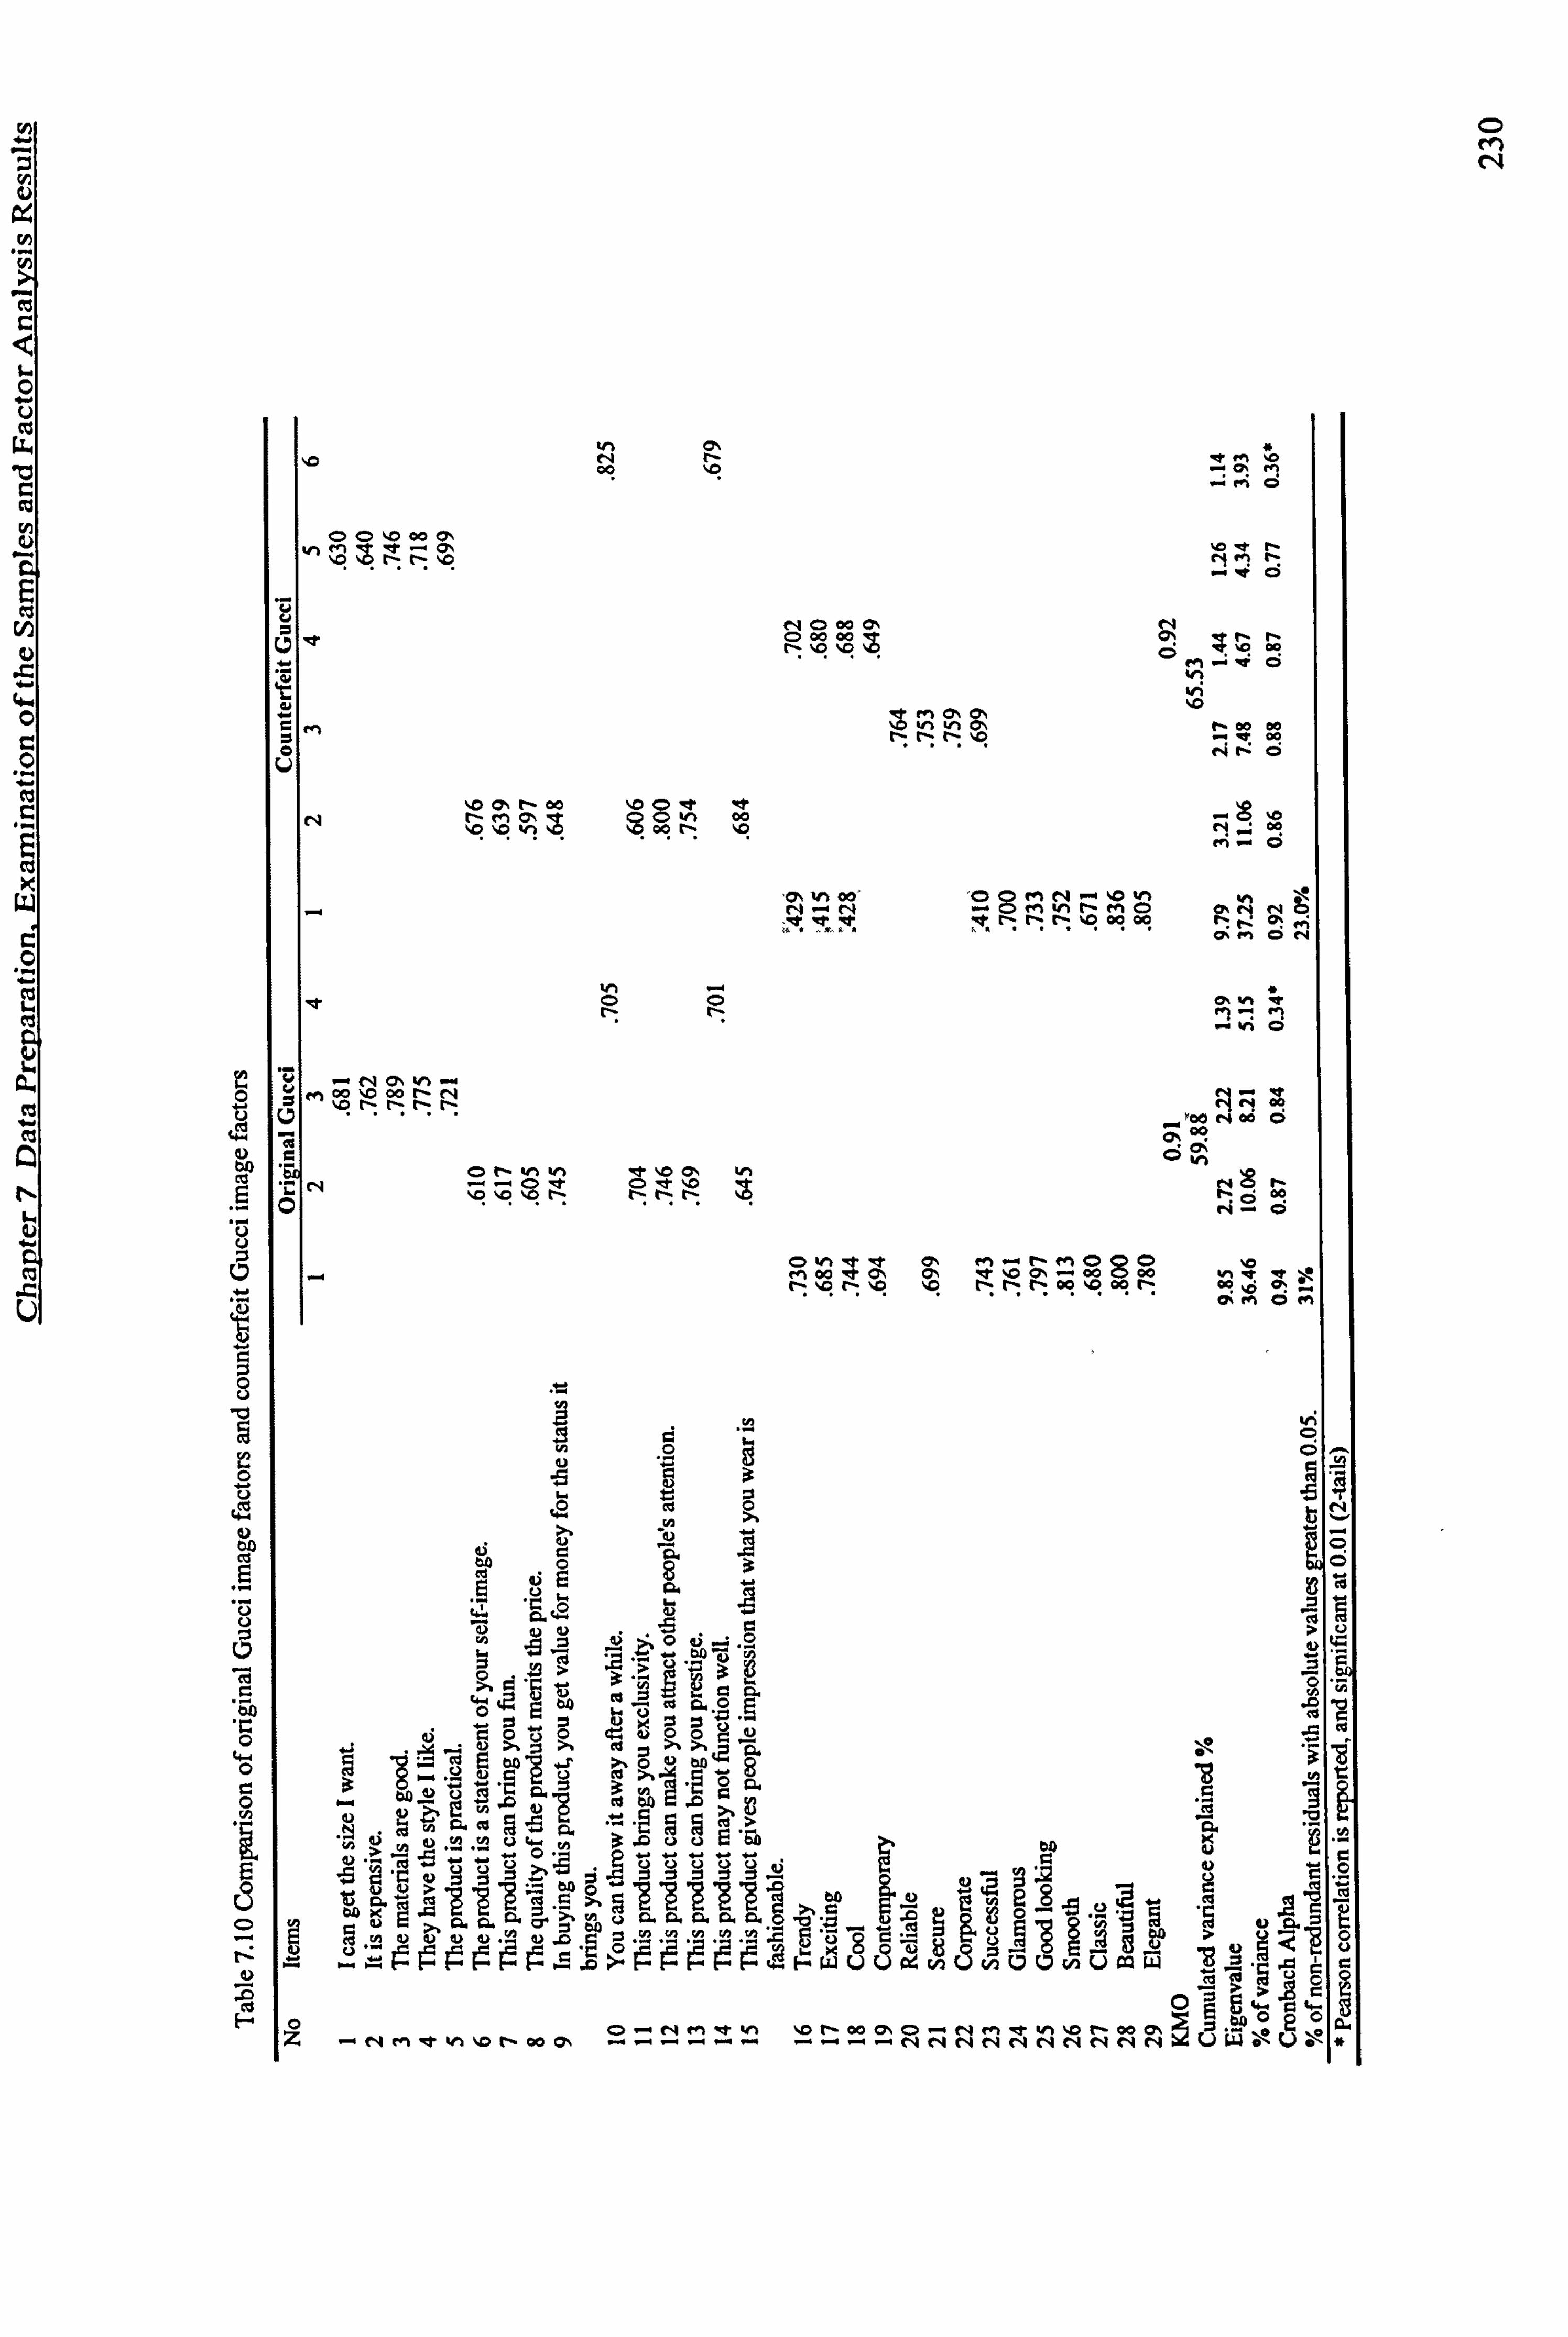
CD M N
V
OO 'O OO O, mý"-
kM
O
ýo o+týoo '. Ogg et N r- "a1 2oN 00
ýO OO
uM oo 1.0 00 [- N ý ýcnnnn
on ýn ýn vo rn v, N ýöýö°cn °9n I
w a .ý 'o ra "1
ei Ö
0v N ryM N .... o
rq (Z) 00 al CD 00 00
b h C\
N 00 00 rý Il ll 1D -+ < ao
NNÖ
-a '0 1
.. Oo
tý1 rÖ
O\ vt oö 'O g ein r4 ý+ ýO N NNeN1MO C' ty N
nnn 00 00 0'
^0N ` Oý eý1 ÖN
ON ei
.+ v1 Ö
fýN OO NOÖ Ö
h ýp
NO 1- N0 00
,. j rp
Ov7ýeF O+ M-oN 000 MOO Qý ON V' O+ 00 00 v1
. DR <
Iý lý co 00 lý YG ýp Oi !,.
oC e+i O
"ý
N V1
N N
tr ° ýy "a'- N3
0 C p
bö 4 1
a3 P6 13
ö %
.0 . ~
0-11-1 7
td H 11 .
_ti
Ö
ei 0
ý' '
> tC
c mý>± >t d
4J
S yy3äi "N
i.. Ca V°i
N
°° ýK°o t
., 1 ai Ä7T
VNÜ
ýN
°T TCa
ld >ýX" 8
ö
S 1
$ "3
° a-
"ý a 13 qa>
V .-0 , fj C aý
7 i
v a
A bO ý Ö ° " " ä
N aaaC. 5N . "' "" ..
N.. ýNC , CN ,
NC ýNC ýNL ýNGCýi. "' k C
° F"F-ýF-ýF'" '"F"
VaaaasO' "i7 `"' ýy
IýJyy[ i
iy
eQdý "ý NNN _N
N_ 'ý7 C "V nQ "ý QV ýd V t0 "' %" ""W
QHJ W
aU VOý VIUh VV V1UWýt7 ""
id N
. ýy p a7 r. ý i r . . F ý F F i C '. r. "
092 .
. 7-. ^" N en 'r kA ýO 1- 00 ON NNN4clNN UWeUe
F
Chapter 7 Data Preparation, Examination of the Samples and Factor Analysis Results
just above 0.40 on the other factor, which is only slightly higher than the pre-set up 0.40
criteria, these items remain in the heavily related factor, but are excluded from the less
related factor. The extracted factors explain 59.88 percent of the overall variance for
the original Gucci and 65.53 percent for the counterfeit version. The results are
presented in Table 7.10.
The factor strongly related to items such as `trendy', `exciting', `cool'. `contemporary',
`secure', `successful', `glamorous', `good looking', `smooth', `classic', `beautiful' and
`elegant', as most of these items were adopted from Aaker's (1997) personality scale;
this factor is named as `personality factor' for the original Gucci. In the case of the
counterfeit Gucci, the three brand personality related factors are described as
`sophistication factor', `competence factor' and `excitement factor' since most of the
items gathered under these factors are either exactly the same as the items loaded on
these factors in Aaker's (1997) study, or similar in principle. It is worth highlighting
that `classic', `beautiful' and `elegant' were not included in Aaker's (1997) work.
However, they all fitted in well with the other items of the `sophistication factor'.
These results in further challenge to the universal applicability of Aaker's personality
scale.
For both original Gucci and counterfeit Gucci, the factor which is strongly related to
`size', `expensive', `material', `style' and `practicality' is interpreted as ̀ general product
attribute factor'. It differs from Rolex; `style' and `practicality' group well with other
product attribute related items in one factor. It is beyond the researcher's capability to
offer any solid explanation to this demonstrated difference. That said, one assumption
which could be made is that this might be an indication that different product attributes
might weigh differently across different brands. The factor related to `disposability' and `functionality' suggests a relation to product life cycle and performance, and therefore is
named `functional benefit factor'. The rest of the product benefit related items ('self-
image', `fun', `quality and price', `status', `exclusivity', `attention attracting', `prestige'
and `fashionability') gathered under one factor. Since they are all associated with
purchase image gain, this is labelled `image benefit factor'.
Whenever the Cronbach Alpha applied, for all the extracted factors across both
versions, the Cronbach Alpha coefficients are higher than 0.80 with only one exception,
231
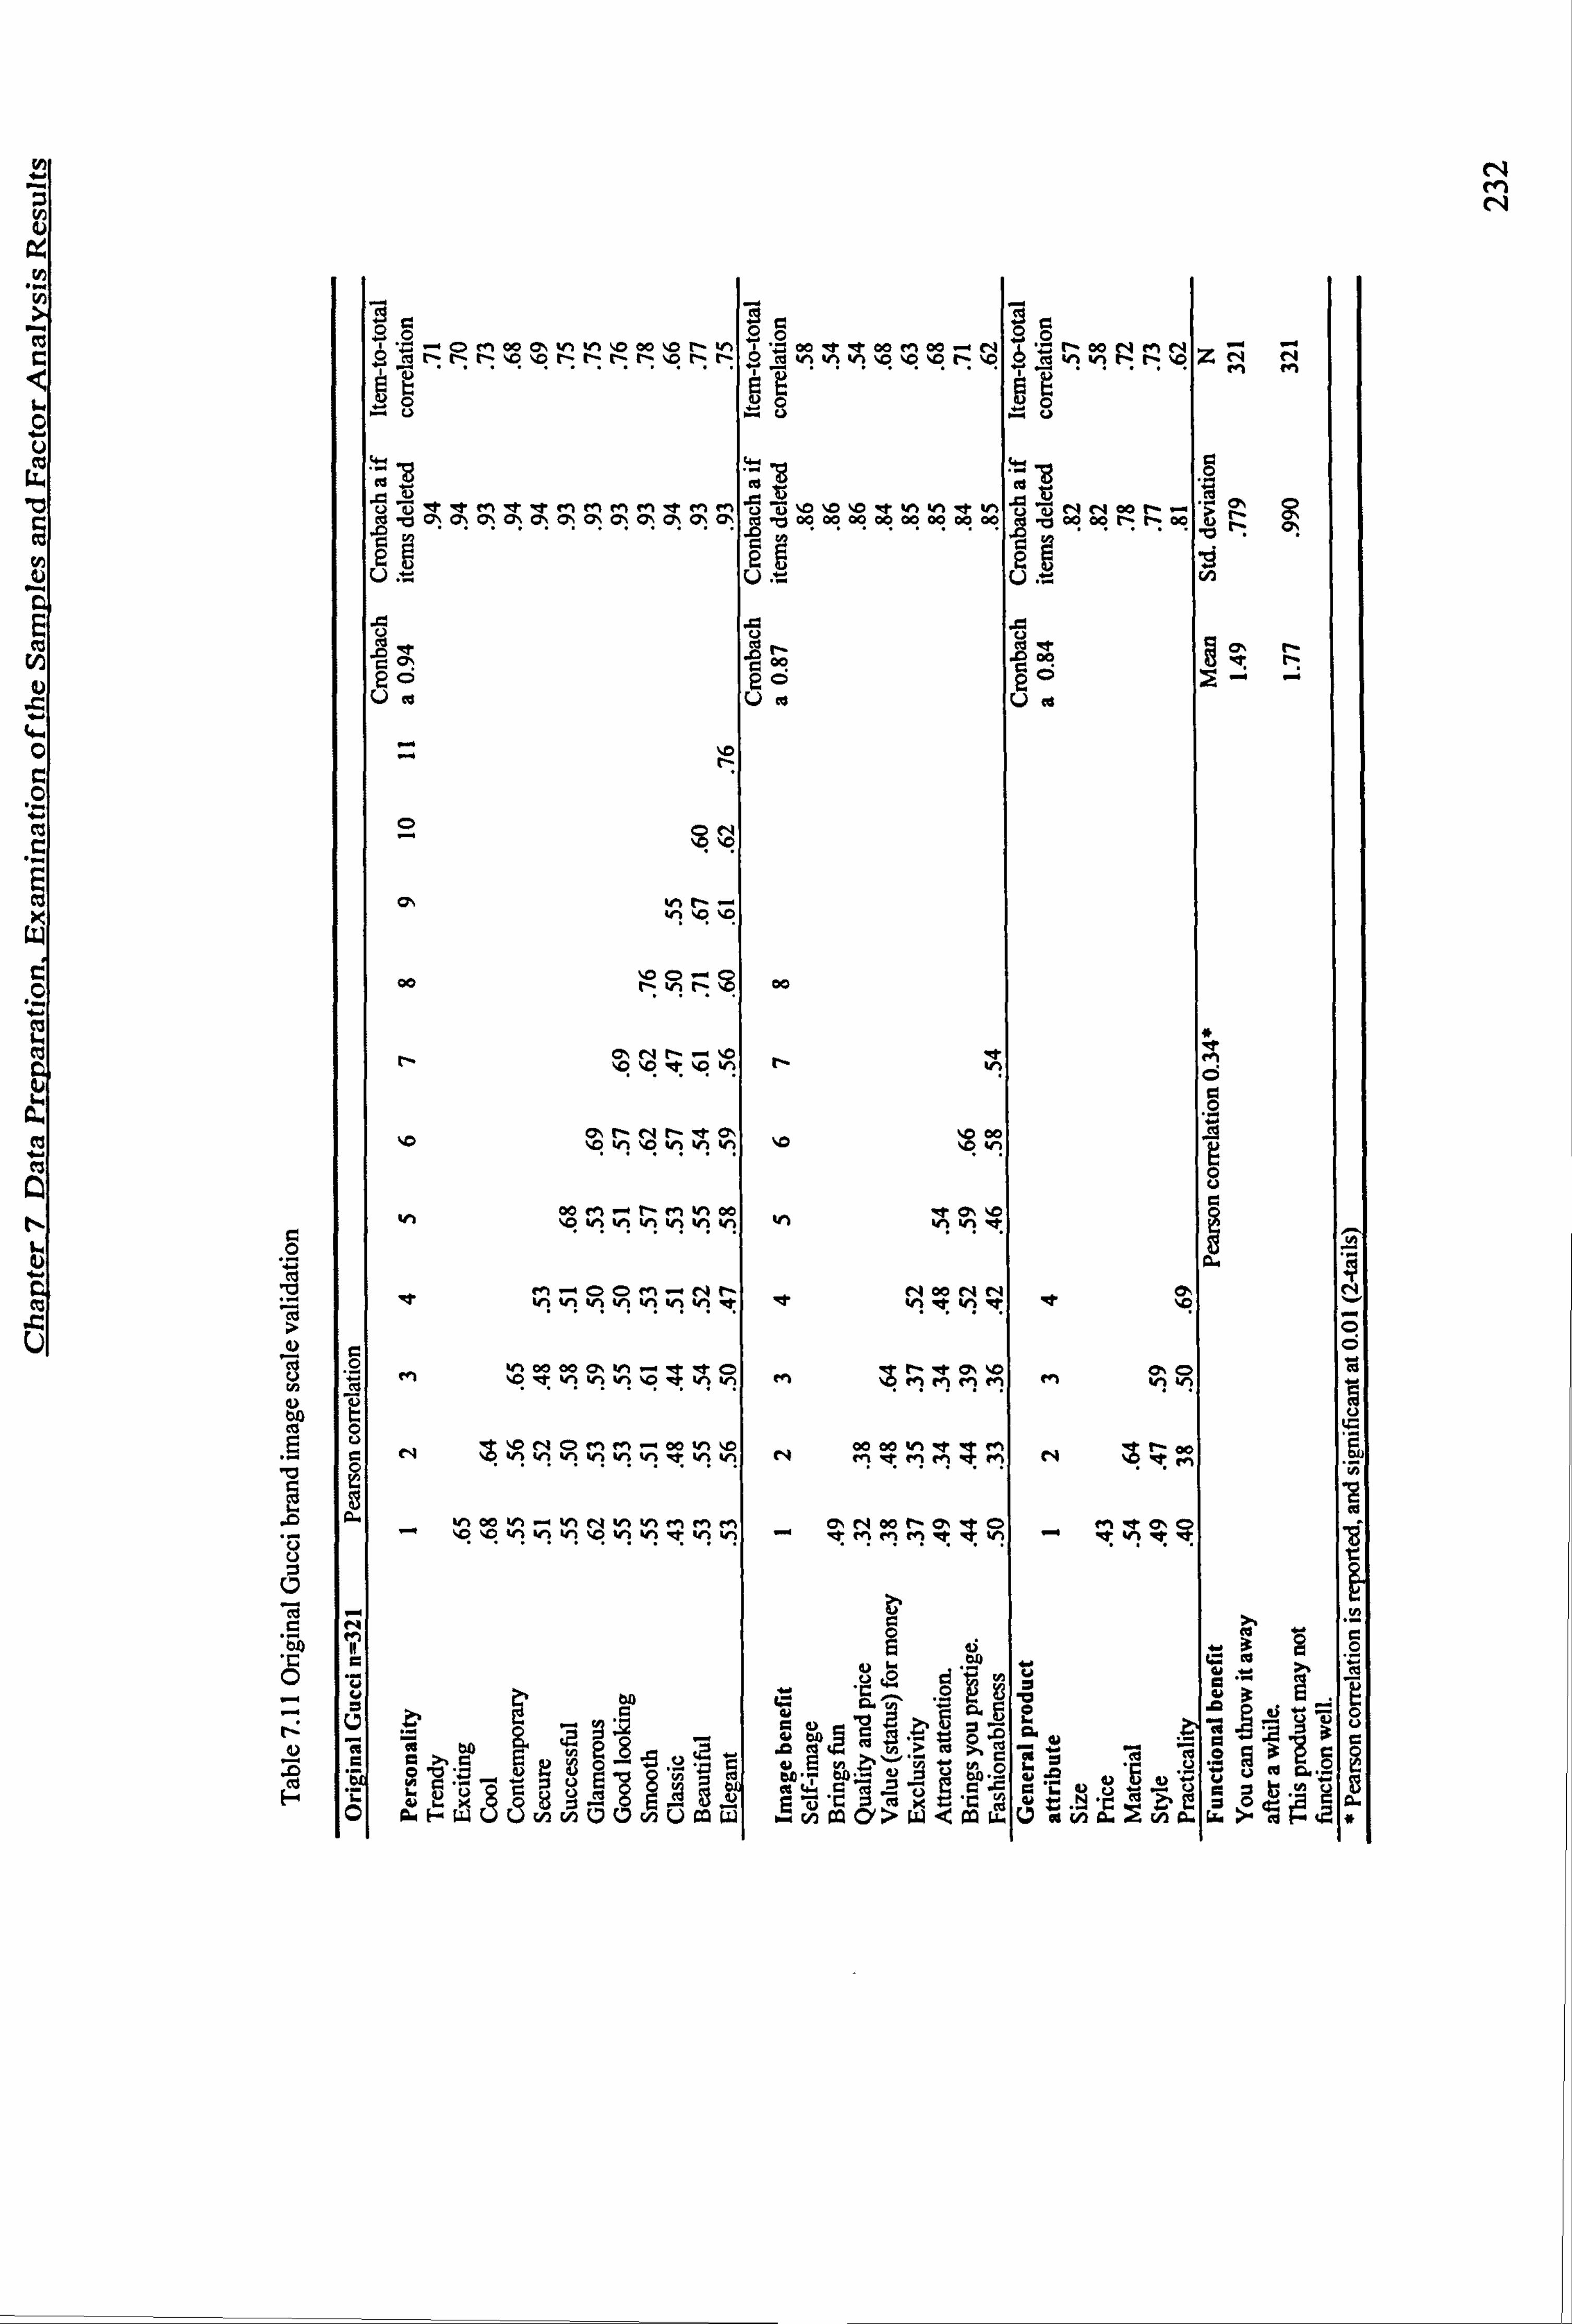
N
fV
C 0
U U
b0
E 'O
Ü U 7
V
C
0
n
U
.D
F
ý ö ý ö 'O Moo Oýýn v1 X000 ýO lýv1
ö 00 eh oo Mo0 N ,ö riceN MN y
aertZ 7oronýýn on c- Ö
dviviv1ýOOýOlýO iv%vi ZNN MM
Np ý
$ 2 'g = 'g Ö ÜdM
'7 MMMM 'R MM eC b Oý Oý Oý dý cý oý bý O. c; T cý T
ýý ýO '7 V1 V1 ÜNh 2
-y og 09 06 00 00 00 00 00 yNN 00 [ý . -ý
ey - 00 00 t1: t1: oo n
> N
bO
ac a? c'° ?r 0 p
0 0 Ü ý~ r ce ýe ýa
N
0 ON
O\ Nn G N IR
.
00 %0 O --+ rrI.
t- ON G ýO
hh b N N
00 M ý-+ tN M NCC N %O NN V1 NN
M --ý O C. M- NN
N 00 00 0% N 'ýt O
W v O. . . n00
V h- - 11 1 i 1 1
N 00 N . -ý NN vl MM "" ýO ýR NN Wi SON NhN
a
Tq6 0Tý Q
ý' y V~Q Cý ýy Y Fý N
aw F. ;nW t7 c7 nQWW
cc
Nh
QN
�Wiý
výivveiv
M et r- O1 .O
.MMMM
00 00 VY 'ef M NM e{ MMM
C, Ioonrn o "t ei MM't V1
Cwo
d býq ca y'
pN
dý ýn ýv"yvý ýHC
E výýi
"r &iiu.
a$
C'
Nn ar 00
- lq: vii ä
ö c 0
0 0 U C. '
M.
a+ C 3°
ä; ý ö
C dd 5i d
mU CC C
M C 7
49-. am Cý zG
. >.
. fr. %
öl ö
C
C 0 U U CQ
L: C.
C.

M M N
ä 'ý lý Oý oo MNOO Oý eo N t- t- t- r- noooo ö
oýnZnn27! viIo
.. o ýo UU
^+ N9c Sl o0 Co Co 0 00 Co oo oo 00 oo rn o± o: o; 0o
a .c CNpý
00 Ud Uö
00
M
b 00 b
l-
1.0 V1 V W) V
lr V V1 f
l} if hh
en N Mr
N oo ll O Or Cyv, v, s ei
4Meo0. Or-r MMMheTe
r. Q
m b0 ý
pvyýi
v°ýC7C7viÜfÄ W ývý0. G1d9oaC11U
öö
eý �O�
0 v; es cc l (Y,
.ono, -. 00 0 ý, bcýnnýcr
r U
A Q Qn
10 Uö
ý vv
Ný c1 N
- ry°Mhv
ä "9 NnbM
4. $ Co J: 3 Z
'. 0 bCo Aoo Co Ü
.ý
m
Qý Uö
00
I
"c ao ýý
0V9
ýÜ N. in ä viä
ÜwvýiÜvn
öd
;n 00 oll o ýýýýzM
4) 00 00 00 00
m ýo ein
>vý Üýö
N
'I R
"a Nný?
WC
CO C
UR
py C
-b ýO h ,2 ýC aü 'C
SOü
3R
'° öt
ro yNR
Q Eý c
Go cý
M ýU.. iU
ýGp ÖÖ"s
WF W! -p UUk. >F-r
Chapter 7 Data Preparation, Examination of the Samples and Factor Analysis Results
that of the `product attribute factor' of the counterfeit Gucci (Table 7.11 and Table
7.12). The Cronbach Alpha coefficient is 0.76 which is classified as acceptable
(Stevens 1992). Moreover, due to the Cronbach Alpha, the coefficient will increase as
the number of the items on a factor increases (Hair et al. 2004), and the factor in this
study only consists of 4 items, it can be argued that there is a sign of internal
consistency. The Pearson correlations are reported when the Cronbach Alpha is not
applicable. The Pearson correlation of the `functional benefit factor' is 0.34 for the
original Gucci and 0.36 for the counterfeit Gucci, which are both significant at the 0.01
level.
The reliability of the scale is further confirmed by the Pearson inter-correlation of the
items included in this scale, which are all significant at the 0.01 level. In principle, the
item-total correlation for all items is higher than the suggested 0.50 level (Bearden and
Netemeyer 1999), with the exception of the `price' item of the `product attribute factor'
of the counterfeit Gucci (Table 7.12). Therefore, to some extent it is safe to say that the
scales adopted for measuring consumers' perceptions of brand image of Gucci watches
is both reliable and valid.
7.5.3.2.3 Original Burberry and Counterfeit Burberry
For both the original Burberry and the counterfeit Burberry data, five factors are
extracted. The eigenvalues of all the factors are greater than 1.0. In principal, the
structures of the factors across two versions of Burberry are similar, with the brand
personality items group in one factor, product attribute items load on two factors, and brand benefit/consequence items gathered under two factors. Moreover, the content of
the factors are not very different. The slight differences are: the `price' item represents
one factor on its own for the original Burberry, and constructs one factor together with
the item `material' for the counterfeit Gucci; both `high quality' items and the
`exclusivity' item loaded on one brand benefit related factor nicely with some other
items for the original Burberry, but do not appear to group with any other brand
benefit/consequence items in the counterfeit Burberry data. The extracted factors
account for 61.84 percent of the total variance for the original Gucci data, and 59.43
percent for the counterfeit Gucci data (Table 7.13).
The factor related to brand personality items is labelled simply as `personality factor', as the adjectives used are all adjectives used to describe human personality. The factor
234
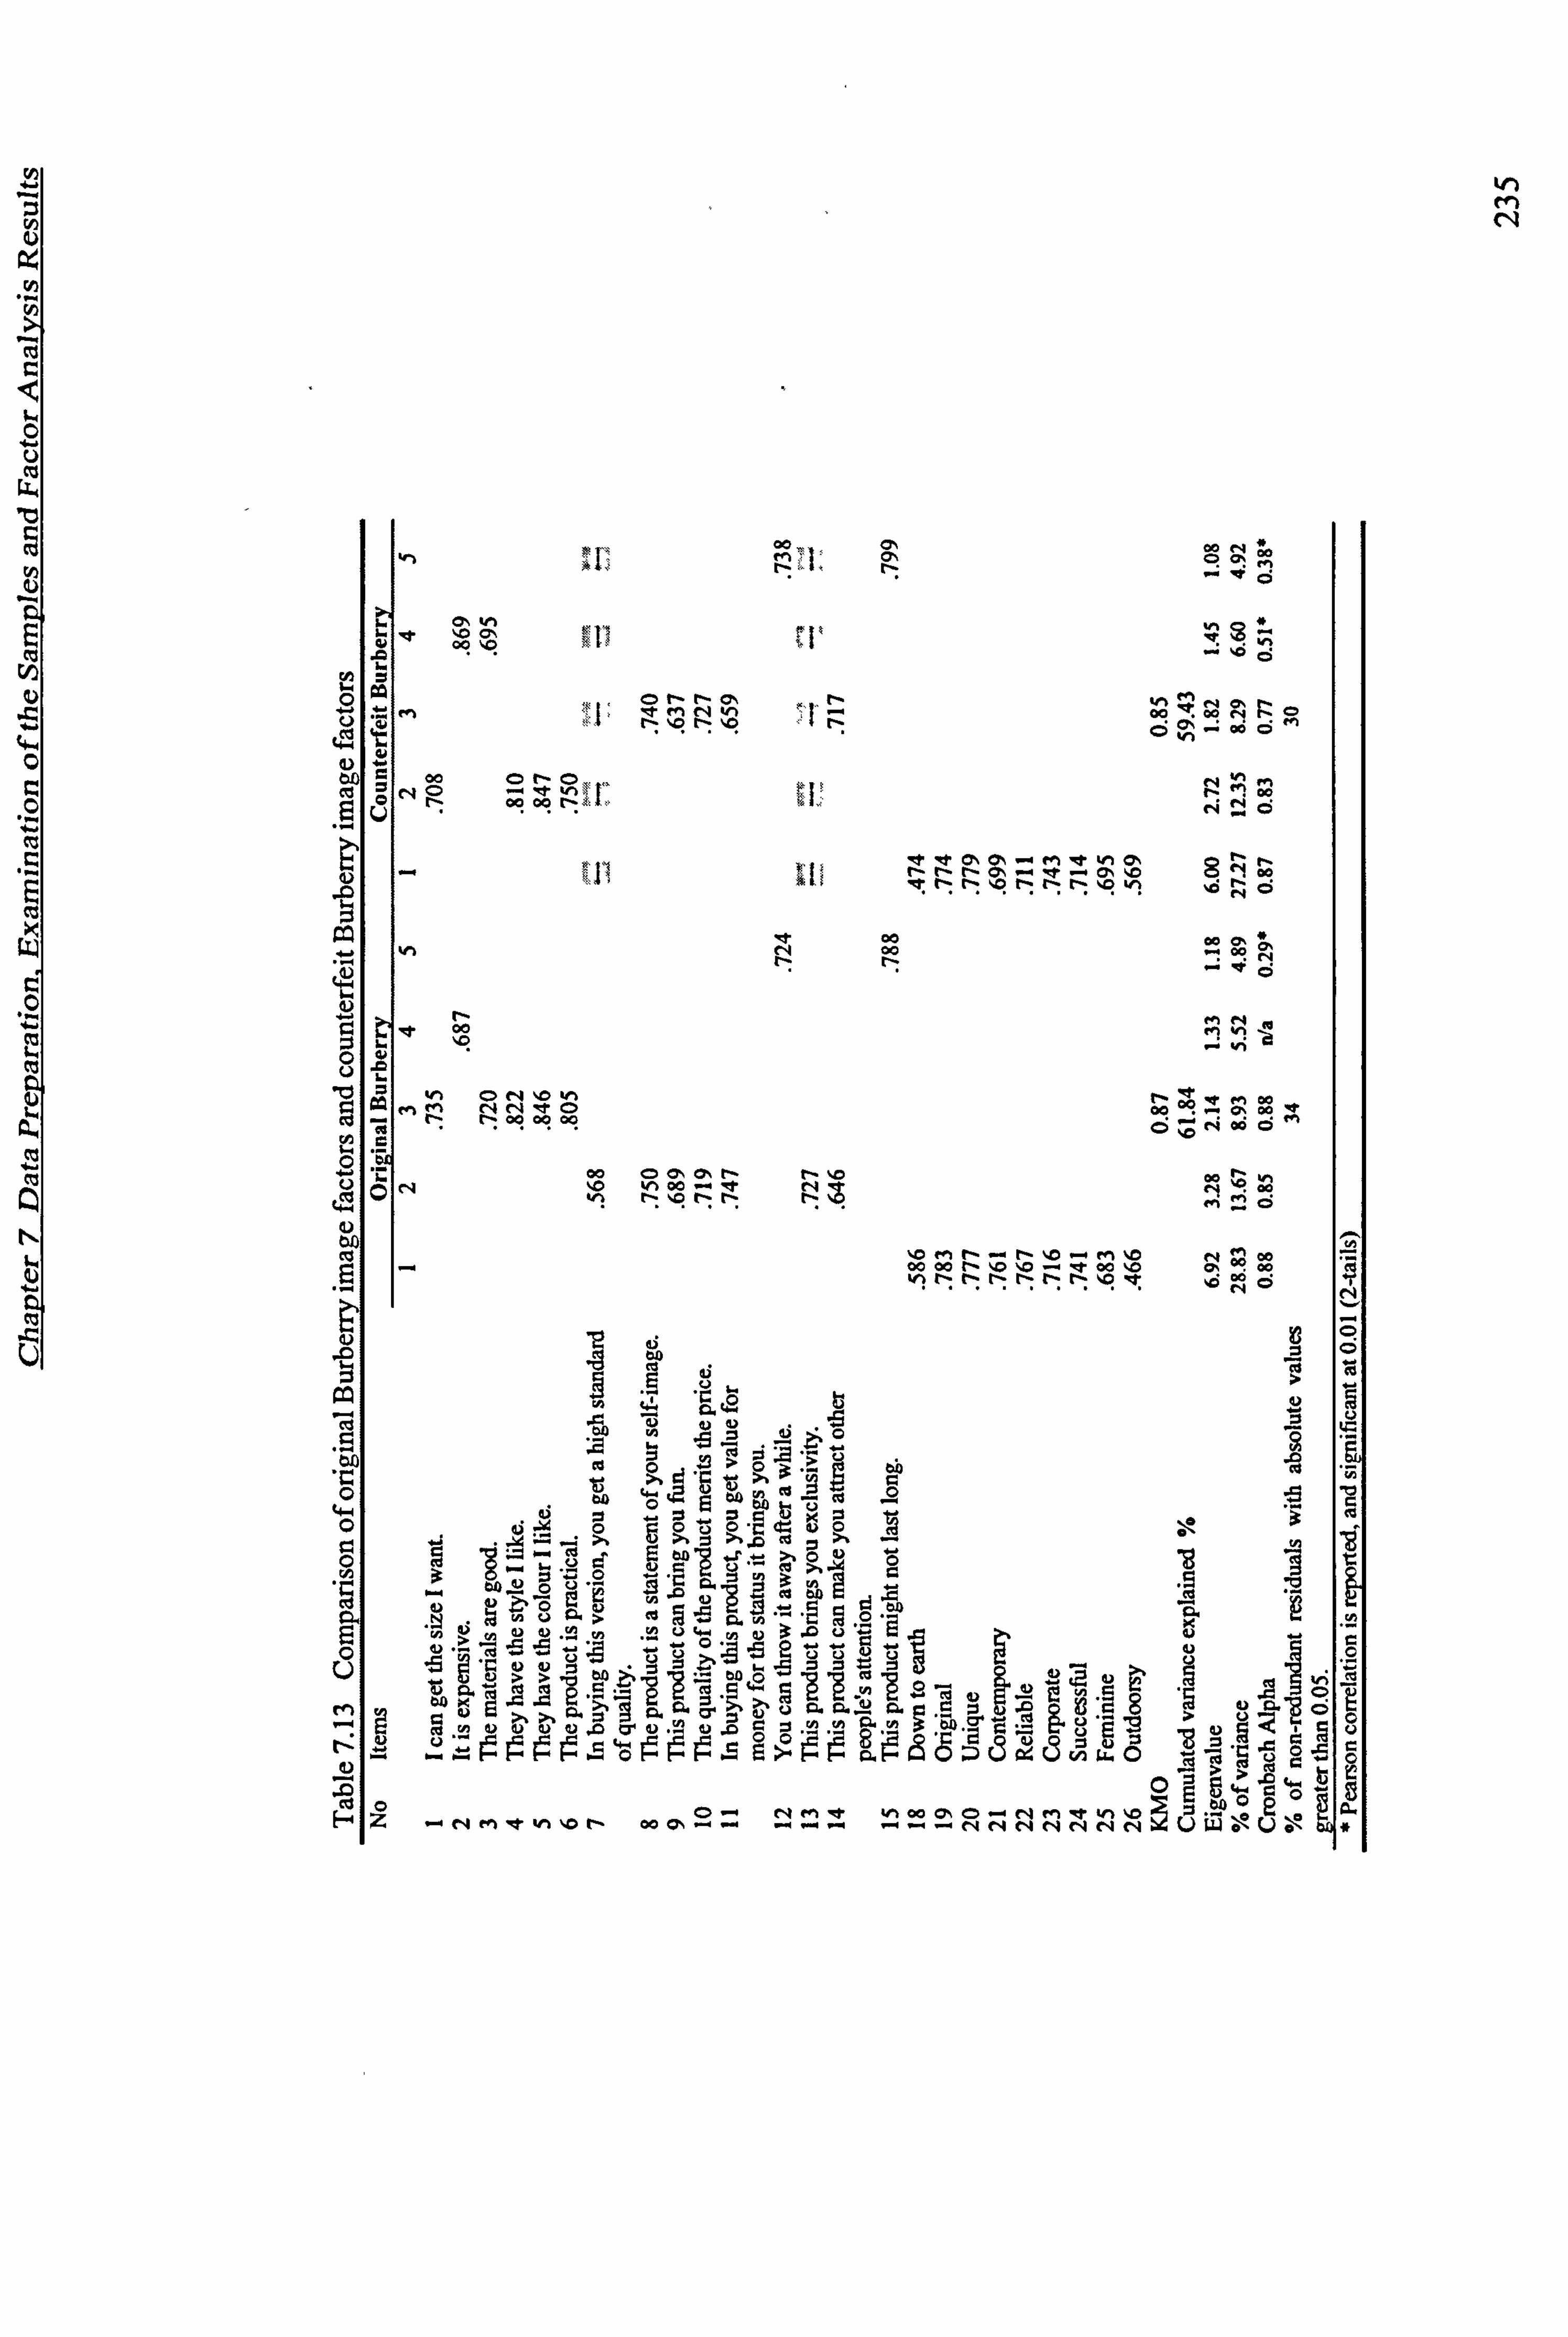
KA M N
h fl
Iý ro0 01
pSNO
0 00 ýO 44ey ýO v1
V ý
ONN 01 NM ,NM `" ,ý lý ýO lý ýO
n"[., N 00 ONO N
.. ýo00
vi
OÜ N ö0ý0. Will-
" i¬! týN
°° C-4 Ö
-It V. a, ON en W1 ON
v co " W 00 N
O
N 00
0h
A
vý ON .O VY N rf 00 MN N000
00 0 C5 0,00 C5 C eV od ö
n ýo �. 00 0 oo
kA 00 N vý°i N.
ONN
4 coo oMO
N 'ö
\Q `S F 0MO
0ä°. 000
A c;
ý id gÜ7
Ayy äi ýa y
ö vý G
d 7c 0
Ir w .VpNVy t0 >. ýgE
iä eNU d ýo 0 C6 w
N ;yN
Ei HNVwNw3v ý4 67
N
CV äý g 0"0- ä. S1Ttj ää ä
ýf Ca 8'E ö 0. )
0. Tc
ld ,ýýNNd .a CI' NNd .O L' 7NN GL N bpD
(ýý+ "-. ý.
' Ü (ý. ' ýdýýä
. °. F°1~S ö
12 S Eý äfý5ÜÜwÖ
°O ""r Mh oo (71 ONM --r In '0 p ý+ Z -N Metvl0NN 00 (71 . -ý . -. . +. -. r. NNNNNNN
ý dw;

Chapter 7 Data Preparation, Examination of the Samples and Factor Analysis Results
related to items such as `size', `material' (not included in counterfeit Burberry), `style',
`colour' and `practicality' is interpreted as `general product attribute factor', while the
factor related to `price' and `material' (only in counterfeit Burberry) is named as `price
factor' due to `price' either represents a factor on itself or it contributes more than the
`material' item in terms of formation of this factor. The factor strongly related to `high
quality (original Burberry only)', `self-image statement', `fun' `quality and price', `value (status) for money' `exclusivity (original Burberry only)' and `attention
attracting' are all associated with a kind of purchase benefit related to image, therefore
it is interpreted as `image benefit factor'. Following the same rule applied to Rolex and Gucci, the factor related to `disposability' and `functionality' is named as the
`functional benefit factor'.
Whenever the Cronbach Alpha is applicable, for all the extracted factors across both
versions, the Cronbach Alpha coefficients are higher than 0.80 with only one exception
of the `image benefit factor' of the counterfeit Burberry (Table 7.14). The Cronbach
Alpha coefficient is 0.77, which is classified as acceptable (Stevens 1992). Moreover,
due to the fact that the Cronbach Alpha coefficient will increase as the number of the
items on a factor increases (Hair et al. 1998), and the factor in this study consists of only four items, it can be argued that this is a sign of internal consistency. The Pearson
correlations are reported when the Cronbach Alpha is not applicable. The Pearson
correlation of the `function benefit factor' is 0.29 for the original Burberry, 0.38 for the
counterfeit Burberry, and 0.51 for the `price and material factor' of the counterfeit Burberry, which are all significant at the 0.01 level.
The reliability of the scale is further confirmed by the Pearson inter-correlation of the
items included in this scale, which are all significant at the 0.01 level. The item-total
correlation for all items is higher than the suggested 0.50 level (Bearden and Netemeyer
1999), with an exception of `outdoorsy' of the original Burberry (0.40) and `down to
earth' of the counterfeit Burberry (0.37). Therefore, to some extent it is safe to say that
the scales adopted for measuring consumers' perceptions of brand image of Gucci
watches are both reliable and valid. Results are presented in Table 7.14 and Table 7.15.
It should be highlighted here that the ̀ high quality' item does not group well with other items in any cases other than that of the original Burberry. Therefore, as can be
236
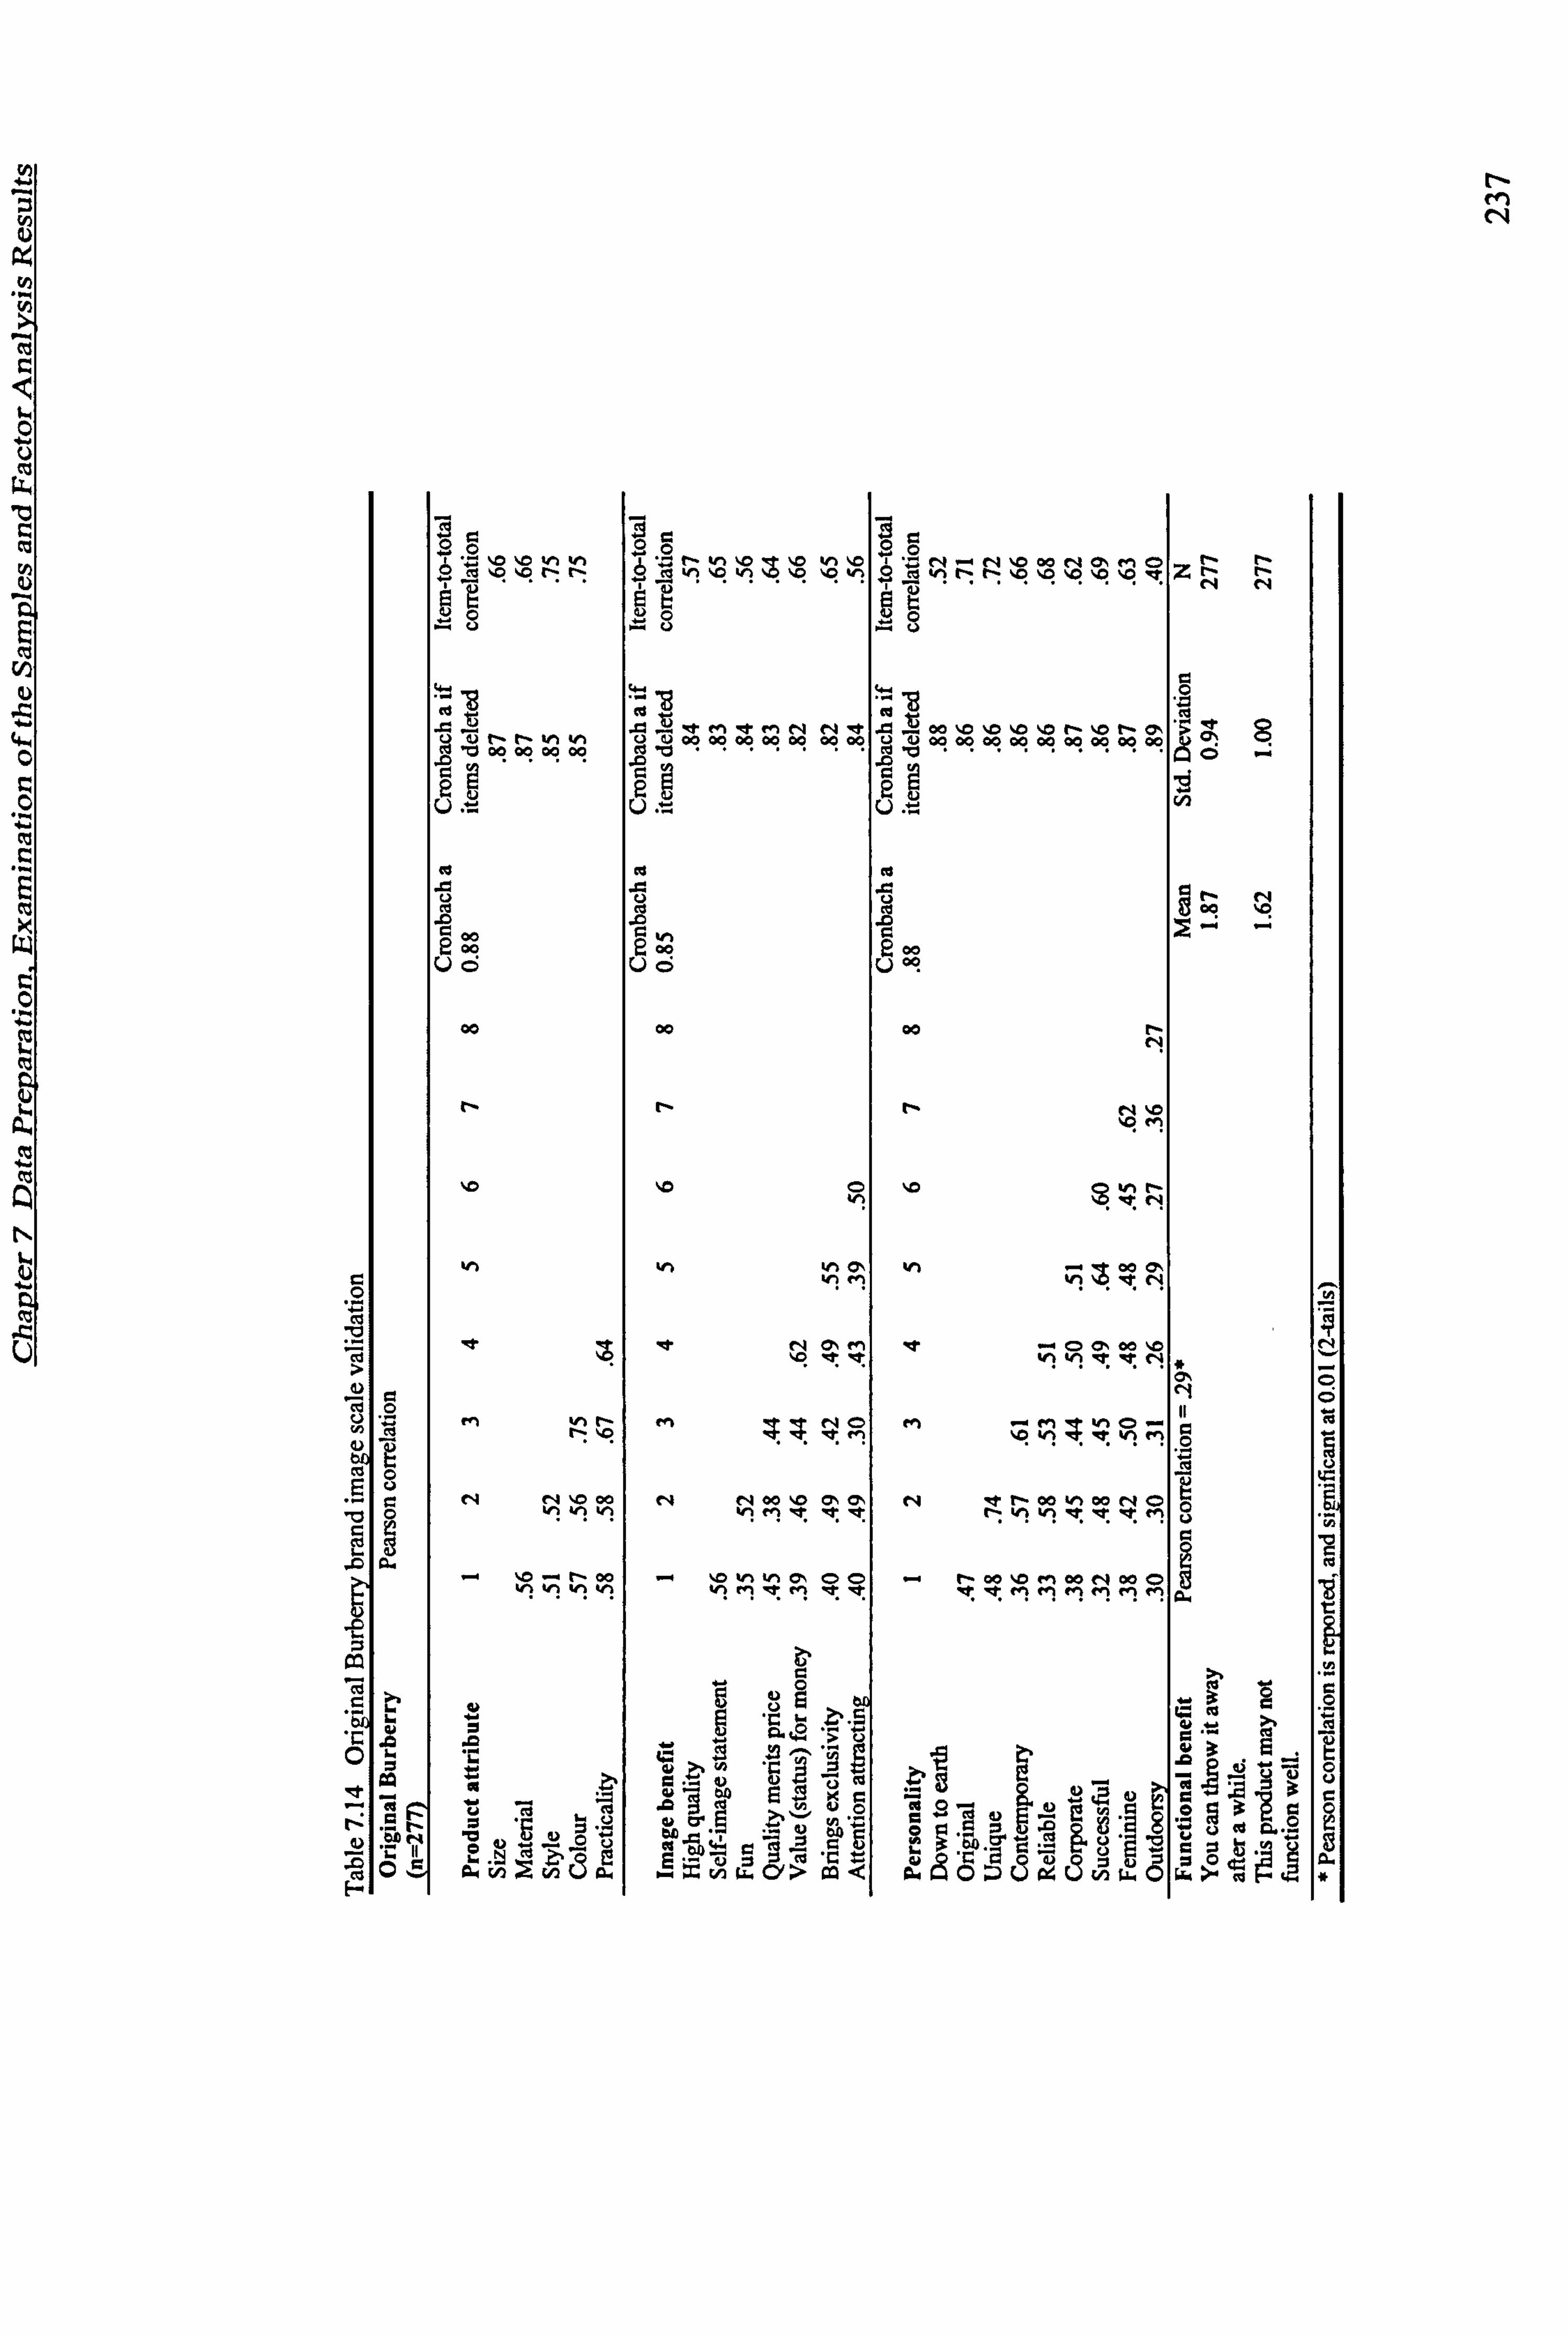
r- M N
io
U G O
, io.
I d 0 ý4 7
Qa
O
I-
Qr ýoo000000 D ^o co 00 co 00
0 U d
0Q
F 00
Uö
00
r-
ý,
W) r-
NNNN
.. ýo .. r t- 00 hh v1 vi
Y
I- ü is
'fl O
cw v2 U V2 (3
Ö
[ý %r ýO ýO ýn ýO ý" 'ý NN ýO o0 N O, ein C 4-22Z-eZ ova i ei z ýoýo oýov
Ü .rÜ
w..
7 'V'M0MN Ný J7 090
ý0g0000 tl
ý oO 00 00 00 00 00 00 vN 0 c0 00 00 0 00 00 00 oc
a ýe V
aa
00 1 00 N
NNN 'C ýO e+'
ýD N 'O \D 'hV'
li ei
NM le -O (> oo .C lo ixt v1 v1R nth
MV NN OMN V'b le:
O
NN 00 ei t ''OO VT's
N rlý
N 00 I 00 NC
- ýo V1 *n C00-N 00 .bM 00 N 00 C h Mý M 'V'V ýt QMMMM H1 fý
O0t, ECpý. s
d OQ
AV ýj
aý Kö Ng 12
ýýdýý ýa "C
ýdý . Co.
ä C "d t" ý
.. xýwa> ma a$oacýacýý ýý
ZN N NN
C O C
Äý ti
iýý
a Cl II ö
0 0 U L'.
a
ý3ä
eýaa "v V ty p�O

00 M N
Oý O vý Oý v1 NV `q 'ý r- 00 00 N v1 O+ eý p tý lý Ö iC ýn týtýýD Ö id v1 vývnvl vl b iaM ýO ýO ýO ýO ýO ýO ýO V5 "ý-. N N
wwwÖ
ell %n -Ir 'n W1 ýc W "0009 NNN Cl 0) boo oo 00 00 00 00 00 00 09 Qä>ý `
Ü U. - "N
Cl cd . CI 99ä
lei H
vv Üö Üýö 2
N.
00 00 00 ON M
h Vf M
V1 Mh V1 hNV
OMC VN'1 M Ct C
00 Cl q
NM `ý tMhh `ýt h' VM IO
cti Uq
tri 00
q
NU NqNNN1MMNNNV1NMM fp
ld "
I0. M. +010 NhMlz V1 QOM1ý Nh 'ýt 'ýt M V1 PNMMN H1 ^; iL
0
ýQOýÖ
yNV. NOE 'C O. E y ., ý.
e4 u R. WÜq. 0a II i. y; sJ L° .
q' C al tý0
ýrJ . -Ui Ü
Vpd mod'
Öv
4i q id .. 7. Ni bD. a 72 00b
. vl U
,,, E- o: vivj Q avýw Y>Q äÄÖ. 7ýÜwÜýn fUrýý ý ý2
ýNNI
ü ci (: `
]cc
3r
tý I
11
CU d ý"ý
C OQ
V .r ,c L iF- *
Chapter 7 Data Preparation Examination of the Samples and Factor Analysis Results
observed, it did not appear in any factors in other brands. This result seems
contradictory to what the focus group data suggested. One possible explanation could
be that all the other tested items are very much specified, whereas the `high quality'
item is too general. Therefore, it is more likely that it is significantly correlated to most
of the items. Consequently, this item shares very low common variance with other
factors in most cases. If this is the case, then why dese `high quality' load well with
other items in one factor for the original Burberry? The researcher is obliged to admit
that it is beyond her capability to provide a sound explanation. One assumption might
be that it is something to do with the nature of Burberry brand itself. For example, due
to the brand image of Burberry being heavily contaminated, consumers do not perceive
much emotional benefit associated with Burberry. At the same time, they do not
perceive Burberry as possessing high quality. The perceived benefit perceptions might
achieve a high level of consistency. As such, these items load nicely together. Another
explanation this research can provide is that the unexpected result might be caused by
some kind of limitation of the research.
7.5.3.2.4 Original Louis Vuitton and Counterfeit Louis Vuitton
Following extraction and Varimax rotation, four factors of the original Louis Vuitton
and five factors of the counterfeit Louis Vuitton with eigenvalues greater than 1 emerge
from analysis of the brand image and accumulatively account for 62.71 percent of the
total variance for the original Louis Vuitton and 64.14 percent for the counterfeit
version. Factor loadings of individual brand image items in relation to the factor
solution are shown in Table 7.16. All personality related items gather in one group for
both versions, and brand benefit items load on two factors. Product attribute items
group in one factor for the original Louis Vuitton, with `price' splits from other items
and `material' item cross loads on two factors for the counterfeit Louis Vuitton. The
`material' item is discarded from both factors of the counterfeit version. Therefore, for
the counterfeit Louis Vuitton, the fifth factor is comprised of one item - `price'. The
fifth one-item factor is kept due to its high factor loading (0.87) and price is also
considered to be an important influential variable in consumer decision-making. It is
interesting to see how it influences consumer likelihood of consideration and purchase
intention of counterfeit branded product. The `exclusivity' item is also dropped, as it
does not seem to fit in well with any factor for the counterfeit Louis Vuitton.
239

0 NT N
00 Nw oo O Go Ch
J° y
O eß'1 ýO O of x 00 00 'p Qty, ý, ý00 00 Vif= ow Go %0 y Výo000 N NTÖN
ý 00 C' M v1 Cl V1 ma ooooýnvn"rn ,y.
UNý ýD ýO IýIýIýtý Nd
00
N1
eO yý 00 ON ný ý+1
ýo n N C' Nn F4 00
C4 cs p Oý
ýN
. 21 r- 00 C> W) ID (71 LN °gnnn411 00 ný
A --0; o fV ,
'ý Ö
eý O D
'0 0ONNnnnh0
fl1i 00 tÄ
p 0. ^+ .. d.
ems ä. ä ýö°" ° 42
. '.
" ' 4
p ÖO ýJ' U .rU ý"' vl NPUCU wd vi d3
ýyJ aý
o' öý ji
U i
t. 0 23-
CUUUU ý' d .oCR. wyav, v, vi
: ° ~ Eý ä 21 � ~3 c$ aö
n a a =Ü y. Cý
''. . ;1 . , 5 1 1 r i ý w E u C
ýW
_O
ýW
Ct
0.

Chapter 7 Data Preparation, Examination of the Samples and Factor Analysis Results
As the contents of extracted factors across two versions are very similar, it is possible to
interpret the rotated factors simultaneously. The first factor is strongly related to the
variables `statement of self-image', `fun', `quality and price', `value (status) for
money', `exclusivity' (original Louis Vuitton only), `attention attracting', `prestige' and `fashionability' and could be described as indicating `purchase image benefit'. The
second factor is strongly related to the variables, `size', `price (original Louis Vuitton
only)', `material (original Louis Vuitton only)', `colour', `style' and `practicality',
which suggest a `general product attribute factor'. Factor 3 is strongly related to
`trendy', `contemporary', `sucessful', 'upper class', `feminine', and `smooth' and can be interpreted as `personality factor'. Factor 5 is strongly related to `disposability' and
`long lasting', which indicate `functional benefit factor'. For the counterfeit Louis
Vuitton, `price' represents one factor with a relatively high factor loading (0.72). This
factor is labelled `price factor'.
For all the first three emerged factors of both versions of Louis Vuitton, the Cronbach
Alpha coefficients are higher than 0.80 with the highest one reaching 0.91. The Pearson
correlation coefficients of the `product life factor' are 0.35 for the original Louis
Vuitton and 0.39 for the counterfeit version, which are both highly significant with a
level of 0.01. In addition, the Pearson item-total correlations are all above the 0.50
benchmark suggested by Bearden and Netemeyer (1999), with the exception of 0.49 for
`price' of the original Louis Vuitton. As 0.49 is only slightly less than the suggested 0.50, it is decided that this is acceptable at this stage. Based on these findings it can be
argued that the scale used to measure Louis Vuitton brand image is valid and reliable. See Tables 7.17,7.18 for details.
The exclusion of `material' item in the extracted factors for counterfeit Louis Vuitton is
theoretically interesting, as one would immediately assume that material is such important factor of `product attribute'. Two assumptions are offered here. First, this
might have something to do with the nature of the counterfeit branded product. Secondly, it might be caused by the way the material attribute was addressed. More
specifically, it is too general compared with the way other product attributes were expressed.
241
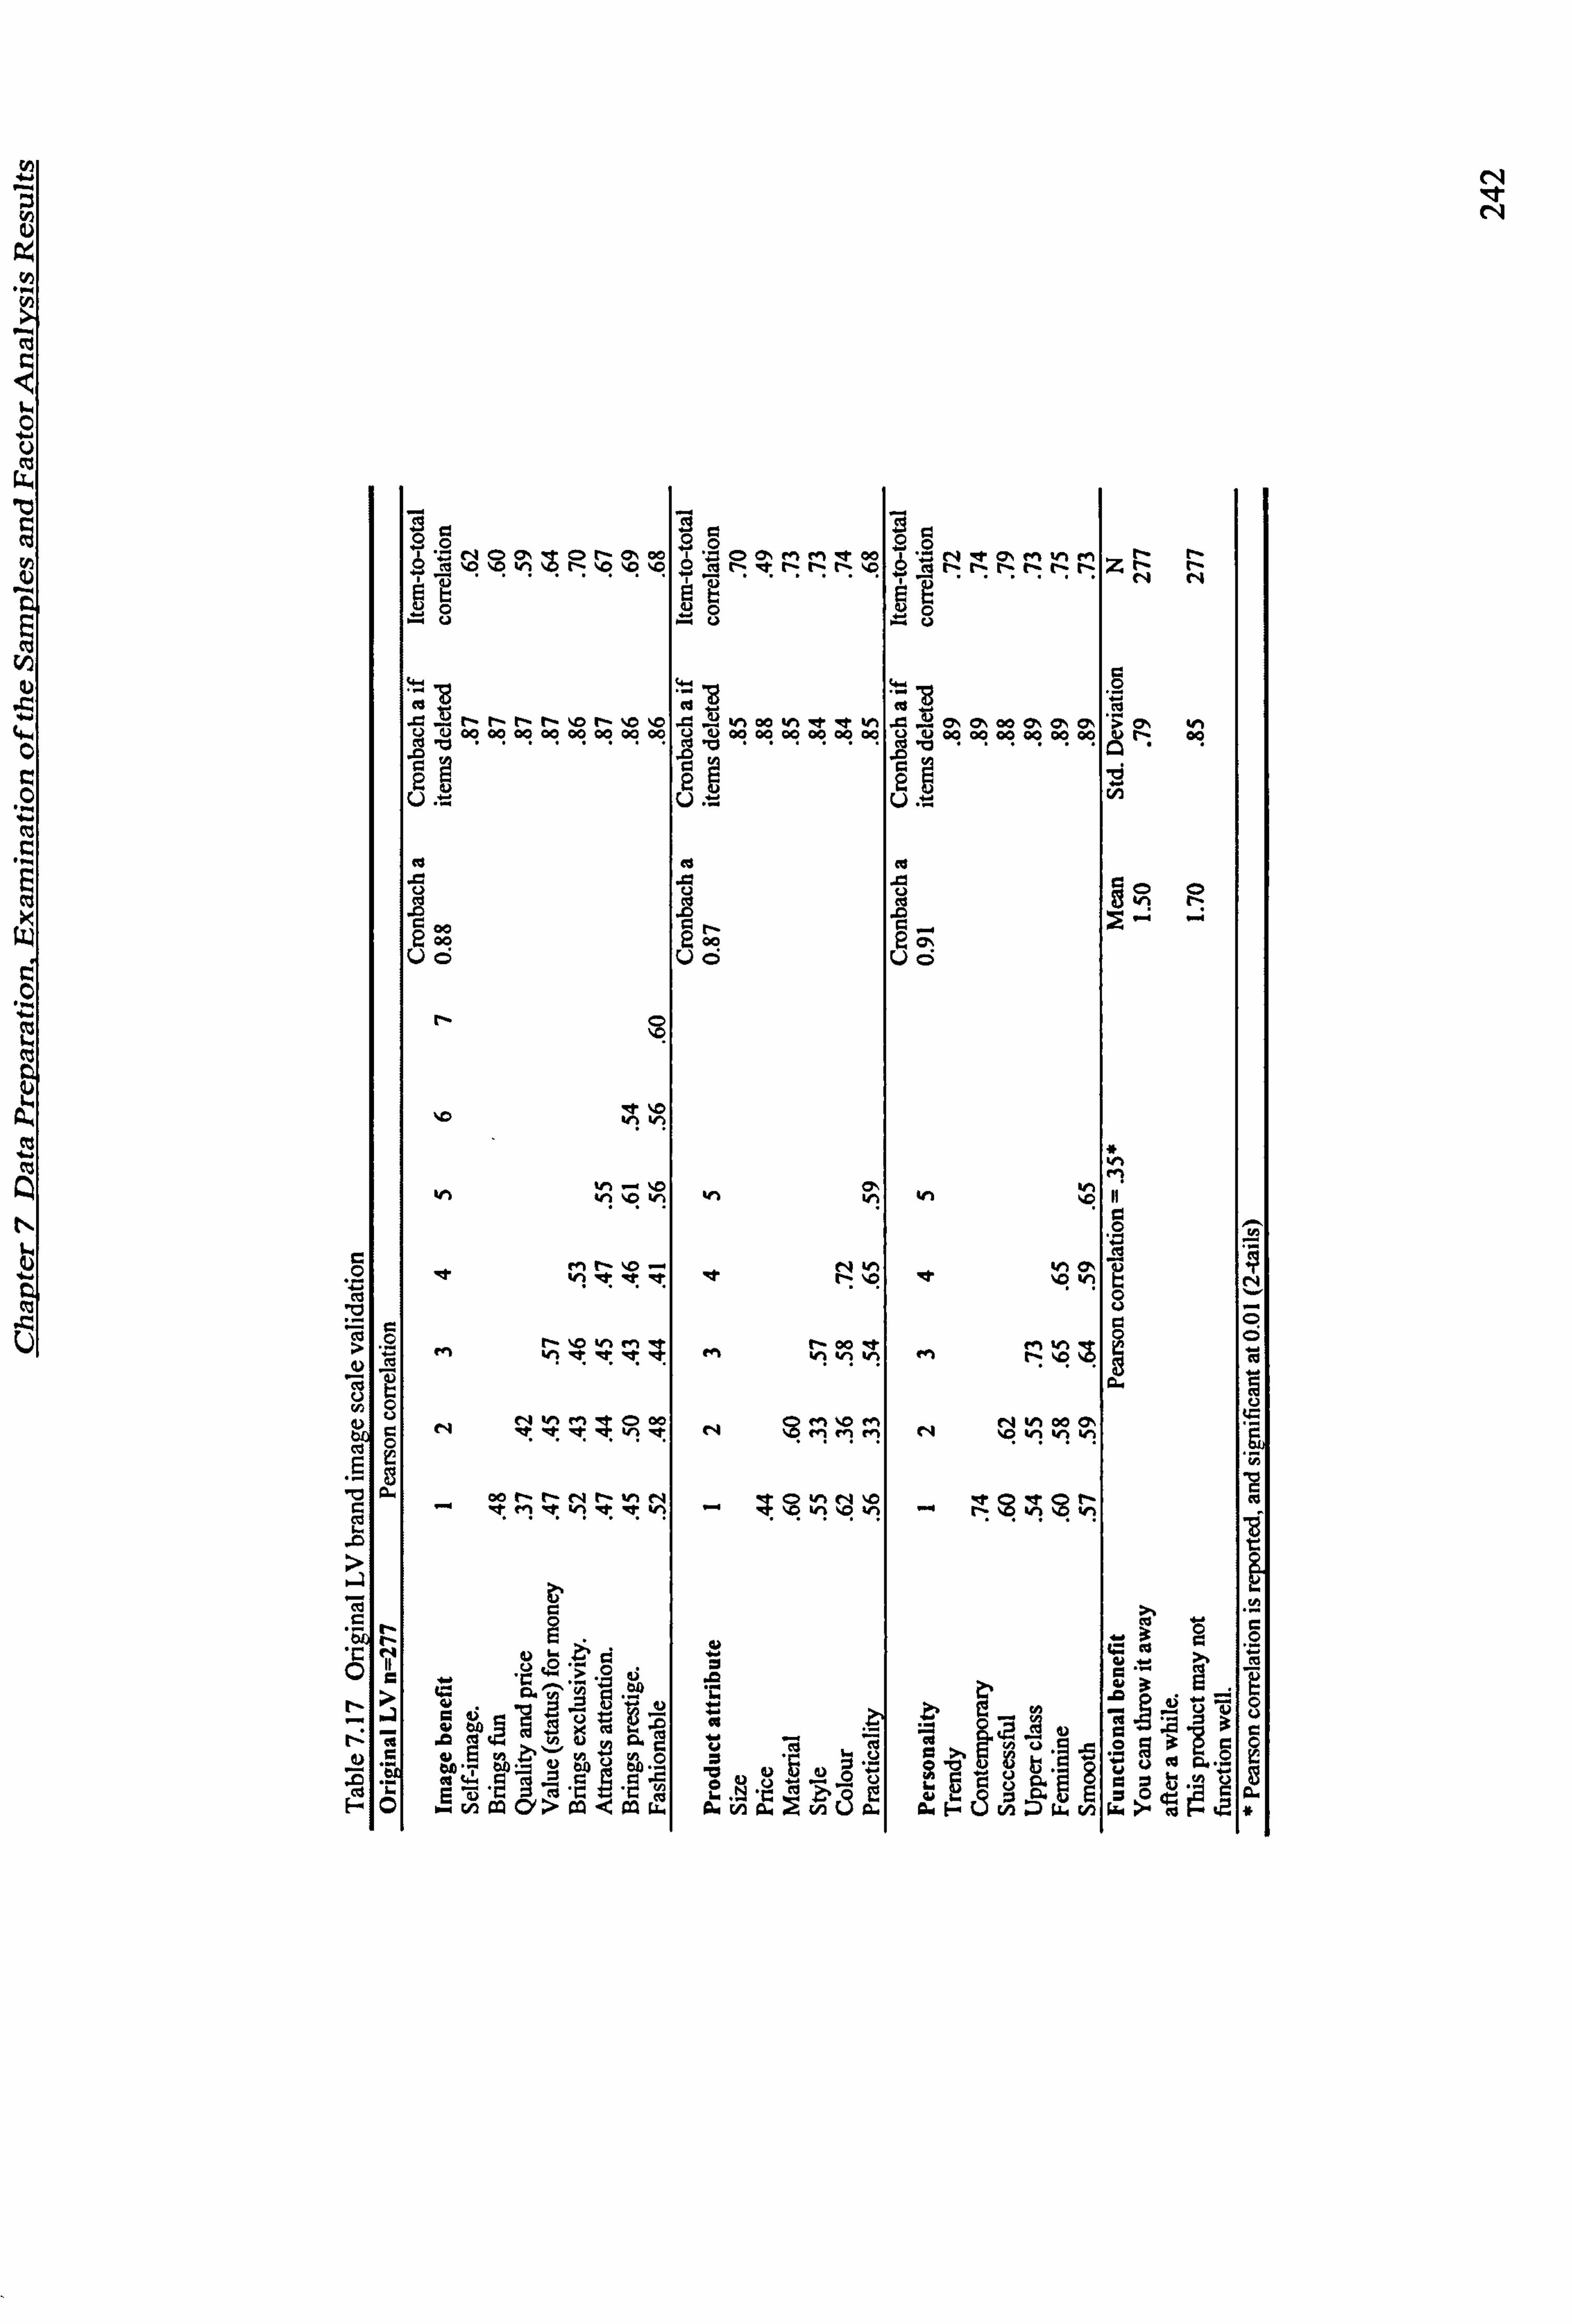
N 'Rt N
0
C 0 U
O
Cr
N N IIC
HÖ
a700 MM .,
R
°NýrnMVýM znN ýb tý NN !ýNnNN
t- r- r- ýo t- %0 ýc 0 wlt It It km J2 (71 ON co ON ON as C), b 110 00 00 00 00 00 00 00 00 00 0O 0o 00 00 L) 00 00 00 00 00 00 N 00
-2 i
'o 1 ti
Din o 1
.02.4 .4 209 8-9 Q G, Uo
N
hWý
M
ýn 4n 'ý viiýöv`ý vii o II
o
pO
141 V "V 'ýt M vet. h
let M Iý ýO b id 777x333
pU ää m <D Wi"
ý MMý !V Nýo00+ N IIR Ui NO
00 N nInN O'b etp etp P t(00 MR V1 V1 V1 V1 vi
F. yýqO
yO
.GCF..
iO
ý+ CwN=
V"'
-c03.
C Ný bI'.. "d3 U rn .. d. ÜyU
wuw Fy ý ýr o3äo
.. ha, a>a, aa, w O(6 a af-Üv, ýwrnw>» go
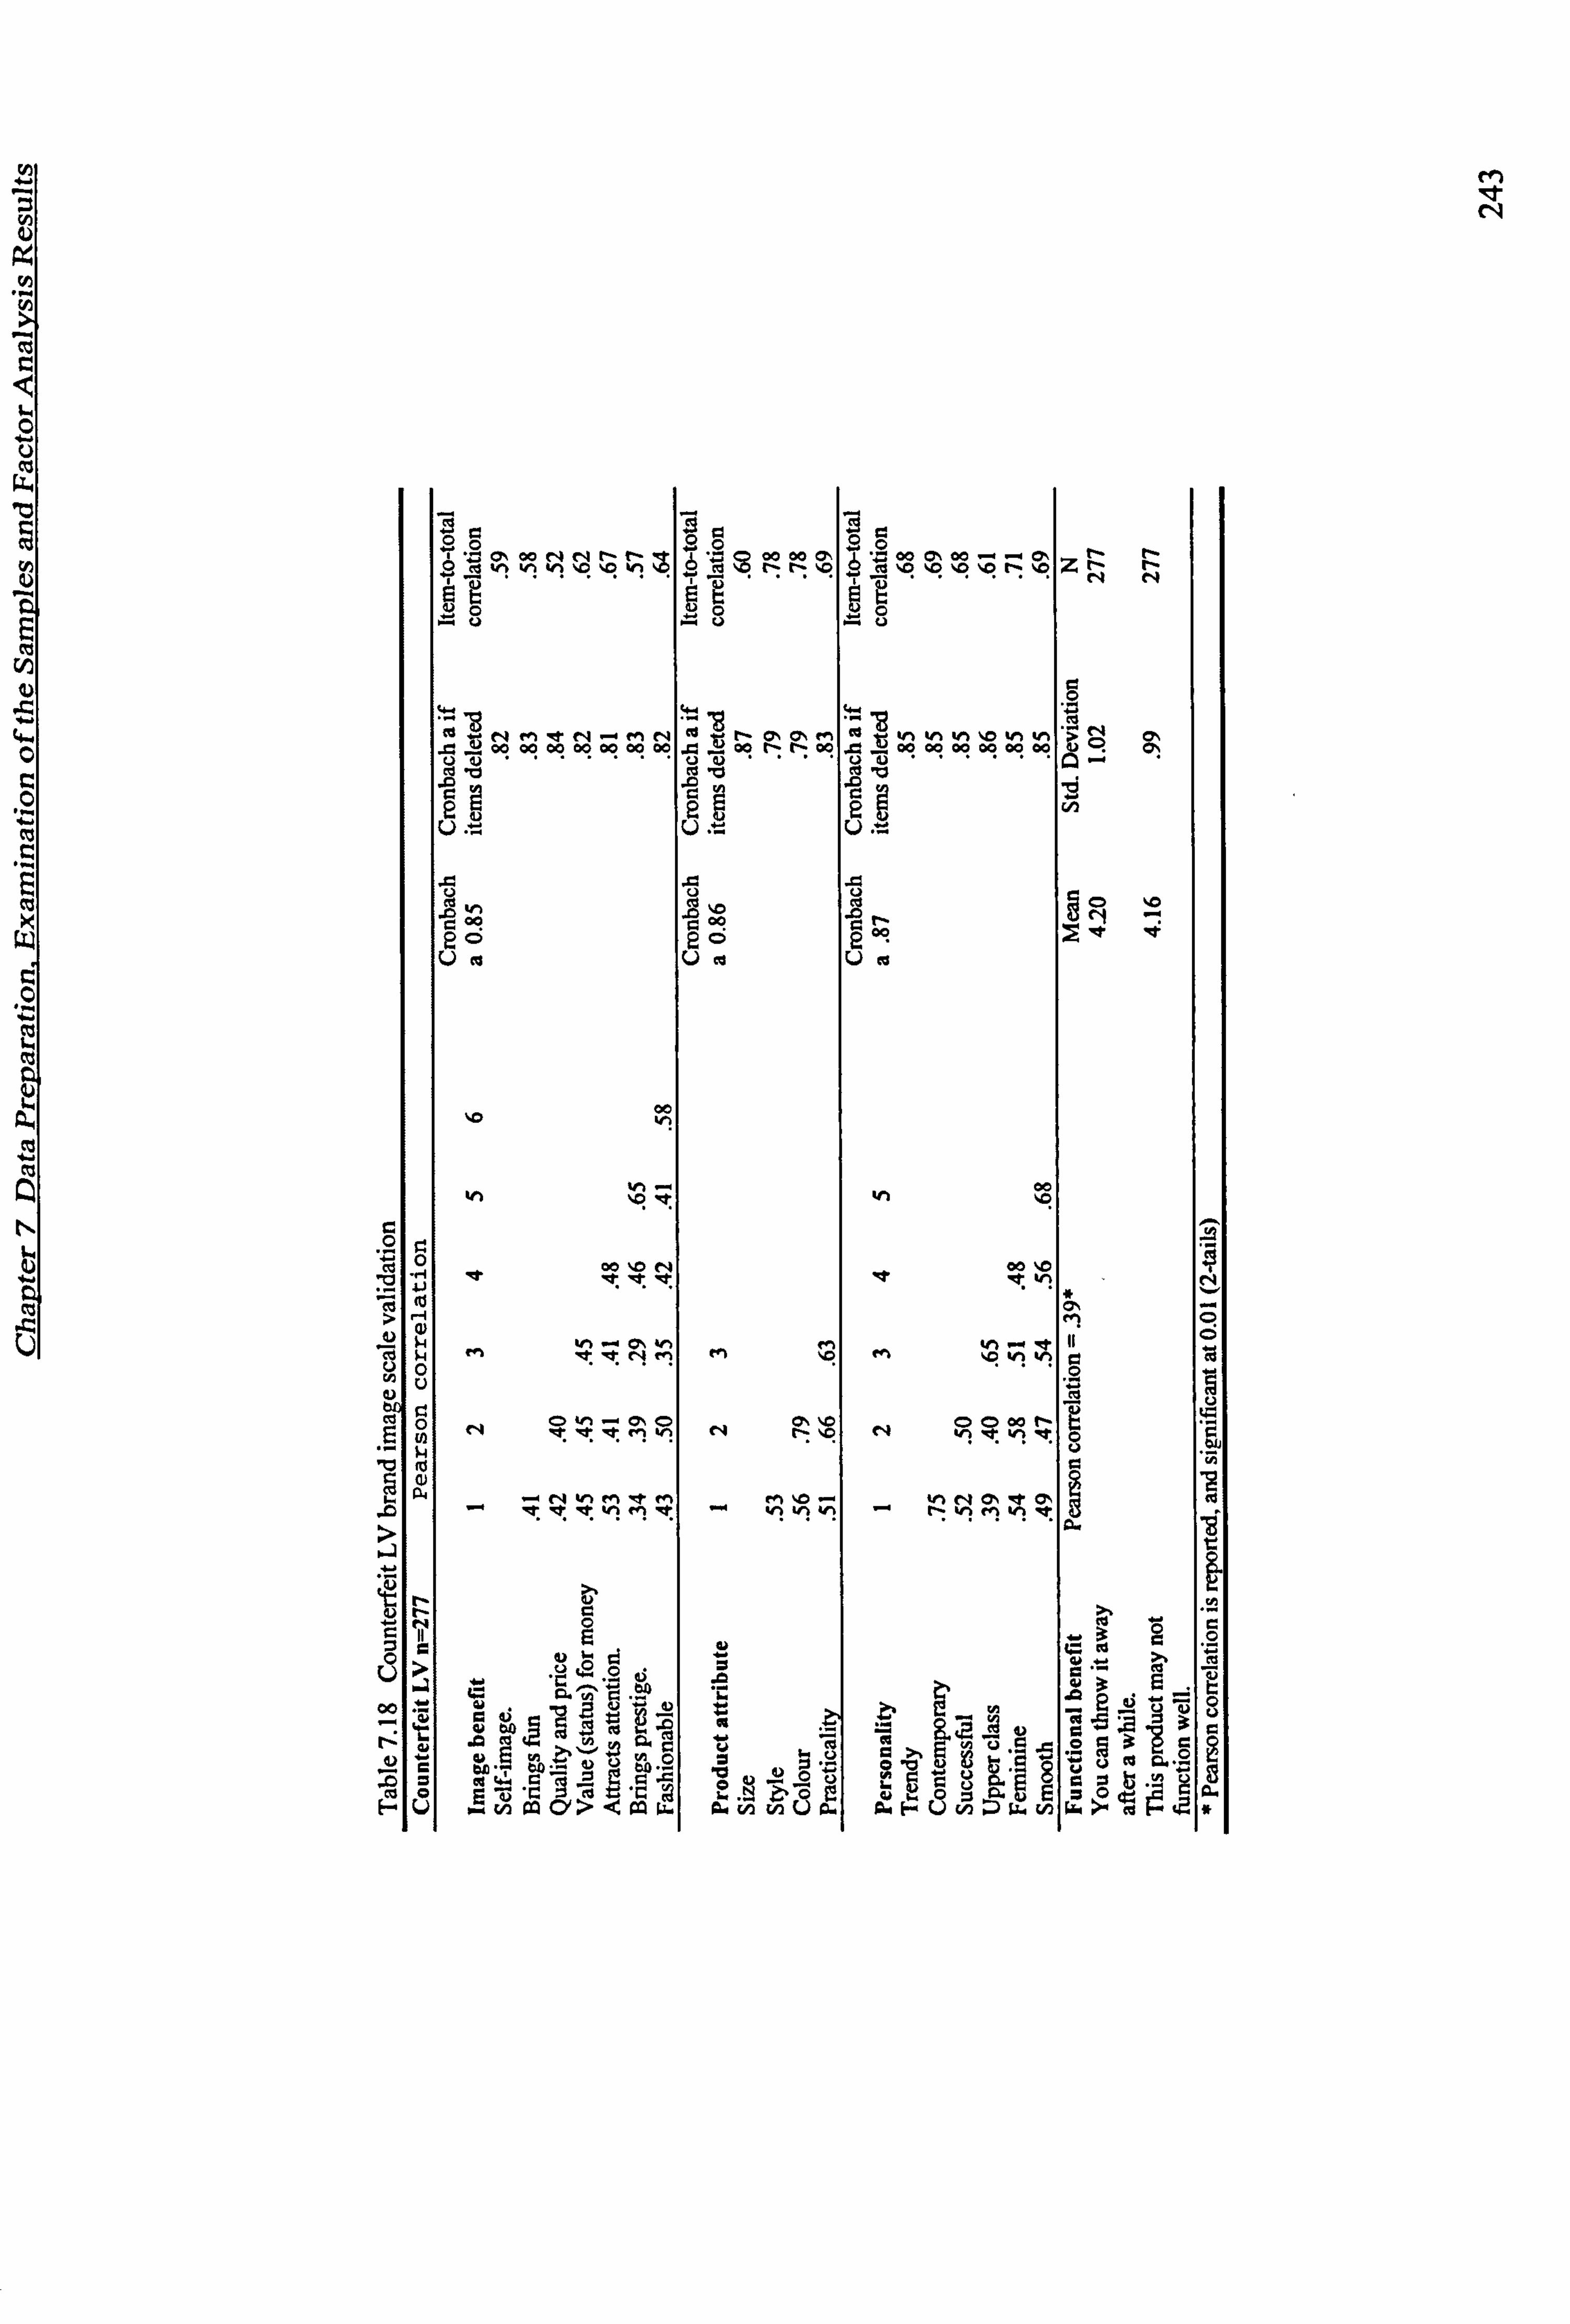
M le c9
O
U
b
c 0 0 U
H
et O, ooNNl- t- cýýd v1 hh ýO ýO N CO 6 *, A ýý ' *, ' cý t)o Gg0,
. 0000000000I. 9SOSS00
Ä
j U U
D ýO
?O O
'C
M ýV
7N
a42 Od
4 äy 4. a
0 11 ý era b0' ý CD
ýyV Oi
--i VI Qýa. 7 W
00
ro
N N N Iý
a
d C 7 O U
M
N (> IC
-hh V1
Goco0000000I 9.0 uÜ
Uc
tn 00
00
.- N
N Nfl- 0 "It Vi
C4 ON In 11
C ý
+U OU "" - ý ä L G7 U ä, E cLn iÜ ä. HÜvýýw
NN
. e4 L) Cä
, "N >_a v
U to >, 1ý d3 E_ °' o_C ýdÜ
ö3$c I ea . c ýi "y `8

Chapter 7 Data Preparation, Examination of the Samples and Factor Analysis Results
7.5.3.2.5 Key Findings Related to Brand Image
The brand image items were generated from a variety of sources and further tested using
focus group discussion (for details please refer to Chapter 5), in order to minimize the
number of items included in the questionnaire and ensure their relevancy. It appeared
that the previous effort (qualitative study) worked out extremely well. Apart from one
`high quality' item that did not appear to fit in well with other items in most of the
cases, in principle the behaviour of all other items corresponded to what was revealed by the focus group data. This result further cross-validated the scales adopted in this
research.
Other items such as ̀ social risk related items', `financial risk' and ̀ security item' were
not included in PCA. These items were excluded from the analysis due to the inclusion
of these items appearing to interfere with extraction of factors. Detailed results are not
presented here due to the constraint of space. A close look revealed that the exclusion
of these items from the PCA does make theoretical sense. Social risk and financial risk
and security concern might correlate to other dimensions of brand image (e. g. image
benefit and functional benefit), but theoretically they are well-defined constructs and differ from items gathered under brand image construct. Moreover, in most cases they
appeared as a single item in the data, therefore they did not group together well with
other items to form a factor. These items are screened out for further consideration in
the regression analysis. These results confirm that risk and security concerns might be
different components of the benefit/consequence dimension to both image and functional related benefits/consequences of the brand image.
All in all, the brand image scales developed from focus group discussions proved to a
great extent to be valid and reliable. The research results further demonstrated that
consumer perception of risk and security are constructs theoretically distinguishable
from image and functional benefits/consequences. However, the subjects did not appear
to distinguish them in the focus group discussions. In addition, the fact that almost all included items were well loaded on extracted factors in most of cases indicates that the focus group discussions were very effective in assisting in constructing a robust
research instrument for this research and the developed research. The self-administered instrument achieved a high level of validity and reliability.
244
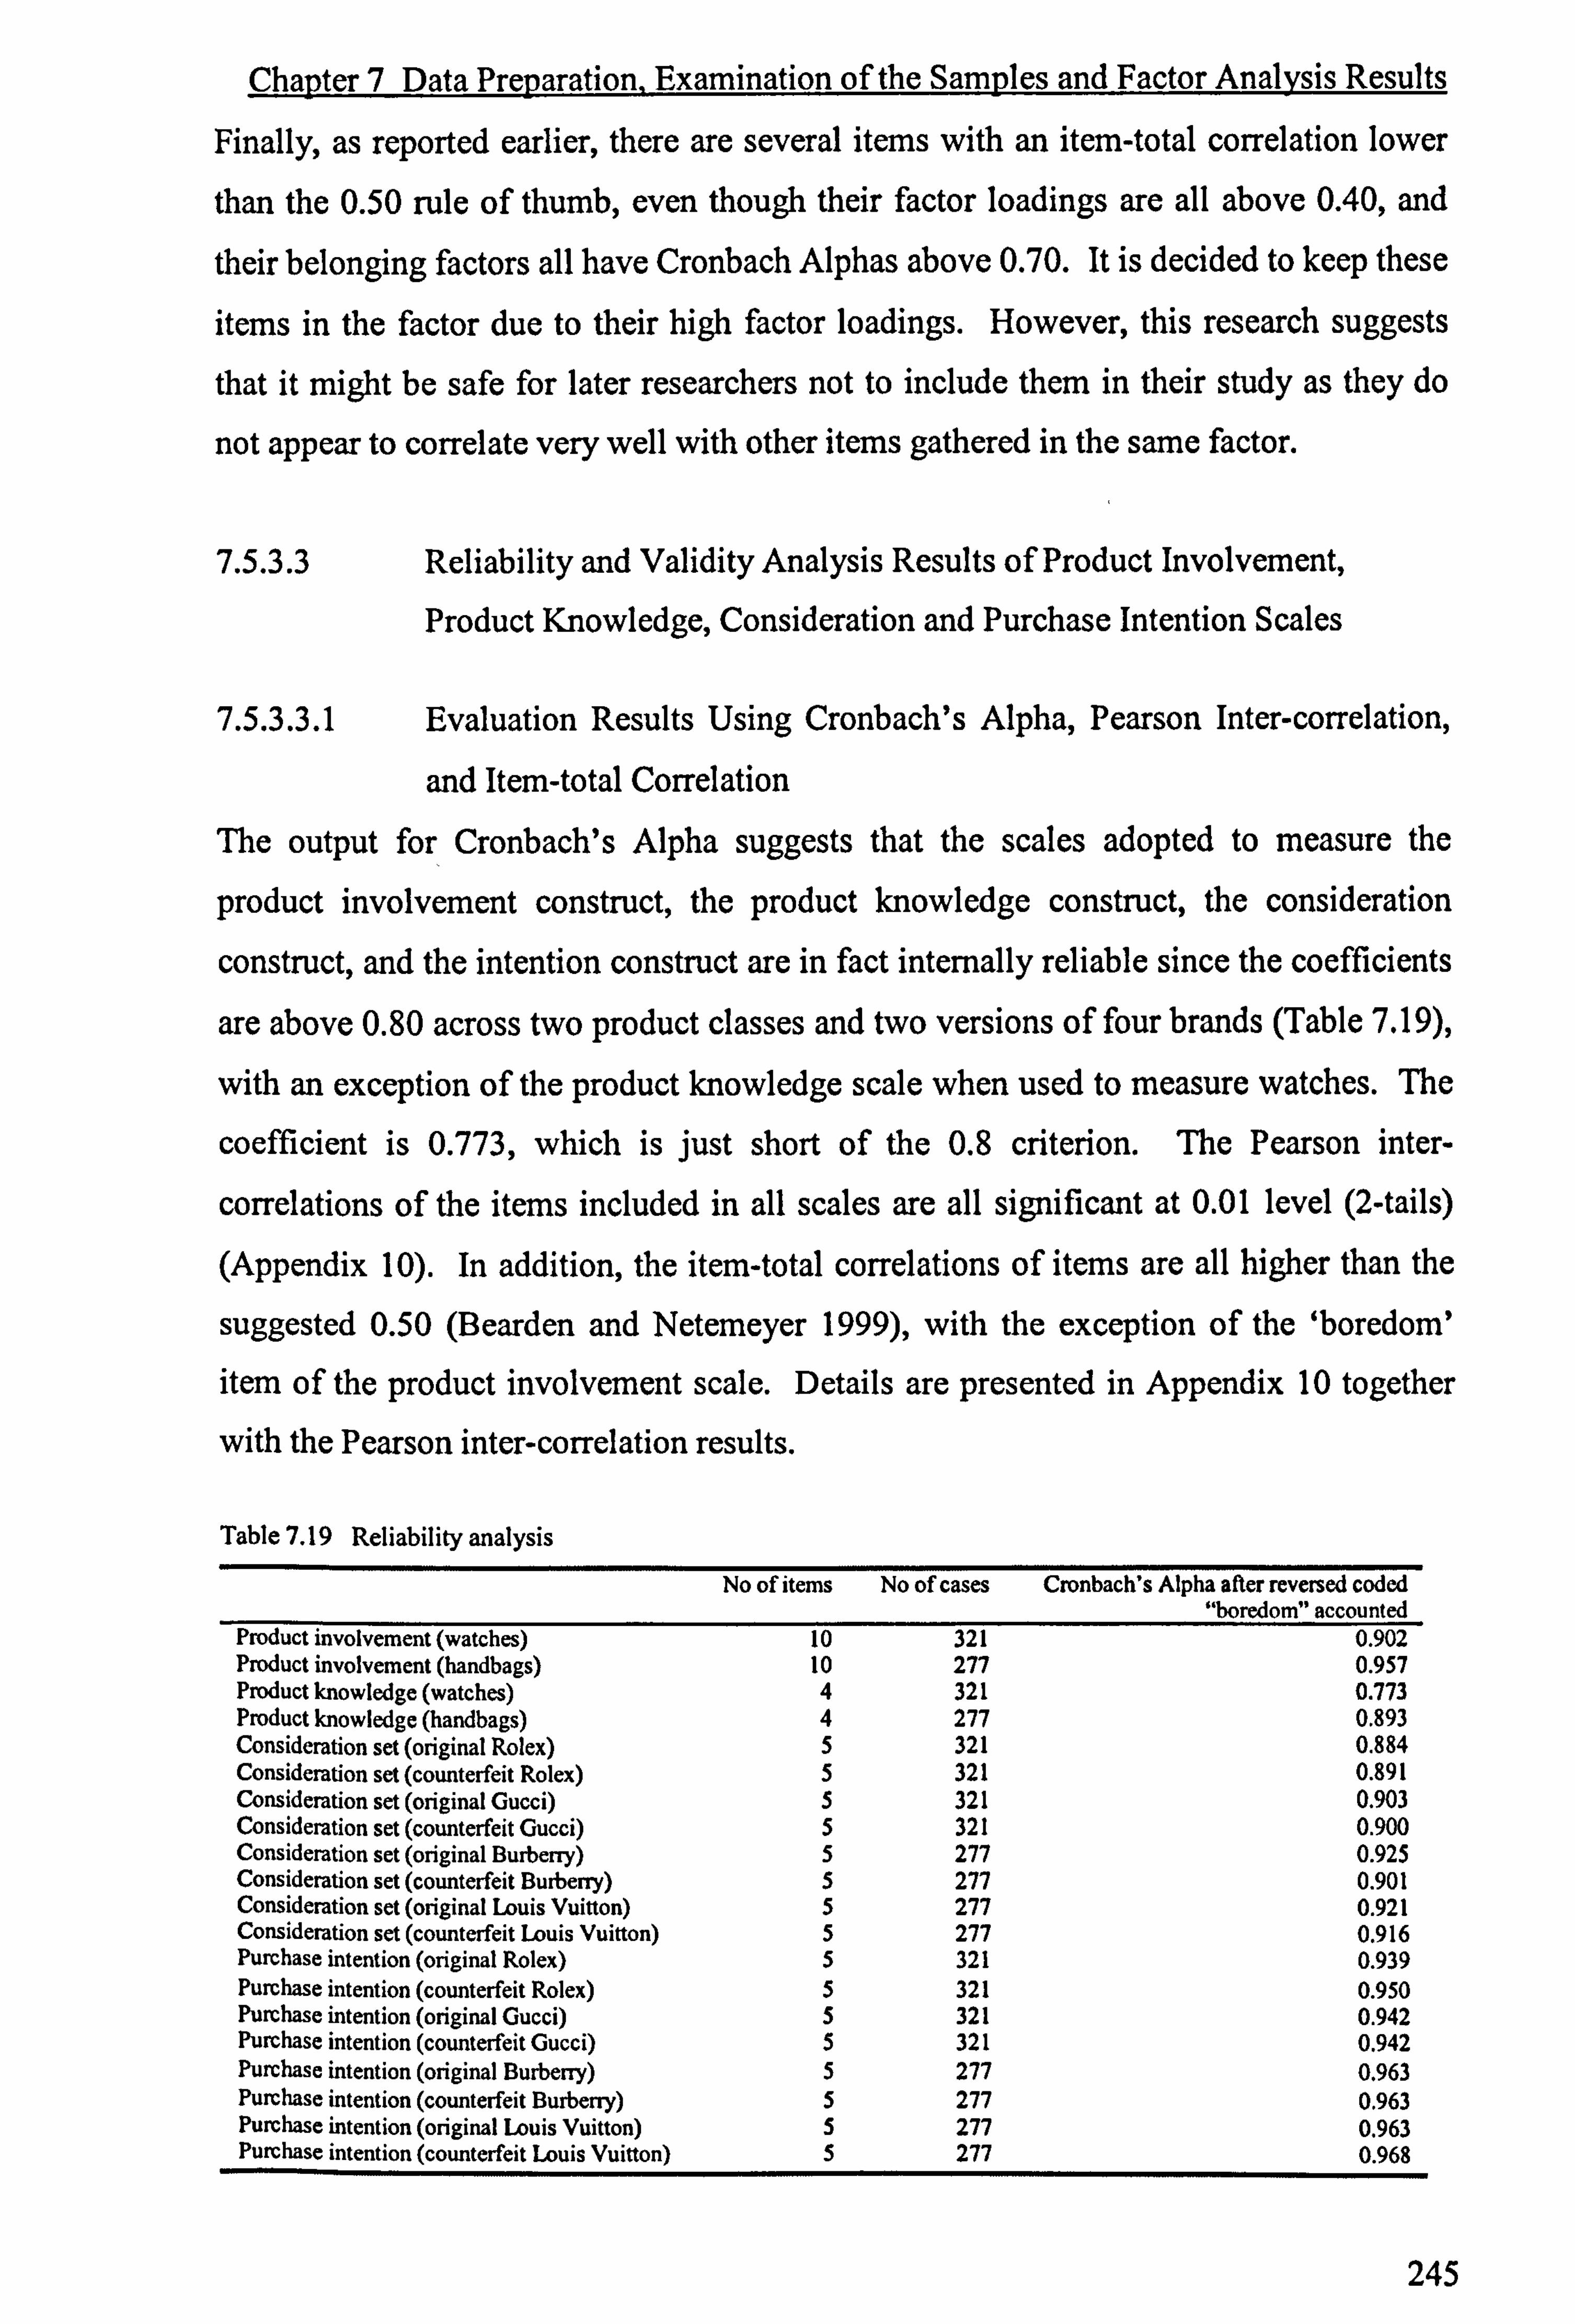
Chapter 7 Data Preparation, Examination of the Samples and Factor Analysis Results
Finally, as reported earlier, there are several items with an item-total correlation lower
than the 0.50 rule of thumb, even though their factor loadings are all above 0.40, and
their belonging factors all have Cronbach Alphas above 0.70. It is decided to keep these
items in the factor due to their high factor loadings. However, this research suggests
that it might be safe for later researchers not to include them in their study as they do
not appear to correlate very well with other items gathered in the same factor.
7.5.3.3 Reliability and Validity Analysis Results of Product Involvement,
Product Knowledge, Consideration and Purchase Intention Scales
7.5.3.3.1 Evaluation Results Using Cronbach's Alpha, Pearson Inter-correlation,
and Item-total Correlation
The output for Cronbach's Alpha suggests that the scales adopted to measure the
product involvement construct, the product knowledge construct, the consideration
construct, and the intention construct are in fact internally reliable since the coefficients
are above 0.80 across two product classes and two versions of four brands (Table 7.19),
with an exception of the product knowledge scale when used to measure watches. The
coefficient is 0.773, which is just short of the 0.8 criterion. The Pearson inter-
correlations of the items included in all scales are all significant at 0.01 level (2-tails)
(Appendix 10). In addition, the item-total correlations of items are all higher than the
suggested 0.50 (Bearden and Netemeyer 1999), with the exception of the `boredom'
item of the product involvement scale. Details are presented in Appendix 10 together
with the Pearson inter-correlation results.
Table 7.19 Reliability analysis No of items No of cases Cronbach's Alpha after reversed coded
"boredom" accounted Product involvement (watches) 10 321 0.902 Product involvement (handbags) 10 277 0.957 Product knowledge (watches) 4 321 0.773 Product knowledge (handbags) 4 277 0.893 Consideration set (original Rolex) 5 321 0.884 Consideration set (counterfeit Rolex) 5 321 0.891 Consideration set (original Gucci) 5 321 0.903 Consideration set (counterfeit Gucci) 5 321 0.900 Consideration set (original Burberry) 5 277 0.925 Consideration set (counterfeit Burberry) 5 277 0.901 Consideration set (original Louis Vuitton) 5 277 0.921 Consideration set (counterfeit Louis Vuitton) 5 277 0.916 Purchase intention (original Rolex) 5 321 0.939 Purchase intention (counterfeit Rolex) 5 321 0.950 Purchase intention (original Gucci) 5 321 0.942 Purchase intention (counterfeit Gucci) 5 321 0.942 Purchase intention (original Burberry) 5 277 0.963 Purchase intention (counterfeit Burberry) 5 277 0.963 Purchase intention (original Louis Vuitton) 5 277 0.963 Purchase intention (counterfeit Louis Vuitton) 5 277 0.968
245
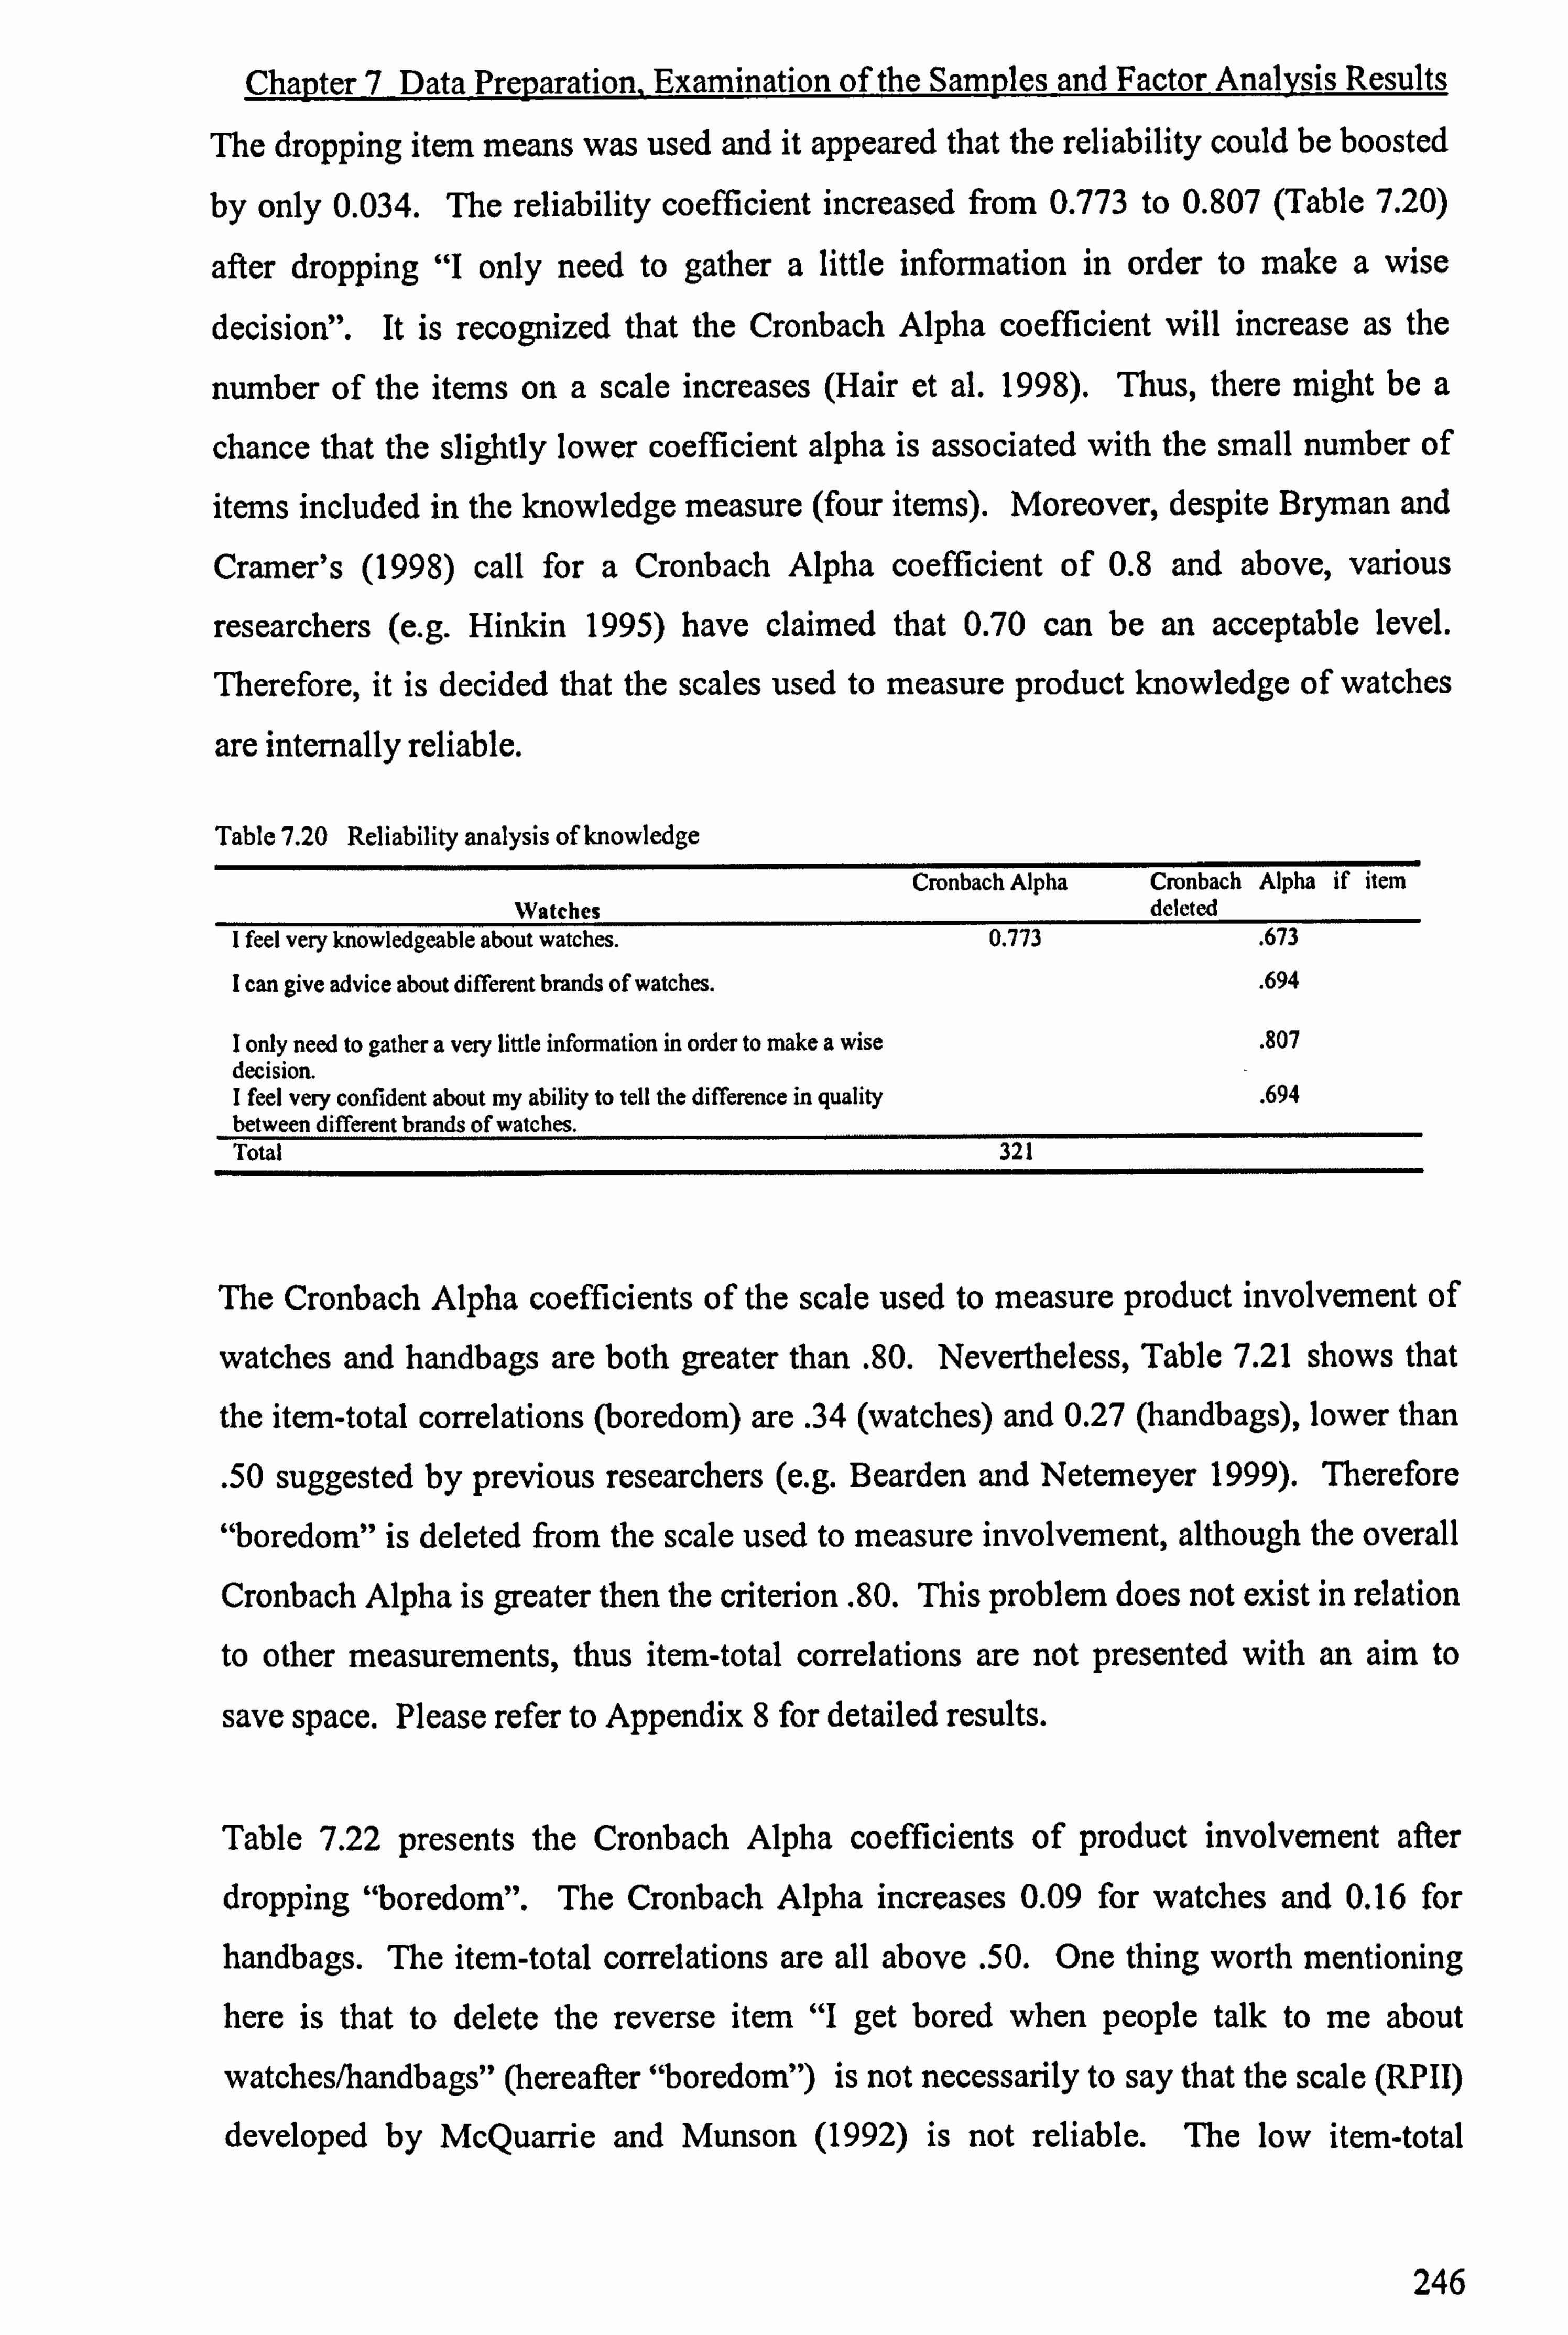
Chapter 7 Data Preparation, Examination of the Samples and Factor Analysis Results
The dropping item means was used and it appeared that the reliability could be boosted
by only 0.034. The reliability coefficient increased from 0.773 to 0.807 (Table 7.20)
after dropping "I only need to gather a little information in order to make a wise
decision". It is recognized that the Cronbach Alpha coefficient will increase as the
number of the items on a scale increases (Hair et al. 1998). Thus, there might be a
chance that the slightly lower coefficient alpha is associated with the small number of
items included in the knowledge measure (four items). Moreover, despite Bryman and
Cramer's (1998) call for a Cronbach Alpha coefficient of 0.8 and above, various
researchers (e. g. Hinkin 1995) have claimed that 0.70 can be an acceptable level.
Therefore, it is decided that the scales used to measure product knowledge of watches
are internally reliable.
Table 7.20 Reliability analysis of knowledge
Cronbach Alpha Cronbach Alpha if item Watches deleted
I feel very knowledgeable about watches. 0.773 . 673
I can give advice about different brands of watches. . 694
I only need to gather a very little information in order to make a wise . 807 decision. I feel very confident about my ability to tell the difference in quality . 694 between different brands of watches. Total 321
The Cronbach Alpha coefficients of the scale used to measure product involvement of
watches and handbags are both greater than . 80. Nevertheless, Table 7.21 shows that
the item-total correlations (boredom) are . 34 (watches) and 0.27 (handbags), lower than
. 50 suggested by previous researchers (e. g. Bearden and Netemeyer 1999). Therefore
"boredom" is deleted from the scale used to measure involvement, although the overall
Cronbach Alpha is greater then the criterion . 80. This problem does not exist in relation
to other measurements, thus item-total correlations are not presented with an aim to
save space. Please refer to Appendix 8 for detailed results.
Table 7.22 presents the Cronbach Alpha coefficients of product involvement after dropping "boredom". The Cronbach Alpha increases 0.09 for watches and 0.16 for
handbags. The item-total correlations are all above . 50. One thing worth mentioning here is that to delete the reverse item "I get bored when people talk to me about
watches/handbags" (hereafter "boredom") is not necessarily to say that the scale (RPII)
developed by McQuarrie and Munson (1992) is not reliable. The low item-total
246
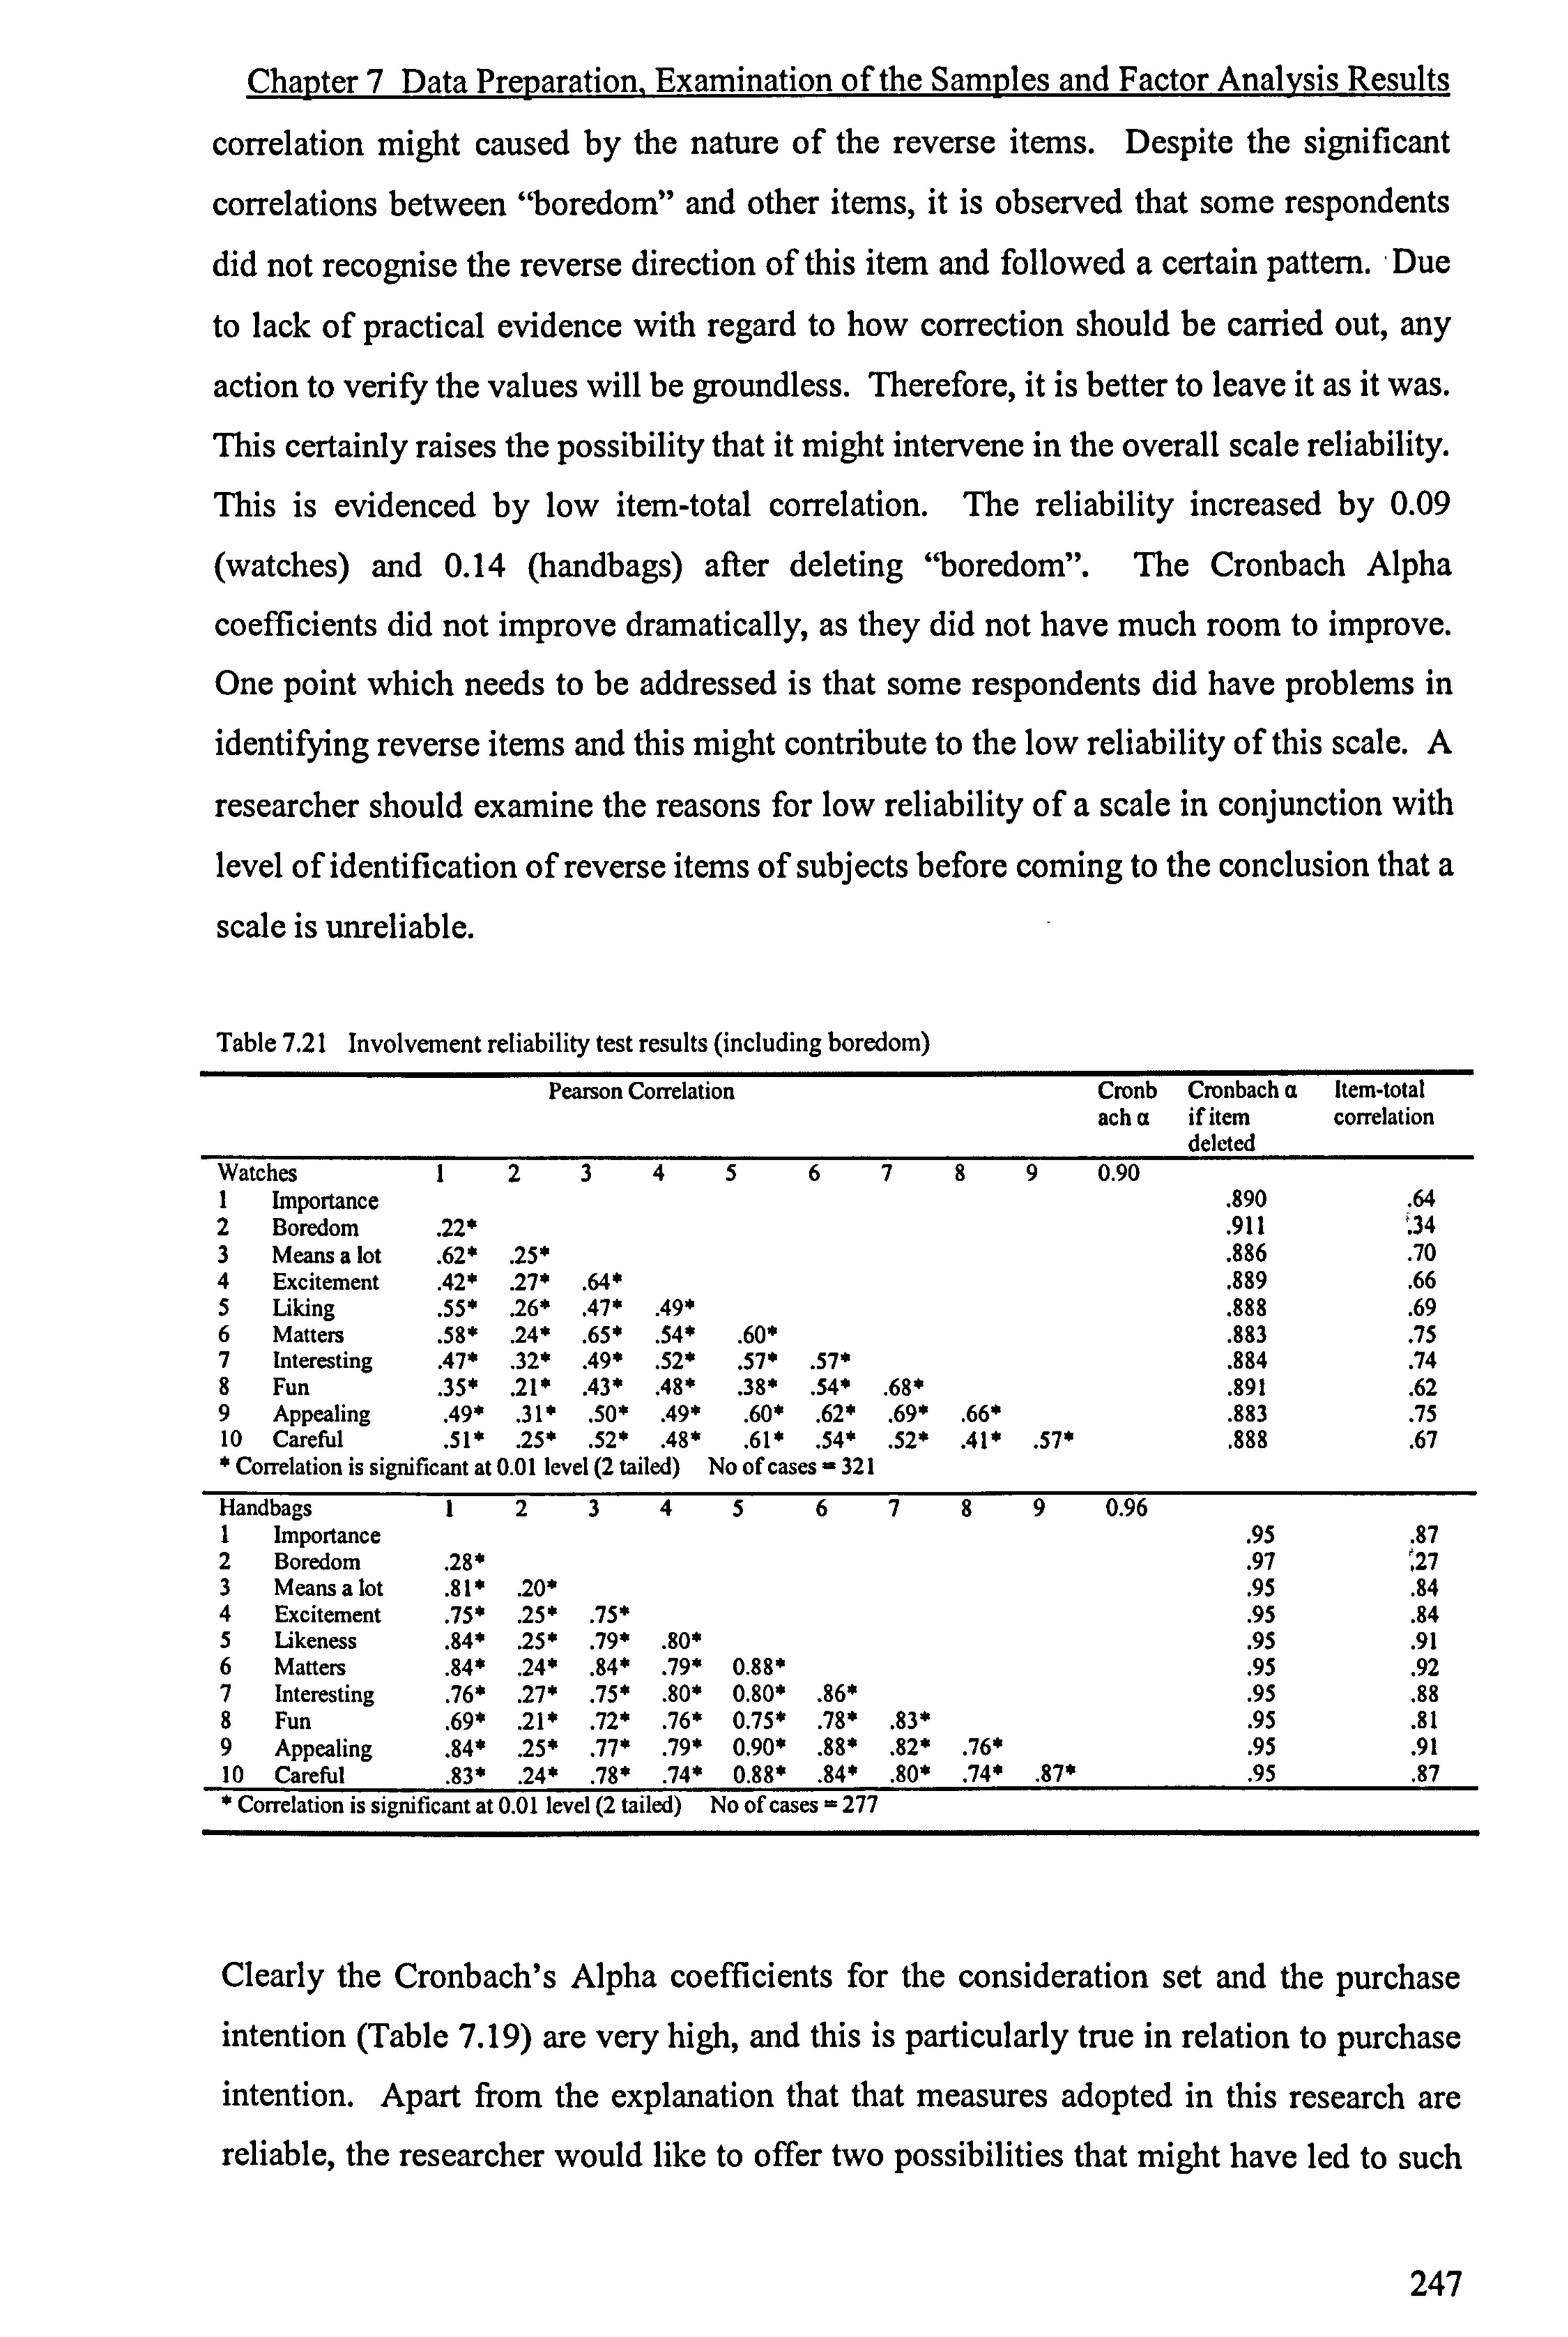
Chapter 7 Data Preparation, Examination of the Samples and Factor Analysis Results
correlation might caused by the nature of the reverse items. Despite the significant
correlations between "boredom" and other items, it is observed that some respondents
did not recognise the reverse direction of this item and followed a certain pattern. Due
to lack of practical evidence with regard to how correction should be carried out, any
action to verify the values will be groundless. Therefore, it is better to leave it as it was.
This certainly raises the possibility that it might intervene in the overall scale reliability.
This is evidenced by low item-total correlation. The reliability increased by 0.09
(watches) and 0.14 (handbags) after deleting "boredom". The Cronbach Alpha
coefficients did not improve dramatically, as they did not have much room to improve.
One point which needs to be addressed is that some respondents did have problems in
identifying reverse items and this might contribute to the low reliability of this scale. A
researcher should examine the reasons for low reliability of a scale in conjunction with
level of identification of reverse items of subjects before coming to the conclusion that a
scale is unreliable.
Table 7.21 Involvement reliability test results (including boredom)
Pearson Correlation Cronb Cronbach a Item-total ach a if item correlation
deleted Watches 1 2 3 4 5 6 7 890.90 1 Importance . 890 . 64 2 Boredom . 22* . 911 34 3 Means a lot . 62* . 25* . 886 . 70 4 Excitement . 42* . 27* . 64* . 889 . 66 5 Liking . 55* . 26* . 47* . 49* . 888 . 69 6 Matters . 58* . 24* . 65* . 54* . 60* . 883 . 75 7 Interesting . 47* . 32* . 49* . 52* . 57* . 57* . 884 . 74 8 Fun . 35* . 21* . 43* . 48* . 38* . 54* . 68* . 891 . 62 9 Appealing . 49* . 31* . 50* . 49* . 60* . 62* . 69* . 66* . 883 . 75 10 Careful . 51* . 25* . 52* . 48* . 61* . 54* . 52* . 41* . 57* . 888 . 67 * Correlation is significant at 0.01 level (2 tailed) No of cases - 321
Handbags 1 2 3 4 5 6 7 890.96 1 Importance . 95 . 87 2 Boredom . 28* . 97 ', 27 3 Means a lot . 81 * . 20* . 95 . 84 4 Excitement . 75* . 25* . 75* . 95 . 84 5 likeness . 84* . 25* . 79* . 80* . 95 . 91 6 Matters
. 84* . 24* . 84* . 79* 0.88* . 95 . 92 7 Interesting . 76* . 27* . 75* . 80* 0.80* . 86* . 95 . 88 8 Fun
. 69* . 21* . 72* . 76* 0.75* . 78* . 83* . 95 . 81 9 Appealing . 84* . 25* . 77* . 79* 0.90* . 88* . 82* . 76* . 95 . 91 10 Careful . 83* . 24* . 78* . 74* 0.88* . 84* . 80* . 74* . 87* . 95 . 87 * Correlation is si gnificant at 0.01 level (2 tailed) No of cases = 277
Clearly the Cronbach's Alpha coefficients for the consideration set and the purchase intention (Table 7.19) are very high, and this is particularly true in relation to purchase intention. Apart from the explanation that that measures adopted in this research are
reliable, the researcher would like to offer two possibilities that might have led to such
247

Chapter 7 Data Preparation. Examination of the Samples and Factor Analysis Results
high, desired coefficient values. First of all, in relation to purchase intention, this might
be something to do with the almost identical statements of the measure. For further
details, please refer to the purchase intention section of the Research Instrument
(Appendix 4). Secondly, the high coefficient values associated with consideration set
and purchase intention to some extent might connect with the nature of the studied
brands. The brands this research is examining are well-known luxury brands.
Therefore, a large number of people will not consider buying nor have any intention of
buying them for various reasons. As reported earlier, only about one third of consumers
will knowingly purchase CBP (e. g. Tom et al. 1998; Wee et al. 1995). This figure
represents consumers' purchase intention of counterfeit products in general. When it
comes to a more specific brand, these figures could decline sharply, as consumers'
perceptions/attitude of the specific brand together with other factors could have an
impact on consideration of purchase and purchase intention. Therefore, it is expected
that the subjects' responses to these questions would more skewed to the negative side
of the scale. In turn, it has an impact on the Cronbach Alpha coefficients.
Table 7.22 Involvement reliability test results (after dropping boredom)
Pearson Correlation Cronbac Cronbach a if Item-total ha item deleted correlation
Watches 1 2 34 5 6 780.912 1 Importance . 904 . 65 2 Means a lot . 62* . 900 . 71 3 Excitement . 42* . 64* . 903 . 66 4 Irking . 55* . 47* . 49* . 901 . 69 5 Matters . 58* . 64* . 53* . 60* . 895 . 76 6 Interesting . 47* . 49* . 52* . 57* . 57* . 898 . 73 7 Fun 35* . 43* . 48* . 38* . 54* . 68* . 905 . 63 8 Appealing . 49* . 50* . 49* . 60* . 62* . 69* . 66* . 896 . 75 9 Careful . 51* . 52* . 48* . 61* . 54* . 52* . 41* . 57* . 902 . 67 * Correlation is signi ficant at 0.01 level (2 tailed) No of cases = 321
Handbags 1 2 34 5 6 780.973 1 Importance . 970 . 87 2 Means a lot . 81* . 971 . 85 3 Excitement . 75* . 75* . 971 . 85 4 Liking . 84* . 79* . 80* . 968 . 92 5 Matters . 84* . 84* . 79* . 88* . 968 . 93 6 Interesting . 76* . 75* . 80* . 80* . 86* . 969 . 88 7 Fun . 69* . 72* . 76* . 75* . 78* . 83* . 972 . 82 8 Appealing . 84* . 77* . 79* . 90* . 86* . 82* . 76* . 968 . 91 9 Careful
. 83* . 78* . 74* . 88* . 84* . 80* . 74* . 87* . 969 . 89 * Correlation is significant at 0.01 level (2 tailed) No of cases - 277
In sum, the high value of Cronbach Alpha item-total correlations of each scales, as well
as the consistent significant Pearson inter-correlation values, all give evidence that the
measures adopted from or verified based on previous research not only achieved internal reliability to measure specific product class and specific brand, but also
248

Chapter 7 Data Preparation, Examination of the Samples and Factor Analysis Results
consistent reliability across two product classes, four brands and two versions of brands.
This result justified the rationale of adoption of these scales.
7.5.3.3.2 Evaluation Results Using PFA
The principal-axis factoring in SPSS (11.5 version) is used to conduct this task. The
factor analysis solutions of product involvement and product knowledge are reported in
Table 7.23; solutions of the consideration set and the purchase intention across brands
are presented in Table 7.24.
Table 7.23 shows that a one-factor solution is appropriate based on a minimum
eigenvalue of one for both product involvement and product knowledge measures
across two product classes. The item factor loadings for product involvement fall
between 0.67 and 0.80 for watches, and from 0.86 to 0.94 for handbags. Factor
loadings for product knowledge range from 0.43 to 0.82 for watches, and from 0.73 to
0.88 for handbags. To some extent, all items included in these two scales load nicely on
the extract factor across both the product involvement and the product knowledge
construct. The variances explained by the one factor are 58.73 percent for the product involvement of watches, and 82.24 percent for handbags. The one factor accounts for
60.30 percent (watches) and 75.78 percent (handbags) of the total variance for the
product knowledge construct. It is quite clear that the extracted factors of both the
product knowledge scale and the product involvement scale explained more variance for
handbags than for watches. This might be explained by the higher level of subject
similarity of one product (handbag) than the other (watch). As reported earlier, some
men did not complete the handbag section of the questionnaire, leading to women being
over-represented in the handbag data.
Clearly, all items comprising the involvement scale share a common factor; all the items
comprising the knowledge scale load on one factor. This applies to both watches and handbags. Therefore, both the scales are mono-dimensional. This provides some
evidence of content validity for the scales used to measure product involvement and product knowledge construct across two product classes.
Table 7.24 shows that the items comprising the consideration set scale converge into
one dimension. This applies to all eight cases (four brands x two versions of each
249
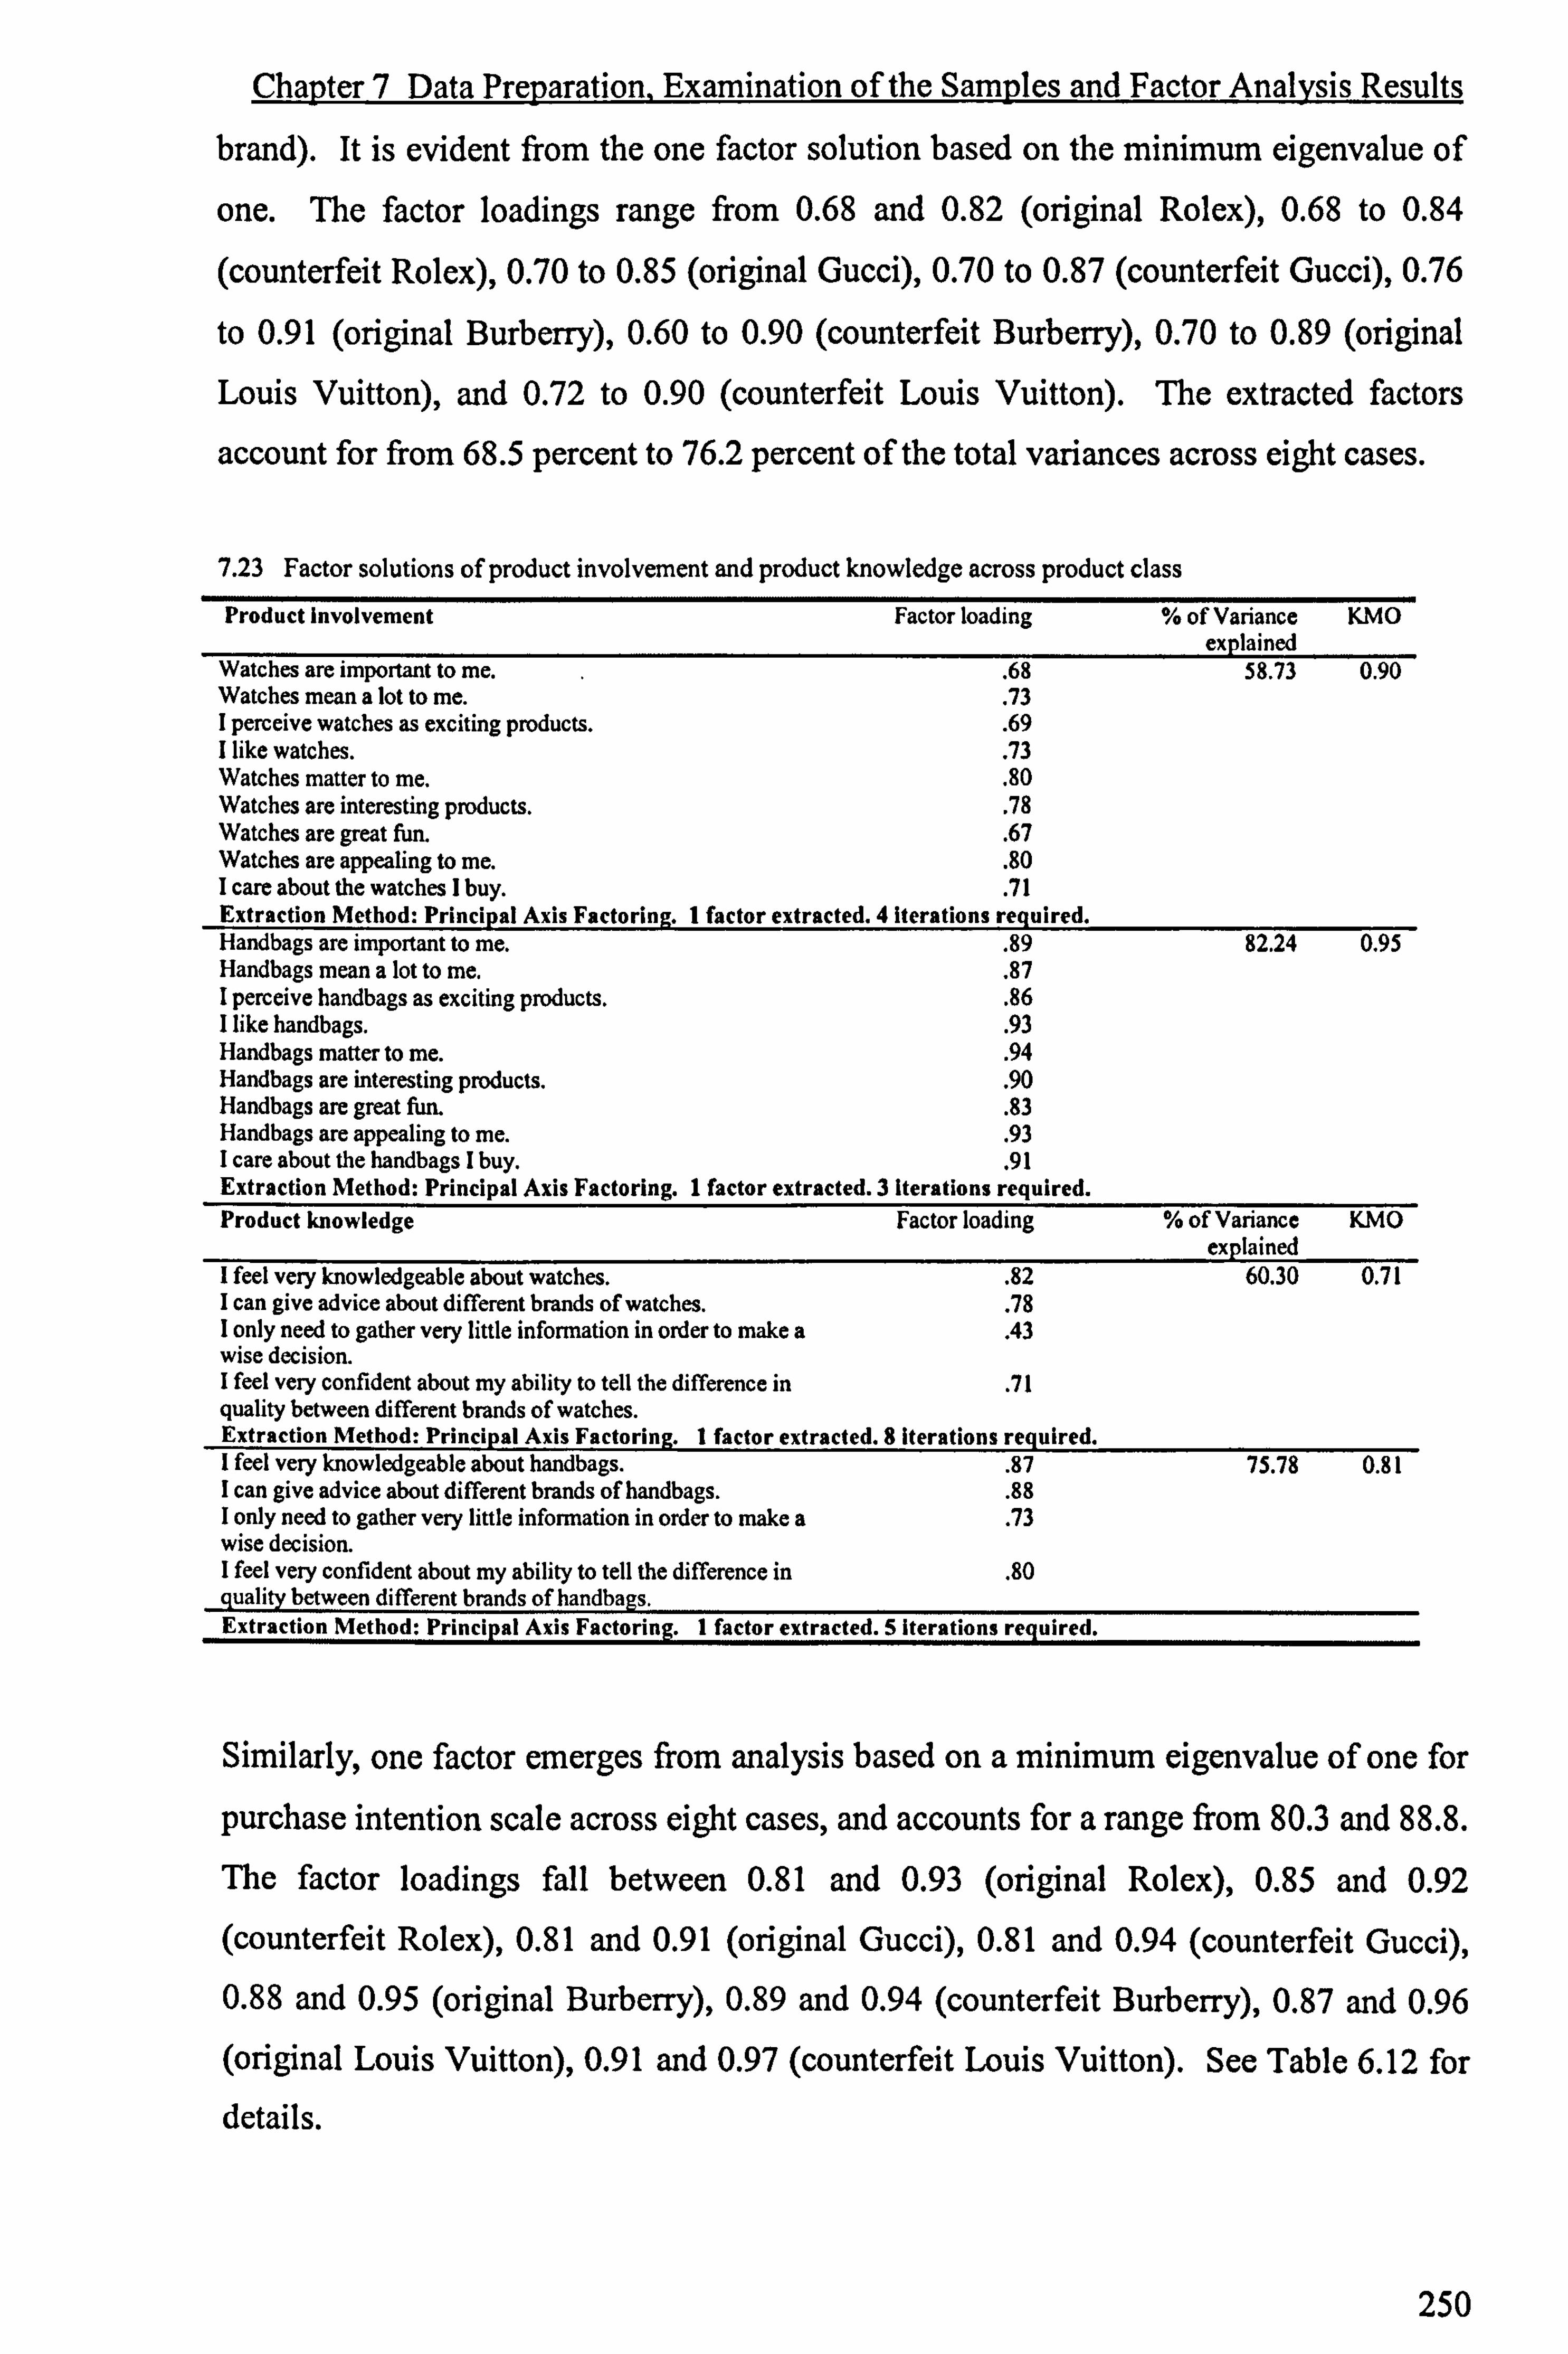
Chapter 7 Data Preparation. Examination of the Samples and Factor Analysis Results
brand). It is evident from the one factor solution based on the minimum eigenvalue of
one. The factor loadings range from 0.68 and 0.82 (original Rolex), 0.68 to 0.84
(counterfeit Rolex), 0.70 to 0.85 (original Gucci), 0.70 to 0.87 (counterfeit Gucci), 0.76
to 0.91 (original Burberry), 0.60 to 0.90 (counterfeit Burberry), 0.70 to 0.89 (original
Louis Vuitton), and 0.72 to 0.90 (counterfeit Louis Vuitton). The extracted factors
account for from 68.5 percent to 76.2 percent of the total variances across eight cases.
7.23 Factor solutions of product involvement and product knowledge across product class Product Involvement Factor loading % of Variance KMO
explained Watches are important to me. . 68 58.73 0.90 Watches mean a lot to me. . 73 I perceive watches as exciting products. . 69 I like watches. . 73 Watches matter to me. . 80 Watches are interesting products. . 78 Watches are great fun. . 67 Watches are appealing to me. . 80 I care about the watches I buy. . 71 Extraction Method: Principal Axis Factoring. 1 factor extracted. 4 iterations required. Handbags are important to me. . 89 82.24 0.95 Handbags mean a lot to me. . 87 I perceive handbags as exciting products. . 86 I like handbags. . 93 Handbags matter to me. . 94 Handbags are interesting products. . 90 Handbags are great fun. . 83 Handbags are appealing to me. . 93 I care about the handbags I buy. . 91 Extraction Method: Principal Axis Factoring. 1 factor extracted. 3 iterations required. Product knowledge Factor loading % of Variance KMO
explained I feel very knowledgeable about watches. . 82 60.30 0.71 I can give advice about different brands of watches. . 78 I only need to gather very little information in order to make a . 43 wise decision. I feel very confident about my ability to tell the difference in . 71 quality between different brands of watches. Extraction Method: Principal Axis Factoring. I factor extract ed. 8 Iterations required. I feel very knowledgeable about handbags.
. 87 75.78 0.81 I can give advice about different brands of handbags. . 88 I only need to gather very little information in order to make a . 73 wise decision. I feel very confident about my ability to tell the difference in . 80
quality between different brands of handbags. Extraction Method: Principal Axis Factoring. 1 factor extracted. 5 iterations required.
Similarly, one factor emerges from analysis based on a minimum eigenvalue of one for
purchase intention scale across eight cases, and accounts for a range from 80.3 and 88.8.
The factor loadings fall between 0.81 and 0.93 (original Rolex), 0.85 and 0.92
(counterfeit Rolex), 0.81 and 0.91 (original Gucci), 0.81 and 0.94 (counterfeit Gucci),
0.88 and 0.95 (original Burberry), 0.89 and 0.94 (counterfeit Burberry), 0.87 and 0.96
(original Louis Vuitton), 0.91 and 0.97 (counterfeit Louis Vuitton). See Table 6.12 for
details.
250
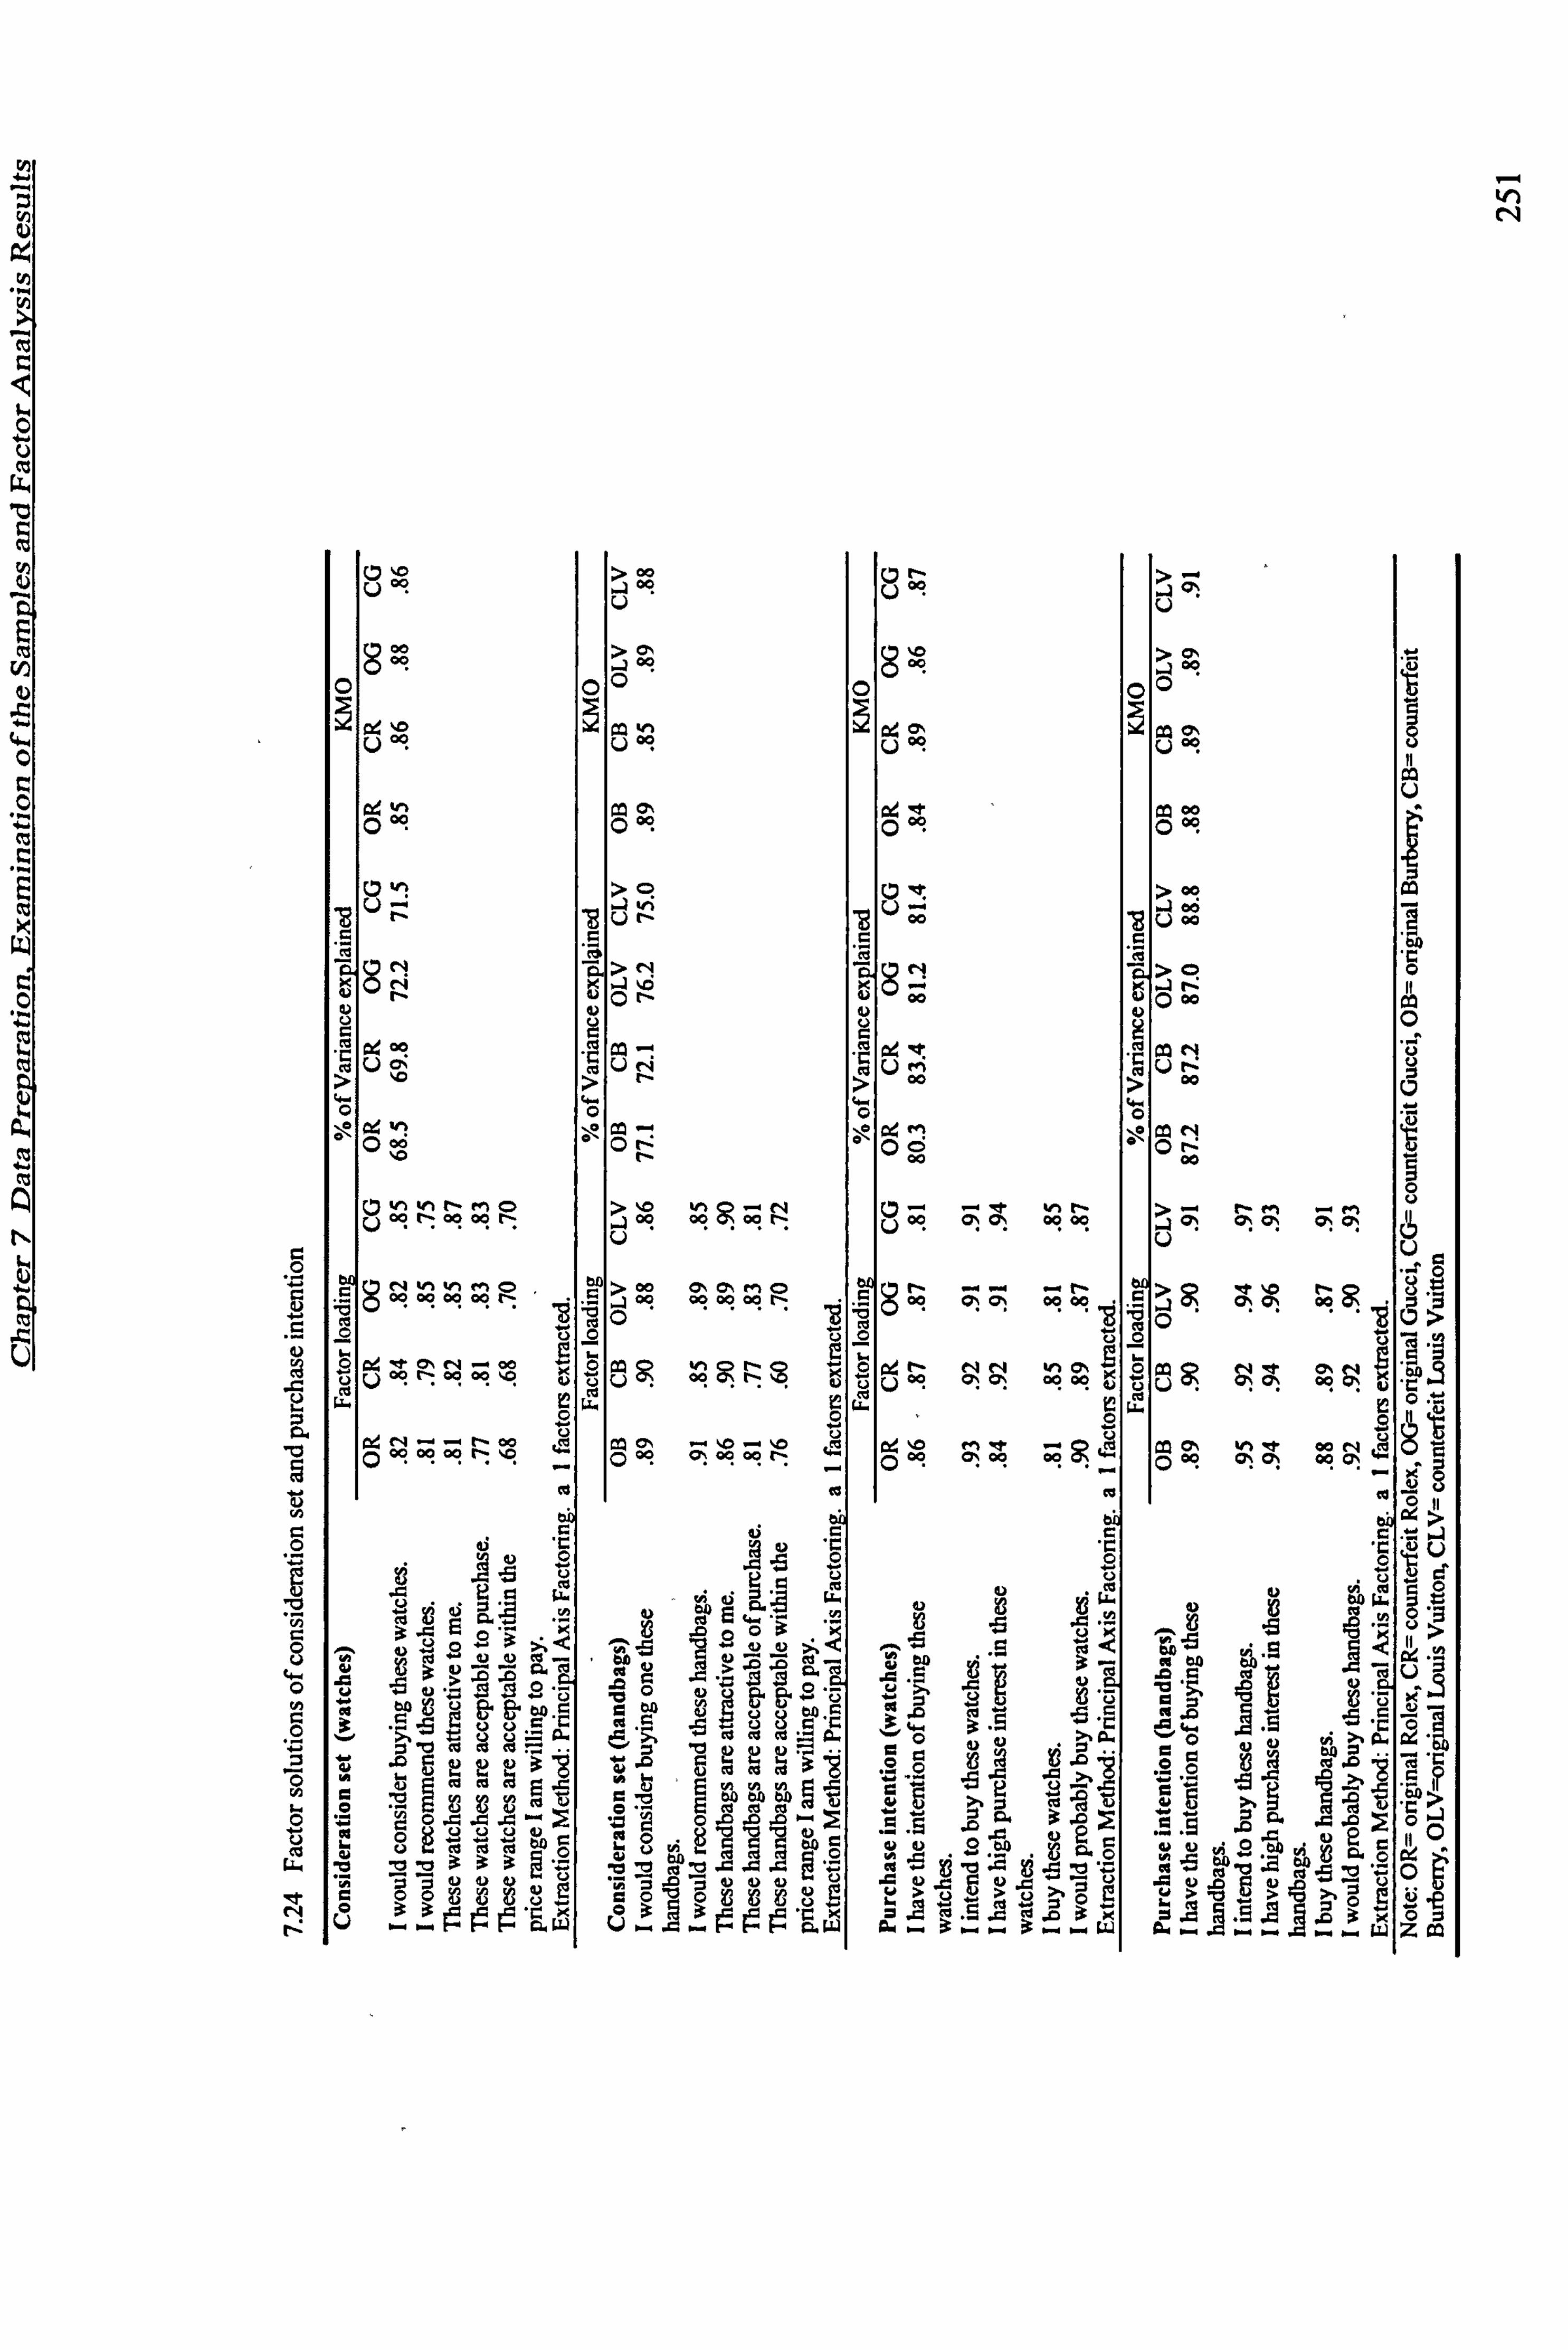
In N
0 "C
ti.
M
C7 o U
0
U°O"
0 00
"8 UP
CO
8N eV
N U
ýUo
0 (yw N 000
C7V Iflt-MO Uoo l'ý eoo0N
C (ý NulV1M0 00 DO co 00 l-
b A O
vU *9
n 00 ell 00
oö Cd
00 O o0 00 o0 N .0
ö ai "t
b8
03 Ecu ö
'3 wd3 äýpp äý
o =v co 8=
ýy yUR! id id
ý LL. "a "0 -0 333
eööf V3 3ýýý öýp
00 00
00
u OR
a 09
T Ü r. G
LL i t
.4 ýo U U eV n
O
09 ooc o U
oo oo
O. ' Oý MO co 00 °o tý
O V
moo /O . "r NO
O'co °o I- Im,
-
rl- OR
o
x00 J00
öco
ÜM
00
04 M
00
00 0000 0
5 ooq ö öý oö 00
n n N Üo oo
rn o oooq
w F
00 0
09 00 Oý 4
o aÄe
2 poU0 er U'2ä Ii
y"3uce
*u
12 ý
nin
- mau, ,
qi VCN bd V
i" u
'y päNNNV . 05 y
"5 a
>y -5 ``äi äi Výý NTÖ 3m 3ýIo: '` 3 5_ 3ý 3ü
äý U
>c7, O0
Üo
0000 9
8
m U
> oo w Üo
0 0 O
C7N "ý U0
CO N fý O S ý
Q
ýj ö ö rn öö U
U U
o`r. oýO NO o a , , c q
0 Üö
onoO C in oA
[Q Oý V1 et ooN 8
1 000 O\O: 000
co -A !
ä
N
7 w 0
b
Ä O
IO
W.
0 'A w
cl m
ä° .8 "ý
am
34 "C
C
.9 116, t ° .5 . c' °.
00 co äS d ,O
ä... iä5`ä 3E
W

Chapter 7 Data Preparation, Examination of the Samples and Factor Analysis Results
Accordingly, all the items comprising the consideration set scale grouped under a
common factor, all the items of the purchase intention scale load on one factor. This
applies to all eight cases across two versions of four brands. Therefore, both the scales
are mono-dimensional. This provides some evidence of content validity for the scales
used to measure the consideration set and purchase intention constructs across four
brands and two versions of each brand.
In sum, the items used to measure the same constructs across two versions of each brands did measure the same concept. Therefore, it can be said that the scales used to
measure involvement, knowledge, consideration set and purchase intention have the
evidence of construct validity. This is based on the claim of Kaplan and Saccuzo
(1997), that evidence of construct validity shows that measures of the same construct `converge' on the same construct, which is intended to be measured.
When more than two items loaded on one factor, the internal consistency of these items
was tested using Cronbach Alpha and correlation coefficient. Pessmeier and Bruno
(1971) noted that if a set of items is really measuring some underlying trait or attitude, then the underlying trait causes the covariation among the items. That is, the higher the
correlation, the better the items are for measuring the same underlying construct. Churchill (1999) claimed that internal consistency of the items is also the essence of
content validity. Although internal consistency is not a sufficient condition for
construct validity and content validity, it is a necessary condition (Churchill 1999).
Based on this, high internal consistency of items used to measure a construct might be
an indication of possibility of construct validity and content validity. This is the notion for the use of assessing correlation among the items of the measures adopted in this
research to analyse the construct validity and the content validity of the scales. All in
all, the overall satisfactory output of Cronbach Alpha coefficients, correlations
coefficients and factor analysis results demonstrate that the scales adopted in this
research have a high level of validity and reliability.
7.6 Final Stage of Data Preparation for the Main Modelling Approach
After the thorough evaluation of the scales validity and reliability, this stage of the
research focuses on computing new variables for the use of at the modelling stage. More specifically, factor scores are calculated using SPSS factor score function.
252
Chapter 7 Data Preparation. Examination of the Samples and Factor Analysis Results
Multiple item scales are transformed into one new variable. This is achieved by adding
all the score of the items and then dividing by the number of items. The factor scores
and newly computed variables are saved. Following Hutcheson and Sofroniou (1999)
suggestion, outliers are screened and possibility of multicollinearity is examined before
input them directly into a model. As the extreme cases are part of the population from
which the sample was intended to be taken, these cases should not be deleted.
Typically, researchers give the case a new score so that it is one raw score more or less
than the next extreme value on a particular variable (Hutcheson and Sofroniou 1999).
In this research, the outliers are identified and replaced by new scores following this
common practice before the factors are included into regression of the likelihood of
consideration of the original Rolex, Gucci, Burberry and Louis Vuitton, but are treated
as part of non-normal regression in relation to likelihood of consideration of the
counterfeit brands, as well as likelihood of purchase intention of both original and
counterfeit brands. This is because, to some extent, the likelihood of consideration of
original Rolex is normally distributed. In contrast, in all other cases the respondent
variables appear non-normally distributed (see Chapter 8 for details).
VIF and tolerance statistics are used to assess the assumption of no multicollinearity.
VIF is a technique for measuring multicollinearity among the explanatory variables. It
is referred to as a variance-inflation factor (VIF). It can be calculated by using the
Equation VIF = 1/1- R2 .R is the multiple correlation coefficient that regresses the ith
independent variable, x, on the remaining independent variables (Field 2000). In
respect to the formula, VIF tends to be larger when the ith independent variable has a
strong relation with the other independent variables. The denominator of equation, 1-
R2 is defined as the tolerance of variable. There are no hard and fast rules about what
value of the VIF and tolerance value should be. Myers (1990) suggests that a value of 10 is a good value at which to be concerned. Bowerman and O'Connell (1990) suggest
that if the average VIF is substantially greater than 1, then multicollinearity may be
biasing the regression model. Therefore, tolerance values below 0.1 indicate serious
problems. Nevertheless, Menard (1995) suggests that values below 0.2 are worthy of
concern. This research considers a VIF value above 5 and tolerance value below 0.2 as
problems. These rules are commonly accepted by researchers (e. g. Field 2000,
Hutcheson and Sofroniou 1999, Bryman and Cramer 1999).
253
Chapter 7 Data Preparation, Examination of the Samples and Factor Analysis Results
The VIF and tolerance levels are reported in Table 7.25. The tolerance values (ranging
between 0.450 and 0.989) are all higher than 0.20, the benchmark level (Hutcheson and
Sofroniou 1999), and VIF values (range between 1.011 and 2.260) are all lower than 5.
Thus, the levels of multicollinearity between the extracted factors, risk related variables,
security variables, involvement and knowledge are all within acceptable limits.
Bivariate correlations between the extracted factors and social risk, security, and financial risk are examined and the results are presented in Appendix 11. It is obvious
some of the extracted factors are significantly correlated with other variables which
were not included in the factor analysis. In some cases, the variables which were not included in factors are also significantly correlated with each other. However, due to
the VIF and tolerance values all lying in the acceptable range, the latent variables, risk
related variables, security variable, involvement variable and knowledge are
theoretically distinct, and it is considered that the extractors together with the other
variables can be put into a model and will be less likely to cause multicollinearity
problem.
7.7 Summary
Prior to their submission for analysis, the responses are subjected to an extensive series
of checks to identify possible biases, which could be controlled for during the analysis
stage (for details, see Punj and Staelin 1983). The checks conducted in this research involve examination of the raw data, the distribution of values of each variable, the data
representativeness, adopted scales of reliability and validity and possibility of
multicollinearity problem.
In total, 430 questionnaires were collected, with 321 of them being usable after careful
checking, editing and data cleaning, which resulted in a 74.7 percent usable rate. It is
clear that the unusable questionnaire rate is relatively high. Detailed analysis of the
unusable questionnaires is provided. It is revealed that some respondents' lack of
cooperation and the lengthy nature of the research instrument were the main reasons for
the cause of high unusable questionnaire rate. The length of the questionnaire was determined by the complex nature of this research. A great deal of effort has been put into improving respondents' level of cooperation (e. g. use of incentive, use of gaze and touch method, use of pleasant greeting statement). As a result, there was very little the
researcher could have improved on, rather than accept the reality.
254
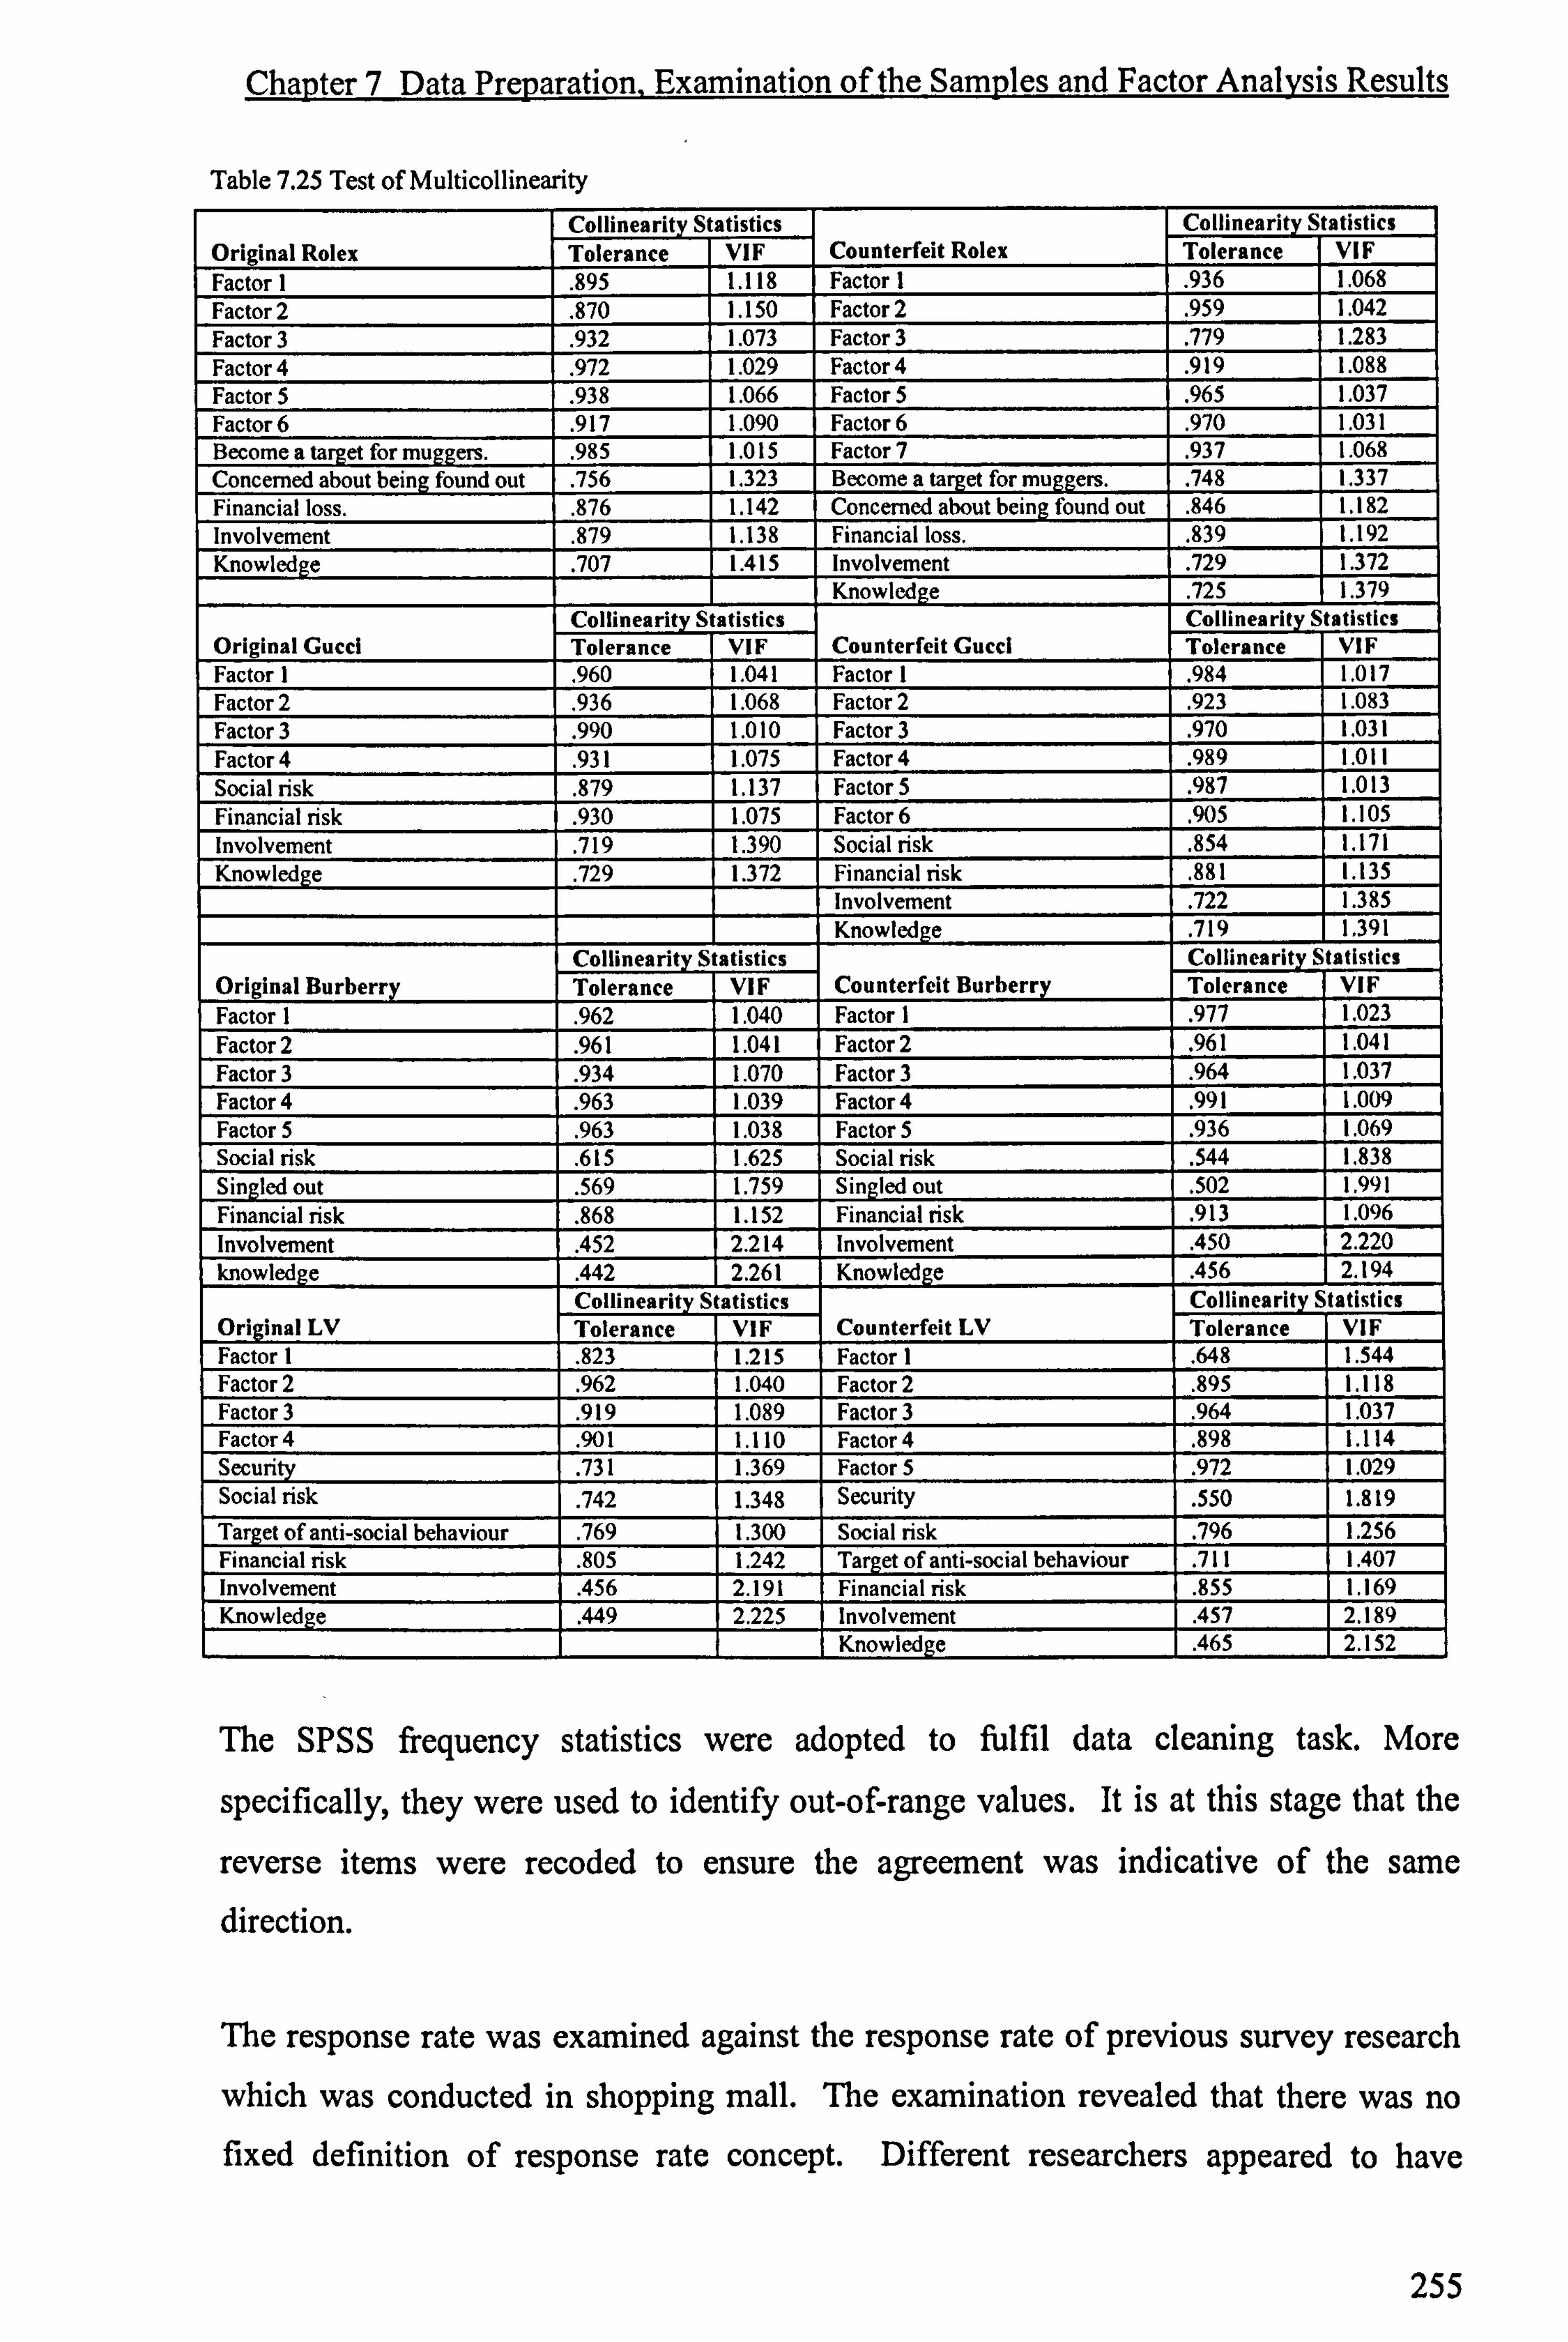
Chapter 7 Data Preparation, Examination of the Samples and Factor Analysis Results
Table 7.25 Test of Multicollinearity
Collinearity Statistics Collinearity Statistics Original Rolex Tolerance VIF Counterfeit Rolex Tolerance VIF Factor 1 . 895 1.118 Factor 1 . 936 1.068 Factor 2 . 870 1.150 Factor 2 . 959 1.042 Factor 3 . 932 1.073 Factor 3 . 779 1.283 Factor 4 . 972 1.029 Factor 4 . 919 1.088 Factor 5 . 938 1.066 Factor 5 . 965 1.037 Factor 6 . 917 1.090 Factor 6 . 970 1.031 Become a target for muggers. . 985 1.015 Factor 7 . 937 1.068 Concerned about being found out . 756 1.323 Become a target for muggers. . 748 1.337 Financial loss. . 876 1.142 Concerned about being found out . 846 1.182 Involvement . 879 1.138 Financial loss. . 839 1.192 Knowledge . 707 1.415 Involvement . 729 1.372
Knowledge . 725 1.379 Collinearity Statistics Collinearity Statistics
Original Gucci Tolerance VIF Counterfeit Gucci Tolerance VIF Factor 1 . 960 1.041 Factor 1 . 984 1.017 Factor 2 . 936 1.068 Factor 2 . 923 1.083 Factor 3 . 990 1.010 Factor 3 . 970 1.031 Factor 4 . 931 1.075 Factor 4 . 989 1.011 Social risk . 879 1.137 Factor 5 . 987 1.013 Financial risk . 930 1.075 Factor 6 . 905 1.105 Involvement . 719 1.390 Social risk . 854 1.171 Knowledge . 729 1.372 Financial risk . 881 1.135
Involvement . 722 1.385 Knowledge . 719 1.391
Collinearity Statistics Collinearity Statistics Original Burberry Tolerance VIF Counterfeit Burberry Tolerance VIF Factor 1 . 962 1.040 Factor 1 . 977 1.023 Factor 2 . 961 1.041 Factor 2 . 961 1.041 Factor 3 . 934 1.070 Factor 3 . 964 1.037 Factor 4 . 963 1.039 Factor 4 . 991 1.009 Factor 5 . 963 1.038 Factor 5 . 936 1.069 Social risk . 615 1.625 Social risk . 544 1.838 Singled out . 569 1.759 Singled out . 502 1.991 Financial risk . 868 1.152 Financial risk . 913 1.096 Involvement . 452 2.214 Involvement . 450 2.220 knowledge . 442 2.261 Knowledge . 456 2.194
Collinearity Statistics Collinearity Statistics Original LV Tolerance VIF Counterfeit LV Tolerance VIF Factor 1 . 823 1.215 Factor 1 . 648 1.544 Factor 2 . 962 1.040 Factor 2 . 895 1.118 Factor 3 . 919 1.089 Factor 3 . 964 1.037 Factor 4 . 901 1.110 Factor 4 . 898 1.114 Security . 731 1.369 Factor 5 . 972 1.029 Social risk . 742 1.348 Security
. 550 1.819 Target of anti-social behaviour . 769 1.300 Social risk . 796 1.256 Financial risk . 805 1.242 Target of anti-social behaviour . 711 1.407 Involvement . 456 2.191 Financial risk . 855 1.169 Knowledge . 449 2.225 Involvement . 457 2.189
Knowledge . 465 2.152
The SPSS frequency statistics were adopted to fulfil data cleaning task. More
specifically, they were used to identify out-of-range values. It is at this stage that the
reverse items were recoded to ensure the agreement was indicative of the same direction.
The response rate was examined against the response rate of previous survey research
which was conducted in shopping mall. The examination revealed that there was no fixed definition of response rate concept. Different researchers appeared to have
255
Chapter 7 Data Preparation, Examination of the Samples and Factor Analysis Results
different understandings. Consequently, in most cases the reported response rates in
different research are not comparable unless the researchers demonstrated how the
response rate was calculated in their research. It was concluded that the reported
response rate by the fieldworkers of the present research is considered acceptable and
even slightly higher than that of Gate and Solomon (1982), who used the same response
rate calculation method in their shopping mall survey.
The reasonable response rate achieved in the current research benefited from the
appropriate use of the incentive approach as well as customized fieldwork
administration. In addition to the advantages reported earlier (Chapter 5) relating to the
comfortable workplace provided by the cooperative supermarkets, the researcher also
realised that constant rejections from potential respondents did have great impact on
fieldworkers' efficiency. In order to overcome this problem, all fieldworkers were told
to take a short break if they were constantly rejected. This means was reported as
working well in terms of improving overall response rate. Meanwhile, the use of
chocolate as the incentive did appear to assist in achieving a higher response rate.
Nevertheless, this research reports that an incentive does not necessarily work on
everybody. To simplify, this study categorises the research respondents into three broad
groups - research affiliation (they are not attracted by the incentive), people with a
neutral attitude to research (they can be attracted not only by the incentive), and
incentive-driven people (people who are only attracted by the incentive). The last group
of people can be further grouped into two subgroups - incentive-driven and cooperative
people, and incentive driven and uncooperative people. It is suggested that the
incentive can work well with the people with a neutral attitude to research and those
who are both incentive-driven and cooperative.
Descriptive statistics were used to investigate the distribution of values of each variable. It is reported that all measures represent reasonable variance. Following this, the
characteristics of the samples were examined against publicly available statistics. In
general, it appears that the samples represent the target population well in terms of age, household income, gender and education. Therefore, it justifies the generalisability of the research findings based on the current sample.
This research provides extensive discussion and investigation of the measurement
reliability and validity. Given the time constraint for this research, the research only
256

Chapter 7 Data Preparation, Examination of the Samples and Factor Analysis Results
focuses on examination of measurements of internal consistency. The techniques used
to conduct evaluations of reliability and validity include Cronbach's Alpha, Pearson's
Correlation Analysis, item-total correlation and factor analysis. Both exploratory factor
analysis and confirmatory factor analysis were adopted for different purposes. The
exploratory factor analysis was used to extract the factors of the brand image construct
across four brands and each version of a brand. Confirmatory factor analysis was used
to test measurement validity. The research results demonstrate that all the scales
adopted in this research achieved a high level of reliability and validity across brands
and different versions of a brand.
Before bringing this chapter to a close, the final stage of data preparation was
conducted. It is at this stage the factor scores were calculated and saved, multiple item
scales were transformed into one new variable and the variable value was computed
using a summing up method. The outliers were dealt with according to Hutcheson and Sofroniou's (1999) suggestion. The VIF, tolerance level and bivariate correlations between the extracted factors and other variables which were not included when the
factor analysis conducted were investigated. The results show that the VIF and
tolerance levels are all within the acceptable level. Although some significant
relationships appeared between variables, considering they are, distinctive concepts
theoretically, as well as the reasonable VIF and tolerance levels, it is believed that there
was less chance that they would cause a multicollinearity problem.
So far, it has been demonstrated that the samples represent the target population very
well, the data collected are valid with limited level of bias, and the scales used in this
research are highly reliable and valid. Moreover, the data preparation for the main
modelling stage is complete. It has been proved that there is little chance of having a
multicollinearity problem. All the main tasks set up for this part of the research have
been implemented successfully, and it is ready to run the regressions.
Another thing worth mentioning is that this research has discovered that it is more likely
that risk concerns and security concerns shall not be regarded as a sub-dimension of the benefit/consequence concept. This finding challenges the exhaustiveness of Plummer's (1985,2000) brand image dimension concept. As there is little empirical work in the literature studying detailed brand image dimensions, this research might have opened a door to future research.
257
Chapter 8 GLM Analysis and Results

Chapter 8 GLM Analysis and Results
Chapter 8 GLM Analysis and Results
8.1 Introduction
This chapter provides the data analysis results. Separate multiple regressions are run for
each dependent variable and for each version of four selected brands. Two commonly
used statistical software programmes are used to analyse the data. SPSS is used to
analyse the likelihood of consideration of original brands, R-commander is applied to
purchase intention of original brands and likelihood of consideration and purchase intention of counterfeit brands. The use of R-commander is required due to the
uncommon nature (severely skewed) of the data. Compared with SPSS, R-commander
appears to be more powerful in terms of data transformation. Box-Cox and Box-
Tidwell techniques are employed to implement transformation of response variables and
transformation of explanatory variables.
This chapter starts with a discussion of the analysed variables, with the aim of providing
brief information on all involved variables. Thereafter, the choice of statistical data
analysis techniques is discussed in detail to provide the theoretical back-up for choice of
the software and the analytical methods. Data analysis results are presented in two
sections - SPSS Results and R-commander Results. This chapter ends with a brief
summary.
8.2 Information about the Analysed Variables
This section provides detailed information about all examined variables. The discussion
focuses on how they are measured, the nature of the variables, as well as how they are
categorised and the rationale behind the categorisations in the case of the variables being categorical variables.
8.2.1 Categories of Demographic Variables
The demographic variables examined in this study include age, gender, education
and household income. Consumers are categorised into five levels of age subgroups. They
are groups of those aged up to 20 , 21 to 30 years old, 31 to 40 years old, 41 to 50 years
old, and 51 years old and over. The guidelines used in determining the categories are firstly, that the number of cases in each category is reasonably large. Secondly, the
258
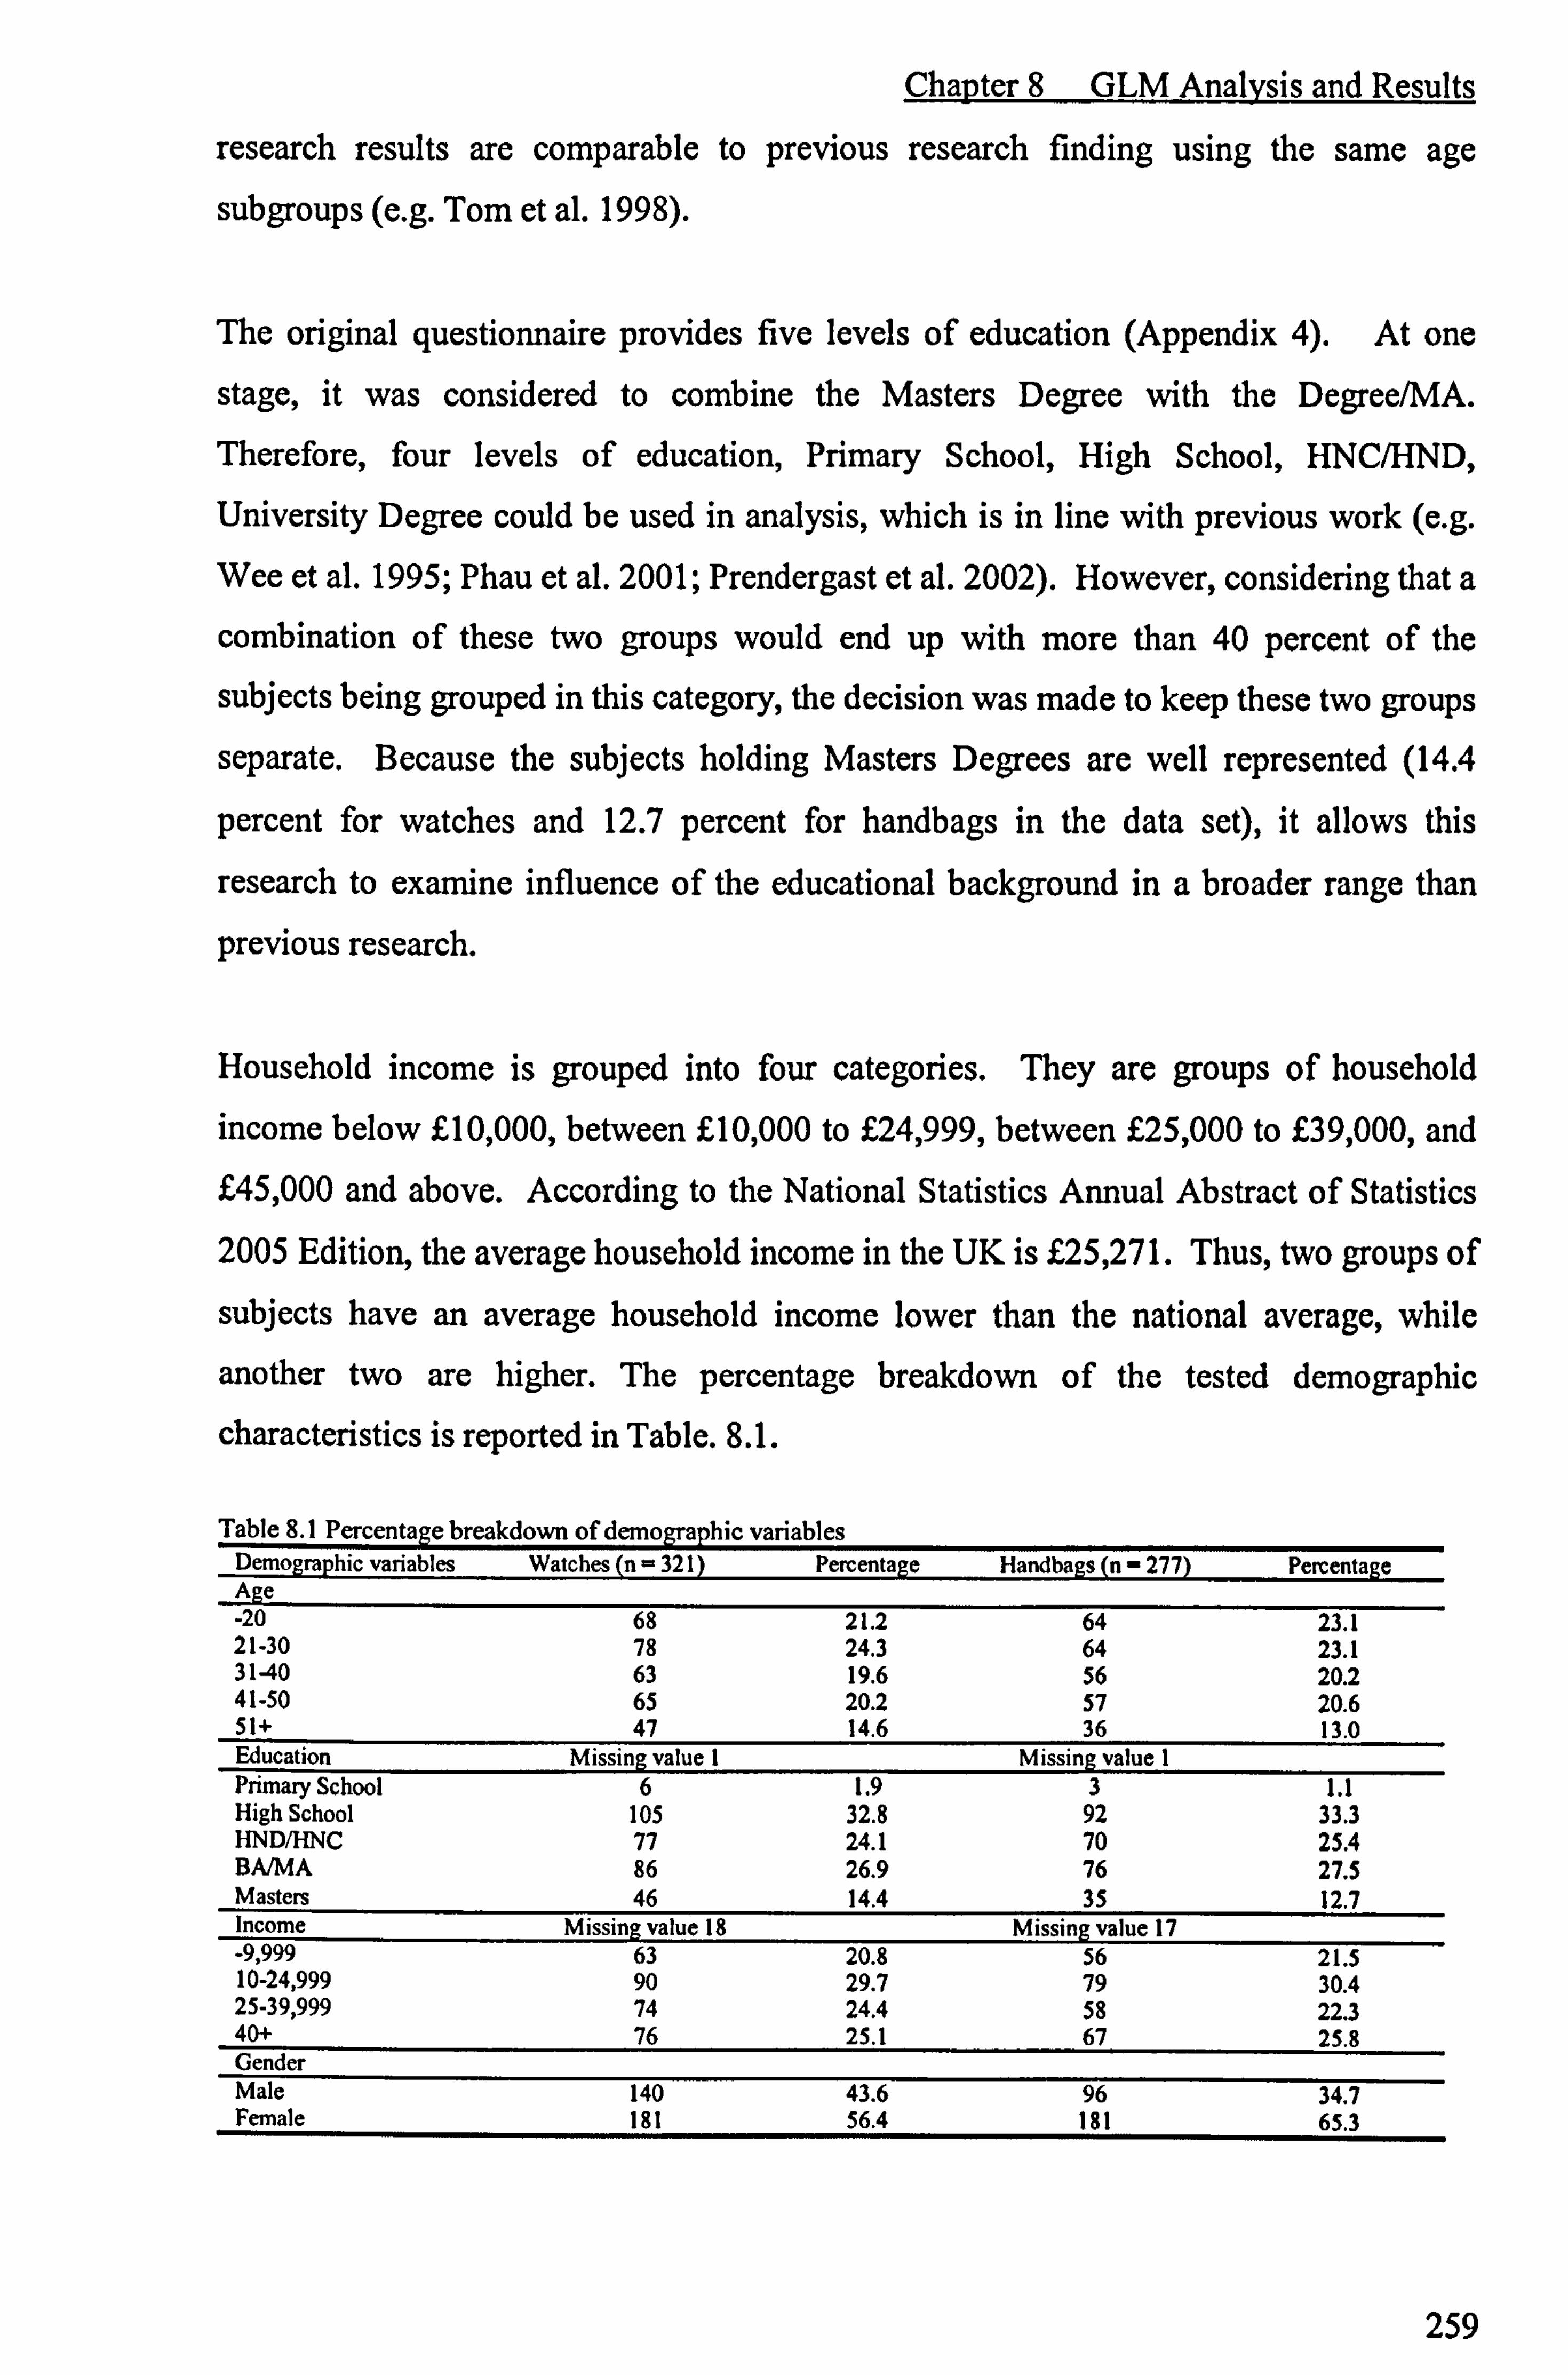
Chapter 8 GLM Analysis and Results
research results are comparable to previous research finding using the same age
subgroups (e. g. Tom et al. 1998).
The original questionnaire provides five levels of education (Appendix 4). At one
stage, it was considered to combine the Masters Degree with the Degree/MA.
Therefore, four levels of education, Primary School, High School, HNC/HND,
University Degree could be used in analysis, which is in line with previous work (e. g. Wee et al. 1995; Phau et al. 2001; Prendergast et al. 2002). However, considering that a combination of these two groups would end up with more than 40 percent of the
subjects being grouped in this category, the decision was made to keep these two groups
separate. Because the subjects holding Masters Degrees are well represented (14.4
percent for watches and 12.7 percent for handbags in the data set), it allows this
research to examine influence of the educational background in a broader range than
previous research.
Household income is grouped into four categories. They are groups of household
income below £10,000, between £10,000 to £24,999, between £25,000 to £39,000, and £45,000 and above. According to the National Statistics Annual Abstract of Statistics
2005 Edition, the average household income in the UK is £25,271. Thus, two groups of
subjects have an average household income lower than the national average, while
another two are higher. The percentage breakdown of the tested demographic
characteristics is reported in Table. 8.1.
Table 8.1 Percentage breakdown of demoeranhic variables Demographic variables Watches (n - 321) Percentage Handbags (n - 277) Percentage Age -20 68 21.2 64 23.1 21-30 78 24.3 64 23.1 31-40 63 19.6 56 20.2 41-50 65 20.2 57 20.6 51+ 47 14.6 36 13.0
Primary School 6 1.9 3 1.1 High School 105 32.8 92 33.3 HND/HNC 77 24.1 70 25.4 BA/MA 86 26.9 76 27.5 Masters 46 14.4 35 12.7 Income Missing value 18 Missing value 17 -9,999 63 20.8 56 21.5 10-24,999 90 29.7 79 30.4 25-39,999 74 24.4 58 22.3 40+ 76 25.1 67 25.8 Gender Male 140 43.6 96 34.7 Female 181 56.4 181 65.3
259
Chapter 8 GLM Analysis and Results
8.2.2 Interaction between Product Knowledge and Product Involvement
A review of product knowledge and product involvement literature shows that a number
of researchers have suggested that product involvement and product knowledge are
correlated (Batra and Ray 1986; Celsi and Olson 1988; Sujan 1985). More specifically,
product involvement and subjective product knowledge is highly interacted (Batra and
Ray 1986). Interpretation of these results in previous research is that the higher a
consumer's involvement, the more the consumer will try to obtain more product knowledge (Andrews 1988; Batra and Ray 1986; Petty et al. 1981). In addition, Lutz et
al. (1983) reported that consumers who have greater knowledge of a specific product are
more likely to perceive the product as important than consumers who have less
knowledge. The previous empirical results imply that product involvement and
subjective product knowledge interact with each other. Therefore, it is necessary to
check interactions of these two constructs across models and include in the model those
which are significant, as significant interactions affect the parameters which are
calculated for the other terms in the model (Hutcheson and Sofroniou 1999).
8.2.3 Other Variables Involved
Apart from the demographic variables and the newly created interaction variable of
product knowledge and product involvement (KxI), the rest of the explanatory variables
are self-assessed product knowledge, product involvement, extracted factors related to
brand image, likelihood of consideration and purchase intention. There are two response
variables in the conceptual model. They are consideration set and purchase intention.
As reported in Chapter 6, these variables are all measured using multi-item five-point
Likert scales. However, they can all be regarded as continuous variables, including the
response variables. The detailed reasons are provided in the following section.
8.3 Choice of Statistical Analysis Technique
This section provides the detailed justification of the choices of the statistical analysis
techniques used for data analysis in this study. The considerations of ordinary least
square (OLS), logistic regression, loglinear regression are reported in detail. Moreover,
the rationale for the use of second statistical analysis software -R commander - is
discussed.
260
Chapter 8 GLM Analysis and Results
8.3.1 Consideration of OLS
OLS regression is used to analyse part of the data. OLS requires that variables being
modelled must be continuous scale or be recorded on at least an interval scale
(Hutcheson and Sofroniou 1999). Though explanatory variables are also required to be
continuous, multi-category ordered and unordered categorical data can legitimately be
used in an OLS model subject to their being appropriately coded into a number of
dichotomous `dummy' categories (Fox 1997). The explanatory variables and the
response variables were measured using a multi-item five-point Likert scale (1=
strongly disagree, 5= strongly agree) in this study, with the exception of the
demographic variable. Two explanatory demographic variables, `gender' and
`education', are either dichotomous data or ordered categorical data, with `age' and
`income' measured using interval scales. The four demographic variables can all be
dummy coded. The values of the variables (excluding the demographic variables) were
obtained by adding up all Likert scores of items involved, then dividing by the number
of the items. In other words, the average values of all qualified items are used in data
analysis. Since the final scores take on a wide range of discrete values, it is acceptable
to treat them as continuous variables (Hutcheson and Sofroniou 1999). In the case of
the extracted factors of the brand image construct, as the factors scores are to be used in
modelling, these extracted factors are considered as continuous by nature. Therefore,
OLS is considered as an appropriate means to model the response variables.
OLS regression is a powerful technique for modelling continuous data, particularly
when it is used in conjunction with dummy variable coding and data transformation; it
can be used to both identify significant relationships (explanation) and predict values of
the response variable (prediction) (Hutcheson and Sofroniou 1999). In this research, the OLS regression explanatory function is explored.
The OLS regression assumes that each variable and all linear combinations of the
variables are normally distributed, the variance of one variable is about the same at each
level of a second variable, the relationship between the response variable and the
exploratory variable(s) appears linear and the observations are not linked or dependent
(Field 2005; Hutcheson and Sofroniou 1999). To meet the assumption of normality is
important, since statistical inference or exploratory power is weakened when departures
occur from normality (Cohen et al. 2003; Hutcheson and Sofroniou 1999). There are a
261

Chapter 8 GLM Analysis and Results
number of means one can use to examine normality, for example, skewness and kurtosis,
histogram, and quantile-quantile (Q-Q) plots. Most of these approaches can only be
used to examine normality of an individual variable. In contrast, the residual test can
identify departures which are the result of combinations of explanatory variables
(Hutcheson and Sofroniou 1999). In this study, frequency histograms for the response
variables and histograms of the residuals are used to examine the normality of the
response variables. The choice for using the graphic method over statistical tests such
as skewness and kurtosis is because the graphic method is visible and might also
indicate how one might transform the variable to become normal. Figures 8.1 to 8.16
present the results of tests of normality of the response variables. Figures 8.17 to 8.32
demonstrate histogram graphs of the residuals. One should be aware that the
histograms of the residuals are generated based on provisional models rather than on the
final models with the aim of illustrating violation of OLS normality assumption.
Likelihood of consideration ltl0
140
1211
1UU
HU
hban JOt ý_I
'1ýI lMV"11J
oýý_ý. I l -1
1t1 rSid JDeýoQt
to
IIL rwn -1 oe
1 Oo 1 12 1 nn
125 1" 225 2]5 25 J]5 d. 5 <]5 11.11O 2W 2h0 J00 J50 400 0511 500
Rolex Consideration Rolex intention
Figure 8.1 Distribution of likelihood of consideration of Figure 8.2 Distribution of purchase intention of original Rolex
original Rolex
Std Lt
N= 321 0
Counterfeit Rolex consideration
Figure 8.3 Distribution of likelihood of consideration of counterfeit Rolex
87
- 148
21 00
100 150 200 250 300 35(14(104(1) 500
Counterfeit Rolex intention
Figure 9.4 Distribution of purchase intention ul eounterleit Rolex
262
Purchase intention

Chapter 8 GLM Analysis and Results
ban "J 10
O
01L 61W1i i ý"A ' J21 OO
' 1.5 i 1ý
a125 1,
" J 5'
"ß'J JS,
^. 4 ý5y
". ý]5'.
xý
Gucci consideration
Figure 8.5 Distribution of likelihood of consideration of original Gucci
bv", 15
. 208
: 100
Gucci imenuon
Figure 8.6 Distribution o( purchase intention of original Gucci
Std o., =1. !. In n. ae
N 3l1 00 )ý' LN- : 11I IMI
,. d 00 a 50 SOU 1 (ýcl .. iii 1 hll f IMI I III i lHl 1 ". II _IN)
Lountertwl Gucci ý. onsiucrahon Counturlnd Guccl Inlenhon
Figure 8.7 Distribution of likelihood of consideration of Figure 8.8 Distribution of pu chase intention of counterfeit Gucci
counterfeit Gucci 100 200
8
6
Std LM =I ]I
1. ban =2 5a
N=21/oU
tO4
N l! /(MI
Burberry consideration Burberry intention
Figure 8.9 Distribution of likelihood of consideration of Figure 8.10 Distribution of purchase intention of original original Burberry Burberry
, _94 1 70
w
SdD. y- eo k%- -1 37 N=277W
Counterfeit Burberry consideration Counterfeit Burberry intention
Figure 8.11 Distribution of likelihood of consideration of Figure 8.12 Distribution of purchase intention of counterfeit counterfeit Burberry Butbetry
263
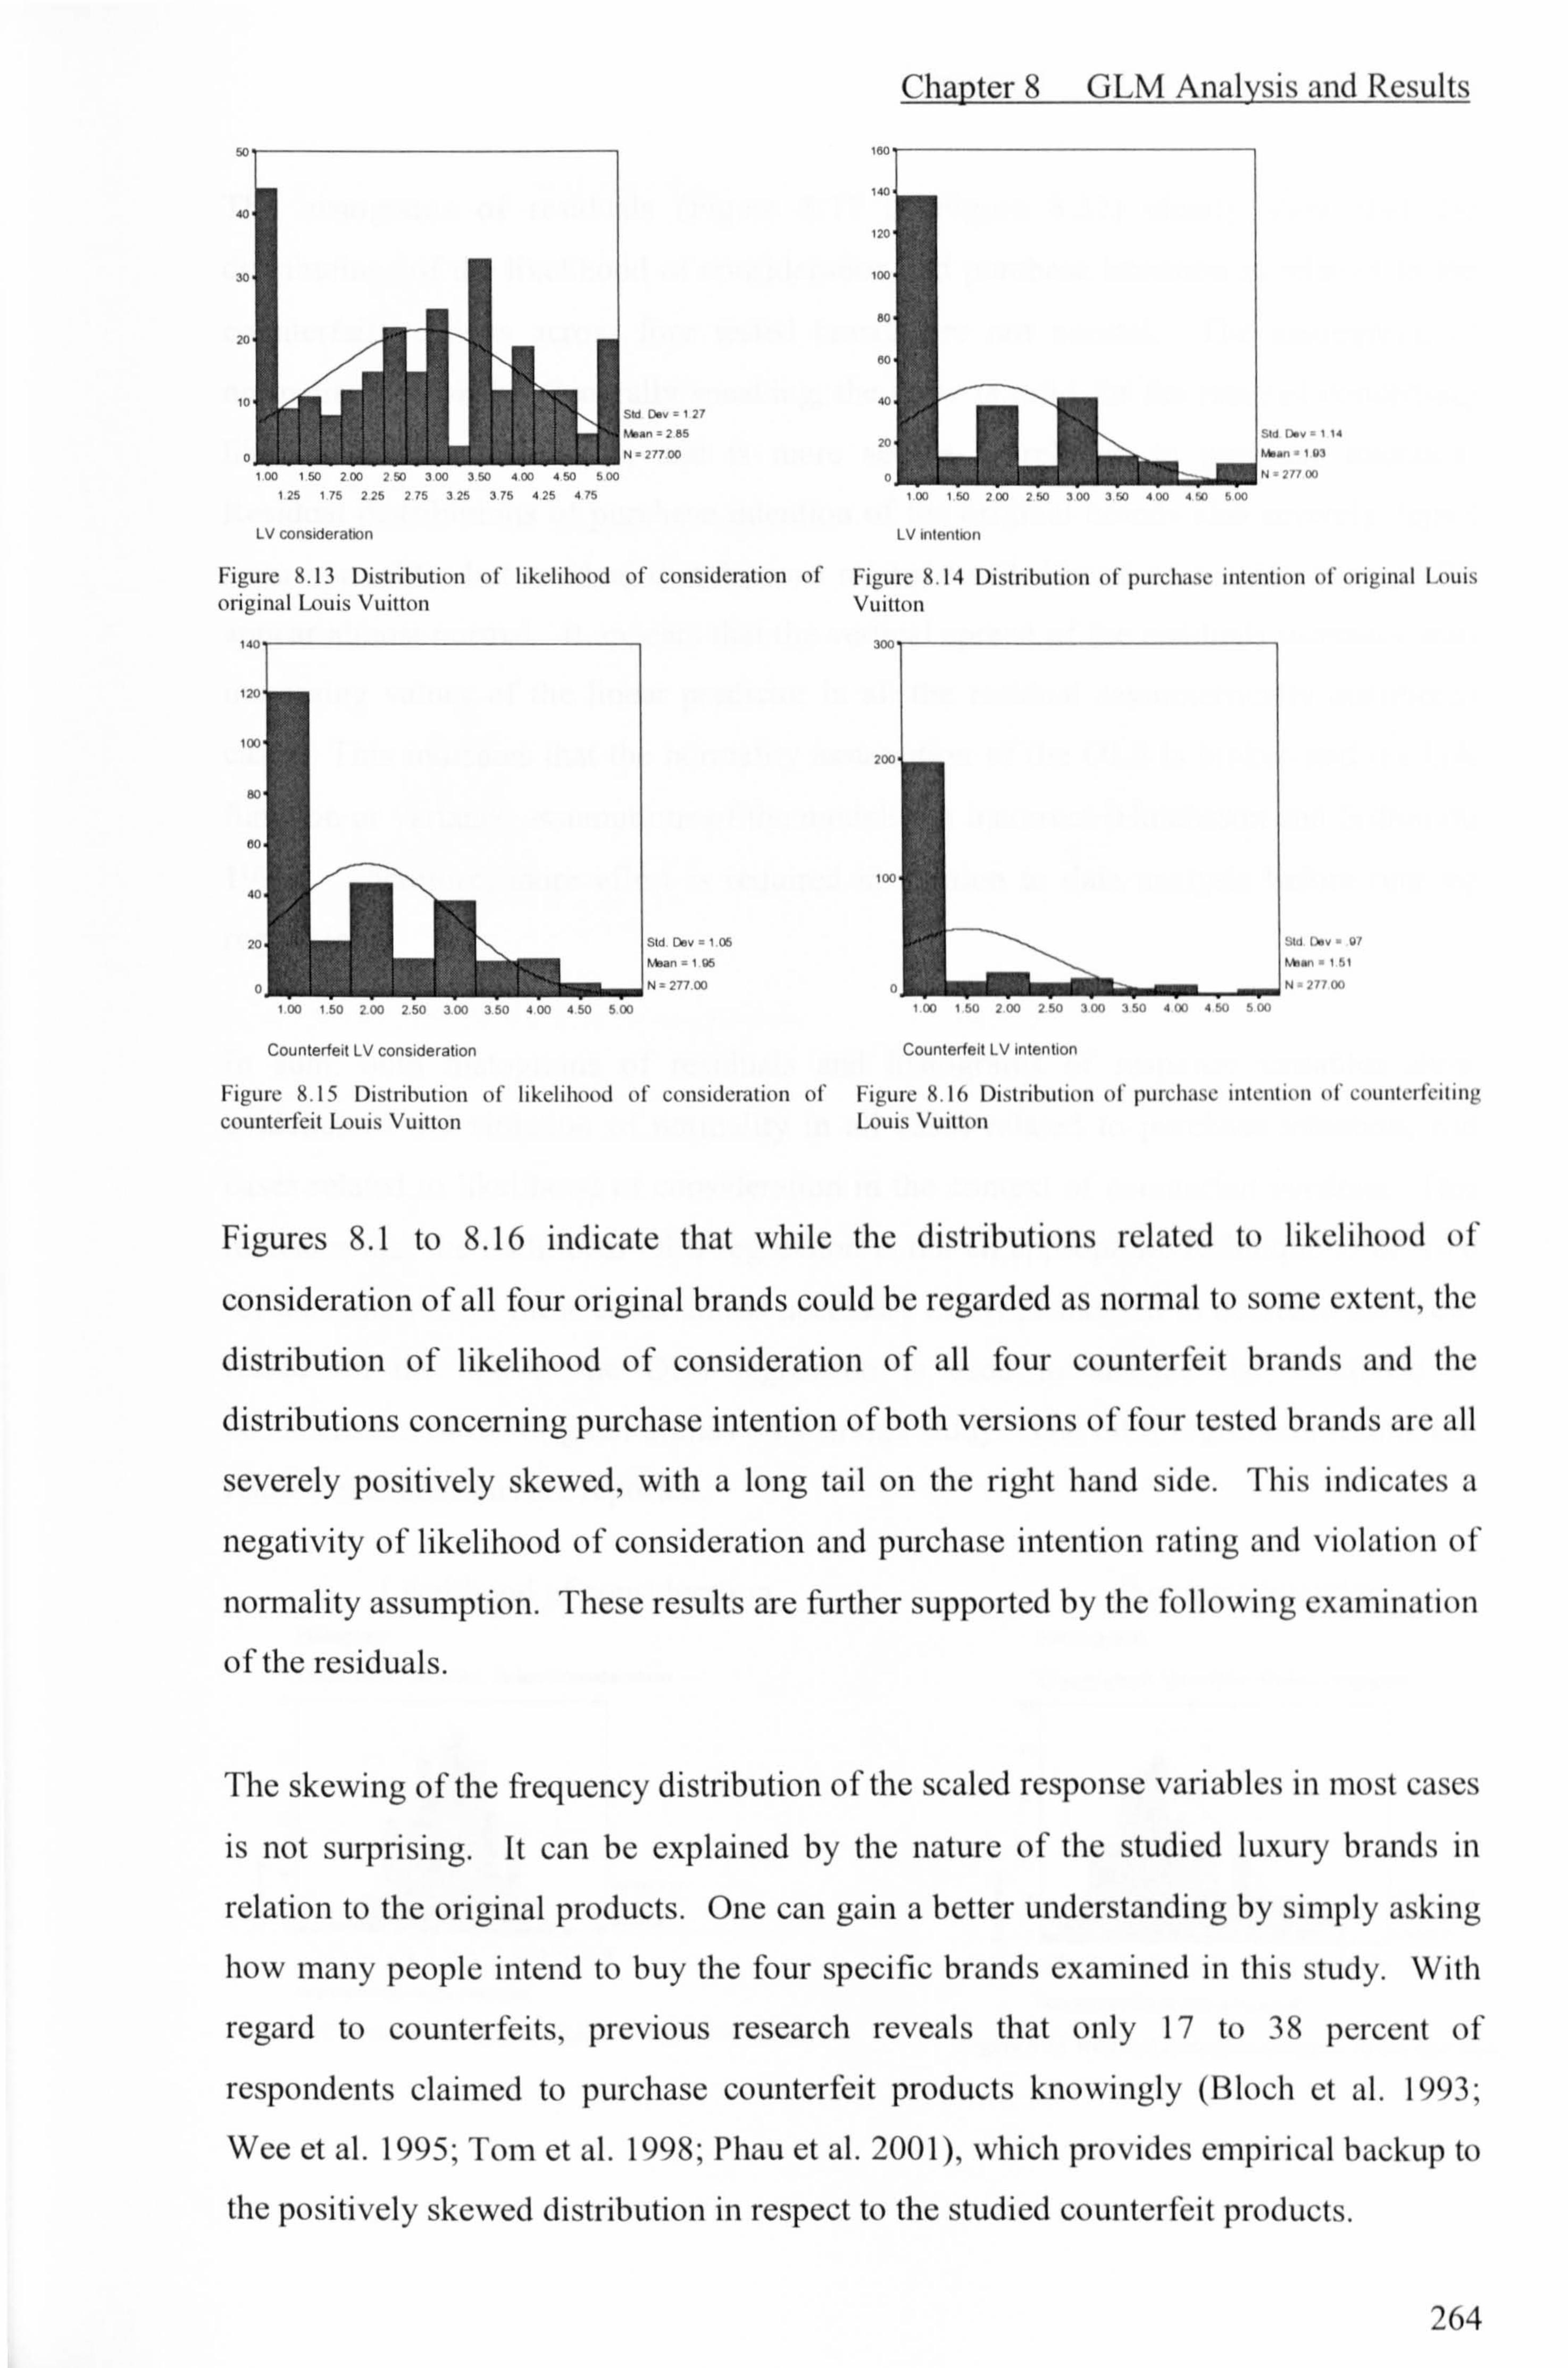
Chapter 8 GLM Analysis and Results
by=, n =, es 17
LV consideration LV ntent. m
4vi
Y,
1.
// Ib
Figure 8.13 Distribution of likelihood of consideration of Figure 8.14 Distribution of purchase intention of original Louis original Louis Vuitton Vuitton
by=,
I
7? t%l
Counterte t LV consideration Counterfeit LV intention
ºV " 07
AAer "1 51
N-77700
Figure 8.15 Distribution of likelihood of consideration of Figure 8.16 Distribution of purchase intention of counterfeiting counterfeit Louis Vuitton Louis Vuitton
Figures 8.1 to 8.16 indicate that while the distributions related to likelihood of
consideration of all four original brands could be regarded as normal to some extent, the
distribution of likelihood of consideration of all four counterfeit brands and the
distributions concerning purchase intention of both versions of four tested brands arc all
severely positively skewed, with a long tail on the right hand side. This indicates a
negativity of likelihood of consideration and purchase intention rating and violation of
normality assumption. These results are further supported by the following examination
of the residuals.
The skewing of the frequency distribution of the scaled response variables in most cases
is not surprising. It can be explained by the nature of the studied luxury brands in
relation to the original products. One can gain a better understanding by simply asking
how many people intend to buy the four specific brands examined in this study. With
regard to counterfeits, previous research reveals that only 17 to 38 percent of
respondents claimed to purchase counterfeit products knowingly (Bloch et al. 1993;
Wee et al. 1995; Tom et al. 1998; Phau et al. 2001), which provides empirical backup to
the positively skewed distribution in respect to the studied counterfeit products.
264
00 1W I 02W 2iO 300 J! A 4U0 4 'U SIH)
. 50 33 50 400 4 50 500 I. I"1 2 00 2 S0 ]IM) JSO aýx, 4 '. u ]IXE

Chapter 8 GLM Analysis and Results
The histograms of residuals (Figure 8.17 to Figure 8.32) clearly show that the
distributions of the likelihood of consideration and purchase intention in relation to the
counterfeit versions across four tested brands are not normal. The assumption of
normality is broken. Generally speaking, the skew is mild for the residual concerning
likelihood of consideration, and is more severe in relation to purchase intention.
Residual distributions of purchase intention of the original brands also severely depart
from normality, but residual distributions related to likelihood of consideration of' ßP
appear almost normal. It appears that the vertical spread of the residuals increases with
increasing values of the linear predictor in all the residual asymmetrically distributed
cases. This indicates that the normality assumption of the OLS is broken and the link
function or variance assumptions of the models are incorrect (Hutcheson and Sofroniou
1999). Therefore, more effort is required in relation to data analysis bctorc running
regressions.
In sum, both histograms of residuals and histograms of response variables show
evidence of the violation of normality in all cases related to purchase intention, and
cases related to likelihood of consideration in the context of counterfeit versions. This
indicates that the traditional OLS regression is not an appropriate technique to he used
for data analysis in these cases unless necessary effort is adopted to decrease the skew.
Based on the above, the OLS regression is used to analyse the likelihood of
consideration of the original brands only in this study. The OLS regression results and
related examinations are reported.
Likelihood of consideration Histogram
Dependent Variable: Rolex consideration
30
ý ,o ýo
.tf5_SS SFJ'
Regression Standas diced Restdual
Figure 9.17 Residual histogram (original Rolex consideration)
Purchase intention Histogram
Dependent Variable: Rolex intention
Q7 s s
.v" ue "000
MW
Regression Standar Jized Residual
Figure 8.18 Residual histogram (original Rolex intention)
265
"'t, ,II, `, ý, "b
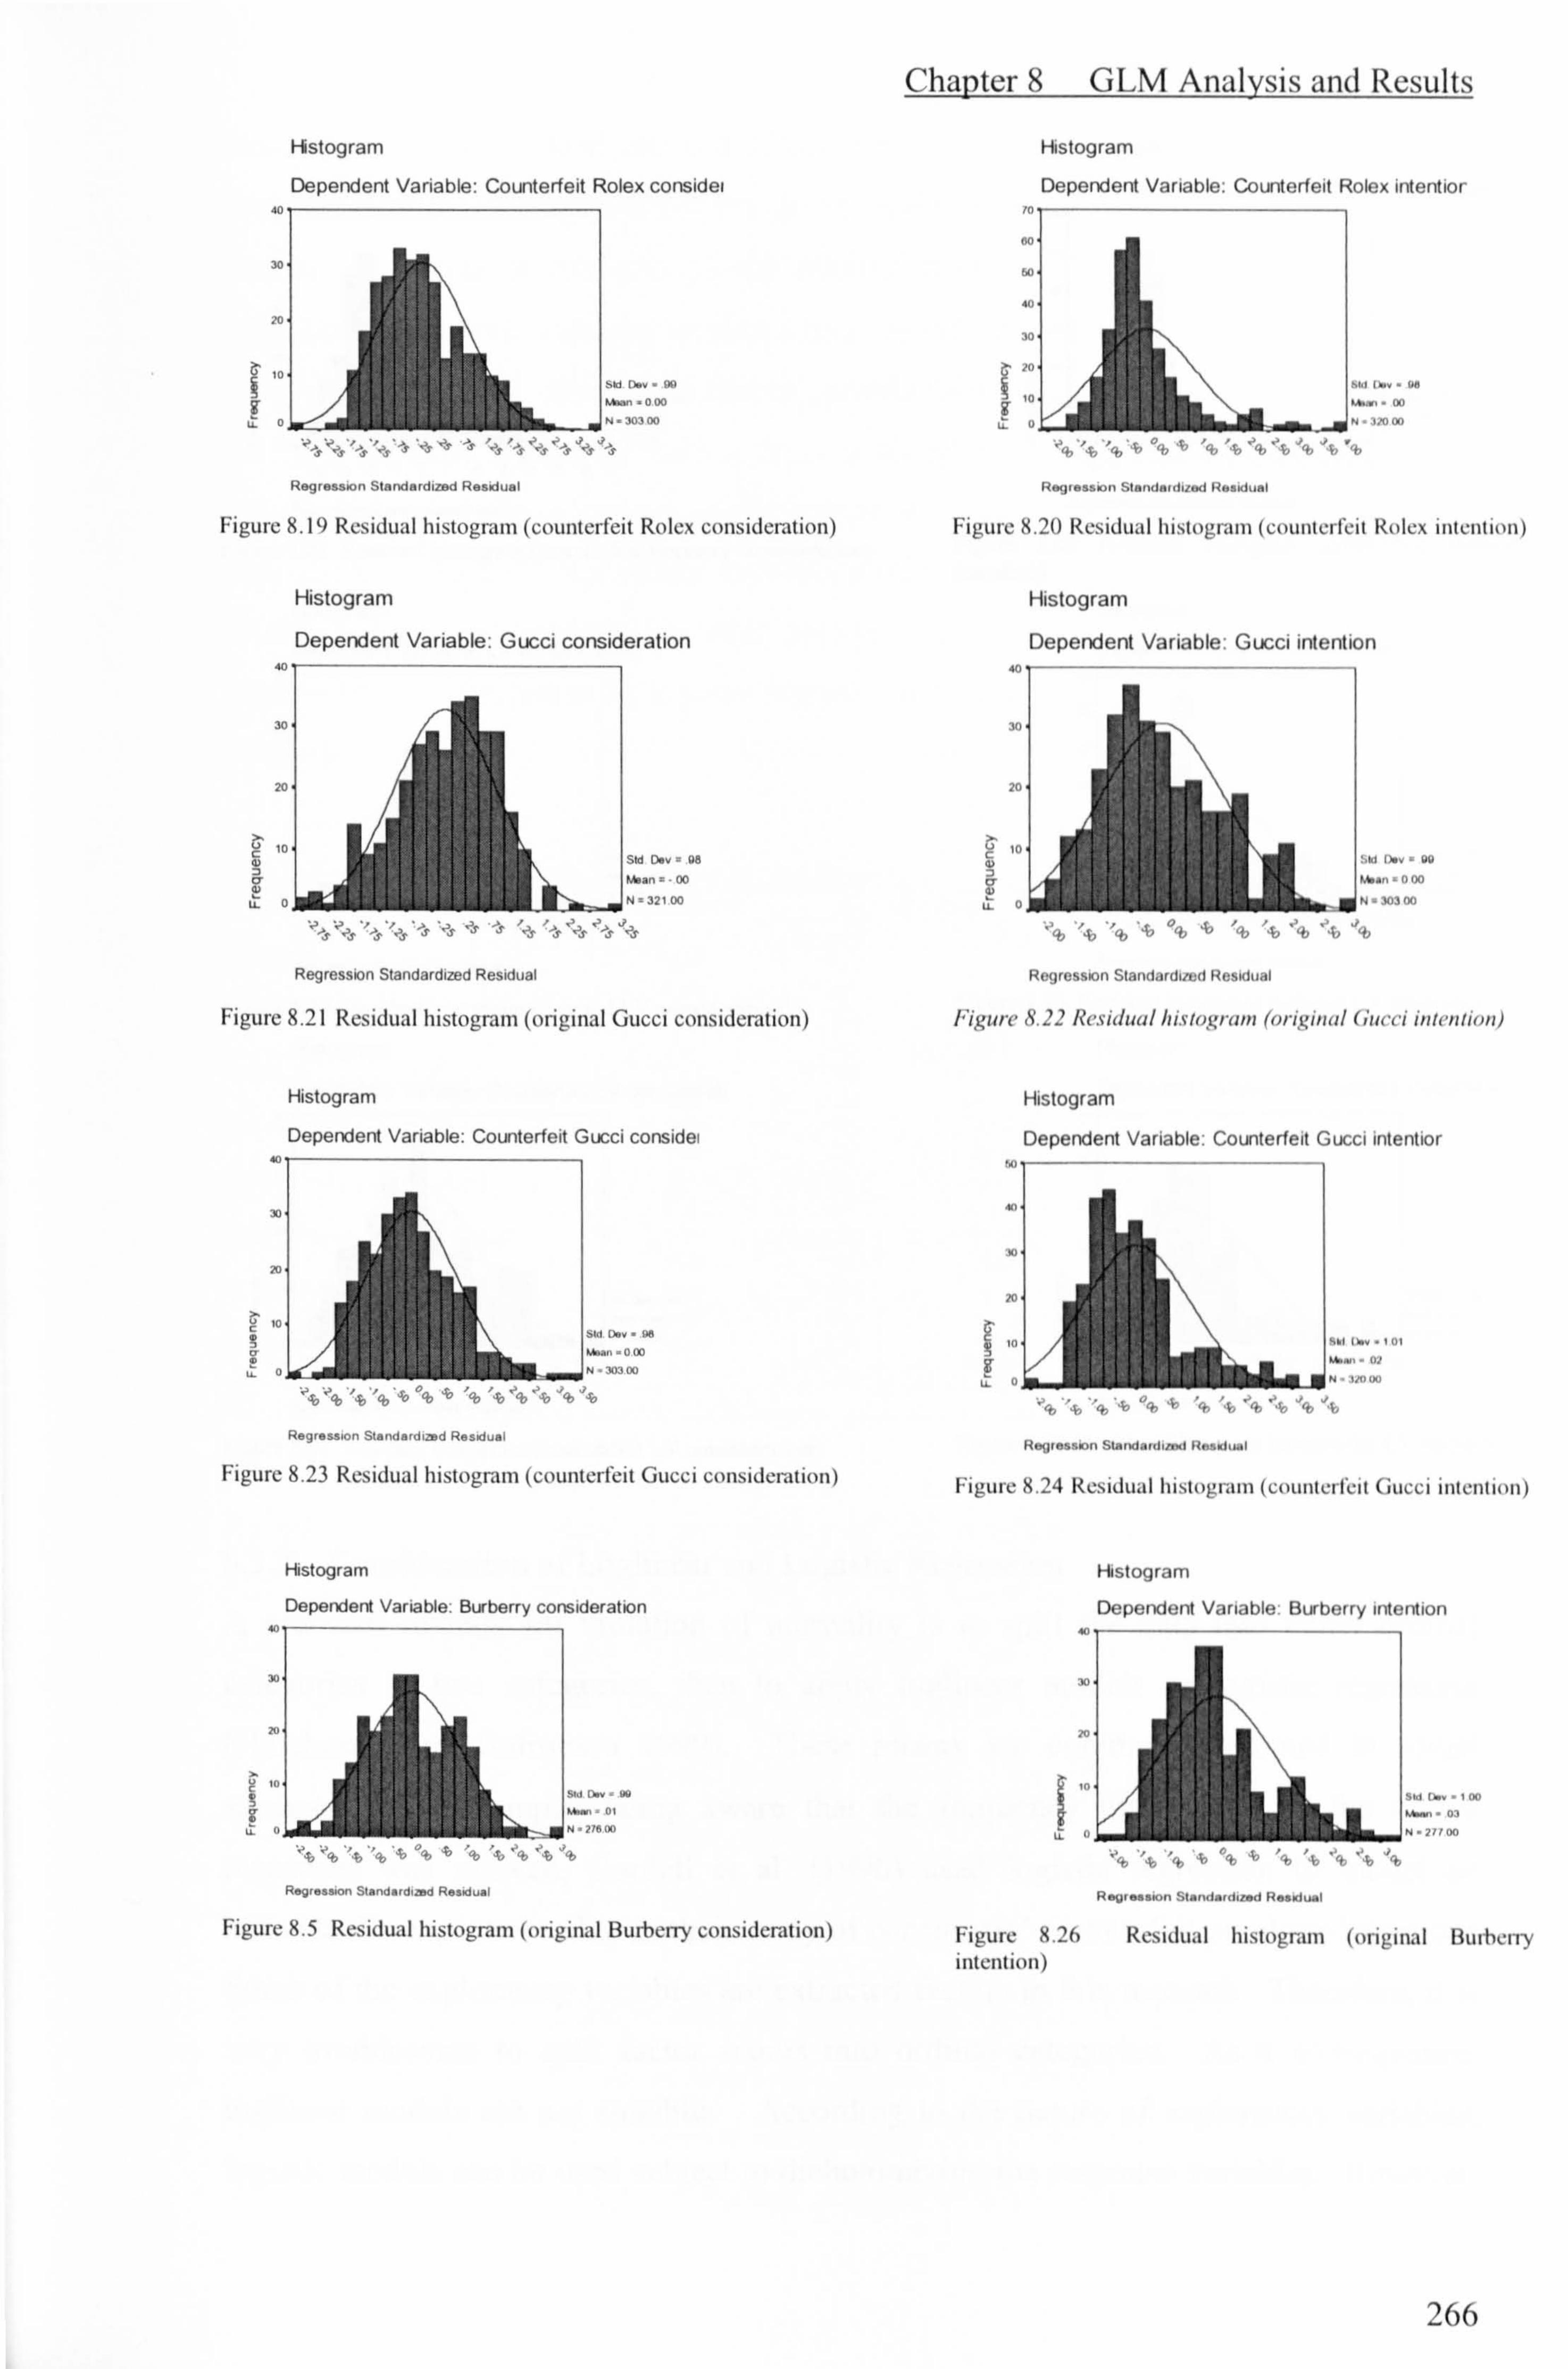
Fistogram
Dependent Variable: Counterfeit Rolex consider
ýý Sd 0. v - BB
g I. bvi-0 UO
Regresstun SleruferdLzed Resduul
Figure 8.19 Residual histogram (counterfeit Rolex consideration)
Histogram
Dependent Variable: Gucci consideration
JU
20
s. D. 9
2 T) J ýt ýS J ýS
Regression Standardized Residual
Figure 8.21 Residual histogram (original Gucci consideration)
Histogram
Dependent Variable: Counterfeit Gucci consider
Reg, ession Slandardimd Resd aI
Figure 8.23 Residual histogram (counterfeit Gucci consideration)
Histogram
Dependent Variable: Burberry consideration
s S
ftegression Standardirre Revaual
Figure 8.5 Residual histogram (original Burberry consideration)
Chapter 8 GLM Analysis and Results
Histogram
Dependent Variable: Counterfeit Rolex intentior
so ei u... ue
Rerýress*n. SInrrrlniifiirrct R,, s! dua
Figure 8.20 Residual histogram (cuunierlrit Rulcx intention)
Histogram
Dependent Variable: Gucci intention
m
N=b]00
Regression Slandardvrd Residual
Figure 8.22 Residual histogram (original Gucci intention)
Histogram
Dependent Variable: Counterfeit Gucci intentior
Ilo u iý.. lal rs. N- oa
mw
R )ýessnýý SIxýW aiýlinxl It. isxJ .I
Figure 8.24 Residual histogram (counterfeit Gucci intention)
Histogram
Dependent Variable: Burberry intention
Re{jies e. iiiý Stu,, (I. ýliie(l Renxfuul
Figure 8 . 26 Residual histogram (original Burberry
intention)
266
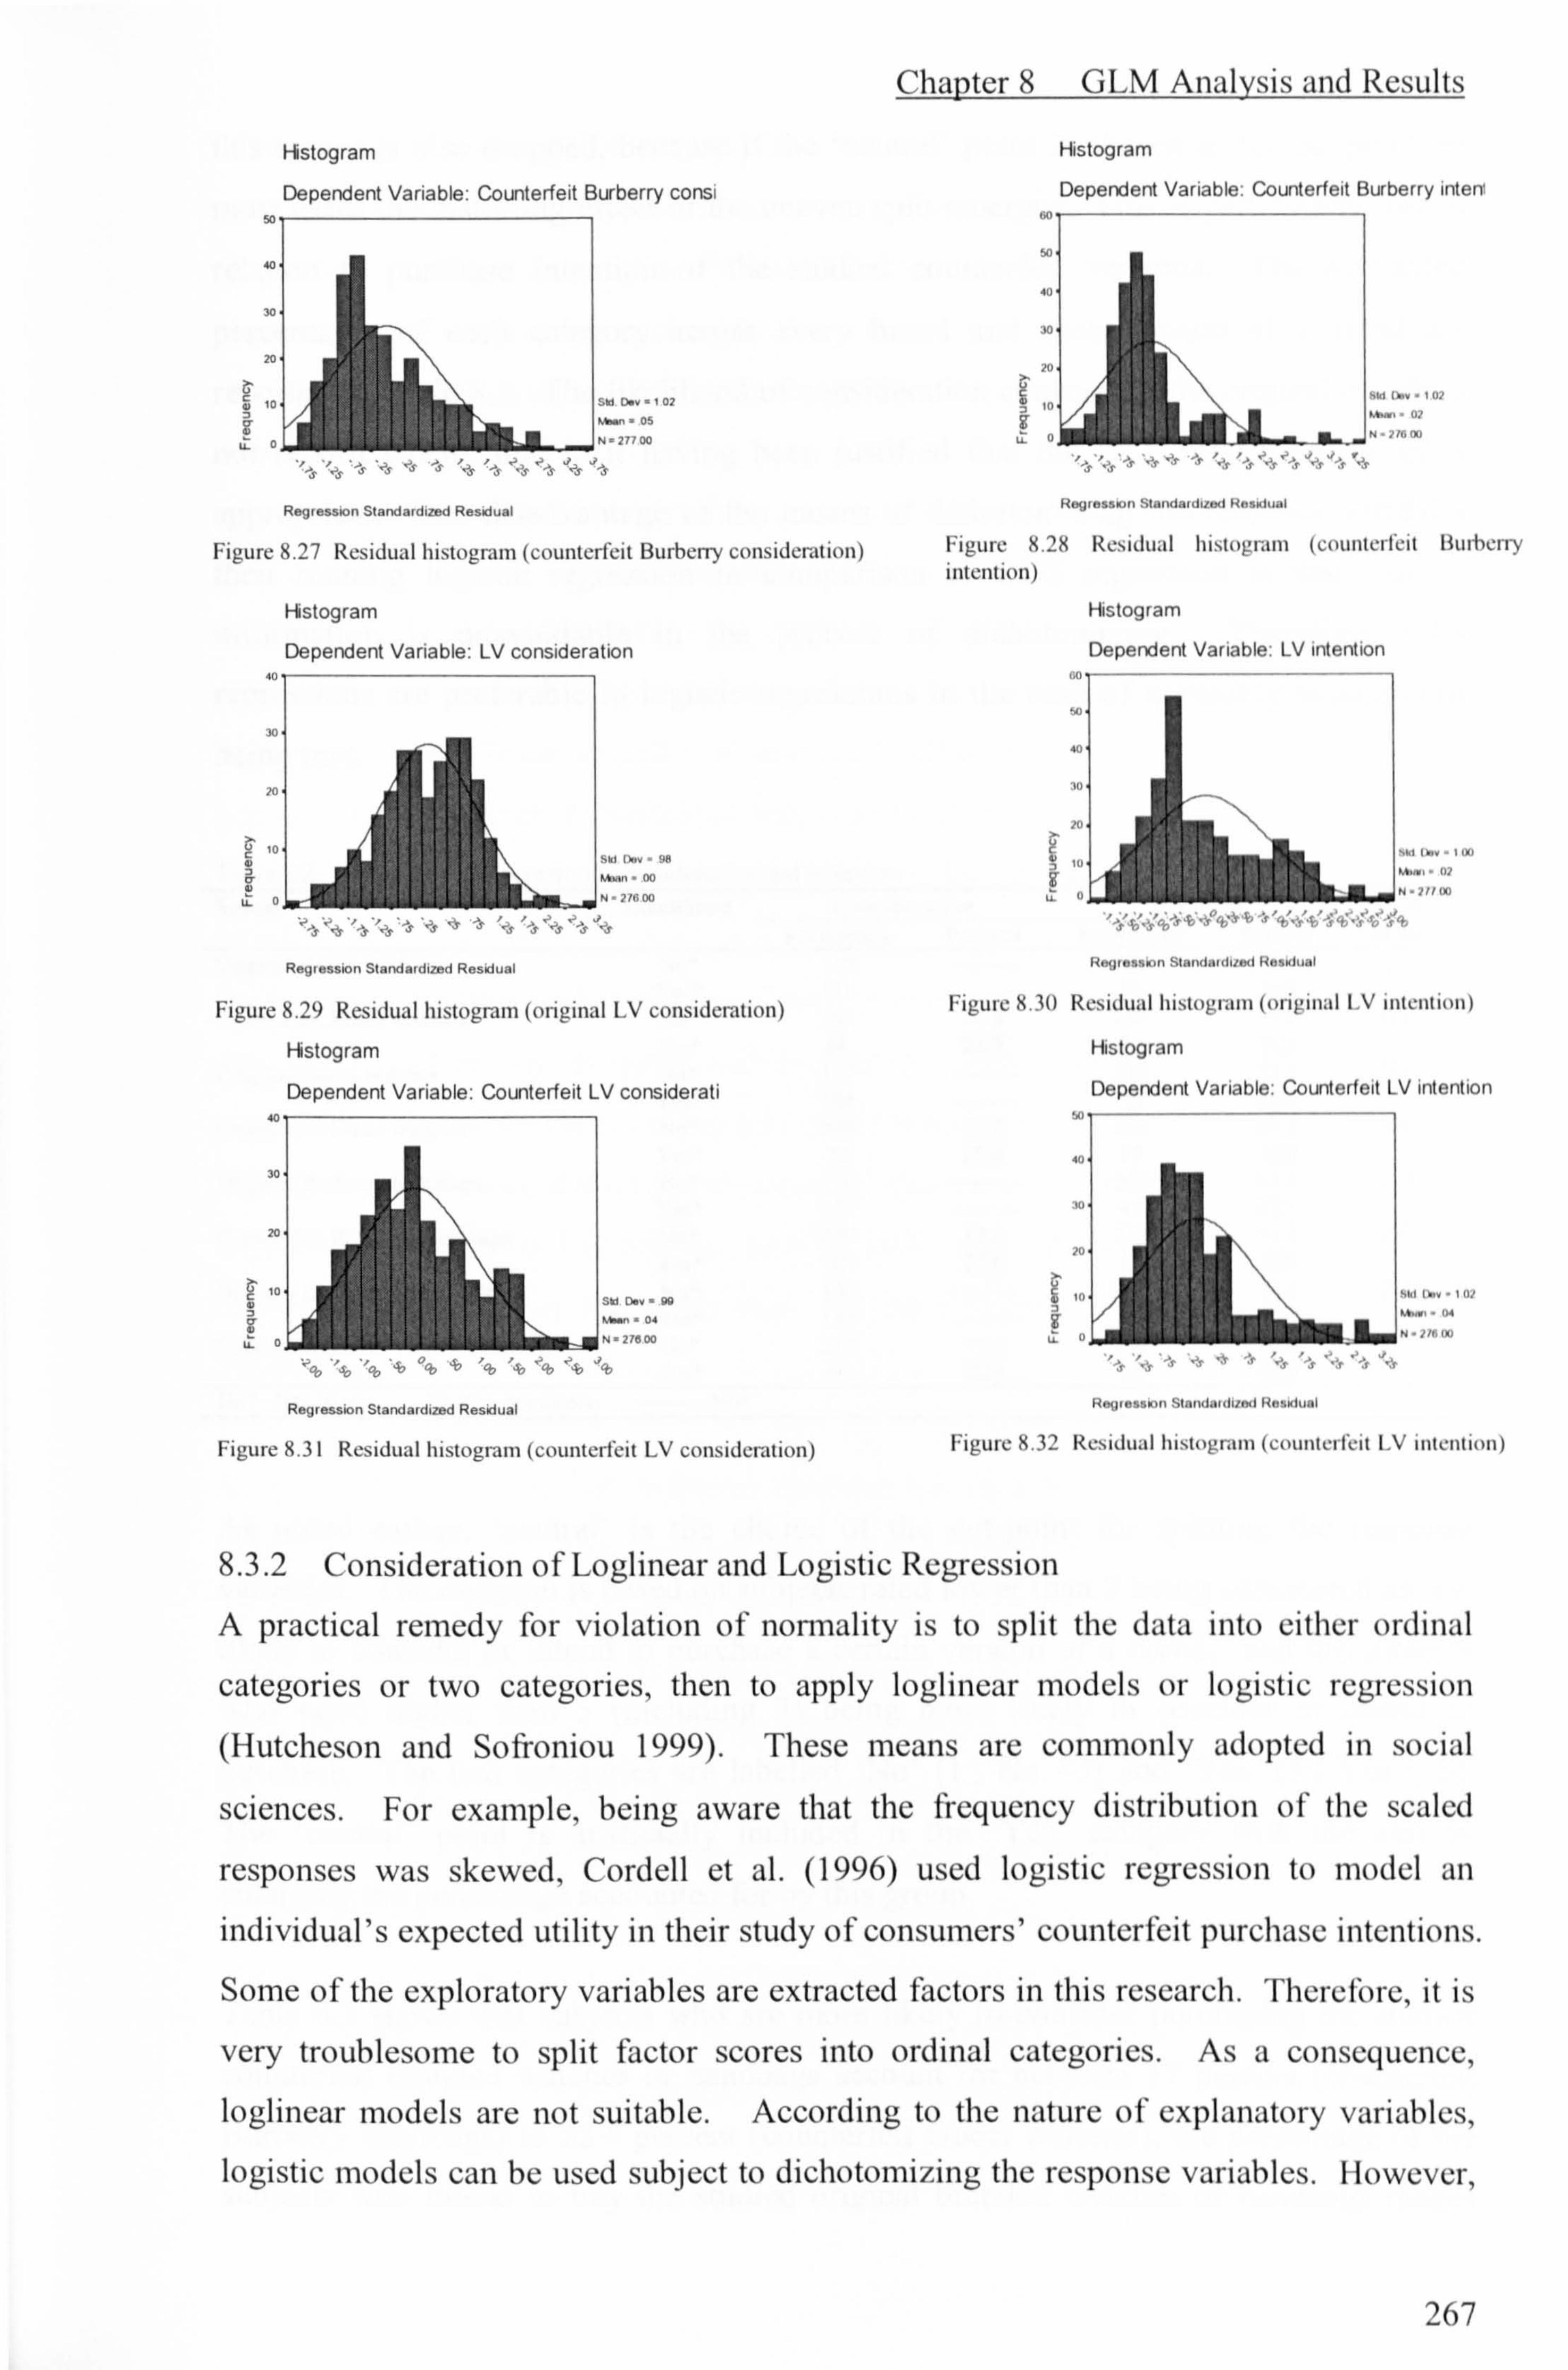
Chapter 8 GLM Analysis and Results
listogram
Dependent Variable: Counterfeit Burberry cons
s Stl. 0. v"t 01
Abvý + OS
N"1]]Op *iJ__
Regression Standardized Residual
Figure 8.27 Residual histogram (counterfeit Burberry consideration)
Histogram
Dependent Variable: LV consideration
LL of rýý UU ii fi1. -2;
ý98
Regression Standardized Residual
Figure 8.29 Residual histogram (original LV consideration)
Histogram
Dependent Variable: Counterfeit LV considerati
s, o.. YD
ýn " Ot
27800
Regression Standardized Residual
Figure 8.31 Residual histogram (counterfeit LV consideration)
Histogram
Dependent Variable: Counterfeit Burberry intent
ý la I>dv -1 a] In
Regressen SIa1ldaldl[eil Resxh I
Figure 8.28 Residual histogram (counterfeit ltwt)e ry intention)
Histogram
Dependent Variable: LV intention
s i,,. -w iu ýMý
Roglessoti 3latuia hsza(i HoSxlual
Figure S. 30 Residual histogram (original IN intention)
Histogram
Dependent Variable: Counterfeit LV intention
40
Ha Jiessxnn Siannlainlval Husxlu: ll
Figure 8.32 Residual histogram (counterfeit LV intention)
8.3.2 Consideration of Loglinear and Logistic Regression
A practical remedy for violation of normality is to split the data into either ordinal
categories or two categories, then to apply loglinear models or logistic regression
(Hutcheson and Sofroniou 1999). These means are commonly adopted in social
sciences. For example, being aware that the frequency distribution of the scaled
responses was skewed, Cordell et al. (1996) used logistic regression to model an
individual's expected utility in their study of consumers' counterfeit purchase intentions.
Some of the exploratory variables are extracted factors in this research. Thcrci-ore, it is
very troublesome to split factor scores into ordinal categories. As a consequence,
loglinear models are not suitable. According to the nature of explanatory variables,
logistic models can be used subject to dichotomizing the response variables. I lowever,
267
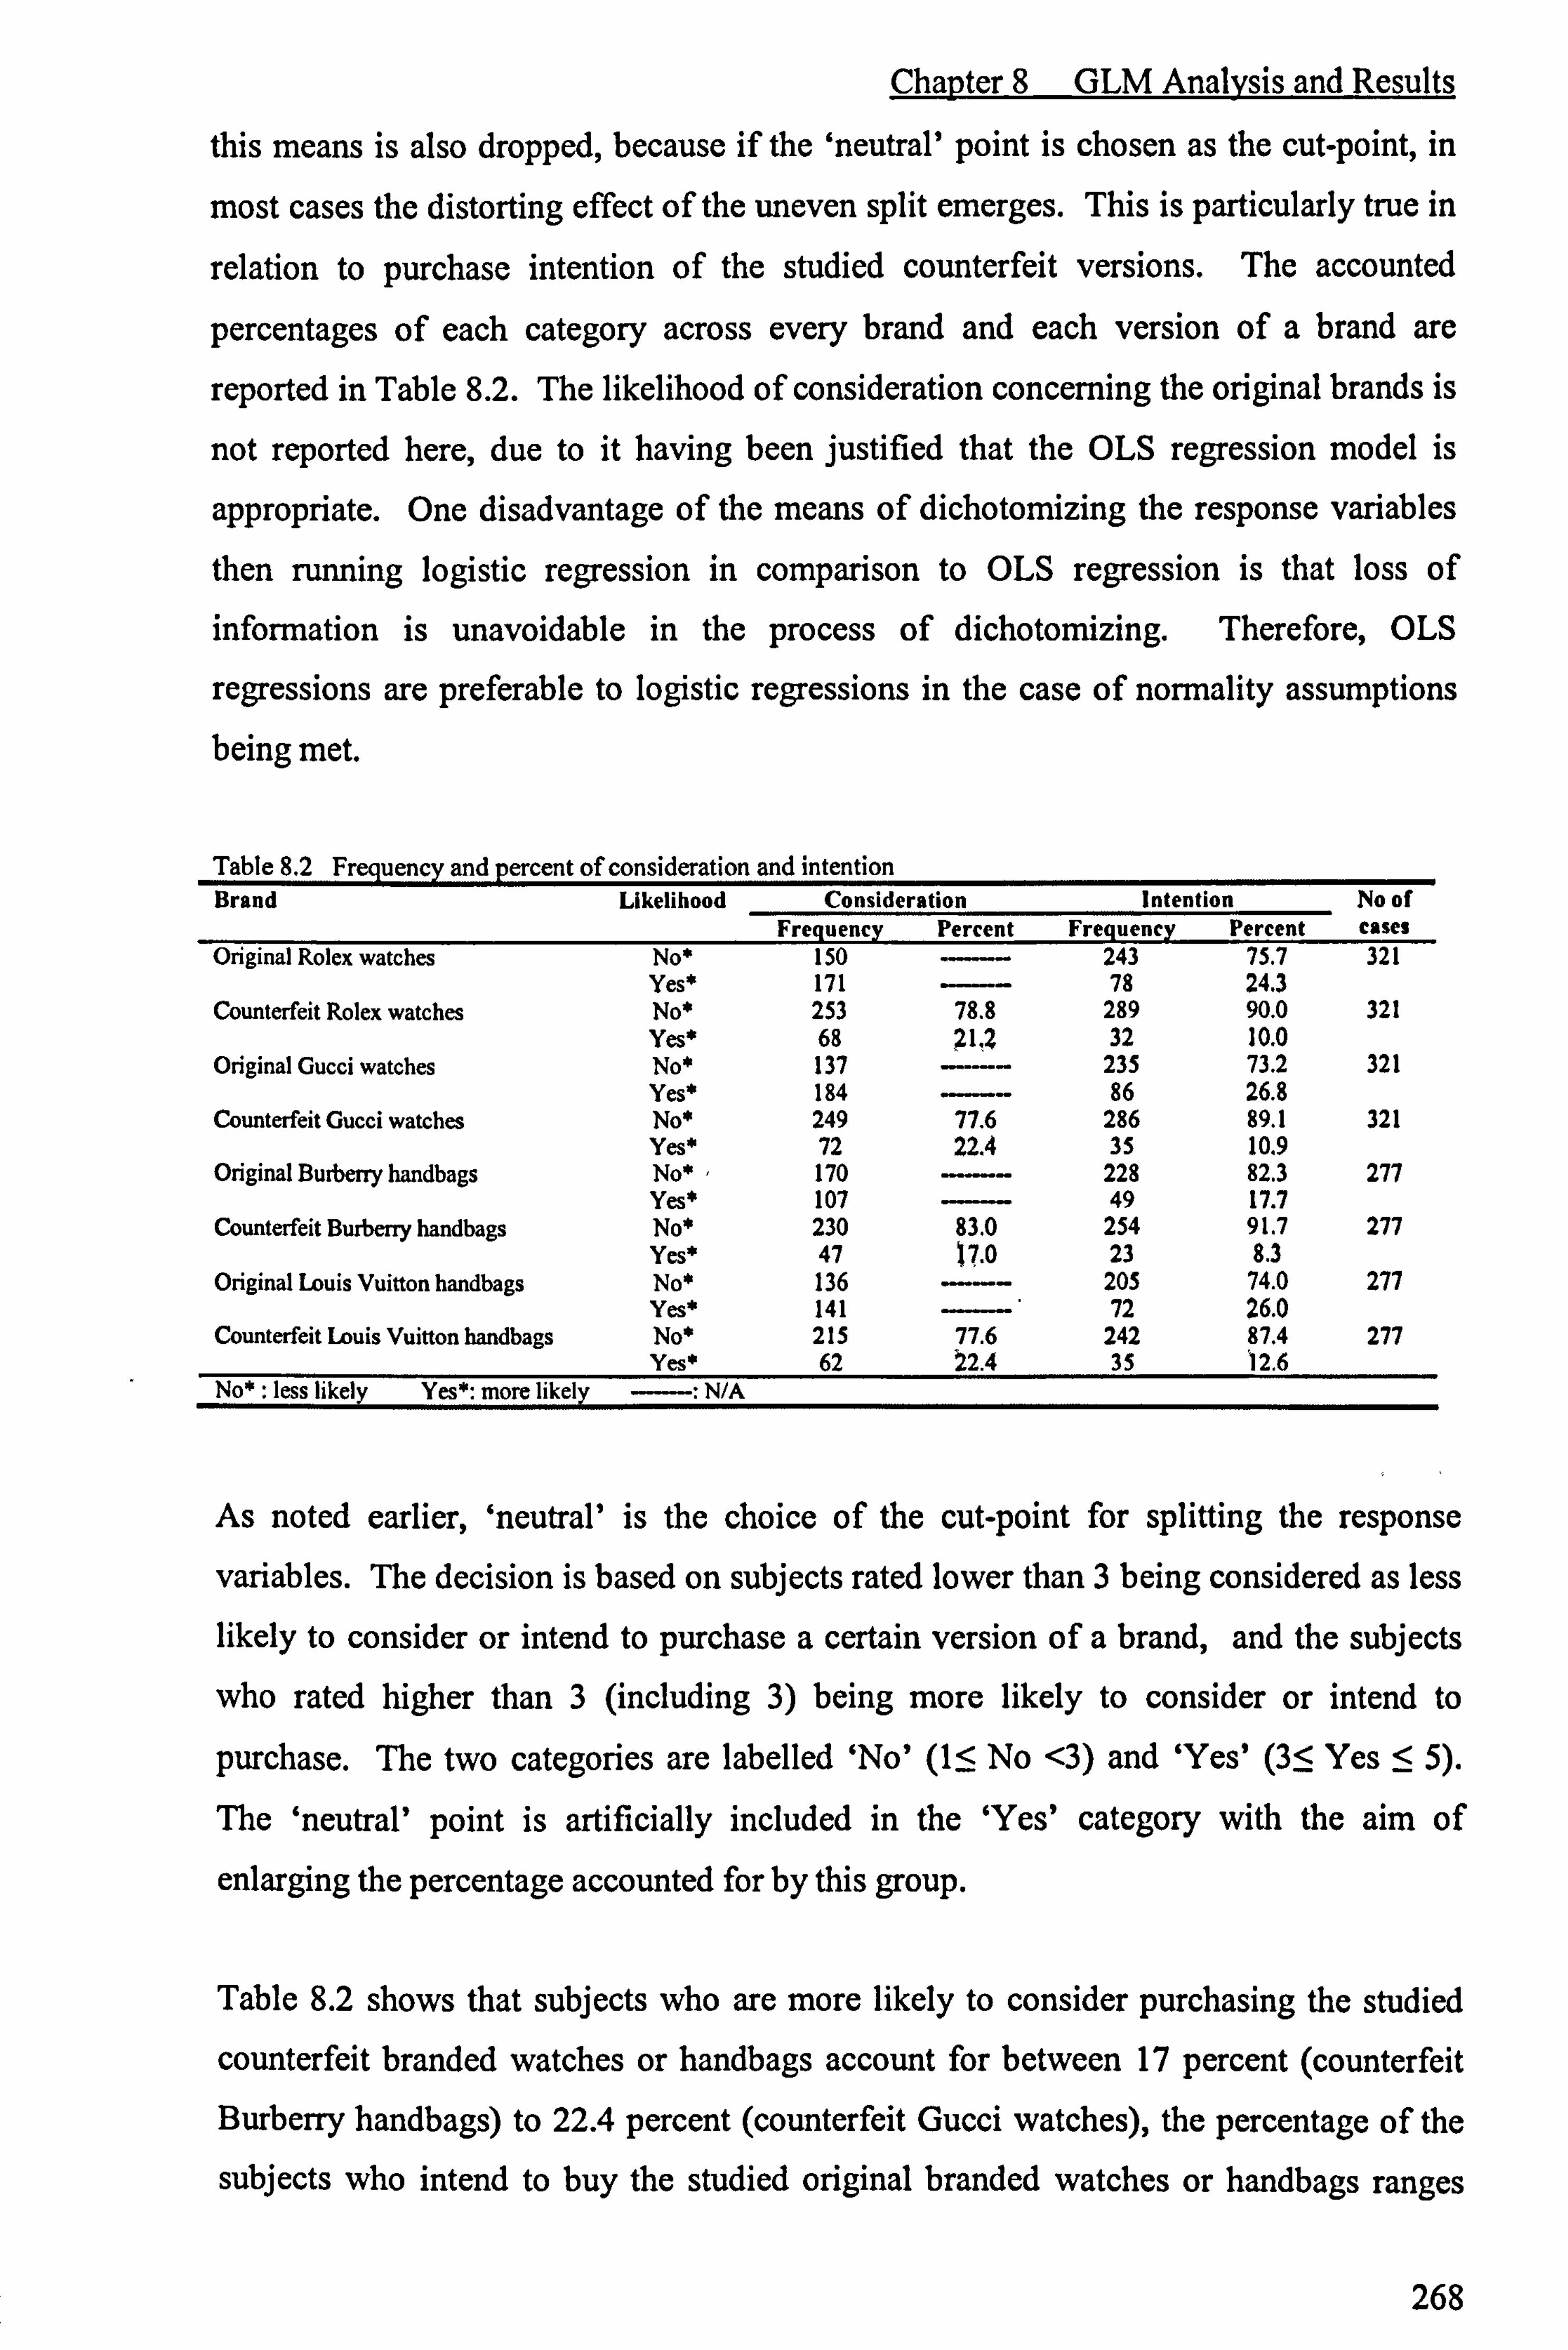
Chapter 8 GLM Analysis and Results
this means is also dropped, because if the `neutral' point is chosen as the cut-point, in
most cases the distorting effect of the uneven split emerges. This is particularly true in
relation to purchase intention of the studied counterfeit versions. The accounted
percentages of each category across every brand and each version of a brand are
reported in Table 8.2. The likelihood of consideration concerning the original brands is
not reported here, due to it having been justified that the OLS regression model is
appropriate. One disadvantage of the means of dichotomizing the response variables
then running logistic regression in comparison to OLS regression is that loss of
information is unavoidable in the process of dichotomizing. Therefore, OLS
regressions are preferable to logistic regressions in the case of normality assumptions being met.
Table 8.2 Freauencv and percent of consideration and intention Brand Likelihood Consideration
Frequency Percent Intention
Frequency Percent No of cases
Original Rolex watches No* 150 ----- 243 75.7 321 Yes* 171 ------ 78 24.3
Counterfeit Rolex watches No* 253 78.8 289 90.0 321 Yes* 68 21,2 32 10.0
Original Gucci watches No* 137 ------ 235 73.2 321 Yes* 184 ------- 86 26.8
Counterfeit Gucci watches No* 249 77.6 286 89.1 321 Yes* 72 22.4 35 10.9
Original Burberry handbags No* 170 ------ 228 82.3 277 Yes* 107 49 17.7
Counterfeit Burberry handbags No* 230 83.0 254 91.7 277 Yes* 47 17.0 23 8.3
Original Louis Vuitton handbags No* 136 ------- 205 74.0 277 Yes* 141 72 26.0
Counterfeit Louis Vuitton handbags No* 215 77.6 242 87.4 277 Yes* 62 22.4 35 12.6
No* : less likely Yes*: more likely -: N/A
As noted earlier, `neutral' is the choice of the cut-point for splitting the response
variables. The decision is based on subjects rated lower than 3 being considered as less
likely to consider or intend to purchase a certain version of a brand, and the subjects
who rated higher than 3 (including 3) being more likely to consider or intend to
purchase. The two categories are labelled `No' (15 No <3) and `Yes' (35 Yes _<
5).
The `neutral' point is artificially included in the `Yes' category with the aim of
enlarging the percentage accounted for by this group.
Table 8.2 shows that subjects who are more likely to consider purchasing the studied
counterfeit branded watches or handbags account for between 17 percent (counterfeit
Burberry handbags) to 22.4 percent (counterfeit Gucci watches), the percentage of the
subjects who intend to buy the studied original branded watches or handbags ranges
268

Chapter 8 GLM Analysis and Results
between 17.7 (original Burberry handbags) and 26.8 (original Gucci watches), the
percentage of the subjects who admit to having the intention of purchasing the studied
counterfeit branded versions lies between 8.3 (counterfeit Burberry handbags) and 12.6
(counterfeit Louis Vuitton handbags). The uneven split, or even 90-10% split in some
cases, suggests that logistic regression cannot be used for data analysis (Hutcheson and
Sofroniou 1999).
8.3.3 Justification of Transformation of Data and Use of R-commander
Traditionally, the transformation of variables by a mathematical function is used to
remedy violation of normality, linearity and constant variance. However, this can result
in some complex linear models. Moreover, Hutcheson and Sofroniou (1999) suggest
that the transformation of variables may lead to optimizing one aspect, but may also
have side-effects on another. McCullagh and Neider (1989) emphasize changing the
link function of a model. In their review of the consumer satisfaction rating literature,
Peterson and Wilson (1992) suggest departure from traditional approaches when scaled
response variables are skewed, and recommend data transformation methods. The
advantage involved in transforming data over the transformation of variables is that data
transformation leaves the observed scale of measurement untouched, which is more
desirable (Moutinho and Hutcheson 2007). The R statistical analysis software is used to
implement this task, as the SPSS does not have as powerful a data transformation
function as R.
R is an integrated suite of software facilities for data manipulation, calculation and
graphical display. It can be regarded as an implementation of the S language which was
developed at Bell Laboratories by Rick Becker, John Chambers and Allan Wilks. R
was initially written by Ross Ihaka and Robert Gentleman at the Department of
Statistics of the University of Auckland, New Zealand. This is also partially the reason
why it is named R. R works on multiple computing platforms and can be downloaded
free of charge (Dalgaard 2002). Some people use R as a statistical system, while others
prefer to think of R as an environment within which many classical and modem
statistical techniques have been implemented (Venables and Smith 2005). There are
about twenty-five standard and recommended packages supplied with R, and many
more are available through the CRAN family of internet sites.
269
Chapter 8 GLM Analysis and Results
R-commander (Rcmdr) is one of the packages of R software. The R-Commander
graphic user's (GUI) interface is designed by John Fox. The object of John Fox in
designing and implementing this GUI was to cover the content of a basis-statistics
course. The R Commander implements the basis practices of statistics (e. g. data
transformation) plus some additional statistics (e. g. linear and generalized linear
models). In the current study, the R-Commander data transformation function and the
GLM statistics are utilized. Specifically, The Box-Cox (Box and Cox 1964) and Box-
Tidwell (Box and Tidwell 1962) techniques are applied to identify transformations
needed in relation to the response variables and the explanatory variables.
8.4 OLS Regression Using SPSS
Despite its being criticised for taking many input and methodological decisions out of
the hands of the researcher (Field 2000), the regression procedure used is stepwise
regression. This is because the stepwise method is considered appropriate for
exploratory model building (Wright 1997), which fits in well with the exploratory
nature of this study. Once again, the OLS is only utilised to regress the likelihood of
consideration concerning the tested original branded products. For economy's sake,
only the results obtained for the final stage of the stepwise regression procedure are
reported.
As the multicollinearity tests were reported in Chapter 7, here the focus is on assessing
the assumption of constant variance and identifying outliers. The constant variance
assumption is investigated by examining the residuals of the fitted models. The outliers
are removed if it is necessary. The extreme cases are identified using the SPSS residual
statistics function. Cook's distance and leverage values of individual cases are further
examined. Cases with Cook's distance greater than 1 (Cook and Weisberg 1982) or
leverage value greater than three times k/n (k is the number of model parameters
including the intercept, and n is the number of cases) are considered problematic
(Steven 1992) and discarded for their undue influence on the model.
This section first reports the examination of constant variance and results then follows
with casewise diagnostics and solutions. The initial OLS regression and final regression
results are reported and compared. Based on the comparison, a decision is made with
270

Chapter 8 GLM Analysis and Results
regard to which model is more appropriate. Detailed interpretation and discussion of
the model which is perceived as more appropriate are presented.
8.4.1 Constant Variance Test
Figure 8.33 to Figure 8.36 are plots of the residuals versus the fitted values. According
to the plots the residuals versus the fitted values of every consideration model of the
original brands to a great percent lie in a horizontal band, no severe fan out appears.
Therefore, the conclusion is drawn that the model is a good approximation and the
variance is constant.
s
P E F
`s
Scatterplot
Dependent Variable: Rolex consideration
Scatterplot
Dependent Variable: Gucci consideration
ýý 8ýdr88, no
`f o
oý ýýy uB° An
wood 8 ýL
-z 1o1za
Regression Standardized Predicted Value
Figure 8.33 Residual versus fitted value (original Rolex)
Scatterplot
Dependent Variable: Burberry consideration
Y
tl
N
K
`ýca �f p` gýpýP ýýg ý'°t7ý ýuý ý$ýý$ý, q o dýýaýodý uo0 "qm+ýý
as
ý ýe
4 om
-3 -2 1012
Regression Standardized Predicted Value
Figure 8.35 Residual versus tilted value (original Burberry)
4
F N
4
ü
a
z y,
-i ýýý, ýýn
ýý o ýý
1 1Y "m
.,
.e.. ý .ýinie
Regression Standardized Predicted Value
Figure 8.34 Residual versus tilted value (original Gucci)
Scatterplot
Dependent Variable: LV consideration
-] -J 111z]
Rogrossion Standardized Prothctod Valuo
Figure 8.36 Residual versus fitted value (original la uis Vuitton)
8.4.2 Casewise Diagnostics
As noted earlier, outliers are detected by looking for extreme standardized residuals. In
an average, normally distributed sample, the standardised residual should have some
useful characteristics. For instance, 95% of the standard residuals of all cases should he
within ±2.0 (Field 2000). So we would expect only 5% of cases to lie outside of these
limits. Table 8.3 shows that 11 cases related to Rolex, 15 cases related to Gucci, 11
cases related to Burberry, 14 cases related to Louis Vuitton lie outside of the limits.
The sample size is 320 for watches, and 276 for handbags, therefore the number of
271
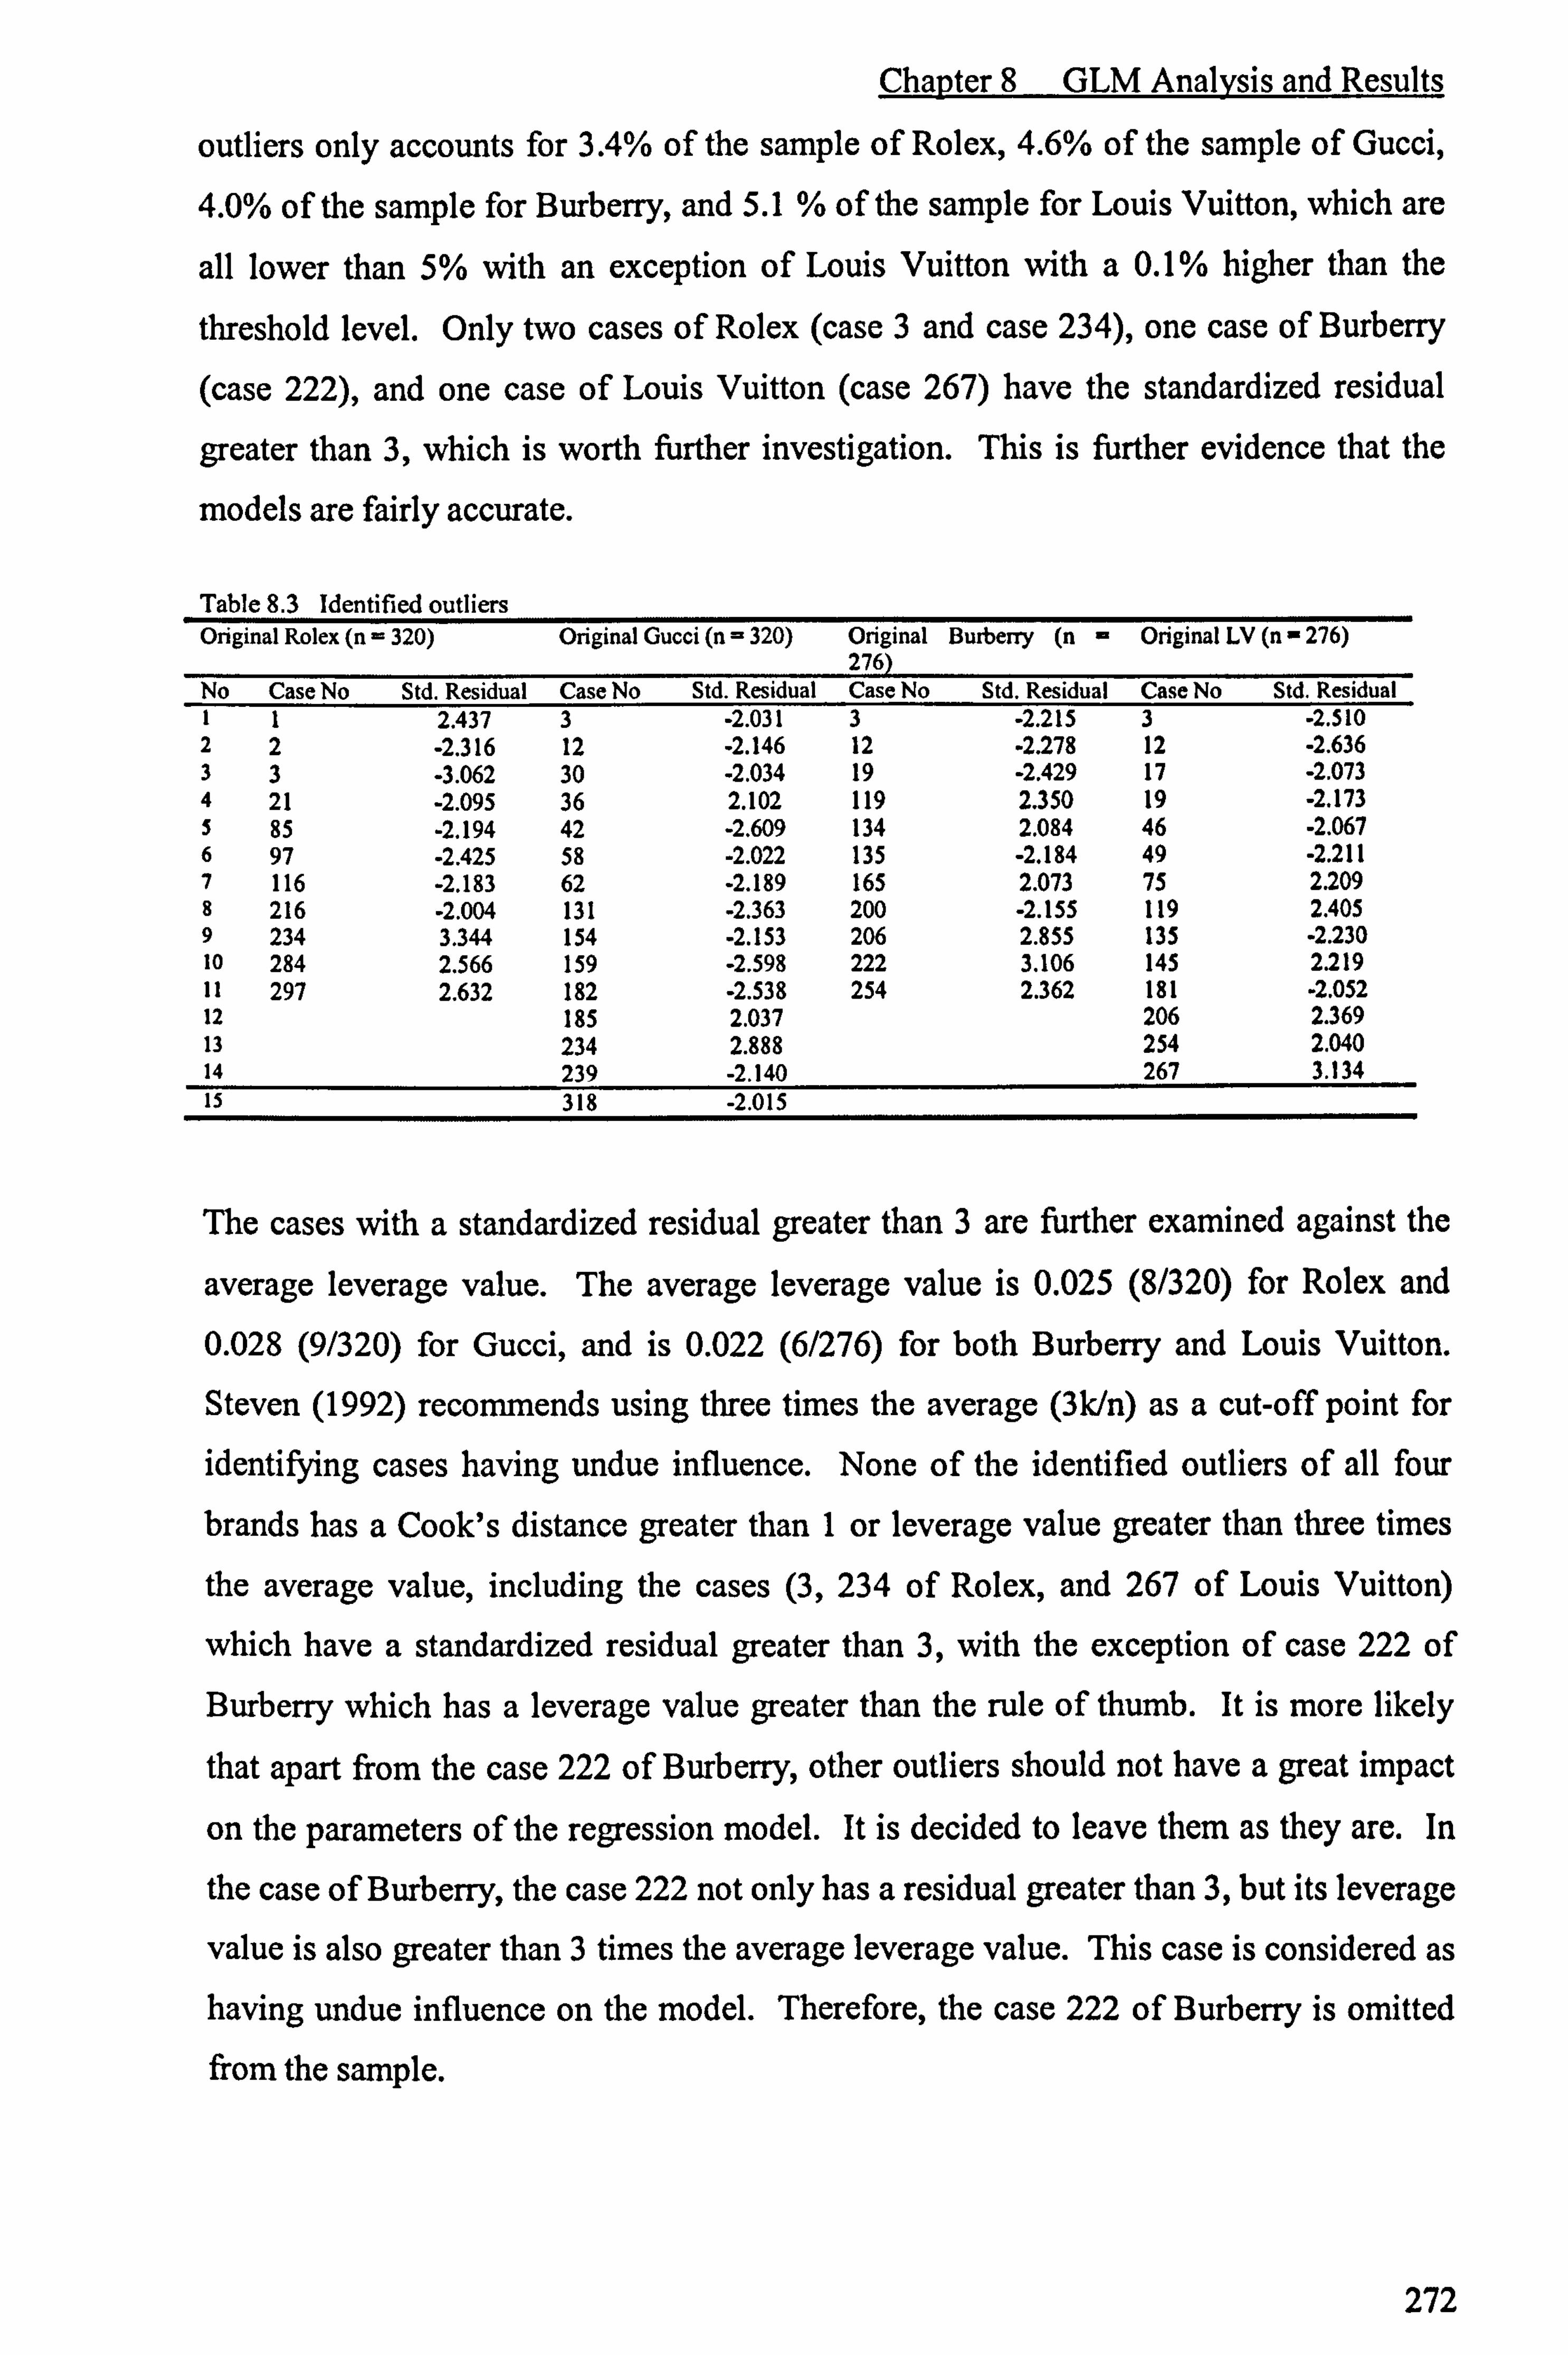
Chapter 8 GLM Analysis and Results
outliers only accounts for 3.4% of the sample of Rolex, 4.6% of the sample of Gucci,
4.0% of the sample for Burberry, and 5.1 % of the sample for Louis Vuitton, which are
all lower than 5% with an exception of Louis Vuitton with a 0.1% higher than the
threshold level. Only two cases of Rolex (case 3 and case 234), one case of Burberry
(case 222), and one case of Louis Vuitton (case 267) have the standardized residual
greater than 3, which is worth further investigation. This is further evidence that the
models are fairly accurate.
Table 8.3 Identified outliers Original Rolex (n ffi 320) Original Gucci (n = 320) Original Burberry (n - Original LV (n - 276)
276) No Case No Std. Residual Case No Std. Residual Case No Std. Residual Case No Std. Residual 1 1 2.437 3 -2.031 3 -2.215 3 -2.510 2 2 -2.316 12 -2.146 12 . 2.278 12 -2.636 3 3 -3.062 30 -2.034 19 -2.429 17 -2.073 4 21 -2.095 36 2.102 119 2.350 19 -2.173 5 85 -2.194 42 -2.609 134 2.084 46 -2.067 6 97 -2.425 58 -2.022 135 -2.184 49 -2.211 7 116 -2.183 62 -2.189 165 2.073 75 2.209 8 216 -2.004 131 -2.363 200 -2.155 119 2.405 9 234 3.344 154 -2.153 206 2.855 135 . 2.230 10 284 2.566 159 -2.598 222 3.106 145 2.219 11 297 2.632 182 -2.538 254 2.362 181 . 2.052 12 185 2.037 206 2.369 13 234 2.888 254 2.040 14 239 -2.140 267 3.134 15 318 -2.015
The cases with a standardized residual greater than 3 are further examined against the
average leverage value. The average leverage value is 0.025 (8/320) for Rolex and
0.028 (9/320) for Gucci, and is 0.022 (6/276) for both Burberry and Louis Vuitton.
Steven (1992) recommends using three times the average (3k/n) as a cut-off point for
identifying cases having undue influence. None of the identified outliers of all four
brands has a Cook's distance greater than 1 or leverage value greater than three times
the average value, including the cases (3,234 of Rolex, and 267 of Louis Vuitton)
which have a standardized residual greater than 3, with the exception of case 222 of
Burberry which has a leverage value greater than the rule of thumb. It is more likely
that apart from the case 222 of Burberry, other outliers should not have a great impact
on the parameters of the regression model. It is decided to leave them as they are. In
the case of Burberry, the case 222 not only has a residual greater than 3, but its leverage
value is also greater than 3 times the average leverage value. This case is considered as having undue influence on the model. Therefore, the case 222 of Burberry is omitted from the sample.
272

Chapter 8 GLM Analysis and Results
The investigation of leverage value reveals that there are 6 cases of Rolex, 4 cases of
Gucci, 6 cases of Burberry and 5 cases of Louis Vuitton with greater than 3 times the
average leverage value. Table 8.4 reports the case summary results of the cases with
leverage value greater than 3 times the average leverage value. Despite the commonly
accepted recommendation that leverage value greater than two or three times the
average leverage value might cause concern (Hoaglin and Welsch 1978, Steven 1992),
Field (2000) claims that cases with large leverage values will not necessarily have a
large influence on the regression coefficients because they are measured on the outcome
variables rather than the predictor. Due to the debatable view on the effect of the
leverage values, it is decided to run the regression with the suspicious cases excluded.
The decision is made based on comparison of two models. The model which is
considered more appropriate is interpreted and discussed in further detail.
Table 8.4 Cases with undue influence Original Rolex (n = 320) Original Gucci (n = 320) Original Burberry (n - Original LV (n - 276)
No Case No Iev 2> Case No Iev 2 >- Case No lev _2
>- Case No lev_2 -
1 4 Selected 9 Selected 9 Selected 9 Selected 2 11 Selected 12 Selected 16 Selected 16 Selected 3 30 Selected 93 Selected 25 Selected 25 Selected 4 68 Selected 142 Selected 59 Selected 59 Selected 5 100 Selected 94 Selected 95 Selected 6 313 Selected 222 Selected
8.4.3 OLS Regression Results
The summarized OLS regression initial results for the four original brands are shown in
Table 8.5 (Rolex and Gucci) and Table 8.6 (Burberry and Louis Vuitton), while the
OLS regression results when unduly influential cases are excluded are presented in
Table 8.7 (Rolex and Gucci) and Table 8.8 (Burberry and Louis Vuitton). Table 8.9
(Rolex), Table 8.10 (Gucci), Table 8.11 (Burberry) and 8.12 (Louis Vuitton) report the
difference in the parameters of the regression models with unduly influential cases included and excluded.
8.4.3.1 Choice of Appropriate Models
Primary school education is found to be negative and significant in three (Rolex,
Burberry and Louis Vuitton) out of four initial regression models (Table 8.5 and Table
8.6). An investigation of the subjects with primary school education shows that none of these cases is categorised as outliers (Table 8.3). In contrast, all cases with primary
school education background across all three models appear to have leverage value
273

Chapter 8 GLM Analysis and Results
greater than three times the average leverage value (Table 8.13). The cases with
primary school education account for between 50 percent and 100 percent of the total
number of cases that have leverage value higher than 3 times of the average value
(Table 8.13). As a consequence, exclusion of cases with undue influence on the models
results in exclusion of cases with primary education attainment in the sample. In fact,
due to the cases having primary school education background only accounting for a
very low percentage of the samples (1.9 percent for watches and 1.1 percent for
handbags), it is rational to exclude them from the model. Therefore, cases of all original brands that have leverage values greater than 3 times the average leverage value are
omitted. Based on this, the models, excluding cases of undue influence, (Table 8.7 and Table 8.8) should be interpreted and discussed.
Table 8.5 Multiple reeression analysis of likelihood of consideration of orieinal branded watches Original Rolex Likelihood of consideration OLS stepwise regression Step Variables entered T to enter Significance 2 2 Overall F
R Adjusted R 1 # 4.643 . 000 . 139 . 136 48.59
KXI 2 Practical attributes 5.723 . 000 . 201 . 196 37.82 3 Sincerity 5.699 . 000 . 261 . 253 38.13 4 Quality and price 5.898 . 000 . 319 . 310 34.88 5 Competence 5.124 . 000 . 372 . 362 35.22 6 Image benefit 2.938 . 004 . 388 . 375 31.24 7 Primary school -2.364 . 019 . 399 . 385 27.99 Regression equation
Variable entered B SE B fi T Significant
KXI # . 060 . 013 . 221 4.643 . 000
Practical attributes . 318 . 056 . 266 5.723 . 000 Sincerity . 309 . 054 . 259 5.699 . 000 Quality and price . 324 . 055 . 270 5.898 . 000 Competence . 287 . 056 . 233 5.124 . 000 Image benefit . 160 . 054 . 135 2.938 . 004 Primary school -. 938 . 397 -. 109 -2.364 . 019 Constant 2.534 . 119 21.270 . 000
Original Gucci Likelihood of consideration OLS stepwise regression Step Variables entered Tto enter Significance 2 2 Overall F
R Adjusted R 1 Personality 6.263 . 000 . 136 . 133 47.20 2 Image benefit 4.364 . 000 . 191 . 186 35.42 3 General attributes 3.296 . 001 . 230 . 222 29.70 4
KXI # 3.750 . 000 . 250 . 240 24.80
5 Male . 3.034 . 003 . 267 . 255 21.68 6 Social risk -3.112 . 002 . 284 . 269 19.53 7 Functional benefit 2.762 . 006 . 300 . 284 18.08 8 Age 41 to 50 -2.416 . 016 . 314 . 295 16.81 Regression equation
Variable entered B SE B T Significant Personality . 372 . 059 . 310 6.263 . 000 Image benefit . 262 . 060 . 219 4.364
. 000 General attributes . 196 . 059 . 163 3.296 . 001
# . 052 . 014 . 194 3.750 000 KXI . Male -. 369 . 122 -. 152 -3.034 . 003 Functional benefit -. 154 . 050 -. 156 -3.112 . 002 Product life . 168 . 061 . 138 2.762
. 006 Age 41 to 50 -. 349 . 145 -. 118 -2.416 . 016 Constant 3.257 . 176 18.479
. 000 " The overall Fs are significant at 0.000 level # Interaction of product knowledge and product involvement
274

Chapter 8 GLM Analysis and Results
Table 8.6 Multiple regression analysis of likelihood of consideration of original branded handbags
Original Burberry Likelihood of consideration OLS stepwise regression Step Variables entered T to enter Significance 2 2 Overall F'
R Adjusted R 1 Personality 1 6.564 . 000 . 127 . 124 35.57 2 General attributes 3 4.057 . 000 . 171 . 165 26.60 3 Benefit 2 3.842 . 000 . 213 . 204 23.10 4 Price -2.412 . 017 . 228 . 216 18.84 5 Primary school -2.235 . 026 . 243 . 228 16.31 Regression equation
Variable entered B SE B ß T Significant Personality 1 . 463 . 071 . 358 6.564 . 000 General attributes 3 . 286 . 071 . 223 4.057 . 000 Benefit 2 . 273 . 071 . 210 3.842 . 000 Price -. 171 . 071 -. 132 -2.412 . 017 Primary school -1.508 . 675 -. 123 . 2.235 . 026 Constant 2.536 . 072 35.276 . 000
Original Louis Vuitton Likelihood of consideration OLS stepwise regression Step Variables entered T to enter Significance 2 2 Overall F'
R Adjusted R 1 Personality 2 4.848 . 000 . 091 . 088 25.96 2 # 2.922 . 004 . 145 . 139 21.87
KX1 3 Benefit 1 3.798 . 000 . 183 . 174 19.17 4 General attributes 3 3.455 . 001 . 216 . 204 17.59 5 Primary school -2.113 . 036 . 230 . 215 15.16 Regression equation
Variable entered B SE B T Significant Personality 2 . 344 . 071 .. 272 4.848 . 000
# . 035 . 012 . 169 2.922 . 004 KX1 Benefit 1 . 265 . 070 . 211 3.798 . 000 General attributes 3 . 244 . 071 . 195 3.455 . 001 Primary school -1.393 . 659 -. 117 -2.113 . 036 Constant 2.571 . 120 21.431 . 000
* The overall Fs are significant at 0.000 level # Interaction of product knowledge and product involvement
That said, one thing which is quite clear according to the results is that subjects with
primary school education are less likely to consider buying original Rolex, Gucci and
Louis Vuitton in comparison with people who have a Masters educational level.
Nevertheless, one should view this finding with caution, due to there being only a small
number of subjects with primary school education in this particular sample.
Tables 8.9 to 8.13 demonstrate the influence of large leverage values on the models.
More specifically, these tables present the influence of cases with large leverage values
on the explanatory power of variables and differences between parameters before and
after these cases are excluded. According to the results, the large leverage values not
only have influence on the regression coefficients (changes range from . 001 to absolute
value of . 047) but could also have significant influence on the explanatory power of a
certain variable. For example, Table 8.10 shows that when the cases with large leverage
values are included, the ̀ Price' factor is negative and significant in the Burberry model.
275

Chapter 8 GLM Analysis and Results
However, when the cases with large leverage values are excluded, the `Price' factor is
no longer significant in the model. Based on this empirical result, it might be safer if
one excluded the cases with large leverage values rather than misinterpret Field's (2000)
claim that `cases with large leverage value will not necessary have a large influence on
the regression coefficients because they are measured on the outcome variable rather
than the predictor' as an indication of legality for not examining unduly influential cases.
This further supports the earlier decision that models with unduly influential cases
excluded are interpreted and discussed for all four brands.
Table 8.9 The difference in the parameters of the regression model when unduly influential cases are excluded
Parameter (ß) Suspicious cases included Suspicious cases excluded Difference Constant (intercept) 2.534 2.543 -. 009
KXI # . 221 . 219 . 002
Practical attributes . 266 . 267 -. 001 Excitement . 259 . 253 . 006 Quality and price . 270 . 271 -. 001 Competence . 233 . 238 -. 005 Image benefit . 135 . 140 -. 005 Primary school -. 109 -. 109 # Interaction of product knowledge and product involvement
N/A
Table 8.10 The difference in the parameters of the regression model when unduly influential cases are excluded (Gucci)
Parameter (ß) Suspicious cases included Suspicious cases excluded Difference Constant (intercept) 3.257 3.279 . 022 Personality . 310 . 297 . 013 Image benefit . 219 . 218 . 001 General attributes . 163 . 189 -. 026
# . 194 . 189 . 005 KX1 Male -. 152 -. 158 . 006 Social risk -. 156 -. 158 . 002 Product life . 138 . 161 -. 023 Age 41 to 50 -. 118 -. 104 -. 014 # Interaction of product knowledge and product involvement
Table 8.11 The difference in the parameters of the regression model when undue influential cases are excluded (Burberrv)
Parameter () Suspicious cases included Suspicious cases excluded Difference Constant (intercept) 2.536 2.501 0.035 Personality . 358 0.378 -. 020 General attributes . 223 0.270 -. 047 Image benefit . 210 . 203 . 007 Price -. 132 -. 132 Primary school -. 123 -. 123 # Interaction of product knowledge and product involvement
N/A
276
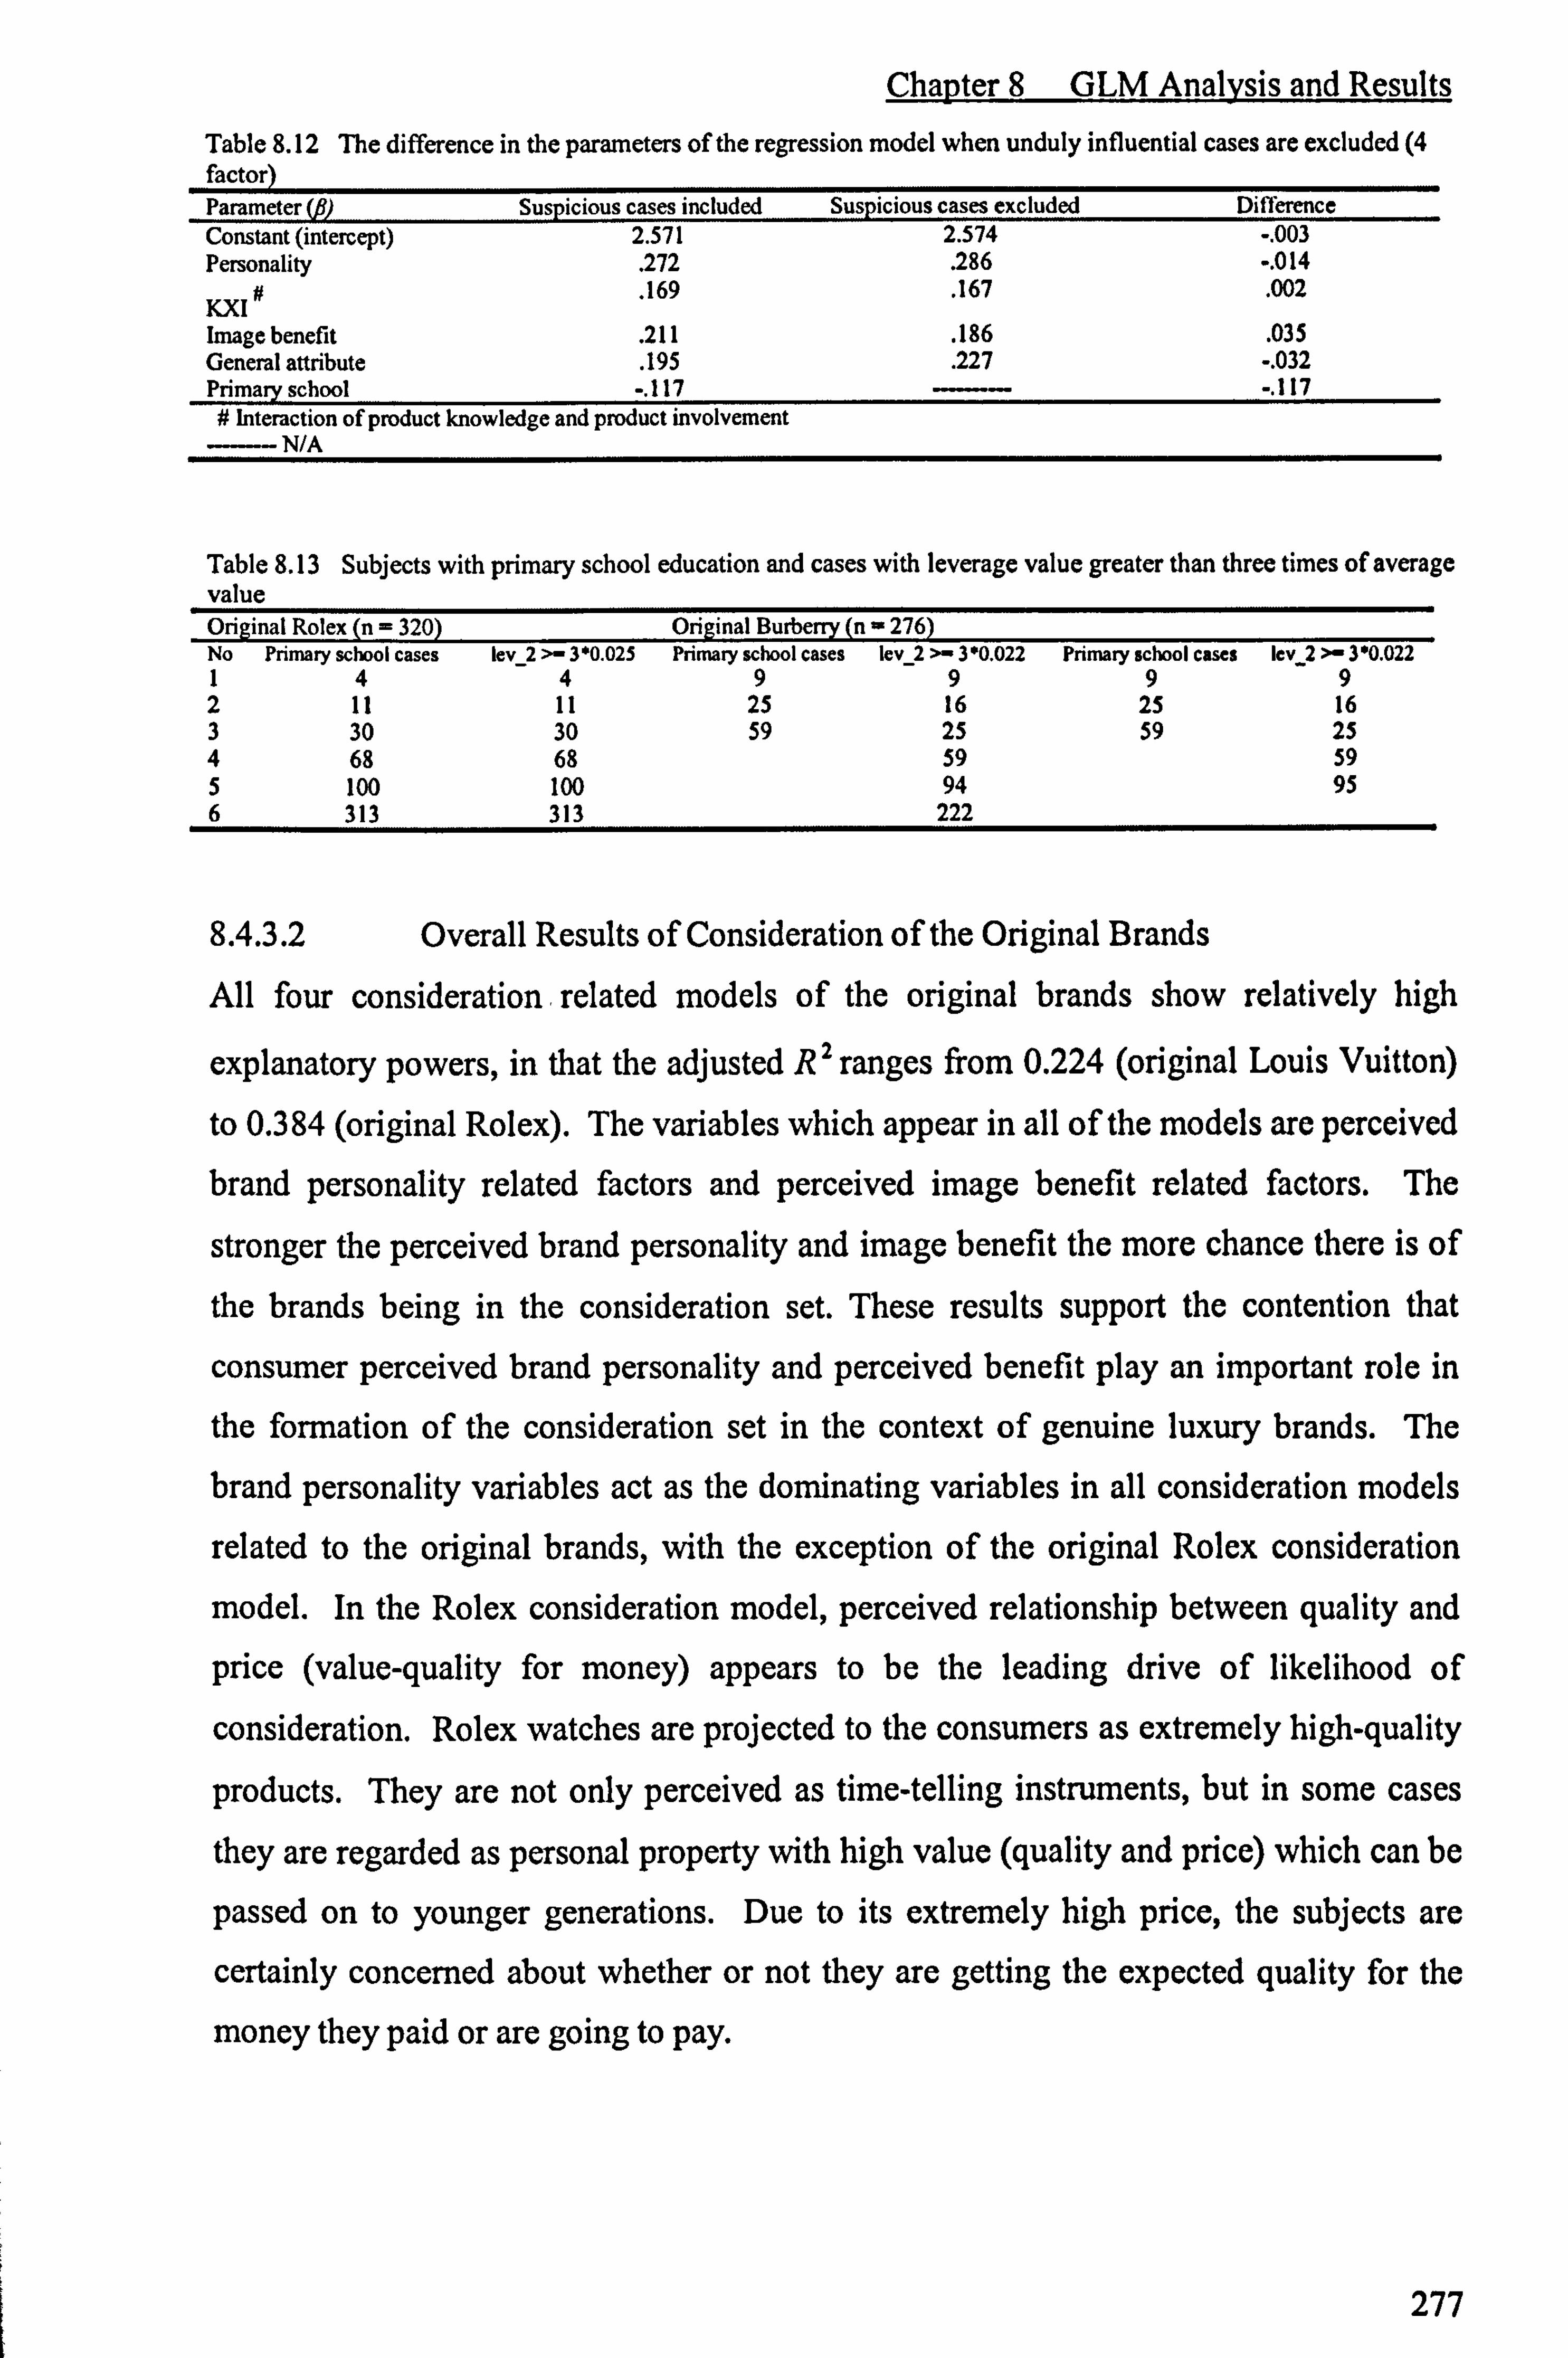
Chapter 8 GLM Analysis and Results Table 8.12 The difference in the parameters of the regression model when unduly influential cases are excluded (4
Parameter (ß) Suspicious cases included Suspicious cases excluded Difference Constant (intercept) 2.571 2.574 -. 003 Personality . 272 . 286 -. 014
KXI # . 169 . 167 . 002
Image benefit . 211 . 186 . 035 General attribute . 195 . 227 -. 032 Primary school -. 117 -. 117 # Interaction of product knowledge and product involvement
N/A
Table 8.13 Subjects with primary school education and cases with leverage value greater than three times of average value Original Rolex (n = 320) Original Burberry (n - 276) No Primary school cases lev_2 >- 3'0.025 Primary school cases lev_2 >_ 3'0.022 Primary school cases lev_2 > 3'0.022 14 4 9 9 9 9 2 11 11 25 16 25 16 3 30 30 59 25 59 25 4 68 68 59 59 5 100 100 94 95 6 313 313 222
8.4.3.2 Overall Results of Consideration of the Original Brands
All four consideration, related models of the original brands show relatively high
explanatory powers, in that the adjusted R2 ranges from 0.224 (original Louis Vuitton)
to 0.384 (original Rolex). The variables which appear in all of the models are perceived
brand personality related factors and perceived image benefit related factors. The
stronger the perceived brand personality and image benefit the more chance there is of
the brands being in the consideration set. These results support the contention that
consumer perceived brand personality and perceived benefit play an important role in
the formation of the consideration set in the context of genuine luxury brands. The
brand personality variables act as the dominating variables in all consideration models
related to the original brands, with the exception of the original Rolex consideration
model. In the Rolex consideration model, perceived relationship between quality and
price (value-quality for money) appears to be the leading drive of likelihood of
consideration. Rolex watches are projected to the consumers as extremely high-quality
products. They are not only perceived as time-telling instruments, but in some cases
they are regarded as personal property with high value (quality and price) which can be
passed on to younger generations. Due to its extremely high price, the subjects are
certainly concerned about whether or not they are getting the expected quality for the
money they paid or are going to pay.
277
Chapter 8 GLM Analysis and Results
In other cases where the brand personality takes the dominant role in the models, this
can be interpreted as being associated with the fashionable nature (Gucci watch) of the
studied brands as well as advanced technology in watch and handbag manufacturing. The achievement in technology has caused quality to be taken for granted. Although
the functionality of a Gucci watch is still an important factor which people evaluate before any purchase, image-sensitive consumers are nevertheless more concerned about
whether the brand personality matches the consumers' self-image or not. In other
words, image-sensitive consumers are more likely to seek an association between the brand they buy and their self-image. As a direct result, the perceived brand personality becomes the core influential factor in consumer purchase consideration.
Regardless of the commonly accepted notion which claims that benefits are what
consumers want to buy (e. g. Kotler 1999), the research results show that the consumer
perceived brand benefits (both image benefit and functional benefit) do not have a very
strong influence on the likelihood of consideration of the examined original brands,
with the Gucci model as an exception. It appears that perceived brand image benefit
factors are either the least or the second least influential variables (behind perceived brand personality and product attributes) in the Rolex, Burberry and Louis Vuitton
models. It is only in the Gucci model that this variable holds the second most powerful
exploratory position, which is again behind the perceived brand personality factor. The
functional benefit only appears to be significantly influential on the Gucci consideration
model, but not on other models. Again, it is listed in fourth place in terms of
explanatory power to the model, which is behind brand personality, image benefit, and
general product attributes. This research believes that when quality is no longer
consumers' main concern due to technological achievements, quality related benefits
(for example long product life) will certainly slip down from the top priority of the
consumer, which provides the brand personality or even some other factors with the
chance to take the leading role of concern. This also explains why the functional benefit
does not appear to be significantly influential in three out of four models.
Then why did image benefit appear to be on the bottom half of the list of the influential
variables of the consideration of the examined original brands? The explanations this
research can attempt to offer are as follows. Firstly, to some extent the respondents
might be reluctant to admit that image benefits are the main drive of their purchase
278
Chapter 8 GLM Analysis and Results
consideration, which results in compromised data. Secondly, according to human
cognitive processes, product attributes and brand personalities are what come to
consumers' minds first, whereas perceived benefits are the results of the perceived
product attributes and brand personalities, which come at the second stage of cognition. Some information might have been lost during the transaction, which may affect the
explanatory power of this variable. All these provide reasons for why the image benefit
factor has less explanatory power on purchase consideration than the brand personality factor and the product attribute factor in three out of four cases. With regard to the
second dominant role played by the image benefit in the Gucci model, this research believes that this is a unique case and could have something to do with the clear-cut, trendy, cool and contemporary campaign of the original Gucci watches.
For three out of four brands, the interaction variable between product knowledge and
product involvement is found to be positive and significant in three consideration
models (Rolex, Gucci, and Louis Vuitton). For Burberry, the interaction variable does
not have significant explanatory power on the model, neither do the original individual
product knowledge and the product involvement variables. This indicates that self-
assessed product knowledge and perceived product involvement of handbags do not
influence likelihood of consideration of Burberry handbags. The Burberry brand image
has been contaminated heavily. This is particularly true in the UK. Focus group data
reveals that some people consider people who wear Burberry as `chavs', who are even banned from entering some public places. Therefore, the subjects who consider handbags as important may or may not consider purchasing Burberry. People who buy
Burberry handbags may or may not regard this branded product as important to them.
Meanwhile, handbags are fashionable products rather than functional products. It is not
necessary to obtain abundant knowledge in order to make the right choice. This
explains why product knowledge does not appear to be significantly influential on the
likelihood of consideration of original Burberry.
In the three cases in which KxI appears significant influential, the beta values range from 0.035 to 0.059. These beta values are very small, which indicates that with other
parameters holding unchanged, a one unit increase of KxI only leads to a maximum 0.059 increase of likelihood of consideration. Thus, the effect of KxI on the product
entry of consideration set is very limited, even if it appears to be important.
279

Chapter 8 GLM Analysis and Results
The general product attribute factor appears in the models related to branded handbags
and the Gucci model. On the other hand, the general product attribute factor is not
found to be significant in the Rolex model. Interestingly, the practical attribute factor is
found to be positive and significant in the Rolex model. This result can be explained by
the distinguishing waterproof function and product design of Rolex, the nature of handbags and Gucci watches. For example, handbags are more exposed to the public
view than watches. Therefore, in general, product attributes (size, material, style, colour
and practicality) can be more important to buyers. Gucci watches are fashionable
products, therefore the perceived general product attributes (e. g. size, material and so on)
are important to entry into the consideration set.
Gender appears to be significantly influential only in the Gucci model, but not in the
other three brands. This implies that generally, Gucci watches have more chance of being considered by females than males. Even though handbags can be considered as
more feminine products, due to subjects who claimed to have no interest in handbags or
never consider buying handbags being excluded from the sample, as a result the male
subjects left in the sample are most likely familiar with handbags. Consequently,
gender difference does not show significant influence on the formation of the
consideration set related to handbags. The Rolex watch is projected as a gender neutral
product. This provides justification for the exclusion of gender in the Rolex
consideration model.
Contrary to expectation, education and household income are not included in any of the
regression models. This might be explained by the fact that at the formation of
consideration stage, consumers are not treating financial cost as seriously as at purchase intention stage and final purchase decision stage. One more explanation this research
can offer is that this unexpected result might be caused by the stimulus method used in
this research. When the stimulus method is used, consumers are exposed to both the
original and counterfeit luxury brands which might lead them to have more a positive
view of the original brands in comparison with the counterfeit versions. According to
the result, education and household income cannot be used as segmentation variables for likelihood of purchase consideration of the studied original branded products. That
said, one should not forget that all the models are generated with all respondents
280
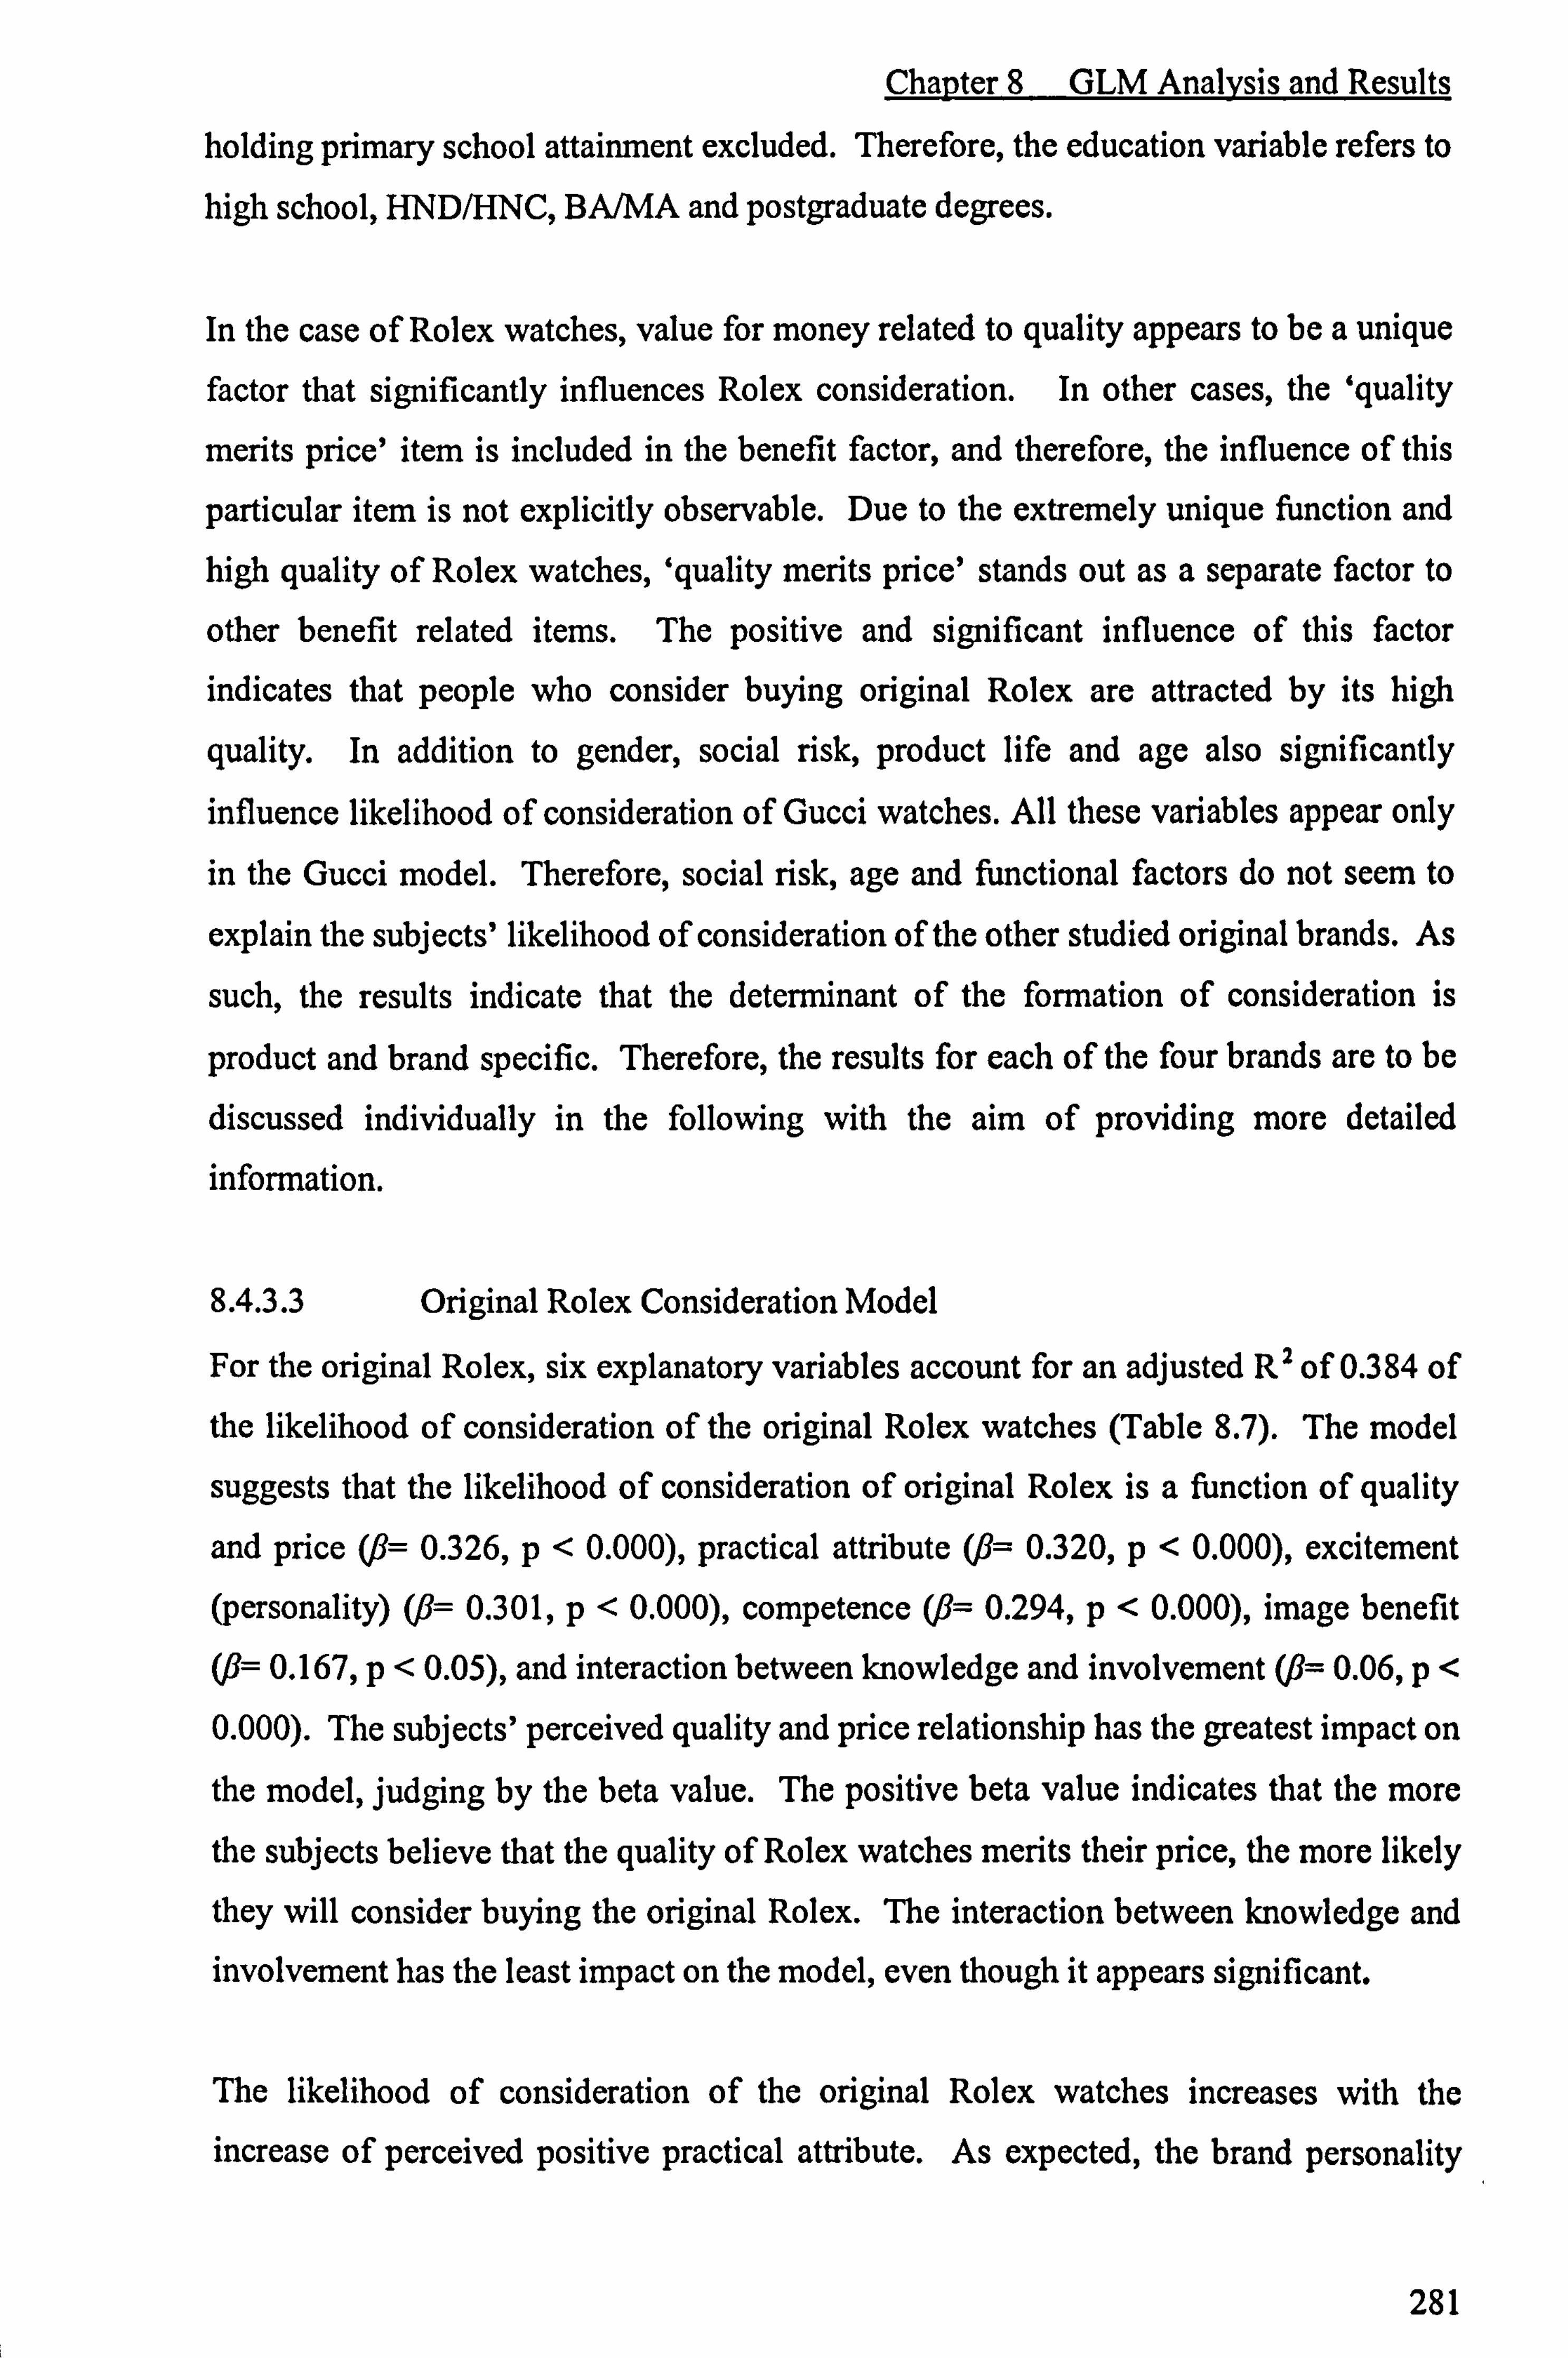
Chapter 8 GLM Analysis and Results
holding primary school attainment excluded. Therefore, the education variable refers to
high school, HND/HNC, BA/MA and postgraduate degrees.
In the case of Rolex watches, value for money related to quality appears to be a unique factor that significantly influences Rolex consideration. In other cases, the `quality
merits price' item is included in the benefit factor, and therefore, the influence of this
particular item is not explicitly observable. Due to the extremely unique function and high quality of Rolex watches, ̀ quality merits price' stands out as a separate factor to
other benefit related items. The positive and significant influence of this factor
indicates that people who consider buying original Rolex are attracted by its high
quality. In addition to gender, social risk, product life and age also significantly influence likelihood of consideration of Gucci watches. All these variables appear only in the Gucci model. Therefore, social risk, age and functional factors do not seem to
explain the subjects' likelihood of consideration of the other studied original brands. As
such, the results indicate that the determinant of the formation of consideration is
product and brand specific. Therefore, the results for each of the four brands are to be
discussed individually in the following with the aim of providing more detailed
information.
8.4.3.3 Original Rolex Consideration Model
For the original Rolex, six explanatory variables account for an adjusted R2 of 0.384 of
the likelihood of consideration of the original Rolex watches (Table 8.7). The model
suggests that the likelihood of consideration of original Rolex is a function of quality
and price (ß= 0.326, p<0.000), practical attribute (%i= 0.320, p<0.000), excitement
(personality) (ß= 0.301, p<0.000), competence (ß= 0.294, p<0.000), image benefit
(/3= 0.167, p<0.05), and interaction between knowledge and involvement (%3= 0.06, p<
0.000). The subjects' perceived quality and price relationship has the greatest impact on
the model, judging by the beta value. The positive beta value indicates that the more
the subjects believe that the quality of Rolex watches merits their price, the more likely
they will consider buying the original Rolex. The interaction between knowledge and involvement has the least impact on the model, even though it appears significant.
The likelihood of consideration of the original Rolex watches increases with the increase of perceived positive practical attribute. As expected, the brand personality
281

Chapter 8 GLM Analysis and Results
related variables (excitement and competence) are found to be positive and significantly
explain the response variable. Thus, the more the subjects perceive the original Rolex
to have these personalities, the higher the chance they will consider purchasing these
watches.
The results show that the image benefit variable has a positive and significant effect on
the original Rolex consideration model. The explanation has been provided in the
overall results section. The subjects purchase consideration of the original Rolex
watches is positively related to the perceived image benefit. Consumer decision-
making is influenced by perceived benefits (Jobber 2004; Cho et al. 2002; Bove and Johnson 2000). Consumers not only pursue functional benefit but also image benefit.
This is particular true in the case of luxury branded products.
8.4.3.4 Original Gucci Consideration Model
For the original Gucci, the consideration likelihood is a function of personality (ýß=
0.361, p<0.000), benefit (, ß= 0.268, p<0.000), general attribute (fl= 0.234, p<0.000),
functional benefit (ß= 0.203, p<0.001), social risk (fl= -0.157, p<0.01), interaction
between knowledge and involvement (ß= 0.051, p<0.000) and gender (8= -0.383, p<
0.01) and age category (41 to 50) (ß= -0.309, p<0.05). The eight variables accounts
for an adjusted R2 of 0.304 of the likelihood of consideration of purchase of original
Gucci watches (Table 8.7). The brand personality plays the major role in determining
the formation of the consideration set. When the categorical variables are excluded, the
interaction variable shows the least impact on the model.
The results also show that the more positive the general product attributes the subjects
perceive, the more likely it is that they would consider buying the original Gucci
watches. This is not surprising considering that consumers like positive product
attributes. The functional benefit appears to have positive and significant impact on
consideration of purchase Gucci watches. The positive beta value indicates that the
subjects are more likely to consider purchasing Gucci watches as their perceived functional benefit increases. Although Gucci watches are regarded as fashionable
products, they are still highly priced products, therefore it is not easy for the subjects to
purchase a new version to replace the old one when the fashion has passed. It is
imaginable that most consumers still keep the used watches even though they may not
282

Chapter 8 GLM Analysis and Results
wear them as often as before. Therefore, they would certainly expect the watches to function well and to last a long time.
Table 8.7 Multiple regression analysis of likelihood of consideration of original branded watches final model Original Rolex Likelihood of consideration OLS stepwise regression Step Variables entered Tto enter Significance 2 2 Overall F* R Adjusted R I
KXI # 4.547 . 000 . 138 . 135 47.15
2 Quality and price 5.902 . 000 . 200 . 194 36.71 3 Practical attributes 5.682 . 000 . 262 . 254 34.66 4 Excitement 5.523 . 000 . 322 . 313 34.70 5 Competence . 000 . 377 . 367 35.25
5.185 6 Image benefit 3.027 . 045 . 396 . 384 31.73 Regression equation
Variable entered B SE B ß T Significant # . 059 . 013 . 219 4.547 . 000 KXI
Quality and price . 326 . 055 . 271 5.902 . 000 Practical attributes . 320 . 056 . 267 5.682 . 000 Sincerity . 301 . 055 . 253 5.523 . 000 Competence . 294 . 057 . 238 5.185 . 000 Image benefit . 167 . 055 . 140 3.027 . 003 Constant 2.543 . 119 21.308
. 000 Original Gucci Likelihood of consideration OLS stepwise regression Step Variables entered T to enter Significance 2 2 Overall F'
R Adjusted R 1 Personality 6.016 . 000 . 130 . 127 44.19 2 Image benefit 4.342 . 000 . 186 . 180 33.80 3 General attributes 3.812 . 000 . 237 . 229 30.48 4
KXI # 3.640 . 000 . 255 . 245 25.19
5 Male -3.154 . 002 . 273 . 261 22.04 6 Functional benefit 3.221 . 001 . 288 . 274 19.71 7 Social risk -3.143 . 002 . 312 . 296 18.86 8 Age 41 to 50 -2.113 . 035 . 323 . 304 17.26 Regression equation
Variable entered B SE B T Significant Personality . 361 . 060 . 297 6.016 . 000 Image benefit . 268 . 062 . 218 4.342 . 000 General attributes . 234 . 061 . 189 3.812
. 000
KXI # . 051 . 014 . 189 3.640 . 000
Male -. 383 . 121 -. 158 -3.154 . 002 Functional benefit . 203 . 063 . 161 3.221
. 001 Social risk -. 157 . 050 -. 158 -3.143 . 002 Age 41 to 50 -. 309 . 146 -. 104 -2.113 . 035 Constant 3.279 . 177 18.497 . 000
* The overall Fs are significant at 0.000 level # Interaction of product knowledge and product involvement
The negative beta value of social risk variables implies that the more risk the subject
perceived the original Gucci might bring them, the less likely it is that they would
consider buying this product. This is in line with the risk-averse theory (e. g. Arror 1965; Mitchell 1999). The negative beta value of the gender variable is caused by the choice of reference category. Here, the female category is chosen as the reference category. Thus, the result indicates that males are less likely to include the original Gucci in their
283
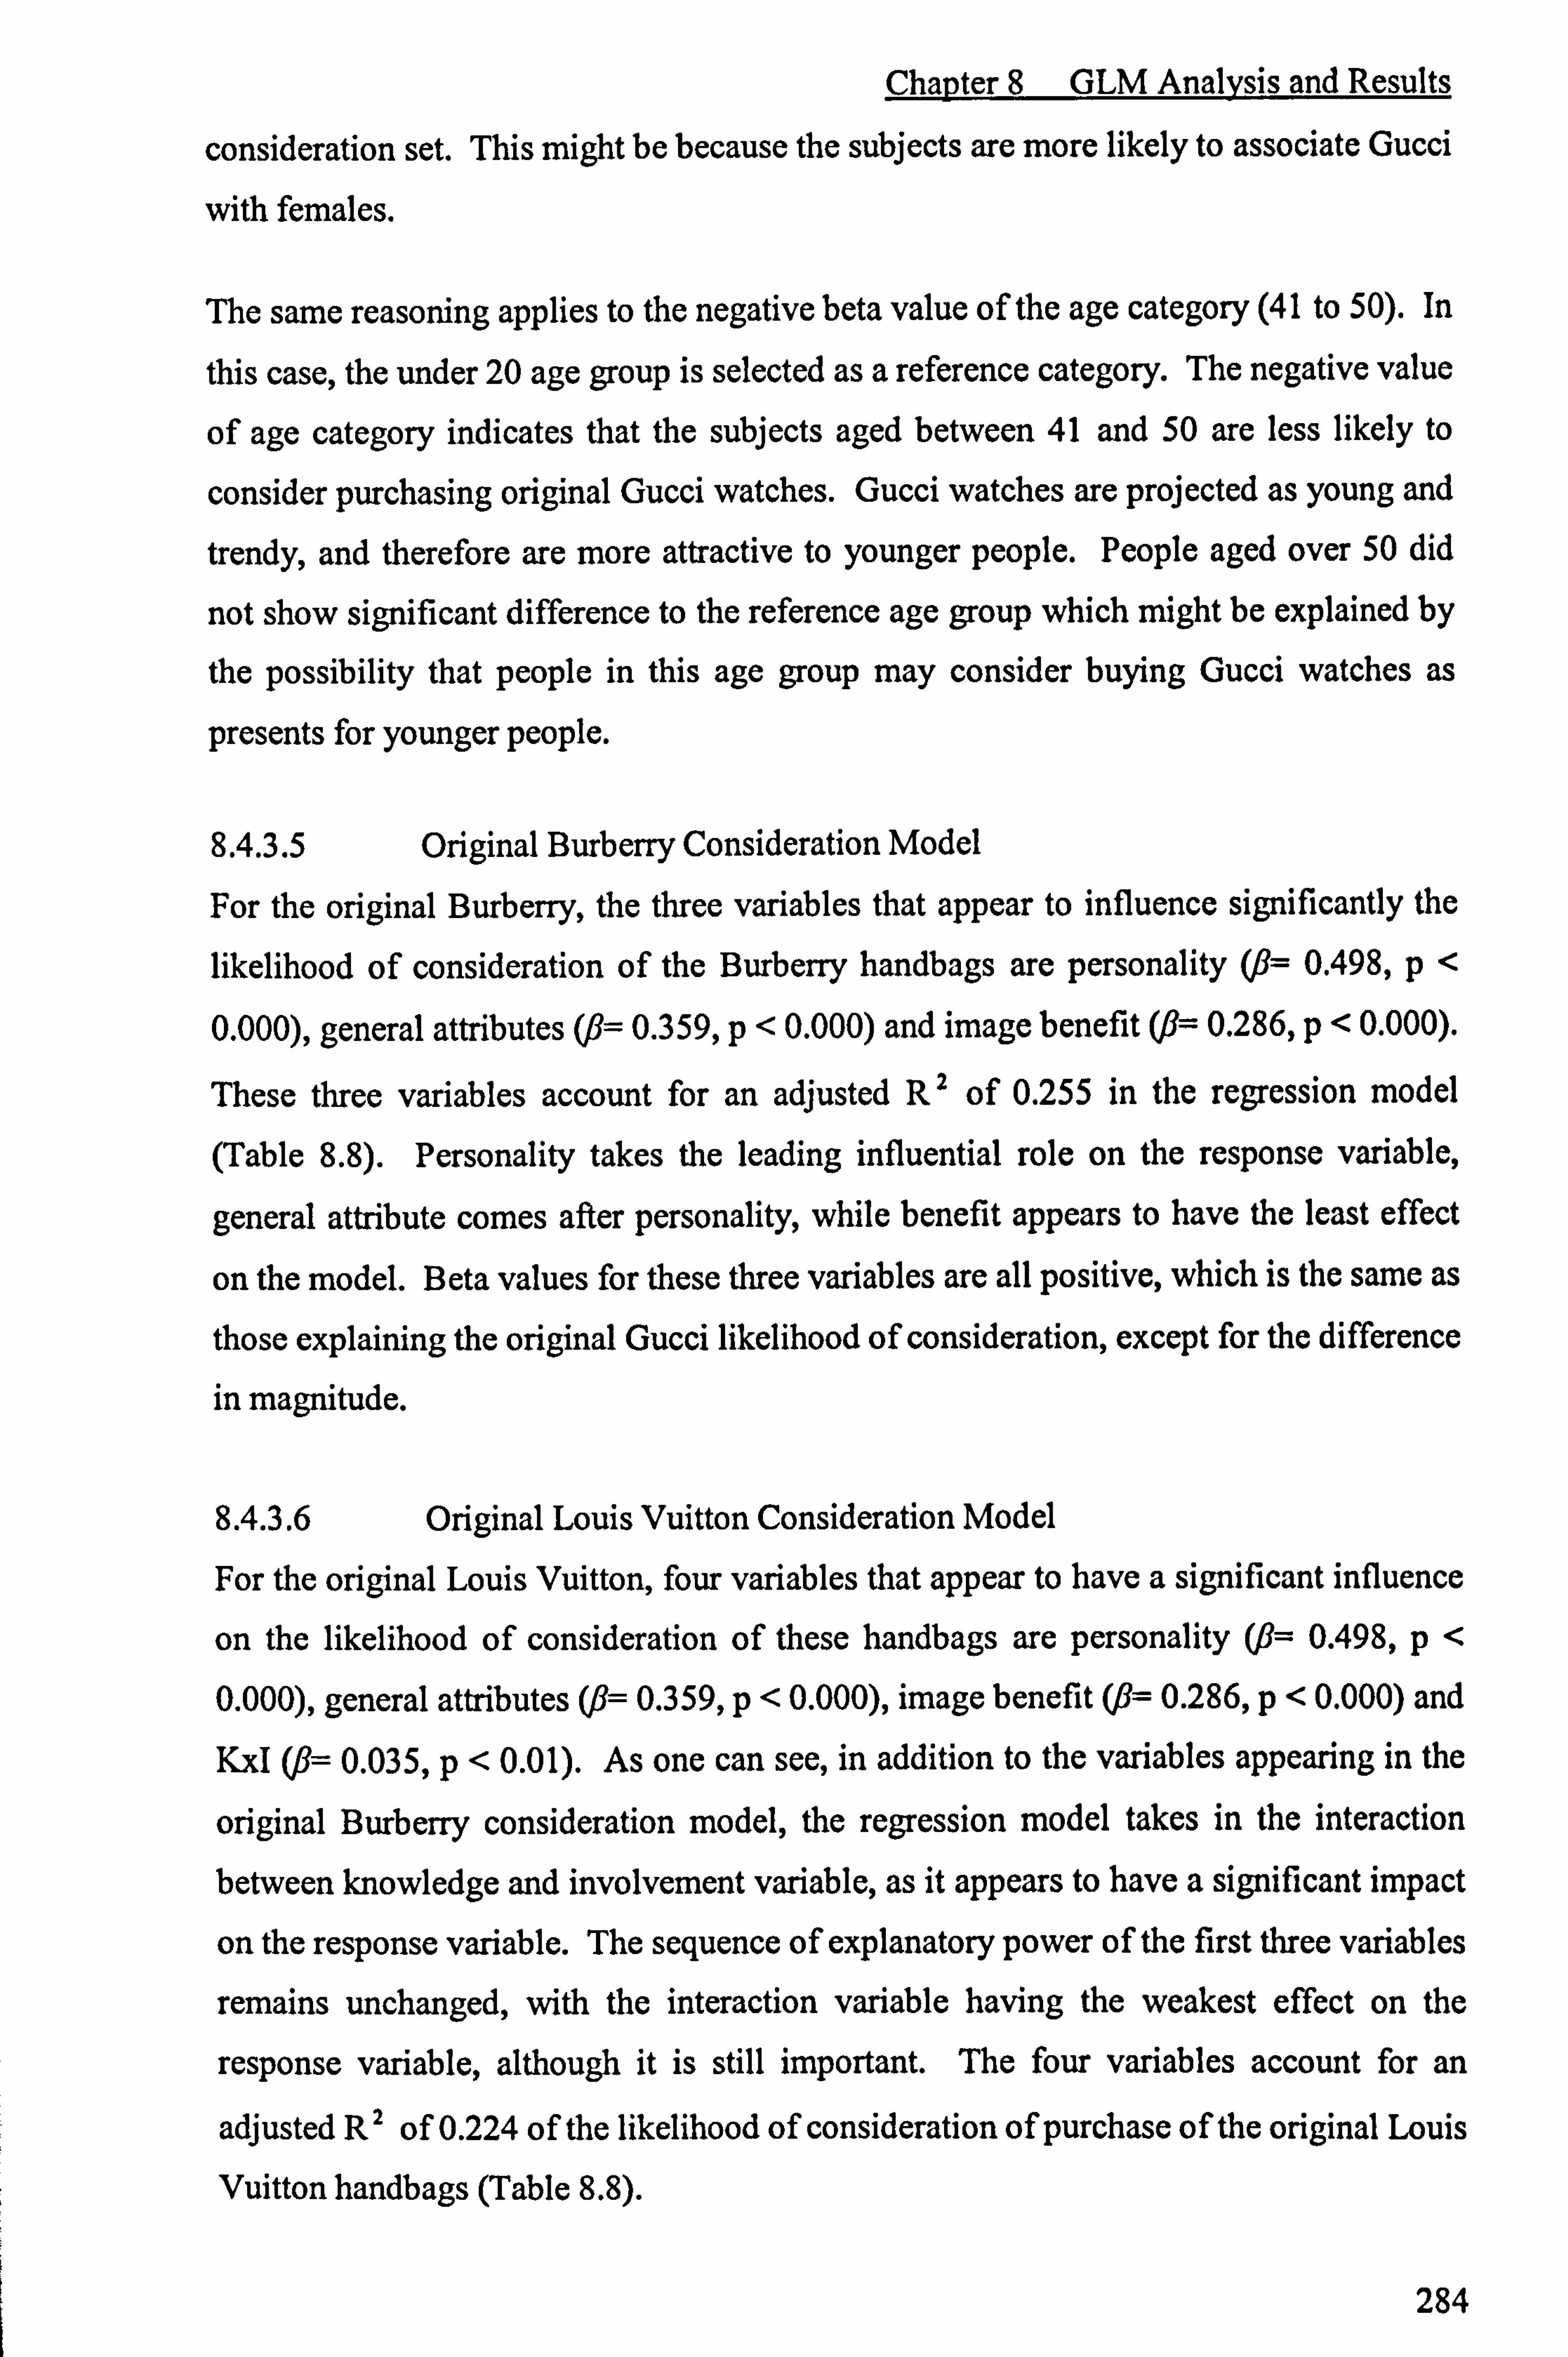
Chapter 8 GLM Analysis and Results
consideration set. This might be because the subjects are more likely to associate Gucci
with females.
The same reasoning applies to the negative beta value of the age category (41 to 50). In
this case, the under 20 age group is selected as a reference category. The negative value
of age category indicates that the subjects aged between 41 and 50 are less likely to
consider purchasing original Gucci watches. Gucci watches are projected as young and
trendy, and therefore are more attractive to younger people. People aged over 50 did
not show significant difference to the reference age group which might be explained by
the possibility that people in this age group may consider buying Gucci watches as
presents for younger people.
8.4.3.5 Original Burberry Consideration Model
For the original Burberry, the three variables that appear to influence significantly the
likelihood of consideration of the Burberry handbags are personality (Q= 0.498, p<
0.000), general attributes (8= 0.359, p<0.000) and image benefit (fl= 0.286, p<0.000).
These three variables account for an adjusted R2 of 0.255 in the regression model
(Table 8.8). Personality takes the leading influential role on the response variable,
general attribute comes after personality, while benefit appears to have the least effect
on the model. Beta values for these three variables are all positive, which is the same as
those explaining the original Gucci likelihood of consideration, except for the difference
in magnitude.
8.4.3.6 Original Louis Vuitton Consideration Model
For the original Louis Vuitton, four variables that appear to have a significant influence
on the likelihood of consideration of these handbags are personality (ß= 0.498, p<
0.000), general attributes (/3= 0.359, p<0.000), image benefit (ß= 0.286, p<0.000) and
KxI (ß= 0.035, p<0.01). As one can see, in addition to the variables appearing in the
original Burberry consideration model, the regression model takes in the interaction
between knowledge and involvement variable, as it appears to have a significant impact
on the response variable. The sequence of explanatory power of the first three variables
remains unchanged, with the interaction variable having the weakest effect on the
response variable, although it is still important. The four variables account for an
adjusted R2 of 0.224 of the likelihood of consideration of purchase of the original Louis
Vuitton handbags (Table 8.8).
284
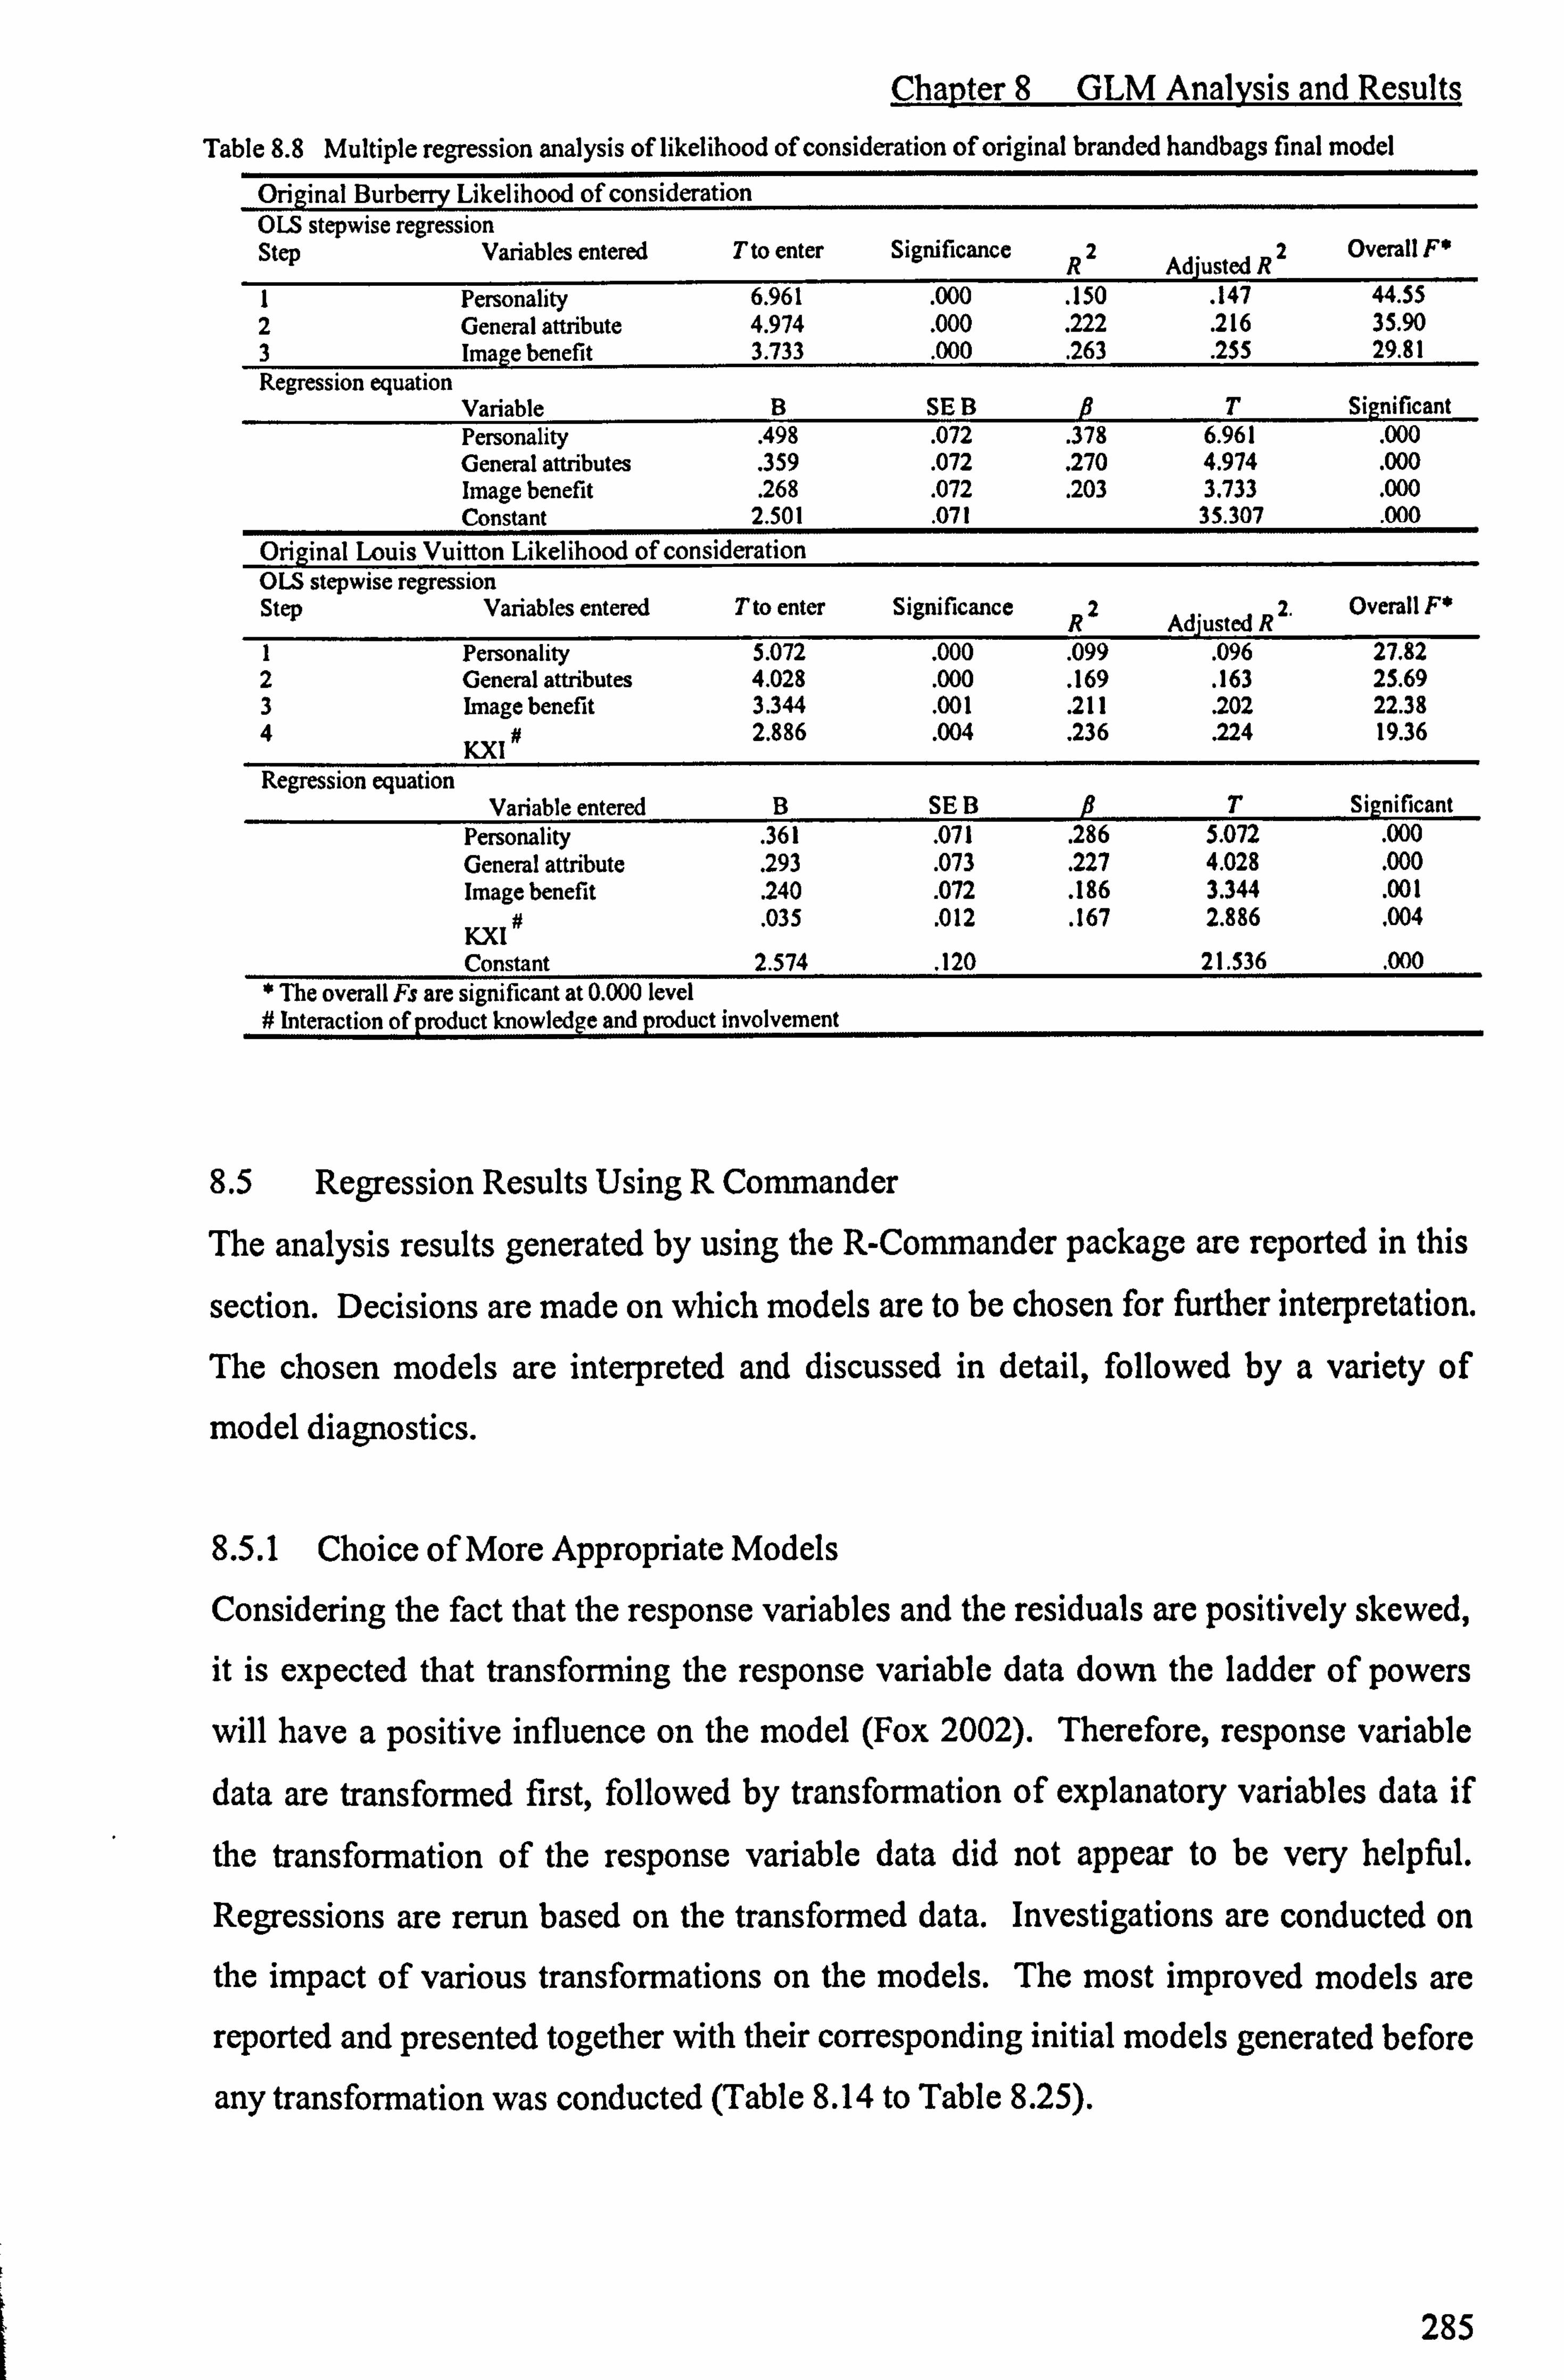
Chapter 8 GLM Analysis and Results Table 8.8 Multiple regression analysis of likelihood of consideration of original branded handbags final model
Original Burberry Likelihood of consideration OLS stepwise regression Step Variables entered Tto enter Significance 2 2 Overall F*
R Adjusted R 1 Personality 6.961 . 000 . 150 . 147 44.55 2 General attribute 4.974 . 000 . 222 . 216 35.90 3 Image benefit 3.733 . 000 . 263 . 255 29.81 Regression equation
Variable B SE B T Significant Personality . 498 . 072 . 378 6.961 . 000 General attributes . 359 . 072 . 270 4.974 . 000 Image benefit . 268 . 072 . 203 3.733 . 000 Constant 2.501 . 071 35.307 . 000
Original Louis Vuitton Likelihood of consideration OLS stepwise regression Step Variables entered Tto enter Significance 2 2. Overall F*
R Adjusted R 1 Personality 5.072 . 000 . 099 . 096 27.82 2 General attributes 4.028 . 000 . 169 . 163 25.69 3 Image benefit 3.344 . 001 . 211 . 202 22.38 4 # 2.886 . 004 . 236 . 224 19.36
KXI Regression equation
Variable entered B SE B T Significant Personality . 361 . 071 . 286 5.072 . 000 General attribute . 293 . 073 . 227 4.028 . 000 Image benefit . 240 . 072 . 186 3.344 . 001
# . 035 . 012 . 167 2.886 . 004 KXI Constant 2.574 . 120 21.536 . 000
* The overall Fs are significant at 0.000 level # Interaction of product knowledge and product involvement
8.5 Regression Results Using R Commander
The analysis results generated by using the R-Commander package are reported in this
section. Decisions are made on which models are to be chosen for further interpretation.
The chosen models are interpreted and discussed in detail, followed by a variety of
model diagnostics.
8.5.1 Choice of More Appropriate Models
Considering the fact that the response variables and the residuals are positively skewed, it is expected that transforming the response variable data down the ladder of powers
will have a positive influence on the model (Fox 2002). Therefore, response variable data are transformed first, followed by transformation of explanatory variables data if
the transformation of the response variable data did not appear to be very helpful.
Regressions are rerun based on the transformed data. Investigations are conducted on the impact of various transformations on the models. The most improved models are
reported and presented together with their corresponding initial models generated before
any transformation was conducted (Table 8.14 to Table 8.25).
285

Chapter 8 GLM Analysis and Results
In general, transformation of data has a positive impact on the models, with the
exception of the counterfeit Gucci purchase intention model and counterfeit Gucci
likelihood of consideration model, where transformation of data affects the models
negatively. For the improved models, the improvement of F-statistics ranges from -1.41 (counterfeit Gucci consideration model) to 6.59 (counterfeit Burberry Likelihood of
consideration), and adjusted R-Square improved by between -0.028 (counterfeit Gucci
consideration model) and 0.04 (counterfeit Burberry Likelihood of consideration). As
one can see, both the improvement of F-statistics and adjusted R-Squares are relatively
small. In addition, the regression diagnostics results (histogram of residuals and Q-Q
plot) suggest that to some extant the regression assumptions have not been met after the
transformation or did not improve much in comparison with the initial situation (see
section 8.3.1 for the test of regression assumption results). Accordingly, the conclusion is drawn that the transformation processes have not made any improvement to the
models or have not made much improvement to the models. For economy, the
histogram of residuals and Q-Q plot of the models after transformation(s) are presented in Appendix 12.
Although in some cases transformation of data led to some degree of improvement in
some models, as noted earlier, the improvement is very limited. Moreover, interpreting
the transformed model has practical difficulties. Therefore, it is considered to be
acceptable and sensible to retain the models which are not involved in any data
transformation. In addition, this also makes comparison with SPSS OLS results possible. One thing which needs to be clarified is that the choice is the best one under the current circumstances. Later researchers should justify their choice according to their specific circumstances.
8.5.2 Overall Results Using R Commander
The adjusted R' of all twelve models (three each for four brands) ranges from 0.154
(counterfeit Burberry likelihood of consideration) to 0.313 (original Rolex purchase intention), which is considered acceptable. The only variable which appears in all of the
models is perceived brand personality. These results are in line with the results
generated using SPSS in the previous section. Moreover, the personality variable
appears to have a dominating effect on purchase intention and consideration for all 12
models. These further demonstrate the important role played by brand personality in
286

Chapter 8 GLM Analysis and Results
consumer choice processes. More specifically, the brand personality significantly
influences the formation of the consumer consideration set and consumer purchase
intention. This is consistent across both versions of all four studied luxury brands.
As expected, interaction between product knowledge and product involvement variables is found to be positive and significant in all purchase intention models relating to the
original brands. Contrary to expectations, this variable also appears to be positive and
significant in all purchase intention models related to counterfeit brands, with the
exception of the counterfeit Burberry purchase intention model, in which the interaction
variable is not significant. This implies that, generally, consumers with a higher score
of interaction between product knowledge and product involvement have a higher
tendency to purchase both counterfeit and original branded products, with the exception
of counterfeit Burberry. The level of score of interaction between product knowledge
and product involvement has no effect on his or her intention to purchase counterfeit
Burberry. The interaction variable has the lowest beta values in comparison with other
included variables. This result is consistent across all models, which implies that the
interaction variable has a limited effect on the models even though it appears
significantly influential across all purchase intention models (excluding the counterfeit
Burberry purchase intention model). This result is along the same lines as the results of
the consideration models of the original brands using SPSS.
Interestingly, the interaction variable does not appear in any of the consideration models
relating to counterfeit brands. Product knowledge has positive and significant
explanatory power on the consideration models of counterfeit Gucci and counterfeit
Louis Vuitton, but not on the other two counterfeit brands. Product involvement does
not appear in any consideration models relating to counterfeit brands. This indicates
that the level of product involvement does not seem to explain the subjects' likelihood
of consideration of counterfeit brands; impact of product knowledge is brand specific.
The results related to product involvement are not as expected. This can be explained as
a direct outcome of not controlling the usage situation in this current research.
Consumers might buy different versions (counterfeit or legitimate) of a brand for
different usage situations. For example, a person who possesses high product involvement towards watches might buy original Gucci for work but purchase
counterfeit Gucci for a holiday.
287

Chapter 8 GLM Analysis and Results
Education does not appear in any of the purchase intention regression models. This
implies that whether the subjects are well-educated or not has no effect on his/her
purchase intention of both original branded products and counterfeit branded products. The results of the current study in relation to the purchase intention of the counterfeits
are in line with those of Pau et al. (2001), but contradictory to those of Wee et al. (1995).
Similarly, education does not show any significant effect on the consideration models of the counterfeits across four tested brands. These findings are in line with the original branded product consideration models. Gender only has a positive and significant impact on purchase tendency of the original Gucci, but not on the purchase intention
model of other original brands. The reasoning provided in SPSS results section can be
applied here too (see section 8.4.3.2). Interestingly, the results show that gender has no
significant impact on the subjects' purchase tendency of the studied counterfeit branded
products, or on likelihood of consideration of the counterfeit version of the examined brands. This implies that gender does not affect consumers' likelihood of consideration
and purchase tendency of branded counterfeit products. This might also be true even if
the branded product is not projected as gender neutral.
The results also show that the age variable only appears in the original Gucci purchase
intention model. Two older age groups (aged 41-50, and aged 50+) have less intention
to purchase original Gucci watches. As noted earlier, older people might feel Gucci
watches are less attractive to them, as these products are projected to consumers as
young and trendy. Given that age does not have a significant effect on the likelihood of
consideration and the purchase intention of both counterfeit and branded products
expect for the purchase intention of the original Gucci watches, this might indicate that
age difference does not make any difference to purchase tendency and consideration of
counterfeit luxury brands, but the influence of age on purchase intention of the original brand might be brand specific. These results support Bloch et al. (1993) and Wee et al's
(1995) research findings, but are contradictory to those of Tom et al. (1998), who claim
a negative relationship between age and consumer purchase behaviour of counterfeits.
The income variable does not appear to be significantly influential on most models,
with exceptions of the original Rolex purchase intention model and the counterfeit Gucci likelihood of consideration model. The positive influential role the income
288

Chapter 8 GLM Analysis and Results
variable plays in the Rolex purchase intention model can be explained by the highly
priced nature of the Rolex watch. It is beyond the researcher's capability to provide any
sound explanation for the inclusion of income in the counterfeit Gucci likelihood of
consideration model, but not other models. Nevertheless, the results show that in
general, the income variable has no significant explanatory power on consumer
purchase intention and consideration of both counterfeit and original branded products.
Surprisingly, financial risk and social risk do not appear to have a significant impact on
the likelihood of consideration and the purchase tendency in most of the models. More
specifically, financial risk is only statistically significant in the counterfeit Gucci
consideration model, with social risk only appearing to have significant predictive
power on the consideration of counterfeit Burberry handbags. There are a number of
explanations which can be offered. In the case of the original branded products, financial risk is not a concern to consumers due to the excellent warranty scheme. This
is in response to the focus group finding which reveals that consumers do not perceive financial risk as an issue in relation to the original branded products. In the case of
counterfeit branded products, because the prices of the counterfeits are very low in
comparison with the original versions, it might not be considered as a serious financial
loss even if this money was lost by buying some shoddy stuff. Moreover, consumers
might consider that counterfeit handbags and watches can perform similarly to their
original counterparts as making them does not require high technology. In addition, handbags are fashionable products, which might less likely require to be long lasting.
Consumers are satisfied as long as they look like the original one. Watches are slightly different to handbags due to their requiring a higher level of functionality. This might be the reason for financial risk appearing to be a significant predictor to the
consideration of counterfeit Gucci watches. Financial risk not appearing in the
consideration of counterfeit Rolex watches can be explained by the price charged for the
counterfeit Rolex and counterfeit Gucci being the same. Consumers might expect a lower price on counterfeit Gucci basing their judgement on the price difference between
the two original branded products.
The research finding that social risk does not appear to be a significant predictor to the
consideration and the purchase tendency of both counterfeit and branded products is in
line with past work. For example, Veloutsou and Bian (forthcoming) suggest that social
289
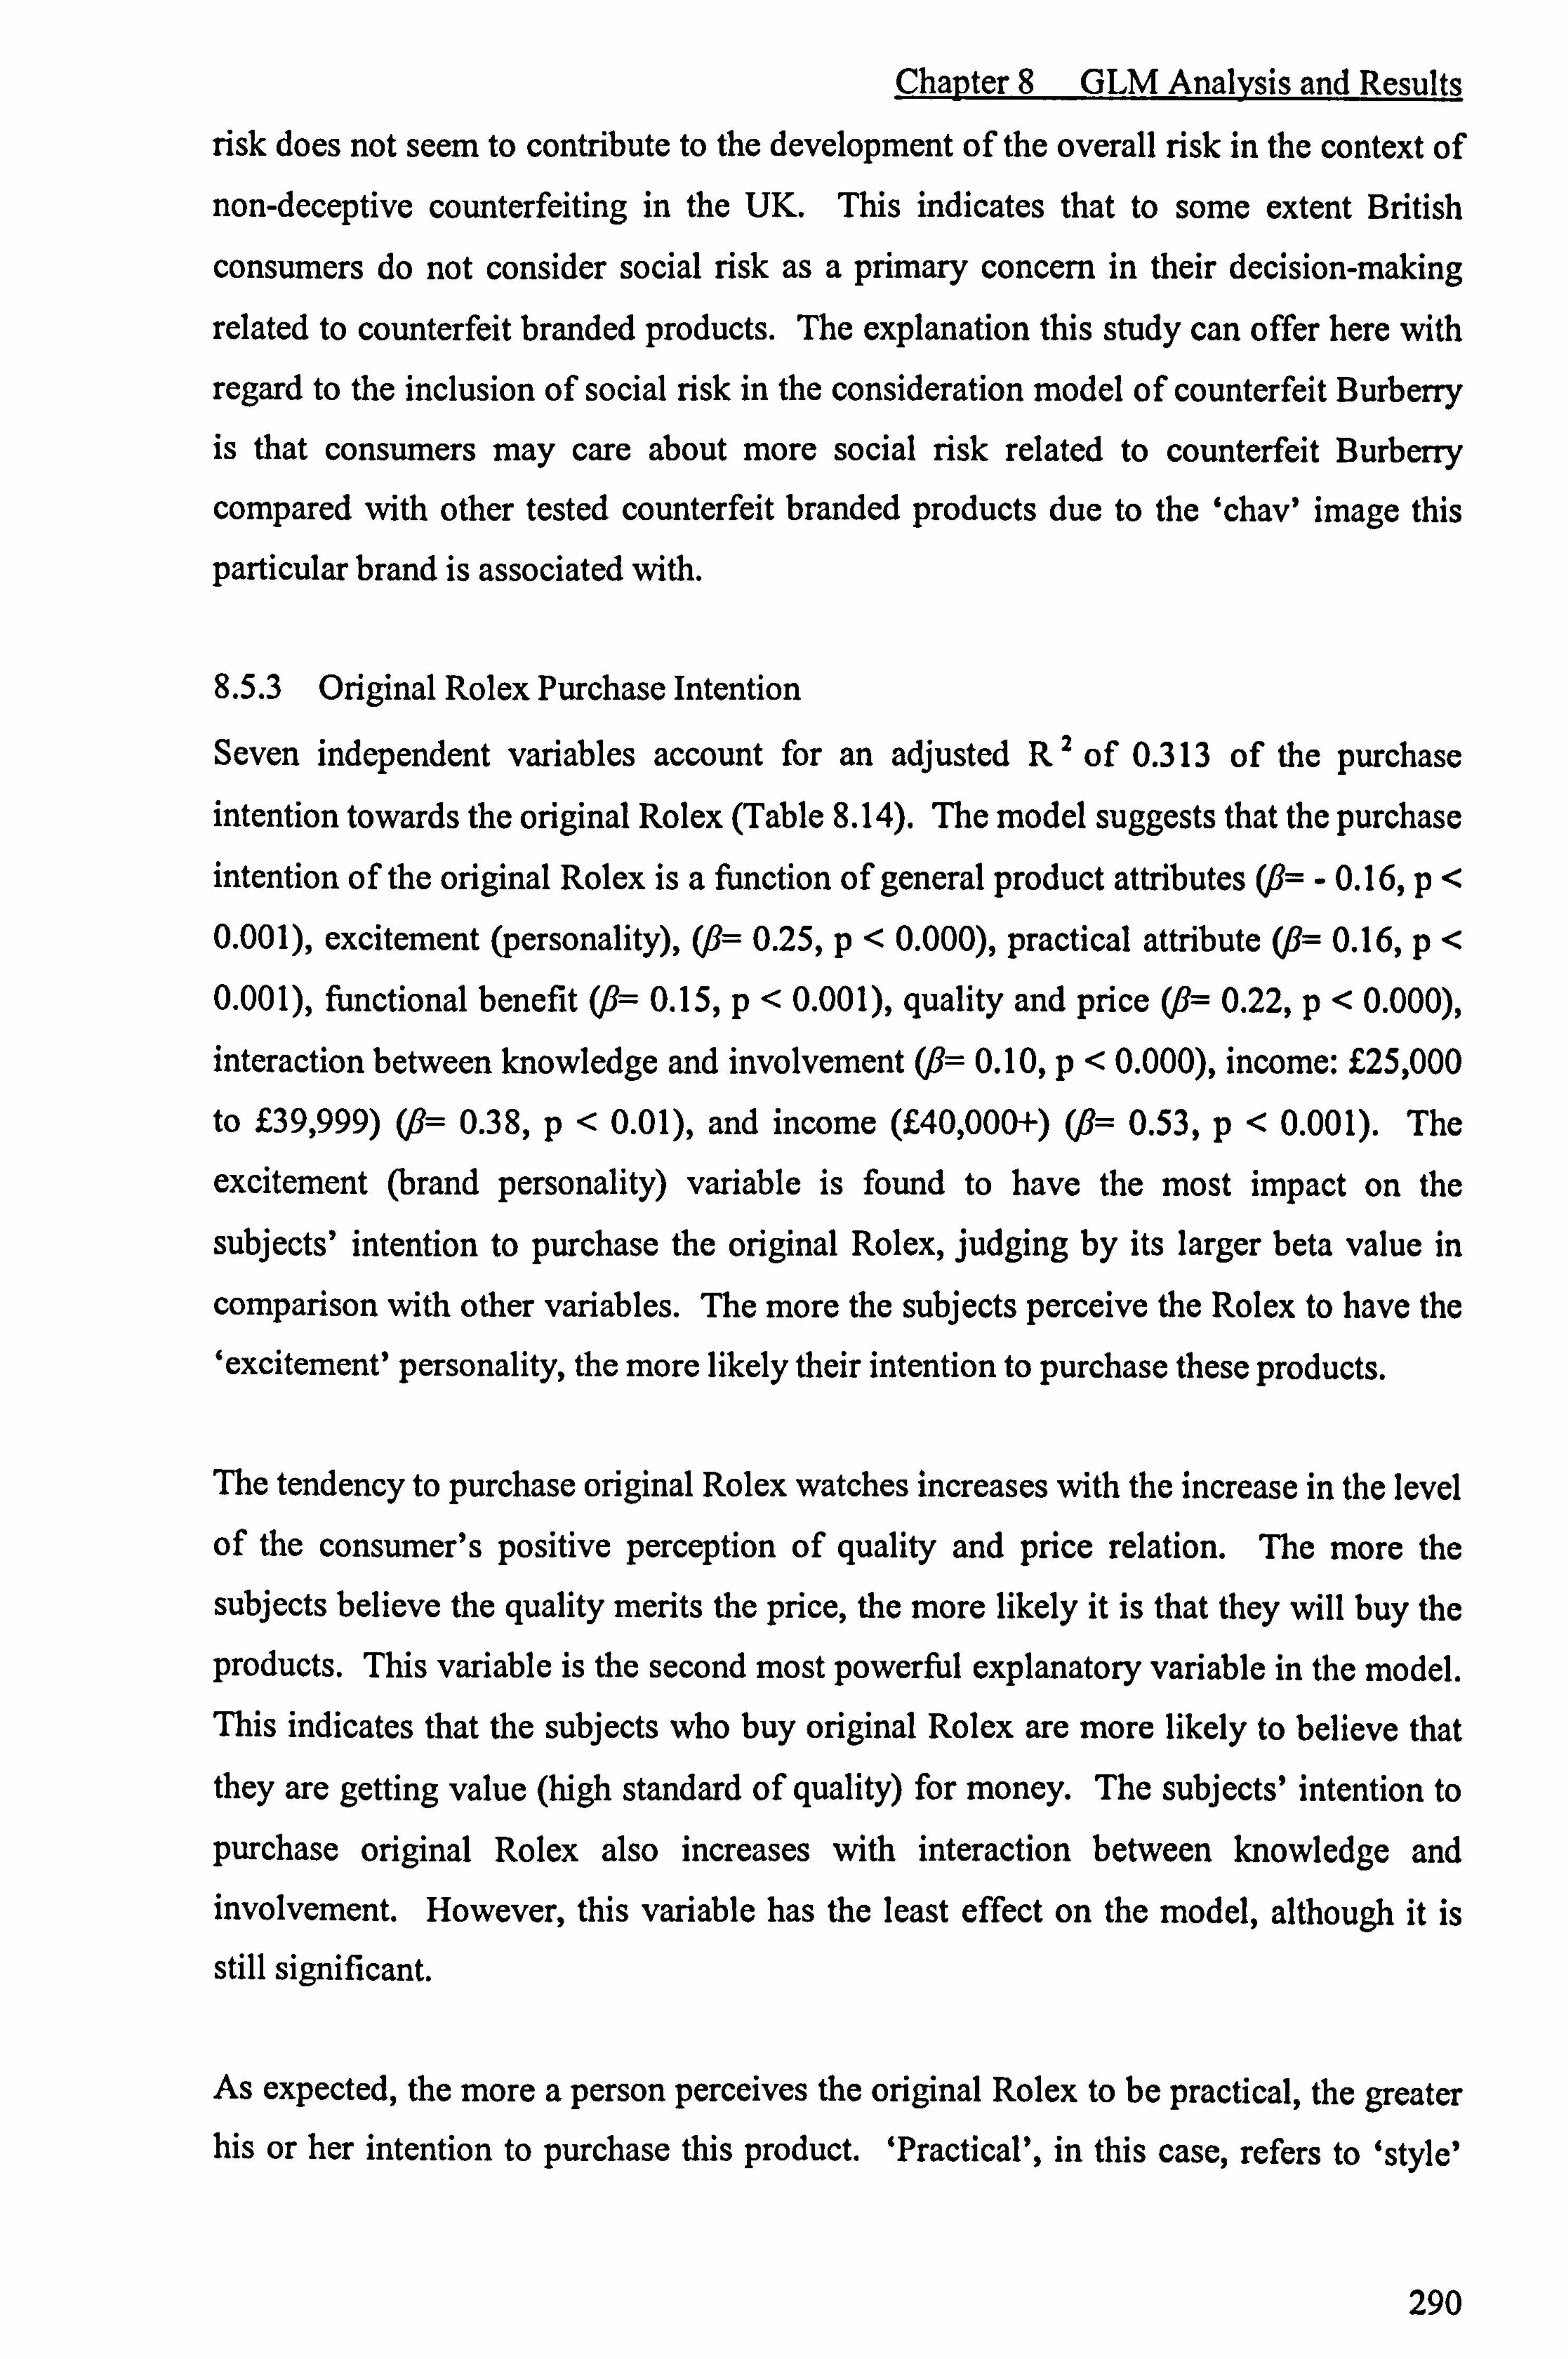
Chapter 8 GLM Analysis and Results
risk does not seem to contribute to the development of the overall risk in the context of
non-deceptive counterfeiting in the UK. This indicates that to some extent British
consumers do not consider social risk as a primary concern in their decision-making
related to counterfeit branded products. The explanation this study can offer here with
regard to the inclusion of social risk in the consideration model of counterfeit Burberry
is that consumers may care about more social risk related to counterfeit Burberry
compared with other tested counterfeit branded products due to the `chav' image this
particular brand is associated with.
8.5.3 Original Rolex Purchase Intention
Seven independent variables account for an adjusted R2 of 0.313 of the purchase intention towards the original Rolex (Table 8.14). The model suggests that the purchase intention of the original Rolex is a function of general product attributes (fl= - 0.16, p< 0.001), excitement (personality), (fl= 0.25, p<0.000), practical attribute (fl= 0.16, p< 0.001), functional benefit (/3= 0.15, p<0.001), quality and price (1= 0.22, p<0.000), interaction between knowledge and involvement (ß= 0.10, p<0.000), income: £25,000
to £39,999) (13= 0.38, p<0.01), and income (£40,000+) (J3= 0.53, p<0.001). The
excitement (brand personality) variable is found to have the most impact on the
subjects' intention to purchase the original Rolex, judging by its larger beta value in
comparison with other variables. The more the subjects perceive the Rolex to have the
`excitement' personality, the more likely their intention to purchase these products.
The tendency to purchase original Rolex watches increases with the increase in the level
of the consumer's positive perception of quality and price relation. The more the
subjects believe the quality merits the price, the more likely it is that they will buy the
products. This variable is the second most powerful explanatory variable in the model. This indicates that the subjects who buy original Rolex are more likely to believe that
they are getting value (high standard of quality) for money. The subjects' intention to
purchase original Rolex also increases with interaction between knowledge and involvement. However, this variable has the least effect on the model, although it is
still significant.
As expected, the more a person perceives the original Rolex to be practical, the greater his or her intention to purchase this product. `Practical', in this case, refers to `style'
290
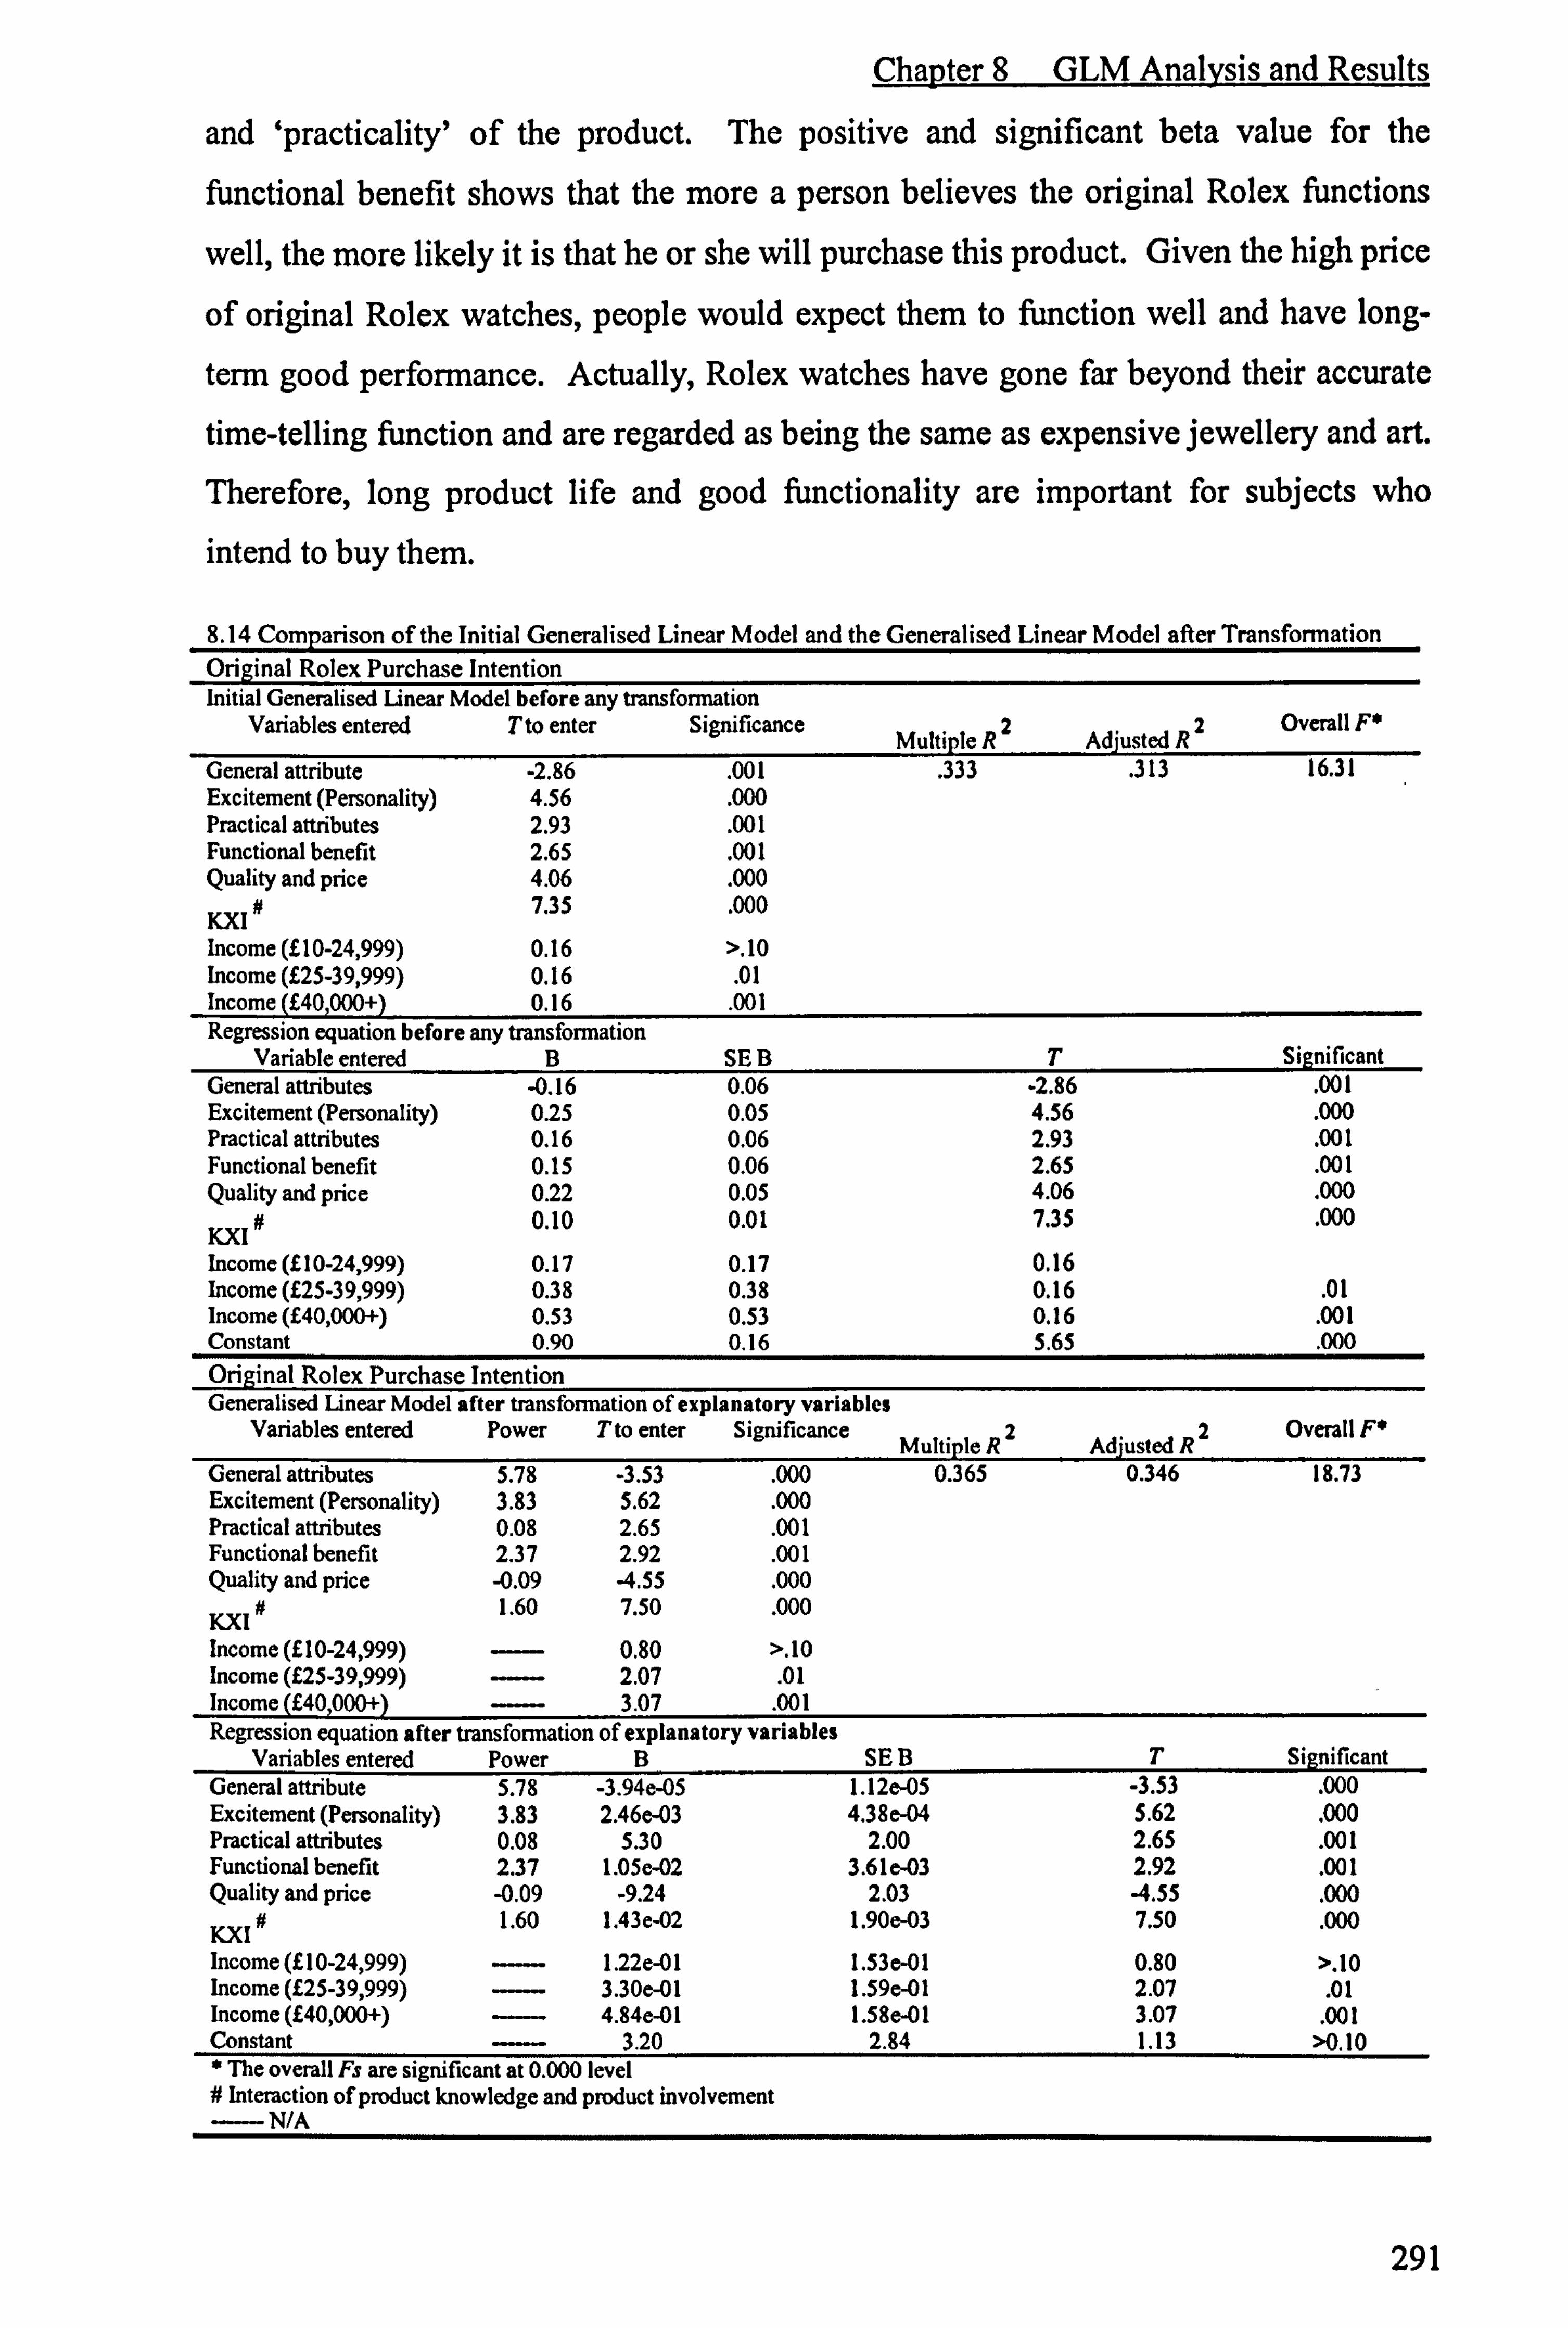
Chapter 8 GLM Analysis and Results
and `practicality' of the product. The positive and significant beta value for the
functional benefit shows that the more a person believes the original Rolex functions
well, the more likely it is that he or she will purchase this product. Given the high price
of original Rolex watches, people would expect them to function well and have long-
term good performance. Actually, Rolex watches have gone far beyond their accurate
time-telling function and are regarded as being the same as expensive jewellery and art. Therefore, long product life and good functionality are important for subjects who intend to buy them.
8.14 Comparison of the Initial Generalised Linear Model and the Generalised Linear Model after Transformation Original Rolex Purchase Intention Initial Generalised Linear Model before any transformation
Variables entered T to enter Significance 2 2 Overall F' Multiple R Adjusted R
General attribute -2.86 . 001 . 333 . 313 16.31 Excitement (Personality) 4.56 . 000 Practical attributes 2.93 . 001 Functional benefit 2.65 . 001 Quality and price 4.06 . 000
# 7.35 . 000 KXI Income (f 10-24,999) 0.16 >. 10 Income (£25-39,999) 0.16 . 01 Income (f40,000+) 0.16 . 001 Regression equation before any transformation
Variable entered B SE B T Significant General attributes -0.16 0.06 -2.86 . 001 Excitement (Personality) 0.25 0.05 4.56 . 000 Practical attributes 0.16 0.06 2.93 . 001 Functional benefit 0.15 0.06 2.65 . 001 Quality and price 0.22 0.05 4.06 . 000
KXI # 0.10 0.01 7.35 . 000
Income (£ 10-24,999) 0.17 0.17 0.16 Income (£25-39,999) 0.38 0.38 0.16 . 01 Income (£40,000+) 0.53 0.53 0.16 . 001 Constant 0.90 0.16 5.65 . 000 Original Rolex Purchase Intention Generalised Linear Model after transformation of explanatory variables
Variables entered Power Tto enter Significance 2 2 Overall F' Multiple R Adjusted R
General attributes 5.78 -3.53 . 000 0.365 0.346 18.73 Excitement (Personality) 3.83 5.62 . 000 Practical attributes 0.08 2.65 . 001 Functional benefit 2.37 2.92 . 001 Quality and price -0.09 -4.55 . 000
KXI # 1.60 7.50 . 000
Income (£10-24,999) - 0.80 >. 10 Income (£25-39,999) ----- 2.07 . 01 Income (£40,000+) - 3.07 . 001 Regression equation after transformation of explanatory variables
Variables entered Power B SE B T Signif icant General attribute 5.78 -3.94e-05 1.12e-05 -3.53 . 000 Excitement (Personality) 3.83 2.46e-03 4.38e-04 5.62 . 000 Practical attributes 0.08 5.30 2.00 2.65 . 001 Functional benefit 2.37 1.05e-02 3.61e-03 2.92 . 001 Quality and price -0.09 -9.24 2.03 -4.55 . 000
KXI # 1.60 1.43e-02 1.90e-03 7.50 . 000
Income (f 10-24,999) - 1.22e-01 1.53e-01 0.80 >. 10 Income (f25-39,999) ------ 3.30e-0 1 1.59e-01 2.07 . 01 Income (E40,000+) --- 4.84e-01 1.58e-01 3.07 . 001 Constant 3.20 2.84 1.13 >0.10 * The overall Fs are significant at 0.000 level # Interaction of product knowledge and product involvement --- N/A
291

Chapter 8 GLM Analysis and Results
It is interesting to see that the general product attributes factor has significant but
negative impact on the model. A close examination of the items forming this factor
reveals that price and packing are the two items which have the highest factor loading.
Therefore, the negative sign indicates that the less expensive the subjects perceive the
product to be, the higher the intention of purchase; the better the quality of the packing
they perceive, the less likely it is that they will purchase them. The latter indication can
be explained by saying that when consumers perceive the package is overriding the
product itself, they do not consider that they are getting value for money. As such,
these products are less likely to be purchased. Finally, in comparison with the lowest
income category, the two income categories above the UK average income level are
found to have a higher level of tendency to buy an original Rolex. The second lowest
income category does not show a significant difference from the lowest income
category. This is not surprising, as an original Rolex is a luxury and extremely
expensive product. Low income subjects cannot afford to buy them.
8.5.4 Counterfeit Rolex Purchase Intention
For the counterfeit Rolex (Table 8.15), five independent variables account for an
adjusted R2 of 0.166 of the purchase intention towards this version. The model shows
that the purchase intention is a function of competence (fl= 0.28, p<0.000), value for
money (/3= 0.12, p<0.00 1), practical attributes (ß= 0.11, p<0.01), interaction between
knowledge and involvement (/3= 0.02, p<0.01) and social risk (peer) (ß= -0.09, p< 0.001). In contrast to the original Rolex purchase intention model, the `excitement'
personality is not significant any more and is replaced by the `competence' personality,
which has the most positive effect on the model. This result implies that the brand
personality plays very important role in the Rolex purchase intention models. Nevertheless, this is not necessarily to say that the same personality will appear
consistently in both the counterfeit related model and original related model. More
specifically, the subjects might consider different brand personalities as important in
different models related to different versions of a brand.
Value for money is the second most influential explanatory variable in the model. As
noted in Chapter 6, the value for money variable is a factor consisting of fun, quality
meriting price and status gained for money expended. Therefore, the results suggest
292

Chapter 8 GLM Analysis and Results
that the more the subject believes the counterfeit Rolex is fun, merits its price and can bring them status, the more likely it is that they will purchase counterfeit products. This
finding is consistent with that of Nia and Zaichchow (2000), who report that counterfeit
prone consumers claim that counterfeit luxury products are fun and worth the price they
paid for them.
8.15 Comparison of the Initial Generalised Linear Model and the Generalised Linear Model after Transformation Counterfeit Rolex Purchase Intention Initial Generalised Linear Model before any transformation
Variables entered Tto enter Significance 2 2 Overall F' Multiple R Adjusted R
Competence (Personality) 6.31 . 000 0.179 0.166 13.73 Value for money 2.74 . 001 Practicality attributes 2.54 . 01
KX1 # 1.98 . 01
Social risk -2.828 . 001 Regression equation before any transformation
Variable entered B SE B T Significant Competence (Personality) 0.28 0.04 6.31 . 000 Value for money 0.12 0.04 2.74 . 001 Practicality attributes 0.11 0.04 2.54 . 01
KXI # 0.02 0.01 1.98 . 01
Social risk -0.09 -2.828 . 001 Constant 1.59 0.13 11.79 . 000 Counterfeit Rolex Purchase Intention Generalised Linear Model after transformation of explanatory variables
Variables entered Power Tto enter Significance 2 2 Overall F' Multiple R Adjusted R
Competence (Personality) 1.20 6.27 . 000 0.182 0.169 14.05 Value for money 2.05 2.69 . 001 Practicality attributes 0.57 2.51 . 01
KXI # 0.39 2.02 . 01
Social risk 1.69 -2.86 . 001 Regression equation after transformation of explanatory variables
Variables entered Power B SE B T Significant Competence (Personality) 1.20 0.20 0.032 6.27 . 000 Value for money 2.05 0.01 0.005 2.69 . 001 Practicality attributes 0.57 0.31 0.122 2.51 . 01
JOG # 0.39 0.19 0.094 2.02 . 01
Social risk 1.69 -0.03 0.009 -2.86 . 001 Constant -- -0.02 0.33 -0.075 >. 10 * The overall Fs are significant at 0.000 level # Interaction of product knowledge and product involvement - N/A
Practical attributes appear to have a positive and significant effect on this model. This
is in the same vein as the original Rolex model, which indicates that practicality is
considered to be an important factor in the process of Rolex watch (both original and
counterfeit versions) evaluation and significantly influences consumer purchase behaviour. Here, the practical attributes consist of `watch style' and `practicality'.
Surprisingly, the results show that the interaction variable of product knowledge and involvement has a positive and significant effect on the counterfeit Rolex purchase intention. The positive ß value indicates that the higher the value of the interaction
293
Chapter 8 GLM Analysis and Results
variable the more likely the subjects are to purchase counterfeit Rolex. This differs
from our expectation. However, it can be explained that with advancements in watch
technology, the accurate time-telling function of watches is no longer difficult to
achieve. In other words, in terms of time-telling, counterfeit watches can be similar, or
even as good as the original. The more knowledgeable the person is about watches, the
more he or she is aware of this fact.
The results also show that social risk (peer) has significant explanatory power on the
model. The negative beta value indicates that the higher the subject's perception of the
social risk related to the purchase of counterfeit Rolex, the less likely it is that he or she
will have a tendency to purchase it. This is not surprising and it echoes the focus group finding. Moreover, it is also in line with the risk reverse theory. The expectation is
supported. This variable does not appear in the original Rolex purchase intention model,
which suggests that perceived level of social risk does not have an effect on consumer
purchase tendency of the original Rolex watch. This indicates that variables considered
as important by the subjects are different in relation to counterfeit and original brands in
the purchase intention stage of consumer choice processes.
There are some differences between the counterfeit Rolex purchase intention model and
the original Rolex purchase intention model. Apart from the practical attributes and the
interaction variable, functional benefit, general product attributes, excitement variable,
and income which are significant in the original Rolex purchase intention model do not
appear to have a significant effect on the counterfeit Rolex purchase intention model. The exclusion of income in the counterfeit Rolex intention model is not surprising. This
is in line with Tom et al. (1998), who report that not only do low income consumers knowingly purchase counterfeits, consumers with higher incomes do admit intention to
purchase counterfeits too. Replacing the dominant role of the `excitement' (personality)
factor in the original Rolex model, the `competence' (personality) factor has the most
significant effect on the purchase intention of counterfeit Rolex. As the subjects'
perceived competence brand personality of the counterfeit Rolex watch increases, his or her intention of purchase will increase. The value for money factor of the counterfeit Rolex intention model takes in `fan' and `status' elements, which implies that
counterfeit Rolex prone consumers do perceive a higher level of fun and status benefit
from the counterfeit version. Nevertheless, these elements do not appear to be
294
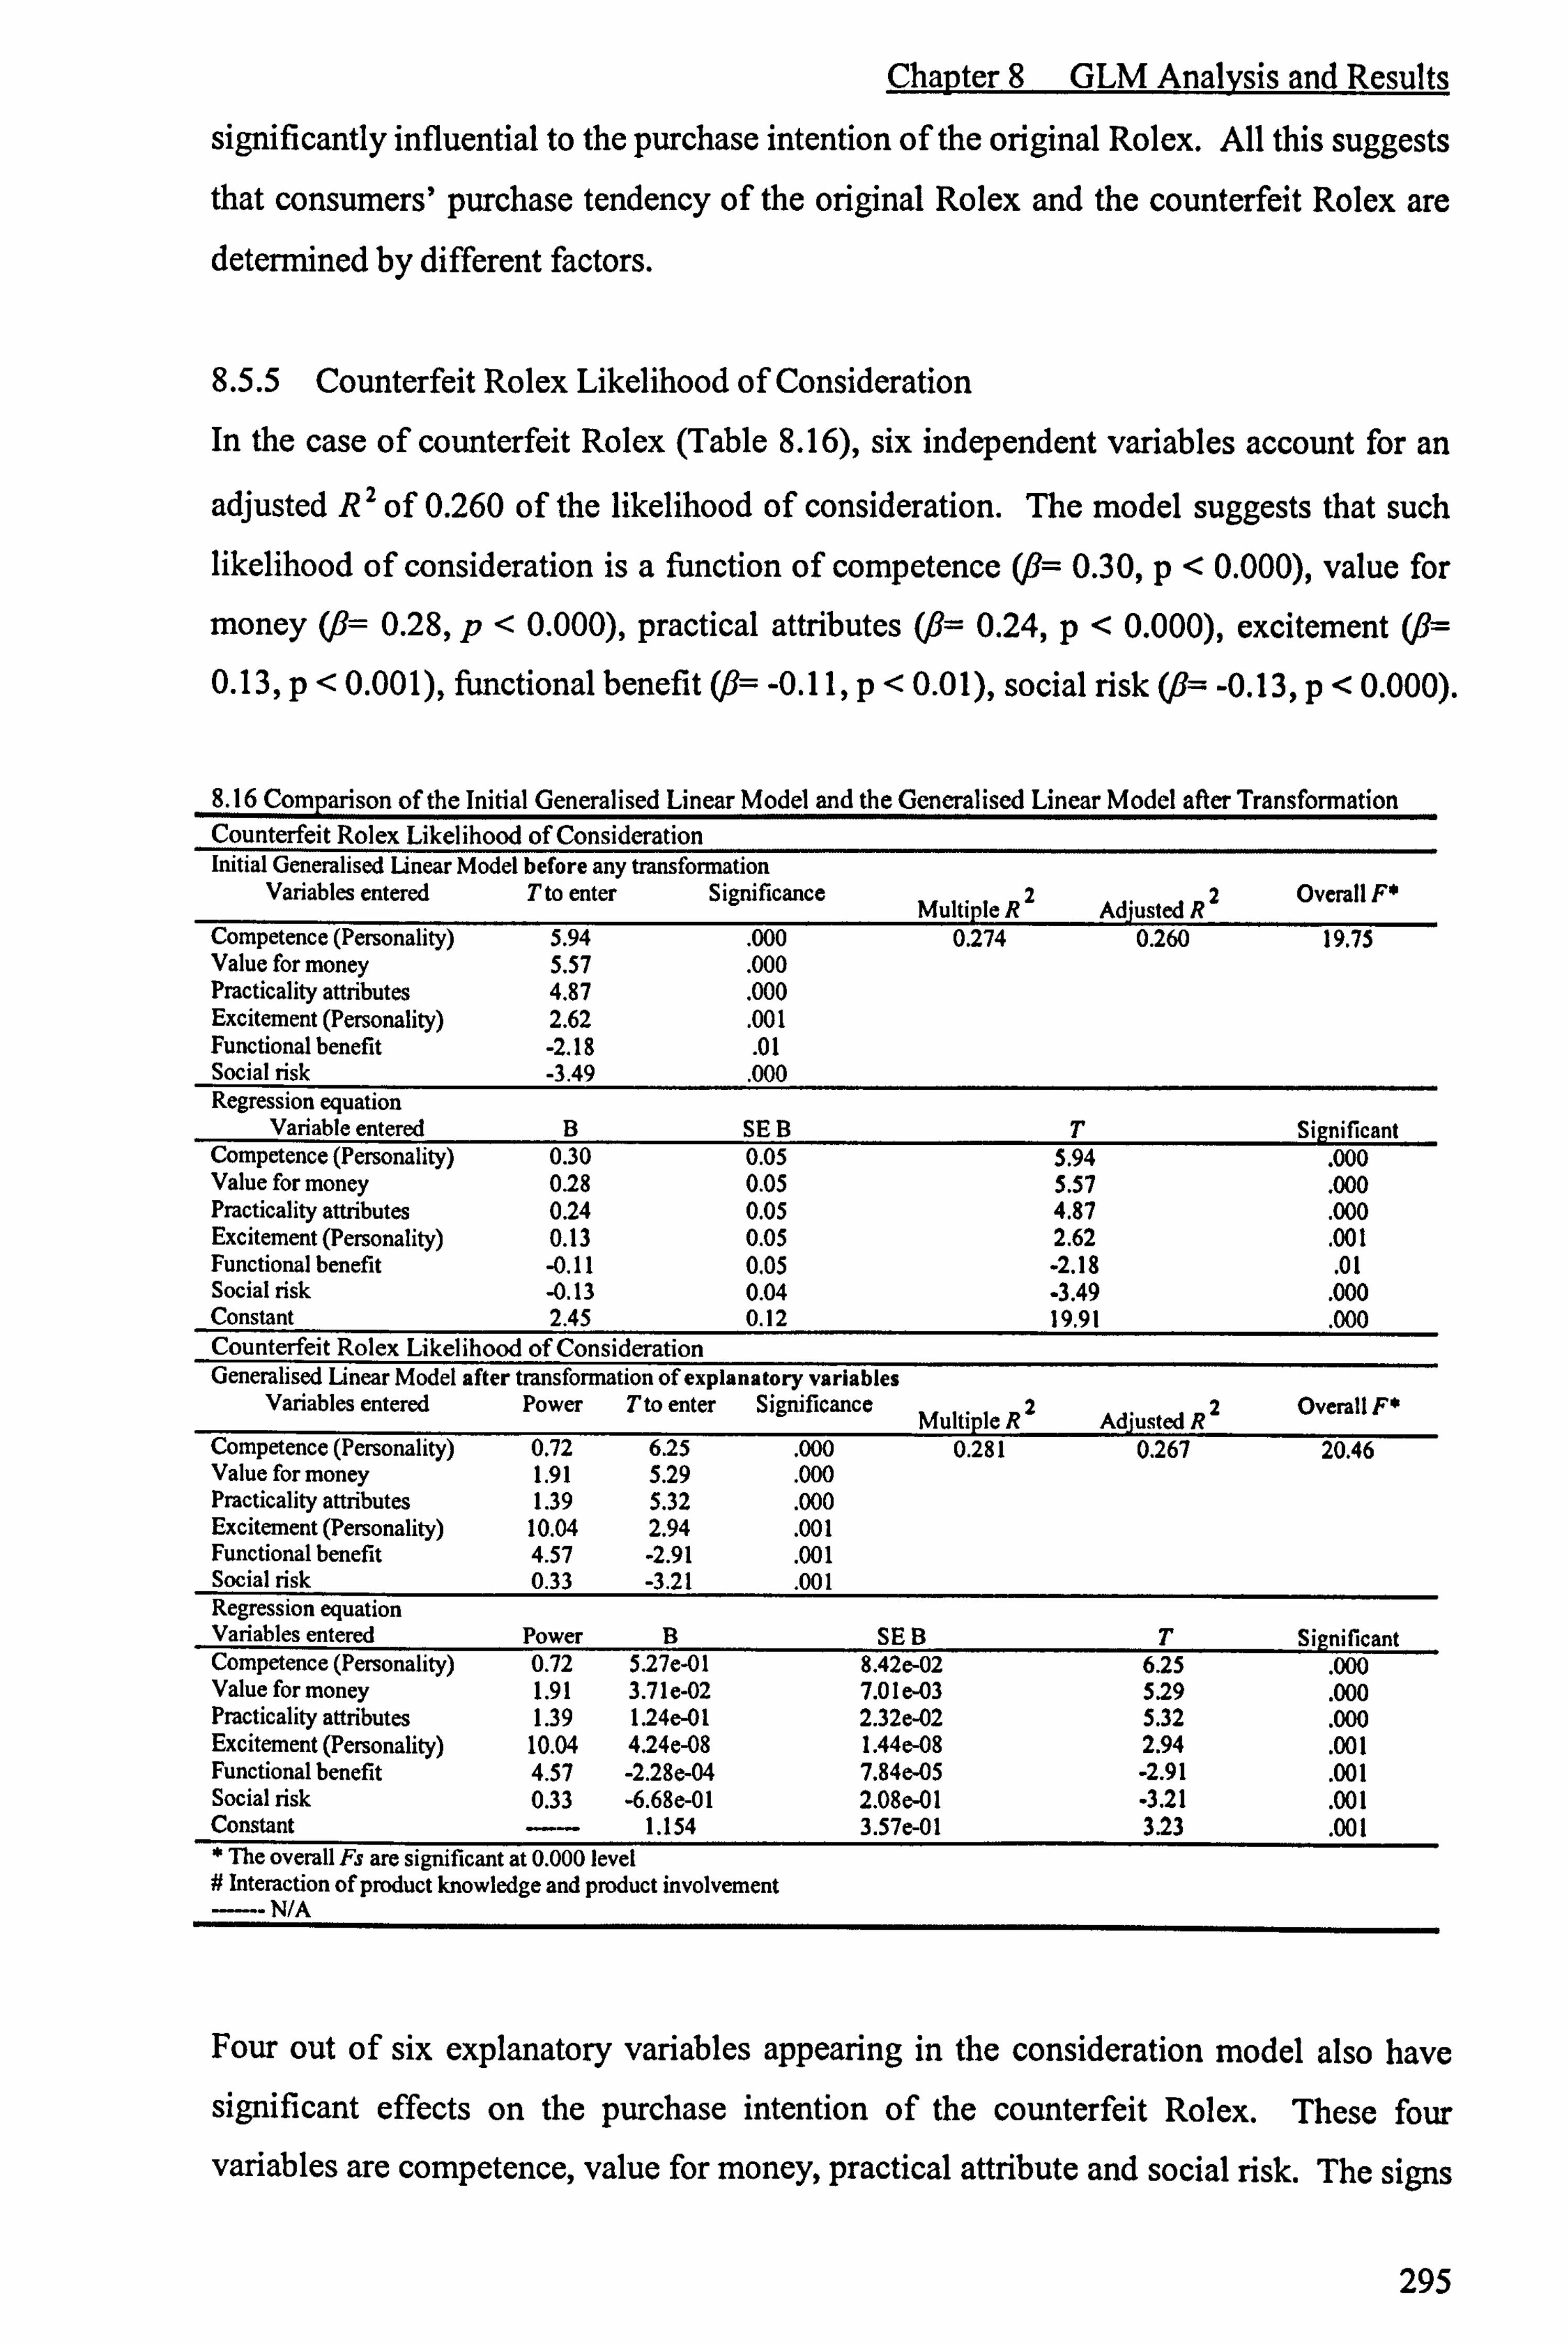
Chapter 8 GLM Analysis and Results
significantly influential to the purchase intention of the original Rolex. All this suggests that consumers' purchase tendency of the original Rolex and the counterfeit Rolex are determined by different factors.
8.5.5 Counterfeit Rolex Likelihood of Consideration
In the case of counterfeit Rolex (Table 8.16), six independent variables account for an
adjusted R2 of 0.260 of the likelihood of consideration. The model suggests that such likelihood of consideration is a function of competence (/3= 0.30, p<0.000), value for
money (J3= 0.28, p<0.000), practical attributes (ß= 0.24, p<0.000), excitement (ß=
0.13, p<0.00 1), functional benefit (ß= -0.11, p<0.01), social risk (ß= -0.13, p<0.000).
8.16 Comparison of the Initial Generalised Linear Model and the Generalised Linear Model after Transformation Counterfeit Rolex Likelihood of Consideration Initial Generalised Linear Model before any transformation
Variables entered Tto enter Significance Mullinie R2 Adjusted R2
Overall F0
Competence (Personality) 5.94 . 000 0.274 0.260 19.75 Value for money 5.57 . 000 Practicality attributes 4.87 . 000 Excitement (Personality) 2.62 . 001 Functional benefit -2.18 . 01 Social risk -3.49 . 000 Regression equation
Variable entered B SE B T Significant Competence (Personality) 0.30 0.05 5.94 . 000 Value for money 0.28 0.05 5.57 . 000 Practicality attributes 0.24 0.05 4.87 . 000 Excitement (Personality) 0.13 0.05 2.62 . 001 Functional benefit -0.11 0.05 -2.18 . 01 Social risk -0.13 0.04 -3.49 . 000 Constant 2.45 0.12 19.91 . 000 Counterfeit Rolex Likelihood of Consideration Generalised Linear Model after transformation of explanatory variables
Variables entered Power Tto enter Significance Multiple R2 Adjusted R2
Overall F*
Competence (Personality) 0.72 6.25 . 000 0.281 0.267 20.46 Value for money 1.91 5.29 . 000 Practicality attributes 1.39 5.32 . 000 Excitement (Personality) 10.04 2.94 . 001 Functional benefit 4.57 -2.91 . 001 Social risk 0.33 -3.21 . 001 Regression equation Variables entered Power B SE B T Significant Competence (Personality) 0.72 5.27e-01 8.42e-02 6.25 . 000 Value for money 1.91 3.71 e-02 7.01 e-03 5.29 . 000 Practicality attributes 1.39 1.24e-01 2.32e-02 5.32
. 000 Excitement (Personality) 10.04 4.24e-08 1.44e-08 2.94
. 001 Functional benefit 4.57 -2.28e-04 7.84e-05 -2.91 . 001 Social risk 0.33 -6.68e-01 2.08e-01 . 3.21 . 001 Constant ---- 1.154 3.57e-01 3.23
. 001 * The overall Fs are significant at 0.000 level # Interaction of product knowledge and product involvement -- N/A
Four out of six explanatory variables appearing in the consideration model also have
significant effects on the purchase intention of the counterfeit Rolex. These four
variables are competence, value for money, practical attribute and social risk. The signs
295
Chapter 8 GLM Analysis and Results
of the beta values of each variable remain the same across two models, with only the
explanatory magnitude varying slightly. One more thing that has no difference is that
the personality related variable (competence) also plays the dominant explanatory role in the counterfeit Rolex consideration model.
In contrast to the original Rolex consideration model, the functional benefit appears to
negatively influence consideration of counterfeit Rolex. The negative beta value is
because the `disposability' item has the higher factor loading. The negative and
significant beta value for this variable shows that the more the subject perceive the
counterfeit Rolex as disposable, the more likely he or she will consider buying this
product. In comparison with the very low price of the counterfeit product, consumers
might not expect the product to have a very long product life. Actually, consumers
might consider the disposable nature of the counterfeit product as an advantage over the
original branded products. The low price of the counterfeit product makes it possible to
change the watches frequently. The low price of the counterfeit product also causes less
psychological burden if the subject's interest in the product fades away.
The excitement factor, another dimension of the Rolex personality, has a positive and
significant impact on the likelihood of consideration of the counterfeit Rolex. The more
the subjects believe that the counterfeit Rolex has the `excitement' personality, the more likely it is that he or she will consider buying this product. This personality does not
appear to have a significant effect on the purchase intention of the counterfeit Rolex.
This implies that if the brand is considered to have multiple personalities, this is not
necessarily to say that they all play important explanatory roles in influencing the
formation of consideration and the purchase intention. In other words, different stages
of consumer choice processes might be influenced by different factors.
8.5.6 Original Gucci Purchase Intention
For the original Gucci, the purchase intention is a function of personality (/3= 0.19, p< 0.001), image benefit (8= 0.18, p<0.001), functional benefit (ß= 0.19, p<0.000),
gender (8= -0.28, p<0.01), interaction between knowledge and involvement (13= 0.07, p < 0.000), age category (41 to 50) (8= -0.45, p<0.01) and age category (50+) (13= -0.53,
p<0.001). These variables account for an R2 of 0.215 (Table 8.17) of purchase intention towards the original Gucci.
296

Chapter 8 GLM Analysis and Results
8.17 Comparison of the Initial Generalised Linear Model and the Generalised Linear Model after Transformation Original Gucci Purchase Intention Initial Generalised Linear Model before any transformation
Variables entered Tto enter Significance 2 2 Overall F* Multiple R Adjusted R
Personality 3.15 . 001 0.237 0.215 10.76 Image benefit 3.06 . 001 Functional benefit 3.34 . 000 Gender 2.39 . 01
KXI # 5.12 . 000
Age (41-50) -2.47 . 01 Age (50+) -2.70 . 001 Regression equation
Variable entered B SE B T Significant Personality 0.19 0.06 3.15 . 001 Image benefit 0.18 0.06 3.06 . 001 Functional benefit 0.19 0.06 3.34 . 000 Gender 0.28 0.12 2.39 . 01
KXI # 0.07 0.01 5.12 . 000
Age (41-50) -0.45 0.18 -2.47 . 01 Age (50+) -0.53 0.18 -2.70 . 001 Constant 1.48 0.19 7.89 . 000 Original Gucci Purchase Intention Generalised Linear Model after transformation of explanatory variables
Variables entered Power T to enter Significance 2 2 Overall F* Multiple R Adjusted R
Personality 2.70 3.44 . 000 0.242 0.220 11.05 Image benefit 0.25 3.24 . 001 Functional benefit -0.006 3.34 . 000 Gender ------ -2.32 . 01
KXI # 1.10 5.17 . 000
Age (41-50) ------- -2.42 . 01 Age (50+) -2.64 . 001 Regression equation
Variables entered Power B SE B T Significant Personality 2.70 0.008 0.002 3.44 . 000 Image benefit 0.25 1.75 0.54 3.24 . 001 Functional benefit -0.006 0.19 0.06 3.34 . 000 Gender ------ -0.27 0.12 -2.32 . 01 KxI # 1.10 0.05 0.01 5.17 . 000
Age (41-50) ---- -0.03 0.18 -2.42 . 01 Age (50+) -0.43 0.18 -2.64 . 001 Constant -1.61 0.79 -2.03 . 01 * The overall Fs are significant at 0.000 level # Interaction of product knowledge and product involvement --- N/A
Similar to the original Rolex intention model, personality, functional benefit and interaction between knowledge and involvement variables all have a significant effect
on the purchase intention of the original Gucci. Moreover, the directions of influence of these variables are identical to those of the Rolex intention model. Therefore, it is
decided that no further interpretation is to be provided on these three variables. One
more thing worth noting is that, as with the original Rolex purchase intention model, the
personality variable plays a dominating role on explanation of the purchase intention of the original Gucci, and interaction between knowledge and involvement has the least
effect on the model.
297
Chapter 8 GLM Analysis and Results
Perceived image benefit comes after brand personality in determining the purchase
intention of the original Gucci. See Chapter 7 for detailed content of the perceived
image benefit factor of the original Gucci. Since most purchase behaviour is benefit-
driven (Jobber 2004), it is not surprising that the more image benefit the subject
perceives, the more likely it is that he or she will purchase this product.
Gender exerts a positive influence on the intention to purchase original Gucci. As the R
commander dummy coded male as the reference category, the results indicate female
subjects are more likely to purchase original Gucci. This is in line with the original Gucci consideration model. Interestingly, gender only appears in models related to the
original Gucci intention model. Nevertheless, this result is in line with the original Gucci consideration model. The possible explanations provided in the original Gucci
consideration model section are applicable here.
The negative beta values of the older age groups (aged between 41 to 50 and 50 above) imply that these age groups have less purchase tendency towards the original Gucci.
This can be explained by the fact that Gucci watches are projected as young, fashionable and trendy in order to attract young people. Consequently, older age groups
are more likely perceive Gucci watches as products for younger generations.
8.5.7 Counterfeit Gucci Purchase Intention
The regression model for the counterfeit Gucci shows that purchase intention for
purchasing counterfeit Gucci watches is a function of competence (personality) (J3= 0.23,
p<0.000), sophistication (personality) (8= 0.21, p<0.000), excitement (personality)
(/i= 0.17, p<0.000), product attributes (/3= 0.17, p<0.000), image benefit (ß= 0.15, P<
0.000) and interaction between knowledge and involvement (8= 0.12, p<0.01). The
six variables account for an adjusted R2 of 0.216 in explaining the subjects' intention to
purchase the counterfeit Gucci (Table 8.18).
In comparison with the original Gucci purchase intention model, the counterfeit model
consists of fewer explanatory variables. Gender and age are not significantly influential
on the purchase intention towards the counterfeit Gucci, which indicates that they
should be utilised to segment the counterfeit Gucci prone consumers. In addition, the
298

Chapter 8 GLM Analysis and Results
functional benefit factor does not show a significant effect on the purchase tendency
towards the counterfeit Gucci either. This implies that it cannot necessarily be said that
consumers who knowingly purchase counterfeit Gucci perceive a higher level of functional benefit of counterfeits than the ones who do not buy.
8.18 Comparison of the Initial Generalised Linear Model and the Generalised Linear Model after Transformation Counterfeit Gucci Purchase Intention Initial Generalised Linear Model before any transformation
Variables entered Tto enter Significance Multiple R2 Adjusted R2
Overall F'
KXI # 2.46 . 01 0.230 0.216 15.70
Sophistication (personality) 4.91 . 000 Image benefit 3.35 . 000 Competence (personality) 5.17 . 000 Excitement (personality) 3.85 . 000 Product attributes 3.99 . 000
B
KXI # 0.12 0.05 2.46 . 01
Sophistication (personality) 0.21 0.04 4.91 . 000 Image benefit 0.15 0.04 3.35 . 000 Competence (personality) 0.23 0.04 5.17 . 000 Excitement (personality) 0.17 0.04 3.85 . 000 Product attributes 0.17 0.04 3.99 . 000 Constant 1.19 0.14 8.65 . 000 Counterfeit Gucci Purchase Intention Generalised Linear Model after transformation of response variables
Variables entered Power Tto enter Significance 2 2 Overall F' Multiple R Adjusted R
KXI # --- -2.39 . 01 0.202 . 0187 13.29
Sophistication (personality) -- -4.74 . 000 Image benefit -3.02 . 000 Competence (personality) -4.23 . 000 Excitement (personality) ----- -3.54 . 000 Product attributes --- -4.01 . 000 Purchase intention** -2 Regression equation
Variables entered Power B SE B T Significant
KXI # --- -0.05 0.02 -2.39 . 01 Sophistication (personality) ------ -0.09 0.02 -4.74 .
000 Image benefit ------ -0.06 0.02 -3.02 . 000 Competence (personality) ------ -0.08 0.02 -4.23 . 000 Excitement (personality) ------ -0.07 0.02 -3.54 . 000 Product attributes -0.07 0.02 -4.01 . 000 Constant 0.86 0.06 14.63
. 000 'The overall Fs are significant at 0.000 level ** Response variable # Interaction of product knowledge and product involvement ----- N/A
The other variables that appeared in the counterfeit Gucci purchase intention model are
all included in the original Gucci purchase intention. The directions of influence of these variables are all the same in the original Gucci purchase intention model, with the
explanatory magnitude varying slightly. The three extracted personality factors related to the counterfeit Gucci all have significant effect on the purchase intention toward the
counterfeits. The personality factors are the dominant factors in explanatory variables
299

Chapter 8 GLM Analysis and Results
in the counterfeit Gucci purchase intention model, while the KxI appears to be the least
influential variable, although it is still significant.
8.5.8 Counterfeit Gucci Likelihood of Consideration
For the counterfeit Gucci, nine variables account for an adjusted R2 of 0.280 in
explaining the subjects' likelihood of consideration of this version of Gucci watches
(Table 8.19). The model suggests that such likelihood of consideration is a function of
image benefit (8= 0.34, p<0.000), sophistication (personality) (ß= 0.26, p<0.000),
excitement (personality) (ß= 0.23, p<0.000), competence (personality) (fl= 0.16, p<
0.001), product attributes (13= 0.24, p<0.000), product knowledge (fl= 0.13, p<0.01), financial risk (ß= -0.11, p<0.001), social risk (ß= -0.09, p<0.01), income (£25 - 39,999)(ß= -0.41, p<0.001) and income (£40,000+) (8= -0.54, p<0.000).
In comparison to the counterfeit Gucci purchase intention model, this model consists of
more explanatory variables. Five out of six explanatory variables of the counterfeit
Gucci intention model appear in the counterfeit Gucci consideration model. They are
image benefit, sophistication, excitement, competence and product attributes. The
difference is that in the counterfeit consideration model, the image benefit variable
replaces the sophistication variable as the dominant explanatory variable, with the
sophistication variable as the second most influential variable. This suggests that
consumers who consider purchasing counterfeit Gucci perceive a higher level of image
benefit. The direction of the beta values related to all these five variables remains the
same as the counterfeit Gucci intention model.
Two risk related variables are included in the counterfeit Gucci consideration model, but not in the counterfeit Gucci purchase intention model. The negative beta values of both financial risk and social risk indicate that the higher the perceived risks the less
likely the subject will consider the counterfeit Gucci. This implies that perceived risks
are the consumers' concern in relation to counterfeit and have a significant impact on
the inclusion of counterfeit Gucci in their consideration set. One thing worth mentioning is that the risk variables are the least important explanatory variables in the model,
although they appear to have significant explanatory power. These results suggest
perceived risks have only limited effect on the inclusion of counterfeit Gucci in
consumers' consideration set.
300
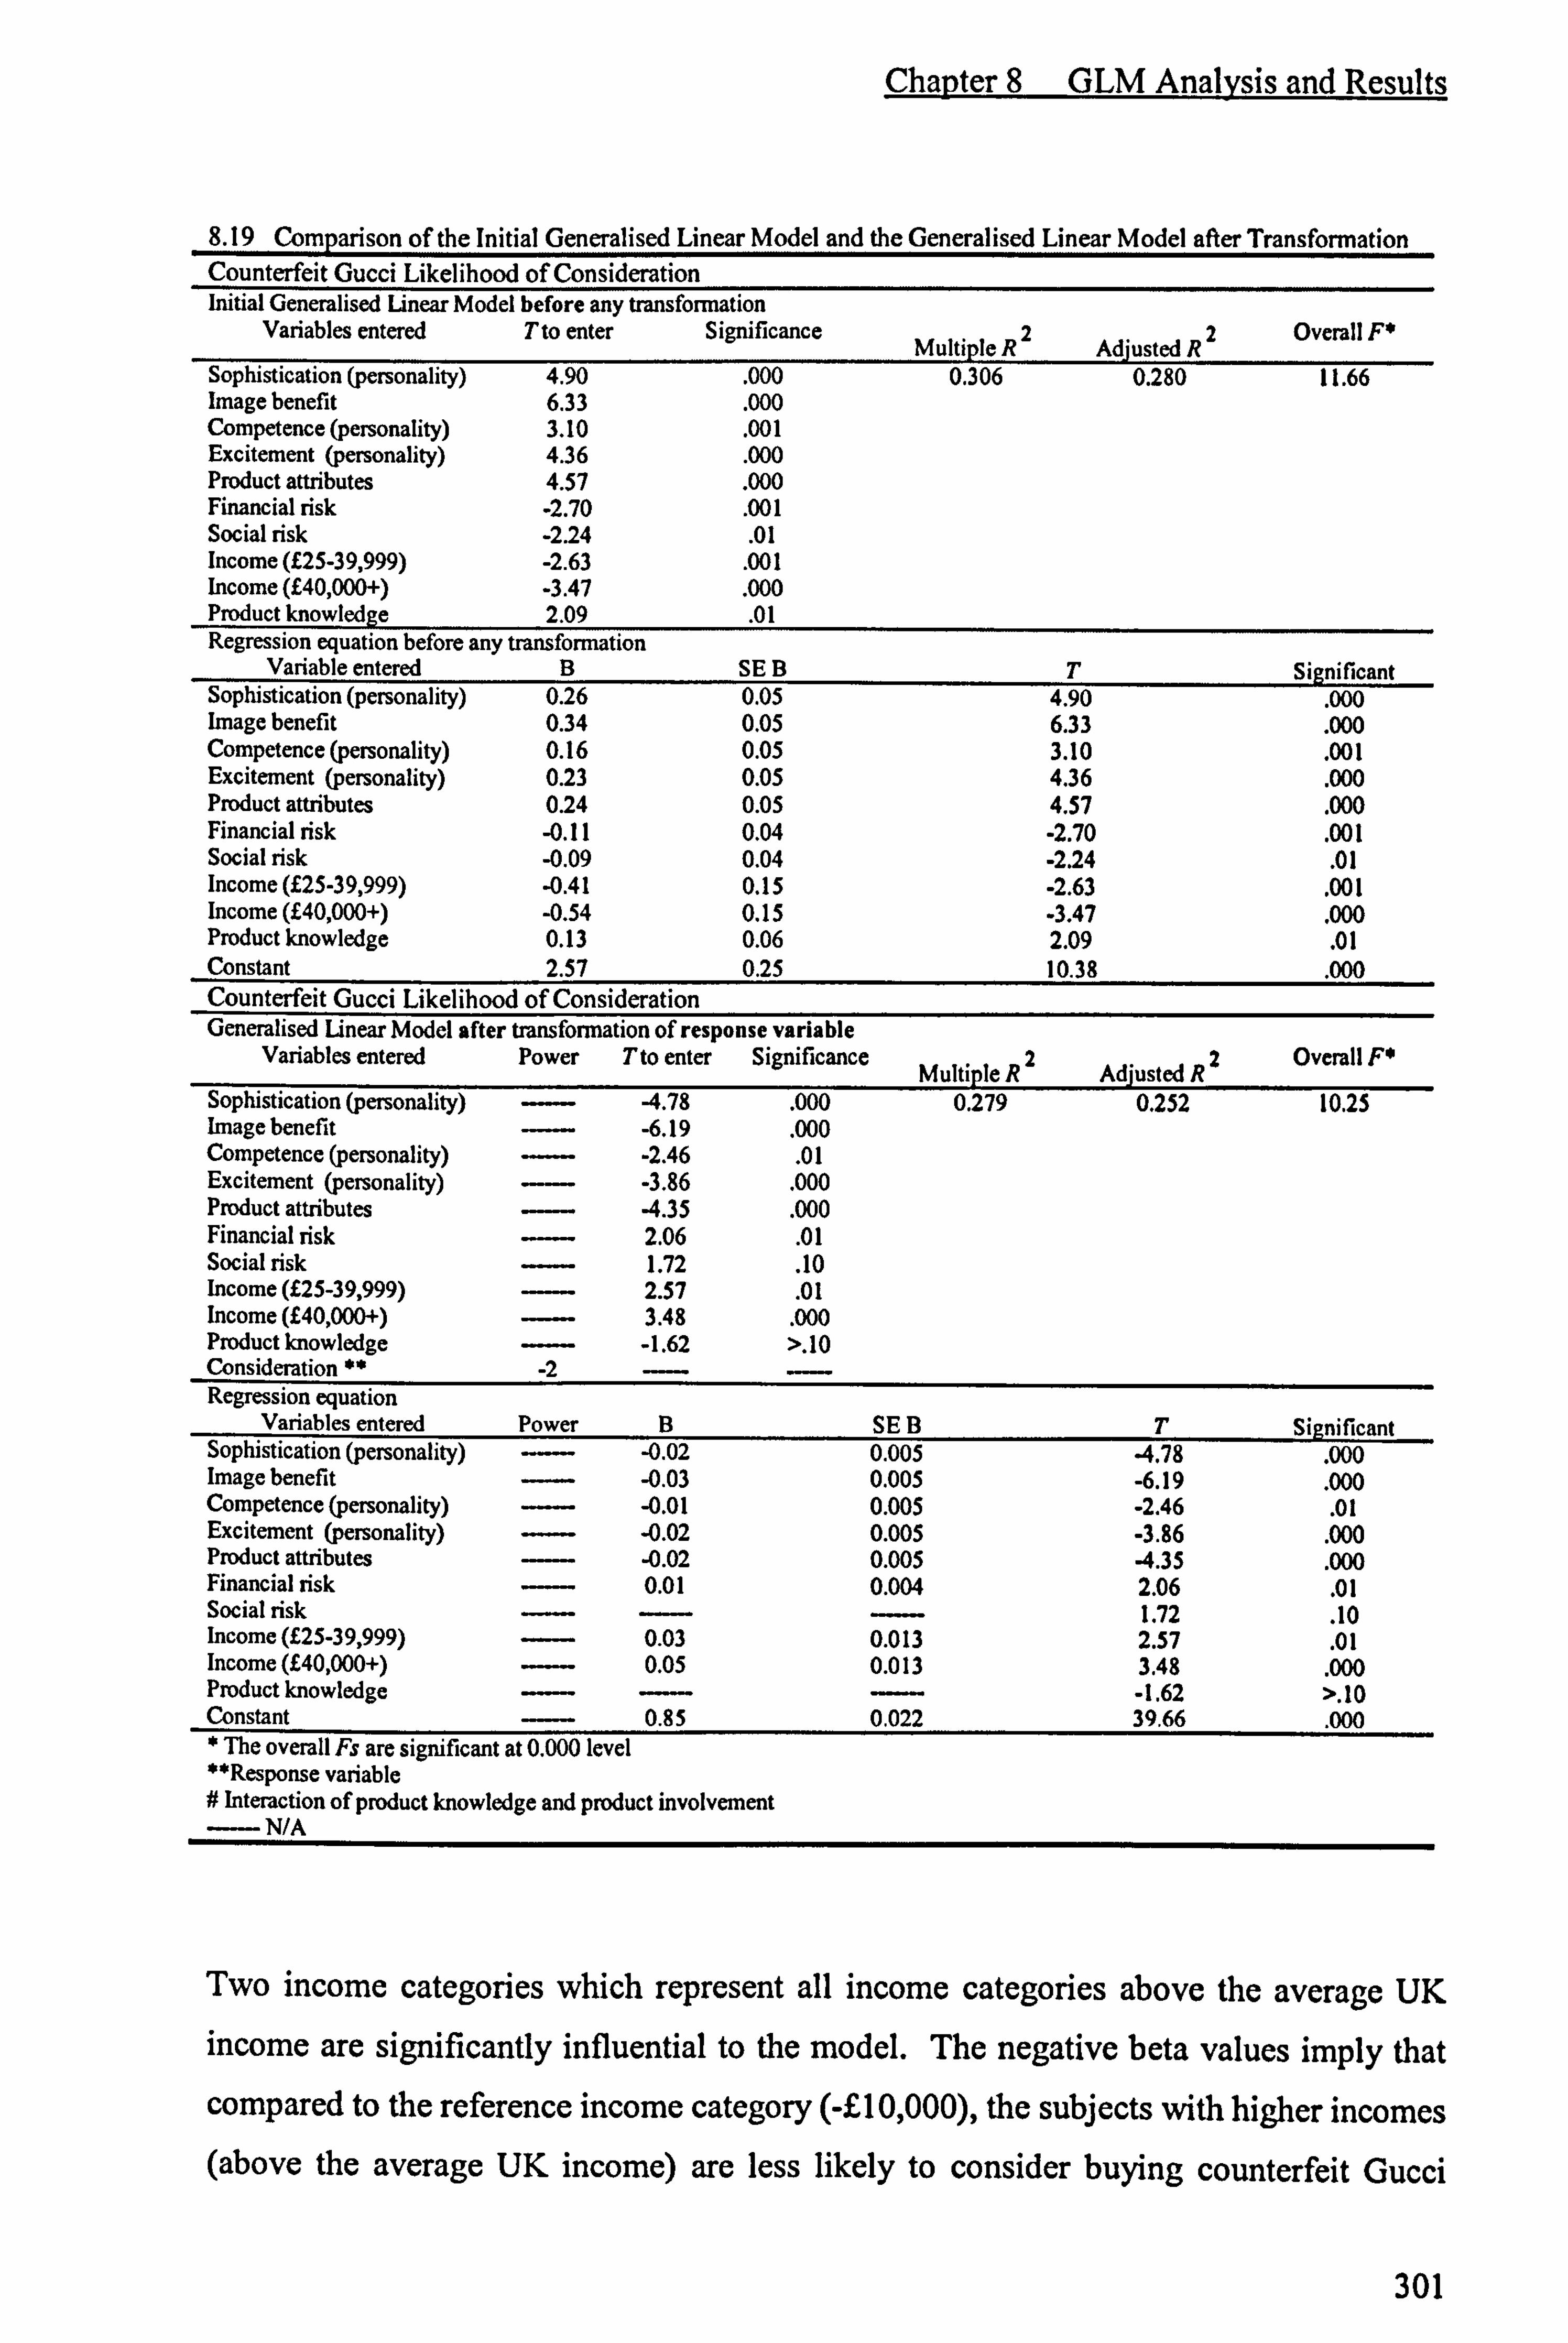
Chapter 8 GLM Analysis and Results
8.19 Comparison of the Initial Generalised Linear Model and the Generalised Linear Model after Transformation Counterfeit Gucci Likelihood of Consideration Initial Generalised Linear Model before any transformation
Variables entered Tto enter Significance Mullinie R2 Adjusted R2
Overall F*
Sophistication (personality) 4.90 . 000 0.306 0.280 11.66 Image benefit 6.33 . 000 Competence (personality) 3.10 . 001 Excitement (personality) 4.36 . 000 Product attributes 4.57 . 000 Financial risk -2.70 . 001 Social risk -2.24 . 01 Income (£25-39,999) -2.63 . 001 Income (£40,000+) -3.47 . 000 Product knowledge 2.09 . 01 Regression equation before any transformation
Variable entered B SE B T Significant Sophistication (personality) 0.26 0.05 4.90 . 000 Image benefit 0.34 0.05 6.33 . 000 Competence (personality) 0.16 0.05 3.10 . 001 Excitement (personality) 0.23 0.05 4.36 . 000 Product attributes 0.24 0.05 4.57 . 000 Financial risk -0.11 0.04 -2.70 . 001 Social risk -0.09 0.04 -2.24 . 01 Income (125-39,999) -0.41 0.15 -2.63 . 001 Income (£40,000+) -0.54 0.15 -3.47 . 000 Product knowledge 0.13 0.06 2.09 . 01 Constant 2.57 0.25 10.38 . 000 Counterfeit Gucci Likelihood of Consideration Generalised Linear Model after transformation of response variable
Variables entered Power Tto enter Significance Multiple R2 Adjusted R2
Overall FP
Sophistication (personality) ----- -4.78 . 000 0.279 0.252 10.25 Image benefit ------ -6.19 . 000 Competence (personality) --- -2.46 . 01 Excitement (personality) - -3.86 . 000 Product attributes --- -4.35 . 000 Financial risk ----- 2.06 . 01 Social risk - 1.72 . 10 Income (£25-39,999) --- 2.57 . 01 Income (£40,000+) - 3.48 . 000 Product knowledge - -1.62 >. 10 Consideration ** -2 Regression equation
Variables entered Power B SE B T Significant Sophistication (personality) ------- -0.02 0.005 4.78 . 000 Image benefit --- -0.03 0.005 -6.19 . 000 Competence (personality) --- -0.01 0.005 -2.46 . 01 Excitement (personality) ------ -0.02 0.005 -3.86 . 000 Product attributes - -0.02 0.005 -4.35 . 000 Financial risk --- 0.01 0.004 2.06
. 01 Social risk - ------- 1.72 . 10 Income (£25-39,999) --- 0.03 0.013 2.57 . 01 Income (£40,000+) - 0.05 0.013 3.48
. 000 Product knowledge ----- ------- ----- -1.62 >. 10 Constant - 0.85 0.022 39.66
. 000 * The overall Fs are significant at 0.000 level **Response variable # Interaction of product knowledge and product involvement --- N/A
Two income categories which represent all income categories above the average UK
income are significantly influential to the model. The negative beta values imply that
compared to the reference income category (-£10,000), the subjects with higher incomes
(above the average UK income) are less likely to consider buying counterfeit Gucci
301
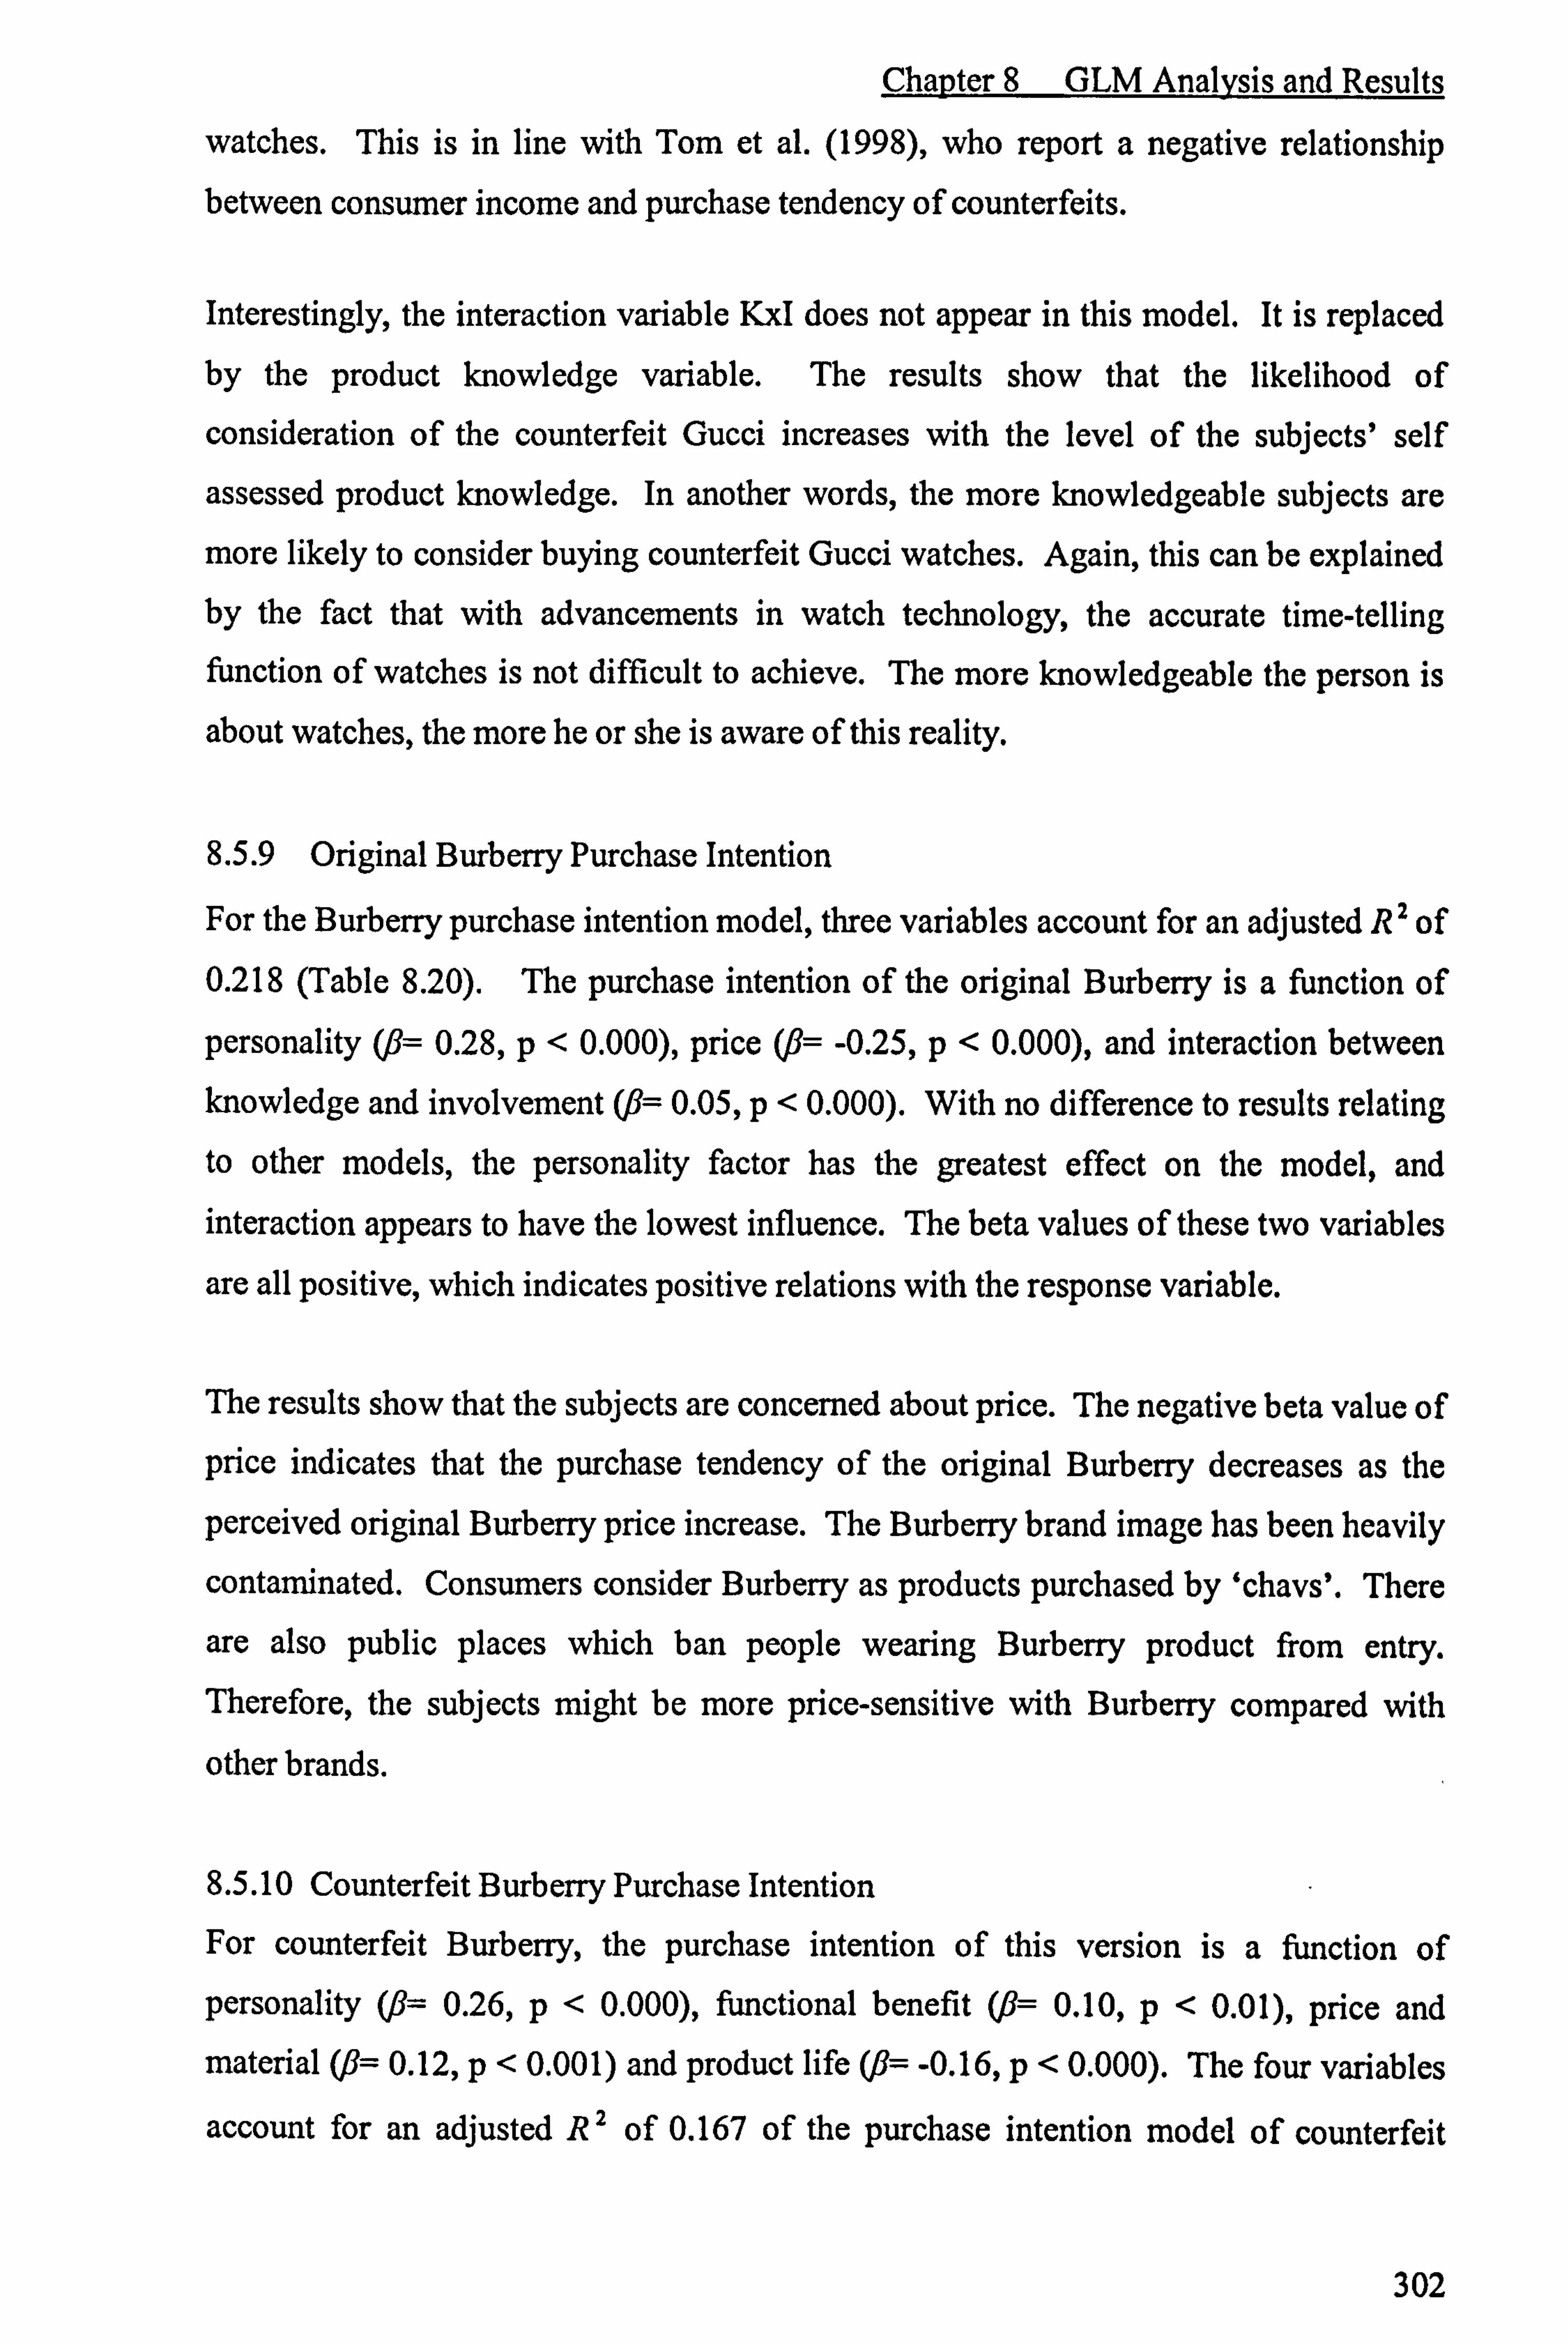
Chapter 8 GLM Analysis and Results
watches. This is in line with Tom et al. (1998), who report a negative relationship
between consumer income and purchase tendency of counterfeits.
Interestingly, the interaction variable KxI does not appear in this model. It is replaced by the product knowledge variable. The results show that the likelihood of
consideration of the counterfeit Gucci increases with the level of the subjects' self
assessed product knowledge. In another words, the more knowledgeable subjects are
more likely to consider buying counterfeit Gucci watches. Again, this can be explained by the fact that with advancements in watch technology, the accurate time-telling
function of watches is not difficult to achieve. The more knowledgeable the person is
about watches, the more he or she is aware of this reality.
8.5.9 Original Burberry Purchase Intention
For the Burberry purchase intention model, three variables account for an adjusted R2 of 0.218 (Table 8.20). The purchase intention of the original Burberry is a function of
personality (ß= 0.28, p<0.000), price (8= -0.25, p<0.000), and interaction between
knowledge and involvement (ß= 0.05, p<0.000). With no difference to results relating
to other models, the personality factor has the greatest effect on the model, and interaction appears to have the lowest influence. The beta values of these two variables
are all positive, which indicates positive relations with the response variable.
The results show that the subjects are concerned about price. The negative beta value of
price indicates that the purchase tendency of the original Burberry decreases as the
perceived original Burberry price increase. The Burberry brand image has been heavily
contaminated. Consumers consider Burberry as products purchased by `chavs'. There
are also public places which ban people wearing Burberry product from entry. Therefore, the subjects might be more price-sensitive with Burberry compared with
other brands.
8.5.10 Counterfeit Burberry Purchase Intention
For counterfeit Burberry, the purchase intention of this version is a function of
personality (ß= 0.26, p<0.000), functional benefit (ß= 0.10, p<0.01), price and
material (/3= 0.12, p<0.001) and product life (ß= -0.16, p<0.000). The four variables
account for an adjusted R2 of 0.167 of the purchase intention model of counterfeit
302
Chapter 8 GLM Analysis and Results
Burberry (Table 8.21). With no change, the personality variable has dominant
explanatory power on the purchase intention of the counterfeit Burberry.
8.20 Comparison of the Initial Generalised Linear Model and the Generalised Linear Model after Transformation Original Burberry Purchase Intention Initial Generalised Linear Model before any transformation
Variables entered Tto enter Significance Multiple R2 Adjusted R2
Overall F*
Personalityl 4.97 . 000 0.226 0.218 26.61 Price4 -4.53 . 000
# 5.61 . 000
Variable entered B SE B T Significant Personality! 0.28 0.06 4.97 . 000 Price4 -0.25 0.05 -4.53 . 000
KXI # 0.05 0.01 5.61 . 000
Constant 1.23 0.09 13.52 . 000 Original Burberry Purchase Intention Generalised Linear Model after transformation of explanatory variables
Variables entered Power Tto enter Significance 2 2 Overall F* Multiple R Adjusted R
Personalityl 1.23 5.02 . 000 0.250 0.241 30.27 Price4 2.04 -4.27 . 000
# 3.88 6.30 . 000 KX1 Regression equation after transformation of explanatory variables Variables entered Power B SE B T Significant Personalityl 1.23 1.79e-01 3.556e-02 5.02 . 000 Price4 2.04 -2.68e-02 6.27e-03 -4.27 . 000
# 3.88 7.93e-06 1.26e-06 6.30 . 000 KXI Constant l . 31 e+00 1.89e-01 6.93 . 000 * The overall Fs are significant at 0.000 level # Interaction of product knowledge and product involvement ----- N/A
Surprisingly, the price and material factor, which is the second most powerful
explanatory variable in the model, appears to be positively related to the response
variable. This is contrary to expectation. The price and material factor consists of
consumers' perception of expensiveness of price and quality of product material. Normally one would expect consumers' purchase intention to be negatively related to
perceived expensiveness of price and positively related to perceived quality of product
material. One possible explanation the researcher can offer for this unexpected result is
that the perceived expensiveness of price lies under the tolerance level. Under the
tolerance level if the perceived price is very low, consumers might start questioning
what they are going to gain for the price they pay. Simply, they might believe that it is
too cheap to be true. Consumers might believe that you get what you pay for.
Therefore, they might be reluctant to admit that the counterfeits are unbelievably cheap. There is another possible reason for this unexpected result which is that it might be an indication that some of the respondents were misled by the one direction answers to
other questions and did not recognise the direction change of the price related question.
303
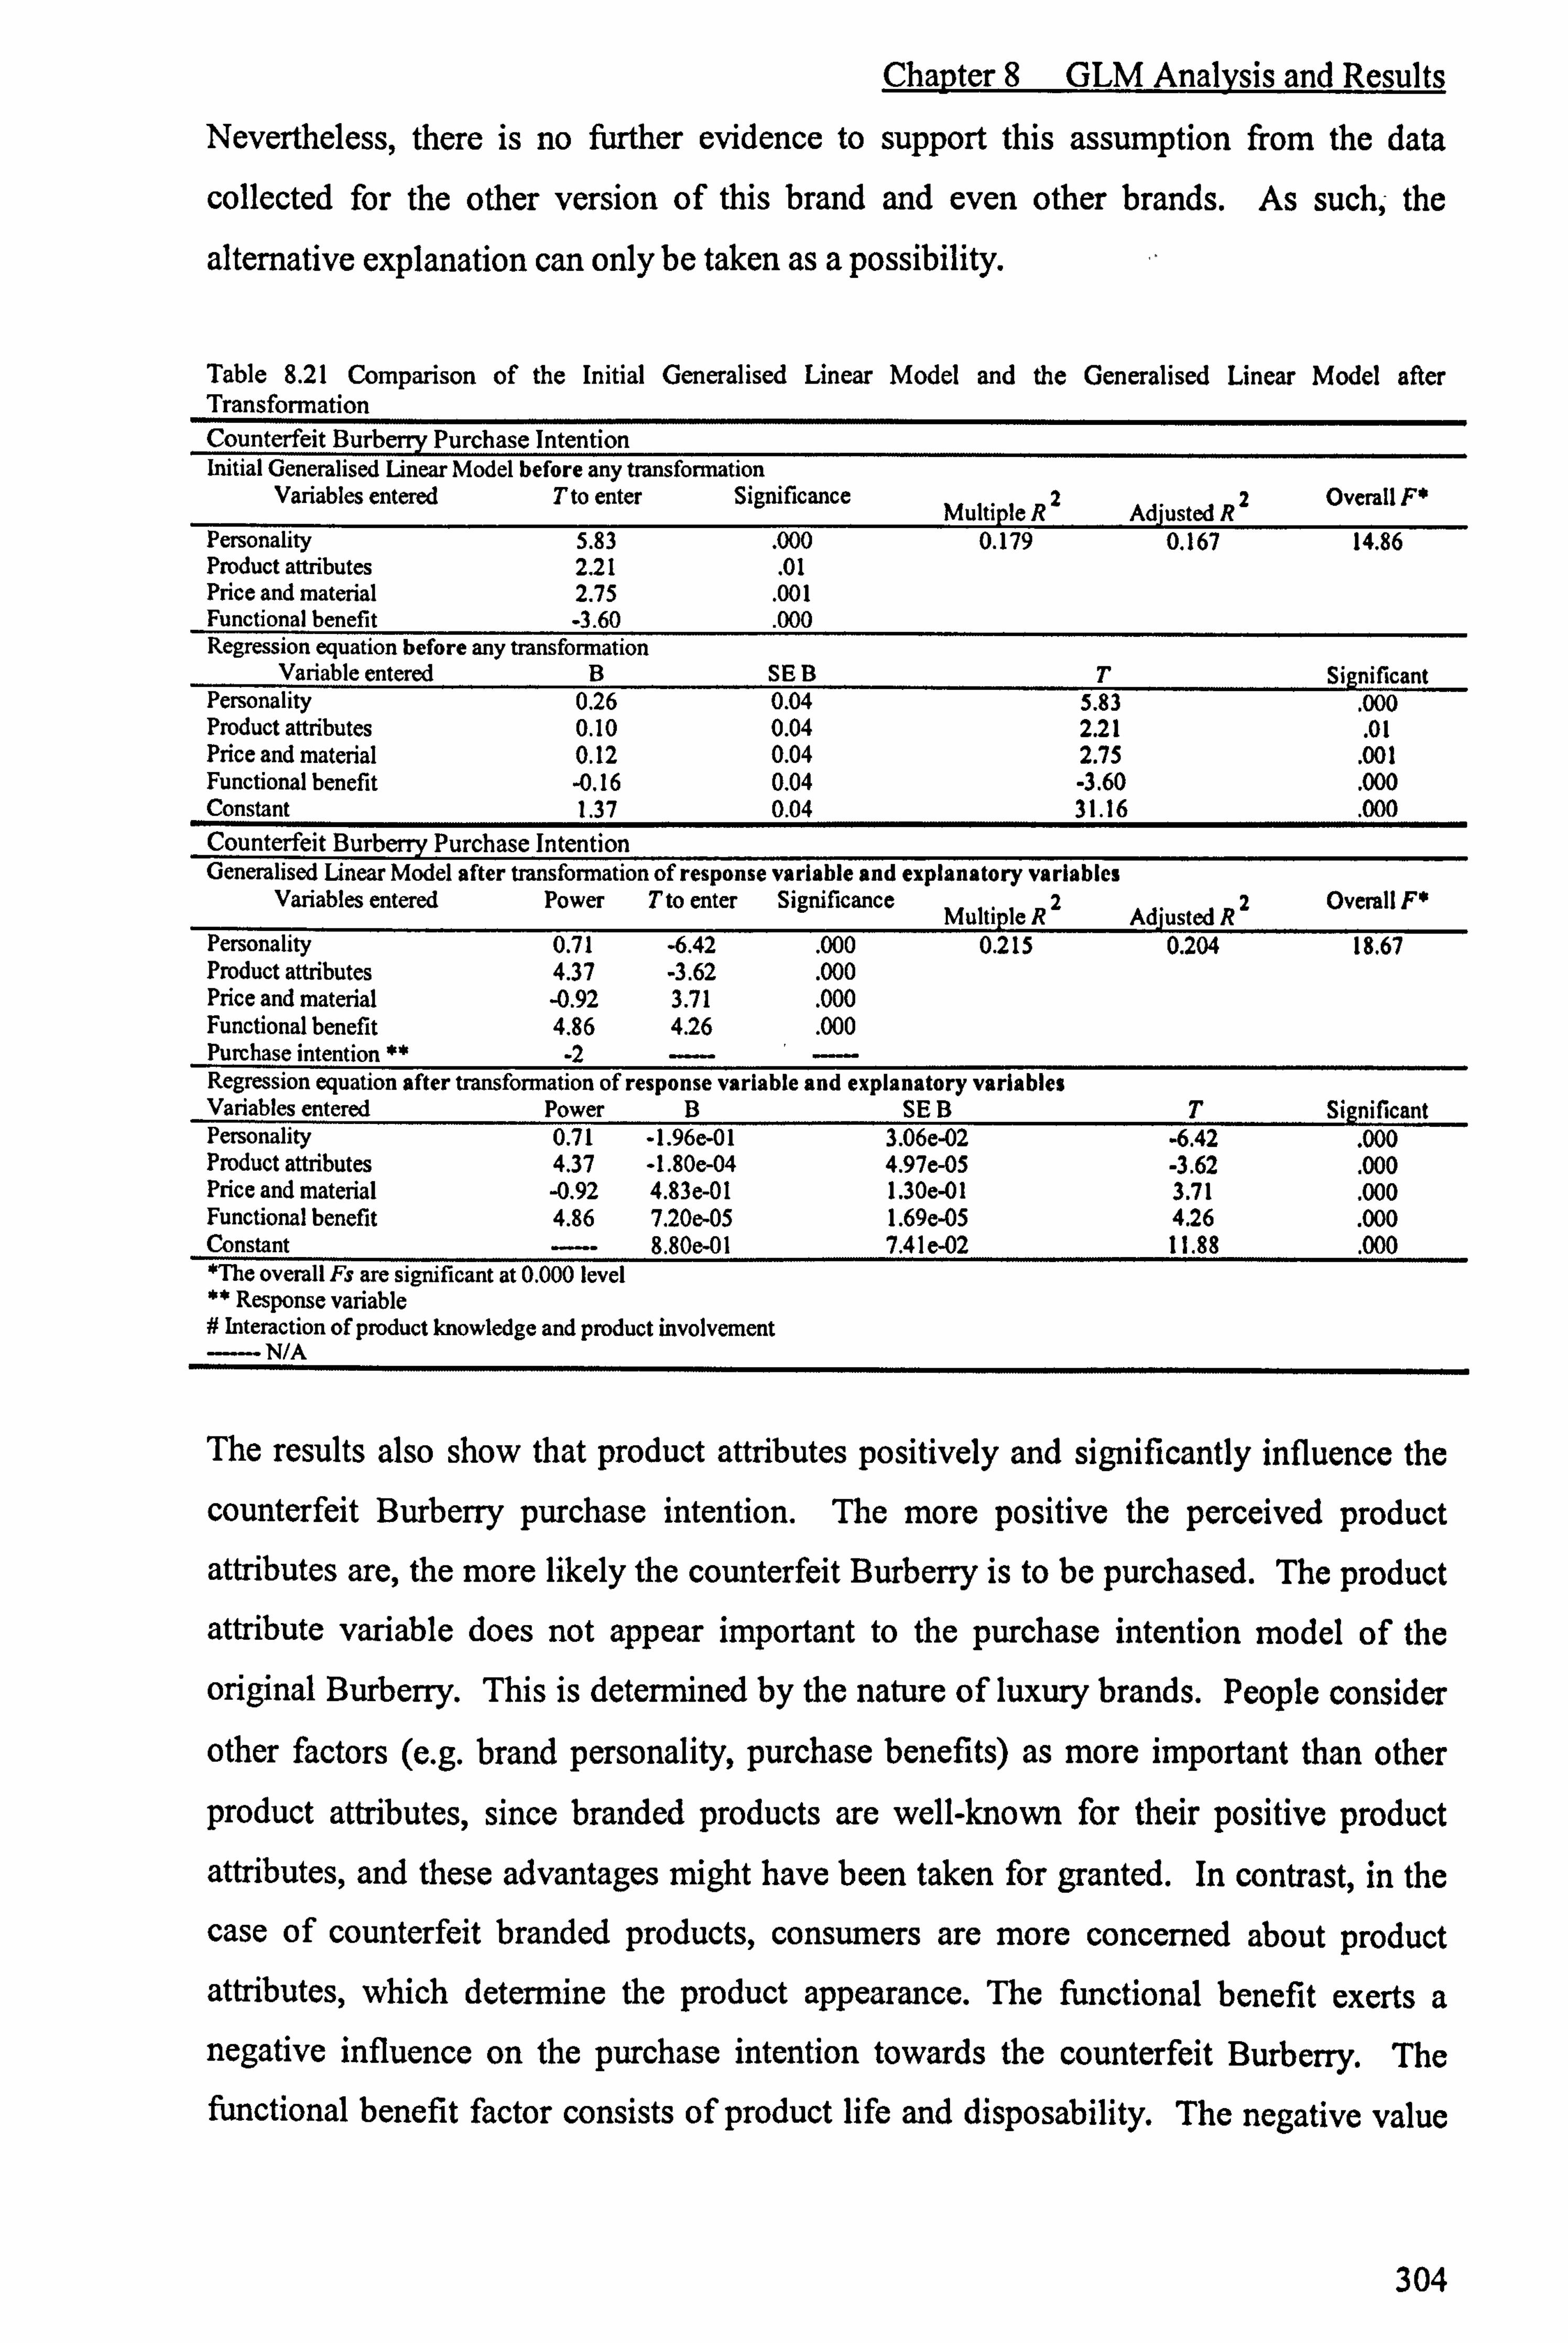
Chapter 8 GLM Analysis and Results
Nevertheless, there is no further evidence to support this assumption from the data
collected for the other version of this brand and even other brands. As such, the
alternative explanation can only be taken as a possibility.
Table 8.21 Comparison of the Initial Generalised Linear Model and the Generalised Linear Model after Transformation Counterfeit Burberry Purchase Intention Initial Generalised linear Model before any transformation
Variables entered T to enter Significance Multiple R2 Adjusted R2
Overall F*
Personality 5.83 . 000 0.179 0.167 14.86 Product attributes 2.21 . 01 Price and material 2.75 . 001 Functional benefit -3.60 .
000 Regression equation before any transformation
Variable entered B SE B T Significant Personality 0.26 0.04 5.83 . 000 Product attributes 0.10 0.04 2.21 . 01 Price and material 0.12 0.04 2.75 . 001 Functional benefit -0.16 0.04 -3.60 . 000 Constant 1.37 0.04 31.16 . 000 Counterfeit Burberry Purchase Intention Generalised Linear Model after transformation of response variable and explanatory variables
Variables entered Power T to enter Significance Multiple R2 Adjusted R2
Overall F*
Personality 0.71 -6.42 . 000 0.215 0.204 18.67 Product attributes 4.37 -3.62 . 000 Price and material -0.92 3.71 . 000 Functional benefit 4.86 4.26 . 000 Purchase intention -2 Regression equation after transformation of response variable and explanatory variables Variables entered Power B SE B T Significant Personality 0.71 -1.96e-01 3.06e-02 -6.42 . 000 Product attributes 4.37 -1.80e-04 4.97e-05 -3.62 . 000 Price and material -0.92 4.83e-01 1.30e-01 3.71 . 000 Functional benefit 4.86 7.20e-05 1.69e-05 4.26 . 000 Constant 8.80e-01 7.41 e-02 11.88 . 000 *The overall Fs are significant at 0.000 level ** Response variable # Interaction of product knowledge and product involvement --- N/A
The results also show that product attributes positively and significantly influence the
counterfeit Burberry purchase intention. The more positive the perceived product
attributes are, the more likely the counterfeit Burberry is to be purchased. The product
attribute variable does not appear important to the purchase intention model of the
original Burberry. This is determined by the nature of luxury brands. People consider
other factors (e. g. brand personality, purchase benefits) as more important than other
product attributes, since branded products are well-known for their positive product
attributes, and these advantages might have been taken for granted. In contrast, in the
case of counterfeit branded products, consumers are more concerned about product
attributes, which determine the product appearance. The functional benefit exerts a
negative influence on the purchase intention towards the counterfeit Burberry. The
functional benefit factor consists of product life and disposability. The negative value
304
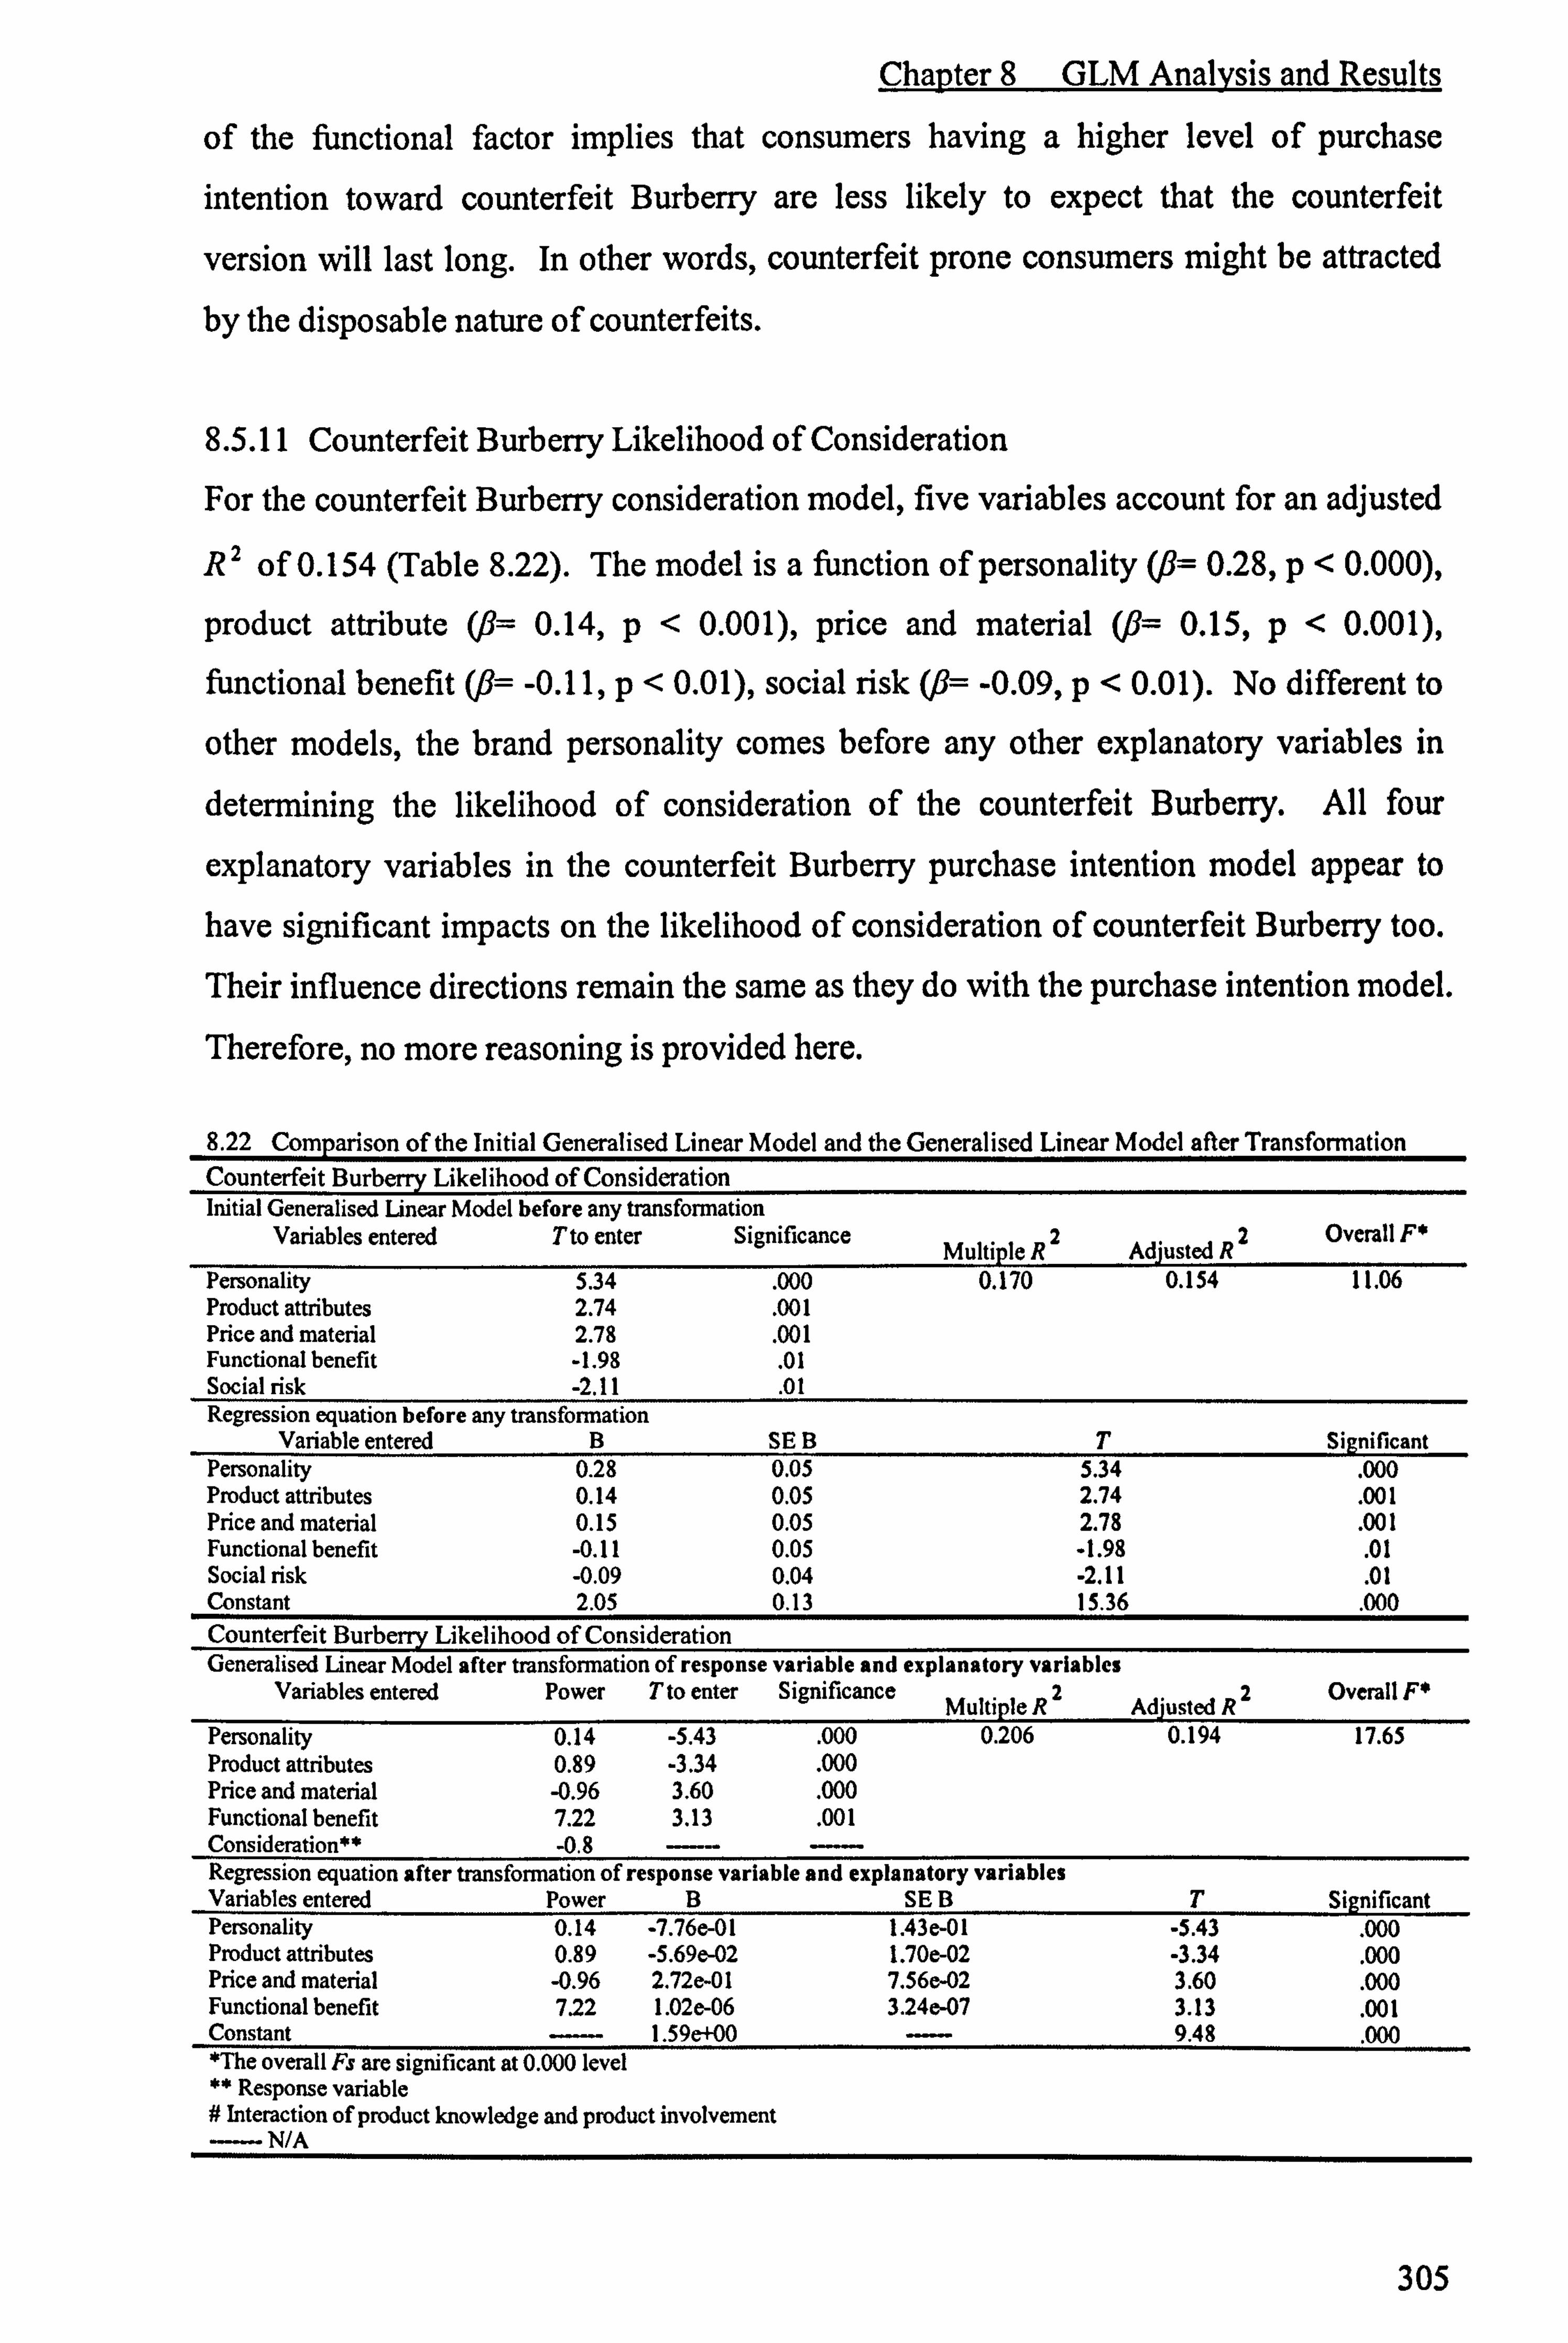
Chapter 8 GLM Analysis and Results
of the functional factor implies that consumers having a higher level of purchase intention toward counterfeit Burberry are less likely to expect that the counterfeit
version will last long. In other words, counterfeit prone consumers might be attracted by the disposable nature of counterfeits.
8.5.11 Counterfeit Burberry Likelihood of Consideration
For the counterfeit Burberry consideration model, five variables account for an adjusted
R2 of 0.154 (Table 8.22). The model is a function of personality (ß= 0.28, p<0.000),
product attribute (ß= 0.14, p<0.001), price and material (ß= 0.15, p<0.001), functional benefit (/3= -0.11, p<0.01), social risk (fl= -0.09, p<0.01). No different to
other models, the brand personality comes before any other explanatory variables in
determining the likelihood of consideration of the counterfeit Burberry. All four
explanatory variables in the counterfeit Burberry purchase intention model appear to
have significant impacts on the likelihood of consideration of counterfeit Burberry too.
Their influence directions remain the same as they do with the purchase intention model.
Therefore, no more reasoning is provided here.
8.22 Compari son of the Initial Generalised Linear Model and the Generalised Linear Model after Transformation Counterfeit Burberry Likelihood of Consideration Initial Generalised linear Model before any transformation
Variables entered T to enter Significance 2 2 Overall F* Multiple R Adjusted R
Personality 5.34 . 000 0.170 0.154 11.06 Product attributes 2.74 . 001 Price and material 2.78 . 001 Functional benefit -1.98 .
01 Social risk -2.11 . 01 Regression equation before any transformation
Variable entered B SE B T Significant Personality 0.28 0.05 5.34 . 000 Product attributes 0.14 0.05 2.74 . 001 Price and material 0.15 0.05 2.78 . 001 Functional benefit -0.11 0.05 -1.98 . 01 Social risk -0.09 0.04 -2.11 . 01 Constant 2.05 0.13 15.36 . 000 Counterfeit Burberry Likelihood of Consideration Generalised Linear Model after transformation of response variable and explanatory variables
Variables entered Power T to enter Significance 2 2 Overall F* Multiple R Adjusted R
Personality 0.14 -5.43 . 000 0.206 0.194 17.65 Product attributes 0.89 -3.34 . 000 Price and material -0.96 3.60 . 000 Functional benefit 7.22 3.13 . 001 Consideration** -0.8 Regression equation after transformation of response variable and explanatory variables Variables entered Power B SE B T Significant Personality 0.14 -7.76e-01 1.43e-01 -5.43 . 000 Product attributes 0.89 -5.69e-02 1.70e-02 -3.34 . 000 Price and material -0.96 2.72e-01 7.56e-02 3.60
. 000 Functional benefit 7.22 1.02e-06 3.24e-07 3.13
. 001 Constant 1.59e+00 9.48
. 000 *The overall Fs are significant at 0.000 level ** Response variable # Interaction of product knowledge and product involvement - N/A
305

Chapter 8 GLM Analysis and Results
Contrary to the counterfeit Burberry purchase intention model, the results show that
social risk has significant explanatory power to the likelihood of consideration model of
the counterfeit Burberry. The negative beta value implies that the more social risk the
subjects perceive in relation to counterfeit Burberry, the less likely it is that he or she
will consider buying it. Once again, this is in line with the risk-averse theory.
8.5.12 Original Louis Vuitton Purchase Intention
For the original Louis Vuitton, two explanatory variables account for an adjusted R2 of
0.159 of the behavioural intention towards the purchase of original Louis Vuitton (Table
8.23). The model suggested that the purchase intention toward the original Louis
Vuitton handbags is a function of personality (ß= 0.26, p<0.01), and interaction
between knowledge and involvement (/3= 0.07, p<0.000). Thus, the higher level of
brand personality the subjects perceive, the more likely they are to have higher purchase
tendency; the higher the value of the interaction variable, the more likely is the subjects'
intention to buy the original Louis Vuitton. These variables are the same as in the
purchase intention and consideration models related to other brands, except for the
difference in magnitude. Therefore, no more explanation is provided here for the
avoidance of repetition.
8.23 Comparison of the Initial Generalised Linear Model and the Generalised Linear Model after Transformation Original Louis Vuitton Purchase Intention Initial Generalised Linear Model before any transformation
Variables entered T to enter Significance 2 2 Overall F* Multiple R Adjusted R
Personality 2.07 0.01 0.165 0.159 27.17
KXI # 6.63 . 000
Regression equation before any transformation Variable entered B SE B T Significant
Personality 0.13 0.06 2.07 0.01
KXI # 0.07 0.01 6.63 . 000
Constant 1.36 0.11 12.73 . 000 Original Louis Vuitton Purchase Intention Generalised Linear Model after transformation of explanatory variables
Variables entered Power Tto enter Significance Multiple R2 Adjusted R2
Overall F'
Personality 0.26 2.09 . 01 . 166 . 160 27.34
KX1 # 1.22 6.64 . 000
Regression equation after transformation of explanatory variables Variables entered Power B SE B T Significant
Personality 0.26 1.20 0.57 2.09 . 01
KXI # 1.22 0.03 0.005 6.64 . 000
Constant -0.26 0.081 -0.32 >0.10 *The overall Fs are significant at 0.000 level # Interaction of product knowledge and product involvement --- N/A
306
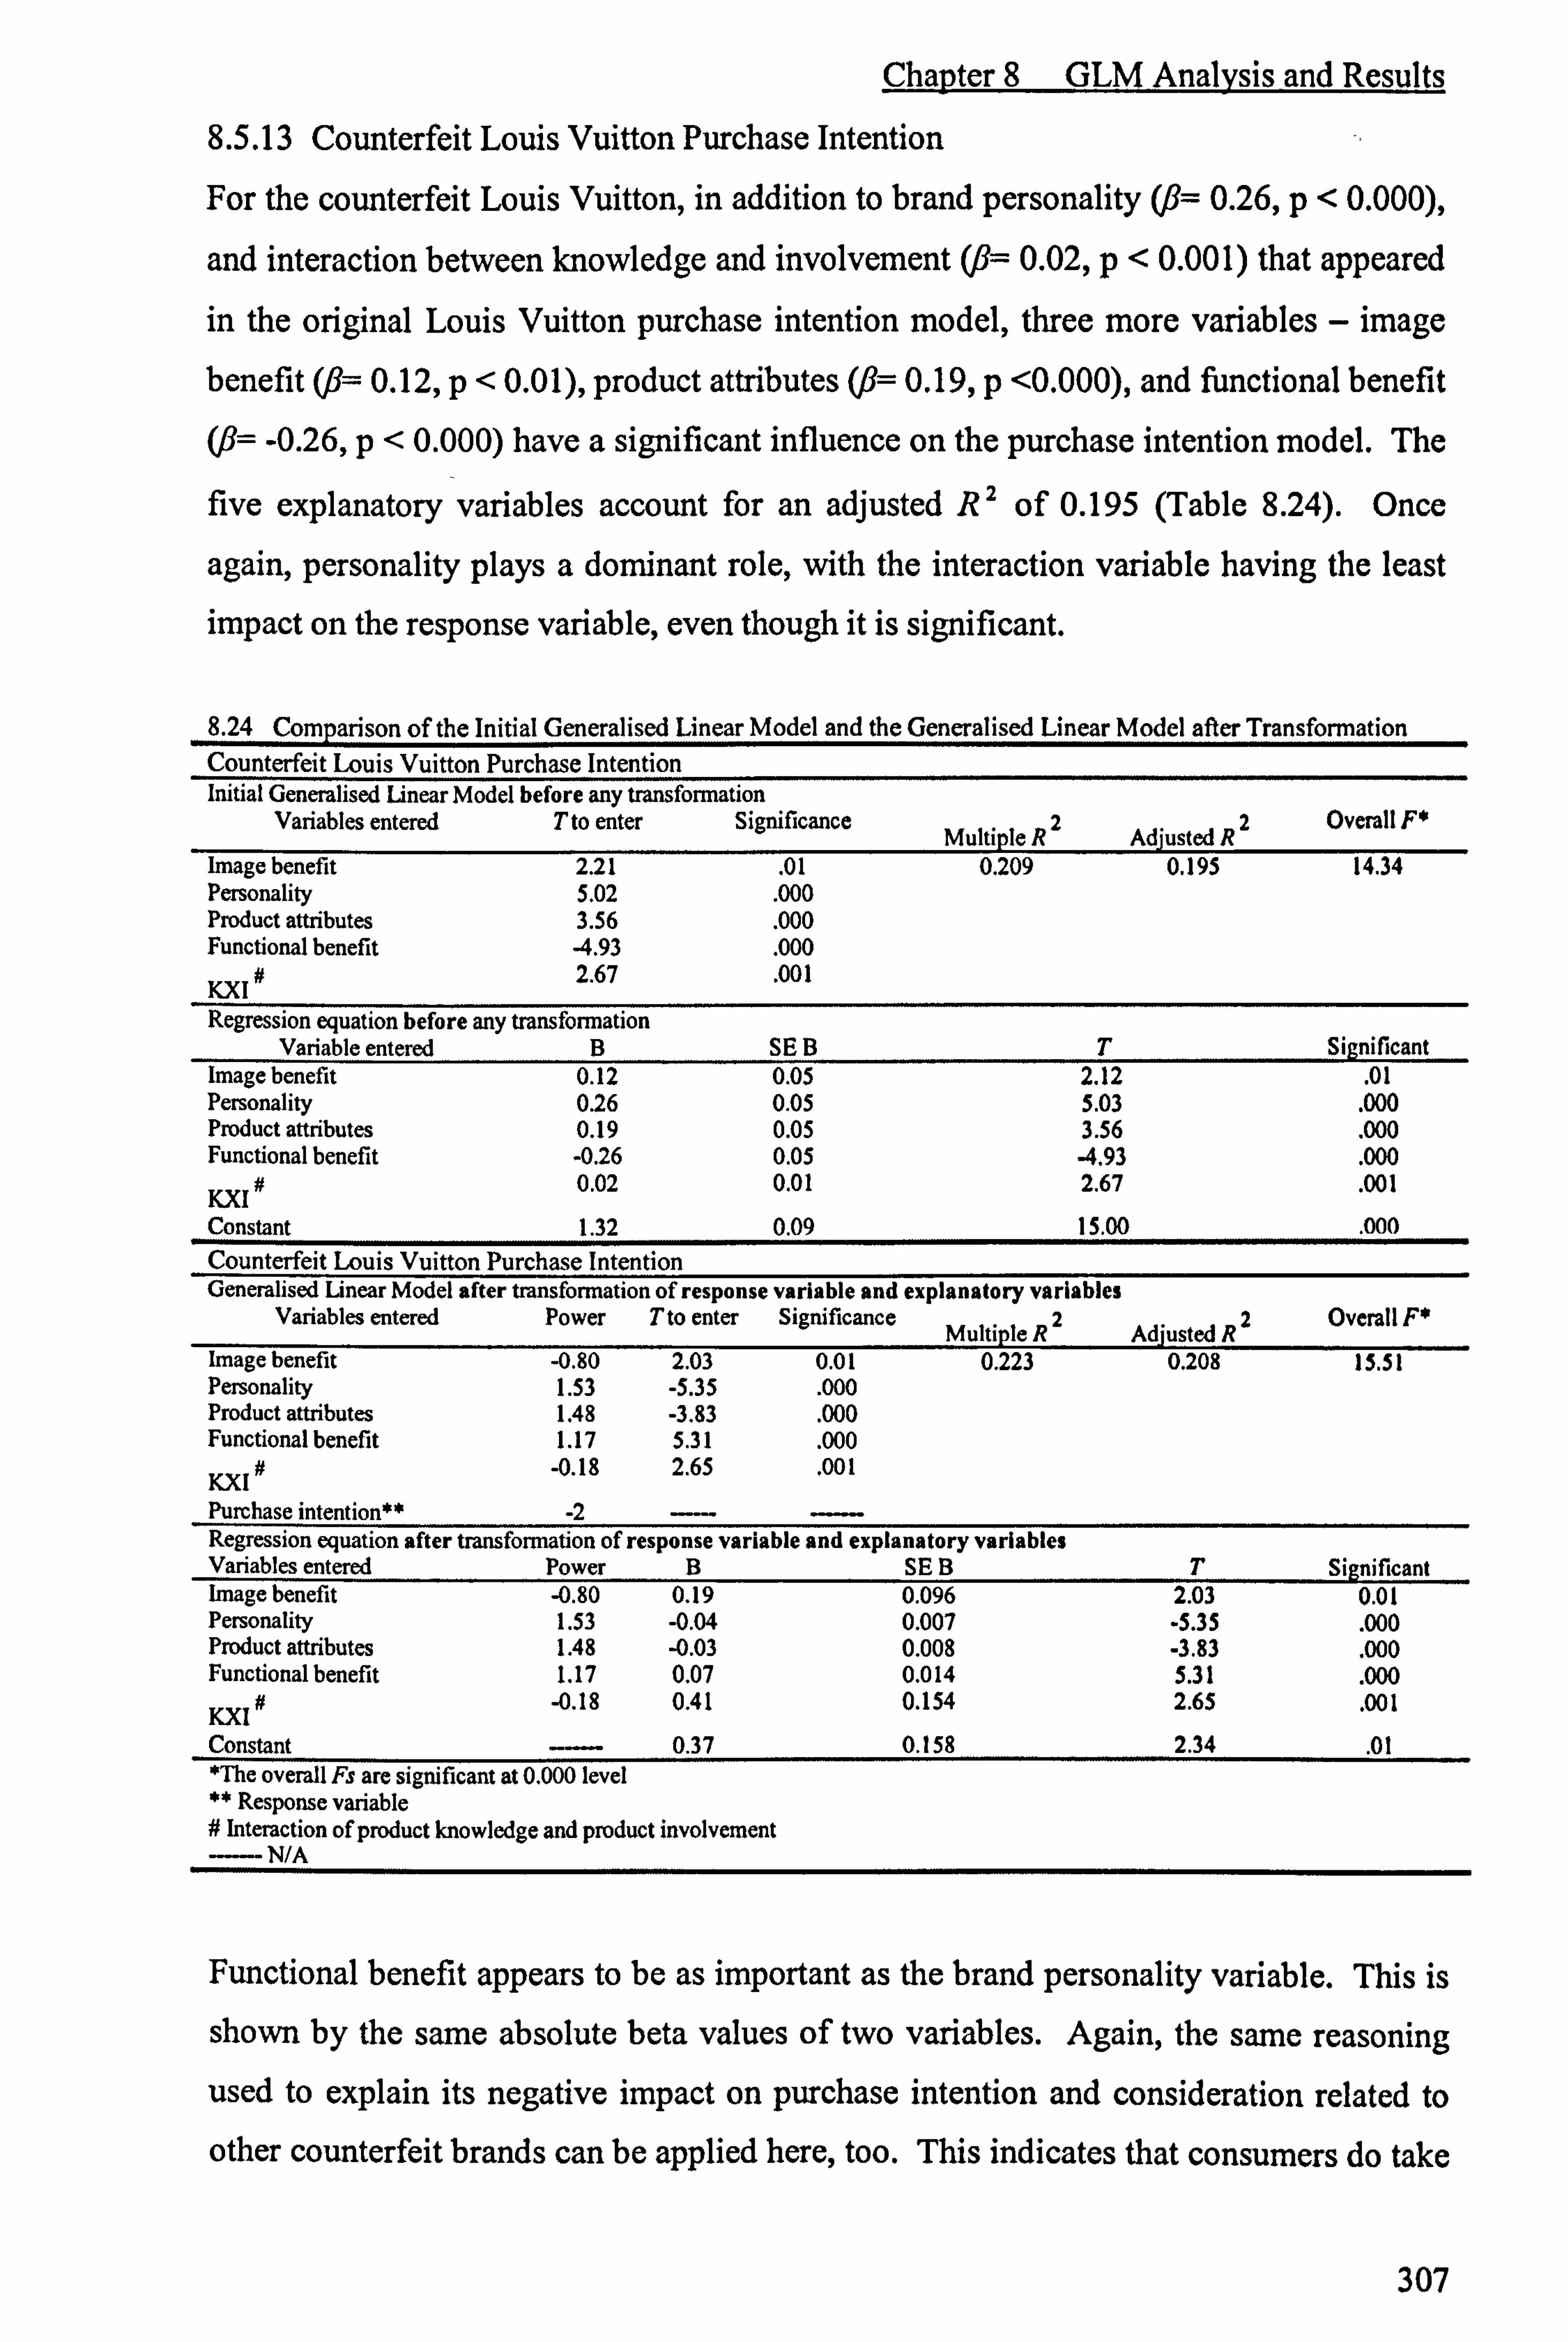
Chapter 8 GLM Analysis and Results
8.5.13 Counterfeit Louis Vuitton Purchase Intention
For the counterfeit Louis Vuitton, in addition to brand personality (ß= 0.26, p<0.000),
and interaction between knowledge and involvement (fl= 0.02, p<0.001) that appeared
in the original Louis Vuitton purchase intention model, three more variables - image
benefit (ß= 0.12, p<0.01), product attributes (fl= 0.19, p <0.000), and functional benefit
(, ß= -0.26, p<0.000) have a significant influence on the purchase intention model. The
five explanatory variables account for an adjusted R2 of 0.195 (Table 8.24). Once
again, personality plays a dominant role, with the interaction variable having the least
impact on the response variable, even though it is significant.
8.24 Comparison of the Initial Generalised Linear Model and the Generalised Linear Model after Transformation Counterfeit Louis Vuitton Purchase Intention Initial Generalised Linear Model before any transformation
Variables entered Tto enter Significance Multiale R2 Adjusted R2
Overall F+
Image benefit 2.21 . 01 0.209 0.195 14.34 Personality 5.02 . 000 Product attributes 3.56 . 000 Functional benefit -4.93 . 000
I#2.67 . 001
Regression equation before any transformation Variable entered B SE B T Significant
Image benefit 0.12 0.05 2.12 . 01 Personality 0.26 0.05 5.03 . 000 Product attributes 0.19 0.05 3.56 . 000 Functional benefit -0.26 0.05 -4.93 . 000
# 0.02 0.01 2.67 . 001 KXI Constant 1.32 0.09 15.00 . 000 Counterfeit Louis Vuitton Purchase Intention Generalised linear Model after transformation of response variable and explanatory variables
Variables entered Power Tto enter Significance 2 2 Overall F* Multiple R Adjusted R
Image benefit -0.80 2.03 0.01 0.223 0.208 15.51 Personality 1.53 -5.35 . 000 Product attributes 1.48 -3.83 . 000 Functional benefit 1.17 5.31 . 000
KXI # -0.18 2.65 . 001
Purchase intention** -2 Regression equation after transformation of response variable and explanatory variables Variables entered Power B SE B T Significant Image benefit -0.80 0.19 0.096 2.03 0.01 Personality 1.53 -0.04 0.007 -5.35 . 000 Product attributes 1.48 -0.03 0.008 -3.83 . 000 Functional benefit 1.17 0.07 0.014 5.31 . 000
KXI # -0.18 0.41 0.154 2.65 . 001
Constant 0.37 0.158 2.34 . 01
*The overall Fs are significant at 0.000 level ** Response variable # Interaction of product knowledge and product involvement ----- N/A
Functional benefit appears to be as important as the brand personality variable. This is
shown by the same absolute beta values of two variables. Again, the same reasoning used to explain its negative impact on purchase intention and consideration related to
other counterfeit brands can be applied here, too. This indicates that consumers do take
307

Chapter 8 GLM Analysis and Results
product life into account in the process of decision-making in relation to counterfeit luxury brands and it appears to be very influential to purchase behaviour related to
counterfeits.
Image benefit and product attributes all appear to have positive and significant effects
on the purchase intention of the counterfeit Louis Vuitton handbags. The higher the
level of image benefit the subjects perceive, the higher purchase tendency they have.
This result is not surprising, as consumer purchase behaviour is benefit-driven (Bloch et
al. 1993; Jobber 2004). The reasoning provided in the section of purchase intention of
counterfeit Burberry in relation to the explanation of the positive and significant effect
of product attribute on purchase intention can also be applied here to explain the
influential role of product attribute on the purchase tendency of the counterfeit Louis
Vuitton.
8.5.14 Counterfeit Louis Vuitton Likelihood of Consideration
Five variables account for an adjusted R2 of 0.307 in the consideration of the
counterfeit Louis Vuitton model (Table 8.25). Four out of these five variables also
appear in the counterfeit Louis Vuitton purchase intention model. They are personality (ß= 0.32, p<0.000), image benefit (/i= 0.27, p<0.000), product life (ß= -0.23, p<
0.000), and product attributes (/3= 0.32, p<0.000). These variables are the same as
those explaining the purchase intention for the counterfeit Louis Vuitton, except for the
difference in magnitude. One thing remaining unchanged is the dominant role of brand
personality.
The interaction between knowledge and involvement in the purchase intention model is
replaced by the product knowledge variable (, ß= 0.12, p<0.05) in the counterfeit Louis
Vuitton consideration model. These results show that consumer perceived product
importance or relevance does not have a significant effect on their consideration of
counterfeit Louis Vuitton. Nevertheless, the positive and significant impact of the
product knowledge implies that the more knowledgeable the subject considers he or she
to be, the more likely it is that he or she will have a higher tendency to consider buying
counterfeit Louis Vuitton handbags. This variable appears to the least explanatory
power on the model.
308

Chapter 8 GLM Analysis and Results
8.5.15 Model diagnostics
The chosen models for interpretation are tested for possibility of multicollinearity, non-
constant error variance problems and outliers. VIF and GVIF (when it is necessary) are
used to assess the assumption of no multicollinearity. Fox and Monette (1992)
suggested that the VIF method for detecting collinearity is not fully applicable to
models that include related sets of regressors, such as dummy regressors constructed from a categorical variable. They generalize the notion of variance inflation by
considering the relative size of the joint confidence region for the coefficients associated
with a related set of regressors. The measure is named generalized variance-inflation factor (GVIF). R-commander automatically generates the GVIF value when a
categorical variable is included in the model. The constant variance assumption is
assessed by examining the plot of studentized residuals against fitted values of the
chosen models. Cook's distance and leverage value are used to identify outliers. The
rules set up in previous sections in relation to all these tests are still applicable here.
Therefore, there is no need for repetition.
8.25 Comparison of the Initial Generalised Linear Model and the Generalised Linear Model after Transformation Counterfeit Louis Vuitton Likelihood of Consideration Initial Generalised Linear Model before any transformation
Variables entered Tto enter Significance Multiple R2 Adjusted R2
Overall F1
Image benefit 5.10 . 000 0.320 0.307 25.50 Personality 6.17 . 000 Product attributes 6.15 . 000 Disposability -4.43 . 000 Knowledge 2.46 . 01 Regression equation before any transformation
Variable entered B SE B T Significant Image benefit 0.27 0.05 5.10 . 000 Personality 0.32 0.05 6.17 . 000 Product attributes . 032 0.05 6.15 . 000 Disposability -0.23 0.05 -4.43 . 000 Knowledge 0.12 0.05 2.46 . 01 Constant 0.13 12.92
. 000 Counterfeit Louis Vuitton Likelihood of Consideration Generalised Linear Model after transformation of explanatory variables
Variables entered Power T to enter Significance Multiple R2 Adjusted R2
Overall F*
Image benefit 1.28 4.89 . 000 0.325 0.312 26.08 Personality 1.13 6.33 . 000 Product attributes 0.49 6.25 . 000 Disposability 2.43 -4.58 . 000 Knowledge 0.33 2.62 . 001 Regression equation after transformation of explanatory variables
Variables entered Power B SE B T Significant Image benefit 1.28 0.15 0.031 4.89 . 000 Personality 1.13 0.25 0.040 6.33
. 000 Product attributes 0.49 1.13 0.181 6.25
. 000 Disposability 2.43 -0.02 0.003 -4.58 . 000 Knowledge 0.33 0.66 0.254 2.62
. 001 Constant ------ -1.87 0.483 -3.87 . 000 *The overall Fs are significant at 0.000 level --- N/A
309

O
M
5ÖOÖOÖN Oý O
975
%äm. e m291 239
8 25 8ö
M
d ä 0
k .r2 'u' GgG~7
a4Hý
OÖÖÖ u "u e
ü
1cw
Jizuw xr3 ý4
e? OOO9
K d a 1
=ý8 9 0 -2 V XC"5ý
O
3
'z u08CV
iD Xd
>cug> @ä w
5OÖÖÖÖ-O
O
"G m 'ý 'V rG :3Wv ý' ... 2
it
>C7 't+ eö ¢w. ögä Q4
1
ýä
Cý8 88öö
0
ý8gs 2- -2 äý
ý. I ýý ö
C 0
1
>o
daJ m 0,1-1 ui >ä ýIBJS
0
Cy
C U
ö
1
ý^ -2 2 b O
zit:
Chapter 8 GLM Analysis and Results
Table 8.26 and Table 8.27 show the multicollinearity test results. For all chosen models,
the VIF or GVIF are all well below 5, ranges between 1.00 and 1.15. For the
counterfeit Burberry purchase intention model, all the VIF is constant with a value of 1.
This is because all the explanatory variables in the model are factors extracted from
factor analysis, and the factors are extracted using the Varimax method. Therefore,
there is no relationship between all involved variables. It is clear that none of the
models is suffering from a multicollinearity problem.
The plots of the residuals versus the fitted values lie in an almost horizontal band; there is no trace of fanning out (Appendix 13). This shows the likelihood of constant
variance. However, one should be aware that in all cases, it appears that quite a high
percentage of observations gathered are along one line. This is caused by the severely
skewed nature of the data. None of the cases has a Cook's distance greater than 1
across all selected models. The identified cases with leverage values greater than three
times the average value are presented in Table 8.28. The number of undue influential
cases ranges between 1 and 9, accounting for only very small percentage (all less than 5
percent) of the overall sample. Therefore, it is considered acceptable.
In sum, the various model diagnostics results show that there is no multicollinearity
problem, non-constant error variance problems is not a concern either. There are some
outliers. However, their number is very limited (less than 5 percent in every model). Discarding the outliers does not cause significant changes to the models, nor to the
regression coefficients. Here, Field's (2000) claim that cases with large leverage values may not necessary have a strong influence on the regression coefficients because they
are measured on the outcome variables rather than the predictor is supported. All this
provides evidence that our models are fairly accurate. Therefore, it is decided that there is no necessity to report the regression results without the outliers.
8.6 Summary
This chapter focuses on data analysis and presenting data analysis results. Regression
techniques are adopted for data analysis in the current research. A decision is made on the choice of the OLS over the loglinear regression and the logistic regression after a
scrupulous examination of the collected data. Various model diagnostics are conducted. In addition to the multicollinearity test conducted in Chapter 7, the adopted diagnostics
311
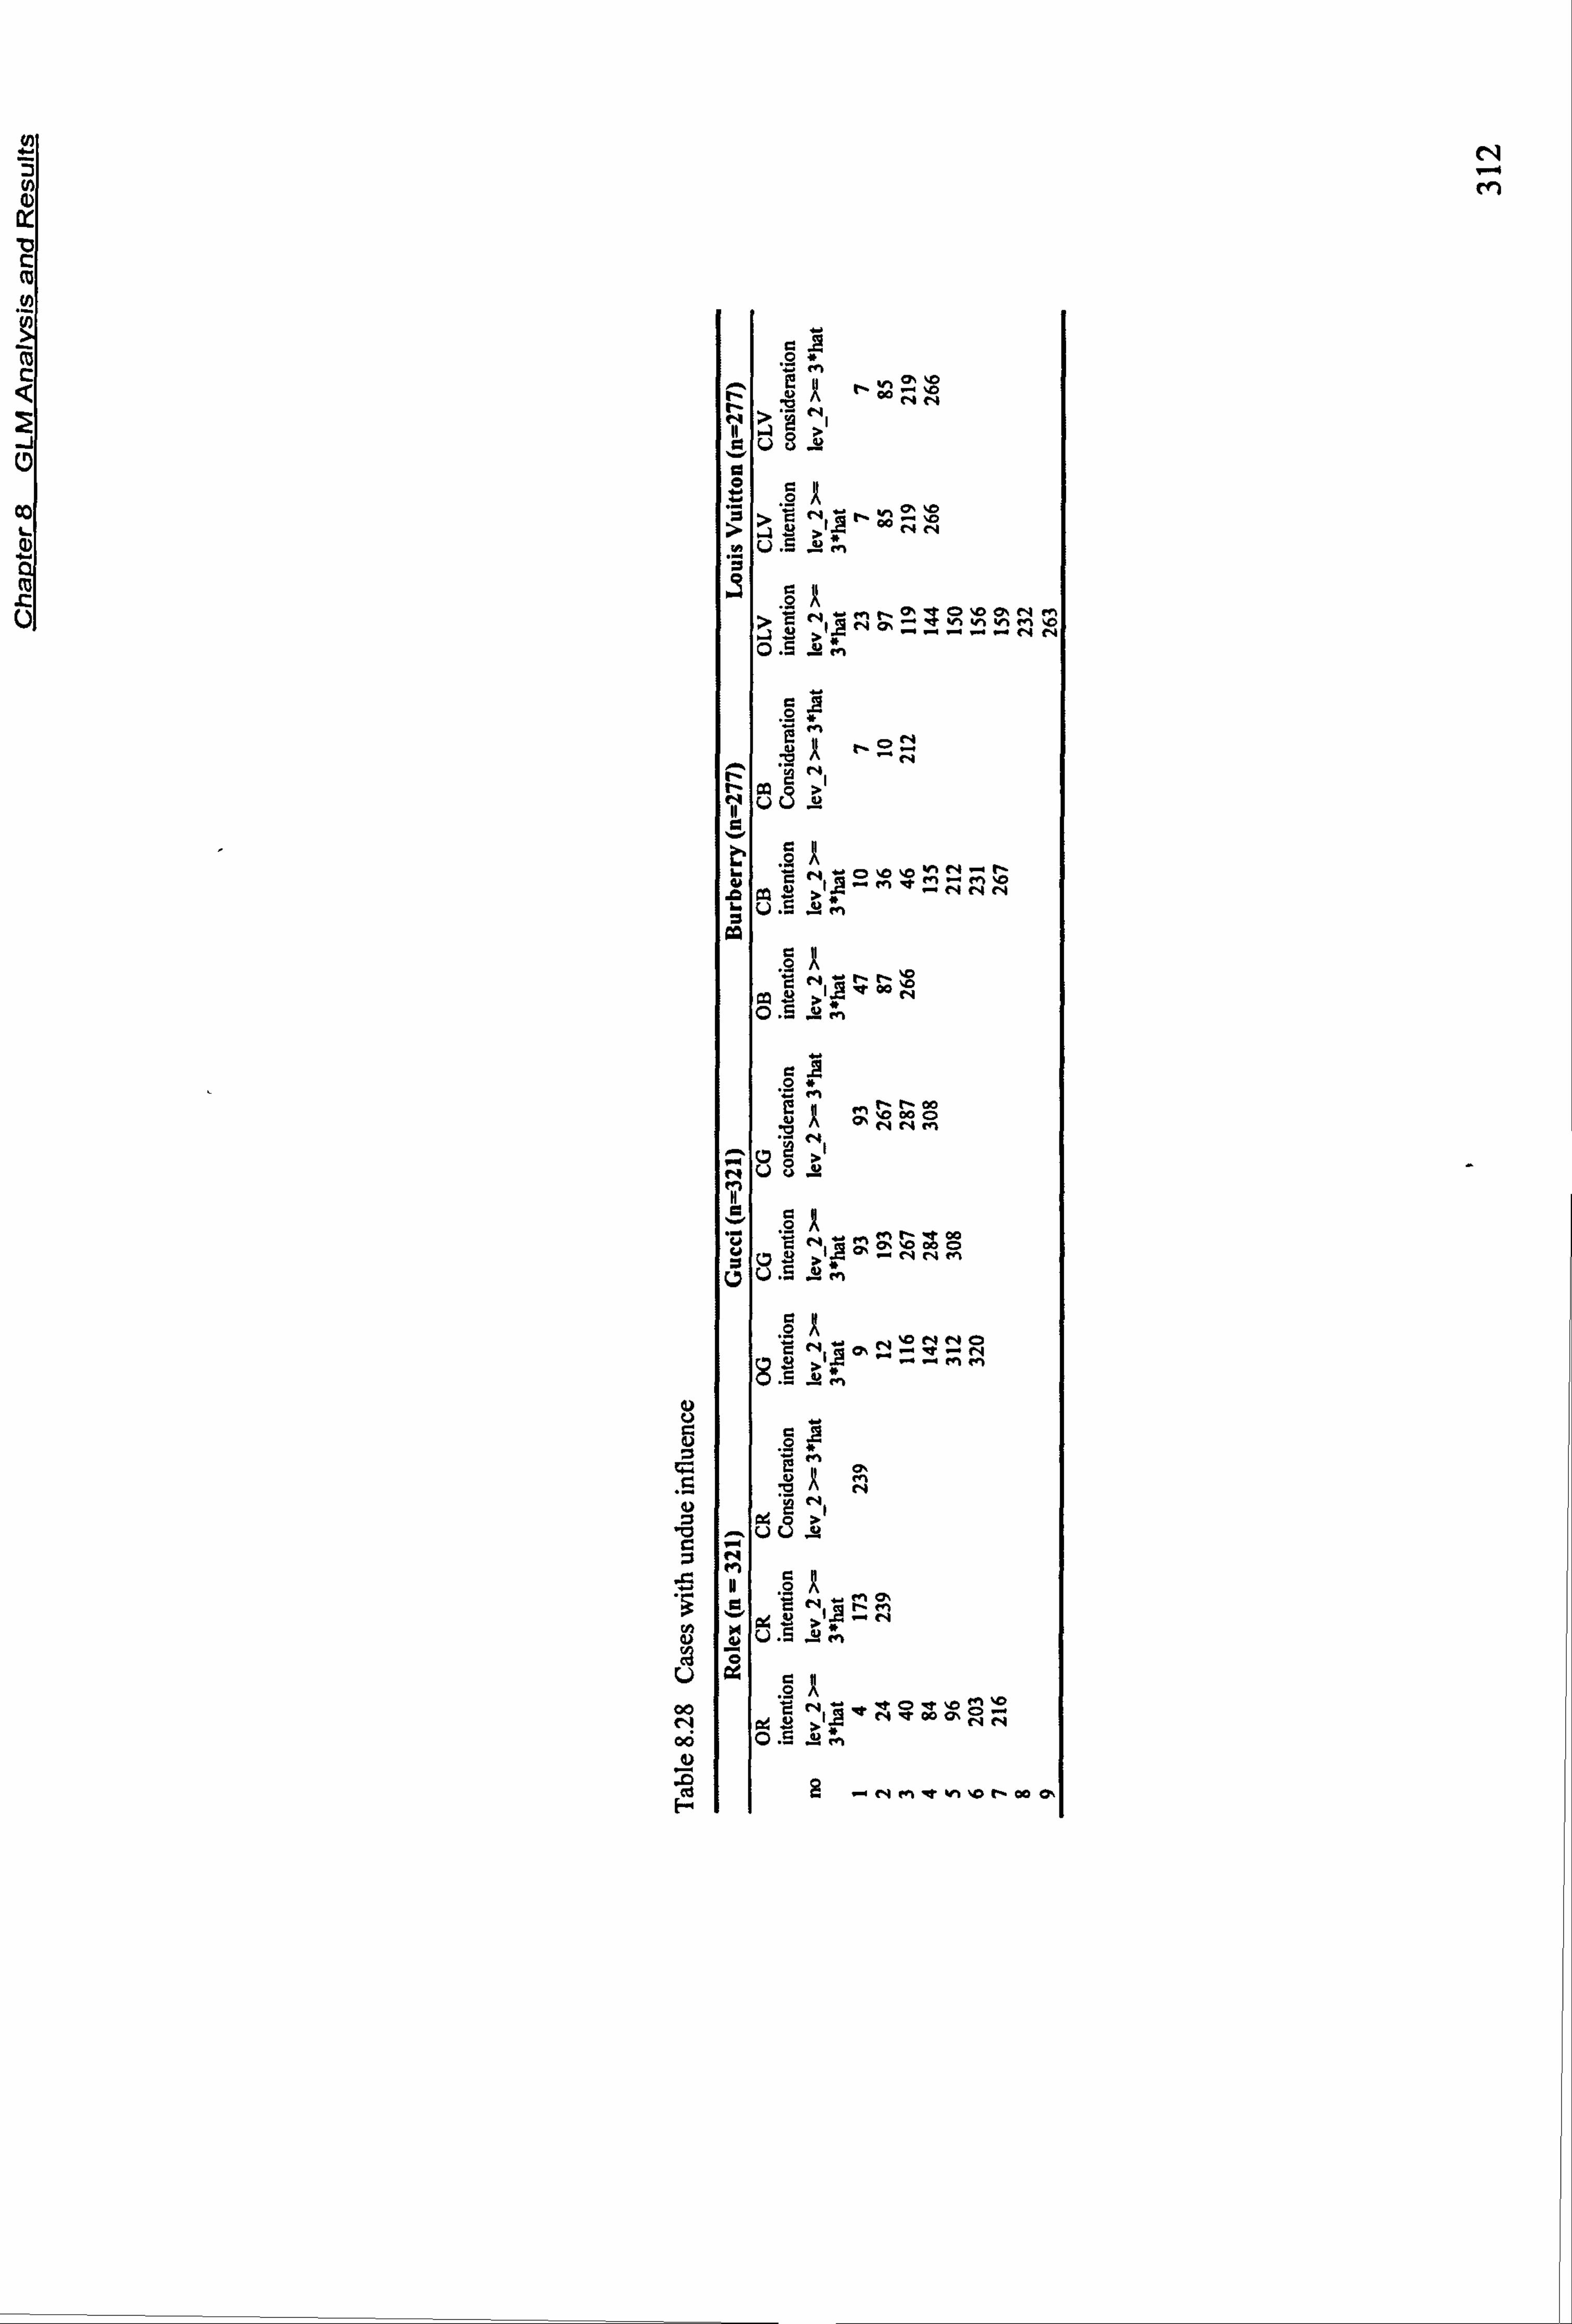
N
M
U
C)
ed
A t, ý.. 10 r- 0nN
ou
> 00
CU-
NN mUc:?
gAC
"IA N Qýh. ý.. wN..
Nt
01 Hm
. /ý
NON
RN
r- M
qrNr tý
äÜ[NI, L
^lV
ý Mi NNN
ö
C ýI, yvoýo `O ý6j N
0 .E.
Ö
'r M '0
0000 NN0
1
Uu
0
qi NO
831, g*w
N1
.. ud
N M
a en N
u öR a 'ý NnM
MÜE. uý,
ö
asR RORbO C ýIyýýNROO
O. NN
0 . rte'
.. d. M
2 -N M<ý 1On m0
Chapter 8 GLM Analysis and Results
techniques include a constant variance test, a casewise diagnostics test (outliers and
undue influential cases).
According to the skewed nature of the collected data, two commonly adopted statistical
analysis software programmes - SPSS and R statistical software - are used to analyse
data in order to obtain more robust results. The SPSS software is used to analyse the
data when the assumptions of the OLS are met to a large extent, whereas when the
assumptions of the OLS are severely broken the R is utilised to transform the data and
for regression of the response variables. Mainly, the Box-Cox and Box-Tidwell
techniques and the GLM statistics are used. Results generated using the two software
programmes are presented in two separate sections. The more appropriate ones are
chosen to be interpreted in detail.
Despite the researcher's efforts, data transformation does not appear to improve the
overall models greatly. As a consequence, the models generated based on the
untransformed data are selected for interpretation and discussion. Nevertheless, in order
to provide the reader with a clear view about the improvement brought to the regression
model after the data transformation, the results generated from the transformed data are
presented as well. Although data transformation does not bring about much more ideal
results, the use of the data transformation method backs up the notion that the initial
models regressed based on the untransformed data are the best choices under the current
circumstances.
The research results shows that the determinants of the consideration set and purchase intention are brand and product specific for both original and counterfeit branded
products. However, the personality variable is the only one which constantly appears in
every model and acts as the dominant explanatory variable to the response variables in
fifteen out of sixteen models. Detailed explanations and interpretations are provided in
this chapter alongside the presented research results. Given that the main objective of
this chapter is to present the research results and to provide detailed interpretation of the
results, the summary of the research finding are not reported here. This is one of the
objectives of the final chapter of this research.
313

Chapter. 9_-',, :. Conclusion
Chapter 9 Conclusion
Chapter 9 Conclusion
9.1 Introduction
The main objectives of this final, closing chapter of the thesis are to provide a short
summarisation of the project by underscoring the main conclusions reached from the
study and the main contributions of the current research. Moreover, this chapter will
also identify the managerial implications of the study and discuss some limitations of
the approach taken in the present study. In addition, this chapter offers some
recommendations for further research that could be encouraged or assisted by the
present work.
Given that detailed discussions about each individual model were provided directly after
the research results presented in Chapter 8, this chapter starts with a summary of the
research findings. To recap, as well as in response to Chapter 4, an overview of the
proposed research hypothesis is conducted and presented at the end of the ̀ Summary of
Findings' section. The hypotheses test results are demonstrated in a table format with
the aim of providing readers with a clear, overall picture.
The evidence of the worthwhile nature of this research is outlined in detail in the
research contribution section. Specifically, the theoretical contributions and
methodological contributions of the research are discussed. This section highlights the
capability of the researcher as a doctoral student of mastering the existing knowledge in
relevant areas as well as being able to go beyond the existing knowledge.
The discussion on the implications has two themes: managerial implications and policy implications. In other words, the findings of the present study will benefit
marketers/strategists of brand owners, and national and international policy makers.
Following the implications section, the research limitations are analysed. Lastly, the
various possible avenues for further research in the study of counterfeiting, consumer
choice process, and branding-related issues are suggested. As usual, this chapter
concludes with a brief chapter summary.
314

Chanter 9 Conclusion
9.2 Summary of Research Findings
The aim of this study is to evaluate the variables which are most important in the different stages of consumer choice process in the context of non-deceptive
counterfeiting. From the results of the multiple regression analysis, it can be seen that
various determinants have significant impact on the formation of the consideration set
and consumers' purchase intention towards both counterfeit and original branded luxury
products. These determinants include brand personality, benefits (image benefit, functional benefit and value for money in relation to gained quality), consequences (including social risk, financial risk, and security concerns) product attributes (general
attributes and practical attributes), product knowledge, interaction between product knowledge and product involvement, demographics (age, household income and
gender). However, there exist some differences in the kinds of determinants and their degree of importance on the purchase intention toward different brands and different
versions (counterfeit and genuine) of a brand. This is also true in the formation of the
consideration set.
Brand personality variable is the only variable which appears in all 16 regression
models. In addition, the brand personality's dominant position in terms of explaining the response variables remains unchanged across all but two models of two studied
consumer choice processes, with it dropping to the third most important variable on
only one occasion (after the value for money and practical product attribute variables); in one case it is the second most influential variable (after the perceived image benefit
variable). In general, the findings seem to suggest that, among the variables tested in
this study, the brand personality variable performs the best in explaining the formation
of the consideration set and consumers' purchase intention towards counterfeit and original luxury brands.
As noted earlier, brand personality is regarded as the communication tool for marketing
strategies to build, sustain and increase consumer trust and loyalty (Siguaw et al. 1999;
Johnson et al. 2000). Without denying the above notion, the research findings of this
study move one step forward by suggesting that favourable brand personality is the core influential variable in the two crucial stages of consumer choice process. In other words, whether a branded product is chosen by a consumer or not is determined by the level of preference of the perceived brand personality (both counterfeit and genuine). The more
315

Chapter 9 Conclusion
favoured the perceived brand personality is, the more likely the branded product is to be
purchased. The brand personality has a direct and substantial effect on consumer
purchase behaviour of luxury branded products. As a result, the perceived brand
personality has a direct influence on a brand's market share. Therefore, these findings
provide empirical support to Biel (1993) and Aaker (1991), who claim that brand
personality is a key determinant of brand equity.
The image benefit variable has auniform and positive effect on the likelihood of
consideration across all four original branded products. Nevertheless, it only appears to
be influential on the purchase intention of the original Gucci but not other purchase intention models of the original branded products. The influence of image benefit on
counterfeit luxury branded products is consistent across the consideration process and
the purchase intention process. In other words, when it appears to be
significantly/insignificantly influential on the likelihood of consideration of a
counterfeit, it is also has uniform effect (significant/insignificant) on the purchase intention toward the counterfeit. The effects of image benefit on consumer choice
processes are more likely to be brand specific. No pattern emerged within a specific
product category in relation to the image benefit effect on the stages of consumer choice
process. Generally speaking, image benefit has a limited effect on both consideration
process and purchase intention process, although its influence is significant, with the
exception of Gucci models.
The functional benefit variable features positively and prominently in the likelihood of
consideration and the purchase intention towards original branded watches (more
function-oriented products) with the exception of the Rolex consideration model. In
contrast, the functional benefit variable does not appear to be influential on consumer
consideration and purchase intention towards original branded handbags (more fashion-
oriented products). The scenario is almost the other way round in relation to counterfeit
brands. The functional benefit has a significant uniform effect on the purchase
consideration and the intention towards counterfeit handbags, but no influence (except
on the counterfeit Rolex consideration model) on the likelihood of consideration and the
purchase intention towards counterfeit watches. Consumers' consideration and intention
to purchase both original and counterfeit Rolex is dominated by the value for money
variable. For the original Rolex the value for money variable refers to quality and price
316

Chanter 9 Conclusion
relationship, whereas for the counterfeit Rolex the value for money variable is more
complex, it is composed of `fun', `status' and ̀ quality and price relationship'.
Despite the fact that numerous researchers have demonstrated a significant and positive
relationship between perceived benefit and consumer decision-making (e. g. Bove and
Johnson 2000; Mai and Ness 1997; Cho et al. 2002), the current research findings
suggest that it is not always the case that the perceived benefit has significant effects on
both the consideration and purchase intention process. In addition, whenever the
influence of the perceived benefit is significant, its influence on the studied choice
processes appear to be very limited in comparison with other influential variables.
These results challenge previous research findings. Moreover, the research results of
the present study further suggest that the influence of the perceived benefit is brand
specific and product specific (functional vs. fashionable), as well as product version
specific (counterfeit vs. genuine).
For fashion or fashion-oriented luxury branded products (Gucci, Burberry, Louis
Vuitton), the general product attribute variable is important to consumers' consideration
and purchase intention in relation to counterfeits. On the other hand, it appears to be
influential on the likelihood of consideration of the original branded products, but not
the consumers' purchase intention. For function-oriented luxury branded products (Rolex), the general attribute variable does not seem to be influential on the consumers'
consideration of either counterfeit or original luxury branded products, nor on the
consumers' purchase intention of a counterfeit version. Nevertheless, it does have a
significant effect on the consumers' purchase intention towards original branded
products.
The practical product attribute variable does not have an effect on consumer
consideration and purchase intention towards fashion or fashion-oriented branded
products (Gucci, Burberry, and Louis Vuitton). This is consistent across both
counterfeit and original versions of these brands. On the other hand, consumer
consideration and purchase intention towards function-oriented luxury branded products (Rolex) is significantly influenced by the practical product attributes. This effect
appears to be significant in both counterfeit and original versions. In general, it seems
that the influence of the practical product attribute on different stages of consumer
317
Chapter 9 Conclusion
choice processes can be categorised according to the functional or fashionable nature of the studied brands. More specifically, the practical product attribute is influential on the
consumer choice processes (consideration and intention) of function-oriented branded
products, whereas general product attributes are more likely to have a significant impact
on consumer choice processes in relation to fashion-oriented luxury branded products.
Consumers perceive two broad categories of product attributes in relation to luxury
brands (both counterfeit and genuine versions). These categories are named general
product attributes and practical attributes. Even though consumers use perceived
product attributes to evaluate brands/products in their decision-making process (Puth et
al. 1999), this is not necessarily to say that one can expect the perceived product
attributes to have a significant effect on consumer choice in all cases. In general, the
influence of the perceived general attributes and practical attributes is product specific
(functional vs. fashionable) and brand version specific (counterfeit vs. genuine).
In comparison with the extracted factors relating to brand image, the results of the
current study clearly show that the perceived brand personality has more explanatory
power on the two examined consumer choice processes (consideration and purchase intention) than either perceived benefits/consequences and perceived product attributes.
The dominant influential power of the perceived brand personality is consistent across
all 16 regression models with two exceptions only. These results certainly demonstrate
the important role played by the perceived brand personality on determination of
consumer behaviour. This research provides substantial support to the notion that
perceptions of a brand are the real drivers of consumer purchase behaviour (Biel 1992;
Friedman and Zimmer 1988; Assael 2004) by suggesting that consumers' perceptions of luxury have a substantial influence on two of the most crucial stages (consideration set
and purchase intention) of the consumer choice process.
This research reveals that neither the product involvement nor the self-assessed product knowledge (excluding the counterfeit Louis Vuitton consideration model and the
counterfeit Gucci consideration model) shows a significant effect on the formation of the consideration set and the consumers' purchase intention on their own, with two
exceptions out of 16 models. Generally speaking, the product knowledge variable and product involvement variable influence consumer choice processes through their
318
Chapter 9 Conclusion
interaction variable when they appear to be influential. The interaction variable of the
self-assessed product knowledge and the product involvement has a positive and
uniform effect on the consideration of the original luxury branded products, and the
purchase intention towards both counterfeit and original luxury branded products. It
does not have a significant impact on the consideration of counterfeit luxury brands.
These findings suggest that there is a higher probability that consumers with a higher
level of product knowledge as well as a higher level of product involvement will
consume both original luxury branded products and their counterfeit versions. The
positive influence of the interaction variable on the purchase intention towards the
counterfeit luxury branded products contradicts the expectation of this research. It is
believed that these unexpected results can be explained by consumers with a higher
level of product knowledge and product involvement perhaps purchasing counterfeits for different usage situations to those of the genuine branded luxury brands, as they
regard the counterfeits as a lower grade of the genuine ones (Nia and Zaichkowsky 2000;
Penz and Stöttinger 2003).
Although the interaction variable appears to have significant explanatory power in the
consumer choice processes, its magnitude of influence is nevertheless not substantial. In most cases, it has the least influence on the models in comparison with other
variables. This finding has important implications for policy makers and luxury
branded goods manufacturers in their fight against counterfeiting. Detailed discussion
is provided in the research implication section.
In contrast to Wee et al. (1995), who find that demographic variables feature
prominently in the set of non-price determinants of purchase intention towards
counterfeit goods, the findings of this research suggest that demographic variables (age,
gender, educational attainment and income) do not show much effect on consumer
choice processes. This is particularly true with the luxury branded handbags. None of
the demographic variables remains in any of the handbag related models. In the case of
the luxury watch related models, the results are not as straightforward as with handbags.
Nevertheless, the appearances of these variables in the models are still very limited.
Income, age and gender only show significant effect on two out of eight models related
to watches. Consumers' educational attainment does not affect any stage of consumer
319
Chaster 9 Conclusion
choice process across all four brands and two versions of each brand; this is in the same vein as Bian and Vcloutsou's (2006) finding.
The overall research results suggest that security concerns have no effect on either likelihood of consideration or consumer purchase intentions towards counterfeit and original luxury branded products. There is not much difference with financial risk. It
only appears to have a significant effect on one out of 16 models. It seems that there is
more chance of social risk affecting consideration process than purchase intention
process in relation to counterfeits, whereas it does not affect any stage of the consumer choice process concerning original luxury branded products, with the exception of the original Gucci consideration model. These results provide further evidence that the determinants can vary across different stages of consumer choice process. The level of consumers' perceived risk appears to have a negative relationship with the likelihood of consideration and the purchase intention whenever the relationship is significant. These
results are in line with Charkraboty et al. (1996) and Wee et al. 's (1995) research findings. In addition, the current research further suggests that among six risk dimensions, social risk might be the only risk dimension that concerns consumers when they are facing a choice of counterfeit luxury branded products.
According to the above summarized research findings, this research also shows that the determinants of likelihood of consideration and purchase intention towards original branded products and counterfeit branded products are brand specific and brand version Specific. These findings go beyond previous research. For example, Granbois and Summers (1975) and Kalwani and Silk (1982) reported that purchase intention is
Product specific. More recently, Wee et al. (1995) suggested that determinants of Purchase intention towards counterfeit products are product specific. Nevertheless, it is
once again undoubted that brand personality is the dominant determinant variable of the formation of the consideration set and the consumers' purchase intention towards both
counterfeit and original luxury branded products.
In addition, this research also suggests that there exist some differences in the kinds of determinants of the consideration process and the purchase intention process. Accordingly. this research proposes that the differences in the kinds of determinants of the consideration process and the purchase intention process to a large extent might
320
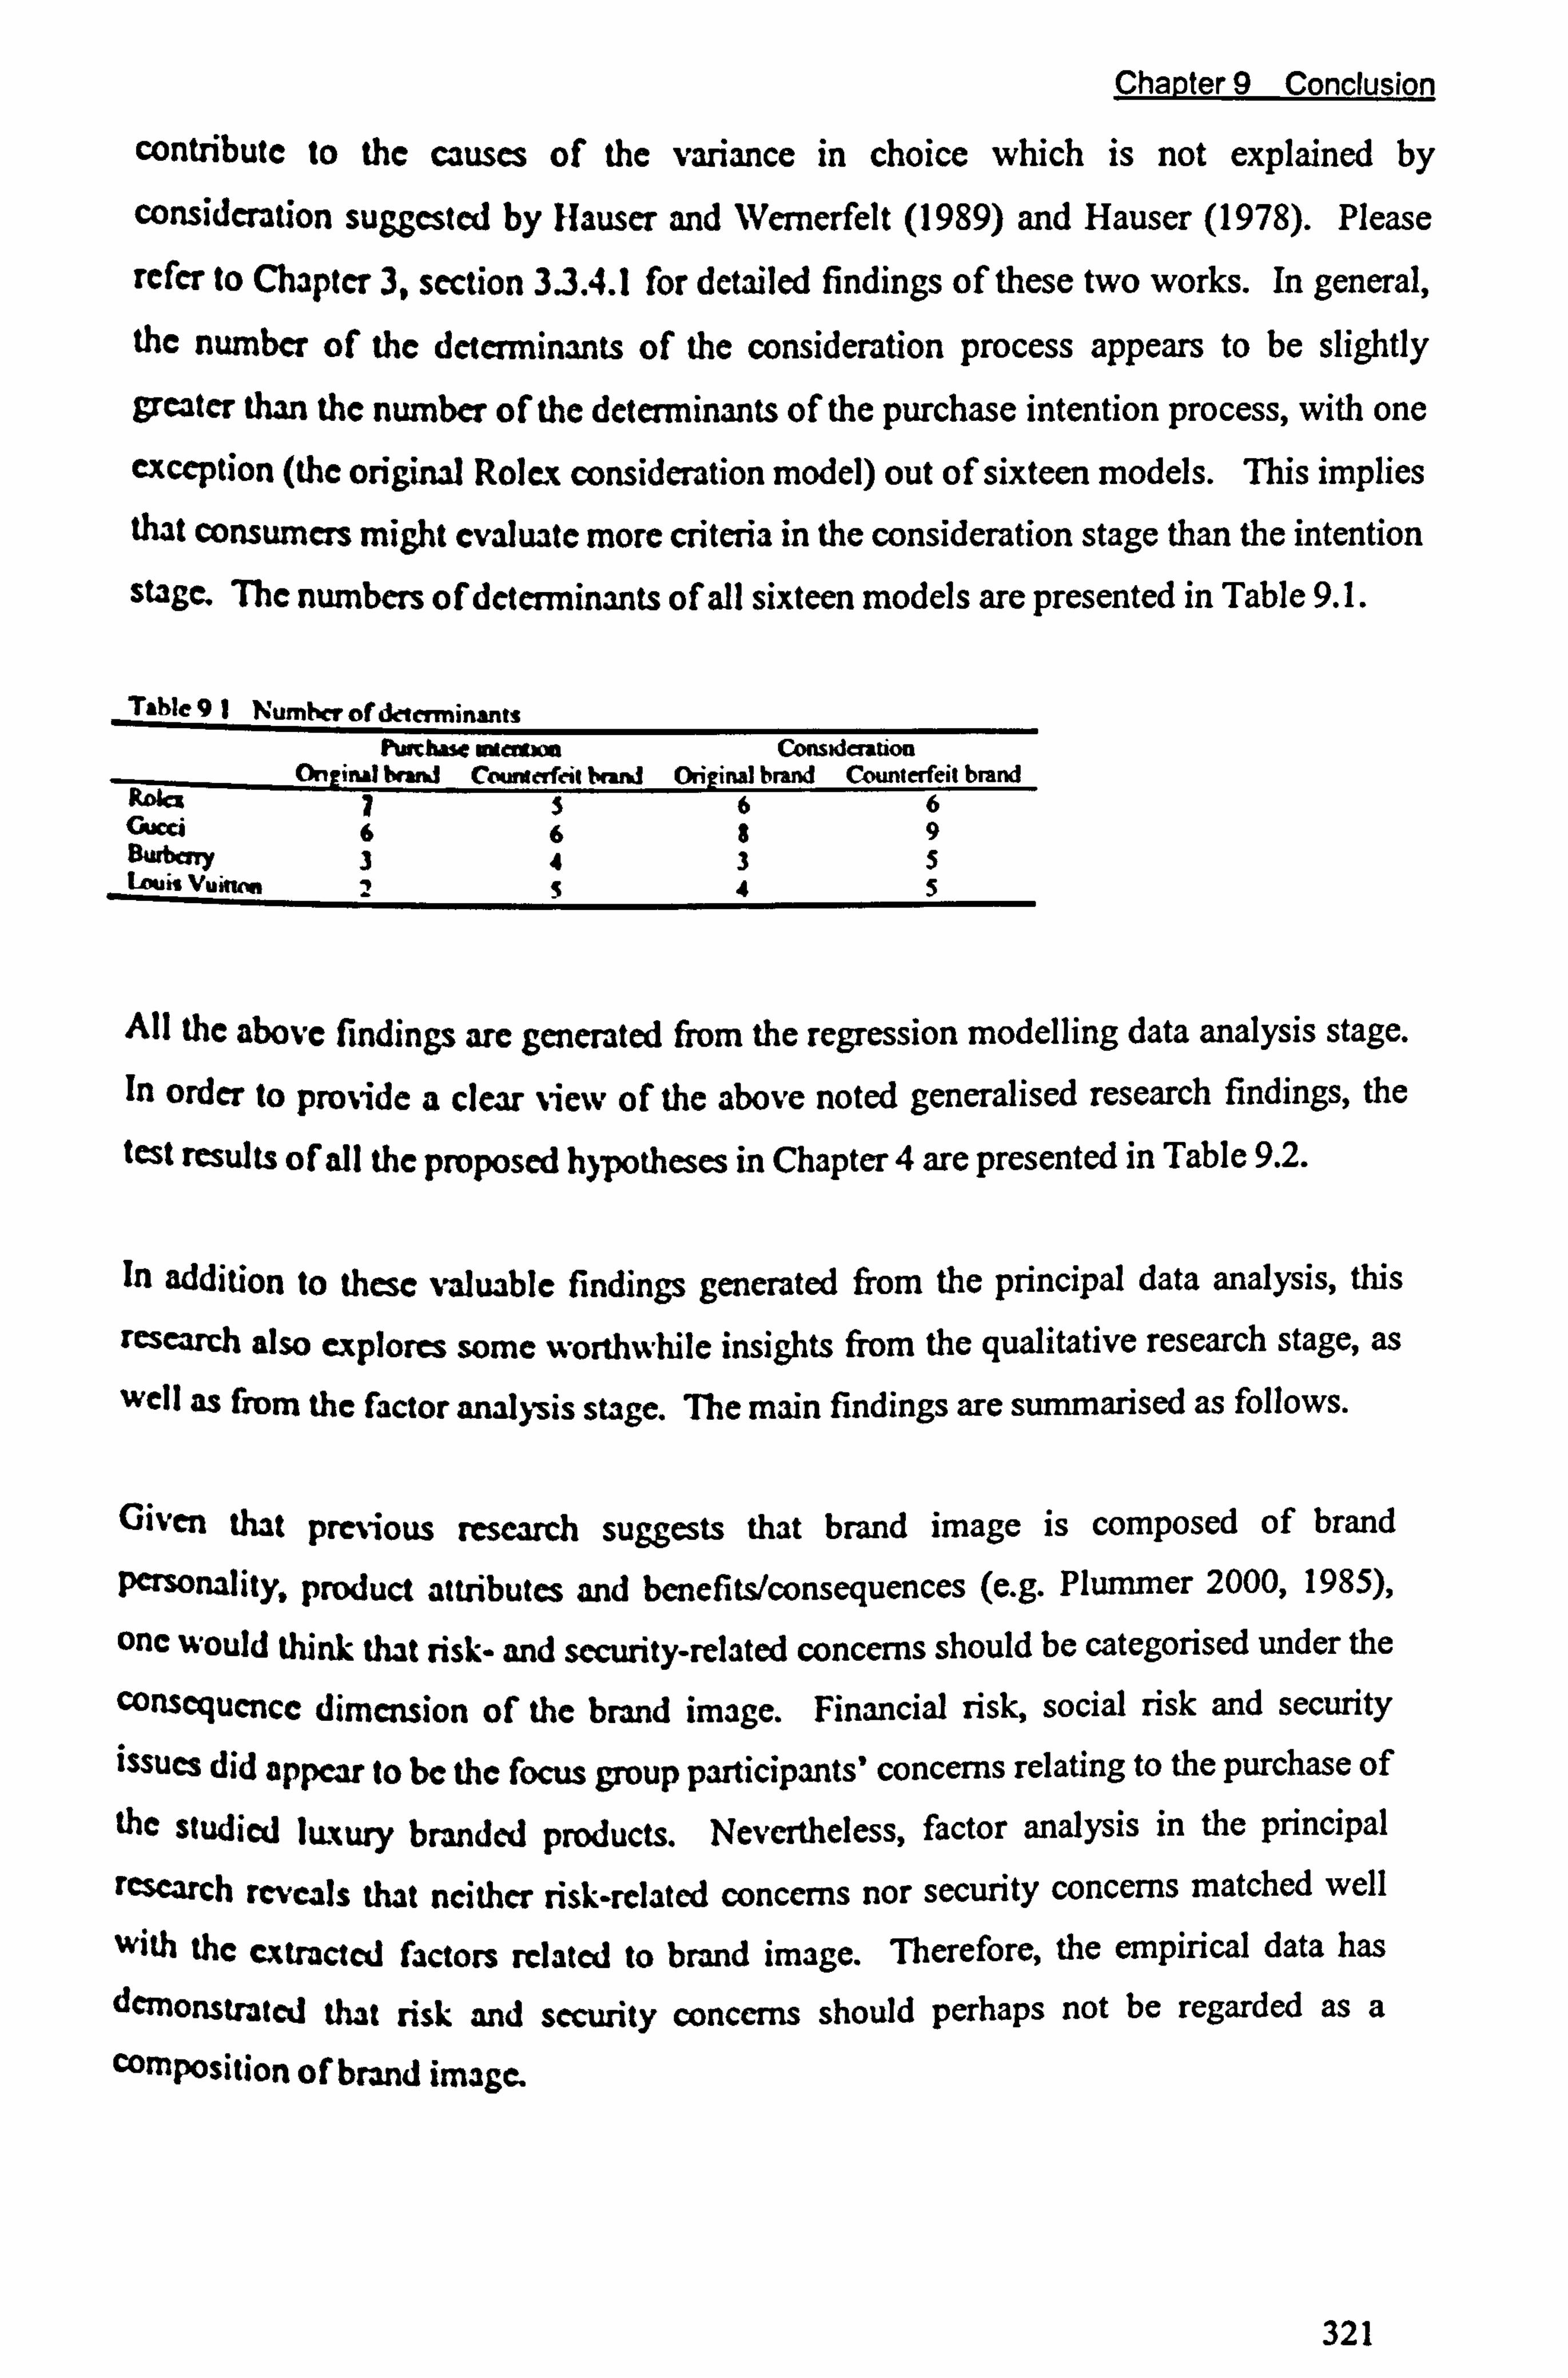
Chapter 9 Conclusion
contribute to the causes of the variance in choice which is not explained by
consideration suggested by Hauser and WVemerfelt (1989) and Hauser (1978). Please
refer to Chapter 3, section 3.3.4.1 for detailed findings of these two works. In general, the number of the determinants of the consideration process appears to be slightly
greater than the number of the determinants of the purchase intention process, with one
exception (the original Rolex consideration model) out of sixteen models. This implies
that consumers might evaluate more criteria in the consideration stage than the intention
stage. The numbers of determinants of all sixteen models are presented in Table 9.1.
TAblc 91 Number of determinants PWtluse u ersim
On ieul bran! Ct mterfeit brand Consideration
Original brand Counterfeit brand MCI 7 5 6 6 cAocci 6 6 8 9 8iwbcny 3 4 3 5 Louis Vuiiy 5 4 5
All the above findings are generated from the regression modelling data analysis stage. In order to provide a clear view of the above noted generalised research findings, the
test results of all the proposed hypotheses in Chapter 4 are presented in Table 9.2.
In addition to these valuable findings generated from the principal data analysis, this
research also explores some worthwhile insights from the qualitative research stage, as
well as from the factor analysis stage. The main findings are summarised as follows.
Given that previous research suggests that brand image is composed of brand
Personality, product attributes and benefits/consequences (e. g. Plummer 2000,1985),
one would think that risk- and security-related concerns should be categorised under the
consequence dimension of the brand image. Financial risk, social risk and security issues did appear to be the focus group participants' concerns relating to the purchase of the studied luxury branded products. Nevertheless, factor analysis in the principal
research reveals that neither risk-related concerns nor security concerns matched well
with the extractCd factors related to brand image. Therefore, the empirical data has demonstrated that risk and security concerns should perhaps not be regarded as a composition of brand imsgc.
321
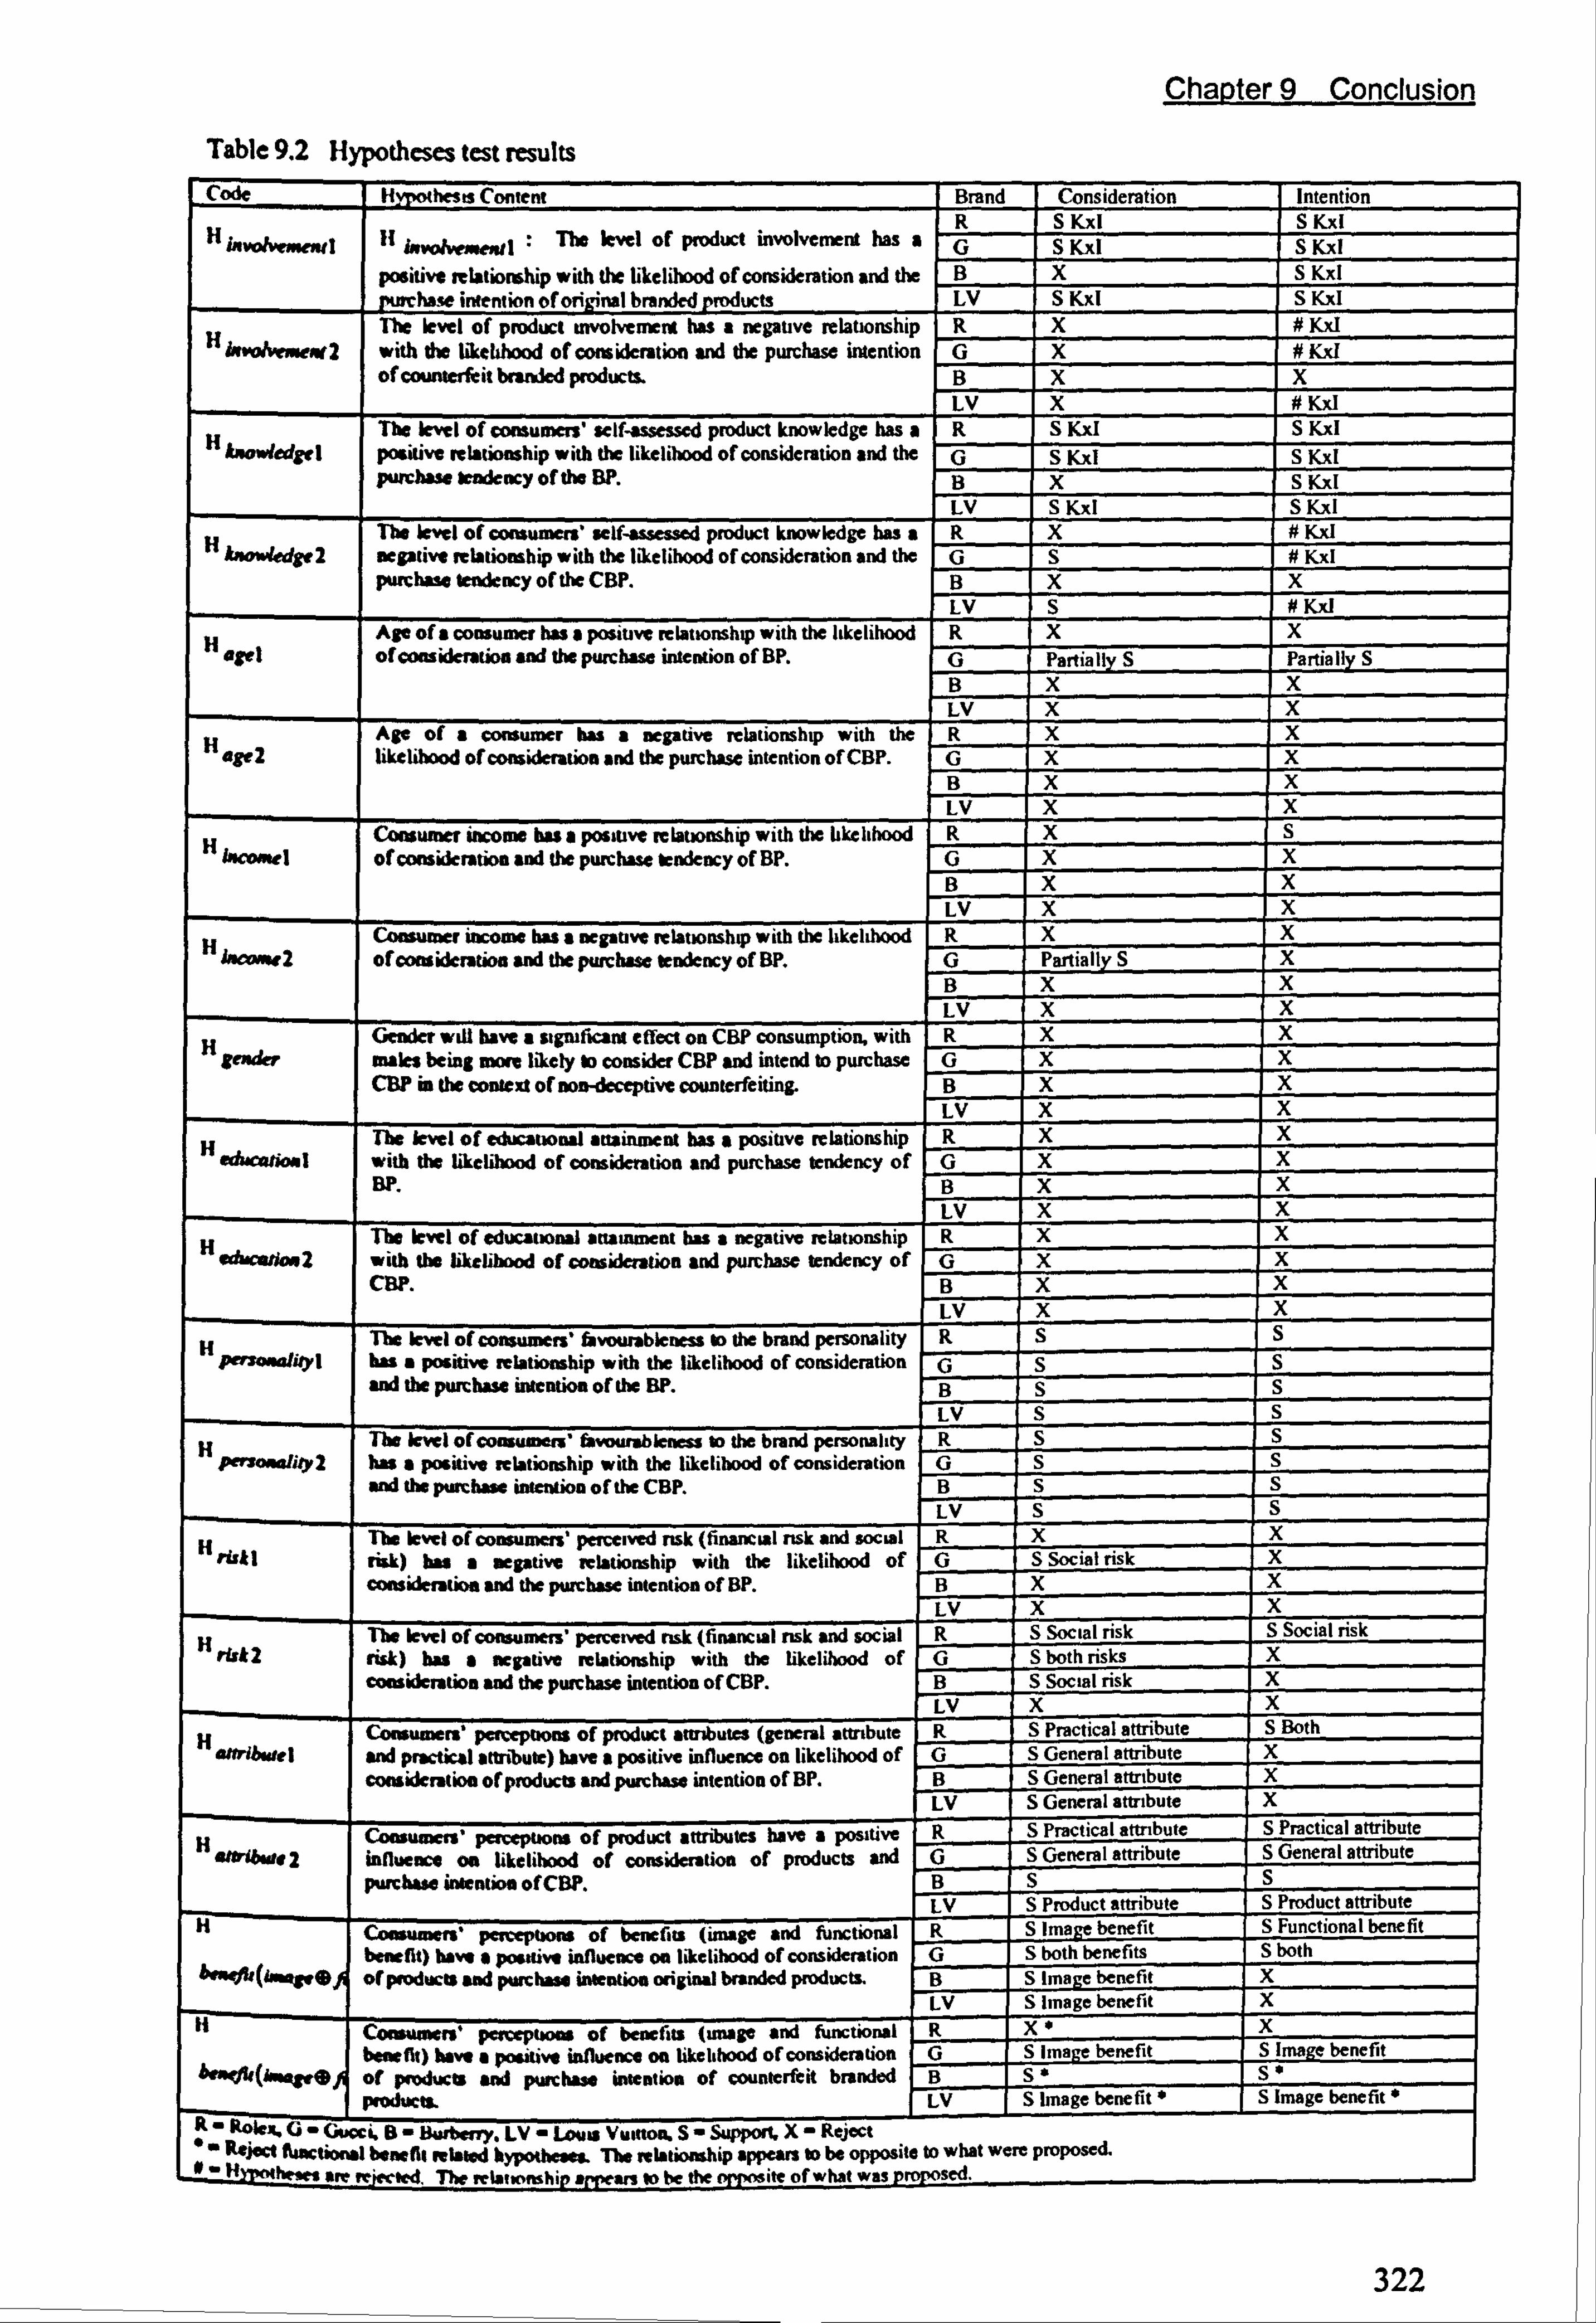
Chapter 9 Conclusion
Table 9.2 Hypotheses test results Code H Nests Content Brand Consideration Intention
R S KxI S KxI H levdveate I If Iavolvewetul : The level of product involvement has a G S Kxl S KxI
positive relationship with the likelihood of consideration and the B X S KxI Nase intention of on 'nal branded products LV S KxI S KxI
The level of product involvement has a negative relationship R X # KxI H kvolvewext2 with the likelihood of consideration and the purchase intention G X # KxI
of counterfeit branded products. B X X LV X # KxI
H The level of consumers' self-assessed product knowledge has a R S KxI S KxI knowledgel positive relationship with the likelihood of consideration and the G S KxI S KxI
purchase tendency of the BP. B X S KxI LV S KxI S KxI
The level of consumers' self-assessed product knowledge has a R X # Kxl H bwwledge2 negative relationship with the likelihood of consideration and the G S # Kxl
purchase tendency of the CBP. B X X LV S # KxI
H Age of & consumer has a positive relationship with the likelihood R X X aye) ofcoasideratioo and the purchase intention of BP. G Partially S Partially S
B X x LV X X
H Age of a consumer has a negative relationship with the R X X
age2 likelihood of consideration and the purchase intention of CBP. G X X B X X LV X X
Consumer income has a positive relationship with the likelihood R X S H ! scoatel of consideration and the purchase tendency of BP. G X X
B X X LV X X
Consumer income has a negative relationship with the likelihood R X X H incowe2 ofeonsideratioa and the purchase tendency of BP. G Partially S X
B X X LV X X
Gender will have a significant effect on CBP consumption, with R X X H
gender males being mom likely to consider CBP and intend to purchase G X X CBP in the context of non-deceptive counterfeiting. B X X
LV X X The level of educational attainment has a positive relationship R X X
H educatioal with the likelihood of consideration and purchase tendency of G X X
BP. B X X LV X x
H The level of educational attainment has a negative relationship R X X
sdanados2 with the likelihood of consideration and purchase tendency of G X X CBP. B X X
LV X X
H The level of consumers' 6vourabkness to the brand personality R S S persandityl has a positive relationship with the likelihood of consideration C, S S
and the purchase intention of the BP. B S S LV S S
The level ofeotsumer' favousbleness to the brand personality R S S H
persoadity 2 has a positive relationship with the likelihood of consideration G S S and the purchase intention of the CBP. B S S
LV S S
The level of consumers' perceived risk (financial risk and social R X X H kl risk) has a negative relationship with the likelihood of G S Social risk X
consideration and the purchase intention of BP. B X X LV X X
The level of consumers' perceived risk (financial risk and social R S Social risk S Social risk H ºirk2 risk) bas a negative relationship with the likelihood of G S both risks x
consideration and the purchase intention of CBP. B S Social risk x LV X X
Consumers' perceptions of product attributes (general attribute R S Practical attribute S Both He
trlbrsel and practical attribute) have a positive influence on likelihood of G S General attribute x consideration of products and purchase intention of BP. B S General attribute x
H e2
Consumers' perceptions of product attributes have a positive influence on likelihood of consideration of products and
LV R G
S General attribute S Practical attribute S General attribute
x S Practical attribute S General attribute
purchase intention ofCBP. B S S
H Consumers' perceptions of benefits (image and functional benefit) have a positive influence on likelihood of consideration
LV R G
S Product attribute S Image benefit S both benefits
S Product attribute S Functional benefit S both
b +ýlarsý® of products and purchase intention original branded products B S Image benefit x LV S Image benefit x
Consumers' perceptions of benefits (image and functional R X" X benefit) Nava a positive influence on likelihood of consideration G S Imo benefit S Image benefit
ý+bk(Mrje of products and purchase intention of counterfeit branded B S* S products. LV S Image benefit' S Image benefit
R" Roles. G" Guoc4 B" Burberry, LV " Louts Vuitton. S" Support. X" Reject " Reject functional benefit misted hypotheses. The relationship appears to be opposite to what were proposed.
N" H)VeNhesea ne . ei~wt fl..... t........ º.,.......... r. n.. ow -site of what was eronosed.
322
Chapter 9 Conclusion
The qualitative research part of this research shows that Aaker's (1997) brand
personality measure is not practical due to its lengthy nature. In addition, it is not
greatly applicable to any examination concerning individual luxury brands. This is
because, first of all, focus group data shows that all individual luxury brands possess
customised brand personalities which have not been covered by Aakers' scale.
Secondly, the projected brand personalities are normally very much focused. In most
cases, they are only several personal traits rather than several dozen. This research
reveals that the number of relevant personality traits of the examined luxury brand
ranges from 6 to 14, which is at least two-thirds fewer than the 42 traits suggested by
Aaker (1997). In addition, this research also shows that some personality traits included
in Aaker's (1997) brand personality scale are not applicable in the UK context. This
finding is in the same vein of those of Davies and Roper (2001) and Diamantopoulos et
al. (2005).
9.3 Research Contributions
It is argued that this research will contribute to both the literature of the consumer
choice process, the study of counterfeiting and branding, as well as to the research
method, in several ways. The discussion about the research contributions are presented in two separate sub-sections - theoretical contributions and methodological
contributions.
9.3.1 Theoretical Contributions First, the study links together two important research streams (counterfeiting study and
consumer choice process study), thus providing insights into how consumers'
perceptions of CBP and BP affect the formation of the consideration set and the
purchase intention in the context of non-deceptive counterfeiting. This research
contributes to the existing literature by establishing the determinants of different
consumer choice processes of both CBP and BP, which appears to be a significantly
under-researched area.
People respond on the basis of their perceptions of reality, not reality per se (Lewin
1936; Puth et al. 1999). A number of researchers confirm that perceptions are important
to study of consumer decision-making (e. g. Schiffman and Kanuk 1991), even if they
are misconceptions of actual events (Porter and Claycomb 1997). Analysis of consumer
323

Chapter 9 Conclusion
perceptions and decision-making processes is therefore extremely important in order to
understand consumer behaviour, so marketers can determine more readily what influences consumers to buy (Schiffinan and Kanuk 1991), and draft better positioning
strategies. In line with these views, this research argues that Priester et al's (2004)
"A2SC2" model might provide little that is new to the existing literature, due to the
possibility of incorrect appliance of the reasoned action theory and the adoption of
unreliable measures (see Chapter 3 for details). Accordingly, this research argues that
examination of the influence of consumers' perceptions of brands on consumer choice
processes will provide valuable insights in understanding consumer behaviour in the
context of non-deceptive counterfeiting.
Brand image is defined as being how the brand is perceived by consumers (Aaker 1996).
In other words, the brand image is the consumers' perceptions of a brand. As this
research aims to investigate luxury branded products, the influence of brand image of
the studied brands on the consumer choice processes (consideration set formation
process and purchase intention process) is examined. This is the first research which has been undertaken with the aim of understanding consumer purchase behaviour from
brand level. As reported earlier, the brand personality is the only factor which appears
to have significant influence on both the consideration and consumer purchase tendency
of the examined brands. This result is consistent across all four examined brands and
two versions of each brand. In addition, generally speaking, the brand personality also
appears to be the most influential variable in all consideration models and purchase intention models, except one. The current research findings provide empirical support to Batra et al. (1993) and Biel (1993) who claim that brand personality is considered to
be an important factor for the success of a brand in terms of preference and choice, and Dubois and Patemault (1995) who suggest that luxury items are bought for what they
mean, more than for what they are. More importantly, the consistent research findings
across four investigated luxury brands and different versions of a brand make it safe to
say that consumers' perceptions of a brand are significantly influential on the formation
of the consideration and the development of the purchase intention. These findings,
together with other research findings in this study, have established the crucial role
played by brand image in the formation of the consideration set stage and purchase intention stage of consumer choice process.
324
Chapter 9 Conclusion
This research not only fills the identified literature gap by discovering the determinants
of the formation of the consideration set and the purchase intention from a brand
perspective, but also reveals that consumers are more likely to evaluate more criteria in
the consideration process than in the intention process, the criteria used by the
consumers to evaluate the branded luxury being different to some extent to the one they
use to judge the counterfeit version. This finding is completely new to marketing literature.
Secondly, although it is not the main priority of this research, the present study tested
Plummer's (2000) brand image component proposition. Brand image concept has
attracted a lot of research interest. Within the last half century, numerous researchers have offered their propositions about the components of this notion (see Chapter 5 for
details). The most recent one is Plummer (1985,2000) who claims that brand image
has three primary components - the physical elements/attributes, the functional
characteristics/benefits or consequences of using a brand, and the way the brand is
characterised/brand personality. All the propositions of previous researchers are
theoretical in nature. It appears that empirical supports to the theoretical propositions
are scarce. The present research fills this research gap.
In general, the research results of this study support Plummer's (2000) proposition. However, this research further reveals that the perceived benefit/consequence
component of brand image is not only restricted to functional characteristics as Plummer (2000) claimed. In fact, consumers also perceive experiential benefits (for
example, fun) and symbolic related benefits (e. g. prestige). This research finding is
consistent with the conventional benefit literature (see Park et al. 1986; Solomon 1987;
Keller 1993), which suggests that the perceived benefit/consequence component of brand image should take a broader view, rather than limiting itself to functional
characteristics.
The qualitative study of this research also suggests that consumers do perceive risks and even have security worries when -facing the choice of BP and CBP. Consumers
consider these perceived risks and security worries as possible purchase consequences. Nevertheless, the survey research reveals that the perceived risks and security worries do not fit in well with any factor extracted using factor analysis. This research suggests
325

Chapter 9 Conclusion
that risk and security concerns should not be taken as a subcontract of the consequence
component of the brand image. Obviously, these findings refine the brand image theory
and enrich the brand image literature.
9.3.2 Methodological Contributions
Contribution to brand personality measure This study tests the generalizability of Aaker's (1997) brand personality scale by
examining the stability of the five brand personality dimensions in different empirical
settings (different brand, different versions of a brand and different country). Despite
the fact that Aaker's (1997) brand personality scale is commonly adopted, the current
research reveals a number of shortcomings of this scale. The items included in the
Aaker (1997) personality scale are not exhaustive. The qualitative research results show
that two out of four tested brands take in new items, which implies that Aaker's (1997)
scale is not exhaustive. More than two-thirds of the items included in the Aaker (1997)
scale are considered irrelevant and unimportant to the studied brands. These findings are
consistent across all studied brands. The number of remaining items ranges from 6 to 14
after testing, which is obviously far fewer than what Aaker (1997) recommended. The
items remaining in the scale appear to be distinguishable across brands, which
corresponds to the brand specific nature. In line with previous research, the present
research finds that some items are difficult to understand for UK residents, as some items have different meanings to what they might have in America. In sum, consistent
with prior researchers (e. g. Davies and Roper 2001; Koebel and Ladwein 1999), the
current research provides empirical evidence to support the view that Aaker's (1997)
personality scale is not problem-free and should not be considered as universally
applicable.
That said, one thing that must be clarified is that this research has no intention
whatsoever of devaluing Aaker's (1997) contribution to the brand personality measure development. On the contrary, what the present research has done is to regard the
Aaker (1997) scale as a foundation of the brand personality traits of all the studied brands. The master list of the brand personality traits of each studied brand was generated mainly based on the brand personality traits included in the Aaker (1997) brand personality scale with brand personality traits extracted from other three sources as complementary. The level of importance and relevance of the pool of brand
326
Chapter 9 Conclusion
personality traits were then tested using focus group discussions. The most important
and relevant personality traits were retained for further examination. Consequently, the
approach adopted by the current research not only enriches and customizes the brand
personality of each brand, but at the same time it also helps to revalidate the scale.
Therefore, it might be worth duplicating in future research.
Contribution to scale development
Given that this research is designed to investigate four brands and two versions
(counterfeit and original) of each brand, a number of questions had to be asked more
than once in the questionnaire. In some cases, they were repeated eight times. As a
result, the initial research instrument was more than fourteen pages long. Considering
the possibility that some potential respondents might be put off by the very lengthy
questionnaire, and as repetition can accelerate boredom (McLauchlan 1987), the
researcher developed a new technique which is applicable to research examination of
more than one brand/product. This new technique was developed based on Kelly's
(1955) repertory-grid technique and the commonly-adopted Likert scale (Likert 1932).
Apart from retaining all the advantages of the repertory-grid technique and the Liked
scale, the newly developed scales also reduce the possibility of "haloing" effects warned
of by Beckwith and Lehmann (1975). In addition, the application of these scales
reduced the length of the research instrument almost by half. For further details of the
new technique, please refer to Chapter 5.
The applicability of this scale was tested in the principal study. In general, the majority
of the respondents did not appear to have any difficulties in terms of responding to the
structure of the new scale. Nevertheless, it appears that one fifth of the unusable
questionnaires were the result of the use of the new scales. Considering that they only
accounted for less than five percent of the total questionnaires collected, it is concluded
that the new scale worked well in practice in the current study. Based on the identified
problems related to use of this scale, it is further suggested that the usable response rate
would be improved on a larger scale if later researchers/fieldworkers addressed the
multiple uses of one statement to respondents. The newly developed scales provide
alternative choices to future researchers who are interested in investigating multiple brands or products in their research.
327
Chapter 9 Conclusion
Contribution to measures of gender This research first challenges the exhaustiveness of the conventional means in terms of
categorising people as male and female. It appears that there might be an alternative
gender category (or categories). Although only one respondent regards himself/herself
as "intersexed", this is sufficient to advise caution concerning how to address gender
issues in future research. For example, `gay' males might appear to be feminine and have similar preferences and even purchase behaviour to females. On the contrary, `gay' females might appear to be masculine and behave similarly to males. Researchers
should take this into account, as data collected from these groups might be different to
those of other groups, and as a result might bias related research findings.
Contribution to data analysis Although numerous researchers have stressed the importance of meeting the
assumptions of OLS before this technique is applied (e. g. Field 2005; Cohen et al. 2003),
it appears that a number of researchers have not taken this suggestion into account in the
study of counterfeiting (e. g. Wee et al. 1995). In agreement with Cordell et al. (1996),
the current study argues that researchers should avoid any blind use of OLS in the study
of the counterfeiting phenomenon. Additionally, this research provides a detailed
discussion on the suitability of the conventional logistic regression and loglinear
technique as a replacement for OLS when the normality assumption of GLM is broken,
before it coming to the conclusion that OLS regression is considered more appropriate
under current circumstances, subject to data transformation being conducted when
necessary. The idea of the use of loglinear regression is discarded for the inclusion of factor scores in the regression models in the current study. Logistic regression is
considered inappropriate due to the emergence of the severely uneven split of the data.
This argument puts a question mark against the rationale for the use of logistic
regression in Cordell et al. (1996).
The R Commander package's box. cox and box. tidwell data transformation functions are
applied for the first time in analysing counterfeiting related data. Through detailed
discussion, this current research demonstrates that the conventional OLS and logistic
regression statistics should be used with caution, particularly in the examination of consumers' purchase intention of counterfeits and highly-priced original luxury branded
products; it also presents future researchers with guidance on the analytical and
328

Chapter 9 Conclusion
systematic procedures which should be followed before coming to a decision with
regard to which statistics are more accurate for a specific research. The current research is the first to integrate the advantages of both SPSS and R software.
9.4 Implications
The predominance of the brand personality variable in determinants of the consideration
and the purchase intention of counterfeit and original luxury branded product challenges
previous notions, such as perceived benefits usually being the most important in
judgements of preference or choice (Lefkoff-Hagius and Mason 1993). The uniform
positive influence of brand personality on purchase intention towards both counterfeit
and original luxury branded products indicates there is a greater chance that consumers
will make a purchase of the counterfeits over the original branded luxury products when
they perceive the counterfeits possess a similar kind of brand personality to the original
ones. Original luxury branded goods manufacturers should therefore try to differentiate
their brand personality as much as possible from the counterfeit versions. This can be
achieved by emphasising the brand personality differences of these two versions. As
this research suggested earlier (Chapter 6), the `typical user, brand endorsers, company
employees and the CEO of the company' are the direct influential factors on consumer
perceived brand personality. As such, marketing campaigns might gain remarkable
success if they were set up around the themes of differences between the typical user, brand endorsers, company employees and the CEO of the company of the original luxury brand and the counterfeited versions.
Since the image benefit has a positive and significant effect on the consideration and the
purchase intention of some specific counterfeit luxury brands, in their anti-counterfeit
efforts these original luxury brand manufacturers could emphasis the distinctive image
benefits the original branded products can bring to consumers and the diminishing of
positive image benefits or even the negative image benefit related to the counterfeit
versions. The message that needs to be communicated to consumers should be that no
counterfeits can deliver the same image benefit projected by the original luxury branded
products.
To stress the functional benefit of the original luxury branded products over the
counterfeits would be a good strategy in terms of increasing sales for the manufacturers
329

Chapter 9 Conclusion
of the function-oriented luxury original branded products, as the functional benefit
appears to be significantly influential on consumers' purchase intention of the original function-oriented luxury branded products. Meanwhile, the function-oriented luxury
original branded product manufacturers should always bear in mind that perceived functional benefit is their advantages and they should never compromise it on any
occasion. Nevertheless, this strategy may not necessarily work well in terms of decreasing the consumer demand for counterfeit function-oriented luxury branded
product due to there being no sign that the functional benefit has a negative relationship
with purchase intention towards the function-oriented counterfeit luxury products. Given that the functional benefit has no effect on neither the consideration nor the
purchase intention towards the fashion-oriented original luxury branded products, to
emphasise the function benefit may not necessarily have any positive effect on sales of
the fashion-oriented luxury branded products.
One thing which must be clarified is that the `functional benefit' related to handbags
refers to `disposability', meaning ̀ with short but acceptable length of product life' and `can be thrown away without too much concern about the financial loss involved'.
Therefore, the research finding is in fact suggesting that the more likely it is that
consumers believe that the counterfeit luxury branded products are disposable, the more
chance there is that they are going to buy them. `High level of disposability' and ̀ only
a fraction of the price of the original luxury branded product' are two kinds of
characteristic possessed by the counterfeits only, which the original luxury branded
product cannot ever achieve. This appears to be a real challenge faced by the original luxury branded products manufacturers. To win this campaign from this particular
aspect, this research would suggest that marketers or strategists of the original luxury
branded products manufacturers should think about directing consumer consumption. For example, they could emphasise the importance of consuming the `genuine product'
and being `genuine'; they could also stress the benefits and sense related to `go for one
which is really good, rather than for ten crappy things'. The image that needs to be
established for the original luxury branded products should be `genuine', `green' and `long-lasting'.
Integrating environmental protection and anti-counterfeiting tasks, policy makers can help to educate the public by informing them about the environmental concern caused
330

Chapter 9 Conclusion
by a massive amount of disposable goods. This device might be more effective if the
policy makers could provide the public with some solid figures in relation to how many disposables can be generated per head in a lifetime, the scope of environmental
concerns caused by the counterfeit manufacturing process, as well as the consumption
of counterfeits.
As interaction between the self-assessed product knowledge and the product involvement is found to be an important determinant in purchase intention of both
counterfeit and original luxury branded products, consumers who scored higher values in the interaction variable are inclined towards the purchase of counterfeit and original branded products, except for the counterfeit Burberry. The effect of the interaction
variables on the consideration and purchase intention is insufficient, although it appears
to be significant. There are two implications for the original luxury branded product
manufacturers. When one variable is held unchanged, improving the score of another
variable will increase consumers' purchase tendency of both original and counterfeit luxury branded products. Looking at this result might give the first impression that this
does not make any logical sense at all, particularly when the value of the product knowledge is held unchanged, since people will expect that consumers with higher
product involvement are less counterfeit-prone. Nevertheless, as explained earlier,
people with higher product involvement might buy counterfeit luxury goods for other
purposes, or to use them in different situations to the original branded luxury ones. Acknowledging this, improving product knowledge and product involvement of a luxury branded product might have a positive effect on sales of the product, but it is not
a device which will work effectively in terms of curbing counterfeits. Perhaps the
marketers of the original luxury branded products may need to think seriously about the
marketing mix strategy they adopt. According to the figures presented in Chapter 2,
counterfeits are clearly taking a serious market share. Consumers buy counterfeits over the original ones to use them under certain consumption situations in the context of non- deceptive counterfeiting. Therefore, the marketers of the original luxury branded
product manufactures could consider carrying out differentiated marketing, which involves targeting several market segments. Here one should be aware that this research is suggesting that the marketers should segment the markets according to the different
product usage situation, but without segmenting the consumers.
331
Chapter 9 Conclusion
The current research findings suggest that, generally speaking, demographic variables do not appear to have a significant effect on consumer purchase intention towards
counterfeit and the original luxury branded products. This is particularly true with the
purchase tendency towards the counterfeits. Nevertheless, there are two unique cases
which show that age and gender or income do appear to be significantly influential. As
a result, this research suggests that purchase intention is not only product-specific but
also brand-specific too. In general, the findings relating to the demographic variables in
this research support the recommendation concerning segmenting the markets according to the different product usage situations. This is in contrast to Wee et al. (1995), who
recommend the segmentation of consumers according to their demographic profiles. However, the Gucci case does provide some evidence for Wee et al's (1995) suggestion. All in all, marketers should acknowledge the brand specific nature of the consumer
purchase intention. They should work on an individual brand basis rather than
following the traditional product specific rule in the study of counterfeits.
The discovery of the differences in the kinds and numbers of determinants of the
consideration process and the purchase intention process has serious implications for
marketers. It shows that, to some extent, consumers adopt different criteria to evaluate
goods at different stages of the choice process, and the number of criteria used by the
consumer decreases when nearing the final decision. As being included in the
consideration set is, to a great extent, a necessary condition for ensuring a product is
purchased (Hauser and Wernerfelt 1990; Kardes 1994; Roberts and Lattin 1991;
Shocker et al. 1991; Nedungadi 1990), there is a need for marketers to be fully aware of the criteria utilised by their consumers to form the consideration set of the branded
products of their interest. In addition, they should also acknowledge the determinants of the consumer purchase intention. The effectiveness assessment of their marketing
strategy may need to take into account how well the strategy fits in with the identified
determinants of the different stage of choice processes. So doing will lead to a more
cost effective and efficient marketing strategy, and will provide them with clear ideas
what they lose to competitors if their product is considered, but not chosen by their
consumers. Given that the consideration set is dynamic, this requires the marketers to
monitor the identified determinants of the consideration set and the purchase intention
on a regular basis to ensure that the strategy modification is led in the right direction.
332

Chapter 9 Conclusion
This research argues that marketers should never forget the salient role played by their
consumers. There might be a gap between the brand identity they are trying to establish
and the brand image which represents how consumers perceive their brands. This
research suggests and demonstrates that the most scientific approach to obtaining the
precise information about their brand image is to collect information from their
potential consumers. The approach adopted in the current study sets up an example for
marketers in terms of collecting accurate brand image data. Marketers have an important role to play in terms of attempting to build a certain brand identity. However,
they have very limited control of the brand image. Nevertheless, they can achieve a
good understanding of their consumers' perceptions of their brands by replicating the
methods the current research has utilised, as these will help them to monitor the
projected brand identity and readjust their brand identity if necessary.
9.5 Limitations
The present study is exploratory in nature, and to some extent lacks the sophistication
and statistical rigours found in most confirmatory types of research. For instance, a
convenience sample was used rather than a probability sample. Although the use of the
convenience sample has been justified thoroughly from both theoretical and practical
perspectives and the researcher is convinced of its practical advantages, the researcher is
nevertheless still not entirely confident in claiming that the sampling method she
adopted is better theoretically than probability sampling. As such, generalisability to
the whole population of consumers may be limited to some extent.
With regard to the sample of the qualitative study, this research used small focus groups (five to six participants), and one group on each brand to create the list of brand image
related items to be tested in the principal survey research. Even though the researcher
and the observer were extremely well-prepared for the focus group discussions, and
sincerely made every endeavour they could to keep it under their control, they still
could not possibly avoid criticisms about having reached a conclusive list of items too
quickly. It is accepted that more than one focus group on each brand would certainly
appear to be more rigorous academically. However, considering the very tight budget
and the time constraint, to conduct more focus group discussions would have been a luxury the researcher could not envisage. Consequently, the door is left open to a
certain degree to the possibility of an inexhaustive and possibly biased pool of items.
333

Chapter 9 Conclusion
In this research, only one version of CBP of each tested brand was used as stimulus. In
reality, the tested original branded products might have a range of counterfeit versions
(Gentry et al. 2001) available in the market place. The perceived image of these
counterfeit versions might be distinguishable from each other even in the context of
non-deceptive counterfeiting. Therefore, the research findings should be viewed with
caution. More specifically, they might only be applicable to the counterfeit versions
appearing in flea markets but not the ones sold in shopping malls, which are more likely
to be better quality and higher price versions of counterfeits (Gentry et al. 2001).
The findings of this study are the outcome of an empirical analysis of the respondents'
responses to four luxury brands in a stimulus-based situation. The findings cannot be
used to make generalisations of generic brands. In addition, the research findings are
not `all- encompassing' because they do not consider deceptive counterfeiting and blur
counterfeiting. Consumers might have different perceptions of the CBP in the cases of deceptive counterfeiting and blur counterfeiting in comparison to the non-deceptive
counterfeiting, which would rebalance the explanatory power of the individual factors.
As a result, it is likely that the factors with significantly influential power on the
consideration set and the purchase intention could be different to the factors remaining in the models in this present study. Therefore, the research findings of this research
should not be applied to deceptive counterfeiting and blur counterfeiting.
Neither did this research maintain the consistency of the stimuli used in this study. Real
counterfeit examples (provided by the Trading Standards Glasgow) and pictures of the
original BP as stimuli were used in the present study. The researcher is fully aware that
some bias might occur due to using different product formats as stimuli. However, due
to the studied brands being all highly-priced products, buying the genuine products was
not an option due to the restricted research budget. Moreover, it is also considered that
to provide the real original products to research participants in the field might cause
security concerns to the field workers. Therefore, the use of pictures of the original branded products is regarded as acceptable under the specific circumstance. For the
detailed justification of using different formats of stimuli, please refer to Chapter 5.
334

Chapter 9 Conclusion
The very lengthy nature of the research questionnaire was a handicap of this research. As reported earlier, this was one of the direct reasons for the relatively high rate of
unusable questionnaires collected. The researcher was fully aware of this shortcoming before the field work started. As can be clearly seen in Chapter 5, great effort was put into reducing the length of the research instrument. These include a piece of qualitative
research and the development of a new scale suitable for measuring multiple brands or
products. The length of the research instrument was reduced, but the final questionnaire
covers seven pages (excluding the cover page and the contact information page), so it is
still relatively long. However, the length of the research questionnaire was determined
by the nature of this research. There was not much else the researcher could have done.
By law, manufacturing and selling counterfeits in the UK are crimes (see the Patent
Office re the 2002 Act). Purchasing counterfeits is considered as morally unacceptable
and even as supporting organised crime. This research data is based on consumers'
self-reports, which means that the data collected could be influenced by the
respondents' attempts to produce more socially acceptable responses. Therefore, there
is a possibility that the data collected might be biased to a certain degree. In order to
avoid this happening, a number of devices were adopted in this research (use of neutral language, clarification of the academic use of the data at the beginning of the
questionnaire, displaying the figure that one-third of UK consumers knowingly
purchase counterfeits). The researcher would certainly expect all her efforts to have
assisted in minimizing the bias if not avoiding it completely.
This research only examined two product categories and two brands of each product
category (watches and handbags). As consumer consideration and purchase intention of CBP and BP are found to be brand specific in this study, previous research suggests that
consumer accomplices of counterfeits are product specific (e. g. Wee et al. 1995); as
such, perhaps a more diverse choice of products and a more rigorous sampling
procedure could have been adopted to improve the validity of this exploratory study. Saying that, to investigate more brands is a kind of luxury the researcher could not even
contemplate under the financial budget for this research. The sampling procedure was
also restrained by the budget and time limitation. The researcher has no intention of denying that there is a room for improvement. Nevertheless, the improvement could
335

Chapter 9 Conclusion
have only been achieved if a much larger budget had been available and she had had
more time for this piece of work.
In the case of non-deceptive counterfeiting, most of the time consumers encounter
counterfeits with the absence of the BP. Therefore, the designed stimulus approach in
the present study to some extent moves away from the real purchase situation of
counterfeits. In fact, consumers often face a large set of counterfeit alternatives in the
market place (which can be a variety of brands and different designs of one brand).
Previous research findings based on the study of genuine products suggest that
consumers use screening criteria to reduce the number of alternatives that will
ultimately be compared. In a familiar purchase situation, a simple screening rule might
rely on brand familiarity or memory accessibility (Desai and Hoyer 2000; Johnson and
Lehman 1997). In a novel purchase situation, especially one that is stimulus based, the
consumer is likely to focus on one or more attribute cut-offs (Chakravarti and
Janiszewski 2003). If this holds true in the context of non-deceptive counterfeiting, it
is not surprising that the current research findings to a certain degree might differ to the
findings generated from data collected from any real market places.
This research used simple multiple regression analysis rather than multiple discriminant
analysis, as the researcher felt that unless it was certain that the consumers' perceptions
of the branded products were the determinants of the consideration and purchase intention in the context of non-deceptive counterfeits, using multiple discriminant
analysis to distinguish between buyers and non-buyers of CBP and BP based on their
demographics, consumers' perceptions of studied brands and consumer's attitudes
towards the examined product categories (product involvement and self-assessed
product knowledge) would perhaps be rather premature.
The research findings are preliminary in their nature. More fine-tuning is required,
especially to address the methodological and statistical issues mentioned above. Despite these limitations, it is anticipated that the preliminary findings reported in this
study will evoke greater research interest in the study of counterfeiting. It is also
expected that the current work will engender future research activities which can contribute to our understanding of this aspect of consumer cognitive processes and final
consumer behaviour.
336
Chapter 9 Conclusion
9.6 Further Research
The counterfeiting phenomenon has attracted more and more research interest since
counterfeits burgeoned in the 1970s. A great amount of academic research has emerged
in both regional and international journals over the last two decades. Nevertheless,
there do not exist any systematic review articles to synthesise the previous research.
Consequently, research in the study of counterfeiting appears to be arbitrary to later
researchers. A systematic review of the previous work can provide future researchers
with guidance from both theoretical and methodological perspectives. In addition, a
synthesis of the previous research findings would certainly assist in generating strategic
and managerial implications, which are based on a broader view in comparison to any
individual research.
This research tested the influence of the financial risks and the social risks on two
individual stages of the consumer choice process in the context of non-deceptive
counterfeiting. None of the tested types of the risks appeared to be statistically
significant in either the consideration models or the purchase intention models.
Psychological risk was not examined in this research. The reason for this sub-construct
of the risk concept being left unexamined in this research is that the influential variables
related to brand image were generated from focus group discussions, and the
psychological risk did not appear to be a principal concern of the participants of the
focus groups. However, this construct is found to be the best predictor of the overall
risk in the context of non-deceptive counterfeiting (Veloutsou and Bian, forthcoming).
Further research should investigate the effect of this particular sub-construct of the risk
concept on consumer behaviour in the context of non-deceptive counterfeiting.
Despite the appealing and practical role played by the consideration set, a commonly
accepted measure of this concept does not exist for the reason that this construct appears
to be difficult to measure and quantify (Punj and Srinivasan 1989). Given the absence
of a scientific measure of this construct, research related to the consideration set is
restricted to investigating issues related to consideration set size and components. The
studied brands/categories are categorised as either `considered' or `not considered'. With limited sources, the researcher found that the only exception was Troye (1983)
who used a 5-item scale to measure this concept. However, as reported earlier in
Chapter 5, Troye did not report how he developed this 5-item scale; neither did he test
337

Chapter 9 Conclusion
the scale's reliability and validity. The researcher adopted this scale for the very simple
reason that this measure was the only multi-item scale she could find. The scale's
reliability and validity were tested in the present study and it proved to be both reliable
and valid. Clearly, there is a need for developing a better consideration set
measurement scale.
The empirical model would be a more sophisticated and more complex one, in which
self-image construct is taken into consideration explicitly. Specifically, self-image
might play a moderating role in the consideration and purchase intention models. Similarly, later researchers could extend the current research by examining the
moderating role of the self-assessed product knowledge on consumer choice processes. Alternatively, they could also investigate the impact of the objective product knowledge
on consumer behaviour in the non-deceptive counterfeiting. This would reveal whether heavy users would behave in the same way as light users of a particular brand/product
when facing the choice of counterfeits.
Future research could test more brands (say around ten brands in one product category), including generic brands, using both similarity judgement and attribute-based
multidimensional scaling techniques to explore where CBP and BP are located in the
spatial map. This is consistent with Malhotra (1999), who suggested that eight brands
or stimuli should be included to obtain a well-defined spatial map. Direct similarity judgement may be used for obtaining the spatial map, and attribute ratings may be used
as an aid to interpret the dimensions of the perceptual map. Similar procedures can be
used for preference data. These efforts will assist marketers to obtain a clear view as to
where their brands stand in the market place where the counterfeits exist.
The present study investigated the determinants of the consideration set and the
purchase tendency of both CBP and BP. Future research should examine whether these
effects replicate when consumers' actual behaviour is measured. Ideally this should be
conducted on the site of sales. The recommended research is worthwhile because
purchase intention does not necessarily explain the final choice very well (e. g. Bonfield 1974). Thus, it would be interesting to see whether modelling the final choice would result in identical research results to modelling the purchase tendency in the context of non-deceptive counterfeiting.
338
Chapter 9 Conclusion
This research discovered in the process of the preliminary qualitative study that the
respondents encountered difficulties in defining the brand personality when the
personality related to direct sources, and indirect sources do not stay at the same level
(see Chapter 5 for details). In other words, the participants appeared to be confused
when their perceived brand personalities did not match with their perceived personality
of the brand's typical users, brand endorsers and company employees (direct source of
brand personality according to Aaker (1997); the direct influential factors to brand
personality according to this current research). Additionally, this research also revealed
that the so-called direct sources of brand personality set out by Aaker (1997) are not
exhaustive (see Chapter 5 for details). Considering the commonality of this confusion
that appeared in the focus group participants, this research illustrates that this kind of
confusion did not emerge by chance. It may have occurred in previous research, but it
does not appear to have been reported. To explore this issue further is beyond the scope
of the current research, and therefore remains unexamined in this research. It is
proposed that it might be more accurate if Aaker's (1997) `direct sources' of brand
personality were renamed as ̀ influential factors' of brand personality. Whether there are
any more `influential factors' and how the `influential factors' influence the perceived
brand personality are matters to be explored. These are what future researchers should
devote their efforts to.
If the sample size is large enough, when the severe skew effect appears, future
researchers might consider separating the observations into flooring/ceiling cases and
shifting cases. Here, the flooring cases refer to the observations of those who claimed
`strongly disagree', the ceiling cases are the observations of those who claimed
`strongly agree', with the shifting cases being observations of those who stated
`disagree', `neutral', `agree' and `strongly agree' in relation to tests on the likelihood of
consideration and purchase intention. Researchers might consider running regressions
on the shifting observations data. This will provide insights about consumers who do
not hold strong negative or positive purchase intentions towards the tested
brand/product. In addition, an examination of demographic differences between the two
groups might also provide some useful insights.
339
Chapter 9 Conclusion
The current research only investigates the determinants of the consideration set and the
purchase intention in the context of non-deceptive counterfeiting from the brand image
level. It is still not quite clear whether the BP brand image is affected or not after entry
of CBP. To achieve this, a before-after experimental design with control would enable
researchers to observe the potential change in brand image as a result of the entry of CBP. This type of design has been used by a number of previous studies in the study of brand extension (e. g. Diamantopoulos et al. 2005; Morrin 1999) due to its high level of
control in accounting for extraneous factors which can assist in enhancing the internal
validity of the research (Calder et al. 1981).
The research results of the present research show strong influence of the perceived brand personality on the purchase intention and consideration models. This dominant,
positive and significant influence is consistent across ' all studied brands and two
versions of each brand. All studied brands are luxury brands in this study. As such, it
may be interesting as future research to investigate generic brands, for which
consumers' perceived brand personality level might differ to that of luxury brands.
Given that this research is conducted in the UK context, additional research is necessary to support firmly the suitability of the consumer-related measures and models across cultures. Therefore, the study should be replicated to other types of products, larger
samples and in other culture groups.
340

Appendix

Appendix 1 Letter to Supermarkets
General Manager Asda Superstores 20, Rothes Drive Glasgow G23 5EZ
25`h October 2005
Dear General Manager
Your Assistance in Academic Research
I am writing to you to ask for your assistance in a piece of academic research concerning the study of consumer perceptions of counterfeit branded products as opposed to genuine branded products. The studied brands are Louis Vuitton, Burberry, Gucci and Rolex. This study is being undertaken by the Business and Management School at the University of Glasgow as a part of my doctoral research.
Your store has been selected as a potential site for data collection. I would be grateful if you will allow this research to be conducted at the entrance of your store. If so, a well trained interviewer wearing a badge with his/her name, and the university logo will collect data at the entrance of your store between 15 ̀h November 2005 and 30`h November 2005.
Every nth shopper is met by the interviewer who wishes the individual good morning (evening) and asks whether the subject is a Glasgow resident. The Glasgow resident is offered a package of chocolate (worth about £2.50). The interviewer then introduces him/herself as a student working on a university research project and asks the shopper to participate in a 15-20 minutes survey and ensures confidentiality.
I wonder whether you would be able to provide the interviewer with a desk and two chairs at the entrance of your store for displaying the samples used in this study and for the use of the survey participants. We would certainly greatly appreciate whatever help you can provide in assisting completion of this research.
As a doctoral researcher, I am unable to offer you anything other than purchasing the chocolate used in this research from your store. However, if you are interested in our research findings, I am willing to develop a specific executive summary of the findings, as well as the implications at the end of the project, as a mark of my gratitude for the help you provide.
Once again, I would like to express my sincere thinks for your help. I look forward to hearing from you very soon.
Yours sincerely
(Doctoral Researcher) Xuemei Bian
Supervisors: Professor Luiz Moutinho Chair of Marketing Professor Angus Laing Head of Business and Management School
341

Appendix 2 Response from Supermarket 1
FAO Xuemei Bian Business and Management School University of Glasgow Gilbert Scott Building GLASGOW G12 8QQ
Dear Xuemei,
Thank you for your letter regarding academic research.
TESCO
Tesco Stores Ltd. Westbourne Centre Kelburn Street Barrhead Glasgow G78 ILS
0141 532 7300
10/11/05
I am very sorry but we will be unable to accommodate you on this occaision due to the lack of space and also the time of year.
I would like to wish you well for the future.
Yours sincerely, For and on Behalf of Tesco Stores Ltd.
V. 13-'ý Murray Leslie Store Manager
3I2 tesco Stores Ltd, (519500). Company Registered in England. Registered Office: Tesco House, Delamare Road, Cheshunt, Hertfordshire EN8 9SL

Page 1 of 1
Appendix 3 Response from Supermarket 2 Print - Close Window
From: "Loraine Weir" <Ioraineweir@fsmail. net>
To: xuemeibianl@yahoo. com
Subject: Study of consumer perceptions at Tesco Miingavie
Date: Mon, 7 Nov 2005 21: 37: 58 +0100 (CET)
Dear Mr Bian,
Regarding your letter dated the 26th of October 2005 to carry out some research at Tesco Milngavie on consumer perception, between the 15th November and 30th of November 2005.
am unable to allow you to do this as all research, charity collections etc, has to go through our Head Office who authorise this and provide you with a headed letter, stating that you can carry out this research. This is to ensure we do not have people double booked and too much congestion at the store.
If you would still like to carry out this research you can contact our head office at:
Tesco Stores Ltd, Tesco House, Delamare Road, Cheshunt, Hertfordshire, EN8 9SL.
Sorry for the delay in replying to your letter, but I have only just received it.
If you would like to discuss this further with me, you can contact me at the store on 0141 532 7465.
Yours Sincerely
Loraine Weir
Services Manager
Tesco Milngavie
3Zf3 httD: //us. f368. mail. vahoo. com/ym/ShowLetter? box=Inbox&MsgId=9227_2... 07/11/2005
Appendix 4 Research Instrument
, aim
8 `ýý
vekirýsý'ýe
UNIVERSITY of
GLASGOW
An Examination of the Factors Influencing the Formation of the Consideration set and Consumer Purchase Intention in the Context
of Non-deceptive Counterfeiting
by
Xuemei Bian
Your participation is absolutely crucial to the completion of this research. Any information you provided will be kept strictly confidential. Information identifying the respondent will not be disclosed under any circumstances.
In case you require further explanation, please contact Mrs. Xuemei Bian at x. bian. 1(&research. gla. ac. uk or on: 0141 330 2000 (ext: 0311).
Before you start completing this questionnaire, please note that:
" Counterfeit product Counterfeit products are those bearing a trademark that is identical to, or indistinguishable form, a trademark registered to another party.
" Research findings suggests that about one third of British people knowingly purchase counterfeit branded products.
" There are no right or wrong answersto the following statements.
" We are interested in your opinion even if you have no direct experience with any counterfeit product. In this study, you are provided with counterfeit examples and pictures of original branded products. Please base your opinion on the objects provided to you.
344
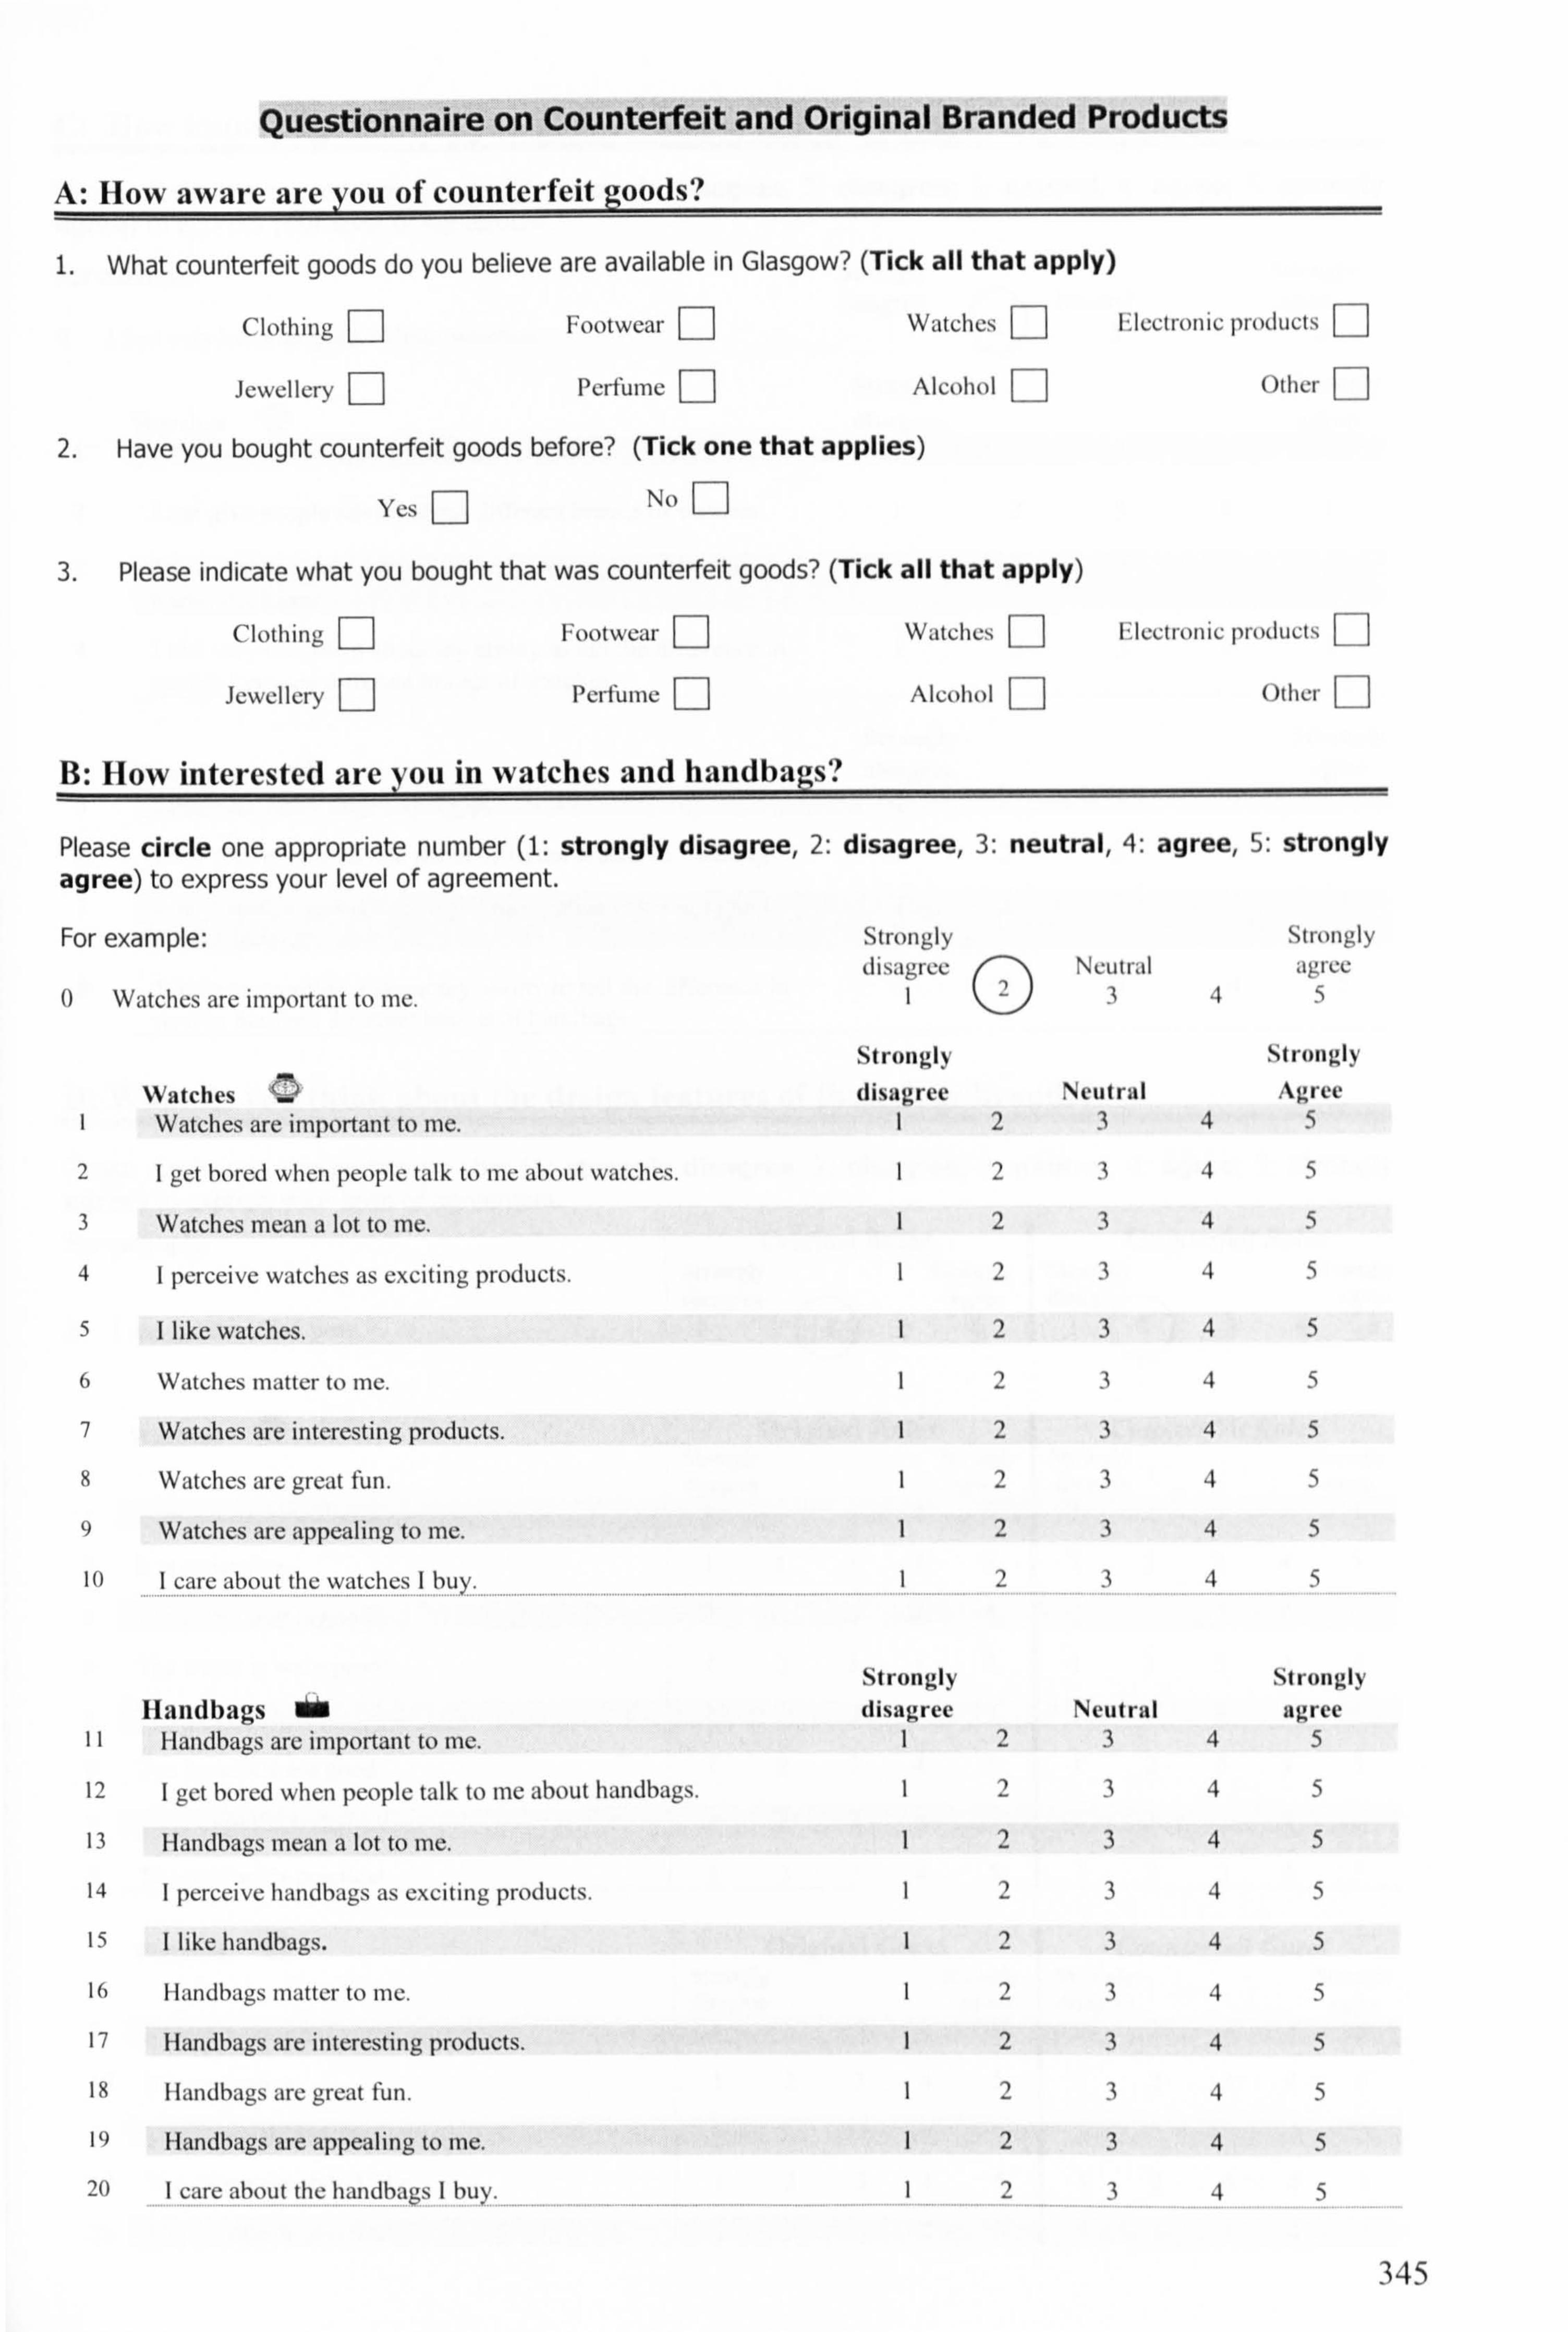
Questionnaire on Counterfeit and Original Branded Products
A: How aware are you of counterfeit goods?
1. What counterfeit goods do you believe are available in Glasgow? (Tick all that apply)
Clothing Footwear F-I Watches El FIccuromic products
Jewellery Perfume Alcohol Other
2. Have you bought counterfeit goods before? (Tick one that applies)
Yes No F-I 3. Please indicate what you bought that was counterfeit goods? (Tick all that apply)
Clothing F-I Footwear Watches E llectronic products
Jewellery F-I Perfume F] Alcohol E] Other D
B: How interested are you in watches and handbags?
Please circle one appropriate number (1: strongly disagree, 2: disagree, 3: neutral, 4: agree, 5: strongly agree) to express your level of agreement.
For example: Strongly Strongly disagree Neutral agree
0 Watches are important to mc. 10345
Strongly Strongly
Watches iie disagree Neutral Agree I Watches are important to me. I 2 3 4 5
2 I get bored when people talk to me about watches. I 2 3 4 5
3 Watches mean a lot to me. I 2 3 4 5
4 I perceive watches as exciting products. I 2 3 4 5
5 I like watches. I 2 3 4 5
6 Watches matter to me. I 2 3 4 5
7 Watches are interesting products. 1 2 3 4 5
8 Watches are great fun. 1 2 3 4 5
9 Watches are appealing to me. 1 2 3 4 5
10 I care about the watches I buy. I 2 3 4 5
Strongly Strongly Handbags OW disagree Neutral agree
I Handbags are important to me. I 2 3 4 5
12 I get bored when people talk to me about handbags. I 2 3 4 5
13 Handbags mean a lot to me. 1 2 3 4 5
14 I perceive handbags as exciting products. 1 2 3 4 5
15 I like handbags. 1 2 3 4 5
16 1landbags matter to me. I 2 3 4 5
17 Handbags are interesting products. 1 2 3 4 5
18 Handbags are great fun. I 2 3 4 5
19 Handbags are appealing to me. I 2 3 4 5
20 1 care about the handbags I buy. 1 2 3 4 5
345

C: How knowledgeable are you about watches and handbags?
Please circle one appropriate number (1: strongly disagree, 2: disagree; 3: neutral, 4: agree; 5: strongly agree) to express your level of agreement.
For example: Strongly Strongly disagree Neutral agree
01 feel very knowledgeable about watches. 10345
Strongly Strongly
Watches disagree agree 1 1 feel very knowledgeable about watches. 12 3 4 5
2 I can give people advice about different brands of watches. I2 3 4 5
3 1 only need to gather very little information in order to make I2 3 4 5
a wise decision.
4 I feel very confident about my ability to tell the difference in I2 3 4 5
quality between different brands of watches.
Strongly Strongly Handbags " disagree agree
5 I feel very knowledgeable about handbags. I2 3 4 5
6 I can give people advice about diffcrcnt brands of handbags. I2 3 4 5
7 1 only need to gather very little information in order to make I2 3 4 5
a wise decision.
8 1 feel very confident about my ability to tell the difference in I2 3 4 5
quality between different brands of handbags.
D: What do you think about the design features of these four brands?
Please circle one appropriate number (1: strongly disagree, 2: disagree; 3: neutral, 4: agree; 5: strongly agree) to express your level of agreement. For example: Original Rolex Coutiter/i-iu Rules
Strongly Strongly Strongly Strongly disagree agree disagrýý agree
01 can get the size I want. 12 U3
45 I= J345
Watches
I I can get the size I want.
2 It is expensive.
3 The packaging is good.
4 The watch is waterproof.
5 lt is Swiss made.
6 The materials are good.
7 They have the style I like.
8 The product is practical.
Watches
91 can get the size I want.
10 It is expensive.
II The materials are good.
12 They have the style I like
13 The product is practical
Original Rolex Strongly Strongly disagree agree
12 3 4 5
2 3 4 5
2 3 4 5
2 3 4 5
2 3 4 5
2 3 4 5
12 3 4 5
2 3 4 5
Original Gucci Strongly Strongly disagree agree
12 3 4 5
2 3 4 5
12 3 4 5
2 3 4 5
12 3 4 5
Counterfeit Rolex Strongly Stimgly disagree agree
2 3 4 5
2 3 4 5
12 3 4 5
2 3 4 5
2 3 4 5
2 3 4 5
12 3 4 5
2 3 4 5
Counterli"if Gucci Strongly Strongly disagree agree
12345
2345
12345
12345
12345
346

Handbags Original Burberry Counterfeit Burherry Strongly Strongly Strongly Strongly disagree agree disagree agree
14 1 can get the size I want. 12 3 4 5 I2 3 4 5
15 It is expensive. I2 3 4 5 I2 3 4 5
16 The materials are good. 12 3 4 5 I2 3 4 5
17 They have the style I like 12 3 4 5 I2 3 4 5
18 1 can get the colour 1 want. 12 3 4 5 I2 3 4 5
19 The product is practical. ......... ..... _.....
I2 .... .............................
3 4 5 I2 3 4 5
Handbags ii Original Louis Vu itton C'ounterfie it Lou is Vuitton Strongly Strongly Strongly Strongly disagree agree disagree agree
20 1 can get the size I want. 12 3 4 5 12 3 4 5
21 It is expensive. 12 3 4 5 I2 3 4 5
22 The materials are good. 12 3 4 5 I2 3 4 5
23 They have the style I like I2 3 4 5 I2 3 4 5
24 1 can get the colour I want. I2 3 4 5 I2 3 4 5
25 The product is practical 12 3 4 5 12 3 4 5
E: What the benefit or consequences be for you, in buying these goods?
Please circle the appropriate number (1: strongly disagree, 2: disagree; 3: neutral, 4: agree; 5: strongly agree) to express the level of your agreement.
For example: Original Rolex Cou, trer/Cit Rolex Strongly s trongly SIrongly strongly
0 In buying this version, you get high standard quality. disagree
I" (3 4 agree
5 disagrý''"ý
1(21 3 4 agree
5
Watches - Ori ginal Rolex + - Couwerfieir Rolex + I In buying this version, you get a high standard of I2 34 5 12 3 4 5
quality. 2 This product is a statement of your self-image. I2 34 5 I2 3 4 5
3 This product can bring you fun. I2 34 5 I2 3 4 5
4 The quality of the product merits the price. I2 34 5 I2 3 4 5
5 In buying this product, you get value for money for the I2 34 5 I2 3 4 5 status it brings you.
6 You can throw it away after a while. I2 34 5 I2 3 4 5
7 This product brings you exclusivity. 12 34 5 I2 3 4 5
8 This product can make you attract other people's 12 34 5 I2 3 4 5
attention. 9 This product can bring you prestige. I2 34 5 I2 3 4 5
10 This product may not tünction well. I2 34 5 I2 3 4 5
II This product might make you become a target for I2 34 5 I2 3 4 5 muggers.
12 You are concerned about being tiiund out by your I2 34 5 I2 3 4 5 peers for using this product.
13 In buying this product, you are concerned about 12 34 5 I2 3 4 5 financial loss.
347
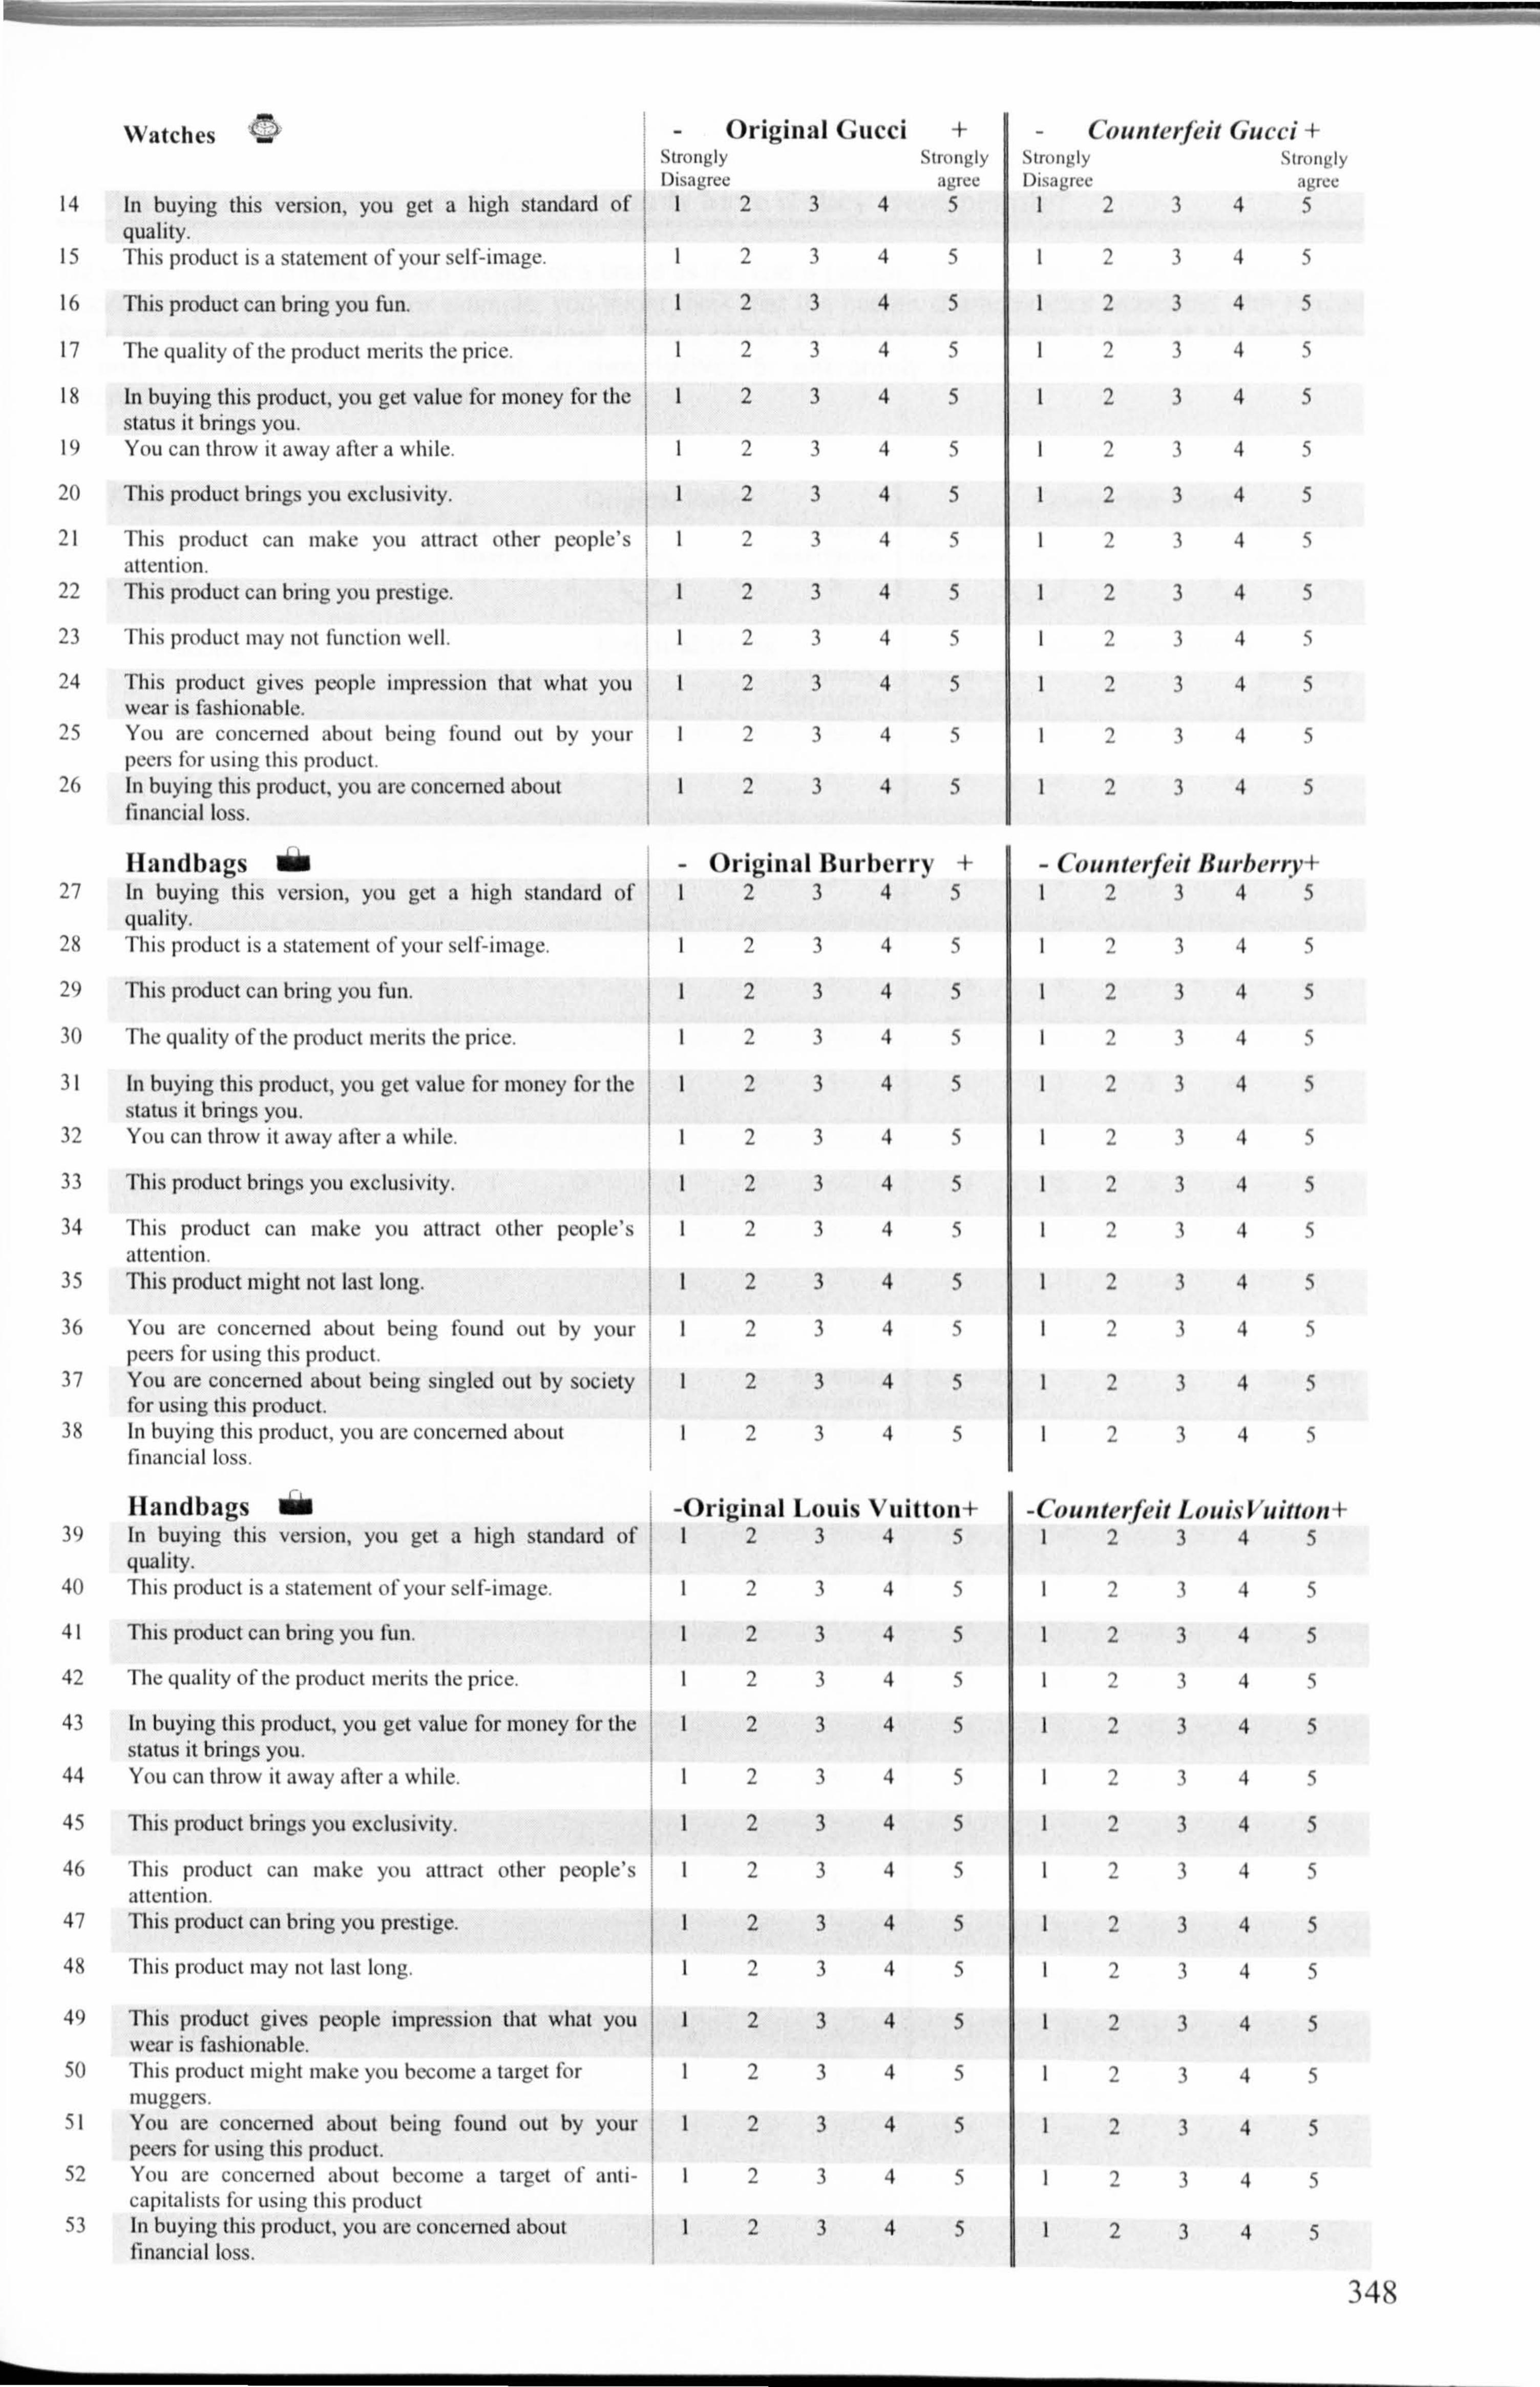
Watches ' - Original Gucci + - Counterfeit Gucci + Strongly Strongly Strongly Strongly Disagree agree Disagree agree
14 In buying this version, you get a high standard of 12 3 4 5 12 3 4 5 quality.
15 This product is a statement of your self-image. I2 3 4 5 I2 3 4 5
16 This product can bring you fun. 12 3 4 5 I2 3 4 5
17 The quality of the product merits the price. I2 3 4 5 I2 3 4 5
18 In buying this product, you get value for money for the I2 3 4 5 I2 3 4 5 status it brings you.
19 You can throw it away after it while. I2 3 4 5 I2 3 4 5
20 This product brings you exclusivity. I2 3 4 5 I2 3 4 5
21 This product can make you attract other people's I2 3 4 5 I2 3 4 5 attention.
22 This product can bring you prestige. 12 3 4 5 12 3 4 5
23 This product may not function well. I2 3 4 S I2 3 4 5
24 This product gives people impression that what you I2 3 4 5 I2 3 4 5 wear is fashionable.
25 You are concerned about being found out by your I2 3 4 5 I' 3 4 5 peers t'01 using this product.
26 In buying this product, you are concerned about I2 3 4 5 12 3 4 5 financial loss.
Handbags " - Original Bu rberry + - ('c, unterfiit Burberrp+ 27 In buying this version, you get a high standard of I2 3 4 5 I2 3 4 5
quality. 28 This product is a statement of you self-image. I2 3 4 5 I 3 4 5
29 This product can bring you fun. I2 3 4 5 I2 3 4 5
30 The quality of the product merits the price. I2 3 4 5 I2 3 4 5
31 In buying this product, you get value for money for the I2 3 4 5 I2 3 4 5 status it brings you.
32 You can throw it away after a while. I2 3 4 5 I2 3 4 5
33 This product brings you exclusivity. I2 3 4 5 I2 3 4 5
34 This product can make you attract other people's I2 3 4 5 12 3 4 5 attention.
35 This product might not last long. I2 3 4 5 12 3 4 5
36 You are concerned about being found out by your I2 3 4 5 I2 3 4 5 peers for using this product.
37 You are concerned about being singled out by society I2 3 4 5 I2 3 4 5 for using this product.
38 In buying this product, you are concerned about I2 3 4 5 I2 3 4 5 financial loss.
Handbags OW -Original Louis Vui tton+ -Cuun1erfcit Lo uis I'uitton+ 39 In buying this version, you get a high standard of l2 3 4 5 12 3 4 5
quality. 40 This product is a statement of your self-image. I2 3 4 5 I2 3 4 5
41 This product can bring you fun. 12 3 4 5 12 3 4 5
42 The quality of the product merits the price. I2 3 4 5 I' 3 4 5
43 In buying this product, you get value for money for the I2 3 4 5 I2 3 4 5 status it brings you.
44 You can throw it away after a while. I2 3 4 5 I2 3 4 5
45 This product brings you exclusivity. I2 3 4 5 I2 3 4 5
46 This product can make you attract other people's I2 3 4 5 I2 3 4 5 attention.
47 This product can bring you prestige. I2 3 4 5 I2 3 4 5
48 This product may not last long. I2 3 4 5 I2 3 4 5
49 This product gives people impression that what you I2 3 4 5 I2 3 4 5 wear is fashionable.
50 This product might make you hecome a target tier I2 3 4 5 I2 3 4 5 muggers.
SI You are concerned about being found out by your I2 3 4 5 I2 3 4 5 peers for using this product.
52 You are concerned about become it target of anti- I2 3 4 5 I2 3 4 5 capitalists for using this product
53 In buying this product, you are concerned about I2 3 4 5 I2 3 4 5 financial loss.
348
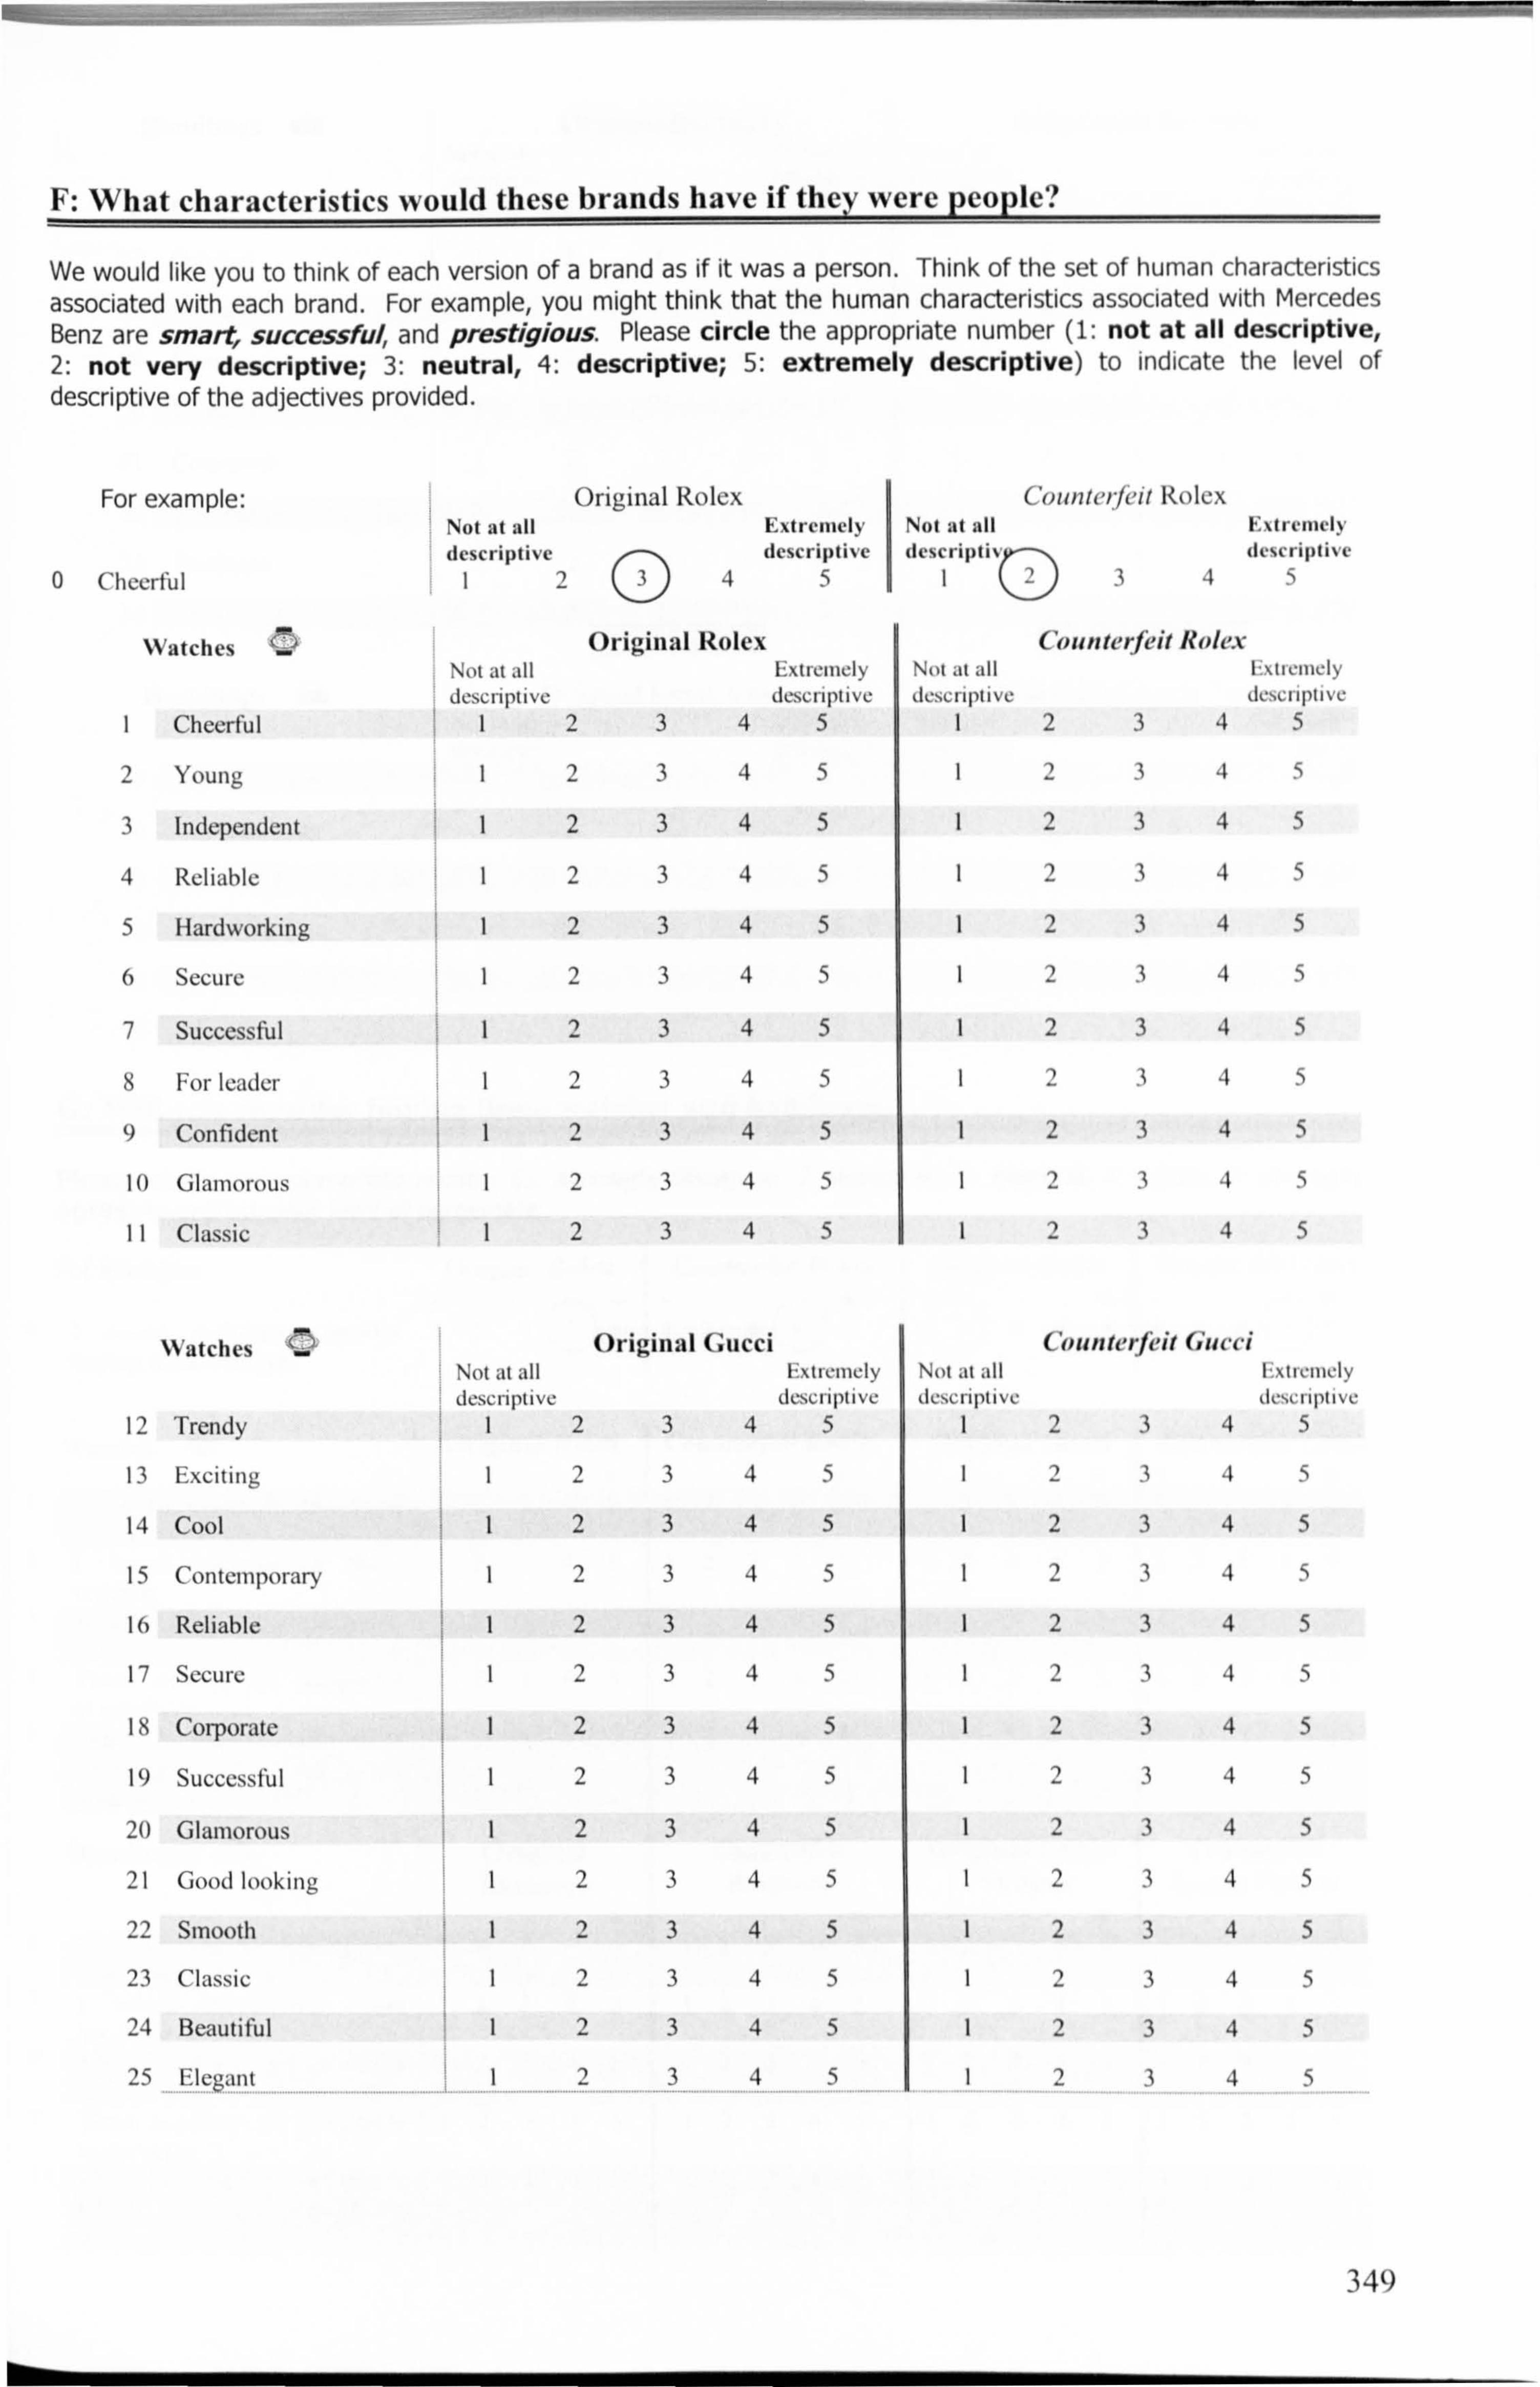
F: What characteristics would these brands have if they were people?
We would like you to think of each version of a brand as if it was a person. Think of the set of human characteristics associated with each brand. For example, you might think that the human characteristics associated with Mercedes Benz are smart, successful, and prestigious. Please circle the appropriate number (1: not at all descriptive, 2: not very descriptive; 3: neutral, 4: descriptive; 5: extremely descriptive) to indicate the level of descriptive of the adjectives provided.
For example: Original Rolex Not at all Extremely descriptive descriptive
0 Cheerful I 2 O4
5
Watches Original Rolex Not at all Extremely
descriptive descriptive I Cheerful I 2 34 5
2 Young 1 2 34 5
3 Independent 1 2 34 5
4 Reliable I 2 34 5
5 Hardworking I 2 34 5
6 Secure 1 2 34 5
7 Successful I 2 34 5
8 For leader 1 2 34 5
9 Confident 1 2 34 5
1 0 Glamorous 1 2 34 5
I I Classic 1 2 34 5
Watches Original Gucci Not at all H. ctmmCIV descriptive descriptive
12 Trendy I2 3 4 5
13 Exciting 12 3 4 5
14 Cool 12 3 4 5
15 Contemporary I2 3 4 5
16 Reliable I2 3 4 5
17 Secure 12 3 4 5
18 Corporate I2 3 4 5
19 Successful I2 3 4 5
20 Glamorous I2 3 4 5
21 Good looking 12 3 4 5
22 Smooth I2 3 4 5
23 Classic I2 3 4 5
24 Beautiful 12 3 4 5
25 Elegant 12 3 4 5
Count rieh Roles Not at all Extremely descripti descriptive
I C)
3 4 5
Cot nterfert Rolex Not at all Extremely descriptive descriptive
2 3 4 5
I2 3 4 5
2 3 4 5
2 3 4 5
12 3 4 5
12 3 4 5
2 3 4 5
2 3 4 5
2 3 4 5
2 3 4 5
2 3 4 5
Counterftit Gucci Not it all I'1 tlel111'Iy
dell'. IIIII I VI' lIescI Ipllvl'
2 3 4 5
2 3 4 5
2 3 4 5
2 3 4 5
2 3 4 5
2 3 4 5
2 3 4 5
2 3 4 5
2 3 4 5
2 3 4 5
2 3 4 5
2 3 4 5
2 3 4 5
2 3 4 5
349

Handbags IM Original Burberry Counterfeit Burberry Not at all Extremely Not at all Extremely descriptive descriptive descriptive descriptive
26 Down to earth 12 3 4 5 I2 3 4 5
27 Original I2 3 4 5 I2 3 4 5
28 Unique 12 3 4 5 12 3 4 5
29 Contemporary 12 3 4 5 I2 3 4 5
30 Reliable I2 3 4 5 I2 3 4 5
31 Corporate 12 3 4 5 I2 3 4 5
32 Successful 12 3 4 5 I2 3 4 5
33 Feminine 12 3 4 5 I2 3 4 5
34 Outdoorsy 12 3 4 5 12 3 4 5
Handbags Origin al Louis Vu itton Counterfeit Lou is I'uitton Not at all Extremely Not at all I(. elrcmcly descriptive descriptive descriptive dk, cnptive
35 Trendy 12 3 4 5 I2 3 4 5
36 Contemporary 12 3 4 5 I2 3 4 5
37 Successful I2 3 4 5 12 3 4 5
38 Upper class I2 3 4 5 I2 3 4 5
39 Feminine 12 3 4 5 I2 3 4 5
40 Smooth 12 3 4 5 12 3 4 5
G: Will you consider buvini these watches and handbags?
Please circle one appropriate number (1: strongly disagree, 2: disagree; 3: neutral, 4: agree; 5: strongly agree) to express your level of agreement.
For example: Original Rolex Counterfeit Rolex Original Gucci ('uunterfc'it Gucci
fý I would definitely consider I2 3(D 5123O5 IC 345123 4O 5 buying these watches.
Watches Original Rolex
I I would consider buying these 123 4 5 watches.
2 I would recommend these I23 4 5 watches.
3 These watches are attractive to I23 4 5 nie.
4 These watches are acceptable 123 4 5
to purchase. 5 These watches are acceptable 123 4 5
within the price range I am willing to pay.
Handbags " Original Burberry
6 1 would consider buying one 123 4 5 these handbags.
7 I would recommend these 123 4 5 handbags.
8 These handbags are attractive I23 4 5 to me.
9 These handbags are acceptable I23 4 5 to purchase.
Ill These handbags are acceptable 123 4 5 within the price range I am willing to pay.
Counterfeit Rolex
12 3 4 5
12 3 4 5
12 3 4 5
12 3 4 5
12 3 4 5
Counterfeit Burberry
2 3 4 5
12 3 4 5
12 3 4 5
12 3 4 5
12 3 4 5
Original Cucci
12 3 4 5
12 3 4 5
12 3 4 5
12 3 4 5
12 3 4 5
Original Louise Vuitton
12345
12345
12345
12345
12345
('uunterfidt Gucci
12345
12345
12345
12345
12345
Counter/i-it Louise Vuitton
12345
12345
12345
12345
12345
350

H: Do you intend to buv these watches?
Please circle one appropriate number (1: strongly disagree, 2: disagree; 3: neutral, 4: agree; 5: strongly agree) to express your level of agreement.
For example: Original Rolex Counterfeit Rolex Original Gucci C'ouunter/eit Gucci
01 will never buy these watches. 12 045
12 3(D 5 10 345 123 04
5
Watches Original Rolex Counterfeit Rolex Original Cucei Counterfeit Gucci
+ -+ -+ -+ II have intention to buy these 12345 12 345 12345 12 345
watches. 21 intend to buv these watches. 12345 I2345 I2345 I2345
31 have high purchase interest of 12 345 12 345 12345 12 345 these watches.
41 buy these watches. 12345 12345 12345 12345
51 probably buy these watches. 12 345 12345 12 345 12 345
Handbags ii Original Burberry
6I have intention to buy these I2345 handbags.
71 intend to buy these handbags. I2345
8I have high purchase interest of 12 345
these handbags. 9I buy these handbags. 12 345
10 1 probably buy these handbags. 12345
I: Information about you
Counterfeit Burberry
12345
12345
12345
12345
12345
Original Louis CounterJe t \'uilton Louis Vuitton
+-+ 1234512345
1234512345
1234512345
2345I2345
1234512345
Please indicate your personal details by ticking the appropriate category that you engage in.
Age -20 21-30 n 31-40 41-50 EI 51-60 61-70 E 70' LI
Gender Male Female
Marital status Single Married Divorced/Separated Widowed ('o-habiting
Number of children living with you 0 [] I2345 or more
Your Job Craftsman, "Tradesman
Public service
Self-employed
Student
Your household income before tax
Under £9,999 LI
£30-34,999 LI
£45-49,999 LI
Your education
Office/shop/clerical E]
Middle management
Retired
Unemployed F-I £10-24,999 F]
£35-39,999 F]
£50-54,999
Factory/manual worker
Professional
I louscwile
Other
£25- 29,999
£40-44,999
£55,000 above
Primary-school Fj HND/HNC Post Graduate
High-school BA/MA
Thank you very much for taking the time to fill out this questionnaire!
351
Contact information
Your time and effort in relation to completion of this question is very much appreciated. In case that we need to contact you for additional information associated to this questionnaire, could we contact you? Please tick one that applies.
Yes jj No
We would highly appreciate if you could provide us with your contact details, but if you would prefer to remain anonymous, please return the questionnaire with the following section blank.
Your name: .............................................................................................................................................
Address: .............................................................................................................................................
Telephone no: ..............................................................................................................................................
Email address: ..................................................................................................
If you have decided not to participate
Please list reasons for not being able to participate in this research:
Thank you very much for your cooperation!
352

Appendix 5 Cover Letter
1 0th November 2005
Dear Participant
I would like to invite you to participate in a piece of academic research on study of consumers' perceptions of counterfeit branded products as opposed to genuine branded products. This study is undertaken by the Business and Management School at the University of Glasgow as a part of my doctoral research.
Previous research reveals that consumer demand for counterfeit products is one of the reasons why this practice is booming despite societies' effort in trying to curb it. Therefore, your participation is absolutely crucial to the successful completion of this research, and to the completion of my PhD.
It doesn't matter whether or not you buy counterfeit products, you are still qualified to participate. Please complete the attached questionnaire to help me. The questionnaire is designed to be user-friendly. It will take you about 15 to 25 minutes to complete.
Any information provided by you will be kept strictly confidential and is for academic use only. Information identifying the respondent will not be disclosed under any circumstances.
Once more I would like to stress that your participation is critical in completing this research and would be highly appreciated. Should you have any query about this in relation to this question, please do not hesitate to contact me on 0141 3302000 (ext: 0311), alternatively you can email me at X. Bian. 1(research. gla. ac. uk.
Yours sincerely
Xuemei Bian
PhD Candidate
Business and Management School
University of Glasgow
353
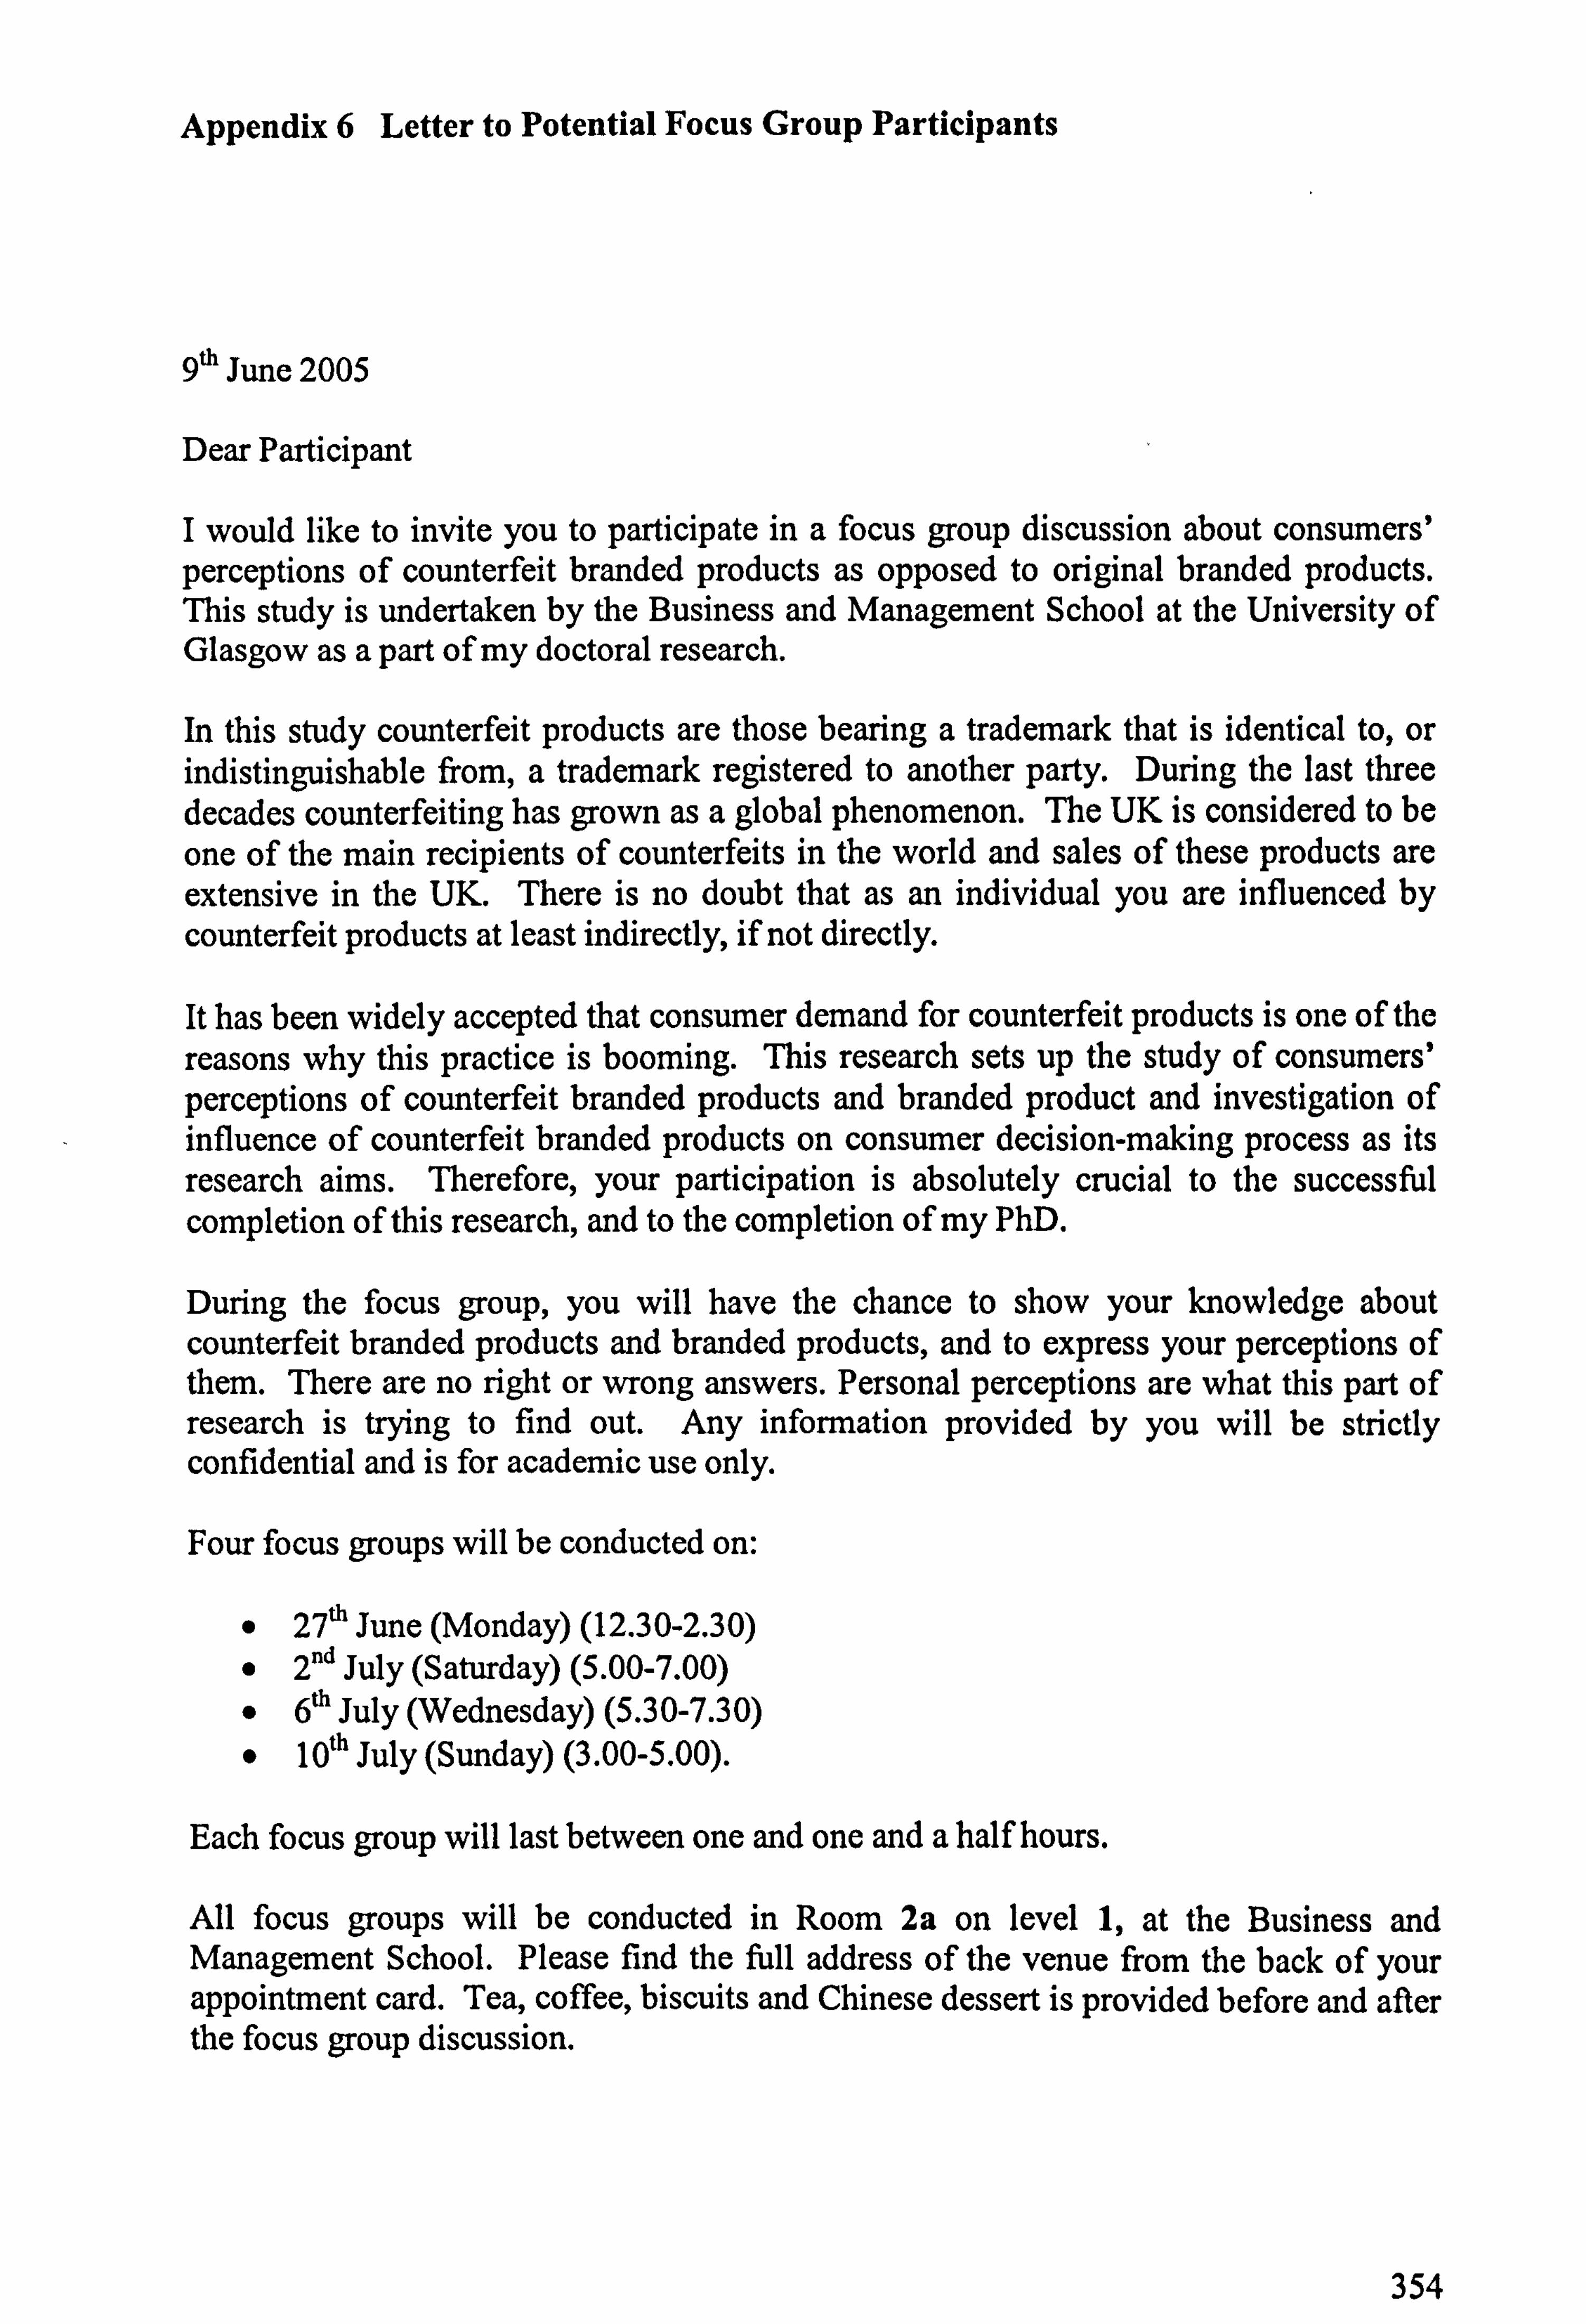
Appendix 6 Letter to Potential Focus Group Participants
9th June 2005
Dear Participant
I would like to invite you to participate in a focus group discussion about consumers' perceptions of counterfeit branded products as opposed to original branded products. This study is undertaken by the Business and Management School at the University of Glasgow as a part of my doctoral research.
In this study counterfeit products are those bearing a trademark that is identical to, or indistinguishable from, a trademark registered to another party. During the last three decades counterfeiting has grown as a global phenomenon. The UK is considered to be one of the main recipients of counterfeits in the world and sales of these products are extensive in the UK. There is no doubt that as an individual you are influenced by counterfeit products at least indirectly, if not directly.
It has been widely accepted that consumer demand for counterfeit products is one of the reasons why this practice is booming. This research sets up the study of consumers' perceptions of counterfeit branded products and branded product and investigation of influence of counterfeit branded products on consumer decision-making process as its research aims. Therefore, your participation is absolutely crucial to the successful completion of this research, and to the completion of my PhD.
During the focus group, you will have the chance to show your knowledge about counterfeit branded products and branded products, and to express your perceptions of them. There are no right or wrong answers. Personal perceptions are what this part of research is trying to find out. Any information provided by you will be strictly confidential and is for academic use only.
Four focus groups will be conducted on:
" 27th June (Monday) (12.30-2.30) " 2°a July (Saturday) (5.00-7.00)
" 6th July (Wednesday) (5.30-7.30) " 10th July (Sunday) (3.00-5.00).
Each focus group will last between one and one and a half hours.
All focus groups will be conducted in Room 2a on level 1, at the Business and Management School. Please find the full address of the venue from the back of your appointment card. Tea, coffee, biscuits and Chinese dessert is provided before and after the focus group discussion.
354

Once more I would like to stress that your participation is very important for this study and will be highly appreciated. Please choose a time suitable for you from the Appointment Card and write down your name and contact number in the place provided in the back of the cards and return one of them to the person who contacted you and keep one for your own reference.
Please also find enclosed my contact card. Should you have any query, please do feel free to contact me.
Yours sincerely,
Xuemei Bian Doctoral Researcher
355
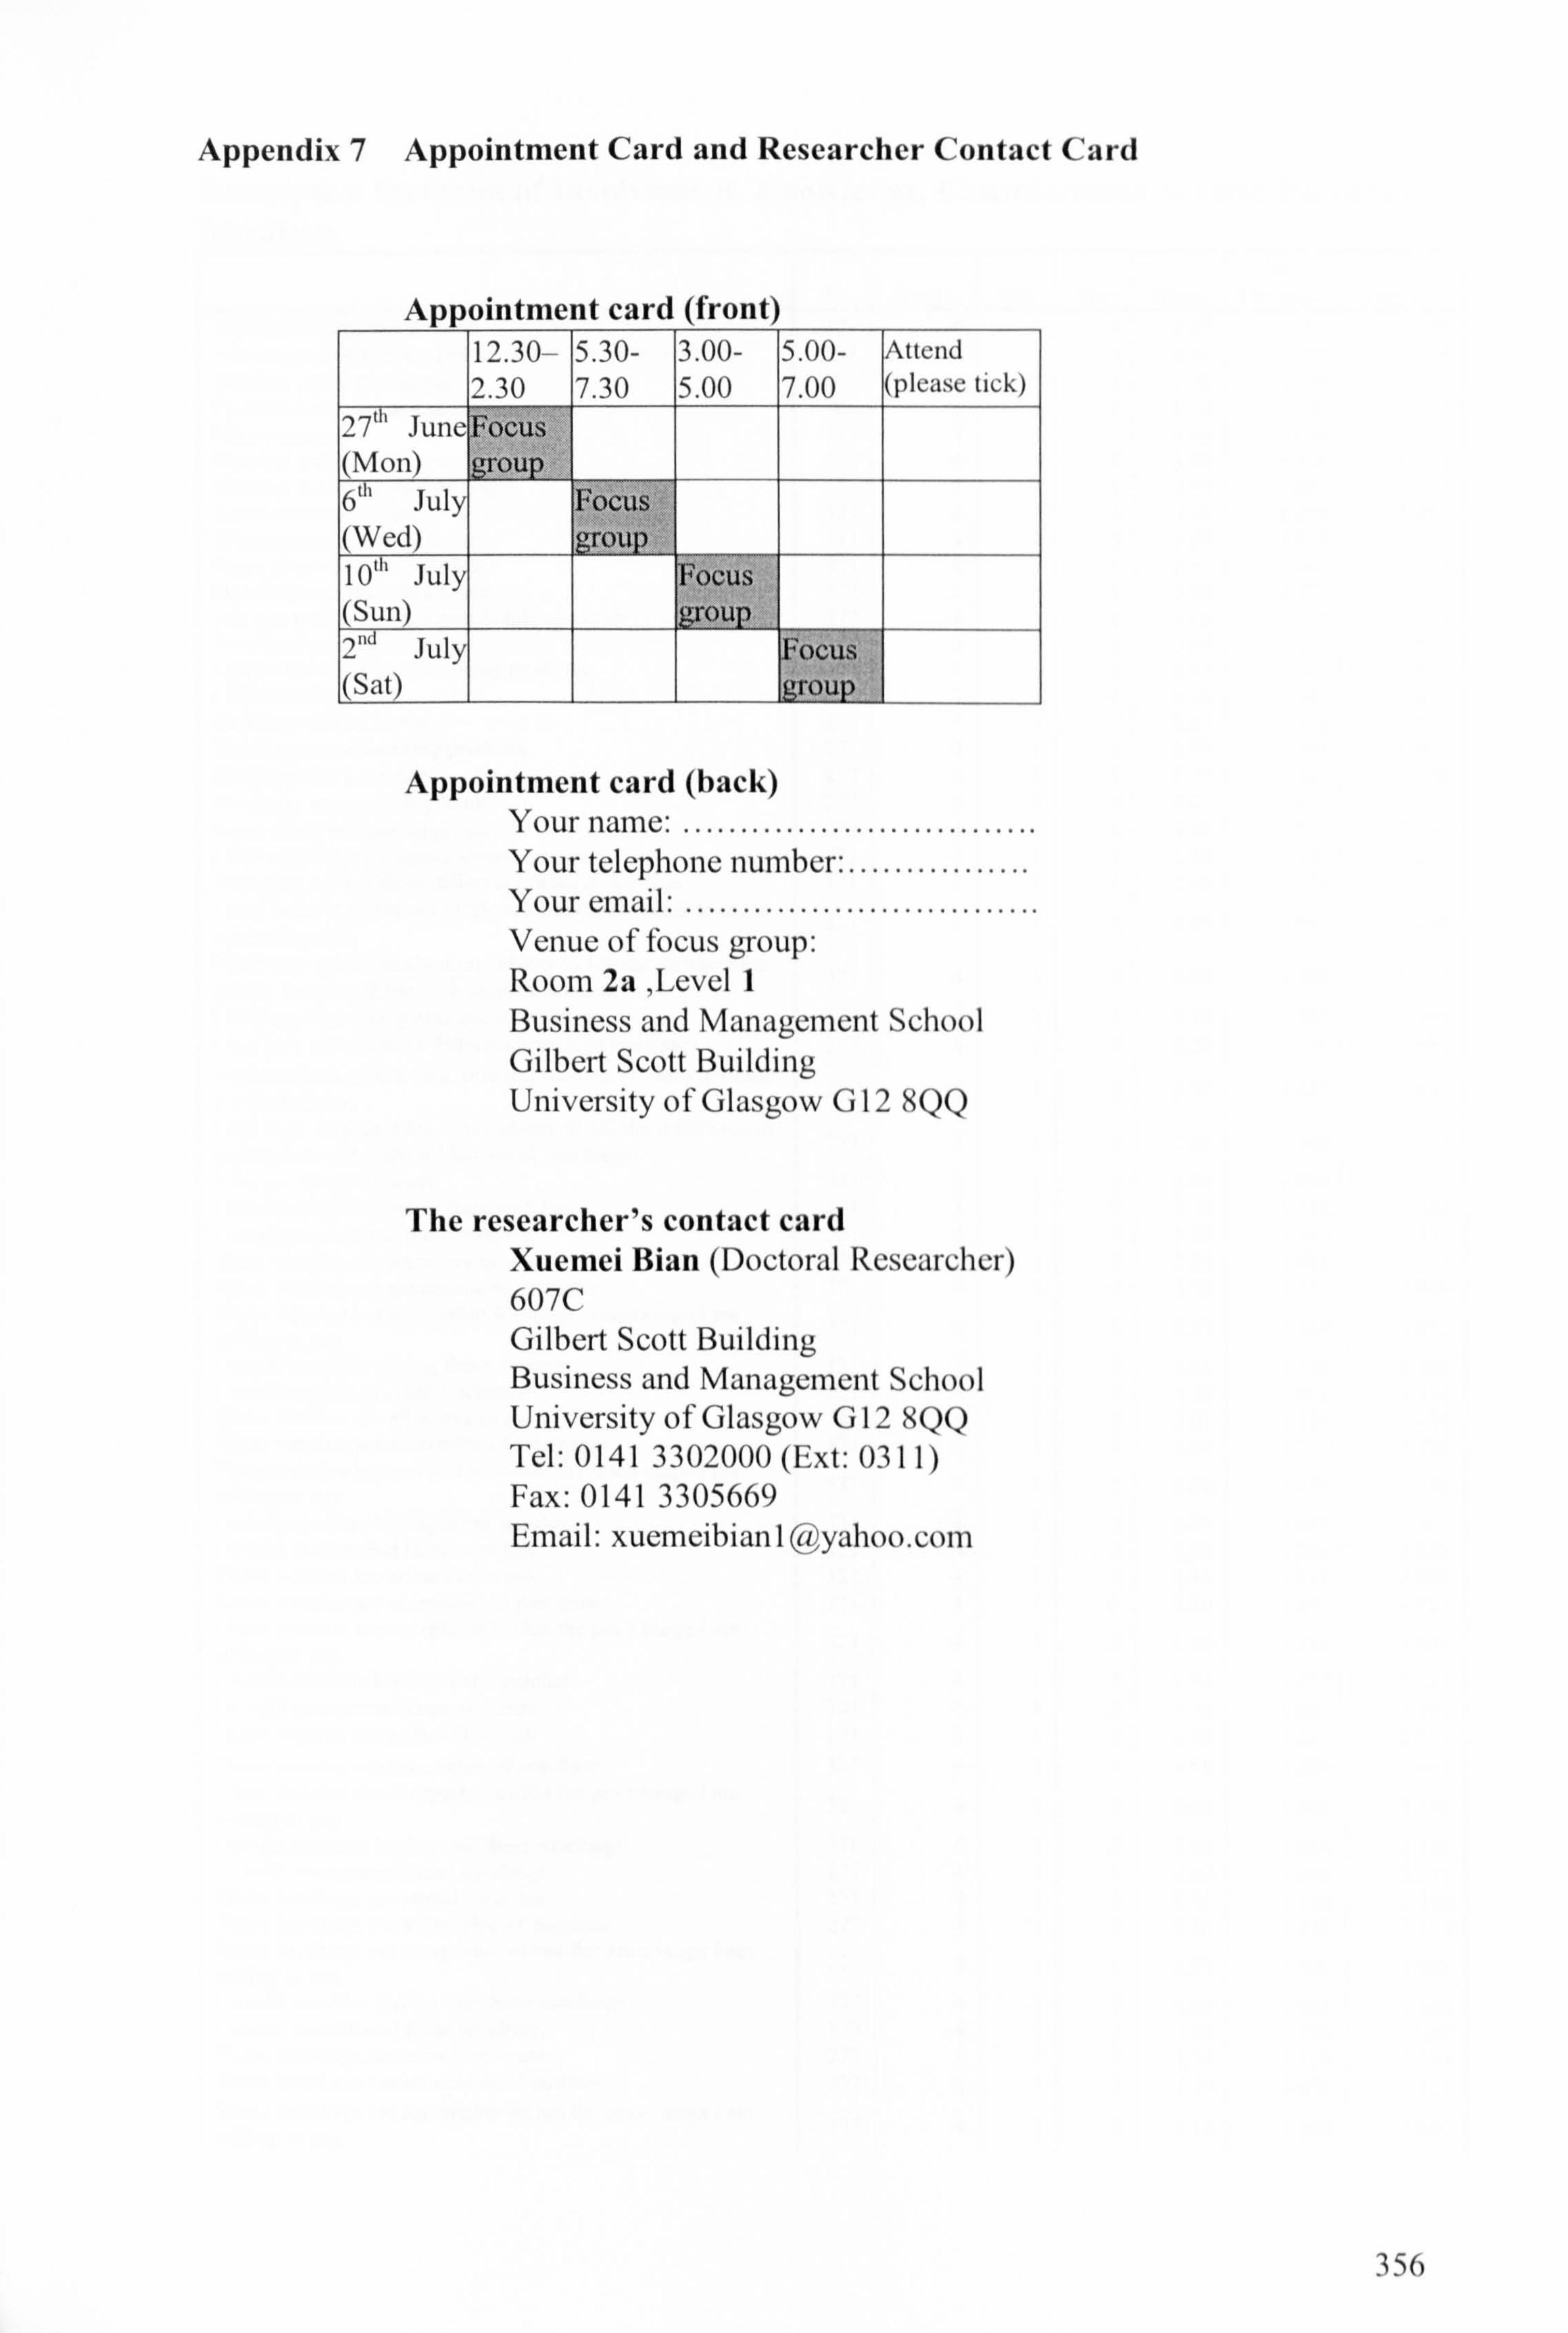
Appendix 7 Appointment Card and Researcher Contact Card
Appointment card (front) 12.30- 5.30- 3.00- 5.00- Attend 2.30 7.30 5.00 7.00 (please tick)
Jul
Jul
Appointment card (back) Your name: ............................... Your telephone number: ................ Your email: ............................... Venue of focus group: Room 2a, Level I Business and Management School Gilbert Scott Building University of Glasgow G 12 8QQ
The researcher's contact card Xuemei Bian (Doctoral Researcher) 607C Gilbert Scott Building Business and Management School University of Glasgow G 12 KQQ Tel: 0141 3302000 (Ext: 0311) Fax: 0141 3305669 Email: xuemeibian1 uyahoo. com
356

Appendix 8 Descriptive Statistics of Involvement, Knowledge, Consideration Set and Purchase Intention
N Range Min Max Mean Std.
Deviation Variance Watches are important to me. 321 4 1 5 3.23 1.183 1.398 I do not get bored when people talk to me about watches. 321 4 1 5 2.60 1.195 1.428 Watches mean a lot to me. 321 4 1 5 2.78 1.188 1.410 I perceive watches as exciting products. 321 4 1 5 2.74 1.130 1.277 I like watches. 321 4 1 5 3.46 . 958 . 918 Watches matter to me. 321 4 1 5 3.09 1.116 1.245 Watches are interesting products. 321 4 1 5 2.95 1.052 1.107 Watches are great fun. 321 4 1 5 2.59 1.018 1.037 Watches are appealing to me. 321 4 1 5 3.05 1.073 1.150 I care about the watches i buy. 321 4 1 5 3.53 1.202 1.444 Handbags are important to me. 277 4 1 5 2.99 1.472 2.167 I do not get bored when people talk to me about handbags. 277 4 1 5 3.12 1.372 1.883 Handbags mean a lot to me. 277 4 1 5 2.79 1.314 1.726 I perceive handbags as exciting products. 277 4 1 5 2.83 1.342 1.801 I like handbags. 277 4 1 5 3.18 1.397 1.953 Handbags matter to me. 277 4 1 5 2.87 1.353 1.831 Handbags are interesting products. 277 4 1 5 2.90 1.365 1.862 Handbags are great fun. 277 4 1 5 2.77 1.317 1.734 Handbags are appealing to me. 277 4 1 5 3.01 1.417 2.007 I care about the handbags I buy. 277 4 1 5 3.18 1.517 2.301 I feel very knowledgeable about watches. 321 4 1 5 2.50 1.116 1.245 I can give advice about different brands of watches. 321 4 1 5 2.18 1.154 1.332 I only need to gether very little information in order to make 321 4 1 S 89 2 043 1 089 1 a wise decision. . . . I feel very confident about my ability to tell the difference in 321 4 1 5 2 76 194 1 427 1 quality between different brands of watches. . . . I feel very knowledgeable about handbags. 277 4 1 5 2.39 1.262 1.594 I can give advice about different brands of handbags. 277 4 1 5 2.28 1.259 1.585 I only need to gether very little information in order to make 277 4 1 5 2 57 1 215 1 477 a wise decision. . . . I feel very confident about my ability to tell the difference in 277 4 1 5 2 58 1 340 1 795 quality between different brands of handbags. . . . I can get the size I want. 321 4 1 5 3.84 1.096 1.201 I would consider buying these watches. 321 4 1 5 2.73 1.512 2.286 I would recommend these watches. 321 4 1 5 3.36 1.419 2.013 These watches are attractive to me. 321 4 1 5 3.25 1.473 2.171 These watches are acceptable of purchase. 321 4 1 5 3.35 1.417 2.008 These watches are acceptable within the price range I am 321 4 1 5 2 37 1 368 1 872 willing to pay. . . . I would consider buying these watches. 321 4 1 5 1.96 1.242 1.542 I would recommend these watches. 321 4 1 5 1.79 1.065 1.134 These watches are attractive to me. 321 4 1 5 2.01 1.214 1.475 These watches are acceptable of purchase. 321 4 1 5 2.04 1.239 1.536 These watches are acceptable within the price range I am 321 4 1 5 2 50 1 473 2 170 willing to pay. . . . I would consider buying these watches. 321 4 1 5 2.95 1.483 2.200 I would recommend these watches. 321 4 1 S 3.32 1.365 1.862 These watches are attractive to me. 321 4 1 5 3.35 1.415 2.003 These watches are acceptable of purchase. 321 4 1 5 3.30 1.397 1.953 These watches are acceptable within the price range I am 321 4 1 5 willing to pay.
2.56 1.382 1.909 I would consider buying these watches. 321 4 1 5 1.98 1.277 1.631 I would recommend these watches. 321 4 1 5 1.76 1.031 1.063 These watches are attractive to me. 321 4 1 5 1.99 1.237 1.531 These watches are acceptable of purchase. 321 4 1 5 1.96 1.209 1.461 These watches are acceptable within the price range I am 321 4 1 5 2.46 468 1 2 156 willing to pay. . . I would consider buying one these handbags. 278 4 1 5 2.31 1.466 2.148 I would recommend these handbags. 277 4 1 5 2.60 1.509 2.277 These handbags are attractive to me. 277 4 1 5 2.56 1.530 2.342 These handbags are acceptable of purchase. 277 4 1 5 2.85 1.541 2.375 These handbags are acceptable within the price range I am 277 4 1 willing to pay.
5 2.37 1.407 1.981 I would consider buying one these handbags. 277 4 1 5 1.66 1.081 1.168 I would recommend these handbags. 277 4 1 5 1.61 . 975 . 950 These handbags are attractive to me. 277 4 1 5 1.75 1.115 1.244 These handbags are acceptable of purchase. 277 4 1 S 1.79 1.059 1.121 These handbags are acceptable within the price range I am 277 4 1 willing to pay. 5 2.16 1.355 1.837
357
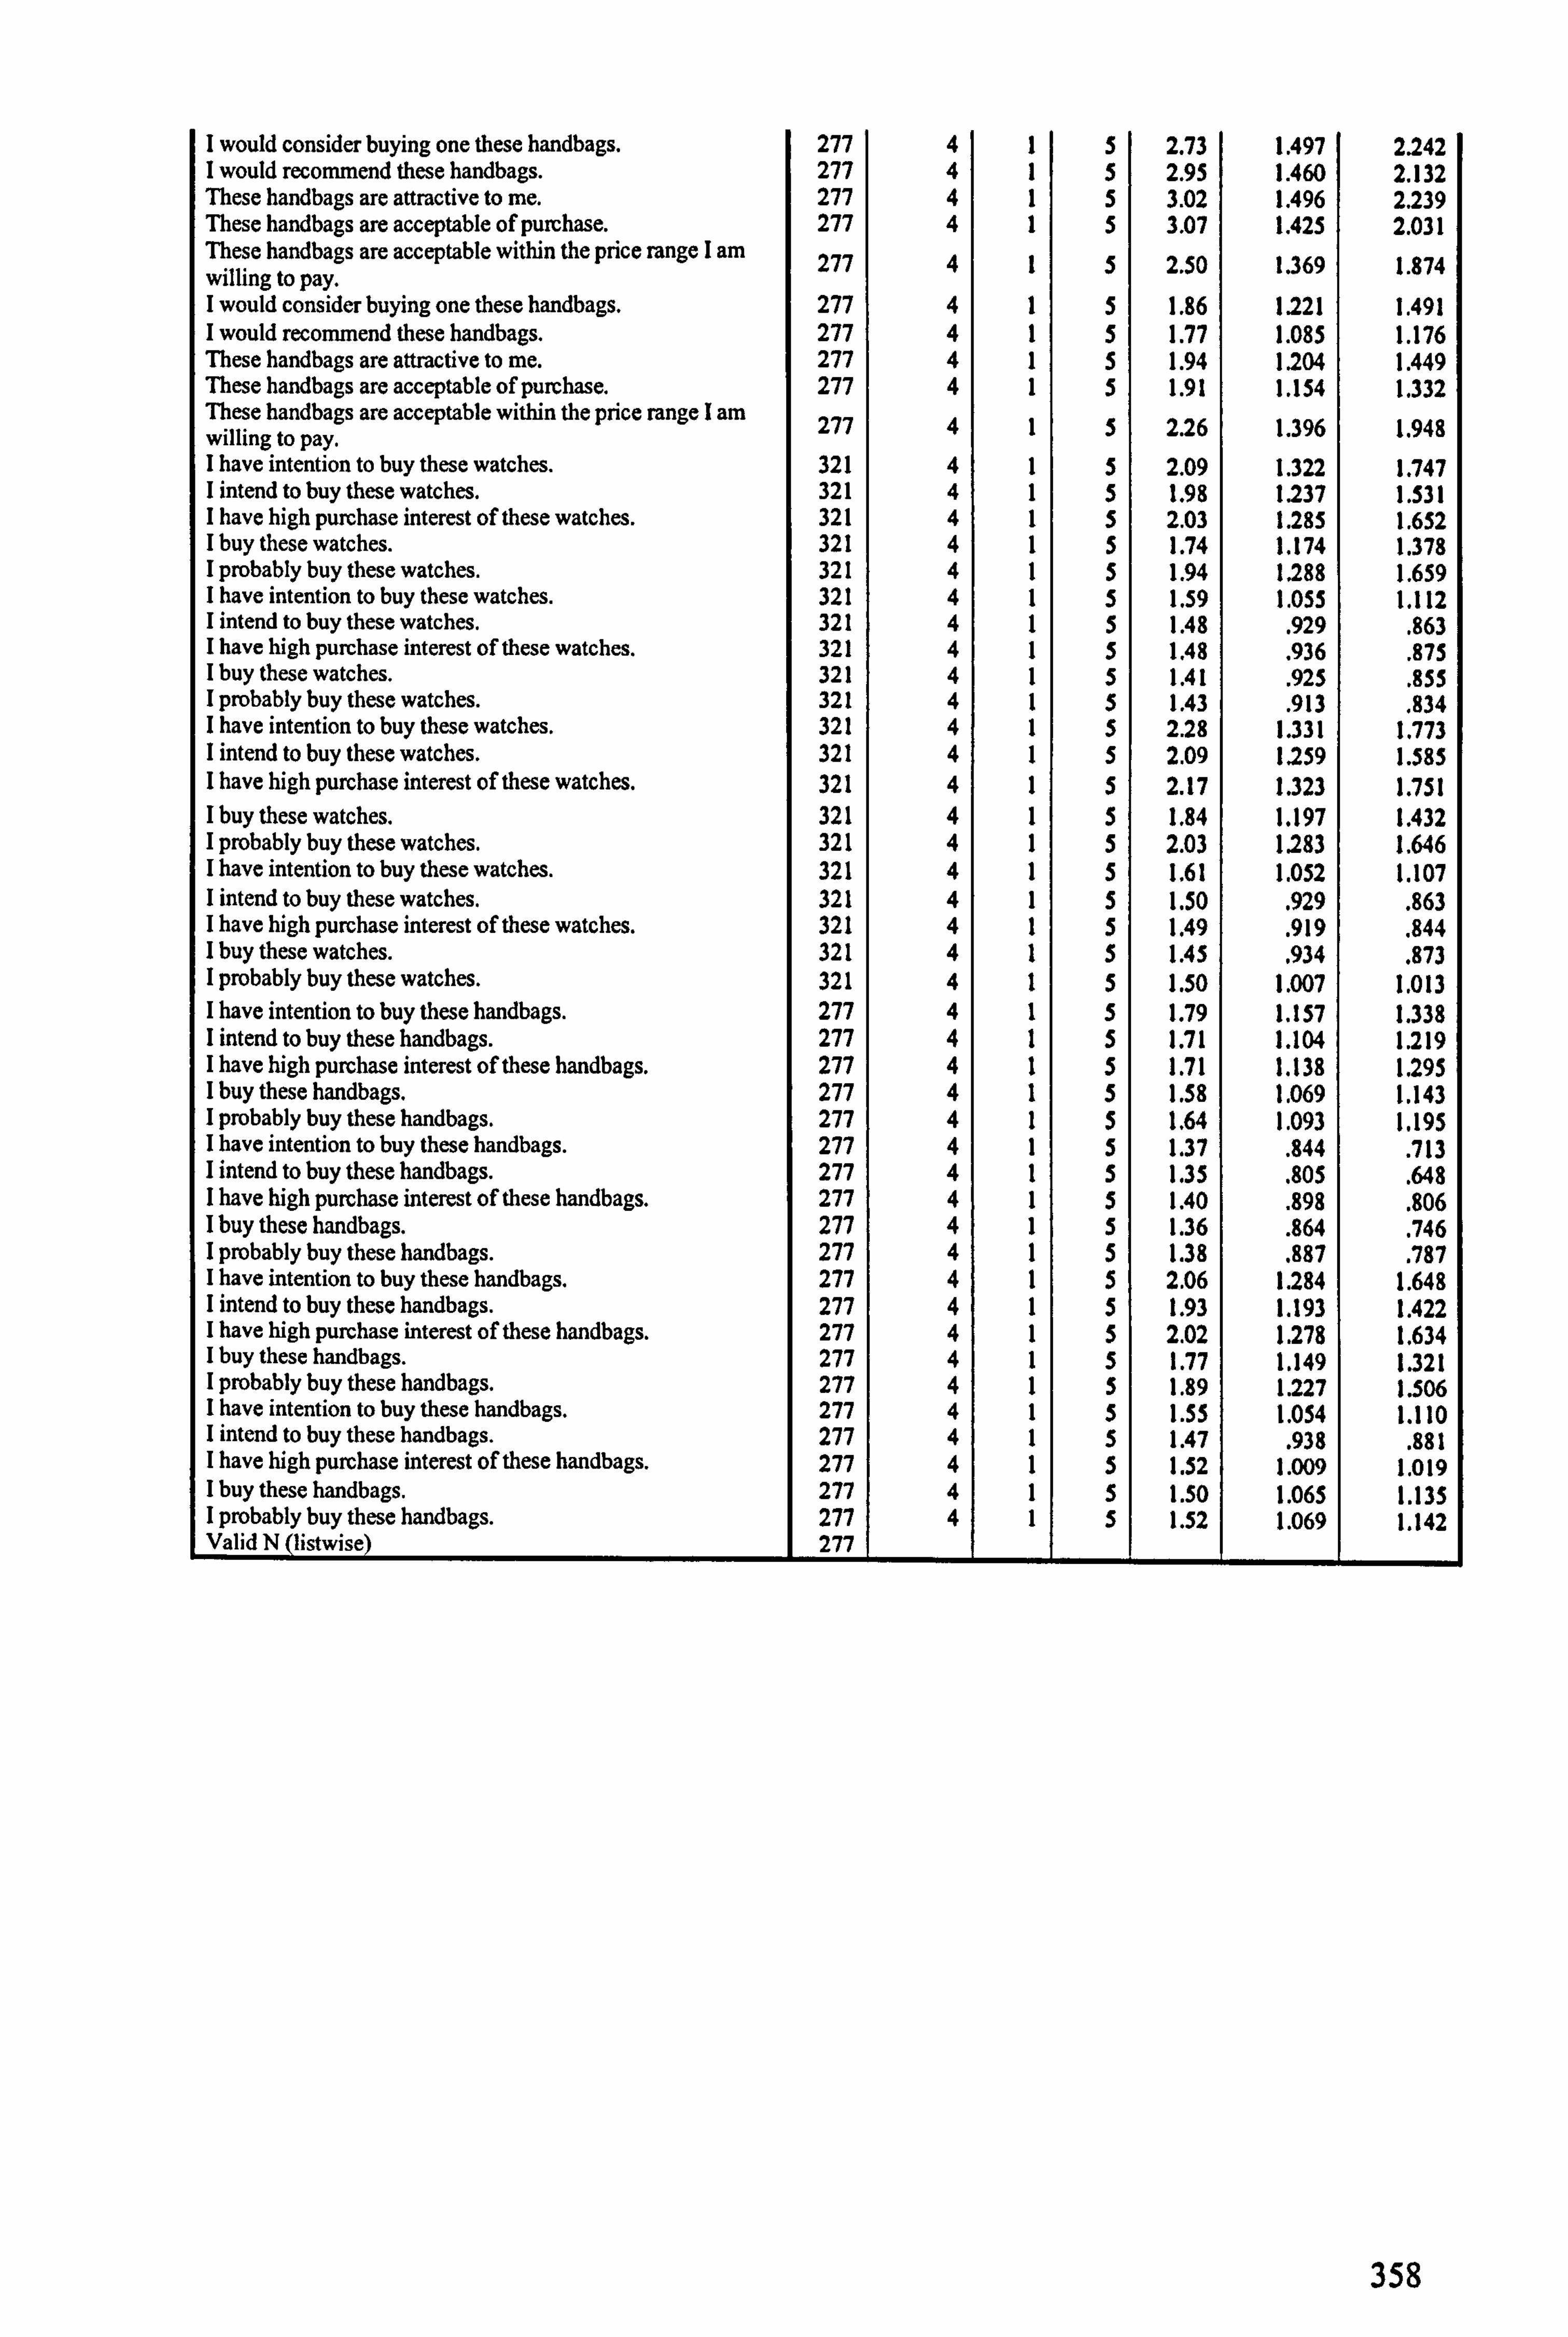
I would consider buying one these handbags. 277 4 1 5 2.73 1.497 2.242 I would recommend these handbags. 277 4 1 5 2.95 1.460 2.132 These handbags are attractive to me. 277 4 1 5 3.02 1.496 2.239 These handbags are acceptable of purchase. 277 4 1 5 3.07 1.425 2.031 These handbags are acceptable within the price range I am 277 4 1 5 2.50 1.369 874 1 willing to pay. . I would consider buying one these handbags. 277 4 1 5 1.86 1.221 1.491 I would recommend these handbags. 277 4 1 5 1.77 1.085 1.176 These handbags are attractive to me. 277 4 1 5 1.94 1.204 1.449 These handbags are acceptable of purchase. 277 4 1 5 1.91 1.154 1.332 These handbags are acceptable within the price range I am 277 4 1 5 2 26 396 1 948 1 willing to pay. . . . I have intention to buy these watches. 321 4 1 5 2.09 1.322 1.747 I intend to buy these watches. 321 4 1 5 1.98 1.237 1.531 I have high purchase interest of these watches. 321 4 1 5 2.03 1.285 1.652 I buy these watches. 321 4 1 5 1.74 1.174 1.378 I probably buy these watches. 321 4 1 5 1.94 1.288 1.659 I have intention to buy these watches. 321 4 1 5 1.59 1.055 1.112 I intend to buy these watches. 321 4 1 5 1.48 . 929 . 863 I have high purchase interest of these watches. 321 4 1 5 1.48
. 936
. 875
I buy these watches. 321 4 1 5 1.41 . 925 . 855 I probably buy these watches. 321 4 1 5 1.43 . 913 . 834 I have intention to buy these watches. 321 4 1 5 2.28 1.331 1.773 I intend to buy these watches. 321 4 1 5 2.09 1.259 1.585 I have high purchase interest of these watches. 321 4 1 5 2.17 1.323 1.751 I buy these watches. 321 4 1 5 1.84 1.197 1.432 I probably buy these watches. 321 4 1 5 2.03 1.283 1.646 I have intention to buy these watches. 321 4 1 5 1.61 1.052 1.107 I intend to buy these watches. 321 4 1 5 1.50 . 929 . 863 I have high purchase interest of these watches. 321 4 1 5 1.49 . 919 . 844 I buy these watches. 321 4 1 5 1.45 . 934 . 873 I probably buy these watches. 321 4 1 5 1.50 1.007 1.013 I have intention to buy these handbags. 277 4 1 5 1.79 1.157 1.338 I intend to buy these handbags. 277 4 1 5 1.71 1.104 1.219 I have high purchase interest of these handbags. 277 4 1 5 1.71 1.138 1.295 I buy these handbags. 277 4 1 5 1.58 1.069 1.143 I probably buy these handbags. 277 4 1 5 1,64 1.093 1.195 I have intention to buy these handbags. 277 4 1 5 1.37 . 844 . 713 I intend to buy these handbags. 277 4 1 5 1.35 . 805 . 648 I have high purchase interest of these handbags. 277 4 1 5 1.40 . 898 . 806 I buy these handbags. 277 4 1 5 1.36 . 864 . 746 I probably buy these handbags. 277 4 1 5 1.38 . 887 . 787 I have intention to buy these handbags. 277 4 1 5 2.06 1.284 1.648 I intend to buy these handbags. 277 4 1 5 1.93 1.193 1.422 I have high purchase interest of these handbags. 277 4 1 5 2.02 1.278 1.634 I buy these handbags. 277 4 1 5 1.77 1.149 1.321 I probably buy these handbags. 277 4 1 5 1.89 1.227 1.506 I have intention to buy these handbags. 277 4 1 5 1.55 1.054 1.110 I intend to buy these handbags. 277 4 1 5 1.47 . 938 . 881 I have high purchase interest of these handbags. 277 4 1 5 1.52 1.009 1.019 I buy these handbags. 277 4 1 5 1.50 1.065 1.135 I probably buy these handbags. 277 4 1 5 1.52 1.069 1.142 Valid N (listwise) 277
358
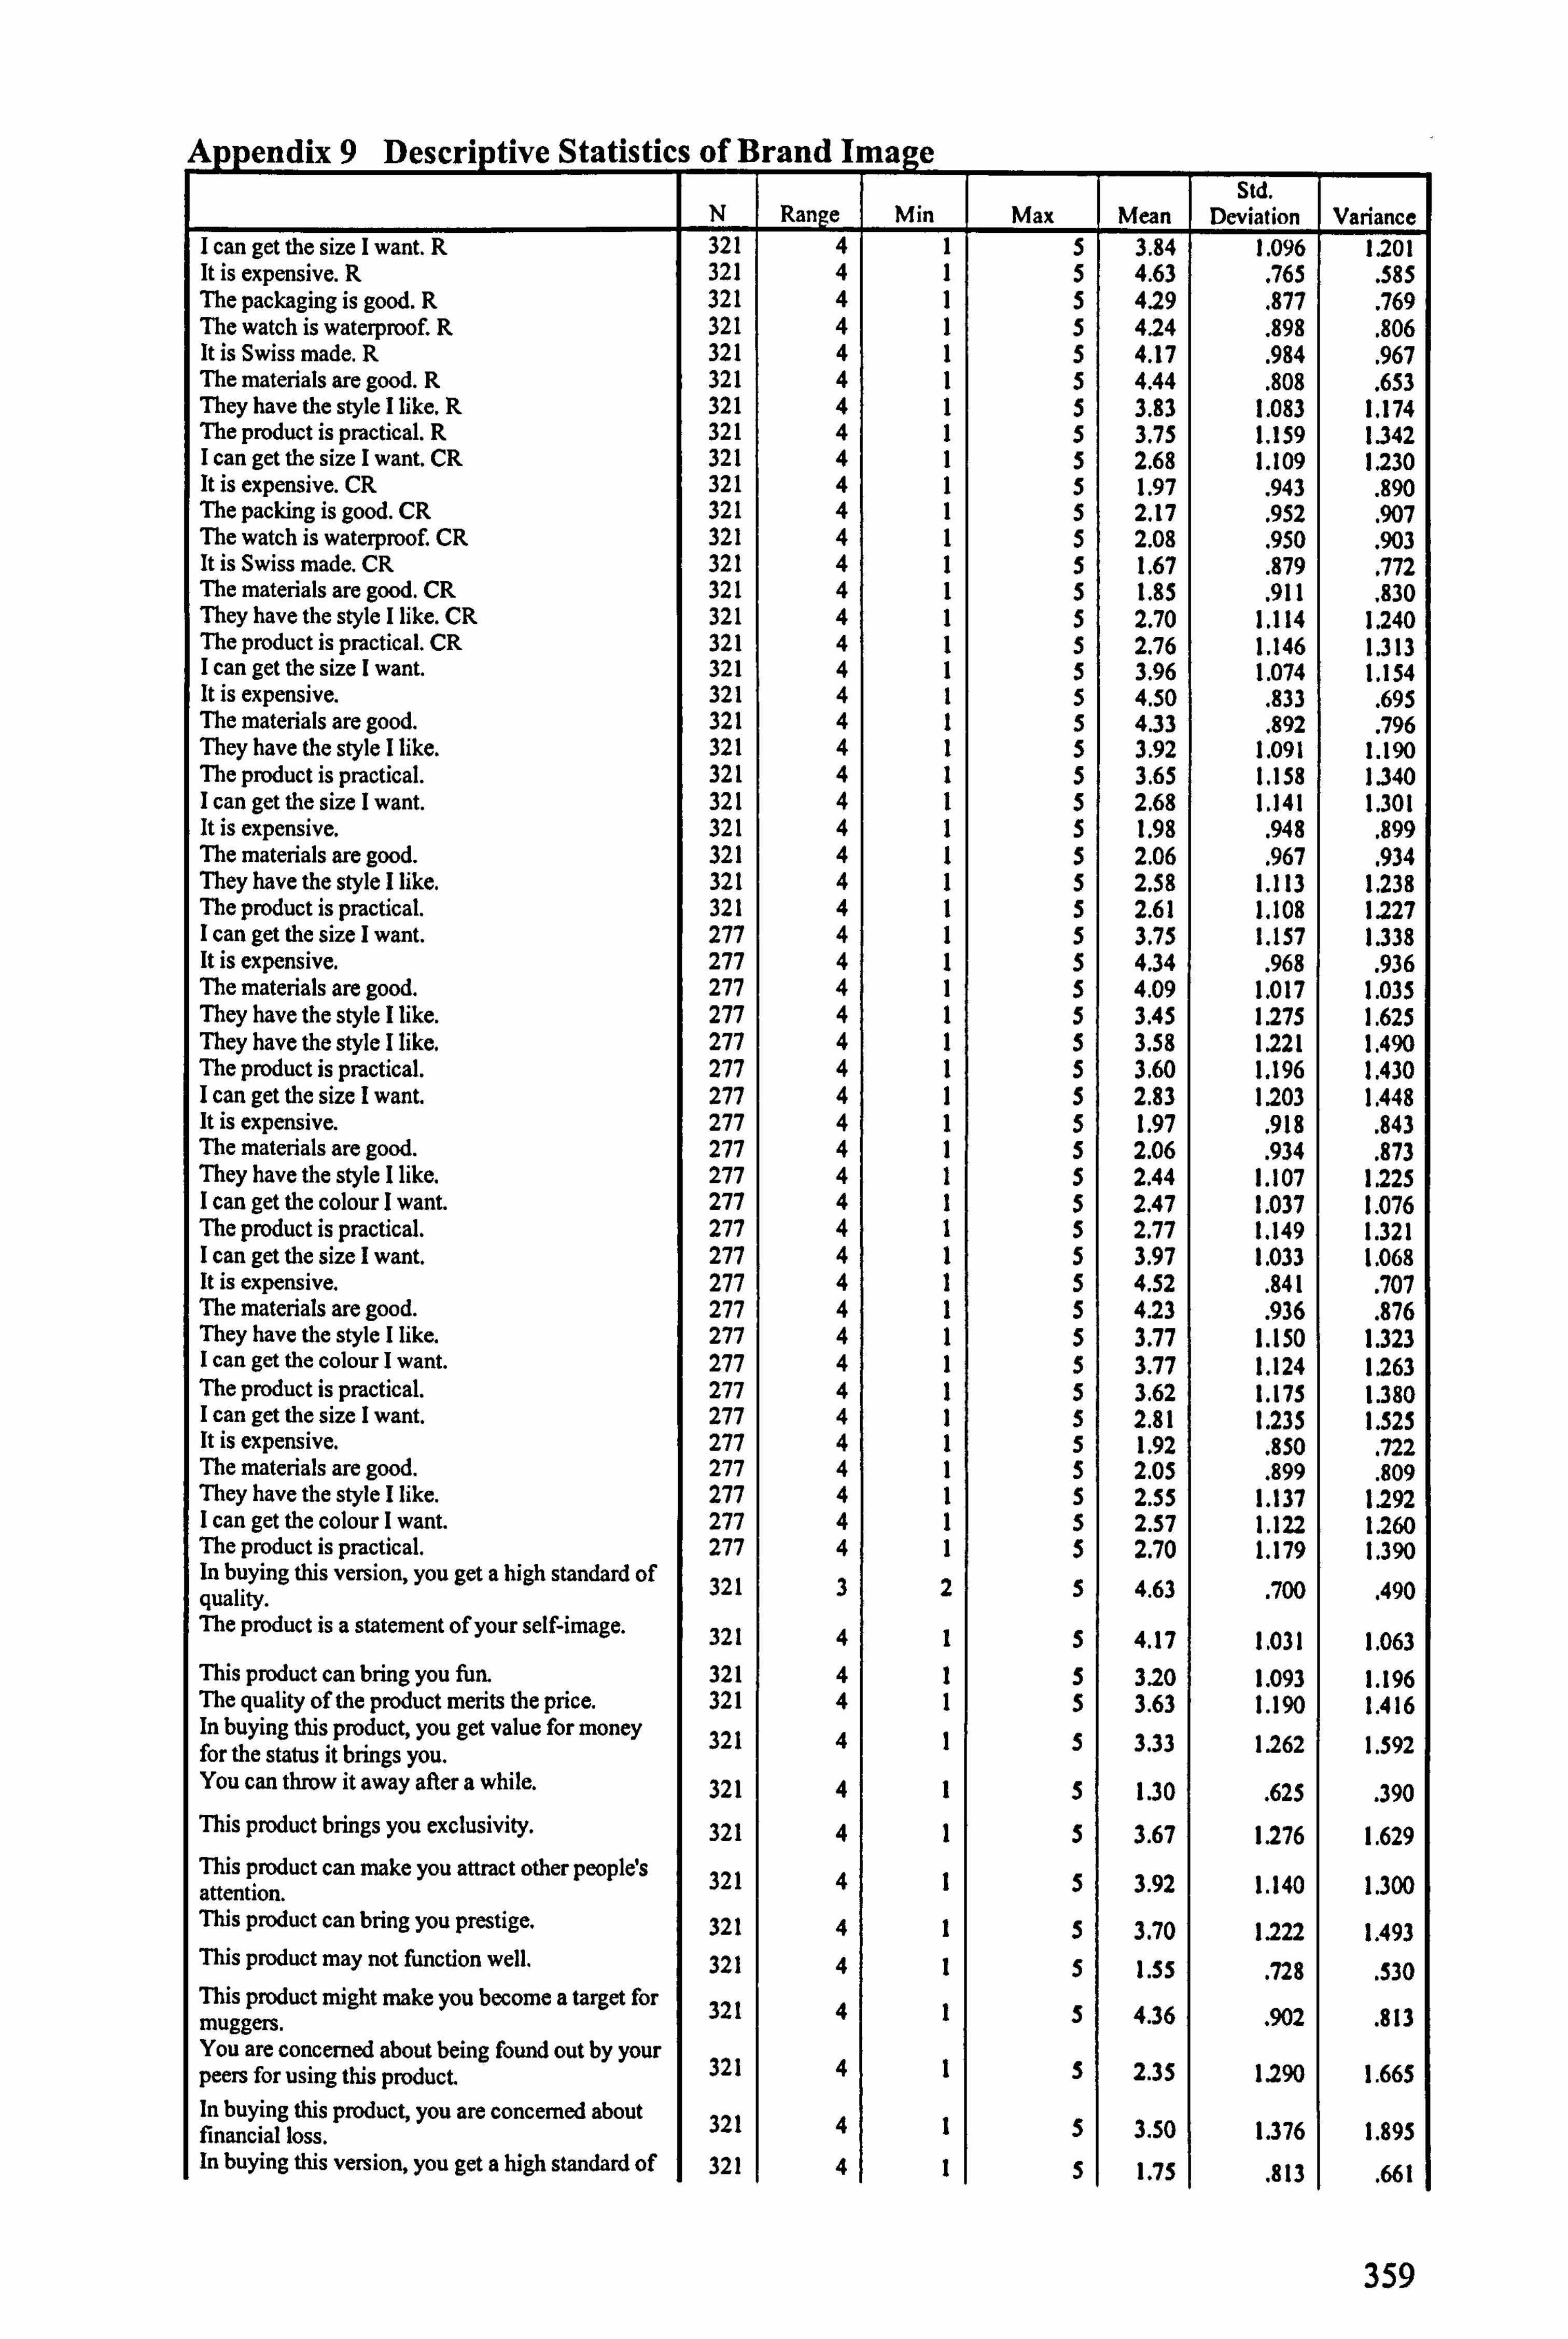
Appendix 9 Descriptive Statistics of Brand Image
N Range Min Max Mean Std.
Deviation Variance I can get the size I want. R 321 4 1 5 3.84 1.096 1.201 It is expensive. R 321 4 1 5 4.63 . 765 . 585 The packaging is good. R 321 4 1 5 4.29 . 877 . 769 The watch is waterproof. R 321 4 1 5 4.24 . 898 . 806 It is Swiss made. R 321 4 1 5 4.17 . 984 . 967 The materials are good. R 321 4 1 5 4.44 . 808 . 653 They have the style I like. R 321 4 1 5 3.83 1.083 1.174 The product is practical. R 321 4 1 5 3.75 1.159 1.342 I can get the size I want. CR 321 4 1 5 2.68 1.109 1.230 It is expensive. CR 321 4 1 5 1.97 . 943 . 890 The packing is good. CR 321 4 1 5 2.17 . 952 . 907 The watch is waterproof. CR 321 4 1 5 2.08 . 950 . 903 It is Swiss made. CR 321 4 1 5 1.67 . 879 . 772 The materials are good. CR 321 4 1 5 1.85 . 911 . 830 They have the style I like. CR 321 4 1 5 2.70 1.114 1.240 The product is practical. CR 321 4 1 5 2.76 1.146 1.313 I can get the size I want. 321 4 1 5 3.96 1.074 1.154 It is expensive. 321 4 1 5 4.50 . 833 . 695 The materials are good. 321 4 1 5 4.33 . 892 . 796 They have the style I like. 321 4 1 5 3.92 1.091 1.190 The product is practical. 321 4 1 5 3.65 1.158 1.340 I can get the size I want. 321 4 1 5 2.68 1.141 1.301 It is expensive. 321 4 1 5 1.98 . 948 . 899 The materials are good. 321 4 1 5 2.06 . 967 . 934 They have the style I like. 321 4 1 5 2.58 1.113 1.238 The product is practical. 321 4 1 5 2.61 1.108 1.227 I can get the size I want. 277 4 1 5 3.75 1.157 1.338 It is expensive. 277 4 1 5 4.34 . 968 . 936 The materials are good. 277 4 1 5 4.09 1.017 1.035 They have the style I like. 277 4 1 5 3.45 1.275 1.625 They have the style I like. 277 4 1 5 3.58 1.221 1.490 The product is practical. 277 4 1 5 3.60 1.196 1.430 I can get the size I want. 277 4 1 5 2.83 1.203 1.448 It is expensive. 277 4 1 5 1.97 . 918 . 843 The materials are good. 277 4 1 5 2.06 . 934 . 873 They have the style I like. 277 4 1 5 2.44 1.107 1.225 I can get the colour I want. 277 4 1 5 2.47 1.037 1.076 The product is practical. 277 4 1 5 2.77 1.149 1.321 I can get the size I want. 277 4 1 5 3.97 1.033 1.068 It is expensive. 277 4 1 5 4.52 . 841 . 707 The materials are good. 277 4 1 5 4.23 . 936 . 876 They have the style I like. 277 4 1 5 3.77 1.150 1.323 I can get the colour I want. 277 4 1 5 3.77 1.124 1263 The product is practical. 277 4 1 5 3.62 1.175 1.380 I can get the size I want. 277 4 1 5 2.81 1.235 1.525 It is expensive. 277 4 1 5 1.92 . 850 . 722 The materials are good. 277 4 1 5 2.05 . 899 . 809 They have the style I like. 277 4 1 5 2.55 1.137 1.292 I can get the colour I want. 277 4 1 5 2.57 1.122 1.260 The product is practical. 277 4 1 5 2.70 1.179 1.390 In buying this version, you get a high standard of 321 3 2 5 4 63 700 490 quality. . . . The product is a statement of your self-image. 321 4 1 5 4.17 1.031 1.063 This product can bring you fun. 321 4 1 5 3.20 1.093 1.196 The quality of the product merits the price. 321 4 1 5 3.63 1.190 1.416 In buying this product, you get value for money 321 4 1 5 3 33 1 262 592 1 for the status it brings you. . . . You can throw it away after a while. 321 4 1 5 1.30 . 625 . 390 This product brings you exclusivity. 321 4 1 5 3.67 1.276 1.629 This product can make you attract other people's 321 4 1 5 92 3 attention. . 1.140 1.300 This product can bring you prestige. 321 4 1 5 3.70 1.222 1.493 This product may not function well. 321 4 1 5 1.55 . 728 . 530 This product might make you become a target for 321 4 1 muggers. 5 4.36
. 902 . 813 You are concerned about being found out by your peers for using this product 321 4 1 5 2.35 1 290 1.665 In buying this product, you are concerned about 321 4 1 financial loss. 5 3.50 1.376 1.895 In buying this version, you get a high standard of 321 4 1 5 1.75
. 813 . 661
359

quality. The product is a statement of your self-image. 321 4 1 5 2.64 1.255 1.575 This product can bring you fun. 321 4 1 5 2.57 1.144 1.308 The quality of the product merits the price. 321 4 1 5 2.82 1.377 1.896 In buying this product, you get value for money for the status it brings you. 321 4 1 5 2.41 1.204 1.449
You can throw it away after a while. 321 4 1 5 4.19 1.011 1.021
This product brings you exclusivity. 321 4 1 5 2.03 1.069 1.143
This product can make you attract other people's 321 4 1 5 2.87 1.327 1 760 attention. . This product can bring you prestige. 321 4 1 5 2.32 1.115 1.242 This product may not function well. 321 4 1 5 4.22 . 962 . 925 This product might make you become a target for 321 4 1 5 3.21 1.391 1.936 muggers. You are concerned about being found out by your peers for using this product. 321 4 1 5 3.01 1.396 1.950
In buying this product, you are concerned about 321 4 1 5 2 20 271 1 1 616 financial loss. . . . In buying this version, you get a high standard of 321 4 1 5 4.47 . 767 . 588 quality. The product is a statement of your self-image. 321 4 1 5 4.06 1.034 1.068 This product can bring you fun. 321 4 1 5 3.24 1.155 1.333 The quality of the product merits the price.
321 4 1 5 3.68 1.170 1.369
In buying this product, you get value for money 321 4 1 5 42 3 1 210 463 1 for the status it brings you. . . . You can throw it away after a while. 321 4 1 5 1.49 . 779 . 607 This product brings you exclusivity. 321 4 1 5 3.54 1.247 1.555 This product can make you attract other people's 321 4 1 5 3.88 1.120 255 1 attention. . This product can bring you prestige. 321 4 1 5 3.58 1.240 1.538
This product may not function well. 321 4 1 5 1.77 . 990 . 980
This product gives people impression that what you wear is fashionable. 321 4 1 5 4.01 1.043 1.087
You are concerned about being found out by your peers for using this product. 321 4 1 5 2.34 1.220 1.488
In buying this product, you are concerned about 321 4 1 5 41 3 1 371 881 1 financial loss. . . . In buying this version, you get a high standard of 321 4 1 5 1 77 909 826 quality. . . . The product is a statement of your self-image. 321 4 1 5 2.64 1.263 1.595 This product can bring you fun. 321 4 1 5 2.58 1.141 1.301 The quality of the product merits the price. 321 4 1 5 2.80 1.356 1.839 In buying this product, you get value for money for the status it brings you. 321 4 1 5 2.45 1.150 1.323
You can throw it away after a while. 321 4 1 5 4.16 1.051 1.105 This product brings you exclusivity. 321 4 1 5 2.18 1.046 1.094 This product can make you attract other people's 321 4 1 5 2.90 294 1 1 675 attention. . . This product can bring you prestige. 321 4 1 5 2.41 1.115 1.242 This product may not function well. 321 4 1 5 4.13 1.044 1.089 This product gives people impression that what you wear is fashionable. 321 4 1 5 3.04 1.298 1.686
You are concerned about being found out by your 321 4 1 peers for using this product. 5 3.10 1.272 1.618 In buying this product, you are concerned about 321 4 1 5 2 36 financial loss. . 1.275 1.624 In buying this version, you get a high standard of 277 4 1 5 4 30 975 950 quality. . . . The product is a statement of your self-image. 277 4 1 5 3.98 1.111 1.235 This product can bring you fun. 277 4 1 5 3.16 1.241 1.540 The quality of the product merits the price. 277 4 1 5 3.59 1.258 1.583
360

In buying this product, you get value for money for the status it brings you. 277 4 1 5 3.33 1.278 1.634
You can throw it away after a while. 277 4 1 5 1.62 . 939 . 882 This product brings you exclusivity. 277 4 1 5 3.36 1.274 1.623 This product can make you attract other people's 277 4 1 5 85 3 141 1 303 1 attention. . . . This product might not last long. 277 4 1 5 1.87 . 996 . 993 You are concerned about being found out by your 277 4 1 5 2 57 305 1 703 1 peers for using this product. . . . You are concerned about being singled out by society for using this product. 277 4 1 5 2.87 1.361 1.853
In buying this product, you are concerned about 277 4 1 5 24 3 342 1 800 1 financial loss. . . . In buying this version, you get a high standard of 277 4 1 5 82 1 945 893 quality. . . . The product is a statement of your self-image. 277 4 1 5 2.69 1.275 1.627 This product can bring you fun. 277 4 1 5 2.57 1.201 1.442 The quality of the product merits the price. 277 4 1 5 2.74 1.351 1.825 In buying this product, you get value for money for the status it brings you.
277 4 1 5 2.43 1.158 1.340
You can throw it away after a while. 277 4 1 5 4.22 . 989 . 979 This product brings you exclusivity. 277 4 1 5 2.19 1.051 1.105 This product can make you attract other people's 277 4 1 5 2 95 262 1 592 1 attention. . . . This product might not last long. 277 4 1 5 4.24 . 941 . 885 You are concerned about being found out by your peers for using this product. 277 4 1 5 3.10 1.327 1.761
You are concerned about being singled out by society for using this product. 277 4 1 5 2.99 1.330 1.768
In buying this product, you are concerned about 277 4 1 5 48 2 276 1 1 627 financial loss. . . . In buying this version, you get a high standard of 277 4 1 5 4 37 945 894 quality. . . . The product is a statement of your self-image. 277 4 1 5 4.00 1.120 1.254
This product can bring you fun. 277 4 1 5 3.24 1.238 1.532 The quality of the product merits the price. 277 4 1 5 3.57 1.294 1.673 In buying this product, you get value for money for the status it brings you. 277 4 1 5 3.43 1.294 1.674
You can throw it away after a while. 277 4 1 5 1.50 . 792 . 628 This product brings you exclusivity. 277 4 1 5 3.60 1.204 1.450 This product can make you attract other people's 277 4 1 attention. 5 3.90 1.105 1.222 This product can bring you prestige. 277 4 1 5 3.52 1206 1.453 This product might not last long. 277 4 1 5 1.70
. 851 . 724 This product give people impression that what you wear is fashionable. 277 4 1 5 3.83 1.190 1.417
This product might make you become a target for 277 4 1 5 4.08 1 102 1 21S muggers. . . You are concerned about being found out by your peers for using this product. 277 4 1 5 2.49 1 276 1.628
You are concerned about become a target of anti- capitalist for using this product.
277 4 1 5 2.76 1.189 1.414
In buying this product, you are concerned about 277 4 1 5 14 3 1 404 972 1 financial loss. . . . In buying this version, you get a high standard of 277 4 1 5 1 88 1 028 057 1 quality. . . . The product is a statement of your self-image. 277 4 1 5 2.71 1.270 1.613 This product can bring you fun. 277 4 1 5 2.52 1.169 1.366 The quality of the product merits the price. 277 4 1 5 2.79 1.384 1.915 In buying this product, you get value for money 277 4 1 for the status it brings you. 5 2.53 1.211 1.467 You can throw it away after a while. 277 4 1 5 4.20 1.018 1.037 This product brings you exclusivity. 277 4 1 5 2.26 1.046 1.093 This product can make you attract other people's 277 4 1 attention. 5 2.94 1.271 1.616
361

This product can bring you prestige. 1 277
14111512.39 1 1.077
1 1.159
This product might not last long. 277 4 1 5 4.16 . 989 . 977 This product give people impression that what 277 4 1 5 2.94 1.275 1.626 you wear is fashionable. This product might make you become a target for 277 4 1 5 3.13 1.278 1.633 muggers. You are concerned about being found out by your 277 4 1 5 2.96 1.322 1.748 peers for using this product. You are concerned about become a target of anti- 277 4 1 5 2.55 1.130 1.278 capitalist for using this product. In buying this product, you are concerned about 277 4 1 5 2.39 1.218 1.484 financial loss. Cheerful 321 4 1 5 2.80 1.168 1.364 Young 321 4 1 5 2.49 1.140 1.301 Independent 321 4 1 5 3.49 1.151 1.326 Reliable 321 4 1 5 4.12 . 965 . 932 Hardworking 321 4 1 5 4.08 . 950 . 903 Secure 321 4 1 5 4.03 1.047 1.096 Successful 321 4 1 5 4.32 . 908 . 825 For leader 321 4 1 5 3.88 1.047 1.096 Confident 321 4 1 5 4.11 1.015 1.031 Glamorous 321 4 1 5 3.79 1.103 1.216 Classic 321 4 1 5 4.08 1.095 1.200 Cheerful 321 4 1 5 2.51 1.118 1.251 Young 321 4 1 5 2.55 1.193 1.423 Independent 321 4 1 5 2.45 1.051 1.104 Reliable 321 4 1 5 2.11 1.054 1.110 Hardworking 321 4 1 5 2.22 1.044 1.090 Secure 321 4 1 5 2.19 1.068 1.140 Successful 321 4 1 5 2.24 1.126 1.269 For leader 321 4 1 5 2.16 1.057 1.117 Confident 321 4 1 5 2.42 1.132 1.281 Glamorous 321 4 1 5 2.32 1.055 1.112 Classic 321 4 1 5 2.24 1.144 1.310 Trendy 321 4 1 5 4.07 . 999 . 998 Exciting 321 4 1 5 3.52 1.073 1.150 Cool 321 4 1 5 3.71 1.104 1.219 Contemporary 321 4 1 5 3.74 1.064 1.133 Reliable 321 4 1 5 3.89 1.078 1.162 Secure 321 4 1 5 3.74 1.100 1.211 Corporate 321 4 1 5 3.62 1.089 1.186 Successful 321 4 1 5 4.00 1.032 1.066 Glamorous 321 4 1 5 4.04 1.008 1.017 Good looking 321 4 1 5 3.78 1.154 1.331 Smooth 321 4 1 5 3.69 1.097 1.203 Classic 321 4 1 5 3.68 1.083 1.174 Beautiful 321 4 1 5 3.73 1.154 1.331 Elegant 321 4 1 5 3.87 1.078 1.162 Trendy 321 4 1 5 2.87 1.193 1.423 Exciting 321 4 1 5 2.54 1.063 1.130 Cool 321 4 1 5 2.53 1.084 1.175 Contemporary 321 4 1 5 2.55 1.092 1.192 Reliable 321 4 1 5 2.13 1.030 1.062 Secure 321 4 1 5 2.17 1.038 1.078 Corporate 321 4 1 5 2.18 1.030 1.061 Successful 321 4 1 5 2.23 1.071 1.147 Glamorous 321 4 1 5 2.47 1.151 1.325 Good looking 321 4 1 5 2.55 1.164 1.355 Smooth 321 4 1 5 2.34 1.039 1.080 Classic 321 4 1 5 2.25 1.028 1.056 Beautiful 321 4 1 5 2.30 1.092 1.192 Elegant 321 4 1 5 2.32 1.124 1.262 Down to earth 277 4 1 5 2.48 1.209 1.461 Original 277 4 1 5 3.07 1.356 1.839 Unique 277 4 1 5 2.91 1.360 1.851 Contemporary 277 4 1 5 3.17 1.149 1.320 Reliable 277 4 1 5 3.47 1.166 1.359 Corporate 277 4 1 5 3.32 1.170 1.370 Successful 277 4 1 5 3.54 1.217 1.481 Feminine 277 4 1 5 3.43 1.233 1.521 Outdoorsy 277 4 1 5 2.83 1.229 1.511 Down to earth 277 4 1 5 2.36 1.180 1.392 Original 277 4 1 5 1.89
. 964 . 930 Unique 277 4 1 5 1.87 . 966 . 932 Contemporary 277 4 1 5 2.26 1.088 1.184 Reliable 277 4 1 5 1.98 . 985 . 971
362

Corporate 277 4 1 5 2.08 . 991 . 982 Successful 277 4 1 5 2.01 1.046 1.094 Feminine 277 4 1 5 2.51 1.215 1.475 Outdoorsy 277 4 1 5 2.23 1.118 1.251 Trendy 277 4 1 5 3.94 1.108 1.228 Contemporary 277 4 1 5 3.76 1.057 1.117 Successful 277 4 1 5 3.99 1.068 1.141
Upper class 277 4 1 5 4.02 1.139 1.297 Feminine 277 4 1 5 3.93 1.068 1.140 Smooth 277 4 1 5 3.61 1.154 1.332 Trendy 277 4 1 5 2.67 1.220 1.490 Contemporary 277 4 1 5 2.62 1.119 1.252 Successful 277 4 1 5 2.24 1.075 1.155 Upper class 277 4 1 5 2.05 1.090 1.189 Feminine 277 4 1 5 2.69 1.238 1.532 Smooth 277 4 1 5 2.32 1.060 1.123 Valid N (listwise) 277
363
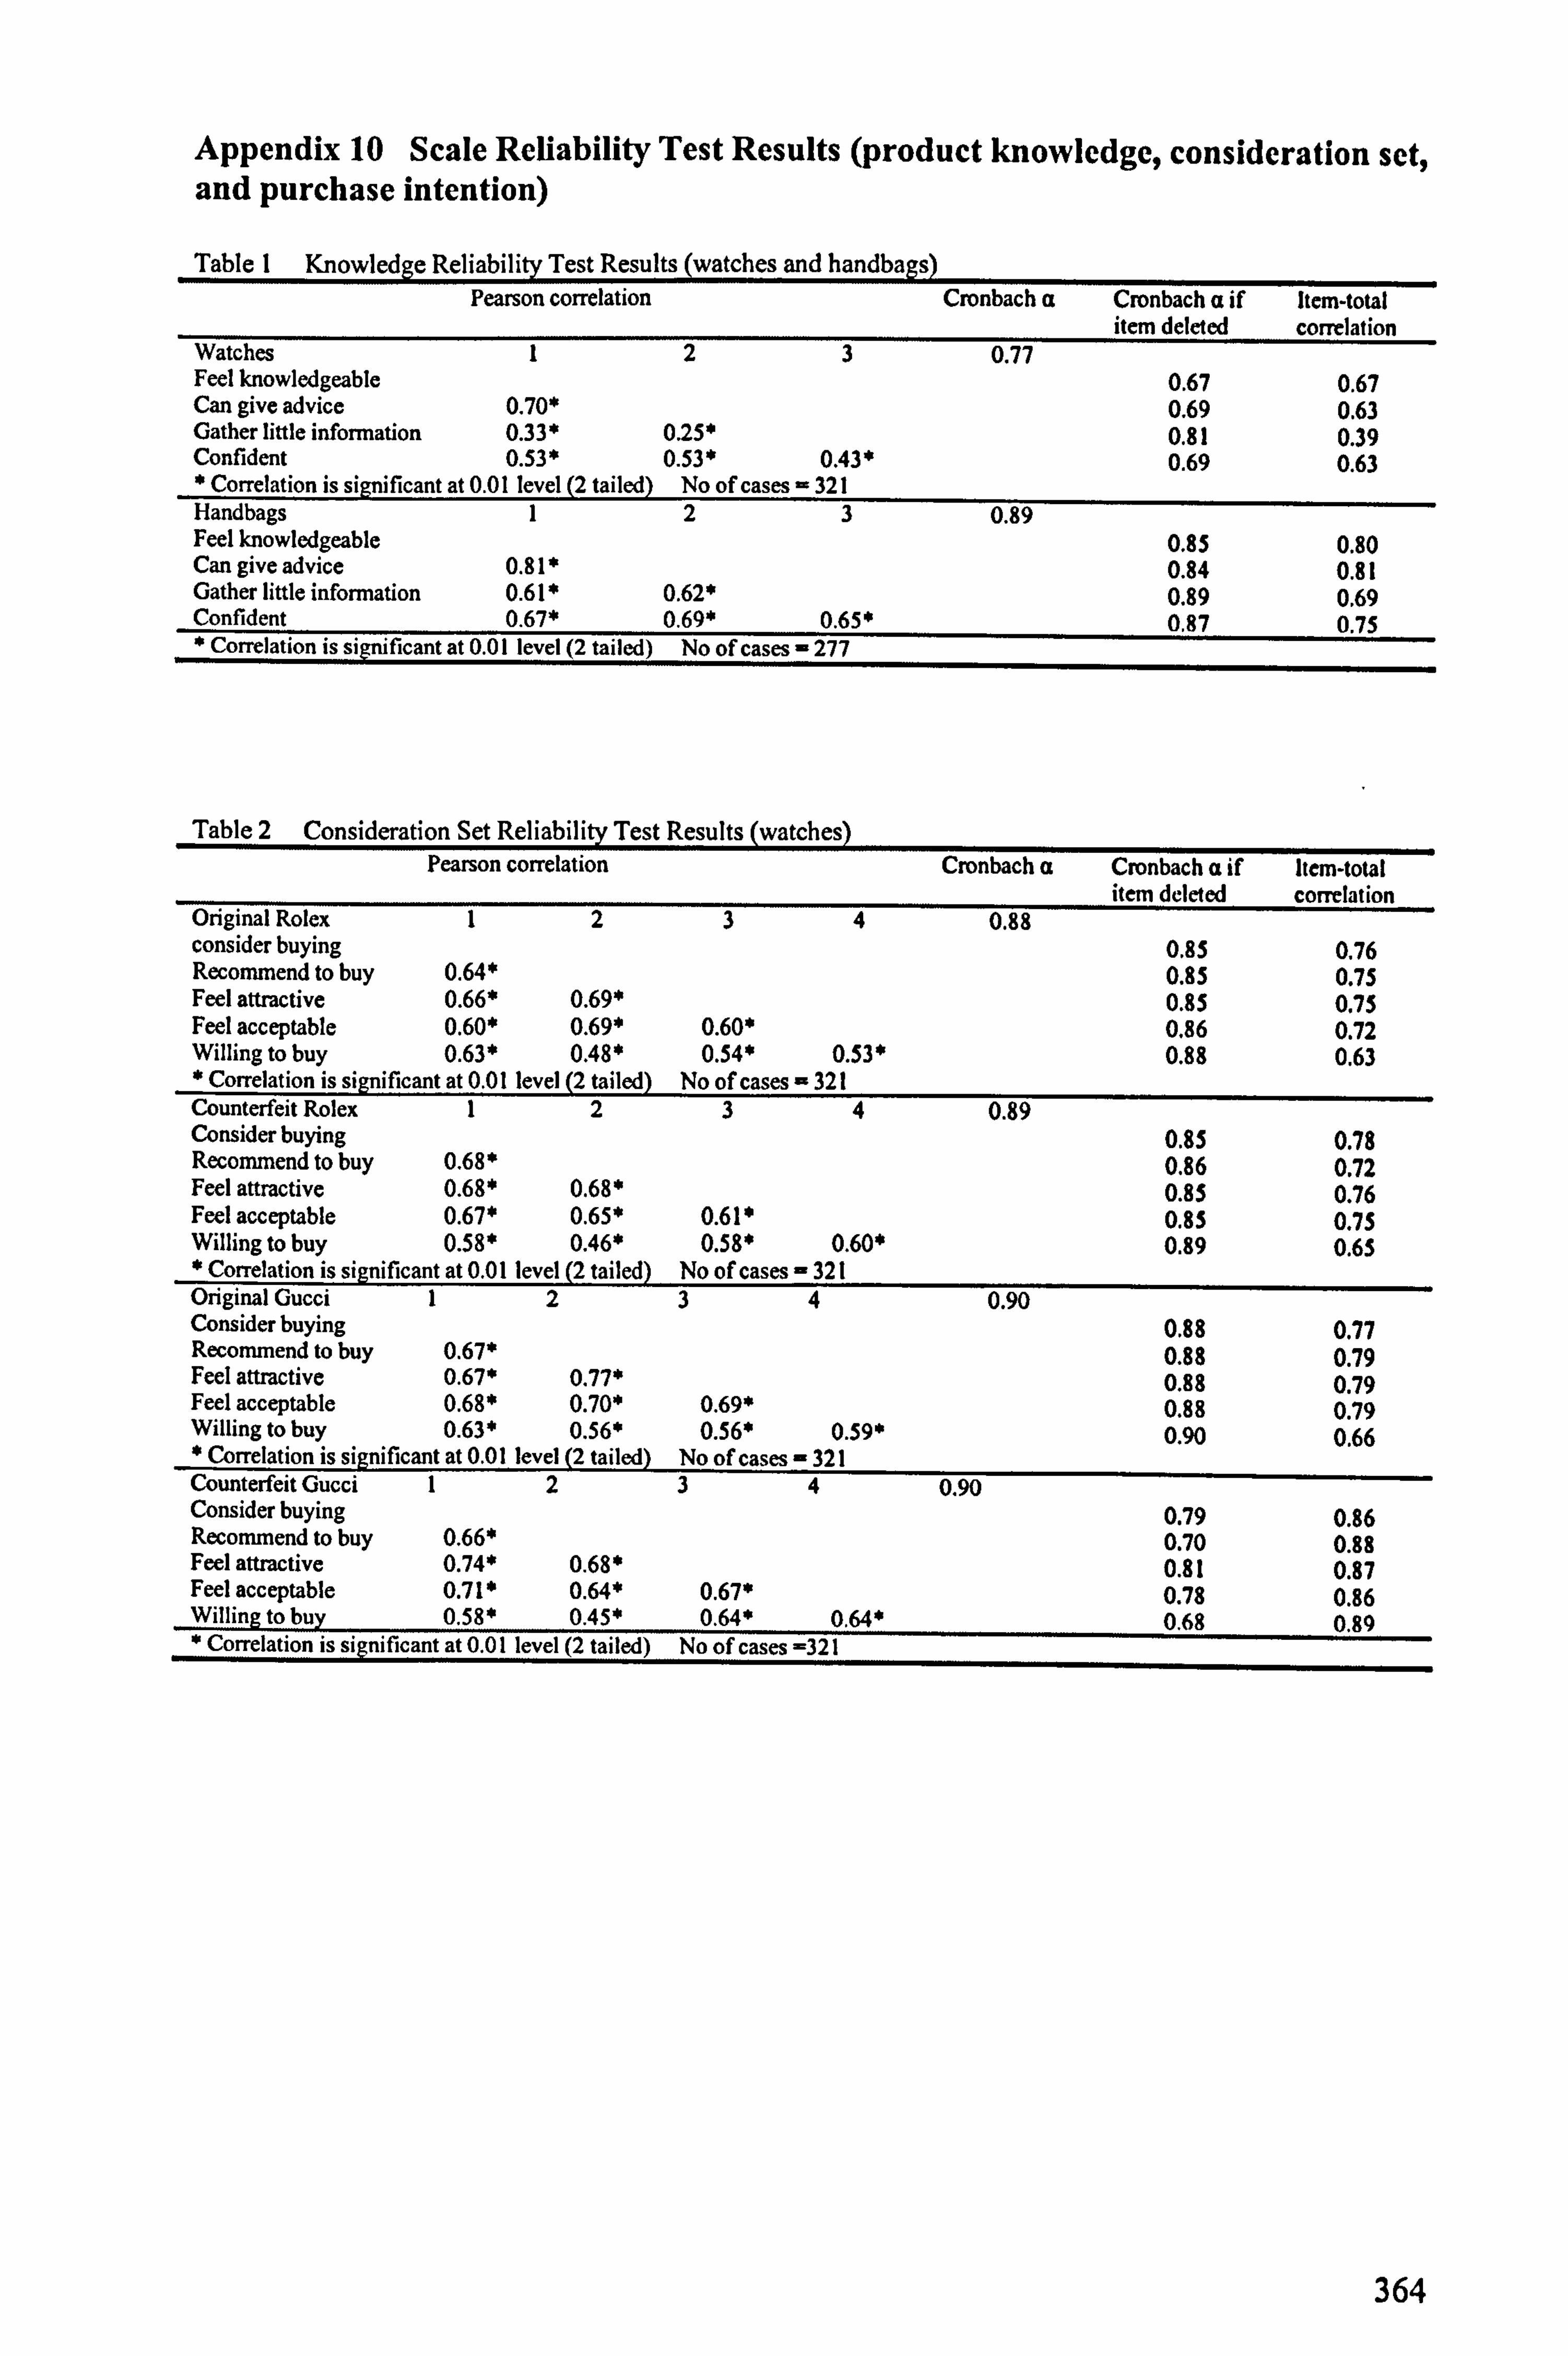
Appendix 10 Scale Reliability Test Results (product knowledge, consideration set, and purchase intention)
Table I Knowledee Reliability Test Results (watches and handbaes Pearson correlation Cronbach a Cronbach a if Item-total
item deleted correlation Watches 1 23 0.77 Feel knowledgeable 0.67 0.67 Can give advice 0.70* 0.69 0.63 Gather little information 0.33* 0.25* 0.81 0.39 Confident 0.53* 0.53* 0.43 * 0.69 0.63 * Correlation is significant at 0.01 level (2 tailed) No of cases = 321 Handbags 1 23 0.89 Feel knowledgeable 0.85 0.80 Can give advice 0.81* 0.84 0.81 Gather little information 0.61* 0.62* 0.89 0.69 Confident 0.67* 0.69* 0.65* 0.87 0.75 * Correlation is significant at 0.01 level (2 tailed) No of cases - 277
Table 2 Consideration Set Reliability Test Results (watches Pearson correlation Cronbach a Cronbach a if Item-total
item deleted correlation Original Rolex 12 34 0.88 consider buying 0.85 0.76 Recommend to buy 0.64* 0.85 0.75 Feel attractive 0.66* 0.69* 0.85 0.75 Feel acceptable 0.60* 0.69* 0.60* 0.86 0.72 Willing to buy 0.63* 0.48* 0.54* 0.53* 0.88 0.63 * Correlation is significant at 0.01 level (2 tailed) No of cases = 321 Counterfeit Rolex 12 34 0.89 Consider buying 0.85 0.78 Recommend to buy 0.68* 0.86 0.72 Feel attractive 0.68* 0.68* 0.8S 0.76 Feel acceptable 0.67* 0.65* 0.61* 0.8S 0.75 Willing to buy 0.58* 0.46* 0.58* 0.60* 0.89 0.6S * Correlation is significant at 0.01 level (2 tailed) No of cases 321 Original Gucci 12 34 0.90 Consider buying 0.88 0.77 Recommend to buy 0.67* 0.88 0.79 Feel attractive 0.67* 0.77* 0.88 0.79 Feel acceptable 0.68* 0.70* 0.69* 0.88 0.79 Willing to buy 0.63* 0.56* 0.56* 0.59* 0.90 0.66 * Correlation is significant at 0.01 level (2 tailed) No of cases - 321 Counterfeit Gucci 12 34 0.90 Consider buying 0.79 0.86 Recommend to buy 0.66* 0.70 0.88 Feel attractive 0.74* 0.68* 0.81 0.87 Feel acceptable 0.71 * 0.64* 0.67* 0.78 0.86 Willing to buy 0.58* 0.45* 0.64* 0.64* 0.68 0.89 * Correlation is significant at 0.01 level (2 tailed) No of cases =321
364
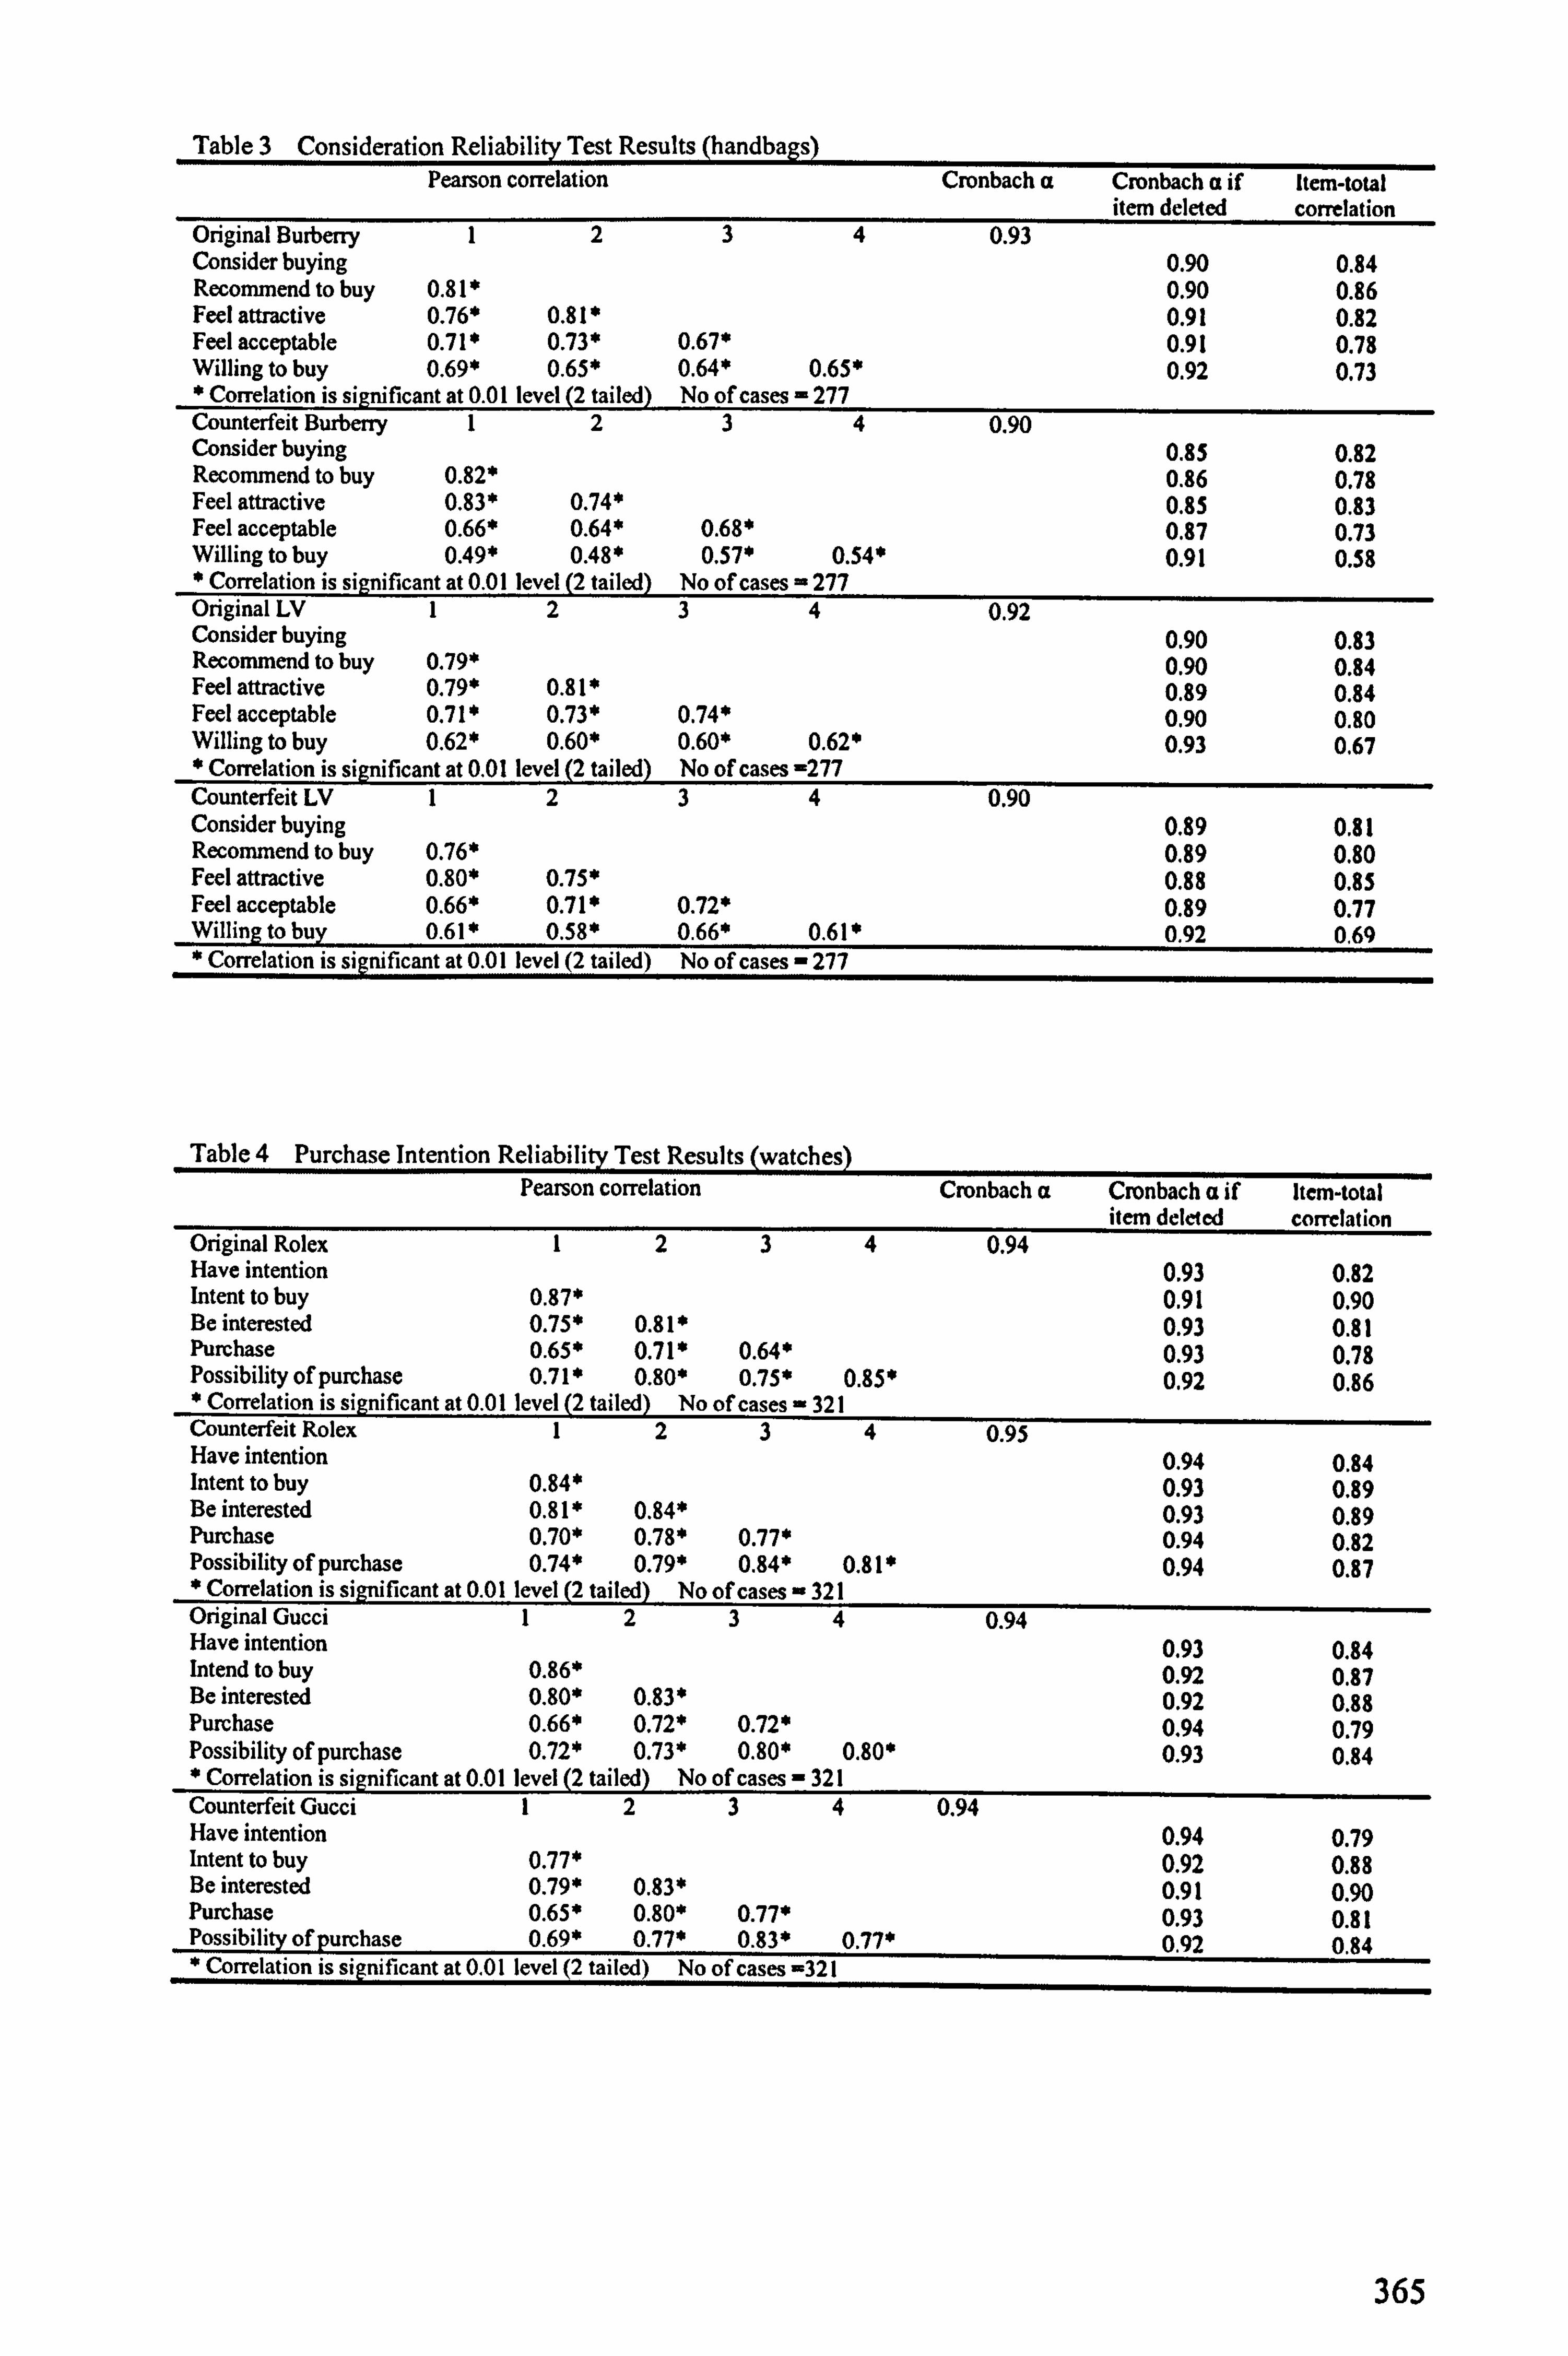
Table 3 Consideration Reliability Test Results (handbags Pearson correlation Cronbach a Cronbach a if Item-total
item deleted correlation Original Burberry 12 34 0.93 Consider buying 0.90 0.84 Recommend to buy 0.81* 0.90 0.86 Feel attractive 0.76* 0.81* 0.91 0.82 Feel acceptable 0.71* 0.73* 0.67* 0.91 0.78 Willing to buy 0.69' 0.65* 0.64' 0.65* 0.92 0.73 * Correlation is significant at 0.01 level (2 tailed) No of cases = 277 Counterfeit Burberry 12 34 0.90 Consider buying 0.85 0.82 Recommend to buy 0.82' 0.86 0.78 Feel attractive 0.83' 0.74' 0.85 0.83 Feel acceptable 0.66' 0.64' 0.68* 0.87 0.73 Willing to buy 0.49* 0.48' 0.57' 0.54* 0.91 0.58 * Correlation is significant at 0.01 level (2 tailed) No of cases = 277 Original LV 12 34 0.92 Consider buying 0.90 0.83 Recommend to buy 0.79' 0.90 0.84 Feel attractive 0.79' 0.81' 0.89 0.84 Feel acceptable 0.71' 0.73* 0.74* 0.90 0.80 Willing to buy 0.62* 0.60* 0.60' 0.62' 0.93 0.67 * Correlation is significant at 0.01 level (2 tailed) No of cases -277 Counterfeit LV 12 34 0.90 Consider buying 0.89 0.81 Recommend to buy 0.76' 0.89 0.80 Feel attractive 0.80' 0.75' 0.88 0.85 Feel acceptable 0.66' 0.71' 0.72' 0.89 0.77 Willing to buy 0.61 * 0.58' 0.66* 0.61 * 0.92 0.69 * Correlation is significant at 0.01 level (2 tailed) No of cases - 277
Table 4 Purchase Intention Reliability Test Results (watches Pearson correlation Cronbach a Cronbach a if Item-total
item deleted correlation Original Rolex 12 34 0.94 Have intention 0.93 0.82 Intent to buy 0.87* 0.91 0.90 Be interested 0.75* 0.81* 0.93 0.81 Purchase 0.65* 0.71* 0.64* 0.93 0.78 Possibility of purchase 0.71* 0.80* 0.75* 0.85* 0.92 0.86 * Correlation is significant at 0.01 level (2 tailed) No of cases - 321 Counterfeit Rolex 12 34 0.95 Have intention 0.94 0.84 Intent to buy 0.84* 0.93 0.89 Be interested 0.81* 0.84* 0.93 0.89 Purchase 0.70* 0.78* 0.77* 0.94 0.82 Possibility of purchase 0.74* 0.79* 0.84* 0.81* 0.94 0.87 * Correlation is significant at 0.01 level (2 tailed) No of cases e 321 Original Gucci 12 34 0.94 Have intention 0.93 0.84 Intend to buy 0.86* 0.92 0.87 Be interested 0.80* 0.83* 0.92 0.88 Purchase 0.66* 0.72* 0.72* 0.94 0.79 Possibility of purchase 0.72* 0.73* 0.80* 0.80* 0.93 0.84 * Correlation is significant at 0.01 level (2 tailed) No of cases - 321 Counterfeit Gucci 12 34 0.94 Have intention 0.94 0.79 Intent to buy 0.77* 0.92 0.88 Be interested 0.79* 0.83* 0.91 0.90 Purchase 0.65* 0.80* 0.77* 0.93 0.81 Possibility of purchase 0.69* 0.77* 0.83* 0.77* 0.92 0.84 * Correlation is significant at 0.01 level (2 tailed) No of cases -321
365

Table 5 Purchase Intention Reliability Test Results (handbags Pearson correlation Cronbach a Cronbach a if Item-total
item deleted correlation Original Burberry 1 2 3 4 0.96 Have intention 0.96 0.87 Intent to buy 0.90* 0.95 0.93 Be interested 0.86* 0.89* 0.95 0.92 Purchase 0.73* 0.82* 0.82* 0.96 0.86 Possibility of purchase 0.78* 0.85* 0.86* 0.87* 0.95 0.90 * Correlation is significant at 0.01 level (2 tailed ) No of cases - 277 Counterfeit Burberry 1 2 3 4 0.96 Have intention 0.96 0.88 Intent to buy 0.86* 0.95 0.90 Be interested 0.85* 0.87* 0.95 0.92 Purchase 0.78* 0.83* 0.82* 0.96 0.87 Possibility of purchase 0.83* 0.82* 0.88* 0.86* 0.95 0.90 * Correlation is significant at 0.01 level (2 tailed ) No of cases - 277 Original LV 1 2 3 4 0.96 Have intention 0.96 0.88 Intent to buy 0.88* 0.95 0.92 Be interested 0.87* 0.92* 0.95 0.93 Purchase 0.77* 0.80* 0.82* 0.96 0.86 Possibility of purchase 0.80* 0.82* 0.86* 0.84* 0.96 0.88 * Correlation is significant at 0.01 level (2 tailed) No of cases =277 Counterfeit LV 1 2 3 4 0.97 Have intention 0.96 0.89 Intent to buy 0.90* 0.96 0.94 Be interested 0.84* 0.90* 0.96 0.91 Purchase 0.80* 0.86* 0.84* 0.96 0.89 Possibility of purchase 0.83* 0.88* 0.86* 0.87* 0.96 0.91 * Correlation is significant at 0.01 level (2 tailed) No of cases - 277
366

Appendix 11 Bivariate Correlation
Table I Original Rolex Factor I Factor 2 Factor 3 Factor
4 Factor S Factor 6 Factor
7 Security Social
risk Financial involvement
risk Factor 2
. 000
Factor 3 . 000 . 000
Factor 4 . 000 . 000 . 000
Factor 3 . 000 . 000 . 000 . 000
Factor 6 . 000 . 000 . 000 .
000 . 000
Factor 7 . 000 . 000 . 000 . 000 . 000 . 000
Security . 132(*) . 248("") . 163("*) . 055 -. 080 -. 228(") -. 032
Social risk -. 240("") . 033 -. 072 . 112(") -. 030 . 077 . 037 . 093
Financial risk -. 050 . 149(8*) . 009 . 024 . 012 -. 003 -. 081 . 283(") . 136(')
Involvement . 119(x) . 195(") . 129(8) . 096 . 168(") -. 013 . 073 . 051 -. 036 -. 049
Knowledge . 043 . 203("") . 134(0) . 090 . 200(") -. 079 . 050
. 078 . 063 -. 043 . SOS(**)
* Correlation is significant at the 0.05 level (2-tailed). ** Correlation is significant at the 0.01 level (2-tailed).
Table 2 Counterfeit Rolex Factor I Factor 2 Factor 3 Factor 4 Factor 5 Factor Factor 7 Security Social risk Financial Involvement
6 risk
Factor 2 . 000
Factor 3 . 000 . 000
Factor 4 . 000 . 000 . 000
Factor 5 . 000 . 000 . 000 . 000
Factor 6 . 000 .
000 . 000
. 000 . 000
Factor 7 . 000 . 000 . 000 . 000 . 000 . 000
Security . 152(0 ) -. 036 . 380(*') . 187(") . 149(**) . 105 . 043
Social risk . 034 . 191(**) . 079 . 083 . 099 . 216(0*) . 176(") 146(")
Financial . 050 . 154(**) . 293(**) -. 110(*) . 014 . 074 -. 066 . 172(") . 168(61) risk Involvement
. 008 -. 058 . 016
. 092 -. 017 -. 005 -. 035 -. 007
. 003
. 006
Knowledge -. 049 -. 110(') -. 009 -. 007 . 028 -. 058 -. 002 -. 026 . 005 -. 055 . 505(")
** Con-elation is significant at the 0.01 level (2-tailed). * Correlation is significant at the 0.05 level (2-tailed).
Table 3 Orieinal Gucci Factor 1 Factor 2 Factor 3 Factor 4 Social risk Financial Involvement
risk Factor 2 . 000
Factor 3 . 000 . 000
Factor 4 . 000 . 000 . 000
Social risk -. 144(**) . 079 -. 016 . 212(**)
Financial risk -. 098 -. 037 . 037 -. 085 . 202(**)
Involvement . 096 . 210(**) . 079 -. 085 -. 051 -. 057
Knowledge . 107 . 193(**) . 064 -. 035 . 021 -. 050
. 505(**)
** Correlation is significant at the 0.01 level (2-tailed).
367
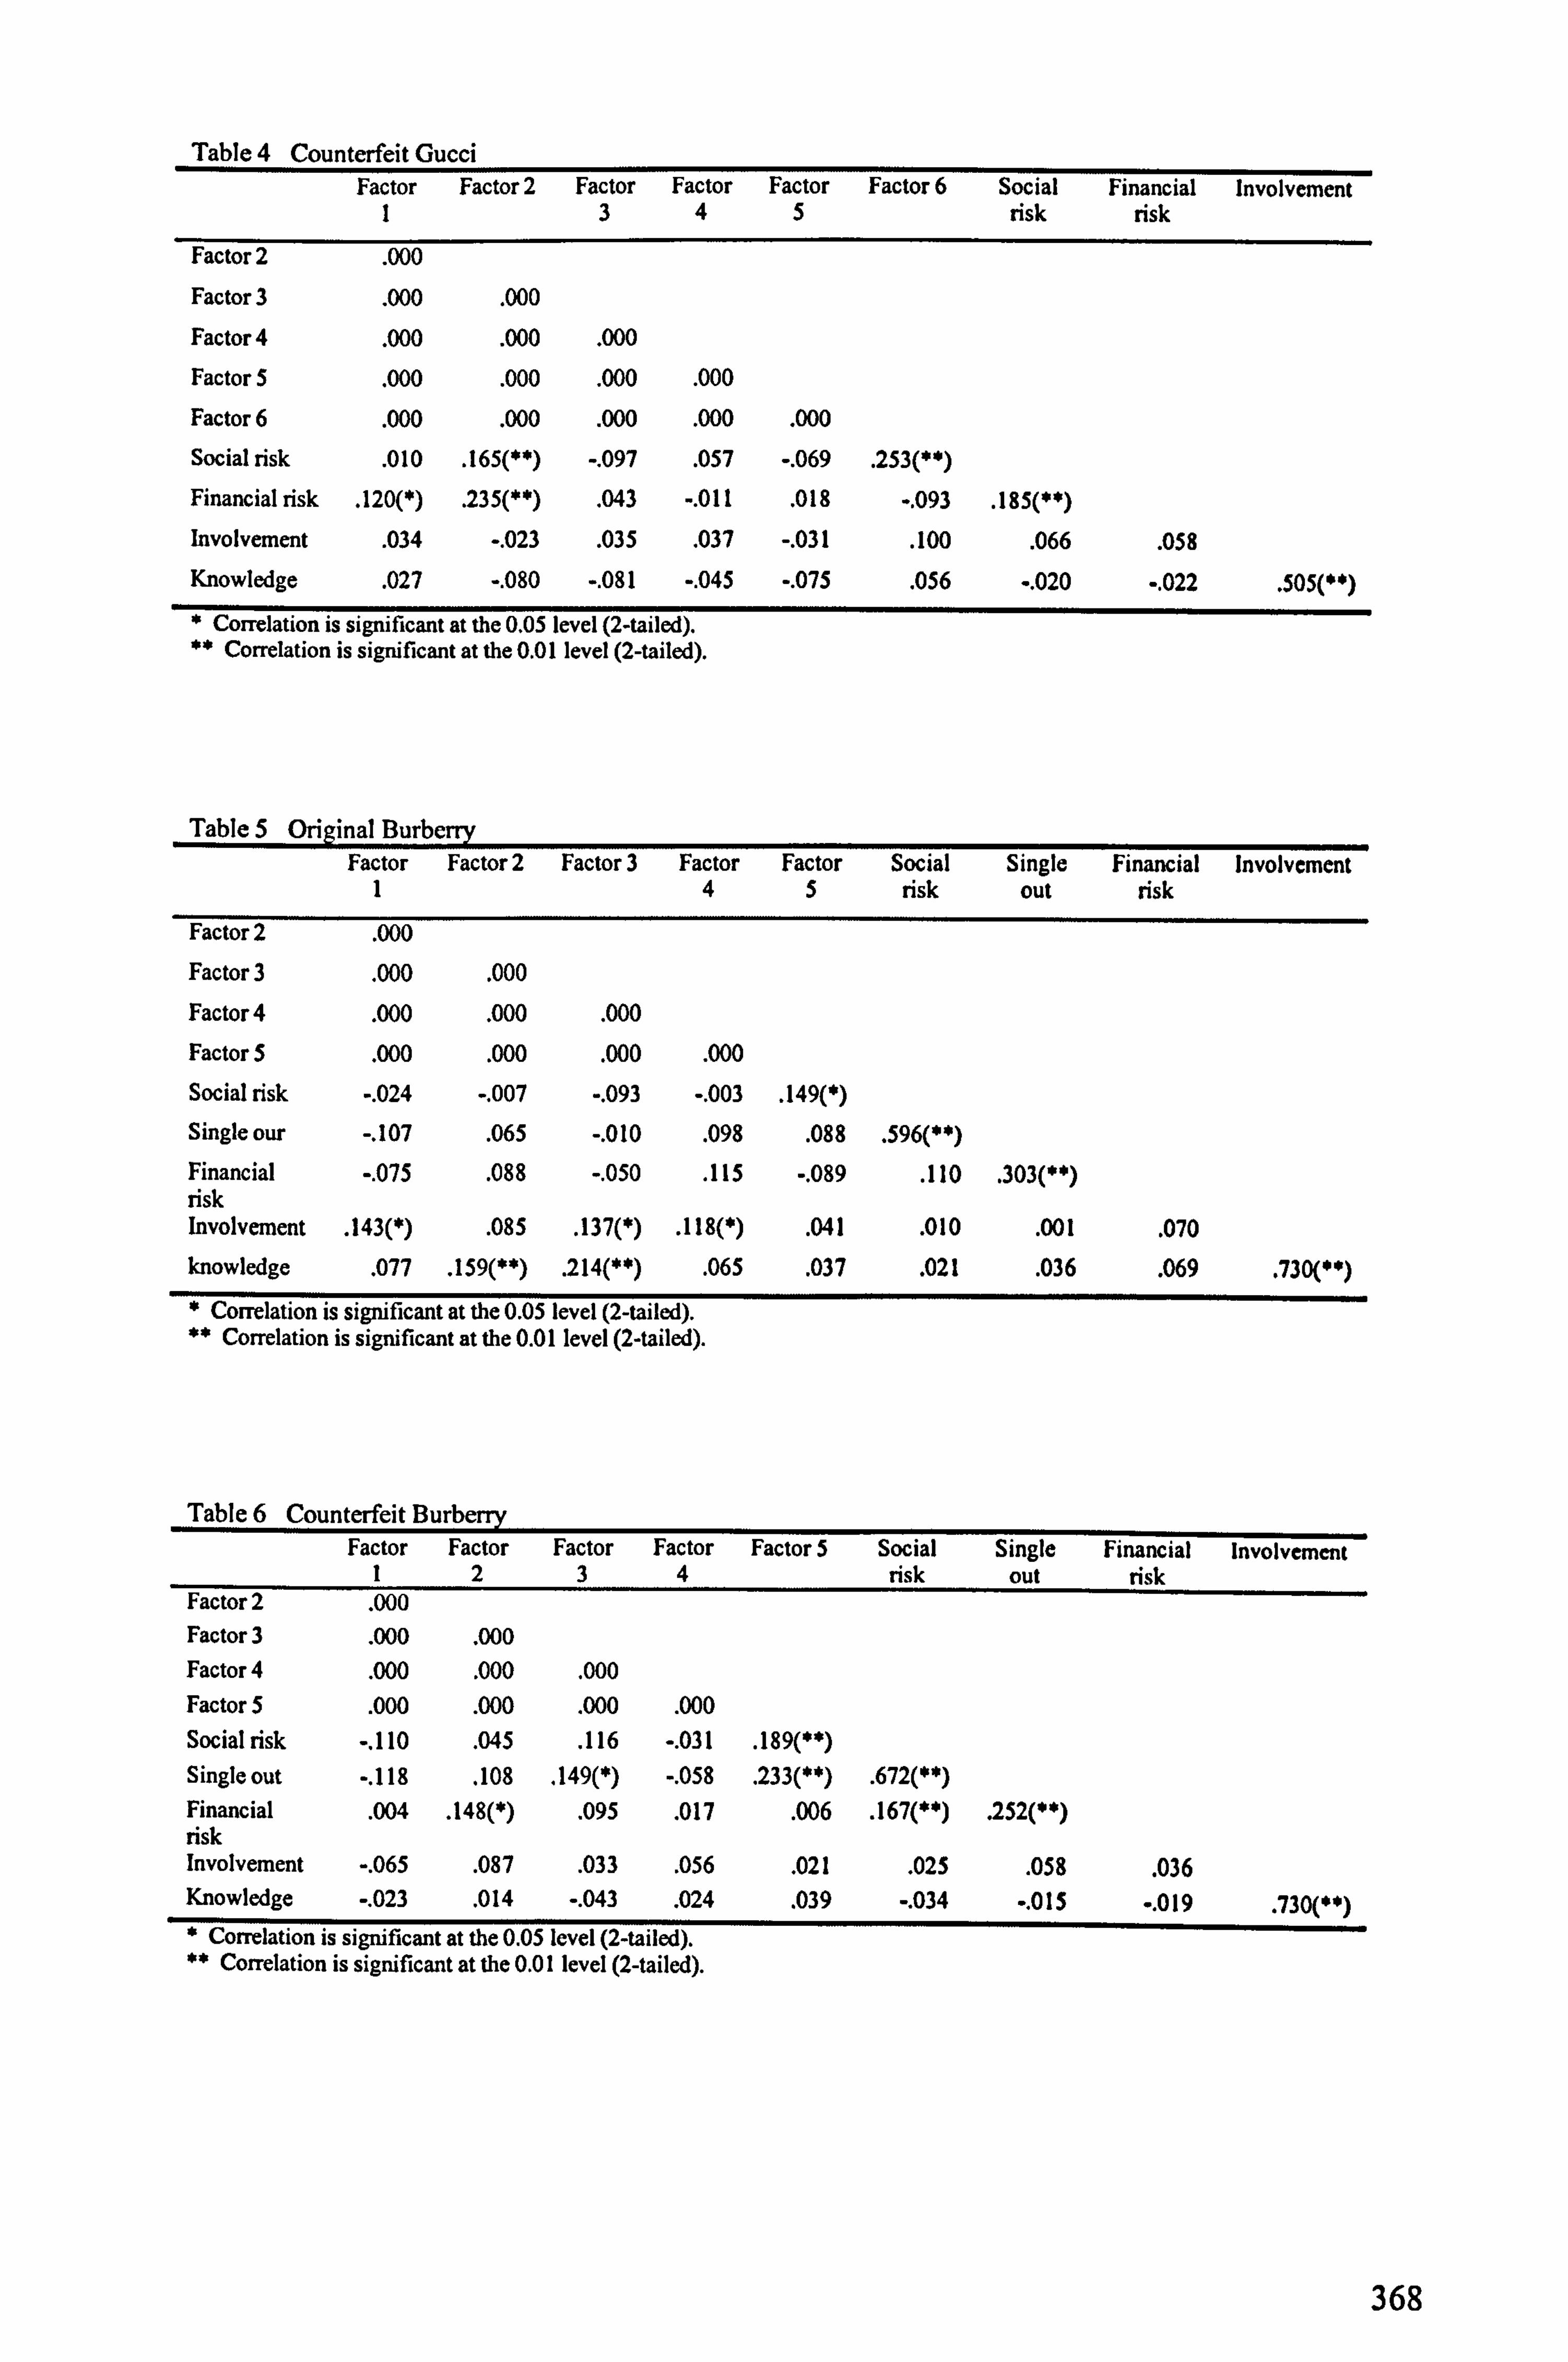
Table 4 Counterfeit Gucci Factor
1 Factor 2 Factor
3 Factor
4 Factor
5 Factor 6 Social
risk Financial Involvement
risk Factor 2 . 000
Factor 3 . 000 . 000
Factor 4 . 000 . 000 . 000
Factor 5 . 000 . 000 . 000 . 000
Factor 6 . 000 . 000 . 000 . 000 . 000
Social risk . 010 . 165(**) -. 097 . 057 -. 069 . 253(**)
Financial risk . 120(*) . 235(**) . 043 -. 011 . 018 -. 093 . 185(**)
Involvement . 034 -. 023 . 035 . 037 -. 031 . 100 . 066 . 058
Knowledge . 027 -. 080 -. 081 -. 045 -. 075 . 056 -. 020 -. 022 . 505('*)
' Correlation is significant at the 0.05 level (2-tailed). " Correlation is significant at the 0.01 level (2-tailed).
Table 5 Orieinal Burbe Factor
1 Factor 2 Factor 3 Factor
4 Factor
5 Social risk
Single out
Financial Involvement risk
Factor 2 . 000
Factor 3 . 000 . 000
Factor 4 . 000 . 000 . 000
Factor 5 . 000 . 000 . 000 . 000
Social risk -. 024 -. 007 -. 093 -. 003 . 149(')
Single our -. 107 . 065 -. 010 . 098 . 088 . 596('*) Financial -. 075 . 088 -. 050 . 115 -. 089 . 110 . 303('*) risk Involvement
. 143(*) . 085 . 137(*) . 118(*) . 041 . 010 . 001 . 070
knowledge . 077 . 159(*') . 214(**) . 065 . 037 . 021 . 036
. 069 . 730(**)
' Correlation is significant at the 0.05 level (2-tailed). " Con-elation is significant at the 0.01 level (2-tailed).
Table 6 Counterfeit Burb Factor
1 Factor
2 Factor
3 Factor
4 Factor 5 Social
risk Single
out Financial Involvement
risk Factor 2 . 000 Factor 3 . 000 . 000 Factor 4
. 000 . 000 . 000 Factor 5 . 000 . 000 . 000 . 000 Social risk -. 110 . 045 . 116 -. 031 . 189(**) Single out -. 118 . 108 . 149(*) -. 058 . 233(**) . 672(**) Financial
. 004 . 148(*) . 095 . 017 . 006 . 167(**) . 252(**) risk Involvement -. 065 . 087 . 033 . 056 . 021 . 025 . 058
. 036 Knowledge -. 023 . 014 -. 043 . 024 . 039 -. 034 -. 015 -. 019
. 730(**) ' Correlation is significant at the 0.05 level (2-tailed). ** Correlation is significant at the 0.01 level (2-tailed
368
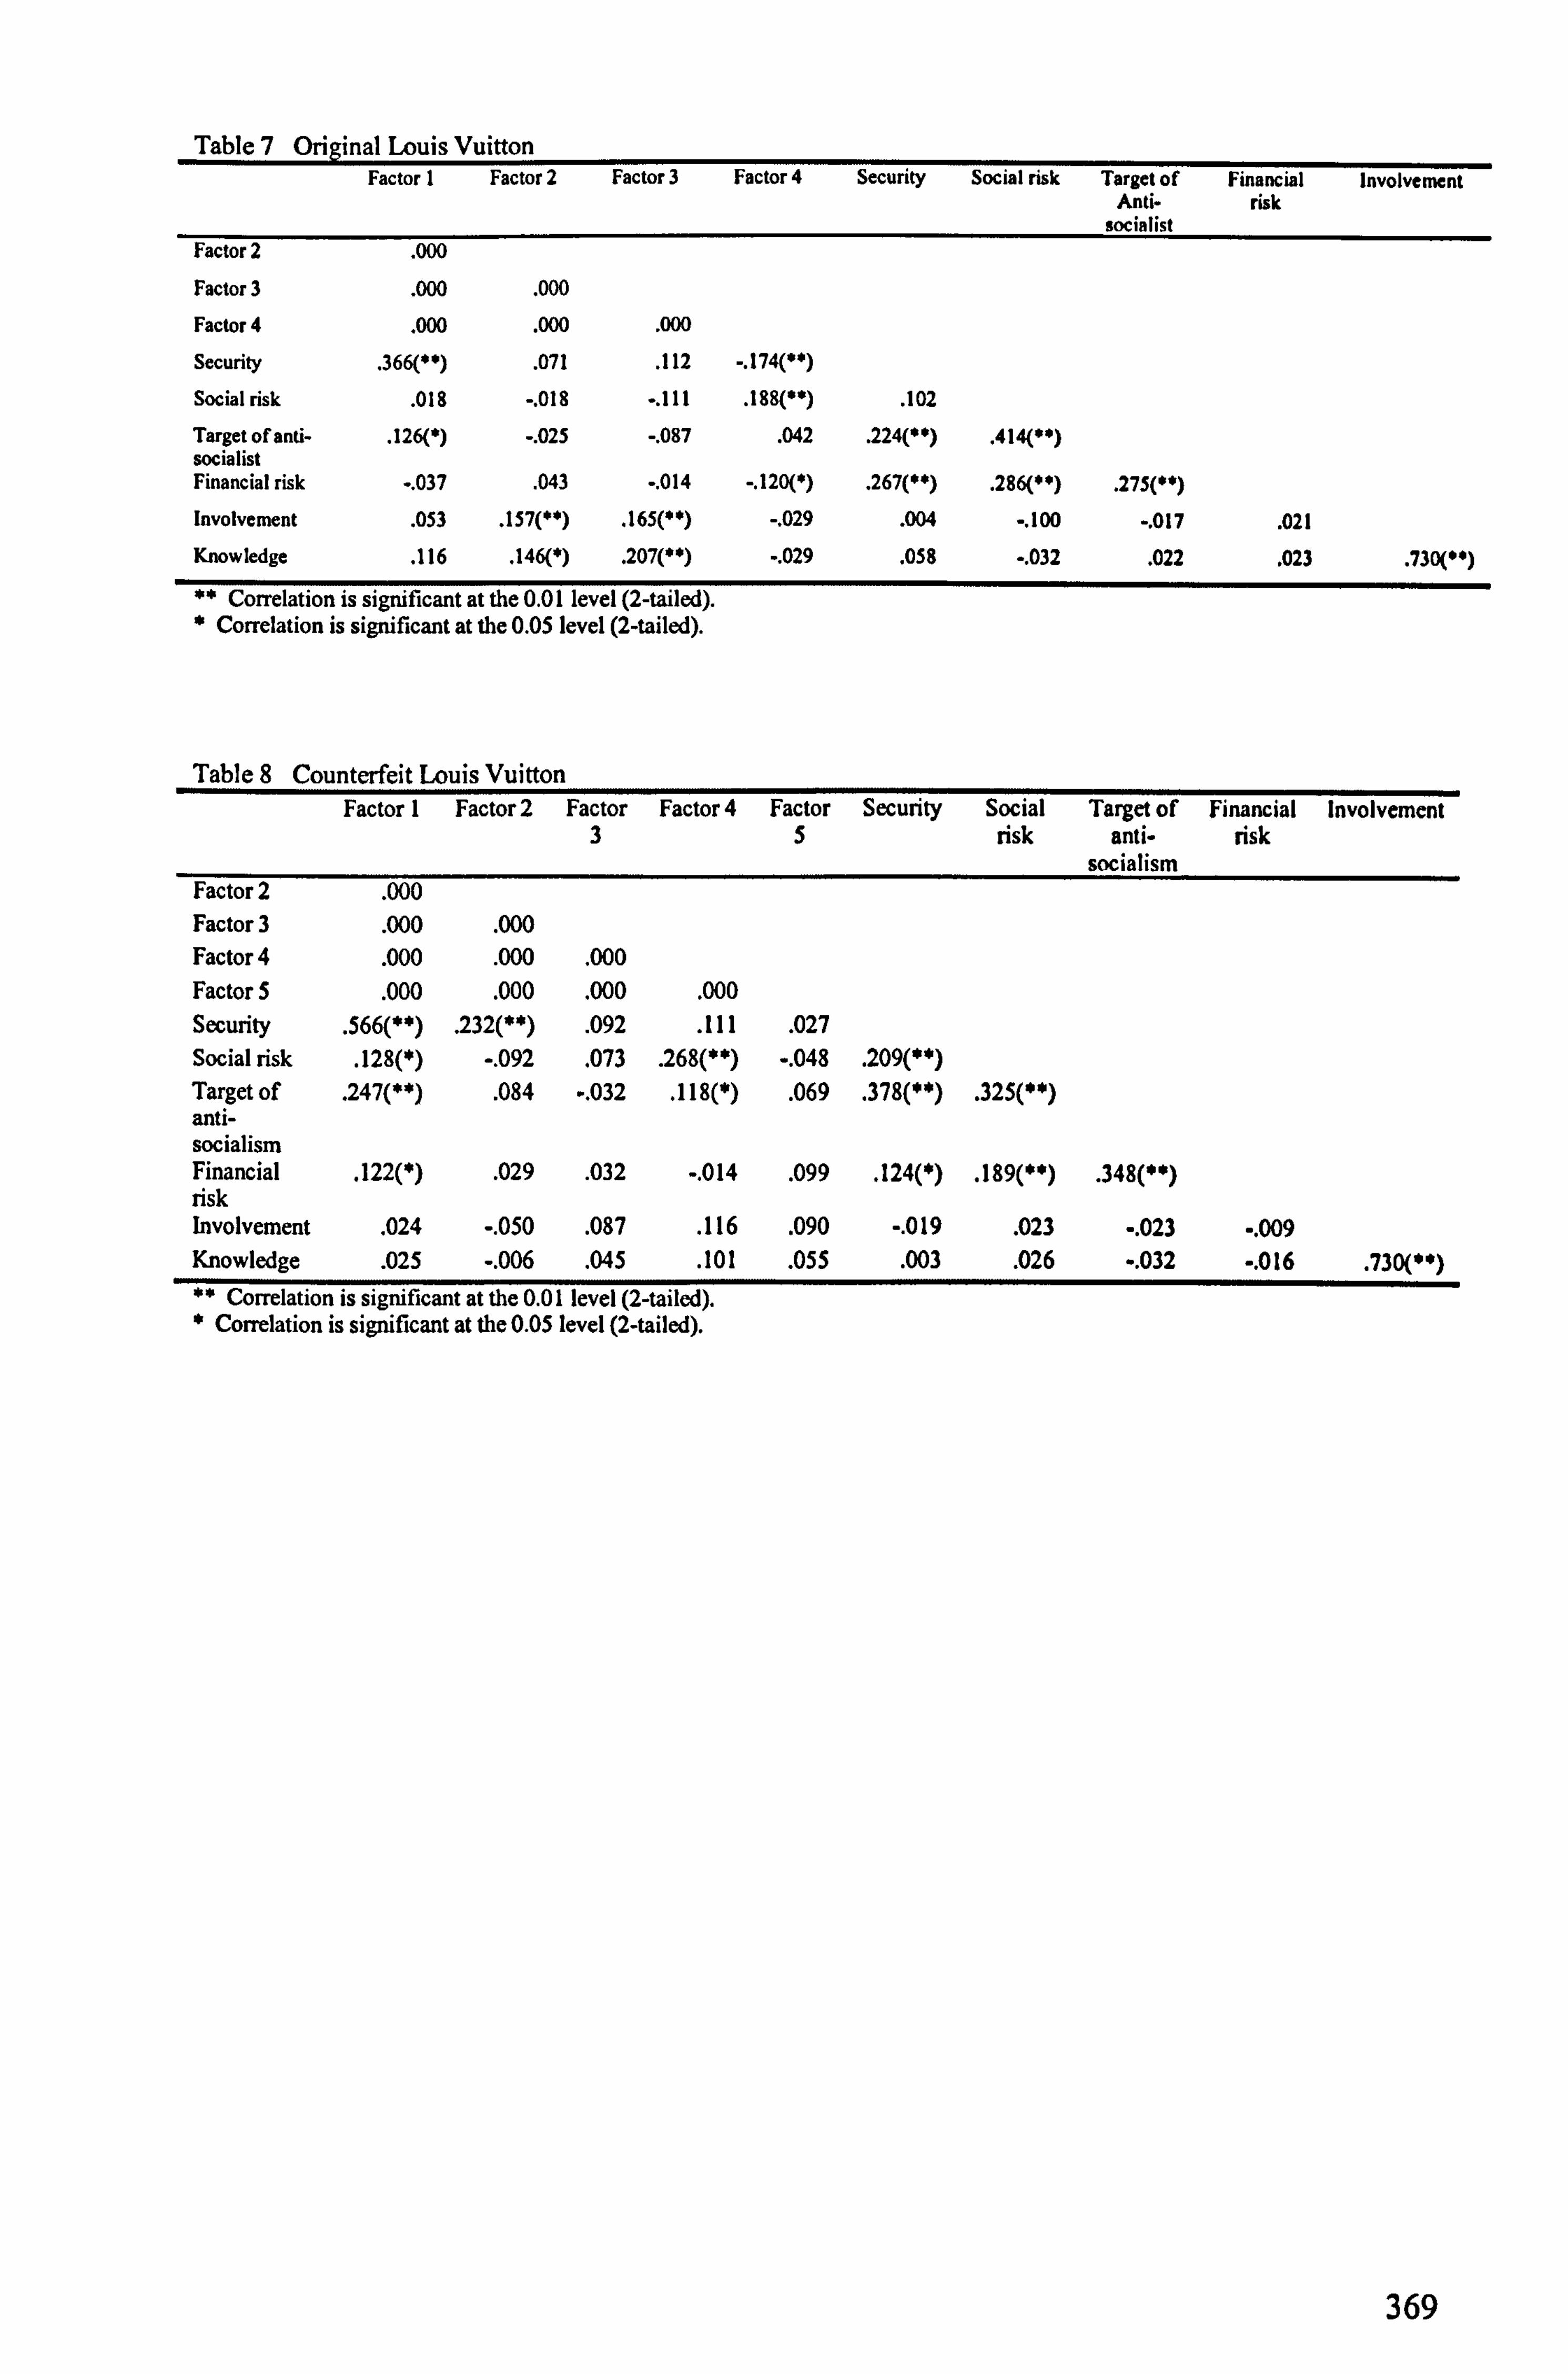
Table 7 Original Louis Vuitton Factor 1 Factor 2 Factor 3 Factor 4 Security Social risk Target of Financial Involvement
Anti- risk socialist
Factor 2 . 000
Factor 3 . 000 . 000
Factor 4 . 000 . 000 . 000
Security . 366(e) . 071 . 112 -. 174(")
Social risk . 018 -. 018 -. 111 . 188(e) . 102
Target of anti- . 126(') -. 025 -. 087 . 042 . 224(") . 414(")
socialist Financial risk -. 037 . 043 -. 014 -. 120(*) . 267(") . 286(") . 275(")
Involvement . 053 . 157(e) . 165(") -. 029 . 004 -. 100 -. 017 . 021
Knowledge . 116 . 146(') . 207(") -. 029 . 058 -. 032 . 022 . 023 . 730(")
Correlation is significant at the 0.01 level (2-tailed). * Correlation is significant at the 0.05 level (2-tailed).
Table 8 Counterfeit Louis Vuitton Factor 1 Factor 2 Factor
3 Factor 4 Factor
5 Security Social
risk Target of
anti- socialism
Financial Involvement risk
Factor 2 . 000 Factor 3 . 000 . 000 Factor 4 . 000 . 000 . 000 Factor 5 . 000 . 000 . 000 . 000 Security
. 566(**) . 232(**) . 092 . 111 . 027 Social risk . 128(*) -. 092 . 073 . 268(**) -. 048 . 209(**) Target of . 247(**) . 084 -. 032 . 118(*) . 069 . 378(**) . 325('*) anti- socialism Financial
. 122(*) . 029 . 032 -. 014 . 099 . 124(*) . 189(**) . 348(**) risk Involvement
. 024 -. 050 . 087 . 116 . 090 -. 019 . 023 -. 023 -. 009 Knowledge
. 025 -. 006 . 045 . 101 . 055 . 003 . 026 -. 032 -. 016 . 730('*) Correlation is significant at the 0.01 level (2-tailed
Correlation is significant at the 0.05 level (2-tailed).
369

Annendiy 19 4ictnorsm of Residues and oa-plot after Transformation IYbyr«n Nrw1AILMW MNJ) ýý P. "
1
t
aa", as . rWýýkN
Original Rolex purchase intention
alw"+t"
Original Rolex purchase intention Nbb"rw elnsMýLM«ModNAW) ý"1 Q0 P""
$ t"
I , f
Counterfeit Rolex purchase intention Counterfeit Rolex purchase intention
Hkwg,.. dr""Id(Lh -Mod"I. CRC23) M""r^"I Q PI
I"
1
a ` V
+s -0 o+2s aaa"+""
«. w+w. NOE«. cNC7a) 1I IIlo rw
Counterfeit Rolex likelihood of consideration Counterfeit Rolex likelihood of consideration
HI"tog. m f- Id(LIN""rMod"I. COZ) H. rwt"IO-0PM
S
8
i"
R s
r"
-a -+ "o+os aae"e"
Original Gucci purchase intention Original Gucci purchase intention
370
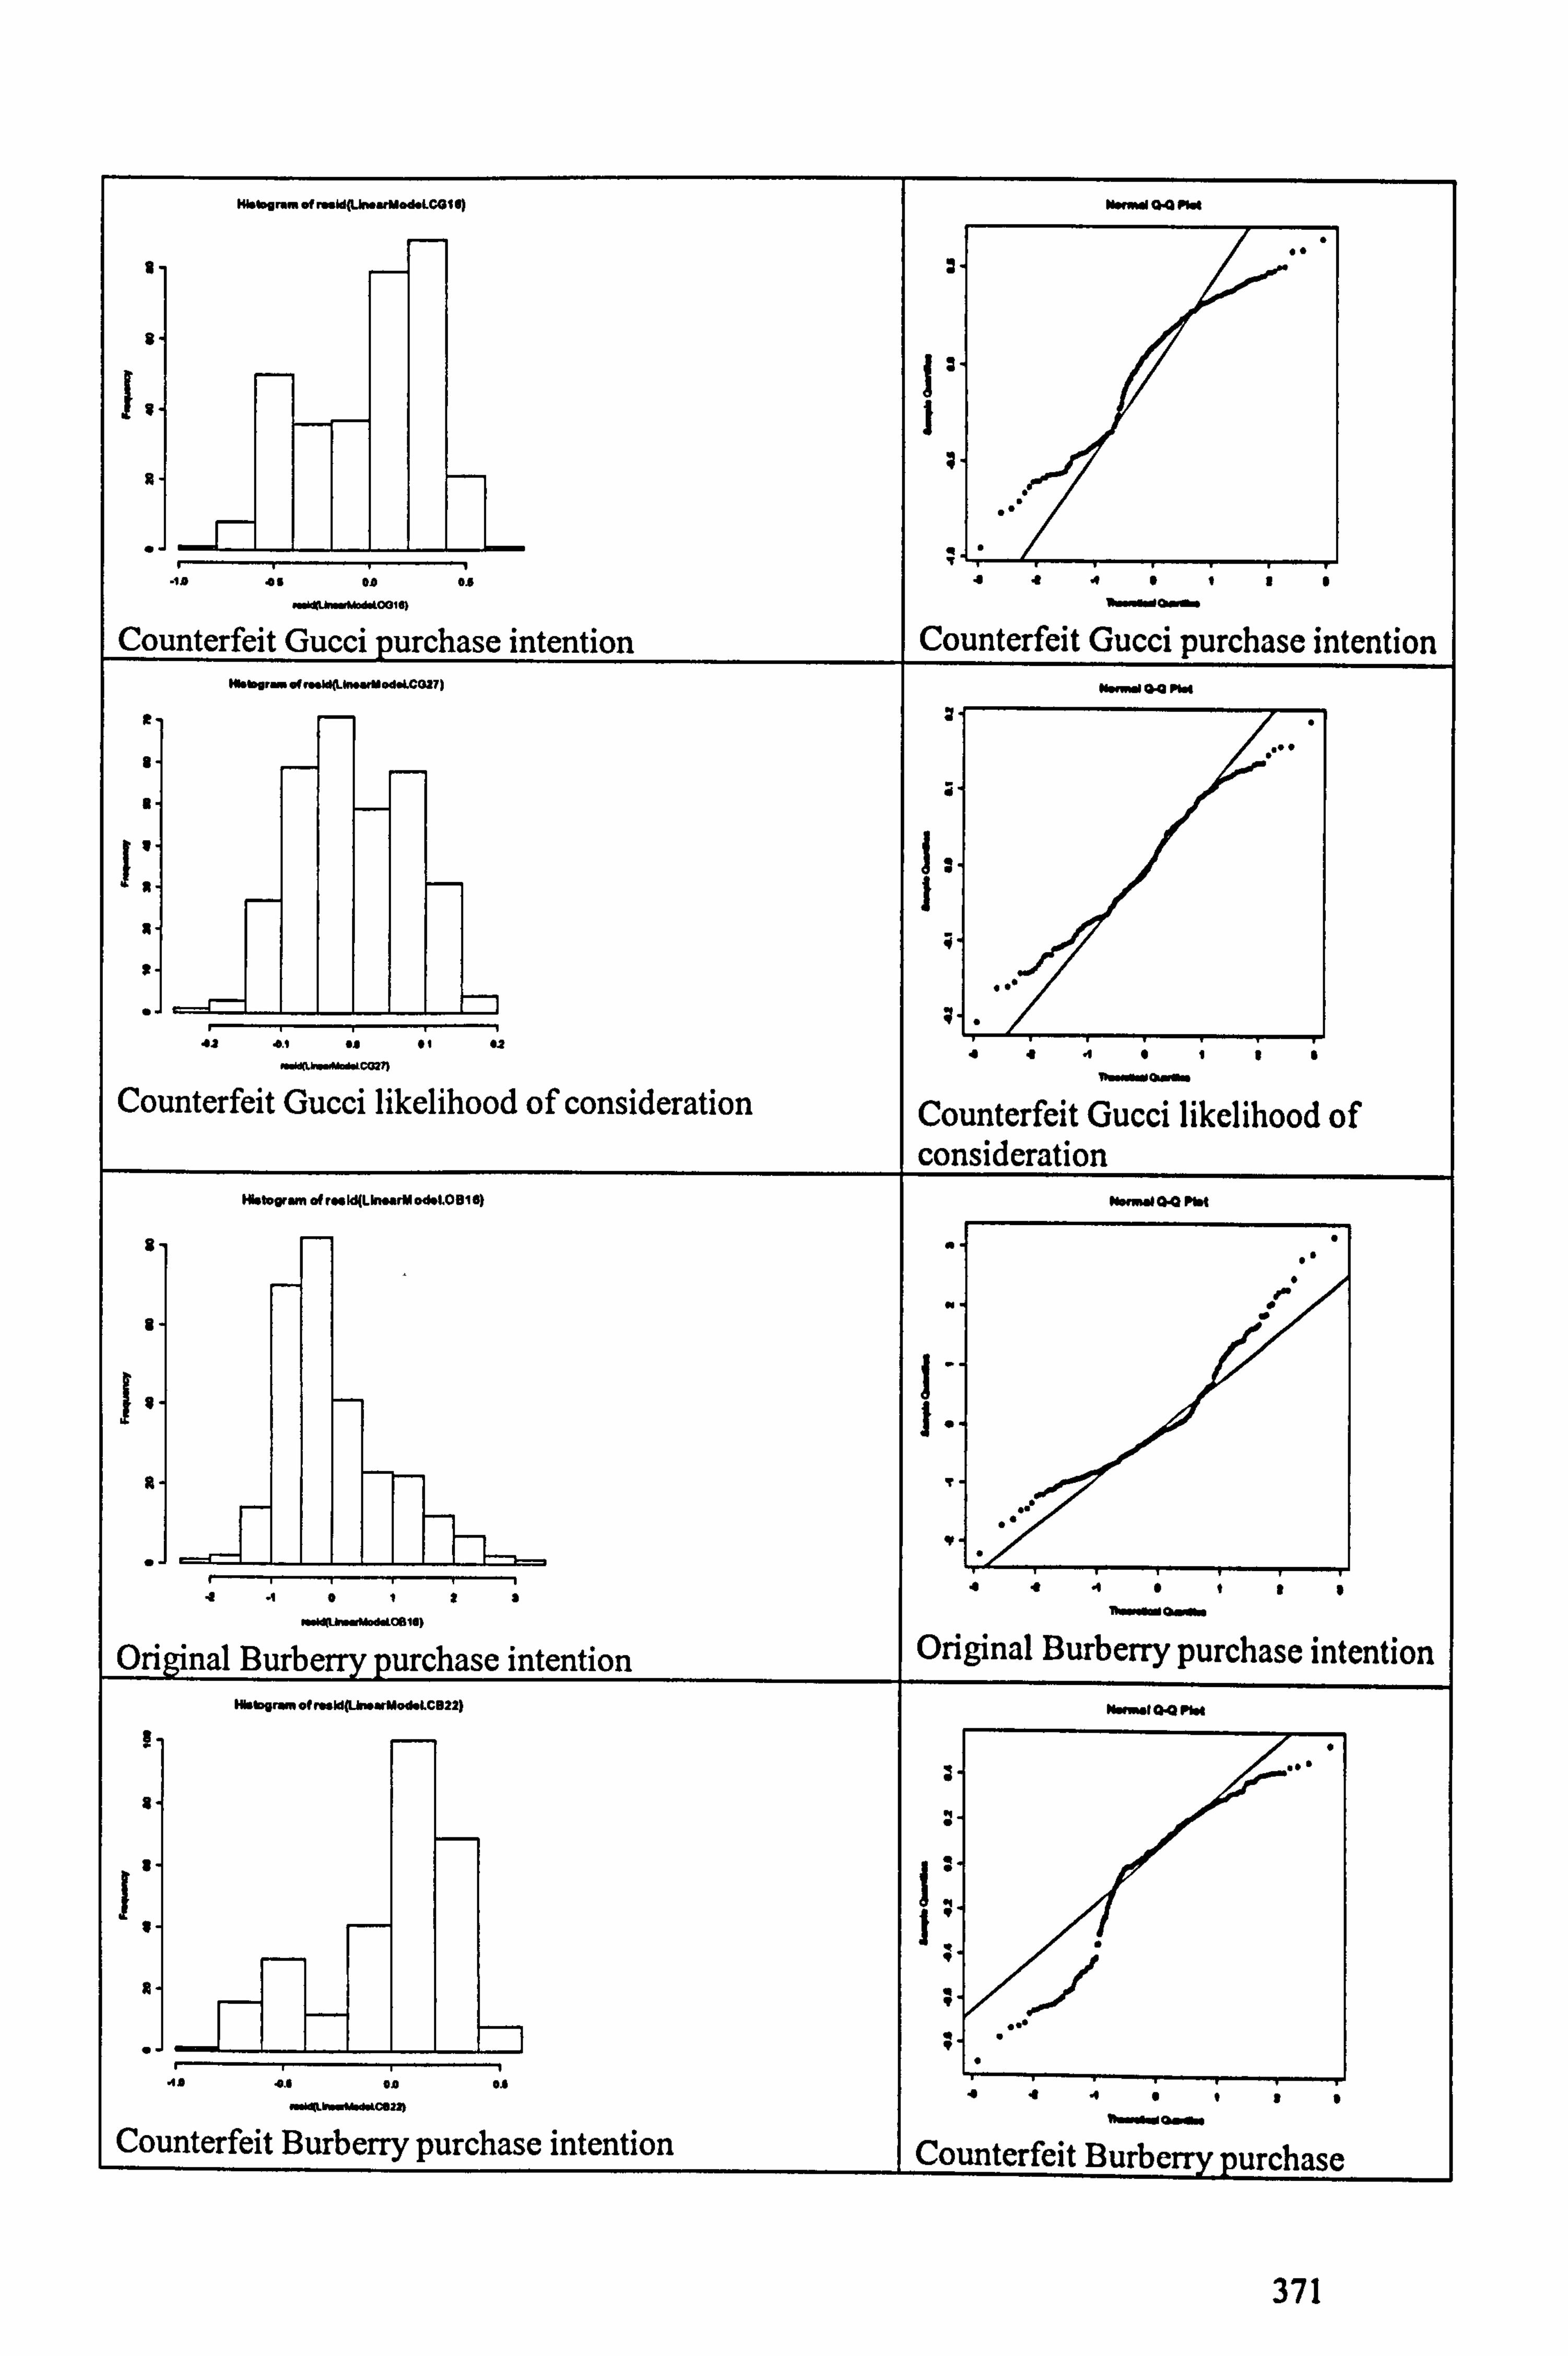
KWbgrun of lW(Un.. rM"d. LCGI4) W. Mm 04 /Id
A 7
A { J
i
AY as 0a 0a ++ .0"0
. gLl 1. eNau, n wra.. rorr
Counterfeit Gucci purchase intention Counterfeit Gucci purchase intention NMMrr"drwWLM. r11oAKC077) 01 . OO NN
R 7
t
1
" 7
u +. 1 00 0I 03
i. wMbnld. l0027) ++A"1".
L"nW1101ý01ý
Counterfeit Gucci likelihood of consideration Counterfeit Gucci likelihood of consideration
IIllog mdr«WLNwrM o&LO016) N. " C14 MN
A
A
++d. $t
n wwa"ý.. ww+oaiq
Original Burberry purchase intention
ý.. ro. ww
Original Burberry purchase intention IN. bgr.. f-IdPln.. rMod. LCB22) N I04 .M
{ a :
r"IgIY". MrOrl4lifl 11ra O y0
Counterfeit Burberry purchase intention . r 1ýr0
Counterfeit Burberry purchase
371

intention
ýi
R tw "
ir
os .. 42 U Si Si
y1t1
Counterfeit Burberry likelihood of consideration
a .8"11. Tw. YOý.
Counterfeit Burberry likelihood of consideration
NW"rn.. 1,.. IdPJ-M. d. LCLV16) "-I OO ºM
r+ý
i
R Original Louis Vuitton purchase intention Original Louis Vuitton purchase
intention HI. W W- oh.. Id(Un... M. d. 1. CL110) HW0,01 QQ ºlof
Y
0
R ,"
-0A . 0A 00 0.6
w6iglrrrwwan0l a"4. t! "
o. r. "rOrw.
Counterfeit Louis Vuitton purchase intention Counterfeit Louis Vuitton purchase intention
372
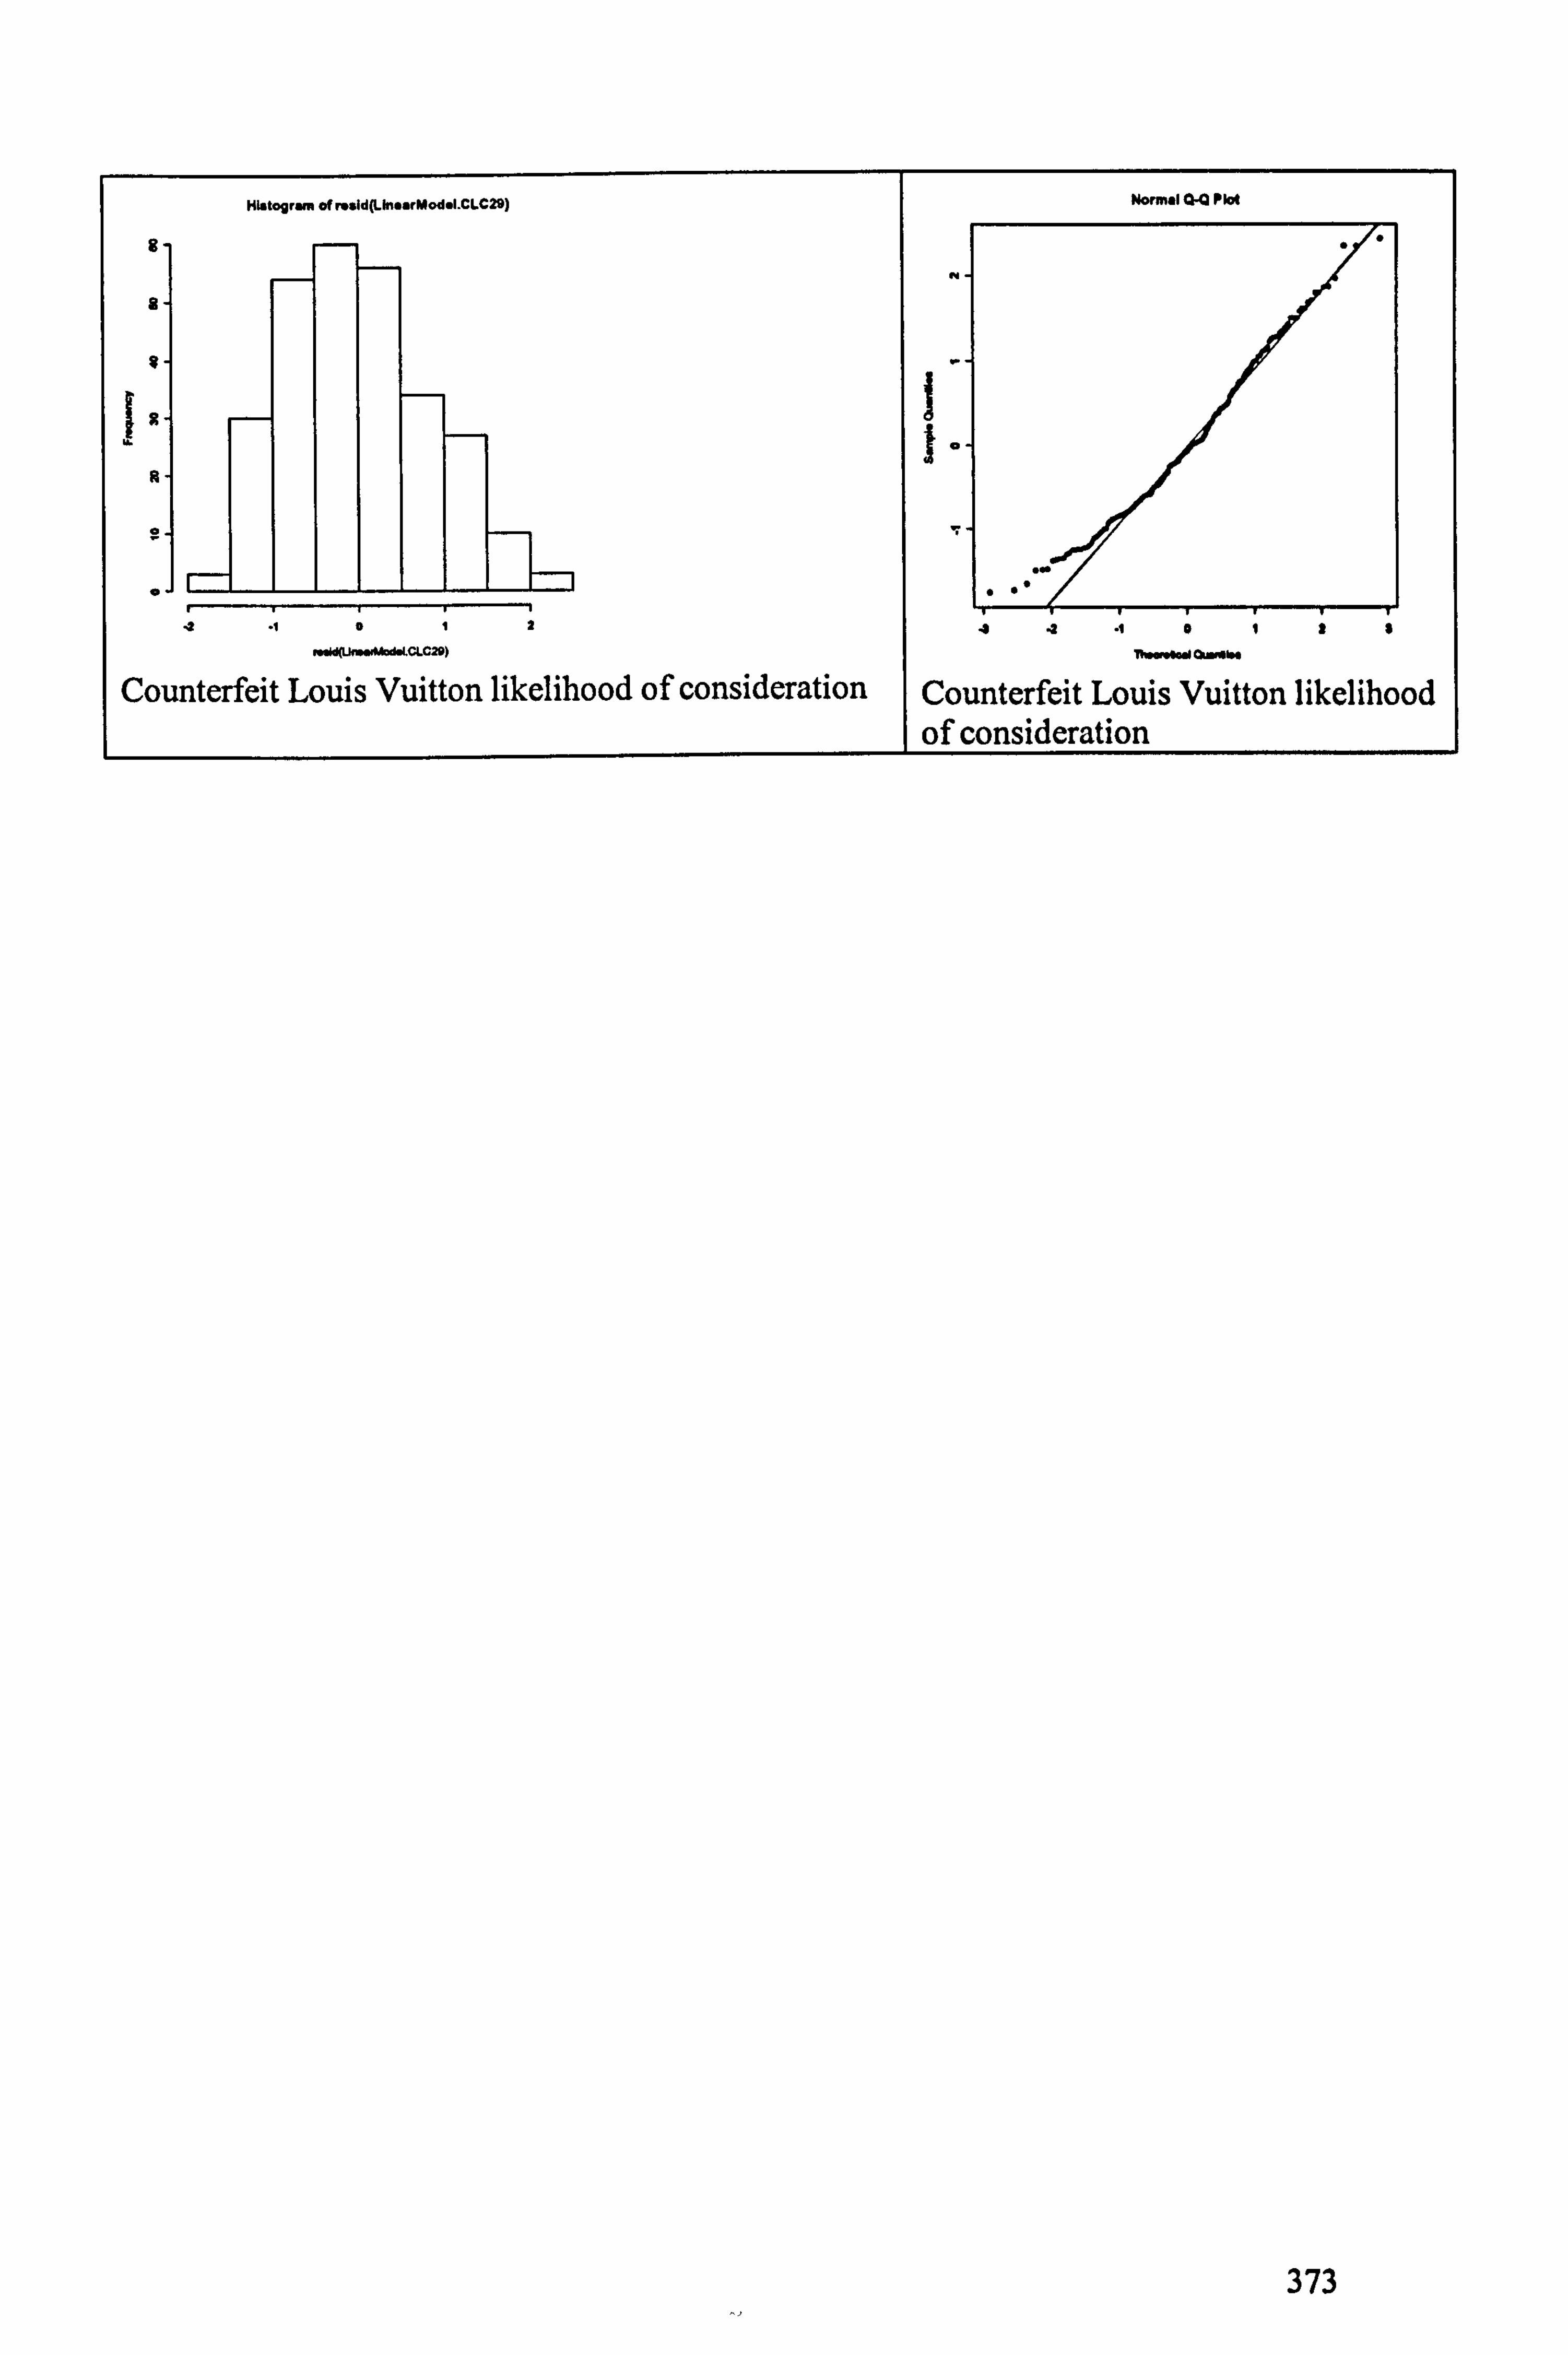
Normei ua Plot
8"
8"
18"
R
e
3 .1012
.. WtýCLC2D)
Counterfeit Louis Vuitton likelihood of consideration
. jý
4ßd01! $
71-mm 0ý1"
Counterfeit Louis Vuitton likelihood of consideration
373
Histogram of rssid(LMaarMod. I. CLC29)
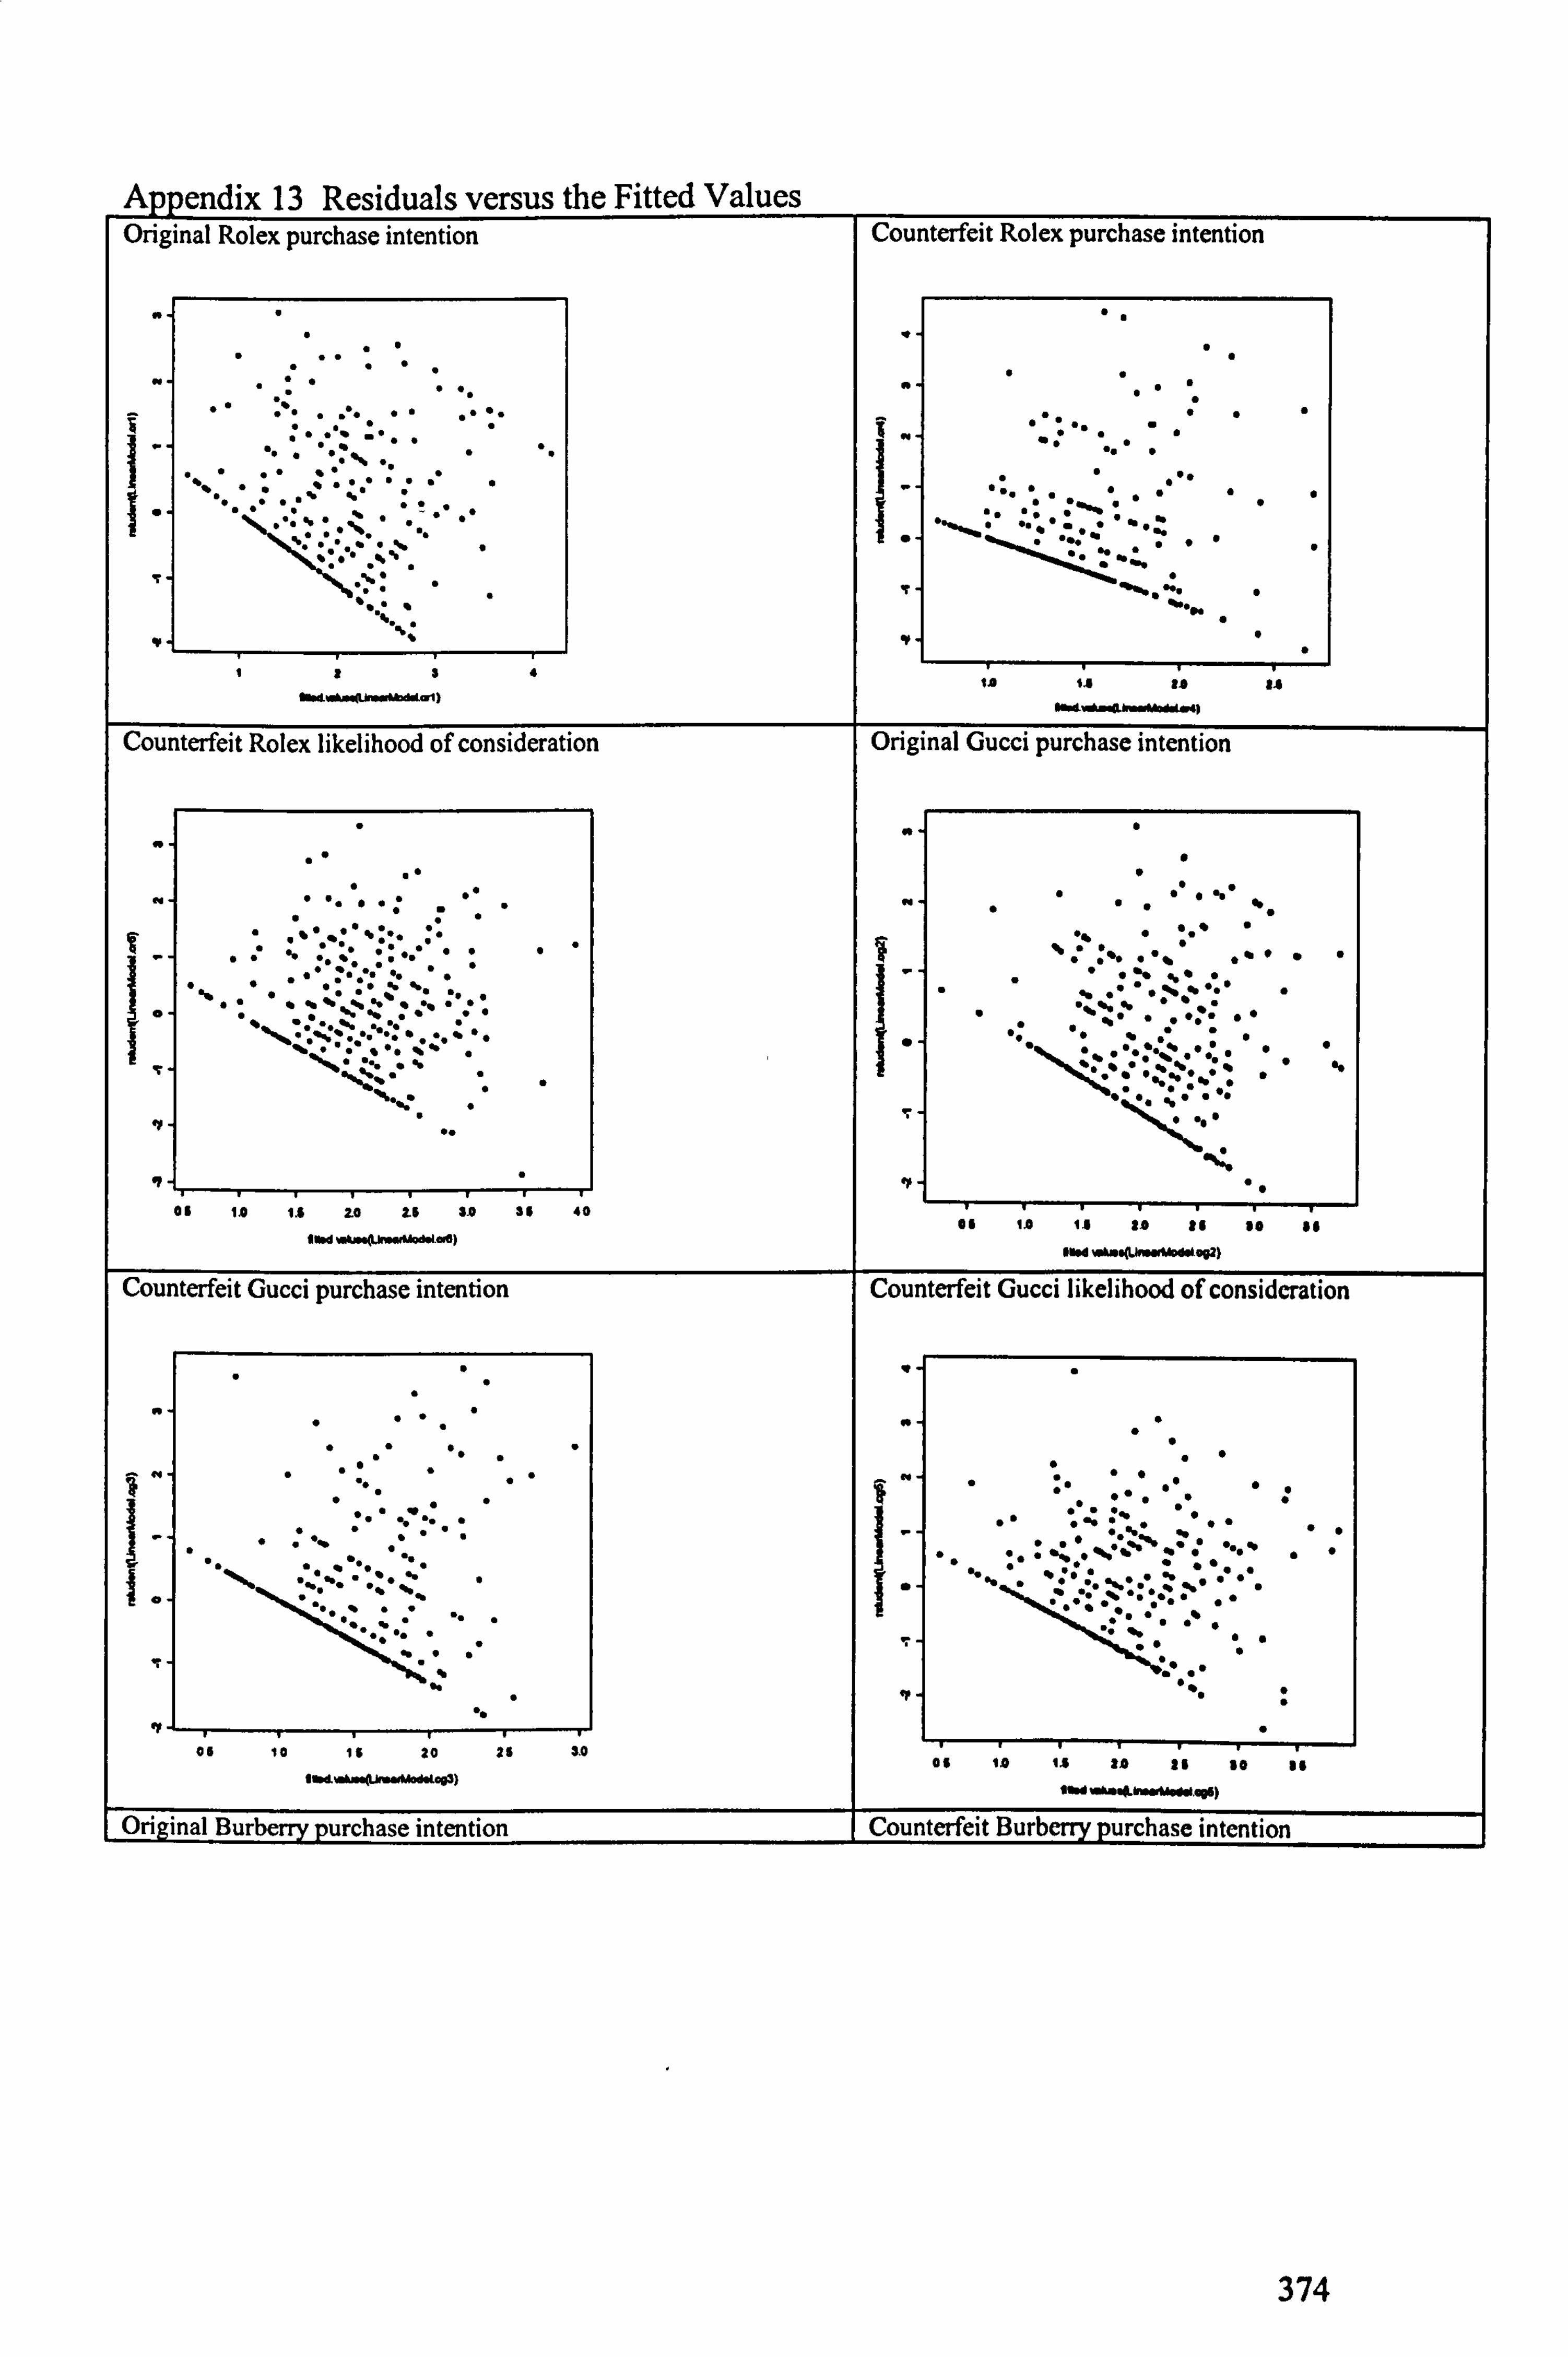
Appendix 13 Residuals versus the Fitted Values Orig inal Rolex purchase intention Counterfeit Rolex purchase intention
y tiý y
1! 71
6r/wWü""Wlýol) /D 1D !DU
6rlýß. w"Wý"1)
Coun terfeit Rolex likelihood of consideration Original Gucci purchase intention
" w
7 ry ""
as 1A 1.0 20 26 !A 06 f0 06 fA is to !0 f0
0"M WA-(U OA., . 6) 60N vlw"(LMw"rMO0Mp7)
Counterfeit Gucci purchase intention Counterfeit Gucci likelihood of consideration
" T"" i
06 1{ 20 tb 7.0 0{ IA IA !A !{ 00 0{
6raW.. ýu. wewaw"{s) {r". r. p. wruar. gp)
Original Burberry purchase intention Counterfeit Burberry Purchase intention
374

e `,
" %
7
0{ 10 to 20 !. 6 20
0ýý`ý
"" 7 ""
IA 1/ !0
00.0 WýlMeY11oC"10.1)
Counterfeit Burberry likelihood of consideration Orig inal Louis Vuitton purchase intention
1.0 1.6 20 !6 30 to /. { !A !{ {D
OOM. WwLY"rMOO"L. 00) ! btl rt1WlY"rG1o0M. aM)
Counterfeit Louis Vuitton purchase intention Counterfeit Louis Vuitton likelihood of consideration
e ,
T \ý "
"
y
"
0$ 1.0 1{ 2A !{
08 IA is U to as U
OrC WytM MSYtl"11)
Iftd*k ylMwMUddrM2)
375

References
References:
Aaker, D. A. (1991). Managing Brand Equity: Capitalizing on the Value of a Brand Name, New York: The Free Press.
Aaker, D. A. (1996). Building Strong Brands, New York: The Free Press.
Aaker, D. A. and Joachimsthaler, E. (2000). Brand Leadership, New York and London: The Free Press.
Aaker, D. A. and Keller, K. L. (1990). Consumer Evaluation of Brand Extension, Journal of Marketing, Vol. 54, January, pp. 27-41.
Aaker, D. A. and Myers, J. G. (1987). Advertising Management, 4`h Edition, Englewood Cliffs, NJ: Prentice-Hall.
Aaker, D. A., Batra, R. and Myers, J. G. (1992). Advertising Management, 4`h Edition, Englewood Cliffs, NJ: Prentice-Hall.
Aaker, D. A., Kumar, V. and Day, G. S. (1997). Marketing Research, 6th Edition, New York: John Wiley & Sons, Inc.
Aaker, J. L. (1995, October). Measuring the Human Characteristics of a Brand: a Brand Personality Hierarchy, Paper presented at the Annual Conference of the Association for Consumer Research, Boston, MA.
Aaker, J. L. (1997). Dimensions of Brand Personality, Journal of Marketing Research, Vol. 34, Issue 3, August, pp. 347-356.
Aaker, J. L. (1999). The Malleable Self: the Role of Self-expression in Persuasion, Journal of Marketing Research, Vol. 36, Issue 1, pp. 45-57.
Aaker, J. L. (2000). Accessibility or Diagnosticity? Disentangling the Influence of Culture on Persuasion Processes and Attitudes, Journal of Consumer Research, Vol. 26, Issue 4, March, pp. 340-357.
Aaker, J. L., Benet-Martinez, V. and Garolea, J. (2001). Consumption Symbols as Carries of Culture: A Study of Japanese and Spanish Bran Personality Constructs, Journal of Personality and Social Psychology, Vol. 81, Issue 3, pp. 492-508.
Aaker, J. L., Fournier, S., Allen D. E. and Olson, J. (1995). A Brand as a Character, a Partner and a Person: Three Perspectives on the Question of Brand Personality, Advances in Consumer Research, Vol. 22, Issue 1, pp. 391-395.
Abalos, R. (1985). Commercial Trademark Counterfeiting in the United States, the Third World and Beyond: American and International Attempts to Stem the Tide, Boston College Third World Law Journal, Vol. 5, June, pp. 151-183.
Ajzen, I. (1991). The Theory of Planned Behavior, Organization Behavior and Human Decision Processes, Vol. 50, pp. 179-211.
376

Ajzen, I. and Fishbein, M. (1973). Attitudinal and Normative Variables as Predictors of Specific Behaviors, Journal of Personality and Social Psychology, Vol. 27, July, pp. 41-47.
Alba, J. W. and Chattopadhyay, A. (1985). Effects of Context and Part-Category Cues on Recall of Competing Brands, Journal of Marketing Research, Vol. 12, Issue 3, August, pp. 340-349.
Alba, J. W. and Hutchinson J. W. (1987). Dimensions of Consumer Expertise, Journal of Consumer Research, Vol. 13, Issue 4, March, pp. 411-454.
Alba, J. W. and Hutchinson, J. W. (2000). Knowledge Calibration: What Consumers Know and What They Think They Know, Journal of Consumer Research, Vol. 27, Issue 2, pp. 123-157.
Alba, J. W., Hutchinson, J. W. and Lynch, J. (1991). Memory and Decision Making, in H. H. Kassarjian and T. S. Robertson (eds. ), Handbook of Consume Theory and Research, Englewood Cliffs, NJ: Prentice Hall, pp. 1-49.
Albers-Miller, N. (1999). Consumer Misbehavior: Why People Buy Illicit Goods, Journal of Consumer Marketing, Vol. 16, Issue 3, pp. 273-287.
Anand, P. (1993). Foundations of Rational Choice under Risk, Oxford: Clarendon Press.
Anand, P., Holbrook, M. B. and Stephens, D. (1988). The Formation of Affective Judgements: The Cognitive-Affective Model versus the Independence Hypothesis, Journal of Consumer Research, Vol. 15, Issue 3, December, pp. 386-391.
Anderson, R. D., Engledow, J. L. and Becker, H. (1979). Evaluating the Relationships among Attitude toward Business Product Satisfaction, Experience, and Search Effort, Journal of Marketing Research, Vol. 16, Issue 3, August, pp. 394-400.
Andrews, E. M. (1984). Construct Validity and Error Components of Survey Measures, Public Opinion Quarterly, Vol. 48, Issue 2, Summer, pp. 409-442.
Andrews, J. C. (1988). Motivation, Ability, and Opportunity to Process Information: Conceptual and Experimental Manipulation Issues, Advances in Consumer research, Vol. 15, Issue 1, pp. 219-225.
Andrews, J. C., Akhter, S. H., Durvasula, S. and Muehling, D. (1992). The Effects of Advertising Distinctiveness and Message Content Involvement on Cognitive and Affective Responses to Advertising, Journal of Current Issues and Research in Advertising, Vol. 14, Issue 1, Spring, pp. 45-58.
Andrews, R. L. and Srinivasan, T. C. (1995). Studying Consideration Effects in Empirical Choice Models Using Scanner Panel Data, Journal of Marketing Research, Vol. 32, Issue 1, February, pp. 30-41.
Ang, S. (2000). The Influence of Physical Beneficial and Image Properties on Responses to Parallel Imports, International Marketing Review, Vol. 17, Issue 6, pp. 509-524.
377
Ang, S., Cheng, P., Lim, E. and Tambyah, S. (2001). Spot the Difference: Consumer Responses towards Counterfeits, Journal of Consumer Marketing, Vol. 18, Issue 3,
pp. 219-235.
Anti-Counterfeiting Group Survey Report (2004). Why Should You Care about Counterfeiting [online], available from: http: //www. a-cg. com/guest-frames. html, [cited l 1th September 2006].
Arndt, J. (1967). Word of Month Advertising and Informal Communication, in Cox, D. F. (eds. ), Risk Taking and Information Handling in Consumer behaviour, Boston, MA: Division of Research, Graduate School of Business Administration, Harvey University, pp. 188-239.
Arnold, D. (1992). The Handbook of Brand Management, New York: Harper Collins Publishers.
Arons, L. (1961). Does Television Viewing Influence Store Image and Shopping Frequency, Journal of Retailing, Vol. 37, pp. 1-13.
Arora, R. (1982). Validation of an S-O-R Model for Situation, Enduring, and Response Components of Involvement, Journal of Marketing Research, Vol. 19, Issue 4, pp. 505-516.
Arrindell, W. A. and van der Ende, J. (1985). An Empirical Test of the Utility of the Observer-to-variables Ratio in Factor and Components Analysis, Applied Psychological Measurement, Vol. 9, pp. 165-178.
Arrow, K. J. (1965). Aspects of the Theory of Risk-Bearing, Yrjö Jahnssonin Säätiö: Helsinki.
Asian Wall Street Journal (1999). Copyright Piracy Declines in Asia for US Companies, February 18, pp. 7.
Assael, H. (2004). Consumer Behavior -A Strategic Approach, Boston: Houghton Mifflin.
Assael, H. and Keon, J. (1982). Nonsampling vs. Sampling Errors in Survey Research, Journal of Marketing, Vol. 45, Issue 1, Spring, pp. 114-123.
Aurier, P., Jean, S. and Zaichkowsky, J. L. (2000). Consideration Set Size and Familiarity with Usage Context, Advances in Consumer Research, Vol. 27, Issue 1,
pp. 307-313.
Austin, J. R., Siguaw, J. A. and Mattila, A. S. (2003). A Re-examination of the Generalisability of the Aaker Brand Personality Measurement Framework, Journal
of Strategic Marketing, Vol. 11, Issue 2, June, pp. 77-92.
Axelrod, J. N. (1968). Attitude Measures that Predict Purchase, Journal of Advertising Research, Vol. 8, Issue 1, pp. 3-17.
Azoulay, A. and Kapferer, J-N. (2003). Do Brand Personality Scales Really Measure Brand Personality?, Journal of Brand Management, Vol. 11, Issue 2, pp. 143-155.
378

Backstrom, C. H. and Hursh, G. D. (1963). Survey Research, Evanston IL: Northwestern University Press.
Bagozzi, R. (1981). Attitudes, Intentions, and Behavior: A Test of Some Key Hypotheses, Journal of Personality and Social Psychology, Vol. 41, Issue 4, pp. 607- 627.
Bagozzi, R. (1992a). The Self-Regulation of Attitudes, Intentions, and Behavior, Social Psychology Quarterly, Vol. 55, No. 2, June, pp. 178-204.
Bagozzi, R. and Warshaw, P. (1992). An Examination of the Etiology of the Attitude- behavior Relation for Goal-directed Behaviors, Multivariate Behavioral Research, Vol. 27, Issue 4, pp. 604-634.
Bagozzi, R. and Yi, Y. (1988). On the Evaluation of Structural Equation Models, Journal of Academy of Marketing Science, Vol. 16, Issue 1, Spring, pp. 74-94.
Bagozzi, R. P. (1992b). Acrimony in the Ivory Tower: Stagnation or Evolution?, Journal
of the Academy of Marketing Science, Vol. 20, Issue 3, Fall, pp. 355-359.
Bagozzi, R. P. and Burnkrant, R. E. (1979). Attitude Organization and Attitude-Behavior Relationship, Journal of Personality and Social Psychology, Vol. 37, Issue 5, pp. 913-929.
Baker, T., Hunt, J. B. and Scribner, L. L. (2002). The Effect of Introducing A New Brand on consumer Perceptions of Current Brand Similarity: The Roles of Product Knowledge and Involvement, Journal of Marketing Theory and Practice, Vol. 10, Issue 4, Fall, pp. 45-57.
Baker, W., Hutchinson, W., Moore, D. and Nedungadi, P. (1986). Brand Familiarity and Advertising: Effects on the Evoked Set and Brand Preference, Advances in Consumer Research, Vol. 13, No. 1, pp. 637-643.
Bamossy, G. and Scammon, D. (1985). Product Counterfeiting: Consumers and Manufacturers Beware, Advances in Consumer Research, Vol. 12, Issue 1, pp. 334- 340.
Barker, R. F. (1987). A Demographic Profile of Marketing Research Interviewers, Journal of the Market Research Society (UK), Vol. 29, Issue 3, July, pp. 279-292.
Batra R. and Ray, M. L. (1986). Situational Effects of Advertising Repetition: The Moderating Influence of Motivation, Ability, and Opportunity to Respond, Journal of Consumer Research, Vol. 12, Issue 4, pp. 432-445.
Batra, R. and Ray, M. L. (1985). Operationalizing Involvement as Depth and Quality of Cognitive Response, Advances in Consumer Research, Vol. 12, Issue 1, pp. 309-313.
Batra, R., Lehmann, D. R. and Singh, D. (1993). The Brand Personality Component of Brand Goodwill: Some Antecedents and Consequences, in D. A. Aaker and A. Biel (eds. ), Brand Equity and Advertising: Advertising's Role in Building Strong Brands, Hillsdale, NJ: Lawrence Erlbaum Associates Inc., pp. 83-97.
379

Bauer, R. A. (1960). Consumer Behaviour as Risk Taking, in R. S. Hancock (ed. ), Dynamic Marketing for a Changing World, Chicago: American Marketing Association, pp. 389-398.
Bearden, W. and Netemeyer, R. (1999). Handbook of Marketing Scales: Multi-Item Measure for Marketing and Consumer Behaviour Research, 2°d Edition, London: Sage Publications.
Beatty, S. and Smith, S. (1987). External Search Effort: An Investigation Across Several Product Categories, Journal of Consumer Research, Vol. 14, Issue 1, June, pp. 83-96.
Beatty, S. E. and Talpade, S. (1994). Adolescent Influence in Family Decision Making: A Replication with Extension, Journal of Consumer Research, Vol. 21, Issue 2, September, pp. 332-341.
Beckwith, N. E. and Lehmann, D. R. (1975). The Importance of Halo Effects in Multi- Attribute Models, Journal of Marketing Research, Vol. 12, Issue 3, August, pp. 265- 275.
Beerli, A. and Santana, H. D. M. (1999). Design and Validation of An Instrument for Measuring Advertising Effectiveness in the Printed Media, Journal of Current Issues and Research in Advertising, Vol. 21, No. 2, pp. 11-30.
Belch, H. W. and Belch, M. A. (1995). Introduction to Advertising and Promotion: An Integrated Marketing Communications Perspective, 3`d Edition, Boston, MA: Irwin.
Belk, R. W. (1988). Possessions and the Extended Self, Journal of Consumer Research, Vol. 15, Issue 2, September, pp. 139-168.
Bellenger, D. N., Steinberg, E. and Stanton, W. W. (1976). The Congruence of Store Image and Self Image, Journal of Retailing, Vol. 52, Issue 1, Spring, pp. 17-32.
Belonax, J. A. and Mittelstaedt, R. A. (1978). Evoked Set Size as a Function of Number of Choice Criteria and Information Variability, Advances in Consumer Research, Vol. 5, Issue 1, pp. 48-51.
Berelson, B. (1952). Content Analysis in Communications Research, Glencoe, Ill: The Free Press.
Berger, I. E., Ratchford, B. T. and Haines Jr., G. H. (1994). Subjective Product Knowledge as A Moderator of the Relationship between Attitudes and Purchase Intentions for a Durable Product, Journal of Economic Psychology, Vol. 15, Issue 2, June, pp. 301-314.
Berner, R. and Kiley, D. (2005). Global Brands: Business Week/interbrand Rank the Companies that Best Built Their Images and Made Them Stick, Business Meek, Issue 3945.
Berry, L., Lepkowith, E. K. and Clark, O. (1988). What's in A Name, Harvard Business Review, Vol. 66, No. 5, September/October, pp. 28-30.
380
Bettinger, C. O., Dawson Jr., L. E. and Wales, H. G. (1979). The Impact of Free-Sample Advertising, Journal ofAdvertising Research, Vol. 19, No. 3, pp. 35-39.
Bettman, J. (1979). An Information Processing Theory of Consumer Choice, Reading, MA: Addosopm-Wesley.
Bettman, J. A. and Park, C. W. (1980). Effects of Prior Knowledge and Experience and Phase of the Choice Process on Consumer Decision Making Processes: A Protocol Analysis, Journal of Consumer Research, Vol. 7, Issue 3, December, pp. 234-248.
Bhat, S. and Reddy, S. (1998). Symbolic and Functional Positioning of Brands, Journal of Consumer Marketing, Vol. 15, No. 1, pp. 32-43.
Bian, X. and Veloutsou, C. (2004, May). Perceived Risk When Purchasing Non- Deceptive Counterfeit Products, Paper presented at the 33rd European Marketing Academia Conference, Spain.
Bian, X. and Veloutsou, C. (2006). Consumer's Attitudes Regarding Non-Deceptive Counterfeit Brands in the UK and China, Journal of Brand Management, Vol. 14, No. 1, pp. 1-13.
Biel, A. (1992). How Brand Image Drives Brand Equity, Journal of Advertising Research, Vol. 32, Issue 6, November/December, pRC6-RC12.
Biel, A. (1993). Converting Image into Equity, in D. A. Aaker and A. Biel (eds. ), Brand Equity and Advertising, Hillsdale, NJ: Lawrence Erlbaum Associates, pp. 67-82.
Bikoff, J. (1983). Counterfeiters of Industrial Products Posing New Threats to Industrial Buyers, AMA Forum, pp. 32-33.
Billesbach, T. Harrison, A. and Croom-Morgan, S. (1991). Just-in-Time: A United States-United Kingdom Comparison, International Journal of Operation & Production Management, Vol. 11, Issue 10, pp. 44-57.
Biocca, F., Li, H. and Daughety, R. M. (2001 May). Experiential E-Commercc: Relationship of Physical and Social Presence to Consumer Learning, Attitudes, and Decision-Making, paper presented at the Presence Conference, Philadelphia, PA.
Bird, M., Channon, C. and Ehrenberg, A. (1970). Brand Image and Brand Usage, Journal of Marketing Research, Vol. 7, Issue 3, August, pp. 307-314.
Birdwell, A. E. (1968). A Study of Influence of Image Congruence on Consumer Choice, Journal of Business, Vol. 41, No. 1, pp. 76-88.
Black, H. C. and Garner, B. A. (1996). Black's Law Dictionary, 5`h Edition, St. Paul: West Publishing.
Blair, M. E. and Innis, D. E. (1996). The Effects of Product Knowledge on the Evaluation of Warranted Brands, Psychology and Marketing, Vol. 13, No. 5, pp. 445-456.
Blatt, J. (1993). Battling Counterfeit Products on the US Side of the Pacific Rim, The International Computer Lawyer, Vol. 1, Issue 13, pp. 32-33.
381

Bloch, J., Depret, P., Gallo, E., Gamier, H., Ginesfe, F., Leconte, B., Le Ny, A., Postel, C., Reutilin, X. and Casalis, G. (1997). Dictionnaire Fondamental de la Psychologie, Paris, France: Larousse-Bordas.
Bloch, P., Bush, R. and Campbell, L. (1993). Consumer `Accomplices' in Product Counterfeiting, Journal of Consumer Marketing, Vol. 10, No. 4, pp. 27-36.
Bloch, P. H., Black, W. C. and Lichtenstein, D. (1989). Involvement with the Equipment Component of Sport: Links to Recreational Commitment, Leisure Science, Vol. 11, Issue 3, pp. 187-200.
Bloor, M., Frankland, J., Thomas, M. and Robson, K. (2001). Focus Groups in Social Research, London, Thousand Oaks, New Delhi: Sage Publications.
Bolton, R. N. (1991). An Exploratory Investigation of Questionnaire Pretesting with Verbal Protocol Analysis, Advances in Consumer Research, Vol. 18, Issue 1, pp. 558-565.
Bolton, R. N., Chapman, R. G. and Zych, J. M. (1990). Pretesting Alternative Survey Administration Design, Applied Marketing Research, Vol. 30, No. 3, pp. 8-13.
Bonfield, E. (1974). Attitude, Social Influence, Personal Norms, and Intention Interactions as Related to Brand Purchase Behavior, Journal of Marketing Research, Vol. 11, Issue 4, November, pp. 379-389.
Borgers, A. and Timmermans, H. (1987). Choice Model Specification, Substitution and Spatial Structure Effects: A Simulation Experiment, Regional Science and Urban Economics, Vol. 17, pp. 29-47.
Boulding, W., Kalra, A., Staelin, R. and Zeithaml, V. A. (1993). A Dynamic Process Model of Service Quality: From Expectations to Behavioral Intentions, Journal of Marketing Research, Vol. 30, Issue 1, February, pp. 7-27.
Bove, L. L. and Johnson, L. W. (2000). A Customer-Service Worker Relationship Model, International Journal Service Industry Management, Vol. 11, No. 5, pp. 491-511.
Bowerman, B. L. and O'Connell, R. T. (1990), Linear statistical models: an applied approach, 2nd Edition, Belmont, CA: Duxbury.
Box, G. E. P. and Cox. D. R. (1964). An Analysis of Transformation, Journal of the Royal Statistical Society, B, Vol. 26, Issue 1, March, pp. 211-252.
Box, G. E. P. and Tidwell, P. W. (1962). Transformation of the Independent Variables, Technometrics, Vol. 4, Issue 4, November, pp. 531-550.
Boyatzis, R. E. (1998). Transforming Qualitative Information, Thousand Oaks, London, New Delhi: Sage Publications.
Boyd Jr., H. W., Westfall, R. and Stasch, S. F. (1989). Marketing Research - Text and Cases, 7`h Edition, Homewood IL: Irwin.
382

Bradburn, N. M. and Sudman, S. (1991). Current Status of Questionnaire Research, in P. P. Biemer, R. M. Groves, L. E. Lyberg, N. A. Mathiowetz, and S. Sudman (eds. ), Measurement Errors in Surveys, New York: John Wiley and Sons, pp. 29-40.
Brennan, M. (1992). The Effect of Monetary Incentives on Mail Survey Response Rates: New Data, Journal of the Market Research Society, Vol. 34, No. 2, pp. 173-177.
Briggs, S. (1992). Assessing the Five-Factor Model of Personality Description, Journal of Personality, Vol. 60, No. 2, pp. 253-293.
Brisoux, J. E. and Cheron, E. J. (1990). Brand Categorization and Product Involvement, Advances in Consumer Research, Vol. 17, Issue 1, pp. 101-109.
Broderick, A. J. and Mueller, R. D. (1999). A theoretical and Empirical Exegesis of the Consumer Involvement Construct: The Psychology of the Food Shopper, Journal of Marketing Theory and Practice, Vol. 12, Issue 4, Full, pp. 97-108.
Bronnenberg, B. J. and Vanhonacker, W. R. (1996). Limited Choice Sets, Local Price Response, and Implied Measures of Price Competition, Journal of Marketing Research, Vol. 33, Issue 2, May, pp. 163-173.
Brooker, G. (1984). An Assessment of An Expanded Measure of Perceived Risk, Advances in Consumer Research, Vol. 11, Issue 1, pp. 439-441.
Browne, B. A. and Kaldenberg, D. O. (1997). Conceptualizing Self-monitoring: Links to Materialism and Product Involvement, Journal of Consumer Marketing, Vol. 14, No. 1, pp. 31-44.
Brucks, M. (1985). The Effects of Product Class Knowledge on Information Search Behavior, Journal of Consumer Research, Vol. 12, Issue 1, June, pp. 1-16.
Brucks, M. (1986). A Typology of Consumer Knowledge Content, Advances in Consumer Research, Vol. 13, Issue 1, pp. 58-63.
Bryman, A. and Cramer, D. (1999). Quantitative Data Analysis: with SPSS Release 8 for Windows A Guide for Social Scientists, London and New York: Routledge.
Bums, A. C, and Bush, R. F. (2000). Marketing Research, P Edition, London: Prentice- Hall International (UK) Limited.
Bums, A. C. and Harrison, M. C. (1979). A Test of the Reliability of Psychographics, Journal of Marketing Research, Vol. 16, Issue 1, February, pp. 32-38.
Bush, R., Bloch, P. and Dawson, S. (1989). Remedies for Product Counterfeiting, Business Horizon, Vol. 32, Issue 1, January - February, pp. 59-65.
Calder, B. J., Phillips, L. W. and Tybout, A. M. (1981). Designing research for application, Journal of Consumer Research, Vol. 8, No. 9, pp. 197-207.
Campbell, M. and Goodstein, R. (2001). The Moderating Effect of Perceived Risk on Consumers' Evaluation of Product Incongruity: Preference for the Norm, Journal of Consumer Research, Vol. 28, Issue 3, December, pp. 439-449.
383

Caprara, G. V., Barbaranelli, C. and Guido, G. (2001). Brand Personality: How to Make the Metaphor Fit, Journal of Economic Psychology, Vol. 22, Issue 3, June, pp. 377- 395.
Carr, S. (1996). The Cult of Brand Personality, Marketing News, Vol. 30, No. 10, pp. 4- 9.
Carty, P. (1994). Fake's Progress, Accountancy, Vol. 114, Issue 1216, December, pp. 44-46.
Caruso, J. C. and Cliff, Norman. (1998). The Factor Structure of the WAIS-R: Replicability Across Age-Groups, Multivariate Behavioral Research, Vol. 33, Issue 2, pp. 273-293.
Celsi, R. L. and Olson, J. C. (1988). The Role of Involvement in Attention and Comprehension Processes, Journal of Consumer Research, Vol. 15, Issue 2, September, pp. 210-224.
Chakraborty, G., Allred, A. and Bristol, T. (1996). Exploring Consumers' Evaluations of Counterfeits: The Roles of Country of Origin and Ethnocentrism, Advances in Consumer Research, Vol. 23, Issue 1, pp. 379-384.
Chakraborty, G., and Allred, A., Sukhdial, A. S. and Bristol, T. (1997). Use of Negative Cues to Reduce Demand for Counterfeit Products, Advances in Consumer Research, Vol. 24, Issue 1, pp. 345-349.
Chakravarti, A. and Janiszewski, C. (2003). The Influence of Macro-Level Motives on Consideration Set Composition in Novel Purchase Situations, Journal of Consumer Research, Vol. 30, Issue 2, September, pp. 244-258.
Chang, C. (2004). The Interplay of Product Class knowledge and Trial Experience in Attitude Formation, Journal ofAdvertising, Vol. 33, No. 1, Spring, pp. 83-92.
Chang, J. (2002). Will A Family Brand Image Be Diluted by An Unfavorable Brand Extension, Advances in Consumer Research, Vol. 29, Issue 1, pp. 299- 304.
Chaudhry, P. E. and Walsh, M. G. (1996). An Assessment of the Impact of Counterfeiting in International Markets: the Piracy Paradox Persists, Columbia Journal of World Business, Vol. 31, Issue 3, Fall, pp. 34-49.
Chiang, J., Siddhartha, C. and Chakravarthi, N. (1999). Markov Chain Monte Carlo and Models of Consideration Set and Parameter Heterogeneity, Journal of Econometrics, Vol. 89, Issue Y2
, March/April, pp. 223-248.
Chisnall, P. M. (1986). Marketing Research, 2"d Edition, London: McGraw-Hill Book Company (UK) Limited.
Chisnall, P. M. (1995). Consumer Behaviour, 3`" Edition, London: McGraw-Hill Book Company (UK) Limited.
Cho, Y., Im, I., Hiltz, R. and Fjermestad, J. (2002). The Effects of Post-Purchase Evaluation Factors on Online vs. Offline Customer Complaining Behavior:
384

Implications for Customer Loyalty, Advances in Consumer Research, Vol. 29, Issue 1, pp. 318-326.
Chow, D. (2000). Enforcement Against Counterfeiting in the People's Republic of China, Northwestern Journal of International Law & Business, Vol. 20, Issue 3, Spring, pp. 447-475.
Chung K., Han, D. and Park, S-B. (2001). the Effect of Brand Personality and Brand Identification on Brand Loyalty: Applying the Theory of Social Identification, Japanese Psychological Research, Vol. 43, No. 4, pp. 195-206.
Chung, H. and Zhao, X. (2003). Humour Effect on Memory and Attitude: Moderating Role of Product Involvement, International Journal of Advertising, Vol. 22, Issue 1, pp. 117-144.
Church, A. (1993). Estimating the Effect of Incentives on Mail Survey Response Rates: a Meta-analysis, Public Opinion Quarterly, Vol. 57, No. 1, pp. 62-79.
Churchill, G. A. (1979). A Paradigm for Developing Better Measures of Marketing Constructs, Journal of Marketing Research, Vol. 16, Issue 1, February, pp. 64-73.
Churchill, G. A. (1999). Marketing Research: Methodological Foundations, 7`h Edition, London: The Dryden Press.
Clarke, K. and Belk, R. W. (1978). The Effects of Product Involvement and Task Definition on Anticipated Consumer Effort, Advances in Consumer Research, Vol. 5, Issue 1, pp. 313-318.
Clunas, C. (1991). Superfluous Things: Material Culture and Social Status in Early Modern China, Urbana, IL: University of Illinois Press.
Coates, S., Butler, L. and Berry, D. (2004). Implicit Memory: A Prime Example for Brand Consideration and Choice, Applied Cognitive Psychology, Vol. 18, Issue 9, December, pp. 1195-1211.
Cobb-Walgren, C. J., Ruble, C. A. and Donthu, N. (1995). Brand Equity, Brand Preference, and Purchase Intent, Journal of Advertising, Vol. 24, No. 3, Fall, pp. 25- 40.
Coffey, A. and Atkinson, P. (1996). Making Sense of Qualitative Data, London: Sage Publications.
Cohen, J., Cohen, P., West, S. and Aiken, L. (2003). Applied Multiple Regression/Correlation Analysis for the Behavioural Sciences, 3'd Edition, London: Lawrence Erlbaum Associates Publishers.
Cohen, J. B. (1983). Involvement and You: 1000 Great Ideas, Advances in Consumer Research, Vol. 10, Issue 1, pp. 325-328.
Cohen, L. (1966). The Level of Consciousness: A Dynamic Approach to the Recall Technique, Journal of Marketing Research, Vol. 3, Issue 2, May, pp. 142-148.
385
Cole, C. A. and Balasubramanian, S. K. (1993). Age Differences in Consumers Search for Information: Public Policy Implications, Journal of Consumer Research, Vol. 20, Issue 1, June, pp. 157-160.
Cole, C. A., Gaeth, G. and Singh, S. N. (1986). Measuring Prior Knowledge, Advances in Consumer Research, Vol. 13, Issue 1, pp. 64-66.
Collins, M. and Butcher, B. (1983). Interviewer and Clustering Effects in an Attitude Survey, Journal of Market Research Society (UK), Vol. 25, Issue 1, January, pp. 39- 58.
Comrey, A. L. & Lee, H. B. (1992). A First Course in Factor Analysis, 2"d Edition, Hillsdale NJ: Erlbaum.
Conover, J. N. (1982). Familiarity and the Structure of Product Knowledge, Advances in Consumer Research, Vol. 9, Issue 1, pp. 494-498.
Cook, R. D. and Weisberg, S. (1982). Residuals and Influence in Regression, New York: Chapman & Hall.
Cordell, V. and Wongtada, N. (1991). Consumer Responses to Counterfeit Products, in T. Childers (eds. ), Marketing Theory and Application, pp. 247.
Cordell, V., Wongtada, N. and Kieschnick, L. (1996). Counterfeit Purchase Intentions: Role of Lawfulness Attitudes and Product Traits as Determinants, Journal of Business Research, Vol. 35, Issue 1, January, pp. 41-53.
Cottman, L. (1992). It Is not the Real Thing, Security Management, Vol. 36, No. 12, pp. 68-70.
Cox, D. F. (ed. ) (1967). Risk Raking and Information Handling in Consumer Behaviour, Boston, MA: Division of Research, Graduate School of Business Administration, Harvard University.
Cox, D. F. and Rich, S. (1964). Perceived Risk and Consumer Decision-Making - The Case of Telephone Shopping, Journal of Marketing Research, Vol. 1, Issue 4, November, pp. 32-39.
Crainer, S. (1995). The Real Power of Brands: Making Brands Work for Competitive Advantage, London: Pitman Publishing.
Cronin Jr., J. J. and Taylor, S. A. (1992). Measuring Service Quality, A Reexamination and Extension, Journal of Marketing, Vol. 56, Issue 3, July, pp. 55-68.
Cunningham, S. M. (1967). The Major Dimensions of Perceived Risk, in D. F. Cox (eds. ), Risk Taking and Information Handling in Consumer Behaviour, Boston, MA: Division of Research, Graduate School of Business Administration, Harvey University, pp. 82-108.
d'Astous, A. and Gargouri, E. (2001). Consumer Evaluations of Brand Imitations, European Journal of Marketing, Vol. 35, No. 1/2, pp. 153-167.
Dalgaard, P. (2002). Introductory Statistics with R, London: Springer.
386

Daneshvary, R. and Schwer, R. K. (2000). The Association Endorsement and Consumers' Intention to Purchase, Journal of Consumer Marketing, Vol. 17, No. 3, pp. 203-213.
Davies, G. and Roper, S. (2001). The Personification Metaphor as a Measurement Approach for Corporate Reputation, Corporate Reputation Review, Vol. 4, No. 2, pp. 113-127.
de Chamatony L. and Dall'Olmo Riley, F. (1998). Defining A "Brand": Beyond The Literature With Experts' Interpretations, Journal of Marketing Management, Vol. 14, Issue 4/5, pp. 417-443.
de Chernatony, L. (2001). From Brand Vision to Brand Evaluation, Oxford: Butterworth Heinemann.
de Chernatony, L. and McDonald, M. H. B. (1998). Creating Powerful Brands in Consumer, Service and Industrial Markets, Oxford: Butterworth-Heinemann.
De Wulf, K., Odekerken-Schröder, G. and Lacobucci, D. (2001). Investments in Consumer Relationships: a Cross-Country and Cross-Industry Exploration, Journal of Marketing, Vol. 65, Issue. 4, October, pp. 33-51.
Debevec, K. and Iyer, E. (1986). The Influence of Spokespersons in Altering A Product's Gender Image: Implications for Advertising Effectiveness, Journal of Advertising, Vol. 15, No. 4, pp. 12-19.
Delener, N. (2000). International Counterfeit Marketing: Success without Risk, Review of Business, Vol. 21, Issue 'h, pp. 16-21.
Dennis, C., Murphy, J., Marsland, D., Cockett, T. and Patel, T. (2002). Measuring Image: Shopping Centre Case Studies, The International Review of Retail, Distribution and Consumer Research, Vol. 12, No. 4, October, pp. 355-373.
Derbaix, C. (1983). Perceived Risk and Risk Relievers - an Empirical Investigation, Journal of Economic Psychology, Vol. 3, Issue 1, March, pp. 19-38.
Desai, K. K. and Hoyer, W. D. (2000). Descriptive Characteristics of Memory-Based Consideration Sets: Influence of Usage Occasion Frequency and Usage Location Familiarity, Journal of Consumer Research, Vol. 27, Issue 3, December, pp. 309-323.
Desarbo, W. S. and Jedidi, K. (1995). The Spatial Representation of Heterogeneous Consideration Sets, Marketing Science, Vol. 14, No. 3, pp. 326-342.
Dhar, R., Nowlis, S. M. and Sherman, S. J. (1999). Comparison Effects on Preference Construction, Journal of Consumer Research, Vol. 26, Issue 3, December, pp. 293- 306.
Dholakia, U. M. (1997). An Investigation of the Relationship Between Perceived Risk and Product Involvement, Advances in Consumer Research, Vol. 24, Issue 1, pp. 159-167.
Dholakia, U. M. (1998). Involvement-Response Models of Joint Effects: An Empirical Test and Extension, Advances in Consumer Research, Vol. 25, Issue 1, pp. 499-506.
387
Dholakia, U. M. (2000). A Motivational process Model of Product Involvement and Consumer Risk Perception, European Journal of Marketing, Vol. 35, No. 11/12, pp. 1340-1360.
Diamantopoulos, A. and Schlegelmilch, B. B. (2002). Taking the Fear out of Data Analysis, UK: Thomson.
Diamantopoulos, A., Reynolds, N. and Schlegelmilch, B. (1994). Pretesting in Questionnaire Design: the Impact of Respondent Characteristics on Error Detection, Journal of Market Research Society, Vol. 36, No. 4, pp. 295-313.
Diamantopoulos, A., Smith, G. and Grime, I. (2005). The Impact of Brand Extensions on Brand Personality: Experimental Evidence, European Journal of Marketing, Vol. 39, No. 'h, pp. 129-149.
Diamond, A. (1981). Trademark Problems and How to Avoid Them, Chicago, IL: Crain Communications, Inc.
Dichter, E. (1985). What's In An Image, Journal of Consumer Marketing, Vol. 2, Issue 1, Winter, pp. 75-81.
Dobni, D. and Zinkhan, G. M. (1990). In Search of Brand Image: A Foundation Analysis, Advances in Consumer Research, Vol. 17, Issue 1, pp. 110-119.
Dodge, H. R., Edwards, E. A. and Fullerton, S. (1996). Consumer Transgressions in the Marketplace: Consumers' Perspectives, Psychology & Marketing, Vol. 13, Issue 8, December, pp. 821-835.
Dolich, I. J. (1969). Congruence Relationships Between Self Images and Product Brands, Journal of Marketing Research, Vol. 6, Issue 1, February, pp. 80-84.
Dowling, G. R. (1986). Perceived Risk: The Concept and Its Measurement, Psychology and Marketing, Vol. 3, Issue 3, Fall, pp. 193-210.
DTI (2005). DTI Employment Relations-National Minimum Wage, [online], Available from: http: //www. dti. gov. uk/emplo ment/pay/national-minimum-wage/index. html, [cited 18`h October 2005].
Dube, L. and Morgan, M. S. (1996). Trend Effects and Gender Differences in Retrospective Judgments of Consumption Emotions, Journal of Consumer Research, Vol. 23, Issue 2, p156.
Dubois, B. and Paternault, C. (1995). Observations: Understanding the World of International Luxury Brands: the Dream Formula, Journal of Advertising Research, Vol. 35, No. 4, pp. 69-75.
Dupont, T. D. (1987). Do Frequent Mall Shoppers Distort Mall-intercept Survey Results?, Journal of Advertising Research, Vol. 27, Issue 4, August/September, pp. 45-51.
Durgee, J. F. and Stuart, R. W. (1987). Advertising Symbols and Brand Names That Best Represent key Product Meanings, The Journal of Consumer Marketing, Vol. 4, No. 3, Summer, pp. 15-24.
388

Elliott, M. T. and Warfield, A. E. (1993). Do Market Mavens Categorize Brands Differently, Advances in Consumer Research, Vol. 20, Issue 1, pp. 202-208.
Engel, J. F. and Blackwell, R. D. (1982). Consumer Behavior, New York: Dryden Press.
Engel, J. F., Blackwell, R. D. and Miniard, P. W. (1990). Consumer Behaviour, 6`h Edition, Chicago USA: The Dryden Press.
Engel, J. F., Blackwell, R. D. and Miniard, P. W. (1993). Consumer Behavior, 7`h Edition, Chicago, IL: Dryden Press.
Erdem, T. (1998). An Empirical Analysis of Umbrella Branding, Journal of Marketing Research, Vol. 35, Issue 3, May, pp. 339-351.
Erdem, T. and Swait, J. (1998). Brand Equity as A Signalling Phenomenon, Journal of Consumer Psychology, Vol. 7, Issue 2, pp. 131-157.
Fazio, R. H. (1990). Multiple Processes by Which Attitude Guide Behavior: the Mode Model as an Integrative Framework, in M. P. Zabba (eds. ), Advances in Experimental Social Psychology, Vol. 23, New York, NK: Academic Press, pp. 75-109.
Fazio, R. H. (1995). Attitudes as Object-Evaluation Associations: Determinants, Consequences, and Correlated of Attitude Accessibility, in R. E. Petty and J. A. Krosnick (eds. ), Attitude Strength: Antecedents and Consequences, Mahwah, NJ: Lawrence Erlbaum, pp. 247-282.
Fazio, R. H., Powelll, M. and Williams, C. (1989). The Role of Attitude Accessibility in the Attitude-to-Behavior Process, Journal of Consumer Research, Vol. 16, Issue 3, December, pp. 280-288.
Feldwick, P. (1996). What is Brand Equity Anyway, and How Do You Measure It?, Journal of the Market Research Society, Vol. 38, Issue 2, April, pp. 85-104.
Fern, E. F. (2001). Advanced Focus Group Research, Thousand Oaks, London, Now Delhi: Sage.
Ferrandi, J-M., Kreziak, F. S. and Valette-Florence, P. (1999). Aaker's Brand Personality Scale in A French Context: A Replication and a Preliminary Test of its Validity, In Proceedings ofAcademy of Marketing Science, Vol. 23, pp. 7-13.
Field, A. (2000). Discovering Statistics Using SPSS for Windows: Advanced Techniques for the Beginner, London: Sage Publications.
Field, A. (2005). Discovering Statistics Using SPSS, 2°d Edition, London: Sage Publications.
Fill, C. (1999). Marketing Communications: Contexts, Contents and Strategies, 2"d Edition, London: Prentice Hall Europe.
Fischohoff, B., Slovic, P. and Lichtenstein, S. (1977). Knowing with Certainty: The Appropriateness of Extreme Confidence, Journal of Experimental Psychology: Human Perception and Performance, Vol. 3, Issue 5, November, pp. 552-564.
389
Fishbein, M. (1967). Attitude and the Prediction of Behaviour, in M. Fishbein (eds. ), Attitude Theory and Measurement, New York: John Wiley and Sons Inc., pp. 477- 492.
Fishbein, M. and Ajzen, I. (1975). Belief, Attitude, Intention and Behavior: An Introduction to Theory and Research, Reading, MA: Addison-Wesley.
Fisher, R. J. and Dube, L. (2005). Gender Differences in Responses to Emotional Advertising: A Social Desirability Perspective, Journal of Consumer Research, Vol. 31, Issue 4, pp. 850-858.
Fletcher, L. and Wald, J. (1987). The 40`h Year of Administration of Lanham Trademark Act of 1946, the Trademark Reporter, Vol. 77, Issue 6, pp. 471-663.
Fournier, S. (1995). Toward the Development of Relationship Theory at the Level of the Product and Brand, Advances in Consumer Research, Vol. 22, Issue 1, pp. 661- 662.
Fournier, S. (1998). Consumers and Their Brands: Developing Relationship Theory in Consumer Research, Journal of Consumer Research, Vol. 24, No. 4, pp. 343-373.
Fox, J. (1997). Applied Regression Analysis, Linear Models, and Related Methods, London: Sage Publications.
Fox, J. (2002). An R and S-Plus to Applied Regression, London: Sage Publications.
Foxman, E., Muehling, D. and Berger, P. (1990). An Investigation of Factors Contribution to Consumer Brand Confusion, Journal of Consumer Affairs, Vol. 24, Issue 1, pp. 170-189.
Fransella, F. and Bannister, D. (1977). A Manual for Repertory Grid Technique, London: Academic Press.
Frazer, C. F. (1983). Creative Strategy: A Management Perspective, Journal of Advertising, Vol. 12, No. 4, pp. 36-41.
Fred, W. M. (1990). Judicial Standards for Survey Research: An Update and Guidelines, Journal of Marketing, Vol. 54, Issue 1, January, pp. 59-70.
Freedman, H. (1999). Chinese Copycat Are Leaving International Brands Fit to be Tied, Forbes, Vol. 163, April, pp. 48-54.
Freling, T. and Forbes, L. (2005). An Examination of Brand Personality Through Methodological Triangulation, Journal of Brand Management, Vol. 13, No. 2, November, pp. 148-162.
Friedmann, R. (1986). Psychological Meaning of Products: Identification and Marketing Applications, Psychology & Marketing, Vol. 3, Issue 1, Spring, pp. 1-15.
Friedmann, R. and Lessig, V. P. (1987). Psychological Meaning 'of Products and Product Positioning, Journal of Product Innovation Management, Vol. 4, Issue 4, pp. 265- 273.
390
Friedmann, R. and Zimmer, M. (1988). The Role of Psychological Meaning in Advertising, Journal ofAdvertising, Vol. 17, Issue 1, pp. 31-40.
Gabbott, J. and de Chernatony, L. (2005). Customer and brand manager perspective on brand relationships: a conceptual framework, Journal of Product and Brand Management, Vol. 4, No. 5, pp. 300-309.
Gabbott, M. (1991). The Role of Product Cues in Assessing Risk in Second-hand Markets, European Journal of Marketing, Vol. 25, No. 9, pp. 38-50.
Ganesh, J., Arnold, M. J. and Reynolds, K. E. (2000). Understanding the Customer Base
of Service Providers: An Examination of the Differences Between Switchers and Stayers, Journal of Marketing, Vol. 64, Issue 3, July, pp. 65-87.
Garber Jr., L. L. (1995). The Package Appearance in Choice, Advances in Consumer Research, Vol. 22, pp. 653-660.
Gardner, B. and Levy, S. (1955). The Product and the Brand, Harvard Business Review, March-April, pp. 33-39.
Gardner, M. P. (1985). Mood States and Consumer Behavior: A Critical Review. Journal of Consumer Research, Vol. 12, Issue 3, December, pp. 281-300.
Gates, R. and Solomon, P. J. (1982). Research Using the Mall Intercept: State of the Art, Journal ofAdvertising Research, Vol. 22, No. 4, pp. 43-49.
Gensch, D. (1987). A Two-Stage Disaggregate Attribute Choice Model, Marketing Letters, Vol. 2, No. 1, pp. 47-57.
Gensch, D. H. and Soofi, E. S. (1995). Information-Theoretic Estimation of Individual Consideration Sets, International Journal of Research in Marketing, Vol. 12, May, pp. 25-38.
Gensh, D. H. (1978). Image Measurement Segmentation, Journal of Marketing Research, Vol. 15, Issue 3, August, pp. 384-395.
Gentry J. W., Putrevu, S., Shultz, C. J. and Commuri, S. (2001). How Now Ralph Lauren? The Separation of Brand and Product in a Counterfeit Culture, Advances in Consumer Research, Vol. 27, Issue 1, pp. 258-265.
Gentry, J. W., Putrevu, S. and Shultz, C. J. (2006). The effects of counterfeiting on consumer search, Journal of Consumer Behaviour, Vol. 5, Issue 3, pp. 245-256.
Giner-Sorolla, R. (1999). Affect in Attitude: Immediate and Deliberative Perspectives, in S. Chaiken and Y. Trope (eds. ), Dual-Process Theories in Social Psychology, New York: The Guilford Press, pp. 441-461.
Givon, M., Mahajan, V. and Muller, E. (1995). "Software Piracy: Estimation of Lost Sales and the Impact on Software Diffusion", Journal of Marketing, Vol. 59, Issue 1, January, pp. 29-37.
Globerman, S. (1988). Addressing International Product Piracy, Journal of International Studies, Vol. 17, No. 3, Fall, pp. 497-504.
391
Glynn, L. R., Goldsmith, R. E. and Eastman, J. K. (1996). Opinion Leaders and Opinion Seekers: Two New Measurement Scales, Journal of the Academy of Marketing, Vol. 24, Issue 1, Spring, pp. 137-147.
Goetz, E. G., Tyler, T. R. and Cook, F. L. (1984). Promised Incentives in Media Research, Journal of Marketing Research, Vol. 21, Issue 2, May, pp. 148-154.
Goldberg, L. R. (1990). An Alternative `Description of Personality': The Big Five Factor Structure, Journal of Personality and Social Psychology, Vol. 59, Issue 6, December, pp. 1216-1229.
Goyder, J. (1994). An Experiment with Cash Incentives on a Personal Interview Survey, Journal of the Market Research Society, Vol. 36, No. 4, pp. 360-366.
Graeff, T. (1997). Consumption Situations and the Effects of Brand Image on Consumers' Brand Evaluations, Psychology & Marketing, Vol. 14, No. 1, January, pp. 49-70.
Granbois, D. H. and Summers, J. O. (1975). Primary and Secondary Validity of Consumer Purchase Probabilities, Journal of Consumer Research, Vol. 1, No. 3, pp. 31-38.
Granzin, K. (1992). Gaining Retailers' Assistance in Fighting Counterfeiting: Conceptualization and Empirical Test of a Helping Model, Journal of Retailing, Vol. 68, No. 1, pp. 90-110.
Green, P. E., Tull, D. S. and Albaum, G. (1988). Research for Marketing Decisions, 5Ih Edition, Enlewood Cliffs NJ: Pretice-Hall.
Green, R. T. and Smith, T. (2002). Executive Insights: Countering Brand Counterfeiters, Journal of International Marketing, Vol. 10, No. 4, pp. 89-106.
Greenwald, A. G. and Leavitt, C. (1984). Audience Involvement in Advertising: Four Levels, Journal of Consumer Research, Vol. 11, Issue 2, June, pp. 581-592.
Grewal, D., Monroe, K. B. and Krishnan, R. (1998). The Effects of Price-Comparison Advertising on Buyers' Perceptions of Acquisition Value, Transaction Value, and Behavioral Intentions, Journal of Marketing, Vol. 62, Issue 2, April, pp. 46-59.
Gronhaug, K. (1973). Some Factors Influencing the Size of the Buyer's Evoked Set, European Journal of Marketing, Vol. 7, Issue 3, pp. 232-241.
Grossman, G. and Shapiro, C. (1988a). Foreign Counterfeiting of Status Goods, Journal of Economics, Vol. 103, Issue 1, February, pp. 79-100.
Grossman, G. and Shapiro, C. (1988b). Counterfeit-Product Trade, American Economic Review, Vol. 78, Issue 1, March, pp. 59-75.
Grubb, E. and Grathwhol, H. (1967). Consumer Self-Concept, Symbolism and Market Behavior, Journal of Marketing, Vol. 31, Issue 3, October, pp. 22-27.
392
Guadagnoli, E. and Velicer, W. (1988). Relation of Sample Size to the Stability of Component Patterns, Psychological Bulletin, Vol. 103, Issue 2, September, pp. 265- 275.
Gunter, B. (1998). Understanding the Older Consumer: The Grey Market, London: Routledge.
Gunter, B. and Furnham, A. (1998). Children as Consumers, London: Routledge.
Hague, P. N. (1987). The Industrial Market Research Handbook, 2°d Edition. London: Kogan Page.
Hair Jr., J. F., Anderson, R. E., Tatham, R. L. and Black, W. C. (1987). Multivariate Data Analysis with Readings, New York: Macmillan Publishing Company.
Hair, J. F., Tatham, R. L. and Anderson, R. (2004). Multivariate data analysis, London: Prentice Hall PTR.
Halliday, J. (1996). Chrysler Brings Out Brand Personalities with '97 Ads', Advertising Age, Vol. 67, Issue 40, September, pp. 3-4.
Hammersley, M. and Atkinson, P. (2004). Ethnography Principles in Practice, 2nd Edition, London and New York: Routledge.
Harmon, R. R. and Resnik, A. J. (1983). The Impact of Sponsorship and Incentive on Survey Response Rates, in AMA Educators' Proceedings of American Marketing Association, pp. 432-435.
Harvey, M. G. (1987). Industrial Product Counterfeiting: Problems and Proposed Solutions, Journal of Business & Industrial Marketing, Vol. 2, No. 4, pp. 5-13.
Harvey, M. G. (1988). A New Way to Combat Product Counterfeiting, Business Horizons, Vol. 31, No. 4, pp. 19-28.
Harvey, M. G. and Ronkainen, I. A. (1985). International Counterfeiters: Marketing Success without the Cost and the Risk, Columbia Journal of World Business, Vol. 20, Issue 3, Fall, pp. 37-45.
Harvey, P. J. and Walls, W. D. (2003). the Revealed Demand for Pirate Goods: Probit Analysis of Experimental Data, International Journal of Management, Vol. 20, No. 2, pp. 194-201.
Hauser J. R. and Wernerfelt, B. D. (1990). An Evaluation Cost Model of Consideration Sets, Journal of Consumer Research, Vol. 16, Issue 4, March, pp. 393-408.
Hauser, J. R. (1978). Testing the Accuracy, Usefulness, and Significance of Probabilistic Choice Models, Operations Research, Vol. 26, Issue 3, May/June, pp. 406-421.
Hauser, J. R. and Wernerfelt, B. D. (1989). The Competitive Implications of Relevant- Set Response Analysis, Journal of Marketing Research, Vol. 26, No. 4, pp. 391-405.
393

Hauser, J. R., Urban, G. L. and Roberts, J. (1983). Forecasting Sales of a New Consumer Durable, in F. S. Zufryden (eds. ), Advances and Practices of Marketing Science, Providence, RI: The Institute of Management Science, pp. 115-128.
Havitz, M. E. and Howard, D. R. (1995). How Enduring Is Enduring Involvement? A Seasonal Examination of Three Recreational Activities, Journal of Consumer Psychology, Vol. 4, No. 3, pp. 255-276.
Heath, T. B. (1990). The Logic of Mere Exposure: A Reinterpretation of Anand, Holbrook and Stephen (1988), Journal of Consumer Research, Vol. 17, Issue 2, September, pp. 237-241.
Helgeson, J. G. and Supphellen, M. (2004). A Conceptual and Measurement Comparison of Self-congruity and Brand Personality, International Journal of Market Research, Vol. 46, Issue 2, pp. 205-233.
Hem, L. E. and Iversen, N. M. (2002). Decomposed Similarity Measures in Brand Extensions, Advances in Consumer Research, Vol. 29, Issue 1, pp. 199-206.
Henderson, P., Cote, J., Leong, S. and Schmitt, B. (2003). Building Strong Brands in Asia: Selecting the Visual Components of Image to Maximize Brand Strength, International Journal of Research in Marketing, Vol. 20, Issue 4, pp. 297-314.
Herzog, H. (1963). Behavioral Science Concepts for Analyzing the Consumer, in P. Bliss (eds. ), Marketing and the Behavioral Sciences, Boston: Allyn and Bacon Inc.,
pp. 76-86.
Hinkin, T. (1995). A Review of Scale Development Practices in the Study of Organisations, Journal of Management, Vol. 21, No. 5, pp. 967-968.
Hirschman, E. (1982). Ethnic Variation in Hedonic Consumption, Journal of Social Psychology, Vol. 118, Issue 2, December, pp. 225-234.
Hirschman, E. C., Greenberg, B. and Robertson, D. H. (1978). The Intermarket Reliability of Retail Image Research: An Empirical Examination, Journal of Retailing, Vol. 54, No. 1, pp. 3-12.
Hisrich, R., Dornoff, R. and Kernan, J. (1972). Perceived Risk in Store Selection, Journal of Marketing Research, Vol. 9, Issue 4, November, pp. 435-439.
Hoaglin, D. and Welsch, R. (1978). The Hat Matrix in Regression and ANOVA, American Statistician, Vol. 32, Issue 1, pp. 17-22.
Hoe, L., Hogg, G. and Hart, S. (2003). Fakin It: Counterfeiting and Consumer Contradictions, in Proceedings of European Advances in Consumer Research, Vol. 6.
Holbrook, M. (1981). Integrating Compositional and Decompositional Analyses to Represent the Intervening Role of Perceptions in Evaluative Judgement, Journal of Marketing Research, Vol. 18, Issue 1, February, pp. 13-28.
Holden, S. J. S. (1993). Understanding Brand Awareness: Let Me Give You a C(lue), Advances in Consumer Research, Vol. 20, Issue 1, pp. 383-388.
394

Holt, D. B. (2002). Why Do Brands Cause Trouble? A Dialectical Theory of Consumer Culture and Branding, Journal of Consumer Research, Vol. 29, Issue 1, June, pp. 70- 90.
Holt, D. B. (2003). What Becomes an Icon Most, Harvard Business Review, March, pp. 43-49.
Hopkins, D., Kontnik, L., and Trunage, M. (2003). Counterfeiting Exposed-Protecting Your Brand and Customers, USA: John Wiley & Sons, Inc.
Hopkins, K. and Gullickson, A. (1992). Response Rates in Survey Research: A Meta- analysis of the Effects of Monetary Gratuities, Journal of Experimental Education, Vol. 61, No. 1, pp. 52-62.
Hornik, J. (1982). Impact of Pre-call Request form and Gender Interaction on Response to the Mail Survey, Journal of Marketing Research, Vol. 19, Issue 1, pp. 144-151.
Hornik, J. and Ellis, S. (1988). Strategies to Secure Compliance for A Mall Intercept Interview, Public Opinion Quarterly, Vol. 52, Issue 4, Winter, pp. 539-551.
Horowitz, J. L. and Louviere, J. J. (1995). What is the Role of Consideration Sets in Choice Modeling, International Journal of Research in Marketing, Vol. 12, Issue 1, May, pp. 39-54.
Houston, M. J. and Rothschild, M. L. (1978). Conceptual and Methodological Perspectives on Involvement. In Proceedings of Educators' of American Marketing Association, pp. 184-187.
Howard, J. A. (1963). Marketing Management: Analysis and Planning, Homewood IL: Richard Irwin.
Howard, J. A. (1977). Consumer Behavior: Application of Theory, NY: McGraw Hill.
Howard, J. A. and Ostlund, L. E. (1973). The Model: Current Status of Buying Behavior Theory, in J. A. Howard and L. E. Ostlund (eds. ), Buyer Behavior, New York: Knopf, pp. 3-32.
Howard, J. A. and Sheth, J. N. (1969). The Theory of Buyer Behavior, Now York: Wiley.
Hoyer, W. (1984). An Examination of Consumer Decision Making for a Common Repeat Purchase Product, Journal of Consumer Research, Vol. 11, Issue 3, December, pp. 822-829.
Hsieh, M. H. (2002). Identifying Brand Image Dimensionality and Measuring the Degree of Brand Globalization: A Cross-National Study, Journal of International Marketing, Vol. 10, No. 2, pp. 46-67.
Hsu, T-H. and Lee, M. (2003). The Refinement of Measuring Consumer Involvement - An Empirical Study, Competitiveness Review, Vol. 13, No. 1, pp. 56-65.
Hulin, C., Cudeck, R., Netemeyer, R., Dillon, W. and McDonald, R. (2001). "Measurement", Journal of Consumer Psychology, Vol. 10, Issue 'h, November, pp. 56-69.
395

Hung, C. L. (2003). The Business of Product Counterfeiting in China and the Post - WTO Membership Environment, Asia Pacific Business Review, Vol. 10, No. 1, Autumn, pp. 58-77.
Hunt, S. D., Sparkman Jr., R. D. and Wilcox, J. B. (1982). The Pretest in Survey Research: Issues and Preliminary Findings, Journal of Marketing Research, Vol. 19, Issue 2, May, pp. 265-275.
Hupfer, N. and Gardner, D. (1971). Differential Involvement with Products and Issues: An Exploratory Study, in Proceedings of Association for Consumer Research, pp. 262-269.
Hutcheson, G. and Sofroniou, N. (1999). The Multivariate Social Scientist, London: Sage Publications.
Hutchinson, J. W. (1983). Expertise and the Structure of Free Recall, Advances in Consumer Research, Vol. 10, Issue 1, pp. 585-590.
Hutchinson, J. W. and Farrand, B. (1982). Dimensional Validity, Consistency of Preference and Product Familiarity: An Exploratory Investigation of Wine Tasting, Advances in Consumer Research, Vol. 9, Issue 1, pp. 398-401.
Hutchinson, W. J., Raman, K. and Mantrala, M. (1994). Finding Choice Alternatives in Memory: Probability Models of Brand Name Recall, Journal of Marketing Research, Vol. 31, Issue 4, November, pp. 441-461.
ICC Policy Statement (2003). The Fight Against Piracy and Counterfeiting of Intellectual property, Submitted to the 35`h World Congress [online], Available from: httT): //www. iccwbo. org/home/l*ntellectual property/fightalgainst piracy. ndf., [Cited 11 September 2006].
Jaccard, J. (1981). Attitudes and Behavior: Implications of Attitudes toward Behavioral Alternatives, Journal of Experimental Social Psychology, Vol. 17, Issue 3, May, pp. 286-307.
Jacoby, J. and Kaplan, L. (1972). The Components of Perceived Risk, in Proceedings of the 3'd Annual Conference, pp. 382-393, Chicago.
Jacoby, J., Chestnut, R. W. and Silberman, W. (1977). Consumer Use and Comprehension of Nutrition Information, Journal of Consumer Research, Vol. 4, Issue 2, September, pp. 119-128.
Jacoby, J., Troutman, T., Kuss, A. and Mazursky, D. (1986). Experience and Expertise in Complex Decision Making, Advances in Consumer Research, Vol. 13, No. 1, pp. 496-473.
Jaffe, E. D. and Nebenzahl, I. D. (1984). Alternative Questionnaire Formats for Country Image Studies, Journal of Marketing Research, Vol. 21, Issue 4, November, pp. 463- 471.
Jain, A. K. and Etgar, M. (1976). Measuring Store Image through Multidimensional Scaling of Free Response Data, Journal of Retailing, Vol. 52, No. 4, pp. 61-70.
396
James, D. L., Durand, R. M. and Dreves, R. A. (1976). The Use of a Multi-Attribute Attitude Model in A Store Image Study, Journal of Retailing, Vol. 52, No. 2, pp. 23- 32.
James, T. (1997). Results of Wave 1 Incentive Experiment in the 1996 Survey of Income and Program Participation, in Proceedings of the Survey Research Section of the American Statistical Association, pp. 834-839.
James, T. and Bolstein, R. (1990). The Effect of Monetary Incentives and Follow-up Mailings on the Response Rate and Response Quality in Mail Surveys, Public Opinion Quarterly, Vol. 54, No. 3, pp. 346-361.
Jobber, D. (2004). Principles and Practice of Marketing, 4`h Edition, London: The McGraw-Hill Companies.
Johar, G., Sengupta, J. and Aaker, J. (2005). Two Roads to Updating Brand Personality Impressions: Trait versus Evaluative Inferencing, Journal of Marketing Research, Vol. 42, Issue 4, November, pp. 458-469.
Johar, J. and Sirgy, M. (1991). Value-expressive versus Utilitarian Advertising Appeals: When and Who Use Which Appeal, Journal ofAdvertising, Vol. 20, No. 3, pp. 23-33.
Johnson, E. and Meyer, R. (1984). Compensatory Choice Models of Non-Compensatory Processes: The Effect of Varying Context, Journal of Consumer Research, Vol. 11, Issue 1, June, pp. 528-541.
Johnson, E. J. and Russo, J. E. (1984). Product Familiarity and Learning New Information, Journal of Consumer Research, Vol. 11, Issue 1, June, pp. 542-550.
Johnson, L. W., Soutar, G. N. and Sweeney, J. C. (2000). Moderators of the Brand Image/Perceived Product Quality Relationship, The Journal of Brand Management, Vol. 7, No. 6, pp. 425-43 3.
Johnson, M. D. and Lehmann, D. R. (1997). Consumer Experience and Consideration Sets for Brands and Product Categories, Advances in Consumer Research, Vol. 24, Issue 1, pp. 295-300.
Johnson, M. D. and Lehmann, D. R. (1997). Consumer Experience and Consideration Sets for Brands and Product Categories, Advances in Consumer Research, Vol. 24, Issue 1, pp. 295-300.
Johnson, M. D. and Puto, C. P. (1987). A Review of Consumer Judgement and Choice, in M. Houston (eds. ), Review of Marketing, USA: American Marketing Association, pp. 236-292.
Jolliffe, I. T. (1973). Discarding Variables in a Principal Component Analysis II: Real Data, Journal of the Royal Statistical Society: Series C (Applied Statistics), Vol. 22 Issue 1, pp. 21-32.
Jolliffe, I. T. (1986). Principal Component Analysis, New York: Springer.
397

Josiam, B., Kinley, T. and Kim, Y. (2005). Involvement and the tourist shopper: Using the Involvement Construct to Segment the American Tourist Shopper at the Mall, Journal of Vacation Marketing, Vol. 11, Issue 2, pp. 135-154.
Juster, F. T. (1966). Consumer Buying Intentions and Purchase Probability: An Experiment in Survey Design, Journal of the American Statistical Association, Vol. 61, Issue 315, September, pp. 659-696.
Kahn, R. L. and Cannell, C. F. (1957). The Dynamics of Interviewing, New York: John Wiley.
Kaiser, H. F. (1960). The Application of Electronic Computers to Factor Analysis, Educational and Psychological Measurement, Vol. 20, Issue 1, pp. 141-151.
Kaiser, H. F. (1970). A Second-generation Little Jiffy, Psychometrika, Vol. 35, Issue 4, pp. 401-415.
Kaiser, H. F. (1974). An Index of Factorial Simplicity, Psychometrika, Vol. 39, No, 1, March, pp. 31-36.
Kalwani, M. U. and Silk, A. J. (1982). On the Reliability and Predictive Validity of Purchase Intention Measures, Marketing Science, Vol. 1, No. 3, pp. 243-286.
Kanwar, R., Olson, J. C. and Sims, L. S. (1981). Toward Conceptualizing and Measuring Cognitive Structures, Advances in Consumer Research, Vol. 7, Issue 1, pp. 122-127.
Kapferer, J-N. (1995a). Brand Confusion: Empirical Study of a Legal Concept, Psychology & Marketing, Vol. 12, Issue 6, pp. 551-569.
Kapferer, J-N. (1995b). Stealing Brand Equity: Measuring Perceptual Confusion Between National Brands and `Copycat' Own labels, Marketing and Research Today, Vol. 23, Issue 2, May, pp. 96-103.
Kapferer, J-N. (1998). Strategic Brand Management, 2°d Edition, New York and London: Kogan Page.
Kaplan, R. M. and Saccuzzo, D. P. (1997). Psychological Testing: Principles, Applications and Issues, 4th Edition, CA: Brooks/Cole Pacific Grove.
Kardes, F. (1994). Consumer Judgment and Decision Processes, in R. S. Wyer Jr. and T. K. Srull (eds. ), Handbook of Social Cognition, Vol. 2, Hillsdale, NJ: Lawrence Erlbaum, pp. 399-466.
Kardes, F. R., Kalyanaram, G., Chandrashekaran, M. and Domoff, R. J. (1993). Brand Retrieval, Consideration Set Composition, Consumer Choice, and the Pioneering Advantage, Journal of Consumer Research, Vol. 20, Issue 1, June, pp. 62-75.
Kass, R. A. and Tinsley, H. E. A. (1979). Factor Analysis, Journal of Leisure Research, Vol. 11, Issue 2, pp. 120-138.
Kassarjian, H. H. (1971). Personality and Consumer Behavior: A Review, Journal of Marketing Research, Vol. 8, Issue 4, November, pp. 409-418.
398
Kassarjian, H. H. (1977). Content Analysis in Consumer Research, Journal of Consumer Research, Vol. 4, issue 1, June, pp. 8-18.
Kay, H. (1990). Fake's Progress, Management Today, July, pp. 54-59.
Keller, K. L. (1993). Conceptualizing, Measuring, and Managing Consumer-Based Brand Equity, Journal of Marketing, Vol. 57, Issue 1, January, pp. 1-22.
Keller, K. L. (1998). Strategic Brand Management: Building, Measuring, and Managing Brand Equity, Hemel Hempstead: Prentice-Hall International.
Kelly, G. A. (1955). The Psychology of Personal Constructs, New York: W. W. Norton.
Kempf, D. S. and Smith, R. E. (1998). Consumer Processing of Product Trial and the Influence of Prior Advertising: A Structural Modelling Approach, Journal of Marketing Research, Vol. 35, Issue 3, August, pp. 325-338.
Kessler, M. (1998). Fake Products Threaten Share Prices, Internal Auditor, Vol. 55, Issue 4, August, pp. 11-12.
Khermouch, G., Brady, D., Holmes, S., Moon, I., Kripalani, M. and Picard, J. (2003). Brands in An Age of Anti-Americanism, Business Week, Issue 3844, August 0, pp. 69-71.
Kiel, G. C. and Layton, R. A. (1981). Dimensions of Consumer Information Seeking, Journal of Marketing Research, Vol. 18, Issue 2, May, pp. 233-239.
King, K. and Vaughan, J. L. (2004). Influence of Paper Color and Monetary Incentive on Response Rate, Psychological Reports, Vol. 95, Issue 2, October, pp. 432-434.
Kinnear, T. C. and Taylor, J. R. (1996). Marketing Research An Applied Approach, 5th Edition, New York: McGraw Hill.
Kirmani, A. and Rao, A. (2000). No Pain, No Gain: A Critical Review of the Literature on Signaling Unobservable Product Quality, Journal of Marketing, Vol. 64, Issue 2, pp. 66-79.
Kirvesoja, H. and Väyrynen, S. (2000). Comparative Evaluation of the Conjoint Analysis and Paired Comparison Methods Applied to the Design and Evaluation of Multipurpose Chairs, Theoretical Issues in Ergonomics Science, Vol. 1, No. 3, pp. 283-299.
Kirvesoja, H., Väyrynen, S., Kisko, K. and Virokannas, H. (1996). Product Evaluation Using Conjoint Analysis, Home Simulator, User Group and Computer Software, in A. Mital, H. Krueger, S. Kumar, M. Menozzi and J. -E. Fernandez (eds. ), Advances in Occupational Ergonomics and Safety I, Cincinnati, OH: ISOES Press, pp. 135-140.
Kleine, R. E., Klein, S. S. and Kernan, J. B. (1993). Mundane Consumption and the Self: A Social-Identity Perspective, Journal of Consumer Research, Vol. 3, Issue 3, December, pp. 327-343.
399
Kleiser, S. B. and Wagner, J. A. (1999). Understanding the Pioneering Advantage from the Decision Maker's Perspective: The Case of Product Involvement and the Status Quo Bias, Advances in Consumer Research, Vol. 26, Issue 1, pp. 593-597.
Koch, R. (1994). The Financial Times A-Z of Management and Finance, London: Pitman.
Koebel, M. N. and Ladwein, R. (1999). L'echell de personnalit6 de la marque dc Jennifer Aaker, Adaptation au Contexte Francais' Decisions Marketing, Vol. 16, January-April, pp. 81-108.
Koekemoer, L. (1991). Marketing Communication Management: A South African Perspective, Durban: Butterworths.
Kokkinaki, F. (1999). Predicting Product Purchase and Usage: The Role of Perceived Control, Past Behavior and Product Involvement, Advances in Consumer Research, Vol. 26, Issue 1, pp. 576-583.
Kollat, D. I., Engel, J. and Blackwell, R. D. (1970). Current Problems in Consumer Behaviour Research, Journal of Marketing Research, Vol. 7, Issue 3, August, pp. 327-332.
Kotler, P. (1999). Marketing Management: Analysis, Planning, Implementation, and Control, NJ: Prentice-Hall.
Kotler, P., Armstrong, G., Saunders, J. and Wong, V. (1996). Principles of Marketing, Hemel Hempstead: Prentice Hall Europe.
Koufaris, M. (2002). Applying the Technology Acceptance Model and Flow Theory to Online Consumer Behavior, Information Systems Research, Vol. 13, No. 2, June, pp. 205-223.
Krieger, A. M., Green, P. E. and Wind, Y. J. (2003). Dual Consideration, Marketing Research, Vol. 15, Issue 4, pp. 8-13.
Krippendorff, K. (2004). Content Analysis: An Introduction to Its Methodology, Thousand Oaks: Sage Publications.
Krueger, R. A. (1994). Focus Groups: a Practical Guide for Applied Research, 2" Edition, Thousand Oaks: Sage Publications.
Krugman, H. E. (1962). An Application of Learning Theory to TV Copy Testing, Public Opinion Quarterly, Vol. 26, Issue 4, Winter, pp. 626-634.
Krugman, H. E. (1965). The Impact of Television Advertising: Learning without Involvement, Public Opinion Quarterly, Vol. 29, Issue 3, Fall, pp. 349-356.
Krugman, H. E. (1967). The Measurement of Advertising Involvement, Public Opinion Quarterly, Vol. 30, Issue 2, Winter, pp. 583-596.
Krugman, H. E. (1977). Memory without Recall, Exposure without Perception, Journal ofAdvertising Research, Vol. 17, Issue 4, August, pp. 7-12.
400
Laaksonen, P. (1994). Consumer Involvement: Concepts and Research, London: Routledge.
Lai, K. and Zaichkowsky, J. (1999). Brand Imitation: Do the Chinese Have Different Views?, Asia Pacific Journal of Management, Vol. 16, Issue 2, August, pp. 179-192.
Lapersonne, E., Laurent, G. and Goff, J. (1995), Consideration Set of Size One: An Empirical Investigation of Automobile Purchases, International Journal of Research in Marketing, Vol. 12, Issue 1, May, pp. 55-66.
Laroche, M. and Brisouz, J. E. (1989). Incorporating Competition into Consumer Behavior Models: The Case of the Attitude-intention Relationship, Journal of Economic Psychology, Vol. 10, Issue 3, November, pp. 343-362.
Laroche, M., Bergeron, J. and Goutaland, C. (2003). How Intangibility Affects Perceive Risk: the Moderating Role of Knowledge and Involvement, Journal of Services Marketing, Vol. 17, No. 2, pp. 122-140.
Laroche, M., Kim, C. and Zhou, L. (1996). Brand Familiarity and Confidence as Determinants of Purchase Intention: An Empirical Test in a Multiple Brand Context, Journal of Business Research, Vol. 37, Issue 2, October, pp. 115-120.
Lastovicka, J. L. and Gardner, D. M. (1978). Components of Involvement, in J. C. Maloney and B. Silverman (eds. ), Attitude Research Plays for Nigh Stakes, Chicago: American Marketing Association, pp. 53-73.
Laurent, G. and Kapferer, J-N. (1985), Measuring Consumer Involvement Profiles, Journal of Marketing Research, Vol. 22, Issue 1, February, pp. 41-53.
Lee, Y. H. (2000). Manipulating Ad Message Involvement through Information Expectancy: Effects on Attitude Evaluation and Confidence, Journal of Advertising, Vol. 29, Issue 2, pp. 29-43.
Lefkoff-Hagius, R. and Mason, C. (1993). Characteristics, Beneficial, and Image Attributes in Consumer Judgements of Similarity and Preference, Journal of Consumer Research, Vol. 20, Issue 1, pp. 100-110.
Lehmann, D., Gupta, S. and Steckel, J. (1998). Marketing Research, New York: Addison-Wesley.
Levy, S. and Rook, D. W. (1981). Brands, Trademarks and the Law, in B. M. Enis and K. J. Roering (eds. ), Review of Marketing, Chicago, ILL: American Marketing Association, pp. 185-194.
Levy, S. J. (1958). Symbols by Which We Buy, in Proceedings of the Advancing Marketing Efficiency of the American Marketing Association, December, pp. 409. 416.
Levy, S. J. (1978). Marketplace Behavior, New York: AMACOM.
Lewin, K. (1936). Principles of Topological Psychology, New York: McGraw-Hill.
401
Li, H., Daugherty, T. and Biocca, F. (2002). Impact of 3-D Advertising on Product Knowledge, Brand Attitude, and Purchase Intention: The Mediating Role of Presence, Journal ofAdvertising, Vol. 31, No. 3, Fall, pp. 43-57.
Likert, R. (1932). A Technique for the Measurement of Attitudes, Archives of Psychology, Vol. 22, No. 140, June, pp. 5-55.
Lindquist, J. D. (1974). Meaning of Image: A Survey of Empirical and Hypothetical Evidence, Journal of Retailing, Vol. 50, No. 4, pp. 29-38.
Lleiser, S. B. and Wagner, J. A. (1999). Understanding the Pioneering Advantage from the Decision Maker's Perspective: the Case of Product Involvement and the Status Quo Bias, Advances in Consumer Research, Vol. 26, Issue 1, pp. 593-597.
Loken, B., Ross, I. and Hinkle, R., (1986). Consumer "Confusion" of Origin and Brand Similarity Perceptions, Journal of Public Policy & Marketing, Vol. 5, Issue 1, pp. 195-211.
Lueg, J. E., Ponder, N., Beatty, S. E., Capella, M. L. (2006). Teenagers' Use of Alternative Shopping Channels: A Consumer Socialization Perspective, Journal of Retailing, Vol. 82, Issue 2, June, ppl37-153,
Lutz, R. J. (1985). Affective and Cognitive Antecedents of Attitude Toward the Ad: A Conceptual Framework, in L. F. Alwitt and A. A. Mitchell, (eds. ), Psychological Processes and Advertising Effects: Theory, Research and Application, Hillsdale, NJ: Lawrence Erlbaum Associates, pp. 45-63.
Lutz, R. J., MacKenzie, S. B. and Belch, G. E. (1983). Attitude toward the Ad as A Mediator of Advertising Effectiveness: Determinants and Consequences, Advances in Consumer Research, Vol. 10, Issue 1, pp. 532-539.
LVMH (2006). How Does LVMH Tackle Counterfeiting of Luxury Products?, [online], Available from: http: www. lvmh. com/group/search. htm, [cited 6th June 2006].
Lynch Jr., J. G. and Srull, T. K. (1982). Memory and Attentional Factors in Consumer Choice: Concepts and Research Methods. Journal of Consumer Research, Vol. 9 Issue 1, June, pp. 18-39.
Lynn, P. and Sturgis, P. (1997). Boosting Survey Response through a Monetary Incentive and Fieldwork Procedures: An Experiment, Survey Methods Centre Newsletter, Vol. 17, No. 3, pp. 18-22.
Lynn, P., Thomsom, K. and Brook, L. (1998). An Experiment with Incentives on the British Social Attitudes Survey, Survey Methods Newsletter, Vol. 18, No. 2, pp. 12- 14.
MacCallum, R. C., Widaman, K. F., Zhang, S. and Hong, S. (1999). Sample Size in Factor Analysis, Psychological Methods, Vol. 4, No. 1, pp. 84-99.
Mack, S., Huggins, V. Keathley, D. and Sundukchi, M. (1998). Do Monetary Incentives Improve Response Rates in the Survey of Income and Programme Participation, in Proceedings of the Section on Survey Methodology of the American Statistical Association, pp. 529-534.
402
MacKenzie, S. B., Lutz, R. J. and Belch, G. E. (1986). The Role of Ad as a Mediator of Advertising Effectiveness: A Test of Competing Explanations, Journal of Marketing
Research, Vol. 23, Issue 2, May, pp. 130-143.
MaConaghy, M. and Beerten, R. (2003). Influencing Response on the Family Resources Survey by Using Incentives, Survey Methodology Bulletin, Vol. 51, pp. 27-35.
Madden, T., Hewett, K. and Roth, M. (2000). Managing Images in Different Cultures: A Cross-National Study of Color Meanings and Preferences, Journal of International Marketing, Vol. 8, No. 4, pp. 90-107.
Mai, Li-Wei, and Ness, M. (1997). Consumers' Perceptions of Mail-order Speciality Foods, Journal of Marketing Management, Vol. 13, Issue 7, October, pp. 705-724.
Malhotra, N. K. (1981). A Scale to Measure Self-Concepts, Person Concepts and product Concepts, Journal of Marketing Research, Vol. 23, Issue 4, November, pp. 456-464.
Malhotra, N. K. (1986). An Approach to the Measurement of Consumer Preferences Using Limited Information, Journal of Marketing Research, Vol. 23, issue 1, February, pp. 33-40.
Malhotra, N. K. (1988). Self Concept and Product Choice: An Integrated Perspective,
Journal of Economic Psychology, Vol. 9, Issue 1, March, pp. 1-28.
Malhotra, N. K. (1996). Marketing Research: An Applied Orientation, 2"d Edition, London: Prentice-Hall International, Inc.
Malhotra, N. K. (1999). Marketing Research: An Applied Orientation, 3"l Edition, London: Prentice-Hall International, Inc.
Mandel, N. (2003). Shifting Selves and Decision Making: The Effects of Self-Construal Priming on Consumer Risk-Taking, Journal of Consumer Research, Vol. 30, Issue 1, June, pp. 30-40.
Manrai, A. K. (1995). Mathematical Models of Brand Choice Behavior, European Journal of Operational Research, Vol. 82, Issue 1, April, pp. 1-17.
Manrai, A. K. and Andrews, R. L. (1998). Two-stage Discrete Choice Models for Scanner Panel Data: An Assessment of Process and Assumptions, European Journal of Operational Research, Vol. 111, Issue 2, December, pp. 193-215.
Mantel, S. and Kardes, F. (1999). The Role of Direction of Comparison, Attribute-based Process in Consumer Preference, Journal of Consumer Research, Vol. 25, No. 4, pp. 335-352.
Marks, L. J. and Olson, J. C. (1981). Toward a Cognitive Structure Conceptualization of Product Familiarity, Advances in Consumer Research, Vol. 8, Issue 1, pp. 145-150.
Marks, R. B. (1976). Operationalizing the Concept of Store Image, Journal of Retailing, Vol. 52, No. 3, pp. 3 7-46.
403
Martin, C. A. and Bush, A. J. (2000). Do Role Models Influence Teenagers' Purchase Intentions and Behavior?, Journal of Consumer Marketing, Vol. 17, Issue 4/5, pp. 441-455.
Martineau, P. (1958). The Personality of the Retail Store, Harvard Business Review, Vol. 36, No. 1, pp. 47-55.
Maslow, A. H. (1954). Motivation and Personality, New York: Harper & Row.
May, E. G. (1974). Practical Applications of Recent Retail Image Research, Journal of Retailing, Vol. 50, No. 4, pp. 15-20.
Mayer, C. S. and Piper, C. (1982). A Note on the Importance of Layout in Self- Administered Questionnaires, Journal of Marketing Research, Vol. 19, Issue 3, August, pp. 390-391.
McCullagh, P. and Neider, J. A. (1989). Generalized Linear Models, 2°d Edition, New York: Chapman and Hall.
McDonald. G. M. and Roberts, C. (1994). Product Piracy: The Problem Will Not Go Away, Journal of Product & Brand Management, Vol. 3, Issue 4, pp. 55-65.
McGrath, J. M. and Mahood, C. (2004). The Impact of Arousing Programming and Product Involvement on Advertising Effectiveness, Journal of Current Issues and Research in Advertising, Vol. 26, No. 2, Fall, pp. 41-51.
McLauchlan, B. (1987). How to Design a Perceptual Mapping Study, in Proceedings of the Sawtooth Software Conference on Perceptual Mapping, Conjoint Analysis, and Computer Interviewing, pp. 179-188.
McNeil, J. (1974). Federal Programs to Measure Consumer Purchase Expectations, 1946-73: A Post-Mortem, Journal of Consumer Research, Vol. 1, Issue 3, December, pp. 1-10.
McQuarrie, E. F. and Munson, J. M. (1992). A Revised Product Involvement Inventory: Improved Usability and Validity, Advances in Consumer Research, Vol. 19, Issue 1, pp. 108-115.
Meeds, R. (2004). Cognitive and Attitudinal Effects of Technical Advertising Copying: the Roles of Gender, Self-assessed and Objective Consumer Knowledge, International Journal ofAdvertising, Vol. 23, Issue 3, pp. 309-335.
Mehta, N., Rajiv, S. and Srinivasan, S. (2003). Price Uncertainty and Consumer Search: A Structural Model of Consideration Set Formation, Marketing Science, Vol. 22, No. 1, Winter, pp. 58-84.
Menard, S. (1995). Applied Logistic Regression Analysis, Quantitative Applications in the Social Sciences, London: Sage Publication.
Meters-Levy, J., Louis, T. A. and Curren, M. T. (1994). How Does the Congruity of Brand Names Affect Evaluations of Brand Name Extensions?, Journal of Applied Psychological, Vol. 79, Issue 1, June, pp. 46-53.
404

Meuhling, D. D., Laczniak, R. N and Andrews, J. C. (1993). Defining, Operationalizing, and Using Involvement in Advertising Research: A Review, Journal of Current Issues and Research in Advertising, Vol. 15, No. 1, Spring, pp. 21-57.
Meyer-Levy, J. and Maheswaran, D. (1991). Exploring Differences in Males' and Females' Processing Strategies, Journal of Consumer Research, Vol. 18, Issue 1, June, pp. 63-71.
Miles, M. B. and Huberman, A. M. (1984). Qualitative Data Analysis: A Sourcebook of New Methods, Beverly Hills, CA: Sage Publications.
Miller, G. A. (1956). The Magic Number Seven, Plus or Minus Two: Some Limits on Our Capacity for Processing Information, The Psychological Review, Vol. 63, Issue 1, March, pp. 81-97.
Mintzberg, H. and Waters, J. A. (1982). Tracking Strategy in an Entrepreneurial Firm, Academy of Management Journal, Vol. 25, Issue 3, pp. 465-499.
Mishra, S., Unesh, U. N. and Stem Jr., D. E. (1993). Antecedents of the Attraction Effect: An Information-Processing Approach, Journal of Marketing Research, Vol. 30, Issue 3, August, pp. 331-349.
Mitchell V-W. and Boustani, P. (1993). Market Development Using New Products and New Customers: A Role for Perceived Risk, European Journal of Marketing, Vol. 27, No. 2, pp. 17-32.
Mitchell, A. A. (1979). Involvement: A Potentially Important Mediator of Consumer Behavior, Advances in Consumer Research, Vol. 6, Issue 3, pp. 191-196.
Mitchell, A. A. and Dacin, A. (1996). The Assessment of Alternative Measures of Consumer Expertise, Journal of Consumer Research, Vol. 23, Issue 3, December, pp. 219-239.
Mitchell, L. (1999). Combining Focus Groups and Interviews: Telling How It Is; Telling How It Feels, in R. Barbour and J. Kitzinger (eds. ), Developing Focus Group Research, London, Thousand Oaks, New Delhi: Sage Publications, pp. 36-46.
Mitchell, V-W. (1999). Consumer Perceived Risk: Conceptualisations and Models, European Journal of Marketing, Vol. 33, No. %2, pp. 163-195.
Mitchell, V-W. and Greatorex, M. (1989). Risk Reducing Strategies Used in the Purchase of Wine in the UK, European Journal of Marketing, Vol. 23, Issue 9, pp. 31-47.
Mitra, A. (1995). Advertising and the Stability of Consideration Sets over Multiple Purchase Occasions, International Journal of Research in Marketing, Vol. 12, Issue 1, pp. 81-94.
Mitra, A. and Lynch, J. (1995). Toward a Reconciliation of Market Power and Information Theories of Advertising Effects on Price Elasticity, Journal of Consumer Research, Vol. 21, Issue 4, March, pp. 644-659.
405
Mittal, B. (1995). Comparative Analysis of Four Scales of Consumer Involvement, Psychology & Marketing, Vol. 12, No. 7, pp. 663-682.
Mittal, B. and Lee, M-S. (1989). A Causal Model of Consumer Involvement, Journal of Economic Psychology, Vol. 10, Issue 3, November, pp. 363-389.
Monroe, K. B. (1976). The Influence of Price Differences and Brand Familiarity on Brand Preferences, Journal of Consumer Research, Vol. 3, Issue 1, June, pp. 42-49.
Moore, D. L. and Hutchinson, J. W. (1985). The Influence of Affective Reactions to Advertising: Direct and Indirect Mechanisms of Attitude Change, in L. Alwitt and A. A. Mitchell (eds. ), Psychological Processes and Advertising Effects: Theory, Research and Application, Hillsdale, NJ: Erlbaum, pp. 65-87.
Morgan, D. L. and Scannell, A. U. (1998). Planning Focus Groups: Focus Group Kit 2, Thousand Oaks: Sage Publications.
Morrin, M. (1999). The Impact of Brand Extensions on Parent Brand Memory Structures and Retrieval Processes, Journal of Marketing Research, Vol. 36, Issue 4, pp. 517-525.
Moutinho, L. and Hutcheson, G. (2007 forthcoming). Statistic Modelling for Management, London: Sage.
Mowen, J. C. (1993). Consumer Behaviour, 3`d Edition, New York: Macmillan Publishing Company.
Mukhopadhyay, A. (2005). Tracing the Daisy Chain: Post-Purchase Affect and Its Influences on Subsequent Consumption, Advances in Consumer Research, Vol. 32, Issue 1, pp. 495-498.
Muniz, A. M. and O'Guinn Jr., T. C. (2001). Brand Community, Journal of Consumer Research, Vol. 27, Issue 4, March, pp. 412-432.
Murry, J. P., Lastovicka, J. L. and Bhalla, G. (1989). Demographic and Lifestyle Selection Error in Mall-Intercept Data, Journal of Advertising Research, Vol. 29, Issue 1, February/March, pp. 46-52.
Myers, J. and Shocker, A. (1981). The Nature of Product-Related Attributes, in J. Shcth, (eds. ), Research in Marketing, Vol. 5, Greenwich, CT: JAI Press, Inc., pp. 211-236.
Myers, R. (1990), Classical and Modem Regression with Applications (2"d edition), Boston, MA: Duxbury.
Nantel, J. (1986). Attitude-Behavior Consistency: Some Considerations Specific to Marketing Research, in T. E. Muller (eds. ), Marketing, Vol. 7, Montreal: Administrative Sciences Association of Canada, pp. 271-279.
Narayana, C. L. and Markin, R. J. (1975). Consumer Behavior and Product Performance: An Alternative Conceptualization, Journal of Marketing, Vol. 39, Issue 4, October, pp. 1-6.
406

National Statistic Annual Abstract of Statistics 2005 Edition (2005). [online], Available from: htip: //www. statistics. gov. uk/downloads/theme compendia/Aa2005/Annual Abstract 2005. pdf., [cited on 2"d April 2006].
Nedungadi, P. (1990). Recall and Consumer Consideration Sets: Influencing Choice Without Altering Brand Evaluations, Journal of Consumer Research, Vol. 17, Issue 3, December, pp. 263-276.
Nejdet, D. (2000). International Counterfeit Marketing: Success Without Risk, Review of Business, Vol. 21, Issue Y2, pp. 16-20.
Newman, J. W. (1957). Now Insight, New Progress, For Marketing, Harvard Business Review, November-December, pp. 95-102.
Newman, J. W. and Staelin, R. (1973). Information Sources for Durable Goods, Journal of Advertising Research, Vol. 13, Issue 2, April, pp. 19-29.
Nia, A. and Zaichowsky, J. (2000). Do Counterfeit Devalue the Ownership of Luxury Brands?, Journal of Product and Brand Management, Vol. 9, No. 7, pp485-497.
Nill, A. and Schultz II, C. J. (1996). The Scourge of Global Counterfeiting, Business Horizons, Vol. 39, Issue 6, November/December, pp. 37-43.
Nilson, T. (1996). Competitive Branding, Hoboken, NJ: John Wiley & Sons.
Noth, W. (1988). The Language of Commodities Groundwork for a Semiotics of Consumer Goods, International Journal of Research in Marketing, Vol. 4, Issue 3, January, pp. 173-186.
Nowell, C. and Stanley, L. R. (1991). Length-biased Sampling in Mall Intercept Surveys, Journal of Marketing Research, Vol. 28, Issue 4, November, pp. 475-479.
Nowlis, S. M. and Simonson, I. (2000). Sales Promotions and the Choice Context as Competing Influences on Consumer Decision Making, Journal of Consumer Psychology, Vol. 9, No. 1, pp. 1-16.
O'Cass, A. and Lim, K. (2002). Toward Understanding the Young Consumer's Brand Associations and Ethnocentrism in the Lion's Port, Psychology & Marketing, Vol. 19, Issue 9, September, pp. 759-775,
Olsen, J and Granzin, L. (1992). Gaining Retailers' Assistance in Fighting Counterfeiting: Conceptualisation and Empirical Test of a Helping Model, Journal of Retailing, Vol. 68, Issue 1, Spring, pp. 90-109.
Olson, J. and Muderrisoglu, A. (1979). The Stability of Responses Obtained by Free Association: Implications for Measuring Attribute Salience and Memory Structure, Advances in Consumer Research, Vol. 6, Issue 1, pp. 269-275.
Oppenheim, A. N. (2000). Questionnaire Design, Interviewing and Attitude Measurement, New Edition, London and New York: Continuum.
407
Ostrom, T. M. (1969). The Relationship Between the Affective, Behavioral, and Cognitive Components of Attitude, Journal of Experimental Social Psychology, Vol. 5, pp. 12-30.
Oxenfeldt, A. R. (1974). Developing A Favorable Price-Quality Image, Journal of Retailing, Vol. 50, No. 4, pp. 8-14.
Oxenfeldt, A. R. and Swann, C. (1964). Management of the Advertising Function, Belmont, CA: Wadsworth Publishing Co.
Papadopoulos, T. (2004). Pricing Strategy and Practice: Pricing and Pirate Product Market Formation, Journal of Product & Brand Management, Vol. 13, No. 1, pp. 56- 63.
Park C., Jaworski, B. and Maclnnis D. (1986). Strategic Brand Concept-Image Management, Journal of Marketing, Vol. 50, Issue 4, October, pp. 135-145.
Park, C. and Srinivasan, V. (1994). A Survey-Based Method for Measuring and Understanding Brand Equity and Its Extendibility, Journal of Marketing Research, Vol. 31, Issue 2, May, pp. 271-288.
Park, C., Milberg, S. and Lawson, R. (1991). Evaluation of Brand Extension: The Role of Product-Level Similarity and Brand Concept Consistency, Journal of Consumer Research, Vol. 18, Issue 2, September, pp. 185-193.
Park, C. W. and Lessig, V. P. (1981). Familiarity and Its Impact on Consumer Biases and Heuristics, Journal of Consumer Research, Vol. 8, Issue 2, September, pp. 223-230.
Park, C. W. and Mittal, B. (1985). A Theory of Involvement in Consumer Behavior: Problems and Issues, in J. N. Sheth (eds. ), Research in Consumer Behavior, Vol. 1, Greenwich, CT: JAI Press, pp. 201-23 1.
Park, C. W. and Young, S. M. (1986). Consumer Response to Television Commercials: the Impact of Involvement and Background Music on Brand Attitude Formation, Journal of Marketing Research, Vol. 23, Issue 1, February, pp. 11-24.
Park, C. W., Gardner, M. P. and Thukral, V. K. (1988). Self-perceived Knowledge: Some Effects on Information Processing for a Choice Task, American Journal of Psychology, Vol. 101, No. 3, Fall, pp. 401-424.
Park, C. W., Mothersbaugh, D. L. and Feick, L. (1994). Consumer Knowledge Assessment, Journal of Consumer Research, Vol. 21, Issue 1, June, pp. 71-82.
Parkinson, T. L. and Reilly, M. (1979). An Information Processing Approach to Evoked Set Formation, Advances in Consumer Research, Vol. 6, Issue 1, pp. 227-231.
Penz, E. and Stöttinger, B. (2003, May). Brands and Counterfeits - What Do they Have in Common?, Paper presented at the European Marketing Academy Conference, UK.
Penz, E. and Stöttinger, B. (2005). Forget the "Real" Thing-Take the Copy! An Explanatory Model for the Volitional Purchase of Counterfeit Products, Advances in Consumer Research, Vol. 32, Issue 1, pp. 568-575.
408

Pepall, L. and Richards, D. (1994). Innovation, Imitation and Social Welfare, Southern Economic Journal, Vol. 60, Issue 3, pp. 673-685.
Perreault, W. D. and Leigh, L. E. (1989). Reliability of Nominal Data Based on Qualitative Judgements, Journal of Marketing Research, Vol. 26, Issue 2, May, pp. 135-148.
Perrier, R. (ed. ) (1997). Brand Valuation, London: Premier Books.
Perry, M. and Hamm, B. C. (1969). Canonical Analysis of Relations between Socioeconomic risk and Personal Influence in Purchase Decisions, Journal of Marketing Research, Vol. 6, Issue 3, August, pp. 351-354.
Pessmeier, E. and Bruno, A. V. (1971). An Empirical Investigation of the Reliability and Stability of Activity and Attitude Measures, Reprint Series No. 391, Krannert Graduate School of Industrial Administration, Purdue University.
Peter, J. and Lauf, E. (2002). Reliability in Cross-national Content Analysis, Journalism
and Mass Communication Quarterly, Vol. 79, Issue 4, Winter, pp. 815-832.
Peter, J. P. and Olson, J. C. (2004). Consumer Behaviour and Marketing Strategy, 7th Edition, Boston, MA: Irwin.
Peter, P. and Tarpey Sr., L. (1975). A Comparative Analysis of Three Consumer Decisions Strategies, Journal of Consumer Research, Vol. 2, Issue 1, pp. 29-37.
Peter, P. J. and Olson, J. C. (1994). Understanding Consumer Behaviour, Burr Ridge, Illinois: McGraw-Hill/Irwin.
Peterson, R. and Wilson, W. (1992). Measuring Customer Satisfaction: Fact and Artifact, Journal of the Academy of Marketing Science, Vol. 20, No. 1, pp. 61-71.
Petty, R. and Cacioppo, J. T. (1986). The Elaboration Likelihood Model of Persuasion, in L. Berkowitz (eds. ), Advances in Experimental Social Psychology, Vol. 19, New York: Academic Press, pp. 123-205.
Petty, R., Haugtvedt, C. and Smith, S. (1995), Elaboration as a Determinant of Attitude Strength: Creating Attitudes That Are Persistent, Resistant, and Predictive of Behavior, in R. Petty and J. Krosnick (eds. ), Attitude Strength: Antecedents and Consequences, Hillsdale, NJ: Lawrence Erlbaum, pp. 93-130.
Petty, R. E. and Cacioppo, J. T. (1981). Issue Involvement as Moderator of the Effects on Attitude of Advertising Content and Context, Advances in Consumer Research, Vol. 8, Issue 1, pp. 20-24.
Petty, R. E., Cacioppo, J. T. and Goldman, R. (1981). Personal Involvement as a Determinant of Argument-based Persuasion, Journal of Personality and Social Psychology, Vol. 41, Issue 5, November, pp. 847-855.
Petty, R. E., Cacioppo, J. T., and Schumann, D. (1983). Central and Peripheral Routes to Advertising Effectiveness: The Moderating Role of Involvement, Journal of Consumer Research, Vol. 10, Issue 2, September, pp. 135-144.
409
Phau, I. and Lau, K. C. (2001). Brand Personality and Consumer Self-expression: Single or Dual Carriageway?, Journal of Brand Management, Vol. 8, No. 6, pp. 428-444.
Phau, I., Prendergast, G. and Chuen, L. H. (2001). Profiling Brand-Piracy-Prone Consumers: An Exploratory Study in Hong Kong's Clothing Industry, Journal of Fashion Marketing and Management, Vol. 5, Issue 1, pp. 45-55.
Playle, S. (2003). Legal Update, Brand Management, Vol. 10, No. 6, pp. 457-459.
Plummer, J. T. (1985). How Personality Makes a Difference, Journal of Advertising Research, Vol. 24, No. 6, December/January, pp. 27-83.
Plummer, J. T. (2000). How Personality Makes a Difference, Journal of Advertising Research, Vol. 40, Issue 6, November/December, pp. 79-83.
Poiesz, R. B. C. (1989). The Image Concept: Its Place in Consumer Psychology, Journal of Economic Psychology, Vol. 10, Issue 4, December, pp. 457-472.
Poortinga, Y. (1989). Equivalence of Cross-cultural Data: An Overview of Basis Issues, International Journal of Psychology, Vol. 24, Issue 6, December, pp. 737-756.
Pope, N. K. and Voges, K. E. (2000). The Impact of Sport Sponsorship Activities, Corporate Image, and Prior Use on Consumer Purchase Intention, Sport Marketing Quarterly, Vol. 9, No. 2, pp. 96-102.
Porter, L. W. (1976). Organizations a Political Animals, Washington, DC, Presidential Address, Division of Industrial-Organizational Psychology, 841x' Annual Meeting of the American Psychological Association.
Porter, S. S., and Claycomb, C. (1997). The Influence of Brand Recognition on Retail Store Image, Journal of Product & Brand Management, Vol. 6, Issue 6, pp. 373-398.
Posavac, S. S., David M., Cronley, M. L. and Kardes, F. R. (2001). The Effects of Strengthening Category-Brand Associations on Consideration Set Composition and Purchase Intent in Memory-Based Choice, Advances in Consumer Research, Vol. 28, Issue 1, pp. 186-189.
Poulter, S. (2006). Cheap and Chic Fakes Snapped up by the Smart Set, Daily Mail, April 28 ', p. 28.
. Prasad, A. and Mahajan, V. (2003), "How Many Pirates Should a Software Firm
Tolerate? An Analysis of Piracy Protection on the Diffusion of Software", International Journal of Research in Marketing, Vol. 20, Issue 4, December, pp. 337-353.
Preacher, K. J. and MacCallum, R. C. (2003). Repairing Tom Swift's Electric Factor Analysis Machine, Understanding Statistics, Vol. 2, No. 1, pp. 13-43.
Prendergast G., Chuen L. and Phau, I. (2002). Understanding Consumer Demand for Non-deceptive Pirated Brands, Marketing Intelligence & Planning, Vol. 20, Issue 7, pp. 4.5-416.
Prendergast, G. and Hwa, H. C. (2003). An Asian Perspective of Offensive Advertising on the Web, International Journal ofAdvertising, Vol. 22, Issue 3, pp. 393-411.
410

Priester, J. and Petty, R. (2003). The Influence of Spokenperson Trustworthiness on Message Elaboration, Attitude Strength, and Advertising Effectiveness, Journal of Consumer Psychology, Vol. 13, No. 4, pp. 408-421.
Priester, J. R., Nayakankuppam, D., Fleming, M. A. and Godek, J. (2004). The A2SC2 Model: The Influence of Attitudes and Attitude Strength on Consideration and Choice, Journal of Consumer Research, Vol. 30, Issue 4, March, pp. 574-587.
Pugsley, L. (1996). Focus Groups, Young people and Sex Education, in J. Pilcher and A. Coffey (eds. ) Gender and Qualitative Research, Aldershot: Avebury, pp. 114-130.
Punj, G. and Srinivasan, N. (1989). Influence of Expertise and Purchase Experience on the Formation of Evoked Sets, Advances in Consumer Research, Vol. 6, Issue 1, pp. 507-514.
Punj, G. and Staelin, R. (1983). A Model of Consumer Information Search Behavior for New Automobiles, Journal of Consumer Research, Vol. 9, Issue 4, March, pp. 366- 380.
Puth, G., Mostert, P. and Ewing, M. (1999). Consumer Perceptions of Mentioned Product and Brand Attributes in Magazine Advertising, Journal of Product & Brand Management, Vol. 8, No. 1 pp. 38-49.
Quester, P. G., Karunaratna, A. and Li Kee Goh, A. (2000). Self-congruity and Product Evaluation: A Cross-cultural Study, Journal of Consumer Marketing, Vol. 17, Issue 6/7, pp. 525-537.
Raju, P. S. and Reilly, M. D. (1980). Product Familiarity and Information Processing Strategies: An Exploratory Investigation, Journal of Business Research, Vol. 8, Issue 2, June, pp. 187-212.
Raju, P. S., Lonial, S. C. and Mangold, W. G. (1995). Differential Effects of Subjective Knowledge, Objective Knowledge, and Usage Experience on Decision Making: An Exploratory Investigation, Journal of Consumer Psychology, Vol. 4, Issue 2, pp. 152- 180.
Rao, A. R. and Monroe, K. B. (1988). The Moderating Effect of Prior Knowledge on Cue Utilization in Product Evaluations, Journal of Consumer Research, Vol. 15, Issue 2, September, pp. 253-264.
Ratchford, B. T. (1987). New Insights about the FCB Grid, Journal of Advertising Research, Vol. 27, Issue 4, August/September, pp. 24-38.
Ratneshwar, S. and Shocker, A. D. (1991), Substitution in Use and the Role of Usage Context in Product, Journal of Marketing Research, Vol. 28, Vol. 3, pp. 281-296.
Ratneshwar, S., Pechmann, C. and Shocker, A. D. (1996). Goal-Derived Categories and the Antecedents of Across-Category Consideration, Journal of Consumer Research, Vol. 23, December, pp. 240-250.
Reilly, M. and Parkinson, R. L. (1985). Individual and Product Correlates of Evoked Set Size for Consumer Package Goods, Advances in Consumer Research, Vol. 12, Issue 1, pp. 492-497.
411
Reynolds, N. and Diamantopoulos, A. (1998). The Effects of Pretest Method on Error Detection Rates, European Journal of Marketing, Vol. 32, Issue 5/6, p396-396.
Reynolds, T. J. and Gutman, J. (1984). Advertising is Image Management, Journal of Advertising Research, Vol. 24, Issue 1, February-March, pp. 27-38.
Richins, M. L. and Bloch, P. H. (1986). After the New Wears off: The Temporal Context of Product Involvement, Journal of Consumer Research, Vol. 13, Issue 2, September, pp. 280-285.
Richins, M. L., Bloch, P. H. and McQuarrie, E. F. (1992). How Enduring and Situational Involvement Combine to Create Involvement Responses, Journal of Consumer Psychology, Vol. 1, No. 2, pp. 143-153.
Roberts, C. (1985). Can the flood of Counterfeit Product Be Stopped?, Security Management, October, pp. 32-3 8.
Roberts, J. H. (1989). A Grounded Model of Consideration Set Size and Composition, Advances in Consumer Research, Vol. 16, Issue 1, pp. 749-757.
Roberts, J. H. and Lattin, J. M. (1991). Development and Testing of a Model of Consideration Set Formation, Journal of Marketing Research, Vol. 28, Issue 4, November, pp. 429-440.
Roberts, J. H. and Lattin, J. M. (1997). Consideration: Review of Research and Prospects for Future Insights, Journal of Marketing Research, Vol. 34, Issue 3, August, pp. 406- 410.
Romaniuk, J. (2003). Brand Attributes - `distribution outlets' in the Mind, Journal of Marketing Communications, Vol. 9, Issue 2, June, pp. 73-92.
Roselius, T. (1971). Consumer Rankings of Risk Reduction Methods, Journal of Marketing, Vol. 35, Issue 1, January, pp. 56-61.
Roth, M. (1995). Effects of Global Market Conditions on Brand Image Customization and Brand Performance, Journal ofAdvertising, Vol. 24, No. 4, Winter, pp. 55-72.
Rothschild, M. L. (1984). Perspectives on Involvement: Current Problems and Future Directions, Advances in Consumer Research, Vol. 11, Issue 1, pp. 216-217.
Rothschild, M. L. (1979). Marketing Communications in Nonbusiness Situations or Why It's So Hard to Sell Brotherhood like Soup, Journal of Marketing, Vol. 43, Issue 1, Spring, pp. 11-20.
Russel, A. (1983). In Defence of Piracy, Executive, September, pp. 15-20.
Russo, J. E. and Johnson, E. J. (1980). What Do Consumers Know about Familiar Products, Advances in Consumer Research, Vol. 7, Issue 1, pp. 417-423.
Sanchez, M. E. (1992). Effects of Questionnaire Design on the Quality of Survey Data, Public Opinion Quarterly, Vol. 56, Issue 2, Summer, pp. 206-217.
412
Schacter, D. L. (1983). Feeling of Knowing in Episodic Memory, Journal of Experimental Psychology: Learning, Memory, and Cognition, Vol. 9, Issue 1, January, pp. 39-54.
Schaninger, C. M. and Danko, W. D. (1993). A Conceptual and Empirical Comparison of Alternative Household Life Cycle Models, Journal of Consumer Research, Vol. 19, Issue 4, March, 580-594.
Schiffman, L. G. and Kanuk, L. L. (1991). Consumer Behavior, 4`h Edition, London: Prentice-Hall International.
Schwartzman, D. (1976). Innovation in the Pharmaceutical Industry, Baltimore, MD: Johns Hopkins University Press.
Scott, K. (1953). Counterfeiting in Colonial New York, New York: The American Numismatic Society.
Scottish Household Survey (2005). Annual Abstract of Statistics 2005 [online], available from: http: //www. statistics. gov. uk/downloads/theme compendia/Aa2006/ AnnualAbstract2006complete. pdf, [cited I Ph September 2006].
Scribner, L. L. and Weun, S. (2001). Developing a Multidimensional Subjective Product Knowledge Scale, Working Paper, University of North Carolina at Wilmington.
Seguela, J. (1982). Hollywood Lave Plus Blanc, Paris: Flammarion.
Shapiro, S., Macinnis, D. J. and Heckler, S. E. (1997). The Effects of Incidental Ad Exposure on the Formation of Consideration Sets, Journal of Consumer Research, Vol. 24, Issue 1, June, pp. 94-104.
Sherif, C. W., Sherif, M. and Nebergall, R. E. (1965). Attitude and Attitude Change, Philadelphia: Saunders.
Sherif, M. and Cantril, H. (1947). The Psychology of Ego Involvement, New York: Wiley.
Sheth, J. N. and Venkatesan, M. (1968). Risk Reduction Process in Repetitive Consumer Behavior, Journal of Marketing Research, Vol. 5, Issue 3, August, pp. 307-310.
Shettle, C. and Mooney, G. (1999). Monetary Incentives in US Government Surveys, Journal of Official Statistics, Vol. 15, No. 2, pp. 231-250.
Shimp, T. and Bearden, W. (1982). Warranty and Other Extrinsic Cue Effects on Consumers' Risk Perceptions, Journal of Consumer Research, Vol. 9, Issue 1, June, pp. 38-46.
Shocker, A. D. and Srinivasan, V. (1979). Multiattribute Approaches for Product Concept Evaluation and Generation: A Critical Review, Journal of Marketing Research, Vol. 16, Issue 2, May, pp. 159-180.
Shocker, A. D., Ben-Akiva, M., Boccara, B. and Nedungadi, P. (1991). Consideration Set Influences on Consumer Decision-Making and Choice: Issues, Models, and Suggestions, Marketing Letters, Vol. 2. No. 3, pp. 181-197.
413

Shultz II, C. and Ardrey, W. (1995). Trends and Further Prospects for Sino-Vietnamese Relations: Are Trade and Commerce the Critical Factors for Peace?, Contemporary Southeast Asia, Vol. 17, Issue 2, September, pp. 126-146.
Shultz II, C. and Le, K. (1993). Vietnam's Inconsistencies between Political Structure and Socioeconomic Practice: Implications for the Future, Contemporary Southeast Asia, Vol. 15, Issue 2, September, pp. 179-194.
Shultz II, C. J. and Saporito, B. (1996). Protecting Intellectual Property: Strategies and Recommendations to Deter Counterfeiting and Brand Piracy in Global Markets, The Columbia journal of World Business, Vol. 31, Issue 1, Spring, pp. 18-28.
Siguaw, J. A., Mattila, A. and Austin, J. R. (1999). The Brand-Personality Scale, Cornell Hotel and Restaurant Administration Quarterly, Vol. 40, Issue 3, June, pp. 48-55.
Silk, A. J. and Urban, L. (1978). Pre-Test Market Evaluation of New Packaged Goods: A Model and Measurement Methodology, Journal of Marketing Research, Vol. 15, Issue 2, May, pp. 171-191.
Simonson, I. and Tversky, A. (1992). Choice in Context: Trade off Contrast and Extremeness Aversion, Journal of Marketing Research, Vol. 29, Issue 3, August, PP. 281-295.
Singer, E., Groves, R. and Coming, A. (1999). Differential Incentives: Beliefs about Practices, Perceptions of Equity, and Effects on Survey Participation, Public Opinion Quarterly, Vol. 63, No. 2, pp. 251-260.
Singh, J. (1991). Redundancy in Constructs: Problem, Assessment, and an Illustrative Example, Journal of Business Research, Vol. 22, Issue 3, May, pp. 255-280.
Singh, J. (1995). Measurement Issues in Cross-national Research, Journal of International Business Studies, Vol. 26, No. 3, pp. 579-619.
Sirgy, J. (1982). Self-Concept in Consumer Behavior: A Critical Review, Journal of Consumer Research, Vol. 9, Issue 3, December, pp. 287-300.
Sivakumaran, B. and Kannan, P. K. (2002). Consideration Sets Under Variety Seeking Conditions: An Experimental Investigation, Advances in Consumer Research, Vol. 29, Issue 1, pp. 209-210.
Slama, M. E. and Tashchian, A. (1985). Selected Socioeconomic and Demographic Characteristics Associated with Purchasing Involvement, Journal of Marketing, Vol. 49, Issue 1, Winter, pp. 72-82.
Smith, D. C. and Park, C. W. (1992). The Effects of Brand Extensions on Market Share and Advertising Efficiency, Journal of Marketing Research, Vol. 29, Issue 3, August, pp. 296-313.
Smith, R., Olah, D., Hansen, B. and Cumbo, D. (2003). The Effect of Questionnaire Length on Participant Response Rate: A Case Study in the U. S. Cabinet Industry, Forest Products Journal, Vol. 53, No. 11/12, pp. 33-36.
414

Soloman, Michael R., Surprenant, C., Czepiel, John A. and Guttman, Evelyn G. (1985), A Role Theory Perspective on Dyadic Interactions: The Service Encounter, Journal of Marketing, Vol. 49, No. 1, pp. 99-111.
Solomon, M. (1987). The Wardrobe Consultant: Exploring the Role of a New Retail Partner, Journal of Retailing, Vol. 63, Issue 2, pp. 111-128.
Solomon, S. L. and O'Brien, J. A. (1991). The Effect of Demographic Factors on Attitudes toward Software Piracy, in R. Dejoie, G. Fowler and D. Paradice (eds. ), Ethical Issues in Information Systems, Boston, MA: Boyd & Fraser, pp. 168-181.
Spear, N. and Singh, S. (2004). Measuring Attitude toward the Brand and Purchase Intentions, Journal of Current Issues and Research in Advertising, Vol. 26, No. 2, pp. 53-66.
Srinivasan, T. (1987). An Integrative Approach to Consumer Choice, Advances in Consumer Research, Vol. 14, Issue 1, pp. 96-101.
Srivastava, R., Alpert, M. I. and Shocker, A. D. (1984). A Customer-Oriented Approach for Determining Market Structures, Journal of Marketing, Vol. 48, Issue 2, Spring, pp. 32-45.
Srull, T. K. (1983). The Role of Prior Knowledge in the Acquisition, Retention, and Use of New Information, Advances in Consumer Research, Vol. 10, Issue 1, pp. 572-576.
Staelin, R. (1978). The Effects of Consumer Education on Consumer Product Safety Behavior, Journal of Consumer Research, Vol. 5, Issue 1, June, pp. 30-41.
Stem Jr., D. E., Lamb Jr., C. W. and MacLachlan, D. L. (1977). Perceived Risk: A Synthesis, European Journal of Marketing, Vol. 11, Issue 4/5, pp. 312-319.
Stevens, J. P. (1992). Applied Multivariate Statistics for the Social Sciences, 2"d Edition, Hillsdale, NJ: Erlbaum.
Stewart, H. (2003). Online Piracy of Recorded Music, Brand Management, Vol. 11, No. 2, pp. 129-132.
Stigler, G. (1961). The Economics of Information, Journal of Political Economy, Vol. 69, No. 3, pp. 213-225.
Stokmans, M. (1991). The Relative Importance of Product Attributes: Consumer Decision Theories in New-Product Development, Published Doctorial Dissertation, Delft: Delft University Press.
Stone, A. (2001). Illegal Tender, Harvard International Review, Vol. 23, Issue 2, pp. 7- 9.
Stone, P. J., Dunnphy, D. C. and Bernstein, A. (1966). The Analysis of Product Image, The General Inquirer: A Computer Approach to Content Analysis, Cambridge, MA: MIT Press.
Stratford, N., Simmonds, N. and Nicolaas, G. (2003). National Travel Survey 2002: Incentives Experiment Report, [online], Available from: http: //www. dft. og v. uk/
415
stcllcnV, ursldR-transstats/documents/page/dfltramsstats 023300. doc, [cited 8`h Junc 2006].
Sudman, S. (19S0). Improving the Quality of Shopping Center Sampling, Journal of Marketing Research, Vol. 17, Issue 4, November, pp. 423-431.
Sujan, M. (1935). Consumer Knowledge: Effects on Evaluation Strategies Mediating Consumer Judgments, Journal of Consumer Research, Vol. 12, Issue 1, June, pp. 31- 46.
Supphellcn, M. and Gronhaug, K. (2003). Building Foreign Brand Personalities in Russia: the Moderating Effect of Consumer Ethnocentrism, International Journal of Advertising. Vol. 22, Issue 2, pp. 203-226.
Swartz, T. A. (1933). Brand Symbols and Message Differentiation, Journal of Advertising Research, Vol. 23, No. 5, October/November, pp. 59-64.
Sweeney, J., Greenberg, S. and Bilter, M. (1994). Heading them off at the Pass - Can Counterfeit Goods of Foreign Origin be Stopped at the Counterfeiter's Border, The Trademark Reporter. Vol. 48, Issue 5, pp. 477-494.
Tabachnick, B. G, & Fidell, L. S. (2001). Using Multivariate Statistics, 41h Edition, Boston: Allyn & Bacon.
Target Group Index Survey (2002). [online], Available from: http: //www. bmrb- tgi. co. ul: /main. asp? p=135&r=2916.155, [cited on 120, April 2006].
Tauber, E. M. (1975). Predictive Validity in Consumer Research, Journal of Advertising Research, Vo. 15, Issue 5, October, pp. 59-64.
Tauber, E. M. (19S8). Brand Leverage Strategy for Growth in a Cost-controlled World, Journal ofAdvertising Research, Vol. 28, No. 4, August/September, pp. 26-30.
Taylor, J. (1974). The Role of Risk in Consumer Behaviour, Journal of Marketing, Vol. 38, Issue 2, April, pp. 54-60.
Taylor, J., Houlahan, J. and Gabriel, A. (1975). The Purchase Intention Question in New Product Development: A Field Test, Journal of Marketing, Vol. 39, Issue 1, pp. 90-92.
The Patent Office (2002). The Copyright. Etc., and Trade Marks (Offences and Enforcement) Act 2002: Guidance Note, Department of Trade and Industry, the United Kingdom, [online], Available from: http//www. patent. gov. uk, [cited on 24`h July 2006].
Tom, G., Garibaldi, B., Zeng, Y., and Pilcher, J. (1998). Consumer Demand for Countcrfcit Goods, Psychology & Marketing, Vol. 15, Issue 5, August, pp. 405-421.
Traylor, S. E. (1981). A Categorization Approach to Stereotyping, in D. Hamilton (eds. ), Cognitive Processes in Stcrcot)ping and Inter group Behavior, Hillsdale, NJ: Erlbaum, pp. 88"114.
416

Troye, S. (1983). Evoke Set Formation from the Perspective of Decision Making as an Instance of Categorization, PhD thesis, University of Illinois at Urbana-Champaign, Illinois.
Troye, S. V. (1984). Evoked Set Formation as a Categorization Process, Advances in Consumer Research, Vol. 11, No. 1, pp. 180-187.
Tull, D. S. and Hawkins, D. I. (1987). Marketing Research: Measurement and Method, 4`h Edition, London: Collier Macmillan Publishers.
Tull, D. S. and Hawkins, D. I. (1993). Marketing Research: Measurement and Method, 6th Edition, New York: Macmillan Publishing Co.
Tull, D. S. and Richards, L. E. (1980). "What Can Be Done about Interviewer Bias, " in J. Sheth (eds. ), Research in Marketing, Greenwich, CT: JAI Press, pp. 143-162.
Turley, L. W. and LeBlanc, R. P. (1995). Evoked Sets: A Dynamic Process Model, Journal of Marketing Theory and Practice, Vol. 3, No. 2, pp. 28-36.
Tzamourani, P. and Lynn, P. (2000). Do Respondent Incentives Affect Data Quality? Evidence from an experiment, Survey Methods Newsletter, Vol. 20, No. 2, pp. 3-7.
Urban, G. L., Hullland, J. S. and Weinberg, B. D. (1993). Premark Forecasting for New Consumer Durable Goods: Modelling Categorisation, Elimination, and Consideration Phenomena, Journal of Marketing, Vol. 57, Issue 2, April, pp. 47-63.
Van Tripj, H. C. M., Hoyer, W. D. and Inman, J. J. (1996). Why Switch? Product Category-Level Explanations for True Variety-Seeking Behavior, Journal of Marketing Research, Vol. 33, Issue 3, August, pp. 281-292.
Vaughn, S., Schumm, J. S. and Sinagub, J. (1996). Focus Group Interviews in Psychology and Education, Thousand Oaks: Sage Publications.
Veloutsou, C. and Bian, X. (2005, May). Consumer's Attitude Towards Non-Deceptive Counterfeit Brands in the UK and China, Paper presented at the 34`h European Marketing Academia Conference, Milan.
Veloutsou, C. and Bian, X. (forthcoming). A Cross-National Examination of Consumer Perceived Risk in the Context of Non-Deceptive Counterfeit Brands, Journal of Consumer Behaviour.
Veloutsou, C., Gilbert, G., Moutinho, L. and Goode, M. (2005). Measuring Transaction- Specific Satisfaction in Services- Are the Measures Transferable across Cultures?, European Journal of Marketing, Vol. 39, No. 5/6, pp. 606-628.
Venable, B. T., Rose, G. M., and Gilbert, F. Q. (2003). Measuring the Brand Personality of Non-profit Organisations, Advances in Consumer Research, Vol. 30, Issue 1, pp. 379-380.
Venables, W. N., Smith, D. M. and the R Development Core Team (2005). An Introduction to R [online], Available from: htip: //cran. r-12roject. orp-/doc/manuals/R- intro_pdf#search=%22an%20introduction%20to%20R%22, [cited on 22' September 2006].
417
Vroomen, B., Frances, P. and Nierop, E. (2004). Modeling Consideration Sets and Brand Choice Using Artificial Neural Network, European Journal of Operational Research, Vol. 154, Issue 1, April, pp. 206-217.
Warlop, L., Ratneshwar, S. and Osselaer, S. (2005). Distinctive Brand Cues and Memory for Product Consumption Experiences, International Journal of Research in Marketing, Vol. 22, Issue 1, March, pp. 27-44.
Wealth of the Nation Report (2006). [online], Available from: http: //www. caci. co. uk/msd. asp? url=won2006. htm, [cited on 24th July 2006].
Wee, T. T. (2004). Extending Human Personality to Brands: the Stability Factor, Journal of Brand Management, Vol. 11, No. 4, pp. 317-330.
Wee. C., Tan, S-J. and Cheok, K-H. (1995). Non-price Determinants of Intention to Purchase Counterfeit Goods, International Marketing Review, Vol. 12, Issue 6, pp. 19-47.
White, I. S. (1959). The Functions of Advertising in Our Culture, Journal of Marketing, Vol. 23, Issue 1, July, pp. 8-14.
Whitlark, D. B., Geurts, M. D. and Swenson, M. I. (1993). New Product Forecasting with A Purchase Intention Survey, Journal of Business Forecasting, Vol. 12, Issue 3, Fall, pp. 18-21.
Wilke, R. and Zaichkowsky, J. L. (1999). Brand Imitation and Its Effects on Innovation Competition, and Brand Equity, Business Horizons, Vol. 42, Issue 6, November/December, pp. 9-19.
Wilkes, R. E. (1995). Household Life-Cycle Stages, Transitions, and Product Expenditures, Journal of Consumer Research, Vol. 22, Issue 1, June, pp. 27-43.
Willimack, D., Schuman, H., Pennell, B. and Lepkowski, J. (1995). Effects of Pre-paid Non-Monetary Incentives on Response Rates and Response Quality in Face to Face Surveys, Public Opinion Quarterly, Vol. 59, No. 1, pp. 78-92.
Wind, Y. (1973). A New Procedure for Concept Evaluation, Journal of Marketing, Vol. 37, Issue 4, October, pp. 2-11.
Wiseman, F., Schafer, M. and Schafer, R. (1983). An Experimental Test of the Effects of a Monetary Incentive on Cooperation Rates and Data Collection Costs in Central. Location Interviewing, Journal of Marketing Research, Vol. 20, Issue 4, November,
pp. 439-442.
Woodside, A., Frey, L. and Daly, R. (1989). Linking Service Quality, Customer Satisfaction and Behavioral Intention, Journal of Health Care Marketing, Vol. 9, Issue 4, December, pp. 5-17.
Wright, D. B. (1997). Understanding Statistics: An Introduction for the Social Sciences, London: Sage Publications.
Wright, P. (1973). Cognitive Processes Mediating Acceptance of Advertising, Journal of Marketing Research, Vol. 10, Issue 1, February, pp. 53-62.
418
Wright, P. (1974). Analysing Media Effects on Advertising Response, Public Opinion Quarterly, Vol. 38, Issue 2, Summer, pp. 192-205.
Wright, P. and Barbour, F. (1977). Phased Decision Strategies: Sequels to Initial Screening, in Multiple Criteria Decision Making: North Holland TIMS Studies, in M. Starr and M. Zeleny (eds. ), the Management Science, Amsterdam: North-Holland Publishing Company, pp. 91-109.
Wu, J. and Rangaswamy, A. (2003). A Fuzzy Set Model of Search and Consideration with an Application to an Online Market, Marketing Science, Vol. 22, No. 3, Summer, pp. 411-434.
Yao, J. (2005). How a Luxury Monopolist Might Benefit from a Stringent Counterfeit Monitoring Regime, International Journal of Business and Economics, Vol. 4, No. 3, pp. 177-192.
Zaichkowsky, J. L. (1985). Measuring the Involvement Construct, Journal of Consumer Research, Vol. 12, Issue 3, December, pp. 341-352.
Zajonc, R. B. and Markus, H. (1982). Affective and Cognitive Factors in Preferences, Journal of Consumer Research, Vol. 9, Issue 2, September, pp. 123-13 1.
Zeithaml, V. A. (1988). Consumer Perceptions of Price, Quality, and Value: A Means- End Model and Synthesis of Evidence, Journal of Marketing, Vol. 52, Issue 3, July, pp. 2-22.
Zeithaml, V. A., Berry, L. L. and Parasuraman, A. (1996), The Behavioral Consequences of Service Quality, Journal of Marketing, Vol. 60, Issue 2, April, pp. 31-46.
GLASGOW UNIVERSITY LIBRARY
419
Copyright © 2022 FDOKUMEN