Trinidad d Tobago - World Bank Documents & Reports
183
Trinidad d Tobago A Program for Policy Reform and Renewed Growth /m -. / Q NS, ... X ..-. O/-1 / ': .' .: - ---- -.-- - 0 1- t--7- Public Disclosure Authorized Public Disclosure Authorized Public Disclosure Authorized Public Disclosure Authorized Public Disclosure Authorized Public Disclosure Authorized Public Disclosure Authorized Public Disclosure Authorized
-
Upload
khangminh22 -
Category
Documents
-
view
3 -
download
0
Transcript of Trinidad d Tobago - World Bank Documents & Reports

Trinidad d TobagoA Program for Policy Reform
and Renewed Growth
/m -. / Q NS,
... X ..-.
O/-1 / ': .' .: ----- -.-- - 0 1- t--7-
Pub
lic D
iscl
osur
e A
utho
rized
Pub
lic D
iscl
osur
e A
utho
rized
Pub
lic D
iscl
osur
e A
utho
rized
Pub
lic D
iscl
osur
e A
utho
rized
Pub
lic D
iscl
osur
e A
utho
rized
Pub
lic D
iscl
osur
e A
utho
rized
Pub
lic D
iscl
osur
e A
utho
rized
Pub
lic D
iscl
osur
e A
utho
rized
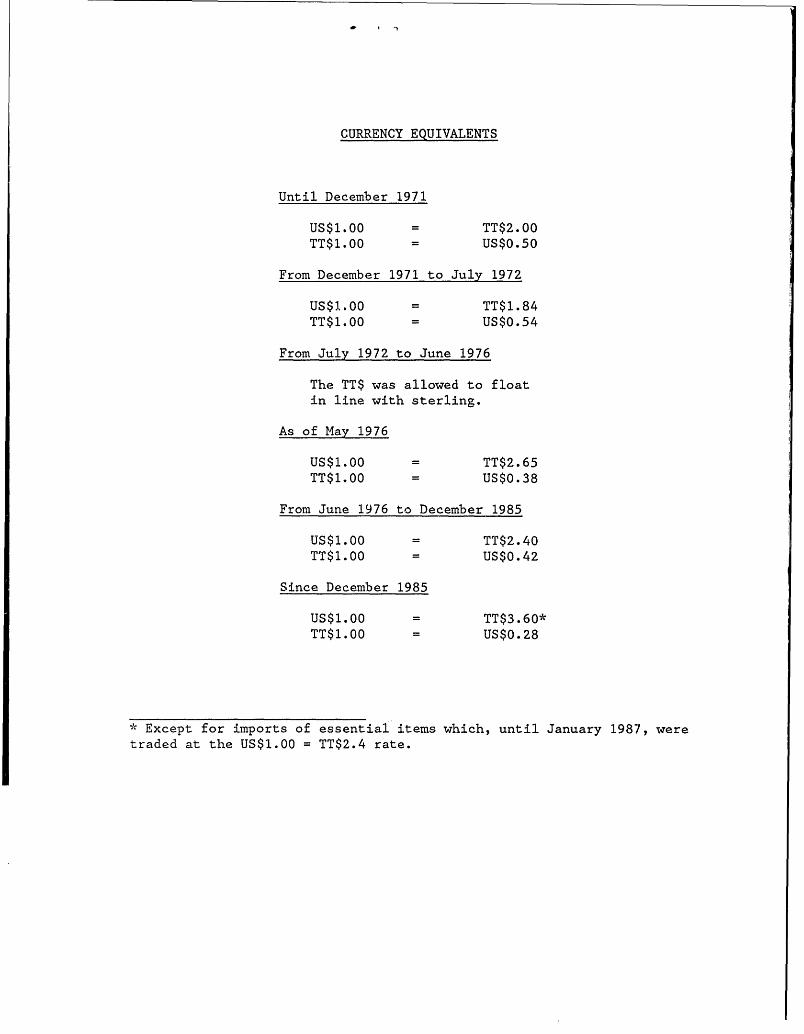
CURRENCY EQUIVALENTS
Until December 1971
US$1.00 = TT$2.00TT$1.00 = US$0.50
From December 1971 to July 1972
US$1.00 = TT$1.84TT$1.00 = US$0.54
From July 1972 to June 1976
The TT$ was allowed to floatin line with sterling.
As of May 1976
US$1.00 = TT$2.65TT$1.00 = US$0.38
From June 1976 to December 1985
US$1.00 = TT$2.40TT$1.00 = US$0.42
Since December 1985
US$1.00 = TT$3.60*TT$1.00 = US$0.28
- Except for imports of essential items which, until January 1987, were
traded at the US$1.00 = TT$2.4 rate.
A WORLD BANK COUNTRY STUDY
Trinidad and TobagoA Program for Policy Reform
and Renewed Growth
The World BankWashington, D.C., U.S.A.

Copyright (© 1988The World Bank1818 H Street, N.W.Washington, D.C. 20433, U.S.A.
All rights reservedManufactured in the United States of AmericaFirst printing September 1988
World Bank Country Studies are reports originally prepared for intemal use as part
of the continuing analysis by the Bank of the economic and related conditions of its
developing member countries and of its dialogues with the. governments. Some of the
reports are published informally with the least possible delay for the use of govemrnments
and the academic, business and financial, and development communities. Thus, the
typescript has not been prepared in accordance with the procedures appropriate to formal
printed texts, and the World Bank accepts no responsibility for errors.Any maps that accompany the text have been prepared solely for the convenience of
readers. The designations and presentation of material in them do not imply the
expression of any opinion whaisoever on the part of the World Bank, its affiliates, or its
Board or member countries concerning the legal status of any country, territory, city, or
area or of the authorities thereof or concerning the delimitation of its boundaries or its
national affiliation.The material in this publication is copyrighted. Requests for permission to reproduce
portions of it should be sent to Director, Publications Department at the address shownin the copyright notice above. The World Bank encourages dissemination of its work
and will normally give permission promptly and, when the reproduction is for
noncommercial purposes, without asking a fee. Permission to photocopy portions for
dassroom use is not required, though notification of such use having been made will beappreciated.
The complete bacdlist of publications from the World Bank is shown in the annual
Index of Publications, which contains an alphabetical title list and indexes of subjects,
authors, and countries and regions; it is of value principally to libraries and institutionalpurchasers. The latest edition of each of these is available free of charge from the
Publications Sales Unit, Department F, The World Bank, 1818 H Street, NW., Wash-
ington, D.C. 20433, U.S.A., or from Publications, The World Bank, 66 avenue d'I6na,75116 Paris, France.
Library of Congress Cataloging-in-Publication Data
Trinidad and Tobago : a program for policy reform and renewed growth /
the World Bank.p. cm. -- (A World Bank country study)
ISBN 0-8213-1126-31. Trinidad and Tobago--Economic conditions. 2. Trinidad and
Tobago--Economic policy. I. International Bank for Reconstruction
and Development. II. Series.HC157.T84 1988338.97298'3--dcl9 88-26106
CIP
- iii -
PREFACE AND ABSTRACT
This report is based on the work of an IBRD economic mission to
Trinidad and Tobago in October 1987, led by Mr. Nadaraja Ramachandran.Contributing to the report were Messrs. Richard Auty (manufacturing),Douglas Adkins (agriculture), Robert Brown (tourism), Marc Payot (planning
organization), Ramesh Ramsaran (public finance and financial sector) and
Branko Grdjic (statistics).
This report reviews recent economic developments and the main,
policy issues in Trinidad and Tobago. It is in two parts. Part I, the
Main Report focuses on the state of the economy and steps towards a programof policy reform for renewed growth in Trinidad and Tobago, and presentsthe salient features of the analysis of selected sectors. Part II deals in
more detail with four areas selected for special review--manufacturing,agriculture, tourism and planning organization. The last Bank economicreport was in June 1983.
The Trinidad and Tobago economy is at a crossroads. The nationaland per capita incomes have been plummeting since 1982 with the decline of
the oil industry. GNP per capita fell from US$6,920 in 1982 to US$5,120 in
1986. For 1987 the per capita income is estimated to be about US$4,195.Net foreign exchange reserves have dwindled from US$3,091 million in 1982(equivalent to 13.3 months' imports) to US$81 million by end 1987. As thepetroleum receipts declined, so have government's capital expenditureswhich dropped from 19% of GNP in 1982 to about 5% in 1986. With thecontraction in the economy the number of unemployed as a percentage of thelabor force swelled from 10% in 1982 to 22% in 1987. Unemployment is nowone of the most serious social problems facing the country. However, withthe failure to effect significant reductions in current expenditure, thecurrent account balance of the Central Government turned negative in 1986.The financial system too has come under great stress with the downturn inthe economy and public confidence has been shaken by the closure of anumber of non-bank financial institutions. Trinidad and Tobago cannot beclassified as heavily indebted, but there is critical bunching of thecommercial bank debt of State Enterprises guaranteed by Government over the
period 1988-1990.
It is clear that the exacerbation or persistence of the decliningeconomic trends cannot continue for much longer without endangering the
social stability of the country. Even as the economy went into a tail-
soin, the policy responses were delayed and weak. Beginning inOctober 1983, a variety of corrective measures were introduced, notably, a
partial devaluation in December 1985, consolidated in January 1987.Manufactured exports (excluding petroleum and related products) increased.
Nevertheless, the evidence suggests that the Trinidad and Tobago dollar is
still overvalued. A new Government took office in December 1986. It hasindicated that recovery of the economy will be its prime concern, with the
private sector playing a more important role in growth.
Trinidad and Tobago has a good resource base, both physical and
human. And provided the international economy remains stable, there is no

- iv -
reason why the economy should not resume its growth again if an adequate
macroeconomic framework consisting of exchange rate, fiscal and monetary
policies is in place. In particular, the competitiveness of the economy
has to improve and the economy become more diversified. In the short-term,
revival is linked to recovery in the oil sector. In the medium to longer
term, with growth of the energy based projects, the industrial sector could
emerge as the lead sector, replacing oil. Earnings from tourism and other
services could be expanded considerably. Agriculture, too, has a critical
role, but it needs to become more efficient and competitive.
The policies to facilitate the recovery will need to be multi-
faceted: continued restraint in consumption, both public and private,
reduction of the overall domestic financing gap, phasing-out of public
sector recourse to Central Bank credit, increased resource availability to
the private sector, revival of public investment which in turn will spur
private investment, rationalization of state enterprises and improved
incentive framework for the private sector, trade liberalization and shift
in emphasis from import substitution to export promotion, flexible exchange
rate policy, more determined efforts to encourage domestic savings,
systematic approach to job creation and greater attention to population
growth. Such a recovery program will need to be buttressed by adequate
levels of external borrowing (about US$225 million a year over the next few
years) plus technical assistance, particularly in the areas of national
economic planning and policy coordination, project preparation and
implementation, marketing and tourism planning and implementation.

TRINIDAD AND TOBAGO
TABLE OF CONTENTS
PART I: SUkAURY AND L'AIN REPORT
Page No.
COUNTRY DATA viii
SUMMARY AND MAIN ISSUES ................................... xi
I. MACRO-ECONOMIC POLICIES SINCE 1973 .................... 1
Economic Policies Since 1973 ....................... 3
Economic Performance in 1986/87 ...........................5
II. PUBLIC SECTOR FINANCES ....................................... 7Recent Trends in Revenues .................................7
Revenue Reform ............................................8
Current Expenditures ..................................... 11
Public Sector Investment ................................. 11
Recommendations ................................... 14
III. TRADE AND INDUSTRIAL POLICY ................................. 15
Balance of Payments Performance .......................... 15
The Manufacturing Sector ................................. 16
Incentives and Investment ................................ 18
Trade Policy ................................ ..... 19
Recommendations ................................... 21
IV. AGRICULTURAL POLICY ................................... 22
The Structure of Protection .............................. 22
The Sugar Industry ................................ 23
Recent Trends in Major Agricultural Subsectors .... 23
Agricultural Resources ................................... 24
Institutional Context and Services ................ 25
Recommendations ................................... 26
V. TOURISM .............................................. 27
The Tourism Product ...................................... 27
Size of the Toutism Sector .............................. 28
Prospects for Tourism Development ........................ 28
Conclusions ....................;................. 30
Recommendations.,................................... 30
VI. THE FINANCIAL SECTOR ................................. 32
Commercial Banking ....................................... 32
Interest Rate Policy .............................. 34
Resource Mobilization .................................... 36
The Stock Exchange ....................................... 36
Recommendations .................................. 37

- vi -
TABLE OF CONTENTS (cont'd)
Page No.
VII. EMPLOYMENT/UNEMPLOYMENT ISSUES .............................. 39
Employment Strategies .................................... 40
Current Employment and Wage Policy Issues ............... 41
Conclusions ....................................... 43
Recommendations ................................. .43
VIII. STRAT'EGY FOR MEDIUM-TERM GROWTH ............................. 44
Debt and Borrowing ................................ 44
Policies for Recovery ............................. 45
Two Scenarios ...................................... 48
PART II: SECTOR REVIEWS
IX. THE MANUFACTURING SECTOR ............................. 52
The Structure of Production and Trade to the
The Mid-Eighties ............................... 52
Prospect for the Heavy Hydrocarbon-BasedIndustries ..................................... 55
Prospects for the Non-Hydrocarbon ManufacturingSector ......................................... 64
Institutional Reform For Industrial Promotion 69
Conclusions ....................................... 74
X. THE AGRICULTURAL SECTOR .............................. 77
Agriculture in Context ............................ 77
Government Policy ................................. 80
Recent Trends in Major Agricultural Subsectors 84
Institutional Structure ........................... 89
Conclusions and Recommendations ................... 91
XI. TOURISM SECTOR REVIEW ........... ......................... 93The Tourism Sector .................... . 93
Recent Developments ................... . . 94Market Potential and Prospects .. ............... 96
Policies and Incentives ...................... 98
Supporting Policies .............................. 100
Conclusions ............................................... 104
Recommendations ........................................... 105
XII. INSTITUTIONAL STRUCTURE FOR PLANNING .................. 107
Planning Institutions ............................ 107
Integrated Socio-Economic Development Planning ... 109Integrated Regional Development Planning ................ 110
National Planning Data ................................... 110
Financing the Pre-Investment Phase ..................... 111

-vii-
TABLE OF CONTENTS (cont'd)
Page No.
Standardizing Project Proposals Documents ........ illMonitoring the General Economic Situation 11........ iTechnical Assistance Requirements .......................111
Conclusion ........................ .............. 112
STATISTICAL ANNEX ........................................... 114
MAP IBRD 20573R

- viii - Page 1 of 3
COUNTRY DATA - TRINIDAD A TOBAGO
AREA POPULATION DENSITY 1988
6,128.0 km2 1,199,161 (mid 1986) 233.8 per sq km2
Rate of Growth: 1.8 (1982 to 1988) 600.9 per km2 of
Arable Land
POPULATION CHARACTERISTICS 1986 HEALTH 1988
Crude Birth Rate (per 1,000) 27.0 Population per Physician 1,400
Crude Death Rat. (per 1,000) 7.0 Population per Hospital Bed 200
Infant Mortality (per 1,000 14.9
live births, 1982)
INCOME DISTRIBUTION GINI COEFFICIENT a/
1982 0.44
ACCESS TO PIPED WATER 1988 ACCESS TO ELECTRICITY 1982
% of Population - Urban 97 X of population 84.3
- Rural 77
REGISTERED MOTOR VEHICLES 1986 (in 900) EDUCATION 1980 (X of i;otal)
Private 212.4 No Education 4.9
Other 139.0 Primary School 68.7
Tntal 351.4 Secondary School 32.4
University 2.2
Not Stated 1.8
GNP PER CAPITA, 1988 USS 6,120 b/
GROSS NATIONAL PRODUCT 1988 GDP f.c. ANNUAL RATE OF GROWTH
(%, constant 1970 prices)
USS Mil. X 1984/83 1986/84 1986/86
GNP at Market Pric*s 6,033.3 -12.8 -2.9 -8.4
Gross Domestic 1,111.1 22.1
Investment
Gross National Saving 692.8 11.8
Current Account Balance -603.7
Exports of Goods, NFS 1,605.0 31.9
Imports of Goods, NFS 1,989.0 39.1
n/ Measure of income distribution, ranging between O and 1, with 1 represonting the
greatest dogree of inequality in income distribution.
b/ Basod on the World Bank Methodology.

- ix - Page 2 of 3
LABOR FORCE, OUTPUT ANDPRODUCTIVITY IN 1986
Value Added Labor Force / V.A. Per Worker
US Ml X 1,000 X UiSJ Xofaverage
Agriculture 262.4 .64 &412 11.4 6,938.7 47.7
Industry 1,408.9 29.2 66.7 14.4 25,294.4 203.1
Other 3,169.8 85.4 268.0 74.2 10,971.5 88.1
Total GDP f.c./Average 4,831.1 100.0 387.9 100.0 12,464.4
GOVERNMENT FINANCE 1986
General Government Central Government
TTS Mln. X of GDP f.c, TTS Min. % of GDP f.c.
Current Receipts 6,281.6 30.6 5,257.6 30.2
Current Expenditures 6,52656 31.8 5,485.5 31.6
Current Surplus -244 -227.9
Capital Expenditures 844.9 4.9 844.9 4.9
and Net Lending
MONEY, CREDIT AND PRICES 1983 1984 1985 1988
(Million TTS outstainding end period)
Money and Quasi Money 8,939.6 7,160.4 7,321.5 7,236.0
Bank Credit to Public -1,400.7 -86.7 669.1 1,995.2
Sector
Bank Credit to Private 6,620.8 6,944.7 6,B97.1 6,806.9
Sector
(Porcentago or Index Numbers)
Money and Quasi Money 35.1 37.2 38.7 41.6
as X of GDP f.c.
Retail Price Index 116.2 130.5 140.5 151.3
(Sept 1982 =100)
Annual Percentage Changes in:
Retail Price Index 16.7 13.3 7.7 7.7
Bank Credit to Public Sector 366.7
Bank Credit to Private Sector 16.4 7.7 -4.2 1.9
E/ Employed only.
Not available

- x - Page 3 of 3
BALANCE OF PAYMENTS (US$ MIL.) MERCHANDISE EXPORTS/198B d/
1984 '1985 1988 USM Mil. ,
Exports 2,110.8 2,164.7 1,388.2 Petroleum and 981.8 70.2
Imports -1,917.3 -1,657.3 -1,484.1 F'roducts c/
Services -832.8 -829.0 -449.7 Food, Beverages 68.4 4.1
Unrequited -83.2 -80.6 -38.1 A Tobacco
Transfers All Other 352.2 25.7
Current Account -522.5 -92.2 -803.7 Commodities
Total 1,370.4 100.0
Public Sector 19.8 88.8 79.6
Capital EXTERNAL DEBT, DECEMBER 31, 1988
USS Mil.
Direct Investment 113.2 1.2 -14.6 Public Debt f/ 1,807.0
Commercial Banks 19.2 -41.0 -27.2
Other -271.4 -38.7 -98.4 DEBT SERVICE RATIO for 1988 a/Capital Account -119.4 12.1 -58.8
Public Dobt., Incl. 15.8X
Errors -100.2 -180.9 -36.3 Guaranteed
Overall Balanco -742.1 -241.0 -697.8
Change in Reserves 742.1 241.0 897.8
(Increase = -)
RATE OF EXCHANGE IBRD/IDA LENDING, December 1988
USS MIL.
JN.-DC. 1984 IBRD IDA
US:1.00 = TTt2.40 Outstanding A Disbursed 29.4 0.0
TTS1.00 = US30.42 Undisbursed 0.0 0.0
Outstanding Including 29.4 0.0
JN.-NV. 1985 Undisbur,ed
US31.00 = 2.40
TTt1.00 = USt0.42
As of DC. 1986
USt1.00 = TTt3.80
TTt1.00 = USSO.28
JN. 1988
USS1.00 = TTt3.B0
TTt1.00 = USt0.28
d/ Including domestic exports and ro-w:ports.
*/ Excludes exports under petroleum prJocossing agroement and stores and bunkers.
f/ Includes guaranteed debt disbursed only.
/ Ratio of debt service to exports of goods and non-factor services.

- xi -
SUMMARY AND MAIN ISSUES
i. Trinidad and Tobago is a small country in terms of both physical
size and population. Based largely on its petroleum resources, it has been
able to attain a relatively high standard of living. With a per capita GNP
of US$5,120 in 1986, it now ranks among the upper middle-income developing
countries. The economy has been highly dependent on oil exports and in
public investment financing from this source. This has made the economy
highly vulnerable to fluctuations in the international demand and price of
oil. The most recent boom stemmed from the high oil prices prevailing in
the period 1974 to 1981, which yielded the Government a significant amount
of resources that are now exhausted. As dependence on oil grew, the other
sectors were increasingly neglected, to the detriment of future growth. As
a result of increased Government spending, the economy grew at an average
annual rate of almost 7% in real terms between 1976 and 1982. Since 1983,
however, economic activity has declined in every year as the economy failed
to diversify in light of changing world demand and prices for oil.
ii. With the emergence of the petro-chemical sector, Trinidad and
Tobago is now the most industrialized of the Commonwealth Caribbeannations. The country also has good infrastructure, a fair amount of
entrepreneurship, cheap energy, skilled human resources and political
stability. With these assets and the adoption of policies which will lead
to a via-ble macroeconomic framework and increased and more diversified
exports, -the economy should resume its growth at rates of around 2% to 3%
per annum over the medium term. On the other hand, if improvements in
export performance and in the manufacturing, agricultural and tourism
sectors are only marginal, and if there is no effective program of
diversification, the decline in the economy Twould persist and unemployment
would be exacerbated.
iii. The development strategies followed since the mid-1970s have aimed
at industrializing the economy by creating energy-based export industries
to maximize the benefits of the oil resources and serve as the driving
force of the economy as the reserves became depleted. At the same time,
the Government endeavored to expand educational and other social facilities
and to participate in the ownership of commercial and industrialenterprises. Since 1983, as oil revenues declined, so have government
current expenditures. The brunt of fiscal adjustment has fallen on
government capital expenditures, which dropped from 19% of GDP in 1982 to
4.7% in 1986. Fiscal policy over the last decade became an instrument for
redistributing the benefits of the increased oil revenues and ensuring that
many of the basic needs of the poorer segments of the population were met.
The balance of payments also reflected developments in the oil sector
closely. Beginning in October 1983, a variety of measures were introduced
to deal with the sharp fall in reserves, most notably a devaluation in
December 1985.
iv. A new Government took office in December 1986. It has indicated
that its approach to development and management of the economy will be
quite different in a number of areas. The Government has expressed its
intention to encourage the private sector to play a more important role and
wants to reorganize state enterprises with a view to increasing their

efficiency and reducing their dependence on the Central Government. Public
spending is to be monitored more closely to cut down waste, and the
Government has committed itself to greater public accountability and more
effective use of national resources.
v. The policy initiatives of the new Government so far have, however,
been unable to offset the pervasive effects of the oil price collapse in
1986 and to arrest the decline of the economy. Real GDP at factor cost
fell by 6.4% in 1986 and by an estimated 2.3% in 1987. The fall in oil
price in 1986 and in oil production in 1986 and 1987 were the dominant
underlying factors. Domestic inflation in 1986 remained at the 7.7% level
of 1985, but accelerated to over 10% in 1987 with the price increases
following the unification of the exchange rate in January 1987. The
overall public sector deficit rose from 5.5% of GDP in 1985 to 6.0% of GDP
by 1986. Revenue collections fell in 1986 with the downturn in oil prices.
Reductions in government expenditure, particularly in current expenditure,
were inadequate to compensate for the revenue decline and the overall
deficit grew. Financing of the deficit was largely through the domestic
banking system. Export earnings plummeted by 36% in 1986, principally
because of a decline in both the volume and prices of petroleum products.
Import values, however, fell by only 5% and the balance of payments current
account deficit grew from 1% of GDP in 1985 to 12% in 1986.
vi. Current revenues of the Central Government increased at an average
annual rate of 39% between 1973 and 19.81 but have declined steadily since
1982. The fall in the price of oil has been the main factor contributing
to this trend. Another has been the decline in domestic crude oil
production. In December 1986 the new Government introduced a number of
revenue measures, pending the findings of the Tax Performance Committee
that is studying ways to rationalize the tax system.
vii. In the light of falling real income, and as an incentive for
effort, a downward revision of certain taxes, particularly the personal
income tax and the company tax would be desirable at this time. In the oil
sector, the rate of the Supplemental Petroleum Tax (SPT) has been a
disincentive to companies wishing to undertake further exploration to
increase production in the medium to long term. In the 1988 Budget the
Government adjusted these taxes, but should continue to monitor the effects
of these changes with a view to further adjustment. Given the prospect of
a fall in oil prices in current terms in 1988 and 1989, the oil tax regime
may require further modification. More revenue could be obtained through
cost recovery from services. Health and education facilities for example,
could be so administered as to recover some costs. Elimination of
subsidies to public utilities could also shore up the fiscal position.
viii. With enhanced revenues following the oil boom, the Government
increased both current and capital expenditures. As a portion of GDP,
current expenditures rose from 17% in 1973 to 40% in 1981. Since 1982 it
has averaged around 30%. Increased current spending was generated by a
variety of misdirected policies: featherbedding in the public service;
wage and salary increases that were unwarranted; subsidy programs that only
marginally benefitted intended beneficiaries; and transfers to public
utilities and state enterprises without serious insistence on efficiency
improvements and cost reductions.

- xiii -
ix. Given that significant increases in recurrent revenues areunlikely in the foreseeable future (in fact, revenues could fall further)the Government needs to make a determined effort to reduce recurrentspending. The Government should reverse the deteriorating trends in publicfinances by generating a surplus in its current account. At the same time,the Government should progressively eliminate the domestic financing gapand phase-out public sector recourse to Central Bank credit. In the shortterm, it is rightly focusing on the rationalizing of expenditures under thecategory of transfers and subsidies, where there seems to be considerablescope for reductions. The Government will, however, also have to effecteconomies in its wage bill. Redeployment within the public service couldalso provide some room for maneuver.
x. The burden of fiscal adjustment has, as noted, fallen most heavilyon Government capital expenditures. The Government became involved in anumber of expensive capital-intensive industrial undertakings some of whichhave suffered financial losses. The present Government in its 1987 budgetindicated that while state enterprises have a role to play in the processof transformation, a plan for divestment, capital enhancement, training,expansion of production and greater accountability will be developed foreach enterprise as appropriate. The team undertaking this task has so farexamined at least 10 of the 35 enterprises with significant stateinvolvement. Most Government capital spending in 1987 has been formaintenance/preservation and continuation of some ongoing work. TheGovernment's inability to raise the desired foreign capital partly explainswhy hardly any new projects have been started. The Government in its 1988Budget has recognized the need for an augmented public investment programif the economy is to recover but is severely handicapped by a lack ofskills in project formulation and implementation. A pipeline of well-formulated projects, indispensable in preparing the next plan, does not yetexist. The dearth of skills in project formulation and implementation hasalso reduced the effectiveness of money spent and at times created asituation where available funds are difficult to disburse. Training andtechnical assistance in the relevant project areas warrant a high priority.
xi. At the sectoral level, the need to reduce dependence on petroleumand diversify the economy has long been an objective of Government policy.In response to a wide range of incentives, the manufacturing sector hasgrown since the early 1950s, and its contribution now is about 10% of GDP.The development of gas-based industries (notably steel, fertilizer andmethanol) was the major plank of the last Government's diversificationdrive. Most of these enterprises have been affected by teething problems,cost overruns, fluctuating prices and uncertainties in export markets.However, they are technically efficient and have the potential tocontribute significantly to the economy. Management and marketing willplay a key role in the future of these enterprises. Non-energy-basedmanufacturing has suffered from over, capacity, the result of a fall inlocal demand, trade restrictions within CARICOM and, in many cases, aninability to compete in extra-regional markets.
xii. The disappointing performance of manufacturing has brought out theweaknesses in the strategy pursued. Most conspicuous has been the grantingof protection and import duty exemptions which have discouraged export
- xiv-
initiatives and led to unnecessary losses of revenue. The new Government,
in a policy statement of August 1987, is attempting to revamp the incentive
framework for private investment by offering a broad range of incentives.
However, there is still no clear strategy for shifting the emphasis from
import substitution to export promotion. The Government should consider
granting free-trade status to export industries right away as a first step
in revamping the structure of incentives with the intention of eliminating
the existing anti-export bias.
xiii. The Government might consider establishing a task force with a
strong commercial orientation to plan the shift to export promotion.
Businesses perceive the procedures for securing licenses for the import of
raw materials as being slow. These procedures ought to be simplified and
the controls relaxed. The tax incidence on investment needs to be revie-wed
so that Trinidad and Tobago can become competitive in attracting foreign
investment. Import duty exemptions should be eliminated on imports used by
manufacturers producing for the local market so as to arrest this
unwarranted revenue loss. The Alien Landholdings Act is seen as
restrictive and needs to be reconsidered to provide a more positive setting
for investment opportunities. The dearth of marketing expertise, a key
constraint on export growth, should be addressed as quickly as possible by
utilizing foreign expertise.
xiv. The protective trade system needs to be liberalized. The negative
list has been providing almost continuous protection to some activities so
that there has been little reason to improve efficiency. Increasing
reliance on tariffs, with a gradual phase-down over time, is needed. The
recent decision by CARICOM states to remove all intra-regional trade
restrictions on a list of items can be used as a first step in a program to
expose local manufacturers to increasing competition.
xv. As to export competitiveness, the devaluation in December 1985 has
improved competitiveness in the manufacturing sector, and manufactured
exports (excluding petroleum and related products) have grown by over 15%
in each of the last two years. Nevertheless, the evidence indicates that
the Trinidad and Tobago dollar (TT$) is still overvalued. In comparison
with its 1976 level --1976 is the earliest year for which data are
available for this series-- the real effective exchange rate, based on a
basket of currencies of major trading partners, had appreciated by 16% by
the third quarter of 1987 and this in spite of the continued fall in the
value of the US dollar since 1985, to which the TT dollar is pegged.
Reductions in wages and salaries in recent years have been consistent with
the adjustment effort. The priority now should be wage restraint and
further reform of industrial incentives and adoption of additional fiscal
and income policies aimed at containing and reducing costs to preserve the
1985 devaluation edge and improve the competitiveness of the country's non-
oil related exports outside the CARICOM market. Flexible management of the
exchange rate would further boost export competitiveness. By end 1987 net
foreign exchange reserves had dwindled to about US$81 million. If foreign
exchange reserves were to continue to fall, further action on the exchange
rate will be required to establish equilibrium in the balance of payments,
And since exchange rate adjustments play a key role in the generation of
expectations, the Government will need to supplement these efforts with
fiscal and monetary measures.

- xv -
xvi. Agriculture has a key role to play in diversifying the Trinidadand Tobago economy and reducing its vulnerability to external developments.Agriculture's share in the economy accounted for about 5% of GDP and 11% ofthe labor force in 1986. The overall picture is of an agricultural sectorwhich for the most part is unable to compete in world markets. At the sametime, agro-processing industries, particularly those where human capitaland technology compensate for higher labor costs, have gained a foothold ininternational markets. The system of protection for agriculture, consistsof controls and budgetary subsidies. For most commodities, the heart ofthe system is the virtual import ban via licensing of imports or foreignexchange. Agriculture needs to become more efficient and competitive. Anappropriate official policy would be to switch as much as possible awayfrom quantitative restrictions and toward tariff protection.
xvii, Trinidad and Tobago retains a seriously obsolete sugar industrythat produces sugar at about 10 times the world price with prices farhigher than the roughly US$500 per ton received under the EEC and USquotas, and costs the country about $120-160 million annually, over US$100per capita and in excess of US$10,000 per sugar worker or farmer. As theindustry apparently cannot be rehabilitated to achieve competitiveness, aphase-out on an agreed schedule should be undertaken. The pace of thisoperation will clearly depend on developing viable alternative economicactivities and avoiding any aggravation of unemployment which had reached22% by 1987. Where possible, the number of Government instlL.utionssupporting agriculture needs to be scaled back. In particular, theGovernment should end most marketing activities. Strengthening the linkbetween extension and research would be beneficial. Trinidad and Tobagohas an agricultural tradition that, if meshed with modern techniques and anappropriate policy framework, could result in its contributingsignificantly to the economy.
xviii. Tourism-related activities constitute about 3% of GDP. Thissector, which the private sector and Government have largely neglecteduntil now, suffers from a number of major problems: a small number ofhotel rooms,, low occupancy, generally low quality and low profitability ofhotels, difficult access to Tobago from the major source markets, poorvalue for money, poor marketing, particularly with respect to the image ofTrinidad and Tobago, considerable outward movement by residents andconsequent loss of foreign exchange, and the general lack of a tourismambiance in the country.
xix. Despite these problems, there is considerable potential fordeveloping a vibrant tourism sector, comprising both the international anddomestic visitor markets. Already a positive trend is emerging withvisitor arrivals up 12% in the first six months of 1987 over 1986.Appropriate short-term actions would be to improve hotel occupancy ratesand boost profitability by upgrading t1ae existing hotel stock by aselectively targetted, 4oint marketing program, e.g., Trinidad and Tobagowith Grenada/Barbados/Venezuela, by improving coordination among thetourism agencies, by providing more direct flights from Europe and NorthAmerica at peak seasons and improving the airport and seaport terminals. Aconcurrent five-year development program might include a doubling of the
- xvi -
number of hotel rooms by the private sector, particularly in Tobago and on
the north coast of Trinidad (an additional 1,500 rooms), developing
Chaguaramas as a tourist resort and increasing significantly the cruiseship
passengers to both islands. Tourism development would be better served by
either a Ministry of Tourism or a Minister of Tourism within an appropriate
ministry, rather than being submerged in a major ministry, as now.
Technical assistance could be used in implementing tourism policy.
xx. With the downturn in the economy, the financial system has come
under a great deal of stress. The tight liquidity situation has led banks
to seek increasing accommodation by the Central Bank, as their
profitability dropped by 53% between 1984 and 1986 and total deposits and
value of total loans outstanding stagnated. A more determined effort is
needed to encourage greater savings. Since the early 1980s, real interest
rates in Trinidad and Tobago have never been positive. Given present
circumstances, however, higher nominal interest rates are unlikely to
achieve the desired effect of increased savings in the short-term. A
preferred solution to achieve positive real interest rates would be to
bring down the rate of inflation to international levels and in this way
improve the allocation of resources. While interest rates may have some
influence on the volume of savings, income appears to be the more crucial
variable. An alternative, is to exempt from the income tax all interest
income accruing to individuals. An important issue is the relatively large
spread (7 points between the average deposit rate of 6% and lending rates
of 13%). Whilst bank profitability has been declining and the banks may
need to shore up their profit position, action is nevertheless needed to
reduce the interest rate spread.
xxi. How resources at the disposal of commercial banks are utilized is
crucial to development. It is desirable that a greater proportion of
commercial bank funds be channelled into productive sectors. However, this
flow should be accomplished by moral suasion rather than by fiat. A number
of non-bank financial institutions and insurance companies have suspended
operations or closed by the Central Bank since 1984, with depositors losing
their savings, insurance claims going unmet and the public confidence being
shaken. To prevent an erosion of confidence in the financial system,
legislation passed in 1986 set up a deposit insurance scheme. There is
some evidence that confidence in this sector may be returning. However,
efforts to restore public confidence in the integrity and operation of
these financial intermediaries have to be intensified. Stock exchange
activity declined markedly in recent years. As a medium for raising
capital, the exchange has not been fully used by either the Government or
the private sector. Measures to increase use of the stock exchange could
include raising the number of listed companies from the present 34, and
review of the legislation relating to the exchange.
xxii. Unemployment is one of the most serious social problems facing the
country. The number of unemployed as a percentage of the labor force has
grown from 10.3% in 1982 to 22% in 1987, as employment has shrunk with the
contraction of the economy. The effect was felt more in the private th-- in
the public sector. There has been no strategy to deal with the emplo-..ient

- xvii -
challenge, and the approach taken to job creation has been ad hoc.Following disturbances in 1970, an unemployment levy was imposed onindividuals and companies in order to provide jobs. The levy yieldedTT$2.2 billion between 1970 and 1986, but the proceeds were never properlyutilized to create permanent jobs. Government itself often increased itslabor force to provide jobs rather than to meet a need. Government wagepolicy has been destructive to the economy. Its temporary work programshave afforded wages higher than those in low productivity sectors such asagriculture, which have lost labor and experienced a consequent fall inoutput.
xxiii. Alleviation of the unemployment problem rests heavily on theability of the economy to grow again. The private sector will have to bearthe brunt of the burden of creating permanent jobs, particularly in theareas of manufacturing, agriculture, tourism and agro-based industries. Intourism, for instance, even modest growth could more than double presentemployment of about 4,000. Some labor has already been attracted back toagriculture, a trend that needs to be encouraged. Measures should beinstituted to stem the rapid flow of young people into the labor force,such as by changing the structure and content of course programs and therequirements for graduation to better meet employer needs and employmentprospects. More widespread adoption of apprenticeship schemes could alsohelp. A youth training employment partnership (YTEP) program has recentlybeen instituted.
xxiv. One of the main objectives of any new development strategy has tobe the creation of permanent jobs. In the past, too many Governmentresources were diverted to providing transient employment opportunities, anapproach that tended to reduce the urgency of this problem.
xxv. The Government has to pay greater attention to the populationgrowth rate and formulate a population policy in the context of theresources and potential of the country. Systematic manpower planning isnecessary. Human resources are one of Trinidad and Tobago's major assets.Properly developed and channelled, they become a creative force. Neglectedand misdirected, they could have serious consequences for the tourism andinvestment climates.
xxvi. Recovery and medium-term growth require both an improved policyenvironment (as discussed above) and an adequate inflow of externalresources, both capital and technical, to facilitate and sustainadjustment. Trinidad and Tobago cannot be classified as a heavily indebtedcountry, even though it is experiencing severe strain in meeting its debtservicing obligations. With slow growth in exports, the debt service ratioreached 19% in 1987, the public external debt, 37% of GDP. Further, thebulk of the external debt is in medium-term loans repayable within the nextfive years, so that debt servieing will become increasingly problematicover that period. Assuming that appropriate policies for recovery are inplace, an external borrowing program of about US$225 million a year shouldbe feasible. The debt service ratio would escalate to 34% in 1990 anddecline to about 26% by 1995. The balance of payments current accountdeficit would increase to 4.4% of GDP by 1990 from 2.4% in 1987 and is

- xviii -
projected to be reduced to 1% by 1995. The external debt/GDP ratio is
projected to decline to 36% in 1990 and to 29% in 1995.
xxvii. The lack of know-how and the unavailability of local personnel
with required experience are proving important constraints on recovery. In
the areas reviewed here, there is a lacuna in skills relating to national
economic planning and policy coordination, project preparation and
implementation, marketing and tourism planning and implementation. The
Government should fill these gaps quickly with programs of technical
assistance and training.
xxviii. This report concludes with a presentation of two scenarios that
assess the future trends in the economy. The first, the baseline
scenario, assumes that the trends observed in 1987 will continue; the
projections for some sectors are based on recent patterns of growth. Under
this scenario, real GDP to 1990 shows a declining trend and the economic
slide continues. This scenario is, however, untenable, as it assumes that
the brunt of the adjustment will be met by increased foreign borrowings,
whereas recent experience shows that such borrowing is not likely to
materialize.
xxix. The second scenario (para. xxvi above) assumes improved policies,
along the lines suggested here and therefore takes a more optimistic view
of future developments. In this scenario, the deteriorating trends are
arrested and the economy adjusts in 1988 and starts growing again in 1989,
the Government's investment program is strengthened and its sectoral
policies start taking effect. GDP growth averages 3% per annum in the
period 1990-95. Growth prospects improve with a rise in the investment/GDP
ratio from 20% in 1988 to 29% in 1990-95 and with a comparable rise in the
domestic savings ratio. Government efforts to attract private foreign
investment result in a net positive inflow from 1988 on, a reversal of the
trend of previous years. With the right mix of policies, and assuming that
the international economic environment remains favorable, this scenario
should be feasible. Nevertheless, projected GDP growth rates are modest,
and with population growing at just under 2%, per capita income will only
rise a little through 1995 which is indicative of the deep-rooted problems
fac.i'g the Trinidad and Tobago economy.
SYNOPSIS OF RECOMMENDATIONS
Public Sector Finances
Revenue Measureso Undertake tax review expeditiously. Consider downward
revision of selected taxes, particularly personal
income/company tax;o Monitor effects on oil production of recent adjustments in
Supplemental Petroleum Tax;
- xix -
o Recover some proportion of costs from services such as healthand education.
Recurrent Expenditureso Reduce Government's wage bill;o Eliminate subsidies to public utilities;o Insist on efficiency improvements and cost reduction of state
enterprises;o Generate a current account surplus in fiscal operations.
Capital Expenditureso Shore up level of public capital expenditures to strengthen
social/economic infrastructure;o Develop a pipeline of well-formulated projects;o Utilize expeditiously funds already committed;o Seek comprehensive re-scheduling of external debt, including
debt of state enterprises;o Implement programs of divestment of selected state
enterprises.
Trade System and Export Competitivenesso Liberalize the protective trade system. Rely more on tariffs,
with a gradual phase-down over time;o Reform industrial incentives further;o Restrain wages. Adopt additional fiscal and income policies
aimed at containing and reducing costs to preserve the 1985devaluation edge;
o Adopt flexible management of the exchange rate to furtherboost competitiveness of manufactures, agriculture andtourism.
Monetary and Financial Policieso Progressively eliminate the overall domestic financing gap and
phase-out public sector recourse to Central Bank credit;o Increase credit availability to private sector;o Exempt from income tax interest income accruing to individuals
to improve incentives to save;o Encourage banks to reduce interest rate spread and channel
greater proportion of funds to productive sectors;o Intensify efforts to restore public confidence in financial
intermediaries;o Review legislation relating to the stock exchange.
Sector Issues: Manufacturingo Consider granting free-trade status to export industries;o Establish a task force with strong commercial orientation to
plan shift to export-promotion;o Simplify procedures for obtaining licenses for import of raw
materials, relax controls and focus on greater utilization ofidle capacity;
o Review tax incidence on investment;o Reconsider Alien Landholding Act to provide a more positive
setting for investment opportunities;o Hire foreign expertise in marketing.

- xx -
Atricultureo Establish ongoing capacity to measure cost of protection in
each agricultural subsector;
o Carry out effective economic analysis prior to investment in
infrastructure;o Consider phase-out of sugar industry on an agreed schedule;
o Focus on agro-processing industries which could compete in
foreign export markets;
o Streamline Government institutions supporting agriculture.
End most marketing activities;
o Strengthen link between research and extension services.
Tourismo As a short term measure, improve existing hotel stock and
implement selectively targeted joint marketing programs with
neighboring countries;
o Strengthen supporting activities in market research of major
markets, coordinating of tourism agencies, more direct flights
from Europe and North America and improved airport and seaport
terminals;o Under a five-year development plan, increase the private
sector's supply of hotel accommodations to around 1500 new
rooms, develop tourist facilities at Chaguaramas and target
major increase in cruiseship passengers;
o Consider establishing a Ministry of Tourism or Minister of
Tourism within an appropriate ministry;
o Secure technical assistance to focus on implementation of
tourism policy.
Employment/Unemployment Issueso Set up mixed private sector/Government task force to examine
reasons for closure of firms and suggest remedial actions;
o Consider changes in structure/content of course programs and
more widespread adoption of apprenticeship schemes to stem
rapid flow of young people into labor force;
o Adopt a more systematic approach to manpower planning;
o Consider formulating a population policy.
Technical Assistanceo Fill gaps quickly with technical assistance in national
economic planning/policy coordination, project preparation and
implementation, marketing and tourism planning/implementation.

Chapter I
MACRO-ECONOMIC POLICIES SINCE 1973
1.1 Trinidad and Tobago is a small country in terms both of physicalsize (area 5,128 sq km) and population (the mid 1986 estimate is almost 1.2million). Based largely on its petroleum resources, it has been able toattain a high standard of living compared to many developing countries.GNP per capita reached US$6,920 in 1982 and the country ranked among theupper middle income developing countries. Since then, however, incomelevels have fallen and GNP per capita dropped to US$5,120 in 1986 and toabout US$4,195 in 1987. 1
1.2 The country's economy is highly vulnerable to externaldevelopments and traditionally has been highly dependent on foreign tradeand investment. The level of domestic activity in the recent past hascorresponded very closely to movements in commodity prices, particularlythose of sugar and oil. The most recent boom stemmed from the high oilprices prevailing in the period 1974 to 1981, placing at the disposal ofthe Government a significant amount of resources which has now beenexhausted.
1.3 As a result of increased Government spending, between 1976 and1982, the economy grew at an average annual rate of almost 7%. Since thenit has declined in every year. Total output in 1986 was estimated to be27% below the 1982 level. The decline in the non-petroleum sector has beensharper, with output falling by 31% between 1982 and 1986. A further fallin real GDP is expected in 1987. The oil sector taken as a whole hasstagnated since the early 1980s, although the petro-chemical component hasexperienced some growth.
1.4 With the emergence of the petro-chemical sector, Trinidad andTobago is now the most industrialized of the Commonwealth Caribbeannations. However, over 75% of the estimated proven oil reserves havealready been exploited, and as the country's oil development has matured,
natural production has declined, with production falling from 230,000barrels per day (bd) during the late 1970s to 155,000 bd in 1987. Abundantreserves of natural gas (about 18 trillion cubic feet) are, however,sufficient to meet on-shore demand for more than 100 years, including therequirements of the increasingly important gas-based industries. Thecountry also has good infrastructure, substantial tracts of arable land(about 39% of total land area) and relatively untapped tourism resources(beautiful scenery, beaches and a wide range of flora and fauna). Thepopulation is highly literate, and the recent growth experience has
produced a range of skills in both the oil and non-oil sectors. Trinidadand Tobago has a stable political climate and a high degree of political
maturity, as evidenced recently by the orderly change to the new electedGovernment replacing one that had been in power for 30 years.
1/ This per capita GNP figure is calculated using the Bank Atlas three-year average methodology.

-2-
Table 1.1: GDP AT CONSTANT FACTOR COST, 1982-86
(In millions of 1970 $TT)
1982 1983 1984 1985 1986
Petroleum Sector 310.9 281.3 310.1 345.0 342.7
Non-Petroleum Sector 2,679.3 2,489.8 2,106.7 2,001.0 1,853.2
Agriculture 67.9 79.4 78.7 82.7 84.8
Manufacturing a/ 2'i3.0 290.6 252.6 216.5 227e8
Construction 468.1 380.3 305.3 232.3 189.6
Other 1,825.3 1,739.5 1,470.1 1,469.5 1,351.0
GDP at factor cost 2,990.2 2,771.1 2,416.8 2,346.0 2,195.9
Annual Growth Rates
Petroleum Sector 0.3 -9.5 10.2 11.3 -0.7
Non-Petroleum Sector 4.5 -7.1 -15.4 -5.0 -7.4
Agriculture 3.2 16.9 -0.9 5.1 2.5
Manufacturing a/ -1.9 -8.6 -13.1 -14.3 5.2
Construction 5.3 -18.8 -19.7 -23.9 -18.4
GDP at factor cost 4.0 -7.3 -12.8 -2.9 -6.4
a/ Excluding oil refining and petrochemical industries.
Source: Annex Table 1.
1.5 With these assets, and provided the international economy remains
stable, there is no reason why the economy should not resume its growth
again, if the Government adopts policies which will lead to a viable
macroeconomic framework. It is essential that the new Government move
quickly to articulate its development strategy and put in place policies
that can support its objectives. The Government has indicated that in a
number of areas its approach to development and management of the economy
will be quite different from that of its predecessor. It wants to
encourage the private sector to play a more important role in the economy
and to reorganize the state enterprises with a view to increasing theair
efficiency and reducing their dependence on the Central Government. To cut
waste, public spending is to be monitored more closely, and the Government
is committed to an increased degree of public accountability and morie
effective use of national resources.
1.6 As oil prices are expected to decline in nominal terms in 1988 and
1989 (as is suggested by World Bank estimates) measures will all the more
be necessary to encourage greater oil production, curb the rate of growth
of current spending and increase investment. The downstream activities
related to the energy-based sector and agro-industry appear to offer the
greatest potential for private investment and for leading the way in an
ongoing effort to shift the economy from its heavy reliance on petroleum.
-3-
One area with substantial potential for growth is tourism. Hithertolittlc has been done to promote this industry, which in the Caribbean isextremely competitive. If tourism is to get off the ground to anysignificant scale, the Government will need to make a conscious andpersistent effort to create a uniquely Trinidad and Tobago industry thattakes into account the rich cultural and natural assets of the twin islandstate., Certain infrastructure will be crucial, particularly in Tobago.Equally important, however, is a reorganization of the support services fortourism.
1.7 Agriculture also has a key role in terms of producing asignificant portion of domestic food requirements--for which the countryhas the resources--and of providing employment. When there is a thrivingdomestic food sector, local living standards are less subject to thevicissitudes of foreign exchange availability. While dordstic agricultureshowed some growth in the 1960s and early 1970s, it stagnated between 1972and 1981. Since 1982, there have been signs of increased activity,reflecting the return of some unemployed to an occupation that a few yearsago could not offer remuneration comparable to those of other sectors.Trinidad and Tobago has an agricultural tradition that, if meshed withmodern techniques and an appropriate policy framework, could result in amore significant role for this activity in the economy.
ECONOMIC POLICIES SINCE 1973
1.8 Progress by the Trinidad and Tobago economy has been linkedclosely with the fortunes of oil. The energy sector grew rapidly and hastended to be the determining factor in the budget and balance of payments,and, consequently, of the economy as a whole. With the rise in oil exportprices in the second half of the 1970s, Trinidad and Tobago's economyexperienced rapid growth. Rising revenue made possible an escalation inpublic capital and other expenditures. Following the decline in oil pricesand output in 1983, however, growth rates turned negative, and thefinancial situation deteriorated because of delays in shrinkingexpenditures to reflect the reduced income.
1.9 The development strategies followed since the mid-1970s have aimedat creating energy-based export industries that were to serve as thedriving force of the economy, and to replace the oil sector, as those oilreserves were expected to be depleted by the 1980s. At the same time, theGovernment endeavored to expand educational and other social facilities.Even before the boom began, the Government had already begun to participatein the ownership of commercial and industrial enterprises as part of itslocalization drive and, more importantly, as part of its effort to takecontrol of what it saw as the commanding heights of the economy. Whilerecognizing the need to develop local technical and managerialcapabilities, a continued role for foreign capital and expertise wasenvisaged, particularly in the oil sector.
1.10 Following the oil boom, the Government set up Special Funds forLong Term Development to conserve the surplus resources until thedevelopment program was drawn up. Of total expenditures of TT$8.6 billionfrom the Special Funds over the period 1974-81, 53% went for energy-basedprojects coming on stream (ammonia, urea, methanol, steel and cement). The

-4-
industrial sector now accounts for 15% of GDP (at cu:rert factor cost),
close to the share of the petroleum sector (16% of GDP), and it could serve
as one of the growth poles of the economy.
1.11 As Government current expenditures fell only slowly with the
decline in the economy since 1983, the brunt of the fiscal adjustment fell
on Government capital expenditures, which fell from 19% of GDP in 1982 to
about 5% in 1986. This reduction was felt in both physical investment and
capital transfers to public enterprises. The decline in capital outlays
came about because several large public sector projects, including
industrial plants, a hospital complex and the construction of government
offices, were completed, at the same time that other projects were scaled
down or postponed.
1.12 Fiscal policy was used to redistribute the benefits of increased
oil revenues and to ensure that many of the basic needs of the poorer
segments of the population were met. At the end of 1974, net foreign
reserves were more than ten times the reserves at the end of the previous
year. Here, too, the Government seized the opportunity to expand a range
of social services in the areas of education, health, water and
environmental protection. It also boosted the level and range of social
assistantce and subsidies. In the period 1973-78, food subsidies totaled
over TT$200 million, while the gasoline subsidy amounted to TT$168 million.
Subsidies including old age pensions, public assistance, food stamps, free
bus transport, free books and income tax rebates cost the Exchequer some
TT$715 million in the 1973-,78 period, a figure that was higher than
recurrent expenditures in 19374. To keep prices downX, the Government
reduced a number of indireclt taxes in 1979. It also committed itself to
subsidizing of the public utilities. Between 1974 and 1979, the deficits
of the utilities (publlc transport, electricity, water, telephone and port)
amounted to over TT$900 million. Transfer payments also rose sharply; they
included contributions to meet the operating costs of public utilities that
had not increased their tariffs for several years. Wages in the government
sector escalated at an average rate of 30-40% a year between 1973 and 1980.
In the 1980s, however, the annual wage increases slowed. In 1982-84,
average wage increases of 15-20% were still higher than consumer price
increases which ranged from 11-17%. Since 1985, however, wage increases
have moderated to less than 10%, more in line with the rate of increase in
consumer prices. As part of the fiscal adjustment measures, subsidies were
also scaled down beginning. in 1984.
1.13 Revenues have also fluctuated with the fortunes of the petroleum
sector. They swelled from 20% of GDP in 1970 to 41% of GDP by 1980 but
declined to 30% of GDP by 1986 following the oil price slump.
1.14 Trinidad and Tobago's balance of payments also reflected the
developments in the oil sector closely. The current account, which had
been in deficit in 1970-73, showed a surplus until 1982. Since then it has
shown deficits. Direct foreign investment, primarily investment by oil
companies, increased to US$226 million in 1981 but turned negative in 1986.
Trinidad and Tobago provided assistance to other CARICOM member states,
with gross disbursements petaking at US$85 million in 1981. Although
official borrowings by Trinidad and Tobago were very limited, the
Government occasionally borrowed significant amounts (US$157 million in
1977 and US$110 million in 1982) to strengthen the country's reserves to
-5-
meet the financing needs of the energy-based projects and to establish the
country as a borrower in the international capital markets. Official
international reserves of US$3,090 million, equivalent to 13 months of
imports in 1982 dwindled to US$81 million by end 1987, providing less than
a month's import cover. The debt service ratio has now reached 20%, versus
the less than 3% of goods and non-factor services in the 1970s.
1.15 A variety of measures have been introduced to deal with the
balance of payments problem. In January 1985, the Government placed a levy
of 10% on sales of foreign exchange for vacation and business travel and
for enuigration. A stamp duty of 12% was imposed on imports other than food
and drugs. In December 1985, the Government devalued the exchange rate and
established a dual exchange rate system. The old rate of TT$2.40 to
US$1.00 continued to apply to a range of foods, drugs, agricultural imports
and school books. In the face of the foreign exchange and revenue crisis
the new Government unified the exchange rate, and increased taxes. In its
first Budget, presented in January 1987, it also committed itself to reduce
expenditures.
ECONOMIC PERFORMANCE IN 1986/87
1.16 As the economy of Trinidad and Tobago slid after 1982, real GDP
declined by 6.4% in 1986 and is estimated to have fallen by a further 2.3%
in 1987. The only growth in 1986 occurred in agriculture, manufacturing
and refining. The fall in petroleum output as a result of the depletion of
the wells had been reversed in 1983 by tax incentives that had stimulated
new recoveries. In 1986, however, production declined by 4% following the
collapse in oil export prices. With the reduction in public investment,
the service and construction sectors also contracted. A further fall in
oil production has been the dominant factor in the continued decline of the
economy in 1987.
1.17 In 1986 inflation (as measured by the retail price index) remained
at the 7.7% level of 1985. Price increases were contained at this level,
with the preferential exchange rate of TT$2.40 per US dollar applicable to
essential goods (about 25% of imports) and the increased production of
fruit and vegetables. Other components of the cost of living, such as
rents, electricity and household services, remained relatively stable in
1986. In 1987, however, inflation accelerated to over 10%, largely because
of the price increases which followed the unifit- ,'.ion of the exchange rate
in December 1986.
1.18 The overall public sector deficit rose from 7.5% of GDP in 1984/85
to 9% of GDP by 1986. Revenue collections fell in 1986 with the collapse
of oil prices. The reductions in government expenditure, particularly in
current expenditures, were, however, not steep enough to compensate for the
revenue decline, and the overall deficit grew. An increasing proportion of
this deficit was financed by the domestic banking system and net external
financing was not significant. With increased government borrowing in
1986, overall credit expansion increased almost twofold. Correspondingly,
credit to the private sector has declined.
1.19 Export earnings plummeted by 36% in 1986, principally because of a
decline in both the volume and prices of exports of petroleum products; oil
prices fell by 40% in 1986. Earnings from natural gas-based products

-6-
(ammonia, urea and methanol) declined only'marginally, while those of other
manufactures grew by 30%. In contrast to the steep fall in export
earnings, import values fell by only 5% in 1986, following the exchange
rate adjustment of December 1985 and the drop in domestic demand. Cutbacks
were effected in both consumer and intermediate goods, while imports of
capital goods rose.
1.20 The sharper decline in exports than in imports in 1986 resulted in
a merchandise trade deficit, following two years of surpluses. Offsetting
this deterioration, however, was an improvement in the services account,
attributable largely to a greatly reduced outflow for travel following the
devaluation of December 1985. Nevertheless, the current account deficit
grew from 1% of GDP in 1985 to 12% in 1986.
1.21 As to the capital account, net capital flows grew increasingly
negative in 1986. Contributing factors were increased repayments, reduced
disbursements on existing lines of credit and heightened outflow of private
capital. Official net international reserves were drawn down by US$645
million in 1986; by year-end they stood at US$473.7 million (3.9 months of
imports) and in 1987 fell further to US$81 million.

-7-
Chapter II
PUBLIC SECTOR FINANCES
2.1 The Government significantly expanded the scale of its operationsin the period between 1974 and 1981 as a result of the oil windfall.Extraordinary growth in revenues and in both current and capitalexpenditures took place in this period. Total public expenditures as apercentage of GDP increased from less than 25% percent in the early 1970sto 49% in 1982. Since then, the proportion has declined, reaching 35% in1986. A significant part of development expenditures has been financedfrom local sources. There was an overall budgetary deficit in only oneyear in the period 1974 to 1981, but in every year since 1982. Of thetotal deficit in the period 1982-86 of TT$8.2 billion, 88% was financedfrom domestic sources.
RECENT TRENDS IN REVENUES
2.2 Between 1973 and 1981, the annual current revenues of the CentralGovernment increased from TT$494 million to TT$6,819 million, or more thanthirteen times (in nominal terms), at an average rate of 39%. Revenuesincreased marginally in 1982 but have declined steadily since. Between1982 and 1986, total recurrent revenues fell by almost 25%. The price ofoil has been the main factor influencing this trend. For example, thedrama-ic collapse in oil prices in 1986 resulted in A decline in revenuesof about 15% over the previous year. Even though oil prices started risingagain in 1987 (averaging about US$17 per barrel), it is estimated thatrecurrent revenue fell further by about 2% in 1987. One of the mainreasons is that domestic crude oil production is not picking up. Anotheris the increase in unemployment.
2.3 Whereas petroleum revenues accounted for 24% percent of the totalrecurrent revenues of the Central Government in 1973, between 1974 and1981, their contribution averaged 64%. Since 1981, this share has beendeclining, reaching just over 32% in 1986. Revenues from the oil sectorare derived through a variety of fiscal measures, including a petroleumimpost, excise duties, petroleum production levy, royalties, a supplementalpetroleum tax (SPT) and, since 1987, a national recovery impost. In termsof revenue, the most important of these measures is the SPT, the petroleumprofits tax and royalties, in that order. The SPT, introduced in 1981, iscalculated on gross income derived from the disposal of crude, less certainallowances.
2.4 Oil revenues have tended to fall more sharply than othercomponents of aggregate revenue. As a proportion of GDP, this incomedropped from almost 28% in 1980 to just over 17% in 1982 and to less than10% percent in 1986 (Table 2.1). The ratio for non-oil revenue, on theother hand, has hardly changed since 1982, with the average for the periodto 1986 being about 20%.
2.5 Non-oil revenues come from a variety of direct and indirect taxes.In recent years, over half of non-oil recurrent revenues has come fromincome taxes. The progressive individual income tax has contributed over
30% since 1979, as compared to less than 20% from companies. Besides a 45%

-8-
profits tax, companies are also required to pay 5% of their profits as an
unemployment levy. This levy also applies to individuals with a chargeable
income of TT$20,000 or more. The unemployment levy was imposed in 1970 to
provide the government with additional funds to relieve unemployment.
Table 2.1: REVENUE AS A PERCENT OF GDP, 1973-87
(Current Market Prices)
Year Oil Non-oil Total Tax Non-Tax
Revenue Revenue Revenue Revenue
(1) (2) (3)=(1)+(2)-(4) (4)
1973 4.5 14.7 17.6 1.6
1976 23.8 9.7 36.5 3.0
1977 23.5 13.6 37.1 2.3
1978 20.3 11.8 32.1 2.1
1979 21.5 19.8 33.2 1.7
1980 27.6 12.0 39.6 1.8
1981 25.0 13.3 38.8 1.8
1982 17.1 18.5 33.8 1.8
1983 12.9 20.8 31.1 2.6
1984 14.5 19.9 32.1 2.1
1985 13.0 20.6 31.1 2.6
1986 9.4 19.4 25.4 3.4
1987 Prel 12.2 19.9 28.8 3.3
Prel: Preliminary.
Source: Ministry of Finance and the Economy; Central Statistical Office.
2.6 Property taxes tend to contribute less than 1% of non-oil
recurrent revenues. Revenues from taxes on gcDds and services have
averaged around 15% since 1983, as compared to about 11% in the previous
three years. The most important of the measures in this category are the
purchase taxes, excise duties, motor vehicle taxes and betting and
entertainment taxes. Among the taxes on international trade, import duties
are by far the most important, accounting in 1986 for 9% of non-petroleum
revenues.
REVENUE REFORM
2.7 The Government's 1987 budget sought to deal with the crLtical
financial situation by taking action onL both the revenues and expenditure
sides. With respect to the former, individuals whose total income in any
year did not exceed TT$12,000 were madei exempt from income tax, and certain
allowances and claims were modified. The purchase tax, gasoline levy and
airline ticket tax were raised, and a n,ational recovery impost was
introduced in addition to the existing unemployment levy. While the impost
affected only individuals with chargeable income above TT$70,000, the
corporation profits tax was effectivelyt raised. These measures were taken
pending the recommendations of a Tax Pe!rformance Committee which was set up
to monitor the tax system on a continuous basis.

- 9 -
2.8 The 1988 Budget presented in January 1988 has attempted to reducecurrent expenditure. Some tax reliefs have been granted but net taxrevenues are estimated to increase by over TT$400 million as a result ofthe changes introduced. The marginal income tax rates applicable toindividuals have generally been reduced with the top rate coming down from70% to 50%. The Unemployment Levy and the National Recovery Impost onindividuals have been removed, but a mobilization tax of 5% on the netincomes of individuals has been introduced. Individuals with a total netincome of TT$12,000 and less are exempt. The tax on interest income hasbeen reduced to 10%, but the exemption limit of TT$5,000 has been removed.
2.9 With respect to companies, relief has been provided in the waylosses will be treated and in a reduction of the corporation profit tax.Companies engaged in petroleum operations or in the manufacture ofpetroleum products or petro-chemicals will be subject to tax at 45%, whileall other companies will now pay 40%. The Supplemental Petroleum Tax(SPT), which oil companies had complained did not properly account forcosts,* has now been adjusted, and a new set of arrangements are to be putin place to encourage oil production. With respect to the SPT a newconcept in the form of base oil and additional oil has been introduced.Base oil which is related to 1987 production levels will be taxed at theexisting rates of 55% for marine oil and 15% for land. Additional oil willattract lower rates, these being 20% for marine production and 5% for landproduction.
2.10 As far as indirect taxes are concerned, there have been furtherincreases in stamp duty, purchase taxes and some excise duties. Certainfees have also been increased. Consumers of electricity will now pay 5% oftheir billings to Government, while non-residential telephone subscriberswill contribute 10% of their billings. All goods and equipment nowimported duty free will be subject to a special tax of 12.5%. As apreliminary measure, a business levy at the rate of 1.5% of chargeableprofits has been imposed, pending the completion of a study of tax reformwhich envisages the introduction of a general sales tax in 1989.
2.11 While trying to raise increased revenues, the 1988 Budget hasattempted to provide some incentives to stimulate economic activity.However, the increase in the stamp duty and the imposition of the 12.5% taxon goods and equipment hitherto imported duty free will increase the costof production and competitiveness could be affected adversely. The declineof the economy, the greater emphasis on the development of the non-oilsector, the desire to encourage greater private sector participation in theeconomy and the need to make the economy more competitive suggest the needfor a fundamental restructuring of the tax system. Some clear decisionshave to be taken with respect to the balance between direct and indirecttaxes. The increasing number of direct and indirect taxes and levies needto be streamlined and structured so that the tax system can meet itsintended objectives. The reduction in the marginal rates of the individualincome tax and in the corporation profits tax is a move in the rightdirection, given the changing economic circumstances. The rationalizationof personal allowances should receive urgent attention. The personalincome tax has suffered from considerable evasion, particularly by theself-employed and a greater effort ought to be made to increase thecontribution from this source. The reduction of the profits tax was

- 10 -
necessary to encourage greater investment and to attract foreign capital.
Ev.;. at 40% (which is the level applicable to non-oil companies) the tax is
still higher than that of its counterpart in Barbados.
2.12 Both the previous administration and the present Government have
been slow in addressing the slide in the oil sector. During the period
when oil prices were high, the tax structure was adjusted to capture the
windfall, and the Petroleum Taxes Act of 1974 introduced a new regime.
Though crude oil production has been falling for some years, it was felt
that the country could not afford the revenue loss that would be occasioned
by any downward adjustment of the tax regime. It was also often argued
that a reduction in taxes by itself would not necessarily lead to increased
activity in the sector. Faced by a continued decline of oil production in
1987 (largely reflecting the drop in output from existing wells) and a fall
in marine drilling activities (notwithstanding the recovery of oil prices),
the Government has used the 1988 Budget, not only to adjust the SPT but to
announce a number of measures aimed at encouraging greater exploration.
Given the prospect of a fall in oil prices in 1988 and 1989, the
concessions may need further modification and it will be necessary to keep
the tax regime under continuous review.
Table 2.2: CENTRAL GOVERNMENT AND ADMINISTRATION OPERATIONS, 1982-87(In millions of STT)
192 1'983 1984 ' 98 1986 1987
Consolidated General Government **
Total revenue 7,083.0 8,661.7 6,586.0 8,658.4 6,281.6 N.A.
Total expenditure andnet lending * 9,455.0 8,548.0 8,184.8 7,828.5 8,370.4 N.A.
Current expenditures 6,802.7 8,077.8 8,224.5 8,005.0 5,626.5 N.A.
Capital expenditureand net lending 3,862.3 2,488.2 1,980.3 1,821.5 844.9 N.A.
Overall Balance -2,392.0 -1,994.3 -1,598.8 -1,081.1 -1,088.9 N.A.
Central Administration
Total revenue 7,048.8 8,629.3 8,658.7 8,639.3 6,267.8 6,010.8
Total expenditure andnet lending 9,448.4 8,544.0 8,168.9 7,601.8 6,330.4 6,276.8
Current expenditure 5,794.1 8,075.8 8,208.8 6,980.3 6,486.5 5,033.7
Capital expenditureand net lending 3,862.3 2,488.2 1,980.3 1,821.6 844.9 1,241.8
Overall balance -2,397.8 -2,014.7 -1,610.2 -1,082.6 -1,072.8 -1,286.1
* Net lending refers to capital transfers to public enterprises.
** Data on Consolidated General Government have been excluded because of problems
encountered in the interpretation of definitions used in this category.
N.A.: Not Available
Source: Annex Table 14.

CURRENT EXPENDITURES
2.13 The Government used the enhanced revenues from the oil boom toincrease both current and capital expenditures. As a proportion of GDP,current expenditures rose from 17.4% in 1973 to 40% in 1981. Since 1982,they have averaged around 30% (Annex Table 15). The increased currentspending flowed from a variety of policies that were not carefully thoughtout. To provide jobs, the civil service was expanded beyond what wasnecessary for its functions. Wages and salaries were increased far beyondwhat was warranted by way of productivity, and in recent years, wages andsalaries have accounted for over 40 percent of current expenditures. Tokeep the cost of living down, the Government subsidized a number of itemsheavily. Many of the subsidy programs were badly structured andadministered, in that intended beneficiaries received little benefit, whileothers who did not really need it got assistance. Public utilities andstate enterprises received transfers as a matter of course, without seriousinsistence on their adopting policies to improve efficiency and reducecosts. The share of transfers (which includes interest payments) andsubsidies in current expenditures increased from less than 30% in the early1970s to an average of 45% in recent years. Expenditures on goods andservices generally accounted for less than 5% of current expenditures.
2.14 The 1988 Budget proposes a reduction in current expenditure byreducing or eliminating certain forms of subsidies. Transfers to stateenterprises are also to be cut by 15%. The effort to reduce currentexpenditures has to continue. However desirable it might be from a socialpoint of view, the Government cannot afford to provide the present level ofwelfare and heavily state-subsidized services without adopting tax measuresthat could affect the recovery of the economy. Some services could be re-organized, and provided at a lower cost. In certain cases, e.g., healthand education, facilities could be administered so as to recover somecosts, without depriving the less fortunate of these services.
PUBLIC SECTOR INVESTMENT
2.15 Between 1974 and 1985, the capital expenditures of the CentralGovernment amounted to TT$20.5 billion, on an annual average expenditure ofTT$1.7 billion, In 1986, however, the figure fell to less than TT$1billion and despite the Government estimate of an increased level ofcapital spending in 1987, actual expenditure on capital projects is notlikely to be much higher as a result of the difficulties in raising capitalfunds. In 1974, as noted, the Government instituted savings throughSpecial Long Term Funds, which received some TT$14.3 billion between 1974and 1983. The main purpose behind this policy was to put aside resourcesfor future financing of projects that would assist in diversification ofproduction, the creation of jobs and the development of foreign exchangeearnings capacity in the non-oil sector. The total appropriations to theLong Term Funds by sector show that 30% went for economic sectors, 22% forsocial sectors, and 39% for infrastructure, while 9% was unclassified. Thesavings in the Long Term Funds were completely exhausted by the end of1986.
2.16 Beginning in 1974, the prior Government became involved in anumber of expensive capital-intensive industrial undertakings either as afull owner or in partnership with foreign firms.

- 12 -
2.17 Work on the development programs undertaken in the boom years
suffered from a lack of certain basic skills, particularly in the areas of
feasibility studies, financial planning, management and financial and
investment negotiations. Also lacking was a proper framework for national
planning and implementation. The results were flaws in conception, costly
overruns and delays in completion of some projects.
2.18 The financial losses suffered by some state enterprises, given the
financial difficulties of the Government, raised questions about a strategy
that placed so much emphasis on a few large and costly undertakings. In
its 1987 budget, the present Government indicated that while state
enterprises have a role to play, a new approach is needed. The Government
announced a plan for capital restructuring, including divestment or capital
enhancement, expansion of production, changes in management styles and
accountability for each enterprise. A team appointed to undertake this
work has so far examined at least 10 of the 35 ente;-prises with significant
state involvement.
2.19 The 1987 Budget also contained a list of development projects, but
at year end major ones had not yet started. Social projects weighed
heavily on the list. Among the most important economic undertakings were
re-development of the Piarco and Crown Point airports and development of
deep water harbor facilities at Scarborough in Tobago. Both projects are
seen as important, given the emphasis on tourism. They are now scheduled
to begin in 1988. The extension of the Churchill-Roosevelt Highway to the
Piarco roundabout for which the Inter-American Development Bank (IDB) is
providing funding started at the beginning of 1988.
2.20 The original estimate of capital expenditures of TT$2,852 million
was retained. Given an estimated current account surplus of TT$300
million, a deficit of TT$2,552 million had to be filled. The Government
anticipated getting TT$791 million from foreign loans and TT$300 million
from the local market to finance the gap. However, Government has not
been able to raise the desired amounts in the foreign capital markets, one
-reason the development program has generally not got off the ground.
External borrowing, particularly in light of present international
economic circumstances, requires properly formulated project proposals,
which generally have not been undertaken.
2.21 In the absence of start-ups of new projects, a significant part of
the capital spending in 1987 has been for maintenance/renovation and
continuation of some ongoing work. Recognizing the need for a public
investment program if the economy is to start growing again, in mid-October
1987 the Government appointed a team of experts, to prepare a list of
projects for the 1988 budget. Criteria for selection, are that projects
must be: self-sustaining and profitable; implementable with minimum
reliance on protection and fiscal concessions; bankable; capable of
producing output with a high local value added; and capable of creating
greater linkages among existing industries, producing inputs for
established producing units or undertaking downstream processing. Job
creation and the earning or saving of foreign exchange are other guiding
principles.

- 13 -
2.22 At best, these guidelines provide only a broad framework forproject selection. Instead, feasibility studies are critical to the costand benefit of each project. The Government's capability here is weak,however, and high priority needs to be given to training and technicalassistance in this area. A pipeline of well-formulated projects,indispensable in preparing; the next plan, does not yet exist. The absenceof skills in project formtLlation and implementation has also reduced theeffectiveness of money spent and has at times made the disbursement ofresources difficult (Annex- Table 33). The Government needs to make fulluse of the resources available to it (including technical assistance), evenwhile deciding on a prograi for further borrowing.
2.23 In his 1988 Budget the Prime Minister and Minister of Financepointed to the need for increased public and private capital spending in1988, with emphasis being placed on projects and programs that will impactdirectly on the level of economic activity. Diversification is to be animportant objective of the capital program in 1988. High priority is to beplaced on agriculture, agro-industrial activity and tourism. Based largelyon private sector initiatives, the number of hotel rooms in Tobago isprojected to double at the end of 1988. Other supporting facilities intourism will also receive attention. Another aim of the program plannedfor 1988 is the encouragement of the small business sector. Towards thisend, it is proposed to establish a Business Incubator Facility. The 1988program also envisages the development of the Pelican gas field by theSouth East Coast Consortium and the establishmbent of a new methanol plan atPoint Fortin.
2.24 With respect to financing, the 1988 Budget projects a smallsurplus. An overall deficit of TT$1,748 million is envisaged. Sources offinance are not clearly identified, and unless the Government can raisecapital funds, the 1988 development program will turn out to be far smallerthan is envisaged. Increased public and private capital spending isessential to halt the slide in the economy.
2.25 Despite the large capital expenditures of 1974-85 and improvementsin certain areas, the social and economic infrastructure will still needstrengthening to sustain the recovery and transformation of the economy.Lack of access roads remains a major impediment to agriculturaldevelopment, and a number of important major roads are not yet completedeither. Utilities remain inadequate, with distribution a problem in thecase of water and electricity. In Tobago, improvement in the watersituation with respect to both capacity and distribution is important tothe growth of the tourism industry.
2.26 During the boom years, the Government placed a great deal ofemphasis on secondary schools. As a result of the neglect of primaryschools, not only are new ones necessary, but many existing ones needrepair, if not complete rebuilding. The new Government has decided torenegotiate an IDB loan for primary school building, with the aim ofincreasing the number of new schools from 16 to 25, using a differentdesign. There is also a shortage of trained teachers and a need for atleast three more technical/vocational schools. At the tertiary level, theuniversity facilities need expanding to cater to the growing number of
- 14 -
applicants in light of the increasing costs of education overseas. Town
and district hospitals need major repairs. Although demand has fallen as a
result of the downturn in the economy, there is still a chronic shortage of
housing units. To address the housing shortage, the Government is
emphasizing the provision of sites and facilities, leaving the actual
building to owners.
RECOMMENDATIONS
1. In light of current economic conditions, the Government needs
to realize a sizeable surplus in its fiscal operations. To do this it
needs to cut recurrent spending and emphasize stimulating the economy.
2. In the short term, the Government is rightly focusing on the
rationalization of transfers and subsidies to public enterprises, which
could be reduced significantly. The Government may, also, however, have to
effect economies on its wage bill.
3. Tax review needs to be undertaken expeditiously. The
Government has introduced various taxes and levies without examining their
full implications. Recognizing this the Government has now employed a
consulting firm to undertake a review of the entire tax system with the aim
of rationalizing the tax structure. In restructuring the tax system, the
possibility of user charges must be taken into account. Health and
education services, for example, could be administered so as to recover
some costs.
4. Given the ad hoc nature of recent tax changes, their effects
should be monitored closely. In particular their impact on
competitiveness, revenue and distribution of income should be kept under
constant review. As oil prices are expected to fall in 1988 and 1989 the
oil tax regime may require further modification.
5. External borrowing is required to strengthen the social and
economic infrastructure and must be pursued with properly formulated
project proposals. At the same time, utilization of external resources has
been slow. The Government needs to make full use of the resources
available to it.
6. Feasibility studies are critical to gauge the cost and
benefits of each capital project. Given the Government's weak capability,
this area ought to be targeted for training and technical assistance.

- 15 -
Chapter III
TRADE AND INDUSTRIAL POLICY
BALANCE OF PAYMENTS PERFORMANCE
3.1 Trinidad and Tobago's balance of payments reflects the downwardtrend of the economy. The fall in the country's international reservesfrom over US$3 billion in the early 1980s to US$81 million by end 1987epitomizes the critical situation confronting the country's economy.Trinidad and Tobago has an open economy. Between 1982 and 1986, exports ofgoods and services averaged 35% of GDP, as compared to 42% for imports ofgoods and services. The export trade is highly concentrated, however. In1986, petroleum and petroleum products have accounted for around 72% ofdomestic exports. As a result of the high oil prices obtained in the1970s, the country experienced a steady trade surplus between 1974 and1981. As a result of the drop in oil prices in 1982 and 1983 and the fallin local crude oil production, there were significant trade deficits inthose years. This trend was reversed in 1984 and 1985 despite thestagnation in oil production and declining oil prices. However, thefurther fall in oil prices to less than US$12 in 1986, again hurt theeconomy, and led to a trade deficit amounting to 2.3% of GDP.
3e2 Net movements in the services account since 1974 more often thannot have tended to be negative. Between 1974 and 1986, there was a netoutflow in this account of over US$2 billion. Some of the maincontributors to this outflow have been investment income (includinginterest payments on the foreign debt), foreign travel and a miscellaneouscategory of services encompassing professional and technical fees,management fees, non-merchandise insurance premia, commissions androyalties.
3.3 The current account balance, which was negative in only one yearbetween 1974 and 1981, has been consistently negatJve since then. Thecapital inflows have not offset these deficits, and the overall balance hasalso been negative since 1982. And as noted, foreign reserves have droppeddramatically.
3.4 The indicators are that, despite the higher prices for oil in1987, the value of exports in the first six months of 1987 was lower thanthat in the corresponding period in 1986. The value of imports, however,was even lower, so that there was a trade surplus in the first six months.While projections point to a small trade surplus at the end of the year,both the current account and overall accounts are still expected to benegative. Despite the emergence of non-oil exports, it is clear that, inthe short term, oil will continue to be the country's major foreignexchange earner. Factors affecting crude oil production should accordinglybe reviewed with a sense of urgency.

- 16 -
Table 3.1: BALANCE OF PAYMENTS, 1982-86(In millions of US$)
1982 1983 1984 1985 1986
Current Account -644.9 -1,002.9 -522.5 -92.2 -603.7
Exports 2,228.6 2,026.5 2,110.8 2,154.7 1,368.2
Imports 2,783.8 2,514.4 1,917.3 1,557.3 1,484.1
Services 50.3 -434.4 -632.8 -629.0 -449.7
Unrequited transfers -140.0 -80.6 -83.2 -60.6 -38.1
Capital Account 438.9 395.3 -119.4 12.1 -58.6
Public sector capital 163.8 158.1 19.6 88.6 79.5
Direct investment (net) 203.5 117.7 113.2 1.2 -14.5
Commercial banks 3.2 39.0 19.2 -41.0 -27.2
Other private capital 68.3 80.5 -271.4 -36.7 -96.4
Errors and omissions -65.8 -366.0 -100.2 -160.0 -35.3
Overall balance -271.8 -973.6 -742.1 -241.0 -697.6
Source: Annex Table 24.
THE MANUFACTURING SECTOR
3.5 Reduced dependence on petroleum and a diversified economy have
long been objectives of Government policy. In response to a wide range of
incentives, the manufacturing sector has grown since;the early 1950s. In
real terms, its contribution is now about 10% of GDP. Petroleum is still
the dominant sector, accounting for about 20-25% of GDP, while
agriculture's share has fallen to about 4-5%. With respect to employment,
the manufacturing sector accounted for about 9% of jobs in 1986, as
compared to about 12% for agriculture (including sugar production), 5% for
the petroleum industries and about 10% for the Central and Local
Governments. As to the composition of real output, food processing
dominated (35%), followed by assembly industries (25%) and petrochemicals
(17%), including gas-based petrochemicals.
3.6 Development of gas-based industries (notably steel, fertilizer and
methanol) was a major plank of the prior Government's diversification
drive. A significant part of its oil revenues was concentrated on a few
large-scale capital intensive projects. With respect to output, employment
and export earnings, the performance of those plants have generally been
disappointing. One problem has been their burdensome debt service. In
addition, most enterprises have been affected by teething problems, cost
overruns, fluctuating prices and uncertainty in the export markets. They
are, however, technically efficient and have potential for making a
significant contribution to the economy. Management and marketing will
play a key role in their future.

- 17 -
Table 3.2: VOLUME OF PRODUCTION OF MAJOR INDUSTRIAL PRODUCTS, 1982-87
1982 1983 1984 1986 1988 1987
Petroleum (mill of barrels) 84.6 68.3 62.0 64.3 81.7 58.8Input into refineries 55.1 27.2 28.2 29.6 30.3 31.5Refinery output 54.1 28.3 28.4 30.0 33.7 31.4
Natural Gas (mi!: of m3) 8,918.4 8,318.3 7,230.0 7,550.0 7,669.3 7,872.0Fertilizers (in 000 tons) 939.7 1,274.3 1,458.1 1,863.5 1,883.9 1,803.3Methanol (in 000 tons) - - 180.9 358.2 323.5 424.3
Steel produ.Ps (in 000 tons) 512.6 876.1 572.8 613.0 881.0 N.A.Cement (in 000 tons) 139.2 389.8 406.4 328.5 337.8 176.6 *Assembly products (in 000 units)
Motor Vehicles 16.0 20.7 22.9 11.9 10.7 3.2 *Refrigerators 28., 19.9 21.8 8.4 14.4 8.3 *
N.A.: Not Available.
* January-June
Source: Annex Tables 5 and 7.
3.7 The non-energy-based manufacturing sector has suffered from over-capacity, resulting from the fall in local demand, trade restrictions incertain CARICOM countries and, in many cases, an inability to compete inthe extra-regional markets, due in part to the neglect of marketing skills.Difficulty in obtaining foreign exchange to purchase raw materials has beenan added problem. A significant part of this sector is involved in localpackaging or assembly of goods previously imported. The domestic linkagesenvisaged some years ago have generally not materialized. In certain areasof the sector, particularly automobile assembly, over-investment is aproblem.
3.8 The disappointing performance of the manufacturing sector hasbrought out the weaknesses in the strategy pursued. The structure andadministration of the incentive system have contributed in no small measureto the evolution of the manufacturing sector. Protection, tax holidays andexemptions from the duties on machinery and raw materials have been grantedliberally. One effect is the unnecessary loss of a great deal of revenue:TT$643 million in 1986 alone was foregone as a result of the exemption ofimported raw material and machinery from duties and taxes. The tendency togrant unqualified protection for unlimited periods has discouraged exportinitiatives, as most manufacturers have been content to serve the protectedlocal and regional market.
3.9 The manufacturing sector has been handicapped by the dearth ofmarketing expertise and the absence of a clear strategy for shifting fromimport substitution to export production. The key Goverrment agenciesrecognize the need to shift their priority toward competitive export

-18-
manufacturing, but they have been slow to do so, and the newer export
institutions are underfunded. A task force with a strong commercial
orientation is needed to plan a phased shift toward exports and the
Government needs to act quic'kly on its recommendations.
INCENTIVES AND INVESTMENT
3.10 The international environment for private foreign capital has
become increasingly competitive. To compete, Trinidad and Tobago needs to
give more prominence to its excellent resource base. The Government has
indicated its intention to encourage greater private investment, both local
and foreign. It has issued an investment policy (Investment Policy of
Trinidad and Tobago, August 27, 1987) that outlines opportunities for
private investment in various sectors of the economy.
3.11 Many of the incentives are already in place. Of both a fiscal and
non-fiscal nature, they include: exemption from the income tax for periods
of 5-10 years; import duty concessions; investment allowances; temporary
protection from competing imnports; export allowances; subsidies to
encourage training; export credit insurance; and loans for small
enterprises. The Government is considering a system of special incentives
to exporters. A new proposal would allow local enterprises that earn
significant foreign exchangie easier access to foreign exchange requirements
for their operations. A on,e-stop-facility has been established to assist
both local and foreign investors. The aim is not only to reduce the red
tape that hampers quick decision-making, but also to provide other forms of
assistance, such as access 'to capital at home and abroad and to help in
negotiating lines of credit and similar facilities. Foreign-owned
enterprises are required to provide opportunities for the training and
advancement of nationals. Certain areas of the economy are reserved for
nationals: local petroleum marketing, land development, petroleum-related
services, small-scale production, distributive trades, light manufactt>ring
operations and t'he news media. In other areas, joint ventures between
foreign and local enterprises are regarded as the most desirable form of
direct foreign investment, but 100% foreign ownership is permissible under
special circumstances.
3.12 The range of incentives is very broad. However, the incentives
need to be administered witlh greater efficiency. Licensing for imports of
raw materials is slow, and these procedures need to be simplified and the
controls relaxed. The facilities to aid investors should not only be aimed
at attracting new investors, but also at helping existing ones. The one-
stop facility should also serve as an industrial ombudsman that could
answer queries and complaints. The failure of officials to respond to
questions and concerns hurts the investment climate. Often the result of
inadequate coordination between departments and senior officials, there is
evidence that the concentration of certain kinds of decisions at Port of
Spain, where congestion is growing rather than diminishing, is causing
delays. Decision-making needs to be decentralized around the country,
particularly to San Fernando and Tobago, in order to help businessmen and
others in these areas. Critical Government departments where
decentralization is needed include the Central Bank, Inland Revenue and
even the IDC.

19 -
3.13 With respect to the tax structure, the incidence still appears
to be high and should be reviewed not only in the context of its effects on
local initiatives, but also against the background of what is happening incompeting states. The Alien Landholdings Act needs to be reconsidered in
order to provide a more positive investment setting. Data for recent years
indicate that the net flow of direct investment has fallen steadily in
recent years. In fact, there was a net outflow of over US$14 million in
1986. Identification of investment opportunities is an important means of
attracting foreign capital. Finally, there is room for improvement in
industrial relations. The Government, private sector and workers'
organizations would do well to review jointly some of the factors bearing
on this issue.
TRADE POLICY
3.14 Both exports and imports have fallen in recent years. The
Government has instituted a number of policies and measures to deal with
the foreign exchange crisis resulting from the depletion of reserves,
particularly a stamp duty of 12.5% on bills of entry, devaluation of the TT
dollar and introduction of import budgeting by the Central Bank. The
tariff regime has been guided by the Common External Tariff of CARICOM.
Most food, drugs, basic raw materials and machinery enter Trinidad and
Table 3.3: SELECTED EXPORTS AND IMPORTS, 1982-86(In millions of TS$A)
1982 1983 1984 1985 1986
Selected Exports
Crude petroleum 1,116.4 1,099.4 955e4 1,021.0 551.8Petroleum products 697.8 611.6 705.1 680.7 410.0
Ammonia 96.8 151.5 180.3 166.2 125.4
Sugar 21.9 25.8 28.7 22.0 25.3
Metal products 33.2 41.8 57.1 35.8 80.6
Total Domestic Exports 2,102.7 2,018.9 2,034.7 2,098.1 1,340.8
Selected Imports
Consumer goods 638.2 703.5 605.6 456.9 297.5
Food 255.3 297.0 268.3 245.8 157.9
Construction Materials 237.6 217.1 144.2 87.1 68.0
Assembly industries 165.9 199.3 136.1 86.0 91.2
Chemicals 32.5 33.3 28.7 27.4 34.4
Agricultural Materials 141.1 121.7 121.2 93.1 65.0
Capital goods 1,128.0 841.0 443.6 412.3 433.2
Total Imports 2,783.8 2,514.4 1,917.3 1,557.3 1,372.2
Source: Annex Tables 25 and 27.

-20 -
Tobago duty-free or at the lower rates, while intermediate inputs face
higher rates (15%6-25%) and competing final goods the highest rates (up to
50%). In addition to tariffs, imports face purchase taxes and the 12.5%
stamp duty.
3.15 Imports are also affected by a negative list that permits the
import of a number of products only with a license. Items are added or
deleted from time to time. The products on the list are wide-ranging. The
category of food and food-related products alone contain over 60 items, and
there are at least another 150 manufactured goods on the list. In theory,
licenses are granted where a domestic producer of a particular good is
unable to meet local demand in terms of price and quality. In practice,
the negative list is used in combination with tariffs to protect industry.
Without competition, many enterprises have held to the local market,
focusing on packaging or assembling goods previously imported.
3.16 The country's new industrial thrust might take advantage of local
raw materials and develop products in which it has or can develop a
comparative advantage. Recently the CARICOM states decided to remove all
intra-regional trade restrictions on a list of items that amounts to a
fairly substantial proportion of CARICOM trade. This opportunity could be
used as a first step in a program to expose local manufacturers to
increasingly greater competition following a long pericod of restrictive
trade in the region. Trade with CARICOM should not, however, preclude
efforts to penetrate extra-CARICOM markets. The drive to increase
competitiveness must bLe intense and my _al_l for ad_m-nistrati_e and
institutional changes to facilitate the implementation of supporting
policies. The Government should consider granting free-trade status to
export industries right away as a first step in revamping the structure of
incentives with the intention of eliminating the existing anti-export bias.
3.17 Tariffs and imports taxes serve several different functions that
may be in conflict. In a situation where financing is scarce, the revenue
objective tends to dominate, and longer term goals can be overlooked. The
various tax functions have to be balanced carefully over time, and
administration is crucial.
3.18 As to export competitiveness, the devaluation of December 1985 has
improved the competitiveness of the manufacturing sector, and manuifactured
exports (excluding petroleum and related products) have grown by over 15%
in each of the last two years. Nevertheless, the evidence indicates that
the TT dollar is still overvalued. In comparison with its 1976 level
--1976 is the earliest year for which data are available for this series --
the real effective exchange rate, based on a basket of currencies of major
trading partners, had appreciated by 16% by the third quarter of 1987. The
extent of this overvaluation has been mitigated by the continued fall in
the value of the US dollar since 1985, to which the TT dollar is pegged.
Reduction in real wages and salaries in recent years have been consistent
with the adjustment effort. In the private sector even nominal wages are
being cut. The priority now should be wage restraint and further reform of
industrial incentives and measures to preserve the edge provided by the
1985 devaluation. In addition, flexible management of the exchange rate
would boost export competitiveness.

- 21 -
RECOMMENDATIONS
1. The manufacturing sector must become more export oriented. Atask force with a strong commercial orientation should be established toplan a phased shift toward export orientation. The Government shouldconsider granting free-trade status to export industries right away as afirst step iii revamping the structure of incentives.
2. A critical review and revision of the system of protection isneeded. The negative list has been used to provide almost perpetualprotection to some activities, such that there is no incentive forimproving efficiency. Increased reliance on tariffs is appropriate, with agradual phase-down over time. The opening up of the CARICOM market throughremoval of tariff and non-tariff restrictions on intra-CARICOM tradeprovides an opportunity that can be used as a first step in exposing localmanufacturers to greater competition.
3. The devaluation of December 1985 has improved thecompetitiveness of the manufacturing sector. Flexible management of theexchange rate, supplemented by appropriate fiscal, monetary and wagepolicies, would augment competitiveness.
4. The procedures for securing licenses for imports of rawmaterials ought to be simplified and controls relaxed, and more attentionneeds to be focused on the greater use of idle capacity. Greater:oordination among the institutions promoting industry is needed.
5. The tax incidence on investment could be reviewed to allowTrinidad and Tobago to become more competitive with other countries inattracting foreign investment. The restrictive aspects of the AlienLandholdings Act should be reconsidered.
6. While most gas-based industries are experiencing difficulties,they have potential for increasing the foreign exchange earning of thecountry. Their debt servicing problems should be included in efforts toformulate an approach for dealing with the national debt situation.
7. To deal with the dearth of marketing expertise, a keyconstraint on export growth even within CARICOM that urgently needsaddressing, the Government might consider hiring individuals or firms fromabroad.

-22 -
Chapter IV
AGRICULTURAL POLICY
4.1 Agriculture is a relatively small sector in the Trinidad and
Tobago economy, consisting of about 5% of GDP and 10% of the labor force.
Despite its small size, it is expected to provide food security for the
country, employ the farm population at adequate incomes, act as employer of
last resort, earn foreign exchange, provide raw materials for industry, and
perform certain environmental tasks. Government expenditures on
agriculture are relatively large, approximately US$175 million in 1986,
equal to about 67% of agricultural value added.
4.2 Despite numerous studies of the sector, little analysis has been
done on which crops and agro-products, if any, have potential medium- to
long-term comparative advantage. Agricultural and food exports currently
account for only about 2% of exports. Aside from sugar, coffee and cocoa,
all of which are heavily subsidized, virtually no crops have been exported
in recent years. Trinidad and Tobago demonstrates competitiveness in world
mai:kets only in aromatic bitters and rum, both processed items. Overall
the sector seems unable to compete internationally, except for agro-
processing, which has secured a small foothold in both the regional and
international markets.
4.3 The structure of farms is heavily skewed toward small holdings,
which grow numerous types of crops and livestock, but there is also a
plantation sector of some size. According to the latest data, 89% of the
30,500 private holdings were less than 5 ha. accounting for 40% of the area
in private holdings. Another 20% of this area consisted of farms of 5-10
ha. At the other end of the scale, 41% of the total area (both public and
private) was either public holdings (mostly the huge parastatal sugar
plantation) or private holdings of 50 ha. or more. While private
ownership is widespread, 53% of private holders, farming 35% of the land in
private holdings, either rented, squatted, or obtained their land in some
other way than through ownership.
4.4 Despite the uncompetitiveness of most of agriculture, virtually
everyone wants an agricultural sector of some scale, even at the cost of
significant subsidies from consumers and the Government.
THE STRUCTURE OF PROTECTION
4.5 Given the determination of the Government to protect a large
number of agricultural subsectors, it is important to assess systematically
the social cost of each one, both that borne by consumers in terms of
higher prices and lower quality and that part borne by the Government
through input and output subsidies and through its coverage of the losses
of Government enterprises. The cost of protection has generally been
ignored, and no quantitative measurement has been attempted.
4.6 The protective scheme for agriculture consists of controls and
budgetary subsidies. For most commodities, the heart of the system is a
virtual ban on imports of items for which the country produces close

- 23 -
substitutes via import or foreign exchange licensing. In the case ofexports or subsectors where significant imports compete with domesticproduction, the Government also provides price supports.
4.7 If protection is to be provided, tariffs are the best tool, withappropriate anti-dumping safeguards. The Government recognizes thebenefits of moving to a tariff-based system and views the current negativelist as temporary. However, shifting to a tariff-based system will not beeasy as Trinidad and Tobago does not control its own tariffs. At the sametime, CARICOM imports are now being allowed in and are exempt from the12.5% stamp duty (except for imports from Barbados because of a lack ofreciprocity). This salutary development will subject Trinidad and Tobagoagriculture to a certain measure of regional competition. In turn,Trinidad and Tobago will gain from the opening up of the CARICOM market tcits own industrial exports.
THE SUGAR INDUSTRY
4.8 Trinidad and Tobago supports a seriously obsolete sugar industrythat produces sugar at about 10 times the world price and costs the countryabout US$120-160 million per year, a split between the consumer (about 40%)and Government subsidies (60%). This subsidy amounts to more thanUS$10,000 per sugar worker or farmer per year. More than half this subsidyis required to satisfy preferential sugar quotas, as production costs arefar higher than the roughly US$500 per ton received under the EEC and USquotas.
4.9 Since 1978, there have been four major studies of the sugarindustty, in addition to the World Bank Economic Report of 1983, and eachhas concluded that the basic cost and productivity of the industry areunviable. All the studies propose restructuring the industry (for socialreasons, none proposed shutting it down). As it does not appear possibleto rehabilitate the industry to a competitive footing, it is logical thatthe industry ought to be phased out on an agreed schedule. The pace ofthis operation will clearly depend on the development of viable alternativeeconomic activities and the imperative of not exacerbating unemployment.
RECENT TRENDS IN MAJOR AGRICULTURAL SUBSECTORS
4.10 The last devaluation and the influx of young unemployed workersinto the agriculture sector at reduced wages in 1987 have created morefavorable conditions than in the recent past in the secularly decliningtree crop and forestry subsectors. The wage rates of TT$100 a day for theunskilled of a few years ago, equivalent then to about US$50, appear tohave fallen to a range of TT$35-50 a day in 1987 (US$10-15 at the currentexchange rate), following the devaluation, which is a large drop. As aresult, increased harvesting and some modest rehabilitation of cocoa and
coffee are taking place. Forestry, though, remains depressed.
4.11 The vegetable subsector has recently become more vigorous. It is
dominated by small farmers, who cultivate small plots near urban areasintensively. Root crops are, however, mostly imported, by weight abouthalf from CARICOM and half from North America, as are beans., peas and other
dry legumes. The exception is pigeon peas, whose production has recentlybeen expanded locally.

- 24 -
, Table 4.1: OUTPUT OF SELECTED AGRICULTURAL PRODUCTS, 1982-1987
1982 1983 1984 1985 1988 1987
Sugar (in 000 tons)Raw sugar 78.7 77.2 64.7 81.0 92.3 85.4
Refined sugar 11.4 9.4 31.3 33.5 37.6 38.0Area cropped (in 000 ha) 25.2 21.2 19.8 22.4 27.2 24.8
Coffee beans (in 000 kg) 1,794.0 1,388.0 852.0 2,142.0 1,334.0 1,892.1
Cocoa beans (in 000 kg) 2,248.0 1,717.0 1,560.0 1,307.0 1,428.0 1,501.1
Source: Annex Table 7.
4.12 With approxImately 90% of the rice consumed imported, the
Government has stated a desire to attain self-sufficiency. However, the
subsidy required to support a self-sufficient rice industry may reach about
US$21 million a year, and this may be too high a cost in the present
circumstances.
4.13 The production of fresh meat and eggs remained largely stable in
the 1980s, except for broilers, which suffered a 25% decline in 1986
because of the effects of the devaluation, recession and reduction in
subsidies. Milk production, in contrast, has increased by 130% since 1980.
No estimates of the cost of protection are available for the various
livestock subsectors, but undoubtedly it is high for the small, uneconomic,
but growing dairy subsector, and it may also be high for beef. Overall,
direct subsidies have fallen, except for milk, which rose, in relative
terms, from 8% to 70% of the total over the 1983-86 period. There are some
2,000 artisanal fishermen in Trinidad and Tobago, who use pirogues and
single-line technology. The small fleet of shrimp trawlers, receives a
TT$67 diesel fuel subsidy and is protected by the negative list. National
Fisheries Co., Ltd. is planning to expand its exports based on the by-catch
of shrimpers.
AGRICULTURAL RESOURCES
4.14 The resource problems of the agriculture sector are mainly the
result of low profitability. While the Government has tried to shield the
sector through protection and subsidies, except in the case of broiler,
dairy and vegetable production, it has not done so significantly or
consistently enough to result in sustained profitability. Consequently,
the sector has generally not been able to pay the going prices for capital,
management and labor and thus to compete for them with other sectors.
Only, recently, with labor supplies now available at lower wage rates, has
it been possible to start up abandoned activities. Nevertheless, new
private sector investments in agriculture should not be expected.
4.15 While changes in policies cannot really affect shortages of
capital and labor, current Government constraints are preventing land from
being used as productively as possible. Most important, agricultural land
near urban areas is underpriced because of zoning restrictions. For
instance, in the Port of Spain-Arima corridor, agricultural land sells for
TT$5,000-10,000 per acre. Residential land in the same areas sells for

- 25 -
TT$10-15 per sq ft, equivalent to TT$440,000-650,000 per acre, or is 100times more expensive. The restrictions that cause such uneconomic pricedifferentials also cause rigidity in the land markets. Small parcels areheld speculatively in anticipation of a de facto relaxation of therestrictions. A second large factor in the rigidity of the land markets isthe Governments's ownership of about 37% of the land in agriculturalholdings. Only rarely is this land traded.
INSTITUTIONAL CONTEXT AND SERVICES
4.16 The structure of the institutions affecting agriculture is highlycomplex because of the import-substitution thrust of agricultural policyand the consequent need to manage the system of protection, subsidies,services, resources and the environment.
4.17 In the area of agricultural services, MFPMEFE's2 ExtensionDivision is not effectively carrying out its principal functions oftraining and technology transfer. In the first place, its employees havetoo many extraneous tasks. MFPMEFE has too few workers at the field level,particularly relative to field-level functions. The Extension Division isalso not linking farmers to useful research. What might be needed is aformalized arrangement with the research institutions whereby researchworkers double as subject matter specialists and are responsible fortraining extension workers. The small size of the extension service arguesagainst establishing subject matter specialists within the ExtensionDivision.
4.18 A further problem is that five agricultural research organizationsthemselves produce little research of relevance to Trinidad and Tobago'sagriculture. A lack of focus on potentially profitable crops, and the widevariety of crops and livestock being produced, has led to a diffuseresearch program. If agriculture were instead responsive to internationalmarket forces, natural focal points for research would emerge.
4.19 If Trinidad and Tobago is to develop regional or internationalcompetitiveness in agriculture, it will probably be in the area ofprocessed products as superior human capital and technology can compensatefor high labor costs. The Caribbean Industrial Research Institute (CARIRI)is using a promising approach with passion fruit, integrating marketing,processing and extension in a single package.
4.20 Although coordination among the research institutions has beenlacking in the past, MFPMEFE's current approach appears to be sound. Itsown research unit needs strengthening, however, by transferring resourcesfrom support wages to equipment and operating expenses.
4.21 Past Government efforts have generally had a negative influence onthe quality of marketing in Trinidad and Tobago. With the end of mostsubsidy programs, the private sector now has full responsibility to marketmost fresh vegetables, fruit and meat and the inputs and outputs of agro-processing. Except for playing a role in relocating the wholesale market,
2/ Ministry of Food Production, Marine Exploitation, Forestry andEnvironment.
- 26 -
the Government should probably end its marketing operations, as well as its
attempts at entrepreneurship, now that a vigorous agro-processing industry
is emerging.
RECOMMENDATIONS
1. Agriculture can play a significant role in the recovery and
diversification of the economy, but it needs to become more efficient and
competitive to do so. The Government needs to establish an ongoing
ca,pacity to measure the cost of protection in each agricultural subsector.
Official policy should aim at shifting as much as possible to tariff
protection of agriculture and away from quantitative restrictions, with
appropriate anti-dumping safeguards.
2. Effective economic analysis of the agriculture sector,
including measurement of the cost of protection, ought to be carried out
prior to investment in infrastructure.
3. It is logical that the sugar industry should be phased out on
an agreed schedule, with the pace of this operation dependent on developing
alternative economic activities and not exacerbating unemployment.
4. Agro-processing industries, particularly those where human
capital and technology compensate for higher labor costs, could compete in
the foreign export markets. A flexible exchange rate policy would
stimulate the gro-wth of theae and other agrlic.ltural exports.
5. Where possible, the Government institutions supporting
agriculture should be streamlined. In particular, the Government should
end most marketing activities.
6. The link between research and extension services should be
strengthened; the Extension Division should not be responsible for non-
extension matters. Coordination of research should proceed along the lines
proposed by MFPMEFE.

- 27 -
Chapter V
TOURISM
THE TOURISM PRODUCT
5.1 Trinidad and Tobago is the most southerly country in theCaribbean. Venezuela, the nearest South American country, is under fivemiles away from Trinidad. Flight times to Grenada and Barbados, thenearest Caribbean islands, are about 45 minutes. Miami, however, is overfour hours flying time from Port of Spain. Tobago, about 30 km north-eastof Trinidad, can be reached in unde.r 15 minutes on the regular inter-islandjet service.
5.2 Trinidad is approximately 4,800 sq km in size, Tobago only some.300 sq km. Both islands share similar physical characteristics, vegetationand tropical climate. In addition to their beautiful scenery, beaches,lush jungles, swamps and plantations, both islands possess a wide range offlora and fauna and historical and cultural attractions. There are also anumber of nature centers, bird sanctuaries and historical fortifications(some restored). The islands are also the home of calypso and steelbandmusic, which are important cultural expressions and assets of the people.Carnival, which occurs in February/March each year, is internationallyrenowned in the English-speaking world and attracts a large number oftourists. Sports. fishing, sea sports. eolf and other ad hoc acti__tiesand attractions draw additional tourists but are largely undevelopedassets.
5.3 Despite the similarities, the two islands experienced differenttypes and stages of economic development, a factor that has an importantinfluence on development of tourism. Trinidad has experienced rapidgrowth, particularly related to the development of oil and associatedindustries. As a consequence, there has been rapid industrial and urbangrowth, together with significant increases in real incomes and wagelevels. With a diverse, cosmopolitan population of nearly 1.2 million,Trinidad has in recent decades found itself the focus of business, visitingfriends and relatives (VFR) and cultural tourism. A significant outwardtourist market has emerged, particularly for shopping, business andeducation purposes. While there are. attractive areas with tourismpotential, particularly on the north coast, because of various constraints,including a lack of physical infrastructure, and resort accommodations,inadequate marketing and a policy that does not promote tourismdevelopment, Trinidad has not participated in the sun, sand and sea tourismenjoyed by the rest of the Caribbean.
5.4 Tobago's population is only 44,000. While the islandtraditionally has been regarded as the international holiday tourismdestination of the country, with unspoiled beaches, fine scenery, coconutgroves, the Buccoo Reef, etc., a variety of factors have led to littledevelopment to date.
5.5 Trinidad is also the only Caribbean country in which Christiancathedrals, Hindu temples and Islamic mosques co-exist in close proximity.

- 28 -
5.6 Both islands contain relatively few first class hotel rooms.
Relatively few international tourists stay at hotels while on vacation in
Trnin-dad and Tobago, nor do the islands attract a significant number of
cruiseship passengers.
SIZE OF THE TOURISM SECTOR
5.7 Table 5.1 shows the breakdown of visitor arrivals in Trinidad and
Tobago in 1986. Vacation and cruiseship passengers amounted to less than
40,000 a year or just under 7% of total arrivals. The total number of
hotel guests from both overseas and domestic sources was 114,347 with
average three-night stays, total bed-night demand was 343,000. Given the
number of acceptable standard (three star and above) rooms under 1,800 the
overall room occupancy rate was 47%. In the first half of 1987, visitor
arrivals grew by 12%, largely through improved management and marketing of
several hotels in Tobago.
Table 5.1: TOTAL INTERNATIONAL ARRIVALS BY CATEGORY, 1986 AND 1987
1986 1987
% of % of
(000) Total (000) Total
Visito rsHotel Holiday 20 3.5 23 3.8
Private Holiday (VFR) 108 18.8 113 18.7
Business 60 10.5 60 9.9
Other 4 0.6 6 0.9
Sub-total 192 33.5 202 33.4
Temporary HaltCruiseship Passengers 19 3.3 16 2.6
Other 85 14.8 75 12.4
Sub-total 104 18.1 91 15.0
Residents 228 40.0 261 43.1
Transit Passengers 45 7.9 47 7.8
Other 4 0.6 4 0.7
Total Arrivals 573 100.0 605 100.0
Source: Central Statistical Office.
PROSPECTS FOR TOURISM DEVELOPMENT
5.8 Over a five-to-seven-year period, it should be feasible to
approximately double the number of rooms in first-class hotels from about
1,200 to 2,500. While this increase appears modest, much of the existing
hotel stock is in urban business hotels in Port of Spain, and a
considerable developmental and marketing effort would be required to
increase the existing accommodations by this amount.

- 29 -
5.9 A commonly expressed viewpoint is that Trinidad and Tobago cannotcompete with the more established destinations in the Caribbean, especiallyfor sun, sand and sea tourism. However, a destination within a recognizedtourism region that offers the requisite attractions will draw visitors,almost irrespective of specific locations, and the stage of developmentvis-a-vis competing regional destinations.
5.10 Nevertheless, in the short to medium term, Trinidad and Tobagocannot, and should not, develop a mass tourism market. Based on the natureof the market and the country's attractions, including climate, scenery andbeaches, the crucial need is to upgrade and expand existing hotels andcreate new resort hotels, particularly in Tobago. The best approach is todevelop hotels of modest size -- 50-150 rooms -- with excellent service andfood. The target market might be middle- to upper-income families fromselected regions of the US, e.g., the northeast, midwest and sunbelt.Canada is also a potential market, together with the UK, Italy, the FederalRepublic of Germany and Switzerland. The former two European countries arealready providing limited numbers of tourists, constrained by the stock ofaccommodations.
5.11 Demand from North America for the conventional beach vacation andfrom Europe for two weeks could be met by developing special interest andmulti-destination vacations. The former should capitalize on the potentialof its natural history, scuba and other sports, culture, fishing, golf and
-------------- e the la ter hchii.a explit t-- collntru9'A
location as the most southern Caribbean island and its close proximity toSouth America. All these points of tourism potential could be marketedjointly.
5.12 A further source of tourism could be exploited through bettercruiseship facilities in both Tobago and Port of Spain in Chaguaramas.Currently, cruiseship passengers number only 19,000 annually. Trinidadwith its strategic location, bunkering and water facilities, air facilitiesand first-class accommodations in Port of Spain, could become a major baseport for cruiseship operators if positively promoted.
5.13 Currently, the population, work force, Government institutions andprivate sector are ambivalent about tourism, and they are not organized,trained or coordinated so as to exploit the potential of tourism. Thegeneral population needs to become aware of the benefits of tourism andthat it is important for personnel directly involved with tourists toprovide a relaxed, happy atmosphere. Staff in hotels and restaurants wouldbenefit from further training related to their job functions.
5.14 The Government needs to provide a framework within which theprivate sector can develop profitable hotels, restaurants and other touristand leisure-related facilities. Of major concern is the organization ofthe tourism sector, specifically the Tourist Bureau as well as theGovernment departments and institutions dealing with policy, financing,investment promotion, air access, local transportation, site development,and airport and seaport facilities. Tourism promotion is not effective andneeds to be reviewed in light of the target markets to be developed and thebudget. Concurrently with successful reorganization of the tourism sector,

- 30 -
the Government needs to mobilize both international and local capital, a
step that likely will require reappraising of the system of incentives. Of
most benefit would be Government guarantees for hotel funding, the
development of joint ventures with the private sector. provision of public
land as equity to projects, and a reduction of the bureaucracy involved in
processing applications for funding and development. In addition to
specific resort planning, the Government is well-advised to develop a
coherent tourism strategy for Tobago, Chaguaramas National Park and the
north coast of Trinidad. Technical assistance will be required for these
tasks.
CONCLUSIONS
5.15 While in the past the private sector and GovernmenLt have largely
neglected tourism, a new consensus is emerging on the direction for new
t'ourism policies. The benefits of a sound tourism policy would be
mainfold: increased generation and decreased loss of foreign exchange;
increased employment, training and job opportunities; fairer distribution
of social and economic benefits, especially between the two islands;
development of a strong and profitable private sector; increased
opportunities for vacation and leisure for the domestic tourist; potential
for inter-sectoral linkagess; and diversification and strengthening of the
general economy.
5.16 The major problems in the tourism sector are: the low number of
tourists; small number of hOtel rooms; low occupancy rate, general quality
and profitability of hotels; difficult access to Tobago from major markets;
poor value for money; poor marketing image of Trinidad and Tobago by
tourists and the travel trade in North America and Europe; considerable
outward movement by residents and consequent loss of foreign exchange; lack
of attractions, inadequate organization of those that do exist and general
lack of tourism ambience; lack of, and high cost of, infrastructure; and
lack of supporting tourism facilities, including restaurants and shops.
RECOMMENDATIONS
1. A priority short-term measure is to improve the existing hotel
stock and implement selectively targeted, joint marketing programs that
emphasize the tourism assets of Trinidad and Tobago alone and together with
other countries, e.g., Trinidad and Tobago with Grenada/Barbados/Venezuela.
This short-term measure could improve hotel occupancy rates and
profitability.
2. A number of supporting activities need strengthening:
-- Market research of the major target markets.
-- Improved coordination of tourism agencies, specifically,
improved cooperative and selectively targetted promotion
of appropriate markets.
-- More direct flights from Europe and North America and
increased availability of seats for international tourists
during peak periods.

- 31 -
-- Improved infrastructure, especially airport and seaportterminals.
3. A concurrently five-yi,ar development program might include:
°- An inc,e_.ase in the supply of hotel accommodations in termsof both hotel size and new hotels, particularly in Tobago,the latter to be of small- and medium-size (50-150 rooms),both measures to provide a total of around 1,500 newrooms.
-- Major tourism and leisure development at Chaguaramas aimedat both international and domestic tourists.
-- A major increase in cruiseship passengers visiting bothislands.
4. In the longer term, development of the north coast of Trinidadfor both international and domestic tourists.
5. Flexible management of the exchange rate would complement thisprogram. Tourism development would be better served if there were either aMinistry of Tourism or Minister of Tourism within an appropriate ministry,rather than having this sector submerged in a major ministry.Infrastructure assessment and provision will be required to support theenvisaged rourism development.
6. In implementing the recommendations detailed above, theGovernment would benefit from technical assistance. Given the generallysound tourism policies currently being proposed, and the strength andability of those people involved in the tourism sector, it is apparent thatthe technical assistance program should focus on the implementation ofpolicy.

- 32 -
Chapter VI
TmE FINANCIAL SECTOR
6.1 The financial sectoi: comprises a broad range of institutions that
have emerged to meet certain financial needs in the economy. At the end of
1986, there were eight commercial banks operating 117 branches. In
addition, there were eight active finance companies, six trust companies
(independent affiliates of commercial banks), two mortgage finance
companies, four thrift institutions and three privately owned building
societies. Over 50 companies were registered for insurance operations, of
which 43 were doing new business. Of these, 17 were life insurance
companies. There are also three development finance companies
(Agricultural Development Bank, Development Finance Corporation and
Trinidad and Tobago Mortgage Finance Company), two merchant banks, more
than 300 registered credit unions, over 140 registered pension funds, a
stock exchange and the Trinidad and Tobago Unit Trust.
COMMERCIAL BANKING
6.2 As with other sectors of the economy, the financial institutions
have felt the effects of the economic downturn. The after-tax profits of
the commercial banking sector increased from TT$51.0 million in 1979 to
TT$125.8 million in 1984. Since then, they have been falling, dropping to
TT$58.9 million in 1986, or 53% between 1984 and 1986. Total deposits have
hardly grown since 1984 and the value of total loans outstanding has
stagnated.
6.3 To stimulate the economy, the Central Bank reduced the cash
reserve requirement of the banks from 17% to 15% of deposit liabilities
beginning July 2, 1986. At the same time, it raised the rate of interest
on special deposits held in secondary reserves from 3% to 4% a year and
encouraged the commercial banks to lower their loan charges in view of the
reduced cost of funds. The commercial banks responded by dropping the
median prime loan rate from 12.5% to 11.5% and by fixing a ceiling of 15.5%
on loans. The Central Bank also revised the installment credit guidelines
set in March 1973 with respect to hire purchase transactions. Repayment
periods for these loans to consumers weBre lengthened, and the requirement
of a minimum down payment was waived.
6.4 These measures have had little effect on the lending activities of
banks. Domestic credit to the private sector (end of month totals) for the
first seven months of 1987 averaged TT$5,800 million as compared to about
TT$5,990 million at the end of September 1986. There was, however, some
increase in the funds made available to the public sector. With respect to
Central Government, net claims outstanding increased from TT$399 million at
the end of September 1986 to TT$470 million at the end of July 1987. As to
the rest of the public sector, credits outstanding moved from about
TT$1,020 million to TT$1,310 million over the same period (Table 6.1).
6.5 The tight liquidity of recent years has led the commercial banks
to seek increasing accommodation from the Central Bank. Loans outstanding
frbm the Central Bank increased from zero at the end of 1983 to TT$469
million at the end of February 1987. Since then, the figure has been
declining, reaching TT$287 million at the end of July.

- 33 -
6.6 In recent years the commercial banks have been able to attract an
increasing clientele by expanding their activities and providing a wider
range of services. Banking is a widespread practice. The branch/
population ratio in 1986 was 1 to 10.2 thousand. Some urban areas,
however, have too many banks, a problem that contributes to the overall
cost of operations.
6.7 The disposition of the commercial bank resources plays a crucial
role in development. Commercial banks are essentially short- to medium-
term lenders. In recent years, the Government and public bodies have
accounted for 10-15% of the loans and advances outstanding. Agriculture's
share has been less than 2%, while petroleum's has fluctuated between 1.5-
2.5% since the early 1980s. One or two banks are making some special
efforts to increase their lending to agriculture, but the resources being
made available are still extremely small. Lending to the manufacturing
sector has increased in recent years, and this sector now accounts for over
13% of the total. On the other hand, construction's share has tended to
fall with the decline in the economy, as has consumer lending, from over
30% in the early 1980s to around 25% at the end of 1986. Hotels and guest
houses have accounted for less than 1% of bank loans and advances
outstanding, while distributive trades have received about 10-15%, and
finance, insurance and real estate have maintained their share at 10-13%.
Table 6.1: DOMESTIC CREDIT OUTSTANDING OF COMMERCIAL BANKS, 1986-87(TT$ Million)
Central PublicEnd of Government Sector Private
Period (Net) Entities Sector Total
1986
September 399.5 1,023.4 5,987.2 7,410.1
December 397.7 1,039.4 5,908.9 7,346.0
1987
March 446.0 1,206.5 5,884.0 7,536.5
June 452.0 1,305.7 5,701.6 7,459.3
September 426.0 1,386.7 5,693.6 7,506.3
Av. Jan.-Sept. 446.2 1,285.1 5,776.9 7,508.2
Source: Central Bank, Monthly Statistical Digest, September 1987.
6.8 Apart from statutory requirements, generally the banks (like other
financial institutions) use their own discretion in disposing their funds.
With respect to consumer lending, the Central Bank, as indicated earlier,
has issued some guidelines, which were liberalized in 1986 to stimulate the
economy.

- 34 -
6.9 While the Government would like to have a greater proportion of
funds channeled to the productive sectors, it should continue to rely on
moral suasion. Any framework of control should allow for skillful
management, since a loss of public confidence in the present circumstances
could affect the recovery.
INTEREST RATE POLICY
6.10 An important issue is the use of interest rate as an instrument of
economic policy. Since 1978, the Central Bank has had the power to control
interest rates but has chosen not to exercise it, opting to allow market
forces to exert their influence. Since the early 1980s, deposit rates have
tended to come down. Generally, those paid by commercial banks have been
below the rate of inflation as reflected in the retail price index.
Despite this situation, total deposits in the banking sector increased from
TT$759 million at the end of 1973 to TT$7,417 million at the end of 1986.
6.11 While the interest rate may have some influence on the volume of
savings, income appears to be a more crucial variable. Given present
circumstances, raising nominal deposit rates is not likely to stimulate
greater savings. In fact, this action may only serve to justify raising
lending rates, whereas their containment is called for by the depressed
conditions and high indebtedness of business firms. A preferred solution
to achieve positive real interest rates would be to bring down the rate of
inflation to international levels and in this way improve t'he allOcation of
resources. In light of the declining profits of banks, it is unrealistic
to expect any significant reduction in loan rates in the short term. Some
relief could come from lower costs associated with lending. While the cost
of funds is not unimportant in decision-making, the major disincentives to
investment appear to come fron the depressed condition of the economy, as
reflected in the state of demand, the industrial relations climate, certain
labor legislation and official bureaucratic red tape.
6.12 Another important issue is the spread between banks' lending and
deposit rates. Average lending rates in 1987 have been around 13% compared
to average deposit rates of 6%, yielding a relatively large margin of 7
points between the two rates. While it appears that banks need to shore up
their profit position, nevertheless, efforts should be made to reduce their
operating costs which result in a high interest rate spread.
Non-Bank Financial Intermediaries
6.13 Finance companies grew rapidly during the boom years of the 1970s
and early 1980s. By offering significantly higher interest rates than
commercial banks, they attracted a significant part of individual and
company savings. Total deposits increased from TT$83 million at the end of
1986 to TT$960 million at the end of 1986.
6.14 An absence of control over the operations of these institutions
until 1979 allowed them to disregard prudent financial practices, a
eitut±9ton that caused them serious problems with economic downturn. Since
1984, at least seven have either suspended operations or closed down and a
number of depositors lost their savings.
- 35 -
6.15 To prevent an erosion of confidence in the financial system,
legislation was passed in 1986 to set up a deposit insurance scheme.
Membership in the scheme is compulsory for all licensed banks and financial
institutions, which must pay an initial contribution and an annual premium.Under this scheme, the Central Bank is required to match the initialcontribution made by members of the Deposit Insurance Fund. There is some
indication that such measures are restoring confidence in the sector.
6.16 Deposits held by the finance houses amount to only about 10% of
that of the commercial banks. With respect to their loans portfolio, about
75% of their loans have been for business purposes, with personal loans
accounting for the other 25%.
6.17 The assets of the trust and mortgage finance companies have grownsteadily since the early 1970s. Total assets increased from TT$54 millionat the end of 1973 to TT$1,647 million at the end of September 1986. The
most important source of funds are deposits which have tended to accountfor over 90% of total liabilities. Resources have also been borrowed from
outside the country from time to time to support domestic lending.
6.18 Insurance companies play an important role in the economic system.
They not only provide a necessary service but are significant mobilizers of
savings, and they also undertake investment. Between 1981 and 1985, total
investments of those companies engaged in long-term business more than
doubled. In excers of 90% of these assets are neac±oca±±y mortgages
tend to account for more than half the value of local assets.
6.19 A major feature of the insurance industry in Trinidad and Tobago
is the large number of companies involved in it. Increasing income and
property assets in the 1970s, and the small capitalization required,attracted several newcomers, some with little insurance experience. In the
competition for business, some companies chose to lower their premium rates
to levels that became difficult to sustain. As the market shrank and
claims shot up in recent years, several companies have come under severe
pressure. A few have closed, while others are experiencing great financialdifficulty and cannot meet legitimate claims. The public's confidence in
the non-life sector has been shaken in particular.
6.20 Because insurance companies perform a social and developmentalfunction, the regulatory authorities need to devote more attention to the
industry. The avenues for dealing with complaints by the public are
inadequate. A review of the insurance legislation, particularly the
provisions relating to capital structure is in order. The efficiency of
the industry as a whole should be looked into, including the possibilities
for reducing the number of companies without eliminating competition. To
earn foreign exchange and generally widen the scope of their operations,
local companies should be given incentives to operate abroad. The
Government and the industry own a re-insurance company through which local
companies place a small part of their business. It has been making a
profit, and expansion should be considered.

- 36 -
RESOURCE MOBILIZATION
6.21 One of the major factors in the decline in both public and private
investment is a shortage of financial resources. All financial
intermediaries have been affected in various degrees. The downturn in
economic activities has also revealed serious flaws in the operation and
management of some of them, and in certain cases the authorities moved too
late to protect the public. The crisis of confidence has not been
resolved, despite legislative measures. The financial institutions need to
be monitored more carefully, given the public's sensitivity to their
performance.
6.22 In the past, the state has used a number of devices to encourage
savings with varying degrees of success. The 1988 Budget has changed the
approach to taxation of income and a special tax of 10%, deductible at
source, was introduced. The important issue now is whether to exempt from
income tax all interest from savings to encourage greater savings.
6.23 There is also need for taking a closer look at the various avenues
through which the community saves and for exploring ways to enhance saving
instruments. This may enlarge the pool of funds available to both the
public and private sectors for investment.
THE STOCK EXCHANGE
6.24 Activity in the Stock Exchange has declined mar'kedly in recent
years. An informal securities market existed for many years before 1981,
at which time the Trinidad and Tobago Stock Exchange came into being with
the passing of the Securities Industry Act of 1981. The main purpose of an
Exchange is not only to allow companies to raise investment capital, but
also to provide an opportunity for investors to save through the purchase
of shares in companies of their choice. The volume of public company
shares traded increased from 32 million (market value of TT$140 million) in
1981 to 90 million (market value of TT$557 million) in 1982. The volume
fell to 48.5 million (market value of TT$186 million) in 1984. The figure
for 1986 includes two unusual transactions involving about 25 million
shares.
6.25 Although the Government continues to raise new capital in the
local market, in recent years it has not been using the Stock Exchange.
With respect to the private sector, there have been no new issues of public
company shares since 1984, when about TT$7 million was raised. Between
1982 and June 1987, the private sector raised only TT$52 million through
the issue of new shares (primary issues). During the same periods, funds
paid to alien shareholders from the sale of shares to nationals of Trinidad
and Tobago amounted to TT$175 million.
6.26 To encourage greater use of the Stock Exchange, the number of
listed companies needs to be increased from the present 34. Doing so
requires changing the criteria presently used to admit companies to the
Exchange List. The Government might also consider allowing a percentage of
new issues to be tax-deductible. Allowing the tax deduction for some
proportion of dividends received from new investment might encourage
savings.

- 37
6.27 With respect to the Exchange itself, certain steps are needed to
make it more effective. Existing legislation needs to be reviewed with an
eye to giving the Exchange more authority and to allow the Government to
use it. The company law should also be updated, in particular,
strengthening its disclosure provisions. To encourage greater foreign
portfolio investment, the Aliens (Landholding) Ordinance which is overly
restrictive, should be amended to allow a greater inflow of foreign
resources within a reasonable framework of control. Greater foreign
participation in the stock market may serve to counter the downward
pressure arising from local economic conditions.
6.28 In its Investment Policy, the Government has stated its intention
to encourage nationals living and working abroad with savings overseas to
invest them in Trinidad and Tobago. To this end, it guarantees the
convertibility of all savings returned to the country (including interest
and dividends) and allows nationals returning hard currency to hold the
funds in either foreign currency and/or local currency accounts, as
desired. The funds must be retained in the country for a minimum of six
months. Interest earned on these savings will not be subject to the
corporate or personal income tax. The Government also guarantees the
confidentiality of the bank/client relationship.
RECOMMENDATIONS
IL*# ULA Cati "OILcL.LLLIn t.'LU ecC%onommy, the inancial 8-
under a great deal of stress. While the legal framework of operations has
improved, it is far from satisfactory. The &^vings/investment process
involves an array of institutions that have lost the public's confidence to
varying degrees. Public concerns and complaints need to be dealt with
adequately. Appropriate measures include:
1. A more determined effort to encourage a greater volume of
savings is needed. As higher interest rates are unlikely to have the
desired effect of increased savings the Government might consider exempting
from the income tax all interest income accruing to individuals.
2. Rationalization of the insurance industry is an urgent
priority. Existing insurance law and regulations need reviewing with the
aim of increasing efficiency and affording greater protection to the
public.
3. Measures are needed for a reduction in the spread between
banks' lending and deposit rates. Reduction of the operating costs
associated with lending is advisable.
4. Moral suasion to get banks and other financial institutions to
lend a greater proportion of their resources for productive investment is
the optimal tool, rather than fiat.
5. Increasing the number of companies listed on the Stock Exchange
will give investors a wider choice, a measure that requires changing the

- 38 -
criteria presently used to admit companies to the Exchange List. Another
possible measure is to encourage both companies and the Government to make
greater use of the Exchange for raising capital.
6. Offering a wider range of securities to the public would be a
propitious step. Properly structured in terms of yield and liquidity, this
step might raise more funds for the Government and the level of savings in
the economy. In this connection, the creation of secondary markets for
Government securities merits attention.

- 39 -
Chapter VII
EMPLOYMENT/UNEMPLOYMENT ISSUES
7.1 Unemployment is one of the most serious social problems facing the
country. Although the number of unemployed as a percentage of the labor
force dropped from an average of about 15% in the mid-1970s to 10.3% in
1982, it has grown steadily since, from 43,000 in 1982 to 84,000 in 1986,or almost 18% of the labor force in the latter year (Annex Table 12). The
estimated rate for 1987 is in the region of 22%. In terms of numbers,
total employed fell from 401,000 in 1982 to 388,000 in 1986; put another
way, 13,000 jobs were lost in the five-year period.
7.2 Unemployment among the male segment of the labor force has grown
at a faster rate than among the female segment. In 1982, the male
unemployment rate was 8.6%, but by 1986, the level had almost doubled,
reaching 16.8%. On the other hand, the female unemployment increased from
13.5% percent to 19.9% over the same period. Although unemployment has
risen in almost all age groups, it is most concentrated in the younger
categories (Table 7.1).
Table 7.1: UNEMPLOYMENT RATIOS BY AGE GROUPS,DECEMBER 1986 AND MARCH 1987
Age Group Unemployment Ratio (%)(Years) December 1986 Prelim. March 1987
15-19 40.1 47.720-24 30.13 38.925-39 18,7 24.030-34 13.6 15.735-39 '9.9 12.640-44 11.1 9.8
Source: Central Statistical Office.
7.3 In terms of the geographical distribution of unemployment, jobs
have been lost in all regions, although some have suffered more than
others. For instance, while unemployment in Port of Spain increased from
5.1% in 1983 to 10.6% in 1986; in San Fernando, the comparable figures were
8.5% and 23%; in Nariva/Mayaro, 14.1% and to 15.0%; in Tobago, 13.6% and
16.7%. With respect to the sectoral distribution of employment, there has
been a decline in almost every sector in recent years, with some sectors
more severely affected than others. For example, the unemployment rate in
the petroleum indusLries increased from less than 10% in 1980 to 21% in
mid-1986. In construction, too, the unemployment rate increased sharply
from 10.5% in 1980 to over 30% in 1986. In the wholesale and retail trade,
the figure moved from 8.8% to 14.2% over the period. Between 1982 and
1986, 23,497 jobs were lost in the private sector as a result of the
closure of some companies or the rationalization of their labor force by
others still in operation.

- 40 -
7.4 In order not to worsen the situation, the present Government, like
its predecessor, has so far refused to reduce the civil service work force
to any significant extent. The civil service (including defense, teaching
and protective services, as well as statutory bodies) has about 63,000
positions. Of this number, about 7,000 are with the statutory boards and
similar bodies. Actual employment in the Central and Local Governments at
the end of 1986 was about 40,000. Because of its buoyant revenue position
during the boom years, the Government was able to increase the number of
jobs in the service significantly: the wage and salary bills of the
Central Government went from TT$361 million in 1974 to an average of
TT$2,670 million in recent years.
7.5 In the context of its present revenue position, the Government is
finding it increasingly difficult to maintain the present work force. In
its January 1987 budget submission, the Government cut the salary of
ministers by 5% and suspended COLA and merit increases. Management
salaries in several state enterprises were also reduced. Some relief was,
however, given to people in the lower salary ranges.
7.6 The private sector has felt the shrinkage of employment more than
the public sector. One consequence of the growing unemployment has been a
weakened trade union movement. During the boom years of the 1970s and
early 1980s, the labor unions were able to win wage and salary increases
far in excess of labor productivity. For the public service, the last wage
contract allowed for an increase of 59.5% over the period 1981 (37.5%),
CIL I19835 l 0 .5.uAab wrL nave Dean a r.amer om new
agreements in the private sector, the average increase has fallen
substantially since the early 1980s. For instance, an examination of 139
agreements in 1982 (covering 15,130 workers) showed an average rise of 58%
over a three-year period. The percentage increases ranged between 23% and
118%. On the other hand, the average rate of increase of 31 agreements
signed in 1986 was only 14%, with a range of 3-33%.
EMPLOYMENT STRATEGIES
7.7 in recent years, the population of Trinidad and Tobago has grown
at an average rate of 1.6% while the labor force has grown by 1.3%. The
absence of a strategy to deal with the employment challenge was largely
responsible for the ad hoc approach taken to job creation. The
unemployment levy imposed on individuals and companies since 1970 to help
provide jobs, yielded TT$2.2 billion, through 1986. However, the proceeds
were never properly utili7.ed to create permanent jobs.
7.8 The issue of empk1yment also seems to have received minor
consideration in the recent industrialization strategy, which placed heavy
emphasis on large capital-intensive projects aimed at enhancing the foreign
exchange earnings capacity of the country. Even while the economy was
growing, the question of training was not properly addressed, with the
result that a shortage of skills persisted in certain areas at the same
time that unemployment was a problem. In boom periods, construction was a
major employer, and the seriousness of the problem of structural
unemployment and underemployment were not as much a concern. The
Government itself often increased its labor force to provide jobs rather
than out of need.
- 41 -
Table 7.2: LABOR FORCE AND EMPLOYMENT, 1982-87
Prel.1982 1983 1984 1986 1986 1987
(In 000 of persons)
Labor force 445.0 452.8 478.7 473.9 472.0 476.1
Employed 400.9 402.5 414.4 399.7 387.9 370.0
Unemployed 42.6 61.2 87.5 76.4 84.1 105.1
(% of total labor force)
Employed 90.5 88.7 85.9 83.9 82.2 79.9
Unemployed 9.5 11.3 14.1 18.1 17.8 22.1
Source: Annex Table 12.
7.9 Government wage policy in Trinidad and Tobago has been detrimental
to the economy. By paying wages in temporary work programs higher than
those in the low productivity sectors such as agriculture, the Government
attracted labor away from those sectors, a situation that contributed to a
fall in output. With the increase in urban unemployment, some of this1_hn_r r4tutrn4na to a2cuturc I Tn agenerAl 4t 4 now easier to find
labor for certain kinds of jobs, and at more reasonable wage rates than in
the boom years, when the private sector had to compete for labor and
therefore to offer remuneration comparable to that in the the public
sector. Also during the boom years, the labor supply was augmented byillegal immigrants from neighboring countries. While this inflow helped
the construction sector, it placed greater pressure on the social services.
CURRENT EMPLOYMENT AND WAGE POLICY ISSUES
7.10 Wage levels vary widely across sectors of the economy. Real wages
have been falling over the last few years, as nominal wages have remained
fixed in the face of rising prices. The last raise for the civil service
was in 1983, when it received 10.5%, the last part&of a three-year
agreement. Since 1983, prices have increased at an average rate of over
10%. Even some firms in the private sector, have cut nominal wages, while
in other cases, the nominal increases have ber below the rate of
inflation. A number of firms have been force 6o close because of
financial problems arising from debt servicing. There is now a
controversial piece of legislation pending that would provide compensation
for workers who lose their jobs.
7.11 As regards public sector employment, in dealing with the budgetary
problem, the Government may have to effect economies in its wage bill. The
options are to reduce the labor force while keeping wages at existing
levels--an action that would aggravate unemployment--or to keep the work
force largely intact, but cut nominal wages and salaries further. While
the burden of adjustment needs to be shared by every group, at the same
time a wage and salary structure in both the public and private sector that
attracts and retains the skills necessary for development is needed.

- 42 -
7.12 The Ministry of Labour administers a few programs aimed at placing
people with low skills or who have less than five Ordinary Level passes in
temporary positions to gain experience that they can use to acquire more
permanent jobs. These programs are, however, limited. The Government also
has a farm program through which a small number of agriculture workers go
to North American (mainly Canada) on a seasonal basis to do unskilled
agricultural work.
7.13 The Government needs more innovative approaches to dealing with
the unemployment problem. Given the high growth rate of the labor force,
it will have to devise measures that encourage prospective entrants into
the labor force to spend longer time in school or training. This step can
be accomplished by adding a variety of short courses to the existing
curricula at both the secondary and tertiary levels. The technical/
vocational programs can be lengthened to provide broader course content.
Apprenticeship schemes that require modest outlays could be adopted on a
larger scale as part of the private sector's contribution. Self-employment
opportunities need to be more clearly identified and a framework for
assistance articulated. Even these measures will be insufficient, however,
if the population continues to increase at the rates of recent years.
Attempts should be made not only to reduce the natural growth rate further,
but also to stem the flow of illegal immigrants.
7.14 As far as the creation of jobs in the short term is concerned, the
few Govar.m-nt p-rojects about to start will generate some opportunities,
directly and indirectly. Whnile construction is not likely in the
foreseeable future to reach the levels experienced in the 1970s and early
1980s, incentives should be used to encourage this sector, given its labor
intensity. The brunt of the burden of creating permanent jobs will have to
be borne by the private sector, particularly in the areas of manufacturing,
agriculture, tourism and agro-based industries. Agriculture has already
attracted some labor back and now has one of the lowest unemployment rates,
(less than 3% in 1986).
7.15 Given the increasingly large number of graduates with secondary
and university education who cannot find jobs, the Government has to take a
more serious approach to manpower planning within the context of its
development strategy. There needs to be a clear assessment of present and
future skill requirements in the context of the economic directions adopted
by the Government. While considerable funds have been spent on education,
little emphasis seems to have been placed on course content or reform of
the general curriculum with a view to developing the skills that could have
facilitated development and lead to more employment.
7.16 Human resources must be seen as one of Trinidad and Tobago's major
assets, Properly developed and channeled, they become a creative force.
Neglected and misdirected they could turn into an explosive problem, with
serious consequences for the tourism and investment climate.

- 43 -
CONCLUSIONS
7.17 Between 1982 and 1987 the number of unemployed has more thandoubled. However, alleviation of unemployment rests heavily on the abilityof the economy to resume growth. Even modest rise in tourism, could, forinstance, more than double the present employment in this sector of about4,000, over the next five-year period. Revival of the economy calls for anincrease in the current levels of private and public investment. It alsorequires a stepping up of production, which has been affected by the fallin domestic demand official policies and problems in the export markets.Given the critical foreign exchange position and the high import propensityof the economy, the extent to which domestic demand is stimulated has to beclosely monitored. A more determined effort by all sectors of the economyto increase exports is needed. The Government can play an active role hereby removing existing policy and bureaucratic barriers and providing thenecessary assistance to the institutions that promote exports.
RECOMMENDATIONS
1. A mixed private sector/Government task force could be set upto investigate why a number of private firms have closed or arecontemplating closure, and what assistance might be helpful. Urgentfollow-up action needs to be taken on its findings.
addressed in the cOntext of public fiscal constraints. Redeployment withinthe public sector could provide some room for maneuver.
3. Possible measures to stem the rapid flow of young people intothe labor force include changes in the structure and content of courseprograms and the requirements for graduation to better meet employer needsand employment prospects. More widespread adoption of apprenticeshipschemes could also help. A youth training employment partnership (YTEP)program has recently been instituted.
4. The development of agriculture on a more efficient andcompetitive basis needs to be accelerated. With falling wages in the urbansectors and increasing 'unemployment, farm wages have also fallen, and it isnow easier to find labor for agricultural work. Programs bearing onagricultural financing, marketing and technical assistance ought to bereviewed, with the aim of increasing their effectiveness.
5. A more systematic approach to manpower planning is needed inconjunction with whatever changes are envisaged for education and training.

- 44 -
Chapter VIII
STRATEGY FOR MEDIUM-TERM GROWTH
8.1 The new Government has indicated that it intends to change the
framework of development of the previous administration. It wants to
reduce the extent of state participation in the economy and to have the
private sector play a greater role. An increasing share of domestic
investment and job creation is to come from the private sector, with the
Government's role becoming more regulatory and increasingly confined to
infrastructural development and enterprises essential to public welfare.
Given its financial position, the state can no longer invest on the scale
it has since 1974, or provide a wide range of services at low cost. Market
forces are likely to become increasingly predominant as Government
financial assistance is reduced and state enterprises try to match revenues
and costs. Nevertheless, enterprises that are essential to the public
welfare will be kept under state ownership, even though they may not be
economically viable immediately.
DEBT AND BORROWING
8.2 Since 1974, Government expenditures have been the main determinant
of growth in the economy. This pattern cannot be sustained. The shift to
p r=Jth ate re - l g e ozit rOhL -- 1.1''- be {mea-ate- as a framework has to be
put in place. Thus, in the short term, the Government still has a critical
role to play in diverting the economy from its path of the negative growth.
At the same time, the Governme-nt has no savings, and the public debt has
become increasingly burdensome in the context of declining foreign exchange
earnings and revenues. Further, the proportion of public debt denominated
in Japanese yen and European currencies increased to about 60% in 1986.
The burden of the external debt in U.S. dollar terms has thus risen with
the U.S. dollar depreciation, producing an effect similar to that of a
deterioration in the country's terms of trade. The Central Government's
external debt/GDP ratio has been increasing sharply, from 8.1% in 1983 to
20% in 1986. If the foreign debt of US$751 million relating to state
enterprises is taken into account, the total external debt of the country
would rise to US$1,807 million in 1986, equivalent to 37% of GDP,3 while
3/ With respect to Central Government debt outstanding at the end of 1986,
5.0% was owed to bilateral agencies, 3.2% to multilateral institutions,
and 65.4% to private financial institutions; 26.4% was borrowed in the
form of bonds. The lenders contributing to the outstanding debt of
state enterprises were: bilateral agencies, 21.6%; multilateral
agencies, 17.3%; private financial institutions, 43.5% and suppliers'
credits, 17.6%. As far as repayment of Central Government debt is
concerned, 64% had an original maturity of less than 5 years, while the
other 36% fell into the 5-10-year category. Almost all Central
Government external debt outstanding at the end of 1986 will be repaid
by 1993 if the Government does not default.

- 45 -
debt service payments are estimated at 17% of exports of goods andservices. During the first 11 months of 1987, only two new foreign loanswere raised, and this was one for US$100 million in the Japanese market.Locally, the Government borrowed TT$345 million (US$95.8 million) in thisperiod.
8.3 Though Trinidad and Tobago was able to access several capitalmarkets (in particular the Japanese private placement market) over the1985-87 period, the terms have in general been burdensome (Annex Table 30).The amounts raised were also significantly less than the amounts sought andthere was only one public issue over the period, i.e., on the sterlingmarket.
8.4 Until 1985, the growth of the public debt did not appear to pose agreat problem as far as servicing was concerned. The situation changeddramatically in 1986 with the collapse of oil prices. The Government hasmet all its debt servicing obligations despite dwindling foreign exchangereserves. However, not only has the domestic situation changed, but creditconditions in the international capital markets have become more difficult.
8.5 Trinidad and Tobago cannot be classified as a heavily indebtedcountry, even though it is experiencing severe strain in servicing itsdebt; indeed debt servicing will become increasingly problematic over thenext few years when much of the debt will fall due for repayment. Ournroiections suzzest that external borrowinzs of about USS225 million a vearcould be targeted over the next few years to sustain the recovery. To meetits debt service payments and build up reserves, Trinidad and Tobago will,however, require higher levels of capital inflows. It is inadvisable thatthe Government borrow to service past loans, however. New borrowing shouldbe aimed at financing projects critical to adjustment and stimulation ofthe economy. Borrowing increasingly on hard terms in the financial marketswould be imprudent. While there may be little scope for negotiatinginterest rates, the Government would do well, through enhancing Trinidadand Tobago's credit rating, to seek loans with longer repayi-1ent periods.
8.6 As far as local borrowing is concerned, the Government has reachedthe limit of its borrowing capacity from the Central Bank. Some funds areavailable in the private sector, but Government will have to be careful notto crowd out private borrowers, at a time when it is trying to encouragegreater private investment.
POLICIES FOR RECOVERY
8.7 The focus here is on policies with respect to the transition fromshort-term recovery to medium-term growth. Even at this time, the countryhas a reasonable export capacity (both in goods and services) that it hasnot fully exploited. In the long term, earnings from tourism could beexpanded considerably if the Government implements certain measures and thecapacity of the industry is increased. An appropriate short- to medium-term policy would be greater utilization of existing capacity (i.e.,

- 46 -
increasing the occupancy rate) and trying to attract a larger number of
cruiseships. At the same time that greater professionalism in the Industry
at the local level is encouraged, promotional efforts need to be
intensified. Related industries such as handicrafts and souvenirs sl\ould
be envisaged. More adequate shopping facilities could help in earning
foreign exchange.
8.8 Trinidad and Tobago might also think seriously about developing a
capacity to export certain types of services, such as those relating to
construction, engineering and a range of other professional ones. It is
not fully exploiting its know-how, even though a major part of the budget
goes for training and education. An adequate return on that investment
requires that technically trained people look beyond national borders.
8.9 With respect to the oil sector, earnings from exports of petroleum
and petroleum products have been falling since 1980. Between 1980 and
1985, earnings fell by almost 30% and in the first six months of 1987, they
were 12% below those in the corresponding period of 1986 as petroleum
production declined. The reason was that as the fields got older and their
producing capacity diminished, it became increasingly costly to extract
oil. Exploration efforts were also insufficient.
8.10 The Government itself has a heavy stake in the oil sector, as it
has acquired considerable assets in recent years, and it owns all the
-;--2 o-t,"-:+ Five comnan{es are engaged in crude oil production with
AMOCO (which is foreign-ow-ned and operates largelv in the marine area),
accounting for more than half of total production.
8.11 In the sh--rt term, oil remains the country's most important
foreign exchange earner and thus holds the key to the short-term recovery
efforts. Government policies can be used to stimulate production. An
urgent first step is to revriew the policies affecting the petroleum
industry. Government tax and incentive policies must be aimed not only at
encouraging enhanced recovery, but also at sustaining a high level of
explo-ation and drilling. The impact of the decline in oil prices and the
trends in costs should be examined objectively with the oil companies with
a view to reversing present: trends.
8.12 Non-oil exports have been increasing in recent years, with
chemical goods accounting for a large portion of these. Recent declines in
prices have affected the performance of some of the energy-based
industries. Now that the new methanol and urea plants are on-line, this
sector should show improved performance in 1987 and 1988. Even now and
given the existing exchange rate, there is scope for increasing exports to
CARICOM and the other neiglhboring countries. Because the scarcity of
foreign exchange has constrained export growth, the Government should
follow through on its co=mitment to allow exporting firms more favorable
access to foreign exchange resources. Priority could be given to reducing
bureaucratic red tape. As many firms are operating below capacity,
increased output would also improve the employment situation. Firms
themselves need to market aggressively. Steps have been taken to free up a
large par-t of intra-CARICOM trade, and Trinidad and Tobago manufacturers
should be able to take greater advantage of this regional market.
- 47 -
8.13 In the medium to longer term, the Government faces the task ofreorienting the manufacturing sector from import-substitution, encouragedby high protective barriers, to export. So with the growth of energy-basedprojects, the industrial sector could emerge as the lead sector in theeconomy, replacing oil.
8.14 Agriculture, too, has a critical role in the medium-term recovery,but it needs to become more efficient and competitive. In view of theunemployment problem, many people have been attracted back to the land,which many had abandoned during the boom period. This process should beencouraged. In devising a framework of assistance to this sector, it willbe necessary to establish clear objectives and priorities. Many measuresto date have been ineffective. For example, subaidy programs aimed athelping farmers have often been off target, wasting a great deal ofresources. The state itself, through its wholly-ow-ned company, CaroniLimited, has been trying, with some success to diversify away from sugar.The know-how acquired by Caroni could be integrated with the extensionservices of the Ministry of Agriculture to develop a technical resource forfarmers, once the direction for agricultural development is articulated anda framework put in place.
8.15 Increasing domestic savings needs to be a primary objective ofeconomic policy to sustain higher investment levels. For its own part, theGovernment will have to cut wasteful expenditures and attain greaterefficiency in public spending. Individual and corporate savings also needto be encouraged if the country is to undertake a higher level ofinvestment. It would be beneficial to speed up the review of the taxsystem. The work on reorganizing and restructuring the state enterprisesshould make them more efficient and less dependent on the CentralGovernment. External debt servicing is a serious problem for a few ofthem, a situation the Central Government will have to take into account indevising approaches to its own debt situation.
8.16 A longer term context for decision-making is essential if presentsocial and economic trends are to be reversed. Short-term measures oughtnot to detract from the Government's longer term goals to restructure theeconomy and attain greater efficiency. Nor can the Goverrnment allow itsown fiscal situation to interfere with the implementation of policiesnecessary for longer term growth. If not, it may find itself in aperpetual financial crisis.
8.17 In the past, the Government took too long to assess theeffectiveness of its policies relative to their initial objectives andimpact. Thus, problems such as contradictory policies, lack ofcoordination among different branches, and delays in decision-making werecommon. Ad hoc approaches replaced development planning. Long-term goalsmust guide short-term policy-making, if the economy is to move along thedesired path. The long-term goals must themselves be formulated againstthe background of the resources and capability of the country and must'.;: -..vide clear directions to the various sectors of the economy. Atimeframe is also important in pursuing development objectives.

- 48 -
8.18 The new National Alliance for Reconstruction (NAR) Government has
adopted some measures to deal with these problems and these ate beginning
to have some positive effects. A Ministry of Planning and Moblization is a
key part of the new administrative structure. A National Planning
Commission, chaired by the Prime Minister and in which the trade union
movement and the private business sector are represented, has also been set
up with the aim of discussing the impact of particular policies on the
economy.
TWO SCENARIOS
Baseline Scenario
8.19 In assessing future trends, two scenarios were examined: a
baseline scenario and a higher growth one based on improved policies. A
comparison of the highlights of the two scenarios is given in Table 8.1.
The first, the baseline scenario, is based essentially on the work done by
the Government's Central Statistical Office and published in "A Macro-
economic Survey of Projections 1987-90." The basic assumption of that work
is a continuation of the trends of 1987. Thus, the projections for some
sectors are based on growth in the recent past.
Table 8.1: BASELINE SCE1NARIO COMPARED WITH HIGHER GROWTH SCENARIO:
SELECTED ECONOMIC INDICATORS(In Percent)
Higher Growth Scenario
Baseline Scenario with Improved Policies
'1985-90 1990-95 1985-90 1990-95
Growth Rates
GDP -3.2 0.9 0.4 3.0
Investment -1.8 0.8 1.S 3.8
Total Consumption -3.6 -0.7 1.0 2.2
Agriculture 2.6 0.5 2.7 2.5
Industry -0.7 0.9 1.7 2.7
Services -6.3 1.0 -1.4 3.3
Total Exports -12.2 2.1 -11.1 2.9
Total Imports -11.1 -1.7 -10.4 1.8
PercentagesInvestment/GDY 26.6 26.5 28.1 33.6
Consumption/GDY 73.9 68.1 76.7 67.7
Source: Annex Tables 35-40.

- 49 -
8.20 Under this scenario, projections of real GDP to 1990 show adeclining trend, with the level of real GDP in 1990 estimated to be 15%below that of 1985, for an average annual rate of decline of 3.2%. Whileexport agriculture is expected to stagnate, domestic agriculture willexperience some growth. The Epetroleum sector will decline slightly in 1987and 1988; some growth will be seen thereafter. The underlying assumptionof this projection is that oil prices will hover around US$16 until 1990and that the SPT will be reduced in 1988 and held constant at that levelover the period 1989-90. The reduced SPT in turn is expected to stimulatedrilling. It is also assumed that the expected cost/revenue ratio perbarrel of oil will be relatively constant and that the relationship of theexploration and production subsectors to the rest of the petroleum industrywill remain at the 1986 level.
8.21 Using growth rates of the recent past, the manufacturing sector isprojected to continue its dowaward trend. The implementation of someGovernment projects in 1988 will slow the continued decline of constructionactivities, but in the absence of a continuous and sustained level ofexpenditures, the slide will continue, unless construction in the privatesector picks up significantly. The hotel sector is projected to grow atabout 4.4% a year between 1987 and 1990. The value added in "GeneralGovernment" will remain constant over the period.
8.22 Trinidad and Tobago will maintain a positive trade balance, butthe deficit on the services account will increasingly become negative overtime. The current account balance will remain negative through 1990.Given the poor state of reserves, significant long-term borrowing isenvisaged in the next few years.
8.23 This scenario is untenable, as it assumes that the brunt of theadjustment will be met by increased foreign borrowing in the order ofUS$325 million a year. The experience of 1987, when foreign borrowingreached only US$100 million, shows that this scenario is unfeasible.Further, exacerbation or persistence of the declining economic trends since1983 cannot continue for much longer without endangering the socialstability of the country.
Scenario with Improved Policies
8.24 The second scenario, which takes a more optimistic view of futuredevelopments, is predicated on the adoption of an improved policy agendaalong the lines suggested in this report. This second scenario assumesthat the economy will start growing again in 1988 with a GDP rate of 0.5%projected for 1988 and 3.0% for 1990 and beyond. It is assumed that theGovernment ilnvestment program will be strengthened in 1988 and that itssectoral policies will start taking effect. The investment/GD?P ratio isprojected to rise from 20% in 1988 to an average of 29% during 1990-95.Oil prices are projected to remain at around US$16 per barrel until 1990and to rise to US$24 by 1995. It is assumed that Government policies canreverse the declining trend in oil production of recent years, and oilproduction is projected to increase by 2% in 1989 and by 2% between 1990and 1995. Urea prices are projected to rise from US$117 per metric ton in1987 to US$200 in 1990 and to reach US$244 in 1995.
- 50 -
8.25 Government efforts to attract private foreign investment should
result in a net positive inflow from 1988 on, reversing the trend of
previous years, but the amounts are not likely to be significant in the
short term. Increased external borrowing is projected at an average annual
rate of US$225 million between 1988 and 1990. However, to cover debt
servicing the country would require additional capital inflows. If debt
servicing of these additional amounts is provided for, the debt service
ratio would escalate from 20% in 1987 to 34% in 1990 and decline to about
26Z by 1995. The balance of payments current account deficit would
increase to 4.4% of GDP by 1990 and would be reduced to 1% of GDP by 1995.
The external debt/GDP ratio (37% in 1987) would also decline to 36% in 1990
and to 29% by 1995. Interest as a percentage of GDP will similarly decline
from 3.2% in 1990 to 2.8% in 1995.
8.26 With the right mix of policies and assuming that the international
economic environment remains favorable, the Government can reverse the
declining trends in exports and increase its import capacity. As far as
oil is concerned, it is increasingly costly to extract it from existing
wells, and greater incentives for exploration and drilling are needed. The
1988 Budget has provided some concession to the oil sector, but in view of
the expected decline in oil prices, these concessions may require further
modification. In the gas-based industries sector there is potential for a
significant increase in non-oil exports.
8.27 Given the fairly well-developed industrial infrastructure, cheap
energy and pool of skilled labor, a turnaround in the economy is possible,
and the scenario presented here is feasible. GDP growth rates are expected
to be modest, however, and with population rising at just under 2% per
capita, incomes will rise only a little through 1995.

- 51 -
PART II
SECTOR REVIEWS

- 52 -
Chapter IX
THE MANUFACTURING SECTOR
THE STRUCTURE OF PRODUCTION AND TRADE TO THE MID-EIGHTIES
9.1 Trinidad and Tobago's experience as a long-established exporter of
crude and refined hydrocarbons had imposed "dutch disease" effects on the
economy even before the first oil boom. As Table 9.1 shows, on the eve of
the first oil shock, the non-oil tradables sector (basically agriculture
and manufacturing) was much smaller than the norm for a country of similar
size and level of development. In 1972, agriculture and manufacturing
combined generated 28% of non-oil output, compared with a norm of 42%. The
share in' non-oil output of agriculture (an important source of inputs in
the early stages of industrialization) was below 6% and less than 40% of
the norm. Although output in the manufacturing sector was almost 80% of
the norm, it was dominated by refined petrochemicals, whose markets were
to decline sharply after the second (1979-81) oil boom. Moreover,
manufacturing other than oil refining was relatively uncompetitive and
heavily dependent on protection: like most Caribbean countries during the
post-war period, Trinidad and Tobago has favored a strategy of import
substitution over competitive manufactured exports.
9.2 Industrial production expanded during the oil booms of 1974-78 and
1979-81, but its share of non-oil output shrank and its viability was
uncertain. The contribution of the new large-scale gas-based industries
(notably steel, fertilizer and methanol), established with windfall
investments during the booms, was disappointing, primarily because of
chronic marketing problems that reflected a persistent overcapacity in the
international steel and petrochemical markets. Moreover, their relatively
meager expansion was offset by the sharp decline in oil refining, hitherto
the dominiant manufacturing sector. Meanwhile, the uncompetitiveness of the
non-hydrocarbon manufacturing sector was exacerbated by the appreciation of
Trinidad and Tobago's real exchange rate, especially during the second oil
boom.
9.3 Manufacturing value added was TT$1.43 billion in 1986, accounting
for 8.2% of GDP and 10.4% of non-mining GDP. Food processing dominated
(35%), followed by assembly industries (23%) and petrochemicals (17%),
including gas-based petrochemicals.
9.4 All three leading manufacturing subsectors are flawed, and none
furnishes a sure foundation for rapid expansion of production. Food
processing draws on a domestic agriculture that does not provide a
competitive base for sizable and rapid export growth and suffers from
deficiencies in packaging. Some export market niches have been established
in fruit juices, ethnic foods and fresh vegetables (which take advantage of
the limited surplus air freight capacity), but initially these gains are
likely to be offset by subsectoral losses through rationalization, notably
of the extremely high-cost domestic sugar industry. The assembly

- 53 -
Table 9.1: NON-OIL ECONOMY PRE-SHOCK STRUCTURE AND CHANGE, 1972-81(Percent)
Actual Share Chenery and Syrquin Norm a/
Initial Conditions
Agriculture 7.6 16
Manufacturing 19.5 26
Construction 6.0 6
Services 66.9 52
(Mining) 20.5 2
Average Annual Change, 1972-81, at Constant Prices
Agriculture -0.31 -0.49
Manufacturing -1.03 0.20
Construction 0.37 0.05
Services 0.99 0.35
Dutch Disease Index b/
1972 +14.21972-81 Change +10.5
Source: A. H. Gelb, "Windfall Gains, A Blessing or a Curse? A
Comparative Study of Six Oil Exporting Countries 1973-84," mimeo,
World Bank, Washington, D. C., 1986, p. 14.
a/ The norm is calculated from H. G. Chenery, and M. Syrquin,
Patterns of Development 1950-70, Oxford: Oxford University
Press, 1975.b/ Index = normal share of agriculture plus industry minus the
actual share of agriculture plus industry.
industries are dominated by complet.ely knocked down (CKD) autos (50% of
subsector output), which are of lower quality and greater cost than are
imported vehicles. CKD is a prime candidate for closure. As to
petrochemicals, the mid-eighties' expansion of gas-based fertilizers and
methanol was almost exactly offset by the collapse of refined oil products.
Other resource-based industries (such as ceramics and wood processing),
along with apparel and tourist goods, are perceived locally to present
growth opportunities, but none is sufficiently large to boost GDP
significantly in the medium term.
9.5 Although there are no obvious manufacturing subsectors that can be
targeted for growth, the recent performance of individual manufacturing
firms does provide grounds for optimism. Evidence emerged during the post-
boom period of more productive use of infrastructure, plants, labor and
freight. Policy measures therefore need to concentrate on the competitive
environment of the firm rather than, as hitherto, on the sector.

- 54 -
Table 9.2: CHANGING STRUCTURE OF THE MANUFACTURING SECTOR, 1970-87
1970 1975 1980 1985 1987P
Value (TT$ billion,current prices)
Total GDP 1.771 5.300 14.966 18.140 15.933
Non-oil GDP 1.643 3.445 9.090 14.460 12.715
Manufacturing: 0.397 0.792 1.338 1.676 1.941
Food, Drink & Tobacco 0.397 0.792 1.338 1.676- 0.690
Textiles, Garments,Footwear, Headwear 0.015 0.026 0.073 0.061 0.092
Printing, Publishing & Paper 0.013 0.026 0.046 0.109 0.167
Wood & Related Products 0.008 0.023 0.061 0.061 0.037
Oil Refining 0.166 0.319 0.416 (0.002) 0.1'55
Petrochemicals 0.032 0.045 0.078 0.280 0.241
Other Chemicals 0.041 0.088 0.222 0.292 0.037
Miscellaneous Manufacturing 0.008 0.021 0.025 0.031 0.052
Volume (1980=100)
Total GDP 59.8 68.5 100.0 83.3 n.a.
Non-oil GDP 59.3 65.9 100.0 83.3 n.a.
Manufacturing 83.7 78.3 100.0 87.4 n.a.
Food, Drink & Tobacco 56.3 83.2 100.0 87.4 n.a.
Textiles, Garments,Footwear, Headwear 122.7 93.3 100.0 39.5 n.a.
Printing, Publishing & Paper 93.6 108.5 100.0 79.4 n.a.
Wood & Related Products 42.6 66.7 100.0 56.3 n.a.
Oil Refining 197.7 94.3 100.0 36.9 n.a.
Petrochemicals 80.8 50.5 100.0 294.4 n.a.
Other Chemicals 71.0 78.8 100.0 83.5 n.a.
Assembly Industries 40.8 57.5 100.0 72.2 n.a.
Miscellaneous Industries 96.2 162.0 100.0 77.2 n.a.
P = Preliminaryn.a. Not available.Source: National Income of Trinidad and Tobago 1966-85, Port-of-Spain: CSO,
1987.
9.6 Unfortunately, the impressive improvements in productivitygenerated by the more efficient post-boom use of resources have been
associated with rising unemployment (Table 9.3). Particularly sharp declines
in employment occurred in textiles, garments, footwear and headwear prior to
the mid-eighties' devaluation and in the assembly industries thereafter.
However, the unemployment rate in the manufacturing sector was close to the
national average of 17% in early 1986. This rate was significantly better
than those for oil (26%) and construction (34%) but much worse than that of
agriculture (6%). At that time, the manufacturing sector accounted for 12.2%
of total employment, or around 48,000 jobs (including an estimated 3,600 in
oil refineries and 1,500 in sugar manufacture).

- 55 -
Table 9.3: EMPLOYMENT IN THE MANUFACTURING SECTOR, 1981-85(thousands)
1981 1983 1985
Total Labor Force 435.0 449.5 465.0
Total Employment 389.6 399.4 392.2
Mining 10.7 8.5 5.3
Agriculture, Fisheries & Forestry 43.2 38.8 45.6
Construction 77.4 74.5 63.5
Manufacturing 52.5 54.3 49.5
Food, Drink & Tobacco 10.3 11.6 10.3
Textiles, Garments, Footwear, Headwear 9.2 8.1 9,3
Printing, Publishing, Paper 3.2 3.8 3.2
Wood & Related Products 0.7 0.7 0.9
Oil Refining 6.3 5.5 4.3
Chemicals and Non-metallic Minerals 5.7 4.3 4.3
Assembly Industries 4.2 5.2 4.0
Miscellaneous Industry 12.9 15.1 13.2
Source: CSO The National Income of Trinidad and Tobago 1960-85,CSO Port of-Spain: CSO 1987; pp. 276-77
9.7 A corollary of the oil booms was a shrinkage of non-oil exports:
between 1976 and 1982, the share of domestic non-oil exports in GDP shrank
from 12.6% to 4.2% (Table 9.4). Food exports declined from one-third to
one-tenth of all non-oil exports, while manufactured exports expanded
significantly (in nominal terms), with chemicals rising to account for more
than half such exports. Trade figures for early 1986 suggest that a sharp
rebound was underway in the export of other manufactured goods, notably
white goods, albeit from a very small base. The fact that imports during
the same period show a marked swing away from consumer goods toward
intermediates and capital goods also suggests that the combined impact of
the post-boom contraction and exchange rate adjustments on the output and
trade of the manufacturing sector (although not on employment) was
beneficial.
9.8 The growth potential for manufacturing output, employment and
exports is examined in more detail below, starting with the energy-
intensive industries.
PROSPECTS FOR THE HEAVY HYDROCARBON-BASED INDUSTRIES
9.9 A significant fraction of the oil rents went into industrial
diversification via gas-based industries. Excluding infrastructure, the
gas-based plants absorbed more than US$1.45 billion. This income, which
had an ICOR of three, could have generated TT$1.2 billion of value added at
the 2.40 exchange rate and a still higher level of net export earnings, all
with fewer than 2,100 employees. Actual direct value added from the gas-
based industries has, however, been less than one-sixth what was expected
because of difficulties with plant start-up and unexpectedly depressed
international markets. In addition, the anticipated (although never
carefully researched) proliferation of linked industries such as component
supplies and downstream processing was constrained by doubts concerning the
viability of the gas-based industries.

Iablk 9.4: RECENT TRENDS IN NON-OIL TRADE, 1978 and 1980-85
1978 1980 1981 1982 1983 1984 1985 1988 1985 1988
First 8 months
Domestic Non-oil ExDorts (TTSm) 465.9 630.4 678.3 828.5 738.7 876.5 930.8 1290.1 n.a. n.a.
X Non-oil GDP 12.6 6.8 4.9 4.2 4.8 6.1 6.8 9.4 n.a. n.a.
X Non-oil ExportsFood A Live Animals n.a. 32.4 27.1 15.8 13.9 11.1 9.3 n.a. 10.7 12.8
Beverages A Tobacco n.a. 4.3 3.7 4.8 3.1 2.5 2.6 n.a. 2.8 3.3
Crude Materials (Excl. Fuel) n.a. 0.3 0.1 0.0 0.0 0.0 0.0 n.a. 1.5 1.9
Oils and Fats n.a. 0.3 0.1 0.0 0.0 0.0 0.0 n.a. 0.0 0.0
Chemicals n.a. 48.0 49.2 55.3 60.8 84.2 72.7 n.a. 71.8 66.5
Manufactured Goods n.a. 13.7 17.3 20.4 18.5 18.0 11.2 n.a. 10.9 22.6
Machinery A Transport n.a. 1.9 1.8 2.7 1.3 0.8 0.5 n.a. 0.8 0.9
Miscellaneous n.a. 0.4 0.3 0.2 3.4 2.2 2.0 n.a 2.0 2.2
Domestic Non-oil Imports (TTlb) n.a. 4.798 4.787 6.594 5.881 4.581 3.831 n.a. 1.779 2.271
X Non-oil Imports
Consumer Goods n.a. 24.2 27.7 23.2 27.3 31.7 30.1 n.a. 28.5 21.7
Intermediates n.a. 33.0 33.8 30.3 34.2 37.0 35.5 n.a. 34.8 37.6
Raw Materials n.a. 8.4 7.5 8.3 5.7 8.0 7.0 n.a. 7.8 8.5
Capital Goods n.a. 36.4 31.1 40.2 32.7 23.2 27.2 n.a. 28.9 34.1
Source: CSO, Review of the Economy, Port-of-Spain: CSO, 1987, Appendices 75.70.

- 57 -
9.10 The disappointing experience of Trinidad and Tobago'sdiversification into gas-based industries parallels that of other oil-exporting countries. The start-up of such new capital-intensive, scale-sensitive plants in developing countries exhibits a distinctive timetrajectory, measured in terms of direct added value and indirect (linked)activities (Figure 1). The initial stimulus to the domestic economy takesthe form of a construction-related blip. Next there is a period of mutedactivity in which the viability of the new gas-based enterprise may be indoubt. Finally, there is the high probability of a rebound in domesticoutput following retirement of the debt. Consequently, the long-termbenefits to the economy may be substantial, but come only after adisappointing start. The gas-based industries of Trinidad and Tobago arestill in the second stage shown in Figure 1. The critical question iswhether the rebound will come, and when.
9.11 Table 9.5 summarizes the important characteristics of Trinidad andTobago's gas-based plants. Although cost overruns and teething problemswere especially severe in the case of the steel plant and moderately so forthe Fertrin ammonia plant, all the Trinidad and Tobago gas-based plants aretechnically efficient and (with debt restructuring in steel), they are allpotentially competitive at prices covering the replacement costs of anefficient new producer. The joint-venture ammonia plants already generateprofits; the wholly state-owned methanol and (less so) urea plants cancover their variable and most debt-service costs except in times of acuteprice declines (as occurred in 1986); and ISCOTT is moving strongly towardbreak-even, albeit after accumulating sizable operating losses.
9.12 The gas-based industries of Trinidad and Tobago have considerablepotential for a rebound in their contribution to both GDP and exportearnings for three reasons: the eventual attainment of long-termequilibrium prices will raise revenues and ease debt retirement.; a largerpost-debt cash flow will facilitate low-cost capacity expansion; and theirimproved viability will trigger investments in linked supply and downstreamprocessing industries. Since there are also prospective gains from therationalization of the oil refinery sector, the 1986 output level inhydrocarbon processing (i.e., oil- and gas-based industry combined) issignificantly below potential. A rebound in output would boost Trinidadand Tobago's total exports significantly, since petrochemicals and steelgenerated 20% of Trinidad and Tobago's export earnings in the mid-eighties,compared with 75% from crude oil and 5% for agriculture and the non-hydrocarbon manufacturing sector. Unfortunately, the timing of the reboundcannot be accurately ascertained, nor is its occurrence guaranteed.
Table 9.5: CHARACTERISTICS OF TRINIDAD AND TOBAGO'S GAS-BASED INDUSTRY
Company Ownership Plant Cost Product Start-up Employment( % State) (US$m) (Year)
ISCOTT 100 460 Steel 1981 1,150
TTMC 100 180 Methanol 1984) 148
TRINGEN 1 51 107 Ammonia 1977) 425
FERTRIN 51 315 Ammonia 1981 270
TTU 100 19U Urea 1Q84 80

Figure 1. TypicaL Time Trajectory For Direct And Indirect Added VaLue In Gas-Based Inaustry
-HIGH RISK PHASES + . REDUCED RISK PHASES A
+ + -.
CnIRECT ANsCtruct Debt Retirement. Capital Low Cost Expansion+INDIRECT -ion Blip T*chnical Accumulstion Linkage Proliferation+ //
ADDED VALUE Improvement Agglomeration Benefits /
/o
|__,______-_-ACTUAL TOTAL DIRECTAND INDIRECT IMPACT
TREND TOTAL DIRECT-- / .. AND INDIRECT IMPACT
' -- v- - ---- TREND DIRECT
/ / 'IMPACT ONLY
-5 0 5 10 20. 40
TIME (YEARS FROM START-UP)

- 59 -
9.13 Each principal hydrocarbon-based industry subsector is now examinedin turn.
The ISCOTT Iron (DRI)/Steel Plant
9.14 ISCOTT had an unusually protracted and difficult start-up. Capacityutilization did not exceed 29% during the first five years of operation, bywhich time accumulated losses approached TT$1.5 billion (Table 9.6).Although marketing was the key deficiency, little progress was made inresolving the typical technical, labor and managerial teething problems of anew plant. Plant closure was actively considered. By 1987 ISCOTT hadaccumulated operating debts of TT$1.8 billion, but from early 1986 on it hasmade solid progress in solving its problems.
9.15 A two-year management agreement with New Hamburg Steel and VorstAlpine commenced in January 1986, and within 19 months it had achievedsignificant improvements. Clear progress was made in implementing acorporate plan that aimed for operational break-even by 1989 and completeself-financing two years later (Table 9.6). However, further funding by theTrinidad and Tobago Government is needed until 1989, assuming the markets areno worse (and are no better) than at present. Total additional Governmentfunding is projected as an equity infusion of TT$279 million over 1987-88.Thereafter ISCOTT should be self-financing.
9.16 The new ISCOTT strategy is predicated upon the attainment of fullcapacity and a reorientation of the product mix from predominantly low valuemesh to predominantly high value wire rod products. This shift will capturethe benefits of the plant's high technical specifications. The planprudently assigns a minor role to the US market (less than one-tenth ofsales) and looks to accelerate diversification into the major EEC and FarEastern markets. The new marketing strategy is projected to increase netsales by 50% between 1987-90. However, renegotiation of a previous agreementwith a local steel processor, Centrin, is required. In addition tosuccessful marketing, the plan calls for executing long-delayed technical andoperational improvements. It is estimated that TT$69 million in investmentsare needed for the required improvements through 1987-88. Table 9.6summarizes the cash flow projected under the ISCOTT plan.
9.17 The management contract is tackling the typical post-start-upimprovements, but after a costly five-year delay. The plan's goals appearrealistic and do not depend on a price rebound or devaluation (both of whichwould make the task easier). Some anxiety centers around the renegotiationof the management contract at the close of 1987: the acquisition of amajority equity stake by a private partner is under discussion. The presentmanagers are expected to take the equity stake, but whoeven does so, it isdesirable that they contribute to the capital infusion the plan requires,rather than entering gratis. This approach would help the Trinidad andTobago Government and serve as an expression of commitment to futureviability.

Table 9.B: ACTUAL AND PROJECTED ISCOTT CASH FLOW, 1984-91
(TT3 million)
Actual Proiected
1984 1986 1988 1987 1988 1989 1990 1991
Net Sales 109.2 103.3 233.0 412.0 499.6 580.9 612.7 621.2
Net Profit (195.6) (260.6) (234.2) (180.9) (64.0) 21.0 73.1 99.2
Total Receipts 647.0 285.2 487.6 843.7 643.2 665.6 676.6 617.2
Disbursements:Government Advances - - - - - - - 68.3
Purchases 122.6 109.6 161.2 240.7 349.6 322.3 338.3 328.9
Principal 306.3 83.1 104.4 99.8 100.0 100.4 100.6 60.6
Interest 43.0 43.2 61.1 48.2 39M9 31.3 22.5 14.9
Taxes 12.0 12.1 16.4 68.1 14.7 12.9 11.5 9.2
Labor 60.0 51.8 68.1 63.6 65.2 57.1 57.1 67.1
Consortium - - 43.3 59.7 28.4 13.4 - - la
Other Cost - - 60.9 62.7 48.9 48.8 48.6 48.6
Capital Investmont - - 0.7 42.8 26.0 - - -
Total 634.3 279.8 476.1 873.2 672.7 688.0 678.6 687.7
Total Assets 1181.8 1140.0 1183.4 1167.8 1158.3 1105.5 1051.4 1027.6
Current Liabilities 187.3 326.7 387.0 371.7 303.8 282.6 188.7 162.6
Long Term: Loans 346.0 459.7 410.3 314.3 218.3 122.5 67.2 35.0
Govt. Advances 673.7 718.2 246.7 390.1 624.3 624.3 524.3 468.0
Euro-Loan - - 43.3 146.8 200.2 213.6 213.6 213.6
Total Liabilities 1105.9 1504.6 1086.3 1221.8 1246.6 1143.0 993.8 857.0
Net Worth:
Capital Stock 1112.8 1112.8 1830.9 1830.9 1830.9 1830.9 1830.9 1830.9
Rotained Earnings (1037.0) (1477.8) (1734.0) (1885.0) (1919,.2) (1868.4) (1773.3) (1660.3)
Total Liabilities
A Net Worth 1181.8 1139.6 1183.4 1167.8 1158.3 1105.5 1061.4 1027.6
Source: ISCOTT.
- 61 -
9.18 The ISCOTT plan is sensible and, if successful, will boost output(already doubled in 1985-87) by a further 25%. As the foreign debt isretired, ISCOTT should contribute significantly to both domestic valueadded value and net foreign exchange earnings. Subsequent expansion vianew investment is not under consideration, unlike in the methanol andfertilizer subsectors.
The Trinidad and Tobago Methanol Company (TTMC)
9.19 As with ISCOTT, the methanol plant was constructed as a whollystate-owned venture, but the total investment was smaller (US$180 million)and the cost overrun more modest (5%). The plant appears technicallyefficient, although electrical outages and initial technical modificationsdelayed attainment of full capacity until 30 months after start-up. Atfull capacity in 1987, the cash costs are just over US$60 a tonne, of whichgas priced at US$1.06/MCF comprises two-thirds. That a plant with such acompetitive cost structure still faces problems is testimony to the extremedifficulties caused by the excess capacity in the international methanolmarket.
9.20 Unlike ISCOTT, marketing arrangements (long-term contracts withthree firms for 85% of production) permitted rapid attainment of fullcapacity (in excess of 390,000 tonnes). Yet, even with low operating costsand assured market access, the prices prevailing in the mid-eighties havenot provided an adequate margin for debt service. TTMC has an outstandingbank loan of US$50 million and suppliers' credits of just over US$65million. Its debt/equity ratio is around 2:1. Repayment of the interestand principal on the bank loan commenced in 1985, and it adds theequivalent of US$33 to each tonne produced at full capacity operations in1987. Repayment of the principal on the suppliers' credit commences in1988. With associated interest charges, it will add almost US$40 to eachtonne in that year, tapering off to US$28 a tonne in 1992, the final yearof debt servicing. The break-even price needed to service the full 1988debt burden is therefore US$135 > tonne, whereas the World Bank projectsprices of US$ 110/tonne into thu mid-nineties. This figure contrasts withprojections of the World Bank of over US$300 a tonne in 1982, when theTrinidad and Tobago plant was sanctioned. The difference reflects the
ilure of the expected methanol fuel market to materialize.
9.21 Neither mothballing nor lower output will reduce the expectedlosses. However, there is scope for cost saving through a one-thirdreduction in the price of gas (to the levels paid by ISCOTT); lowerinsurance; a one-third reduction in sales discounts (presently 10% ofrevenues); intearnationalization of the administrative services presentlysupplied by NEC; and release of TTMC from its contract to pay freight rates50% above spot prices in order to cover the capital recovery costs of threestate-owned (and yen-financed) methanol tankers. These measures wouldpermit the methanol plant to generate adequate revenues to cover itsoperating costs and debt service charges at prices of US$110 a tonne in1988, when the debt service is most burdensome.

- 62 -
9.22 Some measure of the volatility of the methanol market is given by
the fact that as recently as early 1986, expansion prospects seemed
promising. At that time, the Government of Trinidad and Tobago and ICI
were negotiating for the construction of a second methanol p.ant at Point
Fortin. It was planned that ICI would take 30% of the equit,v and the
Government 30% with the remainder financed by the CDC/IFC. "he project was
costed at US$150 million. Of that, an estimated US$17 million was the
extra cost of construction required if the plant was sited at Point Fortin
rather than alongside the other plants at Point Fortin location (which the
Government favored for social reasons) and also brought pressure to trim
the price of gas. Agreement could not be reached. Although NEC reports
continuing interest in a second methanol plant, as well as in downstream
plants (including a 25,000 tonne acetic acid plant, a 30,000 tonne
formaldehyde plant and an MTBE unit), investment prospects in methanol
appear slim until the viability of TTMC improves, i.e., until the debt
burden is relieved and/or prices become firm.
The Fertilizer Sector
9.23 Fertilizer is the most successful of the gas-based industries.
With the exception of the recently constructed, wholly state-owned urea
plant, fertilizer production in Trinidad and Tobago has been undertaken by
or with foreign partners. The first ammonia plant was constructed in the
late 50s by W.R. Grace to serve the countries of the Commonwealth
Caribbean. In the mid 70s, that company built a second plant, Tringen, as
a joint venture in which the Government held 51% of the equity. A third
and larger fertilizer plant, Fertrin, was brought on-stream in the early
80s as a joint venture between the Government and AMOCO, the country's
largest producer of crude oil and gas. A wholly state-owned urea plant
absorbs some 40% of Fertrin's output at full capacity (400,000 tonnes).
Finally, another ammonia unit, Tringen II, is schedtuled to enter production
in 1988 and will raise total ammonia capacity in Trinidad and Tobago from
1.03 million tonnes to 1.48.
9.24 Cash costs for ammonia production in Trinidad and Tobago are
estimated at US$80 a tonne, about the middle of the global price range and
around $20 a tonne cheaper than US producers. The country is well-located
to serve markets in North America, Latin America and Europ,, but low
international prices in the late 80s limit expansion prospects. This
situation is unfortunate, since there are significant benefits from any
expanslon of existing plants, as noted earlier and as Tringen II
demonstrates. The initial Tringen plant was highly successful: Grace was
responsible for sales on a take-or-pay basis, and as the debt was retired
and prices firmed, the joint venture cash flow expanded, prompting Grace to
propose Tringen II in 1983. Tringen I has retired its third-party debt,
and the new project (costed at US$190 million) is financed from internal
cash flow and loan capital. The cash costs of the new plant will be lower
than those of its sister plant, even though it will pay more for gas,
because it will use 20% less gas than Tringen I. Moreover, significant
savings to the joint venture in lower labor and overhead costs are expected
from the expansion. Nevertheless, Grace reported that the sales it made on
behalf of Tringen in 1986 were unprofitable, and, although the position
eased in 1987, the parent company plans to sell its worldwide agro-
chemicals operations. Grace cites low margins, which it attributes to the
high level of participation by state enterprises in global markets.

- 63 -
9.25 Even thov'gh AMOCO's joint venture plant faces a more difficult
launch than those of Grace and is potentially higher cost, it appears less
skeptical about market prospects. Its view parallels that of the World
Bank, which expects significant price firming through the mid-term.
Fertrin experienced a 30% cost overrun that pushed its debt/equity ratio in
excess of 73%. It speedily pursued productivity-enhancing improvements,
including the upgrading of both production units in 1984. Plans are under
consideration to boost capacity by 14% while simultaneously lowering gas
consumption per tonne. AMOCO handled marketing during the first five
years, but Fertrin will assume full responsibility in 1988. The original
loatn was denominated in US dollars and will be retired by 1990, but low
ammonia prices have required further loans from the equity partners in
order to cover debt service (Table 9.7). The 1985 devaluation adversely
affected the plant and necessitated a TT$153 million write-down on account
of the US dollar-denominated loan. Since the shareholder loans (which
carry 12% interest) have become burdensome, consideration is being given totheir conversion into equity.
9.26 The urea plant, managed by Fertrin, is technically sound. But it
encountered marketing problems that depressed capacity utilization to below
90% in 1986 and 50% in mid-1987. Although Fertrin supplies ammonia to thewholly state-owned urea plant that was completed in 1984, it wiselydeclined direct investment. Urea sales are more volatile than ammonia
sales since they tend to rely more on spot markets. Operating losses were
TT$20 million in 1986. The Government proposed to merge the urea plant
with a new joint-venture ammonia unit, using its investment in the ureaunit as equity. NEC is considering a new US$250 million ammonia plant
(capacity 550,000 tonnes), but an equity partner that could market both the
increased ammonia output and the urea had not been found as of mid-1987.
9.27 Recent price movements have not only depressed value added and netforeign exchange in Trinidad and Tobago's most successful gas-basedindustry, they have also dimmed prospects for further investment that two
years ago appeared promising. In the subsector as a whole, netbacks on gas
(the margin per MCF of gas left after allowing for processing and freightcosts but before deducting gas extraction costs) have fallen from theprojections in excess of US$3/MCF during the 1979-81 boom to aroundUS$1/MCF for ammonia and negative for steel and urea.
9.28 Nevertheless, rebound potential exists from new investment as well
as existing plants. Trinidad and Tobago has proven and potential gas
reserves in excess of 18 trillion cubic feet, sufficient to expand existing
product lines and to support an LNG project. More immediately, further
investment in gas extraction is required to meet present commitments
through the early 90s. AMOCO is presently the leading supplier, but the
Government of Trinidad and Tobago prefers to diversify its suppliers be
bringing in its own SECC fields. Under the most conservative estimate(assuming that only proven reserves are extracted and using a 14% discount
rate), the long-run marginal cost of extraction from the fields is
US$0.81/MCF. That figure falls to US$0.26/MCF if credit is given for the
extraction of probable as well as proven reserves and also for the revenues
from the sale of the sizable condensate resources. Morgan Grenfell expects
that it will be possible to raise the required TT$800 million on a project-
financed basis, with no Government guarantees.

- 64 -
9.29 In the longer term, Tenneco/Midcon, which negotiated for a large
LNG project with the Trinidad and Tobago Government during the second oil
boom, has once more expressed interest in LNG. The recent overture is
based on expectations that US environmentalist concerns will place a
premium on clean, safe offshore gas imports in the late 90s. Construction
of the LNG plant woul.d need to start around 1992.
The Oil Refining Sector
9.30 The gains in GDP from the expansion of gas-based industries have
been offset by the collapse of the other major hydrocarbon-based industry,
oil refining, since the second oil boom. The rated capacity of the
country's two oil refineries more than halved in the mid 80s, from 460,000
barrels per day (bpd), while combined throughput shrank to below 90,000bpd. Annual losses of the refinery industry were projected at over US$100
million in 1985, when the state-owned oil company, Trintoc, purchased the
Texaco refinery.
9.31 There is no firm timetable (such as that for ISCOTT) for restoring
the viability of the refining operations. It remains far from clear
whether, without offshore investments in distribution facilities, the
Trintoc refining complex can achieve viability. Closure of the Point
Fortin refinery appears desirable and mighLt be facilitated by establishing
of an export processing zone there to ameliorate the unemployment.
PROSPECTS FOR THE NON-HYDROCARBON MANUFACIURING SECTOR
9.32 The uncertainties surrounding the, future of the export-dependent
hydrocarbon-based industries underscore thLe benefits from diversificationinto other manufactured exports. Yet the non-hydrocarbon manufacturingsector is strongly import-oriented: it generates negligible exports and is
a large net consumer of foreign exchange. It depends heavily on the high-
cost processing of overwhelmingly imported inputs and reflects the
reluctance of previous administrations to wean the sector from infant
industry status. In particular, restrictions on competing manufacturedimports and the rolling-over of infant indlustry incentives have assured
good margins on domestic sales, so that the attraction of exports and
competitive pressures are diminished. Reliance on captive demand had led
to the neglect of marketing skills. Inste!ad, public institutions such as
the Industrial Development Corporation (IDC) have stressed technical
matters. Private institutions have reinforced the split between production
of previously imported items; private importers have tended to contract
domestic production out to affiliates whose job was physical productionrather than production and marketing combilned. The cost of such a system
has been borne by the consumer in terms of higher prices, lower quality
goods and the higher taxation needed to offset the duty concessions given
to the manufacturing sector, However, the post-boom contraction is leading
to shifts, spurred by the devaluation. They could be accelerated by
Government reform of incentives and the support institutions.
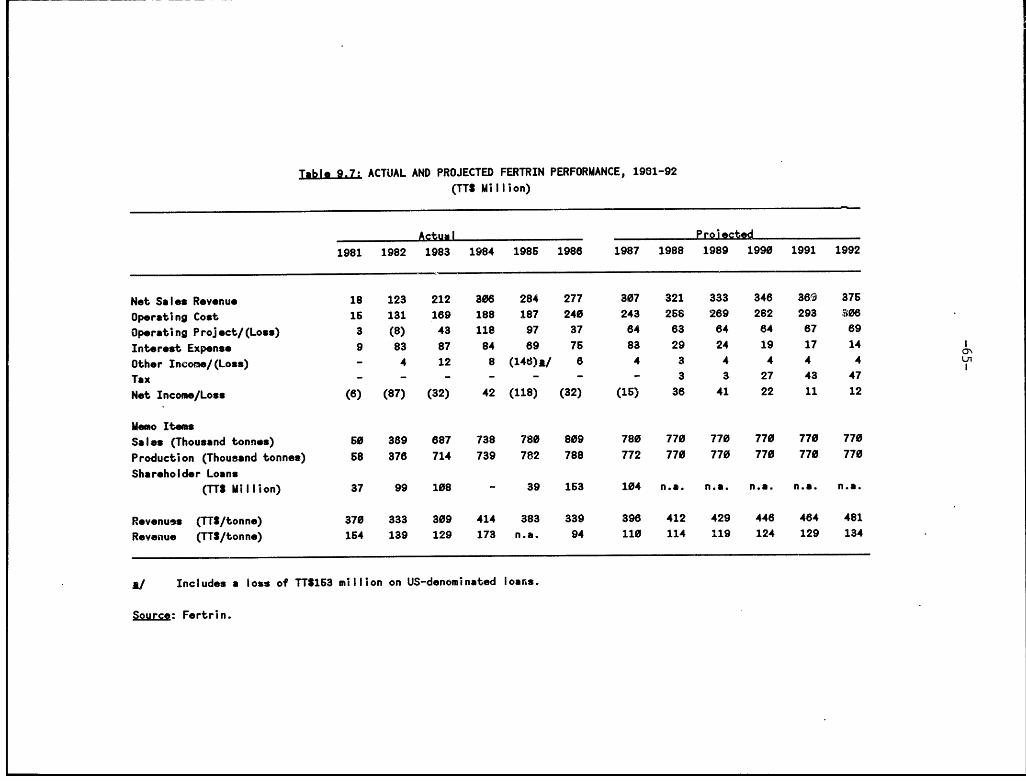
Table 9.7. ACTUAL AND PROJECTED FERTRIN PERFORMANCE, 1981-92
(TTS Million)
Actual Projected
1981 1982 1983 1984 1985 1988 1987 1988 1989 1990 1991 1992
Not Sales Revenue 18 123 212 306 284 277 307 321 333 346 3 85 375
Operating Cost 15 131 189 188 187 240 243 266 289 282 293 308
Operating Project/(Loss) 3 (8) 43 118 97 37 84 83 84 84 87 89
Intorest Expense 9 83 87 84 89 76 83 29 24 19 17 140\
Other Income/(Loss) - 4 12 8 (146)i/ 8 4 3 4 4 4 4 un
Tax - - - - - - - 3 3 27 43 47
Not Income/Loss (6) (87) (32) 42 (118) (32) (16) 38 41 22 11 12
Memo Items
Sales (Thousand tonnes) 60 389 887 738 780 809 780 770 770 770 770 770
Production (Thousand tonnes) 58 376 714 739 782 788 772 770 770 770 770 770
Shareholder Loans
(TTS Million) 37 99 108 - 39 153 104 n.a. n.a. n.a. n.a. n.a.
Revenuos (TTh/tonne) 370 333 309 414 383 339 398 412 429 448 484 481
Revenue (TTS/tonne) 154 139 129 173 n.a. 94 110 114 119 124 129 134
k/ Includes a loss of TTS153 million on US-denominated loarns.
Sourco: Fertrin.

- 66 -
9.33 In the absence of clear target subsectors, measures to expand
manufacturing output must be oriented toward individual firms. In this
context, the existing framework of institutions and incentives are critical
constraints. Individual firms in Trinidad and Tobago exhibit wide
variations in behavior, with successful competitive behavior being
displayed by some of the least likely firms. Nevertheless, within Trinidad
and Tobago, there is a general consensus that non-hydrocarbon resource
processing offers considerable scope for expansion, whereas labor-intensive
and assembly industries do not. A comparison of these two subsectors
follows; it qualifies these conclusions, illustrates the manufacturing
sector's problems, and points to opportunities that enterprising companies
are already g'rasping.
Non-Hydrocarbon Resource Processing: Food Processing
9.34 After the gas-based industries, processing of non-hydrocarbon
resources is widely perceived to offer the strongest base for expanding
manufacturing output, employment and exports in Trinidad and Tobago. Food
processing is perceived especially favorably, and important successes
appear to support this view. Closer inspection reveals, however, that this
success owes more to the initiative of specific individuals and firms than
to an inherent comparative advantage. The performance of the sector as a
whole has been disappointing: the food processing industry essentially
engages in repackaging; it is a heavy consumer of foreign exchange; most
inputs are imported (the sector is estimated to import more than 80% of its
inputs and to be responsible for one-quarter of total food imports); there
are relatively few links to domestic agriculture; and extra-regional
exports ran less than 5% of total sales in 1983. Packaging material in
partlcular is imported, since domestic production of cans and polyethylene
film has been relatively inefficient.
9.35 Food processors complain that domestic food supplies are
unreliable, overpriced and of variable quality. In fact, domestic food
production is overly diversified and relatively uncompetitive. It needs to
concentrate on growing fewer crops with greater efficiency. At the same
time, the country's packaging industry must improve its price, quality and
product range. The suggestion has been made that large-scale agribusiness
is required to supply some food inputs either by growing them itself or by
coordinating the generally small farms of Trinidad and Tobago. The large
state-owned sugar producer, Caroni, could pay a useful role here, assuming
certain reorganizational changes to put the company on a more efficient
basis.
9.36 Nationalized in two stages between 1970 and 1975, Caroni had a
capacity of 220,000 tonnes that it never attained because of declining
yields, deteriorating sucrose extraction, high absenteeism and arson. As
output fell, costs soared, and Caroni became one of the world's highest
cost producers. While the situation has improved, Trinidad and Tobago will
be fortunate in 1987-88 to produce at US$600/tonne, three times the cost of
an efficient producer. Plans to divest cane production to smallholders as
part of a redundancy scheme seem likely to depress both yields/hectare and
sucrose extraction further.

- 67 -
9.37 To reduce its financial dependence on the Central Government and
to play a more active role in lessening the food import bill, Caroni has
been devoting an increasing amount of its resources to the production of
food crops. Some are still in the experimental stage. As part of the
effort to work out its own survival, Caroni has of necessity become more
involved in the agro-industrial business. Caroni, however, should not get
a monopoly in the field.
9.38 The ra-ionalization of Caroni is likely to depress agro-industry
in the mid-term, but there will be offsetting expansion. For example,
advantage has been taken of spare air freight capacity to supply fresh
produce to the EEC markets, notably off-season fruits to the UK. One such
manufact-urer has successfully penetrated the health food juice market in
the United Kingdom and is preparing to move into the North American market.
A second food manufacturer, employing 400 workers, has expanded its share
of the CARICOM market for confectionary, snack foods and cereals to aroiund
one-third of sales and has begun to enter the US market via Puerto Rico.
Export incentives, including grants of 50% toward market research and tax
offsets equivalent to 150% of export profits, were used. However, duty-
free imports and negative listing of rival international brand name
products are considered essential to maintaining the higher margin
domestic market. That a firm with no clear comparative advantage, but with
high domestic value added can export into a highly competitive market,
suggests the primacy of initiative, as the determinant of export
performance. However, over the short term, the agro-industry sector may
actually contract as gains by expanding firms are more than offset by the
losses of firms responding to structural change.
Non-Hydrocarbon Resource Processing: Construction Industries
9.39 The expected (but never carefully researched) linked investments
in downstream processing from ISCOTT have been disappointing. The
subsector is dominated by locally owned Dansteel, which is the parent
company for two subsidiaries using ISCOTT products. The smaller subsidiary
is the TT$20 million Trinidad Steel and Wire Products Company Ltd., which
has 36,000 tonnes of capacity and employs 157 workers in the production of
nails and drawn wire for the CARICOM market. The larger subsidiary Is
Centrin, which represents an investment of TT$120 milliofi in a 90,000 tonne
plant that transforms ISCOTT billet into merchant bars and reinforcing
bars. The plant employs 250 workers and exports 90% of its output, mostly
to Puerto Rico. Mindful of US anti-dumping charges, Centrin shunned
Government incentives and instead extracted an extremely favorable pricing
agreement for its key input (steel) from the previous ISCOTT management.
9.40 A pricing disagreement between ISCOTT and Centrin has been caught
up in negotiations over ownership of the steel plant. Centrin argues
against foreign ownership. ISCOTT management (also the prospective foreign
equity partner) claims that Centrin's operations are at variance with the
long-term plan for upgrading product quality and value and that vertical
integration is unnecessary, since Centrin is free to imtport billet at
competitive prices. To the extent that this agreement prevents ISCOTT from
selling higher quality products at higher prices, it depresses the revenues
of the main plant. If the Centrin pricing agreement is legally binding,

- 68 -
the Trinidad and Tobago Government may have to compensate one of the
signatories so that the agreement is voided and the steel rehabilitation
plan can be implemented.
9.41 In 1982, price controls in the cement industry required a subsidy
of TT$69 million. Even so, the inefficient state-owned cement factory
still lost almost TT$7 million, even with cheap electricity and gas
supplies. In the following year, capacity doubled with the start-up of a
new plant, and price controls were eased and subsidies phased out. In
1984, the expanded facility received no subsidy, operated at 81% of
capacity and recorded relatively modest losses of TT$12.8 million.
However, as Table 9.8 shows, the productivity gains and loss reduction were
halted by the sharp decline in domestic demand that accompanied the
recession. Cement exports, which recommenced in 1986 in order to make up
the shortfall from the sister Barbados plant, are projected to grow
fivefold in 1987, as the Trinidad and Tobago plant uses this avenue to
boost capacity utilization and reach break-even. Still greater efficiency
can be achieved through closure of the original kilns and through greater
energy conservation and labor productivity in the new units.
Table 9.8: PERFORMANCE OF TRINIDAD AND TOBAGO CEMENT LTD., 1982-86
Jan-Jun.
1982 1983 1984 1985 1986 1987
Volume (thousand tonnes)Domestic Demand 457.9 485.6 410.1 341.5 319.3 152.7
Domestic Capacity 250.0 500.0 500.0 500.0 500.0 500.0
Domestic Production 189.2 389.5 405.4 328.1 329.9 186.2
Exports - - - - 9.5 26.1
Key Input Costs (TT$/t)Labor 90.65 66.82 65.24 68.77 68.22 40.14
Electricity 3.26 1.57 9.47 9.18 8.06 9.00
Gas 12.80 6.06 14.39 13.C1 1 19.88 1.95
Subsidy 363.99 11.40 - - -
Performance IndicatorsCapacity Utilization (%) 76 78 ; 1 66 66 74.5
Output/Worker(tonnes) 350 620 703 593 611 700
Profit (Loss) (TT$/tonne) - (49.41) (31.65) (17.24) (27.03) (40.29)
(*) Includes interest on government loans towards capital expenditure
on the new plant which was comission in 1984Soturce: Trinidad and Tobago Cement Ltd.
9.42 Other non-hydrocarbon resource-based projects under consideration
include a joint venture with an Italian firm for the production of ceramic
tiles for the US market; the production of asphalt roofing tiles for the
North American market; and the manufacture of teak furniture. There is
also interest in processing Guyanese resources such as kaolin, taking
advantage of Trinidad and Tobago's cheap gas as well as its political
stability to attract investment in processing that is unlikely to be
attracted to Guyana, given that country's economic problems. Only one of
these projects was firm in mid-1987.

- 69 -
The Assembly and Associated Component Industries
9.43 The assembly industries are dominated by the inefficient CKD
automobile assembly firm. Some assembly activities, however, notably
kitchen appliances, managed to expand their export sales to the CARICOM
market after the devaluation. The domestic assembly of automobiles was
pushed in part because of the potential to spin off component manufacture.
The operation is high cost, produces an inferior product and has spawned an
inefficient component industry.
9.44 The industry is plagued with surplus capacity. Domestic demand
peaked at 24,000 vehicles in 1983 and is projected to contract to 6,800 in
1987. 'While annual demand under "normal" conditions is estimated at 10,000
units, the three domestic assembly firms could produce 30,000 units per
year on a single shift operating five days a week. One assembler has
closed, and there are plans to rationalize the two remaining units by
reducing the number of models from the original 15 to 8, then to 5 and
finally to 2. Plans to shift some domestic assembly capacity to buses and
light vans are also being considered. Closure of the sector is presently
ruled out by unemployment considerations.
9.45 The linkages generated by the assembly industry, which include
locally manufactured tires, paints and batteries, have been disappointing.
One factory has manufactured tires since 1986, receiving duty-free import
concessions, negative listing of competing products and a 10-year tax
holiday. It produces a high cost, low quality product: even though
imported tires cost 25% more than domestic ones (including duty of 84%),
they are preferred. Profits were made in the domestic rubber industry
(which the tire factory dominates) during the boom years, averaging 6% of
total sales in 1980-82, of which one-third was attributable to duty
concessions. In the mid 80s, the tire plant operated at around 55% of
capacity (it has never surpassed 65% capacity), supplied just under half
the domestic market and lost money. In the absence of management changes
and considerable new investment, there is no possibility of exporting.
9.46 The strategy of increasing the sourcing car components is favored
by the IDC, even though it has been very disappointing. Local sourcing has
boosted the cost of cars: the car kit shipper makes a deletion allowance
where local products are to be substituted, but the allowance is seldom
more than a fraction of the local manufacturing cost. Some observers
suggest that Trinidad and Tobago should opt for global sourcing by
concentrating on a single component (springs, based on ISCOTT steel, were
suggested) that it could produce on a scale sufficient to capture the
economies of long production runs. It is unlikely that this approach will
be feasible. In any case, it is being overtaken by the switch--occasioned
by ever shorter product cycles--from production line to flexible operation
in industrial countries. Such a technological shift may eventually relieve
tiny countries of the disadvantage of a small domestic market, but that is
a long-term prospect.
INSTITUTIONAL REFORM FOR INDUSTRIAL PROMOTION
9.47 Since subsector targeting has not worked, a company-level approach
is presently more appropriate: Trinidad and Tobago firms show clear
evidence of being able to flourish in speciality market niches ranging from

- 70 -
offshore engineering equipment through speciality garments to ethnic foods.
Initially there are opportunities to link underused domestic productive
capacity and cheap (relative to industrial countries) skilled labor to
overseas markets. Already in post-boom Trinidad and Tobago, more
productive use is being made of infrastructure, manufacturing plants, labor
and spare freight capacity. Key Government institutions are still focusing
too much attention on the longer term goal of attracting new investment.
Marketing knowledge and skills, rather than new investment, are the
immediate bottleneck: the manufacturing sector of Trinidad and Tobago
requires contact between domestic manufacturers and prospective industrial
country marketers/investors.
9.48 The new infrastructure, which appeared inadequate under the boom
conditions, is more appropriate in the post-boom period, as the economy
has contracted and initial teething troubles have been reduced.
Significant improvements have occurred in electricity generation and
transmission; road congestion has eased; telecommunications are effective;
and shipping turnaround times have been shortened, as port throughput has
declined, with workers responding to the recession by accepting real cuts
in wages and being more responsive to productivity improvements. For
example, a clay brick factory laid off 95 of its 410 workers over a single
year without any loss of output; or again, the workforce in a plant
manufacturing offshore oil industry equipment instituted a bonus system
that boosted output eight-fold and raised labor costs by only 40% in
1985-87. A CSO comparison (Review of the Economy, 1986, page 59) of change
in the average weekly earnings and productivity of productive workers in
industry provides an overview of the switch. In 1984, wages increased
14%, and productivity grew by only 5%. However, in 1985, wages grew 5% and
productivity 10%, while in the first six months of 1986 wages declined 9%
and productivity jumped 31%. The new equipment installed by manufacturers
during the boom is now frequently underutilized, and the need to amortize
it exerts pressure for more efficient use which in turn gives a strong
incentive to seek out new markets.
9.49 Finally, turning to freight, the large physical imbalance between
non-oil imports and exports means that considerable spare export capacity
is available at attractive rates by both air and sea. Trinidad and
Tobago's institutions, long preoccupied with attracting new investment to
an expanding captive market, need to move quickly to bolster the push to
outside markets that post-boom conditions have launched.
Industrial Development Corporation
9.50 The Industrial Development Corporation (IDC) continues to dominate
industrial policy as it has for almost three decades. However, it has been
slow to exchange its traditionally strong nationalistic and technology-
oriented role as the promoter of local manufacturing production for that of
the commercially oriented, outward-looking seeker of foreign investment and
export markets that is now urgently required. In contrast, the
commercially oriented agencies established to promote investment and
exports (the Export Development Corporation and the Development Finance
Corporation) are underfunded. Moreover, the Ministry of Industry and State

- 71 -
Enterprises functions in the shadow of the IDC and is primarily a buffer
between it and the legislature. The Ministry's potentially important
monitoring and coordinating role appears to have devolved to the IDC, which
lacks the mandate, expertise and authority to assemble the data needed to
execute that task successfully. Some reallocation of resources between
these institutions and away from the IDC is desirable.
9.51 The IDC clarified the incentive framework in a review document in
August 1987. It also established a one-stop facility to reduce the
bureaucracy required to process applications. While such moves are
welcome, the review document is a compendium of past and present incentives
which fails to taickle the reduction in import substitution incentives that
must complement export inducements. Moreover, its list of target
industries is merely a catalogue that avoids prioritizing the options. In
short, the document lacks well-informed insight, shows little sense of
urgency and--above all--displays no evidence that a clear timetable for
industrial reorientation exists.
9.52 In addition to the usual package of incentives available to new
investors in many countries (such as the provision of industrial estates,
factory shells and soft loans for small investors), the IDC relies heavily
on customs incentives through reduced import duties on imported inputs and
tariff protection of 45% for final product manufactures. The incentive
concessions are reviewed at five-year intervals and are usually renewed.
More important, imports that compete with domestically manufactured items
may be subject to a quota or be banned by being placed on the "negative
list." While price controls are available to prevent potential abuse of
any monopoly in the small domestic market, such controls are primarily
directed at a few basic items. This combination of near-automatic
incentive renewal and a heavily protected domestic market does little to
encourage domestic manufacturers to strive for greater productive
efficiency, improved marketing skills and export expansion.
9.53 Progressively replacing the negative list with tariff protection
will build a more competitive environment. A stamp duty will afford the
required rate flexibility that CARICOM presently denies individual member
countries. Subsequently, a phased reduction in tariff protection could be
used to signal and promote an increased orientation to exports. It will
also be necessary to prevent traders simply running their manufacturing
investment into the ground and then reverting to imports with a high profit
margin. Investment and export incentives for manufacturers have a role to
play here. In particular, greater use could be made of tax holidays for
industrial investors. It will also be necessary to liberalize competition
between importers, eliminating back-up sanctions such as the preference for
manufacturers over traders in the allocation of foreign exchange and
controls on import mark-ups.
9.54 Since the IDC investment policy document has not produced a phased
industrial reorientation strategy, there is a case for setting up a special
task force. It could function as part of a transfer of the industrial
policy formulation mechanism to the Ministry of Planning or to a
strengthened Ministry of Industry and State Enterprise.
- 72 -
9.55 The export incentives for manufacturers include: tax reductions
equivalent to 150% of export sales; market development grants covering 50%
of expenses; export credit insurance; and preferential access to foreign
exchange. The productivity drive and surplus capacity created by post-boomt
conditions is raising interest in such incentives, but, unfortunately,
their effective use is blunted by inadequate information on export market
opportunities and by the underfunding of export support institutions.
Having closed its overseas offices in New York and Toronto and also
neglected European Economic Community (EEC) opportunities, the IDC proposes
to make greater use of Trinidad and Tobago's overseas embassies and
consulates to identify export opportunities. This approach, which reflects
a preference for relying on state involvement and "growing your own," which
is likely to be too slow and cumbersome. An alternative strategy would be
to hire experienced foreign marketers (individuals and consulting firms)
whose job would be to link existing underutilized manufacturing capacity in
Trinidad and Tobago with prospective importers (including investment
partners) in target markets such as North America, Western Europe and the
Far East. The consulting firms might be encouraged to hire locals who
could subsequently establish their own marketing enterprises, so that
Trinidad and Tobago can acquire marketing skills and institutions over the
long term. Hiring established expertise offers a flexible approach capable
of rapid expansion and, if required, contraction.
Export Development Corporation
9.56 The Export Developme.-t Corporation (EDC) was established in April
1984 as a largely, autonomous government agency for the promotion of
exports. The EDC's activities, which have been underfunded include: the
maintenance of a data bank on market opportunities; publicity for export
achievements; promotion of overseas export fairs; the establishment of an
export trading company to market for small traders who cannot perform that
function for themselves; and administration of the Market Development Fund,
which disburses grants equivalent to 50% of the expenses incurred in
developing new markets. Between November 1985 and December 1986, the EDC
gave 69 grants totaling TT$634,000 under the Market Development Fund.
Twenty-seven of the applicants developed some exports, but two (the steel
fabricator, Centrin, and Angostura Bitters) accounted for all but TT$3.5
million of the TT$41 million total exports generated. In response to the
underfunding, EDC has applied to the EEC under the Lome Convention for two
loans totaling 2 million ECUs. It is difficult to evaluate the
effectiveness of the EDC under such constrained conditions.
9.57 EXICO (the Export Credit Insurance Agency), which is under EDC,
provides export finance insurance to a small number of exporters, mostly in
the CARICOM market. It has a staff of only two and TT$200,000 in funds.
It is allowed to insure up to 35 times its share of capital, i.e., up to
TT$7 million at present. EXICO has requested a tenfold increase in its
share capital and permission to offer preshipment insurance (input purchase
insurance), which would be particularly beneficial to manufacturers. Its
experience parallels that of the EDC and underscores Trinidad and Tobago's
failure to reorient swiftly away from import substitution toward export
promotion.
- 73 -
Development Finance Corporation
9.58 The Development Finance Corporation (DFC) was established in 1970to provide long-term funding to manufacturing in the face of a risk-aversedomestic private banking system. It draws 50% of its funds mostly from theEuropean tivestment Bank, with the balance made up from Government loans,which seem unlikely to be renewed. The DFC is relatively small, with anominal portfolio of TT$250 million, of which 78% comprises long-term loansand most of the remainder short-term financing for raw material purchases.
9.59 The role of the DFC in industrial finance is small in relation tothat of the Central Bank. DFC interest rates are not subsidized, althoughon the long-term loans they are slightly below commercial rates for short-term financing and are at overdraft rates. The DFC was adversely affectedby the boom: its loans peaked in 1982 and were heavily skewed toward theconstruction industry (and within that sector, toward quarrying), which wasespecially severely hurt by the recession. Other sectors that performedbadly included large-scale clothing manufacture and small businesses. One-third of DFC's loans are non-performing. The more secure loans have beento the larger and more diversified companies with little dependence onGovernment spending, which possess the flexibility to adjust to marketupheaval. Virtually none of DFC's loans support exporting firms: althoughsome clients were considered capable of exporting, they lacked theincentive to do so.
9.60 The DFC appears to be a commercially oriented agency rather thanan arm of the bureaucracy. Its 12-man board contains no Governmentofficials, although four have had long experience in the civil service.Nevertheless, the DFC has come under pressure to support state enterprises,pressure it has resisted for fear of worsening its portfolio performance.It is seeking to strengthen its role as a long-term lender to themanufacturing sector and will concentrate on loans that boost employmentand exports. The DFC is directing viable projects that do not meet thesecriteria to the commercial banks. It is also seeking to sell to thecommercial banks some of its performing lo;.ns that are of low nationalpriority, notably in the printing sector. The DFC considers itselftechnically well-equipped to conduct economic appraisals of projects andbenefits in terms of data quality from the confidentiality it can guaranteeto clients. It also feels it can help fill gaps in the marketing skills ofdomestic manufacturers. However, somewhat ominously, the DFC had fewexport-oriented projects under study in mid-1987.
9.61 The strongly nationalistic policies of Trinidad and Tobago duringthe two oil booms shrank foreign participation in the light manufacturingsector and inadvertently diminished an important post-boom conduit formarketing expertise and investment. The IDC industrial policy documentnotes a preference for joint ventures, but will permit up to 100% foreignownership where the enterprise relies wholly on foreign capital and/or istotally oriented to the export market. These requirements may be easedwhere extensive use is made of local raw materials or where significantemployment is promised. Foreign purchase of local firms is allowed up to amaximum of 20% before an "Alien's License" is required, and favorableconsideration is given for applications for external capital needed to

- 74 -
avert business failure or to carry out a significant business
reorientation. However, many businesses are reserved for local investors.
The fears behind the nationalistic legislation are understandable, but
measures to encourage foreign participation are needed. The disincentive
to foreign investment lingering from past policies will take time to
recede.
9.62 The IDC industrial policy document notes that an Export Promotion
Zone (EPZ) is being incorporated into the Piarco Airport development plan
and that a second zone may be considered at Point Fortin. The report
expresses reservation about the long-term impact of these zones, although
substantial short-term (employment) gains are anticipated. In Trinidad and
Tobago, it is generally believed that labor is too expensive to compete
with alternative Caribbean locations: for instance, wage rates in Jamaica
are estimated to be 40% of those in Trinidad and Tobago. However, Trinidad
and Tobago has excellent access to European and North American markets and
is politically stable. It should capture market niches in the industrial
countries now for its more skcilled workforce as a first step in realizing
its potential for efficient economic management and an increasingly
productive manufacturing sector.
9.63 The two major problems for Trinidad and Tobago are the present
dearth of marketing expertise and the absence of a clear strategy for
shifting emphasis away from import substitution to export production. The
key Government agencies recognize the need to shift priority toward
competitive export manufacture, but they have been slow to do so. The
newer export institutions have been starved of funds, while the older ones,
which dominate the available resources, are burdened by past practices (and
in the case of the DFC, the financial burden thereof). A task force with a
strong commercial orientation, perhaps could be setup under the Ministry of
Planning. Its function would be to plan a phased shift towards export
orientation. It should clearly distinguish between two tasks: first, the
urgent short-term need to link underused productive capacity with exte>rnal
markets (dravTing heavily on foreign expertise in the first instance) and,
second, the long-term goal of triggering new export-oriented investment.
The task force should address the incentive system and consider carefully
the relationship between manufacturers and traders: inducements to the
former may require reinforcement through disincentives to the latter.
CONCLUSIONS
9.64 Boom conditions aggravated the structural weaknesses in Trinidad
and Tobago's non-hydrocarbon manufacturing sector, rendering it more
inwardly oriented and uncompetitive. The gas-based industries have a long
gestation period and their prices move broadly in line with energy prices
so that they represent only a minimal shift away from dependence on
hydrocarbons,. They are potentially competitive at prices set by the
replacement costs of efficient new producers. As the usual technical and
managerial post-start--up improvements take effect, existing plants can
cover their cash costs at prevailing depressed prices and also make some
contributiorL to debt service. The most problematic plant, ISCOTT, is
embarked on a prudent production and marketing strategy that promises, on a
- 75 -
sunk cost basis, to make the plant self-financing after 1988. If its plansucceeds, it will boost manufacturing value added and net foreign exchangeearnings. The other gas-based plants can augment their rebound as debt isretired and prices improve. The resulting boost to their long-termviability will open the way for further investment in expansion and also inlinked industries. Unfortunately, the timing (and even certainty) of aprice rebound cannot be accurately forecast, while depressed prices havepostponed the modest new project investment in ammonia and methanol thatwas widely anticipated less than two years ago.
9.65 The non-hydrocarbon manufacturing sector also shows potential forrebound. The devaluation has improved competitiveness. The post-boomrecession (together with the resolution of initial teething troubles) hasreduced infrastructure congestion; coaxed productivity improvements andreal wage cuts from workers; spurred manufacturers to seek markets for idleplants; and led shippers to offer cheap rates for idle outbound freightcapacity.
9.66 There are unlikely to be any sizable immediate new investments inthe manufacturing sector, and, although there is considerable medium- tolong-term potential for both a rebound in output and enhanced exportearnings, non-hydrocarbon production may initially fall further, whilemanufacturing employment will almost certainly shrink further. Speedyreform of the industrial incentives and measures to preserve the 1985devaluation edge are an immediate priority. Flexible management of theexchange rate, supplemented by appropriate policies, would further augmentcompetitiveness.
9.67 A task force should be established to reorient industrial policyand set concrete goals for reform of the non-hydrocarbon manufacturingsector. Since industrial targeting has failed in the past and there are nomanufacturing subsectors with a clear comparative advantage, Governmentsupport must encourage enterprise initiatives by individual firms. Theincentive regime requires reform as part of a bold, incisive reorientationstrategy that clearly recognizes the need to switch emphasis away fromdomestic to export markets; from long-term investment toward short-term useof idle capacity; and from production technology to commercial marketing.Assuming that the resources for this task are fixed, then more resourceswill have to be given to those institutions that are responsive to theseneeds, notably the EDC and EXICO. The deficiency in marketing expertiseshould be addressed as quickly as possible by hiring individuals and firmsf rota abroad.
9.68 Besides bolstering export initiatives, it is necessary to reducethe attraction of the domestic market. To do so, the negative list mustprogressively be replaced by tariff support using a stamp duty and othermeasures to circumvent the inflexibility that membership of CARICOMimposes. To discourage manufacturers from running their plants into theground and substituting lucrative trading monopolies for production ones,complementary measures are required to increase competition and controlmargins in the import business.

- 76 -
9.69 Table 9.9 shows that TT$650 million in new loans was made from
revenue received by public companies during 1986, mainly utilities, and
pushed the cumulative total to about TT$6 billion. The reduced role for
the Government in directly productive investment (forced on it by
constrained financial circumstances) is welcome provided the breathing
space is used to improve the efficiency of the state-owned sector.
Table 9.9: NEW LOANS TO PUBLIC CORPORATIONS IN 1986
(TT$ Million)
Corporation Loan
FarmingForres Park Ltd. 0.269
Caroni (1975) Ltd. 115.000
Food and Agriculture Corporation 0.832
ManufacturingNational Energy Corporation 7.375
Trinidad and Tobago Electronics, Ltd. 2.000
ISCOTT 57.822
TransportationNational (Secondary Roads) Development
Company, Ltd. 7.224
Port Authority of Trinidad and Tobago 66.510
Public Transport Corporation 132.322
Trinidad and Tobago (BWIA International)
Airways Corporation 18.000
Chaguramas Development Authority 0.832
UtilitiesTrinidad and Tobago Electricity Commission 39.268
Trinidad and Tobago Telephone Co., Ltd. 29.981
Water and Sewerage Authority 168.029
Other 3.037
Total Loans made in 1986 650.361
Cumulative Total Loans to December 31, 1986 6,205.284
Source: Report of the Auditor General on the Public Accounts of the
Republic of Trinidad and Tobago, Year Ended December 31, 1986
mimeo, Port of Spain, paras. 5.08 and 5.09.

- 77 -
Chapter X
THE AGRICULTURAL SECTOR
AGRICULTURE IN CONTEXT
10.1 Before the development of petroleum exports, agriculture was theprincipal earner of foreign exchange in Trinidad and Tobago, but inTrinidad's post-World War II oil-and gas-based economy, all of thetraditional export crops have experienced declining outputs and exports.Agriculture is now a relatively small sector in the economy. In 1986, itproduced about 5% of the GDP and employed 11% of the labor force, and itis no longer a major source of foreign exchange (Table 10.1). Sugar is theonly significant export crop, with about 1% of foreign exchange earnings in1986, but it is kept afloat only by massive domestic and foreign subsidies.
10.2 Despite its diminished status in international markets and itssmall size, agriculture is accorded a prominent place in policy discussion,as it is expected to perform several important roles: (i) to achieve foodsecurity for the country; (ii) to employ the existing farm population atdecent incomes; (iii) to act as employer of last resort for the unemployedin other sectors of the economy; (iv) to earn foreign exchange; (v) toprovide raw materials for industry, and (vi) to perform certainenvironmental tasks. Numerous analyses of the sector have been made inrecent years, and Governmental expenditures on agriculture are relativelylarge, reading approximately US$175 million in 1986, equal to about 67% ofvalue added in agriculture.
Comparative Advantage
10.3 Despite numerous studies, little analysis has been done on which,if any, crops and agricultural technologies have potential comparativeadvantage in the medium to long term. The export data indicate thatTrinidad and Tobago generally lacks comparative advantage in agriculture atthe prevailing exchange rate. Table 10.2 lists the 10 three-digitagricultural and agro-processed exports with more than TT$1 million inexport revenues in 1985 (in order of value): sugar, rum, cerealpreparations (mostly biscuits), coffee, cocoa, food preparations, aromaticbitters, non-alcoholic beverages, citrus juices and chocolate preparations.These 10 exports accounted for 94.5% of total food and beverage exports,the total of which, however, accounted for only 2.1% of total exports.
10.4 Aside from sugar, coffee and cocoa (all heavily subsidized), therewere virtually no crop exports. Only aromatic bitters and rum, both
processed items, were exports of any size (minor) in which Trinidad andTobago clearly demonstrated competitiveness in the world markets irn 1985.Within CARICOM's tariff walls, Trinidad and Tobago's most significantagricultural or food export, biscuits, was based almost entirely onimported inputs, as were all but one of the five items primarily exportedto CARICOM.

TJbl* O.1: PRODlCTION AN EXPORTS OF MAJOR ACRICLTURAL PRODUCTS, 1975-86
1975 1980 1981 1982 1983 1984 - 1985 1 986 1987
Produc. Export Produc. Export. Produc. Exports Produc. Export Produc. Export- Produc. Export- Produc. Exports Produc. Exports Produc. Exports
Sugar ('000 ton.) 162.6 110.6 112.1 64.0 92.6 66.8 79.9 51.0 77.4 62.2 96.0 64.1 114.3 66.0 119.4 57.2 123.4 51.0
Local C.ne 162.6 110.6 112.1 64.0 92.6 66.7 79.9 51.0 77.4 62.2 69.7 64.1 80.9 66.0 81.9 57.2 85.4 -
Imported Ra. Sugar - - - - - - - - - - 26.3 - 33.4 - 37.4 - 25.0 -
Cocos Beans Cton-(\) 5240.0 4761.0 2380.0 2158.0 3145.0 2910.0 225.0 191.0 1732.0 1691.0 1560.0 1500.0 1307.0 1306.0 1426.0 1303.0 1501.1 1478.4
Coffee Beans (tons) 4024.0 3138.0 2239.0 865.0 24<33.0 1056.0 180.0 157.0 1389.0 859.0 852.0 N.A. 2141.0 755.0 1334.0 802.0 N.A. N.A.
Oranges (tons) 2684.0 541.0 1792.0 661.0 623.0 1267.0 2450.0 1581.0 N.A. N.A.
Whole fruit (ton-n - 658.0 - 183.0 - 28.0 - 49.0 - 8.0 - 4.0 - 6.0 - 4.0 N.A. N.A.00
Juice ('000 liters) - 1200.0 - 1628.0 - 1056.0 - 760.0 - 753.0 - 311.0 - 297.0 - 360.0 N.A N.A.
Cr.psfruits (tons) 6263.0 4049.0 2945.0 1175.0 2316.0 1997.0 3629.0 2740.0 N.A. N.A.
Whole fruit (tons) 365.0 276.0 38.0 - 72.0 - 2.0 - N.A. - N.A. - N.A. N.A. N.A.
Juice ('000 lit-rs) 1077.0 316.0 229.0 - 142.0 - 178.0 - 38.0 - 63.0 - 40.0 N.A. N.A.
Copra ('000 tons) 8.9 4.1 5.2 5.9 6.5 5.6 4.3 4.8 5.1 -
Molluscs (tons) 25.8 1.5
Tobacco (tons) 285.7 N.A. 14.1 N.A. 43.0 52.0 41.2 61.4 43.5 70.7 66.8 -
N.A.: Not avaiilable.
Source: Central St-tistical Office.

Table 10.2. EXPORTS OF MAJOR FOODS, FOOD PREPARATIONS AND BEVERAGES, 1985(TTS 000)
Export Category Destination3-digit SITC (Rev. 2) Categories with More Than TTS1 Ml. in Exports CARICOM International Total
Unsubsidized, Sold Primarily on World Markets112 Aromatic Bitters (112.-49.6) 313 3,130 3,443112 Alcoholic Beverages (excl. 112-49.6)
Primarily Rum* 3,137 13,808 16,948
Subtotal 3,450 16,938 20,386
Subsidized, Sold Primarily On World Markets071 Coffee 1,789 5,884 7,653071 Cocoa 2 7,211 7,213
Subtotal 1,7,1 13,095 14,886
Subsidized, Sold Primarily in Quota Markets061 Sugar and Molasses 119 52,564 52,883
Sold Primarily in CARICOM Markets048 Cereal Preparations (incl. 0.48 A 047, Flours,
Primarily Biscuits) 8,113 184 8,297058 Fruit (Primarily Orange and Grapefruit Juice) 1,632 62 1,694073 Chocolate Preparations 817 507 1,324098 Food Preparation, N.E .S. (ncl. spices 075,
Primarily Tomato, Ketchup A Sauce,Baking Powder, Popper Sauce and Curry Powder) 2,760 1,024 3,784
111 Non-Alcoholic Beverages 2,177 748 2,925
Subtotal 15,499 2,525 L8,024
Total These Exports 20,839 85,120 106,969(Other than Sugar and Molasses) (20,720) (32,556) (63,278)
Total All Food and Beverage Exports(SITC Categories 0 & 1) 23,703 88,431 112,134
(Other than Sugar and Molasses) (23,854) (35,867) (59,451)
Source: Central Statistical Office, Overseas Trade, 19&o.
Nts There were no crude agr4cultural materials or any other three-digitagricultural exports above TTS1 million outside the food and beveragecategories.
* Rum is unsubsidized in the sense that the sugar-based raw materials used in itsmanufacture, though subsidized, are more costly than if imported.

- 80 -
10.5 The overall picture is of an agriculture generally unable to
compete in the world markets. The agro-processing industry, however, did
secure a small foothold in both regional and international markets. It
would be difficult to predict, however, what real exchange rate would
permit significant exports of agricultural and agro-processed products
(using some local agricultural outputs) in either the CARICOM or world
markets. Agro-processing industries are likely to emerge first, as the
real exchange rate increases. Some relatively labor-unintensive crop
exports (requiring significant technology and management inputs) could
possibly also emerge at higher real exchange rates, but there are no
obvious candidates, other than perhaps hybrid cocoa and shrimp. In
addition to any competitive exports that might emerge at higher real
exchange rate levels, natural trade barriers, such as transportation and
perishability, would probably allow some competitive fresh vegetables and
perhaps poultry subsectors to survive international competition.
Structure of Agriculture
10.6 The structure of farms in Trinidad and Tobago is heavily skewed
toward small holdings, which grow numerous types of crops and livestock,
but there is also a plantation sector of some size (Table 10.3). According
to the latest agricultural census (1982), 89% of the 30,500 private
bLoldings were less than 5 ha, and they contained 40% of the t tal area in
private holdings. Another 20% of the area in private holdings was in farms
of 5-10 hectares. At the other end of the scale, 41% of the total area
(both public and private) was either in public holdings (mostly the huge
from huge parastatal sugar plantation) or private-holdings of 50 ha or
more. Private ownership is widespread (78% of the area in 1982), but 53%
of private holders, farming 35% of the land in private holdings, either
rented, squatted, or obtained their land in some other way than ownership.
Demographically, private holders were relatively old, with 63% of them over
45. This structure of many small, poorly educated, older farmers would
have to undergo wrenching changes if the protective barriers were lowered
and efficient specilization became the order of the day.
GOVERNMENT POLICY
10.7 Despite the uncompetitiveness of most of agriculture, there is
virtually unanimous opinion that an agricultural sector of some significant
scale is desirable, even at the cost of significant subsidies from
consumers and the Government. Current policy to protect agriculture is
designed to maintain the employment of existing farmers and also to
preserve agriculture as the employment sector of last resort for those
unemployed in other sectors. Alternative measures to ensure the welfare of
the farm population and to assist the unemployed will, therefore, be
necessary, if agriculture is to become significantly more competitive.
The Protective Structure in Agriculture
The Cost of Protection
10.8 The cost of protection is a second major analytical question that
remains unanswered, despite the number of studies of the agriculture

- 81 -
sector. Given the determination of the Government to protect a large
number of agricultural subsectors, it becomes important to systematically
assess the social cost of protection of each subsector. The cost is
twofold: that borne by consumers in tenms of higher prices and lower
quality (compared to imports), and that borne by the Government through
input and output subsidies and through its coverage of the losses of
Government corporations. In at least one case -- wheat and other grains
(except rice) -- the Government has made a conscious decision that the
subsector is too costly to protect. In another subsector -- sugar -- the
cost of protection and subsidization, while not precisely measured, is
understood to be unsupportably high. The Government is considering
significant ameliorative measures. These cases are the exceptions,
however. The cost of protection of other agricultural subsectors has
generally been neglected as a problem, and measuring this cost
quantitatively has not been attempted.
Table 10.3: STRUCTURE OF AGRICULTURAL HOLDINGS, 1982
1 Type of Organization (ha) (X) Private -- 78.3 Public -- 21.7
2 Tenure (Priwate Holdings) Own Rent/ Squat/
Own Lease Other
Numbor of Holders (X) 47.0 38.1 18.9
Hectarage in Class (X) 84.7 22.8 12.5
3 Size Distributions: <2 2<6 5<10 10<60 50+
(Private Holdings)
Number of Holders (%) 52.5 33.4 9.8 4.0 0.4
Hectarage in Class (%) 11.2 29.3 19.7 20.8 19.2
4 Private Holders -- Age <26 26-34 36-44 45.64 65+
Number of Holders (%) 3.0 12.2 21.4 25.3 38.0
6 Private Holders -- Education 0-4 Yr. >5+ Yr. Some Some Other
Primary Primary Secondary Univers.
Number of Holders (%) 26.9 82.3 9.6 0.9 1.3
Source: Central Statistical Office, 'l982 Agricultural Census.
10.9 Quantitative measurements of the cost of protection in each
subsector would allow the Government to: monitor the cost of protection to
both consumers and Government and warn if it was reaching an unacceptably
high level; compare the costs of alternative protection schemes; provide
the analytical basis for a de facto tariff scheme; see what has happened to
the cost of protection over time; and provide a measure of the resources
that might be applied to substitute welfare mechanisms.
Protection Mechanisms
10.10 The protective scheme for agriculture involves a set of controls
and budgetary subsidies in five parts: (i) exchange controls on all

- 82 -
commodities (administered by the Central Bank); (ii) import controls on an
extensive "negative list" of agricultural and other commodities
(administered by the Ministry of Industry, Enterprise and Tourism, MIET);
(iii) import taxes, based on the CARICOM Common External Tariff and
supplemented by a 12.5% stamp duty (administered by the! Controller of
Customs and Excise); (iv) subsidized support prices for some commodities
(administered by the Ministry of Food Production, Marine Exploitation,
Forestry and Environment, MFPMEFE, and other agencies); and (v) input
subsidies (administered by MFPMEFE and other agencies). For most
agricultural commodities, the heart of the protective scheme is the virtual
import ban--through foreign exchange licensing--on items for which the
country produces close substitutes.
10.11 In the recent past, a system of guaranteed prices for 20
commodities was also in place, but it proved unworkable and became inactive
for most commodities, except for exports or significant imports, where the
unwanted impact of international prices is unavoidable. In the case of
exports (sugar, cocoa, coffee, copra and citrus), payments are usually made
through industry bodies and financed by subventions from the budget.
Without these payments, exports would cease. In the case of subsectors
where significant imports compete with domestic production (rice, milk and
hatching eggs), producers are also provided support prices above
international prices. For rice, Government import monopoly (National Flour
Mills) allows the cost of the subsidy to be passed on to consumers in the
form of higher rice prices. The monopoly profits from imported rice are
used to finance the subsidy to farmers. For milk and hatching eggs, which
also have substantial imports, no institutional mechanisms for passing the
price of the subsidies on to consumers have been put in place, and the
subsidies are financed through the budget.
Managing the Protective Structure
10.12 For a small, open economy like Trinidad and Tobago's, the tariff,
when it can be used9 is the least costly type of protection for society as
a whole. Tariffs have several well-known advantages over quantitative
restrictions. Unlike the latter, the level of tariff protection is
limited, stable, transparent (for primary products) and relatively non-
discretionary. Again, unlike quantitative restrictions, tariff revenue
provides a benefit to society as a whole that partially offsett the cost of
protection borne by consumers. When quantitative restrictions are applied,
what would have been tariff revenue under a tariff system is earned instead.
by foreign exporters or by elements within the import distribution chain.
10.13 The authorities recognize the benefits of moving to a tariff-based
system and view the current negative list arrangement as temporary.
However, shifting to a tariff-based system will not be easy, as Trinidad
and Tobago does not control its own tariffs. CARICOM imports are, however,
now being allowed in and the 12.5% stamp duty on CARICOM imports has been
eliminated (except on imports from Barbados because of a lack of
reciprocity). This salutory development is welcome as it subjects Trinidad
and Tobago agriculture to a certain measure of regional competition. In
turn, Trinidad and Tobago will gain from the opening up of the CARICOM
market for its own industrial exports.

- 83 -
Disposition of the Sugar Industry
Dimensions of the Problem
10.14 Trinidad and Tobago supports a seriously obsolete sugar industry
that produces sugar at about 10 tim-- the wotld price. This industry is a
particularly good example of an agricultural protective structure carried
to the extreme. The industry is dominated by a large parastatal
corporation, Caroni, Ltd., which produces two-thirds of the country's sugar
cane output and processes and markets all of it. The remaining one-third
is produced by small farmers, many of whom lease their land from Caroni,
Ltd.
10.15 Retaining the sugar industry costs the country about US$120-160
million annually, over US$100 per capita and in excess of US$10,000 per
sugar worker or farmer. Consumers pay approximately US$50 million a year
of the total in higher than necessary sugar expenditures, and the
Government pays about US$70-110 million annually in subsidies and outlays
to cover the losses of its sugar parastatal.
10.16 Satisfying preferential quota tonnages is also very costly for
Trinidad and Tobago. Production costs are far higher than the roughly
US$500 price per ton received under EEC and US quotas. It is difficult to
calculate from published financial data how much it currently costs to
produce a ton of sugar in Trinidad and Tobago, but an approximate figure
can be derived from Caroni, Ltd.'s published cost estimate of US$2,600 per
ton for the 1984 production year. With the devaluation of 1985-86 and
improvements in efficiency, this figure may have fallen significantly,
perhaps to US$1,800. Using these figures, it appears that Trinidad and
Tobago is paying net about US$1,300-2,000 per ton for the privilege of
exporting sugar under quota, or in total, about US$65-100 million a year.
Dimensions of the Solution
10.17 Since 1978, four major studies of the sugar industry have
concluded that the basic cost and productivity situation of the industry is
structurally unviable. (The World Bank Economic Report of 1983 reached a
similar conclusion). All studies proposed restructuring the industry to
alleviate the problem, but none proposed shutting it down for social
reasons. In each case, therefore, the recommendations implied continuing
large (although, under their projections, reduced) subsidies. The reports
all suggested that the appropriate scale for the industry should be at
least the 60,000-70,000 metric ton domestic market, and most recommended
continued production for the EEC and US quota markets, despite the huge
losses.
10.18 As it appears the industry cannot be rehabilitated on a
competitive footing, it has to be phased out on an agreed schedule. The
pace of this operation will clearly depend on the development of viable
alternative economic activities and by the imperative of not exacerbating
unemployment, which had reached 22% by 1987.

- 84 -
RECENT TRENDS IN MAJOR AGRICULTURAL SUBSECTORS
Decrease in Support Payments and Input Subsidies
10.19 The extensive system of guaranteed prices and input subsidies in
place in recent years has been largely eliminated in favor of the
protective structure outlined above. Even in nominal TT dollars, all
subsidies except for milk have been scaled back significantly since 1983
(Table 10.4). Not including losses and capital transactions of Government
entities, agricultural public works and certain other items, total subsidy
obligations declinled from TT$62 million in 1983 to TT$12 million in 1986.
A decrease in support payments to cocoa and coffee growers -- from TT$39
million in 1983 to TT$1 million in 1986 --was the most important reason for
the decline. Input subsidies also dropped substantially, from TT$18
million to TT$2.5 million. Milk subsidies failed to decline, 'however, and
in the context of generally declining subsidies, rose from 8% of the total
in 1983 to 70% in 1986.
Tree Crop Production
10.20 All major tree crops (cocoa, coffee, citrus and coconut) have been
affected adversely for several decades by the factors that have rendered
Trinidad and Tobago's agric-llture inter.nationally uncompetitive: the high
exchange rate derived from petroleum exports; vigorous demand for labor in
other economic sectors resulting in high wage rates; and the emergence of
increased low-cost output in other developing countries. Government
subsidy and rehabilitation programs have not increased profitability enough
to arrest the slide in the tree crop subsector, and significant hectarage
has been abandoned.
10.21 In a few cases, the emergence of a protected domestic market for
fruit (citrus fruit and green coconut) and for agro-processing (citrus
fruit) has produced new components of demand. The recent devaluation of
the TT dollar and the influx of young unemployed workers into the
agriculture sector at reduced wages have also created somewhat different
conditions than in the past for the tree crop subsector. Under these
conditions, greater harvesting a,nd some modest rehabilitation of existing
cocoa, coffee and citrus orchards may be taking place.
Rice Industry
10.22 Although approximately 90% of the rice consumed in Trinidad and
Tobago is imported, the Government has indicated in principle a desire to
attain self-sufficiency in rice. A preliminary estimate of the subsidy
required to support a self-sufficient rice industry producing Trinidad and
Tobago's annual consumption of about 40,000 metric tons is about US$21
million a year. Even without self-sufficiency, as at present, a subsidy of
this level would have to come from consumers, unless the Government's
monopoly parastatal importer is given clear guidelines to avoid it.
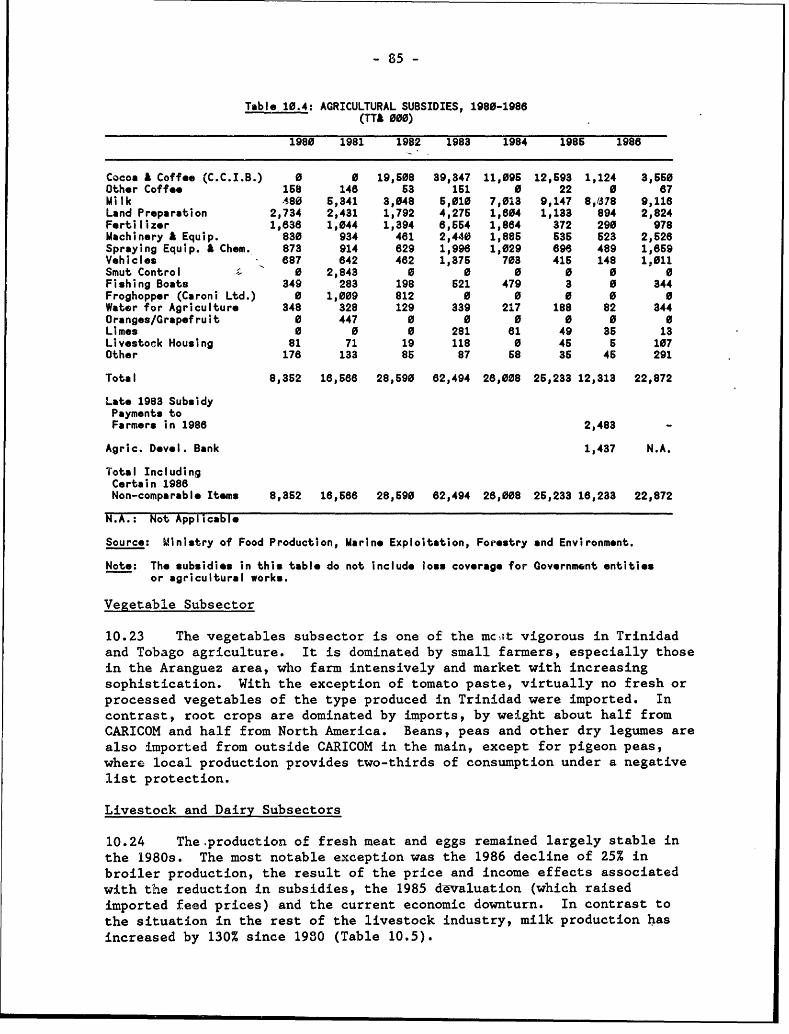
- 85 -
Table 10.4: AGRICULTURAL SUBSIDIES, 1980-1986(TTA 000)
1980 1981 1982 1983 1984 1986 1988
Cocoa A Coffee (C.C.I.B.) 0 0 19,608 39,347 11,095 12,693 1,124 3,660Other Coffee 158 148 53 161 0 22 0 87Milk 480 6,341 3,048 6,010 7,013 9,147 8,1378 9,118Land Preparation 2,734 2,431 1,792 4,275 1,604 1,133 894 2,824Fertilizer 1,638 1,044 1,394 6,654 1,884 372 290 978Machinery A Equip. 830 934 481 2,440 1,886 636 523 2,526Spraying Equip. A Chem. 873 914 829 1,998 1,029 896 489 1,669Vehicles 887 842 482 1,376 703 416 148 1,011Smut Control 0 2,843 0 0 0 0 0 0Fishing Boats 349 283 198 621 479 3 0 344Froghopper (Caroni Ltd.) 0 1,009 812 0 0 0 0 0Water for Agriculture 348 328 129 339 217 188 82 344Oranges/Grapefruit 0 447 0 0 0 0 0 0Limes 0 0 0 281 81 49 35 13Livestock Housing 81 71 19 118 0 46 5 107Other 178 133 86 87 58 35 45 291
Total 8,362 18,688 28,690 82,494 28,008 26,233 12,313 22,872
Late 1983 SubsidyPayments toFarmers in 1988 2,483 -
Agric. Devel. Bank 1,437 N.A.
Total IncludingCertain 1988Non-comparable Items 8,352 16,566 28,690 82,494 28,008 26,233 18,233 22,872
N.A.: Not Applicable
Source: Ministry of Food Production, Marine Exploitation, Forestry and Environment.
Note: The subsidies in this table do not include loss coverage for Government entitiesor agricultural works.
Vegetable Subsector
10.23 The vegetables subsector is one of the mc,tt vigorous in Trinidad
and Tobago agriculture. It is dominated by small farmers, especially those
in the Aranguez area, who farm intensively and market with increasing
sophistication. With the exception of tomato paste, virtually no fresh or
processed vegetables of the type produced in Trinidad were imported. In
contrast, root crops are dominated by imports, by weight about half from
CARICOM and half from North America. Beans, peas and other dry legumes are
also imported from outside CARICOM in the main, except for pigeon peas,
where local production provides two-thirds of consumption under a negative
list protection.
Livestock and Dairy Subsectors
10.24 The .production of fresh meat and eggs remained largely stable in
the 1980s. The most notable exception was the 1986 decline of 25% in
broiler production, the result of the price and income effects associated
with the reduction in subsidies, the 1985 dBvaluation (which raised
imported feed prices) and the current economic downturn. In contrast to
the situation in the rest of the livestock industry, milk production has
increased by 130% since 1980 (Table 10.5).

- 86 -
10.25 High-cost import substitution of animal products has been the
Government's policy since the 1970s. Technically, implementation of the
policy has been successful for poultry, eggs and fresh pork (including ham
and bacon), but not for beef and milke Despite two decades of import
substitution policy, imports of animal products and of feed still account
for 8% of total commodity imports.
10.26 No estimates of the cost of protection are available for the
various livestock subsectors, but that of the small and uneconomic dairy
subsector is probably the highest on a per unit output basis. The explicit
budgetary subsidy alone was equal to TT$8.7 million in 1986. Because milk
production has been expanding, this subsidy has also been expanding: in
1986 it constituted 70% of explicit Government subsidies to agriculture
(not counting the loss coverage of Government entities) and was triple the
1980-1982 average. The Government should consider whether the apparent
magnitude and growth of the cost of protection for the dairy subsector
makes it, along with sugar and rice, a prime candidate for phase-out.
Fisheries and Forestry
10.27 Most of Trinidad and Tobago's catch involves the production of a
sizable, highly protected group of about 2,000 artisanal fishermen using
pirogues and single-line technology. No estimate of the cost of protection
in the fishery subsector is available, but it is probably high because the
subsector receives a TT$0.67 per liter diesel fuel subsidy and negative
list protection. Another section of the industry, however, the commercial
trawler fleet, is economic enough (with the fuel subsidy and the Caribbean
Basin Initiative trade preference) to export shrimp and processed fish
products to USA. The National Fisheries Co Ltd., which handles most of
these exports, expects to double its export of fish products in 1988 to
1500 tons, as a new line of breaded fish products comes into production.
10.28 Despite the high demand for wood products in the previously
booming construction industry, timber outturn has declined by 75% since
1975. This inability to substitute for imports, even during a construction
boom, suggests that even the recent devaluation may not have been
sufficient to restore it to profitability, let alone to allow exports.
Agricultural Resources
10.29 The resource problems of Trinidad and Tobago agriculture are
mainly the result of low profitability. The Government has tried to shield
the sector through protection and subsidies, but, except for broiler, dairy
and vegetable production, it has not been willing to do so handsomely or
consistently enough to result in sustained profitability. The sector has
consequently generally not been able to pay going prices for capital,
management and labor and thus to compete for them with other sectors of the
economy. With labor supplies recently available at lower wage rates,
c-rtain previously abandoned activities are being resumed, as marginal
revenues come to exceed marginal costs, but large new private-sector
investments in agriculture should not be expected in the near future.

-87-
TRINIDAD AND TOBAGO - COUNTIES AND WARDS
TRINIDADSCALE I 64 O OOO
5 0 5 6gO 15 Status MilesIII TOCO1|5 1IT
I 0 5 10 15 20 25 Kilometres- - - 6~~LANCHISSE S l
fE ATiN S ST. EOGE VALECI MTU
POR r Of spA/. ANNS |TACARIG ID
TOBAGOSCALE 1:6440,000 CUNUI
---------- 1C , RLCTTEVILLE \ RAFAELt ST \NI
/,RO,XBOROUG-H CHAGU4NAS TU. URT
¢PtMQUIH - r. .a ~ / RCOVN tONTSRRA' CEtRUM.A
SCRBOROUGH N RIVA
GRANDE MUAp VI 0RIA
NAPAARIMA 9 ORTOIRE | GUAAI AA
~~8 ST PATRICKI lt \ ~ <T.RINITY
ED-O ERIN \)SIPARIA MORUGA-
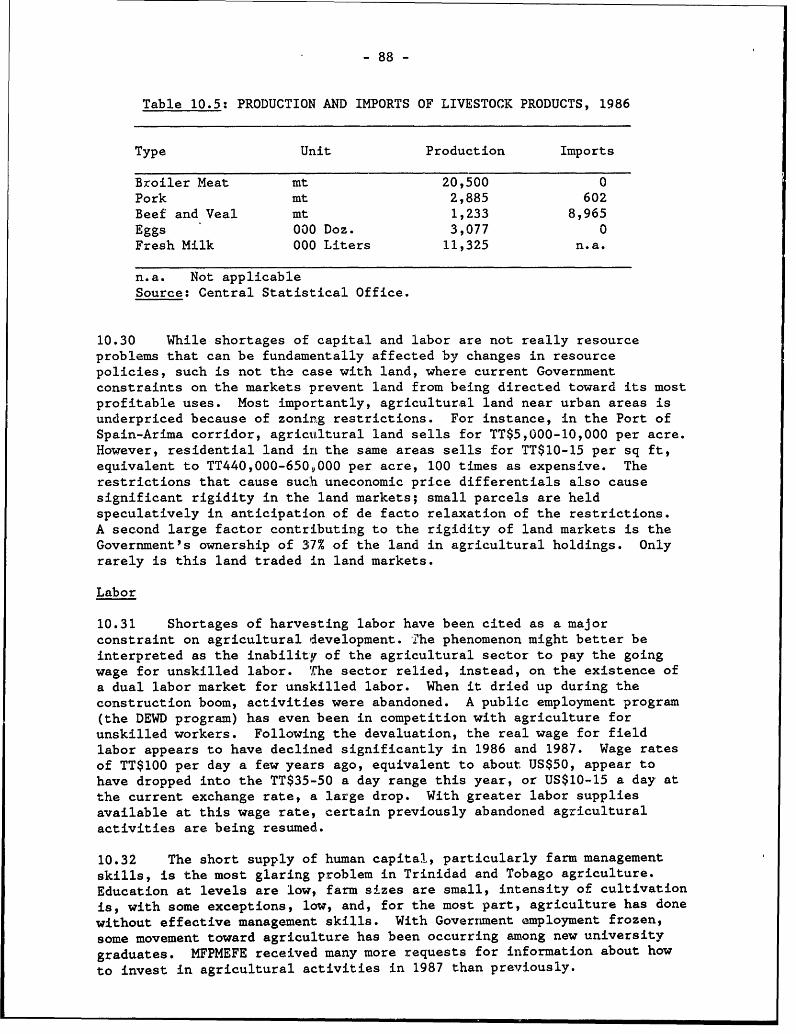
-88-
Table 10.5: PRODUCTION AND IMPORTS OF LIVESTOCK PRODUCTS, 1986
Type Unit Production Imports
Broiler Meat mt 20,500 0
Pork mt 2,885 602
Beef and Veal mt 1,233 8,965
Eggs 000 Doz. 3,077 0
Fresh Milk 000 Liters 11,325 n.a.
n.a. Not applicableSource: Central Statistical Office.
10.30 While shortages of capital and labor are not really resource
problems that can be fundamentally affected by changes in resource
policies, such is not ths case with land, where current Government
constraints on the markets prevent land from being directed toward its most
profitable uses. Most importantly, agricultural land near urban areas is
underpriced because of zoning restrictions. For instance, in the Port of
Spain-Arima corridor, agrictutltural land sells for TT$5,000-10,000 per acre.
However, residential land ini: the same areas sells for TT$10-15 per sq ft,
equivalent to TT440,000-650,000 per acre, 100 times as expensive. The
restrictions that cause sucla uneconomic price differentials also cause
significant rigidity in the land markets; small parcels are held
speculatively in anticipation of de facto relaxation of the restrictions.
A second large factor contributing to the rigidity of land markets is the
Government's ownership of 37% of the land in agricultural holdings. Only
rarely is this land traded in land markets.
Labor
10.31 Shortages of harvesting labor have been cited as a major
constraint on agricultural development. The phenomenon might better be
interpreted as the inability of the agricultural sector to pay the going
wage for unskilled labor. 'The sector relied, instead, on the existence of
a dual labor market for unskilled labor. When it dried up during the
construction boom, activities were abandoned. A public employment program
(the DEWD program) has even been in competition with agriculture for
unskilled workers. Following the devaluation, the real wage for field
labor appears to have declined significantly in 1986 and 1987. Wage rates
of TT$100 per day a few years ago, equivalent to about US$50, appear to
have dropped into the TT$35-50 a day range this year, or US$10-15 a day at
the current exchange rate, a large drop. With greater labor supplies
available at this wage rate, certain previously abandoned agricultural
activities are being resumed.
10.32 The short supply of human capital, particularly farm management
skills, is the most glaring problem in Trinidad and Tobago agriculture.
Education at levels are low, farm sizes are small, intensity of cultivation
is, with some exceptions, low, and, for the most part, agriculture has done
without effective management skills. With Goverunent employment frozen,
some movement toward agriculture has been occurring among new university
graduates. MFPMEFE received many more requests for information about how
to invest in agricultural activities in 1987 than previously.

- 89 -
10.33 Bank credit has been available to agro-processing through at leastone commercial bank in Trinidad and Tobago (Republic Bank), but formalmedium-term credit to agriculture itself is provided almost exclusively bythe Government's Agricultural Development Bank (ADB). Current Governmentpolicy, however, does not allow for routine ADB budgetary support. It hasalso started a new program to attract deposits, with new loan rates(10-12%) closer to money market rates.
Technology
10.34 Trinidad and Tobago farmers are sensitized to the benefits ofusing new technology. The most difficult problem is that, even withimproved technology, many agricultural activities remain unprofitable.Most new technology is transferred to farmers in Trinidad and Tobagothrough commercial agro-chemical and pharmaceutical channels, rather thanthrough the Government's extension service.
INSTITUTIONAL STRUCTURE
10.35 The structure of institutions affecting agriculture is highlycomplex because of the import-substitution thrust of agricultural policy.The complexity arises from the need to manage: the macroeconomic and tradepolicies that determine the real exchange rate and the protective structureof agriculture; the subsidy system; service provision for an industry thatis o-verly complex for its size; and land, marine and environmentalresources. Without fully abandoning the import substitution strategy, eachof these tasks could be significantly reduced in complexity by the actionssuggested in this review.
Extension
10.36 MFPMEFE9s Extension Division is not effectively carrying out itstraining and technology transfer functions. The extension service hasenough personnel, with an average of about 1 extension officer per 200farmers. The problem is that most of those who are formally assigned tothe Extension Division are not doing district-level extension work.Instead they are either supervisors or are assigned to handle landproblems. Those doing district-level extension work are typicallyresponsible for servicing 1,000 to 2,000 farmers and are consequently notable to visit farmers' fields at the scheduled times.
10.37 District-level extension workers are assigned other tasks thattake up much of their time. In past years, and continuing into the presentto a significant extent, the district-level worker functions as the defacto MFPMEFE district representative. He is expected to handle subsidypayments, arrange tours, take fire damage surveys, etc. Some of thecomplexity of MFPMEFE's operations is hidden by landing all field tasksonto extension workers. The extension officer's de facto role as MFPMEFEfield representative needs to be transferred to other MFPMEFE personnel.
10.38 Perhaps the greatest failing of the present system is that thereis no provision for strong, two-way communications between farmers,extenision and research. The extension service is not performing itsfunction of linking farmers to research results. This problem is widely
- 90 -
recognized, and a proposal has been made to recruit a cadre of subject
matter specialists within the service. Because of the small size of the
extension service, this proposal needs to be treated cautiously. The
number and quality of these specialists would be greater if they retained
their primary links to the research institutions. As it is, given that
Trinidad and Tobago is a small country, farmers often visit university and
other research workers in search of specific information, particularly from
plant pathologists, who already spend a lot of time doing extension work
outside extension channels. Thus, an alternative approach would be to
formalize an arrangement with the research institutions whereby the
research worker doubles as a subject matter specialist and takes
responsibility for training extension workers.
Research
10.39 Despite the existence of five major agricultural research
organizations on Trinidad, they have done little work of real relevance to
the country's agriculture. The natural specializations that would emerge
were research responsive to agriculture and regional and international
market forces have not emerged. Researchers, thus, have not been given the
guidance that market forces naturally offer. A second major reason that
research has been mostly irrelevant to the needs of farmers is the
extension servicels failure to be the link between farmers and the research
institutions.
10.40 One pressing research need of farmers is now to auapt and validate
for Trinidadian conditions the technical information offered by agro-
chemical and pharmaceutical manufacturers or in seed catalogues. This type
of research would be among the most relevant to farmers. Research
organizations should be organized to produce it, and researchers should be
given the necessary incentives.
10.41 Non-traditional crops have found few niches in local farming
systems. An approach used by the Caribbean Industrial Research Institute
(CARIRI) appears promising for Trinidad and Tobago and should be used more
often. CARIRI started with an agro-processing package--fertilizer, water,
pest regime and processing technology, worked out with the potential
processors and analyzed for profitability. If Trinidad and Tobago is to
develop regional or international competitiveness in agricultural products,
it will probably be in processed products such as the CARIRI passion fruit
product, where human capital and technology compensate for high labor
costs.
10.42 Research coordination has been lacking almost entirely in the
past. The approach of MFPMEFE to research coordination would appear to be
sound -- appoint coordinating committee for agricultural technology (COCAT)
within MFPMEFE, with representation from all research institutions,
including regional ones like the Caribbean Agricultural and Research
Development Institute (CARDI). Meetings of this committee would provide
MFPMEFE with a forum. MFPMEFE's might also consider focusing its research
budget. Perhaps the prime tool, however, would be to reorganize the
extension service to be a bridge between farmers' needs and institutional
research capabilities.

- 91 -
10.43 MFPMEFE's own research unit needs strengthening in straightforwardways, in particular, by transferring of resources from wages to equipmentand operating expenses. At the Aripo livestock research center, theemphasis on employment has been carried to such an extreme that there isone worker for every 2.8 animals. At Centeno, basic research equipment hasbeen foregone to finance unneeded support staff.
Marketing
10.44 In general, Government subsidy and marketing efforts, often mergedin the past, havie had a negative influence on the quality of marketing inTrinidad and Tobago. The administration of subsidy programs and theoperation of Government marketing enterprises have often suppressed thenatural development of quality differentials. With the cutback in thesubsidy programs, the private sector now has full marketing responsibilityfor most fresh vegetables, fruit and meat, for inputs into agro-processingand for the outputs of that processing. A major role in the marketing areafor MFPMEFE could be in the negotiations that will be necessary to replacethe congested Central Marketing Agency (CMA) wholesale market in Port ofSpain. A proposal to relocate it to the highway junctions near Valsyn isunder consideration.
10.45 MFPMEFE's market information operations could also be closed.Local markets are undoubtedly more efficient at communicating price andmarket information than the Ministry is. The operations of the ExportDevelopment Co. Ltd. (EDC) should be examined to see if its marketinformation capability is worth the expenditures, the regionalorganization, CATCO, could provide regional marketing services.
CONCLUSION AND RECOMMENDATIONS
10.46 Agriculture needs to become more efficient and competitive to playthe significant role to play in recovery and diversification the Governmentenvisages. An ongoing capability to measure the cost of protection in eachagricultural subsector is needed. Official policy should aim at switchingas much as possible to tariff or de facto tariff protection of agricultureand away from quantitative restrictions. The opening up of the Trinidadand Tobago market to CARICOM imports .is a welcome step that would subjectTrinidad and Tobago agriculture to a certain measure of regionalcompetition.
10.47 Effective economic analysis of the agricultural sector, includingmeasurement of the costs of protection, is best carried out prior toinvestment in infrastructure.
10.48 It is logical that the sugar industry should be phased out on anagreed schedule. The pace of this operation will clearly depend on thedevelopment of viable alternative economic activities and by the imperativeof not exacerbating unemployment.
10.49 Agro-processing industries, particularly those where human capitaland technology compensate foL higher labor costs, could compete well in theexport markets. Flexible management of the exchange rate would stimulatethe growth of these and other agricultural exports.

- 92 -
10.50 Where possible, the complexity of Government institutions
supporting agriculture should be streamlined. In particular, the
Government should end most of its marketing activities.
10.51 The link between extension and research should be strengthened and
non-extension matters turned over to another institution then the Extension
Division. Research coordinat;ion should proceed along the lines proposed by
MFPMEFE.

- 93 -
Chapter XI
TOURISM SECTOR REVIEW
THE TOURISM SECTOR
11.1 Trinidad, approximately 4,800 sq km in size, and Tobago, only some300 sq km share similar physical characteristics, vegetation and tropicalclimate. In addition to beautiful scenery, beaches, lush jungles, swampsand plantations, both islands possess a wide range of flora and fauna andhistorical and cultural attractions. There are also a number of naturecenters, bird sanctuaries and historical fortifications (some restored).Trinidad is-the only Caribbean country in which Christian cathedrals, Hindutemples and Islamic mosques co-exist in close proximity. The islands arealso the home of calypso and steelband music, which are important culturalexpressions and assets of the people. Carnival, which occurs inFebruary/March each year, is internationally renowned in the English-speaking world and attracts a large number of tourists. Sports, fishing,sea sports, golf and other ad hoc activities and attractions drawadditional tourists but are largely undeveloped assets. Despite thesimilarities, the two islands experienced different types and stages ofeconomic development, and that factor has had an important influence on thedevelopment of tourism. Trinidad has seen rapid growth, particularlybecause of the development of oil and associated industries. As aconsequence, there has been rapid industrial and urban growth, togetherwith significant increases in real incomes and wages. With a diverse,cosmopolitan population of nearly 1.2 million, Trinidad has, in recentdecades, found itself the focus of business, visiting friends and relatives(VFR) and cultural tourism. There has also developed a significant outwardtourist market, particularly for shopping, business and education. Whilethere are attractive areas with tourism potential, particularly on thenorth coast, various constraints, including a lack of physicalinfrastructure, lack of resort accommodation, inadequate marketing and apolicy that does not favor tourism development, have meant that Trinidadhas not participated in the sun, sand and sea tourism enjoyed by the restof the Caribbean.
11.2 Tobago's population is only 44,000. While Tobago hastraditionally been regarded as the international holiday tourismdestination of the country, with unspoilt beaches, fine scenery, coconutgroves, the Buccoo Reef, etc., a variety of factors have led to only a lowlevel of development.
11.3 Both islands have relatively few first class hotel rooms and whatthere are generally do not display any Caribbean ambience. In general,relatively few international vacation tourists stay in hotels in Trinidadand Tobago, nor do the islands attract a significant number of cruiseshippassengers. It is worth addressing this situation, as Trinidad and Tobagocan derive increasing economic benefits from a flourishing tourism sector.
- 94 -
Size
11.4 Table 5.1 above shows the breakdown of visitor arrivals in
Trinidad and Tobago in 1986. The three major arrival groups were: (i)
residents returning from business, holidays or shopping abroad (40% of the
total); (ii) visitors not staying at hotels, mainly the visiting friends
and relatives (VFR) segment (20%); and (iii) visitors on business (11%).
11.5 The more usually defined vacation tourists, together with cruise-
ship passengers, amounted to less than 40,000 a year, or 7% of total
arrivals.
Markets
11.6 Of the of 64,000 overseas hotel visitors in 1986, over 40% came
from the US, 9% from Canada. Visitors from Europe comprised 23%, of which
14% percent (or just under half) came from the UK.
Local Destinations
11.7 Tobago is the main destination of the hotel holiday tourist, but
specific events and attractions such as Carnival and the need to transit
via Port of Spain generate a limited number of hotel holiday tourists in
Trinidad.
Accommodations
11.8 Trinidad and Tobago have about 1,200 first class (or "better
quality") hotel rooms, of which 75% are in Trinidad. Almost 700 rooms are
contained within two city business hotels in Port of Spain. Trinidad and
Tobago therefore suffer from an inadequate stock of good quality resort
accommodations at beach sites.
11.9 In 1986, average hotel occupancy rates were under 50% but a 12%
increase in visitor arrivals in the first half of 1987 indicates a
recovery. This improvement is largely the result of improved management
and marketing at several hotels jn Tobago, although possibly at the expense
of reduced room revenue. While the trend is encouraging, the fundamental
problems of inadequate acconmodations, limited air access and the general
view in the international travel trade that Trinidad and Tobago represent
poor value for money remain.
RECENT DEVELOPMENTS
11.10 Examination of visitor arrivals since 1978 shows, a static picture
until 1987 where the first six months registered an increase of 12% over
the same period in 1986 (Table 11.1).
In 1980, when 199,000 visitors were recorded, there were some 33,000 hotel
holiday visitors, versus 19,000 in 1986.
11.11 It is believed that a variety of factors, including deterioration
in basic services and utilities, air transportation, the standard of
- 95 -
accommodation, services at Piarco airport and a major fiasco with a golf
tournament in Tobago led to increasing dissatisfaction from consumers and
the travel trade alike.
11.12 A positive trend is repeated with the holiday hotel visitor, which
showed a 12.4% growth in the fist six month.s of 1987 over 1986. Overseas
hotel visitors, who include businessmen and vacationers also increased by
23% in 1986 over 1985.
11.13 Despite the increase in visitor arrivals during 1986, overall
hotel occupancies fell by 5 percentage points to 36.8% in 1986. However,
it is noteworthy that the occupancy rate for Trinidad fell by 4.8 points,
while that for Tobago increased by 1.4 points.
11.14 Much of the recent increase in overseas hotel visitors came from
Europe, the UK in particular, the result of increased marketing efforts bycertain hotels.
11.15 Domestic hotel holiday guests rose 12.2% in 1986 compared to 1985.
This increase was attributed to the devaluation, which made overseas travel
for residents more expensive, and to the increased promotion efforts of the
Tourist Board and the hotel sector. A large segment of the populationstill travels overseas for a variety of purposes, but the devaluation has
Table 11.1: ANNUAL CHANGES IN VISITOR ARRIVALS, 1978-1987
Visitor ArrivalsYear (OOOs) % Change
1978 177 -1979 190 +7.3
1980 199 +4.71981 187 -6.01982 184 -1.61983 189 +2.71984 192 +1.61985 187 -2.61986 191 +2.11987 202 +5.7
Source: Central Statistical Office.
changed their favored destinations of Grenada, Barbados and St. Vincent to
Venezuela, which was devalued even more than the TT dollar, and to Curacao.
11.16 In terms of accommodation, a number of new hotel projects have
been discussed extensively but no new hotel has been built for many years.
With the election over, and the Government committed to tourism
development, a number of projects may proceed.

- 96 -
MARKET POTENTIAL AND PROSPECTS
Market Potential
11.17 In 1986, over 8 mLillion tourists visited the Caribbean a further 4
million Mexico and Venezuetla. Some 3 million cruiseship passenger arrivals
were also registered at Caribbean destinations. Over 300,000 overseas
tourists were recorded visiting the islands of Aruba, Bonaire and Curacao,
nearly 60,000 visited Grenada, and over 300,000 visited Barbados, these
islands being similar distances from the main source markets of North
America and Europe. Apart from the traditional sun, sand and sea
destinations, several Caribbean islands, including Dominica (24,000
visitors), Montserrat (16,000) and Belize (50,000), promote different types
of tourism, such as scenery and wildlife. A significantly smaller volume
of visitors have gone to Central and Southern America, which offer a mix of
tourism attractions, e.g., sun, sand and sea, historical, natural beauty,
flora and fauna, adventure, etc.
11.18 Because of the development of oil and oil-related industries and
the resultant high-cost economy, Trinidad and Tobago have a poor marketing
image with the travel trade and have been regarded as a poor value for
money destination by tourists, a situation that has been partly mitigated
by the devaluation of the TT dollar in 1986.
11.19 In some respects, Trinidad and Tobago may be regarded as
possessing complementary tourism products, although the north coast of
Trinidad has possibly longer term potential for sun, sand and sea tourism.
While Trinidad has cultural assets and a number of attractions, these are
difficult to market, particularly in their own right.
11.20 The viewpoint is often expressed locally that Trinidad and Tobago
cannot compete with other more established destinations for sun, sand and
sea tourism. However, the general travel trade believes is that any
destination which offers the requisite attractions within a recognized
tourism region will succeed, almost irrespective of location. Based on
this view of the market, and the attractions of Trinidad and Tobago,
including climate., scenery and beaches, the crucial need is to upgrade
existing hotels and create new resort accommodations. This need applies
particularly to Tobago in the medium term.
11.21 Markets that can be targeted include middle to upper-income
families, particularly from the north east of the US but from the midwest,
western and other regions as well. Canada also provides a developing
source market and Europe, particularly the UK, Italy, Federal Republic of
Germany and Switzerland, would be suitable targets of marketing efforts.
The UK and Italy are already providing some numbers of tourists, despite
the limited existing stock of accommodations.
11.22 The attractions of good accommodations, a variety of dining
opportunities and the natural advantages of the country could, in our view,
attract an increased number of tourists. Further demand can be expected by
developing special interest vacations related to natural history (wildlife
and scenery), scuba snorkeling and 'water sports, culture, fishing, golf and
other leisure activities.

-97-
11.23 Trinidad and Tobago might also be a part of multi-destination
vacations to other Caribbean and South American destinations. Both special
interest and multi-destination vacations should be promoted on the basis of
sun, sand and sea tourism attractions of the islands and be jointly
marketed. A further potential source of tourism demand is cruiseship
passengers, which could be generated by providing better cruiseship
facilities in Tobago and in Port of Spain or Chaguaramas. With a strategic
location, good bunkering and water facilities, potentially good air access
and first class rooms in Port of Spain, Trinidad could become a base port
for cruiseship lines if positively developed.
11.24 The prospscts for tourism development are tied to the following:
(i) improvement of the existing hotel stock and implementation of
selectively targeted, joint marketing programs that promote the
tourism assets of Trinidad and Tobago and/or other countries,e.g., TrinJdad and Tobago with Grenada/Barbados/Venezuela. A
beneficial short-term action could be to improve hotel occupancy
rates and profitability by improving coordination of the tourism
agencies in both Trinidad and Tobago, supported by a major
marketing thrust, and by utilizing, in particular, the tremendous
potential of the country's airline capacity;
(ii) concurrently, as part of a five-year development program, we would
envisage:
-- An increase in the supply of hotel accommodations,particularly in Tobago, in small and medium size
establishments (50-150 rooms), to provide a total of 1,500
new rooms.
-- Major tourism and leisure development at Chaguaramas aimed
at both international and domestic tourists.
-- A major increase in cruiseship passengers visiting both
islands.
(iii) In the longer term, development of the north coast of Trinidad
for both international and domestic tourists.
11.25 Exchange rate adjustment would greatly support this program,
consistent with the needs of the overall economy. Development of the
infrastructure, following an assessment, will also be required.
Employment Generation
11.26 In 1986, some 4,500 people were directly employed in totnrism-
related industries, as follows:
Accommodations 1,560Airlines 2,140Tourist Board andTobago House of Assembly 320Other 4,020

-98-
11.27 As employment in hotels is partly related to occupancy, increased
occupancies could result in employment levels approaching 2,000 in the
existing hotels in the short term. If 1,500 new rooms were constructed
over the five-year period, the resulting new direct employment
opportunities would double the number of present staff to 4,000. Airline
and Government staff would not increase commensurately, but there would be
some increase both directly and indirectly.
POLICIES AND INCENTIVES
Policy Framework
11.28 Government tourism policy is in a state of flux, with the policies
of the previous administration largely superseded and new policy under
preparation, subject to Government approval. It is apparent that the new
Government intends to: assign to tourism a higher priority; promote
Trinidad and Tobago jointly; focus attention on smaller scale up-market
tourism; develop tourism in Tobago; promote tourism by marketing culture,
natural history, sport and other assets; provide the necessary supporting
infrastructure; and provide the necessary organizational marketing and
incentive framework to encourage the private sector to develop the
necessary hotel accommodations and related facilities.
Priority Areas
11.29 The following are possible Government priorities areas for
development and financial incentives:
In terms of locations, the priorities are likely to be:
The north coast of Trinidad between Maracas and Blanchisseuse; Tobago;
Chaguaramas; Piarco Airport; and Port of Spain.
11.30 Additional opportunities for investment have been identified as a
part of the national strategy to increase the contribution of the tourism
sector to the econiomy in the following areas: nature trails and wildlife
reserves, scubadiving, deep sea fishing and water sports, golf, tennis,
squash and other sports, group tours, entertainment, cultural attractions,
cruises/boat tours and production of souvenirs.
11.31 Incentives include:
(i) a tax exemption for a period of not less than 5 years and no more
than 10 years with respect to the gains or profits accruing to the
hotel operator and/or owner of the new hotel;
(ii) an accelerated depreciation of depreciable equipment owned by the
hotel operator and/or owner and used in the new hotel;
(iii) capital allowances with respect to approved capital expenditures
related to new hotel construction;
(iv) repatriation of profits under the Exchange Control Act, where
foreign investors have taken equity in the new hotel;

-99 -
(v) double taxation relief where applicable;
(vi) carry-over of losses incurred during the tax exemption period by
the owner and/or operator;
(vii) tax exemption on dividends accruing to the owner;
(viii) tax exemption on the interest on an approved loan for a period of
10 years or the period of the loan, whichever is less; and
(ix) customs and excise duty exemptions on building materials and hotel
equipment to be used exclusively in connection with the
construction and equipment of a hotel project.
11.32 These incentives are comparable to the incentives provided by many
other Caribbean countries.
Pricing Policy and Costs
11.33 Pricing in the tourism sector is largely unregulated. There is no
hotel classification system and advertised room rates may be high given the
quality of the accommodations. However, most hotels offer special lower
rates to domestic visitors. Although assisted by the devaluation of 1986,
other local costs, particularly mealsi beverage and local transport, are
also regarded as uncompetitive with other regional destinations. Much of
the justification for the high prices has been the high costs of labor and
local manufacturing and of transport for imported goods. However, energy
costs are relatively low, with improved volumes of business hotels and
restaurants in the tourism sector could become more competitive.
Financial Aspects of the Hotel Sector
Operating Profitability
11.34 Hotel occupancies, on average, are low. Even Tobago, which has
suffered less from the economic recession and the loss of business visitors
has occupancy levels just under 50%. Average room rates are also low,
caused in part by the low level of demand and excessive discounting, and
compounded by the low rates that have been offered to the domestic hotel
visitor. With high fixed costs, particularly of labor, most hotels are not
operating profitably, even before debt service. Nevertheless, analysis of
the operating cost parameters, including payroll, energy, food cost, etc.,
indicates that, with appropriate size and facilities, levels of service,
management, physical product and marketing, the hotel industry should be
able to trade successfully in the local market. It will be necessary to
resolve the differential in the rates for local and international visitors.
Construction Costs and Finance
11.35 Construction costs for new hotels in Trinidad and Tobago can range
from US$30,000 per room to US$100,000 and higher, depending on standards,
location, extent of the infrastructure requirements and other factors.
While a range of standards should be encouraged, from deluxe to jungle

-100-
retreats, it is important to relate the construction cost to the market to
be targetted and the room rates that can be achieved. In this way, under-
or over-building can be avoided.
11.36 The Development Finance Corporation, which is almost entirely
state-owned, provides financing for projects, including those in the
tourism sector. In principle it can become involved in any size hotel
whose cost is above US$150,000, lending up to 70% of the project cost.
Indicative terms are 12% and repaym-ent period of 10-15 years, with 2-5
years' grace, including construction. While relatively high, they are not
excessively so by Caribbean standards.
11.37 Of greater concern in the financing of projects the need to
mobilize both local and international capital and to reduce the time and
bureaucracy involved in processing development applications through the
stages of Government appruval.
Future Incentive Policy
11.38 The incentives currently available are comparable to those at
other Caribbean destinations, while prices and costs, although excessive in
the past, appear to be somewhat more acceptable now and should allow
profitable hotel operations. Therefore, the focus of future incentives
policy should be related to:
(i) consideration of Government g',arantees for funding priority
tourism projects;
(ii) identification and preparation of appropriate resort sites and
development of joint ventures with the private sector, with land
provided as equity by the Government;
(iii) site development and attractive rates for fuel and water forcruiseship operators, particularly those having a base port in
Trinidad; and
(iv) faster processing of applications for funding and development by
Government institutions.
SUPPORTING POLICIES
Air Aiccess
11.39 In principle, air access to Trinidad and Tobago is among the best
in the Caribbean, with scheduled services provided by Air Canada, Air
Martinique, iLM, American Airlines, British Airways, British West Indies
Airlines (BWIA), Cubana, Eastern Airlines, Guyana Airways, KLM, LAV, LIAT,
and Pan American. There are also a number of charter flights at peak
periods of the year mainly from Europe in the summer.
11.40 The country has Its own airline, BWIA, which operates 4 long-haul
250-seat jets, 3 mid-range 140-seat jets and 4 mid-and short-haul 120-seat
jets. It operates 5 services to Europe, 9-12 services to New York and 5-8
services to Toronto, with a further 17-22 narrow body flights from Miami,

- 101 -
Boston-Baltimore and New York, weekly. There is also extensive weekly
service to other Caribbean islands and 7-10 domestic daily flights between
Trinidad and Tobago. Airline management sees a need to increase the fleet
capacity with both wide- and narrow-bodied aircraft. Load factors on
international routes vary ,between 75% to London and 50% to Boston-
Baltimore, with the majority being in the mid-60 percent range.
11.41 While BWIA has a major presence in the tourism sector and is
represented on the Tourist Board, there appear to be major conflicts around
the following objectives:
(i) the necessity to operate on a commercial basis;
(ii) the need to cater to the tourist industry by offering more
direct flights, packages, block bookings and making more seats
available, particularly at peak tourist periods;
(iii) the carrying of domestic tourists overseas; and
(iv) service for the tourist industries of other Caribbean islands.
Promotional Strategy and Budget and Tourism Organization
11.42 During the current period of economic recession and given the
reconsideration of tourism policies, promotional strategy and budgeting and
tourism organization have generally drifted without any overall guidance.
Promotional Strategy and Budget
11.43 The promotional budget has fallen in recent years, while no clear
indication of the level of either of the 1987/88 or 1988/89 budgets has yet
emerged. Total expenditures of the Tourist Board for the years 1985 and
1986 amounted to US$4.7 million, of which some US$0.4 million was spent on
advertising as follows: within Trinidad and Tobago, US$66,000; United
States, US$163,000; Canada, US$73,000; UK/Europe, US$98,000; Venezuela,
US$2,500; and Caribbean, US$10,000. These expenditures appear to be low
and too thinly spread, there has been no monitoring to assess how effective
they have been and whether targets have been achieved.
11.44 In the short term, marketing and promotion should concentrate on
the following activities aimed at improving hotel occupancy rates and
filling the new rooms likely to come on stream in 1988/89:
(i) market research, particularly in North America and Europe,
aimed at identifying market opportunities in conjunction with
the travel trade, wholesalers, travel agents, airlines, etc.;
(ii) joint Government/private sector/airline promotion in selected
target areas identified above as having potential; and
(iii) promotion with cruiseship operators of Trinidad and Tobago as
attractive destinations.
11.45 In general, because of the lengthy lead time required to construct
and open a new hotel, the best shorter term marketing strategy would be to

-102 -
stabilize, coordinate and make effective the existing level of expenditures
for promotion and, through market research, to identify areas for
significantly increased promotion in future years.
Tourism Organization
11.46 The main agency responsible for tourism in Trinidad and Tobago is
the Tourist Board, a statutory board falling under the purview of the
Ministry of Industry, Commerce and Consumer Affairs. Tobago has a separate
Tobago Tourist Bureau under the purview of the Tobago House of Assembly (in
accordance with the Tobago House of Assembly Act 37 of 1980, effective from
1982) and is responsible for the development and maintenance of the tourism
industry in Tobago. The Trinidad and Tobago Tourist Board assists in
marketing, promotion and facilitation for arranged groups visiting Tobago
and is responsible for the overseas marketing of the island.
11.47 Other organizations are also involved in tourism, including:
Industrial Development Corporation--responsible for administering the hotel
incentive scheme, hotel construction and promotion and for defining
priority areas for hotel development; Development Finance Company-
-responsible for the finance of hotel and tourist facilities; private
sector organizations such as the Hotel Association and Travel Agents'
Association; BWIA; Airports Authority; Port Authority; and other tourism-
related bodies. Coordination among these organizations has been weak.
11.48 Responsibility for tourism in Trinidad and Tobago is divided
betwgeen Government departments and, at the political and administrative
level, is a relatively small component of the Ministry of Industry,
Commerce and Consumer Affairs.
11.49 Tourism development would be better served if there were either a
Ministry of Tourism or Minister of Tourism within an appropriate ministry.
Tourism requires the close coordination of many inter-related sectors and
interests and needs representation at the highest level if the inevitable
conflicts and issues are to be satisfactorily resolved. Further, tourism
development needs a less blurred image and to be portrayed to the
international travel trade as an important sector, if Trinidad and Tobago
are to be put on the tourism map of the Caribbean. This objective would
also be furthered by improved financing of tourism. Currently, it is
supported out of general revenues, with no real objective assessment of its
required level. In certain other Caribbean countries, the hotel tax is the
basis of the tourism budget. In this case, increases in the number of
tourists booscs the budget and provides a built-in incentive for success.
This option warrants examination as part of the review of the organization
of tourism in Trinidad and Tobago.
Local Transportation
11.50 With most tourists comprised of business travellers, local
transportation is expensive in Trinidad, particularly as the airport is
nearly 20 km from Port of Spain, the capital and main destination of
visitors. The airport in Tobago is close to most hotels and taxis are more
oriented to the vacation traveller. However, any expansion of the tourism
sector will require an improved local transportation system, including:

- 103 -
(i) reinstatement of the hotel-airport bus system;
(ii) fixed prices, widely displayed, for taxis and/or the
introduction of a meter system within urban areas; and
(iii) the use of cheaper medium-size vehicles as taxis.
Port and Airport Services
Port Services
11.51 The Port Authority is responsible for the berthing of ships, their
infrastructure requirements and the operation of the ferry service to
Tobago. Currently, cruiseships visiting Trinidad berth at Port of Spain,
where visitors sightsee, shop and enjoy entertainment. The private sector
has proposed developing several cruiseship berthing areas into a major
tourist facility, to include shops, restaurants, banks, etc., cruise
vessels could be stationed there, attracted by the location of Trinidad and
Tobago on the cruise circuit and cheaper fuel.
11.52 Other cruise vessels prefer to visit Tobago. They anchor off one
of the scenic points of the island and ferry passengers from the ship to
land by tender. There are firm proposals to develop a cruise pier facility
at the capital of the island, Scarborough. The new facility would also
cater to the inter-island ferry service. Currently there are two
car/passenger ferries, with a capacity of approximately 700 passengers and
125 cars, with twice daily sailings in each direction on weekdays and one
sailing in each direction on weekends. The 85-mile journey, which takes
betweeni 4-5 hours depending on sea conditions, costs TT$26 return, a fare
that is heavily subsidized. The passenger load factor for 1986 was under
40% but there were still capacity problems at the peak periods.
Airport Services
11.53 The Airport Authority of Trinidad and Tobago operates Piarco
airport, the main international airport of the country, and Crown Point
airport, which serves Tobago. Almost all international flights arrive at
Piarco, and passengers for Tobago then take a domestic flight there.
Piarco airport can handle all wide-bodied aircraft, but the terminal
facilities are poor, with slow processing of visitors, and are generally
unsatisfactory for major passenger flows. Crown Point airport has, by
contrast, a pleasant modern terminal that caters satisfactorily tor the
domestic services it receives. Its runway will accommodate Boeing 727
aircraft, but it needs to be able to receive wide-bodied aircraft from the
major source markets. Doing so will require extending the runway and
remodelling the terminal.
Training
Currently, training for the tourism sector is confined to the
efforts of individual hotels, restaurants and the Hotel Training School of
Chaguaramas. The training school produces some 100-120 graduates per year,
up to the chef and middle management level, although most enter the lower
-104 -
staff levels. Only some 40% of students enter the hotel industry, the rest
being deterred by salary levels lower than expected. The type of work and
difficult hours also have an impact on loss of staff. The recent economic
recession has, however, increased the standard of the students entering the
training courses and has reduced the wastage.
11.54 The training school is funded mainly by the IDC, with some revenue
from course fees. It is apparent that the expansion of the tourism sector,
with new accommodations, restaurants and other facilities, will require an
additional and different type of training facility. It will need to be:
tourism-oriented; resort-oriented; capable of training a wider variety of
staff levels and functions; and organized around courses that develop and
promote inter-sectoral linkages, e.g., chefs' courses aimed at more local
foods and more Caribbean/local menus, and designer courses aimed at opening
up the areas of soft furnishings, furniture, etc., to local or regional
manufacturers. The school might be located in Tobago.
Inter-Sectoral Linkages
11.55 Linkages between the tourism sector and the rest of the economy
are limited. While the agricultural sector supplies much of the fresh
vegetable requirement, fruit and certain meat products are largely
imported. Non-food requirements, including soft furnishings, furniture,
chinaware, cutlery and, electrical equipment, are also mostly imported.
11.56 Because of the lead time for the production of new crops, short-
term benefits from inter-sectoral linkages are unlikely. However, in the
medium term, the development of tropical fruit crops and agri-processing
industries appears to have potential, but will need encouragement at all
levels of both industries. The prospects for locally manufactured items to
be produced locally for the tourism sector appear to be more difficult,
although smaller scale hotels, constructed and equipped with traditional,
local materials, offer some potential for increasing inter-sectoral
linkages.
CONCLUSIONS
11.57 Tourism-related activities, which constitute about 3% of GDP, have
potential for considerable expansion. Whereas in the past tourism has been
largely neglected by the private sector and Government, a new consensus is
emerging on the direction new tourism policies should take. The benefits
of a sound tourism policy would be mainfold: increased generation of
foreign exchange revenue; decreased loss of foreign exchange; increased
employment, training and job opportunities; fairer distribution of social
and economic benefits, especially between the two islands; development of a
strong and profitable private sector; increased opportunities for vacation
and leisure activities for the domestic tourist; potential for inter-
sectoral linkages; and diversification and strengthening of the general
economy.
11.58 The major problems in the tourism sector are: the low number of
tourists; small number of hotel rooms; low occupancy rates and generally
low quality and low profitability of hotels; difficult access to Tobago
from the major source markets; poor value for money; poor marketing image

- 105 -
of Trinidad and Tobago of tourists and the travel trade in North Americaand Europe; considerable outward movement by residents and consequent loss
of foreign exchange; lack of attractions, inadequate organizatIon of thosethat do exist and general lack of tourism ambience in the country; lack of,and high cost of, infrastructure; and lack of supporting tourismfacilities, including restaurants and shops.
RECOMMENDATIONS
1. Improvement of the hotel stock and selectively targetted, jointmarketing programs that combine the tourism assets of Trinidad and Tobagoand/or other countries, e.g., Trinidad and Tobago with Grenada/Barbados/Venezuela are needed. Short-term actions to improve hotel occupancy rates
and profitability will require much improved coordination of the tourismagencies in both Trinidad and Tobago, supported by a major marketing effortand utilization, in particular, of the tremendous potential of thecountry's airline capacity.
2. Improved supporting policies including the following, areneeded;
(i) market research into the major source markets to be targetted;
(ii) improved coordination of the tourism agencies, and specificallyimproved, coordinated and selectively targetted promotion ofapproprlate source markets;
(iii) more direct flights, packages, block bookings and increased seatavailability for international tourists at peak periods; and
(iv) improved infrastructure, including airport and cruise portdevelopments in Trinidad and Tobago.
3. A concurrent five-year development program should include:
(i) an increase in the supply of hotel accommodations, in terms ofhotel size and new small and medium size (50-150 rooms) hotels,to provide a total of about 1,500 new rooms;
(ii) major tourism and leisure development aimed at both internationaland domestic tourists at Chaguaramas; and
(iii) a major increase in cruiseship passengers visiting both islands.
4. The longer term program should cover development of the northcoast of Trinidad for both international and domestic tourists.
11.59 These measures are best supported by exchange rate adjustment,consistent with the needs of the overall economy. Further, tourism
development would be better served if there were either a Ministry ofTourism or a Minister of Tourism within an appropriate ministry, and not
submerged in a major ministry. Financing arrangements for tourism shouldalso be improved.

- 106 -
11.60 As to technical assistance, a tourism advisor and
planning/implementation programs for the following three areas are needed:
Tobago Tourism Development Study; Chaguaramas National Part Development
Study; and Northcoast Development Study, Trinidad.
- 107 -
Chapter XII
INSTITUTIONAL STRUCTURE FOR PLANNING
12.1 Following independence, the Government created a Ministry ofPlanning in 1955 with responsibility for planning the country's socio-economic development. It carried out its role through a series of five-year plans developed in conjunction with the other ministries. In 1974,following major changes in the economic environment, the Ministry ofPlanning was abolished, its only trace being an integrated planningdepartment within the Treasury, whose activities were focused mainly onpublic finances and the economy. In December 1986, the newly electedGovernment decided to set up a new Ministry of Planning and Reconstructionthat would be concerned with all aspects of socio-economic development.
PLANNING INSTITUTIONS
The Ministry of Planning and Reconstruction
12.2 The new Ministry of Planning has not been ratified by thelegislature, and its budget is so modest that it does not have adequatestaff to undertake the task of organizing and integrating the country'ssocio-economic development. Moreover, when the previous Ministry wasdissolved in 1974, its starf were reassigned to otner Governmentdepartments and agencies and were not available to the new Ministry.
12.3 The staff of the new Ministry of Planning consists of personnel ofthe Planning Division of the Treasury, which has been moved to theMinistry; these personnel are essentially specialists in the economy andpublic finances. The new Ministry has very few or no specialists indevelopment planning, regional development and other key fields of planning(manpower, labor, education, etc.). As such there are doubts whether itcan carry out its mandate. Because of the budget constraints, it will beimpossible in the immediate future to fill a number of the positionsidentified for the Ministry. The 1987 budget appropriates only TT$32.7million or 0.8% of the projected national total, to the Ministry.
Sectoral Planning Units
12.4 Eight of the 14 ministriPs and a number of the major publicagencies have their own sectoral planning units, some of them competent andwell-staffed. These decentralized sectoral planning units grew graduallyout of the void left by the dissolution of the Ministry of Planning in1974, filling the need for planning at the sectoral and regional levels.Some units, already 10 years old, have accumulated valuable experience, andtheir contribution to general and national planning is significant. Theministries and public agencies that formed their own operational planningunits after 1974 are: Ministry of Youth, Sport, Culture and Creative Arts;Ministry of Labour and Manpower Resources; Ministry of Education; Ministryof Health, Welfare and the Status of Women; Ministry of Works, Settlementsand Infrastructure (each of the departments of Public Works, Construction,
Transportation and Utilities Administration having its own planning staff);Ministry of Food Production, Marine Exploration, Forestry and Environment;

- 108 -
Ministry of Energy; Office of the Prime Minister (Decentralization);
Industrial Development; Development Finance Company; and Tourism Office.
The most fully developed planning units belong to the Ministries of:
Agriculture (Food Production, Marine Exploitation, Forestry and
Environment); Public Works (Works, Settlements and Infrastructure); Health
(Health, Welfare and Status of Women); Education (primary, secondary and
higher); and Energy.
12.5 In the wake of the restructuring of the Government in December
1986, a number of the ministries that had planning units reorganized them
to fit their new responsibilities (e.g., Youth and Sport, and Labour and
Manpower Resources).
12.6 Some Ministerial planning units need to be strengthened in terms
of efficiency and effectiveness, and six ministries still have no planning
staff. For example, the Ministry of Industry, has not had the opportunity
to set up a planning unit, although upper level officials there are fully
conscious of the need to do so. To this end they have begun serious
discussions with the Office of the Prime Minister and Ministry of Planning
and Reconstruction.
12.7 The importance of planning units is illustrated by the differing
experience of two ministries that received World Bank loans or lines of
credit: Trinidad and Tobago received the two loans in 1972, both to mature
in 1989, for a total of US$4,333,000. These funds, administered by the
Development Finance Company, were intended to finance industrial projects
that were either wholly Government-owned or in which the Government had a
majority holding. Only 21.8% of the total made available was invested in
projects of this type. Obviously, there is a lack of capacity in both the
governmental and mixed-economy sectors to absorb industrial development
capital. This shortcoming can be linked directly to the fact that the
Ministry of Industry possesses neither a sectoral planning unit nor a
division dealing with the technical and financial appraisal of new
projects. On the other hand, a World Bank loan of US$6 million to the
Ministry of Health for the construction of six new medical centers was
disbursed fully and satisfactorily within the scheduled time period. This
Ministry possesses: a sectoral planning unit; a division for technical and
financial appraisal of new projects; and a division for monitoring project
execution.
Integrated Regional Development Planning
12.8 Each subregional authority in Trinidad and Tobago has its own
planning division that prepares, coordinates and monitors all socio-
economic development within its territory. Considering the human and
physical resources in a subregion, this responsibility is extensive and
extremely diversified.
Decentralization Planning Division, Office of the Prime Minister
12.9 In 1983, what was then the Ministry of Community Development was
abolished and replaced by a Decentralization Planning Division attached to
the Office of the Prime Minister. The Division's activities and
responsibilities are virtually the same as those of the former Ministry,
almost all of whose staff were reassigned to it.

- 109 -
12.10 The Division takes part in regional activities through: 11
representatives to the regions; 4 representatives on the City Councils of
the major urban centers; 7 representatives on County Councils; 8 districtcommunity developmernt officers.
12.11 The Division's representatives participate whenever possible in
village councils, adult education, and the training of future community
development workers. They also help create new employment opportunitiesthrough the development of small-scale non-industrial enterprises and
cottage industries and through the granting of loans for small developmentventures. The district officers are responsible for community development
in conjunction with locally represented Government departments. Communitydevelopment also involves supporting cultural activities, competitionsbetween villages, etc.
12.12 The foregoing applies to Trinidad. Tobago, hfs its own particular
legal status, and a somewhat different system.
INTEGRATED SOCIO-ECONOMIC DEVELOPMENT PLANNING
12.13 The Ministry of Planning has been in existence too little time to
have been able to codify the work it does in conjunction with the various
planning units. Instead, the Ministry is using working meetings as a means
of sustained contact with the planning units and with those Ministries and
public agencies that still do not possess one. The objective is to work
patterns, information channels, and steps preparatory to decision-making,
as well as to standardize all systems and procedures and the documentationaccompanying them.
Shortcomings in General Socio-economic Development Planning
12.14 The weak points in socio-economic development planning, theoutcome of the factors outlined above, are as follows.
Ministry of Planning and Reconstruction
12.15. The first shortcoming, and the most serious one, is inadequate
staffing. Qualified staff are needed so that the Ministry can
satisfactorily discharge its responsibilities. Between the dispersal of
the staff of the old Ministry and retirements, the stock of know-how in
national socio-economic development planning has largely vanished.
Furthermore, during this long down period, no specialists were being
trained in the various facets of national planning.
12.16 A second shortcoming is the many decentralized planning units.
The new Ministry is in no position to question or quickly modify these
extremely varied structures without leopardizing or halting ongoingdevelopment efforts.
12.17 A third shortcoming relates to the disparities in the human,
financial and physical resources of the various planning units. The
Ministry itself does not have a large enough budget to fund new activitiesor the rapid growth of old ones.
- 110 -
12.18 A fourth, the Ministry's role and responsibilities have not yet
been clearly and officially defined. However, this situation could prove
beneficial. During this transitional phase, the Ministry may be able,
based on its experienced to determine its place in the scheme of things and
orient its activities toward:
(i) taking advantage of what already exists3
(ii) Resolving perceived weak points in sectoral and regional planniing;
(iii) helping to create new planning units;
(iv) taking up fully the role of coordinator and prime mover socio-
economic development, a role that clearly belongs to it. In doing
so, it would logically rely on existing sectoral and regional
planning units. While recognizing that the planning units in the
individual ministries are important, the Ministry of Planning has
to play a greater coordinating role. Doing so will require that
specific structures be put in place and that there be a clear
political direction; and
(v) reinforcing its coordinating function. For instance, loan
applications to external sources could be coordinated through the
Ministry, working in collaboration with the Ministry of Finance.
Technical assistance could be vetted in and channeled through the
Ministry of Planning.
Sectoral Ministries
12.19 As pointed out earlier, three of the eight ministerial planning
units need to be strengthened and the six ministries with no planning units
need to establish them. The Ministry of Industry is currently working with
the Ministry of Planning toward that end. Finally, all Ministries need to
develop a system of work organization that all can profitably follow.
INTEGRATED REGIONAL DEVELOPMENT PLANNING
12.20 The island of Trinidad has achieved good results in this area.
The same is not true of Tobago, where much remains to be done. One problem
is that staffing, financing and physical resources are not available on a
scale to meet needs.
NATIONAL PLANNING DATA
12.21 Three points are worth noting here. First, there is no central
data bank equipped to process and generate all required national planning
data, although the Central Statistical Office does amass considerable
statistics. It would be advisable to consolidate these resources by
setting up a data processing unit within the Ministry of Planning to work
in areas supplementary and parallel to those handled by the CSO. Second,
the lack of a project data bank affects preparation of the forthcoming
plan. It would be advisable to create such a resource from pre-project

documentation, initially from identification studies but ideally from pre-
feasibility studies. This approach would allow projects under
consideration to be incorporated in the Development Plan. Third, a
computerized central project register should be set up so as to facilitate
monitoring of the various phases of any project (e.g., preinvestment,
investment, commencement of operations, comparison of actual and projected
results, and explanation of shortfalls and gaps observed). It would also
be a major help in drafting annual project progress reports that provide a
comprehensive statement of forthcoming activities and propose any remedial
actions the authorities need to take.
FINANCING THE PRE-INVESTMENT PHASE
12.22 There is no official national fund for pre-investment financing,
although a number of contacts have been made and some preliminary work done
to this end.
STANDARDIZING PROJECT PROPOSAL DOCUMENTS
12.23 In studies relating to the identification, feasibility or
evaluation of projects, local authorities generally use documents provided
by the agency or bank handling the financial package. Since the methods
and documents are not standardized, it is difficult to compare one project
with another in any particular sector when the financing arrangements are
made by different sources.
MONITORING THE GENERAL ECONOMIC SITUATION
12.24 Regular and systematic monitoring (for instance, every half-year)
of major socio-economic indicators and macro-economic balances, together
with analysis of the current situation, have not yet been instituted.
TECHNICAL ASSISTANCE REQUIREMENTS
12.25 In the interest of dealing as rapidly as possible with the urgent
needs noted, the Government is well-advised to seek a program of technical
assistance. The kind of planning assistance required might be as follows.
Assignment of Experts
12.26 Given the gaps in training and lack of practical experience of
staff involved with national planning, it would be advantageous to assign a
small team of resident experts for a certain time. In addition to
technical assistance per se, they would provide on-the-job instruction and
training for local personnel. The team could consist of the following: a
project manager, would be responsible for helping the Ministry of Planning
prepare the next National Socio-Economic Development Plan and set up
liaison and decision-making structures and mechanisms to improve the
operations of the whole planning operation (24 man-months). An expert with
sound knowledge of sectoral development and project feasibility and
evaluation studies would assist in strengthening the sectoral planning
units without adequate staff and equipment. The expert would also provide
the authorities on the establishment of new sectoral planning units in the
ministries and public agencies without them (a minimum of 12 man-months).

- 112 -
An expert in integrated regional socio-economic development and planning
might be included on the team (12 man-months). It should be possible to
obtain the services of more highly specialized experts on a consulting
basis in such areas as: manpower and employment; the different branches of
industt7 and rural development; tourism; etc.
Training Assistance
12.27 Fellowships for qualified students or individuals already in
service and interested in specializing in general national development
planning are needed, as is short-term training for personnel attached to
and designated by the Ministry, locally or abroad. This training could
take the form of: specialized seminars in any subject area bearing on
national problems; and traineeships in Government departments or agencies
in other countries that face or have found solutions to problems similar to
those in Trinidad and Tobago.
12.28 Working seminars on major issues raised by the domestic planning
process would also be beneficial. Examples are: two seminars, a year
apart, on project feasibility studies and different working methods (two-
week duration); one seminar on the advantages of a central bank for
internal and external socio-economic data, in conjunction with the Central
Statistical Office (four-day duration); two seminars, a year apart, on
development project appraisal and ex post evaluation, based on a study of
specific cases (two-week duration); and one seminar on different methods of
generating short-, medium- and long-term forecasts and projections, and on
the advantages of a long-term master plan (two-week duration).
Assistance in Establishing a National Fund
12.29 It would be used to finance pre-investment studies of development
projects geared to National Development Plan goals.
Equipment
12.30 Needed equipment includes: a computer hardware (personal
computers with various data input terminals, and also on-line or off-line
access) to be compatible with that already in use, in particular the
hardware of the Central Statistical Office hardware; and photocopying
equipment that would aJl3ow very rapid reproduction of documents and graphic
materials for immediate dissemination to interested Government departments
and agencies.
CONCLUSION
12.31 Despite the dissolution of the Ministry of Planning in 1974, the
principle of planning economic and social activities survived in the form
of sectoral planning by units in different Ministries and integrated
regional socio-economic development planning by the former Ministry of
Community Development, later traKisferred to the Decentralization Planning
Division of the Office of the Prime Minister.
12.32 The new Ministry of Planning and Reconstruction is in its early
stages of development. It has not had time to: (i) dovetail with the
sectoral and regional planning units, so that it has not succeeded in
113 -
playing its proper role as prime mover and coordinator; (ii) make a serious
start on the new National Development Plan because suitably qualified and
experienced personnel -- nationals proficient in the disciplines associated
with integrated national socio-economic planning -- are rare; and (iii)
inadequate data base and computer facilities needed to carry out the types
of work within its sphere of responsibility.
12.33 Another problem is that the sectoral and regional planning units
vary as regards financing and staff, and in some areas--the Ministry of
Industry, for example--no units have yet been formed.
12.34 Other problems affect the formulation and monitoring of the
National Development Plan and monitoring the local socio-economic
situation. As yet, there is no development project; it is indispensable to
have one for the preparation of the next Plan. Arrangements are not yet in
place for regular and systematic tracking (on a half-yearly basis, for
instance) of the major socio-economic indicators and changes in macro-
economic balances, and analysis of the current situation. There is no
central project register to allow monitoring and follow-up of progress and
identification of deviations from plans and schedules essential if useful
annual planning reports are to be put together. Working methods for
project feasibility and appraisal studies have not yet been standardized, a
situation that precludes valid comparisons. A national fund to finance
project pre-investment work is envisaged but does not yet exist.
12.35 To deal rapidly with the needs identified above, the Government
ought to seek a comprehensive program of technical assistance and training.

-114-
TRINIDAD AND TOBAGO
STATISTICAL ANNEX
Table of Contents
Table No.
1 GDP At Constant Factor Cost By Sectors Of Origin, 1982-87
2 GDP At Current Factor Cost by Sectors of Origin, 1982-87
3 National Accounts by Final Expenditures, 1982-86
4 Savings and Investment, 1982-865 Volumes of Production and Utilization of Crude Oil, Natural Gas
and Related Products, 1982-876 Domestic Prices of Selected Refined Petroleum Products, 1982-88
7 Output of Selected Products, 1982-87
8 Retail Price Index, 1982-889 Index of Producer Prices by Industry, 1982-88
10 Index of Minimum Wage Rates for Production and Ancillary Workers
by Industry, 1982-8711 Indices of Production, Earnings, Employment and Costs in
Manufacturing (All Employees), 1982-8712 Labor Force and Employment, 1982-8713 Work Stoppages by Industry, 1982-8714 Consolidated General Government Operations, 1982-87
15 Summary of Central Administration Operations, 1982-87
16 Central Administration Revenues, 1982-8717 Central Administration Expenditures, 1982-8718 Central Administration Transfers and Net Lending to Public
Enterprises, 1982-8719 Central Administration Domestic Debt, 1982-87
20 Summary Operations of Statutory Authorities, 1982-86
21 Summary Operations of the Public Utilities, 1982-86
22 Summary Operations of the National Insurance Board (NIB), 1982-87
23 Summary Accounts of the Financial System, 1982-87
24 Balance of Payments, 1982-8725 Adjusted Exports, f.o.b., 1982-8726 Volume, Value, and Unit Value of Selected Exports, 1982-87
27 Adjusted Imports, c.i.f., 1982-8728 Direction of Trade, 1982-8729 Trade with CARICOM Countries, 1982-87
30 Financial Market Activity, 1985-8731 Summary of Outstanding External Public Debt by Borrower, Lender,
and Maturity, 1982-8632 Summary of Central Government External Debt by Lender, 1982-86
33 Undisbursed Loans as at December 1986
34 Exchange Rates, 1976-8735 Baseline Scenario, Actual and Projected National Accounts, 1985-95
36 Baseline Scenario, Projected Trade Growth, 1985-95
37 Baseline Scenario, Balance of Payments, 1985-95
38 Scenario With Improved Policies, Actual and Projected National
Accounts, 1985-9539 Scenario With Improved Policies, Projected Trade Growth, 1985-95
40 Scenario With Improved Policies, Balance of Payments, 1985-95

- 115 -
Table 1. TRINIDAD AND TOBAGO -- GDP AT CONSTANT FACTORCOST BY SECTORS OF ORIGIN, 1982-87
Prel. Est. Est.1982 1983 1984 1986 1988 1987
(In millions of 1970 Trinidad and Tobago dollars)
Petroleum sector 310.9 281.3 310.1 345.0 342.7 299.2
Exploration andpproduction 162.4 148.8 166.4 161.5 167.0 -
Refining 69.1 29.2 30.2 31.0 33.6 -Service contractors 17.8 13.3 11.4 13.0 12.9 -Other, including petro-chemicals 71.8 92.2 113.0 139.5 139.3 -
Non-petroleum sector 2,679.3 2,489.8 2,108.7 2,001.0 1,853.2 1,848.2
Agriculture 67.9 79.4 78.7 82.7 84.8 87.1
Manufacturing a/ 318.0 290.8 252.8 218.6 227.8 273.9
Electricity ana water 88.9 114.9 119.7 121.8 126.4 137.1
Construction 468.1 380.3 306.3 232.3 189.8 118.2
Transport and storage 514.8 573.2 432.1 428.9 398.4 219.1
Distribution and restaurants 449.0 316.1 229.7 199.9 168.2 198.2
Finance, insurance and realestate 608.1 470.4 418.4 436.2 377.4 228.9
Government 238.4 238.4 233.9 225.9 229.6 199.3
Other services 26.1 27.9 38.3 60.0 63.1 388.4
GDP at factor cost 2,990.2 2,771.1 20418.8 2,346.0 2,195.9 2,146.4
(Annual percentage changes)
Petroleum sector 0.3 -9.5 10.2 11.3 -0.7 -12.7
Exploration and production -8.5 -9.7 8.0 3.9 -2.8 -Refining -12.8 -50.8 3.4 2.8 8.1 -Service contractors -9.2 -26.3 -14.3 14.0 -0.8 -Other, including petro-
chemicals 48.4 28.8 22.7 23.3 -- -
Non-petroleum sector 4.6 -7.1 -16.4 -6.0 -7.4 -0.4
Agriculture 3.2 18.9 -0.9 5.1 .2.6 2.7
Manufacturing a/ -1.9 -8.8 -13.1 -14.3 6.2 20.2
Electricity an3 water 18.2 29.2 4.2 1.6 3.9 8.4
Construction 5.3 -18.8 -19.7 -23.9 -18.4 -37.7
Transport and storage 12.4 11.3 -24.8 -1.2 -8.7 -45.0Distribution and restaurants -2.8 -29.8 -27.1 -13.0 -18.9 18.1
Finance, insurance and realestate 8.6 -7.4 -11.5 4.5 -13.3 -39.9
Government -4.3 -0.2 -1.7 -3.4 1.8 -13.2
Other services 63.6 6.9 37.3 56.7 -11.5 631.4
GDP at factor cost 4.0 -7.3 -12.8 -2.9 -8.4 - 2.3
a/ Excluding oil refining and petrochemical industries.
Source: Central Statistical Office.

Table 2: TRINIDAD AN9D TOBAGO -- GDP AT CURRENT FACTOR COST BY SECTORS OF ORIGIN, 1982-87
Prel. Est. Est.19:82 1983 1984 1985 1988 1987
(In millions of Trinidad and Tobago dollars)
Petroleum sector 5,164.4 4,488.8 4,939.8 4,847.0 3,646.1 3,603.3Exploration and production 4,683.4 3,848.1 3,949.0 3,680.3 2,768.8 2,609.8Refining 137.5 211.8 309.5 412.2 309.8Service contractors 193.2 173.3 168.8 187.0 142.1 993.6Other, including Detro-chemicals 140.3 256.8 b22.7 567.6 428.8
Non-petroleum sector 14,877.2 15,296.6 14,288.3 14,074.8 13,748.8 11,719.4Agriculture 432.5 814.8 887.0 877.1 944.9 639.6Manufacturing at 1,349.0 1,447.7 1,433.2 1,286.2 1,427.1 1,497.0Electricity ana water 379.8 372.3 385.4 404.4 390.9 324.6Construction 3,152.0 2,898.4 2,390.6 1,864.3 1,671.9 1,568.1Transport and storage and
communication 2,126.3 2,819.8 2,246.4 2,292.6 2,238.4 1,685.7Distribution 1,988.3 1,692.7 1,315.3 1,232.8 1,100.8 1,643.3Finance, insurance and
real estate 2,166.5 2,341.7 2,318.4 2,606.4 2,427.2 1,600.8Government 2,868.2 2,815.7 2,875.4 2,745.4 2,880.6 2,332.6Other servicss 416.8 593.7 867.6 785.7 787.1 1,852.0
GDP at factor cost 20,031.6 19,783.4 19,226.1 18,921.8 17,391.9 16,322.7
Plus: Indirect taxes 818.8 989.0 1,047.3 1,156.4 1,040.0Less: Subsidies 1,874.7 1,633.0 1,187.9 1,172.6 420.0 810.1
GDP at market prices 19,176.6 19,119.4 19,085.5 19,404.6 18,011.9 15,932.8
Plus: Factor income fromabroad 858.8 652.8 339.8 479.7 384.4 390.0
Less: Factor income paidabroad 687.7 848.0 1,088.7 1,298.0 1,080.7 1,100.0
Gross national income 19,444.8 18,824.0 18,356.4 18,086.3 17,279.6 15,22-X.8
(in percent of GDP at factor cost)
Petroleum sector 26.7 22.7 25.7 26.8 21.0 23.6Exploration and production 23.4 19.4 20.6 19.6 16.9 17.0Refining 0.7 1.1 1.8 2.2 1.8Service contractors 1.0 0.9 0.8 1.0 0.8 8.8Other, including petro-chemicals 0.7 1.3 2.7 3.0 2.5
Non-petroleum sector 74.3 77.3 74.3 74.4 79.0 78.4AWI1culture 2.2 4.1 4.6 4.6 6.4 4.2Manufacturing a/ 8.7 7.3 7.6 8.7 8.2 9.8Electricity ana water 1.9 1.9 2.0 2.1 2.2 2.1Construction 15.7 13.8 12.4 9.9 9.0 10.2Transport, storage andcommunication 10.8 14.z 11.7 12.1 12.9 10.2
Distribution 9.9 8.1 8.8 8.5 6.3 10.2Finance, insurance and real
Estate 10.8 11.8 12.0 13.8 14.0 10.4Government 14.3 13.2 13.9 14.5 18.8 16.2Other services 2.1 3.0 3.4 4.2 4.4 4.1
a! Excluding oil refining and potrochemical industries.
Source: Central Statistical Office.
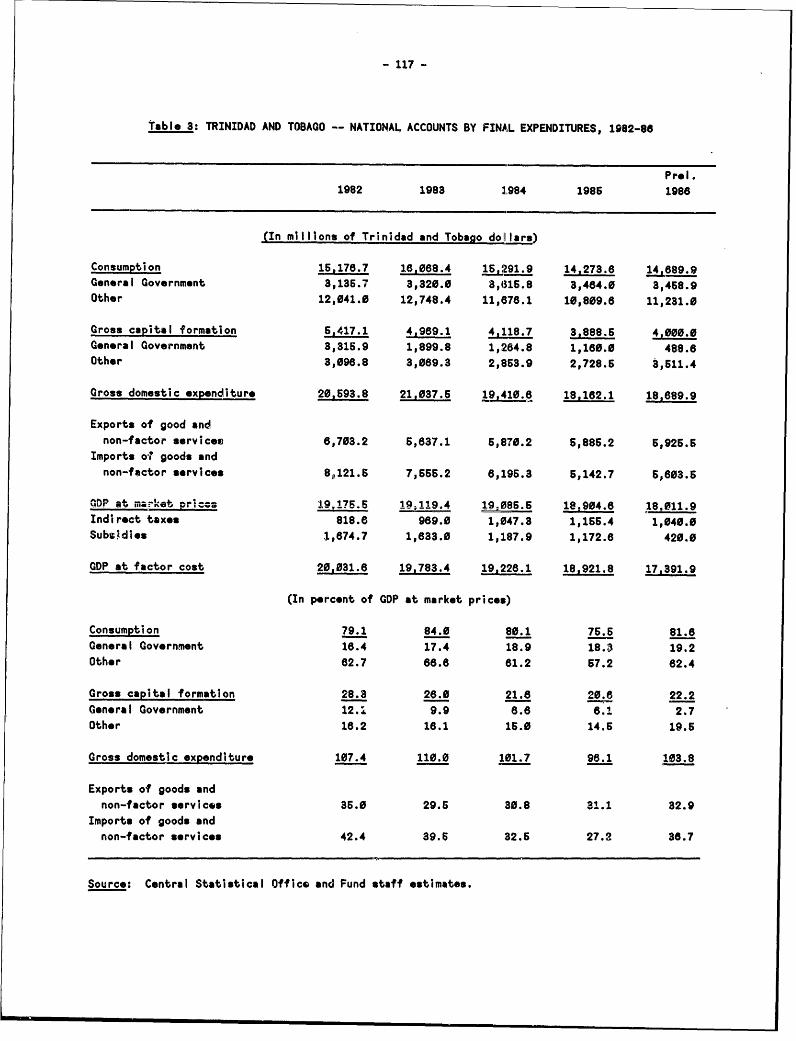
- 117
Table 3: TRINIDAD AND TOBAGO -- NATIONAL ACCOUNTS BY FINAL EXPENDITURES, 1982-88
Prol.
1982 1983 1984 1986 1986
(In millions of Trinidad and Tobago doll ars)
Consumption 16,176.7 16,068.4 15,'291.9 14,273.8 14,689.9
General Government 3,136.7 3,320.0 3,1315.8 3,484.0 3,458.9
Other 12,041.0 12,748.4 11,678.1 10,809.8 11,231.0
Gross capital formation 6,417.1 4,989.1 4,118.7 3,888.6 4,000.0
General Government 3,315.9 1,899.8 1,264.8 1,160.0 488.6
Other 3,098.8 3,089.3 2,853.9 2,728.6 3,511.4
Gross domestic expenditure 20,593.8 21,037.5 19,410.8 18,182.1 18,689.9
Exports of good and
non-factor services 6,703.2 6,837.1 6,870.2 5,886.2 5,926.6
Imports ot goods and
non-foctor services 8,121.6 7,556.2 8,195.3 6,142.7 65,03.5
'"D at imarkst ?ricoS i9*17656 19 9 19.086.5 leW48 18,011.9
Indirect taxes 818.e 989.0 1,047.3 1,155.4 1,040.0
Subs dies 1,874.7 1,833.0 1,187.9 1,172.8 420.0
GDP at factor cost 20,031.6 19,783.4 19,228.1 18,921.8 17,391.9
(In percent of GDP at market prices)
Consumption 79.1 84.0 80.1 75.5 81.8
General Government 18.4 17.4 18.9 18.3 19.2
Other 62.7 88.8 81.2 57.2 82.4
Gross capital formation 28.3 28.0 21.8 20.8 22.2
General Government 12.; 9.9 8.8 8.1 2.7
Othor 18.2 18.1 15.0 14.6 19.6
Gross domestic expenditure 107.4 110.0 101.7 98.1 103.8
Exports of goods and
non-factor services 36.0 29.6 30.8 31.1 32.9
Imports of goods and
non-factor services 42.4 39.6 32.5 27.2 36.7
Source: Central Statistical Office and Fund staff estimates.

- 118 -
Table 4: TRINIDAD AND TOBAGO -- SAVINGS AND INVESTMENT, 1982-88
Pr-l.
1982 1983 1984 1985 1986
(In millions of Trinidad and Tobago dollars)
Gross national savings 3,889.3 2,652.1 2,884.7 3,8B7.2 2,134.2
General Government 1,354.9 683.6 484.7 711.7 -82.4
Other 2,514.4 1,978.8 2,380.0 2,965.3 2,218.8
Gross capital formation 6,417.1 4,989.1 4,118.7 3,888.6 4,000.0
Central Administration 2,320.3 1,899.8 1,284.8 1,180.0 488.8
Other 3,098.8 3,089.3 2,853.9 2,728.6 3,511.4
Net national savings Pi -1,547.8 -2,407.0 -1,254.0 -221.3 -1865.8
General Government -986.4 -1,318.3 -780.1 -448.1 -671.0
Other -682.4 -1,090.7 -473.9 228.8 -1,294.8
Use of foroign savings 1,547.8 2,407.0 1,254.0 221.3
Accumulation of not in-
(incroase -) 862.3 2,338.8 1,781.0 678.4 2,361.3
Net foreign borrowing 896.6 70.4 -527.0 -357.1 -485.5
(In percent of GDP at market prices)
Gross national savings 20.2 13.4 16.0 19.4 11.9
General Government 7.1 3.1 2.6 3.8 -0.4
Othor 13.1 10.3 12.6 16.8 12.3
Gross capital formation 28.3 26.0 21.8 20.8 22.2
General Government 12.1 9.9 8.8 6.1 2.7
Other 18.2 18.1 15.0 14.5 19.6
Net national savings / -8.1 -12.8 -8.8 -1.2 -10.4
a/ Gross national savings less gross capital formation, equivalent to the external current account
deficit.
Sources: Statistical Appendix Table 2; Central Statistical Office; and Fund staff estimatos.

Table 6: TRINIDAD AND TOBAGO -- VOLUMES OF PRODUCTIONANL, UTILIZATION OF CRUDE OIL, NATURAL
GAS AND RELATED PRODUCTS, 1982-87
1982 1983 1984 1986 1986 1987
I. Crude Oil and Refined Petroleum Products(In millions of barrels)
Production 64.6 58.3 62.0 64.3 61.7 56.6Exports 37.4 31.1 32.6 35.4 27.6 28.4
Input into refineries 65.1 27.2 28.2 29.6 30.3 31.5Domestic crude 31.7 27.2 28.1 29.4 29.8 28.1
Imported crudo 23.4 - 0.1 0.2 0.6 3.4
Refinery output 64.1 28.3 26.4 30.0 33.7 31.4Exports 65.1 27.2 28.1 25.0 31.0 26.4
II. Natural Gas(In millions of cubic mtors)
Production 6,916.4 6,318.3 7,230.0 7,660.0 7,669.3 7,672.0
Uses:Fuel 3,920.6 3,102.2 2,662.0 2,906.0 2,089.1 8,311.0Processed gas 686.6 919.6 1,106.0 1,163.0 2,266.5 N.A.Othor 969.0 1,121.6 1,717.0 1,766.0 2,328.9 N.A.
Vented/losses 1,353.6 1,175.0 1,856.0 1,665.0 886.8 N.A.
III. FertilizersLin thousanas oT to-ns)
Production 939.7 1,274.3 1,458.1 1,663.6 1,883.9 1,303.3Exports 850.6 1,213.9 1,281.6 1,460.1 1,65.6 1,827.9Local Sales 64.2 48.8 1e8.9 273.3 300.1 N.A.
IV. Methanol
Production - - 180.9 358.2 823.6 424.3Exports - - 171.8 360.8 315.4 426.7
Memorandum itemsInstalld refinery capacity
(in thousands of barrelsa day 305 306 305 305 306 306
Capacity utilization(in percent) 49 24 26 27 26.9 28.1
Production of rofined products(in percent of total)Fuel oils 60.6 61.2 65.3 59.7 63.4 N.A.Motor gasolines 20.5 29.7 22.7 23.7 26.6 N.A.
Gas/diesel oil 17.6 16.9 16.9 14.0 11.9 N.A.
Other 11.3 3.2 8.1 2.6 9.1 N.A.
Motors drillod(in thousands) 262.9 183.8 208.8 199.4 222.6 189.7
N.A.: Not Applicable
Source: Ministry of Energy.

-120-
Table B: TRINIDAD AND TOBAGO -- DOMESTIC PRICES OF SELECTEDREFINED PETROLEUM PRODUCTS, 1982-88
1982 1983 1984 1985 1988 1987 1988
(In Trinidad and Tobago dollars per liter)
Super motor gasoline
Wholesale 0.22 0.49 0.77 0.77 0.77 0.82 1.016
Retail 0.28 0.56 0.85 0.85 0.86 0.90 1.100
Regular motor gasoline
Wholesalo 0.18 VJ.40 0.73 0.73 0.73 0.78 0.976
Retail 0.23 0.46 0.80 0.80 0.80 0.86 1.060
Gas oil
Wholesale 0.24 0.41 0.89 0.89 0.89 0.89 0.716
Retail 0.28 0.45 0.75 0.76 0.76 0.75 0.780
Diesel oil 0.23 0.40 0.70 0.70 0.70 0.70 0.730
Kerosene
Wholesale 0.08 0.32 0.71 0.71 0.71 0.71 0.706
Retafl 0.1f 0.36 0.77 0.77 0.77 0.77 0.770
(In Trinidad and Tobago dollars per pound)
Liquified gas
Wholesale 0.43 0.68 0.85 0.88 0.88 0.88 0.B8
Retail 0.50 0.86 0.75 0.76 0.75 0.76 0.76
Source: Ministry of Energy.

- 121 -
Table 7: TRINIDAD AND TOBAGO -- OUTPUT OF SELECTED PRODUCTS, 1982-87
(In thousands of specified units)
Jan-Jun.
1982 1983 1984 1986 1988 1987
Sugar (tons)
Raw sugar 78.7 77.2 84.7 81.0 92.3 88;4
Refined sugar 11.4 9.4 31.3 33.6 37.6 10.0
Area cropped (ha) 26.2 21.2 19.8 22.4 27.2 14.6
Coffee beans (kg) 1,794 1,388 862 2,142 1,334 1,797
Of which: Exports 1,573 859 - 755 802 -
Cocoa beans (kg) 2,246 1,717 1,560 1.307 1.428 1,331
Steel products (tons) 612.8 878.1 572.8 613.0 881.0 -Of which: Exports 156.8 190.6 208.8 143.2 282.0
Cement (tons) 139.2 389.8 406.4 328.5 337.8 178.6
Assembly products (units)
Motor vehicles 16.0 20.7 22.9 11.9 10.7 3.2
Refrigerators 28.4 19.9 21.8 8.4 14.4 8.3
Memorandum item
Imports of coment (tons) 282.8 94.8 0.7 1B 6 2.8 -
Sources: Ce-ntral Bank of Trinidad and Tobago; and Central Stitistical Office.

- 122 -
Table 8: TRINIDAD AND TOBAGO -- RETAIL PRICE INDEX, 1982-88 a/
(Relative March
Weights) pj 1982 1983 1984 1986 1988 1987 1988
(Septembor 1982=100)
A. Period average
Overall index 1,000 98.7 115.2 130.6 140.6 161.3 167.8 174.8
Food 361 97.6B 121.6 133.6B 144.9 18B0.2 191.2 202.2
Meals out 15 99.7 106.0 113.2 119.1 119.2 126.2 127.7
Drinks and tobacco 47 96.7 113.9 133.8 165.0 188.4 171.4 187.2
Fuel and light 28 99.9 124.1 281.8 282.9 286.7 289.3 299.0
Housing 138 101.6 103.6 109.8 128.2 139.4 149.7 151.1
Maintenance 12 99.8 128.6 134.2 138.4 141.6 143.0 146.0
Rent 128 102.3 101.8 107.2 125.2 139.2 160.4 161.7
Housohold supplies 84 98.6 106.8 116.9 123.6 130.0 138.9 142.8
Services 14 98.1 115.6 133.3 150.8 164.3 153.2 168.0
Clothing 189 98.7 106.6 115.2 119.6 124.8 131.6 132.8
Transportation 88 82.1 140.0 180.9 188.2 179.4 188.4 197.2
Education 26 99.4 1 1233 12 I 133.8 144e2 155.8 189.0
Medical goods and services 26 96.8 108.2 118.1 121.1 124.4 148.4 163.3
B. End of period
Overali index 102.8 118.8 136.3 144.3 168.4 171.8 -
Food 105.3 126.9 141.2 163.8 172.9 199.7 -
Meals out 100.9 108.2 116.9 120.1 121.0 127.2 -
Drinks and tobacco 102.4 117.3 138.6 166.8 183.8 172.7 -
Fuol and Light 100.1 124.1 282.0 283.2 287.0 290.0 -
Housing 101.9 104.0 118.1 129.4 147.9 151.4 -
Maintonance 11B.1 129.7 136.7 136.6 143.8 142.9 -
Rent 100.8 101.8 114.2 128.8 148.3 162.2 -
Housohold supplies 101.6 109.8 118.8 124.9 134.2 141.6 -
Services 100.9 120.3 137.6 164.2 153.7 162.8 -
Clothing 101.0 109.9 117.3 120.2 129.0 132.8 -
Transportation 102.0 143.1 183.4 184.8 182.8 187.1 -
Education 100.0 114.4 128.8 138.3 145.7 182.7 -
Medical goods and sorvices 100.3 114.2 118.8 122.7 126.9 162.1 -
(continued)

- 123 -
Table 8: TRINIDAD AND TOBAGO -- RETAIL PRICE INDEX, 1982-88 a/
(continued)
March
1982 1983 1984 1986 1986 1987 1988
(Annual percentage changes)
A. Period avera!..
Overall index 11.5 16.7 13.3 7.7 7.7 10.8 6.4
Food 13.7 24.5 10.0 8.6 10.6 19.4 9.6
Meals out 4.8 6.3 7.8 6.2 -- 6.0 4.7
Drinks and tobacco 18.2 19.0 17.6 16.6 6.7 3.0 9.7
Fuel and light 5.6 24.2 127.1 0.4 1.0 1.3 3.6
Housing 0.6 1.9 5.9 15.1 10.6 7.4 2.1
Maintenance 18.1 26.8 6.1 1.6 3.7 1.1 1.1Rent -2.0 -1 0 6.8 16.8 11.1 8.1 2.2
Household supplies 10.6 8.4 8.6 6.6 6.3 6.8 6.1
Services 10.6 17.7 16.4 13.0 2.6 -0.7 1.3
Clothing 8.6 8.9 9.2 3.7 4.3 5.6 1.8
Transportation 13.6 70.6 14.9 3.3 7.9 3.9 6.4
Education 8.9 13.0 10.1 8.1 7.9 8.0 13.6
Medical goods anr! services 30.3 13.2 7.3 4.3 2.7 19.3 B 0
D. Uln of period
Overall index 10.8 15.4 14.1 6.7 9.8 8.3 -
Food 12.8 20.0 12.2 8.8 12.8 15.5 -Meals out 4.4 6.3 9.1 3.6 0.7 6.1 -Drinks and tobacco 18.5 14.6 16.4 14.0 6.1 5.6 -Fuel and light 5.2 24.0 127.2 0.4 1.3 1.0 -Housing -1.7 2.1 11.6 11.5 14.3 2.4 -
Maintenance 27.9 14.7 4.6 -0.1 6.0 -0.5 -Rent -5.6 0.8 12.4 12.8 16.1 2.6 -
Household supplies 9.5 8.1 8.2 6.1 7.4 5.4 -Services 10.2 19.2 14.3 12.1 -0.3 0.6 -Clothing 7.6 8.8 6.7 2.6 7.3 2.9 -Transportation 13.3 40.3' 14.2 0.9 10.8 2.5 -Education 8.0 14.4 10.7 7.7 6.9 11.7 -Medical goods and services 28.8 13.9 3.9 3.6 2.6 20.7 -
a/ The weights reflect the 1976-76 expenditure pattern of low- and middle-income families.
Source: Central Statistical Office.
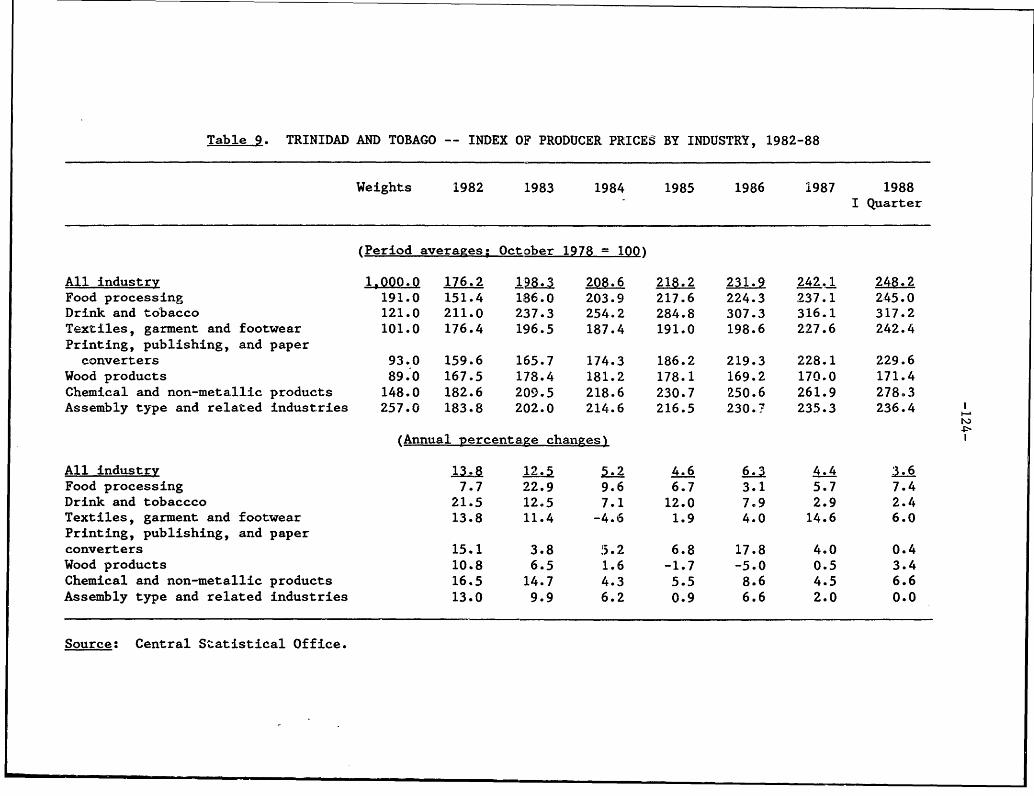
Table 9. TRINIDAD AND TOBAGO -- INDEX OF PRODUCER PRICES BY INDUSTRY, 1982-88
Weights 1982 1983 1984 1985 1986 1987 1988I Quarter
(Period averages; October 1978 = 100)
All industry 1,0Q..0 176.2 1i'B., 208.6 218.2 231.9 242.1 248.2
Food processing 191.0 151.4 186.0 203.9 217.6 224.3 237.1 245.0
Drink and tobacco 121.0 211.0 237.3 254.2 284.8 307.3 316.1 317.2
Textiles, garment and footwear 101.0 176.4 196.5 187.4 191.0 198.6 227.6 242.4
Printing, publishing, and paper
converters 93.0 159.6 165.7 174.3 186.2 219.3 228.1 229.6
Wood products 89.0 167.5 178.4 181.2 178.1 169.2 170.0 171.4
Chemical and non-metallic products 148.0 182.6 209.5 218.6 230.7 250.6 261.9 278 3
Assembly type and related industries 257.0 183.8 202.0 214.6 216.5 230.7 235.3 236.4
(Annual percentage changes)
All industry 13. 12.5 5.2 4.6 6.3 4.4 .6
Food processing 7.7 22.9 9.6 6.7 3.1 5.7 7.4
Drink and tobaccco 21.5 12.5 7.1 12.0 7.9 2.9 2.4
Textiles, garment and footwear 13.8 11.4 -4.6 1.9 4.0 14.6 6.0
Printing, publishing, and paper
converters 15.1 3.8 5.2 6.8 17.8 4.0 0.4
Wood products 10.8 6.5 1.6 -1.7 -5.0 0.5 3.4
Chemical and non-metallic products 16.5 14.7 4.3 5.5 8.6 4.5 6.6
Assembly type and related industries 13.0 9.9 6.2 0.9 6.6 2.0 0.0
Source: Central Statistical Office.

Table 10: TRINIDAD AND TOBAGO -- INDEX OF MINIMUM WAGE RATES FOR PRODUCTIONAND ANCILLARY WORKERS BY INDUSTRY, 1982-87
(Novenber 1978 100)
1982 1983 1984 i9es 1988 1 987Weights May Nov. May Nov. hilay Nov. May No-,;. May Nov. May Nov.
Total industrv 10j0 315.8 338.8 377.8 a96.0 421.0 433.2 446L2 454.2 482.4 473.e 454.6 481.0
Manufacture of food,drink and tobacco 415 351.3 371.1 439.5 478.7 508.4 528.7 550.5 569.2 597.1 610.2 820.2 632.2
Manufacture of textiles,garments and footwear 420 377.8 400.8 463.8 523.9 648.2 557.0 578.3 580.7 800.5 576.5 577.0 530.0
Other manufacturing
industries 548 318.2 340.5 370.9 418.1 464.4 475.8 498.2 511.1 521.4 529.6 527.0 552.6Assembly type and related
industries 557 404.9 417.1 444.8 471.8 49S.3 502.3 525.8 634.3 543.7 b55.2 563.9 685.9Electricity, water and
sewerage 415 234.6 303.1 343.4 349.8 375.8 379.9 381.9 383.4 386.8 387.5 337.0 368.6Building and construction 498 315.2 327.8 352.3 364.8 390.2 411.8 415.5 432.6 435.2 438.6 439.5 448.0Distribution 1,298 308.8 335.5 391.9 410.7 448.5 608.9 515.8 522.3 537.0 593.7 570.0 571.8
Services 822 311.2 383.8 405.3 425.7 472.2 478.9 503.1 509.0 517.9 528.5 516.8 523.0
Transport, communicationsand storage 425 295.2 360.8 372.7 383.7 410.9 413.8 459.4 477.1 485.4 487.5 482.6 460.2
Central and Local Govern-
ments 3,121 321.3 327.1 376.8 383.0 400.0 499.5 399.5 399.5 399.5 399.8 358.8 358.8Petroleum industries 1,133 283.2 276.9 293.3 313.7 323.4 327.8 340.1 384.7 379.4 397.9 403.3 423.7
Manufacture of sugar 350 342.2 346.1 358.3 362.9 370.7 375.8 428.7 434.0 437.9 437.9 437.9 492.4
Source: Central Statistical Office.

-126-
Table 11. TRINIDAD AND TOBAGO -- INDICES OF PRODUCTION, EARNINGS,
EMPLOYMENT AND COSTS IN MANUFACTURING (ALL EMPLOYEES), 1982-87
(Average of four quarters 1977 = 100)
1987
First Second 3rd
1982 1983 1984 1986 1988 Quarter Quarter Quarter
All industry
Production 97.9 113.2 111.0 108. 8 130.3 137.9 130.1 133.0
Weekly earnings 249.6 297.5 340.4 385.7 372.2 377.5 383.7 391.6
Productivity 100.4 120.3 122.8 133.5 167.9 182.7 170.7 178.5
Employment 97.2 96.4 89.8 80.6 77.8 75.5 74.6 73.2
Hours worked 97.8 97.0 90.8 80.0 77.8 76.0 74.8 74.6
Unit labor costs 248.5 247.3 277.7 273.9 222.7 - - -
Manufacturing (excluding
oil and sugar
rroduction 72 v 7&7. . .. .....8- .2.. .213=5 204.1 207.8
Weekly earnings 247.8 301.5 351.5 377.3 385.6 385.6 388.4 400.2
Productivity 118.9 164.9 183.2 188.7 243.0 268.8 248.3 261.5
Employment 101.4 103.2 97.4 85.6 83.1 80.0 79.5 78.6
Hours worked 106.1 107.1 101.3 88.8 84.3 79.5 80.2 79.4
Unit labor costs 208.4 182.8 215.4 202.1 158.8 - - -
Oil refining
Production 82.0 34.0 38.2 38.8 35.2 36.7 36.8 40.8
Weekly earnings 250.8 298.2 324.2 340.1 347.2 384.0 371.3 386.2
Productivity 73.5 44.5 63.4 66.0 63.9 54.9 65.1 59.8
Employment 87.6 76.4 70.1 67.8 64.2 32.7 60.2 61.6
Hours worked 84.2 76.6 87.8 68.6 85.3 86.8 65.1 88.6
Unit labor costs 341.0 866.6 807.1 618.4 693.4 - - -
Sugar refining
Production 44.1 43.7 45.4 33.2 32.6 65.9 33.8 14.8
Weekly earnings 262.0 284.8 276.2 316.4 306.0 334.6 366.8 327.2
Productivity 58.4 59.6 78.8 59.4 84.3 120.7 67.7 36.2
Employment 86.6 78.7 72.9 71.8 87.3 71.8 62.8 56.5
Hours worked 82.4 67.6 53.1 62.0 46.9 64.8 49.9 42.0
Unit labor costs 448.8 445.0 349.2 531.0 476.9 - - -
Source: Central Statistical Office.

-127-
Table 12. TRINIDAD AND TOBAGO -- LABOR FORCE AND EMPLOYMENT, 1982-87
Prov.Prel. March
1982 1983 1984 1986 1988 1987
(Thousands of persons)
Population a/ 1,128.8 1,149.3 1,158.6 1,181.2 1,199.3 1,241.1
Labor Force 445.0 452.8 478.7 473.9 472.0 475.1Male 297.7 307.1 319.2 317.3 313.8 313.8Female 147.3 145.7 169.6 158.8 158.4 181.3
Employed 400.9 402.6 414.4 399.7 387.9 370.0Male 273.8 279.1 280.8 289.7 281.0 249.7Female 127.3 123.4 133.8 130.0 128.9 '120.3
Unemeloyed 42.8 51.2 87.5 78.4 84.1 106.1Seeking work 22.3 32.3 42.5 47.1 52.1 65.5Other 20.3 i8.9 25.0 29.3 32.0 39.6
(Percent of total labor force)
Unemeloyed 9.5 11.3 14.1 18.l 17.8 22.1Seeking work 6.0 7.7 8.9 9.9 11.0 13.8Other 4.6 4.2 6.2 8.2 8.8 8.3
Employed by economic sector
(Thousands of persons)
Agriculture and fishing 32.7 33.9 38.6 42.7 44.2 48.9Mining, quarrying andmanufacturing 72.8 88.1 63.2 69.2 56.7 60.3
Construction (includingelectricity, gas, and water) 86.5 85.7 82.3 73.8 81.4 63.6
Commerce 87.3 92.9 98.1 95.2 98.8 88.6Transport and communications 28.3 32.2 33.9 27.9 27.3 27.2Other services 93.6 89.7 98.4 100.9 102.6 103.4
(Percentage of employed)
Agriculture and fishing 8.1 8.4 9.3 10.7 11.4 13.2Mining, quarrying and
manufacturing 18.1 16.9 15.3 14.8 14.4 13.6Construction (including
electricity, gas and water) 21.8 23.1 19.8 18.5 15.8 14.5Commerce 21.8 21.3 23.7 23.8 25.0 23.4Transport and communications 7.1 8.0 8.2 7.0 7.0 7.4Other services 23.3 22.3 23.7 25.2 28.4 27.9
aJ Mid-year estimates.
Source: Central Statistical Office

-128-
Table 13: TRINIDAD AND TOBAGO -- WORK STOPPAGES BY INDUSTRY, 1982-87
Jan-June
1982 1983 1984 1985 1986 1987
Number of work stoppages 12 38 38 45 18 2
Sugar industry - 15 - 7 2 -
Petroleum industry 2 8 8 2 2
Assembly type and
related industries 2 2 8 4 -
Other manufacturing - 12 11 3 4 1
Construction 4 1 2 2 2 -
Services 4 2 11 23 4 1
Number of ~man-days lost 20,521 54,681 259,654 7e,564 80,707 245
Sugar industry - 3,458 - 440 - -
Petroleum industry 450 8,226 94,188 1,513 18,300 -
Assembly type and
rAlatAd industrias 5.770 878 34,131 49,730 16,031 -
Other manufacturing 1,189 28,941 74,041 13,310 43,178 240
Construction 5,118 7,600 13,730 4,948 - -
Services 7,996 9,878 43,588 8,813 4,200 6
Source: Ministry of Labor, Employment and Manpower Resources.

- 129 -
Table 14: TRINIDAD AND TOBAGO -- CONSOLIDATED GENERAL GOVERNMENT OPERATIONS a/, 1982-87(In millions of Trinidad and Tobago dollars)
1982 1983 1984 1986 1988 1987 (*)
I. Consolidated General Govornment
Total revonue 7,063.0 8,651.7 8,686.0 6,565.4 5,28 -
Total expenditure and not lending 9,456.0 8,648.0 8,184.8 7,826.5 8,370.4
Current expendituro 6,802.7 8,077.8 6,224.6 8,006.0 6,626.6
Wages and salaries 3,097.4 2,863.2 3,047.4 3,033.2 3,073.7
Contributions to NIB 67.5 69.2 67.2 6B.1 67.2Other goods and services 460.6 494.8 814.7 487.9 476.3
Transfers and subsidies 2,011.7 2,451.1 2,219.9 2,107.9 1,448.2
Other 176.8 219.5 285.2 319.9 473.2
Capital expenditure and net lending !,862.3 2,488.2 1,980.3 1,821.5 844.9
Overall balance -2 392.0 -1,994.3 -1698.8 -1081.1 -1,088.9
Finarncing 2,392.0 1,994.3 1 , 98. 1,081.1 1,088.9
Foreign 292.8 237.8 403.2 420.0 829.0
Domestic 2,099.2 1,768.7 1,996.8 841.1 259.9
II. Central administration
Total revenue 7,048.8 8,529.3 8,558.7 8,639.3 6,257.8 6,010.6
Total expenditure and net lending 9,448.4 8,644.0 8,188.9 7,801.8 8,330.4 8,276.7
Current expendituro 5,794.1 8,075.8 8,208.8 6980.3 6,486.5 5,033.9
Wages and salaries 2,765.3 2,384.3 2,542.1 2,627.6 2,675.8 2,276.4
Contributions to NIB 44.5 48.0 44.1 42.8 44.3 40.8
Other goods and services 383.4 388.2 470.9 348.3 380.9 339.4
Transfers 2,470.2 3080.2 2,888.0 2,780.3 2,083.1 1,782.7
Interest paymonts 180.7 197.1 286.6 281.8 441.7 695.8
Capital expenditure and not lending 3,862.3 2,488.2 1,980.3 1,621.5 844.9 1,241.8
Overall balance -2,397.8 -2,014.7 -1,810.2 -1,N82.o -1,072.8 -1,285.1
III. Statutory authorities
Total Revenue 84.4 87.8 91.3 76.2 135.8 183.6
Operating revenue 8.8 12.0 8.1 48.6
Transfers from central administration 81.7 79.0 79.3 86.0 127.6 135.1
Total expenditure 83.0 88.2 94.4 99.0 93.4 181.8
Wi's aidsaaies liTi .3 s 6 8.4 B l. eBO.9 112 0Contributions to NIB 0.8 1.1 1.2 1.2 1.2 2.7
Other goods and services 23.8 2.8 34.8 38.8 31.3 67.1
Overall balance 1.4 -0.6 -3.1 -22.9 -2.2 1.8
IV. Local Governments b/
Total expenditure 408.5 683.9 802.1 822.1 560.1 682.6
Operating revenue 11.7 13.8 16.3 16.9 16.8 1O.0
Transfers from contral administration 398.8 660.1 688.8 808.4 489.3 647.5
Total expenditure 404.1 542.9 687.6 698.0 683.6 684.2
Wages and salaries 303 6 414.6 448.9 444.6 437.2 418.1
Contributions to NIB 12.2 12.1 11.9 12.3 11.7 7.6
Goods and servicos 79.1 100.2 113.9 109.1 88.8 98.8
Other 9.3 18.0 14.9 32.0 27.9 39.9
Overall balarce 4.4 21.0 14,6 24.3 -58.4 -1.7
Financing (domestic) -4.4 -21.0 -14.6 -24.3 58.4 1.7
S/ Excludas the National Insurance Board.i/ Comprises Arima Borough Council, San Fernando Borough, Port-of-Spain Council, Point Fortin Borough
Council, Tobago House of Assembly, and six county councils. Capital expenditures for Local
Governments are included in the central administration budget.
(*) Data on Consolidated General Government have not been presented for 1987 because of problems
encountered in the interpretation of definitions used in this category.
Sources: Ministry of Financo and the Economy; and Fund staff estimates.

-130-
Table 15: TRINIDAD AND TOBAGO -- SUMMARY OF CENTRAL ADMINISTRATION OPERATIONS a/, 1982-87
Prel.
1982 1983 1984 1986 1988 1987
(In thousands of TTS)
Total revenue 7,048.B 6,529.3 8,558.7 8,539.3 6,267.8 6,846.1
Petroleum revenue 3,274.2 2,481.6 2,769.7 2,467.4 1,891.0 1,940.1
Non-petroleum revenue 3,774.4 4,087.8 3,799.0 4,071.9 3,688.6 3,706.0
Total expenditure and net lending 9,446.4 8,544.0 8,188.9 7,601.8 6,330.4 6,276.7
Current expenditure 5,794.1 8,075.8 8,208.6 6,980.3 6,485.6 6,033.9
Wages and salaries 2,765.3 2,384.3 2,642.1 2,627.5 2,676.8 2,276.4
Contributions to NIB 44.5 48.0 44.1 42.8 44.3 40.8
Other goods and services 383.4 238.2 470.8 348.3 380.9 339.4
Transfers a&Rd subsidies 2,470.2 3,080.2 2,888.0 2,780.3 2,063.1 1,782.7
Interest payments 180.7 197.1 265.5 281.8 441.7 595.8
Capital expmnditure and net lending 3,762.3 2,488.2 1,960.3 1,821.6 844.9 1,241.8
Overall balance -2,397.8 -2014.7 -1,810.2 1,062.5 -1072.8 -1,265.1
Financing 2,397.8 2,014.7 1,610.2 1,082.5 1,072.8 1,265.1
External 288.8 140.8 195.0 187.8 -273.2 -95.7
Drawings 356.9 636.9 636.4 567.0 190.4 382.8
Repayments -69.1 -395.3 -341.4 -369.2 -427.6 -478.5
Domestic 2,111.0 1,874.1 1,416.2 915.4 1,310.0 1,360.8
Financial system 2,020.3 1,799.8 1,168.2 342.6 1,142.0 N.A.
of which: Central Bank 2,011.6 1,658.3 1,117.8 405.0 1,195.4 N.A.
Other sources b/ 90.7 74.3 259.0 672.9 168.0 N.A.
(In percent of GDP at market pric3s)
Total revenue 36.8 34.2 34.4 34.8 30.8 36.4
Petroleum revenue 17.1 12.9 14.5 13.1 10.0 12.2
Non-petroleum revenue 19.7 21.3 19.9 21.6 20.9 23.3
Total expenditure and not lending 49.3 44.7 42.8 40.2 37.0 39.4
Current expenditure 30.2 31.8 32.5 31.8 32.1 31.8
Capital expenditure and net lending 19.0 12.9 10.3 8.8 4.9 7.8
Overall balance -12.5 -10.5 -8.4 -5.8 -8.3 -7.9
a/ Includes accounts of the Consolidated Fund, Unemployment Fund, and Special Funds-for long-term
Development.b/ Includes drawdown of sinking fund deposits.
N.A.: Not available.
Source: Ministry of Finance and the Economy.

Table 16. TRINIDAD AND TOBAGO -- CENTRAL ADMINISTRATION REVENUES, 1982-87(In millions of Trinidad and 'r,bago dollars)
1982 1983 1984 1985 1988 1987
Total revenue 7,048.8 6,529.3 8,568.7 8,539.3 5,257.8 6,846.1
Petroleum revenue 3,274.2 2,481.6 2,769.7 2,467.4 1,891.0 1,940.1
Corporation tax 2,704.3 1,979.2 2,178.6 1,863.6 1,182.2 1,410.6
Withholding tax 6.8 1.8 3.7 18.8 8.8 1.6
Royalties 636.3 444.2 442.9 451.1 381.0 382.2
Oil impost 7.5 16.6 18.2 16.7 18.4 0.9
Unemployment levy -- -- 58.8 50.4 35.6 37.0
Excise duties 20.3 20.8 63.6 67.8 67.1 86.2
National Recovery Impost - - - - 21.7
Non-petroleum revenues 3,774.4 4,067.8 3,799.0 4,071.9 3,656.6 3,708.0
Tax revenue 3,213.6 3,485.3 3,378.1 3,443.6 2,921.2 3,176.1
Taxes on income 2,274.1 2,387.4 2,279.6 2,096.4 1,779.5 1,565.3
Companies 606.5 589.0 645.9 438.6 346.3 298.2
Individuals 1,520.9 1,604.9 1,517.6 1,411.6 1,171.1 999.2
Unemployment levy 156.8 134.8 97.6 69.6 79.1 84.6
National health surcharge -- -- 83.9 108.7 08.9 104.2
Other a/ 90.9 58.7 64.8 70.0 86.1 69.2
Social Security contributions 8.0 7.8 7.8 7.8 7.6 N.A.
Taxes on property 17.6 14.2 14.3 24.2 27.2 26.6
Taxis on goods and services 333.7 479.9 574.3 640.4 695.2 678.8
Purchase tax 146.2 212.3 324.8 327.0 345.8 417.3
Excise duties 23.8 31.2 44.7 64.2 63.9 78.1
entertainment uuty 19.0 20.2 20.4 17.1 1_39 12.2Motor vehicle tax 127.8 186.3 147.3 161.4 141.8 101.9
Other b/ 18.1 29.9 37.1 80.7 29.8 N.A.
Taxes on international trade 541.8 661.7 469.7 823.2 488.1 378.6
Import duties 639.6 661.5 459.7 316.7 311.8 312.2
Stamp tax on bills of entry -- -- -- 251.6 176.3 132.2
Levy on sale of foreign exchange -- -- -- 65.7 1.0 N.A.
Other c/ 2.2 0.2 0.1 0.2 -- N.A.Stamp duties 38.6 44.3 42.4 61.6 33.7 28.2
Non-tax revenue 680.8 682.6 420.9 828.4 645.4 630.9
Fees and service charges d/ 12.7 13.9 13.5 21.1 18.6 26.7
Property income 636.0 646.4 381.0 392.5 630.6 477.2
Profits from non-financialenterprises 18.0 18.3 23.7 156.8 29.9 27.2
Of which: National lottery 14.2 12.2 18.6 28.8 21.7 17.6
Rentals 3.4 3.6 2.9 5.8 3.5 3.4
Interest e/ 269.2 127.7 57.2 27.3 26.9 N.A.
Central sank profits 233.6 372.9 276.0 178.1 438.8 278.4
Operating surpluses ofdepartmental enterprises f/ 20.9 23.9 22.2 27.6 33.6 27.1
Other g/ 13.1 22.2 28.4 214.8 98.2 N.A.
a/ Consists of withholding tax and insurance surrender tax./ Excludes national insurance health surcharge, but includes liquor and miscellaneous
business licenses and fees.c/ Includes export tax.d/ Excludes oil impost.e/ Inciudes interest paid to the funds for long-term development and unemployment.
/ Consists of non-industrial sales and post office profit.af Includes fines and forfeitures, non-petroleum royalt-es, miscellaneous property and other
non-tax revenues, and capital revenues.N.A.: Not available
Source: Ministry of Finance and the Economy. Includes receipts of the Unemployment Fund.
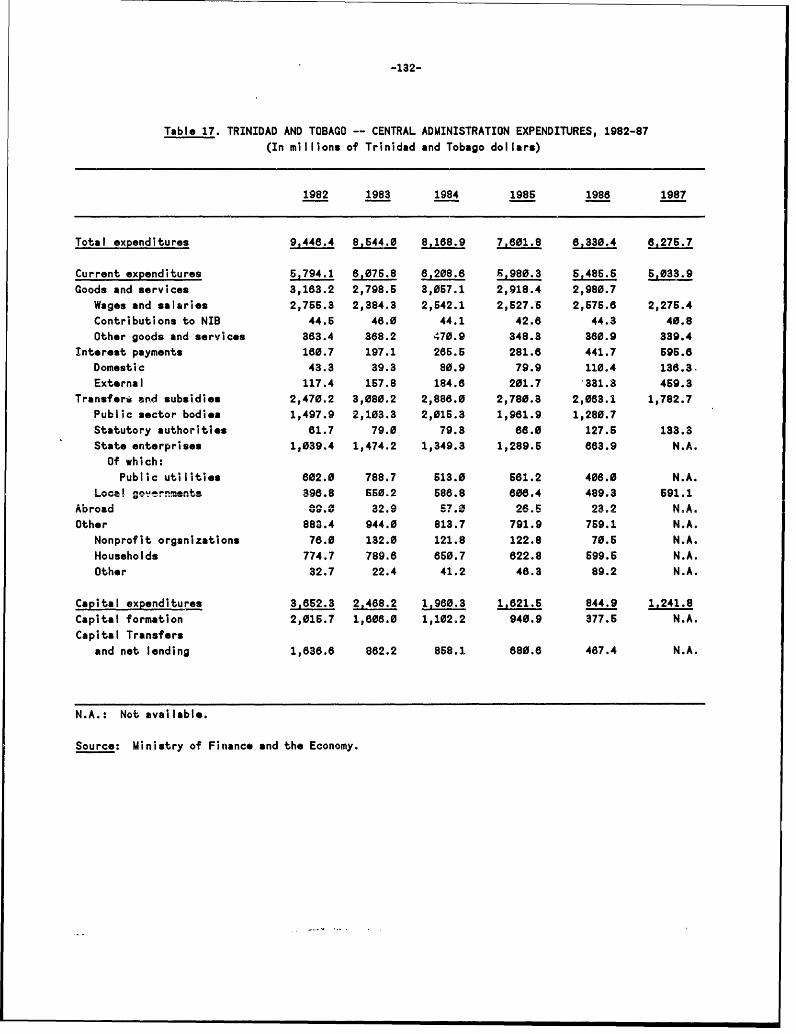
-132-
Table 17. TRINIDAD AND TOBAGO -- CENTRAL ADMINISTRATION EXPENDITURES, 1982-87
(In millions of Trinidad and Tobago dollars)
1982 1983 1984 1985 1988 1987
Total expenditures 9,448.4 8,544.0 8,168.9 7,601.8 6,330.4 6,276.7
Current expenditures 5,794.1 8,076.8 6,208.6 6,980.3 5,485.6 6,033.9
Goods and services 3,183.2 2,798.6 3,067.1 2,918.4 2,980.7
Wages and salaries 2,755.3 2,384.3 2,642.1 2,627.5 2,676.8 2,276.4
Contributions to NIB 44.5 46.0 44.1 42.8 44.3 40.8
Other goods and services 383.4 388.2 470.9 348.3 380.9 339.4
Interest payments 160.7 197.1 265.6 281.8 441.7 696.8
Domestic 43.3 39.3 80.9 79.9 110.4 138.3.
External 117.4 167.8 184.6 201.7 331.3 459.3
Transfers and subsidies 2,470.2 3,080.2 2,888.0 2,780.8 2,083.1 1,782.7
Public sector bodies 1,497.9 2,103.3 2,015.3 1,981.9 1,280.7
Statutory authorities 81.7 79.0 79.3 68.0 127.6 133.3
State enterprises 1,039.4 1,474.2 1,349.3 1,289.6 883.9 N.A.
Of which:Public utilities 802.0 788.7 513.0 581.2 408.0 N.A.
L^-! ne"w-mentZ I988 550.2 688.8 8B0.4 489.3 691.1
.. . ox~~~~ae a a 7X 9 NAAbroad 9. 329 57.0 26.5 23.2 NeA.
Other 883.4 944.0 813.7 791.9 769.1 N.A.
Nonprofit organizations 76.0 132.0 121.8 122.8 70.6 N.A.
Households 774.7 789.8 860.7 822.8 699.6 N.A.
Other 32.7 22.4 41.2 48.3 89.2 N.A.
Capital expenditures 3,B52.3 2,488.2 1,9B0.3 1,821.6 844.9 1,241.8
Capital formation 2,015.7 1,808.0 1,102.2 940.9 377.6 N.A.
Capital Transfersand net lending 1,838.8 882.2 868.1 880.8 487.4 N.A.
N.A.: Not available.
Source: Ministry of Finance and the Economy.

-133-
Table 18. TRINIDAD AND TOBAGO -- CENTRAL ADMINISTRATION TRANSFERS AND
NET LENDING TO PUBLIC ENTERPRISES, 1982-87
1982 1983 1984 1985 1986 1987
(In millions of Trinidad and Tobago dollars)
Total transfers 2,87B.0 2,338.4 2,207.4 1.970.1 1,131.3 840.1
Current transfers 1,039.4 1,474.2 1,349.3 1,289.5 683.9 465.2
Public utilities 802.0 788.7 613.0 561.2 408.0 366.4
TTEC 110.0 128.9 27.2 44.1 39.2 8.0
PA 102.1 283.7 106.0 120.8 88.6 73.7
PTSC 116.9 141.0 169.8 182.7 132.3 141.6
WASA 274.0 266.1 221.2 233.8 188.0 134.2
Other enterprises 439.6 890.6 834.1 728.3 267.9 109.8
BWIA 34.0 66.6 68.8 78.8 18.0 -
CARONI 115.8 164.2 276.0 197.8 116.0 106.8
TRINTOC -- 82.0 164.8 171.2 -- -
Other 287.8 403.8 347.7 282.7 124.9 4.0
Capital transfers and net lending 1,638.6 882.2 868.1 880.8 467.4 374.9
Public utilities 473.8 293.8 218.8 124.0 92.2 13.2
TTEC 165.6 127.9 74.6 28.3 3.7 3.7
PTSC 1.9 19.8 24.7 34.2 9.5 6.1
TELCO 210.3 85.3 68.8 8.6 78.0 -
WASA 08.1 80.8 80.8 66.0 3.0 3.4
Other enterprises 1,182.8 688.4 839.3 665.8 376.2 381.7
BWIA 83.2 -- -- -- -- --
CARONI 230.4 2.8 10.0 -- -- --
ISCOTT 440.6 145.0 379.2 78.2 245.8 217.2
National Energy Corporation 128.6 110.9 170.0 120=2 87.9 87.5
Methanol plant 63.8 47.0 66.9 93.8 47.2
Urea plant 67.4 83.9 63.8 28.8 36.3
Other 17.8 -- 80.3 -- 5.0
Trinidad Cement Limited 38.1 18.9 1.3 0.8 -- 7.7
TRINTOC -- -- -- 294.2 -- --
Development Finance Corporation 48.0 -- 20.4 -- -- --
Mortgage Finance Corporation 85.0 60.0 26.0 25.0 4.8 --
Other 133.1 242.8 33.4 40.2 38.9 49.3
(In percent of GDP at market prices)
Total transfers 13.9 12.2 11.8 10.4 8.3 6.3
Current transfers 6.4 7.7 7.1 8.8 S.7 2.9
Capital transfers 8.5 4.6 4.5 3.8 2.8 2.4
Sourco: Ministry of Finance and the Economy; and individual public entities.
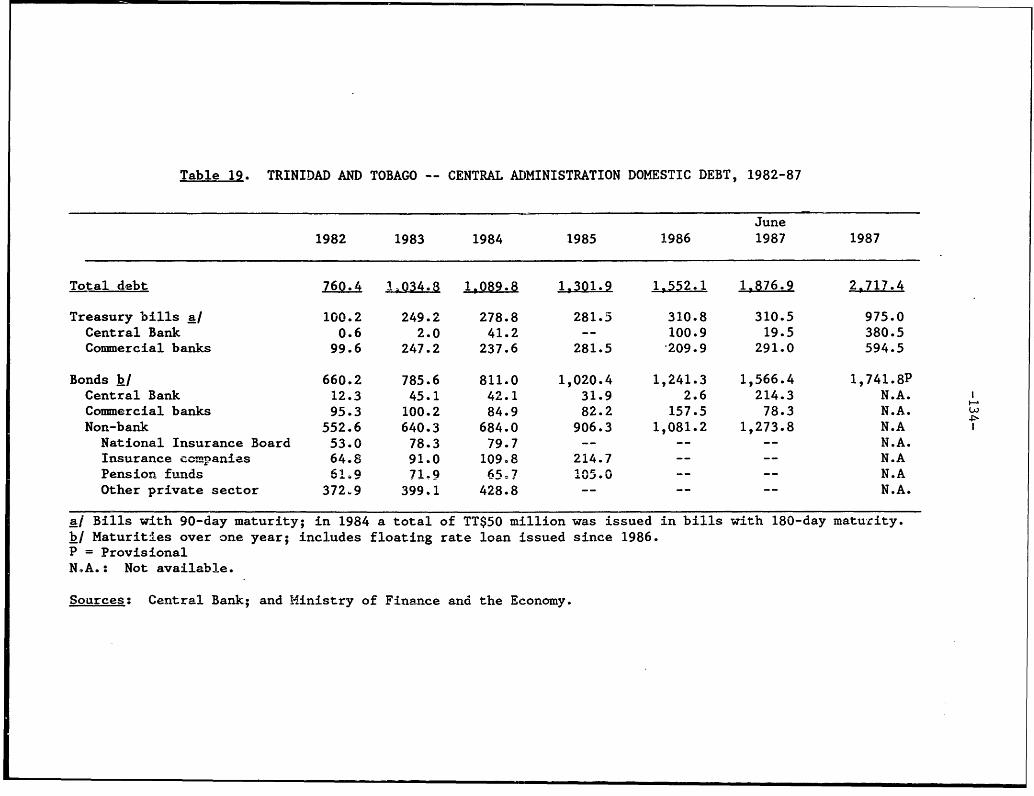
Table 19. TRINIDAD AND TOBAGO -- CENTRAL ADMINISTRATION DOMESTIC DEBT, 1982-87
June
1982 1983 1984 1985 1986 1987 1987
Total debt 760.4 1,034.8 1089.8 1,301.9 1,552.1 1,876.9 2,717.4
Treasury bills a/ 100.2 249.2 278.8 281.5 310.8 310.5 975.0
Central Bank 0.6 2.0 41.2 -- 100.9 19.5 380.5
Commercial banks 99.6 247.2 237.6 281.5 209.9 291.0 594.5
Bonds b/ 660.2 785.6 811.0 1,020.4 1,241.3 1,566.4 1,741.8P
Central Bank 12.3 45.1 42.1 31.9 2.6 214.3 N.A.
Commercial banks 95.3 100.2 84.9 82.2 157.5 78.3 N.A.
Non-bank 552.6 640.3 684.0 906.3 1,081.2 1,273.8 N.A
National Insurance Board 53.0 78.3 79.7 -- -- -- N.A.
Insurance companies 64.8 91.0 109.8 214.7 -- -- N.A
Pension funds 61.9 71.9 65=7 13V5 -- -- N.A
Other private sector 372X9 399.1 428.8 -- -- N.A.
ai Bills with 90-day maturity; in 1984 a total of TT$50 million was issued in bills with 180-day maturity.
b/ Maturities over one year; includes floating rate loan issued since 1986.
P = ProvisionalNA.: Not available.
Sources: Central Bank; and Ministry of Finance and the Economy.

Tablo 20. TRINIDAD AND TOBAGO -- SUMMARY OPERATIONS OF STATUTORY AUTHORITIES, 1982-86
(In millions of Trinidad and Tobago dollars)
1982 1983 1984 1986 1986
I. All statutory authorities
Total revenue 64.4 87.6 91.3 76.2 135.8
Oporating revenues 2.7 8.6 12.d 10.2 8.1
Transfers from central administration 61.7 79.0 79.3 66.0 127.6
Total expendituro 83.0 88.1 94.4 99.0 93.4
Wages and salarios 38.8 64.3 68.4 81.1 80.9
Contributions to NIB 0.8 1.1 1.2 1.2 1.2
Other goods and servicos 23.8 32.8 34.8 38.8 31.3
of which: IDC transfers to households 4.6 2.7 2.3 3.8 0.9
Overall balance 6.4 9.1 12.6 0.8 -4.1
II. Industrial Developmont Corporation (IDC)
Total revenuo 20.3 18.1 19.2 18.4 16.3
Operating revenues 1.1 2.1 2.2 2.2 3.2
Transfors from central administration 19.2 18.0 17.0 18.2 13.1
Total expendituro 18.7 16.1 17.5 19.0 15.4
Waass and salaries 9.8 9.2 lu.6 10.7 9.9
Contributions to NIB 0.2 002 0.2 0.2 0.2
Goods and services 4.1 4.0 4.6 4.3 3.7
Transfers to housoholds and privateenterprises 4.6 2.7 2.3 3.8 1.6
Overall balance 1.8 2.0 1.7 -0.6 0.9
III. Othor statutory authorities */
Revenue 44.1 89.6 72.1 67.8 119.3
Oporating rovenues 1.8 6.6 9.8 8.0 4.9
Transfers from central administration 42.5 63.0 62.3 49.8 114.4
Total oxpenditure 44.3 72.0 78.9 80.1 78.0
Wagos and salaries 28.8 45.1 47.9 60.4 51.0
Contributions to NIB 0.8 0.9 1.0 1.0 1.0
Othor goods and services 14.9 28.1 28.0 28.7 28.0
Overall balance 3.8 7.1 10.9 1.3 -5.0
a/ Comprises the following entities: Tobago Council for Handicappod Childron, Sugar Industry
Labor Wolfaro Fund, Airports Authority, Public Utilitios Commission, Agricultural Society,
Board of Industrial Training, Trinidad Public Library, Carnegie Froe Library, Trinidad and
Tobago National Commission for UNESCO, Princess Elizaboth Home for Handicapped Children,
Association for' Retarded Childron, Port Fortin Civic Conter, Mayaro Civic Contor, Sangre Grande
Civic Conter, T rinidad and Tobago Tourist Board, Managemont Devolopment and Produc- tivity
Conter, Bureau tf Standards, Trinidad and Tobago Export Dovelopment Corporation, Cipriani
Labour College, Association in Aid of the Doaf, Blind Wolfare Association, Queon's Hall, and
Naparima Bowl.
Source: Ministry of Finance and the Economy.

Table 21. TRINIDAD AND TOBAGO -- SUMMARY OPERATIONS OF THE PUBLIC UTILITIES, 1982-86
(In millions of Trinidad and Tobago dollars)
1982 1983 1984 1985 1986
I. Consolidated financial operations
Operating rovenuos 300.0 387.9 683.3 689.8 809.3
Operating expendituros 978.4 1,123.1 1,302.6 1,206.5 1,328.8
Wags and salaries 661.0 747.2 776.5 724.1 692.2
Contributions to NIB 4.8 6.0 7.3 10.3 11.3
Interest payments 56.1 86.4 130.7 168.8 237.7
Other goods and servico 287.6 285.6 388.0 312.3 386.8
Operating balance -878.4 -736.2 -719.2 -636.7 -617.5
Current transfers from central
i.dministration 602.0 788.7 613.0 661.2 406.0
Capital transfers from contral
administration 473.8 293.8 218.8 124.0 92.2
Capital contributions 38.4 43.2 48.7 22.0 7.8
Capital expenditures 426.7 680.0 478.9 645.7 282.0
Overall balance 9.1 -189.5 -41656 -374.2 -273.6
Foreign financing 19.8 182.7 88.3 474.6 122.8
Domestic financing -28.9 26.8 327.3 -100.3 160.7
II. Trinidad and Tobago Electricity Commission (TTEC)
Operating Revenue 111.6 117.3 282.6 308.4 343.3
Operating expenditure 197.3 230.1 319.8 276.1 338.3
Wages and salaries 103.9 130.8 147.8 138.1 141.6
Contributions to NIB 0.7 0.7 2.2 2. t 2.3
Interest payments 0.7 0.6 0.3 19.3 29.4
Other goods and services 92.0 98.0 169.6 116.5 165.0
Operating balance -86.7 -112.8 -37.1 33.3 5.0
Current transfers from central
administration 110.0 128.9 27.2 44.1 39.2
Capital transfers from central
administration 155.5 127.9 74.6 28.3 3.7
Capital contributions 1.2 2.6 2.8 10.4 1.8
Capital oxpenditure 128.8 234.8 133.4 89.9 65.8
(Continued)

- 137 -
Table 21: Summary Operationa of the Public Utilities, (cont'd)
1982 1983 1984 1986 1988
13verall balance 62.4 -88.2 -88.0 24.2 -18.3
Foreign financing -- 123.8 9.1 8.0 21.7
Domestic financing -52.4 -365. 68.9 -30.2 -6.4
III. Port Authority of Trinidad and Tobago
Operating revenue 113.1 121.9 109.1 77.2 98.9
Operating expenditure 298.8 329.3 311.7 280.8 253.6
Wages and salaries 197.9 207.9 179.0 171.4 118.0
Contributions to NIB 2.8 2.9 2.8 2.3 1.9
Interest payments 38.3 63.7 84.0 73.8 82.8
Other goods and services 73.8 84.8 88.1 13.3 62.8
Operating balance -185.6 -207.4 -202.8 -183.4 -158.6
Administration 102.1 283.7 106.0 120.8 88.5
Capital contributions 19.8 12.7 7.8 7.8 8.2
Capital expenditure 31.6 9.9 8.9 10.9 8.3
Overall balance -95.1 69.1 -98.7 -88.1 -9P',1z
Domostic financing 96.1 -69.1 98.7 78.3 90.2
IV. Public Transport Service Corporation (PTSC)
Operating revenue 8.0 13.9 17.4 24.2 30.0
Operating expenditure 131.0 137.7 181.7 172.7 188.4
Wages and salaries 78.1 94.9 124.0 123.6 128.6
Contributions to NIB 1.3 1.4 2.5 2.4 3.0
Other goods and services 68.6 61.3 65.2 48.8 38.9
Operating balance -125.0 -123.8 -184.3 -148.6 -138.4
Current transfers from central
administration 116.9 141.0 169.8 182.7 132.3
Capital trans?ers from central
administration 1.9 19.8 24.7 34.2 9.5
Capital expenditure 2.8 8.4 31.8 23.2 13.8
Overall balance -9.8 30.8 -11.8 26.2 -8.2
Domestic financing 9.8 -30.8 11.8 -25.2 8.2
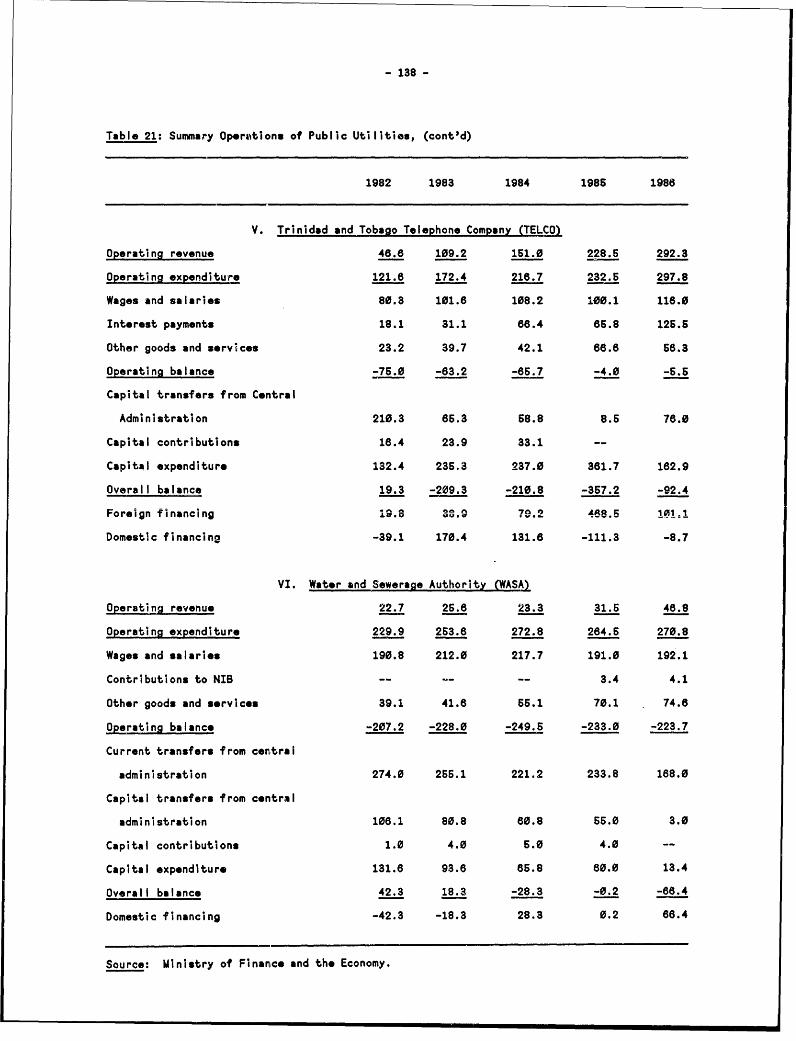
- 138 -
Table 21: Summary Op.rmtions of Public Utilities, (cont'd)
1982 1983 1984 1985 1986
V. Trinidad and Tobago Telephone Company (TELCO
Operating revenue 46.6 109.2 151.0 228.5 292.3
Operating expenditure 121.6 172.4 216.7 232.5 297.8
Wages and salaries 80.3 101.6 108.2 100.1 116.0
Interest payments 18.1 31.1 66.4 66.8 126.5
Other goods and services 23.2 39.7 42.1 66.6 56.3
Operating balance -76.0 -63.2 -85.7 -4.0 -6.5
Capital transfers from Contral
Administration 210.3 65.3 68.8 8.6 76.0
Capital contributions 16.4 23.9 33.1 --
Capital expenditure 132.4 235.3 237.0 361.7 182.9
Overall balance 19.3 -209.3 -210.8 -357.2 -92.4
Foreign financing 198 3 8.9 79.2 4886 101=1
Domestic financing -39.1 170.4 131.6 -111.3 -8.7
VI. Water and Sewerage Authority (WASA)
Operating revenue 22.7 25.6 23.3 31.5 46.8
Operating expenditure 229.9 253.8 272.8 284.5 270.8
Wages and salaries 190.8 212.0 217.7 191.0 192.1
Contributions to NIB -- - -- 3.4 4.1
Other goods and services 39.1 41.8 66.1 70.1 74.6
Operating balance -207.2 -228.0 -249.5 -233.0 -223.7
Current transfers from central
administration 274.0 266.1 221.2 233.8 168.0
Capital transfers from contral
administration 108.1 80.8 60.8 55.0 3.0
Capital contributions 1.0 4.0 6.0 4.0 --
Capital expenditure 131.6 93.6 65.8 60.0 13.4
Overall balance 42.3 18.3, -28.3 -0.2 -88.4
Domestic financing -42.3 -18.3 28.3 0.2 68.4
Source: Ministry of Financ, and the Economy.

-139-
Table 22. TRINIDAD AND TOBAGO -- SUMMARY OPERATIONS OF THE
NATIONAL INSURANCE BOARD (NIB), 1982-87 a/
1982 1983 1984 1986 1988 1987
(In millions of Trinidad and Tobago dollars)
Total revenues 311.2 349.6 387.6 281.8r 320.0r 360.6
Contributions 251.9 257.8 287.0 242.2 238.5 238.1
Central Administration 44.5 46.0 44.1 42.8 44.3 --Local Governments 9.0 9.5 9.1 9.8 8.9 --
Industrial Development
Corporation 0.2 0.2 0.2 0.2 0.2 --
Othor 198.2 202.1 213.8 189.8 186.1 --Investment income 69.3 91.8 100.5 39.6r 81.5r 114.6
Total expenditures and
not lending 278.6 406.1 321.9 301.8 263.5 --Current expenditures 118.8 128.1 146.9 224.2 220.1 189.6Cap'tA 'uros 4.A 0.Q 1.0 1.0 .7 0._Not lending 163.8 278.2 174.0 76.4 42.7 --
Overall balance 34.7 -55.6 46.8 65.8 108.6 --
Domestic Financing -34.7 6556 -46.8 -58.8 108.6 --
Government securities -3.8 8.1 1.4 -- -- -
Deposits -30.4 88.2 64.7 -- -- --
Other -0.7 -33.8 -111.7 -- -- --
(In percant of GDP at market prices)
Overall balance 0.2 -0.3 0.2 0.3 0.8 --
a/ For years ending June.
r - revised
Source: National Insurance Board.

Table 23. TRINIDAD AND TOBAGO -- SUMMARY ACCOUNTS OF THE FINANCIAL SYSTEM, 1982-87
(In Millions of Trinidad and Tobago dollars; end of period)
TTS2.4 = US$ TT33.6 = UStMar.
1982 1983 1984 1935 1985 1986 1988 1987
(In millions of Trinidad and TobagaLdol lais; !ar of Dori)d.Not fo.ieian assets 7, 88.8 _.1Z§iJ 3,419.0 3,112.6f 4i5.3 E 2,294.2 3,L67.1 2,073.7
Net domestic assets 1, 28.7 4,647.4 8L842.* 7,416A . ,138*0 7,774.0 7,288.2. 7,750.0
Not claims on public sector -3,439.4 -1,367.5 -73.0 674.2 574.2 1,995.5 1,105.0 2,165.9
Central Government -3,292.2 -1,470.1 -386.4 69.1 69.1 1,244.6 466.4 1,247.1
Local Gcvernments -92.3 -111.6 -80.0 -70.9 -70.9 -10.1 -59.9 -8.6
Statutory bodies -96.0 -13.4 44.5 86.5 86.5 169.2 129.4 269.3
State entAerprises 41.1 227.6 347.9 489.5 489.5 591.8 570.1 858.1
Credit to private sector 6,495.5 7,691.4 8,276.8 8,263.9 8,253.9 7,864.0 8,399.7 7,812.1
Other assets net / -2,027.4 -1,676.5 -1,353.9 -1,212.1 -2,692.1 -2,075.6 -2,218.5 -2,218.0
SDR allocation 122.4 11.L2 108 8 L'LL2 182.8 203.8 189.4 201.2
Liabilities to DCivaytsector 8,4928 9,707. 10,1B12 10,B0B- 10,B0B.7 9.8B5.2 10,BB3.9 9,B31.p
Money 1,929.0 1,979.0 1,807.8 1,765.7 1,765.7 1,883.5 1,591.5 1,612.0
Time deposits 3,764.1 4,675.8 5,149.0 5,501.8 5,601.8 4,888.9 5,820.4 4,834.7
Savings and other doposits 2,278.5 2,416.5 2,422.1 2,448.3 2,448.3 2,624.7 2,500.9 2,638.5
Private capital and surplus 631.2 636.6 781.4 890.9 890.9 688.1 951.1 646.8
J Includes valuation adjustment of TT$1,087.9 million in 1985 and 1988.
Source: Central Bank of Trinidad and Tobago.

TABLE 24: TRINIDAD AND TOBAGO -- BAUiNCE OF PAYMENTS, 1982-87
(In Millions of US Dlollars)
- . .1983 1Credit Dobit Balance Crrd71a Debit Balance Credit Debit Balance
Current account A166 L .800A4 -e44.9 2. AL 3,691.3 -1,002.9 2...44A 3,1285 -522.6Morchandis. trade 2,228.6 2,783.8 -555.2 2,028.5 2,514.4 -487.9 2,110.8 1,917.3 193.5Services 921.4 871.0 50.3 652.5 986.9 -434.4 478.7 1,109.4 -832.8
Investment income 357.0 270.9 86.1 230.3 353.3 -123.1 141.5 445.3 -303.8Interest 367.0 70.8 288.4 230.3 178.5 51.8 141.5 181.2 -39.7Public sector 354.9 81.3 293.8 226.9 147.3 79.6 139.5 148.6 -9.0
Central administration 354.9 48.8 308.1 226.9 65.7 181.2 139.5 76.9 62.6State enterprises -- 12.5 -12.25 81.6 -81.6 -- 71.7 -71.7
Private 2.1 9.3 -7.3 3.4 31.2 -27.8 2.0 32.6 -30.7Other investment income -- 200.3 -200.3 -- 174.8 -174.8 -- 264.1 -264.1Reinvested earnings -- 171.8 -171.8 -- 105.7 -105.7 -- 104.7 -104.7Remitted profits -- 2.4 -2.4 -- 46.7 -46.7 -- 132.3 -132.3Dividends -- 26.0 -26.0 -- 22.5 -22.5 -- 27.2 -27.2
Other transportation 239.7 143.3 96.4 209. 6 128.4 81.2 202.2 135.9 66.3Travel 197.0 226.0 -28.0 8.7.0 261.4 -174.5 98.5 276.2 -177.7Other government 37.1 32.9 4.2 12.7 16.0 -3.3 17.8 13.0 4.8Other 90.6 199.0 -108.4 13 1 227.8 -214.8 16.6 239.0 -222.4Unrequited transfers 656 145.6 -140.0 9.3 89.9 -80.6 16.6 99.8 -83.2Private 5.5 87.0 -81.5 5,5 78.8 -71.3 4.3 75.8 -71.5Government -- 58.5 -68.5 3.8 13.2 -9.3 12.3 24.0 -11.7
CaDital Account 874.1 2352 4389 MLL 342.0 395.3 522.7 B42.1 -119U 4Public sector capital 223.6 59.8 163.8 377.8 219.7 168.1 333.9 314.3 19.6
Central administrationborrowing 148.3 26.3 122.0 212.5 113.1 99.4 223.5 54.6 168.9
Central Administration lending -- 2.5 -2.5 10.8 61.6 -40.8 -- 87.7 -87.7Other public sector 75.3 31.0 44.3 154.5 E5.0 99.5 110.4 172.0 -61.6
Direct Investment 215.1 11.6 203.5 134.8 17.1 117.7 164.2 51.0 113.2Reinvested earnings 171.1 -- 171.8 105.7 -- 106.7 104.7 -- 104.7Other 43.3 11.6 31.7 29.1 17.1 12.0 59.6 51.0 8.5
Commercial banks 17.7 14.5 3.2 39.0 -- 39.0 24.5 E .4 19.2Other private capital 217.7 149.3 68.3 186.7 105.2 80.5 -- 271.4 -271.4
Long-term capital 214.2 41.2 173.0 58.6 47.9 10.7 -- 116.3 -116.3Short-term capital 3.4 108.1 -104.7 127.,.1 57.3 69.8 -- 155.2 -155.2
Errors and omissions -B5.8 -38.0 -100.2Overall balance -271.8 -973.6 -742.1Change in reserves:Monetary authorities (increase -) 272.9 973.2 741.5Central Government (increase -) -1.1 0.4 0.6
(Continuecl)

Table 24: Balance of Payments, (cont'd)
1985 Prel. 19?8 1987Credit Debit Balance Credit Debit Balance Credit Debit Balance
Current account 2,B66.6 2,757.7 -92.2 1,704L. 2,3as.3 -B03.7 1,410.9 1,917.0 -371.1Merchandise trade 2,154.7 1,657.3 697.4 1,368.2 1,484.1 -116.9 1,249.1 1,144.5 104.6Services 497.4 1,126.3 -629.0 334.6 784.3 -449.7 285.4 708.9 -423.5
Investment income 199.9 540.8 -341.0 97.7 299.3 -201.8 13.3 272.9 -285.6Interest 199.9 208.1 -8.3 92.7 159.9 -82.2 13.3 130.8 -117.5Public sector 198.4 187.0 11.5 1.6 142.6 -141.1 0.8 130.8 -130.0
Central administration 198.4 84.0 114.4 1.5 93.8 -92.3 0.8 76.9 -78.1State enterprises -- 102.9 -102.9 -- 48.8 -48.8 -- 53.9 -53.9
Private 1.5 21.2 -19.7 98.2 17.3 78.9 12.5 -- 12.5Other investment income -- 332.7 -332.7 -- 139.4 -139.4 -- 142.1 -142.1
Reinvosted earnings -- 191.0 -191.0 -- 33.4 -33.4 -.
Remitted profits -- 114.4 -114.4 -- 87.8 -87.8 --
Dividends -- 27.3 -27.3 - 18.2 -18.2 --
Freight -- -- -- 8.2 -- 8.2 8.2 -- 8.2Other transportation 181.8 141.5 20.3 128.1 109.3 18.8 134.4 100.6 33.8Travel 4 99.2 223.3 -124.1 83.3 165.2 -81.9 111.2 181.4 -60.2
Other Government 18.9 14.3 4.8 13.6 11.9 1.7 13.4 11.6 1.8Other 17.7 208.5 -188.8 5.7 198.8 -192.9 4.9 162.4 -157.5
Unrequited transfers 13.5 74.1 -60.8 1.8 39.7 -38.1 5.4 57.8 -52.2Private 4.2 80.8 -65.6 1.3 31.6 -30.3 0.8 38.5 -37.7Government 9.3 13.3 -4.0 0.5 8.3 -7.8 4.8 19.1 -14.5
CaDital account 628.4 14.3 1 29i42 32.8 -58.6 435.3 227L5 207.8
Public sector capital 331.0 242.3 88.8 288.5 209.0 79.5 345.0 220.2 124.8Central administration
borrowing 220.3 84.8 135.8 27.1 99.8 72.7 219.9 127.5 92.4Central administration lending -- 74.4 -74.4 27.3 12.8 14.5 15.8 -- 15.8Other public sector 110.7 83.3 27.4 234.1 98.4 137.7 109.3 92.7 16.8
Direct investment 251.5 250.3 1.2 -- 14.5 -14.5 81.1 -- 61.1Reinvested earnings 191.0 -- 191.0 81.1 -- 81.1Other 80.5 250.3 -189.8 -- -- -- -- -- --
Commercial banks - 41.0 -41.0 -- 27.2 -27.2 29.2 7.3 -21.9Other private capital 43.9 80.8 -38.7 5.7 102.1 -98.4 ..
Long-term capital 8.3 73.8 -85.6Short-term capital 36.7 6.9 28.8
Errors and omissions 21.LS. 3 z36.3 3 12Overall balance -241.0 -897.B .- 13.3Change in reserves:
Monetary authorities (increase -) 238.7 701.3 ..
Central Government (increase -) 2.3 -3.7
(e) - estimates- not available
SouCrcs: Central Statistical Office

- 143 -
Table 26. TRINIDAD AND TOBAGO -- ADJUSTED EXPORTS, f.o.b., 1982-87 !J
Prsl. Jan-June1982 1983 1984 1986 1988 1987
(Millions of U.S. dollars)
Total 2,228.A 2,028.6 2,110.8 2,164.7 1,370.4 702.2
R-exports 122.1 89.4 71.6 74.6 29.6 10.3Of which Machinery and
equipment 71.9 81.0 29.5 62.4 22.2 8.2
Domestic *xports 2,102.7 2,018.9 2,034.7 2,098.1 1,340.8 891.1Major petroleum, mineral
and related products 1,940.9 1,879.0 1,863.3 1,981.9 1,172.2 588.3Crude petroleum 1,116.4 1,099.4 956.4 1,021.0 651.8 284.6Petroleum products 897.8 811.8 706.1 680.7 410.0 238.0Ammonia 98.8 161.5 180.3 186.2 125.4 61.4Fertilizers 8.2 7.8 8.7 62.7 47.4 18.1Asphalt 2.8 2.8 4.6 6.8 6.1 3.1Methanol 0.03 0.24 19.8 34.9 31.3 15.2Tar oil 18.9 6.9 9.3 -- -- 0.0
Major agricultural products 30.4 31.6 32.8 28.2 31.6 28.8Sugar 21.9 25.8 28.7 22.0 25.3 26.1Coffee 3.9 2.7 0.8 3.2 2.7 0.3Cocoa 4.6 2.9 3.2 3.0 3.1 3.2Citrus 0.1 -- -- -- 0.4 0.2
Othor food and beverages 26.7 21.0 16.6 17.6 24.7 14.2Dairy products 1.3 0.3 0.1 0.1 0.1 0.1Fish 1.8 0.3 0.7 0.3 1.8 1.8Rum 6.8 4.0 5.1 5.8 8.7 2.1Bitters 1.3 1.4 0.9 1.4 1.6 0.8Other 165. 16.0 9.7 9.9 14.7 9.7
Manufactured goods classifiedchiefly by materials 44.4 60.9 86.2 43.3 88.7 43.8Pap*r 4.3 3.0 2.0 2.2 2.0 1.6Textiles 3.3 2.7 2.0 1.4 1.1 0.aMetal manufactures 33.2 41. 3 57.1 36.8 80.8 38.7Other 3.6 3.4 4.1 3.9 2.9 3.0
Other manufactured goods 81.3 368. 37.1 47.2 20.8 12.8Furniture 0.2 0.2 0.1 2.2 0.4 0.3Clotling 2.4 2.0 1.1 0.9 1.7 1.0Footwear 0.2 -- -- -- -- 0.0Machinery 7.0 3.9 2.1 2.0 3.8 2.7Miscellaneous chemicals 30.0 21.6 20.2 11.8 7.9 6.2Other 21.6 8.9 13.8 30.3 7.1 3.4
Coverage adjustment 3.8 -81.8 4.6 -17.9 4.7 4.2
(As percent of domestic exports)Major petroleum, mineral and
related products 92.3 93.0 91.8 93.6 87.4 86.1Major algricultural productsexcluding sugar 0.4 0.2 0.2 0.3 0.6 0.6
Sugar 1.0 1.2 1.4 1.0 1.9 3.8All othor products 8.3 6.8 8.8 6.2 10.2 10.8
*/ Excludes exports of oil products under the processing agreement and of stores and bunkers.
Sources: Central Statistical Office.

- 144 -
Table 28: TRINIIDAD AND TOBAGO -- VOLUME, VALUE, AND UNIT
VALUIE OF SELECTED EXPORTS, 1982-87
(Volume as indicated, value in millions of US dollars,and unit value in U.S. dollars)
1982 1983 1984 1985 1988 1987
Crude petroleumVolume (million barrels) 32.0 33.7 31.3 34.8 32.9 28.4
Value 1,111B.4 1,099.4 955.4 1,021.0 651.8 619.8
Unit value 34.9 32.6 30.5 29.3 18.8 18.3
Petroleum products a/Volume (millions barrels) 25.1 20.1 26.3 24.7 26.3 36.2
Value 793.2 803.0 772.0 711.3 424.7 616.7
Unit value 31.5 29.9 30.5 28.8 18.8 14.7
Anhydrous ammonia
Volume (million kilograms) 712.6 1,198.8 1,173.9 1,157.6 1,120.7 1,078.4
Value 98.8 161.6 180.3 168.2 125.4 112.8
Unit value 0.14 0.13 0.16 0.14 0.11 0.10
UreaVolume (thousand metric tons) 44.8 38.7 81.9 381.8 602.7 465.3
Value 83.8 6.9 8.8 652.7 47.0 41.4
Unit value 147.3 162.6 142.2 146.7 93.6 89.0
Methanol
Volume (million kilograms) 0.03 0.92 208.6 314.7 334.8 315.4
Value 0.03 0.24 19.8 34.9 31.3 41.1
Unit value 0.88 0.28 0.10 0.11 0.09 0.13
Steel productsVolume (thousand metric tons) 116.1 189.9 215.4 129.8 316.8 N.A.
Value 18.8 28.1 38.5 22.2 78.6 72.6
Unit value 183.3 153.8 189.6 171.3 234.5 N.A.
SugarVolume (thousand motrlc tons) 50.2 82.5 73.3 88.2 57.5 63.2
Value 21.9 26.8 28.7 22.0 23.3 28.1
Unit value 438.3 412.8 391.6 322.8 404.8 628.2
CocoaVolume (thousand kilograms) 1.91 1.70 1.60 1.31 1.31 N.A.
Value 4.5 2.9 3.2 3.0 3.1 N.A.
Unit value 2.4 1.7 2.1 2.3 2.4 N.A.
a/ Includes products exported under the processing agreement.
N.A.: Not availablo.
Sources: Central Statistical Office.

- 145 -
Tabl- 27: TRINIDAD AND TOBAGO -- ADJUSTED IMPORTS, c.i.?., 1982-87 a/
Jan-Jun;
1982 1983 1984 1986 1988 1987
(In millions of U.S. dollars)
Total 2,783.8 2,514.4 1,917.3 1,667.3 1,372.2 671.7
Consumer goods 838.2 703.6 806.6 468.9 297.6 133.0
Non-durables 384.8 441.3 391.6 338.6 226.0 107.1
Food 266.3 297.0 268.3 245.8 167.9 78.1
Other 129.5 144.3 123.2 90.8 87.1 29.0
Semi-durables 116.0 126.8 105.1 62.1 35.7 12.3
Durables 137.4 136.4 109.0 68.2 386.8 13.8
Raw materials and inter-mediate goods 1,008.2 1,029.2 859.6 680.2 694.6 283.3
Construction materials 237.6 217.1 144.2 1 68.0 27.7
Steel works and materials 80.6 96.0 66.6 43.2 36.9 15.2
Chemicals 32.5 33.3 28.7 27.4 34.4 12.7
Agricultural materials 141.1 121.7 121.2 93.1 65.0 37.7
Metal and stone 46.1 38.3 47.9 29.3 31.4 16.0
Assembly industries 165.9 199.3 136.1 88.0 91.2 17.1
Other 304.4 323.5 325.9 314.7 267.6 166.9
Capital goods 1,128.0 841.0 443.8 412.3 433.2 150.4
Power generating, agricul-tural machinery, etc. 268.2 222.9 33.0 36.6 29.7 11.0
Oil and mining machinery 139.4 73.6 24.0 69.6 40.4 16.7
Metal manufactures, etc. 373.9 345.9 219.8 180.2 202.9 84.3
Motors and parts 142.8 120.6 96.6 79.3 42.1 17.0
Aircraft and parts 124.3 11.0 11.8 13.8 61.8 6.8
Other 89.4 67.1 69.7 43.8 66.4 16.$
Coverage adjustment b/ 9.4 -69.3 8.8 7.9 47.0 6.0
(As percent of total imports)
Consumer goods 22.9 28.0 31.8 29.3 21.7 23.3
Raw materials and inter-mediate goods 38.2 40.9 44.8 43.7 43.3 49.6
Capital goods 40.6 33.4 23.1 26.5 31.8 28.3
Adjustment 0.4 -2.3 0.6 0.6 3.4 0.8
a/ Exclude Imports of oil under the processing agreement._/ The coverage adjustment derives mainly from the discrepancy betw4an official revisions to
the estimate for total imports and the unadjusted detailed classification.
Sources: Central Statistical Office.
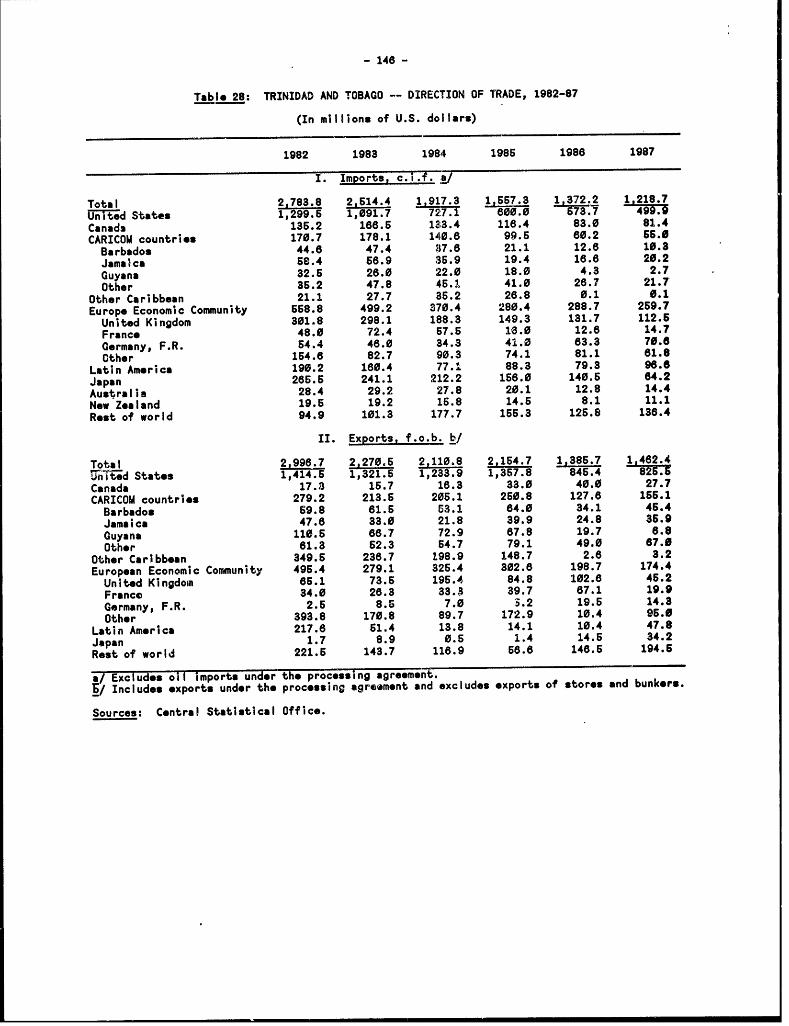
- 148 -
Table 28: TRINIDAD AND TOBAGO -- DIRECTION OF TRADE, 1982-87
(In millions of U.S. dollars)
1982 1983 1984 1986 1988 1987
I. Imports, c.l.T. ;a/
Total 2,783.8 2,514.4 1,917.3 1,667.3 1,372.2 1,218.7
United States 1,299.5 1,091.7 72:7.1 800.0 573.7 499.9
Canada 136.2 188.5 133.4 118.4 83.0 81.4
CARICOM countries 170.7 178.1 140.8 99.6 80.2 65.0
Barbados 44.8 47.4 37.8 21.1 12.8 10.3
Jamaica 68.4 58.9 36.9 19.4 18.8 20.2
Guyana 32.6 28.0 22.0 18.0 4.3 2.7
Other 35.2 47.8 45.1 41.0 28.7 21.7
Other Caribbean 21.1 27.7 36.2 28.8 0.1 0.1
Europe Economic Community 668.8 499.2 370.4 280.4 288.7 269.7
United Kingdom 301.8 298.1 188.3 149.3 131.7 112.6
France 48.0 72.4 67.5 13.0 12.8 14.7
Germany, F.R. 64.4 48.0 34.3 41.0 83.3 70.6
Other 164.8 82.7 90.3 74.1 81.1 81.8
Latin America 190.2 160.4 77.1 88.3 79.3 96.6
Japan 285.6 241.1 212.2 156.0 140.6 84.2
Australia 28.4 29.2 27.8 20.1 12.8 14.4
Now Zealand 19.6 19.2 16.8 14.5 8.1 11.1
Rest of world 94.9 101.3 177.7 155.3 126.8 136.4
II. Exports, f.o.b. b/
Total 2,998.7 2,270.5 2,110.8 2,154.7 1,386.7 1,482.4
UWnMid States 1,414.5 1,321.5 1,233.9 1,357.8 845.4 825.5
Canada 17.3 16.7 18.3 33.0 40.0 27.7
CARICOM countries 279.2 213.6 206.1 250.8 127.8 166.1
Barbados 69.8 81.6 53.1 84.0 34.1 46.4
Jamaica 47.8 33.0 21.8 39.9 24.8 36.9
Guyana 110.6 88.7 72.9 87.8 19.7 8.8
Other 81.3 62.3 54.7 79.1 49.0 87.0
Other Car;bbean 349.6 238.7 198.9 148.7 2.8 3.2
European Economic Community 495.4 279.1 325.4 302.8 198.7 174.4
United Kingdom 86.1 73.5 195.4 84.8 102.8 46.2
France 34.0 28.3 33.3 39.7 87.1 19.9
Germany, F.R. 2.6 8.5 7.0 3.2 19.5 14.3
Other 393.8 170.8 89.7 172.9 10.4 96.0
Latin America 217.8 61.4 13.8 14.1 10.4 47.8
Japan 1.7 8.9 0.5 1.4 14.6 34.2
Rest of world 221.6 143.7 118.9 58.8 148.5 194.6
a/ Excludes oil imports under the processing agreement.b/ Includes exports under the processing agreoment and excludes exports of storos and bunkers.
Sources: Central Statistical Office.

-147-
Table 29: TRINIDAD AND TOBAGO -- TRADE WITH CARICOM COUNTRIES, 1982-87(In millions of U.S. dollars)
1982 1983 1984 1986 1988 1987
Exports, f.o.b 279.2 213.5 205.1 250.8 127.8 156.1
By countryGuyana 110.5 66.7 72.9 87.8 19.7 8.8
Dominica 2.8 2.0 2.8 2.9 3.2 3.6
Grenada 11.8 8.7 9.0 10.8 10.8 12.0
St. Vincent 7.7 8.3 8.3 8.2 6.9 9.4
St. Lucia 12.3 9.1 11.0 14.0 11.1 18.8
Barbados 59.8 61.6 53.1 84.0 34.1 46.4
Jamaica 47.8 33.0 21.8 39.9 24.8 36.9
Antigua 18.9 20.3 18.8 23.0 9.8 13.7
Other a/ 7.8 5.9 9.8 20.2 7.2 11.8
By product categoriesMineral fuels, lubricants,etc. (SITC 3) 200.7 150.3 159.7 204.8 75.5 N.A.
Other 72.5 83.2 45.4 44.7 52.1 N.A.
Food, beverages and tobacco(SITC 0 plus 1) 23.9 21.8 10.4 9.9 14.7 N.A.
Chemicals (SITC 5) 18.4 13.3 8.8 7.7 7.4 N.A.
Manufactured goods (SITC 8) 17.1 17.2 18.8 19.1 18.0 N.A.
Machinery and transporbequipment (SITC 7) 7.4 6.0 3.0 2.8 6.5 N.A.
Miscellaneous manufactures(SITC 8) 6.2 6.4 3.8 3.4 5.2 N.A.
Other 0.5 0.7 1.0 1.8 1.3 N.A.
Imports, c.i.f. 170.7 178.1 140.8 99.5 80.2 55.0
By countryGuyana 32.5 28.0 22.0 18.0 4.3 2.7
Dominica 0.2 2.3 3.6 2.0 1.2 0.8
Grenada 4.0 6.3 4.0 4.4 3.0 1.0
St. Vincent 8.3 18.1 17.2 24.0 16.9 8.9
St. Lucia 4.0 6.8 3.6 1.4 1.7 1.8
Barbados 44.8 47.4 37.8 21.1 12.6 10.3
Jamaica 58.4 65.9 36.9 19.4 18.8 20.2
Antigua 8.8 8.8 2.8 1.2 -- 0.1
Other */ 11.9 11.9 14.3 8.0 4.0 11.3
By product categoriesMineral fuels and lubricants 0.4 6.3 0.1 0.1 0.3 N.A.
Other 170.t 172.8 140.5 99.4 69.9 N.A.
Food, beverages and tobacco(SITC 0 plus 1) 45.8 63.4 47.8 61.3 28.2 N.A.
Chemicals (SITC 5) 24.3 24.0 20.1 16.0 10.3 N.A.
Manufactured goods (SITC 8) 23.8 28.2 26.0 11.4 8.4 N.A.
Machinery an4 transpiortequipmnent (SITC 7) 17,3 9.8 8.0 2.7 2.6 N.A.
Miscellaneous manufactures(SITC 8) 62.8 51.9 36.8 13.6 6.1 N.A.
Other 8.7 6.5 8.0 6.6 5.3 N.A.
*/ Anguilla, Montserrat, St Kitts and Nevis, anc Belize.
N.A.: Not available.
Sources: Central Statistical Office.

Table 30: TRINIDAD AND TOBAGO - FINANCIAL MARKET ACTIVITY, 1985-87 (U.S.$) 1/
Loans Interest Rates US$ Yen DM SF FF
Private Placement7.5 B Yen 7.5 28,636,363
Syndicated Loan Jap/ L.T.P. 20,371,900
5.0 B Yen plus 0.5%Private Placement
7.5 B Yen 7.5% 35,020,661
Export CreditB.N.P. FF200,232,036 11.11% 19,458,085
Issue of Floating RateNotes on Eurodollar Libor Plus
Market. US$50 M 1-3/8% 50,000,000
Two Issues of F.R.N.s on 7%Swiss Bond Market Libor Plus
SF50 M and SF60 M 1-3/8% 42,609,756
Japanese Market -Leasing Companies18 B Yen 8.125% 72,000,000
Syndicate of Inter- Libor Plus
national Banks US$9 M & 1-1/8% (Comm.Banks) 60,000,000
Eximbank US$51 M 10.7%
1986Export Credit Financingfrom Germany andAustriaKFW - DM 59.2 M 3.5%
BHF - DM 46.9 M Libor Plus 1-1/3% 74,647,158
GZB - DM 53.7 M 8.5%
Export Credit Financingfrom BNP FF 25,245,000 8.68% 3,534,091
1987Japanese Private
Placement Market -Issues of BondsYen 7.5 B 6.8% 48,429,752
Y-en 7.5 B 6.7% 58,202,479
1/ All amounts converted to US$. Source. Ministry of Finance and the Economy.
Sgmary 9<518Extornal BorrowingRequirements 432 328.2 218.0Loans Raised j/ 328.1 78.2 106.6(Shortfall)/Surplus (103.9) (248.0) (111.4)

-149-
Table 31: TRINIDAD AND TOBAGO -- SUMMARY OF OUTSTANDING
EXTERNAL PUBLIC DEBT BY BORROWER, LENDER, AND MATURITY, 1982-86
(In millions of U. S. dollars)
Prel.
1982 1983 1984 1985 1986
Pt>blic sector 1,115 1,306 1,398 1,643 1,807
Central Governmenit 554 646 800 1,017 1,056
By lenderBilateral agencies 73 72 75 64 53
Multilateral agencies 45 44 40 37 34
Financial markets a/ 415 510 552 676 690
Bonds a/ 20 19 133 240 279
By maturityUnder 5 years 85 200 153 430 677
5-10 years 431 422 533 495 379
Over 10 years 38 24 114 92 --
Public enterprises 361 660 598 626 751
By lenderBilateral agencies 123 110 106 118 162
Multilateral agencies 24 22 24 25 130
Financial markets a/ 374 488 428 443 327
Suppliers' credit and other 40 40 40 40 132
a/ Includes lending by the commercial banks.
Sources: Ministry of Finance and the Economy; and Ministry of State Enterprises.
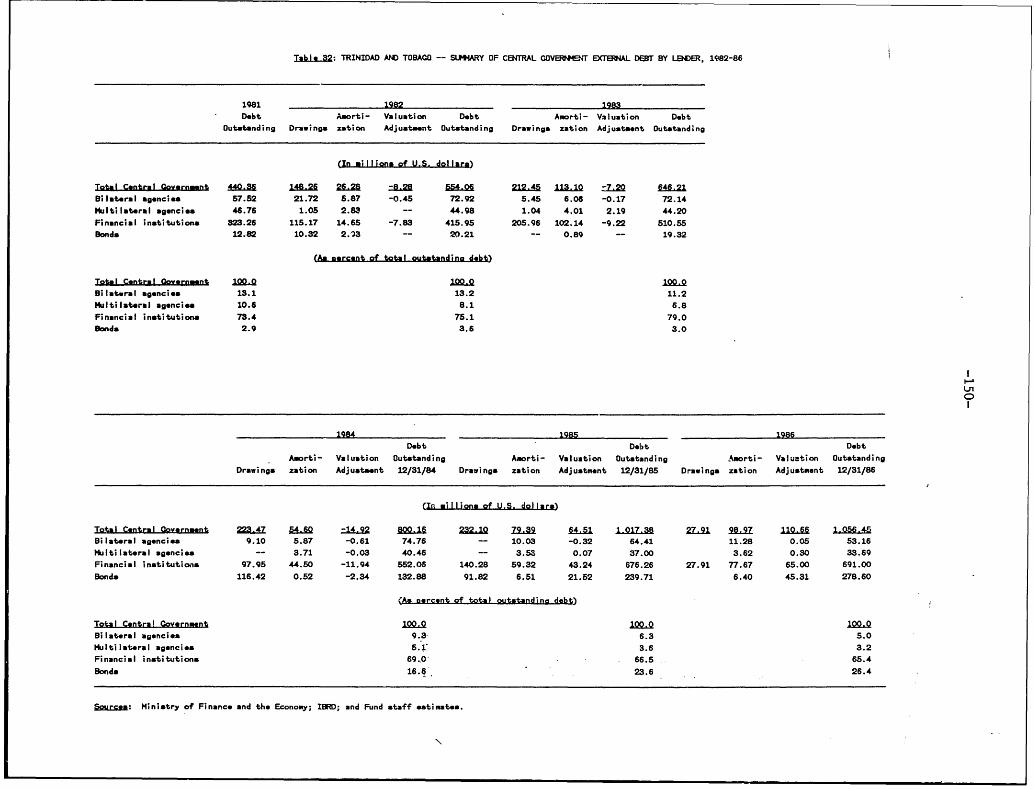
TabI Io32: TRINIDAD AND TOBAGO -- SUMMARY OF CENTRAL COVERNMhIiT EXTERAL DEBT BY LEBER, 1982-86
1981 1982 1983
Debt Asorti- Valuation Debt Amorti- Valuation Debt
Outstanding Drawings zation Adjustent Outstanding Drawings zation Adjustment Outstanding
(In millions of U.S. dollar)
Total Central Governmnt 440 36 148 26 2628 L2l SM-06 212A4S 11SX10 L720 646.21
Bilateral agencies 57.52 21.72 5.87 -0.45 72.92 5.45 6.06 -0.17 72.14
Multilateral agencies 46.76 1.05 2.83 -- 44.98 1.04 4.01 2.19 44.20
Financial institutions 323.26 115.17 14.65 -7.83 415-95 205.96 102.14 -9.22 510.55
Bonds 12.82 10.32 2.13 -- 20.21 -- 0.89 -- 19.32
(An ercent of total outstanding debt)
Total Central Gov-rnent 1QQ,Q 100 0 100
Bilateral agencies 13.1 13.2 11.2
Multilateral agencies 10.6 8.1 6.8
Financial institutions 73.4 75.1 79.0
Bonds 2.9 3.6 3.0
1984 1985 1986
Debt Debt Debt
Asorti- Valuation Outstanding Amorti- Valuation Outstanding Amorti- Valuation Outstanding
Drawings zation Adjustment 12/31/84 Drawings zation Adjustment 12/31/85 Drawings zation Adjustment 12/31/86
(In willions of U.S. dollarj)
Total Central Governent Z24Z7 54.60 1492 800.16 232.10 79.39 64.51 1,017 38 27.91 98.97 110 66 1,056,45
Bilateral agencies 9.10 5.87 -0.61 74.76 -- 10.03 -0.32 64.41 11.28 0.05 53.16
Multilateral agencies 3.71 -0.03 40.46 -- 3.53 0.07 37.00 3.62 0.30 33.69
Financial institutions 97.95 44.50 -11.94 552.06 140.28 59.32 43.24 676.26 27.91 77.67 65.00 691.00
Bonds 116.42 0.52 -2.34 132.88 91.82 6.51 21.52 239.71 6.40 45.31 278.60
(As ercent of total outstandina debt)
Total Central Governent 100 0 100.0 100 0
Bilateral agencies 9.3- 6.3 5.0
Multilateral agencies 5. 1' 3.6 3.2
Financial institutions 69.0-- 66.5 65.4
Bonds 16.6- 23.6 26.4
Sourc-- Ministry of Finance and the Economy; IBRD; and Fund staff estimates.

-151-
Table 33: TRINIDAD AND TOBAGO--UNDISBURSED LOANS AS AT DECEMBER 1986
(In Millions US$)
Lenderor
Loan II Total Disbursed Undisbursed Agency Year
84 1.0 0.4 0.6 EEC85 0.7 -- 0.7 EEC 79
116 66.9 64.8 2.1 84117 9.0 8.1 0.9 US BANK 85118 12.0 -- 10.8 -- 85
119 39.0 -- 35.1 EXIM 85
126 3.9 2.3 1.6 FRG - 86127 23.9 12.0 11.9 FRG -86128 3.3 2.3 1.0 LUXEMB 86129 8.2 3.1 5.1 FRG 86130 12.5 10.3 2.2 FRG 86
146 24.6 0.8 23.8 IDB N.A.95.8
N.A.: Not available.
Source: Ministry of Finance and Economy.

-152-
Table 34. TRINIDAD AND TOBAGO -- EXCHANGE RATES, 1976-87
Period Averages (1976=100)Nominal Effec- Real Effec-
End of Period tive Exchange tive Exchange
(SDR per TT$) Rate Rate a/
1976 0.359 100.0 100.0
1977 0.343 101.0 103.7
1978 0.320 96.2 105.0
1979 0.316 95.0 105.5
1980 0.327 94.0 106.0
1981 0.358 99.7 116.6
1982 0.378 105.9 129.4
1983 0.398 109.9 149.9
1984 0.425 116.9 172.1
1985 0.253 118.8 180.0
1986 0.227 78.2 124.4
1985 - I 0.420 125.7 188.4
II 0.417 122.1 183.7
III 0.393 118.2 179.9
IV 0.253 109.3 167.9
1986 - I 0.244 80.4 123.5
II 0.236 78.4 123.4
III 0.229 77.0 123.6
IV 0.227 77.3 127.4
1987 - I 0.216 70.0 116.4
II 0.215 67.0 112.9
III 0.217 67.3 116.4
a/ Trinidad and Tobago exchange rate divided by the weighted
average of the exchange rates of its trading partners; the
exchange rates are deflated by consumer price indices.
Sources: IMF, International Financial Statistics; and Fund staff
estimates.
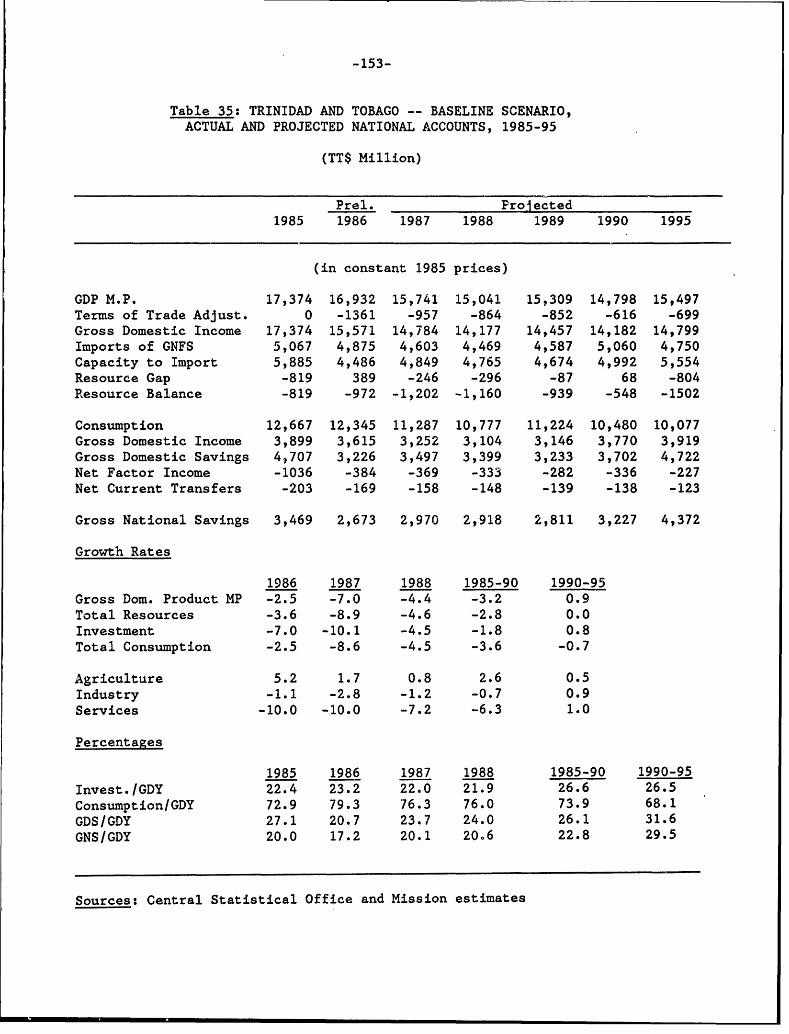
-153-
Table 35: TRINIDAD AND TOBAGO -- BASELINE SCENARIO,ACTUAL AND PROJECTED NATIONAL ACCOUNTS, 1985-95
(TT$ Million)
Prel. Prolected1985 1986 1987 1988 1989 1990 1995
(in constant 1985 prices)
GDP M.P. 17,374 16,932 15,741 15,041 15,309 14,798 15,497
Terms of Trade Adjust. 0 -1361 -957 -864 -852 -616 -699
Gross Domestic Income 17,374 15,571 14,784 14,177 14,457 14,182 14,799
Imports of GNFS 5,067 4,875 4,603 4,469 4,587 5,060 4,750
Capacity to Import 5,885 4,486 4,849 4,765 4,674 4,992 5,554
Resource Gap -819 389 -246 -296 -87 68 -804
Resource Balance -819 -972 -1,202 -1,160 -939 -548 -1502
Consumption 12,667 12,345 11,287 10,777 11,224 10,480 10,077
Gross Domestic Income 3,899 3,615 3,252 3,104 3,146 3,770 3,919
Gross Domestic Savings 4,707 3,226 3,497 3,399 3,233 3,702 4,722
Net Factor Income -1036 -384 -369 -333 -282 -336 -227
Net Current Transfers -203 -169 -158 -148 -139 -138 -123
Gross National Savings 3,469 2,673 2,970 2,918 2,811 3,227 4,372
Growth Rates
1986 1987 1988 1985-90 1990-95
Gross Dom. Product MP -2.5 -7.0 -4.4 -3.2 0.9
Total Resources -3.6 -8.9 -4.6 -2.8 0.0
Investment -7.0 -10.1 -4.5 -1.8 0.8
Total Consumption -2.5 -8.6 -4.5 -3.6 -0.7
Agriculture 5.2 1.7 0.8 2.6 0.5
Industry -1.1 -2.8 -1.2 -0.7 0.9
Services -10.0 -10.0 -7.2 -6.3 1.0
Percentages
1985 1986 1987 1988 1985-90 1990-95
Invest./GDY 22.4 23.2 22.0 21.9 26.6 26.5
Consumption/GDY 72.9 79.3 76.3 76.0 73.9 68.1
GDS/GDY 27.1 20.7 23.7 24.0 26.1 31.6
GNS/GDY 20.0 17.2 20.1 20.6 22.8 29.5
Sources: Central Statistical Office and Mission estimates
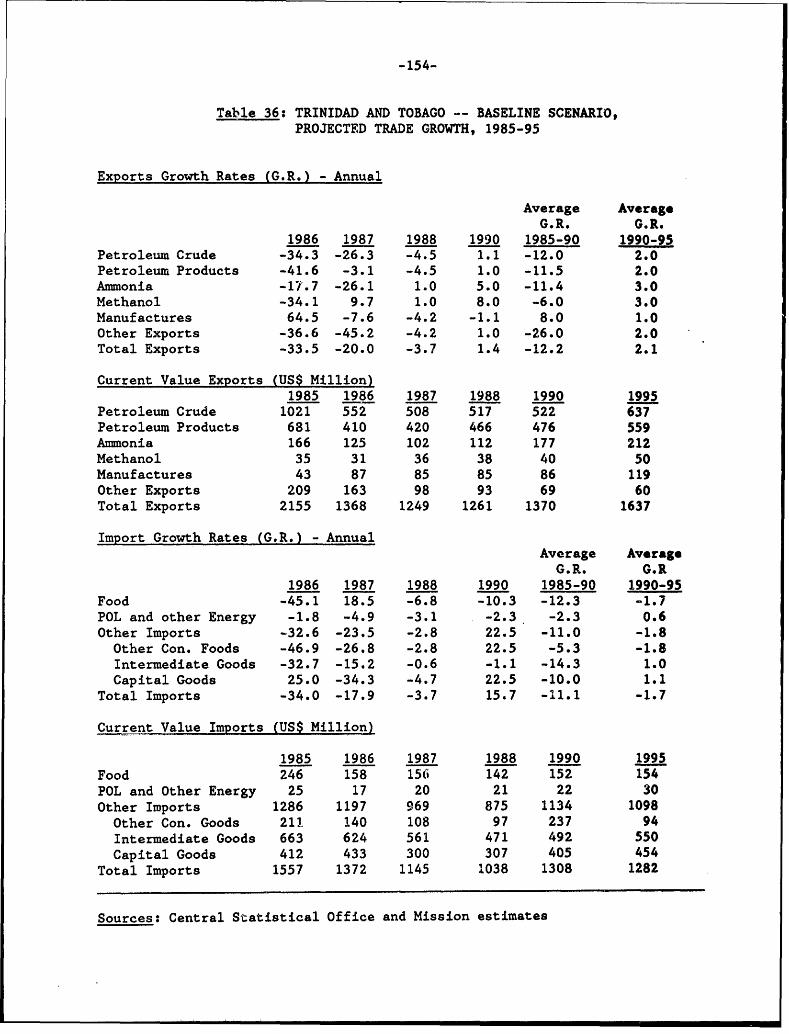
-154-
Table 36: TRINIDAD AND TOBAGO -- BASELINE SCENARIO,PROJECTED TRADE GROWTH, 1985-95
Exports Growth Rates (G.R.) - Annual
Average AverageG.R. G.R.
1986 1987 1988 1990 1985-90 1990-95Petroleum Crude -34.3 -26.3 -4.5 1.1 -12.0 2.0Petroleum Products -41.6 -3.1 -4.5 1.0 -11.5 2.0Ammonia -17.7 -26.1 1.0 5.0 -11.4 3.0Methanol -34.1 9.7 1.0 8.0 -6.0 3.0Manufactures 64.5 -7.6 -4.2 -1.1 8.0 1.0Other Exports -36.6 -45.2 -4.2 1.0 -26.0 2.0Total Exports -33.5 -20.0 -3.7 1.4 -12.2 2.1
Current Value Exports (US$ Million)1985 1986 1987 1988 1990 1995
Petroleum Crude 1021 552 508 517 522 637Petroleum Products 681 410 420 466 476 559Ammonia 166 125 102 112 177 212Methanol 35 31 36 38 40 50Manufactures 43 87 85 85 86 119Other Exports 209 163 98 93 69 60Total Exports 2155 1368 1249 1261 1370 1637
Import Growth Rates (G.R.) - AnnualAverage Average
G.R. G.R1986 1987 1988 1990 1985-90 1990-95
Food -45.1 18.5 -6.8 -10.3 -12.3 -1.7POL and other Energy -1.8 -4.9 -3.1 -2.3 -2.3 0.6Other Imports -32.6 -23.5 -2.8 22.5 -11.0 -1.8
Other Con. Foods -46.9 -26.8 -2.8 22.5 -5.3 -1.8Intermediate Goods -32.7 -15.2 -0.6 -1.1 -14.3 1.0Capital Goods 25.0 -34.3 -4.7 22.5 -10.0 1.1
Total Imports -34.0 -17.9 -3.7 15.7 -11.1 -1.7
Current Value Imports (US$ Million)
1985 1986 1987 1988 1990 1995Food 246 158 156 142 152 154POL and Other Energy 25 17 20 21 22 30Other Imports 1286 1197 969 875 1134 1098
Other Con. Goods 211 140 108 97 237 94
Intermediate Goods 663 624 561 471 492 550Capital Goods 412 433 300 307 405 454
Total Imports 1557 1372 1145 1038 1308 1282
Sources: Central Statistical Office and Mission estimates

-155-
Table 37: TRINIDAD AND TOBAGO -- BASELINE SCENARIO,BALANCE OF PAYMENTS, 1985-95
(Millions of Current US$)
Prel. Prolected1985 1986 1987 1988 1989 1990 1995
Exports of GNFS 2452 1605 1521 1536 1551 1669 2003
Imports of GNFS 2143 1969 1581 1632 1763 1855 1920Resource Balance 309 -364 -60 -96 -212 -186 83
Net Factor Income -341 -202 -259 -122 -126 -204 -215Interest -200 -62 -118 -156 -167 -238 -214Other -141 -140 -141 34 41 34 -1
Net Current Transfers -60 -38 -52 -55 -54 -53 -51Current AccountBalance -92 -604 -371 -273 -292 -325 -183
Direct Investment 1 -15 61 7 1 8 36Net LT Loans -66 -96 -77 -129 -81 -167 -249
Disbursements 251 95 111 167 206 210 205Repayments 185 191 188 296 28e7 377 454
Other LT inflows (Net) 29 -102 95 118 102 33 65Total Other Items(Net) -84 119 129 210 96 98 105
Financing Gap a/ - - - 248 227 388 277Change in Net Reserves 241 698 163 -181 -53 -35 -51Reserve Level 984 474 81 262 315 350 401Reserve Level itsMonths of Imports 5.5 2.9 1.0 1.9 2.1 2.3 2.5
Debt Service/Exportsand NFS (%) 15.7 15.8 20.1 29.4 29.3 36.8 33.3
a/ Does not include rescheduling.
Sources: Central Statistical Office and Mission estimates

-156-
Table 38: TRINIDAD AND TOBAGO -- SCENARIO WITH IMPROVED POLICIES,
ACTUAL AND PROJECTED NATIONAL ACCOUNTS, 1985-95
(TT$ Million)
Prel. Prolected1985 1986 1987 1988 1989 1990 1995
(in constant 1985 prices)
GDP M.P. 17,374 16,932 16,550 16,637 16,876 17,354 20,135
Terms of Trade Adjust. 0 -1,361 -431 -1,012 -1,074 -890 -1,025
Gross Dom. Income 17,374 15,571 15,619 15,625 15,802 16,464 19,110
Imports of GNFS 5.067 4,870 4,862 4,886 4,903 5,841 6,330
Capacity to Import 5,885 4,487 4,875 4,747 4,767 5,063 6,071
Resource Gap -819 383 -13 139 136 778 259
Resource Balance -819 -977 -944 -872 -939 -112 -767
Consumption 12,667 12,339 12,262 12,383 12,504 12,622 12,942
Gross Dom. Investment 3,889 3,615 3,343 3,302 3,433 4,620 6,427
Gross Dom. Savings 4,707 3,232 3,357 3,242 3,298 3,842 6,168
Net Factor Income -1,036 -384 -369 -330 -278 -332 -211
Net Current Transfers -203 -169 -158 -148 -139 -138 -123
Gross National Sav. 3,469 2,678 2,829 2,764 2,881 3,371 5,835
Growth Rates
1986 1987 1988 1985-90 1990-95
GDP M.P. -2.5 -2.3 0.5 0.0 3.0
Total Resources -3.6 -4.8 4.1 1.2 2.6
Investment -7.0 -7.5 1.2 2.1 6.5
Total Consumption -2.6 -0.6 1.0 0.1 0.6
Agriculture 5.2 1.7 0.8 2.7 2.5
Industry -1.1 -0.4 1.0 0.1 2.7
Services -10.0 -3.3 0.2 1.2 3.3
Percentages1985 1986 1987 1988 1985-90 1990-95
Invest./GDY 22.4 23.2 21.4 21.6 28.1 33.6
Consumption/GDY 72.9 79.2 78.5 79.2 76.7 67.7
GDS/GDY 27.1 20.8 21.5 20.8 23.3 32.3
GNS/GDY 20.0 17.2 18.1 17.7 20.5 30.5
Sources: Central Statistical Office and Mission estimates

-157-
Table 39: TRINIDAD AND TOBAGO -- SCENARIO WITH IMPROVED POLICIES,PROJFCTED TRADE GROWTH, 1985-95
Export Growrth Rates 1986 1987 1988 1989 1990 1985-90 1990-95
Petroleum Crude -5.5 -4.0 -4.5 1.0 1.0 -2.5 2.0
Petroleum Products 2.4 4.0 1.5 1.5 1.0 2.1 3.0Ammonia -4.2 1.0 1.0 1.0 5.0 0.8 5.0Methanol 6.3 1.0 0.9 1.0 5.0 2.3 5.0Manufactures -4.5 -3.9 -4.2 -3.0 -1.1 -3.4 5.0Uther Exports -4.5 -3.9 1.2 1.0 1.0 -0.9 3.0Total Export:s -0.6 -0.6 -1.5 1.1 1.3 -0.2 2.9
Current Value Exports (US$ Million)
1985 1986 1987 1988 1989 1990 1995
Petroleum Crude 681 530 636 583 577 583 711Petroleum Products 475 501 551 590 632 674 833Ammonia 111 97 108 139 168 226 298Methanol 23 33 36 38 40 42 57Manufactures 19 22 23 23 -23 23 31Other Exports 33 39 39 42 45 45 55
Total Exports 1409 1334 1506 1542 1623 1739 2174
Import Growth Rates 1986 1987 1988 -989 1990 1985-90 199C-95
Food -3.8 3.3 0.7 -1.6 2.9 '0.1 2.6POL and Energy -1.8 -1.5 0.2 0.9 2.1 -0.1 2.1Other Imports -3.0 -1.0 0.6 0.2 2.9 -0.1 1.6Total Imports -3.1 -3.4 0.6 0.1 2.4 -0.2 1.8
Current Value Imports (US$ Million)
1985 1986 1987 1988 1989 1990 1995
Food 212 239 205 229 240 253 293POL and Other Energy 25 17 21 22 23 24 36Other Imports 802 1068 1119 1189 1255 1286 1832
Other ConsumerGoods 111 133 146 155 163 233 365
Capital Goods 316 409 409 435 458 510 701Total Imports 1039 1325 1345 1440 1518 1563 2161
Price Index (L985=100)
Exports 100.0 95.2 108.2 112.4 117.1 123.4 134.0Imports 100.0 131.7 133.9 142.4 150.4 150.5 163.4
Terms of Trade 100.0 72.3 80.8 78.9 7i.9 82.0 82.0
Sources: Central Statistical Office and Mission estimates

-158-
Table 40: TRINIDAD AND TOBAGO -- SCENARIO WITH IMPROVED POLICIES,
BALANCE OF PAYMENTS, 1985-95
(Millions of Current US$)
Prel Proiec .L'A
1985 1986 1987 1988 1989 1990 1995
Exports of GNFS 2452 1605 1521 1573 1667 1774 2296
Imports of GNFS 2143 1969 1581 1627 1722 1839 2178
Resource Balance 309 -364 -60 -54 -55 -65 118
Net Factor Income -341 -202 -259 -12S,. -1.33 -175 -147
Interest -200 -62 -118 -156 -175 -211 -152
Other -141 -140 -141 34 43 37 5
Net Current Transfers -60 -38 -52 -55 -54 -53 -51
Current Account Balance -92 -604 -371 -238 -242 -293 -80
Direct Invest. 1 -15 61 7 21 43 82
Net LT Loans -66 -96 -77 -129 -90 -294 -434
Disbursements 251 95 111 167 206 210 205
Repayments 185 191 188 296 296 394 439
Other LT invlows (Net) 29 -102 95 -35 -26 -87 195
Other Items (Net) -84 119 129 158 96 98 105
Financing Gap a/ - - - 395 350 403 168
Change in Net Reserves 241 698 163 -158 -109 -44 -236
Reserve Level 984 474 81 239 348 392 628
Reserve Level asMonths of Import 5.5 2.9 1.0 1.8 2.4 2.6 3.5
Debet Service /Exportsand NFS (%) 15.7 15.8 20.1 28.7 28.3 34.1 25.7
External Debt/GDP (%) 37.0 37.8 37.1 35.4 34.1 35.9 29.4
a/ Does not include rescheduling.
Sources: Central Statistical Office and Mission estimates

DISTRIBUTORS OF WORLD BANK PUBLICATIONS
ARGEN'TINA GERMIANY. FEDERAL REPUBLIC OF KOREA, REPUBLIC OF SPAIN
Carlo Hirsh. SRL LtNO-Verlag Pan Korea Book Coqxpoatton Cuas-Penlo 37 s SA
Galeria Guemes Poppelsdoder Alley 55 P. 0. Box 101. Kwang.hamun aselo3
Flo,d-a 165. 4th Floor-Ofc. 453/465 D-53(5) Bonn I Seoul 28001 Madrid
1333 Buenos Aires GREEKUWAIT SRI LANKA ANT) THE MALDIVES
AUSTRAkLIA, PAPUA NEW GLINEA. FUIJI KEMIE MEMRB L-ake House Bookshop
SOLOMION LSLANDS, VANUATU. AND 24. Ippod.ansou Street P,O. Box 5465 P.0. Box 244
WETSTERIN SAMIOA Athens-I1 1635 100. Sir Chittnspalani A. Gurdiner Mawahis
InoLieMALAYSIA Colombo2
Ino-LrnesDounnDe. GUATEMALA University of Malaya Coprtive SWEDENop
Bo '- nt DliGer Librenas Piedr. Santa Limited SEE
Boad50. GPO200 Centro Cultural Piedra Sania P 0. Boa 1127. Jalan Pantat Barut For single ritles:I I afl 6-5 zoa IKual LupurABCE Fritzes Kungi. Hovbokhandel
ASTRIA) GSu201 t malle6. Cotya IKaaRegeringsgat.an 12, Box 16356
AGSrolA Ganteulo.ity EXICO S-103 27 Stockholm
G-10ld atnd o HONG KONG. iMACAU INFOTEC
A-lOln 3i1r Asia 2000 Ltd. Apafldo Potta 22-8W For Subscription orders:~
Gae316 Fl.. 146 Prince Edward Road, W. Col. PEIA P'obr Wenntergmre-Williani AB
BAHRAIN Kowlksn 14060 TIlpan. Mexico D.F. Box 30004
MESEMRB Information Services Hong Kong MIOROCCO S40G4 25 Stockholm
P 0. Box 2750 HUNGARY Societ d'Etudes Marketung Maroaitie SWITERLAND
Maniarra Town 317 Kulturs 2 Rue Moiere. Bd. d'Anfa ubrairie Payot
BANGLADESH P0, %a-. 139 Cusblanca 6. ru Grettus
Micr Industnes Development Assistance I38v Budapest 62 NETERLANDS Case postal 381
Society (MIDAS) INDIA linOr-Publikaties b.v. CH 1211 Geneva II1
G.P.O. Box -0 Allied Publishers Priv,ate Ltd. P.O. Box 14 TANZANIA
Dhaka 751 Mount Road 7240 BA Lochem Oxor Uoiveniy Press
BELGIUrM Madras - 600 002 NE ZEALAND P.O0. Box 5299
Puiblications des Nations Unies Hills Library anid Inforttation Service Oar es Saliams
A,,. du Roi 202 15 JIN. Heredia Marg oaeBg IALN
lOW0 Brussels Ballardl Estate Nrvaew Marke CeTrAI ADeaan Ste
BRAZIL Boby-4008Auckland 306 Si1om Road
Pisbbcacoc Tecnicas Internactonais LIda. 13/14 Asaf All Road NIGERIA Bangkok
Riua Prisoto Gotnide, 209 New Delhi - 110 002 University Press Urinted TRINIDAD) & TOBAGO. ANTIGUA,
049SoPuoSPThree Crowns Building Jericho BARBUDA.BARBADCS, DOMINICA
CAINADA 17 Chittamnijan Avenue Private Mall Bag 509 GRENADA, GUIYANA, JAMAICA.
Le Daffuseur Calcutta - 700 072 lbadan MONTSERRAT, ST. KITTS AND WMVIS
C.P. 15. 1501 Ampere Stret ST. LUCIA, ST. VINCENT &
Bouctierville, Quebec Jayadeva Hostel Building NORWAYJA i,Ml odGnhngrTanum Karl Johan. A.S. GRENADINIlS
Ba E65hznga Road 560 h raga P. 0. Box 1177 Sentrun Syteatc Swie Road
CHiA Bnaoe-5009Oslo I CuFst an od
Chn iaca cnmcP,srhn os, 3-5-1129 Kachiguda Cros Road OMAN Trinidad. Wes5 Indiea
8.Das Fo Si Dong lie H4ydecabad - 500 027 MEMRB Information Services
Beijing P.O. Box 1613, Seea Airport asTURKiEYeiAS
COLOMBEIA Pmarthana Flats. 2ntd Floor Muscat Hase Cadiev.A.S
Enlace Lrda. Near Thakome Balig. NavtangpuramKSA Derutpalit Coadde15
area6N.1-1-Mirza Book Agency Topkapi
Bogota OFE. Patiala House 65, Shahrah-Quaid-e-AzamS Istabul
Apastao Aereo 4430l6AsokMr P.O. Box No. 729
Ca.VleLu~know - 226 001 Lahort 3 UGANDA
COSTA RICA l1(N5A PERU Pga). Box 7145
UbraTrejos INDOESI Editorial Desafrollo SA Pa.O. o 714
A,.Fmne ul 1 a auag 7Apartado 3824 UNITED ARAB EMULATES
CanlJoe Jak3II arta Ruaniag 37 im MEMRB Gulf Co.
SanE D'OR P.O. Box 181 PHiLIPPINES P. 0. Box 6097
COnt dE ditioneteDfuinArcie IRELAND National Book Store Sharjah
(Cenr EdAto) td ifuinArie TDC Publishers 701 Rizal Avenue UNITED KINGDOM
IC4EDAI54 12 North Frederick Street Meuo ManiL- Microinfo Ltd.
Abxe 04 Pla' Dublin I POLAND P. 0. Box 3
CYPRUS ISRAEL ORP'AN Alton, Hampshime GU3.4 2PG(
The Jerusalem Post Palac Kulnury i Nauki England
NIENIRB InforrTnation Services The Jerusalm Post Building 00-001 Wamss.waURGA
P.O. Box 2098 P.O. Box 8I POTUALUnGiUtNAYinldc i
DENNIc.AK Rornsma Jcrusalcm 91000 L-ivrania Portugal San Jose 11 16
DEmndsLAnrK tu ITALY Ruan Do Camino 10-74 Montevideo
RsaminoitemsAlleII Licosa Conunissionaria Sansoni.SPA 1200 LisbonVEFU A
Dosen9ern Aldenkbr C. Via Lamsarriora 45 SAUDI ARABIA. QATAR Uibrerta del Este
DK17 rdrkbt ,Casella Postale 5¶2 Jari Book Store Aptdo. 60,337
DOMI'EN-ICAN REPUBLIC 50121 Florence P. o. Box 3196 Cawaas ID0W-A
Editors Taller, C. por A. JAPAN Riyadhs 11471 YGSAI
Apoepstalrc 19n Eastems Book Service SINGAPORE, TAIWAN. BURMA, BRUNEI Jugoslovettska Knjiga
Sapdo. postal219 37-3. Hongo 3-Chorme. Burtkyo-ku 113 Infornsation publicatioos YU-1 Iooo0 Belgrade Teg Republike
SanPto Domin EUBLCo Tokyo Private, L-td.
EY ,AABRPBIOFJORDAN 02-06 Ist Fl.. Pei-Fu Industrial ZIMBABWE''
AJArmJordan Center for Marketing Research Bldg., 24 Now Industrial Road TxBoa k SaesPv.td
Al Galaa Street P.O Box 3143 Singapome Hara379
C'MJabal, Amman SOUHrARIC
FIN-LANDSOT ARC
Akateeruneit; Kirjaksuppa KENYA For single titles
P 0. Box 128 Africa Book Service I E.A.I Ltd. Oxford University Press Southern Africa
SF-00101 P.O0. Box 45245 P.O. Box 1141
Helsinki lO Nairobi Cape Town 8000
FRASCE For subscription orders
WAorld Bank Publications International SubscriptrionSerice
Ito. avenue d'lena P.O. Box 41095
75116 Paris Craigh.11Joiasnnesburg 2024

CUBA DOMINICAN 61°30' 60000REPUBLIC
HAITI JTRINIDAD AND TOBAGO
TRINIDAD &TOBAGO Chrlille Main Roads
o VENEUA Spepide Pr;ncipal Ports
UEL TOBAGO
Mori Vh , gh Secondary Ports
6PW lymoulk National Capital
BI, R.,k b TCwns
Scorborough J Oil Refineries
Ca Oil Fields
Unassociated Gas Fields
Gas Pipelines
v11000'
International Boundaries
0 10 20 MILES
o 10 20 30 KILOMETERS
VENEZUELA Choguoro mas SonpSem Vlclo g
PORT-OF-SPAIN udi
C' ogre Gr-dul
. 0n1030
T 10°30'f E. Manzanilla
B|ig 0 Br.eo lDh,"\
Sodd 'E or
B,-h 10.000-
S.E. Gal-eala
0
620061'000 6030 6000'Cn
6200r61030'
N

-c 1! - - -
The World Bank
Headquarters European Office Tokyo Office L1818 H Street, N.W. 66, avenue d'I6na Kokusai BuildingWashington, D.C. 20433, U.S.A. 75116 Paris, France 1-1 Marunouchi 3-chome
Telephone: (202) 477-1234 Telephone: (1) 47.23.54.21 Chiyoda-ku, Tokyo 100, JapanTelex: WUI 64145 WORLDBANK Telex: 842-620628 Telephone: (03) 214-5001
RCA 248423 WORLDBK Telex: 781-26838Cable Address: INTBAFRAD
>VASHINGTONDC
__ _ _ _ _ _ _- .¢* .1 ' ,--''*- ' ---- ' ------- -.-.--. - - - _ _ _ _ _ _ _.--
z. , -
4-4
EK ..
4.z
~-A
$1'
IiI NS '0r4 pMIS..,8