The Report of the OAS Secondary Education Meeting February 2009 - Trinidad and Tobago
Upload
khangminh22Category
view
0download
0
1
UNITED NATIONS POPULATION FUND – CARIBBEAN SUB-REGION
COUNTRY PROFILE: TRINIDAD AND TOBAGO
OVERVIEW The twin island Republic of Trinidad and Tobago is located in the Southern Caribbean, just off the cost of North Eastern Venezuela and South of Grenada in the Lesser Antilles. It shares maritime boundaries with other nations including Barbados to the Northeast, Guyana to the Southeast and Venezuela to the South and West. It is a multi-cultural (comprising 35.4% East Indians descent; 34.2% African descent; and 22.8% mixed people), and resource rich. However, with the drop in oil and gas priced, the country is presently experiencing a recession with challenges in obtaining foreign exchange, the closure of companies and related lay-offs and the reduction in Government spending, including those for social programmes. Furthermore, despite its wealth, it still struggles with a number of health and social issues.
POLITICAL CLIMATE In September 2015, the People’s National Movement became the ruling national political party with the Honourable Dr. Keith Rowley sworn in as Prime Minister of the Republic of Trinidad and Tobago. Similar to former British dependents, Trinidad and Tobago is a parliamentary democracy with a Senate and a House of Representatives. It is a member of the Commonwealth and has retained the Judicial Committee of the Privy Council in London as its highest court of appeal. “Vision 2030”, the country’s new development plan, was presented to Cabinet in May 2017 and for national consultation. Tobago has some level of autonomy and is governed by the Tobago House of Assembly, which comprises 13 elected members. There are ten (10) Divisions of the THA that do not necessarily match the national ministerial portfolios. The THA had elections in January 2017 and a new Chief Secretary, Kelvin Charles, was appointed.
POPULATION DYNAMICS

2
Table 1
Indicators 1990 2000 2005 2010 2011 Land area 1,841 square miles (4768 square kilometres) Total population 1,213,733 1,262,366
(CSO, 2012))
1,315,386 1,341,465 1,328,019
(CSO 2012) Population density 236.7 246 259 Life expectancy at birth 69 68 69 70 70 Crude birth rate (births per 1000 population) 16 15 15 15 15 Age dependency ratio 59 48 41.9 Population 0-14, percenti 32 26 22 21 21 Population age 65 and over, per cent 6 6
7.1 (2000 Census)
6 7 9.0 (2011
Census) Annual population growth rate 0.7 0.4 0.4 0.4 0.4
0.5 Census International migrants % of population 3.6 3.3 2.9 2.6
3.7 National poverty rate (% of population) 24 (’97) 15.5 (’05)
Per capita GDP 9,092 12,338 20,058 25,669 26,210 (2013)
Unemployment rates 17.2 12.1 8.0 4.6 (’08) 3.5 (4thq 2015 – Central
Bank) Adult HIV Prevalence Rate 1.5% 1.65%
(GARP, 2016)
HIV prevalence rate among MSM 20% (Lee, 2006)
27.7% (GARP,
2016)
Sources: Central Statistical Office of Trinidad and Tobago, published data from Censuses, Surveys and Administrative Data; UNPD Trends in Pop Migrant Stock, 2008 Revision; World Bank; UNPD World Population Prospects, Government of Trinidad and Tobago MDG Report, 2015
DEMOGRAPHICS The 2011 mid-year estimates indicate that the population of Trinidad and Tobago was approximately 1,328,019 with slightly more males (50.17%) than females (49.83%). According to the 2011 Census results the average annual growth rate has remained more or less the same at 0.5 during 2000-2011 from 0.4 during 1990-2000. The median age of the population has increased from 24.1 to 32.6 between 1990 and 2011 and the number of children under age 15 as a proportion of the total population is now estimated to be at around 20.6%, a decrease from 2000 when it was estimated to be just over 25%. Trinidad and Tobago is enjoying its demographic bonus with the working-age population, persons 15-64 years, increasing from 67.6% in 2000 to 70.4% in 2011 and its age dependency ratio decreasing from 48 in 2000 to 41 in 2011. The population 65 years and over comprise approximately 9% of the population an increase from 2000 when it comprised 7.1%.

3
Chart 1 Chart 2
While there have been several studies conducted, many of the findings have not yet been published. This includes the Survey of Living Conditions (2015); Infant Mortality (2014); and the Multiple Indicators Cluster Survey (2013). In 2014/2015, UNFPA supported the development of a national population policy with technical support to the development of a population situation analysis (PSA). As a result of the support, a national population policy was adopted in 2015, but is now being reviewed by the present administration.
ECONOMICS
Trinidad and Tobago is characterised by the World Bank as “high-income”1 country with a Gross National Income (GNI) per capita of US$17,6402. GDP per capita increased dramatically between 1995 and 2010 with most of the increase taking place between 2000 and 2010. At over 25,000 at PPP Trinidad and Tobago has the second highest Per Capita GDP in the Caribbean after Bahamas. The growth in the country’s economy was due largely to investments in liquefied natural gas, petrochemicals and steel. Although Trinidad and Tobago is the leading producer and exporter of oil and gas in the Caribbean, it also exports food, beverages and cement to other Caribbean countries. Foreign earnings are largely derived from the energy sector with significant contributions to the Gross Domestic Product (GDP) from manufacturing and tourism. Agriculture and the tourism sectors are the main sources of income for many in Tobago. It should be noted that although oil and gas account for a very high percentage of GDP, it does not account for a correspondingly high percentage of employment. Unemployment decreased between 1997 and 2005 from 24% to 15%. The overall unemployment rate is at approximately 4.43. However, since the decline in oil prices, a few
1 World Bank, 2017
2 Ibid (2015 data, per capita, ATLAS method)
3 Trade Economics, 2017 (2016 data, quarter 2)
100000 50000 0 50000 100000
0-4 5-9
10-14 15-19 20-24 25-29 30-34 35-39 40-44 45-49 50-54 55-59 60-64 65-69 70-74 75-79
80 +
Population
Age
Gro
up
s
Age and Sex Structure: Trinidad and Tobago 2000
Males Female
100000 50000 0 50000 100000
0-4 5-9
10-14 15-19 20-24 25-29 30-34 35-39 40-44 45-49 50-54 55-59 60-64 65-69 70-74 75-79
80 +
Population A
ge G
rou
ps
Age and Sex Structure: Trinidad and Tobago 2011
Males Female

4
companies have closed and there have been a number of people layed off from work. Furthermore, the new administration is trying to reduce the number of contract workers and as a result, there is an absence of a number of key positions in Government. Chart 3 Chart 4
Chart 5
MIGRATION
According to the 2011 Population and Housing Census approximately 15,445 persons migrated from Trinidad and Tobago to other countries during the period 2000 to 2011. This figure has not been adjusted to account for instances where entire households may have migrated and hence is an underestimation of emigration during
0
5,000
10,000
15,000
20,000
25,000
30,000
1995 2000 2005 2010 2011
PP
P
Year
Trinidad: GDP per Capita
0.0
5.0
10.0
15.0
20.0
25.0
30.0
1997 2005 P
ove
rty
Rat
es
Year
Trinidad: Poverty Rates
0.0
2.0
4.0
6.0
8.0
10.0
12.0
14.0
16.0
18.0
20.0
1995 2000 2005 2008 2011
Un
em
plo
yme
nt
Rat
es
Year
Trinidad: Unemployment Rates

5
the inter-censensal period. The preferred destination countries continued to be the United States, Canada and the United Kingdom accounting for 81% of the emigrants with the USA alone receiving 59%. Women accounted for 56.6% of all emigrants. The number of foreign-born accounted for 3.7% of the total population of Trinidad and Tobago at census date which was not a substantial increase from 3.3% in 2000. The countries contributing the most to the foreign born population were Guyana (19.7%) Grenada (16.1%), St. Vincent and the Grenadines (12.9%) and the USA (11.6). Since the 2011 Census, although there are presently no accurate figures, it is believed that the numbers of irregular migrants have increased particularly from Cuba, Syria, Jamaica, Colombia and Venezuela. Many of the female Latin migrants (mainly from Colombia and the Dominican Republic) are presumed to have been trafficked into the country and many are used in the sex trade. As of May 2017, there were 640 Refugees, asylum-seekers, and other persons of concern in Trinidad and Tobago. There is a 62% increase in asylum seekers from 2015 to 2016. A local Office of UNHCR opened in 2016 in Trinidad and Tobago to address the growing number of asylum seekers in the country.
AGING
Although persons over the age of 65 still form a relatively small proportion of the total population of Trinidad and Tobago (2011 Census: 9.0), there is a clear indication that it is changing and will continue to increase at a faster pace in the future. Persons 15-64 years increased from 67.6% in 2000 to 70.4% in 2011 and the population 65 years and now comprise approximately 9% of the population, an increase from 2000 when it comprised 7.1%. In their National Report at the 2012 Intergovernmental Conference on Ageing, Trinidad and Tobago stated that a Division of Ageing was established within the Ministry of Social Development in 2003 (now Ministry of Social Development and Family Services) with one of its key responsibilities being the formulation and implementation of a National Ageing Policy, later passed in 2006. According to the Division’s website, the twelve areas addressed by the policy are: Social Security; Income Security and Employment; Participation, Involvement and Social Inclusion; Dignity and Respect for the Elderly; Healthcare and Standards for hospitals and care facilities; Housing; Education and Training; Recreation; Legislation; Transportation; Disaster Preparedness; and Research. The 2012 National Report further stated that some of the initiatives taken since 2007 include an inaugural Senior Citizens Parliament, Cataract Surgeries Reduction programme, Geriatric Adolescent Partnership Programme, and Retirees Adolescent Partnership Programme (RAPP). Some of the key actions to be taken to further strengthen the implementation of the Brasilia Declaration are advocacy, creation of an Older Persons Information Center (OPIC), public education at community and media levels, continuum of health and social support services for Older Persons and Residential Long-term Care and Assisted Living Facilities. The need for greater income security was also identified.
WOMEN’S HEALTH Table 2
Indicators 1995 2000 2005 2010 2012
Health expenditure as a % of GDP 4.7 3.9 5.7 6.3 5.7
Women 15-49 as % of total female population 53.3 56.6 58.6 56.7 53.1
6
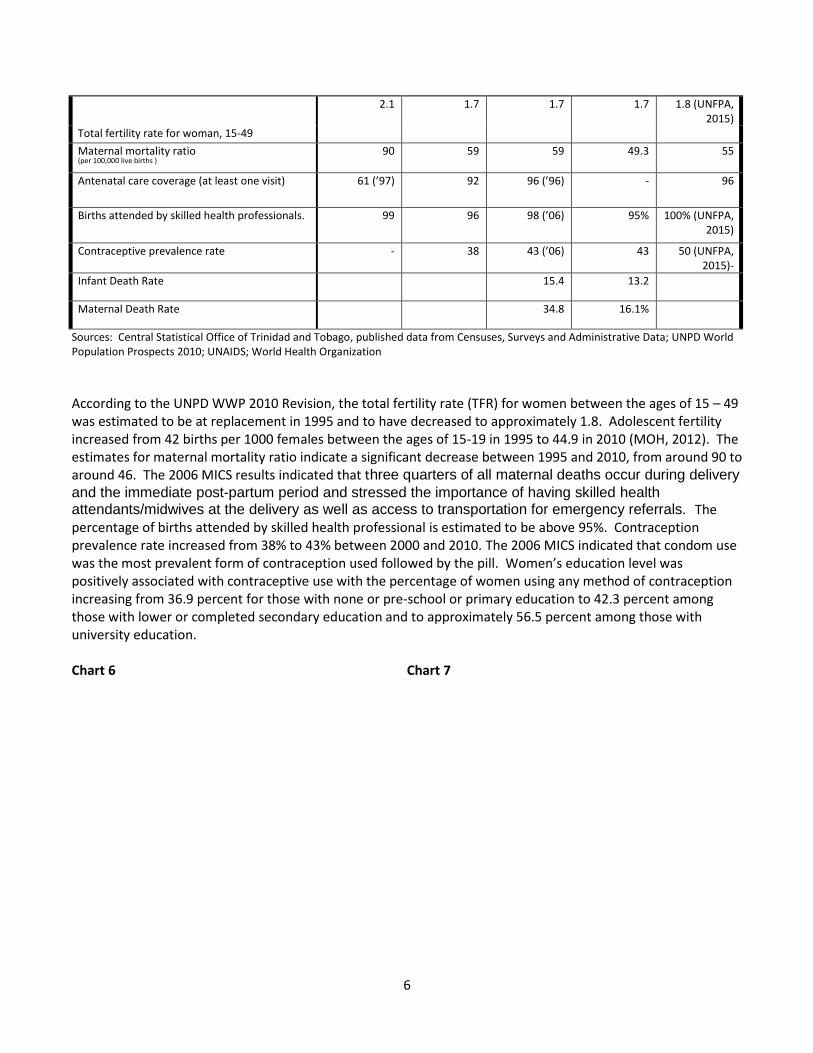
2.1 1.7 1.7 1.7 1.8 (UNFPA, 2015)
Total fertility rate for woman, 15-49
Maternal mortality ratio
(per 100,000 live births )
90 59 59 49.3 55
Antenatal care coverage (at least one visit) 61 (’97) 92 96 (’96) - 96
Births attended by skilled health professionals. 99 96 98 (’06) 95% 100% (UNFPA, 2015)
Contraceptive prevalence rate - 38 43 (’06) 43 50 (UNFPA, 2015)-
Infant Death Rate 15.4 13.2
Maternal Death Rate 34.8 16.1%
Sources: Central Statistical Office of Trinidad and Tobago, published data from Censuses, Surveys and Administrative Data; UNPD World Population Prospects 2010; UNAIDS; World Health Organization According to the UNPD WWP 2010 Revision, the total fertility rate (TFR) for women between the ages of 15 – 49 was estimated to be at replacement in 1995 and to have decreased to approximately 1.8. Adolescent fertility increased from 42 births per 1000 females between the ages of 15-19 in 1995 to 44.9 in 2010 (MOH, 2012). The estimates for maternal mortality ratio indicate a significant decrease between 1995 and 2010, from around 90 to around 46. The 2006 MICS results indicated that three quarters of all maternal deaths occur during delivery
and the immediate post-partum period and stressed the importance of having skilled health attendants/midwives at the delivery as well as access to transportation for emergency referrals. The percentage of births attended by skilled health professional is estimated to be above 95%. Contraception prevalence rate increased from 38% to 43% between 2000 and 2010. The 2006 MICS indicated that condom use was the most prevalent form of contraception used followed by the pill. Women’s education level was positively associated with contraceptive use with the percentage of women using any method of contraception increasing from 36.9 percent for those with none or pre-school or primary education to 42.3 percent among those with lower or completed secondary education and to approximately 56.5 percent among those with university education. Chart 6 Chart 7

7
Chart 8
YOUNG PEOPLE Table 3
Indicators 1995 2000 2005 2010 2012
1.5
1.7
1.9
2.1
2.3
2.5
2.7
2.9
1995 2000 2005 2010 2011
TFR
Year
Trinidad and Tobago: Total Fertility Rates
35
36
37
38
39
40
41
42
43
44
2000 2006 2010
Co
ntr
ace
pti
ve P
reva
len
ce R
ate
Year
Trinidad and Tobago: Contraceptive Prevalence
0
20
40
60
80
100
1995 2000 2005 2010 2012
MM
R
Year
Trinidad and Tobago: Maternal Mortality Rates

8
Proportion of youth 18.6 20.7 21.4 17.8 14.0
Unemployment rate for youth (female) 35.2 27.6 21.6 Unemployment rate for youth (male) 28.3 20.3 12.9 8.8 (’08)
Adolescent fertility rate
Per 1,000 young women 42 38 35 44.9 44.9
HIV prevalence rate among 15 – 24 year olds 1.8%
Total Number of Teenage Pregnancies 2014: 1972; 2015: 2,168 (Ag’s Office, 2016)
Child Marriage 51 in 2015 (1-13; 10-14; 10- 15; and 30 – 16) and 10 in 2015 (1-13; 1-14; 7-15; and 1-16), AG’s Office, 2016
# of Sexual Offences Involving Children under 18 245 in 2014 and 156 in 2015 (AG’s Office, 2016)
Sources: Central Statistical Office of Trinidad and Tobago, published data from Censuses, Surveys and Administrative Data; World Bank; UNPD World Population Prospects, UNAIDS The proportion of 15-24 year old persons when compared to the total population of Trinidad and Tobago is 14.0%, a decrease of less than 4 percentage points since 1995. Global School-Based Student Health Survey conducted in 2007 showed that around 26% of high school students had had sex and 17.6% with multiple partners. Boys were significantly more likely to have had sex than girls and to have had sex with multiple partners. Although close to 60% of students who had sex reported using a condom the last time they had sex, only around 22% reported always using a method of contraception most of the time or always with their partner. The 2011 Global School Based Health Survey notes that 27.1% of the young people age 13 - 15 years had sexual intercourse and of those who ever had sexual intercourse, 62.2% of students 13-15 years reported sexual initiation before age 14 (MOH, 2011). The HIV prevalence rate among young women is estimated to be higher than that of young men (1.0 to 0.6), which some believe is due to more testing among young women. Chart 9 Chart 10
GENDER EQUALITY Table 4
0.0
5.0
10.0
15.0
20.0
25.0
30.0
35.0
40.0
1995 2000 2005 2010 2011
Un
em
plo
yme
nt
Rat
es
Year
Trinidad and Tobago: Unemployment rates among young persons
Young females
Young males
General population
0.0
5.0
10.0
15.0
20.0
25.0
30.0
35.0
40.0
45.0
1995 2000 2005 2010
Fert
ility
Rat
es
Year
Trinidad and Tobago: Adolescent Fertility Rates

9
Indicators 1995 2000 2005 2010 2011
Ratio of girls to boys in primary school 99 (’96) 99 97 97 Ratio of girls to boys in secondary school 102 (’93) 110 107 (’04) 107 (’08) Ratio of girls to boys in tertiary school 70 (’93) 148 128
Unemployment rate (male) 15.2 10.2 5.8 3.5 (08) 3.9 (CSO)
Unemployment rate (female) 20.6 15.1 11 6.2 (’08) 6.3 (CSO)
Share of women in non-agricultural employment (5) 39 40 44
Proportion of seats in parliament held by Women 11 11 (’01) 19 29 29
Percentage of female parliamentarians
27
27.4
Sources: Central Statistical Office of Trinidad and Tobago, published data from Censuses, Surveys and Administrative Data; World Bank; UNPD World Population Prospects, UNAIDS, UNESCO
The number of males attending primary school outnumber females at both the primary and secondary
levels. At the tertiary levels, females outnumber males. Unemployment rates for women are greater
that the unemployment rates for men and men still hold more managerial and professional positions. .
Chart 11 Chart 12
In a UNDP Security Survey conducted in 2010 approximately 8.3% of respondents indicated that they
had experienced domestic violence with women being more likely to have experienced domestic
violence. In her address at the launch of 16 Days of Activism on November 24, 2012, Chief Magistrate
Marcia Ayers-Caesar yesterday quotes the Judiciary’s Annual Report saying that for the 2009/2010 law
term in the Trinidad and Tobago Magistrates’ Courts, 12,106 new domestic violence applications were
filed and 10,817 applications were determined. For the 2010/2011 period, 11,984 new applications were
filed and 12, 041 applications were determined. Given that a large percentage of domestic violence
cases that go unreported these statistics are indeed alarming for Trinidad and Tobago. With increase
awareness, there has also been increased reporting. For 2013, there were 550 reported cases of sexual
violence including reports of rapes, incest and other sexual offences. This increased to 829 in 2014
50
100
150
200
250
1995 2000 2005 2010
Par
tici
pat
ion
Rat
es
Year
Trinidad and Tobago: School Enrollment Ratios Girls to Boys
Primary
Secondary
Tertiary
0.0
5.0
10.0
15.0
20.0
25.0
2000 2005 2010 2011
Un
em
plo
yme
nt
Rat
es
Year
Trinidad and Tobago: General Male/Female Unemployment Rates
Male
Female
10
(MNS, 2014). Furthermore, the Children’s Authority notes that in 2014, 976 children were victims of
serious crimes, of which 705 were sexual offences (Guardian, 10 June 2015).
i
Copyright © 2022 FDOKUMEN