Semiautomatic brain region extraction: a method of parcellating brain regions from structural...
11
Semiautomatic brain region extraction: a method of parcellating brain regions from structural magnetic resonance images L.A. Dade, a,b,c F.Q. Gao, b N. Kovacevic, b P. Roy, b C. Rockel, b C.M. O’Toole, a,b N.J. Lobaugh, b,c A. Feinstein, b,c B. Levine, a,b,c and S.E. Black a,b,c, * a Rotman Research Institute, Baycrest Centre for Geriatric Care, Canada b Sunnybrook and Women’s College Health Science Centre, Canada c University of Toronto, Toronto Ontario, Canada Received 16 October 2003; revised 3 March 2004; accepted 8 March 2004 Structural MR imaging has become essential to the evaluation of regional brain changes in both healthy aging and disease-related processes. Several methods have been developed to measure structure size and regional brain volumes, but many of these methods involve substantial manual tracing and/or landmark identification. We present a new technique, semiautomatic brain region extraction (SABRE), for the rapid and reliable parcellation of cortical and subcortical brain regions. We combine the SABRE parcellation with tissue compartment segmentation [NeuroImage 17 (2002) 1087] to produce measures of gray matter (GM), white matter (WM), ventricular CSF, and sulcal CSF for 26 brain regions. Because SABRE restricts user input to a few easily identified landmarks, inter-rater reliability is high for all volumes, with all coefficients between 0.91 and 0.99. To assess construct validity, we contrasted SABRE-derived volumetric data from healthy young and older adults. Results from the SABRE parcellation and tissue segmentation showed significant differences in multiple brain regions in keeping with regional atrophy described in the literature by researchers using lengthy manual tracing methods. Our findings show that SABRE is a reliable semiautomatic method for assessing regional tissue volumes that provides significant timesavings over purely manual methods, yet maintains information about individual cortical landmarks. D 2004 Elsevier Inc. All rights reserved. Keywords: SABRE; Brain; MRI Introduction Advances in imaging technology have allowed for greater precision in the assessment of volumetric changes in brain tissue in vivo. Analysis of the frequency, rate, and region of tissue volume change has given rise to increased understanding and more specific hypotheses about both healthy and disease-driven process- es of cerebral change. For example, regional MRI volumetric studies have revealed atrophy in the hippocampal (Jack et al., 1992; Kesslak et al., 1991; Kohler et al., 1998), parahippocampal (Kesslak et al., 1991; Kohler et al., 1998), and entorhinal (Juotto- nen et al., 1998) cortices in patients with Alzheimer’s Disease. Similar approaches have been taken in the investigation of epilepsy (Cendes et al., 1993), frontotemporal dementia (Chan et al., 2001b; Frisoni et al., 1999; Rosen et al., 2002), schizophrenia (Barta et al., 1990; Crespo-Facorro et al., 2000), as well as normal aging (Bigler et al., 1997; Jack et al., 1992; Salat et al., 2002; Tisserand et al., 2000). Findings such as these have raised the possibility of using volumetric measures to assist in diagnosis. Several different methods have been used to assess structure size and volume by measuring MR images. Regional volumetric measurements require careful slice-by-slice tracing of well-defined structures or specific cortical areas. Due to the labor-intensive requirements of the planimetric method, studies using this ap- proach are typically limited to the analysis of a small number of structures. Even more simplified methods of examining structural size, such as linear measures (e.g., structural length of the hippo- campus along the y axis, Dade et al., 2002, or medial temporal lobe width, Gao et al., 2003, 2004), can require substantial time for training. Linear measures allow for the measurement of more regions, but the time required for the user to find and evaluate the appropriate structural endpoints is significant. For example, demarcation of appropriate landmarks for linear measures of temporal lobe structures can take up to 3 h (Crane, 1999; J. Crane Personal communication, 2002). Despite the time costs of manual methods, they are often necessary to account for individual variability in the shape and course of anatomical structures. Measurement of cortical regions of interest is particularly difficult as cerebral sulci are variable in their presence and location (Caviness et al., 1996; Ono et al., 1990; Rademacher et al., 1993). Nevertheless, several groups have developed methodologies for manual tracing and parcellation of cortical regions (Allen et al., 2002; Caviness et al., 1996; Kim et al., 2000; Rademacher et al., 1992; Tzourio-Mazoyer et al., 2002). These approaches involve identification and manual tracing of numerous specific landmark locations and have ultimately provided effective strategies for determining cortical volumes. However, localizing and tracing all 1053-8119/$ - see front matter D 2004 Elsevier Inc. All rights reserved. doi:10.1016/j.neuroimage.2004.03.023 * Corresponding author. Division of Neurology, Sunnybrook and Women’s Health Sciences Centre, 2075 Bayview Avenue, A421, Toronto, Ontario, Canada M4N 3M5. Fax: +1-416-480-4552. E-mail address: [email protected] (B. Levine). Available online on ScienceDirect (www.sciencedirect.com.) www.elsevier.com/locate/ynimg NeuroImage 22 (2004) 1492 – 1502
-
Upload
independent -
Category
Documents
-
view
0 -
download
0
Transcript of Semiautomatic brain region extraction: a method of parcellating brain regions from structural...

www.elsevier.com/locate/ynimg
NeuroImage 22 (2004) 1492–1502
Semiautomatic brain region extraction: a method of parcellating
brain regions from structural magnetic resonance images
L.A. Dade,a,b,c F.Q. Gao,b N. Kovacevic,b P. Roy,b C. Rockel,b C.M. O’Toole,a,b
N.J. Lobaugh,b,c A. Feinstein,b,c B. Levine,a,b,c and S.E. Blacka,b,c,*
aRotman Research Institute, Baycrest Centre for Geriatric Care, CanadabSunnybrook and Women’s College Health Science Centre, CanadacUniversity of Toronto, Toronto Ontario, Canada
Received 16 October 2003; revised 3 March 2004; accepted 8 March 2004
Structural MR imaging has become essential to the evaluation of
regional brain changes in both healthy aging and disease-related
processes. Several methods have been developed to measure structure
size and regional brain volumes, but many of these methods involve
substantial manual tracing and/or landmark identification. We present
a new technique, semiautomatic brain region extraction (SABRE), for
the rapid and reliable parcellation of cortical and subcortical brain
regions. We combine the SABRE parcellation with tissue compartment
segmentation [NeuroImage 17 (2002) 1087] to produce measures of
gray matter (GM), white matter (WM), ventricular CSF, and sulcal
CSF for 26 brain regions. Because SABRE restricts user input to a few
easily identified landmarks, inter-rater reliability is high for all
volumes, with all coefficients between 0.91 and 0.99. To assess construct
validity, we contrasted SABRE-derived volumetric data from healthy
young and older adults. Results from the SABRE parcellation and
tissue segmentation showed significant differences in multiple brain
regions in keeping with regional atrophy described in the literature by
researchers using lengthy manual tracing methods. Our findings show
that SABRE is a reliable semiautomatic method for assessing regional
tissue volumes that provides significant timesavings over purely
manual methods, yet maintains information about individual cortical
landmarks.
D 2004 Elsevier Inc. All rights reserved.
Keywords: SABRE; Brain; MRI
Introduction
Advances in imaging technology have allowed for greater
precision in the assessment of volumetric changes in brain tissue
in vivo. Analysis of the frequency, rate, and region of tissue
volume change has given rise to increased understanding and more
specific hypotheses about both healthy and disease-driven process-
1053-8119/$ - see front matter D 2004 Elsevier Inc. All rights reserved.
doi:10.1016/j.neuroimage.2004.03.023
* Corresponding author. Division of Neurology, Sunnybrook and
Women’s Health Sciences Centre, 2075 Bayview Avenue, A421, Toronto,
Ontario, Canada M4N 3M5. Fax: +1-416-480-4552.
E-mail address: [email protected] (B. Levine).
Available online on ScienceDirect (www.sciencedirect.com.)
es of cerebral change. For example, regional MRI volumetric
studies have revealed atrophy in the hippocampal (Jack et al.,
1992; Kesslak et al., 1991; Kohler et al., 1998), parahippocampal
(Kesslak et al., 1991; Kohler et al., 1998), and entorhinal (Juotto-
nen et al., 1998) cortices in patients with Alzheimer’s Disease.
Similar approaches have been taken in the investigation of epilepsy
(Cendes et al., 1993), frontotemporal dementia (Chan et al., 2001b;
Frisoni et al., 1999; Rosen et al., 2002), schizophrenia (Barta et al.,
1990; Crespo-Facorro et al., 2000), as well as normal aging (Bigler
et al., 1997; Jack et al., 1992; Salat et al., 2002; Tisserand et al.,
2000). Findings such as these have raised the possibility of using
volumetric measures to assist in diagnosis.
Several different methods have been used to assess structure
size and volume by measuring MR images. Regional volumetric
measurements require careful slice-by-slice tracing of well-defined
structures or specific cortical areas. Due to the labor-intensive
requirements of the planimetric method, studies using this ap-
proach are typically limited to the analysis of a small number of
structures. Even more simplified methods of examining structural
size, such as linear measures (e.g., structural length of the hippo-
campus along the y axis, Dade et al., 2002, or medial temporal lobe
width, Gao et al., 2003, 2004), can require substantial time for
training. Linear measures allow for the measurement of more
regions, but the time required for the user to find and evaluate
the appropriate structural endpoints is significant. For example,
demarcation of appropriate landmarks for linear measures of
temporal lobe structures can take up to 3 h (Crane, 1999; J. Crane
Personal communication, 2002). Despite the time costs of manual
methods, they are often necessary to account for individual
variability in the shape and course of anatomical structures.
Measurement of cortical regions of interest is particularly
difficult as cerebral sulci are variable in their presence and location
(Caviness et al., 1996; Ono et al., 1990; Rademacher et al., 1993).
Nevertheless, several groups have developed methodologies for
manual tracing and parcellation of cortical regions (Allen et al.,
2002; Caviness et al., 1996; Kim et al., 2000; Rademacher et al.,
1992; Tzourio-Mazoyer et al., 2002). These approaches involve
identification and manual tracing of numerous specific landmark
locations and have ultimately provided effective strategies for
determining cortical volumes. However, localizing and tracing all

L.A. Dade et al. / NeuroImage 22 (2004) 1492–1502 1493
the required landmarks can take several hours, even if one was
evaluating only frontal cortical regions. It then takes many more
hours to complete the necessary tracing to obtain volumes for
regions of the entire brain. In addition, there are often difficulties in
determining structural start and end points, with costs to reproduc-
ibility (Kim et al., 2000). This is particularly relevant in the
measurement of neocortical regions (Caviness et al., 1996; Ono
et al., 1990; Rademacher et al., 1993).
One interesting new development is a recently described
automated program (Fischl et al., 2002) that uses information from
MRI image intensities and spatial information about brain struc-
tures to allow automated labeling of subcortical regions. By using
these two sources of information, volumes of several subcortical
structures are obtained. This type of methodology alleviates
operator landmark localization and errors that occur due to hand
tracing. However, this method has not yet been extended to more
complex neocortical divisions.
Other researchers have taken the approach of using simplified
manual tracing (Bokde et al., 2002), automated evaluation of the
whole brain (Chan et al., 2001a; Fox et al., 1999), or restricting
analysis to total intracranial volumes (Eritaia et al., 2000). Such
methods provide rapid and reliable measures of gross atrophy for
between- or within-subject comparisons. However, if atrophy is
present, the whole brain approach must be integrated with a
method of regional parcellation to determine the specific location
of the atrophy (e.g., Chan et al., 2001a), which then raises the
previously stated difficulties in manual measurement.
An alternative method of identifying regional brain tissue
differences between groups is voxel-based morphometry (VBM).
This method typically involves spatial normalization of brain
images to a template along with tissue segmentation, and then
smoothing of the image to obtain a more normal distribution of the
image data (Ashburner and Friston, 2000; Good et al., 2001;
Watkins et al., 2001). Statistical between-group tissue comparisons
are then made voxel by voxel to determine differences in tissue
composition at each voxel. Advantages to this approach include its
complete automation and extremely high reliability, lending itself
well to analysis of large subject groups. However, the possibility
has been raised that the sensitivity of VBM may not be consistent
over all brain areas, as detection decreases for regions with greater
anatomical variability (Quarantelli et al., 2002; Tisserand et al.,
2002). In addition, VBM does not provide truly quantitative
measures of tissue differences but rather provides a more qualita-
tive analysis of regional differences. It is also not currently
applicable to individual subject analyses, which limits its clinical
application.
In this paper, we describe a new method, semiautomatic brain
region extraction (SABRE), for parcellating cortical and subcorti-
cal regions. This approach is a meld of manual and automatic
approaches and is based on user defined landmarks and regions of
interest defined by the Talairach grid (Talairach and Tournoux,
1988). There are marked interindividual differences in cerebral
anatomy (Ono et al., 1990). For example, Steinmetz et al. (1989)
found in normal individuals using the Talairach grid that the central
sulcus varied up to 2 cm in its anterior–posterior location.
Accounting for these differences may be important in the study
of patient populations where anatomical variability is increased, as
well as in healthy subjects. SABRE combines manual tracing of a
few important anatomical landmarks (providing anatomical spec-
ificity), with automated Talairach grid divisions. Regions of
interest defined by Talairach grid divisions have been shown by
others to have a high correspondence with manual regional tracings
(Andreasen et al., 1994; Tisserand et al., 2002).
The SABRE program is used in conjunction with tissue
compartment segmentation software (Kovacevic et al., 2002) to
provide rapid and reliable regional volumes of gray matter (GM),
white matter (WM), and cerebrospinal fluid (CSF). Following
manual identification of 15 easily located landmarks, 26 brain
regions (13 left, 13 right) are automatically parcellated. The entire
process can be completed in less than 1 h, providing significant
timesavings over manual tracing methods. We present two analyses
addressing the reliability and construct validity of SABRE. Inter-
rater reliability of the approach was assessed by two raters who
independently measured images in a sample of healthy young and
older adults. Construct validity was assessed by comparing and
contrasting regional tissue volumes in healthy young and older
adults to determine if SABRE is effective in detecting regional
atrophy as described previously in the aging literature.
Methods
Participants
The scans of 10 young (mean age = 28.4, range: 22–43) and 11
older healthy adults (mean age = 78.3, range: 56–91) were used
for assessing the reproducibility of SABRE-defined regional tissue
compartment volumes. To evaluate SABRE’s construct validity,
the same 10 scans of the healthy young subjects were compared to
a slightly younger sample of older adults (mean age = 66.8, range:
56–78). None of the participants had a history of neurological
disease, and all older adults were living independently in the
community. This study was approved by the Sunnybrook and
Women’s Research Ethics Board. All participants gave informed
consent.
MR protocols
MR images were acquired on a 1.5 T Signa scanner (GE
Medical Systems). Three image sets were required to complete
the protocol: T1-weighted (axial 3D SPGR with a 5 ms TE, 35 ms
TR, 1 NEX, 35j flip angle, 22 � 16.5 cm FOV, 0.859 � 0.859 mm
in-plane resolution, and 1.2- to 1.4-mm-slice thickness), proton-
density (PD), and T2-weighted (interleaved axial spin echo with
TEs of 30 and 80 ms, 3 s TR, 0.5 NEX, 22 � 22 cm FOV, 0.859 �0.859 mm in-plane resolution, and 3-mm-slice thickness).
Image analysis
Manual AC–PC alignment and SABRE landmark identifica-
tion and tracing (described below) were completed using ANA-
LYZE software (Biomedical Imaging Resource, Mayo foundation,
Rochester, MN, USA). MR image coregistration and AC–PC
transformations were completed using the Automatic Image Reg-
istration package v3.07 (Woods et al., 1998).
Initial processing of the MR images involved removing the
skull and nonbrain tissues using the PD-T2-weighted images to
generate a brain mask encompassing the entire intracranial cavity,
excluding infratentorial cranium. As the cerebellum is not part of
the Talairach coordinate system, it was also removed at this time.
The final brain mask was then applied to the T1 image (Kovacevic
et al., 2002). The binary mask was transformed using nearest

Fig. 1. (A) Original T1 image, (B) segmented image showing color-coded gray matter (dark gray), white matter (light gray), and ventricular (yellow) and
subdural and sulcal CSF (blue) compartments.
L.A. Dade et al. / NeuroImage 22 (2004) 1492–15021494
neighbor interpolation. The T1 image was manually aligned along
the plane passing through the anterior and posterior commissures
(AC–PC), and the masked T1 image was rotated (sinc interpola-
tion) into an isotropic AC–PC volume. The AC–PC T1 image was
segmented (Kovacevic et al., 2002), and ventricular CSF voxels
were identified and assigned as vCSF, with remaining CSF
identified as subdural and sulcal CSF (ssCSF) (Fig. 1). A 3D
‘‘eroded’’ version of the acquired T1 image, with the skull and
subdural CSF removed, was created for the SABRE landmarking
procedure. This preprocessing step takes approximately 20 min.
The SABRE mask was then created and applied to the edited
segmented image to derive tissue volumes for 26 regions.
Semiautomatic brain region extraction
Our selection of the 26 regions (13 per hemisphere) was
governed by major anatomical divisions (e.g., separation of
cortical lobes), distinctions of theoretical interest in patients with
brain disease (e.g., separation of lateral from medial frontal
regions), and practical considerations, namely the optimization
of reliability and efficiency. The standard Talairach atlas (Talair-
ach and Tournoux, 1988) was used as a guide to make initial
estimates of borders between regions. To minimize regional
misclassification of tissue due to individual variations in brain
anatomy, criteria for boundaries of problematic regions (i.e.,
medial temporal and inferior frontal/anterior temporal) were
modified until there was consensus across the 10 brains that the
divisions were appropriate (completed by authors FQG and LAD).
An experienced neurologist (SEB) provided final affirmation of
the boundary definitions.
Three steps are required to obtain the SABRE regional divi-
sions and tissue volumes: (1) 15 landmarks are identified on the
eroded AC–PC aligned T1 volume, (2) an individual Talairach
grid is created automatically, and (3) the SABRE algorithm
automatically delineates 26 brain regions. These three steps can
be completed in approximately 20 min. The following sections
provide an overview of these steps; additional technical informa-
tion is presented in the Appendices.
Manual landmark identification
Fifteen landmarks are used to provide boundaries for the
anatomical regions and to provide coordinates for the creation of
an individualized Talairach grid for each brain image (see Fig.
2). Coordinates for the following seven landmarks are obtained
from the AC–PC aligned T1 image: (1) the z (superior– inferior)
coordinate defining the top of the anterior and posterior com-
missures (AC–PC); (2 and 3) the y (anterior–posterior) coor-
dinates indicating the coronal planes anterior to the anterior
commissure (ac); and anterior to the posterior commissure (pc);
(4) the posterior midpoint coronal slice, which is the halfway
point between the pc and the posterior edge of the brain; (5 and
6) the most inferior points of the left and right pre-occipital
notch (Lpron, Rpron); and (7) the midline slice dividing the
hemispheres (m).
The remaining eight landmarks are traced on 3D-rendered
eroded AC–PC T1 images, four on each hemisphere: central
sulcus (C), superior midline point of the central sulcus (mC),
sylvian fissure (SF), and the parieto-occipital sulcus (poc). Rules
for tracing were derived from Ono et al. (1990) (see Appendix A).
These tracings are used to define the major boundaries between the
four brain lobes. All sulcal tracings are automatically projected
through the hemisphere from lateral to medial aspects to complete
the regional boundaries, and projected out to the edge of the image
volume so that ssCSF is included in the final tissue volumes.
Automatic proportional Talairach grid
Transformation or warping of brain images into a standardized
Talairach space (Talairach and Tournoux, 1988) is a common
procedure used to correct for individual differences in brain shape
and size. However, when these image transformations are made

Fig. 2. (A) Example of an individualized Talairach grid on an eroded brain image. AC = anterior commissure, PC = posterior commissure. White circles
indicate points used to designate the anterior and posterior temporal lobe division. (B) Axial view with Talairach grid. m = midline, at = anterior, pt = posterior.
L.A. Dade et al. / NeuroImage 22 (2004) 1492–1502 1495
important subtleties of structural information about an individual’s
brain can be lost. Therefore, to maintain the individual shape
variability and correct for differences in intracranial capacity, the
SABRE program creates a proportional Talairach grid (Talairach
and Tournoux, 1988) for each individual’s AC–PC aligned image
(Fig. 2).
The extreme top, bottom, left, and right edges of the eroded
image are determined automatically and define the edges of the
Talairach bounding box. In the anterior to posterior direction, four
equal divisions are created anterior to the AC and posterior to the
PC. The region between the AC and PC is divided into three equal
sections. From superior to inferior, the brain is divided into eight
equal divisions above the AC–PC, and into four equal divisions
below the AC–PC. Each of the left and right hemispheres is
divided into four equal sagittal regions (see Fig. 2b). This creates
equivalent proportional divisions of each subject’s cortical tissue.
Regional definition
The landmark coordinates are combined with the proportional
Talairach grid coordinates to divide the each individual’s brain into
26 equivalent proportional cortical regions: 13 in the left hemi-
sphere and 13 in the right. The divisions shown in Fig. 3 include
lateral and medial superior frontal (LSF, MSF), lateral and medial
middle frontal (LMF, MMF), lateral and medial inferior frontal
(LIF, MIF), superior parietal (SP), inferior parietal (IP), occipital
(O), anterior temporal (AT), medial temporal (MT), posterior
temporal (PT), and basal ganglia and thalamus (BGT).
Frontal lobe. The frontal lobe is divided into six regions: inferior,
middle, and superior, each separated into medial and lateral divi-
sions (Fig. 3A; Appendix A.2.1). The medial inferior frontal region
would be similar to the orbitofrontal region as described by Salat et
al. (2001) and Salat et al. (2002). The lateral inferior frontal region
is separated from the anterior temporal region by the sylvian fissure
trace and a series of angled lines that vary incrementally at specified
levels below the AC–PC line (Fig. 3B, arrows; Appendix A.2.1).
Parietal lobe. The parietal lobe is divided into superior and
inferior regions (Fig. 3A; Appendix A.2.2). The division between
superior and inferior regions occurs at the same axial slice as for the
superior and middle frontal regions.
Temporal lobe. The temporal lobe is divided into three regions:
anterior, posterior, and medial (Fig. 3A; Appendix A.2.3). The
extent of the medial temporal lobe region was based initially on
Talairach atlas coordinates and was refined to largely encompass
hippocampus, amygdala, parahippocampal, and entorhinal cortices
in our test brains (Appendix A.2.3).
Occipital lobe. The parietal–occipital sulcus forms a natural
division between the parietal and occipital lobes. The occipital
and temporal lobes are separated by a straight line (OT) calculated
to drop vertically from the intersection of the parieto-occipital
sulcus and the TP line (Appendix A.2.4).
Basal ganglia and thalamus. For the present implementation, the
basal ganglia and thalamus are combined into a single region (Fig.
3B). An automated linear algorithm based on the Talairach atlas
(Talairach and Tournoux, 1988) is used to demarcate the area of the
basal ganglia and thalamus (see Appendix A.2.5 and Fig. 3B).
Segmented tissue volumes
Regional volumes of GM, WM, vCSF, and ssCSF were
obtained automatically by applying the SABRE mask to the
segmented AC–PC T1 image (Fig. 1). Across subjects, the regional
volumes represent equivalent proportions of total brain volume,
thus providing a correction for individual differences in head size.
Volumes for each tissue compartment within regions are expressed
as percentages of the regional volume. Regions of atrophy would be
indicated by a significantly greater percent of sulcal or ventricular
CSF in that region in one group compared to another. Not all brain
regions have ssCSF or vCSF measures (e.g., BGT).
Inter-rater-reliability analysis
Two trained and experienced operators (FQG and PR) identified
the SABRE coordinates on a series of 21 scans, which had been
previously AC–PC aligned and segmented. Inter-rater reliability
on the 26 regional tissue volumes was assessed using the intraclass
correlation coefficient (ICC) using a two-way random effects
model (Shrout and Fleiss, 1979). Coefficients were calculated for
total regional volumes (across all tissue compartments), as well as
for the separate regional tissue compartments.
Results
Total volume ICCs ranged between 0.97 and 0.999 for the left
hemisphere and 0.91–0.998 for the right. The confidence inter-
vals averaged F0.03, and the mean difference between left and

Fig. 3. SABRE regional cortical divisions in lateral and horizontal views. Three axial views at horizontal divisions approximately equal to Talairach z = 14, z =
�8, z = �4. Abbreviations: LSF = lateral superior frontal, MSF = medial superior frontal, LMF = lateral middle frontal, MMF = medial middle frontal, LIF =
lateral ventral frontal, MIF = medial ventral frontal, SP = superior parietal, IP = inferior parietal, O = occipital, AT = anterior temporal, MT = medial temporal,
PT = posterior temporal, BGT = basal ganglia and thalamus, X = sagittal coordinate in Talairach space, C Sulcus = central sulcus, PO sulcus = parieto-occipital
sulcus, SF = sylvian fissure, SFP line = superior– frontal–parietal dividing line, ATPT line = division between anterior and poster temporal lobe, OT line =
occipital– temporal dividing line.
L.A. Dade et al. / NeuroImage 22 (2004) 1492–15021496
right ICCs for the different regions was 0.005. As there were no
meaningful differences between ICC’s for homologous left and
right regions, regional data were collapsed across the hemi-
spheres, yielding 13 regions. Not surprisingly, intraclass correla-
tions remained high for all regions (0.95 – 0.99), with
measurements for only five regions falling below 0.98 (anterior
temporal, posterior temporal, basal ganglia and thalamus, superior
parietal, and inferior parietal). The majority of areas with slightly
lower ICCs (0.95–0.97) were defined in part by sulcal tracings,
which may have added a small amount of variability. Intraclass
correlations for individual tissue compartments (GM, WM,
ssCSF, and vCSF) in each region were also high, ranging between
0.97 and 0.99. These data confirm SABRE’s high inter-rater
reliability.
Construct validity analysis
To assess SABRE’s construct validity, regional volumes were
compared between healthy younger and older adults and examined
in the context of published age-related global (Greenwood, 2000)
and regional volume differences (Raz, 2000; Raz et al., 1997;
Resnick et al., 2003). Although aging is associated with general-
ized brain volume loss (Greenwood, 2000), several studies have
shown that this loss is greatest over the frontal lobes, particularly in
frontal gray matter (Raz, 2000; Raz et al., 1997).
A single trained and experienced operator (FQG) identified the
SABRE landmarks on 20 participants’ scans. As there were no
differences across right and left hemispheres, data were averaged
across hemispheres for the sake of simplicity. Tissue compartment
volumes are expressed as a percent of the total volume for each
region. Regions of atrophy would be indicated by a significantly
greater percentage of sulcal or ventricular CSF (and corresponding
loss of GM and/or WM) in that region in one group compared to
another.
The effects of age on tissue volumes within the SABRE-defined
regions were assessed with mixed-design ANOVAs. Only five of
the regions (MMF, IP, MT, PT, O) contained all four tissue types,
and ventricular and sulcal/subdural CSF types were not equally
represented across these areas. To avoid listwise deletion of regions
that did not contain ssCSF or vCSF tissue types, three separate
analyses were conducted for parenchymal and CSF compartments.
The first Group by Region by Tissue type ANOVA was restricted
to gray and white matter tissue compartments and included all 13

L.A. Dade et al. / NeuroImage 22 (2004) 1492–1502 1497
regions. The second analysis focused on vCSF and ssCSF differ-
ences and included the five regions containing both vCSF and
ssCSF compartments: medial middle frontal, inferior parietal,
medial temporal lobe, posterior temporal lobe, and occipital lobe.
A final ANOVA examined the Group by Region effect for the
remaining ssCSF volumes: superior and inferior frontal (lateral and
medial divisions), lateral middle frontal, superior parietal, and
anterior temporal regions. Significant interactions were decom-
posed with simple effect analyses using a pooled error term.
Results
Percentages of GM and WM for each region are presented in
Fig. 4. For parenchymal compartments (GM and WM), a signif-
icant main effect for group, F1,18 = 31.4, P < 0.001, confirmed
expected age-related generalized atrophy. This atrophy, however,
was not consistent across regions and tissue compartments, as
indicated by a three-way interaction, F12,216 = 2.09, P < 0.019.
Regional Group by Tissue type analyses indicated significantly
greater tissue loss in gray matter than white matter for the older
adults in two regions: lateral superior frontal, F1,234 = 5.03, P <
0.03, and lateral inferior frontal cortices, F1,234 = 4.3, P < 0.04. A
Group by Region analysis revealed a significant overall volume
Fig. 4. Regional gray and white matter volumes in young and old groups.
Gray and white volumes are presented as a percentage of total regional
volume. Abbreviations as in Fig. 3. There was a significant overall volume
loss in the old as compared to the young in all regions, with the exception of
the BGT division. *In comparison to other regions, older adults showed
significantly greater loss of gray matter than white matter in LSF and LIF
regions ( P < 0.04).
Fig. 5. Regional ventricular CSF and subdural/sulcal CSF volumes in
young and old groups. Abbreviations as in Fig. 3. In the five regions that
contained both vCSF and ssCSF (MMF, IP, MT, PT, O), a significant Age
by Region by CSF-type effect showed that older adults had significantly
greater ssCSF in MT, PT, and O regions.
loss in the elderly in all regions, except the basal ganglia/thalamus
division.
The analysis of regions containing both vCSF and ssCSF
(MMF, IP, MT, PT, O) (Fig. 5) revealed the expected significant
group effect of larger CSF volumes in the older group (F1,18 =
26.96, P < 0.001). Once again, a significant Region by Tissue Type
by Group interaction (F4,72 = 4.9, P < 0.001) indicated that this
effect was not equivalent across regions. Post hoc analyses showed
significant interactions in the occipital lobe (F1,90 = 2.4, P < 0.01),
and medial (F1, 90 = 7.2, P < 0.01) and posterior (F1,90 = 8.1, P <
0.01) temporal lobe regions. In these regions, there was a signif-
icantly greater volume of ssCSF in older adults as compared to
younger adults, and this volume difference was larger than the
group difference in ventricular vCSF volumes (see Fig. 5).
The final analysis of CSF differences examined the five regions
containing only ssCSF areas. Older individuals showed the
expected effect of increased CSF volume (F1,18 = 46.2, P <
0.001), but there was no Group by Region interaction. These
results reflect the main effect of age as shown in the gray and
white matter analyses.
L.A. Dade et al. / NeuroImage 22 (2004) 1492–15021498
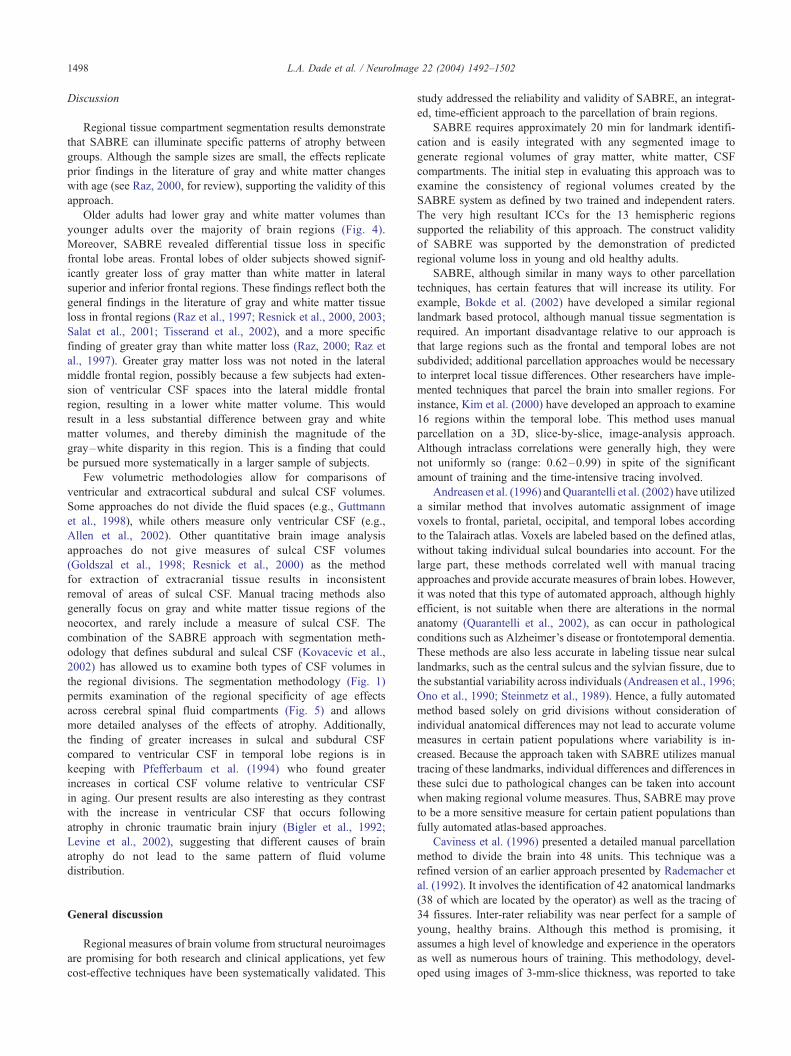
Discussion
Regional tissue compartment segmentation results demonstrate
that SABRE can illuminate specific patterns of atrophy between
groups. Although the sample sizes are small, the effects replicate
prior findings in the literature of gray and white matter changes
with age (see Raz, 2000, for review), supporting the validity of this
approach.
Older adults had lower gray and white matter volumes than
younger adults over the majority of brain regions (Fig. 4).
Moreover, SABRE revealed differential tissue loss in specific
frontal lobe areas. Frontal lobes of older subjects showed signif-
icantly greater loss of gray matter than white matter in lateral
superior and inferior frontal regions. These findings reflect both the
general findings in the literature of gray and white matter tissue
loss in frontal regions (Raz et al., 1997; Resnick et al., 2000, 2003;
Salat et al., 2001; Tisserand et al., 2002), and a more specific
finding of greater gray than white matter loss (Raz, 2000; Raz et
al., 1997). Greater gray matter loss was not noted in the lateral
middle frontal region, possibly because a few subjects had exten-
sion of ventricular CSF spaces into the lateral middle frontal
region, resulting in a lower white matter volume. This would
result in a less substantial difference between gray and white
matter volumes, and thereby diminish the magnitude of the
gray–white disparity in this region. This is a finding that could
be pursued more systematically in a larger sample of subjects.
Few volumetric methodologies allow for comparisons of
ventricular and extracortical subdural and sulcal CSF volumes.
Some approaches do not divide the fluid spaces (e.g., Guttmann
et al., 1998), while others measure only ventricular CSF (e.g.,
Allen et al., 2002). Other quantitative brain image analysis
approaches do not give measures of sulcal CSF volumes
(Goldszal et al., 1998; Resnick et al., 2000) as the method
for extraction of extracranial tissue results in inconsistent
removal of areas of sulcal CSF. Manual tracing methods also
generally focus on gray and white matter tissue regions of the
neocortex, and rarely include a measure of sulcal CSF. The
combination of the SABRE approach with segmentation meth-
odology that defines subdural and sulcal CSF (Kovacevic et al.,
2002) has allowed us to examine both types of CSF volumes in
the regional divisions. The segmentation methodology (Fig. 1)
permits examination of the regional specificity of age effects
across cerebral spinal fluid compartments (Fig. 5) and allows
more detailed analyses of the effects of atrophy. Additionally,
the finding of greater increases in sulcal and subdural CSF
compared to ventricular CSF in temporal lobe regions is in
keeping with Pfefferbaum et al. (1994) who found greater
increases in cortical CSF volume relative to ventricular CSF
in aging. Our present results are also interesting as they contrast
with the increase in ventricular CSF that occurs following
atrophy in chronic traumatic brain injury (Bigler et al., 1992;
Levine et al., 2002), suggesting that different causes of brain
atrophy do not lead to the same pattern of fluid volume
distribution.
General discussion
Regional measures of brain volume from structural neuroimages
are promising for both research and clinical applications, yet few
cost-effective techniques have been systematically validated. This
study addressed the reliability and validity of SABRE, an integrat-
ed, time-efficient approach to the parcellation of brain regions.
SABRE requires approximately 20 min for landmark identifi-
cation and is easily integrated with any segmented image to
generate regional volumes of gray matter, white matter, CSF
compartments. The initial step in evaluating this approach was to
examine the consistency of regional volumes created by the
SABRE system as defined by two trained and independent raters.
The very high resultant ICCs for the 13 hemispheric regions
supported the reliability of this approach. The construct validity
of SABRE was supported by the demonstration of predicted
regional volume loss in young and old healthy adults.
SABRE, although similar in many ways to other parcellation
techniques, has certain features that will increase its utility. For
example, Bokde et al. (2002) have developed a similar regional
landmark based protocol, although manual tissue segmentation is
required. An important disadvantage relative to our approach is
that large regions such as the frontal and temporal lobes are not
subdivided; additional parcellation approaches would be necessary
to interpret local tissue differences. Other researchers have imple-
mented techniques that parcel the brain into smaller regions. For
instance, Kim et al. (2000) have developed an approach to examine
16 regions within the temporal lobe. This method uses manual
parcellation on a 3D, slice-by-slice, image-analysis approach.
Although intraclass correlations were generally high, they were
not uniformly so (range: 0.62–0.99) in spite of the significant
amount of training and the time-intensive tracing involved.
Andreasen et al. (1996) and Quarantelli et al. (2002) have utilized
a similar method that involves automatic assignment of image
voxels to frontal, parietal, occipital, and temporal lobes according
to the Talairach atlas. Voxels are labeled based on the defined atlas,
without taking individual sulcal boundaries into account. For the
large part, these methods correlated well with manual tracing
approaches and provide accurate measures of brain lobes. However,
it was noted that this type of automated approach, although highly
efficient, is not suitable when there are alterations in the normal
anatomy (Quarantelli et al., 2002), as can occur in pathological
conditions such as Alzheimer’s disease or frontotemporal dementia.
These methods are also less accurate in labeling tissue near sulcal
landmarks, such as the central sulcus and the sylvian fissure, due to
the substantial variability across individuals (Andreasen et al., 1996;
Ono et al., 1990; Steinmetz et al., 1989). Hence, a fully automated
method based solely on grid divisions without consideration of
individual anatomical differences may not lead to accurate volume
measures in certain patient populations where variability is in-
creased. Because the approach taken with SABRE utilizes manual
tracing of these landmarks, individual differences and differences in
these sulci due to pathological changes can be taken into account
when making regional volume measures. Thus, SABRE may prove
to be a more sensitive measure for certain patient populations than
fully automated atlas-based approaches.
Caviness et al. (1996) presented a detailed manual parcellation
method to divide the brain into 48 units. This technique was a
refined version of an earlier approach presented by Rademacher et
al. (1992). It involves the identification of 42 anatomical landmarks
(38 of which are located by the operator) as well as the tracing of
34 fissures. Inter-rater reliability was near perfect for a sample of
young, healthy brains. Although this method is promising, it
assumes a high level of knowledge and experience in the operators
as well as numerous hours of training. This methodology, devel-
oped using images of 3-mm-slice thickness, was reported to take

L.A. Dade et al. / NeuroImage 22 (2004) 1492–1502 1499
skilled investigators hours to complete, and would double or triple
in time when applied to higher resolution images.
The SABRE method provides timesavings, which is important
in both the context of large group studies, and within a clinical
environment. However, this technique is not without some limi-
tations. The regional divisions were based on a combination of
naturally occurring anatomical regions and parsimonious linear
divisions that were employed in areas where tracing methods
became laborious or less reliable. This results in regional divisions
that do not strictly follow gross anatomical regions or cytoarchi-
tectonic divisions. Therefore, this methodology will not be appli-
cable to those researchers who are interested in exact tissue
volumes of a specific gyrus or of small brain regions. Nevertheless,
the SABRE program is relatively adaptable and new algorithms
can be added to the program to examine regions of interest more
closely. For example, we are currently examining approaches for
creating reliable divisions of the cingulate gyrus.
Without an empirical test, it remains to be seen if the SABRE
approach would be more accurate than a purely automated ap-
proach. One of our future goals is to answer the question of
whether this more specific form of semiautomated measurement
will help to elucidate differences in patient populations where
anatomical variability between individuals will be large, as in
dementia and traumatic brain injury. We have already demonstrated
SABRE’s capacity to detect frontal and anterior temporal lobe
volume differences between depressed and nondepressed MS
patients (Feinstein et al., 2004).
Given the current absence of reliable automatic tracing of
anatomical landmarks, researchers must make decisions about the
desired balance between preserving anatomical detail and the time
required to attain reliable measures at this level of detail. Relative
to other tracing methods, the semiautomatic SABRE approach
offers a reliable, valid, and temporally economical option. This
system can be easily applied in large group studies where divisions
based on individual landmarks are desired without the intensive
labor involved in tracing of numerous sulci. It can also be utilized
as a primary step to elucidate regions of difference quickly, perhaps
leading to a more detailed investigation. Another advantage of the
SABRE system is that it maintains individual differences through
integrating individually traced landmarks while dividing areas into
equivalent proportional regions. Maintenance of these individual
differences is minimized when brains are typically transformed into
standardized space, resulting in a loss of the brain’s topographical
uniqueness. Although we have maintained some of the individual
markers in our approach, we have also been able to decrease the
number of individual landmarks to be identified. This should
minimize differences in volume measures due to variability in
investigator/operator performances, and result in more reliable and
meaningful analyses of regional tissue compartments.
Acknowledgments
This work was supported by Canadian Institutes of Health
Research grant 13129 to Dr. S.E. Black, grants 15001 and 36535 to
Dr. A. Feinstein, and grant 37535 to Dr. B. Levine. As well as by
NIH grant 42385 and an Ontario Premier’s Research Excellence
Award to Dr. Levine. We thank the subjects who participated in this
experiment, and Joel Ramirez for his assistance with the image
analysis. We also thank Malcom Binns for consultation on
statistical issues.
Appendix A
A.1 . Landmarks
All landmarks are located manually on the AC–PC aligned T1
image.
The AC–PC line. The z (inferior–superior) coordinate where
the tops of the anterior (AC) and posterior (PC) commissures are
observable.
AC and PC points. The x (medial– lateral) and y (anterior–
posterior) coordinates anterior to the AC and PC obtained at the
level of the AC–PC plane. These coordinates are used to create the
Talairach grid and to define some regional boundaries.
Posterior midpoint. In the AC–PC plane, the y coordinate
halfway between the PC and the posterior edge of the brain defines
the coronal slice from which the pre-occipital notch (pron) is
determined.
Pre-occipital notch (pron: left and right). The lowest z coor-
dinates for the left and right occipital cortices on the posterior
midpoint coronal slice. These landmarks are used to define the
endpoints of the occipital– temporal lines (OT).
Midline (m). The x coordinate in the center of the cerebral
aqueduct, 10 axial slices below the AC–PC plane. It defines the
division between left and right hemispheres.
Central sulcus (C). The central sulcus extends obliquely
between the precentral and postcentral gyri. There is commonly
a bridge between the precentral and postcentral gyri that inter-
rupts the inferior portions of the central sulcus (Ono et al., 1990).
When this occurs, the two sections of the central sulcus are
connected with a straight vertical line. The superior endpoint of
the central sulcus is determined by either the turning point of the
sulcus from the lateral surface to the superior medial surface, or
by the joining point of a ‘‘Y’’ or ‘‘T’’ termination (Ono et al.,
1990).
Sylvian fissure (SF). Anterior tracing of the Sylvian fissure
commences just below the point of curvature of the anterior
temporal lobe. The end point is determined at one of three
possible anatomical markers: (1) the bifurcation of the terminal
ascending segment and posterior transverse temporal sulcus (most
common), (2) the bifurcation of a ramified end, or (3) at its simple
end (a straight end without obvious branches, rarely seen) (Ono et
al., 1990).
Medial point of the central sulcus (mC). The superior portion of
the central sulcus is not visible from the lateral view. To complete
this upper portion, we took a simplified approach of obtaining the
mC point at seven sagittal slices lateral to the midline plane. A
point is placed on the central sulcus, which is then automatically
connected to the central sulcus tracing to form the superior
frontal–parietal line (SPF line).
Parieto-occipital sulcus (PO). The parieto-occipital sulcus is a
consistent landmark on the posterior medial surface of the brain. It
is traced on the same sagittal slice as mC, inferiorly from the
intersection point with the tentorium along the center of the sulcus
to its most superior point. At the surface of the cortex, the line is
projected out to the edge of the image volume.
A.2 . Regional boundaries
Coordinates defined below are expressed relative to the Talair-
ach reference planes as the number of grid coordinates [e.g.,
vPC(�2) = two vertical grid lines posterior to the PC; Fig. 2].

L.A. Dade et al. / NeuroImage 22 (2004) 1492–15021500
A.2.1 . Frontal lobe
Posterior border. This consists of the central sulcus tracing with
automated extensions at the superior and inferior ends. The central
sulcus tracing is connected to the mC point creating the superior
frontal–parietal (SFP) line. From the inferior point of the central
sulcus, a vertical line is dropped down to AC–PC(�0.5) to
complete the posterior boundary. For middle and inferior regions,
the posterior border is defined by the central sulcus or the sylvian
fissure, depending on which line is first encountered in the z plane
for that particular image.
Divisions between inferior, middle, and superior frontal
regions. The AC–PC plane creates the division between inferior
and middle frontal (Callen et al., 2001). Superior and middle
frontal regions are divided at AC–PC(+4), the midpoint between
the AC–PC plane and the top of the brain.
Medial and lateral frontal regions. These divisions occur at the
Talairach grid midline(F1).
Inferior frontal regions. The inferior frontal demarcation is
more complex to minimize inclusion of tissue in the anterior
temporal lobe. The division between inferior frontal and anterior
temporal regions consists of four angled line segments extending
from midline to the outer edge of the brain. The placement of these
lines was confirmed on our series of test brains. The angles of these
lines (arrows, Fig. 3B) vary incrementally at seven specified z
levels between AC–PC(0) and AC–PC(�2.5).
A.2.2 . Parietal lobe
Anterior and posterior borders. The central sulcus tracing and
SFP line define the anterior border, and the parietal–occipital
sulcus tracing defines the posterior border.
Division between superior and inferior regions. The parietal
lobe is divided at the same level used for the frontal regions [AC–
PC(+4)].
Inferior parietal/temporal border. The sylvian fissure forms the
anterior portion of the division, which is completed by the
temporal–parietal line (TP line). The TP line is parallel to the
AC–PC plane and extends from the most posterior point of the
sylvian fissure to the intersection of the parietal–occipital sulcus
and the occipital– temporal line (OT line, below).
A.2.3 . Temporal lobe
Superior and anterior borders. The superior border is defined
by the sylvian fissure and the temporal–parietal line. The anterior
border is the inferior frontal demarcation (above).
Division between AT and PT. The ATPT line starts at the bottom
of the brain and is drawn from vAC(�1.5), AC–PC(�3) to
vAC(+0.5), AC–PC(0). The line continues upward until it inter-
sects with the sylvian fissure (Figs. 2, open dots, and 3A).
Medial border of AT and PT. Anterior and posterior to the MT,
the medial border is the hemispheric midline (x = 0). For all other
slices, the medial border is defined by the MT (M F 2).
Medial temporal region (MT). This region begins in the inferior
temporal lobe near the ATPT line and progresses up through the
posterior temporal region to the level of the basal ganglia and
thalamus. The MT extends sagitally from midline (M) to M(F2
sagittal grid divisions). The superior– inferior boundaries are at
AC–PC to AC–PC(�4). At the most inferior level (AC–PC), the
anterior–posterior extent is from vAC (+0.5) to vAC (�2). From
here, the region is moved smoothly up and back through the MT,
such that the anterior–posterior extent at the most superior level
(AC–PC [�4]) is from vAP (�0.5) to vAP (�1).
A.2.4 . Occipital lobe
The parietal–occipital sulcus, one of the manually traced
landmarks (Appendix A), forms a natural division between the
parietal and occipital lobes. The SABRE program automatically
truncates the tracing at vPC(�2). At this point, the occipital
temporal line (OT line) is drawn automatically along vPC(�2),
terminating inferiorly at the parietal occipital notch (Fig. 3A).
A.2.5 . Basal ganglia and thalamus (BGT)
This region consists of a series of polyhedra through the
midbrain. The inferior–superior extent of this region is from
AC–PC(�0.5) to AC–PC(+2). To account for the changes in
shape of these structures, the regional definition is modified: (1)
between AC–PC(�0.5) to AC–PC(�0.25), the maximal extents
of the polygon are from vAC(+2) to vAC(�1) and M(F1.66);
(2) at AC–PC(�0.25) to AC–PC(+1.5), the polygon is enlarged
in the anterior–posterior direction and extends from vAC(+2) to
vPC(�0.5) and M(F1.66); (3) at ACPC +1.5 to +2.0, the shape
changes to a rectangle, from vAC(+2) to vPC(�0.5) and
M(F1.0).
References
Allen, J.S., Damasio, H., Grabowski, T.J., 2002. Normal neuroanatomical
variation in the human brain: an MRI-volumetric study. Am. J. Phys.
Anthropol. 118, 341–358.
Andreasen, N.C., Flashman, L., Flaum, M., Arndt, S., Swayze, V., O’Leary,
D.S., Ehrhadt, J.C., Yuh, W.T.C., 1994. Regional brain abnormalities in
schizophrenia measured with magnetic resonance imaging. J. Am. Med.
Assoc. 272, 1763–1769.
Andreasen, N.C., Rajarethinam, R., Cizadlo, T., Arndt, S., Swayze, V.,
Flashman, L., O’Leary, D.S., Ehrhadt, J.C., Yuh, W.T.C., 1996. Auto-
matic atlas-based volume estimation of human brain regions from MR
images. J. Comput. Assist. Tomogr. 20, 98–106.
Ashburner, J., Friston, K.J., 2000. Voxel-based morphometry—The me-
thods. NeuroImage 11, 805–821.
Barta, P.E., Pearlson, G.D., Powers, R.E., Richards, S.S., Tune, L.E., 1990.
Auditory hallucinations and smaller superior temporal gyral volume in
schizophrenia. Am. J. Psychiatry 147, 1457–1462.
Bigler, E.D., Kurth, S.M., Blatter, D., Abildskov, T.J., 1992. Degenerative
changes in traumatic brain injury: post-injury magnetic resonance iden-
tified ventricular expansion compared to pre-injury levels. Brain Res.
Bull. 28, 651–653.
Bigler, E.D., Blatter, D.D., Anderson, C.V., Johnson, S.C., Gale, S.D.,
Hopkins, R.O., Burnett, B., 1997. Hippocampal volume in normal ag-
ing and traumatic brain injury. Am. J. Neuroradiol. 18, 11–23.
Bokde, A.L., Teipel, S.J., Zebuhr, Y., Leinsinger, G., Gootjes, L., Schwarz,
R., Buerger, K., Scheltens, P., Moeller, H.J., Hampel, H., 2002. A new
rapid landmark-based regional MRI segmentation method of the brain.
J. Neurol. Sci. 194, 35–40.
Callen, D.J., Black, S.E., Gao, F., Caldwell, C.B., Szalai, J.P., 2001. Be-
yond the hippocampus: MRI volumetry confirms widespread limbic
atrophy in AD. Neurology 57, 1669–1674.
Caviness Jr., V.S., Meyer, J., Makris, N., Kennedy, D.N., 1996. MRI-
based topographic parcellation of human neocortex: an anatomically
specified method with estimate of reliability. J. Cogn. Neurosci. 8,
566–587.
Cendes, F., Andermann, F., Gloor, P., Evans, A., Jones-Gotman, M., Wat-
son, C., Melanson, D., Olivier, A., Peters, T., Lopes-Cendes, I., et al.,
1993. MRI volumetric measurement of amygdala and hippocampus in
temporal lobe epilepsy. Neurology 43, 719–725.
Chan, D., Fox, N.C., Jenkins, R., Scahill, R.I., Crum, W.R., Rossor, M.N.,
2001a. Rates of global and regional cerebral atrophy in AD and fronto-
temporal dementia. Neurology 57, 1756–1763.

L.A. Dade et al. / NeuroImage 22 (2004) 1492–1502 1501
Chan, D., Fox, N.C., Scahill, R.I., Crum, W.R., Whitwell, J.L., Leschziner,
G., Rossor, A.M., Stevens, J.M., Cipolotti, L., Rossor, M.N., 2001b.
Patterns of temporal lobe atrophy in semantic dementia and Alzheimer’s
disease. Ann. Neurol. 49, 433–442.
Crane, J., 1999. Right Medial Temporal-Lobe Contribution to Object-Lo-
cation Memory. Doctoral Thesis. McGill University, Montreal.
Crespo-Facorro, B., Kim, J., Andreasen, N.C., O’Leary, D.S., Magnotta, V.,
2000. Regional frontal abnormalities in schizophrenia: a quantitative
gray matter volume and cortical surface size study. Biol. Psychiatry
48, 110–119.
Dade, L.A., Zatorre, R.J., Jones-Gotman, M., 2002. Olfactory learning:
convergent findings from lesion and brain imaging studies in humans.
Brain 125, 86–101.
Eritaia, J., Wood, S.J., Stuart, G.W., Bridle, N., Dudgeon, P., Maruff, P.,
Velakoulis, D., Pantelis, C., 2000. An optimized method for estimating
intracranial volume from magnetic resonance images. Magn. Reson.
Med. 44, 973–977.
Feinstein, A., Roy, P., Lobaugh, N., Feinstein, K., O’Connor, P., Black,
S.E., 2004. Structural brain abnormalities in multiple sclerosis patients
with major depression. Neurology 62, 586–590.
Fischl, B., Salat, D.H., Busa, E., Albert, M., Dieterich, M., Haselgrove, C.,
van der Kouwe, A., Killiany, R., Kennedy, D., Klaveness, S., et al.,
2002. Whole brain segmentation: automated labeling of neuroanatom-
ical structures in the human brain. Neuron 33, 341–355.
Fox, N.C., Scahill, R.I., Crum, W.R., Rossor, M.N., 1999. Correlation
between rates of brain atrophy and cognitive decline in AD. Neurology
52, 1687–1689.
Frisoni, G.B., Laakso, M.P., Beltramello, A., Geroldi, C., Bianchetti, A.,
Soininen, H., Trabucchi, M., 1999. Hippocampal and entorhinal cor-
tex atrophy in frontotemporal dementia and Alzheimer’s disease.
Neurology 52, 91–100.
Gao, F.Q., Black, S.E., Leibovitch, F.S., Callen, D.J., Lobaugh, N.J.,
Szalai, J.P., 2003. A reliable MR measurement of medial temporal
lobe width from the Sunnybrook Dementia Study. Neurobiol. Aging
24, 49–56.
Gao, F.Q., Black, S.E., Leibovitch, F.S., Callen, D.J., Rockel, C.P., Szalai,
J.P., 2004. Linear width of the medial temporal lobe can discriminate
Alzheimer’s disease from normal aging: the Sunnybrook Dementia
Study. Neurobiol. Aging 25 (4), 441–448.
Goldszal, A.F., Davatzikos, C., Pham, D.L., Yan, M.X., Bryan, R.N.,
Resnick, S.M., 1998. An image-processing system for qualitative and
quantitative volumetric analysis of brain images. J. Comput. Assist.
Tomogr. 22, 827–837.
Good, C.D., Johnsrude, I.S., Ashburner, J., Henson, R.N., Friston, K.J.,
Frackowiak, R.S., 2001. A voxel-based morphometric study of ageing
in 465 normal adult human brains. NeuroImage 14, 21–36.
Greenwood, P.M., 2000. The frontal aging hypothesis evaluated. J. Int.
Neuropsychol. Soc. 6, 705–726.
Guttmann, C.R., Jolesz, F.A., Kikinis, R., Killiany, R.J., Moss, M.B., San-
dor, T., Albert, M.S., 1998. White matter changes with normal aging.
Neurology 50, 972–978.
Jack Jr., C.R., Petersen, R.C., O’Brien, P.C., Tangalos, E.G., 1992. MR-
based hippocampal volumetry in the diagnosis of Alzheimer’s disease.
Neurology 42, 183–188.
Juottonen, K., Lehtovirta, M., Helisalmi, S., Riekkinen Sr., P.J., Soininen,
H., 1998. Major decrease in the volume of the entorhinal cortex in
patients with Alzheimer’s disease carrying the apolipoprotein E epsi-
lon4 allele. J. Neurol., Neurosurg. Psychiatry 65, 322–327.
Kesslak, J.P., Nalcioglu, O., Cotman, C.W., 1991. Quantification of mag-
netic resonance scans for hippocampal and parahippocampal atrophy in
Alzheimer’s disease. Neurology 41, 51–54.
Kim, J.J., Crespo-Facorro, B., Andreasen, N.C., O’Leary, D.S., Zhang, B.,
Harris, G., Magnotta, V.A., 2000. An MRI-based parcellation method
for the temporal lobe. NeuroImage 11, 271–288.
Kohler, S., Black, S.E., Sinden, M., Szekely, C., Kidron, D., Parker, J.L.,
Foster, J.K., Moscovitch, M., Winocour, G., Szalai, J.P., et al., 1998.
Memory impairments associated with hippocampal versus parahippo-
campal-gyrus atrophy: an MR volumetry study in Alzheimer’s disease.
Neuropsychologia 36, 901–914.
Kovacevic, N., Lobaugh, N.J., Bronskill, M.J., Levine, B., Feinstein, A.,
Black, S.E., 2002. A robust method for extraction and automatic seg-
mentation of brain images. NeuroImage 17, 1087–1100.
Levine, B., Katz, D., Dade, L.A., Black, S., 2002. Novel approaches to the
assessment of frontal damage and executive deficits in traumatic brain
injury. In: Stuss, D.T., Knight, R. (Eds.), The Age of the Frontal Lobes.
Oxford Univ. Press, New York, pp. 448–465.
Ono, M., Kubik, S., Abernathey, C.D., 1990. Atlas of the Cerebral Sulci
Georg Thieme Verlag, New York.
Pfefferbaum, A., Mathalon, D.H., Sullivan, E.V., Rawles, J.M., Zipursky,
R.B., Lim, K.O., 1994. A quantitative magnetic resonance imaging
study of changes in brain morphology from infancy to late adulthood.
Arch. Neurol. 51, 874–887.
Quarantelli,M., Larobina,M.,Volpe, U., Amati, G., Tedeschi, E., Ciarmiello,
A., Brunetti, A., Galderisi, S., Alfano, B., 2002. Stereotaxy-based region-
al brain volumetry applied to segmented MRI: validation and results in
deficit and nondeficit schizophrenia. NeuroImage 17, 373–384.
Rademacher, J., Galaburda, A.M., Kennedy, D.N., Filipek, P.A., Caviness
Jr., V.S., 1992. Human cerebral cortex: localization, parcellation, and
morphometry with magnetic resonance imaging. J. Cogn. Neurosci. 4,
352–374.
Rademacher, J., Caviness Jr., V.S., Steinmetz, H., Galaburda, A.M., 1993.
Topographical variation of the human primary cortices: implications for
neuroimaging, brain mapping, and neurobiology. Cereb. Cortex 3,
313–329.
Raz, N., 2000. Aging of the brain and its impact on cognitive performance:
integration of structural and functional findings. In: Craik, F.I.M., Salt-
house, T.A. (Eds.), The Handbook of Aging and Cognition. Lawrence
Erlbaum Associates, MahWah, NJ, pp. 1–90.
Raz, N., Gunning, F.M., Head, D., Dupuis, J.H., McQuain, J., Briggs, S.D.,
Loken, W.J., Thornton, A.E., Acker, J.D., 1997. Selective aging of the
human cerebral cortex observed in vivo: differential vulnerability of the
prefrontal gray matter. Cereb. Cortex 7, 268–282.
Resnick, S.M., Goldszal, A.F., Davatzikos, C., Golski, S., Kraut, M.A.,
Metter, E.J., Bryan, R.N., Zonderman, A.B., 2000. One-year age changes
in MRI brain volumes in older adults. Cereb. Cortex 10, 464–472.
Resnick, S.M., Pham, D.L., Kraut, M.A., Zonderman, A.B., Davatzikos,
C., 2003. Longitudinal magnetic resonance imaging studies of older
adults: a shrinking brain. J. Neurosci. 23, 3295–3301.
Rosen, H.J., Gorno-Tempini, M.L., Goldman, W.P., Perry, R.J., Schuff, N.,
Weiner, M., Feiwell, R., Kramer, J.H., Miller, B.L., 2002. Patterns of
brain atrophy in frontotemporal dementia and semantic dementia. Neu-
rology 58, 198–208.
Salat, D.H., Kaye, J.A., Janowsky, J.S., 2001. Selective perseveration and
degeneration within the prefrontal cortex in aging and Alzheimer dis-
ease. Arch. Neurol. 58, 1403–1408.
Salat, D.H., Kaye, J.A., Janowsky, J.S., 2002. Greater orbital prefrontal
volume selectively predicts worse working memory performance in
older adults. Cereb. Cortex 12, 494–505.
Shrout, P., Fleiss, J., 1979. Intraclass correlations: uses in assessing rater
reliability. Psycholog. Bull., 420–428.
Steinmetz, H., Furst, G., Freund, H.J., 1989. Cerebral cortical localization:
application and validation of the proportional grid System in MR im-
aging. J. Comput. Assist. Tomogr. 13, 10–19.
Talairach, J., Tournoux, P., 1988. Co-Planar Stereotaxic Atlas of the Human
Brain. Thieme Medical, New York.
Tisserand, D.J., Visser, P.J., van Boxtel, M.P., Jolles, J., 2000. The relation
between global and limbic brain volumes on MRI and cognitive per-
formance in healthy individuals across the age range. Neurobiol. Aging
21, 569–576.
Tisserand, D.J., Pruessner, J.C., Sanz Arigita, E.J., van Boxtel, M.P.,
Evans, A.C., Jolles, J., Uylings, H.B., 2002. Regional frontal cortical
volumes decrease differentially in aging: an MRI study to compare
volmetric approaches and voxel-based morphometry. NeuroImage 17,
657–669.

L.A. Dade et al. / NeuroImage 22 (2004) 1492–15021502
Tzourio-Mazoyer, N., Landeau, B., Papathanassiou, D., Crivello, F.,
Etard, O., Delcroix, N., Mazoyer, B., Joliot, M., 2002. Automated
anatomical labeling of activations in SPM using a macroscopic ana-
tomical parcellation of the MNI MRI single-subject brain. NeuroImage
15, 273–289.
Watkins, K.E., Paus, T., Lerch, J.P., Zijdenbos, A., Collins, D.L., Neelin, P.,
Taylor, J., Worsley, K.J., Evans, A.C., 2001. Structural asymmetries in
the human brain: a voxel-based statistical analysis of 142 MRI scans.
Cereb. Cortex 11, 868–877.
Woods, R.P., Grafton, S.T., Holmes, C.J., Cherry, S.R., Mazziotta, J.C.,
1998. Automated image registration: I. General methods and intrasub-
ject, intramodality validation. J. Comput. Assist. Tomogr. 22, 139–152.