Genetic and environmental influences on the size of specific brain regions in midlife: The VETSA MRI...
11
Genetic and environmental influences on the size of specific brain regions in midlife: The VETSA MRI study William S. Kremen a,b,c, ⁎, Elizabeth Prom-Wormley d , Matthew S. Panizzon a , Lisa T. Eyler a,c , Bruce Fischl e , Michael C. Neale d , Carol E. Franz a , Michael J. Lyons f , Jennifer Pacheco e , Michele E. Perry a,g , Allison Stevens e , J. Eric Schmitt d , Michael D. Grant f , Larry J. Seidman h , Heidi W. Thermenos h , Ming T. Tsuang a,b,c , Seth A. Eisen i , Anders M. Dale j,k , Christine Fennema-Notestine a,j a Department of Psychiatry, University of California, San Diego, 9500 Gilman Drive (MC 0738), La Jolla, CA 92093, USA b Center for Behavioral Genomics, University of California, San Diego, La Jolla, CA, USA c VA San Diego Healthcare System, La Jolla, CA, USA d Departments of Psychiatry and Human Genetics, Virginia Commonwealth University, Richmond, VA, USA e Department of Radiology, Harvard Medical School and Massachusetts General Hospital, Boston, MA, USA f Department of Psychology, Boston University, Boston, MA, USA g Department of Cognitive Neuroscience, University of California, San Diego, La Jolla, CA, USA h Department of Psychiatry, Harvard Medical School, Boston, MA, USA i Department of Veterans Affairs, Washington, DC and Departments of Medicine and Psychiatry, Washington University, St. Louis, MO, USA j Department of Radiology, University of California, San Diego, La Jolla, CA, USA k Department of Neurosciences, University of California, San Diego, La Jolla, CA, USA abstract article info Article history: Received 15 April 2009 Revised 28 August 2009 Accepted 21 September 2009 Available online 26 September 2009 Keywords: Heritability Twins Magnetic resonance imaging (MRI) Brain structure Cortical thickness The impact of genetic and environmental factors on human brain structure is of great importance for understanding normative cognitive and brain aging as well as neuropsychiatric disorders. However, most studies of genetic and environmental influences on human brain structure have either focused on global measures or have had samples that were too small for reliable estimates. Using the classical twin design, we assessed genetic, shared environmental, and individual-specific environmental influences on individual differences in the size of 96 brain regions of interest (ROIs). Participants were 474 middle-aged male twins (202 pairs; 70 unpaired) in the Vietnam Era Twin Study of Aging (VETSA). They were 51–59 years old, and were similar to U.S. men in their age range in terms of sociodemographic and health characteristics. We measured thickness of cortical ROIs and volume of other ROIs. On average, genetic influences accounted for approximately 70% of the variance in the volume of global, subcortical, and ventricular ROIs and approximately 45% of the variance in the thickness of cortical ROIs. There was greater variability in the heritability of cortical ROIs (0.00–0.75) as compared with subcortical and ventricular ROIs (0.48–0.85). The results did not indicate lateralized heritability differences or greater genetic influences on the size of regions underlying higher cognitive functions. The findings provide key information for imaging genetic studies and other studies of brain phenotypes and endophenotypes. Longitudinal analysis will be needed to determine whether the degree of genetic and environmental influences changes for different ROIs from midlife to later life. © 2009 Elsevier Inc. All rights reserved. Elucidating the extent to which genetic and environmental factors influence adult brain structure is of great importance for understand- ing age-related normal and pathological changes in brain and cognition. Twin studies provide the optimal behavioral genetic method for clarifying this issue because they make it possible to decompose the variance of any variable into genetic, shared environmental influences, and individual-specific environmental influences. The twin method also complements molecular genetic approaches in that heritability – the proportion of phenotypic variance due to genes – is a key component for selection of phenotypes. Despite many published magnetic resonance imaging (MRI) studies involving twins (reviewed by Glahn et al., 2007; Peper et al., 2007; Schmitt et al., 2007a), the picture regarding the heritability of specific brain regions remains incomplete. In some studies, samples sizes were quite small and are thus likely to provide unstable estimates (Visscher, 2004). With a couple of exceptions, relatively few specific regions of interest (ROIs) have been examined. The different ROIs that have been measured in previous studies have often been examined in different samples. It would be advantageous to be able to compare heritabilities of different ROIs in the same individuals, thus NeuroImage 49 (2010) 1213–1223 ⁎ Corresponding author. Department of Psychiatry, University of California, San Diego, 9500 Gilman Drive (MC 0738), La Jolla, CA 92093, USA. Fax: +858 822 5856. E-mail address: [email protected] (W.S. Kremen). 1053-8119/$ – see front matter © 2009 Elsevier Inc. All rights reserved. doi:10.1016/j.neuroimage.2009.09.043 Contents lists available at ScienceDirect NeuroImage journal homepage: www.elsevier.com/locate/ynimg
-
Upload
independent -
Category
Documents
-
view
5 -
download
0
Transcript of Genetic and environmental influences on the size of specific brain regions in midlife: The VETSA MRI...

NeuroImage 49 (2010) 1213–1223
Contents lists available at ScienceDirect
NeuroImage
j ourna l homepage: www.e lsev ie r.com/ locate /yn img
Genetic and environmental influences on the size of specific brain regions in midlife:The VETSA MRI study
William S. Kremen a,b,c,⁎, Elizabeth Prom-Wormley d, Matthew S. Panizzon a, Lisa T. Eyler a,c, Bruce Fischl e,Michael C. Neale d, Carol E. Franz a, Michael J. Lyons f, Jennifer Pacheco e, Michele E. Perry a,g,Allison Stevens e, J. Eric Schmitt d, Michael D. Grant f, Larry J. Seidman h, Heidi W. Thermenos h,Ming T. Tsuang a,b,c, Seth A. Eisen i, Anders M. Dale j,k, Christine Fennema-Notestine a,j
a Department of Psychiatry, University of California, San Diego, 9500 Gilman Drive (MC 0738), La Jolla, CA 92093, USAb Center for Behavioral Genomics, University of California, San Diego, La Jolla, CA, USAc VA San Diego Healthcare System, La Jolla, CA, USAd Departments of Psychiatry and Human Genetics, Virginia Commonwealth University, Richmond, VA, USAe Department of Radiology, Harvard Medical School and Massachusetts General Hospital, Boston, MA, USAf Department of Psychology, Boston University, Boston, MA, USAg Department of Cognitive Neuroscience, University of California, San Diego, La Jolla, CA, USAh Department of Psychiatry, Harvard Medical School, Boston, MA, USAi Department of Veterans Affairs, Washington, DC and Departments of Medicine and Psychiatry, Washington University, St. Louis, MO, USAj Department of Radiology, University of California, San Diego, La Jolla, CA, USAk Department of Neurosciences, University of California, San Diego, La Jolla, CA, USA
⁎ Corresponding author. Department of Psychiatry,Diego, 9500 Gilman Drive (MC 0738), La Jolla, CA 92093
E-mail address: [email protected] (W.S. Kremen).
1053-8119/$ – see front matter © 2009 Elsevier Inc. Adoi:10.1016/j.neuroimage.2009.09.043
a b s t r a c t
a r t i c l e i n f oArticle history:Received 15 April 2009Revised 28 August 2009Accepted 21 September 2009Available online 26 September 2009
Keywords:HeritabilityTwinsMagnetic resonance imaging (MRI)Brain structureCortical thickness
The impact of genetic and environmental factors on human brain structure is of great importance forunderstanding normative cognitive and brain aging as well as neuropsychiatric disorders. However, moststudies of genetic and environmental influences on human brain structure have either focused on globalmeasures or have had samples that were too small for reliable estimates. Using the classical twin design, weassessed genetic, shared environmental, and individual-specific environmental influences on individualdifferences in the size of 96 brain regions of interest (ROIs). Participants were 474 middle-aged male twins(202 pairs; 70 unpaired) in the Vietnam Era Twin Study of Aging (VETSA). They were 51–59 years old, andwere similar to U.S. men in their age range in terms of sociodemographic and health characteristics. Wemeasured thickness of cortical ROIs and volume of other ROIs. On average, genetic influences accounted forapproximately 70% of the variance in the volume of global, subcortical, and ventricular ROIs andapproximately 45% of the variance in the thickness of cortical ROIs. There was greater variability in theheritability of cortical ROIs (0.00–0.75) as compared with subcortical and ventricular ROIs (0.48–0.85). Theresults did not indicate lateralized heritability differences or greater genetic influences on the size of regionsunderlying higher cognitive functions. The findings provide key information for imaging genetic studies andother studies of brain phenotypes and endophenotypes. Longitudinal analysis will be needed to determinewhether the degree of genetic and environmental influences changes for different ROIs from midlife to laterlife.
© 2009 Elsevier Inc. All rights reserved.
Elucidating the extent to which genetic and environmental factorsinfluence adult brain structure is of great importance for understand-ing age-related normal and pathological changes in brain andcognition. Twin studies provide the optimal behavioral geneticmethod for clarifying this issue because they make it possible todecompose the variance of any variable into genetic, sharedenvironmental influences, and individual-specific environmentalinfluences. The twin method also complements molecular genetic
University of California, San, USA. Fax: +858 822 5856.
ll rights reserved.
approaches in that heritability – the proportion of phenotypic variancedue to genes – is a key component for selection of phenotypes.
Despite many published magnetic resonance imaging (MRI)studies involving twins (reviewed by Glahn et al., 2007; Peper et al.,2007; Schmitt et al., 2007a), the picture regarding the heritability ofspecific brain regions remains incomplete. In some studies, samplessizes were quite small and are thus likely to provide unstableestimates (Visscher, 2004). With a couple of exceptions, relatively fewspecific regions of interest (ROIs) have been examined. The differentROIs that have been measured in previous studies have often beenexamined in different samples. It would be advantageous to be able tocompare heritabilities of different ROIs in the same individuals, thus

1214 W.S. Kremen et al. / NeuroImage 49 (2010) 1213–1223
circumventing the problem of variation of estimates due to differ-ences in sample characteristics or imaging methods. Assessing all ofthe ROIs within the same individual allows for direct comparison ofone brain structure to another.
Examination of a large number of ROIs in the same people has beenperformed in a small study of adults in which 92 ROIs (46 perhemisphere) plus total brain volume and lateral ventricles wereexamined in 9 monozygotic (MZ) and 10 dizygotic (DZ) twin pairs(Wright et al., 2002), and in the large NIMH twin sample of childrenand adolescents (126 twin pairs plus siblings) in which ROIsthroughout the neocortex plus a few subcortical and ventricularROIs were measured (Lenroot et al., 2009; Schmitt et al., 2008;Wallace et al., 2006). Another large study of children (105 nine-year-old twin pairs) examined global brain measures plus the lateralventricles and cerebellum (Peper et al., 2009).
We are aware of only two relatively large published adult MRItwin samples: a sample of older men (NHLBI study; 145 pairs)(Carmelli et al., 1998) and a Dutch adult sample (112 pairs)(Posthuma et al., 2000). These samples focused mainly on globalbrain measures or a few selected ROIs. To our knowledge, the presentstudy is the first large-scale study to include a comprehensiveassessment of genetic and environmental influences on cortical,subcortical, and ventricular ROIs all in the same individuals. We referhere specifically to ROI-based analyses. We are aware of importantstudies using point-by-point gray matter density analyses or voxel-based methods (e.g., Hulshoff Pol et al., 2006; Peper et al., 2009;Thompson et al., 2001), but we have not focused on these here, inpart, because they are not very comparable to ROI-based analyses(see Discussion).
In adults, heritabilities tend to be very high for global measures,averaging around 80% or more for whole-brain volume, total graymatter, and total white matter (Carmelli et al., 1998; Posthuma et al.,2000; Wright et al., 2002). The heritability of lateral ventricularvolume has yielded very mixed findings with estimates ranging from0% to 78% (Baaré et al., 2001; Carmelli et al., 2002; Chou et al., 2008;Schmitt et al., 2007b; Wright et al., 2002). The heritability ofhippocampal volume has been estimated at 40% in older adults and66%–71% in younger andmiddle-aged adults (Sullivan et al., 2001; vanErp et al., 2004; Wright et al., 2002). The heritability of cerebellarvolume was 66%–67% in younger adults and 81% in middle-agedadults (Posthuma et al., 2000; Wright et al., 2002).
In the case of children and adolescents, Pennington et al. (2000)reported monozygotic (MZ) and dizygotic (DZ) twin correlationsthat suggest heritabilities of approximately 80% for total brainvolume and 66% and 56% for right and left hemisphere volumes,respectively. In the NIMH sample, heritabilities ranged from 77% to89% for total gray and white matter and lobar volumes (Wallaceet al., 2006). Heritabilities were 80% for the caudate nucleus (Wallaceet al., 2006), 72% for thalamus, 81% for basal ganglia, 55% for totalcerebellum volume, and 32% for lateral ventricles (Schmitt et al.,2007b). All but the caudate were subsequently analyzed controllingfor total brain volume or intracranial volume; these analyses resultedin lower heritabilities of 42% for thalamus, 64% for basal ganglia, 24%for cerebellum, and 17% for the lateral ventricles (Lenroot et al.,2009; Schmitt et al., 2007b, 2008). The average heritability of thethickness of 54 cortical ROIs (27 per hemisphere) in the NIMHsample was 32% (range: 1%–57%). Estimates of shared environmentalvariance were zero or near zero for virtually all of the cortical andsubcortical ROIs.
In the present study, the Vietnam Era Twin Study of Aging(VETSA), we comprehensively assessed the heritability of 96 brainROIs in 404 middle-aged male twins (202 pairs). Specification of thisas a midlife sample with a narrow age range is important becausegene expression may be age dependent, and different geneticallymediated processes may affect brain structure at different agesbecause of substantial brain growth and development during
childhood and processes influencing loss of brain tissue in adults.Because the same phenotype may be influenced by different geneticfactors at different developmental stages, such potential age-relateddifferences may also have important implications for geneticassociation studies. However, the present analyses do not addressage-related changes because these data represent only the first waveof this longitudinal study of genetic and environmental contributionsto cognitive and brain aging.
Methods
Participants
An overview of the longitudinal VETSA project can be foundelsewhere (Kremen et al., 2006). The study was approved by theHuman Subjects Committees of all involved institutions, and allparticipants gave written informed consent. A total of 1237 twinsparticipated in wave 1. They were randomly selected from a largerpool of individuals in a prior Vietnam Era Twin Registry study(Tsuang et al., 2001). Registry members are male–male twin pairsborn between 1939 and 1957 who both served in the United Statesmilitary between 1965 and 1975. The registry is not a VA or apatient sample, and the large majority was not in Vietnam orexposed to combat. Registry members are currently middle-agedmen living throughout the United States. We began the VETSA MRIstudy in the third year of the primary VETSA study. At the time ofthis report, there were 474 individual VETSA participants withanalyzable MRI data; 241 were scanned in San Diego and 233 werescanned in Boston. Of those, 404 were paired (i.e., 202 twin pairs):110 MZ and 92 DZ pairs. The unpaired twins contribute to thecalculations of means and variances, but the focus of the geneticanalyses is the paired twins. Zygosity was initially classifiedaccording to questionnaire and blood group information. Theseclassifications are being updated on the basis of 25 satellite markers.To date, 56% of the MRI study participants have DNA-determinedzygosity. Consistent with the overall VETSA project, 95% of thequestionnaire/blood group-based classifications were in agreementwith the DNA-based classifications; when differences occurred weused the DNA-based classifications.
Participants were given the option of traveling to San Diego orBoston for a day-long series of assessments. The MRI session wastypically the day after the in-lab evaluation. Only 6% of VETSAparticipants whowere invited to undergoMRI declined to participate;59% were included. The remaining participants were excluded fromthe MRI study for reasons such as possible metal in the body (7%),claustrophobia (3%), unwillingness to travel to the MRI study sites(5%), scanner problems (8%), co-twin being excluded (9%), and otherreasons (3%).
Mean age of the MRI participants was 55.8 (2.6) years (range: 51–59), mean years of education was 13.9 (SD=2.1), and 85.2% wereright-handed. Most participants were employed full-time (74.9%),4.2% were employed part-time, and 11.2% were retired. There were88.3% non-Hispanic white, 5.3% African-American, 3.4% Hispanic, and3.0% “other” participants. Self-reported overall health status was asfollows: excellent (14.8%); very good (36.5%); good (37.4%); fair(10.4%); and poor (0.9%). These demographic characteristics did notdiffer from the entire VETSA sample, nor were there significantdifferences between MZ and DZ twins. Basic demographic and healthcharacteristics of the VETSA sample are comparable to U.S. censusdata for similarly aged men. For example, the prevalence ofhypertension and diabetes in American men between 2003 and2006 based on reports of diagnosis by a doctor was 41.2% and 9.6%,respectively (National Centers for Disease Control and Prevention,2003–2006); the corresponding prevalences for the VETSA samplewere 39% and 11%.
1215W.S. Kremen et al. / NeuroImage 49 (2010) 1213–1223
Image acquisition
Images were acquired on Siemens 1.5 Tesla scanners (241 atUniversity of California, San Diego; 233 at Massachusetts GeneralHospital). Sagittal T1-weighted MPRAGE sequences were employedwith a TI=1000 ms, TE=3.31 ms, TR=2730 ms, flip angle=7degrees, slice thickness=1.33mm, and voxel size=1.3×1.0×1.3 mm.Raw DICOM MRI scans (including two T1-weighted volumes per case)weredownloaded to theMGHsite. Imageswere automatically correctedfor spatial distortion caused by gradient nonlinearity and B1 fieldinhomogeneity. The two T1-weighted images were registered andaveraged to improve signal-to-noise.
Image processing
Volumetric segmentation (Fischl et al., 2002, 2004a) and corticalsurface reconstruction (Dale et al., 1999; Dale and Sereno, 1993; Fischlet al., 1999, 2002, 2004a,b) methods were based on the publiclyavailable FreeSurfer software package. The semi-automated, fully 3Dwhole-brain segmentation procedure uses a probabilistic atlas andapplies a Bayesian classification rule to assign a neuroanatomical label
Fig. 1. FreeSurfer automated segmentation compared with expert manual measurementsegmentation results based on the atlas of Buckner et al. (2004). ASeg 2 refers to automaautomated segmentation based on the VETSA-specific atlas. The center vertical line at Z=Center for Morphometric Analysis for both atlases.
to each voxel (Fischl et al., 2002, 2004a). A widely used training atlashas been shown to be comparable to that of expert manual labelingand is sensitive to subtle brain changes in Alzheimer's disease andnormal aging (Fischl et al., 2002, 2004a). However, we created a newmanually derived training set from 20 unrelated, randomly selectedVETSA participants. Both atlases were created at the same laboratoryat the MGH Center for Morphometric analysis using the samereliability criteria. The rationale for the VETSA-specific atlas wasthat it would be more representative of the VETSA sample, thusyielding more accurate measurements. As an example, Fig. 1 showsthe results of different versions of the general atlas and the VETSA-specific atlas for some subcortical and global structures in comparisonto the “gold standard,” manually segmented brains. The figure showsthe ROIs based on each atlas in standard deviation units from themanually segmented brains. The zero-point represents the manualmeasurements. As can be seen, the VETSA-specific atlas yielded themost accurate measurements, all of which were very close to themanual measurements and within the 99% confidence intervals (CIs).In addition, FreeSurfer provides an estimate of total intracranialvolume (TIV) derived from the atlas scaling factor on the basis of thetransformation of the full brain mask into atlas space (Buckner et al.,
s based on VETSA-specific and other atlases. ASeg 1 refers to the initial automatedted segmentation after updates in the FreeSurfer processing stream. VETSA refers to0 represents the manual segmentation measurements, which were done at the MGH

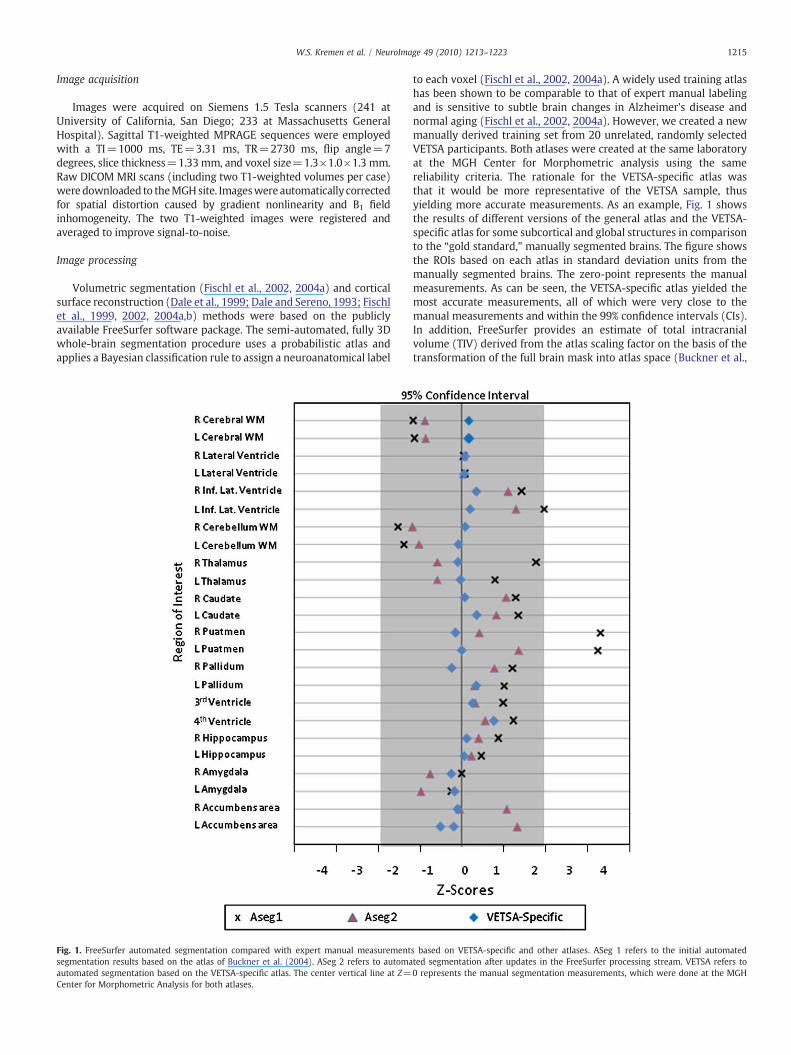
Fig. 2. Univariate ACE model. A=Additive genetic influences; C=Shared (common)environmental influences; E=Individual-specific (unique) environmental influences.a, c, and e=parameter estimates for A, C, and E, respectively.
1216 W.S. Kremen et al. / NeuroImage 49 (2010) 1213–1223
2004). TIV was used to control for differences in head size forvolumetric measures.
Volume measuresVolumetric measures were created for hippocampus, amygdala,
caudate, putamen, thalamus, nucleus accumbens, cerebellum, ven-tricles, cerebral cortex, cerebral white matter, and abnormal hypoin-tense white matter regions. Measured white matter abnormalitiesreflect areas within the white matter that have abnormally low, orhypointense, signal values relative to normal white matter; theseareas are analogous to the more commonly referenced hyperinten-sities derived from T2-weighted images and may reflect areas ofinflammation, demyelination, or axonal loss.
Cortical thickness measuresUsing semi-automated cortical surface reconstruction methods
(Dale et al., 1999; Dale and Sereno, 1993; Fischl and Dale, 2000; Fischlet al., 1999, 2004b) available in FreeSurfer, we measured thickness ateach surface location, or vertex. Intensity variations due to magneticfield inhomogeneities are corrected, a normalized intensity image iscreated, and the skull (non-brain) is removed from the normalizedimage. The preliminary segmentation is partitioned using a connectedcomponents algorithm, with connectivity not allowed across theestablished cutting planes that separate the cerebral hemispheres anddisconnect brainstem and cerebellum. Any interior holes in thecomponents representing white matter are filled, resulting in a singlefilled volume for each cortical hemisphere. The resulting surface iscovered with a triangular tessellation and smoothed to reduce metricdistortions. After the initial surface model has been constructed, arefinement procedure is applied to obtain a representation of thegray/white boundary. This surface is subsequently deformed out-wards to obtain an explicit representation of the pial surface.
The surface was then divided into distinct cortical ROIs (Fischlet al., 2004b). Each surface location, or vertex, was assigned aneuroanatomical label based on (1) the probability of each label ateach location in a surface-based atlas space, based on a manuallyparcellated training set; (2) the local curvature information; and (3)the contextual information, encoding spatial neighborhood relation-ships between labels (conditional probability distributions derivedfrom the manual training set). The parcellation scheme labels corticalsulci and gyri according to Desikan et al. (2006), and thickness valuesare calculated in the 66 ROIs (33 per hemisphere) produced by thisparcellation. We renamed the regions referred to as the posterior andisthmus cingulate in the original parcellation scheme (Desikan et al.,2006); these are referred to here as the rostral posterior cingulate andretrosplenial cortex, respectively. We also use the term “subcortical”as a shorthand for the following cerebral gray matter ROIs that are notincluded in the cortical surface reconstruction: thalamus, caudate,putamen, pallidum, nucleus accumbens, hippocampus, and amygdala.
Quality controlDr. Dale and colleagues developed and refined the image
acquisition and processing methods for the present study inconjunction with the Morphometry Biomedical Informatics ResearchNetwork (BIRN; http://www.nbirn.net/research/morphometry/index.shtm), which is sponsored by the National Institutes of Healthand the National Center for Research Resources. A major goal of theBIRN is to develop tools to enable cross-site and cross-platformreliability, and BIRN-affiliated studies have consistently demonstratedthe reliability and validity of these image acquisition and processingmethods across different sites and platforms (Dickerson et al., 2008;Fennema-Notestine et al., 2007; Han et al., 2006; Jovicich et al., 2006,2009). Once generated, the cortical surfacemodel is visually inspectedand edited for technical accuracy by trained technicians. Minimalmanual editing – blind to any participant characteristics – wasperformed in alignmentwith standard, objective editing rules. Studies
demonstrate a high correlation of automatic and manual measures invivo and ex vivo (Fischl and Dale, 2000; Walhovd et al., 2005).Qualitative review of the volumetric segmentation was also per-formed to check for technical failure of the application. Of the 493scans available at the time of these analyses, quality control measuresexcluded 0.6% (3 cases) due to scanner artifact and 3% (16 cases) dueto inadequate image processing results (e.g., poor contrast causedremoval of non-brain to fail).
Statistical analysis
ROI volume or thickness was adjusted for age and site in allanalyses. Although site effects on the means of MRI measures wereobserved for some regions, these made very little difference to theestimates of heritability (results available on request). In addition,volume measures were analyzed with and without adjustment forTIV. The primary focus was on analyses adjusted for TIV because wewanted to examine heritabilities for specific ROIs over and abovegeneral effects of head size and because most studies report valuesbased on similar adjustments. The primary emphasis for analyses ofcortical thickness did not include any adjustment for TIV because, asshown in the Results section, adjusting cortical thickness for ICV hadvirtually no effect on heritability. All of the ventricular and whitematter hypointensity measures were log transformed in order tonormalize their distributions.
The standard twin (“ACE”) model estimates the proportion ofphenotypic variance due to additive genetic effects (A), shared orcommon environmental effects (C), and individual-specific environ-mental effects (E) (Eaves et al., 1978; Neale and Cardon, 1992).Shared environmental influences are those that make twins similar;individual-specific environmental influences are those that maketwins different. Because measurement error is assumed to berandom, it is uncorrelated within twin pairs; consequently; it isincluded in the individual-specific environmental variance. Fig. 2shows the basic univariate ACE model: (1) additive genetic factorscorrelate 1.0 for MZ twins and 0.5 for DZ twins; (2) sharedenvironmental factors correlate 1.0 across twins regardless ofzygosity; and (3) individual-specific environmental factors areuncorrelated across twins. The fit of the models to the data wastested by means of Mx, a maximum-likelihood-based structuralequation modeling program (Neale et al., 2003).
If MZ correlations are substantially more than double the DZcorrelations, non-additive (dominant/epistatic) genetic influencesmay also be operating. These effects can be incorporated into an“ADE” model in which D refers to non-additive/dominance genetic

1217W.S. Kremen et al. / NeuroImage 49 (2010) 1213–1223
effects; in the ADE model, non-additive genetic factors are assumedto correlate 0.25 in DZ twins. We first compared the fit of the full(ACE or ADE) models with saturated models, which are models thatfit the data perfectly. For only 3 of the 97 (ROIs including TIV) wasthe fit of the full model significantly worse than the fit of thesaturated model; these were for right cerebral cortex, white matterhypointensities, and left pericalcarine cortex). Because this outcomeis fewer than would be expected by chance, based on an alpha levelof 0.05, we consider the model testing to be appropriate. Theseresults are not presented here but are available from the authors. Wedid not have sufficient power to differentiate between A and Deffects in the ADE models, but broad heritability estimates (A+D)were extremely similar to estimates based on the A component inthe corresponding ACE models. We present only the ACE models sothat it is easier to compare results across ROIs. ADE model results areavailable from the authors.
After fitting univariate ACE models for each ROI, we tested thesignificance of each A, C, and E parameter by dropping each fromthe model. This procedure produces nested submodels in which thedifference in maximum likelihood asymptotically follows a χ2
distribution with degrees of freedom equal to the difference inthe number of free parameters in most cases (Eaves et al., 1978;Neale and Cardon, 1992). Models were compared using the
Table 1Regional brain volume measures adjusted for age, site, and total intracranial volume: param
Region of interest rMZ rDZ Variance components
a2 95% CI c2 95
Global measuresTotal intracranial volumea 0.80 0.49 0.79 (0.52; 0.87) 0.04 (0Cerebral cortex—L 0.83 0.39 0.77 (0.40; 0.85) 0.10 (0Cerebral cortex—R 0.76 0.33 0.70 (0.51; 0.83) 0.00 (0Cerebral WM—L 0.76 0.36 0.76 (0.46; 0.83) 0.00 (0Cerebral WM—R 0.63 0.04 0.75 (0.45; 0.73) 0.00 (0WM hypointensities 0.83 0.39 0.62 (0.44; 0.83) 0.00 (0
Subcortical gray matter regionsb
Thalamus—L 0.68 0.35 0.68 (0.35; 0.77) 0.00 (0Thalamus—R 0.71 0.48 0.60 (0.30; 0.81) 0.14 (0Caudate—L 0.87 0.52 0.79 (0.54; 0.91) 0.09 (0Caudate—R 0.82 0.47 0.70 (0.43; 0.86) 0.11 (0Putamen—L 0.86 0.42 0.85 (0.56; 0.90) 0.01 (0Putamen—R 0.85 0.34 0.84 (0.63; 0.88) 0.00 (0Pallidum—L 0.69 0.41 0.66 (0.33; 0.78) 0.05 (0Pallidum—R 0.76 0.33 0.75 (0.44; 0.81) 0.00 (0Nucleus accumbens—L 0.64 0.12 0.60 (0.39; 0.70) 0.00 (0Nucleus accumbens—R 0.53 0.15 0.48 (0.14; 0.60) 0.00 (0Hippocampus—L 0.66 0.21 0.63 (0.36; 0.72) 0.00 (0Hippocampus—R 0.70 0.05 0.64 (0.47; 0.74) 0.00 (0Amygdala—L 0.65 0.27 0.63 (0.28; 0.72) 0.00 (0Amygdala—R 0.69 0.25 0.66 (0.33; 0.74) 0.00 (0
CerebellumCerebellum cortex—L 0.77 0.41 0.64 (0.33; 0.81) 0.11 (0Cerebellum cortex—R 0.81 0.38 0.76 (0.44; 0.85) 0.03 (0Cerebellum WM—L 0.82 0.29 0.79 (0.54; 0.84) 0.00 (0Cerebellum WM—R 0.83 0.28 0.81 (0.61; 0.86) 0.00 (0
VentriclesLateral ventricle—L 0.79 0.11 0.76 (0.63; 0.82) 0.00 (0Lateral ventricle—R 0.76 0.22 0.73 (0.53; 0.80) 0.00 (0Inf. lateral ventricle—L 0.68 0.19 0.65 (0.40; 0.73) 0.00 (0Inf. lateral ventricle—R 0.39 0.10 0.37 (0.02; 0.51) 0.00 (03rd ventricle 0.76 0.42 0.79 (0.52; 0.85) 0.00 (04th ventricle 0.76 0.28 0.75 (0.53; 0.81) 0.00 (0
a2=additive genetic influences; c2=shared (common) environmental influences; e2=ind−2 log-likelihood for the full model; no A=test of CE model, i.e., hypothesis of no additiveeffects; no AC=test of E only model, i.e., hypothesis of no familial (additive genetic or shaSignificant genetic influences based on ACE models (pb0.05 in “no A” column) are shown
a Total intracranial volume is adjusted for age and site only.b Use of the term subcortical is a shorthand for these cerebral gray matter ROIs that are
likelihood-ratio chi-square (LRC) statistic. The LRC is obtained bycomparing the −2 log-likelihood (−2LL) of the comparison modelto the −2LL of a nested (reduced) model. The LRC statistic is thedifference in −2LL. A significant LRC indicates that the componentremoved from the model accounts for a statistically significantproportion of variance.
Results
MZ and DZ correlations and the proportions of varianceaccounted for by genetic, shared environmental, and individual-specific environmental influences for each of the age, site, and TIV-adjusted volume-based ROIs are shown in Table 1. The same indicesfor the ROIs measured by thickness (adjusted for age and site only)are shown in Table 2 and in Fig. 3. MZ correlations were consistentlyhigher than DZ correlations, suggesting genetic influences on the sizeof almost all ROIs. The full (ACE) models are shown, although theestimates of shared environmental (C) effects were near zero in mostcases. On average in the full models, individual-specific environ-mental influences accounted for 29% of the variance in the size ofspecific subcortical ROIs and 51% of the variance in the size of specificcortical ROIs.
eter estimates for univariate ACE Models and tests of submodels.
p-values
% CI e2 95% CI −2Lnl no A no C no AC
; 0.30) 0.17 (0.13; 0.23) 1020.68 <0.0001 0.79 b0.0001; 0.40) 0.20 (0.14; 0.27) 749.50 <0.0001 1.00 b0.0001; 0.22) 0.24 (0.17; 0.34) 716.04 <0.0001 0.58 b0.0001; 0.27) 0.25 (0.18; 0.35) 688.84 <0.0001 1.00 b0.0001; 0.08) 0.38 (0.27; 0.55) 676.67 <0.0001 1.00 b0.0001; 0.32) 0.23 (0.17; 0.31) 1017.61 <0.0001 1.00 b0.0001
; 0.29) 0.32 (0.23; 0.43) 893.37 <0.0001 1.00 b0.0001; 0.41) 0.26 (0.19; 0.35) 869.31 <0.0001 0.36 b0.0001; 0.34) 0.12 (0.09; 0.17) 807.28 <0.0001 0.53 b0.0001; 0.37) 0.19 (0.14; 0.26) 856.31 <0.0001 0.49 b0.0001; 0.29) 0.14 (0.10; 0.19) 881.26 <0.0001 0.96 b0.0001; 0.21) 0.16 (0.12; 0.22) 890.61 <0.0001 1.00 b0.0001; 0.34) 0.29 (0.22; 0.40) 927.95 <0.0001 0.78 b0.0001; 0) 0.25 (0.19; 0.34) 941.07 <0.0001 1.00 b0.0001; 0) 0.40 (0.30; 0.53) 1045.27 <0.0001 1.00 b0.0001; 0) 0.52 (0.40; 0.66) 1080.91 0.01 1.00 b0.0001; 0) 0.37 (0.28; 0.49) 975.32 0.00 1.00 b0.0001; 0.14) 0.36 (0.27; 0.47) 955.97 <0.0001 1.00 b0.0001; 0.31) 0.37 (0.28; 0.49) 990.35 0.00 1.00 b0.0001; 0.30) 0.34 (0.26; 0.45) 969.31 0.0002 1.00 b0.0001
; 0.40) 0.25 (0.18; 0.33) 916.02 <0.0001 0.53 b0.0001; 0.34) 0.21 (0.15; 0.28) 914.60 <0.0001 0.87 b0.0001; 0.23) 0.21 (0.16; 0.29) 877.48 <0.0001 1.00 b0.0001; 0.19) 0.19 (0.14; 0.26) 882.03 <0.0001 1.00 b0.0001
; 0.11) 0.24 (0.18; 0.33) 928.65 <0.0001 1.00 b0.0001; 0.18) 0.27 (0.20; 0.37) 948.68 <0.0001 1.00 b0.0001; 0.21) 0.35 (0.27; 0.47) 1029.27 <0.0001 1.00 b0.0001; 0.27) 0.63 (0.49; 0.79) 1077.54 0.04 1.00 b0.0001; 0) 0.21 (0.15; 0.28) 946.32 <0.0001 1.00 b0.0001; 0.19) 0.25 (0.19; 0.35) 1025.94 <0.0001 1.00 b0.0001
ividual-specific (unique) environmental influences; CI=confidence interval; −2Lnl=genetic (A) effects; no C=test of AE model, i.e., hypothesis of no shared environmentalred environmental) effects; WM=white matter; Inf.=inferior.in bold font.
not included in the cortical surface reconstruction.

Table 2Regional cortical thickness measures adjusted for age and site: parameter estimates for univariate ACE models and tests of submodels.
Region of interest rMZ rDZ Variance components p-values
a2 95% CI c2 95% CI e2 95% CI −2Lnl no A no C no AC
Frontal lobeSuperior frontal gyrus—L 0.79 0.21 0.75 (0.53; 0.81) 0.00 (0; 0.21) 0.25 (0.19; 0.34) 1003.70 <0.0001 1.00 b0.0001Superior frontal gyrus—R 0.72 0.26 0.68 (0.33; 0.76) 0.00 (0; 0.32) 0.32 (0.24; 0.42) 1026.60 0.0001 1.00 b0.0001
Middle frontal gyrusRostral division—L 0.48 0.13 0.45 (0.15; 0.58) 0.00 (0; 0.24) 0.55 (0.42; 0.70) 1076.41 0.01 1.00 b0.0001Rostral division—R 0.53 0.23 0.52 (0.16; 0.63) 0.00 (0; 0.30) 0.48 (0.37; 0.62) 1072.43 0.01 1.00 b0.0001Caudal division—L 0.63 0.06 0.57 (0.35; 0.67) 0.00 (0; 0.17) 0.43 (0.33; 0.56) 1089.44 0.0001 1.00 b0.0001Caudal division—R 0.60 0.36 0.41 (0.03; 0.68) 0.17 (0; 0.50) 0.42 (0.32; 0.55) 1083.08 0.04 0.37 b0.0001
Inferior frontal gyrusPars opercularis—L 0.64 0.23 0.62 (0.36; 0.72) 0.00 (0; 0.23) 0.38 (0.28; 0.50) 1075.05 0.0001 1.00 b0.0001Pars opercularis—R 0.42 0.08 0.37 (0; 0.50) 0.00 (0; 0.31) 0.63 (0.50; 0.78) 1099.11 0.05 1.00 b0.0001Pars triangularis—L 0.48 0.13 0.44 (0.08; 0.57) 0.00 (0; 0.31) 0.56 (0.43; 0.70) 1126.59 0.02 1.00 b0.0001Pars triangularis—R 0.44 0.06 0.40 (0.14; 0.54) 0.00 (0; 0.20) 0.60 (0.46; 0.75) 1119.28 0.01 1.00 b0.0001Pars orbitalis—L 0.42 0.07 0.37 (0.08; 0.51) 0.00 (0; 0.22) 0.63 (0.49; 0.79) 1086.29 0.02 1.00 b0.0001Pars orbitalis—R 0.48 0.20 0.47 (0.13; 0.59) 0.00 (0; 0.27) 0.53 (0.41; 0.68) 1115.41 0.01 1.00 b0.0001
Orbitofrontal cortexLateral division—L 0.50 0.12 0.47 (0.21; 0.59) 0.00 (0; 0.20) 0.53 (0.41; 0.68) 1067.63 0.003 1.00 b0.0001Lateral division—R 0.56 0.07 0.52 (0.32; 0.64) 0.00 (0; 0.15) 0.48 (0.36; 0.63) 1097.87 0.0002 1.00 b0.0001Medial division—L 0.38 0.11 0.35 (0; 0.49) 0.00 (0; 0.32) 0.65 (0.51; 0.80) 1126.70 0.07 1.00 b0.0001Medial division—R 0.39 0.17 0.39 (0; 0.53) 0.00 (0; 0.30) 0.61 (0.47; 0.77) 1111.77 0.05 1.00 b0.0001Frontal pole—L 0.37 0.01 0.32 (0.07; 0.47) 0.00 (0; 0.17) 0.68 (0.53; 0.86) 1131.85 0.02 1.00 0.00Frontal pole—R 0.17 0.01 0.14 (0; 0.31) 0.00 (0; 0.20) 0.86 (0.69; 1.00) 1128.59 0.33 1.00 0.30Precentral gyrus—L 0.37 −0.01 0.66 (0.43; 0.74) 0.00 (0; 0.19) 0.34 (0.26; 0.45) 1064.42 <0.0001 1.00 b0.0001Precentral gyrus—R 0.17 0.01 0.60 (0.22; 0.73) 0.05 (0; 0.38) 0.35 (0.27; 0.46) 1045.79 0.00 0.78 b0.0001Paracentral lobule—L 0.69 0.20 0.62 (0.26; 0.71) 0.00 (0; 0.32) 0.38 (0.29; 0.49) 1074.72 0.001 1.00 b0.0001Paracentral lobule—R 0.67 0.34 0.64 (0.37; 0.73) 0.00 (0; 0.25) 0.36 (0.27; 0.47) 1071.23 <0.0001 1.00 b0.0001
Parietal lobePostcentral gyrus-L 0.63 0.21 0.59 (0.26; 0.69) 0.00 (0; 0.29) 0.41 (0.31; 0.53) 1074.82 0.001 1.00 b0.0001Postcentral gyrus—R 0.71 0.20 0.65 (0.33; 0.73) 0.00 (0; 0.29) 0.35 (0.27; 0.46) 1053.04 0.0002 1.00 b0.0001Supramarginal Gyrus—L 0.61 0.23 0.58 (0.21; 0.68) 0.00 (0; 0.32) 0.42 (0.32; 0.54) 1083.97 0.003 1.00 b0.0001Supramarginal gyrus—R 0.56 0.15 0.51 (0.19; 0.63) 0.00 (0; 0.28) 0.49 (0.37; 0.62) 1094.60 0.004 1.00 b0.0001Superior parietal cortex—L 0.64 0.24 0.62 (0.30; 0.71) 0.00 (0; 0.28) 0.38 (0.29; 0.50) 1060.71 0.0005 1.00 b0.0001Superior parietal cortex—R 0.70 0.15 0.67 (0.47; 0.75) 0.00 (0; 0.17) 0.33 (0.25; 0.44) 1049.06 <0.0001 1.00 b0.0001Inferior parietal cortex—L 0.67 0.23 0.65 (0.37; 0.74) 0.00 (0; 0.24) 0.35 (0.26; 0.46) 1026.90 <0.0001 1.00 b0.0001Inferior parietal cortex—R 0.52 0.16 0.50 (0.18; 0.61) 0.00 (0; 0.26) 0.50 (0.39; 0.65) 1064.35 0.01 1.00 b0.0001Precuneus—L 0.71 0.09 0.66 (0.47; 0.74) 0.00 (0; 0.15) 0.34 (0.26; 0.46) 1085.46 <0.0001 1.00 b0.0001Precuneus—R 0.64 0.07 0.57 (0.33; 0.67) 0.00 (0; 0.21) 0.43 (0.33; 0.55) 1073.97 0.0003 1.00 b0.0001
Occipital lobeLingual gyrus—L 0.57 0.28 0.57 (0.19; 0.67) 0.00 (0; 0.32) 0.43 (0.33; 0.56) 1072.86 0.004 1.00 b0.0001Lingual gyrus—R 0.61 0.27 0.60 (0.28; 0.70) 0.00 (0; 0.27) 0.40 (0.30; 0.53) 1059.52 0.001 1.00 b0.0001Pericalcarine cortex—L 0.57 −0.09 0.46 (0.27; 0.58) 0.00 (0; 0.15) 0.54 (0.42; 0.68) 1107.95 0.001 1.00 b0.0001Pericalcarine cortex—R 0.43 0.15 0.39 (0; 0.51) 0.00 (0; 0.39) 0.61 (0.49; 0.76) 1100.20 0.11 1.00 b0.0001Cuneus—L 0.59 0.02 0.51 (0.27; 0.62) 0.00 (0; 0.20) 0.49 (0.38; 0.62) 1076.76 0.001 1.00 b0.0001Cuneus—R 0.62 0.17 0.57 (0.26; 0.67) 0.00 (0; 0.27) 0.43 (0.33; 0.56) 1062.02 0.001 1.00 b0.0001Lateral occipital cortex—L 0.61 0.17 0.57 (0.27; 0.67) 0.00 (0; 0.25) 0.43 (0.33; 0.56) 1073.60 0.001 1.00 b0.0001Lateral occipital cortex—R 0.59 0.16 0.55 (0.26; 0.65) 0.00 (0; 0.25) 0.45 (0.35; 0.58) 1064.85 0.001 1.00 b0.0001
Temporal lobeLateral aspectSuperior temporal gyrus—L 0.60 0.03 0.53 (0.33; 0.64) 0.00 (0; 0.16) 0.47 (0.36; 0.60) 1098.14 0.0002 1.00 b0.0001Superior temporal gyrus—R 0.71 0.34 0.54 (0.18; 0.74) 0.12 (0; 0.45) 0.33 (0.25; 0.44) 1036.85 0.003 0.54 b0.0001Middle temporal gyrus—L 0.44 0.10 0.39 (0.02; 0.52) 0.00 (0; 0.31) 0.61 (0.48; 0.76) 1093.45 0.04 1.00 b0.0001Middle temporal gyrus—R 0.45 0.21 0.46 (0.05; 0.58) 0.00 (0; 0.32) 0.54 (0.42; 0.70) 1082.33 0.03 1.00 b0.0001Inferior temporal gyrus—L 0.45 0.25 0.45 (0.01; 0.58) 0.00 (0; 0.35) 0.55 (0.42; 0.71) 1075.43 0.04 1.00 b0.0001Inferior temporal gyrus—R 0.51 0.35 0.40 (0; 0.66) 0.14 (0; 0.46) 0.45 (0.34; 0.60) 1059.33 0.05 0.43 b0.0001Transv. temporal cortex—L 0.58 0.21 0.58 (0.32; 0.68) 0.00 (0; 0.20) 0.42 (0.32; 0.56) 1100.85 0.0004 1.00 b0.0001Transv. temporal cortex—R 0.55 0.12 0.50 (0.19; 0.61) 0.00 (0; 0.26) 0.50 (0.39; 0.64) 1101.37 0.005 1.00 b0.0001Banks Sup. Temp. sulcus—L 0.02 0.09 0.00 (0; 0.22) 0.05 (0; 0.19) 0.95 (0.78; 1.00) 1129.39 1.00 0.61 0.74Banks Sup. Temp. sulcus—R 0.21 0.15 0.08 (0; 0.37) 0.13 (0; 0.32) 0.79 (0.63; 0.95) 1099.91 0.76 0.57 0.02
Medial aspectEntorhinal cortex—L 0.32 0.28 0.21 (0; 0.51) 0.14 (0; 0.40) 0.65 (0.49; 0.82) 1127.90 0.40 0.46 b0.0001Entorhinal cortex—R 0.38 0.19 0.34 (0; 0.52) 0.04 (0; 0.39) 0.62 (0.48; 0.79) 1095.55 0.17 0.84 b0.0001Parahippocampal gyrus—L 0.44 0.24 0.46 (0; 0.59) 0.01 (0; 0.37) 0.53 (0.41; 0.70) 1084.41 0.05 1.00 b0.0001Parahippocampal gyrus—R 0.56 0.22 0.55 (0.24; 0.66) 0.00 (0; 0.25) 0.45 (0.34; 0.58) 1075.46 0.002 1.00 b0.0001Temporal pole—L 0.56 −0.03 0.47 (0.26; 0.59) 0.00 (0; 0.17) 0.53 (0.41; 0.67) 1082.58 0.001 1.00 b0.0001Temporal pole—R 0.32 −0.07 0.25 (0; 0.40) 0.00 (0; 0.20) 0.75 (0.60; 0.92) 1112.59 0.06 1.00 0.01Fusiform gyrus—L 0.47 0.20 0.46 (0.05; 0.58) 0.00 (0; 0.33) 0.54 (0.42; 0.69) 1048.02 0.03 1.00 b0.0001Fusiform gyrus—R 0.52 0.28 0.54 (0.12; 0.65) 0.00 (0; 0.34) 0.46 (0.35; 0.61) 1045.61 0.01 1.00 b0.0001
1218 W.S. Kremen et al. / NeuroImage 49 (2010) 1213–1223

Table 2 (continued)
Region of interest rMZ rDZ Variance components p-values
a2 95% CI c2 95% CI e2 95% CI −2Lnl no A no C no AC
Cingulate cortexRostral anterior division—L 0.25 0.16 0.14 (0; 0.40) 0.10 (0; 0.33) 0.76 (0.60; 0.92) 1117.04 0.61 0.65 0.01Rostral anterior division—R 0.22 0.27 0.00 (0; 0.36) 0.24 (0; 0.37) 0.76 (0.62; 0.89) 1118.24 1.00 0.14 b0.0001Caudal anterior division—L 0.23 0.28 0.00 (0; 0.38) 0.26 (0; 0.38) 0.74 (0.60; 0.88) 1129.26 1.00 0.14 b0.0001Caudal anterior division—R 0.45 0.13 0.43 (0.12; 0.56) 0.00 (0; 0.24) 0.57 (0.44; 0.72) 1103.94 0.01 1.00 b0.0001Rostral posterior division—L 0.43 0.15 0.42 (0.04; 0.55) 0.00 (0; 0.31) 0.58 (0.45; 0.73) 1102.90 0.03 1.00 b0.0001Rostral posterior division—R 0.48 0.07 0.47 (0.21; 0.60) 0.00 (0; 0.20) 0.53 (0.40; 0.68) 1074.89 0.003 1.00 b0.0001Retrosplenial cortex—L 0.56 0.21 0.54 (0.20; 0.65) 0.00 (0; 0.28) 0.46 (0.35; 0.59) 1100.87 0.003 1.00 b0.0001Retrosplenial cortex—R 0.47 0.35 0.20 (0; 0.58) 0.27 (0; 0.52) 0.53 (0.41; 0.68) 1106.43 0.34 0.18 b0.0001
a2=additive genetic influences; c2=shared (common) environmental influences; e2=individual-specific (unique) environmental influences; CI=Confidence interval; −2Lnl=−2 log-likelihood for full the model; no A=test of CE model, i.e., hypothesis of no additive genetic (A) effects; no C=test of AE model, i.e., hypothesis of no shared environmentaleffects; no AC=test of E only model, i.e., hypothesis of no familial (additive genetic or shared environmental) effects; Transv.=transverse; Sup. Temp.=superior temporal.Significant genetic influences based on ACE models (pb 0.05 in “no A” column) are shown in bold font.
1219W.S. Kremen et al. / NeuroImage 49 (2010) 1213–1223
Unadjusted volume measures
Global volumes measures, subcortical gray matter ROIs (thalamus,caudate, putamen, pallidum, hippocampus, amygdala, nucleus accum-bens), and ventricular measures were generally highly heritable. Theaverage heritabilities for these three groups of measures were 0.82,0.73, and 0.71, respectively.
Volume measures adjusted for TIV
The average heritability of the global volume measures was 0.72.Heritabilities for total gray matter and white matter volumes rangedfrom 0.70 to 0.77, and the heritability of white matter hypointensityvolume was 0.62. The mean heritability of subcortical gray matter
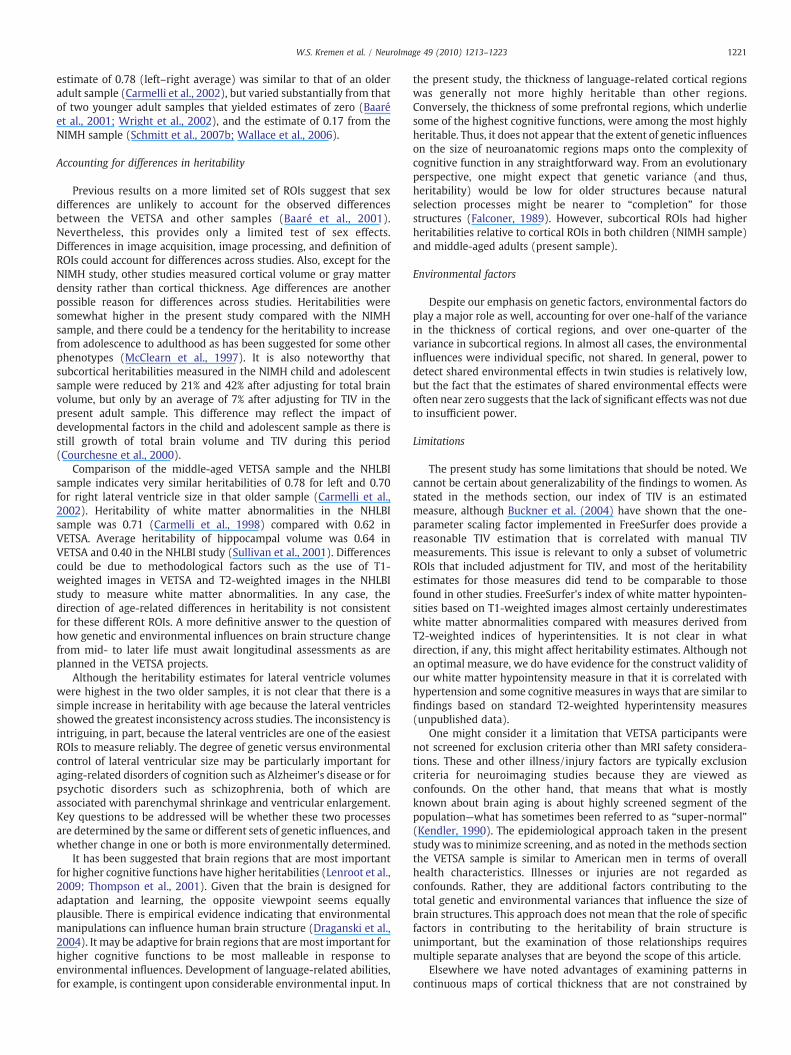
Fig. 3. Heritabilities of the thickness of specific cortica
ROIs was 0.68 for both left–right hemisphere regions (range=0.48–0.85). These tended to be highest in basal ganglia structures (puta-men, caudate, pallidum), with a range of 0.66 to 0.85. The next highestheritabilities were in limbic and diencephalic regions (hippocampus,amygdala, thalamus), with a range of 0.60 to 0.68. The averageheritability of ventricular measures was 0.68. The reductions inheritability for these volume measures after adjusting for TIVaveraged 8%.
Cortical thickness measures
The average heritability of the individual ROIs within each majorlobe was 0.60 for parietal, 0.53 for occipital, 0.49 for frontal, and0.40 for temporal. The average left–right difference was less than
l ROIs defined according to Desikan et al. (2006).

1220 W.S. Kremen et al. / NeuroImage 49 (2010) 1213–1223
0.01 for each of the major lobes. The average heritabilities were notdifferent for the lateral (0.39) and medial (0.41) aspects of thetemporal lobe. Average heritability of thickness for all specificcortical ROIs was 0.47 in the left hemisphere and 0.45 in the righthemisphere (range=0.00–0.75). Heritability was moderate forparahippocampal gyrus (0.46 left; 0.55 right) but lower forentorhinal cortex (0.21 left; 0.34 right). The average heritability ofthe cingulate cortex thickness was 0.29 for both the left and theright hemisphere, but there was considerable variability withestimates ranging from 0.00 to 0.54.
Cortical volume measures
Our focus was on thickness, but many studies report volumemeasures of cortical ROIs. The overall average heritability of theunadjusted cortical ROI volumes was 0.44 compared with 0.46 for theoverall average for thickness ROIs. Adjusting for TIV did not affectcortical thickness heritability (mean=0.45), but it did reduce averagecortical volume heritability to 0.31. This constitutes an averagereduction of 30% for the heritability of cortical volumes comparedwith only 2% for cortical thickness.
False discovery rate
Significance of the heritabilities can be determined by the columnshowing no A effects or by the 95% CIs in the tables. All of theheritabilities for global, subcortical, and other volume-based ROIswere statistically significant. In total, there were 96 ROIs, and basedon the ACE models, 91 of the 96 ROIs (95%) had significantheritability at the pb 0.05 level. As defined by Benjamini andHochberg (1995), the false discovery rate is determined bycomputing ai by ranking the p-value of each of the n tests fromsmallest (p1) to largest (pn) and multiplying each p-value by ndivided by the rank (i) of that p-value (ai=pi⁎n/i). If we allow for a5% false discovery rate, all tests for which aib 0.05 would beconsidered as significant. Based on that criterion, only 4 out of 91ROIs would be considered false discoveries. Even those four would beconsidered marginally significant, with ai values ranging from 0.053to 0.055. Because the C estimates were near zero in most cases, itwas possible to drop C without any significant loss in model fit. In theresulting AE models, the 95% CIs for the A components were muchnarrower than they were in ACE models and only two had p-valuesN0.05. The AE models may also be useful for comparison with otherreports; see Supplementary Table 1 for volume-based measures andSupplementary Table 2 for cortical thickness measures. Finally,homologous regions in the left and right hemispheres tended tohave very similar heritabilities. There was considerable overlap in the95% CIs for all homologous left–right pairings, suggesting thatdifferences in heritability were not significant.
Discussion
To our knowledge, this is the first large-scale study tocomprehensively examine genetic and environmental influenceson the size of specific cortical, subcortical, and ventricular brainstructures all in the same individuals. On average, about 70% of thevariance in the size of subcortical ROIs and ventricles is determinedby genetic factors. Cortical ROIs showed a moderate degree ofgenetic influence, accounting, on average, for about 45% of thevariance in thickness. There was also greater variability among thecortical ROIs, with heritabilities ranging from 0.00 to 0.75 comparedwith 0.48 to 0.85 for the subcortical ROIs. On average, heritabilitiesfor homologous left hemisphere and right hemisphere regions wereroughly equivalent.
Cortical thickness measures
The left and right hemisphere similarities are consistent with theNIMH child and adolescent sample. The average heritability of allspecific cortical ROIs of 0.46 in the present studywas somewhat higherthan the average of 0.31 in the NIMH sample. With regard to specificcortical regions, superior frontal gyrus, pre- and postcentral gyri, andsupramarginal gyrus were among those with the highest heritabilitiesin both studies. However, there were also several inconsistenciesregarding specific regionswith the highest or lowest heritabilities. Theresults in the present study were not especially consistent with thoseofWright et al. (2002), but their sample size of only 19 twin pairs maybe unlikely to provide reliable heritability estimates.
There are also voxel-based or point-by-point analyses of brainstructure. We have performed similar analyses in other work with theVETSA sample (Rimol et al., in press), but such analyses are not readilycomparable to ROI-based analyses. For example, Thompson et al.(2001) examined a continuous map of gray matter density (i.e.,proportion of voxels classified as gray matter), so that there are notROIs that can be compared with the present study. Many of theheritabilities reported in that study were between 0.90 and 1.00,higher than any observed in the present study. Heritabilities inhomologous left and right regions were reported to be significantlyhigher in Wernicke's areas than in its right hemisphere homologue.However, as stated by Thompson et al. (2001), “With a sample size ofonly 40 twins, heritability coefficients cannot be estimated precisely,and limited statistical power precludes the detection of differences inheritability between individual regions of cortex.” Hulshoff Pol et al.(2006) identified 14 gray matter density voxels with significantheritability and the regions in which they were located, but it may bemisleading to compare significant heritability in a few voxels withinan ROI versus the heritability of the entire ROI. Indeed, if the othervoxels within the ROI were not significantly heritable, the logicalconclusion may be that the size of that ROI as a whole is not heritable.Also, in these studies, dramatic adjustments were made to the family-wise error rate to correct for multiple testing. That approach protectsagainst any type I error but substantially increases the risk of failing todetect true effects. In our study, we controlled the expected falsediscovery rate, i.e., the proportion of significant results that areactually type I errors. That analysis indicated that 79 of 83 significantheritabilities were likely to be truly significant. Given the priorliterature on the heritability of brain structures, it is reasonable toexpect that most ROIs would be heritable.
In contrast to our detailed characterization of cortical thickness,we presented only a brief summary of results for cortical volumemeasures. An advantage of cortical thickness is that, unlike corticalvolume measures, heritability estimates were unrelated to TIV.Consequently, the difficulties of interpreting adjusted versus unad-justed ROIs are avoided for cortical thicknessmeasures. Elsewhere, wehave shown that cortical thickness and surface area are determined bylargely independent sets of genes; because volume is basically theproduct of thickness and surface area, it is not possible to separatethese two sources of genetic variance if the phenotype is corticalvolume (Panizzon et al., 2009). Analysis of genetic and environmentalinfluences on the surface area of each of the cortical ROIs is the subjectof a separate article.
Volume measures
The present results are consistent with two of three reports forhippocampal volume (Sullivan et al., 2001; van Erp et al., 2004;Wright et al., 2002). Our heritability estimates for cerebellar volumewere fairly similar to that of another large adult twin sample(Posthuma et al., 2000), but they were substantially lower in theNIMH sample (Wallace et al., 2006). The most extreme variabilityacross studies is in the heritability of the lateral ventricles. Our
1221W.S. Kremen et al. / NeuroImage 49 (2010) 1213–1223
estimate of 0.78 (left–right average) was similar to that of an olderadult sample (Carmelli et al., 2002), but varied substantially from thatof two younger adult samples that yielded estimates of zero (Baaréet al., 2001; Wright et al., 2002), and the estimate of 0.17 from theNIMH sample (Schmitt et al., 2007b; Wallace et al., 2006).
Accounting for differences in heritability
Previous results on a more limited set of ROIs suggest that sexdifferences are unlikely to account for the observed differencesbetween the VETSA and other samples (Baaré et al., 2001).Nevertheless, this provides only a limited test of sex effects.Differences in image acquisition, image processing, and definition ofROIs could account for differences across studies. Also, except for theNIMH study, other studies measured cortical volume or gray matterdensity rather than cortical thickness. Age differences are anotherpossible reason for differences across studies. Heritabilities weresomewhat higher in the present study compared with the NIMHsample, and there could be a tendency for the heritability to increasefrom adolescence to adulthood as has been suggested for some otherphenotypes (McClearn et al., 1997). It is also noteworthy thatsubcortical heritabilities measured in the NIMH child and adolescentsample were reduced by 21% and 42% after adjusting for total brainvolume, but only by an average of 7% after adjusting for TIV in thepresent adult sample. This difference may reflect the impact ofdevelopmental factors in the child and adolescent sample as there isstill growth of total brain volume and TIV during this period(Courchesne et al., 2000).
Comparison of the middle-aged VETSA sample and the NHLBIsample indicates very similar heritabilities of 0.78 for left and 0.70for right lateral ventricle size in that older sample (Carmelli et al.,2002). Heritability of white matter abnormalities in the NHLBIsample was 0.71 (Carmelli et al., 1998) compared with 0.62 inVETSA. Average heritability of hippocampal volume was 0.64 inVETSA and 0.40 in the NHLBI study (Sullivan et al., 2001). Differencescould be due to methodological factors such as the use of T1-weighted images in VETSA and T2-weighted images in the NHLBIstudy to measure white matter abnormalities. In any case, thedirection of age-related differences in heritability is not consistentfor these different ROIs. A more definitive answer to the question ofhow genetic and environmental influences on brain structure changefrom mid- to later life must await longitudinal assessments as areplanned in the VETSA projects.
Although the heritability estimates for lateral ventricle volumeswere highest in the two older samples, it is not clear that there is asimple increase in heritability with age because the lateral ventriclesshowed the greatest inconsistency across studies. The inconsistency isintriguing, in part, because the lateral ventricles are one of the easiestROIs to measure reliably. The degree of genetic versus environmentalcontrol of lateral ventricular size may be particularly important foraging-related disorders of cognition such as Alzheimer's disease or forpsychotic disorders such as schizophrenia, both of which areassociated with parenchymal shrinkage and ventricular enlargement.Key questions to be addressed will be whether these two processesare determined by the same or different sets of genetic influences, andwhether change in one or both is more environmentally determined.
It has been suggested that brain regions that are most importantfor higher cognitive functions have higher heritabilities (Lenroot et al.,2009; Thompson et al., 2001). Given that the brain is designed foradaptation and learning, the opposite viewpoint seems equallyplausible. There is empirical evidence indicating that environmentalmanipulations can influence human brain structure (Draganski et al.,2004). It may be adaptive for brain regions that aremost important forhigher cognitive functions to be most malleable in response toenvironmental influences. Development of language-related abilities,for example, is contingent upon considerable environmental input. In
the present study, the thickness of language-related cortical regionswas generally not more highly heritable than other regions.Conversely, the thickness of some prefrontal regions, which underliesome of the highest cognitive functions, were among the most highlyheritable. Thus, it does not appear that the extent of genetic influenceson the size of neuroanatomic regions maps onto the complexity ofcognitive function in any straightforward way. From an evolutionaryperspective, one might expect that genetic variance (and thus,heritability) would be low for older structures because naturalselection processes might be nearer to “completion” for thosestructures (Falconer, 1989). However, subcortical ROIs had higherheritabilities relative to cortical ROIs in both children (NIMH sample)and middle-aged adults (present sample).
Environmental factors
Despite our emphasis on genetic factors, environmental factors doplay a major role as well, accounting for over one-half of the variancein the thickness of cortical regions, and over one-quarter of thevariance in subcortical regions. In almost all cases, the environmentalinfluences were individual specific, not shared. In general, power todetect shared environmental effects in twin studies is relatively low,but the fact that the estimates of shared environmental effects wereoften near zero suggests that the lack of significant effects was not dueto insufficient power.
Limitations
The present study has some limitations that should be noted. Wecannot be certain about generalizability of the findings to women. Asstated in the methods section, our index of TIV is an estimatedmeasure, although Buckner et al. (2004) have shown that the one-parameter scaling factor implemented in FreeSurfer does provide areasonable TIV estimation that is correlated with manual TIVmeasurements. This issue is relevant to only a subset of volumetricROIs that included adjustment for TIV, and most of the heritabilityestimates for those measures did tend to be comparable to thosefound in other studies. FreeSurfer's index of white matter hypointen-sities based on T1-weighted images almost certainly underestimateswhite matter abnormalities compared with measures derived fromT2-weighted indices of hyperintensities. It is not clear in whatdirection, if any, this might affect heritability estimates. Although notan optimal measure, we do have evidence for the construct validity ofour white matter hypointensity measure in that it is correlated withhypertension and some cognitive measures in ways that are similar tofindings based on standard T2-weighted hyperintensity measures(unpublished data).
One might consider it a limitation that VETSA participants werenot screened for exclusion criteria other than MRI safety considera-tions. These and other illness/injury factors are typically exclusioncriteria for neuroimaging studies because they are viewed asconfounds. On the other hand, that means that what is mostlyknown about brain aging is about highly screened segment of thepopulation—what has sometimes been referred to as “super-normal”(Kendler, 1990). The epidemiological approach taken in the presentstudy was to minimize screening, and as noted in the methods sectionthe VETSA sample is similar to American men in terms of overallhealth characteristics. Illnesses or injuries are not regarded asconfounds. Rather, they are additional factors contributing to thetotal genetic and environmental variances that influence the size ofbrain structures. This approach does not mean that the role of specificfactors in contributing to the heritability of brain structure isunimportant, but the examination of those relationships requiresmultiple separate analyses that are beyond the scope of this article.
Elsewhere we have noted advantages of examining patterns incontinuous maps of cortical thickness that are not constrained by

1222 W.S. Kremen et al. / NeuroImage 49 (2010) 1213–1223
traditional ROI boundaries (Rimol et al., in press), although it isimportant to examine genetic and environmental influences on thebasis of traditional ROIs as well. These types of ROIs are widely used,and they do have anatomical and functional significance and providecomparison for much existing work. Moreover, subcortical structureswithout the layered structure of the cortex are less amenable tocontinuous maps.
Implications
The considerable variability in heritability across individual ROIsprovides insight toward a better understanding of the effect of geneson brain structure and function, an important goal in the post-genomic era. The findings are also relevant to candidate gene andgenetic association studies because they contribute importantinformation regarding brain endophenotypes that might be used inthe study of cognitive and brain aging as well as neurological andpsychiatric disorders. Future work may elucidate the geneticarchitecture across different brain regions in multivariate analyses,and longitudinal analyses may reveal changes in genetic andenvironmental influences that take place in normal and pathologicalbrain aging.
Acknowledgments
Funded by the National Institute on Aging (AG022381, AG018384,AG018386, AG022982); the National Center for Research Resources(P41-RR14075; NCRR BIRN Morphometric Project BIRN002); theNational Institute for Biomedical Imaging and Bioengineering(R01EB006758); the National Institute for Neurological Disordersand Stroke (R01 NS052585-01); and the Mental Illness andNeuroscience Discovery (MIND) Institute, part of the National Alliancefor Medical Image Computing (NAMIC), funded by the NationalInstitutes of Health through the NIH Roadmap for Medical Research,Grant U54 EB005149. Additional support was provided by The Autism& Dyslexia Project funded by the Ellison Medical Foundation. The U.S.Department of Veterans Affairs has provided financial support for thedevelopment and maintenance of the Vietnam Era Twin (VET)Registry. Numerous organizations have provided invaluable assis-tance in the conduct of this study, including the Department ofDefense; the National Personnel Records Center, National Archivesand Records Administration; the Internal Revenue Service; theNational Opinion Research Center; the National Research Council,National Academy of Sciences; and the Institute for Survey Research,Temple University. Most importantly, the authors gratefully acknowl-edge the continued cooperation and participation of the members ofthe VET Registry and their families. Without their contribution thisresearch would not have been possible.
Appendix A. Supplementary data
Supplementary data associated with this article can be found, inthe online version, at doi:10.1016/j.neuroimage.2009.09.043.
References
Baaré, W.F.C., Hulshoff Pol, H.F., Boomsma, D.I., Posthuma, D., de Geus, E.J.C., Schnack, H.G., van Haren, N.E.M., van Oel, C.J., Kahn, R.S., 2001. Quantitative genetic modelingof variation in human brain morphology. Cereb. Cortex 11, 816–824.
Benjamini, Y., Hochberg, Y., 1995. Controlling the false discovery rate: a practical andpowerful approach to multiple testing. J. R. Stat. Soc. Ser. B (Methodological) 57,289–300.
Buckner, R.L., Head, D., Parker, J., Fotenos, A.F., Marcus, D., Morris, J.C., Snyder, A.Z., 2004.A unified approach for morphometric and functional data analysis in young, old,and demented adults using automated atlas-based head size normalization:reliability and validation against manual measurement of total intracranial volume.NeuroImage 23, 724–738.
Carmelli, D., DeCarli, C., Swan, G.E., Jack, L.M., Reed, T., Wolf, P.A., Miller, B.L., 1998.Evidence for genetic variance in white matter hyperintensity volume in normalelderly male twins. Stroke 29, 1177–1181.
Carmelli, D., Swan, G.E., DeCarli, C., Reed, T., 2002. Quantitative genetic modeling ofregional brain volumes and cognitive performance in older male twins. Biol.Psychol. 61, 139–155.
Chou, Y.Y., Lepore, N., Chiang, M.C., Avedissian, C., Barysheva, M., McMahon, K.L., deZubicaray, G.I., Meredith, M., Wright, M.J., Toga, A.W., Thompson, P.M., 2008.Mapping genetic influences on ventricular structure in twins. NeuroImage 44,1312–1323.
Courchesne, E., Chisum, H.J., Townsend, J., Cowles, A., Covington, J., Egaas, B., Harwood,M., Hinds, S., Press, G.A., 2000. Normal brain development and aging: quantitativeanalysis at in vivo MR imaging in healthy volunteers. Radiology 216, 672–682.
Dale, A.M., Sereno, M.I., 1993. Improved localization of cortical activity by combiningEEG and MEG with MRI cortical surface reconstruction: a linear approach. J. Cogn.Neurosci. 5, 162–176.
Dale, A.M., Fischl, B., Sereno, M.I., 1999. Cortical surface-based analysis. I: segmentationand surface reconstruction. NeuroImage 9, 179–194.
Desikan, R.S., Segonne, F., Fischl, B., Quinn, B.T., Dickerson, B.C., Blacker, D., Buckner, R.L.,Dale, A.M., Maguire, R.P., Hyman, B.T., Albert, M.S., Killiany, R.J., 2006. An automatedlabeling system for subdividing the human cerebral cortex on MRI scans into gyralbased regions of interest. NeuroImage 31, 968–980.
Dickerson, B.C., Fenstermacher, E., Salat, D.H., Wolk, D.A., Maguire, R.P., Desikan, R.,Pacheco, J., Quinn, B.T., Van der Kouwe, A., Greve, D.N., Blacker, D., Albert, M.S.,Killiany, R.J., Fischl, B., 2008. Detection of cortical thickness correlates of cognitiveperformance: reliability across MRI scan sessions, scanners, and field strengths.NeuroImage 39, 10–18.
Draganski, B., Gaser, C., Busch, V., Schuierer, G., Bogdahn, U., May, A., 2004.Neuroplasticity: changes in grey matter induced by training. Nature 427, 311–312.
Eaves, L.J., Last, K.A., Young, P.A., Martin, N.G., 1978. Model-fitting approaches to theanalysis of human behavior. Heredity 41, 249–320.
Falconer, D.S., 1989. Introduction to Quantitative Genetics, 3rd ed. Longsman Green/Wiley, Essex, UK.
Fennema-Notestine, C., Gamst, A.C., Quinn, B.T., Pacheco, J., Jernigan, T.L., Thal, L.,Buckner, R., Killiany, R., Blacker, D., Dale, A.M., Fischl, B., Dickerson, B., Gollub, R.L.,2007. Feasibility of multi-site clinical structural neuroimaging studies of agingusing legacy data. Neuroinformatics 5, 235–245.
Fischl, B., Dale, A.M., 2000. Measuring the thickness of the human cerebral cortex frommagnetic resonance images. Proc. Natl. Acad. Sci. 97, 11050–11055.
Fischl, B., Sereno, M.I., Dale, A.M., 1999. Cortical surface-based analysis. II: inflation,flattening, and a surface-based coordinate system. NeuroImage 9, 195–207.
Fischl, B., Salat, D.H., Busa, E., Albert, M., Dieterich, M., Haselgrove, C., van der Kouwe, A.,Killiany, R., Kennedy, D., Klaveness, S., Montillo, A., Makris, N., Rosen, B., Dale, A.M.,2002. Whole brain segmentation: automated labeling of neuroanatomicalstructures in the human brain. Neuron 33, 341–355.
Fischl, B., Salat, D.H., van der Kouwe, A.J., Makris, N., Segonne, F., Quinn, B.T., Dale, A.M.,2004a. Sequence-independent segmentation of magnetic resonance images.NeuroImage 23 (Suppl. 1), S69–S84.
Fischl, B., van der Kouwe, A., Destrieux, C., Halgren, E., Segonne, F., Salat, D.H., Busa, E.,Seidman, L.J., Goldstein, J., Kennedy, D., Caviness, V., Makris, N., Rosen, B., Dale, A.M.,2004b. Automatically parcellating the human cerebral cortex. Cereb. Cortex 14,11–22.
Glahn, D.C., Thompson, P.M., Blangero, J., 2007. Neuroimaging endophenotypes:strategies for finding genes influencing brain structure and function. Hum. BrainMapp. 28, 488–501.
Han, X., Jovicich, J., Salat, D., van der Kouwe, A., Quinn, B., Czanner, S., Busa, E., Pacheco,J., Albert, M., Killiany, R., Maguire, P., Rosas, D., Makris, N., Dale, A., Dickerson, B.,Fischl, B., 2006. Reliability of MRI-derived measurements of human cerebralcortical thickness: the effects of field strength, scanner upgrade and manufacturer.NeuroImage 32, 180–194.
Hulshoff Pol, H.E., Schnack, H.G., Posthuma, D., Mandl, R.C., Baare, W.F., van Oel, C., vanHaren, N.E., Collins, D.L., Evans, A.C., Amunts, K., Burgel, U., Zilles, K., de Geus, E.,Boomsma, D.I., Kahn, R.S., 2006. Genetic contributions to human brain morphologyand intelligence. J. Neurosci. 26, 10235–10242.
Jovicich, J., Czanner, S., Greve, D., Haley, E., van der Kouwe, A., Gollub, R., Kennedy, D.,Schmitt, F., Brown, G., Macfall, J., Fischl, B., Dale, A.M., 2006. Reliability in multi-sitestructural MRI studies: effects of gradient non-linearity correction on phantom andhuman data. NeuroImage 30, 436–443.
Jovicich, J., Czanner, S., Han, X., Salat, D., van der Kouwe, A., Quinn, B., Pacheco, J., Albert,M., Killiany, R., Blacker, D., Maguire, P., Rosas, D., Makris, N., Gollub, R., Dale, A.,Dickerson, B.C., Fischl, B., 2009. MRI-derived measurements of human subcortical,ventricular and intracranial brain volumes: reliability effects of scan sessions,acquisition sequences, data analyses, scanner upgrade, scanner vendors and fieldstrengths. NeuroImage 46, 177–192.
Kendler, K.S., 1990. The super-normal control group in psychaitric genetics: possibleartifactual evidence for coaggregation. Psychiatr. Genet. 1, 45–53.
Kremen, W.S., Thompson-Brenner, H., Leung, Y.J., Grant, M.D., Franz, C.E., Eisen, S.A.,Jacobson, K.C., Boake, C., Lyons, M.J., 2006. Genes, environment, and time: TheVietnam Era Twin Study of Aging (VETSA). Twin Res. Hum. Genet. 9, 1009–1022.
Lenroot, R.K., Schmitt, J.E., Ordaz, S.J., Wallace, G.L., Neale, M.C., Lerch, J.P., Kendler, K.S.,Evans, A.C., Giedd, J.N., 2009. Differences in genetic and environmental influenceson the human cerebral cortex associated with development during childhood andadolescence. Hum. Brain Mapp. 30, 163–174.
McClearn, G.E., Johansson, B., Berg, S., Pedersen, N.L., Ahern, F., Petrill, S.A., Plomin, R.,1997. Substantial genetic influence on cognitive abilities in twins 80 or more yearsold. Science 276, 1560–1563.

1223W.S. Kremen et al. / NeuroImage 49 (2010) 1213–1223
National Centers for Disease Control and Prevention, 2003–2006. Health DataInteractive. National Center for Health Statistics, Hyattsville, MD.
Neale, M.C., Cardon, L.R., 1992. Methodology for Genetic Studies of Twins and Families.Kluwer Academic Publishers, Dordrecht, The Netherlands.
Neale, M.C., Boker, S.M., Xie, G., Maes, H.H., 2003. Mx: Statistical Modeling, 6th ed.Department of Psychiatry, Medical College of Virginia, Richmond, VA.
Panizzon, M.S., Fennema-Notestine, C., Eyler, L.T., Jernigan, T.L., Prom-Wormley, E.,Neale, M., Jacobson, K., Lyons, M.J., Grant, M.D., Franz, C.E., Xian, H., Tsuang, M.,Fischl, B., Seidman, L., Dale, A., Kremen, W.S., 2009. Distinct genetic influences oncortical surface area and cortical thickness. Cereb. Cortex 19, 2728–2735.
Pennington, B.F., Filipek, P.A., Lefly, D., Chhabildas, N., Kennedy, D.N., Filley, C.M.,Galabura, A., DeFries, J.C., 2000. A twin MRI study of size variations in the humanbrain. J. Cogn. Neurosci. 12, 223–232.
Peper, J.S., Brouwer, R.M., Boomsma, D.I., Kahn, R.S., Hulshoff Pol, H.E., 2007. Geneticinfluences on human brain structure: a review of brain imaging studies in twins.Hum. Brain Mapp. 28, 464–473.
Peper, J.S., Schnack, H.G., Brouwer, R.M., Van Baal, G.C., Pjetri, E., Szekely, E., vanLeeuwen, M., van den Berg, S.M., Collins, D.L., Evans, A.C., Boomsma, D.I., Kahn, R.S.,Hulshoff Pol, H.E., 2009. Heritability of regional and global brain structure at theonset of puberty: a magnetic resonance imaging study in 9-year-old twin pairs.Hum. Brain Mapp. 30, 2184–2196.
Posthuma, D., de Geus, E.J.C., Neale, M.C., Hulshoff Pol, H.E., Baare, W.E.C., Kahn, R.S.,Boomsma, D., 2000. Multivariate genetic analysis of brain structure in an extendedtwin design. Behav. Genet. 30, 311–319.
Rimol, L.M., Panizzon, M.S., Fennema-Notestine, C., Eyler, L.T., Fischl, B., Franz, C.E.,Hagler, D.J., Lyons, M.J., Neale, M.C., Pacheco, J., Perry, M.E., Schmitt, J.E., Grant, M.D.,Seidman, L.J., Thermenos, H.W., Tsuang,M.T., Eisen, S.A., Kremen,W.S., Dale, A.M., inpress. Cortical thickness is influenced by regionally-specific genetic factors.Biological Psychiatry.
Schmitt, J.E., Eyler, L.T., Giedd, J.N., Kremen, W.S., Kendler, K.S., Neale, M.C., 2007a.Review of twin and family studies on neuroanatomic phenotypes and typicalneurodevelopment. Twin Res. Hum. Genet. 10, 683–694.
Schmitt, J.E., Wallace, G.L., Rosenthal, M.A., Molloy, E.A., Ordaz, S., Lenroot, R., Clasen,L.S., Blumenthal, J.D., Kendler, K.S., Neale, M.C., Giedd, J.N., 2007b. A multivariateanalysis of neuroanatomic relationships in a genetically informative pediatricsample. NeuroImage 35, 70–82.
Schmitt, J.E., Lenroot, R.K., Wallace, G.L., Ordaz, S., Taylor, K.N., Kabani, N., Greenstein, D.,Lerch, J.P., Kendler, K.S., Neale, M.C., Giedd, J.N., 2008. Identification of geneticallymediated cortical networks: a multivariate study of pediatric twins and siblings.Cereb. Cortex 18, 1737–1747.
Sullivan, E.V., Pfefferbaum, A., Swan, G.E., Carmelli, D., 2001. Heritability in hippocampalsize in elderly twin men: equivalent influence from genes and environment.Hippocampus 11, 754–762.
Thompson, P.M., Cannon, T.D., Narr, K.L., van Erp, T., Poutanen, V.P., Huttunen, M.,Lonnqvist, J., Standertskjold-Nordenstam, C.G., Kaprio, J., Khaledy, M., Dail, R.,Zoumalan, C.I., Toga, A.W., 2001. Genetic influences on brain structure. Nat.Neurosci. 4, 1253–1258.
Tsuang, M.T., Bar, J.L., Harley, R.M., Lyons, M.J., 2001. The Harvard Twin Study ofSubstance Abuse: what we have learned. Harv. Rev. Psychiatr. 9, 267–279.
van Erp, T.G., Saleh, P.A., Huttunen, M., Lonnqvist, J., Kaprio, J., Salonen, O., Valanne, L.,Poutanen, V.P., Standertskjold-Nordenstam, C.G., Cannon, T.D., 2004. Hippocampalvolumes in schizophrenic twins. Arch. Gen. Psychiatr. 61, 346–353.
Visscher, P.M., 2004. Power of the classical twin design revisited. Twin Res. 7,505–512.
Walhovd, K.B., Fjell, A.M., Reinvang, I., Lundervold, A., Fischl, B., Salat, D., Quinn, B.T.,Makris, N., Dale, A.M., 2005. Cortical volume and speed-of-processing arecomplementary in prediction of performance intelligence. Neuropsychologia 43,704–713.
Wallace, G.L., Schmitt, J.E., Lenroot, R., Viding, E., Ordaz, S., Rosenthal, M.A., Molloy, E.A.,Clasen, L.S., Kendler, K.S., Neale, M.C., Giedd, J.N., 2006. A pediatric twin study ofbrain morphometry. J. Child Psychol. Psychiatr. 47, 987–993.
Wright, I.C., Sham, P., Murray, R.M., Weinberger, D.R., Bullmore, E.T., 2002. Geneticcontributions to regional variability in human brain structure: methods andpreliminary results. NeuroImage 17, 256–271.