A semiautomatic AC/DC thermal voltage converter calibration ...
72
m A 11 101 mb4 A2 NBS PUBLICATIONS NBSIR 32-2576 A Semiautomatic AC/DC Thermal Voltage Converter Calibration System U.3. DEPARTMENT OF COMMERCE National Bureau of Standards National Engineering Laboratory Center for Electronics and Electrical Engineering Electrosyste.-ns Division Washington, DC 20234 September 1932 Final Report -QO- — * ored in part by lOu Department of Defense . U56 ration Coordination Group <J2-23/6 19o 2 C . 2
-
Upload
khangminh22 -
Category
Documents
-
view
0 -
download
0
Transcript of A semiautomatic AC/DC thermal voltage converter calibration ...

mA 11 101 mb4 A2
NBS
PUBLICATIONS
NBSIR 32-2576
A Semiautomatic AC/DC ThermalVoltage Converter Calibration
System
U.3. DEPARTMENT OF COMMERCENational Bureau of Standards
National Engineering Laboratory
Center for Electronics and Electrical Engineering
Electrosyste.-ns Division
Washington, DC 20234
September 1932
Final Report
-QO-—
*
ored in part by
lOu Department of Defense
. U56ration Coordination Group
<J2-23/6
19o2
C . 2

national bureauOP STANDARDS
LIBRARY
MAR U 1983
NBSIR 82-2576
A SEMIAUTOMATIC AC/DC THERMAL 2c?
VOLTAGE CONVERTER CALIBRATIONSYSTEM
K. J. Lentner, S. G. Tremaine
U.S. DEPARTMENT OF COMMERCENational Bureau of Standards
National Engineering Laboratory
Center for Electronics and Electrical Engineering
Electrosystems Division
Washington, DC 20234
September 1 982
Final Report
Sponsored in part by:
U.S. Department of Defense
Calibration Coordination Group
U.S. DEPARTMENT OF COMMERCE, Malcolm Baidrige, Secretary
NATIONAL BUREAU OF STANDARDS, Ernest Ambler, Director


FOREWORD
The development of the system described in this report was partiallyfunded by the U.S. Department of Defense Calibration Coordination Group(DoD/CCG). Members of the DC and LF Committee were from the AerospaceGuidance and Metrology Center, Newark Air Force Station, Newark, Ohio 43055;the U.S. Army Metrology and Calibration Center, Redstone Arsenal,Huntsville, Alabama 35809; and the Metrology Engineering Center, Bureauof Naval Weapons Representative, Pomona, California 91766.
The DoD/CCG project number assigned was CCG 79-123, and work wasperformed under NBS cost center 7220463.
In order to adequately describe the system discussed in this report,commercial equipment and instruments are identified by manufacturer'
s
name and model number. In no case does such identification implyrecommendation or endorsement by the National Bureau of Standards, nordoes it imply that the material or equipment identified is necessarilythe best available for the purpose.
i i i


CONTENTS
Page
Foreword iii
LIST OF TABLES v
LIST OF FIGURES v
Abstract . . . 1
1. INTRODUCTION 1
1.1 Objectives 1
1 .2 Background 1
2. TECHNICAL APPROACH 2
2.1 Principle of Operation2.2 Hardware Considerations 5
2.2.1 General 5
2.2.2 Measurement Procedures 6
2.3 Software Considerations 11
2.3.1 General 11
2.3.2 Operating Procedure for AC/DC Difference Tests ... 14
3. MEASUREMENT RESULTS AND UNCERTAINTIES 20
4. CONCLUSIONS AND RECOMMENDATIONS 23
5. ACKNOWLEDGEMENTS 23
6. REFERENCES 25
APPENDIX A. Hardware 26
APPENDIX B. ACDCHV Detailed Program Descriptionand Program Listing 34
iv


LIST OF TABLES
Page
Table 1. N-Test-F data 13
Table 2. ACCAL data 15
Table 3. Low voltage stability test data 16
Table 4. Stability test data summary 17
Table 5. AC/DC difference data 19
Table 6. Transport standard ac/dc differences (ppm) 21
Table 7. Range of ac/dc differences for transport standard (ppm) . 22
Table 8. AC/DC difference for TVC "FA 50" (ppm) 24
Table 9. AC/DC difference for TVC "FC 100" (ppm) 24
LIST OF FIGURES
Figure 1. Overall view of system 3
Figure 2. System block diagram 4
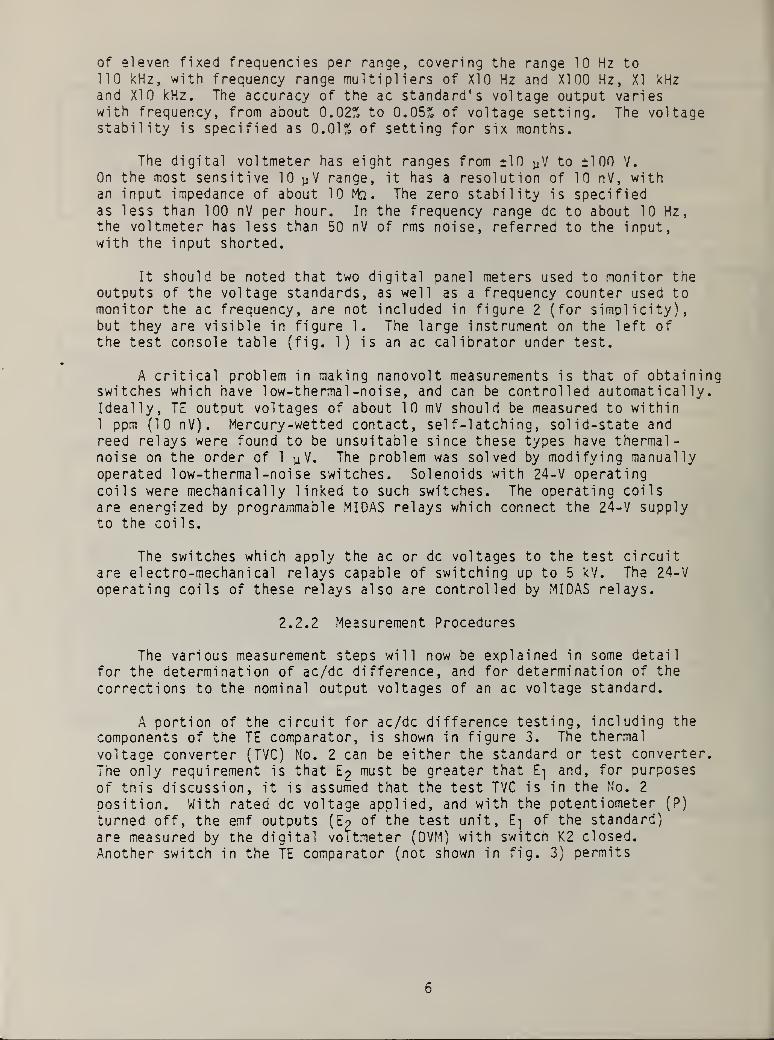
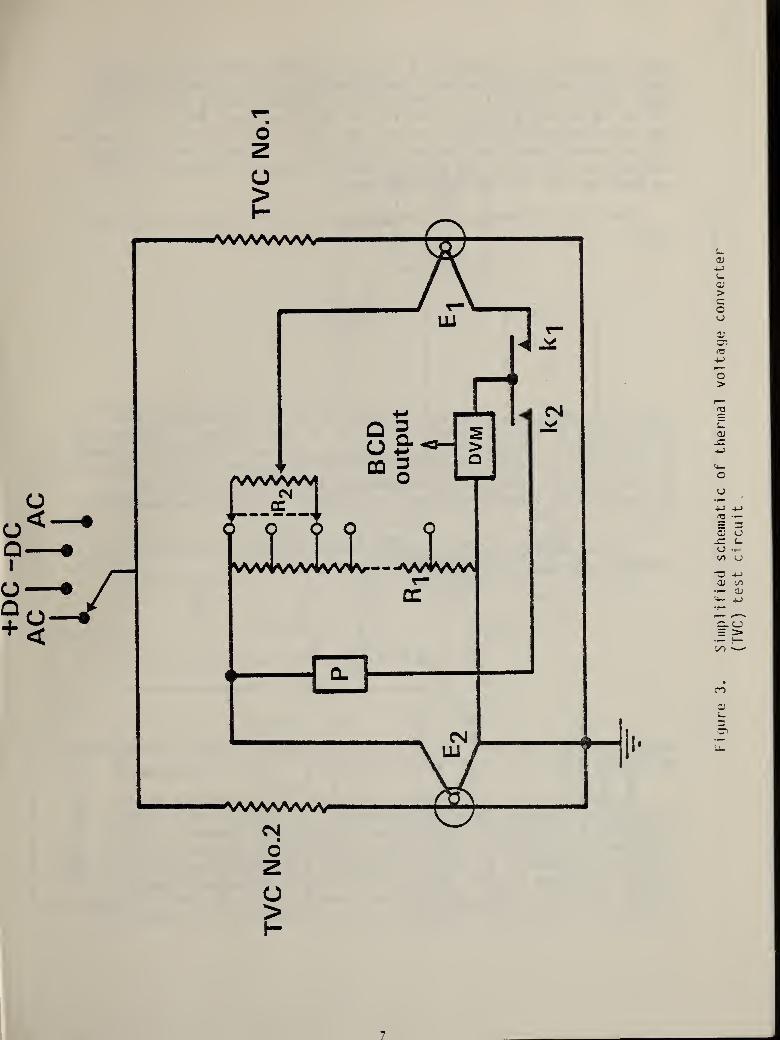
Figure 3. Simplified schematic of thermal voltage converter(TVC) test circuit 7
Figure 4. Block diagram of system for calibrating an ac standardor voltmeter 9
v

.

A SEMIAUTOMATIC AC/DC THERMAL VOLTAGE CONVERTER CALIBRATION SYSTEM
K. J. Lentner and S. G. Tremaine
Abstract
A semiautomatic ac/dc difference calibration system is
described. The system operates over a frequency range of 20 Hz
to TOO kHz, covering the voltage range from 0.5 V to 1 kV. For
all voltages at frequencies in the range from 20 Hz to 20 kHz,
the total uncertainty is 50 parts per million (ppm), and 100 ppmfor voltages at frequencies between 20 kHz and 100 kHz. In
addition to ac/dc difference testing, the system can be readilyadapted to calibrate precision ac digital voltmeters or ac
calibrators. Results of extensive intercomparison testing of
the new system against a manual test system are reported, usinga multi range thermal transfer instrument as a transport standard.The results indicate that the ac/dc differences measured are well
within the combined total uncertainty limits of the two systems.
Key words: ac/dc difference; ac voltage measurement; automation;calibration; metrology; thermal voltage converter.
1. INTRODUCTION
1.1 Objectives
The Semiautomatic AC/DC Thermal Voltage Converter Calibration System,developed at the National Bureau of Standards and described in this report,was designed to use electronic technology to overcome the deficienciesof existing manual test methods. Specific objectives for the new systemincluded: 1) use of commercially available, programmable instrumentswhenever possible; 2) elimination of the need for manual data entry into a
computer for reduction; 3) elimination of the frequent data checks andcross-checks required in manual tests; 4) elimination of as much operatorintervention as possible during the test procedure; 5) simplification of
necessary remaining interaction by providing displayed operator instructionvia computer control; 6) close control of the time interval betweenapplication of both ac and dc voltages to the test circuit in order to
minimize drift effects; and 7) achievement of the same level of uncertaintyas is presently possible with manual testing methods.
1.2 Background
Techniques for performing precision ac/dc difference testing, not
only at the National Bureau of Standards (NBS), but also in other national
and industrial or governmental metrology 1 aboratori es,generally make use
of manual testing methods which utilize photocell preampl i fiers and light-
beam galvanometers as voltage detectors in conjunction with manually
1

balanced voltage comparators [1,2]J Careful attention to the eliminationor reduction of systematic and random uncertainties in testing methods,range resistors, and thermoelements (TE's) has resulted in sufficientconfidence in test data to allow results to be reported with totaluncertainties at the 10-100 ppm level (or better, in some cases) overwide voltage and frequency ranges [3,4]. These manual test methods,however, are very time-consuming and subject to errors due to operatorfatigue. To overcome these deficiencies, and to expedite test reportgeneration, a semiautomatic ac/dc calibration system was developed.
Because of the low-level dc voltages that must be measured(about 10 nV), large temperature coefficients of TE's, ac or dc sourceinstabilities, and dc reversal differences of TE's, stringent requirementsare placed upon the measurement system. In addition, light beam galvanometerssuffer the disadvantage of not being easily adaptable to automation.However, with the advent of digital electronics, digital nanovoltmetersare available with sensitivity, resolution, and accuracy sufficientto meet the requirements of precision automatic ac/dc difference testing.Programmable ac and dc voltage calibrators are also available which lendthemselves to adaption for automatic testing. Advances in analog/digitalinterfaces have greatly improved the ease with which computers can be
used to control these instruments. The semiautomatic system which evolvedis shown in figure 1, and is described in detail in this report. The systemoperates over a frequency range of 20 Hz to 100 kHz, covering the voltagerange from 0.5 V to 1 kV. For all voltages at frequencies in the rangefrom 20 Hz to 20 kHz, the total uncertainty is 50 ppm, and 100 ppm for
all voltages at frequencies between 20 kHz and 100 kHz. In addition to
ac/dc difference testing, the system can be readily adapted to calibratingprecision ac digital voltmeters or ac calibrators. Extensive testing of
the new system using a multirange thermal transfer instrument as a transportstandard indicates that the test results are well within the reporteduncertainty limits. In addition, data obtained with the system indicatethat total random uncertainties (3a limits) of about 3 ppm can be obtainedfor some ac/dc difference tests.
2. TECHNICAL APPROACH
2.1 Principle of Operation
A block diagram of the semiautomatic system is shown in figure 2.
In principle, the system is similar to the manual system presently used
at NBS for routine calibration work, except that overall system control
and data acquisition and processing are provided by a 16-bit minicomputer.Programmable ac and dc standards supply the voltages to the thermal
converters (consisting of the TE and various range resistors). Such
voltage standards are often referred to as ac or dc calibrators. The
output voltages of the two converters (as well as the difference between
the two voltages) are measured in a semiautomatic mode by means of a
^Numbers in brackets refer to the literature references listed at the
end of this report.
2

Figure
1.
Overall
view
of
system

CRT andKeyboard(SystemConsole)
16-Bit
MinicomputerSystem
RS-232CRS-232C | Interface
Modular Interactive
Data Acquisition
System (MIDAS)
RS-232C
TTY(Test
Report)
Programmable}^DC Standard
BCDInterface
BCDInterface
ProgrammableAC Standard
StandardRange
Resistor
Standard (PtH ,^/?Pa
.
r
Jt0r
, ±$) Te“tThermo-
—I
(K-V Divider & \r~<^ Iesx
Potentiometer)Thermoelement
Unit
Under
Low ThermalSwitches
Digital
Voltmeter
BCD Interface
Figure 2. System block diagram

manually operated TE comparator and a digital voltmeter which is
automatically controlled via the computer. The computer, its peripheralequipment, and the Modular Interactive Data Acquisition System (MIDAS) [5]are interconnected utilizing the standard RS-232C interface. The
programmable instruments and the high voltage and 1 ow-thermal -noi se
switches are controlled by the computer via the MIDAS digital interface.
In operation, the ac or dc voltages are applied simultaneously tothe standard TE and the unit under test (UUT). The difference in theoutput voltages is primarily balanced out by the TE comparator. The small
residual differences in the TE output voltages are automatically measuredwith the digital voltmeter as the inputs are switched between the ac anddc voltages. Typically, the voltage differences are manually balanced toless than 100 nV. The residual voltages are then measured with a resolutionof 10 nV, requiring a voltmeter with only moderate accuracy but with low
noise. In addition, the voltmeter is used to measure the nominal outputvoltages of both converters.
2.2 Hardware Considerations
2.2.1 General
As mentioned previously, the components of the semiautomatic system(except for the computer, its peripheral equipment, and interfaces) are
similar to manual systems used at NBS. The principle differences for thenew system are the use of a sensitive digital voltmeter and programmabledc and ac voltage standards. A listing of the hardware contained in thesystem is provided in appendix A.
Overall system control is provided by means of a 16-bit minicomputerwhich has 64 kbytes of core memory and a dual floppy-disk unit for programand data storage. The system console (CRT), the teletypewri ter (TTY),and MIDAS are connected to the computer by means of interfaces whichconform to the EIA RS-232-C standard [6]. MIDAS hardware is based on theCAMAC standard [7] and consists of several functional modules which areinserted into slots in an equipment rack. A power supply and MIDAScontroller module also are required to make the MIDAS system operational.Communication between the controller module and individual MIDAS modulesis in accordance with the ASCII standard code for information interchange [8].
The dc and ac voltage standards must have wide voltage and frequencyranges to meet the requirements of calibration work for which the systemis intended. In addition, the standards must be stable and have sufficientresolution to permit precision measurements to be made. The dc voltagestandard has ranges of 10 V, 100 V, and 1 kV with resolutions of 1 yV,
10 yV, and 100 yV per step, respectively, with ten steps per range.
The specified accuracy is about 30 ppm of range for all three ranges,
with output stability of about 15 ppm of programmed output per month.The ac voltage standard has seven decade ranges covering the voltagesfrom 1 mV to 1 kV (full-scale ranges) with a resolution of 10 ppm of
range per step, with ten steps per range. The frequency ranges consist
5
of eleven fixed frequencies per range, covering the range 10 Hz to110 kHz, with frequency range multipliers of XI 0 Hz and XI 00 Hz, XI kHzand X10 kHz. The accuracy of the ac standard's voltage output varieswith frequency, from about 0.02% to 0.05% of voltage setting. The voltagestability is specified as 0.01% of setting for six months.
The digital voltmeter has eight ranges from ±10 yV to ±100 V.
On the most sensitive 10 yV range, it has a resolution of 10 nV, withan input impedance of about 10 Mn. The zero stability is specifiedas less than 100 nV per hour. In the frequency range dc to about 10 Hz,the voltmeter has less than 50 nV of rms noise, referred to the input,with the input shorted.
It should be noted that two digital panel meters used to monitor theoutputs of the voltage standards, as well as a frequency counter used tomonitor the ac frequency, are not included in figure 2 (for simplicity),but they are visible in figure 1. The large instrument on the left ofthe test console table (fig. 1) is an ac calibrator under test.
A critical problem in making nanovolt measurements is that of obtainingswitches which have 1 ow-thermal -noi se, and can be controlled automatically.Ideally, TE output voltages of about 10 mV should be measured to within
1 ppm (10 nV). Mercury-wetted contact, self-latching, solid-state andreed relays were found to be unsuitable since these types have thermal
-
noise on the order of 1 y V. The problem was solved by modifying manuallyoperated 1 ow-thermal -noi se switches. Solenoids with 24 -V operatingcoils were mechanically linked to such switches. The operating coilsare energized by programmable MIDAS relays which connect the 24- V supplyto the coi Is.
The switches which apply the ac or dc voltages to the test circuitare electro-mechanical relays capable of switching up to 5 kV. The 24-Voperating coils of these relays also are controlled by MIDAS relays.
2.2.2 Measurement Procedures
The various measurement steps will now be explained in some detail
for the determination of ac/dc difference, and for determination of the
corrections to the nominal output voltages of an ac voltage standard.
A portion of the circuit for ac/dc difference testing, including thecomponents of the TE comparator, is shown in figure 3. The thermal
voltage converter (TVC) No. 2 can be either the standard or test converter.
The only requirement is that E£ must be greater that E-j and, for purposes
of this discussion, it is assumed that the test TVC is in the No. 2
position. With rated dc voltage applied, and with the potentiometer (P)
turned off, the emf outputs (E? of the test unit, E] of the standard)
are measured by the digital voltmeter (DVM) with switch K2 closed.
Another switch in the TE comparator (not shown in fig. 3) permits
6
+DC
-DC
O
O
I"
o>H
7
Figure
3.
Simplified
schematic
of
thermal
voltage
converter

manual selection of either the £3 or E-j voltages. With the voltmeterreading E 2 > the potentiometer is adjusted until the voltmeter indicatesabout 500 n V. Switch K2 is opened, K1 is closed, and the Kel vi n-Varl eydivider is adjusted until the voltmeter indicates about 100 nV. The testthen proceeds automatically, and ac, dc+, dc-, and ac voltages are applied(in the order listed) to the test circuit [2]. The difference voltagesbetween the outputs of the test and standard thermal voltage convertersare measured for all four input voltages.
The ac/dc difference, in ppm, for the unit under test, as derived in
[ 2 ], is
6t i
where 6 $ is the correction to the standard, E<j is the average emf of
the standard TE with two directions of dc voltage applied, E a is the emfof the standard TE with ac voltage applied, n s is a dimensionless factor
(£2) of the standard, and E s is the output emf of the standard TE at rated
dc voltage input. If E<j - Ea is measured in nanovolts, and E s in
millivolts, the expression for ot is conveniently given in ppm, providedthat <5 S is in ppm.
If the standard TE has a higher output emf than the test TE, the
previous expression is modified to become
6t
5
where all terms and units are as previously defined, and E^ is the output
emf of the test TE at rated dc voltage input.
A block diagram of the system when used for calibrating an ac
standard or voltmeter is shown in figure 4. As shown in this figure,
the system's ac standard is connected for testing. However, the UUT,
indicated as "AC STD," could as well be an external ac standard or a
precision voltmeter. K 1 and K2 are the dc+ and dc- high voltage switching
relays, K3 is the ac high voltage relay, and K4 is a 1 ow-thermal -noi se
switch. Using this test circuit, the corrections to the nominal output
voltage (at a given dial setting) of an ac standard can be determined
3

MINICOMPUTER
h*
MIDAS
r-H"
9

by using the system's programmable dc voltage standard (set to the samenominal value as the ac standard) and a thermal voltage converter, bothhaving known corrections. For this case, only the Lindeck potentiometer(P) of the TE comparator is used. The correction to the UUT, in ppm, is
‘ eh
Ci » 6 + — + C , ,1 s
nE dc
where 6s is the ac/dc difference correction (in ppm) of the TVC at
the test frequency, Ea is the reading of the voltmeter (DVM) with ac
voltage applied (i.e., the difference between the TE's output emf andthe fixed voltage of the Lindeck potentiometer), E^ is the average ofthe DVM readings with direct voltage of both polarities applied, n is a
dimensionless factor equal to 2 if the TE has a square-law response, E
is the TE's output emf at the applied test voltage, and C<j c is thecorrection (in ppm) to the dc voltage standard's nominal output. As
for ac/dc difference tests, the equation is conveniently given in ppm if
E a - Eq is in nanovolts and E is in millivolts, with 6 S and C^c also in
ppm.
The denominator of the correction equation contains the dimensionlesscharacteristic "n." Most TE's do not have an ideal square-law response,hence, the value of n must be determined. Since n generally ranges in
value from 1.6 to 2, neglecting to measure a TE's actual value of n* can
lead to significant errors in the correction to the UUT. For example,in the worst case, if n is assumed to be 2, but actually is 1.6, thenthe error amounts to ( 2-1 . 6) / ( 2) = 0.2, or 20 percent of the correction.
The procedure for measuring n (to a first order of approximation) is
based on the fact that a TE's output voltage (E) can be expressed as
n
E = kl ,
where I is the current through the TE's heater element.
Therefore,
n-1dE = knl dl,
and dE/E = ( k n
I
P “
‘ d I ) / ( k
I
R
)
.
Hence, dE/E = n (dl/I )
,
10

and, assuming constant heater resistance and a stable voltage source,
dE/E « n (dV/V)
,
where V is the dc voltage applied across the series combination of a rangeresistor and a TE.
Two techniques can be used to measure the characteri sti c n. One
involves making small, accurately known changes in the voltage (AV).The second involves making changes in the TE's heater current (I) withthe applied voltage held constant. In the second method, which is usedfor the MIDAS-based system, small changes in the heater current throughthe TE under test are obtained when a 400 Q resistor, in series with a
40 kn range resistor, is shorted by closing a MIDAS relay.
2.3 Software Considerations
2.3.1 General
In order to reduce the effort involved in making routine tests,the software for the system was designed to provide as much interactionbetween the system console and the operator as possible. This interactionis used to reduce the possibility of damage to either the standard or
UUT when either software or hardware failures occur. Also, by progressinglogically through the initialization portions of the test routines, theoperator, when necessary, can take whatever corrective actions might be
required. A significant advantage of the resulting software design is
that sufficient warm-up time is automatically provided between applicationof the various test voltages so that the effects of errors due to thewarm-up drifts of the standard and test units are reduced. In addition,the computer closely controls the time intervals between voltmeter readings;hence, the effects of linear drift are minimized.
The programs, which are written in BASIC, provide the means for
automatically setting the ac or dc voltages and ac frequency, operatingthe voltage relays and 1 ow-thermal -noi se switches, triggering the voltmeterto obtain voltage readings, and storing these readings in the computermemory. Six programs constitute the major testing software package.Program ACDCLV is used for making ac/dc difference tests at voltagesfrom 0.5 to 95 V, and ACDCHV is used for similar tests at voltages greaterthan 1 05 V up to 1 kV.
Since the major application of the work described in this report is
ac/dc difference testing, a typical sequence of operations for this type
of testing is described below where the ACDCHV program is discussed.The other five programs will only be mentioned briefly; however, detailedinformation is available upon request.
11

ACDCHV is a program which provides partial automatic control ofac/dc difference testing at voltages greater than 105 V. Since theMIDAS interface does not have isolated analog and digital grounds, it
was necessary to develop a separate software package for high-voltagetesting. At high voltages, it was found that operating either the ac
or dc voltage relays introduced transient voltage surges into the MIDASdigital circuitry. The MIDAS controller interpreted these surges as
voltage level changes identical to programmed commands. The result wasthat incorrect relays might be opened or closed, the voltmeter might be
falsely triggered to obtain a reading, or any other of a series ofunwanted events might occur. Hence, the ACDCHV program was developedto ensure that no high-voltage standards are turned on whenever a voltagerelay is operated. To avoid unnecessary operation of the high-voltagerelays, program ACDCLV should be used for tests below 100 V.
Basically, ACDCHV contains three general sections. At the beginning,test documentation (e.g., date, test number, observer, and instrument) is
requested. String and array variables are dimensioned, and various simplevariables are initialized. A heading for the test documentation is
created by the operator. The midsection includes a network of subroutinesthat interact with the operator. Displayed instructions prompt theoperator to define test parameters for setting ac and dc voltages, to
switch the TE comparator from E-high to E-low, and to initially balancethe Kel vi n-Varl ey divider and rebalance it when necessary. Repeatedlyaccessed subroutines close and open the appropriate relays, set the input
voltages, determine the TE emf output voltages, trigger the voltmeter to
read the TE difference voltages, and calculate the ac/dc difference of
the UUT for four determinations at each test point. Finally, statisticalcalculations are performed and the results are printed on the TTY.
Options are then provided for the operator to choose whether to stop,
repeat a test with or without averaging, or change parameters and run
another test.
Program NTSTF is used to determine a TE's dimensionless factor, n [1,2].The variation of n as a function of a TE's heater current can be expressed
as n = g (E), and this function is assumed to vary linearly. The programautomati cal ly fits a least-squares line to the data. The computational
techniques used are fully discussed on pages 5-10 of [10]. Typical test
results are illustrated in table 1.
12

Tabl e 1 . N-Test-F data
DATE . . THUR. 29 MARCH 79 OBSERVER.. . .KJL
TEST NO. . . . N-TEST INST NO. . .FA
VOLTS E N AVE.N NE 500/
N
100 2.70 (1.992 1.991 1.990 1.990) 1.991 5.37 251 .2
100 2.70 (1 .988 1 .988 1.989 1.991) 1.990 5.37 251 .3
120 3.88 (1.973 1.973 1 .974 1 .975) 1.974 7.66 253.3
120 3.88 (1 .973 1.974 1.975 1.975) 1.974 7.66 253.3
140 5.24 (1.954 1.955 1.956 1.956) 1.955 10.25 255.7
140 5.24 (1.954 1.955 1 .957 1.956) 1.955 10.25 255.7
160 6.79 (1.922 1.923 1.925 1.923) 1 .923 13.06 260.0
160 6.79 (1.922 1.923 1.924 1.923) 1.923 13.06 260.0
180 8.50 (1 .881 1 .881 1 .883 1 .882) 1 .882 16.00 265.7
180 8.50 (1.878 1.881 1 .883 1.882) 1 .881 15.99 265.8
200 10.34 (1.833 1.833 1.835 1.833) 1.833 18.96 272.7
200 10.34 (1.826 1 .832 1.834 1 .834) 1 .833 13.95 272.8
THE CURVE FITTING PROCESS USES A LEAST-SQUARES FIT
FOR A POLYNOMIAL OF DEGREE ONE. THE N (LOWER CASE)
TE CHARACTERISTIC (Y-AXIS) VERSUS TE EMF (X-AXIS) IS
ASSUMED TO BE A LINEAR FUNCTION OF THE FORM Y = B+MX
OR, IN THIS CASE:
MI = M-NE
WHERE NI = TE CHARACTERISTIC
M = ZERO X INTERCEPT
N = NEGATIVE OF CURVE SLOPE
E = TE OUTPUT EMF
M = 2.05518
N = 206568E-1
13

ACCAL is a program used to calibrate an ac voltage standard,a precision ac digital voltmeter, or the ac standard of the system in
terms of a thermal voltage converter and the system's calibrated dcstandard, as discussed in the previous section. Results for thecalibration of an ac voltage standard are illustrated in table 2.
The last column, "T CORR PPM," shows the correction to the calibrator'snominal output voltage.
Stability of the system's dc and ac standards can be checked by
using programs called STABLV and STABHV. These progams are used forvoltage ranges similar to those for ACDCLV and ACDCHV. Occasionally,test results appear to be erratic. These stability tests are useful in
determining if the supplies are functioning properly. Stability of thesources is measured by using a programmable 6-1/2 digit multimeterwhose function, ranges, and reading rates are remotely controlled.Initial stability test parameters for voltage, frequency, timebetween readings, and total number of readings are defined by the
operator. The program then exercises automatic control over the ac anddc standards, the voltage relays, and the voltmeter. At completion,stability data including the values of minimum, maximum, range, average,standard deviation of the mean, and three times the standard deviationof the mean (calculated 3a limits) for both ac and dc voltage readingsare printed on the TTY. Table 3 shows the results of a test at 95 V,
50 kHz, with the voltmeter programmed to use a 10-second integrationtime. The total time for the test illustrated was about 12 minutes,which is about the time it takes to do a test run (i.e., four
determinations) for ac/dc difference tests at one frequency and voltage.
The advantages of the stability tests are illustrated in table 4.
The difference -in the ranges of the ac voltage for tests at 95 V and
200 V indicates that the ac high-voltage amplifier had become unstable.The instability was verified by a 12-minute test in which the ac voltage
range was about 1150 ppm at 20 V as opposed to about 347 ppm at 95 V.
In addition to the test capabilities discussed above, the methodology
and computer programs were developed for testing one model of a precisionmultirange automatic thermal transfer instrument as a voltmeter. Detailedinformation is available and can be supplied upon request.
2.3.2 Operating Procedure for AC/DC Difference Tests
For the reader not interested in the operational details of this
program (contained in appendix B), the following overview is provided.The specific operating procedures include the following steps and
instructions:
1) Input via the system console, the test number, voltage, frequency,
observer's name, and code for the standard thermal converter.
2) Visually check to see that both software and hardware are
operating correctly by checking the system's digital panel meters and
frequency meter for correct readings of the outputs from the ac and dc
standards. If the outputs are incorrect, repeat step 1.
14

Table 2. ACCAL data
DATE . . . OBSERVER. .
TEST NO INST. •
KHZ *CORR V TEST STANDARD E NE T CORRPPM RANGE TE RANGE MV PPM
100.0 100.0 FB 100.0 10.4 18.6
0.8 0 (7 8 7 10) -8 -8
0.8 0 (7 6 7 3) -7 -7
0.8 0 (7 8 8 3) -7 -7
0.8 0 (5 1 4 3) -6 -6
2.4 0 (29 32 33 33) 32 32
2.4 0 (30 35 34 35) 33 33
2.4 0 (32 35 25 38) 33 33
2.4 0 (31 31 32 35) 33 33
4.8 0 (278 282 281 284) 281 281
4.8 0 (278 284 284 283) 282 282
4.8 0 (278 284 284 285) 282 282
4.8 0 (281 283 285 283) 283 283
0.4 0 (11 13 10 9) 11 11
0.4 0 (3 8 9 8) 8 8
0.4 0 (5 8 9 9) 8 8
0.4 0 (5 9 11 8) 8 8
15

Table 3. Low voltage stability test data
READING DC-VOLTAGE PPM AC-VOLTAGE PPM
NO. 1 95.00530 55.9 ***
NO. 1 (A) 94.51200 -5136.9
NO. 2 95.00530 55.9
NO. 2 (A) *** 94.51300 -5126.3
NO. 3 95.00530 55.9 ***•
NO. 3 (A) **** 94.51200 -5136.9
NO. 4 95.00540 56.5 ***
NO. 4 (A)**•*•*
94.51200 -5136.9
NO. 5 95.00530 55.9
NO. 5 (A) **** **** 94.51200 -5136.9
NO. 6 95.00530 55.9 **** ****•
NO. 6 (A) **** 94.51100 -5147.4
NO. 7 95.00510 54.0 ****
NO. 7 (A) 94.51000 -5158.0
NO. 8 95.00510 54.0
NO. 8 (A) **** **** 94.50800 -5179.0
NO. 9 95.00520 54.6
NO. 9 (A) **** **** 94.50700 -5189.4
NO. 10 95.00510 54.0
NO. 10 (A) **** *** 94.50700 -5189.4
DC
NO. OFREADINGS
MEAN(PPM)
STAN. DEV.
OBSERVATIONSTAN. DEV.
MEANSTAN. DEVMEAN *3'
10 55.3 1.0 0.3 1.0
MIN = 53.9679 MAX = 56.5378 RANGE = 2. 5699
AC
NO. OFREADINGS
MEAN(PPM)
STAN. DEV.
OBSERVATIONSTAN. DEV.
MEANSTAN. DEVMEAN *3
10 -5153.7 23.9 7.5 22.6
MIN = 5189.43 MAX = -5126.31 RANGE = 63 .1211
V- NOMINAL95
FREQUENCY50 kHz
INT. TIME10 SEC
TIME DELAY10
16

Table 4. Stability test data summary
Program: STABLV - Overnight (17 hr) Test
DC
No. ofReadings
Mean(PPM)
Stan. Dev.
ObservationStan. Dev.
MeanStan. DevMean *3
50Min = 36.7817
42.1
Max5.0
= 56.53780.7
Range =2.1
19.7561
ACNo. ofReadings
Mean(PPM)
Stan. Dev.
ObservationStan. Dev.
MeanStan. DevMean *3
50
Min = 84.1643216.6
Max51.0
= 431.5837.2
Range =21 .6
347.419
V-Nomi nal Frequency Int . Time Time Delay
95 1 kHz 10 sec 57500
Program: STABHV - Overnight (17 hr) Test
DC
No. of
ReadingsMean(PPM)
Stan. Dev.
ObservationStan. Dev.
MeanStan. DevMean *3
50
Min = 9.9945117.1
Max2.7
= 19.9890.4
Range =1.1
9.99451
ACNo. ofReadi ngs
Mean(PPM)
Stan. Dev.
ObservationStan. Dev.
MeanStan. Dev
Mean *3
50
Min = -25400-4168.96
Max428.0
= -2345060.5
Range =181 .6
1949.99
V-Nomi nal Frequency Int . Time Time Delay
200 50 kHz 10 sec 3000
Program: STABHV - 12 Minute Test
DC
No. ofReadings
Mean(PPM)
Stan. Dev.
ObservationStan. Dev.
MeanStan. Dev
Mean *3
10
Min = 9.9945110.0
Max0.0
= 9.994510.0
Range =0.0
0
AC
No. ofReadi ngs
Mean(PPM)
Stan. Dev.
ObservationStan. Dev.
MeanStan. DevMean *3
10
Min = -24750-3890.0
Max433.9
= -23600137.2
Range =
411.61149.98
V-Nomi nal Frequency Int . Time Time Delay
200 50 kHz 10 sec 5
17

3) Manually set the TE comparator to its "high TE" voltage inputposition, and switch the voltmeter to its 10-mV range. The programautomatically closes the dc voltage relay and a~l ow-thermal -noi se switch(K2) turns on the dc standard and triggers the voltmeter to obtain theTE voltage output reading.
4) Switch the TE comparator to its "low TE" voltage input position.The program then triggers the voltmeter to read the voltage. The valuesof the high- (from the previous step) and low-voltage readings are compared.If the latter is actually larger in magnitude than the former, the operatoris instructed to interchange the two TE inputs after the dc voltage has
been turned off. The program automatically stores the correct value ofE-low, since that value is used in the equation to determine the ac/dcdifference of the test unit (see section 2.2).
5) Switch the TE comparator to the "high TE" voltage input position.This step in the procedure is done only if the test unit actually has a
greater emf output than the standard. If not, the comparator switchremains in the "low TE" voltage input position. In either event, the
operator is then instructed to turn on the Lindeck potentiometer, changethe voltmeter to its 10 yV range, and manually adjust the potentiometeruntil the voltmeter indicates about 500 nV.
6) Switch K2 is opened, and a second low-thermal noise-switch ( K1
)
is closed. The operator now manually adjusts the Kel vi n-Varl ey divideruntil the voltmeter indicates a voltage within the range ±100 n V.
7) Switch K1 is opened, K2 closed, the ac voltage relay is closed,the ac standard turned on, and its voltage is automatically incrementedor decremented until the output voltage of the UUT's TE is _< 1 yV of
its value with dc voltage applied, as in step 6.
8) At this point, the manual initialization process is complete,switch K2 is opened, K1 is closed, and the test proceeds automaticallyunder program control. A sequence of voltage readings is obtained by
the voltmeter when ac, dc+, dc-, and ac voltages are applied to the
standard thermal voltage converter and UUT. These four voltage readings
are each obtained from the average of ten readings of the voltmeter.The standard deviation of the ten readings is computed, and if this value
is < 200 nV, the program continues. If the standard deviation is _> 200 nV,
due to drifts in either the standard converter or the UUT, or the ac or
dc standards, or any of these effects combined, the series of ten readingsis repeated. After five attempts, if the voltmeter readings have not
stabilized, the test is aborted.
9) The sequence of readings with ac, dc+, dc-, and ac voltages
applied constitutes one determination of the ac/dc correction to the UUT.
The process is continued for four determi nati o/is ;the average value of
four determinations is computed and printed. The operator then may
elect to repeat the test, change voltage range or frequency, or stop the
test. A sample of data printed on the tel etypewri ter is illustrated in
table 5. Although only low-voltge test results are shown, the data
format is identical for high-voltage tests.
18
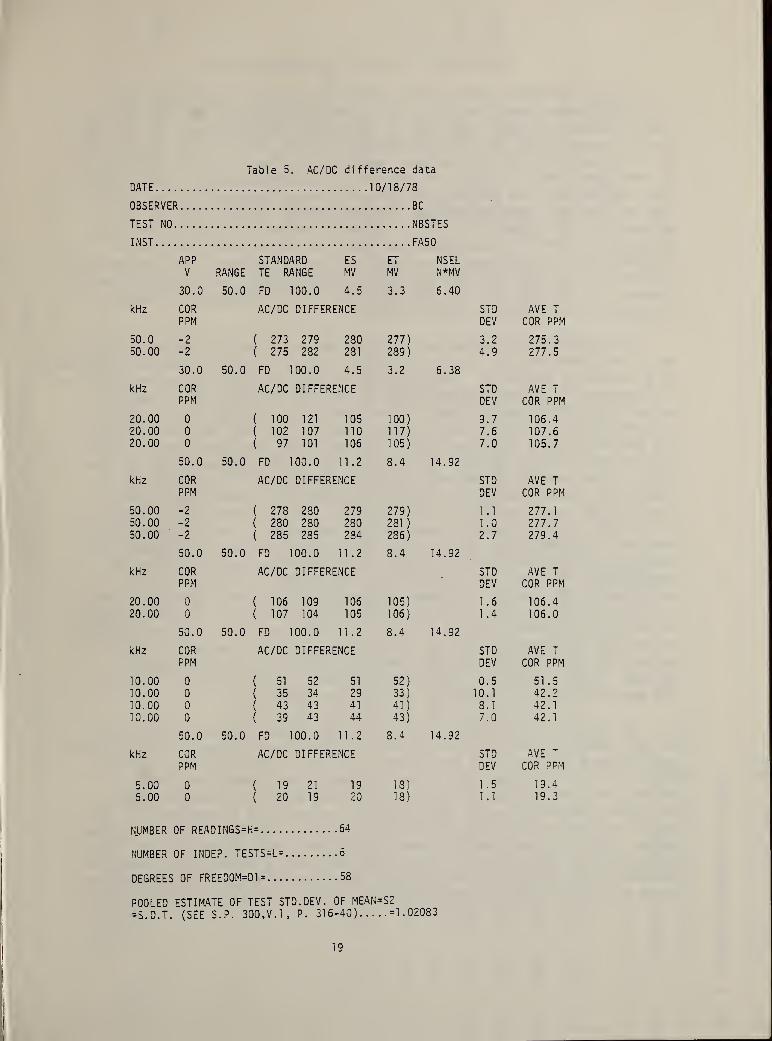
Table 5. AC/DC difference data
DATE 10/18/78
OBSERVER BC
TEST NO NBSTES
INST FA50
APP STANDARD ES ET NSELV RANGE TE RANGE MV MV N*MV
30.0 50.,0 FD 100.0 4.5 3.3 6..40
kHz COR AC/DC DIFFERENCE STD AVE TPPM DEV COR PPM
50.0 -2( 273 279 280 277) 3.2 275.3
50.00 -2( 275 282 281 289) 4.9 277.5
30.0 50..0 FD 100.0 4.5 3.2 6..38
kHz COR AC/DC DIFFERENCE STD AVE TPPM DEV COR PPM
20.00 0 ( 100 121 105 100) 9.7 106.420.00 0 ( 102 107 no 117) 7.6 107.620.00 0 ( 97 101 106 105) 7.0 105.7
50.0 50. 0 FD 100.0 11.2 8.4 14..92
kHz COR AC/DC DIFFERENCE STD AVE T
PPM DEV COR PPM
50.00 -2( 278 280 279 279) 1.1 277.1
50.00 -2( 280 280 280 281 ) 1.0 277.7
50.00 -2( 285 285 284 236) 2.7 279.4
50.0 50. 0 FD 100.0 11.2 8.4 14..92
kHz COR AC/DC DIFFERENCE STD AVE T
PPM DEV COR PPM
20.00 0 ( 106 109 106 105) 1.6 106.420.00 0 ( 107 104 105 106) 1.4 106.0
50.0 50. 0 FD 100.0 11.2 8.4 14..92
kHz COR AC/DC DIFFERENCE STD AVE T
PPM DEV COR PPM
10.00 0 ( 51 52 51 52) 0.5 51.510.00 0 ( 35 34 29 33) 10.1 42.210.00 0 ( 43 43 41 41) 8.1 42.1
10.00 0 ( 39 43 44 43) 7.0 42.1
50.0 50. 0 FD 100.0 11.2 8.4 14..92
kHz COR AC/OC DIFFERENCE STD AVE T
PPM DEV COR PPM
5.00 0 ( 19 21 19 18) 1.5 19.4
5.00 0 ( 20 19 20 18) 1.1 19.3
NUMBER OF READINGS-H= . .64
NUMBER OF INDEP. TESTS=L= 6
DEGREES OF FREED0M=D1 = 58
POOLED ESTIMATE OF TEST STD. DEV. OF MEAN=S2
=S. D.T. (SEE S.P. 300, V.l, P. 316-40) =1.02083
19

3. MEASUREMENT RESULTS AND UNCERTAINTIES
There are many factors which contribute to the uncertainty ofac/dc difference measurements of the type described in this report.Similar manual systems have been in operation for many years at NBS andtheir uncertainties have been documented [1-3]. DC reversal differenceof a TE, self-heating and ambient temperature effects, drift effects dueto non-equal time intervals during the voltage measurements, unbalancedlead impedances, and induced voltages from electromagnetic fields aresome of the more common factors. The process of determining an
estimated total uncertainty for a system is based upon experience withthe system, careful measurements of standards with accurately knowncorrections, or intercomparison tests of two independent test methods [3].The latter procedure, involving comparison of a wel 1 -characteri zed manualsystem with the new one, was followed, since the uncertainty sources arebelieved to be similar in both systems.
The system performance was verified by an extensive testing procedurewhich involved the use of a multi -range thermal voltage converter instrumentas a transport standard. The transport standard was first tested for ac/dcdifferences at various combinations of applied voltages and frequenciesusing the MIDAS-based system. It was then tested, at similar voltagesand frequencies with the same standard thermal voltage converters, usingthe manual testing technique which has been used for many years at NBS.
A third test was performed, again using the MIDAS system. Finally, theMIDAS system was disassembled, physically relocated, reassembled, and
tested for proper operation. Then the transport standard was tested a
fourth time, again using the MIDAS system. It should be noted that not
all voltage range-f requency combinations were tested for all four tests.However, in those cases where fewer than four tests were performed, the
results indicated sufficiently small differences between at least twoindependent test methods to establish that further testing was not
warranted. The results of these independent intercomparison tests are
listed in table 6, and the range of ac/dc differences is listed in table 7.
In evaluating these results, it must be remembered that, for calibratingmulti range instruments like the transport standard, the manual testsystem has uncertainties of the same magnitude as the semiautomaticsystem. Hence, combined total uncertainties of the order of 100 and
200 ppm are possible depending upon the test frequency.
In table 7, the column listing "Voltage Range" refers to the input
voltage range of the transport standard, the "Test Voltage" is the actual
test voltage applied, and the different columns for frequency are the
actual test frequencies used. The numbers listed under the frequencycolumns are the maximum differences (in ppm) of the calibrated ac/dcdifference corrections for the transport standard as determined for at
least two, and up to a maximum of four, of the test conditions describedabove. That is, the numbers reported are the range (magnitude of the
maximum minus the minimum) of the ac/dc difference corrections measuredfor each test voltage and frequency. The total elapsed time between the
first and final tests of the transport standard was about eight weeks.
20

Table
6.
Transport
standard
ac/dc
differences
(ppm)
i
Nzjo
oo
Nlz_x:
o03
_N
OCM
05 ,
—
03 03• i 1 1 i
•: 1 1 • • • • 1
• o i 1 1 i 1 1 CO CM CO CO 1
o CMz — 1
i
CO 03 ( 00 05• • 1 1 |
• • 1 1 1 i 1
• CM r— 1 1 I CM CO 1 1 1 i 1
o CO o 1z <— <—
o o o o o o o o o o oCM • • • • • • • • • • •
p"- CO co 03 CO O CM CO CO CO 00 r-*• CO 05 r— r— r— 1 r— 03 CO CMo fmmm 1 1 CMz 1
CO CO CM CO '
—
05 CO CO P-. o CM
o 03 03 *3" CO CM CO CO CO oz o CM r— 1 1 o 03 COr— f— 1
—
i P-. o1 r—
*3*,
—
CO CO CM CO• • • • • • •
• CO 1 1 1 1 | 1 CO 1
—
o CO 05 COO 05 1 1 1 1 l 1 CO 1 co CO CMz CO
1
CM
CO 05 05 CM 05• • 1 1 . 1 • • 1 1 1 1 1 1
• CM r— 1 1 1 03 CM 1 1 1 1 1 1
o oz r—
CM o o o O o O o o o o o O o• «
• CM *3- <3- r— CO CO r> CO 03o p
—
CM r— t CO CO 05z •”1
CM
CO CO 03 CO CO o 03 o 03 •3- CO
6 CO 1"- oo CM CO CM O p^ 1z o r-. p— r—
-
r— r— CO CO CO'
CO1
1
*3-
CM CO r— CO r— o CO• • i i | 1 n i • • • • • •
O 05 i i i 1 i i 03 05 CO CO 03z <3- CVJ
1
COCO r".
• • • i i 1 • • 1 1 I 1 1 i
o 1-^ CO i i 1 r— o 1 1 1 1 1 iz 03 CO 1—
CM O o o o o o o o o o o c oo r-. 03 fmmm CO P-. CO o CO 03 05 C3z CO •— CM CM 1
*3" 05 CM CO o o 05 CO 1— '03 CO 03• • • • • • • • « • • • • 1
o CO CO CM P-* 05 03 CM CO CO CO o *
z 03 CO <— <— CM
cI I •
I I I
—
I I
I I
«3-
CC
CM
oCM
o <u<D CD in•f ra +j• 4-> «
—
CL i— CQ. O >< >
gjc
;
<TD
I
03
o
03
oI
03CM
I
03
o’
,— CM
CM
I
CO
'cr
i
CM
CO
CO
CO
I
<=r
CM
CO
I
CO
CO o— CO
CMCO
I
CO
o03
«3"
CO
CMCO
co03
COCM
*3"
CO
OoCM
o03CM
03CM
I I I
I I I
o oo o03 03
oo
c03
oooooo
I I I
o03CM
o03
Qi
m>.oo
o
<2
5
<x>
m5?
3
*o
oI
CM
I
CO
I
Repeat
Automatic
System
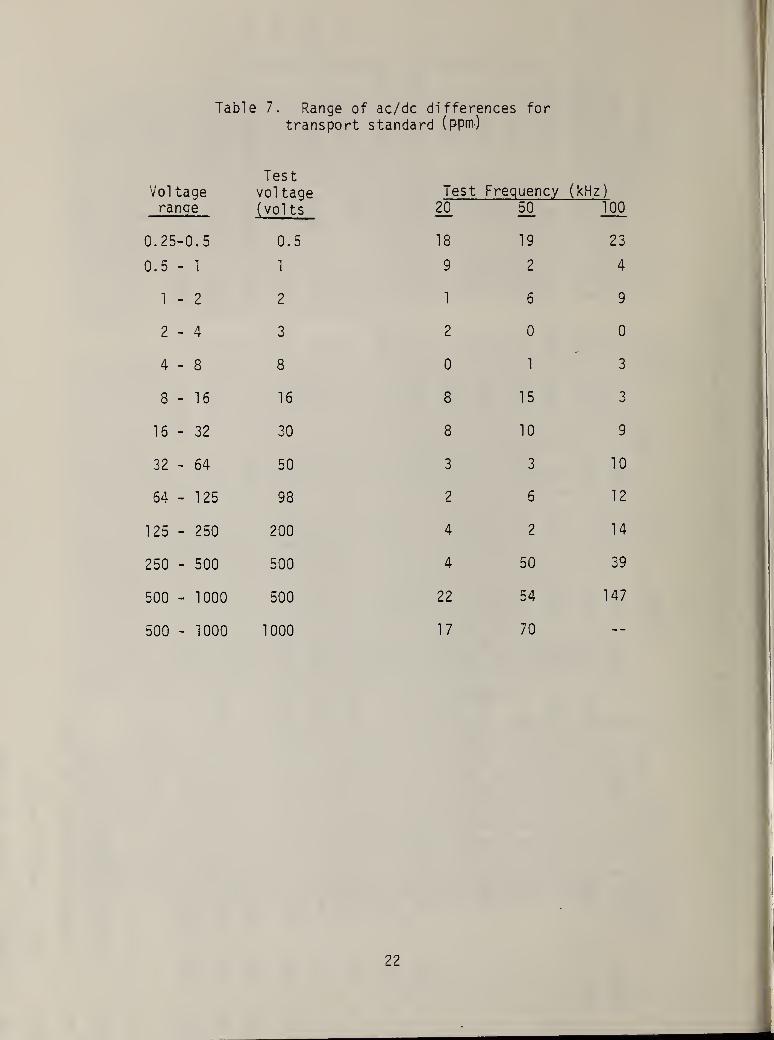
Table 7. Range of ac/dc differences fortransport standard (ppm)
Vol tageTest
vol tage Test Frequency (kHz)ranqe (volts 20 50 100
0.25-0.5 0.5 18 19 23
0.5 - 1 1 9 2 4
1 - 2 2 1 6 9
2 - 4 3 2 0 0
4 - 8 8 0 1 3
8 - 16 16 8 15 3
16-32 30 8 10 9
32 - 64 50 3 3 10
64 - 125 98 2 6 12
125 - 250 200 4 2 14
250 - 500 500 4 50 39
500 - 1000 500 22 54 147
500 - 1000 1000 17 70 --

The test results show that at 20 kHz the average value of therange of ac/dc differences for all voltages is only 8 ppm. At 50 kHz theaverage value of the range is 19 ppm, and at 100 kHz, where skin effectsand stray capacitance effects predominate, the largest range (at 500 V)
was 147 ppm. However, this large range is within the expected combinedtotal uncertainty of 200 ppm for the two systems. Even with this onerange greater than 100 ppm, the average value of the range at 100 kHz is
still only 23 ppm. No intercomparison results were obtained at 1000 V,
100 kHz, since the high-voltage-amplifiers in both systems could not
supply sufficient power at that vol tage-f requency combination.
Additional intercomparison tests were made using a single-range,coaxial type thermal voltage converter with large, but accuratelyknown, ac/dc differences. The summary of the test results is shown in
table 8. From the data, it is obvious that the two systems agreed well
within the estimated total uncertainty limits.. In fact, the data clearlyshow that the MIDAS-based system performed much better than had beenanticipated when the project was undertaken.
As a final check of the system's performance, intercomparisontests were made using a single-range, coaxial type converter, which is
used as a working standard for ac/dc testing at NBS. The results of
these tests are summarized in table 9. Again, the results indicateexcellent agreement between the two systems.
4. CONCLUSIONS AND RECOMMENDATIONS
The results of the work reported indicate that it is possible tomeasure ac/dc differences semi automatical ly with uncertainties about thesame as those obtained with manual testing techniques. The major advantageof the system appears to be the elimination of most of the tedium involvedin manual testing, in which deflections of light beam galvanometers mustbe observed and recorded.
For future work, it appears that further improvements in system
operation can be obtained by development of self-balancing TE comparators.
Additionally, by taking advantage of improvements in digital voltmeter
sensitivity, stability, linearity, and resolution, desktop computers,
and system components whose operation is compatible with new
digital /analog interfaces, it may be possible to develop improved ac/dc
difference testing techniques.
5. ACKNOWLEDGEMENTS
The authors are indebted to C. B. Childers who made many of the
tests, assembled the equipment, and helped the programmers test tne
software. E. S. Williams designed and built the 1 ow-thermal -noi se and
high-voltage switching modules, and provided some of the initial software
which eventually became part of the total programming package.
R. E. Kleimann, S. C. Bailey, and W. C. Caterisano each contributed
portions to some of the computer programs. Thanks are also due B. A. Bell
who provided helpful comments, encouragement, and support.
23

Table 8. AC/DC difference for TVC "FA 50" (ppm)
System
1
Appl iedvol tage
2
FrequencykHz
3
Manual4
MIDAS3-4
Di fference
50 5 24 22 2
50 10 52 50 2
50 20 116 113 3
50 50 308 305 3
Table 9. AC/DC difference for TVC "FC 100" (ppm)
1
Appl iedvol tage
2
FrequencykHz
3
Manual
4
MIDAS
3-4
Di fference
100 20 3 5 -2
100 50 3 4 -1
100 100 13 18 -5
<
2 *

6. REFERENCES
[1 ] F. L. Hermach, E. W. Williams, Thermal Converters for Audio-Frequency Voltage Measurement of High Accuracy, IEEE Trans.Instrum. Meas., Vol . IM-15, pp. 260-268, Dec. 1 966.
[2] E. S. Williams, Thermal Voltage Converters and Comparator for Very
Accurate AC Voltage Measurements, J. Res. Nat. Bur. Stand. (U.S.).75C: 145-154, Dec. 1971.
[3] F. L. Hermach, AC-DC Comparators for Audio-Frequency Current and
Voltage Measurements of High Accuracy, IEEE Trans. Instrum. Meas.,Vol. I M— 25 , pp. 489-494, Dec. 1 976.
[4] R. S. Turgel , A Comparator for Thermal AC-DC Transfer Standards,ISA Trans., Vol. 6, No. 4, pp. 286-292, 1967.
[5] C. H. Popenoe, M. S. Campbell, MIDAS modular interactive dataacquisition system - description and specifications, Nat. Bur. Stand.(U.S.), Tech. Note 790, Aug. 1973.
[6] Interface Between Data Terminal Equipment and Data CommunicationEquipment Employing Serial Binary Data Interchange, EIA RS-232-C.Electronic Ind. Assoc., 2001 Eye St., N.W., Washington, D.C. 20006Aug. 1969.
[7] IEEE Standard Modular Instrumentation and Digital Interface System(CAMAC) - Computer Automated Measurement and Control , IEEE Stand.583 - 1975, IEEE, 345 E. 47 Street, New York, NY 10017.
[8] American National Standard Code for Information Interchange,ANSI X3.4 - 1977, Amer. Nat. Stand. Inst., Inc., 1430 Broadway,New York, NY 10018.
[9] Ku, H. H., ed. Statistical Concepts and Procedures, Nat. Bur. Stand.
(U.S.), Spec. Pub. 300; 1, Feb. 1969, 436 p.
[10] Natrella, M. G., Experimental Statistics, Nat. Bur. Stand. (U.S.),
Handb. 91 , Aug. 1 963.
25
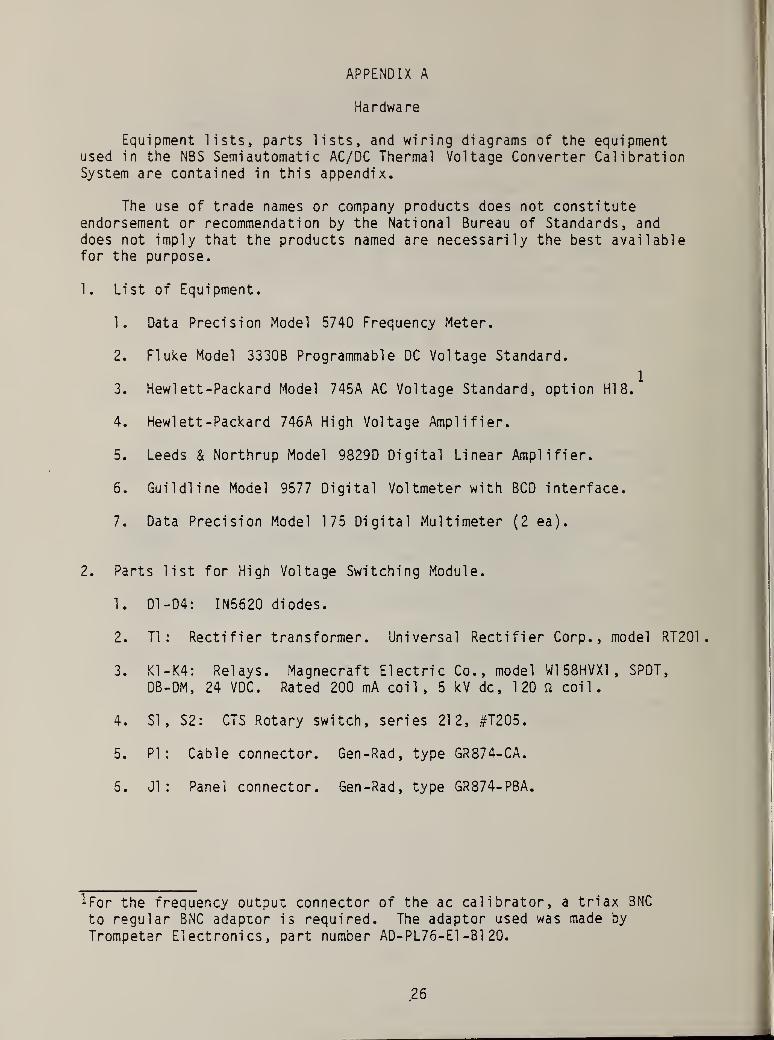
APPENDIX A
Hardware
Equipment lists, parts lists, and wiring diagrams of the equipmentused in the NBS Semiautomatic AC/DC Thermal Voltage Converter CalibrationSystem are contained in this appendix.
The use of trade names or company products does not constituteendorsement or recommendation by the National Bureau of Standards, anddoes not imply that the products named are necessarily the best availablefor the purpose.
1 . List of Equipment.
1. Data Precision Model 5740 Frequency Meter.
2. Fluke Model 3330B Programmable DC Voltage Standard.
1
3. Hewlett-Packard Model 745A AC Voltage Standard, option HI 8.
4. Hewlett-Packard 746A High Voltage Amplifier.
5. Leeds & Northrup Model 9829D Digital Linear Amplifier.
6. Guildline Model 9577 Digital Voltmeter with BCD interface.
7. Data Precision Model 175 Digital Multimeter (2 ea).
2. Parts list for High Voltage Switching Module.
1. D1-D4: IN5620 diodes.
2. T1 : Rectifier transformer. Universal Rectifier Corp., model RT201
.
3. K1-K4: Relays. Magnecraft Electric Co., model W1 58HVX1 , SPOT,
DB-DM, 24 VDC. Rated 200 mA coil, 5 kV dc, 1 20 a coil.
4. SI, S2: CTS Rotary switch, series 212, #T205.
5. PI: Cable connector. Gen-Rad, type GR874-CA.
6. J1 : Panel connector. Gen-Rad, type GR874-PBA.
^For the frequency output connector of the ac calibrator, a triax BNC
to regular BNC adaptor is required. The adaptor used was made by
Trompeter Electronics, part number AD-PL76-E1 -81 20.
26
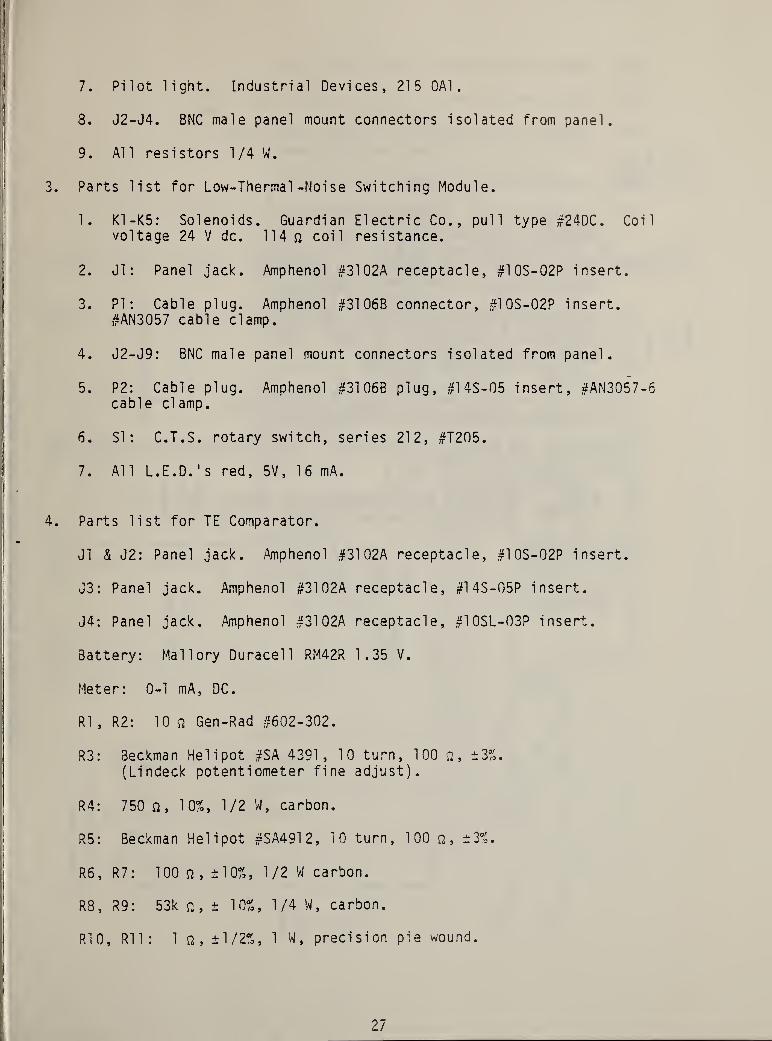
7. Pilot light. Industrial Devices, 215 0A1
.
8. J2-J4. BNC male panel mount connectors isolated from panel.
9. All resi stors 1 /4 W.
Parts list for Low-Thermal -Noise Switching Module.
1. K1-K5: Solenoids. Guardian Electric Co., pull type #24DC. Coilvoltage 24 V dc. 114 n coil resistance.
2. J1 : Panel jack. Amphenol #31 02A receptacle, #1 0S-02P insert.
3. PI: Cable plug. Amphenol #31 06B connector, #1 0S-02P insert.#AN3057 cable clamp.
4. J2-J9: BNC male panel mount connectors isolated from panel.
5. P2: Cable plug. Amphenol #31 06B plug, #14S-05 insert, #AN3057-6cable clamp.
6. SI: C.T.S. rotary switch, series 212, #T205.
7. All L.E.D.'s red, 5V, 16 mA.
Parts list for TE Comparator.
J1 & J2: Panel jack. Amphenol #31 02A receptacle, #10S-02P insert.
J3: Panel jack. Amphenol #31 02A receptacle, #1 4S-05P insert.
J4: Panel jack. Amphenol #31 02A receptacle, #10SL-03P insert.
Battery: Mallory Duracell RM42R 1.35 V.
Meter: 0-1 mA, DC.
R1 , R2: 10 a Gen-Rad #602-302.
R3: Beckman Helipot #SA 4391, 10 turn, 100 a, ±3%.(Lindeck potentiometer fine adjust).
R4: 750 a, 10%, 1/2 W, carbon.
R5: Beckman Helipot #SA4912, 10 turn, 1 00 a , ±3%.
R6 , R7 : 100 a, ±10%, 1/2 W carbon.
R8 , R9 : 53k a, ± 10%, 1/4 W, carbon.
R10, Rll
:
1 a, ±1/2%, 1 W, precision pie wound.
27

R12: Precision pie wound, Ik n, ±1/2%, 1 W.
R13: Precision pie wound, 0.05 n , ±1/2%, 1 W.
R14: Beckman He!i pot #SA5427 , 1 0 turn, 1 00 n , ±3%.
(Kel vi n-'/arl ey divider fine adjustment).
R15: Gen-Rad #602-303, 100 a.
SI: Leeds & Northrup 12 position, 2 pole rotary selector switch#031262. (Function switch).
S2: Leeds a Northrup 12 position, 3 pole rotary selector switch #031263.(Kel vin-Varl ey divider coarse adjust).
S3: Leeds a Northrup 12 position, 6 pole rotary selector switch #031266.(E-high or E-low selector switch).
S4: SPST bat handle toggle switch.
S5, S6: Set and read detector sensitivity switches. Leeds a NorthrupSPST #031187.
S7, S8: Set and read switches. Leeds a Northrup Guarded Low Thermal Keyswitch DPST #031189.
S9: C.T.S. 7 position 2 pole rotary switch, series 212, #T205.(Lindeck potentiometer coarse adjust).
28

High
Voltage
Switching
Module
Wire
Diagram
off ®
3a_c
oQ
<
<£ <o <5““ n t—
cCO
<— > £oj «?
L

w-Thermal-Noise
Switching
Module
Wire
Diagram

NBS
Model
“BB”
TE
Comparator
.CAL
j
3
Output
to
the
Low-
S1
READ^R13
Thermal-Noise
Switching
Module
EoLL qj
31
Set
Read

Cable
Between
the
Low-Thermal-Noise
SA
_
MM
oczk.<3
CL
EoO
<3
CL)
3T3O
05C
0
1CO
32
145-05S,
AN
3057-6
Cable
Clamp

Midas
Equipment
List
c3oQaoh-
Eo>—
LL
CO
COH-ZirT
II
uCO<9
cc
9co
C*5
II
XHI
CM
HI
T”
II
>
3co
a>w'o
>, 5a Ico J<u
3oCL
1/5
co
a
a)
c
"a co
c3 CO
O QH3o-i O Osi
”co q a« o oCC 00 CQ
£ O t- N- 00
c3oaaoi-
Eo—u_
nII
OacvT
II
O<
II
CCoaxf
905 9
o CO 05
3 OCO
co > o9 O >o a OCO
9 <a)X9
o>
JC3 a
a. .£ U. X05 r r
05 053 X 9 95 CC CC
c><_ca Q a
o 9 O o03 a: 03 CQ
05 o CMCM CM CM
23
BCDI/O.DVM
24
System
Controller
APPENDIX B
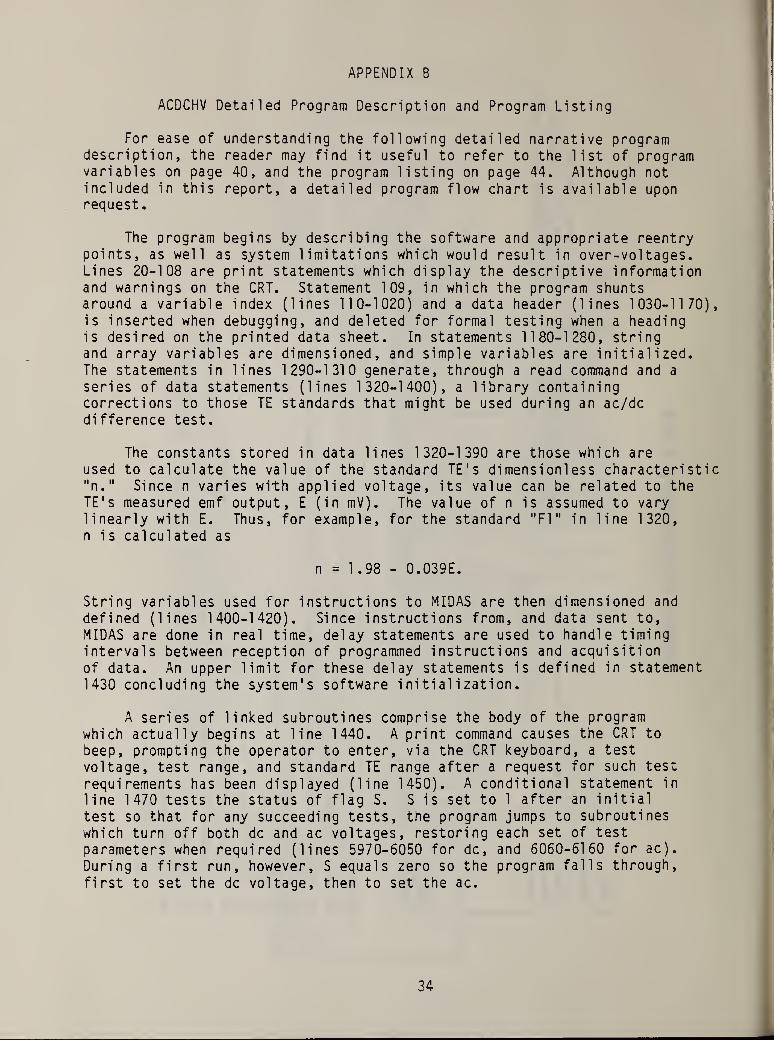
ACDCHV Detailed Program Description and Program Listing
For ease of understanding the following detailed narrative programdescription, the reader may find it useful to refer to the list of programvariables on page 40, and the program listing on page 44. Although notincluded in this report, a detailed program flow chart is available uponrequest.
The program begins by describing the software and appropriate reentrypoints, as well as system limitations which would result in over-voltages.Lines 20-108 are print statements which display the descriptive informationand warnings on the CRT. Statement 109, in which the program shuntsaround a variable index (lines 110-1020) and a data header (lines 1030-1170),is inserted when debugging, and deleted for formal testing when a headingis desired on the printed data sheet. In statements 1180-1280, stringand array variables are dimensioned, and simple variables are initialized.The statements in lines 1290-1310 generate, through a read command and a
series of data statements (lines 1320-1400), a library containingcorrections to those TE standards that might be used during an ac/dcdifference test.
The constants stored in data lines 1320-1390 are those which are
used to calculate the value of the standard TE's dimensionless characteristic"n." Since n varies with applied voltage, its value can be related to theTE's measured emf output, E (in mV). The value of n is assumed to varylinearly with E. Thus, for example, for the standard "FI" in line 1320,n is calculated as
n = 1.98 - 0.039E.
String variables used for instructions to MIDAS are then dimensioned and
defined (lines 1400-1420). Since instructions from, and data sent to,
MIDAS are done in real time, delay statements are used to handle timingintervals between reception of programmed instructions and acquisitionof data. An upper limit for these delay statements is defined in statement1430 concluding the system's software initialization.
A series of linked subroutines comprise the body of the programwhich actually begins at line 1440. A print command causes the CRT to
beep, prompting the operator to enter, via the CRT keyboard, a test
voltage, test range, and standard TE range after a request for such test
requirements has been displayed (line 1450). A conditional statement in
line 1470 tests the status of flag S. S is set to 1 after an initial
test so that for any succeeding tests, the program jumps to subroutines
which turn off both dc and ac voltages, restoring each set of test
parameters when required (lines 5970-6050 for dc, and 6060-6160 for ac).
During a first run, however, S equals zero so the program falls through,
first to set the dc voltage, then to set the ac.
34
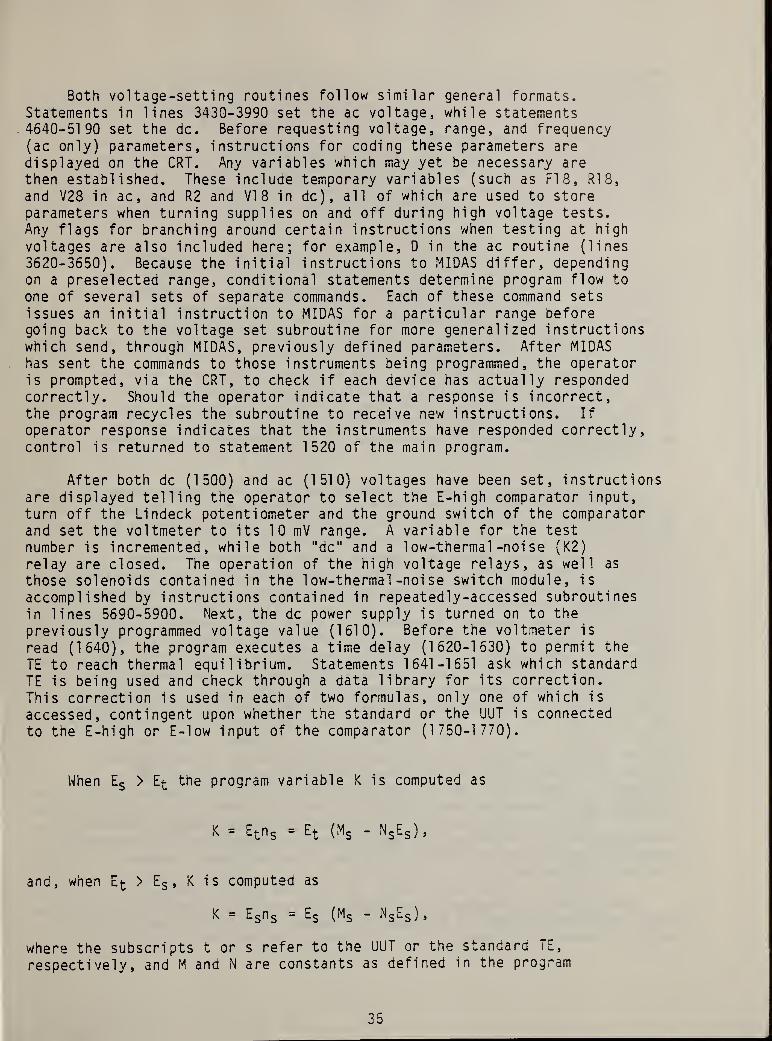
Both voltage-setting routines follow similar general formats.Statements in lines 343Q-3990 set the ac voltage, while statements4640-5190 set the dc. Before requesting voltage, range, and frequency(ac only) parameters, instructions for coding these parameters are
displayed on the CRT. Any variables which may yet be necessary arethen established. These include temporary variables (such as F18, R18,
and V28 in ac, and R2 and VI 8 in dc), all of which are used to storeparameters when turning supplies on and off during high voltage tests.Any flags for branching around certain instructions when testing at high
voltages are also included here; for example, D in the ac routine (lines
3620-3650). Because the initial instructions to MIDAS differ, dependingon a preselected range, conditional statements determine program flow to
one of several sets of separate commands. Each of these command sets
issues an initial instruction to MIDAS for a particular range beforegoing back to the voltage set subroutine for more generalized instructionswhich send, through MIDAS, previously defined parameters. After MIDAShas sent the commands to those instruments being programmed, the operatoris prompted, via the CRT, to check if each device has actually respondedcorrectly. Should the operator indicate that a response is incorrect,the program recycles the subroutine to receive new instructions. If
operator response indicates that the instruments have responded correctly,control is returned to statement 1520 of the main program.
After both dc (1500) and ac (1510) voltages have been set, instructionsare displayed telling the operator to select the E-high comparator input,
turn off the Lindeck potentiometer and the ground switch of the comparatorand set the voltmeter to its 10 mV range. A variable for the testnumber is incremented, while both "dc" and a 1 ow-thermal -noi se (K2)
relay are closed. The operation of the high voltage relays, as well as
those solenoids contained in the 1 ow-thermal -noi se switch module, is
accomplished by instructions contained in repeatedly-accessed subroutines
in lines 5690-5900. Next, the dc power supply is turned on to the
previously programmed voltage value (1610). Before the voltmeter is
read (1640), the program executes a time delay (1620-1630) to permit the
TE to reach thermal equilibrium. Statements 1641-1651 ask which standardTE is being used and check through a data library for its correction.
This correction is used in each of two formulas, only one of which is
accessed, contingent upon whether the standard or the UUT is connected
to the E-high or E-low input of the comparator (1750-1770).
When E s > E^ the program variable K is computed as
X > Et n s = Et (Ms - N
S E S ),
and, when Et > E s , K is computed as
K = E s n s = Es (Ms - N S E S ),
where the subscripts t or s refer to the UUT or the standard TE,
respectively, and M and N are constants as defined in the program
35

variable list on page 40. These equations have been derived in [2].The emf of the TE connected to the E-high input is read first by
the voltmeter, and its value displayed on the CRT. Should E-low have a
greater emf output than the TE connected to the comparator's E-highinput, the operator is instructed to switch comparator connections,the test is aborted (1655-1718), and the initialization process begunagain. If the standard and test TE's are properly connected to thecomparator, K is computed and printed on the data sheet along with voltage,test range, standard TE range, and emf outputs for both the standard andthe UUT.
If the UUT's emf actually is E-high, the operator is prompted toselect the E-high input of the TE comparator (if E-test < E-high, theinput selector switch remains at the E-low position). The potentiometeris turned on, the 10 yV range of the voltmeter selected, and thepotentiometer adjusted until the voltmeter indicates within ±500 n V.
Instructions and prompts in the statements in lines 1830-1950 cue theoperator to execute these manual operations. Then relay K2 opens andrelay K1 closes (lines 1970-1 990). The operator is then instructed toadjust the Kel vi n-Varley voltage divider (±100 nV), after which dc
voltage parameters are stored, and the dc standard turned off. Both"dc" and K1 relays open now, while relay K2 closes. Column headings forthe data sheet are printed, and variables for statistical calculationare initialized.
Appropriate frequency corrections are computed for the standard TE.
Statements 2220-2230 prompt the operator to define the test frequency,and statements 2240-2320 use this frequency value to determine thecorrection and truncate the computed correction to a whole number. Now
the "dc" relay closes, and the dc power supply is turned on to thepreviously selected test voltage, at which point the K2 relay closes.The operator is then directed to readjust the potentiometer, after whichthe dc voltage and range values are stored, the power supply turned off,and the "dc" relay opened. Then the "ac" relay closes and the ac powersupply is turned on, first at 105 volts and finally to the proper highvoltage. A time delay in lines 2480-2490 allows the ac supply to settleand the TE to reach thermal equilibrium before transferring control to
an ac voltage check subroutine (4000-4630) that adjusts the ac voltageso that the output of the test TE is within 1000 nanovolts of its outputwith dc voltage applied. The subroutine branches, depending upon whetherthe ac voltage is too high or too low. The ac voltage is adjusted to
provide nominally equal UUT output only with direct dc voltage applied,and not when reversed dc is applied. Furthermore, this ac voltage
adjustment is made only once at the beginning of the measurement sequence
to obtain four determinations of ac/dc difference. Hence, it is possible,for UUT's with large dc reversal differences, for second-order errors to
become significant. However, the multirange instrument and single range
thermal converters tested with this system did not possess large dc
reversal differences.
The system was intended to calibrate high-quality thermal converters.
Hence, additional balancing steps to eliminate uncertainties due to
large dc reversal difference (i.e., difference between the dc direct and
36

reverse voltages required for the same TE emf output of the UUT) were notneeded. For the worst case, using 2.0 and 1.6 as the two extremes ofthe characteristic n which may occur for the standard and UUT TE's, it
can be shown [4] that systematic uncertainties of less than one-fourththe UUT's dc reversal difference will occur. Minor software changes caneliminate this systematic error if large reversal voltages are anticipated.The changes would amount to adjusting the ac voltage for a TE outputequal to that when dc reversed voltage is applied to the test circuit.The only penalty for such a change in the operating procedure would bean increase in testing time of perhaps one or two minutes (for fourdeterminations of ac/dc difference).
There is also the possibility of a systematic uncertainty if the acor dc voltage standards drift during a sequence of four determinations.However, for the same extremes of n, the uncertainty is only 10 ppm if
either source drifts by as much as 100 ppm. The STABLV and STABHYprograms readily provide information about the stabilities of the sources.
Once the ac voltage has been adjusted for about equal TE output as
when dc is applied, relay K2 opens and relay K1 closes (2510-2540).Cautions are displayed on the CRT to allow the voltmeter to stop driftingbefore rebalancing the divider, should that be necessary. Statements in
lines 2600-2610 generate a time delay before the program jumps to testthe 10 voltmeter readings (5500-5650) to determine if the standarddeviation of an observation of 10 readings is < 200 nV. The test routineallows for up to five reading sequences to be obtained before the test is
aborted and a suitable warning displayed on the CRT.
AC/DC difference is reported on the basis of the average of fourdeterminations. Each determination is calculated from the voltagemeasurements with ac, dc+, dc-, and ac voltages applied simultaneouslyin this sequence to the standard and test TE's. The last ac reading of
one determination becomes the first ac reading of the next determination.Each reading is taken by closing the appropriate relays, bringing up thepower supplies to previously programmed values, displaying the readingin nanovolts, then storing the voltage parameters, powering down, andopening the relays. This measurement process is accomplished by meansof statements in lines 2650-3050 and concludes the midsection of the
program.
The final section of the program computes statistical parameters,formats the final output, generates a copy of the test data, and providesmeasurement options to the operator. Statements 3060-3130 calculate the
mean of the four determinations and the standard deviation of an observationin ppm, while statements 3140-3150 format the printed data, and tne
statement in line 3160 causes the data to be printed. Should the operatorwish to run another test, variables used to determine a pooled standarddeviation are then incremented in lines 3170-3230. Finally, options are
displayed (3240-3250) asking whetner to repeat a test with or withoutaveraging, to change parameters, or to terminate. Since ac was the last
measurement to be taken, its voltage is turned off, although the ac
37
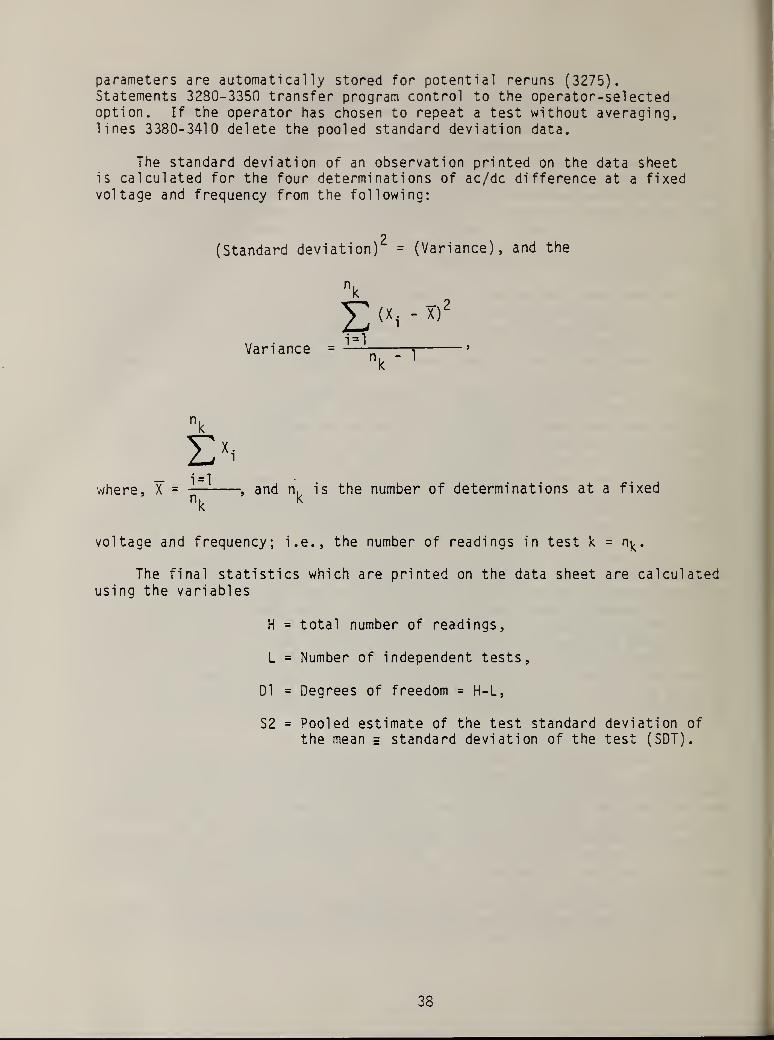
parameters are automatically stored for potential reruns (3275).Statements 3280-3350 transfer program control to the operator-sel ectedoption. If the operator has chosen to repeat a test without averaging,lines 3380-3410 delete the pooled standard deviation data.
The standard deviation of an observation printed on the data sheetis calculated for the four determinations of ac/dc difference at a fixedvoltage and frequency from the following:
p(Standard deviation) = (Variance), and the
nk
£ <*i-
,, • i=lVariance =
i5
where, is the number of determinations at a fixed
voltage and frequency; i.e., the number of readings in test k = n^.
The final statistics which are printed on the data sheet are calculatedusing the variables
H = total number of readings,
L = Number of independent tests,
D1 = Degrees of freedom = H-L,
S2 = Pooled estimate of the test standard deviation ofthe mean = standard deviation of the test (SDT).
38

An estimate of the total random uncertainty is calculated as threetimes the SDT and this product is therefore an estimate of the average3a value for the test, and is calculated as
3a =
(n-t) (n/t)
where, the degrees of freedom = n-t,
total number of readings = n =
k=l
number of independent tests = t.
These concepts are discussed fully in [9], pp. 316, ff.
39

ACDCHV PROGRAM VARIABLES
Note: 0
Vari abl
e
Name
A
Ad
A2
A4
A5
A6
B
B0
B1
B$
C
C7
C$
C0$
D
D1
D$
zero and not letter "oh"
Definition
Voltage applied to test and standard TE.
Array used to store the four determinations of ac/dc difference.
Variable in the subroutine used to increase or decreasethe ac voltage when driving the UUT's output to within1000 nV of its value with dc voltage applied.
Variable which is input by the operator after verifying thedc voltage (0 or 1 ).
Variable which is input by the operator after verifyingthe ac voltage and frequency (0 or 1).
Variable which is input by the operator after determiningwhether or not to change the frequency after the ac voltageis set.
Voltage range of test TE.
Average of all determinations at one voltage and frequency.
Average of the four latest determinations of the test. B1
is used in the computation of the standard deviation of the
test.
Array used to store the data related to a particular TE.
Frequency correction to standard TE which is calculated by
using test frequency (P).
Variable used to increment or decrement the ac voltage to
drive the UUT's output to within 1000 nV of its value withdi rect dc applied.
String containing name of standard TE.
Variable used in input string to dc source to set range,
polarity, remote trip, and voltage trip range.
Flag to initially turn on ac supply at 105 V, and then
return and set the correct voltage and range.
Variable used for degrees of freedom in statistical
calculations. Dl = H-L.
String used to input date.
40

VariableName
E
E9
E1-E4
F0$
FI $
G
H
I
10
1$
18
19
J
J1
K
Kf)
Definition
E-high voltage reading, in mV.
E-low voltage reading, in mV.
DLA voltage difference readings with ac, +dc, -dc, and ac
voltages applied to the standard and UUT TE's.
Used to input frequency to the ac source.
Storage variable for the ac source frequency used in the
ac voltage setting routine.
Dummy variable.
Total number of determinations of ac/dc difference per
test run.
Variable defining a for/next loop in which the standard TE
code file is established.
Variable used to designate the first element in array A
(the test voltage) when defining the variables M and N.
Also used to define El = near-null voltage reading with ac
applied, E2 = reading with +dc, E3 = reading with -dc,
E4 = reading with ac.
String used to input the test instrument manufacturer
,
name, and model number.
Variable used to define the for/next time interval loop.
Variable used to define the for/next "wait" timing loop;
e.g., to allow the dc or ac supplies to settle, or to
allow time for a TE to reach thermal equilibrium.
Flag for abort and total reset.
Variable used to define for/next loop in which X6 is computed.
J1 is used in the pooled estimate of the test standarddeviation of the mean.
Result of the standard TE's emf multiplied by the TE
character!-
sti c ns
when Es < E^, or the test TE's emf times
n s when E s > E^.
Variable used to define a for/next loop in which the ten
DLA near-null voltage readings are obtained, and then calculate
the standard deviation of the ten readings.
41

Vari ableName
L
M
M0
R1
R2$
R05
R$
R1 $
S
51
52
T
T0
T$
V$
vo$
VI $
V2$
V
Defi nition
Number of independent tests for a complete test run; i.e.,for all voltages and frequencies.
One of two constants used in the calculation of ns . The
other constant is N.
Variable used to implement MIDAS calls. M0 is the computer'sPASLA channel number in decimal.
Variable used to set the range of the dc supply.
Variable used to store the range of the dc supply beforeturning it off.
Variable used to select the range for the ac supply.
Character string reference used for relay operation.
Variable used to store the range of the ac supply beforeturning it off.
Flag for initial dc and ac voltage ranges.
Standard deviation of an observation for four or moredeterminations of ac/dc difference at one voltage and
frequency.
Pooled estimate of the test standard deviation of the mean.
Decision point variable.
Time delay variable.
Output format string.
MIDAS input string.
String used to set voltages on both ac and dc supplies.
Variable used to store the dc voltage value in the dc
voltage setting routine.
Variable used to store the ac voltage value in the ac
voltage setting routine.
Numeric value of V$. V is the value of the voltagereadi ng.
42

Vari abl e
Name Definition
w Divisor used in the calculation of the mean of four or moredeterminations at one voltage and frequency.
X, XI ,X2 All used in the standard deviation of the test (SDT).calculation
.
X5,X6,X7 Used in calculating the pooled estimate of the standarddeviation of the mean.
Y Intermediate variable used in calculating Y1
.
Y1 Standard deviation of ten voltmeter readings.
Z Counter in the five standard deviation abort subroutine.
43

ACDCHV PROGRAM LISTING
20304050607080
90959697981001011021031041051061071081091101111121131141151161171201301401451501601 70
180190195200210220224226230240
;*PROG*;*PROG*
NAME=ACDCH7TESTS AC-DC
PROGRAM CONTAINSHI* V* AMP* (AC) ATHIS PROGRAM HASINITIALLY AT 105PROG* CAN BE USED
DIFF* AT HI 70 1 007,‘RANGE* 1 0 00 )*
SUBROUTINE CS) FOR TURNING ON A OFF*FLUKE (DC , DCR ) WHEN SWITCHING RELAYS'AUTOMATIC CONTINGENCY FOR TURNING ON70LTS*
"
AT BOTH LO* A HI* 70LTAGES*
"
HI* 7* AMP*
TO RESET, RUN 5 9 1 0 *
TO MAKE DEC IS ION (S
)
AFTER INITIAL RUN, RUN 3240*
CAUTION*J" READ THIS CAREFULLY!*;* FLUKE ALWAYS USES 1 K7 RANGE! HENCE, FOR LO 70LTAGE TESTS*i* TO PRE7ENT DC 07ER70LTAGE, USE PRECEEDING ZEROES FOR CORRECTJ*EG* 97 ON 1K7 RAN GE*0 0 90 0 00 , AND 907 ON 1 K7 RANGE* 0 90 00 0 0*; "MAKE SURE HP HI-70LT* AMP* IS ON*;*TIME DELAY TO SET IN LINE 1430*;
7'
GOTOREMREMREMREMREMREMREMREMREMREMREMREMREMREMREMREMREMREMREMREMREMREMREM
'
REMREM
1180INDEXTHIS PROG* USES THE FOLLOWING 7ARIABLESA, A0 ,A2,A4,A5,B,B0 ,B1,3S,C,C7,CS,C0S,D,D1 ,DS,E,E1 ,E2,E3,E4,E9,F0S,F1S,G,H,I, 10, 18, 19, IS , J, J1 , K, K0 , L, M, M0 ,M1 , M2 ,
N,NS,0,OS,02S,P,PO,R,RO,R1 ,R2,RS ,R0S ,Rl S
,
S,S1 ,S2,T,TQ,TS,7,7S,70S,71S,72S,W,X,X1 , X2,X5,X6,X7,Y,Y1 ,ZPRG* LINES 110-1020: PROGRAM INDEX A DEF. OF 7ARIA3LES1030-11701180-1460
147014801490
1530-23202330-25702590-30502940-29503060-32303240-34103420-3990
36003730-37404000-4630
TEST DATA HEADING PRINTOUTINITIALIZATION OF DATACONDITIONAL FOR RANGE CHANGECALL TO DC 70LTAGE SET SUB*CALL TO AC 70LTAGE SET SUB*EH A EL READINGS A 7ARIABLE INPUTSAC 70LTAGE APPLIEDAC-DC -DCR READINGSSAFETY MEAS* - CLOSE READ IN CASE OPENDATA PRINT A STATIS* CALCS-END OF TEST DECISION POINTAC 70LTAGE SET ROUTINEINITIAL STORAGE OF AC FREQUENCYINITIAL STORAGE OF AC PARAMETERSAC CHECK ROUTINE (DRI7ES AC WITHIN100 NAN070LTS OF DC)
44

241 REM242 REM243 REM250 REM2S5 REM260 REM270 REM280 REM290 REM300 REM310 REM312 REM314 REM316 REM318 REM320 REM330 REM340 REM350 REM360 REM370 REM380 REM390 REM400 REM410 REM420 REM430 REM440 REM450 REM460 REM470 REM480 REM490 REM500 REM510 REM520 REM530 REM540 REM550 REM560 REM570 REM580 REM590 REM600 REM610 REM612 REM614 REM616 REM618 REM620 REM630 REM631 REM640 REM650 REM651 REM660 REM661 REM
NOTE: TO CHANGE NULL RANGE - LINE 40 80TO CHANGE INCREMENT - LINES 4150 4 4400 FOR L«V.FOR H.V. INCREMENT - LINES 4170 4 4420
' *
4640-5190 : DC 'VOLTAGE SET ROUTINE4760-4770: INITIAL STORAGE OF DC PARAMETERS5200-5390: STATIS. PRINT ROUTINE FOR POOLED S-D.5400-5490: DLA READ ROUTINE * *
5500-5680: STD. DEV. TEST (OF DLA READINGS)5690-5790 : E-MOD. RELAY SET ROUTINE CHI. V. SV. )
580 0-5 90 0 : K-MOD.' RELAY SET ROUTINE CLO*' THER. "SV. )
5910-6640: RESET; TURN-OFF 4 TURN-ON SUBROUTINE5950-6050: TURN-OFF FLUKE 4 REDEFINE DC PARAM.6060-6160: TURN-OFF HI. V. AMP. A REDEFINE AC PARAM.6170-6330: TURN-ON FLUKE A RESTORE DC PARAM.6340-6630: TURN-ON HI. V. AMP. A RESTORE DC PARAM.RUN 3360: TO CHANGE RANGE
1510: TO CHANGE FREQUENCY2330: TO REPEAT TEST3290: TO RESET RELAYS ONLY3380: TO TO REPEAT V/O AVE.5200: TO GET POOLED S*D. STATIS. PRINTOUT
. 5910: TO ABORT A RESET ALL RELAYSA*VOLTAGE APPLIED TO STANDARD TE.A0 “ARRAY USED TO STORE THE 4 DETERMINATIONS.A2* INCREMENTED IN AC VOLTAGE CHECK ROUTINE
*
3= RANGE OF TEST TEB0 *AVE« OF ALL RDGS* OF A PARTICULAR TEST.Bl-AVE.' OF ONLY 4 LATEST READINGS*BS“ARRAY USED TO STORE EACH TE 'S CONSTANTS.C“STD. TE FREQ. CORR. DETERMINED FROM INPUT FREQ*PC7-VOLTAGE INCREMENT 'IN AC BALANCE ROUT.C$=STRING CONTAINING I.D. OF STD. TEC 0 S*USED IN INPUT STRING ’TO DC SOURCED=COUNTER FOR INITIAL INPUT (105 V) FOR HI . V. AMP. (AC
)
D1 “DEGREES . OF FREEDOM* H-L” '
DS* STRING USED TO INPUT DATEE*E-HI GH MILLIVOLT READING (EH)E9*E-LOV MILLIVOLT READING (EL)El TO E4*ALTERNATING AC-DC-DCR-AC NULL READINGSF0 S*USED TO INPUT FREQ. TO AC SOURCEG*DUMMY VARIABLEH*TOTAL NO. OF DETERMINATIONS PER RUNIS“STRIN G USED TO INPUT TEST INSTRUMENT MFG • 4 MODEL NO*J*COUNTER FOR ABORT 4 TOTAL RESETK= PRODUCT RESULT OF STD. EMF*STD.TE CHARACTERISTIC (N* LOVER CASE I
VHEN ES<ETOR TEST EMF*STD TE CHARACTERISTIC(N j LOVER CASE) VHEN ES>ETL-TOTAL NO. OF TESTS PER RUNM=CON STANT 'USED TO DETERMINE STD. TE
CHARACTERISTIC N-SUBSCRIPT S (N, LOVER CASE)M0* IN MIDAS CALL IS THE PASLA CHANNEL NO- IN DEC.M 1 “MAX. LENGTH OR TERMINATING CHAR.
OF MIDAS INPUT STRINGM2«STATUS VARIABLE SET AFTER
EACH MIDAS CALL - - - -- -
45

680 REM NS-STRING USED TO INPUT OPERATOR'S NAMeJ690 REM OS* INPUT STRING SPECIFYING PHYSICAL &DDRESS700 REM 02S*STRING USED TO INPUT TEST NO.710 REM P-FREQUENCY INPUT (KHZ)720 REM R*RANGE OF STD. TE730 REM R0-VARIABLE SELECTS RELAY OPERATION740 REM HV RELAYS. E-MODULE. R0-1.. CLOSE DCR RELAY750 REM R0*2. .CLOSE AC RELAY760 REM R0- 3.'.'CLOSE DC RELAY770 REM R0*ir.'.OPEN DCR RELAY780 REM R0- 12.'.'OPEN AC RELAY790 REM R0* 13.'.'OPEN DC RELAY800 REM K-MODULE. RQ-3* CLOSE EH. R0*2* CLOSE EL RELAY.810 REM R0*4.. CLOSE SET RELAY82 0 REM R0 *5.'.'CLOSE READ RELAY830 REM R0*13; OPEN EH. R0-12, OPEN EL RELAY.840 REM R0* 1 4 • .OPEN SET RELAY850 REM R0* 15.'.'OPEN READ RELAY860 REM R0*0 . '.'OPEN ALL RELAYS870 REM R0S*RANGE SELECT FOR AC SOURCE880 REM RS-CHARACTER STRING REFERENCE USED FOR RELAY OPERATION890 REM S-COUNTER FOR RANGE900 REM S1*STD. DEV. OF AN OBS. FOR901 REM 4 OR MORE DETERMINATIONS910 REM S2-P00LED EST. OF TEST S.D. OF MEAN920 REM T*DECISION POINT VARIABLE
'*
930 REM T0*T IME DELAY LOOP VARIABLE940 REM TS*OUTPUT FORMAT950 REM VS-STRING OUTPUT FROM MIDAS960 REM V0S*5TRING INPUT TO SET VOLTAGE961 REM ON BOTH AC & DC SOURCES970 REM V-NUMERIC VALUE OF VS980 REM V*D IV ISOR IN AVE. CALC.990 REM X* XI * X2* X5 * X6* X7*"ALL USED IN S.D.T.1000 REM Y*USED IN Y1 CALC.1010 REM Yi *STD. DEV. OF 10 DLA READINGS1020 REM Z*COUNTER OF Yl 'S Z*5»A30RT1030 DIM O2S(6)*IS(20>sDS(15)*NS(25)1040 J" INPUT CURRENT DATE* YOUR NAME*TEST NO. * AND TEST INST."1050 ;•
1060 INPUT DS*NS*02S* IS
1070 J ON C
6
) "DATE "*DS1080 ; ON C6>1 090 ; ON ( 6 ) "OBSERVER "*NS1100 ; ON (6)1110 ; ON <6 ) "TEST NO "*02S1120 ; ON (6)1130 ; ON (6)* INST "*IS1140 ; ON (6 )
* *
1150 ; ON (6)1160 ; ON (6)" APP TEST STANDARD ES ET1170 ; ON <6)" V RANGE TE RANGE MV MV"1180 DIM F0S(2)*F1S(2)*R0S(1)*R1S(1)*VQSC7)*VIS(7)*V2SC7)1190 DIM C0S(3)sCS(2)«TS(72)j3S(7s8)sA(8s2)
X*
46

1200 S*Q1210 J*01220 D*01230 MO *3
8
1240 Z*Q1250 H«01260 L*01270 X7*Q1280 V*01290 FOR 1*1 TO 81300 READ BSCI)*ACI*1 )*ACI*2>1310 NEXT I
1320 DATA "Fi"*l.98*. 39E-
1
1330 DATA " F2 " * 2 • 0 3 * .2 8E-
1
1340 DATA * FG" *2. 04* .'3 1 E- 1
1350 DATA "FC"* 1•* 9* • 32E-
1
1360 DATA "FH"*2.02*'.32£-i1370 DATA "FA" *2.'Q3**'42E-11380 DATA "F3“* 1*94* •’ 14E-11390 DATA "FD"* 2* 03 *
•
42E-
1
1400 DIM VSC12>*0SC29>*RSC16>1410 VS*"1420 RS*"7?6>5*4<3;2: 1908"1430 T0*1 80
0
1440 ;• "
1450 J" INPUT TEST VOLTAGE* TEST RANGE* STD. RANGE" .
1460 INPUT A*B*R1470 IF S*G GOTO 15001480 GOSUB 59701490 GOSUB 60601500 GOSUB 46401510 GOSUB 34201520 ;" "
1530 ;"SET COMP. TO E-HIGH* POT #R OFF * DLA 10 MV* GND OFF"1540 ;"TO CONTINUE* RETURN"1550 INPUT G1560 L*L+11570 R0*31580 GOSUB 56901590 R0 *41600 GOSUB 58001610 GOSUB 61701620 FOR 19*1 TO 16001630 NEXT 191640 GOSUB 54001641 J" INPUT THE CODE FOR STANDARD #TE *
C IN QUOTES )
"
1642 ;" "
1643 INPUT CS1644 FOR 1*1 TO 8
1645 IF 3SCIX>CS THEN 16481646 10*11647 1*1001648 NEXT I
1649 IF X>*100 THEN 16531650 ;• STANDARD NOT FOUND; TRY AGA IN"
1651 ;• •
-

165216531654165516601670168016901700171017121714171617181720173 0
1740175017601770178017901800181018201830184018501940195019601970198019902000201020202030203520402050206020 7020802090211021202130214021502160217021802190220 0
2210
GOTO 1641M*A (10*1 )
N*A( 10 #2
)
E*V #l 000
i*E-HIGH - m *Z* "MILLIVOLTS"J" CHANGE #BB * TO E-LOV* THEN RETURN *
INPUT GGOSUB 5400E9»V*1 000;*E-LOV *" jE9* "MILLIVOLTS*IF E>E9 THEN 1720
-
;"E-LOV IS GREATER THAN E-HIGH, SWITCH CONNECTIONS*GOTO 5910TS^'IMMMMM.I •••*• •• Mt.t ••••; ON (6)
' .. ..;• *
;*if*;cs;*is e-hxgh, input *\ if not* input #o
# ."
INPUT GIF G* 0 GOTO 1810K»E9*CM-E*N>; ON (6) USING TS>A.»B # C5^R^E^E9#KGOTO 1940K=E9*<M-E9*N>; ON C 6 ) USING TS>A>B^CS>R>E9.»E^K;* *
J"SET COMPARATOR TO E-HIGH. RETURN"INPUT GJ "POT 'R ON - SET DLA 10 MICRO-VOLTS - SET NULL^ RETURN
"
;* *
INPUT G
R0 * 1
4
GOSUB 5800R0-5GOSUB 5800^"BALANCE DIVIDER* THEN RETURN";*
INPUT GGOSUBR0 * 1 5
5970
GOSUBR0 * 1 3
5800
GOSUBR0*4
5690
GOSUB 5800; on (6); on (6)* KHZ COR; on < 6
)" STD AVE T
; on <6>" PPM; on ( 6
) "DEV COR PPM; onX-0X1»Q
(6)
X2*0C*0V=* 0
AC -DC DIFFERENCE
*
48

2220223022402250226022702280229023002310232023302340235023602370238023902400241 0
2420243024402445245 0
2460247024802490250 0
25102520253025402550256025 702580259026002610262026302640265 0
266026702680269027002710272027302740275 0
J * INPUT" FREQUENCY C KHZ )
*
;•
INPUT PIF R< 1 0 0 THEN C*0IF R* 100 THEN C*-CP*2/1 0 00
)
IF R=200 THEN C* - <P*2/ 1 0 0 0
)
IF R-300 THEN C* CP"2/1 0 0 0 ) * 1 .
5
IF R-60 0 THEN C* CP*2/1 000 >* 1 -3IF R=1001 THEN C* CP* 2/ l 0 0 > *2-PIF Ra 1002 THEN C*P*2*.12E-1C* INT CC )
R0*3T*3GOSUB 5690GOSUB 6170
"
R0 *4GOSUB 5800J" SET POT NULL# THEN RETURN"INPUT GGOSUB 5970R 0 = 1 3
GOSUB 5690GOSUB 6060R0 =2GOSUB 5690GOSUB 6340FOR 19* 1 TO 2000NEXT 19GOSUB 4000R0* 1
4
GOSUB 5800R0*5GOSUB 5800IF V<>0 THEN 2600;*VAIT FOR DLA TO STOP DRIFT.*; "REBALANCE DIVIDER IF NECESSARY#
INPUT G
FOR 19*1 TO TONEXT 19GOSUB 5500E1*V*. 1 El 0
;*E1 ‘ *"#E1# "NANOVOLTS*FOR 10=1 TO 4
GOSUB 6060R0 * 1 2GOSU3 5690RQ*3GOSUB 5690GOSUB 6170FOR 19*1 TO TONEXT 19
,
GOSUB 55JJJUE2*V*. 1E10
THEN RETURN."
49

2760 ;"E2 ‘ -"^E2> “NANOVOLTS"2770 GOSUB 59702780 R0 * 1
3
2790 GOSUB 56902800 R0-12810 GOSUB 56902820 GOSUB 61702830 FOR 19-1 TO TO2840 NEXT 192850 GOSUB 55002860 E3»V*.1E102870 ;*E3 ' * - *E3* "NANOVOLTS"2880 GOSUB 59702890 R0*112900 GOSUB 56902910 R0 *22920 GOSUB 56902930 GOSUB 63402940 R0 *52950 GOSUB 58002960 FOR J9*l TO TO2970 NEXT 192980 GOSUB 55002990 E4*V*.1E103000 ;”E4 '* *",E4«*"N
(AN0V0LTS"
q 0 1 0 A0 < 10 )=C-E1 E2*E3-E4)/<2*K)3020 IF 10*4 THEN 30503030 El *E43040 ;“E1 *",EW "NANOVOLTS"3050 NEXT 103060 V»V+430 70 X=X+A0 < 1 )"2+A0 (2 )~2+A0 (3 )"2+A0 C4)"230 80 X1=X1 +A0 <1 ) +A0 C2)+A0 C3)+A0 <4>3090 B1*A0 <1 >+A0 C2)+A0 C3)+A0 <4)3100 Bl*Bl/43110 B0*X1/V3115 P0*CX1/V)*KC>3120 X2 fi30 *X13130 S1»SQRC CX-X2)/(V-1 ))
3140 T$C1*5Q)«"»0«. M- -ft ( -# § f 9 -9999 -9999 -9099 )
3150 TSC5W72)*" '•##.§ -«««••• "
3160 J ON C 6 ) USING TSjP*C*A 0 Cl )>A0 <2 ) ^ A0 (3 ) AO C4)*S1>P03170 Hs H+43180 X6*
0
3190 FOR Jl=l TO 43200 X5 = CA0 CJ1 )-Bl ) ~ 2
3210 X6=X6+X53220 NEXT J13230 X7-X7+X63240 J " REPEAT .» FREQUENCY* RANGE* STOP > REPEAT V/O AVE. 7"
3250 ;* 1 2 34 5"
3260 ;• “
3270 INPUT T3275 GOSUB 60603280 IF T-4 THEN 5200
50

3290 Ml *03300 0S*"<35>E89: ;<a>?K89: ;<*>?"3310 CALL 1 *MO*OS*VS*M1 *M23320 IF T* 1 THEN 23303330 IF T*2 THEN 15103340 IF T*3 THEN 33603350 IF T*5 THEN 33803360 S*13370 GOTO 14503380 X7=X7-X63390 H*H-4340 0 ; ON C 6
) “ABOVE DATA DELETED FROM TEST*3410 GOTO 21603420 GOSUB 60603430 ;
3440 ;* AC VOLTAGE SET3450 J********* IMPORTANT NOTE**** ****••-*•
3460 * " WHEN SETTING AN AC VOLTAGE OF i*10*OR 100 VOLTS* YOU MUST*3470 J“CHOOSE THE MAX. OUTPUT OF THE CORRESPONDING RANGE* FOR EXAMPLE*3480 * * VHEN APPLYING 10 V YOU MUST PROGRAM 5-NINES (99999) ON THE 10 V*3490 ;*RAN GE* AND NOT (REPEAT NOT) 1 00 00 ON THE 100 V RANGE*3500 ;
3510 ;
3520 ;*THE FREQUENCY IS CODED IN TVO DIGITS. THE FIRST DIGIT MUST BE*3530 ;*A NUMBER FROM 1 TO 11* MEANING THE HIGH ORDER DIGIT. THE*3540 ** SECOND DIGIT ARE MULTIPLES OF 10* STARTING WITH 0*X1'Q AND*3550 ;*3 ® XI 0 K. IN HEX- A TEN IS A'j' AND A ELEVEN IS A';'.*3560 ;
3570 ;* *
3580 i* INPUT FREQUENCY-3590 INPUT F0S3600 F1$*F0S3610 1
3620 D»13630 ROSa-6*3640 GOSUB 64203650 D*03660 ;*TO SET VOLTAGE AND RANGE* FIRST INPUT THE CORRECT RANGE-3670 ** FOLLOWED BY THE 5-DIGIT VOLTAGE. A RANGE OF 0 * 1MV* 1 * 1QMV*"3680 ;*2 * 100MV * 3 * IV * 4 « 1 0V * 5 - 100V * AND 6 * 1000V."3682 1* VHEN TEST LO A HI AC MUST SET RANGE TO NEXT-3684 ;* HIGHEST RAN GE LIMIT FROM TEST VOLTAGE-3686 ;* (EX. 1 - TEST 4 V AC SET RANGE AT 4=10V OR*3688 ;* EX. '2 - TEST 100 V AC SET RANGE AT 6*1000).*3690 ;
3700 ;* *
3710 ;* INPUT RANGE* VOLTAGE-3720 INPUT RQS*V0S3730 RISaROS3740 V2S* VO S
3750 IF R0S**6* GOTO 38203760 OS«*<35>C?"+V0S(l*5)+RQS+F0S+"02"3770 CALL 1 *M0 *OS*VS*Ml *M23780 Ml * 1
3790 OS*"<3S>rO*
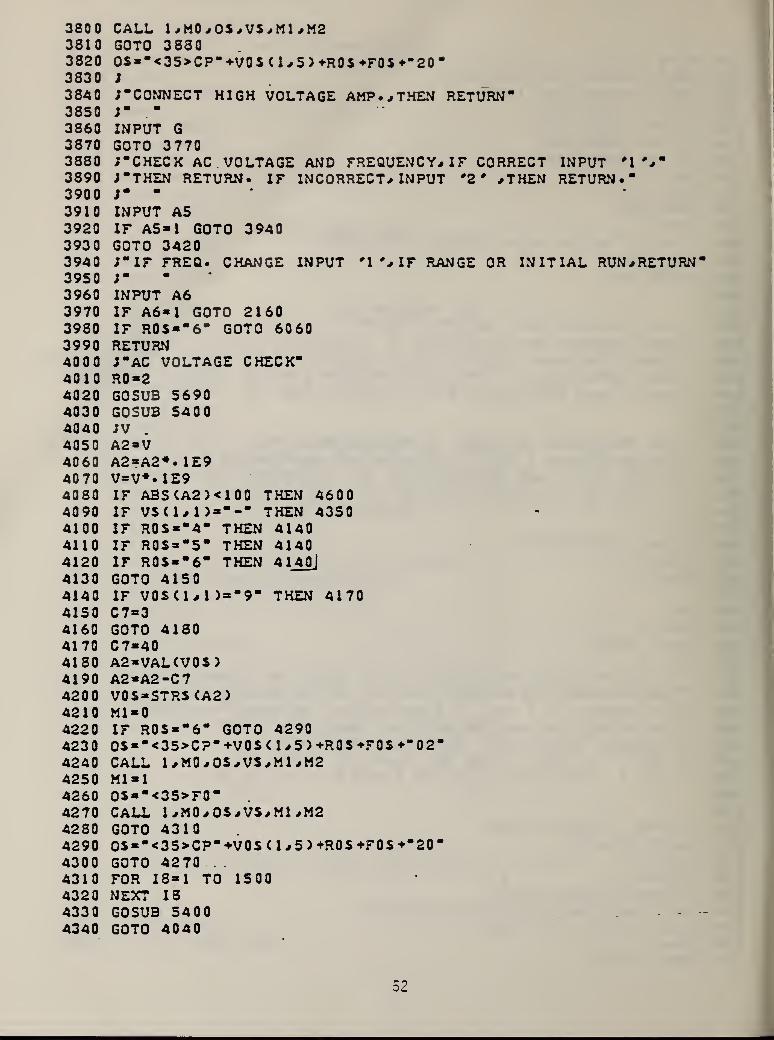
3800 CALL 1 *MO*OS*VS*M1 *M23810 GOTO 38803820 OS**<35>CP*+VOS C 1 * 5 ) +R0S +F0S +*2 0
*
3830 ;
3840 ^"CONNECT HIGH VOLTAGE AMP* * THEN RETURN*3850 ;* *
3860 INPUT G3870 GOTO 37703880 CHECK AC. VOLTAGE AND FREQUENCY* I F CORRECT INPUT '1 # **
3890 J "THEN RETURN. IF INCORRECT* INPUT *2 * *THEN RETURN.*3900 i* *
3910 INPUT A53920 IF A5-1 GOTO 39403930 GOTO 34203940 i*IF FREQ. CHANGE INPUT #
1 * * IF RANGE OR INITIAL RUN * RETURN*3950 ;*
3960 INPUT A63970 IF A6* 1 GOTO 21603980 IF R0S*"6* GOTO 60603990 RETURN4000 ;*AC VOLTAGE CHECK*4010 RQ*24020 GOSUB 56904030 GOSUB 54004040 JV .
4050 A2*V4060 A2*A2*.1E94070 V=V*. 1 E94080 IF A3SCA2X10Q THEN 46004090 IF VS ( 1 * 1 ) = *-• THEN 43504100 IF R0S**4* THEN 41404110 IF R0$a*5* THEN 41404120 IF R0S** 6" THEN 414014130 GOTO 41504140 IF VOS (1*1 )**9* THEN 41704150 C7 a 3
4160 GOTO 41804170 C 7*404180 A2*VAL(V0S)4190 A2*A2-C7420 0 V0 S*STRS <A2 )
4210 Ml *04220 IF R0S«"6* GOTO 4290423 0 OS*“<35>CP*+V0S ( 1 * 5 ) +R0S FO S * 0
2*
4240 CALL l*M0*OS*VS*Ml *M24250 Ml a 1
4260 OS** <35>F0
*
4270 CALL 1*MO*OS*VS*M1*M24280 GOTO 43104290 OS**<35>CP*+V0S U *5 ) +R0S +F0S +"20*
4300 GOTO 42704310 FOR 18*1 TO 15004320 NEXT 184330 GOSUB 5400 -
4340 GOTO 4040
52

4350 IF RQS*"4* THEN 43904360 IF R0S*"5" THEN 43904370 IF R0S*"6" THEN 43904380 GOTO 44004390 IF V0S<1#1>*"9" THEN 44204400 C7*34410 GOTO 44304420 C7-404430 A2*VAL(VQS>4440 A2-A2+C74450 VQS*STRSCA2>4460 Ml *04470 IF R0S*"6" GOTO 45404480 OS*"<35>CP" VO SCl#5)+R0S+F0S+"02"4490 CALL 1 #M0#O$#VS#Ml #M24500 Ml *
l
4510 OS*"<35>F0
"
4520 CALL 1 #MO#OS#VS#M1 #M24530 GOTO 45604540 OS*"<35>CP"+V0S Cl#5)+RQS+FQS+"20"4550 GOTO 45204560 FOR 18*1 TO 15004570 NEXT 184580 GOSUB 54004590 GOTO 40404600 R0 *24610 V*V/.1E94620 GOSUB 56904630 RETURN4640 ;• DC VOLTAGE SET "
4650 VS*"4660 ;
4670 ;"TO SET THE VOLTAGE RANGE AND TRIP# INPUT FIRST THE CORRECT"4680 i"RANGE FOLLOWED BY A COMMA AND THE DESIRED VOLTAGE. RANGES"4690 ;"OF 10# 100# AND 1000 ARE ALLOWED. VOLTAGE MUST BE 7 DIGITS."4695 ;" WHEN TEST AT LO V C<*100 V DC ) MUST SET RANGE AT 1000."4700 ;
4710 ;• INPUT RANGE# VOLTAGE"4720 ;•
4730 M0*384740 Ml *04750 INPUT R1 # VOS4760 R2*R14770 VlS*V0S4780 IF Rl-10 GOTO 49904790 IF R1-1QQ GOTO 50304800 IF R1 * 1 0 0 0 GOTO 50704810 GOTO 47104820 OS*"<35>DP"+V0S+"j;"^C0S4830 CALL 1 #M0 # OS # VS#M 1 #M24340 Ml * 1
4850 05*"<35>FQ"4860 CALL 1 #M0
#
OS # VS#M1 # M24870 VS C2#2 )** "
4880 ;vs
53

4890 IF VAL CVS ) <> 6 THEN 51104900 J" CHECK DC VOLTAGE* IF CORRECT INPUT M '* THEN RETURN."4910 J" IF INCORRECT* INPUT *2 ** THEN RETURN-4920 J-4930 INPUT A44940 IF A4* 1 GOTO 49504945 IF A4*2 GOTO 51304950 GOTO 59704960 RETURN4970 GOTO 46404980 RETURN4990 C0S*"840"5000 os*"<35»dpoooqooo;;"*m:os5010 CALL 1 * M0 * 05 * VS* Ml *M25020 GOTO 48205030 COS*" 942"5040 OS*"<35>DP0Q0000Q;;"*C0S5050 CALL l*MQ*OS*VS*Ml *M25060 GOTO 48205070 CQ$*"*4l
"
5080 OS*"<35>DP0000Q00J;"+C0S5090 CALL 1*MO*OS*VS*M1 *M25100 GOTO 48205110 J" WARN ING - SYSTEM TRIPPED* SUPPLY AUTOMATICALLY RESET-5120 J* TRY AGAIN."5130 Ml *05140 V0S*-0000000-5150 C0S*"000"5160 OS*"<35>DP"+V0S+"00"+C0S5170 CALL 1*MO*OS*VS*M1*M25180 GOTO 46405190 RETURN5200 ;"DO YOU WANT STATISTICS PRINTOUT?"5210 ;*IF YES* ENTER *1 # AND RETURN-5220 ;*IF NOT * ENTER '2 # AND RETURN-5230 ;- “
5240 INPUT T5250 IF T*2 THEN 59105260 D1*H-L5270 S2*SQRC (X7/D1 )/<H/L>
>
5280 J ON (6)5290 J ON C 6
) "NUMBER OF READINGS*H* "*H5300 ; ON (6)5310 i ON < 6
) "NUMBER OF INDEP. TESTS*L*. . "*L5320 J ON (6)5330 ; ON (6 )"DEGREES OF FR£EDOM*Dl * "*D15340 ; ON <6)5350 J ON <6 )*PQOLED ESTIMATE OF TEST STD. DEV. OF MEAN*S2"5360 I ON (6)"*S.D.T. (SEE S.P. 300*V«1* P*' 31 6-40 >....*" *S25370 ; ON <6)
• • •
5380 ; ON <6)-3*S.D.T.« "*3*S25390 GOTO 59105400 Ml * 1
2
5410 0S*"<35>BTTU<1 7>_^ .
54

5420 CALL 1 #M0#OS#VS#Ml #M25430 VS (LEN (VS ) +1 # LEN (VS)+i)*“ *
5440 IF VS (2# 2 )*" : “ THEN 54805450 IF . VS (2# 2 ) *" * " THEN 54805460 V*VALCVS>5470 RETURN5480 V*20 0 0
5490 RETURN5500 Y*
0
5510 Y1 *05520 FOR K0* l TO 105530 GOSUS 54005540 Y*Y+V . .
5550 Y1*Y1+V*V5560 NEXT K05570 Yl*SQRCCYl-(Y#Y/iO))/9)5530 IF Y1 *• IE1 0<20 0 THEN 56605590 J*STD. ‘DEV. **# Y1 *. IE 1 0
* "NANOVOLTS*5600 Z*Z+1
*
5610 IF Z*5 THEN 56305620 GOTO 55005630 J " WARN IN G-JOB ABORTED# TESTS EQUAL FIVE# SYSTEM UNSTABLE"5640 ;* *
5650 GOTO 59105660 V* Y/ 1
0
5670 Z*05680 RETURN5690 R0 * INT CR0
)
5700 IF RQ>*0 AND R0<19 THEN 57305710 ;* INVALID RELAY ADDRESS*5720 RETURN5730 Ml *05740 R1 * INT (R0/ 10)57S0 R2* INTCR0-R1*10>5760 IF R0 <> 0 THEN OS** <35>E* +RS C2*R2-1+R1 # 2*R2 -1 +R1 )
5770 IF R0*0 THEN 0S**<35>E89 i
J
<*>?*5780 CALL 1 #M0 # OS #VS #M1 #M25790 RETURN5800 R0 * INT CR0
)
5810 IF R0>*0 AND RQ<19 THEN 58405820 ;* INVALID RELAY ADDRESS*5830 RETURN5840 Ml *05850 R1 * INT (R0/ 1 0 )
5860 R2* INT (R0-R1*1Q)5870 IF R0 <> 0 THEN OS*" <35> K* +RS <2*R2- 1 +R1 # 2*R2 -1 +R1
)
5380 IF R0 * 0 THEN OS** <35 > K89 :,’<*> ?*
5890 CALL 1 #MO#OS#VS#M1 #M25900 RETURN5910 R0 *
0
5940 J*15950 R0 *0
5960 Z*05970 Ml *0
55

5980 VOS*-OOOOQOO"5990 C0S--000*6000 OS*"<35>DP"*V0S+"00*«’C0S6010 CALL l.»M0,OS,VS,Ml.,M26020 IF J?I GOTO 60806030 VQS*V1S6040 R1*R26050 RETURN6060 Ml *06070 V0s*"0000000*6080 RQ S* “
0
"
6090 F0 S* * 0 0
“
610 0 OS*“<35>CP" ^VOS ( 1 # 5 ) +RQS +F0S "00*6110 CALL l*MO#OS#VS.»Ml#M26114 GOSUB 56906120 IF J*1 GOTO 66406130 R0 $*R1
S
6140 V0S*V2S6150 F0S*F1S6160 RETURN6170 MO *386180 Ml *06190 C0S*"*41
*
6200 OS*"<35>DPOOOOOOO;;"+COS6210 CALL .1,MO,OS,VS,M1.,M26220 V0S*V1S6230 R1 =R26240 FOR 19*1 TO 1006250 NEXT 196260 OS*-<35>DP"+V0S+-;; ,,
«-C0S
6270 CALL 1 ^MO^OS^VS^Ml ,M26280 Ml * 1
6290 OS = * <35> F0
*
6300 CALL l*M0*OS*V5*Ml *M26310 R2*Ri6320 V1S*V0S6330 RETURN6340 Ml *06350 V0s*-Q000000*6360 R0 S* "
0
"
6370 F0S*"Q 0"
6380 OS*"<35>CP"+VQS (1*5 > +R0S +FQS
0
0
"
6390 CALL 1 *M0 * OS * VS*M1 *M26400 R0S*R1S6410 F0S*F1S6420 VQS*“ 10500"6430 FOR 19*1 TO 1006440 NEXT 19645 0 OS*-<35>CP*«-V0SC W5>*R0S+F0S+"2Q"6460 CALL 1 *M0 * OS*VS*Ml *M26470 Ml * 1
6480 OS* " <35> F0
"
6490 CALL l*M0*OS*VS*Ml *M2
56

65006510652065306540655 0
6560657065606590660 0
661066206630664 0
665 0
FOR 19-1 TO 150NEXT 19Ml *0
IF D-l GOTO 6630V0S-V2S0$="<35>CP"+VOS(1*5)+RO$+FQ$+"2Q"CALL 1 >MO^OS/VS^M1 >M2Ml -
1
OS*-<35>F0"CALL 1#MOjOS>VSjM1sM2F1S-F0SR1S-R0SV2S = V0_Sj
RETURNGOSUB 5800END
57


NBS-114A (rev. 9-78)
U.S. DEPT. OF COMM.
BIBLIOGRAPHIC DATASHEET
1. PUBLICATION OR REPORT NO.
NBSIR 82-2576
2-Go^L Accession No.
4. TITLE AND SUBTITLE
A SEMIAUTOMATIC AC/DC THERMAL VOLTAGE CONVERTERCALIBRATION SYSTEM
5. Publication Date
September 1982
6. Performing Organization Code
7. AUTHOR(S)
K. J. Lentner and S. G. Tremaine
8. Performing Organ. Report No.
9. PERFORMING ORGANIZATION NAME AND ADDRESS
NATIONAL BUREAU OF STANDARDSDEPARTMENT OF COMMERCEWASHINGTON, DC 20234
10. Project/Task/Work Unit No.
11. Contract/Grant No.
12. SPONSORING ORGANIZATION NAME AND COMPLETE ADDRESS (Street, City, State, ZIP)
U.S. Department of DefenseCalibration Coordination Group
13. Type of Report & Period Covered
Final
14. Sponsoring Agency Code
15. SUPPLEMENTARY NOTES
|
' Document describes a computer program; SF-185, FIPS Software Summary, is attached.
IS. ABSTRACT (A 200^word or less /actual summary of most significant information . If document includes a si gnificant bibliography or
literature survey, mention it here.)
A semiautomatic ac/dc difference calibration system is
described. The system operates over a frequency range of 20 Hz
to 100 kHz, covering the voltage range from 0.5 V to 1 kV. For
all voltages at frequencies in the range from 20 Hz to 20 kHz,the total uncertainty is 50 parts per million (ppm), and 100 ppm
for voltages at frequencies between 20 kHz and 100 kHz. In
addition to ac/dc difference testing, the system can be readilyadapted to calibrate precision ac digital voltmeters or ac
calibrators. Results of extensive i ntercompari son testing of
the new system against a manual test system are reported, usinga multirange thermal transfer instrument as a transport standard.The results indicate that the ac/dc differences measured are well
within the combined total uncertainty limits of the two systems.
17. KEY WORDS (six to twelve entries ; alphabetical order ; capitalize only the first letter of the first key word unless a proper name
separated by semicolons)
ac/dc difference; ac voltage measurement; automation; calibration;
metrology; thermal voltage converter.
18. AVAILABILITYi Xr Unlimited
!
;
For Official Distribution. Do Not Release to NTIS
j
Order From Suo. of Doc., U.S. Government Printing Office, Washington, DC20402, SD Stock No, SN003-003-
PC Order From National Technical Information Service (NTIS), Springfield,
VA. 22161
19. SECURITY CLASS(THIS REPORT)
UNCLASSIFIED
20. SECURITY CLASS(THIS PAGE)
UNCLASSIFIED
21. NO. OFPRINTED PAGES
62
22. Price
59.00
JSCOMM.-C