Self-Organizing Networks - UPCommons
63
B.Eng. Thesis Bachelor of Engineering Self-Organizing Networks Energy Saving Maria Gonzalez Calabuig s175943 Kongens Lyngby, June 2018
-
Upload
khangminh22 -
Category
Documents
-
view
1 -
download
0
Transcript of Self-Organizing Networks - UPCommons

BEng ThesisBachelor of Engineering
Self-Organizing NetworksEnergy Saving
Maria Gonzalez Calabuigs175943
Kongens Lyngby June 2018
AuthorMaria Gonzalez Calabuig
SupervisorsHenrik Lehrmann ChristiansenMatteo ArtusoRamon Ferruacutes Ferreacute
Project DetailsStart date January 29th 2018End date June 22nd 2018Defense date July 2nd 2018Credits 20 ECTS points
DTU FotonikDepartment of Photonics EngineeringTechnical University of Denmark
Oslashrsteds PladsBuilding 3432800 Kongens Lyngby DenmarkPhone +45 4525 6352wwwfotonikdtudk
AbstractDue to the growth of mobile traffic data networks are becoming more complex sys-tems In order to provide service for all the users and maintain a good quality ofservice new infrastructure is deployed and more complex protocols are developed Inthis situation operators face a rise in operational and capital expenditures
Self-Organizing Networks appear as a solution to reduce these expenditures aswell as to improve the utilization of the resources These type of networks providecertain level of autonomy to the network minimizing the human intervention in dif-ferent functions and providing autonomous and adaptive solutions
The concept and its characteristics is presented in this thesis focusing in a partic-ular use case Energy Saving
The thesis narrows down from the general concept of Self-Organizing Networksto the concrete use case of Energy Saving The document provides an overview ofSelf-Organizing Networks followed by the study of the Self-Optimization category andending with an extensive discussion of the Energy Saving use case
Furthermore the simulation and results of an algorithm implementing an EnergySaving solution are presented with an evaluation of its performance in order to deter-mine if it obtains energy efficiency Without degrading the network performance areduction up to 45 of consumed power can be obtained with the proposed algorithm
PrefaceThis thesis was prepared at the Fotonik department at the Technical Universityof Denmark in fulfillment of the requirements for acquiring a Bachelorrsquos degree inTelecommunications Technologies and Services Engineering
Kongens Lyngby June 22 2018
Maria Gonzalez Calabuig
AcknowledgementsI would like to offer my special thanks to my co-supervisors Dr Henrik LehrmannChristiansen Dr Matteo Artuso and Dr Ramon Ferruacutes Ferreacute for all the givenadvises Their willingness to give their time disposition to help and answer my ques-tions is very much appreciated
I wish to thank the Polytechnic University of Catalonia and the Technical Univer-sity of Denmark for offering me this opportunity and making it a reality
Finally I would also like to thank my family friends from home and all the newfriends made during these few months for all the trust deposited on me
ContentsAbstract i
Preface ii
Acknowledgements iii
Contents iv
Acronyms vi
List of Figures viii
List of Tables ix
1 Introduction 111 Problem Statement 112 Project Scope 213 Thesis outline 2
2 Self-Organizing Networks 321 Motivation 322 SON Taxonomy Use Cases 423 Alternative Taxonomies 624 3GPP Standardized Features 725 Summary 9
3 Self-Optimization Use Cases 1031 RACH Optimization 1032 Mobility Robustness Optimization 1233 Mobility Load Balancing 1334 Coverage and Capacity Optimization 1435 Interference Control 1536 Energy Saving 1637 Use Cases Compatibility 1738 Summary 20
4 Energy Saving Use Case 2141 Motivation 21
Contents v
42 Consumption of a Base Station 2243 Energy Saving Approaches 2344 Standarized Features 2445 Energy Saving State of the Art 2646 Summary 29
5 Energy Saving Algorithm Evaluation of Performance 3151 Model 3152 Simulation parameters 3653 Performance Evaluation 3754 Summary 43
6 Conclusion 4461 Future Work 45
Bibliography 46
Acronyms3GPP 3rd Generation Partnership ProjectACK AcknowledgmentANR Automatic Neighbour RelationshipBBU Baseband UnitCAPEX Capital ExpendituresCCO Coverage and Capacity OptimizationCIO Cell Individual OffsetCQI Channel Quality IndicatorDL DownlinkDMR Detection Miss RatioeNB Evolved Node BECGI E-UTRAN Cell Global IdentifierES Energy SavingESM Energy Saving ManagementE-UTRAN Evolved Universal Terrestrial Radio Access NetworkFDD Frequency Division DuplexingGHG Global Green-House GasHARQ Hybrid Automatic Repeat RequestHO HandoverIC Interference ControlICT Information and Communication TechnologyITU International Telecommunication UnionLOS Line of SightLTE Long Term EvolutionMLB Mobility Load BalanceMRO Mobility Robustness OptimizationNACK Non-AcknowledgmentNCBRA Non-Contention based Random AccessNE Network ElementNLOS Non-Line of SightNRT Neighbour Relation TableOPEX Operating ExpendituresOampM Operation And MaintenancePCI Physical Cell IdentityPUSCH Physical Uplink Shared ChannelQoS Quality of Service
Acronyms vii
RACH Random Access ChannelRAT Radio Access TechnologiesRF Radio FrequencyRNC Radio Network ControllerSNR Signal to Noise RatioSON Self-Organizing NetworksTCI Target Cell IdentifierTTT Time-to-TriggerUE User EquipmentUL UplinkUMTS Universal Mobile Telecommunications System
List of Figures11 Mobile Data Traffic by 2021 by Cisco (47 CAGR) [1] 112 Mobile Devices by 2021 by Cisco (20 CAGR) [1] 1
21 Network architecture 322 Simplified diagram of the interaction of the SONrsquos categories adapted from
[5] [6] 423 Time scale classification adapted from [4] 624 SON architectures adapted from [10] 725 ANR functions scheme adapted from [12] 8
31 Random Access procedures 1132 Downlink inter-cell interference 1533 Uplink inter-cell interference 1634 Use Casesrsquo intersections 17
41 Mobile operatorrsquos energy consumption adapted from [38] 2242 BS Components power consumption adapted from [38] 2243 Energy Saving Management states 26
51 Example of a simulation layout with 5 base stations and 3 users 3252 Example of the dependence between the state variation and utilization
thresholds in a time scale 3553 Energy Saving states 3654 Consumption of the Macro base station with loThr=20 3855 Consumption of the Micro base stations with loThr=20 3956 Consumption of the Micro base stations with loThr=40 3957 Consumption of the Micro base stations with loThr=60 4058 Number of HARQ retransmissions per base station using different thresholds 4159 Total number of HARQ retransmissions in the network 42
List of Tables31 Parameters optimized by each use case 1732 Optimization effect 19
51 Fixed Simulations parameters of the base stations 3752 Fixed Simulations parameters of a User 3753 Power consumed(W) and saved() by each base station 40
1Introduction11 Problem StatementDuring the past years mobile data traffic has grown exceeding all expectations By2021 there will be 116 billion mobile-connected devices and the mobile data trafficwill have increased a 47 since 2016 [1] On figure Figure 11 and Figure 12 it canbe seen the mobile data traffic growth estimated by Cisco as well as the number ofthe increase in number of devices
Figure 11 Mobile Data Traffic by 2021 by Cisco (47 CAGR) [1]
Figure 12 Mobile Devices by 2021 by Cisco (20 CAGR) [1]
Operators have to keep up with the demand providing coverage for all new de-vices and improving the service provided to the user For this purpose networks arebecoming more complex systems as new infrastructure is deployed and more complexprotocols are being developed
In this situation Self-Organizing Networks appear as a potential solution to re-duce the operative and capital expenditures A Self-Organizing Network provides alevel of autonomy to the network allowing a set of functions to perform with minimumhuman intervention and adapt to the changes of the network
Apart from the cost that supposes the deployment of new infrastructures and exe-cution of new protocols a major concern for society appears linked to these significant
12 Project Scope 2
changes the environmental impact
The network infrastructure has great impact on the environment Society de-mands to take action on two main factors the hardware elements and the energyconsumption The elements have to be obtained in a sustainable way either by recy-cling other disposed artifacts or with conflict-free and non harmful materials At theend of their life cycle their recycling or deposition as to be easy and feasible On theother hand energy consumption should be minimized as much as possible [2]
The objective of the Energy Saving use case fitting in the Self-Optimizing categoryof Self-Organizing Networks takes action on the second factor mentioned above
12 Project ScopeThe objective of this project is to provide a theoretical background about the conceptof Self-Organizing Networks more precisely on the Energy Saving use case For thisreason the main topic Self-Organizing Networks is broken down and sequentiallyexplained until the Energy Saving use case is reached
A small section of the thesis provides the results of an Energy Saving algorithmcompleting the whole picture for this use case Due to time and resource limitationsthe experiment only presents the simulation of one scenario
13 Thesis outlineThe report is organized in six chapters
Chapter 2 introduces the concept of Self-Organizing Networks along with its tax-onomies and standards
Chapter 3 focuses on the use cases of the Self-Optimization category A briefexplanation and related works of each use case are presented
In Chapter 4 the characteristics of the Energy Saving use case are exposed Ex-amples of research works are summarized at the end of the chapter
Chapter 5 evaluates and analyses an Energy Saving algorithm in means of energyefficiency
Finally in Chapter 6 the conclusions of the thesis are presented
2Self-Organizing NetworksThe acronym SON stands for Self-Organizing Networks A Self-Organizing Networkis an automated adaptative network capable of performing a set of functions withthe minimum human intervention
This chapter is an introduction to the SON concept Firstly what motivated theappearance of this concept is exposed Afterwards the use cases and taxonomies areexplained The last section focuses on the standardized features
21 MotivationProviding service to a user is a complex procedure with a lot of parties includedThere are multiples parameters to take into account as well as a great number ofprotocols and technologies operating at the same time
Figure 21 Network architecture
The more the network expands the more complex the system is [3] A complexsystem requires more supervision so operating expenses (OPEX) increase At thesame time human supervision is tied to human errors which degrade the service pro-vided to the users Finally as there are multiple protocols and functions conflictsmay arise damaging the network performance The Self-Organizing Network conceptappears as a solution to these issues [4]
22 SON Taxonomy Use Cases 4
A self-organizing network provides a certain level of autonomy to the networkThe benefits are many improving the usage of the networkrsquos resources can be di-rectly translated in a decrement of OPEX and also as explained in [2] ldquoPracticalexperience shows that the application of 3G SON technologies in current UMTSinfrastructure can yield a capacity gain of 50 without carrying out any CAPEXexpansionrdquo
With the improvement of the networkrsquos features and the saving in capital SONbecomes a potential solution to the different problems mentioned above
22 SON Taxonomy Use CasesSON applications commonly known as SON Use Cases are classified in differentcategories Although there is no official classification the one that will be followedthrough this document groups the use cases in three categories Self-ConfigurationSelf-Optimization and Self-Healing The interaction of the categories betweeneach other has been pictured on Figure 22
Figure 22 Simplified diagram of the interaction of the SONrsquos categories adaptedfrom [5] [6]
221 Self-ConfigurationThe Self-Configuration of a network includes the functions needed for the prepara-tion of the deployment of the different nodes that conform it This category is also in
22 SON Taxonomy Use Cases 5
charge of the set-up of the network that includes preparation installation authenti-cation and verification of the nodes
In this category the use cases are [7] [8]
minus Intelligently selecting site locations detect degradation during operationand provide a solution
minus Automatic generation of default parameters for NE insertion providesa default set of radio network related parameters to a newly installed NE
minus Network authentication establishment of mutual authentication betweenthe eNB and the network
minus Hardwarecapacity extension allows the continuity of service when a eNBis having new hardware installed
minus Automated Configuration of Physical Cell Identity automated selectionof the Physical Cell Identity when a eNB is newly deployed The selection hasto avoid any collision with the neighbouring cells when selecting the identifier
minus Automatic Neighbour Relation Function builds the Neighbour RelationsTable containing all the neighbour eNBs
222 Self-OptimizationThe Self-Optimization category has the purpose of tuning the network setting oncethe network is in the operating state This category covers a wide number of UseCases Some examples are the optimization of the neighbour list interference con-trol optimization of handover parameters load balance optimization of QoS-relatedparameters energy saving etc
This category will be further discussed in chapter 3
223 Self-HealingSelf-Healing oversees preventing or repairing any arising problem It is centred onthe maintenance performance done by an operator Its Use Cases cover
minus Hardware extensionreplacement providing service and granting its qual-ity while the hardware is replaced
minus Software upgrade installation of new software updates
minus Network monitoring which consists of performing measurements and analy-sis to the network in order to recognize insufficiencies or needed improvements
minus Failure recovery the network has to be able of recovering after a breakdown
23 Alternative Taxonomies 6
23 Alternative TaxonomiesThe use cases classification presented above is a phase based classification The usecases are classified depending on which phase they work on The three phases Self-Configuration Self-Optimization and Self-Healing correspond to the three phases ofthe life of a base station deployment optimization and maintenance But this is notthe only existing classification [4]
Another possible way of classifying use cases is the time scale The use casersquosalgorithms operate on different time scales depending on the part of the networkwhere it is executed On Figure 23 the different time scales are represented
Figure 23 Time scale classification adapted from [4]
It is also possible to classify them depending on the objective of the self-organizingalgorithms This approachrsquos problem is that the same algorithm may be used to or-ganize multiple use cases
Finally some authors have classified the use cases according to the conflicts [9]Firstly this classification identifies the potential conflicts between Self-Organizingfunctions Later the conflicts get categorized The principal issue of this method isthe repetition of use cases A use case can cause different types of conflicts
24 3GPP Standardized Features 7
24 3GPP Standardized FeaturesThe 3GPP (3rd Generation Partnership Project) is a union of telecommunicationsstandard development organizations which provide reports with Requirements andSpecifications that define technologies The project has worked with the SON stan-dardizing its features in terms of architecture actor roles along with other require-ments
241 ArchitectureDepending on where the SON function take place the architecture type can be clas-sified in three groups [7]
Figure 24 SON architectures adapted from [10]
minus Centralized the SON functions are located in the OampM system in the corenetwork In this category the algorithms can be executed at the NetworkManagement level or at the Element Management level
minus Distributed (De-centralized) when the SON functions are performed bythe eNodeB a distributed architecture is being used
minus Hybrid this type of architecture combines a set of SON functions placed ondifferent levels on the OampM hierarchy
242 FrameworkThere are some SON functionalities already standardized The Automatic NeighbourRelationship and the Plug-and-Play are an example These use cases are used by theresearch community has a framework when implementing other SON functionalities
24 3GPP Standardized Features 8
2421 Automatic Neighbour Relationship
The Automatic Neighbour Relationship (ANR) configures the neighbour list of aneNB newly deployed and updates it while the base station is operative This usecase fits in two categories Self-Configuration and Self-Optimization When the eNBis deployed the ANR mission is to minimize the required work for its configurationwhile when already operative the ANR mission is to optimize the configuration [11]Figure 25 shows the different parts and the interaction between each part
Figure 25 ANR functions scheme adapted from [12]
The ANR is divided in three functions Neighbour Removal Neighbour Detectionand NRT Management ANR follows a distributed architecture all functions takeplace in the RNC node which connects with the core network
The neighbour removal and detection are responsible of deciding if it is needed toadd or remove an entry on the Neighbour Relation Table (NRT) Each entry of theNRT is a neighbour base station which is identified by a unique Target Cell Identifier(TCI) The TCI includes the PCI and the E-UTRAN Cell Global Identifier (ECGI)[2]
The NRT Management is the function which will update the NRT after a decisionis made This last function is also coordinated by the OampM situated in the corenetwork which can also decide if the NRT has to be updated
25 Summary 9
2422 Plug-and-Play
The Plug-and-Play use case reduces the effort of deploying a base station the onlymanual required acction is the physical installation of the sites Only the deploymentis required while all other functions are executed automatically The eNB configuresthe Physical Cell Identity transmission frequency and power S1 and X2 interfaces IPaddress and connection to IP backhaul [11] [13] The Plug-and-Play covers differentuse cases of the Self-Configuration category
25 SummaryThe concept of SON appears motivated by the reduction of OPEX and CAPEX Astraffic grows more complex networks are needed The complexity of these systemsmay exceed human capacity of controlling and exploiting all the resources of the net-work A self-organizing network reduces OPEX as some functions are automatizedand may only require minimum human intervention and also reduces CAPEX asa better usage of the resources can be done and therefore the service may improvewithout the need of deploying more infrastructures
Self-organizing networks are divided in three categories Self-Configuration Self-Optimization and Self-Healing Each one of these categories cover different use cases
Even though the previous taxonomy is the most common there exist other classi-fications The use cases can be classified by time scale objective or conflicts
The 3GPP project standardized the SON architecture in three variants dependingon where the SON algorithms take place It can be a centralized distributed or hybridarchitecture Also the same project has already proposed solutions for some use casessuch as Automatic Neighbour Relationship or Plug-and-Play
3Self-Optimization Use CasesAs explained on the previous section the Self-Optimization category covers the tuningof the network once it is in the operating mode This chapter will take a deeper lookat the Use Cases of most interest to the research community on this category [14]
minus RACH Optimization
minus Mobility Robustness Optimization
minus Mobility Load Balancing
minus Coverage and Capacity Optimisation
minus Interference Control
minus Energy Saving
After explaining each use case and providing some examples of research worksa discussion will take place The analysis of each optimization along with the com-patibility between use cases will be dicussed to provide a general over view of theSelf-Optimization category
31 RACH OptimizationAn UE trying to access the network for the first time has to perform a Random AccessProcedure The information exchange for this procedure is done through the RandomAccess Channel (RACH) which is shared with other UEs
An UE will perform a Random Access on four situations 1) initial access when inIdle mode 2) handover to a different cell 3) re-establishment of the radio link afterradio link failure and 4) uplink or downlink data transmission when the UE has nosynchronization on the uplink [15]
Two scenarios can take place when the UE is requesting the access On the firstone there could be another UE requesting access at the same time and therefore acollision This scenario is called Contention based Random Access procedure On thesecond scenario the network can notify a preamble sequence to the UE to preventany collision with others UEs In this case a Non-Contention or Contention freebased Random Access procedure would be used
31 RACH Optimization 11
Figure 31 Random Access procedures
A preamble sequence is a specific pattern which differentiates UEs As specifiedin [15] the total number of RACH preambles available in LTE is 64
In a network optimal RACH performance is essential in order to obtain highercoverage and lower delays The number of resources allocated to random access hasa direct impact on the delays Allocating a larger number of resources involves lowercollision probability This translates on lower delays but at the same time the ULcapacity is also lowered The Random Access performance can be expressed on termsof Access Probability and Access Delay Probability
In the existent literature different approaches have been taken to improve theaccess probability and the access delay probability Most of the research on this fieldis based on the evaluation of a parameter of the Random Access procedure and aproposal of an algorithm focused on that unique parameter The RACH parametersthat can be optimized are resource unit allocation preamble split back off parametervalue and transmission control parameters [5] These parameters can be different oneach cell and time variant Some of the approaches can be seen on [16 17 18 15]
In [16] through simulations the benefits of optimization and self-tuning of RACHparameters is proved The dependence between RACH parameters and the DetectionMiss Ratio and Contention Ratio is evaluated These parameters are the PUSCHLoad the RACH Load the power ramping step and the interference on PUSH gen-erated by the preamble transmissions Finally a Self-tuning algorithm for energysaving is proposed By automatically adjusting the desired received power the DMRcan be controlled to meet a given performance This algorithm gives room to im-provement by adjusting the other evaluated parameters
32 Mobility Robustness Optimization 12
On the other hand on [17] the study is focused on the uplink resource allocationdepending on the traffic changes The proposed algorithm tries to improve the uplinkcapacity to ensure a success rate at the random access first attempt That impliesreducing the handover and call setup delays
Following that on [18] the resource allocation optimization is approached by theconfiguration of RACH subframes given the arrival rate If two users transmit thesame preamble on the same RACH subframe there will be a collision Both userswill have to retransmit the random access preambles By adjusting the number ofsubframes allocated on the RACH the collision probability is lowered and thereforethe access delay
Finally the authors on [15] focus on preamble split Three algorithms are pro-posed to improve the Random Access success rate On the first algorithm the avail-able preambles are split based on the ratio of Non-Contention based Random Accessto the total random accesses (NCBRA ratio) The second algorithm proposes animprovement by considering the access failure rate The last algorithm also providesan improvement by considering the random access arrival rate
32 Mobility Robustness OptimizationWhile a mobile device is connected to the network it measures the signal strength ofneighbouring cells Based on the devicersquos reports the eNodeB can take the decisionof performing a handover which consists of handing over the connection to a neigh-bour cell with a better signal The handover procedure prevents the connection fromdropping and improves the data throughput
The Mobility Robustness Optimization use case focuses on improving the handoverprocess The problems in which MRO focuses are the following ones [5]
minus Connection failure due to intra-LTE or inter-RAT mobilityThe connection failure can be due a too early HO due to a too late HO or dueto a HO to a wrong cell
minus Unnecessary HO to another RAT (too early IRAT HO with no radiolink failure)It can happen that the UE is handed over from E-UTRAN to another RAT (egUTRAN or GERAN) even though the coverage was sufficient for the serviceTherefore the handover may be considered unnecessary
minus Inter-RAT ping-pongAn UE can perform a handover from a cell in a source RAT to another cell witha different RAT then after a limited amount of time the UE is handed backto the source cell again This event may happen more than one time
33 Mobility Load Balancing 13
The parameters that can be optimized by the MRO functionality are the time totrigger hysteresis cell individual offset frequency-specific offset and cell reselectionparameters [14] These parameters are used for tuning the triggering of the measure-ment report events [19]
A1 Serving becomes better than the threshold
A2 Serving becomes worse than threshold
A3 Neighbour becomes offset better than serving
A4 Neighbour becomes better than threshold
A5 Serving becomes worse than threshold1 and neighbour becomes better thanthreshold2
B1 Inter RAT neighbour becomes better than threshold
B2 Serving becomes worse than threshold1 and inter RAT neighbour becomesbetter than threshold2
In the literature most of the research is centred on the improvement of the con-netion to avoid failure The approach taken in [20] provides a solution by adaptativelymodifying the hysteresis parameters depending on the user speed Most recent workssuch as [21] focus on adapting the time-to-trigger cell individual off-sets and A3parameters according to the dominant handover failure (too late too early or wrongcell handover)
On the other hand [22] approaches the problems of inter-RAT handovers Theseproblems are ping-pong effect and connexion failure The parameters that are modi-fied in this case are the event thresholds time-to-trigger and filter coefficients Theirconclusion is that the MRO has to work locally on each cell as the mobility condi-tions differ Inter-RAT handovers are more sensitive to changes on the B2 threshold1 than on the TTT
33 Mobility Load BalancingThe number of users on a cell and the data usage of each of them can be modelledas random variables that differ depending on the date or time This leads to unequalload scenarios for neighbouring cells It may happen that at a given time a cell isoverloaded while its neighbour cell is underloaded The quality of the service on theoverloaded cell may not meet the QoS requirements while on the underload cell theresources are not being fully used
34 Coverage and Capacity Optimization 14
The Mobility Load Balancing feature is in charge of detecting the load imbalanceand reassigning the users on all the available cells within a zone This way an efficientusage of the radio resources of the network is performed while granting the quality ofservice of the users The Load balancing can be performed in two scenarios [14]
minus Intra-LTE Load Balancing
minus Inter-RAT Load Balancing
In both scenarios the eNodeBs need to have information about the load of theneighbour cells to take the appropriate action for the loading balance On the Intra-LTE scenario the eNodeBs exchange load information through the X2 interface whileon the Inter-RAT scenario the information exchange is done through the S1 inter-face These reports are also essential to avoid unnecessary handovers and inter-RATping-pong handovers
This use case is strongly tied to Mobility Robustness Optimization As said be-fore this use case focuses on reallocating the load of a zone and to do so it is neededto tune handover parameters This way users on overloaded cells can be forced intounderloaded neighbouring cells and thus re-distribute the load Some researchesthat approach this issue are [23 24 25]
In [23] they refer to their algorithm as Neighbourhood mobility load balance Thisalgorithm tries to find the Cell Individual Offset (CIO) that maximises the offloadof the overloaded cell The researchrsquos conclusion is that by using their algorithmconsiderable gain on the QoS of the users is achieved at the expense of reducing thespectral efficiency In [24] the proposed algorithm (Zone-based mobility load balanc-ing) tries to distribute uniformly the excess of traffic on all the neighbour cells of theoverloaded cell in comparation to the conventional MLB which focuses on transfer-ring the traffic only to one of the neighbouring cells
Finally in [25] the research is focused on the A3 handover event The proposed al-gorithm (Inter-frequency load balancing) tunes the handover thresholds and frequency-specific offsets in order to trigger the handover from an overloaded cell to an under-loaded cell
34 Coverage and Capacity OptimizationThe Coverage and Capacity Optimization use case focuses on providing the optimalcoverage and capacity while the network is operative Coverage and Capacity prob-lems may arise due to five causes [26]
minus Coverage holeArea where the UE cannot access the network due to the low pilot signalstrength It may be caused by physical obstacles or inadequate RF planning
35 Interference Control 15
minus Weak coveragePilot signal strength or SNR below the level to maintain a planned performancerequirement
minus Pilot pollutionHigh interference and energy consumption with a low cell performance due tooverlapping cells
minus Overshoot coverageDue to reflections on buildings or lakes the coverage of a cell may reach farbeyond what was planned causing high interference and call drops
minus DL and UL channel coverage mismatchDL channel coverage larger than the UL channel coverage
The parameters that can be tuned to obtain the optimal coverage and capacityare the downlink transmit power antenna tilt and antenna azimuth
Most of the existing works approach the issue by adjusting the antennarsquos tilt[27 28 10 29] In [30] the authors affirm that ldquoAdjusting the antenna tilt is oneof the most powerful techniques to solve coverage and capacity problems in cellularnetworksrdquo
35 Interference ControlThe Interference Control use case focuses on reducing the impact of the transmissionon neighbour cells In LTE all cells reuse the same carrier frequencies [31] Whilean UE is near the station of the serving cell the received power of this cell will behigher than the received power of the neighbour cells using the same carrier frequencyProblems arise when the UE is on the edge of two or more coverage areas Thereceived power from neighbour cells will be higher and the interference it causes willbe considerable This would be called Downlink inter-cell interference
Figure 32 Downlink inter-cell interference
At the same time the UE can cause interference to the neighbour cell as it alsosends information to all the other cells apart from the serving one In this case the
36 Energy Saving 16
UE would be causing Uplink inter-cell interference On the cell edge the interferenceis higher
Figure 33 Uplink inter-cell interference
The Interference Control has to take into account both scenarios and reduce theinterference to increase the capacity and quality of service of the users
The studies that confront this use case mainly focus on Optimization of SpectrumAllocation or Optimization of Power Settings In [32] after summarizing the relatedworks their proposed algorithm regulates the transmitted power according to thechannel quality indicator (CQI) received from the user The CQI is computed basedon the SINR from the received interference
On the other hand in [33] they present a solution with an optimization modulethat improves sectorization antenna angle selection and spectrum allocation Afterthat a second module called power allocation module finds the best relation betweencapacity and interference
36 Energy SavingThe main objective of the Energy Saving is the reduction of the energy consumptionThis can be obtained by matching the offered capacity with the needed traffic demandat any given time while the network is operative [14]
The Support to the Energy Saving use case on the 3GPP specification [5] definesa switching-off solution based on cell load information To effectuate the switch-offthe eNB has to have a general oversight of the situation of all neighbouring cells
This use case will be discussed more extensively on the next chapter
37 Use Cases Compatibility 17
37 Use Cases CompatibilityAfter a summarized explanation of the major use cases of the Self-Optimization cat-egory it has been seen that some of them modify the same type of parameters (egHandover parameters) This may lead to the question whether the different use casesare compatible with each other
The following table has been extracted from the previous sections In it it can beseen which parameters are optimized by each use case
Table 31 Parameters optimized by each use caseTransmission Handover Antenna RACH Spectrum
Power Parameters Parameters Parameters AllocationRACH XMRO XMLB XCCO X XIC X X XES X
From the table the intersections can be depicted as it can be seen in Figure 34Notice that the information of the table can vary as new approaches for the use casecan be taken
Figure 34 Use Casesrsquo intersections
Three groups are obtained The use cases that do not share parameters are com-patible with each other but the ones that share parameters have to be carefully im-plemented One clear example is the intersection between MRO and MLB Both usecases modify handover parameters If they modify the same parameter on oppositedirections a conflict will arise ping-pong effect with both functions will appear andan inefficient use of the functions will be done degrading the service The same hap-
37 Use Cases Compatibility 18
pens with IC Energy Saving and Coverage and Capacity optimization The three usecases work on the adaptation of the transmitted power If a use case tries to increasethe power to increase the coverage area the IC may try to decrease it to minimizethe interference or the Energy Saving may try to reduce the energy consumption bydoing the same At the same time with this last example the Energy Saving andIC could be compatible as both achieve their objective by reducing the transmittedpower
That is why knowing which parameters they have in common is not enough adeeper analysis has to be done Figure 34 could be interpreted in different way asthe effect of each modification on the other use cases has to be taken into account
The use cases improve some features at the expense of lowering some other ones
As explained previously RACH Optimization is important to increase coveragebut along with coverage interference is also increased This use case also achieveslower delays With lower delays the QoS of the users improves but the capacitydecreases as more resources are getting allocated
The Mobility Robustness improves the QoS by tuning the handover parameters
With the Mobility Load Balancing an improvement of the capacity is achievedby redistributing the users on the cells This way the QoS of the users increases
The Coverage and Capacity optimization improves as the name says the capacityand coverage of the network If the coverage increases the impact on the interferenceas to be considered as it may increase The techniques used are based on modifyingthe transmitted power or changing some antennarsquos parameters Both modificationshave a direct effect on the energy consumption which will increase
Following with the Interference Control use case the objective is to reduce theinterference to obtain a better experience for the user which is the same as sayingbetter QoS In Section 35 it was seen that there were two ways of mitigating theinterference optimizing the spectrum allocation or optimizing the transmitted powerUsing the first way there is a compromise with the capacity of the network whilewith the second way there is a compromise with the coverage
Finally the Energy saving reduces the energy consumption As the used methodconsists on switching off and on base stations to meet the capacity on each scenariocoverage may be affected negatively which will be positive for interference reduction
In Table 32 it can be observed the effect of each optimization
While this table does not provide a clear intersection as the one obtained focusingon the optimized parameters it is essential for the compatibility of use cases
37 Use Cases Compatibility 19
Table 32 Optimization effectEnergy Interference
Capacity Coverage QoS Consumption AllocationRACH darr uarr uarr uarrMRO uarrMLB uarr uarrCCO uarr uarr uarr uarrIC uarr darr uarr darrES darr darr darr
If the table is divided as explained before no collision can be seen between theMobility Robustness and the Mobility Load Balancing Both have the same objectivethe improvement of the user experience
Meanwhile with Coverage and Capacity Interference Control and Energy Savingthe collision explained on previous paragraphs can be seen again Focusing on thecompatibility Coverage and Capacity - Interference Control the Interference controlreduces the interference while the Coverage and Capacity optimization involuntarilywhile trying to improve the coverage it also increases the interference A ping-pongeffect would occur with both use cases Evaluating the Coverage and Capacity ndashEnergy Saving the same happens but with the energy consumption of the network
Combining both analysis the conclusion is that there are three cases which canproduce conflict
minus Mobility Robustness with Mobility Load Balancing
minus Coverage and Capacity with Interference Control
minus Coverage and Capacity with Energy Saving
On the other hand the information on the table provides an overview of thegeneral performance of the network It can be seen if the use cases implemented onthe network will have a negative or positive impact on the different features Forexample RACH optimization causes more interference on the network which couldbe mitigated by implementing Interference Control But by combining these thecapacity will be significantly reduced and the improvement on both capacity andcoverage obtained with RACH will be nullified by the decrement of the same featuresusing Interference Control So what seemed a solution may have handicaps on otherdirections
38 Summary 20
38 SummaryThe use cases of most interest for the community research in the Self-Optimizationcategory are RACH Optimization Mobility Robustness Optimization Mobility LoadBalancing Coverage and Capacity Optimization Interference Control and EnergySaving
RACH Optimization focuses on optimizing the procedure that a UE performs inorder to access the network for the first time Mobility Robustness Optimizationrsquosobjective is the improvement of the handover process while the Mobility Load Balanc-ing detects the load imbalance and reassigns the users within a zone Coverage andCapacity Optimization provides the optimal coverage and capacity while the networkis operative Interference Control reduces the impact of the transmissions on neigh-bouring cells Finally Energy Saving rsquos purpose is to reduce the energy consumption
Collision between use cases may occur if the use cases happen to optimize thesame parameters If more than one use case is implemented the improvement thatit has on the network can be nullified by the degrading effect of another use case onthe same feature Three major conflicts have been identified
minus Mobility Robustness with Mobility Load Balancing
minus Coverage and Capacity with Interference Control
minus Coverage and Capacity with Energy Saving
To sum up it has been seen that the implementation of more than one Self-optimization use case has to be carefully planned The collision on the parametersthat they optimize along with the impact on the performance of the network has tobe taken into account Having all these in mind is what makes the implementationof use cases a complex procedure
4Energy Saving Use CaseIn this section a deeper and extensive analysis of the Energy Saving use case will bedone This use case has been chosen by the author for personal interest due to itsenvironmental impact
First the motives that led to the appearance of the Energy Saving use case areexposed Afterwards to understand the problem and later the solutions the powerconsumption of base stations is modeled Different approaches to minimize energyconsumption are presented The following section focuses on the functions and fea-tures already standardized by 3GPP Finally some of the most cited works are ex-plained
41 MotivationThe Energy Saving use case appears due to two main motivations reduce the environ-mental impact as well as reduce the cost [34] As mobile traffic grows more complexnetworks are needed That implies as the most common solution adding more basestations to the network [35] That new addition supposes a great impact on the en-vironment which draws the attention of our society that expects an environmentallyfriendly infrastructure [2] Also the more complex a network is the greater the costfor the operator will be By using Energy Saving solutions the cost can be reducedwhile the impact on the environment also decreases
The International Telecommunications Union provides some data about the globalimpact on the environment that supposes the telecommunications area It has esti-mated that the ICT sector contributes between 2 and 25 on the Global Green-house Gas (GHG) emissions [36]
In [37] it is said that 10 of the total worldwide electricity is consumed by thetelecommunications network By 2030 it is estimated that the energy consumptionwill increase to the 51
In a network the base station is the element that consumes most of the energy[38] has it can be seen on Figure 41
42 Consumption of a Base Station 22
Figure 41 Mobile operatorrsquos energy consumption adapted from [38]
42 Consumption of a Base StationThe energy consumption of a base station depends on lots of factors Some of themare the location size load etc In Figure 42 the percentages of power consumptionof some components can be seen [39]
Figure 42 BS Components power consumption adapted from [38]
43 Energy Saving Approaches 23
The different components seen on the previous figure are the power amplifier (PA)which is the most consuming component the Main supply a DC-DC converter a ra-dio frequency part (RF) a baseband unit (BBU) and a cooling system
In general the energy consumed by a base station is composed by three factors[40]
EBS = PoTF + EDAT A + ESIGN (41)
Eq(41) provides the computation of the required energy by a base station totransmit N channels to N users randomly spread on an area The first term PoTF is a fixed factor that corresponds to the energy needed for the base station to beoperative Po corresponds to the power needed to switch on the BS and TF is thetime duration EDAT A is the energy required for data transmissions and ESIGN isthe energy required for signaling transmissions These last factors have a direct de-pendence on the traffic load and are variable
Following the reasoning of Eq(41) the base station dependence with the loadcan be expressed in terms of power as follows [39]
Pin =
NT RX(P0 + ∆pPout) 0 lt Pout le Pmax
NT RXPsleep Pout = 0(42)
Where P0 is the term corresponding to the fixed power amount needed for thebase station to be operative and the Pout term is the load power which is variableand is adjusted by ∆p The parameter NT RX indicates the number of transceiverschains while Pmax is the maximum RF output power at maximum load
43 Energy Saving ApproachesDifferent approaches can be taken to solve the Energy Saving paradigm [2] If theproblem is discussed from the point of view of hardware the most relevant approachesare
minus Energy-efficient design of handsetsEfficient hardware design of handsets in an energy consumption point of view
minus Energy- efficient design of base stationsEfficient harware design of base stations in an energy consumption point ofview
minus Construction strategies that consider Air Conditioning (AC) sys-tems
44 Standarized Features 24
AC activity should be kept to a minimum during periods with lower networkactivity and lower temperature
On the other hand if the problem is discussed from the point of view of optimiza-tion the relevant approaches are as follows
minus Reduction of the used power in radio transmissionsReduce the transmited power in terms of pilot power and power allocated touser data tranmission
minus Optimization of the battery duration of handsetsMaximize the duration of the battery handsets by applying radio planning andoptimization techniques
minus Optimization of the number of operative base stationsMinimization of the number of operative base stations (or modules within basestations) by switch-off and on according to network state
44 Standarized Features
441 RequirementsWhen implementing an Energy Saving solution the following requirements have tobe met [41]
minus Coverage holesThe Energy Saving mechanism has to ensure that once operative it does notlead to the appearance of coverage holes In most of the existing scenarios toguarantee a good QoS and avoid coverage holes a large number of base stationsis deployed to avoid risks As said previously one of the approaches for EnergySaving is the optimization of the number of operative base stations Whenswitching off a base station to reduce the energy consumption the algorithm asto guarantee that any coverage holes will appear
minus User perceptionThe user has to not be able of noticing when the mechanism is operativewhether when the Energy Saving is switched on switched off or during itsperformance The Energy Saving mechanism has to guarantee the QoS of theusers during all times
minus Energy saving potentialDuring its performance the Energy Saving mechanism has to maximise theenergy saving potential taking into account the network situation It is under-stood has network situation the traffic or load and the power consumption
44 Standarized Features 25
minus Interference avoidanceGuarantee compatibility with other operative SON functions of the networkAvoid any interference and instead benefit from the different features alreadyimplemented
minus Instabilities avoidanceThe Energy Saving algorithm has not to lead the network to ambiguous orundefined states All instabilities have to be prevented
minus Minimum interventionAs in all SON use case the Energy Saving algorithms have to operate with theminimum manual intervention
442 Energy Saving ManagementOn the frame of 3GPP some features have been standardized to contribute to theminimization of the energy consumption The Energy Saving Management (ESM) isa function in charge of the optimization of the used resources of the network from anenergy saving perspective The general architectures to offer energy saving solutionsare [42]
minus Centralized
bull NM-Centralized The decisions will be taken from the Network Man-agement level where the Energy Saving algorithms will have been imple-mented
bull EM-Centralized The decisions will be taken from the Element Man-agement level where the Energy Saving algorithms will have been imple-mented
minus Distributed The decisions will be taken at the Network Element level wherethe Energy Saving algorithms will have been implemented
minus Hybrid The decisions will be taken from both the Network Element and theOampM System
Two basic energy saving states can be defined [43]
minus notParticipatingInEnergySaving State where the energy saving functionsare inactive
minus energySaving State where the system is applying energy saving measures
45 Energy Saving State of the Art 26
In some cases a third state may be needed the compensatingForEnergySavingOn this state the network will adjust parameters on neighbour cells affected by theenergySaving state On Figure 43 the complete statersquos diagram is shown with theactions required for each transition
Figure 43 Energy Saving Management states
A list of requirements is specified by the standard [42] The Energy Saving Man-agement has to meet all of them in order to perform correctly
45 Energy Saving State of the ArtMost of the works that try to minimize the energy consumption of the network requirehuman intervention therefor they do not fit in the self-organizing frame Among theones that approach the subject from the SONrsquos point of view most of the works focuson the optimization of the number of operative base stations Possible solutions forthe energy saving use case will be explained next
The following works have been chosen due to the used method (most commonmethods) and importance in the research community (number of citations) Eachwork uses a different method and approach
I-H Hou and C S Chen [44] propose a distributed protocol for Self-OrganizingHeterogeneous LTE Systems The proposed protocol switches off the base stationswhich do not have clients If the base station has any client associated it will remainactive
Through a trade-off the objective of the proposed protocol is to obtain spectraland energy efficiency
45 Energy Saving State of the Art 27
The energy consumption model that is used breaks the consumption into two cat-egories operational power and transmission power Power used for any end otherthan transmitting computation or cooling for example corresponds to the opera-tional power Even so it is remarked that a base station in active mode will consumemore operational power than a base station in sleep mode
Base stations decide whether to switch from active to sleeping by comparing esti-mated throughputs The estimated throughput that the base station m would provideto the client is compared with the largest throughput provided by any other base sta-tion to the same client if m was in sleep mode If the latter is higher the basestation switches off
To change from the sleep mode to the active mode a base station has to period-ically wake up and broadcast beacon messages on all resource blocks To make thedecision the base station needs to estimate the throughput of the users that will beconnected to it when active
All decisions consider the price of the energy which is a factor used to estimatethe throughput of the clients
Their results show that with a higher price of energy the algorithm decides toput base stations to sleep The energy efficiency increases and the throughput decre-ments They conclude that the algorithm is capable of obtaining a trade-off betweenenergy efficiency and spectrum efficiency by choosing the suitable price of the energy
In [45] M F Hossain K S Munasinghe and A Jamalipour propose a mecha-nism which dynamically adapts the sectors of the eNB to reduce energy consumptionThe mechanism is traffic aware and during its performance QoS requirements arekept in specific limits As it operates on the eNB it is a distributed technique whichalso does not require human intervention
As said the mechanism adapts the number of sectors of an eNB according to thetraffic During peak hours the maximum number of sector will be active while dur-ing low traffic time the number of sectors can be 1 So when reducing the number ofsectors active sectors have to adjust their transmission beam width so they can coverall the area of the base station Two techniques are mentioned to cover that aspectequiping the base station with multiple sets of antennas where each set corresponds toa certain number of sectors or using finite beam switching using linear antenna arrays
The objective of their algorithm is the minimization of the number of sectorswhile maintaining sufficient signal strength and keeping call blocking within a speci-fied limit
The algorithm starts with the assigment of resource blocks and adjusting thetransmitted power Afterwards it estimates the call blocking probability if a new
45 Energy Saving State of the Art 28
user was connected to all the sectors Then three conditions have to be checked
The first condition compares the number of resource blocks assigned to the usersof all the current active sectors with the total number of RBs assigned to a provisionalnumber k of sectors The second condition checks if the total transmitted power toall user of all sectors is lower or equal to the total transmit power in the provisionalsectors An the third one defines the specified limit of the call blocking probability
If the three conditions are satisfied the number of active sectors will be switchedto the k number of active sectors The eNB will be reconfigured as needed But ifany of the conditions is not satisfied the whole process will be recalculeted with k =k+1
Unlike the works explained above R Kwan [46] focuses on adapting the trans-mitted power to match the QoS required in each moment The algorithm focuses oneliminating unnecessary transmit power which causes inter-cell interference to neigh-bouring cells At the same time the reduction of interference will reduce the requiredpower to obtain a certain value of QoS Using this approach the author wants to provethat a significant reduction of energ consumption can be obtained
The algorithm checks the impact that a cell has over another cell when using asub-band By checking the impact the power can be incremented or reduced alwaystaking into account a maximum limit of transmitted power If there is room for apotential power increase is checked by whether the cell is already happy The cellrsquoshappiness is a way to quantifie a bit rate requirement for the user If so the powercan be reduced in order to avoid interference and reduce the energy consumption Onthe other hand if the bit rate requirement is not met power will be increased Whenthe impact on other cells is considered negative the power associated is also reduced
Results show that transmitting only what is needed generates less interferenceThis decrement of interference can be directly translated into reducing the need toovercome interference from the neighbour cells This way a reduction of power con-sumption is obtained The performance of the network is not affected as the algorithmmakes the power converge slowly into a significant lower value
Combining two different approaches Henrik Klessig Albrecht Fehske and Ger-hard Fettweis suggest a solution based on using cell load as an indicator Theirsolution presented in [18] is an extension of their work and serves has an example ofthe implementation and coordination of multiple SON use case The use cases thatwork together in their model are the coverage optimization mobility load balancingand cell outage compensation
A centralized SON architecture is being used The SON algorithm has two ob-jectives The first objective is obtaining energy efficiency from the network pointof view The second objective is from the user point of view obtain throughput
46 Summary 29
optimality
Energy-efficiency is obtained by minimizing the sum of the loads of a fixed setof active base stations this way the network energy consumption is also minimizedDecrement in the consumption is enforced by the switching-off of the base stationsThe base station that will be switched off is the one with the lowest load MinimumRSPR coverage has to be ensured
When shutting down a base station the throughput decreases rapidly and theperformance get degraded This is compensated by adjusting antennas tilts and ap-plying a CIO (Cell individual offsets) algorithm
The base station energy consumption is modelled as 188ηi + 260W Notice thatthe model used is again separating in two terms the consumption The first term isa variable value that depends on the load (ηi) and the second term is constant
As seen these four works by using different methods try to reduce the energyconsumption while preserving the network performance In the next chapter a eval-utation of the performance of an Energy Saving algorithm will take place in order toprovide a look into the results of these types of algorithms It will be determined ifthe algorithm is capable of achieving energy efficiency
46 SummaryFor the sake of the environment as well as to reduce the cost of the performance ofthe network measures must be taken in order to improve the energy consumption
It has been seen that a base station is the element which consumes the most energyof all the system Its power consumption is defined by some projects as EARTH asa sum of a fixed value plus a variating value which depends on the load of the network
Also it has been seen that different approaches can be taken to reduce the energyconsumption They have been classified depending on if they focus on hardware oroptimization of features
The standardized features for this use case do not provide a specific method ormechanism Instead they serve has a guide for the implementation of algorithms bydefining the number of states requirements and the supported architectures
Finally different solutions for the energy saving use case have been explained Allsolutions in the chapter focus on the optimization approach for the use case Mostof the articles work with switching-off and on the number of base stations Whilethe first algorithm regulated the number of operative base stations while consideringspectral efficiency the second algorithm switched-off and on the sectors of a basestation This second mechanism took into account the QoS provided to the users to
46 Summary 30
regulate which sectors must be kept active and which sectors could be changed tosleep mode
The third protocol approached the subject from a different point of view Theenergy consumption was reduced by decrementing the interference among cells Bymonitoring the impact of a cell on neighbour cells and adjusting the transmittedpower accordingly the interference can decrease and an improvement on the energyconsumption can be obtained
Lastly the last solution explained in the chapter serves as example of coordinationbetween multiple SON use cases To save energy the authors suggest a method whichcombines two different approaches cell load balancing enhanced by the shutting-offof base stations If the networkrsquos performance gets degraded antenna tilt and usersassociation mechanisms are turned on to compensate it
5Energy Saving AlgorithmEvaluation of PerformanceIn Chapter 4 Section 45 different techniques to approach the energy saving usecase have been explained This chapter will focus on a concrete algorithm still indevelopment by the research group Network Technologies and Service Platforms ofthe Technical University of Denmark The used model along with the scenario willbe explained Then the results obtained from the performed simulations will bepresented and discussed The objective of this section is to evaluate if the algorithmallows the operator to reduce power consumption without degrading the networkperformance in other words determine if the algorithm is energy efficient
51 ModelThe algorithm that will be analysed is developed using MATLAB It is included inthe MONSTeR project a scalable and modular modeling and simulation frameworkfor mobile networks A key factor for the setup of the scenario is the LTE systemtoolbox from MATLAB which provides the low-layer signal processing and channelmodelling for the communications system The higher levels and networking compo-nents have been developed by the MONSTeR team
The scenario for each simulation can be modified as it presents a great numberof features to simulate all types of situations This allows to obtain close-to-realityresults This sectionrsquos objective is to explain how the scenario is generated and pro-vide an overview of all the features than can be chosen
The simulations take place on a 500m x 500m urban area The buildings distri-bution follows a Manhattan grid and the buildingsrsquo height varies between 20 m and50 m Figure 51 shows an example of layout
The carrier frequency on the UL direction is 17477 MHz and 18425 MHz in theDL link (LTE band 3 using FDD (Frequency Division Duplexing))
51 Model 32
Figure 51 Example of a simulation layout with 5 base stations and 3 users
511 Base stationsAs said before the algorithm allows us to customize the scenario of the simulationsThree sizes for the cells of the base stations can be used Macrocells Microcells andPicocells Each base station bears one cell It is possible to define how many basestation of each type will be in the scenario
The Macrocell station will always be positioned on the center of the scenarioWith Macrocell and Picocell stations the distribution can be chosen There are threepossible positioning
minus UniformPlaces the base stations equidistantly from the Macro base station and fromthe other base stations
minus RandomThe placement does not follow any pattern
minus ClusterizedThe base stations are placed in groups or clusters
Other network parameters can be defined such as number of subframes or heightof each base station
512 UsersThe number of users at the network can also be configured Height and number ofsubframes can also be modified The users are distributed randomly over the areaand can have different types of mobility
51 Model 33
minus Static
minus Pedestrian
minus Vehicular
513 ChannelThere are several types of channel model to be chosen WINNER II eHATA andITUR1546
WINNER II is a project under the framework of the IST WINNER project whoseobjective is to provide a reliable and repeatable model that mimics the radio environ-ment adequately and is easy to implement [47]
WINNER II is a geometry-based stochastic model It provides a large range ofpropagation scenarios different types of indoor rural or urban scenarios
The macro scenario chosen from the WINNER II project is the Typical urbanmacro-cell This scenario is only defined for the NLOS (Non-line of sight) case Forthe micro and pico scenarios a Typical urban micro-cell is used In this case thescenario is defined by both NLOS and LOS cases as the user could be blocked tem-porarily by other objects (eg busses)
The eHATA model is an extension of the Hata Model The Hata model providesempirical formulas for propagation loss based on the land-mobile measurements ofOkamura et al The extension of the model consists in the extension of the frequencyranges of the original model [48]
The ITUR1546 is based on the ITU-R Recommendation 1546 The ITU-R Recom-mendations provide a set of technical rules obtained from studies approved by all themembers of the ITU organization The ITU-R 1546 provides a prediction method forpoint-to-area propagation The method is based on the interpolationextrapolationof field-strength curves empirically deduced as functions of the distance height if theantenna frequency and time percentage [49]
514 TrafficThe models of traffic that can be used are fullBuffer videoStreaming or webBrowsing
The fullBuffer model is a non-realistic model where it is assumed that the useralways has data to transmit and the packet arrival queue is always full [50] In thevideoStreaming model also known as Finite buffer the user is downloading a singlefile between The model is based on the sampling of an actual video The trafficis not constant unless there is a large number of user on the scenario Finally the
51 Model 34
webBrowsing model is similar to the videoStreaming model but in this case the useris accessing a web page This model is also based on a real browsing session
515 SchedulingFor scheduling a Round Robin strategy is followed This strategyrsquos objective is toallocate resources to each user in a fair way A time-based technique is used to allocateresources in turns granting that the allocation is fair First of all a unit of time isdefined Then one of the users ready to transmit starts sending data If the useruses up all the unit of time the system allocates the resources to another user [51]
516 Hybrid Automatic Repeat RequestTo report transmission errors and quickly retransmit packets an Hybrid AutomaticRepeat reQuest (HARQ) scheme is used In LTE asynchronous HARQ is used inthe downlink direction meaning that the erroneous data does not have to be sentright away In the uplink direction synchronous HARQ is used In this case theretransmission of the data will take place after a fixed amount of time [31]
When there is data transmission the sender expects an ACK from the receiver ifthe data has been received correctly Otherwise if the received data contains errorsand can not be decoded the receiver will send a NACK All sent data by the senderis stored in a buffer When an ACK is received the package that was sent is removedfrom the buffer and the next package is transmitted but if a NACK is received thesender will retransmit the erroneous data
517 Energy Saving algorithmThe presented algorithm allows to perform an energy saving mechanism in the LTEscenario This mechanism is based on the optimization of operative base stationsmeaning that it allows to reduce the consumption of energy by swithching off and onbase stations (cells) according to the network state
Bases stations independently of the type can be in six states active overloadunderload shutdown inactive or boot The decision to change to one state or anotherdepends on time references and two thresholds Low utilization threshold (loThr) anda High utilization threshold (hiThr)
The utilization of a base station represents the percentage of resources that arebeing used Its value is computed based on the utilization of the physical resourceblocks When the utilization is lower than the loThr the base station will be consid-ered to be underloaded In the case where the utilization is higher than the hiThrthe base station will be considered to be overloaded
51 Model 35
Figure 52 provides an example of the load of a base station expressed in ofutilization In this figure the dependence between the change of the states and thetwo thresholds can be seen in a temporal scale
The time to change from Underload to Shut-down and from Shut-down to Inactiveare regulated by countdowns
Figure 52 Example of the dependence between the state variation and utilizationthresholds in a time scale
In Figure 53 the complete flow chart of the different states and the conditions tochange from one to another have been depicted
52 Simulation parameters 36
Figure 53 Energy Saving states
At the start of the simulation all base stations are in active mode The utilizationof each of them is checked in each round of simulations If the utilization is higherthan the hiThr the base station will change to the Overload state If it remains inthis state for more than a certain amount of time (hysteresis time) the eNodeB willtry to offload within its neighbours If there is an inactive neighbour that can provideservice it will be activated Otherwise if the load decreases before the hysteresis timeis exceeded the eNodeB will return to the active state
On the other hand when in active mode if the utilization is lower than the loThrthe base station changes to the underload state In that state if the utilizationkeeps at a low level and a certain amount of time (hysteresis time) is exceeded theshut-down will start The shut-down ends when the utilization is still under thethreshold and the switch-off countdown ends Then the base station will remainin inactive mode until it receives a signal to activate from an overloaded neighbourFrom inactive it will change to Boot and then if the utilization is still low and theswitch-on countdown ends it will change to Active
52 Simulation parametersFor the simulations the parameters in Table 51 and Table 52 are constant
The duration of the simulations is configured by changing the number of roundsEach rounds stands for a millisecond A thousand rounds have been simulated withall thresholds with a value of one millisecond
53 Performance Evaluation 37
Table 51 Fixed Simulations parameters of the base stationsMacro station
Parameter ValueHeight 35 m
Subframes 50Bandwidth 10 MHzMax Power 20 W
Micro stationParameter Value
Height 25 mSubframes 25Bandwidth 5 MHzMax Power 63 W
Pico stationParameter Value
Height 5 mSubframes 6Bandwidth 12 MHzMax Power 013 W
Table 52 Fixed Simulations parameters of a User
Parameter ValueHeight 15 m
Subframes 25
Fourteen users with the pedestrian mobility have been placed on the scenario Thebase stations follow a uniform positioning There is one Macro base station and fourMicro base stations The channel model used is WINNER II and a VideoStreamingmodel is used to model the traffic
The evaluation of the energy saving mechanism will be done through generatingstatistics of the power consumption with different lower thresholds The simulatedlower thresholds take the values of 1 20 40 and 60 The higher threshold will not beused assuming that the base station will never be overloaded The reference for allthe calculations is the lower threshold with the value 1 This threshold simulates theoperation of the base stations without the energy saving algorithm being operative
53 Performance EvaluationAfter executing the simulation of the situation previously explained below it canbe seen the graphics generated with the diferent thresholds in comparison with thereference threshold
In Figure 54 it can be seen the power consumption of the Macro base stationWith loThr=20 loThr=40 and loThr=60 the variation of the consumed power ofthe Macro station is minimal While the power consumption has a constant value of224 W with a loThr=1 the values with the other thresholds oscillate in the interval[75218] with a mean of 110 W
53 Performance Evaluation 38
Figure 54 Consumption of the Macro base station with loThr=20
For the micro base stations the variation between the different values of lowerthreshold is minimal In all the cases the base stations 2 and 4 have a constantconsumption while the base stations 1 and 3 vary along almost all the rounds of thesimulation This may be due to the position of the users and their movement on thescenario
The consumption of all Micro base stations without the energy saving algorithmis 72 W With loThr=20 the eNodeBs 2 and 4 reduce their consumption to 39 WThis means that these two stations are shutted-down and therefore not operativeTheir consumption is the fixed term needed to keep the base station operative in orderto minimize the time of switch-on when needed The first Micro base station variesduring all the rounds of the simulation having a mean value of consumed power equalto 4873 W Unlike the first Micro base station the third one varies during half ofthe simulations rounds The mean of consumed power is 4091 W in this case
53 Performance Evaluation 39
Figure 55 Consumption of the Micro base stations with loThr=20
As said before the waveform obtained with the different thresholds only variesslightly For a value of loThr=40 the Micro base stations 2 and 4 keep reducing theirpower consumption to 39 The mean value of the Micro base station 1 is 4918 Wwhile the Micro base station 3rsquos mean is 4122 W
Figure 56 Consumption of the Micro base stations with loThr=40
For loThr=60 the Micro base stations 2 and 4 reduce their consumed power to39 W again In this case the mean value of the Micro 1 is 4891 W and the meanvalue for the Micro 3 is 4038 W
53 Performance Evaluation 40
Figure 57 Consumption of the Micro base stations with loThr=60
To sum up the saving in power is shown in Table 53 The different values exposedabove for the different base station have been used to compute an estimation of thepercentage of saved power The saved power has been calculated has follows in (51)
SavedPower = 100 minus
((sum5
bs=1 PowerConsumedLoThr = x) lowast 100sum5bs=1 PowerConsumedLoThr = 1
)[] (51)
Where x can be 20 40 or 60 and bs is the index of the base stations
Table 53 Power consumed(W) and saved() by each base station
loThr Macro Micro 1 Micro 2 Micro 3 Micro 4 Power saved()1 224 72 72 72 72 -20 110 4873 39 4091 39 457740 110 4918 39 4122 39 456260 110 4891 39 4038 39 4584
All the thresholds allow approximately 45 of power saving The variation be-tween the different percentages is minimum
As said before the algorithm optimizes the number of operative base stationsAccording to the network state base stations are switched-off in order to save energyIn this simulation two base stations are switched-off during all the simulation microbase station 2 and 4 and micro base station 3 is switched-off half of the time It is tobe expected to save energy if the number of operative base station is reduced even
53 Performance Evaluation 41
just for a small period of time Table 53 demonstrates this rational argument
In Chapter 4 and more concretely in Section 45 all worksrsquo objective was to ob-tain energy efficiency Energy efficiency consist on reducing the energy consumptionwhile preserving the quality of the service [52] So not only the saving in power hasto be analysed the network performance is a key factor in determining the energyefficiency of the algorithm HARQ as mentioned previously indicates de number ofretransmitions due to transmission errors Analysing this parameter an overview ofthe network performance will be obtained
For all base stations the variations of the HARQ through the different thresholdshave been depicted It can be seen that the Micro base stations 2 and 4 as theyare switched-off have 0 HARQ retransmissions The behaviour of the waveform forMicro base station 1 and 3 is similar eventhough Micro 1 has more retransmissionsthan Micro 3 This is to be expected because as said before the Micro base station 3is only operative half of the simulationrsquos rounds In both stations for loThr=20 andloThr=40 the number of HARQ retransmissions is constant while with loThr=60the retransmissions decrement obtaining a better performance than with the refer-ence threshold (loThr=1) that would represent standard operating conditions Forthe Macro base station the best threshold is 20 which improves the performance ofthe network in regard to standard operating conditions With loThr=40 the perfor-mance gets greatly degradated
Figure 58 Number of HARQ retransmissions per base station using differentthresholds
53 Performance Evaluation 42
Figure 59 Total number of HARQ retransmissions in the network
After seing the variation of HARQ on each base station separately in Figure 59a representation of the sum of the HARQ of each base station has been represented
The worst performance is obtained with loThr=40 but the performance of thenetwork for loThr=20 and loThr=60 is nearly the same as the performance withoutthe algorithm being slightly better in the latter case
It can be concluded that in this scenario with its particular conditions forloThr=20 and loThr=60 the algorithm achieves energy efficiency There is a 45 ofsaving in power without degrading the network performance
SON appeared as a potential solution to reduce OPEX and CAPEX and at thesame time it proved to optimize the utilization of resources of the network With theEnergy Saving use case the compromise between power saved and network perfor-mance has been seen In this simulation the difference between the power saved usingany of the three thresholds was minimum but in a scenario where the difference ishigher it is the operatorrsquos responsibility to decide if it is worth degrading the networkperformance in order to save power As the reduction of power is directly translatedin OPEX saving and environmental benefits the operator will decide what is in hisbest interest
As only one scenario has been simulated a general statement can not be givenThe energy efficiency of the algorithm has only been proven for the particular settingexplained through this chapter
Even so for networks with the same characteristics the algorithm can be usedto reduce the energy consumption It is important to point out that the algorithmis able to obtain energy efficiency thanks to being implemented in an urban envi-ronment The position of the Macro and Micro base stations is crucial for a correctperformance In the type of scenario of the simulation the Macro base station ispositioned in the center and the Micro base stations are situated equidistantly fromit With this setting even if a Micro base station is switched-off there will not becoverage holes as there is the Macro base station In all the cases the network
54 Summary 43
ensures that all the users have coverage On the other hand in a rural area an algo-rithm based in the optimization of the operative number of base stations can not beimplemented In rural scenarios when a base station is switched-off it can easily pro-duce coverage holes as there is less overlap of coverage areas than in an urban scenario
In conclusion in an urban scenario an energy saving algorithm is implementablemeaning that a saving in energy can be achieved Obtaining energy efficiency willdepend on the number of users and base stations but it has been proved that for afourteen users scenario with a Macro base station and four Micro base stations it ispossible to achieve energy efficiency
54 SummaryIn this section after a brief explanation of the modelrsquos parameters which includetraffic models scheduling channel models etc a evaluation of a concrete situationhas been done
The situation simulated consisted on a Macro base station and four Micro basestations following a uniform distribution Fourteen users were placed on the scenario
In order to evaluate and determine if the Energy Saving algorithm obtained en-ergy efficiency the power consumed and the number of HARQ retransmissions havebeen analysed for four values of threshold The values of the threshold were 1 2040 and 60 being 1 the reference threshold corresponding to the standard simulationwithout applying the algorithm
The results have shown that with all the threshold values (2040 and 60) approxi-mately a 45 of power saving can be achieved As for the number of HARQ retrans-missions with a threshold=40 the network performance got degradated meanwhilewith threshold=20 and threshold=60 the number of retransmissions was nearly thesame as the reference threshold So with these two threshold energy efficiency isachieved for this concrete situation
The saving in power will reduce the OPEX of the network As there exist com-promise between the performance of the network and the saved power operators willbe responsible of choosing the adequate threshold that fits better with their interest
To sum up with an urban scenario with fourteen users one Macro base stationand four Micro base stations it is possible to implement energy saving algorithmsand it has been demonstrated that is possible to achieve energy efficiency In ruralscenarios algorithms based on switching-off and on base stations according to thenetwork performance are not implementable
6ConclusionAs time goes by traffic grows and more complex networks are needed This increasingcomplexity may become a handicap for a full exploitation of the network resourcesas human capacity may not be able of overcoming the challenge At the same timemore complexity is directly translated in an increase of OPEX and CAPEX Self-Organizing Networks appear motivated by the reduction of OPEX and CAPEX andare able of providing a better usage of the network resources
A Self-Organizing Network is an automated adaptive network capable of per-forming a set of functions with minimum human intervention The most commontaxonomy divides the topic in three categories Self-Configuration Self-Optimizationand Self-Healing Each category at the same time is divided in different use cases
The Self-Optimization category covers the tuning of the network once it is in op-erating mode The use cases of most interest for the research community are RACHOptimization Mobility Robustness Optimization Mobility Load Balance Coverageand Capacity Optimization Interference Control and Energy Saving
Collision between use cases may occur if the use cases happen to optimize the sameparametersThree major conflicts have been identified Mobility Robustness with Mo-bility Load Balance Coverage and Capacity with Interference Control and Coverageand Capacity with Energy SavingIt has been seen that the implementation of morethan one Self-optimization use case has to be carefully planned The collision onthe parameters that they optimize along with the impact on the performance of thenetwork has to be taken into account
This thesis has been focused on the Energy Saving use case The two main mo-tivations for the apparition of this use case are the reduction of the environmentalimpact of networks as well as reducing the cost of operation
Some projects have been working on this issue One of them is the Third Gen-eration Partnership Project (3GPP) Their standarized features have been presentedin this document At the same time different solutions for the energy saving usecase have been explained All solutions focused on the optimization approach for theuse case While the first algorithm regulated the number of operative base stationsthe second algorithm switched-off and on the sectors of a base station In the thirdprotocol the energy consumption was reduced by decreasing the interference amongcells Lastly the last solution explained served as example of coordination between
61 Future Work 45
multiple SON use cases
To conclude the study of the Energy Saving use case an algorithm still in devel-opment has been studied The algorithm is run on MATLAB and provides an entirecommunications system environment to run close-to-reality simulations Base stationscan be in six different states The changes from one state to another are regulatedby two thresholds (lower threshold and higher threshold) and multiple countdowns
To evaluate the performance of the algorithm the simulations have been per-formed with different values of the lower threshold The power consumed and num-ber of HARQ retransmissions has been analyzed for loThr=1 loThr=20 loThr=40and loThr=60 The case of loThr=1 simulates the scenario where no energy savingalgorithm is operative and is used as a reference Results show that for all values ofthreshold a 45 of power can be saved but only with loThr=20 and loThr=60 energyefficiency is obtained as the number of HARQ retransmissions is nearly the same aswith the reference threshold With loThr=40 the number of HARQ retransmissionsis higher than in the reference threshold meaning that the network performance getsdegraded
In a rural environment algorithms based on optimization of the number of basestations can not be implemented Contrarily in urban scenarios they allow the op-erators to save power It has been demonstrated that it is possible to obtain energyefficiency in a fourteen users scenario with five base stations
The saving in power will allow the operator to reduce the OPEX of his networksas well as to reduce the environmental impact It will be the operators responsabilityto choose the thresholds that fits best within his interest taking into account thecompromise between saving and network performance
61 Future WorkThe algorithm that has been evaluated leaves room to further analysis of its featuresas it allows us to modify a great number of parameters and simulate numerous situ-ations
The results presented in this thesis have been obtained from only one simulationof the scenario To improve the results the simulated scenario could be reproducedseveral times This way a general statement of the saving in power in a fourteenusers scenario with five base stations could be provided The study of the mean anddeviation of the percentage of saved power as well as the number of HARQ retrans-missions for the same situation and scenario could be performed
Future work could involve the impact of the variation of the number of users onthe energy efficiency A major number of rounds could also be simulated for a longterm evaluation
Bibliography[1] Cisco Visual Networking Index Global Mobile Data Traffic Forecast Update
2016ndash2021 White Paper - Cisco url httpswwwciscocomcenussolutions collateral service - provider visual - networking - index -vnimobile-white-paper-c11-520862html (visited on 06122018)
[2] Juan Ramiro and Khalid Hamied Self-organizing networks self-planning self-optimization and self-healing for GSM UMTS and LTE Wiley 2012 p 292isbn 9781119954224
[3] Tommaso Pecorella et al ldquoApplication driven SONrdquo In 2014 InternationalWireless Communications and Mobile Computing Conference (IWCMC) IEEEAug 2014 pp 985ndash989 isbn 978-1-4799-0959-9 doi 101109IWCMC20146906489 url httpieeexploreieeeorglpdocsepic03wrapperhtmarnumber=6906489
[4] Osianoh Glenn Aliu et al ldquoA Survey of Self Organisation in Future CellularNetworksrdquo In IEEE Communications Surveys amp Tutorials 151 (2013) pp 336ndash361 issn 1553-877X doi 101109SURV201202131200116 url httpieeexploreieeeorgdocument6157579
[5] 36300-f00[6] R Menon et al ldquoSON for Government Spectrum Applicationsrdquo In MILCOM
2013 - 2013 IEEE Military Communications Conference IEEE Nov 2013pp 1308ndash1315 isbn 978-0-7695-5124-1 doi 101109MILCOM2013223 urlhttpieeexploreieeeorgdocument6735805
[7] 3GPP Specification 32500 url httpsportal3gpporgdesktopmodulesSpecificationsSpecificationDetailsaspxspecificationId=2031 (vis-ited on 05062018)
[8] Neil Scully et al ldquoINFSO-ICT-216284 SOCRATES Use Cases for Self-OrganisingNetworks Executive Summaryrdquo In () url httpwwwfp7-socrateseufilesDeliverablesSOCRATES7B5C_7DD2120Use20cases20for20self-organising20networkspdf
[9] Hafiz Yasar Lateef Ali Imran and Adnan Abu-Dayya ldquoA framework for clas-sification of Self-Organising network conflicts and coordination algorithmsrdquo In2013 IEEE 24th Annual International Symposium on Personal Indoor andMobile Radio Communications (PIMRC) IEEE Sept 2013 pp 2898ndash2903isbn 978-1-4673-6235-1 doi 10 1109 PIMRC 2013 6666642 url http ieeexploreieeeorgdocument6666642
Bibliography 47
[10] Iva Luketić Dina Šimunić and Tomislav Blajić ldquoOptimization of Coverageand Capacity of Self-Organizing Network in LTErdquo In 34MIPRO (Nov 2011)p 130 url httpswwwbibirbhr553813
[11] Magdalena Nohrborg SON url http www 3gpp org technologies keywords-acronyms105-son (visited on 05092018)
[12] 3GPP Specification 25484 url httpsportal3gpporgdesktopmodulesSpecificationsSpecificationDetailsaspxspecificationId=1225 (vis-ited on 05092018)
[13] Seppo Haumlmaumllaumlinen Henning Sanneck and Cinzia Sartori LTE self-organisingnetworks network management automation for operational efficiency Wiley2012 p 398 isbn 1119970679
[14] 3GPP Specification 36902 url httpsportal3gpporgdesktopmodulesSpecificationsSpecificationDetailsaspxspecificationId=2581 (vis-ited on 05132018)
[15] Daehee Kim Wook Kim and Sunshin An ldquoAdaptive random access preamblesplit in LTErdquo In 2013 9th International Wireless Communications and MobileComputing Conference (IWCMC) IEEE July 2013 pp 814ndash819 isbn 978-1-4673-2480-9 doi 101109IWCMC20136583662 url httpieeexploreieeeorgdocument6583662
[16] Mehdi Amirijoo et al ldquoTowards Random Access Channel Self-Tuning in LTErdquoIn VTC Spring 2009 - IEEE 69th Vehicular Technology Conference IEEE Apr2009 pp 1ndash5 doi 101109VETECS20095073889 url httpieeexploreieeeorgdocument5073889
[17] Osman N C Yilmaz Jyri Hamalainen and Seppo Hamalainen ldquoSelf-optimizationof Random Access Channel in 3GPP LTErdquo In 2011 7th International Wire-less Communications and Mobile Computing Conference IEEE July 2011pp 1397ndash1401 isbn 978-1-4244-9539-9 doi 101109IWCMC20115982742url httpieeexploreieeeorgdocument5982742
[18] Seunghyun Choi et al ldquoAutomatic configuration of random access channel pa-rameters in LTE systemsrdquo In 2011 IFIP Wireless Days (WD) IEEE Oct2011 pp 1ndash6 isbn 978-1-4577-2028-4 doi 101109WD20116098212 urlhttpieeexploreieeeorgdocument6098212
[19] 3GPP Specification 25331 url httpsportal3gpporgdesktopmodulesSpecificationsSpecificationDetailsaspxspecificationId=1180 (vis-ited on 05132018)
[20] Zhenzhen Wei ldquoMobility robustness optimization based on UE mobility forLTE systemrdquo In 2010 International Conference on Wireless Communicationsamp Signal Processing (WCSP) IEEE Oct 2010 pp 1ndash5 isbn 978-1-4244-7556-8 doi 101109WCSP20105629525 url httpieeexploreieeeorgdocument5629525
Bibliography 48
[21] Thang Minh Nguyen Sungoh Kwon and Hongsoog Kim ldquoMobility RobustnessOptimization for Handover Failure Reduction in LTE Small-Cell Networksrdquo InIEEE Transactions on Vehicular Technology (2017) pp 1ndash1 issn 0018-9545doi 101109TVT20172787602 url httpieeexploreieeeorgdocument8240626
[22] Ahmad Awada et al ldquoTowards Self-Organizing Mobility Robustness Optimiza-tion in Inter-RAT Scenariordquo In 2011 IEEE 73rd Vehicular Technology Confer-ence (VTC Spring) IEEE May 2011 pp 1ndash5 isbn 978-1-4244-8332-7 doi10 1109 VETECS 2011 5956234 url http ieeexplore ieee org document5956234
[23] Nauman Zia and Andreas Mitschele-Thiel ldquoSelf-organized neighborhood mobil-ity load balancing for LTE networksrdquo In 2013 IFIP Wireless Days (WD) IEEENov 2013 pp 1ndash6 isbn 978-1-4799-0543-0 doi 101109WD20136686466url httpieeexploreieeeorgdocument6686466
[24] Min Sheng et al ldquoZone-Based Load Balancing in LTE Self-Optimizing NetworksA Game-Theoretic Approachrdquo In IEEE Transactions on Vehicular Technology636 (July 2014) pp 2916ndash2925 issn 0018-9545 doi 101109TVT20132293785 url httpieeexploreieeeorgdocument6678648
[25] Raymond Kwan et al ldquoOn Mobility Load Balancing for LTE Systemsrdquo In2010 IEEE 72nd Vehicular Technology Conference - Fall IEEE Sept 2010pp 1ndash5 isbn 978-1-4244-3573-9 doi 101109VETECF20105594565 urlhttpieeexploreieeeorgdocument5594565
[26] 3GPP Specification 32522 url httpsportal3gpporgdesktopmodulesSpecificationsSpecificationDetailsaspxspecificationId=2042 (vis-ited on 05132018)
[27] A Engels et al ldquoAutonomous Self-Optimization of Coverage and Capacity inLTE Cellular Networksrdquo In IEEE Transactions on Vehicular Technology 625(June 2013) pp 1989ndash2004 issn 0018-9545 doi 101109TVT20132256441url httpieeexploreieeeorgdocument6492108
[28] Sascha Berger et al ldquoOnline Antenna Tilt-Based Capacity and Coverage Opti-mizationrdquo In IEEE Wireless Communications Letters 34 (Aug 2014) pp 437ndash440 issn 2162-2337 doi 10 1109 LWC 2014 2327228 url http ieeexploreieeeorgdocument6822546
[29] Jietao Zhang et al ldquoA hybrid framework for capacity and coverage optimizationin self-organizing LTE networksrdquo In 2013 IEEE 24th Annual InternationalSymposium on Personal Indoor and Mobile Radio Communications (PIMRC)IEEE Sept 2013 pp 2919ndash2923 isbn 978-1-4673-6235-1 doi 101109PIMRC20136666646 url httpieeexploreieeeorgdocument6666646
[30] Victor Buenestado et al ldquoSelf-tuning of remote electrical tilts based on calltraces for coverage and capacity optimization in LTErdquo In IEEE Transactionson Vehicular Technology (2016) pp 1ndash1 issn 0018-9545 doi 101109TVT20162605380 url httpieeexploreieeeorgdocument7558145
Bibliography 49
[31] Martin Sauter From GSM to LTE-Advanced Chichester UK John Wiley ampSons Ltd Aug 2014 isbn 9781118861943 doi 10 1002 9781118861943url httpdoiwileycom1010029781118861943
[32] Mohammadreza Behjati and John Cosmas ldquoSelf-organizing interference coordi-nation for future LTE-Advanced network QoS improvementsrdquo In 2014 IEEEInternational Symposium on Broadband Multimedia Systems and BroadcastingIEEE June 2014 pp 1ndash6 isbn 978-1-4799-1654-2 doi 101109BMSB20146873493 url httpieeexploreieeeorglpdocsepic03wrapperhtmarnumber=6873493
[33] Fei Qi et al ldquoCognitive radio based adaptive SON for LTE-A heterogeneousnetworksrdquo In 2014 IEEE Global Communications Conference IEEE Dec 2014pp 4412ndash4417 isbn 978-1-4799-3512-3 doi 101109GLOCOM20147037502url httpieeexploreieeeorgdocument7037502
[34] Konstantinos Samdanis et al ldquoSelf Organized Network Management Functionsfor Energy Efficient Cellular Urban Infrastructuresrdquo In Mobile Netw Appl 17(2012) pp 119ndash131 doi 101007s11036 - 011- 0293- 7 url httpslinkspringercomcontentpdf1010077B5C7D2Fs11036-011-0293-7pdf
[35] Josip Lorincz Tonko Garma and Goran Petrovic ldquoMeasurements and mod-elling of base station power consumption under real traffic loadsrdquo In Sensors(Basel Switzerland) 124 (2012) pp 4181ndash310 issn 1424-8220 doi 103390s120404281 url http www ncbi nlm nih gov pubmed 22666026 20http www pubmedcentral nih gov articlerender fcgi artid =PMC3355411
[36] ITU ICTs and Energy Efficiency url httpswwwituintenactionclimatePagesenergy7B5C_7Defficiencyaspx (visited on 04152018)
[37] Nicola Piovesan et al ldquoEnergy sustainable paradigms and methods for futuremobile networks A surveyrdquo In Computer Communications 119 (Apr 2018)pp 101ndash117 issn 0140-3664 doi 101016JCOMCOM201801005 urlhttpswwwsciencedirectcomsciencearticlepiiS0140366417309088
[38] Congzheng Han et al ldquoGreen radio radio techniques to enable energy-efficientwireless networksrdquo In IEEE Communications Magazine 496 (June 2011) pp 46ndash54 issn 0163-6804 doi 10 1109 MCOM 2011 5783984 url http ieeexploreieeeorgdocument5783984
[39] ldquoINFSO-ICT-247733 EARTH Deliverable D23 Energy efficiency analysis of thereference systems areas of improvements and target breakdownrdquo In () urlhttpsbscwict-eartheupubbscwcgid71252EARTH7B5C_7DWP27B5C_7DD237B5C_7Dv2pdf
[40] Romeo Giuliano Franco Mazzenga and Marco Petracca ldquoPower ConsumptionAnalysis and Dimensioning of UMTS-LTE with Relaysrdquo In Procedia Com-puter Science 40 (2014) pp 74ndash83 issn 18770509 doi 101016jprocs201410033 url httplinkinghubelseviercomretrievepiiS1877050914014008
Bibliography 50
[41] Richard Waldhauser et al ldquoSelf-Organising Networks (SON)rdquo In LTE Self-Organising Networks (SON) Chichester UK John Wiley amp Sons Ltd Dec2011 pp 39ndash80 doi 1010029781119961789ch3 url httpdoiwileycom1010029781119961789ch3
[42] 3GPP Specification 32826 url httpsportal3gpporgdesktopmodulesSpecificationsSpecificationDetailsaspxspecificationId=2232 (vis-ited on 04172018)
[43] 3GPP Specification 32551 url httpsportal3gpporgdesktopmodulesSpecificationsSpecificationDetailsaspxspecificationId=2055 (vis-ited on 04172018)
[44] I-Hong Hou and Chung Shue Chen ldquoAn Energy-Aware Protocol for Self-OrganizingHeterogeneous LTE Systemsrdquo In IEEE Journal on Selected Areas in Commu-nications 315 (May 2013) pp 937ndash946 issn 0733-8716 doi 101109JSAC2013130512 url httpieeexploreieeeorgdocument6502488
[45] Md Farhad Hossain Kumudu S Munasinghe and Abbas Jamalipour ldquoTowardself-organizing sectorization of LTE eNBs for energy efficient network operationunder QoS constraintsrdquo In 2013 IEEE Wireless Communications and Network-ing Conference (WCNC) IEEE Apr 2013 pp 1279ndash1284 isbn 978-1-4673-5939-9 doi 101109WCNC20136554748 url httpieeexploreieeeorgdocument6554748
[46] Raymond Kwan ldquoDistributed Energy-Saving Mechanism for Self-OrganizingFemto LTE Networksrdquo In 2012 IEEE Vehicular Technology Conference (VTCFall) IEEE Sept 2012 pp 1ndash5 isbn 978-1-4673-1881-5 doi 10 1109 VTCFall20126399139 url httpieeexploreieeeorgdocument6399139
[47] Juha Meinilauml et al ldquoWINNER II Channel Models 40 Radio Technologies andConcepts for IMT-Advancedrdquo In (2009) url httpsonlinelibrarywileycomdoipdf1010029780470748077ch3
[48] Edward F Drocella Jr et al 35 GHz Exclusion Zone Analyses and Methodology| National Telecommunications and Information Administration Tech rep urlhttps www ntia doc gov report 2015 35 - ghz - exclusion - zone -analyses-and-methodology
[49] Itu-R Recommendation ldquoMethod for point-to-area predictions for terrestrialservices in the frequency range 30 MHz to 3 000 MHz P Series Radiowavepropagationrdquo In () pp 1546ndash5 url httpswwwituintdms7B5C_7Dpubrecitu-rrecpR-REC-P1546-5-201309-IPDF-Epdf
[50] Pablo Ameigeiras et al ldquoTraffic models impact on OFDMA scheduling designrdquoIn () doi 1011861687-1499-2012-61 url httpslinkspringercomcontentpdf1011867B5C7D2F1687-1499-2012-61pdf
[51] M Habaebi et al ldquoComparison between Scheduling Techniques in Long TermEvolutionrdquo In (2013)
Bibliography 51
[52] Mauro De Sanctis Ernestina Cianca and Viraj Joshi ldquoEnergy Efficient Wire-less Networks Towards Green Communicationsrdquo In Wireless Personal Commu-nications 593 (Aug 2011) pp 537ndash552 issn 0929-6212 doi 101007s11277-011-0244-4 url httplinkspringercom101007s11277-011-0244-4
- Abstract
- Preface
- Acknowledgements
- Contents
- Acronyms
- List of Figures
- List of Tables
- 1 Introduction
-
- 11 Problem Statement
- 12 Project Scope
- 13 Thesis outline
-
- 2 Self-Organizing Networks
-
- 21 Motivation
- 22 SON Taxonomy Use Cases
- 23 Alternative Taxonomies
- 24 3GPP Standardized Features
- 25 Summary
-
- 3 Self-Optimization Use Cases
-
- 31 RACH Optimization
- 32 Mobility Robustness Optimization
- 33 Mobility Load Balancing
- 34 Coverage and Capacity Optimization
- 35 Interference Control
- 36 Energy Saving
- 37 Use Cases Compatibility
- 38 Summary
-
- 4 Energy Saving Use Case
-
- 41 Motivation
- 42 Consumption of a Base Station
- 43 Energy Saving Approaches
- 44 Standarized Features
- 45 Energy Saving State of the Art
- 46 Summary
-
- 5 Energy Saving Algorithm Evaluation of Performance
-
- 51 Model
- 52 Simulation parameters
- 53 Performance Evaluation
- 54 Summary
-
- 6 Conclusion
-
- 61 Future Work
-
- Bibliography
-
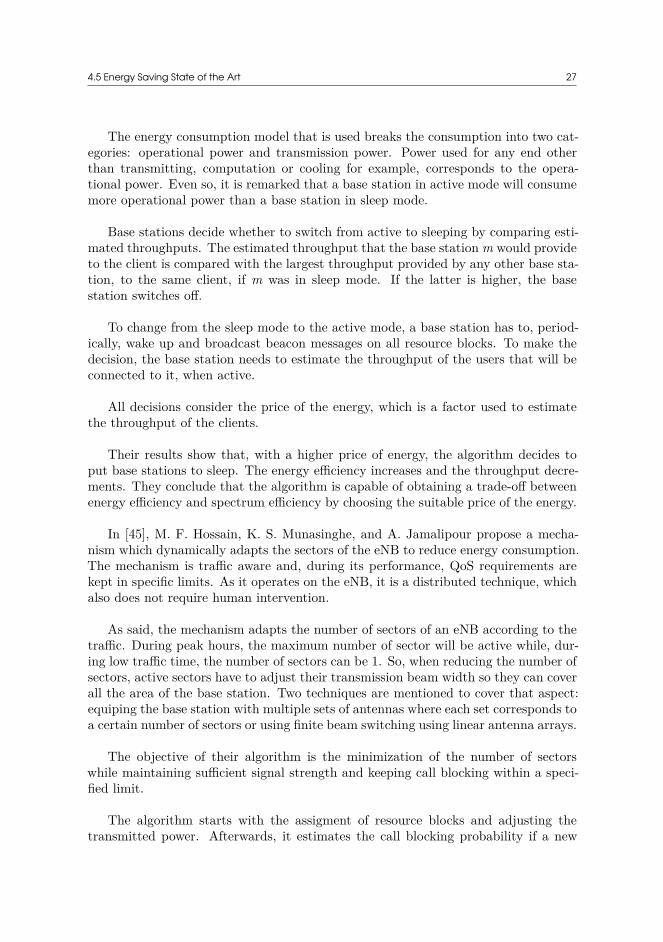