Effects of input representation on self-organizing and bottom ...
36
Volume: 6 Issue: 1 Year: 2009 Effects of input representation on self-organizing and bottom-up model of chord schema Nart Bedin Atalay* Abstract Effects of input representation on self-organizing and bottom-up model of chord schema were investigated. A single layer self-organizing map was trained with 12 major and 12 minor chords. Training was repeated five times, each time with a different input representation. In this model, activation of chords is determined by the representation and activation of pitches that compose the chords. Important findings of chord perception were simulated with this model. Simulation results showed that input representation was critical to simulate all of the findings. Keywords: chord perception; self-organizing maps; bottom-up models; chord schema; cognitive model Giriş gösterimlerinin kendini örgütleyen ve aşağıdan yukarıya çalışan akor şemalarına etkisi Nart Bedin Atalay* Özet Giriş gösterimlerinin kendini örgütleyen ve aşağıdan yukarıya çalışan akor şemalarına etkisi incelenmiştir. Tek katmanlı kendini örgütleyen ağ 12 major ve 12 minör akor ile eğitilmiştir. Eğitim her seferinde başka bir giriş gösterimi kullanılarak beş kez tekrar edilmiştir. Bu modelde akor gösterimlerinin seviyesi sadece akoru oluşturan seslerin gösterimleri ve seviyesi ile belirlenmektedir. Akor algısının önemli bulguları bu model ile benzetilmiştir. Benzetim sonuçları göstermektedir ki bütün bulguların modellenebilmesi için uygun giriş gösterimlerinin seçilmesi gerekmektedir. Anahtar Kelimeler: akor algısı; kendini örgütleyen ağlar; aşağıdan yukarıya çalışan modeller; akor şeması; bilişsel model ________________________ * Selçuk University, Sosyal Bilimler Enstitüsü ve Dilek Sabancı Devlet Konservatuvarı; [email protected].
-
Upload
khangminh22 -
Category
Documents
-
view
1 -
download
0
Transcript of Effects of input representation on self-organizing and bottom ...

Volume: 6 Issue: 1 Year: 2009
Effects of input representation on self-organizing and bottom-up model of chord schema
Nart Bedin Atalay*
Abstract Effects of input representation on self-organizing and bottom-up model of chord schema were investigated. A single layer self-organizing map was trained with 12 major and 12 minor chords. Training was repeated five times, each time with a different input representation. In this model, activation of chords is determined by the representation and activation of pitches that compose the chords. Important findings of chord perception were simulated with this model. Simulation results showed that input representation was critical to simulate all of the findings. Keywords: chord perception; self-organizing maps; bottom-up models; chord schema; cognitive model
Giriş gösterimlerinin kendini örgütleyen ve aşağıdan yukarıya çalışan akor şemalarına etkisi
Nart Bedin Atalay*
Özet Giriş gösterimlerinin kendini örgütleyen ve aşağıdan yukarıya çalışan akor şemalarına etkisi incelenmiştir. Tek katmanlı kendini örgütleyen ağ 12 major ve 12 minör akor ile eğitilmiştir. Eğitim her seferinde başka bir giriş gösterimi kullanılarak beş kez tekrar edilmiştir. Bu modelde akor gösterimlerinin seviyesi sadece akoru oluşturan seslerin gösterimleri ve seviyesi ile belirlenmektedir. Akor algısının önemli bulguları bu model ile benzetilmiştir. Benzetim sonuçları göstermektedir ki bütün bulguların modellenebilmesi için uygun giriş gösterimlerinin seçilmesi gerekmektedir. Anahtar Kelimeler: akor algısı; kendini örgütleyen ağlar; aşağıdan yukarıya çalışan modeller; akor şeması; bilişsel model ________________________ * Selçuk University, Sosyal Bilimler Enstitüsü ve Dilek Sabancı Devlet Konservatuvarı; [email protected].

Atalay, N., B. (2009). Effects of input representation on self-organizing and bottom-up model of chord schema.
International Journal of Human Sciences [Online]. 6:1. Available: http://www.insanbilimleri.com
377
Introduction Since the inception of the cognitivist approach to the musical mind, numerous symbolic AI
and connectionist models of music perception have been proposed (see Balaban, Ebcioglu &
Laske, 1992; Bharucha, 1988; Griffith & Todd, 1994; Todd & Loy, 1991; see also
Toiviainen, 2000 for a critical review). Some of them were introduced as working
hypotheses about the architecture and mechanism of the components of the musical mind.
These models have been developed hand-in-hand with the experimental studies: results of
experiments on music cognition have been compared with outputs of the models;
matched/mismatched comparisons have been the motivation to vindicate/reject the proposed
architecture and/or mechanism.
Many aspects of music perception have been modeled (see Purwins, Grachten, Herrera,
Hazan, Marxer, & Serra, 2008; Purwins, Herrera, Grachten, Hazan, Marxer, & Serra, 2008
for reviews). In this study, the focus is on modeling chord perception with neural networks.
The classic neural network model of chord perception is MUSACT (MUSical ACTivations,
Bharucha, 1987). MUSACT is an interactive theory of tonal schema. According to the
interactive view, mental representation of a chord is determined both by the mental
representation of pitches of the chord, and the mental representation of the key of the musical
context in which the chord resides. MUSACT (Bharucha, 1987) proposes a hierarchical
organization of mental representations of pitches, chords, and keys, which occupy different
layers in the neural network (see Figure 2). Information flow between layers is bi-directional
(bottom-up and top-down). The activation flows from the lower layers to upper layers
(bottom-up activation) as well as from upper-layers to lower layers (top-down activation).
For example, activation of the chord layer is shaped both by the pitch layer (the bottom-up
effect) and key layer (the top-down effect). MUSACT (Bharucha, 1987) has successfully
simulated effects of musical context on chord perception (see Krumhansl, 2005; Tillman,
Bharucha & Bigand, 2000 for review).
Connections of MUSACT were hand-wired (Bharucha, 1987); they were not developed as a
result of training the network with a representative sample of Western tonal music. This is
not a common method for modeling perceptual processes, especially when they depend on
learning (see Rumelhart and McClelland, 1986). A complete model of chord perception “…
should simulate the internalization of Western pitch regularities by mere exposure, allowing

Atalay, N., B. (2009). Effects of input representation on self-organizing and bottom-up model of chord schema.
International Journal of Human Sciences [Online]. 6:1. Available: http://www.insanbilimleri.com
378
the connection weights to adapt to the musical environment.” (Tillmann et al. 2000, p. 891).
Tillmann et al. (2000) showed that this was possible.
Tillmann et al. (2000) used a two-layer self-organizing map (Kohonen, 1982). Layers were
trained one after the other, with simultaneous and sequential combinations of tones.
Consequently, the first layer represented the major and minor chords, and the second layer
represented major tonalities. Then, Tillmann et al. (2000) pruned some connections and
scaled weights between layers. Pruning and scaling of connections were necessary to build a
working top-town and bottom-up signal flow between layers. At the end, the two-layer map
was architecturally equivalent to MUSACT (Bharucha, 1987), i.e. layers were organized
hierarchically, and information flow was bi-directional (top-down and bottom-up). With this
model, Tillmann et al. (2000) simulated a broad range of experiments that investigated
perception of tones, chords and keys.
This study is a follow-up of Tillmann et al. (2000). The goal is to develop a bottom-up model
of chord schema with self-organization. A single-layer self-organizing map was trained with
chord categories; and there was no pruning and scaling of connections. The model has
bottom-up connections (no top-down connections) operate on a single layer. In addition,
effects of pitch representation on the performance of the model were investigated.
The article is organized as follows. The first section briefly summarizes important findings
on the perception of chords. The second section introduces the MUSACT (Bharucha, 1987)
model. The third section informed the reader about the mechanism of self-organizing maps;
and the fourth section describes self-organizing models of tonal schema, especially of
Tillmann et al. (2000). The fifth section reports a bottom-up self-organizing model of chord
schema. The last section reports and discusses the results of simulations.
Perception of chords
It is worth to note that, the study of perception of chords is not limited to those summarized
below (see Justus & Bharucha, 2002; Krumhansl, 1990, 1991, 2000, 2005 for comprehensive
reviews). In this section, important findings on the perception of chords are summarized.
Perception of chords has been investigated with chord similarity ratings (Bharucha &
Krumhansl, 1983; Krumhansl, Bharucha, Kessler, 1982), recognition memory for chord

Atalay, N., B. (2009). Effects of input representation on self-organizing and bottom-up model of chord schema.
International Journal of Human Sciences [Online]. 6:1. Available: http://www.insanbilimleri.com
379
sequences (Bharucha & Krumhansl, 1983), chord priming (Bharucha & Stoeckig, 1986), and
probe chord paradigms (Krumhansl 1990).
Probe chord paradigm investigates the perceptual fit of a chord into a tonal context. In
Krumhansl (1990), participants listened to a musical context, followed by a probe chord. The
context was a scale or a chord sequence of a major or minor key. Participants were asked to
rate how well the probe chord fit with the context (Krumhansl, 1990). The ratings of chords
were hierarchical: the highest score was given to tonic chord, followed by subdominant,
dominant, and mediant, followed by other diatonic chords, followed by non-diatonic chords
(see Krumhansl, 1990, Table 7.3).
Chord similarity experiments (Krumhansl et al., 1982; Bhaucha & Krumhansl, 1983)
investigate how well two chords sound together after a musical context. In Bhaucha and
Krumhansl (1983), participants listened to chord sequences in five different keys (C, G, A,
B, and F# major) followed by all possible pairs of chords from the C and F# major keys.
Results showed that the higher the two chords were in the hierarchy, the similar they were.
This was called contextual distance principle (Bhaucha & Krumhansl, 1983). For example, C
and G major chords were perceived more similar when they followed C major key (C and G
major chords are tonic and dominant of the C major key.), compared to when they followed
F# major key (C and G major chords are non-diatonic chords of the F# major key.). In
addition, results showed that the last chord of the pair contributed the perceived similarity
more, compared to the first one. This was called contextual asymmetry principle (Bhaucha &
Krumhansl, 1983). For example, C and F# major chords were perceived more similar when
they followed F# major key (F# major chord is tonic of the F# major key) compared to when
they followed C major key (F# major chord is a non-diatonic chord of the F# major key).
Krumhansl (1990) in Table 8.2 reproduced ratings given to diatonic chord pairs observed in
Bhaucha and Krumhansl (1983). Analyses showed that contextual distance and contextual
asymmetry principles apply to the ratings of diatonic chords as well (Krumhansl, 1990).
In chord priming paradigm, effects of tonal context on the processing of the target chord are
examined. The tonal context (prime) may be a single chord (Bharucha & Stoeckig, 1986) or
a chord sequence (Bigand & Pineau, 1997). The target chord follows the context
immediately. Participants are asked to make a binary judgment with an objectively correct

Atalay, N., B. (2009). Effects of input representation on self-organizing and bottom-up model of chord schema.
International Journal of Human Sciences [Online]. 6:1. Available: http://www.insanbilimleri.com
380
answer on the target chord (Bharucha & Stoeckig, 1986, 1987; Bigand & Pineau, 1997;
Bigand, Madurell, Tillmann & Pineau, 1999; Tillmann, Bigand, & Pineau, 1998; Tekman &
Bharucha, 1992, 1998).
In Bharucha and Stoeckig (1986), participants listened to two chords; and they were asked to
decide whether the second chord was in-tune or not. Results showed that participants were
faster and more accurate for their judgments when the priming chord was harmonically
related to the target chord compared to when they were not related. (For example, C major is
primed more by Bb major chord compared to F# major.) This was true even if the
harmonically unrelated target share a pitch with the prime (Tekman & Bharucha, 1998). (For
example, C and E major chords share a pitch, but C major is primed more by D major chord
compared to E major.) In other words, chord priming is not governed by acoustical similarity
(Tekman & Bharucha, 1998).
In Bigand and Pineau (1997), participants listened to two chord sequences; and they were
asked to decide whether the last chord of the sequence was consonant or not. The two chord
sequences were arranged in different keys. The last two chords of the sequences were
identical. Depending on the key of the sequence the final chord (the target) was either tonic
or subdominant. Participants were faster and more accurate for their judgments when the
target was tonic compared to when it was subdominant (Bigand & Pineau 1997, Bigand,
Madurell, Tillmann & Pineau 1999, Experiment 1). This effect was called global priming.
The penultimate chord (the chord that immediately preceded the target) was identical in
different sequences. Therefore, factors that may cause priming could not be local (within the
immediate vicinity of the target).
The amount of musical training and the explicit knowledge about music did not correlate
with chord priming (Bharucha & Stoeckig, 1987; Tekman & Bharucha, 1992, 1998); and
global priming of chords has been repeatedly observed from both musicians and non-
musicians (Bigand & Pineau 1997; Bigand et al., 1999; Bigand, Poulin, Tillmann, &
D’Adamo, 2003). These results demonstrate that chord priming is a result of an implicit
musical learning process.

Atalay, N., B. (2009). Effects of input representation on self-organizing and bottom-up model of chord schema.
International Journal of Human Sciences [Online]. 6:1. Available: http://www.insanbilimleri.com
381
Circle of fifths (Figure 1) is a geometric representation of harmonic relation between chords.
Chords closer on the circle of fifths are harmonically related. There has been one-to-one
correspondence between the results of harmonic priming studies and the distance on the
circle of fifths: primes (both local and global) closer to the target on the circle of fifths
facilitated responses compared to distant primes (Bharucha & Stoeckig, 1986, 1987; Bigand
& Pineau, 1997; Bigand et al. 1999; Justus & Bharucha, 2002; Tekman & Bharucha, 1992,
1998). In other words, there is a close link between harmonic relation and harmonic priming.
Figure 1. Circle of fifths.
Bharucha (1987) proposed that chord priming is due to the implicit knowledge about the
relationship between pitches, chords and tonalities. He implemented the implicit tonal
knowledge with a neural network model, which is called MUSACT (Bharucha, 1987). The
MUSACT model (Bharucha, 1987) simulated results of all local chord priming experiments
(Bharucha & Stoeckig, 1987; Justus & Bharucha, 2002; Tekman & Bharucha, 1992, 1998)
and many global chord priming experiments (Bigand & Pineau 1997, Bigand et al. 1999,
Experiment 1; Bigand et al., 2003; Tillmann, et al.,1998; Tillmann, Janata, Birk, &
Bharucha, 2003). Bharucha (1992) and Tillmann et al. (2000) argued that feature detectors
that are sensitive to statistical properties of events in the environment could learn implicit
tonal harmonic knowledge.

Atalay, N., B. (2009). Effects of input representation on self-organizing and bottom-up model of chord schema.
International Journal of Human Sciences [Online]. 6:1. Available: http://www.insanbilimleri.com
382
MUSACT
MUSACT (Bharucha, 1987) is an artificial neural network consisting of three groups of
interconnected units, which represents pitch categories (12 units), major and minor chords
(12 units for each), and major keys (12 units) (Figure 2). Every chord unit is connected to the
units representing the three pitches contained in that chord. Every major key unit is
connected to the units representing the three major and three minor chords that are possible
in that key. All connections are bi-directional. Connections and connection weights of
MUSACT are hand-wired.
Figure 2. MUSACT (Bharucha, 1987). Functioning of the network is based on phasic spreading of activation. Each unit has a level
of activation associated with it. Only the activation of the pitch units can be changed by an
external input. All other changes in the activation result from the activation transmitted
through the weighted connections and the decay of activation towards zero. Transmission of
activation from a unit is proportional to the difference between what the unit holds and
receives as a signal. The spread of activation continues until the equilibrium is reached.
Equilibrium is defined as an activation change below a threshold value.
Tillmann et al. (2000) have demonstrated that implicit tonal harmonic knowledge could
develop with self-organizing maps as a result of training with combinations of tones and
combinations of chords that are typical in Western tonal music. Their model highly
correlated with MUSACT (Bharucha, 1987). Tillmann et al. (2000) gave accounts of various
empirical studies on perception of tones, chords and keys with their model.
Atalay, N., B. (2009). Effects of input representation on self-organizing and bottom-up model of chord schema.
International Journal of Human Sciences [Online]. 6:1. Available: http://www.insanbilimleri.com
383
iwiw jj *
twtithttwtw jcjjj 1
Ttt /00 /005.0
j
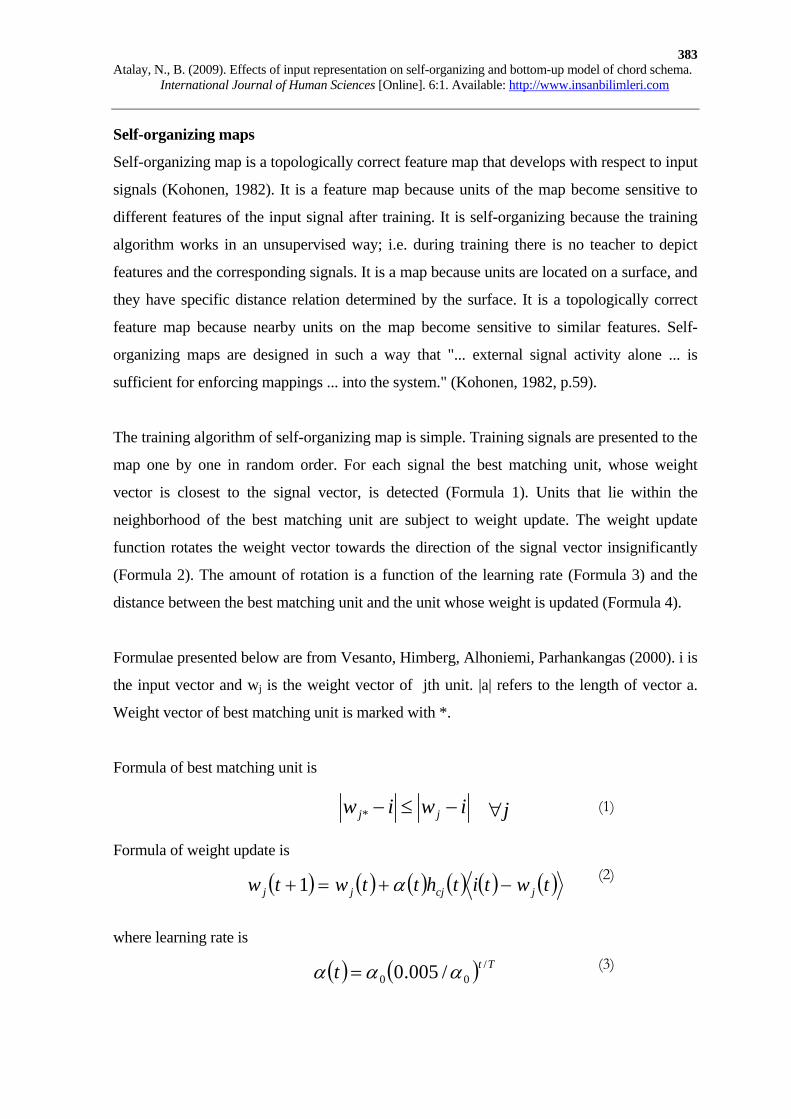
Self-organizing maps
Self-organizing map is a topologically correct feature map that develops with respect to input
signals (Kohonen, 1982). It is a feature map because units of the map become sensitive to
different features of the input signal after training. It is self-organizing because the training
algorithm works in an unsupervised way; i.e. during training there is no teacher to depict
features and the corresponding signals. It is a map because units are located on a surface, and
they have specific distance relation determined by the surface. It is a topologically correct
feature map because nearby units on the map become sensitive to similar features. Self-
organizing maps are designed in such a way that "... external signal activity alone ... is
sufficient for enforcing mappings ... into the system." (Kohonen, 1982, p.59).
The training algorithm of self-organizing map is simple. Training signals are presented to the
map one by one in random order. For each signal the best matching unit, whose weight
vector is closest to the signal vector, is detected (Formula 1). Units that lie within the
neighborhood of the best matching unit are subject to weight update. The weight update
function rotates the weight vector towards the direction of the signal vector insignificantly
(Formula 2). The amount of rotation is a function of the learning rate (Formula 3) and the
distance between the best matching unit and the unit whose weight is updated (Formula 4).
Formulae presented below are from Vesanto, Himberg, Alhoniemi, Parhankangas (2000). i is
the input vector and wj is the weight vector of jth unit. |a| refers to the length of vector a.
Weight vector of best matching unit is marked with *.
Formula of best matching unit is
Formula of weight update is
where learning rate is
(1)
(2)
(3)

Atalay, N., B. (2009). Effects of input representation on self-organizing and bottom-up model of chord schema.
International Journal of Human Sciences [Online]. 6:1. Available: http://www.insanbilimleri.com
384
22 2/tcj
d
cj eth
and unit distance (neighborhood) is
During training learning rate and neighborhood gradually decrease. Training stops when the
learning rate is zero. Kohonen (2000) suggests that better map organization is achieved by
splitting training into two phases: rough organization and fine tuning. In the rough
organization phase, neighborhood is large, learning rate is high and training takes short. In
the fine tuning phase, neighborhood and learning rate are small and training takes long.
Self-organizing maps (Kohonen, 1982) produce topologically correct maps with neuron-like
computations. Topological mappings were found in many places of the brain (Knudsen, du
Lac, & Esterly, 1987 cited in Kohonen, 1982), which suggests that it has an important
function for neural computation. Tonotopic mapping is an example of topological mapping.
In tonotopic maps, spatial arrangement of neurons reflects frequencies of sound waves. One
of the tonotopic maps of the nervous system is located in the right-temporal cortex (Pantev,
Hoke, Lehnertz, Lütkenhöner, Anogianakis, & Wittkowski, 1988).
Self-organizing models of chord schema
MUSACT (Bharucha, 1987) is a neural network model of tonal schema. Units, connections
and connection weights of MUSACT were hand-wired (Bharucha, 1987). However
connections and weights of the model of tonal schema should develop by a self-organizing
mechanism that adapts regularities in the musical environment (Tillmann et al. 2000, p. 891).
Tillmann et al. (2000) showed that this was possible by training two self-organizing maps
that are connected in layers. The first map was composed 6X6 (36) units located on a square
surface. It was trained with chord categories to develop representations of chords. Training
data were composed of 24 vectors, which represented 12 major and 12 minor chord
categories. Chords were coded with either sparse or rich coding. In sparse coding, chords
were represented by three pitches (pitches of the chord), whose weights were equal. Chords
that share pitches were similar to each other in sparse coding. In rich coding chords were
represented by the sum of the subharmonics of the pitches of the chords (Parncutt, 1988).
Rich encoding mirrored similarities between psycho-acoustical representations of chords
(4)

Atalay, N., B. (2009). Effects of input representation on self-organizing and bottom-up model of chord schema.
International Journal of Human Sciences [Online]. 6:1. Available: http://www.insanbilimleri.com
385
(Leman, 1995; Terhadt, 1974; Parncutt, 1988). At the end of training, 24 units of the first
map represented 12 major and 12 minor chord categories. These units were located on the
first map with respect to the similarity between input representations of different chords (see
Figures 4 and 6 of Tillmann et al., 2000).
The second map was composed of 4X4 (16) units, which were fully connected to the units of
the first map. The second map was trained with chord sequences to develop representations
of keys. This was done after the first map was fully trained. Simulations were carried with
two chord corpora. In the first corpus (the small corpus) there were 12 chord sequences,
which were composed of six chords. The chords were the three major and the three minor
chords that were possible in a major key. In the second corpus (the large corpus) there were
120 chord sequences. Ten chord sequences were constructed semi-randomly by referring to
common chord progressions (Piston, 1978), statistical distributions of chords (Budge, 1943,
cited in Tillmann et al., 2000) and termination rules of chord sequences (Piston, 1978). These
sequences were played in 12 major keys making 120 chord sequences in total. Pitches that
composed chords of the sequences were presented to the first map. Activation of the best
matching unit on the first map was kept constant till the end of the sequence. The best
matching unit was always one of the 24 chord categories. The second map was trained with
the activation pattern of the first map observed at the end of sequences. After training, 12
units of the second map represented 12 major keys. These units were located on the second
map by forming a circle of fifths. As a result, hierarchically self-organized maps detected
chord and tonality categories at this stage of training.
These maps were not architecturally identical to MUSACT (Bharucha, 1987). MUSACT has
bi-directional connections. Activation reverberates between layers in MUSACT; and after
some time the reverberation reaches to a steady state. The map of Tillmann et al. (2000) had
only bottom-up connections at this stage. In order to convert the architecture of the two-layer
self-organized map to the architecture of MUSACT (Bharucha, 1987), Tillmann et al. (2000)
pruned some links and scaled weights. Pruning was necessary to rule out reverberation of
activation between units that did not represent a category. At the pruning step, training
stimuli were presented again to the network. For each stimulus, the unit with the highest
activation was detected. Weights of links between the input signal and best matching unit
were increased and the remaining weights were decreased (Tillmann et al., 2000). At the end

Atalay, N., B. (2009). Effects of input representation on self-organizing and bottom-up model of chord schema.
International Journal of Human Sciences [Online]. 6:1. Available: http://www.insanbilimleri.com
386
of pruning, only the three pitches contained in a chord are connected to the unit that
represents the chord; and only the three major and three minor chords that are possible in a
key are connected to the unit that represents the key. In other words, after pruning, the
linkage between units became identical to the MUSACT (Bharucha, 1987) model. Tillmann
et al. (2000) scaled weights of the remaining links. Scaling of weights was necessary to
ensure the termination of reverberation of activation after some time. The termination of
reverberation depends on eigenvalues of connection matrices, which must be lower than 1
(footnote 7, Tillmann et al. 2000). In order to meet this constraint, weights of the network
were scaled (Tillmann et al. 2000, p. 894). It is worth to note that, pruning and scaling are
not part the self-organizing map algorithm.
Tillmann et al. (2000) simulated wide range of experimental results on perception chords1.
Tillmann et al. (2000) showed that principles of chord perception, i.e. contextual identity,
contextual distance, and contextual asymmetry (Bharucha & Krumhansl, 1983) were
simulated with their model. They simulated the local and global chord priming effects
(Bharucha & Stoeckig, 1986; Tekman & Bharucha, 1998; Bigand & Pineau, 1997); and ERP
findings that used chords as stimuli (Patel, Gibson, Ratner, Besson, & Holcomb, 1998).
Activations of the self-organized chord schemata of Tillmann et al. (2000) were highly
correlated with activations of MUSACT (Bharucha, 1983). The lowest correlation was
observed with the model that was trained with the rich coding and the big corpus (r=0.97,
p<0.01, N=24) (Tillmann et al., 2000, Table 1). The highest correlation observed with the
model that was trained with the sparse coding and the small corpus (r=0.99, p<0.01, N=24)
(Tillmann et al., 2000, Table 1).
Although simulations carried by Tillmann et al. (2000) were quite successful, steps taken on
the way to develop their model depended on many questionable assumptions. According to
the self-organization scenario, chords are learned earlier than keys; and it is necessary to
develop a chordal representation to learn keys. These hypotheses were not supported by
empirical findings in Tillmann et al. (2000). Similarly, pruning and scaling steps suggested
corresponding stages in the time-course of learning chord and tonality categories. Most
1 They simulated findings on perception of pitches and keys as well.

Atalay, N., B. (2009). Effects of input representation on self-organizing and bottom-up model of chord schema.
International Journal of Human Sciences [Online]. 6:1. Available: http://www.insanbilimleri.com
387
importantly, activation and output algorithm of a unit in Tillmann et al. (2000) changed at
the time of training and testing the network. At the time of training they followed the
procedures of self-organizing maps (Kohonen, 1982); at the time of training they were
identical to MUSACT (Bharucha, 1987). Activation and output functions of MUSACT and
self-organizing map are different. Activation of a unit on MUSACT is addition of three
elements: activation directly coming from input, previous activation, and activation as a
result of the reverberation in the network (Tillmann et al. 2000, Formula 1). On the other
hand, activation of a unit on a self-organization map depends only on the current input
(Tillmann et al. 2000, Formula 2; Kohonen, 1982, Formula 1). Output of a unit on MUSACT
is the difference between signal that unit holds and receives (Bharucha, 1987). On the other
hand, output of a unit on self-organizing map is a linear function of input (i.e. input and
output was identical) (see Tillmann et al. 2000, Formula 2). Tillmann et al. (2000) did not
explain these changes between the learning stage and the final-stage of the network.
Tillmann et al. (2000) was not the only study that investigated self-organization of chord
schema. Leman (1995) and Leman and Carreras (1997) trained self-organizing maps
(Kohonen, 1982) to model learning of chords and keys. Their maps were composed of
20X20 (400) units (Leman, 1995) and 100X100 (10000) units (Leman & Carreras, 1997)
located on a torus. Input representations were firing patterns of auditory nerves calculated
from acoustical signals. Calculations were based on models of perception of pitches and
chords (Parncutt, 1988; Terhadt, 1982; Terhardt, Stoll & Seewan, 1982a,b; Van Immerseel &
Martens, 1992), each of which generated a different input representation. In some
simulations temporal relations between inputs were represented with a short-term memory
model. Short-term memory model integrated activations of recent history into the current
activation pattern (Leman, 1995, p.100).
Leman (1995) utilized two training sets. The first training set consisted of 115 chord
categories. (These were 12 major, 12 major, 12 diminished, 4 augmented, 12 major seventh,
12 minor seventh, 12 dominant seventh, 12 half-diminished seventh, 12 augmented-seventh,
12 minor with major seventh, 3 diminished seventh chords.) Acoustical representations of
chord categories were converted to the input representations (the patterns of auditory nerve
firings). The second training set consisted of 48 chord sequences. Sequences were divided
into 72 acoustical windows. Acoustical representations of each window were converted to

Atalay, N., B. (2009). Effects of input representation on self-organizing and bottom-up model of chord schema.
International Journal of Human Sciences [Online]. 6:1. Available: http://www.insanbilimleri.com
388
the input representations, on which effects of short-term memory were added. Leman and
Carreras (1997) utilized real performances of Johann Sebastian Bach’s Well-Tempered
Clavier as the training set. Training stimuli were divided into acoustical windows of three
seconds, and converted to the patterns of auditory nerve firings.
Training different network structures with different sets of data gave similar results (see
Leman, 1995; Leman & Carreras, 1997). After training, units represented chord and tonality
categories as a function of the training set. Tonality category units were located in a way that
reminded the circle of fifths. Location and activation and of chord category units reflected
the organization of the circle of fifths. On the other hand, Leman (1995) and Leman and
Carreras (1997) did not simulate perception of chords with their models.
Gjerdingen (1992) employed the ART 3 architecture (Carpenter & Grossberg, 1990) to train
a self-organizing network sensitive to temporal patterns of chords. A short-term memory was
employed to convert temporal patterns of chords into activation patterns of input. However,
this model was not designed to capture the perception of chords (Gjerdingen, 1992, p. 563).
Bottom-Up Self-Organizing Model of Chord Schema
The goal of this set of simulations is to show that findings on chord perception can also be
simulated with self-organizing networks that have only bottom-up connections. This study is
a follow-up of Tillmann et al. (2000). They trained a two-layer self-organizing map to
develop a tonal-schema model that contains bottom-up and top-down connections. Tillmann
et al. (2000) simulated various findings on perception of chord, key and pitch with their
model. On the other hand, in order to guarantee the correct operation of top-down
connections, they pruned and scaled connections, and changed the activation and output
algorithms of the units in the network. In this study, the aim is to develop self-organizing
model of chord schema that is functionally, but not structurally, equivalent to MUSACT
(Bharucha, 1987). Unlike Tillmann et al. (2000), there were no computations apart from
those described in Kohonen (1982), i.e no pruning and scaling of weights; no change in the
output and activation functions. In addition, effects of input representation on the
performance of the model were investigated. Major and minor chords, which constituted the
training set, were constructed from pitches. Five pitch representations were investigated.
Pitch representations generated different representations of major and minor chords. Self-

Atalay, N., B. (2009). Effects of input representation on self-organizing and bottom-up model of chord schema.
International Journal of Human Sciences [Online]. 6:1. Available: http://www.insanbilimleri.com
389
organizing map was trained five times, each time with a different chord representation.
Through simulations, the network architecture, and the parameters of the training algorithm
of the self-organizing map did not change.
Self-organizing map algorithms were run with SOM Toolbox 2.0 (Vesanto et al., 2000),
which is a MATLAB® library developed by Laboratory of Information and Computer
Science in Helsinki University of Technology. Training data were assembled with Midi
Toolbox (Eerola & Toiviainen, 2004), which is also a MATLAB® library developed by
Department of Music Laboratory in University of Jyvaskyla.
Self-organizing map was trained with vectors of 12 major and 12 minor chords. Chordal
representations were constructed by the addition of the pitch vectors that compose the chord.
For example, C major is composed of C, E, and G. The vector that represented C major
chord, c_maj2, thus equals to c+e+g, which were the vectors that represented pitches C, E,
and G respectively. In this study, effects of input representation on the performance of self-
organizing chord schema were investigated. Through simulations pitch representations were
changed. Pitch representations reflected the similarity between pitches. Distance between
pitch vectors reflected the similarity between them3.
Many geometric models were introduced to describe similarity between pitches (Longuet-
Higgings & Steedman, 1971; Shepard, 1982; Krumhansl, 2005). In this study, effects of five
types of pitch representations were tested. These were orthogonal representation, the chroma
circle, the circle of fifths, the torodial representation, and the lattice representation of pitches.
Chroma circle captures cyclic relation between pitch categories (Shepard, 1964). Circle of
fifths (Figure 1) captures the stability of pitches after a tonal context4 (Krumhansl &
Shepard, 1979). Shepard (1982) suggested a torodial representation of pitches to capture
2 In this article lower case bold letters denote vectors. Major and minor chords are labeled with “_maj” and “_min” suffixes. 3 Distance between vectors a and b is |a−b| = Σn sqrt((ai-bi)2), where sqrt is the square root function, n is the number of elements of vectors, and ai is the ith element of the vector a. For example, if C is similar to E compared to F#, then |c−f#| > |c−e|; that is distance between c and f# is bigger than between c and e. 4 In the previous chapters, circle of fifths was introduced as a geometric description of the harmonic relation between chords. This is not a contradiction. There are three readings of the circle of fifths. If the letters on the circle are interpreted as pitches, a continuous region on the circle covers pitches that belong to the same key. If they interpreted as major chords, and major keys, distance on the circle reflects the harmonic relation between chords and keys.

Atalay, N., B. (2009). Effects of input representation on self-organizing and bottom-up model of chord schema.
International Journal of Human Sciences [Online]. 6:1. Available: http://www.insanbilimleri.com
390
features of chroma circle and circle of fifths together. Longuet-Higgings and Steedman
(1971) located pitches on a lattice in their pitch spelling algorithm (see Figure 3). The lattice
is two dimensional. On the horizontal axis pitches perfect fifth apart were located nearby,
reminding the circle of fifths. On the vertical axis pitches major third apart were located
nearby. This representation was suggested as a model of intonation by Euler (1739, cited in
Lerdahl, 2001).
A# E# B# Fx Cx Gx
F# C# G# D# A# E#
D A E B F# C#
Bb F C G D A
Gb Db Ab Eb Bb F
Ebb Bbb Fb Cb Gb Dbb
Figure 3. Lattice of pitches developed by Euler (1739), and utilized by Longuet-Higgings and Steedman (1971) and Chew (2001).
In this study, effects of input representation on the performance of self-organizing chord
schema were investigated. Self-organizing chord schema was trained with chords. Chords
were constructed by the addition of the pitch representations that compose the chord.
Different pitch representations reflected different similarity structures between pitches.
Training was repeated by changing the pitch representations. Five types of pitch
representations were tested: "orthogonal", "chroma", "circle of fifths", "chroma + circle of
fifths", "major3rd + circle of fifths".
In "orthogonal" representation distance between pitch vectors was equal. Figure 4 presents
some pitch vectors of the “orthogonal” representation. Figure 5 presents the distance
between c and the other pitch vectors of the “orthogonal" representation.

Atalay, N., B. (2009). Effects of input representation on self-organizing and bottom-up model of chord schema.
International Journal of Human Sciences [Online]. 6:1. Available: http://www.insanbilimleri.com
391
1.00
2.00
3.00
4.00
5.00
C# D D# E F F# G G# A A# B
Pitch Categories
Vec
tor
Dis
tanc
e fr
om C
Figure 4. Some of the pitch vectors of the "orthogonal" representation.
Figure 5. Distance between c and the other pitch vectors of “orthogonal" representation.
In "chroma" representation distance between pitch vectors approximated the chroma circle.
Chroma circle captures the cyclic relation between pitches (Shepard, 1964). Figure 6
presents some pitch vectors of the "chroma" representation. Figure 7 presents the distance
between c and the other pitch vectors of the “chroma" representation.

Atalay, N., B. (2009). Effects of input representation on self-organizing and bottom-up model of chord schema.
International Journal of Human Sciences [Online]. 6:1. Available: http://www.insanbilimleri.com
392
1.00
2.00
3.00
4.00
5.00
C# D D# E F F# G G# A A# B
Pitch Categories
Vec
tor
Dis
tanc
e fr
om C
Figure 6. Some of the pitch vectors of the "chroma" representation.
Figure 7. Distance between c and the other pitch vectors of “chroma" representation.
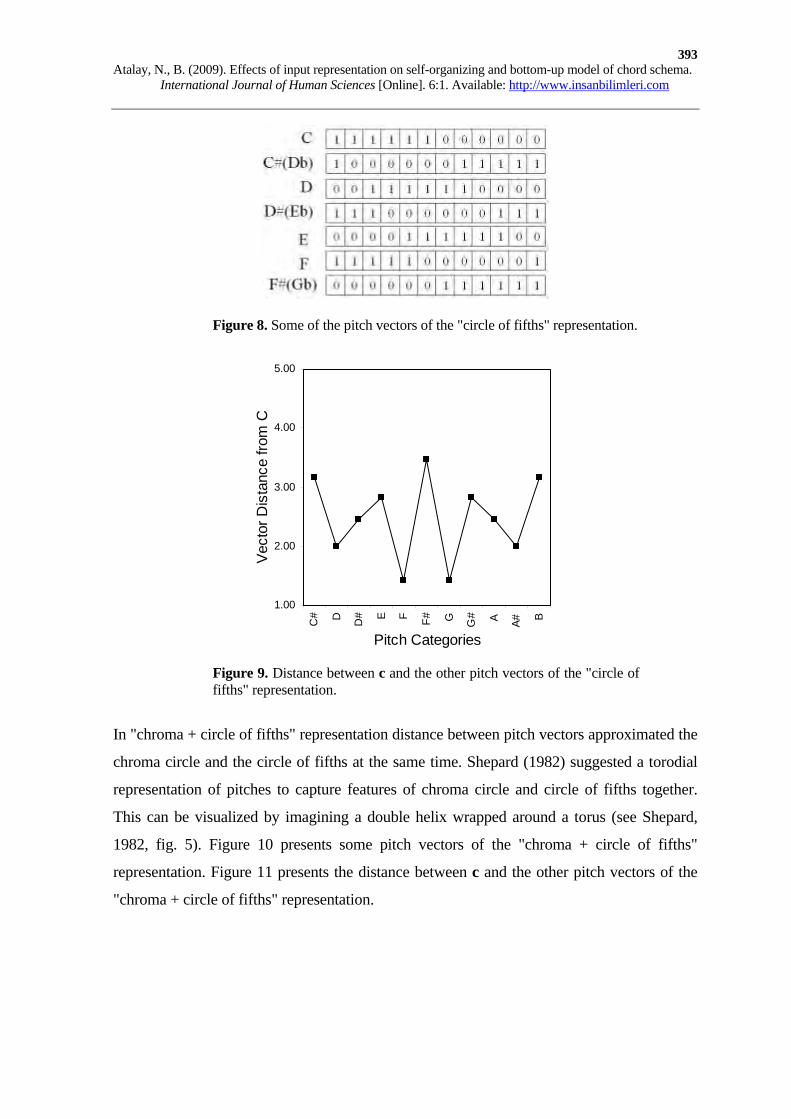
In "circle of fifths" representation distance between pitch vectors approximated the circle of
fifths (Figure 1). Circle of fifths captures relation between pitches after a tonal context.
Pitches that belong to the same key form a continuous region on the circle of fifths. For
example, F, C, G, D, A, E and B are located on the circle of fifths in this order; and these
pitches belong to the C Major key. Figure 8 presents some pitch vectors of the "circle of
fifths" representation. Figure 9 presents the distance between c and the other pitch vectors of
the “circle of fifths" representation.
Atalay, N., B. (2009). Effects of input representation on self-organizing and bottom-up model of chord schema.
International Journal of Human Sciences [Online]. 6:1. Available: http://www.insanbilimleri.com
393
Figure 8. Some of the pitch vectors of the "circle of fifths" representation.
Figure 9. Distance between c and the other pitch vectors of the "circle of fifths" representation.
In "chroma + circle of fifths" representation distance between pitch vectors approximated the
chroma circle and the circle of fifths at the same time. Shepard (1982) suggested a torodial
representation of pitches to capture features of chroma circle and circle of fifths together.
This can be visualized by imagining a double helix wrapped around a torus (see Shepard,
1982, fig. 5). Figure 10 presents some pitch vectors of the "chroma + circle of fifths"
representation. Figure 11 presents the distance between c and the other pitch vectors of the
"chroma + circle of fifths" representation.
1.00
2.00
3.00
4.00
5.00
C# D D# E F F# G G# A A# B
Pitch Categories
Vec
tor
Dis
tanc
e fr
om C

Atalay, N., B. (2009). Effects of input representation on self-organizing and bottom-up model of chord schema.
International Journal of Human Sciences [Online]. 6:1. Available: http://www.insanbilimleri.com
394
1.00
2.00
3.00
4.00
5.00
C# D D# E F F# G G# A A# B
Pitch Categories
Vec
tor
Dis
tanc
e fr
om C
Figure 10. Some of the pitch vectors of the "chroma + circle of fifths" representation.
Figure 11. Distance between c and the other pitch vectors of "chroma + circle of fifths" representation.
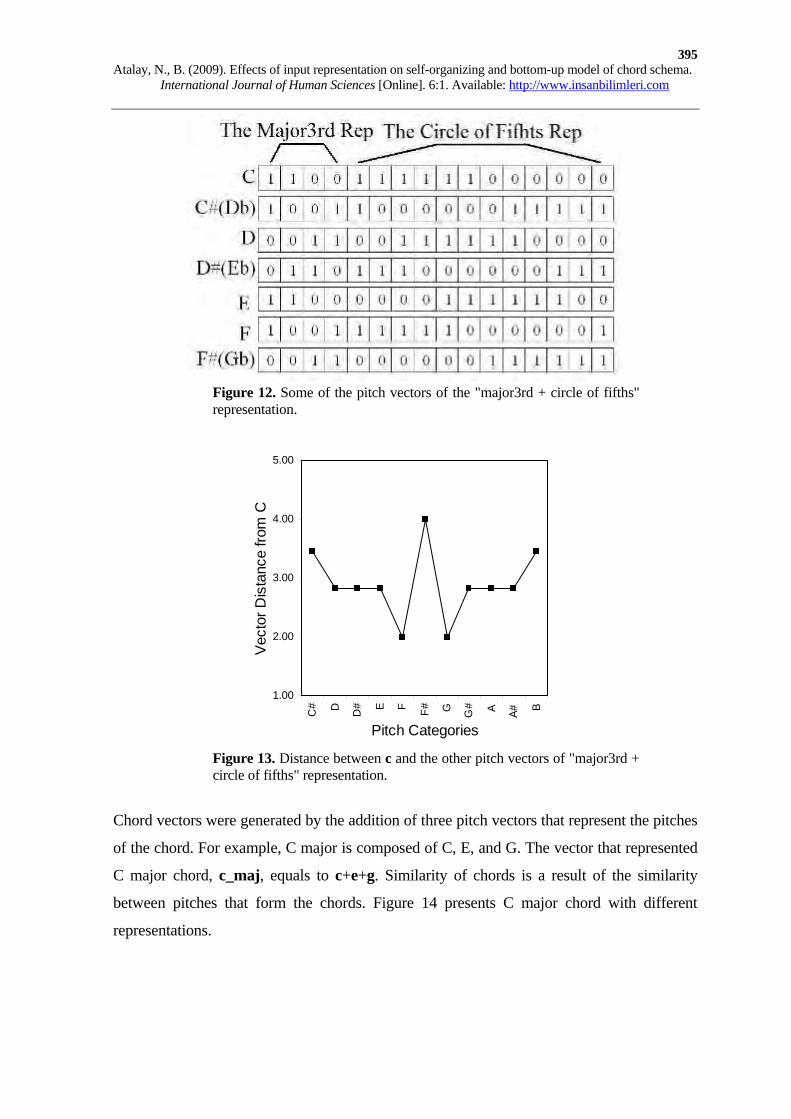
In "major3rd + circle of fifths" representation the distance between pitch vectors
approximated distances on the lattice of pitches (Figure 3). Longuet-Higgings and Steedman
(1971) utilized the lattice in their pitch spelling algorithm. Figure 12 presents some pitch
vectors of the "major3rd + circle of fifths" representation. Figure 13 presents the distance
between c and the other pitch vectors of the "major3rd + circle of fifths" representation.
Atalay, N., B. (2009). Effects of input representation on self-organizing and bottom-up model of chord schema.
International Journal of Human Sciences [Online]. 6:1. Available: http://www.insanbilimleri.com
395
1.00
2.00
3.00
4.00
5.00
C# D D# E F F# G G# A A# B
Pitch Categories
Vec
tor
Dis
tanc
e fr
om C
Figure 12. Some of the pitch vectors of the "major3rd + circle of fifths" representation.
Figure 13. Distance between c and the other pitch vectors of "major3rd + circle of fifths" representation.
Chord vectors were generated by the addition of three pitch vectors that represent the pitches
of the chord. For example, C major is composed of C, E, and G. The vector that represented
C major chord, c_maj, equals to c+e+g. Similarity of chords is a result of the similarity
between pitches that form the chords. Figure 14 presents C major chord with different
representations.

Atalay, N., B. (2009). Effects of input representation on self-organizing and bottom-up model of chord schema.
International Journal of Human Sciences [Online]. 6:1. Available: http://www.insanbilimleri.com
396
Figure 14. C major chord vector in different input representations.
In this study, effects of input representations on the performance of self-organizing chord
schema were investigated. Self-organizing map was composed of 24X36 (864) units located
on a torus5. Training data consisted of 24 chord vectors (12 major and 12 minor chords).
Chord vectors were normalized to guarantee a fair comparison between different
representations. Training of the self-organizing map was repeated with each input
representation. The network architecture and the parameters of the training algorithm were
kept same. Activation of a unit on the self-organizing map reflected the cosine of the angle
(correlation) between the input vector and the weight vector of the unit. Before training,
weights of units were randomized. Training was divided into two phases, rough organization
and fine tuning. For all simulations, average quantization error (average distance between the
weight vector of the best matching unit and the corresponding input vector) was less than
0.1. Simulations repeated many times in order to be sure that average quantization error did
not decrease/increase considerably. After training, 12 major and 12 minor chords were
labeled on the map. Labeling was done by presenting the 12 major and 12 minor chords to
the map and selecting the best matching unit (the unit with the highest level of activation) for
each chord. Simulations of experimental results were conducted by reading activations of the
labeled units.
Using different input representations resulted in different topographic organization of 12
major and 12 minor chords. The location of the chords on the map reflected the similarity
5 Torus is a surface having the shape of a doughnut. This network topology has been successfully applied to the self-organization of chords and keys (Leman, 1995; Leman and Carreras, 1997; Toiviainen & Krumhansl, 2003).

Atalay, N., B. (2009). Effects of input representation on self-organizing and bottom-up model of chord schema.
International Journal of Human Sciences [Online]. 6:1. Available: http://www.insanbilimleri.com
397
between representations of chords. With “orthogonal” representation, chords that share
pitch(es) were located nearby on the map (Figure 15). For example, C Major shares two
pitches with A minor (C and E), C minor (C and G) and E minor (E and G). The distance
between C major and these chords on the map were almost equal. With the “circle of fifhts”
representation, the topographical organization of chords reminded the lattice of pitches
(Figure 3)6. On the horizontal direction, major and minor chords that share the root (C major
and C minor) alternate with major and minor chords whose roots were major third away. For
example, on the one side of the C minor - C major pair, there was E minor - E major pair; on
the other side there was G# minor – G# major pair. On the vertical direction rotated about 45
degrees, chords were located according to the circle of fifths. For example, C major was
located near the G major on the one side, F major on the other.
Figure 15. Topographic organization of chords with the “orthogonal” representation. Torodial surface of the map is projected on the plane. The upper and the lower edges of the figure are adjacent, as well as the left and right edges.
6 Toiviainen and Krumhansl (2003) observed almost identical topographical organization from a self-organizing map trained with stability profiles of keys.

Atalay, N., B. (2009). Effects of input representation on self-organizing and bottom-up model of chord schema.
International Journal of Human Sciences [Online]. 6:1. Available: http://www.insanbilimleri.com
398
Figure 16. Topographic organization of chords with the “circle of fifths” representation. Torodial surface of the map is projected on the plane. The upper and the lower edges of the figure are adjacent, as well as the left and right edges.
Correlations between activation of target units of self-organizing models were high (Table
1). The highest correlation was between self-organizing chord schemata that used the "circle
of fifths" and the "chroma + circle of fifths" input representations (r=0.99, p<.01, N=96).
Correlations between target unit activations of MUSACT and self-organizing models were
not high, but they were significant (Table 1). The highest correlation with MUSACT was
observed with the models which used the "circle of fifths" and the "chroma + circle of fifths"
input representations (r=0.43, p<.01, N=96).
Table 1. Correlations between activation of target units of self-organizing models with different input representation (Maj3rd+COF, Chroma, Chroma, COF, Orthogonal) and MUSACT (Bharucha, 1987). (N=96, p<.01 for all correlations.).
Maj3rd+COF Chroma Chroma+COF COF Orthogonal
Chroma 0.82 Chroma+COF 0.98 0.72
COF 0.96 0.65 0.99 Orthogonal 0.92 0.90 0.84 0.79
MUSACT 0.42 0.31 0.43 0.43 0.37

Atalay, N., B. (2009). Effects of input representation on self-organizing and bottom-up model of chord schema.
International Journal of Human Sciences [Online]. 6:1. Available: http://www.insanbilimleri.com
399
Simulation Results and Discussion
After the training, performance of chord schemata was evaluated by simulating important
findings of chord perception (Bhaucha & Krumhansl, 1983; Bharucha & Stoeckig, 1986;
Bigand & Pineau, 1997; Tekman & Bharucha, 1998; Krumhansl, 1990). All of these findings
were simulated successfully with the self-organizing chord schema of Tillmann et al. (2000).
Simulations were run by presenting the stimuli of the experiments as input to the map. Then
activations of the target chords were read. The targets were the chords from which the human
data was collected in the chosen studies. Activations of the target chords were either
compared categorically with the human data or correlated with it. The temporal relation
within input sequences was coded with the short-term memory model of Toiviainen and
Krumhansl (2003). According to this short-term memory model, accent (importance) of a
pitch is a function of duration of the pitch, and accent gradually decreases as time passes.
This is calculated with the following equation (Toiviainen & Krumhansl, 2003, eq. 2).
In this equation is the time derivative of kth pitch category ; is the Dirac delta
function (unit impulse function); is time constant set to 0.5 seconds. Onset and offset
times of tones having kth pitch are denoted by and respectively. represents
total number of times the kth pitch occurs. With equation 5 pitch accents "… saturates at
about 1 s after tone onset approximating the durational accent as a function of tone duration
(Parncutt 1994)." (Toiviainen & Krumhansl, 2003, p. 11).
Durational accents were integrated into memory, which was subject to a decay (Toiviainen
& Krumhansl, 2003, eq. 3)
where is set to 3 seconds which estimated capacity of auditory sensory memory
(Toiviainen & Krumhansl, 2003, p. 11). These functions are available in Midi Toolbox
(Eerola & Toiviainen, 2004).
(5) kk n
i
fkik
n
i
nki
p
ko
k ttpttp
p11
kp
p
m
o mpm
(6)
m
nkit f
kit kn
o
kp

Atalay, N., B. (2009). Effects of input representation on self-organizing and bottom-up model of chord schema.
International Journal of Human Sciences [Online]. 6:1. Available: http://www.insanbilimleri.com
400
-0.40
-0.20
0.00
0.20
0.40
0.60
0.80
1.00
Maj
3th+
CO
F
Chr
oma
Chr
oma+
CO
F
CO
F
Ort
hogo
nal
Pitch Category Representations
Co
rre
latio
n Major ContextMinor Context
Simulation results are presented in Figures 17-25. Krumhansl (1990) observed stability of
chords after major and minor musical contexts. Participants listened to chord sequences in
major and minor tonalities followed by a chord. They rated how well the last chord sounded
after the sequence. Ratings were given in Table 7.3 of Krumhansl (1990). To simulate the
results, activations of the 12 major and 12 minor chords were read after the input stimuli (C-
F-Bdim-Em-Am-Dm-G-C for the major context; and Cm-Fm-Bb-Eb-Ab-Ddim-G-C for the
minor context). Activations were correlated with stability ratings of the 12 major and 12
minor chords in Table 7.3 (Krumhansl, 1990). Correlations are presented in Figure 17.
Correlations were high and significant. The highest correlation was observed with the
"orthogonal" representation (r=0.8, p<.01, N=24 for the major context; r=0.76, p<.01, N=24
for the minor context). The lowest correlation was observed with the "circle of fifths"
representation (r=0.67, p<.01, N=24 for the major context; r=0.64, p<.01, N=24 for the
minor context). But all of the correlations were higher than the correlation calculated with
the target unit activations of MUSACT (r=0.56, p<.01, N=24 for the major context; r=0.51,
p<.05, N=24 for the minor context) (not presented in Figure 17).
Figure 17. Correlations between stability ratings of chords (Krumhansl. 1990, table 7.3) and targets unit activations. (N=24, p<.01 for all correlations.)
Bhaucha and Krumhansl (1983) investigated perception of chordal similarity. Participants
listened to chord sequences in five different keys (C, G, A, B, and F# major) followed by all
possible pairs of chords from the C and F# major keys. Participants rated the similarity of the

Atalay, N., B. (2009). Effects of input representation on self-organizing and bottom-up model of chord schema.
International Journal of Human Sciences [Online]. 6:1. Available: http://www.insanbilimleri.com
401
chord pairs. To explain the data, principles of contextual distance and contextual asymmetry
were articulated (Bhaucha & Krumhans, 1983; Krumhansl, 1990). The principle of
contextual distance states that the higher the two chords are in the hierarchy of stability, the
similar they were. The principle of contextual asymmetry states that the last chord of the pair
contributed the perceived similarity more, compared to the first one.
To simulate the results, experimental stimuli (IV, V, I cadence in C, G, A, B, and F# major
keys) followed by the first chord of the pair was presented as input, and the activation of the
second chord of the pair was read. The average activation of the second chord was calculated
for four different types of pairs: when both chords in C major, both chords in F# major, the
first in C major and the second in F# major, the first in F# major and the second in C major.
For brevity, simulation results of the “orthogonal” and the “circle of fifths” representations
were presented only. Performances of the other self-organizing maps were not significantly
different. Figures 18 and 19 presents the simulation results of the contextual distance
principle with the “orthogonal” and the “circle of fifths” input representations respectively.
When the chords of the pair were in C major, the average activation of the second chord
decreases as the distance between the context and the C major increases on the circle of
fifths; when the chords of the pair were in F# major, the average activation of the second
chord increases as the distance between the context and the F# major decreases on the circle
of fifths.
The contextual asymmetry principle was also simulated with the “orthogonal” and the “circle
of fifths” input representations7 (Figures 20 and 21). When the chords of the pair were not in
the same key (i.e. one is in C major and the other is in F# major) the average activation of the
second chord decreases as distance between the context and key of the of the second chord
increases on the circle of fifths
7 Performance of the other self-organizing maps was similar.

Atalay, N., B. (2009). Effects of input representation on self-organizing and bottom-up model of chord schema.
International Journal of Human Sciences [Online]. 6:1. Available: http://www.insanbilimleri.com
402
-1.00
-0.80
-0.60
-0.40
-0.20
0.00
0.20
0.40
0.60
0.80
1.00
C G
A B F#
Key Context
Act
ivat
ion
Both in CBoth in F#
-1.00
-0.80
-0.60
-0.40
-0.20
0.00
0.20
0.40
0.60
0.80
1.00
C G
A B F#
Key Context
Act
ivat
ion
Both in CBoth in F#
Figure 18. Average activation of the second chord of the pair on the model trained with the “orthogonal” input representation, after the stimuli of Bhaucha and Krumhansl (1983) and the first chord of the pair as input. Chords of the pair were in the same key.
Figure 19. Average activation of the second chord of the pair on the model trained with the “circle of fifths” input representation, after the stimuli of Bhaucha and Krumhansl (1983) and the first chord of the pair as input. Chords of the pair were in the same key.
.

Atalay, N., B. (2009). Effects of input representation on self-organizing and bottom-up model of chord schema.
International Journal of Human Sciences [Online]. 6:1. Available: http://www.insanbilimleri.com
403
-1.00
-0.80
-0.60
-0.40
-0.20
0.00
0.20
0.40
0.60
0.80
1.00
C G
A B F#
Key Context
Act
ivat
ion
First in C, Second in F#First in F#, Second in C
-1.00
-0.80
-0.60
-0.40
-0.20
0.00
0.20
0.40
0.60
0.80
1.00
C G A B F#
Key Context
Act
ivat
ion
First in C, Second in F#First in F#, Second in C
Figure 20. Average activation of the second chord of the pair on the model trained with the “orthogonal” input representation, after the stimuli of Bhaucha and Krumhansl (1983) and the first chord of the pair as input. Chords of the pair were in different keys.
Figure 21. Average activation of the second chord of the pair on the model trained with the “circle of fifths” input representation, after the stimuli of Bhaucha and Krumhansl (1983) and the first chord of the pair as input. Chords of the pair were in different keys.

Atalay, N., B. (2009). Effects of input representation on self-organizing and bottom-up model of chord schema.
International Journal of Human Sciences [Online]. 6:1. Available: http://www.insanbilimleri.com
404
-0.4
-0.2
0
0.2
0.4
0.6
0.8
1
Maj
3th+
CO
F
Chr
oma
Chr
oma+
CO
F
CO
F
Ort
hogo
nal
Pitch Category Representations
Cor
rela
tion
**
Figure 22. Correlations between ratings of similarity between diatonic chords (Krumhansl. 1990, table 8.2) and target unit activations. (N=36, * p<.05, p<.01 for all other correlations.)
Table 8.2 of Krumhansl (1990) presented data of the diatonic pairs from the study of
Bhaucha and Krumhansl (1983). Activations of the second chord were correlated with the
ratings of Table 8.2 (Krumhansl, 1990). Correlations are presented in Figure 22. Correlations
were high and significant. The highest correlation was observed with the "circle of fifths"
input representation (r=0.86, p<.01, N=36). The lowest correlation was observed with
"chroma" input representation (r=0.35, p<.05, N=36). But all of the correlations were lower
than the correlation calculated with the target unit activations of MUSACT (r=0.97, p<.01,
N=36) (not presented in Figure 22).
Bharucha and Stoeckig (1986) demonstrated the facilitative performance on the target chord
when the prime was closer to the target on the circle of fifths. This study was the first
demonstration of the priming paradigm and its relation with the circle of fifths. In order to
simulate this result, activation of the target unit should be higher after the input one-step-
away from the target, compared to the input six-steps-away. All of the models with different
input representations simulated the result (Figure 23).

Atalay, N., B. (2009). Effects of input representation on self-organizing and bottom-up model of chord schema.
International Journal of Human Sciences [Online]. 6:1. Available: http://www.insanbilimleri.com
405
-1.00
-0.80
-0.60
-0.40
-0.20
0.00
0.20
0.40
0.60
0.80
1.00
Maj
3th+
CO
F
Chr
oma
Chr
oma+
CO
F
CO
F
Ort
hogo
nal
Pitch Category Representations
Act
iva
tion
One-step aw aySix-steps aw ay
Figure 23. Activation of target units after harmonically close and distant primes on models with different input representations.
Tekman and Bharucha (1998) demonstrated the facilitative performance on a target chord
when the prime was two-steps away from the target on the circle of fifths compared to when
it was four-steps away. Target and four-steps-away prime share a pitch. Target and two-
steps-away prime do not share a pitch. This study observed the fact that priming was not due
to the shared pitches (not due to the acoustical similarity), but due to the distance on the
circle of fifths (harmonic similarity). In order to simulate the result of Tekman and Bharucha
(1998), activation of the target unit must be higher after the input two-steps-away from the
target, compared to the input four-steps-away. Only models with the "circle of fifths" and the
"chroma + circle of fifths" input representations simulated the result (Figure 24). Other input
representations failed to simulate this finding.
Bigand and Pineau (1997) demonstrated the facilitative performance on a target chord when
it was tonic compared to when it was subdominant. This study observed the fact that
harmonic function of a chord affects the priming of the chord. In order to simulate this result,
average activation of the tonic target unit should be higher, compared to the average
activation of the subdominant target unit. All input representations simulated the result
(Figure 25).

Atalay, N., B. (2009). Effects of input representation on self-organizing and bottom-up model of chord schema.
International Journal of Human Sciences [Online]. 6:1. Available: http://www.insanbilimleri.com
406
-1.00
-0.80
-0.60
-0.40
-0.20
0.00
0.20
0.40
0.60
0.80
1.00
Maj
3th+
CO
F
Chr
oma
Chr
oma+
CO
F
CO
F
Ort
hogo
nal
Pitch Category Representations
Act
iva
tion
Tw o-steps aw ayFour-steps aw ay
-0.40
-0.20
0.00
0.20
0.40
0.60
0.80
1.00
Maj
3th+
CO
F
Chr
oma
Chr
oma+
CO
F
CO
F
Ort
hogo
nal
Pitch Category Representations
Act
iva
tion
Tonic Subdominant
Figure 24. Activation of the target units after the stimuli of Tekman & Bharucha (1998) on models with different input representations.
Figure 25. Average activation of target units after stimuli of Bigand & Pineau (1997) on models with different input representations.
As a result, training self-organizing networks with different input representations gave
promising results for modeling of chord perception with a bottom-up model. This model is
architecturally dissimilar to MUSACT (Bharucha, 1987), which proposes that top-down and
bottom-up associations between representations of chords and keys shapes the mental
representation of chords. Tillmann et al. (2000) simulated the self-organization of a tonal
schema, which is architecturally identical to MUSACT (Bharucha, 1987). To reach this end,

Atalay, N., B. (2009). Effects of input representation on self-organizing and bottom-up model of chord schema.
International Journal of Human Sciences [Online]. 6:1. Available: http://www.insanbilimleri.com
407
they pruned and scaled weights, and changed the activation and output functions of the units.
On the other hand, simulations of the current study showed that top-down connections were
not necessary to model perception of chords. Important findings of chord perception were
modeled with self-organizing networks that have bottom-up connections only. Input
representation was critical for a successful simulation. Different input representations
simulated many of the findings, but not all of them. All of the findings were simulated only
when the self-organizing map utilized the "circle of fifths" and the "chroma + circle of fifths"
input representations.
In addition, the highest correlation between the activation patterns of MUSACT (Bharucha,
1987) and the self-organizing bottom up models was observed with the "circle of fifths" and
the "chroma + circle of fifths" input representations. Correlation of chord stability ratings
with the target unit activations of these models were higher compared to the correlation with
the target unit activations of MUSACT (Bharucha, 1987). However, MUSACT (Bharucha,
1987) was better correlated with the similarity ratings of diatonic chords. This result suggest
that relations between diatonic chords were better captured with MUSACT; but stability
ratings were better captured with the bottom-up models with the "circle of fifths" and the
"chroma + circle of fifths" input representations.
On the other hand, it may be proposed that none of the models simulated the results of
Tekman and Bharucha (1998). In Tekman and Bharucha (1998), there were four different
prime durations: 50, 500, 1,500, and 2,500 ms. When the prime played for 50 ms,
participants responded faster after the four-steps-away prime (the acoustically similar prime)
compared to the two-steps-away prime (the harmonically related prime). For durations of
500 ms or more, this pattern reversed. This suggests that through time, the nature of priming
changes from the acoustical similarity to the harmonic relatedness. MUSACT, as well as the
model of Tillmann et al. (2000), simulated the result of 50 and 500 ms or longer primes, by
reading target unit activations at the beginning and the end of the equilibrium. The model
develop in this study doesn’t have the mechanisms to simulate the time course of chord
priming. Signals reach instantly from the pitch representations to the chord representations.
Therefore, only the result with 500 ms or longer primes was simulated in this study. The
simulations with MUSACT and the model of Tillmann et al. (2000) were carried by reading
the target chord unit activation. In other words they assumed that priming with 50 ms stimuli

Atalay, N., B. (2009). Effects of input representation on self-organizing and bottom-up model of chord schema.
International Journal of Human Sciences [Online]. 6:1. Available: http://www.insanbilimleri.com
408
is also governed by the mental representations of chords but not mental representations of
pitches or sensory representations of sounds.
This study showed that it is possible to simulate important findings of chord perception with
self-organizing bottom-up models. In these models the activation of chords are not shaped by
the activation of keys. Only the representation and activation of pitches determine the
chordal activation. It is critical to select proper pitch representation for a valid bottom-up
network. This study can be seen as another theory of chord perception. According to this
theory, mental representations of chords are not shaped by the mental representations of
keys; i.e. there is no top-down influence on chordal percepts. One way to test this theory is to
contrast the predictions of interactive and bottom-up models; and conduct empirical research
according to the predictions.
Recent studies showed that MUSACT (Bharucha, 1987) failed to predict effects of non-
diatonic chords on chord priming (Atalay, Tekman, 2006; Atalay, Tekman, Toiviainen,
2006; see also Atalay, 2007). These findings suggested that listeners of Western music
internalized not only the common harmonic relations between chords (those described with
the circle of fifths), but also chordal relations that are contradictory to the general rules. The
common and the exceptional chordal relations cannot be represented within the same
interactive activation network, where activation of a unit is partly determined as a result of
reverberation of the activation within the whole network. Bottom-up networks can represent
contradictory relations within the same network since activation is a result of local
associations. Indeed Rumelhart and McClelland (1986) showed that bottom-up networks
with error-back-propagation training algorithm could learn both general rules and exceptions
of past tense formation in English. Studying bottom-up models seems to be important to
develop comprehensive models of chord perception.
Acknowledgements
I gratefully acknowledge support from METU-ÖYP Grant (BAP-08-11-DPT-2002-K-
120510). This article is based on an unpublished Ph.D. thesis by Nart Bedin Atalay (2007). I
would like to thank to Carol Krumhansl, Hasan Gürkan Tekman, and Petri Toiviainen for
helpful discussions on earlier versions of this study. Needles to say, all mistakes are mine.

Atalay, N., B. (2009). Effects of input representation on self-organizing and bottom-up model of chord schema.
International Journal of Human Sciences [Online]. 6:1. Available: http://www.insanbilimleri.com
409
References
Atalay, N.B. (2007). The role of non-diatonic chords in perception of harmony. Unpublished PhD thesis, Middle East Technical University, Ankara.
Atalay, N.B. Tekman, H.G. & Toiviainen, P. (2006) Priming by non-diatonic chords: The case of the Neapolitan chord. In Proceedings of 9th International Conference on Music Perception and Cognition, Bologna, Italy
Atalay, N.B. & Tekman, H.G. (2006) Integration of non-diatonic chords into diatonic sequences: Results from scrambling sequences with secondary dominant chords. In Proceedings of 9th International Conference on Music Perception and Cognition, Bologna, Italy
Balaban, M., Ebcioglu K. & Laske, O. (1992). Understanding Music with AI. Cambridge, MA: MIT Press
Bharucha, J.J. (1987). Music cognition and perceptual facilitation: A connectionist framework. Music Perception, 5, 1-30.
Bharucha, J.J. (1988) Neural net modeling of music. In Proceedings of the first workshop on AI and music, pp. 173–182. Minneapolis/St. Paul: AAAI-88
Bharucha, J.J. (1992). Tonality and learnability. In M.R. Jones & S. Holleran (Eds.), Cognitive bases of musical communication (213-223). Washington, DC: American Psychological Association.
Bharucha, J.J., & Krumhansl, C.L. (1983). The presentation of harmonic structure in music: Hierarchies of stability as a function of context. Cognition, 13, 63-102.
Bharucha, J.J., & Stoeckig, K. (1986). Reaction time and musical expectancy: Priming of chords. Journal of Experimental Psychology: Human Perception and Performance, 12, 403-410.
Bharucha, J.J., & Stoeckig, K. (1987). Priming of chords: Spreading activation or overlapping frequency spectra. Perception & Psychophysics, 41, 519-524.
Bigand, E., & Pineau, M. (1997). Global context effects on musical expectancy. Perception and & Psychophysics, 59, 1098-1107.
Bigand, E., Madurell, F., Tillmann, B., & Pineau, M. (1999). Effect of global structure and temporal organization on chord processing. Journal of Experimental Psychology: Human Perception and Performance, 25, 184-197.
Bigand, E., Poulin, B., Tillmann, B., & D’Adamo, D. (2003). Sensory versus cognitive components in harmonic priming. Journal of Experimental Psychology: Human Perception and Performance, 29, 159–171.
Budge, H. (1943). A study of chord frequencies (Contributions to Education No.882). New York: Columbia University Teacher Collage.
Carpenter, G.A. & Grossberg, S. (1990). ART 3: Hierarchical search using chemical transmitters in self- organizing pattern recognition architectures. Neural Networks, 3, 129-152.
Chew, E. (2001). Modeling Tonality: Applications to Music Cognition. In J.D. Moore & K. Stenning (Eds.), Proceedings of the 23rd Annual Meeting of the Cognitive Science Society, CogSci2001 (206-211). Mahwah, NJ/London: Lawrence Erlbaum Assoc. Pub.
Eerola, T. & Toiviainen, P. (2004). MIR in Matlab: The Midi Toolbox. In Proceedings of 5th International Conference on Music Information Retrieval (ISMIR 2004) (22-27). Barcelona: Universitat Pompeu Fabra.
Gjerdingen, R.O. (1992) Learning syntactically significant temporal patterns of chords: A masking field embedded in an ART3 architecture, Neural Networks, 5, 551-564.
Atalay, N., B. (2009). Effects of input representation on self-organizing and bottom-up model of chord schema.
International Journal of Human Sciences [Online]. 6:1. Available: http://www.insanbilimleri.com
410
Griffith, N. & Todd, P. (Eds.) (1994). Connection Science, 6(2-3). Special issue: music and creativity.
Justus, T.C. & Bharucha, J.J. (2002). Music perception and cognition. In S. Yantis & H. Passler (Eds.), Steven's Hanbook of Ecperimental Psychology, Volume 1: Sensation and Perception (Third Edition). New York: Wiley, 2002.
Knudsen, E.I., du Lac, S. and Esterly, S.D. (1987). Computational maps in the brain. Annual Review of Neuroscience, 10, 41-65.
Kohonen, T. (1982). Self-organized formation of topologically correct feature maps. Biological Cybernetics, 43, 59-69.
Kohonen, T. (2001). Self-organizing maps (3th Ed.). Springer: Berlin. Krumhansl, C.L. (1990). Cognitive foundations of musical pitch. New York: Oxford
University Press. Krumhansl, C.L. (1991). Music psychology: Tpnal structures in perception and memory.
Annual Review of Psychology, 42, 277-303. Krumhansl, C.L. (2000). Rhythm and pitch in music cognition. Psychological Bulletin, 126,
159-179. Krumhansl, C.L. (2005). The cognition of tonality – as we know it today. Journal of New
Music Research, 33, 253-268. Krumhansl, C.L. & Shepard, R.N. (1979). Quantification of the hierarchy of tonal functions
within a diatonic context. Journal of Experimental Psychology: Human Perception and Performance, 5, 579-594.
Krumhansl, C.L., Bharucha, J.J., & Castellano, M.A. (1982). Key distance effects on perceived harmonic structure in music. Perception and Psychophysics, 32, 96-108.
Leman, M. (1995). Music and schema theory. Berlin: Springer. Leman, M. (1997). Music, gestalt and computing. Berlin: Springer. Leman, M. & Carreras, (1997). Schema and Gestalt: Testing the hypothesis of psychoneural
isomorphism by computer simulation. In M. Leman (Ed.), Music, gestalt and computing. Berlin: Springer.
Lerdahl L. (2001). Tonal Pitch Space. New York: Oxford University Press. Longuet-Higgins, H.C. & Steedman, M.J. (1987). On interpreting Bach. In H.C. Longuet-
Higgins (Ed.), Mental processes: Studies in Cognitive Science (82–104). British Psychological Society/MIT Press, London, England and Cambridge, Mass.
Pantev, C., Hoke, M., Lehnertz, K., Lütkenhöner, B., Anogianakis, G., Wittkowski, W. (1988). Tonotopic organization of the human auditory cortex revealed by transient auditory evoked magnetic fields. Electroencephaphy in Clinical Neurophysiology, 69, 160-170.
Parncutt, R. (1988). Revision of Terhardt's psychoacoustical model of the root(s) of a musical chord. Music Perception, 6, 65-94.
Parncutt, R. (1994). Template-matching models of musical pitch and rhythm perception. Journal of New Music Research, 23, 145-168.
Patel, A.D., Gibson, E., Ratner, J., Besson, M. & Holcomb, P.J. (1998). Processing syntactic relations in language and music: An event-related potential study. Journal of Cognitive Neuroscience, 10, 717-733.
Piston, W. (1978). Harmony (4th ed.). New York: Norton. Purwins H., Grachten M., Herrera P., Hazan A., Marxer R., & Serra X. (2008).
Computational models of music perception and cognition I: Domain specific music processing. Physics of Life Reviews, 5, 169-182.

Atalay, N., B. (2009). Effects of input representation on self-organizing and bottom-up model of chord schema.
International Journal of Human Sciences [Online]. 6:1. Available: http://www.insanbilimleri.com
411
Purwins H., Herrera P., Grachten M., Hazan A., Marxer R., & Serra X. (2008). Computational models of music perception and cognition I: The perceptual and cognitive processing chain. Physics of Life Reviews, 5, 151-168.
Rumelhart, D.E. & McClelland, J.L. (Eds.) (1986). Parallel distributed processing, Vol. I: Foundations. Cambridge, MA: MIT Press.
Rumelhart, D.E. & McClelland, J.L. (1986). On Learning the Past Tenses of English Verbs, in Parallel Distributed Processing: Experiments in the Microstructure of Cognition, vol. 2, J.L. McClelland, D.E. Rumelhart and the PDP research Group (ed.), MIT Press, Cambridge, 216-271.
Shepard, R.N. (1964). Circularity in judgment of relative pitch. Journal of the Acoustical Society of America, 36, 2346–2353.
Shepard, R.N. (1982). Geometric approximations to musical pitch. Psychological Review, 89, 305-333.
Tekman, H. G., & Bharucha, J. J. (1992). Time course of chord priming. Perception & Psychophysics, 51, 33-39.
Tekman, H. G., & Bharucha, J. J. (1998). Implicit knowledge versus psychoacoustic similarity. Journal of Experimental Psychology: Human Perception and Performance, 12, 252-260.
Terhardt, E. (1974). Pitch, consonance, and harmony. Journal of Acoustical Society of America, 55, 1061-1069.
Terhardt, E., Stoll, G., & Seewan, M. (1982a). Pitch of complex signals according to virtual-pitch theory: Tests, examples, and predictions. Journal of the Acoustical Society of America, 71, 671-678.
Terhardt, E., Stoll, G., & Seewan, M. (1982b). Algorithm for extraction of pitch and pitch salience from complex tonal signals. Journal of the Acoustical Society of America, 71, 679-687.
Tillmann, B., Bigand, E., & Pineau, M. (1998). Effects of local and global context on harmonic expectancy. Music Perception, 16, 99-118.
Tillmann, B., Bharucha, J.J., & Bigand, E. (2000). Implicit learning of tonality. Psychological Review, 4, 885-913.
Tillmann B., Janata P., Birk J. & Bharucha J.J. (2003). The costs and benefits of tonal centers for chord processing. Journal of Experimental Psychology: Human Perception and Performance, 29, 470-482.
Todd P. & Loy G. (Eds.) (1991). Music and Connectionism. Cambridge, MA: MIT Press. Toiviainen, P. (2000). Symbolic AI versus connectionism in music research. In E. Miranda
(Ed.), Readings in Music and Artificial Intelligence. Amsterdam: Harwood Academic Publishers, 47-68.
Toiviainen, P. & Krumhansl, C.L. (2003). Measuring and modeling real-time responses to music: the dynamics of tonality induction. Perception, 32, 741-766.
Van Immerseel L. & Martens, J. P. (1992). Pitch and voiced/unvoiced determination with an auditory model, Journal of the Acoustical Society of America, 91, 3511-3526.
Vesanto, J., Himberg, J., Alhoniemi, E., & Parhankangas, J. (2000). SOM Tool-box for Matlab 5. Technical Report A57, Helsinki University of Technology.