Self-organized mechanisms of the head direction sense
10
© 2015 Nature America, Inc. All rights reserved. NATURE NEUROSCIENCE ADVANCE ONLINE PUBLICATION ARTICLES The relationship between stimulus-driven and internally gener- ated activity is a recurring topic in neuroscience. Yet, the manner in which feed-forward sensory signals in subcortical, thalamic and cortical networks interact with internally organized (self-generated or ‘spontaneous’) activity is not well-understood, largely as a result of the high dimensionality of sensory signal attributes 1–4 . In con- trast, the one-dimensional HD sense offers an opportunity to explore such interactions experimentally. HD neurons fire robustly when the animal’s head points in a specific direction 5–8 . The HD system encompasses multiple, serially connected brain networks, including the brainstem, mammillary bodies, anterodorsal thalamic nucleus (ADn), post-subiculum (PoS) and entorhinal cortex 6–13 . Neurons in the PoS provide feedback projections to neurons in the ADn and mammillary bodies 7 . Similar to other sensory systems that pass through the thalamus, the HD sense has been tacitly assumed to be largely controlled by peripheral inputs, mainly the vestibular and ancillary afferents 7,8 , as firing rates of HD cells are affected by both HD and the angular velocity of head rotation in the exploring rodent 9,14 . Visual inputs can also influence the HD signal 6,9,10 via reciprocal connections of the PoS with visual areas 7,8 , but visual inputs are not sufficient to drive HD cells in the PoS after lesioning the ADn 14 . The HD network is a key part of the brain’s navigational system and HD information is believed to be critical for the emergence of grid cells in the entorhinal cortex 12,13,15–17 . Computational models have assumed that HD cells with similar preferred directions fire together and that the temporally correlated group of HD neurons (activity packet) moves on a virtual ring as the animal turns its head (Supplementary Movie 1). Although members of the activity packet rotate on the ring, neighboring neurons are suppressed by lateral inhibition 18–23 . Experimental demonstration of the existence of internally organized neuronal populations endowed with such properties, often referred to as attractor networks 22,24–26 , requires monitoring populations of HD neurons simultaneously and demonstrating that the activity packet remains temporally organ- ized even in the absence of vestibular and other peripheral signals. We therefore reasoned that the postulated attractor dynamic can be revealed by comparing the population activity of HD cells during sleep and in the waking brain 27,28 . RESULTS Ensembles of HD neurons from ADn (8.4 ± 5.1 s.d. units per ses- sion) and PoS (5 ± 2.8 s.d.) were recorded by multi-site silicon probes (Fig. 1a and Supplementary Fig. 1) in seven mice foraging for food in an open environment (42 sessions) and in their home cages during sleep (Supplementary Table 1). In three mice (21 sessions), ADn and PoS recordings were performed simultaneously. HD cell ensembles covered the full span of HDs (Fig. 1b–d). ADn and HD cells were characterized by a uniform bell-shaped tuning curve (Fig. 1b and Supplementary Fig. 2a). ADn neurons exhibited peak rates almost threefold higher than those of PoS cells (P < 10 −10 , Mann-Whitney U test, n = 242 ADn and n = 111 PoS HD cells; Supplementary Fig. 2b) and conveyed 30% more HD information than PoS cells (1.44 versus 1.11 bits per spike, P < 10 −6 , Mann-Whitney U test; Online Methods and Supplementary Fig. 2c), firing more consistently with the HD. Under the hypothesis of an internally organized HD system, one expects that the temporal relationship of HD cells should persist in different brain states. To this end, we monitored neuronal ensembles during sleep sessions (5 h ± 1 s.d.), before and/or after active explo- ration in the open field. Sleep stages were classified as slow-wave sleep (SWS) or rapid eye movement (REM) sleep based on the ani- mal’s movement and time-resolved spectra of the local field potential recorded from the hippocampus or PoS (Fig. 1c and Online Methods). During sleep, individual neurons formed robustly similar sequential The Neuroscience Institute, School of Medicine and Center for Neural Science, New York University, New York, New York, USA. Correspondence should be addressed to G.B. ([email protected]). Received 20 October 2014; accepted 1 February 2015; published online 2 March 2015; doi:10.1038/nn.3968 Internally organized mechanisms of the head direction sense Adrien Peyrache, Marie M Lacroix, Peter C Petersen & György Buzsáki The head-direction (HD) system functions as a compass, with member neurons robustly increasing their firing rates when the animal’s head points in a specific direction. HD neurons may be driven by peripheral sensors or, as computational models postulate, internally generated (attractor) mechanisms. We addressed the contributions of stimulus-driven and internally generated activity by recording ensembles of HD neurons in the antero-dorsal thalamic nucleus and the post-subiculum of mice by comparing their activity in various brain states. The temporal correlation structure of HD neurons was preserved during sleep, characterized by a 60°-wide correlated neuronal firing (activity packet), both within and across these two brain structures. During rapid eye movement sleep, the spontaneous drift of the activity packet was similar to that observed during waking and accelerated tenfold during slow-wave sleep. These findings demonstrate that peripheral inputs impinge on an internally organized network, which provides amplification and enhanced precision of the HD signal.
Transcript of Self-organized mechanisms of the head direction sense
©20
15N
atu
re A
mer
ica,
Inc.
All
rig
hts
res
erve
d.
nature neurOSCIenCe advance online publication
a r t I C l e S
The relationship between stimulus-driven and internally gener-ated activity is a recurring topic in neuroscience. Yet, the manner in which feed-forward sensory signals in subcortical, thalamic and cortical networks interact with internally organized (self-generated or ‘spontaneous’) activity is not well-understood, largely as a result of the high dimensionality of sensory signal attributes1–4. In con-trast, the one-dimensional HD sense offers an opportunity to explore such interactions experimentally. HD neurons fire robustly when the animal’s head points in a specific direction5–8. The HD system encompasses multiple, serially connected brain networks, including the brainstem, mammillary bodies, anterodorsal thalamic nucleus (ADn), post-subiculum (PoS) and entorhinal cortex6–13. Neurons in the PoS provide feedback projections to neurons in the ADn and mammillary bodies7.
Similar to other sensory systems that pass through the thalamus, the HD sense has been tacitly assumed to be largely controlled by peripheral inputs, mainly the vestibular and ancillary afferents7,8, as firing rates of HD cells are affected by both HD and the angular velocity of head rotation in the exploring rodent9,14. Visual inputs can also influence the HD signal6,9,10 via reciprocal connections of the PoS with visual areas7,8, but visual inputs are not sufficient to drive HD cells in the PoS after lesioning the ADn14. The HD network is a key part of the brain’s navigational system and HD information is believed to be critical for the emergence of grid cells in the entorhinal cortex12,13,15–17.
Computational models have assumed that HD cells with similar preferred directions fire together and that the temporally correlated group of HD neurons (activity packet) moves on a virtual ring as the animal turns its head (Supplementary Movie 1). Although members of the activity packet rotate on the ring, neighboring neurons are suppressed by lateral inhibition18–23. Experimental demonstration of the existence of internally organized neuronal populations endowed
with such properties, often referred to as attractor networks22,24–26, requires monitoring populations of HD neurons simultaneously and demonstrating that the activity packet remains temporally organ-ized even in the absence of vestibular and other peripheral signals. We therefore reasoned that the postulated attractor dynamic can be revealed by comparing the population activity of HD cells during sleep and in the waking brain27,28.
RESULTSEnsembles of HD neurons from ADn (8.4 ± 5.1 s.d. units per ses-sion) and PoS (5 ± 2.8 s.d.) were recorded by multi-site silicon probes (Fig. 1a and Supplementary Fig. 1) in seven mice foraging for food in an open environment (42 sessions) and in their home cages during sleep (Supplementary Table 1). In three mice (21 sessions), ADn and PoS recordings were performed simultaneously. HD cell ensembles covered the full span of HDs (Fig. 1b–d). ADn and HD cells were characterized by a uniform bell-shaped tuning curve (Fig. 1b and Supplementary Fig. 2a). ADn neurons exhibited peak rates almost threefold higher than those of PoS cells (P < 10−10, Mann-Whitney U test, n = 242 ADn and n = 111 PoS HD cells; Supplementary Fig. 2b) and conveyed 30% more HD information than PoS cells (1.44 versus 1.11 bits per spike, P < 10−6, Mann-Whitney U test; Online Methods and Supplementary Fig. 2c), firing more consistently with the HD.
Under the hypothesis of an internally organized HD system, one expects that the temporal relationship of HD cells should persist in different brain states. To this end, we monitored neuronal ensembles during sleep sessions (5 h ± 1 s.d.), before and/or after active explo-ration in the open field. Sleep stages were classified as slow-wave sleep (SWS) or rapid eye movement (REM) sleep based on the ani-mal’s movement and time-resolved spectra of the local field potential recorded from the hippocampus or PoS (Fig. 1c and Online Methods). During sleep, individual neurons formed robustly similar sequential
The Neuroscience Institute, School of Medicine and Center for Neural Science, New York University, New York, New York, USA. Correspondence should be addressed to G.B. ([email protected]).
Received 20 October 2014; accepted 1 February 2015; published online 2 March 2015; doi:10.1038/nn.3968
Internally organized mechanisms of the head direction senseAdrien Peyrache, Marie M Lacroix, Peter C Petersen & György Buzsáki
The head-direction (HD) system functions as a compass, with member neurons robustly increasing their firing rates when the animal’s head points in a specific direction. HD neurons may be driven by peripheral sensors or, as computational models postulate, internally generated (attractor) mechanisms. We addressed the contributions of stimulus-driven and internally generated activity by recording ensembles of HD neurons in the antero-dorsal thalamic nucleus and the post-subiculum of mice by comparing their activity in various brain states. The temporal correlation structure of HD neurons was preserved during sleep, characterized by a 60°-wide correlated neuronal firing (activity packet), both within and across these two brain structures. During rapid eye movement sleep, the spontaneous drift of the activity packet was similar to that observed during waking and accelerated tenfold during slow-wave sleep. These findings demonstrate that peripheral inputs impinge on an internally organized network, which provides amplification and enhanced precision of the HD signal.

©20
15N
atu
re A
mer
ica,
Inc.
All
rig
hts
res
erve
d.
advance online publication nature neurOSCIenCe
a r t I C l e S
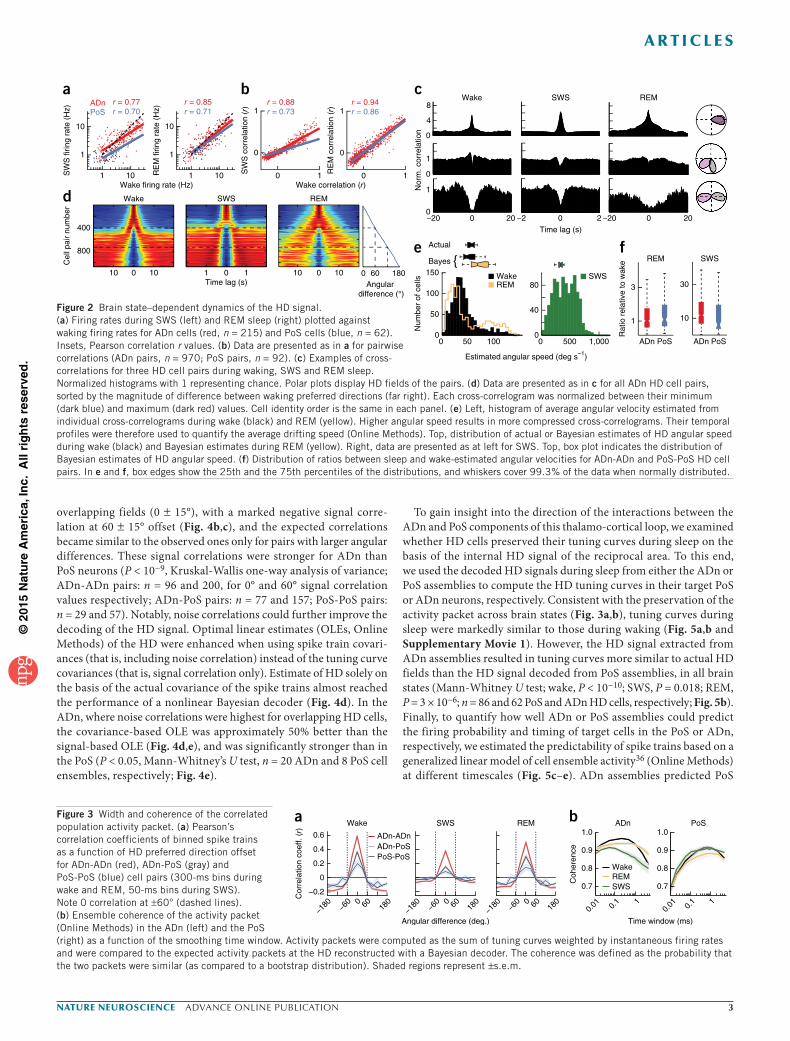
patterns as in the waking state. Using a Bayesian-based decoding of the HD signal from the population of HD cells (Online Methods) and the animal’s actual head orientation (Fig. 1c), we could infer a ‘vir-tual gaze’—that is, which direction the mouse was ‘looking’—during sleep (Fig. 1c,d, Supplementary Fig. 3 and Supplementary Movie 1). Quantitative brain state comparisons of firing patterns revealed three important features of the ongoing network dynamics. First, the firing rates of HD neurons remained strongly correlated across brain states (Fig. 2a). Second, the pairwise correlations between HD neuron pairs both within and across structures were robustly similar across states (Fig. 2b), indicating the preservation of a coherent representation. Third, the rate of change of the virtual gaze differed between brain states. The angular velocity of the internal HD signal, either estimated by a Bayesian decoder or from the temporal profile of pairwise cross-correlograms (Fig. 2c–e, Online Methods and Supplementary Fig. 4), was approximately tenfold faster during SWS than during waking (Fig. 2e,f), similar to the temporal ‘compression’ of unit correlations observed in the hippocampus29–31 and neocortex32,33. Angular veloc-ity of the internal HD signal was similar during waking and REM sleep (Fig. 2e,f).
Models of attractor networks suggest that only a subset of cells fire at any given time, referred to as the activity packet, and the subset shifts at a predictable velocity8,12,18,19,23,25,26. The distribution of the magnitude of temporal correlations between discharge activities of HD cell pairs at time zero revealed a bell-shaped packet. Pairs of neurons with <60° offset showed positive correlations, pairs with >60°
offset showed negative correlations and pairs with approximately 60° offset were uncorrelated (Fig. 3a). The relationship between the 0-lag correlation and the preferred angular direction was preserved across brain states for cell pairs recorded in a structure (ADn-ADn and PoS-PoS) and between structures (ADn-PoS) (P < 10−6 for all brain states and conditions, Pearson’s test, n = 907 ADn-ADn pairs, n = 512 ADn-PoS pairs, n = 92 PoS-PoS pairs; Fig. 3a). HD signal was more strongly preserved in the ADn than in the PoS, as shown by the stronger pairwise correlations in any brain state (P < 10−5, Mann-Whitney U test for all pairs closer than 60° in all brain states, n = 345 ADn-ADn pairs, n = 55 PoS-PoS pairs), and this difference was independent of firing rate differences between the two structures (Supplementary Fig. 5). The actual activity packets, both in the ADn and the PoS, and across brain states, were highly similar to the predic-tions given by the signal decoded from a Bayesian estimator (Fig. 3b) in waking, REM sleep and SWS, thereby demonstrating the self- consistency of HD representations34. Thus, at any time, the activity packet corresponded to a bounded probabilistic representation of the HD (Supplementary Movie 1).
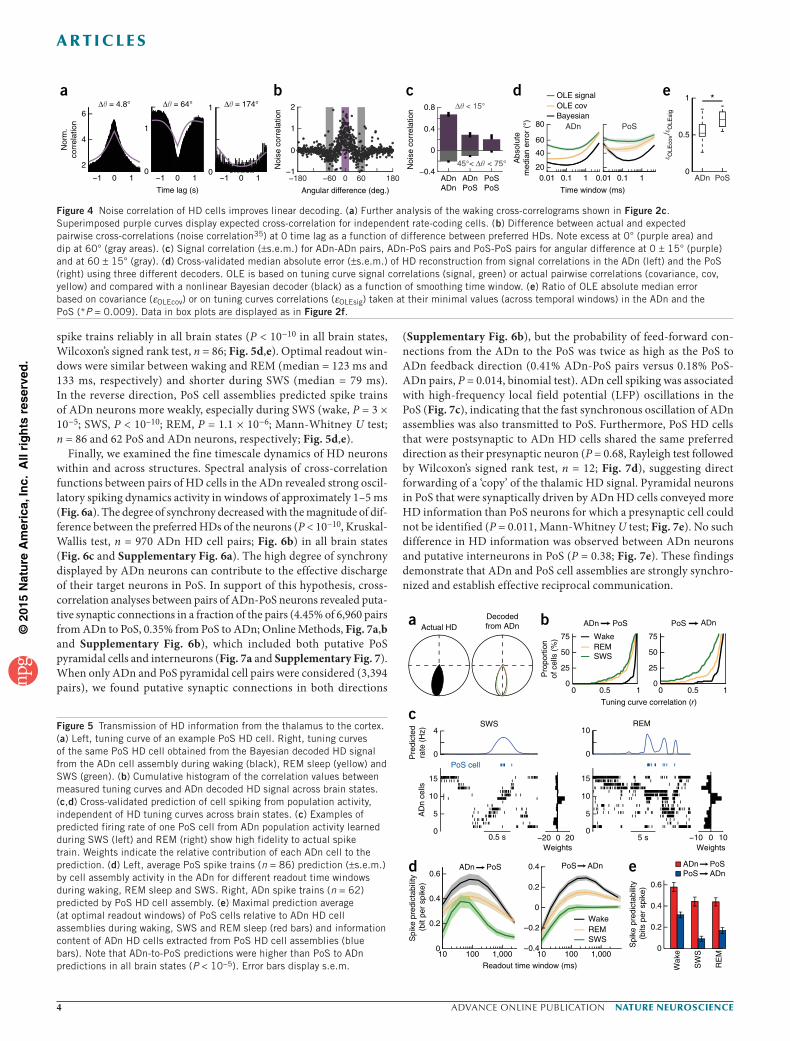
In the waking animal, HD cell dynamics can be explained by inputs arriving from the peripheral sensors7,8. Under this hypothesis, HD neurons in ADn and PoS inherit their directional information from upstream neurons and respond independently of each other. However, correlations expected from independent rate-coded neurons could not fully account for the observed pairwise correlations of HD cells (Fig. 4a). ‘Noise’ correlations35 were observed for neuron pairs with
10
20
AD
nP
oS
250 ms
SWS REMWake
2.5 s 2.5 s
0°
90°
180°
270°
360°
0°
360°
0°
360° Thalamic signal
ADn
PoS
2 18 140 Hz
Fre
q. (
Hz)
Actual HD
RT
ADn
DAPI + PV-YFP
PoS S
UB
RSPV1
DAPI
ADn PoS
−180 −60 0 60 180Orientation (°)
Nor
mal
ized
rat
e
AD
nP
oS
SWS REMWake
10 s
ADn
PoSa b c
d
Figure 1 Persistence of information content during wake and sleep in the thalamo-cortical HD circuit. (a) Dual site recording of cell ensembles in the ADn and the PoS. Shown is 4′,6-diamidino-2-phenylindole (DAPI) staining of a coronal section through the PoS (top, arrowheads indicate tracks) and ADn (bottom, DAPI combined with parvalbumin yellow fluorescent protein, PV-YFP). RT, reticular nucleus; SUB, subiculum; RSP, retrosplenial cortex; V1, primary visual cortex. Recording shank tracks are 200 µm from each other. (b) Tuning curves of simultaneously recorded HD cells in the ADn and the PoS. Polar plots indicate average firing rates as a function of the animals’ HD. Colors encode peak firing rate. Middle, average normalized tuning curves (±s.d.) in Cartesian coordinates. (c) Activity of HD cell ensembles during wake, SWS and REM sleep. Top, PoS LFP spectrograms; middle, actual (black line) and reconstructed HD signal using Bayesian decoding of ADn (red) or PoS (blue) cells; bottom, raster plots of PoS (blue) and ADn (red) cell spike times. Cells were ordered according to their preferred HD during waking. (d) Magnified samples from c. Raster plots of neurons are colored according to their preferred HD during waking. Curves show the reconstructed HD signal from ADn HD cells. Circular y values are shifted for the sake of visibility, but color indicates true decoded HD information.
©20
15N
atu
re A
mer
ica,
Inc.
All
rig
hts
res
erve
d.
nature neurOSCIenCe advance online publication
a r t I C l e S
overlapping fields (0 ± 15°), with a marked negative signal corre-lation at 60 ± 15° offset (Fig. 4b,c), and the expected correlations became similar to the observed ones only for pairs with larger angular differences. These signal correlations were stronger for ADn than PoS neurons (P < 10−9, Kruskal-Wallis one-way analysis of variance; ADn-ADn pairs: n = 96 and 200, for 0° and 60° signal correlation values respectively; ADn-PoS pairs: n = 77 and 157; PoS-PoS pairs: n = 29 and 57). Notably, noise correlations could further improve the decoding of the HD signal. Optimal linear estimates (OLEs, Online Methods) of the HD were enhanced when using spike train covari-ances (that is, including noise correlation) instead of the tuning curve covariances (that is, signal correlation only). Estimate of HD solely on the basis of the actual covariance of the spike trains almost reached the performance of a nonlinear Bayesian decoder (Fig. 4d). In the ADn, where noise correlations were highest for overlapping HD cells, the covariance-based OLE was approximately 50% better than the signal-based OLE (Fig. 4d,e), and was significantly stronger than in the PoS (P < 0.05, Mann-Whitney’s U test, n = 20 ADn and 8 PoS cell ensembles, respectively; Fig. 4e).
To gain insight into the direction of the interactions between the ADn and PoS components of this thalamo-cortical loop, we examined whether HD cells preserved their tuning curves during sleep on the basis of the internal HD signal of the reciprocal area. To this end, we used the decoded HD signals during sleep from either the ADn or PoS assemblies to compute the HD tuning curves in their target PoS or ADn neurons, respectively. Consistent with the preservation of the activity packet across brain states (Fig. 3a,b), tuning curves during sleep were markedly similar to those during waking (Fig. 5a,b and Supplementary Movie 1). However, the HD signal extracted from ADn assemblies resulted in tuning curves more similar to actual HD fields than the HD signal decoded from PoS assemblies, in all brain states (Mann-Whitney U test; wake, P < 10−10; SWS, P = 0.018; REM, P = 3 × 10⁻⁶; n = 86 and 62 PoS and ADn HD cells, respectively; Fig. 5b). Finally, to quantify how well ADn or PoS assemblies could predict the firing probability and timing of target cells in the PoS or ADn, respectively, we estimated the predictability of spike trains based on a generalized linear model of cell ensemble activity36 (Online Methods) at different timescales (Fig. 5c–e). ADn assemblies predicted PoS
1
10
SW
S fi
ring
rate
(H
z)
0 1
0
1
SW
S c
orre
latio
n (r
)
0 1
0
1
RE
M c
orre
latio
n (r
)
1 10
1
10
RE
M fi
ring
rate
(H
z)
a bWake SWS REM
−20 0 200
1
−2 0 2 −20 0 20
0
4
8
0
1
c
Time lag (s)
Nor
m. c
orre
latio
n
1 10
ADnPoS
r = 0.85r = 0.71
r = 0.88r = 0.73
r = 0.94r = 0.86
Cel
l pai
r nu
mbe
r
10 0 10 1 0 1 10 0 10 0 60
Wake firing rate (Hz)
Wake SWS REM
Wake correlation (r)
d
Angular difference (°)
400
800
180Time lag (s)
Num
ber
of c
ells
Estimated angular speed (deg s–1)
ADn PoS ADn PoS
Rat
io r
elat
ive
to w
ake SWSREM
e f
0 50 1000
50
100
150
0 500 1,0000
40
80Wake
Actual
Bayes
1
3
10
30SWS
REM
r = 0.77r = 0.70
Figure 2 Brain state–dependent dynamics of the HD signal. (a) Firing rates during SWS (left) and REM sleep (right) plotted against waking firing rates for ADn cells (red, n = 215) and PoS cells (blue, n = 62). Insets, Pearson correlation r values. (b) Data are presented as in a for pairwise correlations (ADn pairs, n = 970; PoS pairs, n = 92). (c) Examples of cross- correlations for three HD cell pairs during waking, SWS and REM sleep. Normalized histograms with 1 representing chance. Polar plots display HD fields of the pairs. (d) Data are presented as in c for all ADn HD cell pairs, sorted by the magnitude of difference between waking preferred directions (far right). Each cross-correlogram was normalized between their minimum (dark blue) and maximum (dark red) values. Cell identity order is the same in each panel. (e) Left, histogram of average angular velocity estimated from individual cross-correlograms during wake (black) and REM (yellow). Higher angular speed results in more compressed cross-correlograms. Their temporal profiles were therefore used to quantify the average drifting speed (Online Methods). Top, distribution of actual or Bayesian estimates of HD angular speed during wake (black) and Bayesian estimates during REM (yellow). Right, data are presented as at left for SWS. Top, box plot indicates the distribution of Bayesian estimates of HD angular speed. (f) Distribution of ratios between sleep and wake-estimated angular velocities for ADn-ADn and PoS-PoS HD cell pairs. In e and f, box edges show the 25th and the 75th percentiles of the distributions, and whiskers cover 99.3% of the data when normally distributed.
Figure 3 Width and coherence of the correlated population activity packet. (a) Pearson’s correlation coefficients of binned spike trains as a function of HD preferred direction offset for ADn-ADn (red), ADn-PoS (gray) and PoS-PoS (blue) cell pairs (300-ms bins during wake and REM, 50-ms bins during SWS). Note 0 correlation at ±60° (dashed lines). (b) Ensemble coherence of the activity packet (Online Methods) in the ADn (left) and the PoS (right) as a function of the smoothing time window. Activity packets were computed as the sum of tuning curves weighted by instantaneous firing rates and were compared to the expected activity packets at the HD reconstructed with a Bayesian decoder. The coherence was defined as the probability that the two packets were similar (as compared to a bootstrap distribution). Shaded regions represent ±s.e.m.
−180 −6
0 0 60 180
Cor
rela
tion
coef
f. (r
)
−180 −6
0 0 60 180
−180 −6
0 0 60 180
−0.2
0
0.2
0.4
0.6 ADn-ADnADn-PoSPoS-PoS
Wake SWS REMa
0.7
0.8
0.9
1.0
Coh
eren
ce
0.01 0.
1 10.
01 0.1 1
SWSREMWake
ADn PoS
Time window (ms)Angular difference (deg.)
0.7
0.8
0.9
1.0
b
©20
15N
atu
re A
mer
ica,
Inc.
All
rig
hts
res
erve
d.
advance online publication nature neurOSCIenCe
a r t I C l e S
spike trains reliably in all brain states (P < 10−10 in all brain states, Wilcoxon’s signed rank test, n = 86; Fig. 5d,e). Optimal readout win-dows were similar between waking and REM (median = 123 ms and 133 ms, respectively) and shorter during SWS (median = 79 ms). In the reverse direction, PoS cell assemblies predicted spike trains of ADn neurons more weakly, especially during SWS (wake, P = 3 × 10⁻⁵; SWS, P < 10–10; REM, P = 1.1 × 10⁻⁶; Mann-Whitney U test; n = 86 and 62 PoS and ADn neurons, respectively; Fig. 5d,e).
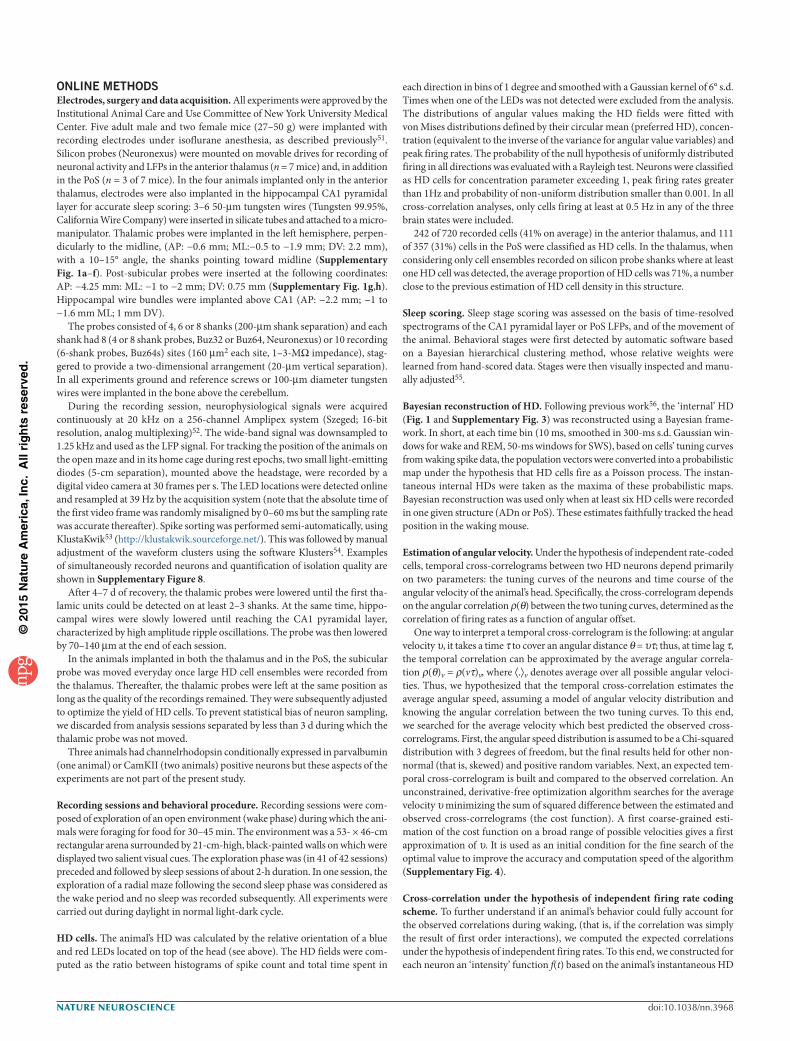
Finally, we examined the fine timescale dynamics of HD neurons within and across structures. Spectral analysis of cross-correlation functions between pairs of HD cells in the ADn revealed strong oscil-latory spiking dynamics activity in windows of approximately 1–5 ms (Fig. 6a). The degree of synchrony decreased with the magnitude of dif-ference between the preferred HDs of the neurons (P < 10−10, Kruskal-Wallis test, n = 970 ADn HD cell pairs; Fig. 6b) in all brain states (Fig. 6c and Supplementary Fig. 6a). The high degree of synchrony displayed by ADn neurons can contribute to the effective discharge of their target neurons in PoS. In support of this hypothesis, cross- correlation analyses between pairs of ADn-PoS neurons revealed puta-tive synaptic connections in a fraction of the pairs (4.45% of 6,960 pairs from ADn to PoS, 0.35% from PoS to ADn; Online Methods, Fig. 7a,b and Supplementary Fig. 6b), which included both putative PoS pyramidal cells and interneurons (Fig. 7a and Supplementary Fig. 7). When only ADn and PoS pyramidal cell pairs were considered (3,394 pairs), we found putative synaptic connections in both directions
(Supplementary Fig. 6b), but the probability of feed-forward con-nections from the ADn to the PoS was twice as high as the PoS to ADn feedback direction (0.41% ADn-PoS pairs versus 0.18% PoS-ADn pairs, P = 0.014, binomial test). ADn cell spiking was associated with high-frequency local field potential (LFP) oscillations in the PoS (Fig. 7c), indicating that the fast synchronous oscillation of ADn assemblies was also transmitted to PoS. Furthermore, PoS HD cells that were postsynaptic to ADn HD cells shared the same preferred direction as their presynaptic neuron (P = 0.68, Rayleigh test followed by Wilcoxon’s signed rank test, n = 12; Fig. 7d), suggesting direct forwarding of a ‘copy’ of the thalamic HD signal. Pyramidal neurons in PoS that were synaptically driven by ADn HD cells conveyed more HD information than PoS neurons for which a presynaptic cell could not be identified (P = 0.011, Mann-Whitney U test; Fig. 7e). No such difference in HD information was observed between ADn neurons and putative interneurons in PoS (P = 0.38; Fig. 7e). These findings demonstrate that ADn and PoS cell assemblies are strongly synchro-nized and establish effective reciprocal communication.
Figure 4 Noise correlation of HD cells improves linear decoding. (a) Further analysis of the waking cross-correlograms shown in Figure 2c. Superimposed purple curves display expected cross-correlation for independent rate-coding cells. (b) Difference between actual and expected pairwise cross-correlations (noise correlation35) at 0 time lag as a function of difference between preferred HDs. Note excess at 0° (purple area) and dip at 60° (gray areas). (c) Signal correlation (±s.e.m.) for ADn-ADn pairs, ADn-PoS pairs and PoS-PoS pairs for angular difference at 0 ± 15° (purple) and at 60 ± 15° (gray). (d) Cross-validated median absolute error (±s.e.m.) of HD reconstruction from signal correlations in the ADn (left) and the PoS (right) using three different decoders. OLE is based on tuning curve signal correlations (signal, green) or actual pairwise correlations (covariance, cov, yellow) and compared with a nonlinear Bayesian decoder (black) as a function of smoothing time window. (e) Ratio of OLE absolute median error based on covariance (εOLEcov) or on tuning curves correlations (εOLEsig) taken at their minimal values (across temporal windows) in the ADn and the PoS (*P = 0.009). Data in box plots are displayed as in Figure 2f.
0
4
0.5 s0
5
10
15
−20 0 20
AD
n ce
lls
Weights
0
10
0
5
10
15
−10 0 10
Pre
dict
edra
te (
Hz)
5 sWeights
SWS REM
PoS cell
Actual HDDecodedfrom ADn
0 0.5 10
25
50
75
Pro
port
ion
of c
ells
(%
)
Tuning curve correlation (r)
0 0.5 10
25
50
75 WakeREMSWS
ADn PoS PoS ADn
10 100 1,0000
0.2
0.4
0.6
Readout time window (ms)
Spi
ke p
redi
ctab
ility
(bi
t per
spi
ke)
−0.4
–0.2
0
0.2
0.4
Wak
e
SW
S
RE
M10 100 1,0000
0.2
0.4
0.6
WakeREMSWS
Spi
ke p
redi
ctab
ility
(bi
ts p
er s
pike
)
ADn PoS PoS ADn ADn PoSPoS ADn
a
c
d e
b
Figure 5 Transmission of HD information from the thalamus to the cortex. (a) Left, tuning curve of an example PoS HD cell. Right, tuning curves of the same PoS HD cell obtained from the Bayesian decoded HD signal from the ADn cell assembly during waking (black), REM sleep (yellow) and SWS (green). (b) Cumulative histogram of the correlation values between measured tuning curves and ADn decoded HD signal across brain states. (c,d) Cross-validated prediction of cell spiking from population activity, independent of HD tuning curves across brain states. (c) Examples of predicted firing rate of one PoS cell from ADn population activity learned during SWS (left) and REM (right) show high fidelity to actual spike train. Weights indicate the relative contribution of each ADn cell to the prediction. (d) Left, average PoS spike trains (n = 86) prediction (±s.e.m.) by cell assembly activity in the ADn for different readout time windows during waking, REM sleep and SWS. Right, ADn spike trains (n = 62) predicted by PoS HD cell assembly. (e) Maximal prediction average (at optimal readout windows) of PoS cells relative to ADn HD cell assemblies during waking, SWS and REM sleep (red bars) and information content of ADn HD cells extracted from PoS HD cell assemblies (blue bars). Note that ADn-to-PoS predictions were higher than PoS to ADn predictions in all brain states (P < 10−5). Error bars display s.e.m.

©20
15N
atu
re A
mer
ica,
Inc.
All
rig
hts
res
erve
d.
nature neurOSCIenCe advance online publication
a r t I C l e S
DISCUSSIONWe found that correlated activity of thalamic ADn and PoS HD neurons was preserved across different brain states. These empiri-cal observations demonstrate similarities to HD models of one-dimensional attractors in which the activity packet moves on a ring8,18,19,22,25. We hypothesize that, in the exploring animal, the exact tuning curves of HD neurons result from a combination of internal and external processes19,20,25,26,37 and can quickly rotate in response to environmental manipulations9,10 conveyed by vestibular and other peripheral inputs7,8.
Our findings provide experimental support for the postulated ring-attractor hypothesis of HD system organization18–20,24,26, although it remains to be clarified whether the HD attractor mechanism resides in the thalamus or is inherited from more upstream structures. We found that, during sleep, the drift of the attractor can be inde-pendent of sensory inputs38 and the speed of the activity packet is determined by brain state dynamics. An expected advantage of the internally organized HD attractor is that, in the exploring animal, sen-sory inputs7,8 can be combined with the prediction of the internally generated HD sense25,26 and rapidly adapt to re-configured environ-ments9,10. In the case of ambiguous signals, the internally organized HD attractor mechanisms may substitute or improve the precision of HD information by interpolating across input signals and help resolve conflicts during navigation19,20,26. Overall, our observations suggest that coordinated neuronal activity in the HD system is shaped
not only by the nature of incoming sensory HD signals, but is also strongly influenced by internal self-organized mechanisms. Notably, the HD system may have analogous counterparts in other thalamus-mediated sensory systems.
The internally organized HD system is ‘embedded’ in the inter-nal global brain dynamics during sleep, including an ~10-fold time
0 60 120 180 240 300
Fre
quen
cy (
Hz)
z sc
ored
corr
elat
ion
(z)
HD (deg)
20 20 20
Nor
mal
ized
rate
–20 –20 –20
Time (ms)
200
400
0
4
0.3
0.6
1.7
2.5
0.4
0.8
Nor
m.
corr
elat
ion
a
0 60 120
Pea
k am
plitu
de (z)
Angular difference (°)
1
2
3
4
b
Pow
er (
dB)–2
–1
0
1
2
Frequency (Hz)
SWSREMWake
40 100 400
c
Figure 6 Fast synchronous oscillations in ADn HD cells. (a) Bottom, HD fields of the reference cell (dashed curve) and three other HD cells recorded on a different shank. Top, examples of spike cross-correlogram between the three ADn cell pairs and their normalized (equal to 1 when independent) and z scored cross-correlograms (number of s.d. from baseline obtained from 100 correlograms of spike trains jittered uniformly in ±10-ms windows). Middle, wavelet transforms of z-scored cross-correlograms, all normalized to the same scale from minimal power (dark blue) to maximal power (dark red). (b) Amplitude of pairwise synchrony (in z values from baseline ± s.e.m., as in a as a function of preferred direction difference (P < 10−10). (c) Average power (±s.e.m.) of wavelet-transformed z-scored cross-correlograms across brain states.
−20 0 205
6
7
8
9
Time lag (ms)
Nor
m.
cros
s-co
rrel
ogra
m 3 ms
a
−10 0 10 ms−2
0
2
0
1
0
5
ADn-ADn
Cor
rela
tion
(z)
bADn-PoS PYRADn-PoS INT
−20 0 20
1
1.2
1.4
Time lag (ms)
2.5 ms
Nor
m.
cros
s-co
rrel
ogra
m
−100 0 100
200
400
Fre
quen
cy (
Hz)
0 −505 dB
2 µV5 µV
c
−10 0 10 ms
Time lag (ms)
ADn-PoS LFP
n = 1290
270
180 0
d
0
1
2
HD
info
rmat
ion
(bits
per
spi
ke)
0
0.1e
*Pyramidal Interneuron
Postsy
napt
ic
Postsy
napt
icNot
conn
ecte
d Not
conn
ecte
d
Figure 7 ADn-to-PoS transmission of the HD signal. (a) Top, example cross-correlogram (black) between spikes of an ADn neuron (time 0) and a putative pyramidal PoS HD cell shows a sharp peak at positive time lag, indicating a putative mono-synaptic connection. Solid gray line indicates expected firing rate after jittering the spikes by ±10 ms. Dashed lines show the 99.9% interval of confidence. Inset, HD fields of the ADn (red) and PoS (blue) neurons. Bottom, data are presented as in top for an ADn neuron-PoS putative interneuron pair. (b) Top, average cross-correlogram (±s.e.m.) of ADn HD cells mono-synaptically connected to putative pyramidal cells (blue) and interneurons (red). Bottom, average cross-correlograms between ADn HD cells. (c) High-frequency neuronal oscillations in the PoS. Bottom, average wideband (0–1,250 Hz, ±s.e.m.) LFP trace triggered by ADn HD cell spikes (white trace) and color-coded average spectrum (in dB) of the LFP (based on all spikes of ADn HD cells in each session). Top, zoomed trace of the band pass–filtered LFP (80–250 Hz). (d) Distribution of the difference between preferred HD of individual ADn HD cells and their putative postsynaptic target neuron in PoS (P > 0.5). (e) Left, distribution of HD information content of PoS pyramidal cells synaptically connected to recorded ADn HD cells (left) or not (right). *P = 0.011. Right, putative interneuron HD information content (P = 0.38). Data in box plots are displayed as in Figure 2f.

©20
15N
atu
re A
mer
ica,
Inc.
All
rig
hts
res
erve
d.
advance online publication nature neurOSCIenCe
a r t I C l e S
acceleration during SWS29–33 compared with waking and REM sleep, reminiscent of the temporally compressed replay of waking hippo-campal and neocortical activity29–33,39. However, the magnitude of the persistent representation in the HD system is an order of magnitude higher than those previously reported in hippocampus and neocortex. A possible explanation for this robust effect is that the HD system processes a simple one-dimensional signal (that is, the head angle), whereas neurons in cortical systems likely represent intersections of multiple representations (for example, place, context, goals, speed and other idiothetic information). It should also be mentioned that, strictly speaking, replay refers to the increased correlations of neu-ronal coactivation after waking experience compared with the pre-experience control sleep31–33. In contrast with the robust wake-sleep correlations of firing rates coactivation of neuron pairs and neuronal sequences during both SWS and REM sleep reported here, a previous report failed to find replay in the PoS28. Potential explanations for such discrepancy include the rather large time window for Bayesian reconstruction (500 ms) in that previous study28, which may have filtered out the replay effect and/or the limited number of neuronal pairs that were available for statistical comparisons.
Similar to previous findings in visual40 and somatosensory41 sys-tems, we observed highly reliable spike transmission between tha-lamic ADn and its cortical PoS target. Both putative interneurons and pyramidal cells of PoS were driven reliably at short latency by the ADn neurons, most of which were HD cells. The effectiveness of the ADn-PoS transmission was enhanced by a fast (130–160 Hz) oscillation synchrony of coherent HD cell assemblies in ADn in all brain states, which was also reflected in the ADn spike-triggered LFP in the PoS. Similar prominent oscillations have been described in the optic tectum of birds, which have been shown to reflect synchro-nous co-firing of neighboring neurons to flashing or visual motion stimulation42. Notably, firing patterns of PoS neurons could be reli-ably predicted from the population activity of ADn neurons. In the reversed direction, the prediction was poorer. Furthermore, HD pre-diction could be more reliably reconstructed from ADn than from PoS populations, especially during SWS28. These findings are compatible with a feed-forward labeled line transmission of sensory information from the periphery to cortex43. Unexpectedly, however, the magni-tude and reliability of internal prediction was higher in ADn than in PoS, at least when the same total number of neurons was used for HD reconstruction. One possible explanation for such difference is that neurons of ADn are dedicated specifically to HD information, whereas PoS neurons respond to a variety of other inputs as well, making them appear to be ‘noisier’. It is possible, however, that if a much larger fraction of PoS were to be recorded, PoS activity could be equally predictive.
Although the exact anatomical substrate of the hypothetical self-organized attractor remains to be identified, three findings are in favor of the involvement of the thalamocortical circuits. First, the noise correlations between ADn neuron pairs support locally organized mechanisms. Second, the speed of rotation of the HD neurons varied with the thalamocortical state, indicating direct cortical influence on the substrate of the attractor29–33. Third, processing of the HD signal was embedded in fast oscillations that coordinated HD cell assemblies in and across ADn and PoS. Thus, the ADn-PoS-ADn excitatory loop may also contribute to the postulated attractor. Finally, although ADn neurons do not excite each other or other thalamic nuclei44, they can communicate with each other via the inhibitory neurons of the reticular nucleus45,46. Recent work has demonstrated that such recur-rent inhibitory connectivity can also give rise to internally organized activity47,48. We note that several models assume that HD information
is critical for the integrity of entorhinal grid cells12,49, which tessellate the explored space with equilateral triangles50. Notably, the structural requirements of a prominent grid model is identical to the recurrent inhibitory loops of the ADn-reticular nucleus circuit47,48. How the internally organized HD system is related to the formation of grid cells remains to be determined.
METHODSMethods and any associated references are available in the online version of the paper.
Note: Any Supplementary Information and Source Data files are available in the online version of the paper.
AcknowledgMenTSThis work was supported by US National Institute of Health grants NS34994, MH54671 and NS074015, the Human Frontier Science Program and the J.D. McDonnell Foundation. A.P. was supported by EMBO Fellowship ALTF 1345-2010, Human Frontier Science Program Fellowship LT000160/2011-l and National Institute of Health Award K99 NS086915-01.
AUTHoR conTRIBUTIonSA.P. and G.B. designed the experiments. A.P., M.M.L. and P.C.P. conducted the experiments. A.P. designed and performed the analyses. A.P. and G.B. wrote the paper with input from the other authors.
coMPeTIng FInAncIAl InTeReSTSThe authors declare no competing financial interests.
Reprints and permissions information is available online at http://www.nature.com/reprints/index.html.
1. Varela, F., Lachaux, J.P., Rodriguez, E. & Martinerie, J. The brainweb: phase synchronization and large-scale integration. Nat. Rev. Neurosci. 2, 229–239 (2001).
2. Engel, A.K. & Singer, W. Temporal binding and the neural correlates of sensory awareness. Trends Cogn. Sci. 5, 16–25 (2001).
3. Buzsáki, G. Rhythms of the Brain (Oxford University Press, 2006).4. Rao, R.P. & Ballard, D.H. Predictive coding in the visual cortex: a functional
interpretation of some extra-classical receptive-field effects. Nat. Neurosci. 2, 79–87 (1999).
5. Ranck, J.B. Head direction cells in the deep cell layer of dorsal presubiculum in freely moving rats. in Electrical Activity of Archicortex (eds. Buzsáki, G. & Vanderwolf, C.H.) 217–220 (Akademiai Kiado, 1985).
6. Taube, J.S., Muller, R.U. & Ranck, J.B. Jr. Head-direction cells recorded from the postsubiculum in freely moving rats. II. Effects of environmental manipulations. J. Neurosci. 10, 436–447 (1990).
7. Taube, J.S. The head direction signal: origins and sensory-motor integration. Annu. Rev. Neurosci. 30, 181–207 (2007).
8. Sharp, P.E., Blair, H.T. & Cho, J. The anatomical and computational basis of the rat head-direction cell signal. Trends Neurosci. 24, 289–294 (2001).
9. Taube, J.S. Head direction cells recorded in the anterior thalamic nuclei of freely moving rats. J. Neurosci. 15, 70–86 (1995).
10. Zugaro, M.B., Arleo, A., Berthoz, A. & Wiener, S.I. Rapid spatial reorientation and head direction cells. J. Neurosci. 23, 3478–3482 (2003).
11. Knierim, J.J., Kudrimoti, H.S. & McNaughton, B.L. Place cells, head direction cells and the learning of landmark stability. J. Neurosci. 15, 1648–1659 (1995).
12. McNaughton, B.L., Battaglia, F.P., Jensen, O., Moser, E.I. & Moser, M.-B. Path integration and the neural basis of the ‘cognitive map’. Nat. Rev. Neurosci. 7, 663–678 (2006).
13. Sargolini, F. et al. Conjunctive representation of position, direction, and velocity in entorhinal cortex. Science 312, 758–762 (2006).
14. Goodridge, J.P. & Taube, J.S. Interaction between the postsubiculum and anterior thalamus in the generation of head direction cell activity. J. Neurosci. 17, 9315–9330 (1997).
15. Brandon, M.P. et al. Reduction of theta rhythm dissociates grid cell spatial periodicity from directional tuning. Science 332, 595–599 (2011).
16. Langston, R.F. et al. Development of the spatial representation system in the rat. Science 328, 1576–1580 (2010).
17. Wills, T.J., Cacucci, F., Burgess, N. & O’Keefe, J. Development of the hippocampal cognitive map in preweanling rats. Science 328, 1573–1576 (2010).
18. Skaggs, W.E., Knierim, J.J., Kudrimoti, H.S. & McNaughton, B.L. A model of the neural basis of the rat’s sense of direction. Adv. Neural Inf. Process. Syst. 7, 173–180 (1995).
19. Zhang, K. Representation of spatial orientation by the intrinsic dynamics of the head-direction cell ensemble: a theory. J. Neurosci. 16, 2112–2126 (1996).

©20
15N
atu
re A
mer
ica,
Inc.
All
rig
hts
res
erve
d.
nature neurOSCIenCe advance online publication
a r t I C l e S
20. Redish, A.D., Elga, A.N. & Touretzky, D.S. A coupled attractor model of the rodent head direction system. Netw. Comput. Neural Syst. 7, 671–685 (1996).
21. Burak, Y. & Fiete, I.R. Fundamental limits on persistent activity in networks of noisy neurons. Proc. Natl. Acad. Sci. USA 109, 17645–17650 (2012).
22. Knierim, J.J. & Zhang, K. Attractor dynamics of spatially correlated neural activity in the limbic system. Annu. Rev. Neurosci. 35, 267–285 (2012).
23. Blair, H.T. Simulation of a thalamocortical circuit for computing directional heading in the rat. in Advances in Neural Information Processing Systems 8 (eds. Touretzky, D.S., Mozer, M.C. & Hasselmo, M.E.) 152–158 (MIT Press, 1996).
24. Amari, S. Dynamics of pattern formation in lateral-inhibition type neural fields. Biol. Cybern. 27, 77–87 (1977).
25. Song, P. & Wang, W.J. Angular path integration by moving “hill of activity”: a spiking neuron model without recurrent excitation of the head-direction system. J. Neurosci. 25, 1002–1014 (2005).
26. Ben-Yishai, R., Bar-Or, R.L. & Sompolinsky, H. Theory of orientation tuning in visual cortex. Proc. Natl. Acad. Sci. USA 92, 3844–3848 (1995).
27. Buzsáki, G. Two-stage model of memory trace formation: a role for ‘noisy’ brain states. Neuroscience 31, 551–570 (1989).
28. Brandon, M.P., Bogaard, A.R., Andrews, C.M. & Hasselmo, M.E. Head direction cells in the postsubiculum do not show replay of prior waking sequences during sleep. Hippocampus 22, 604–618 (2012).
29. Skaggs, W.E. & McNaughton, B.L. Replay of neuronal firing sequences in rat hippocampus during sleep following spatial experience. Science 271, 1870–1873 (1996).
30. Nádasdy, Z., Hirase, H., Czurkó, A., Csicsvari, J. & Buzsáki, G. Replay and time compression of recurring spike sequences in the hippocampus. J. Neurosci. 19, 9497–9507 (1999).
31. Lee, A.K. & Wilson, M.A. Memory of sequential experience in the hippocampus during slow wave sleep. Neuron 36, 1183–1194 (2002).
32. Euston, D.R., Tatsuno, M. & McNaughton, B.L. Fast-forward playback of recent memory sequences in prefrontal cortex during sleep. Science 318, 1147–1150 (2007).
33. Peyrache, A., Khamassi, M., Benchenane, K., Wiener, S.I. & Battaglia, F.P. Replay of rule-learning related neural patterns in the prefrontal cortex during sleep. Nat. Neurosci. 12, 919–926 (2009).
34. Johnson, A., Seeland, K. & Redish, A.D. Reconstruction of the postsubiculum head direction signal from neural ensembles. Hippocampus 15, 86–96 (2005).
35. Averbeck, B.B., Latham, P.E. & Pouget, A. Neural correlations, population coding and computation. Nat. Rev. Neurosci. 7, 358–366 (2006).
36. Harris, K.D., Csicsvari, J., Hirase, H., Dragoi, G. & Buzsaki, G. Organization of cell assemblies in the hippocampus. Nature 424, 552–556 (2003).
37. Mehta, M.R., Barnes, C.A. & McNaughton, B.L. Experience-dependent, asymmetric expansion of hippocampal place fields. Proc. Natl. Acad. Sci. USA 94, 8918 (1997).
38. Muir, G.M. et al. Disruption of the head direction cell signal after occlusion of the semicircular canals in the freely moving chinchilla. J. Neurosci. 29, 14521–14533 (2009).
39. Wilson, M.A. & McNaughton, B.L. Reactivation of hippocampal ensemble memories during sleep. Science 265, 676 (1994).
40. Reid, R.C. & Alonso, J.-M. Specificity of monosynaptic connections from thalamus to visual cortex. Nature 378, 281–284 (1995).
41. Bruno, R.M. & Sakmann, B. Cortex is driven by weak but synchronously active thalamocortical synapses. Science 312, 1622–1627 (2006).
42. Neuenschwander, S. & Varela, F.J. Visually Triggered neuronal oscillations in the pigeon: an autocorrelation study of tectal activity. Eur. J. Neurosci. 5, 870–881 (1993).
43. Craig, A.D. (Bud). Pain mechanisms: labeled lines versus convergence in central processing. Annu. Rev. Neurosci. 26, 1–30 (2003).
44. Jones, E.G. The Thalamus (Cambridge University Press, 2007).45. Shibata, H. Topographic organization of subcortical projections to the anterior
thalamic nuclei in the rat. J. Comp. Neurol. 323, 117–127 (1992).46. Gonzalo-Ruiz, A. & Lieberman, A.R. Topographic organization of projections from
the thalamic reticular nucleus to the anterior thalamic nuclei in the rat. Brain Res. Bull. 37, 17–35 (1995).
47. Couey, J.J. et al. Recurrent inhibitory circuitry as a mechanism for grid formation. Nat. Neurosci. 16, 318–324 (2013).
48. Moser, E.I., Moser, M.-B. & Roudi, Y. Network mechanisms of grid cells. Philos. Trans. R. Soc. B Biol. Sci. 369, 20120511 (2014).
49. Burgess, N., Barry, C. & O’Keefe, J. An oscillatory interference model of grid cell firing. Hippocampus 17, 801–812 (2007).
50. Moser, E.I., Kropff, E. & Moser, M.-B. Place cells, grid cells, and the brain’s spatial representation system. Annu. Rev. Neurosci. 31, 69–89 (2008).
©20
15N
atu
re A
mer
ica,
Inc.
All
rig
hts
res
erve
d.
nature neurOSCIenCe doi:10.1038/nn.3968
ONLINE METHODSelectrodes, surgery and data acquisition. All experiments were approved by the Institutional Animal Care and Use Committee of New York University Medical Center. Five adult male and two female mice (27–50 g) were implanted with recording electrodes under isoflurane anesthesia, as described previously51. Silicon probes (Neuronexus) were mounted on movable drives for recording of neuronal activity and LFPs in the anterior thalamus (n = 7 mice) and, in addition in the PoS (n = 3 of 7 mice). In the four animals implanted only in the anterior thalamus, electrodes were also implanted in the hippocampal CA1 pyramidal layer for accurate sleep scoring: 3–6 50-µm tungsten wires (Tungsten 99.95%, California Wire Company) were inserted in silicate tubes and attached to a micro-manipulator. Thalamic probes were implanted in the left hemisphere, perpen-dicularly to the midline, (AP: −0.6 mm; ML:−0.5 to −1.9 mm; DV: 2.2 mm), with a 10–15° angle, the shanks pointing toward midline (Supplementary Fig. 1a–f). Post-subicular probes were inserted at the following coordinates: AP: −4.25 mm: ML: −1 to −2 mm; DV: 0.75 mm (Supplementary Fig. 1g,h). Hippocampal wire bundles were implanted above CA1 (AP: −2.2 mm; −1 to −1.6 mm ML; 1 mm DV).
The probes consisted of 4, 6 or 8 shanks (200-µm shank separation) and each shank had 8 (4 or 8 shank probes, Buz32 or Buz64, Neuronexus) or 10 recording (6-shank probes, Buz64s) sites (160 µm2 each site, 1–3-MΩ impedance), stag-gered to provide a two-dimensional arrangement (20-µm vertical separation). In all experiments ground and reference screws or 100-µm diameter tungsten wires were implanted in the bone above the cerebellum.
During the recording session, neurophysiological signals were acquired continuously at 20 kHz on a 256-channel Amplipex system (Szeged; 16-bit resolution, analog multiplexing)52. The wide-band signal was downsampled to 1.25 kHz and used as the LFP signal. For tracking the position of the animals on the open maze and in its home cage during rest epochs, two small light-emitting diodes (5-cm separation), mounted above the headstage, were recorded by a digital video camera at 30 frames per s. The LED locations were detected online and resampled at 39 Hz by the acquisition system (note that the absolute time of the first video frame was randomly misaligned by 0–60 ms but the sampling rate was accurate thereafter). Spike sorting was performed semi-automatically, using KlustaKwik53 (http://klustakwik.sourceforge.net/). This was followed by manual adjustment of the waveform clusters using the software Klusters54. Examples of simultaneously recorded neurons and quantification of isolation quality are shown in Supplementary Figure 8.
After 4–7 d of recovery, the thalamic probes were lowered until the first tha-lamic units could be detected on at least 2–3 shanks. At the same time, hippo-campal wires were slowly lowered until reaching the CA1 pyramidal layer, characterized by high amplitude ripple oscillations. The probe was then lowered by 70–140 µm at the end of each session.
In the animals implanted in both the thalamus and in the PoS, the subicular probe was moved everyday once large HD cell ensembles were recorded from the thalamus. Thereafter, the thalamic probes were left at the same position as long as the quality of the recordings remained. They were subsequently adjusted to optimize the yield of HD cells. To prevent statistical bias of neuron sampling, we discarded from analysis sessions separated by less than 3 d during which the thalamic probe was not moved.
Three animals had channelrhodopsin conditionally expressed in parvalbumin (one animal) or CamKII (two animals) positive neurons but these aspects of the experiments are not part of the present study.
Recording sessions and behavioral procedure. Recording sessions were com-posed of exploration of an open environment (wake phase) during which the ani-mals were foraging for food for 30–45 min. The environment was a 53- × 46-cm rectangular arena surrounded by 21-cm-high, black-painted walls on which were displayed two salient visual cues. The exploration phase was (in 41 of 42 sessions) preceded and followed by sleep sessions of about 2-h duration. In one session, the exploration of a radial maze following the second sleep phase was considered as the wake period and no sleep was recorded subsequently. All experiments were carried out during daylight in normal light-dark cycle.
Hd cells. The animal’s HD was calculated by the relative orientation of a blue and red LEDs located on top of the head (see above). The HD fields were com-puted as the ratio between histograms of spike count and total time spent in
each direction in bins of 1 degree and smoothed with a Gaussian kernel of 6° s.d. Times when one of the LEDs was not detected were excluded from the analysis. The distributions of angular values making the HD fields were fitted with von Mises distributions defined by their circular mean (preferred HD), concen-tration (equivalent to the inverse of the variance for angular value variables) and peak firing rates. The probability of the null hypothesis of uniformly distributed firing in all directions was evaluated with a Rayleigh test. Neurons were classified as HD cells for concentration parameter exceeding 1, peak firing rates greater than 1Hz and probability of non-uniform distribution smaller than 0.001. In all cross-correlation analyses, only cells firing at least at 0.5 Hz in any of the three brain states were included.
242 of 720 recorded cells (41% on average) in the anterior thalamus, and 111 of 357 (31%) cells in the PoS were classified as HD cells. In the thalamus, when considering only cell ensembles recorded on silicon probe shanks where at least one HD cell was detected, the average proportion of HD cells was 71%, a number close to the previous estimation of HD cell density in this structure.
Sleep scoring. Sleep stage scoring was assessed on the basis of time-resolved spectrograms of the CA1 pyramidal layer or PoS LFPs, and of the movement of the animal. Behavioral stages were first detected by automatic software based on a Bayesian hierarchical clustering method, whose relative weights were learned from hand-scored data. Stages were then visually inspected and manu-ally adjusted55.
Bayesian reconstruction of Hd. Following previous work56, the ‘internal’ HD (Fig. 1 and Supplementary Fig. 3) was reconstructed using a Bayesian frame-work. In short, at each time bin (10 ms, smoothed in 300-ms s.d. Gaussian win-dows for wake and REM, 50-ms windows for SWS), based on cells’ tuning curves from waking spike data, the population vectors were converted into a probabilistic map under the hypothesis that HD cells fire as a Poisson process. The instan-taneous internal HDs were taken as the maxima of these probabilistic maps. Bayesian reconstruction was used only when at least six HD cells were recorded in one given structure (ADn or PoS). These estimates faithfully tracked the head position in the waking mouse.
estimation of angular velocity. Under the hypothesis of independent rate-coded cells, temporal cross-correlograms between two HD neurons depend primarily on two parameters: the tuning curves of the neurons and time course of the angular velocity of the animal’s head. Specifically, the cross-correlogram depends on the angular correlation ρ(θ) between the two tuning curves, determined as the correlation of firing rates as a function of angular offset.
One way to interpret a temporal cross-correlogram is the following: at angular velocity υ, it takes a time τ to cover an angular distance θ = υτ; thus, at time lag τ, the temporal correlation can be approximated by the average angular correla-tion ρ(θ)v = ρ(vτ)v, where ⟨.⟩v denotes average over all possible angular veloci-ties. Thus, we hypothesized that the temporal cross-correlation estimates the average angular speed, assuming a model of angular velocity distribution and knowing the angular correlation between the two tuning curves. To this end, we searched for the average velocity which best predicted the observed cross- correlograms. First, the angular speed distribution is assumed to be a Chi-squared distribution with 3 degrees of freedom, but the final results held for other non-normal (that is, skewed) and positive random variables. Next, an expected tem-poral cross-correlogram is built and compared to the observed correlation. An unconstrained, derivative-free optimization algorithm searches for the average velocity υ minimizing the sum of squared difference between the estimated and observed cross-correlograms (the cost function). A first coarse-grained esti-mation of the cost function on a broad range of possible velocities gives a first approximation of υ. It is used as an initial condition for the fine search of the optimal value to improve the accuracy and computation speed of the algorithm (Supplementary Fig. 4).
cross-correlation under the hypothesis of independent firing rate coding scheme. To further understand if an animal’s behavior could fully account for the observed correlations during waking, (that is, if the correlation was simply the result of first order interactions), we computed the expected correlations under the hypothesis of independent firing rates. To this end, we constructed for each neuron an ‘intensity’ function f(t) based on the animal’s instantaneous HD

©20
15N
atu
re A
mer
ica,
Inc.
All
rig
hts
res
erve
d.
nature neurOSCIenCedoi:10.1038/nn.3968
and the cell’s tuning curve. Thus, for neuron i, fi(t) = hi(θ(t)), where θ(t) is the orientation of the animal at time t and hi the HD field of cell i.
The cross-correlations Cij(t) (Fig. 4a–c) of the discretized intensity functions fi(t) and fj(t) were computed as
C tN
f t fij i j( ) ( ) ( )= +∑1
tt t
where N is the length of the vectors fi and fj.HD and neuronal data were binned in 10-ms windows. To ensure a valid
comparison, correlations of the binned spike trains were computed the same way as the intensity functions.
The difference between the intensity function and binned spike train correla-tions averaged between −50 and +50 ms was referred to as noise correlations35 (Fig. 4b,c).
Information measures. These methods aim to quantify the predictability of a spike train relatively to a given behavioral or physiological observable36. In short, as described in the previous section, a spike train can be predicted by an intensity function f. It can be shown57 that the log-likelihood Lf of a spike train ts, given a given intensity function, is
L f t f t dtfs
s= −∑ ∫log( ( )) ( )
This log-likelihood, measuring the predictability of the spike train, was compared with the log-likelihood L0 of a homogeneously firing neuron, at the average firing rate observed during the training epoch. Thus, the predictability of the spike train was defined as the difference (or log-likelihood ratio) L = Lf − L0.
This predictability can be interpreted as an information rate about the variable used to generate the intensity function. It is thus expressed in bit per second. Throughout the study, these rates were normalized by the cell’s firing rate during the epochs of interest and were thus given in bit per spike.
To quantify the predictability of a spike train, we used a cross-validation pro-cedure. The log-likelihood ratio was thus computed on a different epoch, the test set, than the one used to train the intensity function, the training set. Each epoch of interest was divided in ten segments: spike train from one segment was tested against the intensity function estimated from the training set made from the remaining nine other segments.
The simplest case is the estimation of the HD information content shown in Supplementary Figure 2c. The HD field Htraining(θ) of a cell is generated on the training set, which is 90% of the wake epoch. Knowing the behavior of the animal (that is, its HD, θ(t)) during the test epoch (the remaining 10% of the waking period), the spike trains were tested against the intensity function f(t) = Htraining(θ(t)).
To quantify the extent to which a cell ensemble can predict the spiking of a given neuron (as in Fig. 5c–e), the intensity function was derived from a gen-eralized linear model of the ensemble spiking activity. More specifically, a rate r(t) was defined, for each time, as a linear combination of the activity of the cells belonging to the ensemble
r t q ti
i i( ) ( )= ∑w
where ωi is the weights associated with the neuron i in the predictive ensemble, and qi(t) its activity at time t.
The associated intensity function was then defined as
f t g r tensemble( ) ( ( ))=
where the link function g is a modified exponential function (linear for posi-tive arguments), a necessary modification to avoid excessively high predicted intensities36.
The spiking activity of the cells was binned in 10-ms windows. It was then convolved with Gaussian kernels of variable width, referred to as readout win-dows in Figure 5d.
The weights were determined by minimizing for each training set the log-likelihood ratio using a multivariate, unconstrained and derivative-free
search algorithm. To improve computation speed, the weights of the first training set were used as initial conditions for the nine others.
Only the neurons that were positively predicted for at least one readout time window were included in the final analysis in Figure 5d,e (ADn from PoS assemblies: n = 62; PoS from ADn assemblies: n = 86).
ensemble coherence. To examine the coherence of the activity packet we applied the measure as described previously34: the actual activity packet (the sum of the normalized tuning curves weighted by the instantaneous firing rates) was compared to the expected activity packet given the estimated HD by a Bayesian decoding of the population. To build proper statistics (and normalize between 0 and 1 the coherence measure), for each degree of the HD, 5,000 population vectors were randomly chosen from the wake recordings and compared to the expected packet at the decoded angle. Next, the actual packets during each brain state were tested under the null hypothesis that they are similar to the expected packets at the decoded HD. A coherence measure close to 1 (and, statistically speaking, whenever it is greater than 0.05) indicates significant similarity.
detection of mono-synaptic connections. The spike train cross-correlogram of two neurons can reveal synaptic contacts between each other58,59. This takes the form in the cross-correlogram of short time-lag (1–10 ms) positive or negative deviations from baseline indicating putative excitatory or inhibitory connections, respectively. Such detection is based on statistics testing the null hypothesis of a homogeneous baseline at short time-scale58. To this end, cross-correlograms binned in 0.5-ms windows were convolved with a 10-ms s.d. Gaussian window resulting in a predictor of the baseline rate. At each time bin, the 99.9 percentile of the cumulative Poisson distribution (at the predicted rate) was used at the statistical threshold for significant detection of outliers from baseline. In this study, we focused on excitatory connections for two reasons: (i) all thalamo-cortical and cortico-thalamic connections are expected to be excitatory and (ii) all candidates for inhibitory connections resulted from short timescale oscillatory processes associated with a excitatory connection in the other direction. A putative connection was considered significant when at least two consecutive bins in the cross-correlograms passed the statistical test.
classification of PoS neurons as putative interneurons or pyramidal cells. Cortical pyramidal cells and the majority of cortical GABAergic interneurons were classified on the basis of their waveform features60,61. Putative pyramidal were characterized by broad waveforms, whereas putative interneurons had nar-row spikes. To separate between the two classes of cells, we used two waveform features: (i) total duration of the spike, defined as the inverse of the maximum power associated frequency in its power spectrum (obtained from a wavelet trans-form) and (ii) the trough-to-peak duration (Supplementary Fig. 7). Putative interneurons were defined as cells with narrow waveform (duration < 0.9 ms) and short trough to peak (<0.42 ms). Conversely, cells with broad waveforms (duration > 0.95 ms) and long trough-to-peak (>0.42 ms) were classified as puta-tive pyramidal cells.
Statistical analysis. All statistical analyses were performed in Matlab (MathWorks). Number of animals and number of recorded cells were similar to those generally employed in the field6,10,11,28. All tests were two-tailed. For all tests, non-parametric Mann-Whitney U test, Wilkinson’s signed rank test and Kruskal-Wallis one-way analysis of variance were used. Correlations were computed using Pearson’s correlation coefficient.
A Supplementary Methods checklist is available.
51. Stark, E., Koos, T. & Buzsáki, G. Diode probes for spatiotemporal optical control of multiple neurons in freely moving animals. J. Neurophysiol. 108, 349–363 (2012).
52. Berényi, A. et al. Large-scale, high-density (up to 512 channels) recording of local circuits in behaving animals. J. Neurophysiol. 111, 1132–1149 (2014).
53. Harris, K.D., Henze, D.A., Csicsvari, J., Hirase, H. & Buzsáki, G. Accuracy of tetrode spike separation as determined by simultaneous intracellular and extracellular measurements. J. Neurophysiol. 84, 401–414 (2000).
54. Hazan, L., Zugaro, M. & Buzsáki, G. Klusters, NeuroScope, NDManager: a free software suite for neurophysiological data processing and visualization. J. Neurosci. Methods 155, 207–216 (2006).
55. Grosmark, A.D., Mizuseki, K., Pastalkova, E., Diba, K. & Buzsáki, G. REM sleep reorganizes hippocampal excitability. Neuron 75, 1001–1007 (2012).

©20
15N
atu
re A
mer
ica,
Inc.
All
rig
hts
res
erve
d.
nature neurOSCIenCe doi:10.1038/nn.3968
56. Zhang, K., Ginzburg, I., McNaughton, B.L. & Sejnowski, T.J. Interpreting neuronal population activity by reconstruction: unified framework with application to hippocampal place cells. J. Neurophysiol. 79, 1017–1044 (1998).
57. Brown, N.E., Barbieri, R., Eden, U.T. & Frank, L.M. Likelihood methods for neural spike train data analysis. in Computational Neuroscience: a Comprehensive Approach (ed. Feng, J.) 252–283 (Chapman and Hall/CRC, 2003).
58. Stark, E. & Abeles, M. Unbiased estimation of precise temporal correlations between spike trains. J. Neurosci. Methods 179, 90–100 (2009).
59. Fujisawa, S., Amarasingham, A., Harrison, M.T. & Buzsáki, G. Behavior-dependent short-term assembly dynamics in the medial prefrontal cortex. Nat. Neurosci. 11, 823–833 (2008).
60. McCormick, D.A., Connors, B.W., Lighthall, J.W. & Prince, D.A. Comparative electrophysiology of pyramidal and sparsely spiny stellate neurons of the neocortex. J. Neurophysiol. 54, 782–806 (1985).
61. Barthó, P. Characterization of neocortical principal cells and interneurons by network interactions and extracellular features. J. Neurophysiol. 92, 600–608 (2004).