Do the Numbers Make Sense?
15
Do the Numbers Make Sense? Everyautumn, U.S. News& World Report publishesa story ranking accredited four-year colleges and universities throughout the United States.These ratings by U.S.News & World Report are very influential in determining publicopin- ion aboutthe quality of the nation's colleges and uni- versities. However, criticsof the ratings question the quality of the data used to rank schools. For exam- ple, onecriticasserted that some colleges deliberately manipulate the data they report in order to obtain higher rankings. Business data, advertising claims, debate on pub- lic issues-we are assailed dailyby numbers intended to prove a point, buttress an argument, or assure us that all is well. Sometimes, as the critics of the U.S. News & World Report rankingsmaintain, we are fed fake data. Sometimes peoplewho use data to argue a causecare more for the causethan for the accu- racyof the data. Others simply lack the skills needed to employnumbers carefully. We knowthat we should always ask . How werethe data produced? . What exactly was measured? We alsoknow quite a bit about what good answers to these questions soundlike. That's wonderful, but it isn't enough. We also need "number sense," the habit of asking if numbers makesense. Developing number sense is the purpose of this chapter. To help developnumbersense, we will look at how bad data, or good dataused wrongly, cantrick.the unwary. r What didn't they tell us? The most common way to misleadwith data is to cite correct numbersthat don't quite mean what they appearto say because we aren't told the full story.The numbersare not made up, so the fact that the information is a 165
-
Upload
khangminh22 -
Category
Documents
-
view
4 -
download
0
Transcript of Do the Numbers Make Sense?

Do the Numbers Make Sense?
Every autumn, U.S. News & World Reportpubl ishes a story ranking accredited
four-year colleges and universities throughout theUnited States. These ratings by U.S. News & WorldReport are very influential in determining public opin-ion about the qual i ty of the nat ion's col leges and uni-versities. However, critics of the ratings question thequality of the data used to rank schools. For exam-ple, one critic asserted that some colleges deliberatelymanipulate the data they report in order to obtainhigher rankings.
Business data, advert is ing claims, debate on pub-l ic issues-we are assai led dai ly by numbers intendedto prove a point, buttress an argument, or assure usthat all is well. Sometimes, as the critics of the U.S.News & World Report rankings maintain, we are fedfake data. Sometimes people who use data to arguea cause care more for the cause than for the accu-racy of the data. Others simply lack the ski l ls neededto employ numbers carefully. We know that we shouldalways ask
. How were the data produced?
. What exactly was measured?
We also know quite a bit about what good answers to these questions sound like.That's wonderful, but it isn't enough. We also need "number sense," the habit ofasking i f numbers make sense. Developing number sense is the purpose of thischapter. To help develop number sense, we will look at how bad data, or gooddata used wrongly, can tr ick. the unwary. r
What didn't they tell us?The most common way to mislead with data is to cite correct numbers thatdon't quite mean what they appear to say because we aren't told the fullstory. The numbers are not made up, so the fact that the information is a
165

166 CHAPTER 9 Do the Numbers Make Sense?
bit incomplete may be an innocent oversight. Here are some examples. Youdecide how innocent thev are.
EXAMPLE 1 Snow! Snow! Snow!
Crested Butte attracts skiers by advertising that it has the highestaverage snowfall of any ski town in Colorado. That's true. But skiers wantsnow on the ski slopes, not in the town-and many other Colorado resortsget more snow on the slopes.
EXAMPLE 2 Yet more snow
News reports of snowstorms say things like'A winter storm spread snowacross the area, causing 28 minor traffic accidents." Eric Meyer, a re-porter in Milwaukee, Wisconsin, says he often called the sheriff to gathersuch numbers. One day he decided to ask the sheriff how many minoraccidents are typical in good weather: about 48, said the sheriff. Per-haps, says Meyer, the news should say, "Today's winter storm prevented20 minor traffic accidents."
" Sure your potients hov e 50% f ew er cavities. Thot's becouse they hav e 50%fewer teethl"
EXAMPLE 3 We attract really good students
Colleges know that many prospective students look at popular guidebooksto decide where to apply for admission. The guidebooks print informationsupplied by the colleges themselves. Surely no college would simply lie
a
Are the numbers consistent with each other?
about, say, the average SAT score of its entering students. But we do wantour scores to look good. How about leaving out the scores ofour interna-tional and remedial students? Northeastern University did this, makingthe average SAT score of its freshman class 50 points higher than if allstudents were included. If we admit economically disadvantaged studentsunder a special program sponsored by the state, surely no one will com-plain if we leave their SAI scores out of our average? New York Universitydid this.
The point of these examples is that numbers have a context. If you don'tknow the context, the lonely, isolated, naked number doesn't tell you much.
Are the numbers consistent with each other?Here's an example.
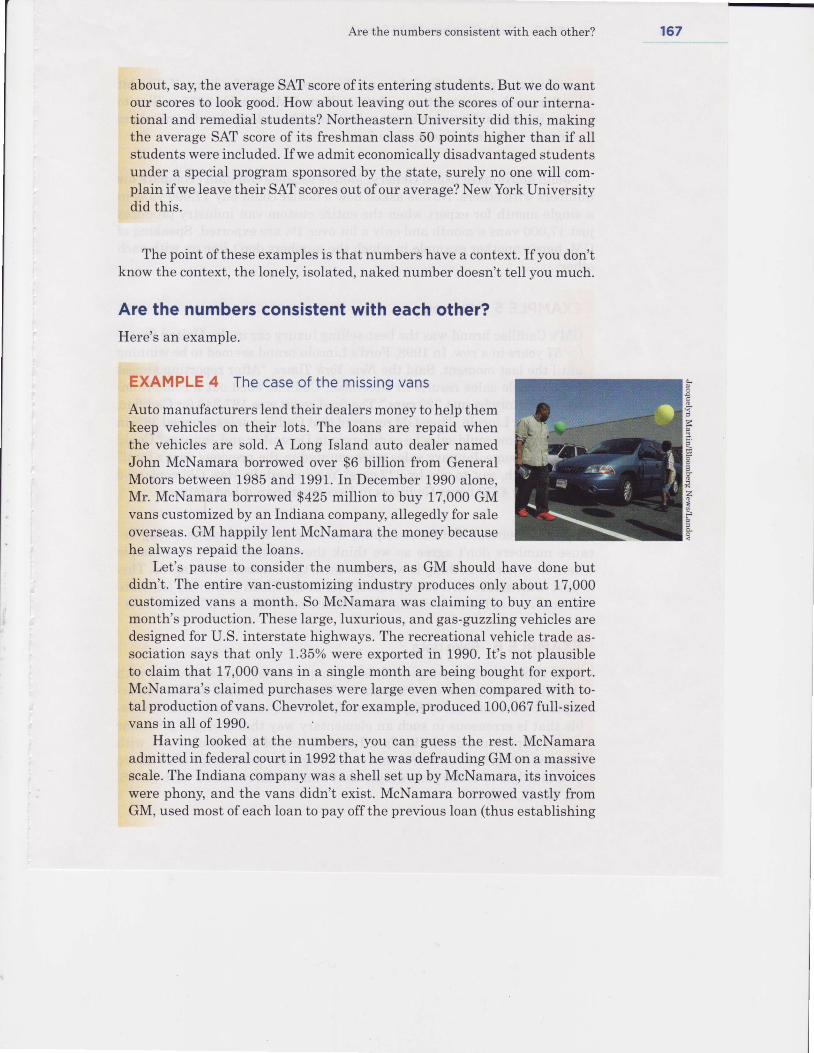
EXAMPLE 4 The case of the missing vans
Auto manufacturers lend their dealers money to help themkeep vehicles on their lots. The loans are repaid whenthe vehicles are sold. A Long Island auto dealer namedJohn McNamara borrowed over S6 billion from GeneralMotors between 1985 and 1991. In December 1990 alone,Mr. McNamara borrowed $425 million to buy 17,000 GMvans customized by an Indiana company, allegedly for saleoverseas. GM happily lent McNamara the money becausehe always repaid the loans.
Let's pause to consider the numbers, as GM should have done butdidn't. The entire van-customizing industry produces only about 17,000customized vans a month. So McNamara was claiming to buy an entiremonth's production. These large,luxurious, and gas-guzzling vehicles aredesigned for U.S. interstate highways. The recreational vehicle trade as-sociation says that only 1.35% were exported in 1990. It's not plausibleto claim that 17,000 vans in a single month are being bought for export.McNamara's claimed purchases were large even when compared with to-tal production of vans. Chevrolet, for example, produced 100,067 fuII-sizedvans in all of 1990.
Having looked at the numbers, you can guess the rest. McNamaraadmitted in federal court in l992thathe was defrauding GM on a massivescale. The Indiana company was a shell set up by McNamara, its invoiceswere phony, and the vans didn't exist. McNamara borrowed vastly fromGM, used most of each loan to pay off the previous loan (thus establishing
767
3
z{

168 CHAPTER 9 Do the Numbers Make Sense?
a record as a good credit risk), and skimmed off a bit for himself. The bithe skimmed amounted to over $400 million. GM set aside $275 million tocover its losses. Ttvo executives, who should have looked at the numbersrelevant to their business, were fired.
John McNamara fooled General Motors because GM didn't compare hisnumbers with others. No one asked how a dealer could buy 17,000 vans ina single month for export when the entire custom van industry producesjust 17,000 vans a month and only a bit over 1o/o are exported. Speaking ofGM, here's another example in which the numbers don't line up with eachother.
EXAMPLE 5 We won!
GM's Cadillac brand was the best-selling luxury car in the United Statesfor 57 years in a row. In 1998, Ford's Lincoln brand seemed to be winninguntil the last moment. Said the New York Times, "After reporting almostunbelievable sales results in December, Cadillac eked out a come-from-behind victory by just 222 cars." The final count was 187,343 for Cadillac,187,IzL for Lincoln. Then GM reported that Cadillac sales dropped 38% inJanuary. How could sales be so different in December and January? Couldit be that some January sales were counted in the previous year's total?Just enough, say, to win by 222 cars? Yes, indeed. In May, GM confessedthat it sold 4773 fewer Cadillacs in December than it had claimed.
In the General Motors examples, we suspect something is wrong be-cause numbers don't agree as we think they should. Here's an examplewhere we know something is wrong because the numbers don't agree. Thisis part of an article on a cancer researcher at the Sloan-Kettering Institutewho was accused of committing the ultimate scientific sin, falsifying data.
EXAMPLE 6 Fake data
"One thing he did manage to finish was a summary paper dealing withthe Minnesota mouse experiments.... That paper, cleared at SKI and ac-cepted by the Journal of Experimental Medicine, contains a statistical ta-ble that is erroneous in such an elementary way that a bright grammarschool pupil could catch the flaw. It lists 6 sets of 20 animals each, withthe percentages ofsuccessful takes. Although any percentage of20 has tobe a multiple of 5, the percentages that Summerlin recorded were 53, 58,63, 46,48, and 67."

-Are the numbers too Eood to be true?
Are the numbers plausible?
As the General Motors examples illustrate, you can often detect dubiousnumbers simply because they don't seem plausible. Sometimes you cancheck an implausible number against data in reliable sources such as theannual Statistical Abstract of the United States. Sometimes, as the nextexample illustrates, you can do a calculation to show that a number can'tbe right.
EXAMPLE 7 The abundant melon field
The very respectablejournal Science, in an article on insects that attackplants, mentioned a California field that produces 750,000 melons peracre. A reader responded, "I learned as a farm boy that an acre covers43,560 square feet, so this remarkable field produces about 17 melonsper square foot. If these are cantaloupes, with each fruit covering about1 square foot, I guess they must grow in a stack 17 deep." Here is thecalculation the reader did:
melons per square foot :melons per acre
169
square feet per acre
750,000 1d i43560
: Lt 'z
The editor, a bit embarrassed, replied that the correct figure was about11,000 melons per acre.
9.1 Bombarded by Baptists? In a May 8, 1976, article, theNew York Tlmes reported, "Altogether, in some 30 associations
and groups of independents, there are almost 80 million Baptists in thenation. They are outnumbered only by the Roman Catholics." Is the number80 million plausible? Visit the Web site www.census.gov/popest/archives/199Os/popclockest.txt to see what the population of the United States wasin 1976.
Are the numbers too good to be true?In Example 6, Iack of consistency led to the suspicion that the data werephony. Too much precision or regularity can lead to the same suspicion, aswhen a student's lab report contains data that are exactly as the theory pre-dicts. The laboratory instructor knows that the accuracy of the equipmentand the student's laboratory technique are not good enough to give such

170
Just a little arithmeticmistakeIn 1994, an investment c lub ofgrandmotherly women wrote abest-sel ler, The Beardstown Ladies'Common-Sense /nvestment Guide:How We Beat the Stock Market-and How You Can, Ioo. On thebook cover and in their many TVappearances, the down-home au-thors c la imed a 23.4% annual re-turn, beat ing the market and mostprofessiona s, Four years later. askept ic discovered that the c lubtreasurer had entered data incor-rect ly. The Beardstown ladies' t ruereturn was only 9.1%, far short ofthe overall stock market return of14.9o/o in the same period. We allmake mistakes, but most of themdon' t earn as much money as th isone did,
In this case, suspicious regularity (identical datapoints) combined with inconsistency (different numbersof animals) led a careful reader to suspect fraud.
ls the arithmetic r ight?Conclusions that are wrong or just incomprehensibleare often the result of plain old-fashioned blunders.Rates and percentages cause particular trouble.
EXAMPLE 9 Oh, those percents
Here are some examples from Australia. TheCanberra Times reported, "Of those aged more than 60living alone, 34%o are women and only ISoh are men."That's 49% of those living alone. Are we to supposethat the other 51% are neither women nor men?
Even smart people have problems with percent-ages. A newsletter for female university teachersasked, "Does it matter that women are 550o/o (five anda half times) Iess likely than men to be appointedto a professional grade?" Now 100% of something is'ali there is. If you take away l00yn, there is nothingleft. We have no idea what "550oA less likely" mightmean. Although we can't be sure, it is possible thatthe newsletter meant that the likelihood for womenis the likelihood for men divided bv 5.5. In this case.
CHAPTER 9 Do the Numbers Make Sense?
perfect results. He suspects that the student made them up. Here is anexample drawn from an article rn Science about fraud in medical research.
EXAMPLE I More fake data
"Lasker had been asked to write a letter of support. But in reading twoof Slutsky's papers side by side, he suspected that the same 'control' ani-mals had been used in both without mention of the fact in either. Identicaldata points appeared in both articles, but . . . the actual number of animalscited in each case was different. This suggested at best a sloppy approachto the facts. Almost immediately after being asked about the statisticaldiscrepancies, Slutsky resigned and left San Diego."

-Is the arithmetic right? 171
the percentage decrease would be
percentage decrease :likelihood for men - likelihood for women
,.likelihood for men
likelihood for men - likelihood for men/5.5
likelihood for men
:+x1oo%
L00%
x IO0%
x IO0%:8I.8Yo
It seems that few people do arithmetic once they leave school. Those whodo are less likely to be taken in by meaningless numbers. A little thoughtand a calculator go a long way.
EXAMPLE tO Summert ime is burglary t ime
An advertisement for a home security system says, "Whenyou go on vacation, burglars go to work. According to FBIstatistics, over 260/o of home burglaries take place betweenMemorial Day and Labor Day."
This is supposed to convince us that burglars are moreactive in the summer vacation period. Look at your calen-dar. There are 14 weeks between Memorial Day and LaborDay. As a percentage of the 52 weeks in the year, this is
14; :0.269 (that is, 26'9%)5Z
So the ad claims that 26% of burglaries occur in 27% of the year. Youshould not be impressed.
EXAMPLE 11 The old folks are coming
A writer rn Science claimed in 1976 that "people over 65, now numberingl-0 million, will number 30 million by the year 2000, and will constitutean unprecedented 25 percent of the population." Sound the alarm: theelderly were going to triple in a quarter century to become a fourth of thepopulation.
Let's check the arithmetic. Thirty million is 25o/o of I20 million,because
30- 0.25
r20
4.55.5
3
o
a

172 CHAPTER 9 Do the Numbers Make Sense?
So the writer's numbers make sense oniy if the population in 2000 is120 million. The U.S. population in 1975 was already 216 million. Some-thing is wrong.
Thus alerted, we can check the Statistical Abstracl to learn the truth.In 1975, there were 22.4 mlllion people over age 65, not 10 million. That'smore than I0% of the total population. The estimate of 30 million by theyear 2000 was only about 17% of the population of 281 million for thatyear. Looking back from the year 2000, we now know that people at least65 years old are 12% of the total U.S. population. As people live longer,the numbers of the elderly are growing. But growth from 10% to 72%o over25 years is far slower than the Science writer claimed.
Calculating the percentage increase or decrease in some quantity seemsparticularly prone to mistakes. The percentage change in a quantity isfound by
percentage change :amount of change
x 100starting value
EXAMPLE 12 Stocks go up, stocks go down
On September 10, 2001, the NASDAQ composite index of stock pricesclosed at 1695.38. The next day the September 11 terrorist attacks oc-curred. A year later, on September 9,2002, the NASDAQ index closed at1304.60. What percentage decrease was this?
percentage change :amount of change
starting value
1304.60 - 1695.38
1695.38-390.78
: 16gbjg
x 100 : -0.230 x 100 : -23.0o/o
That's a sizable drop. Of course, stock prices go up as well as down. FromSeptember L0,2002, to September 9, 2003, the NASDAQ index rose from1320.09 to 1873.43. That's a percentage increase of
amount of change100: 47.9%
bhe smaller value, in the
x 100
x 100
x 1oo - 553'34
x1320.09starting value
Remember to always use the starting value, notdenominator of your fraction.
9.2 Percentage increase and decrease. On the first quiz ofthe term (worth 20 points total), a student scored a 5. On the
second quiz, he scored a 10. Verify that the percentage increase from thefirst to the second quiz is l0O%. On the third quiz, the student again scored

-Is there a hidden asenda?
a 5. Is it correct to say that the percentage decrease from the second to thethird ouiz is 100%?
A quantity can increase by any amount-a 100% increase just meansit has doubled. But nothing can go down more than 100%-it has then lost100% ofits value, and 100% is all there is.
ls there a hidden agenda?Lots of people feel strongly about various issues, so strongly that they wouldlike the numbers to support their feelings. Often they can find support innumbers by choosing carefully which numbers to report or by working hardto squeeze the numbers into the shape they prefer. Here are two examples.
EXAMPLE 13 Heart d isease in women
A highway billboard says simply, "Halfof all heart disease victims are women."What might be the agenda behind thistrue statement? Perhaps the billboardsponsors just want to make women awarethat they do face risks from heart disease.(Surveys show that many women under-estimate the risk of heart disease.)
On the other hand, perhaps the spon-sors want to fight what some people seeas an overemphasis on male heart dis-ease. In that case, we might want to knowthat although half of heart disease vic-tims are women, they are on the averagemuch older than male victims. Roughly 50,000 women under age 65 and100,000 men under age 65 die from heart disease each year. The AmericanHeart Association says, "Risk of death due to coronary heart disease inwomen is roughly similar to that of men 10 years younger."
EXAMPLE 14 Income inequal i ty
During the economic boom of the 1980s and 1990s in the United States,the gap between the highest and lowest earners widened. In 1980, thebottom fifth of households received 4.3% of all income, and the top fifthreceived 43.7%. By 1998, the share of the bottom fifth had failen to 3.6% ofall income, and the share of the top fifth of households had risen to 49.2%.That is, the top fifth's share was almost 14 times the bottom fifth's share.
173
E
E
a
:=
>1 ffi
c'd Ye c#
d

174 CHAPTER 9 Do the Numbers Make Sense?
Can we massage the numbers to reduce the income gap? An article inForbes (a magazine read mainly by rich folk) tried. First, according to datafrom the Current Population Survey, household income tends to be largerfor larger households, so let's change to income per person. The rich paymore taxes, so look at income after taxes. The poor receive food stampsand other assistance, so let's count that. FinaIIy, high earners work morehours than low earners, so we should adjust for hours worked. After allthis, the share of the top fifth is only 3 times that of the bottom fifth. Ofcourse, hours worked are reduced by illness, disability, care of childrenand aged parents, and so on. If Forbes's hidden agenda is to show thatincome inequality isn't important, we may not agree.
Yet other adjustments are possible. Income, in these Census Bureaufigures, does not include capital gains from, for example, selling stocksthat have gone up. Almost all capital gains go to the rich, so includingthem would widen the income gap. Forbes didn't make this adjustment.Making every imaginable adjustment in the meaning of "income," saysthe Census Bureau, gives the bottom fifth of households 4.7% of totalincome in 1998 and the top fifth 45.8%.
STATISTICS IN SUMMARY
The aim of statistics is to provide insight by means of numbers. Num-bers are most likely to yield their insights to those who examine themclosely. Pay attention to voluntary response samples and to confounding.Ask exactly what a number measures and decide if it is a valid measure.Look for the context of the numbers and ask if there is important missinginformation. Look for inconsistencies, numbers that don't agree as theyshould, and check for incorrect arithmetic. Compare numbers that areimplausible-surprisingly large or small-with numbers you know areright. Be suspicious when numbers are too regular or agree too wellwith what their author would like to see. Look with special care if you sus-pect the numbers are put forward in support of some hidden agenda. Ifyou form the habit of looking at numbers ciosely, your friends will soonthink that you are brilliant. They might even be right.
CASE STUDYEVALUATED
The Case Study that opened the chapter is discussed morethoroughly in the EESEE story "Qual i ty of Col lege Rankings."
This story describes some "suspect" data in the 1995 U.S. News & World Reporf sannual rankings of accredited four-year col leges and universi t ies. Read the storyand then examine the data described in the story. Are any of the numbers suspect?Why? You might look at the quest ions in the EESEE story to help you ident i fypossible sources of suspicious numbers. r

-
Chapter 9 Exercises
CHAPTER 9 EXERCISES
For Exercise 9.1, see page 169; for Exercise 9.2, see page 172.
jX g.g Drunk driving. A newspaper article on drunk driving cited
S data on traffic deaths in Rhode Island: "Forty-two percent of allffiffi fatalities occurred on Friday, Saturday, and Sunday, apparently becauseof increased drinking on the weekends." What percent of the week do Friday,Saturday, and Sunday make up? Are you surprised that 42o/o of fatalities occuron those days?
9.4 Advertising painkillers. An advertisement for the pain reliever T$enolwas headlined'IMhy Doctors Recommend T\'lenol More Than All Leading As-pirin Brands Combined." The makers of Bayer Aspirin, in a reply headlined'Makers of T$enol, Shame on You!" accused Tllenol of misleading by grvingthe truth but not the whole truth. You be the detective. How is Tllenol's claimmisleading even if true?
9.5 Advertising painkillers. Anacin was long advertised as containing "moreof the ingredient doctors recommend most." Another over-the-counter pain re-Iiever claimed that "doctors specify Bufferin most" over other "leading brands."Both advertising claims were literally true; the Federal Tlade Commissionfound them both misleading. Explain why. (Hint: What is the active pain re-liever in both Anacin and Bufferin?)
9.6 Deer in the suburbs. Westchester County is a suburban area covering438 square miles immediately north of New York City. A garden magazineclaimed that the county is home to 800,000 deer. Do a calculation that showsthis claim to be implausible.
9.7 Suicides among Vietnam veterans. Did the horrors of fighting inVietnam drive many veterans of that war to suicide? A figure of 150,000 sui-cides among Vietnam veterans in the 20 years following the end of the warhas been widely quoted. Explain why this number is not plausible. To help you,here are some facts: about 20,000 to 25,000 American men commit suicide eachyear; about 3 million men served in Southeast Asia during the Vietnam War;there were roughly 93 million adult men in the United States 20 years afterthe war.
9.8 Tlash at sea? A report on the problem of vacation cruise ships pollutingthe sea by dumping garbage overboard said:
On a seuen-day cruise, a medium-size ship (about 1,000 passengers) mightaccurnulate 222,000 coffe.e cups, 72,000 soda cans, 40,000 beer cans andbottles, and 11,000 wine bottles.
Are these numbers plausible? Do some arithmetic to back up your conclusion.Suppose, for example, that the crew is as large as the passenger list. How manycups of coffee must each person drink every day?
175

176 CHAPTER 9 Do the Numbers Make Sense?
9.9 Funny numbers. Here's a quotation from a book review in a scientificjournal:
. . . a set of 20 studies with 57 percent reporting signifi.cant results, of which42 percent agree on one conclusion while the remaining 15 percent fauoranother conclusion, often the opposite one.
Do the numbers given in this quotation make sense? Can you decide how manyof the 20 studies agreed on "one conclusion," how many favored another con-clusion, and how many did not report significant results?
9.10 Airport delays. An article in a midwestern newspaper aboutflight delays at major airports said:
According to a Gannett News Seruice study of U.S. airlines'performance during the past fiue months, Chicago's O'Hare Field scheduled114,370 fliqhts. Nearly 10 percent, 1,136, were canceled.
Check the newspaper's arithmetic. What percent of scheduled flights fromO'Hare were actuallv canceled?
9.11 How many miles do we drive? Here is an excerpt from RobertSullivan's'A Slow-Road Movement?" in the Sunday magazine sectionof the New Yorh Tf.mes on June 25. 2006:
According to the Automobile Association of America, in 1956, Americansdroue 628 million miles; in 2002, 2.8 billion. The euen bigger story is trucks.In 1997, according to the Department of Tbansportation, the InterstateSystem handled. more than 1 trillion ton-miles of stuff, a feat executed by21 million truckers driuing approximately 412 billion miles.
(a) There were at least 100 million drivers in the United States in 2002. Howmany miles per driver per year is 2.8 billion miles? Does this seem plausible?(b) According to the report, on average how many miles per year do truckersdrive? Does this seem plausible?(c) Check the most recent Statistical Abstract of the United States at www.census.gov and determine how many miles per year Americans actually drive.
9.12 Battered women? A letter to the editor of the New York Tlmescomplained about a Times editorial that said "an American woman isbeaten by her husband or boyfriend every 15 seconds." The writer ofthe
letter claimed that "at that rate,2I million women would be beaten by theirhusbands or boyfriends every year. That is simply not the case." He cited theNational Crime Victimization Survey, which estimated 56,000 cases of violenceagainst women by their husbands and 198,000 by boyfriends or formerboyfriends. The survey showed 2.2 million assaults against women in all, mostby strangers or someone the woman knew who was not her past or present hus-band or boyfriend.(a) First do the arithmetic. Every 15 seconds is 4 per minute. At that rate, howmany beatings would take place in an hour? In a day? In a year? Is the letterwriter's arithmetic correct?

Chapter 9 Exercises
(b) Is the letter writer correct to claim that the Tl.mes overstated the numberof cases of domestic violence against women?
,-ZS 9.13 We can read, but can we count? The Census Bureau once
\:) gave a simple test of literacy in English to a random sample of 3400r*i^'7e*s people. The Neru York Times printed some of the questions under theheadline "1l3yo of Adults in U.S. Failed This Test." Why is the percent in theheadline clearly wrong?
9.14 Stocks go down. On September 17, 2001, the Dow Jones IndustrialAverage dropped 685 points from its opening level of9605. This was the biggestone-day decline ever and occurred on the first day the New York Stock Exchangewas open following the attacks on September 11, 2001. By what percentage didthe Dow drop that day? On October 28, t929, the Dow Jones Industrial Averagedropped 38 points from its opening level of261. By what percentage did the Dowdrop that day? This was the second-biggest one-day percentage drop ever.
9.15 Poverty. The number of Americans living below the official poverty lineincreased from 24,975,000 to 36,950,000 in the 30 years between 1976 and2005. What percentage increase was this? You should not conclude from thisthat poverty grew more common in these years, however. Why not?
9.16 We don't lose your baggage. Continental Airlines once advertised thatit had "decreased lost baggage by 100% in the past six months." Do you believethis claim?
9.17 Rinse your mouth. A new mouth rinse claimed to "reduce plaque onteeth by 300%." Explain carefully why it is impossible to reduce anything by300%.
9.18 Greeks on campus. The question-and-answer column of a campus news-paper was asked what percentage of the campus was "Greek" (that is, membersof fraternities or sororities). The answer given was that "the figures for the fallsemester are approximately 12 percent for the girls and 15-18 percent for theguys, which produces a 'Greek' figure of approximately 27-30 percent of theundergraduates." Discuss the campus newspaper's arithmetic.
9.19 Don't dare to drive? A university sends a monthly newsletter on healthto its employees. One issue included a column called "What Is the Chance?" thatsaid:
Chance that you'll die in a car accident this year: 1 in 75.
There are about 304 million people in the United States. About 42,000 peopledie each year from motor vehicle accidents. What is the chance a typical personwill die in a motor vehicle accident this year?
9.20 How many miles of highways? Organic Gardening magazine once saidthat "the U.S. Interstate Highway System spans 3.9 million miles and is wear-ing out 50% faster than it can be fixed. Continuous road deterioration adds$7 billion yearly in fuel costs to motorists." The distance from the east coast tothe west coast of the United States is about 3000 miles. How many separate
177

178 CHAPTER 9 Do the Numbers Make Sense?
highways across the continent would be needed to account for 3.9 million milesof roads? What do you conclude about the number of miles in the interstatesystem?
9.21 In the garden. Organic Gardening magazine, describing how to improveyour garden's soil, said, "Since a 6-inch layer of soil in a l00-square-foot plotweighs about 45,000 pounds, adding 230 pounds of compost will give you aninstant 1Yo otganic matter."(a) What percent of 45,000 is 230?(b)Water weighs about 62 pounds per cubic foot. There are 50 cubic feet in a gar-den layer 100 square feet in area and 6 inches deep. What would 50 cubic feetof water weigh? Is it plausible that 50 cubic feet of soil weighs 45,000 pounds?(c) It appears from (b) that the 45,000 pounds isn't right. In fact, soil weighsabout 75 pounds per cubic foot. Ifwe use the correct weight, is the "5% organicmattey'' conclusion roughly correct?
9.22 No eligible men? A news report quotes a sociologist as saying that forevery 233 unmarried women in their 40s in the United States, there are only100 unmarried men in their 40s. These numbers point to an unpleasant socialsituation for women of that age. Are the numbers plausible? (Optional: TheStatistical Abstract of the United States has a table titled'Marital status of thepopulation by age and sex" that gives the actual counts.)
9.23 Too good to be true? The late English psychologist Cyril Burt wasknown for his studies of the IQ scores of identical twins who were raised apart.The high correlation between the IQs of separated twins in Burt's studiespointed to heredity as a major factor in IQ. ("Correlation" measures how closelytwo variables are connected. We will meet correlation in Chapter 14.) Burtwrote several accounts of his work, adding more pairs of twins over time. Hereare his reported correlations as he published them:
Publication date TWins reared apart TWins reared together
19551966
0,77I (2L pairs)0.77I (53 pairs)
0.944 (83 pairs)0.944 (95 pairs)
What is suspicious here?
9.24 Where you start matters. When comparing numbers over time, you canslant the comparison by choosing your starting point. Say the Chicago Cubs lose5 games, then win 4, then lose 1. You can truthfully say that the Cubs have lost6 of their last t0 games (sounds bad) or that they have won 4 of their last 5(sounds good).
The median income of American families (in dollars of 2OO4 buying power)was $50,705 in 1996, $54,285 in2002, and $54,061 in 2004. By what percentagedid family income increase between 1996 and 2OO4? Between 2002 and 2OO4?You see that you can make the income trend sound bad or good by choosingyour starting point.
9.25 Being on top also matters. The previous exercise noted that medianfamily income decreased slightly between 2002 and 2004. The top 5o/o of

Chapter 9 Exercises
households earned $172,605 or more in 2002 and $173,640 or more in 2004.(These amounts are in dollars of 2004 buying power.) By what percentage didthe income of top earners increase between 2002 and,2OO4?
9.26 Boating safety. Data on accidents in recreational boating in the Statis-tical Abstract of the United States show that the number of deaths has droppedfrom 1360 in 1980 to 676 in 2004. However, the number of injuries reportedgrew from 2650 in 1980 to 3363 in 2004. Why are there so few deaths in thesegovernment data relative to the number of injuries? Which count (deaths or in-juries) is probably more accurate? Why might the injury count rise when deathsdo not?
9.27 Time off. The pointy-haired boss in the Dilbert cartoon once noted that40o/o of all sick days taken by the staff are Fridays and Mondays. Is this evidencethat the staff are tryrng to take long weekends?
179
9.28 Web-based exercise. Find an example of one of the following. Ex-plain in detail the statistical shortcomings of your example.
Leaving out essential information
Lack of consistency
Implausible numbers
Faulty arithmetic
One place to look is in the online Chance News. The CHANCE Web siteat Dartmouth College contains lots of interesting stuff (at least if youare interested in statistics). In particular, the Cha.nce Nerus section, www.dartmouth.edu/-chance/chance-news/news.html, offers a wiki that keepstrack of statistics in the press, including dubious statistics.
9.29 Web-based exercise. In Exercise 9.14 you were asked to computethe percentage drop in the Dow Jones Industrial Average on Septem-ber 17, 2001. Because the index had gone up so much in previous years,this was not the biggest percentage drop ever. Go to http://djindexes.com/mdsi&r/index.cfm?event=showAvgStats and determine if this is even inthe top 10 biggest percentage drops. Explain, in plain language, how thedrop on September I7, 2001, can be the biggest drop in actual value butnot in percentage.
9.30 Web-based exercise. The Statistical Abstract of the United Statesis an essential compilation of data. You can find it online at the Census Bu-reau Web site. The most recent edition is at www.census.gov/compendia/statab/. To find what you want, you can use the search tool at the Website. Use the Statistical Abstracl to determine the percentage change inthe annual average price of regular gasoline in New York, NY, for the twomost recent years reported.