Amazing Numbers in Biology
301
-
Upload
khangminh22 -
Category
Documents
-
view
2 -
download
0
Transcript of Amazing Numbers in Biology

Rainer Flindt · Amazing Numbers in Biology
Rainer Flindt
Amazing Numbersin Biology
Translated by Neil Solomon
ABCA
Professor Dr. Rainer FlindtDietrich-Bonhoeffer-Weg 1671462 LudwigsburgGermany
Translated by:
Neil SolomonDantestr. 5369115 HeidelbergGermany
This is the translation of the 6th German Edition of
“Biologie in Zahlen”© 2003 Elsevier GmbH, Spektrum Akademischer Verlag, Heidelberg(ISBN 3-8274-1171-8)
The translation was undertaken by Springer Verlag
Library of Congress Control Number: 2005938321
ISBN-10 3-540-30146-1 Springer Berlin Heidelberg New YorkISBN-13 978-3-540-30146-2
This work is subject to copyright.All rights reserved, whether the whole or part of the material is con-cerned, specifically the rights of translation, reprinting, reuse of illustrations, recitation, broadcasting,reproduction on microfilm or in any other way, and storage in data banks. Duplication of this publi-
fcation or parts thereof is permitted only under the provisions of the German Copyright Law ofSeptember 9, 1965, in its current version, and permission for use must always be obtained fromSpringer-Verlag. Violations are liable for prosecution under the German Copyright Law.
Springer-Verlag is a part of Springer Science + Business Mediaspringeronline.com
© Springer-Verlag Berlin Heidelberg 2006Printed in Germany
The use of general descriptive names, registered names, trademarks, etc. in this publication does notimply, even in the absence of a specific statement, that such names are exempt from the relevant pro-tective laws and regulations and therefore free for general use.
Editor: Dr. Dieter Czeschlik, Heidelberg, GermanyDesk Editor: Dr. Jutta Lindenborn, Heidelberg, GermanyCover design: Design & Production, HeidelbergTypesetting and Production: Friedmut Kröner, HeidelbergPrinted on acid-free paper – 39/3152-YK – 5 4 3 2 1 0
Contents
Introduction to the 6th German Edition . . . . . . . . . . . . . . . . . . . . . . . 1
Part 1: Zoology
1.1 General: Size, Weight, Age … . . . . . . . . . . . . . . . . . . . . . . . . 41.1.0 Numbers that Amaze . . . . . . . . . . . . . . . . . . . . . . . . . . . . . 41.1.1 Approximate Numbers of Species in Selected Major Animal Taxa . . . . 51.1.2 Maximum Age of Selected Animals . . . . . . . . . . . . . . . . . . . . . 61.1.3 Largest Representatives of Selected Animal Taxa
(Excluding Vertebrates and Insects) . . . . . . . . . . . . . . . . . . . . . 81.1.4 The Largest Insects . . . . . . . . . . . . . . . . . . . . . . . . . . . . . . 101.1.5 Size of Populations in Colony-Building Insects . . . . . . . . . . . . . . 111.1.6 Size and Weight of Selected Fish . . . . . . . . . . . . . . . . . . . . . . 121.1.7 Maximum Length of Selected Amphibians . . . . . . . . . . . . . . . . . 131.1.8 Maximum Length and Weight of Selected Reptiles . . . . . . . . . . . . 141.1.9 Weight and Wingspan of Selected Birds . . . . . . . . . . . . . . . . . . 151.1.10 Maximum Length and Weight of Selected Mammals . . . . . . . . . . . 161.1.11 Size of Selected Breeds of Dog . . . . . . . . . . . . . . . . . . . . . . . . 181.1.12 Height at the Withers (= Shoulder Height) of Horses . . . . . . . . . . . 191.1.13 Size and Weights of Selected Extinct Vertebrates . . . . . . . . . . . . . 201.1.14 Size of Horns and Teeth . . . . . . . . . . . . . . . . . . . . . . . . . . . 211.1.15 Number of Vertebrae of Selected Vertebrates . . . . . . . . . . . . . . . 221.1.16 Number of Cervical (Neck) Vertebrae of Selected Vertebrates . . . . . . 221.1.17 Relative Skeletal Weight of Selected Vertebrates . . . . . . . . . . . . . . 231.1.18 Size of Selected Animal Cells . . . . . . . . . . . . . . . . . . . . . . . . 231.1.19 Water Content of Vertebrate Tissue . . . . . . . . . . . . . . . . . . . . . 241.1.20 Amino Acid Composition of the Protein of Vertebrates . . . . . . . . . . 251.1.21 Effects of Animal Poisons (Not Including Those of Snakes) . . . . . . . 251.1.22 Effects of Snake Venoms . . . . . . . . . . . . . . . . . . . . . . . . . . . 271.1.23 Poisonous Effect of Selected Insecticides on Vertebrates . . . . . . . . . 28
1.2 Movement, Locomotion . . . . . . . . . . . . . . . . . . . . . . . . . . . 291.2.0 Numbers that Amaze . . . . . . . . . . . . . . . . . . . . . . . . . . . . . 291.2.1 Diameter of Muscle Fibers . . . . . . . . . . . . . . . . . . . . . . . . . . 301.2.2 Twitch Times for Muscles . . . . . . . . . . . . . . . . . . . . . . . . . . 301.2.3 Contraction Times of Selected Muscles . . . . . . . . . . . . . . . . . . . 311.2.4 Maximum Muscular Strength of Selected Muscles . . . . . . . . . . . . 311.2.5 Load-Bearing Record of Selected Muscles . . . . . . . . . . . . . . . . . 321.2.6 Number of Wingbeats per Second in Insects . . . . . . . . . . . . . . . . 321.2.7 Surface Areas and Surface Loads of Insect Wings . . . . . . . . . . . . . 331.2.8 Wingbeat Frequencies in Birds . . . . . . . . . . . . . . . . . . . . . . . 341.2.9 Surface Areas and Surface Loads of Bird Wings . . . . . . . . . . . . . . 351.2.10 Maximum Speeds of Selected Animals . . . . . . . . . . . . . . . . . . . 36
1.2.11 Jumping Distances of Selected Animals . . . . . . . . . . . . . . . . . . 381.2.12 Flight Speeds During Bird Migration . . . . . . . . . . . . . . . . . . . . 381.2.13 Flight Distances During Bird Migration . . . . . . . . . . . . . . . . . . 391.2.14 Migratory Times of Selected Birds Native to Germany . . . . . . . . . . 40
1.3 Alimentation, Digestion . . . . . . . . . . . . . . . . . . . . . . . . . . . 411.3.0 Numbers that Amaze . . . . . . . . . . . . . . . . . . . . . . . . . . . . . 411.3.1 Absorption of Nutrients in the Body . . . . . . . . . . . . . . . . . . . . 421.3.2 Required Daily Food Intake . . . . . . . . . . . . . . . . . . . . . . . . . 421.3.3 Dental Formulae of Selected Mammals . . . . . . . . . . . . . . . . . . . 431.3.4 Intestinal Length of Selected Vertebrates . . . . . . . . . . . . . . . . . . 461.3.5 Relative Intestinal Length of Selected Animals . . . . . . . . . . . . . . . 471.3.6 Proportion of the Total Volume of the Intestinal Tract Made Up
by Stomach, Small Intestine, and Appendix in Selected Mammals . . . . 481.3.7 Capacity of the Digestive Tract and its Parts
in Selected Domestic Animals . . . . . . . . . . . . . . . . . . . . . . . . 481.3.8 pH Optimum of Selected Digestive Enzymes in Mammals . . . . . . . . 491.3.9 pH Value of the Saliva of Selected Mammals . . . . . . . . . . . . . . . . 501.3.10 pH Values in the Intestinal Tract of Selected Birds . . . . . . . . . . . . 501.3.11 pH Values in the Intestinal Tract of Selected Mammals . . . . . . . . . . 511.3.12 pH Values in the Mid-intestine of Selected Invertebrates . . . . . . . . . 511.3.13 Duration of Intestinal Passage in Selected Vertebrates . . . . . . . . . . 521.3.14 Relative Weight of Liver in Selected Vertebrates . . . . . . . . . . . . . . 521.3.15 Daily Bile Production in Selected Vertebrates . . . . . . . . . . . . . . . 53
1.4 Metabolism . . . . . . . . . . . . . . . . . . . . . . . . . . . . . . . . . . 541.4.1 Basal Metabolic Rate of Selected Animals . . . . . . . . . . . . . . . . . 541.4.2 Body Temperatures of Selected Homoiothermic Animals . . . . . . . . 551.4.3 Size of Daily Variations in Body Temperature
in Selected Homoiothermic Animals . . . . . . . . . . . . . . . . . . . . 571.4.4 Preferred Temperatures of Selected Animals . . . . . . . . . . . . . . . . 571.4.5 Duration of Hibernation (Torpor, Winter Rest)
of Selected Vertebrates Native to Germany . . . . . . . . . . . . . . . . . 59
1.5 Excretion . . . . . . . . . . . . . . . . . . . . . . . . . . . . . . . . . . . 601.5.1 Number of Glomeruli in the Kidneys of Selected Vertebrates . . . . . . 601.5.2 Urine Production of Selected Mammals . . . . . . . . . . . . . . . . . . 611.5.3 Maximum Urine Concentration in Selected Mammals . . . . . . . . . . 611.5.4 Composition of the Excrement of Selected Vertebrates . . . . . . . . . . 621.5.5 Urea in the Urine of Selected Mammals . . . . . . . . . . . . . . . . . . 621.5.6 Freezing Point Depression and Osmotic Pressure
of Urine in Selected Animals . . . . . . . . . . . . . . . . . . . . . . . . 631.5.7 Aquatic Salt Concentration Tolerance Limits of Selected Animals . . . 64
VI Contents
1.6 Heart, Circulation . . . . . . . . . . . . . . . . . . . . . . . . . . . . . . 651.6.0 Numbers that Amaze . . . . . . . . . . . . . . . . . . . . . . . . . . . . . 651.6.1 Heart Weights of Selected Vertebrates (Absolute and Relative) . . . . . . 661.6.2 Heart Rates of Selected Animals . . . . . . . . . . . . . . . . . . . . . . . 681.6.3 Heart Minute Volumes of Selected Animals . . . . . . . . . . . . . . . . 701.6.4 Blood Pressure of Selected Animals . . . . . . . . . . . . . . . . . . . . . 71
1.7 Blood . . . . . . . . . . . . . . . . . . . . . . . . . . . . . . . . . . . . . 721.7.1 Blood Volumes of Vertebrates . . . . . . . . . . . . . . . . . . . . . . . . 721.7.2 Number and Size of Red Blood Cells in Selected Vertebrates . . . . . . . 731.7.3 Number of Platelets of Selected Animals . . . . . . . . . . . . . . . . . . 741.7.4 Coagulation Times of Blood in Vertebrates . . . . . . . . . . . . . . . . 741.7.5 Lifespan of Blood Cells . . . . . . . . . . . . . . . . . . . . . . . . . . . . 751.7.6 Hematocrit Levels of Selected Vertebrates . . . . . . . . . . . . . . . . . 761.7.7 Hemoglobin Levels in the Blood of Selected Animals . . . . . . . . . . . 761.7.8 Molecular Weight of the Hemoglobin of Selected Animals . . . . . . . . 771.7.9 Oxygen Capacity of the Blood (or Hemolymph) of Selected Animals . . 771.7.10 Blood Sugar Levels in Selected Vertebrates . . . . . . . . . . . . . . . . . 791.7.11 Protein Levels of Bodily Fluids (Blood, Hemolymph, Coelom Fluid)
of Selected Animals . . . . . . . . . . . . . . . . . . . . . . . . . . . . . . 801.7.12 Freezing Point Depression and Osmolarity of the Blood
of Selected Animals . . . . . . . . . . . . . . . . . . . . . . . . . . . . . . 811.7.13 Freezing Point Depression und Osmotic Pressure
of Hemolymphs of Arthropods . . . . . . . . . . . . . . . . . . . . . . . 821.7.14 Physiological Salt Solutions (Ringer’s, Tyrode’s, Locke’s Solutions)
for Selected Animals . . . . . . . . . . . . . . . . . . . . . . . . . . . . . 82
1.8 Respiration . . . . . . . . . . . . . . . . . . . . . . . . . . . . . . . . . . 831.8.0 Numbers that Amaze . . . . . . . . . . . . . . . . . . . . . . . . . . . . 831.8.1 Relative Lung Weight in Selected Vertebrates . . . . . . . . . . . . . . . 841.8.2 Interior Lung Surface of Selected Animals . . . . . . . . . . . . . . . . . 851.8.3 Breathing Rate and Single-Breath Air Volume of Selected Vertebrates . . 851.8.4 Oxygen Consumption of Selected Animals . . . . . . . . . . . . . . . . . 871.8.5 Oxygen Consumption During Hibernation
of Selected European Mammals . . . . . . . . . . . . . . . . . . . . . . . 871.8.6 Maximum Diving Depth and Diving Time
of Air-Breathing Vertebrates . . . . . . . . . . . . . . . . . . . . . . . . . 88
1.9 Reproduction, Development . . . . . . . . . . . . . . . . . . . . . . . . . 891.9.0 Numbers that Amaze . . . . . . . . . . . . . . . . . . . . . . . . . . . . . 891.9.1 Size of Egg Cells in Selected Animals (Excluding Birds) . . . . . . . . . 901.9.2 Dimensions of Sperm of Selected Animals . . . . . . . . . . . . . . . . . 911.9.3 Chromosome Sets of Selected Animals . . . . . . . . . . . . . . . . . . . 91
Contents VII
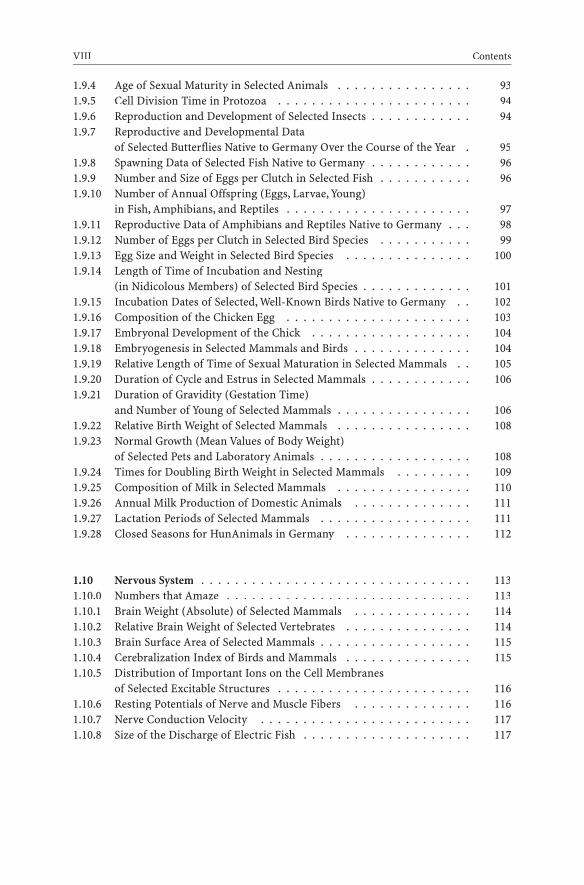
1.9.4 Age of Sexual Maturity in Selected Animals . . . . . . . . . . . . . . . . 931.9.5 Cell Division Time in Protozoa . . . . . . . . . . . . . . . . . . . . . . . 941.9.6 Reproduction and Development of Selected Insects . . . . . . . . . . . . 941.9.7 Reproductive and Developmental Data
of Selected Butterflies Native to Germany Over the Course of the Year . 951.9.8 Spawning Data of Selected Fish Native to Germany . . . . . . . . . . . . 961.9.9 Number and Size of Eggs per Clutch in Selected Fish . . . . . . . . . . . 961.9.10 Number of Annual Offspring (Eggs, Larvae, Young)
in Fish, Amphibians, and Reptiles . . . . . . . . . . . . . . . . . . . . . . 971.9.11 Reproductive Data of Amphibians and Reptiles Native to Germany . . . 981.9.12 Number of Eggs per Clutch in Selected Bird Species . . . . . . . . . . . 991.9.13 Egg Size and Weight in Selected Bird Species . . . . . . . . . . . . . . . 1001.9.14 Length of Time of Incubation and Nesting
(in Nidicolous Members) of Selected Bird Species . . . . . . . . . . . . . 1011.9.15 Incubation Dates of Selected, Well-Known Birds Native to Germany . . 1021.9.16 Composition of the Chicken Egg . . . . . . . . . . . . . . . . . . . . . . 1031.9.17 Embryonal Development of the Chick . . . . . . . . . . . . . . . . . . . 1041.9.18 Embryogenesis in Selected Mammals and Birds . . . . . . . . . . . . . . 1041.9.19 Relative Length of Time of Sexual Maturation in Selected Mammals . . 1051.9.20 Duration of Cycle and Estrus in Selected Mammals . . . . . . . . . . . . 1061.9.21 Duration of Gravidity (Gestation Time)
and Number of Young of Selected Mammals . . . . . . . . . . . . . . . . 1061.9.22 Relative Birth Weight of Selected Mammals . . . . . . . . . . . . . . . . 1081.9.23 Normal Growth (Mean Values of Body Weight)
of Selected Pets and Laboratory Animals . . . . . . . . . . . . . . . . . . 1081.9.24 Times for Doubling Birth Weight in Selected Mammals . . . . . . . . . 1091.9.25 Composition of Milk in Selected Mammals . . . . . . . . . . . . . . . . 1101.9.26 Annual Milk Production of Domestic Animals . . . . . . . . . . . . . . 1111.9.27 Lactation Periods of Selected Mammals . . . . . . . . . . . . . . . . . . 1111.9.28 Closed Seasons for HunAnimals in Germany . . . . . . . . . . . . . . . 112
1.10 Nervous System . . . . . . . . . . . . . . . . . . . . . . . . . . . . . . . . 1131.10.0 Numbers that Amaze . . . . . . . . . . . . . . . . . . . . . . . . . . . . . 1131.10.1 Brain Weight (Absolute) of Selected Mammals . . . . . . . . . . . . . . 1141.10.2 Relative Brain Weight of Selected Vertebrates . . . . . . . . . . . . . . . 1141.10.3 Brain Surface Area of Selected Mammals . . . . . . . . . . . . . . . . . . 1151.10.4 Cerebralization Index of Birds and Mammals . . . . . . . . . . . . . . . 1151.10.5 Distribution of Important Ions on the Cell Membranes
of Selected Excitable Structures . . . . . . . . . . . . . . . . . . . . . . . 1161.10.6 Resting Potentials of Nerve and Muscle Fibers . . . . . . . . . . . . . . 1161.10.7 Nerve Conduction Velocity . . . . . . . . . . . . . . . . . . . . . . . . . 1171.10.8 Size of the Discharge of Electric Fish . . . . . . . . . . . . . . . . . . . . 117
VIII Contents

1.11 Senses . . . . . . . . . . . . . . . . . . . . . . . . . . . . . . . . . . . . . 1181.11.1 Minimum Stimuli for Activating a Sensory Organ . . . . . . . . . . . . . 1181.11.2 Size of the Eyeball in Selected Animals . . . . . . . . . . . . . . . . . . . 1181.11.3 Focal Distance of the Lenses in the Eyes of Selected Animals . . . . . . 1191.11.4 Number of Photoreceptors in the Eyes of Selected Animals . . . . . . . 1191.11.5 Number of Photoreceptors per Dendrite in the Eyes
of Selected Vertebrates . . . . . . . . . . . . . . . . . . . . . . . . . . . . 1201.11.6 Visual Acuity Angle (Angle of Minimum Separability)
of Selected Animals . . . . . . . . . . . . . . . . . . . . . . . . . . . . . . 1201.11.7 Visual Field (Horizontal) of Both Eyes in Selected Animals . . . . . . . 1211.11.8 Number of Unit Eyes (Ommatidia) in the Compound Eyes
of Selected Arthropods . . . . . . . . . . . . . . . . . . . . . . . . . . . . 1221.11.9 Flicker Fusion Rate of the Eyes of Selected Animals . . . . . . . . . . . . 1221.11.10 Absorption Maxima of the Visual Pigments of Selected Invertebrates . . 1231.11.11 Absorption Maxima of the Rhodopsins of Selected Vertebrates . . . . . 1231.11.12 Eardrum Surface Area of Selected Animals . . . . . . . . . . . . . . . . 1241.11.13 Upper Limit of Hearing Ability in Selected Animals . . . . . . . . . . . 1241.11.14 Auditory Acuity of Selected Animals . . . . . . . . . . . . . . . . . . . . 1251.11.15 Number of Taste Buds of Selected Vertebrates . . . . . . . . . . . . . . . 1261.11.16 Dimensions of Olfactory Epithelium in Selected Animals . . . . . . . . 1261.11.17 Vibration Threshold at Optimal Frequency . . . . . . . . . . . . . . . . 127
Part 2: Botany
2.1 General Data: Dimensions, Age, etc. . . . . . . . . . . . . . . . . . . . . 1312.1.0 Numbers that Amaze . . . . . . . . . . . . . . . . . . . . . . . . . . . . . 1312.1.1 Number of Species of Plant Taxa and Fungi . . . . . . . . . . . . . . . . 1322.1.2 Number of Species Within the Individual Taxa of Seed-Bearing Plants . 1322.1.3 Maximum Age of Selected Plants . . . . . . . . . . . . . . . . . . . . . . 1332.1.4 Rotation Periods of Important Harvested Trees . . . . . . . . . . . . . . 1342.1.5 Lifespan of Leaves and Needles of Selected Evergreen Plants . . . . . . 1352.1.6 Root Depth of Selected Plants . . . . . . . . . . . . . . . . . . . . . . . . 1352.1.7 Leaf Surface Areas of Selected Plants . . . . . . . . . . . . . . . . . . . . 1362.1.8 Diameter of the Blossoms of Selected Plants . . . . . . . . . . . . . . . . 1362.1.9 Specific Weight of Woods . . . . . . . . . . . . . . . . . . . . . . . . . . 1372.1.10 Water Content of Selected Plant Organs . . . . . . . . . . . . . . . . . . 138
2.2 Cellular Values . . . . . . . . . . . . . . . . . . . . . . . . . . . . . . . . 1392.2.1 Dimensions of Selected Plant Fibers . . . . . . . . . . . . . . . . . . . . 1392.2.2 Vessel Diameters in Woods . . . . . . . . . . . . . . . . . . . . . . . . . 1392.2.3 Number of Stomata on the Leaves of Selected Plants . . . . . . . . . . . 1402.2.4 Length of the Stoma Pore in Selected Plants . . . . . . . . . . . . . . . . 1412.2.5 Size of Chloroplasts of Selected Plants . . . . . . . . . . . . . . . . . . . 1422.2.6 Size of Starch Grains in Selected Useful Plants . . . . . . . . . . . . . . 1432.2.7 Size of Pollen Grains in Selected Plants . . . . . . . . . . . . . . . . . . . 143
Contents IX

2.2.8 Dimensions of Spores of a Selection of Well-Known Species . . . . . . 1442.2.9 Chromosome Sets of Selected Plants . . . . . . . . . . . . . . . . . . . . 145
2.3 Germination and Growth . . . . . . . . . . . . . . . . . . . . . . . . . . 1472.3.1 Germination Time and Optimal Germination Temperature
of the Seeds of Selected Plants . . . . . . . . . . . . . . . . . . . . . . . . 1472.3.2 Germination Speed of the Seed of Selected Useful Plants . . . . . . . . . 1482.3.3 Vernalization Temperatures and Periods of Selected Plants . . . . . . . 1482.3.4 Growth Speed of Selected Plant Organs Under Optimal Conditions . . . 1492.3.5 Annual Vertical Growth Over Lifespan
of Selected Important Harvested Trees Under Optimal Conditions . . . 1502.3.6 Height of Selected Trees . . . . . . . . . . . . . . . . . . . . . . . . . . . 1502.3.7 Maximum Trunk Diameters of Selected Tree Species . . . . . . . . . . . 1512.3.8 Greatest Recorded Trunk Circumferences for Selected Trees . . . . . . . 1522.3.9 Slenderness Ratio and Height of Selected Plants . . . . . . . . . . . . . 1522.3.10 Length of Runners of Selected Plants Over the Course of a Year . . . . . 1532.3.11 Cardinal Temperature Points for the Growth of Selected Useful Plants . 1542.3.12 Optimal pH Soil Levels for Plant Growth . . . . . . . . . . . . . . . . . . 1552.3.13 Polar Limits for the Cultivation of Selected Useful Plants . . . . . . . . 1562.3.14 Dryness Limits for the Cultivation of Selected Useful Plants . . . . . . . 157
2.4 Reproduction: Blossoms, Fruits, Seeds . . . . . . . . . . . . . . . . . . . 1582.4.1 Linnaeus’ Flower-Clock . . . . . . . . . . . . . . . . . . . . . . . . . . . 1582.4.2 Floral Formulas of Selected Plant Families . . . . . . . . . . . . . . . . . 1592.4.3 Blossoming Period of Selected Plants . . . . . . . . . . . . . . . . . . . . 1612.4.4 Critical Day Length for Inducing Blossoming
in Long-Day and Short-Day Plants . . . . . . . . . . . . . . . . . . . . . 1612.4.5 Blossoming Data for Selected Trees and Shrubs Native to Germany . . . 1622.4.6 Blossoming Data for Selected Monocotyledonous Plants
Native to Germany . . . . . . . . . . . . . . . . . . . . . . . . . . . . . . 1642.4.7 Blossoming Data for Selected True Grasses (Poaceae)
Native to Germany . . . . . . . . . . . . . . . . . . . . . . . . . . . . . . 1652.4.8 Blossoming Data for Selected Dicotyledonous Plants Native to Germany 1652.4.9 Time of Spore Maturation in Selected Ferns Native to Germany . . . . . 1682.4.10 Formation Time of Fruiting Bodies of Fungi Native to Germany . . . . 1692.4.11 Annual Number of Seeds of Selected Plants . . . . . . . . . . . . . . . . 1702.4.12 Number of Seeds per Capsule in Selected Plants . . . . . . . . . . . . . 1712.4.13 Weight of Selected Seeds . . . . . . . . . . . . . . . . . . . . . . . . . . . 1712.4.14 Thousand Seed Weights (TSW) und Hectoliter Weights
of the Seeds of Selected Useful Plants . . . . . . . . . . . . . . . . . . . . 1722.4.15 Age of Seeds of Selected Plants . . . . . . . . . . . . . . . . . . . . . . . 1732.4.16 Maximum Distance Seeds Catapulted by Ballistic Fruits . . . . . . . . . 174
X Contents

2.5 Constituents . . . . . . . . . . . . . . . . . . . . . . . . . . . . . . . . . . 1752.5.1 Composition of Cereal Grains . . . . . . . . . . . . . . . . . . . . . . . . 1752.5.2 Composition of Legumes . . . . . . . . . . . . . . . . . . . . . . . . . . 1752.5.3 Fat Content of Selected Plant Organs . . . . . . . . . . . . . . . . . . . . 1762.5.4 Fat Content of the Seeds and Fruits of Selected Plants
as a Percentage of Fresh Weight . . . . . . . . . . . . . . . . . . . . . . . 1772.5.5 Raw Protein Content of Selected Seeds and Fruits . . . . . . . . . . . . . 1782.5.6 Composition of Tubers . . . . . . . . . . . . . . . . . . . . . . . . . . . . 1782.5.7 Sugar Content of the Nectar of Selected Plants . . . . . . . . . . . . . . 1792.5.8 Energy Contents of Plant Material . . . . . . . . . . . . . . . . . . . . . 179
2.6 Physiological Values . . . . . . . . . . . . . . . . . . . . . . . . . . . . . 1802.6.1 Speed of Plasma Flow in Selected Plant Organs . . . . . . . . . . . . . . 1802.6.2 Osmotic Pressure in the Cell Sap of Selected Plant Leaves . . . . . . . . 1802.6.3 Osmotic Values in Plants . . . . . . . . . . . . . . . . . . . . . . . . . . . 1812.6.4 Acidity in the Pressed Juice of Fruits and Vegetables . . . . . . . . . . . 1822.6.5 Temperature Tolerances of Plants . . . . . . . . . . . . . . . . . . . . . . 1822.6.6 Annual Levels of Evaporation of Selected Plants . . . . . . . . . . . . . 1842.6.7 Transpiration Levels of Selected Plants . . . . . . . . . . . . . . . . . . . 1842.6.8 Cuticular Transpiration in Selected Plants . . . . . . . . . . . . . . . . . 1852.6.9 Water Consumption for Selected Plants Required for Production
of 1 Kg Plant Dry Matter (So-Called Transpiration Coefficient) . . . . . 1852.6.10 Hydraulic Conductivity of Selected Woods . . . . . . . . . . . . . . . . . 1862.6.11 Speed of Hydraulic Conductance in Selected Plants . . . . . . . . . . . . 1862.6.12 Respiration Rates of Selected Lower Plants (Thallophyta) . . . . . . . . 1872.6.13 Respiration Rates of Selected Plants and Plant Parts . . . . . . . . . . . 1872.6.14 Sugar and Starch Production in Photosynthesis . . . . . . . . . . . . . . 1882.6.15 Annual Worldwide Photosynthesis Production and Carbon Exchange . 1892.6.16 Speed of Rotation in Selected Twining Plants . . . . . . . . . . . . . . . 1902.6.17 Resting Potential of Plant Cells and Concentration
of Potassium Ions in the Membrane (Plasmalemma) . . . . . . . . . . . 1912.6.18 Conduction Velocity in Selected Plants . . . . . . . . . . . . . . . . . . . 1912.6.19 Absorption Maxima of Plant Pigments . . . . . . . . . . . . . . . . . . . 192
Part 3: Microbiology
3.1 Size and Structure of Viruses . . . . . . . . . . . . . . . . . . . . . . . . 1953.2 Dimensions of Bacteria . . . . . . . . . . . . . . . . . . . . . . . . . . . 1953.3 Generation Time of Selected Bacteria . . . . . . . . . . . . . . . . . . . 1963.4 pH Ranges for the Growth of Bacteria and Fungi . . . . . . . . . . . . . 1973.5 Lethal Temperatures for Selected Microorganisms . . . . . . . . . . . . 1973.6 Inactivation Temperatures and Times for Selected Viruses . . . . . . . . 1983.7 Respiration Rate of Selected Bacteria and Fungi . . . . . . . . . . . . . . 1993.8 Incubation Times of Several Important Infectious Diseases . . . . . . . 200
Contents XI

Part 4 Human Biology
4.1 General Data . . . . . . . . . . . . . . . . . . . . . . . . . . . . . . . . . 2034.1.0 Numbers that Amaze . . . . . . . . . . . . . . . . . . . . . . . . . . . . . 2034.1.1 Life Span of Cells in Selected Organs of the Human Body . . . . . . . . 2044.1.2 DNA and RNA Contents of Selected Human Cells . . . . . . . . . . . . . 2044.1.3 Composition of the Human Body from the Elements . . . . . . . . . . . 2054.1.4 Composition of the Body of an Adult Human . . . . . . . . . . . . . . . 2054.1.5 Relative Share of Individual Tissues in Body Composition
of Man and Woman . . . . . . . . . . . . . . . . . . . . . . . . . . . . . . 2064.1.6 Growth of the Human Embryo During Pregnancy . . . . . . . . . . . . 2064.1.7 Normal Growth of Boys and Girls . . . . . . . . . . . . . . . . . . . . . . 2074.1.8 Number of Bones in the Human Body . . . . . . . . . . . . . . . . . . . 2084.1.9 Dimensions and Weight of Selected Human Organs . . . . . . . . . . . 2094.1.10 Specific Weight of Selected Human Organs . . . . . . . . . . . . . . . . 2094.1.11 Water Content of Human Organs and Tissue . . . . . . . . . . . . . . . 2094.1.12 Temperature of Selected Organs and Parts of the Human Body . . . . . 2104.1.13 pH-Values of Human Bodily Fluids . . . . . . . . . . . . . . . . . . . . . 211
4.2 Skin, Skin Adnexa (Hair, Nails, Glands) . . . . . . . . . . . . . . . . . . 2124.2.1 Human Skin in Numbers . . . . . . . . . . . . . . . . . . . . . . . . . . . 2124.2.2 Number of Human Hairs . . . . . . . . . . . . . . . . . . . . . . . . . . . 2124.2.3 Number of Hairs per cm2 on Various Parts of the Body . . . . . . . . . 2134.2.4 Hair Diameters (Averages) in an Adult Male . . . . . . . . . . . . . . . . 2134.2.5 Speed of Hair and Nail Growth . . . . . . . . . . . . . . . . . . . . . . . 2144.2.6 Number of Perspiratory Glands . . . . . . . . . . . . . . . . . . . . . . . 214
4.3 Heart, Circulation, Blood . . . . . . . . . . . . . . . . . . . . . . . . . . 2154.3.1 Numbers on the Heart and Heartbeat of Humans . . . . . . . . . . . . . 2154.3.2 Temporal Dimensions of the Human Heartbeat . . . . . . . . . . . . . . 2154.3.3 Dimensions of the Human Blood Vessel System . . . . . . . . . . . . . . 2164.3.4 Diameter of the Arteries of an Adult Human . . . . . . . . . . . . . . . 2174.3.5 Blood Pressure at Different Points in the Human Circulatory System . . 2174.3.6 Age and Sex Dependency of Blood Pressure in Humans . . . . . . . . . 2174.3.7 Blood Flow Through Selected Human Organs . . . . . . . . . . . . . . . 2184.3.8 Proportional Blood Flow Through Selected Human Organs . . . . . . . 2194.3.9 Composition of Human Blood . . . . . . . . . . . . . . . . . . . . . . . 2194.3.10 Most Important Proteins in Human Blood Plasma . . . . . . . . . . . . 2204.3.11 Quantity of Hemoglobin (Hb) and Number of Blood Cells in Humans . 2214.3.12 Number of Leukocytes in Humans . . . . . . . . . . . . . . . . . . . . . 2214.3.13 Composition of Lymph and Blood Plasma in Humans – A Comparison 2224.3.14 Percentual Distribution of Blood Groups in Selected Peoples . . . . . . 222
XII Contents
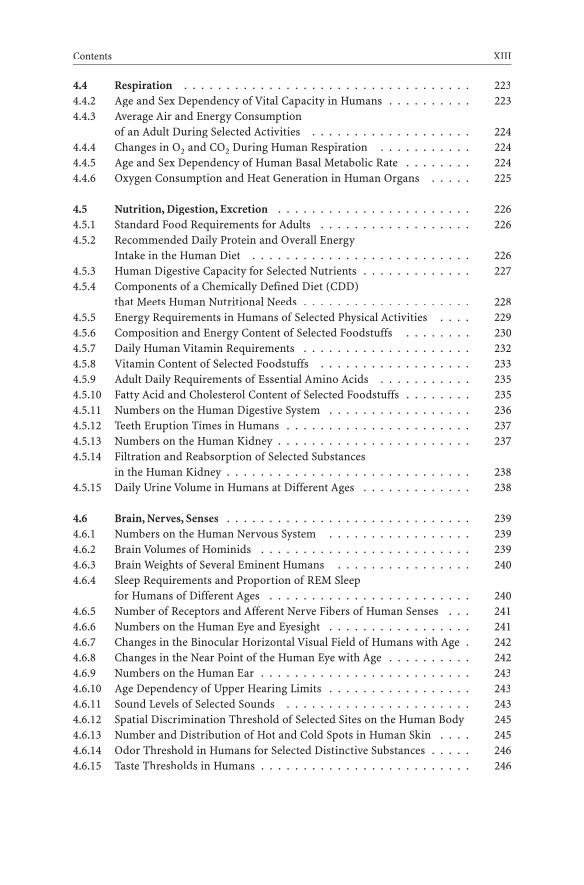
4.4 Respiration . . . . . . . . . . . . . . . . . . . . . . . . . . . . . . . . . . 2234.4.2 Age and Sex Dependency of Vital Capacity in Humans . . . . . . . . . . 2234.4.3 Average Air and Energy Consumption
of an Adult During Selected Activities . . . . . . . . . . . . . . . . . . . 2244.4.4 Changes in O2 and CO2 During Human Respiration . . . . . . . . . . . 2244.4.5 Age and Sex Dependency of Human Basal Metabolic Rate . . . . . . . . 2244.4.6 Oxygen Consumption and Heat Generation in Human Organs . . . . . 225
4.5 Nutrition, Digestion, Excretion . . . . . . . . . . . . . . . . . . . . . . . 2264.5.1 Standard Food Requirements for Adults . . . . . . . . . . . . . . . . . . 2264.5.2 Recommended Daily Protein and Overall Energy
Intake in the Human Diet . . . . . . . . . . . . . . . . . . . . . . . . . . 2264.5.3 Human Digestive Capacity for Selected Nutrients . . . . . . . . . . . . . 2274.5.4 Components of a Chemically Defined Diet (CDD)
that Meets Human Nutritional Needs . . . . . . . . . . . . . . . . . . . . 2284.5.5 Energy Requirements in Humans of Selected Physical Activities . . . . 2294.5.6 Composition and Energy Content of Selected Foodstuffs . . . . . . . . 2304.5.7 Daily Human Vitamin Requirements . . . . . . . . . . . . . . . . . . . . 2324.5.8 Vitamin Content of Selected Foodstuffs . . . . . . . . . . . . . . . . . . 2334.5.9 Adult Daily Requirements of Essential Amino Acids . . . . . . . . . . . 2354.5.10 Fatty Acid and Cholesterol Content of Selected Foodstuffs . . . . . . . . 2354.5.11 Numbers on the Human Digestive System . . . . . . . . . . . . . . . . . 2364.5.12 Teeth Eruption Times in Humans . . . . . . . . . . . . . . . . . . . . . . 2374.5.13 Numbers on the Human Kidney . . . . . . . . . . . . . . . . . . . . . . . 2374.5.14 Filtration and Reabsorption of Selected Substances
in the Human Kidney . . . . . . . . . . . . . . . . . . . . . . . . . . . . . 2384.5.15 Daily Urine Volume in Humans at Different Ages . . . . . . . . . . . . . 238
4.6 Brain, Nerves, Senses . . . . . . . . . . . . . . . . . . . . . . . . . . . . . 2394.6.1 Numbers on the Human Nervous System . . . . . . . . . . . . . . . . . 2394.6.2 Brain Volumes of Hominids . . . . . . . . . . . . . . . . . . . . . . . . . 2394.6.3 Brain Weights of Several Eminent Humans . . . . . . . . . . . . . . . . 2404.6.4 Sleep Requirements and Proportion of REM Sleep
for Humans of Different Ages . . . . . . . . . . . . . . . . . . . . . . . . 2404.6.5 Number of Receptors and Afferent Nerve Fibers of Human Senses . . . 2414.6.6 Numbers on the Human Eye and Eyesight . . . . . . . . . . . . . . . . . 2414.6.7 Changes in the Binocular Horizontal Visual Field of Humans with Age . 2424.6.8 Changes in the Near Point of the Human Eye with Age . . . . . . . . . . 2424.6.9 Numbers on the Human Ear . . . . . . . . . . . . . . . . . . . . . . . . . 2434.6.10 Age Dependency of Upper Hearing Limits . . . . . . . . . . . . . . . . . 2434.6.11 Sound Levels of Selected Sounds . . . . . . . . . . . . . . . . . . . . . . 2434.6.12 Spatial Discrimination Threshold of Selected Sites on the Human Body 2454.6.13 Number and Distribution of Hot and Cold Spots in Human Skin . . . . 2454.6.14 Odor Threshold in Humans for Selected Distinctive Substances . . . . . 2464.6.15 Taste Thresholds in Humans . . . . . . . . . . . . . . . . . . . . . . . . . 246
Contents XIII
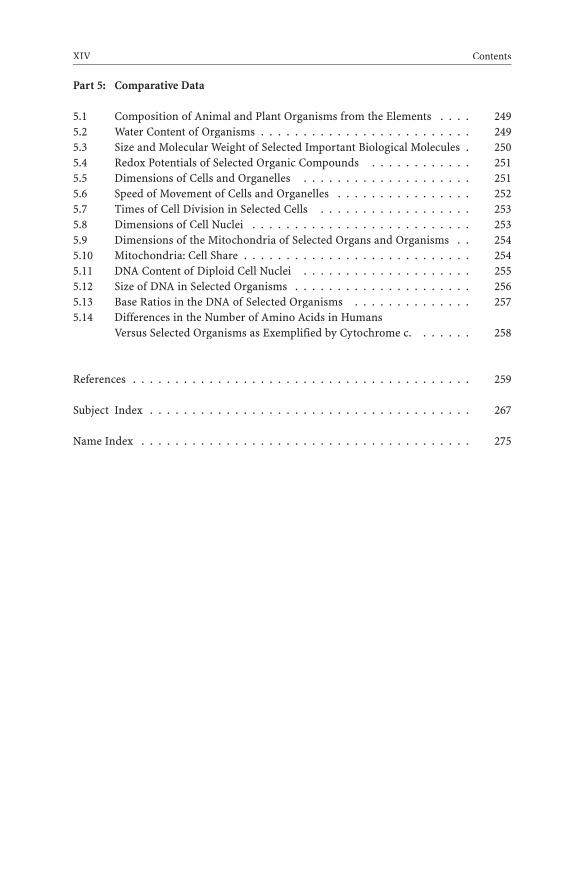
Part 5: Comparative Data
5.1 Composition of Animal and Plant Organisms from the Elements . . . . 2495.2 Water Content of Organisms . . . . . . . . . . . . . . . . . . . . . . . . . 2495.3 Size and Molecular Weight of Selected Important Biological Molecules . 2505.4 Redox Potentials of Selected Organic Compounds . . . . . . . . . . . . 2515.5 Dimensions of Cells and Organelles . . . . . . . . . . . . . . . . . . . . 2515.6 Speed of Movement of Cells and Organelles . . . . . . . . . . . . . . . . 2525.7 Times of Cell Division in Selected Cells . . . . . . . . . . . . . . . . . . 2535.8 Dimensions of Cell Nuclei . . . . . . . . . . . . . . . . . . . . . . . . . . 2535.9 Dimensions of the Mitochondria of Selected Organs and Organisms . . 2545.10 Mitochondria: Cell Share . . . . . . . . . . . . . . . . . . . . . . . . . . . 2545.11 DNA Content of Diploid Cell Nuclei . . . . . . . . . . . . . . . . . . . . 2555.12 Size of DNA in Selected Organisms . . . . . . . . . . . . . . . . . . . . . 2565.13 Base Ratios in the DNA of Selected Organisms . . . . . . . . . . . . . . 2575.14 Differences in the Number of Amino Acids in Humans
Versus Selected Organisms as Exemplified by Cytochrome c. . . . . . . 258
References . . . . . . . . . . . . . . . . . . . . . . . . . . . . . . . . . . . . . . . . 259
Subject Index . . . . . . . . . . . . . . . . . . . . . . . . . . . . . . . . . . . . . . 267
Name Index . . . . . . . . . . . . . . . . . . . . . . . . . . . . . . . . . . . . . . . 275
XIV Contents
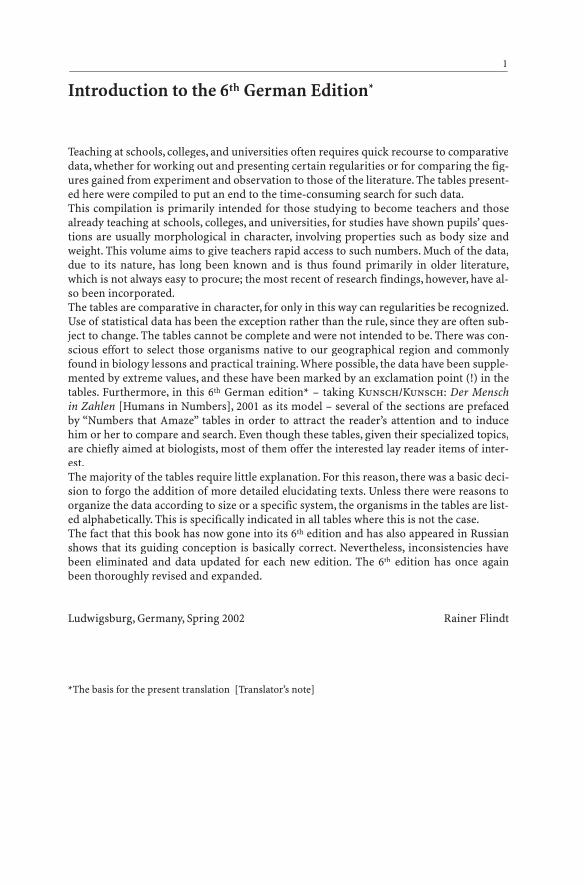
Introduction to the 6th German Edition*
Teaching at schools, colleges, and universities often requires quick recourse to comparativedata, whether for working out and presenting certain regularities or for comparing the fig-ures gained from experiment and observation to those of the literature. The tables present-ed here were compiled to put an end to the time-consuming search for such data.This compilation is primarily intended for those studying to become teachers and thosealready teaching at schools, colleges, and universities, for studies have shown pupils’ ques-tions are usually morphological in character, involving properties such as body size andweight. This volume aims to give teachers rapid access to such numbers. Much of the data,due to its nature, has long been known and is thus found primarily in older literature,which is not always easy to procure; the most recent of research findings, however, have al-so been incorporated.The tables are comparative in character, for only in this way can regularities be recognized.Use of statistical data has been the exception rather than the rule, since they are often sub-ject to change. The tables cannot be complete and were not intended to be. There was con-scious effort to select those organisms native to our geographical region and commonlyfound in biology lessons and practical training. Where possible, the data have been supple-mented by extreme values, and these have been marked by an exclamation point (!) in thetables. Furthermore, in this 6th German edition* – taking Kunsch/Kunsch: Der Mensch in Zahlen [Humans in Numbers], 2001 as its model – several of the sections are prefacedby “Numbers that Amaze” tables in order to attract the reader’s attention and to inducehim or her to compare and search. Even though these tables, given their specialized topics,are chiefly aimed at biologists, most of them offer the interested lay reader items of inter-est.The majority of the tables require little explanation. For this reason, there was a basic deci-sion to forgo the addition of more detailed elucidating texts. Unless there were reasons toorganize the data according to size or a specific system, the organisms in the tables are list-ed alphabetically. This is specifically indicated in all tables where this is not the case.The fact that this book has now gone into its 6th edition and has also appeared in Russianshows that its guiding conception is basically correct. Nevertheless, inconsistencies havebeen eliminated and data updated for each new edition. The 6th edition has once againbeen thoroughly revised and expanded.
Ludwigsburg, Germany, Spring 2002 Rainer Flindt
*The basis for the present translation [Translator’s note]
1

Part 1: Zoology
As a point of comparison, data on humans have been included in the majority of tableswithout explicit mention of this in the table legends.
1.1 General: Size, Weight, Age …
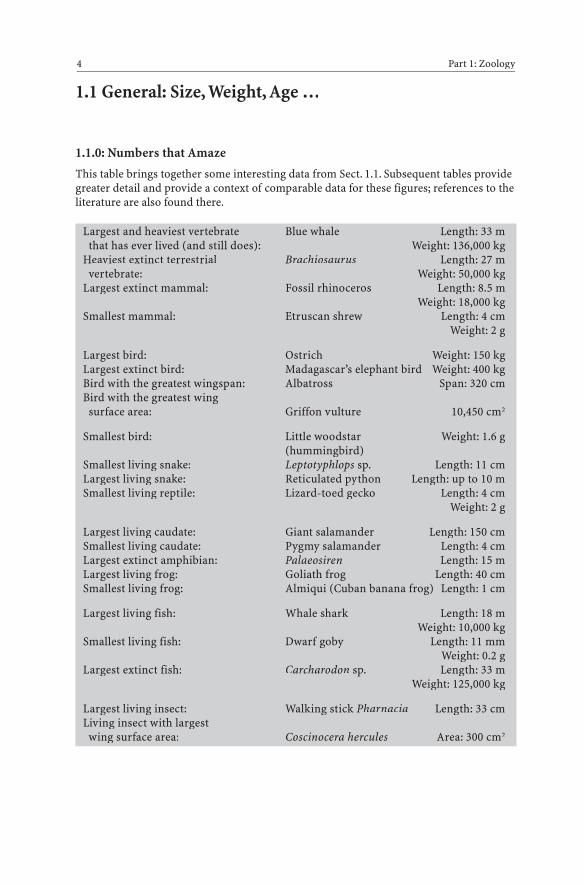
1.1.0: Numbers that Amaze
This table brings together some interesting data from Sect. 1.1. Subsequent tables providegreater detail and provide a context of comparable data for these figures; references to theliterature are also found there.
4 Part 1: Zoology
Largest and heaviest vertebrate Blue whale Length: 33 mthat has ever lived (and still does): Weight: 136,000 kg
Heaviest extinct terrestrial Brachiosaurus Length: 27 mvertebrate: Weight: 50,000 kg
Largest extinct mammal: Fossil rhinoceros Length: 8.5 mWeight: 18,000 kg
Smallest mammal: Etruscan shrew Length: 4 cmWeight: 2 g
Largest bird: Ostrich Weight: 150 kgLargest extinct bird: Madagascar’s elephant bird Weight: 400 kgBird with the greatest wingspan: Albatross Span: 320 cmBird with the greatest wing
surface area: Griffon vulture 10,450 cm2
Smallest bird: Little woodstar Weight: 1.6 g(hummingbird)
Smallest living snake: Leptotyphlops sp. Length: 11 cmLargest living snake: Reticulated python Length: up to 10 mSmallest living reptile: Lizard-toed gecko Length: 4 cm
Weight: 2 g
Largest living caudate: Giant salamander Length: 150 cmSmallest living caudate: Pygmy salamander Length: 4 cmLargest extinct amphibian: Palaeosiren Length: 15 mLargest living frog: Goliath frog Length: 40 cmSmallest living frog: Almiqui (Cuban banana frog) Length: 1 cm
Largest living fish: Whale shark Length: 18 mWeight: 10,000 kg
Smallest living fish: Dwarf goby Length: 11 mmWeight: 0.2 g
Largest extinct fish: Carcharodon sp. Length: 33 mWeight: 125,000 kg
Largest living insect: Walking stick Pharnacia Length: 33 cmLiving insect with largest
wing surface area: Coscinocera hercules Area: 300 cm2

Table 1.1.1: Approximate Numbers of Species in Selected Major Animal Taxa
For figures on plants, see Tables 2.1.1 and 2.1.2.In all, 1.4 million animal species have been described.
Figures from Bertelsmann 1977, Die Roten Listen 1997, Kästner 1973, Kraus and Kubitzki1982, Lexikon der Biologie 1983-87, Meyer 1964, Naturschutz aktuell 1977, Renner 1984, Storchand Welsch 1991
Taxon on Earth in Germany
Protozoa 40,000 3,200Sponges 5,000 28Cnidaria 10,000 130Flatworms 16,100 1,100Roundworms 23,000 1,600Mollusks 130,000 500
Snails 85,000 380Clams 25,000 100Cephalopods 600 15
Segmented worms (annelids) 17,000 1,900Arthropods > 1,000,000 32,500
Arachnids 68,000 2,300Crustaceans 50,000 900Insects 1,000,000 28,900
Dragonflies 4,700 80Cockroaches 4,000 12Locusts, grasshoppers 20,000 80True bugs 73,000 1,800Beetles 350,000 5,727Bees and ants (hymenoptera) 110,000 10,000Butterflies 120,000 3,000Flies, gnats 120,000 8,000
Echinoderms 6,500 34Vertebrates 46,500 476
Fish (incl. lampreys) 20,600 130Amphibians 3,300 21Reptiles 6,300 14Birds 8,600 273Mammals 3,700 98
General: Size, Weight, Age … 5
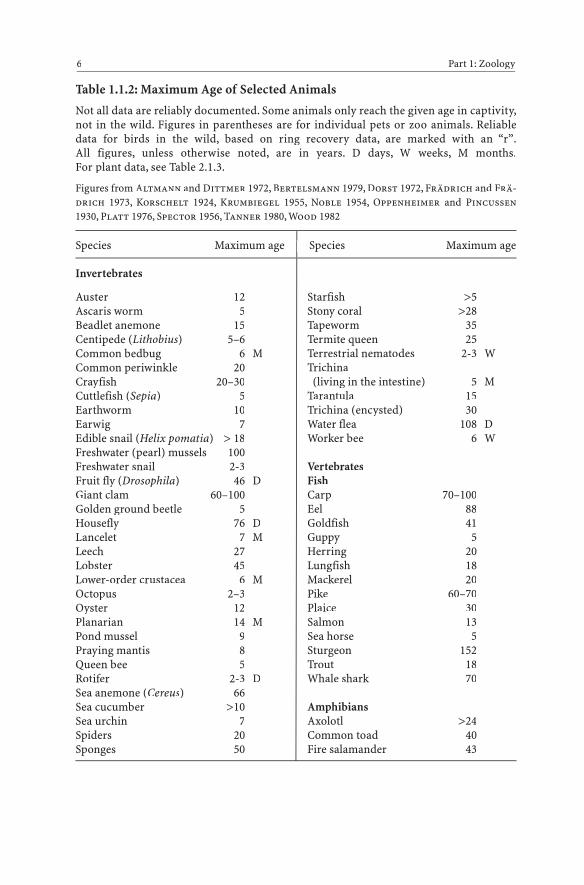
Table 1.1.2: Maximum Age of Selected Animals
Not all data are reliably documented. Some animals only reach the given age in captivity,not in the wild. Figures in parentheses are for individual pets or zoo animals. Reliabledata for birds in the wild, based on ring recovery data, are marked with an “r”.All figures, unless otherwise noted, are in years. D days, W weeks, M months.For plant data, see Table 2.1.3.
Figures from Altmann and Dittmer 1972, Bertelsmann 1979, Dorst 1972, Frädrich and Frä-drich 1973, Korschelt 1924, Krumbiegel 1955, Noble 1954, Oppenheimer and Pincussen1930, Platt 1976, Spector 1956, Tanner 1980, Wood 1982
Species Maximum age Species Maximum age
Invertebrates
6 Part 1: Zoology
Auster 12Ascaris worm 5Beadlet anemone 15Centipede (Lithobius) 5–6Common bedbug 6 MCommon periwinkle 20Crayfish 20–30Cuttlefish (Sepia) 5Earthworm 10Earwig 7Edible snail (Helix pomatia) > 18Freshwater (pearl) mussels 100Freshwater snail 2-3Fruit fly (Drosophila) 46 DGiant clam 60–100Golden ground beetle 5Housefly 76 DLancelet 7 MLeech 27Lobster 45Lower-order crustacea 6 MOctopus 2–3Oyster 12Planarian 14 MPond mussel 9Praying mantis 8Queen bee 5Rotifer 2-3 DSea anemone (Cereus) 66Sea cucumber >10Sea urchin 7Spiders 20Sponges 50
Starfish >5Stony coral >28Tapeworm 35Termite queen 25Terrestrial nematodes 2-3 WTrichina
(living in the intestine) 5 MTarantula 15Trichina (encysted) 30Water flea 108 DWorker bee 6 W
VertebratesFishCarp 70–100Eel 88Goldfish 41Guppy 5Herring 20Lungfish 18Mackerel 20Pike 60–70Plaice 30Salmon 13Sea horse 5Sturgeon 152Trout 18Whale shark 70
AmphibiansAxolotl >24Common toad 40Fire salamander 43

Giant salamander 55Smooth newt 28Tree frog 22
ReptilesAmerican alligator 66Anaconda 31Boa 40Cobra 28European pond turtle 120Galapagos giant tortoise 150Lizards (Lacerta) 5-8Rattlesnake 19Slowworm 33 (-54)Tortoise 137Tuatara 100
BirdsBarn owl 14 rBlackbird 18, 10 rBuzzard (or Am.: hawk) 24 rCanary 24 (34)Chaffinch 29Chicken 30Cockatoo 100Common raven 69Common swift 21 rCondor 65Crane 62Crow 118 20rCuckoo 40Duck 25 20rEagle 60–80 21rEagle owl 68European starling 20 rGarden warbler 24Goose 31 (50)Gray heron 60 24.5rGreat cormorant 21 18rGreat crested grebe 23Great tit 9Griffon vulture 118Herring gull 44 32rHouse sparrow 23
Hummingbird 8Larks 8 rMagpie 25Ostrich 62Owls 60–70Oystercatcher 29Pelican 50–60Penguin 26Pheasant 27Pigeons/doves 35Red-throated loon or diver 23 rRobin 11 rStork 70–100 22rSwallows 16 rSwan 30 (-100)Winter wren 5
MammalsBeaver 20–25Baboon 35Bactrian camel 29Bison 30Brown bear 47Capuchin monkey 41Cat 35Cattle 20–25 (-49)Chamois 25–30Chimpanzee >50Common or Harbor seal 26Deer 30Dogs 15–20 (-34)Dolphin 25–30Domestic pig 27Donkey 100Dromedary 28Elephant 70European hare 8Fallow deer 25Fat dormouse 9Fox 14Gibbon >23Giraffe 34Goat 20Golden or Syrian hamster 4
General: Size, Weight, Age … 7
Species Maximum age Species Maximum age
(Cont.) →

Gorilla 60Gray seal 42Guinea pig 9.5 (-15)Hedgehog 14Hippopotamus 54Horses 40–50 (-61)Horseshoe bat 24Human 118Ibex 30Kangaroo 30Lion 30Llama 15Long-beaked echidna 49Mole 3–4Moose (in Europe: elk) 25Mouse 4Mule 45Myotis (bat) 24
Orangutan 59Polar bear 41Rabbit 18Rat 3Reindeer 16Rhinoceros 45Roe deer 16Sea lion 28Sheep 20Shrews 1.5Squirrel 12Tiger 30Whale 100Wild boar 20–30Wolf 14Wood mouse 10 MZebra 38
8 Part 1: Zoology
Species Maximum age Species Maximum age
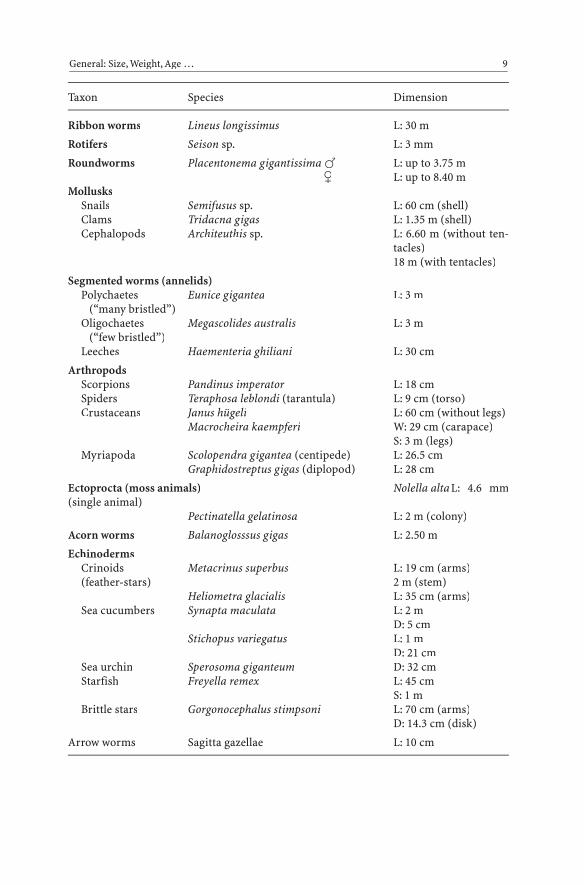
Table 1.1.3: Largest Representatives of Selected Animal Taxa (Excluding Verte-brates and Insects)
For data on vertebrates, see Tables 1.1.6 through 1.1.12; for insects, Table 1.1.4.L = length, D = diameter, W = width, S = span.
Figures from Frank 1976, Kästner 1973
Taxon Species Dimension
Protozoa Nummulites D: 32 cm
Sponges Spheciospongia D: 2 m
CnidariaHydrozoa Brachiocerianthus imperialis, Polyp L: 2.20 m
Aequorea sp., jellyfish D: 40 cmScyphozoa Cyanea arctica, jellyfish D: 2 mSea anemone Stoichactis sp. D: 1.50 mSolitary corals Fungia sp. D: 25 cmCtenophores Cestus veneris L: 1.50 m
FlatwormsTurbellaria Terrestrial planarian L: 60 cmTrematodes Nematobothrioides histoidii L: 6-8 mTapeworms Diphyllobothrium latum L: 15 m
Taxon Species Dimension
Ribbon worms Lineus longissimus L: 30 m
Rotifers Seison sp. L: 3 mm
Roundworms Placentonema gigantissima � L: up to 3.75 m� L: up to 8.40 m
MollusksSnails Semifusus sp. L: 60 cm (shell)Clams Tridacna gigas L: 1.35 m (shell)Cephalopods Architeuthis sp. L: 6.60 m (without ten-
tacles)18 m (with tentacles)
Segmented worms (annelids)Polychaetes Eunice gigantea L: 3 m
(“many bristled”)Oligochaetes Megascolides australis L: 3 m
(“few bristled”)Leeches Haementeria ghiliani L: 30 cm
ArthropodsScorpions Pandinus imperator L: 18 cmSpiders Teraphosa leblondi (tarantula) L: 9 cm (torso)Crustaceans Janus hügeli L: 60 cm (without legs)
Macrocheira kaempferi W: 29 cm (carapace)S: 3 m (legs)
Myriapoda Scolopendra gigantea (centipede) L: 26.5 cmGraphidostreptus gigas (diplopod) L: 28 cm
Ectoprocta (moss animals) Nolella altaL: 4.6 mm(single animal)
Pectinatella gelatinosa L: 2 m (colony)
Acorn worms Balanoglosssus gigas L: 2.50 m
EchinodermsCrinoids Metacrinus superbus L: 19 cm (arms)(feather-stars) 2 m (stem)
Heliometra glacialis L: 35 cm (arms)Sea cucumbers Synapta maculata L: 2 m
D: 5 cmStichopus variegatus L: 1 m
D: 21 cmSea urchin Sperosoma giganteum D: 32 cmStarfish Freyella remex L: 45 cm
S: 1 mBrittle stars Gorgonocephalus stimpsoni L: 70 cm (arms)
D: 14.3 cm (disk)
Arrow worms Sagitta gazellae L: 10 cm
General: Size, Weight, Age … 9
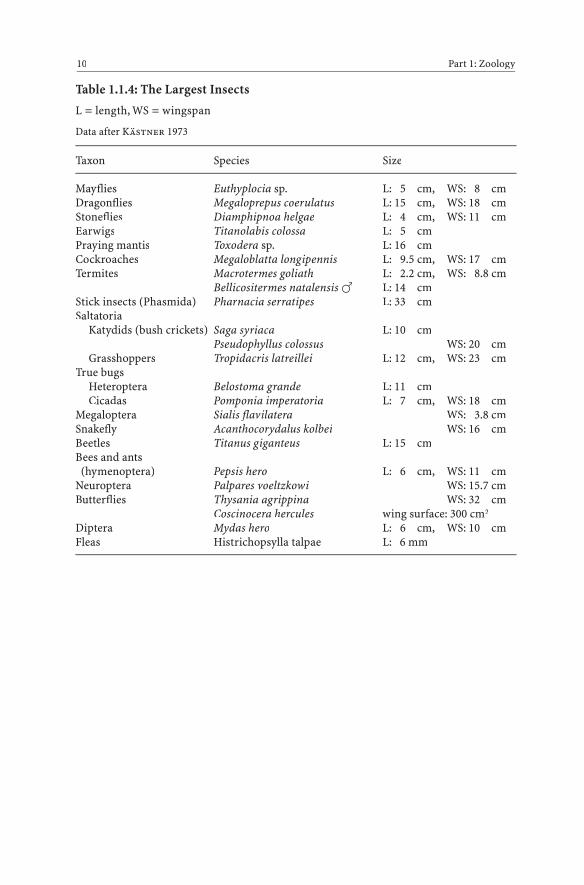
Table 1.1.4: The Largest Insects
L = length, WS = wingspan
Data after Kästner 1973
Taxon Species Size
Mayflies Euthyplocia sp. L: 5 cm, WS: 8 cmDragonflies Megaloprepus coerulatus L: 15 cm, WS: 18 cmStoneflies Diamphipnoa helgae L: 4 cm, WS: 11 cmEarwigs Titanolabis colossa L: 5 cmPraying mantis Toxodera sp. L: 16 cmCockroaches Megaloblatta longipennis L: 9.5 cm, WS: 17 cmTermites Macrotermes goliath L: 2.2 cm, WS: 8.8 cm
Bellicositermes natalensis � L: 14 cmStick insects (Phasmida) Pharnacia serratipes L: 33 cmSaltatoria
Katydids (bush crickets) Saga syriaca L: 10 cmPseudophyllus colossus WS: 20 cm
Grasshoppers Tropidacris latreillei L: 12 cm, WS: 23 cmTrue bugs
Heteroptera Belostoma grande L: 11 cmCicadas Pomponia imperatoria L: 7 cm, WS: 18 cm
Megaloptera Sialis flavilatera WS: 3.8 cmSnakefly Acanthocorydalus kolbei WS: 16 cmBeetles Titanus giganteus L: 15 cmBees and ants
(hymenoptera) Pepsis hero L: 6 cm, WS: 11 cmNeuroptera Palpares voeltzkowi WS: 15.7 cmButterflies Thysania agrippina WS: 32 cm
Coscinocera hercules wing surface: 300 cm2
Diptera Mydas hero L: 6 cm, WS: 10 cmFleas Histrichopsylla talpae L: 6 mm
10 Part 1: Zoology
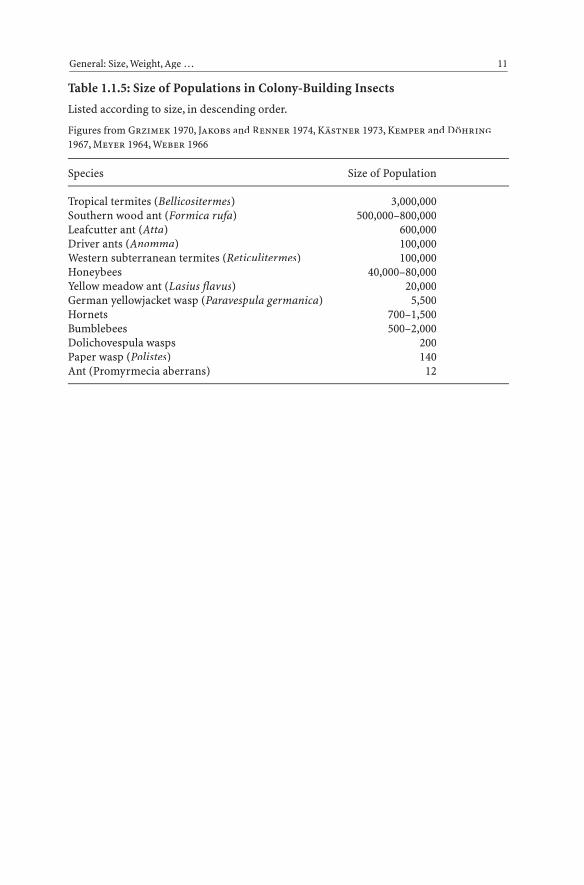
Table 1.1.5: Size of Populations in Colony-Building Insects
Listed according to size, in descending order.
Figures from Grzimek 1970, Jakobs and Renner 1974, Kästner 1973, Kemper and Döhring1967, Meyer 1964, Weber 1966
Species Size of Population
Tropical termites (Bellicositermes) 3,000,000Southern wood ant (Formica rufa) 500,000–800,000Leafcutter ant (Atta) 600,000Driver ants (Anomma) 100,000Western subterranean termites (Reticulitermes) 100,000Honeybees 40,000–80,000Yellow meadow ant (Lasius flavus) 20,000German yellowjacket wasp (Paravespula germanica) 5,500Hornets 700–1,500Bumblebees 500–2,000Dolichovespula wasps 200Paper wasp (Polistes) 140Ant (Promyrmecia aberrans) 12
General: Size, Weight, Age … 11
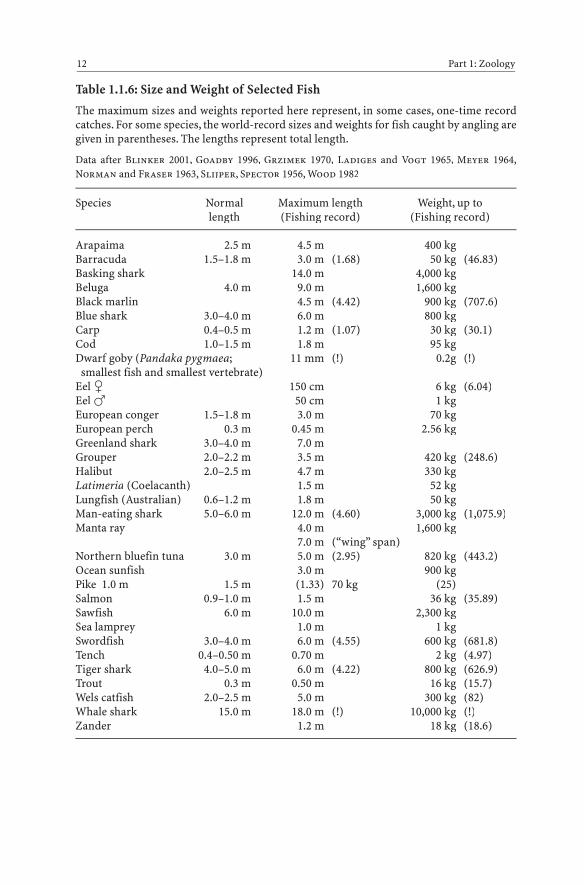
Table 1.1.6: Size and Weight of Selected Fish
The maximum sizes and weights reported here represent, in some cases, one-time recordcatches. For some species, the world-record sizes and weights for fish caught by angling aregiven in parentheses. The lengths represent total length.
Data after Blinker 2001, Goadby 1996, Grzimek 1970, Ladiges and Vogt 1965, Meyer 1964,Norman and Fraser 1963, Slijper, Spector 1956, Wood 1982
Species Normal Maximum length Weight, up tolength (Fishing record) (Fishing record)
Arapaima 2.5 m 4.5 m 400 kgBarracuda 1.5–1.8 m 3.0 m (1.68) 50 kg (46.83)Basking shark 14.0 m 4,000 kgBeluga 4.0 m 9.0 m 1,600 kgBlack marlin 4.5 m (4.42) 900 kg (707.6)Blue shark 3.0–4.0 m 6.0 m 800 kgCarp 0.4–0.5 m 1.2 m (1.07) 30 kg (30.1)Cod 1.0–1.5 m 1.8 m 95 kgDwarf goby (Pandaka pygmaea; 11 mm (!) 0.2g (!)smallest fish and smallest vertebrate)
Eel � 150 cm 6 kg (6.04)Eel � 50 cm 1 kgEuropean conger 1.5–1.8 m 3.0 m 70 kgEuropean perch 0.3 m 0.45 m 2.56 kgGreenland shark 3.0–4.0 m 7.0 mGrouper 2.0–2.2 m 3.5 m 420 kg (248.6)Halibut 2.0–2.5 m 4.7 m 330 kgLatimeria (Coelacanth) 1.5 m 52 kgLungfish (Australian) 0.6–1.2 m 1.8 m 50 kgMan-eating shark 5.0–6.0 m 12.0 m (4.60) 3,000 kg (1,075.9)Manta ray 4.0 m 1,600 kg
7.0 m (“wing” span)Northern bluefin tuna 3.0 m 5.0 m (2.95) 820 kg (443.2)Ocean sunfish 3.0 m 900 kgPike 1.0 m 1.5 m (1.33) 70 kg (25)Salmon 0.9–1.0 m 1.5 m 36 kg (35.89)Sawfish 6.0 m 10.0 m 2,300 kgSea lamprey 1.0 m 1 kgSwordfish 3.0–4.0 m 6.0 m (4.55) 600 kg (681.8)Tench 0.4–0.50 m 0.70 m 2 kg (4.97)Tiger shark 4.0–5.0 m 6.0 m (4.22) 800 kg (626.9)Trout 0.3 m 0.50 m 16 kg (15.7)Wels catfish 2.0–2.5 m 5.0 m 300 kg (82)Whale shark 15.0 m 18.0 m (!) 10,000 kg (!)Zander 1.2 m 18 kg (18.6)
12 Part 1: Zoology
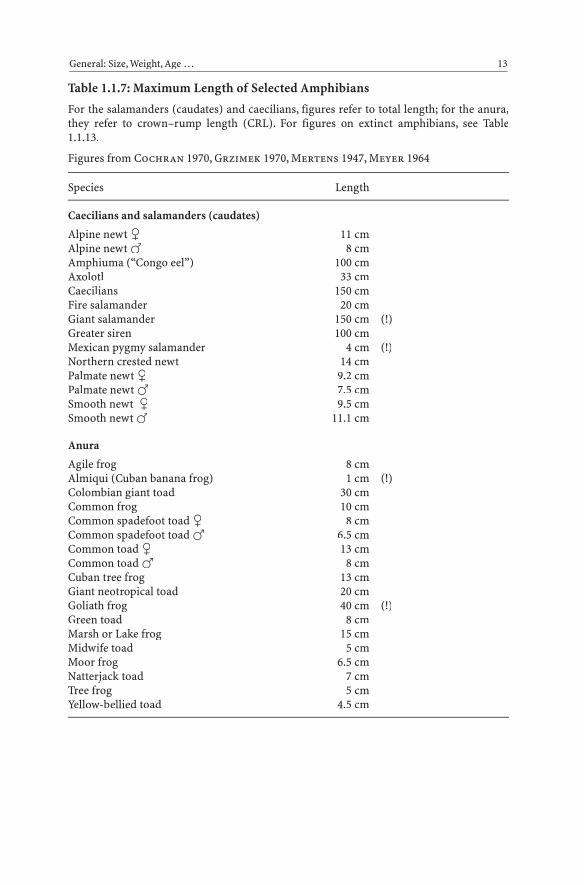
Table 1.1.7: Maximum Length of Selected Amphibians
For the salamanders (caudates) and caecilians, figures refer to total length; for the anura,they refer to crown–rump length (CRL). For figures on extinct amphibians, see Table1.1.13.
Figures from Cochran 1970, Grzimek 1970, Mertens 1947, Meyer 1964
Species Length
Caecilians and salamanders (caudates)
Alpine newt � 11 cmAlpine newt � 8 cmAmphiuma (“Congo eel”) 100 cmAxolotl 33 cmCaecilians 150 cmFire salamander 20 cmGiant salamander 150 cm (!)Greater siren 100 cmMexican pygmy salamander 4 cm (!)Northern crested newt 14 cmPalmate newt � 9.2 cmPalmate newt � 7.5 cmSmooth newt � 9.5 cmSmooth newt � 11.1 cm
Anura
Agile frog 8 cmAlmiqui (Cuban banana frog) 1 cm (!)Colombian giant toad 30 cmCommon frog 10 cmCommon spadefoot toad � 8 cmCommon spadefoot toad � 6.5 cmCommon toad � 13 cmCommon toad � 8 cmCuban tree frog 13 cmGiant neotropical toad 20 cmGoliath frog 40 cm (!)Green toad 8 cmMarsh or Lake frog 15 cmMidwife toad 5 cmMoor frog 6.5 cmNatterjack toad 7 cmTree frog 5 cmYellow-bellied toad 4.5 cm
General: Size, Weight, Age … 13
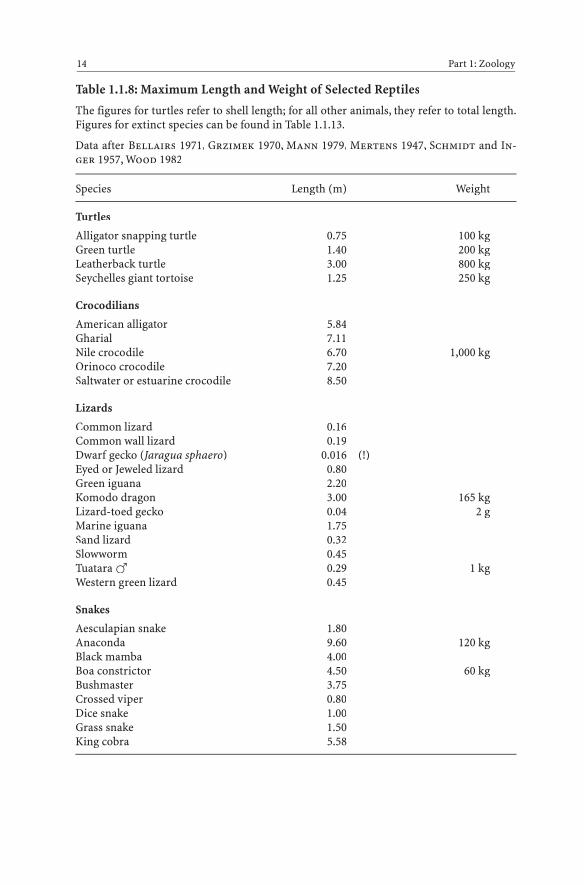
Table 1.1.8: Maximum Length and Weight of Selected Reptiles
The figures for turtles refer to shell length; for all other animals, they refer to total length.Figures for extinct species can be found in Table 1.1.13.
Data after Bellairs 1971, Grzimek 1970, Mann 1979, Mertens 1947, Schmidt and In-ger 1957, Wood 1982
Species Length (m) Weight
Turtles
Alligator snapping turtle 0.75 100 kgGreen turtle 1.40 200 kgLeatherback turtle 3.00 800 kgSeychelles giant tortoise 1.25 250 kg
Crocodilians
American alligator 5.84Gharial 7.11Nile crocodile 6.70 1,000 kgOrinoco crocodile 7.20Saltwater or estuarine crocodile 8.50
Lizards
Common lizard 0.16Common wall lizard 0.19Dwarf gecko (Jaragua sphaero) 0.016 (!)Eyed or Jeweled lizard 0.80Green iguana 2.20Komodo dragon 3.00 165 kgLizard-toed gecko 0.04 2 gMarine iguana 1.75Sand lizard 0.32Slowworm 0.45Tuatara � 0.29 1 kgWestern green lizard 0.45
Snakes
Aesculapian snake 1.80Anaconda 9.60 120 kgBlack mamba 4.00Boa constrictor 4.50 60 kgBushmaster 3.75Crossed viper 0.80Dice snake 1.00Grass snake 1.50King cobra 5.58
14 Part 1: Zoology
Species Length (m) Weight
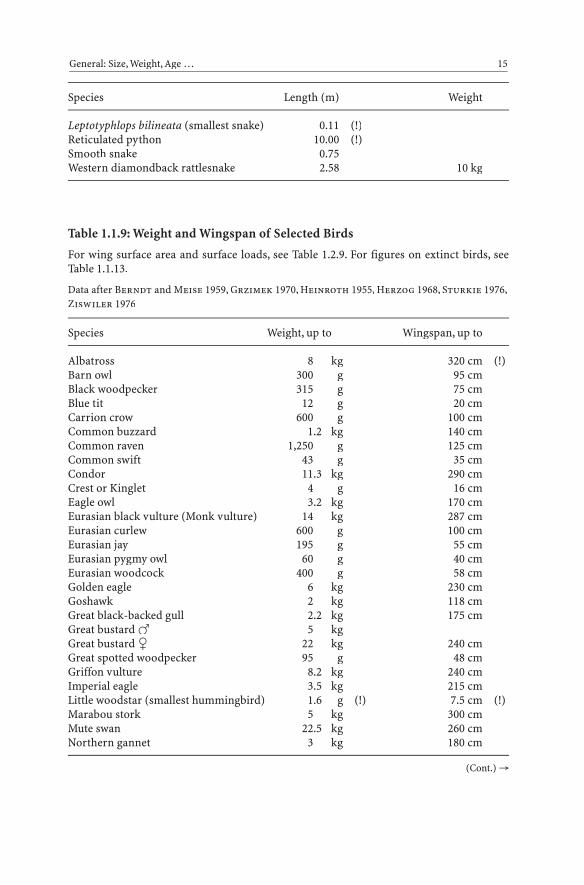
Leptotyphlops bilineata (smallest snake) 0.11 (!)Reticulated python 10.00 (!)Smooth snake 0.75Western diamondback rattlesnake 2.58 10 kg
Table 1.1.9: Weight and Wingspan of Selected Birds
For wing surface area and surface loads, see Table 1.2.9. For figures on extinct birds, seeTable 1.1.13.
Data after Berndt and Meise 1959, Grzimek 1970, Heinroth 1955, Herzog 1968, Sturkie 1976,Ziswiler 1976
Species Weight, up to Wingspan, up to
Albatross 8 kg 320 cm (!)Barn owl 300 g 95 cmBlack woodpecker 315 g 75 cmBlue tit 12 g 20 cmCarrion crow 600 g 100 cmCommon buzzard 1.2 kg 140 cmCommon raven 1,250 g 125 cmCommon swift 43 g 35 cmCondor 11.3 kg 290 cmCrest or Kinglet 4 g 16 cmEagle owl 3.2 kg 170 cmEurasian black vulture (Monk vulture) 14 kg 287 cmEurasian curlew 600 g 100 cmEurasian jay 195 g 55 cmEurasian pygmy owl 60 g 40 cmEurasian woodcock 400 g 58 cmGolden eagle 6 kg 230 cmGoshawk 2 kg 118 cmGreat black-backed gull 2.2 kg 175 cmGreat bustard � 5 kgGreat bustard � 22 kg 240 cmGreat spotted woodpecker 95 g 48 cmGriffon vulture 8.2 kg 240 cmImperial eagle 3.5 kg 215 cmLittle woodstar (smallest hummingbird) 1.6 g (!) 7.5 cm (!)Marabou stork 5 kg 300 cmMute swan 22.5 kg 260 cmNorthern gannet 3 kg 180 cm
General: Size, Weight, Age … 15
(Cont.) →
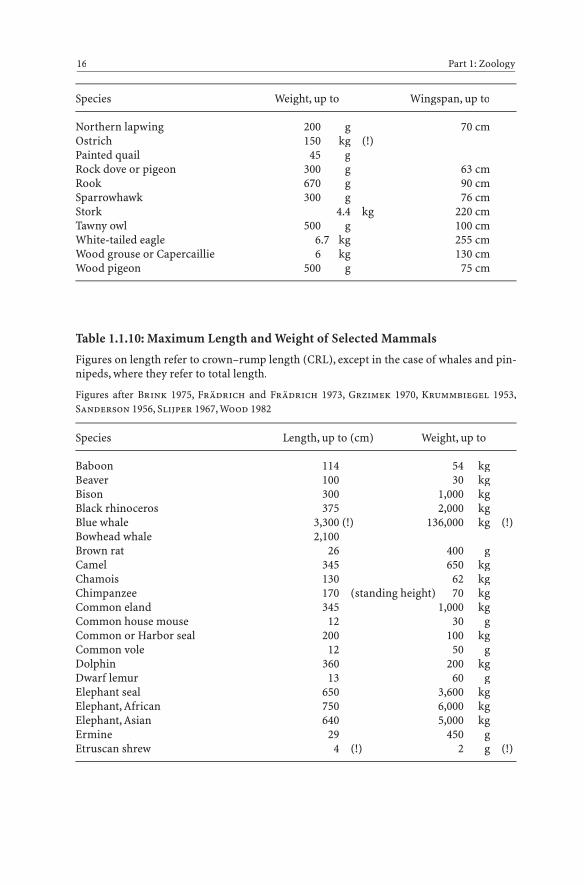
Species Weight, up to Wingspan, up to
Northern lapwing 200 g 70 cmOstrich 150 kg (!)Painted quail 45 gRock dove or pigeon 300 g 63 cmRook 670 g 90 cmSparrowhawk 300 g 76 cmStork 4.4 kg 220 cmTawny owl 500 g 100 cmWhite-tailed eagle 6.7 kg 255 cmWood grouse or Capercaillie 6 kg 130 cmWood pigeon 500 g 75 cm
Table 1.1.10: Maximum Length and Weight of Selected Mammals
Figures on length refer to crown–rump length (CRL), except in the case of whales and pin-nipeds, where they refer to total length.
Figures after Brink 1975, Frädrich and Frädrich 1973, Grzimek 1970, Krummbiegel 1953,Sanderson 1956, Slijper 1967, Wood 1982
Species Length, up to (cm) Weight, up to
Baboon 114 54 kgBeaver 100 30 kgBison 300 1,000 kgBlack rhinoceros 375 2,000 kgBlue whale 3,300 (!) 136,000 kg (!)Bowhead whale 2,100Brown rat 26 400 gCamel 345 650 kgChamois 130 62 kgChimpanzee 170 (standing height) 70 kgCommon eland 345 1,000 kgCommon house mouse 12 30 gCommon or Harbor seal 200 100 kgCommon vole 12 50 gDolphin 360 200 kgDwarf lemur 13 60 gElephant seal 650 3,600 kgElephant, African 750 6,000 kgElephant, Asian 640 5,000 kgErmine 29 450 gEtruscan shrew 4 (!) 2 g (!)
16 Part 1: Zoology
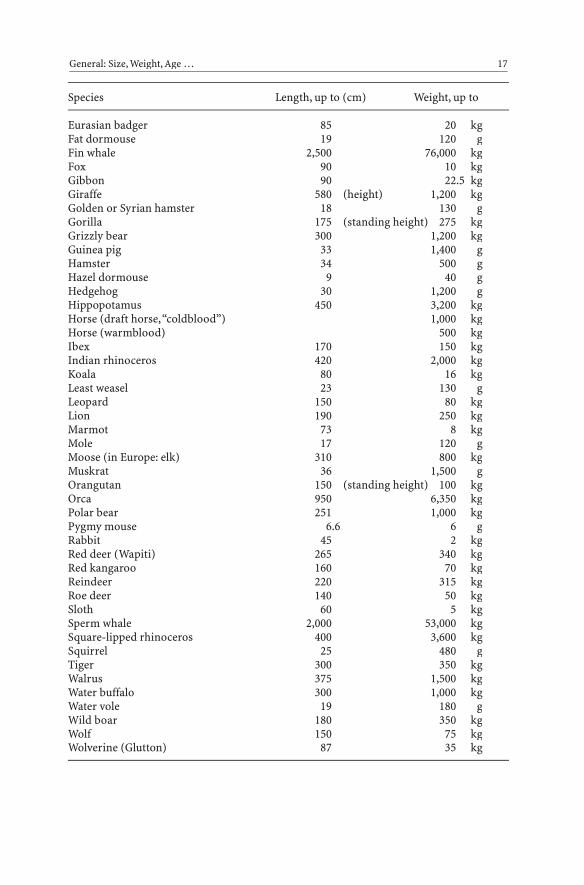
Species Length, up to (cm) Weight, up to
Eurasian badger 85 20 kgFat dormouse 19 120 gFin whale 2,500 76,000 kgFox 90 10 kgGibbon 90 22.5 kgGiraffe 580 (height) 1,200 kgGolden or Syrian hamster 18 130 gGorilla 175 (standing height) 275 kgGrizzly bear 300 1,200 kgGuinea pig 33 1,400 gHamster 34 500 gHazel dormouse 9 40 gHedgehog 30 1,200 gHippopotamus 450 3,200 kgHorse (draft horse,“coldblood”) 1,000 kgHorse (warmblood) 500 kgIbex 170 150 kgIndian rhinoceros 420 2,000 kgKoala 80 16 kgLeast weasel 23 130 gLeopard 150 80 kgLion 190 250 kgMarmot 73 8 kgMole 17 120 gMoose (in Europe: elk) 310 800 kgMuskrat 36 1,500 gOrangutan 150 (standing height) 100 kgOrca 950 6,350 kgPolar bear 251 1,000 kgPygmy mouse 6.6 6 gRabbit 45 2 kgRed deer (Wapiti) 265 340 kgRed kangaroo 160 70 kgReindeer 220 315 kgRoe deer 140 50 kgSloth 60 5 kgSperm whale 2,000 53,000 kgSquare-lipped rhinoceros 400 3,600 kgSquirrel 25 480 gTiger 300 350 kgWalrus 375 1,500 kgWater buffalo 300 1,000 kgWater vole 19 180 gWild boar 180 350 kgWolf 150 75 kgWolverine (Glutton) 87 35 kg
General: Size, Weight, Age … 17

Table 1.1.11: Size of Selected Breeds of Dog
Figures give crown–rump length (CRL) and height at withers (= shoulder height), both incentimeters.
Data after Haltenorth 1958, Smolik 1968
Species CRL Withers
Wolf 100–140 65–90Dingo 100 50–55
Affenpinscher 20–25 26Airedale terrier 55–62 55–62Appenzeller mountain dog 49–58 48–58Barzoi 75–80 71–76Bloodhound 65–72 60–70Boxer 57–73 53–63Chihuahua 15–20 (!) 15–23 (!)Cocker spaniel 35–42 35–42Collie 56–63 50–60Dachshund 23–30 23–27Dalmatian 50–60 50–60Fox terrier 35–40 35–60German shepherd 60–65 55–65Giant schnauzer (Riesenschnauzer) 57–70 60–70Great Dane 75–90 (!) 72–92 (!)Greyhound 65 65–70Italian Greyhound 36 35Miniature poodle 35 30–35Newfoundland 63–75 62–75Pointer 60–65 60–65Pomeranian 28 28Poodle 45–60 45–55Pug 25–32 32Rottweiler 60–65 55–66St. Bernard 68–78 65–80
18 Part 1: Zoology
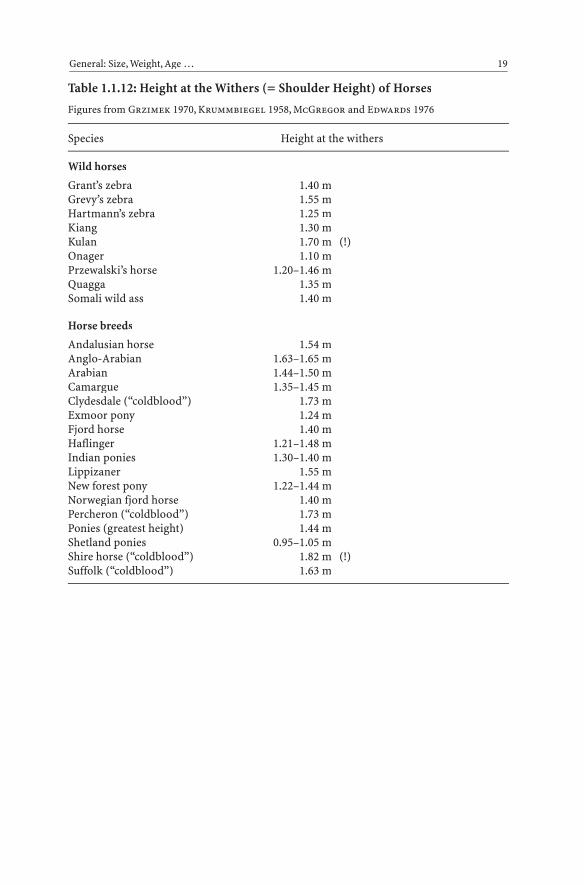
Table 1.1.12: Height at the Withers (= Shoulder Height) of Horses
Figures from Grzimek 1970, Krummbiegel 1958, McGregor and Edwards 1976
Species Height at the withers
Wild horses
Grant’s zebra 1.40 mGrevy’s zebra 1.55 mHartmann’s zebra 1.25 mKiang 1.30 mKulan 1.70 m (!)Onager 1.10 mPrzewalski’s horse 1.20–1.46 mQuagga 1.35 mSomali wild ass 1.40 m
Horse breeds
Andalusian horse 1.54 mAnglo-Arabian 1.63–1.65 mArabian 1.44–1.50 mCamargue 1.35–1.45 mClydesdale (“coldblood”) 1.73 mExmoor pony 1.24 mFjord horse 1.40 mHaflinger 1.21–1.48 mIndian ponies 1.30–1.40 mLippizaner 1.55 mNew forest pony 1.22–1.44 mNorwegian fjord horse 1.40 mPercheron (“coldblood”) 1.73 mPonies (greatest height) 1.44 mShetland ponies 0.95–1.05 mShire horse (“coldblood”) 1.82 m (!)Suffolk (“coldblood”) 1.63 m
General: Size, Weight, Age … 19

Table 1.1.13: Size and Weights of Selected Extinct Vertebrates
Figures from Grzimek 1970, Kuhn 1958, Kuhn-Schnyder 1974, Lüttschwager 1961,Meyer 1974, Slijper 1967, Wood 1982
Species Length Height Estimated(m) (m) weight (kg)
Sharks
Carcharodon megalodon 33 125,000
Fish (placodermi)
Titanichthys 8
Amphibians
Mastodonsaurus 3Palaeosiren beinerti (Caecilian) 15Prionosuchus plummeri 9
Reptiles
DinosaursBrachiosaurus 27 15 50,000Brontosaurus 22 40,000Diplodocus 28 40,000Iguanodon 11 5 10,000Stegosaurus 9 1,750Tyrannosaurus 16 6
CrocodilesPhobosuchus 13.5Rhamphosuchus indicus 18.3
PterosaursPteranodon wingspan 7 m 30Quetzalcoatlus northropi wingspan 12 m 86
IchthyosaursIchthyosaurus 12
SnakesPterosphenus 11
TurtlesArchelon ischirus 6 2,700Colossochelys atlas 6
Birds
Aepyornis (Madagascar’s elephant bird) 1.5 400Archaeopteryx 0.45Argentavis magnificens
(capable of flying, wingspan 7.6 m) 1.5 120Dodo 1 25Giant moa 3.5 250
20 Part 1: Zoology

Species Length Height Estimated(m) (m) weight (kg)
Mammals
Baluchitherium (fossil rhinoceros) 8.5 5.5 18,000Dinotherium (fossil elephant) 4 7,500Cave bear 2.8Mammoth 3.5 4 7,500Aurochs 3 1.8 1,500
Table 1.1.14: Size of Horns and Teeth
The figures represent maximum values from individual hunting trophies. Winding hornsand teeth measured along their external curvature.
Data after Dorst and Dandelot 1973, Haltenorth and Trense 1956
Species Size
Antlers, horns
Alpine ibex 147.32 cmAurochs 80.00 cmCommon eland 112.40 cmImpala 92.08 cmAfrican buffalo 163.80 cmGreater kudu 168.91 cmSable antelope 163.53 cmGemsbok 121.92 cmRed deer (Wapiti) 152.40 cmWater buffalo 197.49 cmBlack wildebeest 67.95 cm
Frontal horn (rhinoceros)
Square-lipped rhinoceros 158.12 cmIndian rhinoceros 60.96 cmBlack rhinoceros 135.90 cm
Teeth
African elephant, tusk 349.25 cm 133.02 kgAsian elephant, tusk 266.70 cm 72.98 kgHippopotamus, lower canine 163.83 cmWarthog, tusk 60.96 cm
General: Size, Weight, Age … 21
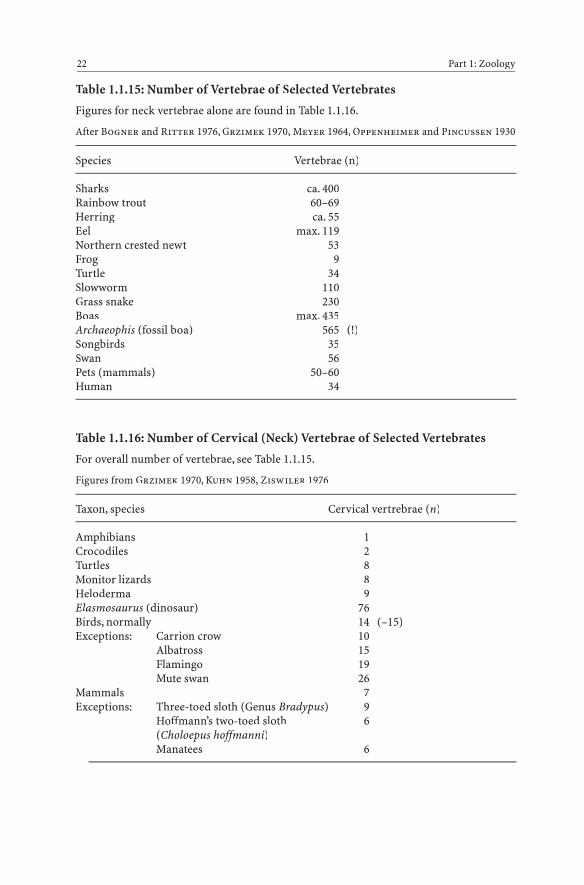
Table 1.1.15: Number of Vertebrae of Selected Vertebrates
Figures for neck vertebrae alone are found in Table 1.1.16.
After Bogner and Ritter 1976, Grzimek 1970, Meyer 1964, Oppenheimer and Pincussen 1930
Species Vertebrae (n)
Sharks ca. 400Rainbow trout 60–69Herring ca. 55Eel max. 119Northern crested newt 53Frog 9Turtle 34Slowworm 110Grass snake 230Boas max. 435Archaeophis (fossil boa) 565 (!)Songbirds 35Swan 56Pets (mammals) 50–60Human 34
Table 1.1.16: Number of Cervical (Neck) Vertebrae of Selected Vertebrates
For overall number of vertebrae, see Table 1.1.15.
Figures from Grzimek 1970, Kuhn 1958, Ziswiler 1976
Taxon, species Cervical vertrebrae (n)
Amphibians 1Crocodiles 2Turtles 8Monitor lizards 8Heloderma 9Elasmosaurus (dinosaur) 76Birds, normally 14 (–15)Exceptions: Carrion crow 10
Albatross 15Flamingo 19Mute swan 26
Mammals 7Exceptions: Three-toed sloth (Genus Bradypus) 9
Hoffmann’s two-toed sloth 6(Choloepus hoffmanni)Manatees 6
22 Part 1: Zoology
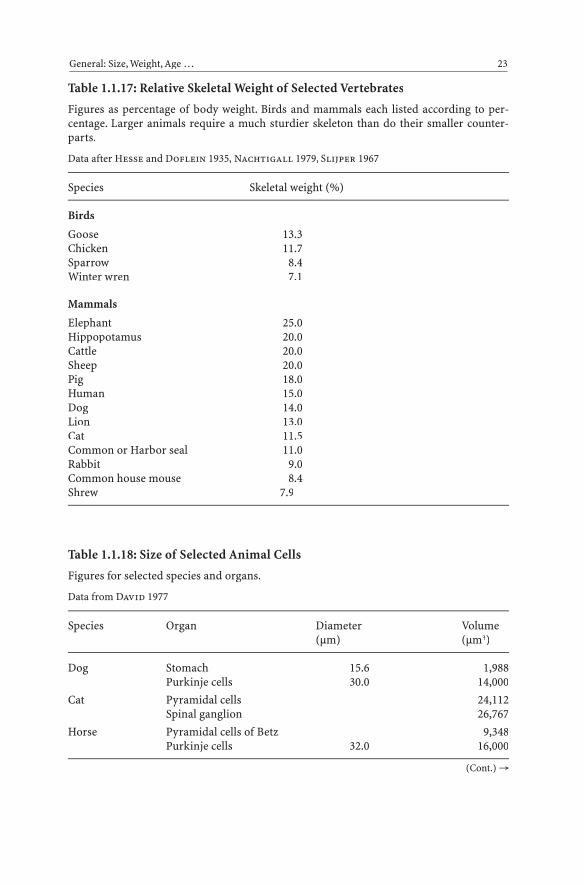
Table 1.1.17: Relative Skeletal Weight of Selected Vertebrates
Figures as percentage of body weight. Birds and mammals each listed according to per-centage. Larger animals require a much sturdier skeleton than do their smaller counter-parts.
Data after Hesse and Doflein 1935, Nachtigall 1979, Slijper 1967
Species Skeletal weight (%)
Birds
Goose 13.3Chicken 11.7Sparrow 8.4Winter wren 7.1
Mammals
Elephant 25.0Hippopotamus 20.0Cattle 20.0Sheep 20.0Pig 18.0Human 15.0Dog 14.0Lion 13.0Cat 11.5Common or Harbor seal 11.0Rabbit 9.0Common house mouse 8.4Shrew 7.9
Table 1.1.18: Size of Selected Animal Cells
Figures for selected species and organs.
Data from David 1977
Species Organ Diameter Volume(μm) (μm3)
Dog Stomach 15.6 1,988Purkinje cells 30.0 14,000
Cat Pyramidal cells 24,112Spinal ganglion 26,767
Horse Pyramidal cells of Betz 9,348Purkinje cells 32.0 16,000
General: Size, Weight, Age … 23
(Cont.) →
Species Organ Diameter Volume(μm) (μm3)
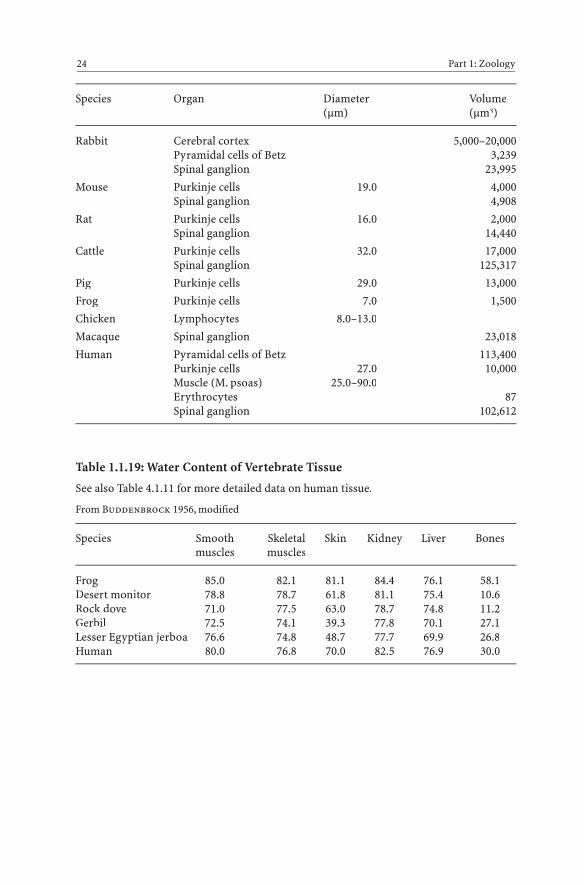
Rabbit Cerebral cortex 5,000–20,000Pyramidal cells of Betz 3,239Spinal ganglion 23,995
Mouse Purkinje cells 19.0 4,000Spinal ganglion 4,908
Rat Purkinje cells 16.0 2,000Spinal ganglion 14,440
Cattle Purkinje cells 32.0 17,000Spinal ganglion 125,317
Pig Purkinje cells 29.0 13,000
Frog Purkinje cells 7.0 1,500
Chicken Lymphocytes 8.0–13.0
Macaque Spinal ganglion 23,018
Human Pyramidal cells of Betz 113,400Purkinje cells 27.0 10,000Muscle (M. psoas) 25.0–90.0Erythrocytes 87Spinal ganglion 102,612
Table 1.1.19: Water Content of Vertebrate Tissue
See also Table 4.1.11 for more detailed data on human tissue.
From Buddenbrock 1956, modified
Species Smooth Skeletal Skin Kidney Liver Bonesmuscles muscles
Frog 85.0 82.1 81.1 84.4 76.1 58.1Desert monitor 78.8 78.7 61.8 81.1 75.4 10.6Rock dove 71.0 77.5 63.0 78.7 74.8 11.2Gerbil 72.5 74.1 39.3 77.8 70.1 27.1Lesser Egyptian jerboa 76.6 74.8 48.7 77.7 69.9 26.8Human 80.0 76.8 70.0 82.5 76.9 30.0
24 Part 1: Zoology

Table 1.1.20: Amino Acid Composition of the Protein of Vertebrates
Figures represent percentage of weight.
From Buddenbrock 1956, modified
Amino acid (%)
Glutamic acid 11.2–13.9Glycine 8.2–10.2Aspartic acid 8.1–10.4Leucine 6.1– 7.5Arginine 5.8– 6.3Lysine 5.6– 7.9Valine 4.4– 5.7Threonine 3.7– 4.3Isoleucine 3.3– 4.7Phenylalanine 3.2– 4.2Methionine 1.7– 2.1Histidine 1.6– 2.1Tryptophan 0.6– 1.0
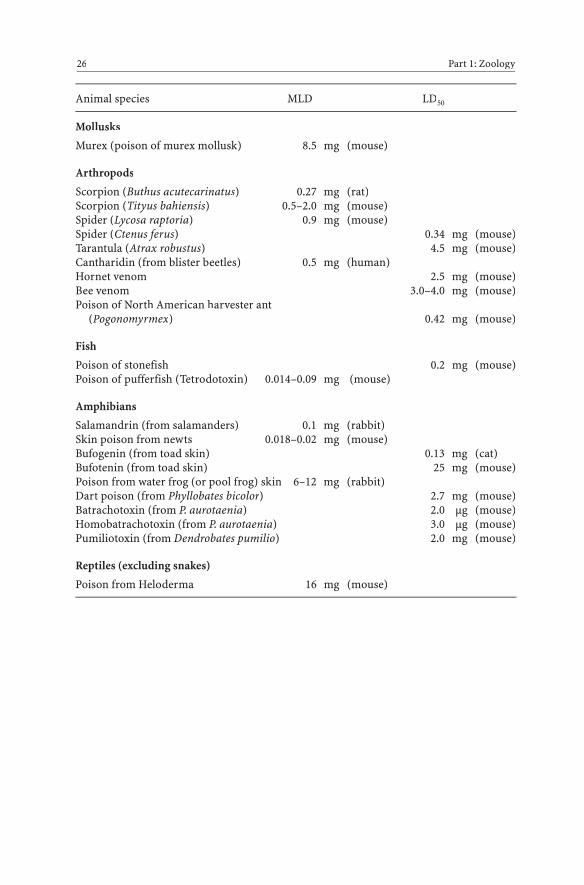
Table 1.1.21: Effects of Animal Poisons (Not Including Those of Snakes)
Figures provided represent either the dose that kills half (50%) of the animals tested (LD50,where LD = lethal dose) or the minimal lethal dose (MLD), calculated in terms of 1 kgbody weight of the examined animal species (species in parentheses).Data on snake poison is found in Table 1.1.22.
Figures from Bassus 1965, Bertelsmann 1979, Mebs 1979
Animal species MLD LD50
Cnidaria
Congestin (from nematocysts of 5 mg (dog)sea anemone)Hypsotoxin (from nematocysts of 2.0–2.5 mg (mouse)
the siphonophore Physalia)Lophotoxin (from nematocysts of 8 mg (mouse)
the gorgonian coral Lophogorgia)Palytoxin (from nematocysts of 0.01 μg (mouse)
the sea mat Palythoa)Thalassin (from nematocysts of 2.5–9 mg (dog)
sea anemone)
General: Size, Weight, Age … 25
(Cont.) →
Animal species MLD LD50
Mollusks
Murex (poison of murex mollusk) 8.5 mg (mouse)
Arthropods
Scorpion (Buthus acutecarinatus) 0.27 mg (rat)Scorpion (Tityus bahiensis) 0.5–2.0 mg (mouse)Spider (Lycosa raptoria) 0.9 mg (mouse)Spider (Ctenus ferus) 0.34 mg (mouse)Tarantula (Atrax robustus) 4.5 mg (mouse)Cantharidin (from blister beetles) 0.5 mg (human)Hornet venom 2.5 mg (mouse)Bee venom 3.0–4.0 mg (mouse)Poison of North American harvester ant
(Pogonomyrmex) 0.42 mg (mouse)
Fish
Poison of stonefish 0.2 mg (mouse)Poison of pufferfish (Tetrodotoxin) 0.014–0.09 mg (mouse)
Amphibians
Salamandrin (from salamanders) 0.1 mg (rabbit)Skin poison from newts 0.018–0.02 mg (mouse)Bufogenin (from toad skin) 0.13 mg (cat)Bufotenin (from toad skin) 25 mg (mouse)Poison from water frog (or pool frog) skin 6–12 mg (rabbit)Dart poison (from Phyllobates bicolor) 2.7 mg (mouse)Batrachotoxin (from P. aurotaenia) 2.0 μg (mouse)Homobatrachotoxin (from P. aurotaenia) 3.0 μg (mouse)Pumiliotoxin (from Dendrobates pumilio) 2.0 mg (mouse)
Reptiles (excluding snakes)
Poison from Heloderma 16 mg (mouse)
26 Part 1: Zoology

Table 1.1.22: Effects of Snake Venoms
Figures provided represent either the dose that kills half (50%) of the mice injected with it(LD50 , where LD = lethal dose) or the minimal lethal dose (MLD), calculated in terms of1 kg body weight of the examined animal species (species in parentheses).For the effect of the poison of other animals, see Table 1.1.21.
Data after Bassus 1965, Ziswiler 1965
Animal species Dry weight LD50 MLD(mg) of poison (mg/kg) (mg/kg)per bite mouse mouse/rabbit
Crossed viper 1–1.4 (mouse)Russell’s viper (Vipera russeli) 130–250 0.82Asp viper 1–2 (mouse)Puff adder (Bitis arietans) 130–250 3.68Rattlesnake 35 0.3
(Crotalus durissus)American copperhead 52 10.5
(Agkistrodon contortrix)Bushmaster (Lachesis muta) 280–450 5.93Coral snake 2–6 0.97 1.5 (mouse)
(Micrurus fulvius)Tiger snake (Notechis scutatus) 70 0.04 0.045 (rabbit)Indian cobra (Naja naja) 170–325 0.4Krait (Bungarus caeruleus) 10 0.09 0.04 (rabbit)Eastern green mamba 80 0.45
(Dendroaspis angusticeps)Beaked sea snake 7–20 0.01
(Enhydrina schistosa)
General: Size, Weight, Age … 27

Table 1.1.23: Poisonous Effect of Selected Insecticides on VertebratesWhen the insecticide is orally administered, 50 % of the animals examined die (LD50 ).Figures in milligrams poison per kilogram body weight. The animal species examined arein parentheses. For a comparison, see also Tables 1.1.21 and 1.1.22.
Figures from Altmann and Dittmer 1973
Insecticide LD50 (mg/kg) (Animal species)
Aldicarb 1 (Rat)Aldrin 44 (Mouse)
33 (Guinea pig)Chlordane 430 (Mouse)DDT 118 (Rat)
400 (Guinea pig)150–400 (Mouse)
DDVP (Dichlorvos) 56– 80 (Rat)Diazinon 76 (Rat)Dieldrin 38 (Mouse)
49 (Guinea pig)38– 87 (Rat)
Endrin 16– 36 (Guinea pig)Heptachlor 68 (Mouse)
116 (Guinea pig)Lindane 86 (Mouse)
100–127 (Guinea pig)Mevinphos 3.7– 6.1 (Rat)Parathion (E 605) 3.6 (Rat)Perthane 9.34 (Rat)Toxaphene 112 (Mouse)
69 (Guinea pig)69 (Rat)
Zectran (mexacarbate) 15– 63 (Rat)
28 Part 1: Zoology

1.2 Movement, Locomotion
Table 1.2.0: Numbers that Amaze
This table brings together several interesting figures from Sect. 1.2, which are cited againin the individual tables below, where they are accompanied by references to the literature.
Movement, Locomotion 29
Number of wingbeats per second in insectsChironomidae (Forcipomyia) 1,046/sHousefly up to 330/s
Number of wingbeats in birdsAmethyst hummingbird 78/sHouse sparrow 13/sPelican 1.3/s
Wing surface areas in birdsGriffon vulture 10,450 cm2
Ruby-throated hummingbird 10 cm2
Greatest surface load in birdsMute swan 167 N/m2
Albatross 155 N/m2
Maximum speed, swimmingSwordfish 90 km/hMarlin 80 km/hOrca 65 km/h
Maximum speed, runningCheetah 120 km/hGreyhound 110 km/hRed kangaroo 80 km/h
Maximum speed, flyingCommon swift 180 km/hSpine-tailed swift 335 km/hPeregrine falcon, in a swoop 290 km/h
Maximum speed, during bird migrationCommon swift 150 km/h
Annual migratory flight distance
Arctic tern 40,000 kmStork 20,000 km
Maximum jumping distance in animalsRed kangaroo 13.5 m
= 9 times its body lengthFlea 60 cm
= 200 times its body length
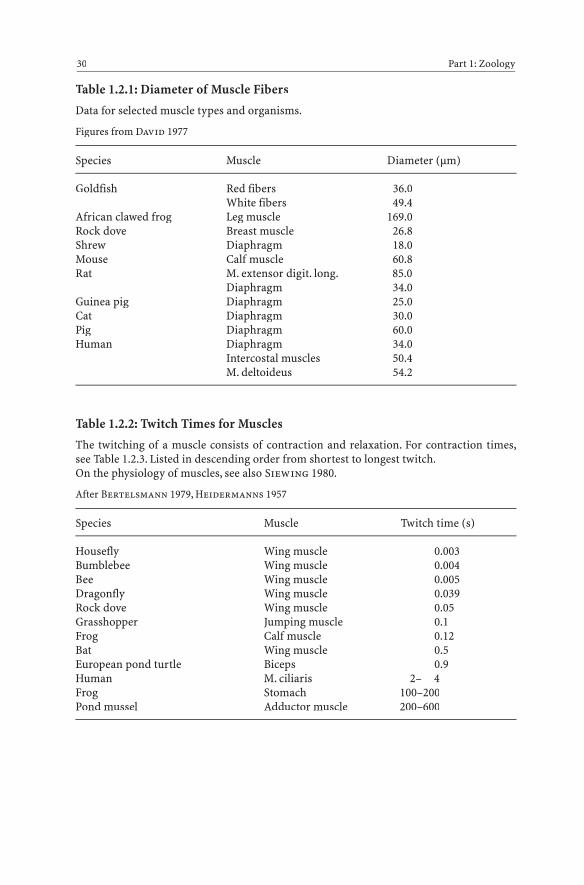
Table 1.2.1: Diameter of Muscle Fibers
Data for selected muscle types and organisms.
Figures from David 1977
Species Muscle Diameter (μm)
Goldfish Red fibers 36.0White fibers 49.4
African clawed frog Leg muscle 169.0Rock dove Breast muscle 26.8Shrew Diaphragm 18.0Mouse Calf muscle 60.8Rat M. extensor digit. long. 85.0
Diaphragm 34.0Guinea pig Diaphragm 25.0Cat Diaphragm 30.0Pig Diaphragm 60.0Human Diaphragm 34.0
Intercostal muscles 50.4M. deltoideus 54.2
Table 1.2.2: Twitch Times for Muscles
The twitching of a muscle consists of contraction and relaxation. For contraction times,see Table 1.2.3. Listed in descending order from shortest to longest twitch.On the physiology of muscles, see also Siewing 1980.
After Bertelsmann 1979, Heidermanns 1957
Species Muscle Twitch time (s)
Housefly Wing muscle 0.003Bumblebee Wing muscle 0.004Bee Wing muscle 0.005Dragonfly Wing muscle 0.039Rock dove Wing muscle 0.05Grasshopper Jumping muscle 0.1Frog Calf muscle 0.12Bat Wing muscle 0.5European pond turtle Biceps 0.9Human M. ciliaris 2– 4Frog Stomach 100–200Pond mussel Adductor muscle 200–600
30 Part 1: Zoology
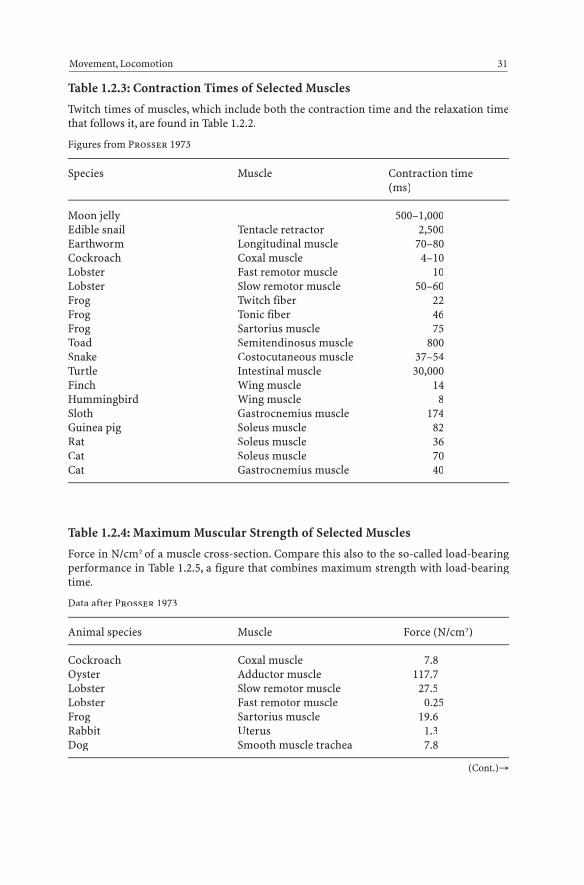
Table 1.2.3: Contraction Times of Selected Muscles
Twitch times of muscles, which include both the contraction time and the relaxation timethat follows it, are found in Table 1.2.2.
Figures from Prosser 1973
Species Muscle Contraction time(ms)
Moon jelly 500–1,000Edible snail Tentacle retractor 2,500Earthworm Longitudinal muscle 70–80Cockroach Coxal muscle 4–10Lobster Fast remotor muscle 10Lobster Slow remotor muscle 50–60Frog Twitch fiber 22Frog Tonic fiber 46Frog Sartorius muscle 75Toad Semitendinosus muscle 800Snake Costocutaneous muscle 37–54Turtle Intestinal muscle 30,000Finch Wing muscle 14Hummingbird Wing muscle 8Sloth Gastrocnemius muscle 174Guinea pig Soleus muscle 82Rat Soleus muscle 36Cat Soleus muscle 70Cat Gastrocnemius muscle 40
Table 1.2.4: Maximum Muscular Strength of Selected Muscles
Force in N/cm2 of a muscle cross-section. Compare this also to the so-called load-bearingperformance in Table 1.2.5, a figure that combines maximum strength with load-bearingtime.
Data after Prosser 1973
Animal species Muscle Force (N/cm2)
Cockroach Coxal muscle 7.8Oyster Adductor muscle 117.7Lobster Slow remotor muscle 27.5Lobster Fast remotor muscle 0.25Frog Sartorius muscle 19.6Rabbit Uterus 1.3Dog Smooth muscle trachea 7.8
Movement, Locomotion 31
(Cont.)→

Animal species Muscle Force (N/cm2)
Sloth Gastrocnemius muscle 15.9Sloth Diaphragm 20.6Rat M. extensor digitorum 29.4Rat Gastrocnemius muscle 17.7Rat Soleus muscle 2.8Rat Cardiac muscle 0.2Cat Tenuissimus muscle 13.7Cat Duodenal sphincter 4.1
Table 1.2.5: Load-Bearing Record of Selected Muscles
The load-bearing performance describes the load in grams that can be borne by 1 cm2
cross-section of a muscle for 1 h.
Data after Heidermanns 1957
Species Mucle type Load-bearing performance
Frog Calf muscle 4– 6Toad Calf muscle 44– 67Human Biceps 97–575Pond mussel Adductor muscle 1– 2 million
Table 1.2.6: Number of Wingbeats per Second in Insects
For the resulting speeds, see Table 1.2.10. For figures for birds, see Table 1.2.8.For greater detail on insect flight, see Siewing 1980.
Data after Bauer et al. 1974, Bertelsmann 1979, Franz 1959, Hanke et at. 1977, Lampeitl 1982,Meyer 1964
Species Frequency
BeeWorker bee 240–250Soldier bee 285Queen bee 226–253Drone 207
Blowfly (Calliphora) 155Bumblebee 130–250Caddis fly 38Cockchafer (May bug) 46
32 Part 1: Zoology
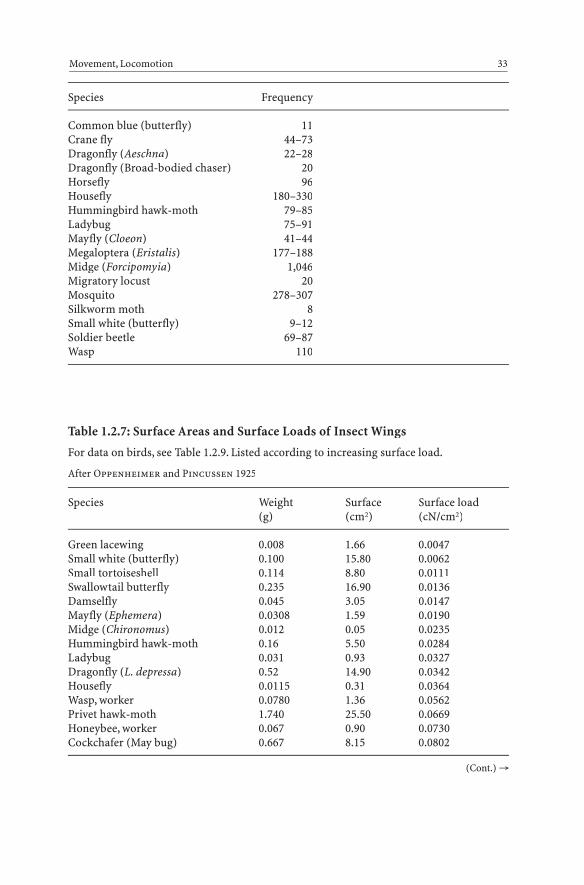
Species Frequency
Common blue (butterfly) 11Crane fly 44–73Dragonfly (Aeschna) 22–28Dragonfly (Broad-bodied chaser) 20Horsefly 96Housefly 180–330Hummingbird hawk-moth 79–85Ladybug 75–91Mayfly (Cloeon) 41–44Megaloptera (Eristalis) 177–188Midge (Forcipomyia) 1,046Migratory locust 20Mosquito 278–307Silkworm moth 8Small white (butterfly) 9–12Soldier beetle 69–87Wasp 110
Table 1.2.7: Surface Areas and Surface Loads of Insect Wings
For data on birds, see Table 1.2.9. Listed according to increasing surface load.
After Oppenheimer and Pincussen 1925
Species Weight Surface Surface load(g) (cm2) (cN/cm2)
Green lacewing 0.008 1.66 0.0047Small white (butterfly) 0.100 15.80 0.0062Small tortoiseshell 0.114 8.80 0.0111Swallowtail butterfly 0.235 16.90 0.0136Damselfly 0.045 3.05 0.0147Mayfly (Ephemera) 0.0308 1.59 0.0190Midge (Chironomus) 0.012 0.05 0.0235Hummingbird hawk-moth 0.16 5.50 0.0284Ladybug 0.031 0.93 0.0327Dragonfly (L. depressa) 0.52 14.90 0.0342Housefly 0.0115 0.31 0.0364Wasp, worker 0.0780 1.36 0.0562Privet hawk-moth 1.740 25.50 0.0669Honeybee, worker 0.067 0.90 0.0730Cockchafer (May bug) 0.667 8.15 0.0802
Movement, Locomotion 33
(Cont.) →

Species Weight Surface Surface load(g) (cm2) (cN/cm2)
Bumblebee 0.118 1.18 0.0981Earth-boring dung beetle 0.9039 5.90 0.1534Water scavenger beetle 4.82 19.50 0.1603
Table 1.2.8: Wingbeat Frequencies in Birds
The speeds reached with these frequencies are found in Table 1.2.10. For figures on insects,see Table 1.2.6.
Data from Dorst 1972, Hertel 1963, Herzog 1968, Ziswiler 1976
Species Beats per second
Amethyst hummingbird 78 (!)Blackbird 5.6Carrion crow 5Common buzzard 3Common swift 12Eurasian coot 5.8European starling 5.1Gray heron 2Herring gull 3House sparrow 13Hummingbirds 30–50Magpie 3Mallard 5–10Mute swan 2.7Owls 4Pelican 1.2Peregrine falcon 4.3Pheasant 9Rock dove 8Stork 2Turkey 3
34 Part 1: Zoology

Table 1.2.9: Surface Areas and Surface Loads of Bird Wings
For corresponding figures for insects, see Table 1.2.7. For the wingspans of birds, see Table1.1.9. Listed in descending order according to surface area.As a point of comparison: gliders have a surface load of 25 N/m2.
After Dorst 1972, Herzog 1968, Oppenheimer and Pincussen 1925
Species Surface area Surface load(cm2) (N/m2)
Griffon vulture 10,450 71Albatross 6,220 155Eagle 5,930 69Mute swan 5,760 167Great bustard 5,550 74Stork 5,520 66Egret 3,590 38Greylag goose 3,070 112Great black-backed gull 2,060 77Crow 2,050 30Goshawk 2,050 40Buzzard/Hawk 2,030 41Herring gull 2,010 41Peregrine falcon 1,540 37Barn owl 1,160 24Mallard 1,150 93Rock dove 840 24Northern lapwing 660 30Magpie 640 32Common kestrel 490 44Blackbird 310 28Great spotted woodpecker 240 30European starling 190 43Barn swallow 140 14Common swift 130 29Sparrow 120 24Great tit 100 21Chaffinch 100 21Crest or Kinglet 50 11Ruby-throated hummingbird 10 24
Movement, Locomotion 35

Table 1.2.10: Maximum Speeds of Selected Animals
All figures are in kilometers per hour. Some of the speeds given are only achieved for shortstretches. The great differences in the data given in the literature on bird flying speeds arebased on the fact that no mention is made whether the cited speeds were achieved with orwithout tailwinds.
Data after Bauer et al. 1974, Bertelsmann 1979, Franz 1959, Grzimek 1970, Hanke et al. 1977,Heinroth 1955, Hertel 1963, Herzog 1968, Hesse and Doflein 1935, Kästner 1973,Krumbiegel 1953, Lampeitl 1982, Mann 1979, Mossmann and Sarjeant 1983, Niethammer1979, Schwerdtfeger 1975, Slijper 1967, Wood 1982, Wunderlich and Gloede 1977, Ziswiler1976
Species km/h Species km/h
36 Part 1: Zoology
SwimmingCommon eider 35Dolphin 46Eel 12Fin whale 55Gentoo penguin 36
(under water)Giant squid 40Grass snake 2.9Gray whale 7.5Great diving beetle 1.8Human (100 m freestyle) 7Marlin 80Orca 65Polar bear 10Ringed seal 32Salmon 39Sea snakes 3.6Shark 36Swordfish 90 (!)Trout 35Tuna 75
Crawling, runningAfrican elephant 39Antilopes 70Bison 55Black mamba 17.6Camel 15Centipede (Lithobius) 1Cheetah 120 (!)Common house mouse 12Common vole 8
Coyote 60Deer 67Dromedary 50Eastern green mamba 11.3Edible snail (Helix pomatia) 0.00324Gazelle 75Giant tortoise 0.33Giraffe 51Gnu 60Greyhound 110Hare 65Herbivorous dinosaurs 6Hippopotamus 48Horse (gallop) 36Horse (trot) 13.5House cat 48Human (100 m race) 36Human (flying start) 44.6Lion 75Mole 4Ostrich 72Pill millipede (Glomeris) 0.013Pine moth larva 0.018Planarian 0.009Polar bear 65Racehorse 69Rat 9.6Rattlesnake 4Red deer (Wapiti) 70Red kangaroo 80Rhinoceros 51Roadrunner 24Shore crab 3.6

Sled dogs 23.4Sloth 0.146Spider (Tegenaria atrica) 1.3Starfish 0.000576Theropods (dinosaurs) 16.5Western green lizard 29Wild ass 65Wild horse 60Wolf 60Zebra 65
FlyingAlbatross 70Bat 50Bee 29Blowfly 11Bumblebee 18Cockchafer (May bug) 11Common buzzard 45Common swift 180Crows 59Dragonfly 30European kingfisher 58European starling 81Falcons 79Flyingfish 75Geese 91
Goshawk 42Gray partridge 85Great cormorant 70Green lacewing 2.2Hawk moth 54Homing pigeon 80Homing pigeon 177
(with a tailwind)Hornets 22Horsefly 50House sparrow 45Housefly 8.2Hummingbird hawk-moth 18Mallard 104Mergus 129Migratory locust 16Mosquito 1.4Peregrine falcon, in a swoop 290Small passerines up to 61Small white (butterfly) 14Sparrowhawk 58Spine-tailed swift 335 (!)Stork 45Swallow 65Swan 50Tabanus bovinus (horsefly) 22Tiger beetle 8
Movement, Locomotion 37
Species km/h Species km/h

Table 1.2.11: Jumping Distances of Selected Animals
Listed in ascending order according to jump in relation to body length (BL).
Data after Cochran 1970, Grzimek 1970, Hesse and Doflein 1935, Krumbiegel 1953
Species Distance jumped (m) Relation to body length (BL)
Lion 4–5 2–3 times BLTiger 5 2–3 times BLFox 2.8 4.3 times BLRed deer (Wapiti) 11 4.5 times BLRoadrunner 3 6 times BLImpala antelope 10 6 times BLLeast weasel 1.2 6 times BLKangaroo 6–10 7 times BL
max. 13.5 Wood mouse 0.7 8 times BLBullfrog 2 10 times BLGibbon 12 13 times BLJerboa 2.5 15 times BLGrasshopper 2 30 times BLAgile frog 2 33 times BLNorthern cricket frog(Acris crepitans) 1.25 36 times BL
Sharp-nosed ridged frog(Rana [Ptychadena] oxyrhynchus) 3.6 45 times BL
Flea 0.6 200 times BL
In comparison:Human, current world record 8.9 5 times BL
Table 1.2.12: Flight Speeds During Bird Migration
For maximum speeds, see Table 1.2.10. For annual flight distances, see Table 1.2.13. Listedhere in ascending order, according to speed.
After Creutz 1965, Dorst 1972, Schüz 1971
Species km/h
Red-backed shrike 40.0Sparrowhawk 41.4Barn swallow 44.0Honey buzzard 45.0Blue-headed wagtail 46.0–48.0Wood pigeon, crane, great black-backed gull, hooded crow 50.0Eurasian siskin 51.0
38 Part 1: Zoology
Species km/h
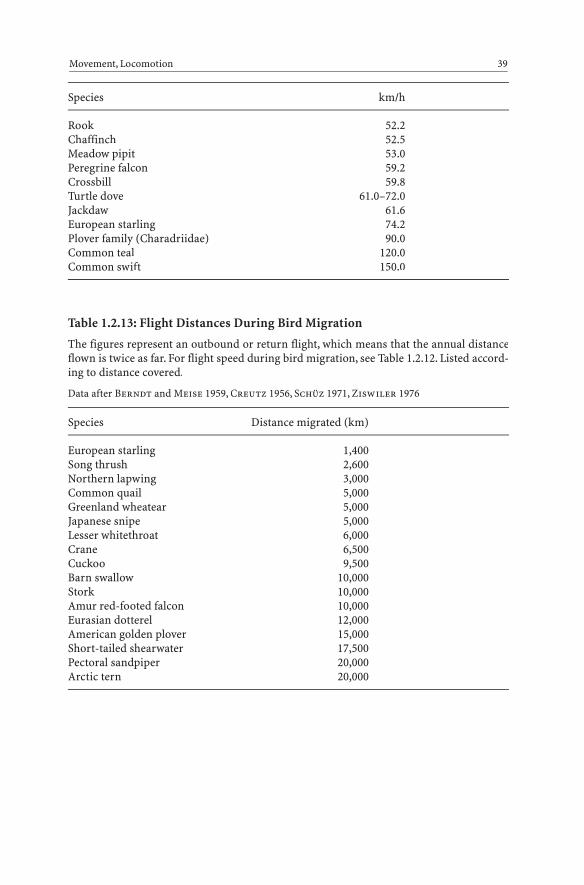
Rook 52.2Chaffinch 52.5Meadow pipit 53.0Peregrine falcon 59.2Crossbill 59.8Turtle dove 61.0–72.0Jackdaw 61.6European starling 74.2Plover family (Charadriidae) 90.0Common teal 120.0Common swift 150.0
Table 1.2.13: Flight Distances During Bird Migration
The figures represent an outbound or return flight, which means that the annual distanceflown is twice as far. For flight speed during bird migration, see Table 1.2.12. Listed accord-ing to distance covered.
Data after Berndt and Meise 1959, Creutz 1956, Schüz 1971, Ziswiler 1976
Species Distance migrated (km)
European starling 1,400 Song thrush 2,600 Northern lapwing 3,000Common quail 5,000 Greenland wheatear 5,000Japanese snipe 5,000 Lesser whitethroat 6,000Crane 6,500Cuckoo 9,500Barn swallow 10,000Stork 10,000Amur red-footed falcon 10,000 Eurasian dotterel 12,000American golden plover 15,000 Short-tailed shearwater 17,500Pectoral sandpiper 20,000Arctic tern 20,000
Movement, Locomotion 39
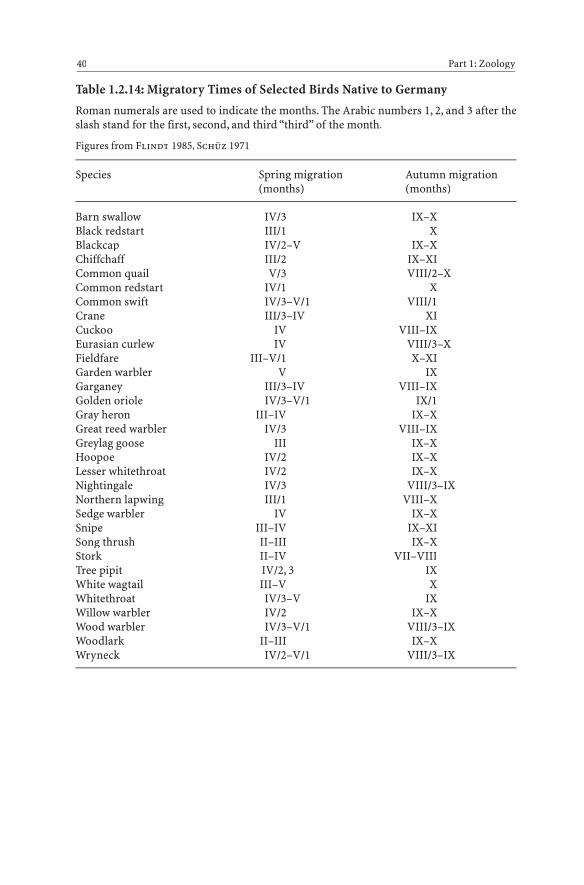
Table 1.2.14: Migratory Times of Selected Birds Native to Germany
Roman numerals are used to indicate the months. The Arabic numbers 1, 2, and 3 after theslash stand for the first, second, and third “third” of the month.
Figures from Flindt 1985, Schüz 1971
Species Spring migration Autumn migration(months) (months)
Barn swallow IV/3 IX–XBlack redstart III/1 XBlackcap IV/2–V IX–XChiffchaff III/2 IX–XICommon quail V/3 VIII/2–XCommon redstart IV/1 XCommon swift IV/3–V/1 VIII/1Crane III/3–IV XICuckoo IV VIII–IXEurasian curlew IV VIII/3–XFieldfare III–V/1 X–XIGarden warbler V IXGarganey III/3–IV VIII–IXGolden oriole IV/3–V/1 IX/1Gray heron III–IV IX–XGreat reed warbler IV/3 VIII–IXGreylag goose III IX–XHoopoe IV/2 IX–XLesser whitethroat IV/2 IX–XNightingale IV/3 VIII/3–IXNorthern lapwing III/1 VIII–XSedge warbler IV IX–XSnipe III–IV IX–XISong thrush II–III IX–XStork II–IV VII–VIIITree pipit IV/2, 3 IXWhite wagtail III–V XWhitethroat IV/3–V IXWillow warbler IV/2 IX–XWood warbler IV/3–V/1 VIII/3–IXWoodlark II–III IX–XWryneck IV/2–V/1 VIII/3–IX
40 Part 1: Zoology

1.3 Alimentation, Digestion
Table 1.3.0: Numbers that Amaze
This table brings together interesting figures from the Sects. 1.3 Alimentation, Digestion,1.4 Metabolism, and 1.5 Excretion. These numbers are cited again in the individual tables,where they are accompanied by references to the literature.BL body length, BW body weight.
Alimentation, Digestion 41
Daily dietary needs as share ofbody weight (BW) Etruscan shrew 200% of BW
Hummingbird 200% of BWAsian elephant 1% of BW
Length of intestineSperm whale (absolute) 288 m– As compared to BL 24 timesMinke whale as compared to BL 56 times
Capacity of a cow’s stomach 252.5 lCapacity of a horse’s appendix 33.5 lCapacity of a horse’s large intestine 96 l
Body temperature Shrew 42 °CBlackbird 43.6 °CRobin 44.6 °CHedgehog during hibernation 6 °C
Length of hibernation Hazel dormouse, fat dormouse 6–7 months
Number of renal glomeruli Cattle 8,000,000
Daily urine production Cattle up to 20 lHorse up to 10 l
Relative weight of liver (as % of BL)Kitefin shark (Scymnorhinus) 22.7%
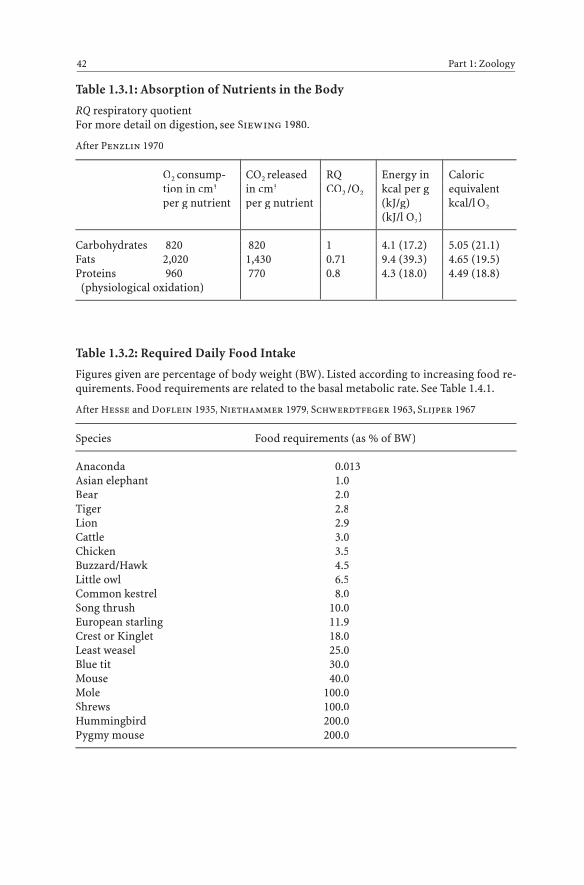
Table 1.3.1: Absorption of Nutrients in the Body
RQ respiratory quotientFor more detail on digestion, see Siewing 1980.
After Penzlin 1970
O2 consump- CO2 released RQ Energy in Caloriction in cm3 in cm3 CO2 /O2 kcal per g equivalentper g nutrient per g nutrient (kJ/g) kcal/l O2
(kJ/l O2)
Carbohydrates 820 820 1 4.1 (17.2) 5.05 (21.1)Fats 2,020 1,430 0.71 9.4 (39.3) 4.65 (19.5)Proteins 960 770 0.8 4.3 (18.0) 4.49 (18.8)(physiological oxidation)
Table 1.3.2: Required Daily Food Intake
Figures given are percentage of body weight (BW). Listed according to increasing food re-quirements. Food requirements are related to the basal metabolic rate. See Table 1.4.1.
After Hesse and Doflein 1935, Niethammer 1979, Schwerdtfeger 1963, Slijper 1967
Species Food requirements (as % of BW)
Anaconda 0.013Asian elephant 1.0Bear 2.0Tiger 2.8Lion 2.9Cattle 3.0Chicken 3.5Buzzard/Hawk 4.5Little owl 6.5Common kestrel 8.0Song thrush 10.0European starling 11.9Crest or Kinglet 18.0Least weasel 25.0Blue tit 30.0Mouse 40.0Mole 100.0Shrews 100.0Hummingbird 200.0Pygmy mouse 200.0
42 Part 1: Zoology

Table 1.3.3: Dental Formulae of Selected Mammals
The numbers above the fraction bar represent the number of the following distinct typesof teeth in the upper jaw: incisors, canines, premolars, and molars, respectively. The num-bers below the fraction bar designate the same types of teeth in the lower jaw.
Data after Brink 1975, Brohmer 1977, Giersberg and Rietschel 1968, Grzimek 1970,Krumbiegel 1953
Species Dental formula
Apes 2 1 2 32 1 2 3
Arvicolinae 1 0 0 31 0 0 3
Bats:Horseshoe bats 1 1 2 3
2 1 3 3
Mouse-eared bats 2 1 3 33 1 3 3
Bears 3 1 4 23 1 4 3
Beaver 1 0 1 31 0 1 3
Beech marten 3 1 4 13 1 4 2
Camel 1 1 3 33 1 2 3
Cat 3 1 3 13 1 2 1
Cattle 0 0 3 33 1 3 3
Chamois Same as cattle
Common or Harbor seal 3 1 4 12 1 4 1
Deer Same as cattle
Dog Same as bears
Dormice Same as beaver
Elephant 1 0 3 30 0 3 3
Alimentation, Digestion 43
(Cont.) →

Species Dental formula
Ermine 3 1 3 13 1 3 2
Eurasian badger Same as pine marten
Fat dormouse Same as beaver
Fox Same as bears
Giraffe Same as cattle
Goat Same as cattle
Guinea pig Same as beaver
Hamster Same as arvicolinae
Hare 2 0 3 31 0 2 3
Hazel dormouse Same as beaver
Hedgehog 3 1 3 32 1 2 3
Hippopotamus 2 1 4 32 1 4 3
Horses 3 1 3 33 1 3 3
Human Same as apes
Hyena 3 1 3 13 1 3 1
Ibex Same as cattle
Least weasel Same as ermine
Lion Same as cat
Llama 1 1 2 33 1 2 3
Lynx 3 1 2 13 1 2 1
Marmot Same as squirrel
Mole 3 1 4 33 1 4 3
44 Part 1: Zoology
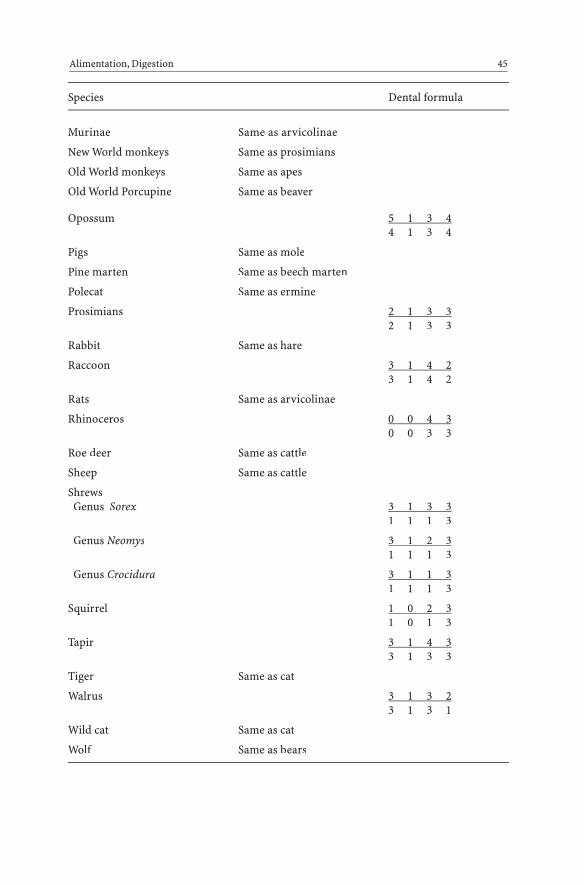
Species Dental formula
Murinae Same as arvicolinae
New World monkeys Same as prosimians
Old World monkeys Same as apes
Old World Porcupine Same as beaver
Opossum 5 1 3 44 1 3 4
Pigs Same as mole
Pine marten Same as beech marten
Polecat Same as ermine
Prosimians 2 1 3 32 1 3 3
Rabbit Same as hare
Raccoon 3 1 4 23 1 4 2
Rats Same as arvicolinae
Rhinoceros 0 0 4 30 0 3 3
Roe deer Same as cattle
Sheep Same as cattle
ShrewsGenus Sorex 3 1 3 3
1 1 1 3
Genus Neomys 3 1 2 31 1 1 3
Genus Crocidura 3 1 1 31 1 1 3
Squirrel 1 0 2 31 0 1 3
Tapir 3 1 4 33 1 3 3
Tiger Same as cat
Walrus 3 1 3 23 1 3 1
Wild cat Same as cat
Wolf Same as bears
Alimentation, Digestion 45
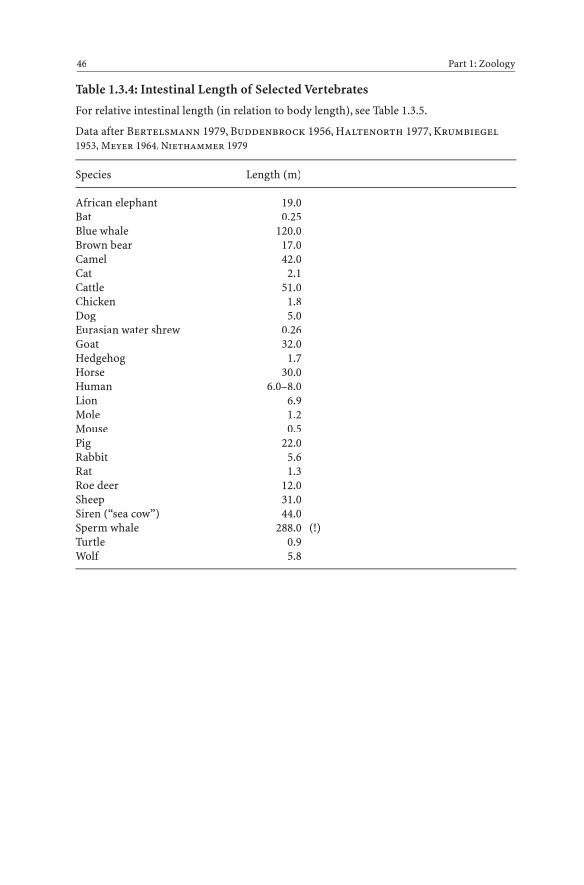
Table 1.3.4: Intestinal Length of Selected Vertebrates
For relative intestinal length (in relation to body length), see Table 1.3.5.
Data after Bertelsmann 1979, Buddenbrock 1956, Haltenorth 1977, Krumbiegel1953, Meyer 1964, Niethammer 1979
Species Length (m)
African elephant 19.0Bat 0.25Blue whale 120.0Brown bear 17.0Camel 42.0Cat 2.1Cattle 51.0Chicken 1.8Dog 5.0Eurasian water shrew 0.26Goat 32.0Hedgehog 1.7Horse 30.0Human 6.0–8.0Lion 6.9Mole 1.2Mouse 0.5Pig 22.0Rabbit 5.6Rat 1.3Roe deer 12.0Sheep 31.0Siren (“sea cow”) 44.0Sperm whale 288.0 (!)Turtle 0.9Wolf 5.8
46 Part 1: Zoology

Table 1.3.5: Relative Intestinal Length of Selected Animals
Numbers indicate relation of intestinal length (IL) to body length (BL) (how many timeslonger the intestine is than the body). For absolute lengths, see Table 1.3.4. Among the her-bivores (long intestines) and carnivores (short intestines), respectively, the intestines ofsmaller animals are relatively longer than those of their larger counterparts. The spermwhale represents an exception to this pattern among whales, probably due to its feeding onoctopus and squid.
Data after Bauer et al.1974,Buddenbrock 1956,Bertelsmann 1979,Haltenorth 1977,Hesse andDoflein 1935, Krumbiegel 1953, Lexikon der Biologie, 1964, Niethammer 1979, Ziswiler 1976
Species Relation of IL Species Relation of ILto BL (times) to BL (times)
Alimentation, Digestion 47
Bat 1.9Blue whale 4.5Brown bear 8Camel 12Cat 3–4Cattle 22–29Chicken 1.8Cockchafer (May bug) 7Common or Harbor seal 28Common shrew 1.3Dog 5–6Dolphin 15Dung beetle (Scarabaeus) 13Elephant 7Eurasian water shrew 3European pond turtle 9Fox 2.9Great diving beetle 1Hedgehog 6.6Hippopotamus 12–14Horse 12Human 7.5Ibex 27
Leguan 0.3Lion 3.9Minke whale 56Mole 8–11Mouse 8Mudpuppy 3Nile crocodile 1.8Orangutan 4.5Pig 14–15Pike 1Porpoise 20Python 1.8Rabbit 10Rat 9–11Rock dove 7Roe deer 11Sea lion 37Sheep 27Snakes 1Sperm whale 16–24Tiger 5Turtles 5Wolf 4.7
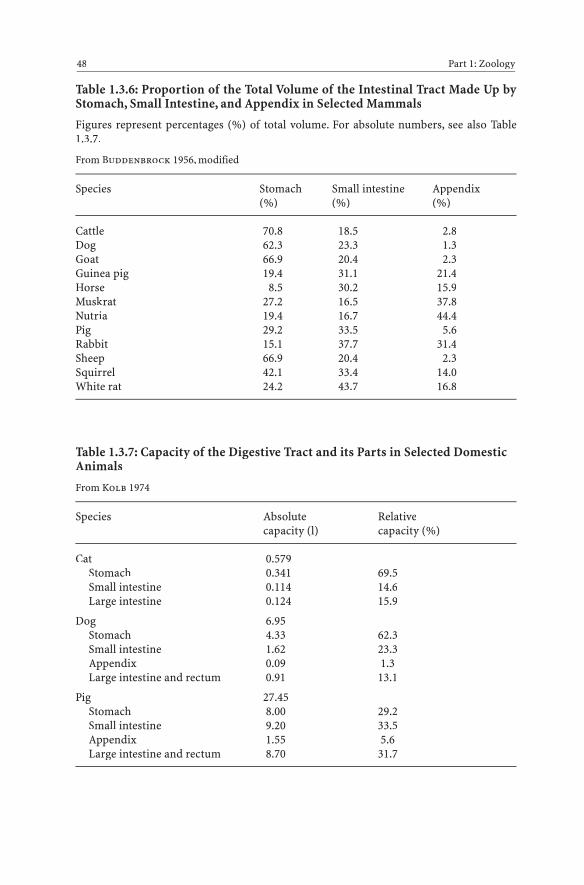
Table 1.3.6: Proportion of the Total Volume of the Intestinal Tract Made Up byStomach, Small Intestine, and Appendix in Selected Mammals
Figures represent percentages (%) of total volume. For absolute numbers, see also Table1.3.7.
From Buddenbrock 1956, modified
Species Stomach Small intestine Appendix(%) (%) (%)
Cattle 70.8 18.5 2.8Dog 62.3 23.3 1.3Goat 66.9 20.4 2.3Guinea pig 19.4 31.1 21.4Horse 8.5 30.2 15.9Muskrat 27.2 16.5 37.8Nutria 19.4 16.7 44.4Pig 29.2 33.5 5.6Rabbit 15.1 37.7 31.4Sheep 66.9 20.4 2.3Squirrel 42.1 33.4 14.0White rat 24.2 43.7 16.8
Table 1.3.7: Capacity of the Digestive Tract and its Parts in Selected DomesticAnimals
From Kolb 1974
Species Absolute Relativecapacity (l) capacity (%)
Cat 0.579Stomach 0.341 69.5Small intestine 0.114 14.6Large intestine 0.124 15.9
Dog 6.95Stomach 4.33 62.3Small intestine 1.62 23.3Appendix 0.09 1.3Large intestine and rectum 0.91 13.1
Pig 27.45Stomach 8.00 29.2Small intestine 9.20 33.5Appendix 1.55 5.6Large intestine and rectum 8.70 31.7
48 Part 1: Zoology
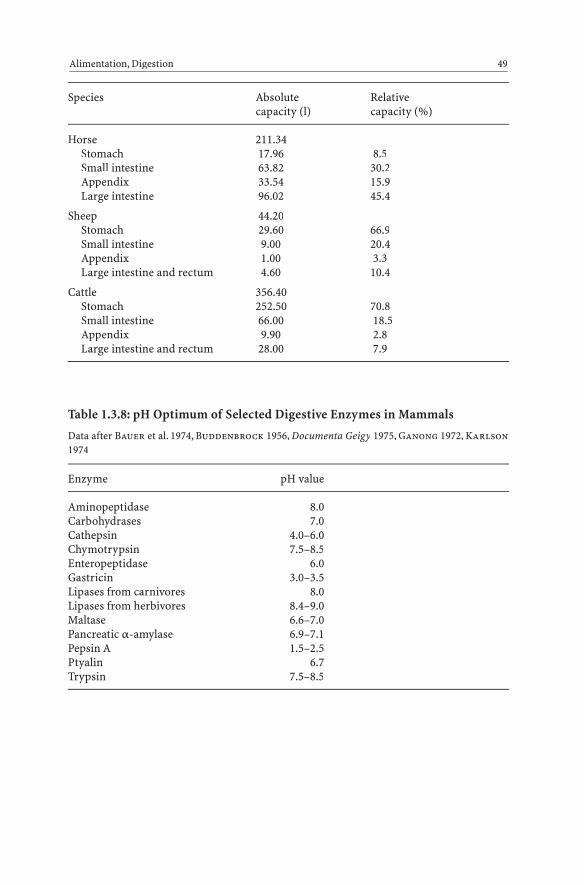
Species Absolute Relativecapacity (l) capacity (%)
Horse 211.34Stomach 17.96 8.5Small intestine 63.82 30.2Appendix 33.54 15.9Large intestine 96.02 45.4
Sheep 44.20Stomach 29.60 66.9Small intestine 9.00 20.4Appendix 1.00 3.3Large intestine and rectum 4.60 10.4
Cattle 356.40Stomach 252.50 70.8Small intestine 66.00 18.5Appendix 9.90 2.8Large intestine and rectum 28.00 7.9
Table 1.3.8: pH Optimum of Selected Digestive Enzymes in Mammals
Data after Bauer et al. 1974, Buddenbrock 1956, Documenta Geigy 1975, Ganong 1972, Karlson1974
Enzyme pH value
Aminopeptidase 8.0Carbohydrases 7.0Cathepsin 4.0–6.0Chymotrypsin 7.5–8.5Enteropeptidase 6.0Gastricin 3.0–3.5Lipases from carnivores 8.0Lipases from herbivores 8.4–9.0Maltase 6.6–7.0Pancreatic a-amylase 6.9–7.1Pepsin A 1.5–2.5Ptyalin 6.7Trypsin 7.5–8.5
Alimentation, Digestion 49
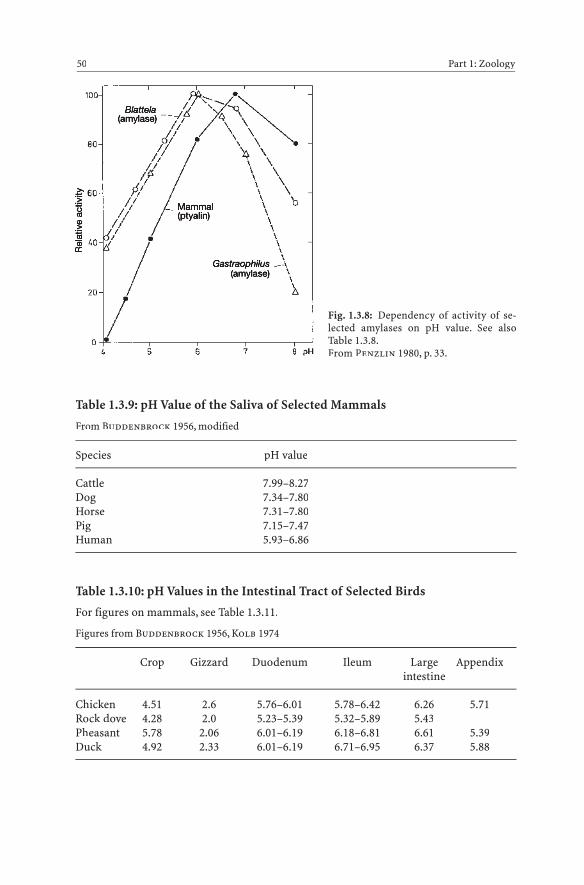
Table 1.3.9: pH Value of the Saliva of Selected Mammals
From Buddenbrock 1956, modified
Species pH value
Cattle 7.99–8.27Dog 7.34–7.80Horse 7.31–7.80Pig 7.15–7.47Human 5.93–6.86
Table 1.3.10: pH Values in the Intestinal Tract of Selected Birds
For figures on mammals, see Table 1.3.11.
Figures from Buddenbrock 1956, Kolb 1974
Crop Gizzard Duodenum Ileum Large Appendixintestine
Chicken 4.51 2.6 5.76–6.01 5.78–6.42 6.26 5.71Rock dove 4.28 2.0 5.23–5.39 5.32–5.89 5.43Pheasant 5.78 2.06 6.01–6.19 6.18–6.81 6.61 5.39Duck 4.92 2.33 6.01–6.19 6.71–6.95 6.37 5.88
50 Part 1: Zoology
Fig. 1.3.8: Dependency of activity of se-lected amylases on pH value. See alsoTable 1.3.8.From Penzlin 1980, p. 33.

Table 1.3.11: pH Values in the Intestinal Tract of Selected Mammals
Figures from various authors in Buddenbrock 1956, modified
Species Stomach Duode- Jeju- Ileum Cecum Colon Rectumnum num
Horse 4.48 7.5 7.79 7.26 6.95Horse 4.45 7.13 7.46 7.23 7.09 6.24Pig 5.46 6.63 7.44 7.24 6.85Rat 6.98 7.32 7.28 7.15Rat 3.2–4.6 6.5– 7.2 5.5–7.3 5.6–7.1Cattle 4.95a 5.98–7.49 7.54 8.68 7.15Cattle 5.53 6.83 8.55 7.93 9.41Suckling calf 4.46 6.8–7.1 6.9–7.2 7–7.3 7.2–7.5 7.1–7.5 7.1–7.5
aAbomasum
Table 1.3.12: pH Values in the Mid-intestine of Selected Invertebrates
From Buddenbrock 1956, modified
Species pH value
Bedbug 6.2Bee 6.3Butterfly (Pyrameis) 8.4Cockroach (Blatella) 6.2Cricket 7.6European rhinoceros beetle 10.0–10.4Grasshopper (Tettigonia) 5.9Greenbottle blowfly (Lucilia) 7.8–8.0Louse 7.2Meal moth 8.4Paper wasp (Polistes) 7.3Primitive insects (Ctenolepisma) 4.8–7.0Soft-shell clam (Mya arenaria) 6.7Walking stick 6.3
Alimentation, Digestion 51
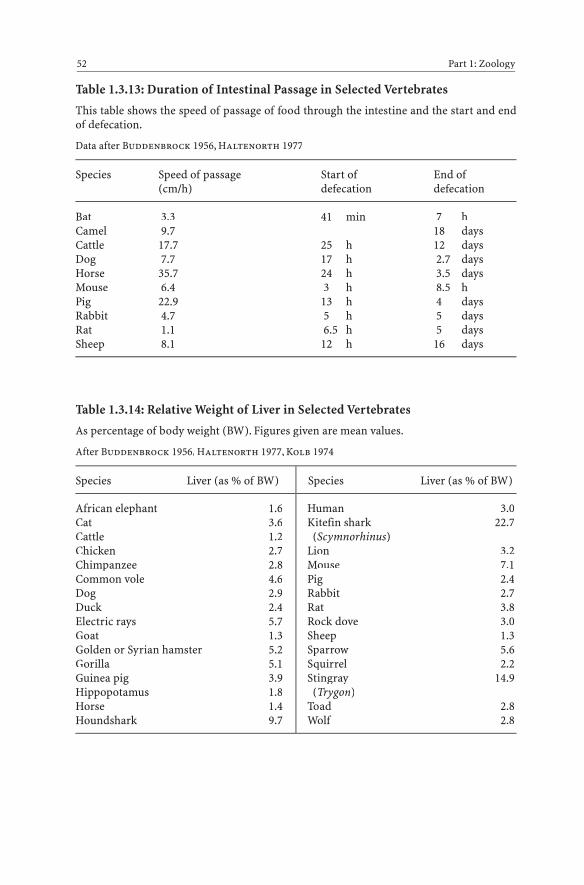
Table 1.3.13: Duration of Intestinal Passage in Selected Vertebrates
This table shows the speed of passage of food through the intestine and the start and endof defecation.
Data after Buddenbrock 1956, Haltenorth 1977
Species Speed of passage Start of End of(cm/h) defecation defecation
Bat 3.3 41 min 7 hCamel 9.7 18 daysCattle 17.7 25 h 12 daysDog 7.7 17 h 2.7 daysHorse 35.7 24 h 3.5 daysMouse 6.4 3 h 8.5 hPig 22.9 13 h 4 daysRabbit 4.7 5 h 5 daysRat 1.1 6.5 h 5 daysSheep 8.1 12 h 16 days
Table 1.3.14: Relative Weight of Liver in Selected Vertebrates
As percentage of body weight (BW). Figures given are mean values.
After Buddenbrock 1956, Haltenorth 1977, Kolb 1974
Species Liver (as % of BW) Species Liver (as % of BW)
52 Part 1: Zoology
African elephant 1.6Cat 3.6Cattle 1.2Chicken 2.7Chimpanzee 2.8Common vole 4.6Dog 2.9Duck 2.4Electric rays 5.7Goat 1.3Golden or Syrian hamster 5.2Gorilla 5.1Guinea pig 3.9Hippopotamus 1.8Horse 1.4Houndshark 9.7
Human 3.0Kitefin shark 22.7
(Scymnorhinus)Lion 3.2Mouse 7.1Pig 2.4Rabbit 2.7Rat 3.8Rock dove 3.0Sheep 1.3Sparrow 5.6Squirrel 2.2Stingray 14.9
(Trygon)Toad 2.8Wolf 2.8
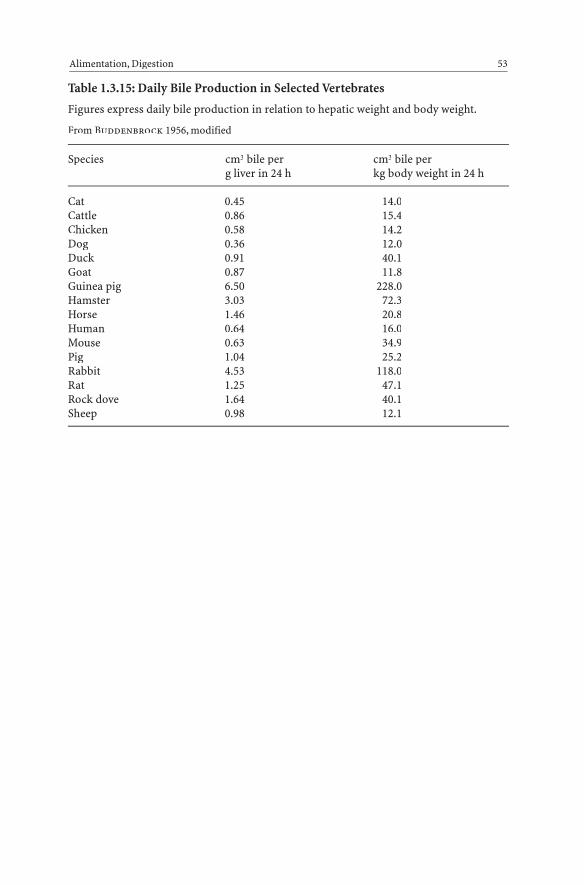
Table 1.3.15: Daily Bile Production in Selected Vertebrates
Figures express daily bile production in relation to hepatic weight and body weight.
From Buddenbrock 1956, modified
Species cm3 bile per cm3 bile perg liver in 24 h kg body weight in 24 h
Cat 0.45 14.0Cattle 0.86 15.4Chicken 0.58 14.2Dog 0.36 12.0Duck 0.91 40.1Goat 0.87 11.8Guinea pig 6.50 228.0Hamster 3.03 72.3Horse 1.46 20.8Human 0.64 16.0Mouse 0.63 34.9Pig 1.04 25.2Rabbit 4.53 118.0Rat 1.25 47.1Rock dove 1.64 40.1Sheep 0.98 12.1
Alimentation, Digestion 53
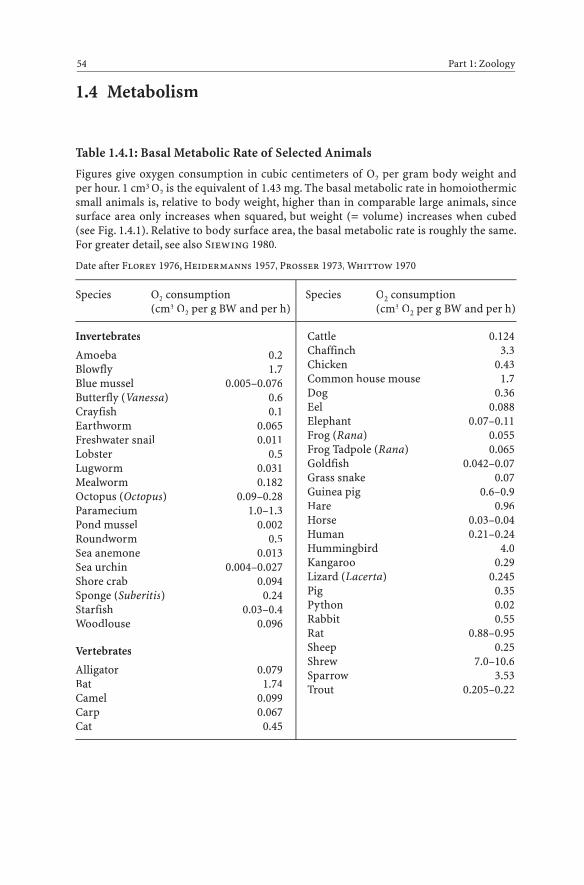
1.4 Metabolism
Table 1.4.1: Basal Metabolic Rate of Selected Animals
Figures give oxygen consumption in cubic centimeters of O2 per gram body weight andper hour. 1 cm3 O2 is the equivalent of 1.43 mg. The basal metabolic rate in homoiothermicsmall animals is, relative to body weight, higher than in comparable large animals, sincesurface area only increases when squared, but weight (= volume) increases when cubed(see Fig. 1.4.1). Relative to body surface area, the basal metabolic rate is roughly the same.For greater detail, see also Siewing 1980.
Date after Florey 1976, Heidermanns 1957, Prosser 1973, Whittow 1970
Species O2 consumption Species O2 consumption(cm3 O2 per g BW and per h) (cm3 O2 per g BW and per h)
54 Part 1: Zoology
Invertebrates
Amoeba 0.2Blowfly 1.7Blue mussel 0.005–0.076Butterfly (Vanessa) 0.6Crayfish 0.1Earthworm 0.065Freshwater snail 0.011Lobster 0.5Lugworm 0.031Mealworm 0.182Octopus (Octopus) 0.09–0.28Paramecium 1.0–1.3Pond mussel 0.002Roundworm 0.5Sea anemone 0.013Sea urchin 0.004–0.027Shore crab 0.094Sponge (Suberitis) 0.24Starfish 0.03–0.4Woodlouse 0.096
Vertebrates
Alligator 0.079Bat 1.74Camel 0.099Carp 0.067Cat 0.45
Cattle 0.124Chaffinch 3.3Chicken 0.43Common house mouse 1.7Dog 0.36Eel 0.088Elephant 0.07–0.11Frog (Rana) 0.055Frog Tadpole (Rana) 0.065Goldfish 0.042–0.07Grass snake 0.07Guinea pig 0.6–0.9Hare 0.96Horse 0.03–0.04Human 0.21–0.24Hummingbird 4.0Kangaroo 0.29Lizard (Lacerta) 0.245Pig 0.35Python 0.02Rabbit 0.55Rat 0.88–0.95Sheep 0.25Shrew 7.0–10.6Sparrow 3.53Trout 0.205–0.22

Table 1.4.2: Body Temperatures of Selected Homoiothermic Animals
Temperatures given are mean values of rectal readings. For daily variations in body tem-perature, see Table 1.4.3.
Data after Bertelsmann 1979, Dorst 1972, Kolb 1974, Meyer 1964, Niethammer 1979, Penzlin1977, Precht et al. 1955, Slijper 1967, Wittke 1972, Ziswiler 1976
Species Body temperature Species Body temperature(°C) (°C)
Metabolisms 55
Fig. 1.4.1: Dependency of basal metabolic rates on the body weight of selected homoiothermicanimals on a double logarithmic scale. See also Table 1.4.1.From Penzlin 1980, p. 49
Birds
Albatross 40.7Blackbird 43.6Black-headed gull 41.4–42.1Carrion crow 42.0Chicken 41.5Common buzzard 42.0Common swift 44.0Duck 40.5–42.5
European starling 41.3Goose 40.7Goshawk 41.9Great spotted woodpecker 42.1–43.3King penguin 37.7Ostrich 37.4Robin 44.6Rock dove 41.8Rufous hummingbird 39.0
(Cont.) →
/
kg

Sparrow 41.4Sparrowhawk 41.2Stork 40.0Tawny owl 41.0Winter wren 41.8
Mammals
Bat 31.0Capuchin monkey 38.5Cat 38.8–39.0Cattle 38.5Chimpanzee 37.0Dog 38.3–39.0Dromedary 38.1Elephant 36.2Fox 38.5Goat 40.0Guinea pig 36.0–39.2
Hazel dormouse 30.0Hedgehog, awake 35.0Hedgehog, in hibernation 6.0Hippopotamus 35.4Horse 37.6–37.8Human 36.2–37.8Kangaroo 36.8Long-beaked echidna 30.0Marmot 36.0Mole 39.4Mouse 38.0Pig 39.0Rabbit 39.2–39.6Rat 38.1Reindeer 37.5–39.8Sheep 39.5Shrew 42.0Spiny anteater 32.0Whale 36.5
56 Part 1: Zoology
Species Body temperature Species Body temperature(°C) (°C)
Fig. 1.4.2: Daily movement of body temperature in selected animals. Note the difference betweennocturnal animals (owl, opossum) and their diurnal counterparts.From Precht, Christophersen and Hensel 1955
(C
)
( )
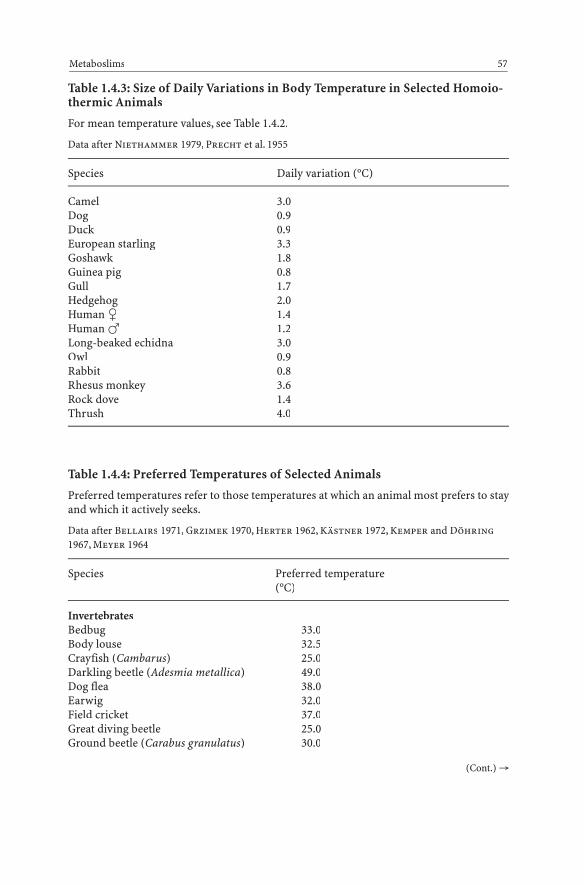
Table 1.4.3: Size of Daily Variations in Body Temperature in Selected Homoio-thermic Animals
For mean temperature values, see Table 1.4.2.
Data after Niethammer 1979, Precht et al. 1955
Species Daily variation (°C)
Camel 3.0Dog 0.9Duck 0.9European starling 3.3Goshawk 1.8Guinea pig 0.8Gull 1.7Hedgehog 2.0Human � 1.4Human � 1.2Long-beaked echidna 3.0Owl 0.9Rabbit 0.8Rhesus monkey 3.6Rock dove 1.4Thrush 4.0
Table 1.4.4: Preferred Temperatures of Selected Animals
Preferred temperatures refer to those temperatures at which an animal most prefers to stayand which it actively seeks.
Data after Bellairs 1971, Grzimek 1970, Herter 1962, Kästner 1972, Kemper and Döhring1967, Meyer 1964
Species Preferred temperature(°C)
InvertebratesBedbug 33.0Body louse 32.5Crayfish (Cambarus) 25.0Darkling beetle (Adesmia metallica) 49.0Dog flea 38.0Earwig 32.0Field cricket 37.0Great diving beetle 25.0Ground beetle (Carabus granulatus) 30.0
Metaboslims 57
(Cont.) →

Species Preferred temperature(°C)
Katydid 40.7Paramecium 23.0–25.0Snow flea (Boreus hiemalis) 9.8Tiger beetle 44.0Wasp, queen 38.1Wasp, worker 35.4Winter moth 6.0
Vertebrates
American alligator 32.0–35.0Carp 21.3Chameleon 45.0Common house mouse 37.0Common toad 27.9Common vole 35.0Crossed viper 33.0Gecko (Tarentola) 38.0Giant tortoise 28.0–33.0Goldfish 18.6Grass snake 34.3Guinea pig 36.0Guppy 24.6Hermann’s tortoise 25.0–33.0Marine iguana 22.0–27.0Rainbow trout 10.5Sand lizard 38.8Slowworm 28.4Water vole 29.0
58 Part 1: Zoology
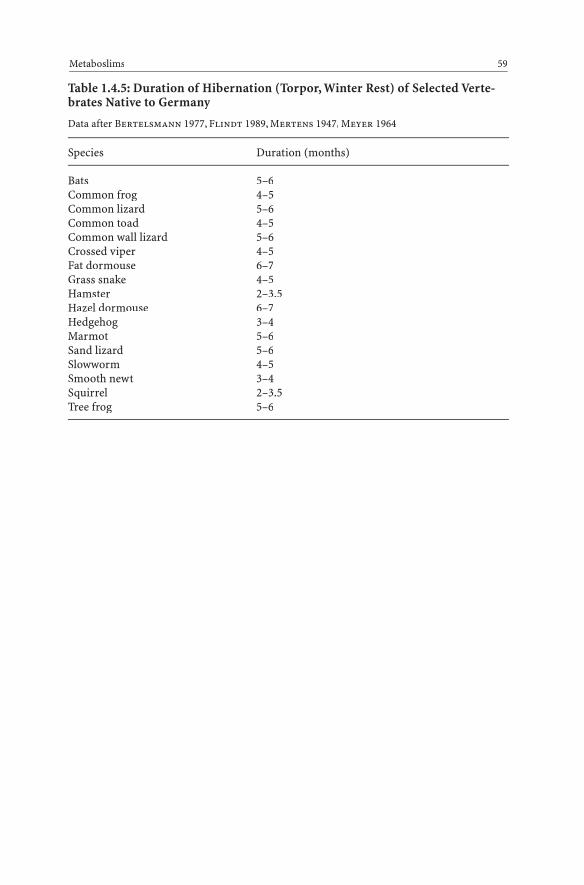
Table 1.4.5: Duration of Hibernation (Torpor, Winter Rest) of Selected Verte-brates Native to Germany
Data after Bertelsmann 1977, Flindt 1989, Mertens 1947, Meyer 1964
Species Duration (months)
Bats 5–6Common frog 4–5Common lizard 5–6Common toad 4–5Common wall lizard 5–6Crossed viper 4–5Fat dormouse 6–7Grass snake 4–5Hamster 2–3.5Hazel dormouse 6–7Hedgehog 3–4Marmot 5–6Sand lizard 5–6Slowworm 4–5Smooth newt 3–4Squirrel 2–3.5Tree frog 5–6
Metaboslims 59
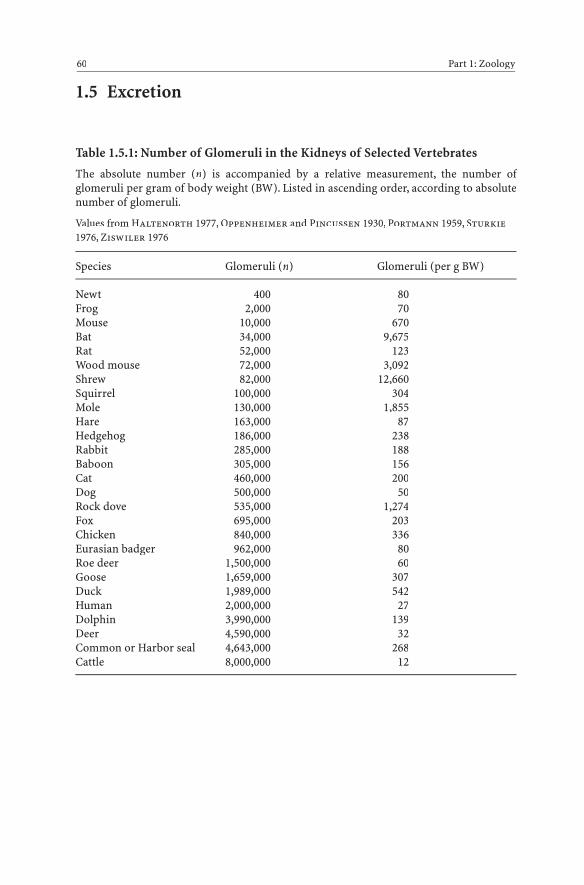
1.5 Excretion
Table 1.5.1: Number of Glomeruli in the Kidneys of Selected Vertebrates
The absolute number (n) is accompanied by a relative measurement, the number ofglomeruli per gram of body weight (BW). Listed in ascending order, according to absolutenumber of glomeruli.
Values from Haltenorth 1977, Oppenheimer and Pincussen 1930, Portmann 1959, Sturkie1976, Ziswiler 1976
Species Glomeruli (n) Glomeruli (per g BW)
Newt 400 80Frog 2,000 70Mouse 10,000 670Bat 34,000 9,675Rat 52,000 123Wood mouse 72,000 3,092Shrew 82,000 12,660Squirrel 100,000 304Mole 130,000 1,855Hare 163,000 87Hedgehog 186,000 238Rabbit 285,000 188Baboon 305,000 156Cat 460,000 200Dog 500,000 50Rock dove 535,000 1,274Fox 695,000 203Chicken 840,000 336Eurasian badger 962,000 80Roe deer 1,500,000 60Goose 1,659,000 307Duck 1,989,000 542Human 2,000,000 27Dolphin 3,990,000 139Deer 4,590,000 32Common or Harbor seal 4,643,000 268Cattle 8,000,000 12
60 Part 1: Zoology
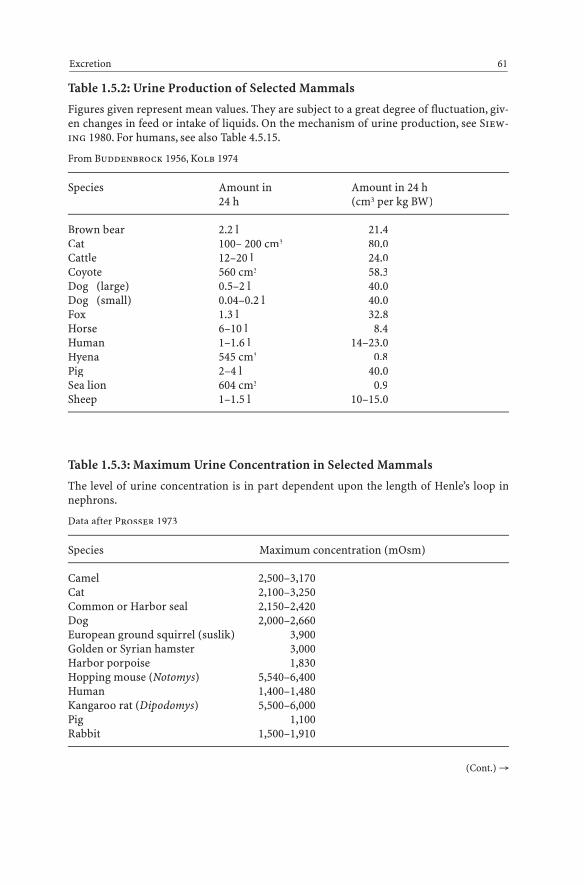
Table 1.5.2: Urine Production of Selected Mammals
Figures given represent mean values. They are subject to a great degree of fluctuation, giv-en changes in feed or intake of liquids. On the mechanism of urine production, see Siew-ing 1980. For humans, see also Table 4.5.15.
From Buddenbrock 1956, Kolb 1974
Species Amount in Amount in 24 h24 h (cm3 per kg BW)
Brown bear 2.2 l 21.4Cat 100– 200 cm3 80.0Cattle 12–20 l 24.0Coyote 560 cm3 58.3Dog (large) 0.5–2 l 40.0Dog (small) 0.04–0.2 l 40.0Fox 1.3 l 32.8Horse 6–10 l 8.4Human 1–1.6 l 14–23.0Hyena 545 cm3 0.8Pig 2–4 l 40.0Sea lion 604 cm3 0.9Sheep 1–1.5 l 10–15.0
Table 1.5.3: Maximum Urine Concentration in Selected Mammals
The level of urine concentration is in part dependent upon the length of Henle’s loop innephrons.
Data after Prosser 1973
Species Maximum concentration (mOsm)
Camel 2,500–3,170Cat 2,100–3,250Common or Harbor seal 2,150–2,420Dog 2,000–2,660European ground squirrel (suslik) 3,900Golden or Syrian hamster 3,000Harbor porpoise 1,830Hopping mouse (Notomys) 5,540–6,400Human 1,400–1,480Kangaroo rat (Dipodomys) 5,500–6,000Pig 1,100Rabbit 1,500–1,910
Excretion 61
(Cont.) →
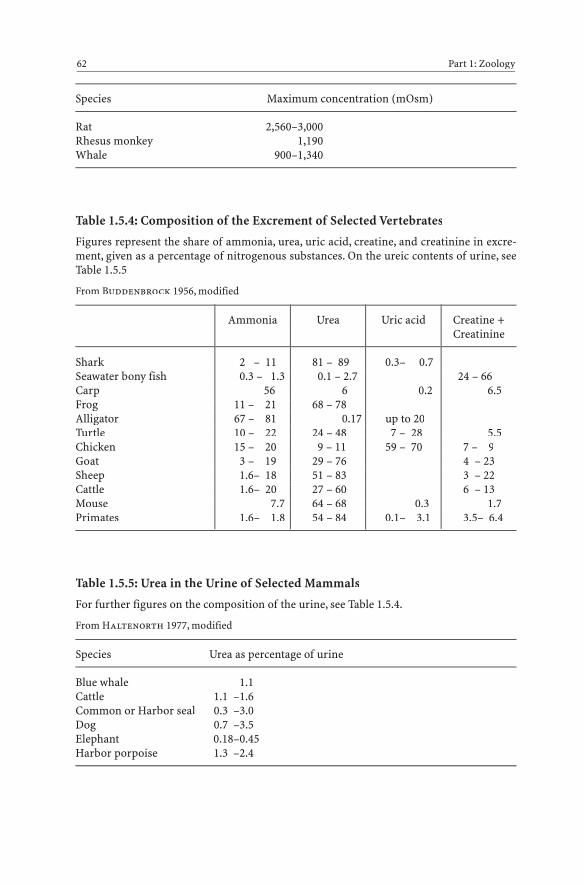
Species Maximum concentration (mOsm)
Rat 2,560–3,000Rhesus monkey 1,190Whale 900–1,340
Table 1.5.4: Composition of the Excrement of Selected Vertebrates
Figures represent the share of ammonia, urea, uric acid, creatine, and creatinine in excre-ment, given as a percentage of nitrogenous substances. On the ureic contents of urine, seeTable 1.5.5
From Buddenbrock 1956, modified
Ammonia Urea Uric acid Creatine +Creatinine
Shark 2 – 11 81 – 89 0.3– 0.7Seawater bony fish 0.3 – 1.3 0.1 – 2.7 24 – 66Carp 56 6 0.2 6.5Frog 11 – 21 68 – 78Alligator 67 – 81 0.17 up to 20Turtle 10 – 22 24 – 48 7 – 28 5.5Chicken 15 – 20 9 – 11 59 – 70 7 – 9Goat 3 – 19 29 – 76 4 – 23Sheep 1.6– 18 51 – 83 3 – 22Cattle 1.6– 20 27 – 60 6 – 13Mouse 7.7 64 – 68 0.3 1.7Primates 1.6– 1.8 54 – 84 0.1– 3.1 3.5– 6.4
Table 1.5.5: Urea in the Urine of Selected Mammals
For further figures on the composition of the urine, see Table 1.5.4.
From Haltenorth 1977, modified
Species Urea as percentage of urine
Blue whale 1.1Cattle 1.1 –1.6Common or Harbor seal 0.3 –3.0Dog 0.7 –3.5Elephant 0.18–0.45Harbor porpoise 1.3 –2.4
62 Part 1: Zoology

Species Urea as percentage of urine
Horse 0.8 –1.6Human 1.8Hyena 2.8 –3.4Mouse 1.5 –3.2Rabbit 0.55–0.9Rat 1.8 –2.7Sheep 0.6 –0.8Tiger 2.9 –3.6
Table 1.5.6: Freezing Point Depression and Osmotic Pressure of Urine in Selected Animals
In some animals the value is dependent upon that of the external medium (seawater, fresh-water); in these cases its freezing point depression is also provided. If this figure is notgiven, then the given values are independent of the external medium.
After Haltenorth 1977, Heidermanns 1957
Species Freezing point depression Osmotic pressure of urineD °C (atm) ([ hPa])
External medium Urine
Cat 4.73 52.3 [52,993]Cattle 1.34 16.2 [16,415]Crayfish 0.02 0.09 1.1 [1,115]Dog 3.29 39.8 [40,327]Elephant 0.34 4.1 [4,154]Freshwater bony fishes 0.02 0.10 1.2 [1,216]Freshwater cartilaginous fishes 0.02 0.70 8.5 [8,613]Frog 0.02 0.17 2.1 [2,128]Goat 1.25 15.1 [15,300]Guinea pig 0.91 11.0 [11,146]Horse 0.32 3.9 [3,952]Human 1.29 15.6 [15,807]Lobster 1.85 1.89 22.9 [23,203]Mitten crab 2.20 2.14 25.9 [26,243]Mitten crab 0.02 1.23 14.9 [15,097]Pig 1.70 20.6 [20,873]Rabbit 0.92 11.1 [11,247]Seawater cartilaginous fishes 1.85 1.92 23.2 [23,507]Shore crab 1.00 1.50 18.2 [18,441]Shore crab (Carcinus) 1.85 1.90 23.0 [23,305]
Excretion 63
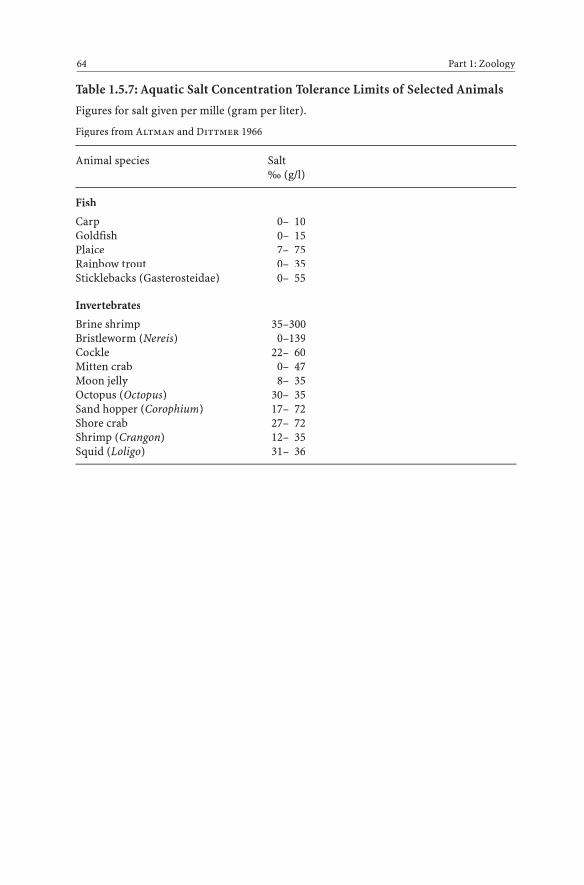
Table 1.5.7: Aquatic Salt Concentration Tolerance Limits of Selected Animals
Figures for salt given per mille (gram per liter).
Figures from Altman and Dittmer 1966
Animal species Salt‰ (g/l)
Fish
Carp 0– 10Goldfish 0– 15Plaice 7– 75Rainbow trout 0– 35Sticklebacks (Gasterosteidae) 0– 55
Invertebrates
Brine shrimp 35–300Bristleworm (Nereis) 0–139Cockle 22– 60Mitten crab 0– 47Moon jelly 8– 35Octopus (Octopus) 30– 35Sand hopper (Corophium) 17– 72Shore crab 27– 72Shrimp (Crangon) 12– 35Squid (Loligo) 31– 36
64 Part 1: Zoology

1.6 Heart, Circulation
Table 1.6.0: Numbers that Amaze
This table brings together some interesting figures from Sects. 1.6 Heart, Circulation,1.7 Blood, and 1.8 Respiration. These numbers are cited again in the individual tables ofthese sections, where they are accompanied by references to the literature.
Heart, Circulation 65
Weight of the heartBlue whale Absolute 598.4 kg
In relation to BW 4.4 ‰Hummingbird Absolute 0.09 g
In relation to BW 23.9 ‰
Heart frequenciesFruit fly (Drosophila) 235/minShrew 1,320/minElephant seal (On the surface) 60/min
While diving 4/min
Blood pressure (systolic/diastolic)Giraffe 340/230 mmHgCanary 220/154 mmHgMouse 147/106 mmHg
Number and size of red blood cellsGoat 18.5 million/mm3 3.5 μm ¥ 3.5 μmOlm 36,000/mm3 58 μm ¥ 34 μm
Coagulation times of bloodLamprey 2–5 sGrass snake 27 min
Inner surface of the lungHorse 500 m2
Human 90 m2
Fire salamander 5 cm2
Breaths per minuteHummingbird 250Mouse 163Fin whale 0.5
Maximum diving times and depths of selected animals with lungsBeaked whale 120 min 500 mSperm whale 75 min 1,143 mLeatherback turtle 1,200 m

Table 1.6.1: Heart Weights of Selected Vertebrates (Absolute and Relative)
The relative weights are given as a per mille of body weight (BW); the absolute weights arein grams. The smaller relative heart weights of larger animals is related to their lower basalmetabolic rate. See Table 1.4.1.
Data after Buddenbrock 1967, Czicsàky 1984, Haltenorth 1977, Dorst 1972, Hesse andDoflein 1935, Sturkie 1976, Ziswiler 1976
Species Relative Absoluteheart weight heart weight(‰ of BW) (g)
Fish
Carp 1.5 1.62Electric rays 0.6Pike 1.9 0.66Salmon 2.0 10.72Tiger shark 1.2 41.6Trout 1.2 0.31Tuna 3.1 616
Amphibians
Axolotl 4.5 0.03Bullfrog 3.2 1.65Fire salamander 1.86 0.04Green toad 8.05Marsh or Lake frog 1.8 0.14Northern crested newt 1.96Tree frog 5.79
Reptiles
Alligator 2.6 137Boa constrictor 3.1 5.64Python 3.0 18.5Western green lizard 3.8 0.91
Birds
Blackbird 12.9 1.33Budgerigar 13.2Carrion crow 10.7Chaffinch 13.2 0.3Chick (just hatched) 9.0Chicken (leghorn) 6.4Common buzzard 7.5 4.81Common kestrel 9.6Common raven 9.0 14.29
66 Part 1: Zoology
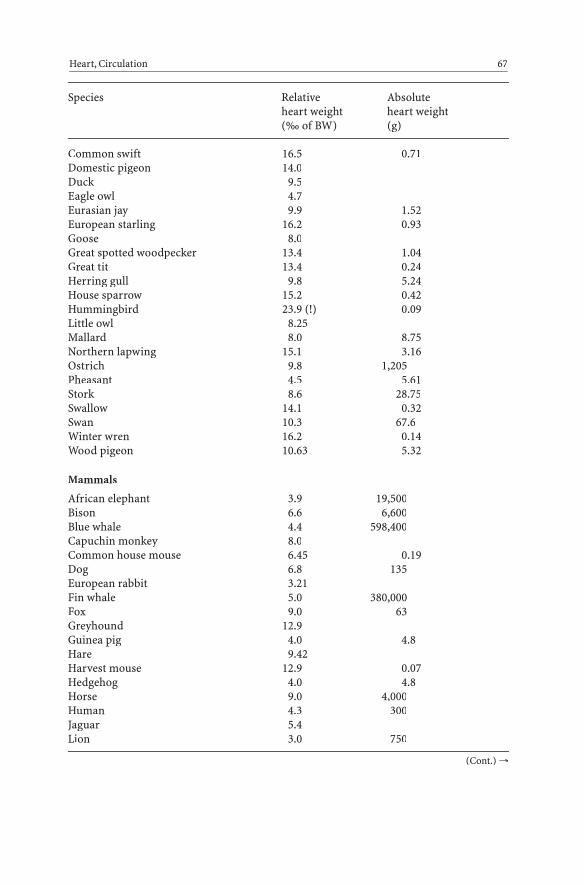
Species Relative Absoluteheart weight heart weight(‰ of BW) (g)
Common swift 16.5 0.71Domestic pigeon 14.0Duck 9.5Eagle owl 4.7Eurasian jay 9.9 1.52European starling 16.2 0.93Goose 8.0Great spotted woodpecker 13.4 1.04Great tit 13.4 0.24Herring gull 9.8 5.24House sparrow 15.2 0.42Hummingbird 23.9 (!) 0.09Little owl 8.25Mallard 8.0 8.75Northern lapwing 15.1 3.16Ostrich 9.8 1,205Pheasant 4.5 5.61Stork 8.6 28.75Swallow 14.1 0.32Swan 10.3 67.6Winter wren 16.2 0.14Wood pigeon 10.63 5.32
Mammals
African elephant 3.9 19,500Bison 6.6 6,600Blue whale 4.4 598,400Capuchin monkey 8.0Common house mouse 6.45 0.19Dog 6.8 135European rabbit 3.21Fin whale 5.0 380,000Fox 9.0 63Greyhound 12.9Guinea pig 4.0 4.8Hare 9.42Harvest mouse 12.9 0.07Hedgehog 4.0 4.8Horse 9.0 4,000Human 4.3 300Jaguar 5.4Lion 3.0 750
Heart, Circulation 67
(Cont.) →

Species Relative Absoluteheart weight heart weight(‰ of BW) (g)
Mole 5.8 0.23Myotis (bat) 10.45 0.22Polar bear 5.8 2,900Rat 3.62 1.45Rhinoceros 6.3Roe deer 8.0 400Shrew 14.0 0.11Sperm whale 3.2 116,000Squirrel 6.7 3.22Weasel 16.7 0.75Wood mouse 7.0 0.13
Table 1.6.2: Heart Rates of Selected Animals
Values given are only directly comparable with one another in birds and mammals. Inpoikilothermic animals they are strongly dependent on temperature. Heart rates in smallhomoiothermic animals reflect basal metabolic rates that are higher than in their largercounterparts. See also Table 1.4.1
After Buddenbrock 1967, Haltenorth 1977, Kolb 1974, Oppenheimer and Pincussen 1925,Ziswiler 1976
Species Heartbeats Species Heartbeatsper minute per minute
68 Part 1: Zoology
Invertebrates
Amber snail 26Anopheles mosquito 110Aquatic sowbug 310Blue mussel 10–15Cockroach 60–80Cross spider (Araneus) 130–134Dragonfly (Anax) 60Edible crab 90–120Edible snail (Helix pomatia) 40–50Fruit fly 235Lobster 50Lugworm 13–22Migratory locust 80–130Octopus (Octopus) 33–40
Pond mussel 4–6Primitive insect (Machilis) 150–160Privet hawk-moth (caterpillar) 39–82Privet hawk-moth (imago) 40–50Shrimp 146Small white (butterfly) 29Stag beetle 16Tunicate (Ciona) 17Woodlouse 180–200
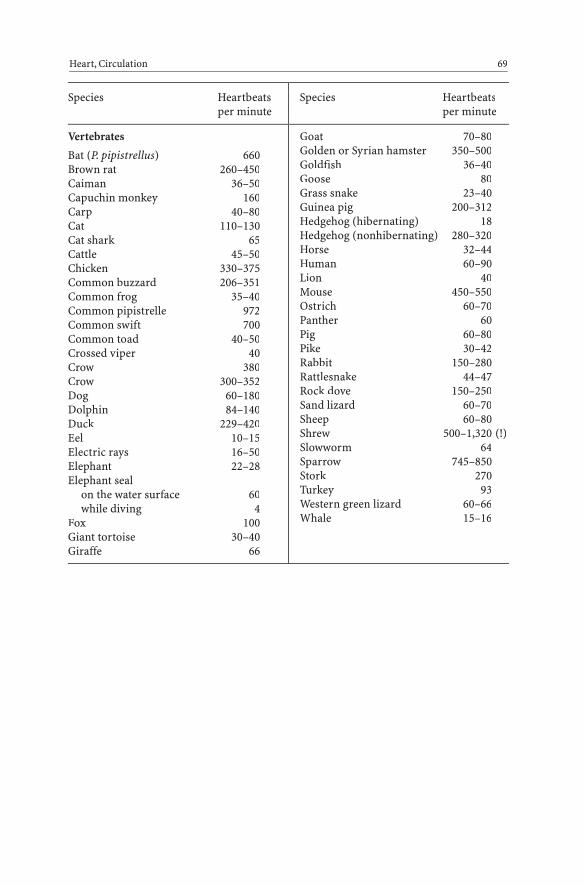
Vertebrates
Bat (P. pipistrellus) 660Brown rat 260–450Caiman 36–50Capuchin monkey 160Carp 40–80Cat 110–130Cat shark 65Cattle 45–50Chicken 330–375Common buzzard 206–351Common frog 35–40Common pipistrelle 972Common swift 700Common toad 40–50Crossed viper 40Crow 380Crow 300–352Dog 60–180Dolphin 84–140Duck 229–420Eel 10–15Electric rays 16–50Elephant 22–28Elephant seal
on the water surface 60while diving 4
Fox 100Giant tortoise 30–40Giraffe 66
Goat 70–80Golden or Syrian hamster 350–500Goldfish 36–40Goose 80Grass snake 23–40Guinea pig 200–312Hedgehog (hibernating) 18Hedgehog (nonhibernating) 280–320Horse 32–44Human 60–90Lion 40Mouse 450–550Ostrich 60–70Panther 60Pig 60–80Pike 30–42Rabbit 150–280Rattlesnake 44–47Rock dove 150–250Sand lizard 60–70Sheep 60–80Shrew 500–1,320 (!)Slowworm 64Sparrow 745–850Stork 270Turkey 93Western green lizard 60–66Whale 15–16
Heart, Circulation 69
Species Heartbeats Species Heartbeatsper minute per minute
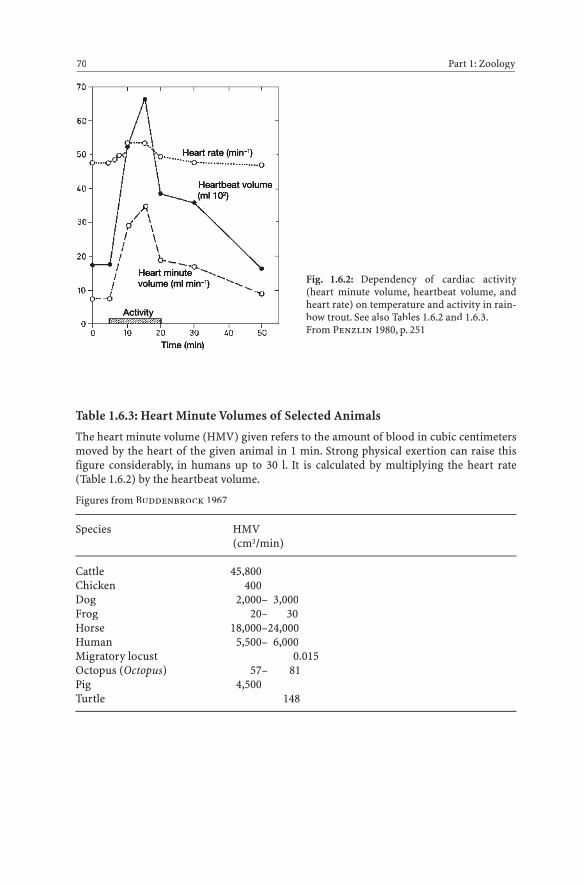
Table 1.6.3: Heart Minute Volumes of Selected Animals
The heart minute volume (HMV) given refers to the amount of blood in cubic centimetersmoved by the heart of the given animal in 1 min. Strong physical exertion can raise thisfigure considerably, in humans up to 30 l. It is calculated by multiplying the heart rate(Table 1.6.2) by the heartbeat volume.
Figures from Buddenbrock 1967
Species HMV(cm3/min)
Cattle 45,800Chicken 400Dog 2,000– 3,000Frog 20– 30Horse 18,000–24,000Human 5,500– 6,000Migratory locust 0.015Octopus (Octopus) 57– 81Pig 4,500Turtle 148
70 Part 1: Zoology
Fig. 1.6.2: Dependency of cardiac activity(heart minute volume, heartbeat volume, andheart rate) on temperature and activity in rain-bow trout. See also Tables 1.6.2 and 1.6.3.From Penzlin 1980, p. 251
Time (min)

Table 1.6.4: Blood Pressure of Selected Animals
Figures represent systolic and diastolic blood pressure, respectively, separated by a slash.Single numbers represent mean values.
After Altman and Dittmer 1974, Buddenbrock 1967, Haltenorth 1977, Kolb 1962
Species Blood pressure (mmHg) (in hPa)
Canary 220/154 (293/205)Cat 155/100 (207/133)Cattle 134/88 (179/117)Chicken 150/120 (200/160)Chimpanzee 136/80 (181/107)Common or Harbor seal 150/105 (200/140)Crocodile 50 (67)Cuttlefish 44/22 (59/29)Dog 156/100 (208/133)Duck 180/134 (240/179)Eel 35– 40 (47–53)Electric rays 16/14 (21/19)European starling 180/130 (240/173)Frog 32/19 (43/25)Giraffe 340/230 (453/307)Goat 120/84 (160/112)Golden or Syrian hamster 170/120 (227/160)Grass snake 89 (119)Guinea pig 77/47 (103/63)Horse 190/120 (253/160)Human 120/80 (160/107)Kangaroo 122/79 (163/105)Lobster 8 (11)Mouse 147/106 (196/141)Pig 169/108 (225/144)Pike 35.5 (47)Rabbit 110/80 (147/107)Rat 145/105 (193/140)Rock dove 187/138 (249/184)Salamander 22/12 (29/16)Salmon 75 (100)Shark 32/16 (43/21)Sheep 103/85 (137/113)Slider turtle 30/26 (40/35)Sparrow 180/140 (240/187)Trout 39/34 (52/45)
Heart, Circulation 71
(!)

1.7 Blood
Table 1.7.1: Blood Volumes of Vertebrates
Data given as percentage of body weight (BW). Considerable variations are possible insome cases.
Data after Bertelsmann 1979, Oppenheimer and Pincussen 1925, Prosser 1973
Species Blood volume as percentage of BWMean value Limits
Bat (Myotis) 13.0Blue whale 6.5Cat 5.6Cattle 5.2– 5.7Chicken 7.0Common frog 5.6 4.7– 6.3Crocodile 15.4Dog 8.6 2.3– 8.7Duck 10.2Eel 2.9Fat dormouse 5.8 5.3– 6.0Goat 7.3Grass snake 7.7Guinea pig 7.5Hare 7.5 6.4– 8.1Hedgehog 8.0Horse 7.6Human � 6.5– 7.1Human � 7.1– 7.8Lizard 5.8 4.7– 7.0Mouse 5.8 4.6– 7.0Mudpuppy 2.9Pig 4.6 2.3– 8.7Rat 7.5Rock dove 7.8Rooster 9.0Salamander 6.1 5.5– 6.8Salmon 2.8Sea lamprey 4.9Sharks 7.0Sheep 8.1 6.6–10.4Slowworm 5.2 3.8– 7.6Turtle 9.1
72 Part 1: Zoology

Table 1.7.2: Number and Size of Red Blood Cells in Selected Vertebrates
The number is in millions per cubic millimeter; size is given in micrometers.
After Buddenbrock 1967, Haltenorth 1977, Heidermanns 1957, Hesse and Doflein 1935,Kolb 1974, Kosmos-Lexikon 1953, Portmann 1959, Sturkie 1976
Species Size (μm) Number (1,000,000/mm3)
Carp 11.0 ¥ 8.2 1.40Carrion crow 12.0 ¥ 7.0 2.49Cat 4.5 ¥ 4.5 8.22Chaffinch 12.4 ¥ 7.5 3.66Chimpanzee 7.4 ¥ 7.4 5.10Common frog 23.0 ¥ 16.0 0.49Common toad 20.5 ¥ 13.3 0.38Dog 7.0 ¥ 7.0 6.65Edible frog 23.0 ¥ 16.0 0.60Eel 15.0 ¥ 12.0 1.1Electric rays 27.0 ¥ 20.0 0.14Elephant 9.0 ¥ 9.0 2.02Fire salamander 43.0 ¥ 25.0 0.09Goat 3.5 ¥ 3.5 18.50 (!)Golden or Syrian hamster 5.6 ¥ 5.6 6.90Grass snake 18.0 ¥ 11.0 0.97Guinea pig 7.4 ¥ 7.4 5.60Horse (“coldblood”) 6.90Horse (thoroughbred) 8.90Human � 7.5 ¥ 7.5 4.50Human � 7.5 ¥ 7.5 5.00Lamprey 15.0 ¥ 15.0 0.13Llama 7.6 ¥ 4.4 13.19Mouse 6.0 ¥ 6.0 9.50Mudpuppy 58.0 ¥ 34.0 (!) 0.036Musk deer 2.5 ¥ 2.5 (!)Natterjack toad 20.7 ¥ 14.4 0.65Northern crested newt 31.0 ¥ 22.0 0.164Ostrich 14.0 ¥ 9.0 1.62Pig 6.0 ¥ 6.0 6.96Rat 7.5 ¥ 7.5 9.00Rock dove 14.0 ¥ 7.0 3.00Sand lizard 16.0 ¥ 10.0 1.42Slowworm 18.0 ¥ 9.0 1.52Sole 12.0 ¥ 9.0 2.00Walrus 9.2 ¥ 9.2
Blood 73
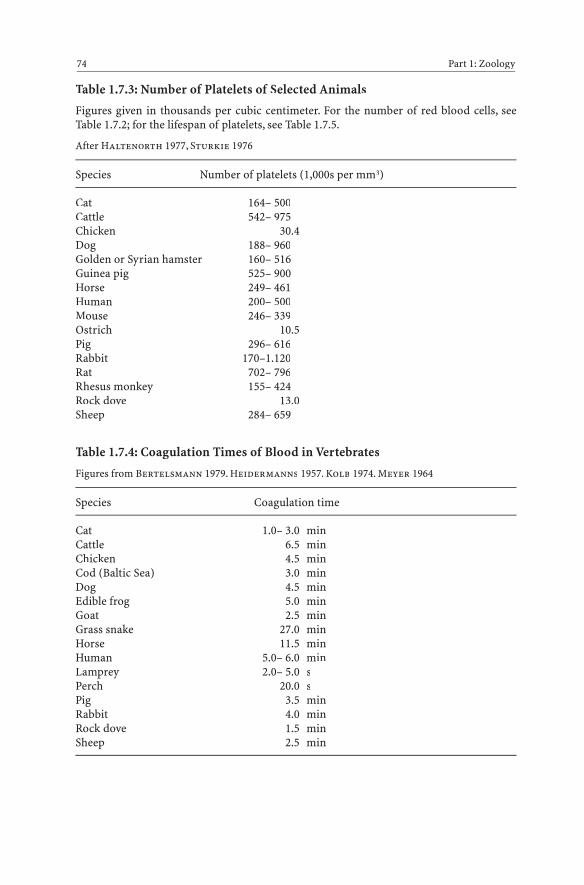
Table 1.7.3: Number of Platelets of Selected Animals
Figures given in thousands per cubic centimeter. For the number of red blood cells, seeTable 1.7.2; for the lifespan of platelets, see Table 1.7.5.
After Haltenorth 1977, Sturkie 1976
Species Number of platelets (1,000s per mm3)
Cat 164– 500Cattle 542– 975Chicken 30.4Dog 188– 960Golden or Syrian hamster 160– 516Guinea pig 525– 900Horse 249– 461Human 200– 500Mouse 246– 339Ostrich 10.5Pig 296– 616Rabbit 170–1.120Rat 702– 796Rhesus monkey 155– 424Rock dove 13.0Sheep 284– 659
Table 1.7.4: Coagulation Times of Blood in Vertebrates
Figures from Bertelsmann 1979. Heidermanns 1957. Kolb 1974. Meyer 1964
Species Coagulation time
Cat 1.0– 3.0 minCattle 6.5 minChicken 4.5 minCod (Baltic Sea) 3.0 minDog 4.5 minEdible frog 5.0 minGoat 2.5 minGrass snake 27.0 minHorse 11.5 minHuman 5.0– 6.0 minLamprey 2.0– 5.0 sPerch 20.0 sPig 3.5 minRabbit 4.0 minRock dove 1.5 minSheep 2.5 min
74 Part 1: Zoology

Table 1.7.5: Lifespan of Blood Cells
In white blood cells, both granulocytes and lymphocytes, there is great variation amongthe individual forms
Figures from Altmann and Dittmer 1972, Buddenbrock 1967, Platt 1976
Species Lifespan
Erythrocytes
Cat 68– 77 daysChicken 35 daysDog 90–135 daysDuck 42 daysGoat 106–125 daysGuinea pig 80– 90 daysHorse 140–150 daysHuman 108–150 daysMouse 20– 45 daysPig 62– 71 daysRabbit 45– 68 daysRat 45– 68 daysRock dove 105 daysSheep 70–153 daysTurtle 500 days
Granulocytes
Human 30– 40 days
Lymphocytes
HumanEffector cells 10 daysMemory cells >10 years
Rat 14 days – 9 months
Platelets
Cat 2– 4 daysCattle 10 daysDog 7– 9 daysGuinea pig 5 daysHuman 8– 14 daysMouse 4 daysRabbit 6 daysRat 4– 5 days
Blood 75

Table 1.7.6: Hematocrit Levels of Selected Vertebrates
The hematocrit is the percentage of total blood volume occupied by red blood cells.
After Buddenbrock 1967, Haltenorth 1977, Kolb 1974, Sturkie 1970
76 Part 1: Zoology
Alligator 30.0–31.0Bonito (fish) 37.1Carrion crow 53.8Cat 40.0Cattle 40.0Chicken 34.5–37.5Chimpanzee 41.5Colubrid [snake] (Natrix) 21.9Common frog 41.8Common or Harbor seal 48.0Dog 45.5Dolphin 51.7Duck 39.5Goat 34.0Golden or Syrian hamster 46.0
Goose 44.0Guinea pig 42.0Horse (“coldblood”) 35.0Horse (thoroughbred) 42.0Human 45.0Mouse 41.5Opossum 35.3Pig 41.5Rabbit 41.5Rat 46.0Rock dove 58.5Sheep 32.0Slider turtle 31.9Sparrow 37.0–52.0
Table 1.7.7: Hemoglobin Levels in the Blood of Selected Animals
Data in grams hemoglobin (Hb) per 100 cm3 blood. For more detailed figures on humans,see Table 4.3.11.
Data after Buddenbrock 1967, Haltenorth 1977, Kolb 1974, Meyer 1964, Sturkie 1976, Wit-tke 1972
Bat 15.0Carp 12.2Carrion crow 16.4Cat 10.2Cat shark 4.8Cattle 16.0Chaffinch 13.9Chicken 11.2Common frog 13.0Dog 16.8Earthworm 3.8Eel 10.9Fox 11.0Goat 10.6Golden or Syrian hamster 15.0Goose 12.7
Great ramshorn snail 1.5Guinea pig 15.9Horse 12.6Human � 12.0–16.0Human � 14.0-18.0Hummingbird 18.0Long-beaked echidna 16.7Mouse 12.5Pheasant 18.9Pig 13.3Rabbit 11.8Reptiles 6.9Rock dove 13.7–16.0Sheep 12.5Sparrow 14.0Thornback ray 2.3
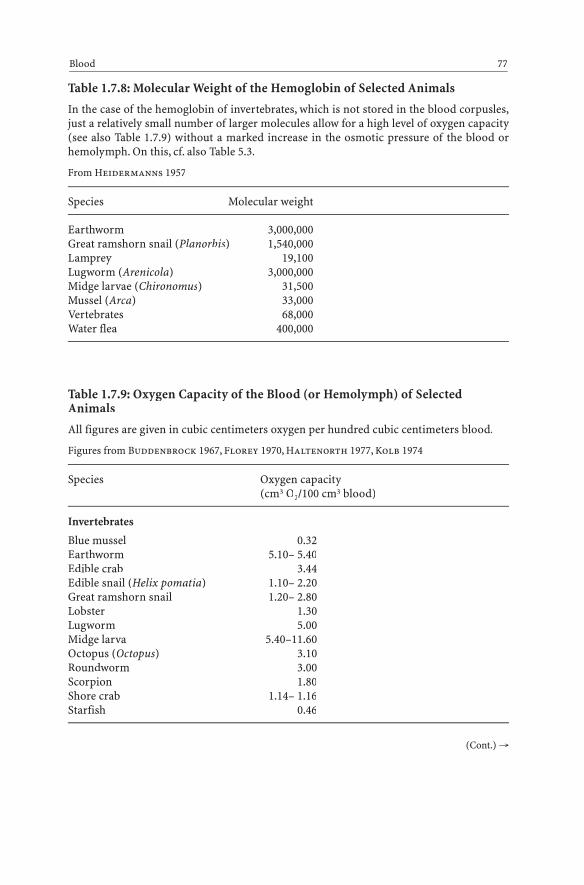
Table 1.7.8: Molecular Weight of the Hemoglobin of Selected Animals
In the case of the hemoglobin of invertebrates, which is not stored in the blood corpusles,just a relatively small number of larger molecules allow for a high level of oxygen capacity(see also Table 1.7.9) without a marked increase in the osmotic pressure of the blood orhemolymph. On this, cf. also Table 5.3.
From Heidermanns 1957
Species Molecular weight
Earthworm 3,000,000Great ramshorn snail (Planorbis) 1,540,000Lamprey 19,100Lugworm (Arenicola) 3,000,000Midge larvae (Chironomus) 31,500Mussel (Arca) 33,000Vertebrates 68,000Water flea 400,000
Table 1.7.9: Oxygen Capacity of the Blood (or Hemolymph) of SelectedAnimals
All figures are given in cubic centimeters oxygen per hundred cubic centimeters blood.
Figures from Buddenbrock 1967, Florey 1970, Haltenorth 1977, Kolb 1974
Species Oxygen capacity(cm3 O2/100 cm3 blood)
Invertebrates
Blue mussel 0.32Earthworm 5.10– 5.40Edible crab 3.44Edible snail (Helix pomatia) 1.10– 2.20Great ramshorn snail 1.20– 2.80Lobster 1.30Lugworm 5.00Midge larva 5.40–11.60Octopus (Octopus) 3.10Roundworm 3.00Scorpion 1.80Shore crab 1.14– 1.16Starfish 0.46
Blood 77
(Cont.) →
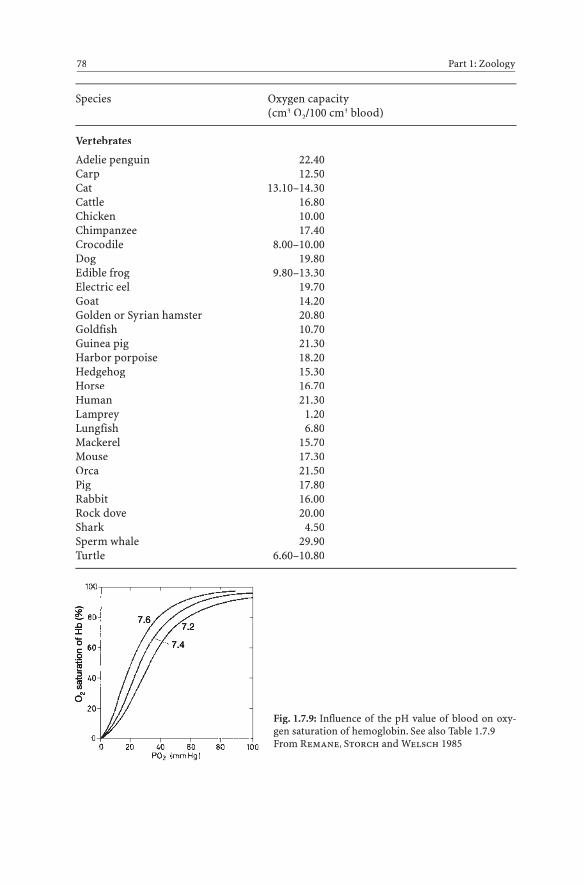
Species Oxygen capacity(cm3 O2/100 cm3 blood)
Vertebrates
Adelie penguin 22.40Carp 12.50Cat 13.10–14.30Cattle 16.80Chicken 10.00Chimpanzee 17.40Crocodile 8.00–10.00Dog 19.80Edible frog 9.80–13.30Electric eel 19.70Goat 14.20Golden or Syrian hamster 20.80Goldfish 10.70Guinea pig 21.30Harbor porpoise 18.20Hedgehog 15.30Horse 16.70Human 21.30Lamprey 1.20Lungfish 6.80Mackerel 15.70Mouse 17.30Orca 21.50Pig 17.80Rabbit 16.00Rock dove 20.00Shark 4.50Sperm whale 29.90Turtle 6.60–10.80
78 Part 1: Zoology
Fig. 1.7.9: Influence of the pH value of blood on oxy-gen saturation of hemoglobin. See also Table 1.7.9From Remane, Storch and Welsch 1985
Of
(%)
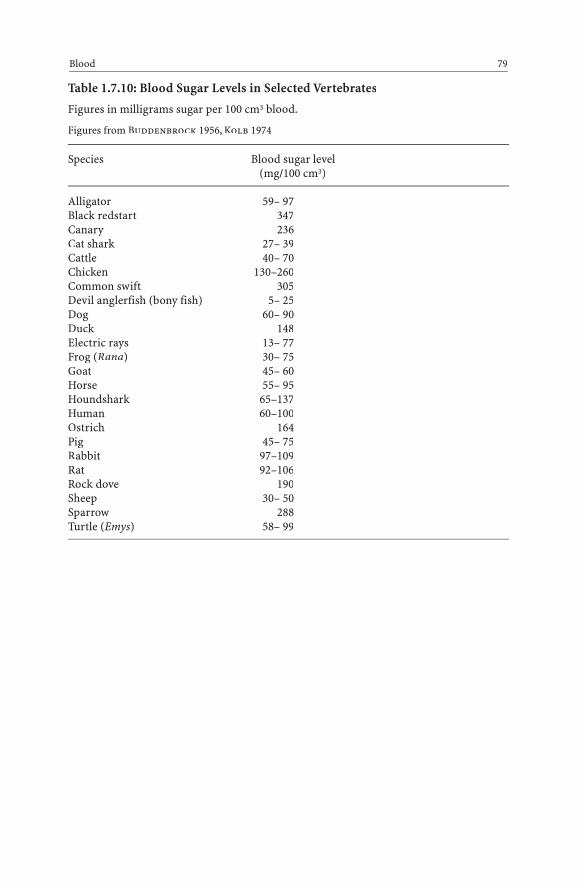
Table 1.7.10: Blood Sugar Levels in Selected Vertebrates
Figures in milligrams sugar per 100 cm3 blood.
Figures from Buddenbrock 1956, Kolb 1974
Species Blood sugar level(mg/100 cm3)
Alligator 59– 97Black redstart 347Canary 236Cat shark 27– 39Cattle 40– 70Chicken 130–260Common swift 305Devil anglerfish (bony fish) 5– 25Dog 60– 90Duck 148Electric rays 13– 77Frog (Rana) 30– 75Goat 45– 60Horse 55– 95Houndshark 65–137Human 60–100Ostrich 164Pig 45– 75Rabbit 97–109Rat 92–106Rock dove 190Sheep 30– 50Sparrow 288Turtle (Emys) 58– 99
Blood 79

Table 1.7.11: Protein Levels of Bodily Fluids(Blood, Hemolymph, Coelom Fluid) of Selected Animals
Figures in milligrams protein per cubic centimeter. 10 mg/cm3 = 1 %. The figures representmean values.
Figures from Buddenbrock 1967, Prosser 1973
Species Protein level(mg/cm3)
Alligator 51.7Blue mussel 1.5Bony fish (common whitefish) 41.9Bumblebee 50.0Cattle 50.2Chicken 31.8Cuttlefish (Sepia) 49.8Dog 58.0–70.0Dolphin 75.0Edible snail (Helix pomatia) 24.0–33.0Frog (Rana) 24.0Goose 30.0Horse 75.0Human 75.0Jellyfish 0.4Lamprey 36.0Lizard 45.7Lobster 40.0Lugworm (Arenicola) 0.2Pond mussel 3.0Rabbit 54.4Rat 59.0Ray 41.2Salamander 21.6Sea cucumber 0.7Sea mouse (bristleworm) 0.9Shark 30.0Shore crab 40.0–60.0Silkworm, caterpillar 10.0Silkworm, imago 60.0Slowworm 40.3Starfish 0.6Walking stick 10.0
80 Part 1: Zoology
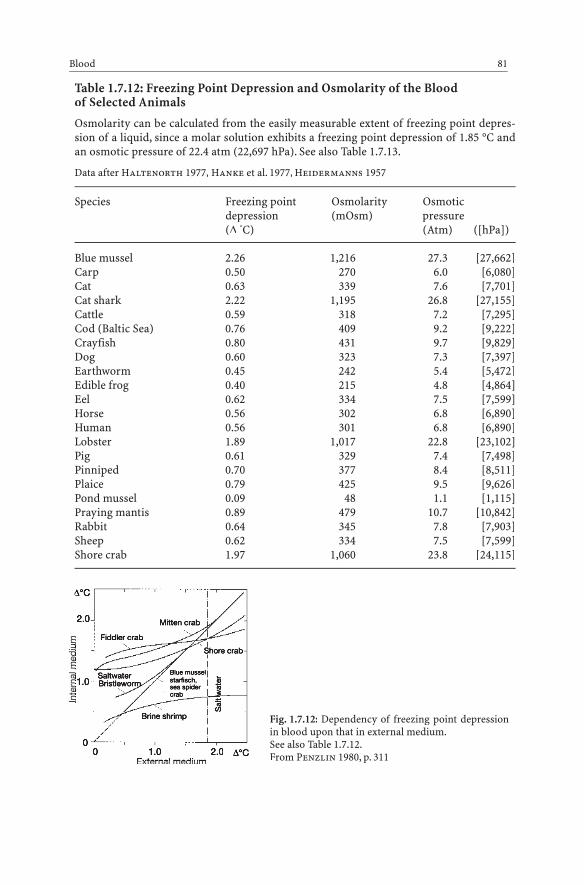
Table 1.7.12: Freezing Point Depression and Osmolarity of the Bloodof Selected Animals
Osmolarity can be calculated from the easily measurable extent of freezing point depres-sion of a liquid, since a molar solution exhibits a freezing point depression of 1.85 °C andan osmotic pressure of 22.4 atm (22,697 hPa). See also Table 1.7.13.
Data after Haltenorth 1977, Hanke et al. 1977, Heidermanns 1957
Species Freezing point Osmolarity Osmoticdepression (mOsm) pressure(D °C) (Atm) ([hPa])
Blue mussel 2.26 1,216 27.3 [27,662]Carp 0.50 270 6.0 [6,080]Cat 0.63 339 7.6 [7,701]Cat shark 2.22 1,195 26.8 [27,155]Cattle 0.59 318 7.2 [7,295]Cod (Baltic Sea) 0.76 409 9.2 [9,222]Crayfish 0.80 431 9.7 [9,829]Dog 0.60 323 7.3 [7,397]Earthworm 0.45 242 5.4 [5,472]Edible frog 0.40 215 4.8 [4,864]Eel 0.62 334 7.5 [7,599]Horse 0.56 302 6.8 [6,890]Human 0.56 301 6.8 [6,890]Lobster 1.89 1,017 22.8 [23,102]Pig 0.61 329 7.4 [7,498]Pinniped 0.70 377 8.4 [8,511]Plaice 0.79 425 9.5 [9,626]Pond mussel 0.09 48 1.1 [1,115]Praying mantis 0.89 479 10.7 [10,842]Rabbit 0.64 345 7.8 [7,903]Sheep 0.62 334 7.5 [7,599]Shore crab 1.97 1,060 23.8 [24,115]
Blood 81
Fig. 1.7.12: Dependency of freezing point depressionin blood upon that in external medium.See also Table 1.7.12.From Penzlin 1980, p. 311
Inte
rnal
med
ium
External medium
D
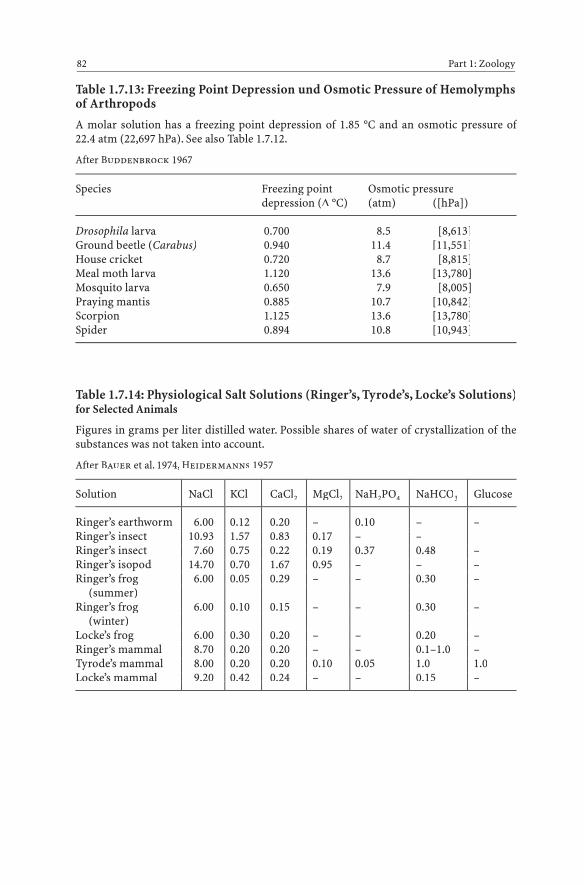
Table 1.7.13: Freezing Point Depression und Osmotic Pressure of Hemolymphsof Arthropods
A molar solution has a freezing point depression of 1.85 °C and an osmotic pressure of22.4 atm (22,697 hPa). See also Table 1.7.12.
After Buddenbrock 1967
Species Freezing point Osmotic pressuredepression (D °C) (atm) ([hPa])
Drosophila larva 0.700 8.5 [8,613]Ground beetle (Carabus) 0.940 11.4 [11,551]House cricket 0.720 8.7 [8,815]Meal moth larva 1.120 13.6 [13,780]Mosquito larva 0.650 7.9 [8,005]Praying mantis 0.885 10.7 [10,842]Scorpion 1.125 13.6 [13,780]Spider 0.894 10.8 [10,943]
Table 1.7.14: Physiological Salt Solutions (Ringer’s, Tyrode’s, Locke’s Solutions)for Selected Animals
Figures in grams per liter distilled water. Possible shares of water of crystallization of thesubstances was not taken into account.
After Bauer et al. 1974, Heidermanns 1957
Solution NaCl KCl CaCl2 MgCl2 NaH2PO4 NaHCO3 Glucose
Ringer’s earthworm 6.00 0.12 0.20 – 0.10 – –Ringer’s insect 10.93 1.57 0.83 0.17 – –Ringer’s insect 7.60 0.75 0.22 0.19 0.37 0.48 –Ringer’s isopod 14.70 0.70 1.67 0.95 – – –Ringer’s frog 6.00 0.05 0.29 – – 0.30 –
(summer)Ringer’s frog 6.00 0.10 0.15 – – 0.30 –
(winter)Locke’s frog 6.00 0.30 0.20 – – 0.20 –Ringer’s mammal 8.70 0.20 0.20 – – 0.1–1.0 –Tyrode’s mammal 8.00 0.20 0.20 0.10 0.05 1.0 1.0Locke’s mammal 9.20 0.42 0.24 – – 0.15 –
82 Part 1: Zoology

1.8 Respiration
Table 1.8.0: Numbers that Amaze
This table brings together some interesting numbers on respiration in animals, which arecited again in the individual tables below.
Respiration 83
Interior lung surfacein humans 90 m2
in horses 500 m2
Breaths per minutein hummingbirds 250in mice 163in Eurasian siskins 114
Air volume inhaled and exhaled in one breath
in orcas 46,200 cm3
in horses 7,500 cm3
by comparison: in humans 500 cm3
Maximum diving timein beaked whales 120 minin leatherback turtles 120 minin bowhead whales 80 min
Maximum diving depthin sperm whales 1,143 min leatherback turtles 1,200 m
Oxygen consumption during exertionper kilogram body weight
in mice 28 gin humans 5.6 g
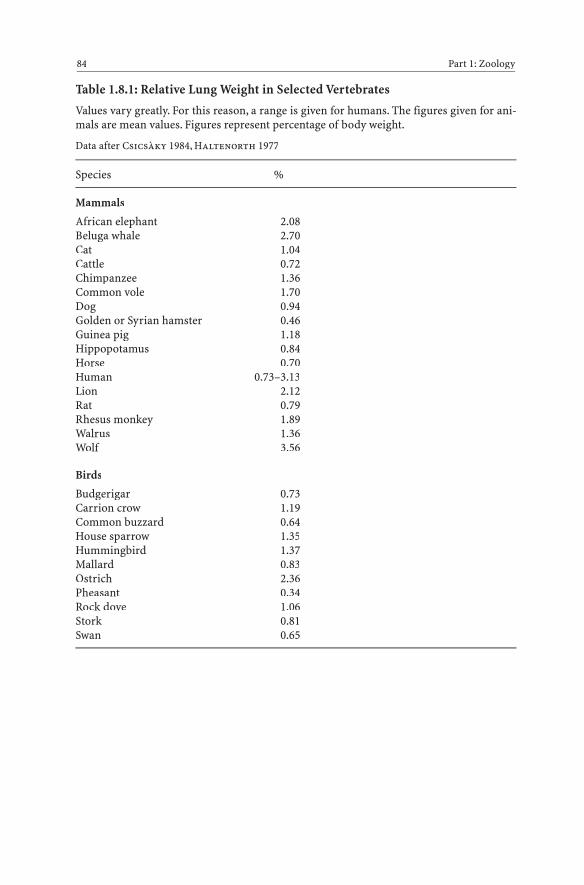
Table 1.8.1: Relative Lung Weight in Selected Vertebrates
Values vary greatly. For this reason, a range is given for humans. The figures given for ani-mals are mean values. Figures represent percentage of body weight.
Data after Csicsàky 1984, Haltenorth 1977
Species %
Mammals
African elephant 2.08Beluga whale 2.70Cat 1.04Cattle 0.72Chimpanzee 1.36Common vole 1.70Dog 0.94Golden or Syrian hamster 0.46Guinea pig 1.18Hippopotamus 0.84Horse 0.70Human 0.73–3.13Lion 2.12Rat 0.79Rhesus monkey 1.89Walrus 1.36Wolf 3.56
Birds
Budgerigar 0.73Carrion crow 1.19Common buzzard 0.64House sparrow 1.35Hummingbird 1.37Mallard 0.83Ostrich 2.36Pheasant 0.34Rock dove 1.06Stork 0.81Swan 0.65
84 Part 1: Zoology

Table 1.8.2: Interior Lung Surface of Selected Animals
Figures represent mean values. Within a given class of vertebrates and among animals ofthe same size, those animals that move quickly are equipped with a larger lung surface.
Values after Altman and Dittmer 1974, Haltenorth 1977, Krumbiegel 1953, Ziswiler 1976
Species Interior lung surface (m2)
Alligator 2.0Bat (myotis) 0.5Cat 20.0Common or Harbor seal 65.0Common toad 0.008Dog 90.0Dolphin 43.0Fire salamander 0.0005Horse 500.0Human 90.0Lungfish 0.016Mouse 0.12Rabbit 5.9Rat 0.56Sloth 5.0
Table 1.8.3: Breathing Rate and Single-Breath Air Volume of SelectedVertebrates
Data after Bertelsmann 1979, Enzyklopädie 1979, Krumbiegel 1953, Meyer 1964,Oppenheimer and Pincussen 1925, Penzlin 1977, Ziswiler 1976
Species Breaths/min Volume (cm3)
Bat 50Buzzard/Hawk 20Capuchin monkey 46Carrion crow 25Cat 30 34Cat shark 52Cattle 30 3,400Chicken 27 31Chimpanzee 19Common swift 90Dog 18 320Duck 42 30Electric rays 60Elephant 6
Respiration 85
(Cont.) →
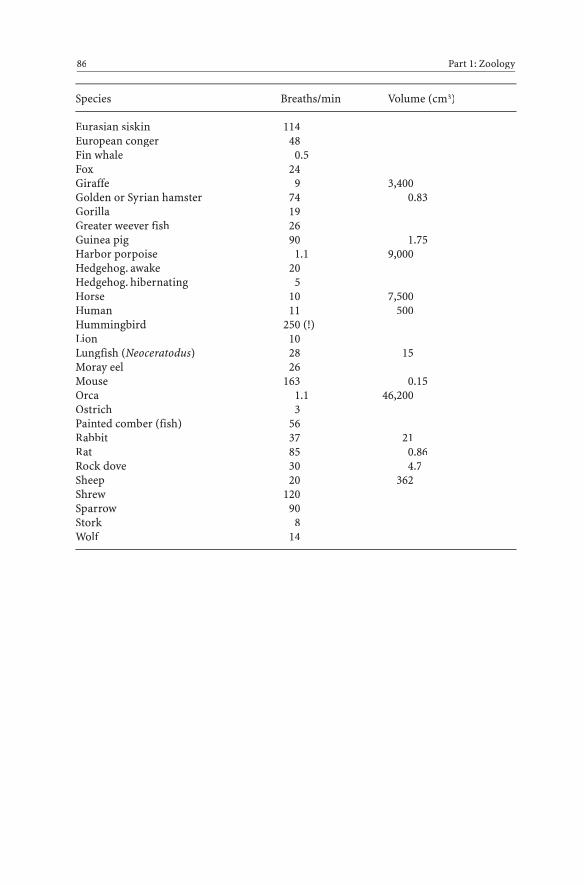
Species Breaths/min Volume (cm3)
Eurasian siskin 114European conger 48Fin whale 0.5Fox 24Giraffe 9 3,400Golden or Syrian hamster 74 0.83Gorilla 19Greater weever fish 26Guinea pig 90 1.75Harbor porpoise 1.1 9,000Hedgehog. awake 20Hedgehog. hibernating 5Horse 10 7,500Human 11 500Hummingbird 250 (!)Lion 10Lungfish (Neoceratodus) 28 15Moray eel 26Mouse 163 0.15Orca 1.1 46,200Ostrich 3Painted comber (fish) 56Rabbit 37 21Rat 85 0.86Rock dove 30 4.7Sheep 20 362Shrew 120Sparrow 90Stork 8Wolf 14
86 Part 1: Zoology
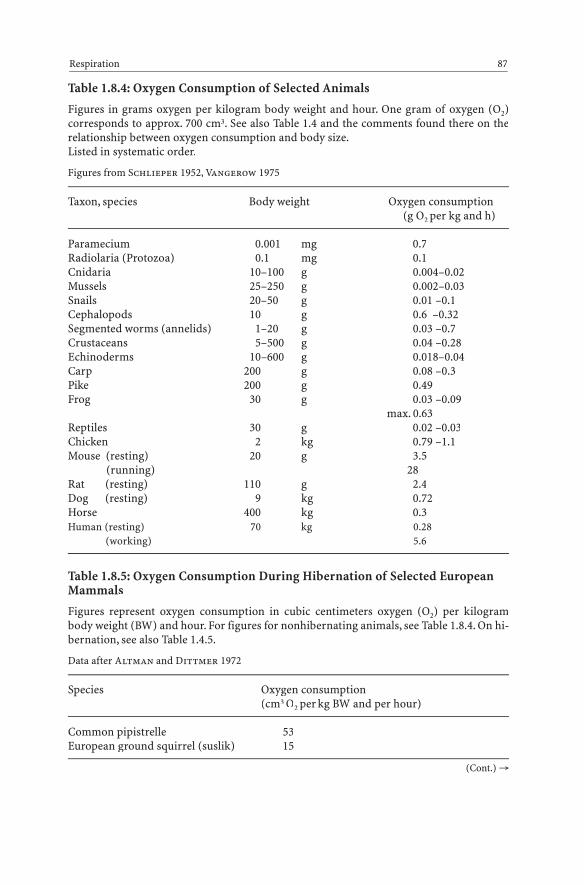
Table 1.8.4: Oxygen Consumption of Selected Animals
Figures in grams oxygen per kilogram body weight and hour. One gram of oxygen (O2)corresponds to approx. 700 cm3. See also Table 1.4 and the comments found there on therelationship between oxygen consumption and body size.Listed in systematic order.
Figures from Schlieper 1952, Vangerow 1975
Taxon, species Body weight Oxygen consumption(g O2 per kg and h)
Paramecium 0.001 mg 0.7Radiolaria (Protozoa) 0.1 mg 0.1Cnidaria 10–100 g 0.004–0.02Mussels 25–250 g 0.002–0.03Snails 20–50 g 0.01 –0.1Cephalopods 10 g 0.6 –0.32Segmented worms (annelids) 1–20 g 0.03 –0.7Crustaceans 5–500 g 0.04 –0.28Echinoderms 10–600 g 0.018–0.04Carp 200 g 0.08 –0.3Pike 200 g 0.49Frog 30 g 0.03 –0.09
max. 0.63Reptiles 30 g 0.02 –0.03Chicken 2 kg 0.79 –1.1Mouse (resting) 20 g 3.5
(running) 28Rat (resting) 110 g 2.4Dog (resting) 9 kg 0.72Horse 400 kg 0.3Human (resting) 70 kg 0.28
(working) 5.6
Table 1.8.5: Oxygen Consumption During Hibernation of Selected EuropeanMammals
Figures represent oxygen consumption in cubic centimeters oxygen (O2) per kilogrambody weight (BW) and hour. For figures for nonhibernating animals, see Table 1.8.4. On hi-bernation, see also Table 1.4.5.
Data after Altman and Dittmer 1972
Species Oxygen consumption(cm3 O2 per kg BW and per hour)
Common pipistrelle 53European ground squirrel (suslik) 15
Respiration 87
(Cont.) →
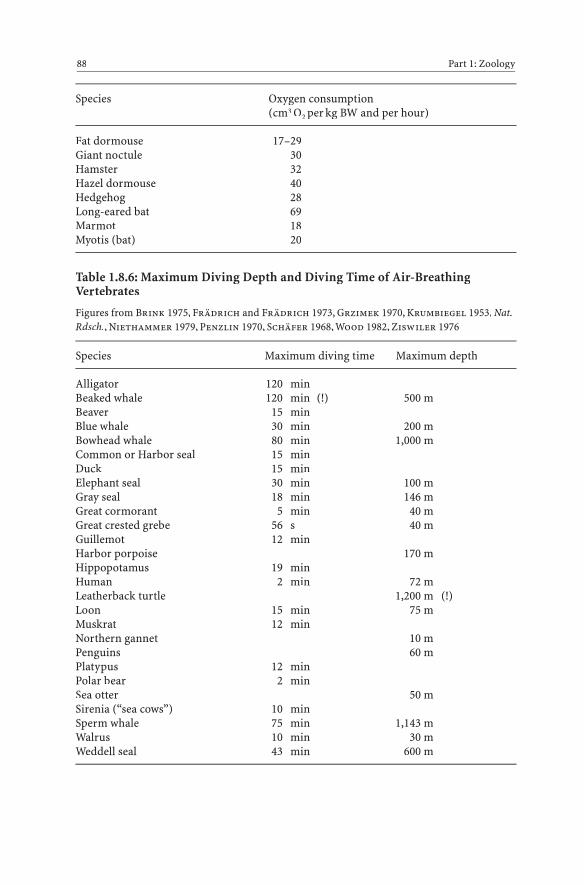
Species Oxygen consumption(cm3 O2 per kg BW and per hour)
Fat dormouse 17–29Giant noctule 30Hamster 32Hazel dormouse 40Hedgehog 28Long-eared bat 69Marmot 18Myotis (bat) 20
Table 1.8.6: Maximum Diving Depth and Diving Time of Air-BreathingVertebrates
Figures from Brink 1975, Frädrich and Frädrich 1973, Grzimek 1970, Krumbiegel 1953, Nat.Rdsch., Niethammer 1979, Penzlin 1970, Schäfer 1968, Wood 1982, Ziswiler 1976
Species Maximum diving time Maximum depth
Alligator 120 minBeaked whale 120 min (!) 500 mBeaver 15 minBlue whale 30 min 200 mBowhead whale 80 min 1,000 mCommon or Harbor seal 15 minDuck 15 minElephant seal 30 min 100 mGray seal 18 min 146 mGreat cormorant 5 min 40 mGreat crested grebe 56 s 40 mGuillemot 12 minHarbor porpoise 170 mHippopotamus 19 minHuman 2 min 72 mLeatherback turtle 1,200 m (!)Loon 15 min 75 mMuskrat 12 minNorthern gannet 10 mPenguins 60 mPlatypus 12 minPolar bear 2 minSea otter 50 mSirenia (“sea cows”) 10 minSperm whale 75 min 1,143 mWalrus 10 min 30 mWeddell seal 43 min 600 m
88 Part 1: Zoology
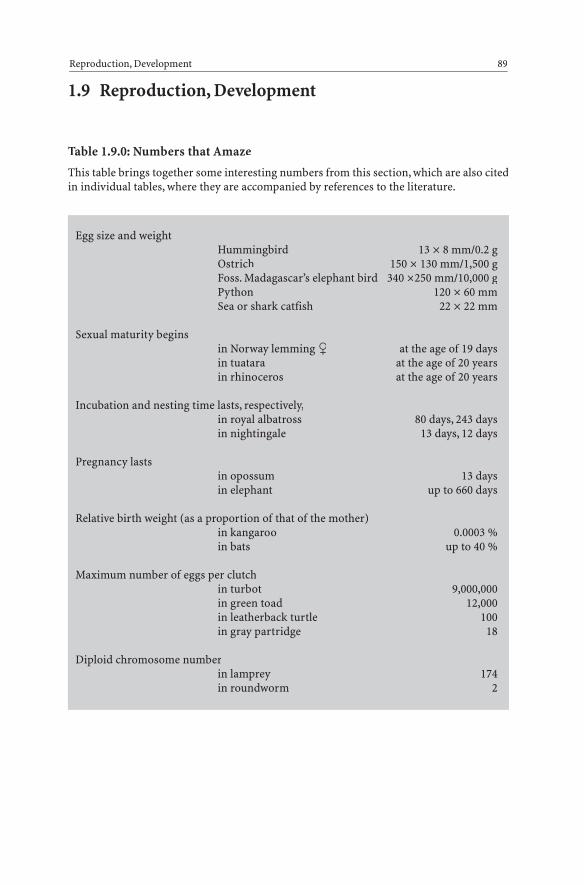
1.9 Reproduction, Development
Table 1.9.0: Numbers that Amaze
This table brings together some interesting numbers from this section, which are also citedin individual tables, where they are accompanied by references to the literature.
Reproduction, Development 89
Egg size and weightHummingbird 13 ¥ 8 mm/0.2 gOstrich 150 ¥ 130 mm/1,500 gFoss. Madagascar’s elephant bird 340 ¥250 mm/10,000 gPython 120 ¥ 60 mmSea or shark catfish 22 ¥ 22 mm
Sexual maturity beginsin Norway lemming � at the age of 19 daysin tuatara at the age of 20 yearsin rhinoceros at the age of 20 years
Incubation and nesting time lasts, respectively,in royal albatross 80 days, 243 daysin nightingale 13 days, 12 days
Pregnancy lastsin opossum 13 daysin elephant up to 660 days
Relative birth weight (as a proportion of that of the mother)in kangaroo 0.0003 %in bats up to 40 %
Maximum number of eggs per clutchin turbot 9,000,000in green toad 12,000in leatherback turtle 100in gray partridge 18
Diploid chromosome numberin lamprey 174in roundworm 2

Table 1.9.1: Size of Egg Cells in Selected Animals (Excluding Birds)
No figures for birds; for these, see Table 1.9.13. For fish, see Table 1.9.9. For insect eggs, thelength is given
Data after Lexikon der Biologie, Oppenheimer and Pincussen 1927, Slijper 1967, Starck 1975,Spector 1956
Species Maximum egg diameter
African clawed frog 1.5 mmAlligator 50 mmBee 1.75 mmCat 130 μmCattle 150 μmCoelacanth 100 mmColorado potato beetle 1.75 mmCommon vole 60 μmDog 140 μmFrog 500 μmFruit fly 500 μmGuinea pig 100 μmHorse 140 μmHouse cricket 2.5 mmHuman 100 μmLamprey 2 mmLancelet 110 μmLungfish 3.75 mmMoon jelly 190 μmPig 140 μmPike 1 mmPlatypus 4 mmPython 60 ¥ 120 mmQuoll 240 μmRabbit 130 μmRat 70 μmRhesus monkey 120 μmRoundworm 45 μmSea urchin 70 μmSheep 180 μmWhale 130 μm
90 Part 1: Zoology

Table 1.9.2: Dimensions of Sperm of Selected Animals
Figures from David 1977
Species Overall length (μm) Length of head (μm)
Cat 54.0 4.0Cattle 73.2 8.8Guinea pig 93.0 13.0Hedgehog 85.0 5.0Human 58.0– 67.0 4.5– 5.5Mouse 100.0 7.0Rat 170.0–200.0 10.0
Table 1.9.3: Chromosome Sets of Selected Animals
Diploid values, numbers of chromosomes (n). For plants, see Table 2.2.9.
After Altmann and Dittmer 1972, Bresch and Hausmann 1972, Daumer 1977, Kosmos 1953,Lexikon der Biologie, Nagl 1976, Nigon and Lueken 1976, Spector 1956, Starck 1974
Species Chromosomes Species Chromosomes(n) (n)
Reproduction, Development 91
InvertebratesBee 32Cockroach � 47Cuttlefish (Sepia) 12Cyclops (water flea) 14Dragonfly (Aeschna) 26Earthworm 32Edible snail (Helix pomatia) 54Firebug 24Fruit fly (Drosophila) 8Great diving beetle 38Head louse 12Heliozoa 44House spider � 43Housefly 12Hydra 32Ixodes ricinus tick 28Lancelet 24Leech (Glossosiphonia) 26
Liver fluke 12Migratory locust � 23Moon jelly 20Mosquito (Culex) 6Praying mantis � 27Roundworm 2Scorpion (Buthus) 14Sea urchin (Paracentrotus) 36Silkworm 20Silverfish 34Small white (butterfly) 30Spider (Aranea) 14Sponge (Sycon) 26Starfish 36Stentor protozoan 28Water flea 20White-lipped banded snail 48Woodlouse 56Yellow mealworm beetle 20
(Cont.) →

Vertebrates
Fish
Carp 104Cat shark 24Goldfish 94Guppy 48Lamprey 174Pike 18Swordtail 48
Amphibians
Axolotl 28Common Eurasian spadefoot toad 26Common frog 26Common toad 22Edible frog 26Fire salamander 24Green toad 22Midwife toad 36Natterjack toad 22Northern crested newt 24Tree frog 24
Reptiles
Alligator 32Asp viper 42Crossed viper 36European pond turtle 50Hawksbill turtle 58Sand lizard 38Slowworm 44
Birds
Blackbird 80Canary 80
Chicken 78Duck 80Egret 68Greylag goose 80House sparrow 76Rock dove 80
Mammals
Baboon 42Bat (Myotis) 44Capuchin monkey 54Cattle 60Chimpanzee 48Common house mouse 40Dog 78Gibbon 52Golden or Syrian hamster 44Gorilla 48Guinea pig 64Hare 48Hedgehog 48Horse 64House cat 38Human 46Kangaroo 22Macaque 44Mole 34Orangutan 44Pig 38Rabbit 44Rat 42Rhesus monkey 42Sheep 54Tarsier 80
92 Part 1: Zoology
Species Chromosomes Species Chromosomes(n) (n)

Table 1.9.4: Age of Sexual Maturity in Selected Animals
For a comparison of time of sexual maturity with lifespan in mammals, see Table 1.9.19.
Data after Altman and Dittmer 1972, Bogner and Ritter 1976, Frädrich and Frädrich 1973,Grzimek 1970, Krumbiegel 1953, Meyer 1964, Michel 1986, Spector 1956, Ziswiler 1976
Species Age of sexual Species Age of sexualmaturity maturity
Reproduction, Development 93
Anura 3–4 yearsBaboon 4– 8 yearsBat 1 yearBeaver 2 yearsBeech marten 2 yearsBirds of prey 3– 6 yearsBison 3 yearsBlue whale 4 yearsBrown bear 5 yearsCamel 4 yearsCarp 4– 5 yearsCat 1 yearCattle 1.5– 2 yearsChickens 1– 2 yearsChimpanzee 8–10 yearsCommon frog 3 yearsCommon or Harbor seal 4 yearsCrocodile 3–6 yearsDeer 1.5 yearsDog 1 yearDomestic pig 7 monthsDucks 1– 2 yearsEdible snail (Helix pomatia) 2– 3 yearsElephants 12–15 yearsEuropean pond turtle 12 yearsFox 10 monthsGibbon 8–10 yearsGiraffe 6– 7 yearsGoat 1– 2 yearsGolden or Syrian hamster 2 monthsGorilla � 6– 7 yearsGorilla � 9–10 years
Guinea pig 55–70 daysHare 6 monthsHedgehog 2 yearsHerring 3– 7 monthsHippopotamus 2.5 yearsHorse 3– 4 yearsHuman 12–18 yearsLion 3–5 yearsLizards 2– 3 yearsLobster 5 yearsMacaque 2 yearsMole 2 yearsMouse 2– 6 monthsNorway lemming � 19 days (!)Opossum 8 monthsOrangutan 10 yearsOstrich 3– 4 yearsPlatypus 2 yearsPolar bear 2– 3 yearsRabbit 5– 9 monthsRat 2– 3 monthsRhinoceros 20 years (!)Roe deer 14 monthsSalamander 3– 4 yearsSheep 1– 2 yearsShrew (Sorex) 1– 2 yearsSongbirds 1 yearTiger 4– 5 yearsTrout 2– 4 yearsTuatara 20 years (!)Wild boar 1.5 yearsWolf 3 years
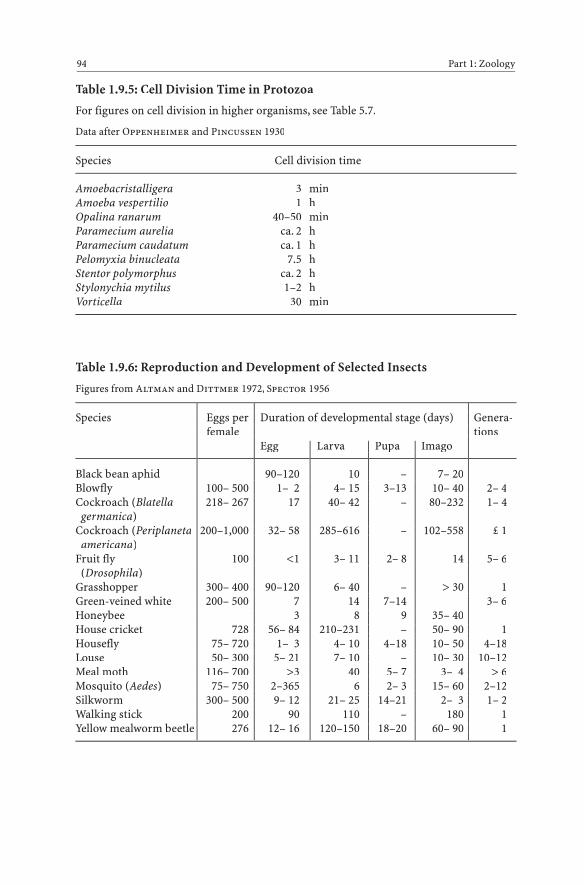
Table 1.9.5: Cell Division Time in Protozoa
For figures on cell division in higher organisms, see Table 5.7.
Data after Oppenheimer and Pincussen 1930
Species Cell division time
Amoebacristalligera 3 minAmoeba vespertilio 1 hOpalina ranarum 40–50 minParamecium aurelia ca. 2 hParamecium caudatum ca. 1 hPelomyxia binucleata 7.5 hStentor polymorphus ca. 2 hStylonychia mytilus 1–2 hVorticella 30 min
Table 1.9.6: Reproduction and Development of Selected Insects
Figures from Altman and Dittmer 1972, Spector 1956
Species Eggs per Duration of developmental stage (days) Genera-female tions
Egg Larva Pupa Imago
Black bean aphid 90–120 10 – 7– 20Blowfly 100– 500 1– 2 4– 15 3–13 10– 40 2– 4Cockroach (Blatella 218– 267 17 40– 42 – 80–232 1– 4
germanica)Cockroach (Periplaneta 200–1,000 32– 58 285–616 – 102–558 £ 1americana)
Fruit fly 100 <1 3– 11 2– 8 14 5– 6(Drosophila)
Grasshopper 300– 400 90–120 6– 40 – > 30 1Green-veined white 200– 500 7 14 7–14 3– 6Honeybee 3 8 9 35– 40House cricket 728 56– 84 210–231 – 50– 90 1Housefly 75– 720 1– 3 4– 10 4–18 10– 50 4–18Louse 50– 300 5– 21 7– 10 – 10– 30 10–12Meal moth 116– 700 >3 40 5– 7 3– 4 > 6Mosquito (Aedes) 75– 750 2–365 6 2– 3 15– 60 2–12Silkworm 300– 500 9– 12 21– 25 14–21 2– 3 1– 2Walking stick 200 90 110 – 180 1Yellow mealworm beetle 276 12– 16 120–150 18–20 60– 90 1
94 Part 1: Zoology

Table 1.9.7: Reproductive and Developmental Data of Selected ButterfliesNative to Germany Over the Course of the Year
For the length of individual stages of selected insects, see Table 1.9.6. Monthly data sepa-rated by semicolons (;) indicate the appearance of several generations.
Figures from Amann 1976, Flindt 1985, Higgins and Riley 1971
Imago Egg Caterpillar Pupa
Admiral V–VI; VII–VIII IV–VII VI–X IX–XIX–X
Brimstone VII–VI VI VI–VII VIIComma VI–VII; VIII–V V; VII V–VI; VI; VIII
VII–VIIIEyed hawk moth VI–VII VI VI–IX IX–VIGarden tiger VII–VIII VII–VIII VIII–V VI–VIIGypsy moth VII–IX IX–V V–VI VI–VIIHummingbird VII–X VI–VIII VII–VIII
hawk mothLarge yellow VI–VII; VIII–IX VIII IX–V V–VI
underwingMap butterfly IV–VI; VII–VIII V; VII VI–VII; VII; IX–V
VIII–IXMourning cloak VII–VI V–VI VI–VII VIIOak processionary VIII–IX IX–V V–VII VIIIOrange tip IV–VI V V–VII VIII–IVPeacock VII–V V–VI V–VII VIIPine hawk moth V–VII V–VI VI–X X–VPine moth VI–VII VII VIII–VI VI–VIIPrivet hawk moth V–VII VI VI–IX IX–VIRed underwing VII–IX VIII–V V–VI VI–VIISilver-washed fritillary VI–IX IX–IV IV–VI VISmall tortoiseshell VI–VII; VIII–VI V; VII V–VI; VI–VII;
VII–VIII VIIISmall white (butterfly) IV–VI; VII–VIII; VI–VII; VII–VIII;
IX–X VIII–X X–VSummer fruit tortrix VIII IV V–VI o. V–IV VIImoth
Swallowtail butterfly IV–VI; VII–VIII V–VI; V–VI; VI–VII;VIII VIII–IX VIII–IV
Winter moth X–XII XI–III III–VI VI–X
Reproduction, Development 95
X–XII XI–III III–VI
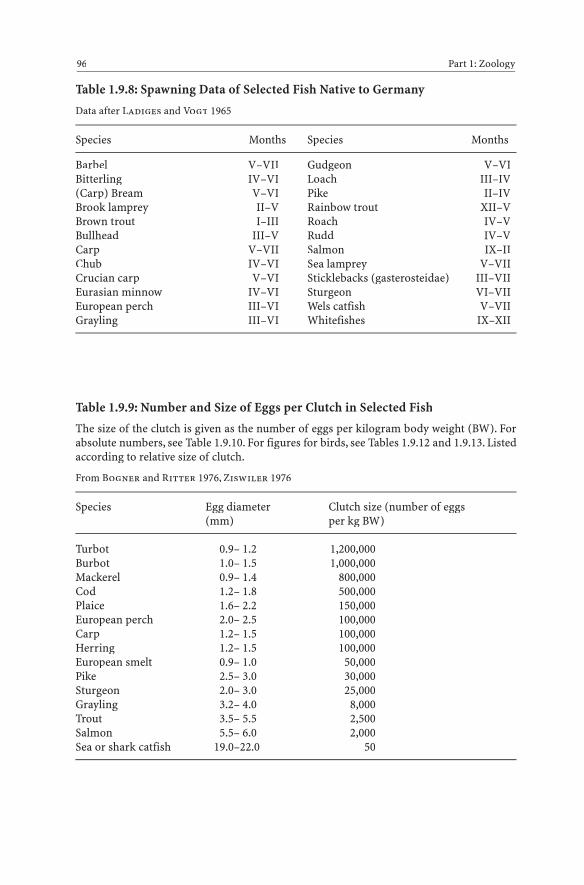
Table 1.9.8: Spawning Data of Selected Fish Native to Germany
Data after Ladiges and Vogt 1965
Species Months Species Months
96 Part 1: Zoology
Barbel V–VIIBitterling IV–VI(Carp) Bream V–VIBrook lamprey II–VBrown trout I–IIIBullhead III–VCarp V–VIIChub IV–VICrucian carp V–VIEurasian minnow IV–VIEuropean perch III–VIGrayling III–VI
Gudgeon V–VILoach III–IVPike II–IVRainbow trout XII–VRoach IV–VRudd IV–VSalmon IX–IISea lamprey V–VIISticklebacks (gasterosteidae) III–VIISturgeon VI–VIIWels catfish V–VIIWhitefishes IX–XII
Table 1.9.9: Number and Size of Eggs per Clutch in Selected Fish
The size of the clutch is given as the number of eggs per kilogram body weight (BW). Forabsolute numbers, see Table 1.9.10. For figures for birds, see Tables 1.9.12 and 1.9.13. Listedaccording to relative size of clutch.
From Bogner and Ritter 1976, Ziswiler 1976
Species Egg diameter Clutch size (number of eggs(mm) per kg BW)
Turbot 0.9– 1.2 1,200,000Burbot 1.0– 1.5 1,000,000Mackerel 0.9– 1.4 800,000Cod 1.2– 1.8 500,000Plaice 1.6– 2.2 150,000European perch 2.0– 2.5 100,000Carp 1.2– 1.5 100,000Herring 1.2– 1.5 100,000European smelt 0.9– 1.0 50,000Pike 2.5– 3.0 30,000Sturgeon 2.0– 3.0 25,000Grayling 3.2– 4.0 8,000Trout 3.5– 5.5 2,500Salmon 5.5– 6.0 2,000Sea or shark catfish 19.0–22.0 50
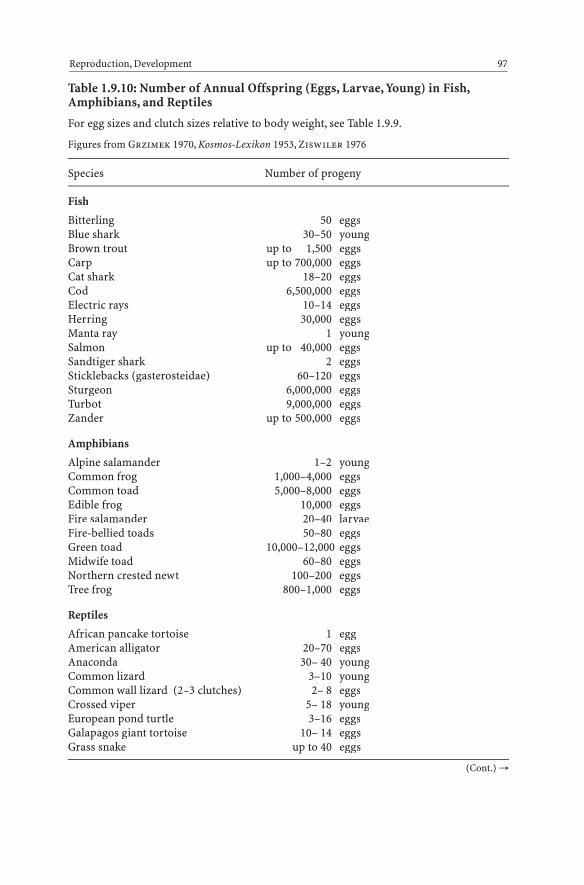
Table 1.9.10: Number of Annual Offspring (Eggs, Larvae, Young) in Fish,Amphibians, and Reptiles
For egg sizes and clutch sizes relative to body weight, see Table 1.9.9.
Figures from Grzimek 1970, Kosmos-Lexikon 1953, Ziswiler 1976
Species Number of progeny
Fish
Bitterling 50 eggsBlue shark 30–50 youngBrown trout up to 1,500 eggsCarp up to 700,000 eggsCat shark 18–20 eggsCod 6,500,000 eggsElectric rays 10–14 eggsHerring 30,000 eggsManta ray 1 youngSalmon up to 40,000 eggsSandtiger shark 2 eggsSticklebacks (gasterosteidae) 60–120 eggsSturgeon 6,000,000 eggsTurbot 9,000,000 eggsZander up to 500,000 eggs
Amphibians
Alpine salamander 1–2 youngCommon frog 1,000–4,000 eggsCommon toad 5,000–8,000 eggsEdible frog 10,000 eggsFire salamander 20–40 larvaeFire-bellied toads 50–80 eggsGreen toad 10,000–12,000 eggsMidwife toad 60–80 eggsNorthern crested newt 100–200 eggsTree frog 800–1,000 eggs
Reptiles
African pancake tortoise 1 eggAmerican alligator 20–70 eggsAnaconda 30– 40 youngCommon lizard 3–10 youngCommon wall lizard (2–3 clutches) 2– 8 eggsCrossed viper 5– 18 youngEuropean pond turtle 3–16 eggsGalapagos giant tortoise 10– 14 eggsGrass snake up to 40 eggs
Reproduction, Development 97
(Cont.) →
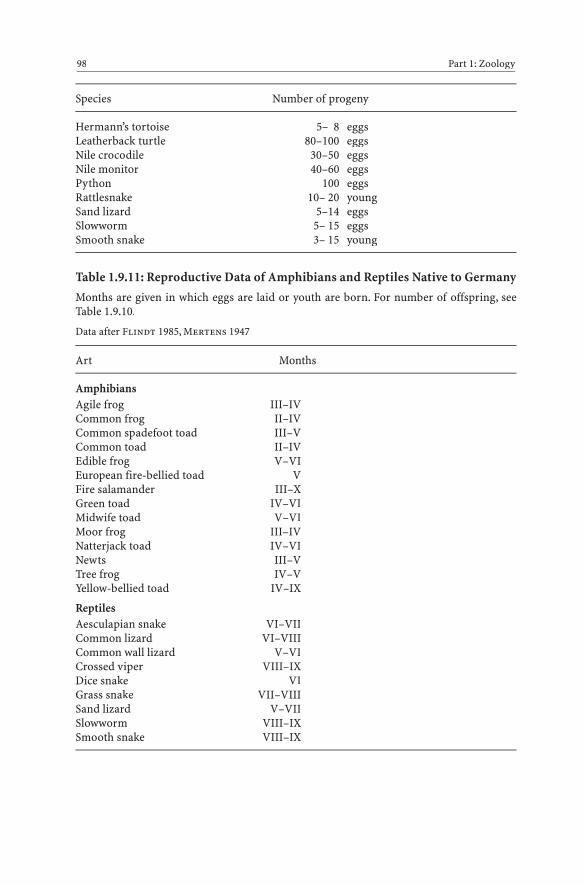
Species Number of progeny
Hermann’s tortoise 5– 8 eggsLeatherback turtle 80–100 eggsNile crocodile 30–50 eggsNile monitor 40–60 eggsPython 100 eggsRattlesnake 10– 20 youngSand lizard 5–14 eggsSlowworm 5– 15 eggsSmooth snake 3– 15 young
Table 1.9.11: Reproductive Data of Amphibians and Reptiles Native to Germany
Months are given in which eggs are laid or youth are born. For number of offspring, seeTable 1.9.10.
Data after Flindt 1985, Mertens 1947
Art Months
AmphibiansAgile frog III–IVCommon frog II–IVCommon spadefoot toad III–VCommon toad II–IVEdible frog V–VIEuropean fire-bellied toad VFire salamander III–XGreen toad IV–VIMidwife toad V–VIMoor frog III–IVNatterjack toad IV–VINewts III–VTree frog IV–VYellow-bellied toad IV–IX
ReptilesAesculapian snake VI–VIICommon lizard VI–VIIICommon wall lizard V–VICrossed viper VIII–IXDice snake VIGrass snake VII–VIIISand lizard V–VIISlowworm VIII–IXSmooth snake VIII–IX
98 Part 1: Zoology
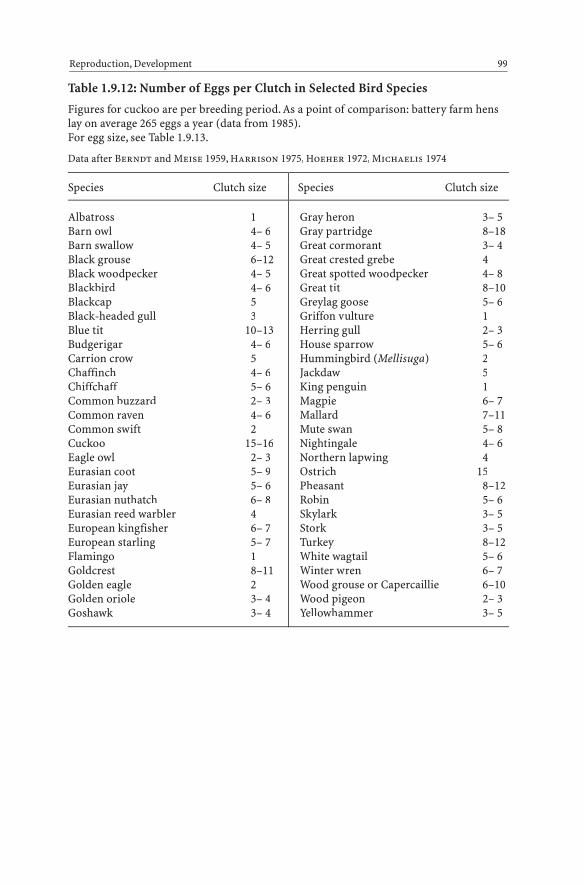
Table 1.9.12: Number of Eggs per Clutch in Selected Bird Species
Figures for cuckoo are per breeding period. As a point of comparison: battery farm henslay on average 265 eggs a year (data from 1985).For egg size, see Table 1.9.13.
Data after Berndt and Meise 1959, Harrison 1975, Hoeher 1972, Michaelis 1974
Species Clutch size Species Clutch size
Reproduction, Development 99
Albatross 1Barn owl 4– 6Barn swallow 4– 5Black grouse 6–12Black woodpecker 4– 5Blackbird 4– 6Blackcap 5Black-headed gull 3Blue tit 10–13Budgerigar 4– 6Carrion crow 5Chaffinch 4– 6Chiffchaff 5– 6Common buzzard 2– 3Common raven 4– 6Common swift 2Cuckoo 15–16Eagle owl 2– 3Eurasian coot 5– 9Eurasian jay 5– 6Eurasian nuthatch 6– 8Eurasian reed warbler 4European kingfisher 6– 7European starling 5– 7Flamingo 1Goldcrest 8–11Golden eagle 2Golden oriole 3– 4Goshawk 3– 4
Gray heron 3– 5Gray partridge 8–18Great cormorant 3– 4Great crested grebe 4Great spotted woodpecker 4– 8Great tit 8–10Greylag goose 5– 6Griffon vulture 1Herring gull 2– 3House sparrow 5– 6Hummingbird (Mellisuga) 2Jackdaw 5King penguin 1Magpie 6– 7Mallard 7–11Mute swan 5– 8Nightingale 4– 6Northern lapwing 4Ostrich 15Pheasant 8–12Robin 5– 6Skylark 3– 5Stork 3– 5Turkey 8–12White wagtail 5– 6Winter wren 6– 7Wood grouse or Capercaillie 6–10Wood pigeon 2– 3Yellowhammer 3– 5
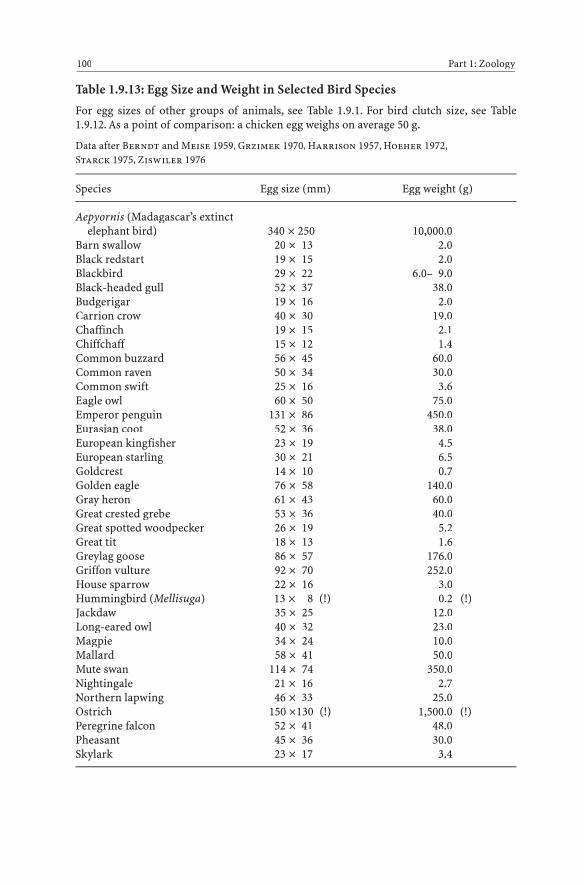
Table 1.9.13: Egg Size and Weight in Selected Bird Species
For egg sizes of other groups of animals, see Table 1.9.1. For bird clutch size, see Table1.9.12. As a point of comparison: a chicken egg weighs on average 50 g.
Data after Berndt and Meise 1959, Grzimek 1970, Harrison 1957, Hoeher 1972,Starck 1975, Ziswiler 1976
Species Egg size (mm) Egg weight (g)
Aepyornis (Madagascar’s extinctelephant bird) 340 ¥ 250 10,000.0
Barn swallow 20 ¥ 13 2.0Black redstart 19 ¥ 15 2.0Blackbird 29 ¥ 22 6.0– 9.0Black-headed gull 52 ¥ 37 38.0Budgerigar 19 ¥ 16 2.0Carrion crow 40 ¥ 30 19.0Chaffinch 19 ¥ 15 2.1Chiffchaff 15 ¥ 12 1.4Common buzzard 56 ¥ 45 60.0Common raven 50 ¥ 34 30.0Common swift 25 ¥ 16 3.6Eagle owl 60 ¥ 50 75.0Emperor penguin 131 ¥ 86 450.0Eurasian coot 52 ¥ 36 38.0European kingfisher 23 ¥ 19 4.5European starling 30 ¥ 21 6.5Goldcrest 14 ¥ 10 0.7Golden eagle 76 ¥ 58 140.0Gray heron 61 ¥ 43 60.0Great crested grebe 53 ¥ 36 40.0Great spotted woodpecker 26 ¥ 19 5.2Great tit 18 ¥ 13 1.6Greylag goose 86 ¥ 57 176.0Griffon vulture 92 ¥ 70 252.0House sparrow 22 ¥ 16 3.0Hummingbird (Mellisuga) 13 ¥ 8 (!) 0.2 (!)Jackdaw 35 ¥ 25 12.0Long-eared owl 40 ¥ 32 23.0Magpie 34 ¥ 24 10.0Mallard 58 ¥ 41 50.0Mute swan 114 ¥ 74 350.0Nightingale 21 ¥ 16 2.7Northern lapwing 46 ¥ 33 25.0Ostrich 150 ¥130 (!) 1,500.0 (!)Peregrine falcon 52 ¥ 41 48.0Pheasant 45 ¥ 36 30.0Skylark 23 ¥ 17 3.4
100 Part 1: Zoology

Species Egg size (mm) Egg weight (g)
Stork 77 ¥ 53 118.0Winter wren 16 ¥ 12 1.3Wood pigeon 40 ¥ 29 19.0
Table 1.9.14: Length of Time of Incubation and Nesting (in NidicolousMembers) of Selected Bird Species
Lengths given in days. NF nidifugous species.As a point of comparison: incubation time for a domestic chicken is 21 days.
Figures from Berndt and Meise 1959, Harrison 1975, Heinroth 1955, Hoeher 1972,Michaelis 1974, Pflugfelder 1962, Spector 1956, Ziswiler 1976
Species Incubation time (days) Nesting time (days)
Barn swallow 14–16 21Black redstart 13 13–16Blackbird 13–14 13–16Black-headed gull 22–24 NFBudgerigar 18 30Canary 12–14 16–20Carrion crow 18–20 30–32Chaffinch 12–13 13–14Chiffchaff 13–14 13–16Common buzzard 33–35 42–49Common raven 20–21 40–50Common swift 18–20 38–54Cuckoo 12 22–23Eagle owl 31–37 70Eurasian coot 21–24 NFEuropean kingfisher 19–21 26–28European starling 14–15 21Golden eagle 43–45 75–80Great crested grebe 25–29 NFGreat spotted woodpecker 12–13 21Great tit 13–14 15–18Griffon vulture 48–50 90House sparrow 12–14 15–16Hummingbirds 14–17 19–29Jackdaw 17–18 30–35King penguin 52 NFLong-eared owl 27–28 21–24Magpie 17–18 25–27
Reproduction, Development 101
(Cont.) →

Species Incubation time (days) Nesting time (days)
Mallard 26–29 NFMute swan 34–38 NFNightingale 13 11–12Northern lapwing 24–29 NFOstrich 42 NFPeregrine falcon 28–29 35–38Pheasant 23–25 NFRoyal albatross 80 (!) 243 (!)Skylark 11–14 9–10Stork 31–34 54–55Winter wren 14–16 15–17Wood pigeon 15–17 21–28
Table 1.9.15: Incubation Dates of Selected, Well-Known Birds Native toGermany
For incubation and nesting times, see Table 1.9.14.Roman numerals are used to indicate the months. The Arabic numbers 1, 2, and 3 after theslash stand for the first, second, and third “third” of the month.
Figures from Flindt 1985
Species Incubation Species Incubationin months in months
102 Part 1: Zoology
Barn swallow IV–VIIIBlack redstart IV–VIIIBlackbird III–VIIBlackcap V–VIIBlack-headed gull IV/3–VI/1Blue tit IV–VICarrion crow III–VIChaffinch IV–VIChiffchaff IV/3–VICommon buzzard III/3–VII/1Common kestrel IV–VII/2Common moorhen IV/2–V/2Common redstart V–VICommon swift V–VICrested lark IV/3–VIDunnock III–VIIEurasian bullfinch V–VIIEurasian coot IV/3–V
Eurasian curlew IV–VI/1Eurasian jay IV–VIEurasian nuthatch IV–VEurasian reed warbler V–VIIIEuropean goldfinch V–VIEuropean greenfinch IV–VIEuropean nightjar V–VIEuropean serin IV–VIEuropean starling IV–VIFirecrest V–VIIGarden warbler V–VIGolden oriole V–VIGrasshopper warbler IV/3–VIIGray heron III/3–VIGray partridge IV/2–VI/1Great reed warbler V–VIGreat spotted woodpecker V/3–VIIGreat tit IV–VII
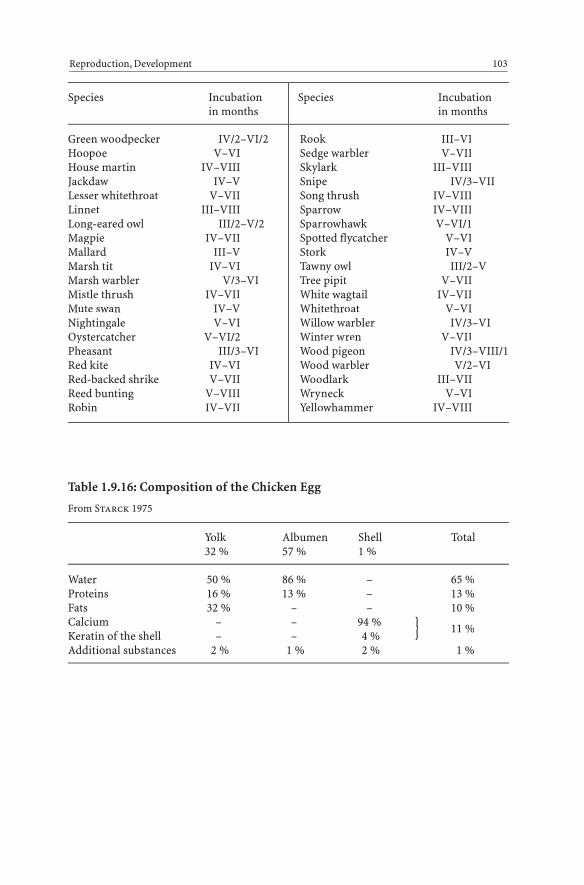
Green woodpecker IV/2–VI/2Hoopoe V–VIHouse martin IV–VIIIJackdaw IV–VLesser whitethroat V–VIILinnet III–VIIILong-eared owl III/2–V/2Magpie IV–VIIMallard III–VMarsh tit IV–VIMarsh warbler V/3–VIMistle thrush IV–VIIMute swan IV–VNightingale V–VIOystercatcher V–VI/2Pheasant III/3–VIRed kite IV–VIRed-backed shrike V–VIIReed bunting V–VIIIRobin IV–VII
Rook III–VISedge warbler V–VIISkylark III–VIIISnipe IV/3–VIISong thrush IV–VIIISparrow IV–VIIISparrowhawk V–VI/1Spotted flycatcher V–VIStork IV–VTawny owl III/2–VTree pipit V–VIIWhite wagtail IV–VIIWhitethroat V–VIWillow warbler IV/3–VIWinter wren V–VIIWood pigeon IV/3–VIII/1Wood warbler V/2–VIWoodlark III–VIIWryneck V–VIYellowhammer IV–VIII
Reproduction, Development 103
Species Incubation Species Incubationin months in months
Table 1.9.16: Composition of the Chicken Egg
From Starck 1975
Yolk Albumen Shell Total32 % 57 % 1 %
Water 50 % 86 % – 65 %Proteins 16 % 13 % – 13 %Fats 32 % – – 10 %Calcium – – 94 % 11 %Keratin of the shell – – 4 %Additional substances 2 % 1 % 2 % 1 %
}
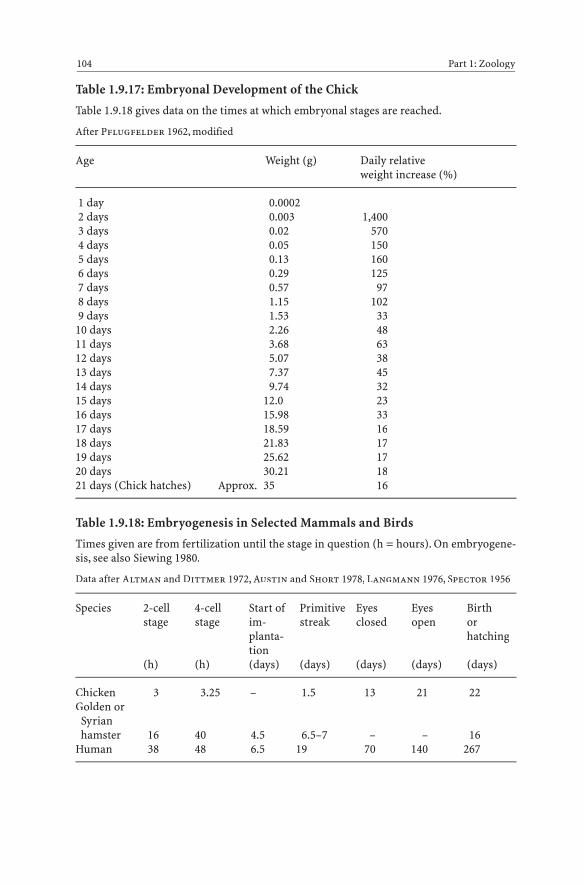
Table 1.9.17: Embryonal Development of the Chick
Table 1.9.18 gives data on the times at which embryonal stages are reached.
After Pflugfelder 1962, modified
Age Weight (g) Daily relative weight increase (%)
1 day 0.00022 days 0.003 1,4003 days 0.02 5704 days 0.05 1505 days 0.13 1606 days 0.29 1257 days 0.57 978 days 1.15 1029 days 1.53 33
10 days 2.26 4811 days 3.68 6312 days 5.07 3813 days 7.37 4514 days 9.74 3215 days 12.0 2316 days 15.98 3317 days 18.59 1618 days 21.83 1719 days 25.62 1720 days 30.21 1821 days (Chick hatches) Approx. 35 16
Table 1.9.18: Embryogenesis in Selected Mammals and Birds
Times given are from fertilization until the stage in question (h = hours). On embryogene-sis, see also Siewing 1980.
Data after Altman and Dittmer 1972, Austin and Short 1978, Langmann 1976, Spector 1956
Species 2-cell 4-cell Start of Primitive Eyes Eyes Birthstage stage im- streak closed open or
planta- hatchingtion
(h) (h) (days) (days) (days) (days) (days)
Chicken 3 3.25 – 1.5 13 21 22Golden or
Syrianhamster 16 40 4.5 6.5–7 – – 16
Human 38 48 6.5 19 70 140 267
104 Part 1: Zoology
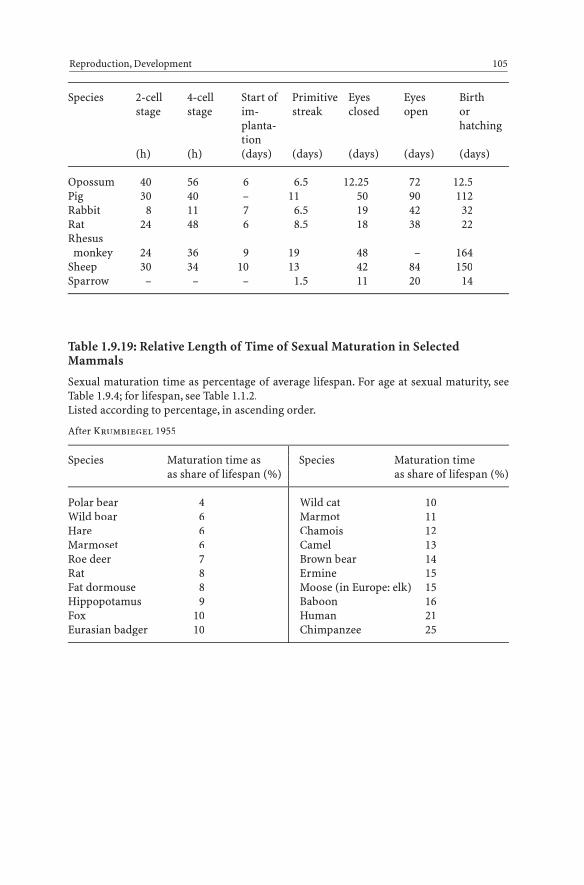
Species 2-cell 4-cell Start of Primitive Eyes Eyes Birthstage stage im- streak closed open or
planta- hatchingtion
(h) (h) (days) (days) (days) (days) (days)
Opossum 40 56 6 6.5 12.25 72 12.5Pig 30 40 – 11 50 90 112Rabbit 8 11 7 6.5 19 42 32Rat 24 48 6 8.5 18 38 22Rhesus
monkey 24 36 9 19 48 – 164Sheep 30 34 10 13 42 84 150Sparrow – – – 1.5 11 20 14
Table 1.9.19: Relative Length of Time of Sexual Maturation in SelectedMammals
Sexual maturation time as percentage of average lifespan. For age at sexual maturity, seeTable 1.9.4; for lifespan, see Table 1.1.2.Listed according to percentage, in ascending order.
After Krumbiegel 1955
Species Maturation time as Species Maturation timeas share of lifespan (%) as share of lifespan (%)
Reproduction, Development 105
Polar bear 4Wild boar 6Hare 6Marmoset 6Roe deer 7Rat 8Fat dormouse 8Hippopotamus 9Fox 10Eurasian badger 10
Wild cat 10Marmot 11Chamois 12Camel 13Brown bear 14Ermine 15Moose (in Europe: elk) 15Baboon 16Human 21Chimpanzee 25
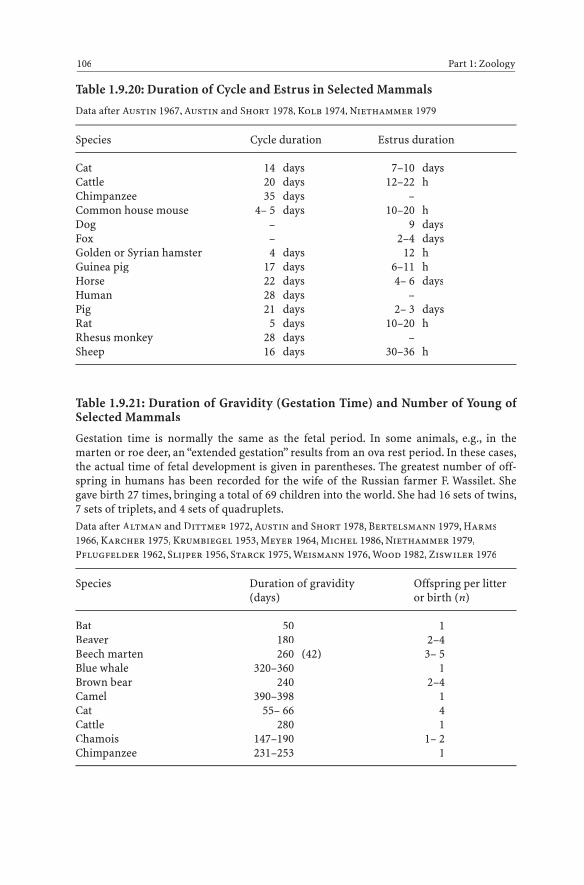
Table 1.9.20: Duration of Cycle and Estrus in Selected Mammals
Data after Austin 1967, Austin and Short 1978, Kolb 1974, Niethammer 1979
Species Cycle duration Estrus duration
Cat 14 days 7–10 daysCattle 20 days 12–22 hChimpanzee 35 days –Common house mouse 4– 5 days 10–20 hDog – 9 daysFox – 2–4 daysGolden or Syrian hamster 4 days 12 hGuinea pig 17 days 6–11 hHorse 22 days 4– 6 daysHuman 28 days –Pig 21 days 2– 3 daysRat 5 days 10–20 hRhesus monkey 28 days –Sheep 16 days 30–36 h
Table 1.9.21: Duration of Gravidity (Gestation Time) and Number of Young ofSelected Mammals
Gestation time is normally the same as the fetal period. In some animals, e.g., in themarten or roe deer, an “extended gestation” results from an ova rest period. In these cases,the actual time of fetal development is given in parentheses. The greatest number of off-spring in humans has been recorded for the wife of the Russian farmer F. Wassilet. Shegave birth 27 times, bringing a total of 69 children into the world. She had 16 sets of twins,7 sets of triplets, and 4 sets of quadruplets.Data after Altman and Dittmer 1972, Austin and Short 1978, Bertelsmann 1979, Harms1966, Karcher 1975, Krumbiegel 1953, Meyer 1964, Michel 1986, Niethammer 1979,Pflugfelder 1962, Slijper 1956, Starck 1975, Weismann 1976, Wood 1982, Ziswiler 1976
Species Duration of gravidity Offspring per litter(days) or birth (n)
Bat 50 1Beaver 180 2–4Beech marten 260 (42) 3– 5Blue whale 320–360 1Brown bear 240 2–4Camel 390–398 1Cat 55– 66 4Cattle 280 1Chamois 147–190 1– 2Chimpanzee 231–253 1
106 Part 1: Zoology

Species Duration of gravidity Offspring per litter(days) or birth (n)
Common house mouse 21– 24 3–10Common or Harbor seal 300 1Common shrew 20 6– 7Common vole 21 4Dog (according to race) 59– 65 1–10Dolphin 276 1Donkey 365 1Dromedary 388 1Elephant 623–660 (!) 1Eurasian badger 200 (56) 2–5Fat dormouse 28 3– 7Fox 49– 55 3– 7Gibbon 210 1Giraffe 431–465 1Goat 150 2– 3Golden or Syrian hamster 16 1–12Gorilla 251–289 1Guinea pig 63– 68 2Hare 42 2– 4Hedgehog 34– 49 4–10Hippopotamus 237–247 1Horse 314–373 1Human 274 1Kangaroos 30– 40 1( + in pouch) 135–240Lion 108 2– 6Macaque 168 1Mole 28– 42 1– 6Opossum 13 (!) up to 12Orangutan 233 1Pig 114 6–12Polar bear 240 2– 4Polecat 180 (43) 3–7Rabbit 30– 32 4–12Rat 21 7– 9Red deer (Wapiti) 234 1Red kangaroo 38– 40 1Reindeer 242 1Rhesus monkey 163 1Rhinoceros 548–578 1Roe deer 280 (150) 1– 2Squirrel 35 3Tiger 105 2– 3Walrus 330–370 1
Reproduction, Development 107
(Cont.) →
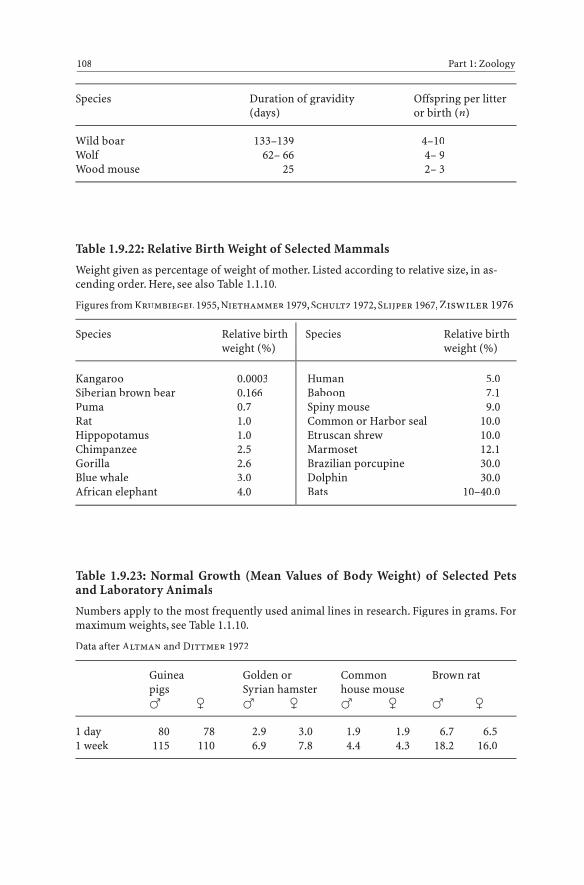
Species Duration of gravidity Offspring per litter(days) or birth (n)
Wild boar 133–139 4–10Wolf 62– 66 4– 9Wood mouse 25 2– 3
Table 1.9.22: Relative Birth Weight of Selected Mammals
Weight given as percentage of weight of mother. Listed according to relative size, in as-cending order. Here, see also Table 1.1.10.
Figures from Krumbiegel 1955, Niethammer 1979, Schultz 1972, Slijper 1967, Ziswiler 1976
Species Relative birth Species Relative birthweight (%) weight (%)
108 Part 1: Zoology
Kangaroo 0.0003Siberian brown bear 0.166Puma 0.7Rat 1.0Hippopotamus 1.0Chimpanzee 2.5Gorilla 2.6Blue whale 3.0African elephant 4.0
Human 5.0Baboon 7.1Spiny mouse 9.0Common or Harbor seal 10.0Etruscan shrew 10.0Marmoset 12.1Brazilian porcupine 30.0Dolphin 30.0Bats 10–40.0
Table 1.9.23: Normal Growth (Mean Values of Body Weight) of Selected Petsand Laboratory Animals
Numbers apply to the most frequently used animal lines in research. Figures in grams. Formaximum weights, see Table 1.1.10.
Data after Altman and Dittmer 1972
Guinea Golden or Common Brown ratpigs Syrian hamster house mouse� � � � � � � �
1 day 80 78 2.9 3.0 1.9 1.9 6.7 6.51 week 115 110 6.9 7.8 4.4 4.3 18.2 16.0
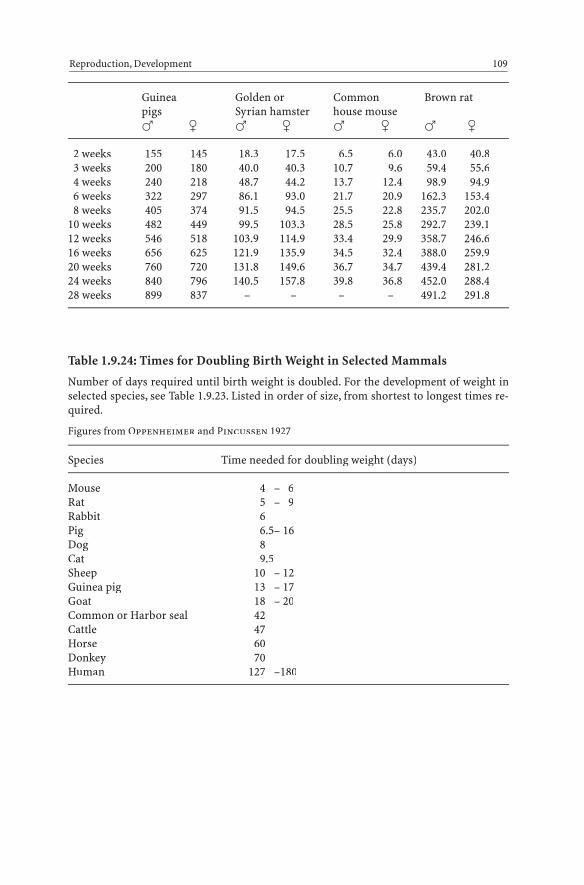
Guinea Golden or Common Brown ratpigs Syrian hamster house mouse� � � � � � � �
2 weeks 155 145 18.3 17.5 6.5 6.0 43.0 40.83 weeks 200 180 40.0 40.3 10.7 9.6 59.4 55.64 weeks 240 218 48.7 44.2 13.7 12.4 98.9 94.96 weeks 322 297 86.1 93.0 21.7 20.9 162.3 153.48 weeks 405 374 91.5 94.5 25.5 22.8 235.7 202.0
10 weeks 482 449 99.5 103.3 28.5 25.8 292.7 239.112 weeks 546 518 103.9 114.9 33.4 29.9 358.7 246.616 weeks 656 625 121.9 135.9 34.5 32.4 388.0 259.920 weeks 760 720 131.8 149.6 36.7 34.7 439.4 281.224 weeks 840 796 140.5 157.8 39.8 36.8 452.0 288.428 weeks 899 837 – – – – 491.2 291.8
Table 1.9.24: Times for Doubling Birth Weight in Selected Mammals
Number of days required until birth weight is doubled. For the development of weight inselected species, see Table 1.9.23. Listed in order of size, from shortest to longest times re-quired.
Figures from Oppenheimer and Pincussen 1927
Species Time needed for doubling weight (days)
Mouse 4 – 6Rat 5 – 9Rabbit 6Pig 6.5– 16Dog 8Cat 9.5Sheep 10 – 12Guinea pig 13 – 17Goat 18 – 20Common or Harbor seal 42Cattle 47Horse 60Donkey 70Human 127 –180
Reproduction, Development 109
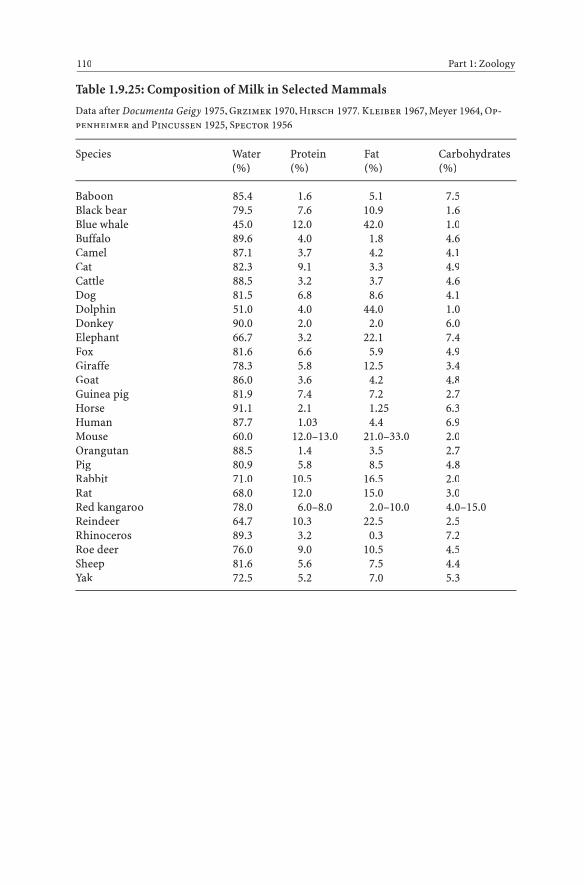
Table 1.9.25: Composition of Milk in Selected Mammals
Data after Documenta Geigy 1975, Grzimek 1970, Hirsch 1977, Kleiber 1967, Meyer 1964, Op-penheimer and Pincussen 1925, Spector 1956
Species Water Protein Fat Carbohydrates(%) (%) (%) (%)
Baboon 85.4 1.6 5.1 7.5Black bear 79.5 7.6 10.9 1.6Blue whale 45.0 12.0 42.0 1.0Buffalo 89.6 4.0 1.8 4.6Camel 87.1 3.7 4.2 4.1Cat 82.3 9.1 3.3 4.9Cattle 88.5 3.2 3.7 4.6Dog 81.5 6.8 8.6 4.1Dolphin 51.0 4.0 44.0 1.0Donkey 90.0 2.0 2.0 6.0Elephant 66.7 3.2 22.1 7.4Fox 81.6 6.6 5.9 4.9Giraffe 78.3 5.8 12.5 3.4Goat 86.0 3.6 4.2 4.8Guinea pig 81.9 7.4 7.2 2.7Horse 91.1 2.1 1.25 6.3Human 87.7 1.03 4.4 6.9Mouse 60.0 12.0–13.0 21.0–33.0 2.0Orangutan 88.5 1.4 3.5 2.7Pig 80.9 5.8 8.5 4.8Rabbit 71.0 10.5 16.5 2.0Rat 68.0 12.0 15.0 3.0Red kangaroo 78.0 6.0–8.0 2.0–10.0 4.0–15.0Reindeer 64.7 10.3 22.5 2.5Rhinoceros 89.3 3.2 0.3 7.2Roe deer 76.0 9.0 10.5 4.5Sheep 81.6 5.6 7.5 4.4Yak 72.5 5.2 7.0 5.3
110 Part 1: Zoology

Table 1.9.26: Annual Milk Production of Domestic Animals
Figures represent averages. Cattle reach top production values of over 10,000 liters annual-ly. High-performance cows in Israel produce up to 13,000 l milk per year.Figures after Bertelsmann 1979, Mann 1979
Species Average annual milk production (liters)
Cattle 4,000–5,000Goat 600– 800Sheep 500– 700Zebu 180– 250
Table 1.9.27: Lactation Periods of Selected Mammals
Figures from Frädrich and Frädrich 1973, Kolb 1974
Species Lactation period
Brown bear 3– 4 monthsCat 4– 6 weeksCattle 8–10 weeksChimpanzee > 1 yearCommon or Harbor seal 4– 6 weeksDeer 3– 4 monthsDog 6 weeksDonkey 12–20 weeksElephants up to 2 yearsFox 7– 8 weeksGorilla 1.5 yearsGuinea pig 2– 3 weeksHedgehog 18–20 daysHorse 12–20 weeksLion 10 weeksOrangutan 3– 4 yearsPig 8–10 weeksRabbit 8 weeksRhesus monkey 7–14 monthsRhinoceri 2 yearsRoe deer 2– 3 monthsSheep 6–12 weeksTiger 8 weeksWild boar 2– 3 monthsWolf 7– 8 weeks
Reproduction, Development 111
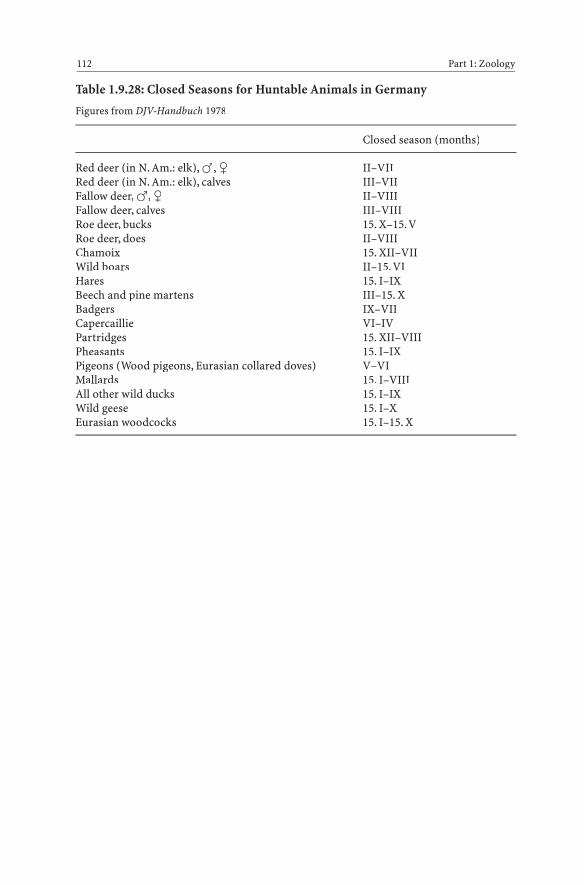
Table 1.9.28: Closed Seasons for Huntable Animals in Germany
Figures from DJV-Handbuch 1978
Closed season (months)
Red deer (in N. Am.: elk), �, � II–VIIRed deer (in N. Am.: elk), calves III–VIIFallow deer, �, � II–VIIIFallow deer, calves III–VIIIRoe deer, bucks 15. X–15. VRoe deer, does II–VIIIChamoix 15. XII–VIIWild boars II–15. VIHares 15. I–IXBeech and pine martens III–15. XBadgers IX–VIICapercaillie VI–IVPartridges 15. XII–VIIIPheasants 15. I–IXPigeons (Wood pigeons, Eurasian collared doves) V–VIMallards 15. I–VIIIAll other wild ducks 15. I–IXWild geese 15. I–XEurasian woodcocks 15. I–15. X
112 Part 1: Zoology
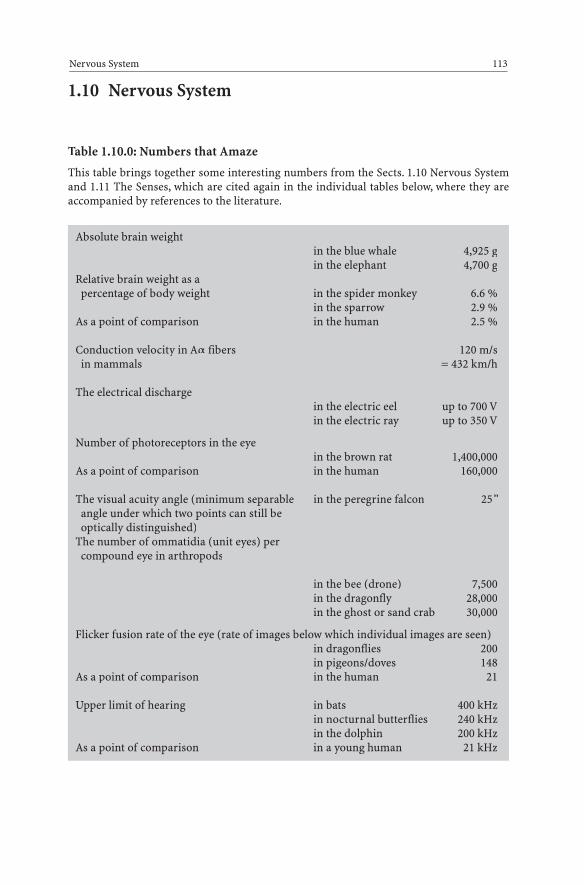
1.10 Nervous System
Table 1.10.0: Numbers that Amaze
This table brings together some interesting numbers from the Sects. 1.10 Nervous Systemand 1.11 The Senses, which are cited again in the individual tables below, where they areaccompanied by references to the literature.
Nervous System 113
Absolute brain weightin the blue whale 4,925 gin the elephant 4,700 g
Relative brain weight as apercentage of body weight in the spider monkey 6.6 %
in the sparrow 2.9 %As a point of comparison in the human 2.5 %
Conduction velocity in Aa fibers 120 m/sin mammals = 432 km/h
The electrical dischargein the electric eel up to 700 Vin the electric ray up to 350 V
Number of photoreceptors in the eyein the brown rat 1,400,000
As a point of comparison in the human 160,000
The visual acuity angle (minimum separable in the peregrine falcon 25’’angle under which two points can still beoptically distinguished)
The number of ommatidia (unit eyes) percompound eye in arthropods
in the bee (drone) 7,500in the dragonfly 28,000in the ghost or sand crab 30,000
Flicker fusion rate of the eye (rate of images below which individual images are seen)in dragonflies 200in pigeons/doves 148
As a point of comparison in the human 21
Upper limit of hearing in bats 400 kHzin nocturnal butterflies 240 kHzin the dolphin 200 kHz
As a point of comparison in a young human 21 kHz

Table 1.10.1: Brain Weight (Absolute) of Selected Mammals
Figures represent mean values. Since absolute values, due to great variations in size withinindividual species, have little explanatory power, see the relative brain weights given inTable 1.10.2. For humans, see also Table 4.6.2.
Figures after Haltenorth 1977, Krumbiegel 1953
Species Brain weight Species Brain weight
114 Part 1: Zoology
Blue whale 4,700 gCat 31.4 gCattle 540 gChimpanzee 350–400 gDog 135 gDolphin 700 gElephant 4,925 gGibbon 118 gGorilla 430– 650 gGuenon 106 gHarbor porpoise 455 g
Hedgehog 3.4 gHippopotamus 580 gHorse 590 gHuman 1,200–1,500 gLion 222 gMouse 0.4 gOpossum 6.5 gOrangutan 370– 400 gPig 112 gRat 3.05 gWolf 114.4 g
Table 1.10.2: Relative Brain Weight of Selected Vertebrates
Figures given as percentage of body weight. A comparison only makes sense within closelyrelated animal forms. For the absolute brain weights of selected species, see Table 1.10.1,and for the cerebralization index, see Table 1.10.4.
Data after Bertelsmann 1979, Haltenorth 1977, Kosmos-Lexikon 1953, Krumbiegel 1953
Species Relative Species Relativebrain weight brain weight(%) (%)
Blue whale 0.007Carp 0.4Cat 0.94Cattle 0.07Chimpanzee 0.8Dog 0.59Eagle 0.6Elephant 0.08Frog 0.6Golden or Syrian hamster 0.88Gorilla 0.2Guinea pig 1.33Hippopotamus 0.05
Horse 0.25Human 2–2.5Lion 0.2Mouse 3.2Orangutan 0.66Ostrich 0.08Rat 1.22Shark 0.04Sheep 0.33Sparrow 2.9Spider monkey (Ateles) 6.6 (!)Tuna 0.003Wolf 0.52
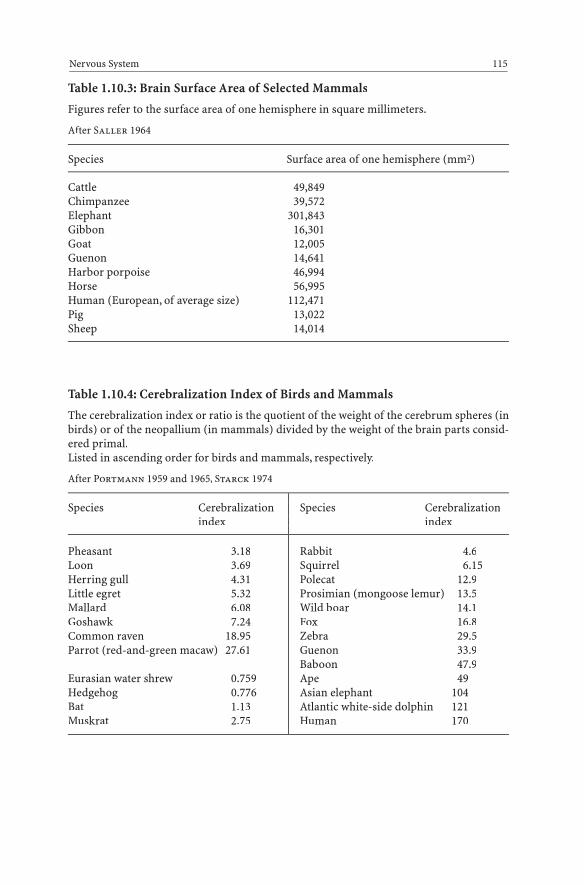
Nervous System 115
Table 1.10.3: Brain Surface Area of Selected Mammals
Figures refer to the surface area of one hemisphere in square millimeters.
After Saller 1964
Species Surface area of one hemisphere (mm2)
Cattle 49,849Chimpanzee 39,572Elephant 301,843Gibbon 16,301Goat 12,005Guenon 14,641Harbor porpoise 46,994Horse 56,995Human (European, of average size) 112,471Pig 13,022Sheep 14,014
Table 1.10.4: Cerebralization Index of Birds and Mammals
The cerebralization index or ratio is the quotient of the weight of the cerebrum spheres (inbirds) or of the neopallium (in mammals) divided by the weight of the brain parts consid-ered primal.Listed in ascending order for birds and mammals, respectively.
After Portmann 1959 and 1965, Starck 1974
Species Cerebralization Species Cerebralizationindex index
Pheasant 3.18Loon 3.69Herring gull 4.31Little egret 5.32Mallard 6.08Goshawk 7.24Common raven 18.95Parrot (red-and-green macaw) 27.61
Eurasian water shrew 0.759Hedgehog 0.776Bat 1.13Muskrat 2.75
Rabbit 4.6Squirrel 6.15Polecat 12.9Prosimian (mongoose lemur) 13.5Wild boar 14.1Fox 16.8Zebra 29.5Guenon 33.9Baboon 47.9Ape 49Asian elephant 104Atlantic white-side dolphin 121Human 170
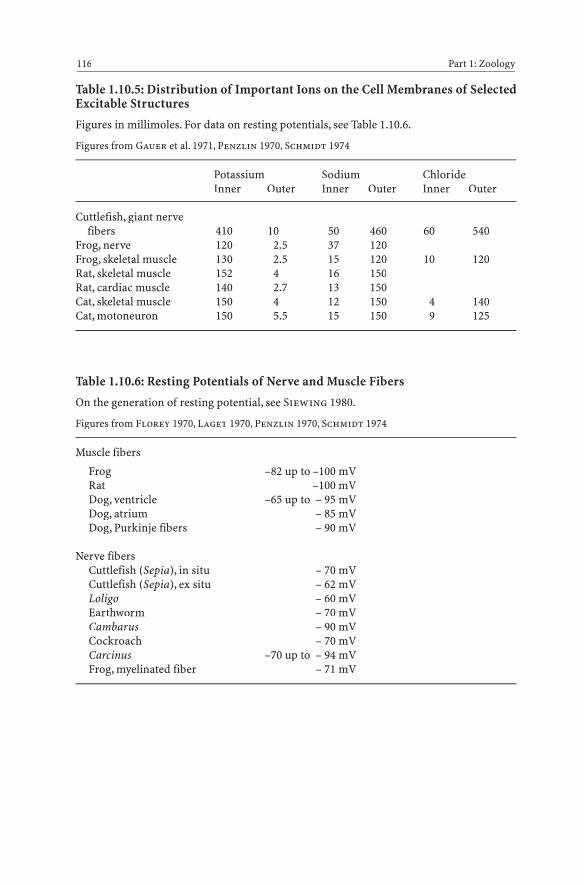
Table 1.10.5: Distribution of Important Ions on the Cell Membranes of SelectedExcitable Structures
Figures in millimoles. For data on resting potentials, see Table 1.10.6.
Figures from Gauer et al. 1971, Penzlin 1970, Schmidt 1974
Potassium Sodium Chloride Inner Outer Inner Outer Inner Outer
Cuttlefish, giant nervefibers 410 10 50 460 60 540
Frog, nerve 120 2.5 37 120Frog, skeletal muscle 130 2.5 15 120 10 120Rat, skeletal muscle 152 4 16 150Rat, cardiac muscle 140 2.7 13 150Cat, skeletal muscle 150 4 12 150 4 140Cat, motoneuron 150 5.5 15 150 9 125
Table 1.10.6: Resting Potentials of Nerve and Muscle Fibers
On the generation of resting potential, see Siewing 1980.
Figures from Florey 1970, Laget 1970, Penzlin 1970, Schmidt 1974
Muscle fibers
Frog –82 up to –100 mVRat –100 mVDog, ventricle –65 up to – 95 mVDog, atrium – 85 mVDog, Purkinje fibers – 90 mV
Nerve fibersCuttlefish (Sepia), in situ – 70 mVCuttlefish (Sepia), ex situ – 62 mVLoligo – 60 mVEarthworm – 70 mVCambarus – 90 mVCockroach – 70 mVCarcinus –70 up to – 94 mVFrog, myelinated fiber – 71 mV
116 Part 1: Zoology

Table 1.10.7: Nerve Conduction Velocity
For the corresponding figures for plants, see Table 2.6.18.
After Florey 1970, Gauer et al. 1971, Hanke et al. 1977, Katz 1971, Laget 1970, Schmidt 1974
Animal species Type of nerve fiber Diameter Nerve conduction(μm) velocity (m/s)
Plumose anemone(Metridium) Nerve net 0.13
Moon jelly (Aurelia) Nerve net 6 – 12 0.5Earthworm Med. giant fiber 50 – 90 30
Lat. giant fiber 40 – 60 11.3Sepia Giant fiber 200 7Loligo Giant fiber 400 (!) 20Lobster Leg nerve 60 – 80 14 – 18Crab Giant fiber 100 –250 15 – 20Cockroach Giant fiber 50 1.5– 3.5Carp Lateral fiber 20 47Frog A fiber 15 30Cat A fiber 13 – 17 78 – 102
Spinal nerve 5.5 50C fiber 0.5– 1 0.6– 2
Human Aa fiber 10 – 20 60 –120 (!)Ab fiber 7 – 15 40 – 90Ag fiber 4 – 8 30 – 45Ad fiber 2.5– 5 5 – 25B fiber 3 3 – 15C fiber 0.3– 1.3 0.6– 2.3
Table 1.10.8: Size of the Discharge of Electric Fish
On the anatomy and function of electric organs, see Siewing 1980.
Figures from Florey 1970
Species Voltage
Electric eel (Electrophorus electricus) 700 VElectric catfish (Malapterurus electricus) 350 VElectric rays (Torpedo nobiliana) 60 VRay (Narcine brasiliensis) 30 VRay (Raja clavata) 4 VElephant fishes (Mormyridae) 1– 12 V
Nervous System 117

1.11 Senses
Table 1.11.1: Minimum Stimuli for Activating a Sensory Organ
Data always for optimal stimuli quality.
Data after Autrum 1948
Sensory organ Minimum stimuli strength
Subgenual organ, cockroach 4 ¥ 10-10 WattEar, grasshopper 5 ¥ 10-17 WattEye, human 5.6 ¥ 10-17 WattEar, human 8 ¥ 10-18 up to 4 ¥ 10-17 Watt
Table 1.11.2: Size of the Eyeball in Selected Animals
Data after Kästner 1973, Oppenheimer and Pincussen 1925
Species Diameter (mm) Volume (mm3)
Bat 1Cat 21 4.9Cattle 40 – 41 31.8Chicken 1.78Common house mouse 3Dog 20 – 21 5.1Elephant 40Giant squid 400Horse 50 – 51 45.0Human 24 6.5Lion 35Pig 25 – 26 9.5Rabbit 16.5 3.0Rat 6Sheep 30.5– 31 11.65Tawny owl 8.32
118 Part 1: Zoology

Table 1.11.3: Focal Distance of the Lenses in the Eyes of Selected Animals
The focal distance of a lens (in meters) can serve as the basis for deriving refractive power(in diopters) as its reciprocal value. Thus, the smaller the focal distance of a lens, thegreater its refractive power. Focal distance varies according to the degree of accommoda-tion (adjustment to proximity/distance). For this reason, the range is given for humansfrom non-accommodation to maximum accommodation.
Data after Berndt and Meise 1959, Buddenbrock 1924, Velhagen 1972
Species Focal distance (mm)
Birds (most) 50Chickens. pigeons/doves 80 –125Divers 20 – 25Owls 250 –500
Blue whale 40Bowhead whale 20Bristleworm (Alciope) 0.3Electric rays 2.23Frog 5Hare 10Human 69.9– 40.4Lion 25.5Pig 13.3
Table 1.11.4: Number of Photoreceptors in the Eyes of Selected Animals
Figures given per square millimeter. For the number of photoreceptors per axon, see Table1.11.5; for the number of ommatidia in the compound eyes of arthropods, see Table 1.11.8.
Data after Buddenbrock 1924, Kästner 1973, Ziswiler 1976
Species Photoreceptors (n)
Brown rat 1,400,000Carp 510,000Cat 397,000Cattle 358,000Chicken 265,000Cuttlefish (squid) 115,000Frog 95,000Human 160,000Tawny owl 680,000Trout 303,000
Senses 119

Table 1.11.5: Number of Photoreceptors per Dendrite in the Eyes of SelectedVertebrates
Figures from Buddenbrock 1924, Siebeck 1977, Ziswiler 1976
Species Photoreceptors/dendrite (n)
Blue whale 5,100Chameleon, fovea 1–2Human, fovea 1Human, periphery 130Pinniped 1,500Porpoise 4,900Shark 40Shark, core 8Sparrow 1Tiger 2,500
Table 1.11.6: Visual Acuity Angle (Angle of Minimum Separability) of SelectedAnimals
The visual acuity angle designates the greatest angle at which two closely adjacent pointscan still just be discriminated from each other.° = degree, ¢ = arcminutes, ≤ = arcseconds.As a point of reference: a 17.5-mm-high object 1 m from the eye appears at a 1° angle;a 0.3-mm-high object appears at 1 arcminute (1¢).
Figures from Berndt and Meise 1959, Buddenbrock 1956, Niethammer 1979, Penzlin 1970,Rahmann 1967, Siebeck 1977
Species Visual acuity angle
Alligator 11¢Asian elephant 10¢ 20≤Bat 3–6°Bee 1°Blackbird 1¢ 20≤Cat 5¢ 30≤Chaffinch 1¢ 20≤Chicken 4¢ 14≤Chimpanzee 28≤Common frog 6¢ 53≤Common hermit crab 4° 12¢Donkey 8¢ 36≤Eurasian minnow 10¢ 50≤European pond turtle 2¢ 51≤Fruit fly 9° 17¢
120 Part 1: Zoology

Species Visual acuity angle
Golden or Syrian hamster 1° 4¢Horse 3¢ 15≤Human 25≤Peregrine falcon 25≤Rat (albino) 40¢Rat (wild) 20¢Red deer (Wapiti) 11¢ 18≤Rhesus monkey 34≤Robin 2¢ 38≤Rock dove 2¢ 42≤Sand lizard 11¢ 28≤Shrimp 4° 35¢Skylark 1¢ 20≤Yellowhammer 3¢ 7≤
Table 1.11.7: Visual Field (Horizontal) of Both Eyes in Selected Animals
Figures represent mean values. Among primates there is considerable variation, dependingon the placement of the eyes.
Data after Siebeck 1977
Species Visual field
Barn owl 160°Common kestrel 300°Crocodiles 295°Dog 250°Frogs 334–360°Lizards 280–300°Plaice 360°Primates 180°Rock dove 300°
Senses 121

Table 1.11.8: Number of Unit Eyes (Ommatidia) in the Compound Eyes ofSelected Arthropods
Presented in ascending order.For greater detail on anatomy and function, see Siewing 1980.
After Kästner 1973, Oppenheimer and Pincussen 1936, Weber 1966
Species Ommatidia (n)
Water flea 22Woodlouse 30Yellow meadow ants 80Earwig 270Firefly � 300Red wood ant 600Firefly � 2,500Housefly 3,200Honeybee (queen) 3,900Blowfly 5,400Cockchafer (May bug) 5,500Shore crab 7,000Honeybee (drone) 7,500Walker 12,200Dragonfly 28,000Ghost or Sand crab 30,000
Table 1.11.9: Flicker Fusion Rate of the Eyes of Selected Animals
Figures represent images per second. At lower image frequencies, individual images areperceived. Listed in ascending order.
Data after Lexikon der Biologie, Siebeck 1977
Species Image frequency (per second)
Salamander 5Human 20Gecko 20Beetle 20– 30Cat 27– 30Guinea pig 30Frog 48Bee 55Rock dove 148Dragonfly 300
122 Part 1: Zoology

Table 1.11.10: Absorption Maxima of the Visual Pigments of Selected Invertebrates
Figures represent the wavelength in nanometers at which light is maximally absorbed. Forrhodopsin values for vertebrates, see Table 1.11.11.
Figures from Altman and Dittmer 1973, Penzlin 1970
Species Maximum absorption at (nm)
Cockroach 500Cuttlefish (Sepia) 492Honeybee 440Horseshoe crab 520Housefly 510, 437Lobster 515Octopus (Octopus) 475Shrimp 555, 496Squid (Loligo) 493
Table 1.11.11: Absorption Maxima of the Rhodopsins of Selected Vertebrates
Figures represent the wavelength in nanometers at which light is maximally absorbed. Fordata on visual pigments in selected invertebrates, see Table 1.11.10. On the basic processesof sight, see Siewing.
Figures from Altman and Dittmer 1973, Penzlin 1980.
Species Maximum absorption (nm) atRetinal 1 Retinal 2
Alligator 499Carp 523Chicken 560, 500Common house mouse 498Duck 502Eel 487 523Frog 502Goldfish 522Guinea pig 497Human 497, 493Lamprey 497 518Monkey 500Pelican 502Rabbit 502Rat 498Rock dove 544, 502Tadpole 512Trout 503 527
Senses 123

Table 1.11.12: Eardrum Surface Area of Selected Animals
On hearing ability, see Table 1.11.13; for humans, see also Table 4.6.10.Presented in ascending order.
Figures from Mann 1972, Rein and Schneider 1971
Species Eardrum surface (mm2)
Mouse 2.7Tree frog 6.2Natterjack toad 7.1Hedgehog 16.0Common frog 20.0Marsh or Lake frog 28.0Rhesus monkey 32.0Cat 42.0Dog 46.0Human 55.0Horse 75.0Bullfrog 78.0Cattle 86.0Gorilla 97.0
Table 1.11.13: Upper Limit of Hearing Ability in Selected Animals
For humans, see also Table 4.6.10.
Data after Berndt and Meise 1959, Bertelsmann 1979, Grzimek 1970, Kästner 1973, Meyer1964, Niethammer 1979, Penzlin 1970, Sturkie 1976
Species Upper limit Species Upper limit(kHz) (kHz)
124 Part 1: Zoology
Axolotl 0.2Bat 400Brown bullhead 13Budgerigar 14Bullfrog 4Canary 10Cat 47Chaffinch 29Chicken 38Chimpanzee 33Cicadas 20Crickets 8Crow < 8
Dog 135Dolphin 200Duck < 8Eagle owl 8Eel 0.6Eurasian bullfinch 21Eurasian minnow 7European starling 15Freshwater turtle 4Goldfish 3Grasshoppers 12Guinea pig 33Human 21
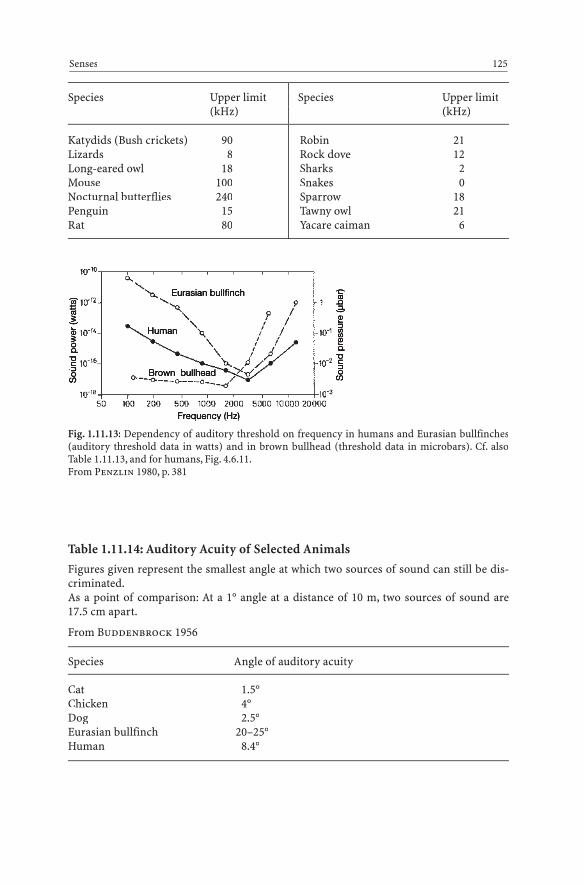
Katydids (Bush crickets) 90Lizards 8Long-eared owl 18Mouse 100Nocturnal butterflies 240Penguin 15Rat 80
Robin 21Rock dove 12Sharks 2Snakes 0Sparrow 18Tawny owl 21Yacare caiman 6
Senses 125
Species Upper limit Species Upper limit(kHz) (kHz)
Fig. 1.11.13: Dependency of auditory threshold on frequency in humans and Eurasian bullfinches(auditory threshold data in watts) and in brown bullhead (threshold data in microbars). Cf. alsoTable 1.11.13, and for humans, Fig. 4.6.11.From Penzlin 1980, p. 381
Table 1.11.14: Auditory Acuity of Selected Animals
Figures given represent the smallest angle at which two sources of sound can still be dis-criminated.As a point of comparison: At a 1° angle at a distance of 10 m, two sources of sound are 17.5 cm apart.
From Buddenbrock 1956
Species Angle of auditory acuity
Cat 1.5°Chicken 4°Dog 2.5°Eurasian bullfinch 20–25°Human 8.4°
q y ( )
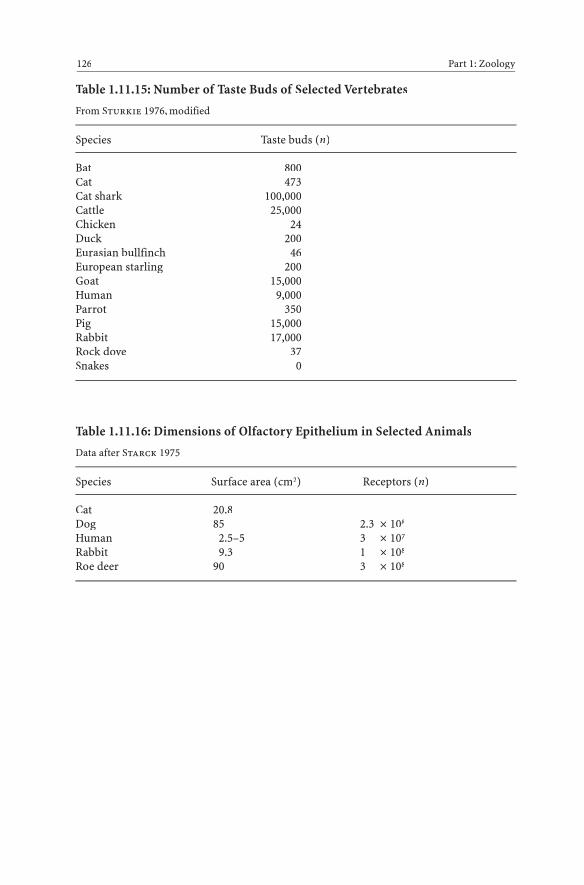
Table 1.11.15: Number of Taste Buds of Selected Vertebrates
From Sturkie 1976, modified
Species Taste buds (n)
Bat 800Cat 473Cat shark 100,000Cattle 25,000Chicken 24Duck 200Eurasian bullfinch 46European starling 200Goat 15,000Human 9,000Parrot 350Pig 15,000Rabbit 17,000Rock dove 37Snakes 0
Table 1.11.16: Dimensions of Olfactory Epithelium in Selected Animals
Data after Starck 1975
Species Surface area (cm2) Receptors (n)
Cat 20.8Dog 85 2.3 ¥ 108
Human 2.5–5 3 ¥ 107
Rabbit 9.3 1 ¥ 108
Roe deer 90 3 ¥ 108
126 Part 1: Zoology
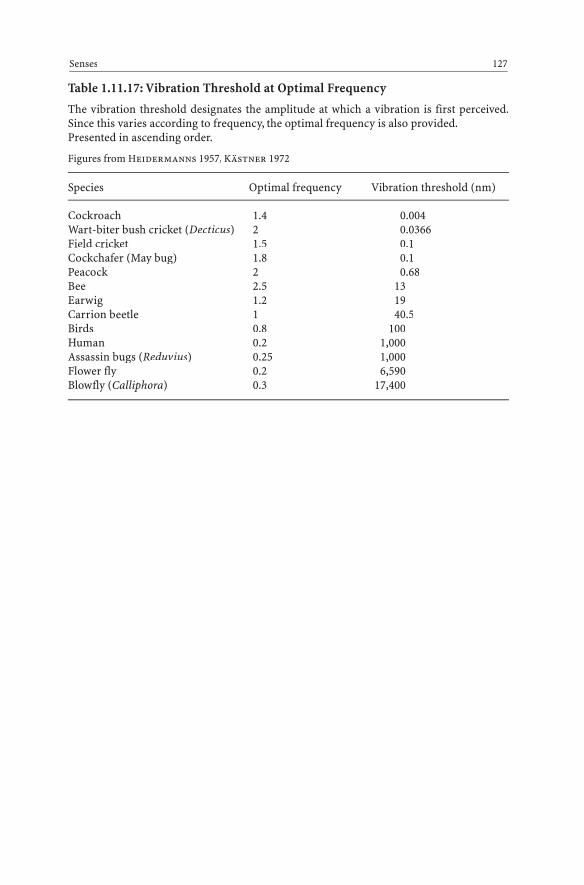
Table 1.11.17: Vibration Threshold at Optimal Frequency
The vibration threshold designates the amplitude at which a vibration is first perceived.Since this varies according to frequency, the optimal frequency is also provided.Presented in ascending order.
Figures from Heidermanns 1957, Kästner 1972
Species Optimal frequency Vibration threshold (nm)
Cockroach 1.4 0.004Wart-biter bush cricket (Decticus) 2 0.0366Field cricket 1.5 0.1Cockchafer (May bug) 1.8 0.1Peacock 2 0.68Bee 2.5 13Earwig 1.2 19Carrion beetle 1 40.5Birds 0.8 100Human 0.2 1,000Assassin bugs (Reduvius) 0.25 1,000Flower fly 0.2 6,590Blowfly (Calliphora) 0.3 17,400
Senses 127

Part 2: Botany
For pragmatic reasons, fungi will be left in Part 2, since both the general public and biolo-gy as it is taught at school continue to consider them as part of the plant kingdom. [In theoriginal German edition of this volume, the German names of local plants were adoptedfrom Schmeil and Fitschen 1968.]For fungi and bacteria, see also Part 4: Microbiology.

2.1 General Data: Dimensions, Age, etc.
Table 2.1.0: Numbers that Amaze
This table brings together several interesting figures from Part 2, which are cited again inthe individual tables below, where they are accompanied by references to the literature.
General Data: Dimensions, Age, etc. 131
Highest known age in a treeRedwood (sequoia) 4,000 yearsBristlecone pine 4,600 years
Root depth Grape vine 12–16 mDesert plants (max.) 20 m
Speed of growthBamboo shoots 57 cm/dayBanana leaf sheaths 160 cm/day
Single leaf with the greatest surface areaVictoria regia (max.) 2 m2
Beech tree has an overall leaf surface area of up to 446 m2
Water vessel diameter in Lianas (max.) 700 μm
This allows a water conductance speed of up to 150 m/h
Heaviest wood Guaiacum (or lignum vitae) 1.23 g/ cm3
Lightest wood Balsa wood 0.18 g/cm3
Tallest tree Australian mountain ash (Eucalyptus regnans) 152 m
Tree with the greatest trunk diameter Baobab 15 mTree with the greatest trunk circumference Baobab 47 m
Longest blooming period of a single blossomOdontoglossum rossii 80 days
Blossom diameter Rafflesia arnoldii 1 m
Number of seeds per tree Birch 30,000,000
Number of seeds per capsule Swan orchid 3,751,000
Seed weight Broomrape 0.000001 gAvocado 60 g
Ballistic fruits catapult their seeds Liana Bauhinia purpurea 15 mLupin 7 m
Osmotic pressure in cell liquid Common glasswort 113 atmSod (Suaeda) 130 atm

Table 2.1.1: Number of Species of Plant Taxa and Fungi
A total of over 400,000 species have now been described. For more specific figures on seed-bearing plants, see Table 2.1.2.
Data after Heywood 1978, Kraus and Kubitzki 1982, Strasburger 1983
Prokaryotes (bacteria, cyanobacteria) 3600Eukaryotic algae 33,000
of which: Green algae 7,000Diatoms 6,000Red algae 4,000Brown algae 1,500
Fungi, including slime molds 90,000of which: Ascomycota (sac fungi) 30,000
Basidiomycota 30,000Mosses 26,000Lichens 20,000Fernlike plants 15,000
of which: Lycopodiophyta 400Horsetails 32
Seed-bearing plants (spermatophytes) 236,000of which: Gymnosperms 800
Angiosperms 235,000
Table 2.1.2: Number of Species Within the Individual Taxa of Seed-BearingPlants
Figures from Heywood 1978
I: Dicotyledoneae (= Magnoliatae) 177,0001. Magnoliidae 13,200
Including: Ranunculales 2,800Piperales 3,000
2. Hamamelididae 1,396Including: Fagales 1,200
3. Caryophylliidae 11,000Including: Caryophyllales 9,700
Polygonales 750
4. Dilleniidae 29,600Including: Malvales 2,700
Urticales 6,000Violales 5,250Ericales 3,570Primulales 2,000
132 Part 2: Botany

5. Rosidae 57,700Including: Rosales 7,100
Fabales 17,000Euphorbiales 5,100Geraniales 2,900Umbellales 3,700
6. Asteridae 64,000Including: Gentianales 5,600
Scrophulariales 8,800Campanulales 2,200Asterales 25,000
II. Monocotyledoneae (=Liliatae) 52,800
1. Alsimatidae 5622. Commelinidae 19,700
Including: Poales 9,000Cyperales 4,000Bromeliales 2,000
3. Arecidae 5,7004. Liliidae 26,800
Including: Liliales 8,700Orchidales 18,100
Table 2.1.3: Maximum Age of Selected Plants
In forestry, trees are felled before reaching their maximum age. This so-called rotation pe-riod is given in Table 2.1.4.Plants are listed in ascending order, according to age.
After Bertelsmann 1979, Czihak et al. 1976, Meyer 1964, Spector 1956
Species Age (years) Species Age (years)
General Data: Dimensions, Age, etc. 133
Lycopodiophyta 7Oak fern 7Moss (polytrichum moss) 10 Blueberry (Vaccinium) 25 Common moonwort (fern) 30Heather 42 Cyclamen 60European rowan 80Mountain avens 100Hazelnut 120 Birch 120 Grape vine 130
European hornbeam 150Goat willow 150 Common aspen 150 Apple 200Sycamore maple 200 Pear 300Cherry 400Dog rose 400Walnut 400 Ivy 440Juniper 500Pine 500
(Cont.) →

Fir 500Elm 500Larch 600 Norway maple 600 Olive 700 Sweet chestnut 700 European beech 900 Spruce 1,100Swiss pine 1,200
Cedar 1,300Platanus 1,300 Oak 1,300Yew 1,800 Tilia (linden, lime) 1,900 Fig (Ficus religiosa) 2,000Cypress (Cupressus) 2,000Redwood (sequoia) 4,000 Bristlecone pine 4,600
134 Part 2: Botany
Table 2.1.4: Rotation Periods of Important Harvested Trees
The average age of trees in forestry is called their rotation period.Cf. this to the maximum ages of plants given in Table 2.1.3.
From Schutzgemeinschaft Deutscher Wald 1967, modified
Species Rotation period (years)
Ash 100–140Birch 60– 80Black alder 60– 80Black poplar 30– 50Douglas fir 60–100Elm 120–140European hornbeam 60–100Fir 90–130Larch 100–140Norway maple 120–140Oak 180–300Pine 100–120Spruce 80–120Sycamore maple 120–140
Species Age (years) Species Age (years)

Table 2.1.5: Lifespan of Leaves and Needles of Selected Evergreen Plants
In ascending order, according to age.
Figures from Bertelsmann 1979, Meyer 1964, Molisch 1965
Species Lifespan (years) Species Lifespan (years)
General Data: Dimensions, Age, etc. 135
Cherry laurel 1–3Ivy 1–3Oleander 1–3Privet 1–3Cowberry (lingonberry) 2Olive 2Pine 2–3English holly 2–4Redwood (sequoia) 2–4
Swiss pine 3–6Juniper 4–5Bay laurel 4–6Spruce 4–6Fir 5–7Yew 6–8Mountain pine 7.5Norfolk Island pine 15Welwitschia 100
Table 2.1.6: Root Depth of Selected Plants
Presented in ascending order.After Bertelsmann 1979, Hager 1960, Meyer 1964
Species Root depth (m) Species Root depth (m)
Dandelion 0.30Hellebore 0.35 Cypress spurge 0.50Swallow-wort 0.60 Field bindweed 1.00Dyer’s greenweed 1.00Carline thistle 1.00Campanula 1.20Broad bean 1.70 Spring wheat 1.90 Rye 2.00
Pea 2.10White lupine 2.10 Red clover 2.10Barley 2.60 Oats 2.60Winter wheat 2.80Winter rapeseed 2.90 Forest trees 5.00–10.00Grape vine 12.00–16.00Desert plants 10.00–20.00
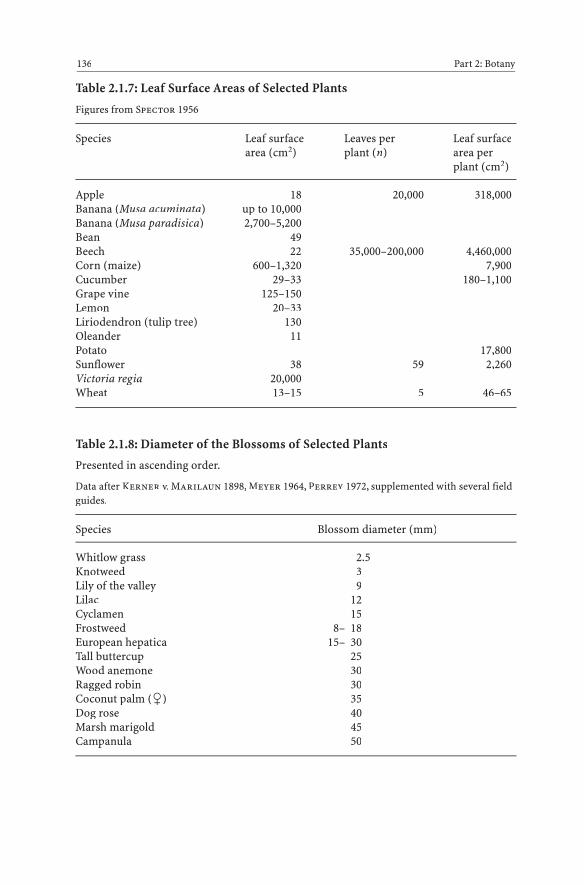
Table 2.1.7: Leaf Surface Areas of Selected Plants
Figures from Spector 1956
Species Leaf surface Leaves per Leaf surfacearea (cm2) plant (n) area per
plant (cm2)
Apple 18 20,000 318,000Banana (Musa acuminata) up to 10,000Banana (Musa paradisica) 2,700–5,200Bean 49Beech 22 35,000–200,000 4,460,000Corn (maize) 600–1,320 7,900Cucumber 29–33 180–1,100Grape vine 125–150Lemon 20–33Liriodendron (tulip tree) 130Oleander 11Potato 17,800Sunflower 38 59 2,260Victoria regia 20,000Wheat 13–15 5 46–65
Table 2.1.8: Diameter of the Blossoms of Selected Plants
Presented in ascending order.
Data after Kerner v. Marilaun 1898, Meyer 1964, Perrey 1972, supplemented with several fieldguides.
Species Blossom diameter (mm)
Whitlow grass 2.5Knotweed 3Lily of the valley 9Lilac 12Cyclamen 15Frostweed 8– 18European hepatica 15– 30Tall buttercup 25Wood anemone 30Ragged robin 30Coconut palm (�) 35Dog rose 40Marsh marigold 45Campanula 50
136 Part 2: Botany
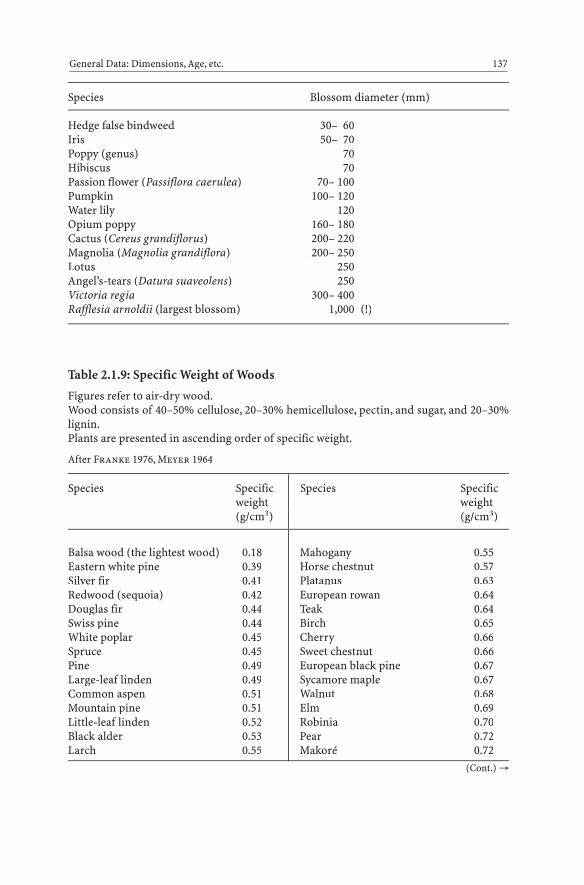
Species Blossom diameter (mm)
Hedge false bindweed 30– 60Iris 50– 70Poppy (genus) 70Hibiscus 70Passion flower (Passiflora caerulea) 70– 100Pumpkin 100– 120Water lily 120Opium poppy 160– 180Cactus (Cereus grandiflorus) 200– 220Magnolia (Magnolia grandiflora) 200– 250Lotus 250Angel’s-tears (Datura suaveolens) 250Victoria regia 300– 400Rafflesia arnoldii (largest blossom) 1,000 (!)
Table 2.1.9: Specific Weight of Woods
Figures refer to air-dry wood.Wood consists of 40–50% cellulose, 20–30% hemicellulose, pectin, and sugar, and 20–30%lignin.Plants are presented in ascending order of specific weight.
After Franke 1976, Meyer 1964
Species Specific Species Specificweight weight (g/cm3) (g/cm3)
General Data: Dimensions, Age, etc. 137
Balsa wood (the lightest wood) 0.18Eastern white pine 0.39Silver fir 0.41Redwood (sequoia) 0.42Douglas fir 0.44Swiss pine 0.44White poplar 0.45Spruce 0.45Pine 0.49Large-leaf linden 0.49Common aspen 0.51Mountain pine 0.51Little-leaf linden 0.52Black alder 0.53Larch 0.55
Mahogany 0.55Horse chestnut 0.57Platanus 0.63European rowan 0.64Teak 0.64Birch 0.65Cherry 0.66Sweet chestnut 0.66European black pine 0.67Sycamore maple 0.67Walnut 0.68Elm 0.69Robinia 0.70Pear 0.72Makoré 0.72
(Cont.) →
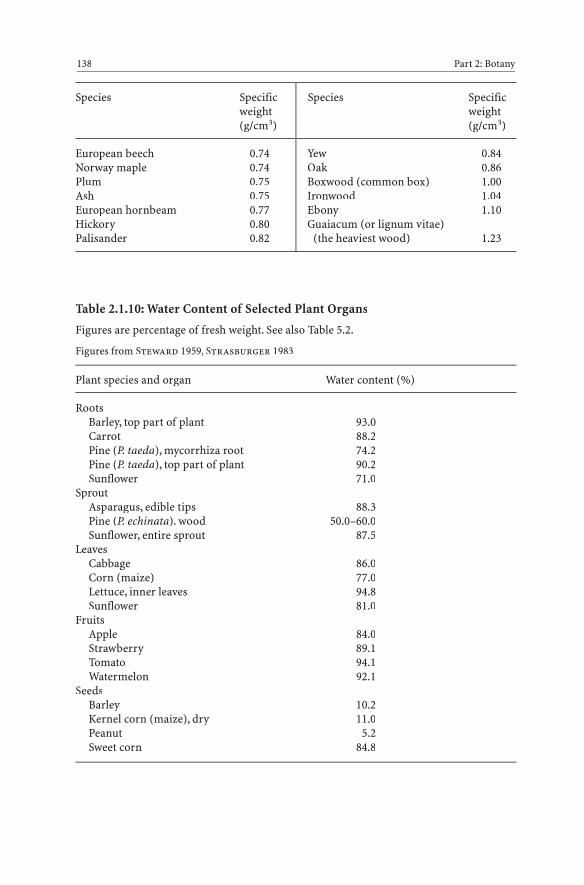
European beech 0.74Norway maple 0.74Plum 0.75Ash 0.75European hornbeam 0.77Hickory 0.80Palisander 0.82
Yew 0.84Oak 0.86Boxwood (common box) 1.00Ironwood 1.04Ebony 1.10Guaiacum (or lignum vitae)
(the heaviest wood) 1.23
138 Part 2: Botany
Table 2.1.10: Water Content of Selected Plant Organs
Figures are percentage of fresh weight. See also Table 5.2.
Figures from Steward 1959, Strasburger 1983
Plant species and organ Water content (%)
RootsBarley, top part of plant 93.0Carrot 88.2Pine (P. taeda), mycorrhiza root 74.2Pine (P. taeda), top part of plant 90.2Sunflower 71.0
SproutAsparagus, edible tips 88.3Pine (P. echinata). wood 50.0–60.0Sunflower, entire sprout 87.5
LeavesCabbage 86.0Corn (maize) 77.0Lettuce, inner leaves 94.8Sunflower 81.0
FruitsApple 84.0Strawberry 89.1Tomato 94.1Watermelon 92.1
SeedsBarley 10.2Kernel corn (maize), dry 11.0Peanut 5.2Sweet corn 84.8
Species Specific Species Specificweight weight (g/cm3) (g/cm3)
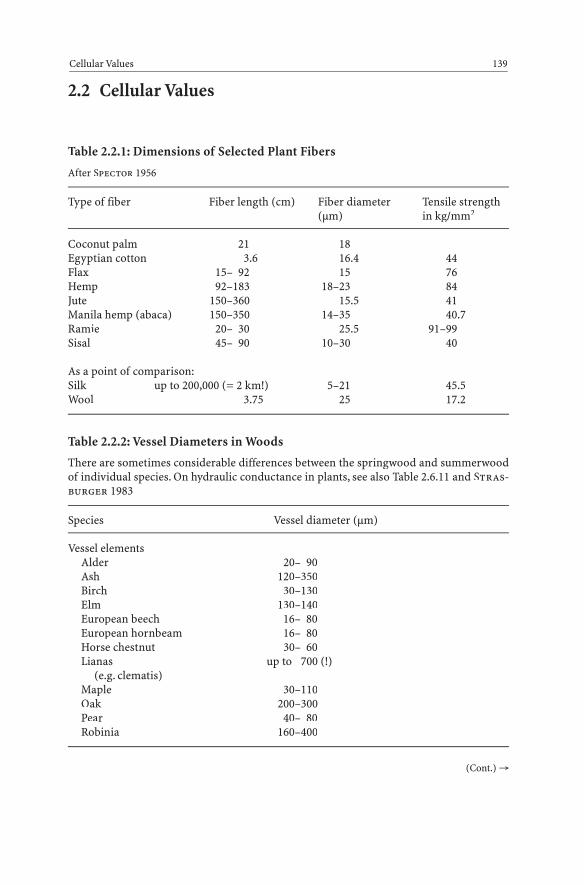
2.2 Cellular Values
Table 2.2.1: Dimensions of Selected Plant Fibers
After Spector 1956
Type of fiber Fiber length (cm) Fiber diameter Tensile strength(μm) in kg/mm2
Coconut palm 21 18Egyptian cotton 3.6 16.4 44Flax 15– 92 15 76Hemp 92–183 18–23 84Jute 150–360 15.5 41Manila hemp (abaca) 150–350 14–35 40.7Ramie 20– 30 25.5 91–99Sisal 45– 90 10–30 40
As a point of comparison:Silk up to 200,000 (= 2 km!) 5–21 45.5Wool 3.75 25 17.2
Table 2.2.2: Vessel Diameters in Woods
There are sometimes considerable differences between the springwood and summerwoodof individual species. On hydraulic conductance in plants, see also Table 2.6.11 and Stras-burger 1983
Species Vessel diameter (μm)
Vessel elementsAlder 20– 90Ash 120–350Birch 30–130Elm 130–140European beech 16– 80European hornbeam 16– 80Horse chestnut 30– 60Lianas up to 700 (!)
(e.g. clematis)Maple 30–110Oak 200–300Pear 40– 80Robinia 160–400
Cellular Values 139
(Cont.) →

Species Vessel diameter (μm)
Sweet chestnut 300–350Tilia (linden, lime) 25– 90Walnut 120–160Willow 80–120
TracheidsConifers 20– 40
Table 2.2.3: Number of Stomata on the Leaves of Selected Plants
Figures represent the number of stomata per square millimeter leaf surface area.The number of stomata can vary greatly according to environmental conditions. For in-stance, leaves in the light present different numbers from their counterparts in the shad-ows. On the anatomy and function of stomata, see Strasburger 1983.
After Greulich and Adams 1962, Heller 1969, Oppenheimer and Pincussen 1929
Species Upper epidermis Lower epidermis
Alfalfa 170 140Apple 0 290Bean 40 280Berberis 0 229Bittersweet (Solanum dulcamara) 60 263Cabbage 140 230Canadian waterweed 0 0Cherry 0 250Corn (maize) 52 68Cypress spurge 0 259Eastern white pine 140 0English holly 0 170English oak 0 450European hepatica 15 74Frostweed 61 194Geranium 170 140Iris 65 58Lilac 0 330Lily 0 330Marsh marigold 78 78Mercurialis 0 65Military orchid 0 29Mistletoe 71 75Net-leaved willow (Salix retusa)} 78 134
140 Part 2: Botany

Species Upper epidermis Lower epidermis
Oats 25 23Olive 0 545Pea 100 200Peach 0 225Poplar 20 115Potato 50 160Sea holly (Eryngium maritimum) 118 108Sedum 35 70Snowdrop 30 45Spiderworts (Tradescantie) 7 28Sunflower 175 325Tomato 12 130Water lily 490 0Wheat 33 14Wood anemone 0 67Woodsorrel 0 35Yellow Star-of-Bethlehem 27 27
Table 2.2.4: Length of the Stoma Pore in Selected Plants
Figures from Oppenheimer and Pincussen 1928, Steward 1965
Species Stoma pore length (μm)
Bishop’s goutweed 15Buckwheat 12Cactus (Cereus) 26Campanula 19Corn (maize) 19Cotton grass 15Cross-leaved heath 3Fireweed 9Hawkweed 12Marsh marigold 28Mountain arnica 21Oak (Qu. falcata) 5Oats 38Pelargonium 19Primrose 30Purple moor grass 10Runner bean (scarlet runner) 7Silver ragwort 21
Cellular Values 141
(Cont.) →
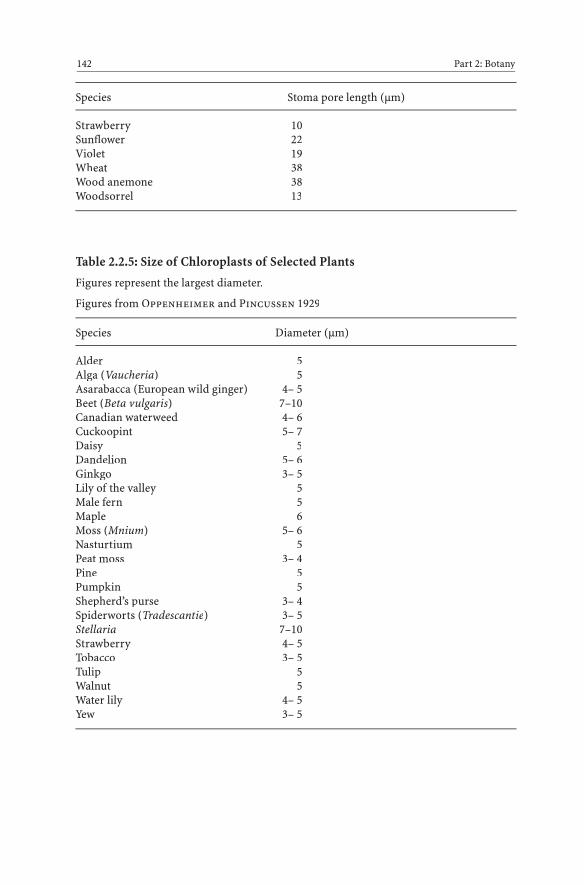
Species Stoma pore length (μm)
Strawberry 10Sunflower 22Violet 19Wheat 38Wood anemone 38Woodsorrel 13
Table 2.2.5: Size of Chloroplasts of Selected Plants
Figures represent the largest diameter.
Figures from Oppenheimer and Pincussen 1929
Species Diameter (μm)
Alder 5Alga (Vaucheria) 5Asarabacca (European wild ginger) 4– 5Beet (Beta vulgaris) 7–10Canadian waterweed 4– 6Cuckoopint 5– 7Daisy 5Dandelion 5– 6Ginkgo 3– 5Lily of the valley 5Male fern 5Maple 6Moss (Mnium) 5– 6Nasturtium 5Peat moss 3– 4Pine 5Pumpkin 5Shepherd’s purse 3– 4Spiderworts (Tradescantie) 3– 5Stellaria 7–10Strawberry 4– 5Tobacco 3– 5Tulip 5Walnut 5Water lily 4– 5Yew 3– 5
142 Part 2: Botany
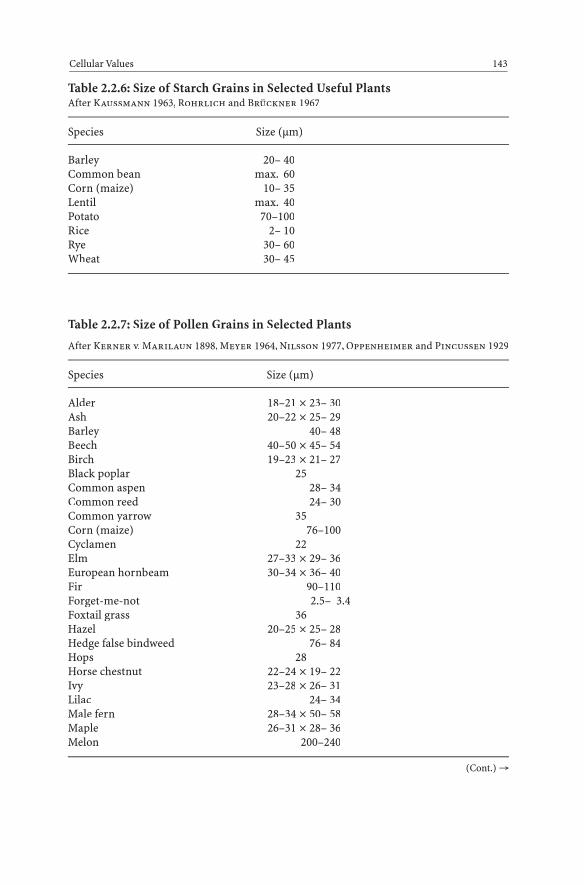
Table 2.2.6: Size of Starch Grains in Selected Useful PlantsAfter Kaussmann 1963, Rohrlich and Brückner 1967
Species Size (μm)
Barley 20– 40Common bean max. 60Corn (maize) 10– 35Lentil max. 40Potato 70–100Rice 2– 10Rye 30– 60Wheat 30– 45
Table 2.2.7: Size of Pollen Grains in Selected Plants
After Kerner v. Marilaun 1898, Meyer 1964, Nilsson 1977, Oppenheimer and Pincussen 1929
Species Size (μm)
Alder 18–21 ¥ 23– 30Ash 20–22 ¥ 25– 29Barley 40– 48Beech 40–50 ¥ 45– 54Birch 19–23 ¥ 21– 27Black poplar 25Common aspen 28– 34Common reed 24– 30Common yarrow 35Corn (maize) 76–100Cyclamen 22Elm 27–33 ¥ 29– 36European hornbeam 30–34 ¥ 36– 40Fir 90–110Forget-me-not 2.5– 3.4Foxtail grass 36Hazel 20–25 ¥ 25– 28Hedge false bindweed 76– 84Hops 28Horse chestnut 22–24 ¥ 19– 22Ivy 23–28 ¥ 26– 31Lilac 24– 34Male fern 28–34 ¥ 50– 58Maple 26–31 ¥ 28– 36Melon 200–240
Cellular Values 143
(Cont.) →

Species Size (μm)
Nettle 13–17 ¥ 15– 20Oak 23– 30Oats 48– 54Orchard grass 30– 38Pine 65– 80Pumpkin 190–240Rye 47– 65Sunflower 39Tilia (linden, lime) 25–28 ¥ 35– 38Tobacco 31Violet 62– 71Viper’s bugloss 10– 14Water lily 38Wheat 45– 60Wild chervil 25–28 ¥ 13– 16Willow 19–21 ¥ 20– 23Zigzag clover 43
Table 2.2.8: Dimensions of Spores of a Selection of Well-Known Species of Fungi
Data after Mauch and Lauber 1975
Species Length (μm) Width (μm)
BasidiomycotaBare-toothed russula (also: flirt) (Russula vesca) 6.0– 8.0 5.0– 6.0Bay bolete 11.0–17.0 4.5– 6.0Chanterelle 7.0– 9.0 4.0– 5.0Clouded funnel or agaric (Clitocybe nearis) 6.0– 7.0 3.0– 4.0Common earthball 8.0–12.0 SphericalDeath cap 8.0–11.0 SphericalDry rot fungus (Serpula lacrymans) 8.5–11.0 4.5– 6.0Field mushroom 7.0– 8.0 4.0– 5.0Fly agaric 9.0–11.0 6.0– 9.0Honey fungus 7.0– 9.0 5.0– 6.0Larch bolete 8.0–11.0 3.0– 4.0Livid pinkgill (Entoloma sinuatum) 8.0–10.0 7.0– 8.5Orange oak bolete (Leccinum quercinum) 13.0–17.0 4.0– 5.0Oyster mushroom 8.0–12.0 3.0– 4.0Panther (cap) (Amanita pantherina) 10.0–12.0 7.0– 8.0Parasol 15.0–20.0 10.0–13.0Peppery milk cap (Lactarius piperatus) 8.0– 9.5 5.5– 7.0Porcini 13.0– 17.0 3.5– 6.0
144 Part 2: Botany

Species Length (μm) Width (μm)
Ramaria aurea (coral fungus) 8.0–15.0 3.0– 6. 0Red-staining inocybe 9.0–14.0 5.0– 8.0Sarcodon imbricatus 6.0– 7.0 5.0– 6.0Shaggy ink cap (Coprinus comatus) 12.0–16.0 7.0– 8.0Sheathed woodtuft
(Kuehneromyces mutabilis) 6.0– 7.0 3.0– 4.5Stinkhorn (Phallus impudicus) 3.5– 5.0 1.5– 2.5Sulphur tuft 6.0– 8.0 4.0Tinder polypore 15.0– 20.0 5.0– 7.0
AscomycotaBlack morel 18.0– 24.0 10.0–14.0Ergot 100.0 1.0False morel 17.0– 25.0 8.0–12.0
Table 2.2.9: Chromosome Sets of Selected Plants
Figures given refer to the diploid set. For diploid values for animals, see Table 1.9.3.
After Bresch and Hausmann 1972, Götz and Konrad 1977, Hess, Landolt and Hirzel 1967,Nagl 1976, Nigon and Lueken 1976, Starck 1975
Species Chromosomes Species Chromosomes(n) (n)
Cellular Values 145
Adder’s-tongue 480Alder 28Alga (Cladophora) 32Almond 16Apple 34, 51, 68Ash 46Asparagus 20Autumn crocus 38Banana 22, 33, 44Barley 14Bedstraw, hedge 22Bee orchid 36Birch 84Brackenfern 104Burdock 36Bush vetch 14Button mushroom 8
Campanula 34Canadian waterweed 24Caraway 20Carrot 18Chamomile 18Cherry, sour 32Cherry, sweet 16, 24, 32
64, 144Christmas rose 32Clusterhead 30Coconut 32Coltsfoot 60Common bean 22Common yarrow 36, 54Corn (maize) 20Corn poppy 14Cornflower 24
(Cont.) →
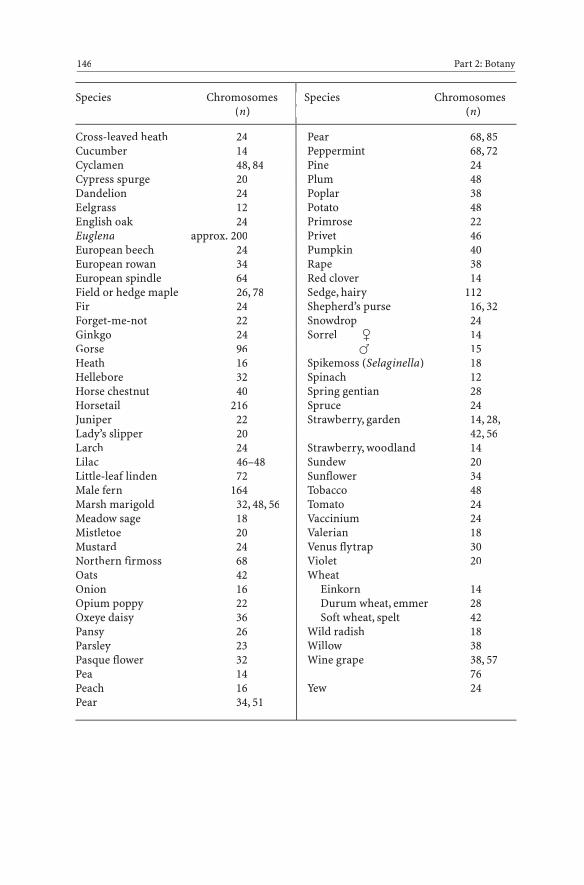
Cross-leaved heath 24Cucumber 14Cyclamen 48, 84Cypress spurge 20Dandelion 24Eelgrass 12English oak 24Euglena approx. 200European beech 24European rowan 34European spindle 64Field or hedge maple 26, 78Fir 24Forget-me-not 22Ginkgo 24Gorse 96Heath 16Hellebore 32Horse chestnut 40Horsetail 216Juniper 22Lady’s slipper 20Larch 24Lilac 46–48Little-leaf linden 72Male fern 164Marsh marigold 32, 48, 56Meadow sage 18Mistletoe 20Mustard 24Northern firmoss 68Oats 42Onion 16Opium poppy 22Oxeye daisy 36Pansy 26Parsley 23Pasque flower 32Pea 14Peach 16Pear 34, 51
Pear 68, 85Peppermint 68, 72Pine 24Plum 48Poplar 38Potato 48Primrose 22Privet 46Pumpkin 40Rape 38Red clover 14Sedge, hairy 112Shepherd’s purse 16, 32Snowdrop 24Sorrel � 14
� 15Spikemoss (Selaginella) 18Spinach 12Spring gentian 28Spruce 24Strawberry, garden 14, 28,
42, 56Strawberry, woodland 14Sundew 20Sunflower 34Tobacco 48Tomato 24Vaccinium 24Valerian 18Venus flytrap 30Violet 20Wheat
Einkorn 14Durum wheat, emmer 28Soft wheat, spelt 42
Wild radish 18Willow 38Wine grape 38, 57
76Yew 24
146 Part 2: Botany
Species Chromosomes Species Chromosomes(n) (n)
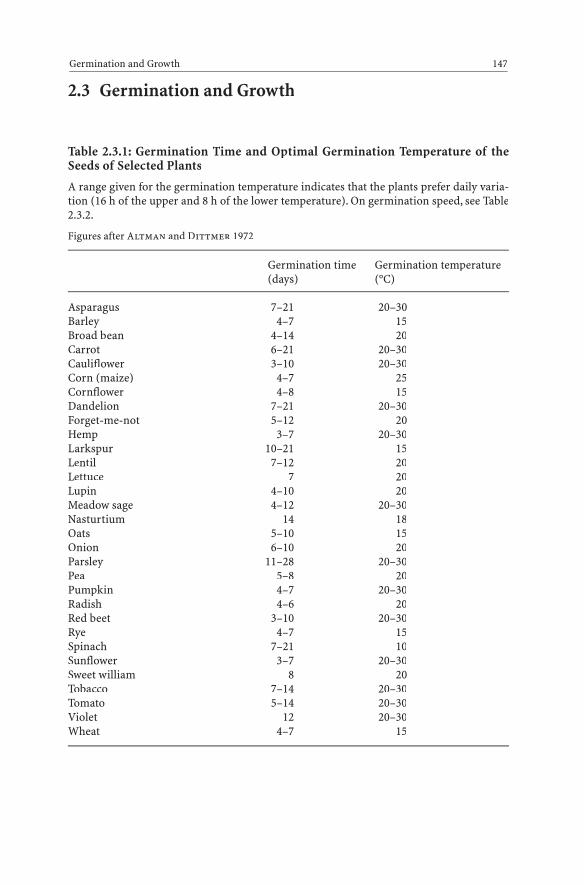
2.3 Germination and Growth
Table 2.3.1: Germination Time and Optimal Germination Temperature of theSeeds of Selected Plants
A range given for the germination temperature indicates that the plants prefer daily varia-tion (16 h of the upper and 8 h of the lower temperature). On germination speed, see Table2.3.2.
Figures after Altman and Dittmer 1972
Germination time Germination temperature(days) (°C)
Asparagus 7–21 20–30Barley 4–7 15Broad bean 4–14 20Carrot 6–21 20–30Cauliflower 3–10 20–30Corn (maize) 4–7 25Cornflower 4–8 15Dandelion 7–21 20–30Forget-me-not 5–12 20Hemp 3–7 20–30Larkspur 10–21 15Lentil 7–12 20Lettuce 7 20Lupin 4–10 20Meadow sage 4–12 20–30Nasturtium 14 18Oats 5–10 15Onion 6–10 20Parsley 11–28 20–30Pea 5–8 20Pumpkin 4–7 20–30Radish 4–6 20Red beet 3–10 20–30Rye 4–7 15Spinach 7–21 10Sunflower 3–7 20–30Sweet william 8 20Tobacco 7–14 20–30Tomato 5–14 20–30Violet 12 20–30Wheat 4–7 15
Germination and Growth 147

Table 2.3.2: Germination Speed of the Seed of Selected Useful Plants
Figures given represent the number of hours until the radicles become visible. Since this ishighly temperature dependent, values are provided for 10, 15, and 25 °C.
After Meyer 1964
10 °C 15 °C 25 °C
Alfalfa 90 66 48Barley 72 48 72Carrot 162 102 56Corn (maize) 272 78 56Cucumber – – 96Oats 90 66 48Pea 72 42 –Poppy (genus) 114 60 48Pumpkin – 258 52Rape 48 24 24Red clover 72 42 24Rye 54 30 32Sunflower 600 72 32Wheat 84 48 33
Table 2.3.3: Vernalization Temperatures and Periods of Selected Plants
Vernalization is defined as the temporary effect of low temperatures on seeds or plants ininitiating the flowering process. In many useful plants, there are great differences betweenindividual varieties.
Figures after various authors in Altman and Dittmer 1973
Species and plant part Period (days) Optimal temperature(°C)
Bean, seeds 30–35 2Beet, plants 30–50 0–2Beet, seeds 80 0–5Cabbage, seeds 28 0Carrot, plants 40–65 4Cauliflower, plants 14 5Celery, plants 15–30 4,5–10Common evening primrose, seeds 30 4Corn (maize), seeds 34 3Crimson clover, seeds 40 0Dactylis glomerata, plants 30–90 0–2Endive, seeds 28 1–2.5
148 Part 2: Botany
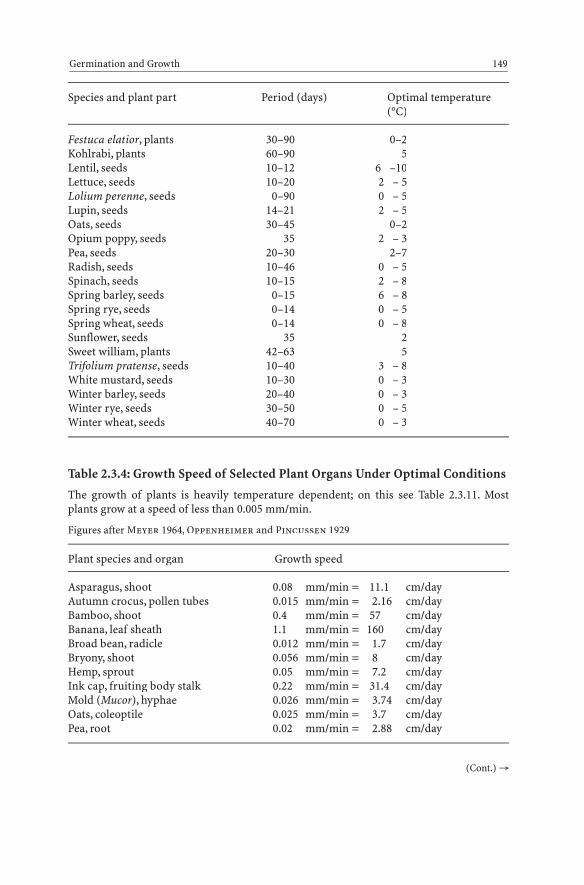
Species and plant part Period (days) Optimal temperature(°C)
Festuca elatior, plants 30–90 0–2Kohlrabi, plants 60–90 5Lentil, seeds 10–12 6 –10Lettuce, seeds 10–20 2 – 5Lolium perenne, seeds 0–90 0 – 5Lupin, seeds 14–21 2 – 5Oats, seeds 30–45 0–2Opium poppy, seeds 35 2 – 3Pea, seeds 20–30 2–7Radish, seeds 10–46 0 – 5Spinach, seeds 10–15 2 – 8Spring barley, seeds 0–15 6 – 8Spring rye, seeds 0–14 0 – 5Spring wheat, seeds 0–14 0 – 8Sunflower, seeds 35 2Sweet william, plants 42–63 5Trifolium pratense, seeds 10–40 3 – 8White mustard, seeds 10–30 0 – 3Winter barley, seeds 20–40 0 – 3Winter rye, seeds 30–50 0 – 5Winter wheat, seeds 40–70 0 – 3
Table 2.3.4: Growth Speed of Selected Plant Organs Under Optimal Conditions
The growth of plants is heavily temperature dependent; on this see Table 2.3.11. Mostplants grow at a speed of less than 0.005 mm/min.
Figures after Meyer 1964, Oppenheimer and Pincussen 1929
Plant species and organ Growth speed
Asparagus, shoot 0.08 mm/min = 11.1 cm/dayAutumn crocus, pollen tubes 0.015 mm/min = 2.16 cm/dayBamboo, shoot 0.4 mm/min = 57 cm/dayBanana, leaf sheath 1.1 mm/min = 160 cm/dayBroad bean, radicle 0.012 mm/min = 1.7 cm/dayBryony, shoot 0.056 mm/min = 8 cm/dayHemp, sprout 0.05 mm/min = 7.2 cm/dayInk cap, fruiting body stalk 0.22 mm/min = 31.4 cm/dayMold (Mucor), hyphae 0.026 mm/min = 3.74 cm/dayOats, coleoptile 0.025 mm/min = 3.7 cm/dayPea, root 0.02 mm/min = 2.88 cm/day
Germination and Growth 149
(Cont.) →
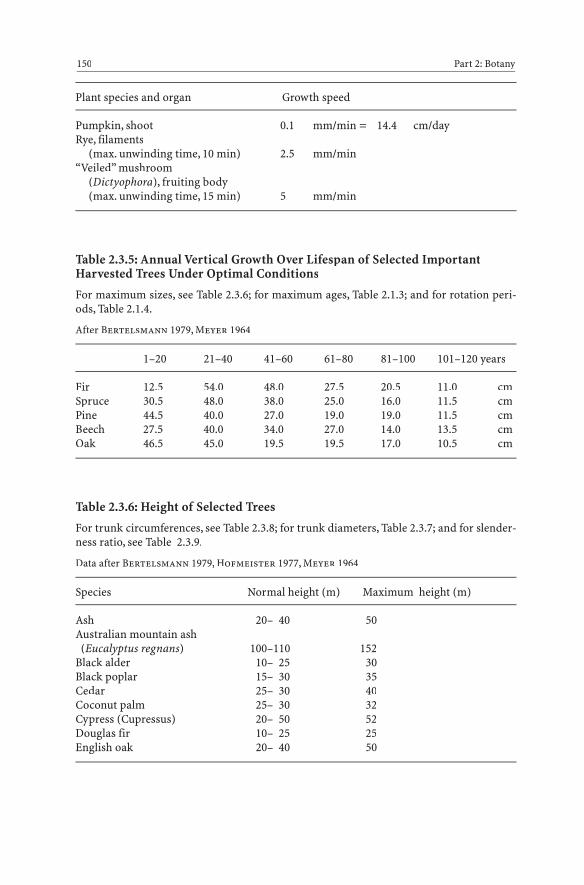
Plant species and organ Growth speed
Pumpkin, shoot 0.1 mm/min = 14.4 cm/dayRye, filaments
(max. unwinding time, 10 min) 2.5 mm/min“Veiled” mushroom
(Dictyophora), fruiting body(max. unwinding time, 15 min) 5 mm/min
Table 2.3.5: Annual Vertical Growth Over Lifespan of Selected ImportantHarvested Trees Under Optimal Conditions
For maximum sizes, see Table 2.3.6; for maximum ages, Table 2.1.3; and for rotation peri-ods, Table 2.1.4.
After Bertelsmann 1979, Meyer 1964
1–20 21–40 41–60 61–80 81–100 101–120 years
Fir 12.5 54.0 48.0 27.5 20.5 11.0 cmSpruce 30.5 48.0 38.0 25.0 16.0 11.5 cmPine 44.5 40.0 27.0 19.0 19.0 11.5 cmBeech 27.5 40.0 34.0 27.0 14.0 13.5 cmOak 46.5 45.0 19.5 19.5 17.0 10.5 cm
Table 2.3.6: Height of Selected Trees
For trunk circumferences, see Table 2.3.8; for trunk diameters, Table 2.3.7; and for slender-ness ratio, see Table 2.3.9.
Data after Bertelsmann 1979, Hofmeister 1977, Meyer 1964
Species Normal height (m) Maximum height (m)
Ash 20– 40 50Australian mountain ash
(Eucalyptus regnans) 100–110 152Black alder 10– 25 30Black poplar 15– 30 35Cedar 25– 30 40Coconut palm 25– 30 32Cypress (Cupressus) 20– 50 52Douglas fir 10– 25 25English oak 20– 40 50
150 Part 2: Botany
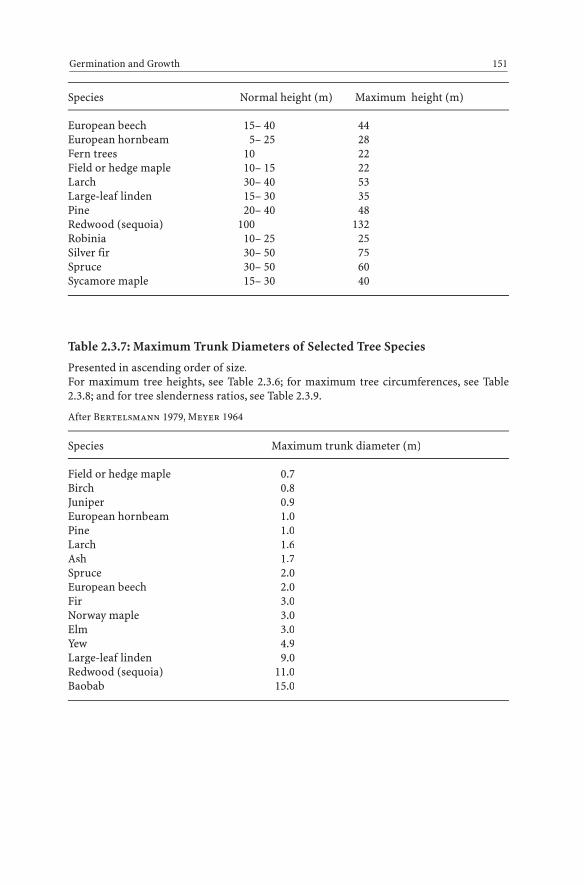
Species Normal height (m) Maximum height (m)
European beech 15– 40 44European hornbeam 5– 25 28Fern trees 10 22Field or hedge maple 10– 15 22Larch 30– 40 53Large-leaf linden 15– 30 35Pine 20– 40 48Redwood (sequoia) 100 132Robinia 10– 25 25Silver fir 30– 50 75Spruce 30– 50 60Sycamore maple 15– 30 40
Table 2.3.7: Maximum Trunk Diameters of Selected Tree Species
Presented in ascending order of size.For maximum tree heights, see Table 2.3.6; for maximum tree circumferences, see Table2.3.8; and for tree slenderness ratios, see Table 2.3.9.
After Bertelsmann 1979, Meyer 1964
Species Maximum trunk diameter (m)
Field or hedge maple 0.7Birch 0.8Juniper 0.9European hornbeam 1.0Pine 1.0Larch 1.6Ash 1.7Spruce 2.0European beech 2.0Fir 3.0Norway maple 3.0Elm 3.0Yew 4.9Large-leaf linden 9.0Redwood (sequoia) 11.0Baobab 15.0
Germination and Growth 151
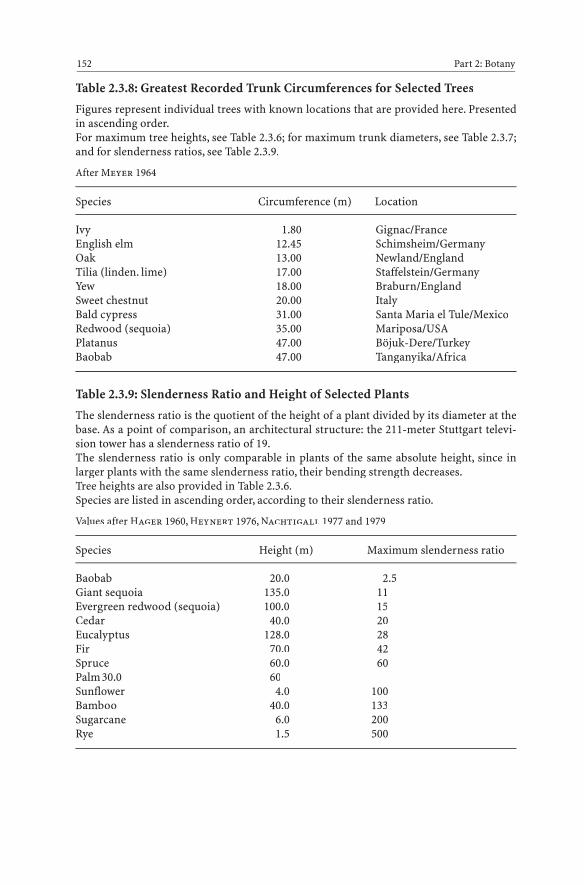
Table 2.3.8: Greatest Recorded Trunk Circumferences for Selected Trees
Figures represent individual trees with known locations that are provided here. Presentedin ascending order.For maximum tree heights, see Table 2.3.6; for maximum trunk diameters, see Table 2.3.7;and for slenderness ratios, see Table 2.3.9.
After Meyer 1964
Species Circumference (m) Location
Ivy 1.80 Gignac/FranceEnglish elm 12.45 Schimsheim/GermanyOak 13.00 Newland/EnglandTilia (linden. lime) 17.00 Staffelstein/GermanyYew 18.00 Braburn/EnglandSweet chestnut 20.00 ItalyBald cypress 31.00 Santa Maria el Tule/MexicoRedwood (sequoia) 35.00 Mariposa/USAPlatanus 47.00 Böjuk-Dere/TurkeyBaobab 47.00 Tanganyika/Africa
Table 2.3.9: Slenderness Ratio and Height of Selected Plants
The slenderness ratio is the quotient of the height of a plant divided by its diameter at thebase. As a point of comparison, an architectural structure: the 211-meter Stuttgart televi-sion tower has a slenderness ratio of 19.The slenderness ratio is only comparable in plants of the same absolute height, since inlarger plants with the same slenderness ratio, their bending strength decreases.Tree heights are also provided in Table 2.3.6.Species are listed in ascending order, according to their slenderness ratio.
Values after Hager 1960, Heynert 1976, Nachtigall 1977 and 1979
Species Height (m) Maximum slenderness ratio
Baobab 20.0 2.5Giant sequoia 135.0 11Evergreen redwood (sequoia) 100.0 15Cedar 40.0 20Eucalyptus 128.0 28Fir 70.0 42Spruce 60.0 60Palm30.0 60Sunflower 4.0 100Bamboo 40.0 133Sugarcane 6.0 200Rye 1.5 500
152 Part 2: Botany

Table 2.3.10: Length of Runners of Selected Plants Over the Course of a Year
In ascending order, according to length.
Data after Kerner v. Marilaun 1898
Species Length (cm)
Yellow mountain saxifrage 4Yellow anemone 5– 10Oregano 5– 10Lemon balm 5– 10Common yarrow 10– 15Field horsetail 10– 15Sweet violet 13Dentaria glandulosa 15– 20Sand sedge 15– 20Spearmint 15– 20Common bugle 20Woodruff 20– 25Peppermint 20– 25Common madder 20– 25Mercurialis 25– 30Quackgrass 25– 30Bishop’s goutweed 25– 30Stiff clubmoss 30– 40Field bindweed 30– 55Soapwort 30– 55Nettle 35– 45Hairy sedge 35– 45Sea milkwort 45– 55Creeping avens 50Broad-leaved ragwort 55– 60Creeping buttercup 60Coltsfoot 60– 75Canada goldenrod 60– 75Rosebay willow herb 85–100Pestilence wort 100–150Silverweed 110Ground ivy 126Creeping cinquefoil 130Stone bramble 140Strawberry 150Periwinkle 200
Germination and Growth 153
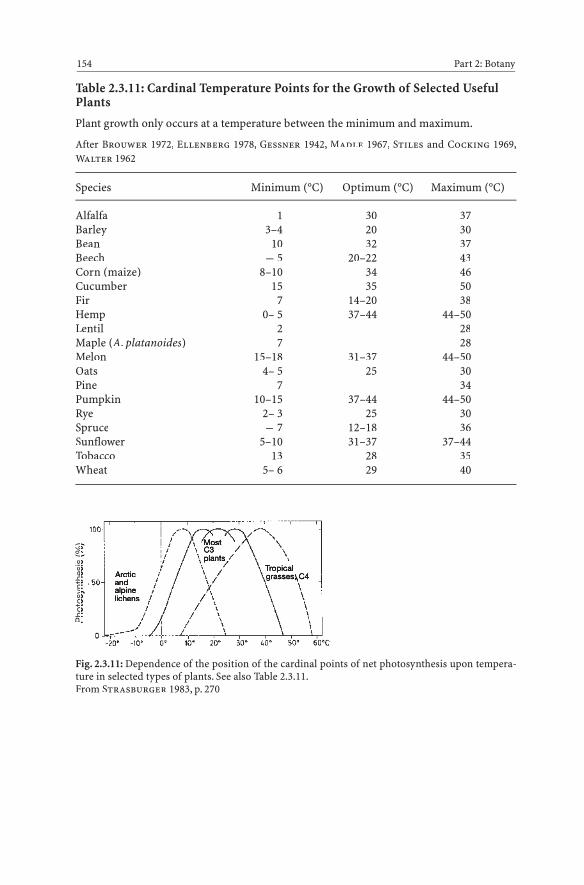
Table 2.3.11: Cardinal Temperature Points for the Growth of Selected UsefulPlants
Plant growth only occurs at a temperature between the minimum and maximum.
After Brouwer 1972, Ellenberg 1978, Gessner 1942, Madle 1967, Stiles and Cocking 1969,Walter 1962
Species Minimum (°C) Optimum (°C) Maximum (°C)
Alfalfa 1 30 37Barley 3–4 20 30Bean 10 32 37Beech – 5 20–22 43Corn (maize) 8–10 34 46Cucumber 15 35 50Fir – 7 14–20 38Hemp 0– 5 37–44 44–50Lentil 2 28Maple (A. platanoides) 7 28Melon 15–18 31–37 44–50Oats 4– 5 25 30Pine 7 34Pumpkin 10–15 37–44 44–50Rye 2– 3 25 30Spruce – 7 12–18 36Sunflower 5–10 31–37 37–44Tobacco 13 28 35Wheat 5– 6 29 40
154 Part 2: Botany
Fig. 2.3.11: Dependence of the position of the cardinal points of net photosynthesis upon tempera-ture in selected types of plants. See also Table 2.3.11.From Strasburger 1983, p. 270
Pho
tosy
nthe
sis
(%)
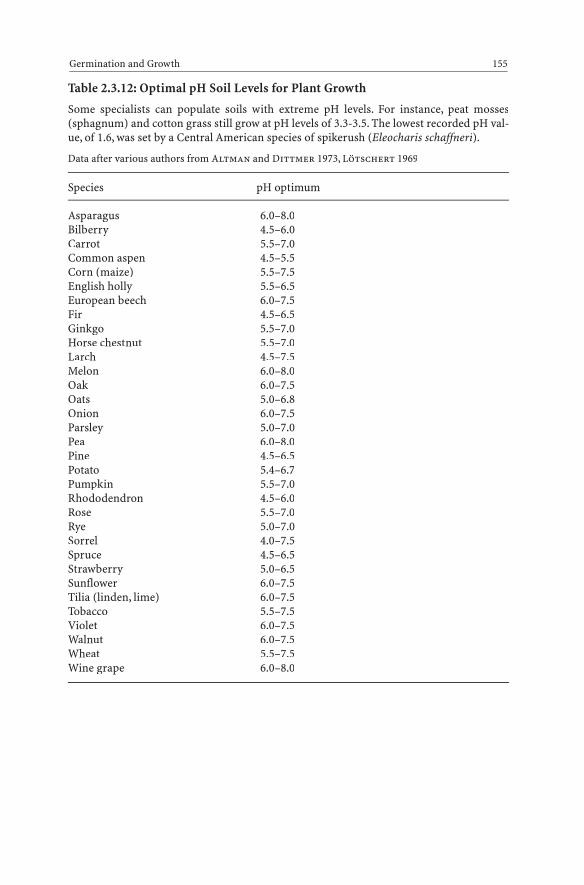
Table 2.3.12: Optimal pH Soil Levels for Plant Growth
Some specialists can populate soils with extreme pH levels. For instance, peat mosses(sphagnum) and cotton grass still grow at pH levels of 3.3-3.5. The lowest recorded pH val-ue, of 1.6, was set by a Central American species of spikerush (Eleocharis schaffneri).
Data after various authors from Altman and Dittmer 1973, Lötschert 1969
Species pH optimum
Asparagus 6.0–8.0Bilberry 4.5–6.0Carrot 5.5–7.0Common aspen 4.5–5.5Corn (maize) 5.5–7.5English holly 5.5–6.5European beech 6.0–7.5Fir 4.5–6.5Ginkgo 5.5–7.0Horse chestnut 5.5–7.0Larch 4.5–7.5Melon 6.0–8.0Oak 6.0–7.5Oats 5.0–6.8Onion 6.0–7.5Parsley 5.0–7.0Pea 6.0–8.0Pine 4.5–6.5Potato 5.4–6.7Pumpkin 5.5–7.0Rhododendron 4.5–6.0Rose 5.5–7.0Rye 5.0–7.0Sorrel 4.0–7.5Spruce 4.5–6.5Strawberry 5.0–6.5Sunflower 6.0–7.5Tilia (linden, lime) 6.0–7.5Tobacco 5.5–7.5Violet 6.0–7.5Walnut 6.0–7.5Wheat 5.5–7.5Wine grape 6.0–8.0
Germination and Growth 155
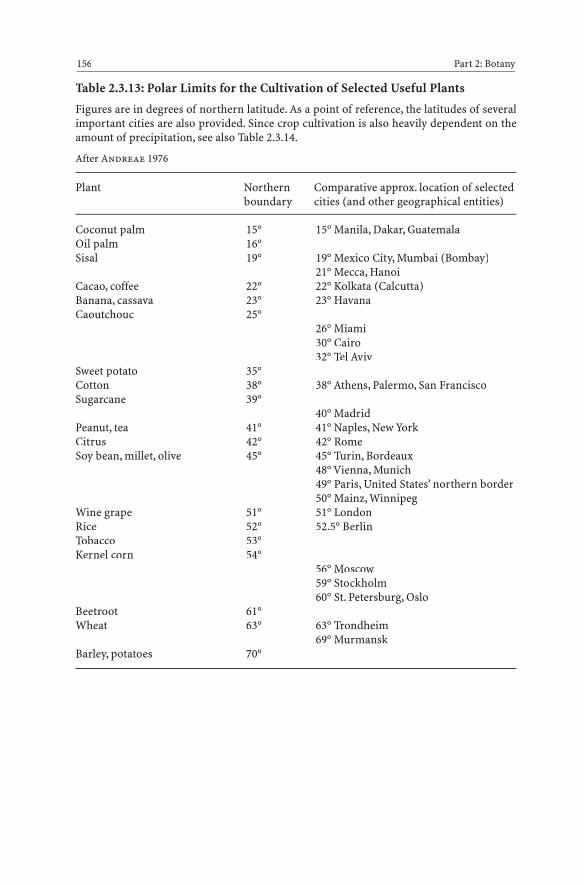
Table 2.3.13: Polar Limits for the Cultivation of Selected Useful Plants
Figures are in degrees of northern latitude. As a point of reference, the latitudes of severalimportant cities are also provided. Since crop cultivation is also heavily dependent on theamount of precipitation, see also Table 2.3.14.
After Andreae 1976
Plant Northern Comparative approx. location of selectedboundary cities (and other geographical entities)
Coconut palm 15° 15° Manila, Dakar, GuatemalaOil palm 16°Sisal 19° 19° Mexico City, Mumbai (Bombay)
21° Mecca, HanoiCacao, coffee 22° 22° Kolkata (Calcutta)Banana, cassava 23° 23° HavanaCaoutchouc 25°
26° Miami30° Cairo32° Tel Aviv
Sweet potato 35°Cotton 38° 38° Athens, Palermo, San FranciscoSugarcane 39°
40° MadridPeanut, tea 41° 41° Naples, New YorkCitrus 42° 42° RomeSoy bean, millet, olive 45° 45° Turin, Bordeaux
48° Vienna, Munich49° Paris, United States’ northern border50° Mainz, Winnipeg
Wine grape 51° 51° LondonRice 52° 52.5° BerlinTobacco 53°Kernel corn 54°
56° Moscow59° Stockholm60° St. Petersburg, Oslo
Beetroot 61°Wheat 63° 63° Trondheim
69° MurmanskBarley, potatoes 70°
156 Part 2: Botany
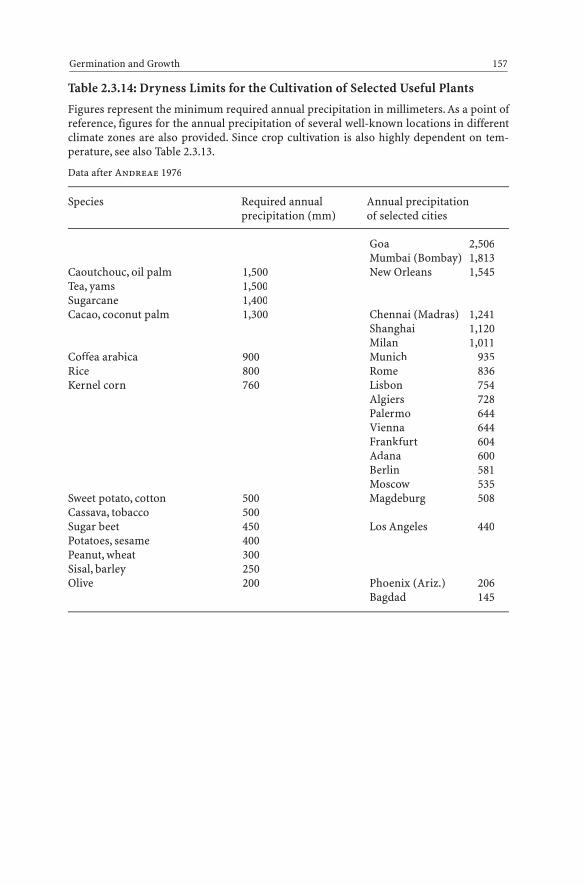
Table 2.3.14: Dryness Limits for the Cultivation of Selected Useful Plants
Figures represent the minimum required annual precipitation in millimeters. As a point ofreference, figures for the annual precipitation of several well-known locations in differentclimate zones are also provided. Since crop cultivation is also highly dependent on tem-perature, see also Table 2.3.13.
Data after Andreae 1976
Species Required annual Annual precipitationprecipitation (mm) of selected cities
Goa 2,506Mumbai (Bombay) 1,813
Caoutchouc, oil palm 1,500 New Orleans 1,545Tea, yams 1,500Sugarcane 1,400Cacao, coconut palm 1,300 Chennai (Madras) 1,241
Shanghai 1,120Milan 1,011
Coffea arabica 900 Munich 935Rice 800 Rome 836Kernel corn 760 Lisbon 754
Algiers 728Palermo 644Vienna 644Frankfurt 604Adana 600Berlin 581Moscow 535
Sweet potato, cotton 500 Magdeburg 508Cassava, tobacco 500Sugar beet 450 Los Angeles 440Potatoes, sesame 400Peanut, wheat 300Sisal, barley 250Olive 200 Phoenix (Ariz.) 206
Bagdad 145
Germination and Growth 157

2.4 Reproduction: Blossoms, Fruits, Seeds
Table 2.4.1: Linnaeus’ Flower-Clock
The times apply to Uppsala, Sweden (60° north latitude).
After Meyer 1964
Time The following blossoms open: The following blossoms close:
3–5 a.m. Yellow goat’s beard
4–5 a.m. Chicory, bristly oxtongue
5 a.m. Tawny daylily, common sow thistle,Icelandic poppy
5–6 a.m. Dandelion
6 a.m. Narrowleaf hawkweedSpotted cat’s-ear
6–7 a.m. Bladderpod, wall hawkweed,Common hawkweed
7 a.m. Anthericum ramosum, white water lily
8 a.m. Scarlet pimpernel, tunic flower
8–10 a.m. Dandelion
9–10 a.m. Field marigold, Yellow goat’s beardRed sandspurry
10 a.m. Chicory
11–12 a.m. Common sow thistle
12 noon Field marigold
1 p.m. Tunic flower
2 p.m. Common wall hawkweedHawkweed
2–3 p.m. Red sandspurry
3–4 p.m. Anthericum ramosum
4 p.m. Bladderpod
4–5 p.m. Spotted cat’s-ear
5 p.m. Narrowleaf hawkweed, whitewater lily
7 p.m. Icelandic poppy
7–8 p.m. Tawny daylily
158 Part 2: Botany
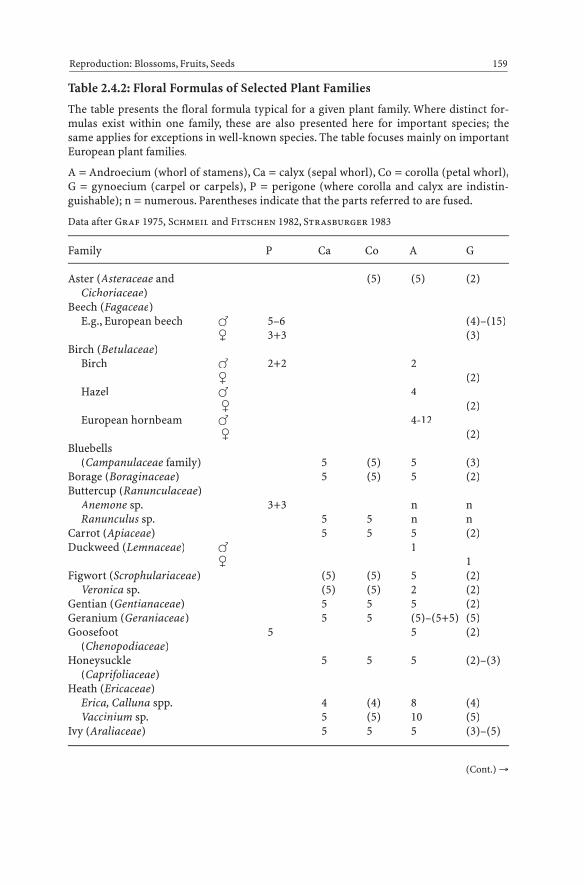
Table 2.4.2: Floral Formulas of Selected Plant Families
The table presents the floral formula typical for a given plant family. Where distinct for-mulas exist within one family, these are also presented here for important species; thesame applies for exceptions in well-known species. The table focuses mainly on importantEuropean plant families.
A = Androecium (whorl of stamens), Ca = calyx (sepal whorl), Co = corolla (petal whorl),G = gynoecium (carpel or carpels), P = perigone (where corolla and calyx are indistin-guishable); n = numerous. Parentheses indicate that the parts referred to are fused.
Data after Graf 1975, Schmeil and Fitschen 1982, Strasburger 1983
Family P Ca Co A G
Aster (Asteraceae and (5) (5) (2)Cichoriaceae)
Beech (Fagaceae)E.g., European beech � 5–6 (4)–(15)
� 3+3 (3)Birch (Betulaceae)
Birch � 2+2 2� (2)
Hazel � 4� (2)
European hornbeam � 4-12� (2)
Bluebells(Campanulaceae family) 5 (5) 5 (3)
Borage (Boraginaceae) 5 (5) 5 (2)Buttercup (Ranunculaceae)
Anemone sp. 3+3 n nRanunculus sp. 5 5 n n
Carrot (Apiaceae) 5 5 5 (2)Duckweed (Lemnaceae) � 1
� 1Figwort (Scrophulariaceae) (5) (5) 5 (2)
Veronica sp. (5) (5) 2 (2)Gentian (Gentianaceae) 5 5 5 (2)Geranium (Geraniaceae) 5 5 (5)–(5+5) (5)Goosefoot 5 5 (2)
(Chenopodiaceae)Honeysuckle 5 5 5 (2)–(3)
(Caprifoliaceae)Heath (Ericaceae)
Erica, Calluna spp. 4 (4) 8 (4)Vaccinium sp. 5 (5) 10 (5)
Ivy (Araliaceae) 5 5 5 (3)–(5)
Reproduction: Blossoms, Fruits, Seeds 159
(Cont.) →

Family P Ca Co A G
Knotweed (Polygonaceae)Rheum sp. 6 9 (3)Rumex sp. 6 6 (3)
Lily (Liliaceae) 3+3 3+3 (3)Paris, Maianthemum spp. 4 4 4+4 (4)
Linden (Tiliaceae) 5 5 n (5)Mallow (Malvaceae)
e.g., Malva sp. 5 5 n (n)Maple (Aceraceae) 5 5 8 (2)Mint (Lamiaceae) (5) (5) 4 (2)Mustard (Brassicaceae) 4 4 4+2 (2)Nettle � 4 4
(Urticaceae) � 2-5 1Nightshade (Solanaceae) (5) (5) 5 (2)Orchid (Orchidaceae) 6 1–2 (3)Orpine (Crassulaceae) 5 5 10 5Pea or legume (Fabaceae)
Laburnum sp. (5) 5 (10) 1Vicia sp. (5) 5 (9)+1 1
Pink (Caryophyllaceae) (5) 5 5+5 (5)Plantain (Plantaginaceae) 4 (4) 4 (2)Primrose (Primulaceae) (5) (5) 5 (5)Poppy (Papaveraceae) 2 2+2 n (2)Rose (Rosaceae) 5 5 5-? 1-?Rush (Juncaceae) 3+3 3+3 (3)Saxifrage (Saxifragaceae) 5 5 5+5 (2)Sedge (Cyperaceae)
Scirpus sp. 3+3 3 (3)Carex sp. � 3
� (2)–(3)Spurge � 1
(Euphorbiaceae) � (3)Sundew (Droseraceae) 5 5 5 (3)Teasel (Dipsacaceae) 4–5 (4)–(5) 4 1True grass (Poaceae) (2)+2 3 (3)Violet (Violaceae) 5 5 5 (3)Water lily (Nymphaeaceae) 4 n n nWillow (Salicaceae)
Salix sp. � 2� (2)
Populus sp. � 3–30� (2)
Wood sorrel (Oxalidaceae) 5 5 5+5 5
160 Part 2: Botany
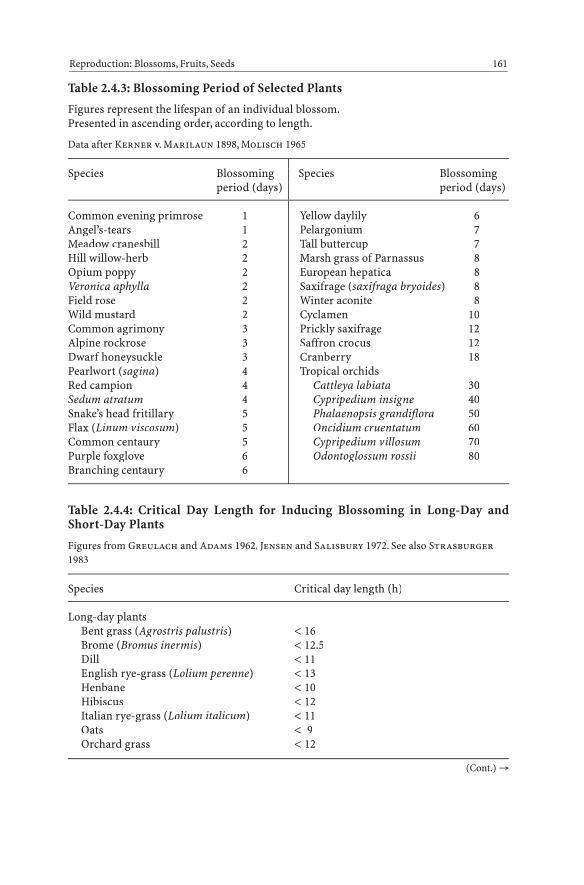
Table 2.4.3: Blossoming Period of Selected Plants
Figures represent the lifespan of an individual blossom.Presented in ascending order, according to length.
Data after Kerner v. Marilaun 1898, Molisch 1965
Species Blossoming Species Blossomingperiod (days) period (days)
Reproduction: Blossoms, Fruits, Seeds 161
Common evening primrose 1Angel’s-tears 1Meadow cranesbill 2Hill willow-herb 2Opium poppy 2Veronica aphylla 2Field rose 2Wild mustard 2Common agrimony 3Alpine rockrose 3Dwarf honeysuckle 3Pearlwort (sagina) 4Red campion 4Sedum atratum 4Snake’s head fritillary 5Flax (Linum viscosum) 5Common centaury 5Purple foxglove 6Branching centaury 6
Yellow daylily 6Pelargonium 7Tall buttercup 7Marsh grass of Parnassus 8European hepatica 8Saxifrage (saxifraga bryoides) 8Winter aconite 8Cyclamen 10Prickly saxifrage 12Saffron crocus 12Cranberry 18Tropical orchids
Cattleya labiata 30Cypripedium insigne 40Phalaenopsis grandiflora 50Oncidium cruentatum 60Cypripedium villosum 70Odontoglossum rossii 80
Table 2.4.4: Critical Day Length for Inducing Blossoming in Long-Day andShort-Day Plants
Figures from Greulach and Adams 1962, Jensen and Salisbury 1972. See also Strasburger1983
Species Critical day length (h)
Long-day plantsBent grass (Agrostris palustris) < 16Brome (Bromus inermis) < 12.5Dill < 11English rye-grass (Lolium perenne) < 13Henbane < 10Hibiscus < 12Italian rye-grass (Lolium italicum) < 11Oats < 9Orchard grass < 12
(Cont.) →
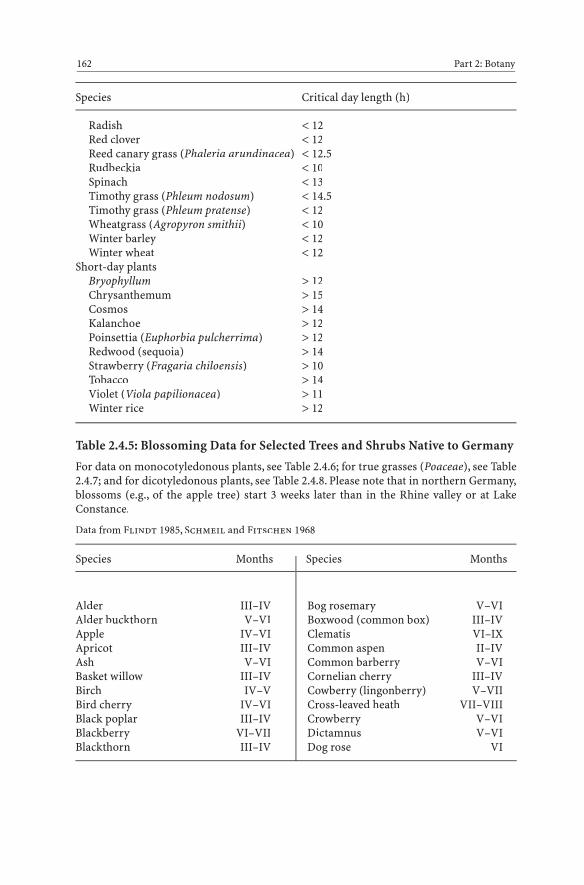
Species Critical day length (h)
Radish < 12Red clover < 12Reed canary grass (Phaleria arundinacea) < 12.5Rudbeckia < 10Spinach < 13Timothy grass (Phleum nodosum) < 14.5Timothy grass (Phleum pratense) < 12Wheatgrass (Agropyron smithii) < 10Winter barley < 12Winter wheat < 12
Short-day plantsBryophyllum > 12Chrysanthemum > 15Cosmos > 14Kalanchoe > 12Poinsettia (Euphorbia pulcherrima) > 12Redwood (sequoia) > 14Strawberry (Fragaria chiloensis) > 10Tobacco > 14Violet (Viola papilionacea) > 11Winter rice > 12
Table 2.4.5: Blossoming Data for Selected Trees and Shrubs Native to Germany
For data on monocotyledonous plants, see Table 2.4.6; for true grasses (Poaceae), see Table2.4.7; and for dicotyledonous plants, see Table 2.4.8. Please note that in northern Germany,blossoms (e.g., of the apple tree) start 3 weeks later than in the Rhine valley or at LakeConstance.
Data from Flindt 1985, Schmeil and Fitschen 1968
Species Months Species Months
162 Part 2: Botany
Alder III–IVAlder buckthorn V–VIApple IV–VIApricot III–IVAsh V–VIBasket willow III–IVBirch IV–VBird cherry IV–VIBlack poplar III–IVBlackberry VI–VIIBlackthorn III–IV
Bog rosemary V–VIBoxwood (common box) III–IVClematis VI–IXCommon aspen II–IVCommon barberry V–VICornelian cherry III–IVCowberry (lingonberry) V–VIICross-leaved heath VII–VIIICrowberry V–VIDictamnus V–VIDog rose VI

Dog rose VIDouglas fir IV–VEared willow IV–VElderberry VI–VIIEnglish elm III–IVEnglish holly V–VIEuropean beech IV–VEuropean hornbeam IV–VIEuropean rowan V–VIIEuropean spindle V–VIIFalse medlar IV–VIField or hedge maple VForsythia III–IVGoat willow III–IVGooseberry IV–VHawthorn V–VIHazel II–IVHorse chestnut IV–VIvy IX–XJuniper IV–VLaburnum IV–VILarch IV–VILarge-leaf linden VILilac V–VILittle-leaf linden VI–VIIMezereon II–IVMistletoe III–VMugo pine V–VINorway maple IV–VOak IV–VPeach IV–V
Pear IV–VPlatanus VPlum IV–VPrivet VI–VIIQuince V–VIRaspberry V–VIRhododendrons V–VIIRobinia V–VIRugosa rose VI–VIIScotch broom V–VIScotch pine V–VISiberian dogwood V–VISilver fir V–VISour cherry IV–VSpiny restharrow VI–VIISpruce IV–VISweet chestnut VISweet gale IV–VSwiss pine VI–VIISycamore maple IV–VIVaccinium V–VIWalnut IV–VWayfaring tree IV–VWhite poplar III–IVWhitebeam V–VIWild cherry IV–VWild rosemary V–VIWine grape VI–VIIWinged broom V–VIIYew III–IV
Reproduction: Blossoms, Fruits, Seeds 163
Species Months Species Months
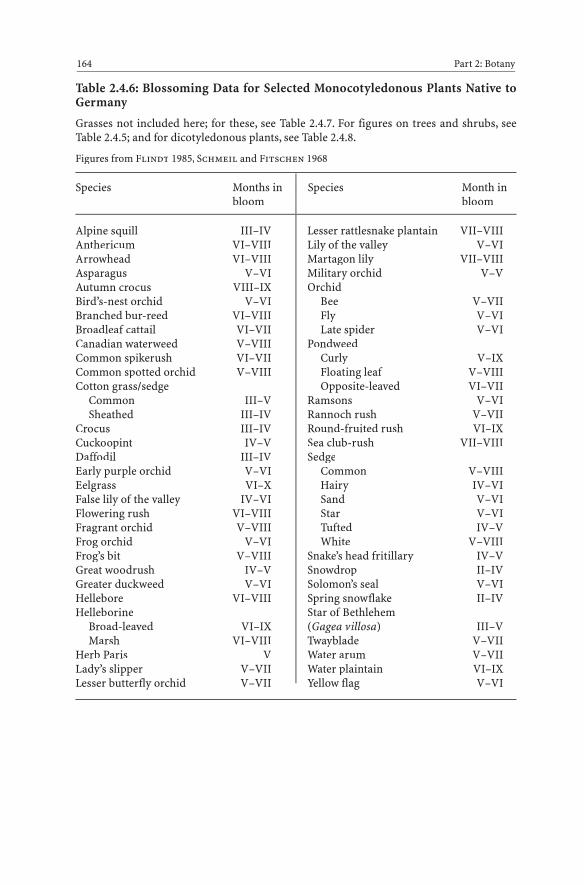
Table 2.4.6: Blossoming Data for Selected Monocotyledonous Plants Native toGermany
Grasses not included here; for these, see Table 2.4.7. For figures on trees and shrubs, seeTable 2.4.5; and for dicotyledonous plants, see Table 2.4.8.
Figures from Flindt 1985, Schmeil and Fitschen 1968
Species Months in Species Month inbloom bloom
164 Part 2: Botany
Alpine squill III–IVAnthericum VI–VIIIArrowhead VI–VIIIAsparagus V–VIAutumn crocus VIII–IXBird’s-nest orchid V–VIBranched bur-reed VI–VIIIBroadleaf cattail VI–VIICanadian waterweed V–VIIICommon spikerush VI–VIICommon spotted orchid V–VIIICotton grass/sedge
Common III–VSheathed III–IV
Crocus III–IVCuckoopint IV–VDaffodil III–IVEarly purple orchid V–VIEelgrass VI–XFalse lily of the valley IV–VIFlowering rush VI–VIIIFragrant orchid V–VIIIFrog orchid V–VIFrog’s bit V–VIIIGreat woodrush IV–VGreater duckweed V–VIHellebore VI–VIIIHelleborine
Broad-leaved VI–IXMarsh VI–VIII
Herb Paris VLady’s slipper V–VIILesser butterfly orchid V–VII
Lesser rattlesnake plantain VII–VIIILily of the valley V–VIMartagon lily VII–VIIIMilitary orchid V–VOrchid
Bee V–VIIFly V–VILate spider V–VI
PondweedCurly V–IXFloating leaf V–VIIIOpposite-leaved VI–VII
Ramsons V–VIRannoch rush V–VIIRound-fruited rush VI–IXSea club-rush VII–VIIISedge
Common V–VIIIHairy IV–VISand V–VIStar V–VITufted IV–VWhite V–VIII
Snake’s head fritillary IV–VSnowdrop II–IVSolomon’s seal V–VISpring snowflake II–IVStar of Bethlehem(Gagea villosa) III–VTwayblade V–VIIWater arum V–VIIWater plaintain VI–IXYellow flag V–VI
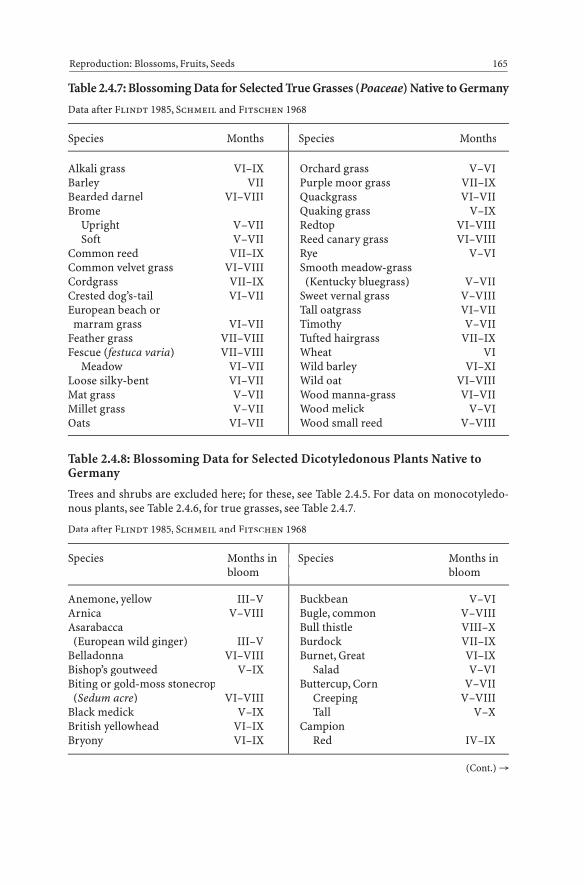
Table 2.4.7: Blossoming Data for Selected True Grasses (Poaceae) Native to Germany
Data after Flindt 1985, Schmeil and Fitschen 1968
Species Months Species Months
Reproduction: Blossoms, Fruits, Seeds 165
Alkali grass VI–IXBarley VIIBearded darnel VI–VIIIBrome
Upright V–VIISoft V–VII
Common reed VII–IXCommon velvet grass VI–VIIICordgrass VII–IXCrested dog’s-tail VI–VIIEuropean beach or
marram grass VI–VIIFeather grass VII–VIIIFescue (festuca varia(( ) VII–VIII
Meadow VI–VIILoose silky-bent VI–VIIMat grass V–VIIMillet grass V–VIIOats VI–VII
Orchard grass V–VIPurple moor grass VII–IXQuackgrass VI–VIIQuaking grass V–IXRedtop VI–VIIIReed canary grass VI–VIIIRye V–VISmooth meadow-grass
(Kentucky bluegrass) V–VIISweet vernal grass V–VIIITall oatgrass VI–VIITimothy V–VIITufted hairgrass VII–IXWheat VIWild barley VI–XIWild oat VI–VIIIWood manna-grass VI–VIIWood melick V–VIWood small reed V–VIII
Table 2.4.8: Blossoming Data for Selected Dicotyledonous Plants Native toGermany
Trees and shrubs are excluded here; for these, see Table 2.4.5. For data on monocotyledo-nous plants, see Table 2.4.6, for true grasses, see Table 2.4.7.
Data after Flindt 1985, Schmeil and Fitschen 1968
Species Months in Species Months inbloom bloom
Anemone, yellow III–VArnica V–VIIIAsarabacca
(European wild ginger) III–VBelladonna VI–VIIIBishop’s goutweed V–IXBiting or gold-moss stonecrop
(Sedum acre) VI–VIIIBlack medick V–IXBritish yellowhead VI–IXBryony VI–IX
Buckbean V–VIBugle, common V–VIIIBull thistle VIII–XBurdock VII–IXBurnet, Great VI–IX
Salad V–VIButtercup, Corn V–VII
Creeping V–VIIITall V–X
CampionRed IV–IX
(Cont.) →

White VI–IXCaraway V–VIICarline thistle VII–IXCarrot, wild V–VIICentaury VII–IXChicory VII–IXChristmas rose II–VICleavers V–XClusterhead
or carthusian pink VI–VIIIColtsfoot III–IVComfrey V–VIICommon agrimony VI–VIIICommon alkanet or bugloss V–IXCommon bean VI–IXCommon bird’s-foot trefoil V–IXCommon butterwort V–VIIICommon chickweed(Stellaria media) III–X
Common evening primrose VI–IX
Common figwort VI–VIICommon fumitory IV–XCommon glasswort VIII–XCommon groundsel III–XCommon hemp-nettle VII–XCommon hogweed VI–XCommon mare’s tail V–VIIICommon milkwort V–VIIICommon yarrow VI–XCorn cockle VI–IXCorn poppy V–VIICorn spurry VI–XCornflower VI–IXCorydalis III–VCowslip IV–VCow-wheat, small V–VIIICranesbill
Bloody V–IXMeadow VI–VIII
Creeping Jenny V–VIICuckoo flower IV–VIICucumber VI–IXCurly dock V–VII
Cyclamen VI–IXCypress spurge IV–VIIDaisy III–XIDandelion IV–VIIDead-nettle
Red III–XWhite IV–VIII
Dodder VI–IXDog fennel or chamomile (Anthemis)
VI–IXDog violet IV–VIEdelweiss VII–IXEnchanter’s nightshade VI–IXEnglish or narrowleaf plantain V–IXEuropean columbine VI–VIIEuropean field pansy V–XEuropean hepatica III–IVEuropean speedwell V–VIIIEuropean yellow-rattle V–IXFairy flax VI–VIIIField bindweed V–XField pennycress IV–VIField scabious V–IXField sow thistle VII–XForget-me-not
Woodland V–VIIFrostweed V–IXGarden loosestrife VI–VIIIGarden orach(e) VII–XGarlic mustard IV–VIGentian
Yellow VI–VIIIMarsh VII–XGentiana sino ornata IV–VIII
German chamomile V–IXGermander speedwell V–VIIIGlobe flower V–VIGolden saxifrage IV–VIGood King Henry IV–XGreater celandine V–IXGround ivy IV–VIHarebell VI–IXHedge false bindweed VI–IXHedge mustard V–X
166 Part 2: Botany
Species Months in Species Months inbloom bloom

Hellebore, stinking III–IVHemp agrimony VII–IXHenbane VI–XHens and chicks VII–IXHerb Robert V–XHoary alyssum VI–XHoary cress V–VIIHonesty V–VIHops VHound’s tongue V–VIKidney vetch V–IXKnotweed V–IXLady’s mantle V–IXLarge pink VI–IXLesser celandine III–VLivelong saxifrage V–VIIILungwort III–VLupin VI–IXMalve V–IXMarsh angelica VII–VIIIMarsh cinquefoil VI–VIIMarsh marigold III–VIMasterwort VI–VIIIMeadow sage V–VIIIMeadowsweet VI–VIIIMercurialis IV–VMonkshood VII–VIIIMoschatel III–VMouse-ear chickweed III–VIMouse-ear hawkweed V–XMustard
Black VI–IXWild VI–IX
Oxeye daisy V–XOxlip III–VParsley VI–VIIPasque flower III–VPea V–VIPeppermint VI–VIIPestilence wort III–VPincushion flower VII–XPinesap VI–VIIIPoison hemlock VI–IXPond-lily, yellow IV–IX
Potato VI–IXPurple foxglove VI–VIIPurple loosestrife VI–IXPussytoes V–VIIRagged robin V–VIIIRampion, spiked V–VIIIRed clover IV–IXRosebay willow herb VI–VIIISainfoin V–VIISea holly
(Eryngium maritimum) VI–XSedum VI–IXSelf-heal VI–IXShepherd’s purse II–IXSilverweed V–VIIISmall scorpion vetch VI–VIISoapwort VI–IXSolid-stem burnet saxifrage VI–IX
Sorrel V–VISpinach V–IXSpring cinquefoil III–VSt. John’s wort VI–VIIIStinging nettle VI–XStrawflower VII–XSundew VI–VIIISunflower VII–XSwallow-wort V–VIIIThyme V–XTomato VII–XTormentil V–VIITouch-me-not VII–IXTufted vetch VI–VIIValerian VII–VIIIVetchling
Spring IV–VMeadow VI–VII
Viper’s bugloss VI–XWater avens IV–VWater chestnut VI–IXWater crowfoot VI-VIIIWater hemlock VII–IXWater lily VI–IXWater parsnip VI–VIII
Reproduction: Blossoms, Fruits, Seeds 167
Species Months in Species Months inbloom bloom
(Cont.) →

Watercress V–VIIIWhitlow grass II–VWild chervil IV–VIIIWild radish VI–VIIIWild strawberry V–VIWinter cress IV–VIIWood anemone III–IVWood betony VI–VIIIWood sanicle V–VII
Woodruff IV–VWoodsorrel IV–VWormseed mustard/wallflower V–IX
Yellow archangel IV–VIIYellow or common toadflax VI–IXYellow sweet clover V–IXYellowcress, creeping VI–IX
168 Part 2: Botany
Species Months in Species Months inbloom bloom
Table 2.4.9: Time of Spore Maturation in Selected Ferns Native to Germany
Data after Flindt 1985, Schmeil and Fitschen 1968
Species Month
Adder’s-tongue VI–VIIIBrackenfern VII–XCommon clubmoss VII–VIIICommon moonwort V–VIICommon polypody VI–IXDeer fern VII–IXField horsetail III–IVGround cedar VIII–IXHart’s tongue fern VII–IXLady fern VII–IXLong beech fern VI–VIIIMaidenhair spleenwort VII–IXMale fern VI–IXMarsh clubmoss VIII–XMarsh horsetail V–VIIMeadow horsetail V–VIOak fern VII–VIIIRoyal fern VI–VIISpikemoss, Swiss (Selaginella helvetica) VI–VIII
Stiff clubmoss VIII–XWall-rue VI–VIIWoodland horsetail V–VI
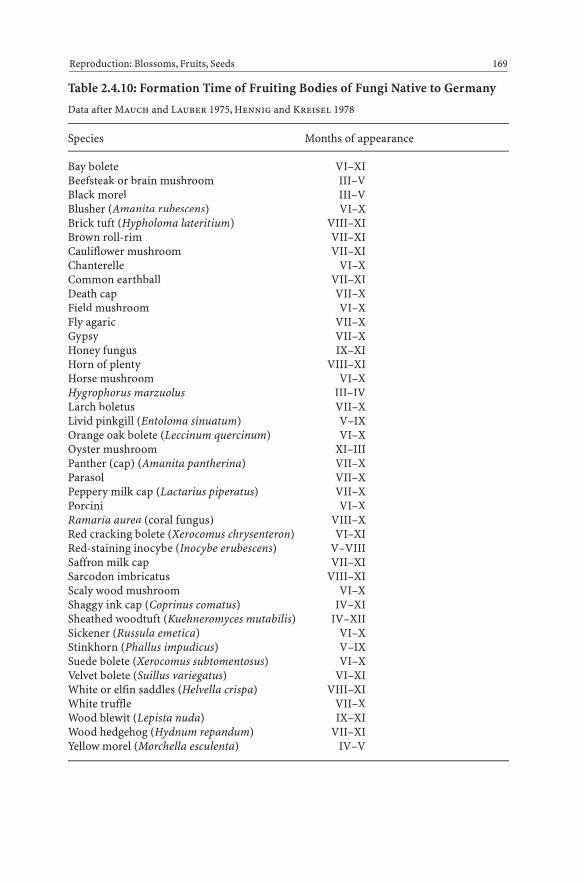
Table 2.4.10: Formation Time of Fruiting Bodies of Fungi Native to Germany
Data after Mauch and Lauber 1975, Hennig and Kreisel 1978
Species Months of appearance
Bay bolete VI–XIBeefsteak or brain mushroom III–VBlack morel III–VBlusher (Amanita rubescens) VI–XBrick tuft (Hypholoma lateritium) VIII–XIBrown roll-rim VII–XICauliflower mushroom VII–XIChanterelle VI–XCommon earthball VII–XIDeath cap VII–XField mushroom VI–XFly agaric VII–XGypsy VII–XHoney fungus IX–XIHorn of plenty VIII–XIHorse mushroom VI–XHygrophorus marzuolus III–IVLarch boletus VII–XLivid pinkgill (Entoloma sinuatum) V–IXOrange oak bolete (Leccinum quercinum) VI–XOyster mushroom XI–IIIPanther (cap) (Amanita pantherina) VII–XParasol VII–XPeppery milk cap (Lactarius piperatus) VII–XPorcini VI–XRamaria aurea (coral fungus) VIII–XRed cracking bolete (Xerocomus chrysenteron) VI–XIRed-staining inocybe (Inocybe erubescens) V–VIIISaffron milk cap VII–XISarcodon imbricatus VIII–XIScaly wood mushroom VI–XShaggy ink cap (Coprinus comatus) IV–XISheathed woodtuft (Kuehneromyces mutabilis) IV–XIISickener (Russula emetica) VI–XStinkhorn (Phallus impudicus) V–IXSuede bolete (Xerocomus subtomentosus) VI–XVelvet bolete (Suillus variegatus) VI–XIWhite or elfin saddles (Helvella crispa) VIII–XIWhite truffle VII–XWood blewit (Lepista nuda) IX–XIWood hedgehog (Hydnum repandum) VII–XIYellow morel (Morchella esculenta) IV–V
Reproduction: Blossoms, Fruits, Seeds 169

Table 2.4.11: Annual Number of Seeds of Selected Plants
Presented in ascending order, according to number of seeds per plant.
After Bertelsmann 1979, Hanf (no date), Meyer 1964, Müller-Schneider 1977
Strict or true forget-me-not 56Coconut palm 70Wild radish 160Red dead-nettle 200Corn cockle 200Herb Robert 300Black nightshade 500Field bindweed 550Field forget-me-not 700Common alkanet or bugloss 900Field pennycress 900Corn buttercup 900Wild mustard 1,200Cornflower 1,600Pansy 2,500Hedge mustard 2,700Creeping bellflower 3,000Wild carrot 4,000Dandelion 5,000Imperforate St. John’s wort 10,600Common chickweed 15,000Canada thistle 19,000Orach(e) 20,000Corn poppy 20,000Meadowsweet 34,000Greater celandine 36,000Groundsel 40,000Henbane 45,000Coltsfoot 60,000Shepherd’s purse 64,000Common spotted orchid 100,000Horseweed 120,000Scentless mayweed 210,000Galinsoga 300,000Tobacco 360,000Mugwort 700,000Butterfly bush 20,000,000Black poplar 28,000,000Birch 30,000,000
170 Part 2: Botany
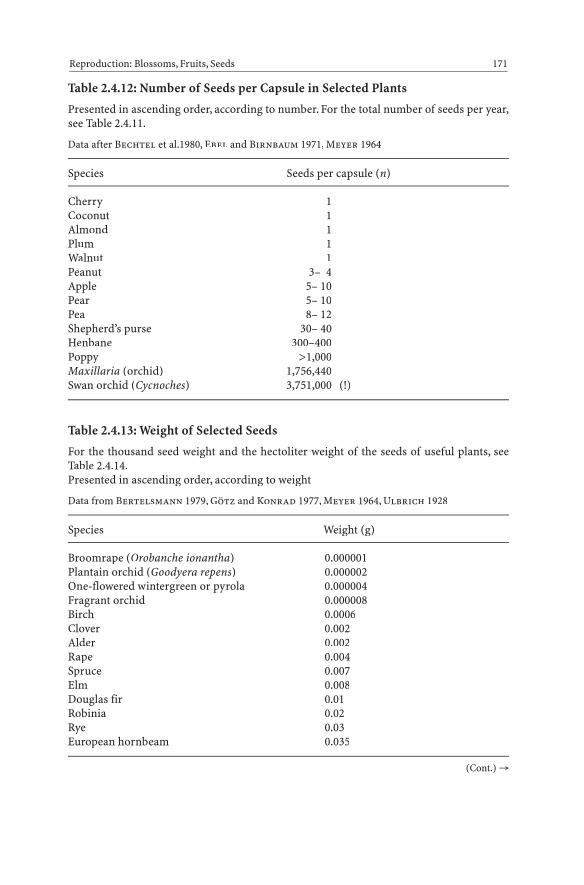
Table 2.4.12: Number of Seeds per Capsule in Selected Plants
Presented in ascending order, according to number. For the total number of seeds per year,see Table 2.4.11.
Data after Bechtel et al.1980, Ebel and Birnbaum 1971, Meyer 1964
Species Seeds per capsule (n)
Cherry 1Coconut 1Almond 1Plum 1Walnut 1Peanut 3– 4Apple 5– 10Pear 5– 10Pea 8– 12Shepherd’s purse 30– 40Henbane 300–400Poppy >1,000Maxillaria (orchid) 1,756,440Swan orchid (Cycnoches) 3,751,000 (!)
Table 2.4.13: Weight of Selected Seeds
For the thousand seed weight and the hectoliter weight of the seeds of useful plants, seeTable 2.4.14.Presented in ascending order, according to weight
Data from Bertelsmann 1979, Götz and Konrad 1977, Meyer 1964, Ulbrich 1928
Species Weight (g)
Broomrape (Orobanche ionantha) 0.000001Plantain orchid (Goodyera repens) 0.000002One-flowered wintergreen or pyrola 0.000004Fragrant orchid 0.000008Birch 0.0006Clover 0.002Alder 0.002Rape 0.004Spruce 0.007Elm 0.008Douglas fir 0.01Robinia 0.02Rye 0.03European hornbeam 0.035
Reproduction: Blossoms, Fruits, Seeds 171
(Cont.) →

Species Weight (g)
Wheat 0.04Oats 0.04Fir 0.04Barley 0.04Ash 0.07Lupin 0.08Lentil 0.082Maple 0.1Pea 0.2Corn (maize) 0.2European beech 0.22Broad bean 0.3Common hogweed 0.4Runner bean (scarlet runner) 0.5Oak 3.0Brazil nut up to 25Avocado up to 60
Table 2.4.14: Thousand Seed Weights (TSW) und Hectoliter Weights of theSeeds of Selected Useful Plants
For seed weights, see also Table 2.4.13.
After Brouwer 1977, Götz and Konrad 1977
Species TSW Hectoliter weight(g) (kg)
Winter wheat 35– 45 74–76Winter rye 25– 35 70–73Spring barley 35– 45 63–63Oats 32– 40 50–60Corn seed 200–450Flint corn 115–300Sweet corn 240–310Popcorn 80–130Victoria peas 200–300 78–82Field peas 150–250 75–82Broad beans 250–350 75–85Common vetches 40– 55 76–80Lupin 100–120 76–80Rape 4– 6 65–72Clover 2– 3 70–80Alfalfa 2– 3 70–80
172 Part 2: Botany
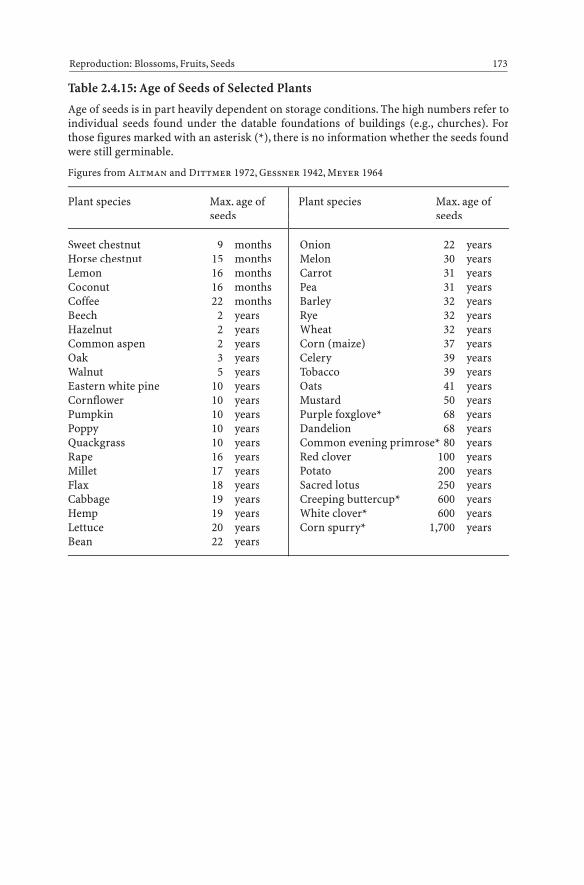
Table 2.4.15: Age of Seeds of Selected Plants
Age of seeds is in part heavily dependent on storage conditions. The high numbers refer toindividual seeds found under the datable foundations of buildings (e.g., churches). Forthose figures marked with an asterisk (*), there is no information whether the seeds foundwere still germinable.
Figures from Altman and Dittmer 1972, Gessner 1942, Meyer 1964
Plant species Max. age of Plant species Max. age ofseeds seeds
Reproduction: Blossoms, Fruits, Seeds 173
Sweet chestnut 9 monthsHorse chestnut 15 monthsLemon 16 monthsCoconut 16 monthsCoffee 22 monthsBeech 2 yearsHazelnut 2 yearsCommon aspen 2 yearsOak 3 yearsWalnut 5 yearsEastern white pine 10 yearsCornflower 10 yearsPumpkin 10 yearsPoppy 10 yearsQuackgrass 10 yearsRape 16 yearsMillet 17 yearsFlax 18 yearsCabbage 19 yearsHemp 19 yearsLettuce 20 yearsBean 22 years
Onion 22 yearsMelon 30 yearsCarrot 31 yearsPea 31 yearsBarley 32 yearsRye 32 yearsWheat 32 yearsCorn (maize) 37 yearsCelery 39 yearsTobacco 39 yearsOats 41 yearsMustard 50 yearsPurple foxglove* 68 yearsDandelion 68 yearsCommon evening primrose* 80 yearsRed clover 100 yearsPotato 200 yearsSacred lotus 250 yearsCreeping buttercup* 600 yearsWhite clover* 600 yearsCorn spurry* 1,700 years

Table 2.4.16: Maximum Distance Seeds Catapulted by Ballistic Fruits
Listed in ascending order.
Data after Bünning 1953, Kerner v. Marilaun 1898, Strasburger 1983, Ulbrich 1928
Species Distance catapulted (m)
Narrowleaf bittercress 0.90 Dog violet 1.00Leopard’s bane (Doronicum decumbens) 1.00Longstalk cranesbill 1.50 Marsh cranesbill 2.50 Early dog violet 3.75Tall violet 4.65 Pansy 4.75Lupin (Lupinus digitatus) 7.00Bear’s breeches (Acanthus mollis) 9.50Squirting cucumber (Ecballium) 12.70Sandbox tree (Hura crepitans) 14.00Bauhinia purpurea (tropical liana) 15.00
As a point of comparison:Pilobolus fungus (ejects sporangium) 2.50
174 Part 2: Botany

2.5 Constituents
Table 2.5.1: Composition of Cereal Grains
Figures are percentages for grains without shells/husks.
After Bertelsmann 1979, Franke 1976, rororo 1976/77
Water Protein Fat Carbo- Ashhydrates
Wheat 13.2 12.4 2.0 66.7 1.8Rye 13.7 9.2 1.8 70.2 1.8Oats 13.0 13.0 7.0 61.3 2.3Barley 11.7 7.5 1.2 73.6 1.3Rice 13.1 7.4 0.4 75.6 0.8Corn (maize) 12.5 11.0 4.4 67.2 1.5Millet 12.1 11.5 3.9 68.1 1.7
Table 2.5.2: Composition of Legumes
Figures represent percentages.From Franke 1976
Water Protein Fat Carbo- Crude Mineralshydrates fiber
Pea, ripe seeds 10.9 22.90 1.40 60.7 1.40 2.70Green peas 76.0 6.70 0.50 13.9 1.90 1.00Bean, ripe seeds 11.6 21.30 1.60 57.6 4.00 3.90Bean, green beans 90.4 2.24 0.26 5.0 1.36 0.74Lentil 12.4 25.10 0.70 59.0 0.70 2.10Broad bean 14.0 23.00 2.00 55.0 6.20 3.10Soy bean 8.3 40.00 18.80 24.0 4.00 4.60Peanut, roasted 2.8 26.50 46.60 19.0 2.40 2.70
Constituents 175

Table 2.5.3: Fat Content of Selected Plant Organs
Figures represent a percentage of dry weight. See also Table 2.5.4, which provides fat con-tent as a percentage of fresh weight.
Data from Franke 1976, Steward 1966
Plant species and organ Fat content (% ofdry weight)
Seeds
Alfalfa 8–10Almond 40–45Bean 8Beechnut 40–46Cacao 50–58Castor seed 35–57Coconut. endosperm 65–72Coffee 5–10Corn (maize) 4.7Cotton 16–24Flax 24–43Hazelnut 60–68Hemp 30–35Horse chestnut 3– 6Oil palm 50Parsley 16–19Peanut 24–56Pecan 65Poppy 40–51Rape 22–49Rice 2.2Sesame 44–54Soy bean 17–22Sunflower 40–65Walnut 64Wheat 2– 2.4
Fruit pericarp
Avocado 70Bay laurel 24–55Oil palm 71–81Olive 35–70
Leaves/Blades
Alfalfa 2.3Cabbage 1.7Orchard grass 2.2
176 Part 2: Botany

Plant species and organ Fat content (% ofdry weight)
Rye-grass (Lolium perenne) 1.7Spinach 0.4
Roots
Beet (Beta vulgaris) 7Mangrove 70
Sprouts
Black-eyed pea (Vigna sinensis) 2.6Soy bean 2.5Tilia (linden, lime) (T. americana). rind 2.3
Table 2.5.4: Fat Content of the Seeds and Fruits of Selected Plants as a Percent-age of Fresh Weight
Compare also to Table 2.5.3, which provides the fat content of the dry weight of selectedplant organs.
Data from Mengel 1968
Species Fat content(% of fresh weight)
Barley 2Corn (maize) 4.8Flax 40Oats 5Olive 20Olive (fruit flesh) 53Pea 2Peanut 45Poppy 45Rape 42Soy bean 36Sunflower (shelled) 50Wheat 1.7
Constituents 177
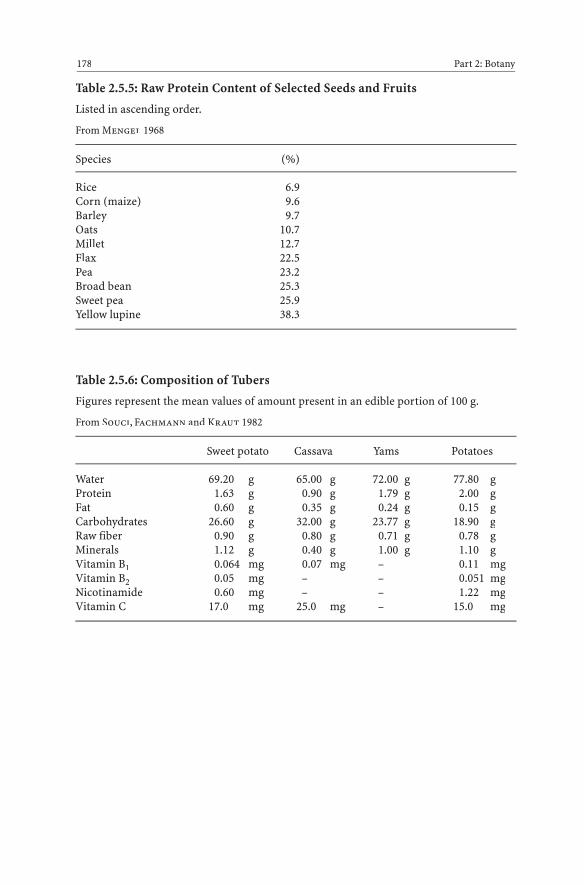
Table 2.5.5: Raw Protein Content of Selected Seeds and Fruits
Listed in ascending order.
From Mengel 1968
Species (%)
Rice 6.9Corn (maize) 9.6Barley 9.7Oats 10.7Millet 12.7Flax 22.5Pea 23.2Broad bean 25.3Sweet pea 25.9Yellow lupine 38.3
Table 2.5.6: Composition of Tubers
Figures represent the mean values of amount present in an edible portion of 100 g.
From Souci, Fachmann and Kraut 1982
Sweet potato Cassava Yams Potatoes
Water 69.20 g 65.00 g 72.00 g 77.80 gProtein 1.63 g 0.90 g 1.79 g 2.00 gFat 0.60 g 0.35 g 0.24 g 0.15 gCarbohydrates 26.60 g 32.00 g 23.77 g 18.90 gRaw fiber 0.90 g 0.80 g 0.71 g 0.78 gMinerals 1.12 g 0.40 g 1.00 g 1.10 gVitamin B1 0.064 mg 0.07 mg – 0.11 mgVitamin B2 0.05 mg – – 0.051 mgNicotinamide 0.60 mg – – 1.22 mgVitamin C 17.0 mg 25.0 mg – 15.0 mg
178 Part 2: Botany

Table 2.5.7: Sugar Content of the Nectar of Selected Plants
After Spector 1956
Plant Sugar content Sugar formation(g per 100 cm3 nectar) per blossom
in 24 h (mg)
Alfalfa 33 0.1Apple 75 0.8Blackberry 15.4–45Borage 22 –29Cucumber 30 1.0Fireweed 18.4–41Horse chestnut 69 1.1Hound’s tongue 36 0.3Ivy 10 –11.5Jasmine 33 0.3Lavender 24 –32Nasturtium 46 1.7Pear 16 0.3Pumpkin 28 28Rape 47 0.5Raspberry 46 7.6Red clover 8.3–30Robinia 55 1.0Snapdragon 45 1.5Sour cherry 15 1.2Sunflower 38 0.3Tilia (linden, lime) 21 –42White dead-nettle 46 1.7White clover 25 –39White mustard 9.3–17.6White sweet clover 36 0.04Wild cherry 21 0.5
Table 2.5.8: Energy Contents of Plant Material
Expressed in kcal (kJ) per g dry weight. Figures are mean values
From Mühlenberg 1976, modified
Leaves 4.2 kcal (17,6 kJ)Stalks and stems 4.3 kcal (18.0 kJ)Roots 4.7 kcal (19.7 kJ)Seeds 5.1 kcal (21.3 kJ)Straw 4.3 kcal (18.0 kJ)
Constituents 179
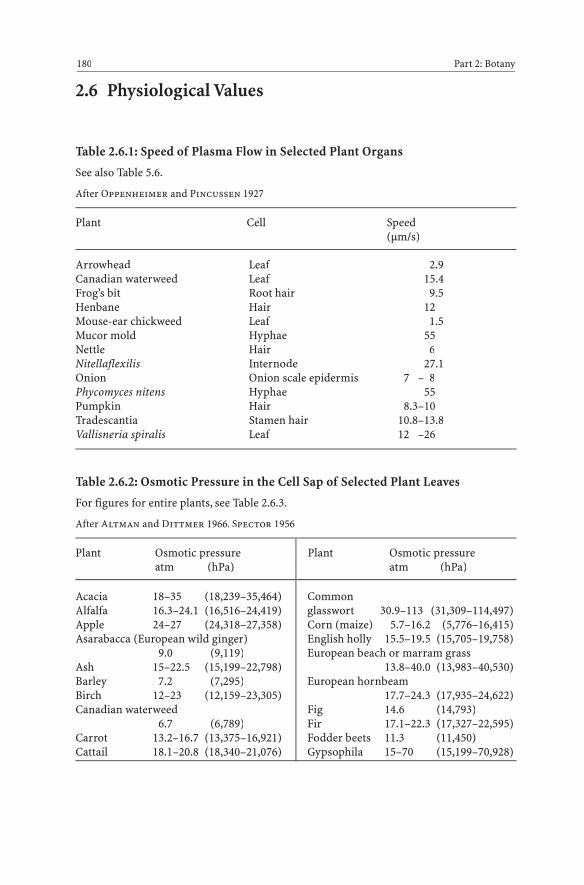
2.6 Physiological Values
Table 2.6.1: Speed of Plasma Flow in Selected Plant Organs
See also Table 5.6.
After Oppenheimer and Pincussen 1927
Plant Cell Speed(μm/s)
Arrowhead Leaf 2.9Canadian waterweed Leaf 15.4Frog’s bit Root hair 9.5Henbane Hair 12Mouse-ear chickweed Leaf 1.5Mucor mold Hyphae 55Nettle Hair 6Nitellaflexilis Internode 27.1Onion Onion scale epidermis 7 – 8Phycomyces nitens Hyphae 55Pumpkin Hair 8.3–10Tradescantia Stamen hair 10.8–13.8Vallisneria spiralis Leaf 12 –26
Table 2.6.2: Osmotic Pressure in the Cell Sap of Selected Plant Leaves
For figures for entire plants, see Table 2.6.3.
After Altman and Dittmer 1966, Spector 1956
Plant Osmotic pressure Plant Osmotic pressureatm (hPa) atm (hPa)
180 Part 2: Botany
Acacia 18–35 (18,239–35,464)Alfalfa 16.3–24.1 (16,516–24,419)Apple 24–27 (24,318–27,358)Asarabacca (European wild ginger)
9.0 (9,119)Ash 15–22.5 (15,199–22,798)Barley 7.2 (7,295)Birch 12–23 (12,159–23,305)Canadian waterweed
6.7 (6,789)Carrot 13.2–16.7 (13,375–16,921)Cattail 18.1–20.8 (18,340–21,076)
Commonglasswort 30.9–113 (31,309–114,497)Corn (maize) 5.7–16.2 (5,776–16,415)English holly 15.5–19.5 (15,705–19,758)European beach or marram grass
13.8–40.0 (13,983–40,530)European hornbeam
17.7–24.3 (17,935–24,622)Fig 14.6 (14,793)Fir 17.1–22.3 (17,327–22,595)Fodder beets 11.3 (11,450)Gypsophila 15–70 (15,199–70,928)
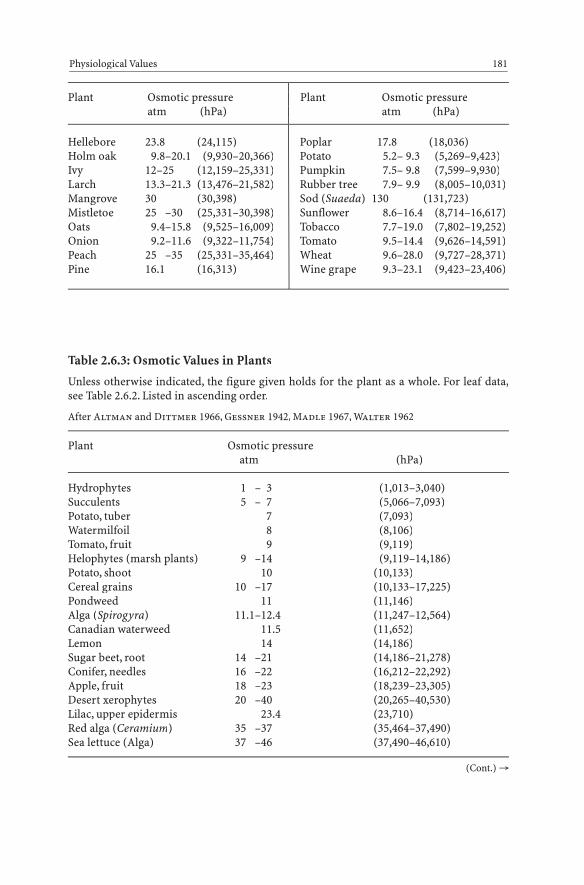
Hellebore 23.8 (24,115)Holm oak 9.8–20.1 (9,930–20,366)Ivy 12–25 (12,159–25,331)Larch 13.3–21.3 (13,476–21,582)Mangrove 30 (30,398)Mistletoe 25 –30 (25,331–30,398)Oats 9.4–15.8 (9,525–16,009)Onion 9.2–11.6 (9,322–11,754)Peach 25 –35 (25,331–35,464)Pine 16.1 (16,313)
Poplar 17.8 (18,036)Potato 5.2– 9.3 (5,269–9,423)Pumpkin 7.5– 9.8 (7,599–9,930)Rubber tree 7.9– 9.9 (8,005–10,031)Sod (Suaeda) 130 (131,723)Sunflower 8.6–16.4 (8,714–16,617)Tobacco 7.7–19.0 (7,802–19,252)Tomato 9.5–14.4 (9,626–14,591)Wheat 9.6–28.0 (9,727–28,371)Wine grape 9.3–23.1 (9,423–23,406)
Physiological Values 181
Plant Osmotic pressure Plant Osmotic pressureatm (hPa) atm (hPa)
Table 2.6.3: Osmotic Values in Plants
Unless otherwise indicated, the figure given holds for the plant as a whole. For leaf data,see Table 2.6.2. Listed in ascending order.
After Altman and Dittmer 1966, Gessner 1942, Madle 1967, Walter 1962
Plant Osmotic pressureatm (hPa)
Hydrophytes 1 – 3 (1,013–3,040)Succulents 5 – 7 (5,066–7,093)Potato, tuber 7 (7,093)Watermilfoil 8 (8,106)Tomato, fruit 9 (9,119)Helophytes (marsh plants) 9 –14 (9,119–14,186)Potato, shoot 10 (10,133)Cereal grains 10 –17 (10,133–17,225)Pondweed 11 (11,146)Alga (Spirogyra) 11.1–12.4 (11,247–12,564)Canadian waterweed 11.5 (11,652)Lemon 14 (14,186)Sugar beet, root 14 –21 (14,186–21,278)Conifer, needles 16 –22 (16,212–22,292)Apple, fruit 18 –23 (18,239–23,305)Desert xerophytes 20 –40 (20,265–40,530)Lilac, upper epidermis 23.4 (23,710)Red alga (Ceramium) 35 –37 (35,464–37,490)Sea lettuce (Alga) 37 –46 (37,490–46,610)
(Cont.) →
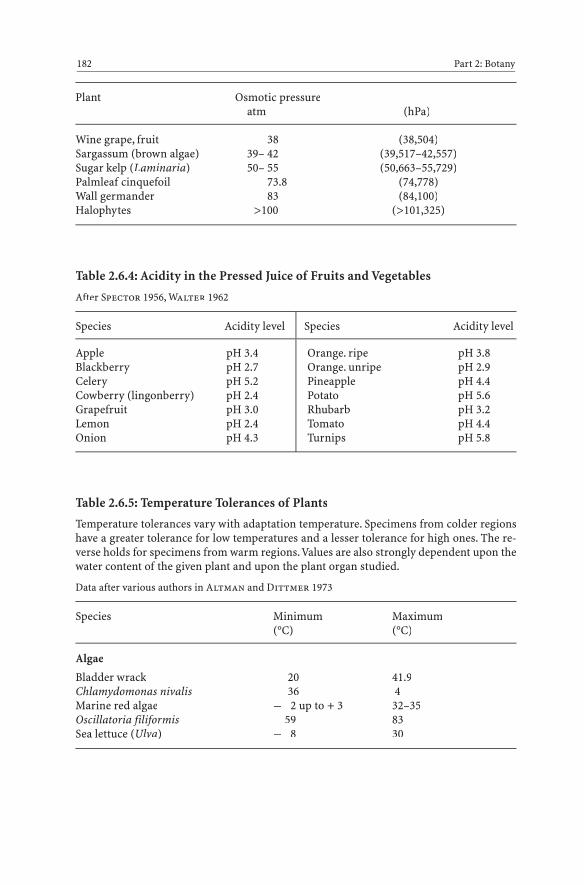
Plant Osmotic pressureatm (hPa)
Wine grape, fruit 38 (38,504)Sargassum (brown algae) 39– 42 (39,517–42,557)Sugar kelp (Laminaria) 50– 55 (50,663–55,729)Palmleaf cinquefoil 73.8 (74,778)Wall germander 83 (84,100)Halophytes >100 (>101,325)
Table 2.6.4: Acidity in the Pressed Juice of Fruits and Vegetables
After Spector 1956, Walter 1962
Species Acidity level Species Acidity level
182 Part 2: Botany
Apple pH 3.4Blackberry pH 2.7Celery pH 5.2Cowberry (lingonberry) pH 2.4Grapefruit pH 3.0Lemon pH 2.4Onion pH 4.3
Orange. ripe pH 3.8Orange. unripe pH 2.9Pineapple pH 4.4Potato pH 5.6Rhubarb pH 3.2Tomato pH 4.4Turnips pH 5.8
Table 2.6.5: Temperature Tolerances of Plants
Temperature tolerances vary with adaptation temperature. Specimens from colder regionshave a greater tolerance for low temperatures and a lesser tolerance for high ones. The re-verse holds for specimens from warm regions.Values are also strongly dependent upon thewater content of the given plant and upon the plant organ studied.
Data after various authors in Altman and Dittmer 1973
Species Minimum Maximum(°C) (°C)
Algae
Bladder wrack – 20 41.9Chlamydomonas nivalis – 36 4Marine red algae – 2 up to + 3 32–35Oscillatoria filiformis 59 83Sea lettuce (Ulva) – 8 30

Species Minimum Maximum(°C) (°C)
Spirogyra – 7 40Sugar kelp – 4 24
Lichens
Lung lichen (“lungwort”) – 196 73Reindeer lichen – 196
Mosses
Bryum sp. – 7 42Frullania dilatata 70–75Plagiothecium curvifolium 60–75
Ferns
Brackenfern (rhizome) – 2.5Common polypody – 18.1 48.5Hart’s tongue fern – 14.8 47.5
Spermatophytes (seed-bearing plants)
Alder, buds – 28Alder, leaves – 3Ash, buds – 27Ash, leaves – 2Barley – 15 up to – 10Canadian waterweed 39–39.5Cross-leaved heath – 20 50.5European beech, buds – 22European beech, leaves – 2.5Field or hedge maple, buds – 23 Field or hedge maple, leaves – 2.5Oats – 12 up to – 9Rye – 25 up to – 15Silver fir (summer) – 4 46Spruce (summer) – 8 up to – 3.5 42.5Spruce (winter) – 38 40.5Swiss pine (summer) – 10Swiss pine (winter) – 40Wheat – 22 up to – 10Woodsorrel – 11.5 40.5Yew (summer) – 4 50.5Yew (winter) – 40 47.5
Physiological Values 183

Table 2.6.6: Annual Levels of Evaporation of Selected Plants
For further figures on the evaporation levels of plants, see Tables 2.6.7 and 2.6.8. Figuresrepresent averages.
After Madle 1967
Plant Annual evaporation level
1 corn (maize) plant 100–180 liters1 ha grain 1.5–2.5 million liters1 ha beech forest 3.6 million liters1 ha spruce forest 3.2–3.9 million liters1 ha pine forest 1.6–2.7 million liters
Table 2.6.7: Transpiration Levels of Selected Plants
Transpiration values (cuticular + stomatal) in milligrams water per 100 cm2 leave surfacearea and hour. For figures on cuticular transpiration, see Table 2.6.8. Evaporation is depen-dent upon many external factors, such as temperature (T), soil moisture (SM), relative airhumidity (RH), light, and wind levels. In so far as these values are known, they are provid-ed here under “External conditions.”
Figures from Altman and Dittmer 1974
Species Water loss External conditions(mg per 100 cm2/h)
Banana 1,100 T = 25 °C, RH = 32 %Barley 958 SM = 15 %Bean 450 T = 30 °C, RH = 35 %Millet 42 T = 30 °COats 1,542 SM = 15 %Pineapple 140 T = 25 °CSunflower 576 T = 30 °C, RH = 35 %Wheat 84 T = 30 °CWine grape 473 T = 20 °C
184 Part 2: Botany
Fig. 2.6.7: Daily course of transpiration(schematic depiction) of a plant. See alsoTable 2.6.7. T = transpiration,A = air temperature, S = openness ofstomata, H = humidity.From Schmeil and Seybold 1958
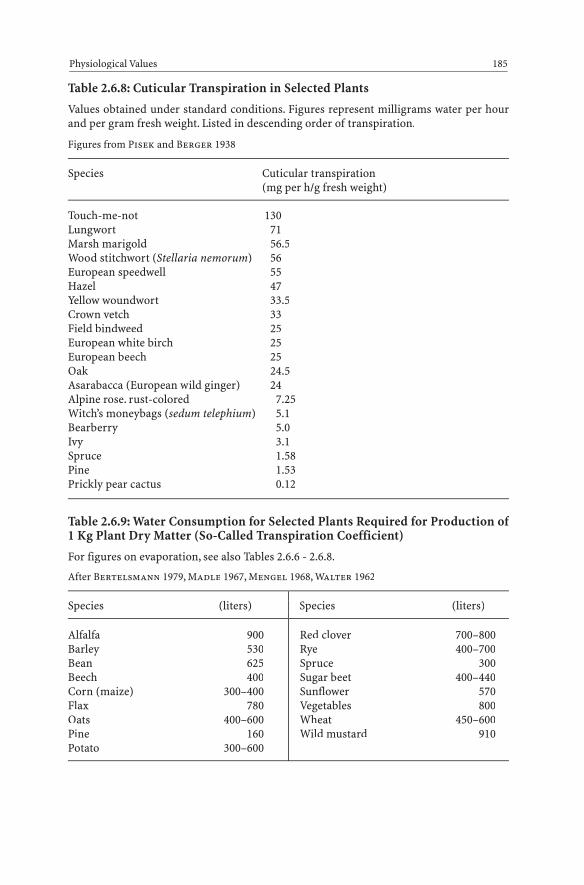
Table 2.6.8: Cuticular Transpiration in Selected Plants
Values obtained under standard conditions. Figures represent milligrams water per hourand per gram fresh weight. Listed in descending order of transpiration.
Figures from Pisek and Berger 1938
Species Cuticular transpiration(mg per h/g fresh weight)
Touch-me-not 130Lungwort 71Marsh marigold 56.5Wood stitchwort (Stellaria nemorum) 56European speedwell 55Hazel 47Yellow woundwort 33.5Crown vetch 33Field bindweed 25European white birch 25European beech 25Oak 24.5Asarabacca (European wild ginger) 24Alpine rose. rust-colored 7.25Witch’s moneybags (sedum telephium) 5.1Bearberry 5.0Ivy 3.1Spruce 1.58Pine 1.53Prickly pear cactus 0.12
Table 2.6.9: Water Consumption for Selected Plants Required for Production of1 Kg Plant Dry Matter (So-Called Transpiration Coefficient)
For figures on evaporation, see also Tables 2.6.6 - 2.6.8.
After Bertelsmann 1979, Madle 1967, Mengel 1968, Walter 1962
Species (liters) Species (liters)
Physiological Values 185
Alfalfa 900Barley 530Bean 625Beech 400Corn (maize) 300–400Flax 780Oats 400–600Pine 160Potato 300–600
Red clover 700–800Rye 400–700Spruce 300Sugar beet 400–440Sunflower 570Vegetables 800Wheat 450–600Wild mustard 910
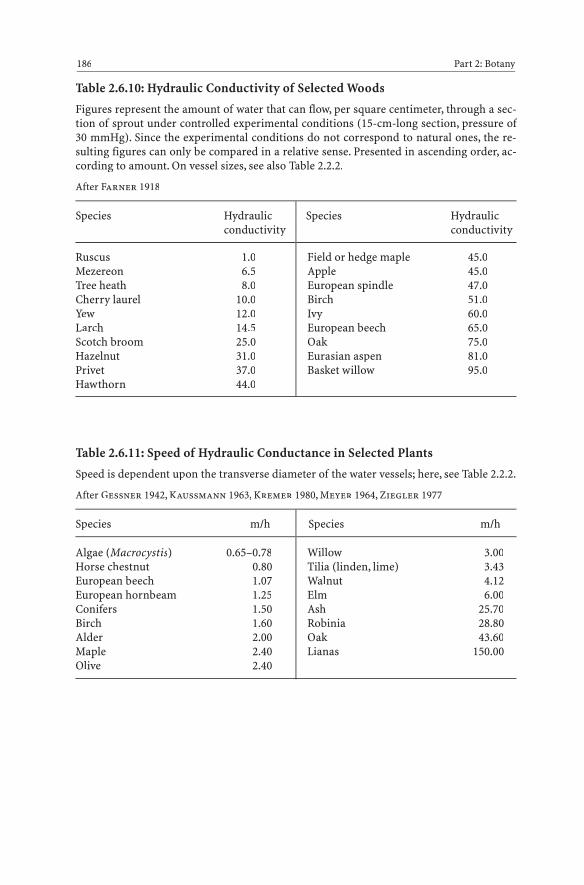
Table 2.6.10: Hydraulic Conductivity of Selected Woods
Figures represent the amount of water that can flow, per square centimeter, through a sec-tion of sprout under controlled experimental conditions (15-cm-long section, pressure of30 mmHg). Since the experimental conditions do not correspond to natural ones, the re-sulting figures can only be compared in a relative sense. Presented in ascending order, ac-cording to amount. On vessel sizes, see also Table 2.2.2.
After Farner 1918
Species Hydraulic Species Hydraulicconductivity conductivity
186 Part 2: Botany
Ruscus 1.0Mezereon 6.5Tree heath 8.0Cherry laurel 10.0Yew 12.0Larch 14.5Scotch broom 25.0Hazelnut 31.0Privet 37.0Hawthorn 44.0
Field or hedge maple 45.0Apple 45.0European spindle 47.0Birch 51.0Ivy 60.0European beech 65.0Oak 75.0Eurasian aspen 81.0Basket willow 95.0
Table 2.6.11: Speed of Hydraulic Conductance in Selected Plants
Speed is dependent upon the transverse diameter of the water vessels; here, see Table 2.2.2.
After Gessner 1942, Kaussmann 1963, Kremer 1980, Meyer 1964, Ziegler 1977
Species m/h Species m/h
Algae (Macrocystis) 0.65–0.78Horse chestnut 0.80European beech 1.07European hornbeam 1.25Conifers 1.50Birch 1.60Alder 2.00Maple 2.40Olive 2.40
Willow 3.00Tilia (linden, lime) 3.43Walnut 4.12Elm 6.00Ash 25.70Robinia 28.80Oak 43.60Lianas 150.00
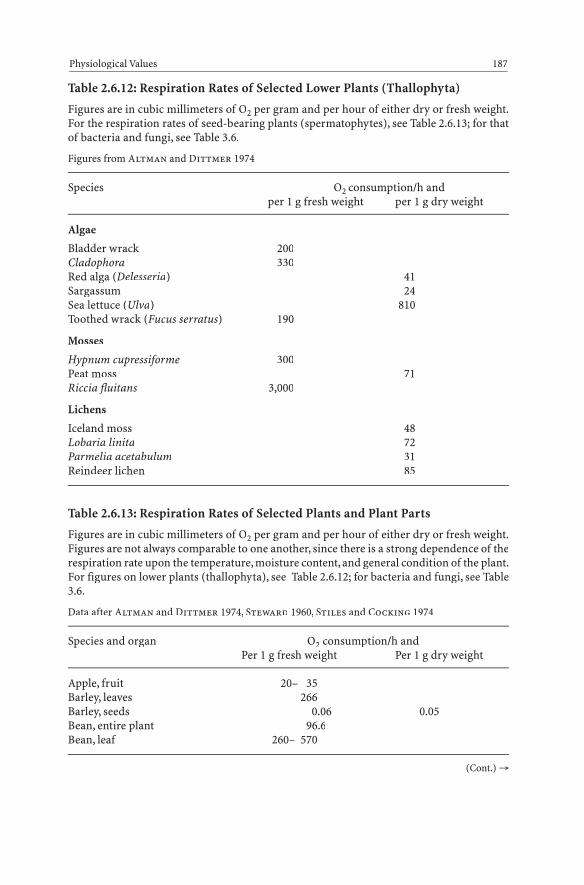
Table 2.6.12: Respiration Rates of Selected Lower Plants (Thallophyta)
Figures are in cubic millimeters of O2 per gram and per hour of either dry or fresh weight.For the respiration rates of seed-bearing plants (spermatophytes), see Table 2.6.13; for thatof bacteria and fungi, see Table 3.6.
Figures from Altman and Dittmer 1974
Species O2 consumption/h andper 1 g fresh weight per 1 g dry weight
Algae
Bladder wrack 200Cladophora 330Red alga (Delesseria) 41Sargassum 24Sea lettuce (Ulva) 810Toothed wrack (Fucus serratus) 190
Mosses
Hypnum cupressiforme 300Peat moss 71Riccia fluitans 3,000
Lichens
Iceland moss 48Lobaria linita 72Parmelia acetabulum 31Reindeer lichen 85
Table 2.6.13: Respiration Rates of Selected Plants and Plant Parts
Figures are in cubic millimeters of O2 per gram and per hour of either dry or fresh weight.Figures are not always comparable to one another, since there is a strong dependence of therespiration rate upon the temperature, moisture content, and general condition of the plant.For figures on lower plants (thallophyta), see Table 2.6.12; for bacteria and fungi, see Table3.6.
Data after Altman and Dittmer 1974, Steward 1960, Stiles and Cocking 1974
Species and organ O2 consumption/h andPer 1 g fresh weight Per 1 g dry weight
Apple, fruit 20– 35Barley, leaves 266Barley, seeds 0.06 0.05Bean, entire plant 96.6Bean, leaf 260– 570
Physiological Values 187
(Cont.) →
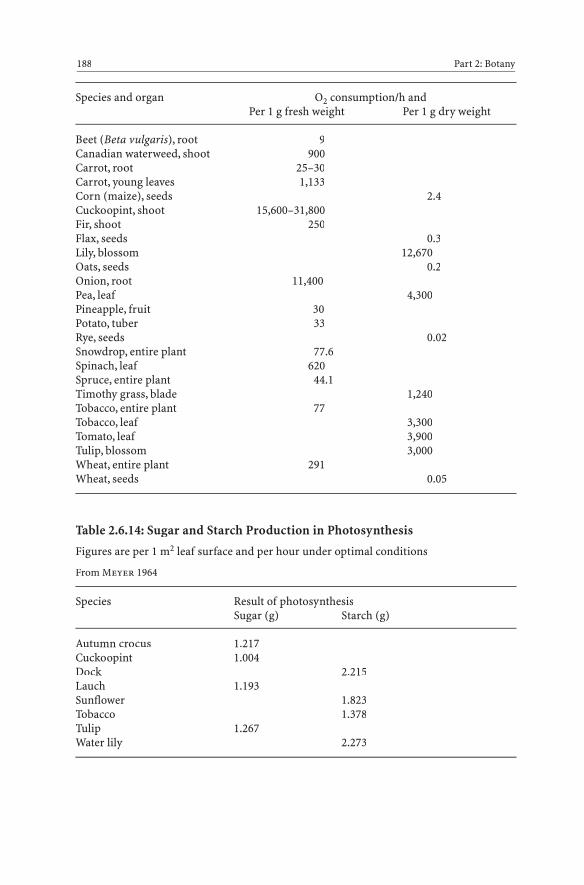
Species and organ O2 consumption/h andPer 1 g fresh weight Per 1 g dry weight
Beet (Beta vulgaris), root 9Canadian waterweed, shoot 900Carrot, root 25–30Carrot, young leaves 1,133Corn (maize), seeds 2.4Cuckoopint, shoot 15,600–31,800Fir, shoot 250Flax, seeds 0.3Lily, blossom 12,670Oats, seeds 0.2Onion, root 11,400Pea, leaf 4,300Pineapple, fruit 30Potato, tuber 33Rye, seeds 0.02Snowdrop, entire plant 77.6Spinach, leaf 620Spruce, entire plant 44.1Timothy grass, blade 1,240Tobacco, entire plant 77Tobacco, leaf 3,300Tomato, leaf 3,900Tulip, blossom 3,000Wheat, entire plant 291Wheat, seeds 0.05
Table 2.6.14: Sugar and Starch Production in Photosynthesis
Figures are per 1 m2 leaf surface and per hour under optimal conditions
From Meyer 1964
Species Result of photosynthesisSugar (g) Starch (g)
Autumn crocus 1.217Cuckoopint 1.004Dock 2.215Lauch 1.193Sunflower 1.823Tobacco 1.378Tulip 1.267Water lily 2.273
188 Part 2: Botany
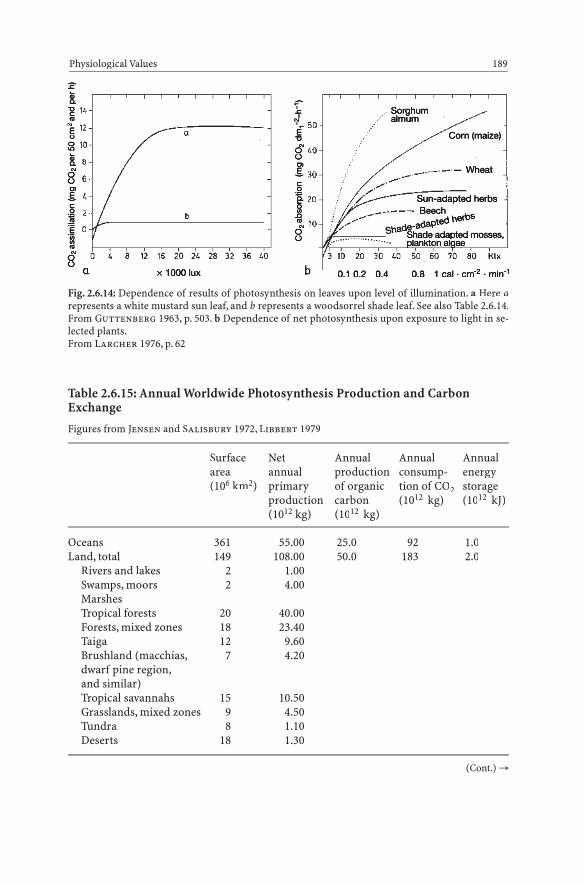
Table 2.6.15: Annual Worldwide Photosynthesis Production and CarbonExchange
Figures from Jensen and Salisbury 1972, Libbert 1979
Surface Net Annual Annual Annualarea annual production consump- energy(106 km2) primary of organic tion of CO2 storage
production carbon (1012 kg) (1012 kJ)(1012 kg) (1012 kg)
Oceans 361 55.00 25.0 92 1.0Land, total 149 108.00 50.0 183 2.0
Rivers and lakes 2 1.00Swamps, moors 2 4.00MarshesTropical forests 20 40.00Forests, mixed zones 18 23.40Taiga 12 9.60Brushland (macchias, 7 4.20dwarf pine region,and similar)Tropical savannahs 15 10.50Grasslands, mixed zones 9 4.50Tundra 8 1.10Deserts 18 1.30
Physiological Values 189
Fig. 2.6.14: Dependence of results of photosynthesis on leaves upon level of illumination. a Here arepresents a white mustard sun leaf, and b represents a woodsorrel shade leaf. See also Table 2.6.14.From Guttenberg 1963, p. 503. b Dependence of net photosynthesis upon exposure to light in se-lected plants.From Larcher 1976, p. 62
(Cont.) →
CO
iil
i(
CO
2d
h)
0.1 0.2 0.4 0.8 1 cal cm min
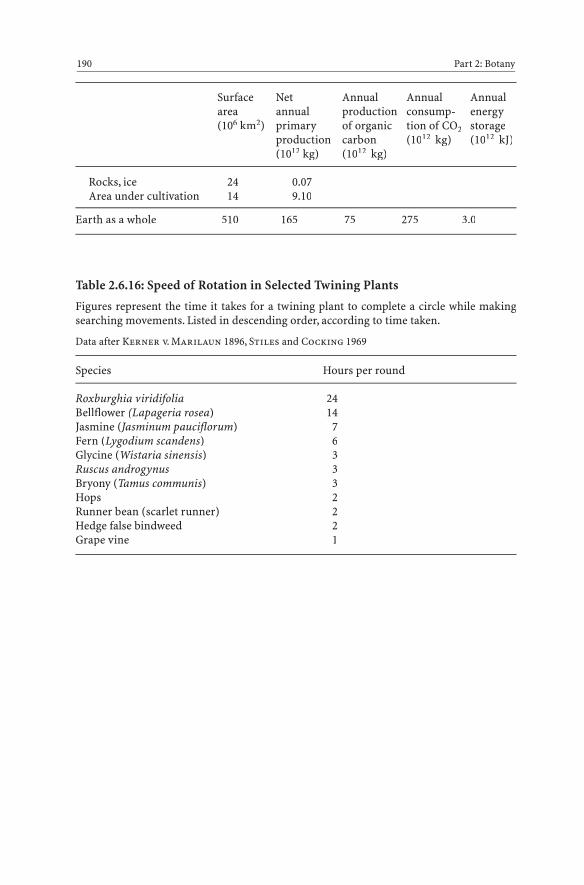
Surface Net Annual Annual Annualarea annual production consump- energy(106 km2) primary of organic tion of CO2 storage
production carbon (1012 kg) (1012 kJ)(1012 kg) (1012 kg)
Rocks, ice 24 0.07Area under cultivation 14 9.10
Earth as a whole 510 165 75 275 3.0
Table 2.6.16: Speed of Rotation in Selected Twining Plants
Figures represent the time it takes for a twining plant to complete a circle while makingsearching movements. Listed in descending order, according to time taken.
Data after Kerner v. Marilaun 1896, Stiles and Cocking 1969
Species Hours per round
Roxburghia viridifolia 24Bellflower (Lapageria rosea) 14Jasmine (Jasminum pauciflorum) 7Fern (Lygodium scandens) 6Glycine (Wistaria sinensis) 3Ruscus androgynus 3Bryony (Tamus communis) 3Hops 2Runner bean (scarlet runner) 2Hedge false bindweed 2Grape vine 1
190 Part 2: Botany
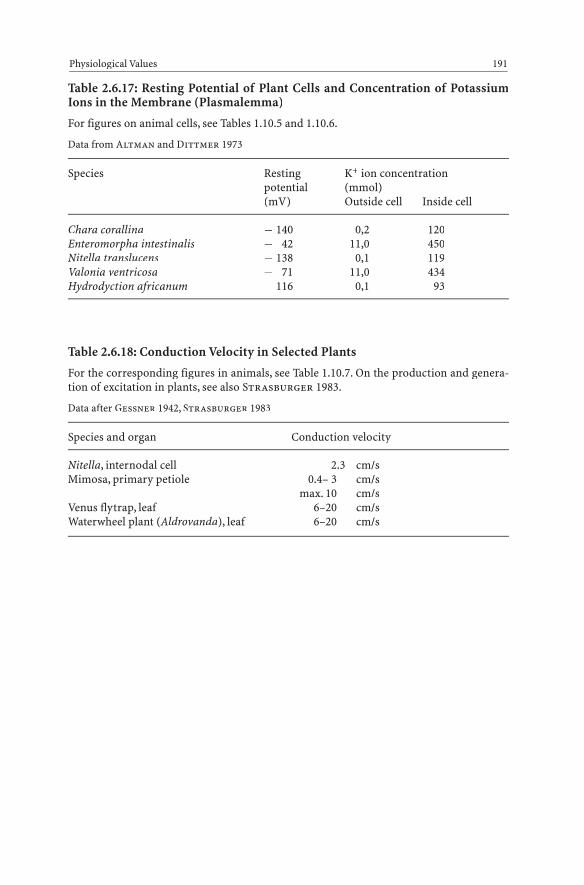
Table 2.6.17: Resting Potential of Plant Cells and Concentration of PotassiumIons in the Membrane (Plasmalemma)
For figures on animal cells, see Tables 1.10.5 and 1.10.6.
Data from Altman and Dittmer 1973
Species Resting K+ ion concentrationpotential (mmol)(mV) Outside cell Inside cell
Chara corallina – 140 0,2 120Enteromorpha intestinalis – 42 11,0 450Nitella translucens – 138 0,1 119Valonia ventricosa – 71 11,0 434Hydrodyction africanum – 116 0,1 93
Table 2.6.18: Conduction Velocity in Selected Plants
For the corresponding figures in animals, see Table 1.10.7. On the production and genera-tion of excitation in plants, see also Strasburger 1983.
Data after Gessner 1942, Strasburger 1983
Species and organ Conduction velocity
Nitella, internodal cell 2.3 cm/sMimosa, primary petiole 0.4– 3 cm/s
max. 10 cm/sVenus flytrap, leaf 6–20 cm/sWaterwheel plant (Aldrovanda), leaf 6–20 cm/s
Physiological Values 191
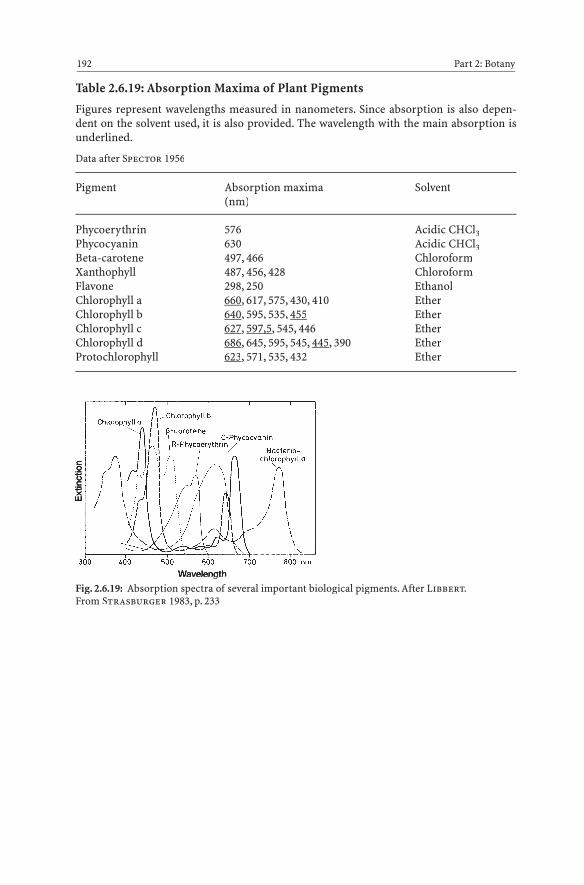
Table 2.6.19: Absorption Maxima of Plant Pigments
Figures represent wavelengths measured in nanometers. Since absorption is also depen-dent on the solvent used, it is also provided. The wavelength with the main absorption isunderlined.
Data after Spector 1956
Pigment Absorption maxima Solvent(nm)
Phycoerythrin 576 Acidic CHCl3Phycocyanin 630 Acidic CHCl3Beta-carotene 497, 466 ChloroformXanthophyll 487, 456, 428 ChloroformFlavone 298, 250 EthanolChlorophyll a 660, 617, 575, 430, 410 EtherChlorophyll b 640, 595, 535, 455 EtherChlorophyll c 627, 597,5, , 545, 446 EtherChlorophyll d 686, 645, 595, 545, 445, 390 EtherProtochlorophyll 623, 571, 535, 432 Ether
192 Part 2: Botany
Fig. 2.6.19: Absorption spectra of several important biological pigments. After Libbert.From Strasburger 1983, p. 233
Wavelength
Ei
i

Part 3: Microbiology

Table 3.1: Size and Structure of Viruses
The term virion is the more recent designation for an infective viral particle; capsomerrefers to the morphological subunit that builds the capsule that envelops the nucleic acid.The virus that triggers AIDS is one of the retroviruses. For data on the size of bacteria, seeTable 3.2.
Data after Grafe 1977, Laskin and Lechevalier 1973, Otte and Brandis 1978, Riesner 1979,Weide and Aurich 1979
Virus group Diameter of Capsomers Molecular weight virion (n) of the genome(nm) (¥ 106)
Adenoviruses 70– 90 252 20 – 30Arenaviruses 50–300 3.2– 5.6Bacteriophage l 54 33Coronaviruses 80–160 9Herpesviruses 160–200 162 92 –102Iridoviruses 130 130Orthomyxoviruses(influenza viruses) 80–120 6Papovaviruses 45– 55 72 3 – 5Paramyxoviruses 150–300 5 – 8Parvoviruses 16– 26 32 ? 1.5– 2.2Picornaviruses 20– 30 32 ? 2.5Pox viruses 170–260 ¥ 300–450 130 –240Reoviruses 60– 80 92 ? 15Retroviruses 80–120 7 – 10Rhabdoviruses 70 ¥ 130 –300 3.5– 4.5Togaviruses 40– 70 32 3 – 4Viroid 40 ¥? 2 0.12
Table 3.2: Dimensions of Bacteria
For data on viruses, see Table 3.1.
Data after Kunstyr et al. 1988, Otte and Brandis 1978, Schlegel 1976
Species Length (μm) Width (μm)
Bacillus anthracis 3.0–10.0 1.0–1.5Bacillus megatherium 5.0 2.0Bordetella pertussis 0.5– 1.0 0.3–0.5Brucella spp. 0.6– 1.5 0.5–0.7Corynebacterium diphtheriae 0.2Clostridium botulinum 2.0–10.0 0.5–1.0Clostridium tetani 2.4– 5.0 0.5–1.1
Size and Structure of Viruses 195
(Cont.) →

Species Length (μm) Width (μm)
Enterobacteria 2.0– 3.0 0.5–1.0Francisella tularensis 0.2– 0.7Haemophilus influenzae 0.3– 0.5Leptospires 7.0– 25.0 0.12Leptotricha buccalis 5.0– 15.0 1.0–1.5Metabacterium criceti 20.0 4.0Micrococcus 0.2Mycobacterium tuberculosis 3.0 0.4Mycoplasmas 0.3– 0.8Neisseria gonorrhoeae 0.8Pseudomonas spp. 0.5– 1.0 1.5–4.0Rickettsia 1.0– 2.0 0.3–0.7Spirochetes 30.0–500.0Staphylococcus 0.8– 1.0Streptococcus pneumoniae 0.8– 1.0Vibrio cholerae 1.5– 3.0 0.5
Table 3.3: Generation Time of Selected Bacteria
Generation time in bacteria represents the time interval from one cell division to the next.Since it is heavily dependent upon temperature, the table also gives the latter. The in partvery large ranges result from the fact that generation time can be dependent upon the giv-en culture medium.
Data after Altman and Dittmer 1972, Spector 1956
Bacterial species Temperature Generation time(°C) (min)
Bacillus cereus 37 18.8Bacillus subtilis 36 35Clostridium botulinum 37 35Diplococcus pneumoniae, Type I 37 20.5–29Diplococcus pneumoniae, Type II 37 23.0–33Escherichia coli 37 12.5–17Lactobacillus acidophilus 37 60.0–87Proteus vulgaris 37 21.5–46Pseudomonas aeruginosa 37 31.0–34Rhizobium leguminosarum 25 79.0–187Salmonella typhimurum 37 24.0–35Salmonella typhosa 37 23.5–33Serratia marcescens 35 28Staphylococcus aureus 37 27.0–32Streptococcus lactis 37 26.0–37Vibrio cholerae 37 21.2–38
196 Part 3: Microbiology

Table 3.4: pH Ranges for the Growth of Bacteria and Fungi
Figures from Thimann 1964
Optimum Minimum Maximum
Bacteria, cocci
Diplococcus pneumoniae 7.8 7.0 8.3Neisseria meningitidis 7.4 6.1 7.8Neisseria gonorrhoeae 7.3 5.8 8.3Streptococcus pyogenes 7.8 4.5 9.2
Bacteria, rods
Agrobacterium tumefaciens 5.7 9.2Azotobacter chroococcum 7.4–7.6 5.8Bacillus subtilis 6.0–7.5 4.5 8.5Clostridium tetanis 7.0–7.6 5.5 8.3Escherichia coli 6.0–7.0 4.3 9.5Mycobacterium tuberculosis 6.8–7.7 5.0 8.4Pasteurella pestis 6.2–7.0 5.0 8.2Proteus vulgaris 6.5 4.4 9.2Salmonella parathyphosum 6.2–7.2 4.0 9.6Salmonella thyphosum 6.8–7.2 4.0 9.6Serratia marcescens 6.0–7.0 4.6 8.0Vibrio cholerae 7.0–7.4 5.6 9.6
Fungi
Fusarium oxysporium 1.8 11.1Mucor glomerula 3.2 9.2Penicillium variabile 1.9 9.3Pilobulus kleinii 6.2 10.1Saccharomyces cerevisiae 4.0–5.0 2.4
Table 3.5: Lethal Temperatures for Selected Microorganisms
Temperature values are accompanied by figures for the time required to kill the respectiveorganism. For data on viruses, see Table 3.6.
Figures from Altman and Dittmer 1973, Schlegel 1976
Microorganism Lethal temperature Time required(°C) (min)
Bacteria
Aerobacter aerogenes 55 30Bacillus anthracis, vegetative form 60 30
Size and Structure of Viruses 197
(Cont.) →
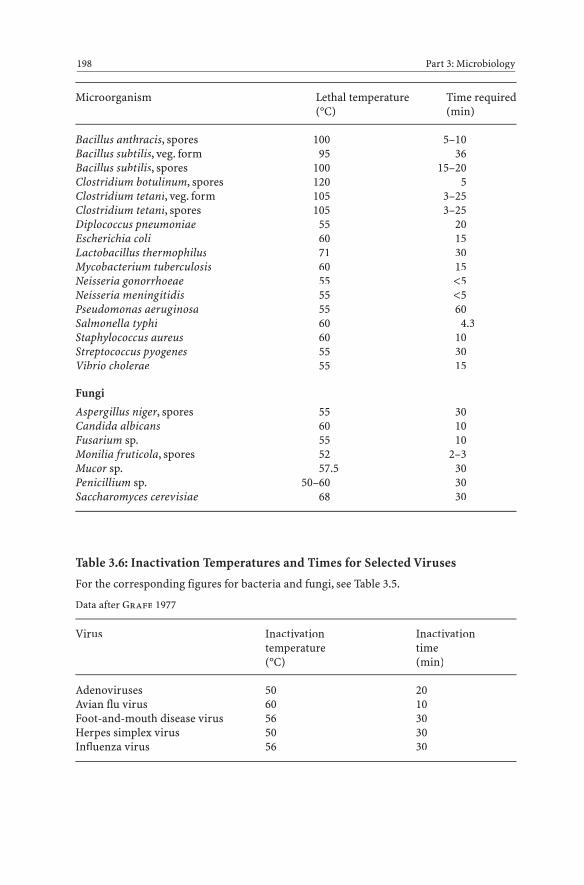
Microorganism Lethal temperature Time required(°C) (min)
Bacillus anthracis, spores 100 5–10Bacillus subtilis, veg. form 95 36Bacillus subtilis, spores 100 15–20Clostridium botulinum, spores 120 5Clostridium tetani, veg. form 105 3–25Clostridium tetani, spores 105 3–25Diplococcus pneumoniae 55 20Escherichia coli 60 15Lactobacillus thermophilus 71 30Mycobacterium tuberculosis 60 15Neisseria gonorrhoeae 55 <5Neisseria meningitidis 55 <5Pseudomonas aeruginosa 55 60Salmonella typhi 60 4.3Staphylococcus aureus 60 10Streptococcus pyogenes 55 30Vibrio cholerae 55 15
Fungi
Aspergillus niger, spores 55 30Candida albicans 60 10Fusarium sp. 55 10Monilia fruticola, spores 52 2–3Mucor sp. 57.5 30Penicillium sp. 50–60 30Saccharomyces cerevisiae 68 30
Table 3.6: Inactivation Temperatures and Times for Selected Viruses
For the corresponding figures for bacteria and fungi, see Table 3.5.
Data after Grafe 1977
Virus Inactivation Inactivationtemperature time(°C) (min)
Adenoviruses 50 20Avian flu virus 60 10Foot-and-mouth disease virus 56 30Herpes simplex virus 50 30Influenza virus 56 30
198 Part 3: Microbiology
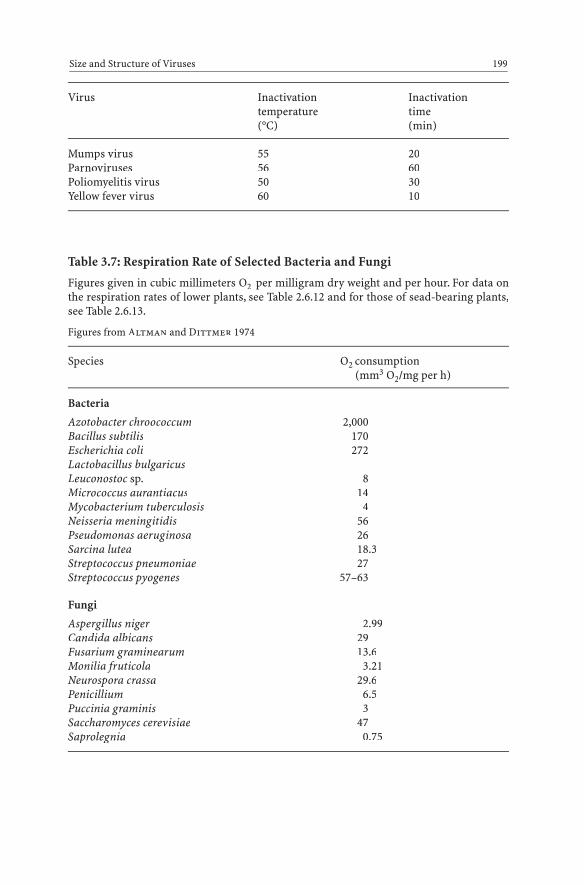
Virus Inactivation Inactivationtemperature time(°C) (min)
Mumps virus 55 20Parnoviruses 56 60Poliomyelitis virus 50 30Yellow fever virus 60 10
Table 3.7: Respiration Rate of Selected Bacteria and Fungi
Figures given in cubic millimeters O2 per milligram dry weight and per hour. For data onthe respiration rates of lower plants, see Table 2.6.12 and for those of sead-bearing plants,see Table 2.6.13.
Figures from Altman and Dittmer 1974
Species O2 consumption(mm3 O2/mg per h)
Bacteria
Azotobacter chroococcum 2,000Bacillus subtilis 170Escherichia coli 272Lactobacillus bulgaricusLeuconostoc sp. 8Micrococcus aurantiacus 14Mycobacterium tuberculosis 4Neisseria meningitidis 56Pseudomonas aeruginosa 26Sarcina lutea 18.3Streptococcus pneumoniae 27Streptococcus pyogenes 57–63
Fungi
Aspergillus niger 2.99Candida albicans 29Fusarium graminearum 13.6Monilia fruticola 3.21Neurospora crassa 29.6Penicillium 6.5Puccinia graminis 3Saccharomyces cerevisiae 47Saprolegnia 0.75
Size and Structure of Viruses 199

Table 3.8: Incubation Times of Several Important Infectious Diseases
Figures from Grafe 1977, Lexikon der Biologie, Otte and Brandis 1978, Siewing 1985
Disease Incubation times
AIDS 2 weeks – 6 yearsAmoebic dysentery 1 day – 4 weeksAnthrax 2– 3 daysChicken pox 11–21 daysCholera 1– 5 daysDiphtheria 2– 5 daysDysentery (shigellosis) 2– 7 daysEpidemic hepatitis 1– 7 weeksGerman measles (rubella) 14–21 daysGonorrhea 1– 2 daysHerpes zoster (shingles) 2– 3 weeksInfluenza 1– 3 daysLeprosy 9 months to several yearsMalaria (M. tropica) 7–12 daysMeasles 9–14 daysMumps 18–21 daysPertussis (whooping cough) 8–15 daysPoliomyelitis 7–14 daysRabies 20–60 daysScarlet fever 2– 7 daysSmallpox 5–14 daysSyphilis 14–21 daysTetanus 4–14 daysTyphus 5–21 daysTyphus 1– 3 daysYellow fever 3– 6 days
200 Part 3: Microbiology
Part 4: Human Biology
Isolated data pertaining to humans can also be found in most of the tables in Part I, Zoolo-gy. More comprehensive data can also be gained from the follow-on volume: Kunsch andKunsch (2001) Der Mensch in Zahlen

4.1 General Data
Table 4.1.0: Numbers that Amaze
This table brings together some interesting numbers on humans, which are cited again inthe individual tables below, where they are accompanied by references to the literature.
General Data 203
Number of cells in the skin 110,000,000,000per cm2 6,000,000in the brain 14,000,000,000
Number of mucous membrane cells in the small intestine 200,000,000,000Number of hairs on a blonde person on the head 150,000
+ body hair 25,000Number of perspiratory glands in total on the skin 1,800,000
per cm2 100
Number of heart beats in 70 years 3,000,000,000Amount of blood conveyed in 70 years 250,000,000 litersLength of the blood capillaries in total 1,200 km
Number of alveoli in the lung 850,000,000Length of capillaries in the alveoli 13 km
Number of salivary glands in total in the mouth 6,000,000Number of intestinal villi in the small intestine 7,000,000
Number of renal corpuscles (glomeruli) 2,000,000Length of the loops of Henle in total 100 km
Number of synapses in the brain 1,000,000,000,000Length of nerve fibers in total in the cerebrum 500,000 km
Number of retinal cones in the eye 7,000,000Number of retinal rods in the eye 125,000,000
Number of hair cells on the basilar membranein the ear 14,000

Table 4.1.1: Life Span of Cells in Selected Organs of the Human Body
Data after Klima 1967, Rucker 1967
Organ Average life span(days)
Stomach (pylorus) 1.8– 1.9Stomach (cardia) 9.1Small intestine 1.3– 1.6Liver 10.0– 20.0Large intestine 10.0Rectum 6.2Anus 4.3Trachea 47.5Lungs (alveoli) 8.1White blood cells 1.0– 3.0Red blood cells 120.0Bladder 64.0
EpidermisLips 14.7Soles 19.1Abdominal skin 19.4Ear 34.5
Nervous system No regeneration
Table 4.1.2: DNA and RNA Contents of Selected Human Cells
Figures in picograms (1 pg = 1 trillionth of a gram = 0.000 000 001 g) per cell. For compar-ative figures for animals, see Table 5.11.
Figures from Altman and Dittmer 1972
Cell DNA RNA(pg/cell) (pg/cell)
Bone marrow 0.87 0.69Brain 0.68 2.63Kidney 0.83 1.10Liver 1.0 2.48Leukocytes 0.73 0.25Sperm 0.31 0.24
204 Part 4: Human Biology
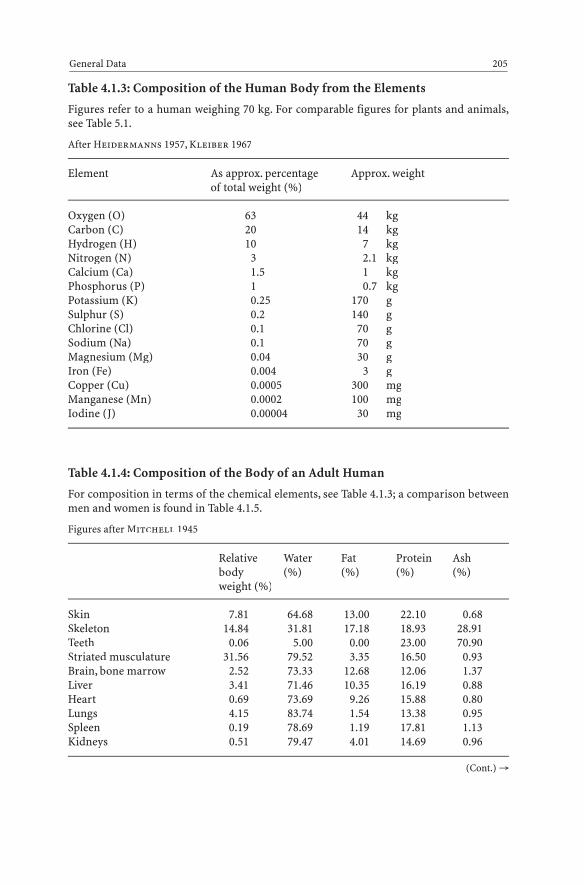
Table 4.1.3: Composition of the Human Body from the Elements
Figures refer to a human weighing 70 kg. For comparable figures for plants and animals,see Table 5.1.
After Heidermanns 1957, Kleiber 1967
Element As approx. percentage Approx. weightof total weight (%)
Oxygen (O) 63 44 kgCarbon (C) 20 14 kgHydrogen (H) 10 7 kgNitrogen (N) 3 2.1 kgCalcium (Ca) 1.5 1 kgPhosphorus (P) 1 0.7 kgPotassium (K) 0.25 170 gSulphur (S) 0.2 140 gChlorine (Cl) 0.1 70 gSodium (Na) 0.1 70 gMagnesium (Mg) 0.04 30 gIron (Fe) 0.004 3 gCopper (Cu) 0.0005 300 mgManganese (Mn) 0.0002 100 mgIodine (J) 0.00004 30 mg
Table 4.1.4: Composition of the Body of an Adult Human
For composition in terms of the chemical elements, see Table 4.1.3; a comparison betweenmen and women is found in Table 4.1.5.
Figures after Mitchell 1945
Relative Water Fat Protein Ashbody (%) (%) (%) (%)weight (%)
Skin 7.81 64.68 13.00 22.10 0.68Skeleton 14.84 31.81 17.18 18.93 28.91Teeth 0.06 5.00 0.00 23.00 70.90Striated musculature 31.56 79.52 3.35 16.50 0.93Brain, bone marrow 2.52 73.33 12.68 12.06 1.37Liver 3.41 71.46 10.35 16.19 0.88Heart 0.69 73.69 9.26 15.88 0.80Lungs 4.15 83.74 1.54 13.38 0.95Spleen 0.19 78.69 1.19 17.81 1.13Kidneys 0.51 79.47 4.01 14.69 0.96
General Data 205
(Cont.) →
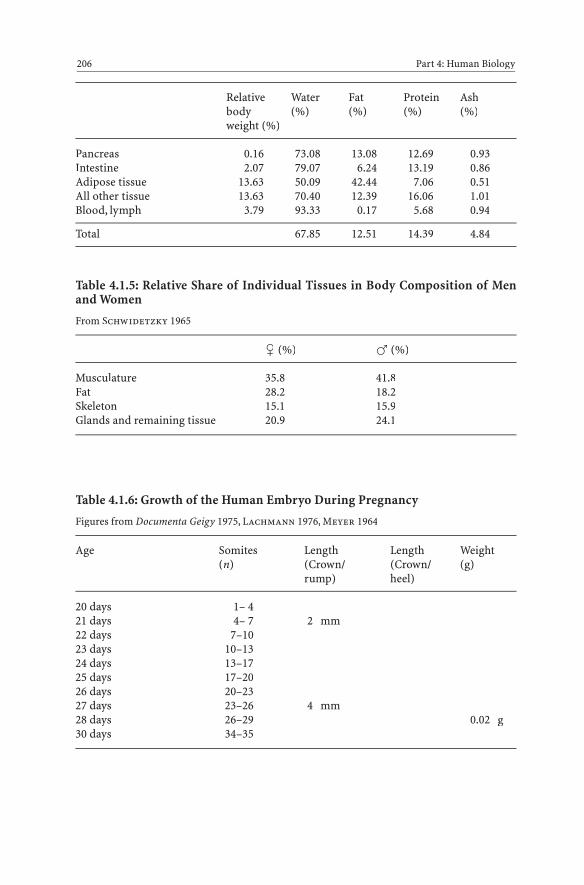
Relative Water Fat Protein Ashbody (%) (%) (%) (%)weight (%)
Pancreas 0.16 73.08 13.08 12.69 0.93Intestine 2.07 79.07 6.24 13.19 0.86Adipose tissue 13.63 50.09 42.44 7.06 0.51All other tissue 13.63 70.40 12.39 16.06 1.01Blood, lymph 3.79 93.33 0.17 5.68 0.94
Total 67.85 12.51 14.39 4.84
Table 4.1.5: Relative Share of Individual Tissues in Body Composition of Menand Women
From Schwidetzky 1965
� (%) � (%)
Musculature 35.8 41.8Fat 28.2 18.2Skeleton 15.1 15.9Glands and remaining tissue 20.9 24.1
Table 4.1.6: Growth of the Human Embryo During Pregnancy
Figures from Documenta Geigy 1975, Lachmann 1976, Meyer 1964
Age Somites Length Length Weight(n) (Crown/ (Crown/ (g)
rump) heel)
20 days 1– 421 days 4– 7 2 mm22 days 7–1023 days 10–1324 days 13–1725 days 17–2026 days 20–2327 days 23–26 4 mm28 days 26–29 0.02 g30 days 34–35
206 Part 4: Human Biology

Age Somites Length Length Weight(n) (Crown/ (Crown/ (g)
rump) heel)
35 days 42–44 5–8 mm6 weeks 10–14 mm7 weeks 17–22 mm 1.9 cm8 weeks 28–30 mm 3.0 cm 1 g
12 weeks 5.6 cm 7.3 cm 14 g16 weeks 11.2 cm 15.7 cm 105 g20 weeks 16.0 cm 23.9 cm 310 g24 weeks 20.3 cm 29.6 cm 640 g28 weeks 24.2 cm 35.5 cm 1,080 g32 weeks 27.7 cm 40.9 cm 1,670 g36 weeks 31.3 cm 45.8 cm 2,400 g40 weeks (birth) 35.0 cm 50.0 cm 3,300 g
Table 4.1.7: Normal Growth of Boys and Girls
Figures given for height and weight. Numbers represent the range covering 80% of all in-dividuals. The shortest documented adult was Pauline Musters, at a height of 0.48 m; thetallest was R.P. Wadlow, at 2.72 m.
Figures from Documenta Geigy 1975, Schmidt 1984
Boys GirlsAge Height Weight Height Weight
(cm) (kg) (cm) (kg)
Birth 49.0– 52.5 2.80– 3.90 47.0– 52.0 2.70– 3.961 month 52.5– 56.8 3.57– 4.58 51.4– 55.5 3.44– 4.423 months 59.0– 63.2 5.40– 6.66 58.0– 61.6 4.89– 6.236 months 65.1– 71.3 7.00– 8.77 64.0– 69.3 6.53– 8.279 months 71.0– 75.0 8.30–10.36 68.6– 73.5 7.62– 9.711 year 73.4– 79.0 9.71–11.13 72.0– 77.0 8.40–11.05
18 months 79.9– 86.0 10.36–12.91 78.5– 85.0 10.15–12.422 years 81.7– 92.3 9.70–15.10 81.4– 91.6 10.10–13.703 years 91.0–101.6 11.90–17.30 89.6–100.8 11.70–16.904 years 97.9–109.1 14.00–19.40 96.5–108.1 13.30–19.305 years 104.2–116.2 16.10–21.70 103.5–114.9 15.20–21.406 years 110.2–122.8 18.00–24.00 109.4–122.4 16.80–24.407 years 115.8–129.0 19.80–26.60 115.3–129.5 18.40–28.608 years 121.3–134.7 20.80–29.80 121.7–134.7 20.70–32.709 years 126.7–139.9 21.70–33.30 126.5–139.9 22.60–35.0010 years 131.2–145.4 23.50–37.50 130.2–144.8 24.80–38.20
General Data 207
(Cont.) →
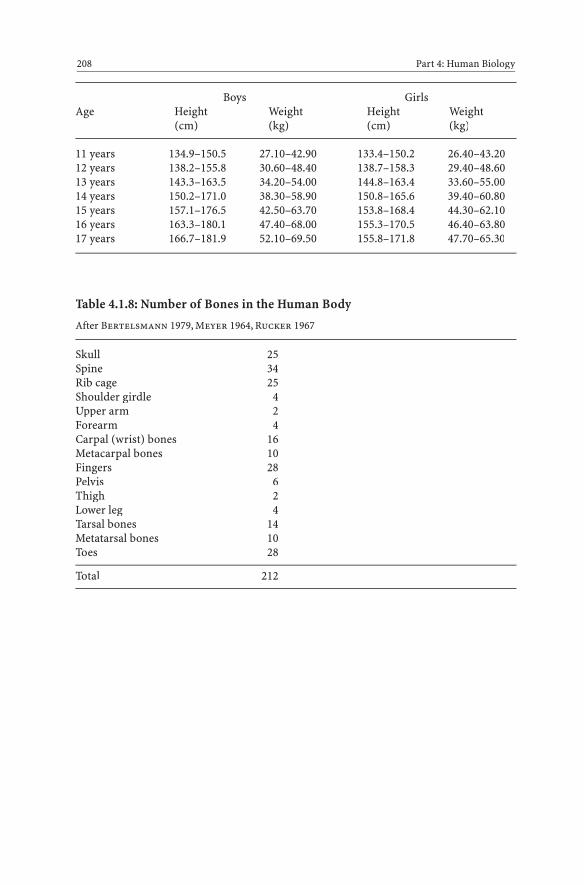
Boys GirlsAge Height Weight Height Weight
(cm) (kg) (cm) (kg)
11 years 134.9–150.5 27.10–42.90 133.4–150.2 26.40–43.2012 years 138.2–155.8 30.60–48.40 138.7–158.3 29.40–48.6013 years 143.3–163.5 34.20–54.00 144.8–163.4 33.60–55.0014 years 150.2–171.0 38.30–58.90 150.8–165.6 39.40–60.8015 years 157.1–176.5 42.50–63.70 153.8–168.4 44.30–62.1016 years 163.3–180.1 47.40–68.00 155.3–170.5 46.40–63.8017 years 166.7–181.9 52.10–69.50 155.8–171.8 47.70–65.30
Table 4.1.8: Number of Bones in the Human Body
After Bertelsmann 1979, Meyer 1964, Rucker 1967
Skull 25Spine 34Rib cage 25Shoulder girdle 4Upper arm 2Forearm 4Carpal (wrist) bones 16Metacarpal bones 10Fingers 28Pelvis 6Thigh 2Lower leg 4Tarsal bones 14Metatarsal bones 10Toes 28
Total 212
208 Part 4: Human Biology
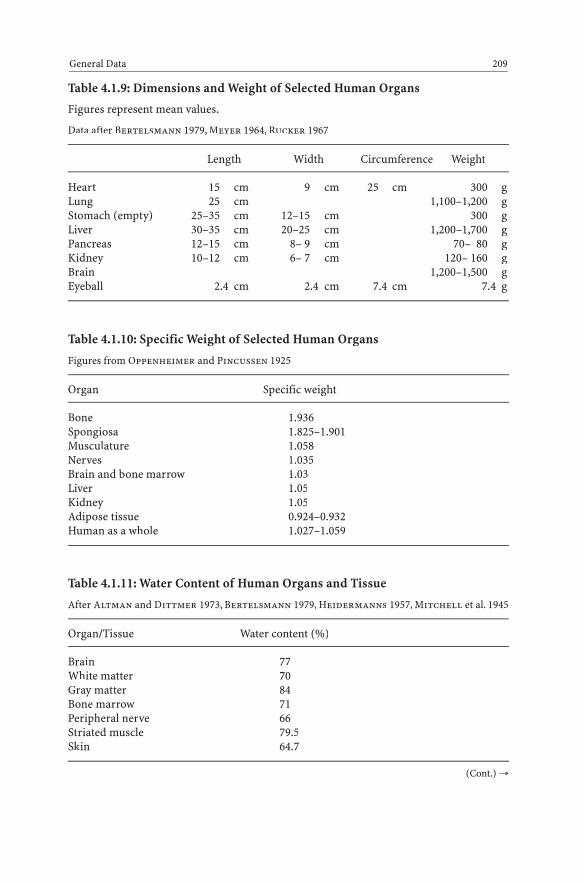
Table 4.1.9: Dimensions and Weight of Selected Human Organs
Figures represent mean values.
Data after Bertelsmann 1979, Meyer 1964, Rucker 1967
Length Width Circumference Weight
Heart 15 cm 9 cm 25 cm 300 gLung 25 cm 1,100–1,200 gStomach (empty) 25–35 cm 12–15 cm 300 gLiver 30–35 cm 20–25 cm 1,200–1,700 gPancreas 12–15 cm 8– 9 cm 70– 80 gKidney 10–12 cm 6– 7 cm 120– 160 gBrain 1,200–1,500 gEyeball 2.4 cm 2.4 cm 7.4 cm 7.4 g
Table 4.1.10: Specific Weight of Selected Human Organs
Figures from Oppenheimer and Pincussen 1925
Organ Specific weight
Bone 1.936Spongiosa 1.825–1.901Musculature 1.058Nerves 1.035Brain and bone marrow 1.03Liver 1.05Kidney 1.05Adipose tissue 0.924–0.932Human as a whole 1.027–1.059
Table 4.1.11: Water Content of Human Organs and Tissue
After Altman and Dittmer 1973, Bertelsmann 1979, Heidermanns 1957, Mitchell et al. 1945
Organ/Tissue Water content (%)
Brain 77White matter 70Gray matter 84Bone marrow 71Peripheral nerve 66Striated muscle 79.5Skin 64.7
General Data 209
(Cont.) →
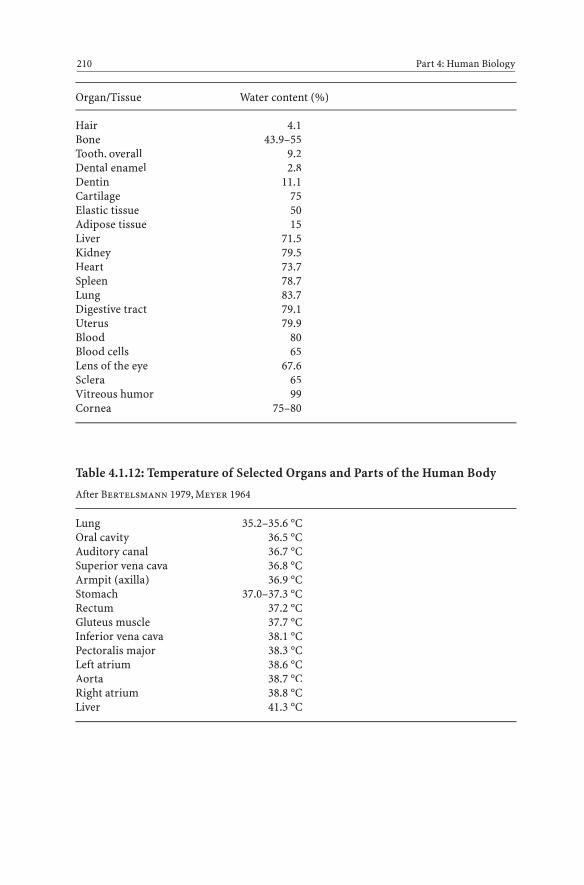
Organ/Tissue Water content (%)
Hair 4.1Bone 43.9–55Tooth. overall 9.2Dental enamel 2.8Dentin 11.1Cartilage 75Elastic tissue 50Adipose tissue 15Liver 71.5Kidney 79.5Heart 73.7Spleen 78.7Lung 83.7Digestive tract 79.1Uterus 79.9Blood 80Blood cells 65Lens of the eye 67.6Sclera 65Vitreous humor 99Cornea 75–80
Table 4.1.12: Temperature of Selected Organs and Parts of the Human Body
After Bertelsmann 1979, Meyer 1964
Lung 35.2–35.6 °COral cavity 36.5 °CAuditory canal 36.7 °CSuperior vena cava 36.8 °CArmpit (axilla) 36.9 °CStomach 37.0–37.3 °CRectum 37.2 °CGluteus muscle 37.7 °CInferior vena cava 38.1 °CPectoralis major 38.3 °CLeft atrium 38.6 °CAorta 38.7 °CRight atrium 38.8 °CLiver 41.3 °C
210 Part 4: Human Biology

Table 4.1.13: pH-Values of Human Bodily Fluids
Figures represent mean values.
Figures from Dokumenta Geigy 1975
Cerebrospinal fluid 7.349Synovial fluid (knee joint) 7.434Arterial blood (adult) 7.39Venous blood (adult) 7.398Lymph 7.4Saliva 6.4Gastric juice, men 1.92Gastric juice, women 2.59Bile 7.15–7.5Feces 7.15Urine 5.7–5.8Sweat 4–6.8Sperm 7.19
General Data 211
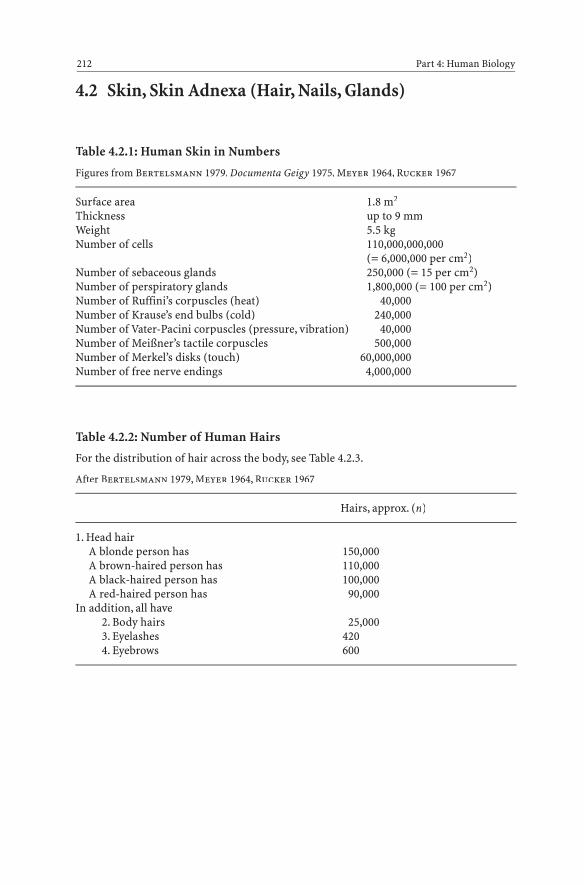
4.2 Skin, Skin Adnexa (Hair, Nails, Glands)
Table 4.2.1: Human Skin in Numbers
Figures from Bertelsmann 1979, Documenta Geigy 1975, Meyer 1964, Rucker 1967
Surface area 1.8 m2
Thickness up to 9 mmWeight 5.5 kgNumber of cells 110,000,000,000
(= 6,000,000 per cm2)Number of sebaceous glands 250,000 (= 15 per cm2)Number of perspiratory glands 1,800,000 (= 100 per cm2)Number of Ruffini’s corpuscles (heat) 40,000Number of Krause’s end bulbs (cold) 240,000Number of Vater-Pacini corpuscles (pressure, vibration) 40,000Number of Meißner’s tactile corpuscles 500,000Number of Merkel’s disks (touch) 60,000,000Number of free nerve endings 4,000,000
Table 4.2.2: Number of Human Hairs
For the distribution of hair across the body, see Table 4.2.3.
After Bertelsmann 1979, Meyer 1964, Rucker 1967
Hairs, approx. (n)
1. Head hairA blonde person has 150,000A brown-haired person has 110,000A black-haired person has 100,000A red-haired person has 90,000
In addition, all have2. Body hairs 25,0003. Eyelashes 4204. Eyebrows 600
212 Part 4: Human Biology
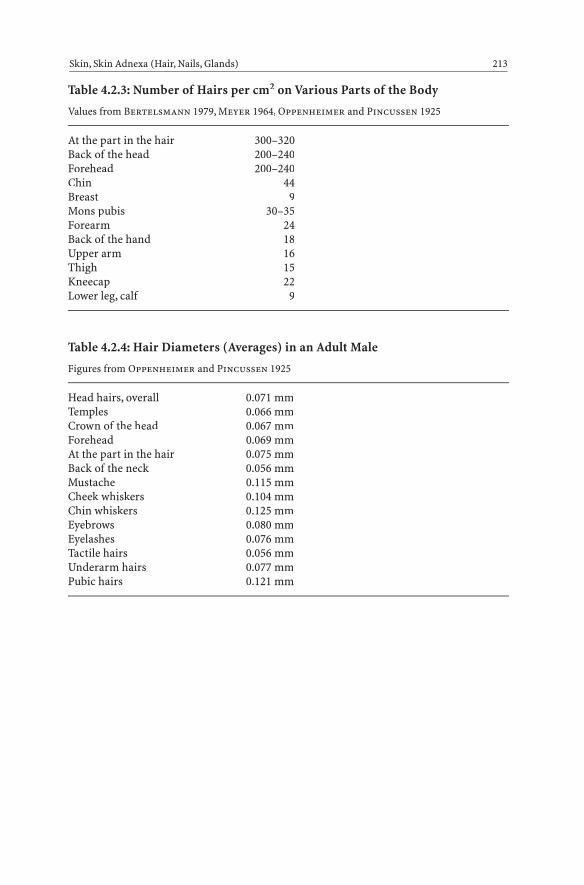
Table 4.2.3: Number of Hairs per cm2 on Various Parts of the Body
Values from Bertelsmann 1979, Meyer 1964, Oppenheimer and Pincussen 1925
At the part in the hair 300–320Back of the head 200–240Forehead 200–240Chin 44Breast 9Mons pubis 30–35Forearm 24Back of the hand 18Upper arm 16Thigh 15Kneecap 22Lower leg, calf 9
Table 4.2.4: Hair Diameters (Averages) in an Adult Male
Figures from Oppenheimer and Pincussen 1925
Head hairs, overall 0.071 mmTemples 0.066 mmCrown of the head 0.067 mmForehead 0.069 mmAt the part in the hair 0.075 mmBack of the neck 0.056 mmMustache 0.115 mmCheek whiskers 0.104 mmChin whiskers 0.125 mmEyebrows 0.080 mmEyelashes 0.076 mmTactile hairs 0.056 mmUnderarm hairs 0.077 mmPubic hairs 0.121 mm
Skin, Skin Adnexa (Hair, Nails, Glands) 213

Table 4.2.5: Speed of Hair and Nail Growth
Data after Altman and Dittmer 1972, Bertelsmann 1979
Head hair 0.35 mm/dayFacial hair 2.1–3.5 mm/weekEyebrows 0.16 mm/dayUnderarm hair 0.3 mm/dayArm hair 1.5 mm/weekThigh hair 0.2 mm/day
Fingernails 0.086 mm/dayThumbnail 0.095 mm/dayToenail 0.004 mm/dayNail of the big toe 0.006 mm/day
Table 4.2.6: Number of Perspiratory Glands
Figures represent the number of glands per square centimeter of skin surface in differentparts of the body. Overall, there are approximately 1.8 million perspiratory glands in thebody.
From Documenta Geigy 1975, Meyer 1964
Number/cm2
Back 55Buttocks 55Cheeks 75Leg 80Top of the foot 125Forearm (top) 150Abdomen 155Breast 155Forearm (underside) 160Forehead 170Throat 185Back of the hand 200Sole of the foot 350–400Palm of the hand 375–425Elbow 750
214 Part 4: Human Biology
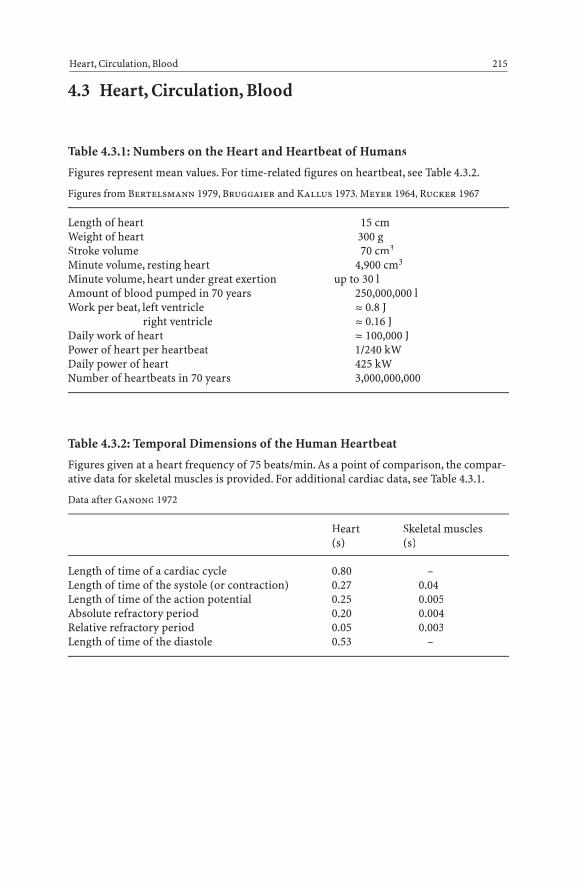
4.3 Heart, Circulation, Blood
Table 4.3.1: Numbers on the Heart and Heartbeat of Humans
Figures represent mean values. For time-related figures on heartbeat, see Table 4.3.2.
Figures from Bertelsmann 1979, Bruggaier and Kallus 1973, Meyer 1964, Rucker 1967
Length of heart 15 cmWeight of heart 300 gStroke volume 70 cm3
Minute volume, resting heart 4,900 cm3
Minute volume, heart under great exertion up to 30 lAmount of blood pumped in 70 years 250,000,000 lWork per beat, left ventricle ª 0.8 J
right ventricle ª 0.16 JDaily work of heart ª 100,000 JPower of heart per heartbeat 1/240 kWDaily power of heart 425 kWNumber of heartbeats in 70 years 3,000,000,000
Table 4.3.2: Temporal Dimensions of the Human Heartbeat
Figures given at a heart frequency of 75 beats/min. As a point of comparison, the compar-ative data for skeletal muscles is provided. For additional cardiac data, see Table 4.3.1.
Data after Ganong 1972
Heart Skeletal muscles(s) (s)
Length of time of a cardiac cycle 0.80 –Length of time of the systole (or contraction) 0.27 0.04Length of time of the action potential 0.25 0.005Absolute refractory period 0.20 0.004Relative refractory period 0.05 0.003Length of time of the diastole 0.53 –
Heart, Circulation, Blood 215
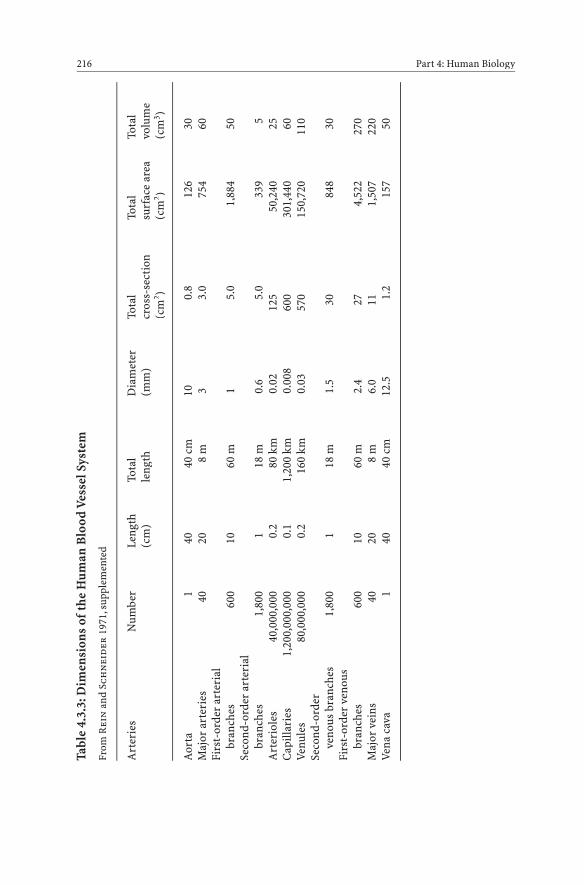
Tabl
e 4.
3.3:
Dim
ensi
ons
ofth
e H
uman
Blo
od V
esse
l Sys
tem
From
Rei
nan
d Sc
hn
eid
er19
71,s
uppl
emen
ted
Art
erie
sN
umbe
rLe
ngth
Tota
lD
iam
eter
Tota
lTo
tal
Tota
l(c
m)
leng
th(m
m)
cros
s-se
ctio
nsu
rfac
e ar
eavo
lum
e(c
m2 )
(cm
2 )(c
m3 )
Aor
ta1
4040
cm
100.
812
630
Maj
or a
rter
ies
4020
8 m
33.
075
460
Firs
t-or
der
arte
rial
br
anch
es60
010
60 m
15.
01,
884
50Se
cond
-ord
er a
rter
ial
bran
ches
1,
800
118
m0.
65.
033
95
Art
erio
les
40,0
00,0
000.
280
km
0.02
125
50,2
4025
Cap
illar
ies
1,20
0,00
0,00
00.
11,
200
km0.
008
600
301,
440
60Ve
nule
s80
,000
,000
0.2
160
km0.
0357
015
0,72
011
0Se
cond
-ord
erve
nous
bra
nche
s 1,
800
118
m1.
530
848
30Fi
rst-
orde
r ve
nous
br
anch
es60
010
60 m
2.4
274,
522
270
Maj
or v
eins
4020
8 m
6.0
111,
507
220
Vena
cav
a1
4040
cm
12.5
1.
215
750
216 Part 4: Human Biology

Table 4.3.4: Diameter of the Arteries of an Adult Human
Data after Oppenheimer and Pincussen 1925
Arteria pulmonalis 24 mmAorta ascendens 22.4 mmAorta renalis 13.3 mmCarotis communis dexter 6.7 mmSubclavia dextra 6.2 mmFemoralis dextra 6.2 mmRenalis dextra 5.3 mmCapillaries 8 μm
Table 4.3.5: Blood Pressure at Different Points in the Human Circulatory System
Figures in millimeters of mercury (mmHg) and, in parentheses, in hectopascals (hPa). Fordata on blood pressure in animals, see Table 1.6.4.
After Rein and Schneider 1971
Systole Diastole
Aortic root 110 (147) 80 (107)Aorta descendens 115 (153) 75 (100)Arteria iliaca 120 (160) 70 (93)Arteria brachialis 110 (147) 80 (107)Arterioles 70–30 (93–40)Capillaries 30–15 (40–20)Veins 15– 0 (20– 0)
Table 4.3.6: Age and Sex Dependency of Blood Pressure in Humans
Figures are mean values in millimeters of mercury (mmHg) and, in parentheses, in hec-topascals (hPa).
From Documenta Geigy 1975, modified
Age Females Males(years) Systolic Diastolic Systolic Diastolic
1 95 (127) 65 (87) 96 (128) 66 (88)2 92 (123) 60 (80) 99 (132) 64 (85)3 100 (133) 64 (85) 100 (133) 67 (88)5 92 (123) 62 (83) 92 (123) 62 (83)
Heart, Circulation, Blood 217
(Cont.) →

Age Females Males(years) Systolic Diastolic Systolic Diastolic
10 103 (137) 70 (93) 103 (137) 69 (92)12 106 (141) 72 (96) 106 (141) 71 (95)15 112 (149) 76 (101) 112 (149) 75 (100)20–24 116 (155) 72 (96) 123 (164) 76 (101)25–29 117 (156) 74 (99) 125 (167) 78 (104)30–34 120 (160) 75 (100) 126 (168) 79 (105)35–39 124 (165) 78 (104) 127 (169) 80 (107)40–44 127 (169) 80 (107) 129 (172) 81 (108)45–49 131 (175) 82 (109) 130 (173) 82 (109)50–54 137 (183) 84 (112) 135 (180) 83 (111)55–59 139 (185) 84 (112) 138 (184) 84 (112)60–64 144 (192) 85 (113) 142 (189) 85 (113)65–69 154 (205) 85 (113) 143 (191) 83 (111)70–74 159 (212) 85 (113) 145 (193) 82 (109)75–79 158 (211) 84 (112) 146 (195) 81 (108)80–84 157 (210) 83 (111) 145 (193) 82 (109)85–89 154 (205) 82 (109) 145 (193) 79 (105)90–94 150 (200) 79 (105) 145 (193) 78 (104)
Table 4.3.7: Blood Flow Through Selected Human Organs
Values represent cubic centimeters of blood per minute and per 100 g organ weight. See al-so Table 4.3.8.
Values from Heidermanns 1957, Kolb 1974
Brain 138Skeletal muscles (at rest) 13Skeletal muscles (working) 85Thyroid gland 591Kidney 150Adrenal gland 700Liver 26Intestine 31
218 Part 4: Human Biology

Table 4.3.8: Proportional Blood Flow Through Selected Human Organs
Figures represent the proportion (%) of the heart minute volume flowing through the giv-en organ. See also Table 4.3.7.
Figures from Bauer et al. 1977
Organ (%)
Lung 100Heart 100Heart arteries 5Brain 15Musculature 15Liver and intestine 35Kidneys 20Skin and skeleton 10
Table 4.3.9: Composition of Human Blood
From Enzyklopädie 1979
Quantity per Quantity per100 cm3 blood 100 g erythrocytes
Water 81 g 63 gHemoglobin 15 g 33 gTotal protein 19 g 35 gTotal fat 560 mg 600 mgNeutral fats 135 mg 95 mgPhosphatide 245 mg 350 mgTotal cholesterol 175 mg –Glycogen 5 mg –Gluose 90 mg 75 mgLactic acid 15 mg –Nonprotein nitrogen 30 mg –Urea 15 mg –Creatine 3.9 mg 8 mgCreatinine 0.9 mg 1.8 mgRNA 64 mg –Sodium 190 mg 42 mgPotassium 190 mg 370 mgCalcium 7 mg 2 mgMagnesium 3.8 mg 6.2 mgIron 48 mg 100 mgChloride 290 mg 270 mg
Heart, Circulation, Blood 219
(Cont.) →

Quantity per Quantity per100 cm3 blood 100 g erythrocytes
Anorganic phosphate 2.5 mg 4 mgTotal phosphate 35 mg 66 mgBicarbonate 220 mg –
Table 4.3.10: Most Important Proteins in Human Blood Plasma
Molecular weight and concentration in plasma.
After Ganong 1972, Gauer et al. 1971, Documenta Geigy 1975, Karlson 1974
Molecular Concentration Relativeweight (mg/100 cm3) concentration
(as %of proteins)
Prealbumin + Albumin 55.3Prealbumin 61,000 10– 40Albumin 69,000 3,900–5,500
a1 globulins 4.8Acid a1 glycoprotein 44,000 70– 110a1 lipoprotein 200,000 290– 770a1 antitrypsin 54,000 200– 400a1 antichymotrypsin 68,000 30– 60
a2 globulins 8.2Ceruloplasmin 132,000 15– 60a2 macroglobulin 720,000 150– 350Haptoglobin 100,000 100– 200
b globulins 11.2b lipoprotein 2,400,000 220– 740Transferrin 80,000 200– 400b1C globulin 80– 140Fibrinogen 341,000 200– 450
g globulins 20.5gG globulin 150,000 800–1,800gA globulin 160,000 90– 450gM globulin 900,000 60– 250gD globulin 0.3– 40
220 Part 4: Human Biology

Table 4.3.11: Quantity of Hemoglobin (Hb) and Number of Blood Cellsin Humans
More precise figures for white blood cells are found in Table 4.3.12.
After Merck 1966
g Hb/100 Red blood White blood Bloodcm3 blood cells cells platelets
(106/mm3) (1,000/mm3) (1,000/mm3)
Males 14–18 4.5–5.5 5– 9 250Females 12–16 4.0–5.0 5– 9 250Newborns 16–26 4.0–6.0 16–22 230Infants 10–15 4.0–6.0 9–15 280Children 10–15.5 4.5–5.5 8–12 340
Table 4.3.12: Number of Leukocytes in Humans
Normal values per cubic millimeter. The average number of leukocytes is currently con-stantly rising among Europeans and Americans. The cause of this is not known.
From Merck 1966, modified
Adults Children Infants
Leukocytes 5,000–9,000 8,000–12,000 9,000–15,000per mm3
Absolute (n) (%) Absolute (n) (%) Absolute (n) (%)
Rodneutrophils 150–450 3–5 0–1,200 0–10 0–1,500 0–10
Segmentedneutrophils 2,500–6,300 50–70 2,000–7,800 23–65 2,250–9,700 25–65
Eosinophils 100–360 2–4 50–600 1–5 90–1,000 1–7Basophils 0–50 0–1 0–140 0–1 0–300 0–2Monocytes 100–600 2–6 –1,000 1–6 –3,000 7–25Lymphocytes 1,000–3,600 20–40 2,000–6,000 25–50 1,500–10,000 20–70
Heart, Circulation, Blood 221
20–40 2,000–6,000 25–50 1,500–10,000
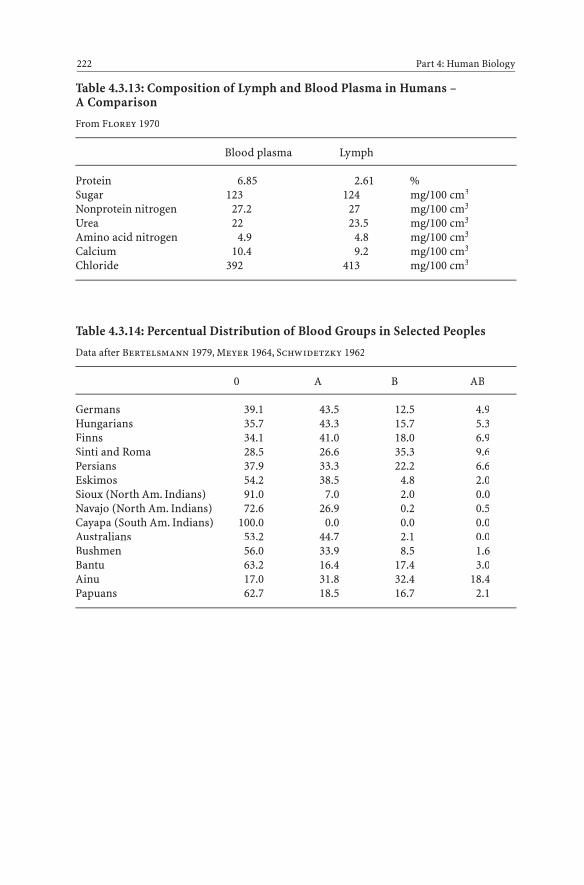
Table 4.3.13: Composition of Lymph and Blood Plasma in Humans – A Comparison
From Florey 1970
Blood plasma Lymph
Protein 6.85 2.61 %Sugar 123 124 mg/100 cm3
Nonprotein nitrogen 27.2 27 mg/100 cm3
Urea 22 23.5 mg/100 cm3
Amino acid nitrogen 4.9 4.8 mg/100 cm3
Calcium 10.4 9.2 mg/100 cm3
Chloride 392 413 mg/100 cm3
Table 4.3.14: Percentual Distribution of Blood Groups in Selected Peoples
Data after Bertelsmann 1979, Meyer 1964, Schwidetzky 1962
0 A B AB
Germans 39.1 43.5 12.5 4.9Hungarians 35.7 43.3 15.7 5.3Finns 34.1 41.0 18.0 6.9Sinti and Roma 28.5 26.6 35.3 9.6Persians 37.9 33.3 22.2 6.6Eskimos 54.2 38.5 4.8 2.0Sioux (North Am. Indians) 91.0 7.0 2.0 0.0Navajo (North Am. Indians) 72.6 26.9 0.2 0.5Cayapa (South Am. Indians) 100.0 0.0 0.0 0.0Australians 53.2 44.7 2.1 0.0Bushmen 56.0 33.9 8.5 1.6Bantu 63.2 16.4 17.4 3.0Ainu 17.0 31.8 32.4 18.4Papuans 62.7 18.5 16.7 2.1
222 Part 4: Human Biology

4.4 Respiration
Table 4.4.1: Numbers on the Human Lung and Respiration
Data after Meyer 1964, Rucker 1967
Length of a lung 25 cmWeight of a lung 1,200 gNumber of pulmonary alveoli 850,000,000Interior surface area 90 m2
Lung capacityVital capacity 4.1 lInspiratory capacity 0.5 lExpiratory reserve volume 1.8 lInspiratory reserve volume 1.8 l
Daily oxygen intake 700 lLength of capillaries in the alveoli 13,000 m
Table 4.4.2: Age and Sex Dependency of Vital Capacity in Humans
Vital capacity is defined as the total amount of air that is set in motion by one breath, givenmaximum inhalation and exhalation. Figures represent mean values.
After Documenta Geigy 1975
Age Females Males(years) (cm3) (cm3)
4 717 8555 959 1,0018 1,513 1,585
10 1,806 2,02212 2,217 2,35714–19 3,330 4,03020–29 3,600 5,44030–39 3,460 5,03040–49 3,680 4,53050–59 3,250 4,65060–64 3,140 3,860
Respiration 223
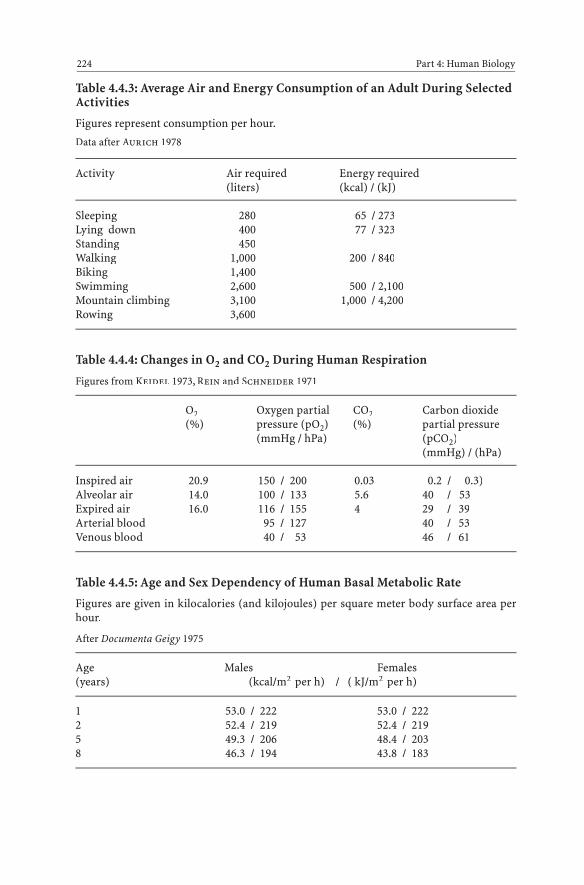
Table 4.4.3: Average Air and Energy Consumption of an Adult During SelectedActivities
Figures represent consumption per hour.
Data after Aurich 1978
Activity Air required Energy required(liters) (kcal) / (kJ)
Sleeping 280 65 / 273Lying down 400 77 / 323Standing 450Walking 1,000 200 / 840Biking 1,400Swimming 2,600 500 / 2,100Mountain climbing 3,100 1,000 / 4,200Rowing 3,600
Table 4.4.4: Changes in O2 and CO2 During Human Respiration
Figures from Keidel 1973, Rein and Schneider 1971
O2 Oxygen partial CO2 Carbon dioxide(%) pressure (pO2) (%) partial pressure
(mmHg / hPa) (pCO2)(mmHg) / (hPa)
Inspired air 20.9 150 / 200 0.03 0.2 / 0.3)Alveolar air 14.0 100 / 133 5.6 40 / 53Expired air 16.0 116 / 155 4 29 / 39Arterial blood 95 / 127 40 / 53Venous blood 40 / 53 46 / 61
Table 4.4.5: Age and Sex Dependency of Human Basal Metabolic Rate
Figures are given in kilocalories (and kilojoules) per square meter body surface area perhour.
After Documenta Geigy 1975
Age Males Females(years) (kcal/m2 per h) / ( kJ/m2 per h)
1 53.0 / 222 53.0 / 2222 52.4 / 219 52.4 / 2195 49.3 / 206 48.4 / 2038 46.3 / 194 43.8 / 183
224 Part 4: Human Biology
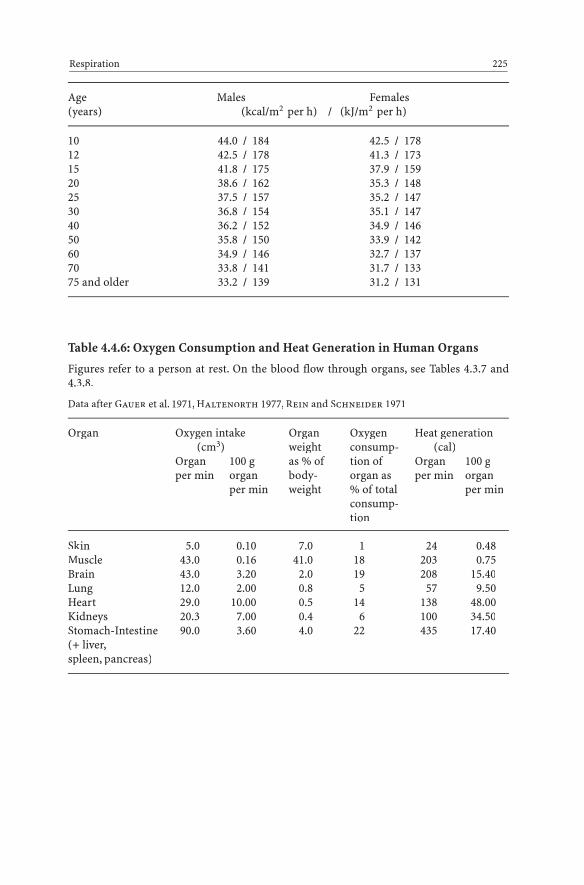
Age Males Females(years) (kcal/m2 per h) / (kJ/m2 per h)
10 44.0 / 184 42.5 / 178 12 42.5 / 178 41.3 / 173 15 41.8 / 175 37.9 / 159 20 38.6 / 162 35.3 / 148 25 37.5 / 157 35.2 / 147 30 36.8 / 154 35.1 / 147 40 36.2 / 152 34.9 / 146 50 35.8 / 150 33.9 / 142 60 34.9 / 146 32.7 / 137 70 33.8 / 141 31.7 / 133 75 and older 33.2 / 139 31.2 / 131
Table 4.4.6: Oxygen Consumption and Heat Generation in Human Organs
Figures refer to a person at rest. On the blood flow through organs, see Tables 4.3.7 and4.3.8.
Data after Gauer et al. 1971, Haltenorth 1977, Rein and Schneider 1971
Organ Oxygen intake Organ Oxygen Heat generation(cm3) weight consump- (cal)
Organ 100 g as % of tion of Organ 100 gper min organ body- organ as per min organ
per min weight % of total per minconsump-tion
Skin 5.0 0.10 7.0 1 24 0.48Muscle 43.0 0.16 41.0 18 203 0.75Brain 43.0 3.20 2.0 19 208 15.40Lung 12.0 2.00 0.8 5 57 9.50Heart 29.0 10.00 0.5 14 138 48.00Kidneys 20.3 7.00 0.4 6 100 34.50Stomach-Intestine 90.0 3.60 4.0 22 435 17.40(+ liver,spleen, pancreas)
Respiration 225

4.5 Nutrition, Digestion, Excretion
Table 4.5.1: Standard Food Requirements for Adults
Figures for the Federal Republic of Germany (FRG) and recommendations of the FAO(Food and Agriculture Organization of the United Nations) for persons 25 years of age. Seealso Table 4.5.2.
After Altman and Dittmer 1974
Vitamins Minerals
Weight Calo- Protein Thia- Ribo- Niacin Vit. C Vit. A Ca Fe(kg) ries (g/day) mine flavin (mg/ (mg/ (IE/ (g/day) (mg/
(mg/ mg/ day) day) day) day)day) day)
FRG� 72 2,550 72 1.7 1.8 18 75 5,000 0.8 10� 60 2,200 60 1.5 1.8 14 75 5,000 0.8 12
FAO� 65 3,200 46 1.3 1.8 21.1 – – 0.4– –
0.5� 55 2,300 39 0.9 1.3 15.2 – – 0.4– –
0.5
Table 4.5.2: Recommended Daily Protein and Overall Energy Intake in the Human Diet
Figures for protein intake represent grams of protein per kilogram of body weight and perday (± 20 %); figures for overall energy intake are given in kilocalories and kilojoules, cal-culated for a primarily sedentary activity. For breast-feeding women, 5 g protein should beadded to the figures given for every 100 g of breast-fed milk.See also Table 4.5.1.
After Verbraucherdienst 1979
Protein intake Energy intake(g) (kcal) / (kJ)� � � �
Adults (age)25 years 0.9 0.9 2,600 / 10,900 2,200 / 9,20045 years 0.9 0.9 2,400 / 10,000 2,000 / 8,40065 years 1.0 1.0 2,200 / 9,200 1,800 / 7,500
226 Part 4: Human Biology
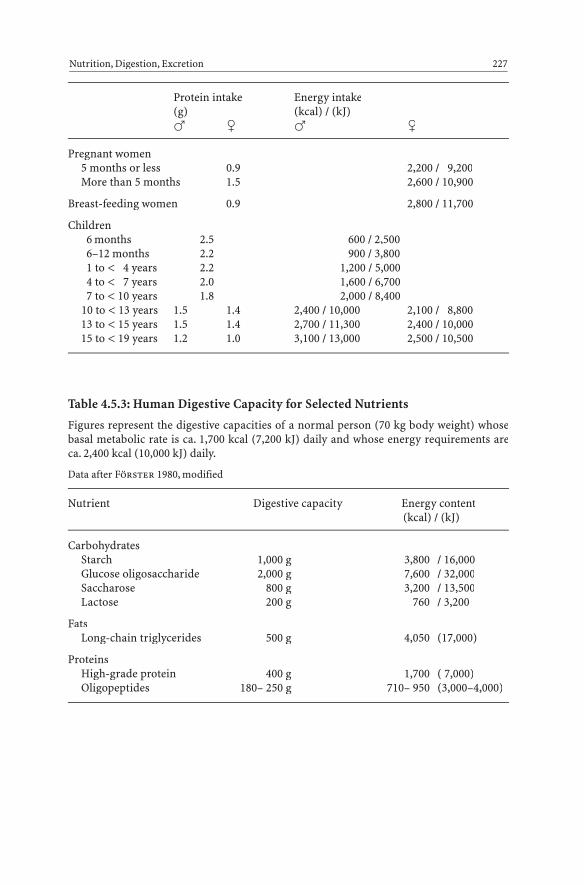
Protein intake Energy intake(g) (kcal) / (kJ)� � � �
Pregnant women5 months or less 0.9 2,200 / 9,200More than 5 months 1.5 2,600 / 10,900
Breast-feeding women 0.9 2,800 / 11,700
Children6 months 2.5 600 / 2,5006–12 months 2.2 900 / 3,8001 to < 4 years 2.2 1,200 / 5,0004 to < 7 years 2.0 1,600 / 6,7007 to < 10 years 1.8 2,000 / 8,400
10 to < 13 years 1.5 1.4 2,400 / 10,000 2,100 / 8,80013 to < 15 years 1.5 1.4 2,700 / 11,300 2,400 / 10,00015 to < 19 years 1.2 1.0 3,100 / 13,000 2,500 / 10,500
Table 4.5.3: Human Digestive Capacity for Selected Nutrients
Figures represent the digestive capacities of a normal person (70 kg body weight) whosebasal metabolic rate is ca. 1,700 kcal (7,200 kJ) daily and whose energy requirements areca. 2,400 kcal (10,000 kJ) daily.
Data after Förster 1980, modified
Nutrient Digestive capacity Energy content(kcal) / (kJ)
CarbohydratesStarch 1,000 g 3,800 / 16,000Glucose oligosaccharide 2,000 g 7,600 / 32,000Saccharose 800 g 3,200 / 13,500Lactose 200 g 760 / 3,200
FatsLong-chain triglycerides 500 g 4,050 (17,000)
ProteinsHigh-grade protein 400 g 1,700 ( 7,000)Oligopeptides 180– 250 g 710– 950 (3,000–4,000)
Nutrition, Digestion, Excretion 227

Table 4.5.4: Components of a Chemically Defined Diet (CDD) that MeetsHuman Nutritional Needs
The amounts given here are the equivalent of 300 kcal (= 1,255 kJ). On human vitamin re-quirements, see also Table 4.5.7. IU = international units
From Grimme 1975, modified
Amino acids
L-Isoleucine 0.275 gL-Leucine 0.435 gL-Lysine monohydrochloride 0.327 gL-Methionine 0.282 gL-Phenylalanine 0.313 gL-Threonine 0.275 gL-Tryptophan 0.085 gL-Valine 0.303 gL-Alanine 0.293 gL-Arginine hydrochloride 0.537 gL-Aspartic acid 0.625 gL-Glutamine 1.032 gGlycine 0.478 gL-Histidine monohydrochloride monohydrate 0.133 gL-Proline 0.329 gL-Serine 0.202 gL-Tyrosine ethylester hydrochloride 0.343 g
6.330 g
Carbohydrates
Glucose monohydrate 24.000 gOligosaccharide (from enzymatically and 45.500 ghydrolytically decomposed cornstarch) 69.500 g
Essential lipid acids
Safflower oil 0.222 g
Vitamins and other substances
Vitamin A acetate 0.287 mg (834 IU)Vitamin C 11.700 mgVitamin D2 1.670 mg (67 IU)Vitamin E acetate 3.330 mgVitamin B1 (aneurine chloride hydrochloride) 0.200 mgD-Biotin 0.033 mgCalcium D-pantothenate 1.670 mgCholine hydrogen tartrate 14.170 mgVitamin B12 (cyanocobalamin) 0.830 μgFolic acid 0.017 mgInositol 19.420 mg
228 Part 4: Human Biology

Nicotinamide 2.220 mgVitamin B6 (pyridoxine hydrochloride) 0.330 mgVitamin B2 (riboflavin 5-phosphate ester,sodium salt) 0.200 mg
Vitamin K1 (phytomenadione) 0.020 mgSodium glycerophosphate 430.000 mgGlucono-d-lactone 1.060 gSorbic acid 150.000 mg
Minerals and trace elements
Sodium chloride 978.000 mgPotassium chloride 672.000 mgCalcium chloride 489.000 mgMagnesium oxide 43.200 mgFerrous sulfate [iron (II) sulfate] 8.260 mgCopper (II) acetate 1.030 mgManganese (II) acetate 2.090 mgZinc chloride 0.140 mgPotassium iodide 0.030 mg
Table 4.5.5: Energy Requirements in Humans for Selected Physical Activities
Figures represent the amount exceeding the basal metabolic rate required per hour.
After Förster 1980
Activity Energy requirement per hour(kcal) (kJ)
Walking 50– 200 200– 800Biking 100– 300 400–1,200“Fitness path”* 200– 400 800–1,600Endurance run 200– 400 800–1,600Dancing 300– 400 1,200–1,600Soccer 400– 500 1,600–2,000Tennis 400– 500 1,600–2,000Swimming 200– 600 800–2,400Jogging 500–1,000 2,000–4,000Skiing 400– 800 1,600–3,200
*Forest paths set up with calisthenics stations
Nutrition, Digestion, Excretion 229
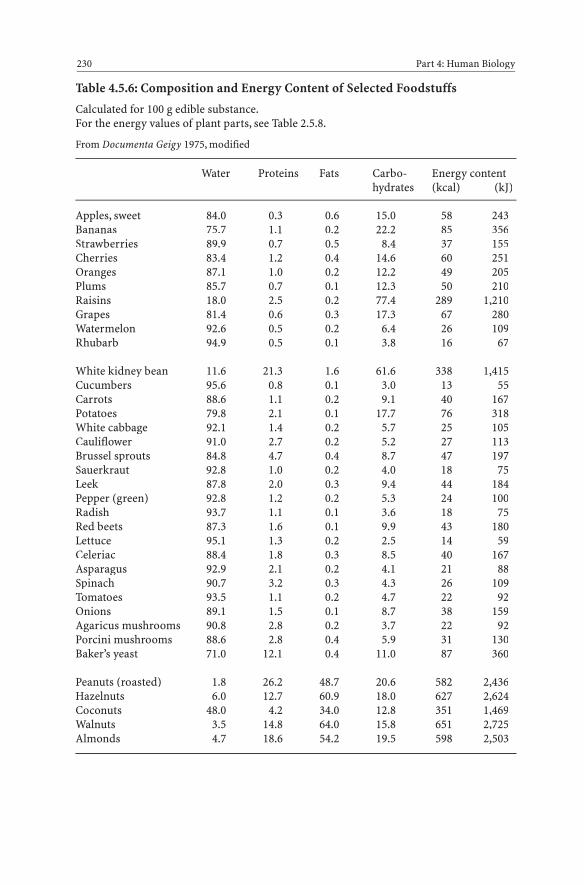
Table 4.5.6: Composition and Energy Content of Selected Foodstuffs
Calculated for 100 g edible substance.For the energy values of plant parts, see Table 2.5.8.
From Documenta Geigy 1975, modified
Water Proteins Fats Carbo- Energy contenthydrates (kcal) (kJ)
Apples, sweet 84.0 0.3 0.6 15.0 58 243Bananas 75.7 1.1 0.2 22.2 85 356Strawberries 89.9 0.7 0.5 8.4 37 155Cherries 83.4 1.2 0.4 14.6 60 251Oranges 87.1 1.0 0.2 12.2 49 205Plums 85.7 0.7 0.1 12.3 50 210Raisins 18.0 2.5 0.2 77.4 289 1,210Grapes 81.4 0.6 0.3 17.3 67 280Watermelon 92.6 0.5 0.2 6.4 26 109Rhubarb 94.9 0.5 0.1 3.8 16 67
White kidney bean 11.6 21.3 1.6 61.6 338 1,415Cucumbers 95.6 0.8 0.1 3.0 13 55Carrots 88.6 1.1 0.2 9.1 40 167Potatoes 79.8 2.1 0.1 17.7 76 318White cabbage 92.1 1.4 0.2 5.7 25 105Cauliflower 91.0 2.7 0.2 5.2 27 113Brussel sprouts 84.8 4.7 0.4 8.7 47 197Sauerkraut 92.8 1.0 0.2 4.0 18 75Leek 87.8 2.0 0.3 9.4 44 184Pepper (green) 92.8 1.2 0.2 5.3 24 100Radish 93.7 1.1 0.1 3.6 18 75Red beets 87.3 1.6 0.1 9.9 43 180Lettuce 95.1 1.3 0.2 2.5 14 59Celeriac 88.4 1.8 0.3 8.5 40 167Asparagus 92.9 2.1 0.2 4.1 21 88Spinach 90.7 3.2 0.3 4.3 26 109Tomatoes 93.5 1.1 0.2 4.7 22 92Onions 89.1 1.5 0.1 8.7 38 159Agaricus mushrooms 90.8 2.8 0.2 3.7 22 92Porcini mushrooms 88.6 2.8 0.4 5.9 31 130Baker’s yeast 71.0 12.1 0.4 11.0 87 360
Peanuts (roasted) 1.8 26.2 48.7 20.6 582 2,436Hazelnuts 6.0 12.7 60.9 18.0 627 2,624Coconuts 48.0 4.2 34.0 12.8 351 1,469Walnuts 3.5 14.8 64.0 15.8 651 2,725Almonds 4.7 18.6 54.2 19.5 598 2,503
230 Part 4: Human Biology
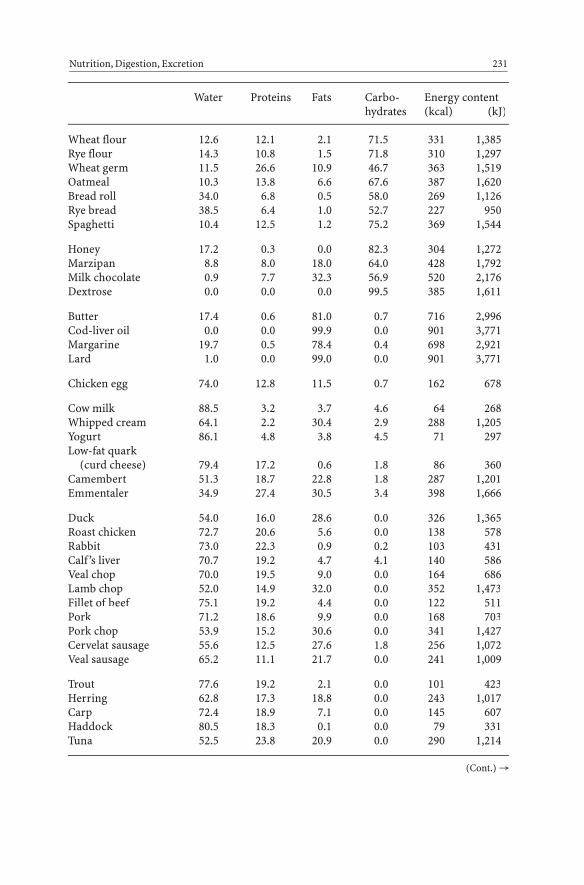
Water Proteins Fats Carbo- Energy contenthydrates (kcal) (kJ)
Wheat flour 12.6 12.1 2.1 71.5 331 1,385Rye flour 14.3 10.8 1.5 71.8 310 1,297Wheat germ 11.5 26.6 10.9 46.7 363 1,519Oatmeal 10.3 13.8 6.6 67.6 387 1,620Bread roll 34.0 6.8 0.5 58.0 269 1,126Rye bread 38.5 6.4 1.0 52.7 227 950Spaghetti 10.4 12.5 1.2 75.2 369 1,544
Honey 17.2 0.3 0.0 82.3 304 1,272Marzipan 8.8 8.0 18.0 64.0 428 1,792Milk chocolate 0.9 7.7 32.3 56.9 520 2,176Dextrose 0.0 0.0 0.0 99.5 385 1,611
Butter 17.4 0.6 81.0 0.7 716 2,996Cod-liver oil 0.0 0.0 99.9 0.0 901 3,771Margarine 19.7 0.5 78.4 0.4 698 2,921Lard 1.0 0.0 99.0 0.0 901 3,771
Chicken egg 74.0 12.8 11.5 0.7 162 678
Cow milk 88.5 3.2 3.7 4.6 64 268Whipped cream 64.1 2.2 30.4 2.9 288 1,205Yogurt 86.1 4.8 3.8 4.5 71 297Low-fat quark
(curd cheese) 79.4 17.2 0.6 1.8 86 360Camembert 51.3 18.7 22.8 1.8 287 1,201Emmentaler 34.9 27.4 30.5 3.4 398 1,666
Duck 54.0 16.0 28.6 0.0 326 1,365Roast chicken 72.7 20.6 5.6 0.0 138 578Rabbit 73.0 22.3 0.9 0.2 103 431Calf ’s liver 70.7 19.2 4.7 4.1 140 586Veal chop 70.0 19.5 9.0 0.0 164 686Lamb chop 52.0 14.9 32.0 0.0 352 1,473Fillet of beef 75.1 19.2 4.4 0.0 122 511Pork 71.2 18.6 9.9 0.0 168 703Pork chop 53.9 15.2 30.6 0.0 341 1,427Cervelat sausage 55.6 12.5 27.6 1.8 256 1,072Veal sausage 65.2 11.1 21.7 0.0 241 1,009
Trout 77.6 19.2 2.1 0.0 101 423Herring 62.8 17.3 18.8 0.0 243 1,017Carp 72.4 18.9 7.1 0.0 145 607Haddock 80.5 18.3 0.1 0.0 79 331Tuna 52.5 23.8 20.9 0.0 290 1,214
Nutrition, Digestion, Excretion 231
(Cont.) →

Water Proteins Fats Carbo- Energy contenthydrates (kcal) (kJ)
Oysters 83.0 9.0 1.2 4.8 68 285Mussels 84.1 11.7 1.9 2.2 76 318Edible snails 82.0 15.0 0.8 2.0 75 314Cuttlefish 82.2 15.3 0.8 0.0 73 306Shrimps 78.2 18.7 2.2 0.0 97 406Lobster 78.5 16.9 1.9 0.5 91 381
Table 4.5.7: Daily Human Vitamin Requirements
For the vitamin content of foodstuffs, see Table 4.5.8.
From Karlson 1980, modified
A Retinol 1.5– 2 mgD Calciferol 0.02 mgE Tocopherol 20 mgK Menaquinone 1 mga, b
B1 Thiamine 1.4 mgB2 Riboflavin 1.7 mgB3 Nicotinamide 20 mga, b
B5 Pantothenic acid 10 mga
B6 Pyridoxine 2 mga
B9 Folic acid 0.4 mga
B12 Cobalamin 0.005 mgC Ascorbic acid 60 mgH Biotin 0.25 mga
aEstimated value, bsynthesized by intestinal bacteria
232 Part 4: Human Biology
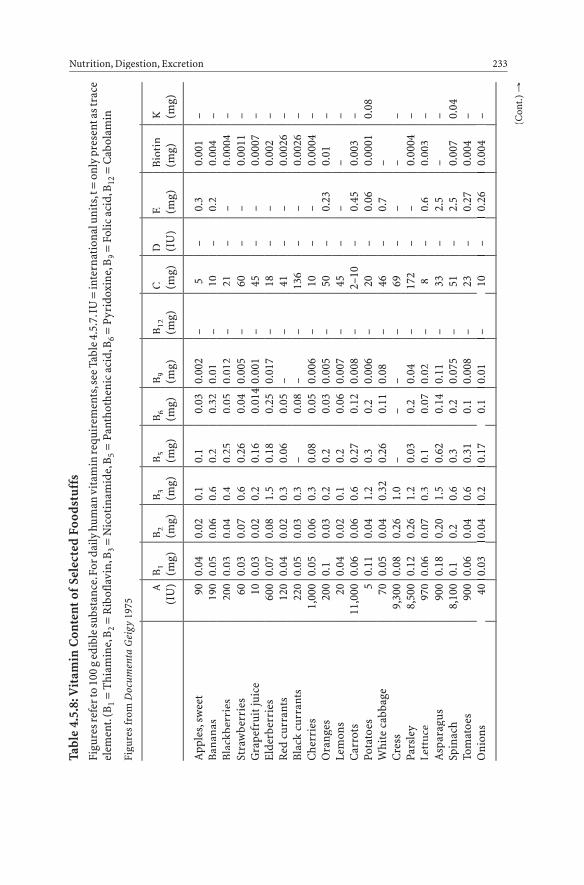
Tabl
e 4.
5.8:
Vit
amin
Con
tent
ofS
elec
ted
Food
stuf
fsFi
gure
s ref
er to
100
g e
dibl
e su
bsta
nce.
For d
aily
hum
an v
itam
in re
quir
emen
ts,s
ee T
able
4.5
.7.I
U =
inte
rnat
iona
l uni
ts,t
= o
nly
pres
ent a
s tra
ceel
emen
t.(B
1=
Thi
amin
e,B 2
= R
ibof
lavi
n,B 3
= N
icot
inam
ide,
B 5=
Pant
hoth
enic
aci
d,B 6
= P
yrid
oxin
e,B 9
= F
olic
aci
d,B 1
2=
Cab
olam
in
Figu
res
from
Doc
umen
ta G
eigy
1975
AB 1
B 2B 3
B 5B 6
B 9B 1
2C
DE
Biot
inK
(IU
)(m
g)(m
g)(m
g)(m
g)(m
g)(m
g)(m
g)(m
g)(I
U)
(mg)
(mg)
(mg)
App
les,
swee
t90
0.04
0.02
0.1
0.1
0.03
0.00
2–
5–
0.3
0.00
1–
Bana
nas
190
0.05
0.06
0.6
0.2
0.32
0.01
–10
–0.
20.
004
–Bl
ackb
erri
es20
00.
030.
040.
40.
250.
050.
012
–21
––
0.00
04–
Stra
wbe
rrie
s60
0.03
0.07
0.6
0.26
0.04
0.00
5–
60–
–0.
0011
–G
rape
frui
t jui
ce10
0.03
0.02
0.2
0.16
0.01
40.
001
–45
––
0.00
07–
Elde
rber
ries
600
0.07
0.08
1.5
0.18
0.25
0.01
7–
18–
–0.
002
–R
ed c
urra
nts
120
0.04
0.02
0.3
0.06
0.05
––
41–
–0.
0026
–Bl
ack
curr
ants
220
0.05
0.03
0.3
–0.
08–
–13
6–
–0.
0026
–C
herr
ies
1,00
00.
050.
060.
30.
080.
050.
006
–10
––
0.00
04–
Ora
nges
200
0.1
0.03
0.2
0.2
0.03
0.00
5–
50–
0.23
0.01
–Le
mon
s20
0.04
0.02
0.1
0.2
0.06
0.00
7–
45–
––
–C
arro
ts11
,000
0.06
0.06
0.6
0.27
0.12
0.00
8–
2–10
–0.
450.
003
–Po
tato
es5
0.11
0.04
1.2
0.3
0.2
0.00
6–
20–
0.06
0.00
010.
08W
hite
cab
bage
700.
050.
040.
320.
260.
110.
08–
46–
0.7
–C
ress
9,30
00.
080.
261.
0–
––
–69
––
––
Pars
ley
8,50
00.
120.
261.
20.
030.
20.
04–
172
––
0.00
04–
Lett
uce
970
0.06
0.07
0.3
0.1
0.07
0.02
–8
–0.
60.
003
–A
spar
agus
900
0.18
0.20
1.5
0.62
0.14
0.11
–33
–2.
5–
–Sp
inac
h8,
100
0.1
0.2
0.6
0.3
0.2
0.07
5–
51–
2.5
0.00
70.
04To
mat
oes
900
0.06
0.04
0.6
0.31
0.1
0.00
8–
23–
0.27
0.00
4–
Oni
ons
400.
030.
040.
20.
170.
10.
01–
10–
0.26
0.00
4–
400.
030.
040.
20.
170.
10.
01–
10–
0.26
0.00
4
Nutrition, Digestion, Excretion 233
(Con
t.) →
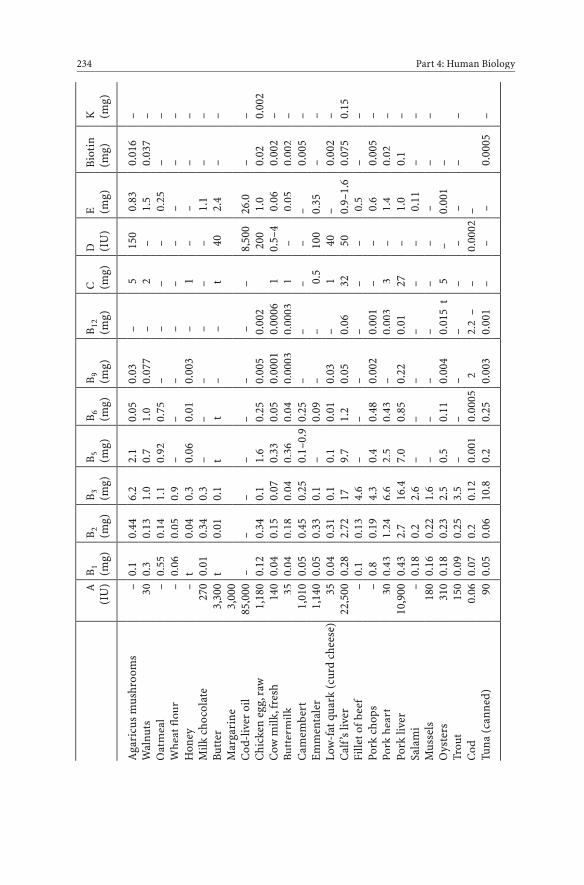
AB 1
B 2B 3
B 5B 6
B 9B 1
2C
DE
Biot
inK
(IU
)(m
g)(m
g)(m
g)(m
g)(m
g)(m
g)(m
g)(m
g)(I
U)
(mg)
(mg)
(mg)
Aga
ricu
s m
ushr
oom
s–
0.1
0.44
6.2
2.1
0.05
0.03
–5
150
0.83
0.01
6–
Wal
nuts
300.
30.
131.
00.
71.
00.
077
–2
–1.
50.
037
–O
atm
eal
–0.
550.
141.
10.
920.
75–
––
–0.
25–
–W
heat
flou
r–
0.06
0.05
0.9
––
––
––
––
–H
oney
–t
0.04
0.3
0.06
0.01
0.00
3–
1–
––
–M
ilk c
hoco
late
270
0.01
0.34
0.3
––
––
––
1.1
––
Butt
er3,
300
t0.
010.
1t
t–
–t
402.
4–
–M
arga
rine
3,00
0–
––
––
––
––
––
–C
od-l
iver
oil
85,0
00–
––
––
––
–8,
500
26.0
––
Chi
cken
egg
,raw
1,18
00.
120.
340.
11.
60.
250.
005
0.00
220
01.
00.
020.
002
Cow
milk
,fre
sh14
00.
040.
150.
070.
330.
050.
0001
0.00
061
0.5–
40.
060.
002
–Bu
tter
milk
350.
040.
180.
040.
360.
040.
0003
0.00
031
–0.
050.
002
–C
amem
bert
1,01
00.
050.
450.
250.
1–0.
90.
25–
––
––
0.00
5–
Emm
enta
ler
1,14
00.
050.
330.
1–
0.09
––
0.5
100
0.35
––
Low
-fat
qua
rk (c
urd
chee
se)
350.
040.
310.
10.
10.
010.
03–
140
–0.
002
–C
alf’s
live
r22
,500
0.28
2.72
179.
71.
20.
050.
0632
500.
9–1.
60.
075
0.15
Fille
t ofb
eef
–0.
10.
134.
6–
––
––
–0.
5–
–Po
rk c
hops
–0.
80.
194.
30.
40.
480.
002
0.00
1–
–0.
60.
005
–Po
rk h
eart
300.
431.
246.
62.
50.
43–
0.00
33
–1.
40.
02–
Pork
live
r10
,900
0.43
2.7
16.4
7.0
0.85
0.22
0.01
27–
1.0
0.1
–Sa
lam
i–
0.18
0.2
2.6
––
––
––
0.11
––
Mus
sels
180
0.16
0.22
1.6
––
––
––
––
–O
yste
rs31
00.
180.
232.
50.
50.
110.
004
0.01
5t
5–
0.00
1–
Trou
t15
00.
090.
253.
5–
––
––
––
––
Cod
0.06
0.07
0.2
0.12
0.00
10.
0005
22.
2–
–0.
0002
–Tu
na (c
anne
d)90
0.05
0.06
10.8
0.2
0.25
0.00
30.
001
––
–0.
0005
–
234 Part 4: Human Biology

Table 4.5.9: Adult Daily Requirements of Essential Amino AcidsSee also Table 4.5.4.
After Documenta Geigy 1975, Karlson 1974
Amino acid Absolute amount (g) mmol/kg Males Females body weight
Valine 0.80 0.65 0.28Leucine 1.10 0.62 0.39Isoleucine 0.70 0.45 0.21Lysine 0.80 0.50 0.24Phenylalanine 0.30 0.22 0.18Tryptophan 0.25 0.16 0.04Methionine 0.20 0.35 0.07Threonine 0.50 0.31 0.20
Table 4.5.10: Fatty Acid and Cholesterol Content of Selected Foodstuffs
Unsaturated fatty acids cannot be synthesized by the body and thus must be ingested. Themost important of these essential fatty acids is linoleic acid.Unless otherwise noted, figures are per 100 g.
Data after Verbraucherdienst 1979
Foodstuff Fatty acids, Fatty acids, Cholesterolpolysaturated polyunsaturated(g) (g) (mg)
Beef, lean 5 2 100Pork, lean 5 1 90Venison 1 1 110Roast chicken 3 1 53Duck 12 8 75Brains 4 1 3,146Kidney 4 1 350Liver 4 3 250Ham 20 4 400Liverwurst 15 5 85Trout 1 1 70Herring 3 3 80Lard 41 10 100Butter 52 2 230
Nutrition, Digestion, Excretion 235
(Cont.) →
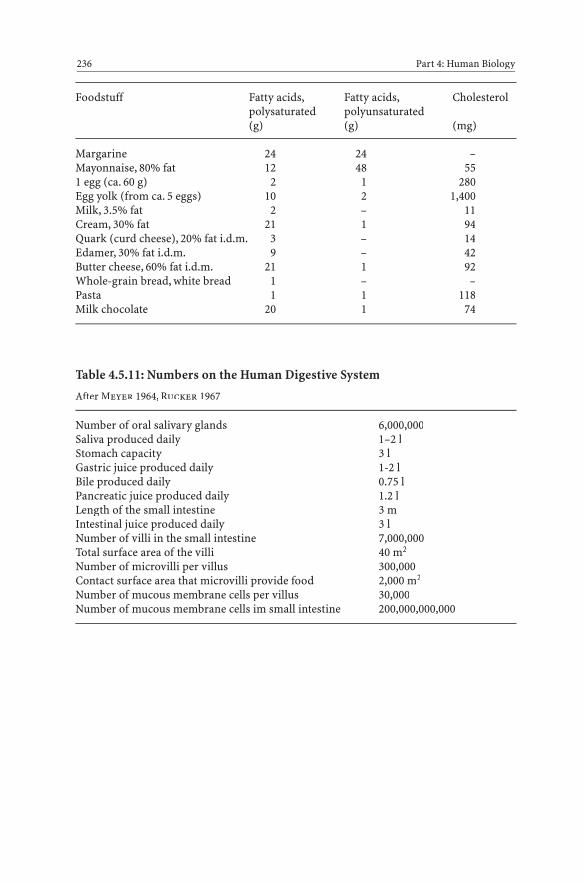
Foodstuff Fatty acids, Fatty acids, Cholesterolpolysaturated polyunsaturated(g) (g) (mg)
Margarine 24 24 –Mayonnaise, 80% fat 12 48 551 egg (ca. 60 g) 2 1 280Egg yolk (from ca. 5 eggs) 10 2 1,400Milk, 3.5% fat 2 – 11Cream, 30% fat 21 1 94Quark (curd cheese), 20% fat i.d.m. 3 – 14Edamer, 30% fat i.d.m. 9 – 42Butter cheese, 60% fat i.d.m. 21 1 92Whole-grain bread, white bread 1 – –Pasta 1 1 118Milk chocolate 20 1 74
Table 4.5.11: Numbers on the Human Digestive System
After Meyer 1964, Rucker 1967
Number of oral salivary glands 6,000,000Saliva produced daily 1–2 lStomach capacity 3 lGastric juice produced daily 1-2 lBile produced daily 0.75 lPancreatic juice produced daily 1.2 lLength of the small intestine 3 mIntestinal juice produced daily 3 lNumber of villi in the small intestine 7,000,000Total surface area of the villi 40 m2
Number of microvilli per villus 300,000Contact surface area that microvilli provide food 2,000 m2
Number of mucous membrane cells per villus 30,000Number of mucous membrane cells im small intestine 200,000,000,000
236 Part 4: Human Biology

Table 4.5.12: Teeth Eruption Times in Humans
Data after Pflugfelder 1962, Rucker 1967, Starck 1975
Deciduous (baby) teeth:
Central incisor Months 6-8Lateral incisor Months 7-9Front molar Months 12-15Canine Months 16-20Back molar Months 20-24
Permanent teeth:
Molar Year 7Central incisor Year 8Lateral incisor Year 9Premolar Year 10Canine Years 11-13Premolar Years 11-152nd molar Years 13-163rd molar (wisdom tooth) Years 18-30
Table 4.5.13: Numbers on the Human Kidney
After Bertelsmann 1979, Meyer 1964, Rucker 1967
Weight of a single kidney 120–160 gLength of a kidney 10–12 cmNumber of renal corpuscles (glomeruli) 2,000,000Number of loops of Henle 2,000,000Total length of the loops of Henle 100 kmInner surface area of the loops of Henle 20 m2
Daily blood flow through kidney 1,500 lGlomerular ultrafiltrate produced daily 180 lUrine produced daily 0.5–4 lSalt reabsorbed daily 1 kgSodium bicarbonate reabsorbed daily 0.5 kgDaily renal oxygen consumption 30 l
Nutrition, Digestion, Excretion 237

Table 4.5.14: Filtration and Reabsorption of Selected Substances in the HumanKidney
Figures from Keidel 1970, Rein and Schneider 1971
Mean Amount in Daily Daily Meanconcen- glomerular reabsorption excretion concen-tration in ultrafiltrate output trationblood = daily in urineplasma filtration(%) (g) (g) (g) (%)
Water 170,000 168,500 1,500Protein 7–8 11 11 0 0Glucose 0.1 170 169.5 0.5 0.01Uric acid 0.0005 8.5 7.97 0.53 0.035Urea 0.025 46 19 27 1.8Creatinine 0.001 1.7 0 1.7 0.11Sodium 0.333 566 561 5 0.333Calcium 0.01 17 16.8 0.2 0.015Potassium 0.017 28.9 26.2 2.7 0.18Chloride 0.373 634 628.7 5.3 0.353HCO3 0.159 270 269.7 0.3 0.02
Table 4.5.15: Daily Urine Volume in Humans at Different Ages
Figures represent mean values. Amounts can be greatly influenced by liquid intake, perspi-ration, and similar phenomena.
Data after Merck 1966
Age (years) Daily urine volume (cm3)
Children 1– 3 500– 6003– 5 600– 7005– 8 650–1,0008–14 1,000–1,400
Adults (> 14) 1,000–1,600
238 Part 4: Human Biology

4.6 Brain, Nerves, Senses
Table 4.6.1: Numbers on the Human Nervous System
Figures represent mean values. For further data on the nervous system, see Tables 4.6.2 and4.6.3.
Values after Rucker 1964
Weight of the brain 1.5 kgWeight of the cerebrum 1.25 kgNumber of neurons in the brain 14,000,000,000Number of interconnections between neurons (synapses) 7,000,000,000,000Thickness of the cerebral cortex 2–5 mmNumber of neurons in the cerebral cortex 12,000,000,000Number of interconnections in the cerebrum 1,000,000,000,000Length of nerve fiber in the cerebrum 500,000 kmLength of nerve fiber outside of the brain 480,000 kmDaily loss of neurons 50,000–100,000
Table 4.6.2: Brain Volumes of Hominids
For the brain weights of animals, see Tables 1.10.1 and 1.10.2.
Figures from Heberer 1968, v. Königswald 1960, Portmann 1959, Saller 1964, Steitz 1979
Range of Meanvariation value(cm3) (cm3)
Chimpanzee 320– 480 394Orangutan 295– 575 411Gorilla 340– 685 498Proconsul 500Australopithecus 450– 750 576Homo erectus erectus (Pithecanthropus) 835– 900 871Homo erectus pekinensis (Sinanthropus) 915–1,225 1,046Homo heidelbergensis 775– 900Homo sapiens preneanderthalensis 1,070–1,280 1,175Steinheim man 1,100–1,200Homo sapiens neanderthalensis 1,300–1,610 1,438Cro-Magnon man (Homo sapiens sapiens) 1,250–1,700 1,400Present humans (Homo sapiens sapiens) 1,010–2,000 1,400
Brain, Nerves, Senses 239
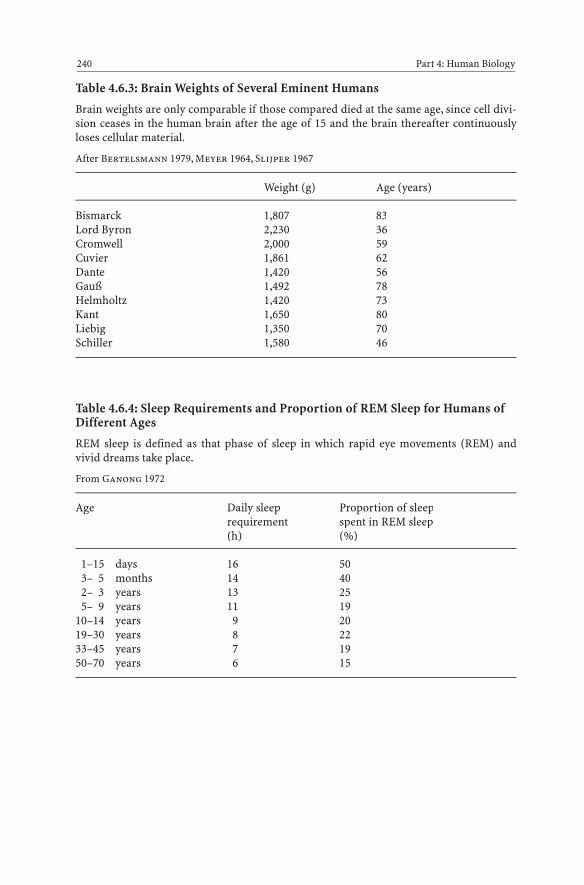
Table 4.6.3: Brain Weights of Several Eminent Humans
Brain weights are only comparable if those compared died at the same age, since cell divi-sion ceases in the human brain after the age of 15 and the brain thereafter continuouslyloses cellular material.
After Bertelsmann 1979, Meyer 1964, Slijper 1967
Weight (g) Age (years)
Bismarck 1,807 83Lord Byron 2,230 36Cromwell 2,000 59Cuvier 1,861 62Dante 1,420 56Gauß 1,492 78Helmholtz 1,420 73Kant 1,650 80Liebig 1,350 70Schiller 1,580 46
Table 4.6.4: Sleep Requirements and Proportion of REM Sleep for Humans ofDifferent Ages
REM sleep is defined as that phase of sleep in which rapid eye movements (REM) andvivid dreams take place.
From Ganong 1972
Age Daily sleep Proportion of sleeprequirement spent in REM sleep(h) (%)
1–15 days 16 503– 5 months 14 402– 3 years 13 255– 9 years 11 19
10–14 years 9 2019–30 years 8 2233–45 years 7 1950–70 years 6 15
240 Part 4: Human Biology
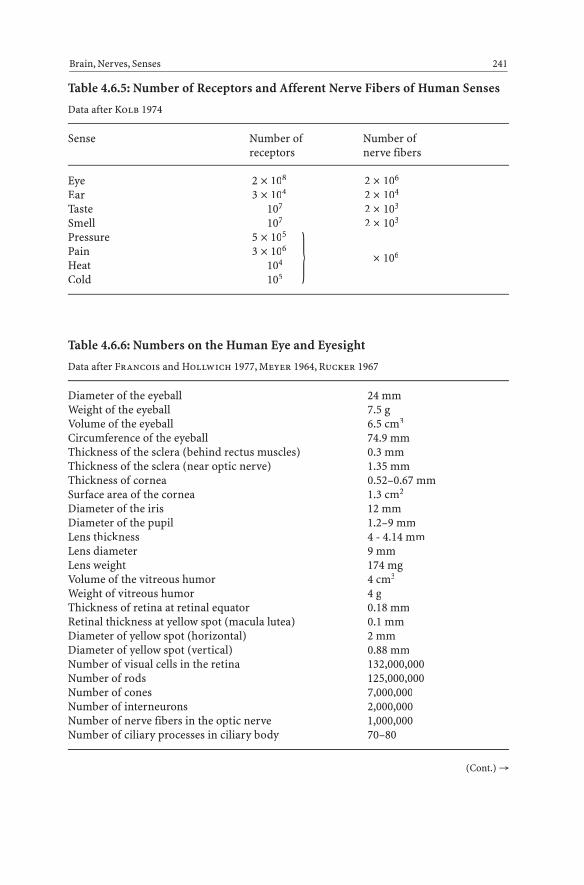
Table 4.6.5: Number of Receptors and Afferent Nerve Fibers of Human Senses
Data after Kolb 1974
Sense Number of Number ofreceptors nerve fibers
Eye 2 ¥ 108 2 ¥ 106
Ear 3 ¥ 104 2 ¥ 104
Taste 107 2 ¥ 103
Smell 107 2 ¥ 103
Pressure 5 ¥ 105
Pain 3 ¥ 106¥ 106
Heat 104
Cold 105
Table 4.6.6: Numbers on the Human Eye and Eyesight
Data after Francois and Hollwich 1977, Meyer 1964, Rucker 1967
Diameter of the eyeball 24 mmWeight of the eyeball 7.5 gVolume of the eyeball 6.5 cm3
Circumference of the eyeball 74.9 mmThickness of the sclera (behind rectus muscles) 0.3 mmThickness of the sclera (near optic nerve) 1.35 mmThickness of cornea 0.52–0.67 mmSurface area of the cornea 1.3 cm2
Diameter of the iris 12 mmDiameter of the pupil 1.2–9 mmLens thickness 4 - 4.14 mmLens diameter 9 mmLens weight 174 mgVolume of the vitreous humor 4 cm3
Weight of vitreous humor 4 gThickness of retina at retinal equator 0.18 mmRetinal thickness at yellow spot (macula lutea) 0.1 mmDiameter of yellow spot (horizontal) 2 mmDiameter of yellow spot (vertical) 0.88 mmNumber of visual cells in the retina 132,000,000Number of rods 125,000,000Number of cones 7,000,000Number of interneurons 2,000,000Number of nerve fibers in the optic nerve 1,000,000Number of ciliary processes in ciliary body 70–80
Brain, Nerves, Senses 241
}
(Cont.) →

Length of a ciliary process 2 mmThickness of a ciliary process 0.5 mmRefractive power of the cornea 43 dioptersRefractive power of the lens 19-33 dioptersResolving power of the eye 1/120 arc degree
Table 4.6.7: Changes in the Binocular Horizontal Visual Field of Humans withAge
Figures from Altman and Dittmer 1973
Age Visual field (degrees)(years) � �
16–19 174.5 176.420–29 174.8 176.230–39 173.8 175.340–49 171.7 172.750–59 167.1 170.160–69 160.1 162.370–79 151.2 155.580 and older 139.8 138.5
Table 4.6.8: Changes in the Near Point of the Human Eye with Age
The near point describes the closest point in front of the eyes at which an object may stillbe seen clearly given maximum accommodation.
After Rein and Schneider 1971, Siebeck 1977
Age Distance of the(years) near point
10 7 cm20 9 cm30 12 cm40 22 cm50 40 cm60 100 cm70 up to 400 cm75 ∞
242 Part 4: Human Biology

Table 4.6.9: Numbers on the Human Ear
See also Table 4.6.10 and, on hearing in animals, see Table 1.11.13.
Figures from Bertelsmann 1979, Meyer 1964, Rucker 1976
Diameter of the eardrum 10 mmThickness of the eardrum 0.1 mmDiameter of the fenestra vestibuli (oval window) 4 mmLength of the basilar membrane 3.35 mmWidth of the basilar membrane at its beginning 0.04 mmWidth of the basilar membrane at its end 0.495 mmNumber of hair cells on the basilar membrane 14,000Number of coils in the cochlea 2.5Spatial resolution of the ear 8.4°
Table 4.6.10: Age Dependency of Upper Hearing Limits
The most important pitches (frequencies) of human language lie between ca. 80 and 600Hz; consonants of the S and T groups lie between ca. 1 and 3 kHz. For animals, see Table1.11.13.
Figures from Rein and Schneider 1971
Age Upper limit (kHz)
Child 2135 years 1559 years 12Elderly man 5
Table 4.6.11: Sound Levels of Selected Sounds
Figures given in A-weighted decibels [dB(A)]. dB(A) describes the intensity of the fre-quency-dependent perception of the human ear. At a frequency of 1,000 Hz, dB(A) valuescoincide with phon values. Since decibel [dB(a)] values represent logarithmic units, asound that increases by 10 dB(A) is sensed to be twice as loud.
Figures after Beltz 1974, Fahrenberger and Müller 1972, Rein and Schneider 1971
dB(A)
Hearing threshold 0Quiet whispering, ticking of a pocket watch, breathing in an echo-free space 10Whispered dialogue (from a film recording studio) 20Alarm clock, residential area at night 30
Brain, Nerves, Senses 243
(Cont.) →

dB(A)
Quiet conversation, quiet apartment 40Normal conversation, loudspeaker set at room volume 50Conversation 60Office typewriter 70Vacuum cleaner, road traffic 80Motorcycle, automobile, heavy road traffic 90Jackhammer, a nearby car horn 100Textile factory 110Propeller airplane, rock ‘n’ roll band 120Pain threshold, noise in a boiler shop 130Jet fighter at takeoff 140Jet engine with afterburners at 25 meters 160Space rocket at blastoff, heard from nearby 170
244 Part 4: Human Biology
Fig. 4.6.11: Relationship between the objectively measurable, frequency-independent sound pres-sure (dB) and the subjectively perceived, frequency-dependent sound level (phon).From Remane, Storch and Welsh 1974
2
Pitch
mer
se
onversation
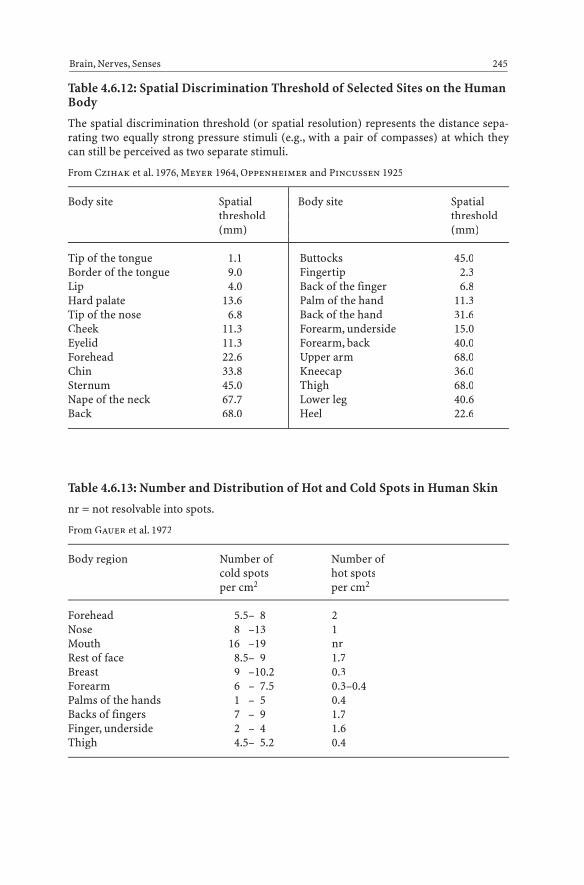
Table 4.6.12: Spatial Discrimination Threshold of Selected Sites on the HumanBody
The spatial discrimination threshold (or spatial resolution) represents the distance sepa-rating two equally strong pressure stimuli (e.g., with a pair of compasses) at which theycan still be perceived as two separate stimuli.
From Czihak et al. 1976, Meyer 1964, Oppenheimer and Pincussen 1925
Body site Spatial Body site Spatialthreshold threshold(mm) (mm)
Brain, Nerves, Senses 245
Tip of the tongue 1.1Border of the tongue 9.0Lip 4.0Hard palate 13.6Tip of the nose 6.8Cheek 11.3Eyelid 11.3Forehead 22.6Chin 33.8Sternum 45.0Nape of the neck 67.7Back 68.0
Buttocks 45.0Fingertip 2.3Back of the finger 6.8Palm of the hand 11.3Back of the hand 31.6Forearm, underside 15.0Forearm, back 40.0Upper arm 68.0Kneecap 36.0Thigh 68.0Lower leg 40.6Heel 22.6
Table 4.6.13: Number and Distribution of Hot and Cold Spots in Human Skin
nr = not resolvable into spots.
From Gauer et al. 1972
Body region Number of Number ofcold spots hot spotsper cm2 per cm2
Forehead 5.5– 8 2Nose 8 –13 1Mouth 16 –19 nrRest of face 8.5– 9 1.7Breast 9 –10.2 0.3Forearm 6 – 7.5 0.3–0.4Palms of the hands 1 – 5 0.4Backs of fingers 7 – 9 1.7Finger, underside 2 – 4 1.6Thigh 4.5– 5.2 0.4
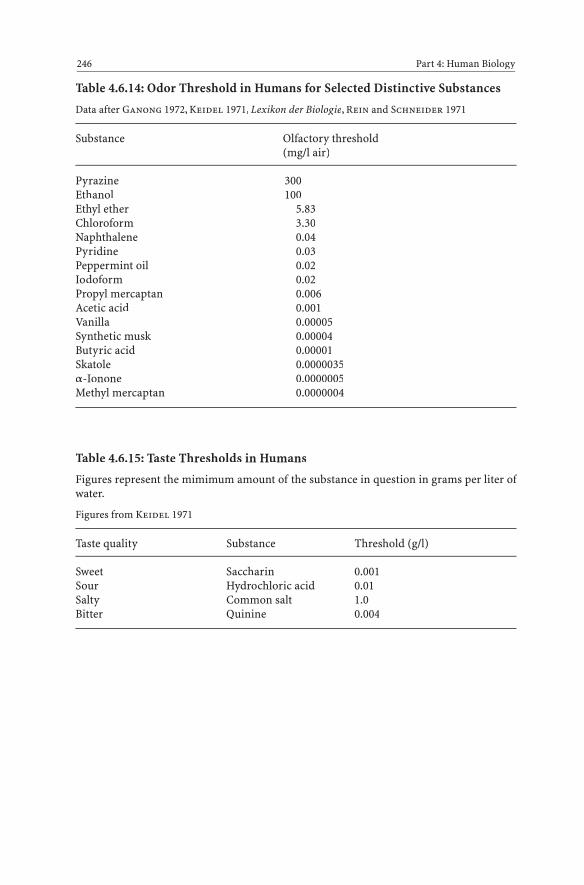
Table 4.6.14: Odor Threshold in Humans for Selected Distinctive Substances
Data after Ganong 1972, Keidel 1971, Lexikon der Biologie, Rein and Schneider 1971
Substance Olfactory threshold(mg/l air)
Pyrazine 300Ethanol 100Ethyl ether 5.83Chloroform 3.30Naphthalene 0.04Pyridine 0.03Peppermint oil 0.02Iodoform 0.02Propyl mercaptan 0.006Acetic acid 0.001Vanilla 0.00005Synthetic musk 0.00004Butyric acid 0.00001Skatole 0.0000035a-Ionone 0.0000005Methyl mercaptan 0.0000004
Table 4.6.15: Taste Thresholds in Humans
Figures represent the mimimum amount of the substance in question in grams per liter ofwater.
Figures from Keidel 1971
Taste quality Substance Threshold (g/l)
Sweet Saccharin 0.001Sour Hydrochloric acid 0.01Salty Common salt 1.0Bitter Quinine 0.004
246 Part 4: Human Biology

Part 5: Comparative Data

Table 5.1: Composition of Animal and Plant Organisms from the Elements
Figures represent the percentage of total weight. Please note that just the four elements ofcarbon, hydrogen, oxygen, and nitrogen account for 99.77% of the weight of plants and96.54 % of animals. See also Table 4.1.3, for the specific figures on the human organism.
From Heidermanns 1957, modified
Animal (here: mammal) Plant (here: stone pine)
Carbon (C) 21.15 53.960Hydrogen (H) 9.86 7.130Oxygen (O) 62.43 38.650Nitrogen (N) 3.10 0.030Calcium (Ca) 1.90 0.007Phosphorus (P) 0.95 0.005Potassium (K) 0.23 0.006Sulphur (S) 0.16 0.052Chlorine (Cl) 0.08 0.001Magnesium (Mg) 0.027 0.003Iodine (I) 0.002 0.002Iron (Fe) 0.005 0.030Fluorine (F) 0.003 0.001Aluminum (Al) 0.001 0.065Silicon (Si) 0.001 0.057Manganese (Mn) 0.0005 0.001
Table 5.2: Water Content of Organisms
Figures as percentage of total weight. See also Tables 1.1.19 and 2.1.10.
Data after Buddenbrock 1956, Heidermanns 1957, Strasburger 1978
Species Water content (%)
Plants
Algae up to 98.0Slime molds 70–94.0Leaves. higher-order plants 80–90.0Cucumber up to 95.0Wood 50.0Dry seeds 13–14.0
Animals
Moon jelly 98.2Leech (Herpobdella) 86.3Ascaris worm 79.3Edible snail (without shell) 84.4
Part 5: Comparative Data 249
(Cont.) →
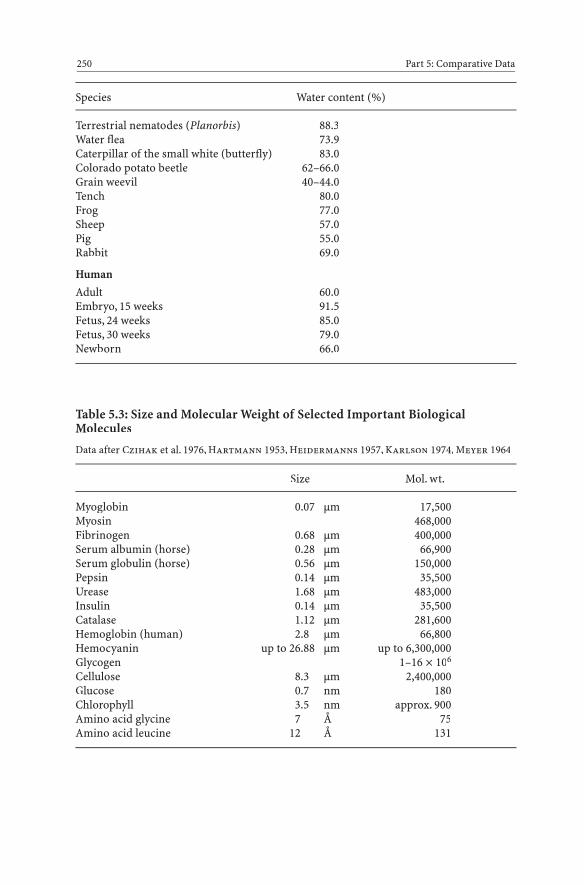
Species Water content (%)
Terrestrial nematodes (Planorbis) 88.3Water flea 73.9Caterpillar of the small white (butterfly) 83.0Colorado potato beetle 62–66.0Grain weevil 40–44.0Tench 80.0Frog 77.0Sheep 57.0Pig 55.0Rabbit 69.0
Human
Adult 60.0Embryo, 15 weeks 91.5Fetus, 24 weeks 85.0Fetus, 30 weeks 79.0Newborn 66.0
Table 5.3: Size and Molecular Weight of Selected Important BiologicalMolecules
Data after Czihak et al. 1976, Hartmann 1953, Heidermanns 1957, Karlson 1974, Meyer 1964
Size Mol. wt.
Myoglobin 0.07 μm 17,500Myosin 468,000Fibrinogen 0.68 μm 400,000Serum albumin (horse) 0.28 μm 66,900Serum globulin (horse) 0.56 μm 150,000Pepsin 0.14 μm 35,500Urease 1.68 μm 483,000Insulin 0.14 μm 35,500Catalase 1.12 μm 281,600Hemoglobin (human) 2.8 μm 66,800Hemocyanin up to 26.88 μm up to 6,300,000Glycogen 1–16 ¥ 106
Cellulose 8.3 μm 2,400,000Glucose 0.7 nm 180Chlorophyll 3.5 nm approx. 900Amino acid glycine 7 Å 75Amino acid leucine 12 Å 131
250 Part 5: Comparative Data
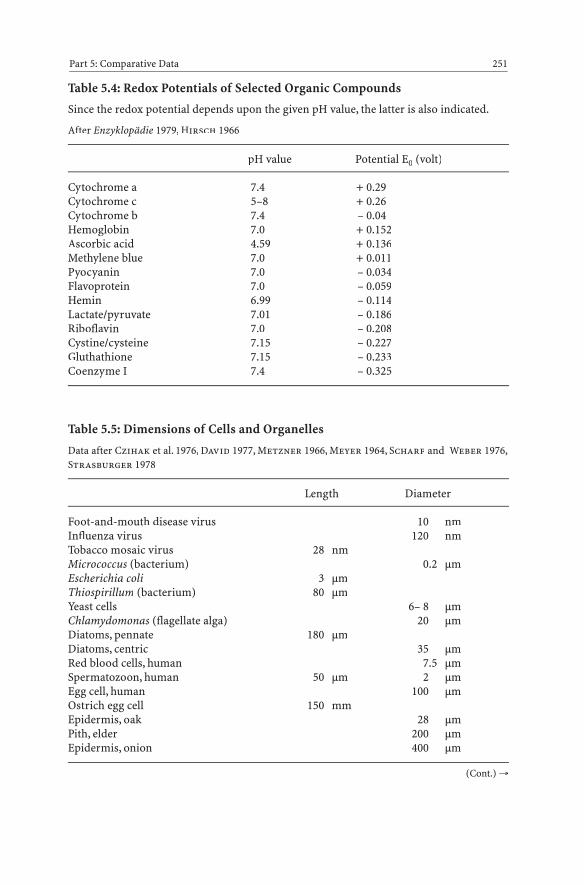
Table 5.4: Redox Potentials of Selected Organic Compounds
Since the redox potential depends upon the given pH value, the latter is also indicated.
After Enzyklopädie 1979, Hirsch 1966
pH value Potential E0 (volt)
Cytochrome a 7.4 + 0.29Cytochrome c 5–8 + 0.26Cytochrome b 7.4 – 0.04Hemoglobin 7.0 + 0.152Ascorbic acid 4.59 + 0.136Methylene blue 7.0 + 0.011Pyocyanin 7.0 – 0.034Flavoprotein 7.0 – 0.059Hemin 6.99 – 0.114Lactate/pyruvate 7.01 – 0.186Riboflavin 7.0 – 0.208Cystine/cysteine 7.15 – 0.227Gluthathione 7.15 – 0.233Coenzyme I 7.4 – 0.325
Table 5.5: Dimensions of Cells and Organelles
Data after Czihak et al. 1976, David 1977, Metzner 1966, Meyer 1964, Scharf and Weber 1976,Strasburger 1978
Length Diameter
Foot-and-mouth disease virus 10 nmInfluenza virus 120 nmTobacco mosaic virus 28 nmMicrococcus (bacterium) 0.2 μmEscherichia coli 3 μmThiospirillum (bacterium) 80 μmYeast cells 6– 8 μmChlamydomonas (flagellate alga) 20 μmDiatoms, pennate 180 μmDiatoms, centric 35 μmRed blood cells, human 7.5 μmSpermatozoon, human 50 μm 2 μmEgg cell, human 100 μmOstrich egg cell 150 mmEpidermis, oak 28 μmPith, elder 200 μmEpidermis, onion 400 μm
Part 5: Comparative Data 251
(Cont.) →
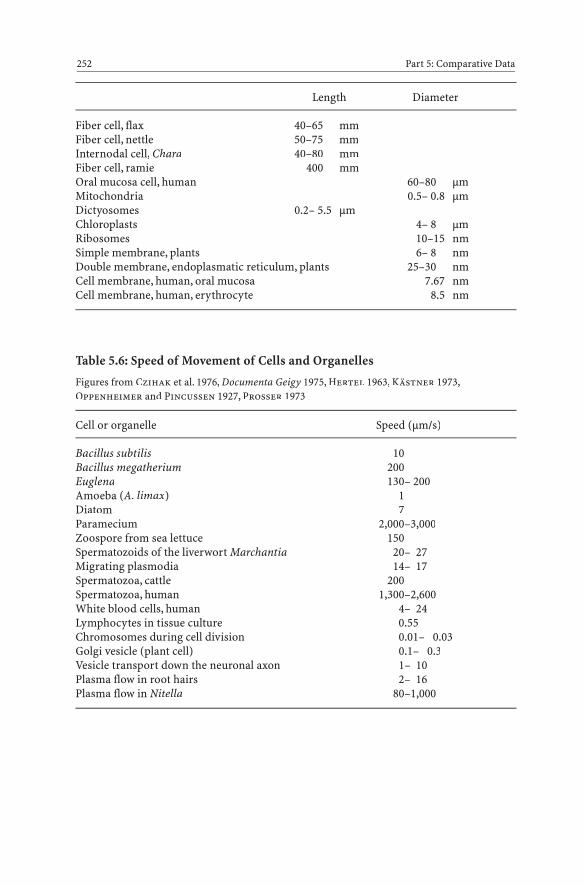
Length Diameter
Fiber cell, flax 40–65 mmFiber cell, nettle 50–75 mmInternodal cell, Chara 40–80 mmFiber cell, ramie 400 mmOral mucosa cell, human 60–80 μmMitochondria 0.5– 0.8 μmDictyosomes 0.2– 5.5 μmChloroplasts 4– 8 μmRibosomes 10–15 nmSimple membrane, plants 6– 8 nmDouble membrane, endoplasmatic reticulum, plants 25–30 nmCell membrane, human, oral mucosa 7.67 nmCell membrane, human, erythrocyte 8.5 nm
Table 5.6: Speed of Movement of Cells and Organelles
Figures from Czihak et al. 1976, Documenta Geigy 1975, Hertel 1963, Kästner 1973,Oppenheimer and Pincussen 1927, Prosser 1973
Cell or organelle Speed (μm/s)
Bacillus subtilis 10Bacillus megatherium 200Euglena 130– 200Amoeba (A. limax) 1Diatom 7Paramecium 2,000–3,000Zoospore from sea lettuce 150Spermatozoids of the liverwort Marchantia 20– 27Migrating plasmodia 14– 17Spermatozoa, cattle 200Spermatozoa, human 1,300–2,600White blood cells, human 4– 24Lymphocytes in tissue culture 0.55Chromosomes during cell division 0.01– 0.03Golgi vesicle (plant cell) 0.1– 0.3Vesicle transport down the neuronal axon 1– 10Plasma flow in root hairs 2– 16Plasma flow in Nitella 80–1,000
252 Part 5: Comparative Data
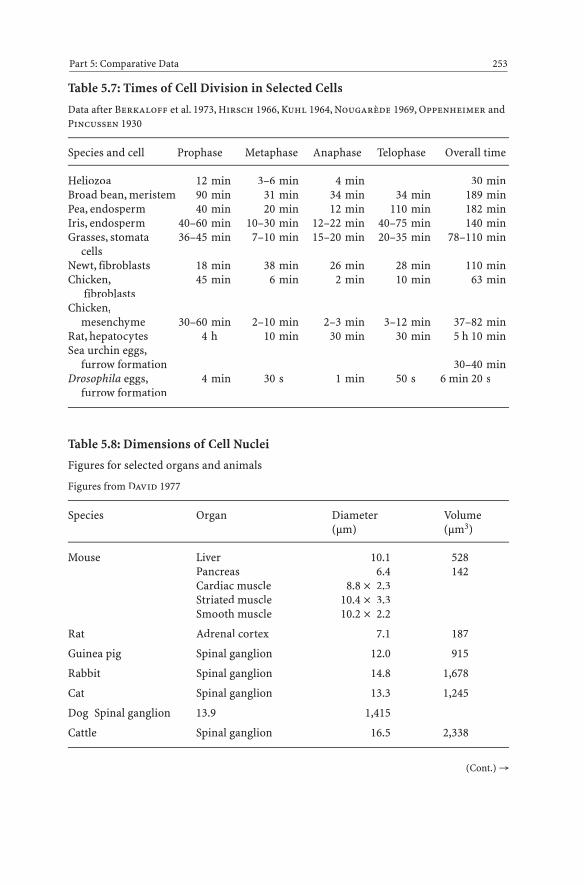
Table 5.7: Times of Cell Division in Selected Cells
Data after Berkaloff et al. 1973, Hirsch 1966, Kuhl 1964, Nougarède 1969, Oppenheimer andPincussen 1930
Species and cell Prophase Metaphase Anaphase Telophase Overall time
Heliozoa 12 min 3–6 min 4 min 30 minBroad bean, meristem 90 min 31 min 34 min 34 min 189 minPea, endosperm 40 min 20 min 12 min 110 min 182 minIris, endosperm 40–60 min 10–30 min 12–22 min 40–75 min 140 minGrasses, stomata 36–45 min 7–10 min 15–20 min 20–35 min 78–110 min
cellsNewt, fibroblasts 18 min 38 min 26 min 28 min 110 minChicken, 45 min 6 min 2 min 10 min 63 min
fibroblastsChicken,
mesenchyme 30–60 min 2–10 min 2–3 min 3–12 min 37–82 minRat, hepatocytes 4 h 10 min 30 min 30 min 5 h 10 minSea urchin eggs,
furrow formation 30–40 minDrosophila eggs, 4 min 30 s 1 min 50 s 6 min 20 s
furrow formation
Table 5.8: Dimensions of Cell Nuclei
Figures for selected organs and animals
Figures from David 1977
Species Organ Diameter Volume(μm) (μm3)
Mouse Liver 10.1 528Pancreas 6.4 142Cardiac muscle 8.8 ¥ 2.3Striated muscle 10.4 ¥ 3.3Smooth muscle 10.2 ¥ 2.2
Rat Adrenal cortex 7.1 187
Guinea pig Spinal ganglion 12.0 915
Rabbit Spinal ganglion 14.8 1,678
Cat Spinal ganglion 13.3 1,245
Dog Spinal ganglion 13.9 1,415
Cattle Spinal ganglion 16.5 2,338
Part 5: Comparative Data 253
(Cont.) →
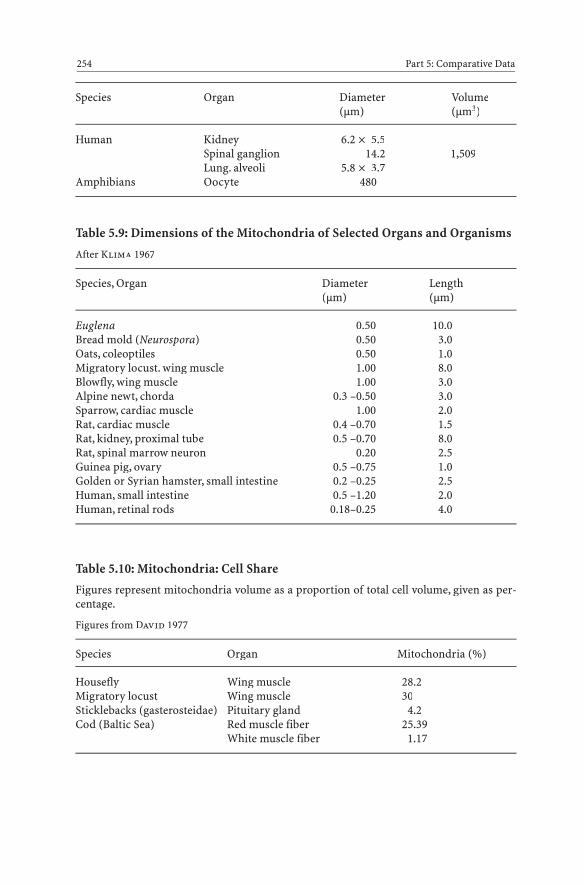
Species Organ Diameter Volume(μm) (μm3)
Human Kidney 6.2 ¥ 5.5Spinal ganglion 14.2 1,509Lung. alveoli 5.8 ¥ 3.7
Amphibians Oocyte 480
Table 5.9: Dimensions of the Mitochondria of Selected Organs and Organisms
After Klima 1967
Species, Organ Diameter Length(μm) (μm)
Euglena 0.50 10.0Bread mold (Neurospora) 0.50 3.0Oats, coleoptiles 0.50 1.0Migratory locust. wing muscle 1.00 8.0Blowfly, wing muscle 1.00 3.0Alpine newt, chorda 0.3 –0.50 3.0Sparrow, cardiac muscle 1.00 2.0Rat, cardiac muscle 0.4 –0.70 1.5Rat, kidney, proximal tube 0.5 –0.70 8.0Rat, spinal marrow neuron 0.20 2.5Guinea pig, ovary 0.5 –0.75 1.0Golden or Syrian hamster, small intestine 0.2 –0.25 2.5Human, small intestine 0.5 –1.20 2.0Human, retinal rods 0.18–0.25 4.0
Table 5.10: Mitochondria: Cell Share
Figures represent mitochondria volume as a proportion of total cell volume, given as per-centage.
Figures from David 1977
Species Organ Mitochondria (%)
Housefly Wing muscle 28.2Migratory locust Wing muscle 30Sticklebacks (gasterosteidae) Pituitary gland 4.2Cod (Baltic Sea) Red muscle fiber 25.39
White muscle fiber 1.17
254 Part 5: Comparative Data
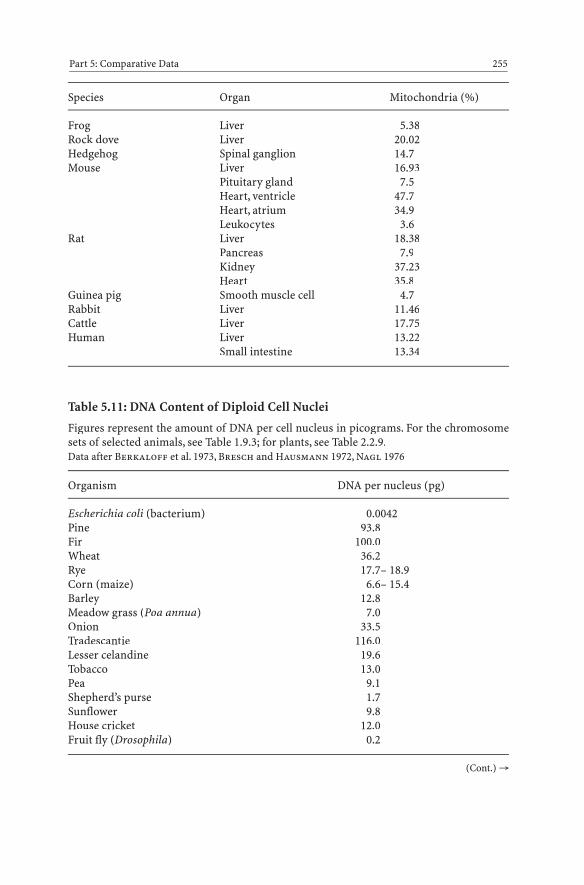
Species Organ Mitochondria (%)
Frog Liver 5.38Rock dove Liver 20.02Hedgehog Spinal ganglion 14.7Mouse Liver 16.93
Pituitary gland 7.5Heart, ventricle 47.7Heart, atrium 34.9Leukocytes 3.6
Rat Liver 18.38Pancreas 7.9Kidney 37.23Heart 35.8
Guinea pig Smooth muscle cell 4.7Rabbit Liver 11.46Cattle Liver 17.75Human Liver 13.22
Small intestine 13.34
Table 5.11: DNA Content of Diploid Cell Nuclei
Figures represent the amount of DNA per cell nucleus in picograms. For the chromosomesets of selected animals, see Table 1.9.3; for plants, see Table 2.2.9.Data after Berkaloff et al. 1973, Bresch and Hausmann 1972, Nagl 1976
Organism DNA per nucleus (pg)
Escherichia coli (bacterium) 0.0042Pine 93.8Fir 100.0Wheat 36.2Rye 17.7– 18.9Corn (maize) 6.6– 15.4Barley 12.8Meadow grass (Poa annua) 7.0Onion 33.5Tradescantie 116.0Lesser celandine 19.6Tobacco 13.0Pea 9.1Shepherd’s purse 1.7Sunflower 9.8House cricket 12.0Fruit fly (Drosophila) 0.2
Part 5: Comparative Data 255
(Cont.) →

Organism DNA per nucleus (pg)
Goldfish 4.0Carp 3.4Pike 1.7Trout 4.9Fire salamander 85.3Edible frog 16.8Common toad 15.0Tree frog 11.6Turtle 5.3Snakes 5.0Chicken 2.5Goose 2.9Sparrow 1.9Rat 5.7Mouse 5.0Guinea pig 5.9Dog 5.3Cattle 6.4Sheep 5.7Human 5.8
Table 5.12: Size of DNA in Selected Organisms
For organisms with chromosomes, figures apply to the haploid chromosome set. For ab-solute quantity in picograms, see Table 5.11.
Figures from Lexikon der Biologie
Species Length of DNA Base pairs
Mitochondrial DNA, human 5.6 μm 16,569Mitochondrial DNA, yeast 25 μm 7.5 ¥ 103
Chloroplast DNA corn (maize) 44 μm 140 ¥ 103
Bacteriophage l 16.5 μm 48,502Escherichia coli 1.36 mm 4 ¥ 106
Yeast (Saccharomyces cerevisiae) 4.6 mm 13.5 ¥ 106
Fruit fly (Drosophila melanogaster) 56 mm 160 ¥ 106
Sea urchin (Strongylocentrotus purpuratus) 170 mm 800 ¥ 106
African clawed frog (Xenopus laevis) 1 m 3 ¥ 109
Mammals, including humans 1 m 3 ¥ 109
256 Part 5: Comparative Data
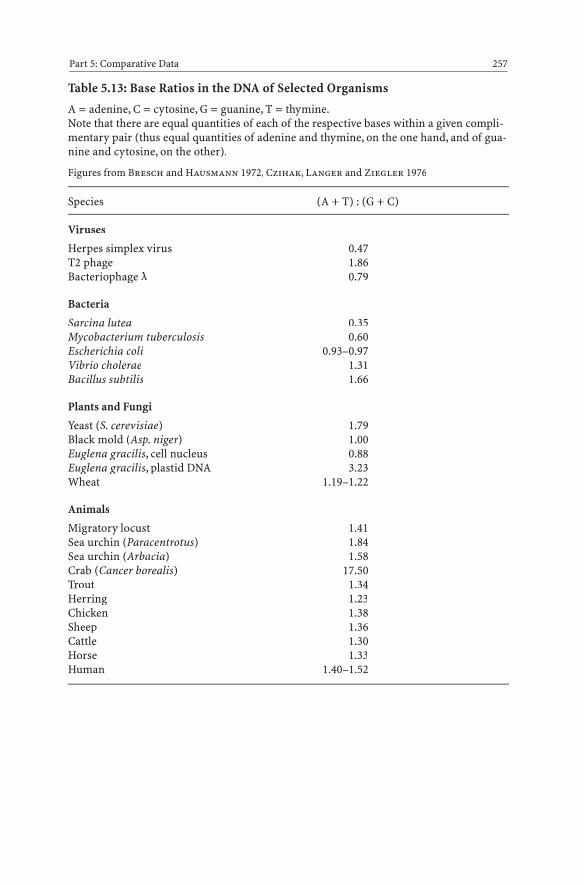
Table 5.13: Base Ratios in the DNA of Selected Organisms
A = adenine, C = cytosine, G = guanine, T = thymine.Note that there are equal quantities of each of the respective bases within a given compli-mentary pair (thus equal quantities of adenine and thymine, on the one hand, and of gua-nine and cytosine, on the other).
Figures from Bresch and Hausmann 1972, Czihak, Langer and Ziegler 1976
Species (A + T) : (G + C)
Viruses
Herpes simplex virus 0.47T2 phage 1.86Bacteriophage l 0.79
Bacteria
Sarcina lutea 0.35Mycobacterium tuberculosis 0.60Escherichia coli 0.93–0.97Vibrio cholerae 1.31Bacillus subtilis 1.66
Plants and Fungi
Yeast (S. cerevisiae) 1.79Black mold (Asp. niger) 1.00Euglena gracilis, cell nucleus 0.88Euglena gracilis, plastid DNA 3.23Wheat 1.19–1.22
Animals
Migratory locust 1.41Sea urchin (Paracentrotus) 1.84Sea urchin (Arbacia) 1.58Crab (Cancer borealis) 17.50Trout 1.34Herring 1.23Chicken 1.38Sheep 1.36Cattle 1.30Horse 1.33Human 1.40–1.52
Part 5: Comparative Data 257
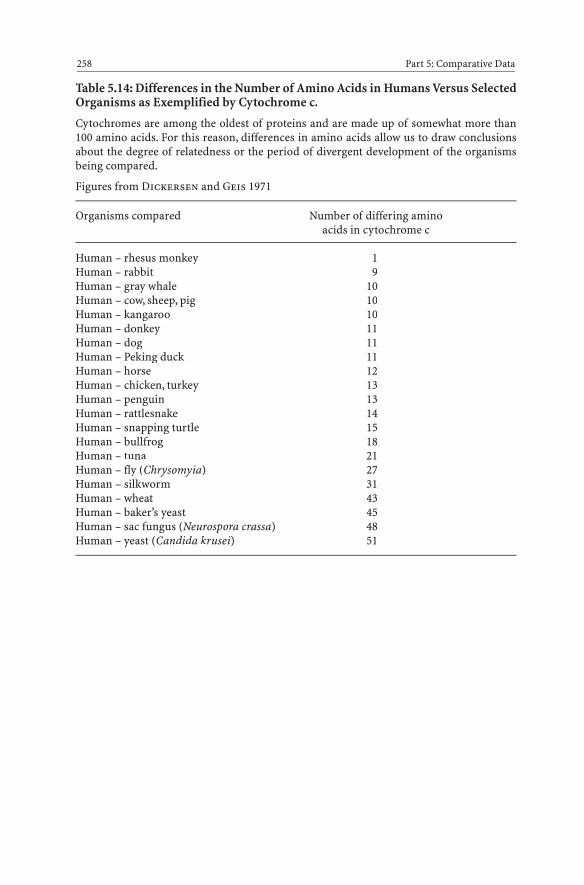
Table 5.14: Differences in the Number of Amino Acids in Humans Versus SelectedOrganisms as Exemplified by Cytochrome c.
Cytochromes are among the oldest of proteins and are made up of somewhat more than100 amino acids. For this reason, differences in amino acids allow us to draw conclusionsabout the degree of relatedness or the period of divergent development of the organismsbeing compared.
Figures from Dickersen and Geis 1971
Organisms compared Number of differing aminoacids in cytochrome c
Human – rhesus monkey 1Human – rabbit 9Human – gray whale 10Human – cow, sheep, pig 10Human – kangaroo 10Human – donkey 11Human – dog 11Human – Peking duck 11Human – horse 12Human – chicken, turkey 13Human – penguin 13Human – rattlesnake 14Human – snapping turtle 15Human – bullfrog 18Human – tuna 21Human – fly (Chrysomyia) 27Human – silkworm 31Human – wheat 43Human – baker’s yeast 45Human – sac fungus (Neurospora crassa) 48Human – yeast (Candida krusei) 51
258 Part 5: Comparative Data

References
Abderhalden, R.: Die Wirkstoffe: Vitamine, Hormone und Fermente. In: Bertalanffy, L.v.(ed.): Handbuch der Biologie, vol. II, Frankfurt 1966
Altman, P.L. and D.S. Dittmer (eds.): Environmental Biology. Bethesda 1966Altman, P.L. and D.S. Dittmer (eds.): Respiration and Circulation. Bethesda 1971Altman, P.L. and D.S. Dittmer (eds.): Biology Data Book. vols. I – III, 2. edn.,
Bethesda 1972–1974Amann, G.: Kerfe des Waldes. 7. edn., Melsungen 1976Andreae, B.: Räumliche Grenzen des Nahrungsspielraums, Naturw. Rdsch. 29, 11, 1976Aurich, H.: Laboratorium des Lebens. Cologne 1978Austin, C.R.: Die Befruchtung. Stuttgart 1967Austin, C.R. and R.V. Short: Fortpflanzungsbiologie der Säugetiere. Berlin 1978Autrum, H.: Über Energie- und Zeitgrenzen der Sinnesempfindungen. Die Naturw. 35, 361,
369, 1948Bassus, W.: Gifte im Tierreich. Die Neue Brehm Bücherei 354, Wittenberg 1965Bauer, H.C., Hofer, R., Knapp, W. and H. Moser: Zoologische Experimente. Munich 1974Bauer, R.D., Pasch, Th. and E. Wetterer: Biomechanik des Blutkreislaufs. In: Hoppe
et al.: Biophysik. Heidelberg 1977Bechtel, H., Cribb, P. and E. Launert: Orchideenatlas. Stuttgart 1980Bellairs, A.: Die Reptilien. In: Die Enzyklopädie der Natur, vols. 10, 11. Lausanne 1971Berkaloff, A., Bourguet, J., Favard, P. and M. Guinnebault: Biologie und Physiologie der
Zelle. Braunschweig 1973Berndt, R. and W. Meise: Naturgeschichte der Vögel. Stuttgart 1959Bertelsmann Lexikon-Institut: Biologie. Daten und Fakten zum Nachschlagen. Gütersloh
1979Beltz-Praxis: Versuche zum Umweltschutz. 2. edn., Weinheim and Basel 1974Blinker: Die Blinker-Hitparade, Blinker 11, 38 – 39, 2001Bogner, H. and H.-Chr. Ritter (eds.): Tierproduktion. Ulmers Taschenbücher. Stuttgart
1976Brauner, L.: Einführung in die Physikalische Chemie der Pflanzenzelle. In: Bertalanffy, L v.
(ed.): Handbuch der Biologie I/1. Konstanz 1965Bresch, C. and R. Hausmann: Klassische und molekulare Genetik. 3. edn., Berlin 1972Brink, F.H. van den: Die Säugetiere Europas. Hamburg 1975Brohmer, P.: Fauna von Deutschland. 14. edn., Heidelberg 1977Brouwer, W.: Handbuch des speziellen Pflanzenbaus. Berlin and Hamburg 1972Bruggaier, W. and D. Kallus: Biologie des Menschen. Frankfurt 1973Buddenbrock, W.v.: Grundriß der vergleichenden Physiologie. vols. I – IV., Berlin 1924,
Basel 1956 – 1967Buddenbrock, W.v.: Wie orientieren sich die Tiere. Stuttgart 1956Bünning, E.: Entwicklungs- und Bewegungsphysiologie der Pflanze. Berlin, Göttingen,
Heidelberg 1953Cochran, D.M.: Knaurs Tierreich in Farben: Amphibien. Munich 1970Creutz, G.: Geheimnisse des Vogelzugs. 5. edn. Die Neue Brehm Bücherei 75, Wittenberg
1965
259
Csicsáky, M.: Vogel und Flugzeug: Wie weit geht die Analogie? BIUZ 14/2, 48–52, 1984Czihak, G., Langer, H. and H. Ziegler (ed.): Biologie. Berlin, Heidelberg, New York 1976David, H.: Quantitative Ultrastructural Data of Animal and Human Cells. Stuttgart, New
York 1977Deutscher Jagdschutz-Verband: DJV-Handbuch 1978. Mainz 1978Dickersen, R.E. and I. Geis: Struktur und Funktion der Proteine. Weinheim 1971Die Roten Listen (ed. E. Jedicke). Stuttgart 1997Dittmer, D.S. and R.M. Grebe (eds.): Handbook of Respiration. Philadelphia and London
1958Documenta Geigy: Wissenschaftliche Tabellen. Stuttgart 1975Dorst, J.: Das Leben der Vögel. In: Die Enzyklopädie der Natur, vols. 12, 13. Lausanne 1972Dorst, J. and P. Dandelot: Säugetiere Afrikas. Hamburg and Berlin 1973Ebel, F. and O. Birnbaum: Schöne und seltsame Welt der Orchideen. Tübingen 1971Ellenberg, H.: Vegetation Mitteleuropas mit den Alpen in ökologischer Sicht. 2. edn.
Stuttgart 1978Fahrenberger, G. and J. Müller: Luft und Wasser in Gefahr. Göttingen 1972Farmer, J.B.: On the Quantitative Differences in the Water-Conductivity of the Wood in
Trees and Shrubs. Parts I und II. Proc. Roy. Soc., B, 90, 218–250, 1918Flindt, R.: Ökologie im Jahreslauf. Biologische Arbeitsbücher 2. 4. edn. Heidelberg 1985Florey, E.: Lehrbuch der Tierphysiologie. Stuttgart 1970Francois, J. and F. Hollwich: Augenheilkunde in Klinik und Praxis. Stuttgart 1977Frank, W.: Parasitologie. Stuttgart 1976Franke, W.: Naturpflanzenkunde. Stuttgart 1976Franz, E.: Der Flug der Insekten. Natur und Volk 89, 1959Ganong, W.F.: Medizinische Physiologie. 2. edn. Berlin, Heidelberg 1972Gauer, O.H., Kramer, K. and R. Jung (eds.): Physiologie des Menschen. Munich 1971George, U.: Flugechsen, die Saurier der Lüfte. Geo 11, 14, 1994Geßner, F.: Die Leistungen des pflanzlichen Organismus. In: Bertalanffy, L.v. (ed.): Hand-
buch der Biologie vol. IV. Potsdam 1942Giersberg, H. and P. Rietschel: Vergleichende Anatomie der Wirbeltiere. Jena 1968Goadby, P.: Billfishing. Camden 1996Götz, A. and J. Konrad: Pflanzenbau. Landwirtschaftliches Lehrbuch I. 5. edn. Stuttgart
1977Graf, J.: Tafelwerk zur Pflanzensystematik. Munich 1975Grafe, A.: Viren. Parasiten unseres Lebensraumes. Heidelberger Taschenbücher 192. Berlin,
Heidelberg, New York 1977Greulach,V.A. and J.E. Adams: Plants – An Introduction to Modern Botany. New York, Lon-
don 1962Grimme, L.H.: Biologische und biotechnologische Beiträge zur Welternährungslage.
Naturw. Rdsch. 28, 5, 1975Grzimek, B. (ed.): Grzimeks Tierleben. Zürich 1970Guttenberg, H.v.: Lehrbuch der allgemeinen Botanik. 6. edn. Berlin 1963Haas, J.: Der Ursprung des Lebens. Munich 1964Hager, P.: Vom Leben des Ackers. Stuttgart 1960Halstead, L.B.: Die Welt der Dinosaurier. Hamburg 1975Haltenorth, T.: Die Stämme des Tierreichs. III. In: Bertalanffy, L.v. and F. Geßner (eds.):
Handbuch der Biologie, vol. VI/3. Wiesbaden 1977Haltenorth, T.: Rassehunde – Wildhunde. Winters Naturw. Taschenb. Heidelberg 1958
260 References

Haltenorth, T. and W. Trense: Das Großwild der Erde und seine Trophäen. Bonn, Munich,Vienna 1956
Hanf, M.: Die Ackerunkräuter und ihre Keimlinge. Limburgerhof (no date) Hanke, W., Hamdorf, K., Horn, E. and C. Schlieper: Praktikum der Zoophysiologie.
Stuttgart, New York 1977Harms, J.W.: Der Lebenslauf der Tiere. In: Bertalanffy, J.v. (ed.): Handbuch der Biologie vol.
II. Frankfurt 1966Harrison, C.: Jungvögel, Eier und Nester aller Vögel Europas, Nordafrikas und des Mit-
tleren Ostens. Hamburg 1975Heberer, G.: Homo – Unsere Ab- und Zukunft. Stuttgart 1968Hegi, G.: Illustrierte Flora von Mittel-Europa. 2. edn. Munich 1965Heidermanns, C.: Grundzüge der Tierphysiologie. 2. edn. Stuttgart 1957Heinroth, O.: Aus dem Leben der Vögel. Verst. Wiss. 34, Berlin 1955Heller, R.: Biologie végétale. vol. II: Nutrition et métabolisme. Paris 1969Hertel, H.: Struktur, Form, Bewegung. Mainz 1963Herter, K.: Der Temperatursinn der Tiere. Die Neue Brehm Bücherei 295, Wittenberg 1962Herzog, K.: Anatomie und Flugbiologie der Vögel. Stuttgart 1968Hess, H.E., Landolt, E. and R. Hirzel: Flora der Schweiz. Basel and Stuttgart 1967Heynert, H.: Grundlagen der Bionik. Heidelberg 1976Heywood, V.H. (ed.): Flowering Plants of the World. Oxford 1978Higgins, L.G. and N.D. Riley: Die Tagfalter Europas und Nordwestafrikas. Hamburg and
Berlin 1971Hirsch, G.C.: Dynamik der tierischen Zelle. In: Bertalanffy, L.v. (ed.): Handbuch der Biolo-
gie, vol. I/1. Konstanz 1965Hirsch, G.C.: Die Zellorganellen und ihre Zusammenarbeit. In: Bertalanffy, L.v. (ed.):
Handbuch der Biologie, vol. I/2. Frankfurt 1966Hirsch, G.C.: Die Lebensäußerungen der Tiere. In: Bertalanffy, L.v. (ed.): Handbuch der Bi-
ologie, vol. V. Wiesbaden 1977Hoeher, S.: Gelege der Vögel Mitteleuropas. Melsungen 1972Hofmeister, H.: Lebensraum Wald. Munich 1977Jacobs, W. and M. Renner: Taschenlexikon zur Biologie der Insekten. Stuttgart 1974Jensen, W.A. and F.B. Salisbury: Botany: An Ecological Approach. Belmont 1972Kästner, A.: Lehrbuch der Speziellen Zoologie. Stuttgart 1973Karcher, H.L.: Wie ein Ei dem anderen. Munich and Zürich 1975Karlson, P.: Kurzes Lehrbuch der Biochemie. 11. edn. Stuttgart 1980Katz, B.: Nerv, Muskel und Synapse. Stuttgart 1971Kaussmann, B.: Pflanzenanatomie. Jena 1963Keidel, W.D.: Kurzgefaßtes Lehrbuch der Physiologie. Stuttgart 1970Kemper, H. and E. Döhring: Die sozialen Faltenwespen Mitteleuropas. Berlin and Hamburg
1967Kerner v. Marilaun, A.: Pflanzenleben. vols. I and II., 2. edn. Leipzig and Vienna 1898Kleiber, M.: Der Energiehaushalt von Mensch und Haustier. Hamburg 1967Klima, J.: Cytologie. Stuttgart 1967Koenigswald, G.v.: Die Geschichte des Menschen. Verst. Wiss. 74, Berlin 1960Kolb, E. (ed.): Lehrbuch der Physiologie der Haustiere. 3. edn. Stuttgart 1974Korschelt, E.: Lebensdauer, Altern und Tod. 3. edn. Jena 1924Kosmos-Lexikon der Naturwissenschaften. Stuttgart 1953Kraus, O. and K. Kubitzky: Biologische Systematik. Denkschrift der DFG. Weinheim 1982
References 261
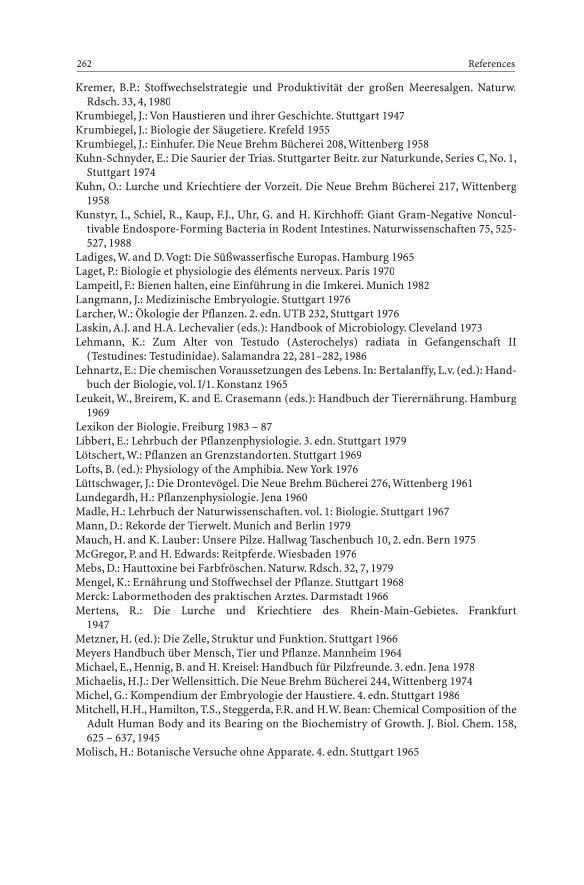
Kremer, B.P.: Stoffwechselstrategie und Produktivität der großen Meeresalgen. Naturw.Rdsch. 33, 4, 1980
Krumbiegel, J.: Von Haustieren und ihrer Geschichte. Stuttgart 1947Krumbiegel, J.: Biologie der Säugetiere. Krefeld 1955Krumbiegel, J.: Einhufer. Die Neue Brehm Bücherei 208, Wittenberg 1958Kuhn-Schnyder, E.: Die Saurier der Trias. Stuttgarter Beitr. zur Naturkunde, Series C, No. 1,
Stuttgart 1974Kuhn, O.: Lurche und Kriechtiere der Vorzeit. Die Neue Brehm Bücherei 217, Wittenberg
1958Kunstyr, I., Schiel, R., Kaup, F.J., Uhr, G. and H. Kirchhoff: Giant Gram-Negative Noncul-
tivable Endospore-Forming Bacteria in Rodent Intestines. Naturwissenschaften 75, 525-527, 1988
Ladiges, W. and D. Vogt: Die Süßwasserfische Europas. Hamburg 1965Laget, P.: Biologie et physiologie des éléments nerveux. Paris 1970Lampeitl, F.: Bienen halten, eine Einführung in die Imkerei. Munich 1982Langmann, J.: Medizinische Embryologie. Stuttgart 1976Larcher, W.: Ökologie der Pflanzen. 2. edn. UTB 232, Stuttgart 1976Laskin, A.J. and H.A. Lechevalier (eds.): Handbook of Microbiology. Cleveland 1973Lehmann, K.: Zum Alter von Testudo (Asterochelys) radiata in Gefangenschaft II
(Testudines: Testudinidae). Salamandra 22, 281–282, 1986Lehnartz, E.: Die chemischen Voraussetzungen des Lebens. In: Bertalanffy, L.v. (ed.): Hand-
buch der Biologie, vol. I/1. Konstanz 1965Leukeit, W., Breirem, K. and E. Crasemann (eds.): Handbuch der Tierernährung. Hamburg
1969Lexikon der Biologie. Freiburg 1983 – 87Libbert, E.: Lehrbuch der Pflanzenphysiologie. 3. edn. Stuttgart 1979Lötschert, W.: Pflanzen an Grenzstandorten. Stuttgart 1969Lofts, B. (ed.): Physiology of the Amphibia. New York 1976Lüttschwager, J.: Die Drontevögel. Die Neue Brehm Bücherei 276, Wittenberg 1961Lundegardh, H.: Pflanzenphysiologie. Jena 1960Madle, H.: Lehrbuch der Naturwissenschaften. vol. 1: Biologie. Stuttgart 1967Mann, D.: Rekorde der Tierwelt. Munich and Berlin 1979Mauch, H. and K. Lauber: Unsere Pilze. Hallwag Taschenbuch 10, 2. edn. Bern 1975McGregor, P. and H. Edwards: Reitpferde. Wiesbaden 1976Mebs, D.: Hauttoxine bei Farbfröschen. Naturw. Rdsch. 32, 7, 1979Mengel, K.: Ernährung und Stoffwechsel der Pflanze. Stuttgart 1968Merck: Labormethoden des praktischen Arztes. Darmstadt 1966Mertens, R.: Die Lurche und Kriechtiere des Rhein-Main-Gebietes. Frankfurt
1947Metzner, H. (ed.): Die Zelle, Struktur und Funktion. Stuttgart 1966Meyers Handbuch über Mensch, Tier und Pflanze. Mannheim 1964Michael, E., Hennig, B. and H. Kreisel: Handbuch für Pilzfreunde. 3. edn. Jena 1978Michaelis, H.J.: Der Wellensittich. Die Neue Brehm Bücherei 244, Wittenberg 1974Michel, G.: Kompendium der Embryologie der Haustiere. 4. edn. Stuttgart 1986Mitchell, H.H., Hamilton, T.S., Steggerda, F.R. and H.W. Bean: Chemical Composition of the
Adult Human Body and its Bearing on the Biochemistry of Growth. J. Biol. Chem. 158,625 – 637, 1945
Molisch, H.: Botanische Versuche ohne Apparate. 4. edn. Stuttgart 1965
262 References
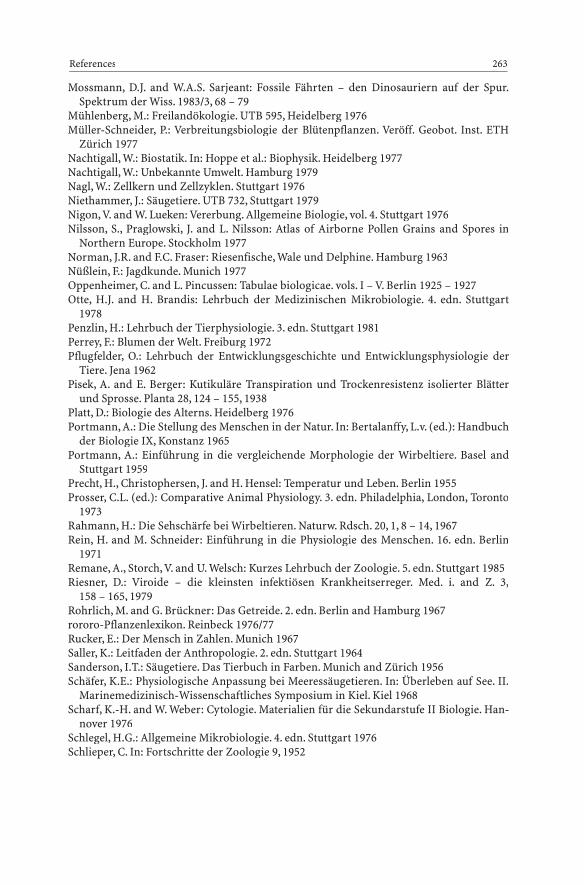
Mossmann, D.J. and W.A.S. Sarjeant: Fossile Fährten – den Dinosauriern auf der Spur.Spektrum der Wiss. 1983/3, 68 – 79
Mühlenberg, M.: Freilandökologie. UTB 595, Heidelberg 1976Müller-Schneider, P.: Verbreitungsbiologie der Blütenpflanzen. Veröff. Geobot. Inst. ETH
Zürich 1977Nachtigall, W.: Biostatik. In: Hoppe et al.: Biophysik. Heidelberg 1977Nachtigall, W.: Unbekannte Umwelt. Hamburg 1979Nagl, W.: Zellkern und Zellzyklen. Stuttgart 1976Niethammer, J.: Säugetiere. UTB 732, Stuttgart 1979Nigon, V. and W. Lueken: Vererbung. Allgemeine Biologie, vol. 4. Stuttgart 1976Nilsson, S., Praglowski, J. and L. Nilsson: Atlas of Airborne Pollen Grains and Spores in
Northern Europe. Stockholm 1977Norman, J.R. and F.C. Fraser: Riesenfische, Wale und Delphine. Hamburg 1963Nüßlein, F.: Jagdkunde. Munich 1977Oppenheimer, C. and L. Pincussen: Tabulae biologicae. vols. I – V. Berlin 1925 – 1927Otte, H.J. and H. Brandis: Lehrbuch der Medizinischen Mikrobiologie. 4. edn. Stuttgart
1978Penzlin, H.: Lehrbuch der Tierphysiologie. 3. edn. Stuttgart 1981Perrey, F.: Blumen der Welt. Freiburg 1972Pflugfelder, O.: Lehrbuch der Entwicklungsgeschichte und Entwicklungsphysiologie der
Tiere. Jena 1962Pisek, A. and E. Berger: Kutikuläre Transpiration und Trockenresistenz isolierter Blätter
und Sprosse. Planta 28, 124 – 155, 1938Platt, D.: Biologie des Alterns. Heidelberg 1976Portmann, A.: Die Stellung des Menschen in der Natur. In: Bertalanffy, L.v. (ed.): Handbuch
der Biologie IX, Konstanz 1965Portmann, A.: Einführung in die vergleichende Morphologie der Wirbeltiere. Basel and
Stuttgart 1959Precht, H., Christophersen, J. and H. Hensel: Temperatur und Leben. Berlin 1955Prosser, C.L. (ed.): Comparative Animal Physiology. 3. edn. Philadelphia, London, Toronto
1973Rahmann, H.: Die Sehschärfe bei Wirbeltieren. Naturw. Rdsch. 20, 1, 8 – 14, 1967Rein, H. and M. Schneider: Einführung in die Physiologie des Menschen. 16. edn. Berlin
1971Remane, A., Storch, V. and U. Welsch: Kurzes Lehrbuch der Zoologie. 5. edn. Stuttgart 1985Riesner, D.: Viroide – die kleinsten infektiösen Krankheitserreger. Med. i. and Z. 3,
158 – 165, 1979Rohrlich, M. and G. Brückner: Das Getreide. 2. edn. Berlin and Hamburg 1967rororo-Pflanzenlexikon. Reinbeck 1976/77Rucker, E.: Der Mensch in Zahlen. Munich 1967Saller, K.: Leitfaden der Anthropologie. 2. edn. Stuttgart 1964Sanderson, I.T.: Säugetiere. Das Tierbuch in Farben. Munich and Zürich 1956Schäfer, K.E.: Physiologische Anpassung bei Meeressäugetieren. In: Überleben auf See. II.
Marinemedizinisch-Wissenschaftliches Symposium in Kiel. Kiel 1968Scharf, K.-H. and W. Weber: Cytologie. Materialien für die Sekundarstufe II Biologie. Han-
nover 1976Schlegel, H.G.: Allgemeine Mikrobiologie. 4. edn. Stuttgart 1976Schlieper, C. In: Fortschritte der Zoologie 9, 1952
References 263
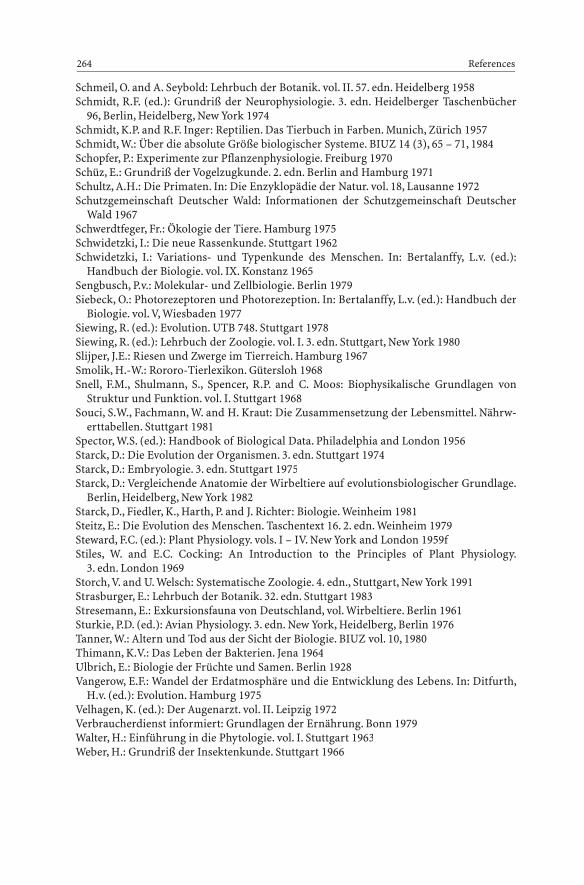
Schmeil, O. and A. Seybold: Lehrbuch der Botanik. vol. II. 57. edn. Heidelberg 1958Schmidt, R.F. (ed.): Grundriß der Neurophysiologie. 3. edn. Heidelberger Taschenbücher
96, Berlin, Heidelberg, New York 1974Schmidt, K.P. and R.F. Inger: Reptilien. Das Tierbuch in Farben. Munich, Zürich 1957Schmidt, W.: Über die absolute Größe biologischer Systeme. BIUZ 14 (3), 65 – 71, 1984Schopfer, P.: Experimente zur Pflanzenphysiologie. Freiburg 1970Schüz, E.: Grundriß der Vogelzugkunde. 2. edn. Berlin and Hamburg 1971Schultz, A.H.: Die Primaten. In: Die Enzyklopädie der Natur. vol. 18, Lausanne 1972Schutzgemeinschaft Deutscher Wald: Informationen der Schutzgemeinschaft Deutscher
Wald 1967Schwerdtfeger, Fr.: Ökologie der Tiere. Hamburg 1975Schwidetzki, I.: Die neue Rassenkunde. Stuttgart 1962Schwidetzki, I.: Variations- und Typenkunde des Menschen. In: Bertalanffy, L.v. (ed.):
Handbuch der Biologie. vol. IX. Konstanz 1965Sengbusch, P.v.: Molekular- und Zellbiologie. Berlin 1979Siebeck, O.: Photorezeptoren und Photorezeption. In: Bertalanffy, L.v. (ed.): Handbuch der
Biologie. vol. V, Wiesbaden 1977Siewing, R. (ed.): Evolution. UTB 748. Stuttgart 1978Siewing, R. (ed.): Lehrbuch der Zoologie. vol. I. 3. edn. Stuttgart, New York 1980Slijper, J.E.: Riesen und Zwerge im Tierreich. Hamburg 1967Smolik, H.-W.: Rororo-Tierlexikon. Gütersloh 1968Snell, F.M., Shulmann, S., Spencer, R.P. and C. Moos: Biophysikalische Grundlagen von
Struktur und Funktion. vol. I. Stuttgart 1968Souci, S.W., Fachmann, W. and H. Kraut: Die Zusammensetzung der Lebensmittel. Nährw-
erttabellen. Stuttgart 1981Spector, W.S. (ed.): Handbook of Biological Data. Philadelphia and London 1956Starck, D.: Die Evolution der Organismen. 3. edn. Stuttgart 1974Starck, D.: Embryologie. 3. edn. Stuttgart 1975Starck, D.: Vergleichende Anatomie der Wirbeltiere auf evolutionsbiologischer Grundlage.
Berlin, Heidelberg, New York 1982Starck, D., Fiedler, K., Harth, P. and J. Richter: Biologie. Weinheim 1981Steitz, E.: Die Evolution des Menschen. Taschentext 16. 2. edn. Weinheim 1979Steward, F.C. (ed.): Plant Physiology. vols. I – IV. New York and London 1959fStiles, W. and E.C. Cocking: An Introduction to the Principles of Plant Physiology.
3. edn. London 1969Storch, V. and U. Welsch: Systematische Zoologie. 4. edn., Stuttgart, New York 1991Strasburger, E.: Lehrbuch der Botanik. 32. edn. Stuttgart 1983Stresemann, E.: Exkursionsfauna von Deutschland, vol. Wirbeltiere. Berlin 1961Sturkie, P.D. (ed.): Avian Physiology. 3. edn. New York, Heidelberg, Berlin 1976Tanner, W.: Altern und Tod aus der Sicht der Biologie. BIUZ vol. 10, 1980Thimann, K.V.: Das Leben der Bakterien. Jena 1964Ulbrich, E.: Biologie der Früchte und Samen. Berlin 1928Vangerow, E.F.: Wandel der Erdatmosphäre und die Entwicklung des Lebens. In: Ditfurth,
H.v. (ed.): Evolution. Hamburg 1975Velhagen, K. (ed.): Der Augenarzt. vol. II. Leipzig 1972Verbraucherdienst informiert: Grundlagen der Ernährung. Bonn 1979Walter, H.: Einführung in die Phytologie. vol. I. Stuttgart 1963Weber, H.: Grundriß der Insektenkunde. Stuttgart 1966
264 References

Weide, H. and H. Aurich: Allgemeine Mikrobiologie. Stuttgart 1979Weismann, E.: Die Entwicklung und Kindheit der Tiere. Dynamische Biologie 4. Ravens-
burg 1976Whittow, G.C. (ed.): Comparative Physiology of Themoregulation. vol. I. New York and
London 1970Wood, G.L.: The Guinness Book of Animal Facts and Feats. 3. edn. Enfield 1982Wundelich, K. and W. Gloede: Natur als Konstrukteur. Leipzig 1977Ziegler, H.: Flüssigkeitsströme in Pflanzen. In: Hoppe et. al.: Biophysik. Heidelberg 1977Ziswiler, V.: Wirbeltiere. vols. I and II. Stuttgart 1976
References 265

AAbsorption maxima 123, 192Acidity level 182Adductor muscle 31Adenine 195, 257Adipose tissue 206Age 4 ff., 133AIDS 200Air requirements 224Albumen 103Albumin 220Aldicarb 28Aldrin 28Amino acid 25, 228, 235, 250, 258Aminopeptidase 49Ammonia 62Amoebic dysentery 200Anaphase 253Anthrax 200Aorta 216Appendix 48 f.Arginine 25Arteriole 216Artery 216Ascorbic acid 251Aspartic acid 25Auditory acuity 125
BBallistic fruits 174Basal metabolic rate 54, 224Basilar membrane 243Batrachotoxin 26Bee venom 26b-carotene 192Bile production 53Bile 211Bird migration 38 f.Birth weight 108 f.Blood cells 73Blood cells 75, 221Blood flow 218 f.Blood groups 222
Blood plasma 220, 222Blood pressure 71, 217Blood sugar level 79Blood vessel 217Blood vessel system 216Blood 72 ff., 80, 206, 211, 215 ff., 219 f.Blood volume 72Blossom diameter 136 f.Blossoming data 162–167Blossoming period 161Blossoms 158 ff.Body hair 212Body size 8, 10, 12–14, 17 f., 20Body temperature 55–57, 210Bone marrow 205Bones 24, 208Botany 129 ff.Brain 205, 239 ff.Brain surface area 115Brain volumes 239Brain weight 114, 240Breast muscle 30Breathing rate 85 f.Bufogenin 26Bufotenin 26
CCalf muscle 30Caloric equivalent 42Cantharidin 26Capillaries 216Capsomer 195Capsule 171Carbohydrases 49Carbohydrates 42, 227 f., 230–232Carbon exchange 189Cardiac cycle 215Cardiac muscle 32Cardinal temperature points 154Carpal (wrist) bones 208Catalase 250Catapult distance 174Cathepsin 49
Subject Index
267
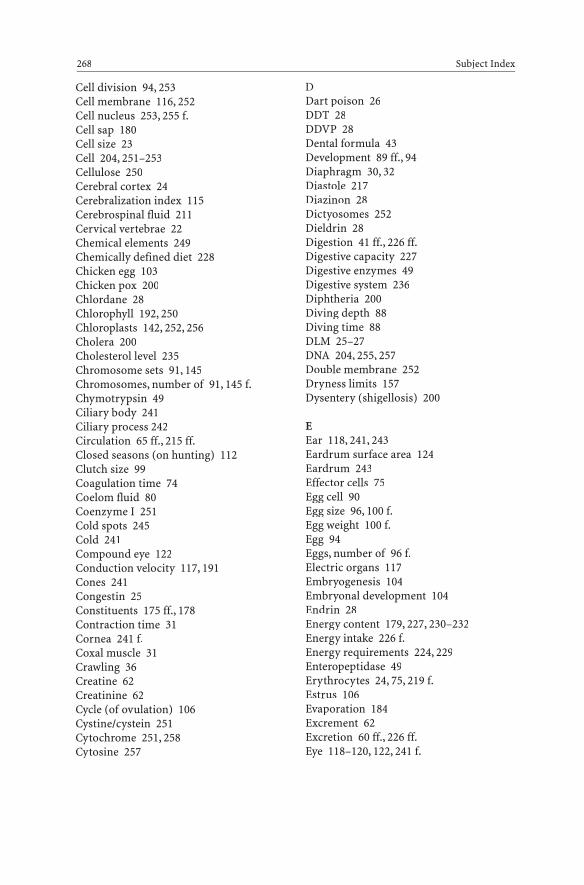
Cell division 94, 253Cell membrane 116, 252Cell nucleus 253, 255 f.Cell sap 180Cell size 23Cell 204, 251–253Cellulose 250Cerebral cortex 24Cerebralization index 115Cerebrospinal fluid 211Cervical vertebrae 22Chemical elements 249Chemically defined diet 228Chicken egg 103Chicken pox 200Chlordane 28Chlorophyll 192, 250Chloroplasts 142, 252, 256Cholera 200Cholesterol level 235Chromosome sets 91, 145Chromosomes, number of 91, 145 f.Chymotrypsin 49Ciliary body 241Ciliary process 242Circulation 65 ff., 215 ff.Closed seasons (on hunting) 112Clutch size 99Coagulation time 74Coelom fluid 80Coenzyme I 251Cold spots 245Cold 241Compound eye 122Conduction velocity 117, 191Cones 241Congestin 25Constituents 175 ff., 178Contraction time 31Cornea 241 f.Coxal muscle 31Crawling 36Creatine 62Creatinine 62Cycle (of ovulation) 106Cystine/cystein 251Cytochrome 251, 258Cytosine 257
DDart poison 26DDT 28DDVP 28Dental formula 43Development 89 ff., 94Diaphragm 30, 32Diastole 217Diazinon 28Dictyosomes 252Dieldrin 28Digestion 41 ff., 226 ff.Digestive capacity 227Digestive enzymes 49Digestive system 236Diphtheria 200Diving depth 88Diving time 88DLM 25–27DNA 204, 255, 257Double membrane 252Dryness limits 157Dysentery (shigellosis) 200
EEar 118, 241, 243Eardrum surface area 124Eardrum 243Effector cells 75Egg cell 90Egg size 96, 100 f.Egg weight 100 f.Egg 94Eggs, number of 96 f.Electric organs 117Embryogenesis 104Embryonal development 104Endrin 28Energy content 179, 227, 230–232Energy intake 226 f.Energy requirements 224, 229Enteropeptidase 49Erythrocytes 24, 75, 219 f.Estrus 106Evaporation 184Excrement 62Excretion 60 ff., 226 ff.Eye 118–120, 122, 241 f.
268 Subject Index

Eyeball 118Eyebrow 212Eyelashes 212
FFat content 176 f.Fat 42, 227, 230–232Feces 211Fenestra vestibuli (oval window) 243Fibrinogen 250Finger 208Fingernail 214Flavone 192Flavoprotein 251Flicker fusion rate 122Flight distances 39Flight speeds 38Floral formulas 159 f.Flying 37Focal distance 119Food intake 42Food requirements 42Foodstuffs 230Forearm 208Freezing point depression 63, 81 f.Fruit(s) 138, 158 ff., 177 f.Fruiting body formation 169Furrow formation 253
GGastric juice 211Gastricin 49Generation time 196German measles (rubella) 200Germination speed 148Germination temperature 147Germination time 147Germination 147 ff.Gestation time 106Globulin 220Glomerular ultrafiltrate 237 f.Glomeruli 60Glucose 250Glutamic acid 25Gluthathione 251Glycine 25, 250Glycogen 250Gonorrhea 200
Granulocyte 75Gravidity 106–108Growth speed 149 f.Growth 147 ff., 155, 206Guanine 257
HHair 212–214Head hair 212, 213Hearing ability 124, 243Heart minute volume 70, 215Heart rate 68 f.Heart weight 65–67Heart 65 ff., 205, 215 ff.Heartbeat 215Heat generation 225Heat 241Hectoliter weights 172Height (of plants) 152Hematocrit values 76Hemin 251Hemocyanin 250Hemoglobin 77, 250 f.Hemoglobin level 76Hemoglobin quantity 221Hemolymph 77, 80 f.Hepatitis 200Heptachlor 28Herpes zoster (shingles) 200Hibernation 59, 69, 87Histidine 25Homobatrachotoxin 26Hornet venom 26Horns 21Hot spots 245Human biology 201 ff.Hydraulic conductance 186Hydraulic conductivity 186Hypsotoxin 25
IImago 94Inactivation temperature 198Incubation times 200Incubation– length of 101 f.– dates of 102Infectious disease 200
Subject Index 269

Influenza 200Insect colonies 11Insecticide 28Insulin 250Intercostal muscles 30Intestinal length 47Intestinal passage 52Intestinal tract 48, 50 f.Intestine 46, 206Ions 116Iris 241Isoleucine 25Jumping distances 38
KKidney 24, 60, 205, 237Krause’s end bulbs 212
LLactate/pyruvate 251Lactation periods 111Large intestine 48 f.Larva 94LD50 25–27Leaf surface area 136Leaves 135, 138Legumes 175Lentil 119, 241 f.Leprosy 200Lethal temperature 197 f.Leucine 25, 250Leukocyte number 221Lifespan 135, 173, 204Lindane 28Linnaeus’ flower-clock 158Lipase 49Lipid acids 228, 235Liver 24, 205Liver weight 52Load-bearing performance 32Locomotion 29 ff.Long-day plant 161Lophotoxin 25Lower leg 208Lung weight 84Lung 85, 205, 223Lymph 206, 211, 222Lymphocytes 24, 75
Lysine 25
MMalaria 200Maltase 49Measles 200Meißner’s tactile corpuscles 212Membrane, simple 252Memory cells 75Merkel’s disk 212Metabolism 54 ff.Metacarpal bones 208Metaphase 253Metatarsal bones 208Methionine 25Methylene blue 251Mevinphos 28Microbiology 193 ff.Mid-intestine 51Migratory times 40Milk 110Milk production 111Minerals 229Minimum separability angle 120Mitochondria 252, 254–256Molecular weight 77, 250Movement 29 ff.Mumps 200Murex 26Muscle fiber 30, 116Muscle 30–32Muscular strength 31Musculature 24, 205Myoglobin 250Myosin 250
NNear point 242Nectar 179Needles 135Nerve(s) 117, 239 ff.Nerve fiber 116, 120Nervous system 113 ff., 239Nesting time 101 f.Normal growth 108, 207Nose 126Nutrition 41 ff., 226 ff.O
270 Subject Index
Odor threshold 246Olfactory epithelium 126Ommatidia 122Organ size 209Organ 210Organelle 251 f.Osmolarity 81Osmotic pressure 63, 81, 180–182Oxygen capacity 77 f.Oxygen consumption 54, 87 f., 187, 225
PPain 241Palytoxin 25Pancreas 206Pancreatic a-amylase 49Parathion 28Pelvis 208Pepsin 49, 250Perthane 28Pertussis (whooping cough) 200pH ranges 197pH value 50 f., 154, 211Phenylalanine 25Photoreceptors 119 f.Photosynthesis 188Photosynthesis production 188 f.Phycocyanin 192Phycoerythrin 192Physiological salt solutions 82Physiological values 180 ff.Pigment 192Plant fibers 139Plasma flow 180Plasma 220Platelets 74 f.Poisonous effect 28Poisons 25 f.Polar limits 156Poliomyelitis 200Pollen grains 143Prealbumin 220Preferred temperatures 57 f.Pregnancy 206Pressure 241Progeny, number of 97Prophase 253Protein 25, 42, 220, 227, 230–232
Protein intake 226 f.Protein level 80Protochlorophyll 192Ptyalin 49Pufferfish poison 26Pumiliotoxin 26Pupa 94Purkinje cells 23 f.Pyocyanin 251Pyramidal cells 23
RRabies 200Raw protein content 178Reabsorption 238Receptors 241Rectal temperature 55Redox potentials 251Refractive power 242REM sleep 240Renal corpuscle 237Reproduction 89 ff., 94, 158 ff.Respiration 83 ff., 223 ff.Respiration rate 187, 199Respiratory quotient (RQ) 42Resting potential 116, 191Retina 241Retinal 1 123Retinal 2 123Rhodopsin 123Rib cage 208Riboflavin 251Ribosomes 252RNA 204Rods 241Root depth 135Roots 138Rotation 190Rotation periods 134Ruffini’s corpuscles 212Runners (plant) 153Running 36
SSalamandrin 26Saliva 50, 211Salt concentration 64Scarlet fever 200
Subject Index 271
Sclera 241Sebaceous gland 212Seeds 138, 147–149, 158 ff., 173 f., 177 f.,
249– number of 170 f.– weight 171 f.Senses 118 ff., 239 ff., 241Serum albumin 250Serum globulin 250Sexual maturation time 105Sexual maturity 93Shell 103Shoot 149 f.Short-day plant 161Shoulder girdle 208Single-breath air volume 85 f.Size 4 ff.Skeletal muscle 215Skeletal weight 23Skeleton 205Skin adnexa 212 ff.Skin 24, 205, 212 ff.Skull 208Sleep requirement 240Slenderness ratio (of plants) 152Small intestine 48 f.Smallpox 200Smell 241Snail 243Snake venom 27Soil 155Somites 206Sound level 243Spatial discrimination threshold 245Spawning data 96Species, number of 5, 132Specific weight 137 f., 209Speed of movement 252Speed 36 f.Sperm 91, 211, 251Sphincter 32Spinal ganglion 23 f.Spine 208Spleen 205Spore maturation 168Spores 144Sprout 138Standard food requirements 226
Starch grains 143Starch 188Stimulus 118Stomach 23, 48 f.Stomata 140 f.Stonefish poison 26Stroke volume 215Subgenual organ 118Sugar content 179Sugar 188Surface load 33–35Sweat gland 212, 214Sweat 211Swimming 36Synovial fluid 211Syphilis 200Systole 217
TTarsal bones 208Taste buds 126Taste threshold 246Taste 241Teeth 21, 205, 237Telophase 253Temperature tolerances 182 f.Tetanus 200Tetrodotoxin 26Thalassin 25Thigh 208Thousand seed weights 172Threonine 25Thymine 257Tissue 206Toenail 214Toes 208Torpor 59Toxaphene 28Trace elements 229Tracheids 140Transpiration coefficient 185Transpiration level 184Transpiration 185Trees– height 150,– vertical growth 150Trunk circumferences 152Trunk diameters 151
272 Subject Index
Trypsin 49Tryptophan 25Tubers 178Twitch times 30Typhus 200
UUpper arm 208Urea 62 f.Urease 250Uric acid 62Urine 62 f., 211, 237 f.Urine concentration 61Urine production 61Urine volume 238Uterus 31
VValine 25Vater-Pacini corpuscles 212Vein 216Venole 216Vernalization temperatures 148Vertebrae, number of 22Vessel– diameter 139– elements 139Vibration threshold 127Virion 195
Visual– acuity angle 120 f.– field 121, 242– pigments 123Vital capacity 223Vitamin 228– content 233– requirements 232Vitreous humor 241
WWater 231– consumption 185– content 24, 138, 209 f., 249 f.Weight 4 ff., 12, 14–17, 20 f.Wing surface area 33–35Wingbeats 32Wingspan 15 f.Winter rest 59Withers, height at 19Wood 137–139, 186
XXanthophyll 192Yellow fever 200Yolk 103
ZZectran 28
Subject Index 273

AAcacia 180Acorn worm 9Adder’s-tongue 146, 168Adelie penguin 78Adenoviruses 195, 198Admiral 95Aepyornis (Madagascar’s elephant
bird) 20, 100Aerobacter 197Aesculapian snake 14, 98Affenpinscher 18African buffalo 21African clawed frog 30, 256African pancake tortoise 98Agile frog 13, 38, 98Agrobacterium 197Airedale terrier 18Albatross 15, 35, 37, 55, 99Alder 139, 142 f., 145, 162, 171, 183, 186Alder buckthorn 162Alfalfa 140, 148, 154, 172, 176 f., 179, 181,
185Alga(e) 132, 142, 145, 181 f., 186, 187, 249Alkali grass 165Alligator snapping turtle 14Alligator 54, 62, 66, 76, 79 f., 85, 88, 90, 92,
120, 123Almiqui (Cuban banana frog) 13Almond 146, 171, 176, 230Alpine ibex 21Alpine newt 13, 254Alpine rose 162, 185Alpine salamander 97Alpine squill 164Alsimatidae 133Amanita pantherina 144, 169Amber snail 68American alligator 7, 14, 58, 98American copperhead 27Amethyst hummingbird 34Amoeba 54, 94, 252
Amphibian(s) 5, 6, 13, 20, 22, 26, 66, 92,97 f., 254
Amphiuma (“Congo eel”) 13Amur red-footed falcon 39Anaconda 7, 14, 41, 97Andalusian horse 19Anemone 153, 168Angelica 167Angel’s-tears 137, 161Angiosperms 132Anglo-Arabian 19Anopheles mosquito 68Ant 11Antelope 36Anthericum 158, 164Ape 44, 115Aphid 94Appenzeller mountain dog 18Apple 133, 136, 138, 140, 145, 162, 171,
179 f., 181 f., 186 f., 230, 233Apricot 162Aquatic sowbug 68Arabian 19Arachnids 5Arapaima 12Archaeophis 22Archaeopteryx 20Archelon 20Arctic tern 39Arecidae 133Arenaviruses 195Argentavis 20Arnica 165Arrow worm 9Arrowhead 164, 180Arthropods 5, 9, 26, 82, 122Arvicolinae 45Asarabacca (European wild ginger) 142,
166, 180, 185Ascomycota (sac fungi) 132, 145, 258Ash 134, 138 f., 143, 145, 150 f., 162, 172,
180, 183, 186Asp viper 27, 92
Name Index
275

Asparagus 138, 146 f., 150, 155, 164, 230,233
Aspergillus 198 f.Assassin bugs 127Aster (family) 160Asterales 133Asteridae 133Atlantic white-side dolphin 115Aurochs 21Australian mountain ash (Eucalyptus reg-
nans) 151Australopithecus 239Autumn crocus 146, 149, 164, 188Avens 153Avian flu virus 198Avocado 172, 176Axolotl 6, 13, 66, 92, 124Azotobacter 197, 199
BBaboon 7, 16, 60, 92 f., 105, 108, 110, 115Bacillus 195–199, 252, 257Bacteria 132, 195–199, 257Bacteriophage l 195, 256 f.Bactrian camel 7Baker’s yeast 230, 258Bald cypress 152Baluchitherium 21Bamboo 149, 152Banana 136, 145, 149, 156, 184, 230, 233Baobab 152Barbel 96Bare-toothed russula 145Barley 135, 138, 143, 145, 147 f., 154, 156 f.,
165, 172 f., 175, 177 f., 180, 183–185,188, 255
Barn owl 7, 15, 35, 99, 121Barn swallow 35, 38–40, 99 f., 102 f.Barracuda 12Barzoi 18Basidiomycota 132, 144Basket willow 163, 186Basking shark 12Bat 30, 37, 43, 46 f., 52, 54, 56, 59 f., 69, 72,
76, 85, 92 f., 107 f., 115, 118, 120, 124,126
Bauhinia purpurea 174Bay boletus 144, 169
Bay laurel 135, 176Beadlet anemone 6Beaked sea snake 27Beaked whale 88Bean 136, 140, 148, 154, 172 f., 175 f., 184 f.,
187, 230Bear 41, 43Bearberry 185Bearded darnel 165Bear’s breeches 174Beaver 7, 16, 43, 88, 92, 106Bedbug 6, 51, 57Bedstraw 146Bee orchid 145Bee 6, 30, 32, 37, 51, 90 f., 120, 122, 127Beech (family) 159Beech marten 45, 93, 107Beech 136, 143, 150, 154, 173, 184 f.see also European beechBeechnut 176Beefsteak or brain mushroom 169Bees and ants (hymenoptera) 5, 10Beet (Beta vulgaris) 142, 177, 188Beet 148Beetle 5, 10, 122Beetroot 156Belladonna 167Bellflower 190Beluga whale 84Beluga 12Bent grass 162, 165Berberis 140Bilberry 155Birch (family) 159Birch 133 f., 137, 139, 143, 145, 151, 159,
162, 170 f., 180, 185 f.Bird cherry 163Birds 5, 7, 15, 20, 22 f., 34, 50, 55, 66, 84, 92,
99 f., 102, 104, 115, 119, 127Bird’s-nest orchid 164Bishop’s goutweed 141, 153, 166Bison 7, 16, 36, 67, 93Bitterling 96 f.Black alder 134, 137, 151Black bear 110Black grouse 99Black medick 166Black mold 257
276 Name Index
Black morel 145, 169Black poplar 134, 144, 151, 163, 170Black redstart 40, 79, 100–102Black rhinoceros 16, 21Black wildebeest 21Black woodpecker 15, 99Blackberry 162, 179, 182, 233Blackbird 7, 34 f., 55, 66, 92, 99–102, 120Blackcap 40, 99, 103Black-eyed pea 177Black-headed gull 55, 99–101, 103Blackthorn 163Bladder wrack 183, 187Bladderpod 158Bloodhound 18Blowfly 32, 37, 54, 94, 122, 127, 254Blue mussel 54, 68, 77, 80 f., 232, 234Blue shark 12, 97Blue tit 15, 41, 99, 102Blue whale 16, 46 f., 62, 67, 72, 88, 93, 106,
108, 110, 114, 119 f.Bluebell (family) 159Blue-headed wagtail 38Blusher 169Boa constrictor 14, 66Boa(s) 7, 22Body louse 57Bog rosemary 163Bonito 76Bony fish 63, 80Borage (family) 160Borage 179Bordetella 195Bowhead whale 16, 88, 119Boxer 18Boxwood (common box) 138, 162Brachiosaurus 20Brackenfern 145, 168, 183Brazil nut 172Brazilian porcupine 108Bread mold 254Bream (Carp) 96Brimstone 95Brine shrimp 64Bristlecone pine 134Bristleworm 64, 119Bristly oxtongue 158British yellowhead 167
Brittle stars 9Broad bean 135, 147, 150, 172, 175, 178, 253Brome 162, 165Bromeliales 133Brontosaurus 20Brook lamprey 96Broomrape 171Brown algae 132Brown bear 7, 46 f., 61, 93, 105 f., 111Brown bullhead 125Brown rat 16, 69, 108 f., 119 (see also Rat)Brown roll-rim 169Brown trout 96 f.Brussel sprouts 230Bryony 150, 168, 190Bryophyllum 162Buchfink 7, 35, 39, 54, 66, 73, 76, 99–102,
120, 124Buckbean 166Buckwheat 141Budgerigar 67, 84, 99, 101 f., 125Buffalo 110Bugle 166Bull thistle 166Bullfrog 38, 66, 124, 258Bullhead 96Bumblebees 11, 30, 32 f., 37, 80Burbot 96Burdock 146, 166Burnet 167Bur-reed 164Bush vetch 146Bushmaster 14, 27Buttercup (family) 159Buttercup 136, 153, 161, 166, 173Butterfly bush 170Butterfly 5, 10, 54, 95Button mushroom 145, 230, 234Buzzard 7, 35, 41, 85see also Common buzzardByrum 183
CCabbage 138, 140, 149, 173, 176, 230, 233Cacao 156 f., 176Cactus 137, 141Caddis fly 32Caecilian 13, 20
Name Index 277
Caiman 69Calliphora 33Camargue horse 19Cambarus 116Camel 16, 36, 43, 46 f., 52, 54, 57, 61, 93,
105, 107, 110Campanula 135 f., 141, 145, 166, 170Campanulales 133Campion 161, 167Canada thistle 170Canadian waterweed 141 f., 146, 164,
180 f., 183, 188Canary 7, 71, 79, 92, 101, 124Candida 198 f.Caoutchouc 156 f.Capuchin monkey 7, 56, 67, 69, 86, 92Caraway 146, 166Carcharodon 20Carcinus 116Carline thistle 135, 167Carp 6, 12, 54, 58, 62, 64, 66, 69, 73, 76, 78,
81, 87, 92 f., 96 f., 114, 117, 119, 123,231, 256
Carrion beetle 127Carrion crow 15, 22, 34, 55, 67, 73, 76, 84,
86, 99–102Carrot (family) 159Carrot 138, 146 f., 148 f., 167, 170, 155, 173,
180, 188, 230, 233Cartilaginous fish 63Caryophyllales 132Cassava 156 f., 178Castor seed 176Cat shark 69, 76, 79, 81, 86, 92, 97, 126Cat 7, 23, 30–32, 43, 46–48, 52–54, 56, 60 f.,
63, 69, 71–76, 78, 81, 84–86, 91, 93,106 f., 109–111, 114, 116–119, 121 f.,124–126, 253
Cat’s-ear 158Cattail 164, 181Cattle 7, 23 f., 41, 45–54, 56, 60–63, 69–72,
74, 76, 78–81, 84, 86, 90–93, 106 f.,109–111, 114 f., 118 f., 124, 126, 252 f.,255–257
Cauliflower 147 f., 230Cauliflower mushroom 169Cave bear 21Cedar 134, 151 f.
Celery 149, 173, 182, 230Centaury 161, 167Centipede 6, 9, 36Cephalopods 5 f., 9, 87Chameleon 58, 120Chamois 7, 16, 43, 105, 107, 112Chamomile 146, 166Chanterelle 144, 169Chara 191, 252Charadriidae 39Cheetah 36Cherry laurel 135, 186Cherry 133, 137, 140, 146, 171, 230, 233Chicken 7, 23 f., 41, 46 f., 50, 52–55, 60, 62,
67, 69–72, 74–76, 78–80, 85, 87, 92 f.,103 f., 118–120, 123–126, 253,256–258
Chicory 158, 167Chiffchaff 40, 99, 101–103Chihuahua 18Chimpanzee 7, 16, 52, 56, 71, 73, 76, 78, 84,
86, 92 f., 105–108, 111, 114 f., 121, 125,239
Chlamydomonas 182, 251Christmas rose 145, 166Chrysanthemum 162Chub 96Cicada 10, 125Cinquefoil 153, 166Citrus 156Cladophora 187Cleavers 166Clematis 163Clostridium 195–198Clover 143, 171 f.Clusterhead 146, 166Clydesdale 19Cnidaria 5, 8, 25, 87Cobra 7, 27Cocci 197Cockatoo 7Cockchafer (May bug) 32, 37, 47, 122, 127Cocker spaniel 18Cockle 64Cockroach 5, 10, 31, 51, 68, 91, 94, 116–118,
123, 127Coconut 146, 171, 173, 176, 230Coconut palm 136, 139, 150, 156 f., 170
278 Name Index

Cod (Baltic Sea) 74, 81, 254Cod 12, 96 f., 234Coelacanth 90Coffee 156 f., 173, 176Collie 18Colombian giant toad 13Colorado potato beetle 90, 250Colossochelys 20Coltsfoot 146, 153, 166, 170Colubrid (snake) 76Comfrey 165Comma 95Commelinidae 133Common agrimony 161, 167Common alkanet or bugloss 167, 170Common aspen 133, 137, 144, 155, 163, 173Common barberry 163Common bean 143, 145, 166Common bird’s-foot trefoil 166Common blue (butterfly) 33Common bugle 153Common butterwort 166Common buzzard 15, 34, 37, 55, 67, 69, 84,
99–101, 103Common chickweed 170Common clubmoss 168Common earthball 144, 169Common eider 36Common eland 16, 21Common Eurasian spadefoot toad 13, 92,
98Common evening primrose 149, 161, 167,
173Common frog 13, 59, 69, 72 f., 76, 92 f.,
97 f., 120, 124Common fumitory 166Common glasswort 167, 181Common hemp-nettle 166Common hermit crab 120Common hogweed 165, 172Common house mouse 16, 23, 36, 54, 58,
67, 92, 106–109, 118, 123see also Mouse
Common kestrel 35, 41, 67, 103, 121Common lizard 14, 59, 98Common madder 153Common mare’s tail 167Common milkwort 166
Common moonwort 133, 168Common or Harbor seal 7, 16, 23, 43, 47,
60 f., 63, 71, 76, 85, 88, 93, 107–109,111
Common periwinkle 6Common pipistrelle 69, 88Common polypody 168, 183Common quail 39 f.Common raven 7, 15, 67, 99–101, 115Common redstart 40, 102Common reed 144, 165Common shrew 47, 108Common sow thistle 158, 166Common spikerush 164Common spotted orchid 170 Common swift 7, 15, 34 f., 37, 39 f., 55, 67,
69, 79, 86, 99–101, 103Common teal 39Common toad 6, 13, 58 f., 69, 73, 85, 92,
97 f., 256Common vetches 172Common vole 16, 36, 52, 58, 84, 90, 107Common wall lizard 14, 59, 98Common yarrow 144, 146, 153, 167Condor 7, 15Coral snake 27Coral 8Cordgrass 165Corn (maize) 136, 138, 140 f., 143, 146–149,
154 f., 172 f., 175–178, 181, 184 f., 188,255
Corn buttercup 170Corn cockle 166, 170Corn poppy 146, 166, 170Corn seed 172Corn spurry 167, 173Cornelian cherry 163Cornflower 146 f., 166, 170, 173Coronaviruses 195Corydalis 166Corynebacterium 195Cosmos 162Cotton grass 142, 164Cotton 139, 156 f., 176Cow 258Cowberry (lingonberry) 135, 163, 182Cowslip 167Cow-wheat 167
Name Index 279

Coyote 36, 61Crab 257Cranberry 161Crane fly 33Crane 7, 38–40Cranesbill 167, 174Crayfish 6, 54, 57, 63, 81Creeping Jenny 167Cress 233Crest (or kinglet) 15, 35, 41Crested dog’s-tail 165Crested lark 102Cricket 51, 124Crimson clover 148Crinoids (feather-stars) 9Crocodile 14, 20, 22, 71 f., 78, 93, 121Crocus 164Cro-Magnon man 239Cross spider (Araneus) 68Crossbill 39Crossed viper 14, 27, 58 f., 69, 92, 97 f.Cross-leaved heath 145, 163, 183Crow 35, 69
see also Common ravenCrow 7, 69, 124Crowberry 163Crown vetch 185Crucian carp 96Crustacean 5 f., 9, 87, 117Ctenophore 8Cuban tree frog 13Cuckoo flower 167Cuckoo 7, 39 f., 99, 101Cuckoopint 142, 164, 187 f.Cucumber 136, 145, 148, 154, 166, 179, 230,
249Currants 233Cuttlefish 6, 70 f., 80, 91, 116, 232Cyclamen 133, 136, 143, 145, 161, 165Cyclops (water flea) 91Cyperales 133Cypress (Cupressus) 134, 151Cypress spurge 135, 141, 146, 168
DDachshund 18Daffodil 164Daisy 142, 166Dalmatian 18Damselfly 33Dandelion 135, 142, 146 f., 158, 166, 170,
173Daylily 158, 161Dead-nettle 167, 170, 179Death cap 144, 169Deer fern 168Deer 7, 8, 36, 43–47, 60, 68, 93, 105, 107,
110–112, 126see also Red deer (wapiti)
Dentaria glandulosa 153Desert monitor 24Desert plants 135Devil anglerfish 79Diatoms 132, 251 f.Dice snake 14, 98Dicotyledoneae 132Dictamnus 162Dill 161Dilleniidae 132Dingo 18Dinosaur 20, 22, 36Dinotherium 21Diplococcus 196–198Diplodocus 20Diptera 10Dock 165, 188Dodder 167Dodo 20Dog 7, 18, 23, 31, 43, 46–48, 50, 52–54, 56 f.,
60–63, 67, 69–76, 78–81, 84 f., 87, 90,92 f., 106 f., 109–111, 114, 116, 118,121, 124–126, 253, 256, 258
Dog fennel or chamomile (Anthemis) 166Dog flea 57Dog rose 133, 136, 163Dog violet 166, 174Dolichovespula wasp 11Dolphin 7, 16, 36, 47, 60, 69, 76, 80, 85, 106,
108, 110, 114, 124Domestic pig 7, 93Domestic pigeon 66Donkey 7, 107, 109–111, 120, 258
280 Name Index

Dormice 43Douglas fir 134, 137, 150, 162, 171Dragonfly 5, 10, 30, 33, 37, 68, 91, 122Driver ants 11Dromedary 7, 36, 56, 106Drosophila, see Fruit flyDry rot fungus (Serpula lacrymans) 144Duck 7, 50, 52 f., 55, 57, 60, 66, 69, 71 f.,
75 f., 79, 85, 88, 92 f., 123 f., 126Duckweed (family) 160Dung beetle 47Earth boring 34Dunnock 102Dwarf gecko 14Dwarf goby 12Dwarf honeysuckle 161Dwarf lemur 16Dyer’s greenweed 135
EEagle 7, 35, 114Eagle owl 7, 15, 67, 99 f., 102, 125Earthworm 6, 31, 54, 76 f., 81 f., 91, 116 f.Earwig 6, 10, 57, 122, 127Eastern white pine 137, 141, 173Echidna 56Echinoderms 5, 9, 87Ectoprocta (Moss animals) 9Edelweiss 166Edible crab 68, 77Edible frog 73 f., 78, 81, 92, 97 f., 256Edible snail 6, 31, 37, 68, 77, 80, 91, 93, 232,
250Eel 6, 12, 22, 36, 54, 69, 71–73, 76, 81, 123 f.Eelgrass 146, 164Egret 35, 92Elderberry 163, 233, 251Electric catfish 117Electric eel 78, 117Electric rays 52, 66, 69, 71, 73, 79, 86, 97,
117, 119Elephant 7, 16, 21, 23, 36, 41, 43, 46 f., 52,
54, 56, 62 f., 67, 69, 73, 84 f., 93, 107 f.,110 f., 114 f., 118, 120
Elephant fish 117Elephant seal 16, 69, 88Elm 134, 137, 140, 144, 151, 171, 186Emperor penguin 100
Enchanter’s nightshade 166Endive 148English elm 152, 162English holly 135, 141, 155, 163, 181English oak 141, 146, 151English or narrowleaf plantain 167Enterobacteria 196Enteromorpha 191Ergot 145Ericales 132Ermine 16, 44, 105Escherichia 196–199, 251, 255–257Etruscan shrew 16, 108Eucalyptus 152Euglena 145, 252, 254, 257Euphorbiales 133Eurasian aspen 186Eurasian badger 17, 44, 60, 105 f., 112Eurasian black vulture (Monk vulture) 15Eurasian bullfinch 102, 124–126Eurasian coot 34, 99–102Eurasian curlew 15, 40, 102Eurasian dotterel 39Eurasian jay 15, 66, 99, 102Eurasian minnow 96, 120, 124Eurasian nuthatch 99, 103Eurasian pygmy owl 15Eurasian reed warbler 99, 103Eurasian siskin 39, 85Eurasian water shrew 46 f., 115Eurasian woodcock 15, 112European beach or marram grass 165, 181European beech 134, 138, 140, 146, 151,
155, 159, 163, 172, 183, 185 f.European black pine 137European columbine 165European conger 12, 86European fire-bellied toad 98European goldfinch 103European greenfinch 102European ground squirrel (suslik) 61, 88European hare 7
see also HareEuropean hepatica 136, 140, 161, 166European hornbeam 133 f., 138 f., 143,
150 f., 159, 163, 171, 180, 186European kingfisher 37, 99–101European nightjar 103
Name Index 281
European perch 12, 96European pond turtle 7, 30, 47, 92 f., 98,
121European rabbit 68European rhinoceros beetle 51European rowan 133, 137, 146, 162European serin 102European smelt 96European speedwell 165, 185European spindle 146, 163, 186European starling 7, 34 f., 37, 39, 41, 55 f.,
67, 71, 99 f., 102 f., 125 f.Exmoor pony 19Eyed hawk moth 95Eyed or Jeweled lizard 14
FFabales 133Fagales 132Fairy flax 167Falcon 37Fallow deer 7, 112False lily of the valley 164False medlar 163False morel 145Fat dormouse 7, 17, 44, 59, 72, 88, 105, 107Feather grass 165Fern tree 150Fernlike plants 132Ferns 168, 183, 190Fescue 165Fiddler and ghost crabs 122Field bindweed 135, 153, 165, 170, 185Field cricket 57, 127Field horsetail 153, 168Field marigold 158Field mushroom 145, 169Field or hedge maple 145, 150 f., 162, 183,
186Field rose 161Fieldfare 40Fig 134, 180Figwort (family) 160Figwort 165Fin whale 17, 36, 67, 85Fink 31Fir 134 f., 144, 146, 150–152, 154 f., 172,
181, 188, 255
Fire salamander 6, 13, 66, 73, 85, 92, 97 f.,256see also Salamander
Fire-bellied toads 97Firebug 91Firecrest 103Firefly 122Fireweed 153, 166, 179Fish 5 f., 12, 20, 26, 64, 66, 92, 96 f.Fjord horse 19Flamingo 22, 99Flatworm 5, 8Flax 139, 161, 173, 176–178, 185, 188, 252Flea 10, 38Flint corn 172Flower fly 127Flowering rush 164Fly agaric 144, 169Fly 5, 258Flyingfish 37Fodder beets 180Forget-me-not 144, 146 f., 167, 170Forsythia 163Fox 7, 17, 38, 44, 47, 56, 60 f., 67, 69, 76, 85,
93, 105–107, 110 f., 115Fox terrier 18Foxtail grass 143Fragrant orchid 164, 171Francisella 196Freshwater (pearl) mussel 6Freshwater turtle 125Frog orchid 164Frog 22, 24, 30–32, 54, 60, 62 f., 70 f., 79 f.,
82, 87, 90, 114, 116 f., 119, 121–123,250, 255
Frog’s bit 164, 180Frostweed 136, 141, 161, 167Fruit fly 6, 68, 82, 90 f., 94, 121, 253, 255 f.Frullania 183Fungus 132, 169, 197–199, 257Funnel (or Agaric) 145Fusarium 197–199
GGalapagos giant tortoise 7, 97Galinsoga 170Garden loosestrife 166Garden tiger (butterfly) 95
282 Name Index
Garden warbler 7, 40, 102Garganey 40Garlic mustard 166Gazelle 36Gecko 58, 122Gemsbok 21Gentian (family) 159Gentianales 133Gentoo penguin 36Geraniales 133Geranium (family) 160Geranium 140Gerbil 24German shepherd 18Germander 182Gharial 14Giant clam 6Giant moa 20Giant neotropical toad 13Giant salamander 7, 13Giant Schnauzer (Riesenschnauzer) 18Giant squid 36, 118Giant tortoise 36, 58, 69Gibbon 7, 17, 38, 92 f., 107, 114 f.Ginkgo 142, 145, 155Giraffe 7, 17, 36, 44, 69, 71, 85, 93, 107, 110Globe flower 167Glycine 190Gnu 36Goat willow 133, 163Goat 8, 45 f., 48, 52 f., 56, 62 f., 69, 71–76,
78 f., 93, 108–111, 115, 126Goldcrest 99, 101Golden eagle 15, 99 f., 102Golden ground beetle 6Golden hamster (or Syrian hamster) 7, 17,
52, 61, 69, 71, 73 f., 76, 78, 84 f., 92 f.,104, 106–109, 114, 120, 254
Golden oriole 40, 99, 103Golden plover 39Golden saxifrage 166Goldenrod 153Goldfish 6, 30, 54, 58, 64, 69, 78, 92, 123 f.,
256Goliath frog 13Good King Henry 166Goose 7, 23, 37, 55, 60, 66, 69, 76, 80, 256
see also Greylag goose
Gooseberry 163Goosefoot (family) 159Gorilla 8, 17, 52, 85, 92 f., 107 f., 111, 114,
124, 239Gorse 146Goshawk 15, 35, 37, 55, 57, 99, 115Grain weevil 250Grain 175Grant’s zebra 19Grape vine 133, 135, 190Grape 230Grapefruit 182Grass snake 14, 22, 36, 54, 58 f., 69, 71–74,
98Grasshopper warbler 102Grasshopper 5, 10, 30, 38, 51, 94, 118, 124Gray heron 7, 34, 40, 99 f., 102Gray partridge 37, 99, 103, 112Gray seal 8, 88Gray whale 36, 258Grayling 96Great black-backed gull 15, 35, 38Great bustard 15, 35Great cormorant 7, 37, 88, 99Great crested grebe 7, 88, 99–101Great Dane 18Great diving beetle 36, 47, 57, 91Great Horse 19Great ramshorn snail 77Great reed warbler 40, 102Great spotted woodpecker 15, 35, 55, 66,
99–102Great tit 7, 35, 67, 99–101, 103Greater celandine 167, 170Greater duckweed 164Greater siren 13Greater weever fish 86Green algae 132Green lacewing 33, 37Green toad 13, 66, 92, 97 f.Green turtle 14Green woodpecker 102Greenbottle blowfly 51Greenland shark 12Greenland wheatear 39Green-veined white 94Grevy’s zebra 19Greyhound 18, 36, 68
Name Index 283
Greylag goose 35, 40, 92, 99 f.Griffon vulture 7, 15, 35, 99–101Grizzly bear 17Ground beetle 57, 82Ground cedar 168Ground ivy 153, 166Groundsel 170Grouper 12Gudgeon 96Guenon 114 f.Guinea pig 8, 17, 30 f., 44, 48, 52–54, 56–58,
63, 67, 69, 71–76, 78, 84, 86, 90–93,106–111, 114, 122–124, 253–256
Gull 57Guppy 6, 58, 92Gymnosperms 132Gypsophila 180Gypsy moth 95Gypsy 169
HHaddock 231Haemophilus 196Haflinger 19Halibut 12Halophytes 182Hamamelididae 132Hamster 17, 44, 53, 59, 87Harbor porpoise 61, 62, 78, 86, 88, 114 f.Hare 36, 44, 54, 60, 67, 72, 92 f., 105, 107,
112, 119Hartmann’s zebra 19Hart’s tongue fern 168, 183Harvest mouse 68Harvester ant 26Hawk moth 37Hawk 7, 35, 41, 85Hawksbill turtle 92Hawkweed 141, 158, 166Hawthorn 163, 186Hazel dormouse 17, 44, 56, 59, 88Hazel 143, 159, 163, 185Hazelnut 133, 173, 176, 186, 230Head louse 91Heath (family) 159Heath 133, 146, 163Hedge false bindweed 137, 144, 168, 190Hedge mustard 167, 170
Hedgehog 8, 17, 44, 46 f., 56 f., 59 f., 67, 69,72, 78, 85, 88, 91–93, 107, 111, 114 f.,124, 169, 255
Heliozoa 91, 253Hellebore 135, 146, 164, 167, 181Helleborine 164Heloderma 22, 26Hemp agrimony 167Hemp 139, 147, 149, 154, 173, 176Henbane 161, 165, 170 f., 180Hens and chicks 166Herb Paris 164Herb Robert 167, 170Herpesviruses 195, 198, 257Herring gull 7, 34 f., 67, 99, 115Herring 6, 22, 93, 96 f., 231, 257Heteroptera 10Hibiscus 137, 161Hickory 138Hippopotamus 8, 17, 21, 23, 36, 44, 47, 52,
56, 84, 88, 93, 105, 107 f., 114Hoary alyssum 166Hoary cress 167Holm oak 181Homing pigeon 37Homo erectus 239Homo heidelbergensis 239Homo sapiens neanderthalensis 239Homo sapiens 239Honesty 167Honey buzzard 38Honey fungus 144, 169Honeybee 11, 33, 94, 122 f.
see also BeeHoneysuckle (family) 159Hooded crow 38Hoopoe 40, 103Hopping mouse 61Hops 143, 166, 190Horn of plenty 169Hornets 11, 37Horse chestnut 137, 139, 144, 146, 155, 163,
173, 176, 179, 186Horse mushroom 169Horse 8, 17, 19, 23, 36, 44–54, 56, 61, 63,
68–76, 78–81, 84–87, 90, 92 f., 106 f.,109–111, 114 f., 118, 121, 124, 257 f.
Horsefly 33, 37
284 Name Index

Horseshoe bat 7, 43Horseshoe crab 123Horsetail 146Horsetails (family) 132Horseweed 170Hound’s tongue 166, 179Houndshark 52, 79House cat 36, 92House cricket 82, 90, 94, 255House martin 103House sparrow 7, 34, 37, 66, 84, 92, 99–101House spider 91Housefly 6, 30, 33, 37, 91, 94, 122 f., 254Human 8, 22–24, 30, 32, 36, 38, 44, 46 f., 50,
52–54, 56 f., 60 f., 63, 67, 69–76, 78–81,84–88, 90–93, 105–110, 114 f.,117–127, 251 f., 254–258
Hummingbird hawk-moth 33, 37, 95Hummingbird 7, 31, 34, 41, 54, 67, 76, 84,
86, 99–101Hydra 91Hydrodyction 191Hydrophytes 181Hydrozoa 8Hyena 44, 61, 63Hygrophorus marzuolus 169Hypnum 187
IIbex 8, 17, 44, 47Iceland moss 187Icelandic poppy 158Ichthyosaurs 20Ichthyosaurus 20Iguanodon 20Impala 21, 38Imperial eagle 15Indian pony 19Indian rhinoceros 17, 21Influenza virus 198, 251Ink cap 150Inocybe 144, 169Insects 5, 10 f., 32 f., 82, 94Invertebrates 6, 54, 57, 64, 68, 77, 91Iridoviruses 195Iris 137, 140, 253Ironwood 138Isopod 82
Italian greyhound 18Ivy (family) 159Ivy 133, 135, 143, 152, 162, 179 f., 185 f.Ixodes ricinus tick 91
JJackdaw 39, 99–102Jaguar 67Jasmine 179, 190Jellyfish 80Jerboa 38Juniper 133, 135, 146, 151, 163Jute 139
KKalanchoe 162Kangaroo rat 61Kangaroo 8, 17, 37, 38, 54, 56, 71, 92, 107 f.,
110, 258Katydid 10, 58, 124Kernel corn 138, 156 f.Kiang 19Kidney vetch 168King cobra 14King penguin 55, 99, 101Kinglet (or crest) 15, 35, 41Kitefin shark 52Knotweed (family) 159Knotweed 136, 167Koala 17Kohlrabi 149Komodo dragon 14Krait 27Kudu 21Kulan 19
LLaburnum 163Lactobacillus 196, 198 f.Lady fern 168Ladybug 33Lady’s mantle 166Lady’s slipper 145, 164Lama 8, 44, 73Lamprey 73 f., 77 f., 80, 90, 92, 123Lancelet 6, 90 f.Larch boletus 144, 169Larch 134, 137, 146, 151, 155, 163, 181, 186
Name Index 285

Large pink 167Large yellow underwing 95Large-leaf linden 137, 151, 163Lark 7Larkspur 147Latimeria 12Lavender 179Leach 91Leafcutter ant 11Least weasel 17, 38, 41, 44Leatherback turtle 14, 88, 97Leech 6, 9, 249Leek 188, 230Leguan 14, 47Lemon balm 153Lemon 136, 173, 181 f., 233Lentil 143, 147, 149, 154, 172, 175Leopard 17Leopard’s bane 174Leptospires 196Leptotricha 196Leptotyphlops 15Lesser butterfly orchid 164Lesser celandine 167, 255Lesser Egyptian jerboa 24Lesser rattlesnake plantain 164, 171Lesser whitethroat 39 f., 102Lettuce 138, 147, 149, 173, 230, 233Leuconostoc 199Liana 139, 186Lichens 132, 183, 187Lilac 136, 140, 143, 145, 163, 181Liliales 133Liliidae 133Lily (family) 160Lily 140, 188Lily of the valley 136, 142, 164Linden (family) 160Linnet 102Lion 17, 23, 36, 38, 41, 44, 46 f., 52, 67, 69,
84, 86, 93, 107, 111, 114, 118 f.Lippizaner 19Liriodendron (tulip tree) 136Little egret 115Little owl 41, 67Little woodstar 15Little-leaf linden 137, 146, 163Livelong saxifrage 167
Liver fluke 91Livid pinkgill (Entoloma sinuatum) 144,
169Lizard 7, 14, 54, 72, 80, 93, 121, 124Lizard-toed gecko 14Loach 96Lobaria 187Lobster 6, 31, 54, 63, 68, 71, 77, 80 f., 93,
117, 123, 232Loligo 116 f.
see also SquidLong beech fern 168Long-beaked echidna 8, 56 f., 76Long-eared bat 87Long-eared owl 100, 102 f., 125Loon 88, 115Loose silky-bent 165Lotus 137Louse 51, 94Lugworm 54, 68, 77, 80Lung lichen („lungwort“) 183Lungfish 6, 12, 78, 85 f., 90Lungwort 166, 185Lupine 135, 147, 149, 166, 172, 174, 178Lycopodiophyta 132, 133, 145, 153, 168Lynx 44
MMacaque 24, 92 f., 107Mackerel 6, 78, 96Magnolia 137Magnoliidae 132Magpie 7, 34 f., 99–102Mahogany 137Maidenhair spleenwort 168Makoré 137Male fern 142, 144, 146, 168Mallard 34 f., 37, 67, 84, 99 f., 102 f., 112,
115Mallow (family) 160Malvales 132Malve 166Mamba 15, 27, 36Mammals 5, 7, 16, 21, 43, 48–50, 56, 61 f.,
67, 84, 87, 104, 105 f., 109–111, 114 f.,256
Mammoth 21Manatees 22
286 Name Index

Man-eating shark 12Mangrove 177, 181Manila hemp 139Manta ray 12, 97Map butterfly 95Maple (family) 159Maple 139, 142 f., 154, 172, 186Marabou stork 15Marchantia 252Marine iguana 14, 58Marlin 12, 36Marmoset 105, 108Marmot 17, 44, 56, 59, 88, 105Marsh cinquefoil 167Marsh clubmoss 168Marsh grass of Parnassus 161Marsh horsetail 168Marsh marigold 136, 141 f., 146, 167, 185Marsh or Lake frog 13, 66, 124Marsh tit 103Marsh warbler 103Martagon lily 164Marten 112Masterwort 167Mastodonsaurus 20Mat grass 165Mayfly 10, 33 f.Meadow ant 11, 122Meadow cranesbill 161Meadow grass 255Meadow horsetail 168Meadow pipit 39Meadow sage 146 f., 167Meadowsweet 166, 170Meal moth 51, 82, 94Mealworm 54Megaloptera 10, 33Melick 165Melon 143, 154 f., 173Mercurialis 140, 153, 165Mergus 37Metabacterium 196Mezereon 163, 186Micrococcus 196, 199, 251Midge 33, 77Midwife toad 13, 92, 97 f.Migratory locust 33, 37, 68, 70, 91, 254, 257Military orchid 140, 164
Millet grass 165Millet 156, 173, 175, 178, 184Mimosa 191Miniature poodle 18Minke whale 47Mint (family) 160Mistle thrush 103Mistletoe 140, 146, 163, 181Mitten crab 63 f.Mold 150, 180Mole 8, 17, 36, 41, 44, 46 f., 56, 60, 67, 92 f.,
107Mollusks 5, 26Monilia 198 f.Monitor lizards 22Monkey 45, 123Monkshood 166Monocotyledoneae 133Moon jelly 31, 64, 90 f., 117, 249Moor frog 13, 98Moorhen 103Moose 8, 17, 105Moray eel 86Moschatel 167Mosquito 33, 37, 82, 91, 94Moss 132 f., 142, 183, 187Mountain arnica 141Mountain avens 133Mountain pine 135, 137Mourning cloak 95Mouse 8, 24, 30, 41, 44, 46 f., 52 f., 56, 60,
62 f., 69, 71–76, 78, 85–87, 91, 93, 109f., 114, 124, 253, 255 f.
Mouse-ear chickweed 166, 180Mucor mold 150, 180Mucor 197 f.Mudpuppy 47, 72 f.Mugo pine 163Mugwort 170Mule 8Mumps virus 199Musk deer 73Muskrat 17, 48, 88, 115Mussel 5, 9, 77, 87Mustard (family) 160Mustard 146, 149, 167, 173, 179Mute swan 15, 22, 34 f., 99–102Mycobacterium 196–199, 257
Name Index 287

Mycoplasmas 196Myotis (bat) 8, 43, 67, 88
NNarrowleaf bittercress 174Nasturtium 142, 147, 179Natterjack toad 13, 73, 92, 98, 124Neisseria 196–199Nettle (family) 159Nettle 143, 153, 165, 180, 252Neuroptera 10Neurospora 199New forest pony 19Newfoundland 18Newt 60, 98, 253Nightingale 40, 99–101, 103Nightshade (family) 160Nightshade 140, 170Nile crocodile 14, 47, 98Nilwaran 98Nitella 180, 191, 252Noctule 87Nocturnal butterfly 124Norfolk Island pine 135Northern crested newt 13, 22, 66, 73, 92, 97Northern cricket frog 38Northern gannet 15, 88Northern lapwing 16, 35, 39 f., 67, 99–101Norway lemming 93Norway maple 134, 138, 151, 163Norwegian fjord horse 19Nutria 48
OOak fern 133, 168Oak processionary 95Oak 134, 138 f., 141, 143, 150, 152, 155, 162,
172 f., 185 f., 251Oats 135, 140 f., 143, 145, 147–149, 154 f.,
161, 165, 172 f., 175, 177 f., 180,183–185, 188, 234, 254
Ocean sunfish 12Octopus 6, 54, 64, 123Oil palm 156 f., 176Old World monkey 43Old World porcupine 45Oleander 135 f.Olive tree 134 f., 140, 156 f., 186
Olive 176 f.Onager 19One-flowered wintergreen or pyrola 171Onion 146 f., 155, 173, 180–182, 188, 230,
233, 251, 255Opalina 94Opium poppy 137, 146, 149, 161Opossum 45, 76, 93, 105, 107, 114Orach(e) 166, 170Orange oak bolete 144, 169Orange tip 95Orange 182, 230, 233Orangutan 8, 17, 47, 92 f., 107, 110 f., 114,
239Orca 17, 36, 78, 86Orchard grass 143, 161, 165, 176Orchid 160 f., 171Ophrys genus 164Orchidales 133Oregano 153Orinoco crocodile 14Orpine (family) 159Orthomyxoviruses 195Oscillatoria 182Ostrich 7, 16, 36, 55, 67, 69, 73 f., 79, 84, 86,
93, 99 f., 102, 114Owl 7, 34, 57, 119Oxeye daisy 146, 166Oxlip 167Oyster mushroom 144, 169Oyster 6, 31, 232, 234Oystercatcher 7, 102
PPainted comber (fish) 86Painted quail 16Palaeosiren 20Palisander 138Palm 152Palmate newt 13Palmleaf cinquefoil 182Pansy 146, 165, 170, 174Panther 69Paper wasp 11, 51Papovaviruses 195Paramecium 54, 58, 87, 94, 252Paramyxoviruses 195Parasol 144, 169
288 Name Index

Parmelia 187Parnoviruses 199Parrot 115, 126Parsley 146 f., 155, 167, 176, 233Parvoviruses 195Pasque flower 146, 166Passion flower 137Pasteurella 197Pea (family) 160Pea 135, 140, 145, 147–149, 155, 166,
171–173, 175, 177 f., 187, 253, 255Peach 141, 146, 163, 181Peacock 95, 127Peanut 138, 156 f., 171, 175–177, 230Pear (tree) 145, 162, 171Pear 133, 137, 139, 179Pearlwort (sagina) 161Peat moss 142, 187Pecan 176Pectoral sandpiper 39Peking duck 258Pelargonium 141, 161Pelican 7, 34, 123Pelomyxia 94Penguin 7, 88, 124, 258Penicillium 197–199Pennycress 166, 170Pepper (vegetable) 230Peppermint 146, 153, 167Peppery milkcap 144, 169Perch 74Percheron 19Peregrine falcon 34 f., 37, 39, 101 f., 121Periwinkle 153Pestilence wort 153, 167Pheasant 7, 34, 50, 66, 76, 84, 99–102, 113,
115Phobosuchus 20Picornaviruses 195Pig 23 f., 30, 45–48, 50–54, 56, 61, 63, 69–76,
78 f., 81, 90, 92, 105–107, 109–111,114 f., 118 f., 126, 250, 258
Pike 6, 12, 47, 66, 69, 71, 87, 90, 92, 96, 256Pill millipede 36Pilobolus fungus 174, 197Pincushion flower 167Pine chafer 122Pine hawk moth 95
Pine marten 45Pine moth 36, 95Pine 133–135, 137 f., 142 f., 146, 150 f.,
154 f., 180, 184 f., 255Pineapple 182, 184, 187Pinesap 166Pink (family) 160Pinniped 81, 120Piperales 132Plagiothecium 183Plaice 6, 64, 81, 96, 121Planarian 6, 36Plantain (family) 160Platanus 134, 137, 152, 163Platypus 88, 90, 93Plum tree 138Plum 146, 163, 171, 230Plumose anemone 117Poales 133Poinsettia 162Pointer 18Poison hemlock 167Polar bear 8, 17, 36, 67, 88, 93, 105, 107Polecat 45, 107, 115Poliomyelitis virus 199Polygonales 132Pomeranian 18Pond mussel 6, 30, 32, 54, 68, 80 f.Pond-lily 167Pondweed 164, 181Poodle 18Popcorn 172Poplar 140, 146, 181Poppy (family) 160Poppy (genus) 137, 148, 171, 173, 176 f.Porcini 145, 169, 230Porpoise 47, 120Potato 136, 140, 143, 146, 155–157, 166,
173, 178, 180–182, 185, 188, 230, 233Pox viruses 195Praying mantis 6, 10, 81 f., 91Prickly pear cactus 185Primates 62, 121Primitive insects 51, 68Primrose (family) 160Primrose 141, 146Primulales 132Prionosuchus 20
Name Index 289
Privet hawk-moth 33, 68, 95Privet 135, 146, 163, 186Proconsul 239Prokaryotes 132Prosimian 45, 115Proteus 196 f.Protozoa(n) 5, 8, 94Przewalski horse 19Pseudomonas 196, 198 f.Pteranodon 20Pterosaur 20Pterosphenus 20Puccinia 199Puff adder 27Pug 18Puma 108Pumpkin 137, 142 f., 146–149, 154 f., 173,
179–181Purple foxglove 161, 166, 173Purple loosestrife 165Purple moor grass 141, 165Pussytoes 166Pygmy mouse 17, 41Pygmy salamander 13Python 47, 54, 66, 90, 98
QQuackgrass 153, 165, 173Quagga 19Quaking grass 165Quetzalcoatlus 20Quince 163Quoll 90
RRabbit 8, 17, 23 f., 31, 45–48, 52–54, 56 f.,
60–63, 69, 71, 74–76, 78–81, 85 f., 90,92 f., 104, 107, 109–111, 115, 118, 123,126, 250, 253, 255, 258
Raccoon 45Racehorse 36Radiolaria 87Radish 147, 149, 161, 230Rafflesia arnoldii 137Ragged robin 136, 166Rainbow trout 22, 58, 64, 70, 96Raisin 230Ramaria aurea 144, 169
Ramie 252Rampion 167Ramsons 164Rannoch rush 164Ranunculales 132Rape 135, 146, 148, 171–173, 176 f., 179Raspberry 163, 179Rat 8, 24, 30–32, 36, 45–48, 51–54, 56, 60,
62, 63, 68, 71–76, 79 f., 84–87, 90–93,105–110, 114, 116, 118, 121, 123, 125,253–256
Rattlesnake 7, 27, 69, 97, 258Ray 80, 117Red algae 132, 181, 183, 187Red beet 147, 230Red clover 135, 146, 148, 162, 167, 173, 179,
185Red cracking bolete 169Red deer (Wapiti) 17, 21, 36 f., 107, 112,
121Red kite 103Red underwing 95Red-backed shrike 38, 103Red-throated loon or diver 7Redwood (sequoia) 134 f., 137, 151 f., 162Reed bunting 103Reed canary grass 162, 165Reindeer lichen 183, 187Reindeer 8, 17, 56, 107, 110Reoviruses 195Reptiles 5, 7, 14, 20, 26, 66, 76, 87, 92, 97 f.Restharrow 163Reticulated python 15Retroviruses 195Rhabdoviruses 195Rhamphosuchus 20Rhesus macaque 57, 62, 74, 84, 90, 92,
105–107, 111, 121, 124, 258Rhinoceros 8, 21, 36, 44, 68, 93, 107, 110 f.Rhizobium 196Rhododendron 155Rhubarb 182, 230Ribbon worms 9Riccia 187Rice 143, 156 f., 175 f., 178Rickettsia 196Ringed seal 36Roach 96
290 Name Index
Roadrunner 36, 38Robin 7, 55, 99, 103, 121, 125Robinia 137, 139, 151, 163, 171, 179, 186Rock dove 7, 16, 24, 30, 34 f., 47, 50, 52 f.,
55 f., 60, 69, 71–76, 78 f., 84, 86, 92,112, 119, 121–123, 125 f., 255
Rook 16, 39, 103Rosales 133Rose (family) 160Rose 155Rosidae 133Rotifer 6, 9Rottweiler 18Roundworm 5, 6, 9, 54, 77, 90 f., 249Roxburghia 190Royal albatross 101Royal fern 168Rubber tree 180Ruby-throated hummingbird 35Rudbeckia 162Rudd 96Rufous hummingbird 55Rugosa rose 162Runner bean (scarlet runner) 141, 172, 190Ruscus 186, 190Rush (family) 159Russell’s viper 27Rye 135, 143, 147–149, 152, 154 f., 165, 171,
173, 175, 183, 185, 188, 255Rye-grass 162, 176
SSable antelope 21Saccharomyces 197–199Sacred lotus 173Saffron crocus 161Saffron milk cap 169Sainfoin 166Salamander 71 f., 80, 93, 122Salmon 6, 12, 36, 66, 71 f., 96 f.Salmonella 196–198Saltwater or estuarine crocodile 14Sand hopper 64Sand lizard 14, 58 f., 69, 73, 92, 98, 121Sandbox tree 174Sandspurry 158Sandtiger shark 97Saprolegnia 199
Sarcina 199, 257Sarcodon imbricatus 144, 169Sargassum 182, 187Sauerkraut 230Sawfish 12Saxifrage (family) 160Saxifrage 153, 161Scabious 165Scaly wood mushroom 169Scarlet pimpernel 158Scentless mayweed 170Scorpion 9, 26, 77, 82, 91Scotch broom 162, 186Scotch pine 163Scrophulariales 133Scyphozoa 8Sea anemone 6, 8, 54Sea club-rush 164Sea cucumber 6, 9, 80Sea holly 141, 167Sea horse 6Sea lamprey 12, 72, 96Sea lettuce 181 f., 187, 252Sea lion 8, 47, 61Sea milkwort 153Sea mouse 80Sea or Shark catfish 96Sea otter 88Sea snakes 36Sea urchin 6, 9, 54, 90 f., 253, 256 f.Sedge (family) 160Sedge warbler 40, 103Sedge 146, 153, 164Sedum 140, 161, 166, 185Segmented worms (annelids) 5, 9, 87Self-heal 165Sepia 117Serratia 196 f.Sesame 157, 176Seychelles giant tortoise 14Shaggy ink cap 144, 169Shark 20, 22, 36, 62, 71 f., 78, 80, 114, 120,
124Sharp-nosed ridged frog 38Sheathed woodtuft 145, 169Sheep 8, 23, 45–49, 52–54, 56, 61–63, 69,
71 f., 74–76, 79, 81, 86, 90, 92 f., 105 f.,109–111, 114 f., 118, 250, 256–258
Name Index 291
Shepherd’s purse 142, 146, 166, 170 f., 255Shetland pony 19Shore crab 36, 54, 63 f., 77, 80 f., 122Short-tailed shearwater 39Shrew 8, 23, 30, 41, 45, 54, 56, 60, 68 f., 86,
93Shrimp 64, 68, 120, 123, 232Siberian brown bear 108Siberian dogwood 163Sickener 169Silkworm 33, 80, 91, 94, 258Silver fir 137, 151, 163, 183
see also FirSilver ragwort 141, 153, 166Silverfish 91Silver-washed Fritillary 95Siren („sea cow„) 46, 88Sisal 156 f.Skylark 99–102, 120Slider turtle 71, 76Slime mold 132, 249Sloth 17, 31 f., 37, 85Slowworm 7, 14, 22, 58 f., 69, 72 f., 80, 92,
97 f.Small scorpion vetch 167Small tortoiseshell 95Small white (butterfly) 33, 37, 68, 91, 95,
250Smooth meadow-grass 165Smooth newt 7, 13, 59Smooth snake 15, 97Snails 5, 9, 87Snake 14, 20, 31, 47, 125 f., 256Snakefly 10Snake’s head fritillary 161, 164Snapdragon 179Snapping turtle 258Snipe 39 f., 102Snow flea 58Snowdrop 141, 146, 164, 188Soapwort 153, 167Sod 181Soft-shell clam 51Soldier beetle 33Sole 73Solid-stem burnet saxifrage 165Solomon’s seal 164Somali wild ass 19
Song thrush 39–41, 103Songbirds 22, 93Sorrel 146, 155, 167Sour cherry 163, 179Soy bean 156, 175–177Sparrow 23, 35, 52, 54 f., 69, 71, 76, 79, 86,
103, 105, 114, 120, 125, 254, 256Sparrowhawk 16, 37 f., 56, 103Spearmint 153Sperm whale 17, 46 f., 68, 78, 88Spermatophytes 132Spider 6, 9, 26, 37, 82, 91Spider monkey 114Spiderworts (Tradescantie) 141, 142, 180,
255Spikemoss 146, 168Spinach 146 f., 149, 162, 167, 177, 188, 230,
233Spine-tailed swift 37Spiny mouse 108Spirochetes 196Spirogyra 181Sponge 5 f., 8, 54, 91Spotted flycatcher 102Spring barley 149, 172Spring rye 149Spring snowflake 164Spring wheat 149Spruce 134 f., 137, 145, 150–152, 154 f., 163,
171, 183–185, 188Spurge (family) 160Square-lipped rhinoceros 17, 21Squid 64, 123Squirrel 8, 17, 45, 48, 52, 59 f., 67, 106, 115Squirting cucumber 174St. Bernard 18St. John’s wort 166, 170Stag beetle 68Staphylococcus 196, 198Star of Bethlehem (Gagea villosa) 164Starfish 6, 9, 37, 54, 77, 80, 91Stegosaurus 20Steinheim man 239Stellaria 142, 167, 185Stentor protozoan 91Stentor 94Sticklebacks (gasterosteidae) 64, 96, 254Stingray 52
292 Name Index
Stinkhorn 145, 169Stone bramble 153Stonecrop 166Stoneflies 10Stony coral 6Stork 7, 16, 34 f., 37, 39 f., 56, 67, 69, 84, 86,
99 f., 102 f.Strawberry 138, 141 f., 145, 153, 155, 162,
166, 230, 233Strawflower 167Streptococcus 196–199Sturgeon 6, 96 f.Stylonychia 94Subterranean termites 11Suede bolete 169Suffolk 19Sugar beet 157, 181, 185Sugar kelp 182Sugarcane 152, 156 f.Sulphur tuft 145, 169Summer fruit tortrix moth 95Sundew (family) 160Sundew 146, 167Sunflower 136, 138, 141 f., 144, 146–149,
152, 154 f., 167, 176 f., 179, 181, 184 f.,188, 255
Swallow 7, 37, 67Swallowtail butterfly 33, 95Swallow-wort 135, 167Swan orchid 171Swan 7, 22, 37, 67, 84
see also Mute swanSweet chestnut 134, 137, 139, 152, 162, 173Sweet clover 167, 179Sweet corn 138, 172Sweet gale 163Sweet pea 178Sweet potato 156 f., 178Sweet vernal grass 165Sweet william 147 f.Swiss pine 134 f., 137, 163, 183Swordfish 12, 36Swordtail 92Sycamore maple 133 f., 137, 150, 162Syrian hamster (or Golden hamster) 7, 17,
52, 61, 69, 71, 73 f., 76, 78, 84 f., 92 f.,104, 106–109, 114, 120, 254
TT2 phage 257Tabanus bovinus 37Tall oatgrass 165Tapeworm 6, 8Tapir 45Tarantula 6, 26Tarsier 92Tawny owl 16, 56, 103, 118 f., 125Tea 156 f.Teasel (family) 159Tench 12, 250Termite 6, 10 f.Terrestrial nematodes 6, 54, 250Thiospirillum 251Thornback ray 76Three-toed sloth 22Thrush 57Thyme 167Tiger beetle 37, 58Tiger shark 12, 66Tiger snake 27Tiger 8, 17, 38, 41, 45, 47, 63, 93, 108, 111,
120Tilia (linden, lime) 134, 139, 143, 152, 155,
177, 179, 186Timothy 161, 165, 188Tinder polypore 145Titanichthys 20Toad 31 f., 52, 93Tobacco mosaic virus 251Tobacco 142, 144, 146 f., 154–157, 162, 170,
173, 181, 188, 255Togaviruses 195Tomato 138, 141, 146 f., 167, 181 f., 188,
230, 233Toothed wrack 187Tormentil 165Tortoise 7, 58, 97Touch-me-not 167, 185Tree frog 7, 13, 59, 66, 92, 97 f., 124, 256Tree heath 186Tree pipit 40, 102Trematode 8Trichina 6Trout 6, 12, 36, 54, 66, 71, 93, 96, 119, 123,
231, 234, 256 f.see also Rainbow trout
Name Index 293
True bugs 5, 10True grass (family) 160, 165Truffle 169Tuatara 7, 14, 93Tufted hairgrass 165Tufted vetch 167Tulip 142, 188Tuna 12, 36, 66, 114, 231, 234, 258Tunic flower 158Tunicate 68Turbellaria 8Turbot 96 f.Turkey 34, 69, 99, 258Turnips 182Turtle dove 39Turtle 14, 20, 22, 31, 46 f., 62, 70, 72, 75,
78 f., 256Twayblade 164Two-toed sloth 22Tyrannosaurus 20
UUmbellales 133Urticales 132
VVaccinium 133, 146, 163Valerian 145, 165Vallisneria 180Valonia 191Veiled mushroom 150Velvet bolete 169Velvet grass 165Venus flytrap 146, 191Veronica 161, 166Vertebrates 5 f., 22 f., 25,28, 46, 52–54,
58–60, 62, 66, 69, 72–74, 76–79, 84 f.,88, 92, 114, 120, 123, 126
Vertebrates, extinct 20Vetchling 167Vibrio 196–198, 257Victoria regia 136 f.Violales 132Violet (family) 160Violet 142, 144, 146 f., 153, 155, 162, 174Viper’s bugloss 143, 167Viroid 195
Virus 195, 198, 251, 257Vorticella 94
WWalking sticks 10, 51, 80, 94Wall-rue 168Walnut 133, 137, 140, 142, 155, 163, 171,
173, 176, 186, 230, 234Walrus 17, 45, 73, 84, 88, 108Wart-biter bush cricket 127Warthog 21Wasp 11, 33, 58Water arum 164Water avens 165Water buffalo 17, 21Water chestnut 167Water flea 6, 77, 91, 122, 250Water hemlock 167Water lily family 160Water lily 137, 141 f., 144, 158, 167, 188Water parsnip 166Water plaintain 164Water scavenger beetle 34Water vole 17, 58Watercress 166Watermelon 138, 230Watermilfoil 181Waterwheel plant 191Wayfaring tree 163Weasel 68Weddell seal 88Wels catfish 12, 96Welwitschia 135Western diamondback rattlesnake 15Western green lizard 14, 37, 66, 69Whale shark 6, 12Whale 8, 56, 62, 69, 90Wheat 135 f., 141–144, 146–148, 154–157,
165, 172 f., 175–177, 181, 183–185,188, 255, 257 f.
Wheatgrass 161White clover 173, 179White or elfin saddles 169White poplar 137, 163White wagtail 40, 99, 102Whitebeam 163Whitefishes 96White-lipped banded snail 91
294 Name Index
White-tailed eagle 16Whitethroat 40, 102Whitlow grass 136, 166Wild ass 37Wild barley 165Wild boar 8, 17, 93, 105, 108, 111 f., 115Wild cat 45, 105Wild cherry 163, 179Wild chervil 144, 167Wild geese 112Wild horse 37Wild mustard 161, 170, 185Wild oat 165Wild radish 145, 166, 170Wild rosemary 163Willow (family) 160Willow warbler 40, 102Willow 140 f., 144, 146, 163, 186Willow-herb 161Wine grape 136, 146, 155, 156, 163, 181,
182, 184Winged broom 163Winter aconite 161Winter barley 149, 162Winter cress 165Winter moth 58, 95Winter rice 162Winter rye 149, 172Winter wheat 149, 162, 172Winter wren 7, 23, 56, 67, 99, 101–103Wolf 8, 17 f., 37, 45–47, 52, 84, 86, 93, 108,
111, 114Wolverine (Glutton) 17Wood anemone 136, 140 f., 166Wood ant 11, 122Wood betony 168Wood blewit 169Wood grouse or Capercaillie 16, 99, 112Wood manna-grass 165Wood mouse 8, 38, 60, 68, 108Wood pigeon 16, 38, 67, 99 f., 102 f.Wood sanicle 167
Wood small reed 165Wood sorrel (family) 160Wood warbler 40, 103Woodland horsetail 168Woodlark 40, 102Woodlouse 54, 68, 91, 122Woodruff 153, 167Woodrush, Great 164Woodsorrel 141 f., 167, 183Wormseed mustard (Wormseed wall-
flower) 165Wryneck 40, 103
YYacare caiman 124Yak 110Yams 157, 178Yeast 251, 256–258Yellow archangel 166Yellow fever virus 198Yellow flag 164Yellow gentian 145, 166Yellow goat’s beard 158Yellow mealworm beetle 91, 94Yellow morelYellow or common toadflax 166Yellow Star-of-Bethlehem 140Yellow woundwort 185Yellow-bellied toad 13, 98Yellowcress 167Yellowhammer 99, 102, 120Yellow-rattle 166Yew 134 f., 138, 142, 145, 151 f., 162, 183,
186
ZZander 12, 97Zebra 8, 37, 115Zebu 111
Name Index 295