Selective Separation of 1-Butanol from Aqueous ... - membranes
15
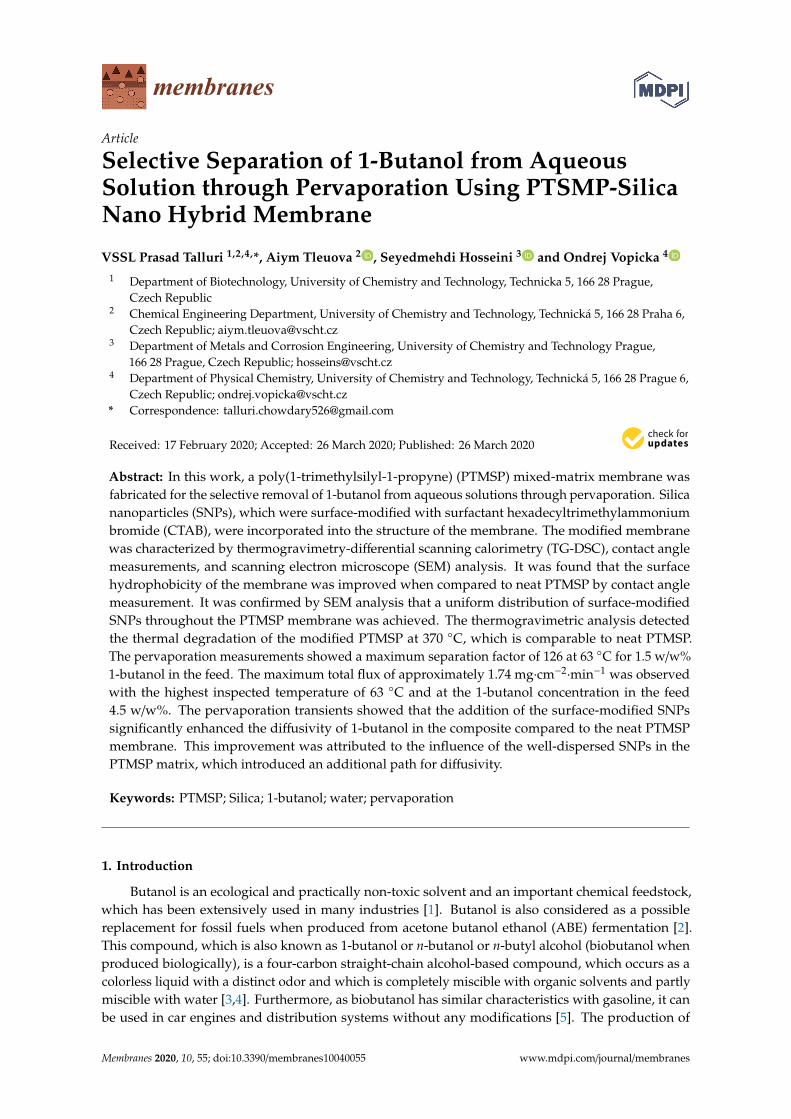
membranes Article Selective Separation of 1-Butanol from Aqueous Solution through Pervaporation Using PTSMP-Silica Nano Hybrid Membrane VSSL Prasad Talluri 1,2,4, *, Aiym Tleuova 2 , Seyedmehdi Hosseini 3 and Ondrej Vopicka 4 1 Department of Biotechnology, University of Chemistry and Technology, Technicka 5, 166 28 Prague, Czech Republic 2 Chemical Engineering Department, University of Chemistry and Technology, Technická 5, 166 28 Praha 6, Czech Republic; [email protected] 3 Department of Metals and Corrosion Engineering, University of Chemistry and Technology Prague, 166 28 Prague, Czech Republic; [email protected] 4 Department of Physical Chemistry, University of Chemistry and Technology, Technická 5, 166 28 Prague 6, Czech Republic; [email protected] * Correspondence: [email protected] Received: 17 February 2020; Accepted: 26 March 2020; Published: 26 March 2020 Abstract: In this work, a poly(1-trimethylsilyl-1-propyne) (PTMSP) mixed-matrix membrane was fabricated for the selective removal of 1-butanol from aqueous solutions through pervaporation. Silica nanoparticles (SNPs), which were surface-modified with surfactant hexadecyltrimethylammonium bromide (CTAB), were incorporated into the structure of the membrane. The modified membrane was characterized by thermogravimetry-differential scanning calorimetry (TG-DSC), contact angle measurements, and scanning electron microscope (SEM) analysis. It was found that the surface hydrophobicity of the membrane was improved when compared to neat PTMSP by contact angle measurement. It was confirmed by SEM analysis that a uniform distribution of surface-modified SNPs throughout the PTMSP membrane was achieved. The thermogravimetric analysis detected the thermal degradation of the modified PTMSP at 370 ◦ C, which is comparable to neat PTMSP. The pervaporation measurements showed a maximum separation factor of 126 at 63 ◦ C for 1.5 w/w% 1-butanol in the feed. The maximum total flux of approximately 1.74 mg·cm -2 ·min -1 was observed with the highest inspected temperature of 63 ◦ C and at the 1-butanol concentration in the feed 4.5 w/w%. The pervaporation transients showed that the addition of the surface-modified SNPs significantly enhanced the diffusivity of 1-butanol in the composite compared to the neat PTMSP membrane. This improvement was attributed to the influence of the well-dispersed SNPs in the PTMSP matrix, which introduced an additional path for diffusivity. Keywords: PTMSP; Silica; 1-butanol; water; pervaporation 1. Introduction Butanol is an ecological and practically non-toxic solvent and an important chemical feedstock, which has been extensively used in many industries [1]. Butanol is also considered as a possible replacement for fossil fuels when produced from acetone butanol ethanol (ABE) fermentation [2]. This compound, which is also known as 1-butanol or n-butanol or n-butyl alcohol (biobutanol when produced biologically), is a four-carbon straight-chain alcohol-based compound, which occurs as a colorless liquid with a distinct odor and which is completely miscible with organic solvents and partly miscible with water [3,4]. Furthermore, as biobutanol has similar characteristics with gasoline, it can be used in car engines and distribution systems without any modifications [5]. The production of Membranes 2020, 10, 55; doi:10.3390/membranes10040055 www.mdpi.com/journal/membranes
-
Upload
khangminh22 -
Category
Documents
-
view
0 -
download
0
Transcript of Selective Separation of 1-Butanol from Aqueous ... - membranes
membranes
Article
Selective Separation of 1-Butanol from AqueousSolution through Pervaporation Using PTSMP-SilicaNano Hybrid Membrane
VSSL Prasad Talluri 1,2,4,*, Aiym Tleuova 2 , Seyedmehdi Hosseini 3 and Ondrej Vopicka 4
1 Department of Biotechnology, University of Chemistry and Technology, Technicka 5, 166 28 Prague,Czech Republic
2 Chemical Engineering Department, University of Chemistry and Technology, Technická 5, 166 28 Praha 6,Czech Republic; [email protected]
3 Department of Metals and Corrosion Engineering, University of Chemistry and Technology Prague,166 28 Prague, Czech Republic; [email protected]
4 Department of Physical Chemistry, University of Chemistry and Technology, Technická 5, 166 28 Prague 6,Czech Republic; [email protected]
* Correspondence: [email protected]
Received: 17 February 2020; Accepted: 26 March 2020; Published: 26 March 2020�����������������
Abstract: In this work, a poly(1-trimethylsilyl-1-propyne) (PTMSP) mixed-matrix membrane wasfabricated for the selective removal of 1-butanol from aqueous solutions through pervaporation. Silicananoparticles (SNPs), which were surface-modified with surfactant hexadecyltrimethylammoniumbromide (CTAB), were incorporated into the structure of the membrane. The modified membranewas characterized by thermogravimetry-differential scanning calorimetry (TG-DSC), contact anglemeasurements, and scanning electron microscope (SEM) analysis. It was found that the surfacehydrophobicity of the membrane was improved when compared to neat PTMSP by contact anglemeasurement. It was confirmed by SEM analysis that a uniform distribution of surface-modifiedSNPs throughout the PTMSP membrane was achieved. The thermogravimetric analysis detectedthe thermal degradation of the modified PTMSP at 370 ◦C, which is comparable to neat PTMSP.The pervaporation measurements showed a maximum separation factor of 126 at 63 ◦C for 1.5 w/w%1-butanol in the feed. The maximum total flux of approximately 1.74 mg·cm−2
·min−1 was observedwith the highest inspected temperature of 63 ◦C and at the 1-butanol concentration in the feed4.5 w/w%. The pervaporation transients showed that the addition of the surface-modified SNPssignificantly enhanced the diffusivity of 1-butanol in the composite compared to the neat PTMSPmembrane. This improvement was attributed to the influence of the well-dispersed SNPs in thePTMSP matrix, which introduced an additional path for diffusivity.
Keywords: PTMSP; Silica; 1-butanol; water; pervaporation
1. Introduction
Butanol is an ecological and practically non-toxic solvent and an important chemical feedstock,which has been extensively used in many industries [1]. Butanol is also considered as a possiblereplacement for fossil fuels when produced from acetone butanol ethanol (ABE) fermentation [2].This compound, which is also known as 1-butanol or n-butanol or n-butyl alcohol (biobutanol whenproduced biologically), is a four-carbon straight-chain alcohol-based compound, which occurs as acolorless liquid with a distinct odor and which is completely miscible with organic solvents and partlymiscible with water [3,4]. Furthermore, as biobutanol has similar characteristics with gasoline, it canbe used in car engines and distribution systems without any modifications [5]. The production of
Membranes 2020, 10, 55; doi:10.3390/membranes10040055 www.mdpi.com/journal/membranes
Membranes 2020, 10, 55 2 of 15
biobutanol over other alcohol-based compounds, such as bioethanol, is more attractive for researchpurposes as biobutanol has a higher energy content and lower volatility. Currently, 1-butanol isproduced through a petrochemical process, and it is used as a chemical feedstock in the plastic, paints,coatings, plasticizers adhesive industries, etc. [6]. The international market demand for 1-butanolis fastened at 2.80 metric tons per year, with a market value of 4.20 billion USD. The 1-butanolmarket is expected to rise from 4.20 billion USD in 2017 to 5.6 billion USD by the year 2022 [7].The main factor contributing to this forecasted increase in biobutanol demand includes a wide range ofproduct development processes driving the market, such as latex paint formulations in industrial andarchitectural activities, enamels, textiles, and paper. The 1-butanol market players are especially fromdeveloped countries such as BASF, OXEA (Germany), Dow Chemical, Eastman Chemical Company(USA), PetroChina, Sinopec (China), Mitsubishi Chemical Corporation (Japan), BASF PETRONAS(Malaysia), and KH Neochem (Japan) [7]. Another reason for the growth of the 1-butanol market isincreasing population, urbanization, and change in lifestyle.
The production of 1-butanol requires its separation from watery mixtures, for which thepervaporation method has been highly accepted because of its high separation and low energyconsumption [8]. Poly(1-trimethylsilyl-1-propyne) (PTMSP) has been intensively studied for membranegas separation and pervaporation [9]. PTMSP is a hydrophobic glassy polymer (Tg > 250 ◦C) with anextremely high free-volume fraction (up to 25%) and exhibits microporosity [10]. The pores of PTMSP areformed during polymer solution casting, and no subsequent treatment is required. This is an advantagewhen compared with other membrane preparations such as immersion precipitation, cross-linking,stretching, etc. [11]. PTMSP has already been studied for the liquid separation process for the removalof ethanol, butanol, acetone, etc., from their aqueous solutions by means of pervaporation [9,12].
Polymer membranes, with an incorporated inorganic filler, so-called mixed-matrix membranes(MMMs), showed great performance in liquid separation processes [13]. The fillers can be, for example,based on silica [14] or carbon nanoparticles [15], clay [16], zeolites [17], carbon nanotubes [18], grapheneoxide [19], metal-organic frameworks [20], covalent organic frameworks [21], and ionic liquids [22].
Recently, it has been shown that the incorporation of silica nanoparticles (SNPs) into PTMSPmembranes improves their separation ability. For example, Claes et al. [23] showed that the additionof 25 wt.% hydrophobic silica into the PTMSP matrix and with a PTMSP separating layer of 2.4 µmthickness, clearly increased the permeate flux. However, this was at the expense of the alcohol/waterselectivity. In the pervaporation of a 1-butanol/water mixture, a flux of 9.5 kg m−2 h−1 and accompanyingseparation factor of 104 was observed [23]. It has also been shown that the efficiency of mixed matrixmembranes depends on the compatibility between the filler and the polymer matrix, as well as theremoval of interfacial defects [24]. SNPs contain an adequate amount of silanol groups on their surface,rendering them facile for surface modification. When SNPs are modified by different organosilanes,the hydrophilic-hydrophobic properties of the SNPs can be flexibly tuned to enhance the compatibilitywith the polymer matrix [25].
In our previous work, we used a neat PTMSP membrane to study transient and steady-statepervaporation to remove 1-butanol from an aqueous mixture. For that purpose, a new apparatus andmodel allowing for the measurement of pervaporation transients and to evaluate diffusivity weredeveloped [26]. The present work is aimed at 1-butanol/water separation using a PTMSP membraneincorporated with 5% surface-modified SNPs with a simple procedure for compactly binding with themembrane. The performance of the new hybrid PTMSP membrane is studied in relation to the totalflux, selectivity, and permeability, as well as diffusivity evaluated from the pervaporation transients.Therefore, a comparison between the neat membrane (data from previously published work) and thenew hybrid PTMSP membrane was conducted.
2. Materials and Methodology
PTMSP was purchased from Gelest, Inc. (Morrisville, Philadelphia, PA, USA), 1-butanol (min.99%, Penta, Prague, Czech Republic), helium (4.8, Siad Czech, Prague, Czech Republic), nitrogen (4.0,
Membranes 2020, 10, 55 3 of 15
Siad Czech), and liquid nitrogen (Siad Czech) were used as received. Aqueous suspension of 40 wt%silica nanoparticles (Ludox TM-40, Sigma Aldrich, St. Louis, MO, USA) was used for the incorporationin the membrane. Cationic surfactant hexadecyltrimethylammonium bromide (CTAB) (≥99%, Sigmaaldrich) was used as received to modify the surface of SNPs. Physical properties of 1-butanol andwater were taken from the database [27].
2.1. SNPs Surface Modification
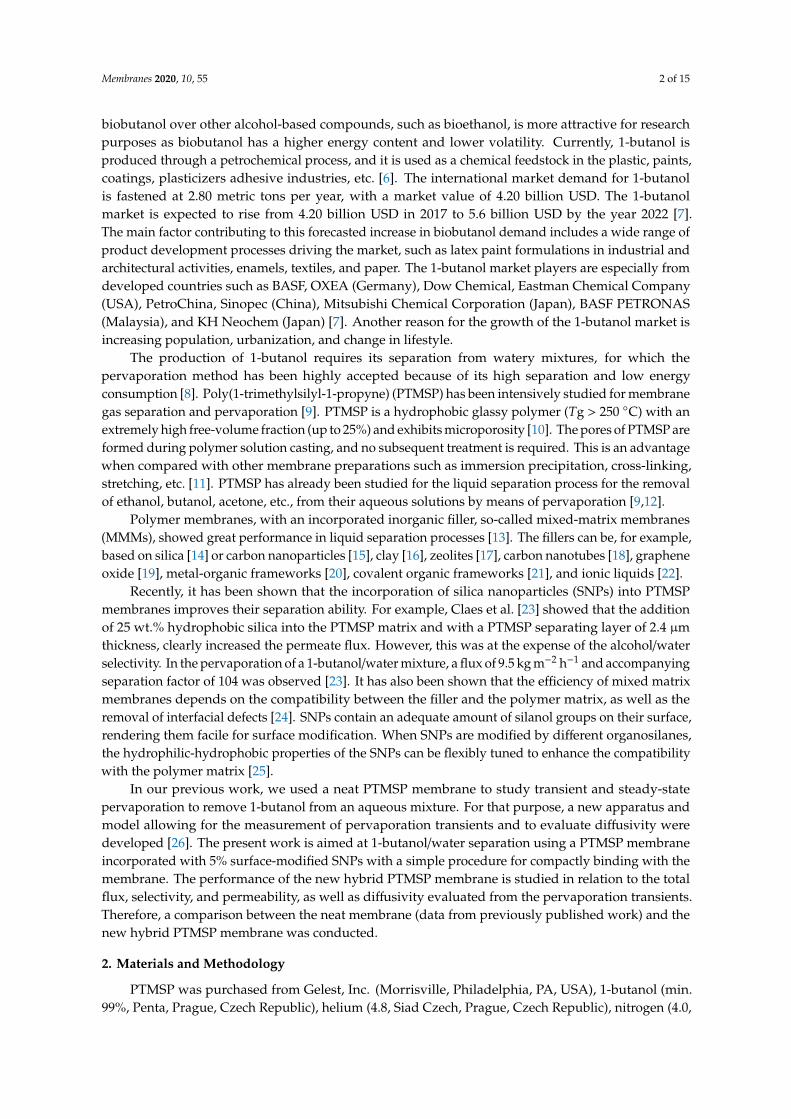
Typically, 5 g of CTAB was added into 100 mL of Ludox TM-40. The resulting mixture was stirredfor 20 min at 50 ◦C. Modified SNPs were washed with deionized water to remove excess CTAB that wasnot adsorbed. The resulting SNPs were dried under vacuum at ambient temperature. The processes ofsurface modification of SNPs was shown schematically in Figure 1.
Membranes 2020, 10, x 3 of 16
Siad Czech), and liquid nitrogen (Siad Czech) were used as received. Aqueous suspension of 40 wt% silica nanoparticles (Ludox TM-40, Sigma Aldrich, St. Louis, MO, USA) was used for the incorporation in the membrane. Cationic surfactant hexadecyltrimethylammonium bromide (CTAB) (≥99%, Sigma aldrich) was used as received to modify the surface of SNPs. Physical properties of 1-butanol and water were taken from the database [27].
2.1. SNPs Surface Modification
Typically, 5 g of CTAB was added into 100 mL of Ludox TM-40. The resulting mixture was stirred for 20 min at 50 °C. Modified SNPs were washed with deionized water to remove excess CTAB that was not adsorbed. The resulting SNPs were dried under vacuum at ambient temperature. The processes of surface modification of SNPs was shown schematically in Figure 1.
2.2. Preparation of Membrane
The mixture of 5% wt modified SNPs were blended with PTMSP using tert-butyl methyl ether (MTBE, min. 99.8%, Lach-ner, Neratovice, Czech Republic) via ultra-sonication for 30 min at 30% power in pulse mode (2.5 s pulse and 0.5 s pause) and stirring for 24 h using the magnetic stirrer to form a uniform suspension. The solution was then cast on a Petri dish, and the solvent was allowed to evaporate slowly over the next 48 h at room temperature. The thickness of the membrane was measured using a dial comparator (Somet, Teplické předměstí, Czech Republic). The membrane was soaked in methanol (p.a., Penta) overnight and then dried in the ambient air before its use to rejuvenate its physical structure [28].
Figure 1. Schematic presentation for surface modification of silica nanoparticles.
2.3. Characterization of Membrane
2.3.1. Morphology Characterization
The surfaces of the membranes were characterized by using the scanning electron microscope (SEM) (Tescan VEGA 3-LMU, 20 kV, Brno, Czech Republic) equipped with an Energy Dispersive X-Ray Spectroscopy (EDS). The samples were coated with a thin layer of gold to prevent charging.
2.3.2. Contact angle Measurement
Figure 1. Schematic presentation for surface modification of silica nanoparticles.
2.2. Preparation of Membrane
The mixture of 5% wt modified SNPs were blended with PTMSP using tert-butyl methyl ether(MTBE, min. 99.8%, Lach-ner, Neratovice, Czech Republic) via ultra-sonication for 30 min at 30%power in pulse mode (2.5 s pulse and 0.5 s pause) and stirring for 24 h using the magnetic stirrer toform a uniform suspension. The solution was then cast on a Petri dish, and the solvent was allowedto evaporate slowly over the next 48 h at room temperature. The thickness of the membrane wasmeasured using a dial comparator (Somet, Teplické predmestí, Czech Republic). The membrane wassoaked in methanol (p.a., Penta) overnight and then dried in the ambient air before its use to rejuvenateits physical structure [28].
2.3. Characterization of Membrane
2.3.1. Morphology Characterization
The surfaces of the membranes were characterized by using the scanning electron microscope(SEM) (Tescan VEGA 3-LMU, 20 kV, Brno, Czech Republic) equipped with an Energy Dispersive X-raySpectroscopy (EDS). The samples were coated with a thin layer of gold to prevent charging.
2.3.2. Contact angle Measurement
The surface hydrophobicity of the membrane was studied by measuring the static contact angle(θ) of the sessile water droplet using the contact angle meter (OneAttension Theta, Biolin Scientific,
Membranes 2020, 10, 55 4 of 15
Stockholm, Sweden). The contact angle was determined by OneAttension 3.0 software. Beforemeasurement, the membrane was cleaned with methanol to degrease its surface. Water droplet with avolume of 2 µL was placed on the surface of the membrane fixed to the glass substrate. The image ofthe water drop was captured using a high definition camera. The contact angle was defined by fittingthe Young–Laplace equation around the droplet using the system software.
2.3.3. Thermogravimetric Analysis
The thermal stability of the silica filled PTMSP membranes was examined using simultaneousthermogravimetry-differential scanning calorimetry (TG-DSC). Experiments were carried out usinga Setaram Sensys Evo thermal analyzer (France; operating range from −120 ◦C to 800 ◦C) equippedwith a symmetrical balance and a Calvet 3D sensor. The temperature ranges from 30 ◦C to 800 ◦C wasinspected with a heating rate of 10 ◦C/min. Nitrogen flow of 20 mL/min was used to remove corrosivegases potentially involved in the degradation and to avoid thermoxidative degradation.
2.4. Pervaporation System:
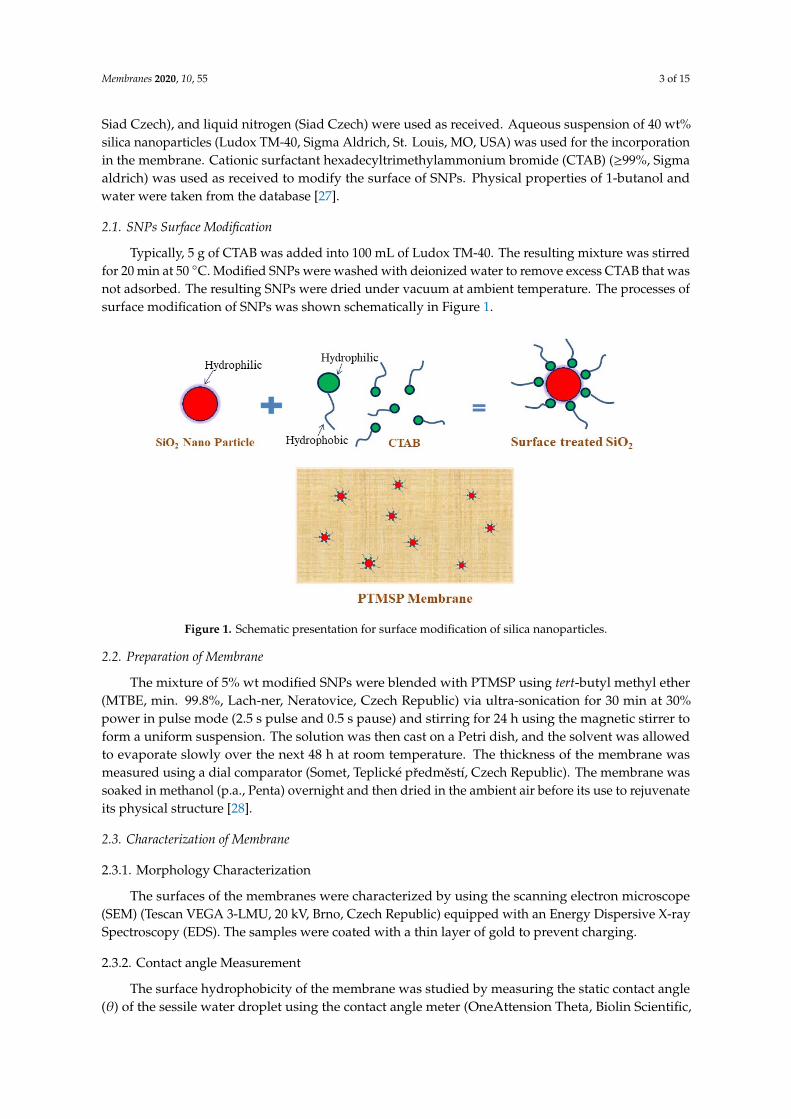
Pervaporation (PV) experiments were conducted using the previously published apparatus [26];the schematic diagram of the system used to carry out the pervaporation experiments is shown inFigure 2. The apparatus consisted of 2 detachable cells made from duralumin. The left part of thecell (Figure 2) holds the feed solution at atmospheric pressure (average 98 kPa), and through theright part, the sweep gas (nitrogen) was conducted to the PTMSP-based membrane fixed between the2 parts; the effective membrane area was 2.3 cm2. The left-side cell was provided with an inlet fortemperature measurement and changing feed concentrations. All the experiments were performed at37, 50, and 63 ◦C temperature with 1.5, 3.0, and 4.5 g of 1-butanol in 100 mL of water at 4 differenttime intervals. The feed solution was stirred during the pervaporation runs with a magnetic stirrer(250 rpm). The cells were double-jacketed and maintained at a constant temperature using a HuberMinistat 125 (Berching, Germany) water thermostat. Nitrogen was used as stripping/sweep gas witha constant flow rate of 75 STP/min by digital mass flow controller (DFC) (Aalborg, Orangeburg, NY,USA). The permeate was condensed and collected in a liquid nitrogen trap, and the permeation ratewas determined from the weight of the collected samples using an Ohaus DV215CD balance (Nänikon,Switzerland) [29]. The molar fractions of 1-butanol and water in the feed and permeate were analyzedthrough gas chromatography.
Membranes 2020, 10, x 4 of 16
The surface hydrophobicity of the membrane was studied by measuring the static contact angle (θ) of the sessile water droplet using the contact angle meter (OneAttension Theta, Biolin Scientific, Stockholm, Sweden). The contact angle was determined by OneAttension 3.0 software. Before measurement, the membrane was cleaned with methanol to degrease its surface. Water droplet with a volume of 2 μL was placed on the surface of the membrane fixed to the glass substrate. The image of the water drop was captured using a high definition camera. The contact angle was defined by fitting the Young–Laplace equation around the droplet using the system software.
2.3.3. Thermogravimetric Analysis
The thermal stability of the silica filled PTMSP membranes was examined using simultaneous thermogravimetry-differential scanning calorimetry (TG-DSC). Experiments were carried out using a Setaram Sensys Evo thermal analyzer (France; operating range from −120 °C to 800 °C) equipped with a symmetrical balance and a Calvet 3D sensor. The temperature ranges from 30 °C to 800 °C was inspected with a heating rate of 10 °C/min. Nitrogen flow of 20 mL/min was used to remove corrosive gases potentially involved in the degradation and to avoid thermoxidative degradation.
2.4. Pervaporation System:
Pervaporation (PV) experiments were conducted using the previously published apparatus [26]; the schematic diagram of the system used to carry out the pervaporation experiments is shown in Figure 2. The apparatus consisted of 2 detachable cells made from duralumin. The left part of the cell (Figure 2) holds the feed solution at atmospheric pressure (average 98 kPa), and through the right part, the sweep gas (nitrogen) was conducted to the PTMSP-based membrane fixed between the 2 parts; the effective membrane area was 2.3 cm2. The left-side cell was provided with an inlet for temperature measurement and changing feed concentrations. All the experiments were performed at 37, 50, and 63 °C temperature with 1.5, 3.0, and 4.5 g of 1-butanol in 100 mL of water at 4 different time intervals. The feed solution was stirred during the pervaporation runs with a magnetic stirrer (250 rpm). The cells were double-jacketed and maintained at a constant temperature using a Huber Ministat 125 (Berching, Germany) water thermostat. Nitrogen was used as stripping/sweep gas with a constant flow rate of 75 STP/min by digital mass flow controller (DFC) (Aalborg, Orangeburg, NY, USA). The permeate was condensed and collected in a liquid nitrogen trap, and the permeation rate was determined from the weight of the collected samples using an Ohaus DV215CD balance (Nänikon, Switzerland) [29]. The molar fractions of 1-butanol and water in the feed and permeate were analyzed through gas chromatography.
Figure 2. Schematic drawing of the pervaporation apparatus.
2.5. Gas Chromatography Analysis
The concentration of 1-butanol in the feed and permeate was determined by gas chromatography with a polar capillary column [26]. The GC-MS system used in these studies consisted of a quadrupole instrument with a direct capillary column interface, an electron-ionization
Figure 2. Schematic drawing of the pervaporation apparatus.
2.5. Gas Chromatography Analysis
The concentration of 1-butanol in the feed and permeate was determined by gas chromatographywith a polar capillary column [26]. The GC-MS system used in these studies consisted of a quadrupoleinstrument with a direct capillary column interface, an electron-ionization type ion source, and aquadrupole detector (Clarus 500, Perkin Elmer-Arnell, Waltham, MA, USA). Helium was used as acarrier gas at a flow rate of 0.6 mL/min, the temperature of the injector and ion source was 180 ◦C and

Membranes 2020, 10, 55 5 of 15
200 ◦C, respectively. The samples were injected with a split ratio of 1:75, and the injection volume was0.2 µL. The mass spectrometer was operated in the electron ionization/selective-ion monitoring mode,collecting ions m/z 41 Da and 56 Da specific for butanol. The chromatograph was calibrated prior tothe measurements.
2.6. Measurement of Transient Pervaporation for Butanol Diffusivity
Butanol diffusivity in the membrane was determined as described previously [26]. Once the1-butanol concentration in the feed was stepwise changed, the stream of nitrogen with the permeateescaping the pervaporation unit was continuously analyzed with a FTIR spectrometer (iS10, ThermoFisher Scientific Inc., Waltham, MA, USA) equipped with a gas cell maintained at 48 ◦C and a MCT/A(mercury cadmium telluride) detector. The approximate volume of the gas cell was 0.25 dm3 [30],and the nitrogen flow rate was 75 cm3 (STP) min−1. The intensities of selected compound-specificbands in the gaseous mixture were measured using the Omnic 8 software; 4 scans were taken for onespectrum under the resolution of 0.5 cm−1 in the time-series of 30 min. Bands ranging from 1146.76 to974.88 cm−1 (1-butanol) were used for the analysis.
2.7. Measurement of Steady Pervaporation
The steady total permeate flux was determined by weighing the permeate collected over a certaintime, thus
J = m/(At) (1)
where m is the weight of the collected permeate, A membrane area and t time. The separationperformance of pervaporation was expressed as the separation factor
β =xB,l /xW,l
xB,0 /xW,0(2)
where xi,l and xi,0 stand for the molar fractions of the respective compounds (1-butanol, water) in thepermeate and feed mixtures, respectively.
Besides the total flux and separation factor, the solution-diffusion model is usually used to describemass transfer in pervaporation. The flux of individual components across the membrane can bedescribed as follows
ji =P.
il
(γL
ioxL
iopsat.
io− pil)
(3)
where ji is the partial flux of component i, γLio
is the activity coefficient of component i in the liquidfeed (denoted by subscript 0) and xL
iois mole fraction of component i in the liquid feed, psat.
iois the pure
component vapour pressure, pil is the partial pressure at the permeate (l) face of the membrane havingthe thickness l and Pi is the gas permeability of the membrane for the component i. Since separationfactor reflects not only material properties of the membrane but also of the entire experimental setup,material properties of different membranes can be well-compared using selectivity [31]:
α =PB
PW(4)
The value of α naturally depends on the units used for permeability; mass-based units were usedin this work. The thermodynamics of the 1-butanol solutions, which was used in Equation (3), wasmodeled using the NRTL model [32] with parameters taken from the literature [33].
3. Results
The new hybrid PTMSP membrane had the thickness of 48 ± 2 µm. After soaking the membranein methanol for 24 h, the membrane did not release detectable amounts of SNPs into the methanol;
Membranes 2020, 10, 55 6 of 15
this was confirmed by measurement of dry membrane mass (see supplementary data). The additionof more SNPs into membrane resulted in the formation of aggregates that may perhaps cause largeclusters in the top layer, and it had a high chance for defects in membranes [34]. Thus, in the presentwork, we used 5 wt% SNPs to cast a defect-free PTMSP membrane.
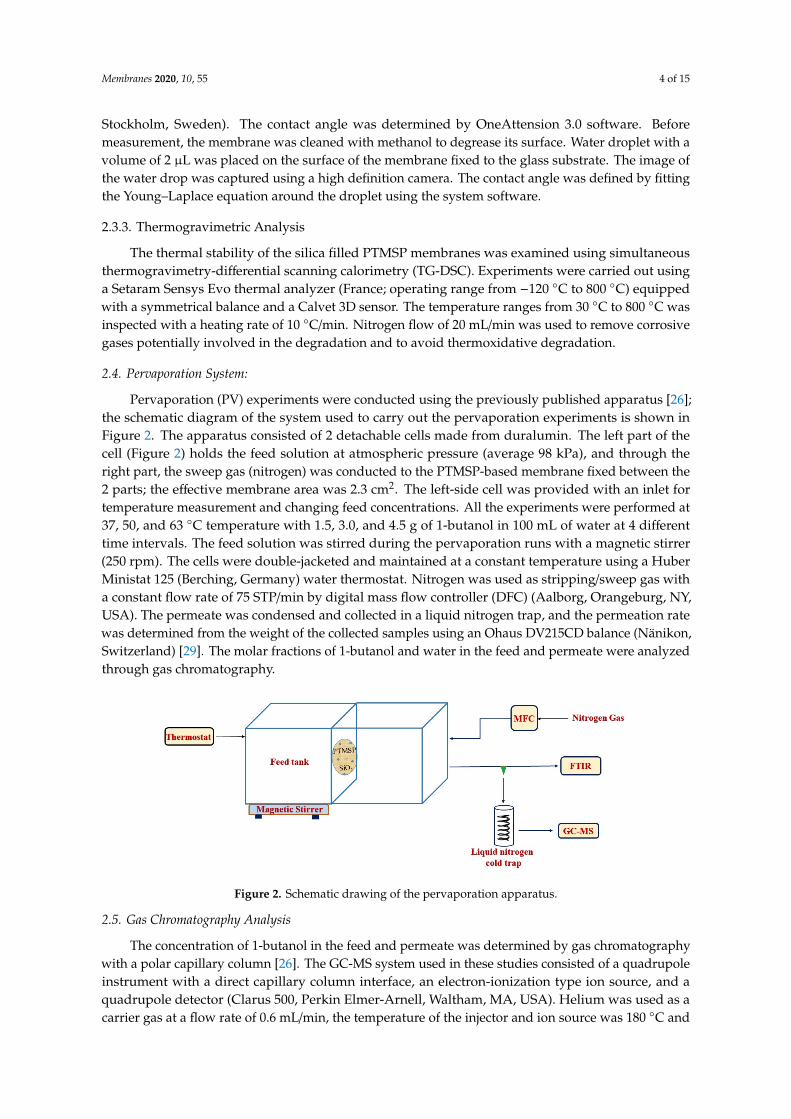
The surface morphology of the PTMSP hybrid membrane containing 5 wt% of SNPs was evaluatedusing SEM (Figure 3). The general problem with the addition of modified silica into membranes isthe formation of aggregates that could cause large clusters in the top layer [34]. It could be seen fromFigure 3A that the SNPs were distributed homogeneously throughout the PTMSP matrix because ofthe hydrophobic interaction between PTMSP and SNPs as schematically shown in Figure 1.
Membranes 2020, 10, x 6 of 16
The new hybrid PTMSP membrane had the thickness of 48 ± 2 μm. After soaking the membrane in methanol for 24 h, the membrane did not release detectable amounts of SNPs into the methanol; this was confirmed by measurement of dry membrane mass (see supplementary data). The addition of more SNPs into membrane resulted in the formation of aggregates that may perhaps cause large clusters in the top layer, and it had a high chance for defects in membranes [34]. Thus, in the present work, we used 5 wt% SNPs to cast a defect-free PTMSP membrane.
The surface morphology of the PTMSP hybrid membrane containing 5 wt% of SNPs was evaluated using SEM (Figure 3). The general problem with the addition of modified silica into membranes is the formation of aggregates that could cause large clusters in the top layer [34]. It could be seen from Figure 3A that the SNPs were distributed homogeneously throughout the PTMSP matrix because of the hydrophobic interaction between PTMSP and SNPs as schematically shown in Figure 1.
(A) (B)
Figure 3. SEM images of poly(1-trimethylsilyl-1-propyne)- Silica nanoparticles (PTMSP-SNPs). (A) Surface of membrane (B) with high magnification.
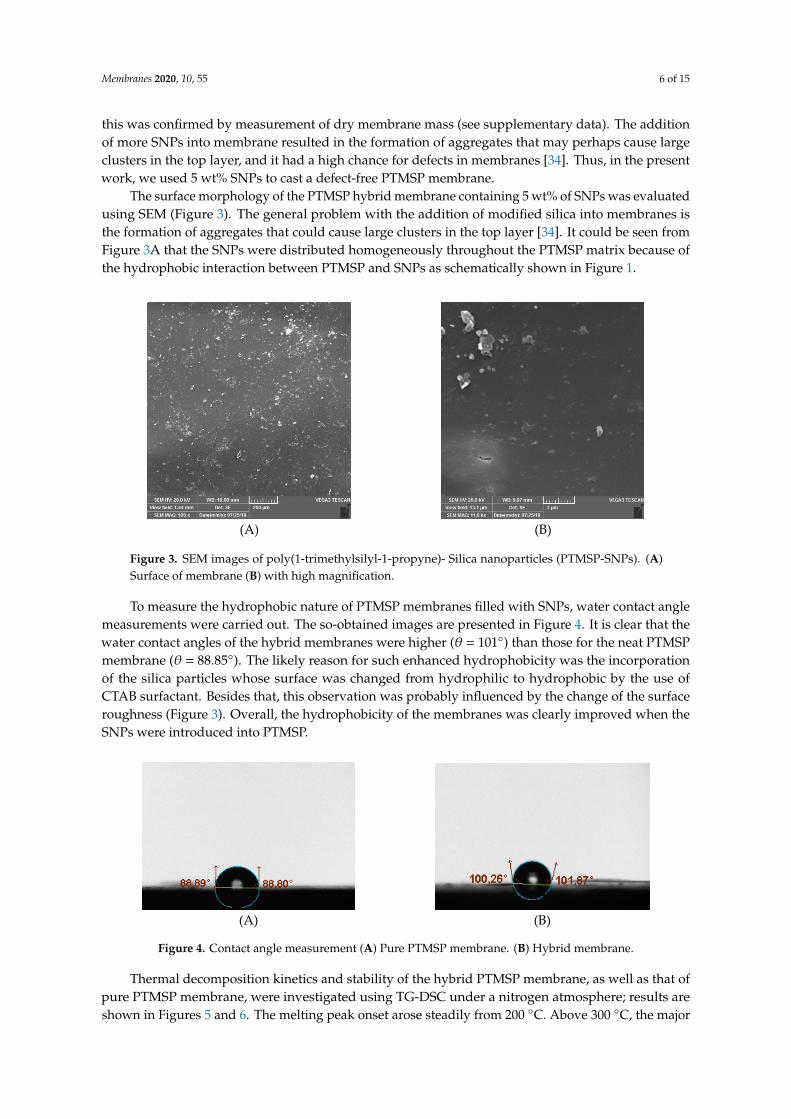
To measure the hydrophobic nature of PTMSP membranes filled with SNPs, water contact angle measurements were carried out. The so-obtained images are presented in Figure 4. It is clear that the water contact angles of the hybrid membranes were higher (θ = 101°) than those for the neat PTMSP membrane (θ = 88.85°). The likely reason for such enhanced hydrophobicity was the incorporation of the silica particles whose surface was changed from hydrophilic to hydrophobic by the use of CTAB surfactant. Besides that, this observation was probably influenced by the change of the surface roughness (Figure 3). Overall, the hydrophobicity of the membranes was clearly improved when the SNPs were introduced into PTMSP.
(A) (B)
Figure 4. Contact angle measurement (A) Pure PTMSP membrane. (B) Hybrid membrane.
Thermal decomposition kinetics and stability of the hybrid PTMSP membrane, as well as that of pure PTMSP membrane, were investigated using TG-DSC under a nitrogen atmosphere; results are shown in Figure 5 and 6. The melting peak onset arose steadily from 200 °C. Above 300 °C, the major
Figure 3. SEM images of poly(1-trimethylsilyl-1-propyne)- Silica nanoparticles (PTMSP-SNPs). (A)Surface of membrane (B) with high magnification.
To measure the hydrophobic nature of PTMSP membranes filled with SNPs, water contact anglemeasurements were carried out. The so-obtained images are presented in Figure 4. It is clear that thewater contact angles of the hybrid membranes were higher (θ = 101◦) than those for the neat PTMSPmembrane (θ = 88.85◦). The likely reason for such enhanced hydrophobicity was the incorporationof the silica particles whose surface was changed from hydrophilic to hydrophobic by the use ofCTAB surfactant. Besides that, this observation was probably influenced by the change of the surfaceroughness (Figure 3). Overall, the hydrophobicity of the membranes was clearly improved when theSNPs were introduced into PTMSP.
Membranes 2020, 10, x 6 of 16
The new hybrid PTMSP membrane had the thickness of 48 ± 2 μm. After soaking the membrane in methanol for 24 h, the membrane did not release detectable amounts of SNPs into the methanol; this was confirmed by measurement of dry membrane mass (see supplementary data). The addition of more SNPs into membrane resulted in the formation of aggregates that may perhaps cause large clusters in the top layer, and it had a high chance for defects in membranes [34]. Thus, in the present work, we used 5 wt% SNPs to cast a defect-free PTMSP membrane.
The surface morphology of the PTMSP hybrid membrane containing 5 wt% of SNPs was evaluated using SEM (Figure 3). The general problem with the addition of modified silica into membranes is the formation of aggregates that could cause large clusters in the top layer [34]. It could be seen from Figure 3A that the SNPs were distributed homogeneously throughout the PTMSP matrix because of the hydrophobic interaction between PTMSP and SNPs as schematically shown in Figure 1.
(A) (B)
Figure 3. SEM images of poly(1-trimethylsilyl-1-propyne)- Silica nanoparticles (PTMSP-SNPs). (A) Surface of membrane (B) with high magnification.
To measure the hydrophobic nature of PTMSP membranes filled with SNPs, water contact angle measurements were carried out. The so-obtained images are presented in Figure 4. It is clear that the water contact angles of the hybrid membranes were higher (θ = 101°) than those for the neat PTMSP membrane (θ = 88.85°). The likely reason for such enhanced hydrophobicity was the incorporation of the silica particles whose surface was changed from hydrophilic to hydrophobic by the use of CTAB surfactant. Besides that, this observation was probably influenced by the change of the surface roughness (Figure 3). Overall, the hydrophobicity of the membranes was clearly improved when the SNPs were introduced into PTMSP.
(A) (B)
Figure 4. Contact angle measurement (A) Pure PTMSP membrane. (B) Hybrid membrane.
Thermal decomposition kinetics and stability of the hybrid PTMSP membrane, as well as that of pure PTMSP membrane, were investigated using TG-DSC under a nitrogen atmosphere; results are shown in Figure 5 and 6. The melting peak onset arose steadily from 200 °C. Above 300 °C, the major
Figure 4. Contact angle measurement (A) Pure PTMSP membrane. (B) Hybrid membrane.
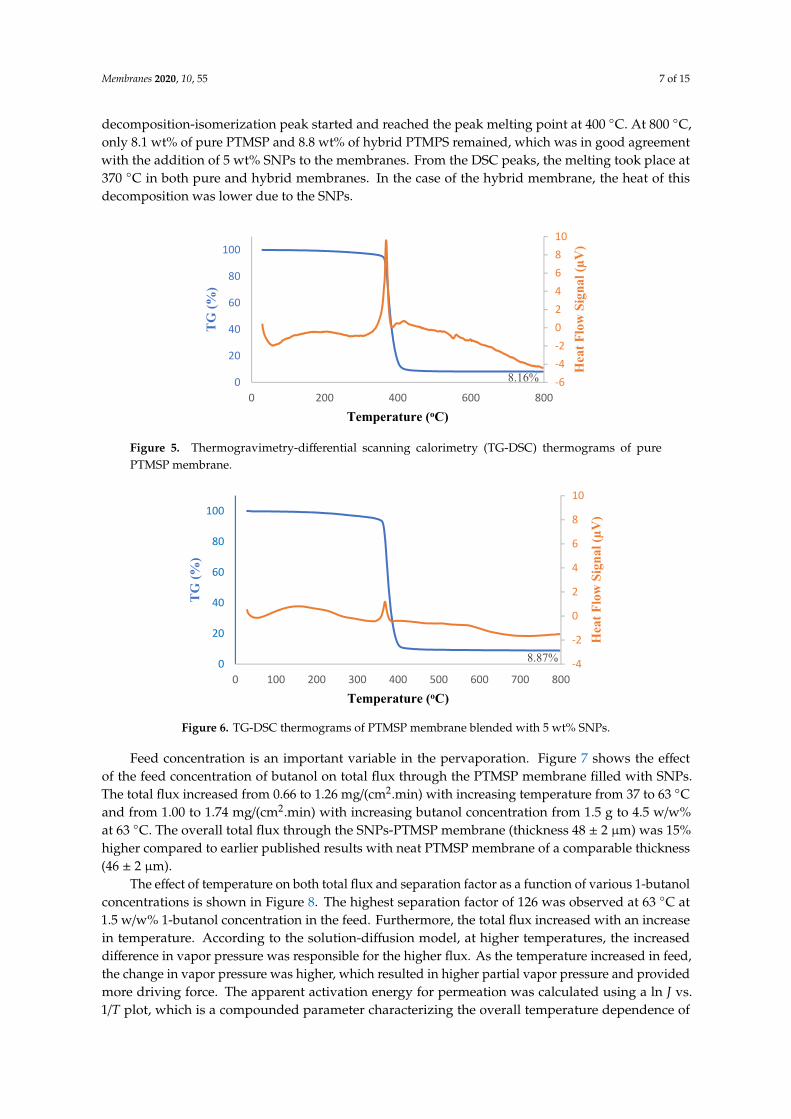
Thermal decomposition kinetics and stability of the hybrid PTMSP membrane, as well as that ofpure PTMSP membrane, were investigated using TG-DSC under a nitrogen atmosphere; results areshown in Figures 5 and 6. The melting peak onset arose steadily from 200 ◦C. Above 300 ◦C, the major
Membranes 2020, 10, 55 7 of 15
decomposition-isomerization peak started and reached the peak melting point at 400 ◦C. At 800 ◦C,only 8.1 wt% of pure PTMSP and 8.8 wt% of hybrid PTMPS remained, which was in good agreementwith the addition of 5 wt% SNPs to the membranes. From the DSC peaks, the melting took place at370 ◦C in both pure and hybrid membranes. In the case of the hybrid membrane, the heat of thisdecomposition was lower due to the SNPs.
Membranes 2020, 10, x 7 of 16
decomposition-isomerization peak started and reached the peak melting point at 400 °C. At 800 °C, only 8.1 wt% of pure PTMSP and 8.8 wt% of hybrid PTMPS remained, which was in good agreement with the addition of 5 wt% SNPs to the membranes. From the DSC peaks, the melting took place at 370 °C in both pure and hybrid membranes. In the case of the hybrid membrane, the heat of this decomposition was lower due to the SNPs.
Figure 5. Thermogravimetry-differential scanning calorimetry (TG-DSC) thermograms of pure PTMSP membrane.
Figure 6. TG-DSC thermograms of PTMSP membrane blended with 5 wt% SNPs.
Feed concentration is an important variable in the pervaporation. Figure 7 shows the effect of the feed concentration of butanol on total flux through the PTMSP membrane filled with SNPs. The total flux increased from 0.66 to 1.26 mg/(cm2.min) with increasing temperature from 37 to 63 °C and from 1.00 to 1.74 mg/(cm2.min) with increasing butanol concentration from 1.5 g to 4.5 w/w% at 63 °C. The overall total flux through the SNPs-PTMSP membrane (thickness 48 ± 2 μm) was 15% higher compared to earlier published results with neat PTMSP membrane of a comparable thickness (46 ± 2 μm).
8.16% -6-4-20246810
0
20
40
60
80
100
0 200 400 600 800
Hea
t Flo
w S
igna
l (µV
)
TG (%
)
Temperature (oC)
8.87% -4
-2
0
2
4
6
8
10
0
20
40
60
80
100
0 100 200 300 400 500 600 700 800
Hea
t Flo
w S
igna
l (µV
)
TG (%
)
Temperature (oC)
Figure 5. Thermogravimetry-differential scanning calorimetry (TG-DSC) thermograms of purePTMSP membrane.
Membranes 2020, 10, x 7 of 16
decomposition-isomerization peak started and reached the peak melting point at 400 °C. At 800 °C, only 8.1 wt% of pure PTMSP and 8.8 wt% of hybrid PTMPS remained, which was in good agreement with the addition of 5 wt% SNPs to the membranes. From the DSC peaks, the melting took place at 370 °C in both pure and hybrid membranes. In the case of the hybrid membrane, the heat of this decomposition was lower due to the SNPs.
Figure 5. Thermogravimetry-differential scanning calorimetry (TG-DSC) thermograms of pure PTMSP membrane.
Figure 6. TG-DSC thermograms of PTMSP membrane blended with 5 wt% SNPs.
Feed concentration is an important variable in the pervaporation. Figure 7 shows the effect of the feed concentration of butanol on total flux through the PTMSP membrane filled with SNPs. The total flux increased from 0.66 to 1.26 mg/(cm2.min) with increasing temperature from 37 to 63 °C and from 1.00 to 1.74 mg/(cm2.min) with increasing butanol concentration from 1.5 g to 4.5 w/w% at 63 °C. The overall total flux through the SNPs-PTMSP membrane (thickness 48 ± 2 μm) was 15% higher compared to earlier published results with neat PTMSP membrane of a comparable thickness (46 ± 2 μm).
8.16% -6-4-20246810
0
20
40
60
80
100
0 200 400 600 800
Hea
t Flo
w S
igna
l (µV
)
TG (%
)
Temperature (oC)
8.87% -4
-2
0
2
4
6
8
10
0
20
40
60
80
100
0 100 200 300 400 500 600 700 800
Hea
t Flo
w S
igna
l (µV
)
TG (%
)
Temperature (oC)
Figure 6. TG-DSC thermograms of PTMSP membrane blended with 5 wt% SNPs.
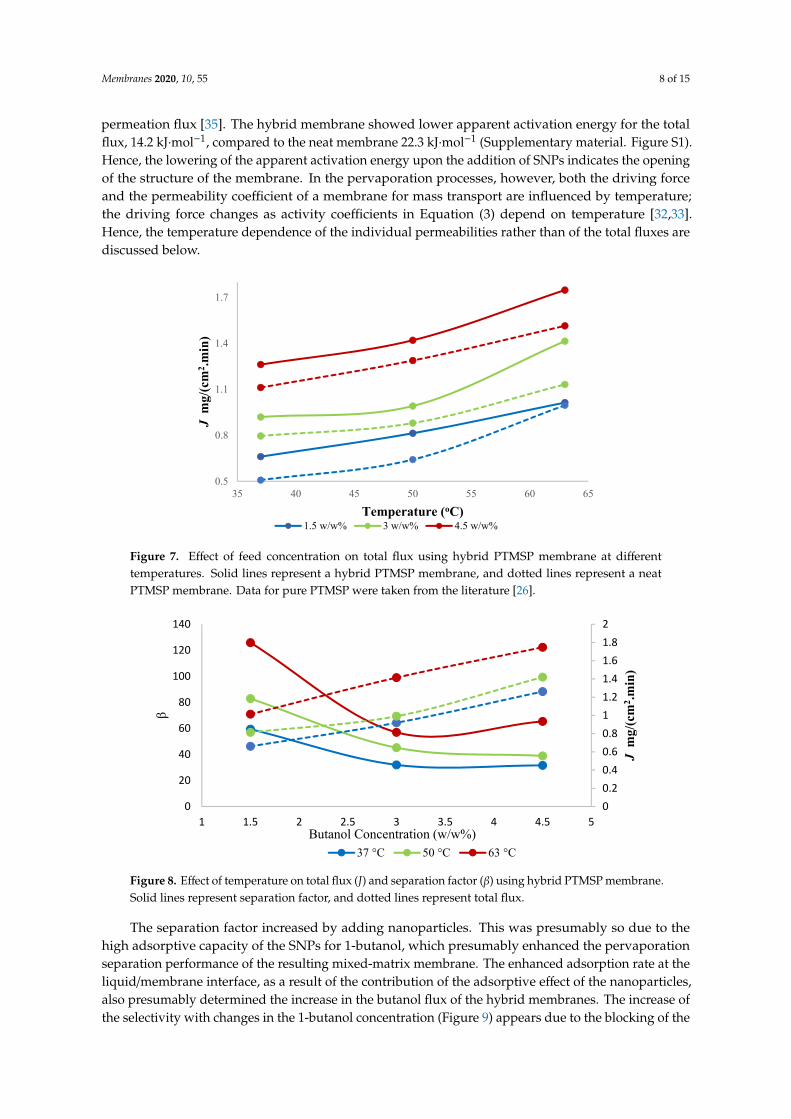
Feed concentration is an important variable in the pervaporation. Figure 7 shows the effectof the feed concentration of butanol on total flux through the PTMSP membrane filled with SNPs.The total flux increased from 0.66 to 1.26 mg/(cm2.min) with increasing temperature from 37 to 63 ◦Cand from 1.00 to 1.74 mg/(cm2.min) with increasing butanol concentration from 1.5 g to 4.5 w/w%at 63 ◦C. The overall total flux through the SNPs-PTMSP membrane (thickness 48 ± 2 µm) was 15%higher compared to earlier published results with neat PTMSP membrane of a comparable thickness(46 ± 2 µm).
The effect of temperature on both total flux and separation factor as a function of various 1-butanolconcentrations is shown in Figure 8. The highest separation factor of 126 was observed at 63 ◦C at1.5 w/w% 1-butanol concentration in the feed. Furthermore, the total flux increased with an increasein temperature. According to the solution-diffusion model, at higher temperatures, the increaseddifference in vapor pressure was responsible for the higher flux. As the temperature increased in feed,the change in vapor pressure was higher, which resulted in higher partial vapor pressure and providedmore driving force. The apparent activation energy for permeation was calculated using a ln J vs.1/T plot, which is a compounded parameter characterizing the overall temperature dependence of
Membranes 2020, 10, 55 8 of 15
permeation flux [35]. The hybrid membrane showed lower apparent activation energy for the totalflux, 14.2 kJ·mol−1, compared to the neat membrane 22.3 kJ·mol−1 (Supplementary material. Figure S1).Hence, the lowering of the apparent activation energy upon the addition of SNPs indicates the openingof the structure of the membrane. In the pervaporation processes, however, both the driving forceand the permeability coefficient of a membrane for mass transport are influenced by temperature;the driving force changes as activity coefficients in Equation (3) depend on temperature [32,33].Hence, the temperature dependence of the individual permeabilities rather than of the total fluxes arediscussed below.Membranes 2020, 10, x 8 of 16
Figure 7. Effect of feed concentration on total flux using hybrid PTMSP membrane at different temperatures. Solid lines represent a hybrid PTMSP membrane, and dotted lines represent a neat PTMSP membrane. Data for pure PTMSP were taken from the literature [26].
The effect of temperature on both total flux and separation factor as a function of various 1-butanol concentrations is shown in Figure 8. The highest separation factor of 126 was observed at 63 °C at 1.5 w/w% 1-butanol concentration in the feed. Furthermore, the total flux increased with an increase in temperature. According to the solution-diffusion model, at higher temperatures, the increased difference in vapor pressure was responsible for the higher flux. As the temperature increased in feed, the change in vapor pressure was higher, which resulted in higher partial vapor pressure and provided more driving force. The apparent activation energy for permeation was calculated using a ln J vs. 1/T plot, which is a compounded parameter characterizing the overall temperature dependence of permeation flux [35]. The hybrid membrane showed lower apparent activation energy for the total flux, 14.2 kJ·mol−1, compared to the neat membrane 22.3 kJ·mol−1 (Supplementary material. Figure S1). Hence, the lowering of the apparent activation energy upon the addition of SNPs indicates the opening of the structure of the membrane. In the pervaporation processes, however, both the driving force and the permeability coefficient of a membrane for mass transport are influenced by temperature; the driving force changes as activity coefficients in Equation (3) depend on temperature [32,33]. Hence, the temperature dependence of the individual permeabilities rather than of the total fluxes are discussed below.
The separation factor increased by adding nanoparticles. This was presumably so due to the high adsorptive capacity of the SNPs for 1-butanol, which presumably enhanced the pervaporation separation performance of the resulting mixed-matrix membrane. The enhanced adsorption rate at the liquid/membrane interface, as a result of the contribution of the adsorptive effect of the nanoparticles, also presumably determined the increase in the butanol flux of the hybrid membranes. The increase of the selectivity with changes in the 1-butanol concentration (Figure 9) appears due to the blocking of the sorption sites of the membrane by 1-butanol, rendering the membrane less permeable towards water (Figure 10), while the membrane appears resistant against plasticization, i.e., butanol permeability does not increase significantly with the increasing butanol concentration in the feed. The maximum selectivity was observed at 63 °C at each of the three explored feed concentrations.
0.5
0.8
1.1
1.4
1.7
35 40 45 50 55 60 65
J m
g/(c
m2 .m
in)
Temperature (oC)1.5 w/w% 3 w/w% 4.5 w/w%
Figure 7. Effect of feed concentration on total flux using hybrid PTMSP membrane at differenttemperatures. Solid lines represent a hybrid PTMSP membrane, and dotted lines represent a neatPTMSP membrane. Data for pure PTMSP were taken from the literature [26].Membranes 2020, 10, x 9 of 16
Figure 8. Effect of temperature on total flux (J) and separation factor (β) using hybrid PTMSP membrane. Solid lines represent separation factor, and dotted lines represent total flux.
Figure 9. Effect of feed concentration on selectivity (α) against temperature. Solid lines represent hybrid PTMSP membrane and dotted lines represent a neat PTMSP membrane. Data for pure PTMSP were taken from the literature [26].
The permeability of both 1-butanol and water dropped noticeably with increasing temperature and increased with increasing concentration of 1-butanol in the feed (Figure 10). Negative activation energies were observed for the permeability of water and 1-butanol in both hybrid and neat membranes (Supplementary materials, Figure S2, S3, and S4), which is consistent with the literature [36]. As we show below, the activation energy of 1-butanol diffusion was positive. Hence, this evidences the exothermic dissolution of 1-butanol in PTMSP and in the hybrid SNPs-PTMSP, while the exothermic dissolution of water in these materials can be expected.
When compared to the neat PTMSP membrane, the hybrid membrane showed an increase in the permeability of 1-butanol and water by 10% and 18%, respectively. The earlier reported results for the neat PTMSP membrane [26] showed, on average, 6% higher selectivity compared to the present hybrid membrane. The hybrid membrane appears, however, more selective in the case of diluted feeds (Figure 9). Similar results were observed with silica-filled PTMSP membranes, which showed permeate flux increases, but selectivity ethanol/water remains unchanged [23].
00.20.40.60.811.21.41.61.82
0
20
40
60
80
100
120
140
1 1.5 2 2.5 3 3.5 4 4.5 5
J m
g/(c
m2 .m
in)
β
Butanol Concentration (w/w%)37 °C 50 °C 63 °C
0
5
10
15
20
25
1 1.5 2 2.5 3 3.5 4 4.5 5
α
Butanol Concentration (w/w%)37 C 50 C 63 C
Figure 8. Effect of temperature on total flux (J) and separation factor (β) using hybrid PTMSP membrane.Solid lines represent separation factor, and dotted lines represent total flux.
The separation factor increased by adding nanoparticles. This was presumably so due to thehigh adsorptive capacity of the SNPs for 1-butanol, which presumably enhanced the pervaporationseparation performance of the resulting mixed-matrix membrane. The enhanced adsorption rate at theliquid/membrane interface, as a result of the contribution of the adsorptive effect of the nanoparticles,also presumably determined the increase in the butanol flux of the hybrid membranes. The increase ofthe selectivity with changes in the 1-butanol concentration (Figure 9) appears due to the blocking of the

Membranes 2020, 10, 55 9 of 15
sorption sites of the membrane by 1-butanol, rendering the membrane less permeable towards water(Figure 10), while the membrane appears resistant against plasticization, i.e., butanol permeabilitydoes not increase significantly with the increasing butanol concentration in the feed. The maximumselectivity was observed at 63 ◦C at each of the three explored feed concentrations.
Membranes 2020, 10, x 9 of 16
Figure 8. Effect of temperature on total flux (J) and separation factor (β) using hybrid PTMSP membrane. Solid lines represent separation factor, and dotted lines represent total flux.
Figure 9. Effect of feed concentration on selectivity (α) against temperature. Solid lines represent hybrid PTMSP membrane and dotted lines represent a neat PTMSP membrane. Data for pure PTMSP were taken from the literature [26].
The permeability of both 1-butanol and water dropped noticeably with increasing temperature and increased with increasing concentration of 1-butanol in the feed (Figure 10). Negative activation energies were observed for the permeability of water and 1-butanol in both hybrid and neat membranes (Supplementary materials, Figure S2, S3, and S4), which is consistent with the literature [36]. As we show below, the activation energy of 1-butanol diffusion was positive. Hence, this evidences the exothermic dissolution of 1-butanol in PTMSP and in the hybrid SNPs-PTMSP, while the exothermic dissolution of water in these materials can be expected.
When compared to the neat PTMSP membrane, the hybrid membrane showed an increase in the permeability of 1-butanol and water by 10% and 18%, respectively. The earlier reported results for the neat PTMSP membrane [26] showed, on average, 6% higher selectivity compared to the present hybrid membrane. The hybrid membrane appears, however, more selective in the case of diluted feeds (Figure 9). Similar results were observed with silica-filled PTMSP membranes, which showed permeate flux increases, but selectivity ethanol/water remains unchanged [23].
00.20.40.60.811.21.41.61.82
0
20
40
60
80
100
120
140
1 1.5 2 2.5 3 3.5 4 4.5 5
J m
g/(c
m2 .m
in)
β
Butanol Concentration (w/w%)37 °C 50 °C 63 °C
0
5
10
15
20
25
1 1.5 2 2.5 3 3.5 4 4.5 5
α
Butanol Concentration (w/w%)37 C 50 C 63 C
Figure 9. Effect of feed concentration on selectivity (α) against temperature. Solid lines representhybrid PTMSP membrane and dotted lines represent a neat PTMSP membrane. Data for pure PTMSPwere taken from the literature [26].
Membranes 2020, 10, x 10 of 16
Figure 10. Effect of feed concentration on the permeability of 1-butanol and water. Solid lines represent a hybrid PTMSP membrane, and dotted lines represent a neat PTMSP membrane. (●—1-butanol and ■—water). Data for pure PTMSP were taken from the literature [26].
The pervaporation transients observed for the experiments at higher temperatures were naturally more rapid (Figure 11). The addition of 5 wt% SNPs into PTMSP resulted in more rapid transients when compared to normal PTMSP membranes, especially at higher temperatures (63 °C).
Figure 11. Transients for 0–1.5 w/w% at different temperatures. Solid lines indicate experimental data devised from the experiments using the PTMSP membrane blended with SNPs and dotted lines without SNPs (neat membrane). Data for pure PTMSP were taken from the literature [26].
The diffusivity of 1-butanol in the hybrid membrane increased with increasing temperature at 1.5 w/w% feed concentration, as shown in Figure 12. The diffusivity increased by 12.2% (from 1.39 ×
0.0001
0.001
35 40 45 50 55 60 65
P m
g.cm
/(cm
2 .min
.KPa
)
Temperature (°C)1.5 w/w% 3 w/w% 4.5 w/w%
-5.00E-01
1.95E+01
3.95E+01
5.95E+01
7.95E+01
9.95E+01
1.20E+02
1.40E+02
1.60E+02
0.0 5.0 10.0 15.0 20.0 25.0 30.0
Buta
nol S
igna
l
Time (Min)37 °C 50 °C 63 °C
Figure 10. Effect of feed concentration on the permeability of 1-butanol and water. Solid lines representa hybrid PTMSP membrane, and dotted lines represent a neat PTMSP membrane. (•—1-butanol and�—water). Data for pure PTMSP were taken from the literature [26].
The permeability of both 1-butanol and water dropped noticeably with increasing temperatureand increased with increasing concentration of 1-butanol in the feed (Figure 10). Negative activationenergies were observed for the permeability of water and 1-butanol in both hybrid and neat membranes
Membranes 2020, 10, 55 10 of 15
(Supplementary materials, Figures S2–S4), which is consistent with the literature [36]. As we showbelow, the activation energy of 1-butanol diffusion was positive. Hence, this evidences the exothermicdissolution of 1-butanol in PTMSP and in the hybrid SNPs-PTMSP, while the exothermic dissolution ofwater in these materials can be expected.
When compared to the neat PTMSP membrane, the hybrid membrane showed an increase in thepermeability of 1-butanol and water by 10% and 18%, respectively. The earlier reported results forthe neat PTMSP membrane [26] showed, on average, 6% higher selectivity compared to the presenthybrid membrane. The hybrid membrane appears, however, more selective in the case of dilutedfeeds (Figure 9). Similar results were observed with silica-filled PTMSP membranes, which showedpermeate flux increases, but selectivity ethanol/water remains unchanged [23].
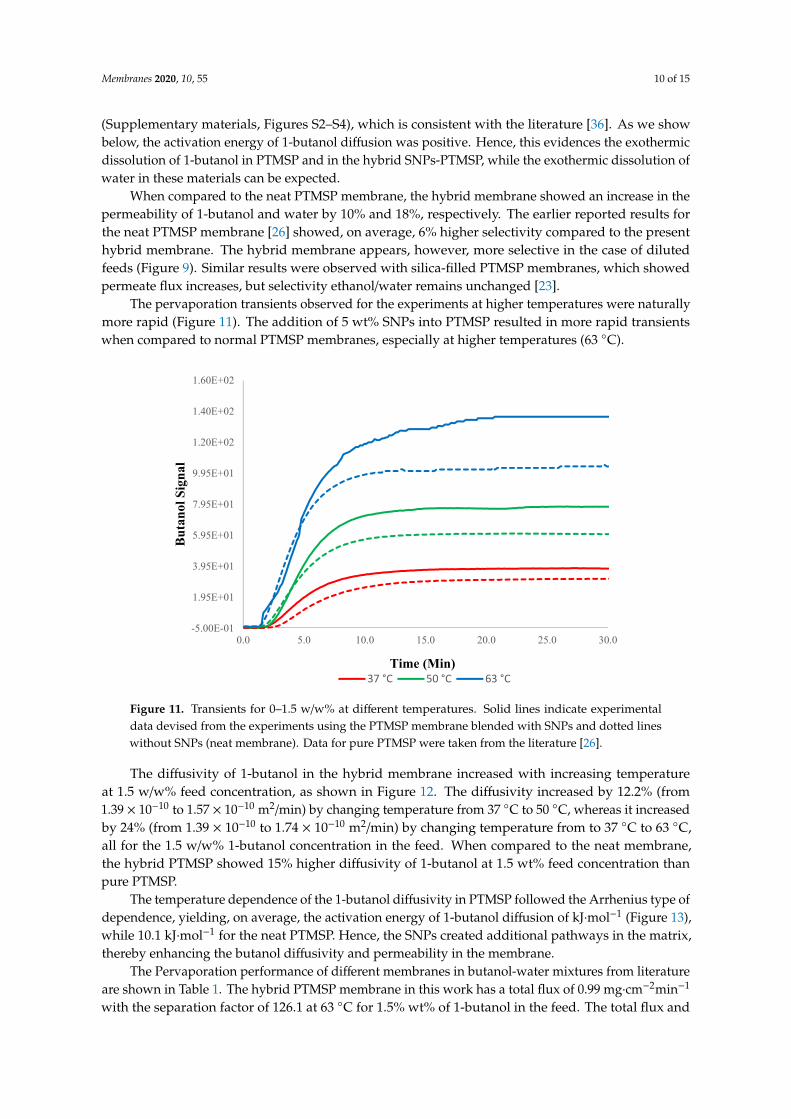
The pervaporation transients observed for the experiments at higher temperatures were naturallymore rapid (Figure 11). The addition of 5 wt% SNPs into PTMSP resulted in more rapid transientswhen compared to normal PTMSP membranes, especially at higher temperatures (63 ◦C).
Membranes 2020, 10, x 10 of 16
Figure 10. Effect of feed concentration on the permeability of 1-butanol and water. Solid lines represent a hybrid PTMSP membrane, and dotted lines represent a neat PTMSP membrane. (●—1-butanol and ■—water). Data for pure PTMSP were taken from the literature [26].
The pervaporation transients observed for the experiments at higher temperatures were naturally more rapid (Figure 11). The addition of 5 wt% SNPs into PTMSP resulted in more rapid transients when compared to normal PTMSP membranes, especially at higher temperatures (63 °C).
Figure 11. Transients for 0–1.5 w/w% at different temperatures. Solid lines indicate experimental data devised from the experiments using the PTMSP membrane blended with SNPs and dotted lines without SNPs (neat membrane). Data for pure PTMSP were taken from the literature [26].
The diffusivity of 1-butanol in the hybrid membrane increased with increasing temperature at 1.5 w/w% feed concentration, as shown in Figure 12. The diffusivity increased by 12.2% (from 1.39 ×
0.0001
0.001
35 40 45 50 55 60 65P
mg.
cm/(c
m2 .m
in.K
Pa)
Temperature (°C)1.5 w/w% 3 w/w% 4.5 w/w%
-5.00E-01
1.95E+01
3.95E+01
5.95E+01
7.95E+01
9.95E+01
1.20E+02
1.40E+02
1.60E+02
0.0 5.0 10.0 15.0 20.0 25.0 30.0
Buta
nol S
igna
l
Time (Min)37 °C 50 °C 63 °C
Figure 11. Transients for 0–1.5 w/w% at different temperatures. Solid lines indicate experimentaldata devised from the experiments using the PTMSP membrane blended with SNPs and dotted lineswithout SNPs (neat membrane). Data for pure PTMSP were taken from the literature [26].
The diffusivity of 1-butanol in the hybrid membrane increased with increasing temperatureat 1.5 w/w% feed concentration, as shown in Figure 12. The diffusivity increased by 12.2% (from1.39 × 10−10 to 1.57 × 10⁻¹⁰ m2/min) by changing temperature from 37 ◦C to 50 ◦C, whereas it increasedby 24% (from 1.39 × 10⁻¹⁰ to 1.74 × 10⁻¹⁰ m2/min) by changing temperature from to 37 ◦C to 63 ◦C,all for the 1.5 w/w% 1-butanol concentration in the feed. When compared to the neat membrane,the hybrid PTMSP showed 15% higher diffusivity of 1-butanol at 1.5 wt% feed concentration thanpure PTMSP.
The temperature dependence of the 1-butanol diffusivity in PTMSP followed the Arrhenius type ofdependence, yielding, on average, the activation energy of 1-butanol diffusion of kJ·mol−1 (Figure 13),while 10.1 kJ·mol−1 for the neat PTMSP. Hence, the SNPs created additional pathways in the matrix,thereby enhancing the butanol diffusivity and permeability in the membrane.
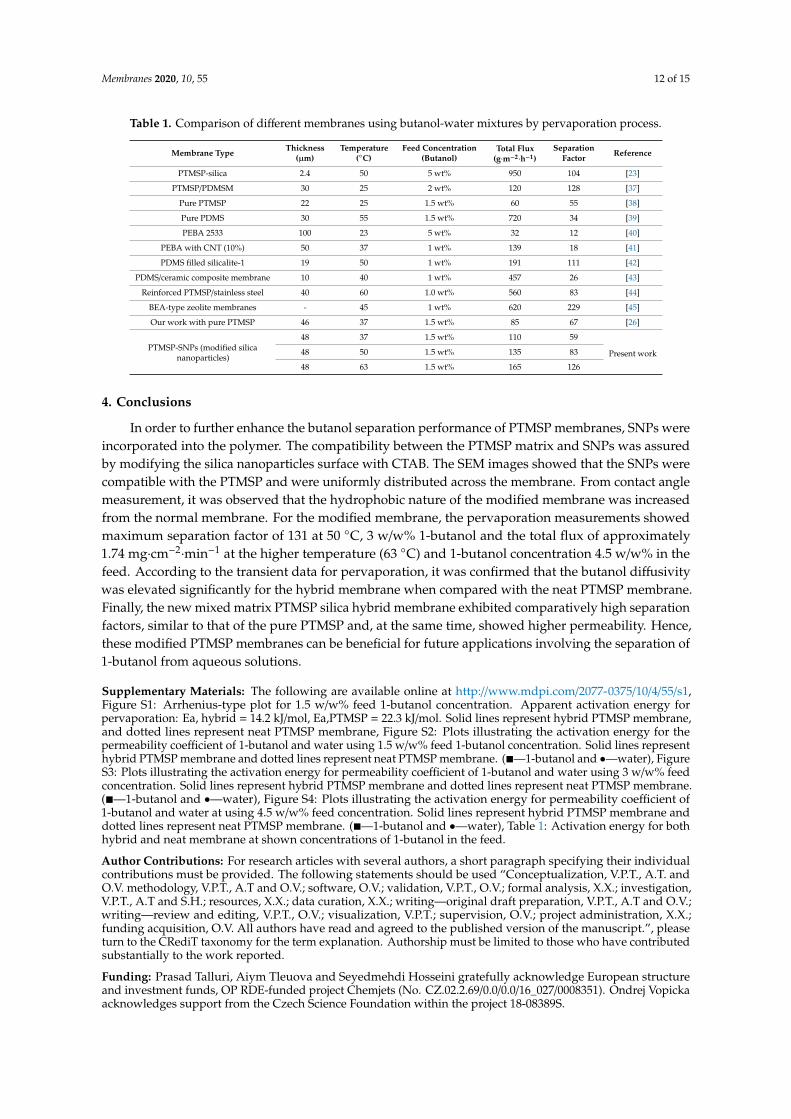
The Pervaporation performance of different membranes in butanol-water mixtures from literatureare shown in Table 1. The hybrid PTMSP membrane in this work has a total flux of 0.99 mg·cm−2min−1
with the separation factor of 126.1 at 63 ◦C for 1.5% wt% of 1-butanol in the feed. The total flux and

Membranes 2020, 10, 55 11 of 15
separation factor for our hybrid PTMSP membrane appeared comparable or higher when compared toother membrane materials reported in the literature.
Membranes 2020, 10, x 11 of 16
10−10 to 1.57 × 10⁻¹⁰ m2/min) by changing temperature from 37 °C to 50 °C, whereas it increased by 24% (from 1.39 × 10⁻¹⁰ to 1.74 × 10⁻¹⁰ m2/min) by changing temperature from to 37 °C to 63 °C, all for the 1.5 w/w% 1-butanol concentration in the feed. When compared to the neat membrane, the hybrid PTMSP showed 15% higher diffusivity of 1-butanol at 1.5 wt% feed concentration than pure PTMSP.
Figure 12. Diffusivity of 1-butanol in hybrid PTMSP-SNPs membrane at different temperatures using 1.5 w/w% feed concentration. Solid lines represent a hybrid PTMSP membrane and dotted lines neat membrane. Data for pure PTMSP were taken from the literature [26].
The temperature dependence of the 1-butanol diffusivity in PTMSP followed the Arrhenius type of dependence, yielding, on average, the activation energy of 1-butanol diffusion of kJ·mol−1 (Figure 13), while 10.1 kJ·mol−1 for the neat PTMSP. Hence, the SNPs created additional pathways in the matrix, thereby enhancing the butanol diffusivity and permeability in the membrane.
Figure 13. Arrhenius-type plot for the temperature dependence of the 1-butanol diffusivity in PTMSP-SNPs and neat PTMSP membranes at 1.5 w/w% feed 1-butanol concentration. The solid line represents the hybrid PTMSP-SNPs membrane and dotted lines for the neat PTMSP membrane. Data for pure PTMSP were taken from the literature [26].
The Pervaporation performance of different membranes in butanol-water mixtures from literature are shown in Table 1. The hybrid PTMSP membrane in this work has a total flux of 0.99
1.00E-10
1.20E-10
1.40E-10
1.60E-10
1.80E-10
35 40 45 50 55 60 65
Dm
2 /min
T (oC)
y = -930.48x - 19.696
y = -1204.2x - 19.006
-22.95-22.9
-22.85-22.8
-22.75-22.7
-22.65-22.6
-22.55-22.5
-22.45-22.4
0.00295 0.003 0.00305 0.0031 0.00315 0.0032 0.00325
ln D
1/T (1/K)
Figure 12. Diffusivity of 1-butanol in hybrid PTMSP-SNPs membrane at different temperatures using1.5 w/w% feed concentration. Solid lines represent a hybrid PTMSP membrane and dotted lines neatmembrane. Data for pure PTMSP were taken from the literature [26].
Membranes 2020, 10, x 11 of 16
10−10 to 1.57 × 10⁻¹⁰ m2/min) by changing temperature from 37 °C to 50 °C, whereas it increased by 24% (from 1.39 × 10⁻¹⁰ to 1.74 × 10⁻¹⁰ m2/min) by changing temperature from to 37 °C to 63 °C, all for the 1.5 w/w% 1-butanol concentration in the feed. When compared to the neat membrane, the hybrid PTMSP showed 15% higher diffusivity of 1-butanol at 1.5 wt% feed concentration than pure PTMSP.
Figure 12. Diffusivity of 1-butanol in hybrid PTMSP-SNPs membrane at different temperatures using 1.5 w/w% feed concentration. Solid lines represent a hybrid PTMSP membrane and dotted lines neat membrane. Data for pure PTMSP were taken from the literature [26].
The temperature dependence of the 1-butanol diffusivity in PTMSP followed the Arrhenius type of dependence, yielding, on average, the activation energy of 1-butanol diffusion of kJ·mol−1 (Figure 13), while 10.1 kJ·mol−1 for the neat PTMSP. Hence, the SNPs created additional pathways in the matrix, thereby enhancing the butanol diffusivity and permeability in the membrane.
Figure 13. Arrhenius-type plot for the temperature dependence of the 1-butanol diffusivity in PTMSP-SNPs and neat PTMSP membranes at 1.5 w/w% feed 1-butanol concentration. The solid line represents the hybrid PTMSP-SNPs membrane and dotted lines for the neat PTMSP membrane. Data for pure PTMSP were taken from the literature [26].
The Pervaporation performance of different membranes in butanol-water mixtures from literature are shown in Table 1. The hybrid PTMSP membrane in this work has a total flux of 0.99
1.00E-10
1.20E-10
1.40E-10
1.60E-10
1.80E-10
35 40 45 50 55 60 65
Dm
2 /min
T (oC)
y = -930.48x - 19.696
y = -1204.2x - 19.006
-22.95-22.9
-22.85-22.8
-22.75-22.7
-22.65-22.6
-22.55-22.5
-22.45-22.4
0.00295 0.003 0.00305 0.0031 0.00315 0.0032 0.00325
ln D
1/T (1/K)
Figure 13. Arrhenius-type plot for the temperature dependence of the 1-butanol diffusivity inPTMSP-SNPs and neat PTMSP membranes at 1.5 w/w% feed 1-butanol concentration. The solid linerepresents the hybrid PTMSP-SNPs membrane and dotted lines for the neat PTMSP membrane. Datafor pure PTMSP were taken from the literature [26].
The Pervaporation performance of different membranes in butanol-water mixtures from literatureare shown in Table 1. The hybrid PTMSP membrane in this work has a total flux of 0.99 mg·cm−2min−1
with the separation factor of 126.1 at 63 ◦C for 1.5 wt% of 1-butanol in the feed. The total flux andseparation factor for our hybrid PTMSP membrane appeared comparable or higher when compared toother membrane materials reported in the literature.
Membranes 2020, 10, 55 12 of 15
Table 1. Comparison of different membranes using butanol-water mixtures by pervaporation process.
Membrane Type Thickness(µm)
Temperature(◦C)
Feed Concentration(Butanol)
Total Flux(g·m−2·h−1)
SeparationFactor Reference
PTMSP-silica 2.4 50 5 wt% 950 104 [23]
PTMSP/PDMSM 30 25 2 wt% 120 128 [37]
Pure PTMSP 22 25 1.5 wt% 60 55 [38]
Pure PDMS 30 55 1.5 wt% 720 34 [39]
PEBA 2533 100 23 5 wt% 32 12 [40]
PEBA with CNT (10%) 50 37 1 wt% 139 18 [41]
PDMS filled silicalite-1 19 50 1 wt% 191 111 [42]
PDMS/ceramic composite membrane 10 40 1 wt% 457 26 [43]
Reinforced PTMSP/stainless steel 40 60 1.0 wt% 560 83 [44]
BEA-type zeolite membranes - 45 1 wt% 620 229 [45]
Our work with pure PTMSP 46 37 1.5 wt% 85 67 [26]
PTMSP-SNPs (modified silicananoparticles)
48 37 1.5 wt% 110 59
Present work48 50 1.5 wt% 135 83
48 63 1.5 wt% 165 126
4. Conclusions
In order to further enhance the butanol separation performance of PTMSP membranes, SNPs wereincorporated into the polymer. The compatibility between the PTMSP matrix and SNPs was assuredby modifying the silica nanoparticles surface with CTAB. The SEM images showed that the SNPs werecompatible with the PTMSP and were uniformly distributed across the membrane. From contact anglemeasurement, it was observed that the hydrophobic nature of the modified membrane was increasedfrom the normal membrane. For the modified membrane, the pervaporation measurements showedmaximum separation factor of 131 at 50 ◦C, 3 w/w% 1-butanol and the total flux of approximately1.74 mg·cm−2
·min−1 at the higher temperature (63 ◦C) and 1-butanol concentration 4.5 w/w% in thefeed. According to the transient data for pervaporation, it was confirmed that the butanol diffusivitywas elevated significantly for the hybrid membrane when compared with the neat PTMSP membrane.Finally, the new mixed matrix PTMSP silica hybrid membrane exhibited comparatively high separationfactors, similar to that of the pure PTMSP and, at the same time, showed higher permeability. Hence,these modified PTMSP membranes can be beneficial for future applications involving the separation of1-butanol from aqueous solutions.
Supplementary Materials: The following are available online at http://www.mdpi.com/2077-0375/10/4/55/s1,Figure S1: Arrhenius-type plot for 1.5 w/w% feed 1-butanol concentration. Apparent activation energy forpervaporation: Ea, hybrid = 14.2 kJ/mol, Ea,PTMSP = 22.3 kJ/mol. Solid lines represent hybrid PTMSP membrane,and dotted lines represent neat PTMSP membrane, Figure S2: Plots illustrating the activation energy for thepermeability coefficient of 1-butanol and water using 1.5 w/w% feed 1-butanol concentration. Solid lines representhybrid PTMSP membrane and dotted lines represent neat PTMSP membrane. (�—1-butanol and •—water), FigureS3: Plots illustrating the activation energy for permeability coefficient of 1-butanol and water using 3 w/w% feedconcentration. Solid lines represent hybrid PTMSP membrane and dotted lines represent neat PTMSP membrane.(�—1-butanol and •—water), Figure S4: Plots illustrating the activation energy for permeability coefficient of1-butanol and water at using 4.5 w/w% feed concentration. Solid lines represent hybrid PTMSP membrane anddotted lines represent neat PTMSP membrane. (�—1-butanol and •—water), Table 1: Activation energy for bothhybrid and neat membrane at shown concentrations of 1-butanol in the feed.
Author Contributions: For research articles with several authors, a short paragraph specifying their individualcontributions must be provided. The following statements should be used “Conceptualization, V.P.T., A.T. andO.V. methodology, V.P.T., A.T and O.V.; software, O.V.; validation, V.P.T., O.V.; formal analysis, X.X.; investigation,V.P.T., A.T and S.H.; resources, X.X.; data curation, X.X.; writing—original draft preparation, V.P.T., A.T and O.V.;writing—review and editing, V.P.T., O.V.; visualization, V.P.T.; supervision, O.V.; project administration, X.X.;funding acquisition, O.V. All authors have read and agreed to the published version of the manuscript.”, pleaseturn to the CRediT taxonomy for the term explanation. Authorship must be limited to those who have contributedsubstantially to the work reported.
Funding: Prasad Talluri, Aiym Tleuova and Seyedmehdi Hosseini gratefully acknowledge European structureand investment funds, OP RDE-funded project Chemjets (No. CZ.02.2.69/0.0/0.0/16_027/0008351). Ondrej Vopickaacknowledges support from the Czech Science Foundation within the project 18-08389S.
Membranes 2020, 10, 55 13 of 15
Acknowledgments: The authors are thankful to Jakub Havlin for the TG/DSC analysis.
Conflicts of Interest: The authors declare no conflict of interest.
Nomenclature
A (m2) Membrane area;.D (m2/min) DiffusivityJ (mg·cm−2
·min−1) Fluxl (µm) Thicknessp (Pa) PressureP (mg·cm·cm−2
·min−1·kPa−1) Permeability
R (J mol−1 K−1) Universal gas constantT (K or ◦C) Temperaturex Molar fraction
Abbreviation
ABE Acetone butanol ethanolFTIR Fourier transform infrared spectroscopyGC-MS Gas chromatography mass spectrometryHPLC High Performance Liquid ChromatographyMFC Mass flow controllerNRTL Non-random two-liquid modelSNPs Silica nano particles (Surface modified with CTAB)STP Standard temperature and pressure (273.15 K, 101.325 kPa)Greek lettersγ Activity coefficientβ Separation factorα Selectivity
References
1. Dürre, P. Biobutanol: An attractive biofuel. Biotechnol. J. 2007, 2, 1525–1534. [CrossRef]2. Lee, S.Y.; Park, J.H.; Jang, S.H.; Nielsen, L.K.; Kim, J.; Jung, K.S. Fermentative butanol production by
Clostridia. Biotechnol. Bioeng. 2008, 10, 209–228. [CrossRef] [PubMed]3. Green, M.E. Fermentative production of butanol—The industrial perspective. Curr. Opin. Biotech. 2011, 22,
337–343. [CrossRef] [PubMed]4. Jin, C.; Yao, C.; Liu, H.; Lee, C.F.; Ji, J. Progress in the production and application of n-butanol as a biofuel.
Renew. Sustain. Energy Rev. 2011, 15, 4080–4106. [CrossRef]5. Ibrahim, M.F.; Ramli, N.; Bahrin, E.K.; Abd-Aziz, S. Cellulosic biobutanol by Clostridia: Challenges and
improvements. Renew. Sustain. Energy Rev. 2017, 79, 1241–1254. [CrossRef]6. Pugazhendhi, A.; Mathimani, T.; Varjani, S.; Rene, R.E.; Kumar, G.; Kim, S.-H.; Ponnusamy, V.K.; Yoon, J.-J.
Biobutanol as a promising liquid fuel for the future—Recent updates and perspectives. Fuel 2019, 253,637–646. [CrossRef]
7. Singh, S. Global N Butanol Market Analysis & Trends—Industry Forecast to 2027; Research and Markets; AccurayResearch LLP: Dublin, Ireland, 2018.
8. Shao, P.; Huang, R. Polymeric membrane pervaporation. J. Membr. Sci. 2007, 287, 162–179. [CrossRef]9. Volkov, A.V.; Volkov, V.V.; Khotimskii, V.S. Membranes based on poly[(1-trimethylsilyl)-1-propyne] for
liquid-liquid separation. Polym. Sci. Ser. A 2009, 51, 2113–2128. [CrossRef]10. Nagai, K.; Masuda, T.; Nakagawa, T.; Freeman, B.D.; Pinnau, I. Poly[1-(trimethylsilyl)-1-propyne] and related
polymers: Synthesis, properties and functions. Prog. Polym. Sci. 2001, 26, 721–798. [CrossRef]11. Khotimsky, V.S.; Tchirkova, M.V.; Litvinova, E.G.; Rebrov, A.I.; Bondarenko, G.N.
Poly[1-(trimethylgermyl)-1-propyne] and poly[1-(trimethylsilyl)-1-propyne] with various geometries:Their synthesis and properties. J. Polym. Sci. Part A Polym. Chem. 2003, 41, 2133–2155. [CrossRef]
Membranes 2020, 10, 55 14 of 15
12. Volkov, V.V.; Fadeev, A.G.; Khotimsky, V.S.; Litvinova, E.G.; Selinskaya, Y.A.; McMillan, J.D.; Kelley, S.S.Effects of synthesis conditions on the pervaporation properties of Poly[1-(Trimethylsilyl)-1-Propyne] usefulfor membrane bioreactors. J. Appl. Polym. Sci. 2004, 91, 2271–2277. [CrossRef]
13. Cheng, X.; Pan, F.; Wang, M.; Li, W.; Song, Y.; Liu, G.; Yang, H.; Gao, B.; Wu, H.; Jiang, Z. Hybrid membranesfor pervaporation separations. J. Membr. Sci. 2017, 541, 329–346. [CrossRef]
14. Zhang, H.; Li, B.; Sun, D.; Miao, X.; Gu, Y. SiO2-PDMS-PVDF hollow fiber membrane with high flux forvacuum membrane distillation. Desalination 2018, 429, 33–43. [CrossRef]
15. Heidari, M.; Hosseini, S.S.; Narsin, M.O.; Ghadimi, A. Synthesis and fabrication of adsorptive carbonnanoparticles (ACNs)/PDMS mixed matrix membranes for efficient CO2/CH4 and C3H8/CH4 separation.Sep. Purif. Technol. 2019, 209, 503–515. [CrossRef]
16. Suhas, D.P.; Aminabhavi, T.M.; Raghu, A.V. Para-toluene sulfonic acid treated clay loaded sodium alginatemembranes for enhanced pervaporative dehydration of IPA. Appl. Clay Sci. 2014, 101, 419–429. [CrossRef]
17. Sudhakar, H.V.; Prasad, C.; Sunitha, K.C.; Rao, K.; Subha, M.; Sridhar, S. Pervaporation separation ofIPA-water mixtures through 4A zeolite-filled sodium alginate membranes. J. Appl. Polym. Sci. 2011, 121,2717–2725. [CrossRef]
18. Shirazi, Y.; Tofighy, A.M.; Mohammadi, T. Synthesis and characterization of carbon nanotubes/poly vinylalcohol nanocomposite membranes for dehydration of isopropanol. J. Membr. Sci. 2011, 378, 551–561.[CrossRef]
19. Bouša, D.; Friess, K.; Pilnácek, K.; Vopicka, O.; Lanc, M.; Fónod, K.; Pumera, M.; Sedmidubský, D.; Luxa, J.;Sofer, Z. Thin high flux self-standing graphene oxide membranes for efficient hydrogen separation from gasmixtures. Chem. Eur. J. 2017, 23, 11416–11422. [CrossRef]
20. Xu, Y.M.; Japip, S.; Chung, T.S. Mixed matrix membranes with nano-sized functional UiO-66-type MOFsembedded in 6FDA-HAB/DABA polyimide for dehydration of C1-C3 alcohols via pervaporation. J. Membr.Sci. 2018, 549, 217–226. [CrossRef]
21. Cheng, Y.; Ying, Y.; Zhai, L.; Liu, G.; Dong, J.; Wang, Y.; Christopher, M.P.; Long, S.; Wang, Y.; Zhao, D. Mixedmatrix membranes containing MOF@COF hybrid fillers for efficient CO2/CH4 separation. J. Membr. Sci.2019, 573, 97–106. [CrossRef]
22. Casado-Coterillo, C.; Fernández-Barquín, A.; Irabien, A. Effect of humidity on CO2/N2 and CO2/CH4
separation using novel robust mixed matrix composite hollow fiber membranes: Experimental and modelevaluation. Membranes 2020, 10, 6. [CrossRef] [PubMed]
23. Claes, R.; Vandezande, P.; Mullens, S.; Sitter, K.D.; Peeters, R.; Van Bael, M.K. Preparation and benchmarkingof thin film supported PTMSP-silica pervaporation membranes. J. Membr. Sci. 2012, 389, 265–271. [CrossRef]
24. Jyothi, M.S.; Reddy, K.R.; Soontarapa, K.; Naveen, S.; Raghu, A.V.; Kulkarni, R.V.; Suhas, D.P.;Shetti, N.P.; Nadagouda, M.N.; Aminabhavi, T.M. Membranes for dehydration of alcohols via pervaporation.J. Environ. Manag. 2019, 242, 415–429. [CrossRef] [PubMed]
25. Torabi, B.; Ameri, E. Methyl acetate production by coupled esterification-reaction process using synthesizedcross-linked PVA/silica nanocomposite membranes. Chem. Eng. J. 2016, 288, 461–472. [CrossRef]
26. Talluri, V.P.; Patakova, P.; Moucha, T.; Vopicka, O. Transient and steady pervaporation of 1-butanol–watermixtures through a poly[1 -(trimethylsilyl)-1-propyne] (ptmsp) membrane. Polymers 2019, 11, 1943. [CrossRef]
27. Design Institute for Physical Properties, Sponsored by AICHE (2005; 2008; 2009; 2010). DipprProject 801—Full Version. Design Institute for Physical Property Research/AICHE. Availableonline: http://knovel.com/web/toc.v/cid:kpDIPPRPF7/viewerType:toc/root_slug:dippr-project-801-full/url_slug:dippr-project-801-full/? (accessed on 11 November 2019).
28. Nagai, K.; Higuchi, A.; Nakagawa, T. Gas permeability and stability of poly(1-trimethylsilyl-1-propyne-co-1-phenyl-1-propyne) membranes. J. Polym. Sci. Part B Polym. Phys. 1995, 33, 289–298. [CrossRef]
29. Vopicka, O.; Radotínský, D.; Friess, K. Sorption of vapor mixtures of methanol and dimethyl carbonate inPDMS: Experimental study. Eur. Polym. J. 2015, 73, 480–486. [CrossRef]
30. Radotínský, D.; Vopicka, O.; Hynek, V.; Izák, P.; Friess, K. Aparatura pro stanovení sorpce a permeaceorganických par v polymerech pomocí infranoervené spektroskopie. Chem. Listy 2015, 109, 619–624.(In Czech)
31. Baker, R.; Wijmans, J.; Huang, Y. Permeability, permeance and selectivity: A preferred way of reportingpervaporation performance data. J. Membr. Sci. 2010, 348, 346–352. [CrossRef]
Membranes 2020, 10, 55 15 of 15
32. Renon, H.; Prausnitz, J. Local compositions in thermodynamic excess functions for liquid mixtures. AIChE J.1968, 14, 135–144. [CrossRef]
33. KoichiI, W.; Hitoshi, K. A correlation method for isobaric vapor–liquid and vapor–liquid–liquid equilibriadata of binary systems. Fluid Phase Equilibria 2008, 266, 202–210.
34. Sitter, K.D.; Leysen, R.; Mullens, S.; Vankelecom, I.; Maurer, F. Silica filled poly(1-trimethylsilyl-1-propyne)and poly(4-methyl-2-pentyne) membranes: Similarities and differences in structural characteristics andmembrane performances. Desalination 2006, 199, 293–295. [CrossRef]
35. Feng, X.; Huang, Y.M. Estimation of activation energy for permeation in pervaporation processes. J. Membr.Sci. 1996, 118, 127–131. [CrossRef]
36. Yakovlev, A.V.; Shalygin, M.G.; Matson, S.M.; Khotimskiy, V.S.; Teplyakov, V.V. Separation of dilutedbutanol–water solutions via vapor phase by organophilic membranes based on high permeable polyacetylenes.J. Membr. Sci. 2013, 434, 99–105. [CrossRef]
37. Borisov, I.L.; Malakhov, A.O.; Khotimsky, V.S.; Litvinova, E.G.; Finkelshtein, E.S.; Ushakov, N.V.; Volkov, V.V.Novel PTMSP-based membranes containing elastomeric fillers: Enhanced 1-butanol/water pervaporationselectivity and permeability. J. Membr. Sci. 2014, 466, 322–330. [CrossRef]
38. Fadeev, A.G.; Selinskaya, Y.A.; Kelley, S.S.; Meagher, M.M.; Litvinova, E.G.; Khotimsky, V.S.; Volkov, V.V.Extraction of butanol from aqueous solutions by pervaporation through poly(1-trimethylsilyl-1-propyne).J. Membr. Sci. 2001, 186, 205–217. [CrossRef]
39. Li, S.; Qin, F.; Qin, P.; Karim, M.N.; Tan, T. Preparation of PDMS membrane using water as solvent forpervaporation separation of butanol-water mixture. Green Chem. 2013, 15, 2180–2190. [CrossRef]
40. Liu, F.; Liu, L.; Feng, X. Separation of acetone–butanol–ethanol (ABE) from dilute aqueous solutions bypervaporation. Sep. Purif. Technol. 2005, 42, 273–282. [CrossRef]
41. Yen, H.-W.; Chen, Z.-H.; Yang, I.K. Use of the composite membrane of poly(ether-block-amide) and carbonnanotubes (CNTS) in a pervaporation system incorporated with fermentation for butanol production byclostridium acetobutylicum. Bioresour. Technol. 2012, 109, 105–109. [CrossRef]
42. Huang, J.; Meagher, M.M. Pervaporative recovery of n-butanol from aqueous solutions and abe fermentationbroth using thin-film silicalite-filled silicone composite membranes. J. Membr. Sci. 2001, 192, 231–242.[CrossRef]
43. Liu, G.; Hou, D.; Wei, W.; Xiangli, F.; Jin, W. Pervaporation Separation of Butanol-Water Mixtures UsingPolydimethylsiloxane/Ceramic Composite Membrane. Chin. J. Chem. Eng. 2011, 19, 40–44. [CrossRef]
44. Golubev, G.S.; Borisov, I.L.; Volkov, V.V.; Volkov, A.V. High-Performance Reinforced PTMSP Membranes forThermopervaporation Removal of Alcohols from Aqueous Media. Membr. Membr. Technol. 2020, 2, 45–53.[CrossRef]
45. Ueno, K.; Yamada, S.; Watanabe, T.; Negishi, H.; Okuno, T.; Tawarayama, H.; Ishikawa, S.; Miyamoto, M.;Uemiya, S.; Oumi, Y. Hydrophobic *BEA-Type Zeolite Membranes on Tubular Silica Supports forAlcohol/Water Separation by Pervaporation. Membranes. 2019, 9, 86. [CrossRef] [PubMed]
© 2020 by the authors. Licensee MDPI, Basel, Switzerland. This article is an open accessarticle distributed under the terms and conditions of the Creative Commons Attribution(CC BY) license (http://creativecommons.org/licenses/by/4.0/).