phenylacetylcarbinol (PAC) Synthesis in Aqueous/Organic ...
232
Bioprocess Development for ( R)-phenylacetylcarbinol (PAC) Synthesis in Aqueous/Organic Two-Phase System Cindy Gunawan, B.E. A thesis submitted in fulfillment of the requirements for the Degree of Doctor of Philosophy School of Biotechnology and Biomolecular Sciences University of New South Wales Sydney, Australia March 2006
-
Upload
khangminh22 -
Category
Documents
-
view
0 -
download
0
Transcript of phenylacetylcarbinol (PAC) Synthesis in Aqueous/Organic ...

Bioprocess Development for (R)-phenylacetylcarbinol
(PAC) Synthesis in Aqueous/Organic Two-Phase System
Cindy Gunawan, B.E.
A thesis submitted in fulfillment of the requirements for the Degree of
Doctor of Philosophy
School of Biotechnology and Biomolecular Sciences
University of New South Wales
Sydney, Australia
March 2006

Declaration I hereby declare that this submission is my own work and to the best of my knowledge it
contains no material previously published or written by another person, nor material
which to a substantial extent has been accepted for the award of any degree or diploma at
UNSW or any other educational institution, except where due acknowledgement is made
in this thesis. Any contribution made to the research by others, with whom I have worked
at UNSW or elsewhere, is explicitly acknowledged in the thesis.
I also declare that the intellectual content of this thesis is the product of my own work,
except to the extent that assistance from others in the project’s design and conception or in
style, presentation and linguistic expression is acknowledged.
__________________________
Cindy Gunawan

for papi and mami

Acknowledgements
i
ACKNOWLEDGEMENTS
I would like to express my deepest gratitude to my supervisor Professor Peter L. Rogers
and co-supervisor Dr Bettina Rosche for their endless guidance, support, and patience
throughout my project and in the preparation of this thesis.
I am very thankful to the Australian Government for awarding me the Endeavour
International Postgraduate Research Scholarship, which has given me priceless
opportunities and invaluable experience in research. I would also like to thank BASF
Ludwigshafen for their sponsorhip of the project.
I am very grateful to Dr. Martin Zarka, Dr. Russel Cail, and Malcolm Noble for their
technical support and to Gerry Ferhard, Peter, and John of the Faculty of Science
Workshop for constructing the Lewis cell.
A warm thank you to all my colleagues Lia, Allen, Noppol, André, and Richard for their
opinions, support, and those happy times. I would also like to thank all my friends Eny,
Ronachai, Onn, Yin, Nico, Adrian and all the staff in the School of Biotechnology and
Biomolecular Sciences (BABS) for their friendship.
My greatest gratitude to my parents, sisters and brothers; Lingling, Mona, Cangcang, and
Penpen for their kindness and warm love. Finally, I wish to thank my husband Frans for
his beautiful heart and endless encouragement.

Abstract
ii
ABSTRACT
(R)-phenylacetylcarbinol or R-PAC is a chiral precursor for the synthesis of
pharmaceuticals ephedrine and pseudoephedrine. PAC is produced through
biotransformation of pyruvate and benzaldehyde catalyzed by pyruvate decarboxylase
(PDC) enzyme. The present research project aims at characterizing a two-phase
aqueous/organic process for enzymatic PAC production.
In a comparative study of several selected yeast PDCs, the highest PAC formation was
achieved in systems with relatively high benzaldehyde concentrations when using C.
utilis PDC. C. tropicalis PDC was associated with the lowest by-product acetoin
formation although it also produced lower PAC concentrations. C. utilis PDC was
therefore selected as the biocatalyst for the development of the two-phase PAC
production.
From an enzyme stability study it was established that PDC deactivation rates in the two-
phase aqueous/octanol-benzaldehyde system were affected by: (1) soluble octanol and
benzaldehyde in the aqueous phase, (2) agitation rate, (3) aqueous/organic interfacial
area, and (4) initial enzyme concentration. PDC deactivation was less severe in the
slowly stirred phase-separated system (low interfacial area) compared to the rapidly
stirred emulsion system (high interfacial area), however the latter system was presumably
associated with a faster rate of organic-aqueous benzaldehyde transfer.
To find a balance between maintaining enzyme stability while enhancing PAC
productivity, a two-phase system was designed to reduce the interfacial contact by
decreasing the organic to aqueous phase volume ratio. Lowering the ratio from 1:1 to
0.43:1 resulted in increased overall PAC production at 4°C and 20°C (2.5 M MOPS,
partially purified PDC) with a higher concentration at the higher temperature. The PAC
was highly concentrated in the organic phase with 212 g/L at 0.43:1 in comparison to 111
g/L at 1:1 ratio at 20°C.
The potential of further two-phase process simplification was evaluated by reducing the
expensive MOPS concentration to 20 mM (pH controlled at 7.0) and employment of

Abstract
iii
whole cell PDC. It was found that 20°C was the optimum temperature for PAC
production in such a system, however under these conditions lowering the phase ratio
resulted in decreased overall PAC production. Two-phase PAC production was relatively
low in 20 mM MOPS compared to biotransformations in 2.5 M MOPS. Addition of 2.5
M dipropylene glycol (DPG) into the aqueous phase with 20 mM MOPS at 0.25:1 ratio
and 20°C improved the production with organic phase containing 95 g/L PAC. Although
the productivity was lower, the system may have the benefit of a reduction in production
cost.

Publications
iv
PUBLICATIONS
Published Paper
C. Gunawan, G. Satianegara, A.K. Chen, M. Breuer, B..Hauer, P.L. Rogers, B. Rosche.
(2006). Yeast Pyruvate Decarboxylases: Variation in Biocatalytic Characteristics for (R)-
phenylacetylcarbinol Production. FEMS Yeast Research: doi:10.1111/j.1567-
1364.2006.00138.x (with pending volume, issue and page numbers).
Paper in preparation
C. Gunawan, M. Breuer, B..Hauer, P.L. Rogers, B. Rosche. (2006). Key Factors
Influencing Enzyme Stability and Biotransformation in Two-Phase Aqueous/Organic
System for (R)-phenylacetylcarbinol Production. In preparation for submission to
Biotechnology and Bioengineering Journal.
Poster and oral presentations
C. Gunawan, M. Breuer, B. Hauer, P.L. Rogers, B. Rosche. (2003). Impact of Process
Parameters on R-phenylacetylcarbinol (PAC) Production in Aqueous/Organic Two-Phase
Biotransformation, Fermentation and Bioprocessing Conference. The Garvan Institute for
Medical Research, Sydney, Australia, 14 – 15 April, poster presentation p. 52, ISBN 0
7334 2023 0.
C. Gunawan, M. Breuer, B. Hauer, P.L. Rogers, B. Rosche. (2003). Process
Development for R-phenylacetylcarbinol (PAC) Production in Aqueous/Organic Two-
Phase Biotransformation. 6th International Symposium on Biocatalysis and
Biotransformations. BIOTRANS 2003, Palacky University, Olomouc, Czech Republic,
28 June – 3 July, poster presentation number 245, p. 507, ISSN 0009-2770.

Publications
v
C. Gunawan, M. Breuer, B. Hauer, P.L. Rogers, B. Rosche. (2003). Investigation on R-
phenylacetylcarbinol (PAC) Production in Aqueous/Organic Two-Phase
Biotransformation, School of Biotechnology and Biomolecular Sciences Third Annual
Symposium, Sydney, Australia, 7 November 2003, poster presentation P-12, ISBN 0
7334 1581 4.
C. Gunawan, M. Breuer, B. Hauer, P.L. Rogers, B. Rosche. (2004). Effect of Organic to
Aqueous Phase Volume Ratio in Two-Phase System for R-phenylacetylcarbinol
Biosynthesis, Fermentation and Bioprocessing Conference. UQ Centre University of
Queensland, Brisbane, Australia, 5 – 6 July 2004, poster presentation number 21, p.55,
ISBN 0 646 43707 0.
C. Gunawan, M. Breuer, B. Hauer, P.L. Rogers, B. Rosche. (2004). Bioprocess
Development for R-phenylacetylcarbinol (PAC) Production in Aqueous/Organic Two-
Phase System, School of Biotechnology and Biomolecular Sciences Third Annual
Symposium, Sydney, Australia, 5 November 2004, oral presentation 2-1, ISBN 0 7334
2162 8.
C. Gunawan, M. Breuer, B. Hauer, P.L. Rogers, B. Rosche. (2005). Optimization of
Aqueous/Organic Two-Phase System for (R)-phenylacetylcarbinol (PAC) Biosynthesis,
7th International Symposium on Biocatalysis and Biotransformations. BIOTRANS 2005,
TU Delft, Delft, The Netherlands, 3 – 8 July, poster presentation number 147, p. 147,
ISBN 90 809691 17.
G. Satianegara, C. Gunawan, A.K. Chen, M. Breuer, B. Hauer, P.L. Rogers, B. Rosche.
(2003). R-phenylacetylcarbinol (R-PAC) Production and Stability Study with Pyruvate
Decarboxylase from Four Yeast Strains, Fermentation and Bioprocessing Conference.
The Garvan Institute for Medical Research, Sydney, Australia, 14 – 15 April, poster
presentation p. 63, ISBN 0 7334 2023 0.
Publications
vi
G. Satianegara, C. Gunawan, A.K. Chen, M. Breuer, B. Hauer, P.L. Rogers, B. Rosche.
Comparison of Four Yeast Pyruvate Decarboxylase for R-phenylacetylcarbinol
Production, 6th International Symposium on Biocatalysis and Biotransformations.
BIOTRANS 2003, Palacky University, Olomouc, Czech Republic, 28 June – 3 July,
poster presentation number 119, p. 430, ISSN 0009-2770.
B. Rosche, V. Sandford, N. Leksawasdi, A. Chen, G. Satianegara, C. Gunawan, M.
Breuer, B. Hauer, P.L. Rogers. (2003). Bioprocess development for ephedrine production,
6th International Symposium on Biocatalysis and Biotransformations. BIOTRANS 2003,
Palacky University, Olomouc, Czech Republic, 28 June – 3 July, poster presentation
P224, ISSN 0009-2770.

Table of Contents
vii
TABLE OF CONTENTS
ACKNOWLEDGEMENTS ............................................................................................i
ABSTRACT ...................................................................................................................ii
PUBLICATIONS ..........................................................................................................iv
TABLE OF CONTENTS ...........................................................................................viii
LIST OF TABLES ....................................................................................................xivv
LIST OF FIGURES ...................................................................................................xvii
PROJECT SCOPE AND OBJECTIVES...............................................................xxixx
1. LITERATURE REVIEW .........................................................................................1
1.1 Introduction ...............................................................................................................2
1.2 Development of Biotransformation Processes ............................................................2
1.3 Ephedrine and Pseudoephedrine Synthesis.................................................................6
1.3.1 Pharmacological Values ..............................................................................6
1.3.2 Traditional Production.................................................................................6
1.3.3 (R)-phenylacetylcarbinol (PAC) as a Precursor............................................7
1.4 Biotransformation of Pyruvate and Benzaldehyde to PAC..........................................9
1.4.1 Reaction Mechanisms..................................................................................9
1.4.1.1 Early Findings ....................................................................................9
1.4.1.2 PAC Formation...................................................................................9
1.4.2 Pyruvate Decarboxylase Enzyme (PDC)....................................................12
1.4.2 1 Natural Role of PDC.........................................................................12
1.4.2.2 Structure of PDC ..............................................................................12
1.4.2.3 Role of Thiamine Pyrophosphate (TPP) ............................................14
1.4.2.4 PDC Isozymes ..................................................................................15
1.4.2.5 Factors Influencing PDC Stability…………………………………...15
1.4.3 Formation of By-Products .......................................................................166
1.4.4 Microorganisms for PAC Production.........................................................16
1.5 Factors Influencing Biocatalysis for PAC Production...............................................18
1.5.1 Enzyme Activity........................................................................................18
1.5.2 Toxicity Effect of Benzaldehyde ...............................................................19
Table of Contents
viii
1.5.3 Effect of Dissolved Oxygen Concentration ................................................19
1.5.4 Effect of pH...............................................................................................20
1.5.5 Biomass Condition ....................................................................................20
1.5.5.1 Effect of Cell Age.............................................................................20
1.5.5.2 Effect of Respiratory Quotient (RQ) .................................................21
1.6 Two-Phase Aqueous/Organic Extractive Bioconversion with Organic Solvent.........22
1.6.1 Definition ..................................................................................................22
1.6.2 Advantages and Disadvantages of the Two-Phase Aqueous/Organic
Biotransformation ..............................................................................................22
1.6.3 Organic Solvent Selection .........................................................................23
1.6.3.1 Solvent Biocompatibility ..................................................................23
1.6.3.2 Solvent Toxicity ...............................................................................25
1.6.3.3 Extraction Efficiency ........................................................................28
1.6.3.4 Ease of Solvent Recovery .................................................................28
1.7 Current Status of Two-Phase Aqueous/Organic Biotransformation for PAC
Production .....................................................................................................................29
1.8 Strategy for Two-Phase Model Development………………………………………..33
2. MATERIALS AND METHODS ...........................................................................355
2.1 Microorganisms.....................................................................................................366
2.2 Chemicals, Enzymes and Sources ..........................................................................366
2.3 Buffer Compositions..............................................................................................399
2.4 PDC Enzyme Production .........................................................................................40
2.4.1 General Steps in the Fermentation Processes .............................................40
2.4.1.1 Media Preparation.............................................................................40
2.4.1.2 Growth on Agar Media .....................................................................42
2.4.1.3 Preseed and Seed ..............................................................................42
2.4.1.4 Final Fermentation............................................................................43
2.4.2 Fermentation Processes .............................................................................44
2.4.2.1 Shake Flask Fermentation.................................................................44
2.4.2.2 Aerobic-Partially Anaerobic Two–Stage Fermentation .....................45
2.4.2.3 pH Shift Fermentation ......................................................................46
2.4.2.4 Sampling Procedure..........................................................................47

Table of Contents
ix
2.4.3 PDC Enzyme Preparations.........................................................................48
2.4.3.1 Whole Cell PDC ...............................................................................48
2.4.3.2 Crude Extract PDC ...........................................................................48
2.4.3.3 Partially Purified PDC ......................................................................48
2.5 Biotransformation Systems for PAC Production ......................................................49
2.5.1 Yeast Pyruvate Decarboxylases: Variation in Biocatalytic Characteristics .49
2.5.2 Effect of Organic to Aqueous Phase Volume Ratio on Two-Phase
Aqueous/Organic PAC Synthesis (2.5 M MOPS)...............................................51
2.5.3 Biotransformation Systems........................................................................51
2.5.3.1 MOPS Buffer System .......................................................................51
2.5.3.2 Aqueous (Soluble Benzaldehyde) and Aqueous/Benzaldehyde
Emulsion Systems ........................................................................................53
2.5.3.3 Two-Phase Aqueous/Octanol-Benzaldehyde System.........................54
2.5.3.4 PDC Enzyme Stock Solution Preparation..........................................55
2.5.4 Biotransformation Experiments .................................................................55
2.5.4.1 Set Up of Biotransformation Systems ...............................................55
2.5.4.2 Controls............................................................................................56
2.5.4.3 Sampling ..........................................................................................56
2.5.5 Determination of Residual PDC Enzyme Activities in Biotransformation
Systems..............................................................................................................57
2.6 PDC Enzyme Deactivation and Organic-Aqueous Benzaldehyde Transfer Studies in
the Two-Phase Aqueous/Octanol-Benzaldehyde System................................................60
2.6.1 Construction of the Aqueous/Organic Phase-Separated System – A
Temperature Controlled Lewis Cell System .......................................................60
2.6.1.1 Lewis Cell Construction ...................................................................60
2.6.1.2 Temperature Control System ............................................................61
2.6.2 PDC Enzyme Deactivation ........................................................................62
2.6.2.1 Experimental Details.........................................................................62
2.6.2.2 Effects of Soluble Octanol and Benzaldehyde in the Aqueous Phase
and Agitation Rate on PDC Deactivation......................................................66
2.6.2.3 Effect of Ratio of Organic Phase Interfacial Area to Aqueous Phase
Volume on PDC Deactivation ......................................................................66
2.6.2.4 Effect of Initial Enzyme Concentration on PDC Deactivation ...........67
Table of Contents
x
2.6.3 Estimation of Organic-Aqueous Benzaldehyde Transfer in Two-Phase
System ...............................................................................................................68
2.6.3.1 Experimental Details.........................................................................68
2.6.3.2 Organic-Aqueous Benzaldehyde Transfer Experiments.....................68
2.7 Two-Phase Aqueous/Organic PAC Synthesis at Lower Buffer Concentration (20 mM
MOPS, Larger Scale).....................................................................................................69
2.7.1 Experimental Details .................................................................................69
2.7.2 Biotransformation Experiments .................................................................71
2.8 Analytical Methods..................................................................................................72
2.8.1 Determination of Cell Culture Optical Density (OD660) ...........................72
2.8.2 Determination of Glucose concentration....................................................72
2.8.3 Determination of Dissolved Oxygen Concentration ...................................72
2.8.4 Determination of Respiratory Quotient ......................................................73
2.8.5 Determination of Dry Biomass ..................................................................74
2.8.6 Determination of Pyruvate Concentration ..................................................74
2.8.7 Determination of Acetaldehyde Concentration...........................................75
2.8.8 Determination of PAC, Benzoic Acid, Benzaldehyde and Benzyl Alcohol
Concentrations ...................................................................................................76
2.8.9 Determination of Acetoin Concentration ...................................................77
2.8.10 Determination of Soluble Octanol Concentration.....................................78
2.8.11 Determination of PDC Enzyme Carboligase Activity...............................79
2.9 Calculations Methods...............................................................................................79
2.9.1 Specific PDC Production...........................................................................79
2.9.2 Biotransformations Systems ......................................................................80
2.9.2.1 Substrate and PDC Enzyme Stock Solution Concentrations ..............80
2.9.2.2 PAC and By-Product Formation .......................................................81
2.9.3 Experimental Errors ..................................................................................83
3. YEAST PYRUVATE DECARBOXYLASES: VARIATION IN BIOCATALYTIC
CHARACTERISTICS .................................................................................................84
3.1 Introduction .............................................................................................................85
3.2 Results and Discussion ............................................................................................86
3.2.1 Specific PDC Activity ...............................................................................86

Table of Contents
xi
3.2.2 Pyruvate Conversion in the Absence of Benzaldehyde...............................86
3.2.3 PAC and By-Product Formation in the Aqueous (Soluble Benzaldehyde)
System................................................................................................................89
3.2.4 PAC and By-Product Formation in the Aqueous/Benzaldehyde Emulsion
System................................................................................................................91
3.2.5 PAC and By-Product Formation in the Aqueous/Octanol-Benzaldehyde
Emulsion System ...............................................................................................93
3.2.6 Efficiency of PAC Formation ....................................................................95
3.2.7 Effect of Benzaldehyde and Acetaldehyde on PAC Formation with C. utilis
and C. tropicalis PDCs.......................................................................................96
3.2.8 PDC Stability ..........................................................................................101
3.2.9 Further Characterization of C. utilis PDC Activity...................................103
3.2.9.1 Effect of Agitation Rate on PDC Deactivation ................................103
3.2.9.2 Effect of Initial Enzyme Concentration on PDC Deactivation .........104
3.3 Conclusions ...........................................................................................................105
4. FACTORS AFFECTING PDC ENZYME DEACTIVATION AND PAC
PRODUCTION IN TWO-PHASE AQUEOUS/ORGANIC SYSTEM ....................106
4.1 Introduction ...........................................................................................................107
4.2 Results and Discussion ..........................................................................................109
4.2.1 Factors Affecting PDC Deactivation........................................................109
4.2.1.1 Effect of Soluble Octanol and Benzaldehyde in the Aqueous Phase 109
4.2.1.2 Effect of Agitation Rate in the Aqueous Phase................................110
4.2.1.3 Effect of Ratio of Organic Phase Interfacial Area to Aqueous Phase
Volume ......................................................................................................111
4.2.1.4 Effect of Initial Enzyme Concentration ...........................................115
4.2.1.5 Discussion of Toxicity Effects on PDC Enzyme .............................117
4.2.1.6 Discussion of Organic-Aqueous Benzaldehyde Transfer .................118
4.2.2 Effect of Organic to Aqueous Phase Volume Ratio on PDC Deactivation
and PAC Production.........................................................................................119
4.2.2.1 PAC and By-Product Formation .....................................................119
4.2.2.2 PDC Deactivation ...........................................................................124
4.2.2.3 Discussion of the Phase Ratio Effects .............................................125

Table of Contents
xii
4.3 Conclusion.............................................................................................................127
5. PROCESS ENHANCEMENT AND FURTHER KINETIC EVALUATIO NS FOR
TWO-PHASE AQUEOUS/ORGANIC SYNTHESIS OF PAC ...............................128
5.1 Introduction ...........................................................................................................129
5.2 Results and Discussion ..........................................................................................130
5.2.1 Effect of Changing the Organic to Aqueous Phase Volume Ratio at 20°C on
Reaction Kinetics.............................................................................................130
5.2.1.1 PAC and By-Product Formation .....................................................130
5.2.1.2 PDC Deactivation ...........................................................................135
5.2.1.3 Discussion ......................................................................................136
5.2.2 Effect of Changing Organic to Aqueous Phase Volume Ratio at 20°C at
Lower MOPS Concentration (20 mM) .............................................................138
5.2.2.1 PAC and By-Product Formation .....................................................138
5.2.2.2 Discussion ......................................................................................141
5.2.3 Effect of Increasing Temperature at Lower MOPS Concentration (20 mM)143
5.2.3.1 PAC and By-Product Formation .....................................................143
5.2.3.2 Discussion ......................................................................................146
5.2.4 Effect of Dipropylene Glycol (DPG) as Additive at Lower MOPS
Concentration (20 mM) with Lowered Organic to Aqueous Phase Volume Ratio149
5.2.4.1 PAC and By-Product Formation .....................................................150
5.2.4.2 Discussion ......................................................................................153
5.3 Conclusion.............................................................................................................155
6. FINAL CONCLUSIONS AND FUTURE WORK ...............................................156
6.1 Yeast Pyruvate Decarboxylases: Variation in Biocatalytic Characteristics..............157
6.2 Factors Affecting PDC Enzyme Deactivation and PAC Production in Two-Phase
Aqueous/Organic System.............................................................................................158
6.3 Process Enhancement and Further Kinetic Evaluations for Two-Phase
Aqueous/Organic Synthesis of PAC ............................................................................159
6.4 Recommended Future Work ..................................................................................160
REFERENCES..........................................................................................................163

Table of Contents
xiii
APPENDIX A ............................................................................................................177
APPENDIX B .............................................................................................................184
APPENDIX C ............................................................................................................192
APPENDIX D ............................................................................................................195

List of Tables
xiv
LIST OF TABLES Table 1.1: Recently developed biocatalytic systems at several chemical companies
(adapted from Schmid et al. [2001] with modifications)............................5
Table 1.2: Effect of benzaldehyde on in vivo PAC production with S. cerevisiae [Long
and Ward, 1989b; c]. ..............................................................................19
Table 1.3: Comparison of baker’s yeast fatty acids and proteins released into the
biotransformation medium with observed biocatalytic activity [Nikolova
and Ward, 1992b]. ..................................................................................26
Table 2.1: Chemicals and enzymes..........................................................................36
Table 2.2: Buffer compositions. ..............................................................................39
Table 2.3: Stock solution concentrations and sterilization methods for the preparation
of agar and liquid media for fermentation. ..............................................41
Table 2.4: Agar media compositions for the various fermentation methods..............42
Table 2.5: Preseed and seed media compositions and operating conditions for the
various fermentation methods. ................................................................43
Table 2.6: Final fermentation media compositions for the various fermentation methods. .44
Table 2.7: Biotransformation systems employed in the selection of biocatalyst for
PAC production (Chapter 3). ..................................................................49
Table 2.8: Biotransformation systems employed in the characterization of the two-
phase aqueous/octanol-benzaldehyde system for PAC production
(Chapters 4 and 5). .................................................................................52
Table 2.9: Treatment and types of measurement performed on the biotransformation
samples. .................................................................................................58
Table 2.10.A: Aqueous-based and two-phase aqueous/organic systems employed in the
PDC enzyme deactivation studies (Chapter 4).........................................63
Table 2.10.B: Performed investigations in the PDC enzyme deactivation studies (Chapter
4)............................................................................................................65
Table 2.11: Biotransformation systems employed in the two-phase aqueous/organic
PAC synthesis with 20 mM MOPS buffer system (Chapter 5). ...............70
Table 2.12: Respiratory quotient (RQ) calculation for fermentation process. .............73

List of Tables
xv
Table 2.13: Composition of the reaction mixture in pyruvate and acetaldehyde (Section
2.8.7) assays (modified from Czok and Lamprecht 1974). ......................75
Table 2.14: Calculation method for pyruvate and acetaldehyde (Section 2.8.7)
concentrations. .......................................................................................75
Table 2.15: Component specifications and operating conditions of the HPLC system for
quantification of PAC, benzoic acid, benzaldehyde and benzyl alcohol. ......77
Table 2.16: Component specifications and operating conditions of the GC system for
quantification of acetoin concentration. ..................................................78
Table 2.17: Calculation method for PDC carboligase activity. ...................................79
Table 2.18: Method for calculating substrate and PDC enzyme stock solution
concentration in setting up the biotransformation systems.......................80
Table 2.19: Method for calculating PAC and by-product concentrations in two-phase
aqueous/octanol-benzaldehyde system....................................................81
Table 2.20.A:Calculation method for unaccounted benzaldehyde in the biotransformation
systems...................................................................................................82
Table 2.20.B:Calculation method for unaccounted pyruvate in the biotransformation
systems...................................................................................................83
Table 2.21: Calculation method for experimental error..............................................83
Table 3.1: Biotransformations with the four yeast PDCs in three different systems:
estimated yields of PAC on consumed benzaldehyde and pyruvate. ........95
Table 4.1: Effect of aqueous phase octanol and benzaldehyde on PDC deactivation at
4°C, pH 7.0. 220 rpm, 2 U/mL PDC carboligase activity (C. utilis partially
purified), 2.5 M MOPS buffer, 0.5 mM Mg2+, 1 mM TPP. Same
experiments as shown in Fig 4.4.a. .......................................................109
Table 4.2: Performance summary: effect of organic to aqueous phase volume ratio on
PAC production in the aqueous/octanol-benzaldehyde emulsion system at
4°C, initial pH 6.5 (48 h). .....................................................................126
Table 5.1: Performance summary: effect of organic to aqueous phase volume ratio on
PAC production in the aqueous/octanol-benzaldehyde emulsion system at
20°C, initial pH 6.5 (48 h). ...................................................................137
Table 5.2: Performance summary: effect of organic to aqueous phase volume ratio on
PAC production in the aqueous/octanol-benzaldehyde emulsion system
with 20 mM MOPS at 20°C, controlled pH 7.0.....................................142

List of Tables
xvi
Table 5.3: Performance summary: effect of temperature on PAC production in the
aqueous/octanol-benzaldehyde emulsion system with 20 mM MOPS,
controlled pH 7.0..................................................................................148
Table 5.4: Performance summary: PAC production in the aqueous/octanol-
benzaldehyde emulsion system with 2.5 M MOPS and 20 mM MOPS +
2.5 M DPG at 0.25:1 ratio and 20°C, pH controlled at 7.0.....................154
Table A.1: Description on the mass transfer rate equations. ....................................177
Table A.2: KA aint and KA values comparison: effects of physical parameters on
organic-aqueous benzaldehyde transfer in two-phase aqueous/octanol-
benzaldehyde system. ...........................................................................183
Table B.1: Performance summary: effect of octanol addition on PAC formation at
4°C, initial pH 7.0 (48h). ......................................................................187
Table B.2: Performance summary: effect of octanol addition on PAC formation at
20°C, initial pH 7.0 (48h). ....................................................................190

List of Figures
xvii
LIST OF FIGURES
Figure 1.1: Cumulative number of biotransformation processes that have been started on
an industrial scale [Straathof et al., 2002]. ...................................................3
Figure 1.2: The type of compounds produced using biotransformation processes (based
on 134 industrial processes) [Straathof et al., 2002]. ....................................3
Figure 1.3: Industrial sectors in which the products of industrial biotransformations are
used (based on 134 industrial processes) [Straathof et al., 2002]. .................4
Figure 1.4: Enzyme types used in industrial biotransformations (based on 134 processes)
[Straathof et al., 2002]. ................................................................................4
Figure 1.5: Two biologically active isomers of ephedrine..............................................6
Figure 1.6: Photograph of Ephedra distachya [Schoenfelder]. .......................................7
Figure 1.7: Synthesis of (1R, 2S) ephedrine and (1S, 2S) pseudoephedrine from PAC. ..7
Figure 1.8: Mechanisms of PAC formation catalyzed by pyruvate decarboxylase [Shin,
1994].........................................................................................................10
Figure 1.9: (a) α, β, and γ domains in PDC subunit [Arjunan et al., 1996] and (b) binding
site of Mg2+ demonstrating octahedral coordination with the enzyme, which
also forms a hydrogen bond with TPP [Furey et al., 1998] (Fig b was
constructed with the program CHAIN). .....................................................13
Figure 1.10:Overall structure of PDC tetramer is shown in ribbon drawing. The side
chains of Cys-221 residues, which involve in substrate activation are shown
in shaded boxes (adapted from Furey et al. [1998] with modification by
Leksawasdi [2004]). ..................................................................................14
Figure 1.11: Structure of thiamine pyrophosphate (TPP) [Campbell, 1999]...................14
Figure 1.12:Scanning electron micrographs of yeast cells isolated from biphasic media
containing: (a) hexane (26 h), (b) decane (26 h), (c) toluene (26 h), (d)
chloroform (0 h), and (e) chloroform (2 h) [Nikolova and Ward, 1992a]....27
Figure 1.13:Batch biotransformation kinetics and model fitting for determination of
overall rate constants for the formation of PAC, acetaldehyde, and acetoin
(Vp, Vq, and Vr) at (a) 50 mM benzaldehyde/60 mM sodium pyruvate with
initial PDC activity of 3.4 U/mL carboligase, (b) 150 mM benzaldehyde/180
mM sodium pyruvate with initial PDC activity of 3.4 U/mL carboligase, and

List of Figures
xviii
(c) 100 mM benzaldehyde/120 mM sodium pyruvate with initial PDC
activity of 1.1 U/mL carboligase: ( ) pyruvate, ( ) benzaldehyde, ()
acetaldehyde, () acetoin, ( ) PAC, and (x) enzyme activity. Line of best
fit through each data profile was created from the optimal value of Vp, Vq,
and Vr [Leksawasdi et al., 2004]. ..............................................................30
Figure 1.14:Diagrammatic representation of the two-phase aqueous/organic PAC
production system [Rosche et al., 2002b; Sandford et al., 2005]. ...............31
Figure 1.15:PAC production as a function of carboligase activity in the rapidly stirred
two-phase system after 40 h, and phase-separated two-phase system after
395 h (4°C, organic octanol phase contained 1500 mM benzaldehyde and
the aqueous phase contained 1430 mM pyruvate, 2.5 M MOPS, 1 mM TPP,
1 mM Mg2+, pH 6.5). A 1:1 volume ratio of organic and aqueous phases was
used...........................................................................................................32
Figure 2.1: 30 L BIOSTAT® C fermenter system used in the aerobic-partially anaerobic
two-stage fermentation method for PDC production. .................................46
Figure 2.2:5 L BIOSTAT® A (B.Braun) fermenter system used in the pH shift
fermentation method for PDC production. .................................................47
Figure 2.3: Sampling procedures for the fermentation processes. ..................................47
Figure 2.4: Freeze drier used in partially purified PDC preparation. ..............................48
Figure 2.5:Lewis Cell for experimentation on the aqueous/organic phase-separated
system. ......................................................................................................61
Figure 2.6:Temperature controlled aqueous/organic phase-separated system (Lewis
Cell). .........................................................................................................62
Figure 3.1: Comparison of specific PDC activities of six yeasts. Culturing conditions
(g/L): 90 glucose, 10 yeast extract, 10 (NH4)2SO4, 3 KH2PO4, 2
Na2HPO4.12H2O, 1 MgSO4.7H2O, 0.05 CaCl2.2H2O, 39 MES buffer, initial
pH 6, 30°C, 160 rpm. The data is shown as mean values for four
fermentation batches for S.c, C.u, C.t, K.m and two batches for S.p and C.g.
S.c: Saccharomyces cerevisiae, C.u: Candida utilis, C.t: Candida tropicalis,
S.p: Schizosaccharomyces pombe, C.g: Candida glabrata, K.m:
Kluyveromyces marxianus. The error bars show highest and lowest values
for the above experiments..........................................................................87

List of Figures
xix
Figure 3.2: Acetaldehyde and acetoin formation in the absence of benzaldehyde. Product
concentrations after 7.3 h at 22°C, initial pH 6.5. Initial agitation 220 rpm,
initial concentrations: 80 mM pyruvate, 1.5 U/ml PDC carboligase activity
(crude extract), 2.5 M MOPS buffer, 1 mM Mg2+, 1 mM TPP. Acetaldehyde
concentrations were immediately measured upon samplings. The mean
values were determined from triplicate experiments and error bars show the
highest and lowest values. Refer to Fig 3.1 for strain abbreviations. ..........88
Figure 3.3:Biotransformation results in the aqueous system (presence of soluble
benzaldehyde): (a) PAC (at 0.5 h and 7.3 h) and (b) by-product (at 7.3 h)
concentrations at 22°C, initial pH 6.5. Initial agitation 220 rpm, initial
concentrations: 80 mM benzaldehyde, 80 mM pyruvate, 1.5 U/ml PDC
carboligase activity (crude extract), 2.5 M MOPS buffer, 1 mM Mg2+, 1 mM
TPP. ..........................................................................................................90
Figure 3.4: Biotransformation results in the aqueous/benzaldehyde emulsion system: (a)
PAC (at 3 h and 24 h) and (b) by-product (at 24 h) concentrations at 22°C,
initial pH 6.5. Initial agitation 220 rpm, initial concentrations: 325 mM
benzaldehyde, 420 mM pyruvate, 1.5 U/ml PDC carboligase activity (crude
extract), 2.5 M MOPS buffer, 1 mM Mg2+, 1 mM TPP. .............................92
Figure 3.5: Biotransformation results in the aqueous/octanol-benzaldehyde emulsion
system: (a) PAC (at 3 h, 24 h and 48 h) and (b) by-product (at 48 h)
concentrations at 22°C, initial pH 6.5. Initial agitation 250 rpm, initial
concentrations: 850 mM TRV benzaldehyde, 450 mM TRV pyruvate, 1.5
U/ml TRV PDC carboligase activity (permeabilized whole cells), 2.5 M
MOPS, 1 mM Mg2+, 1 mM TPP. The organic to aqueous phase volume ratio
was 1:1 and concentrations of substrates, enzyme, product and by-products
are given per total reaction volume by combining both phases (TRV)........94
Figure 3.6: Effect of acetaldehyde on initial PAC formation with: (a) C. utilis (C.u) and
(b) C. tropicalis (C.t) PDCs at various benzaldehyde concentrations in 32
min at 22°C, initial pH 6.5. Agitation 220 rpm, initial concentrations: 250
mM pyruvate, 0 and 30 mM acetaldehyde 1.5 U/ml PDC carboligase
activity (crude extract), 2.5 M MOPS, 1 mM Mg2+ & 1 mM TPP. .............97

List of Figures
xx
Figure 3.7: Effect of acetaldehyde on initial acetoin formation with: (a) C. utilis (C.u)
and (b) C. tropicalis (C.t) PDCs at various benzaldehyde concentrations in
32 min at 22°C, initial pH 6.5. Same experiments as shown in Fig 3.6.......98
Figure 3.8: Ratio of PAC over acetoin with C. utilis (C.u) and C. tropicalis (C.t) PDCs
at various benzaldehyde concentrations in the presence of 30 mM
acetaldehyde (32 min) at 22°°°°C, initial pH 6.5. Same experiments as shown
as Fig 3.6...................................................................................................99
Figure 3.9:Ratio of PAC over acetoin for the four yeast PDCs in the different
biotransformation systems at 22°C, initial pH 6.5. Same experiments as
shown in Figs 3.3, 3.4, and 3.5. ...............................................................100
Figure 3.10:PDC stabilities in the absence and presence of soluble benzaldehyde at
22°C: (a) crude extract and (b) whole cell preparations. Concentrations: 50
mM benzaldehyde, 1.5 U/ml PDC carboligase activity, 2.5 M MOPS (pH
6.5), 1 mM Mg2+ & 1 mM TPP................................................................102
Figure 3.11: Effect of agitation rate on the deactivation of partially purified PDC from C.
utilis in the absence and presence of 48 mM soluble benzaldehyde at 4°°°°C,
pH 7. 95, 220 and 250 rpm agitation, 0 and 48 mM benzaldehyde, 3 U/mL
PDC carboligase activity, 2.5 M MOPS buffer, 0.5 mM Mg2+, 1 mM TPP.
Extensive foam formation at 250 rpm......................................................104
Figure 3.12:Effect of initial enzyme concentration on the deactivation of partially
purified PDC from C. utilis in the absence and presence of 48 mM soluble
benzaldehyde at 4°C, pH 7. 220 rpm agitation, 0 and 48 mM benzaldehyde,
3 and 7.3 U/mL PDC carboligase activity, 2.5 M MOPS buffer, 0.5 mM
Mg2+, 1 mM TPP.....................................................................................104
Figure 4.1: PAC production in various biotransformation systems. ............................108
Figure 4.2: Effect of agitation rate on PDC deactivation in the presence of soluble
octanol and benzaldehyde at 4°C, pH 7.0. 4.5 mM octanol, 48 mM
benzaldehyde, 2 U/mL PDC carboligase activity (C. utilis partially purified),
2.5 M MOPS buffer, 0.5 mM Mg2+, 1 mM TPP.......................................110
Figure 4.3:Effect of aqueous/organic interfacial area on PDC deactivation in the
aqueous/octanol-benzaldehyde phase-separated system at 4°C, pH 7.0. 1.39
M organic phase benzaldehyde, 4.5 mM aqueous phase octanol, 48 mM
aqueous phase benzaldehyde, 60 rpm and 125 rpm agitation for organic and

List of Figures
xxi
aqueous phase respectively in Lewis cell, 4 U/mL aqueous phase or 2 U/mL
TRV PDC carboligase activity, 2.5 M MOPS buffer, 0.5 mM Mg2+, 1 mM
TPP. TRV: total reaction volume by combining both phases....................112
Figure 4.4:Effect of excess octanol and benzaldehyde on PDC deactivation in the
aqueous/octanol-benzaldehyde emulsion system at 4°C, pH 7.0: (a)
aqueous-based system and (b) two-phase aqueous/organic system. 220 rpm
agitation, 2 U/mL TRV PDC carboligase activity, 2.5 M MOPS buffer, 0.5
mM Mg2+, 1 mM TPP. TRV: total reaction volume by combining both
phases. ....................................................................................................113
Figure 4.5: Effect of initial enzyme concentration on PDC deactivation in the two-phase
aqueous/octanol-benzaldehyde system at 4°C, pH 7.0: (a) phase-separated
system, 125 rpm agitation in the aqueous phase and (b) emulsion system,
220 rpm agitation. 1.46 M organic phase benzaldehyde, 4.5 mM aqueous
phase octanol, 48 mM aqueous phase benzaldehyde, 2.5 M MOPS buffer,
0.5 mM Mg2+, 1 mM TPP. The enzyme activities were expressed as
concentrations in the aqueous phase. .......................................................116
Figure 4.6: Effect of organic to aqueous phase volume ratio on PAC production in the
aqueous/octanol-benzaldehyde emulsion system at 1:1 ratio at 4°C, initial
pH 6.5: (a) organic and (b) aqueous phase substrates, PAC and by-product
concentration profiles. Initial agitation 250 rpm, initial concentrations: 1.36
M organic phase benzaldehyde, the aqueous phase contained 1.26 M
pyruvate, 5.6 U/mL PDC carboligase activity (C. utilis partially purified),
2.5 M MOPS buffer, 1 mM Mg2+, 1 mM TPP. ORG: organic phase, AQ:
aqueous phase. Approximate values for acetaldehyde concentration due to
possible evaporative loss during sampling and analysis. The mean values
were determined from triplicate analyses and error bars show the highest
and lowest values. ...................................................................................120
Figure 4.7: Effect of organic to aqueous phase volume ratio on PAC production in the
aqueous/octanol-benzaldehyde emulsion system at 0.67:1 ratio at 4°C, initial
pH 6.5: (a) organic and (b) aqueous phase concentration profiles. Initial
agitation 235 rpm, initial concentrations: 1.7 M organic phase benzaldehyde,
the aqueous phase contained 1.06 M pyruvate, 4.7 U/mL PDC carboligase

List of Figures
xxii
activity (C. utilis partially purified), 2.5 M MOPS buffer, 1 mM Mg2+, 1
mM TPP..................................................................................................121
Figure 4.8: Effect of organic to aqueous phase volume ratio on PAC production in the
aqueous/octanol-benzaldehyde emulsion system at 0.43:1 ratio at 4°C, initial
pH 6.5: (a) organic and (b) aqueous phase concentration profiles. Initial
agitation 220 rpm, initial concentrations: 2.26 M organic phase
benzaldehyde, the aqueous phase contained 0.93 M pyruvate, 4 U/mL PDC
carboligase activity (C. utilis partially purified), 2.5 M MOPS buffer, 1 mM
Mg2+, 1 mM TPP.....................................................................................122
Figure 4.9: Effect of organic to aqueous phase volume ratio on PAC production in the
aqueous/octanol-benzaldehyde emulsion system at 0.25:1 ratio at 4°C, initial
pH 6.5: (a) organic and (b) aqueous phase concentration profiles. Initial
agitation 205 rpm, initial concentrations: 3.48 M organic phase
benzaldehyde, the aqueous phase contained 0.8 M pyruvate, 3.5 U/mL PDC
carboligase activity (C. utilis partially purified), 2.5 M MOPS buffer, 1 mM
Mg2+, 1 mM TPP.....................................................................................123
Figure 4.10:Effect of organic to aqueous phase volume ratio in emulsion
aqueous/octanol-benzaldehyde system at 4°C, initial pH 6.5: residual
enzyme activity. Same experiments as shown in Figs 4.6 – 4.9................125
Figure 5.1: Effect of organic to aqueous phase volume ratio on PAC production in the
aqueous/octanol-benzaldehyde emulsion system at 1:1 ratio at 20°C, initial
pH 6.5: (a) organic and (b) aqueous phase substrates, PAC and by-product
concentration profiles. Initial agitation 250 rpm, initial concentrations: 1.4
M organic phase benzaldehyde, the aqueous phase contained 1.29 M
pyruvate, 5.6 U/mL PDC carboligase activity (C. utilis partially purified),
2.5 M MOPS buffer, 1 mM Mg2+, 1 mM TPP. ORG: organic phase, AQ:
aqueous phase, Approximate values for acetaldehyde concentration due to
possible evaporative losses during sampling and analysis. The mean values
were determined from triplicate analyses and error bars show the highest
and lowest values. ...................................................................................131
Figure 5.2: Effect of organic to aqueous phase volume ratio on PAC production in the
aqueous/octanol-benzaldehyde emulsion system at 0.67:1 ratio at 20°C,
initial pH 6.5: (a) organic and (b) aqueous phase concentration profiles.

List of Figures
xxiii
Initial agitation 235 rpm, initial concentrations: 1.76 M organic phase
benzaldehyde, the aqueous phase contained 1.075 M pyruvate, 4.7 U/mL
PDC carboligase activity (C. utilis partially purified), 2.5 M MOPS buffer, 1
mM Mg2+, 1 mM TPP. ............................................................................132
Figure 5.3: Effect of organic to aqueous phase volume ratio on PAC production in the
aqueous/octanol-benzaldehyde emulsion system at 0.43:1 ratio at 20°C,
initial pH 6.5: (a) organic and (b) aqueous phase concentration profiles.
Initial agitation 220 rpm, initial concentrations: 2.47 M organic phase
benzaldehyde, the aqueous phase contained 0.92 M pyruvate, 4 U/mL PDC
carboligase activity (C. utilis partially purified), 2.5 M MOPS buffer, 1 mM
Mg2+, 1 mM TPP.....................................................................................133
Figure 5.4: Effect of organic to aqueous phase volume ratio on PAC production in the
aqueous/octanol-benzaldehyde emulsion system at 0.25:1 ratio at 20°C,
initial pH 6.5: (a) organic and (b) aqueous phase concentration profiles.
Initial agitation 205 rpm, initial concentrations: 3.625 M organic phase
benzaldehyde, the aqueous phase contained 0.8 M pyruvate, 3.5 U/mL PDC
carboligase activity (C. utilis partially purified), 2.5 M MOPS buffer, 1 mM
Mg2+, 1 mM TPP.....................................................................................134
Figure 5.5: Effect of organic to aqueous phase volume ratio on PDC deactivation in the
aqueous/octanol-benzaldehyde emulsion system at 20°C, initial pH 6.5.
Same experiments as shown in Figs 5.1 – 5.4. .........................................135
Figure 5.6: Effect of organic to aqueous phase volume ratio on PAC production in the
aqueous/octanol-benzaldehyde emulsion system with 20 mM MOPS at
20°C, controlled pH 7.0: organic and aqueous phase concentration profiles
are shown. Constant agitation 160 rpm, initial concentrations: 775 – 810
mM TRV benzaldehyde, 400 – 465 mM TRV pyruvate, 1 U/mL TRV PDC
carboligase activity (C. utilis whole cell), 20 mM MOPS buffer, 1 mM
Mg2+, 1 mM TPP. ORG: organic phase, AQ: aqueous phase, TRV: total
reaction volume by combining both phases. The mean values were
determined from triplicate analyses and error bars show the highest and
lowest values. ..........................................................................................139

List of Figures
xxiv
Figure 5.7: Effect of organic to aqueous phase volume ratio on by-products acetaldehyde
and acetoin formation in the aqueous/octanol-benzaldehyde emulsion
system with 20 mM MOPS at 20°C, controlled pH 7.0: (a) final organic and
(b) aqueous phase concentrations. Same experiments as shown in Fig 5.6.
Approximate values for acetaldehyde concentration due to possible
evaporative losses during sampling and analysis......................................140
Figure 5.8:Effect of temperature on PAC production in the aqueous/octanol-
benzaldehyde emulsion system with 20 mM MOPS, controlled pH 7.0.
Organic phase concentration profiles: (a) 5°C – 20°C and (b) 25°C – 35°C.
Constant agitation 160 rpm, initial concentrations: 1.6 – 1.64 M organic
phase benzaldehyde, the aqueous phase containing 0.93 – 0.98 M pyruvate,
2 U/mL PDC carboligase activity (C. utilis whole cell), 20 mM MOPS
buffer, 1 mM Mg2+, 1 mM TPP, 1:1 organic to aqueous phase volume ratio.
ORG: organic phase. The mean values were determined from triplicate
analyses and error bars show the highest and lowest values. ....................144
Figure 5.9:Effect of temperature on PAC production in the aqueous/octanol-
benzaldehyde emulsion system with 20 mM MOPS, controlled pH 7.0.
Aqueous phase concentration profiles: (a) 5°C – 20°C and (b) 25°C – 35°C.
AQ: aqueous phase. Same experiments as shown in Fig 5.8.....................145
Figure 5.10:Effect of temperature on by-products acetaldehyde and acetoin formation in
the aqueous/octanol-benzaldehyde emulsion system with 20 mM MOPS,
controlled pH 7.0: (a) final organic and (b) aqueous phase concentrations.
ORG: organic phase, AQ: aqueous phase. Same experiments as shown in
Fig 5.8. Estimated values for acetaldehyde concentrations due to evaporative
losses during sampling and analysis.........................................................147
Figure 5.11:Effect of 2.5 M dipropylene glycol (DPG) addition on PAC production in
the aqueous/octanol-benzaldehyde emulsion system with 20 mM MOPS and
partially purified PDC at 20°C, controlled pH 7.0: (a) organic and (b)
aqueous phase substrate, PAC and by-product concentration profiles.
Organic to aqueous phase volume ratio of 0.25:1. Constant agitation 160
rpm, initial concentrations: 3.6 M organic phase benzaldehyde, the aqueous
phase contained 0.785 M pyruvate, 3.5 U/mL PDC carboligase activity (C.
utilis), 20 mM MOPS buffer, 2.5 M DPG, 1 mM Mg2+, 1 mM TPP. ORG:

List of Figures
xxv
organic phase, AQ: aqueous phase. Approximate values for acetaldehyde
concentration due to possible evaporative losses during sampling and
analysis. The mean values were determined from triplicate analyses and
error bars show the highest and lowest values..........................................151
Figure 5.12:Effect of 2.5 M dipropylene glycol (DPG) addition on PAC production in
the aqueous/octanol-benzaldehyde emulsion system with 20 mM MOPS and
whole cell PDC at 20°C, controlled pH 7.0: (a) organic and (b) aqueous
phase concentration profiles. Organic to aqueous phase volume ratio of
0.25:1. Constant agitation 160 rpm, initial concentrations: 3.65 M organic
phase benzaldehyde, the aqueous phase contained 0.83 M pyruvate, 3.5
U/mL PDC carboligase activity (C. utilis), 20 mM MOPS buffer, 2.5 M
DPG, 1 mM Mg2+, 1 mM TPP. ................................................................152
Figure A.1:Concentration profiles across an aqueous/organic interface [Hines and
Maddox, 1985]. .......................................................................................178
Figure A.2:Saturation profiles: effects of physical parameters on organic-aqueous
benzaldehyde transfer in the two-phase aqueous/octanol-benzaldehyde
system: (a) ratio of organic phase contact area to aqueous phase volume,
organic phase benzaldehyde concentration and (b) temperature. 117 and 361
cm2/L organic phase contact area to aqueous phase volume ratios, 1.5 M
and 2.5 M organic phase benzaldehyde concentrations, 4°C and 20°C
temperatures, 60 rpm and 125 rpm agitation for organic and aqueous phase
respectively in Lewis cell, 2.5 M MOPS buffer (pH 7.0). ........................181
Figure A.3: Plot of ln (ABZD* / (ABZD*- A BZD)) as a function of time with slope KA aint:
effects of physical parameters on organic-aqueous benzaldehyde transfer in
the two-phase aqueous/octanol-benzaldehyde system: (a) ratio of organic
phase contact area to aqueous phase volume, organic phase benzaldehyde
concentration and (b) temperature. Calculated from data in experiments
shown in Fig A.2. ....................................................................................182
Figure B.1: Effect of octanol addition on PAC formation at 4°C, initial pH 7.0. Initial
concentrations: 0, 50, 100, 300, 500, 700 and 2600 mM octanol, 725 – 810
mM benzaldehyde, 735 – 785 mM pyruvate, 2.8 U/mL PDC carboligase
activity (C. utilis whole cells), 2.5 M MOPS, 1 mM Mg2+, 1 mM TPP. For
the 1:1 two-phase emulsion system with 2600 mM octanol, all

List of Figures
xxvi
concentrations were given per total reaction volume by combining both
phases (TRV). The mean values were determined from triplicate analyses
and error bars show the highest and lowest values. ..................................185
Figure B.2:Effect of octanol addition on by-products acetaldehyde and acetoin formation
at 4°C, initial pH 7.0 (48 h). Same experiments as shown in Fig B.1.
Approximate values for acetaldehyde concentrations due to possible
evaporative losses during sampling and analysis......................................186
Figure B.3: Effect of octanol addition on PAC formation at 20°C, initial pH 7.0. Initial
concentrations: 0, 50, 100, 300, 500, 700 and 2600 mM octanol, 725 – 760
mM benzaldehyde, 710 – 770 mM pyruvate, 2.8 U/mL PDC carboligase
activity (C. utilis whole cells), 2.5 M MOPS, 1 mM Mg2+, 1 mM TPP. For
the 1:1 two-phase emulsion system with 2600 mM octanol, all
concentrations were given per total reaction volume by combining both
phases (TRV). .........................................................................................188
Figure B.4:Effect of octanol addition on by-products acetaldehyde and acetoin formation
at 20°C, initial pH 7.0 (48 h). Same experiments as shown in Fig B.3.
Approximate values for acetaldehyde concentrations due to possible
evaporative losses during sampling and analysis......................................189
Figure C.1: Effect of organic to aqueous phase volume ratio on PAC production in the
two-phase aqueous/octanol-benzaldehyde emulsion system at 4°C, initial pH
6.5: overall substrate, PAC and by-product concentration profiles. Same
experiments as shown in Figs 4.6 – 4.9....................................................193
Figure C.2: Effect of organic to aqueous phase volume ratio on PAC production in the
aqueous/octanol-benzaldehyde emulsion system at 20°°°°C, initial pH 6.5:
overall substrate, PAC and by-product concentration profiles. Same
experiments as shown in Figs 5.1 – 5.4....................................................194
Figure D.1: Effect of organic to aqueous phase volume ratio on PAC production in the
aqueous/octanol-benzaldehyde emulsion system with 20 mM MOPS at
20°C, controlled pH 7.0: overall concentration profiles are shown. Same
experiments as shown in Fig 5.6. TRV: total reaction volume by combining
both phases. The mean values were determined from triplicate analyses and
error bars show the highest and lowest values..........................................195

List of Figures
xxvii
Figure D.2:Effect of organic to aqueous phase volume ratio on by-products acetaldehyde
and acetoin formation in the aqueous/octanol-benzaldehyde emulsion
system with 20 mM MOPS at 20°°°°C, controlled pH 7.0: overall
concentrations. Same experiments as shown in Fig 5.6. Approximate values
for acetaldehyde concentration due to possible evaporative losses during
sampling and analysis..............................................................................196
Figure D.3:Effect of organic to aqueous phase volume ratio in the aqueous/octanol-
benzaldehyde emulsion system with 20 mM MOPS at 20°C, controlled pH
7.0: acid addition profiles. Same experiments as shown in Fig 5.6. ..........196
Figure D.4:Effect of temperature on PAC production in the aqueous/octanol-
benzaldehyde emulsion system with 20 mM MOPS, controlled pH 7.0:
overall concentration profiles. TRV: total reaction volume by combining
both phases. Same experiments as shown in Fig 5.8. The mean values were
determined from triplicate analyses and error bars show the highest and
lowest values. ..........................................................................................197
Figure D.5:Effect of temperature on PAC production in the 1:1 two-phase
aqueous/octanol-benzaldehyde emulsion system: final overall by-product
acetaldehyde and acetoin formation. Same experiments as shown in Fig 5.8.
Approximate values for acetaldehyde concentrations presumably due to
evaporative losses during sampling and analysis......................................198
Figure D.6:Effect of temperature on PAC production in the 1:1 two-phase
aqueous/octanol-benzaldehyde emulsion system: acid addition profiles are
shown. Same experiments as shown in Fig 5.8. .......................................198
Figure D.7: Effect of 2.5 M dipropylene glycol (DPG) addition on PAC production in the
aqueous/octanol-benzaldehyde emulsion system with 20 mM MOPS at
20°C, controlled pH 7.0: overall concentration profiles of substrates, PAC
and by-products are shown: (a) partially purified PDC and (b) whole cell
PDC. Organic to aqueous phase volume ratio of 0.25:1. Same experiments
as shown in Figs 5.11 and 5.12. TRV: total reaction volumeby combining
both phases. The mean values were determined from triplicate analyses and
error bars show the highest and lowest values..........................................199

List of Figures
xxviii
Figure D.8: Effect of 2.5 M dipropylene glycol (DPG) addition on PAC production in the
aqueous/octanol-benzaldehyde emulsion system with 20 mM MOPS at
20°C, controlled pH 7.0: acid addition profiles are shown. Organic to
aqueous phase volume ratio of 0.25:1. Same experiments as shown in Figs
5.11 and 5.12...........................................................................................200

Project Scope and Objectives
xxix
PROJECT SCOPE AND OBJECTIVES
The current project has focused on the process development of two-phase
aqueous/organic enzymatic biotransformation for (R)-phenylacetylcarbinol (PAC)
production with utilization of pyruvate and benzaldehyde as substrates and pyruvate
decarboxylase enzyme (PDC) as biocatalyst. It is a continuation from the previous
projects by our group to develop an efficient and effective enzymatic process for PAC
production. With the traditional yeast-based fermentation process concentrations of 10 –
12 g/L PAC and 70% yields on added benzaldehyde are normally achieved [Rogers et al.,
1997]. In a cell-free biotransformation process, Shin and Rogers [1996] improved the
production to 28.6 g/L PAC with pyruvate decarboxylase (PDC) enzyme from C. utilis.
Rosche et al. [2002a, b] then investigated an aqueous/benzaldehyde emulsion system
buffered with 2.5 M MOPS and achieved 50 g/L PAC using PDC from yeast and
filamentous fungi. High MOPS concentration was found to have a stabilizing effect on
PDC [Rosche et al., 2002a]. Subsequent research reported by Rosche et al. [2002b] and
Sandford et al. [2005] broadened this approach by developing an enzymatic two-phase
aqueous/octanol-benzaldehyde production system and achieved PAC concentrations in
excess of 100 g/L in the organic phase.
Further characterization and development of the two-phase aqueous/organic system has
been performed in the current project with the following specific objectives:
(1) to investigate variations in the biocatalytic characteristics of several selected yeast
PDCs with regards to PAC and by-product formation in the different biotransformation
systems,
(2) to evaluate the factors affecting PDC deactivation in the two-phase aqueous/octanol-
benzaldehyde system as a basis for designing an improved two-phase PAC production
system,
(3) to investigate the effect of changing the organic to aqueous phase volume ratio on
two-phase PAC production at high MOPS concentration with evaluation at different
temperatures,
(4) to investigate the effect of changing the phase volume ratio on two-phase PAC
production at reduced MOPS concentration and at different temperatures,
The overall objective is to further characterize the enzymatic two-phase
biotransformation and to identify key factors in developing a more cost effective process.

Chapter 1
Introduction
Cindy Gunawan 2006 PhD Thesis
1
CHAPTER 1
LITERATURE REVIEW
1. Introduction
2. Development of Biotransformation Processes
3. Ephedrine and Pseudoephedrine Synthesis
4. Biotransformation of Pyruvate and Benzaldehyde to (R)-
phenylacetylcarbinol (PAC)
5. Factors Influencing Biocatalysis for PAC Production
6. Two-Phase Aqueous/Organic Extractive Bioconversion with
Organic Solvent
7. Current Status of Two-Phase Aqueous/Organic Biotransformation
for PAC Production
8. Strategy for Two-Phase Model Development

Chapter 1
Introduction
Cindy Gunawan 2006 PhD Thesis
2
1.1 Introduction The literature review presents an overview of the development of biotransformation
processes with focus on the production of (R)-phenylacetylcarbinol (PAC), a precursor
for the synthesis of pharmaceuticals (1R, 2S) ephedrine and (1S, 2S) pseudoephedrine.
The PAC is produced from pyruvate and benzaldehyde with pyruvate decarboxylase
enzyme (PDC) as biocatalyst. The review also includes details on factors affecting PAC
production and two-phase aqueous/organic extractive bioconversion.
1.2 Development of Biotransformation Processes
Biotransformation is a process involving the use of biological agents as catalysts to
conduct transformations of chemical compounds. Biotransformation processes have been
employed for thousands of years before they were recognized as having an underlying
microbial cause [Parales et al., 2002]. Louis Pasteur in 1858 identified the role of specific
microbes involved in the favorable and unfavorable grape juice fermentations [Pasteur,
1858]. In the early 1900s, many studies were conducted to reveal the properties of
enzymes and principles of biocatalysis [Michaelis and Menten, 1913]. In 1916, an
industrial-scale fermentation for acetone production was established to meet increasing
demand in wartime of Great Britain [Glazer and Kikaido, 1995]. Since then,
biotransformation technology has been developed and adapted to run on an industrial
scale for the production of fine chemicals. In a study by Straathof et al. [2002], it was
estimated that the biotransformation-based industrial process has grown from less than 10
processes in the 1960’s to 134 processes in 2002 (Fig 1.1), which indicates that
biotransformation has now become a standard technology in the fine chemicals industry.

Chapter 1
Introduction
Cindy Gunawan 2006 PhD Thesis
3
Figure 1.1: Cumulative number of biotransformation processes that have been started on
an industrial scale [Straathof et al., 2002].
Most of the industrial biotransformations lead to the production of natural compounds or
their derivatives (Fig 1.2). Carbohydrates and fat derivatives are used in the food sector
with the other compounds finding applications in the pharmaceutical or agricultural
sectors. Furthermore, many products of industrial biotransformations are mostly used in
the pharma sector [Straathof et al., 2002] (Fig 1.3).
Figure 1.2: The type of compounds produced using biotransformation processes (based
on 134 industrial processes) [Straathof et al., 2002].

Chapter 1
Introduction
Cindy Gunawan 2006 PhD Thesis
4
Figure 1.3: Industrial sectors in which the products of industrial biotransformations are
used (based on 134 industrial processes) [Straathof et al., 2002].
Hydrolases are the most employed biocatalyst in the industrial biotransformations
followed by transferases and lyases (Fig 1.4). High numbers of processes also involve the
use of oxidizing cells with enzymes from all classes being active, together with the
oxidoreductases [Straathof et al., 2002].
Figure 1.4: Enzyme types used in industrial biotransformations (based on 134 processes)
[Straathof et al., 2002].

Chapter 1
Introduction
Cindy Gunawan 2006 PhD Thesis
5
Nowadays, biotransformation processes can be conducted in aqueous as well as in
aqueous/organic environments, therefore apolar organic compounds as well as water-
soluble compounds can be selectively and efficiently transformed with enzymes or active
cells [Schmid et al., 2001]. Table 1.1 shows the various biocatalytic processes recently
developed by chemical companies.
Table 1.1: Recently developed biocatalytic systems at several chemical companies
(adapted from Schmid et al. [2001] with modifications).
>1Addition of water
Niacin hydroxylase
Whole cellsNiacin6-Hydroxynicotinic acid
Lonza
Development product
Addition of water
Nitrilase/
hydroxylase
Whole cells2-Cyanopyrazine5-Hydroxypyrazine-carboxylic acid
Development product
Addition of water
HydroxylaseWhole cells(S)-nicotine6-Hydroxy-S-nicotine
DSM
BASF
Company
>1 to >100Selective coupling
AcylaseEnzymes6-Aminopenicillanic acid
Semisyntheticpenicillins
1000HydrolysisPenicillin acylase
EnzymesPenicillin G/V6-Aminopenicillanic acid (6-APA)
1000Addition of ammonia
Aspartic acid ammonia
lyase
EnzymesFumaricacidL-Aspartic acid
>1HydrolysisNitrilasesEnzymesRacemic mandelonitrileR-Mandelicacid
>100ResolutionLipasesEnzymesRacemic aminesR-Amide, S-amine
1000ResolutionLipasesEnzymesRacemicalcoholsEnantiopurealcohols
Scale
(tons/yr)
ReactionEnzymeBiocatalystSubstrateProduct

Chapter 1
Introduction
Cindy Gunawan 2006 PhD Thesis
6
1.3 Ephedrine and Pseudoephedrine Synthesis
1.3.1 Pharmacological Values
Ephedrine is known chemically as 2-methylamino-1-phenyl-1-propanol. It has
biologically optically active forms: (1R, 2S) ephedrine and (1S, 2S) pseudoephedrine (Fig
1.5).
NHCH
O
CH
H
3
3
CH
NHCH
O
3
H
3
(1R,2S)-Ephedrine ( 1S,2S)-Pseudo-ephedrine
NHCH
O
CH
H
3
3
CH
NHCH
O
3
H
3
(1R,2S)-Ephedrine ( 1S,2S)-Pseudo-ephedrine
NHCH
O
CH
H
3
3NHCH
O
CH
H
3
3
CH
NHCH
O
3
H
3
CH
NHCH
O
3
H
3
(1R,2S)-Ephedrine(1R,2S)-Ephedrine ( 1S,2S)-Pseudo-ephedrine(1S,2S)-Pseudo-ephedrine
Figure 1.5: Two biologically active isomers of ephedrine.
(1R, 2S) ephedrine and (1S, 2S) pseudoephedrine are pharmaceutical alkaloid compounds
with α and β andrenergic activity: ephedrine is used in the treatment of symptoms of
asthma and hypotension, whereas pseudoephedrine is used as a nassal decongestant in
cold and influenza medications.
1.3.2 Traditional Production
Traditionally, ephedrine was extracted from dried young branches of Ephedra sp.: mainly
Ephedra sinica, Ephedra equisetina and Ephedra distachya [Reti, 1953; Boit 1961;
Tanker and Kilicer, 1978] (shown in Fig 1.6); plants with valuable pharmacological
activities. However, the total alkaloid content in Ephedra sp. is generally low, with the
highest being approx. 2.5% by weight with ephedrine and pseudoephedrine occurring as a
racemic mixture. Hence, collection of large quantity of plant materials and complex
separation processes are necessary, leading to time and labour-intensive processing
[Shukla and Kulkarni, 2000].

Chapter 1
Introduction
Cindy Gunawan 2006 PhD Thesis
7
Figure 1.6: Photograph of Ephedra distachya [Schoenfelder].
1.3.3 (R)-phenylacetylcarbinol (PAC) as a Precursor
To overcome the problems associated with its traditional production, ephedrine is
produced in a one-step chemical reaction from the optically active precursor (R)-
phenylacetylcarbinol (PAC). In spite of the fact that PAC can be chemically synthesized,
biotransformations of pyruvate and benzaldehyde to PAC using various yeast species are
the most common production processes [Oliver et al., 1989]. The PAC then undergoes a
reductive amination reaction to produce (1R, 2S) ephedrine and then to (1S, 2S)
pseudoephedrine (Fig 1.7).
)-Pseudo-ephedrine
CH
NHCH
O
3
O
O
CH 3
NHCH
O
CH
H
(R)-PAC
H
(1R,2S)-Ephedrine (1S,2S
H2NCH3H2, Pt
H
3
3 3
)-Pseudo-ephedrine
CH
NHCH
O
3
O
O
CH 3
NHCH
O
CH
H
(R)-PAC
H
(1R,2S)-Ephedrine (1S,2S
H2NCH3H2, Pt
H
3
3 3
)-Pseudo-ephedrine
CH
NHCH
O
3
O
O
CH 3
NHCH
O
CH
H
(R)-PAC
H
(1R,2S)-Ephedrine (1S,2S
H2NCH3H2, Pt
H
3
3 3
Figure 1.7: Synthesis of (1R, 2S) ephedrine and (1S, 2S) pseudoephedrine from PAC.

Chapter 1
Introduction
Cindy Gunawan 2006 PhD Thesis
8
The biotransformation process has several advantages over the chemical process for PAC
production [Oliver et al., 1999]:
(1) only requires relatively mild reaction conditions,
(2) the process is reaction-specific for R-PAC formation. PAC produced by chemical
means is a racemic mixture of R-PAC and S-PAC. The latter cannot be used to synthesize
(1R, 2S) ephedrine and hence (1S, 2S) pseudoephedrine,
(3) waste product can be directed to biological waste treatment.
Nevertheless, there are limitations associated with the biotransformation process [Rogers
et al., 1997]:
(1) toxic effects of benzaldehyde, PAC and by-products on cells and PDC enzyme,
(2) low aqueous benzaldehyde solubility.
To overcome the problems, considerable efforts have been made towards application of a
biphasic liquid-liquid extractive bioconversion process using an organic solvent (see
Section 1.6).

Chapter 1
Introduction
Cindy Gunawan 2006 PhD Thesis
9
1.4 Biotransformation of Pyruvate and Benzaldehyde to PAC
The biotransformation of pyruvate and benzaldehyde to PAC is catalyzed by the cytosolic
enzyme pyruvate decarboxylase (PDC). Pyruvate is first converted to acetaldehyde via a
non-oxidative decarboxylation reaction. The resulting acetaldehyde then ligates with
benzaldehyde to form PAC. Thiamine pyrophosphate (TPP) and Mg2+ are required as
cofactors.
1.4.1 Reaction Mechanisms
1.4.1.1 Early Findings
Neuberg and co-workers in the early 1920s first demonstrated the biochemical production
of PAC by adding benzaldehyde into an actively fermenting top yeast. They proposed two
mechanisms for the biotransformation: the first one was the conversion of pyruvate to an
activated acetaldehyde via non-oxidative decarboxylation reaction catalyzed by a
carboxylase, followed by condensation of the activated acetaldehyde and added
benzaldehyde to form PAC, catalyzed by a carboligase. The second mechanism proposed
was the condensation of pyruvate and benzaldehyde by a carboligase, followed by non-
oxidative decarboxylation of the resulting complex by a carboxylase.
PAC formation by yeast was then considered to be analogous to acetoin formation as
confirmed by Green et al. in 1942 by using a crude yeast enzyme extract. In 1947, Gross
and Werkmann’s studies confirmed the role of acetaldehyde as intermediate in acetoin
formation. They found that addition of isotopically labelled acetaldehyde (13C) into a
dried yeast extract in the presence of pyruvate, resulted in the incorporation of the
labelled acetaldehyde into the acetoin formed. Furthermore, Happold and Spencer in 1952
revealed that production of acetoin might not be significant under physiological
conditions due to the low concentration of acetaldehyde present in yeast cytosol. They
discovered that addition of acetaldehyde resulted in appreciable production of acetoin.
1.4.1.2 PAC Formation
Further studies of the role of PDC in catalyzing the condensation of pyruvate and
benzaldehyde came in 1988, when Bringer-Meyer and Sahm demonstrated the production
of PAC by purified PDC from Zymomonas mobilis and Saccharomyces carlsbergensis.

Chapter 1
Introduction
Cindy Gunawan 2006 PhD Thesis
10
The results were further confirmed by Cardillo et al. in 1991, who revealed that
benzaldehyde was more readily condensed with pyruvate than other substituted aldehydes
by Saccharomyces spp. Shin [1994] described the PAC formation based on the two-site
reaction mechanism proposed by Juni [1961]. As illustrated in Fig 1.8, the TPP-bound
PDC interacts with the carbonyl group of pyruvate (α-carbon), CO2 is then released via a
non-oxidative decarboxylation with the α-carbon still bound to PDC. The resulting
‘active acetaldehyde’ – TPP complex is transferred irreversibly to the other site of PDC.
The ‘active acetaldehyde’ can then undergo two fates: (1) be reversibly dissociated to
‘free acetaldehyde’ and/or (2) be condensed with other aldehydes, in this case
benzaldehyde, to form PAC. In Juni’s work [1961], it was said that the ‘active
acetaldehyde’ condensed with ‘free acetaldehyde’ (released by reversible dissociation of
the bound ‘active acetaldehyde’) to form acetoin. Hence, acetaldehyde and acetoin are
two of the major by-products from PAC formation. Formation of other by-products will
be discussed in Section 1.4.3.
PDC interacts with the carbonyl group
‘active acetaldehyde’
‘free acetaldehyde’AcyloinPAC or acetoin
PDC interacts with the carbonyl group
‘active acetaldehyde’
‘free acetaldehyde’AcyloinPAC or acetoin
Figure 1.8: Mechanisms of PAC formation catalyzed by pyruvate decarboxylase [Shin,
1994].

Chapter 1
Introduction
Cindy Gunawan 2006 PhD Thesis
11
In general, the PAC, acetaldehyde, and acetoin formation can be described by the
following reactions:
(I) Acetaldehyde formation: non-oxidative decarboxylation of pyruvate.
H3C – C – C – OH+ CO2
Pyruvate ‘Active Acetaldehyde’PDC bound
O O
TPP + Mg2+
PDCC
O
H
H3CH3C – C – C – OH+ CO2
Pyruvate ‘Active Acetaldehyde’PDC bound
O O
TPP + Mg2+
PDCC
O
H
H3C
C
O
H
H3CC
O
H
H3C
‘Active Acetaldehyde’PDC bound
‘Free Acetaldehyde’
C
O
H
H3C C
O
H
H3CC
O
H
H3C C
O
H
H3C
‘Active Acetaldehyde’PDC bound
‘Free Acetaldehyde’
(II) Acetoin formation: condensation of PDC bound ‘active acetaldehyde’ and ‘free
acetaldehyde’.
H3C – C – CH – CH3
O OH
+ C
O
H
H3CTPP + Mg2+
PDC
‘Free Acetaldehyde’ Acetoin
C
O
H
H3C
‘Active Acetaldehyde’PDC bound
H3C – C – CH – CH3
O OH
+ C
O
H
H3CTPP + Mg2+
PDC
‘Free Acetaldehyde’ Acetoin
C
O
H
H3C H3C – C – CH – CH3
O OH
H3C – C – CH – CH3
O OH
+ C
O
H
H3C C
O
H
C
O
H
H3CTPP + Mg2+
PDC
TPP + Mg2+
PDC
‘Free Acetaldehyde’ Acetoin
C
O
H
H3C C
O
H
C
O
H
H3C
‘Active Acetaldehyde’PDC bound
(III) PAC formation: condensation of PDC bound ‘active acetaldehyde’ and benzaldehyde.
CH C CH3
OH O
+ C
O
H
Benzaldehyde
TPP + Mg2+
PDC
R-PAC
C
O
H
H3C
‘Active Acetaldehyde’PDC bound
CH C CH3
OH O
CH C CH3
OH O
+ C
O
H
C
O
H
C
O
HTPP + Mg2+
PDC
-
C
O
H
H3C C
O
H
C
O
H
H3C CH C CH3
OH O
+ C
O
H
Benzaldehyde
TPP + Mg2+
PDC
R-PAC
C
O
H
H3C
‘Active Acetaldehyde’PDC bound
CH C CH3
OH O
CH C CH3
OH O
+ C
O
H
C
O
H
C
O
HTPP + Mg2+
PDC
-
C
O
H
H3C C
O
H
C
O
H
H3C

Chapter 1
Introduction
Cindy Gunawan 2006 PhD Thesis
12
1.4.2 Pyruvate Decarboxylase Enzyme (PDC)
1.4.2 1 Natural Role of PDC
Pyruvate decarboxylase (PDC) is a thiamine pyrophosphate (TPP) dependent enzyme,
one of the key enzymes in glycolytic pathway of many yeasts, fungi, plants and some
bacteria [Pohl, 1997]. Pyruvate as the end product of the glycolytic pathway can undergo
many alternative fates; one of them leads to production of ethanol. PDC catalyzes the
non-oxidative decarboxylation of pyruvate to acetaldehyde with release of carbon
dioxide. For each molecule of acetaldehyde produced, one proton (H+) is consumed. The
resulting acetaldehyde is then reduced to ethanol by alcohol dehydrogenase (ADH)
isozymes and/or other unspecific oxidoreductases. For each molecule of ethanol
produced, one molecule of NADH is oxidized to NAD+.
1.4.2.2 Structure of PDC
PDC is a 240 kDa homotetrameric enzyme, the tetrameric molecule is a dimer of dimers
that binds to 4 molecules of TPP and 4 molecules of magnesium ions. PDC is generally
found as dimers or tetramers, whereby the apoenzyme exists as dimers, while the active
holoenzyme exists as tetramers. The existence of the dimer and tetramer forms is pH
dependent. In yeast PDC exists only as tetramers at pH 5.5 – 6.5, as both dimers and
tetramers at pH 6.5 – 9.5 and dimers only at pH greater than 9.5. In addition, PDC in
Zymomonas mobilis has been found to only exists as tetramers [Pohl, 1997].
The dimers are composed of monomers of which contact sites are determined mainly by
aromatic amino acids. The tetramers are composed of dimers of which contact sites are
determined mainly by electrostatic interactions. By far the greater catalytic activity of the
enzyme is related to the tetrameric species [Jabs et al., 2001].
PDC subunits are essentially identical with a slight difference in chain lengths [Hohmann
1997]. The two dimeric subunits are nearly stereochemically identical and are related by
an approximate two-fold symmetry. Each subunit consists of 3 main domains: α, β, and γ
(named accordingly to their consecutive locations in N to C terminal direction); the
domains are shown in Fig 1.9.a. Residues involved in TPP binding are associated with α
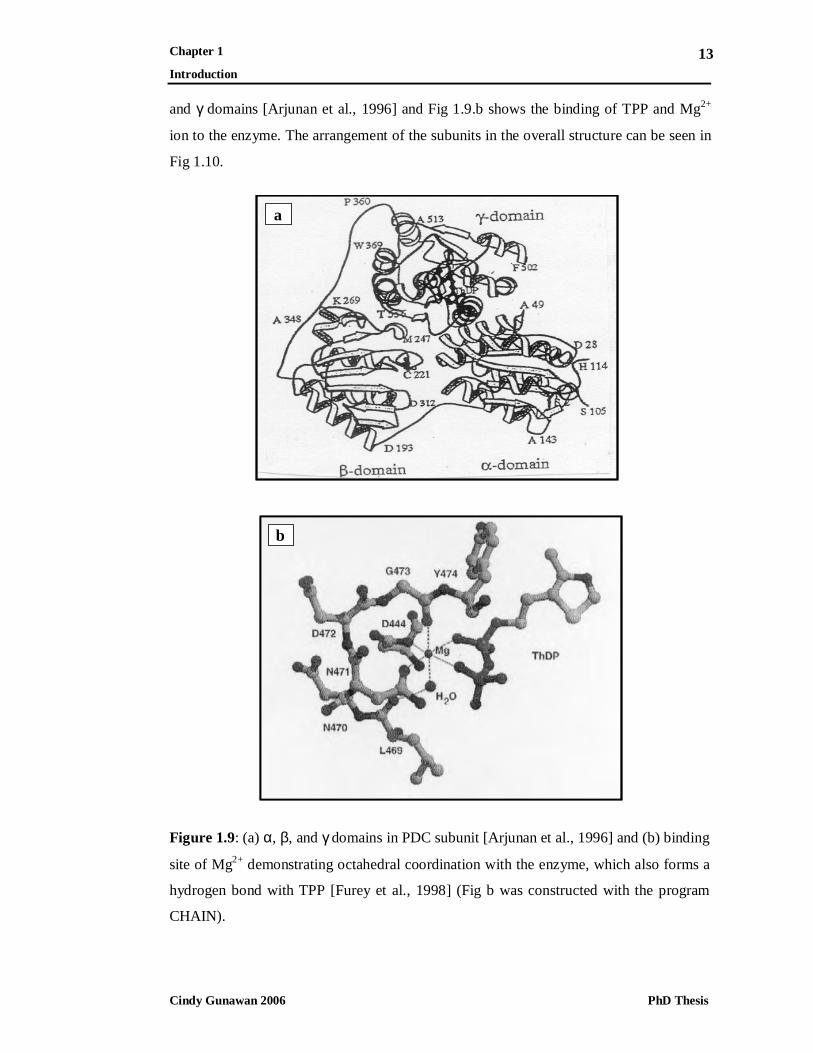
Chapter 1
Introduction
Cindy Gunawan 2006 PhD Thesis
13
and γ domains [Arjunan et al., 1996] and Fig 1.9.b shows the binding of TPP and Mg2+
ion to the enzyme. The arrangement of the subunits in the overall structure can be seen in
Fig 1.10.
aa
bb
Figure 1.9: (a) α, β, and γ domains in PDC subunit [Arjunan et al., 1996] and (b) binding
site of Mg2+ demonstrating octahedral coordination with the enzyme, which also forms a
hydrogen bond with TPP [Furey et al., 1998] (Fig b was constructed with the program
CHAIN).

Chapter 1
Introduction
Cindy Gunawan 2006 PhD Thesis
14
Figure 1.10: Overall structure of PDC tetramer is shown in ribbon drawing. The side
chains of Cys-221 residues, which involve in substrate activation are shown in shaded
boxes (adapted from Furey et al. [1998] with modification by Leksawasdi [2004]).
1.4.2.3 Role of Thiamine Pyrophosphate (TPP)
TPP is a biologically active form of vitamin B1. It functions as a cofactor in many
enzymatic reactions, which involve cleavages of carbon-carbon bonds adjacent to
carbonyl group. The TPP molecule is non-covalently bound in ‘V’ conformation at the
interface between two monomers, involving the α and γ domains [Jabs et al., 2001]. TPP
is bound in such a way that certain residues from the two subunits are able to interact with
the molecule [Arjunan et al., 1996]. The binding strength of TPP is pH dependent and
varies among different types of enzyme [Ullrich, 1970]. Structure of TPP is shown in Fig
1.11.
Figure 1.11: Structure of thiamine pyrophosphate (TPP) [Campbell, 1999].

Chapter 1
Introduction
Cindy Gunawan 2006 PhD Thesis
15
In TPP, the carbon atom between the nitrogen and the sulfur in the thiazole ring is very
reactive. It forms a carbanion (an ion with a negative charge on a carbon atom). It attacks
the carbonyl group of pyruvate to form an adduct, and carbon dioxide splits off. The
carbon-carbon fragment left behind is covalently bonded to TPP and is sometimes called
the ‘active acetaldehyde’. There are then shifts of electrons and the ‘active acetaldehyde’
splits off as ‘free acetaldehyde’ thereby regenerating the carbanion.
1.4.2.4 PDC Isozymes
PDC exists as isozymes; the same enzyme with different subunit configuration. PDC1
and PDC5 are the only structural genes for yeast PDC (the predicted amino acid
sequences are 88% identical); with PDC1 being the major structural gene; PDC5 is only
expressed in PDC1 deletion mutants. Deletion of PDC1 stimulates the promoter activity
of both PDC1 and PDC5; a mechanism called autoregulation, which controls the
expression of PDC1 and PDC5 genes. Deletion of PDC1 gene resulted in 80% reduction
of the wild-type activity, while deletion of PDC5 gene did not result in any decrease of
activity. Mutants with both PDC1 and PDC5 genes deleted did not have any in vitro
pyruvate decarboxylase activity and were unable to consume glucose [Hoffmann and
Valencia 2004].
Other PDC genes had also been identified: PDC2 and PDC6. PDC2 has a role in PDC
synthesis at transcriptional level. PDC6 is a weakly expressed gene and is activated when
fused spontaneously under the control of the PDC1 promoter [Hoffmann and Valencia
2004].
1.4.2.5 Factors Influencing PDC Stability
PDC stability in a biotransformation system may be influenced by the chemical species
present; namely the substrates, product and by-products. Studies by Shin [1994], Chow et
al. [1995], Sandford [2002], and Leksawasdi et al. [2003] showed that there was a
significant deactivating effect of benzaldehyde on PDC. Shin [1994] further investigated
PAC formation with initial pyruvate concentration up to 600 mM and found no inhibition
on the initial reaction rates with the increasing pyruvate level. Sandford [2002] observed
increasing PDC deactivation when the enzyme was incubated with increasing levels of

Chapter 1
Introduction
Cindy Gunawan 2006 PhD Thesis
16
PAC (34 – 274 mM). A similar effect was observed by the above author when incubating
the PDC with increasing acetoin concentration (5 – 60 mM) while exposure to 30 mM
acetaldehyde had no evident effect on PDC deactivation.
1.4.3 Formation of By-Products
Biotransformation of pyruvate and benzaldehyde to PAC also produces a number of by-
products: benzyl alcohol [Neuberg and Libermann, 1921] (activity of ADH and/or other
oxidoreductases), acetaldehyde and acetoin [Neuberg and Welde, 1914], benzoic acid
[Neuberg and Welde, 1914; Smith and Hendlin, 1953], optically active 1-phenyl-1,2-
propanediol [Mochizuki et al., 1995], optically inactive 2-hydroxy-1-phenyl-1-propanone
[Becvarova et al., 1963, Nikolova and Ward, 1991], acetyl benzoyl [Voets et al., 1973;
Nikolova and Ward, 1991] and transcinnamaldehyde [Voets et al., 1973].
1.4.4 Microorganisms for PAC Production
Microorganisms used for PAC production should preferably exhibit high levels of PDC
activity, low levels of ADH activity and high tolerance for benzaldehyde, PAC and by-
products [Oliver et al., 1999]. Another important criterion is the PDC affinity for
benzaldehyde. However, this is rarely measured since high PDC activity does not
necessarily mean high benzaldehyde affinity. This was demonstrated by Bringer-Meyer
and Sahm in 1988; although Zymomonas mobilis possessed five times higher PDC
activity than Saccharomyces carlsbergensis, the sugar-fermenting suspensions of the
yeast exhibited 4 – 5 times higher PAC yields due to higher affinity for benzaldehyde. In
addition, microorganisms with the highest initial PAC productivity were not necessarily
the most productive over an extended period and did not necessarily result in the highest
final concentrations [Netrval and Vojtisek, 1982; Shin and Rogers, 1996a; b].
Various yeast strains have been investigated regarding their ability to form PAC:
(1) both brewer’s (S. carlsbergensis) [Smith and Hendlin, 1953; Netrval and Vojtisek,
1982] and baker’s (S. cerevisiae) yeasts [Becvarova et al., 1963; Nikolova and Ward,

Chapter 1
Introduction
Cindy Gunawan 2006 PhD Thesis
17
1992c] have been shown to possess significant PDC activity, with brewer’s yeast having
the higher ADH activity.
(2) Hansenula anomala, S. carlsbergensis and S. cerevisiae have been reported to have
higher PDC activity than Torula utilis [Becvarova and Hanc, 1963]. S. cerevisiae also had
high benzaldehyde [Mahmoud et al., 1989] and aldehyde tolerance [Seely et al., 1989a].
(3) Candida and Saccharomyces strains formed more PAC in comparison to other yeasts
[Netrval and Vojtisek, 1982; Agarwal et al., 1987].
(4) Candida utilis was reported to produce appreciable levels of PAC [Shin and Rogers,
1995; 1996a; b].
(5) In a screening of 105 yeast strains, Rosche et al. [2003b] observed very low
carboligase activities for PAC formation with Schizosacchromyces pombe but it was
associated with best resistance to pre-incubation with acetaldehyde and benzaldehyde.
Highest carboligase activities combined with medium resistance were reported with
strains of C. utilis, C. tropicalis and C. albicans.
The microorganisms can be genotypically and/or phenotypically modified to improve
PAC yields. Seely et al. [1989b] modified strains of S. cerevisiae and C. flareri for
increased acetaldehyde and ephedrine resistance. However, modifications do not
necessarily guarantee improved PAC production. Dissara and Rogers [1995] found that
an isolated C. utilis strain with reduced growth rate also had reduced productivity,
benzaldehyde tolerance and consumption rate with a lower final PAC concentration in
comparison to the parental strain.

Chapter 1
Introduction
Cindy Gunawan 2006 PhD Thesis
18
1.5 Factors Influencing Biocatalysis for PAC Production
The current commercial PAC process is based on biotransformation of pyruvate and
benzaldehyde by fermenting baker’s yeast. The process consists of first growing the yeast
cells in glucose medium with optimal conditions for PDC production and accumulation of
pyruvate. Benzaldehyde is added at a later stage with sugars to initiate PAC production
[Oliver et al., 1999].
1.5.1 Enzyme Activity
Vojtisek and Netrval [1982] demonstrated that PDC enzyme activity was not a limiting
factor for PAC production with fermenting yeast cells: cells with lower PDC activity may
exhibit higher initial PAC formation rates and final yields. They further reported that
gradual addition of sodium pyruvate to the fermentation medium resulted in increase of
final PAC yield. Moreover, supplementation of the fermentation medium with sodium
pyruvate after a 6 h biotransformation caused the PAC production to re-start at the initial
rate. The authors also suggested that the activities of some enzymes involved in metabolic
pathways between the carbon source and pyruvate affected the PAC formation.
The observation that PDC activity was not a limiting factor for in vivo PAC production
was further confirmed by the work of Nikolova and Ward in 1991 on different strains of
yeast. They also suggested that a step in the glycolytic pathway was rate-limiting. As
previously mentioned, Bringer-Meyer and Sahm [1988] found that the final PAC
concentration with sugar-fermenting cells of Z. mobilis was lower in comparison to cells
of S. carlsbergensis, in spite of the fact that the bacteria contained more PDC activity. In
conclusion, high PDC activity was not always associated with high formation rate and
final yield for in vivo PAC production; they may also be functions of growth quality and
metabolism rate [Tripathi et al., 1997].

Chapter 1
Introduction
Cindy Gunawan 2006 PhD Thesis
19
1.5.2 Toxicity Effect of Benzaldehyde
Long and Ward [1989b;c] studied the toxic effect of benzaldehyde on in vivo PAC
production with S. cerevisiae and sucrose as the carbon source (Table 1.2).
Table 1.2: Effect of benzaldehyde on in vivo PAC production with S. cerevisiae [Long
and Ward, 1989b; c].
Benzaldehyde level
2 g/L pulse fed once
every hour for 6 h
6 g/L fed initially and after 4
h
Initial PAC formation rate Lower Higher
Final PAC yield Higher Lower
Cell viability Increased at early stages
and decreased afterwards
Massive reduction during all
stages
Sucrose metabolism Increased when
benzaldehyde was
limited
Inhibition of metabolism
during all stages
It was revealed that at the lower benzaldehyde concentration, the cellular constituents
were protected by maintenance of the cell membrane permeability barrier towards
benzaldehyde. At the higher benzaldehyde concentration, this barrier was no longer
maintained causing the intracellular concentration of benzaldehyde to be higher than the
extracellular concentration [Long and Ward, 1989b; c].
1.5.3 Effect of Dissolved Oxygen Concentration
PDC is induced under anaerobic conditions, as observed by Sims et al. [1991] using C.
utilis with glucose as the carbon source. The glycolytic flux also increases under
anaerobic conditions thereby producing higher pyruvate levels, as reported by van Dijken
amd Scheffers [1986] by using C. utilis with glucose pulsing.
Anaerobic conditions can be achieved by control of aeration and agitation rates, or by
sparging with nitrogen gas, although as demonstrated by Sims et al. [1991], actively

Chapter 1
Introduction
Cindy Gunawan 2006 PhD Thesis
20
growing biomass in the presence of oxygen also resulted in PDC synthesis. PDC appeared
to be partially deactivated under aerobic conditions [Sims et al., 1991]. Optimum
operating conditions must be experimentally found to produce sufficient biomass with
optimal PDC activity and these conditions are likely to vary among various
microorganisms. Voets et al. [1973] and Ellaiah and Krisna [1988] found that in vivo
PAC production with S. cerevisiae was affected by aeration rate. Culik et al. [1984] in
fermentation with S. coreanus increased the aeration rate when the PAC formation rate
started to decline; they found that the final PAC yield was increased.
1.5.4 Effect of pH
Protons are consumed in the conversion of pyruvate and benzaldehyde to PAC leading to
a pH rise in the biotransformation. Rosche et al. [2002a] reported that PDC carboligase
activity was optimum around pH 6.5, a pH higher than 7 caused reduction in the activity.
A pH range of 4 – 6 has generally been employed for in vivo PAC production using S.
cerevisiae [Smith and Hendlin, 1953; Gupta et al., 1979; Long and Ward, 1989b; c].
Rogers et al. [1997] employed a pH of 6.2 for their three-stage process using C. utilis and
found that PAC production was sensitive to pH.
1.5.5 Biomass Condition
In any fermentation processes for in vivo PAC production, the final concentration will be
largely dependent on the biomass condition, which is affected by medium composition
and the physicochemical conditions used throughout the process [Oliver et al., 1999].
1.5.5.1 Effect of Cell Age
Agarwal et al. [1987] observed the effect of cell age on the PAC concentration in a yeast
fermentation: younger or older biomass than that of optimum age gave lower PAC
production due to lowered PDC activity and benzaldehyde tolerance. In addition, the
freshness (ie total viability) of the yeast was considered to be an important factor in
enhancing PAC production [Voets et al., 1973].

Chapter 1
Introduction
Cindy Gunawan 2006 PhD Thesis
21
1.5.5.2 Effect of Respiratory Quotient (RQ)
The respiratory quotient (RQ) of a fermentation process is defined as the ratio of carbon
dioxide evolution rate over oxygen uptake rate (both expressed as mmoles/L/h). An RQ
of 1 corresponds to full respiratory growth whereas fermentative metabolisms are
associated with an RQ greater than 1. Rogers et al. [1997] cultured C. utilis cells for in
vivo PAC production at 30°C, pH 6 and various controlled RQ values. The RQ was
maintained by adjusting the agitation rate. It was observed that at an RQ of 1, PAC was
produced at a lower specific rate in comparison to that for benzyl alcohol formation.
Increasing the RQ to 4 – 5 resulted in improved PAC production rate and yield due to
increasing fermentative conditions and greater PDC induction. Further studies reported by
Chen et al. [2005] also involved monitoring and control of the RQ value (as well the pH)
to enhance PDC activities.
In recent years, various PAC production processes have been developed for use in
enzymatic biotransformations. The traditional yeast based fermentation method is
associated with limited pyruvate availability and significant loss of benzaldehyde to
benzyl alcohol due to oxidoreductases activity. Such obstacles can be overcome by the
enzymatic process [Rosche et al., 2002a, b; Shin and Rogers, 1996]. In comparison to the
traditional fermentation with 10 – 12 g/L PAC [Rogers et al., 1997], approx. 50 g/L PAC
was produced in enzymatic processes with added pyruvate in an aqueous/benzaldehyde
emulsion system using partially purified PDC from yeast and filamentous fungi [Rosche
et al., 2002a, b; 2003a]. Full details of the enzymatic PAC processes including the effects
of various design and operational factors on product and by-product formation are
presented in the result section.

Chapter 1
Introduction
Cindy Gunawan 2006 PhD Thesis
22
1.6 Two-Phase Aqueous/Organic Extractive Bioconversion with
Organic Solvent
1.6.1 Definition
Extractive bioconversion is a biotransformation process performed in the presence of
substance with extracting capability, most commonly the organic solvent. Two-phase
(biphasic) is defined as the condition in which the organic and aqueous phases are present
in excess of mutual saturation levels [Nikolova and Ward, 1992a].
Substrates with low aqueous solubility (lipophilic) are added to the organic phase,
whereas water-soluble substrates, biocatalyst and required cofactors are added to the
aqueous phase. Transfer of substrate from the organic to the aqueous phase facilitates
biotransformation in the aqueous phase. Application of high agitation rates results in the
formation of emulsion in which small organic phase droplets are suspended in the
aqueous phase thereby facilitating substrate transfer from the organic to the aqueous
phase; and also product back into the organic phase.
1.6.2 Advantages and Disadvantages of the Two-Phase Aqueous/Organic
Biotransformation
Extractive bioconversion can be very useful to processes in which lipophilic substances
are produced or when the substrates and/or products are toxic or when the substrates have
limited aqueous solubility. There are several clear advantages associated with the two-
phase aqueous/organic biotransformation [Bruce and Daugulis, 1991]:
(1) biocatalytic activity advantage – in the presence of a suitable and adequate organic
phase: (a) direct exposure of biocatalyst to toxic substrate can be avoided and (b) product
can be continuously removed into the organic phase. For a biocatalyst that is prone to
toxic substrate deactivation and/or product inhibition, this will lead to increased
productivity,
(2) reaction advantage – with introduction of a suitable and adequate solvent, the
equilibrium position of a biocatalytic reaction can be shifted towards completion.

Chapter 1
Introduction
Cindy Gunawan 2006 PhD Thesis
23
Continuous product removal by the organic phase shifts the equilibrium position towards
product formation without the need to provide large excess of reactant,
(3) product recovery advantage - with employment of a suitable solvent and optimal
volume ratio of the organic to aqueous phase , it is no longer necessary to work with
dilute solutions. As a result, product recovery and waste treatment costs can be
significantly reduced.
A possible problem with two-phase aqueous/organic bioconversion is the effect of solvent
on cell viability and enzyme activity and stability. Some solvents have detrimental effects
on these parameters even at low concentrations, leading to cessation of the bioconversion.
In some cases, solvents that are biocompatible were found to have a low distribution
coefficient and selectivity for the product, leading to ineffective product extraction and
possible solvent recovery difficulties.
1.6.3 Organic Solvent Selection
Selecting the most appropriate organic solvents for biphasic extractive bioconversion is a
difficult task not only because there are abundant types of solvent available, but also there
are many criteria that have to be considered e.g. biocompatibility, toxicity, extracting
capability, and ease of solvent recovery. Solvent biocompatibility may relate to cell
viability, whereas solvent toxicity deals with its effect on the activity and stability of the
biocatalyst. The use of a solvent with high extracting capability towards product is
required for effective product extraction. Finally, a solvent which is easy to recover from
the biotransformation product is desirable as the solvent can be recycled, leading to more
economical process.
1.6.3.1 Solvent Biocompatibility
Non-biocompatible solvents can cause appreciable reductions in cell viability even at low
concentrations. In addition, a solvent should not be biodegradable so that the
microorganism does not use it as substrate [Bruce and Daugulis, 1991]. Laane et al.
[1987] discovered that there was a strong relationship between biocompatibility and the
logarithm of partition coefficient of a solvent in a standard octanol-water system: log Poct

Chapter 1
Introduction
Cindy Gunawan 2006 PhD Thesis
24
which is defined as the ratio of solvent concentration in octanol to solvent concentration
in water in a standard octanol/water two-phase system [Laane et al., 1985]. It was argued
that the octanol-water system provided a sufficient description of hydrophobicity and
transport interaction of a structure when exposed into a biological system. Poct can be
either experimentally determined or predicted from the molecular structure of the solvent.
1.6.3.1.1 Effects of Solvent on Microorganisms
The presence of some solvents can be associated with possible detrimental effects on
microorganisms. Some solvents are very toxic, they greatly reduce cell viability even at
minute concentrations. The possible detrimental effects are listed below:
(1) cytoplasmic shrinkage [Nikolova and Ward, 1992a],
(2) ultrastructural changes – e.g. displacement of the chromosome towards the cell
periphery [Nikolova and Ward, 1992], loss of intracellular electron-dense materials
[Wongkongkatep, 1992],
(3) inhibition of nutrient transport – Hampe [1986] observed that the sugar uptake in yeast
was non-competitively inhibited by alcohols,
(4) loss of membrane organization [Nikolova and Ward, 1992a] – solvents that have been
found to cause modifications of membrane permeability are toluene [Jackson and de
Moss, 1965; de Smet et al., 1978], alcohols [Ingram and Buttke, 1982], and alkanes [Teh
and Lee, 1976]. The modifications can lead to escape of ions (K+, Mg2+), low molecular
weight metabolites (NAD+, NADH), and large molecules (proteins, DNA, RNA) from the
cells [Wongkongkatep, 1992].
1.6.3.1.2 Cell Adaptation to Organic Solvents
In spite of the fact that the mechanisms of solvent tolerance in living microorganisms are
not fully understood, it has been proposed that membrane adaptation can occur,
particularly changes in lipid compositions to recover the membrane fluidity
(homeoviscous adaptation) [Heipieper and de Bont, 1994]. Several membrane
modifications have been recorded in response to solvent addition:

Chapter 1
Introduction
Cindy Gunawan 2006 PhD Thesis
25
(1) changes in saturation index of the membrane lipids. For examples, cells of E. coli
when incubated with benzene and octanol, react to recover increasing membrane fluidity
by increasing the fraction of the saturated membrane fatty acids. Stronger interactions
between saturated chains have been reported to reduce membrane fluidity [Ingram 1977;
Keweloh et al., 1990;],
(2) increase in fatty acid acyl chain length and protein to lipid ratio [Heipieper et al.,
1994].
It is suggested that these modifications can only be carried out by de novo synthesis of
membrane lipids during growth; as most bacteria are not able to alter their membrane
fluidity by post-biosynthetic modifications [Heipieper and de Bont, 1994].
1.6.3.2 Solvent Toxicity
Solvent toxicity is related to the effect of the solvent on the activity and stability of the
biocatalyst. The degree of toxicity is related to the type and concentration of solvent used
and its uptake by the cell membrane. Bar [1987] classified solvent toxicity into two
categories:
(1) dissolved (molecular) toxicity which is essentially the effect of solvent at levels below
saturation in the aqueous phase. It has been argued that there is solvent absorption by the
cell membrane resulting in the modification of membrane permeability, which leads to
enzyme inhibition, deactivation and possibly, breakdown of the transport mechanisms
[Lilly et al., 1987],
(2) physical (phase) toxicity which describes the effect of solvent in excess of saturation
its level. It has been argued that there is direct cell-solvent contact, extraction of nutrients
from the aqueous phase, or limited access to nutrients caused by interfacial cell adherence
or entrapment in an emulsion [Bar, 1988]. At this level of toxicity, a cell may be
surrounded by a solvent coat, causing cell wall disruption and extraction of inner cellular
components [Bar, 1987].

Chapter 1
Introduction
Cindy Gunawan 2006 PhD Thesis
26
Nikolova and Ward [1992a; b] investigated the effects on toxicity and biocompatibility of
various organic solvents in the two-phase aqueous/organic synthesis of PAC at 10%
aqueous phase content with whole cells of S. cerevisiae and pyruvate and benzaldehyde
as substrates. The results of these studies can be summarized as follows:
(1) solvents with the highest biotransformation rates were hexane, dodecane, and
hexadecane, intermediate rates were observed with ethylacetate and butylacetate, and
lowest production were observed with toluene and chloroform,
(2) solvent biocompatibility was evaluated by observing the surface structure of the cells
isolated from the biotransformation systems using scanning electron microscopy.
Solvents with log Poct ≥ 2.5: hexane, decane, and toluene caused no apparent damage to
the cell surface after 26 h (Fig 1.12). More hydrophilic solvents with log Poct < 2:
ethylacetate, butylacetate, and chloroform (Fig 1.12) caused cell puncturing after a shorter
reaction period. The observations were further confirmed by evaluating the amount of
fatty acids and proteins released into the organic and aqueous phase due to cell damage
(Table 1.3).
Table 1.3: Comparison of baker’s yeast fatty acids and proteins released into the
biotransformation medium with observed biocatalytic activity [Nikolova and Ward,
1992b].
Solvent Total fatty acids
(µg/mL)
Total proteins
(µg/mL)
Activity
(mmol PAC / h / mg dry
cells)
Hexane 140 45 60
Butylacetate 164 50 31
Chloroform 170 115 10
Toluene 178 80 7

Chapter 1
Introduction
Cindy Gunawan 2006 PhD Thesis
27
a b c
d e
a b c
dd ee
Figure 1.12: Scanning electron micrographs of yeast cells isolated from biphasic media
containing: (a) hexane (26 h), (b) decane (26 h), (c) toluene (26 h), (d) chloroform (0 h),
and (e) chloroform (2 h) [Nikolova and Ward, 1992a].
Solvents associated with high PAC productivity would certainly cause little or no damage
on the cells after a certain time period (in this case hexane). However, biocompatible
solvents do not necessarily have little toxic effects on the biocatalyst (in this case
toluene). Hence, there was no perfect correlation between the biocatalytic activity and cell
resistance to solvent damage.

Chapter 1
Introduction
Cindy Gunawan 2006 PhD Thesis
28
1.6.3.3 Extraction Efficiency
Based on the nature of their extraction mechanisms [Leon et al., 1998], solvents can be
classified as physical and chemical extractive solvents. Examples of physical extractive
solvents are hydrocarbons, ketones, and esters. In this type of solvents, the interactions
are based on the solvation of products by weak, unspecific donor bonds of different types.
With the chemical extractive solvents, such as trioctyl-phosphine oxide, there are
formations of stable adducts or even new compounds and the interactions are specific and
relatively stable.
Parameters used to define extraction capacity of a solvent with respect to a product are
distribution coefficient (KD) and separation factor (α).KD is defined as the ratio of product
concentration in the organic phase to product concentration in the aqueous culture
medium, at equilibrium [Bruce and Daugulis, 1991]. α is defined as the ratio of the
distribution coefficient of the product to distribution coefficient of any other contaminant
from which the product is isolated (e.g. remaining substrate, by-products) [Leon et al.,
1998]. KD determines the extraction efficiency of a solvent whereas a solvent with a high
α value exhibits high selectivity towards the product in preference to any other substances
[Bruce and Daugulis, 1991]. Daugulis et al. [1987] and Roffer et al. [1988] had shown
that cycling a water-immiscible solvent through the culture medium could result in
simultaneous reaction and product extraction in a single processing unit.
1.6.3.4 Ease of Solvent Recovery
Solvent density, viscosity, and boiling point affect the ease of solvent recovery from the
biotransformation product [Bruce and Daugulis, 1991]. Solvents of which boiling points
are close to those of the product are difficult to recover (with consequent difficult product
isolation from the solvent). Furthermore, for long or continuous biotransformation
processes, chemical and thermal stability of the solvents are necessary since the processes
may involve numerous recycling of the solvents [Bruce and Daugulis, 1991].
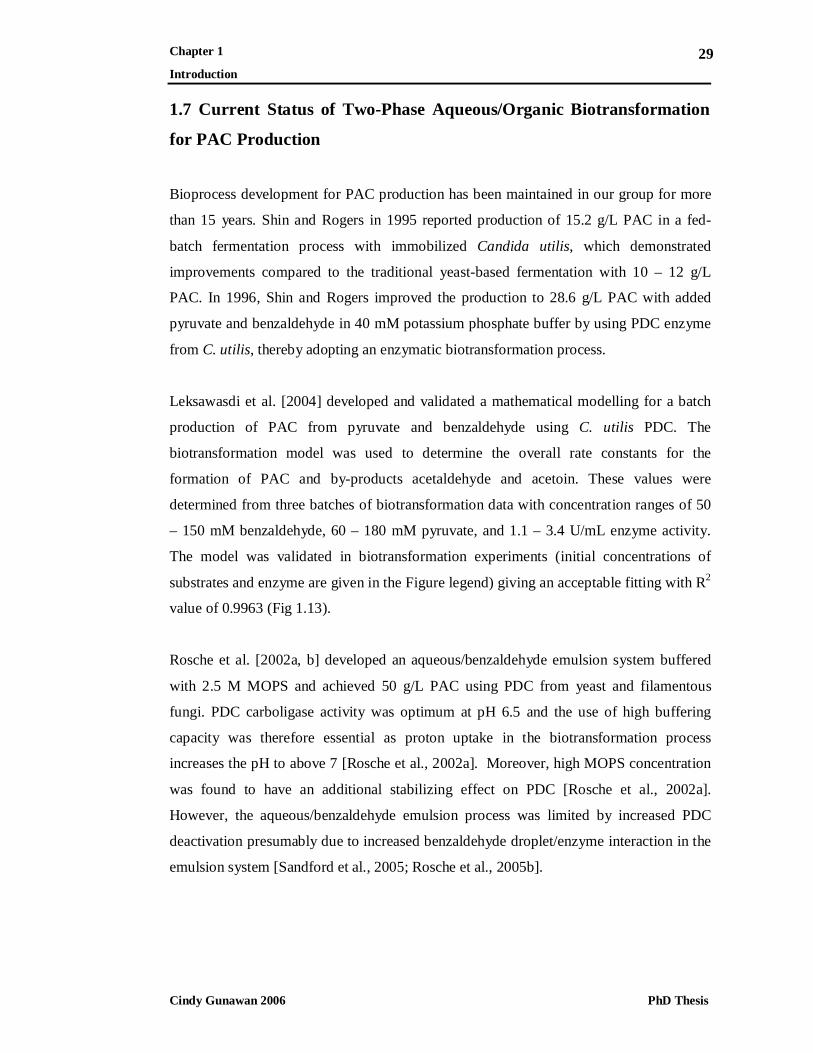
Chapter 1
Introduction
Cindy Gunawan 2006 PhD Thesis
29
1.7 Current Status of Two-Phase Aqueous/Organic Biotransformation
for PAC Production
Bioprocess development for PAC production has been maintained in our group for more
than 15 years. Shin and Rogers in 1995 reported production of 15.2 g/L PAC in a fed-
batch fermentation process with immobilized Candida utilis, which demonstrated
improvements compared to the traditional yeast-based fermentation with 10 – 12 g/L
PAC. In 1996, Shin and Rogers improved the production to 28.6 g/L PAC with added
pyruvate and benzaldehyde in 40 mM potassium phosphate buffer by using PDC enzyme
from C. utilis, thereby adopting an enzymatic biotransformation process.
Leksawasdi et al. [2004] developed and validated a mathematical modelling for a batch
production of PAC from pyruvate and benzaldehyde using C. utilis PDC. The
biotransformation model was used to determine the overall rate constants for the
formation of PAC and by-products acetaldehyde and acetoin. These values were
determined from three batches of biotransformation data with concentration ranges of 50
– 150 mM benzaldehyde, 60 – 180 mM pyruvate, and 1.1 – 3.4 U/mL enzyme activity.
The model was validated in biotransformation experiments (initial concentrations of
substrates and enzyme are given in the Figure legend) giving an acceptable fitting with R2
value of 0.9963 (Fig 1.13).
Rosche et al. [2002a, b] developed an aqueous/benzaldehyde emulsion system buffered
with 2.5 M MOPS and achieved 50 g/L PAC using PDC from yeast and filamentous
fungi. PDC carboligase activity was optimum at pH 6.5 and the use of high buffering
capacity was therefore essential as proton uptake in the biotransformation process
increases the pH to above 7 [Rosche et al., 2002a]. Moreover, high MOPS concentration
was found to have an additional stabilizing effect on PDC [Rosche et al., 2002a].
However, the aqueous/benzaldehyde emulsion process was limited by increased PDC
deactivation presumably due to increased benzaldehyde droplet/enzyme interaction in the
emulsion system [Sandford et al., 2005; Rosche et al., 2005b].
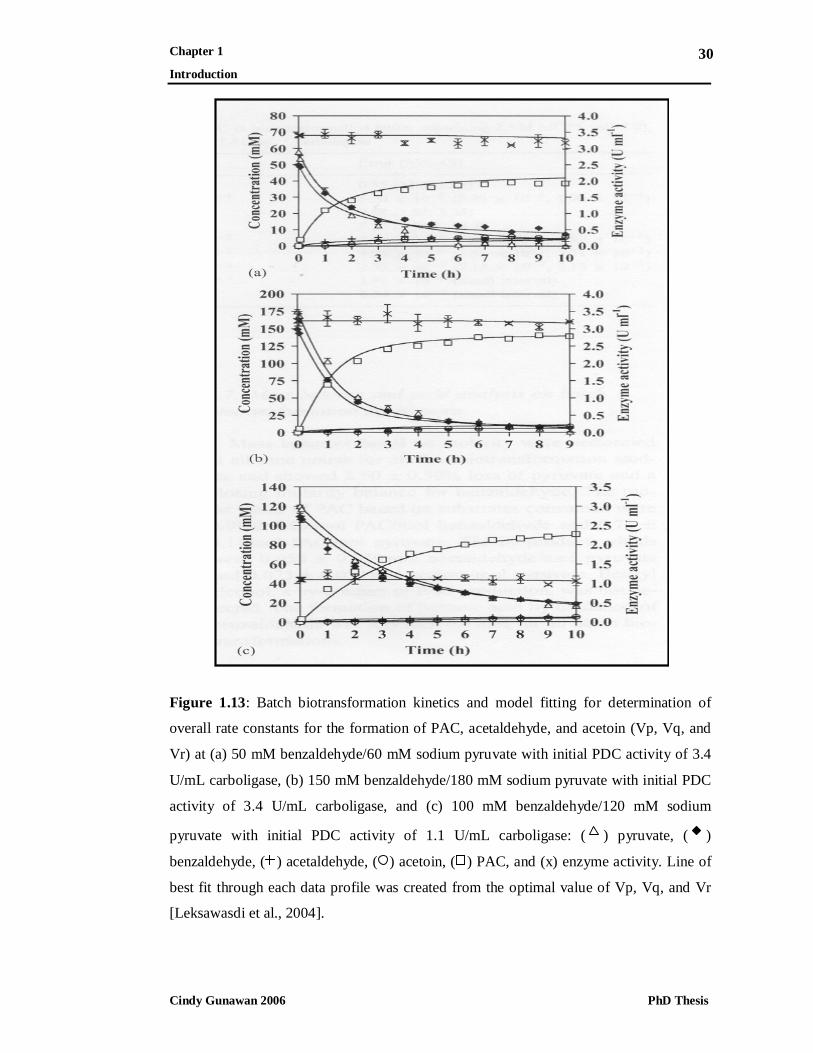
Chapter 1
Introduction
Cindy Gunawan 2006 PhD Thesis
30
Figure 1.13: Batch biotransformation kinetics and model fitting for determination of
overall rate constants for the formation of PAC, acetaldehyde, and acetoin (Vp, Vq, and
Vr) at (a) 50 mM benzaldehyde/60 mM sodium pyruvate with initial PDC activity of 3.4
U/mL carboligase, (b) 150 mM benzaldehyde/180 mM sodium pyruvate with initial PDC
activity of 3.4 U/mL carboligase, and (c) 100 mM benzaldehyde/120 mM sodium
pyruvate with initial PDC activity of 1.1 U/mL carboligase: () pyruvate, ( )
benzaldehyde, () acetaldehyde, () acetoin, ( ) PAC, and (x) enzyme activity. Line of
best fit through each data profile was created from the optimal value of Vp, Vq, and Vr
[Leksawasdi et al., 2004].

Chapter 1
Introduction
Cindy Gunawan 2006 PhD Thesis
31
To overcome the restriction, Sandford et al. [2005] developed a two-phase
aqueous/organic enzymatic biotransformation process for PAC production. They
performed a solvent screening study at a 1:1 organic to aqueous phase volume ratio with
C. utilis PDC and observed highest PAC production with 1-octanol and 1-nonanol as
organic phase solvents. The use of 1-octanol as a suitable solvent for two-phase PAC
production was further confirmed by Rosche et al. [2005] with whole cells of C. utilis.
Sandford et al. [2005] investigated PAC formation as a function of enzyme concentration
in two extreme operations of the two-phase system: the slowly stirred phase-separated
and the rapidly stirred emulsion systems (Fig 1.14).
ORGANIC PHASE
AQUEOUS PHASE
BENZALDEHYDE PAC
PYRUVATE + BENZALDEHYDE PAC + CO2
PDC
ORGANIC PHASE
AQUEOUS PHASE
BENZALDEHYDE PAC
PYRUVATE + BENZALDEHYDE PAC + CO2
PDC
Figure 1.14: Diagrammatic representation of the two-phase aqueous/organic PAC
production system [Rosche et al., 2002b; Sandford et al., 2005].
Phase-Separated Emulsion

Chapter 1
Introduction
Cindy Gunawan 2006 PhD Thesis
32
The phase-separated system was associated with high specific PAC production per unit
enzyme, however productivities were low. In contrast, productivities were high in the
emulsion system, however the specific production was reduced. Fig 1.15 shows PAC
production as a function of initial enzyme concentration in the two systems. Detailed
explanation on the profiles in the context of the present investigation will be presented in
Sections 4.2.1.5 and 4.2.1.6.
Figure 1.15: PAC production as a function of carboligase activity in the rapidly stirred
two-phase system after 40 h, and phase-separated two-phase system after 395 h (4°C,
organic octanol phase contained 1500 mM benzaldehyde and the aqueous phase
contained 1430 mM pyruvate, 2.5 M MOPS, 1 mM TPP, 1 mM Mg2+, pH 6.5). A 1:1
volume ratio of organic and aqueous phases was used.
Leksawasdi et al. [2005] implemented a pH control system in a two-phase PAC
production with 2.5 M MOPS and C. utilis PDC and reported a specific reaction rate of
0.60 mg/U/h, a 1.6 times improvement in comparison to the same biotransformation
without pH control. Lowering the expensive MOPS concentration to 20 mM MOPS with
controlled pH resulted in three times decreased PAC production in comparison to the 2.5

Chapter 1
Introduction
Cindy Gunawan 2006 PhD Thesis
33
M MOPS system. Further addition of low cost 2.5 M dipropylene glycol into the 20 mM
MOPS system resulted in comparable overall PAC production of 92.1 g/L. In the search
of a low cost biocatalyst for PAC production, Satianegara et al. [2006] observed higher
stability of PDC in the form of C. utilis whole cells towards benzaldehyde and
temperature in comparison to the partially purified preparations.
1.8 Strategy for Two-Phase Model Development
Development of a process model for the two-phase PAC production would serve as a tool
to predict optimum parameters for favorable reaction conditions and to allow a
description of the macroscopic reaction [Goetz et al., 2001]. Conceptually, a two-phase
process model would include a description of the reaction kinetics in the aqueous phase
with influence by the organic phase, mass transfer kinetics and determination of changes
in mass balances for both organic and aqueous phase [Willeman et al., 2002]. In addition,
modeling of the rate of PDC enzyme deactivation in the presence of the organic phase
(octanol) would be needed to facilitate overall process optimization.
Reaction Kinetics in Aqueous Phase
Experiments would need to be conducted to plot the time profiles of PAC formation over
a relatively short period (e.g. 30 mins) for a range of enzyme, pyruvate and benzaldehyde
concentrations. The initial rate of PAC formation would be determined by a tangential
method determined at time zero and plotted against the concentration; a mathematical
equation would then be fitted with determination of the kinetic constants for each plot.
Each of these equations would be combined to develop an overall rate equation for PAC
formation. Other rate equations regarding pyruvate and benzaldehyde consumption and
formation of the by-products acetaldehyde and acetoin would also need to be derived.
Batch biotransformation experiments would then be performed for determination of the
overall rate constants. Finally, the completed mathematical model would be validated by
using the model and the calculated rate constants to predict profiles of substrate
consumption, product and by-product formation for certain initial conditions.

Chapter 1
Introduction
Cindy Gunawan 2006 PhD Thesis
34
PDC Enzyme Deactivation Rate in Aqueous Phase
The model should include terms for PDC deactivation rate by soluble benzaldehyde and
octanol in the aqueous phase, presence of aqueous/organic interfacial area. The slowly
stirred phase-separated system would be associated with contact of enzyme with defined
interfacial area while the effect of enzyme-droplet interaction would be evaluated in the
rapidly stirred emulsion system.
Mass Transfer Kinetics
The following mass transfer equation would be included:
φx = kLx a (Corg,x / mx – Caq,x) (mol Laq-1 s-1)
φx is the mass transfer rate from the aqueous to the organic phase (mol Laq-1 s-1)
kLx is the lumped mass transfer coefficient (m s-1)
a is the interfacial area per volume of aqueous phase (m-1)
Cx is the molar concentration of species x. (mol Laq-1)
mx is the ratio of equilibrium concentrations (organic over aqueous phase)
Measurements of kLx a could be conducted during biotransformation when the reaction
rate was much faster than the mass transfer rate, leading to Caq,x ≈ 0. This would enable
the determination of kLx a to be independent of the reaction kinetics.
Mass Balance Equations
PAC synthesis would be considered to only occur in the aqueous phase and by assuming
that no changes in volume would take place during the biotransformation, the following
equations would apply:
Rate of change in the aqueous phase: Vaq dCaq,x / dt = rx Vaq – φx Vaq (mol s-1)
Rate of change in the organic phase: Vorg dCorg,x / dt = φx Vaq (mol s-1)
rx is the reaction rate (mol Laq-1 s-1)
V is the volume of the aqueous or the organic phase (L)
The present research project aims at further developing the two-phase system for an
improved and efficient PAC production process with particular focus on the key factors
likely to influence this particular enzymatic biotransformation. The thesis provides an
experimental basis for subsequent two-phase model development.

Chapter 2
Materials and Methods
Cindy Gunawan 2006 PhD Thesis
35
CHAPTER 2
MATERIALS AND METHODS
1. Microorganisms
2. Chemicals, Enzymes and Sources
3. Buffer Compositions
4. PDC Enzyme Production
5. Biotransformation Systems for PA) Production
6. PDC Enzyme Deactivation and Organic-Aqueous Benzaldehyde
Transfer Studies in the Two-Phase Aqueous/Octanol-
Benzaldehyde System
7. Two-Phase Aqueous/Organic PAC Synthesis at Lower Buffer
Concentration (20 mM MOPS, Larger Scale)
8. Analytical Methods
9. Calculation Methods

Chapter 2
Materials and Methods
Cindy Gunawan 2006 PhD Thesis
36
2.1 Microorganisms
Saccharomyces cerevisiae strain UNSW 102200, Candida utilis strain UNSW 70940,
and Kluyveromyces marxianus strain UNSW 510700 were obtained from the Culture
Collection of the School of Biotechnology and Biomolecular Sciences, University of
New South Wales (World Directory of Culture Collections No. 248), Sydney, Australia.
Candida tropicalis strain 57, Candida glabrata strain LU 10336 and
Schizosaccharomyces pombe strain LU 311 were provided by BASF (Germany). The
stock cultures of the microorganisms were stored in glycerol at –20°C.
2.2 Chemicals, Enzymes and Sources
Table 2.1: Chemicals and enzymes
Name Formula Supplier Cat. No.
Chemicals
2-[N-morpholino]ethanesulfonic acid (MES)
C6H13NO4S Sigma M8250
3-[N-morpholino]propanesulfonic acid (MOPS)
C7H15NO4S Sigma M1254
Acetaldehyde C2H4O Fluka 00071
Acetic acid, glacial CH3COOH Allied Signal 33209
Acetoin C4H8O2 Fluka 00540
Acetone CH3COCH3 LAB-SCAN A3501
Acetonitrile CH3CN APS 2315
Ammonium sulphate (NH4)2SO4 APS 56
Antifoam (propylene glycol) - Fluka 81380
Bacteriological agar - Oxoid Code L11
Benzaldehyde C6H5CHO Crown Scientific
H3C080
Benzoic acid C7H6O2 Sigma B7521
Buffer standard pH 4 - Merck 19239.5W
Buffer standard pH 7 - Merck 19240.5H

Chapter 2
Materials and Methods
Cindy Gunawan 2006 PhD Thesis
37
Table 2.1 (Continued): Chemicals and enzymes.
Name Formula Supplier Cat. No.
Chemicals
Calcium chloride dihydrate CaCl2.2H2O APS 127
Citric acid, anhydrous C6H8O7 Sigma C0759
Copper (II) sulphate, hydrated CuSO4.5H2O APS 10091
Dipropylene glycol (DPG) C6H14O3 Merck 8.03265
Di-sodium hydrogen orthophosphate dodecahydrate
Na2HPO4.12H2O APS 10248
Electrode cleaner (pepsin/HCl) - Ingold Order No.209891250
Electrolyte (1M LiCl in acetic acid) - Mettler Toledo
Order No. 51340051
Ethanol, absolute C2H5OH APS 214
Ethylenediaminetetra-acetic acid (EDTA) di-sodium salt
EDTA-Na2H2.2H2O APS 180
Glucose (D-) anhydrous C6H12O6 APS 783
Hydrochloric acid HCl FSE H/1100/PB17AU
Iron (II) sulphate heptahydrate FeSO4.7H2O APS 226
Magnesium sulphate heptahydrate MgSO4.7H2O APS 302
Manganese chloride heptahydrate MnCl2.7H2O BDH 10152
Methanol (HPLC grade) CH3OH APS 2314
Nicotinamide adenine dinucleotide disodium salt (NADH)
C21H27N7O14P2Na2 Roche 92464233
Octanol C8H18O APS 2370
Phosphoric acid H3PO4 APS 371
Potassium chloride KCl APS 383
Potassium dihydrogen orthophosphate KH2PO4 APS 391
Potassium hydroxyde KOH APS 10210
Reactivation solution for glass electrodes (diluted HF/HCl)
- Ingold Order No. 9895
R-phenylacetylcarbinol (R-PAC) C9H10O2 BASF -
Sodium hydrogen carbonate NaHCO3 APS 475

Chapter 2
Materials and Methods
Cindy Gunawan 2006 PhD Thesis
38
Table 2.1 (Continued): Chemicals and enzymes.
Name Formula Supplier Cat.No.
Chemicals
Sodium hydroxyde NaOH APS 482
Sodium pyruvate (pyruvic acid sodium salt)
C3H3NaO3 Fluka 15990
Sulfuric acid H2SO4 Allied Signal
30743
Thiamine pyrophosphate (TPP) C12H19ClN4O7P2S Sigma C8754
Trichloroacetic acid (TCA) - Sigma T4396
Triethanolamine hydrochloride C6H15NO3HCl Sigma T1502
Yeast Extract - Oxoid Code L21
Zinc sulphate heptahydrate ZnSO4.7H2O BDH 10299
Proteins
Alcohol dehydrogenase (ADH) - Sigma A7011
Lactate dehydrogenase (LDH)
(from rabbit muscle)
- Roche 127876

Chapter 2
Materials and Methods
Cindy Gunawan 2006 PhD Thesis
39
2.3 Buffer Compositions
Table 2.2: Buffer compositions.
Breakage Buffer
Citric acid 200 mM
MgSO4.7H2O 20 mM
TPP 0.5 mM
pH adjusted to 6.5 at 6°C.
Collection Buffer
Citric acid 400 mM
MgSO4.7H2O 40 mM
TPP 4 mM
pH adjusted to 6.0 at 25°C.
Triethanolamine Buffer
Triethanolamine-HCl 250 mM
EDTA-disodium salt 2.5 mM
pH adjusted to 7.6 with 5 M NaOH at 25°C.
NADH Buffer
NADH-disodium salt 7 mM
NaHCO3 120 mM
pH adjustment not necessary.
Carboligase Buffer
Citric acid 200 mM
MgSO4.7H2O 20 mM
TPP 2 mM
Sodium pyruvate 200 mM
Benzaldehyde 80 mM
Ethanol 3 M
pH adjusted to 6.4 at 25°C. The buffer was
stored in aliquots at –20°C for a maximum of
two weeks.
Biotransformation / PDC Enzyme
Deactivation Study Buffer
MOPS 2.5 M or 20 mM / 2.5 M
MgSO4.7H2O 1 mM
TPP 1 mM / 0.5 mM
pH adjusted to 6.5 or 7 with 10 M KOH for
2.5M MOPS and 5 M KOH for 20 mM
MOPS at the temperature of interest.

Chapter 2
Materials and Methods
Cindy Gunawan 2006 PhD Thesis
40
2.4 PDC Enzyme Production PDC enzyme was produced via a yeast fermentation of glucose-based media. Various
scales and methods of fermentation were employed: (I) 2 x 0.22 L shake flask
fermentations to culture 6 yeast strains simultaneously (S. cerevisiae, C. utilis, C.
tropicalis, S. pombe, C. glabrata, and K. marxianus), (II) 20 L aerobic-partially anaerobic
two-stage fermentation for C. utilis partially purified PDC production and (III) 2 x 3 L
pH shift fermentations for C. utilis whole cell production. All fermenters, shake flasks
(Erlenmeyer), apparatus and media used were sterilized by autoclaving at 121°C and 125
kPa for 20 mins (Atherton). Media mixing and yeast culturing processes were performed
in a sterile environment.
2.4.1 General Steps in the Fermentation Processes
Each of the fermentation methods was associated with different operating conditions;
however each process comprised four culturing steps: (I) growth on agar media, (II)
preseed, (III) seed, and (IV) final fermentation (for the shake flask fermentation method
there was no preseed stage).
2.4.1.1 Media Preparation
Three types of media were prepared: (I) solid agar media, (II) liquid preseed and seed
media and (III) liquid final fermentation media. Concentrated stock solutions for each
compound were prepared, autoclaved or filtered, mixed and adjusted to the required
concentrations with sterile RO water. The concentrations of the stock solutions are shown
in Table 2.3.
To prepare solid media, the mixed and volume-adjusted agar solution was poured while
above 60°C into sterile Petri dishes to prevent early solidification. The agar media were
stored at 4°C prior to usage.

Chapter 2
Materials and Methods
Cindy Gunawan 2006 PhD Thesis
41
Table 2.3: Stock solution concentrations and sterilization methods for the preparation of
agar and liquid media for fermentation.
Compound Stock Solution Sterilization
Method
Glucose 400 g/L Autoclaving
Yeast extract 200 g/L Autoclaving
Agar 30 g/L Autoclaving
(NH4)2SO4 5x concentrated 1 Autoclaving
Other Salts
KH2PO4, Na2HPO4.12H2O, MgSO4.7H2O 5x concentrated 1 Autoclaving
CaCl2.2H2O 3 10x and 100x concentrated 1,2 Autoclaving
CuSO4.5H2O, ZnSO4.7H2O,
FeSO4.7H2O 4, MnCl2.4H2O
100x concentrated 1 Autoclaving
MES adjusted to pH 6.0 5 4x concentrated 1 Filtration
(1) With respect to the final concentrations in media
(2) 10X for the shake flask and aerobic-partially anaerobic two-stage fermentation methods 100X for the pH shift fermentation method
(3) Prepared separately due to precipitation, had limited solubility in water
(4) Acid addition prior to autoclaving to prevent oxidation
(5) pH adjustment prior to autoclaving
The liquid preseed and seed media were prepared immediately or maximum 1 – 2 days
prior to the culturing process to minimize the risk of contamination. The mixed and
volume-adjusted media were aliquoted into baffled Erlenmeyer flasks then covered with
cotton bungs to allow release of CO2 during the culturing process. The media were stored
at 4°C prior to usage.
The final fermentation media were prepared 1 – 2 days prior to the culturing process. The
mixed and volume-adjusted media was transferred into 5 L Erlenmeyer flask, which has a
connector to the fermenter. The media were stored at 4°C prior to usage. For the shake
flask fermentation method, in which there was no preseed stage, the final fermentation
medium composition was the same as the seed medium. The mixed and volume-adjusted

Chapter 2
Materials and Methods
Cindy Gunawan 2006 PhD Thesis
42
medium was aliquoted into non-baffled Erlenmeyer flasks to prevent extensive aeration,
thereby achieving a fermentative condition.
2.4.1.2 Growth on Agar Media
Yeast colonies from stock culture were aseptically inoculated onto agar plates. The plates
were sealed with parafilm and incubated at 30°C. Further subculturing was performed
every 2 – 3 days. Outlined below in Table 2.4 are agar media compositions used in the
various fermentation methods.
Table 2.4: Agar media compositions for the various fermentation methods.
Compound Fermentation method
Shake flask (g/L) Aerobic-partially anaerobic
two-stage (g/L)
pH shift (g/L)
Glucose 30 30 20
Yeast extract 5 5 -
Peptone - - 10
(NH4)2SO4 10 10 -
KH2PO4 3 3 1
Na2HPO4.12H2O 2 2 -
MgSO4.7H2O 1 1 0.5
CaCl2.2H2O 0.05 0.05 -
Agar 15 15 15
2.4.1.3 Preseed and Seed
The process involved growing yeast in fresh liquid media in two subsequent steps after
the growth on agar medium. Yeast from an agar plate was inoculated into preseed
medium. Inoculations of the preseed culture to the seed medium and of the seed culture
to the final fermentation medium were performed when OD660 (optical density at 660
nm) was 8 – 10. The preseed and seed steps were conducted in Erlenmeyer flasks with
the media being 10% of the flask volume. The inoculations were performed aseptically

Chapter 2
Materials and Methods
Cindy Gunawan 2006 PhD Thesis
43
and the yeast was cultivated at 30°C in a shaker. Outlined below in Table 2.5 are preseed
and seed media compositions and operating conditions used in the various fermentation
methods.
Table 2.5: Preseed and seed media compositions and operating conditions for the various
fermentation methods.
Compound Fermentation method
Shake flask (g/L)* Aerobic-partially
anaerobic two-stage
(g/L)
pH shift (g/L)
Glucose 90.0 10.0 20.0
Yeast extract 10.0 5.0 -
(NH4)2SO4 10.0 10.0 6.0
KH2PO4 3.0 3.0 1.0
Na2HPO4.12H2O 2.0 2.0 -
MgSO4.7H2O 1.0 1.0 0.5
CaCl2.2H2O 0.05 0.05 0.02
CuSO4.5H2O - - 0.0005
ZnSO4.7H2O - - 0.0106
FeSO4.7H2O - - 0.02
MnCl2.4H2O - - 0.002
MES 39.0 39.0 39.0
Operating conditions Fermentation method
Shake flask * Two-stage pH shift
Initial pH 6.0 6.0 6.0
Shaker Speed 160 rpm 250 rpm 250 rpm
* Same compositions for the seed and final fermentation media
2.4.1.4 Final Fermentation
Seed culture was inoculated into the final fermentation medium aseptically. Adjustment
of glucose concentration was necessary prior to inoculation. Table 2.6 lists the final
fermentation media compositions used in the various fermentation methods.

Chapter 2
Materials and Methods
Cindy Gunawan 2006 PhD Thesis
44
Table 2.6: Final fermentation media compositions for the various fermentation methods.
Compound Fermentation method
Shake flask (g/L) Aerobic-partially
anaerobic two-stage
(g/L)
pH shift (g/L)
Glucose 90.0 90.0 100.0
Yeast extract 10.0 10.0 -
(NH4)2SO4 10.0 10.0 10.0
KH2PO4 3.0 3.0 1.0
Na2HPO4.12H2O 2.0 2.0 -
MgSO4.7H2O 1.0 1.0 0.5
CaCl2.2H2O 0.05 0.05 0.02
CuSO4.5H2O - - 0.0005
ZnSO4.7H2O - - 0.0106
FeSO4.7H2O - - 0.02
MnCl2.4H2O - - 0.002
MES 39.0 - -
2.4.2 Fermentation Processes
2.4.2.1 Shake Flask Fermentation
The shake flask fermentations were performed to culture six yeast strains simultaneously.
The method involved growing yeast in seed medium; the grown yeast was then
inoculated to final fermentation medium (no preseed stage). The harvested culture was
processed for whole cell and crude extract production of PDC. The fermentation method
was described by Chen [2005b].
The final fermentation was conducted with initial pH 6 in two 1 L non-baffled
Erlenmeyer flasks for each yeast strain; each flask accommodating 0.22 L working
volume (0.02 L seed + 0.2 L media). The flasks were fitted in a 30°C shaker, rotating at
160 rpm. The seed culture was prepared by inoculating a single yeast colony from agar
medium into 50 mL medium in each non-baffled Erlenmeyer flask.

Chapter 2
Materials and Methods
Cindy Gunawan 2006 PhD Thesis
45
The cultures were harvested by centrifugation (Hettrich Zentrifugen, Model Universal
32R, Rotor Type 1617) at 5,000 rpm for 15 mins at 4°C when glucose concentration fell
to below 10 g/l, washed with 0.9% NaCl and stored at –20°C. The specific PDC activities
of the yeast strains are shown in Section 3.2.1.
2.4.2.2 Aerobic-Partially Anaerobic Two–Stage Fermentation
The two-stage fermentation was performed to culture C. utilis for partially purified PDC
production. The method involved yeast culturing in two steps in the final fermentation:
first step was to grow the yeast aerobically (RQ = 1), second step was to switch to partial
anaerobic phase (RQ = 4). The respiratory quotient (RQ) was controlled by manually
adjusting the stirrer speed. The harvested culture was processed for partially purified
PDC production. The fermentation method was described by Sandford [2002].
The final fermentation was conducted in a 30 L BIOSTAT® C fermenter system (with
system controller) accommodating 20 L working volume (Fig 2.1). 1.5 L seed culture
aged 8.5 h was inoculated into 18.5 L final fermentation medium. The seed culture was
prepared by inoculating 2.5 mL preseed culture aged 14 h into 250 mL seed medium in
each baffled Erlenmeyer flask. The preseed culture was prepared by inoculating a single
yeast colony from agar medium into 50 mL preseed medium in each baffled Erlenmeyer
flask.
The final fermentation was controlled at 30°C, pH 6 (controlled by 4 M NaOH and 20%
(v/v) H3PO4 addition) and air flow rate was 0.5 vvm. The culture was maintained at RQ =
1 for the first 9 h by keeping the stirrer speed at 500 rpm; the speed was then raised to
750 – 780 rpm until RQ = 1 could not be maintained. The culture was switched to partial
anaerobic phase with RQ = 4±1 for the next 4 h by decreasing the stirrer speed to 275 –
350 rpm to induce PDC production. Dissolved oxygen was above 90% air saturation
initially, it then dropped to 0% at 9 h until the end of fermentation course at 13 h.
The culture was harvested by centrifugation (Sorvall RC-5B, Du-Pont Instruments) at
5,000 rpm for 15 mins at 6°C when glucose concentration fell to 18 g/L, washed with RO

Chapter 2
Materials and Methods
Cindy Gunawan 2006 PhD Thesis
46
water, suspended in breakage buffer and stored at –20°C. The specific PDC activity was
115 U/g dry biomass.
Figure 2.1: 30 L BIOSTAT® C fermenter system used in the aerobic-partially anaerobic
two-stage fermentation method for PDC production.
2.4.2.3 pH Shift Fermentation
In the pH shift fermentation process, the pH was lowered from 6 to 3 in the final
fermentation when 20 g/L glucose had been consumed. The pH was automatically
controlled with acid and base addition. This method had been proven by Chen [2005a] to
dramatically increase the specific PDC production by C. utilis. The harvested culture was
stored as cell pellets.
The final fermentation was conducted in two 5 L BIOSTAT® A (B.Braun) fermenters
systems (with system controllers) accommodating 3 L working volume for each batch
(Fig 2.2). 0.3 L seed culture aged 8 h was inoculated into 2.7 L final fermentation
medium. The seed culture was prepared by inoculating 5 mL preseed culture aged 16 h
into 50 mL seed medium in each baffled Erlenmeyer flask. The preseed culture was
prepared by inoculating a single yeast colony from agar medium into 50 mL preseed
medium in each baffled Erlenmeyer flask. The final fermentation was controlled at 30°C,
initially at pH 6 (controlled by 5 M NaOH and 5 M H2SO4 addition). The stirrer speed
and air flow rate was set at 300 rpm and 0.1 vvm respectively, dissolved oxygen was 0 –
3% air saturation for the two batches.
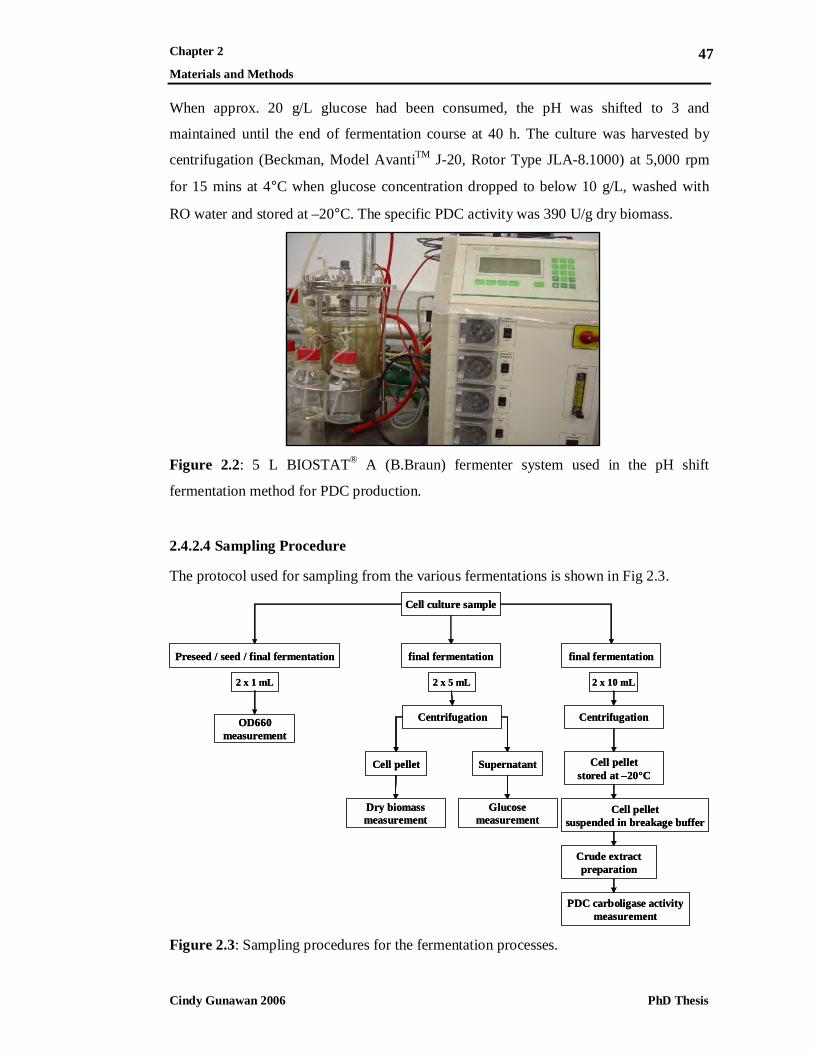
Chapter 2
Materials and Methods
Cindy Gunawan 2006 PhD Thesis
47
When approx. 20 g/L glucose had been consumed, the pH was shifted to 3 and
maintained until the end of fermentation course at 40 h. The culture was harvested by
centrifugation (Beckman, Model AvantiTM J-20, Rotor Type JLA-8.1000) at 5,000 rpm
for 15 mins at 4°C when glucose concentration dropped to below 10 g/L, washed with
RO water and stored at –20°C. The specific PDC activity was 390 U/g dry biomass.
Figure 2.2: 5 L BIOSTAT® A (B.Braun) fermenter system used in the pH shift
fermentation method for PDC production.
2.4.2.4 Sampling Procedure
The protocol used for sampling from the various fermentations is shown in Fig 2.3.
Cell culture sample
Preseed / seed / final fermentation final fermentation final fermentation
2 x 1 mL 2 x 5 mL 2 x 10 mL
OD660measurement
Cell pellet Supernatant
Centrifugation
Dry biomassmeasurement
Glucosemeasurement
Centrifugation
Cell pelletstored at –20°C
Cell pelletsuspended in breakage buffer
Crude extractpreparation
PDC carboligase activitymeasurement
Figure 2.3: Sampling procedures for the fermentation processes.

Chapter 2
Materials and Methods
Cindy Gunawan 2006 PhD Thesis
48
2.4.3 PDC Enzyme Preparations
Three types of PDC preparation were employed as biocatalysts for PAC production: (I)
whole cells, (II) crude extract and (III) partially purified PDC.
2.4.3.1 Whole Cell PDC
The wet frozen cell pellets were thawed in a 25°C water bath. The suspension was then
subjected to treatment specify in Section 2.5.3.4.1.
2.4.3.2 Crude Extract PDC
The frozen cell pellets were thawed in a 25°C water bath and suspended in breakage
buffer. The suspension was frozen with liquid nitrogen and thawed five times and further
blended (Hamilton Beach/Proctor-Silex, Inc., Model 908-220) with 0.5 mm glass beads
(Biospec, Cat. No. 11079105) to release the PDC. Crude extract was isolated after
clarification with centrifugation (Hettrich Zentrifugen, Model Universal 32R, Rotor Type
1617) at 5,000 rpm for 5 mins at 4°C and stored at –20°C.
2.4.3.3 Partially Purified PDC
The partially purified PDC was prepared in a one-step precipitation of the crude extract
with 40 – 50% (v/v) acetone at -10°C. The precipitated protein was isolated by
centrifugation at 5,000 rpm for 5 mins at 0°C. The recovered paste was freeze-dried
(Dynavac, Model FD3) at –50°C and 0.1 mbar for 24 h (Fig 2.4), then ground to powder
and stored at –20°C.
Figure 2.4: Freeze drier used in partially purified PDC preparation.

Chapter 2
Materials and Methods
Cindy Gunawan 2006 PhD Thesis
49
2.5 Biotransformation Systems for PAC Production Biotransformations for PAC production were performed in various systems in the current
project.
2.5.1 Yeast Pyruvate Decarboxylases: Variation in Biocatalytic
Characteristics
As described in Chapter 3, a study was designed to select the best biocatalyst for PAC
production: four yeast PDCs with different properties (S. cerevisiae, C. utilis, C.
tropicalis, and K. marxianus) were tested for the production of PAC and by-products
acetaldehyde and acetoin. The yeast PDCs were tested in three biotransformation systems
with increasing benzaldehyde concentrations: (I) aqueous (soluble benzaldehyde), (II)
aqueous/benzaldehyde emulsion and (III) two-phase aqueous/octanol-benzaldehyde
emulsion systems. There were also investigations of the effects of benzaldehyde and
acetaldehyde on initial PAC formation. Table 2.7 lists the types of biotransformation
system employed and investigations performed in the studies.
Table 2.7: Biotransformation systems employed in the selection of biocatalyst for PAC
production (Chapter 3).
Biotransformation system [Benzaldehyde]
(mM)
[Pyruvate]
(mM)
[Acetaldehyde]
(mM)
Type of PDC
Investigations on PAC and by-products acetaldehyde and acetoin formation at 22(±2)°C
Aqueous (soluble benzaldehyde) 80 80 - Crude extract
Aqueous/benzaldehyde emulsion 325 420 - Crude extract
Two-phase
aqueous/benzaldehyde-octanol
850
(TRV)*
450
(TRV)*
- Whole cells

Chapter 2
Materials and Methods
Cindy Gunawan 2006 PhD Thesis
50
Table 2.7 (continued): Biotransformation systems employed in the selection of
biocatalyst for PAC production (Chapter 3).
Biotransformation system [Benzaldehyde]
(mM)
[Pyruvate]
(mM)
[Acetaldehyde]
(mM)
Type of PDC
Investigations on the effect of benzaldehyde on initial PAC formation at 22(±2)°C
Aqueous (soluble benzaldehyde) 45 250 - Crude extract
80 250 - Crude extract
Aqueous/benzaldehyde emulsion 120 250 - Crude extract
175 250 - Crude extract
Investigations on the effect of acetaldehyde on initial PAC formation at 22(±2)°C
Aqueous (soluble benzaldehyde) 45 250 30 Crude extract
80 250 30 Crude extract
Aqueous/benzaldehyde emulsion 125 250 30 Crude extract
185 250 30 Crude extract
* Total reaction volume (TRV) is determined by combining both phases.
The studies were carried out at 2 mL scale in 4 mL glass vials (inner diameter 12.5 mm,
height 35 mm) at 22(±2)°C and stirred magnetically (Bibby, Model B292) at 220 – 190
rpm for the systems I and II and 250 – 190 rpm for system III (the systems were stirred at
the higher speed initially; the speed was then decreased following volume reduction after
sampling).
In all biotransformations, 2.5 M MOPS buffer system was used with initial pH of 6.5 and
0.5 mM Mg2+ and 1 mM TPP as cofactors. Initial PDC activities were 1.5 U/mL
carboligase for all systems (the two-phase system was associated with 3 U/mL activities
in the aqueous phase or 1.5 U/mL TRV (total reaction volume calculated by combining
the volumes of both phases)). Experiments on each system (with each biocatalyst) were
performed in triplicate and three to four analyses were repeated for each sample; the
mean values were determined and error bars show the highest and lowest values.

Chapter 2
Materials and Methods
Cindy Gunawan 2006 PhD Thesis
51
2.5.2 Effect of Organic to Aqueous Phase Volume Ratio on Two-Phase
Aqueous/Organic PAC Synthesis (2.5 M MOPS)
The selected yeast PDC from the first study was employed as the biocatalyst to improve
PAC production in the two-phase aqueous/octanol-benzaldehyde emulsion system by
changing the organic to aqueous phase volume ratio as detailed in Chapters 4 and 5.
Table 2.8 lists the types of biotransformation system employed and investigations
performed in the studies.
The studies were carried out at 10 mL scale in 20 mL glass vials (inner dia. 24 mm,
height 47 mm) at 4(±1)°C and 20(±1)°C and stirred magnetically (IKA®-Werke, Model
RO 5 power). All biotransformations employed 2.5 M MOPS buffer system with initial
pH of 6.5 and 1 mM Mg2+ and 1 mM TPP as cofactors. Three to four times analyses were
repeated for each sample; the mean values were determined and error bars show the
highest and lowest values.
2.5.3 Biotransformation Systems
For the aqueous (soluble benzaldehyde) and aqueous/benzaldehyde emulsion systems,
pyruvate and benzaldehyde were added into the buffer solution. For the two-phase
aqueous/octanol-benzaldehyde system, the phases were independently prepared: pyruvate
was dissolved into the buffer solution (aqueous phase) whilst benzaldehyde was
dissolved in octanol (organic phase). In all systems, PDC enzyme solution was prepared
separately and added at the start of biotransformations.
2.5.3.1 MOPS Buffer System
All biotransformations in the current studies employed MOPS buffer. High buffering
capacity was required as there was proton consumption during the biotransformation of
pyruvate and benzaldehyde to PAC (optimum pH for PDC was 6.5 – 7.5) [Rosche et al.
2002a]. Furthermore, Leksawasdi et al. [2005] reported that employment of 2.5 M MOPS
in the two-phase aqueous/octanol-benzaldehyde system was associated with higher
aqueous phase benzaldehyde levels in comparison to lower MOPS concentrations.

Chapter 2 Materials and Methods
Cindy Gunawan 2006 PhD Thesis
52
Table 2.8: Biotransformation systems employed in the characterization of the two-phase aqueous/octanol-benzaldehyde system for PAC
production (Chapters 4 and 5).
Biotransformation
system
Organic to
aqueous phase
volume ratio
[Octanol]
(mM)
[Benzaldehyde]
(mM)
[Pyruvate]
(mM)
PDC Enzyme
Carboligase Activity
(U/mL)
Stirrer Speed (rpm)**
Organic
(4°C/20°C)
TRV*
(4°C/20°C)
Aqueous
(4°C/20°C)
TRV*
(4°C/20°C)
Aqueous TRV*
Type
Investigation on the effect of organic to aqueous phase volume ratio in the two-phase aqueous/octanol-benzaldehyde emulsion system
for PAC production (4(±1)°C and 20(±1)°C)
Two-phase
aqueous/octanol
-benzaldehyde
1:1 Benzaldehyde and
octanol creating a
second phase
1360/1400 680/700 1260/1290 630/645 5.6 2.8 Partially purified 250 – 235
0.67:1 As above 1700/1760 680/705 1060/1075 635/645 4.7 2.8 Partially purified 235 – 220
0.43:1 As above 2270/2470 680/740 930/920 650/645 4.0 2.8 Partially purified 220 – 205
0.25:1 As above 3475/3625 695/725 800/800 640/640 3.5 2.8 Partially purified 205 – 175
* Total reaction volume (TRV) by combining both phases. ** The systems were stirred at the higher speed initially; the speed was then decreased following volume reduction after sampling.

Chapter 2 Materials and Methods
Cindy Gunawan 2006 PhD Thesis
53
Despite the advantages offered by the high MOPS concentration, MOPS is an expensive
material. Studies were also performed to evaluate PAC formation at a much lower MOPS
concentration of 20 mM (Chapter 5).
The MOPS buffer was prepared by dissolving the powder in RO water at room
temperature. The solution was adjusted to the desired working pH (6.5 – 7) with 10 M
KOH for 2.5 M MOPS and 5 M KOH for 20 mM MOPS. The buffer solution was stored
at 4°C prior to usage.
2.5.3.2 Aqueous (Soluble Benzaldehyde) and Aqueous/Benzaldehyde Emulsion
Systems
2.5.3.2.1 Substrate and PDC Enzyme Concentrations
The aqueous soluble system contained less than 100 mM benzaldehyde, whereas the
aqueous/benzaldehyde emulsion system contained more than 100 mM benzaldehyde.
Pyruvate concentration was usually determined to be similar or 1.5 times of the
benzaldehyde concentration to minimize the possibility of pyruvate limitation. PDC
activities were in the range of 1.5 – 2.8 U/mL carboligase. The substrate to enzyme stock
solution volume ratio was 4 parts of substrate to 1 part of enzyme making up the
biotransformation system.
2.5.3.2.2 Substrate Stock Solution Preparation
Pyruvate was dissolved in the buffer solution at room temperature. The pH was adjusted
at the biotransformation temperature to 6.5 – 7 with 6.4 % HCl (pyruvate addition tends
to increase the pH). Pyruvate concentration was measured by enzymatic assay and any
insufficiency was corrected (pyruvate addition might have required further pH
adjustment). The pyruvate solution was stored at 4°C prior to usage.
Benzaldehyde (97 – 99% purity) was transferred into the pyruvate solution at room
temperature: fully dissolved for the aqueous system and suspended for the
aqueous/benzaldehyde emulsion system (any dilution on the pyruvate solution was

Chapter 2 Materials and Methods
Cindy Gunawan 2006 PhD Thesis
54
insignificant since pure benzaldehyde was used). The benzaldehyde was added on the day
of biotransformation to avoid evaporative losses. The cofactors Mg2+ and TPP were
added prior to benzaldehyde addition. The container was then wrapped in foil, purged
with nitrogen gas and stored at 4°C prior to usage. Benzaldehyde concentration was
measured by HPLC and any insufficiency corrected.
In the case of acetaldehyde addition, a 5 µL microsyringe was used to add pure
acetaldehyde on the day of biotransformation in a 5°C constant temperature room since
acetaldehyde is very volatile (boiling point 20°C at 1 atm). Enzymatic assay was
performed immediately to determine the acetaldehyde concentration.
2.5.3.3 Two-Phase Aqueous/Octanol-Benzaldehyde System
2.5.3.3.1 Substrate and PDC Enzyme Concentrations
For the organic phase, the concentration of the stock substrate solution was determined
by taking into account the phase volume ratio. For the aqueous phase, the concentrations
of the stock substrate and enzyme solutions were determined by taking into account both
the phase volume ratio and substrate to enzyme stock solution volume ratio. The substrate
(pyruvate only) to enzyme stock solution volume ratio was similar to that in Section
2.5.3.2.1.
2.5.3.3.2 Substrate Stock Solution Preparation
To prepare the organic phase, benzaldehyde was dissolved in octanol on the day of
biotransformation at room temperature. The container was wrapped in foil, purged with
nitrogen gas and stored at 4°C prior to usage. Benzaldehyde concentration was measured
by HPLC and any insufficiency corrected. For the aqueous phase, the same method as in
Section 2.5.3.2.2 was used to dissolve the pyruvate. The cofactors 1 mM Mg2+ and 1 mM
TPP were added into the aqueous phase on the day of biotransformation.

Chapter 2 Materials and Methods
Cindy Gunawan 2006 PhD Thesis
55
2.5.3.4 PDC Enzyme Stock Solution Preparation
2.5.3.4.1 Whole Cell PDC Solution
Frozen wet cell pellets from the fermentation processes were thawed in a 25°C water
bath. The pellet was then suspended in the corresponding MOPS buffer with added 1 mM
Mg2+ and 1 mM TPP cofactors. The suspension was diluted and subjected to carboligase
assay to determine the PDC carboligase activity. The suspension was stored at –20°C
prior to usage and adjusted to the relevant PDC activity.
2.5.3.4.2 Crude Extract PDC Solution
The crude extract was diluted and subjected to carboligase assay, then adjusted to the
relevant PDC activity.
2.5.3.4.3 Partially Purified PDC Solution
Partially purified PDC powder was suspended in the corresponding MOPS buffer with
added 1 mM Mg2+ and 1 mM TPP cofactors, stirred overnight at 125 rpm (Bibby, Model
B292) in a 5°C constant temperature room. The enzyme solution was isolated by
centrifugation (Hettrich Zentrifugen, Model Universal 32R) at 5,000 rpm for 5 mins at
4°C. The solution was diluted and subjected to carboligase assay. The enzyme solution
was stored at -20°C prior to usage and adjusted to the relevant PDC activity.
2.5.4 Biotransformation Experiments
2.5.4.1 Set Up of Biotransformation Systems
The substrate stock solution was incubated in a 25°C water bath for biotransformations at
20°C and 22°C or stored in ice for biotransformations at 4°C. The substrate stock solution
was transferred into vials with magnetic bars and stirred in a constant temperature room.
For the aqueous and aqueous/benzaldehyde emulsion systems, relatively high stirring
speed was immediately employed as to achieve homogeneity. For the two-phase

Chapter 2 Materials and Methods
Cindy Gunawan 2006 PhD Thesis
56
aqueous/octanol-benzaldehyde system, low stirring speed was first employed as to keep
the two phases separate and to allow certain degree of organic-aqueous benzaldehyde
transfer.
After approx. 30 min of stirring, enzyme stock solution was added. For the aqueous and
aqueous/benzaldehyde emulsion systems, the enzyme stock solution was directly added
to the stirring substrate stock solution. For the two-phase system, the enzyme was added
to the aqueous phase by deeply immersing the pipette tip. For all systems, the stirring
speed was increased to the operating speed after enzyme addition.
2.5.4.2 Controls
For each type of biotransformation system, a control experiment was established. A
control contained the same concentrations of substrates without the enzyme. The roles of
control were: (I) confirmation of initial benzaldehyde and pyruvate concentrations, (II)
determination of benzaldehyde and pyruvate loss in the absence of reaction and (III)
determination of benzoic acid build up (from oxidation of benzaldehyde). These values
were determined for material balance purposes.
2.5.4.3 Sampling
Sampling was carried out for both control and reaction vials. For the control, samples
were taken at the beginning and end of reaction. Samples from reaction vials were treated
with tricholoroacetic acid (TCA) (100% w/v) to stop the biotransformation. For the two-
phase aqueous/octanol-benzaldehyde system, all samples were centrifuged (Hettrich
Zentrifugen, Model Universal 32R) at 13,000 rpm for 5 mins at 4°C to separate the
phases and TCA was then added to the aqueous phase.
All samples were stored at –20°C prior to further treatment and measurements. PAC,
benzoic acid and benzaldehyde concentrations were measured by HPLC (Section 2.8.8).
Pyruvate and by-product acetaldehyde concentrations were quantified enzymatically
(Sections 2.8.6 and 2.8.7). By-product acetoin concentration was measured by GC

Chapter 2 Materials and Methods
Cindy Gunawan 2006 PhD Thesis
57
(Section 2.8.9). Table 2.9 lists the treatment and measurements performed on the samples
from different types of biotransformation system.
2.5.5 Determination of Residual PDC Enzyme Activities in Biotransformation
Systems
To determine the residual enzyme activities from a biotransformation system, filtration of
the sample through a gel column (Micro Bio-Spin® 6 Chromatography Column, Bio-
Rad, Cat. No. 732-6200) was necessary for PAC removal. The PDC containing solution
was recovered by centrifugation (Hettrich Zentrifugen, Model Universal 32R) at 1,000 g
for 2 mins at 4°C, trapped in collection buffer and incubated in ice for 20 mins refolding
time. The solution was diluted and subjected to carboligase assay. The residual enzyme
activities were determined from the formed PAC and with respect to 100% activity at
time zero. In the case of a two-phase aqueous/octanol-benzaldehyde system, the enzyme
was contained in the aqueous phase.

Chapter 2 Materials and Methods
Cindy Gunawan 2006 PhD Thesis
58
Table 2.9: Treatment and types of measurement performed on the biotransformation samples. System Measurement Treatment
Substance Dilution Factor (approx.)
Aqueous Phase Control 1 Benzaldehyde, Benzoic
Acid 5 Sampled from stirring vials into tubes filled with RO water for the
dilution factor
2 Pyruvate 20 Further dilution from (1) with RO water
Reaction 3 PAC, Benzaldehyde, Benzoic acid
5 Sampled from stirring vials into tubes filled with 2.5% (v/v) TCA for the dilution factor
4 Pyruvate 20 Further dilution from (3) with RO water
5 Acetaldehyde * Further dilution from (3) with RO water
6 Acetoin * Further dilution from (3) with RO water
Benzaldehyde Emulsion
Control 7 Benzaldehyde, Benzoic Acid
10 – 50 Same method as (1)
8 Pyruvate 100 – 300 Further dilution form (7) with RO water
Reaction 9 PAC, Benzaldehyde, Benzoic acid
10 – 50 Same method as (3)
10 Pyruvate 100 – 300 Further dilution from (9) with RO water
11 Acetaldehyde
* Further dilution from (9) with RO water
12 Acetoin * Further dilution from (9) with RO water

Chapter 2 Materials and Methods
Cindy Gunawan 2006 PhD Thesis
59
Table 2.9 (Continued): Treatment and types of measurement performed on the biotransformation samples. System Measurement Treatment
Substance Dilution Factor (approx.)
Aqueous/Octanol Two-Phase
Control
Octanol Phase 13 Benzaldehyde, Benzoic Acid 100 – 200 Dilution with RO water
Aqueous Phase 14 Pyruvate 300 Same method as (13)
Reaction
Octanol Phase 15 PAC, Benzaldehyde, Benzoic acid 100 – 200 Same method as (13)
16 Acetaldehyde * Same method as (13)
17 Acetoin * Same method as (13)
Aqueous Phase 18 PAC, Benzaldehyde
11
Addition of 10% (v/v) of 100% (w/v) TCA into the aqueous phase Diluted to the dilution factor with RO water
19 Pyruvate
110 – 330 Diluted to the dilution factor with RO water from the TCA added sample
20 Acetaldehyde * Same method as (19)
21 Acetoin
* Same method as (19)
* Dilution factor was determined from the material balance on pyruvate utilization

Chapter 2 Materials and Methods
Cindy Gunawan 2006 PhD Thesis
60
2.6 PDC Enzyme Deactivation and Organic-Aqueous Benzaldehyde
Transfer Studies in the Two-Phase Aqueous/Octanol-Benzaldehyde
System
Intensive studies were performed on the two types of the two-phase aqueous/octanol-
benzaldehyde: the slowly stirred phase-separated and the rapidly stirred emulsion
systems (Chapter 4) regarding factors influencing PDC enzyme deactivation and organic-
aqueous benzaldehyde transfer. A Lewis cell phase-separated system was constructed and
equipped with a temperature control system. The emulsion system was constructed using
a magnetically stirred glass vial in a constant temperature room.
2.6.1 Construction of the Aqueous/Organic Phase-Separated System – A
Temperature Controlled Lewis Cell System
2.6.1.1 Lewis Cell Construction
A Lewis cell in its original version was a device employed to study the interfacial
interaction in a gas-liquid system [Lewis, 1954] and the current investigation adopted a
modified design of the cell [Baldascini et al., 2000].
The Lewis cell used in the present experiment was a glass cylinder with 75 mm inner
diameter and height, which consisted of two compartments: top and bottom parts to
contain 92 – 94 mL of organic and aqueous phase respectively. In the middle, a movable
plate with different hole-sizes was inserted allowing a range of aqueous/organic contact
areas. The phases were independently stirred to achieve homogeneity within each phase
The cell was equipped with a top metal plate lined with rubber O-ring. A middle metal
plate with different openings and attached baffles (to enhance mixing) was fitted into the
cylinder. Two holes were drilled through the top and middle plates to the bottom part of
the cell (aqueous phase) and one hole through the top plate to the top part of the cell
(organic phase) for syringes (3 ml, Becton Dickinson, Cat. No. 639461) (with needles
18G x 1½ inches, Terumo) insertions. The functions of the holes were different

Chapter 2 Materials and Methods
Cindy Gunawan 2006 PhD Thesis
61
depending on the nature of the studies. In the PDC deactivation study, the two aqueous
phase holes were used to transfer the enzyme solution and for sampling purposes. In the
benzaldehyde transfer study, the organic phase hole was used to transfer pure
benzaldehyde and the two aqueous phase holes were used for sampling purposes.
Another hole was drilled through the top plate to accomodate a metal stirrer with a 4
bladed impeller to the organic phase. The Lewis cell was fitted into a transparent
rectangular container filled with water and the container was placed on a magnetic stirrer
(Bibby, Model HC1202). A magnetic bar was placed in the aqueous phase. A diagram of
the Lewis cell is shown in Fig 2.5.
Middle Plate
Baffle
Magnetic Bar
Syringe
Top Plate
Overhead Stirrer Shaft
Middle Plate
Baffle
Magnetic Bar
Syringe
Top Plate
Overhead Stirrer Shaft
Figure 2.5: Lewis Cell for experimentation on the aqueous/organic phase-separated
system.
2.6.1.2 Temperature Control System
A temperature control system was necessary as a relatively large working volume was
employed. Additionally, the system could not be placed inside a constant temperature
water bath since it must be visible for easier maintenance of the defined interfacial area.
The temperature control system comprised of a metal sensor inserted into the Lewis cell.
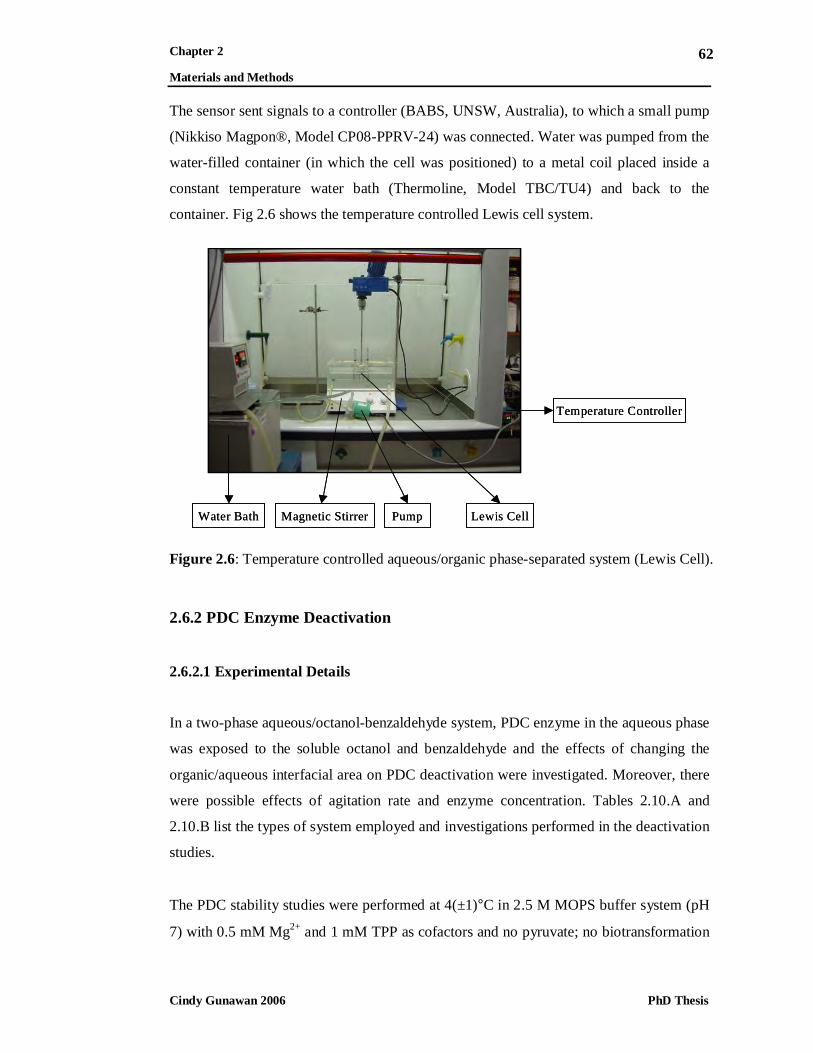
Chapter 2 Materials and Methods
Cindy Gunawan 2006 PhD Thesis
62
The sensor sent signals to a controller (BABS, UNSW, Australia), to which a small pump
(Nikkiso Magpon®, Model CP08-PPRV-24) was connected. Water was pumped from the
water-filled container (in which the cell was positioned) to a metal coil placed inside a
constant temperature water bath (Thermoline, Model TBC/TU4) and back to the
container. Fig 2.6 shows the temperature controlled Lewis cell system.
Temperature Controller
Pump Lewis CellWater Bath Magnetic Stirrer
Temperature Controller
Pump Lewis CellWater Bath Magnetic Stirrer
Figure 2.6: Temperature controlled aqueous/organic phase-separated system (Lewis Cell).
2.6.2 PDC Enzyme Deactivation
2.6.2.1 Experimental Details
In a two-phase aqueous/octanol-benzaldehyde system, PDC enzyme in the aqueous phase
was exposed to the soluble octanol and benzaldehyde and the effects of changing the
organic/aqueous interfacial area on PDC deactivation were investigated. Moreover, there
were possible effects of agitation rate and enzyme concentration. Tables 2.10.A and
2.10.B list the types of system employed and investigations performed in the deactivation
studies.
The PDC stability studies were performed at 4(±1)°C in 2.5 M MOPS buffer system (pH
7) with 0.5 mM Mg2+ and 1 mM TPP as cofactors and no pyruvate; no biotransformation

Chapter 2 Materials and Methods
Cindy Gunawan 2006 PhD Thesis
63
taking place under these conditions. All samples were diluted and subjected to
carboligase assay. The residual enzyme activities were determined from the PAC formed
and with respect to 100% activity at time zero. Triplicate analyses were conducted for
each sample and except for the Lewis cell study, experiments were performed in
triplicate; the mean values were determined and error bars show the highest and lowest
values.
Aqueous-based and two-phase aqueous/organic systems were employed in the study. In
the latter case, the enzyme was contained in the aqueous phase, centrifugation (Hettrich
Zentrifugen, Model Universal 32R) at 13,000 rpm for 5 mins at 4°C was necessary for
aqueous phase isolation.
Table 2.10.A: Aqueous-based and two-phase aqueous/organic systems employed in the
PDC enzyme deactivation studies (Chapter 4).
Aqueous-based system Two-phase aqueous/organic system
I MOPS as control
II MOPS + 4.5 mM octanol
III MOPS + 48 mM benzaldehyde
IV MOPS + 4.5 mM octanol
+ 48 mM benzaldehyde
V Phase-separated system
Organic phase: 1.39 M benzaldehyde in
octanol
Aqueous phase: MOPS + 4.5 mM octanol +
48 mM benzaldehyde
VI Emulsion system
Organic phase: octanol
Aqueous phase: MOPS + 4.5 mM octanol

Chapter 2 Materials and Methods
Cindy Gunawan 2006 PhD Thesis
64
Table 2.10.A (continued): Aqueous-based and two-phase aqueous/organic systems
employed in the PDC enzyme deactivation studies (Chapter 4).
Aqueous-based system Two-phase aqueous/organic system
VII Emulsion system
Organic phase: 1.33 M benzaldehyde in
octanol
Aqueous phase: MOPS + 4.5 mM octanol +
48 mM benzaldehyde
VIII Phase-separated system
Organic phase: 1.46 M benzaldehyde in
octanol
Aqueous phase: MOPS + 4.5 mM octanol +
48 mM benzaldehyde
IX Emulsion system
Organic phase: 1.46 M benzaldehyde in
octanol
Aqueous phase: MOPS + 4.5 mM octanol +
48 mM benzaldehyde

Chapter 2 Materials and Methods
Cindy Gunawan 2006 PhD Thesis
65
Table 2.10.B: Performed investigations in the PDC enzyme deactivation studies (Chapter 4).
* Total reaction volume (TRV) by combining both phases. Investigation System PDC enzyme
carboligase activity
(U/mL)
Stirrer
speed
(rpm)
Specific
interfacial
area
(cm2/L)
Effect of soluble octanol I and II 2 220 -
Effect of soluble benzaldehyde
I and III 2 220 -
Effect of soluble octanol and
benzaldehyde
I and IV 2 220 -
Effect of agitation rate and initial enzyme concentration
In the presence of MOPS (Chapter 3) I 3 and 7.3 95 and
220
-
In the presence of soluble benzaldehyde
(Chapter 3)
III 3 and 7.3 95,220
and 250
-
In the presence of soluble octanol and
benzaldehyde
IV 2 125 and
220
-
Investigation System PDC enzyme
carboligase activity
(U/mL)
Stirrer
speed
(rpm)
Specific
interfacial
area
(cm2/L)
Aqueous TRV*
Effect of interfacial area
In the two-phase phase-separated
system
V 4 2 Organic:
60
Aqueous:
125
117,361,475
In the two-phase emulsion system
I,II,IV
- 2 220 -
V I and
VII
4 2 220 Undefined
Effect of initial enzyme concentration
In the two-phase phase-separated
system
VIII 3.1,5.5,8.6
and 11.9
1.5,2.7,4.3
and 5.9
125 475
In the two-phase emulsion system IX 1.6,4.1,7.1
and 11.6
0.8,2.0,3.5
and 5.8
220 Undefined

Chapter 2 Materials and Methods
Cindy Gunawan 2006 PhD Thesis
66
2.6.2.2 Effects of Soluble Octanol and Benzaldehyde in the Aqueous Phase and
Agitation Rate on PDC Deactivation
The investigations were carried out at 2 mL scale in 4 mL glass vials (inner dia. 12.5 mm,
height 35 mm) and magnetically stirred (Bibby, Model B292). To investigate the effects
of soluble octanol and benzaldehyde, systems (I) to (IV) were employed (Tables 2.10.A
and 2.10.B). All systems were prepared by first dissolving 2.5 M MOPS into RO water
with pH adjusted to 7 with 10 M KOH. System II was prepared by saturating the MOPS
solution with octanol at 4(±1)°C. System IV was prepared by saturating the MOPS
solution with 1.5 M benzaldehyde in octanol in 1:1 phase volume ratio at 4(±1)°C.
System III was prepared by dissolving the same concentration of benzaldehyde as system
IV into the MOPS solution at room temperature. To investigate the effect of agitation
rate, systems I, III, and IV (Tables 2.10.A and 2.10.B) were employed.
PDC enzyme powder was suspended into the systems by wheel rotation at 35 rpm for 1 h
at 4(±1)°C. The resulting suspension was centrifuged (Hettrich Zentrifugen, Model
Universal 32R) at 2,800 g for 5 mins at 4°C to isolate the supernatant.
2.6.2.3 Effect of Ratio of Organic Phase Interfacial Area to Aqueous Phase Volume
on PDC Deactivation
The PDC stability studies were performed in two-phase aqueous/octanol-benzaldehyde
system, comparing the phase-separated and emulsion systems.
2.6.2.3.1 Studies with a Phase-Separated System
The investigations were performed in system V (Tables 2.10.A and 2.10.B) in
temperature controlled Lewis cell system with defined changes in the organic phase
contact area to aqueous phase volume ratio. A relatively small top metal stirrer was used
(BABS, UNSW, Australia) (stirrer dia. 11 mm, shaft dia. 5 mm, shaft length 23 mm) with
stirring in counter clockwise direction. A magnetic bar was placed in the aqueous phase,
stirring in clockwise direction. The aqueous phase comprised of octanol and

Chapter 2 Materials and Methods
Cindy Gunawan 2006 PhD Thesis
67
benzaldehyde saturated MOPS buffer system and concentrated enzyme solution was
added at the start of experiment.
For every volume of enzyme solution transferred into the aqueous phase, the same
volume of the MOPS solution must be withdrawn to maintain a defined interfacial area at
the hole. Later on, for each sample withdrawn, the same volume of the MOPS solution
was transferred into the aqueous phase. A dilution factor was hence included in the
residual enzyme activity calculations at each time point.
2.6.2.3.2 Studies with an Emulsion System
The investigations were carried out at 2 mL scale in the 4 mL glass vials and
magnetically stirred (Bibby, Model B292). Three types of aqueous-based system were
involved: system (I), (II), (IV) with the addition of two types of aqueous/organic system:
system (VI): a 1:1 two-phase system with system (II) as the aqueous phase and octanol as
the organic phase, and system (VII): a 1:1 two-phase system with system (IV) as the
aqueous phase and 1.33 M benzaldehyde in octanol as the organic phase (Tables 2.10.A
and 2.10.B). The PDC enzyme was added in similar manner as in Section 2.6.2.2. For the
two-phase system, the organic phase was added above the enzyme containing aqueous
phase.
2.6.2.4 Effect of Initial Enzyme Concentration on PDC Deactivation
Similar to the experiments on the effect of interfacial area, the PDC stability studies were
conducted in the phase-separated and emulsion two-phase systems. Both systems were
constructed by the 4 mL glass vials and magnetically stirred (Bibby, Model B292). The
investigations were performed in systems VIII and IX (Tables 2.10.A and 2.10.B). The
aqueous phase comprised of octanol and benzaldehyde saturated MOPS buffer system
and enzyme solution. PDC enzyme was added in similar manner as in Section 2.6.2.2.
The organic phase was added above the enzyme containing aqueous phase.

Chapter 2 Materials and Methods
Cindy Gunawan 2006 PhD Thesis
68
2.6.3 Estimation of Organic-Aqueous Benzaldehyde Transfer in Two-Phase
System
2.6.3.1 Experimental Details
In a two-phase aqueous/octanol-benzaldehyde system, PAC formation was affected by
benzaldehyde mass transfer rate from the organic to the aqueous phase. In the current
studies, there were investigations on the effects of organic phase contact area to aqueous
phase volume ratio, organic phase benzaldehyde concentration and temperature on the
mass transfer rate. The investigations were conducted in a similar temperature controlled
aqueous/organic phase-separated (Lewis cell) system as that described in Section 2.6.1.
The only difference was that in the benzaldehyde transfer study, a relatively large top
metal stirrer was used (IKA, Model RW 20n) with an R-1342 impeller (stirrer dia. 5 cm,
shaft dia. 0.8 cm, shaft length 35 cm) with stirring in clockwise direction. A magnetic bar
was also placed in the aqueous phase, stirring in clockwise direction.
The investigations were carried out at 4(±1)°C and 20(±1)°C in 2.5 M MOPS buffer
system with pH 7 and no cofactors, PDC enzyme and pyruvate. Samples were withdrawn
from the aqueous phase, diluted and measured by HPLC for benzaldehyde. Triplicate
analyses were conducted for each sample; the mean values were determined and error
bars show the highest and lowest values.
2.6.3.2 Organic-Aqueous Benzaldehyde Transfer Experiments
When the temperature of the system was maintained constant, pure benzaldehyde was
added into the octanol with a syringe. Samples were withdrawn from the aqueous phase
every min for the first 10 min, every 2 – 10 min for the next 80 min, and every 0.5 h for
the next 3.5 h. For every volume of sample withdrawn, the same volume of the MOPS
solution was added into the aqueous phase to maintain a flat interfacial area. A dilution
factor [((V initial at a previous time point + V MOPS added) / V initial at a previous time
point) x dilution factor at two previous time point] was therefore included in the
benzaldehyde concentration calculations at each time point.

Chapter 2 Materials and Methods
Cindy Gunawan 2006 PhD Thesis
69
2.7 Two-Phase Aqueous/Organic PAC Synthesis at Lower Buffer
Concentration (20 mM MOPS, Larger Scale)
Efforts were made to evaluate process parameters for the two-phase aqueous/octanol-
benzaldehyde synthesis of PAC at lower MOPS concentration of 20 mM (Chapter 5).
Whole cell biotransformations in emulsion system were conducted at various organic to
aqueous phase volume ratios, temperatures and there were evaluations on the effect of 2.5
M dipropylene glycol (DPG) as low cost additive [Leksawasdi et al., 2005]. Table 2.12
lists the types of biotransformation system employed and investigations performed in the
present studies. All biotransformations were temperature and pH controlled.
2.7.1 Experimental Details
The studies were carried out in 180 mL total volume of the organic and aqueous phases in
rapidly stirred emulsion with temperature and pH control. The same glass cylinder with
top metal plate (without the middle plate) and temperature control system as in Sections
2.6.1.1 and 2.6.1.2 were used; the construction of the pH control system was described
below.
Two extra holes were drilled through the top metal plate for insertion of the pH probe and
autoburette delivery tip. A relatively large overhead stirrer (IKA, Model RW 20n) with
R-1342 impeller (stirrer dia. 5 cm, shaft dia. 0.8 cm, shaft length 35 cm) was inserted
through the top plate and stirring at constant speed of 160 rpm. The biotransformations
were performed in a fume cupboard (Conditionaire International, Model 2000 series)
with the whole system shown in Fig 2.7.
In all biotransformations, 20 mM MOPS or 20 mM MOPS + 2.5 M DPG buffer systems
were used, pH was controlled at 7; cofactors were 1 mM Mg2+ and 1 mM TPP. The
organic and aqueous phases were prepared as in Section 2.5.3.3.2. Triplicate analyses
were conducted for each sample; the mean values were determined and error bars show
the highest and lowest values.

Chapter 2 Materials and Methods
Cindy Gunawan 2006 PhD Thesis
70
Table 2.11: Biotransformation systems employed in the two-phase aqueous/organic PAC synthesis with 20 mM MOPS buffer system (Chapter 5).
* Total reaction volume (TRV) by combining both phases. Organic to aqueous phase volume ratio [Benzaldehyde] (mM) [Pyruvate] (mM) PDC enzyme Temperature (°C)
Carboligase activity
(U/mL)
Organic TRV* Aqueous TRV* Aqueous TRV*
Type
Investigation on optimum operating temperature (20 mM MOPS buffer)
1:1 1600 800 980 490 2.0 1.0 Whole cell 4(±1)
1:1 1640 820 960 480 2.0 1.0 Whole cell 10(±1)
1:1 1640 820 950 475 2.0 1.0 Whole cell 15(±1)
1:1 1620 810 930 465 2.0 1.0 Whole cell 20(±1)
1:1 1620 810 950 475 2.0 1.0 Whole cell 25(±1)
1:1 1600 800 950 475 2.0 1.0 Whole cell 30(±1)
1:1 1610 805 940 470 2.0 1.0 Whole cell 35(±1)
Investigation on the effect of organic to aqueous phase volume ratio (20 mM MOPS buffer)
0.67:1 1950 780 715 430 1.7 1.0 Whole cell 20(±1)
0.43:1 2585 775 615 430 1.4 1.0 Whole cell 20(±1)
0.25:1 3900 780 510 410 1.2 1.0 Whole cell 20(±1)
Investigation on the effect of 2.5 M DPG addition (20 mM MOPS + 2.5 M DPG buffer)
Whole cells and partially purified PDC
0.25:1 3650 730 830 665 3.5 2.8 Whole cell 20(±1)
0.25:1 3600 720 785 630 3.5 2.8 Partially purified 20(±1)

Chapter 2 Materials and Methods
Cindy Gunawan 2006 PhD Thesis
71
The pH probe used was a combination pH electrode (Mettler Toledo, Cat. No. 10 465 4505)
with 1 M LiCl in acetic acid as electrolyte. The pH probe was inserted through the top metal
plate to the reaction system. The probe sent signals to a digital pH-stat controller
(Radiometer, Model PHM 290), which was connected to a 20 mL autoburette (Radiometer,
Model ABU901) with an antidiffusion delivery tip (Radiometer, Cat. No. 956-309) inserted
through the metal plate to the reaction system. The autoburette was able to deliver a
minimum dosing volume of 2.5 µL. The pH was controlled at 7 by 5 M acetic acid addition.
The horizon of the adaptive addition algorithm (AAA) of the pH-stat controller was set at 80.
Default time constant of 2 s was used.
2.7.2 Biotransformation Experiments
The substrate and enzyme stock solutions were incubated in ice for biotransformations at
4°C to 15°C or in 25°C water bath for biotransformations at 20°C to 35°C. When the
temperature of the system was maintained constant at the biotransformation temperature, the
enzyme solution was transferred into the reactor with a syringe. For each type of
biotransformation, there was one set of control. Samplings for the reaction systems were
performed using a syringe. Treatments and types of measurement performed on the samples
were listed in Table 2.9.

Chapter 2 Materials and Methods
Cindy Gunawan 2006 PhD Thesis
72
2.8 Analytical Methods
2.8.1 Determination of Cell Culture Optical Density (OD660)
The cell density in the fermentation culture was determined by measuring the absorbance of
the culture at 660 nm using a spectrophotometer (Pharmacia Biotech, Model Ultrospec 2000)
and a 4.5 mL disposable cuvette (Kartell, Cat. No. 1940). The linear range of the ratio
absorbance : biomass concentration was at an absorbance of 0.2 – 0.3; the culture was at
least 20 times diluted prior to measurements in this linear range.
2.8.2 Determination of Glucose concentration
The glucose concentration in the fermentation culture was determined by employing a
glucose and lactate analyser (YSI Model 2300 STAT PLUS). The analysis is based on the
following principle: the glucose is converted to glucono-δ-lactone and hydrogen peroxide
(H2O2); the reaction is catalyzed by an immobilized glucose oxidase enzyme; H2O2 then
diffuses across a membrane. H2O2 is reduced and a Pt anode is oxidized; the two half-
reactions generate a current, which is correlated to the glucose concentration. The samples
were contained in 1.5 mL eppendorf tubes and centrifuged at 13,000 rpm for 5 mins prior to
measurements to remove any impurities. The linear concentration range of glucose was up to
27.8 mM; samples with higher concentrations were diluted.
2.8.3 Determination of Dissolved Oxygen Concentration
The dissolved oxygen (DO) concentration in the fermentation culture was determined as
percentage air saturation using galvanic (BABS, UNSW, Australia) and polarographic
oxygen electrodes (Ingold Cat. No. 341003047). For both electrodes, the oxygen first
diffuses through a gas-permeable membrane; the oxygen is then reduced at the cathode. For
the galvanic electrode, a current generated from the reactions at the cathode and anode gives
rise to a detectable voltage, which is then correlated to DO level. By comparison, for the
polarographic electrode, a constant voltage is applied across the cathode and anode, which

Chapter 2 Materials and Methods
Cindy Gunawan 2006 PhD Thesis
73
gives rise to a detectable current [Bailey and Ollis 1986]. The electrodes were calibrated
against nitrogen then air prior to autoclaving.
2.8.4 Determination of Respiratory Quotient
The respiratory quotient (RQ) in the fermentation culture is described as the ratio of carbon
dioxide evolution rate (CER, mmol/L/h) over oxygen uptake rate (OUR, mmol/L/h). The
exhaust gas leaving the 30 L and 5 L fermenters was passed through a dehumidifier
(Komatsu Electronics Inc., Model DH 1052 G) before entering the online gas analysers,
which measured the O2 (Servomix type 1400A) and CO2 (Servomix-R type 1410)
concentrations in the exhaust gas. The RQ was calculated from these values and the gas flow
rates as shown in Table 2.13.
Table 2.12: Respiratory quotient (RQ) calculation for fermentation process.
Variables Descriptions Values
Fi Inlet flow (L / min)
Oi Concentration of inlet O2 (%) 20.9
Ci Concentration of inlet CO2 (%) 0.03
Ni Concentration of inlet inert gas (%) = 100 – Oi – Ci 79.07
Oe Concentration of exhaust O2 (%) (gas analyser 1400A)
Ce Concentration of exhaust CO2 (%) (gas analyser 1410)
Ne Concentration of exhaust inert gas (%) (100 – Oe – Ce)
Fe Exhaust flow (L / min) = Fi Ni / Ne
Vf Fermentor volume (L)
*K OUR Constant for OUR calculation (min mmol / (L h)) 26.44
*K CER Constant for CER calculation (min mmol / (L h)) 26.59
OUR Oxygen uptake rate (mmol / (L h)) = (Fi Oi – Fe Oe) x (KOUR / Vf)
CER Carbon dioxide evolution rate (mmol / (L h))
= (Fe Ce – Fi Ci) x (KCER / Vf)
RQ Respiratory quotient = CER / OUR
* [Sandford 2002]

Chapter 2 Materials and Methods
Cindy Gunawan 2006 PhD Thesis
74
2.8.5 Determination of Dry Biomass
Fermentation samples of 5 mL volume were transferred into a pre-weighed dry biomass tube
and centrifuged at 5,000 rpm for 5 mins. The supernatant was removed for glucose analysis;
the cell pellet was washed twice with RO water. The tube was then placed in a 108°C oven
overnight. The tube was weighed to determine the dry biomass.
2.8.6 Determination of Pyruvate Concentration
The pyruvate concentration was determined by an enzymatic lactate dehydrogenase (LDH)
assay. The analysis is based on the following principle: the pyruvate is reduced to L-lactate
with NADH oxidized to NAD+; NADH consumption is determined by difference in
absorbance at 340 nm before and after LDH addition.
Pyruvate L-lactate
NADH + H+ NAD+
Pyruvate L-lactate
NADH + H+ NAD+
The reaction was conducted for 8 mins in a buffered system in a 2.5 mL UV disposable
cuvette (Kartell, Cat. No. 1941) at room temperature. The mixture was mixed with a spatula.
The 340 nm absorbance of the mixture was recorded twice using a spectrophotometer
(Pharmacia Biotech, Model Ultrospec 2000): first, before the LDH addition and second, 8
mins after the addition. The linear concentration range of pyruvate was 0.5 – 5 mM; samples
with higher concentrations were diluted prior to measurements. Tables 2.14.A and 2.14.B
show the composition of the reaction mixture and the method of calculating the pyruvate
concentration respectively.

Chapter 2 Materials and Methods
Cindy Gunawan 2006 PhD Thesis
75
Table 2.13: Composition of the reaction mixture in pyruvate and acetaldehyde (Section
2.8.7) assays (modified from Czok and Lamprecht 1974).
Order of addition Volume (µL) Incubation during assay
Triethanolamine buffer 750 25°C water bath
NADH buffer 25 ice
Sample or RO water for blank 25 ice
LDH (550 U / mg) 5 ice
Table 2.14: Calculation method for pyruvate and acetaldehyde (Section 2.8.7)
concentrations.
Variables Descriptions
Ablank,i 340 nm absorbance reading of the blank before LDH addition
Asamp,i 340 nm absorbance reading of the sample before LDH addition
Ablank,8min 340 nm absorbance reading of the blank after 8 min of LDH addition
Asamp,8min 340 nm absorbance reading of the sample after 8 min of LDH addition
Asamp Asamp,8min – Asamp,,i
Ablank Ablank,8min – Ablank,i
A Asamp – Ablank
Vassay Final assay volume = 750 + 25 + 25 + 5 = 805 µL
Vsam Volume of blank or sample = 25 µL
λ Light path length = 1 cm
ε Extinction coefficient of NADH at 340 nm = 6300 L / (mol cm)
[Pyruvate]
[Acetaldehyde)
Pyruvate or acetaldehyde concentration (mM)
= (Vassay / Vsam) x A x (1 / (ελ)) x (1000 mmol / mol) = 5.111 x A
2.8.7 Determination of Acetaldehyde Concentration
The acetaldehyde concentration was determined by an enzymatic alcohol dehydrogenase
(ADH) assay. The principle was similar to the pyruvate assay: the acetaldehyde is reduced to
ethanol with NADH oxidized to NAD+; NADH consumption is determined by difference in
absorbance at 340 nm before and after ADH addition.

Chapter 2 Materials and Methods
Cindy Gunawan 2006 PhD Thesis
76
Acetaldehyde Ethanol
NADH + H+ NAD+
Acetaldehyde Ethanol
NADH + H+ NAD+
The reaction was conducted in similar fashion as Section 2.8.6. The linear concentration
range of acetaldehyde was 1 – 2.5 mM. RO water was used to extract acetaldehyde from the
organic phase with at least 20 times dilution. For the composition of the reaction mixture and
the method of calculating the acetaldehyde concentration, refer to Table 2.14.A and 2.14.B
previously. The acetaldehyde detected was only an approximation with regards to its real
value in the biotransformation system as acetaldehyde is very volatile with boiling point of
20°C at 1 atm.
2.8.8 Determination of PAC, Benzoic Acid, Benzaldehyde and Benzyl Alcohol
Concentrations
The concentrations of PAC, benzoic acid, benzaldehyde and benzyl alcohol were measured
using a High Pressure Liquid Chromatography (HPLC) system (Fig 2.8) as described by
Rosche et al [2001]. PAC, benzoic acid and benzaldehyde were detected at 283 nm and
benzyl alcohol at 263 nm. The samples were centrifuged at 13,000 rpm for 5 mins at 4°C
prior to measurements to remove any impurities. A standard curve was constructed for each
component to correlate the peak areas on the chromatogram to known concentrations. The
concentration ranges of the standards were 0.6 – 19 mM for PAC, 1.5 – 7 mM for benzoic
acid and 6 – 25 mM for benzaldehyde (benzyl alcohol was not detected in any of the
samples). Samples with higher concentrations were diluted. RO water was used to extract the
components from the organic phase with at least 100 times dilution. The mobile phase was
composed of 32% (v/v) acetonitrile and 0.5% (v/v) acetic acid and was prepared by using
milli-Q water and a detergent free glass cylinder. Component specifications and operating
conditions are listed in Table 2.15.

Chapter 2 Materials and Methods
Cindy Gunawan 2006 PhD Thesis
77
Table 2.15: Component specifications and operating conditions of the HPLC system for
quantification of PAC, benzoic acid, benzaldehyde and benzyl alcohol.
C8 Column (Alltech, AlltimaTM C8)
Particle size 5 µm
Column length 15 cm
Column internal diameter 4.6 mm
Guard column (Alltech, Alltima All-guardTM )
Particle size 5 µm
Column length 7.5 mm
Column internal diameter 4.6 mm
Oven type Column oven (Shimadzu, CTO-10AS VP)
Oven temperature Room temperature
Injector type Autoinjector (Shimadzu, SIL-10AD VP)
Pump type Liquid chromatograph (Shimadzu, LC-10AT
VP)
Pump operation Isocratic flow of 1 ml / min
Detector type Diode array detector (Shimadzu, SPD-M10A
VP)
System pressure 1000 – 2000 psi, column threshold 3000 psi
Injection volume 5 µL
Running time 20 min (retention times were 4.5 – 5.5 min, 5.5 – 6.5 min, 7.5 – 8.5 min for PAC, benzoic acid, benzaldehyde respectively.
2.8.9 Determination of Acetoin Concentration
Acetoin concentration was measured using a Gas Chromatography (GC) system (Packard,
Model 427). The samples were centrifuged at 13,000 rpm for 5 mins prior to measurements
to remove any impurities. A standard curve was constructed to correlate the peak areas on
the chromatogram to known concentrations. The concentration range of the standard was 0.1
– 15 mM; samples with higher concentrations were diluted. RO water was used to extract
acetoin from the organic phase with at least 20 times dilution. The mobile phase was

Chapter 2 Materials and Methods
Cindy Gunawan 2006 PhD Thesis
78
nitrogen at 25 psig with mixture of air and hydrogen as ignition source. Component
specifications and operating conditions are listed in Table 2.16.
Table 2.16: Component specifications and operating conditions of the GC system for
quantification of acetoin concentration.
Column (Alltech)
Packing material 10% carbowax® on chromsorb® W-AW
Column mesh range 80 – 100 µm
Column length 3.6 m
Column internal diameter 3.2 mm
Oven temperature 150°C
Injector temperature 175°C
Detector temperature 175°C
Detector type Flame ionisation detector (FID) with hydrogen (15 psig) and air (15
psig)
Operation Isotherm
Injection volume 3 µL
Running time 20 min (retention time was 2 – 2.5 min).
2.8.10 Determination of Soluble Octanol Concentration
The soluble octanol concentration (in the aqueous phase of two-phase aqueous/octanol-
benzaldehyde system) was determined by using a capillary GC with CP-SIL 5 CB column
(chrompack, 47 m x 0.25 µm thin film) operating at 100°C for 5 mins then ramped up to
240°C at 40°C/min, detector and injector temperature of 250°C, mobile phase was nitrogen at
25 psig with mixture of air and hydrogen as ignition source.
The soluble octanol was extracted from the 2.5 M MOPS buffer system with chloroform (n-
decane as internal standard). Octanol standard solutions were prepared with isopropanol,
mixed with the 2.5 M MOPS buffer and extracted with chloroform; the concentration range of
the standard was 2.3 – 20 mM octanol.

Chapter 2 Materials and Methods
Cindy Gunawan 2006 PhD Thesis
79
2.8.11 Determination of PDC Enzyme Carboligase Activity
The PDC carboligase activity was determined by a method described by Rosche et al. [2002]
as carboligase assay. Into the PDC containing sample, an equal volume of carboligase buffer
was added; the mixture was vortexed for 0.5 s and incubated for 20 min in 25°C water bath.
Biotransformation of benzaldehyde and pyruvate to PAC would take place. The reaction was
stopped by addition of 10% volume (10 – 100 µL depending on the volumes of the samples)
of 100% (w/v) trichloroacetic acid (TCA). The mixture was incubated in ice for 5 min prior
to centrifugation at 13,000 rpm for 5 mins at 4°C to remove precipitated proteins. The PAC
formed was measured by HPLC. One unit of PDC carboligase activity was defined as the
amount of enzyme needed to form 1.0 µmol of PAC from benzaldehyde and pyruvate in one
minute at 25°C and pH 6.4 [Rosche et al., 2002]. The linear range of carboligase activity was
0.2 – 0.6 U/mL; samples with higher concentrations were diluted. Table 2.17 shows the
method of calculating the PDC carboligase activity.
Table 2.17: Calculation method for PDC carboligase activity.
Variable Description
Vsamp Sample volume = 100 µL
Vbuff Carboligase buffer volume = 100 µL
VTCA 100% (v/v) trichloroacetic acid volume = 20 µL
DFassay Dilution factor for the assay = total volume / sample volume
= (100 µL + 100 µL + 20 µL) / 100 µL = 2.2
[PAC] PAC concentration formed (mM)
t Assay time = 20 min
Ecarboligase PDC carboligase activity = [PAC] x DFassay / t
= [PAC] x 0.11 (U carboligase / mL)
2.9 Calculations Methods
2.9.1 Specific PDC Production
Specific PDC production=PDC activity in the fermentation sample (U/mL)
Dry biomass (g/mL)Specific PDC production=
PDC activity in the fermentation sample (U/mL)
Dry biomass (g/mL)
2.1

Chapter 2 Materials and Methods
Cindy Gunawan 2006 PhD Thesis
80
2.9.2 Biotransformations Systems
2.9.2.1 Substrate and PDC Enzyme Stock Solution Concentrations
Table 2.18: Method for calculating substrate and PDC enzyme stock solution concentration
in setting up the biotransformation systems.
Variable Description
[Pyruvate]sys [Benzaldehyde]sys
[PDC]sys
Pyruvate, benzaldehyde, PDC concentrations in the biotransformation system
Rsubs/enz Substrate : enzyme stock solution volume ratio = 4
Aqueous (soluble benzaldehyde) and aqueous/benzaldehyde emulsion systems
[Pyruvate]stock Pyruvate concentration in the substrate stock solution = [Pyruvate]sys x (Rsubs/enz + 1) / Rsubs/enz = [Pyruvate]sys x 1.25
[Benzaldehyde]stock Benzaldehyde concentration in the substrate stock solution = [Benzaldehyde]sys x (Rsubs/enz + 1) / Rsubs/enz = [Benzaldehyde]sys x 1.25
[PDC]stock PDC concentration in the enzyme stock solution = [PDC]sys x (Rsubs/enz + 1) = [PDC]sys x 5
Two-phase aqueous/octanol-benzaldehyde system
Rorg/aq Organic : aqueous phase volume ratio
[Pyruvate]TRV [Benzaldehyde]TRV
[PDC]TRV
Pyruvate, benzaldehyde, PDC concentrations in the biotransformation system by combining both phases (total reaction volume)
[Pyruvate]stock = [Pyruvate]TRV x (Rorg/aq + 1) x (Rsubs/enz + 1) / Rsubs/enz = [Pyruvate]TRV x (Rorg/aq + 1) x 1.25
[Benzaldehyde]stock = [Benzaldehyde]TRV x (Rorg/aq + 1) / Rrgt/aq
[PDC]stock
= [PDC]TRV x (Rorg/aq + 1) x (Rsubs/enz + 1) = [PDC]TRV x (Rorg/aq + 1) x 5

Chapter 2 Materials and Methods
Cindy Gunawan 2006 PhD Thesis
81
2.9.2.2 PAC and By-Product Formation
2.9.2.2.1 Concentrations
In the aqueous (soluble benzaldehyde) and aqueous/benzaldehyde emulsion systems, the
calculation on the concentrations of PAC and by-products formed did not include a different
phase factor. In the two-phase aqueous/octanol-benzaldehyde system, the concentrations
could be expressed as the aqueous phase, organic phase and the total reaction volume
concentrations by combining volumes of both phases (Table 2.19).
Table 2.19: Method for calculating PAC and by-product concentrations in two-phase
aqueous/octanol-benzaldehyde system.
Variable Description
[X] aq
[X] org
[X] TRV
PAC or by-product concentration in the aqueous phase, organic phase and the total
reaction volume by combining both phases
[X] TRV = ([X]aq + [X]org Rorg/aq) / (Rorg/aq + 1)
2.9.2.2.2 PAC Productivity
PAC Productivity =PAC concentration (mM or g/L)
Biotransformation period (h)PAC Productivity =
PAC concentration (mM or g/L)
Biotransformation period (h)
2.9.2.2.3 PAC Enzyme Efficiency (Specific PAC Production)
PAC Enzyme Efficiency =PAC concentration (mg/mL)
PDC enzyme activity (U/mL)PAC Enzyme Efficiency =
PAC concentration (mg/mL)
PDC enzyme activity (U/mL)
2.9.2.2.4 Yield on substrates
YPAC/Benzaldehyde(ini) or
YPAC/Benzaldehyde(cons)
=PAC concentration (mM)
Initial or consumed benzaldehyde concentration (mM)
YPAC/Benzaldehyde(ini) or
YPAC/Benzaldehyde(cons)
=PAC concentration (mM)
Initial or consumed benzaldehyde concentration (mM)
2.2
2.3
2.4

Chapter 2 Materials and Methods
Cindy Gunawan 2006 PhD Thesis
82
YPAC/Pyruvate(ini) or
YPAC/Pyruvate(cons)
=PAC concentration (mM)
Initial or consumed pyruvate concentration (mM)
YPAC/Pyruvate(ini) or
YPAC/Pyruvate(cons)
=PAC concentration (mM)
Initial or consumed pyruvate concentration (mM)
2.9.2.2.5 Material Balances
The material balance was performed on the substrate benzaldehyde and pyruvate. Tables
2.20.A and 2.20.B demonstrate the calculation method for unaccounted benzaldehyde and
pyruvate respectively.
Table 2.20.A: Calculation method for unaccounted benzaldehyde in the biotransformation
systems.
Variable Description
[Benzaldehyde]sys,i Initial benzaldehyde concentration in the biotransformation system
= [Benzaldehyde]control,i
[Benzaldehyde]sys,e Benzaldehyde concentration at the end of biotransformation
[Benzaldehyde]control,i Initial benzaldehyde concentration in the control
[Benzaldehyde]control,e Benzaldehyde concentration at the end of biotransformation in the control
[Benzaldehyde]lost Benzaldehyde lost (possibly through evaporation)
= [Benzaldehyde]control,i - [Benzaldehyde]control,e
[Benzoic acid]control,i Initial benzoic acid concentration in the control
[Benzoic acid]sys,e Benzoic acid concentration at the end of biotransformation
[Benzoic acid]prod Benzoic acid produced = [Benzoic acid]sys,e - [Benzoic acid]control,i
[PAC]sys PAC produced
[Benzaldehyde]utilized Benzaldehyde utilized = [PAC]sys + [Benzoic acid]prod
[Benzaldehyde]unacc Unaccounted benzaldehyde
= ([Benzaldehyde]sys,i - [Benzaldehyde]sys,e) - [Benzaldehyde]utilized -
[Benzaldehyde]lost
% Benzaldehydeunacc % Unaccounted benzaldehyde
= [Benzaldehyde]unacc / [Benzaldehyde]sys,i x 100%
2.5

Chapter 2 Materials and Methods
Cindy Gunawan 2006 PhD Thesis
83
Table 2.20.B: Calculation method for unaccounted pyruvate in the biotransformation
systems.
Variable Description
[Pyruvate]sys,i Initial pyruvate concentration in the biotransformation system
= [Benzaldehyde]control,i
[Pyruvate]sys,e Pyruvate concentration at the end of biotransformation
[Pyruvate]control,i Initial pyruvate concentration in the control
[Pyruvate]control,e Pyruvate concentration at the end of biotransformation in the control
[Pyruvate]lost Pyruvate lost = [Pyruvate]control,i - [Pyruvate]control,e
[PAC]sys PAC produced
[Acetaldehyde]sys Acetaldehyde produced
[Acetoin]sys Acetoin produced
[Pyruvate]utilized Pyruvate utilized = [PAC]sys + [Acetaldehyde]sys + 2 x [Acetoin]sys
(1 mol of acetoin was formed from 2 moles of pyruvate)
[Pyruvate]unacc Unaccounted pyruvate
= ([Pyruvate]sys,i - [Pyruvate]sys,e) - [Pyruvate]utilized - [Pyruvate]lost
% Pyruvateunacc % Unaccounted pyruvate
= [Pyruvate]unacc / [Pyruvate]sys,i x 100%
2.9.3 Experimental Errors
Table 2.21: Calculation method for experimental error.
Variable Description
Xmean Mean value from the replicates
Emax Maximum error from the mean value = Maximum value from the replicates – Xmean
Emin Minimum error from the mean value = Xmean – minimum value from the replicates

Chapter 3 Yeast Pyruvate Decarboxylases: Variation in Biocatalytic Characteristics
Cindy Gunawan 2006 PhD Thesis
84
CHAPTER 3
YEAST PYRUVATE DECARBOXYLASES:
VARIATION IN BIOCATALYTIC
CHARACTERISTICS
Selection of productive and stable biocatalyst for PAC
production

Chapter 3 Yeast Pyruvate Decarboxylases: Variation in Biocatalytic Characteristics
Cindy Gunawan 2006 PhD Thesis
85
3.1 Introduction
In spite of the fact that PAC can be chemically synthesized, the current commercial process
is based on biotransformation of pyruvate and benzaldehyde by fermenting baker’s yeast.
Numerous attempts have been made to improve PAC production: reported values are in the
range of 4.5 – 15 g/L PAC for various yeast-based fermentation processes [Becvarova and
Hanc, 1963; Long et al., 1989; Seely et al., 1994; Mochizuki et al., 1995; Shin and Rogers,
1995]. Significant progress has been reported when employing enzyme-based processes with
added substrates pyruvate and benzaldehyde. In an aqueous/benzaldehyde emulsion system
at 4°C, more than 50 g/L PAC with 97% molar yields on consumed benzaldehyde were
achieved when using partially purified PDCs from yeasts and filamentous fungi [Rosche et
al., 2002a; Rosche et al., 2003a]. Furthermore, PAC levels in excess of 100 g/L in the organic
phase with similar molar yields were produced in a two-phase aqueous/octanol-benzaldehyde
system at 4°C [Rosche et al., 2002b; Sandford et al., 2005]. The use of whole cells in such a
system at 21°C resulted in similar PAC concentrations and increased specific productivity
[Rosche et al., 2005].
In a screening of 105 yeast strains for enzymatic PAC production [Rosche et al., 2003b],
three species of Candida were identified as the most interesting candidates since their PDCs
showed the highest PAC formation together with low inactivation and/or inhibition by
benzaldehyde and acetaldehyde. In the present study, six yeast PDCs were considered for a
more detailed study for enzymatic PAC production: PDC from Saccharomyces cerevisiae
(yeast used in commercial PAC production); PDC from three species in which the enzyme
showed resistance towards aldehydes: Candida utilis, Candida tropicalis and
Schizosaccharomyces pombe [Rosche et al., 2003b]; PDC from the pyruvate producer
Candida glabrata [Yonehara and Yomoto, 1987; Yonehara and Miyata, 1994] and PDC from
the thermotolerant Kluyveromyces marxianus [Banat and Marchant, 1995]. Three
biotransformation systems were employed to cover a wide range of benzaldehyde
concentrations (in the order of increasing concentration): (I) aqueous (soluble benzaldehyde)
with crude extract PDC, (II) aqueous/benzaldehyde emulsion with crude extract PDC and
(III) aqueous/octanol benzaldehyde emulsion system with whole cell PDC. Production of

Chapter 3 Yeast Pyruvate Decarboxylases: Variation in Biocatalytic Characteristics
Cindy Gunawan 2006 PhD Thesis
86
PAC and by-products acetaldehyde and acetoin were compared as well as stability of the
various yeast PDCs (refer to Section 2.5 for details of the biotransformation experiments).
3.2 Results and Discussion
3.2.1 Specific PDC Activity
Fig 3.1 demonstrates that the six yeast PDCs were characterized by different specific
activities for PAC formation under similar shake flask culturing conditions (Section 2.4.2.1
of Materials and Methods): C. tropicalis demonstrated the highest specific activity with 255
U/g dry biomass while C. glabrata and S. pombe were the lowest with 65 and 20 U/g dry
biomass respectively. Under these conditions, the PDC activity of C. utilis was 145 U/g dry
biomass. However, it has been reported that up to 392 U/g dry biomass PDC production
could be achieved for C. utilis through employment of a pH shift fermentation method with
controlled pH shifted from 6.0 to 3.0 after consumption of approx. 20 g/L glucose [Chen et
al., 2005], indicating that PDC production could be influenced appreciably by changing the
environmental conditions. C. glabrata and S. pombe were therefore excluded from further
investigations due to their low specific PDC activities.
3.2.2 Pyruvate Conversion in the Absence of Benzaldehyde
PDC catalyses the non-oxidative decarboxylation of pyruvate to acetaldehyde (with release
of CO2) and the PDC bound ‘active acetaldehyde’ is either released or undergoes
carboligation with ‘free acetaldehyde’ to form acetoin. With initial pyruvate of 80 mM and in
the absence of benzaldehyde, experiments with the four PDCs resulted in levels of
acetaldehyde within 7 – 14 mM (highest for C. tropicalis PDC) and acetoin within 22 – 32
mM (highest for K. marxianus PDC) after 7.3 h when the reactions were completed (Fig 3.2).
The results demonstrate that all PDCs are capable of both decarboxylation and carboligation
reactions.

Chapter 3 Yeast Pyruvate Decarboxylases: Variation in Biocatalytic Characteristics
Cindy Gunawan 2006 PhD Thesis
87
0 50 100 150 200 250 300
K.m
C.g
S.p
C.t
C.u
S.c
Str
ain
Specific PDC Activity (U/g dry biomass)
Figure 3.1: Comparison of specific PDC activities of six yeasts. Culturing conditions (g/L):
90 glucose, 10 yeast extract, 10 (NH4)2SO4, 3 KH2PO4, 2 Na2HPO4.12H2O, 1 MgSO4.7H2O,
0.05 CaCl2.2H2O, 39 MES buffer, initial pH 6, 30°C, 160 rpm. The data is shown as mean
values for four fermentation batches for S.c, C.u, C.t, K.m (two batches were grown by Allen
Chen) and two batches for S.p and C.g (grown by Allen Chen). S.c: Saccharomyces
cerevisiae, C.u: Candida utilis, C.t: Candida tropicalis, S.p: Schizosaccharomyces pombe,
C.g: Candida glabrata, K.m: Kluyveromyces marxianus. The error bars show highest and
lowest values for the above experiments.

Chapter 3 Yeast Pyruvate Decarboxylases: Variation in Biocatalytic Characteristics
Cindy Gunawan 2006 PhD Thesis
88
0
5
10
15
20
25
30
35
S.c C.u C.t K.mStrain
[ace
tald
ehyd
e], [
acet
oin]
(m
M)
acetaldehyde acetoin
Figure 3.2: Acetaldehyde and acetoin formation in the absence of benzaldehyde. Product
concentrations after 7.3 h at 22°C, initial pH 6.5. Initial agitation 220 rpm, initial
concentrations: 80 mM pyruvate, 1.5 U/ml PDC carboligase activity (crude extract), 2.5 M
MOPS buffer, 1 mM Mg2+, 1 mM TPP. Acetaldehyde concentrations were immediately
measured upon samplings. The mean values were determined from triplicate experiments and
error bars show the highest and lowest values. Refer to Fig 3.1 for strain abbreviations.

Chapter 3 Yeast Pyruvate Decarboxylases: Variation in Biocatalytic Characteristics
Cindy Gunawan 2006 PhD Thesis
89
3.2.3 PAC and By-Product Formation in the Aqueous (Soluble Benzaldehyde)
System
At a soluble concentration of 80 mM benzaldehyde and with initial 80 mM pyruvate,
pyruvate and benzaldehyde were converted into PAC, acetaldehyde and acetoin at varying
concentrations with the different sources of PDC. As demonstrated in Fig 3.3.a, in the first
0.5 h the biotransformation with C. tropicalis and K. marxianus PDCs produced the highest
level of PAC of approx. 50 mM. At 7.3 h, the most PAC of approx. 60 mM was formed when
using C. tropicalis and K. marxianus PDCs while experiments with C. utilis and S. cerevisiae
PDCs resulted in less PAC formation.
As shown in Fig 3.3.b, biotransformation with C. tropicalis PDC was associated with the
least by-product acetoin formation of approx. 2.5 mM whereas higher levels of 7 – 8 mM
were formed with the other enzymes. The accumulation of acetaldehyde was highest for S.
cerevisiae PDC of approx. 11 mM. At the end of the reaction period (7.3 h), pyruvate was
fully utilized in all biotransformations while some benzaldehyde remained. The substrate
molar balances closed to within ± 5% and ± 10% for benzaldehyde and pyruvate respectively
for all biotransformations.
Comparison of Figs 3.2 and 3.3.b illustrates that in the presence of 80 mM benzaldehyde,
acetoin and acetaldehyde formation were decreased for all enzymes, except for S. cerevisiae
PDC with unchanged acetaldehyde formation. The relatively high acetaldehyde accumulation
with S. cerevisiae PDC might have been responsible for the lowest PAC formation with this
enzyme as acetaldehyde has been previously reported to inhibit PAC formation [Shin and
Rogers, 1995].

Chapter 3 Yeast Pyruvate Decarboxylases: Variation in Biocatalytic Characteristics
Cindy Gunawan 2006 PhD Thesis
90
0
10
20
30
40
50
60
70
S.c C.u C.t K.mStrain
[PA
C] (
mM
)
0.5h 7.3h
a
0
2
4
6
8
10
12
S.c C.u C.t K.mStrain
[ace
tald
ehyd
e], [
acet
oin]
(m
M)
acetaldehyde acetoin
b
Figure 3.3: Biotransformation results in the aqueous system (presence of soluble
benzaldehyde): (a) PAC (at 0.5 h and 7.3 h) and (b) by-product (at 7.3 h) concentrations at
22°C, initial pH 6.5. Initial agitation 220 rpm, initial concentrations: 80 mM benzaldehyde,
80 mM pyruvate, 1.5 U/ml PDC carboligase activity (crude extract), 2.5 M MOPS buffer, 1
mM Mg2+, 1 mM TPP.

Chapter 3 Yeast Pyruvate Decarboxylases: Variation in Biocatalytic Characteristics
Cindy Gunawan 2006 PhD Thesis
91
3.2.4 PAC and By-Product Formation in the Aqueous/Benzaldehyde Emulsion
System
To avoid any substrate limitation effects, the four PDCs were tested in an
aqueous/benzaldehyde emulsion system with initial benzaldehyde and pyruvate concentration
of 325 mM and 420 mM respectively. As shown in Fig 3.4.a, different catalytic
characteristics were demonstrated when compared to the aqueous phase system and it was
found that the reactions were completed after 24 h without substrate limitation. At 24 h with
C. utilis PDC, the highest PAC level of 240 mM was formed; this was followed by lower
concentrations with S. cerevisiae and K. marxianus PDCs; while C. tropicalis PDC was
associated with the least amount (its activity was zero after 3 h).
Acetoin formation was similar to that in the aqueous system with the biotransformation with
C. tropicalis PDC again resulting in the least acetoin (approx. 1.5 mM) and higher
concentrations of 22 – 41 mM being formed with the other three PDCs (Fig 3.4.b). As
shown, S. cerevisiae PDC was associated with the highest concentrations of acetoin (41 mM)
and acetaldehyde (14 mM) (Fig 3.4.b).

Chapter 3 Yeast Pyruvate Decarboxylases: Variation in Biocatalytic Characteristics
Cindy Gunawan 2006 PhD Thesis
92
0
50
100
150
200
250
300
S.c C.u C.t K.mStrain
[PA
C] (
mM
)
3h 24h
a
0
10
20
30
40
50
S.c C.u C.t K.mStrain
[ace
tald
ehyd
e], [
acet
oin]
(m
M)
acetaldehyde acetoin
b
Figure 3.4: Biotransformation results in the aqueous/benzaldehyde emulsion system: (a)
PAC (at 3 h and 24 h) and (b) by-product (at 24 h) concentrations at 22°C, initial pH 6.5.
Initial agitation 220 rpm, initial concentrations: 325 mM benzaldehyde, 420 mM pyruvate,
1.5 U/ml PDC carboligase activity (crude extract), 2.5 M MOPS buffer, 1 mM Mg2+, 1 mM
TPP.

Chapter 3 Yeast Pyruvate Decarboxylases: Variation in Biocatalytic Characteristics
Cindy Gunawan 2006 PhD Thesis
93
3.2.5 PAC and By-Product Formation in the Aqueous/Octanol-Benzaldehyde
Emulsion System
The four PDCs were tested at increasing substrate concentrations in an aqueous/octanol-
benzaldehyde emulsion system with initial benzaldehyde and pyruvate concentrations of 850
mM and 450 mM in the total reaction volume by combining both phases (TRV) respectively.
An organic to aqueous phase volume ratio of 1:1 was used together with whole cell PDC. As
shown in a previous study [Sandford et al. 2005], benzaldehyde and PAC partitioned strongly
into the organic phase whilst pyruvate fully partitioned into the aqueous phase. Results were
obtained after 48 h when neither substrate was limiting. As illustrated in Fig 3.5.a, the trends
were similar to those in the aqueous/benzaldehyde emulsion system although PAC and by-
product concentrations were higher. At 48 h, the most PAC of approx. 310 mM TRV was
produced when using C. utilis PDC; this was followed by lower concentrations with S.
cerevisiae and C. tropicalis PDCs, while K. marxianus PDC was associated with the least
amount.
As for the previous two systems, the biotransformation with C. tropicalis PDC resulted in the
lowest acetoin level of approx 6 mM TRV whereas higher levels of 30 – 45 mM TRV were
formed for the other PDCs (Fig 3.5.b). As shown, S. cerevisiae PDC was associated with the
highest concentrations of acetoin (45 mM TRV) and acetaldehyde (20 mM TRV) (Fig 3.5.b).

Chapter 3 Yeast Pyruvate Decarboxylases: Variation in Biocatalytic Characteristics
Cindy Gunawan 2006 PhD Thesis
94
0
50
100
150
200
250
300
350
S.c C.u C.t K.mStrain
[PA
C] (
TR
V)
(mM
)
3h 24h 48h
a
0
10
20
30
40
50
S.c C.u C.t K.mStrain
[ace
tald
ehyd
e]T
RV
, [ac
etoi
n]T
RV
(m
M)
acetaldehyde acetoin
b
Figure 3.5: Biotransformation results in the aqueous/octanol-benzaldehyde emulsion system: (a)
PAC (at 3 h, 24 h and 48 h) and (b) by-product (at 48 h) concentrations at 22°C, initial pH 6.5.
Initial agitation 250 rpm, initial concentrations: 850 mM TRV benzaldehyde, 450 mM TRV
pyruvate, 1.5 U/ml TRV PDC carboligase activity (permeabilized whole cells), 2.5 M MOPS, 1
mM Mg2+, 1 mM TPP. The organic to aqueous phase volume ratio was 1:1 and concentrations of
substrates, enzyme, product and by-products are given per total reaction volume by combining
both phases (TRV).

Chapter 3 Yeast Pyruvate Decarboxylases: Variation in Biocatalytic Characteristics
Cindy Gunawan 2006 PhD Thesis
95
3.2.6 Efficiency of PAC Formation
The yeast PDCs were associated with varying efficiencies regarding benzaldehyde and
pyruvate conversion to PAC in the different systems (Table 3.1). Overall experiments with C.
utilis PDC resulted in consistent 80 – 85% yields of PAC on consumed benzaldehyde in all
systems. Based on pyruvate consumed, C. tropicalis PDC with the lowest by-product acetoin
formation resulted in consistent 70 – 80% yields of PAC. The yields in these studies are only
indicative values as they were calculated from small-scale data, much more accurate yields
were calculated later in larger scale experiments.
Table 3.1: Biotransformations with the four yeast PDCs in three different systems: estimated
yields of PAC on consumed benzaldehyde and pyruvate.
Strain
Aqueous
(soluble benzaldehyde)
Aqueous/benzaldehyde
emulsion
Aqueous/octanol-
benzaldehyde emulsion
Y PAC / bzdc
Y PAC/pyrc
Y PAC / bzdc
Y PAC/pyrc
Y PAC / bzdc
Y PAC/pyrc
S.c
0.77
0.47 **
0.72
0.58 **
0.74
0.55 **
C.u
0.82
0.59 **
0.87
0.80
0.82
0.70
C.t
0.86
0.71
0.47 *
0.80
0.77
0.81
K.m
0.86
0.72
0.62
0.62
0.77
0.51 **
Calculated from experimental data shown in Figs 3.3, 3.4 and 3.5. Y PAC / bzdc: yield of PAC on
consumed benzaldehyde. Consumed benzaldehyde = PAC formation + evaporative loss +
unaccounted benzaldehyde (conversion to other substance(s)). Y PAC/pyrc: yield of PAC on
consumed pyruvate. Consumed pyruvate = PAC, acetaldehyde and acetoin formation + pyruvate
degradation + unaccounted pyruvate (acetaldehyde evaporation + conversion to other substance(s)). *
Relatively high evaporative losses of benzaldehyde. ** Relatively high pyruvate degradation and
presumably certain degree of evaporative losses of acetaldehyde due to sampling and analysis.

Chapter 3 Yeast Pyruvate Decarboxylases: Variation in Biocatalytic Characteristics
Cindy Gunawan 2006 PhD Thesis
96
3.2.7 Effect of Benzaldehyde and Acetaldehyde on PAC Formation with C. utilis
and C. tropicalis PDCs
Based on the evaluation of the four PDCs in the various biotransformation systems for PAC
and by-product formation, it was evident that C. utilis and C. tropicalis PDCs had
demonstrated the most useful properties, viz. in the systems with the higher benzaldehyde
concentrations, the highest PAC concentrations were produced when using C. utilis PDC
while C. tropicalis PDC was associated with the lowest by-product formation (particularly
acetoin). As a result, the biotransformation characteristics of these two enzymes were further
investigated.
The two PDCs were tested for initial PAC formation (32 min) with and without addition of
30 mM acetaldehyde and with increasing benzaldehyde concentrations: from soluble
concentrations (45 mM and 80 mM) to emulsions (125 mM and 185 mM). At soluble
benzaldehyde concentrations without acetaldehyde addition, C. tropicalis PDC was
associated with a higher initial PAC formation than C. utilis PDC (Figs 3.6.a and b). The
initial PAC formation with C. utilis PDC increased when more benzaldehyde was added (Fig
3.6.a) while this resulted in reduced values with C. tropicalis PDC (Fig 3.6.b).
Only low concentrations of ‘free acetaldehyde’ were formed from pyruvate in these
experiments. In order to investigate the competition of benzaldehyde and ‘free acetaldehyde’
for carboligation with the enzyme bound ‘active acetaldehyde’, 30 mM acetaldehyde was
added to the reaction mixture. The presence of acetaldehyde resulted not only in much lower
initial PAC formation (Figs 3.6.a and c) but also in increased acetoin formation for C. utilis
and C. tropicalis PDCs (Figs 3.7.a and b). In the absence of 30 mM acetaldehyde, no acetoin
was formed with C. tropicalis PDC for all tested benzaldehyde concentrations, while C. utilis
PDC was associated with trace levels of acetoin at the soluble benzaldehyde concentrations
and none at the higher benzaldehyde concentrations (Figs 3.7.a and b).

Chapter 3 Yeast Pyruvate Decarboxylases: Variation in Biocatalytic Characteristics
Cindy Gunawan 2006 PhD Thesis
97
0
5
10
15
20
25
30
35
40
45 80 125 185
[PA
C] (
mM
)
a
0
5
10
15
20
25
30
35
40
45 80 125 185
[Benzaldehyde] (mM)
[PAC
] (m
M)
no acetaldehyde 30 mM acetaldehyde
b
Figure 3.6: Effect of acetaldehyde on initial PAC formation with: (a) C. utilis (C.u) and (b)
C. tropicalis (C.t) PDCs at various benzaldehyde concentrations in 32 min at 22°C, initial pH
6.5. Agitation 220 rpm, initial concentrations: 250 mM pyruvate, 0 and 30 mM acetaldehyde
1.5 U/ml PDC carboligase activity (crude extract), 2.5 M MOPS, 1 mM Mg2+ & 1 mM TPP.

Chapter 3 Yeast Pyruvate Decarboxylases: Variation in Biocatalytic Characteristics
Cindy Gunawan 2006 PhD Thesis
98
0.0
0.2
0.4
0.6
0.8
1.0
45 80 125 185
[Ace
toin
] (m
M)
a
0.0
0.2
0.4
0.6
0.8
1.0
45 80 125 185
[Benzaldehyde] (mM)
[Ace
toin
] (m
M)
no acetaldehyde 30 mM acetaldehyde
b
Figure 3.7: Effect of acetaldehyde on initial acetoin formation with: (a) C. utilis (C.u) and
(b) C. tropicalis (C.t) PDCs at various benzaldehyde concentrations in 32 min at 22°C, initial
pH 6.5. Same experiments as shown in Fig 3.6.

Chapter 3 Yeast Pyruvate Decarboxylases: Variation in Biocatalytic Characteristics
Cindy Gunawan 2006 PhD Thesis
99
The PAC to acetoin ratio is demonstrated in Fig 3.8. Increasing the benzaldehyde
concentration resulted in a general increase in PAC to acetoin ratio for both enzymes;
however the ratio was appreciably higher for C. tropicalis PDC at all benzaldehyde
concentrations.
0
5
10
15
20
25
30
35
45 80 125 185[Benzaldehyde] (mM)
PA
C/A
ceto
in (
mM
/mM
)
C.u C.t
Figure 3.8: Ratio of PAC over acetoin with C. utilis (C.u) and C. tropicalis (C.t) PDCs at
various benzaldehyde concentrations in the presence of 30 mM acetaldehyde (32 min) at
22°C, initial pH 6.5. Same experiments as shown as Fig 3.6.
The lowest acetoin formation was observed with C. tropicalis PDC in the different
biotransformation systems (Figs 3.3.b, 3.4.b, and 3.5.b), and the ratios of PAC to acetoin
were highest for this enzyme (Fig 3.9). The reduced acetoin production was further
confirmed in the presence of added 30 mM acetaldehyde (Figs 3.7 and 3.8). The results
demonstrate that C. tropicalis PDC had a higher preference for benzaldehyde (leading to
PAC formation) over ‘free acetaldehyde’ (leading to acetoin formation) under these
experimental conditions.

Chapter 3 Yeast Pyruvate Decarboxylases: Variation in Biocatalytic Characteristics
Cindy Gunawan 2006 PhD Thesis
100
0
10
20
30
40
50
60
70
S.c C.u C.t K.mStrain
PA
C/A
ceto
in (
mM
/mM
)
aqueous (soluble benzaldehyde) aqueous/benzaldehyde emulsion
aqueous/octanol-benzaldehyde emulsion
Figure 3.9: Ratio of PAC over acetoin for the four yeast PDCs in the different
biotransformation systems at 22°C, initial pH 6.5. Same experiments as shown in Figs 3.3,
3.4, and 3.5.

Chapter 3 Yeast Pyruvate Decarboxylases: Variation in Biocatalytic Characteristics
Cindy Gunawan 2006 PhD Thesis
101
3.2.8 PDC Stability
The stability of the four PDCs were evaluated to further investigate their potential in the
different biotransformation systems. The half-life values of crude extract and whole cell PDC
in the absence and presence of 50 mM benzaldehyde at 22°C are shown in Figs 3.10.a and b.
In the absence of benzaldehyde, S. cerevisiae and C. utilis PDCs were very stable with half-
life values of nearly two weeks for crude extract and slightly longer for whole cells. By
comparison, C. tropicalis PDC was much less stable with half life of 3 days for crude extract
and less than 1 day for whole cells.
In the presence of 50 mM benzaldehyde, C. utilis PDC was the most stable with a half-life
value of 7 days for both crude extract and whole cell preparations. This was followed by S.
cerevisiae and K. marxianus PDCs. C. tropicalis PDC was the least stable with half-life
values of less than 1 day for crude extract and whole cells.
Considering the differences in stability, PDC is a homomeric enzyme, which exists as
tetramers and dimers at physiological conditions [Jabs et al., 2001]. The dimers are
composed of monomers of which contact sites are mainly determined by aromatic amino
acids. The contact sites of dimers forming the tetramers are mainly determined by
electrostatic interactions. The catalytic activity of PDC is mainly related to the tetrameric
species [Jabs et al. 2001]. PDC deactivation occurs when the native tetrameric structure
dissociates into its dimeric halves, TPP and Mg2+ are released from the PDC and there is loss
of biocatalytic activity [Hübner et al. 1990]. The most stable C. utilis PDC might have the
capability to maintain its tetrameric structure more strongly under stress. Other possible
explanation might relate to unfolding phenomenon and covalent modification by
benzaldehyde. In the present studies, the highest PDC stability is associated with the highest
PAC formation when employing C. utilis PDC in systems with relatively high benzaldehyde
concentrations

Chapter 3 Yeast Pyruvate Decarboxylases: Variation in Biocatalytic Characteristics
Cindy Gunawan 2006 PhD Thesis
102
0
2
4
6
8
10
12
14
16
S.c C.u C.t K.m
Hal
f-lif
e (d
ay)
a
0
2
4
6
8
10
12
14
16
S.c C.u C.t K.mStrain
Hal
f-lif
e (d
ay)
No benzaldehyde 50 mM benzaldehyde
b
Figure 3.10: PDC stabilities in the absence and presence of soluble benzaldehyde at 22°C:
(a) crude extract and (b) whole cell preparations. Concentrations: 50 mM benzaldehyde, 1.5
U/ml PDC carboligase activity, 2.5 M MOPS (pH 6.5), 1 mM Mg2+ & 1 mM TPP.
Experiments were performed by Gernalia Satianegara.

Chapter 3 Yeast Pyruvate Decarboxylases: Variation in Biocatalytic Characteristics
Cindy Gunawan 2006 PhD Thesis
103
Other researchers have reported comparisons between PDC characteristics of yeast and
bacteria. For example, Zymomonas mobilis PDC exhibited higher stability than S.
carlsbergensis PDC upon removal of the cofactors thiamine diphosphate and Mg2+ under
slightly alkaline conditions [König et al., 1992; Pohl et al., 1994]. However, S. carlsbergensis
PDC exhibited a 20-fold higher carboligase activity in the presence of 46 – 48 mM
benzaldehyde compared to Z. mobilis PDC [Bringer-Meyer and Sahm, 1988].
3.2.9 Further Characterization of C. utilis PDC Activity
C. utilis PDC (partially purified) was further studied for the effect on deactivation rate of
agitation and initial enzyme concentration in the aqueous system with soluble benzaldehyde.
3.2.9.1 Effect of Agitation Rate on PDC Deactivation
Experiment results in Fig 3.11 show no evident effect of agitation rate on the deactivation
rates of C. utilis PDC in the absence and presence of 48 mM soluble benzaldehyde at 4°C as
long as foam formation was prevented. In the case of extensive foam formation, the half-life
value decreased to approx. 50% in system with 48 mM benzaldehyde. Other researchers have
found that agitation rate of 600 rpm with 200 mL working volume decreased the half-life
value of papain from longer than 50 h to 32 h in system with 0.73 M acetate buffer (pH 5.15)
at 40°C [Feliu et al. 1994].
3.2.9.2 Effect of Initial Enzyme Concentration on PDC Deactivation
As shown in Fig 3.12, the deactivation rates of C. utilis PDC were relatively unaffected by
the initial enzyme concentration (3 and 7.3 U/mL carboligase) in the absence and presence of
48 mM benzaldehyde at 4°C.

Chapter 3 Yeast Pyruvate Decarboxylases: Variation in Biocatalytic Characteristics
Cindy Gunawan 2006 PhD Thesis
104
0
20
40
60
80
100
120
0 20 40 60 80 100 120 140Time (h)
% R
esid
ual E
nzym
e A
ctiv
ity
220 rpm, 0 mM BZD 220 rpm, 48 mM BZD 95 rpm, 0 mM BZD95 rpm, 48 mM BZD 250 rpm, 48 mM BZD
Figure 3.11: Effect of agitation rate on the deactivation of partially purified PDC from C. utilis in the absence and presence of 48 mM soluble benzaldehyde at 4°C, pH 7. 95, 220 and 250 rpm agitation, 0 and 48 mM benzaldehyde, 3 U/mL PDC carboligase activity, 2.5 M MOPS buffer, 0.5 mM Mg2+, 1 mM TPP. Extensive foam formation at 250 rpm.
0
20
40
60
80
100
120
0 20 40 60 80 100 120 140Time (h)
% R
esid
ual E
nzym
e A
ctiv
ity
0 mM BZD, 3 U/mL 0 mM BZD, 7.3 U/mL
48 mM BZD, 3 U/mL 48 mM BZD, 7.3 U/mL
Figure 3.12: Effect of initial enzyme concentration on the deactivation of partially purified PDC from C. utilis in the absence and presence of 48 mM soluble benzaldehyde at 4°C, pH 7. 220 rpm agitation, 0 and 48 mM benzaldehyde, 3 and 7.3 U/mL PDC carboligase activity, 2.5 M MOPS buffer, 0.5 mM Mg2+, 1 mM TPP.

Chapter 3 Yeast Pyruvate Decarboxylases: Variation in Biocatalytic Characteristics
Cindy Gunawan 2006 PhD Thesis
105
3.3 Conclusions
From the present study it was evident that C. utilis PDC had the highest stability compared to
the other yeast PDCs, and this ultimately resulted in the highest PAC production in systems
with relatively high benzaldehyde concentrations. Interestingly, C. tropicalis PDC exhibited
a substantially lower acetoin formation under these conditions. In the present study, C. utilis
PDC was the biocatalyst of choice for further process development to improve two-phase
aqueous/organic PAC production.

Chapter 4 Factors Affecting PDC Enzyme Deactivation and PAC Production in Two-Phase Aqueous/Organic System
Cindy Gunawan 2006 PhD Thesis
106
CHAPTER 4
FACTORS AFFECTING PDC ENZYME
DEACTIVATION AND PAC PRODUCTION IN
TWO-PHASE AQUEOUS/ORGANIC SYSTEM
Identification of key factors in two-phase aqueous/organic
PAC synthesis

Chapter 4 Factors Affecting PDC Enzyme Deactivation and PAC Production in Two-Phase Aqueous/Organic System
Cindy Gunawan 2006 PhD Thesis
107
4.1 Introduction
Previous studies by our group have shown that the enzymatic biotransformation process for
PAC production could be restricted by the toxicity and low aqueous solubility of
benzaldehyde. An aqueous system could usually accommodate up to 100 mM soluble
benzaldehyde (depending on the buffer system), thereby resulting in relatively low PAC
production (Fig 4.1). PAC production was improved in the aqueous/benzaldehyde emulsion
system (Fig 4.1), however the process was restricted by increased PDC deactivation
presumably resulting from benzaldehyde droplet/enzyme interaction in the emulsion system
[Sandford et al., 2005; Rosche et al., 2005b].
To overcome this problem, a two-phase aqueous/organic system with 1-octanol as solvent
has been developed [Rosche et al., 2002b; Sandford et al., 2005]. In this system both PAC
and benzaldehyde strongly partitioned into the octanol phase and thereby the enzyme in the
aqueous phase was protected from high interfacial benzaldehyde concentrations. Organic
phase PAC concentrations in excess of 100 g/L were achieved [Sandford et al., 2005]. Two
aqueous/organic phase systems were evaluated in these studies (Fig 4.1): (1) a rapidly stirred
emulsion system and (2) a slowly stirred phase-separated system. In the first, a relatively
high overall volumetric productivity was achieved (39.1 g PAC/L/day), however the overall
specific PAC production was low (9.4 mg PAC/U). In the latter system, the productivity was
reduced (3.6 g PAC/L/day), however the PDC activity was maintained resulting in an
appreciable improvement in specific PAC production (64 mg PAC/U).
The current study evaluates the key factors involved in PDC deactivation in the two-phase
phase-separated and emulsion systems as means to further improve PAC production. PDC
deactivation in an aqueous/octanol-benzaldehyde system is likely to be influenced by the
soluble octanol and benzaldehyde concentrations in the aqueous phase, aqueous/organic
interfacial area as well as agitation rate and the enzyme concentration (refer to Section 2.6 for
details of the PDC deactivation experiments). The effects of these variables as well as phase
volume ratio have been evaluated as a basis for designing a two-phase process with improved

Chapter 4 Factors Affecting PDC Enzyme Deactivation and PAC Production in Two-Phase Aqueous/Organic System
Cindy Gunawan 2006 PhD Thesis
108
specific PAC production and productivities (refer to Section 2.5 for details of the phase
volume ratio biotransformation experiments).
SaccharomycesSaccharomyces cerevisiaecerevisiae,, Industrial fermentation Industrial fermentation
0 40 80 120 160
PAC (g/l)Candida Candida utilisutilis PDCPDC
Aqueous phase, 7 U/Aqueous phase, 7 U/ mLmL carboligasecarboligase [Shin [Shin and Rogers, 1996]and Rogers, 1996]
C. C. utilisutilis PDCPDC
Aqueous/Aqueous/ benzaldehydebenzaldehyde emulsion, 8.4 U/emulsion, 8.4 U/ mLmLcarboligasecarboligase [[RoscheRosche et al., 2002b]et al., 2002b]
RhizopusRhizopus javanicusjavanicus PDC PDC
Aqueous/Aqueous/ benzaldehydebenzaldehyde emulsion, 8.4 U/emulsion, 8.4 U/ mLmLcarboligasecarboligase [[RoscheRosche et al., 2002b]et al., 2002b]
C. C. utilisutilis PDCPDC
TwoTwo --phase phasephase phase --separated, 0.45 separated, 0.45 U/U/mLmL carboligasecarboligase [[SandfordSandford et al., et al., 2005]*2005]*
C. C. utilisutilis PDCPDC
TwoTwo --phase emulsion, 4.25 U/phase emulsion, 4.25 U/ mLmLcarboligasecarboligase [[SandfordSandford et al., 2005]*et al., 2005]*
Aqueous phase
Organic phase
PAC (g/L)SaccharomycesSaccharomyces cerevisiaecerevisiae,, Industrial fermentation Industrial fermentation
0 40 80 120 160
PAC (g/l)Candida Candida utilisutilis PDCPDC
Aqueous phase, 7 U/Aqueous phase, 7 U/ mLmL carboligasecarboligase [Shin [Shin and Rogers, 1996]and Rogers, 1996]
C. C. utilisutilis PDCPDC
Aqueous/Aqueous/ benzaldehydebenzaldehyde emulsion, 8.4 U/emulsion, 8.4 U/ mLmLcarboligasecarboligase [[RoscheRosche et al., 2002b]et al., 2002b]
RhizopusRhizopus javanicusjavanicus PDC PDC
Aqueous/Aqueous/ benzaldehydebenzaldehyde emulsion, 8.4 U/emulsion, 8.4 U/ mLmLcarboligasecarboligase [[RoscheRosche et al., 2002b]et al., 2002b]
C. C. utilisutilis PDCPDC
TwoTwo --phase phasephase phase --separated, 0.45 separated, 0.45 U/U/mLmL carboligasecarboligase [[SandfordSandford et al., et al., 2005]*2005]*
C. C. utilisutilis PDCPDC
TwoTwo --phase emulsion, 4.25 U/phase emulsion, 4.25 U/ mLmLcarboligasecarboligase [[SandfordSandford et al., 2005]*et al., 2005]*
Aqueous phase
Organic phase
PAC (g/L)
Figure 4.1: PAC production in various biotransformation systems.
* PDC activities in the two-phase system are based on total reaction volume by combining
both phases.

Chapter 4 Factors Affecting PDC Enzyme Deactivation and PAC Production in Two-Phase Aqueous/Organic System
Cindy Gunawan 2006 PhD Thesis
109
4.2 Results and Discussion
4.2.1 Factors Affecting PDC Deactivation
4.2.1.1 Effect of Soluble Octanol and Benzaldehyde in the Aqueous Phase
To further understand the characteristics of a two-phase aqueous/octanol-benzaldehyde
system, the effects on PDC deactivation of soluble octanol (4.5 mM) and soluble
benzaldehyde (48 mM) in the aqueous phase were studied. The data in Table 4.1 shows that
soluble octanol had a minor deactivating effect on PDC after 45 h and confirms the strong
deactivating effect of soluble benzaldehyde. In the presence of both soluble octanol and
benzaldehyde, deactivation was faster and the effects were approximately additive.
The effects of organic solvent molecules of 2-octanone and butylbenzene dissolved in the
aqueous phase on increasing urease deactivation have been reported previously [Ghatorae et
al., 1993], as well as the deactivating effect of soluble benzaldehyde on PDC [Chow et al.,
1995; Leksawasdi et al., 2003]. In general, the mechanism of PDC deactivation by an
aldehyde might involve covalent protein modification or non-covalent interaction. It is not
known though how benzaldehyde inactivates PDC.
Table 4.1: Effect of aqueous phase octanol and benzaldehyde on PDC deactivation at 4°C,
pH 7.0. 220 rpm, 2 U/mL PDC carboligase activity (C. utilis partially purified), 2.5 M MOPS
buffer, 0.5 mM Mg2+, 1 mM TPP. Same experiments as shown in Fig 4.4.a.
Aqueous-based system
Residual activity after 45 h (%)
Buffer
95
4.5 mM octanol
90
48 mM benzaldehyde
63
4.5 mM octanol + 48 mM benzaldehyde
50

Chapter 4 Factors Affecting PDC Enzyme Deactivation and PAC Production in Two-Phase Aqueous/Organic System
Cindy Gunawan 2006 PhD Thesis
110
4.2.1.2 Effect of Agitation Rate in the Aqueous Phase
Comparing the aqueous/organic phase-separated process to the emulsion system, the first
system was associated with a lower agitation rate than the latter. To study the impact of the
different agitation rates, experiments were designed with agitation rates for the aqueous
phase of 125 rpm and 220 rpm, typical of those for the phase-separated and emulsion system
respectively. The profiles in Fig 4.2 illustrate that application of the higher agitation resulted
in a greater PDC deactivation rate in the presence of both soluble octanol (4.5 mM) and
benzaldehyde (48 mM). This indicates that the higher agitation rate will have an additional
impact on PDC deactivation in the higher productivity emulsion system.
0
20
40
60
80
100
120
0 10 20 30 40 50 60 70 80
Time (H)
% R
esid
ual E
nzym
e A
ctiv
ity
125 rpm 220 rpm
Figure 4.2: Effect of agitation rate on PDC deactivation in the presence of soluble octanol
and benzaldehyde at 4°C, pH 7.0. 4.5 mM octanol, 48 mM benzaldehyde, 2 U/mL PDC
carboligase activity (C. utilis partially purified), 2.5 M MOPS buffer, 0.5 mM Mg2+, 1 mM
TPP.

Chapter 4 Factors Affecting PDC Enzyme Deactivation and PAC Production in Two-Phase Aqueous/Organic System
Cindy Gunawan 2006 PhD Thesis
111
Referring to previous results in Fig 3.11, agitation had no effect on PDC deactivation rate in
the presence of soluble benzaldehyde (48 mM) as long as there was no foam formation (the
half-life value was drastically reduced in the event of extensive foam formation at 250 rpm).
The disparity in results might be due to possible entrainment of a small amount of gas in the
system with soluble octanol and benzaldehyde at 220 rpm resulting in increased enzyme
deactivation.
4.2.1.3 Effect of Ratio of Organic Phase Interfacial Area to Aqueous Phase Volume
In addition to exposure to soluble octanol and benzaldehyde in the aqueous phase, PDC in
the two-phase aqueous/octanol-benzaldehyde system is exposed to the aqueous/organic
interface. Interfacial phenomena are likely to have caused some PDC deactivation as there
was presence of a white to yellowish interfacial layer evident in the two-phase synthesis of
PAC (following phase separation with centrifugation), which would have involved close
contact between the PDC and octanol/benzaldehyde interfaces.
It has been reported that protein molecules can gather at gas-liquid interfaces and be
deactivated by interfacial tension effects [Thomas et al. 1979, Thomas and Dunnill 1979,
Harrington et al. 1991]. Feliu et al. [1994] argued also that enzyme molecules could
accumulate at liquid-liquid interfaces and be deactivated by such interfacial effects.
4.2.1.3.1 Studies with a Phase-Separated System
A Lewis cell with aqueous and organic phase layers (each 90 mL) was used to study the
effect of defined changes in the ratio of organic phase contact area to aqueous phase volume
on PDC stability. The aqueous phase containing 4 U/mL carboligase PDC was saturated with
4.5 mM octanol and 48 mM benzaldehyde prior to the experiments and the organic phase
contained 1.39 M benzaldehyde. The agitation rate (125 rpm) was selected to maintain
defined separation between both phases.

Chapter 4 Factors Affecting PDC Enzyme Deactivation and PAC Production in Two-Phase Aqueous/Organic System
Cindy Gunawan 2006 PhD Thesis
112
As illustrated in Fig 4.3, a change from 117 to 475 cm2/L had no effect on PDC deactivation.
Similar half-life values of approx. 80 h were determined for all conditions. The observed
deactivation was due to effects of soluble octanol and benzaldehyde in the aqueous phase at
the mild agitation rate of 125 rpm.
0
20
40
60
80
100
120
0 20 40 60 80 100 120 140
Time (h)
% R
esid
ual E
nzym
e A
ctiv
ity
117 cm2/L 361 cm2/L 475 cm2/L
0
20
40
60
80
100
120
0 20 40 60 80 100 120 140
Time (h)
% R
esid
ual E
nzym
e A
ctiv
ity
117 cm2/L 361 cm2/L 475 cm2/L
Figure 4.3: Effect of aqueous/organic interfacial area on PDC deactivation in the
aqueous/octanol-benzaldehyde phase-separated system at 4°C, pH 7.0. 1.39 M organic phase
benzaldehyde, 4.5 mM aqueous phase octanol, 48 mM aqueous phase benzaldehyde, 60 rpm
and 125 rpm agitation for organic and aqueous phase respectively in Lewis cell, 4 U/mL
aqueous phase or 2 U/mL TRV PDC carboligase activity, 2.5 M MOPS buffer, 0.5 mM
Mg2+, 1 mM TPP. TRV: total reaction volume by combining both phases.
4.2.1.3.2 Studies with an Emulsion System
Since it was not possible to further increase the interfacial contact area in the Lewis cell, a
rapidly stirred emulsion (220 rpm) with a much higher, but undefined interfacial area to
volume ratio was investigated. Some PDC deactivation would occur solely in the aqueous
Chapter 4 Factors Affecting PDC Enzyme Deactivation and PAC Production in Two-Phase Aqueous/Organic System
Cindy Gunawan 2006 PhD Thesis
113
phase without interfacial contact, and in Fig 4.4.a, the effects of soluble octanol (4.5 mM)
and soluble benzaldehyde (48 mM) on PDC deactivation in this aqueous phase are shown. In
Fig 4.4.b, the results of PDC deactivation are shown in an emulsion system with excess
concentrations of both octanol and benzaldehyde (1.33 M) and a 1:1 volume ratio for each
phase. The resultant benzaldehyde concentration in the aqueous phase under these conditions
was 48 mM. As shown in Fig 4.4.b, in the emulsion system, a greater degree of PDC
deactivation resulted from both effects in the aqueous phase as well those from interfacial
contacts with the organic phase.
The combined effects of octanol and benzaldehyde on PDC deactivation are evident from
Figs 4.4.a and b. As shown in Fig 4.4.a for the aqueous phase, PDC was relatively stable in
the MOPS buffer over 70 h (A). When the buffer was saturated with octanol, the stability
decreased slightly (B). Saturating the buffer with octanol and benzaldehyde resulted in
significantly faster deactivation (C). As shown in Fig 4.4.b, for the aqueous/organic emulsion
system, PDC deactivation increased with octanol saturated aqueous phase and only octanol in
the organic phase (D). The addition of high concentration of benzaldehyde (1.33 M) into the
octanol phase caused significantly higher deactivation (E). In analyzing the various factors
affecting PDC deactivation, since A-D is greater than A-B, this demonstrates the additional
effect of aqueous/octanol interface in a benzaldehyde-free emulsion system. Further, since D-
E is much greater than B-C, this indicates the appreciable PDC deactivation, which occurred
as a result of the high benzaldehyde concentration in the excess of octanol, presumably at the
aqueous/organic droplet interfaces in the emulsion.
Other researchers have found that smaller organic droplets (i.e. larger surface contact area) in
aqueous/organic (carbon tetrachloride, trichloroethylene, benzene, toluene, and n-heptane)
emulsion systems lowered the half-life values of an enzyme such as papain [Feliu et al.,
1995]. Furthermore, Ghatorae et al. [1994] reported that the degree of enzyme deactivation
was proportional to the total interfacial area of the solvents hexane and tridecane to which the
enzyme urease was exposed in a liquid-liquid bubble column reactor.

Chapter 4 Factors Affecting PDC Enzyme Deactivation and PAC Production in Two-Phase Aqueous/Organic System
Cindy Gunawan 2006 PhD Thesis
114
0
20
40
60
80
100
120
0 10 20 30 40 50 60 70 80
%R
esid
ual E
nzym
e A
ctiv
ity A
B
C
a
0
20
40
60
80
100
120
0 10 20 30 40 50 60 70 80
Tim e (h)
%R
esid
ual E
nzym
e A
ctiv
ity A
D
E
b
(A ) M O P S B u ffer (B ) 4 .5 m M so lu b le o c ta n o l in M O P S
(C ) 4 .5 m M so lu b le o c ta n o l + 4 8 m M so lu b le b en za ld eh y d e in M O P S
(D ) a s (B ) p lu s ex cess o c ta n o l (tw o -p h a se )
(E ) a s (C ) p lu s ex cess o c ta n o l w ith 1 .3 3 M b en za ld eh y d e (tw o -p h a se )
Figure 4.4: Effect of excess octanol and benzaldehyde on PDC deactivation in the aqueous/octanol-benzaldehyde emulsion system at 4°C, pH 7.0: (a) aqueous-based system and (b) two-phase aqueous/organic system. 220 rpm agitation, 2 U/mL TRV PDC carboligase activity, 2.5 M MOPS buffer, 0.5 mM Mg2+, 1 mM TPP. TRV: total reaction volume by combining both phases.

Chapter 4 Factors Affecting PDC Enzyme Deactivation and PAC Production in Two-Phase Aqueous/Organic System
Cindy Gunawan 2006 PhD Thesis
115
Rosche et al. [2005] reported strong deactivation of 8 U/mL carboligase PDC in octanol-free
benzaldehyde emulsion (400 mM) with half-life value of 0.7 h (2.5 M MOPS, 6°C). The
present study employed 2 U/mL TRV (total reaction volume) carboligase PDC and 1.33 M
benzaldehyde in excess of octanol, yet the PDC was approx. 10 times more stable. Despite
some deactivation effect of the excess octanol, its major advantage is in maintaining the high
benzaldehyde concentration in the organic phase, such that PDC in the aqueous phase is not
directly exposed to the toxic benzaldehyde. This efficient protecting effect of the octanol
phase was observed as well by Sandford et al. [2005].
4.2.1.4 Effect of Initial Enzyme Concentration
The effects of enzyme concentration on PDC deactivation are compared in Fig 4.5 for
systems with low interfacial area (phase-separated) and high interfacial area (emulsion
system). While deactivation was relatively unaffected by enzyme concentration in the phase-
separated system (Fig 4.5.a), the rates of PDC deactivation were greater at all enzyme
concentrations studied (1.6 – 11.9 U/mL in the aqueous phase) in the emulsion system and
the deactivation was faster at the lower initial enzyme activities (Fig 4.5.b). For example, a
half-life value of 16 h was estimated at 4.1 U/mL PDC activity while the value was 49 h at
11.6 U/mL indicating a much greater PDC stability at the higher initial enzyme activity.
Other researchers have reported a similar effect with immobilized creatine amidinohydrolase
on polyurethane polymer support [Berberich et al., 2004].
Enzyme degradation by phase toxicity can be described by: (1) an immediate one-off
sequestration effect and (2) inactivation of the enzyme at the aqueous/organic interface,
followed by replacement of the inactive enzyme molecules by the active ones, leading to
continual inactivation [Feliu et al., 1995]. Observing the effect of initial enzyme
concentration on deactivation rates in the emulsion system (Fig 4.5.b), it was suggested that
the first aspect is more important leading to high deactivation rates at low enzyme loading
and an insignificant effect at high loading. Moreover in comparison to the phase-separated

Chapter 4 Factors Affecting PDC Enzyme Deactivation and PAC Production in Two-Phase Aqueous/Organic System
Cindy Gunawan 2006 PhD Thesis
116
system, the higher agitation rate in the emulsion system with increased exposure of the PDC
to interfacial benzaldehyde presumably resulted in more rapid enzyme deactivation.
0
20
40
60
80
100
120
0 20 40 60 80 100 120 140Time (h)
% R
esid
ual E
nzym
e A
ctiv
ity
3.1 5.5 8.6 11.9 U/mL carboligase activity
a
0
20
40
60
80
100
120
0 20 40 60 80 100 120 140Time (h)
% R
esid
ual E
nzym
e A
ctiv
ity
1.6 4.1 7.1 11.6 U/mL carboligase activity
b
Figure 4.5: Effect of initial enzyme concentration on PDC deactivation in the two-phase
aqueous/octanol-benzaldehyde system at 4°C, pH 7.0: (a) phase-separated system, 125 rpm agitation
in the aqueous phase and (b) emulsion system, 220 rpm agitation. 1.46 M organic phase
benzaldehyde, 4.5 mM aqueous phase octanol, 48 mM aqueous phase benzaldehyde, 2.5 M MOPS
buffer, 0.5 mM Mg2+, 1 mM TPP. The enzyme activities were expressed as concentrations in the
aqueous phase.

Chapter 4 Factors Affecting PDC Enzyme Deactivation and PAC Production in Two-Phase Aqueous/Organic System
Cindy Gunawan 2006 PhD Thesis
117
The increased rate of deactivation with lower enzyme concentrations was not found in
aqueous system. Leksawasdi [2004] reported no evident effect of enzyme concentration (7 –
27 U/mL decarboxylase) on deactivation rate of crude extract PDC from Rhizopus javanicus
with no benzaldehyde (0.6 M MOPS, 6°C). Similar characteristics were observed in the
present study for partially purified PDC from C. utilis (3 and 7.3 U/mL carboligase) with 0
and 48 mM benzaldehyde (2.5 M MOPS, 4°C) (Fig 3.12).
4.2.1.5 Discussion of Toxicity Effects on PDC Enzyme
An enzyme in a two-phase aqueous/organic system may be deactivated by molecules of
organic species dissolved in the aqueous phase, termed molecular toxicity, and by contact of
the enzyme with the bulk organic liquid at the interface, termed phase toxicity [Bar, 1988].
In the present two-phase aqueous/octanol-benzaldehyde systems, the molecular toxicity is
likely to be similar for both phase-separated and emulsion systems (aqueous phase saturated
with benzaldehyde and octanol). However, the phase toxicity will be greater in the emulsion
system due to larger surface area of contact between enzyme molecules and emulsion
droplets. The degree of agitation has also been shown to have a separate deactivation effect
with soluble benzaldehyde and octanol (Fig 4.2) and the effect will be greater in the two-
phase emulsion system. The effect of excess octanol and benzaldehyde concentrations on
PDC deactivation has also been studied and is likely to be evident in both phase-separated
and emulsion systems but greater in the latter system due to higher frequency of contact
between enzyme molecules and excess organics (Figs 4.3 and 4.4.b).
Results from the present PDC deactivation study explained the relatively low organic phase
PAC with concentrations up to 27 g/L formed in the emulsion system at initial PDC activities
in the aqueous phase of 0.5 – 3 U/mL, in comparison to the phase-separated system with high
organic phase PAC concentrations in excess of 100 g/L for similar initial PDC activities
[Sandford et al., 2005]. The former results were consistent with the more severe PDC
deactivation in the emulsion system and increased rates of PDC deactivation at lower enzyme

Chapter 4 Factors Affecting PDC Enzyme Deactivation and PAC Production in Two-Phase Aqueous/Organic System
Cindy Gunawan 2006 PhD Thesis
118
concentrations. The phase-separated system on the other hand, offered relatively high
stability for the PDC and the deactivation rate was unaffected by enzyme concentration. The
specific productivity (PAC/U/h) of the phase-separated system was therefore better; however
the volumetric productivity (PAC/L/h) of the emulsion system was superior presumably due
to higher benzaldehyde transfer rate from the organic into the aqueous phase [Sandford et al.
2005].
4.2.1.6 Discussion of Organic-Aqueous Benzaldehyde Transfer
The present study also investigated the effects of aqueous/organic contact area, organic phase
benzaldehyde concentration, and temperature on the organic-aqueous benzaldehyde transfer
rate. Higher organic phase contact area to aqueous phase volume ratios, higher organic phase
benzaldehyde concentrations, and higher temperatures resulted in increased benzaldehyde
transfer rates (see Appendix A). Equilibrium aqueous phase saturation concentrations of
approx. 50 mM benzaldehyde were achieved in all experimental conditions.
Woodley et al. [1991] reported that combination of a Lewis cell possessing a relatively high
organic-aqueous substrate transfer coefficient (KA aint of 1.8 h-1) together with a lower
enzyme concentration (0.005 g/L aqueous phase) resulted in sufficiently high steady state
aqueous phase substrate concentration to kinetically control the reaction. Conversely, a
Lewis cell experiment designed with a lower organic-aqueous substrate transfer coefficient
(KA aint of 0.64 h-1) together with a higher enzyme concentration (0.01 g/L aqueous phase)
resulted in a lower steady-state aqueous phase substrate concentration at which the reaction
rate was mass transfer limited.
Two-phase synthesis of PAC is likely to show evidence of mass transfer limitation when the
enzyme in the aqueous phase converts a high proportion of pyruvate to acetaldehyde and
acetoin due to low organic-aqueous benzaldehyde transfer rate. Increased by-products with
reduced PAC formation was observed by Sandford et al. [2005] in the biphasic phase-
separated system at initial PDC activities in the aqueous phase higher than 4 U/mL
carboligase, indicating that benzaldehyde mass transfer limitation may have been occuring.

Chapter 4 Factors Affecting PDC Enzyme Deactivation and PAC Production in Two-Phase Aqueous/Organic System
Cindy Gunawan 2006 PhD Thesis
119
By comparison, the biphasic emulsion system with higher agitation was associated with
increased PAC formation for similar initial PDC activities presumably due to higher organic-
aqueous benzaldehyde transfer rates. In addition, lower PDC deactivation rates at the higher
enzyme concentrations were likely to have occured.
4.2.2 Effect of Organic to Aqueous Phase Volume Ratio on PDC Deactivation
and PAC Production
To find a balance between maintaining enzyme stability while enhancing PAC productivity,
a two-phase system was designed in the present investigation to reduce the interfacial contact
by decreasing the organic to aqueous phase volume ratio. In such a system, sufficiently high
organic-aqueous substrate transfer might be attained while achieving reduced deactivating
conditions for the enzyme. Experiments were designed to lower the organic to aqueous phase
volume ratios from 1:1 to 0.25:1 in the emulsion aqueous/octanol-benzaldehyde system at
4°C to determine whether or not this would influence PDC stability and PAC productivity.
4.2.2.1 PAC and By-Product Formation
In Figs 4.6 – 4.9 the profiles are shown for the concentrations of substrates, PAC, and by-
products for each phase for these ratios (see Appendix C for the overall concentration
profiles calculated by combining the volumes of both phases). Results were obtained after 48
h when neither benzaldehyde nor pyruvate was limiting. Pyruvate was consumed at generally
higher rates than benzaldehyde, resulting from additional conversion to acetaldehyde and
acetoin. The rates of PAC formation declined over time, although it was expected that the
biotransformations could proceed beyond 48 h.

Chapter 4 Factors Affecting PDC Enzyme Deactivation and PAC Production in Two-Phase Aqueous/Organic System
Cindy Gunawan 2006 PhD Thesis
120
0
500
1000
1500
2000
2500
3000
3500
0 10 20 30 40 50
[Ben
zald
ehyd
e]O
RG
, [P
AC
]OR
G (
mM
)
0
5
10
15
20
25
[Ace
tald
ehyd
e]O
RG
, [A
ceto
in]O
RG
(mM
)a
0
200
400
600
800
1000
1200
1400
0 10 20 30 40 50T im e (h )
[Ben
zald
ehyd
e]A
Q,
[Pyr
uvat
e]A
Q, [
PA
C]A
Q (
mM
)
0
10
20
30
40
[Ace
tald
ehyd
e]A
Q, [
Ace
toin
]AQ
(m
M)
b
Figure 4.6: Effect of organic to aqueous phase volume ratio on PAC production in the aqueous/octanol-benzaldehyde emulsion system at 1:1 ratio at 4°C, initial pH 6.5: (a) organic and (b) aqueous phase substrates, PAC, and by-product concentration profiles. Initial agitation 250 rpm, initial concentrations: 1.36 M organic phase benzaldehyde, the aqueous phase contained 1.26 M pyruvate, 5.6 U/mL PDC carboligase activity (C. utilis partially purified), 2.5 M MOPS buffer, 1 mM Mg2+, 1 mM TPP. ORG: organic phase, AQ: aqueous phase. Approximate values for acetaldehyde concentration due to possible evaporative loss during sampling and analysis. The mean values were determined from triplicate analyses and error bars show the highest and lowest values.

Chapter 4 Factors Affecting PDC Enzyme Deactivation and PAC Production in Two-Phase Aqueous/Organic System
Cindy Gunawan 2006 PhD Thesis
121
0
500
1000
1500
2000
2500
3000
3500
0 10 20 30 40 50
[Ben
zald
ehyd
e]O
RG
, [P
AC
]OR
G (
mM
)
0
5
10
15
20
25
[Ace
tald
ehyd
e]O
RG
, [A
ceto
in]O
RG
(m
M)a
0
200
400
600
800
1000
1200
1400
0 10 20 30 40 50
T im e (h )
[Ben
zald
ehyd
e]A
Q,
[Pyr
uvat
e]A
Q, [
PA
C]A
Q (
mM
)
0
10
20
30
40
[Ace
tald
ehyd
e]A
Q, [
Ace
toin
]AQ
(mM
)
b
Figure 4.7: Effect of organic to aqueous phase volume ratio on PAC production in the
aqueous/octanol-benzaldehyde emulsion system at 0.67:1 ratio at 4°C, initial pH 6.5: (a)
organic and (b) aqueous phase concentration profiles. Initial agitation 235 rpm, initial
concentrations: 1.7 M organic phase benzaldehyde, the aqueous phase contained 1.06 M
pyruvate, 4.7 U/mL PDC carboligase activity (C. utilis partially purified), 2.5 M MOPS
buffer, 1 mM Mg2+, 1 mM TPP.

Chapter 4 Factors Affecting PDC Enzyme Deactivation and PAC Production in Two-Phase Aqueous/Organic System
Cindy Gunawan 2006 PhD Thesis
122
0
500
1000
1500
2000
2500
3000
3500
0 10 20 30 40 50
[Ben
zald
ehyd
e]O
RG
, [P
AC
]OR
G (
mM
)
0
5
10
15
20
25
[Ace
tald
ehyd
e]O
RG
, [A
ceto
in]O
RG
(m
M)a
0
200
400
600
800
1000
1200
1400
0 10 20 30 40 50T im e (h )
[Ben
zald
ehyd
e]A
Q,
[Pyr
uvat
e]A
Q, [
PA
C]A
Q (
mM
)
0
10
20
30
40
[Ace
tald
ehyd
e]A
Q, [
Ace
toin
]AQ
(mM
)
b
Figure 4.8: Effect of organic to aqueous phase volume ratio on PAC production in the
aqueous/octanol-benzaldehyde emulsion system at 0.43:1 ratio at 4°C, initial pH 6.5: (a)
organic and (b) aqueous phase concentration profiles. Initial agitation 220 rpm, initial
concentrations: 2.26 M organic phase benzaldehyde, the aqueous phase contained 0.93 M
pyruvate, 4 U/mL PDC carboligase activity (C. utilis partially purified), 2.5 M MOPS buffer,
1 mM Mg2+, 1 mM TPP.

Chapter 4 Factors Affecting PDC Enzyme Deactivation and PAC Production in Two-Phase Aqueous/Organic System
Cindy Gunawan 2006 PhD Thesis
123
0
500
1000
1500
2000
2500
3000
3500
0 10 20 30 40 50
[Ben
zald
ehyd
e]O
RG
, [P
AC
]OR
G (
mM
)
0
5
10
15
20
25
[Ace
tald
ehyd
e]O
RG
, [A
ceto
in]O
RG
(m
M)a
0
200
400
600
800
1000
1200
1400
0 10 20 30 40 50
T im e (h )
[Ben
zald
ehyd
e]A
Q,
[Pyr
uvat
e]A
Q, [
PA
C]A
Q (
mM
)
0
10
20
30
40
[Ace
tald
ehyd
e]A
Q, [
Ace
toin
]AQ
(m
M)
b
Figure 4.9: Effect of organic to aqueous phase volume ratio on PAC production in the
aqueous/octanol-benzaldehyde emulsion system at 0.25:1 ratio at 4°C, initial pH 6.5: (a)
organic and (b) aqueous phase concentration profiles. Initial agitation 205 rpm, initial
concentrations: 3.48 M organic phase benzaldehyde, the aqueous phase contained 0.8 M
pyruvate, 3.5 U/mL PDC carboligase activity (C. utilis partially purified), 2.5 M MOPS
buffer, 1 mM Mg2+, 1 mM TPP.

Chapter 4 Factors Affecting PDC Enzyme Deactivation and PAC Production in Two-Phase Aqueous/Organic System
Cindy Gunawan 2006 PhD Thesis
124
Decreasing the phase volume ratio resulted in higher PAC concentrations in both organic and
aqueous phases (Figs 4.6 – 4.9). At a 0.43:1 ratio for example, 1220 mM organic phase PAC
was produced in association with 180 mM PAC in the aqueous phase. These compared with
concentrations at a 1:1 ratio of 745 mM and 130 mM organic and aqueous phase PAC
respectively. As shown from data analysis reported in the Appendix, the overall PAC
concentration based on total reaction volume (TRV) was 490 mM in the former case, and 435
mM for the higher volume ratio.
Lowering the ratio to 0.25:1 resulted in a significantly higher organic and aqueous phase
PAC concentrations of 2220 mM and 225 mM respectively (625 mM TRV), however there
were increased discrepancies (10 – 20%) in the substrate molar balances (Table 4.2) in this
latter case and difficulties in separating the organic phase from the interfacial layer. Increases
in PAC were also found to be accompanied by increases in acetoin formation with overall
concentrations ranging from 18 mM to 30 mM for 1:1 to 0.25:1 ratio respectively (Figs 4.6 –
4.9).
4.2.2.2 PDC Deactivation
The rate of PDC deactivation was not affected by the reduced phase volume ratio with 50 –
60% residual PDC activity after 48 h for an initial overall activity of 2.8 U/mL based on the
total reaction volume (Fig 4.10).
It is possible that the similar deactivation rates resulted from the reduced deactivation
associated with lower interfacial contact being counteracted by the effect of higher organic
phase benzaldehyde concentrations at the lower ratios. Moreover, it appears that the higher
organic phase benzaldehyde concentrations at the lower ratios had a greater effect in
enhancing the organic-aqueous benzaldehyde tranfer rates than reducing interfacial area,
which resulted in enhanced PAC productivities at the lower ratios. The results imply a lesser
interfacial area reduction when decreasing the phase volume ratio from 1:1 (1.36 M organic
benzaldehyde) to 0.25:1 (3.48 M organic benzaldehyde) which corresponds to less than 2.6-

Chapter 4 Factors Affecting PDC Enzyme Deactivation and PAC Production in Two-Phase Aqueous/Organic System
Cindy Gunawan 2006 PhD Thesis
125
fold reduction in interfacial area. Additionally, the relatively high initial enzyme
concentrations (3.5 – 5.6 U/mL in the aqueous phase) might cause the phase toxicity to be
less pronounced.
0
20
40
60
80
100
120
0 10 20 30 40 50
% R
esid
ual E
nzym
e A
ctiv
ity
Time (h)
0
20
40
60
80
100
120
0 10 20 30 40 50
% R
esid
ual E
nzym
e A
ctiv
ity
Time (h)
1:1 0.67:1 0.43:1 0.25:11:11:1 0.67:10.67:1 0.43:10.43:1 0.25:10.25:1
Figure 4.10: Effect of organic to aqueous phase volume ratio in emulsion aqueous/octanol-
benzaldehyde system at 4°C, initial pH 6.5: residual enzyme activity. Same experiments as
shown in Figs 4.6 – 4.9.
4.2.2.3 Discussion of the Phase Ratio Effects
The results are summarized in Table 4.2, which shows increasing overall specific PAC
production and volumetric productivities as the volume ratios were decreased. The PAC
yields on consumed benzaldehyde were close to theoretical, while those on consumed
pyruvate were 90 – 95% theoretical. Good substrate molar balance closure was achieved in

Chapter 4 Factors Affecting PDC Enzyme Deactivation and PAC Production in Two-Phase Aqueous/Organic System
Cindy Gunawan 2006 PhD Thesis
126
all experiments except for the lower ratio of 0.25:1 where sampling problems occurred due to
phase separation difficulties.
Table 4.2: Performance summary: effect of organic to aqueous phase volume ratio on PAC
production in the aqueous/octanol-benzaldehyde emulsion system at 4°C, initial pH 6.5 (48
h).
Organic : aqueous
1:1
0.67:1
0.43:1
0.25:1
Overall PAC (g/L)
65.7
71.9
73.8
93.9
Organic PAC (g/L)
111.8
143.4
182.9
333.1
Aqueous PAC (g/L)
19.6
24.2
27.0
34.1
Overall specific PAC production
(mg/U initial PDC carboligase activity)
23.5
25.7
26.3
33.5
Overall volumetric productivity (g/L/day)
32.9
35.9
36.9
46.9
Overall by-product acetoin (g/L)
1.6
2.1
2.5
2.6
Overall by-product acetaldehyde (g/L)*
0.2
0.2
0.3
0.2
Yield of PAC on consumed benzaldehyde (mol/mol)
1.1
1.0
0.99
1.1
Yield of PAC on consumed pyruvate (mol/mol)
0.94
0.92
0.95
1.1
Benzaldehyde balance (%)
106
104
100
111
Pyruvate balance (%)
103
102
107
122
Calculated from data in experiments shown in Figs 4.6 – 4.9. *Approximate values for
acetaldehyde concentration due to possible evaporative loss during sampling and analysis.
Other researchers have reported that reducing the organic to aqueous phase volume ratio can
have a negative effect on a biocatalysis reaction. In a study reported by Panintrarux et al.
[1995], equilibrium yields of the β-glucosidase catalyzed biphasic production of n-alkyl-β-D

Chapter 4 Factors Affecting PDC Enzyme Deactivation and PAC Production in Two-Phase Aqueous/Organic System
Cindy Gunawan 2006 PhD Thesis
127
glucosides from glucose and n-alcohols were lower when the organic (n-alcohol only) to
aqueous phase volume ratio was decreased. This was associated with higher equilibrium
yields of by-product β-glucobioses. However, Yi et al. (1998) observed increasing reaction
rate of hexyl β-D glucoside production with a decreasing hexanol to water volume ratio.
4.3 Conclusion
The organic to aqueous phase volume ratio has been identified as a key factor in enhancing
the potential of a two-phase enzymatic process for PAC production with results
demonstrating that a more concentrated product stream can be produced by lowering this
ratio. These results were achieved with increasing specific production and productivities of
PAC while maintaining enzyme activity.

Chapter 5 Process Enhancement and Further Kinetic Evaluations for Two-Phase Aqueous/Organic Synthesis of PAC
Cindy Gunawan 2006 PhD Thesis
128
CHAPTER 5
__________________________________________________
PROCESS ENHANCEMENT AND FURTHER
KINETIC EVALUATIONS FOR TWO-PHASE
AQUEOUS/ORGANIC SYNTHESIS OF PAC
Optimization of two-phase aqueous/organic PAC
production

Chapter 5 Process Enhancement and Further Kinetic Evaluations for Two-Phase Aqueous/Organic Synthesis of PAC
Cindy Gunawan 2006 PhD Thesis
129
5.1 Introduction
Identification of the organic to aqueous phase volume ratio in the present investigation as a
key factor in the enhancement of two-phase aqueous/organic PAC synthesis has encouraged
further development of a cost effective two-phase process. To achieve this objective, in the
current investigation the possibility is evaluated of operating the two-phase biotransformation
at lowered organic to aqueous phase volume ratio, increased temperatures, reduced MOPS
concentration, with utilization of whole cell PDC, and addition of low cost solute into the
aqueous phase.
The investigation was started by studying the effect of changing the organic to aqueous phase
volume ratio at the increased temperature of 20°C with partially purified PDC and 2.5 M
MOPS system. Further potential process simplification was evaluated by lowering the MOPS
concentration to 20 mM (MOPS is a relatively expensive material) with employment of
whole cell as biocatalyst to study the effects of changing the phase volume ratio and
temperature on two-phase PAC production. Finally, addition of 2.5 M dipropylene glycol
(DPG) into the aqueous phase as a potential substitute for MOPS [Leksawasdi et al., 2005]
was studied with comparison of whole cell and partially purified PDC (refer to Section 2.7
for details of the biotransformation experiments).

Chapter 5 Process Enhancement and Further Kinetic Evaluations for Two-Phase Aqueous/Organic Synthesis of PAC
Cindy Gunawan 2006 PhD Thesis
130
5.2 Results and Discussion
5.2.1 Effect of Changing the Organic to Aqueous Phase Volume Ratio at 20°°°°C on
Reaction Kinetics
5.2.1.1 PAC and By-Product Formation To illustrate the effect of increasing temperature on two-phase aqueous/organic PAC
synthesis, the results for experiments with decreasing organic to aqueous phase volume ratio
from 1:1 to 0.25:1 at 20°C in the aqueous/octanol-benzaldehyde emulsion system are
presented in Figs 5.1 – 5.4. These figures show the profiles for the concentrations of
substrates, PAC, and by-products for each phase (the overall concentration profiles
calculated by combining the volumes of both phases are shown in Appendix C). Pyruvate
was fully consumed in systems with 0.43:1 and 0.25:1 ratios with some benzaldehyde
remaining. Rates of pyruvate consumption were higher than benzaldehyde consumption due
to by-product formation and the rates of PAC formation were significantly faster in
comparison to biotransformations at 4°C (see Section 4.2.1).
From the data, it is evident that an increase in PAC concentration occurred in both organic
and aqueous phases. For example, biotransformation with 0.43:1 ratio was associated with
1415 mM and 170 mM organic and aqueous phase PAC respectively, in comparison to lower
levels of 740 mM and 100 mM organic and aqueous phase PAC at 1:1 ratio. The overall PAC
concentration based on total reaction volume (TRV) was 545 mM in the former case, and 420
mM for the higher volume to volume ratio (Appendix C). Lowering the ratio to 0.25:1
resulted in higher organic and aqueous phase PAC of 1810 mM and 195 mM, however the
overall PAC concentration based on TRV was reduced slightly (520 mM).

Chapter 5 Process Enhancement and Further Kinetic Evaluations for Two-Phase Aqueous/Organic Synthesis of PAC
Cindy Gunawan 2006 PhD Thesis
131
0
500
1000
1500
2000
2500
3000
3500
4000
0 10 20 30 40 50
[Ben
zald
ehyd
e]O
RG
, [P
AC
]OR
G
(mM
)
0
10
20
30
40
50
60
70
[Ace
tald
ehyd
e]O
RG
, [A
ceto
in]O
RG
(mM
)
a
0
500
1000
1500
2000
2500
3000
3500
4000
0 10 20 30 40 50
[Ben
zald
ehyd
e]O
RG
, [P
AC
]OR
G
(mM
)
0
10
20
30
40
50
60
70
[Ace
tald
ehyd
e]O
RG
, [A
ceto
in]O
RG
(mM
)
0
500
1000
1500
2000
2500
3000
3500
4000
0
500
1000
1500
2000
2500
3000
3500
4000
0 10 20 30 40 500 10 20 30 40 50
[Ben
zald
ehyd
e]O
RG
, [P
AC
]OR
G
(mM
)
[Ben
zald
ehyd
e]O
RG
, [P
AC
]OR
G
(mM
)
0
10
20
30
40
50
60
70
0
10
20
30
40
50
60
70
[Ace
tald
ehyd
e]O
RG
, [A
ceto
in]O
RG
(mM
)
[Ace
tald
ehyd
e]O
RG
, [A
ceto
in]O
RG
(mM
)
a
0
200
400
600
800
1000
1200
1400
0 10 20 30 40 50
[Ben
zald
ehyd
e]A
Q,[P
yruv
ate]
AQ
,
[PA
C]A
Q (
mM
)
0
10
20
30
40
50
60
70
80
[Ace
tald
ehyd
e]A
Q, [
Ace
toin
]AQ
(mM
)
T im e (h)
b
0
200
400
600
800
1000
1200
1400
0 10 20 30 40 50
[Ben
zald
ehyd
e]A
Q,[P
yruv
ate]
AQ
,
[PA
C]A
Q (
mM
)
0
10
20
30
40
50
60
70
80
[Ace
tald
ehyd
e]A
Q, [
Ace
toin
]AQ
(mM
)
0
200
400
600
800
1000
1200
1400
0
200
400
600
800
1000
1200
1400
0 10 20 30 40 500 10 20 30 40 500 10 20 30 40 50
[Ben
zald
ehyd
e]A
Q,[P
yruv
ate]
AQ
,
[PA
C]A
Q (
mM
)
[Ben
zald
ehyd
e]A
Q,[P
yruv
ate]
AQ
,
[PA
C]A
Q (
mM
)
0
10
20
30
40
50
60
70
80
0
10
20
30
40
50
60
70
80
[Ace
tald
ehyd
e]A
Q, [
Ace
toin
]AQ
(mM
)
[Ace
tald
ehyd
e]A
Q, [
Ace
toin
]AQ
(mM
)
T im e (h)
b
Figure 5.1: Effect of organic to aqueous phase volume ratio on PAC production in the
aqueous/octanol-benzaldehyde emulsion system at 1:1 ratio at 20°C, initial pH 6.5: (a) organic and
(b) aqueous phase substrates, PAC, and by-product concentration profiles. Initial agitation 250 rpm,
initial concentrations: 1.4 M organic phase benzaldehyde, the aqueous phase contained 1.29 M
pyruvate, 5.6 U/mL PDC carboligase activity (C. utilis partially purified), 2.5 M MOPS buffer, 1 mM
Mg2+, 1 mM TPP. ORG: organic phase, AQ: aqueous phase, Approximate values for acetaldehyde
concentration due to possible evaporative losses during sampling and analysis. The mean values were
determined from triplicate analyses and error bars show the highest and lowest values.

Chapter 5 Process Enhancement and Further Kinetic Evaluations for Two-Phase Aqueous/Organic Synthesis of PAC
Cindy Gunawan 2006 PhD Thesis
132
0
5 00
1 00 0
1 50 0
2 00 0
2 50 0
3 00 0
3 50 0
4 00 0
0 10 2 0 3 0 4 0 5 0
[Ben
zald
ehyd
e]O
RG
, [P
AC
]OR
G
(mM
)
0
10
20
30
40
50
60
70
[Ace
tald
ehyd
e]O
RG
, [A
ceto
in]O
RG
(mM
)
a
0
5 00
1 00 0
1 50 0
2 00 0
2 50 0
3 00 0
3 50 0
4 00 0
0
5 00
1 00 0
1 50 0
2 00 0
2 50 0
3 00 0
3 50 0
4 00 0
0 10 2 0 3 0 4 0 5 00 10 2 0 3 0 4 0 5 0
[Ben
zald
ehyd
e]O
RG
, [P
AC
]OR
G
(mM
)
[Ben
zald
ehyd
e]O
RG
, [P
AC
]OR
G
(mM
)
0
10
20
30
40
50
60
70
0
10
20
30
40
50
60
70
[Ace
tald
ehyd
e]O
RG
, [A
ceto
in]O
RG
(mM
)
[Ace
tald
ehyd
e]O
RG
, [A
ceto
in]O
RG
(mM
)
a
0
200
400
600
800
100 0
120 0
140 0
0 10 20 30 4 0 5 0
[Ben
zald
ehyd
e]A
Q,[P
yruv
ate]
AQ
,
[PA
C]A
Q (
mM
)
0
1 0
2 0
3 0
4 0
5 0
6 0
7 0
8 0
[Ace
tald
ehyd
e]A
Q, [
Ace
toin
]AQ
(mM
)
b
T im e (h )
0
200
400
600
800
100 0
120 0
140 0
0 10 20 30 4 0 5 0
[Ben
zald
ehyd
e]A
Q,[P
yruv
ate]
AQ
,
[PA
C]A
Q (
mM
)
0
1 0
2 0
3 0
4 0
5 0
6 0
7 0
8 0
[Ace
tald
ehyd
e]A
Q, [
Ace
toin
]AQ
(mM
)
0
200
400
600
800
100 0
120 0
140 0
0
200
400
600
800
100 0
0
200
400
600
800
100 0
120 0
140 0
0 10 20 30 4 0 5 00 10 20 30 4 0 5 0
[Ben
zald
ehyd
e]A
Q,[P
yruv
ate]
AQ
,
[PA
C]A
Q (
mM
)
[Ben
zald
ehyd
e]A
Q,[P
yruv
ate]
AQ
,
[PA
C]A
Q (
mM
)
0
1 0
2 0
3 0
4 0
5 0
6 0
7 0
8 0
0
1 0
2 0
3 0
4 0
5 0
6 0
7 0
8 0
[Ace
tald
ehyd
e]A
Q, [
Ace
toin
]AQ
(mM
)
[Ace
tald
ehyd
e]A
Q, [
Ace
toin
]AQ
(mM
)
b
T im e (h )
Figure 5.2: Effect of organic to aqueous phase volume ratio on PAC production in the
aqueous/octanol-benzaldehyde emulsion system at 0.67:1 ratio at 20°C, initial pH 6.5: (a)
organic and (b) aqueous phase concentration profiles. Initial agitation 235 rpm, initial
concentrations: 1.76 M organic phase benzaldehyde, the aqueous phase contained 1.075 M
pyruvate, 4.7 U/mL PDC carboligase activity (C. utilis partially purified), 2.5 M MOPS
buffer, 1 mM Mg2+, 1 mM TPP.

Chapter 5 Process Enhancement and Further Kinetic Evaluations for Two-Phase Aqueous/Organic Synthesis of PAC
Cindy Gunawan 2006 PhD Thesis
133
0
500
1000
1500
2000
2500
3000
3500
4000
0 10 20 30 40 50
[Ben
zald
ehyd
e]O
RG
, [P
AC
]OR
G
(mM
)
0
10
20
30
40
50
60
70
[Ace
tald
ehyd
e]O
RG
, [A
ceto
in]O
RG
(mM
)
a
0
500
1000
1500
2000
2500
3000
3500
4000
0 10 20 30 40 50
[Ben
zald
ehyd
e]O
RG
, [P
AC
]OR
G
(mM
)
0
10
20
30
40
50
60
70
[Ace
tald
ehyd
e]O
RG
, [A
ceto
in]O
RG
(mM
)
0
500
1000
1500
2000
2500
3000
3500
4000
0
500
1000
1500
2000
2500
3000
3500
4000
0 10 20 30 40 500 10 20 30 40 50
[Ben
zald
ehyd
e]O
RG
, [P
AC
]OR
G
(mM
)
[Ben
zald
ehyd
e]O
RG
, [P
AC
]OR
G
(mM
)
0
10
20
30
40
50
60
70
0
10
20
30
40
50
60
70
[Ace
tald
ehyd
e]O
RG
, [A
ceto
in]O
RG
(mM
)
[Ace
tald
ehyd
e]O
RG
, [A
ceto
in]O
RG
(mM
)
a
0
200
400
600
800
1000
1200
1400
0 10 20 30 40 50
[Ben
zald
ehyd
e]A
Q,[P
yruv
ate]
AQ
,
[PA
C]A
Q (
mM
)
0
10
20
30
40
50
60
70
80
[Ace
tald
ehyd
e]A
Q, [
Ace
toin
]AQ
(mM
)
b
T im e (h )
0
200
400
600
800
1000
1200
1400
0 10 20 30 40 50
[Ben
zald
ehyd
e]A
Q,[P
yruv
ate]
AQ
,
[PA
C]A
Q (
mM
)
0
10
20
30
40
50
60
70
80
[Ace
tald
ehyd
e]A
Q, [
Ace
toin
]AQ
(mM
)
0
200
400
600
800
1000
1200
1400
0
200
400
600
800
1000
1200
1400
0 10 20 30 40 500 10 20 30 40 50
[Ben
zald
ehyd
e]A
Q,[P
yruv
ate]
AQ
,
[PA
C]A
Q (
mM
)
[Ben
zald
ehyd
e]A
Q,[P
yruv
ate]
AQ
,
[PA
C]A
Q (
mM
)
0
10
20
30
40
50
60
70
80
0
10
20
30
40
50
60
70
80
[Ace
tald
ehyd
e]A
Q, [
Ace
toin
]AQ
(mM
)
[Ace
tald
ehyd
e]A
Q, [
Ace
toin
]AQ
(mM
)
b
T im e (h )
Figure 5.3: Effect of organic to aqueous phase volume ratio on PAC production in the
aqueous/octanol-benzaldehyde emulsion system at 0.43:1 ratio at 20°C, initial pH 6.5: (a)
organic and (b) aqueous phase concentration profiles. Initial agitation 220 rpm, initial
concentrations: 2.47 M organic phase benzaldehyde, the aqueous phase contained 0.92 M
pyruvate, 4 U/mL PDC carboligase activity (C. utilis partially purified), 2.5 M MOPS buffer,
1 mM Mg2+, 1 mM TPP.

Chapter 5 Process Enhancement and Further Kinetic Evaluations for Two-Phase Aqueous/Organic Synthesis of PAC
Cindy Gunawan 2006 PhD Thesis
134
0
500
1000
1500
2000
2500
3000
3500
4000
0 10 20 30 40 50
[Ben
zald
ehyd
e]O
RG
, [P
AC
]OR
G
(mM
)
0
10
20
30
40
50
60
70
[Ace
tald
ehyd
e]O
RG
, [A
ceto
in]O
RG
(mM
)
a
0
500
1000
1500
2000
2500
3000
3500
4000
0 10 20 30 40 50
[Ben
zald
ehyd
e]O
RG
, [P
AC
]OR
G
(mM
)
0
10
20
30
40
50
60
70
[Ace
tald
ehyd
e]O
RG
, [A
ceto
in]O
RG
(mM
)
0
500
1000
1500
2000
2500
3000
3500
4000
0
500
1000
1500
2000
2500
3000
3500
4000
0 10 20 30 40 500 10 20 30 40 50
[Ben
zald
ehyd
e]O
RG
, [P
AC
]OR
G
(mM
)
[Ben
zald
ehyd
e]O
RG
, [P
AC
]OR
G
(mM
)
0
10
20
30
40
50
60
70
0
10
20
30
40
50
60
70
[Ace
tald
ehyd
e]O
RG
, [A
ceto
in]O
RG
(mM
)
[Ace
tald
ehyd
e]O
RG
, [A
ceto
in]O
RG
(mM
)
a
0
20 0
40 0
60 0
80 0
1 00 0
1 20 0
1 40 0
0 10 20 3 0 40 50
[Ben
zald
ehyd
e]A
Q,[P
yruv
ate]
AQ
,
[PA
C]A
Q (
mM
)
0
1 0
2 0
3 0
4 0
5 0
6 0
7 0
8 0
[Ace
tald
ehyd
e]A
Q, [
Ace
toin
]AQ
(mM
)
b
T im e (h )
0
20 0
40 0
60 0
80 0
1 00 0
1 20 0
1 40 0
0 10 20 3 0 40 50
[Ben
zald
ehyd
e]A
Q,[P
yruv
ate]
AQ
,
[PA
C]A
Q (
mM
)
0
1 0
2 0
3 0
4 0
5 0
6 0
7 0
8 0
[Ace
tald
ehyd
e]A
Q, [
Ace
toin
]AQ
(mM
)
0
20 0
40 0
60 0
80 0
1 00 0
1 20 0
1 40 0
0
20 0
40 0
60 0
80 0
1 00 0
1 20 0
1 40 0
0 10 20 3 0 40 500 10 20 3 0 40 50
[Ben
zald
ehyd
e]A
Q,[P
yruv
ate]
AQ
,
[PA
C]A
Q (
mM
)
[Ben
zald
ehyd
e]A
Q,[P
yruv
ate]
AQ
,
[PA
C]A
Q (
mM
)
0
1 0
2 0
3 0
4 0
5 0
6 0
7 0
8 0
0
1 0
2 0
3 0
4 0
5 0
6 0
7 0
8 0
[Ace
tald
ehyd
e]A
Q, [
Ace
toin
]AQ
(mM
)
[Ace
tald
ehyd
e]A
Q, [
Ace
toin
]AQ
(mM
)
b
T im e (h )
Figure 5.4: Effect of organic to aqueous phase volume ratio on PAC production in the
aqueous/octanol-benzaldehyde emulsion system at 0.25:1 ratio at 20°C, initial pH 6.5: (a)
organic and (b) aqueous phase concentration profiles. Initial agitation 205 rpm, initial
concentrations: 3.625 M organic phase benzaldehyde, the aqueous phase contained 0.8 M
pyruvate, 3.5 U/mL PDC carboligase activity (C. utilis partially purified), 2.5 M MOPS
buffer, 1 mM Mg2+, 1 mM TPP.

Chapter 5 Process Enhancement and Further Kinetic Evaluations for Two-Phase Aqueous/Organic Synthesis of PAC
Cindy Gunawan 2006 PhD Thesis
135
Increases in PAC production were accompanied by increases in acetoin formation with
overall concentrations between 43 – 63 mM. Acetoin formation was greater at 20°C than
4°C. Increased acetoin production at higher temperatures has been reported previously by
Shin and Rogers [1996] for PAC production using partially purified PDC from C. utilis.
Additionally, the initial benzaldehyde concentration in the aqueous phase was generally
higher at 20°C than 4°C, which is likely to increase the reaction rates.
5.2.1.2 PDC Deactivation
The rates of deactivation for partially purified PDC were similar for all phase ratios in the
two-phase system, being significantly faster at 20°C than 4°C (see Section 4.2.1) with
residual activity of 10 – 20% after 20 h for all ratios at 20°C (Fig 5.5).
T im e (h )
0
2 0
4 0
6 0
8 0
1 0 0
1 2 0
0 1 0 2 0 3 0 4 0 5 0
% R
esid
ual E
nzym
e A
ctiv
ity
T im e (h )
0
2 0
4 0
6 0
8 0
1 0 0
1 2 0
0 1 0 2 0 3 0 4 0 5 0
% R
esid
ual E
nzym
e A
ctiv
ity
1:1 0.67:1 0.43:1 0.25:11:11:1 0.67:10.67:1 0.43:10.43:1 0.25:10.25:1
Figure 5.5: Effect of organic to aqueous phase volume ratio on PDC deactivation in the
aqueous/octanol-benzaldehyde emulsion system at 20°C, initial pH 6.5. Same experiments as
shown in Figs 5.1 – 5.4.

Chapter 5 Process Enhancement and Further Kinetic Evaluations for Two-Phase Aqueous/Organic Synthesis of PAC
Cindy Gunawan 2006 PhD Thesis
136
The effect of temperature on the stability of partially purified PDC at 4°C and 20°C was
confirmed by Satianegara et al. [2006] who reported faster deactivation rates at the higher
temperature. However, these latter studies were obtained only in the absence and presence of
50 mM benzaldehyde and not in the two-phase system.
5.2.1.3 Discussion
The results of these phase ratio studies are summarized in Table 5.1, which shows that
biotransformations at 20°C resulted in higher overall specific PAC production and increased
overall volumetric productivities as the volume ratios were decreased from 1:1 to 0.43:1. No
further improvement occurred at 0.25:1 ratio (in fact a small decline was evident). Substrate
molar balance closures within 8% were achieved in all experiments. The PAC yields on
consumed benzaldehyde were close to theoretical, while those on pyruvate were lower with
values of 80 – 84% due to significant acetoin formation.
Compared to the previous results at 4°C (Table 4.2), the data at 20°C show significantly
higher overall PAC volumetric productivities at all ratios. The PAC yields on consumed
pyruvate were lower at 20°C due to increased acetoin formation.
In comparison to earlier results for PAC production using partially purified PDC in the two-
phase aqueous/octanol-benzaldehyde emulsion system, Sandford et al. [2005] reported PAC
levels of 141 g/L and 19 g/L in the organic and aqueous phase respectively in 49 h at 4°C
with initial PDC carboligase activity of 8.5 U/mL in the aqueous phase and 1:1 organic to
aqueous phase volume ratio. At 21°C and 1:1 ratio with whole cell PDC, Rosche et al. [2005]
reported 103 g/L and 12.8 g/L organic and aqueous phase PAC in 15 h with 5 U/mL initial
PDC carboligase activity in the aqueous phase, indicating that whole cell PDC at the higher
temperature resulted in higher productivity and specific PAC production than with partially
purified PDC at the lower temperature.

Chapter 5 Process Enhancement and Further Kinetic Evaluations for Two-Phase Aqueous/Organic Synthesis of PAC
Cindy Gunawan 2006 PhD Thesis
137
In the present study, lowering the ratio to 0.43:1 resulted in an appreciable improvement in
PAC production with 212 g/L and 25.8 g/L organic and aqueous phase PAC in 20 h at 20°C
with a relatively low 4 U/mL initial PDC carboligase activity in the aqueous phase. The
strategy created conditions which favored both reduced PDC enzyme deactivation rates while
maintaining adequate organic-aqueous benzaldehyde transfer.
Table 5.1: Performance summary: effect of organic to aqueous phase volume ratio on PAC
production in the aqueous/octanol-benzaldehyde emulsion system at 20°C, initial pH 6.5 (48
h).
Organic : aqueous
1:1
0.67:1
0.43:1
0.25:1
Overall PAC (g/L)
63.1
72.4
81.7
77.6
Organic PAC (g/L)
111.1
152.2
212.4
271.2
Aqueous PAC (g/L)
15.1
19.2
25.8
29.2
Overall specific PAC production
(mg/U initial PDC carboligase activity)
22.5
25.9
29.2
27.7
Overall volumetric productivity (g/L/day)*
75.7
86.9
98
93.1
Overall by-product acetoin (g/L)
3.8
4.9
5.5
5.0
Overall by-product acetaldehyde (g/L)**
0.3
0.34
0.32
0.27
Yield of PAC on consumed benzaldehyde (mol/mol)
1.0
1.1
0.97
0.91
Yield of PAC on consumed pyruvate (mol/mol)
0.81
0.84
0.84
0.81
Benzaldehyde balance (%)
105
108
100
95
Pyruvate balance (%)
100
105
106
100
Calculated from data in experiments shown in Figs 5.1 – 5.4. *The productivity was calculated
based on 20 h time point. **Approximate values for acetaldehyde concentration due to possible
evaporative losses during sampling and analysis.

Chapter 5 Process Enhancement and Further Kinetic Evaluations for Two-Phase Aqueous/Organic Synthesis of PAC
Cindy Gunawan 2006 PhD Thesis
138
5.2.2 Effect of Changing Organic to Aqueous Phase Volume Ratio at 20°°°°C at
Lower MOPS Concentration (20 mM)
The effect of organic to aqueous phase volume ratio on two-phase PAC synthesis was studied
with 20 mM MOPS buffer system with the ratio lowered from 1:1 to 0.25:1 in the
aqueous/octanol-benzaldehyde emulsion system at 20°C with whole cell PDC. The pH was
controlled at 7.0 through acetic acid addition (see Appendix D for the acid addition profiles).
The lower MOPS concentration and whole cell PDC conditions were studied as possible
means of improving the overall process economics.
5.2.2.1 PAC and By-Product Formation
The PAC concentration profiles for each phase at the different phase ratios are presented in
Fig 5.6 (the overall concentration profiles calculated by combining the volumes of both
phases are shown in Appendix). Lowering the organic to aqueous phase volume ratio resulted
in faster reaction completion and decreased PAC formation rates (based on total reaction
volume). Neither substrate was limiting in any experiment.
Lowering the ratio resulted in slightly increasing final organic phase PAC with
concentrations of 220 mM at 1:1, followed by 230 mM and 260 mM at 0.67:1 and 0.43:1
respectively, and finally 270 mM at 0.25:1. Lower final PAC concentrations of 12 – 16 mM
partitioned into the aqueous phase. Lowering the ratio was associated with reduced overall
PAC concentration when account is taken of decreasing organic phase volumes. Reductions
in overall PAC concentration were accompanied by decreases in acetoin formation with final
concentrations decreasing from 4.3 mM to 3 mM and 19 mM to 6.5 mM in the organic and
aqueous phases respectively (Fig 5.7).

Chapter 5 Process Enhancement and Further Kinetic Evaluations for Two-Phase Aqueous/Organic Synthesis of PAC
Cindy Gunawan 2006 PhD Thesis
139
0
50
100
150
200
250
300
0 5 10 15 20 25 30 35 40
Time (h)
[PA
C]O
RG
(m
M)
0
10
20
30
40
[PA
C]A
Q (
mM
)
1: 1 0.67 : 1 0.43 : 1 0.25 : 1 Organic phaseAqueous phase1: 1 0.67 : 1 0.43 : 1 0.25 : 1 Organic phaseAqueous phase1: 1 0.67 : 1 0.43 : 1 0.25 : 1 1: 1 0.67 : 1 0.43 : 1 0.25 : 1 Organic phaseAqueous phase
Figure 5.6: Effect of organic to aqueous phase volume ratio on PAC production in the
aqueous/octanol-benzaldehyde emulsion system with 20 mM MOPS at 20°C, controlled pH
7.0: organic and aqueous phase concentration profiles are shown. Constant agitation 160
rpm, initial concentrations: 775 – 810 mM TRV benzaldehyde, 400 – 465 mM TRV
pyruvate, 1 U/mL TRV PDC carboligase activity (C. utilis whole cell), 20 mM MOPS buffer,
1 mM Mg2+, 1 mM TPP. ORG: organic phase, AQ: aqueous phase, TRV: total reaction
volume by combining both phases. The mean values were determined from triplicate
analyses and error bars show the highest and lowest values.

Chapter 5 Process Enhancement and Further Kinetic Evaluations for Two-Phase Aqueous/Organic Synthesis of PAC
Cindy Gunawan 2006 PhD Thesis
140
0
1
2
3
4
5
'1:1' '0.67:1' '0.43:1' '0.25:1'
[Ace
tald
ehyd
e]O
RG
, [A
ceto
in]O
RG
(m
M) a
0
5
10
15
20
'1:1' '0.67:1' '0.43:1' '0.25:1'
Organic : Aqueous
[Ace
tald
ehyd
e]A
Q, [
Ace
toin
]AQ
(m
M)
acetaldehyde acetoin
b
Figure 5.7: Effect of organic to aqueous phase volume ratio on by-products acetaldehyde
and acetoin formation in the aqueous/octanol-benzaldehyde emulsion system with 20 mM
MOPS at 20°C, controlled pH 7.0: (a) final organic and (b) aqueous phase concentrations.
Same experiments as shown in Fig 5.6. Approximate values for acetaldehyde concentration
due to possible evaporative losses during sampling and analysis.

Chapter 5 Process Enhancement and Further Kinetic Evaluations for Two-Phase Aqueous/Organic Synthesis of PAC
Cindy Gunawan 2006 PhD Thesis
141
5.2.2.2 Discussion The results in Figs 5.6 and 5.7 summarized in Table 5.2 show that lowering the organic to
aqueous phase volume ratio in two-phase emulsion PAC synthesis with 20 mM MOPS at
20°C resulted in: (1) slightly increasing organic phase PAC concentration although with
much lower values than with 2.5 M MOPS (Table 5.1), (2) decreasing overall specific PAC
production and volumetric productivities, and (3) decreasing acetoin formation. The low
yields of PAC on consumed benzaldehyde and pyruvate were atypical; high benzaldehyde
concentrations in the organic phase (up to 3.9 M) and operations at 20°C gave rise to a higher
degree of evaporative losses of benzaldehyde and presumably acetaldehyde, as well as
appreciable pyruvate loss (a phenomenon also noticed by Rosche et al. [2002a]).
Benzaldehyde losses were measured using controls at all phase ratios and in some cases up to
45% losses occurred in these larger and more open systems (180 mL).
As opposed to the two-phase biotransformations in 2.5 M MOPS buffer systems, decreasing
the organic to aqueous phase volume ratio in 20 mM MOPS buffer system resulted in
reduction in overall PAC concentration. This might have been caused by reduction in PDC
stability at the lowered phase ratios due insufficient stabilizing effect on PDC by 20 mM
concentration of MOPS [Rosche et al., 2002a].

Chapter 5 Process Enhancement and Further Kinetic Evaluations for Two-Phase Aqueous/Organic Synthesis of PAC
Cindy Gunawan 2006 PhD Thesis
142
Table 5.2: Performance summary: effect of organic to aqueous phase volume ratio on PAC
production in the aqueous/octanol-benzaldehyde emulsion system with 20 mM MOPS at
20°C, controlled pH 7.0.
Organic : aqueous
1:1
0.67:1
0.43:1
0.25:1
Reaction period (h)
38
35
32
27
Overall PAC (g/L)
17.7
15.0
13.3
9.5
Organic PAC (g/L)
33.1
34.6
38.9
40.1
Aqueous PAC (g/L)
2.3
2.0
2.4
1.8
Overall specific PAC production
(mg/U initial PDC carboligase activity)
17.7
15.0
13.3
9.4
Overall volumetric productivity (g/L/day)
11.2
10.3
10.0
8.4
Overall by-product acetoin (g/L)
1.0
0.8
0.7
0.5
Overall by-product acetaldehyde (g/L)*
0.02
0.02
0.01
0.02
Yield of PAC on consumed benzaldehyde (mol/mol)
0.73
0.51
0.45
0.6
Yield of PAC on consumed pyruvate (mol/mol)
0.72
0.79
0.64
0.8
Calculated from data in experiments as shown in Fig 5.6. *Approximate values for acetaldehyde
concentration due to possible losses during sampling and analysis.

Chapter 5 Process Enhancement and Further Kinetic Evaluations for Two-Phase Aqueous/Organic Synthesis of PAC
Cindy Gunawan 2006 PhD Thesis
143
5.2.3 Effect of Increasing Temperature at Lower MOPS Concentration (20 mM)
To investigate the effect of temperature on two-phase aqueous/organic PAC synthesis with
20 mM MOPS, experiments were designed with increasing temperatures from 5°C to 35°C in
1:1 aqueous/octanol-benzaldehyde emulsion system with employment of whole cell PDC to
determine the potential for process simplification and cost reductions. The pH was controlled
at 7.0 through acetic acid addition (see Appendix for the acid addition profiles).
5.2.3.1 PAC and By-Product Formation
The profiles of PAC concentration for each phase at the different temperatures are shown in
Figs 5.8 and 5.9 (the overall concentration profiles calculated by combining the volumes of
both phases are shown in Appendix D). Operation at increasing temperatures resulted in
shortened reaction period and increasing PAC formation rates. Neither substrate was limiting
in any experiments.
As illustrated in Fig 5.8, increasing the temperature from 5°C to 20°C resulted in increased
final organic phase PAC concentrations with values of 155 mM and 190 mM at 5°C and
10°C respectively and 220 mM at 15°C and 20°C. Further increasing the temperature
decreased the final PAC concentrations to 145 mM at 25°C and 30°C, with further reduction
to 75 mM at 35°C. The lower concentrations of final PAC which partitioned into the aqueous
phase (5 – 17 mM) corresponded to the changes in values in the organic phase (Fig 5.9).

Chapter 5 Process Enhancement and Further Kinetic Evaluations for Two-Phase Aqueous/Organic Synthesis of PAC
Cindy Gunawan 2006 PhD Thesis
144
0
50
100
150
200
250
0 10 20 30 40 50 60 70
[PA
C]O
RG
(m
M)
a
0
50
100
150
200
250
0 10 20 30 40 50 60 70
[PA
C]O
RG
(m
M)
a
0
50
100
150
200
250
0 10 20 30 40 50 60 70
[PA
C]O
RG
(m
M)
b
Tim e (h )
0
50
100
150
200
250
0 10 20 30 40 50 60 70
[PA
C]O
RG
(m
M)
b
0
50
100
150
200
250
0 10 20 30 40 50 60 70
[PA
C]O
RG
(m
M)
b
Tim e (h )
4 °°°°C 10 °°°°C 15°°°°C 20 °°°°C 25°°°°C 30 °°°°C 35°°°°C4 °°°°C4 °°°°C 10 °°°°C10 °°°°C 15°°°°C15°°°°C 20 °°°°C20 °°°°C 25°°°°C25°°°°C 30 °°°°C30 °°°°C 35°°°°C35°°°°C
Figure 5.8: Effect of temperature on PAC production in the aqueous/octanol-benzaldehyde emulsion
system with 20 mM MOPS, controlled pH 7.0. Organic phase concentration profiles: (a) 5°C – 20°C
and (b) 25°C – 35°C. Constant agitation 160 rpm, initial concentrations: 1.6 – 1.64 M organic phase
benzaldehyde, the aqueous phase containing 0.93 – 0.98 M pyruvate, 2 U/mL PDC carboligase
activity (C. utilis whole cell), 20 mM MOPS buffer, 1 mM Mg2+, 1 mM TPP, 1:1 organic to aqueous
phase volume ratio. ORG: organic phase. The mean values were determined from triplicate analyses
and error bars show the highest and lowest values.

Chapter 5 Process Enhancement and Further Kinetic Evaluations for Two-Phase Aqueous/Organic Synthesis of PAC
Cindy Gunawan 2006 PhD Thesis
145
0
4
8
12
16
20
0 10 20 30 40 50 60 70
[PA
C]A
Q (
mM
)
a
0
4
8
12
16
20
0 10 20 30 40 50 60 70
[PA
C]A
Q (
mM
)
a
0
4
8
12
16
20
0 10 20 30 40 50 60 70Tim e (h)
[PA
C]A
Q (
mM
)
b
0
4
8
12
16
20
0 10 20 30 40 50 60 70Tim e (h)
[PA
C]A
Q (
mM
)
b
4 °°°°C 10 °°°°C 15°°°°C 20 °°°°C 25°°°°C 30 °°°°C 35°°°°C4 °°°°C4 °°°°C 10 °°°°C10 °°°°C 15°°°°C15°°°°C 20 °°°°C20 °°°°C 25°°°°C25°°°°C 30 °°°°C30 °°°°C 35°°°°C35°°°°C
Figure 5.9: Effect of temperature on PAC production in the aqueous/octanol-benzaldehyde
emulsion system with 20 mM MOPS, controlled pH 7.0. Aqueous phase concentration
profiles: (a) 5°C – 20°C and (b) 25°C – 35°C. AQ: aqueous phase. Same experiments as
shown in Fig 5.8.

Chapter 5 Process Enhancement and Further Kinetic Evaluations for Two-Phase Aqueous/Organic Synthesis of PAC
Cindy Gunawan 2006 PhD Thesis
146
Fig 5.10 shows the final acetaldehyde and acetoin concentrations for each phase (the overall
concentrations are shown in Appendix). Increases in PAC concentration at 5°C to 20°C were
accompanied by increases in acetoin formation with aqueous phase concentrations of
between 10 – 19 mM in association with 0.5 – 4.5 mM in the organic phase. Reductions in
PAC concentration at 25°C to 35°C were associated with decreases in acetoin formation.
Concentrations of 15 mM and 3.5 mM were estimated in the aqueous and organic phase
respectively at 25°C and 30°C, while 7.5 mM and 1.8 mM were determined in the aqueous
and organic phase respectively at 35°C. The reduction in acetaldehyde concentrations at the
higher temperatures may be an artefact, as increasing evaporation of this volatile by-product
will occur as temperature increases.
5.2.3.2 Discussion
The results in Figs 5.8, 5.9, and 5.10 summarized in Table 5.3 show that performing the
aqueous/organic emulsion synthesis of PAC with 20 mM MOPS concentration from 5°C to
35°C resulted in: (1) highest organic phase PAC concentrations at 15°C and 20°C, (2) highest
overall specific PAC production at 15°C and 20°C, (3) overall volumetric productivity
increases with temperature, however the final PAC concentrations are low at the highest
temperature, and (4) highest acetoin concentration at 20°C. As found previously, the PAC
yields on consumed benzaldehyde and pyruvate were relatively low; longer
biotransformation periods at the lower temperatures and operation at higher temperatures
gave rise to increased evaporative losses of benzaldehyde and presumably acetaldehyde, as
well as appreciable pyruvate loss. Benzaldehyde losses were measured using controls at all
temperatures and in some cases up to 40% losses occurred in these larger and more open
systems (180 mL).

Chapter 5 Process Enhancement and Further Kinetic Evaluations for Two-Phase Aqueous/Organic Synthesis of PAC
Cindy Gunawan 2006 PhD Thesis
147
0
1
2
3
4
5
4 10 15 20 25 30 35
[ace
tald
ehyd
e]O
RG
, [ac
etoi
n]O
RG
(m
M)
a
0
5
10
15
20
4 10 15 20 25 30 35
T (oC)
[ace
tald
ehyd
e]A
Q, [
acet
oin]
AQ
(m
M)
acetaldehyde acetoin
b
Figure 5.10: Effect of temperature on by-products acetaldehyde and acetoin formation in the
aqueous/octanol-benzaldehyde emulsion system with 20 mM MOPS, controlled pH 7.0: (a)
final organic and (b) aqueous phase concentrations. ORG: organic phase, AQ: aqueous
phase. Same experiments as shown in Fig 5.8. Estimated values for acetaldehyde
concentrations due to evaporative losses during sampling and analysis.

Chapter 5 Process Enhancement and Further Kinetic Evaluations for Two-Phase Aqueous/Organic Synthesis of PAC
Cindy Gunawan 2006 PhD Thesis
148
Table 5.3: Performance summary: effect of temperature on PAC production in the
aqueous/octanol-benzaldehyde emulsion system with 20 mM MOPS, controlled pH 7.0.
Temperature (°C)
4
10
15
20
25
30
35
Reaction period (h)
60
58
52
38
23
18
6
Initial PAC rate (g/L/h)*
1.3
1.7
2.4
2.9
3.6
4.1
3.6
Overall PAC (g/L)
12.5
15.6
17.6
17.7
11.5
11.7
5.9
Organic PAC (g/L)
23.0
28.8
32.7
33.1
21.5
22.0
11.1
Aqueous PAC (g/L)
2.0
2.5
2.6
2.3
1.6
1.4
0.8
Overall specific PAC production
(mg/U initial PDC carboligase activity)
12.5
15.6
17.6
17.7
11.5
11.7
5.9
Overall volumetric productivity
(g/L/day)
5.0
6.5
8.3
11.2
11.9
15.5
23.8
Overall by-product acetoin (g/L)
0.48
0.71
0.87
1.0
0.84
0.8
0.41
Overall by-product acetaldehyde
(g/L)**
0.13
0.09
0.02
0.02
0.03
0.02
0.0
Yield of PAC on consumed
benzaldehyde (mol/mol)
0.52
0.65
0.72
0.73
0.52
0.73
0.4
Yield of PAC on consumed pyruvate
(mol/mol)
0.72
0.68
0.7
0.72
0.55
0.61
0.4
Calculated from data in experiments as shown in Fig 5.8. *Measured over the first hour.
**Estimated values for acetaldehyde concentration due to evaporative losses during sampling and
analysis.

Chapter 5 Process Enhancement and Further Kinetic Evaluations for Two-Phase Aqueous/Organic Synthesis of PAC
Cindy Gunawan 2006 PhD Thesis
149
The effect of temperature up to 30°C on increasing initial PAC formation rates (Table 5.3,
the formation rate was reduced at 35°C) in the aqueous/octanol-benzaldehyde emulsion
system with whole cell PDC has been shown in the present investigation. A similar increase
was reported by Shin and Rogers [1996a] and Satianegara et al. [2005] in the aqueous
(soluble benzaldehyde) and aqueous/benzaldehyde emulsion system respectively over a more
limited temperature range (up to 20°C) with partially purified PDC. Furthermore as shown in
Chapter 4, two-phase aqueous/organic PAC production was influenced by PDC enzyme
stability as well as the rate of organic-aqueous benzaldehyde transfer, with likely
enhancement of the transfer rate at higher temperatures. In the current study, the highest total
PAC formation was obtained at 15°C and 20°C regardless of the increasing reaction rates at
the higher temperatures. It appeared that the effects of enhanced organic-aqueous
benzaldehyde transfer rates were counteracted by reduction in PDC stability at the higher
temperatures.
5.2.4 Effect of Dipropylene Glycol (DPG) as Additive at Lower MOPS
Concentration (20 mM) with Lowered Organic to Aqueous Phase Volume Ratio
As previously shown, two-phase aqueous/organic PAC production with 20 mM MOPS (pH
controlled at 7.0) and whole cell PDC was relatively low in comparison to biotransformations
with 2.5 M MOPS (see Sections 4.2.2 and 5.2.1). The relatively low PAC production with 20
mM MOPS was observed earlier by Leksawasdi et al. [2005] with partially purified PDC.
The initial benzaldehyde concentrations in the aqueous phase were lower in the 20 mM
MOPS systems of approx. 20 mM in comparison to approx. 40 – 50 mM in systems with 2.5
M MOPS, which indicated a decreased concentration driving force in the lower MOPS
system for PAC formation in the aqueous phase (reported also by Leksawasdi et al. [2005]).
For the viewpoint of PDC stability, deactivation rates would be slower at lower benzaldehyde
concentrations in the aqueous phase, however the decreased PDC stability at lower MOPS
concentration would be likely to counteract this effect [Rosche et al. 2002a].

Chapter 5 Process Enhancement and Further Kinetic Evaluations for Two-Phase Aqueous/Organic Synthesis of PAC
Cindy Gunawan 2006 PhD Thesis
150
From the present study, it was apparent that maintenance of high MOPS concentration was
essential to achieve relatively high specific PAC production and productivities by stabilizing
the PDC enzyme and enhancing benzaldehyde partitioning into the aqueous phase.
Leksawasdi et al. [2005] evaluated the potential of several compounds to serve as possible
substitutes for the expensive MOPS and reported that similar specific PAC production could
be achieved with partially purified PDC in a two-phase emulsion system by replacing 2.5 M
MOPS with 20 mM MOPS and 2.5 M dipropylene glycol (DPG) in the aqueous phase.
The current investigation evaluates the effect on PAC production in the aqueous/octanol-
benzaldehyde emulsion system of 2.5 M DPG and 20 mM MOPS at 20°C. A 0.25:1 organic
to aqueous phase volume ratio was selected to enhance the more concentrated organic phase
product stream. The investigation also compares the use of whole cell and partially purified
PDC for PAC production in the larger scale system. The pH was controlled at 7.0 through
acetic acid addition (see Appendix D for the acid addition profiles).
5.2.4.1 PAC and By-Product Formation
Figs 5.11 and 5.12 show the profiles for the concentrations of substrates, PAC, and by-
products for each phase (the overall concentration profiles calculated by combining the
volumes of both phases are shown in Appendix D). The biotransformations were completed
at 26 h for both whole cell and partially purified PDC. Neither substrate was limiting in
either experiment.
Addition of 2.5 M DPG had a positive effect in enhancing two-phase PAC production in 20
mM MOPS system with organic phase PAC concentration of 420 mM with partially purified
PDC (Fig 5.11.a) and a higher concentration of 630 mM organic phase PAC with whole cell
PDC (Fig 5.12.a). Lower concentrations of 40 mM and 60 mM final PAC partitioned into the
aqueous phase for whole cell and partially purified PDC respectively (Figs 5.11.b and
5.12.b).
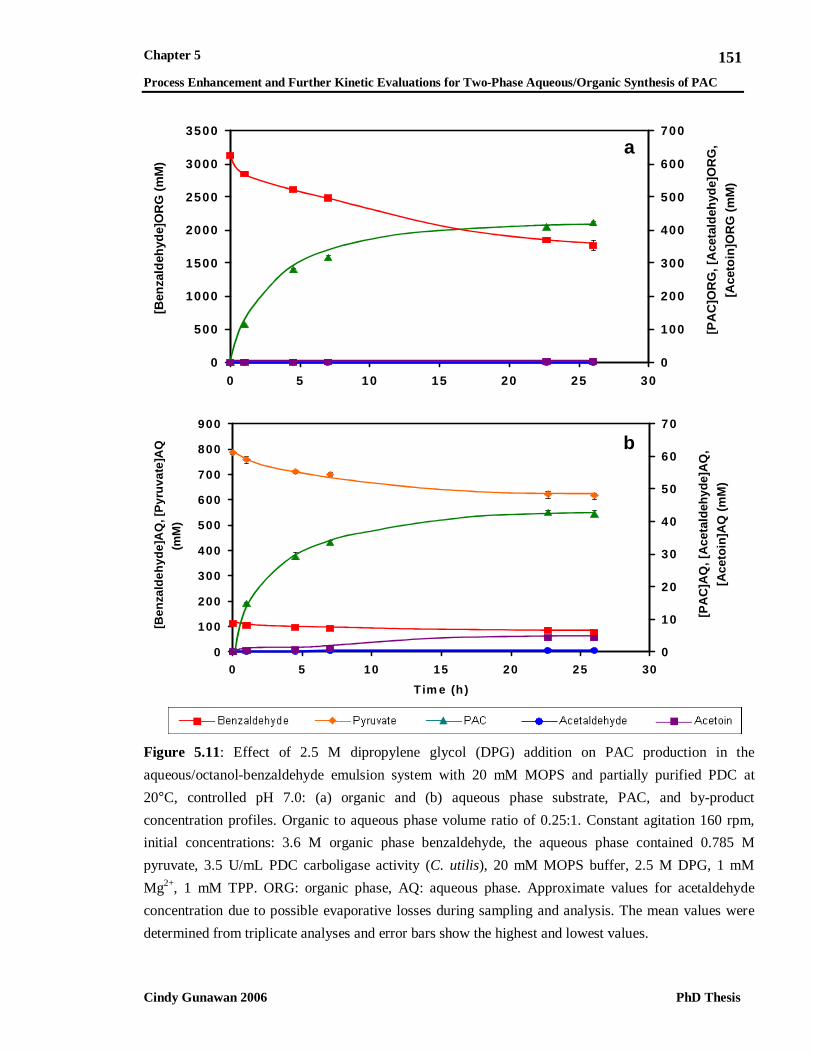
Chapter 5 Process Enhancement and Further Kinetic Evaluations for Two-Phase Aqueous/Organic Synthesis of PAC
Cindy Gunawan 2006 PhD Thesis
151
0
500
1000
1500
2000
2500
3000
3500
0 5 10 15 20 25 30
[Ben
zald
ehyd
e]O
RG
(m
M)
0
100
200
300
400
500
600
700
[PA
C]O
RG
, [A
ceta
ldeh
yde]
OR
G,
[Ace
toin
]OR
G (
mM
)
a
0
100
200
300
400
500
600
700
800
900
0 5 10 15 20 25 30
Tim e (h)
[Ben
zald
ehyd
e]A
Q, [
Pyr
uvat
e]A
Q
(mM
)
0
10
20
30
40
50
60
70
[PA
C]A
Q, [
Ace
tald
ehyd
e]A
Q,
[Ace
toin
]AQ
(m
M)
b
Figure 5.11: Effect of 2.5 M dipropylene glycol (DPG) addition on PAC production in the
aqueous/octanol-benzaldehyde emulsion system with 20 mM MOPS and partially purified PDC at
20°C, controlled pH 7.0: (a) organic and (b) aqueous phase substrate, PAC, and by-product
concentration profiles. Organic to aqueous phase volume ratio of 0.25:1. Constant agitation 160 rpm,
initial concentrations: 3.6 M organic phase benzaldehyde, the aqueous phase contained 0.785 M
pyruvate, 3.5 U/mL PDC carboligase activity (C. utilis), 20 mM MOPS buffer, 2.5 M DPG, 1 mM
Mg2+, 1 mM TPP. ORG: organic phase, AQ: aqueous phase. Approximate values for acetaldehyde
concentration due to possible evaporative losses during sampling and analysis. The mean values were
determined from triplicate analyses and error bars show the highest and lowest values.

Chapter 5 Process Enhancement and Further Kinetic Evaluations for Two-Phase Aqueous/Organic Synthesis of PAC
Cindy Gunawan 2006 PhD Thesis
152
0
5 0 0
1 0 0 0
1 5 0 0
2 0 0 0
2 5 0 0
3 0 0 0
3 5 0 0
0 5 1 0 1 5 2 0 2 5 3 0
[Ben
zald
ehyd
e]O
RG
(m
M)
0
1 0 0
2 0 0
3 0 0
4 0 0
5 0 0
6 0 0
7 0 0
[PA
C]O
RG
, [A
ceta
ldeh
yde]
OR
G,
[Ace
toin
]OR
G (
mM
)
a
0
1 0 0
2 0 0
3 0 0
4 0 0
5 0 0
6 0 0
7 0 0
8 0 0
9 0 0
0 5 1 0 1 5 2 0 2 5 3 0
T im e (h )
[Ben
zald
ehyd
e]A
Q, [
Pyr
uvat
e]A
Q
(mM
)
0
1 0
2 0
3 0
4 0
5 0
6 0
7 0
[PA
C]A
Q, [
Ace
tald
ehyd
e]A
Q,
[Ace
toin
]AQ
(m
M)
b
Figure 5.12: Effect of 2.5 M dipropylene glycol (DPG) addition on PAC production in the
aqueous/octanol-benzaldehyde emulsion system with 20 mM MOPS and whole cell PDC at
20°C, controlled pH 7.0: (a) organic and (b) aqueous phase concentration profiles. Organic to
aqueous phase volume ratio of 0.25:1. Constant agitation 160 rpm, initial concentrations:
3.65 M organic phase benzaldehyde, the aqueous phase contained 0.83 M pyruvate, 3.5
U/mL PDC carboligase activity (C. utilis), 20 mM MOPS buffer, 2.5 M DPG, 1 mM Mg2+, 1
mM TPP.

Chapter 5 Process Enhancement and Further Kinetic Evaluations for Two-Phase Aqueous/Organic Synthesis of PAC
Cindy Gunawan 2006 PhD Thesis
153
Biotransformation with whole cell PDC was associated with higher final acetoin
concentrations of 13 mM and 17 mM in the organic and aqueous phase respectively, while
lower organic and aqueous phase concentrations of 3 mM and 4 mM acetoin were formed
with partially purified PDC (Figs 5.11 and 5.12).
5.2.4.2 Discussion
The summarized results for two-phase PAC production in the aqueous/octanol-benzaldehyde
emulsion system with 2.5 M MOPS (Section 5.2.1) are compared to biotransformations with
20 mM MOPS + 2.5 M DPG (Figs 5.11 and 5.12) at 0.25:1 organic to aqueous phase volume
ratio and 20°C in Table 5.4. In comparison to 2.5 M MOPS system with 270 g/L organic
phase PAC, biotransformation with 20 mM MOPS + 2.5 M DPG produced less concentrated
PAC of 63 g/L in the organic phase with much less overall specific PAC production and
productivity when using partially purified PDC. Employment of whole cell PDC in the latter
system resulted in enhanced PAC production with an organic phase concentration of 95 g/L
and approx. 45% increase in overall specific PAC production and productivity compared to
the results with partially purified PDC.
As shown in Figs 5.11 and 5.12, two-phase systems with 20 mM MOPS + 2.5 M DPG in the
aqueous phase and 0.25:1 ratio (20°C) were associated with relatively high initial
benzaldehyde concentrations in the aqueous phase with levels exceeding 100 mM. This
compares to lower initial aqueous phase benzaldehyde concentrations of approx. 50 mM in
system with 2.5 M MOPS at the same phase ratio (20°C). This might have been one of the
factors responsible for the faster PDC deactivation rates in system containing 20 mM MOPS
+ 2.5 M DPG with no remaining enzyme activity after 26 h (partially purified PDC) (Table
5.4) in comparison to retention of approx. 20% residual activity in the 2.5 M MOPS system
(partially purified PDC) (Fig 5.5). Furthermore, Leksawasdi et al. [2005] observed less
protective effect of 2.5 M DPG on the enzyme stability compared to 2.5 M MOPS.
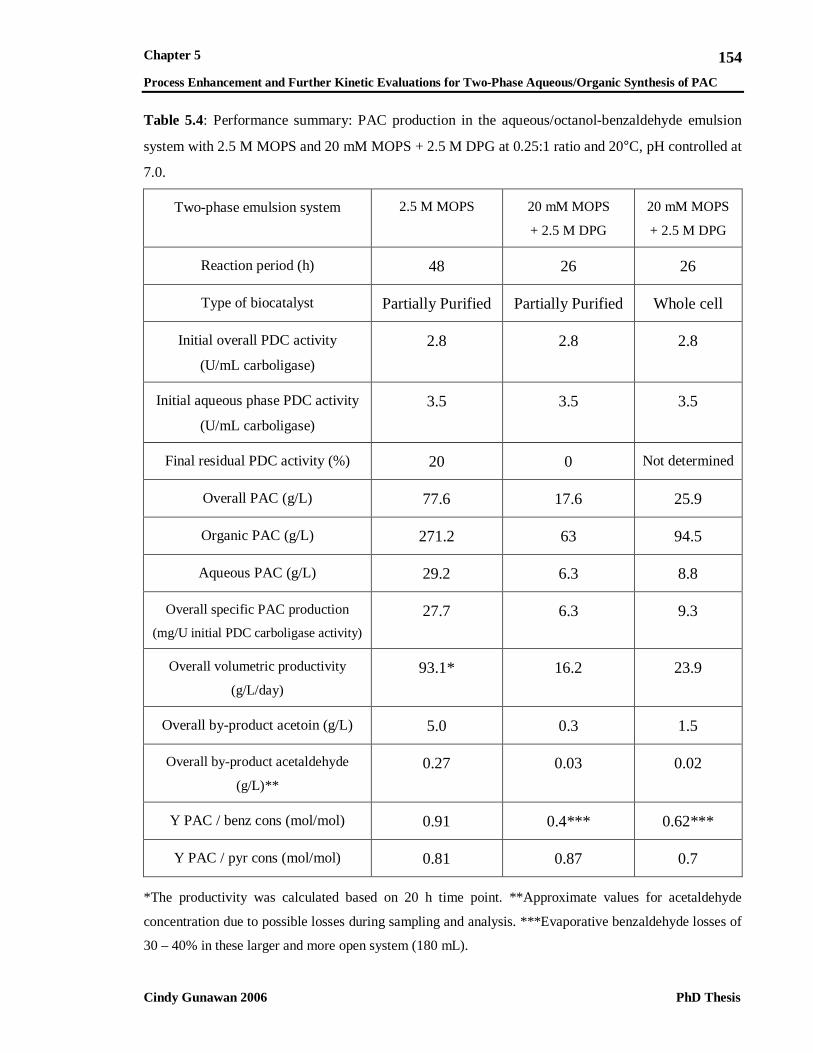
Chapter 5 Process Enhancement and Further Kinetic Evaluations for Two-Phase Aqueous/Organic Synthesis of PAC
Cindy Gunawan 2006 PhD Thesis
154
Table 5.4: Performance summary: PAC production in the aqueous/octanol-benzaldehyde emulsion
system with 2.5 M MOPS and 20 mM MOPS + 2.5 M DPG at 0.25:1 ratio and 20°C, pH controlled at
7.0.
Two-phase emulsion system
2.5 M MOPS
20 mM MOPS
+ 2.5 M DPG
20 mM MOPS
+ 2.5 M DPG
Reaction period (h)
48
26
26
Type of biocatalyst
Partially Purified
Partially Purified
Whole cell
Initial overall PDC activity
(U/mL carboligase)
2.8
2.8
2.8
Initial aqueous phase PDC activity
(U/mL carboligase)
3.5
3.5
3.5
Final residual PDC activity (%)
20
0
Not determined
Overall PAC (g/L)
77.6
17.6
25.9
Organic PAC (g/L)
271.2
63
94.5
Aqueous PAC (g/L)
29.2
6.3
8.8
Overall specific PAC production
(mg/U initial PDC carboligase activity)
27.7
6.3
9.3
Overall volumetric productivity
(g/L/day)
93.1*
16.2
23.9
Overall by-product acetoin (g/L)
5.0
0.3
1.5
Overall by-product acetaldehyde
(g/L)**
0.27
0.03
0.02
Y PAC / benz cons (mol/mol)
0.91
0.4***
0.62***
Y PAC / pyr cons (mol/mol)
0.81
0.87
0.7
*The productivity was calculated based on 20 h time point. **Approximate values for acetaldehyde
concentration due to possible losses during sampling and analysis. ***Evaporative benzaldehyde losses of
30 – 40% in these larger and more open system (180 mL).

Chapter 5 Process Enhancement and Further Kinetic Evaluations for Two-Phase Aqueous/Organic Synthesis of PAC
Cindy Gunawan 2006 PhD Thesis
155
Less acetoin was produced in system with 20 mM MOPS + 2.5 M DPG compared to system
with 2.5 M MOPS. This might due to the relatively high aqueous phase benzaldehyde
concentration and reduction in PDC stability in the former system.
5.3 Conclusion
When compared to a low buffer concentration process (20 mM MOPS), an improved two-
phase aqueous/organic PAC synthesis was achieved by operating the biotransformation with
(1) 20 mM MOPS + 2.5 M DPG in the aqueous phase, (2) lowered organic to aqueous phase
volume ratio of 0.25:1, (3) 20°C temperature, (4) whole cell PDC as biocatalyst, and (5) pH
controlled at 7.0. A product stream containing 95 g/L PAC in the organic phase was
produced in 26 h with an initial enzyme activity of 3.5 U/mL carboligase PDC in the aqueous
phase.

Chapter 6 Final Conclusions and Future Work
Cindy Gunawan 2006 PhD Thesis
156
CHAPTER 6
_____________________________________
FINAL CONCLUSIONS AND FUTURE WORK

Chapter 6 Final Conclusions and Future Work
Cindy Gunawan 2006 PhD Thesis
157
6.1 Yeast Pyruvate Decarboxylases: Variation in Biocatalytic
Characteristics
Strains of four yeasts Saccharomyces cerevisiae, Candida utilis, Candida tropicalis and
Kluyveromyces marxianus were investigated for their pyruvate decarboxylase (PDC) enzyme
properties with regards to PAC production. In the presence of pyruvate only, the PDCs were
associated with similar decarboxylation and carboligation activities based on acetaldehyde
and acetoin formation. Introduction of benzaldehyde (aqueous system with soluble
benzaldehyde) resulted in appreciable PAC formation and reduced acetaldehyde and acetoin
formation, indicating redirection of carboligation activity towards PAC production for all
enzymes.
Evaluating the enzymes for PAC production with increasing benzaldehyde concentrations in
the three different systems, it was found for relatively high benzaldehyde concentrations that
the highest levels of PAC were formed when using C. utilis PDC. This result is consistent
with the highest stability of C. utilis PDC in the absence and presence of 50 mM of the toxic
benzaldehyde. In terms of enantioselectivity, it has been reported that C. utilis PDC is highly
selective with e.e.values of over 90% for R-PAC formation [Rosche et al., 2001]. C.
tropicalis PDC had the advantage that it was associated with the lowest levels of by-product
acetoin in all tested systems. The trend was further confirmed in the presence of added
acetaldehyde (30 mM) and various benzaldehyde concentrations with the PAC to acetoin
ratio higher for C. tropicalis than C. utilis PDC. The commercially employed S. cerevisiae
PDC was associated with medium PAC levels and the highest acetaldehyde and acetoin
accumulation in all tested systems. On present evidence, S. cerevisiae would not appear to be
the most efficient yeast for enzymatic PAC production.
Based on the investigation, it was evident that C. utilis and C. tropicalis PDCs had the most
valuable properties and this observation may open up future opportunities in PDC protein
engineering for construction of a modified enzyme possessing both desirable properties. In
the present study, C. utilis PDC was selected as the biocatalyst for process development to
enhance PAC production in the two-phase aqueous/organic system.

Chapter 6 Final Conclusions and Future Work
Cindy Gunawan 2006 PhD Thesis
158
6.2 Factors Affecting PDC Enzyme Deactivation and PAC Production in
Two-Phase Aqueous/Organic System
The present investigation was designed to identify key factors in PDC deactivation and PAC
production in a two-phase aqueous/octanol-benzaldehyde system. It follows earlier reported
studies by Sandford et al. [2005] that while high PAC productivities can be achieved in an
emulsion system, PDC activities could be sustained only in a more slowly stirred phase-
separated process with a lower degree of interphase contact.
It was shown in the present investigation that some degree of PDC deactivation in the two-
phase system was caused by presence of soluble octanol and benzaldehyde in the aqueous
phase. In a further analysis, the effect of aqueous/organic contact area was studied using a
Lewis cell for depiction of the phase-separated system, and it was demonstrated that changes
in interfacial area over a limited range (117 – 475 cm2/L) had no effect on the rate of PDC
deactivation. However, extension to a more rapidly stirred emulsion system with presumably
much greater interfacial area resulted in faster decline of PDC activity. Additionally, a
decreased rate of PDC deactivation was evident at higher PDC concentrations in the
emulsion system.
To enhance both enzyme efficiency and productivity, a two-phase emulsion system was then
developed with reduced deactivating conditions for PDC while maintaining non-limiting
organic-aqueous substrate transfer. Lowering the organic to aqueous phase volume ratio from
1:1 to 0.43:1 at 4°C (2.5 M MOPS buffer system with partially purified PDC) resulted in
12% higher overall PAC (based on the total reaction volume) while maintaining the PDC
activity. The PAC was highly concentrated in the organic phase with 183 g/L in octanol in
comparison to 112 g/L when using the 1:1 ratio. Under these conditions, both overall specific
PAC production and volumetric productivity were increased while enzyme activity was
maintained. The main advantage of this organic phase volume reduction and higher PAC
concentration is that it greatly facilitates the downstream processing and recovery of the
product.

Chapter 6 Final Conclusions and Future Work
Cindy Gunawan 2006 PhD Thesis
159
6.3 Process Enhancement and Further Kinetic Evaluations for Two-Phase
Aqueous/Organic Synthesis of PAC
Further studies were carried out to improve the two-phase aqueous/organic PAC production
by developing a cost effective process. Lowering the organic to aqueous phase volume ratio
at increased temperature of 20°C (2.5 M MOPS buffer system with partially purifed PDC)
resulted in similar biotransformation patterns as those at 4°C although the higher temperature
was associated with faster reaction rates, increased PDC deactivation, and reduced yields on
pyruvate due to increased acetoin production. Lowering the ratio from 1:1 to 0.43:1 at 20°C
resulted in 29% increase in overall PAC production with an organic phase PAC
concentration of 212 g/L at 0.43:1 in comparison to 111 g/L at 1:1 ratio.
The potential of further two-phase process simplification was evaluated by reducing the
expensive MOPS concentration to 20 mM with pH controlled at 7.0 and employment of
whole cell PDC. It was found that 20°C was the optimum temperature for PAC production in
this system; however at the lower MOPS concentration, lowering the organic to aqueous
phase volume ratio resulted in decreased overall PAC production. Two-phase PAC
production was relatively low in 20 mM MOPS system compared to biotransformations in
2.5 M MOPS system. Addition of 2.5 M dipropylene glycol (DPG) into the aqueous phase in
the former system at 0.25:1 ratio and 20°C improved the PAC production with product
stream containing 95 g/L PAC. Despite its reduced PAC productivity, the system may have
the benefit of a reduction in the production cost as: (1) DPG is ten times cheaper than MOPS
[Sigma catalogue, 2006], (2) utilization of whole cell PDC would mean elimination of the
costly enzyme purification process, (3) operation at 20°C eliminates the necessity for
cooling, and (4) the lower organic phase volume would lead to reduction in the downstream
processing cost.

Chapter 6 Final Conclusions and Future Work
Cindy Gunawan 2006 PhD Thesis
160
6.4 Recommended Future Work
(a) PDC Enzyme Engineering
Following the characterization of the selected yeast PDCs in the present study (Chapter 3),
protein engineering/PDC mutation techniques could be used to develop a modified PDC with
the following properties: (1) increased activity and stability for PAC production, (2)
reduction of by-product formation particularly acetoin, and (3) increased resistance to
benzaldehyde, PAC, and by-products. With regards to reduced acetoin formation, the studies
with C. tropicalis PDC may suggest ways in which the amino acid sequence of the PDC may
be modified. Furthermore, studies on the amino acid sequence of Zymomonas mobilis PDC,
which exhibits high carboligase activity may indicate how activity of PDC could be
improved.
(b) Evaluation of Different Bioreactor Designs for Two-Phase Aqueous/Organic PAC
Production
It has been shown in the present study (Chapter 4) that PDC deactivation in the two-phase
aqueous/octanol-benzaldehyde system was faster in the emulsion system with high
aqueous/organic interfacial area and agitation rate. To minimize the effect on PDC
deactivation at the aqueous/organic interface, a two-phase membrane reactor could be
designed with the enzyme protected from the organic phase. Alternatively, to decrease the
effect of agitation rate on enzyme deactivation, a liquid-liquid bubble column reactor could
be designed with milder shearing effects on the enzyme while maintaining sufficient
aqueous/organic phase contact.
(c) Mathematical Modelling of the Two-Phase Aqueous/Organic PAC Production
Leksawasdi et al. [2004] has developed and validated a mathematical model to determine the
overall rate constants for PAC, acetaldehyde, and acetoin formation in biotransformation

Chapter 6 Final Conclusions and Future Work
Cindy Gunawan 2006 PhD Thesis
161
systems with up to 150 mM benzaldehyde, which also includes a term for PDC deactivation
by benzaldehyde. Further mathematical modeling could be carried out for two-phase
aqueous/octanol-benzaldehyde PAC production in the emulsion system in order to identify
optimal operating conditions and ultimately achieve overall process optimization. The
following are several approaches to facilitate the two-phase system modelling:
(1) evaluate the effects of initial benzaldehyde, pyruvate, and enzyme concentrations on the
reaction rate for whole cell PDC as previous studies have been carried out on partially
purified PDC,
(2) determine the rate of PDC deactivation by soluble benzaldehyde in the presence of
octanol in the aqueous phase and also at the aqueous/organic interface, as experiments
reported in Chapter 4 indicated that soluble octanol (and possibly also interfacial
interactions) affect PDC deactivation kinetics,
(3) include a term for the rate of mass transfer of benzaldehyde from the organic to the
aqueous phase and determine the effects of agitation and organic phase benzaldehyde
concentration on this rate in scale-up studies,
(4) include terms for mass transfer of PAC and possibly by-products from the aqueous to the
organic phase and also determine the effects of agitation and product concentrations on mass
transfer rates.
(d) Economic Analysis on Two-Phase Aqueous/Organic PAC Production
Following the characterization and development of the two-phase process in the present
study, an economic evaluation could be perfomed, including a sensitivity analysis, to
determine the economic feasibility of PAC production by the present two-phase process. The
study would take account of the cost of input materials, PAC production and product
recovery costs as well as yields of product on the two substrates. The following are several

Chapter 6 Final Conclusions and Future Work
Cindy Gunawan 2006 PhD Thesis
162
suggested experiments which could be carried out in association with this economic
evaluation:
(1) investigate possible employment of other organic solvents for reducing cost of product
recovery and solvent recycling,
(2) determine optimum buffer concentration to reduce the costs of addition of expensive
buffers (such as MOPS) while maintaining PDC activity and stability,
(3) determine the optimum organic to aqueous phase volume ratio and temperature to further
minimize production costs,
(4) determine the economic benefit of using an enhanced yeast PDC (via protein engineering)
with lowered by-product formation (particularly acetoin) to ease product recovery and
increase yields on pyruvate.

References
Cindy Gunawan 2006 PhD Thesis
163
REFERENCES
Agarwal, S.C., Basu, S.K., Vora, V.C, Mason, J.R., and Pirt, S.J. Studies on the production
of L-phenylacetylcarbinol by yeast employing benzaldehyde as precursor. Biotechnol.
Bioeng. 29: 783-785 (1987).
Arjunan, P., Umland, T., Dyda, F., Swaminathan, S., Furey, W., Sax, M., Farrenkopf, B.,
Gao, Y., Zhang D., and Jordan, F. Crystal structure of the thiamin diphosphate-dependent
enzyme pyruvate decarboxylase from the yeast Saccharomyces cerevisiae at 2.3A resolution.
J. Nol. Biol. 256: 590-600 (1996).
Bailey, J.E. and Ollis, D.F. Biochemical Engineering Fundamentals, 2nd edn. McGraw-Hill:
Singapore, pp 136 – 137, 661 – 664 (1986).
Baldascini, H., Ganzeveld, K.J., Janssen, D.B., Beenackers, A.A.C.M. Effect of mass transfer
limitations on the enzymatic kinetic resolution of epoxides in a two-liquid-phase system.
Biotechnol. Bioeng. 73: 44-54 (2000).
Banat, I.M. and Marchant, R. Characterization and potential industrial applications of five
novel, thermotolerant, fermentative yeast strains. World J. Microbiol. Biotechnol. 11: 304-
306 (1995).
Bar, R. Effect of interphase mixing on a water-organic solvent two-liquid phase microbial
system. J. Chem. Technol. Biotechnol. 43: 49-62 (1988).
Bar, R. In: Biocatalysis in Organic Media, ed. by Laace, C., Tramper, J., Lilly, M.D.
Elsevier: Amsterdam, pp 147-156 (1987).
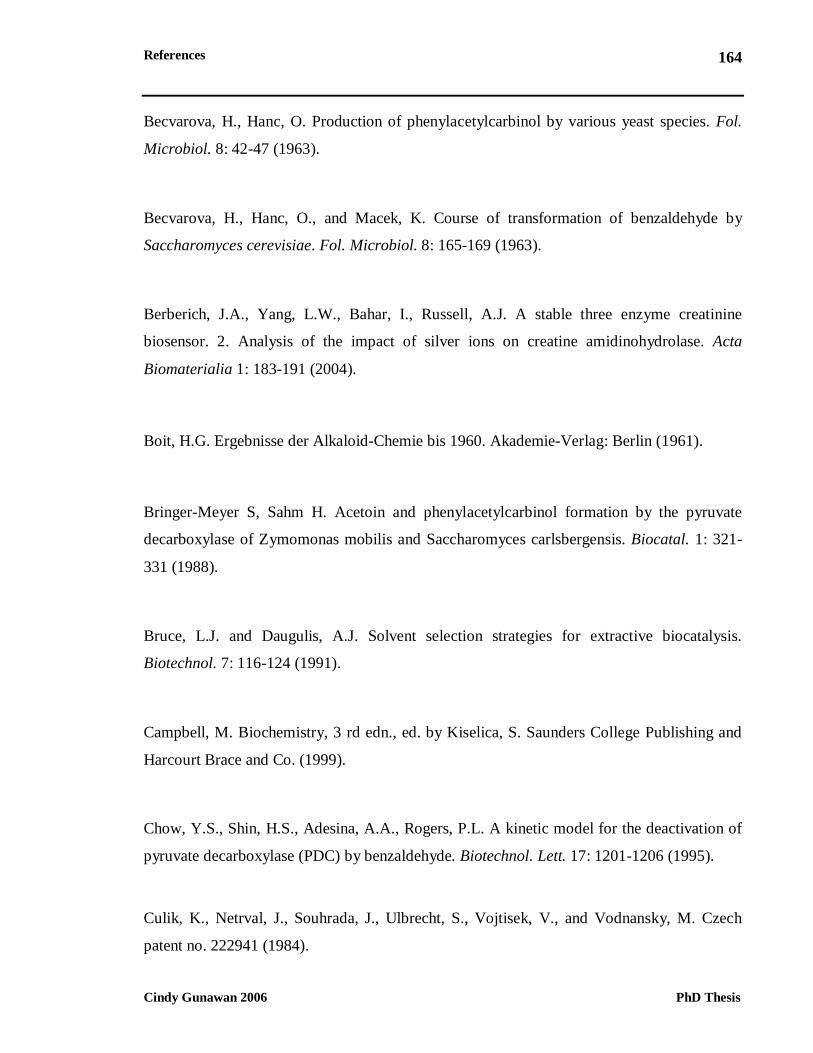
References
Cindy Gunawan 2006 PhD Thesis
164
Becvarova, H., Hanc, O. Production of phenylacetylcarbinol by various yeast species. Fol.
Microbiol. 8: 42-47 (1963).
Becvarova, H., Hanc, O., and Macek, K. Course of transformation of benzaldehyde by
Saccharomyces cerevisiae. Fol. Microbiol. 8: 165-169 (1963).
Berberich, J.A., Yang, L.W., Bahar, I., Russell, A.J. A stable three enzyme creatinine
biosensor. 2. Analysis of the impact of silver ions on creatine amidinohydrolase. Acta
Biomaterialia 1: 183-191 (2004).
Boit, H.G. Ergebnisse der Alkaloid-Chemie bis 1960. Akademie-Verlag: Berlin (1961).
Bringer-Meyer S, Sahm H. Acetoin and phenylacetylcarbinol formation by the pyruvate
decarboxylase of Zymomonas mobilis and Saccharomyces carlsbergensis. Biocatal. 1: 321-
331 (1988).
Bruce, L.J. and Daugulis, A.J. Solvent selection strategies for extractive biocatalysis.
Biotechnol. 7: 116-124 (1991).
Campbell, M. Biochemistry, 3 rd edn., ed. by Kiselica, S. Saunders College Publishing and
Harcourt Brace and Co. (1999).
Chow, Y.S., Shin, H.S., Adesina, A.A., Rogers, P.L. A kinetic model for the deactivation of
pyruvate decarboxylase (PDC) by benzaldehyde. Biotechnol. Lett. 17: 1201-1206 (1995).
Culik, K., Netrval, J., Souhrada, J., Ulbrecht, S., Vojtisek, V., and Vodnansky, M. Czech
patent no. 222941 (1984).

References
Cindy Gunawan 2006 PhD Thesis
165
Czok, R. and Lamprecht, W. Pyruvate, phosphoenolpyruvate and D-glycerate-2-phosphate.
In: Methods of Enzymatic Analysis, Vol. 3, 2nd edn., ed. by Bergmeyer, H.U. Academic
Press: New York, pp 1446 – 1451 (1974).
De Smet, M.J., Kingma, J., and Withold, B. The effect of toluene on the structure and
permeability of the outer cytoplasmic cell membranes of E. coli. Biochem. Biophys. Acta.
506:64-80 (1978).
Dissara, Y. and Rogers, P.L. Evaluation of mutants of Candida utilis for L-PAC production
from benzaldehyde. Proceedings of the 4th Pacific Rim Biotechnology Conference: 248-249
(1995).
Dijken, J.P. van and Scheffers, W.A. Redox balances in the metabolism of sugar by yeasts.
FEMS Microbiol. Rev. 32: 199-224 (1986).
Dyda, F., Furey, W., Swaminathan, S., Sax, M., Farrenkopf, B., and Jordan, F. Catalytic
centers in the thiamine diphosphate dependent enzyme pyruvate decarboxylase at 2.4A
resolution. Biochem. 32: 6165-6171 (1993).
Ellaiah, P. and Krishna, K.T. Studies on the production of phenyl acetyl carbinol from
benzaldehyde by Saccharomyces cerevisiae. Indian. J. Technol. 26:509-510 (1988).
Feliu, J.A., de Mas, C., and López-Santín, J. Studies on papain action in the synthesis of Gly-
Phe in two-liquid-phase media. Enzym. Microb. Technol. 17: 882 – 887 (1995).

References
Cindy Gunawan 2006 PhD Thesis
166
Furey, W., Arjunan, P., Chen, L., Sax, M., Guo, F., and Jordan, F. Structure-function
relationships and flexible tetramer assembly in pyruvate decarboxylase revealed by analysis
of crystal structures. Biochim. Biophys. Acta 1385: 253-270 (1998).
Ghatorae, A.S., Bell, G., Halling, P.J. Inactivation of enzymes by organic solvents: new
technique with well-defined interfacial area. Biotechnol. Bioeng. 43: 331-336 (1994).
Glazer, A.N. and Kikaido, H. Microbial bio/technology. W.H. Freeman and Co.: New York
(1995).
Goetz, G., Iwan, P., Hauer, B., Breuer, M., and Pohl, M. Continuous production of (R)-
phenylacetylcarbinol in an enzyme-membrane reactor using a potent mutant of pyruvate
decarboxylase from Zymomonas mobilis. Biotechnol. Bioeng. 74(4): 317-325 (2001).
Green, D.E., Westerfeld, W.V., Vennesland, B., and Knox, W.E. Carboxylases of animal
tissue. J. Biol. Chem. 145: 69-84 (1942).
Gross, N.H. and Werkmann, C.H. Isotopic composition of acetylmethylcarbinol formed by
yeast juice. Arch. Biochem. 15: 125-131 (1947).
Gupta, K.G., Singh, J., Sahni, G., and Dhawan, S. Production of phenyl acetyl carbinol by
yeasts. Biotechnol. Bioeng. 21: 1085-1089 (1979).
Happold, F.C. and Spencer, C.P. The enzymic formation of acetylmethylcarbinol and related
compounds. Biochem. Biophys. Acta. 8: 543-556 (1952).

References
Cindy Gunawan 2006 PhD Thesis
167
Harrington, T.J., Gainer, J.L., and Kirwan, D.J. Effects of fluid shear on immobilized enzyme
kinetics. Enzyme Microb. Technol. 13: 610 – 616 (1991).
Heipieper, H.J. and de Bont, J.A.M. Adaptation of Pseudomonas putida s12 to ethanol and
toluene at the level of fatty acid composition of membranes. Appl. Environ. Microb. 60:
4440-4444 (1994).
Heipieper, H.J., Weber, F.J., Sikkema, J., Keweloh, H., and de Bont, J.A.M. Mechanisms of
resistance of whole cells to toxic organic solvents. Trends Biotechnol. 12: 409-415 (1994).
Hines, A.L. and Maddox, R.N. Mass Transfer Fundamentals and Applications, ed. by
Amundson, N.R. P.T.R. Prentice-Hall, Inc.: New Jersey (1985).
Hoffmann, R. and Valencia, A. A gene network for navigating the literature. Nat. Genet. 36:
664 (2004).
Hohmann, S. Pyruvate decarboxylases. In: Yeast Sugar Metabolism, ed. by Zimmerman,
F.K. and Entian, K.D. Technomic: Lancaster, pp 187-211 (1997).
Ingram, L.O. and Buttke, T.M. Effects of alcohols on micro-organisms. Adv. Microb. Phys.
25:253-300 (1982).
Ingram, L.O. Changes in lipid composition of Escherichia coli resulting from growth with
organic solvents and with food additives. Appl. Environ. Microbiol. 33: 1233-1236 (1977).
Jabs, M.K., Jabs, A., Lilie, H., Golbik, R., Hübner, G. Active oligomeric states of pyruvate
decarboxylase and their functional characterization. Eur. J. Biochem. 268: 1698-1704 (2001).

References
Cindy Gunawan 2006 PhD Thesis
168
Jackson, R.W. and de Moss, J.A. Effects of toluene on Escherichia coli. J. Bacteriol.
90:1420-1425 (1965).
Juni, E. Evidence for a two-site mechanism for decarboxylation of α - keto acids by α -
carboxylase. J. Biol. Chem. 236: 2302-2308 (1961).
Keweloh, H., Weyracuch, G., and Rehm, H.J. Phenol-induced membrane changes in free and
immobilized Escherichia coli. Appl. Microbiol. Biotechnol. 33: 66-71 (1990).
König, S., Svergun, D., Koch, M.H.J., Hübner, G., Schellenberger, A. Synchrotron radiation
solution X-ray scattering study of the pH dependence of the quarternary structure of yeast
pyruvate decarboxylase. Biochemistry 31: 8726-8731 (1992).
Laane, C., Boeren, S., Vos, K., and Veeger, C. Rules for the optimization of biocatalysis in
organic solvents. Biotechnol. Bioeng. 30: 81-87 (1987).
Laane, C., Boeren, S., and Vos, K. On optimizing organic solvents in multi-liquid phase
biocatalysis. Trends Biotechnol. 3: 251-252 (1985).
Leksawasdi, N., Rosche, B., and Rogers, P. Improved enzymatic two-phase
biotransformation for (R)-phenylacetylcarbinol: Effect of dipropylene glycol and modes of
pH control. Biocatal. Biotrans. 23(6): 445-451 (2005)
Leksawasdi, N., Chow, Y.Y.S., Breuer, M., Hauer, B., Rosche, B., and Rogers, P.L. Kinetic
analysis and modelling of enzymatic (R)-phenylacetylcarbinol batch biotransformation
process. J. Biotechnol. 111: 179-189 (2004).

References
Cindy Gunawan 2006 PhD Thesis
169
Leksawasdi, N., Breuer, M., Hauer, B., Rosche, B., Rogers, P. Kinetics of pyruvate
decarboxylase deactivation by benzaldehyde. Biocatal. Biotrans. 21: 315-320 (2003).
Leksawasdi, N. Kinetics and modeling of enzymatic process for R-phenylacetylcarbinol
(PAC) production. Department of Biotechnology. Sydney, University of New South Wales,
Ph.D. Thesis (2004).
Leon, R., Fernandes, P., Pinheiro, H.M, and Cabral, M.S. Whole-cell biocatalysis in organic
media. Enzym. Microb. Technol. 23: 483-500 (1998).
Lewis, J.B. Chem. Eng. Sci. 3: 248 (1954).
Lilly, M.D., Brazier, A.J., Hocknul, M.D., William, A.C., and Woodley, J.M. In: Biocatalysis
in Organic Media, ed. by Laane, C., Tramper, J., and Lilly, M.D. Elsevier: Amsterdam, pp 3-
20 (1987).
Long, A., James, P., and Ward, O.P. Aromatic aldehydes as substrates for yeast and yeast
alcohol dehydrogenase. Biotechnol. Bioeng. 33: 657-660 (1989a).
Long, A. and Ward, O.P. Biotransformation of aromatic aldehydes by Saccharomyces
cerevisiae: investigations on reaction rate. J. Indust. Microbiol. 4: 49-53 (1989b).
Long, A. and Ward, O.P. Biotransformation of benzaldehyde by Saccharomyces cerevisiae:
characterization of the fermentation and toxicity effects of substrates and products.
Biotechnol. Bioeng. 34: 933-941 (1989c).

References
Cindy Gunawan 2006 PhD Thesis
170
Mahmoud, W.M., El-Sayed, A.H.M.M, and Coughlin, R.W. Production of L-
phenylacetylcarbinol by immobilized yeast cells: 1-batch fermentation. Biotechnol. Bioeng.
36: 47-54 (1989).
Michaelis, L. and Menten, M.L. Die kinetik der invertinwirkung. Biochem. Z. 49:333-369
(1913).
Mochizuki, N., Hiramatsu, S., Sugal, T., Ohta, H., Morita, H., Itokawa, H. Improved
conditions for the production and characterization of 1-arylpropane-1,2-diols and related
compounds. Biosci. Biotech. Biochem. 9: 2282-2291 (1995).
Netrval, J. and Vojtisek, V. Production of phenylacetylcarbinol in various yeast species.
European J. Appl. Microbiol. Biotechnol. 16: 35-38 (1982).
Neuberg, C. and Libermann, L. Zur kenntnis de carboligase. Biochem. Z. 121: 311-315
(1921).
Neuberg, C. and Welde, E. Phytochemisce reduktionen. Biochem. Z. 62: 477-481 (1914).
Nikolova, P. and Ward, O.P. Whole cell yeast biotransformations in two-phase system: effect
of solvent on product formation and cell structure. J. Indust. Microbiol. 10: 169-177 (1992a).
Nikolova, P. and Ward, O.P. Production of phenylacetylcarbinol by biotransformation using
baker’s yeast in two-phase systems. In: Biocatalysis in Non-Conventional Media, ed. by
Tramper, J., Vermue, M.H., Beeftink, H.H, and von Stockar, U. Elsevier Science Publishers:
Amsterdam, pp 675-680 (1992b).

References
Cindy Gunawan 2006 PhD Thesis
171
Nikolova, P. and Ward, O.P. Production of L-phenylacetyl carbinol by biotransformation:
product and by-product formation and activities of the key enzymes in wild-type and ADH
isozyme mutants of Saccharomyces cerevisiae. Biotechnol. Bioeng. 20: 493-498 (1991).
Oliver, A.L., Anderson, B.N., and Roddick, F.A. Factors affecting the production of L-
phenylacetylcarbinol by yeast: A case study. Adv. Microb. Phys. 41(1999).
Osborne, S.J., Leaver, J., and Turner, M.K. Solvent selection for whole cell
biotransformation in organic media. In: Biocatalysis in Non-Conventional Media, ed. by
Tramper, J., Vermue, M.H., Beeftink, H.H, and von Stockar, U. Elsevier Science Publishers:
Amsterdam, pp 31-36 (1992).
Panintrarux, C., Adachi, S., Araki, Y., Kimura, Y., and Matsuno, R. Equilibrium yield of n-
alkyl-β-D-glucoside through condensation of glucose and n-alcohol by β-glucosidase in a
biphasic system. Enzym. Microb. Technol. 17: 32-40 (1995).
Parales, R.E., Bruce, N.C., Schmid, A., and Wackett, L.P. Biodegradation,
Biotransformation, and Biocatalysis (B3). Appl. Environ. Microbiol. 68(10): 4699-4709
(2002).
Pasteur, L. Nouvelles recherches sur de fermentation alcoolique. C. R. Acad. Sci. 47:224.
Pohl, M. Protein design on pyruvate decarboxylase (PDC) by site-directed mutagenesis. Adv.
Biochem. Eng. Biotechnol. 58: 15-43 (1997).
Pohl, M., Grötzinger, J., Wollmer, A., Kula, M.R. Reversible dissociation and unfolding of
pyruvate decarboxylase from Zymomonas mobilis. Eur. J. Biochem. 224: 651-661 (1994).

References
Cindy Gunawan 2006 PhD Thesis
172
Reti, L. Ephedra bases. In: The Alkaloids Chemistry and Physiology Vol. 3, ed. by Manske,
R.H.F. and Holmes, H.L. Academic Press: New York, pp: 339-362 (1953).
Rogers, P.L., Shin, H.S., and Wang, B. Biotransformation for L-ephedrine production. Adv.
Biochem. Eng. Biotechnol. 56: 33-59 (1997).
Rosche, B., Breuer, M., Hauer, B., and Rogers, P.L. Cells of Candida utilis for in vitro (R)-
phenylacetylcarbinol production in aqueous/octanol two-phase reactor. Biotechnol. Lett. 27:
575-581 (2005a).
Rosche, B., Breuer, M., Hauer, B., and Rogers, P.L. Role of pyruvate in enhancing pyruvate
decarboxylase stability towards benzaldehyde. J. Biotechnol. 115: 91 – 99 (2005b).
Rosche, B., Breuer, M., Hauer, B., Rogers, P. Increased pyruvate efficiency in enzymatic
production of (R)-phenylacetylcarbinol. Biotechnol. Lett. 25: 847-851 (2003a).
Rosche, B., Breuer, M., Hauer, B., Rogers, P.L. Screening of yeasts for cell-free production
of (R)-phenylacetylcarbinol. Biotechnol. Lett. 11: 841 – 845 (2003b).
Rosche, B., Leksawasdi, N., Sandford, V., Breuer, M., Hauer, B., and Rogers, P. Enzymatic
(R)-phenylacetylcarbinol production in benzaldehyde emulsions. Appl. Microbiol.
Biotechnol. 60: 94 – 100 (2002a).
Rosche, B., Sandford, V., Breuer, M., Hauer, B., Rogers, P.L. Enhanced production of R-
phenylacetylcarbinol (R-PAC) through enzymatic biotransformation. J. Mol. Catal. B:
Enzym. 19: 109-115 (2002b).

References
Cindy Gunawan 2006 PhD Thesis
173
Rosche, B., Sandford, V., Breuer, M., Hauer, B., and Rogers, P.L. Biotransformation of
benzaldehyde into (R)-phenylacetylcarbinol by filamentous fungi or their extracts. Appl.
Microbiol. Biotechnol. 57: 309 – 315 (2001).
Sandford, V., Breuer, M., Hauer, B., Rogers, P.L., Rosche, B. (R)-phenylacetylcarbinol
production in aqueous/organic two-phase systems using partially purified pyruvate
decarboxylase from Candida utilis. Biotech. Bioeng. 91(2): 190-198 (2005).
Sandford, V.M. Enzymatic bioprocess development for R-PAC: an intermediate for
ephedrine/pseudoephedrine production. Department of Biotechnology. Sydney, University of
New South Wales, Ph.D. Thesis (2002).
Satianegara, G., Breuer, M., Hauer, B., Rogers, P.L., and Rosche, B. Enzymatic (R)-
phenylacetylcarbinol production in a benzaldehyde emulsion system with Candida utilis
cells. Appl. Microbiol. Biotechnol. 70:170-175 (2006).
Seely, R.J., Heefner, D.L., Hageman, R.V., Yarus, M.J., Sullivan, S.A. Process for making L-
Phenyl-Acetylcarbinol (PAC), microorganisms for use in the process, and a method of
preparing the microorganisms. US Patent No. 5312742 (1994).
Seely, R.J., Heefner, D.L., Hageman, R.V., Yarus, M.J., and Sullivan, S.A. US patent
89/04421 (1989a).
Seely, R.J., Hageman, R.V., Yarus, M.J., and Sullivan, S.A. US patent 89/04423 (1989b).
Schmid, A., Dordick, J.S., Hauer, B., Kiener, A., Wubbolts, M., and Witholt, B. Industrial
biocatalysis today and tomorrow. Nature 409: 258-268 (2001).

References
Cindy Gunawan 2006 PhD Thesis
174
Schoenfelder, P. and Schoenfelder, I. Guide of Medicinal Plants. Franckh-Kosmos Verlag:
Stuttgart (2001).
Shin, H.S. Biotransformation kinetics of benzaldehyde to L – phenylacetylcarbinol (L-PAC)
by immobilized Candida utilis and its pyruvate decarboxylase. PhD Thesis, University of
New South Wales, Australia (1994).
Shin, H.S. and Rogers, P.L. Production of L-phenylacetylcarbinol (L-PAC) from
benzaldehyde using partially purified pyruvate decarboxylase (PDC). Biotechnol. Bioeng. 49:
52-62 (1996a).
Shin, H.S. and Rogers, P.L. Kinetic evaluation of biotransformation of benzaldehyde to L-
phenylacetylcarbinol by immobilized pyruvate decarboxylase from Candida utilis.
Biotechnol. Bioeng. 49: 429-436 (1996b).
Shin, H.S. and Rogers, P.L. Biotransformation of benzaldehyde to L-phenylacetylcarbinol, an
intermediate in L-ephedrine production by immobilized Candida utilis. Appl. Microbiol.
Biotechnol. 44: 7-14 (1995).
Shukla, V.B. and Kulkarni, P.R. L-Phenylacetylcarbinol (L-PAC): biosynthesis and
industrial applications. World J. Microbiol. Biotechnol. 16:499-506.
Sims, A.P., Stalbrand, H., and Barnett, J.A. The role of pyruvate decarboxylase in the
Kluyver effect in the food yeast, Candida utilis. Yeast 7: 479-487 (1991).
Smith, P.F. and Hendlin, D. Mechanism of phenylacetylcarbinol synthesis by yeast. J.
Bacteriol. 65: 440-445 (1953).

References
Cindy Gunawan 2006 PhD Thesis
175
Straathof, A.J.J., Panke, S., and Schmid, A. The production of fine chemicals by
biotransformations. Curr. Opin. Biotechnol. 13: 548-556 (2002).
Tanker, M. and Kilicer, I. Determination of l-N-methylephedrine along with d-
pseudoephedrine in the aerial parts of Ephedra major. Ankara Üniv. Eczacilik Fak. Mecm. 8:
101-113 (1978). (Chem. Abstr. 94:61710).
Teh, J.S. and Lee, K.H. Effects of n-alkanes on Cladosporium resinae. Can. J. Microbiol.
20:971-976 (1976).
Thomas, C.R., Nienow, A.W., and Dunnill, P. Action of shear on enzymes: Studies with
alcohol dehydrogenase. Biotechnol. Bioeng. 21: 2263 – 2278 (1979).
Thomas, C.R. and Dunnill, P. Action of shear on enzymes: Studies with catalase and urease.
Biotechnol. Bioeng. 21: 2279 – 2302 (1979).
Tripathi, C.M., Agarwal, S.C., and Basu, S.K. Production of L-phenylacetylcarbinol by
fermentation. J. Ferment. Bioeng. 84: 487-492 (1997).
Ullrich, J., Donner, I. Fluorimetric study of 2-p-toluidinonaphthalene-6-sulfonate binding to
cytoplasmic yeast pyruvate decarboxylase. Hopp-Seyler’s Z. Physiol. Chem. 351: 1030-1034
(1970).
Voets, J.P., Vandamme, E.J., and Vlerick, C. Some aspects of the phenylacetylcarbinol
biosynthesis by Saccharomyces cerevisiae. Z. Allg. Mikrobiol. 13: 355 (1973).

References
Cindy Gunawan 2006 PhD Thesis
176
Willeman, W.F., Jan Gerrits, P., Hanefeld, U., Brussee, J., Straathof, A.J.J., van der Gen, A.,
and Heijnen, J.J. Development of a process model to describe the synthesis of (R)-
mandelonitrile by Prunus amygdalus hydroxynitrile lyase in an aqueous-organic biphasic
reactor. Biotechnol. Bioeng. 77(3): 239-247 (2002).
Wongkongkatep, P. Two-phase fermentation of phenylacetylcarbinol production by Candida
utilis. Department of Biotechnology. Sydney, University of New South Wales, Master Thesis
(1992).
Woodley, J.M., Brazier, A.J., and Lilly, M.D. Lewis cell studies to determine reactor design
data for two-liquid-phase bacterial and enzymic reactions. Biotechnol. Bioeng. 37:133-140
(1991).
Yonehara, T., Miyata, R. Fermentative production of pyruvate from glucose by Torulopsis
glabrata. J. Ferment. Bioeng. 78: 155-159 (1994).
Yonehara, T., Yomoto, K. Pyruvic acid manufacture by Torulopsis. JP Patent 62275688
(1987).
Yi, Q., Sarney, D.B., Khan, J.A., and Vulfson, E.N. A novel approach to biotransformations
in aqueous-organic two-phase systems: enzymatic synthesis of alkyl β-[D]-glucosides using
microencapsulated β-glucosidase. Biotechnol. Bioeng. 60: 385-390 (1998).

Appendix A
Cindy Gunawan 2006 PhD Thesis
177
APPENDIX A
Factors Affecting Organic-Aqueous Benzaldehyde Transfer in the Two-
Phase Aqueous/Octanol-Benzaldehyde System
An investigation was conducted to identify the key factors affecting benzaldehyde transfer
from the organic to the aqueous phase in the aqueous/octanol-benzaldehyde system.
Abbreviations
Table A.1: Description on the mass transfer rate equations.
Term Description
dBZD/dt Organic-aqueous benzaldehyde transfer rate
OBZD Benzaldehyde concentration in the bulk organic phase
ABZD Benzaldehyde concentration in the bulk aqueous phase
OBZDint Benzaldehyde concentration at the interface in the organic phase
ABZDint Benzaldehyde concentration at the interface in the aqueous phase
OBZD* Benzaldehyde concentration in the organic phase in equilibrium with
the concentration of benzaldehyde in the bulk aqueous phase
ABZD* Benzaldehyde concentration in the aqueous phase in equilibrium with
the concentration of benzaldehyde in the bulk organic phase
kO (Local) organic phase mass transfer coefficient
kA (Local) aqueous phase mass transfer coefficient
K O Overall mass transfer coefficient related to the organic phase driving
force
K A Overall mass transfer coefficient related to the aqueous phase driving
force
aint Specific interfacial area (organic phase contact area to aqueous phase
volume ratio)
t Time

Appendix A
Cindy Gunawan 2006 PhD Thesis
178
A.1 Benzaldehyde Transfer across a Phase Boundary
The transfer of benzaldehyde from the organic to the aqueous phase involves transport of
solute across a phase boundary. The transfer rate depends on several factors such as the
organic phase benzaldehyde concentration, the aqueous phase benzaldehyde solubility, and
the design of the mass transfer equipment which accounts for the effects of the
aqueous/organic interfacial area, temperature, and pressure of the process [Hines and
Maddox, 1985]. The route of organic-aqueous phase benzaldehyde transfer is illustrated in
Fig A.1.
Organic phase Aqueous phase
Interface
OBZD
Bulk Thin film BulkThin film
OBZDint
A BZDint
A BZD
Organic phase Aqueous phase
Interface
OBZD
Bulk Thin film BulkThin film
OBZDint
A BZDint
A BZD
Figure A.1: Concentration profiles across an aqueous/organic interface [Hines and Maddox,
1985].
The following are the mass transfer rate equations with the description on the abbreviations
shown in Table A.1.

Appendix A
Cindy Gunawan 2006 PhD Thesis
179
The mass transfer rate is directly proportional to the concentration gradient by means of an
empirical mass transfer coefficient. At steady-state, the benzaldehyde transfer rate through
the organic phase is equal to the rate in the aqueous phase. The organic-aqueous
benzaldehyde transfer rate can be described by the following equation:
Equation A.1 describes the transfer rate in terms of local mass transfer coefficient; the
drawback of such correlation is that the concentration gradient is expressed in terms of
interfacial compositions, which are not usually possible to determine in an experimental
apparatus [Hines and Maddox, 1985]. This is encountered by introducing an overall mass
transfer coefficient such that the concentration gradient is now expressed in terms of
equilibrium compositions (marked by *) (Equation A.2).
The aqueous phase mass transfer rate equation was chosen as the basis for this particular
study on benzaldehyde transfer since PAC biosynthesis takes place in the aqueous phase.
Integrating Equation A.2 (aqueous phase) and setting initial condition at t = 0, ABZD(0) = 0,
resulted in Equation A.3:
By using the saturation profiles and the saturation concentration of benzaldehyde (the
equilirium composition is equal to the saturation composition), the term KA aint was the slope
obtained by plotting ln (ABZD* / (ABZD* - ABZD)) as a function of time. The term KA aint
o rg a n ic p h a s e a q u e o u s p h a s e
o rg a n ic p h a s e a q u e o u s p h a s e
d B Z D (t)
d t= K O ain t (O B Z D ( t) – OB Z D * ) = K A ain t (A B Z D * – A B Z D ( t))
d B Z D (t)
d t= K O ain t (O B Z D ( t) – OB Z D * ) = K A ain t (A B Z D * – A B Z D ( t))
l n (A B Z D * / (A B Z D * - A B Z D ( t ) ) ) = K A a in t t
A.1
A.2
A.3
d B Z D ( t)
d t= kO ain t (O B Z D ( t) – OB Z D in t) = kA ain t (A B Z D in t – A B Z D ( t) )
d B Z D ( t)
d t= kO ain t (O B Z D ( t) – OB Z D in t) = kA ain t (A B Z D in t – A B Z D ( t) )

Appendix A
Cindy Gunawan 2006 PhD Thesis
180
allowed evaluation on the organic-aqueous benzaldehyde transfer characteristics among
various systems.
A.2 Effects of Aqueous/Organic Interfacial Area, Organic Phase Benzaldehyde
Concentration and Temperature
A Lewis cell with an organic and aqueous phase layers (each 90 mL) was employed to
investigate the effects of several physical parameters on organic-aqueous benzaldehyde
transfer: (1) ratio of organic phase contact area to aqueous phase volume, (2) organic phase
benzaldehyde concentration, and (3) temperature.
Figs A.2.a and b present the benzaldehyde saturation profiles for the investigated parameters.
In spite of the fact that similar saturation concentrations of aqueous phase benzaldehyde of
approx. 50 mM were achieved under the experimental conditions, there were distinguishable
differences in the transfer rates: higher ratio of organic phase contact area to aqueous phase
volume, higher organic phase benzaldehyde concentration, and higher temperature resulted in
increased transfer rates.
The effects were quantified by comparing the slopes (KA aint) on Figs A.3.a and b, of which
values were determined for the first 15 mins to depict maximum transfer rates. Referring to
Table A.2, increasing the ratio of organic phase contact area to aqueous phase volume from
117 to 361 cm2/L, the organic phase benzaldehyde concentration from 1.5 M to 2.5 M, and
the temperature from 4°C to 20°C resulted in approximately twice the KA aint values.

Appendix A
Cindy Gunawan 2006 PhD Thesis
181
AB
ZD
(mM
)
0
1 0
2 0
3 0
4 0
5 0
6 0
7 0
0 6 0 1 2 0 1 8 0 2 4 0 3 0 0 3 6 0
aA
BZ
D(m
M)
0
1 0
2 0
3 0
4 0
5 0
6 0
7 0
0 6 0 1 2 0 1 8 0 2 4 0 3 0 0 3 6 0
AB
ZD
(mM
)
0
1 0
2 0
3 0
4 0
5 0
6 0
7 0
0 6 0 1 2 0 1 8 0 2 4 0 3 0 0 3 6 0
a
0
1 0
2 0
3 0
4 0
5 0
6 0
7 0
0 6 0 1 2 0 1 8 0 2 4 0 3 0 0 3 6 0
T im e (m in )
AB
ZD
(mM
)
b
0
1 0
2 0
3 0
4 0
5 0
6 0
7 0
0 6 0 1 2 0 1 8 0 2 4 0 3 0 0 3 6 0
T im e (m in )
AB
ZD
(mM
)
0
1 0
2 0
3 0
4 0
5 0
6 0
7 0
0
1 0
2 0
3 0
4 0
5 0
6 0
7 0
0 6 0 1 2 0 1 8 0 2 4 0 3 0 0 3 6 0
T im e (m in )
AB
ZD
(mM
)
b
Figure A.2: Saturation profiles: effects of physical parameters on organic-aqueous benzaldehyde
transfer in the two-phase aqueous/octanol-benzaldehyde system: (a) ratio of organic phase contact
area to aqueous phase volume, organic phase benzaldehyde concentration and (b) temperature. 117
and 361 cm2/L organic phase contact area to aqueous phase volume ratios, 1.5 M and 2.5 M organic
phase benzaldehyde concentrations, 4°C and 20°C temperatures, 60 rpm and 125 rpm agitation for
organic and aqueous phase respectively in Lewis cell, 2.5 M MOPS buffer (pH 7.0).

Appendix A
Cindy Gunawan 2006 PhD Thesis
182
0
1
2
3
4
0 5 10 15 20
ln (
[AB
ZD]*
/ ([A
BZ
D]*
- [A
BZ
D]))
a
0
1
2
3
4
0 5 10 15 20
Time (m in)
ln (
[AB
ZD]*
/ ([
AB
ZD]*
- [A
BZ
D])
)
b
Figure A.3: Plot of ln (ABZD* / (ABZD*- A BZD)) as a function of time with slope KA aint:
effects of physical parameters on organic-aqueous benzaldehyde transfer in the two-phase
aqueous/octanol-benzaldehyde system: (a) ratio of organic phase contact area to aqueous

Appendix A
Cindy Gunawan 2006 PhD Thesis
183
phase volume, organic phase benzaldehyde concentration and (b) temperature. Calculated
from data in experiments shown in Fig A.2.
Table A.2: KA aint and KA values comparison: effects of physical parameters on organic-
aqueous benzaldehyde transfer in two-phase aqueous/octanol-benzaldehyde system.
System
Temperature
(°C)
aint
[Benzaldehyde]ORG
(M)
KA aint
(h-1)
KA
(m/h)
cm2/L
m2/m3
I
20
361
36.1
2.5
11.45
0.32
II
20
361
36.1
1.5
5.11
0.14
III
20
117
11.7
2.5
5.32
0.46
IV
20
117
11.7
1.5
2.66
0.23
V
5
361
36.1
2.5
4.73
0.13
* Maximum transfer rates (first 15 mins)
A.3 Conclusions
The present study confirms the increased rates of organic-aqueous benzaldehyde transfer in the
two-phase aqueous/octanol-benzaldehyde system with increased ratio of organic phase contact
area to aqueous phase volume, organic phase benzaldehyde concentration, and temperature.

Appendix B
Cindy Gunawan 2006 PhD Thesis
184
APPENDIX B
Effect of Low Octanol : Aqueous Phase Volumes on Whole Cell
Biotransformation for PAC Production
It was evident from the present study (Chapters 4 and 5) that employment of a reduced
octanol phase volume (0.25:1 to 1:1) resulted in improved PAC production in the two-phase
aqueous/octanol-benzaldehyde emulsion system at 4°C and 20°C. Prior to this investigation,
a preliminary study was conducted on the effect of octanol on PAC formation at 4°C and
20°C by creating systems, which are between those of the aqueous/benzaldehyde emulsion
and the two-phase aqueous/octanol-benzaldehyde emulsion system. In addition, employment
of whole cell preparation provides an alternative low cost and efficient biocatalyst for PAC
production [Satianegara et al., 2006; Rosche et al., 2005].
B.1 PAC and By-Product Formation at 4°°°°C
The effect of increasing octanol concentration on PAC formation at 4°C is shown in Fig B.1.
The rates of PAC formation were faster when adding 50 – 700 mM octanol into the octanol-
free aqueous/benzaldehyde emulsion system, however the formation rates dropped when
further increasing the octanol concentration to 2600 mM, creating a two phase
aqueous/octanol-benzaldehyde emulsion system with 1:1 phase volume ratio. The rates of
PAC formation declined overtime, although it was expected that the biotransformations could
proceed beyond 48 h. Neither substrate was limiting in any experiments.
After 48 h, systems with 300 mM, 500 mM and 700 mM octanol were associated with the
highest PAC concentrations of 340 – 350 mM followed by systems with 50 mM and 100 mM
octanol with 290 mM and 310 mM respectively. The octanol-free aqueous/benzaldehyde
emulsion system along with the 1:1 two-phase emulsion system with 2600 mM octanol

Appendix B
Cindy Gunawan 2006 PhD Thesis
185
formed the least concentration of 225 mM (per total reaction volume by combining both
phases (TRV) for the 1:1 two-phase system) (Fig B.1). [P
AC
] (m
M)
0
50
100
150
200
250
300
350
400
0 10 20 30 40 50 60
0 mM
2600 mM
50 – 700 mM
Time (h)
[PA
C] (
mM
)
0
50
100
150
200
250
300
350
400
0 10 20 30 40 50 600 10 20 30 40 50 60
0 mM
2600 mM
50 – 700 mM
Time (h)
Figure B.1: Effect of octanol addition on PAC formation at 4°C, initial pH 7.0. Initial
concentrations: 0, 50, 100, 300, 500, 700 and 2600 mM octanol, 725 – 810 mM
benzaldehyde, 735 – 785 mM pyruvate, 2.8 U/mL PDC carboligase activity (C. utilis whole
cells), 2.5 M MOPS, 1 mM Mg2+, 1 mM TPP. For the 1:1 two-phase emulsion system with
2600 mM octanol, all concentrations were given per total reaction volume by combining both
phases (TRV). The mean values were determined from triplicate analyses and error bars
show the highest and lowest values.
The trends of by-products acetaldehyde and acetoin formation were similar to those for PAC
formation: increasing in systems with 0 – 700 mM octanol with concentrations between 1 –
6.7 mM and 1.8 – 5.5 mM for acetaldehyde and acetoin respectively; then lower in the 1:1
two-phase emulsion system with 2600 mM octanol with 2 mM and 2.7 mM TRV for
acetaldehyde and acetoin respectively (Fig B.2).
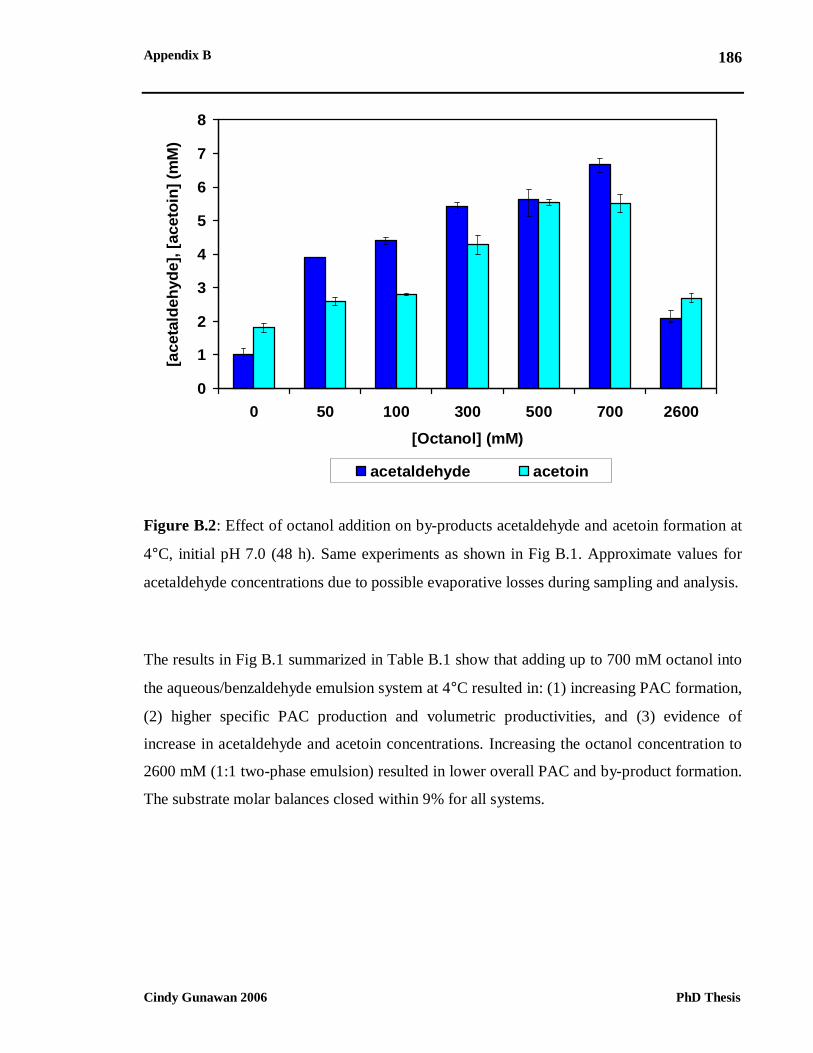
Appendix B
Cindy Gunawan 2006 PhD Thesis
186
0
1
2
3
4
5
6
7
8
0 50 100 300 500 700 2600
[Octanol] (mM)
[ace
tald
ehyd
e], [
acet
oin]
(m
M)
acetaldehyde acetoin
Figure B.2: Effect of octanol addition on by-products acetaldehyde and acetoin formation at
4°C, initial pH 7.0 (48 h). Same experiments as shown in Fig B.1. Approximate values for
acetaldehyde concentrations due to possible evaporative losses during sampling and analysis.
The results in Fig B.1 summarized in Table B.1 show that adding up to 700 mM octanol into
the aqueous/benzaldehyde emulsion system at 4°C resulted in: (1) increasing PAC formation,
(2) higher specific PAC production and volumetric productivities, and (3) evidence of
increase in acetaldehyde and acetoin concentrations. Increasing the octanol concentration to
2600 mM (1:1 two-phase emulsion) resulted in lower overall PAC and by-product formation.
The substrate molar balances closed within 9% for all systems.

Appendix B
Cindy Gunawan 2006 PhD Thesis
187
Table B.1: Performance summary: effect of octanol addition on PAC formation at 4°C,
initial pH 7.0 (48 h).
[Octanol] (mM)
0
50
100
300
500
700
2600*
Specific PAC production
(mg/U initial PDC carboligase activity)
12
15.6
16.7
18.5
18.7
18.3
11.9
Volumetric productivity (g/L/day)
16.8
21.9
23.3
25.9
26.2
25.6
16.7
Yield of PAC on consumed
benzaldehyde (mol/mol)
0.69
0.89
0.89
0.9
0.9
0.9
0.73
Yield of PAC on consumed pyruvate
(mol/mol)
0.87
0.74
0.75
0.77
0.77
0.77
0.66
Benzaldehyde balance (%)
91
98
98
98
98
98
94
Pyruvate balance (%)
98
94
94
98
98
97
92
Calculated from data in experiments shown in Fig B.1. *1:1 two-phase emulsion system: all
results were given per total reaction volume by combining both phases (TRV).
B.2 PAC and By-Product Formation at 20°°°°C
The effect of increasing octanol concentration on PAC formation at 20°C is shown in Fig
B.3. The reactions were completed after 20 – 30 h with neither substrate was limiting. The
rates of PAC formation were faster at 20°C than 4°C with higher rates for systems with 50 –
700 mM octanol for the first 10 h, while the octanol-free aqueous/benzaldehyde emulsion
system and the 1:1 two-phase aqueous/octanol-benzaldehyde emulsion system with 2600
mM octanol were associated with higher formation rates at 10 – 20 h.
At 48 h, systems with 500 mM and 700 mM octanol produced the highest PAC
concentrations of 350 mM followed by systems with 0 – 300 mM octanol with 310 – 320
mM and the 1:1 two-phase emulsion system with 2600 mM octanol was associated with the

Appendix B
Cindy Gunawan 2006 PhD Thesis
188
least formation of 290 mM (per total reaction volume by combining both phases (TRV) (Fig
B.3).
Increase in PAC formation was associated with increase in acetaldehyde and acetoin
formation: increasing in systems with 0 – 700 mM octanol with levels between 2 – 8.3 mM
and 11 – 24 mM for acetaldehyde and acetoin respectively; then lower in the 1:1 two-phase
system with 2600 mM octanol with 4.5 mM and 15.5 mM TRV for acetaldehyde and acetoin
respectively (Fig B.4). Furthermore, acetaldehyde and acetoin concentrations were
appreciably higher at 20°C than at 4°C.
[PA
C] (
mM
)
0
50
100
150
200
250
300
350
400
0 10 20 30 40 50 60Time (h)
2600 mM
0 mM
50 - 700 mM
[PA
C] (
mM
)
0
50
100
150
200
250
300
350
400
0 10 20 30 40 50 600 10 20 30 40 50 60Time (h)
2600 mM
0 mM
50 - 700 mM
Figure B.3: Effect of octanol addition on PAC formation at 20°C, initial pH 7.0. Initial
concentrations: 0, 50, 100, 300, 500, 700 and 2600 mM octanol, 725 – 760 mM
benzaldehyde, 710 – 770 mM pyruvate, 2.8 U/mL PDC carboligase activity (C. utilis whole
cells), 2.5 M MOPS, 1 mM Mg2+, 1 mM TPP. For the 1:1 two-phase emulsion system with
2600 mM octanol, all concentrations were given per total reaction volume by combining both
phases (TRV).

Appendix B
Cindy Gunawan 2006 PhD Thesis
189
0
5
10
15
20
25
30
0 50 100 300 500 700 2600
[Octanol] (mM)
[ace
tald
ehyd
e], [
acet
oin]
(m
M)
acetaldehyde acetoin
Figure B.4: Effect of octanol addition on by-products acetaldehyde and acetoin formation at
20°C, initial pH 7.0 (48 h). Same experiments as shown in Fig B.3. Approximate values for
acetaldehyde concentrations due to possible evaporative losses during sampling and analysis.
The results in Fig B.3 summarized in Table B.2 show that adding up to 700 mM octanol into
the aqueous/benzaldehyde emulsion system at 20°C resulted in: (1) increasing PAC
formation, (2) higher specific PAC production and volumetric productivities, and (3)
evidence of increase in acetaldehyde and acetoin concentrations. Increasing the octanol
concentration to 2600 mM (1:1 two-phase emulsion) resulted in lower overall PAC and by-
product formation. The substrate molar balances closed within 15% for all systems.
In comparison to 4°C, biotransformations at 20°C resulted in significantly higher PAC
volumetric productivities at all octanol concentrations from 0 – 2600 mM. The PAC yields
on consumed benzaldehyde were 70 – 90% and 60 – 70% theoretical at 4°C and 20°C
respectively due to increasingly high evaporative losses of benzaldehyde at 20°C, while those

Appendix B
Cindy Gunawan 2006 PhD Thesis
190
on pyruvate were 70 – 85% theoretical at 4°C and lower at 20°C due to increased acetoin
formation (Tables B.1 and B.2).
Table B.2: Performance summary: effect of octanol addition on PAC formation at 20°C,
initial pH 7.0 (48 h).
[Octanol] (mM)
0
50
100
300
500
700
2600*
Specific PAC production
(mg/U initial PDC carboligase activity)
16.5
16.8
17.1
16.6
19
18.8
15.4
Volumteric productivity (g/L/day)**
44.4
45.1
45.9
44.6
51
50.5
41.4
Yield of PAC on consumed
benzaldehyde (mol/mol)
0.64
0.61
0.59
0.57
0.69
0.7
0.6
Yield of PAC on consumed pyruvate
(mol/mol)
0.75
0.62
0.65
0.6
0.66
0.64
0.57
Benzaldehyde balance (%)
90
87
85
82
92
94
88
Pyruvate balance (%)
90
87
88
86
85
87
85
Calculated from data in experiments shown in Fig B.3. * 1:1 two-phase emulsion system: all
results were given per total reaction volume by combining both phases (TRV). ** Based on
approximate reaction completion at 25 h.
B.3 Discussion and Conclussion
At both 4°C and 20°C, adding octanol up to 700 mM into the octanol-free
aqueous/benzaldehyde emulsion system with employment of whole cell preparation of PDC
resulted in improved PAC production, with the increase being more pronounced at the lower
temperature. Further increasing the octanol concentration to 2600 mM by creating a 1:1 two-
phase aqueous/octanol-benzaldehyde emulsion system resulted in less PAC production at

Appendix B
Cindy Gunawan 2006 PhD Thesis
191
4°C and 20°C. Increases in acetoin formation were observed with increases in PAC, with the
increase being greater at 20°C.
With respect to the aqueous/benzaldehyde emulsion system, octanol addition might have
lowered the degree of benzaldehyde droplet/ PDC enzyme interaction, which would give rise
to less deactivation and thereby increased PAC formation. Sandford et al. [2005] observed
that containment of the high benzaldehyde concentration in octanol in the 1:1
aqueous/organic two-phase systems resulted in a lower degree of PDC deactivation in
comparison to the octanol-free aqueous/benzaldehyde emulsion system. Sandford et al.
[2005] also studied the effect of octanol on PAC production in the aqueous (soluble
benzaldehyde) system with 50 mM benzaldehyde and found that the rate of PAC formation
in the octanol-saturated biotransformation buffer was 46% higher at 50 mM PAC/h than
without octanol at 34 mM PAC/h.
In analysing the systems with less octanol against the 1:1 two-phase emulsion system with
2600 mM octanol, the lower octanol systems were expected to have maintained higher
benzaldehyde concentrations in the aqueous phase due to enhanced transfer of benzaldehyde
into the aqueous phase, which would therefore result in higher PAC production.
Finally, it was demonstrated from the present investigation that addition of octanol resulted
in improved PAC production in the aqueous/benzaldehyde emulsion system. The amount of
octanol added can be seen as a balance between the necessity to provide the PDC enzyme
with sufficient protective effect from direct exposure to toxic benzaldehyde while
maintaining adequate benzaldehyde transfer to the aqueous phase.

Appendix C
Cindy Gunawan 2006 PhD Thesis
192
APPENDIX C Effect of Organic to Aqueous Phase Volume Ratio on PAC Production in
the Aqueous/Octanol-Benzaldehyde System (2.5 M MOPS)
In addition to the concentration profiles of substrates, PAC, and by-products in the organic
and aqueous phases shown in Chapters 4 and 5, Appendix C presents the overall
concentration profiles based on total reaction volume by combining both phases for
comparative purposes (Figs C.1 and C.2). The results demonstrate that lowering the organic
to aqueous phase volume ratio from 1:1 to 0.43:1 in the 2.5 M MOPS system increased the
PAC formation at 4°C and 20°C. Further reducing the phase volume ratio to 0.25:1 at 4°C
resulted in even higher PAC concentration, however the production was slightly reduced at
20°C with this ratio.

Appendix C
Cindy Gunawan 2006 PhD Thesis
193
Figure C.1: Effect of organic to aqueous phase volume ratio on PAC production in the two-phase aqueous/octanol-benzaldehyde
emulsion system at 4°C, initial pH 6.5: overall substrate, PAC and by-product concentration profiles. Same experiments as shown in Figs
4.6 – 4.9.
0
1 00
2 00
3 00
4 00
5 00
6 00
7 00
8 00
0 10 2 0 30 40 50
[Ben
zald
ehyd
e]T
RV
, [P
yruv
ate]
TR
V,
[PA
C]T
RV
(m
M)
0
5
10
15
20
25
30
35
[Ace
tald
ehyd
e]T
RV
, [A
ceto
in]T
RV
(m
M)
0
100
200
300
400
500
600
700
800
0 10 20 30 40 50
[Ben
zald
ehyd
e]T
RV
, [P
yruv
ate]
TR
V,
[PA
C]T
RV
(m
M)
0
5
10
15
20
25
30
35
[Ace
tald
ehyd
e]T
RV
, [A
ceto
in]T
RV
(m
M)
0
100
200
300
400
500
600
700
800
0 10 20 30 40 50
[Ben
zald
ehyd
e]T
RV
, [P
yruv
ate]
TR
V,
[PA
C]T
RV
(m
M)
0
5
10
15
20
25
30
35
[Ace
tald
ehyd
e]T
RV
, [A
ceto
in]T
RV
(m
M)
0
100
200
300
400
500
600
700
800
0 10 20 3 0 40 50
[Ben
zald
ehyd
e]T
RV
, [P
yruv
ate]
TR
V,
[PA
C]T
RV
(m
M)
0
5
10
15
20
25
30
35
[Ace
tald
ehyd
e]T
RV
, [A
ceto
in]T
RV
(m
M)
I. 1:1
III. 0.43:1
II. 0.67:1
IV. 0.25:1
Time (h) Time (h)

Appendix C
Cindy Gunawan 2006 PhD Thesis
194
Figure C.2: Effect of organic to aqueous phase volume ratio on PAC production in the aqueous/octanol-benzaldehyde emulsion system at
20°C, initial pH 6.5: overall substrate, PAC and by-product concentration profiles. Same experiments as shown in Figs 5.1 – 5.4.
0
100
200
300
400
500
600
700
800
0 10 20 30 40 50
[Ben
zald
ehyd
e]T
RV
,
[Pyr
uvat
e]T
RV
, [P
AC
]TR
V (
mM
)
0
10
20
30
40
50
60
70
80
[Ace
tald
ehyd
e]T
RV
, [A
ceto
in]T
RV
(mM
)
0
100
200
300
400
500
600
700
800
0
100
200
300
400
500
600
700
800
0 10 20 30 40 500 10 20 30 40 50
[Ben
zald
ehyd
e]T
RV
,
[Pyr
uvat
e]T
RV
, [P
AC
]TR
V (
mM
)
[Ben
zald
ehyd
e]T
RV
,
[Pyr
uvat
e]T
RV
, [P
AC
]TR
V (
mM
)
0
10
20
30
40
50
60
70
80
0
10
20
30
40
50
60
70
80
[Ace
tald
ehyd
e]T
RV
, [A
ceto
in]T
RV
(mM
)
[Ace
tald
ehyd
e]T
RV
, [A
ceto
in]T
RV
(mM
)
0
100
200
300
400
500
600
700
800
0 10 20 30 40 50
[Ben
zald
ehyd
e]TR
V,
[Pyr
uvat
e]T
RV
, [P
AC
]TR
V (
mM
)
0
10
20
30
40
50
60
70
80
[Ace
tald
ehyd
e]T
RV
, [A
ceto
in]T
RV
(mM
)
0
100
200
300
400
500
600
700
800
0
100
200
300
400
500
600
700
800
0 10 20 30 40 500 10 20 30 40 50
[Ben
zald
ehyd
e]TR
V,
[Pyr
uvat
e]T
RV
, [P
AC
]TR
V (
mM
)
[Ben
zald
ehyd
e]TR
V,
[Pyr
uvat
e]T
RV
, [P
AC
]TR
V (
mM
)
0
10
20
30
40
50
60
70
80
0
10
20
30
40
50
60
70
80
[Ace
tald
ehyd
e]T
RV
, [A
ceto
in]T
RV
(mM
)
[Ace
tald
ehyd
e]T
RV
, [A
ceto
in]T
RV
(mM
)
0
100
200
300
400
500
600
700
800
0 10 20 30 40 50
[Ben
zald
ehyd
e]T
RV
,
[Pyr
uvat
e]T
RV
, [P
AC
]TR
V (
mM
)
0
10
20
30
40
50
60
70
80
[Ace
tald
ehyd
e]T
RV
, [A
ceto
in]T
RV
(mM
)0
100
200
300
400
500
600
700
800
0 10 20 30 40 500 10 20 30 40 50
[Ben
zald
ehyd
e]T
RV
,
[Pyr
uvat
e]T
RV
, [P
AC
]TR
V (
mM
)
[Ben
zald
ehyd
e]T
RV
,
[Pyr
uvat
e]T
RV
, [P
AC
]TR
V (
mM
)
0
10
20
30
40
50
60
70
80
[Ace
tald
ehyd
e]T
RV
, [A
ceto
in]T
RV
(mM
)
[Ace
tald
ehyd
e]T
RV
, [A
ceto
in]T
RV
(mM
)0
100
200
300
400
500
600
700
800
0 10 20 30 40 50
[Ben
zald
ehyd
e]T
RV
, [P
yruv
ate]
TR
V, [
PA
C]T
RV
(m
M)
0
10
20
30
40
50
60
70
80
[Ace
tald
ehyd
e]T
RV
, [A
ceto
in]T
RV
(m
M)
0
100
200
300
400
500
600
700
800
0
100
200
300
400
500
600
700
800
0 10 20 30 40 500 10 20 30 40 50
[Ben
zald
ehyd
e]T
RV
, [P
yruv
ate]
TR
V, [
PA
C]T
RV
(m
M)
[Ben
zald
ehyd
e]T
RV
, [P
yruv
ate]
TR
V, [
PA
C]T
RV
(m
M)
0
10
20
30
40
50
60
70
80
0
10
20
30
40
50
60
70
80
[Ace
tald
ehyd
e]T
RV
, [A
ceto
in]T
RV
(m
M)
[Ace
tald
ehyd
e]T
RV
, [A
ceto
in]T
RV
(m
M)
Time (h) Time (h)
III. 0.43:1 IV. 0.25:1
I. 1:1 II. 0.67:1

Appendix D
Cindy Gunawan 2006 PhD Thesis
195
APPENDIX D
The experimental data given in Appendix D are additional to that given in Chapter 5 on two-
phase aqueous/organic PAC synthesis with reduced MOPS concentration of 20 mM MOPS
and pH controlled at 7.0. The data shows the concentration profiles of substrates, PAC, and
by-products per total reaction volume by combining both phases.
D.1 Effect of Changing the Organic to Aqueous Phase Volume Ratio on
Two-Phase Aqueous/Organic PAC Production with 20 mM MOPS at 20°°°°C
The results illustrate that reducing the organic to aqueous phase volume ratio is not
advantageous for PAC formation in the low MOPS buffer system at 20°C presumably due to
higher rate of PDC deactivation (Figs D.1 and D.2).
0
20
40
60
80
100
120
140
0 10 20 30 40
Time (h)
[PA
C]T
RV
(m
M)
1 to 1 0.667 to 1 0.428 to 1 0.25 to 1
Figure D.1: Effect of organic to aqueous phase volume ratio on PAC production in the
aqueous/octanol-benzaldehyde emulsion system with 20 mM MOPS at 20°C, controlled pH 7.0:
overall concentration profiles are shown. Same experiments as shown in Fig 5.6. TRV: total
reaction volume by combining both phases. The mean values were determined from triplicate
analyses and error bars show the highest and lowest values.

Appendix D
Cindy Gunawan 2006 PhD Thesis
196
0
3
6
9
12
15
'1:1' '0.67:1' '0.43:1' '0.25:1'Organic : Aqueous
[Ace
tald
ehyd
e]T
RV
, [A
ceto
in]T
RV
(m
M)
acetaldehyde acetoin
Figure D.2: Effect of organic to aqueous phase volume ratio on by-products acetaldehyde and acetoin formation in the aqueous/octanol-benzaldehyde emulsion system with 20 mM MOPS at 20°C, controlled pH 7.0: overall concentrations. Same experiments as shown in Fig 5.6. Approximate values for acetaldehyde concentration due to possible evaporative losses during sampling and analysis.
0
1
2
3
4
5
6
0 10 20 30 40
T im e (h )
Aci
d (m
L)
Figure D.3: Effect of organic to aqueous phase volume ratio in the aqueous/octanol-benzaldehyde emulsion system with 20 mM MOPS at 20°C, controlled pH 7.0: acid addition profiles. Same experiments as shown in Fig 5.6.
1 : 1 0 .6 7 : 1 0 .4 3 : 1 0 .2 5 : 11 : 1 0 .6 7 : 10 .6 7 : 1 0 .4 3 : 10 .4 3 : 1 0 .2 5 : 10 .2 5 : 1

Appendix D
Cindy Gunawan 2006 PhD Thesis
197
D.2 Effect of Increasing Temperature on Two-Phase Aqueous/Organic
PAC Production with 20 mM MOPS
It was observed that 20°C was the optimum operating temperature for two-phase PAC
production in the 20 mM MOPS system as it was associated with the highest final PAC
concentration and volumetric productivity.
Time (h)
[PA
C]T
RV
(m
M)
0
20
40
60
80
100
120
140
0 10 20 30 40 50 60 70Time (h)
[PA
C]T
RV
(m
M)
0
20
40
60
80
100
120
140
0
20
40
60
80
100
120
140
0 10 20 30 40 50 60 70
4 °°°°C 10 °°°°C 1 5 °°°°C 2 0 °°°°C 25 °°°°C 30 °°°°C 35 °°°°C4 °°°°C4 °°°°C 10 °°°°C10 °°°°C 1 5 °°°°C1 5 °°°°C 2 0 °°°°C2 0 °°°°C 25 °°°°C25 °°°°C 30 °°°°C30 °°°°C 35 °°°°C35 °°°°C
Figure D.4: Effect of temperature on PAC production in the aqueous/octanol-benzaldehyde
emulsion system with 20 mM MOPS, controlled pH 7.0: overall concentration profiles.
TRV: total reaction volume by combining both phases. Same experiments as shown in Fig
5.8. The mean values were determined from triplicate analyses and error bars show the
highest and lowest values.

Appendix D
Cindy Gunawan 2006 PhD Thesis
198
0
3
6
9
12
15
5 10 15 20 25 30 35
T (C)
[ace
tald
ehyd
e]T
RV
, [ac
etoi
n]T
RV
(m
M)
acetaldehyde acetoin
Figure D.5: Effect of temperature on PAC production in the 1:1 two-phase aqueous/octanol-benzaldehyde emulsion system: final overall by-product acetaldehyde and acetoin formation. Same experiments as shown in Fig 5.8. Approximate values for acetaldehyde concentrations presumably due to evaporative losses during sampling and analysis.
0
1
2
3
4
5
6
0 10 20 30 40 50 60 70
Time (h)
Aci
d (m
L)
Figure D.6: Effect of temperature on PAC production in the 1:1 two-phase aqueous/octanol-benzaldehyde emulsion system: acid addition profiles are shown. Same experiments as shown in Fig 5.8.
4°°°°C 10°°°°C 15°°°°C 20°°°°C 25°°°°C 30°°°°C 35°°°°C4°°°°C 10°°°°C 15°°°°C 20°°°°C 25°°°°C 30°°°°C 35°°°°C

Appendix D
Cindy Gunawan 2006 PhD Thesis
199
D.3 Effect of Dipropylene Glycol (DPG) as Additive on Two-Phase Aqueous/Organic PAC Production with 20 mM MOPS at 20°°°°C and 0.25:1 Organic to Aqueous Phase Volume Ratio Addition of 2.5 M DPG into the aqueous phase in the 20 mM MOPS system at 20°C and 0.25:1 phase volume ratio enhanced the PAC production. Moreover, employment of whole cell PDC resulted in higher formation.
0
100
200
300
400
500
600
700
800
0 5 10 15 20 25 30
[Ben
zald
ehyd
e]TR
V, [
Pyr
uvat
e]TRV (m
M)
0
50
100
150
200
[PAC
]TR
V, [
acet
alde
hyde
]TR
V, [
acet
oin]
TR
V
(mM
)
a
0
100
200
300
400
500
600
700
800
0 5 10 15 20 25 30
Time (h)
[Ben
zald
ehyd
e]TRV,
[Pyr
uvat
e]TR
V (m
M)
0
50
100
150
200
[PAC
]TRV, [
acet
alde
hyde
]TRV,
[ace
toin
]TRV (m
M)
b
Figure D.7: Effect of 2.5 M dipropylene glycol (DPG) addition on PAC production in the aqueous/octanol-benzaldehyde emulsion system with 20 mM MOPS at 20°C, controlled pH 7.0: overall concentration profiles of substrates, PAC and by-products are shown: (a) partially purified PDC and (b) whole cell PDC. Organic to aqueous phase volume ratio of 0.25:1. Same experiments as shown in Figs 5.11 and 5.12. TRV: total reaction volumeby combining both phases. The mean values were determined from triplicate analyses and error bars show the highest and lowest values.

Appendix D
Cindy Gunawan 2006 PhD Thesis
200
0
1
2
3
4
5
6
0 5 10 15 20 25 30
Time (h)
Aci
d (m
L)
partially purified PDC whole cell PDC
Figure D.8: Effect of 2.5 M dipropylene glycol (DPG) addition on PAC production in the
aqueous/octanol-benzaldehyde emulsion system with 20 mM MOPS at 20°C, controlled pH
7.0: acid addition profiles are shown. Organic to aqueous phase volume ratio of 0.25:1. Same
experiments as shown in Figs 5.11 and 5.12.


![Pep Pac [1962] - Internet Archive](https://static.fdokumen.com/doc/165x107/6333c77d3108fad7760f3690/pep-pac-1962-internet-archive.jpg)