NMR metabolic profiling of organic and aqueous sea bass extracts: Implications in the discrimination...
12
Talanta 77 (2008) 433–444 Contents lists available at ScienceDirect Talanta journal homepage: www.elsevier.com/locate/talanta NMR metabolic profiling of organic and aqueous sea bass extracts: Implications in the discrimination of wild and cultured sea bass L. Mannina a,b , A.P. Sobolev b,∗ , D. Capitani b , N. Iaffaldano c , M.P. Rosato c , P. Ragni b , A. Reale a , E. Sorrentino a , I. D’Amico a , R. Coppola a a Dipartimento STAAM, Università degli Studi del Molise, Via De Sanctis, 86100 Campobasso, Italy b Istituto di Metodologie Chimiche, CNR, 00016 Monterotondo Staz., Roma, Italy c Dipartimento SAVA, Università degli Studi del Molise, Via De Sanctis, 86100 Campobasso, Italy article info Article history: Received 22 March 2008 Received in revised form 20 June 2008 Accepted 3 July 2008 Available online 15 July 2008 Keywords: Cultured and wild sea bass NMR Metabolic profile Statistical analysis abstract The nuclear magnetic resonance (NMR) technique was used as analytical tool to determine the complete metabolic profiling of sea bass extracts: water-soluble metabolites belonging to different classes such as sugars, amino acids, dipeptides and organic acids as well as metabolites soluble in organic solvent such as lipids, sterols and fatty acids were identified. The metabolite profiling together with a suitable statistical analysis were used to discriminate between wild and cultured sea bass samples. Preliminary results show that discrimination between wild and cultured sea bass was obtained not only using fatty acid composition but also cholesterol and phosphatidylethanolamine and some water-soluble metabolites such as choline, trimethylamine oxide, glutamine, fumaric and malic acids. © 2008 Elsevier B.V. All rights reserved. 1. Introduction Given the importance of fish as a source of polyunsaturated fatty acids, the major part of metabolic studies on fish has been limited up to now to the analysis of fatty acids composition, almost com- pletely disregarding water-soluble metabolites that are, indeed, Abbreviations: ADP, adenosine diphosphate; ALA, alanine; ANOVA, analy- sis of variance; ASN, asparagine; ANS, anserine; ATP, adenosine triphosphate; CHN, choline; CHO, cholesterol; COSY, correlated spectroscopy; CR/PCR, cre- atine/phosphocreatine; DHA, docosahexaenoic acid; DOSY, diffusion ordered spectroscopy; DSS, sodium 3-(trimethylsilyl)-1-propanesulfonate; DUFA, diunsat- urated fatty acids; EPA, eicosapentaenoic acid; FA, fumaric acid; GARP, globally optimized alternating phase rectangular pulse; GB, glycine-betaine; -GLC, - glucose; -GLC, -glucose; GLN, glutamine; GLU, glutamic acid; GLY, glycine; HSQC, heteronuclear single quantum coherence; HMBC, heteronuclear multiple- bond correlation; HYP, hypoxanthine; ILE, isoleucine; IMP, inosine monophosphate; INO, inosine; LA, lactic acid; LEU, leucine; LYS, lysine; MA, malic acid; MUFA, monounsaturated fatty acids; NMR, nuclear magnetic resonance; NOESY, nuclear Overhauser and exchange spectroscopy; PC, phosphatidylcholine; PCA, principal component analysis; PC + PE, phosphatidylcholine + phosphatidylethanolamine; PE, phosphatidylethanolamine; PUFA, polyunsaturated fatty acids; SA, succinic acid; STA, saturated fatty acids; TAU, taurin; TG, triacylglycerols; TMAO, trimethylamine oxide; TOCSY, total correlation spectroscopy; UFA, unsaturated fatty acids; VAL, valine. ∗ Corresponding author at: Istituto di Metodologie Chimiche, CNR, 00016 Mon- terotondo Staz., Roma, Italy. Tel.: +39 06 90672385; fax: +39 06 90672477. E-mail address: [email protected] (A.P. Sobolev). important from the nutritional point of view. Currently there is an increasing requirement for proper analytical methods capable to give a complete picture of fish metabolism and to assess the nutri- tional quality of the product. These methods should be based on the analysis of a variety of metabolites and not only of a few specific classes of compounds. As a non-specific high-throughput analytical method, nuclear magnetic resonance (NMR) spectroscopy is well suited to the requirements of metabolic profiling [1,2]. It has been extensively used as analytical tool to analyze metabolites of food either of ani- mal [3] or vegetable origin such as olive oils [4], tomatoes [5], lettuce [6], truffles [7] and coffee [8]. In this paper, we report a detailed study of the NMR spectra of the organic and aqueous extracts of the Sea bass (Dicentrarchus labrax), a very popular ocean-going fish with peculiar sensory and nutri- tional qualities. Due to the increased demand for this fish, in the last decade the aquaculture production has significantly increased and sea bass has become one of the most important commercial fish cultured in Mediterranean area (Greece, Turkey, Italy, Spain, Croatia and Egypt). Therefore, the intensive sea bass production has raised concerns over the quality of cultured fish in comparison with that of wild fish and has given rise to the development of robust analytical tools to distinguish cultured and wild samples [9–12]. The choice of NMR analytical approach for the food analy- sis depends on the specific problem. Four different approaches can be used: target analysis, metabolic profiling, metabolomics and 0039-9140/$ – see front matter © 2008 Elsevier B.V. All rights reserved. doi:10.1016/j.talanta.2008.07.006
Transcript of NMR metabolic profiling of organic and aqueous sea bass extracts: Implications in the discrimination...

Talanta 77 (2008) 433–444
Contents lists available at ScienceDirect
Talanta
journa l homepage: www.e lsev ier .com/ locate / ta lanta
NMR metabolic profiling of organic and aqueous sea bass extracts:Implications in the discrimination of wild and cultured sea bass
L. Manninaa,b, A.P. Sobolevb,∗, D. Capitanib, N. Iaffaldanoc, M.P. Rosatoc,P. Ragnib, A. Realea, E. Sorrentinoa, I. D’Amicoa, R. Coppolaa
a Dipartimento STAAM, Università degli Studi del Molise, Via De Sanctis, 86100 Campobasso, Italyb Istituto di Metodologie Chimiche, CNR, 00016 Monterotondo Staz., Roma, Italyc Dipartimento SAVA, Università degli Studi del Molise, Via De Sanctis, 86100 Campobasso, Italy
a r t i c l e i n f o
Article history:Received 22 March 2008Received in revised form 20 June 2008Accepted 3 July 2008Available online 15 July 2008
Keywords:
a b s t r a c t
The nuclear magnetic resonance (NMR) technique was used as analytical tool to determine the completemetabolic profiling of sea bass extracts: water-soluble metabolites belonging to different classes such assugars, amino acids, dipeptides and organic acids as well as metabolites soluble in organic solvent such aslipids, sterols and fatty acids were identified. The metabolite profiling together with a suitable statisticalanalysis were used to discriminate between wild and cultured sea bass samples. Preliminary results showthat discrimination between wild and cultured sea bass was obtained not only using fatty acid composition
Cultured and wild sea bassNMRMS
but also cholesterol and phosphatidylethanolamine and some water-soluble metabolites such as choline,trimethylamine oxide, glutamine, fumaric and malic acids.
1
aup
sCasuogHbImOcpSov
t
ii
0d
etabolic profiletatistical analysis
. Introduction
Given the importance of fish as a source of polyunsaturated fattycids, the major part of metabolic studies on fish has been limitedp to now to the analysis of fatty acids composition, almost com-letely disregarding water-soluble metabolites that are, indeed,
Abbreviations: ADP, adenosine diphosphate; ALA, alanine; ANOVA, analy-is of variance; ASN, asparagine; ANS, anserine; ATP, adenosine triphosphate;HN, choline; CHO, cholesterol; COSY, correlated spectroscopy; CR/PCR, cre-tine/phosphocreatine; DHA, docosahexaenoic acid; DOSY, diffusion orderedpectroscopy; DSS, sodium 3-(trimethylsilyl)-1-propanesulfonate; DUFA, diunsat-rated fatty acids; EPA, eicosapentaenoic acid; FA, fumaric acid; GARP, globallyptimized alternating phase rectangular pulse; GB, glycine-betaine; �-GLC, �-lucose; �-GLC, �-glucose; GLN, glutamine; GLU, glutamic acid; GLY, glycine;SQC, heteronuclear single quantum coherence; HMBC, heteronuclear multiple-ond correlation; HYP, hypoxanthine; ILE, isoleucine; IMP, inosine monophosphate;
NO, inosine; LA, lactic acid; LEU, leucine; LYS, lysine; MA, malic acid; MUFA,onounsaturated fatty acids; NMR, nuclear magnetic resonance; NOESY, nuclearverhauser and exchange spectroscopy; PC, phosphatidylcholine; PCA, principalomponent analysis; PC + PE, phosphatidylcholine + phosphatidylethanolamine; PE,hosphatidylethanolamine; PUFA, polyunsaturated fatty acids; SA, succinic acid;TA, saturated fatty acids; TAU, taurin; TG, triacylglycerols; TMAO, trimethylaminexide; TOCSY, total correlation spectroscopy; UFA, unsaturated fatty acids; VAL,aline.∗ Corresponding author at: Istituto di Metodologie Chimiche, CNR, 00016 Mon-
erotondo Staz., Roma, Italy. Tel.: +39 06 90672385; fax: +39 06 90672477.E-mail address: [email protected] (A.P. Sobolev).
gtac
mrum[
oatlacacwt
sc
039-9140/$ – see front matter © 2008 Elsevier B.V. All rights reserved.oi:10.1016/j.talanta.2008.07.006
© 2008 Elsevier B.V. All rights reserved.
mportant from the nutritional point of view. Currently there is anncreasing requirement for proper analytical methods capable toive a complete picture of fish metabolism and to assess the nutri-ional quality of the product. These methods should be based on thenalysis of a variety of metabolites and not only of a few specificlasses of compounds.
As a non-specific high-throughput analytical method, nuclearagnetic resonance (NMR) spectroscopy is well suited to the
equirements of metabolic profiling [1,2]. It has been extensivelysed as analytical tool to analyze metabolites of food either of ani-al [3] or vegetable origin such as olive oils [4], tomatoes [5], lettuce
6], truffles [7] and coffee [8].In this paper, we report a detailed study of the NMR spectra of the
rganic and aqueous extracts of the Sea bass (Dicentrarchus labrax),very popular ocean-going fish with peculiar sensory and nutri-
ional qualities. Due to the increased demand for this fish, in theast decade the aquaculture production has significantly increasednd sea bass has become one of the most important commercial fishultured in Mediterranean area (Greece, Turkey, Italy, Spain, Croatiand Egypt). Therefore, the intensive sea bass production has raisedoncerns over the quality of cultured fish in comparison with that of
ild fish and has given rise to the development of robust analyticalools to distinguish cultured and wild samples [9–12].The choice of NMR analytical approach for the food analy-
is depends on the specific problem. Four different approachesan be used: target analysis, metabolic profiling, metabolomics and

4 lanta
mittpitpaismsa
woumaooptto∼
tw
2
2
ailp
t(t
2
mtw
wtwtsoaafpws
pfl
2
BqztrsnraC
aass[
1p
a6Bcacct
1
sfi8pfiTasrmafps
2
mnmare due to ILE (1, 1.02 ppm), VAL (3, 1.05 ppm), LA (4, 1.33 ppm), ALA
34 L. Mannina et al. / Ta
etabolic fingerprinting [13]. The target analysis is used when ones interested in a specific metabolite: in this case a selective extrac-ion can be performed before the NMR analysis to concentratehe selected metabolite and to avoid interference from other com-ounds. The metabolic profiling is used when you are interested
n the specific role of a selected metabolic pathway: it requireshe NMR identification and quantification of a selected number ofre-defined metabolites in a given sample. Metabolomics requirescomplete analysis in which all the metabolites are quantified and
dentified. Finally, the metabolic fingerprinting is used when theample classification without quantification of individual specificetabolites is required: in this case, the NMR spectrum can be con-
idered as a fingerprint of the product and all the NMR resonancesre measured without any identification.
In this study a mixed metabolic profiling–metabolomics approachas followed: the 1H spectra of sea bass extracts in aqueous andrganic solvents were analyzed, all the NMR signals were assignedsing 2D NMR spectra, and finally the intensity of the identifiedetabolites were measured and submitted to a suitable statistical
nalysis. Although a complete assignment of the 1H spectra in aque-us and organic solvents was performed, we prefer not to defineur analytical approach as metabolomics since some metabolitesresent in extremely low concentrations could be not revealed dueo the intrinsic low sensitivity of the NMR technique. The detec-ion limit of a given metabolite, analyzed in a 5 mm tube usingne-dimensional 1H NMR spectroscopy at high field (11–16 T), is100 �M [1].
Finally, the analytical metabolic profile was used to investigatehe potentiality of the NMR methodology to discriminate betweenild and cultured sea bass.
. Materials and methods
.1. Materials
Four cultured sea bass (average length and weight: 35 ± 3 cmnd 600 ± 10 g, respectively) were purchased from a sea bass breed-ng located in Molise, Italy, whereas three wild sea bass (averageength and weight: 46 ± 3 cm and 800 ± 10 g, respectively) wereurchased from fishermen in Naples, Tyrrhenian Sea.
The commercial feed (Biomar, Ecolife 66F n. 6.5) used for cul-ured sea bass contained proteins (42%), fats (26%), carbohydrates20%), ash (6.1%), fiber (3.0%), methionine and cysteine (1.34%) andotal phosphorus (0.90%).
.2. Sample preparation
Sea bass were killed by immersing in ice-cold water (hypother-ia), packed into polystyrene containers with ice, and delivered to
he laboratory within 90 min after the harvesting. Sea bass wereashed with potable water and stored at 2 ◦C.
Bligh and Dyer [14] method was used to extract and separateater-soluble and liposoluble metabolites. Four portions (each por-
ion ∼ 8 g) of skin and four portions (each portion ∼8 g) of muscleere accurately sampled from each fish and put into a ceramic mor-
ar adding 24 mL of a chloroform/methanol (1:1, v/v) mixture. Theample was grinded and homogenized with a ceramic pestle; 8 mLf distilled water was then added. The homogenate was centrifugedt a speed of 4000 rpm for 20 min at 4 ◦C. The liquid chloroform
nd water/methanol phases were separated and dried. The lipidicraction was dissolved in 2 mL of CDCl3; 0.7 mL of solution waslaced into a standard 5 mm tube for the NMR measurements. Theater-soluble residue was dissolved in 3 mL of D2O; 0.35 mL of theolution was placed into a 5 mm NMR tube adding 0.35 mL of D2O
(GC(5
77 (2008) 433–444
hosphate buffer (400 mM, pD = 6.5). Finally, the NMR tubes wereame-sealed.
.3. NMR measurements
NMR spectra of sea bass extracts were recorded at 300 K on aruker AVANCE AQS600 spectrometer operating at the proton fre-uency of 600.13 MHz and equipped with a Bruker multinuclear-gradient inverse probehead capable of producing gradients inhe z-direction with a strength of 55.4 G cm−1. 1H spectra wereeferenced to DSS (sodium 3-(trimethylsilyl)-1-propanesulfonate)ignal (ı = 0.00 ppm) in D2O phosphate buffer and to the CH3 sig-al (ı = 0.88 ppm) of the oleic fatty chain in CDCl3. 13C spectra wereeferenced to the CH3 resonance of alanine (ı = 16.8 ppm) in D2Ond to the CH3 resonance of the oleic fatty chain (ı = 14.1 ppm) inDCl3.
The 1H spectrum of the aqueous extract was acquired by co-dding 512 transients with a recycle delay of 3 s and using a 90◦ flipngle pulse of 15.5 �s, and 32 K data points. The water signal wasuppressed using a solvent presaturation (NOESY-presaturationcheme) during the relaxation delay and the mixing time of 160 ms15].
The 1H spectra of the CDCl3 extracts were acquired by co-adding6 transients with a recycle delay of 2 s and using a 90◦ flip angleulse of 10 �s and 64 K data points.
The 13C spectrum of the CDCl3 extract was acquired by co-dding 7000 transients with a recycle delay of 6 s and using a0◦ flip angle pulse of 10 �s and 64 K data points. A standardruker pulse sequence with power-gated proton decoupling andomposite pulse GARP decoupling sequence was used. The sn1,3nd sn2 percentages of fatty acids on the glycerol moiety werealculated by means of the integration of the corresponding 13Carbonyl resonances; the sum of all integrals was normalizedo 100.
2D NMR experiments, namely 1H–1H COSY, 1H–1H TOCSY,H–13C HSQC and 1H–13C HMBC [15], were performed using theame experimental conditions previously reported [7]; the delayor the evolution of long-range couplings in 1H–13C HMBC exper-ments was 80 ms, the mixing time for the 1H–1H TOCSY was0 ms. Pulsed field gradient spin echo (PGSE) experiments wereerformed with a pulsed field gradient unit producing a magneticeld gradient in the z-direction with a strength of 55.4 G cm−1.he stimulated echo pulse sequence using bipolar gradients withlongitudinal eddy current delay was used. The strength of the
ine-shaped gradient pulse with a duration of 1.4 ms, was loga-ithmically incremented in 32 steps, from 2% up to 95% of theaximum gradient strength, with a diffusion time of 200 ms andlongitudinal eddy current delay of 25 ms. After Fourier trans-
ormation and a baseline correction, the diffusion dimension wasrocessed using the DOSY subroutine of the Bruker XwinnmrTM
oftware package.
.4. Measurement of the metabolic content in aqueous extract
The intensity of 19 1H resonances due to water-soluble assignedetabolites were measured with respect to the intensity of DSS sig-
al (0.2 mM) used as internal standard and normalized to 10. The 19easured resonances, see Fig. 1, Fig. 2 and the list of abbreviations,
5, 1.49 ppm), LYS (6, 1.74 ppm), GLU (7, 2.07 ppm), SA (9, 2.41 ppm),LN (8, 2.46 ppm), ASN (11, 2.86 ppm), CR/PCR (12, 3.04 ppm),HN (25, 3.22 ppm), TMAO (14, 3.28 ppm), TAU (15, 3.43 ppm), GLY16, 3.57 ppm), GB (13, 3.91 ppm), MA (10, 4.31 ppm), �-GLC (20,.24 ppm), FA (21, 6.53 ppm), ANS (23, 7.22 ppm).
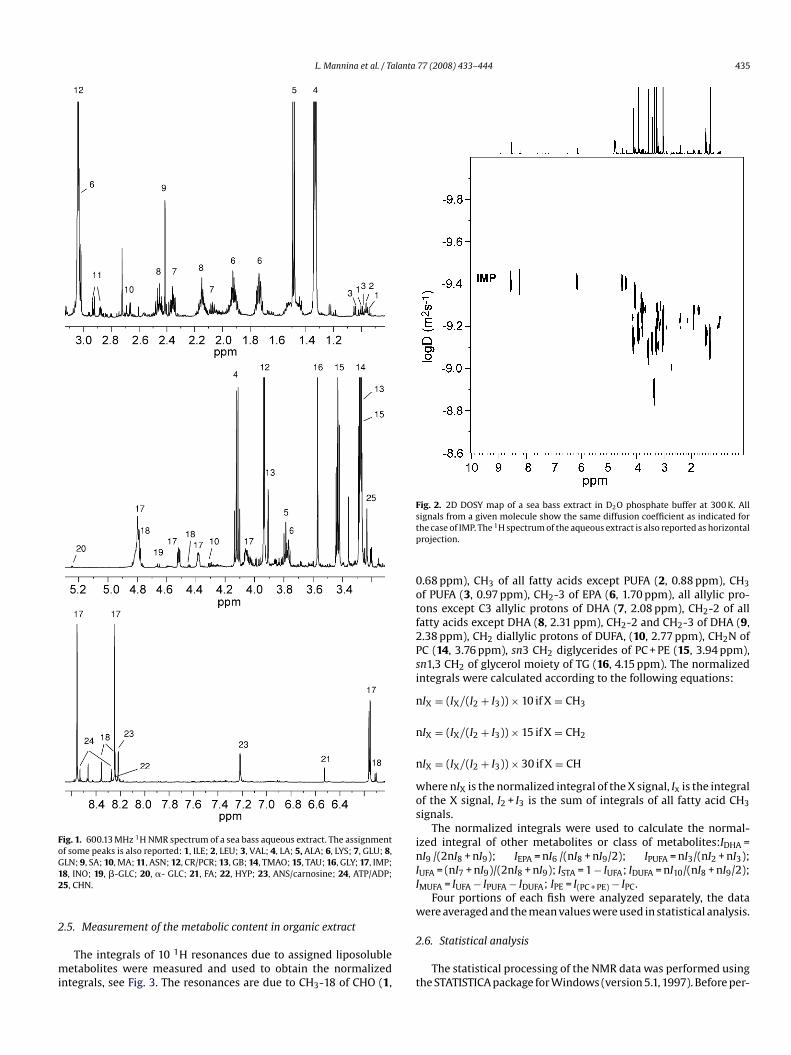
L. Mannina et al. / Talanta 77 (2008) 433–444 435
Fig. 1. 600.13 MHz 1H NMR spectrum of a sea bass aqueous extract. The assignmentof some peaks is also reported: 1, ILE; 2, LEU; 3, VAL; 4, LA; 5, ALA; 6, LYS; 7, GLU; 8,G12
2
mi
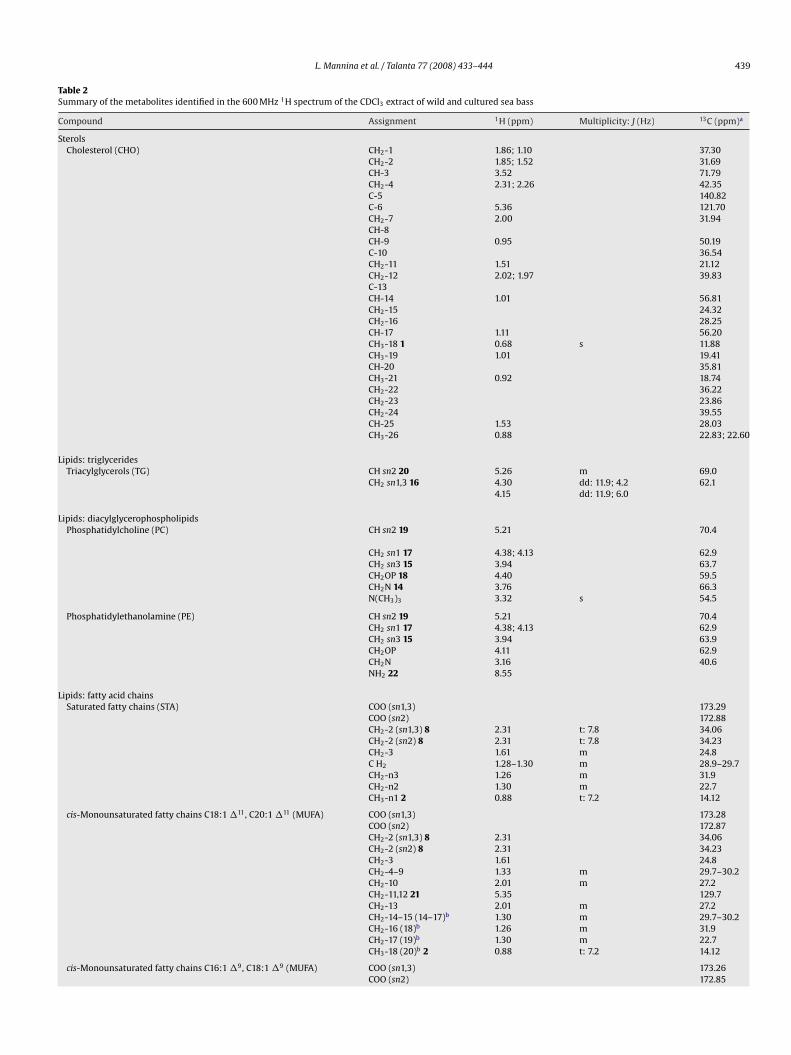
Fig. 2. 2D DOSY map of a sea bass extract in D2O phosphate buffer at 300 K. Allstp
0otf2Psi
n
n
n
wos
inII
w
LN; 9, SA; 10, MA; 11, ASN; 12, CR/PCR; 13, GB; 14, TMAO; 15, TAU; 16, GLY; 17, IMP;8, INO; 19, �-GLC; 20, �- GLC; 21, FA; 22, HYP; 23, ANS/carnosine; 24, ATP/ADP;5, CHN.
.5. Measurement of the metabolic content in organic extract
The integrals of 10 1H resonances due to assigned liposolubleetabolites were measured and used to obtain the normalized
ntegrals, see Fig. 3. The resonances are due to CH3-18 of CHO (1,
2
t
ignals from a given molecule show the same diffusion coefficient as indicated forhe case of IMP. The 1H spectrum of the aqueous extract is also reported as horizontalrojection.
.68 ppm), CH3 of all fatty acids except PUFA (2, 0.88 ppm), CH3f PUFA (3, 0.97 ppm), CH2-3 of EPA (6, 1.70 ppm), all allylic pro-ons except C3 allylic protons of DHA (7, 2.08 ppm), CH2-2 of allatty acids except DHA (8, 2.31 ppm), CH2-2 and CH2-3 of DHA (9,.38 ppm), CH2 diallylic protons of DUFA, (10, 2.77 ppm), CH2N ofC (14, 3.76 ppm), sn3 CH2 diglycerides of PC + PE (15, 3.94 ppm),n1,3 CH2 of glycerol moiety of TG (16, 4.15 ppm). The normalizedntegrals were calculated according to the following equations:
IX = (IX/(I2 + I3)) × 10 if X = CH3
IX = (IX/(I2 + I3)) × 15 if X = CH2
IX = (IX/(I2 + I3)) × 30 if X = CH
here nIX is the normalized integral of the X signal, Ix is the integralf the X signal, I2 + I3 is the sum of integrals of all fatty acid CH3ignals.
The normalized integrals were used to calculate the normal-zed integral of other metabolites or class of metabolites:IDHA =I9 /(2nI8 + nI9); IEPA = nI6 /(nI8 + nI9/2); IPUFA = nI3/(nI2 + nI3);
UFA = (nI7 + nI9)/(2nI8 + nI9); ISTA = 1 − IUFA; IDUFA = nI10/(nI8 + nI9/2);MUFA = IUFA − IPUFA − IDUFA; IPE = I(PC + PE) − IPC.
Four portions of each fish were analyzed separately, the dataere averaged and the mean values were used in statistical analysis.
.6. Statistical analysis
The statistical processing of the NMR data was performed usinghe STATISTICA package for Windows (version 5.1, 1997). Before per-

436 L. Mannina et al. / Talanta 77 (2008) 433–444
Table 1Summary of the metabolites identified in the 600 MHz 1H spectrum of the aqueous extract of wild and cultured sea bass
Compound Assignment 1H (ppm) Multiplicity: J (Hz) 13C (ppm)
Carbohydrates�-Glucose (�-GLC) 19 CH-1 4.66 d: 8.0 96.5
CH-2 3.26 74.7CH-3 3.51 76.3CH-4 3.42 70.5CH-5 3.48 76.4CH2-6,6′ 3.73, 3.89 61.3
�-Glucose (�-GLC) 20 CH-1 5.24* d: 3.8 92.7CH-2 3.54 71.9CH-3 3.72CH-4 3.41 70.2CH-5 3.84 72.2CH2-6,6′ 3.77, 3.84 61.1
Organic acidsMalic acid (MA) 10 �-CH 4.31* dd: 10.0; 3.1 70.9
�,�,-CH2 2.38 dd: 15.4; 10.0 43.22.68 dd: 15.4; 3.1
Fumaric acid (FA) 21 �,�-CH = CH 6.53* s
Succinic acid (SA) 9 �,�-CH2 2.41* s 34.61,4-COOH 181.8
Lactic acid (LA) 4 �-CH 4.12 q: 6.9 20.7�-CH3 1.33* d: 6.9 69.1COOH 183.1
Amino acids and dipetidesValine (VAL) 3 �-CH 3.61 61.0
�-CH 2.28 m 20.7�-CH3 1.00 d: 7.0 17.3�′-CH3 1.05* d: 7.0 18.5COOH 175.0
Leucine (LEU) 2 �-CH 3.73 54.1�-CH2 1.72 m 40.2�-CH 1.73 m 24.5�-CH3 0.97 d: 6.2 22.6�′-CH3 0.96 d: 6.1 21.6
Lysine (LYS) 6 �-CH 3.77 m 55.0�-CH2 1.92 m 30.4�-CH2 1.49 m 21.9�-CH2 1.74* m 26.9�-CH2 3.03 t: 7.6 39.6COOH 175.4
Alanine (ALA) 5 �-CH 3.79 51.2�-CH3 1.49* d: 7.3 16.8COOH 176.4
Asparagine (ASN) 11 �-CH 4.01�,�′-CH2 2.86* dd: 17.0; 7.6
2.95 dd: 17.0; 4.3
Isoleucine (ILE) 1 �-CH 3.68 60.2�-CH 1.98 36.4�-CH3 1.02* d: 7.1 15.3�-CH2 1.26, 1.47 25.2�-CH3 0.94 t: 7.5 10.2COOH
Glutamate (GLU) 7 �-CH 3.77 m 55.1�,�’-CH2 2.07*, 2.14 m 27.6�-CH2 2.36 m 34.1�-CO 181.8COOH 175.1
Glutamine (GLN) 8 �-CH 3.77 55.1�,�′-CH2 2.15 m 26.8�-CH2 2.46* m 31.5�-CO(NH2) 178.3COOH 174.6

L. Mannina et al. / Talanta 77 (2008) 433–444 437
Table 1( Continued )
Compound Assignment 1H (ppm) Multiplicity: J (Hz) 13C (ppm)
Glycine (GLY) 16 �-CH2 3.57* s 42.1COOH 173.0
Creatine/phosphocreatine (CR)/(PCR) 12 N–CH2 3.95 s 54.4
N–CH3 3.04* s 37.6N C
N(�)-(�-Alanyl)-l-1-methylhistidine (ANS) or N(�)-(�-alanyl)-l-1-histidine 23 �-CH2 (�-Ala)�-CH2 (�-Ala)�-CH (His) 4.51 53.6�-CH2 (His) 3.07; 3.264-CH (His) 7.22* 120.22-CH (His) 8.22 d: 1.1 136.1
Osmolytes and nucleoside derivativesTMAO 14 N–CH3 3.28* s 60.1
Glycine-betaine (GB) 13 N–CH3 3.27 s 54.0�-CH2 3.91* s 66.7COOH 170.0
Taurine (TAU) 15 S–CH2 3.28 t: 6.7 48.0N–CH2 3.43* t: 6.7 35.9
Inosine 5’-phosphate (IMP) 17 CH-1’, ribose 6.16 d: 5.7 88.0CH-2’ ribose 4.80 m 75.2CH-3’ ribose 4.52 dd: 3.8;5.0 71.2CH-4’ribose 4.38 m 85.3CH-5’ ribose 4.05 m 64.3CH-2, ring 8.55 s 140.6C4, ring 149.6C5, ring 124.3CH-8, ring 8.25 s
Inosine (INO) 18 CH-1’, ribose 6.11 d: 5.7 88.9CH-2’, ribose 4.77 m 74.8CH-3’, ribose 4.45 dd: 4.0; 5.1 70.9CH-4’, ribose 4.28 m 86.2CH-5’, ribose 3.87 m 71.8CH2, ring 8.36 s 140.9C4, ring 149.0C5, ring 125.1C6, ring 159.1CH-8, ring 8.25 s 146.8
Hypoxanthine (HYP) 22 CH-8 8.21 s 146.2CH-2 8.23 s
Adenosine triphosphate (ATP)/adenosine diphosphate (ADP) 24 CH-8 8.27 sCH-2 8.53 s
A atistic
f1obyvrnovTavagrv
3
3
sadT
3
Choline (CHN) 25
bbreviations and identification numbering are reported. Signals selected for the st
orming the statistical analysis all 29 selected variables, namely,9 variables of the aqueous extracts and the 10 variables of therganic extracts, were mean-centred and each variable was dividedy its standard deviation (autoscaling). Principal component anal-sis (PCA) was performed on the 29 variables: the percentage ofariance for each specific principal component is reported. PCAesults are shown reporting the scores of the principal compo-ents and also as a plot of the variable loadings. In the analysisf the variance (ANOVA) the variables with the highest index ofariability were selected according to their p-level and F values.he p-level represents decreasing index of the reliability of a resultnd gives the probability of error involved in accepting a result as
alid. A p-level of 0.05 (5% probability of error) is usually treated asborderline acceptable error level. The F value is the ratio betweenroups’ variability to within-group variability: the larger is thisatio, the larger is the discrimination power of the correspondingariable.baics
N–CH3 3.22* s 54.7
al analysis are denoted by asterisk, see Section 2.4.
. Results and discussion
.1. NMR metabolic profiling
The NMR characterization of the sea bass extracts in aqueousolution and in organic solvent will be discussed separately. Thessignments of 1H and 13C NMR spectra were obtained using stan-ard two-dimensional experiments such as 1H–1H COSY, 1H–1HOCSY, 1H–13C HSQC, 1H–13C HMBC and the literature data [1].
.1.1. NMR analysis of aqueous extractsMetabolites soluble in water are important nutrients responsi-
le also for specific taste of the fish. The 1H NMR spectrum of thequeous extract and the corresponding assignment are reportedn Fig. 1 and Table 1, respectively. Many signals due to differentompounds are present. In order to assign this mixture a diffu-ion ordered NMR spectroscopy (DOSY) experiment together with

438 L. Mannina et al. / Talanta
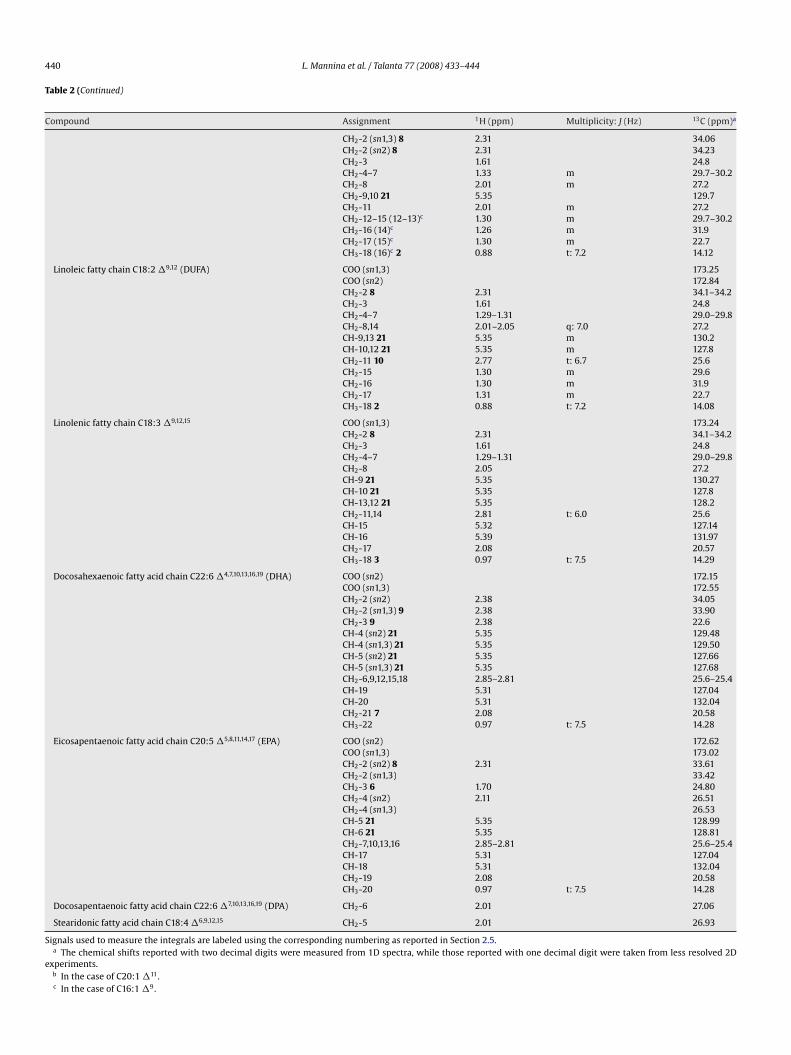
Fig. 3. 600.13 MHz 1H NMR spectrum of a sea bass organic extract. The assignmentof some peaks is also reported: 1,CH3-18 of CHO; 2, CH3 of STA, MUFA and DUFA; 3,CH3 of PUFA; 4, CH2 of all fatty chains; 5, CH2-3 of all fatty chains except DHA andEPA; 6, CH2-3 of EPA; 7, CH2 allylic protons of all fatty chains except DHA; 8, CH2-2of all fatty chains except DHA; 9, CH2-2 and 3 of DHA; 10, CH2, diallylic of DUFA;11, CH of PUFA; 12, CH N of PE; 13, (CH ) N of PC; 14, CH N of PC; 15, sn3 CHdPC
tDssottdtmduhc
o
3baa
3tbfad
s3tw
tap1
3stt
3L
3.1.1.4. Nucleoside derivatives and osmolytes. Trimethylamine-N-oxide (TMAO) plays an important role in the osmotic regulationof body fluids [26]. TMAO was identified in the 1H spectrum by thesinglet at 3.28 ppm due to methyl group. The presence of TMAO inthe extract suggested a good preservation state: in fact, during the
Fig. 4. 150 MHz, 13C NMR spectrum of the sea bass muscle organic extract (car-boxyl spectral region). Labeled peaks assignments: 1, sn1,3-saturated chains; 2,
2 2 3 3 2 2
iglycerides of PE and PC; 16, sn1,3 CH2 of TG; 17, sn1 CH2 diacylglycerols of PE andC; 18, CH2OP of PC; 19, sn2 CH diacylglycerols of PE and PC; 20, sn2 CH2 of TG; 21,H CH of fatty chains, 22, NH2 of PE.
he standard two-dimensional experiments were preformed [16].OSY is a particular convenient way of displaying the molecular
elf-diffusion information in a bi-dimensional array, with the NMRpectrum in one dimension and the self-diffusion coefficient in thether one. DOSY has been successfully used for the analysis of mix-ures [17], for the study of intermolecular interactions [18,19], forhe characterization of aggregates [20], for the molecular weightetermination of uncharged polysaccharides [21]. Here, we reporthe DOSY map of the aqueous extract (Fig. 2). As expected for a
ixture, also in the case of aqueous extract, many signals with
ifferent diffusion coefficients and therefore with different molec-lar weights are present due to different metabolites; on the otherand, signals from the same molecule show the same diffusionoefficient, as it is shown in Fig. 2 for the case of IMP.s−c−s
77 (2008) 433–444
Using DOSY information and 2D experiments a full assignmentf the spectra was obtained, see Fig. 1 and Table 1.
.1.1.1. Sugars. A small amount of glucose was present in the seaass aqueous extract. It was identified by means of the diagnosticnomeric doublets at 4.66 ppm (�-form) and 5.24 ppm (�-form)nd by 2D experiments.
.1.1.2. Free amino acids and dipeptides. The elevated content of pro-eins in fish [22] contributes to the total high nutritional value of fishased products. The 1H spectrum of the aqueous extract allowed theree amino acid composition to be obtained: at least eight aminocids, namely, VAL, LEU, LYS, ALA, ILE, GLU, GLN and GLY wereetected and assigned using 2D experiments and literature data.
Creatine (CR) or/and phosphocreatine (PCR), important energyources, were also identified by means of characteristic singlets at.04 and 3.94 ppm, whereas the presence of taurine (TAU), a condi-ionally essential amino acid with many metabolic actions [23,24]as indicated by the resonances at 3.28 and 3.43 ppm.
Characteristic 1H signals at 7.22 and 8.22 ppm can be ascribedo N(�)-(�-alanyl)-l-1-methylhistidine (anserine, ANS) or N(�)-(�-lanyl)-l-1-histidine (carnosine), dipeptides, which differ for theresence of a N–Me group in the imidazole ring of histidine. TheH chemical shift reported in literature for N–Me of ANS [25] is.75 ppm. In the specific case of the sea bass 1H spectrum, due to thetrong signal overlapping between 3 and 4 ppm, it was impossibleo establish whether the signal at 3.75 ppm was present or not, andherefore to assign the signals at 7.22 and 8.22 ppm unambiguously.
.1.1.3. Organic acids. Some organic acids such as MA, FA, SA andA were also identified in the 1H spectrum.
n1,3 −18:1 �11 and sn1,3 −20:1 �11; 3, sn1,3 −18:1�9 and sn1,3 −16:1�9; 4, sn1,318:2�9,12 (linoleic fatty chain); 5, sn1,3 −20:5 �5,8,11,14,17 (EPA); 6, sn2-saturated
hains; 7, sn2 −18:1�11 and sn2 −20:1�11; 8, sn2 −18:1�9 and sn2 −16:1 �9; 9, sn218:2 �9,12; 10, sn2 −20:5 �5,8,11,14,17 (EPA); 11, sn1,3 −22:6�4,7,10,13,16,19 (DHA);12,
n2 −22:6 �4,7,10,13,16,19 (DHA).
L. Mannina et al. / Talanta 77 (2008) 433–444 439
Table 2Summary of the metabolites identified in the 600 MHz 1H spectrum of the CDCl3 extract of wild and cultured sea bass
Compound Assignment 1H (ppm) Multiplicity: J (Hz) 13C (ppm)a
SterolsCholesterol (CHO) CH2-1 1.86; 1.10 37.30
CH2-2 1.85; 1.52 31.69CH-3 3.52 71.79CH2-4 2.31; 2.26 42.35C-5 140.82C-6 5.36 121.70CH2-7 2.00 31.94CH-8CH-9 0.95 50.19C-10 36.54CH2-11 1.51 21.12CH2-12 2.02; 1.97 39.83C-13CH-14 1.01 56.81CH2-15 24.32CH2-16 28.25CH-17 1.11 56.20CH3-18 1 0.68 s 11.88CH3-19 1.01 19.41CH-20 35.81CH3-21 0.92 18.74CH2-22 36.22CH2-23 23.86CH2-24 39.55CH-25 1.53 28.03CH3-26 0.88 22.83; 22.60
Lipids: triglyceridesTriacylglycerols (TG) CH sn2 20 5.26 m 69.0
CH2 sn1,3 16 4.30 dd: 11.9; 4.2 62.14.15 dd: 11.9; 6.0
Lipids: diacylglycerophospholipidsPhosphatidylcholine (PC) CH sn2 19 5.21 70.4
CH2 sn1 17 4.38; 4.13 62.9CH2 sn3 15 3.94 63.7CH2OP 18 4.40 59.5CH2N 14 3.76 66.3N(CH3)3 3.32 s 54.5
Phosphatidylethanolamine (PE) CH sn2 19 5.21 70.4CH2 sn1 17 4.38; 4.13 62.9CH2 sn3 15 3.94 63.9CH2OP 4.11 62.9CH2N 3.16 40.6NH2 22 8.55
Lipids: fatty acid chainsSaturated fatty chains (STA) COO (sn1,3) 173.29
COO (sn2) 172.88CH2-2 (sn1,3) 8 2.31 t: 7.8 34.06CH2-2 (sn2) 8 2.31 t: 7.8 34.23CH2-3 1.61 m 24.8C H2 1.28–1.30 m 28.9–29.7CH2-n3 1.26 m 31.9CH2-n2 1.30 m 22.7CH3-n1 2 0.88 t: 7.2 14.12
cis-Monounsaturated fatty chains C18:1 �11, C20:1 �11 (MUFA) COO (sn1,3) 173.28COO (sn2) 172.87CH2-2 (sn1,3) 8 2.31 34.06CH2-2 (sn2) 8 2.31 34.23CH2-3 1.61 24.8CH2-4–9 1.33 m 29.7–30.2CH2-10 2.01 m 27.2CH2-11,12 21 5.35 129.7CH2-13 2.01 m 27.2CH2-14–15 (14–17)b 1.30 m 29.7–30.2CH2-16 (18)b 1.26 m 31.9CH2-17 (19)b 1.30 m 22.7CH3-18 (20)b 2 0.88 t: 7.2 14.12
cis-Monounsaturated fatty chains C16:1 �9, C18:1 �9 (MUFA) COO (sn1,3) 173.26COO (sn2) 172.85
440 L. Mannina et al. / Talanta 77 (2008) 433–444
Table 2 (Continued)
Compound Assignment 1H (ppm) Multiplicity: J (Hz) 13C (ppm)a
CH2-2 (sn1,3) 8 2.31 34.06CH2-2 (sn2) 8 2.31 34.23CH2-3 1.61 24.8CH2-4–7 1.33 m 29.7–30.2CH2-8 2.01 m 27.2CH2-9,10 21 5.35 129.7CH2-11 2.01 m 27.2CH2-12–15 (12–13)c 1.30 m 29.7–30.2CH2-16 (14)c 1.26 m 31.9CH2-17 (15)c 1.30 m 22.7CH3-18 (16)c 2 0.88 t: 7.2 14.12
Linoleic fatty chain C18:2 �9,12 (DUFA) COO (sn1,3) 173.25COO (sn2) 172.84CH2-2 8 2.31 34.1–34.2CH2-3 1.61 24.8CH2-4–7 1.29–1.31 29.0–29.8CH2-8,14 2.01–2.05 q: 7.0 27.2CH-9,13 21 5.35 m 130.2CH-10,12 21 5.35 m 127.8CH2-11 10 2.77 t: 6.7 25.6CH2-15 1.30 m 29.6CH2-16 1.30 m 31.9CH2-17 1.31 m 22.7CH3-18 2 0.88 t: 7.2 14.08
Linolenic fatty chain C18:3 �9,12,15 COO (sn1,3) 173.24CH2-2 8 2.31 34.1–34.2CH2-3 1.61 24.8CH2-4–7 1.29–1.31 29.0–29.8CH2-8 2.05 27.2CH-9 21 5.35 130.27CH-10 21 5.35 127.8CH-13,12 21 5.35 128.2CH2-11,14 2.81 t: 6.0 25.6CH-15 5.32 127.14CH-16 5.39 131.97CH2-17 2.08 20.57CH3-18 3 0.97 t: 7.5 14.29
Docosahexaenoic fatty acid chain C22:6 �4,7,10,13,16,19 (DHA) COO (sn2) 172.15COO (sn1,3) 172.55CH2-2 (sn2) 2.38 34.05CH2-2 (sn1,3) 9 2.38 33.90CH2-3 9 2.38 22.6CH-4 (sn2) 21 5.35 129.48CH-4 (sn1,3) 21 5.35 129.50CH-5 (sn2) 21 5.35 127.66CH-5 (sn1,3) 21 5.35 127.68CH2-6,9,12,15,18 2.85–2.81 25.6–25.4CH-19 5.31 127.04CH-20 5.31 132.04CH2-21 7 2.08 20.58CH3-22 0.97 t: 7.5 14.28
Eicosapentaenoic fatty acid chain C20:5 �5,8,11,14,17 (EPA) COO (sn2) 172.62COO (sn1,3) 173.02CH2-2 (sn2) 8 2.31 33.61CH2-2 (sn1,3) 33.42CH2-3 6 1.70 24.80CH2-4 (sn2) 2.11 26.51CH2-4 (sn1,3) 26.53CH-5 21 5.35 128.99CH-6 21 5.35 128.81CH2-7,10,13,16 2.85–2.81 25.6–25.4CH-17 5.31 127.04CH-18 5.31 132.04CH2-19 2.08 20.58CH3-20 0.97 t: 7.5 14.28
Docosapentaenoic fatty acid chain C22:6 �7,10,13,16,19 (DPA) CH2-6 2.01 27.06
Stearidonic fatty acid chain C18:4 �6,9,12,15 CH2-5 2.01 26.93
Signals used to measure the integrals are labeled using the corresponding numbering as reported in Section 2.5.a The chemical shifts reported with two decimal digits were measured from 1D spectra, while those reported with one decimal digit were taken from less resolved 2D
experiments.b In the case of C20:1 �11.c In the case of C16:1 �9.

lanta 77 (2008) 433–444 441
sr
i
(iddp(m[s[
3
ssl
3efa
op1
figa
3taoesd(e(ri
c1
afam
aidgewic1pi
Table 3Fatty acid content and positional distribution in the glycerol moiety of triacylglyc-erols obtained from 13C spectrum of cultured sea bass muscle extract
Fatty acid chain Content (%) sn1,3:sn2 ratio
sn1,3 sn2
Saturated fatty acids (STA) 9.3 13.3 0.7cis-11-Monounsaturated fatty acids. 12.9 2.8 4.5cis-9-Monounsaturated fatty acids 18.3 5.8 3.1Diunsaturated fatty acids (DUFA) 12.8 5.7 2.2EPA 4.8 1.4 3.4DHA 6.3 3.6 1.7L
n
wtfbeastns
paaipmiA
3s1bo(i
3r
pcsbabm
warTn
L. Mannina et al. / Ta
torage TMAO is degraded to the volatile trimethyl ammine (TMA)esponsible for the unpleasant fish odor.
Glycine-betaine (GB), an important osmoprotectant, was alsodentified in the 1H spectrum.
The 1H spectrum shows the diagnostic singlets of hypoxanthineHYP) at 8.21 and 8.23 ppm, inosine (INO) at 8.36 and 8.25 ppm,nosine 5′-phosphate (IMP) at 8.55 and 8.25 ppm. These purineerivatives are formed during the adenosine triphosphate (ATP)egradation according to the sequence: ATP → adenosine diphos-hate (ADP) → adenosine 5′-phosphate (AMP) → IMP → inosineINO) → hypoxanthine (HYP) → xanthine → uric acid. These
etabolites have been used for an estimation of the fish freshness27] and have been measured by NMR technique in sea bassamples submitted to modified atmosphere and �-irradiations28].
.1.2. NMR analysis of chloroform extractsThe 1H and 13C NMR spectra of a sea bass chloroform extract are
hown in Fig. 4Figs. 3 and 4. The assignment of 1H and 13C NMRpectra was obtained using two-dimensional experiments and theiterature data [29–31].
.1.2.1. Triacylglycerols and diacylglycerophospholipids. The pres-nce of triacylglycerols (TG) as the major components of the organicraction is indicated by the strong 1H signals at 4.30 and 4.15 ppmnd at 5.28 ppm of the glycerol moiety.
Different diacylglycerophospholipids were present in therganic extract: in particular, phosphatidylcholine (PC) and phos-hatidylethanolamine (PE) can be distinguished by means of theH resonances of their head group or tail. PC can be easily identi-ed by the characteristic singlet at 3.32 ppm due to the N+(CH3)3roup, whereas PE can be identified by the characteristic resonancet 3.16 ppm due to NCH2 group [7].
.1.2.2. Fatty acids. The 1H spectrum of the organic extract showshe presence of fatty acids easily assigned by means of 2D spectrand literature data [4]. Fatty acid composition of fish lipids dependsn various factors: species, diet, season, part and tissue of the bodytc. The sea bass organic extract contains a high amount of polyun-aturated fatty acids (PUFA) very important for human diet andisease prevention [32–34]. In particular, eicosapentaenoic acidEPA, 20:5n − 3) is shown to be beneficial in coronary heart dis-ase and inflammatory pathologies, whereas docosahexaenoic acidDHA, 22:6n − 3) has fundamental role for the development of neu-al tissue in infants and for the maintenance of the brain functionsn adults.
It has been also reported [35,36] that 13C NMR spectroscopyan be useful to characterize fatty acid chains; in fact, the3C NMR spectrum gives information not only about the fattycids composition but also about the positional distribution ofatty acid chains in the glycerol moiety of triacylglycerols usu-lly assessed using an enzymatic cumbersome and inaccurateethod.In particular, the 13C resonances of fatty acid carboxylic groups
re usually well resolved, see Fig. 4, and can be used for a qual-tative and quantitative analysis of fatty acid chains and for theetermination of the fatty acid acyl positional distribution in thelycerol moiety: in fact, the 13C carboxyl resonances of fatty acidssterified in sn1,3 positions are downfield shifted (ca 0.4 ppm)ith respect to the corresponding resonances of fatty acids ester-
fied in the sn2 position. The assignment, reported in Table 2, wasonfirmed by 2D experiments and literature data: saturated, cis-1-monounsaturated, cis-9-monounsaturated, diunsaturated, andolyunsaturated fatty acids (EPA, DHA and linolenic fatty acid) were
dentified and their content in the sn1,3 and sn2 positions together
av
fid
inolenic acid 3.0 n.d. n.d.
.d. = not detectable.
ith the sn1,3/sn2 ratio are reported in Table 3. Fatty acid distribu-ion in vegetal and animal triacylglycerols is of crucial importancerom a nutritional point of view; in fact, when fish is assumedy animals and humans, during digestive processes, triacylglyc-rols are transformed into 2-monoacyl-sn-glycerols successivelybsorbed by the intestines and utilized as such [37]. Different fishpecies can have different fatty acid distribution. Our results showhat the acyl positional distribution of sea bass muscle samples isotably different from those reported for Atlantic tune and Atlanticalmon [38,39].
In the case of sea bass extract, saturated fatty chains (STA) arereferentially distributed in sn2 position, whereas for Atlantic tunend Atlantic salmon a random distribution is reported. DUFA, EPAnd DHA fatty acids of sea bass lipids are distributed preferentiallyn sn1,3 positions, whereas for Atlantic salmon and Atlantic tune areferential distribution in position sn2 is reported [38,39]. Finally,onounsaturated fatty acids (MUFA) are distributed preferentially
n sn1,3 positions, in agreement with the distribution obtained intlantic tune and Atlantic salmon [38,39].
.1.2.3. Sterols. It is possible to obtain information about theterolic composition by observing the 1H resonance of the CH3-8 in the 0.6–0.7 ppm spectral region [40]. In the case of the seaass organic extract, the 1H spectrum shows a characteristic res-nance at 0.68 ppm, see Fig. 3, due to the CH3-18 of cholesterolCHO); the assignment was verified by 2D experiment and reportedn Table 2.
.2. Wild and cultured sea bass discrimination: preliminaryesults
The NMR analytical profile reported above was used to test theotentiality of the NMR methodology to compare the chemicalomposition of wild and cultured sea bass. Therefore, a preliminarytudy was carried out on four cultures sea bass and three wild seaass. Although usually muscle samples have been used to performnalyses, we chose to analyze also skin samples to detect possi-le differences in the chemical composition of sea bass skin anduscle.Water-soluble and liposoluble metabolites of cultured (C) and
ild (W) sea bass extracted from skin (s) and muscle (m) werenalyzed by 1H NMR: in particular, the intensity of the signals cor-esponding to 29 metabolites or class of metabolites (column 1 inable 4) were measured and submitted both to principal compo-ents analysis to analyze the multivariate structure of the data set
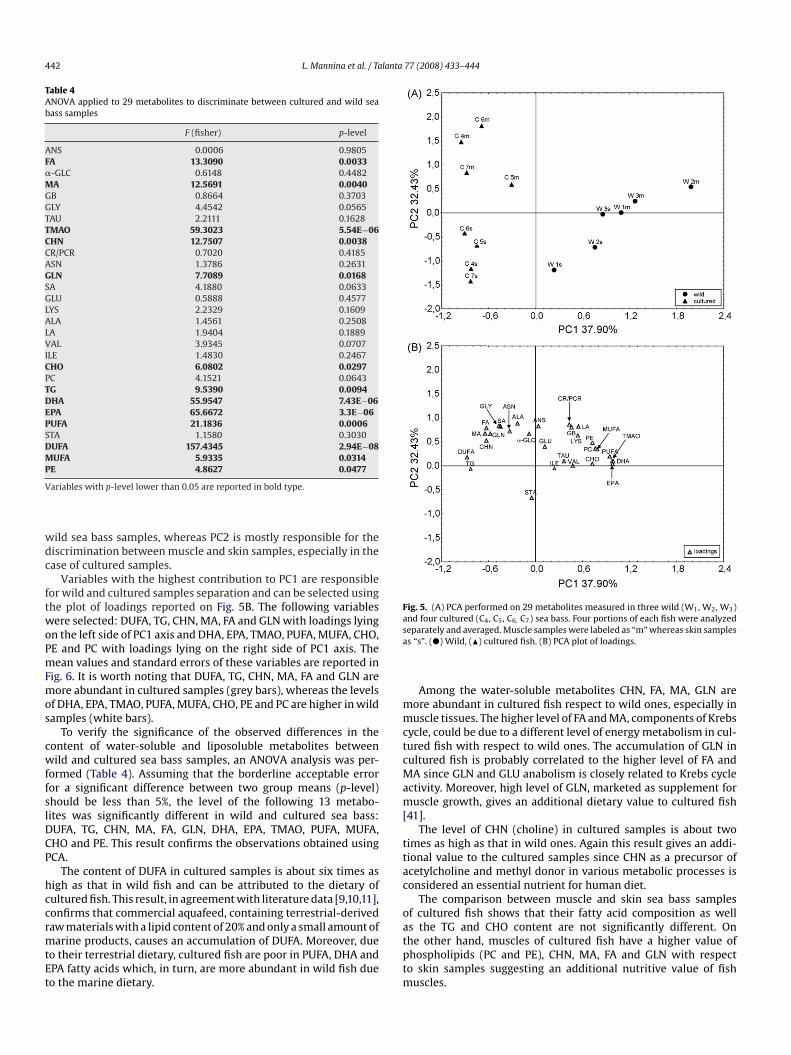
nd to ANOVA analyses (Table 4) to select the most discriminantariables between cultured and wild sea bass samples.Fig. 5A shows a PCA plot of sample scores (PC1 versus PC2). Theserst two PCs account for the 70.3% of the variability within theata. PC1 provides mostly the discrimination between cultured and
442 L. Mannina et al. / Talanta 77 (2008) 433–444
Table 4ANOVA applied to 29 metabolites to discriminate between cultured and wild seabass samples
F (fisher) p-level
ANS 0.0006 0.9805FA 13.3090 0.0033�-GLC 0.6148 0.4482MA 12.5691 0.0040GB 0.8664 0.3703GLY 4.4542 0.0565TAU 2.2111 0.1628TMAO 59.3023 5.54E−06CHN 12.7507 0.0038CR/PCR 0.7020 0.4185ASN 1.3786 0.2631GLN 7.7089 0.0168SA 4.1880 0.0633GLU 0.5888 0.4577LYS 2.2329 0.1609ALA 1.4561 0.2508LA 1.9404 0.1889VAL 3.9345 0.0707ILE 1.4830 0.2467CHO 6.0802 0.0297PC 4.1521 0.0643TG 9.5390 0.0094DHA 55.9547 7.43E−06EPA 65.6672 3.3E−06PUFA 21.1836 0.0006STA 1.1580 0.3030DUFA 157.4345 2.94E−08MUFA 5.9335 0.0314P
V
wdc
ftwoPmFmos
cwffslDCP
hccrmtEt
Fig. 5. (A) PCA performed on 29 metabolites measured in three wild (W1, W2, W3)and four cultured (C , C , C C ) sea bass. Four portions of each fish were analyzedsa
mmctcMam[
ttac
o
E 4.8627 0.0477
ariables with p-level lower than 0.05 are reported in bold type.
ild sea bass samples, whereas PC2 is mostly responsible for theiscrimination between muscle and skin samples, especially in thease of cultured samples.
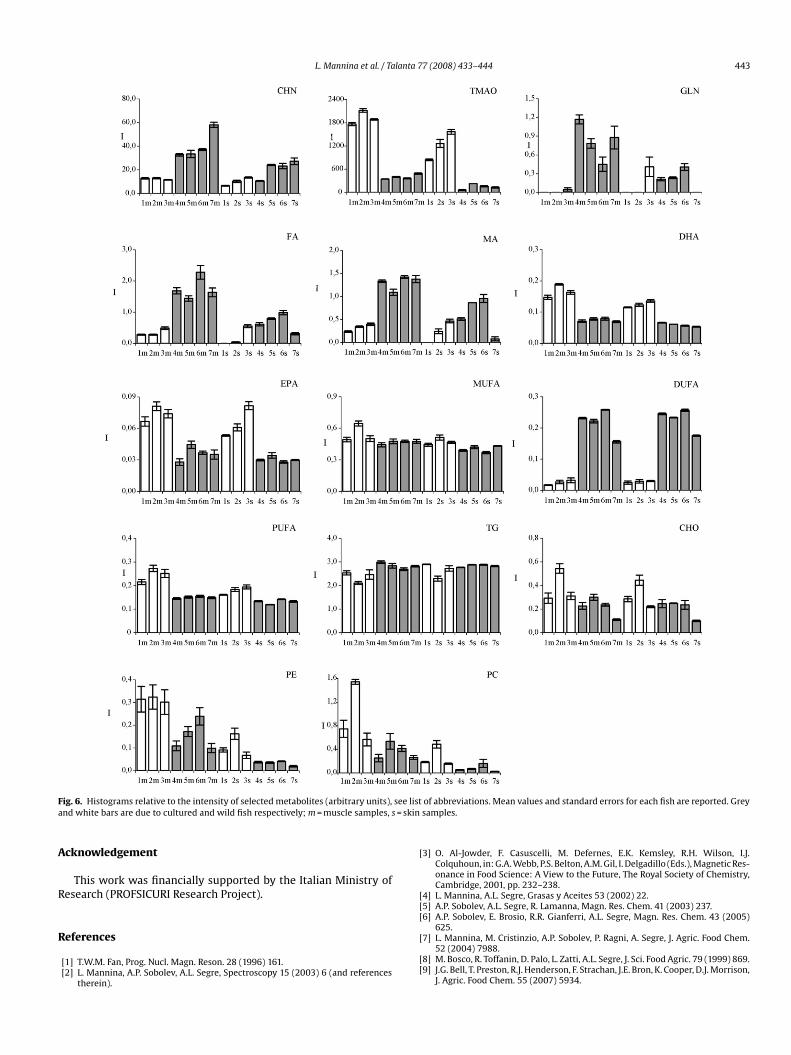
Variables with the highest contribution to PC1 are responsibleor wild and cultured samples separation and can be selected usinghe plot of loadings reported on Fig. 5B. The following variablesere selected: DUFA, TG, CHN, MA, FA and GLN with loadings lying
n the left side of PC1 axis and DHA, EPA, TMAO, PUFA, MUFA, CHO,E and PC with loadings lying on the right side of PC1 axis. Theean values and standard errors of these variables are reported in
ig. 6. It is worth noting that DUFA, TG, CHN, MA, FA and GLN areore abundant in cultured samples (grey bars), whereas the levels
f DHA, EPA, TMAO, PUFA, MUFA, CHO, PE and PC are higher in wildamples (white bars).
To verify the significance of the observed differences in theontent of water-soluble and liposoluble metabolites betweenild and cultured sea bass samples, an ANOVA analysis was per-
ormed (Table 4). Assuming that the borderline acceptable erroror a significant difference between two group means (p-level)hould be less than 5%, the level of the following 13 metabo-ites was significantly different in wild and cultured sea bass:UFA, TG, CHN, MA, FA, GLN, DHA, EPA, TMAO, PUFA, MUFA,HO and PE. This result confirms the observations obtained usingCA.
The content of DUFA in cultured samples is about six times asigh as that in wild fish and can be attributed to the dietary ofultured fish. This result, in agreement with literature data [9,10,11],onfirms that commercial aquafeed, containing terrestrial-derived
aw materials with a lipid content of 20% and only a small amount ofarine products, causes an accumulation of DUFA. Moreover, dueo their terrestrial dietary, cultured fish are poor in PUFA, DHA andPA fatty acids which, in turn, are more abundant in wild fish dueo the marine dietary.
atptm
4 5 6, 7
eparately and averaged. Muscle samples were labeled as “m” whereas skin sampless “s”. (�) Wild, (�) cultured fish. (B) PCA plot of loadings.
Among the water-soluble metabolites CHN, FA, MA, GLN areore abundant in cultured fish respect to wild ones, especially inuscle tissues. The higher level of FA and MA, components of Krebs
ycle, could be due to a different level of energy metabolism in cul-ured fish with respect to wild ones. The accumulation of GLN inultured fish is probably correlated to the higher level of FA andA since GLN and GLU anabolism is closely related to Krebs cycle
ctivity. Moreover, high level of GLN, marketed as supplement foruscle growth, gives an additional dietary value to cultured fish
41].The level of CHN (choline) in cultured samples is about two
imes as high as that in wild ones. Again this result gives an addi-ional value to the cultured samples since CHN as a precursor ofcetylcholine and methyl donor in various metabolic processes isonsidered an essential nutrient for human diet.
The comparison between muscle and skin sea bass samplesf cultured fish shows that their fatty acid composition as well
s the TG and CHO content are not significantly different. Onhe other hand, muscles of cultured fish have a higher value ofhospholipids (PC and PE), CHN, MA, FA and GLN with respecto skin samples suggesting an additional nutritive value of fishuscles.
L. Mannina et al. / Talanta 77 (2008) 433–444 443
F see lisa = skin
A
R
R
ig. 6. Histograms relative to the intensity of selected metabolites (arbitrary units),nd white bars are due to cultured and wild fish respectively; m = muscle samples, s
cknowledgement
This work was financially supported by the Italian Ministry ofesearch (PROFSICURI Research Project).
eferences
[1] T.W.M. Fan, Prog. Nucl. Magn. Reson. 28 (1996) 161.[2] L. Mannina, A.P. Sobolev, A.L. Segre, Spectroscopy 15 (2003) 6 (and references
therein).
t of abbreviations. Mean values and standard errors for each fish are reported. Greysamples.
[3] O. Al-Jowder, F. Casuscelli, M. Defernes, E.K. Kemsley, R.H. Wilson, I.J.Colquhoun, in: G.A. Webb, P.S. Belton, A.M. Gil, I. Delgadillo (Eds.), Magnetic Res-onance in Food Science: A View to the Future, The Royal Society of Chemistry,Cambridge, 2001, pp. 232–238.
[4] L. Mannina, A.L. Segre, Grasas y Aceites 53 (2002) 22.[5] A.P. Sobolev, A.L. Segre, R. Lamanna, Magn. Res. Chem. 41 (2003) 237.[6] A.P. Sobolev, E. Brosio, R.R. Gianferri, A.L. Segre, Magn. Res. Chem. 43 (2005)
625.[7] L. Mannina, M. Cristinzio, A.P. Sobolev, P. Ragni, A. Segre, J. Agric. Food Chem.
52 (2004) 7988.[8] M. Bosco, R. Toffanin, D. Palo, L. Zatti, A.L. Segre, J. Sci. Food Agric. 79 (1999) 869.[9] J.G. Bell, T. Preston, R.J. Henderson, F. Strachan, J.E. Bron, K. Cooper, D.J. Morrison,
J. Agric. Food Chem. 55 (2007) 5934.
4 lanta
[
[
[
[[[
[[[[[[
[[
[[
[
[
[
[[[[[[
[
[
[[
44 L. Mannina et al. / Ta
10] C. Alasalvar, K.D.A. Taylor, E. Zubcov, F. Shahidi, M. Alexis, Food Chem. 79 (2002)145.
11] K. Grikorakis, M.N. Alexis, K.D.A. Taylor, M. Hole, Int. J. Food Sci. Technol. 37(2002) 477.
12] I.U. Grün, H. Shi, L.N. Fernando, A.D. Clarke, M.R. Ellersieck, D.A. Beffa, Lebensm.Wiss. u. Technol. 32 (1999) 305.
13] O. Fiehn, Plant Mol. Biol. 48 (2002) 155.14] E.G. Bligh, W.J. Dyer, Can. J. Biochem. Physiol. 37 (1959) 911.15] S. Braun, H.O. Kalinowski, S. Berger, 150 and More Basic NMR Experiments,
second ed., Wiley-VCH, Weinheim, Germany, 1998.16] K.F. Morris, C.S. Johnson, J. Am. Chem. Soc. 114 (1992) 3139.17] K.F. Morris, P. Stilbs, C.S. Johnson, Anal. Chem. 66 (1994) 211.18] G.S. Kapur, E.J. Cabrita, S. Berger, Tetrahedron Lett. 41 (2000) 7181.19] S. Viel, L. Mannina, A.L. Segre, Tetrahedron Lett. 43 (2002) 2515.20] K.F. Morris, C.S. Johnson, J. Am. Chem. Soc. 115 (1993) 4291.21] S. Viel, D. Capitani, L. Mannina, A.L. Segre, Biomacromolecules 4 (2003)
1843.22] G. Özyurt, A. Polat, Eur. Food Res. Technol. 222 (2006) 316.23] H.P. Redmond, P.P. Stapleton, P. Neary, D. Bouchier-Hayes, Nutrition 14 (1998)
599.24] S. Shaffer, K. Takahashi, J. Auma, Amino acids 19 (2000) 527.25] P. Lundberg, T. Vogel, A. Malusek, P.O. Lundquist, L. Cohen, O. MDL Dahlqvist, The
Magnetic Resonance Metabolomics Database (mdl.imv.liu.se), ESMRMB, Basel,Switzerland, 2005.
26] N. Howell, Y. Shavila, M. Grootveld, S. Williams, J. Sci. Food Agric. 72 (1996) 49.
[
[
[
77 (2008) 433–444
27] I. Karube, H. Matsuoka, S. Suzuki, E. Watanabe, K. Toyama, J. Agric. Food Chem.32 (1984) 314.
28] A. Reale, E. Sorrentino, N. Iaffaldano, M. P. Rosato, P. Ragni, R. Coppola, D.Capitani, A. P. Sobolev, P. Tremonte, M. Succi, L. Mannina, World J. Microbiol.Biotechnol. (2008) http://dx.doi.org/10.1007/s11274-008-9802-7.
29] F.D. Gunstone, Chem. Phys. Lipids 59 (1991) 83.30] F.D. Gunstone, S. Seth, Chem. Phys. Lipids 72 (1994) 119.31] M. Aursand, H. Grasdalen, Chem. Phys. Lipids 62 (1992) 239.32] P.C. Calder, Lipids 36 (2001) 1007.33] P. Calder, Clin. Sci. 107 (2004) 1.34] A.W.G. Moses, C. Slater, T. Preston, M.D. Barber, K.C.H. Fearon, Br. J. Cancer 90
(2004) 996.35] L. Mannina, C. Luchinat, M. Patumi, M.C. Emanuele, E. Rossi, A.L. Segre, Magn.
Reson. Chem. 38 (2000) 886.36] L. Mannina, C. Luchinat, M.C. Emanuele, A.L. Segre, Chem. Phys. Lipids 103
(1999) 47.37] M.C. Carey, D. Small, C.M. Bliss, Ann. Rev. Physiol. 45 (1983) 651.38] R. Sacchi, I. Medina, S.P. Aubourg, I. Giudicianni, L. Paolillo, F. Addeo, J. Agric.
Food Chem. 41 (1993) 1247.
39] M. Aursand, J.R. Rainuzzo, H. Grasladen, J. Am. Oil Chem. Soc. 70 (1993)971.40] W.R. Crasmun, R.M.K. Carlson, in: W.R. Crasmun, R.M.K. Carlson (Eds.), Two
Dimensional NMR Spectroscopy: Applications for Chemists and Biochemists,VHC Publishers, New York, 1994, pp. 785–832.
41] Y. Lin, X. Qiu-Zhou, Aquaculture 256 (2006) 389.