Influence of dietary live yeast on European sea bass ( Dicentrarchus labrax) larval development

FISH TELEMETRY
Use of muscle activity indices as a relative measureof well-being in cultured sea bass Dicentrarchus labrax(Linnaeus, 1758)
G. Lembo Æ P. Carbonara Æ M. Scolamacchia ÆM. T. Spedicato Æ R. S. McKinley
� Springer Science+Business Media B.V. 2007
Abstract Aquaculture of sea bass is widely
spread in the Mediterranean and employs a
variety of husbandry protocols that need to be
evaluated in terms of fish well-being. Behavioural
tests can be used as operational indicators of
short-term stress, because changes in swimming
performance and/or muscle activity (e.g. electr-
omyograms) can be interpreted as response asso-
ciated with a wide variety of stressors. Diagnostic
procedures, based on physiological telemetry, will
thus enable appropriate mitigative strategies to
be implemented to ensure the well-being of
cultured fish. The objective of this study was to
examine the contribution of two muscle types to
the swimming activity of sea bass (Dicentrarchus
labrax, L. 1758). Hard-wire technology was used
to ‘fine-tune’ measures obtained using a physio-
logical transmitter. Fine-tuning showed that the
aerobic muscle displayed an increase in recruit-
ment of muscle fibres relative to increasing
swimming speed up to 0.6–0.7 ms–1 of the Ucrit,
where the anaerobic (white muscle) activity
started to exponentially augment with swimming
speed, reaching up to ~7 times its initial value.
Intensity of electromyogram signals were de-
scribed by logarithmic (red muscle):
y = 0.5922Ln(x) + 1.2251 (R2 = 0.9906) and
exponential (white muscle): y = 0.0977e2.4723x
(R2 = 0.9845) relationships. Fine-tuning indicated
that the two muscle types in the sea bass are
involved in fuelling swimming activity below the
Ucrit. Thus, scope for activity is not supported
solely using aerobic metabolism, though the red
muscle powers the majority of the swimming
ability. Measurement of Ucrit displayed an aver-
age value of 3.43 BLsec–1 (SE = 0.12). Associated
EMG values measured during the forced swim
trials using an implanted bio-sensitive radio
transmitter showed that EMG’s intensity in-
creased, on average, 3.2 times between
0.2 msec–1 and the Ucrit velocity (~1 msec–1).
Above EMG values were fine-tuned using esti-
mates obtained from direct monitoring of the red
and white musculature. Overall, the results dem-
onstrated that the scope for activity, previously
thought to represent only aerobic metabolism, is
composed of both aerobic and anaerobic path-
ways. Fine-tuning of physiological transmitters to
measure activity of free ranging fish can therefore
Guest editors: P. R. Almeida, B. R. Quintella,M. J. Costa and A. MooreDevelopments in Fish Telemetry
G. Lembo (&) � P. Carbonara � M. Scolamacchia �M. T. SpedicatoCOISPA Technology & Research, Bari-Torre a Mare,Italye-mail: [email protected]
R. S. McKinleyCentre for Aquaculture and Environmental Research,The University of British Columbia, Vancouver,Canada BC V7V IN6
123
Hydrobiologia (2007) 582:271–280
DOI 10.1007/s10750-006-0538-9
be utilised to monitor the proportion of the scope
of activity utilised in response to external stres-
sors. This proportion and the level of compensa-
tory ability remaining could represent a measure
of well-being in cultured fish.
Keywords Sea bass � Activity levels �Electromyograms � Fish well-being �Physiological telemetry
Introduction
In the Mediterranean, culture of sea bass (Dicen-
trarchus Labrax L.) and sea bream (Sparus aurata
L.) represents greater than 95% of all marine fish
species farmed. Each of these species is subjected
to a variety of operational protocols and handling
procedures. Assessing the level of stress and
subsequent energetic expenditures associated
with culture protocols, would permit the devel-
opment of appropriate mitigative strategies for
fish, likely improving product quality and yields at
farm sites.
Fish welfare requires that the animal be in
good health with its biological systems function-
ing appropriately and with an ability to compen-
sate stress (FSBI, 2002).
Historically, behavioural tests have been used
as indicators of short-term stress, but examples
are sparse. Measurement of swimming ability,
such as critical swimming speed (Ucrit) has been
used as an indicator of the effects of environ-
mental challenges on the general health of fish
(Randall et al., 1987; Brauner et al., 1994), and
requires the use of a calibrated swim chamber.
Chatelier et al. (2005) have, for example, recently
demonstrated, using salinity and temperature
challenges, that sea bass have an exceptional
ability to regulate plasma osmotic homeostasis
and tissue water balance. Physiological telemetry
is one approach where the response to culture
conditions and procedures can be assessed from
the perspective of free swimming fish.
Recent advances in physiological telemetry
have permitted several investigators to monitor
the relative activity of free swimming fish (Weath-
erley et al., 1996; Økland et al., 1997, 2002), fish
welfare (Beddow and McKinley, 1998; McFarlane
et al., 2004; Chandroo et al., 2005), and seasonal
movement (Demers et al., 1996; Quintella et al.,
2004). In addition, several investigators have used
laboratory derived calibrations of swimming
speed to EMG level and ultimately to oxygen
consumption to estimate energy expenditure to
activity events (Cooke et al., 2000; Geist et al.,
2000). All of these studies relied on the calibra-
tion of a measure of relative activity, typically
transmitter signal level to swimming speed, from
the recordings of electrical activity of the aerobic
muscle. Indeed, calibration of the transmitter
signals level, and swim speed was believed to be
derived primarily from the aerobic muscle.
Once established, investigators can construct
an estimate of scope for activity (McKinley and
Power, 1992) and use the overall measurement of
scope as a correlate of well-being. On the other
side, at the present time the technology does not
include the white muscle (anaerobic muscle)
activity, which is better linked with the fish’s
well-being state (Jain and Farrell, 2003; Chandroo
et al., 2005).
The objective of this study was to examine the
contribution of two muscle types (red and white)
to swimming activity of sea bass. Results were
used to ‘fine-tune’ measures obtained using a
physiological transmitter. Implications for mea-
sures of ‘scope for activity’ and the use of this
measure as an indicator of fish well-being, defined
as the level of compensatory ability available to
an individual fish, are also discussed.
Materials and methods
Experimental animals
Adult sea bass were reared in a 4.5 m3 circular
tank (2.1 m wide, 1.3 m deep), at a density of
10 kg (m3)–1 under natural light conditions. Indi-
viduals were fed once per day to satiation. Tank
water was exchanged five times per day and water
temperature was maintained at 18�C. Eight fish
(average TL: 263.2 ± 11.8 mm; average TW:
178.4 ± 23.2 g) and twelve fish (average TL:
255 ± 12.7 mm; average TW: 163.8 ± 29.1 g)
were used for the EMG and hard-wired monitor-
ing of the electrical activity tests, respectively.
272 Hydrobiologia (2007) 582:271–280
123
Implantation of EMG transmitter
The EMG transmitters (CEMG-R11-25, Lotek
Wireless) measured 11 mm in length and 61 mm
diameter. In these transmitters, the voltage cor-
responding with muscle activity is rectified,
summed and stored over a 5-s period. Before
the end of the 5-s period, average value is
determined and assigned to an activity level
ranging from 0 to 50. Use of radio tags in sea
water has some limitations due to the strong
attenuation of the radio waves. However, in our
experiment, collection of signals from these
transmitters was possible because of the close
proximity of the receiving antenna to the trans-
mitting antenna of the tag.
Transmitter weight (12 g) in proportion to fish
body mass was approximately 6–7%.
All fish submitted to the surgical procedure
were fasted for a minimum of 24 h. Implanta-
tion procedures followed those used in McFar-
lane et al. (2004). Fish were initially
anaesthetized using 30 mgl–1 clove oil (Massee
et al., 1995) and gills were continuously irri-
gated using a maintenance level of anesthetic.
The EMG transmitter was inserted through 3-
cm incision (4-5 cm posterior of the pelvic
girdle). The gold-tipped electrodes were in-
serted into the red muscle band via a hollow
needle (diameter 2 mm, length 50 mm). The
incision was closed using four independent
surgical sutures (3–0). Total surgical time,
including anaesthetization, was generally 15–
18 min. EMG signals from the transmitters were
recorded using a receiver (SRX_400, Lotek)
and then downloaded to a computer.
Electrical activity from muscle types by
hard-wires
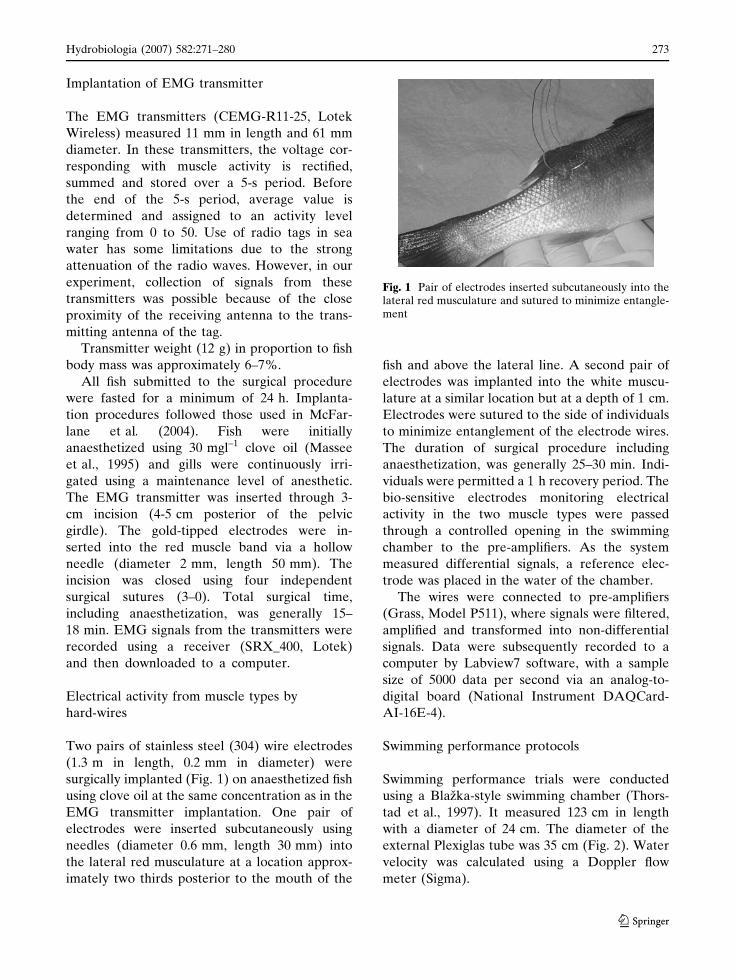
Two pairs of stainless steel (304) wire electrodes
(1.3 m in length, 0.2 mm in diameter) were
surgically implanted (Fig. 1) on anaesthetized fish
using clove oil at the same concentration as in the
EMG transmitter implantation. One pair of
electrodes were inserted subcutaneously using
needles (diameter 0.6 mm, length 30 mm) into
the lateral red musculature at a location approx-
imately two thirds posterior to the mouth of the
fish and above the lateral line. A second pair of
electrodes was implanted into the white muscu-
lature at a similar location but at a depth of 1 cm.
Electrodes were sutured to the side of individuals
to minimize entanglement of the electrode wires.
The duration of surgical procedure including
anaesthetization, was generally 25–30 min. Indi-
viduals were permitted a 1 h recovery period. The
bio-sensitive electrodes monitoring electrical
activity in the two muscle types were passed
through a controlled opening in the swimming
chamber to the pre-amplifiers. As the system
measured differential signals, a reference elec-
trode was placed in the water of the chamber.
The wires were connected to pre-amplifiers
(Grass, Model P511), where signals were filtered,
amplified and transformed into non-differential
signals. Data were subsequently recorded to a
computer by Labview7 software, with a sample
size of 5000 data per second via an analog-to-
digital board (National Instrument DAQCard-
AI-16E-4).
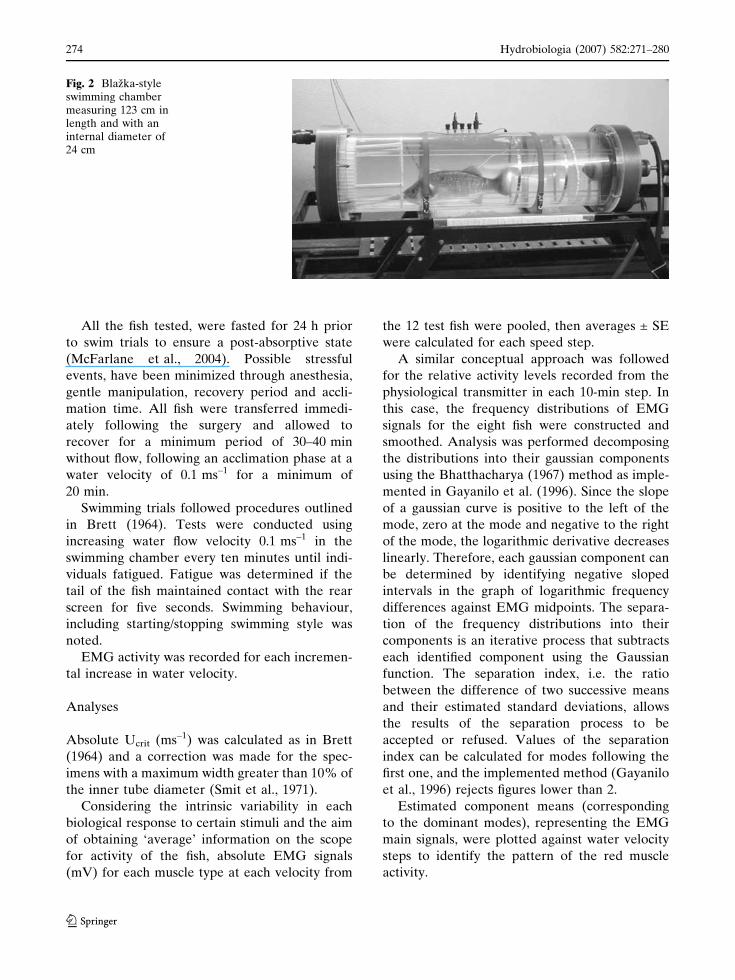
Swimming performance protocols
Swimming performance trials were conducted
using a Blazka-style swimming chamber (Thors-
tad et al., 1997). It measured 123 cm in length
with a diameter of 24 cm. The diameter of the
external Plexiglas tube was 35 cm (Fig. 2). Water
velocity was calculated using a Doppler flow
meter (Sigma).
Fig. 1 Pair of electrodes inserted subcutaneously into thelateral red musculature and sutured to minimize entangle-ment
Hydrobiologia (2007) 582:271–280 273
123
All the fish tested, were fasted for 24 h prior
to swim trials to ensure a post-absorptive state
(McFarlane et al., 2004). Possible stressful
events, have been minimized through anesthesia,
gentle manipulation, recovery period and accli-
mation time. All fish were transferred immedi-
ately following the surgery and allowed to
recover for a minimum period of 30–40 min
without flow, following an acclimation phase at a
water velocity of 0.1 ms–1 for a minimum of
20 min.
Swimming trials followed procedures outlined
in Brett (1964). Tests were conducted using
increasing water flow velocity 0.1 ms–1 in the
swimming chamber every ten minutes until indi-
viduals fatigued. Fatigue was determined if the
tail of the fish maintained contact with the rear
screen for five seconds. Swimming behaviour,
including starting/stopping swimming style was
noted.
EMG activity was recorded for each incremen-
tal increase in water velocity.
Analyses
Absolute Ucrit (ms–1) was calculated as in Brett
(1964) and a correction was made for the spec-
imens with a maximum width greater than 10% of
the inner tube diameter (Smit et al., 1971).
Considering the intrinsic variability in each
biological response to certain stimuli and the aim
of obtaining ‘average’ information on the scope
for activity of the fish, absolute EMG signals
(mV) for each muscle type at each velocity from
the 12 test fish were pooled, then averages ± SE
were calculated for each speed step.
A similar conceptual approach was followed
for the relative activity levels recorded from the
physiological transmitter in each 10-min step. In
this case, the frequency distributions of EMG
signals for the eight fish were constructed and
smoothed. Analysis was performed decomposing
the distributions into their gaussian components
using the Bhatthacharya (1967) method as imple-
mented in Gayanilo et al. (1996). Since the slope
of a gaussian curve is positive to the left of the
mode, zero at the mode and negative to the right
of the mode, the logarithmic derivative decreases
linearly. Therefore, each gaussian component can
be determined by identifying negative sloped
intervals in the graph of logarithmic frequency
differences against EMG midpoints. The separa-
tion of the frequency distributions into their
components is an iterative process that subtracts
each identified component using the Gaussian
function. The separation index, i.e. the ratio
between the difference of two successive means
and their estimated standard deviations, allows
the results of the separation process to be
accepted or refused. Values of the separation
index can be calculated for modes following the
first one, and the implemented method (Gayanilo
et al., 1996) rejects figures lower than 2.
Estimated component means (corresponding
to the dominant modes), representing the EMG
main signals, were plotted against water velocity
steps to identify the pattern of the red muscle
activity.
Fig. 2 Blazka-styleswimming chambermeasuring 123 cm inlength and with aninternal diameter of24 cm
274 Hydrobiologia (2007) 582:271–280
123

Results
Critical swimming speed of sea bass (Fig. 3)
ranged between 0.63 and 1.00 msec–1 (average:
0.87; SE: 0.031) equivalent to 2.58–3.98 BLsec–1
(average: 3.43; SE: 0.12). Few fish were able to
complete 1 msec–1 velocity step, but the swim-
ming performances of the tested individuals were
only slightly lower if compared to that previously
observed in fish of similar size, not surgically
treated (range: 3.6–4.1 BLs–1 Carbonara et al.,
2006).
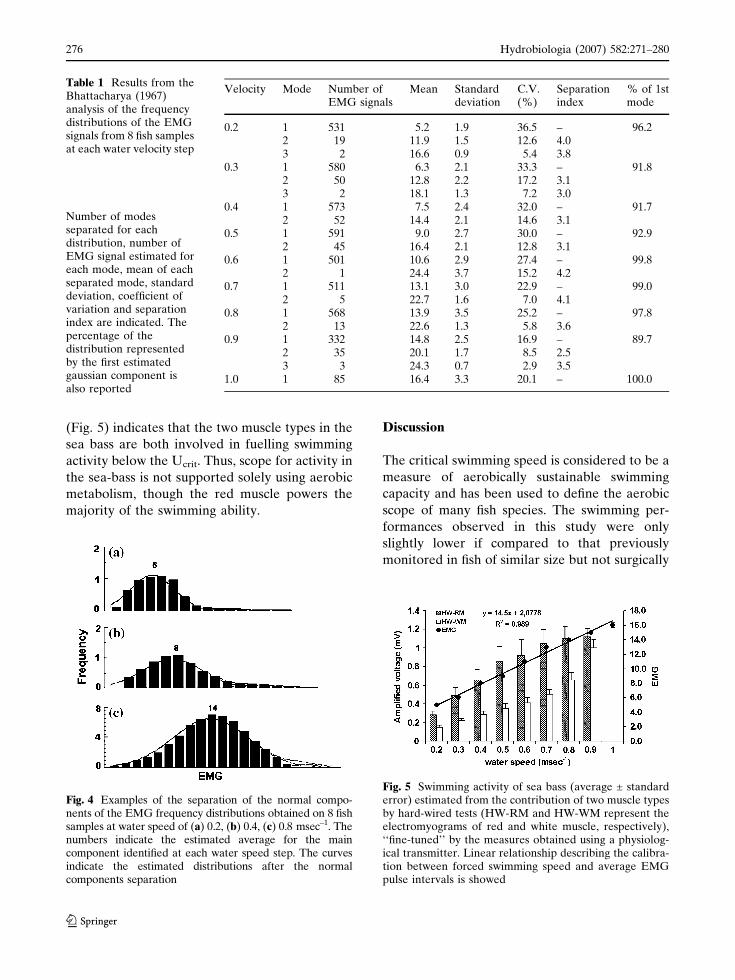
Results from the Bhattacharya’s (1967) analy-
sis of the frequency distributions of the EMG
signals from eight fish samples at each water
velocity stage are reported in Table 1. These
results show the occurrence of 1–3 normal com-
ponents (Table 1), with the first one representing
between 91.7 and 99.8% of the whole distribution.
Dominant modes (Fig. 4) indicate groups of
EMG signals with similar values, thus we assumed
the estimated average of the gaussian component
as representative of the mean EMG value at each
velocity step. Separation index was always higher
than 2, while the coefficient of variation of the
first mode was between 16.9 and 36.5%, high-
lighting that the EMG signals from transmitters
were rather variable, probably for inherent causes
(physiological differences), or technological rea-
sons (characteristics of the transmitter) or as a
consequence of the electrical activity interaction
between the two muscle types. This interference
is probable because of the small width of the red
muscle band. As water speed increased, and the
fish progressively approached the critical swim-
ming speed, the EMG from the transmitter
showed an increasing pattern similar to that
observed for the red muscle monitored by hard
wires (Fig. 5). The correlation (r = 0.97) between
transmitter and red muscle hard wiring EMGs
was significant (P < 0.05).
EMG’s averages were ranging between ~5 at
0.2 msec–1 to ~16 at 1 msec–1 (Table 1), thus the
EMG intensity increased on average 3.2 times
between 0.2 msec–1 and the Ucrit velocity
(~1 msec–1). The calibration between forced
swimming speed and average EMG was described
by the following linear relationship:
y = 14.5x + 2.0778 (R2 = 0.989) where y is the
EMG and x the velocity.
The averages of hard wired-red muscle electr-
omyograms were ranging between 0.28 and
1.19 mV (Fig. 5), thus the intensity increased on
average ~4 times between 0.2 msec–1 and the Ucrit
velocity (~0.9 msec–1). The pattern was initially
rather sharp and then reached a plateau at higher
velocity steps. It was described by the follow-
ing logarithmic relationship: y = 0.5922Ln(x) +
1.2251 (R2 = 0.9906), where y is the electrical
voltage and x the velocity.
The white muscle activity showed a different
pattern if compared to both transmitter and red
muscle-hard wired EMGs. The averages of white
muscle electromyograms varied between 0.15 and
1.00 mV (Fig. 5), thus the intensity increased
exponentially and on average ~6.7 times between
0.2 msec–1 and the Ucrit velocity (~0.9 msec–1).
The relationship between the electrical voltage
(y) and the velocity (x) was the following:
y = 0.0977e2.4723x (R2 = 0.9845).
If the swimming performance of sea bass is
split in three main phases of activity, defined as
(1) resting (0.1–0.3 msec–1 speed), (2) moderate
(0.4–0.6 msec–1) and (3) intense (>0.7 msec–1), it
was observed that the EMG increased ~2 times
between phase 1 and 2, and ~3 times between the
phase 1 and 3. The corresponding increments of
hard wired-red muscle electromyograms were ~3
and ~4, whereas electromyogram’s intensity of
the white muscle grew of ~2 and ~4 times,
respectively.
Fine-tuning of the measures obtained using
physiological transmitters by the hard-wired testsFig. 3 Critical swimming speed (Ucrit) estimated from 12fish tested
Hydrobiologia (2007) 582:271–280 275
123
(Fig. 5) indicates that the two muscle types in the
sea bass are both involved in fuelling swimming
activity below the Ucrit. Thus, scope for activity in
the sea-bass is not supported solely using aerobic
metabolism, though the red muscle powers the
majority of the swimming ability.
Discussion
The critical swimming speed is considered to be a
measure of aerobically sustainable swimming
capacity and has been used to define the aerobic
scope of many fish species. The swimming per-
formances observed in this study were only
slightly lower if compared to that previously
monitored in fish of similar size but not surgically
Fig. 4 Examples of the separation of the normal compo-nents of the EMG frequency distributions obtained on 8 fishsamples at water speed of (a) 0.2, (b) 0.4, (c) 0.8 msec–1. Thenumbers indicate the estimated average for the maincomponent identified at each water speed step. The curvesindicate the estimated distributions after the normalcomponents separation
Table 1 Results from theBhattacharya (1967)analysis of the frequencydistributions of the EMGsignals from 8 fish samplesat each water velocity step
Number of modesseparated for eachdistribution, number ofEMG signal estimated foreach mode, mean of eachseparated mode, standarddeviation, coefficient ofvariation and separationindex are indicated. Thepercentage of thedistribution representedby the first estimatedgaussian component isalso reported
Velocity Mode Number ofEMG signals
Mean Standarddeviation
C.V.(%)
Separationindex
% of 1stmode
0.2 1 531 5.2 1.9 36.5 – 96.22 19 11.9 1.5 12.6 4.03 2 16.6 0.9 5.4 3.8
0.3 1 580 6.3 2.1 33.3 – 91.82 50 12.8 2.2 17.2 3.13 2 18.1 1.3 7.2 3.0
0.4 1 573 7.5 2.4 32.0 – 91.72 52 14.4 2.1 14.6 3.1
0.5 1 591 9.0 2.7 30.0 – 92.92 45 16.4 2.1 12.8 3.1
0.6 1 501 10.6 2.9 27.4 – 99.82 1 24.4 3.7 15.2 4.2
0.7 1 511 13.1 3.0 22.9 – 99.02 5 22.7 1.6 7.0 4.1
0.8 1 568 13.9 3.5 25.2 – 97.82 13 22.6 1.3 5.8 3.6
0.9 1 332 14.8 2.5 16.9 – 89.72 35 20.1 1.7 8.5 2.53 3 24.3 0.7 2.9 3.5
1.0 1 85 16.4 3.3 20.1 – 100.0
Fig. 5 Swimming activity of sea bass (average ± standarderror) estimated from the contribution of two muscle typesby hard-wired tests (HW-RM and HW-WM represent theelectromyograms of red and white muscle, respectively),‘‘fine-tuned’’ by the measures obtained using a physiolog-ical transmitter. Linear relationship describing the calibra-tion between forced swimming speed and average EMGpulse intervals is showed
276 Hydrobiologia (2007) 582:271–280
123
treated (Carbonara et al., 2006). Conversely,
swimming ability of tested fish (average:
3.43 BLsec–1; SE: 0.12) was on average, higher
than reported by Chatelier et al., (2005) (average:
2.25 BLsec–1; SE: 0.08), but results are not strictly
comparable, as consequence of differences in
protocol exercises.
Large variations in swimming ability exist
among teleosteans: the maximum sustainable
speed in tunas is believed to be fuelled solely by
aerobic metabolism (Deware and Graham, 1994,
Ellerby et al., 2000), while for other species the
recruitment of both aerobic and anaerobic muscle
fibres is required, as for example in Atlantic cod
(Reidy et al., 2000). The results of our study show
that in the sea bass, despite the low mass of red,
compared to white muscle, the former fuelled the
majority of the swimming capability below the
Ucrit. The pattern of the recruitment of red
muscle activity increased with speed until a
maximal level was attained. The plateau in the
mass recruitment was maintained despite further
increases in swimming speed, a result similar to
that reported by Rome et al. (1992), whereas
white mass recruitment continued to exponen-
tially increase up to the Ucrit velocity.
The beginning of the recruitment of white
muscle appears to be somewhat species-specific
(Burgetz et al., 1998). It has been suggested, for
example, that anaerobic metabolism must be
taken into account also at speeds above 70%
Ucrit for O. mykiss (generalist swimmer). This fact
is supported by the different placement and
amount of slow-twitch aerobic muscle (for sus-
tained swimming) and fast-twitch fibres (recruited
during fast starts) in different groups (Ellerby
et al., 2000). Scombrids, for example, are special-
ized for sustained swimming by the means of
elongated myotomes and the presence of connec-
tive tendons which lead to an efficient mean of
power transmission caudally along the length of
the fish, though loosing manoeuvrability. Salmo-
noids generate the majority of power by posterior
musculature, while eels (high body curvature) use
primarily their anterior myotome to power steady
swimming.
The Scope For Activity (SFA) or energetic cost
of activity can be defined as the increase in
oxygen uptake in a swimming fish, while SMR
(Standard Metabolic Rate) as the rate of oxygen
uptake measured from a notionally stationary fish
(Fry, 1971). Scope for activity is variable over
time and among fish (Briggs and Post, 1996).
Results of the hard wiring exercise clearly
showed that SFA in the sea-bass is not supported
solely using aerobic metabolism and that the two
muscle types are both involved in fuelling swim-
ming activity below the Ucrit.. Indeed, ‘fine-
tuning’ indicates a very clear pattern, with
increasing aerobic and anaerobic activity accord-
ing to the swimming speed. Results also highlight
that the estimate of the overall scope of activity
should take into account the energy of the white
muscle, and thus the budget available is lower
than expected on the basis of the red muscle
metabolic pathway. In fact if sub-maximal swim-
ming results in the recruitment of anaerobic
fibres, the energy budget will be underestimated
(Burgetz et al., 1998).
To evaluate the energetic expenditure of a
swimming fish (Cooke et al., 2000), the available
physiological transmitter technology allows only
the monitoring of the red muscle and thus of the
aerobic activity. This gives a rough estimate of the
SFA and consequently of the fish physiological
state. Correction of the SFA for the anaerobic
component would provide an accurate accounting
of a fish ability to compensate to stressors, which
act as consumers of the fish reserves affecting
well-being.
Monitoring of free swimming sea bass is
particularly important, not only for introducing
mitigative strategies in aquaculture practices, but
also for giving insights into the migratory behav-
iour of this species, entering coastal lagoons and
spending part of the inter-genetic phase of the life
cycle there. Calibration of swimming speed
through swimming chambers to EMG signals is
considered by many authors as a baseline for
elucidating swimming behaviour of free swim-
ming fish (e.g. Cooke et al., 2000; Thorstad et al.,
2000; Geist et al., 2002; McFarlane et al., 2004).
Some authors suggest that the relationship
between EMG signal and swimming speed would
be constructed for each fish before it is released,
but usually calibration curves are made on a
separate group of fish and then applied to the
ones in the field (Brown and Geist, 2002).
Hydrobiologia (2007) 582:271–280 277
123

However a high variability of EMG among fish,
stocks, or in the same individual at a different
time has also been stressed (e.g. Thorstad et al.,
2000). Similarly, in our study EMG signals from
transmitters were rather variable, probably for
inherent causes (physiological differences), or
technological reasons (characteristics of the trans-
mitter) or as consequence of electrical activity
interaction between the two muscle types. Indeed,
the large gold-tipped electrodes may record a
large proportion of the myotome, and sometimes
multiple myomeres. Variation in depth from the
skin and distance from the lateral line, where the
gold rods are positioned, may affect to what
extent they record EMGs from red or white
muscle fibres, or both (Beddow and McKinley,
1999; Thorstad et al., 2000). Also in our study,
variability of EMG at each velocity stage can be
interpreted considering the possible cross-inter-
ference between the signals emitted by the two
muscle types.
Considering the intrinsic variability in the
physiological response to certain stimuli and the
aim of obtaining an ‘average’ information on
the scope for activity of sea bass we pooled the
data from the fish used for calibrating swimming
speed against EMG. The same procedure was
used for testing hard-wired electromyograms
against velocity. The possibility of reducing the
variability was thus investigated by breaking
down the frequency distributions of EMG signals
into their gaussian components using the Bhatth-
acharya (1967) technique after smoothing. This
method allowed a more objective cleansing of the
data of spurious signals, and thus the identifica-
tion of unbiased average value for each velocity
step. Despite this, standard deviations associated
with the mean of each normal component were
still rather high (Table 1). Consequently, a pre-
cise association between swimming speed and
EMG could be unreliable. Instead, a pathway
splitting the swimming performance of sea bass in
three main phases of activity defined as: (1)
resting (0.1–0.3 msec–1 speed), (2) moderate (0.4–
0.6 msec–1), and (3) intense (>0.7 msec–1) could
be a useful descriptor of swimming ability.
Calibration of the EMG transmitter with hard
wire values allowed assessing white and red muscle
patterns. Only in this way, with the available
technology (EMG radio transmitter), is it possible
to associate certain activity levels of red muscle to
an intensity of white muscle, and then recognize
more accurately a stress-related response (Jain and
Farrell, 2003; Chandroo et al., 2005).
Nevertheless, possible improvement of the
calibration technique should be further investi-
gated with larger samples and replicates before
definitive conclusions are drawn.
The results gained in the study on sea bass
indicate that swimming performance tests (Ucrit,
EMGs, ‘fine-tuning’) represent reliable descrip-
tors of fish condition, and are potentially usable as
operational indicators of well-being status/activity
of farmed and wild fish. Indeed, reduced Ucrit may
be caused by an interaction of anaerobic (white
muscle activity) end product accumulation within
the fish musculature and disturbances in ionore-
gulation (Chandroo et al., 2005). Many stress-
related biological factors influence the swimming
capacity and, for this reason, behavioural indica-
tors may be able to show the fish response to
stressors even when clinical or physiological
indicators, such as plasma cortisol, do not
(Chandroo et al., 2005). The usefulness of swim-
ming performance tests could be further ex-
panded if recovery tests, where fish performance
is analysed in two consecutive sustained exercises,
are combined (Farrell et al., 1998; Carbonara
et al., 2006). Nonetheless, the description of the
fish physiological state based only on a single
indicator may not accurately reflect the overall
fish state and an integrated diagnostic frame
(behavioural tests, plasma cortisol, etc.) would
be more suitable.
Overall, our results showed that defining scope
for activity, based solely on the red muscle, would
overestimate the level of aerobic compensation
available to the individual to respond to any
external stressor or, in the case of cultured fish, to
any handling protocol. Fine-tuning of the scope
for activity for the contribution from white
muscle would permit an accurate estimate of the
aerobic energy available for the fish to expend in
response to stressors, such as husbandry proto-
cols. Obtaining the ability to accurately monitor
the EMG level, using physiological telemetry,
would permit an estimate of the scope or energy
remaining. This estimate could be used to mon-
278 Hydrobiologia (2007) 582:271–280
123
itor the ability of fish to compensate for further
stress attributable to handling protocols and the
level of compensatory activity, available to the
individual, could be viewed as a measure of its
present well-being.
Acknowledgement This study was supported by theSFOP EU funds, co-financed by regional government ofPuglia (Italy).
References
Beddow, T. A. & R. S. McKinley, 1998. Effect of thermalenvironment on electromyographical signals obtainedfrom Atlantic salmon (Salmon salar L.) during forcedswimming. Hydrobiologia 371/372: 225–232.
Beddow, T. A. & R. S. McKinley, 1999. Importance ofelectrode positioning in biotelemetry studies estimat-ing muscle activity in fish. Journal of Fish Biology 54:819–831.
Bhattacharya, C. G., 1967. A simple method of resolutionof a distribution into Gaussian components. Biomet-rics 23: 115–135.
Brauner, C. J., G. K. Iwama & D. J. Randall, 1994. Theeffect of short-duration seawater exposure on theswimming performance of wild and hatchery-rearedjuvenile coho salmon (Oncorhyncus kisutch) duringsmoltification. Canadian Journal of Fisheries andAquatic Sciences 51: 2188–2194.
Brett, J. R., 1964. The respiratory metabolism and swim-ming performance of young sockeye salmon. Journalof Fisheries Research Board of Canada 21: 1183–1226.
Briggs, C. T. & J. R. Post, 1996. In situ activity metabolismof rainbow trout (Oncorhynchus mykiss): estimatesobtained from telemetry of axial muscle electromyo-grams. Canadian Journal of Fisheries and AquaticSciences 54: 859–866.
Brown, R. S. & D. R. Geist, 2002. Determination ofswimming speeds and energetic demands of uprivermigrating fall chinook salmon (Oncorhynchustshawytscha) in the Klickitat river. Bonneville PowerAdministration, U.S. Department of Energy, PacificNorthwest National Laboratory, 76 pp.
Burgetz, I. J., A. Rojas-Vargas, S. G. Hinch & D. J.Randall, 1998. Initial recruitment of anaerobic metab-olism during sub-maximal swimming in rainbow trout(Oncorhynchus mykiss). Journal of ExperimentalBiology 201: 2711–2721.
Carbonara, P., M. Scolamacchia, M. T. Spedicato., G.Lembo & R. S. McKinley, 2006. Swimming perfor-mance as a well-being indicator of reared sea-bass.Preliminary results. Biologia Marina Mediterranea13(1): 488–491.
Chandroo, K. P., S. J. Cooke, R. S. McKinley & R. D.Moccia, 2005. Use of electromyogram telemetry toassess the behavioural and energetic responses ofrainbow trout, Oncorhynchus mykiss (Walbaum) to
transportation stress. Aquaculture Research 36: 1226–1238.
Chatelier, A., D. J. McKenzie & G. Claireaux, 2005.Effects of changes in water salinity upon exercise andcardiac performance in the European seabass (Dicen-trarchus labrax). Marine Biology 147: 855–862.
Cooke, S. J., K. P. Chandroo, T. A. Beddow, R. D. Moccia& R. S. McKinley, 2000. Swimming activity andenergetic expenditure of captive rainbow trout On-corhynchus mykiss (Walbaum) estimated by electro-myogram telemetry. Aquatic Research 31: 495–505.
Dewar, H. & J. B. Graham, 1994. Studies of tropical tunaswimming performance in a large water tunnel, IEnergetics. Journal of Experimental Biology 192: 13–31.
Demers, E., R. S. McKinley, A. H. Weatherley & D. J.McQueen, 1996. Activity pattern of largemouth andsmallmouth bass determined with electromyogrambiotelemetry. Transactions of the American FisheriesSociety 125: 434–439.
Ellerby, D. J., J. D. Altringham, T. Williams & B. A.Block, 2000. Slow muscle function of Pacific Bonito(Sarda chiliensis) during steady swimming. Journal ofExperimental Biology 203: 2001–2013.
Farrell, A. P., K. Gamperl & I. K. Birthwell, 1998.Prolonged swimming, recovery and repeat swimmingperformance of mature sockeye salmon Onchorhyn-cus nerka exposed to moderate hypoxia and penta-chlorophenol. Journal of Experimental Biology 201:2183–2193.
Fry F. E. J., 1971. The effect of environmental factors onthe physiology of fish. In Hoar, W. S. & D. J. Randall(eds), Fish Physiology, VI, Academic Press, NewYork.
FSBI, 2002. Fish Welfare. Briefing Paper 2, FisheriesSociety of the British Isles, Granta InformationSystems, 82A High Street, Sawston, Cambridge CB24H.
Gayanilo, F. C. Jr., P. Sparre & D. Pauly, 1996. FAO-ICLARM Stock Assessment Tools (FISAT) User’sManual. FAO–Computerized Information Series–fish-eries, 1–126.
Geist, D. R., C. S. Abernethy, S. L. Blanton & V. I.Cullinan, 2000. The use of electromyogram telemetryto estimate energy expenditure of adult Fall ChinookSalmon. Transactions of the American FisheriesSociety 129: 126–135.
Geist, D. R., R. S. Brown, K. Lepla & J. Chandler, 2002.Practical application of electromyogramm radiote-lemetry: the suitability of applying laboratory-ac-quired calibration data to field data. NorthAmerican Journal of Fisheries Management 22: 474–479.
Jain, K. E. & A. P. Farrell, 2003. Influence of seasonaltemperature on the repeat swimming performance ofrainbow trout Oncorhynchus mykiss. The Journal ofExperimental Biology 206: 3569–3579.
Massee, K. C., M. B. Rust, R. W. Hardy & R. R. Stickney,1995. The effectiveness of tricaine, quinaldine sulfateand metomidate as anesthetics for larval fish. Aqua-culture 134: 351–359.
Hydrobiologia (2007) 582:271–280 279
123

McFarlane, W. J., K. F. Cubitt, H. Williams, D. Rowsell,R. Moccia, R. Gosine & R. S. McKinley, 2004. Canfeeding status and stress level be assessed by analyz-ing pattern of muscle activity in free swimmingrainbow trout (Oncorhynchus mykiss Walbaum)?Aquaculture 239: 467–484.
McKinley, R. S. & G. Power, 1992. Measurement ofactivity and oxygen consumption for adult lakesturgeon (Aciepenser fulvescens) in the wild usingradio-trasmitted EMG signals. In Priede, I. G. & S. M.Swift (eds), Wildlife Telemetry. Ellis Horwood seriesin environmental management, science and technol-ogy, 307–318 pp.
Økland, F., B. Finstad, R. S. McKinley, E. B. Thorstad &R. K. Booth, 1997. Radio-trasmitted electromyogramsignals as indicators of physical activity in Atlanticsalmon. Journal of Fish Biology 51: 476–488.
Økland, F., I. Fleming, E. B. Thorstad, B. Finstad, S.Einum & R. S. McKinley, 2002. EMG radio tag inrecording the spawning behaviour of Atlantic salmon:effect, reliability and accuracy. In Moore, A. & I.Russell (eds), Proceeding for the Third Conference onFish Telemetry held in Europe, 20–25 June, Norwich,UK. Advance in Fish telemetry, The Centre forEnvironment, Fisheries and Aquaculture Science,Suffolk, UK, 51–58 pp.
Quintella, B. R., N. O. Andrade, A. Koed & P. R.Almeida, 2004. Behavioural patterns of sea lampreys’spawning migration through difficult passage areas,studied by electromyogram telemetry. Journal of FishBiology 65: 961–972.
Randall, D. J., D. Mense & R. G. Boutilier, 1987. Theeffects of burst swimming on aerobic swimming inChinook salmon (Oncorhynchus tshawytscha). MarineBehaviour and Physiology 13: 77–88.
Reidy, S. P., S. R. Kerr & J. A. Nelson, 2000. Aerobic andanaerobic swimming performance of individual Atlan-tic cod. Journal of Experimental Biology 203: 347–357.
Rome, L. C., I. -H. Choi, G. Lutz & A. Sosnicki, 1992. Theinfluence of temperature on muscle function in thefast swimming scup I. Shortening velocity and musclerecruitment during swimming. Journal of Experimen-tal Biology 163: 259–279.
Smit, H., J. M. Amelink-Koutstaal, J. Vijverberg & J. C.Von Vaupel-Klein, 1971. Oxygen consumption andswimming efficiency of swimming goldfish. Compar-ative Biochemistry and Physiology 39: 1–28.
Thorstad, E. B., B. Finstad, F. Økland, R. S. McKinley &R. K. Booth, 1997. Endurance of farmed and sea-ranched Atlantic salmon (Salmon salar L.) at spawn-ing. Aquatic Research 28: 635–640.
Thorstad, E. B., F. Økland, A. Koed & R. S. McKinley,2000. Radio-transmitted electromyogram signals asindicators of swimming speed in lake trout and browntrout. Journal of Fish Biology 57: 547–561.
Weatherley, A. H., P. A. Daseloo, M. D. Gare, J. M. Gunn& B. Lipicnik, 1996. Field activity of lake trout duringthe reproductive period monitored by electromyo-gram radiotelemetry. Journal of Fish Biology 48: 675–685.
280 Hydrobiologia (2007) 582:271–280
123
Copyright © 2022 FDOKUMEN