
Selective Non-Catalytic Reduction of NOx in a ... - Log på - DTU
180
General rights Copyright and moral rights for the publications made accessible in the public portal are retained by the authors and/or other copyright owners and it is a condition of accessing publications that users recognise and abide by the legal requirements associated with these rights. Users may download and print one copy of any publication from the public portal for the purpose of private study or research. You may not further distribute the material or use it for any profit-making activity or commercial gain You may freely distribute the URL identifying the publication in the public portal If you believe that this document breaches copyright please contact us providing details, and we will remove access to the work immediately and investigate your claim. Downloaded from orbit.dtu.dk on: Mar 13, 2022 Selective non-Catalytic Reduction of NOx in a cyclone reactor Ahli Gharamaleki, Mohammad Publication date: 2018 Document Version Publisher's PDF, also known as Version of record Link back to DTU Orbit Citation (APA): Ahli Gharamaleki, M. (2018). Selective non-Catalytic Reduction of NOx in a cyclone reactor. Technical University of Denmark.
-
Upload
khangminh22 -
Category
Documents
-
view
0 -
download
0
Transcript of Selective Non-Catalytic Reduction of NOx in a ... - Log på - DTU
General rights Copyright and moral rights for the publications made accessible in the public portal are retained by the authors and/or other copyright owners and it is a condition of accessing publications that users recognise and abide by the legal requirements associated with these rights.
Users may download and print one copy of any publication from the public portal for the purpose of private study or research.
You may not further distribute the material or use it for any profit-making activity or commercial gain
You may freely distribute the URL identifying the publication in the public portal If you believe that this document breaches copyright please contact us providing details, and we will remove access to the work immediately and investigate your claim.
Downloaded from orbit.dtu.dk on: Mar 13, 2022
Selective non-Catalytic Reduction of NOx in a cyclone reactor
Ahli Gharamaleki, Mohammad
Publication date:2018
Document VersionPublisher's PDF, also known as Version of record
Link back to DTU Orbit
Citation (APA):Ahli Gharamaleki, M. (2018). Selective non-Catalytic Reduction of NOx in a cyclone reactor. Technical Universityof Denmark.
Selective Non-Catalytic Reductionof NOx in a cyclone reactor
Mohammad Ahli-Gharamaleki
Kongens Lyngby 2018
Technical University of DenmarkDepartment of Chemical and Biochemical EngineeringSøltofts Plads, building 229,2800 Kongens Lyngby, DenmarkPhone +45 [email protected]
Summary (English)
This project is focused mainly on providing background knowledge of the cyclonereactors and mapping the effect of fluid dynamics involving flow pattern andtransport phenomena on a chemical reaction. Targeting this main purpose,SNCR for NOx reduction with the injection of ammonia as a reductant has beenchosen as the reaction to be studied. To follow the effect of fluid dynamics onreaction parameters, including temperature profile, residence time and mixing,this thesis presents a detailed study, both with experiments and CFD modeling.
Due to environmental demands and legislation, NOx emission control is be-coming stricter worldwide. In some industries, NOx pass by cyclones beforeemission; therefore, it is essential to investigate the potential of applying cy-clone as an SNCR reactor. This is a more available and cost-effective way tocontrol the NOx emission as a process in the cyclones with some modificationsbefore emission.
Considering all the practical and theoretical demands, a pilot set-up is designedand assembled for this study, providing broad measurement access. An extensiveexperimental design is developed with a focus on fluid dynamics and consideringeffective reaction parameters, including temperature profile, concentration dis-tribution, injection zone, ammonia inlet velocity, molar ratio, and initial NOx.Finally, the effect of particle loading on cyclone is studied. In the next step,a CFD model is developed to map the flow pattern further and provide a sup-portive base to discuss mixing and residence time inside the cyclone. The modelis applied to predict temperature profile and residence time distribution insidecyclone targeting SNCR reduction. In the final step of CFD modeling, the sys-tem worked well, including SNCR reaction, and was validated with pilot scaleexperiments.
ii
This CFD model is highly predictive for effective parameters such as RTD,temperature profile, flow pattern, mixing conditions and reaction zone. Themodel has been validated with experiments and shows good agreement withexperimental results of a detailed study.
The results show that cyclone is non-isothermal and the reactants need to bein a proper temperature zone of the cyclone to react. The cyclone swirl flowprovides proper time for the reactants with a good chance of meeting the high-temperature zone in both downward and upward flow. Rapid mixing of injectedammonia into the flue gas is also necessary and is provided by turbulence.
The results also prove that cyclones ensure excellent heat transfer and provideproper mixing in a short time for SNCR reduction. Adding ammonia fromdifferent positions makes a tiny difference in reduction efficiency. The reactionmainly takes place in the upper part of the cyclone, called reaction zone, in thisthesis and is the upper zone of the cyclone with proper temperature.
The results presented here provide the background knowledge about the cyclonereactor for SNCR and could be applied to scale-up, design and optimizationstudies.
Summary (Danish)
Dette projekt er primært fokuseret på at levere baggrundsviden om cyklonreak-torer og kortlægge effekten af fluid dynamik der involverer strømningsmønsterog transport fænomener af kemisk reaktioner. SNCR for NOx reduktion medtilsætning af ammoniak som et reduktionsmiddel er blevet valgt som reaktionen,der skal undersøges. At følge fluid dynamik effekt på reaktionsparametre her-under temperaturprofil, opholdstid og blanding, denne afhandling præsentereren detaljeret undersøgelse både med eksperimenter og CFD modellering.
På grund af de miljømæssige krav og lovgivning bliver NOx emissionskontrollenstrengere på verdensplan. I nogle brancher passere NOx cyklonen før emissionen,derfor er det meget vigtigt at overvåge potentialet for at anvende cyklon somSNCR reaktor. Dette er mere tilgængelig og omkostningseffektivt at styre NOxemission som et procesled i de cykloner med nogle ændringer før emission.
I betragtning af alle de praktiske og teoretiske krav, er en pilot set-up lavet tildenne undersøgelse og giver samlet set bred adgang til afmåling. Et omfattendeeksperimentelt design er udviklet med fokus på fluid dynamik og overvejer effek-tive reaktionsparametre herunder temperaturprofil, koncentration distribution,injektion zone, ammoniak indløb hastighed, molforholdet og indledende NOx.Endelig effekten af partikelladning til cyklonen er undersøgt.
I det næste trin, er en CFD model udviklet til at kortlægge yderligere flowmønster og giver et fundament for at diskutere om blanding- og opholdstideninde i cyklonen. Modellen anvendes til at forudsige temperaturprofil- og ophold-stidsfordelingen inde cyklonen målrettet SNCR reduktion. I det sidste trin afCFD modellering af systemet løst herunder SNCR reaktion og valideret medpilotskala eksperimenter. Denne CFD model er yderst prædiktiv for effektive
iv
parametre såsom RTD, temperaturprofil, strømningsmønster, blandingsbetin-gelser og reaktionszone. Modellen er valideret med eksperimenter og viser godoverensstemmelse med eksperimentale resultater.
Resultater viser, at cyklonen er ikke-isoterm, reaktanterne skal være i den kor-rekte temperaturzone af cyklonen for at reagere. Cyklonens hvirvelstrømninggiver høj opholdstid for reaktanterne og også chancen for at møde den højetemperaturzone i både nedadgående og opadgående strømning. Hurtig blandingaf injiceret ammoniak i røggassen er også nødvendigt, som giver cyklonen tur-bulens.
Resultaterne beviser agså, at cykloner sikrer fremragende varmeoverførsel og gi-ver en passende blanding på kort tid til SNCR reduktion. Tilføjelse ammoniakfra forskellige positioner gør en meget lille forskel i reduktions effektivitet. Reak-tionen finder primært sted i den øverste del af cyklonen, kaldet reaktionszone idenne afhandling, og er den øverste zone af cyklonen med den rette temperatur.Resultaterne der er præsenteret her giver baggrundsviden om cyklonreaktorentil SNCR og kan anvendes til scale-up, design og optimeringsstudier.
Preface
The thesis has been conducted under the Ph.D. program supported by Tech-nical University of Denmark (DTU). The dissertation is submitted as a partialrequirement of acquiring a Ph.D. degree at the Combustion and Harmful Emis-sion Control (CHEC) research center at the Department of Chemical and Bio-chemical Engineering in the period from December 2013 to January 2017. Theproject was supervised by Professor Kim Dam-Johansen and Associate ProfessorWeigang Lin. The project was financially supported by DTU.
The thesis proposed a new industrial challenge in application of cyclone as reac-tor in addition to its main separation purpose. A pilot set-up has been designedand constructed for pilot scale experiments, and Selective Non-Catalytic Re-duction (SNCR) of NOx is selected as reaction due to its importance in recentindustrial emission controls. A Computational Fluid Dynamics (CFD) model isdeveloped to provide knowledge about flow patterns, mixing and residence timein cyclone reactor. The model is validated with experiments. Results also showhigh reduction efficiency for SNCR NOx reduction in cyclone reactor.
Results have potential to apply as a background knowledge for scale up, indus-trial design, industrial modifications and more specifically for NOx reductioncontrol with high efficiency. The CFD- model can be more developed for allmentioned purposes to support industrial scale studies.
Kgs. Lyngby, 31-January-2018Mohammad Ahli-Gharamaleki
Acknowledgments
I would like to express my gratitude to my supervisors Professor Kim Dam-Johansen and Associate Professor Weigang Lin for advice and encouragementduring this study.
During the design and construction of pilot scale set-up the workshop and tech-nical staff at the department of Chemical and Biochemical Engineering depart-ment helped me with many ideas how to solve practical problems. I would liketo thank specifically Nikolaj V. Nissen, Jens H.Poulsen and Ivan H. Pedersen.
I would like to thank all former and present colleagues in CHEC group whichmade my stay in CHEC group very pleasant. I have also appreciated duringmy study many discussions with my colleagues from CHEC group specificallySeyednezamaddin Azizaddini, Mohammadhadi Nakhaei.
I would like to thank my family: my parents, wife and son for supporting meduring this Ph.D. study.
Abbreviations
BSLkw: Baseline k-ωCFD: Computational Fluid DynamicsCFB: Circulating Fluidized BedCHEMKIN: CHEMical KINeticsDNS: Direct Numerical SimulationDEM: Discrete Element MethodDPM: Discrete phase MethodDCKM: Detailed Chemical Kinetic ModelEBFGT: Electron Beam Flue Gas TreatmentFCC: Fluid Catalytic CrackingLDA: Laser Doppler AnemometryLES: Large Eddy SimulationLRR: Launder, Reece, RodiLRRG: Modification of Launder, Reece, Rodi by Gibson, implementation of
a differential RSTMLPS: Linear Pressure StrainMUSCL: Monotone Upstream-Centered Schemes for Conservation LawsNSCR: Non-Selective Catalytic ReductionPVC: Processing Vortex CorePSIC: Particle Source In CellPSR: Perfectly Stirred ReactorPFR: Plug Flow ReactorPRESTO: PREssure STaggered OptionQUICK: Quadratic Upstream Interpolation for Convective KineticsRANS: Reynolds Averaged Navier–Stokes equationsRNG: Re-Normalization GroupRSTM: Reynolds Stresses Transport Model
viii Contents
RSM: Reynold Stress ModelRTD: Time Distributionrke: Realizable k-εSGS: SubGrid scale modelSSG: Speziale Sarkar GatskiSCR: Selective Catalytic ReductionSNCR: Selective Non-Catalytic Reductionskw: Standard k-ωske: Standard k-εSW: Stress Omegasstkw: Shear Stress Transport k-ωSIMPLEC: Semi-Implicit Method Pressure-Linked Equations ConsistentQPS: Quadratic Pressure StrainUDF: User Defined function
Contents
Summary (English) i
Summary (Danish) iii
Preface v
Acknowledgments vi
Abbreviations vii
1 Introduction 11.1 Background . . . . . . . . . . . . . . . . . . . . . . . . . . . . . . 21.2 Scope of Work . . . . . . . . . . . . . . . . . . . . . . . . . . . . 31.3 Objectives . . . . . . . . . . . . . . . . . . . . . . . . . . . . . . . 31.4 Structure . . . . . . . . . . . . . . . . . . . . . . . . . . . . . . . 4
2 Literature survey 62.1 Cyclone Principles . . . . . . . . . . . . . . . . . . . . . . . . . . 6
2.1.1 Gas flow pattern . . . . . . . . . . . . . . . . . . . . . . . 102.1.2 Particle flow pattern . . . . . . . . . . . . . . . . . . . . . 11
2.2 Application of the cyclone reactors . . . . . . . . . . . . . . . . . 122.2.1 Fluid Catalytic Cracking in cyclone . . . . . . . . . . . . 132.2.2 Fast Pyrolysis . . . . . . . . . . . . . . . . . . . . . . . . . 142.2.3 pulverized coal combustion and gasification . . . . . . . . 162.2.4 Production of niobium powder in a cyclone reactor . . . . 162.2.5 Fine ceramic powders . . . . . . . . . . . . . . . . . . . . 18
2.3 Modeling of gas-solid cyclone reactors . . . . . . . . . . . . . . . 192.3.1 Analytical modeling of the cyclone reactors . . . . . . . . 202.3.2 Phenomenological model . . . . . . . . . . . . . . . . . . . 22
2.4 Selective Non-Catalytic Reduction (SNCR): . . . . . . . . . . . . 242.4.1 NOx Emission and De-NOx methods . . . . . . . . . . . . 242.4.2 Reducing agent in SNCR . . . . . . . . . . . . . . . . . . 282.4.3 Effective parameters on SNCR . . . . . . . . . . . . . . . 302.4.4 Reduced Mechanism for SNCR . . . . . . . . . . . . . . . 41
2.5 Computational fluid dynamics (CFD) simulations . . . . . . . . . 452.5.1 CFD studies on gas flow . . . . . . . . . . . . . . . . . . . 462.5.2 CFD studies on two-phase flow in cyclones . . . . . . . . 492.5.3 CFD studies on cyclone reactors . . . . . . . . . . . . . . 53
x CONTENTS
2.6 Conclusion and perspective of project . . . . . . . . . . . . . . . 55
3 Experimental apparatus 573.1 Fuel dosing system . . . . . . . . . . . . . . . . . . . . . . . . . . 583.2 Swirl burner . . . . . . . . . . . . . . . . . . . . . . . . . . . . . . 603.3 Combustion chamber . . . . . . . . . . . . . . . . . . . . . . . . . 613.4 Cyclone reactor . . . . . . . . . . . . . . . . . . . . . . . . . . . . 623.5 Particle loading system . . . . . . . . . . . . . . . . . . . . . . . . 633.6 Ammonia injection system . . . . . . . . . . . . . . . . . . . . . . 643.7 Post-reactor system . . . . . . . . . . . . . . . . . . . . . . . . . 643.8 Control system . . . . . . . . . . . . . . . . . . . . . . . . . . . . 653.9 Gas sampling system . . . . . . . . . . . . . . . . . . . . . . . . . 663.10 Data acquisition . . . . . . . . . . . . . . . . . . . . . . . . . . . 673.11 Experiments procedure . . . . . . . . . . . . . . . . . . . . . . . . 67
4 Experiments,SNCR in cyclone reactor 704.1 Introduction . . . . . . . . . . . . . . . . . . . . . . . . . . . . . . 704.2 Experimental approach and methodology . . . . . . . . . . . . . 714.3 Experiments and results without particles . . . . . . . . . . . . . 73
4.3.1 Temperature Profile and NOx distribution . . . . . . . . . 734.3.2 Investigation of ammonia injection position . . . . . . . . 794.3.3 Investigation of initial NOx . . . . . . . . . . . . . . . . . 904.3.4 Investigation of molar ratio . . . . . . . . . . . . . . . . . 914.3.5 Investigation of ammonia injection velocity . . . . . . . . 91
4.4 Experiments and results with particles . . . . . . . . . . . . . . . 934.4.1 Temperature Profile in the presence of particles . . . . . . 954.4.2 Investigation of NOx reduction in varying molar ratio in
the presence of particles . . . . . . . . . . . . . . . . . . . 964.5 Conclusion . . . . . . . . . . . . . . . . . . . . . . . . . . . . . . 98
5 CFD of SNCR in the cyclone reactor 1005.1 CFD approach and methodology . . . . . . . . . . . . . . . . . . 1015.2 The governing equations for the gas phase . . . . . . . . . . . . . 1025.3 CFD modeling of cyclone in cold mode . . . . . . . . . . . . . . . 106
5.3.1 Computational Domain and boundary Condition . . . . . 1075.3.2 Turbulence model selection . . . . . . . . . . . . . . . . . 1085.3.3 Mesh Generation and Grid Independence Study . . . . . . 1095.3.4 Simulation strategy . . . . . . . . . . . . . . . . . . . . . 1105.3.5 Solver Settings . . . . . . . . . . . . . . . . . . . . . . . . 1115.3.6 Results . . . . . . . . . . . . . . . . . . . . . . . . . . . . 112
5.4 CFD modeling of heat transfer in a cyclone reactor . . . . . . . . 1135.4.1 Considering fluid species in heat transfer modeling . . . . 1145.4.2 Boundary Conditions . . . . . . . . . . . . . . . . . . . . 1155.4.3 Simulation strategy . . . . . . . . . . . . . . . . . . . . . 1155.4.4 Results and validation . . . . . . . . . . . . . . . . . . . . 115
5.5 CFD modeling of NOx reduction in the cyclone reactor . . . . . 1175.5.1 Modeling approach . . . . . . . . . . . . . . . . . . . . . . 1175.5.2 Results . . . . . . . . . . . . . . . . . . . . . . . . . . . . 122
5.6 Conclusion . . . . . . . . . . . . . . . . . . . . . . . . . . . . . . 134
6 General conclusions and suggestion for future work 136
CONTENTS xi
6.1 Conclusions . . . . . . . . . . . . . . . . . . . . . . . . . . . . . . 1366.2 Future work . . . . . . . . . . . . . . . . . . . . . . . . . . . . . . 139
Appendices 141
A Flue gas compositions 141
B User Defined Function 146
C Binary Diffusion Coefficients for Flue gas composition 149
Bibliography 152
Chapter 1
Introduction
Cyclones are well-known due to their various applications in the industries forseparation purposes, mostly solid particles from the gas stream. In addition,cyclones also have the ability to be applied as a reactor for reactions with ashort reaction time that can enhance the conversion of the reactants for differ-ent applications. Studies have shown that cyclones seem to ensure excellent heattransfer efficiencies between carrier gas, solid particles and walls. Moreover, theresidence time in cyclones is high enough to provide reaction time as a reac-tor. Consequently, it can be anticipated that cyclones would be well suited forcarrying out fast reactions. In addition, turbulent flow inside cyclone providesbetter mixing conditions. There is need to provide more knowledge in differentaspects, e.g., mixing and residence time, to achieve a better understanding ofthe reaction inside the cyclone.
To develop the idea, SNCR reaction of NOx is chosen due to its importancein recent industrial emission controls and also because most of the industrialoutflow path goes through a cyclone to get rid of solid particles. Therefore,the perspective of this study on cyclone reactor is to support real case design,modifications and optimizations in current industries.
2 Introduction
1.1 Background
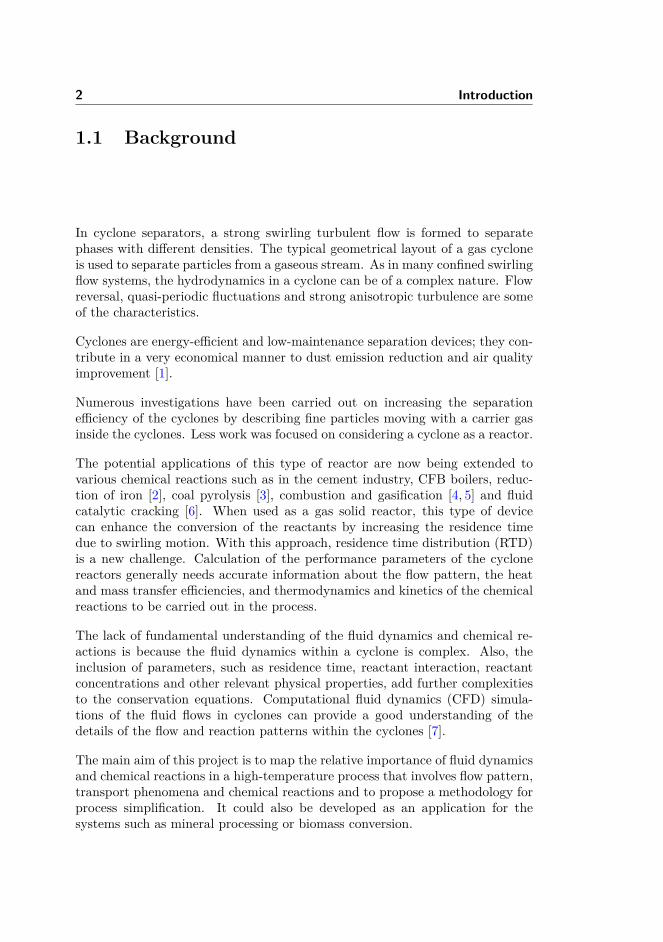
In cyclone separators, a strong swirling turbulent flow is formed to separatephases with different densities. The typical geometrical layout of a gas cycloneis used to separate particles from a gaseous stream. As in many confined swirlingflow systems, the hydrodynamics in a cyclone can be of a complex nature. Flowreversal, quasi-periodic fluctuations and strong anisotropic turbulence are someof the characteristics.
Cyclones are energy-efficient and low-maintenance separation devices; they con-tribute in a very economical manner to dust emission reduction and air qualityimprovement [1].
Numerous investigations have been carried out on increasing the separationefficiency of the cyclones by describing fine particles moving with a carrier gasinside the cyclones. Less work was focused on considering a cyclone as a reactor.
The potential applications of this type of reactor are now being extended tovarious chemical reactions such as in the cement industry, CFB boilers, reduc-tion of iron [2], coal pyrolysis [3], combustion and gasification [4, 5] and fluidcatalytic cracking [6]. When used as a gas solid reactor, this type of devicecan enhance the conversion of the reactants by increasing the residence timedue to swirling motion. With this approach, residence time distribution (RTD)is a new challenge. Calculation of the performance parameters of the cyclonereactors generally needs accurate information about the flow pattern, the heatand mass transfer efficiencies, and thermodynamics and kinetics of the chemicalreactions to be carried out in the process.
The lack of fundamental understanding of the fluid dynamics and chemical re-actions is because the fluid dynamics within a cyclone is complex. Also, theinclusion of parameters, such as residence time, reactant interaction, reactantconcentrations and other relevant physical properties, add further complexitiesto the conservation equations. Computational fluid dynamics (CFD) simula-tions of the fluid flows in cyclones can provide a good understanding of thedetails of the flow and reaction patterns within the cyclones [7].
The main aim of this project is to map the relative importance of fluid dynamicsand chemical reactions in a high-temperature process that involves flow pattern,transport phenomena and chemical reactions and to propose a methodology forprocess simplification. It could also be developed as an application for thesystems such as mineral processing or biomass conversion.
1.2 Scope of Work 3
1.2 Scope of Work
To provide a comprehensive study on reaction inside cyclone, the present workis divided into three practical phases including pilot design/ construction, ex-periments and CFD modeling.
In phase 1, the pilot setup is designed for this study and assembled consideringall the practical and theoretical demands. Special efforts have been made toprovide enough measurement access to the system parameters. In addition, thesystem provides very flexible sampling possibilities which can support measure-ments from many different parts of the cyclone, both horizontally and vertically.This flexible measurement potential provides the ability to carry out a detailedstudy of temperature profile and NOx distribution inside cyclone, which can beused in validating the flow pattern in the model. Most of the former studiesonly apply performance parameters for validation.
In phase 2, a wide range of experiments has been performed to provide a detailedstudy of both heat transfer and reaction inside the cyclone. The SNCR of NOxusing NH3 as reductant was chosen as a reaction for this project. All the exper-iments were carried out in the pilot cyclone mentioned. After safety checks andsystem preparation, the experiments were divided into three sub-groups. First,the cyclone is characterized before any reaction takes place (without addingammonia). In this step, cyclone temperature profile and NOx distribution havebeen studied. In the next step, the reaction inside cyclone has been studied indetail, and in the final step the reaction has been studied when the cyclone isloaded with solid particles.
In phase 3, a CFD model has been developed to further map the flow patternand provide a reliable base to discuss the mixing and residence time inside thecyclone. The model is first initiated for cold mode and validated with experimen-tal literature study. The model properties are applied to simulate heat transferand residence time distribution inside cyclone targeting high-temperature SNCRreduction. In the final step of CFD modeling, the system is solved, includingSNCR reaction with simplified mechanisms. In the two latter steps, the modelhas been validated with pilot scale experiments of phase 2.
1.3 Objectives
The main aim of this project is to map the relative importance of fluid dynamicsinvolving flow pattern and transport phenomena considering reduced chemicalkinetics and to propose a methodology for process simplification for modeling.
4 Introduction
The stepwise objectives of this project are:
• To improve the understanding of fluid dynamics and reaction kinetics in-side a cyclone. For this purpose, a series of experiments supported withCFD modeling has been targeted. In the first step, the system needs tobe simplified considering both reaction and fluid dynamics to be appliedin CFD modeling. To perform a comprehensive experiment set, a flexiblepilot is also designed and constructed. Furthermore, an extensive experi-mental result set is needed to validate the CFD model.
• To provide experimental background knowledge on SNCR in a cyclonereactor, an extensive experimental design has been developed consideringeffective parameters with a focus on fluid dynamics including temperatureprofile, concentration distribution, injection zone, ammonia inlet velocity,molar ratio, initial NOx and finally the effect of particles in dust-loadedcyclone. To monitor the interaction of flow pattern and reaction in cyclone,experiments have been repeated with sampling from different parts of thecyclone both vertically and horizontally. The latter has been done for thefirst time which led to a more detailed validation of the CFD phase.
• Application of CFD model to simulate the flow pattern in a cyclone reactor
The CFD model has been developed and validated in different scopes to providemore practical knowledge to describe the interaction of fluid dynamics insidecyclone and reaction. The CFD model simulated the cyclone reactor for SNCRreaction and predicted effective parameters such as RTD, temperature profile,flow pattern, and mixing condition reaction zone. The model has been validatedwith experiments and shows a very good agreement with experimental resultsof a detailed study.
1.4 Structure
Chapter 2 of the thesis provides the background and literature review on cy-clones in general and cyclone reactors, SNCR NOx reduction importance, mech-anisms and applications, CFD modeling theoretical consideration, practical ap-proaches and applications.
Chapter 3 focuses on experimental apparatus presenting design considerations,material selection, measurement systems and experimental procedure.
Chapter 4 presents experiment design and methodology with a systematic ap-proach. A detailed study on reaction parameters and their interaction with the
1.4 Structure 5
flow pattern in different zones of the cyclone is presented. This chapter endswith a discussion of results and experimental conclusion.
Chapter 5 includes CFD modeling steps, model setting, cold mode, heat transfersimulation and reaction with considering flow patterns and reaction. Results areexplained in different sub-sections with a comparative discussion when needed.The chapter ends with a general conclusion about CFD modeling results witha short notice to the experimental results.
Chapter 6 contains the overall conclusion and highlights the results of experi-ments and CFD. It ends with suggestions for future work.
Chapter 2
Literature survey
Targeting a detailed study of a cyclone reactor, it is highly important to presenta thorough literature study on different aspects involved in the main objective ofthe project. It would be beneficial to know what has been done that is relevantto the target and what is missing to proceed in a more focused direction. Thiswould be even further helpful for future studies following the current Ph.D.perspective and goals.
This section includes five sub-sections: cyclone principles, application of thecyclone reactors, modeling of gas-solid cyclone reactors, selective non-catalyticreduction (SNCR), and computational fluid dynamic simulation. Each partbasically makes a background study for the relevant practical study of thisproject and will be explained and discussed in more detail.
2.1 Cyclone Principles
In this section, cyclone principles will be discussed, specifically cyclone flowpattern and how it affects practical cyclone parameters. This is germane to knowbecause flow pattern in a cyclone is the most important factor discriminating acyclone from other reactors both in the concept of mixing and residence time ofthe reactants as well as the heat transfer. This part will be followed by cyclone
2.1 Cyclone Principles 7
applications as a reactor and how and why it brings value to the special targets.
Basically, a cyclone as a type of centrifugal separator is a stationary mechanicaldevice that utilizes centrifugal force to separate solid or liquid particles fromcarrier gas. A typical cyclone separator is shown Figure(2.1). A cyclone sep-arator is one of the most efficient and robust dust separators. Its robustnessresults from a lack of moving parts and the ability to withstand harsh operatingenvironments [1, 8]. Moreover, cyclones are well suited for high pressure andtemperature applications [9–11].
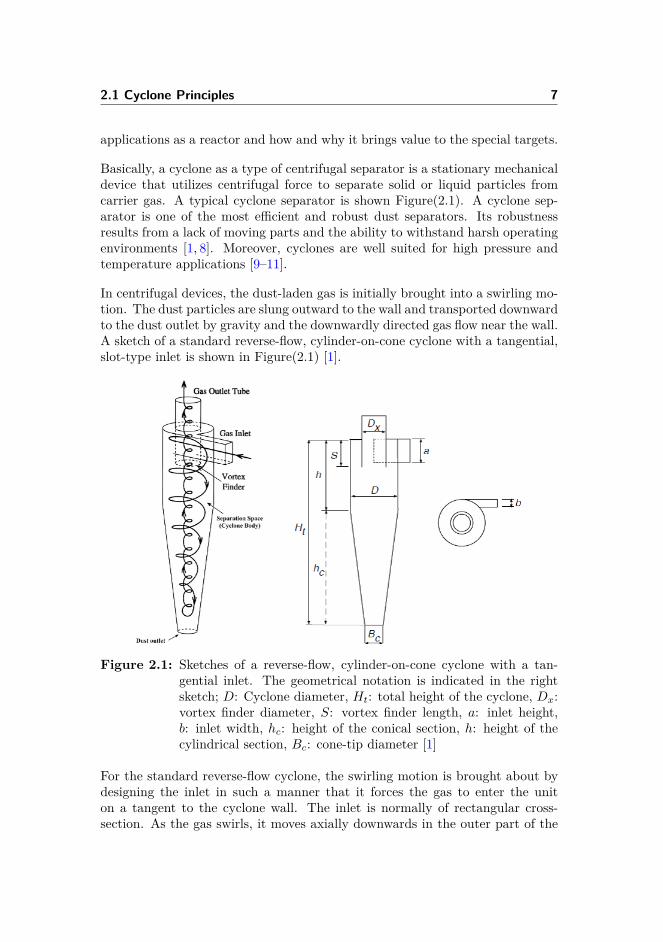
In centrifugal devices, the dust-laden gas is initially brought into a swirling mo-tion. The dust particles are slung outward to the wall and transported downwardto the dust outlet by gravity and the downwardly directed gas flow near the wall.A sketch of a standard reverse-flow, cylinder-on-cone cyclone with a tangential,slot-type inlet is shown in Figure(2.1) [1].
Figure 2.1: Sketches of a reverse-flow, cylinder-on-cone cyclone with a tan-gential inlet. The geometrical notation is indicated in the rightsketch; D: Cyclone diameter, Ht: total height of the cyclone, Dx:vortex finder diameter, S: vortex finder length, a: inlet height,b: inlet width, hc: height of the conical section, h: height of thecylindrical section, Bc: cone-tip diameter [1]
For the standard reverse-flow cyclone, the swirling motion is brought about bydesigning the inlet in such a manner that it forces the gas to enter the uniton a tangent to the cyclone wall. The inlet is normally of rectangular cross-section. As the gas swirls, it moves axially downwards in the outer part of the
8 Literature survey
separation space. In the conical part of the cyclone, the gas is slowly forcedinto the inner region of the cyclone, where the axial movement is upwardlydirected [8]. This flow pattern is often referred to as a double vortex: an outervortex with a downwardly directed axial flow and an inner one with an upwardlydirected flow. The gas exits the cyclone through the so-called vortex finder,which extends downward from the center of the roof. This outlet pipe goes bymany different names, with vortex tube and dip-tube being the most common,aside from the vortex finder. The particles in the inlet gas are slung outwardsto the wall in the centrifugal field and are transported to the dust exit by thedownwardly directed gas flow near the wall [12]. Below more details of the flowpattern in the separation space will be given.
Vortex flow
Swirling flow, or vortex flow, occurs in different types of equipment, such ascyclones, hydrocyclones and vortex burners. Two basic types of swirling flowscan be distinguished:
1. Forced vortex flow, which is a swirling flow with the same tangential ve-locity distribution as a rotating solid body
2. Free vortex flow, which is the way a frictionless fluid would swirl.
In a real swirling flow, however, the tangential velocity distribution in a realswirling flow is intermediate between these two extremes. Now, imagine firstthat the swirling fluid has an infinite viscosity (behaves like a solid body). Hence,no shearing motion exists between fluid layers at different radii. In this case,the fluid elements at all radial positions are forced to have the same angularvelocity Ω, which equals vθ/r where vθ is the tangential velocity. This is theforced vortex flow or solid-body rotation:
vθ = Ωr (2.1)
At the other extreme, if the swirling fluid has no viscosity, the motion of a givenfluid element is not influenced by the neighboring elements at smaller and largerradii. If in such a fluid we bring an element to a smaller radius, its tangentialvelocity will increase, since its moment-of-momentum (mvθr) will be conserved.Such a vortex is called a free or frictionless vortex. In such a flow, we havevθr = C, with C a constant, so that:
2.1 Cyclone Principles 9
vθ = C
r(2.2)
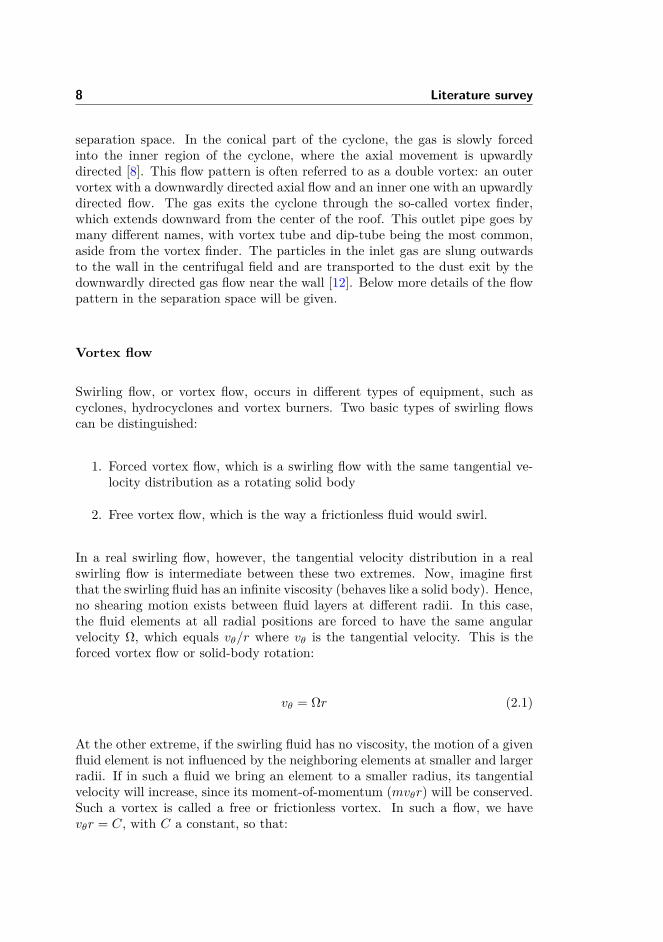
This is the second basic swirl flow. A real swirling flow normally has a coreof near solid-body rotation surrounded by a region of near loss-free rotation assketched in Figure(2.2). This is called a Rankine vortex [13]. For a cyclone it isillustrated in different heights of the cyclone in Figure(2.3(a)).
Figure 2.2: The tangential velocity distribution in a real vortex [14]
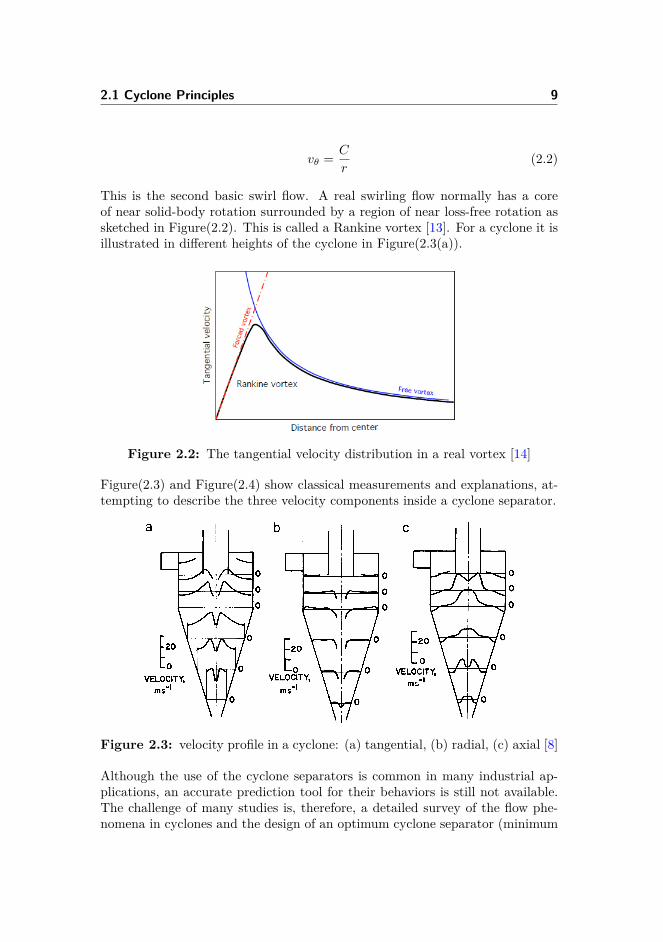
Figure(2.3) and Figure(2.4) show classical measurements and explanations, at-tempting to describe the three velocity components inside a cyclone separator.
Figure 2.3: velocity profile in a cyclone: (a) tangential, (b) radial, (c) axial [8]
Although the use of the cyclone separators is common in many industrial ap-plications, an accurate prediction tool for their behaviors is still not available.The challenge of many studies is, therefore, a detailed survey of the flow phe-nomena in cyclones and the design of an optimum cyclone separator (minimum
10 Literature survey
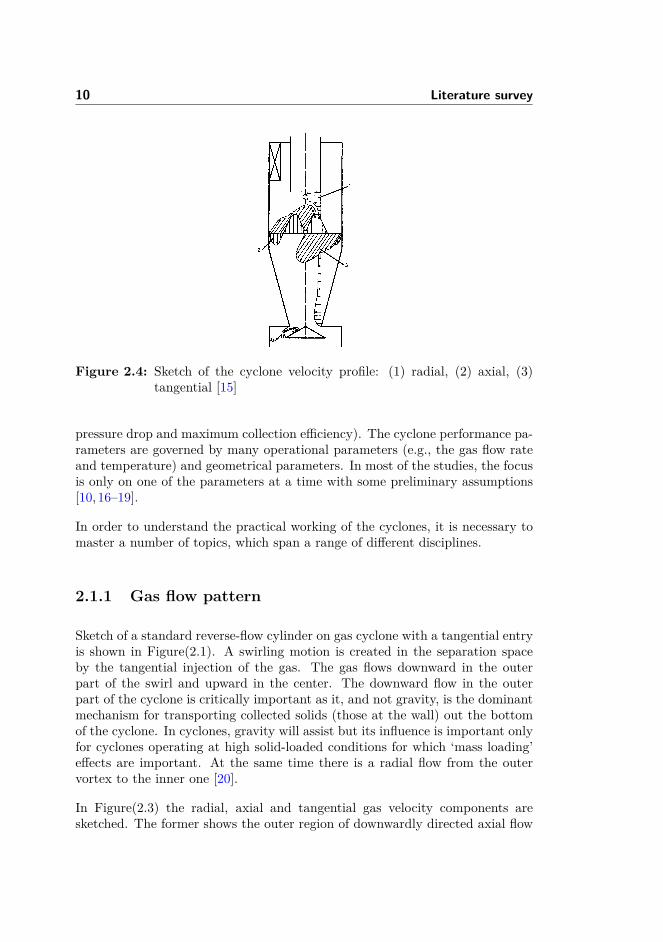
Figure 2.4: Sketch of the cyclone velocity profile: (1) radial, (2) axial, (3)tangential [15]
pressure drop and maximum collection efficiency). The cyclone performance pa-rameters are governed by many operational parameters (e.g., the gas flow rateand temperature) and geometrical parameters. In most of the studies, the focusis only on one of the parameters at a time with some preliminary assumptions[10,16–19].
In order to understand the practical working of the cyclones, it is necessary tomaster a number of topics, which span a range of different disciplines.
2.1.1 Gas flow pattern
Sketch of a standard reverse-flow cylinder on gas cyclone with a tangential entryis shown in Figure(2.1). A swirling motion is created in the separation spaceby the tangential injection of the gas. The gas flows downward in the outerpart of the swirl and upward in the center. The downward flow in the outerpart of the cyclone is critically important as it, and not gravity, is the dominantmechanism for transporting collected solids (those at the wall) out the bottomof the cyclone. In cyclones, gravity will assist but its influence is important onlyfor cyclones operating at high solid-loaded conditions for which ‘mass loading’effects are important. At the same time there is a radial flow from the outervortex to the inner one [20].
In Figure(2.3) the radial, axial and tangential gas velocity components aresketched. The former shows the outer region of downwardly directed axial flow
2.1 Cyclone Principles 11
and the inner one of upwardly directed flow. As mentioned, the downward ve-locity at the wall is the primary mechanism for particle transport out of the dustoutlet. The axial velocity often shows a dip around the center line. Sometimesthis is so severe that the flow there is downwardly directed. The tangentialvelocity profile resembles a Rankine vortex: a near swirl surrounding a core ofnear solid-body rotation [20].
There are limited studies about the radial velocity. It is generally inwardlydirected below the lip of the vortex tube and not uniform with height. Radialvelocity is generally much smaller than the tangential velocity and more difficultto measure accurately.
2.1.2 Particle flow pattern
Studying the particle flow pattern is not easy experimentally. The reason is thatparticles entering the separation space are subject to an inwardly directed dragand an outwardly directed centrifugal force. The separation space starts at thepoint where the incoming gas first experiences rotational flow and the particlescarried along in this gas flow first experience a centrifugal force acting radiallyoutwards. This point varies with inlet design and may start, for example, at theleading edge of an inlet scroll or helix upstream of the upper barrel section ofthe proper cyclone.
Irrespectively, the centrifugal force is proportional to the particle mass and,therefore, the cube of the particle diameter: dp
3. The drag force, which is dueto the flow of gas from the outer to the inner part of the vortex, is proportionalto dp, at least, when Stokes’ law applies (Re P<1) which often does in practice.The largest particles are, therefore, the easiest to separate.
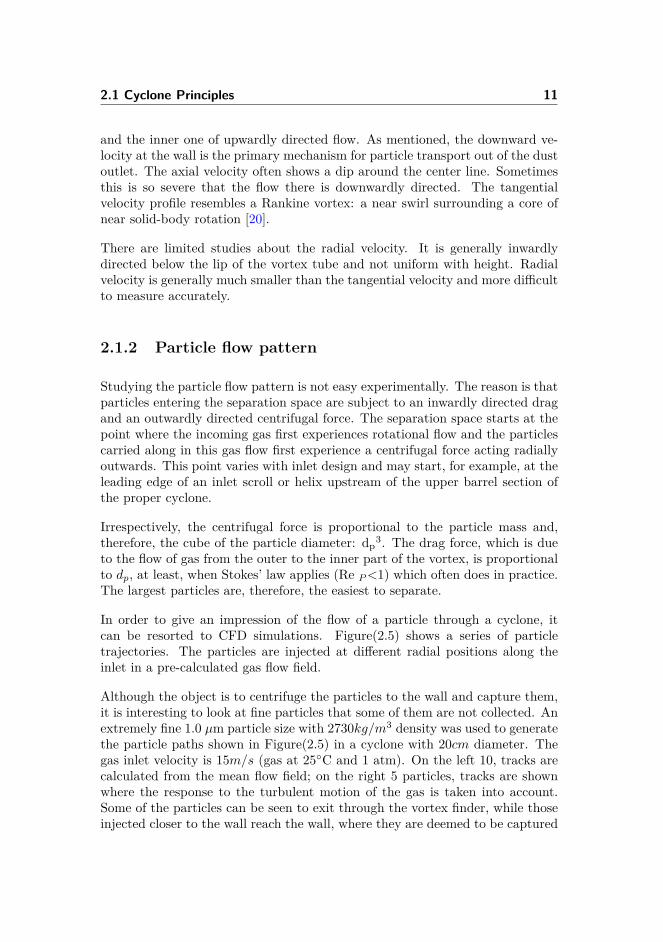
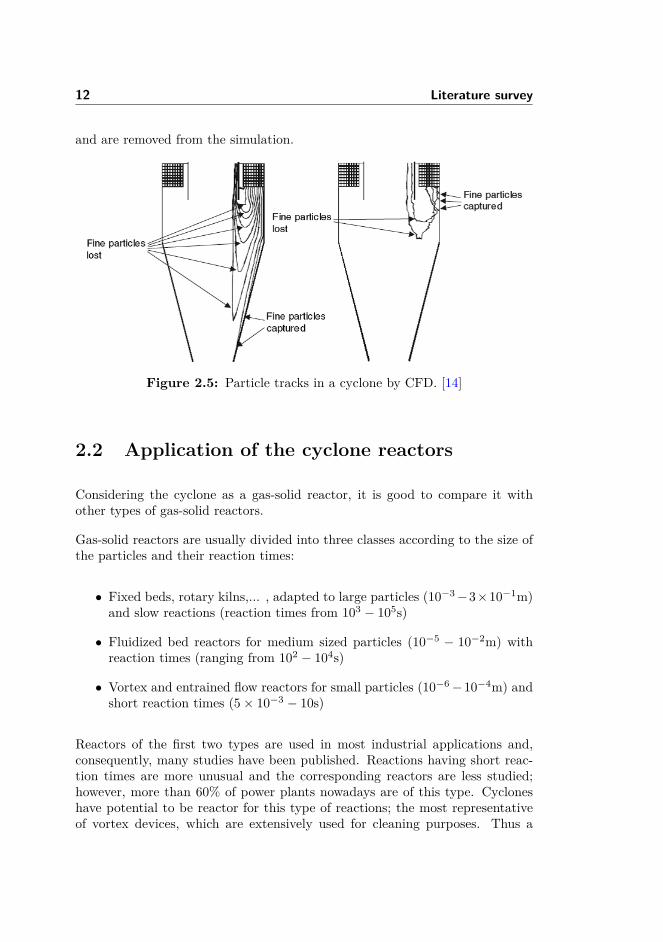
In order to give an impression of the flow of a particle through a cyclone, itcan be resorted to CFD simulations. Figure(2.5) shows a series of particletrajectories. The particles are injected at different radial positions along theinlet in a pre-calculated gas flow field.
Although the object is to centrifuge the particles to the wall and capture them,it is interesting to look at fine particles that some of them are not collected. Anextremely fine 1.0 µm particle size with 2730kg/m3 density was used to generatethe particle paths shown in Figure(2.5) in a cyclone with 20cm diameter. Thegas inlet velocity is 15m/s (gas at 25C and 1 atm). On the left 10, tracks arecalculated from the mean flow field; on the right 5 particles, tracks are shownwhere the response to the turbulent motion of the gas is taken into account.Some of the particles can be seen to exit through the vortex finder, while thoseinjected closer to the wall reach the wall, where they are deemed to be captured
12 Literature survey
and are removed from the simulation.
Figure 2.5: Particle tracks in a cyclone by CFD. [14]
2.2 Application of the cyclone reactors
Considering the cyclone as a gas-solid reactor, it is good to compare it withother types of gas-solid reactors.
Gas-solid reactors are usually divided into three classes according to the size ofthe particles and their reaction times:
• Fixed beds, rotary kilns,... , adapted to large particles (10−3−3×10⁻¹m)and slow reactions (reaction times from 103 − 105s)
• Fluidized bed reactors for medium sized particles (10−5 − 10−2m) withreaction times (ranging from 102 − 104s)
• Vortex and entrained flow reactors for small particles (10−6−10−4m) andshort reaction times (5× 10⁻³ − 10s)
Reactors of the first two types are used in most industrial applications and,consequently, many studies have been published. Reactions having short reac-tion times are more unusual and the corresponding reactors are less studied;however, more than 60% of power plants nowadays are of this type. Cycloneshave potential to be reactor for this type of reactions; the most representativeof vortex devices, which are extensively used for cleaning purposes. Thus a
2.2 Application of the cyclone reactors 13
detailed study of the application of the cyclone reactor provides a better un-derstanding of more industrial applications. In this section, first the publishedapplications of the cyclone reactor will be preset and then factors affecting thecyclone reactors will be discussed in general.
The first studies by Szekely [21] have shown that cyclones seem to ensure ex-cellent heat transfer efficiencies between carrier gas, solid particles and heatedwalls. Moreover, residence times in cyclones are generally of the order of or lowerthan a few seconds. Consequently, it can be anticipated that cyclones wouldbe well suited for carrying out fast reactions of solid particles requiring highheat fluxes. At the same time, it could be expected that solid byproducts andunreacted particles would be automatically separated from gaseous products.
One of the required conditions to achieve reaction inside the cyclones is to heatup reactant under high heat fluxes. It thus seems that the cyclone is well adaptedto such a reaction, five main functions being fulfilled in the same vessel: fastheating of the particles, chemical decomposition, efficient friction of the particlesagainst the walls which eliminates the products, further reactions of the primaryproducts (at the walls or in the gas phase), and cleaning of the evolved gas (forexample, char and mineral ashes being automatically separated at the bottomof the reactor) [22].
The potential applications of this type of reactor are now being extended tovarious chemical reactions such as reduction of iron [2], combustion and gasifi-cation [4,5], coal pyrolysis [3], flash hydropyrolysis [23], flash pyrolysis [22] fastpyrolysis of biomass [24], pyrolysis of bitumen-impregnated sandstone [25], fluidcatalytic cracking [6] and niobium powder production [26]. Some of the mostrelevant cases are briefly presented in this section.
2.2.1 Fluid Catalytic Cracking in cyclone
Usually, the Fluid Catalytic Cracking (FCC) technology in the petroleum in-dustry uses riser reactors. Risers have various shortcomings, such as backmixingof particles due to gravity, particle clustering and radial segregation of solids,long residence time, gas and coke formation problem, etc. With the increase inthe demand for light oil, people pay more attention to improving on traditionalrisers and even develop new types [6].
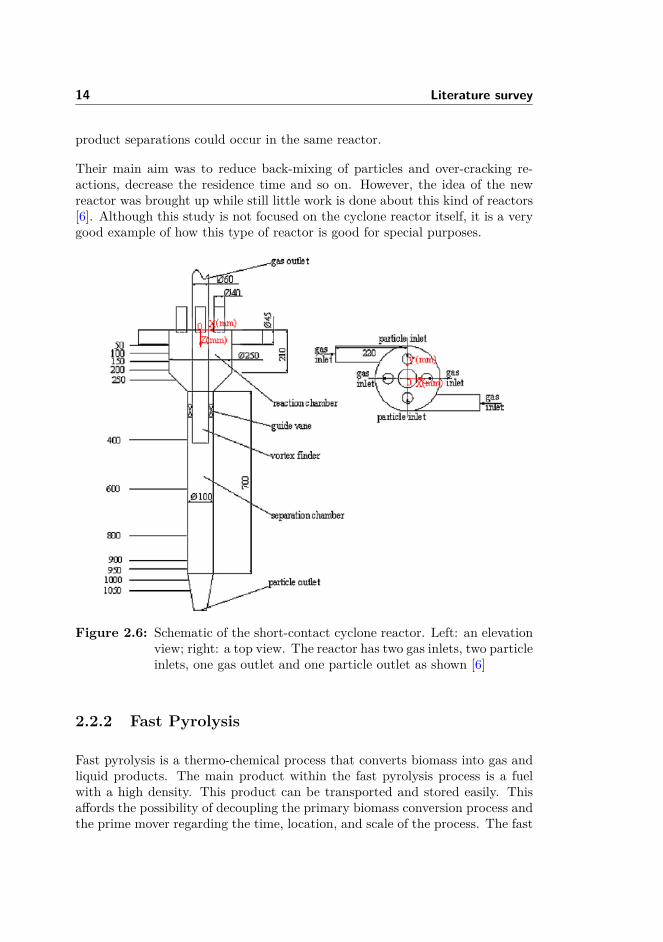
A new reactor for fast gas-solid reactions named short-contact cyclone reactorwas developed on a pilot scale to improve reaction selectivity and facilitate themulti-functional purpose of the petroleum refining industry. The new reactormainly includes two parts: reaction chamber and separation chamber. Thetypical structure is shown in Figure(2.6). The gas-solid catalytic reactions and
14 Literature survey
product separations could occur in the same reactor.
Their main aim was to reduce back-mixing of particles and over-cracking re-actions, decrease the residence time and so on. However, the idea of the newreactor was brought up while still little work is done about this kind of reactors[6]. Although this study is not focused on the cyclone reactor itself, it is a verygood example of how this type of reactor is good for special purposes.
Figure 2.6: Schematic of the short-contact cyclone reactor. Left: an elevationview; right: a top view. The reactor has two gas inlets, two particleinlets, one gas outlet and one particle outlet as shown [6]
2.2.2 Fast Pyrolysis
Fast pyrolysis is a thermo-chemical process that converts biomass into gas andliquid products. The main product within the fast pyrolysis process is a fuelwith a high density. This product can be transported and stored easily. Thisaffords the possibility of decoupling the primary biomass conversion process andthe prime mover regarding the time, location, and scale of the process. The fast

2.2 Application of the cyclone reactors 15
pyrolysis technology can have relatively low investment costs and high energyefficiencies compared with other processes, especially on a small scale [24].
Fast-pyrolysis cleaning and high temperature gas cleaning integrate in one unit.This integrated unit consists of a vortex reactor (a cyclone) with a rotatingparticle separator Figure(2.7) [24].
In the reactor, the biomass and the heat carrier are in direct contact, so efficientheat transfer can take place. During the transport downwards in the reactor, thebiomass particles are dried, heated up and devolatilized. The average processtemperature is 450− 550C. The typical gas residence time in the reactor is 0.5to 1 sec, so secondary cracking in the reactor is prevented. In the gas outlet,in the middle of the cyclone reactor, the fine solid particles are removed fromthe oil vapor by the rotational particle separator. In this separator the micronparticles are captured in a bundle of channels with small diameters, rotatingaround a common axis. The collected particles stick to the channel walls untilthey are periodically removed online and the reactor is left with the main solidstream at the lower outlet of the cyclone. A scheme of the novel reactor is givenFigure(2.7).
In the following study, the flash pyrolysis of wood sawdust is carried out in acyclone reactor with steam as carrier gas between 893 and 1330K [22].
Figure 2.7: A simplified scheme of Pyrolysis reactor [24]
16 Literature survey
2.2.3 pulverized coal combustion and gasification
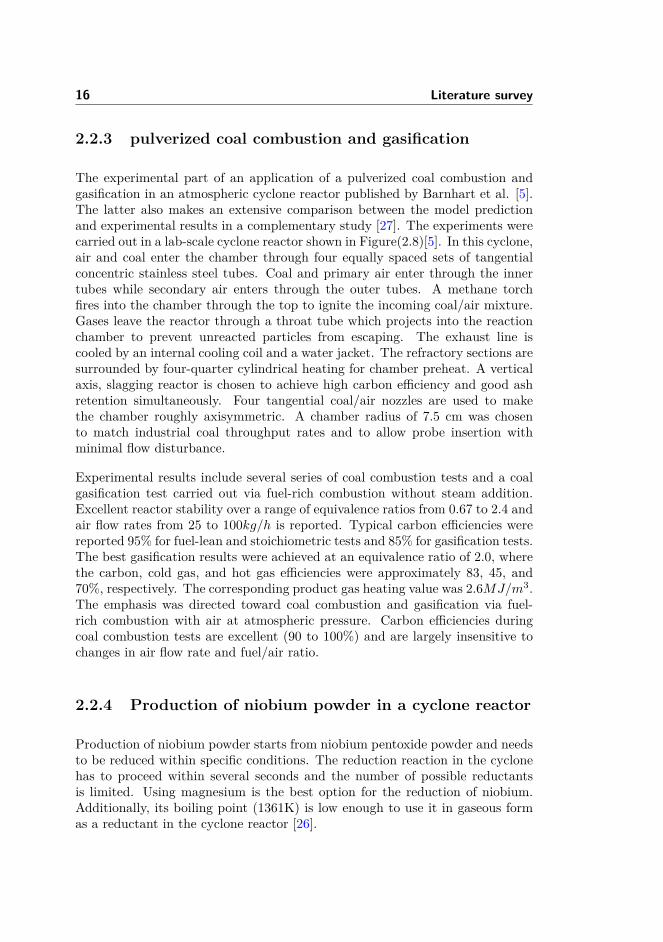
The experimental part of an application of a pulverized coal combustion andgasification in an atmospheric cyclone reactor published by Barnhart et al. [5].The latter also makes an extensive comparison between the model predictionand experimental results in a complementary study [27]. The experiments werecarried out in a lab-scale cyclone reactor shown in Figure(2.8)[5]. In this cyclone,air and coal enter the chamber through four equally spaced sets of tangentialconcentric stainless steel tubes. Coal and primary air enter through the innertubes while secondary air enters through the outer tubes. A methane torchfires into the chamber through the top to ignite the incoming coal/air mixture.Gases leave the reactor through a throat tube which projects into the reactionchamber to prevent unreacted particles from escaping. The exhaust line iscooled by an internal cooling coil and a water jacket. The refractory sections aresurrounded by four-quarter cylindrical heating for chamber preheat. A verticalaxis, slagging reactor is chosen to achieve high carbon efficiency and good ashretention simultaneously. Four tangential coal/air nozzles are used to makethe chamber roughly axisymmetric. A chamber radius of 7.5 cm was chosento match industrial coal throughput rates and to allow probe insertion withminimal flow disturbance.
Experimental results include several series of coal combustion tests and a coalgasification test carried out via fuel-rich combustion without steam addition.Excellent reactor stability over a range of equivalence ratios from 0.67 to 2.4 andair flow rates from 25 to 100kg/h is reported. Typical carbon efficiencies werereported 95% for fuel-lean and stoichiometric tests and 85% for gasification tests.The best gasification results were achieved at an equivalence ratio of 2.0, wherethe carbon, cold gas, and hot gas efficiencies were approximately 83, 45, and70%, respectively. The corresponding product gas heating value was 2.6MJ/m3.The emphasis was directed toward coal combustion and gasification via fuel-rich combustion with air at atmospheric pressure. Carbon efficiencies duringcoal combustion tests are excellent (90 to 100%) and are largely insensitive tochanges in air flow rate and fuel/air ratio.
2.2.4 Production of niobium powder in a cyclone reactor
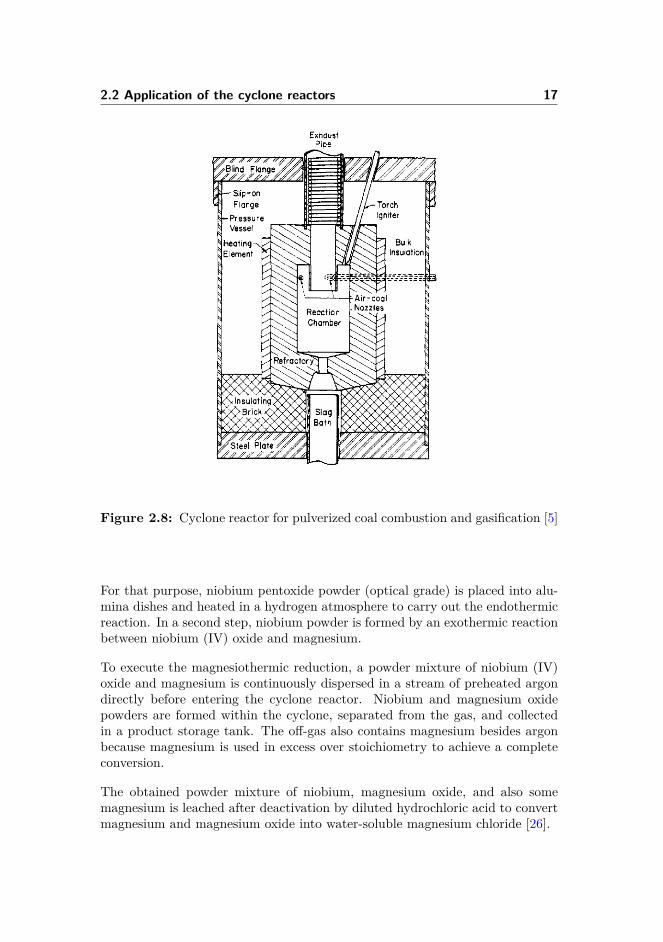
Production of niobium powder starts from niobium pentoxide powder and needsto be reduced within specific conditions. The reduction reaction in the cyclonehas to proceed within several seconds and the number of possible reductantsis limited. Using magnesium is the best option for the reduction of niobium.Additionally, its boiling point (1361K) is low enough to use it in gaseous formas a reductant in the cyclone reactor [26].
2.2 Application of the cyclone reactors 17
Figure 2.8: Cyclone reactor for pulverized coal combustion and gasification [5]
For that purpose, niobium pentoxide powder (optical grade) is placed into alu-mina dishes and heated in a hydrogen atmosphere to carry out the endothermicreaction. In a second step, niobium powder is formed by an exothermic reactionbetween niobium (IV) oxide and magnesium.
To execute the magnesiothermic reduction, a powder mixture of niobium (IV)oxide and magnesium is continuously dispersed in a stream of preheated argondirectly before entering the cyclone reactor. Niobium and magnesium oxidepowders are formed within the cyclone, separated from the gas, and collectedin a product storage tank. The off-gas also contains magnesium besides argonbecause magnesium is used in excess over stoichiometry to achieve a completeconversion.
The obtained powder mixture of niobium, magnesium oxide, and also somemagnesium is leached after deactivation by diluted hydrochloric acid to convertmagnesium and magnesium oxide into water-soluble magnesium chloride [26].
18 Literature survey
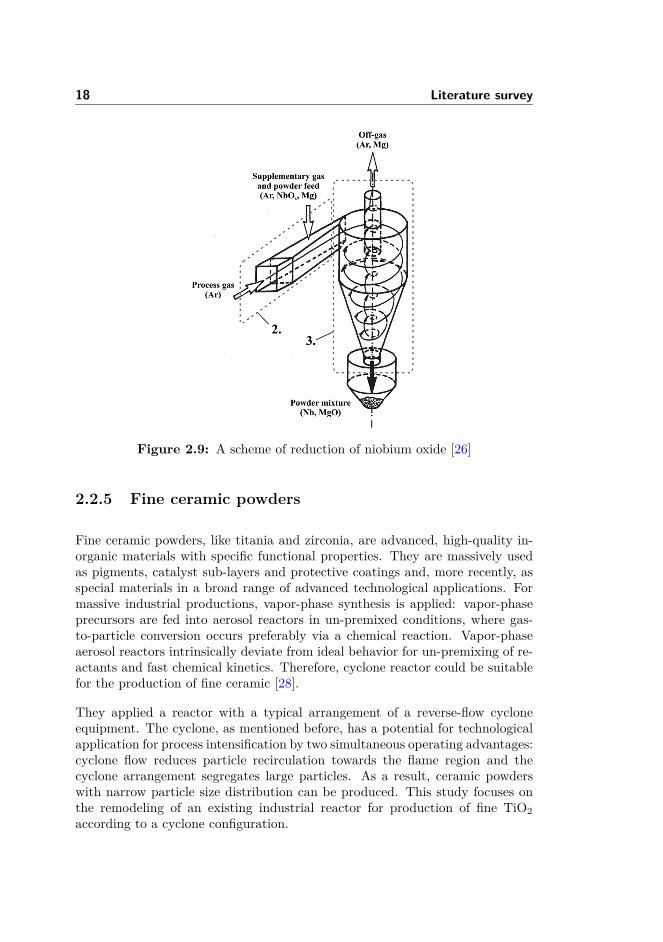
Figure 2.9: A scheme of reduction of niobium oxide [26]
2.2.5 Fine ceramic powders
Fine ceramic powders, like titania and zirconia, are advanced, high-quality in-organic materials with specific functional properties. They are massively usedas pigments, catalyst sub-layers and protective coatings and, more recently, asspecial materials in a broad range of advanced technological applications. Formassive industrial productions, vapor-phase synthesis is applied: vapor-phaseprecursors are fed into aerosol reactors in un-premixed conditions, where gas-to-particle conversion occurs preferably via a chemical reaction. Vapor-phaseaerosol reactors intrinsically deviate from ideal behavior for un-premixing of re-actants and fast chemical kinetics. Therefore, cyclone reactor could be suitablefor the production of fine ceramic [28].
They applied a reactor with a typical arrangement of a reverse-flow cycloneequipment. The cyclone, as mentioned before, has a potential for technologicalapplication for process intensification by two simultaneous operating advantages:cyclone flow reduces particle recirculation towards the flame region and thecyclone arrangement segregates large particles. As a result, ceramic powderswith narrow particle size distribution can be produced. This study focuses onthe remodeling of an existing industrial reactor for production of fine TiO2according to a cyclone configuration.
2.3 Modeling of gas-solid cyclone reactors 19
As it is reported, the quality of the metal-oxide-synthesized powders is signif-icantly affected by fluid dynamics. Therefore, an aerosol cyclone reactor hasbeen proposed and tested. Results show that final product with a narrow par-ticle size distribution can be obtained with this proposed cyclone reactor. Tosupport the idea, some simulation and evaluation were also presented in thesame paper which confirms the improvements by using cyclone reactor for suchsystems.
As a general discussion when used as a gas-solid reactor, this type of devicecan enhance the conversion of the reactants by increasing the residence timeof the solid reactants due to swirling motion. Calculation of the performanceparameters of the cyclone reactors generally needs reliable information about theflow pattern, the heat and mass transfer efficiencies, and thermodynamics andkinetics of the chemical reactions to be carried out in the process. In addition tothe common cyclone parameters, reaction parameters must also be consideredin the cyclone reaction chamber.
In the next section, modeling studies on gas-solid cyclone reactors will be pre-sented briefly. Also, the technical review of the cyclones and cyclone reactorsleads to a general overview of both practical and modeling tools, and how eachproceeds within the scientific and industrial approaches will be reviewed.
2.3 Modeling of gas-solid cyclone reactors
Cyclone geometry, particle properties and operational conditions are used asinputs to make a good approximation for operational cyclone parameters. Thebasis of the available algebraic models is approximations of the velocity fieldwithin the cyclones. The most common models for describing the velocity fieldhave been developed by Barth [29], Alexander [30] and Muschelknautz [31].Based on the velocity field, expressions and methods for determining the cut-size diameter have been suggested by several authors, including Barth [29],Muschelknautz [31], Lapple [32,33] and Leiht [34]. Here instead of the commonmodeling of the cyclone, models developed for the cyclone reactors are reviewed.
First, analytical and experimental modeling related to the hydrodynamics ofthe cyclones is presented. Then, a chemical reaction in cyclone reactors isreviewed as phenomenological models. The aim of this part is to find a wayfor the simplification of very complex phenomena inside the cyclone reactors.To provide a comprehensive background for the state of the art of the cyclonereactors, both analytical and numerical studies are discussed here. It is necessaryto have a brief knowledge of different approaches and models even though thefocus is on the computational fluid dynamic modeling in this Ph.D. project.
20 Literature survey
2.3.1 Analytical modeling of the cyclone reactors
There are fewer studies on modeling of the cyclone reactors because of thelarge number of unknown processes involved such as hydrodynamics, transferresistances and chemical reaction. In this part, the previous experimental andanalytical experience will be reviewed.
The first four models developed for combustion of pulverized coal in a cyclonereactor are cyclone coal combustion, cyclone char combustor, cyclone gasifierand the macroscopic model of the cyclone reactor.
A cyclone coal combustion model is developed based on fluid dynamics andparticle-gas interactions. Simple approximations are used for pyrolysis andchar particle combustion. However, a sophisticated fluid mechanic treatmentincludes a four-region model of the reaction chamber in which the basic conver-sion equations are simplified for each region by appropriate assumptions. Thewall-adjacent region is found to be by far the most important since particleloading and chemical reactions are concentrated in this zone. Important outputparameters from the model include carbon conversion efficiency, ash retention,pressure drop, and radiative and convective heat loss. This investigation re-ported good agreement with limited experimental data from a cyclone operatedby the Pittsburg Energy Research Center [27].
Following the coal combustion, a cyclone char combustor model is developedwith direct analysis of the governing mass, momentum, and energy equations.The equations are non-dimensionalized, and an order of magnitude analysis isperformed to determine the significant dimensionless parameters with an eye to-ward simplifying scale-up of laboratory cyclone reactors. Among the dimension-less groups found to be important are the swirl number, particle loading ratio,the Biot modulus, and a reaction time/residence time ratio. This study suggestsa useful correlation procedure, but the absence of any gasification chemistry orpredictive potential limits the applicability of the model [27].
A parametric analysis of a cyclone gasifier by developing broad assumptions iscarried out. This model gives closed form solutions to the continuity, momen-tum, and species conservation equations. In this model, the energy equationis eliminated in favor of an estimated reactor temperature of 2200K. Particlesare assumed to reside only in the wall-adjacent region, making a detailed de-scription of the bulk fluid flow unnecessary. Parameters that are systematicallyvaried include the gasification rate coefficients, swirl number, and coal massfraction pyrolyzed. Swirl number proved to be of great importance through itseffect on mass transfer rates since the gasification reactions were presumed to bediffusion-controlled. A commonly cited virtue of swirl burners is long particleresidence time; however, the authors point out that increasing residence time is
2.3 Modeling of gas-solid cyclone reactors 21
beneficial only if the mass transfer rate is sufficient to keep gasification productsswept away from the particle surface [27].
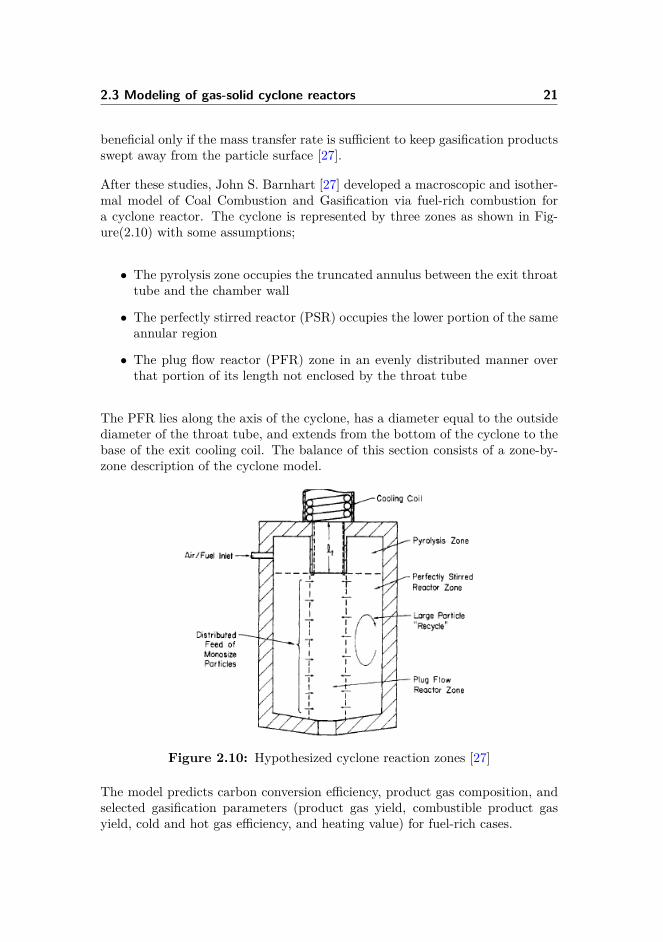
After these studies, John S. Barnhart [27] developed a macroscopic and isother-mal model of Coal Combustion and Gasification via fuel-rich combustion fora cyclone reactor. The cyclone is represented by three zones as shown in Fig-ure(2.10) with some assumptions;
• The pyrolysis zone occupies the truncated annulus between the exit throattube and the chamber wall
• The perfectly stirred reactor (PSR) occupies the lower portion of the sameannular region
• The plug flow reactor (PFR) zone in an evenly distributed manner overthat portion of its length not enclosed by the throat tube
The PFR lies along the axis of the cyclone, has a diameter equal to the outsidediameter of the throat tube, and extends from the bottom of the cyclone to thebase of the exit cooling coil. The balance of this section consists of a zone-by-zone description of the cyclone model.
Figure 2.10: Hypothesized cyclone reaction zones [27]
The model predicts carbon conversion efficiency, product gas composition, andselected gasification parameters (product gas yield, combustible product gasyield, cold and hot gas efficiency, and heating value) for fuel-rich cases.
22 Literature survey
Modeling of fuel-rich gasification would be improved by the inclusion of mecha-nisms for char oxidation by steam and carbon dioxide. Further modifications tothe model are prompted by more detailed exhaust data and internal temperatureand composition profiles, particularly from industrial-scale reactors.
2.3.2 Phenomenological model
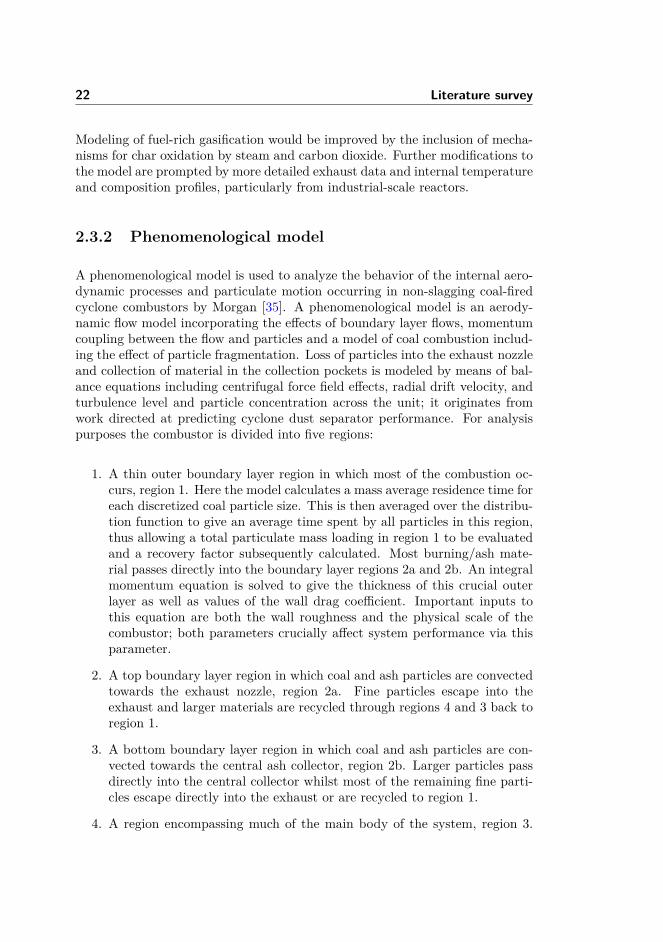
A phenomenological model is used to analyze the behavior of the internal aero-dynamic processes and particulate motion occurring in non-slagging coal-firedcyclone combustors by Morgan [35]. A phenomenological model is an aerody-namic flow model incorporating the effects of boundary layer flows, momentumcoupling between the flow and particles and a model of coal combustion includ-ing the effect of particle fragmentation. Loss of particles into the exhaust nozzleand collection of material in the collection pockets is modeled by means of bal-ance equations including centrifugal force field effects, radial drift velocity, andturbulence level and particle concentration across the unit; it originates fromwork directed at predicting cyclone dust separator performance. For analysispurposes the combustor is divided into five regions:
1. A thin outer boundary layer region in which most of the combustion oc-curs, region 1. Here the model calculates a mass average residence time foreach discretized coal particle size. This is then averaged over the distribu-tion function to give an average time spent by all particles in this region,thus allowing a total particulate mass loading in region 1 to be evaluatedand a recovery factor subsequently calculated. Most burning/ash mate-rial passes directly into the boundary layer regions 2a and 2b. An integralmomentum equation is solved to give the thickness of this crucial outerlayer as well as values of the wall drag coefficient. Important inputs tothis equation are both the wall roughness and the physical scale of thecombustor; both parameters crucially affect system performance via thisparameter.
2. A top boundary layer region in which coal and ash particles are convectedtowards the exhaust nozzle, region 2a. Fine particles escape into theexhaust and larger materials are recycled through regions 4 and 3 back toregion 1.
3. A bottom boundary layer region in which coal and ash particles are con-vected towards the central ash collector, region 2b. Larger particles passdirectly into the central collector whilst most of the remaining fine parti-cles escape directly into the exhaust or are recycled to region 1.
4. A region encompassing much of the main body of the system, region 3.
2.3 Modeling of gas-solid cyclone reactors 23
Here centrifugal forces dominate, particulate loading is small, whilst largerrecirculating coal particles from regions 2a and 2b are flung back intoregion 1. Only very fine ash can be suspended in this region.
5. A central region of flow extending downwards from the outlet region, re-gion 4. This is essentially a plug flow region under combustion conditions.A reverse flow/recirculation zone may be formed in the end of the exhaustnozzle as well as substantial tangential velocity gradients, but these havelittle influence on region 4 inside the cyclone combustor.
Figure 2.11: Analysis Zones and Particle Flows [35]
A non-slagging cyclone combustor operates normally fuel-rich at a mixture ratioof about 0.7 to maintain cyclone chamber gas temperatures below 1300C andwall temperatures at about 1100C. With crushed coal of size range dm ∼=200 − 400 µm 90% < 1mm, having a high ash fusion temperature, good fuelburnout and retention of particles larger than 30µm in the cyclone chamber hasbeen demonstrated. The long residence times of material in the outer regionsof the cyclone chamber cause a large slip velocity between that of the inlet andthe main vortex in the cyclone chamber and this factor affects the design of thetangential inlet.
In this study, burnout of the gasified products of combustion is achieved in asecondary combustor, and Low NOx emissions derive from the low operatingtemperatures of the primary cyclone chamber.
In this section, modeling aspects and assumptions are briefly discussed consid-ering a few papers which study the modeling of the cyclone reactors mostly for
24 Literature survey
combustion purposes. However, the application of the cyclone reactors in theformer section shows more industrial potentials and tendencies for using cyclonereactors. This altogether encourages the demand for more detailed studies oncyclone reactor and its potentials and advantages that could be further appliedto gain more knowledge either in experimental investigations or modeling stud-ies. The general idea of using cyclone reactors can be definitely developed whenthe flow pattern behavior and kinetic effects of reactant residence time will beclarified with a more practical approach. This Ph.D. project follows this objec-tive and hence needs to propose a specific reaction which is doable in cyclonereactor and can be applied further in the industries based on the most recentdemands.
With increasing demand for NOx emission control, in the next section NOxemission and De-NOx methods will be reviewed. Then, background study onselective non-catalytic reduction (SNCR) as a selected reaction for this Ph.D.study will be presented.
2.4 Selective Non-Catalytic Reduction (SNCR):
In this section, general NOx emission sources will be reviewed, and the generalDe-NOx techniques will be briefly discussed as an introductory part to selectivenon-catalytic reduction (SNCR) method that is a core part of this study. TheSNCR method will be described in more detail, and the effect of parameters onNOx reduction will be discussed thoroughly.
2.4.1 NOx Emission and De-NOx methods
There are a number of oxides of nitrogen, including nitrous oxide, N2O, nitricoxide, NO, nitrogen dioxide, NO2, nitrogen trioxide, N2O3, and nitrogen pen-toxide, N2O5, that are referred to collectively as NOx. The three oxides ofnitrogen that are of primary concern to air pollution are NO, NO2 and N2O.NO is a colorless gas that is a precursor to NO2 and is an active compound inphotochemical reactions that produce smog. NO2 is a reddish-brown gas thatgives color to smog and can contribute to opacity in flue gas plumes from stacks.
NO2 is a criteria pollutant with a National Ambient Air Quality Standard of100µg/m3 , or 0.053 ppm, annual average [36]. It is also a precursor to nitricacid and HNO3 in the atmosphere and is a major contributor to acid rain.
By far the largest source of NOx is combustion, although there are other indus-
2.4 Selective Non-Catalytic Reduction (SNCR): 25
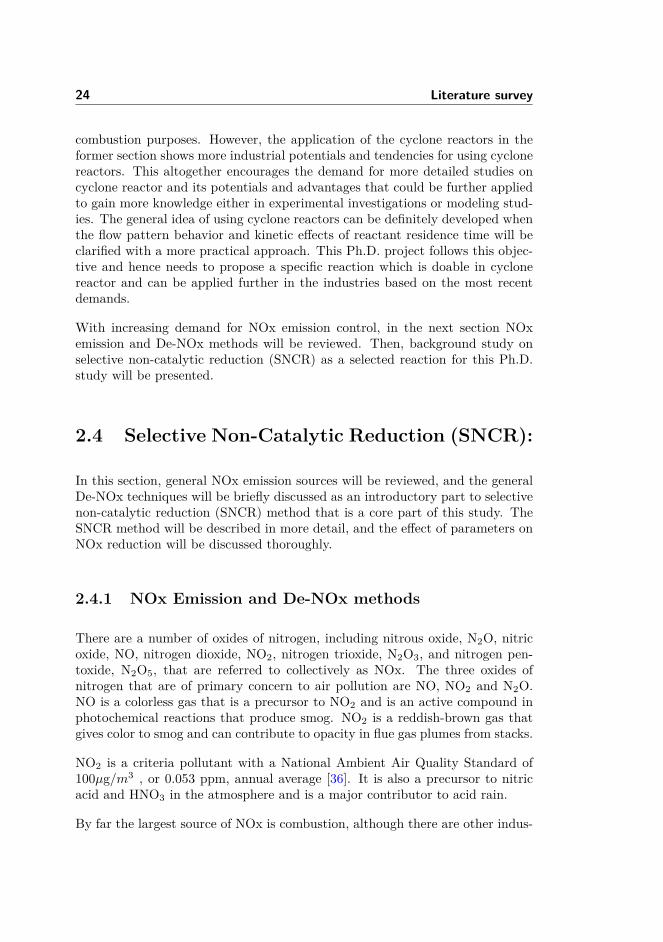
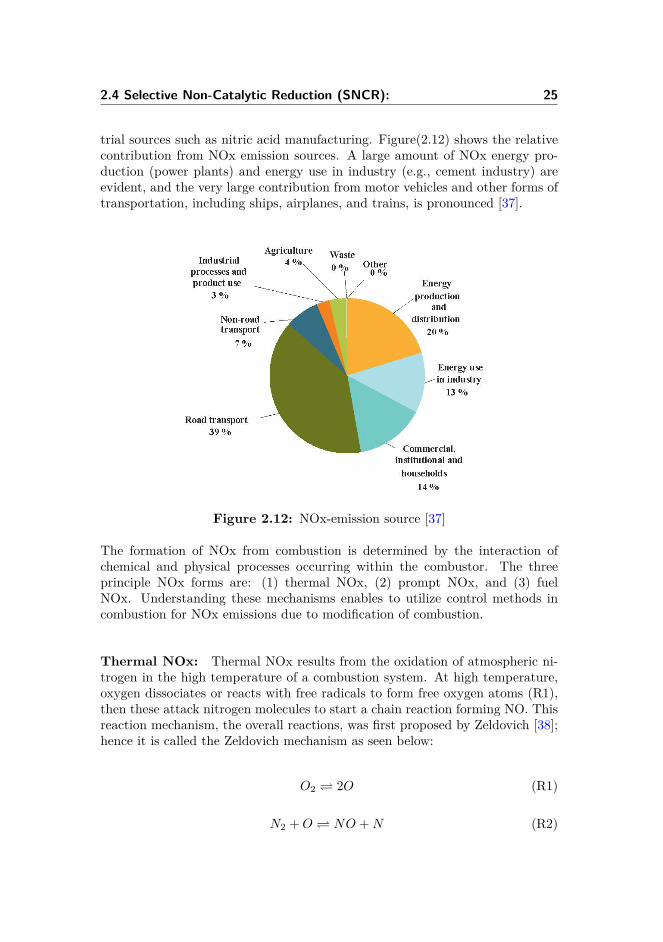
trial sources such as nitric acid manufacturing. Figure(2.12) shows the relativecontribution from NOx emission sources. A large amount of NOx energy pro-duction (power plants) and energy use in industry (e.g., cement industry) areevident, and the very large contribution from motor vehicles and other forms oftransportation, including ships, airplanes, and trains, is pronounced [37].
Figure 2.12: NOx-emission source [37]
The formation of NOx from combustion is determined by the interaction ofchemical and physical processes occurring within the combustor. The threeprinciple NOx forms are: (1) thermal NOx, (2) prompt NOx, and (3) fuelNOx. Understanding these mechanisms enables to utilize control methods incombustion for NOx emissions due to modification of combustion.
Thermal NOx: Thermal NOx results from the oxidation of atmospheric ni-trogen in the high temperature of a combustion system. At high temperature,oxygen dissociates or reacts with free radicals to form free oxygen atoms (R1),then these attack nitrogen molecules to start a chain reaction forming NO. Thisreaction mechanism, the overall reactions, was first proposed by Zeldovich [38];hence it is called the Zeldovich mechanism as seen below:
O2 2O (R1)
N2 +O NO +N (R2)
26 Literature survey
N +O2 NO +O (R3)
So the final reaction that produces NO is (R4):
N2 +O2 2NO (R4)
The overall reaction that produces NO2 is (R5):
NO + 1/2O2 NO2 (R5)
The reaction rate is a strong function of temperature. As an example, by de-creasing the temperature from 1982C to 1760C, the time required to produce500ppm NO increases from 0.1s to 1s [39].
Fuel NOx: Some fuels contain nitrogen, e.g., organically bound nitrogen inhydrocarbon compounds. Nitrogen in the fuel reacts with oxygen. Carbon-nitrogen bonds are broken more easily than diatomic nitrogen bonds, so fuel-NOx formation rates can be higher than thermal-NOx (not at very high temper-atures) in fuels with considerable nitrogen content. Combustion control tech-niques that aim at reducing thermal-NOx formation by reducing flame temper-ature may not be effective for fuels that have high nitrogen content [40].
Prompt NOx: Prompt NOx is the third source of NOx emission attributed tothe reaction of atmospheric nitrogen, N2, with free radicals such as C, CH, andCH2 fragments derived from fuel. Occurring in the earliest stage of combustion,this results in the formation of fixed species of nitrogen such as NH (nitrogenmonohydride), HCN (hydrogen cyanide), H2CN (dihydrogen cyanide) and CN-(cyano radical) which can oxidize to NO.
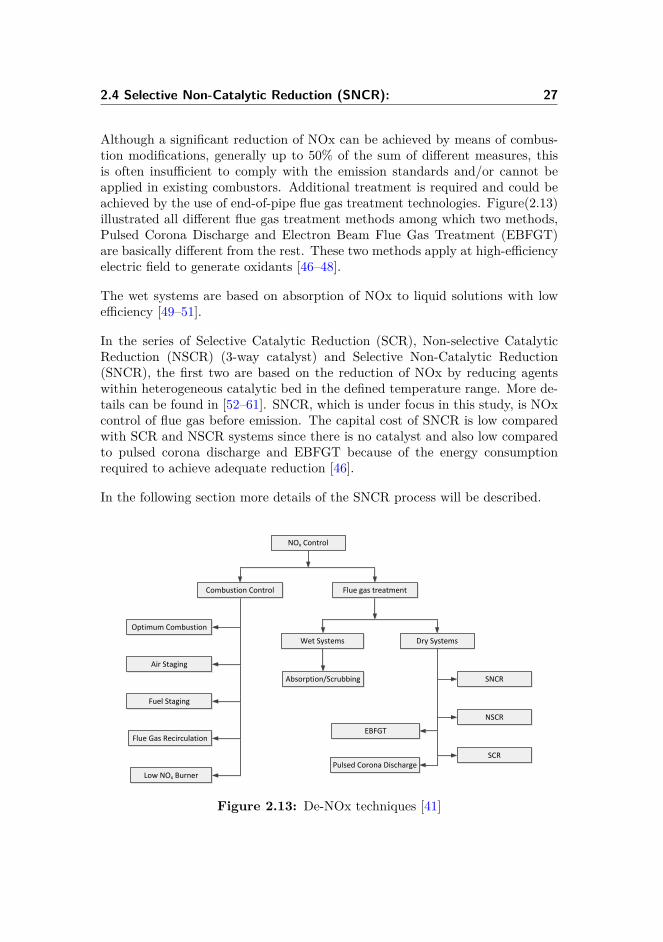
De-NOx techniques: There are various ways to reduce NOx emissions: tem-perature reduction, creation of a combustion environment that restrains NOxformation and end-of-pipe (post-combustion) treatment for removing NOx priorto releasing it into the atmosphere. The two broad categories for the controlof NOx emissions are combustion control and flue gas treatment. Figure(2.13)[41] summarizes the different NOx controlling techniques.
A variety of combustion control techniques are used to limit the formation ofNOx. Some reduce the peak flame temperature, some reduce the oxygen con-centration in the primary flame zone, and one reburn. More details can be foundin [42–45].
2.4 Selective Non-Catalytic Reduction (SNCR): 27
Although a significant reduction of NOx can be achieved by means of combus-tion modifications, generally up to 50% of the sum of different measures, thisis often insufficient to comply with the emission standards and/or cannot beapplied in existing combustors. Additional treatment is required and could beachieved by the use of end-of-pipe flue gas treatment technologies. Figure(2.13)illustrated all different flue gas treatment methods among which two methods,Pulsed Corona Discharge and Electron Beam Flue Gas Treatment (EBFGT)are basically different from the rest. These two methods apply at high-efficiencyelectric field to generate oxidants [46–48].
The wet systems are based on absorption of NOx to liquid solutions with lowefficiency [49–51].
In the series of Selective Catalytic Reduction (SCR), Non-selective CatalyticReduction (NSCR) (3-way catalyst) and Selective Non-Catalytic Reduction(SNCR), the first two are based on the reduction of NOx by reducing agentswithin heterogeneous catalytic bed in the defined temperature range. More de-tails can be found in [52–61]. SNCR, which is under focus in this study, is NOxcontrol of flue gas before emission. The capital cost of SNCR is low comparedwith SCR and NSCR systems since there is no catalyst and also low comparedto pulsed corona discharge and EBFGT because of the energy consumptionrequired to achieve adequate reduction [46].
In the following section more details of the SNCR process will be described.
NOx Control
Optimum Combustion
Air Staging
Fuel Staging
Flue Gas Recirculation
Low NOx Burner
Wet Systems
Absorption/Scrubbing
Dry Systems
SNCR
NSCR
SCR
EBFGT
Pulsed Corona Discharge
Combustion Control Flue gas treatment
Figure 2.13: De-NOx techniques [41]
28 Literature survey
2.4.2 Reducing agent in SNCR
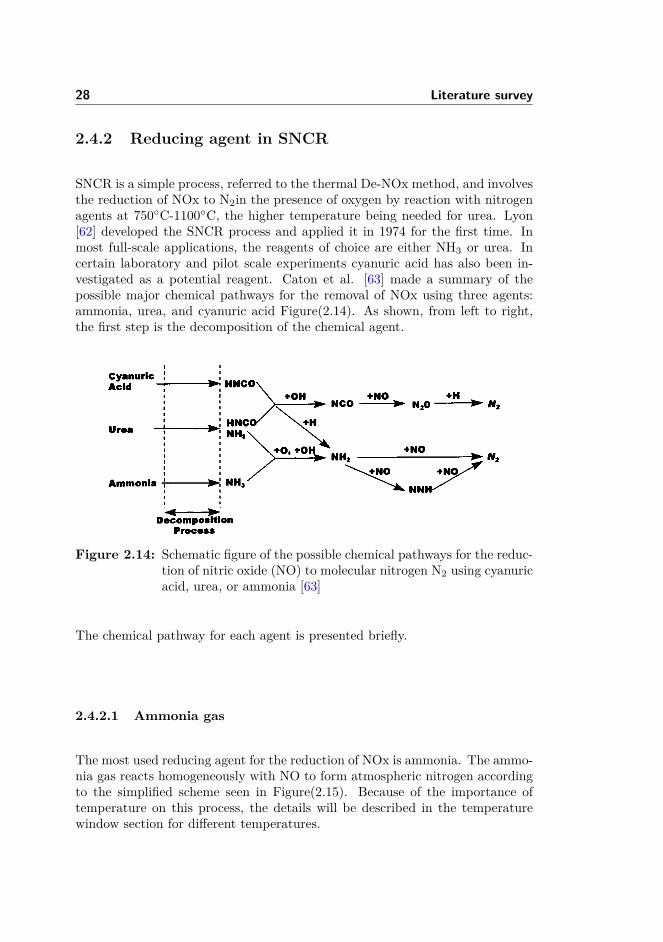
SNCR is a simple process, referred to the thermal De-NOx method, and involvesthe reduction of NOx to N2in the presence of oxygen by reaction with nitrogenagents at 750C-1100C, the higher temperature being needed for urea. Lyon[62] developed the SNCR process and applied it in 1974 for the first time. Inmost full-scale applications, the reagents of choice are either NH3 or urea. Incertain laboratory and pilot scale experiments cyanuric acid has also been in-vestigated as a potential reagent. Caton et al. [63] made a summary of thepossible major chemical pathways for the removal of NOx using three agents:ammonia, urea, and cyanuric acid Figure(2.14). As shown, from left to right,the first step is the decomposition of the chemical agent.
Figure 2.14: Schematic figure of the possible chemical pathways for the reduc-tion of nitric oxide (NO) to molecular nitrogen N2 using cyanuricacid, urea, or ammonia [63]
The chemical pathway for each agent is presented briefly.
2.4.2.1 Ammonia gas
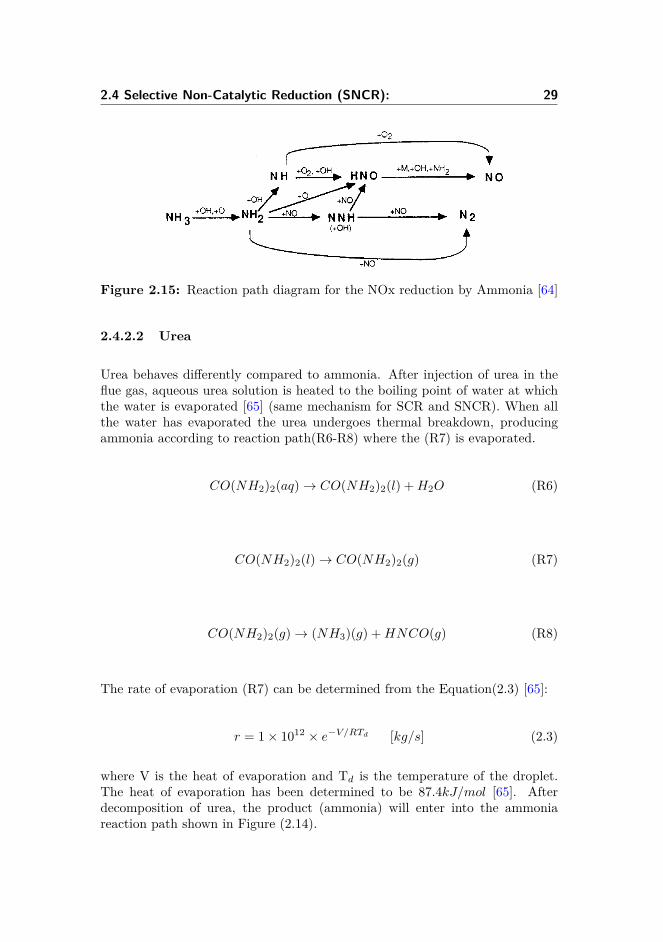
The most used reducing agent for the reduction of NOx is ammonia. The ammo-nia gas reacts homogeneously with NO to form atmospheric nitrogen accordingto the simplified scheme seen in Figure(2.15). Because of the importance oftemperature on this process, the details will be described in the temperaturewindow section for different temperatures.
2.4 Selective Non-Catalytic Reduction (SNCR): 29
Figure 2.15: Reaction path diagram for the NOx reduction by Ammonia [64]
2.4.2.2 Urea
Urea behaves differently compared to ammonia. After injection of urea in theflue gas, aqueous urea solution is heated to the boiling point of water at whichthe water is evaporated [65] (same mechanism for SCR and SNCR). When allthe water has evaporated the urea undergoes thermal breakdown, producingammonia according to reaction path(R6-R8) where the (R7) is evaporated.
CO(NH2)2(aq)→ CO(NH2)2(l) +H2O (R6)
CO(NH2)2(l)→ CO(NH2)2(g) (R7)
CO(NH2)2(g)→ (NH3)(g) +HNCO(g) (R8)
The rate of evaporation (R7) can be determined from the Equation(2.3) [65]:
r = 1× 10¹² × e−V/RTd [kg/s] (2.3)
where V is the heat of evaporation and Td is the temperature of the droplet.The heat of evaporation has been determined to be 87.4kJ/mol [65]. Afterdecomposition of urea, the product (ammonia) will enter into the ammoniareaction path shown in Figure (2.14).
30 Literature survey
According to Miller and Bowman [64], 45% of the formed urea will decomposeto isocyanic acid. This will act to reduce the NOx similar to cyanuric acid.
2.4.2.3 Cyanuric acid
Cyanuric acid (C3H3N3O3) decomposes thermally to isocyanic acid and smallamounts of ammonia. The isocyanic acid enters into the pathway as stated inFigure(2.14).
2.4.3 Effective parameters on SNCR
The SNCR process efficiency relies on temperature, reagent/flue gas mixing,reagent/NOx ratio and oxygen content [66]. SNCR systems reduce NOx emis-sions by 30–90% but the performance is highly variable for different applications.
In this part, effective parameters on SNCR of NOx, mechanism of SNCR andCFD modeling-related studies will be reviewed.
2.4.3.1 The temperature window and Mechanisms of SNCR
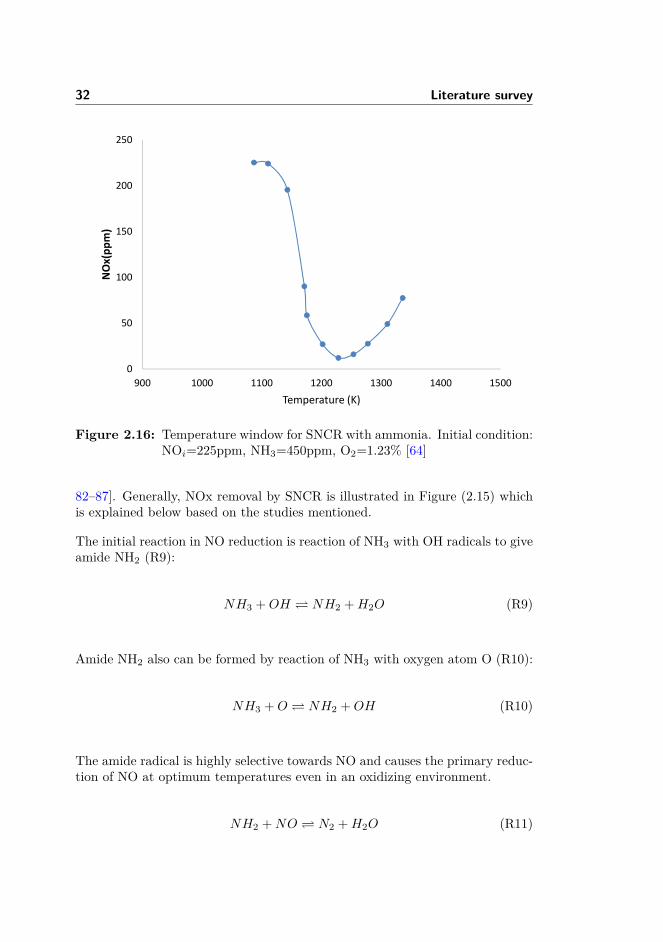
The temperature window is the range of temperatures in which the reductionof NOx takes place. This interval is relatively narrow (750C- 1100C) below750C; the reaction is too slow to give any reduction, and most of the injectedNH3 remains unreacted. At higher temperatures (higher than 1200C) NH3tends to oxidize to form NO [67]. Figure(2.16) shows the experimental results oftemperature window for SNCR with ammonia [64]. The optimum temperatureis approx. 1230K (950C) for this system. Generally, the optimum reductiontemperatures from different observations are in agreement within 50C, varyingroughly between 935 and 985C [67–71].
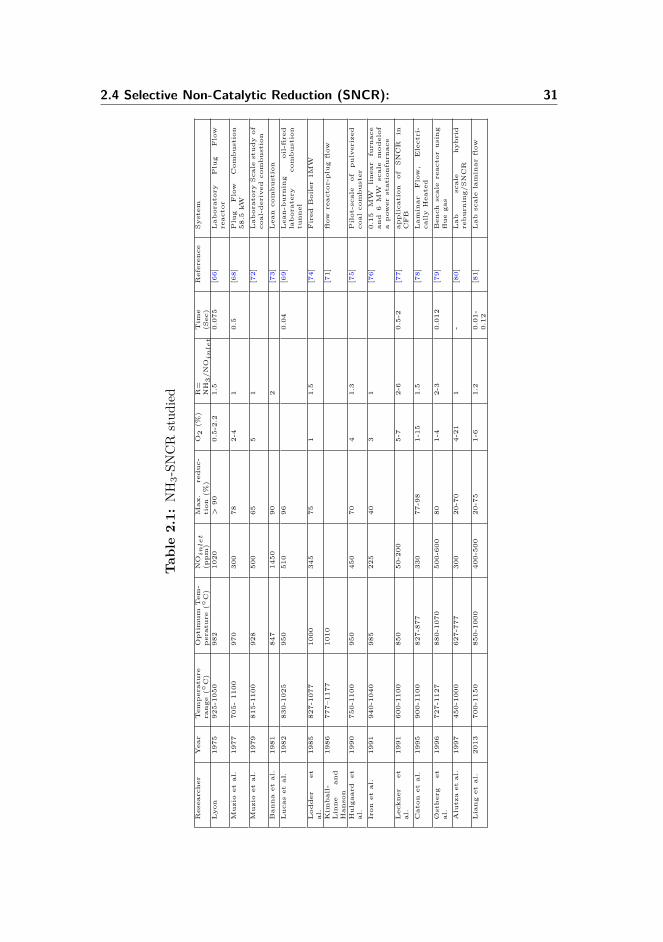
The temperature range depends on some parameters such as flue gas composi-tion (mainly CO and oxygen in low concentration), inlet gas velocity and sys-tem geometry, which influences the mixing between the reagent and the NOx.Therefore, the possibility of NOx removal varies from one system to the other.Table (2.1) shows the temperature ranges and optimum temperatures reportedin various studies [66,68,69,71–81].
Because of the importance and effect of temperature in the kinetic mechanismof reaction, a lot of studies have been done to show the effect of temperature onNH3/NO/O2 on the basis of a kinetic mechanism of chain reactions [64, 70, 72,
2.4 Selective Non-Catalytic Reduction (SNCR): 31
Tab
le2.1:
NH
3-SN
CR
stud
ied
Researcher
Year
Tem
perature
range
(C)
Optimum
Tem
-perature
(C)
NO
in
let
(ppm)
Max
.reduc-
tion
(%)
O2(%
)R=
NH
3/N
Oin
let
Tim
e(Sec)
Reference
System
Lyon
1975
925-1050
982
1020
>90
0.5-2.2
1.5
0.075
[66]
Lab
oratory
Plug
Flow
reactor
Muzioet
al.
1977
705-
1100
970
300
782-4
10.5
[68]
Plug
Flow
Com
bustion
58.5
kWMuzioet
al.
1979
815-1100
928
500
655
1[72]
Lab
oratoryScale
studyof
coal-derived
combustion
Ban
naet
al.
1981
847
1450
902
[73]
Leancombustion
Lucaset
al.
1982
830-1025
950
510
960.04
[69]
Lean-burning
oil-fired
laboratery
combustion
tunnel
Lodder
etal.
1985
827-1077
1000
345
751
1.5
[74]
Fired
Boiler1M
W
Kim
ball-
Linne
and
Han
son
1986
777–1177
1010
[71]
flow
reactor-plugflow
Hulgaard
etal.
1990
750-1100
950
450
704
1.3
[75]
Pilot-scale
ofpulverized
coal
combuster
Iron
etal.
1991
940-1040
985
225
403
1[76]
0.15
MW
linear
furnace
and6MW
scalemodelof
apow
erstationfurnace
Leckner
etal.
1991
600-1100
850
50-200
5-7
2-6
0.5-2
[77]
application
ofSNCR
inCFB
Caton
etal.
1995
900-1100
827-877
330
77-98
1-15
1.5
[78]
Lam
inar
Flow,
Electri-
callyHeated
Østberg
etal.
1996
727-1127
880-1070
500-600
801-4
2-3
0.012
[79]
Bench
scalereactorusing
fluegas
Alutzaet
al.
1997
450-1000
627-777
300
20-70
4-21
1-
[80]
Lab
scale
hybrid
reburning/SNCR
Lianget
al.
2013
700-1150
850-1000
400-500
20-75
1-6
1.2
0.01-
0.12
[81]
Lab
scalelaminar
flow
32 Literature survey
0
50
100
150
200
250
900 1000 1100 1200 1300 1400 1500
NOx(pp
m)
Temperature (K)
Figure 2.16: Temperature window for SNCR with ammonia. Initial condition:NOi=225ppm, NH3=450ppm, O2=1.23% [64]
82–87]. Generally, NOx removal by SNCR is illustrated in Figure (2.15) whichis explained below based on the studies mentioned.
The initial reaction in NO reduction is reaction of NH3 with OH radicals to giveamide NH2 (R9):
NH3 +OH NH2 +H2O (R9)
Amide NH2 also can be formed by reaction of NH3 with oxygen atom O (R10):
NH3 +O NH2 +OH (R10)
The amide radical is highly selective towards NO and causes the primary reduc-tion of NO at optimum temperatures even in an oxidizing environment.
NH2 +NO N2 +H2O (R11)
2.4 Selective Non-Catalytic Reduction (SNCR): 33
NH2 +NO NNH +OH (R12)
Reactions (R11) and (R12) are dependent on concentration of NH2 inside thereactor which is formed in reactions (R9) and (R10) which in turn depend uponOH and O concentrations. This indicates that the concentration of O and OHfor overall reaction is important to continue the NH3 to NH2 conversion. Theymust be regenerated to self-sustain the reaction. This regeneration is describedby the sequence reactions (R13-R16):
NNH +NO N2 +HNO (R13)
HNO +M NO +H +M (R14)
Here, M is the third body which could be any inert molecules and helps thereaction to take place.
H +O2 OH +O (R15)
The O atom either continues Reaction(R16) or, in the presence of water, itreacts:
O +H2O OH +OH (R16)
Thus, there is a net gain of chain carriers per cycle, and as long as branchingsequence occurs at least a quarter of the time, the overall reaction would beself-sustaining [64].
Reactions below 750C: The reactions (R15) and (R16) are strongly depen-dent on temperature. At the temperature lower than 750C, these two reactions
34 Literature survey
are very slow, thus OH concentration is not enough to convert NH3 to NH2 re-action (R9); thereby chain termination reactions compete with the branchingsequence, making limited NO reduction. The chain terminating reactions arereactions (R11), (R17) and (R18):
NH2 +HNO NO +NH3 (R17)
OH +HNO H2O +NO (R18)
These are all undesirable to NO reduction because they consume NH2 and OHradicals without producing any further radicals; whereas for any substantialreduction to occur, enough OH and O radicals are required to convert NH3 toNH2. Thus below 750C, the rates of reactions (R9) and (R10) limit the overallprocess.
Reactions in range 750C –1000C: The reaction sequences (R9-R11) andthe reactions (R9), (R10) and (R12) onwards are dominant over the sequence(R9), (R10) and (R19) even up to temperatures below 1000C. This is becausein the range 750C –1000C, the rate of reaction of (R12) is greater, comparedto those of NH2 oxidation reactions.
NH2 +OH NH +H2O (R19)
NH2 +NH2 NH3 +NH (R20)
In the temperature range 750C–1000C, the mix of branching and terminatingis just right to cause the growth in chain carrier concentration. With the increasein temperature above 750C, the reaction path leading to the chain branchingreaction (R14) becomes more important than the one leading to a terminationreaction such as (R18). This can be explained by greater activation energy of(R14) than (R18). Then H-radicals from the former reactions may react witheither molecules of O2 or water causing more chain branching as follows:
H +H2O OH +H2 (R21)
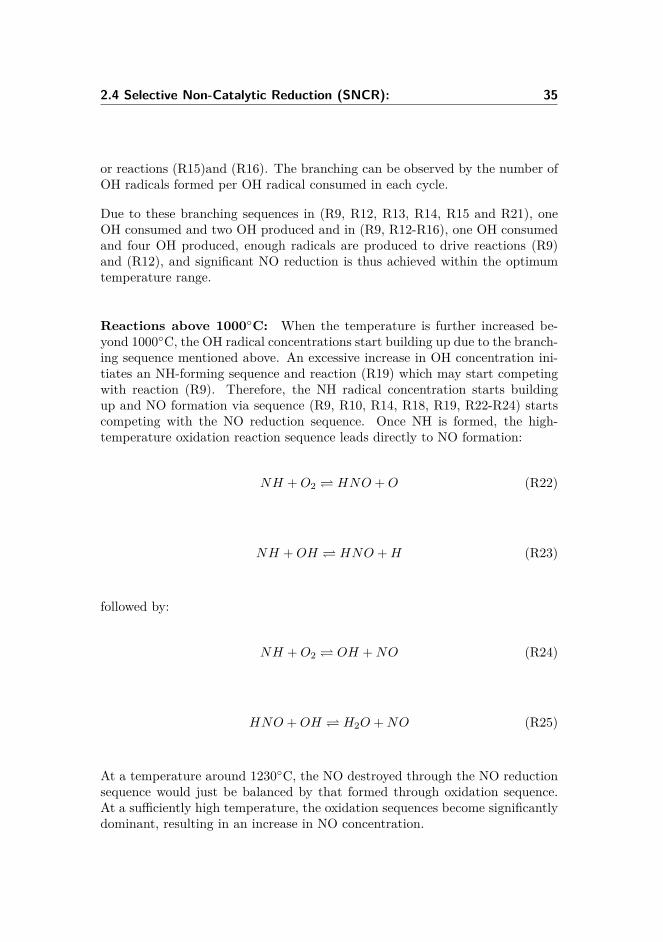
2.4 Selective Non-Catalytic Reduction (SNCR): 35
or reactions (R15)and (R16). The branching can be observed by the number ofOH radicals formed per OH radical consumed in each cycle.
Due to these branching sequences in (R9, R12, R13, R14, R15 and R21), oneOH consumed and two OH produced and in (R9, R12-R16), one OH consumedand four OH produced, enough radicals are produced to drive reactions (R9)and (R12), and significant NO reduction is thus achieved within the optimumtemperature range.
Reactions above 1000C: When the temperature is further increased be-yond 1000C, the OH radical concentrations start building up due to the branch-ing sequence mentioned above. An excessive increase in OH concentration ini-tiates an NH-forming sequence and reaction (R19) which may start competingwith reaction (R9). Therefore, the NH radical concentration starts buildingup and NO formation via sequence (R9, R10, R14, R18, R19, R22-R24) startscompeting with the NO reduction sequence. Once NH is formed, the high-temperature oxidation reaction sequence leads directly to NO formation:
NH +O2 HNO +O (R22)
NH +OH HNO +H (R23)
followed by:
NH +O2 OH +NO (R24)
HNO +OH H2O +NO (R25)
At a temperature around 1230C, the NO destroyed through the NO reductionsequence would just be balanced by that formed through oxidation sequence.At a sufficiently high temperature, the oxidation sequences become significantlydominant, resulting in an increase in NO concentration.
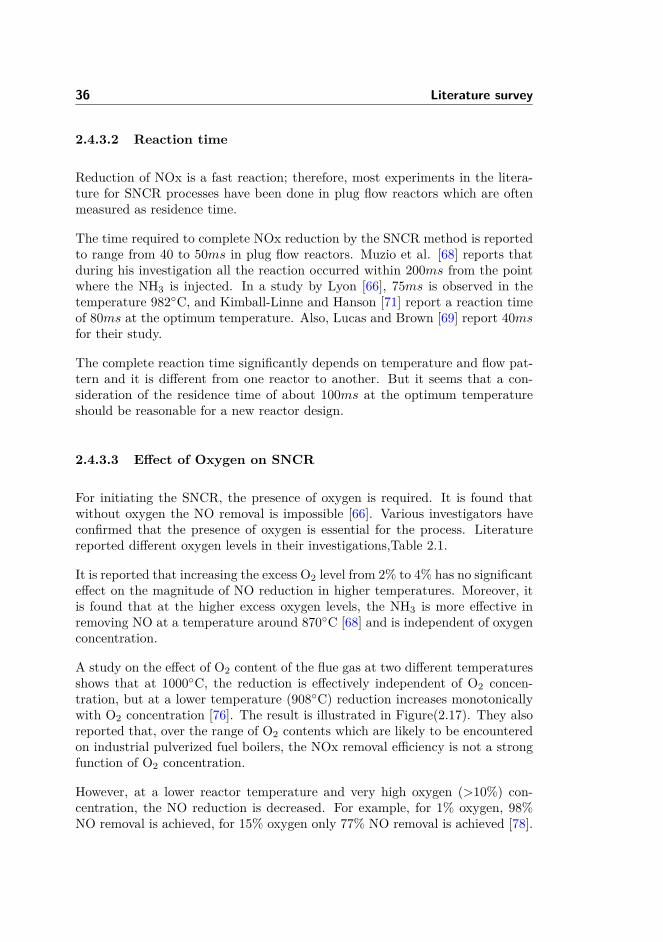
36 Literature survey
2.4.3.2 Reaction time
Reduction of NOx is a fast reaction; therefore, most experiments in the litera-ture for SNCR processes have been done in plug flow reactors which are oftenmeasured as residence time.
The time required to complete NOx reduction by the SNCR method is reportedto range from 40 to 50ms in plug flow reactors. Muzio et al. [68] reports thatduring his investigation all the reaction occurred within 200ms from the pointwhere the NH3 is injected. In a study by Lyon [66], 75ms is observed in thetemperature 982C, and Kimball-Linne and Hanson [71] report a reaction timeof 80ms at the optimum temperature. Also, Lucas and Brown [69] report 40msfor their study.
The complete reaction time significantly depends on temperature and flow pat-tern and it is different from one reactor to another. But it seems that a con-sideration of the residence time of about 100ms at the optimum temperatureshould be reasonable for a new reactor design.
2.4.3.3 Effect of Oxygen on SNCR
For initiating the SNCR, the presence of oxygen is required. It is found thatwithout oxygen the NO removal is impossible [66]. Various investigators haveconfirmed that the presence of oxygen is essential for the process. Literaturereported different oxygen levels in their investigations,Table 2.1.
It is reported that increasing the excess O2 level from 2% to 4% has no significanteffect on the magnitude of NO reduction in higher temperatures. Moreover, itis found that at the higher excess oxygen levels, the NH3 is more effective inremoving NO at a temperature around 870C [68] and is independent of oxygenconcentration.
A study on the effect of O2 content of the flue gas at two different temperaturesshows that at 1000C, the reduction is effectively independent of O2 concen-tration, but at a lower temperature (908C) reduction increases monotonicallywith O2 concentration [76]. The result is illustrated in Figure(2.17). They alsoreported that, over the range of O2 contents which are likely to be encounteredon industrial pulverized fuel boilers, the NOx removal efficiency is not a strongfunction of O2 concentration.
However, at a lower reactor temperature and very high oxygen (>10%) con-centration, the NO reduction is decreased. For example, for 1% oxygen, 98%NO removal is achieved, for 15% oxygen only 77% NO removal is achieved [78].
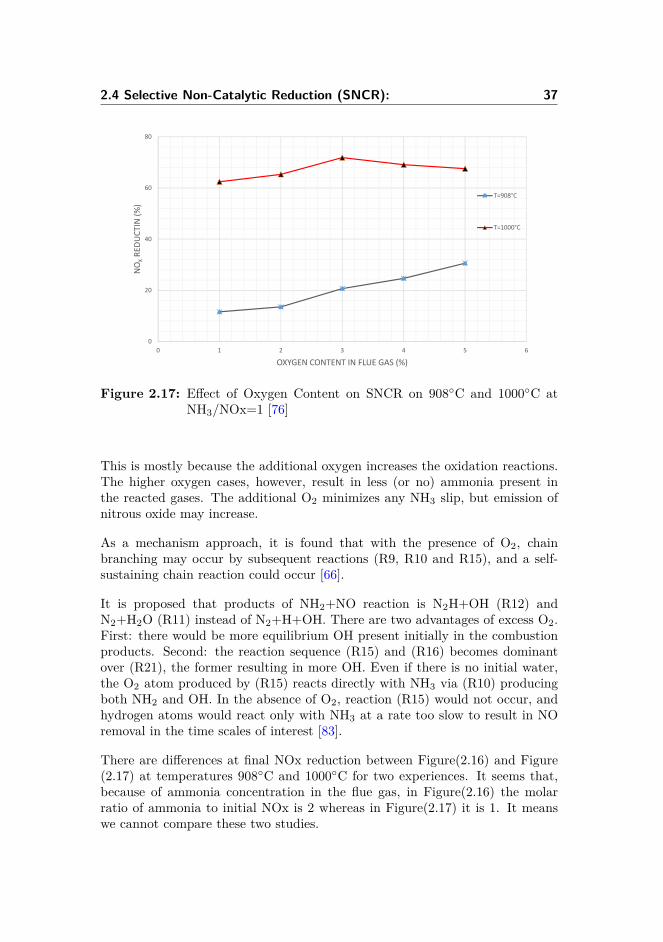
2.4 Selective Non-Catalytic Reduction (SNCR): 37
0
20
40
60
80
0 1 2 3 4 5 6
NOXRE
DUCT
IN (%
)
OXYGEN CONTENT IN FLUE GAS (%)
T=908°C
T=1000°C
Figure 2.17: Effect of Oxygen Content on SNCR on 908C and 1000C atNH3/NOx=1 [76]
This is mostly because the additional oxygen increases the oxidation reactions.The higher oxygen cases, however, result in less (or no) ammonia present inthe reacted gases. The additional O2 minimizes any NH3 slip, but emission ofnitrous oxide may increase.
As a mechanism approach, it is found that with the presence of O2, chainbranching may occur by subsequent reactions (R9, R10 and R15), and a self-sustaining chain reaction could occur [66].
It is proposed that products of NH2+NO reaction is N2H+OH (R12) andN2+H2O (R11) instead of N2+H+OH. There are two advantages of excess O2.First: there would be more equilibrium OH present initially in the combustionproducts. Second: the reaction sequence (R15) and (R16) becomes dominantover (R21), the former resulting in more OH. Even if there is no initial water,the O2 atom produced by (R15) reacts directly with NH3 via (R10) producingboth NH2 and OH. In the absence of O2, reaction (R15) would not occur, andhydrogen atoms would react only with NH3 at a rate too slow to result in NOremoval in the time scales of interest [83].
There are differences at final NOx reduction between Figure(2.16) and Figure(2.17) at temperatures 908C and 1000C for two experiences. It seems that,because of ammonia concentration in the flue gas, in Figure(2.16) the molarratio of ammonia to initial NOx is 2 whereas in Figure(2.17) it is 1. It meanswe cannot compare these two studies.
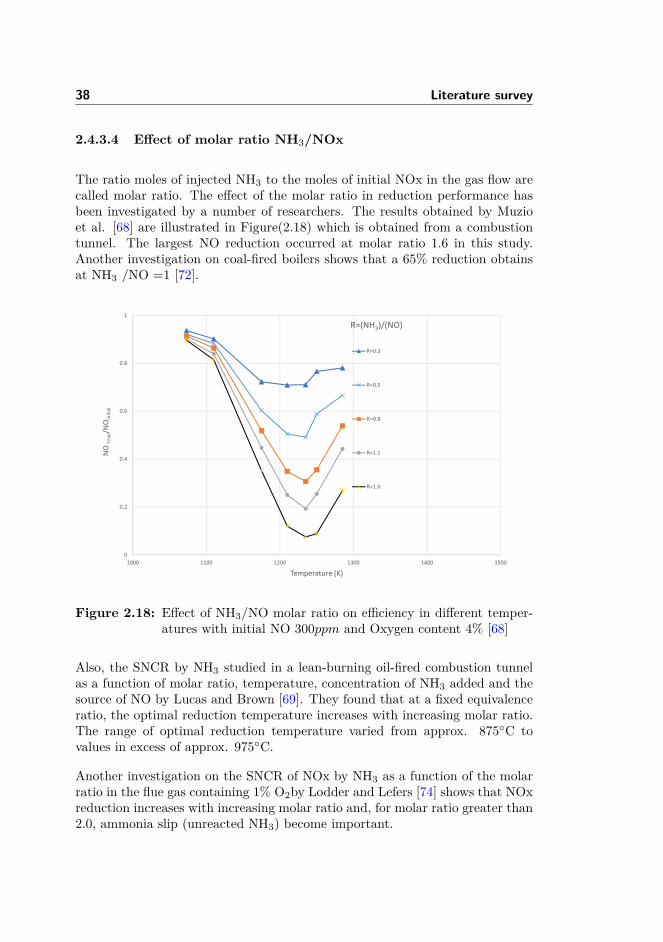
38 Literature survey
2.4.3.4 Effect of molar ratio NH3/NOx
The ratio moles of injected NH3 to the moles of initial NOx in the gas flow arecalled molar ratio. The effect of the molar ratio in reduction performance hasbeen investigated by a number of researchers. The results obtained by Muzioet al. [68] are illustrated in Figure(2.18) which is obtained from a combustiontunnel. The largest NO reduction occurred at molar ratio 1.6 in this study.Another investigation on coal-fired boilers shows that a 65% reduction obtainsat NH3 /NO =1 [72].
0
0.2
0.4
0.6
0.8
1
1000 1100 1200 1300 1400 1500
NO Fi
nal/N
OInitial
Temperature (K)
R=(NH3)/(NO)
R=0.3
R=0.5
R=0.8
R=1.1
R=1.6
Figure 2.18: Effect of NH3/NO molar ratio on efficiency in different temper-atures with initial NO 300ppm and Oxygen content 4% [68]
Also, the SNCR by NH3 studied in a lean-burning oil-fired combustion tunnelas a function of molar ratio, temperature, concentration of NH3 added and thesource of NO by Lucas and Brown [69]. They found that at a fixed equivalenceratio, the optimal reduction temperature increases with increasing molar ratio.The range of optimal reduction temperature varied from approx. 875C tovalues in excess of approx. 975C.
Another investigation on the SNCR of NOx by NH3 as a function of the molarratio in the flue gas containing 1% O2by Lodder and Lefers [74] shows that NOxreduction increases with increasing molar ratio and, for molar ratio greater than2.0, ammonia slip (unreacted NH3) become important.
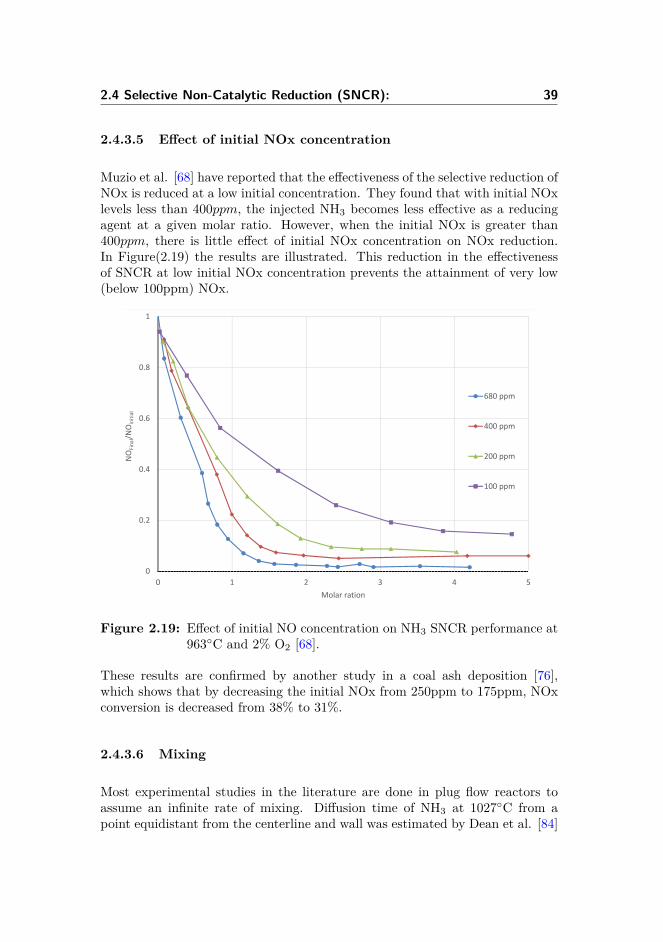
2.4 Selective Non-Catalytic Reduction (SNCR): 39
2.4.3.5 Effect of initial NOx concentration
Muzio et al. [68] have reported that the effectiveness of the selective reduction ofNOx is reduced at a low initial concentration. They found that with initial NOxlevels less than 400ppm, the injected NH3 becomes less effective as a reducingagent at a given molar ratio. However, when the initial NOx is greater than400ppm, there is little effect of initial NOx concentration on NOx reduction.In Figure(2.19) the results are illustrated. This reduction in the effectivenessof SNCR at low initial NOx concentration prevents the attainment of very low(below 100ppm) NOx.
0
0.2
0.4
0.6
0.8
1
0 1 2 3 4 5
NOFinal/N
OInitial
Molar ration
680 ppm
400 ppm
200 ppm
100 ppm
Figure 2.19: Effect of initial NO concentration on NH3 SNCR performance at963C and 2% O2 [68].
These results are confirmed by another study in a coal ash deposition [76],which shows that by decreasing the initial NOx from 250ppm to 175ppm, NOxconversion is decreased from 38% to 31%.
2.4.3.6 Mixing
Most experimental studies in the literature are done in plug flow reactors toassume an infinite rate of mixing. Diffusion time of NH3 at 1027C from apoint equidistant from the centerline and wall was estimated by Dean et al. [84]
40 Literature survey
0.00013 s in a tube with 0.2 cm i.d. and 0.0032 s in a tube with 1.0 cm i.d. Inboth, diffusion time is much shorter than the reaction time for SNCR to supportthe plug flow assumption.
The effect of mixing on the SNCR process is studied by Banna and Branch[73], Branch et al.[88], Østberg et al. [79], Røjel et al.[89], Oliva et al. [90]and [81], but the results appear to be contradictory. Branch et al.[73] observedthat under non-premixed conditions the temperature window for NO reductionwidens, indicating that incomplete mixing may extend the temperature rangein which NO removal is effective to a higher temperature. In contrast, Østberget al. [79] found from bench-scale experiments that delayed mixing tends tonarrow the temperature window. Røjel’s results [89] show that finite rate mixingaffects the SNCR process’s efficiency at high temperatures where it may causea narrowing or a widening of the temperature window, depending on the NOconcentration.
In systems with higher NO levels, finite rate mixing may have an adverse effecton the SNCR process.
2.4.3.7 Effect of CO
The SNCR process will inhibit the oxidation of CO to CO2. Thus, if CO ispresent at the point of injection, its oxidation could be inhibited and it couldbe emitted to the atmosphere [72]. Different investigations [73, 91] confirm theconcurrent inhibition of CO by NH3. In addition, it is observed that additionalCO causes NO reduction curves to shift towards a lower temperature [74]. Thepresence of CO enhances the reaction of NH3 with NO and O2 but decreasesselectivity, i.e., causing more NH3 to react with O2 to form NO rather (in lowertemperature) than to react with NO to reduce it [86]. The oxidation of COcould be carried out at a higher temperature and higher initial CO as (R26):
CO +OH CO2 +H (R26)
In case CO can start the oxidation, much larger concentrations of OH and Owill be produced because the H atom obtained from reaction (R26 ) may startthe sequence followed by (R15 ) and (R16) which accelerates the NH3-NO-O2reaction.
2.4 Selective Non-Catalytic Reduction (SNCR): 41
2.4.4 Reduced Mechanism for SNCR
A reduced chemical kinetic mechanism for the prediction of SNCR chemistry hasbeen developed by Duo et al. [87], which describes the kinetics of the reactionsby a simple model assuming first-order oxidation of NH3 to NO and second-orderreduction of NO to N2. For the purpose of developing a simple and quantitativedescription of the rate of reactions occurring in the thermal De-NOx process, thekinetics of the homogeneous reaction between NO and NH3, with excess of O2,is studied in an isothermal plug flow reactor. In this study it is observed thatwith increasing residence time, the optimum temperature is decreased and thedegree of reduction of NO is also increased. However, it is sensitive to residencetime only at very short residence times at higher temperatures. This study alsoshows that the degree of conversion of NH3 increases with both temperatureand residence time. Simplified Reaction Mechanism for the SNCR Process isa single initiation step followed by two parallel reaction pathways, one leadingto reduction Reaction(R29) and the other to formation (oxidation of ammonia)reaction(R30).
NO +NH3 + 14O2 → N2 + 3
2H2O (R27)
NH3 + 54O2 → NO + 3
2H2O (R28)
The simple model proposed describes the reaction rates as:
RNO = −kr [NO] [NH3] + kox [NH3] (2.4)
RNH3 = −kr [NO] [NH3]− kox [NH3] (2.5)
The rate constants for Eq(2.4) and Eq(2.5) are:
kr =(2.21± 0.33)×1014exp[−(38160± 170)T
] , 1s
kox=(2.45± 0.49)×1014exp[−(29400± 250)T
], m3
mol.s
Results of this study verify that the kinetic model can give a satisfactory pre-diction of the experimental results under different conditions.
The application of this simple model further developed to describe the influenceof the major parameters that can be varied in the De-NOx process (injection
42 Literature survey
temperature, temperature gradient, residence time, amount of injected NH3and amount of injected additive) [92]. In this study the model predictions arecompared to experiments carried out in a fluidized bed boiler and in a pilot plantusing flue gas withdrawn from a coal-fired utility boiler, and it is compared withthe kinetic model of Miller and Bowman [64]. Results show with ideal mixingbetween the injected NH3 (as in the cyclone of the fluidized bed boiler), a goodagreement between the model predictions and the experiment is obtained. Thisempirical model gives a better description of the result for a fluidized bed boilerthan Miller and Bowman’s kinetic model [64].
This mechanism also allows for more investigation on the influence of mixingon SNCR [79]. In this study, an experimental and theoretical investigation ofmixing in the SNCR process is performed. The experiments are carried out ina bench scale reactor using the flue gas from a natural gas burner as the maingas and injection of a jet of NH3 mixed with the carrier gas in cross flow. Theresults show a dependency on the carrier gas flow at temperatures above theoptimum temperature for NOx reduction. It also reported no dependency onthe variation of the O2 concentration in the carrier gas from 0 to 21 vol%. Itis further concluded that an increasing momentum ratio of the jet to the maingas improves the NO reduction up to a limiting value of the momentum ratioof approximately 20, with no further improvements observed above this value.Chemical kinetic modeling of the initiating reactions involving NH3 shows thatthe reaction with OH radicals is the primary initiating reaction. It is also shownthat process performance is influenced by the O2 concentration in the flue gas.The experimental results apply to verify the droplet diffusion model proposedby Østberg and Dam-Johansen in a former study [93].
Another reduced chemical kinetic mechanism for the prediction of SNCR chem-istry is proposed by Brouwer et al. [94] to describe the reduction of NOx byinjection of ammonia or urea with the use of limited computational efforts. Themodel was developed by the reduction of a Detailed Chemical Kinetic Model(DCKM) developed by Miller and Bowman [64]. This DCKM consists of 213reactions.
It is identified that the principle NO reduction pathway occurs by reactionwith NH2 forming N2 for ammonia and by reaction with HCO forming N2Oas intermediate for the cyanuric acid. When using urea both pathways areimportant. This knowledge is used to develop the reduced mechanism. Themechanism assumes instantaneous breakdown of the reactants into ammonia andisocyanic acid (HNOC). Urea breaks down into both ammonia and HNCO in theratio 1.1 moles of NH3 to 0.9 moles of HNCO because HNCO subsequently reactsalong the ammonia pathway [94]. The reaction pathway for the reduction of NOwith ammonia, cyanuric acid and urea is schematically shown in Figure(2.20).
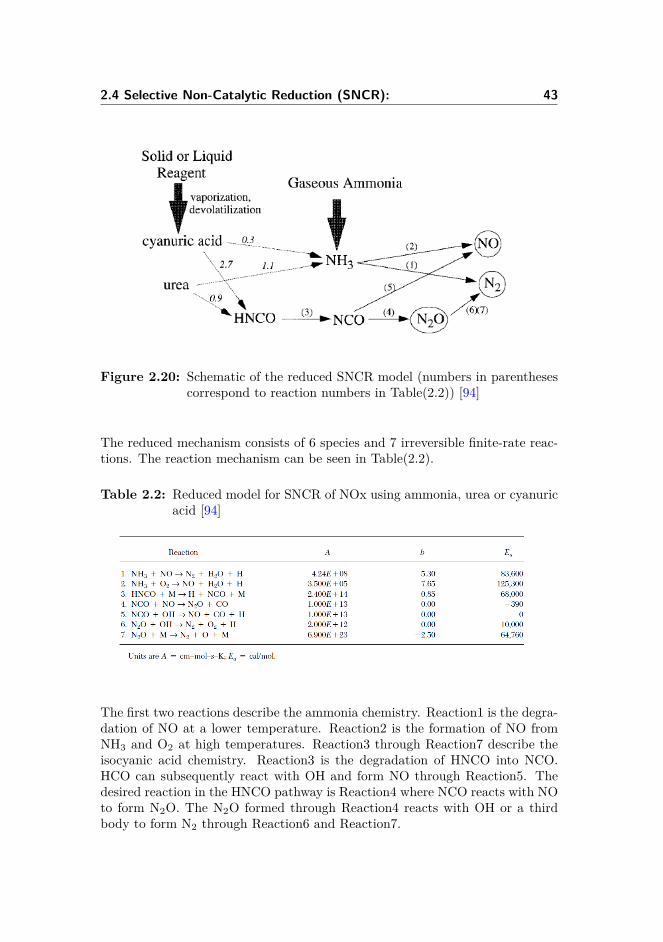
2.4 Selective Non-Catalytic Reduction (SNCR): 43
Figure 2.20: Schematic of the reduced SNCR model (numbers in parenthesescorrespond to reaction numbers in Table(2.2)) [94]
The reduced mechanism consists of 6 species and 7 irreversible finite-rate reac-tions. The reaction mechanism can be seen in Table(2.2).
Table 2.2: Reduced model for SNCR of NOx using ammonia, urea or cyanuricacid [94]
The first two reactions describe the ammonia chemistry. Reaction1 is the degra-dation of NO at a lower temperature. Reaction2 is the formation of NO fromNH3 and O2 at high temperatures. Reaction3 through Reaction7 describe theisocyanic acid chemistry. Reaction3 is the degradation of HNCO into NCO.HCO can subsequently react with OH and form NO through Reaction5. Thedesired reaction in the HNCO pathway is Reaction4 where NCO reacts with NOto form N2O. The N2O formed through Reaction4 reacts with OH or a thirdbody to form N2 through Reaction6 and Reaction7.
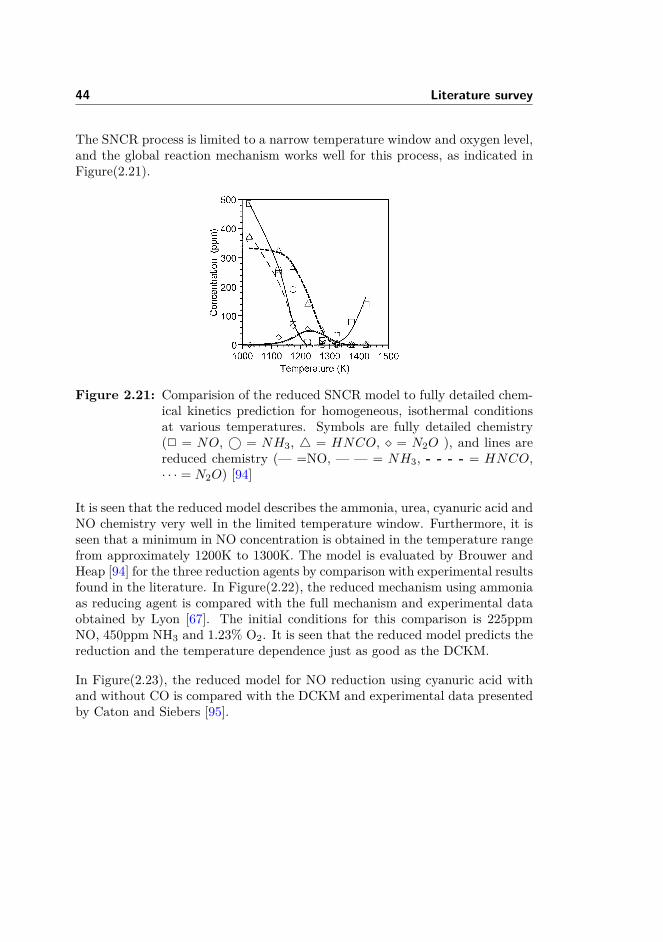
44 Literature survey
The SNCR process is limited to a narrow temperature window and oxygen level,and the global reaction mechanism works well for this process, as indicated inFigure(2.21).
Figure 2.21: Comparision of the reduced SNCR model to fully detailed chem-ical kinetics prediction for homogeneous, isothermal conditionsat various temperatures. Symbols are fully detailed chemistry(2 = NO, © = NH3, 4 = HNCO, = N2O ), and lines arereduced chemistry (— =NO, — — = NH3, - - - - = HNCO,· · · = N2O) [94]
It is seen that the reduced model describes the ammonia, urea, cyanuric acid andNO chemistry very well in the limited temperature window. Furthermore, it isseen that a minimum in NO concentration is obtained in the temperature rangefrom approximately 1200K to 1300K. The model is evaluated by Brouwer andHeap [94] for the three reduction agents by comparison with experimental resultsfound in the literature. In Figure(2.22), the reduced mechanism using ammoniaas reducing agent is compared with the full mechanism and experimental dataobtained by Lyon [67]. The initial conditions for this comparison is 225ppmNO, 450ppm NH3 and 1.23% O2. It is seen that the reduced model predicts thereduction and the temperature dependence just as good as the DCKM.
In Figure(2.23), the reduced model for NO reduction using cyanuric acid withand without CO is compared with the DCKM and experimental data presentedby Caton and Siebers [95].
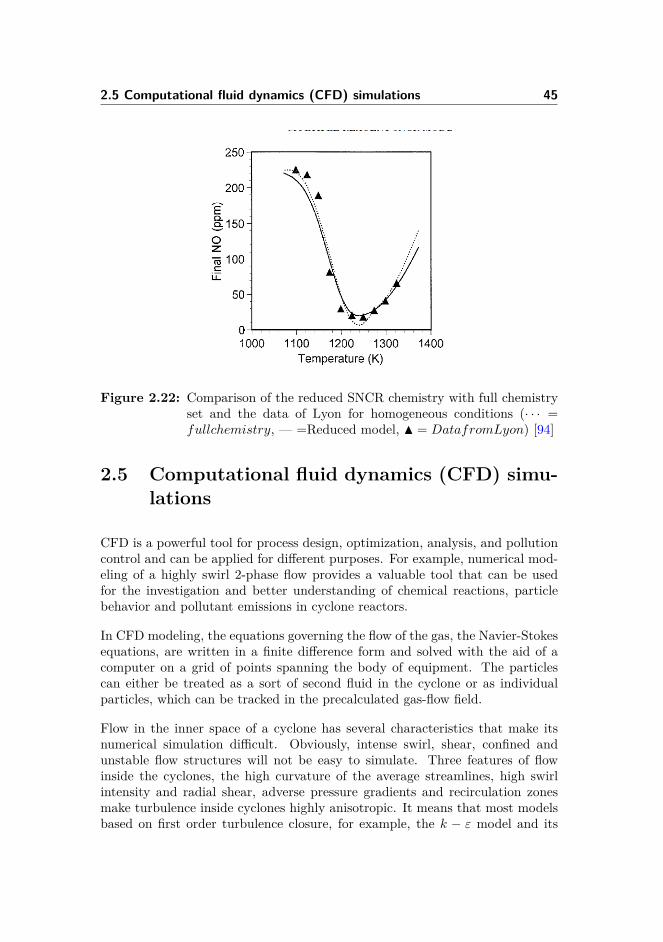
2.5 Computational fluid dynamics (CFD) simulations 45
Figure 2.22: Comparison of the reduced SNCR chemistry with full chemistryset and the data of Lyon for homogeneous conditions (· · · =fullchemistry, — =Reduced model, N = DatafromLyon) [94]
2.5 Computational fluid dynamics (CFD) simu-lations
CFD is a powerful tool for process design, optimization, analysis, and pollutioncontrol and can be applied for different purposes. For example, numerical mod-eling of a highly swirl 2-phase flow provides a valuable tool that can be usedfor the investigation and better understanding of chemical reactions, particlebehavior and pollutant emissions in cyclone reactors.
In CFD modeling, the equations governing the flow of the gas, the Navier-Stokesequations, are written in a finite difference form and solved with the aid of acomputer on a grid of points spanning the body of equipment. The particlescan either be treated as a sort of second fluid in the cyclone or as individualparticles, which can be tracked in the precalculated gas-flow field.
Flow in the inner space of a cyclone has several characteristics that make itsnumerical simulation difficult. Obviously, intense swirl, shear, confined andunstable flow structures will not be easy to simulate. Three features of flowinside the cyclones, the high curvature of the average streamlines, high swirlintensity and radial shear, adverse pressure gradients and recirculation zonesmake turbulence inside cyclones highly anisotropic. It means that most modelsbased on first order turbulence closure, for example, the k − ε model and its
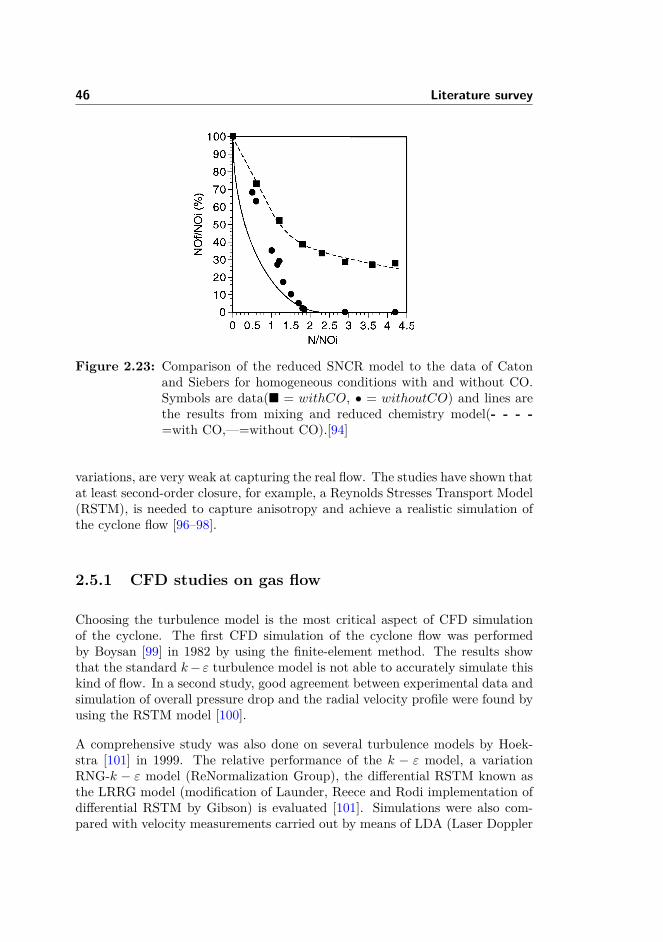
46 Literature survey
Figure 2.23: Comparison of the reduced SNCR model to the data of Catonand Siebers for homogeneous conditions with and without CO.Symbols are data( = withCO, • = withoutCO) and lines arethe results from mixing and reduced chemistry model(- - - -=with CO,—=without CO).[94]
variations, are very weak at capturing the real flow. The studies have shown thatat least second-order closure, for example, a Reynolds Stresses Transport Model(RSTM), is needed to capture anisotropy and achieve a realistic simulation ofthe cyclone flow [96–98].
2.5.1 CFD studies on gas flow
Choosing the turbulence model is the most critical aspect of CFD simulationof the cyclone. The first CFD simulation of the cyclone flow was performedby Boysan [99] in 1982 by using the finite-element method. The results showthat the standard k− ε turbulence model is not able to accurately simulate thiskind of flow. In a second study, good agreement between experimental data andsimulation of overall pressure drop and the radial velocity profile were found byusing the RSTM model [100].
A comprehensive study was also done on several turbulence models by Hoek-stra [101] in 1999. The relative performance of the k − ε model, a variationRNG-k − ε model (ReNormalization Group), the differential RSTM known asthe LRRG model (modification of Launder, Reece and Rodi implementation ofdifferential RSTM by Gibson) is evaluated [101]. Simulations were also com-pared with velocity measurements carried out by means of LDA (Laser Doppler
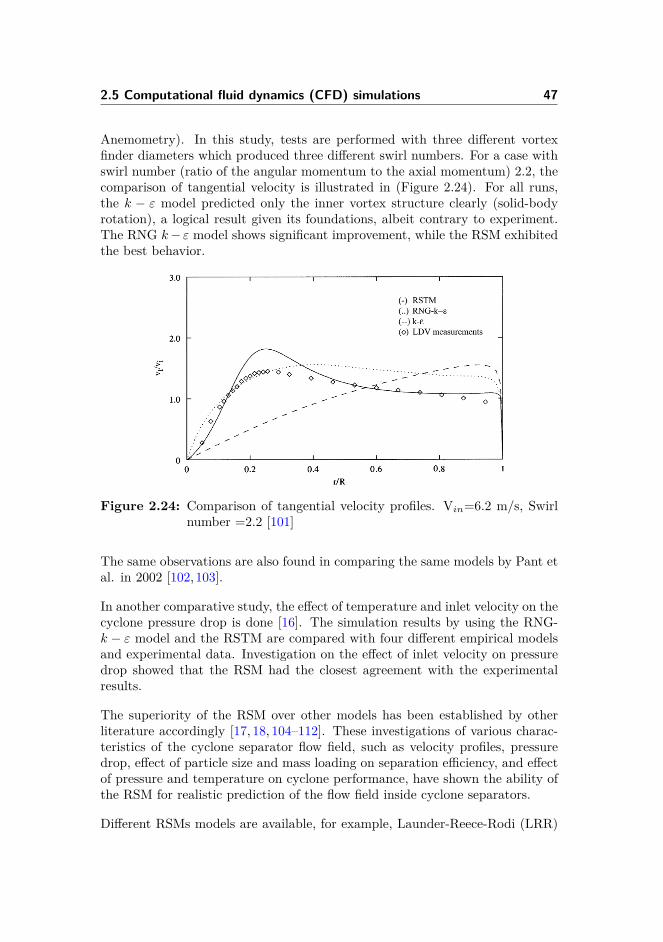
2.5 Computational fluid dynamics (CFD) simulations 47
Anemometry). In this study, tests are performed with three different vortexfinder diameters which produced three different swirl numbers. For a case withswirl number (ratio of the angular momentum to the axial momentum) 2.2, thecomparison of tangential velocity is illustrated in (Figure 2.24). For all runs,the k − ε model predicted only the inner vortex structure clearly (solid-bodyrotation), a logical result given its foundations, albeit contrary to experiment.The RNG k− ε model shows significant improvement, while the RSM exhibitedthe best behavior.
Figure 2.24: Comparison of tangential velocity profiles. Vin=6.2 m/s, Swirlnumber =2.2 [101]
The same observations are also found in comparing the same models by Pant etal. in 2002 [102,103].
In another comparative study, the effect of temperature and inlet velocity on thecyclone pressure drop is done [16]. The simulation results by using the RNG-k − ε model and the RSTM are compared with four different empirical modelsand experimental data. Investigation on the effect of inlet velocity on pressuredrop showed that the RSM had the closest agreement with the experimentalresults.
The superiority of the RSM over other models has been established by otherliterature accordingly [17, 18, 104–112]. These investigations of various charac-teristics of the cyclone separator flow field, such as velocity profiles, pressuredrop, effect of particle size and mass loading on separation efficiency, and effectof pressure and temperature on cyclone performance, have shown the ability ofthe RSM for realistic prediction of the flow field inside cyclone separators.
Different RSMs models are available, for example, Launder-Reece-Rodi (LRR)
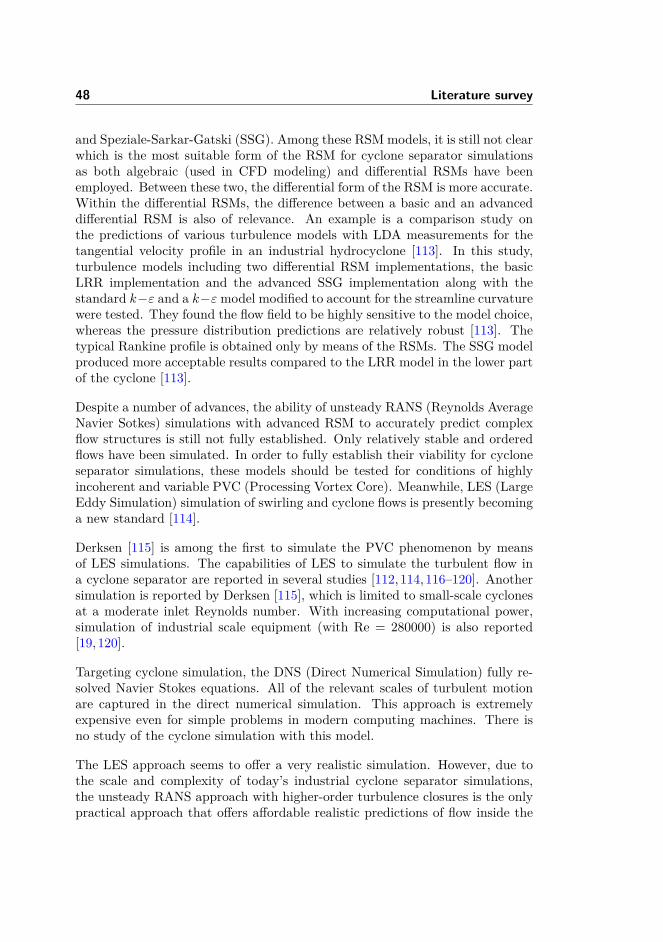
48 Literature survey
and Speziale-Sarkar-Gatski (SSG). Among these RSM models, it is still not clearwhich is the most suitable form of the RSM for cyclone separator simulationsas both algebraic (used in CFD modeling) and differential RSMs have beenemployed. Between these two, the differential form of the RSM is more accurate.Within the differential RSMs, the difference between a basic and an advanceddifferential RSM is also of relevance. An example is a comparison study onthe predictions of various turbulence models with LDA measurements for thetangential velocity profile in an industrial hydrocyclone [113]. In this study,turbulence models including two differential RSM implementations, the basicLRR implementation and the advanced SSG implementation along with thestandard k−ε and a k−εmodel modified to account for the streamline curvaturewere tested. They found the flow field to be highly sensitive to the model choice,whereas the pressure distribution predictions are relatively robust [113]. Thetypical Rankine profile is obtained only by means of the RSMs. The SSG modelproduced more acceptable results compared to the LRR model in the lower partof the cyclone [113].
Despite a number of advances, the ability of unsteady RANS (Reynolds AverageNavier Sotkes) simulations with advanced RSM to accurately predict complexflow structures is still not fully established. Only relatively stable and orderedflows have been simulated. In order to fully establish their viability for cycloneseparator simulations, these models should be tested for conditions of highlyincoherent and variable PVC (Processing Vortex Core). Meanwhile, LES (LargeEddy Simulation) simulation of swirling and cyclone flows is presently becominga new standard [114].
Derksen [115] is among the first to simulate the PVC phenomenon by meansof LES simulations. The capabilities of LES to simulate the turbulent flow ina cyclone separator are reported in several studies [112, 114, 116–120]. Anothersimulation is reported by Derksen [115], which is limited to small-scale cyclonesat a moderate inlet Reynolds number. With increasing computational power,simulation of industrial scale equipment (with Re = 280000) is also reported[19,120].
Targeting cyclone simulation, the DNS (Direct Numerical Simulation) fully re-solved Navier Stokes equations. All of the relevant scales of turbulent motionare captured in the direct numerical simulation. This approach is extremelyexpensive even for simple problems in modern computing machines. There isno study of the cyclone simulation with this model.
The LES approach seems to offer a very realistic simulation. However, due tothe scale and complexity of today’s industrial cyclone separator simulations,the unsteady RANS approach with higher-order turbulence closures is the onlypractical approach that offers affordable realistic predictions of flow inside the
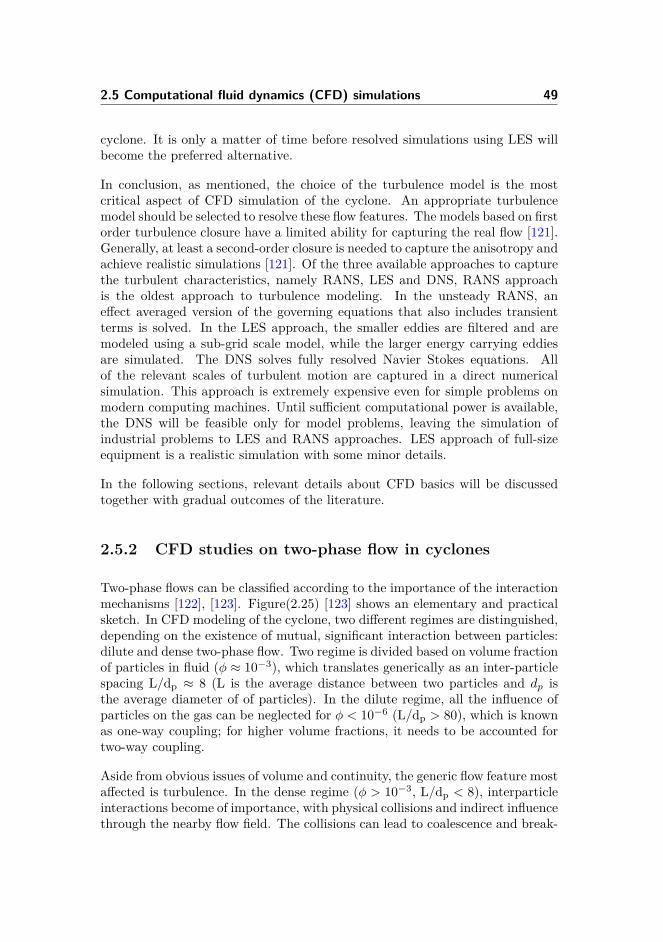
2.5 Computational fluid dynamics (CFD) simulations 49
cyclone. It is only a matter of time before resolved simulations using LES willbecome the preferred alternative.
In conclusion, as mentioned, the choice of the turbulence model is the mostcritical aspect of CFD simulation of the cyclone. An appropriate turbulencemodel should be selected to resolve these flow features. The models based on firstorder turbulence closure have a limited ability for capturing the real flow [121].Generally, at least a second-order closure is needed to capture the anisotropy andachieve realistic simulations [121]. Of the three available approaches to capturethe turbulent characteristics, namely RANS, LES and DNS, RANS approachis the oldest approach to turbulence modeling. In the unsteady RANS, aneffect averaged version of the governing equations that also includes transientterms is solved. In the LES approach, the smaller eddies are filtered and aremodeled using a sub-grid scale model, while the larger energy carrying eddiesare simulated. The DNS solves fully resolved Navier Stokes equations. Allof the relevant scales of turbulent motion are captured in a direct numericalsimulation. This approach is extremely expensive even for simple problems onmodern computing machines. Until sufficient computational power is available,the DNS will be feasible only for model problems, leaving the simulation ofindustrial problems to LES and RANS approaches. LES approach of full-sizeequipment is a realistic simulation with some minor details.
In the following sections, relevant details about CFD basics will be discussedtogether with gradual outcomes of the literature.
2.5.2 CFD studies on two-phase flow in cyclones
Two-phase flows can be classified according to the importance of the interactionmechanisms [122], [123]. Figure(2.25) [123] shows an elementary and practicalsketch. In CFD modeling of the cyclone, two different regimes are distinguished,depending on the existence of mutual, significant interaction between particles:dilute and dense two-phase flow. Two regime is divided based on volume fractionof particles in fluid (φ ≈ 10−3), which translates generically as an inter-particlespacing L/dp ≈ 8 (L is the average distance between two particles and dp isthe average diameter of of particles). In the dilute regime, all the influence ofparticles on the gas can be neglected for φ < 10−6 (L/dp > 80), which is knownas one-way coupling; for higher volume fractions, it needs to be accounted fortwo-way coupling.
Aside from obvious issues of volume and continuity, the generic flow feature mostaffected is turbulence. In the dense regime (φ > 10−3, L/dp < 8), interparticleinteractions become of importance, with physical collisions and indirect influencethrough the nearby flow field. The collisions can lead to coalescence and break-
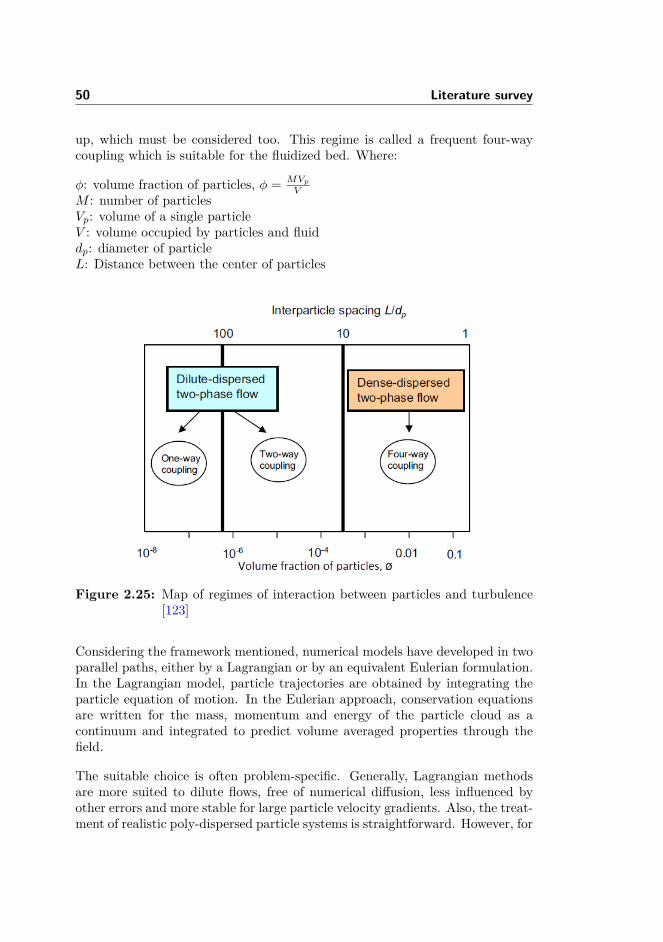
50 Literature survey
up, which must be considered too. This regime is called a frequent four-waycoupling which is suitable for the fluidized bed. Where:
φ: volume fraction of particles, φ = MVp
VM : number of particlesVp: volume of a single particleV : volume occupied by particles and fluiddp: diameter of particleL: Distance between the center of particles
Figure 2.25: Map of regimes of interaction between particles and turbulence[123]
Considering the framework mentioned, numerical models have developed in twoparallel paths, either by a Lagrangian or by an equivalent Eulerian formulation.In the Lagrangian model, particle trajectories are obtained by integrating theparticle equation of motion. In the Eulerian approach, conservation equationsare written for the mass, momentum and energy of the particle cloud as acontinuum and integrated to predict volume averaged properties through thefield.
The suitable choice is often problem-specific. Generally, Lagrangian methodsare more suited to dilute flows, free of numerical diffusion, less influenced byother errors and more stable for large particle velocity gradients. Also, the treat-ment of realistic poly-dispersed particle systems is straightforward. However, for
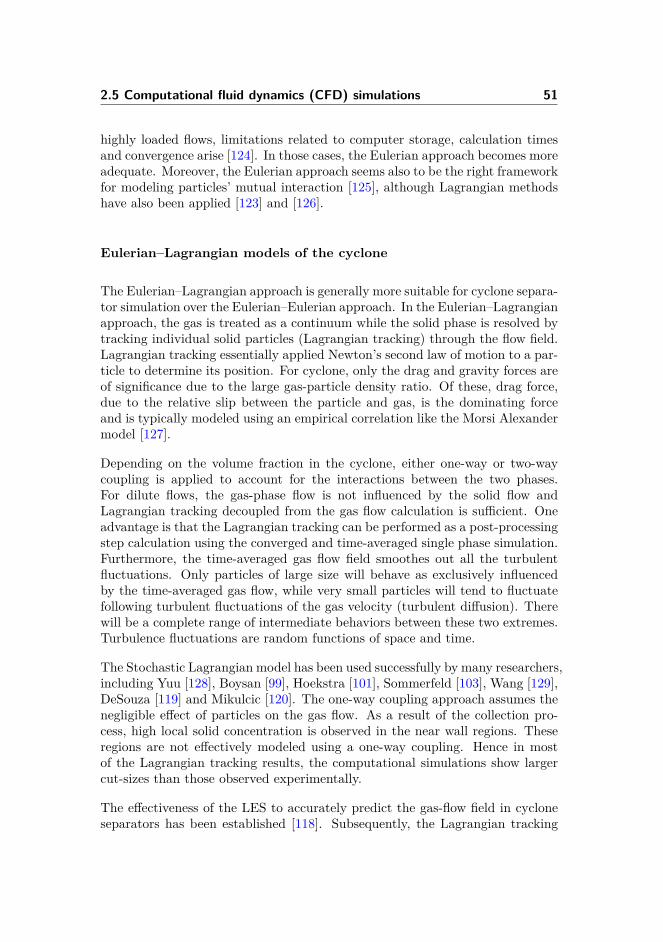
2.5 Computational fluid dynamics (CFD) simulations 51
highly loaded flows, limitations related to computer storage, calculation timesand convergence arise [124]. In those cases, the Eulerian approach becomes moreadequate. Moreover, the Eulerian approach seems also to be the right frameworkfor modeling particles’ mutual interaction [125], although Lagrangian methodshave also been applied [123] and [126].
Eulerian–Lagrangian models of the cyclone
The Eulerian–Lagrangian approach is generally more suitable for cyclone separa-tor simulation over the Eulerian–Eulerian approach. In the Eulerian–Lagrangianapproach, the gas is treated as a continuum while the solid phase is resolved bytracking individual solid particles (Lagrangian tracking) through the flow field.Lagrangian tracking essentially applied Newton’s second law of motion to a par-ticle to determine its position. For cyclone, only the drag and gravity forces areof significance due to the large gas-particle density ratio. Of these, drag force,due to the relative slip between the particle and gas, is the dominating forceand is typically modeled using an empirical correlation like the Morsi Alexandermodel [127].
Depending on the volume fraction in the cyclone, either one-way or two-waycoupling is applied to account for the interactions between the two phases.For dilute flows, the gas-phase flow is not influenced by the solid flow andLagrangian tracking decoupled from the gas flow calculation is sufficient. Oneadvantage is that the Lagrangian tracking can be performed as a post-processingstep calculation using the converged and time-averaged single phase simulation.Furthermore, the time-averaged gas flow field smoothes out all the turbulentfluctuations. Only particles of large size will behave as exclusively influencedby the time-averaged gas flow, while very small particles will tend to fluctuatefollowing turbulent fluctuations of the gas velocity (turbulent diffusion). Therewill be a complete range of intermediate behaviors between these two extremes.Turbulence fluctuations are random functions of space and time.
The Stochastic Lagrangian model has been used successfully by many researchers,including Yuu [128], Boysan [99], Hoekstra [101], Sommerfeld [103], Wang [129],DeSouza [119] and Mikulcic [120]. The one-way coupling approach assumes thenegligible effect of particles on the gas flow. As a result of the collection pro-cess, high local solid concentration is observed in the near wall regions. Theseregions are not effectively modeled using a one-way coupling. Hence in mostof the Lagrangian tracking results, the computational simulations show largercut-sizes than those observed experimentally.
The effectiveness of the LES to accurately predict the gas-flow field in cycloneseparators has been established [118]. Subsequently, the Lagrangian tracking
52 Literature survey
has been applied to calculate the particle flow in the LES simulations.
Depending on the particle size distribution, agglomeration may also becomean important factor in predicting the cyclone efficiency. Particle sizes rangingfrom 1 to 10 µm tend to agglomerate due to the turbulent flow. For this rangeof particle size, the turbulence induced motion is more dominant comparedto gravitational motions. Van der Waal forces are considered strong enoughbetween the particles to result in particle agglomeration and bigger size particles.Sommerfeld [103] observes that the separation efficiency increased considerablyfor smaller particles in an agglomerating regime.
At higher solid concentrations, the interactions between the two phases becomesignificant and a two-way coupling for the momentum between the particulateand fluid phases needs to be considered. Traditionally, the particle-source-in cell(PSIC) model is used for this purpose [130]. In this model, the flow field is cal-culated first without the particle-phase source terms until a converged solutionis achieved. A large number of parcels (i.e., discrete particles representing largegroups with the same properties) are then tracked through the flow field. Thesource terms are then obtained from these tracks for a second Eulerian calcula-tion of the gas flow. The procedure is repeated iteratively until convergence isachieved. The accuracy of this method depends on the number of parcels. Typ-ically, a minimum of 10000 to 20000 parcels are used. Derksen [131] studied theeffect of mass loading on the gas flow and solid particle motion in a Stairmandhigh-efficiency cyclone separator using a two-way coupled Eulerian–Lagrangiansimulation. They observed that compared to one-way coupling the two-waycoupled simulation yield higher overall efficiencies.
The standard Lagrangian approach neglects the particle-particle interactions.However, at a higher solid concentration, these interactions must be included.The discrete element method (DEM) solves the force balance on individual par-ticles and takes into consideration both the particle-particle and particle-gasinteractions and has been used to simulate the motion of particles for highlydense flows [132]. This approach gives information about the position and ve-locities of individual particles.
Eulerian–Eulerian models of the cyclone
In Eulerian particle modeling, the particles are considered as a continuous fluid,just like the gas. This ‘fluid’ interpenetrates with the gas in the cyclone andinteracts with it in accordance with the known laws of interaction, for instance,Stokes’ law. Transport equations, which are coupled through the interactionterms, are solved for both fluid and particle phases.
2.5 Computational fluid dynamics (CFD) simulations 53
Eulerian–Eulerian schemes have been used in many practical multiphase flowsimulations, for instance, and typically, in fluidized-bed applications to whichthey are particularly suited. However, Eulerian models cannot treat differentparticle sizes directly while considering every size class as a distinct phase, whichis evidently a serious drawback for practical problems.
Eulerian–Eulerian mostly used for cyclones, hydrocyclone and Dense Mediumwith high volume fractions of solids [133–137]. In [138] a mixed k− ε /algebraicRSTM, a stationary gas flow model is used along with a simple Eulerian modelof a diluted gas-solid flow. The most important is the reduction in swirl leadingto a reduction of pressure drop. Further in [106], the Eulerian–Eulerian modelis used for the dense regime. Results on collection efficiency, as compared withdedicated experiments, are not conclusive or even deviant. However, interest-ingly, the attenuation of both swirl and turbulence with mass loading is clearlynoticed.
As it is obvious, CFD modeling of the cyclone continues progressively and hasthe potential for more theoretical and practical studies. Closer to the target ofthe present Ph.D. study, not many CFD studies have been developed. In thenext section, outcomes of CFD studies of the cyclone reactors will be discussedto provide a narrow down direction to what is targeted for the present project.
2.5.3 CFD studies on cyclone reactors
CFD simulations of the fluid and particle flows in cyclone reactors have a poten-tial to provide a good understanding of the flow and reaction patterns withinthe cyclones. In this case, the system to be used for the simulations is verycomplicated and needs to be simplified. This would further provide a betterunderstanding and knowledge of design, scale up and optimization studies. Themain aim of this section is to map the relative importance of fluid dynamics andchemical reactions in different high temperature gas-solid processes which arestudied until now.
Experiments and numerical simulation of sawdust gasifica-tion air cyclone gasifier
In this work, experimental and numerical simulation of sawdust gasification in anair cyclone gasifier is investigated to produce a high-quality fuel gas with less tarby Sun [139]. Numerical simulations are made based on commercial CFD codeFluent, with the help of UDF (user defined function) to consider the gasificationreaction rate. The main assumption for simulation that he considered is:
54 Literature survey
• The biomass can be represented as spherical particles and the particle di-ameter remained constant during the gasification, based on the volumetricmodel.
• The fuel was composed of C, H, and O. The gas-phase species included inthe model were CO, CO2, H2O, O2, H2, CH4 and C2H4
• Sawdust pyrolysis was simply described as a one-step global reaction:Sawdust→ char + volatiles, volatiles→ a× gas+ b× tar
In this study, the combustion of volatiles and char was described by eight reac-tions with known kinetic rates of reaction.
A three-dimensional model of a cyclone gasifier is developed. The mesh withapproximately 84,600 cells is designed for a cyclone with diameter 200 mm and2280 mm height. To model the turbulence in the reacting flow model, therealizable k − ε model is used. The stochastic tracking model is applied toanalyze the gas-solid flow field. The model predicts the trajectory of a discrete-phase particle by integrating the force balance on the particle, which is writtenin a Lagrangian reference frame. Species transport model is used to model thereactions in the cyclone gasifier.
The chemistry-turbulence interaction model is Finite-Rate/Eddy-Dissipationwhich computed both the Arrhenius rate and the mixing rate and used theminimum of the two. The simple P-1 radiation model is used in this study. Theradiation model is defined based on the expansion of the radiation intensity intoan orthogonal series of spherical harmonics. The finite volume method is usedto discretize the governing equations and the equations are solved by a SIMPLEalgorithm. The CFD model of the process is validated with experimental data.This developed CFD model provides a good reference for the gasifier to predictoperational parameters such as gas temperatures, gas concentration produced,and heat value produced [139].
Simulation study on production of fine ceramic powders ina cyclone reactor
Another cyclone reactor CFD modeling is done by Maurizio Masi [28] to producefine ceramic powders in a cyclone reactor. In this case, it is reported that thequality of fine metal-oxide powders synthesized in the vapor-phase aerosol reac-tor is significantly affected by fluid dynamics. Under turbulent regimes, depend-ing on nozzles and reactor configuration, backflows may arise with consequentre-circulation of as-synthesized particles in the flame region. Masi proposed an
2.6 Conclusion and perspective of project 55
innovative cyclone aerosol reactor configuration, which can reduce re-circulationof particles and, simultaneously, provide a segregation of the largest particles.As a result, a final product with a narrower particle size distribution can be ob-tained. To evaluate this innovative configuration, an existing industrial aerosolreactor was remodeled according to cyclone geometry and simulated.
Several studies are presented for SNCR in different types of reactors due to theimportance of NOx emission control [140–149] mostly in experimental and pilotscale. There are also some industrial SNCR application studies which applycommon reactors for SNCR [150–152].
The application of the cyclone reactor for SNCR is only mentioned in [153] for anindustrial optimization purpose and also recently in [154]. Both studies includeCFD modeling of SNCR but are mostly focused on SNCR efficiency followingoptimization purposes.
However, a comprehensive study of the cyclone flow and its effect on reactionparameters is not yet available. With considering flow dynamics and reactiontogether, further development studies are needed to support the potential of thecyclone reactors to provide better reaction conditions.
2.6 Conclusion and perspective of project
In this literature survey the principles of the cyclones and their applications arediscussed. The idea of applying cyclone as a reactor is to apply cyclonic flow toachieve more efficient reaction inside the cyclone with providing better reagentmixing and higher residence time for the chemical spices to react. It is furtherdeveloped by considering cyclone heat transfer properties based on the swirlflow which could be an advantage for high temperature reactions.
Therefore, when describing a cyclone as a reactor, it is very important to knowprinciples about flow patterns that subsequently control some reaction param-eters such as residence time, mixing conditions and temperature.
To provide a better understanding of such behavior and regarding the demandsand more recent applications of the SNCR reaction in different industries, SNCRis selected for the present investigation. The reaction is classified as a high-temperature fast reaction and is hence a good choice to investigate chemicalreaction parameters as well as temperature effects when cyclonic flow plays aunique role inside the cyclone reactor.
With regard to the complexity of flow in the cyclone when adding reaction
56 Literature survey
parameters, a proper modeling tool could be beneficial to simulate the system.To simplify this model and avoid unnecessary complexity, a reduced reactionmechanism is preferred. The relevant principle models, including CFD modelsand selected case studies, has been presented in this review and supported bya detailed and well-known reduced reaction mechanism that has been appliedwidely in different case studies.
This review provides background knowledge for a CFD-based SNCR inside acyclone reactor. The suggested method based on the review is to use a CFDcode with a reduced mechanism, which may even consist of a two-step reactionfor NH3-SNCR and results then will be computed and confirmed/optimized andfinally validated by pilot scale experiments in a setup that is specifically designedand manufactured for this purpose.
Adding to the main purpose of characterization of the cyclone reactor consid-ering the environmental legislation and the necessity of additional controls onNOx emission in the industries, the results of this study could be of interestin industries such as CFB boilers in power plants, cement and other chemi-cal/mining industries for applying a simple, available cyclone reactor for NOxemission control. This leads to avoiding extra work/cost for adding a specificSNCR unit to the plant.
In all the industries mentioned, in real case, solid particles are present inside thecyclone. These particles may have an effect on chemical reaction or reaction-flow interaction which is important to investigate. To the author’s knowledge, noparticular study on particle-reaction-flow interaction has been published before,not only in cyclones but even in general combustion technological investigations.
Part of our design purpose is to provide a cyclone reactor with a potential tostudy on the effect of particles. Some experiments will be also provided to checkthe functionary of cyclone in presence of particles, however further detail studyexperiments with particles is not in the scope of this project.
Altogether, with the basic simulation and modeling of the SNCR in the cy-clone reactor, will provide a good background to be applied in detailed kineticsimulations, research purposes, industries, and scale-up targets.
Chapter 3
Experimental apparatus
Introduction
To provide a suitable apparatus to study fluid dynamics and reactions inside acyclone reactor at high temperature, a pilot scale set-up is needed. Therefore,an apparatus was designed and constructed to study SNCR as a fast reactionin a cyclone reactor. The basic design parameters are listed in Table(3.1). Theflue gas is produced by a max 27kW swirl burner fired with natural gas andcompressed air. Combustion takes place in a combuster and enters into thecyclone by a connector tube. This system, combustor, provides internal heatingand proper temperature, also applying to produce initial NOx.
Based on the fact that the system is working in high temperatures and heatingby natural gas combustion, the sandwich three layer plan is used for manufac-turing the combustion chamber and cyclone reactor as well as connecting tubebetween chamber and cyclone. The three-sandwich plan is composed of twolayers refractory material (high-density refractory cement/ high-temperatureresistance and low-density refractory material/good isolation) and steel shell.
Three important parameters in SNCR are temperature, mixing and residencetime of reactant, which could be studied. More specifically, the system is de-signed to provide the ability to inject ammonia in different positions as well asthe possibility of taking samples from different zones.
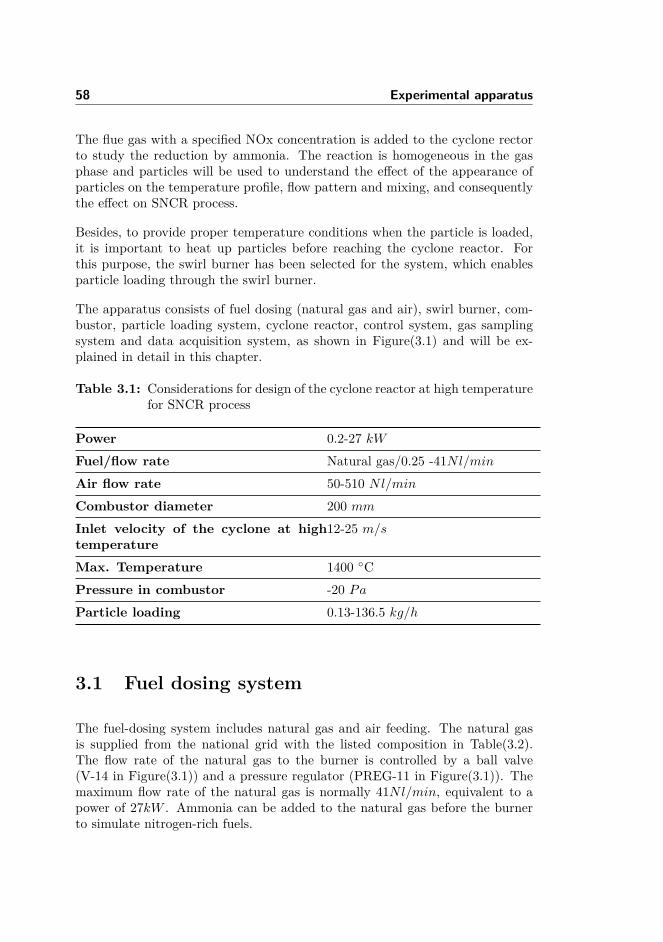
58 Experimental apparatus
The flue gas with a specified NOx concentration is added to the cyclone rectorto study the reduction by ammonia. The reaction is homogeneous in the gasphase and particles will be used to understand the effect of the appearance ofparticles on the temperature profile, flow pattern and mixing, and consequentlythe effect on SNCR process.
Besides, to provide proper temperature conditions when the particle is loaded,it is important to heat up particles before reaching the cyclone reactor. Forthis purpose, the swirl burner has been selected for the system, which enablesparticle loading through the swirl burner.
The apparatus consists of fuel dosing (natural gas and air), swirl burner, com-bustor, particle loading system, cyclone reactor, control system, gas samplingsystem and data acquisition system, as shown in Figure(3.1) and will be ex-plained in detail in this chapter.
Table 3.1: Considerations for design of the cyclone reactor at high temperaturefor SNCR process
Power 0.2-27 kWFuel/flow rate Natural gas/0.25 -41Nl/minAir flow rate 50-510 Nl/minCombustor diameter 200 mmInlet velocity of the cyclone at hightemperature
12-25 m/s
Max. Temperature 1400 CPressure in combustor -20 PaParticle loading 0.13-136.5 kg/h
3.1 Fuel dosing system
The fuel-dosing system includes natural gas and air feeding. The natural gasis supplied from the national grid with the listed composition in Table(3.2).The flow rate of the natural gas to the burner is controlled by a ball valve(V-14 in Figure(3.1)) and a pressure regulator (PREG-11 in Figure(3.1)). Themaximum flow rate of the natural gas is normally 41Nl/min, equivalent to apower of 27kW . Ammonia can be added to the natural gas before the burnerto simulate nitrogen-rich fuels.
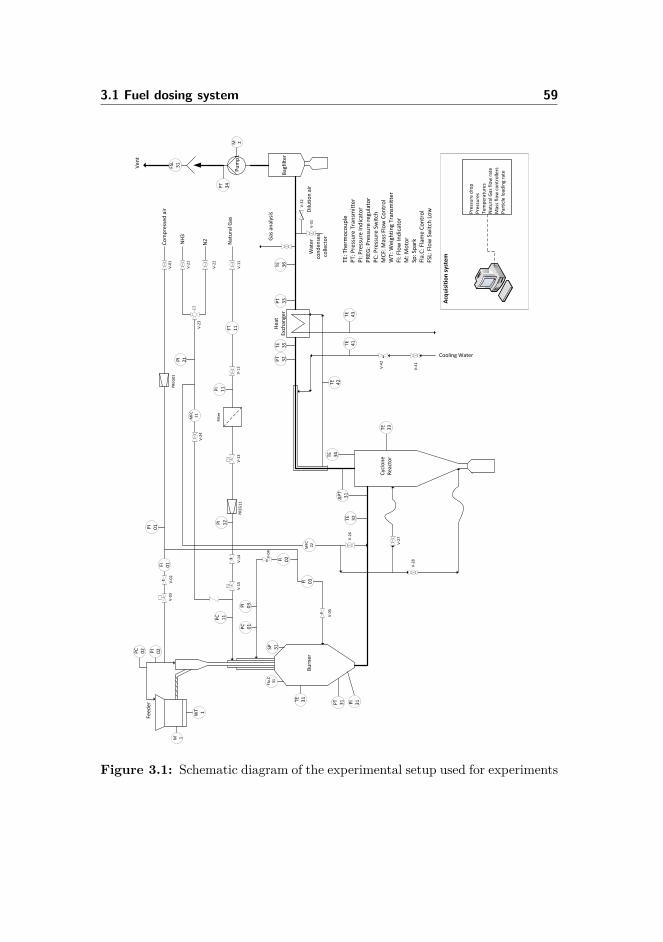
3.1 Fuel dosing system 59
Bag
filt
er
Ven
t
Hea
t Ex
chan
ger
Cyc
lon
e R
eact
or
Bu
rner
Feed
er
NH
3
N2
Nat
ura
l Gas
Co
mp
ress
ed a
ir
PR
EG0
1
V-2
2
V-0
1V
-02
V-0
4
V-2
1
V-2
3
V-2
6
V-2
7
V-2
8
V-1
1V
-13
V-4
1
Gas
an
alys
is
V-1
4P
um
p1
PR
EG1
1
V-0
3
PI
11
PT
34
ΔP
T3
1
TE 36
PC 02
PI
03
FT 11
Fla.
C3
1
PT
31
SP 31
TE 32
TE 31
TE 33
M 1
M 2
PT
33
WT 1
TE 34
PI
01
FI 02
FI 03
PI
21
PC 01
FI 01
PI
02
PI
12
V-1
2
Filt
er
Cooling Water
V-4
2
TE 41
TE 42
TE 35
PT
32
MFC 22
MFC 21
TE: T
her
mo
cou
ple
PT:
Pre
ssu
re T
ran
smit
ter
PI:
Pre
ssu
re In
dic
ato
rP
REG
: Pre
ssu
re r
egu
lato
rP
C: P
ress
ure
Sw
itch
MC
F: M
ass
Flo
w C
on
tro
lW
T: W
eigh
tin
g Tr
ansm
itte
rFI
: Flo
w In
dic
ato
rM
: Mo
tor
Sp: S
par
kFl
a.C
: Fla
me
Co
ntr
ol
FSL:
Flo
w S
wit
ch L
ow
PI
31
FSL
31
V-0
5
Dilu
tio
n a
irW
ater
co
nd
ense
s co
llect
or
V-3
1
V-3
2
V-1
5
PC 11
TE 43
V-2
4
Pre
ssu
re d
rop
Pre
ssu
res
Tem
per
atu
res
Nat
ura
l Gas
flo
w r
ate
Mas
s fl
ow
co
ntr
olle
rsP
arti
cle
load
ing
rate
Acq
uis
itio
n s
yste
m
Figure 3.1: Schematic diagram of the experimental setup used for experiments
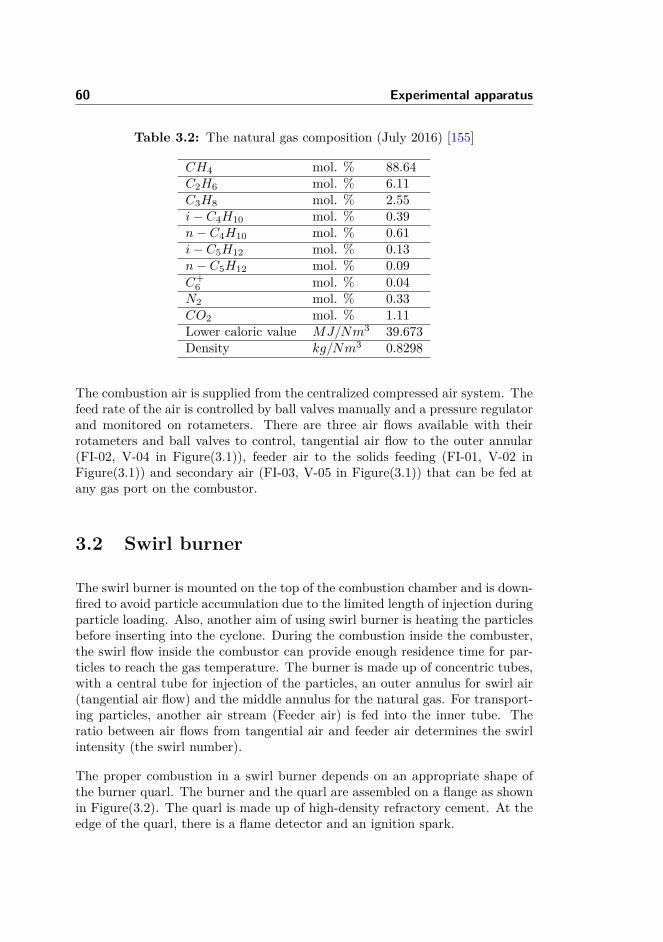
60 Experimental apparatus
Table 3.2: The natural gas composition (July 2016) [155]
CH4 mol. % 88.64C2H6 mol. % 6.11C3H8 mol. % 2.55i− C4H10 mol. % 0.39n− C4H10 mol. % 0.61i− C5H12 mol. % 0.13n− C5H12 mol. % 0.09C+
6 mol. % 0.04N2 mol. % 0.33CO2 mol. % 1.11Lower caloric value MJ/Nm3 39.673Density kg/Nm3 0.8298
The combustion air is supplied from the centralized compressed air system. Thefeed rate of the air is controlled by ball valves manually and a pressure regulatorand monitored on rotameters. There are three air flows available with theirrotameters and ball valves to control, tangential air flow to the outer annular(FI-02, V-04 in Figure(3.1)), feeder air to the solids feeding (FI-01, V-02 inFigure(3.1)) and secondary air (FI-03, V-05 in Figure(3.1)) that can be fed atany gas port on the combustor.
3.2 Swirl burner
The swirl burner is mounted on the top of the combustion chamber and is down-fired to avoid particle accumulation due to the limited length of injection duringparticle loading. Also, another aim of using swirl burner is heating the particlesbefore inserting into the cyclone. During the combustion inside the combuster,the swirl flow inside the combustor can provide enough residence time for par-ticles to reach the gas temperature. The burner is made up of concentric tubes,with a central tube for injection of the particles, an outer annulus for swirl air(tangential air flow) and the middle annulus for the natural gas. For transport-ing particles, another air stream (Feeder air) is fed into the inner tube. Theratio between air flows from tangential air and feeder air determines the swirlintensity (the swirl number).
The proper combustion in a swirl burner depends on an appropriate shape ofthe burner quarl. The burner and the quarl are assembled on a flange as shownin Figure(3.2). The quarl is made up of high-density refractory cement. At theedge of the quarl, there is a flame detector and an ignition spark.
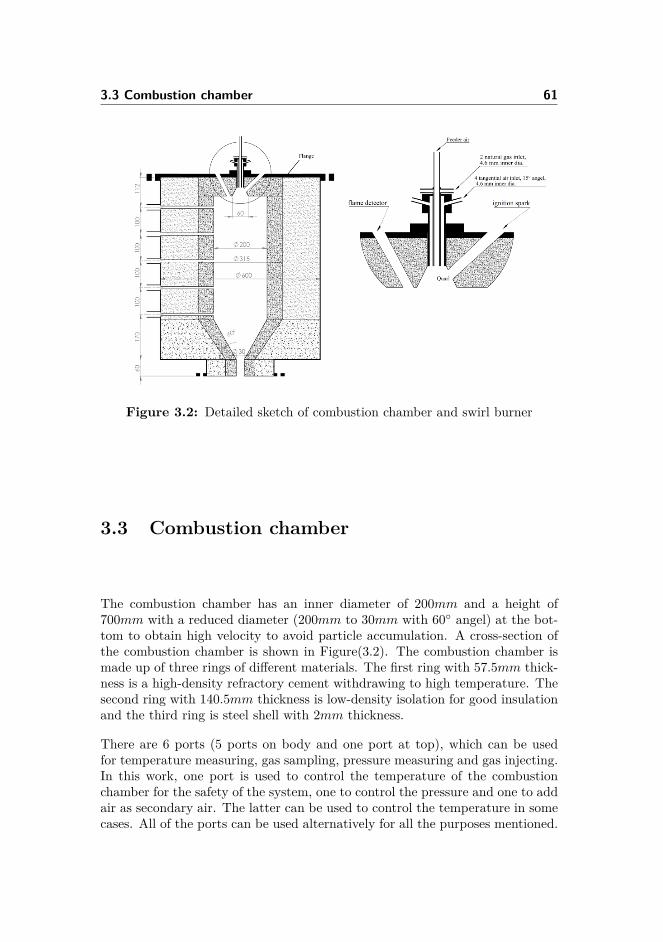
3.3 Combustion chamber 61
Figure 3.2: Detailed sketch of combustion chamber and swirl burner
3.3 Combustion chamber
The combustion chamber has an inner diameter of 200mm and a height of700mm with a reduced diameter (200mm to 30mm with 60 angel) at the bot-tom to obtain high velocity to avoid particle accumulation. A cross-section ofthe combustion chamber is shown in Figure(3.2). The combustion chamber ismade up of three rings of different materials. The first ring with 57.5mm thick-ness is a high-density refractory cement withdrawing to high temperature. Thesecond ring with 140.5mm thickness is low-density isolation for good insulationand the third ring is steel shell with 2mm thickness.
There are 6 ports (5 ports on body and one port at top), which can be usedfor temperature measuring, gas sampling, pressure measuring and gas injecting.In this work, one port is used to control the temperature of the combustionchamber for the safety of the system, one to control the pressure and one to addair as secondary air. The latter can be used to control the temperature in somecases. All of the ports can be used alternatively for all the purposes mentioned.
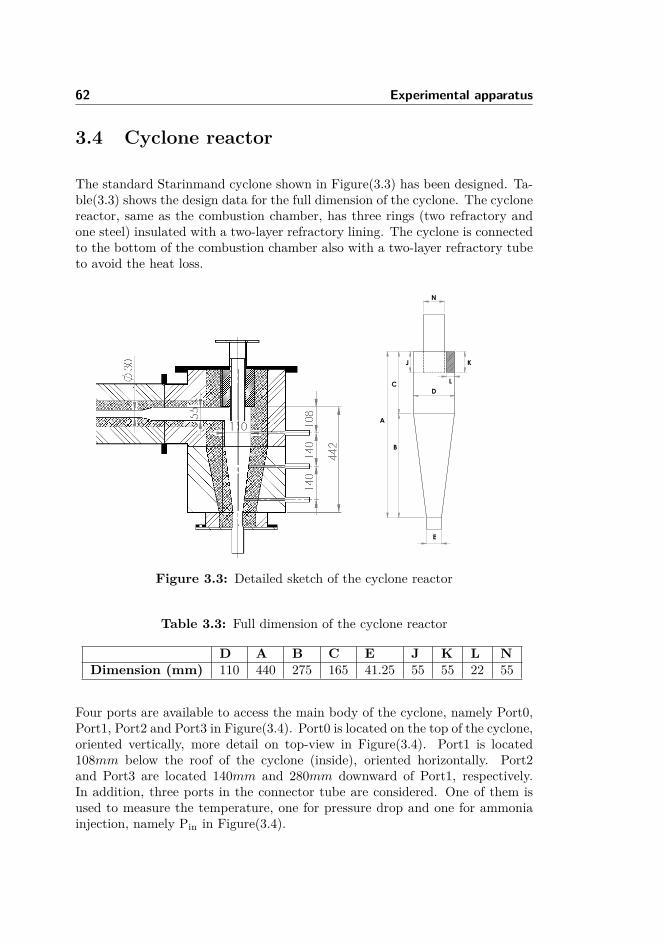
62 Experimental apparatus
3.4 Cyclone reactor
The standard Starinmand cyclone shown in Figure(3.3) has been designed. Ta-ble(3.3) shows the design data for the full dimension of the cyclone. The cyclonereactor, same as the combustion chamber, has three rings (two refractory andone steel) insulated with a two-layer refractory lining. The cyclone is connectedto the bottom of the combustion chamber also with a two-layer refractory tubeto avoid the heat loss.
K
N
J
LD
E
B
C
A
Cyclone29-realWEIGHT:
A4
SHEET 1 OF 1SCALE:1:20
DWG NO.
TITLE:
REVISIONDO NOT SCALE DRAWING
MATERIAL:
DATESIGNATURENAME
DEBUR AND BREAK SHARP EDGES
FINISH:UNLESS OTHERWISE SPECIFIED:DIMENSIONS ARE IN MILLIMETERSSURFACE FINISH:TOLERANCES: LINEAR: ANGULAR:
Q.A
MFG
APPV'D
CHK'D
DRAWN
Figure 3.3: Detailed sketch of the cyclone reactor
Table 3.3: Full dimension of the cyclone reactor
D A B C E J K L NDimension (mm) 110 440 275 165 41.25 55 55 22 55
Four ports are available to access the main body of the cyclone, namely Port0,Port1, Port2 and Port3 in Figure(3.4). Port0 is located on the top of the cyclone,oriented vertically, more detail on top-view in Figure(3.4). Port1 is located108mm below the roof of the cyclone (inside), oriented horizontally. Port2and Port3 are located 140mm and 280mm downward of Port1, respectively.In addition, three ports in the connector tube are considered. One of them isused to measure the temperature, one for pressure drop and one for ammoniainjection, namely Pin in Figure(3.4).
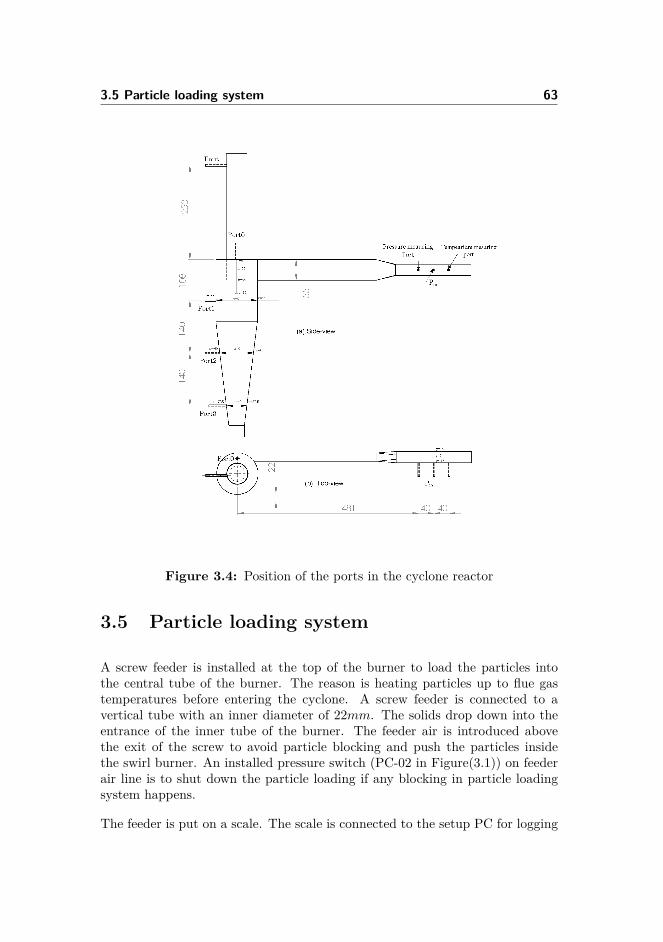
3.5 Particle loading system 63
Figure 3.4: Position of the ports in the cyclone reactor
3.5 Particle loading system
A screw feeder is installed at the top of the burner to load the particles intothe central tube of the burner. The reason is heating particles up to flue gastemperatures before entering the cyclone. A screw feeder is connected to avertical tube with an inner diameter of 22mm. The solids drop down into theentrance of the inner tube of the burner. The feeder air is introduced abovethe exit of the screw to avoid particle blocking and push the particles insidethe swirl burner. An installed pressure switch (PC-02 in Figure(3.1)) on feederair line is to shut down the particle loading if any blocking in particle loadingsystem happens.
The feeder is put on a scale. The scale is connected to the setup PC for logging
64 Experimental apparatus
the data of the particle feed rate. The capacity of the feeder is 0.13kg/h ∼105kg/h. The normal accuracy achieved with this feeder is between ±1.5 and2.5% of set point.
3.6 Ammonia injection system
The ammonia injection system is composed of an ammonia cylinder, nitrogenline from the utility, 3-way magnetic valve, two mass flow controllers and sixball valves Figure(3.5). Ammonia gas flows from cylinder to set-up with approx.2bar pressure for production NOx by injecting to natural gas and reduction ofNOx by injecting to cyclone reactor for SNCR.
This 3-way magnetic valve is designed to make sure of the system safety. It isswitched to ammonia when activated from the labview-system and automaticallyswitched back to N2 in any risky situation, e.g., when the burner is not operatingor temperature is below a certain defined level.
All the piping of ammonia to the setup is stainless steel. Close to the ammo-nia injection ports (for a reduction in cyclone reactor) stainless steel piping isconnected to the adjustable ceramic tube by using a Teflon tube. This ceramictube will be inserted into the cyclone with high temperature. Ammonia gasdecomposes at high temperatures with metal tubes into nitrogen and hydrogen.Using the ceramic tube significantly decreases this fact. The ceramic tube canbe horizontally adjusted to different distances from the cyclone wall to injectammonia in different horizontal positions.
The ammonia flows are controlled by two mass flow controllers, one (MFC-21 inFigure(3.5)) for natural gas to obtain the specific NOx concentration in flue gasand the other one (MFC-22 in Figure(3.5)) to inject ammonia as a reductionagent in different positions in reactor with using provided valves (V-26,V-27 andV-28 in Figure(3.5)). The range of MFC’s are 0–1305Nl/min. If the set-point ofMFC is in the range of 0–260Nl/min, the accuracy will be ±0.18% of set-pointwhereas if the set-point is in the range of 260–1305Nl/min, the accuracy willbe ± 0.9% of set-point.
3.7 Post-reactor system
This system consists of flue gas cooling, water removing and particle removingsub-systems. The flue gas after cyclone reactor is first cooled with two waterjackets and then with a heat exchanger.
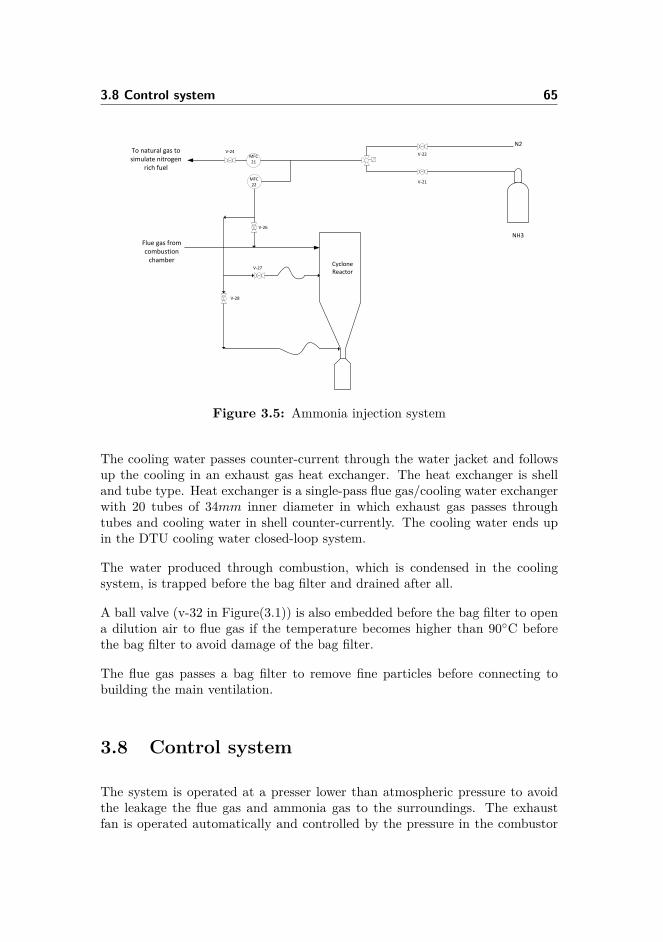
3.8 Control system 65
Cyclone Reactor
MFC22
MFC21
N2
NH3
To natural gas to simulate nitrogen
rich fuel
Flue gas from combustion
chamber
V-26
V-24
V-27
V-28
V-21
V-22
Figure 3.5: Ammonia injection system
The cooling water passes counter-current through the water jacket and followsup the cooling in an exhaust gas heat exchanger. The heat exchanger is shelland tube type. Heat exchanger is a single-pass flue gas/cooling water exchangerwith 20 tubes of 34mm inner diameter in which exhaust gas passes throughtubes and cooling water in shell counter-currently. The cooling water ends upin the DTU cooling water closed-loop system.
The water produced through combustion, which is condensed in the coolingsystem, is trapped before the bag filter and drained after all.
A ball valve (v-32 in Figure(3.1)) is also embedded before the bag filter to opena dilution air to flue gas if the temperature becomes higher than 90C beforethe bag filter to avoid damage of the bag filter.
The flue gas passes a bag filter to remove fine particles before connecting tobuilding the main ventilation.
3.8 Control system
The system is operated at a presser lower than atmospheric pressure to avoidthe leakage the flue gas and ammonia gas to the surroundings. The exhaustfan is operated automatically and controlled by the pressure in the combustor
66 Experimental apparatus
(PT-31 in Figure(3.1)).
To ensure the safe and smooth start-up and operation of the burner, a controlsystem is designed.
The burner control system is composed of a control box, monitoring devices(flame detector, pressure trans-meters and thermocouple) and action device(magnetic valves, gas pressure switches, ignition spark). The startup sequenceis controlled by a microcomputer inside the control box, which is described asfollows.
By starting the control box (Pressing start the burner), air flow check is per-formed by a pressure switch on tangential air by PC-11 (Figure(3.1)). Themagnetic valves (V-13 and V-15 in Figure(3.1)) on natural gas are automati-cally opened 30seconds after combustion air is detected. During 30 seconds, thecombustion air needs to flow into the combustor to remove any gases remainingfrom the previous experiments before starting the ignition. The ignition sparkstarts immediately when the magnetic valves (V-13, V-15) open for naturalgas. If the ignition is not successful, the signal from flame detector orders themagnetic valve to close and the above procedure will be repeated by pressingstart-up burner manually until the ignition is successful.
Another controller is also provided which controls the temperatures, pressures,ammonia injection, particle loading, water cooling flow and ventilation. Thissafety-controller is connected to the burner controller and installed to handleseveral safety situations in the whole system by closing the magnetic valves’communication by burner controller. As some practical examples, if the flameis extinguished accidentally / combustion air feeding stops / blocking in systemhappened / temperature is high in some points / cooling water flow is low or cut/ ventilation cut-off happened, the natural gas feeding will stop. Also, the 3-waymagnetic valve switch to nitrogen and particle loading stops if it is operating.
3.9 Gas sampling system
The gas sampling system includes filtering, quenching, water removal, andpumping to gas analyzer which pass through a scrubber to get rid of ammo-nia.
The gas samples are taken out with 1Nl/min flow rate from designed samplingpoint or as an alternative with a sampling probe from any places of the cycloneusing designed ports (see Figure(3.4) for detail studies). The designed samplingpoint itself is placed after heat exchanger shown in Figure(3.1). The taken
3.10 Data acquisition 67
sample is passing a pretreatment station near the set-up including filtrationto remove fine particles, quenching and water condensing. Then the dry gassample is pumped into the scrubber to remove ammonia with oxalic acid beforereaching the central gas analyzer. There will be a second treatment which isprovided for the central gas analyzer to ensure the gas sample is dry and free ofammonia. The sampled flue gas flows to a series of three gas analyzers.
• Fischer-Rosemount NGA 2000 analyzer to measure CO, CO2 and O2 con-centrations
• Fischer-Rosemount NGA 2000 to measure NO
• CLD 700 EL to measure the NO and NO2 (NOx is the sum of these two)
The concentration of the gases are transferred via the internal network andlogged to a computer.
The continuous gas analyzers must be calibrated using N2 for zero-point adjust-ment and calibration gases with a 2% accuracy for span gases.
3.10 Data acquisition
The data acquisition system is designed for further analysis of the results. Allprocess parameters (temperatures, pressures, pressure drop, flue gas composi-tion, natural gas flow rate, ammonia flow rates, particle loading rate), exceptair flow (which is monitored by rotameters), are acquired on-line by a PC usingthe Labview software via a convector. Converted from voltage or milliampere,the output of the data was expressed in proper engineering units such as Cfor temperature, Pa for pressure or pressure drop, ppm or % for gas concentra-tions and kg/s for feed rate of particles, Nl/min for natural gas flow rate andNml/min for ammonia flow rate.
3.11 Experiments procedure
The procedure for experiments is presented here for a case with flue gas prop-erties as listed in Table(3.4) and reduction by the molar ratio (NH3/NOx) 1.25.
The velocity of flue gas is an important operating parameter which needs to beconstant as a defined value in all experiments. Assuming flue gas is an idealgas, the velocity is a function of moles of the flue gas and temperature.
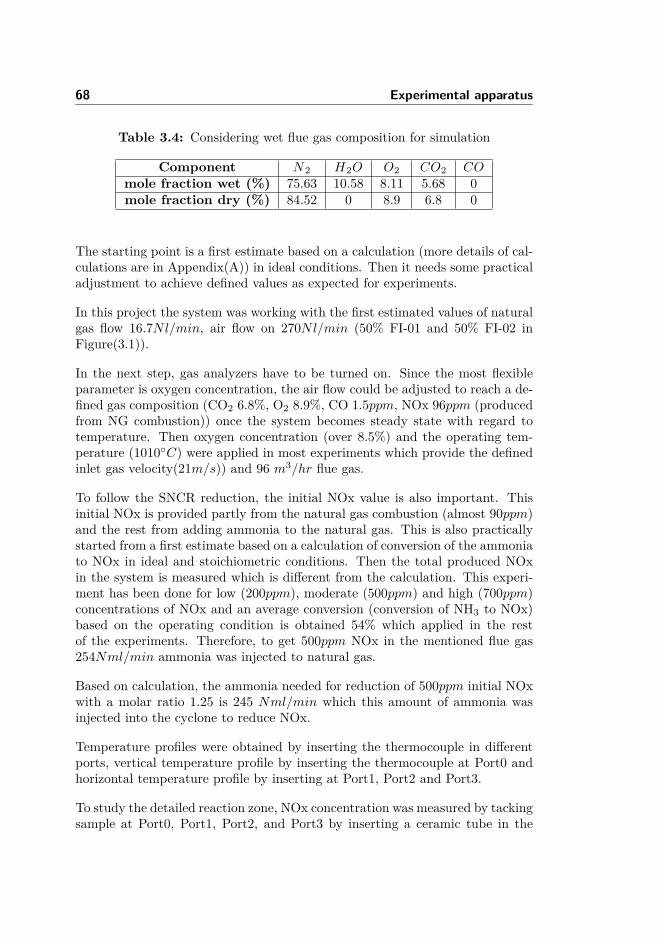
68 Experimental apparatus
Table 3.4: Considering wet flue gas composition for simulation
Component N2 H2O O2 CO2 COmole fraction wet (%) 75.63 10.58 8.11 5.68 0mole fraction dry (%) 84.52 0 8.9 6.8 0
The starting point is a first estimate based on a calculation (more details of cal-culations are in Appendix(A)) in ideal conditions. Then it needs some practicaladjustment to achieve defined values as expected for experiments.
In this project the system was working with the first estimated values of naturalgas flow 16.7Nl/min, air flow on 270Nl/min (50% FI-01 and 50% FI-02 inFigure(3.1)).
In the next step, gas analyzers have to be turned on. Since the most flexibleparameter is oxygen concentration, the air flow could be adjusted to reach a de-fined gas composition (CO2 6.8%, O2 8.9%, CO 1.5ppm, NOx 96ppm (producedfrom NG combustion)) once the system becomes steady state with regard totemperature. Then oxygen concentration (over 8.5%) and the operating tem-perature (1010C) were applied in most experiments which provide the definedinlet gas velocity(21m/s)) and 96 m3/hr flue gas.
To follow the SNCR reduction, the initial NOx value is also important. Thisinitial NOx is provided partly from the natural gas combustion (almost 90ppm)and the rest from adding ammonia to the natural gas. This is also practicallystarted from a first estimate based on a calculation of conversion of the ammoniato NOx in ideal and stoichiometric conditions. Then the total produced NOxin the system is measured which is different from the calculation. This experi-ment has been done for low (200ppm), moderate (500ppm) and high (700ppm)concentrations of NOx and an average conversion (conversion of NH3 to NOx)based on the operating condition is obtained 54% which applied in the restof the experiments. Therefore, to get 500ppm NOx in the mentioned flue gas254Nml/min ammonia was injected to natural gas.
Based on calculation, the ammonia needed for reduction of 500ppm initial NOxwith a molar ratio 1.25 is 245 Nml/min which this amount of ammonia wasinjected into the cyclone to reduce NOx.
Temperature profiles were obtained by inserting the thermocouple in differentports, vertical temperature profile by inserting the thermocouple at Port0 andhorizontal temperature profile by inserting at Port1, Port2 and Port3.
To study the detailed reaction zone, NOx concentration was measured by tackingsample at Port0, Port1, Port2, and Port3 by inserting a ceramic tube in the

3.11 Experiments procedure 69
specified point of the cyclone.
For experiments with particles, the particles were added from the middle ofthe swirl burner with mass loading 2.2kg/hr, density 2550kg/m3 and particledistribution 3–150µm to combustor to heat up particles before entering thecyclone.
Chapter 4Experiments,
SNCR in cyclone reactor
4.1 Introduction
In recent years, NOx emission control has become stricter worldwide. SelectiveNon-Catalytic Reduction (SNCR) with reduction capabilities from 25% to 75%over a range of industrial applications is an effective and economical methodfor the reduction of NOx emission based on injecting nitrogen agents such asammonia (NH3) and urea (CO(NH2)2) in flue gas containing NOx at high tem-peratures. In practice, NOx reduction efficiency is primarily dependent on threefactors: temperature, mixing, and residence time.
The SNCR process is very sensitive to temperature and only happens in a narrowtemperature window. At high temperatures, the selectivity of chemical reactionsdesires oxidation of reductive N-containing species to form NOx, and at optimumtemperatures of temperature window, selectivity desires the reduction of NOx.At low temperatures the reaction rate is slow, so NOx reduction will be slowerand leads to more reductant slip.
Rapid mixing of injected reductant into the flue gas is also necessary in hightemperatures. If mixing is too slow, selectivity desires the oxidation of reduc-tants to NO because of the locally very high NH3 concentration [89]. Therefore,
4.2 Experimental approach and methodology 71
it is highly important to gain knowledge about mixing behavior and temper-ature profile inside the cyclone to provide effective inputs for practical stud-ies/applications.
Most of the studies on SNCR have been conducted in furnaces/kilns/boilers, andthere is a large body of literature on different operating parameters and chemicalreaction/reduced kinetics to provide preferred reaction conditions. In this study,the focus is on cyclones instead of the furnaces/kilns/boilers as a preferredreactor for SNCR, on which there have not been many studies performed.
Studies have shown that cyclones seem to ensure excellent heat transfer efficien-cies between carrier gas, solid particles and walls [21]. Moreover, the residencetime in cyclones is within the range of a few seconds. Consequently, it can beanticipated that cyclones would be well suited for carrying out fast reactions. Inthis case, SNCR is also categorized as a fast reaction. In addition, turbulent flowinside a cyclone provides better mixing conditions. All the benefits mentionedcould contribute to getting a higher reduction efficiency for SNCR.
There is need to provide more knowledge in different aspects of SNCR reaction,e.g., mixing, residence time, and particle effect to achieve a better understandingof the reactions inside the cyclone.
In this section, the first SNCR inside the cyclone is studied without particles.Also, the experiment set is designed to explain the effect of temperature, NOxdistribution, ammonia injection position, reaction zone, initial NOx, molar ratioand ammonia injection velocity in detail. The effect of temperature and molarratio is also studied with a consideration of particle loading.
These studies are planned to provide experiment-based knowledge about thesystem and how it works in real cases, to better explain and improve the mixingand residence time inside the cyclone.
4.2 Experimental approach and methodology
The objective for this section is to find the most effective reaction zone in thecyclone, to investigate mixing behavior and to study the effect of ammoniainjection from different positions to compare the reaction condition in differ-ent temperatures (higher and lower temperatures of the temperature window).Eventually, we will be able to find out where to inject ammonia into the cycloneto get the best reduction rate for NOx.
All experiments are designed to provide a detailed study of temperature profile
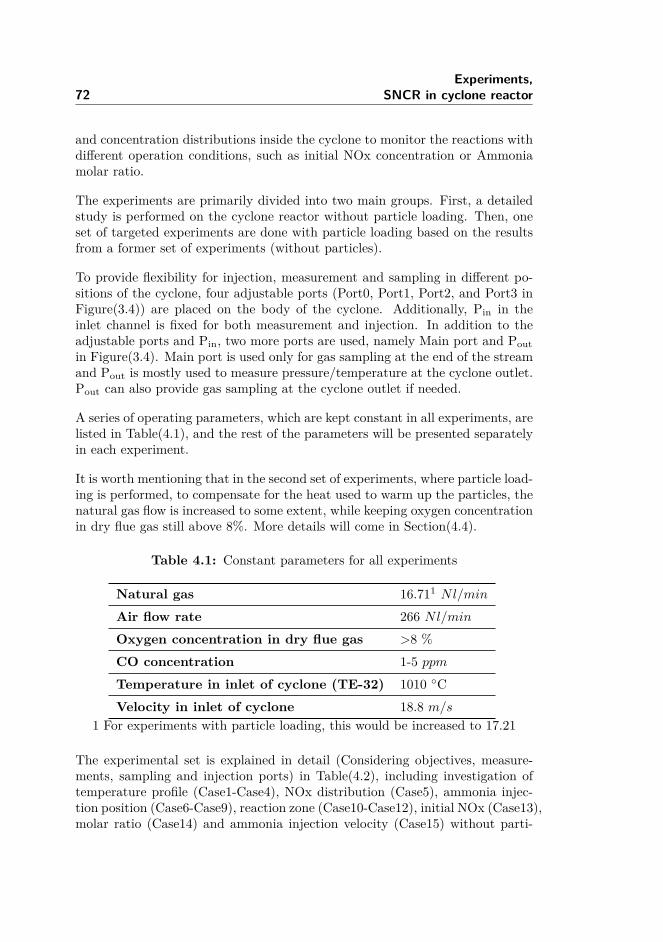
72Experiments,
SNCR in cyclone reactor
and concentration distributions inside the cyclone to monitor the reactions withdifferent operation conditions, such as initial NOx concentration or Ammoniamolar ratio.
The experiments are primarily divided into two main groups. First, a detailedstudy is performed on the cyclone reactor without particle loading. Then, oneset of targeted experiments are done with particle loading based on the resultsfrom a former set of experiments (without particles).
To provide flexibility for injection, measurement and sampling in different po-sitions of the cyclone, four adjustable ports (Port0, Port1, Port2, and Port3 inFigure(3.4)) are placed on the body of the cyclone. Additionally, Pin in theinlet channel is fixed for both measurement and injection. In addition to theadjustable ports and Pin, two more ports are used, namely Main port and Poutin Figure(3.4). Main port is used only for gas sampling at the end of the streamand Pout is mostly used to measure pressure/temperature at the cyclone outlet.Pout can also provide gas sampling at the cyclone outlet if needed.
A series of operating parameters, which are kept constant in all experiments, arelisted in Table(4.1), and the rest of the parameters will be presented separatelyin each experiment.
It is worth mentioning that in the second set of experiments, where particle load-ing is performed, to compensate for the heat used to warm up the particles, thenatural gas flow is increased to some extent, while keeping oxygen concentrationin dry flue gas still above 8%. More details will come in Section(4.4).
Table 4.1: Constant parameters for all experiments
Natural gas 16.711 Nl/min
Air flow rate 266 Nl/minOxygen concentration in dry flue gas >8 %CO concentration 1-5 ppmTemperature in inlet of cyclone (TE-32) 1010 CVelocity in inlet of cyclone 18.8 m/s
1 For experiments with particle loading, this would be increased to 17.21
The experimental set is explained in detail (Considering objectives, measure-ments, sampling and injection ports) in Table(4.2), including investigation oftemperature profile (Case1-Case4), NOx distribution (Case5), ammonia injec-tion position (Case6-Case9), reaction zone (Case10-Case12), initial NOx (Case13),molar ratio (Case14) and ammonia injection velocity (Case15) without parti-
4.3 Experiments and results without particles 73
cle loading and investigation of temperature profile (Case16-Case17) and molarratio (Case18) with particle loading.
The results of these experiments are explained in detail following this section.
4.3 Experiments and results without particles
4.3.1 Temperature Profile and NOx distribution
Temperature plays a key role in NOx reduction in the SNCR process. Therefore,it is important to monitor the effect of flow (velocity) on the temperature profileand also NOx distribution inside the cyclone before adding the reduction agent.
Details of the conditions for experiments in this section are shown in Table(4.1)and Table(4.2). All the experiments have been performed with three replicates.
In general, the temperature profile is obtained by inserting the thermocouplein different ports. The thermocouple typeS-class2 (Pt10%RH-Pt) is used tomeasure the temperature with an accuracy of 1.5C for the range (0-1100C),excluding the measuring error caused by radiation. The radiation effect is ig-nored in the experiments of this project.
The vertical temperature profile of the cyclone is obtained by inserting thethermocouple at Port0. Radial temperature profile is also studied at Port1,Port2 and Port3. With these experiments, the radial temperature profile isobserved at the top, middle and bottom of the cyclone.
In the next step, NOx concentration is measured at Port0, Port1, Port2, andPort3. This helps to know if concentration distribution for NOx is homogeneousinside the cyclone due to the flow. For this part of experiments, 500 ppmNOx has been produced by adding ammonia in natural gas since the amount ofNOx within the natural gas is not enough for our experiments (It is normallybelow 100ppm). Following this experiment, a case is investigated without addingammonia (which would later be added for the purpose of NOx reduction) tomonitor the NOx distribution inside the cyclone.
4.3.1.1 Vertical Temperature Profile
The vertical temperature profile is shown in Figure(4.1).
As can be seen, the temperature is not uniform inside the cyclone reactor which
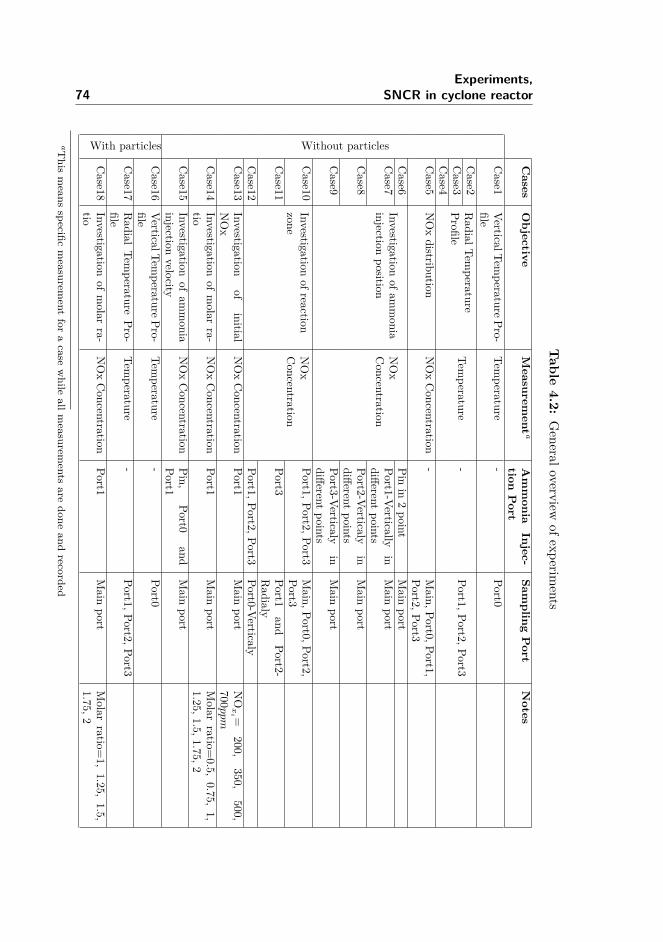
74Experiments,
SNCR in cyclone reactorTable
4.2:Generaloverview
ofexperiments
Cases
Objective
Measurem
ent aAmmonia
Injec-tion
Port
Sampling
Port
Notes
Without particlesCase1
VerticalTemperaturePro-
fileTem
perature-
Port0
Case2
RadialTem
peratureProfile
Temperature
-Port1,Port2,Port3
Case3
Case4
Case5
NOxdistribution
NOxConcentration
-Main,Port0,Port1,
Port2,Port3Case6
Investigationofam
monia
injectionposition
NOx
Concentration
Pinin
2point
Main
portCase7
Port1-Verticallyin
differentpoints
Main
port
Case8
Port2-Verticalyin
differentpoints
Main
port
Case9
Port3-Verticalyin
differentpoints
Main
port
Case10
Investigationofreaction
zoneNOx
Concentration
Port1,Port2,Port3Main,Port0,Port2,
Port3Case11
Port3Port1
andPort2-
Radialy
Case12
Port1,Port2,Port3Port0-Verticaly
Case13
Investigationof
initialNOx
NOxConcentration
Port1Main
portNOx
i =200,
350,500,
700ppm
Case14
Investigationof
molar
ra-tio
NOxConcentration
Port1Main
portMolar
ratio=0.5,
0.75,1,
1.25,1.5,1.75,2Case15
Investigationof
ammonia
injectionvelocity
NOxConcentration
Pin,Port0
andPort1
Main
port
With particles
Case16
VerticalTemperaturePro-
fileTem
perature-
Port0
Case17
Radial
Temperature
Pro-file
Temperature
-Port1,Port2,Port3
Case18
Investigationof
molar
ra-tio
NOxConcentration
Port1Main
portMolar
ratio=1,
1.25,1.5,
1.75,2
aThis
means
specificmeasurem
entfor
acase
while
allmeasurem
entsare
doneand
recorded
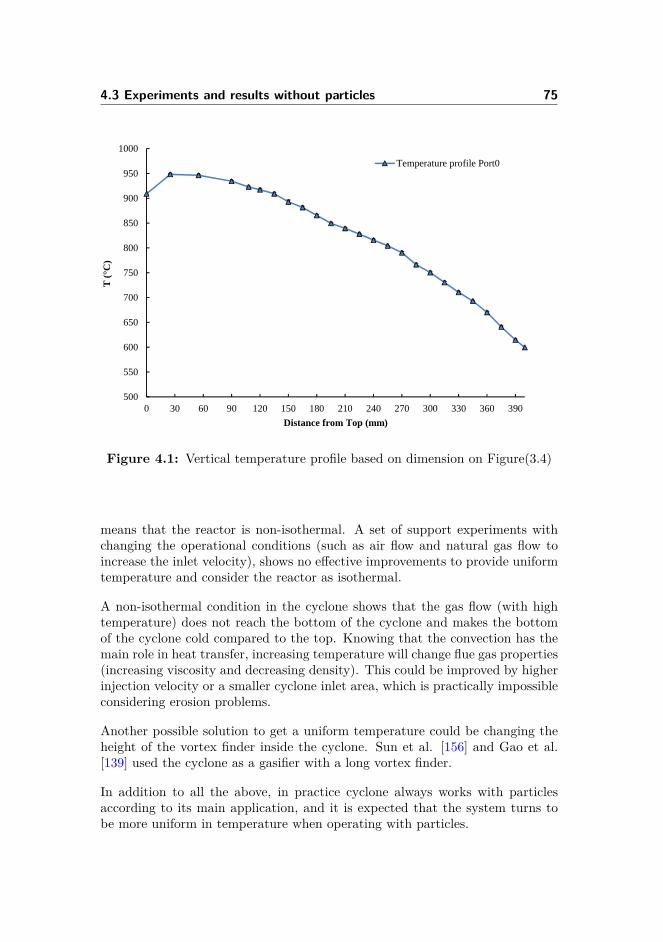
4.3 Experiments and results without particles 75
500
550
600
650
700
750
800
850
900
950
1000
0 30 60 90 120 150 180 210 240 270 300 330 360 390
T (
°C)
Distance from Top (mm)
Temperature profile Port0
Figure 4.1: Vertical temperature profile based on dimension on Figure(3.4)
means that the reactor is non-isothermal. A set of support experiments withchanging the operational conditions (such as air flow and natural gas flow toincrease the inlet velocity), shows no effective improvements to provide uniformtemperature and consider the reactor as isothermal.
A non-isothermal condition in the cyclone shows that the gas flow (with hightemperature) does not reach the bottom of the cyclone and makes the bottomof the cyclone cold compared to the top. Knowing that the convection has themain role in heat transfer, increasing temperature will change flue gas properties(increasing viscosity and decreasing density). This could be improved by higherinjection velocity or a smaller cyclone inlet area, which is practically impossibleconsidering erosion problems.
Another possible solution to get a uniform temperature could be changing theheight of the vortex finder inside the cyclone. Sun et al. [156] and Gao et al.[139] used the cyclone as a gasifier with a long vortex finder.
In addition to all the above, in practice cyclone always works with particlesaccording to its main application, and it is expected that the system turns tobe more uniform in temperature when operating with particles.
76Experiments,
SNCR in cyclone reactor
The measured temperature in the inlet channel of the cyclone (Pin in Fig-ure(3.4)) is 1010C whereas the maximum temperature inside the cyclone is950C at the top of the cyclone as a case study.
Considering the temperature window for reduction, it is possible to have bothreduction of NOx and oxidation of ammonia during ammonia injection at Pinand Port0. By injecting ammonia at Port1 and Port2, the possibility of re-duction is higher than oxidation, whereas close to Port3, the temperature islower than the temperature window and thus a reduction cannot take place,considering only the temperature effect.
In general, the results of temperature profile studies show that NOx reductioncan take place in the inlet channel and from the top of the cyclone down to340mm depth from the top.
4.3.1.2 Radial Temperature Profile
Port1: The radial temperature profile for Port1 is shown in Figure(4.2). Thetemperature range in this port is 880–910C. The temperature measured closeto the port is low because of heat loss rate from the wall of the cyclone, and itis lowest close to the center as expected (fluid from bottom flows in the innervortex).
By considering the temperature window for reduction, Port1 could be the bestchoice for reductant injection. The radial profile is not symmetric as can beseen in Figure(4.2) which shows that the inner vortex is slightly asymmetric.The proof of this theory is provided by studying the flow patterns using CFDmodeling later.
Port2: The experiments are repeated in the same conditions for Port2 andPort3 to find the radial temperature profiles. The results for Port2 are shownin Figure(4.3).
The temperature profile in Port2 shows approximately constant temperaturefor different radial positions while in Port1 there are significant differences indifferent positions. The average temperature for this port is 780C which isin the minimum range of the temperature window for reduction. It means, byinjecting ammonia from this port, the reduction efficiency is expected to be low.
Port3: The same results as Port2 (approximately constant temperature) areobtained for Port3 as shown in Figure(4.4). The temperature in this port is
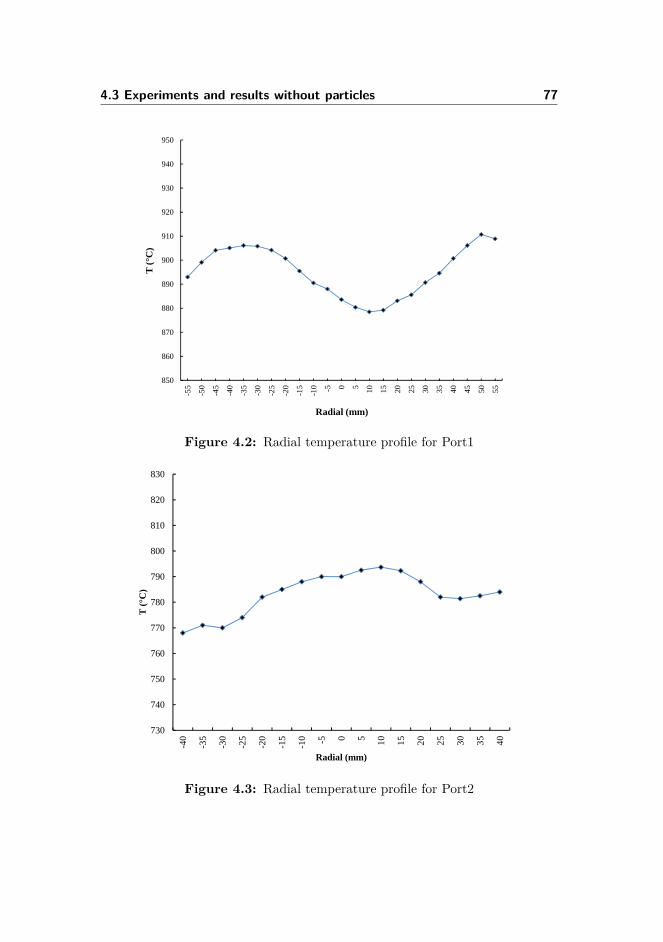
4.3 Experiments and results without particles 77
850
860
870
880
890
900
910
920
930
940
950
-55
-50
-45
-40
-35
-30
-25
-20
-15
-10 -5 0 5 10 15 20 25 30 35 40 45 50 55
T (
°C)
Radial (mm)
Figure 4.2: Radial temperature profile for Port1
730
740
750
760
770
780
790
800
810
820
830
-40
-35
-30
-25
-20
-15
-10 -5 0 5 10 15 20 25 30 35 40
T (
°C)
Radial (mm)
Figure 4.3: Radial temperature profile for Port2
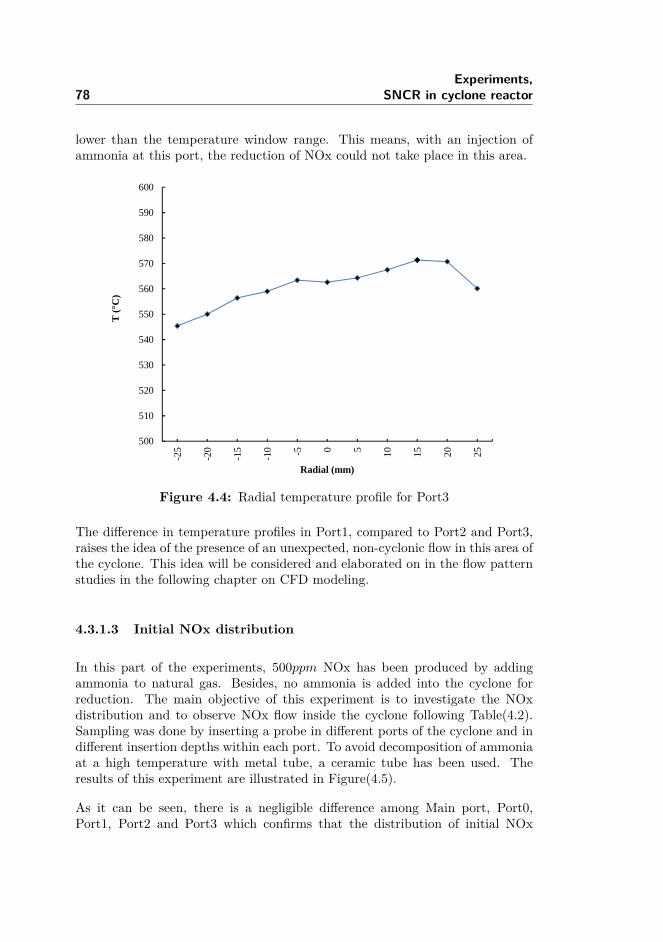
78Experiments,
SNCR in cyclone reactor
lower than the temperature window range. This means, with an injection ofammonia at this port, the reduction of NOx could not take place in this area.
500
510
520
530
540
550
560
570
580
590
600-2
5
-20
-15
-10 -5 0 5 10 15 20 25
T (
°C)
Radial (mm)
Figure 4.4: Radial temperature profile for Port3
The difference in temperature profiles in Port1, compared to Port2 and Port3,raises the idea of the presence of an unexpected, non-cyclonic flow in this area ofthe cyclone. This idea will be considered and elaborated on in the flow patternstudies in the following chapter on CFD modeling.
4.3.1.3 Initial NOx distribution
In this part of the experiments, 500ppm NOx has been produced by addingammonia to natural gas. Besides, no ammonia is added into the cyclone forreduction. The main objective of this experiment is to investigate the NOxdistribution and to observe NOx flow inside the cyclone following Table(4.2).Sampling was done by inserting a probe in different ports of the cyclone and indifferent insertion depths within each port. To avoid decomposition of ammoniaat a high temperature with metal tube, a ceramic tube has been used. Theresults of this experiment are illustrated in Figure(4.5).
As it can be seen, there is a negligible difference among Main port, Port0,Port1, Port2 and Port3 which confirms that the distribution of initial NOx
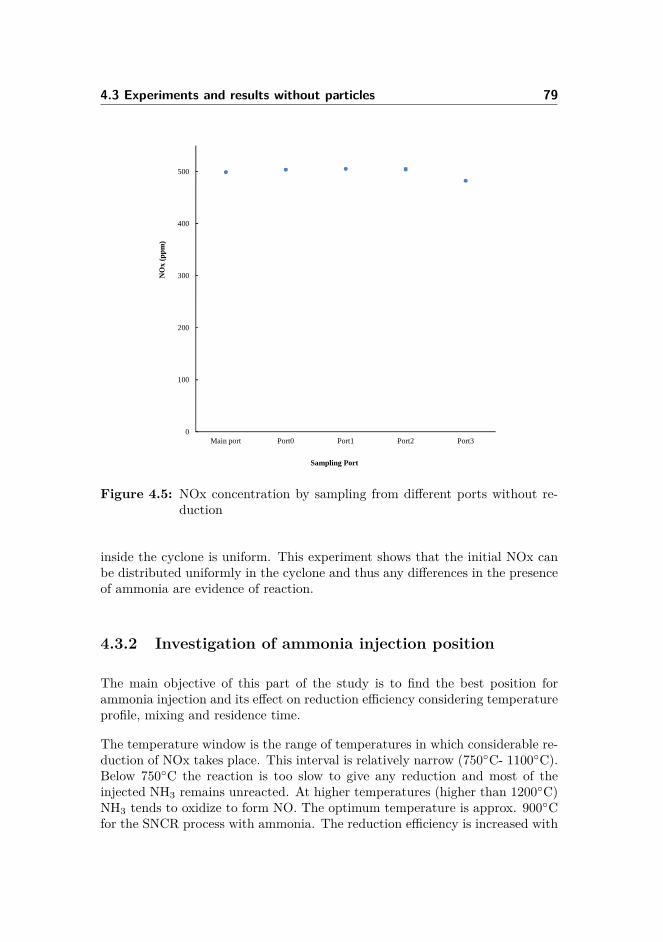
4.3 Experiments and results without particles 79
0
100
200
300
400
500
Main port Port0 Port1 Port2 Port3
NO
x (p
pm
)
Sampling Port
Figure 4.5: NOx concentration by sampling from different ports without re-duction
inside the cyclone is uniform. This experiment shows that the initial NOx canbe distributed uniformly in the cyclone and thus any differences in the presenceof ammonia are evidence of reaction.
4.3.2 Investigation of ammonia injection position
The main objective of this part of the study is to find the best position forammonia injection and its effect on reduction efficiency considering temperatureprofile, mixing and residence time.
The temperature window is the range of temperatures in which considerable re-duction of NOx takes place. This interval is relatively narrow (750C- 1100C).Below 750C the reaction is too slow to give any reduction and most of theinjected NH3 remains unreacted. At higher temperatures (higher than 1200C)NH3 tends to oxidize to form NO. The optimum temperature is approx. 900Cfor the SNCR process with ammonia. The reduction efficiency is increased with
80Experiments,
SNCR in cyclone reactor
increasing the temperature until optimum temperature. By going higher thanoptimum temperature, reduction decreases partly due to ammonia oxidization.It is then of high importance to inject ammonia to the most effective zone ofthe cyclone with regard to possible temperature differences.
The mixing and residence time effect is also bound to the Temperature effect.The reaction shows different behaviors from higher to lower temperatures.
At high temperatures of the temperature window, the reaction is limited mostlyby mixing while at low temperatures the reaction rate is slow and residence timelimits the NOx reduction. Therefore, residence time becomes one of the mostimportant parameters in SNCR in low temperature because of slow reduction,and mixing is more important at high temperatures.
In this section, with a survey on the ammonia injection zone, it is demonstratedthat in different cyclone zones the reaction behavior is different.
4.3.2.1 Injecting ammonia from different ports
In this set of experiments, by injecting ammonia in different ports, the reduc-tion of NOx in different zones of the cyclone is studied. (see Table(4.1) andTable(4.2))
Pin: Temperature range from the injection port until the cyclone inlet is960–1010C which is characterized by high temperatures in the temperaturewindow. The results of adding ammonia at Pin in two vertical positions showreasonable reduction efficiency as expected in this high temperature. The NOxlevel decreases from 505ppm to 197ppm (61%).
Pin provides the longest route for the flue gas passing through the cyclone,which means a higher residence time compared to the other ports. On the otherhand, high reduction efficiency in high temperature confirms that the mixingeffect as the limiting parameter is good enough, leading to a reduction in suchtemperature.
As a result, injecting ammonia in this injection port has satisfied all three impor-tant criteria for reduction: temperature condition, mixing and residence time.
Port0: Adding ammonia at Port0 in two vertical positions to reduce NOx, asillustrated in Figure(4.6), results show around less than 50ppm decrease in NOxconcentration. Low reduction efficiency despite having a high temperature in
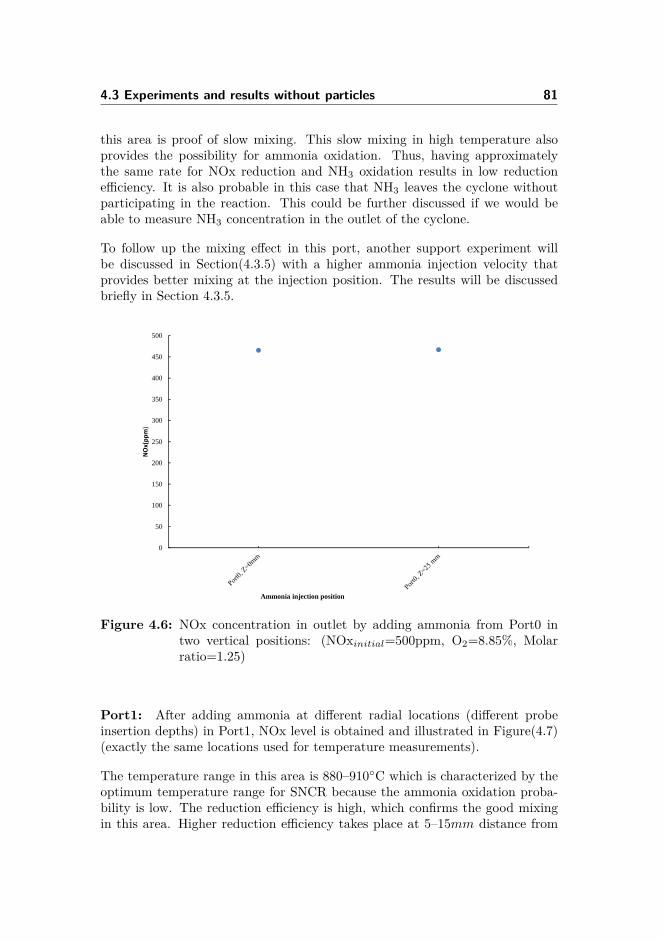
4.3 Experiments and results without particles 81
this area is proof of slow mixing. This slow mixing in high temperature alsoprovides the possibility for ammonia oxidation. Thus, having approximatelythe same rate for NOx reduction and NH3 oxidation results in low reductionefficiency. It is also probable in this case that NH3 leaves the cyclone withoutparticipating in the reaction. This could be further discussed if we would beable to measure NH3 concentration in the outlet of the cyclone.
To follow up the mixing effect in this port, another support experiment willbe discussed in Section(4.3.5) with a higher ammonia injection velocity thatprovides better mixing at the injection position. The results will be discussedbriefly in Section 4.3.5.
0
50
100
150
200
250
300
350
400
450
500
NOx(pp
m)
Ammonia injection position
Figure 4.6: NOx concentration in outlet by adding ammonia from Port0 intwo vertical positions: (NOxinitial=500ppm, O2=8.85%, Molarratio=1.25)
Port1: After adding ammonia at different radial locations (different probeinsertion depths) in Port1, NOx level is obtained and illustrated in Figure(4.7)(exactly the same locations used for temperature measurements).
The temperature range in this area is 880–910C which is characterized by theoptimum temperature range for SNCR because the ammonia oxidation proba-bility is low. The reduction efficiency is high, which confirms the good mixingin this area. Higher reduction efficiency takes place at 5–15mm distance from
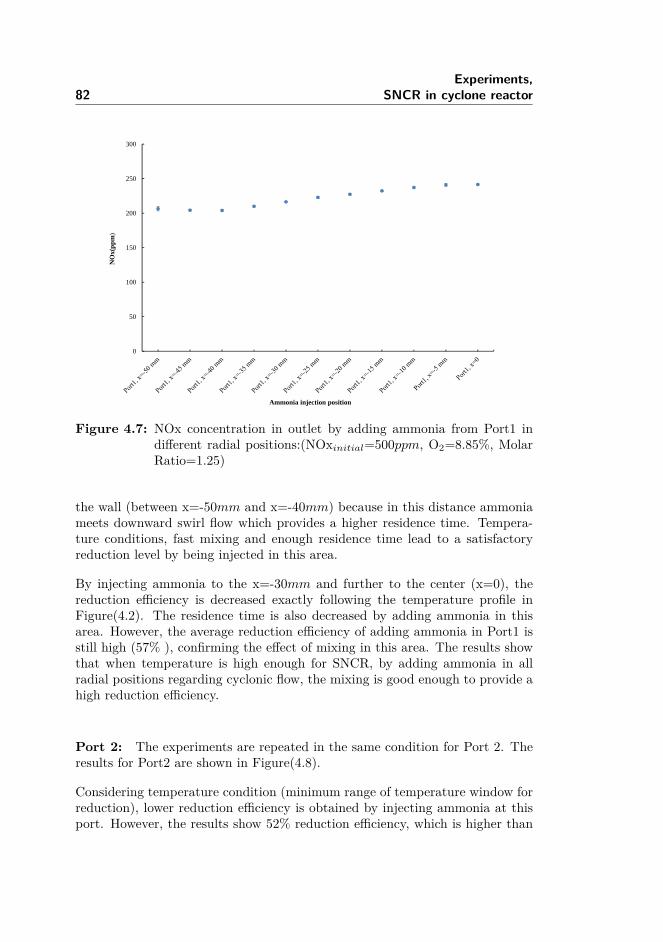
82Experiments,
SNCR in cyclone reactor
0
50
100
150
200
250
300
NO
x(p
pm
)
Ammonia injection position
Figure 4.7: NOx concentration in outlet by adding ammonia from Port1 indifferent radial positions:(NOxinitial=500ppm, O2=8.85%, MolarRatio=1.25)
the wall (between x=-50mm and x=-40mm) because in this distance ammoniameets downward swirl flow which provides a higher residence time. Tempera-ture conditions, fast mixing and enough residence time lead to a satisfactoryreduction level by being injected in this area.
By injecting ammonia to the x=-30mm and further to the center (x=0), thereduction efficiency is decreased exactly following the temperature profile inFigure(4.2). The residence time is also decreased by adding ammonia in thisarea. However, the average reduction efficiency of adding ammonia in Port1 isstill high (57% ), confirming the effect of mixing in this area. The results showthat when temperature is high enough for SNCR, by adding ammonia in allradial positions regarding cyclonic flow, the mixing is good enough to provide ahigh reduction efficiency.
Port 2: The experiments are repeated in the same condition for Port 2. Theresults for Port2 are shown in Figure(4.8).
Considering temperature condition (minimum range of temperature window forreduction), lower reduction efficiency is obtained by injecting ammonia at thisport. However, the results show 52% reduction efficiency, which is higher than
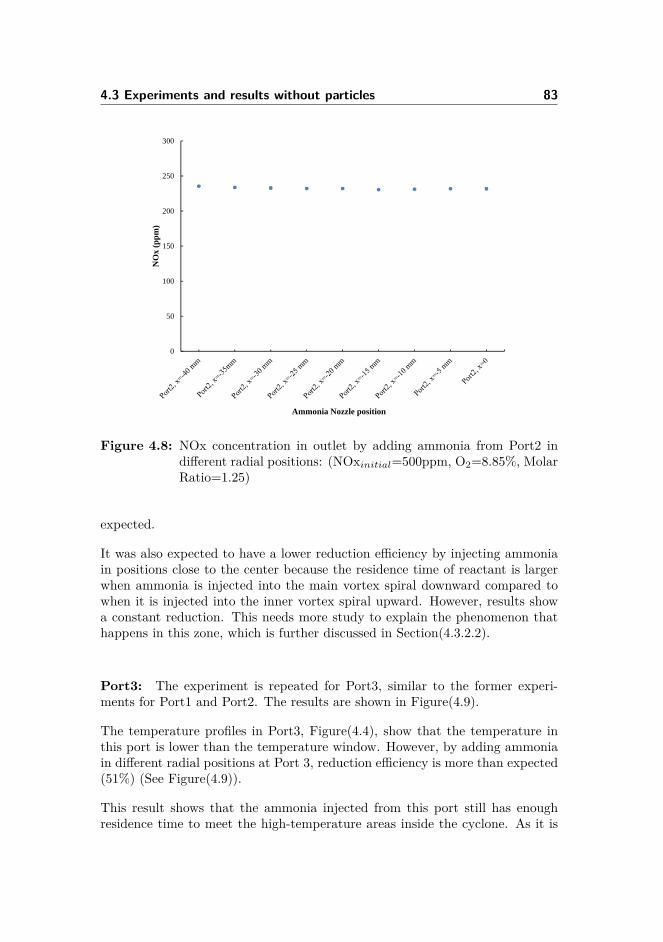
4.3 Experiments and results without particles 83
0
50
100
150
200
250
300
NO
x (p
pm
)
Ammonia Nozzle position
Figure 4.8: NOx concentration in outlet by adding ammonia from Port2 indifferent radial positions: (NOxinitial=500ppm, O2=8.85%, MolarRatio=1.25)
expected.
It was also expected to have a lower reduction efficiency by injecting ammoniain positions close to the center because the residence time of reactant is largerwhen ammonia is injected into the main vortex spiral downward compared towhen it is injected into the inner vortex spiral upward. However, results showa constant reduction. This needs more study to explain the phenomenon thathappens in this zone, which is further discussed in Section(4.3.2.2).
Port3: The experiment is repeated for Port3, similar to the former experi-ments for Port1 and Port2. The results are shown in Figure(4.9).
The temperature profiles in Port3, Figure(4.4), show that the temperature inthis port is lower than the temperature window. However, by adding ammoniain different radial positions at Port 3, reduction efficiency is more than expected(51%) (See Figure(4.9)).
This result shows that the ammonia injected from this port still has enoughresidence time to meet the high-temperature areas inside the cyclone. As it is
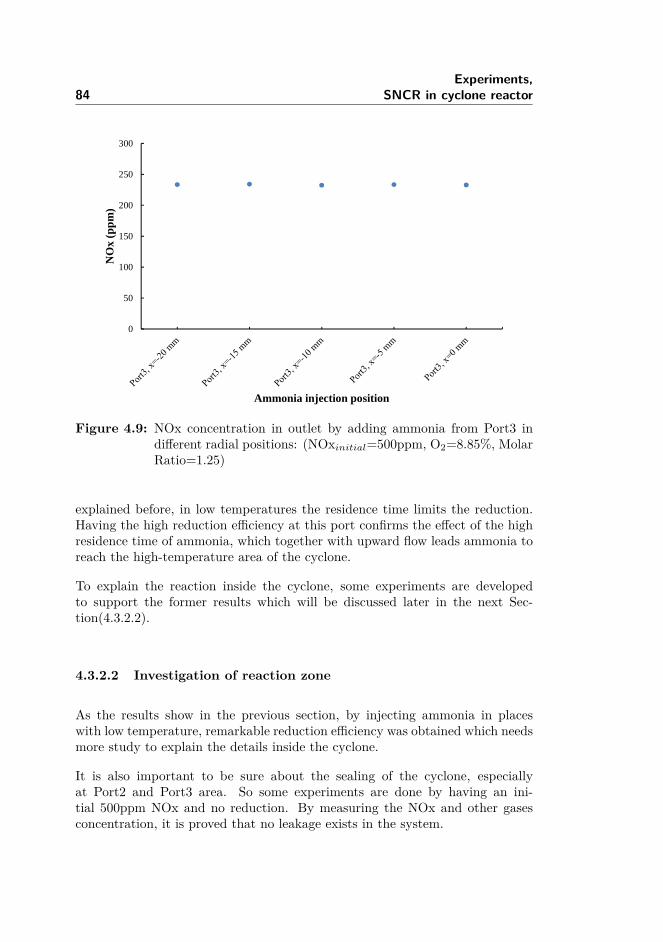
84Experiments,
SNCR in cyclone reactor
0
50
100
150
200
250
300
NO
x (p
pm
)
Ammonia injection position
Figure 4.9: NOx concentration in outlet by adding ammonia from Port3 indifferent radial positions: (NOxinitial=500ppm, O2=8.85%, MolarRatio=1.25)
explained before, in low temperatures the residence time limits the reduction.Having the high reduction efficiency at this port confirms the effect of the highresidence time of ammonia, which together with upward flow leads ammonia toreach the high-temperature area of the cyclone.
To explain the reaction inside the cyclone, some experiments are developedto support the former results which will be discussed later in the next Sec-tion(4.3.2.2).
4.3.2.2 Investigation of reaction zone
As the results show in the previous section, by injecting ammonia in placeswith low temperature, remarkable reduction efficiency was obtained which needsmore study to explain the details inside the cyclone.
It is also important to be sure about the sealing of the cyclone, especiallyat Port2 and Port3 area. So some experiments are done by having an ini-tial 500ppm NOx and no reduction. By measuring the NOx and other gasesconcentration, it is proved that no leakage exists in the system.
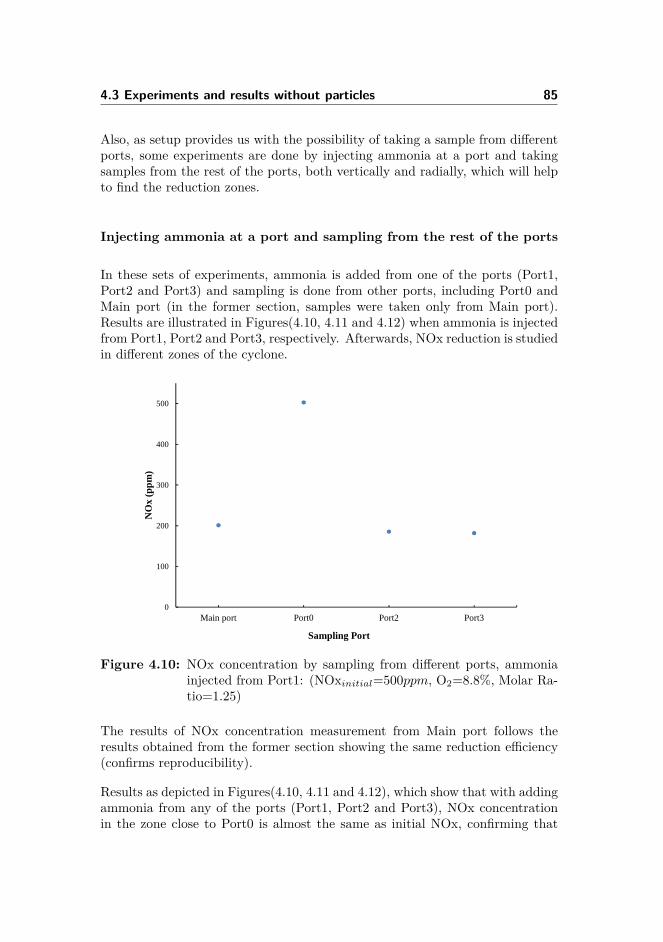
4.3 Experiments and results without particles 85
Also, as setup provides us with the possibility of taking a sample from differentports, some experiments are done by injecting ammonia at a port and takingsamples from the rest of the ports, both vertically and radially, which will helpto find the reduction zones.
Injecting ammonia at a port and sampling from the rest of the ports
In these sets of experiments, ammonia is added from one of the ports (Port1,Port2 and Port3) and sampling is done from other ports, including Port0 andMain port (in the former section, samples were taken only from Main port).Results are illustrated in Figures(4.10, 4.11 and 4.12) when ammonia is injectedfrom Port1, Port2 and Port3, respectively. Afterwards, NOx reduction is studiedin different zones of the cyclone.
0
100
200
300
400
500
Main port Port0 Port2 Port3
NO
x (p
pm
)
Sampling Port
Figure 4.10: NOx concentration by sampling from different ports, ammoniainjected from Port1: (NOxinitial=500ppm, O2=8.8%, Molar Ra-tio=1.25)
The results of NOx concentration measurement from Main port follows theresults obtained from the former section showing the same reduction efficiency(confirms reproducibility).
Results as depicted in Figures(4.10, 4.11 and 4.12), which show that with addingammonia from any of the ports (Port1, Port2 and Port3), NOx concentrationin the zone close to Port0 is almost the same as initial NOx, confirming that
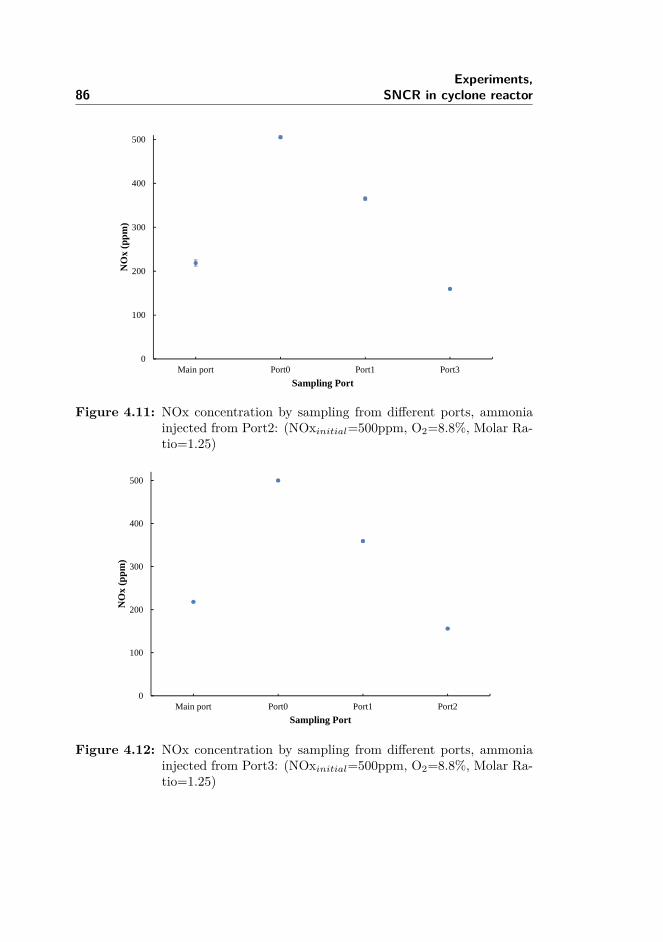
86Experiments,
SNCR in cyclone reactor
0
100
200
300
400
500
Main port Port0 Port1 Port3
NO
x (p
pm
)
Sampling Port
Figure 4.11: NOx concentration by sampling from different ports, ammoniainjected from Port2: (NOxinitial=500ppm, O2=8.8%, Molar Ra-tio=1.25)
0
100
200
300
400
500
Main port Port0 Port1 Port2
NO
x (p
pm
)
Sampling Port
Figure 4.12: NOx concentration by sampling from different ports, ammoniainjected from Port3: (NOxinitial=500ppm, O2=8.8%, Molar Ra-tio=1.25)
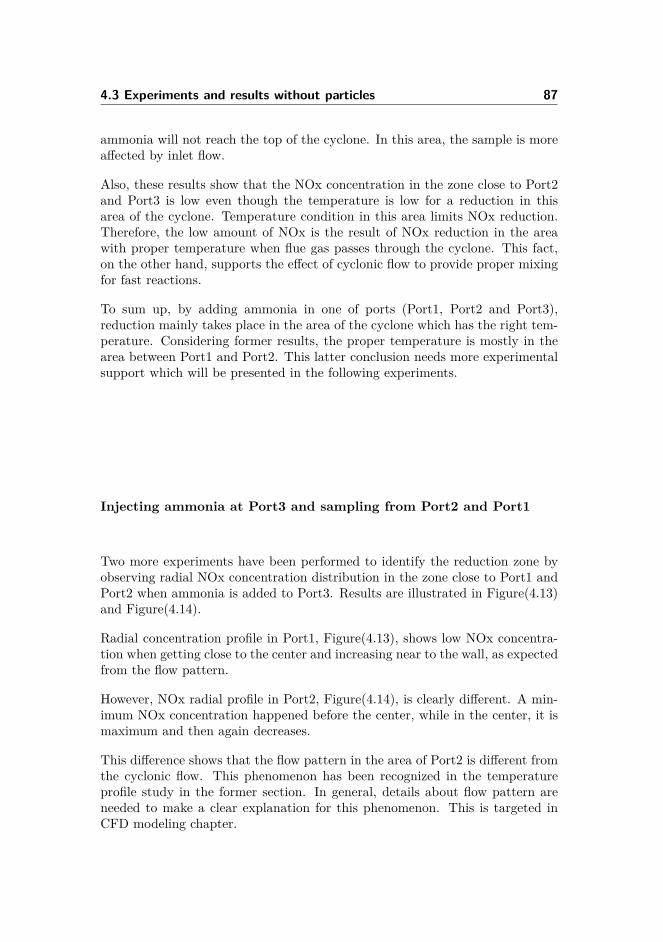
4.3 Experiments and results without particles 87
ammonia will not reach the top of the cyclone. In this area, the sample is moreaffected by inlet flow.
Also, these results show that the NOx concentration in the zone close to Port2and Port3 is low even though the temperature is low for a reduction in thisarea of the cyclone. Temperature condition in this area limits NOx reduction.Therefore, the low amount of NOx is the result of NOx reduction in the areawith proper temperature when flue gas passes through the cyclone. This fact,on the other hand, supports the effect of cyclonic flow to provide proper mixingfor fast reactions.
To sum up, by adding ammonia in one of ports (Port1, Port2 and Port3),reduction mainly takes place in the area of the cyclone which has the right tem-perature. Considering former results, the proper temperature is mostly in thearea between Port1 and Port2. This latter conclusion needs more experimentalsupport which will be presented in the following experiments.
Injecting ammonia at Port3 and sampling from Port2 and Port1
Two more experiments have been performed to identify the reduction zone byobserving radial NOx concentration distribution in the zone close to Port1 andPort2 when ammonia is added to Port3. Results are illustrated in Figure(4.13)and Figure(4.14).
Radial concentration profile in Port1, Figure(4.13), shows low NOx concentra-tion when getting close to the center and increasing near to the wall, as expectedfrom the flow pattern.
However, NOx radial profile in Port2, Figure(4.14), is clearly different. A min-imum NOx concentration happened before the center, while in the center, it ismaximum and then again decreases.
This difference shows that the flow pattern in the area of Port2 is different fromthe cyclonic flow. This phenomenon has been recognized in the temperatureprofile study in the former section. In general, details about flow pattern areneeded to make a clear explanation for this phenomenon. This is targeted inCFD modeling chapter.
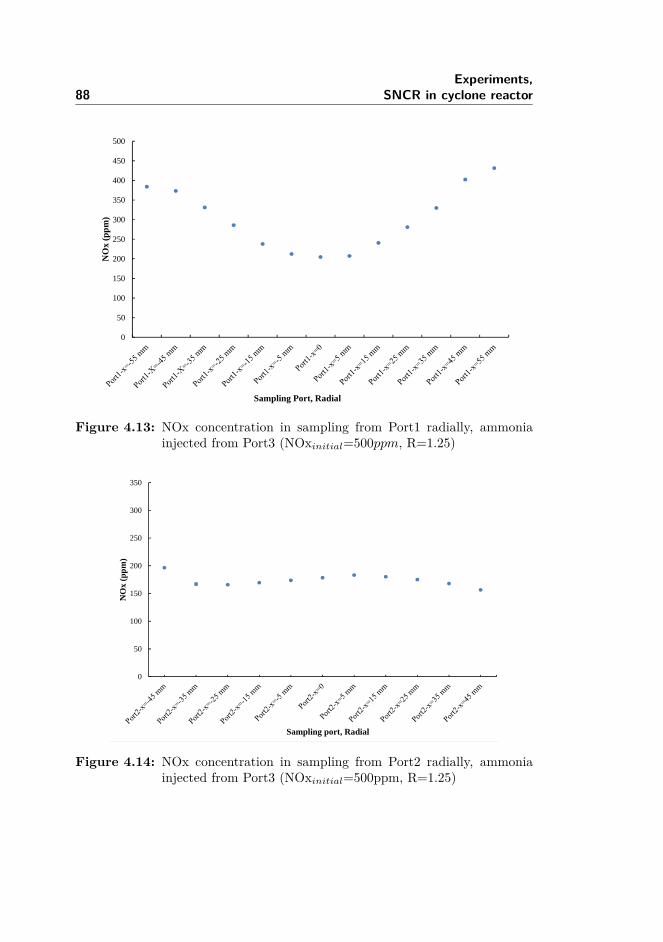
88Experiments,
SNCR in cyclone reactor
0
50
100
150
200
250
300
350
400
450
500
NO
x (p
pm
)
Sampling Port, Radial
Figure 4.13: NOx concentration in sampling from Port1 radially, ammoniainjected from Port3 (NOxinitial=500ppm, R=1.25)
0
50
100
150
200
250
300
350
NO
x (p
pm
)
Sampling port, Radial
Figure 4.14: NOx concentration in sampling from Port2 radially, ammoniainjected from Port3 (NOxinitial=500ppm, R=1.25)
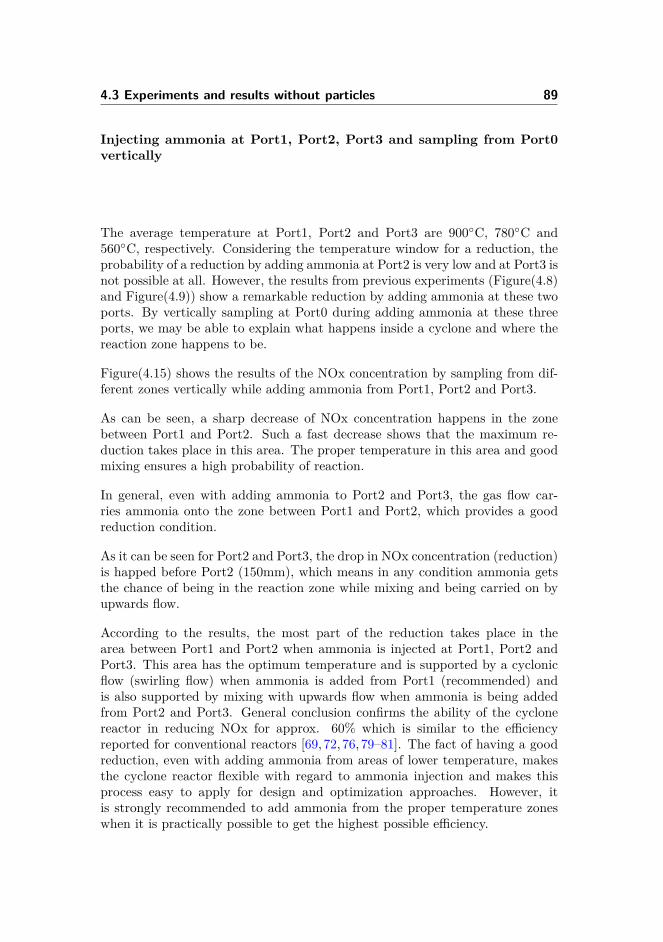
4.3 Experiments and results without particles 89
Injecting ammonia at Port1, Port2, Port3 and sampling from Port0vertically
The average temperature at Port1, Port2 and Port3 are 900C, 780C and560C, respectively. Considering the temperature window for a reduction, theprobability of a reduction by adding ammonia at Port2 is very low and at Port3 isnot possible at all. However, the results from previous experiments (Figure(4.8)and Figure(4.9)) show a remarkable reduction by adding ammonia at these twoports. By vertically sampling at Port0 during adding ammonia at these threeports, we may be able to explain what happens inside a cyclone and where thereaction zone happens to be.
Figure(4.15) shows the results of the NOx concentration by sampling from dif-ferent zones vertically while adding ammonia from Port1, Port2 and Port3.
As can be seen, a sharp decrease of NOx concentration happens in the zonebetween Port1 and Port2. Such a fast decrease shows that the maximum re-duction takes place in this area. The proper temperature in this area and goodmixing ensures a high probability of reaction.
In general, even with adding ammonia to Port2 and Port3, the gas flow car-ries ammonia onto the zone between Port1 and Port2, which provides a goodreduction condition.
As it can be seen for Port2 and Port3, the drop in NOx concentration (reduction)is happed before Port2 (150mm), which means in any condition ammonia getsthe chance of being in the reaction zone while mixing and being carried on byupwards flow.
According to the results, the most part of the reduction takes place in thearea between Port1 and Port2 when ammonia is injected at Port1, Port2 andPort3. This area has the optimum temperature and is supported by a cyclonicflow (swirling flow) when ammonia is added from Port1 (recommended) andis also supported by mixing with upwards flow when ammonia is being addedfrom Port2 and Port3. General conclusion confirms the ability of the cyclonereactor in reducing NOx for approx. 60% which is similar to the efficiencyreported for conventional reactors [69, 72, 76, 79–81]. The fact of having a goodreduction, even with adding ammonia from areas of lower temperature, makesthe cyclone reactor flexible with regard to ammonia injection and makes thisprocess easy to apply for design and optimization approaches. However, itis strongly recommended to add ammonia from the proper temperature zoneswhen it is practically possible to get the highest possible efficiency.
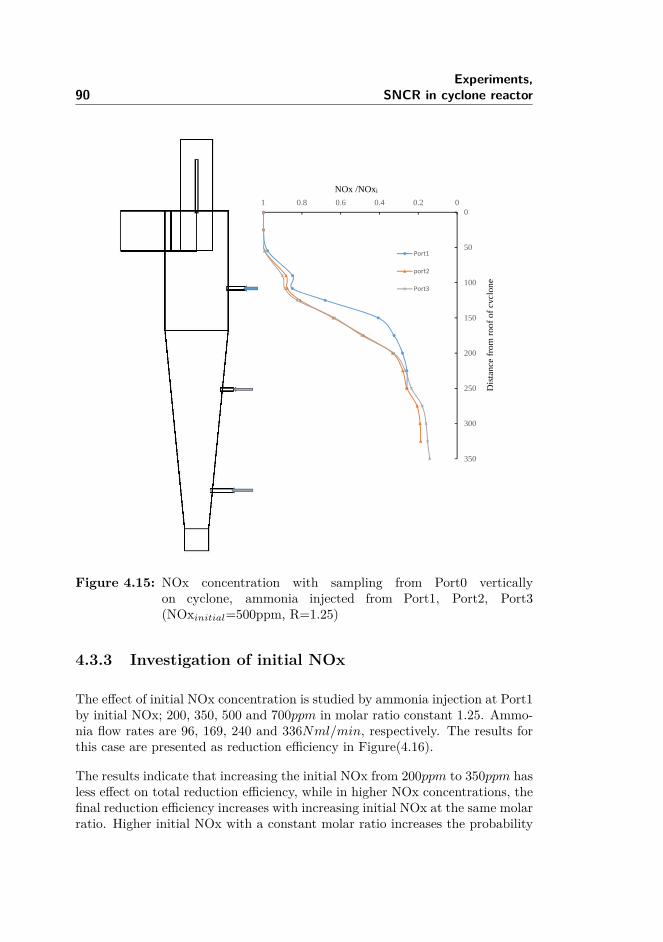
90Experiments,
SNCR in cyclone reactor
NOx /NOxi
0
50
100
150
200
250
300
350
00.20.40.60.81
Port1
port2
Port3
Dis
tanc
efr
omro
ofof
cycl
one
Figure 4.15: NOx concentration with sampling from Port0 verticallyon cyclone, ammonia injected from Port1, Port2, Port3(NOxinitial=500ppm, R=1.25)
4.3.3 Investigation of initial NOx
The effect of initial NOx concentration is studied by ammonia injection at Port1by initial NOx; 200, 350, 500 and 700ppm in molar ratio constant 1.25. Ammo-nia flow rates are 96, 169, 240 and 336Nml/min, respectively. The results forthis case are presented as reduction efficiency in Figure(4.16).
The results indicate that increasing the initial NOx from 200ppm to 350ppm hasless effect on total reduction efficiency, while in higher NOx concentrations, thefinal reduction efficiency increases with increasing initial NOx at the same molarratio. Higher initial NOx with a constant molar ratio increases the probability
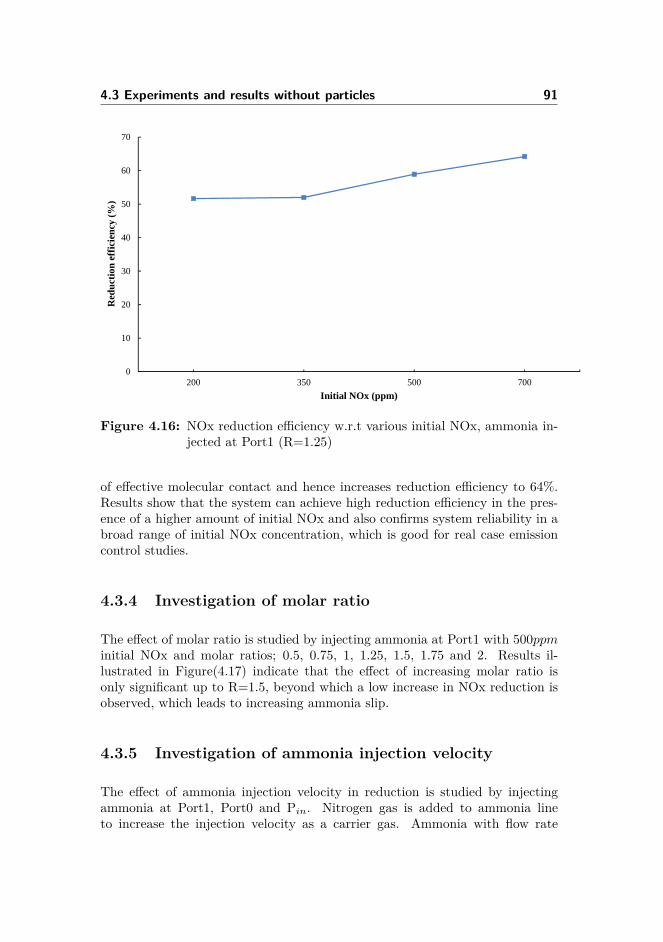
4.3 Experiments and results without particles 91
0
10
20
30
40
50
60
70
200 350 500 700
Red
uct
ion
eff
icie
ncy
(%
)
Initial NOx (ppm)
Figure 4.16: NOx reduction efficiency w.r.t various initial NOx, ammonia in-jected at Port1 (R=1.25)
of effective molecular contact and hence increases reduction efficiency to 64%.Results show that the system can achieve high reduction efficiency in the pres-ence of a higher amount of initial NOx and also confirms system reliability in abroad range of initial NOx concentration, which is good for real case emissioncontrol studies.
4.3.4 Investigation of molar ratio
The effect of molar ratio is studied by injecting ammonia at Port1 with 500ppminitial NOx and molar ratios; 0.5, 0.75, 1, 1.25, 1.5, 1.75 and 2. Results il-lustrated in Figure(4.17) indicate that the effect of increasing molar ratio isonly significant up to R=1.5, beyond which a low increase in NOx reduction isobserved, which leads to increasing ammonia slip.
4.3.5 Investigation of ammonia injection velocity
The effect of ammonia injection velocity in reduction is studied by injectingammonia at Port1, Port0 and Pin. Nitrogen gas is added to ammonia lineto increase the injection velocity as a carrier gas. Ammonia with flow rate
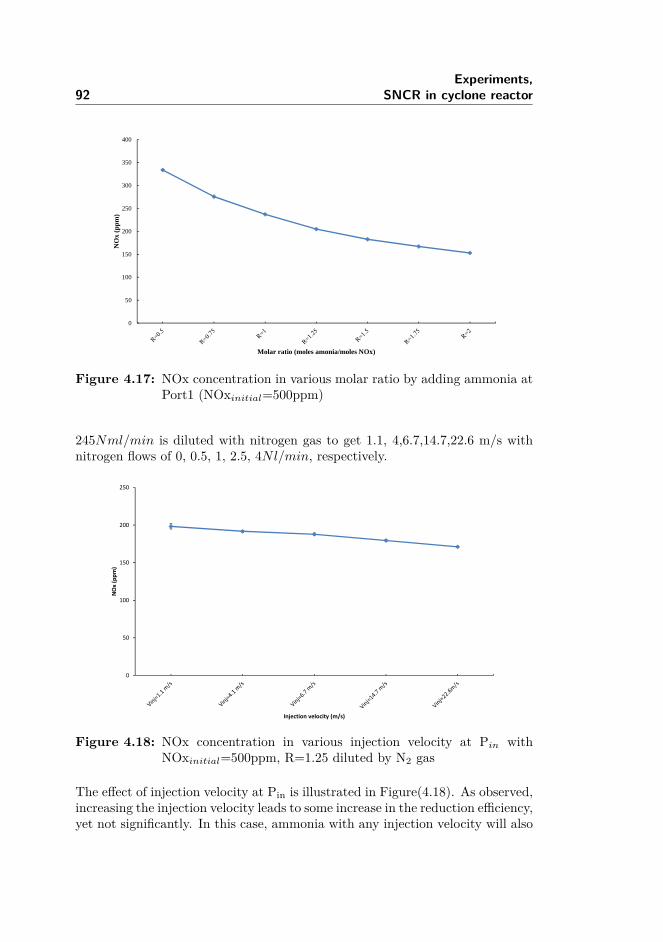
92Experiments,
SNCR in cyclone reactor
0
50
100
150
200
250
300
350
400
NO
x (p
pm
)
Molar ratio (moles amonia/moles NOx)
Figure 4.17: NOx concentration in various molar ratio by adding ammonia atPort1 (NOxinitial=500ppm)
245Nml/min is diluted with nitrogen gas to get 1.1, 4,6.7,14.7,22.6 m/s withnitrogen flows of 0, 0.5, 1, 2.5, 4Nl/min, respectively.
0
50
100
150
200
250
NOx (ppm
)
Injection velocity (m/s)
Figure 4.18: NOx concentration in various injection velocity at Pin withNOxinitial=500ppm, R=1.25 diluted by N2 gas
The effect of injection velocity at Pin is illustrated in Figure(4.18). As observed,increasing the injection velocity leads to some increase in the reduction efficiency,yet not significantly. In this case, ammonia with any injection velocity will also
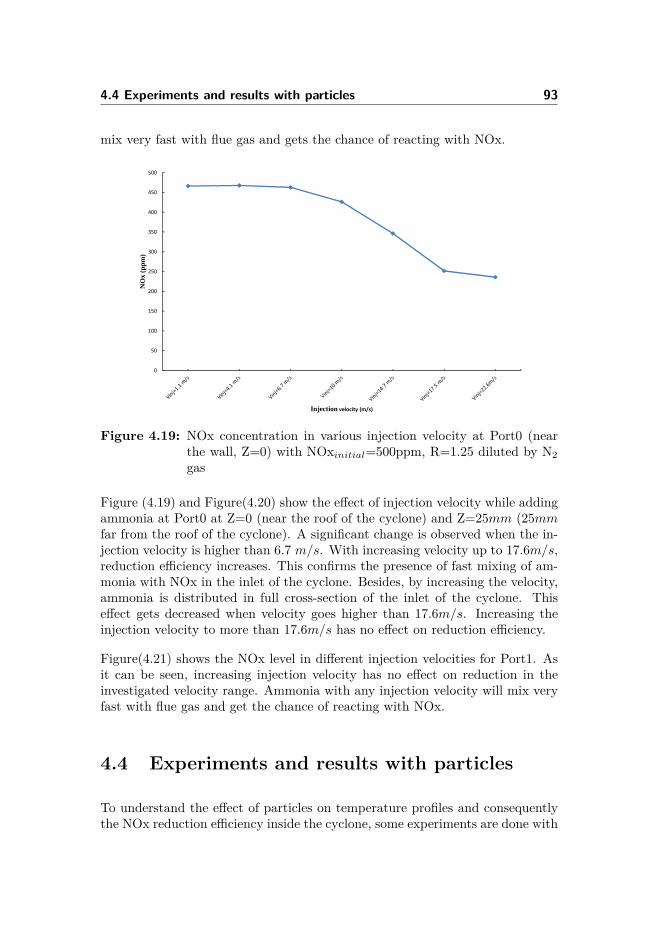
4.4 Experiments and results with particles 93
mix very fast with flue gas and gets the chance of reacting with NOx.
0
50
100
150
200
250
300
350
400
450
500
NO
x (p
pm
)
Injection velocity (m/s)
Figure 4.19: NOx concentration in various injection velocity at Port0 (nearthe wall, Z=0) with NOxinitial=500ppm, R=1.25 diluted by N2gas
Figure (4.19) and Figure(4.20) show the effect of injection velocity while addingammonia at Port0 at Z=0 (near the roof of the cyclone) and Z=25mm (25mmfar from the roof of the cyclone). A significant change is observed when the in-jection velocity is higher than 6.7 m/s. With increasing velocity up to 17.6m/s,reduction efficiency increases. This confirms the presence of fast mixing of am-monia with NOx in the inlet of the cyclone. Besides, by increasing the velocity,ammonia is distributed in full cross-section of the inlet of the cyclone. Thiseffect gets decreased when velocity goes higher than 17.6m/s. Increasing theinjection velocity to more than 17.6m/s has no effect on reduction efficiency.
Figure(4.21) shows the NOx level in different injection velocities for Port1. Asit can be seen, increasing injection velocity has no effect on reduction in theinvestigated velocity range. Ammonia with any injection velocity will mix veryfast with flue gas and get the chance of reacting with NOx.
4.4 Experiments and results with particles
To understand the effect of particles on temperature profiles and consequentlythe NOx reduction efficiency inside the cyclone, some experiments are done with
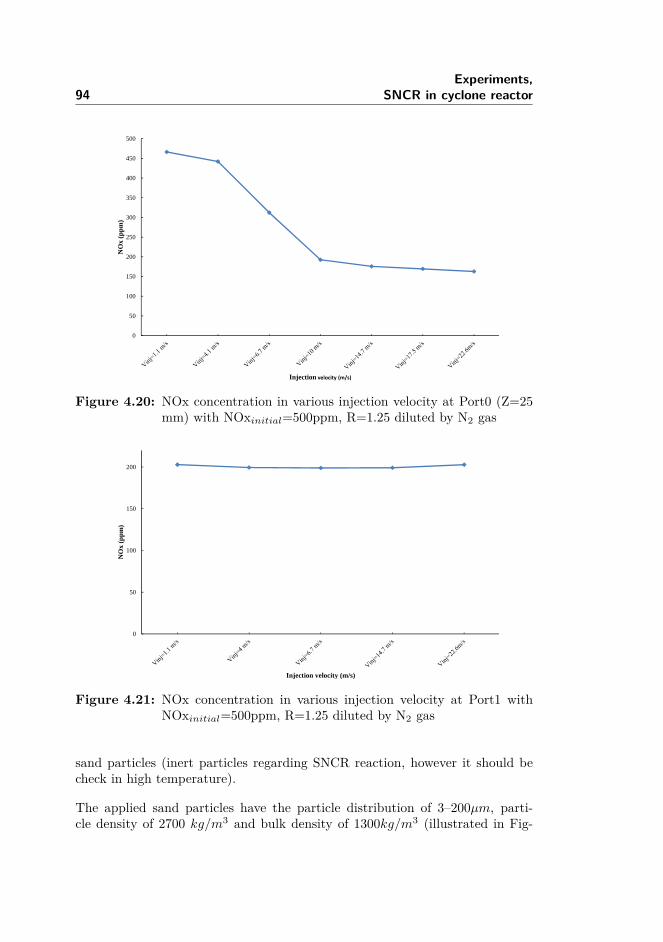
94Experiments,
SNCR in cyclone reactor
0
50
100
150
200
250
300
350
400
450
500
NO
x (p
pm
)
Injection velocity (m/s)
Figure 4.20: NOx concentration in various injection velocity at Port0 (Z=25mm) with NOxinitial=500ppm, R=1.25 diluted by N2 gas
0
50
100
150
200
NO
x (p
pm
)
Injection velocity (m/s)
Figure 4.21: NOx concentration in various injection velocity at Port1 withNOxinitial=500ppm, R=1.25 diluted by N2 gas
sand particles (inert particles regarding SNCR reaction, however it should becheck in high temperature).
The applied sand particles have the particle distribution of 3–200µm, parti-cle density of 2700 kg/m3 and bulk density of 1300kg/m3 (illustrated in Fig-
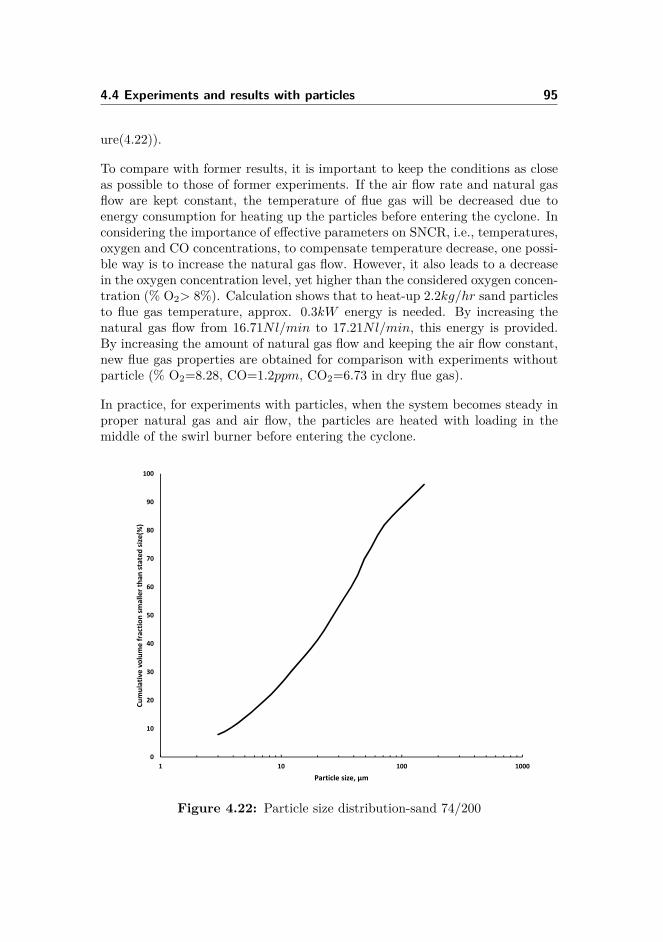
4.4 Experiments and results with particles 95
ure(4.22)).
To compare with former results, it is important to keep the conditions as closeas possible to those of former experiments. If the air flow rate and natural gasflow are kept constant, the temperature of flue gas will be decreased due toenergy consumption for heating up the particles before entering the cyclone. Inconsidering the importance of effective parameters on SNCR, i.e., temperatures,oxygen and CO concentrations, to compensate temperature decrease, one possi-ble way is to increase the natural gas flow. However, it also leads to a decreasein the oxygen concentration level, yet higher than the considered oxygen concen-tration (% O2> 8%). Calculation shows that to heat-up 2.2kg/hr sand particlesto flue gas temperature, approx. 0.3kW energy is needed. By increasing thenatural gas flow from 16.71Nl/min to 17.21Nl/min, this energy is provided.By increasing the amount of natural gas flow and keeping the air flow constant,new flue gas properties are obtained for comparison with experiments withoutparticle (% O2=8.28, CO=1.2ppm, CO2=6.73 in dry flue gas).
In practice, for experiments with particles, when the system becomes steady inproper natural gas and air flow, the particles are heated with loading in themiddle of the swirl burner before entering the cyclone.
0
10
20
30
40
50
60
70
80
90
100
1 10 100 1000
Cumulative volume fractio
n sm
aller tha
n stated
size(%
)
Particle size, µm
Figure 4.22: Particle size distribution-sand 74/200
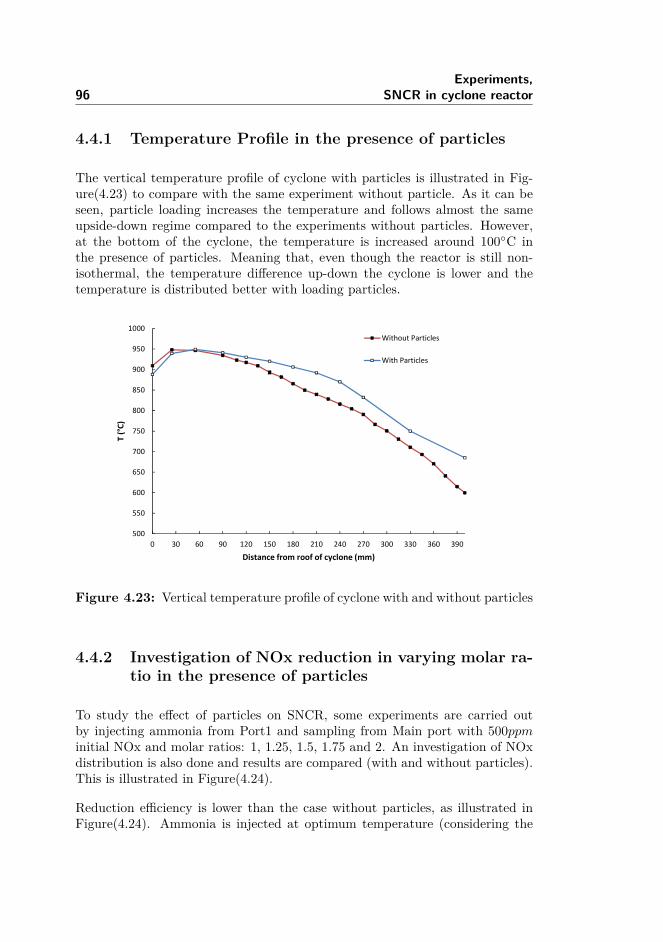
96Experiments,
SNCR in cyclone reactor
4.4.1 Temperature Profile in the presence of particles
The vertical temperature profile of cyclone with particles is illustrated in Fig-ure(4.23) to compare with the same experiment without particle. As it can beseen, particle loading increases the temperature and follows almost the sameupside-down regime compared to the experiments without particles. However,at the bottom of the cyclone, the temperature is increased around 100C inthe presence of particles. Meaning that, even though the reactor is still non-isothermal, the temperature difference up-down the cyclone is lower and thetemperature is distributed better with loading particles.
500
550
600
650
700
750
800
850
900
950
1000
0 30 60 90 120 150 180 210 240 270 300 330 360 390
T (°C)
Distance from roof of cyclone (mm)
Without Particles
With Particles
Figure 4.23: Vertical temperature profile of cyclone with and without particles
4.4.2 Investigation of NOx reduction in varying molar ra-tio in the presence of particles
To study the effect of particles on SNCR, some experiments are carried outby injecting ammonia from Port1 and sampling from Main port with 500ppminitial NOx and molar ratios: 1, 1.25, 1.5, 1.75 and 2. An investigation of NOxdistribution is also done and results are compared (with and without particles).This is illustrated in Figure(4.24).
Reduction efficiency is lower than the case without particles, as illustrated inFigure(4.24). Ammonia is injected at optimum temperature (considering the
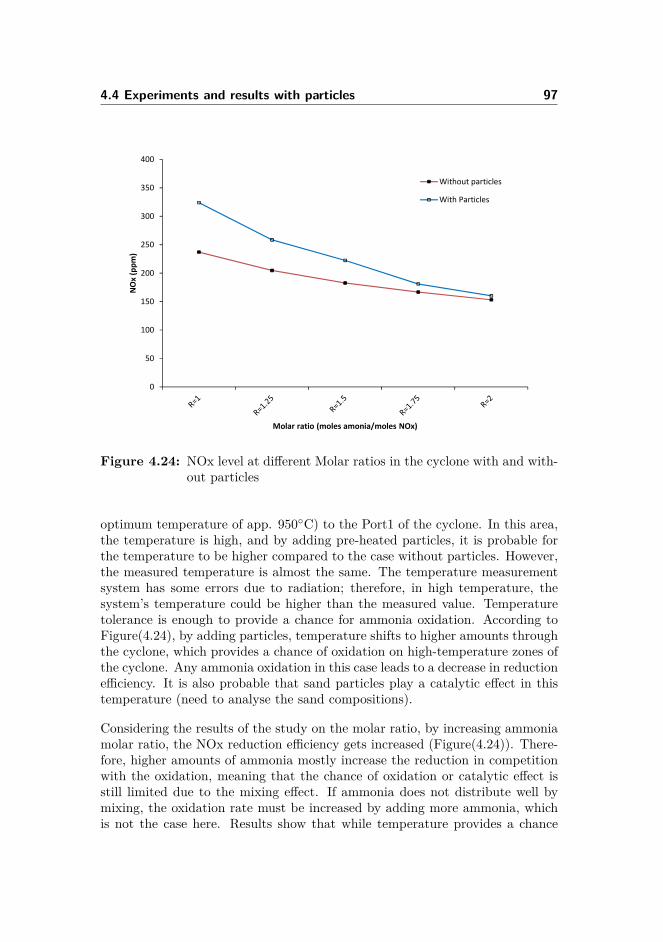
4.4 Experiments and results with particles 97
0
50
100
150
200
250
300
350
400
NOx (ppm
)
Molar ratio (moles amonia/moles NOx)
Without particles
With Particles
Figure 4.24: NOx level at different Molar ratios in the cyclone with and with-out particles
optimum temperature of app. 950C) to the Port1 of the cyclone. In this area,the temperature is high, and by adding pre-heated particles, it is probable forthe temperature to be higher compared to the case without particles. However,the measured temperature is almost the same. The temperature measurementsystem has some errors due to radiation; therefore, in high temperature, thesystem’s temperature could be higher than the measured value. Temperaturetolerance is enough to provide a chance for ammonia oxidation. According toFigure(4.24), by adding particles, temperature shifts to higher amounts throughthe cyclone, which provides a chance of oxidation on high-temperature zones ofthe cyclone. Any ammonia oxidation in this case leads to a decrease in reductionefficiency. It is also probable that sand particles play a catalytic effect in thistemperature (need to analyse the sand compositions).
Considering the results of the study on the molar ratio, by increasing ammoniamolar ratio, the NOx reduction efficiency gets increased (Figure(4.24)). There-fore, higher amounts of ammonia mostly increase the reduction in competitionwith the oxidation, meaning that the chance of oxidation or catalytic effect isstill limited due to the mixing effect. If ammonia does not distribute well bymixing, the oxidation rate must be increased by adding more ammonia, whichis not the case here. Results show that while temperature provides a chance
98Experiments,
SNCR in cyclone reactor
for oxidation, the mixing effect still provides a better chance of reduction forammonia in competition with oxidation.
4.5 Conclusion
Due to the importance of temperature and mixing effect on SNCR, there is astrong need to study the temperature profile and mixing behavior under differentconditions.
In this project, some experiments are performed to obtain the temperatureprofile and to know more about the effective zones with the proper temperaturefor NOx reduction. Another set of experiments are also performed to investigatethe mixing behavior based on NOx reduction efficiency.
With these experiments, the cyclone has been targeted as a reactor to findefficient reduction zone by providing vertical and radial NOx concentration dis-tribution.
The first series provide the temperature profile vertically and radially (in dif-ferent ports). There is a temperature difference up-down of approx. 350C.Considering the temperature window for reduction, the possibility of havingboth reduction of NOx and oxidation of ammonia in Pin and Port0 is higherwhen injecting ammonia at Port1 and Port2. In general, temperature profilestudy shows that reduction can take place in an inlet channel and from the top ofthe cyclone down to 340mm depth from the top. Results show more efficiencywhen injecting ammonia from Port1 because the average temperature in thisarea is 900C, which is the optimum temperature for SNCR NOx reduction.
In addition, the results of radial experiments show that the optimum positionfor adding ammonia from Port1 is 5–15mm distance from the wall (vortex-flow downward). The NOx reduction efficiency was maximum in this condition(60%), and it is expected because of temperature profile and cyclonic flow pat-tern. Larfeldt et al. [153] concluded that by adding ammonia in the inner vortexin the cyclone in CFB boilers (close to Port1 in this project), NOx reductionefficiency is improved by at least 30%.
A further detailed study shows that reduction efficiency is still high (54%) byinjecting ammonia at Port2 and Port3, even though the temperature is at thelowest level of the temperature window in Port2 and below the temperature win-dow for Port3. Further studies have been performed to monitor the reductionpattern by injecting ammonia from one port and point measurement of NOx con-centration vertically and radially (minimum of 10 points for each). The results
4.5 Conclusion 99
of these experiments show that reduction mostly takes place in the zone betweenPort1 and Port2 when ammonia is injected from any of the side ports (Port1,Port2 and Port3), which is the main reason behind achieving high reduction ef-ficiency, even with injecting ammonia in low-temperature zones. Comparing theradial concentration distribution in sampling from Port1 and Port2 (ammoniais injected at Port3), the parabolic concentration profile is obtained for Port1but not for Port2, as expected from the swirl flow inside the cyclone. Results oftemperature profile at the same condition also show the parabolic temperatureprofile for Port1 and non-parabolic for Port2 and Port3. This is the result of anunexpected flow (recycling) in this area which provides mixing towards a propertemperature area and leads to high reduction efficiency (54%).
Following the experimental plan, investigation of initial NOx concentrationshows that by an increase in initial NOx concentration in constant molar ratio,reduction efficiency gets increased.
It is also concluded from our study on a molar ratio with constant initial NOx(500ppm) that with increasing molar ratio, reduction efficiency gets increased.However, the rate of increase is low after molar ratio R = 1.5.
Further investigation on injection velocity shows that, by increasing injection ve-locity for Port0, reduction efficiency gets increased because mixing is performedbetter and faster which avoids ammonia oxidation. However, no increasing pat-tern is recognized for Pin and Port1 in this range of injection velocities. Themixing effect under the cyclonic flow condition is more effective in Port1.
A complementary experiment with adding particles to the cyclone shows thatthe system works as a non-isothermal reactor but the temperature differenceup-down the cyclone is 100C, lower in the presence of particles. A comparativestudy of molar ratio with and without particles shows a lower reduction efficiencyin the presence of particles.
In general, results show that, in cyclone reactor, wherever the swirl flow plays themain role, the mixing effect is extensively good. With regard to the temperatureprofile and NOx distribution, the swirl flow is well-generated in the area betweenPort1 and Port2. This mixing function of swirl flow together with temperatureconditions provides a potential reaction zone in this area (between Port1 andPort2). Adding to flow effect and temperature, with the high residence time ofreactants inside the cyclone, it is highly probable for the reactants to meet thisreaction zone even when the ammonia is injected from the lower temperaturezones, which altogether provides high reduction efficiency and flexible designavailability for real case studies.
In the following chapter, all of the above will be discussed with CFD modelingof the same cyclone. Results of CFD will clarify the flow pattern inside the

100Experiments,
SNCR in cyclone reactor
cyclone and be further applied to discuss the experimental results.
Chapter 5CFD of SNCR in the cyclone
reactor
Introduction
CFD is a method of calculating fluid flows, heat and mass transfer, chemicalreactions and similar phenomena by numerical solving mathematical expression[157]. CFD has emerged to be one of the most important fields of study thatplays a key role in the modern engineering environment. As global industriestend to demonstrate a growing demand for innovative designing, engineering,and manufacturing processes, it is becoming imperative to understand thermaland fluid dynamics of innovation and seamless solutions for core problem areas.Despite the fact that fluid dynamics have always been widely used in design andmanufacturing, it is the significance of computer technology and rapid advance-ments that have made CFD an element of precise and accurate computation inthe engineering industry.
The accuracy of the solutions is dependent on the following properties:
• Consistency: The discretization error should approach zero for infinitesmall grid sizes or time steps. For this case, the algebraic finite differenceequations become equal to the original partial differential equations.
• Stability: Numerical errors should be bounded for each iteration step and
102 CFD of SNCR in the cyclone reactor
not diverge the solution.
• Convergence: A numerical method is convergent if its solution approachesthat of the partial differential equation for decreasing grid sizes and timesteps and if numerical errors are bounded. This means that both consis-tency and stability are required to achieve convergence.
In this Ph.D. project, the CFD simulations are performed with the commercialsoftware program ANSYS-FLUEN 16.
In this part of study the focus is CFD modeling of cyclones as a preferredreactor for SNCR to provide more knowledge in different aspects, e.g., flowpattern, mixing and residence time to achieve a better understanding of thereaction inside the cyclone.
Therefore, to explain the effect of mixing and map the role of fluid dynamicsin the cyclone reactor, CFD modeling is preferred. With CFD, the reactor ismodeled by considering both fluid dynamics and reaction.
The lack of knowledge of fluid dynamics and NOx reduction inside the cycloneis because the fluid dynamics within a cyclone is complex. Moreover, the inclu-sion of parameters, such as residence time, reactant concentration distribution,as well as other relevant physical properties (e.g., viscosity, density, tempera-ture effects, rotational effects), add further complexities. CFD simulations ofthe fluid in the cyclones provide an effective tool for understanding the detailsof the flow and reaction within the cyclones. However, the system to be usedfor the simulations with a detailed reaction scheme is very complicated andthe computational time consumption is high even with powerful computers. Toreach a reasonable computational time, the system needs to be simplified. Themain aim of this project is to map the relative importance of fluid dynamicsand SNCR with the involvement of flow pattern and transport phenomena withreduced chemical kinetics and to propose a methodology for process simplifica-tion for modeling. The results could be applied for optimization and scale-up,e.g., in the cement industry and power plants.
5.1 CFD approach and methodology
In this chapter, the governing equations applied in this study are explained. Thenext step is CFD modeling to simulate the cyclone reactor. The CFD modelingis divided into three steps:
• Develop a reliable fluid dynamic model, which will be validated by exper-
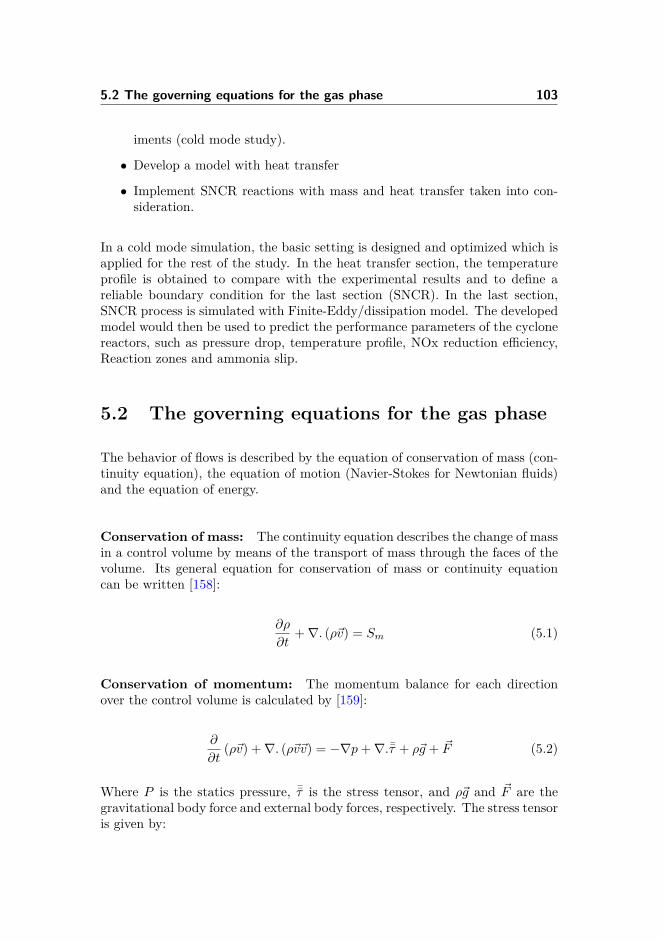
5.2 The governing equations for the gas phase 103
iments (cold mode study).
• Develop a model with heat transfer
• Implement SNCR reactions with mass and heat transfer taken into con-sideration.
In a cold mode simulation, the basic setting is designed and optimized which isapplied for the rest of the study. In the heat transfer section, the temperatureprofile is obtained to compare with the experimental results and to define areliable boundary condition for the last section (SNCR). In the last section,SNCR process is simulated with Finite-Eddy/dissipation model. The developedmodel would then be used to predict the performance parameters of the cyclonereactors, such as pressure drop, temperature profile, NOx reduction efficiency,Reaction zones and ammonia slip.
5.2 The governing equations for the gas phase
The behavior of flows is described by the equation of conservation of mass (con-tinuity equation), the equation of motion (Navier-Stokes for Newtonian fluids)and the equation of energy.
Conservation of mass: The continuity equation describes the change of massin a control volume by means of the transport of mass through the faces of thevolume. Its general equation for conservation of mass or continuity equationcan be written [158]:
∂ρ
∂t+∇. (ρ~v) = Sm (5.1)
Conservation of momentum: The momentum balance for each directionover the control volume is calculated by [159]:
∂
∂t(ρ~v) +∇. (ρ~v~v) = −∇p+∇.¯τ + ρ~g + ~F (5.2)
Where P is the statics pressure, ¯τ is the stress tensor, and ρ~g and ~F are thegravitational body force and external body forces, respectively. The stress tensoris given by:
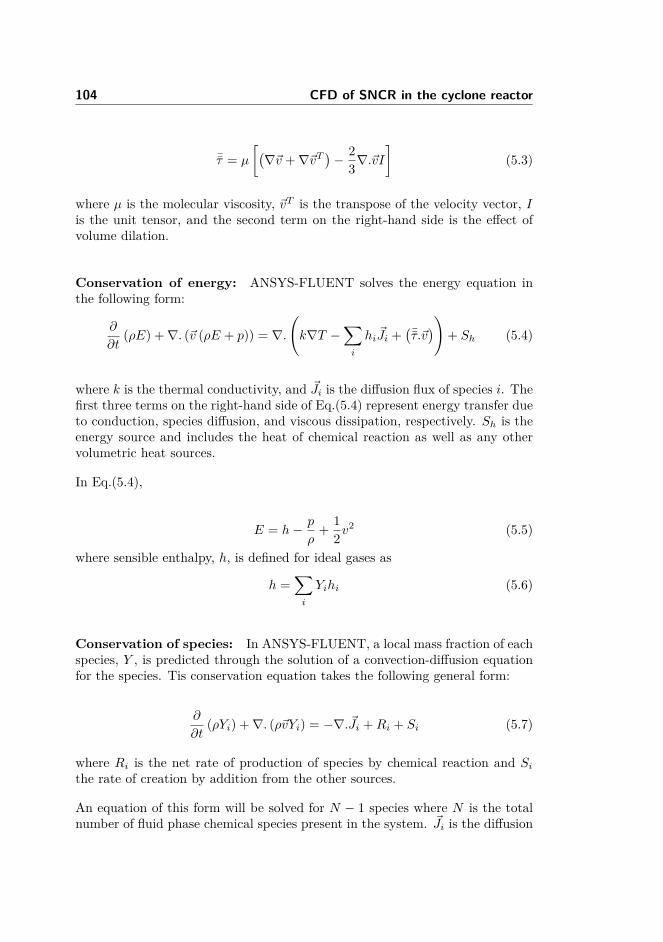
104 CFD of SNCR in the cyclone reactor
¯τ = µ
[(∇~v +∇~vT
)− 2
3∇.~vI]
(5.3)
where µ is the molecular viscosity, ~vT is the transpose of the velocity vector, Iis the unit tensor, and the second term on the right-hand side is the effect ofvolume dilation.
Conservation of energy: ANSYS-FLUENT solves the energy equation inthe following form:
∂
∂t(ρE) +∇. (~v (ρE + p)) = ∇.
(k∇T −
∑i
hi ~Ji +(¯τ.~v))+ Sh (5.4)
where k is the thermal conductivity, and ~Ji is the diffusion flux of species i. Thefirst three terms on the right-hand side of Eq.(5.4) represent energy transfer dueto conduction, species diffusion, and viscous dissipation, respectively. Sh is theenergy source and includes the heat of chemical reaction as well as any othervolumetric heat sources.
In Eq.(5.4),
E = h− p
ρ+ 1
2v2 (5.5)
where sensible enthalpy, h, is defined for ideal gases as
h =∑i
Yihi (5.6)
Conservation of species: In ANSYS-FLUENT, a local mass fraction of eachspecies, Y , is predicted through the solution of a convection-diffusion equationfor the species. Tis conservation equation takes the following general form:
∂
∂t(ρYi) +∇. (ρ~vYi) = −∇. ~Ji +Ri + Si (5.7)
where Ri is the net rate of production of species by chemical reaction and Sithe rate of creation by addition from the other sources.
An equation of this form will be solved for N − 1 species where N is the totalnumber of fluid phase chemical species present in the system. ~Ji is the diffusion
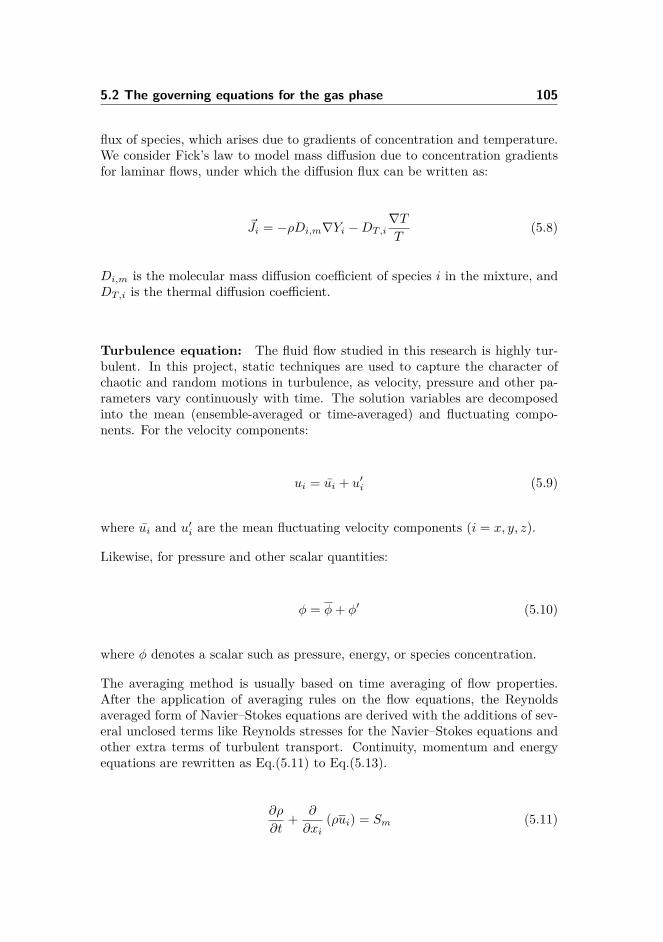
5.2 The governing equations for the gas phase 105
flux of species, which arises due to gradients of concentration and temperature.We consider Fick’s law to model mass diffusion due to concentration gradientsfor laminar flows, under which the diffusion flux can be written as:
~Ji = −ρDi,m∇Yi −DT,i∇TT
(5.8)
Di,m is the molecular mass diffusion coefficient of species i in the mixture, andDT,i is the thermal diffusion coefficient.
Turbulence equation: The fluid flow studied in this research is highly tur-bulent. In this project, static techniques are used to capture the character ofchaotic and random motions in turbulence, as velocity, pressure and other pa-rameters vary continuously with time. The solution variables are decomposedinto the mean (ensemble-averaged or time-averaged) and fluctuating compo-nents. For the velocity components:
ui = ui + u′i (5.9)
where ui and u′i are the mean fluctuating velocity components (i = x, y, z).
Likewise, for pressure and other scalar quantities:
φ = φ+ φ′ (5.10)
where φ denotes a scalar such as pressure, energy, or species concentration.
The averaging method is usually based on time averaging of flow properties.After the application of averaging rules on the flow equations, the Reynoldsaveraged form of Navier–Stokes equations are derived with the additions of sev-eral unclosed terms like Reynolds stresses for the Navier–Stokes equations andother extra terms of turbulent transport. Continuity, momentum and energyequations are rewritten as Eq.(5.11) to Eq.(5.13).
∂ρ
∂t+ ∂
∂xi(ρui) = Sm (5.11)
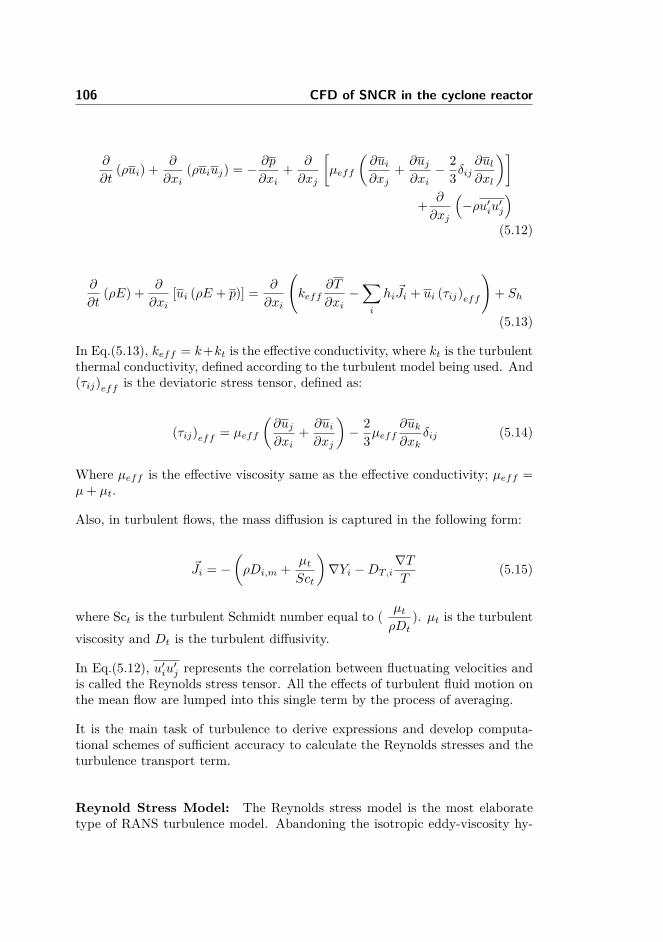
106 CFD of SNCR in the cyclone reactor
∂
∂t(ρui) + ∂
∂xi(ρuiuj) = − ∂p
∂xi+ ∂
∂xj
[µeff
(∂ui∂xj
+ ∂uj∂xi− 2
3δij∂ul∂xl
)]+ ∂
∂xj
(−ρu′iu′j
)(5.12)
∂
∂t(ρE) + ∂
∂xi[ui (ρE + p)] = ∂
∂xi
(keff
∂T
∂xi−∑i
hi ~Ji + ui (τij)eff
)+ Sh
(5.13)
In Eq.(5.13), keff = k+kt is the effective conductivity, where kt is the turbulentthermal conductivity, defined according to the turbulent model being used. And(τij)eff is the deviatoric stress tensor, defined as:
(τij)eff = µeff
(∂uj∂xi
+ ∂ui∂xj
)− 2
3µeff∂uk∂xk
δij (5.14)
Where µeff is the effective viscosity same as the effective conductivity; µeff =µ+ µt.
Also, in turbulent flows, the mass diffusion is captured in the following form:
~Ji = −(ρDi,m + µt
Sct
)∇Yi −DT,i
∇TT
(5.15)
where Sct is the turbulent Schmidt number equal to ( µtρDt
). µt is the turbulentviscosity and Dt is the turbulent diffusivity.
In Eq.(5.12), u′iu′j represents the correlation between fluctuating velocities andis called the Reynolds stress tensor. All the effects of turbulent fluid motion onthe mean flow are lumped into this single term by the process of averaging.
It is the main task of turbulence to derive expressions and develop computa-tional schemes of sufficient accuracy to calculate the Reynolds stresses and theturbulence transport term.
Reynold Stress Model: The Reynolds stress model is the most elaboratetype of RANS turbulence model. Abandoning the isotropic eddy-viscosity hy-
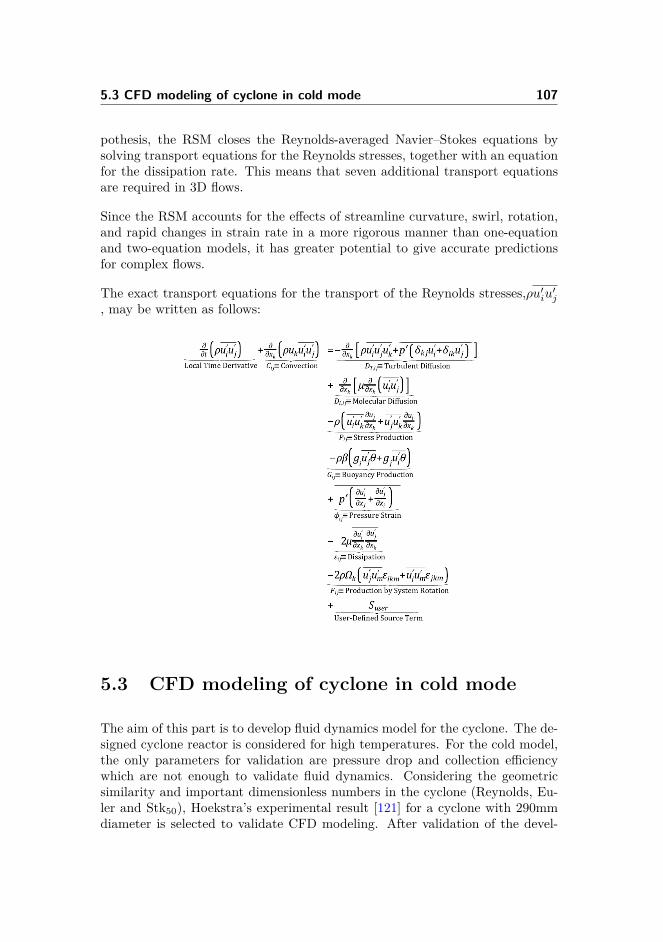
5.3 CFD modeling of cyclone in cold mode 107
pothesis, the RSM closes the Reynolds-averaged Navier–Stokes equations bysolving transport equations for the Reynolds stresses, together with an equationfor the dissipation rate. This means that seven additional transport equationsare required in 3D flows.
Since the RSM accounts for the effects of streamline curvature, swirl, rotation,and rapid changes in strain rate in a more rigorous manner than one-equationand two-equation models, it has greater potential to give accurate predictionsfor complex flows.
The exact transport equations for the transport of the Reynolds stresses,ρu′iu′j, may be written as follows:
5.3 CFD modeling of cyclone in cold mode
The aim of this part is to develop fluid dynamics model for the cyclone. The de-signed cyclone reactor is considered for high temperatures. For the cold model,the only parameters for validation are pressure drop and collection efficiencywhich are not enough to validate fluid dynamics. Considering the geometricsimilarity and important dimensionless numbers in the cyclone (Reynolds, Eu-ler and Stk50), Hoekstra’s experimental result [121] for a cyclone with 290mmdiameter is selected to validate CFD modeling. After validation of the devel-
108 CFD of SNCR in the cyclone reactor
oped model, it is scaled down to 110mm (designed cyclone for this project) andused for the next steps of the project with the same grid and model settings.
Among many known discretization schemes, the finite volume method is oneof the most popular methods since it is relatively simple to understand andimplement in computer code. The method can accommodate any type of gridwhich makes it suitable for complex geometries used in the industry.
In this section, the computational domain and boundary conditions are pre-sented followed by turbulence model selection. Then, mesh generation and gridindependency study are presented. In the next step, solver settings are definedto present phenomena in a cyclone. All the items mentioned are applied tothe heat transfer and reaction studies as well. Results of the cold model arediscussed at the end of this section.
5.3.1 Computational Domain and boundary Condition
Figure(5.1) illustrates the geometry of Stairmand high efficiency cyclone [160]and corresponding dimensions with the definition of the coordinate system thatwill be used throughout the thesis. According to [121], the reference diameteris selected as D = 290mm.
A computational domain can also be seen in this figure. Flow enters to thecyclone from a tangential inlet duct (violet face) to generate the swirl flow andleaves through the exit pipe at the top (red face) which is famous for vortexfinder. The particles leave the cyclone from the bottom of the cyclone.
Velocity inlet boundary condition is applied at the inlet of the cyclone, outflowat gas outlet and wall (no-slip) boundary condition at all other boundaries.The air linear inlet velocity is equal of vin = 16.1 m/s, corresponding to theexperimental study of Hoekstra [121]. The air density of 1.225 kg/m3 andviscosity of 1.7894× 10⁻⁵kg/m.s were defined in this part of the study.
The turbulence quantities (kinetic energy and dissipation rate) are uniformlyfound at the inlet by using the following correlations [161]:
kin = 32 (Ivin)2 (5.16)
εin = C34µ k
32in/L (5.17)
The turbulence intensity, I, equals 10%, and Cµ is an empirical constant equal
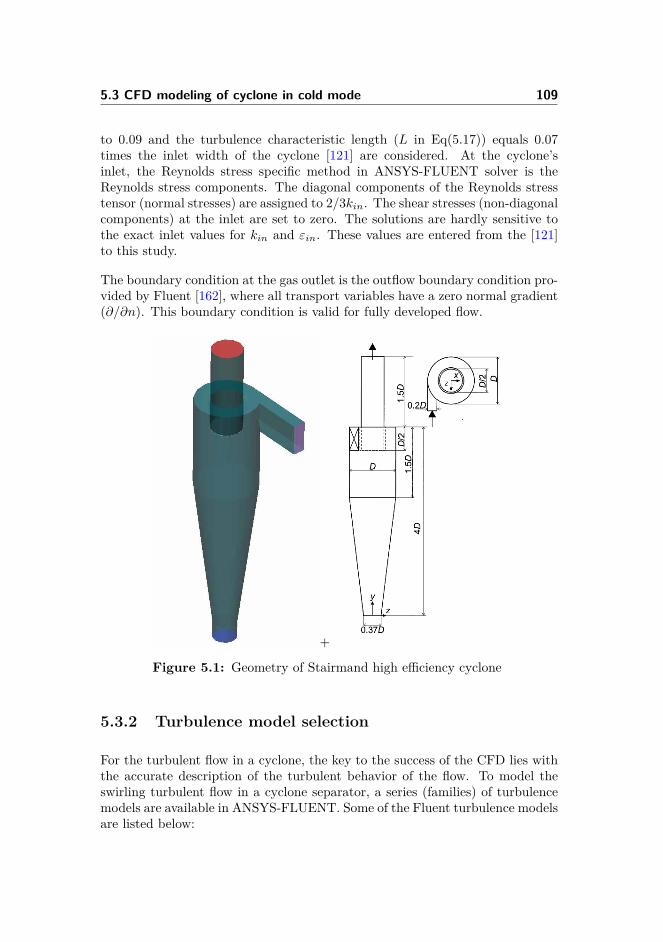
5.3 CFD modeling of cyclone in cold mode 109
to 0.09 and the turbulence characteristic length (L in Eq(5.17)) equals 0.07times the inlet width of the cyclone [121] are considered. At the cyclone’sinlet, the Reynolds stress specific method in ANSYS-FLUENT solver is theReynolds stress components. The diagonal components of the Reynolds stresstensor (normal stresses) are assigned to 2/3kin. The shear stresses (non-diagonalcomponents) at the inlet are set to zero. The solutions are hardly sensitive tothe exact inlet values for kin and εin. These values are entered from the [121]to this study.
The boundary condition at the gas outlet is the outflow boundary condition pro-vided by Fluent [162], where all transport variables have a zero normal gradient(∂/∂n). This boundary condition is valid for fully developed flow.
+
Figure 5.1: Geometry of Stairmand high efficiency cyclone
5.3.2 Turbulence model selection
For the turbulent flow in a cyclone, the key to the success of the CFD lies withthe accurate description of the turbulent behavior of the flow. To model theswirling turbulent flow in a cyclone separator, a series (families) of turbulencemodels are available in ANSYS-FLUENT. Some of the Fluent turbulence modelsare listed below:
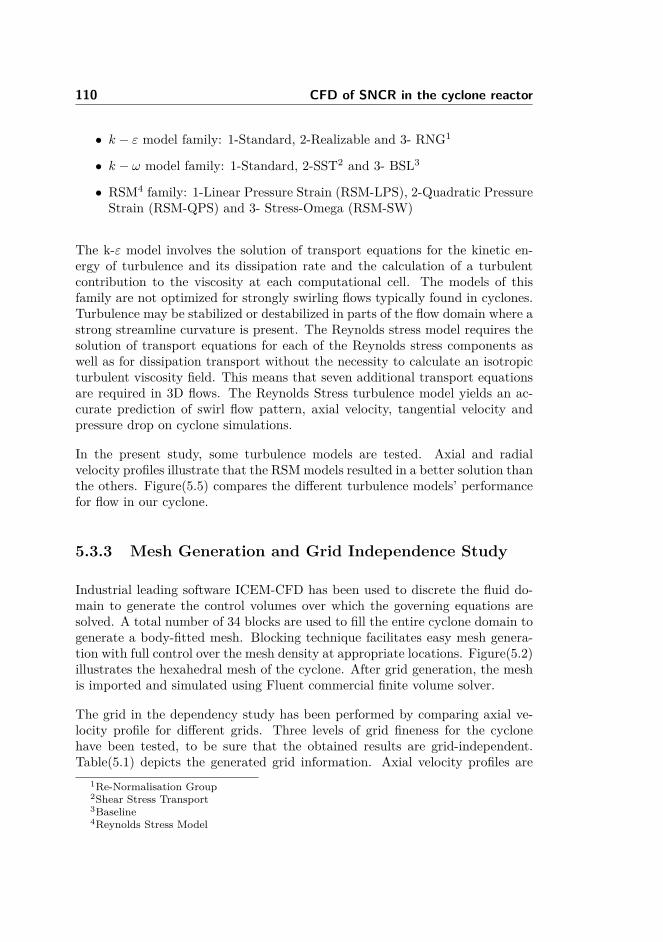
110 CFD of SNCR in the cyclone reactor
• k − ε model family: 1-Standard, 2-Realizable and 3- RNG1
• k − ω model family: 1-Standard, 2-SST2 and 3- BSL3
• RSM4 family: 1-Linear Pressure Strain (RSM-LPS), 2-Quadratic PressureStrain (RSM-QPS) and 3- Stress-Omega (RSM-SW)
The k-ε model involves the solution of transport equations for the kinetic en-ergy of turbulence and its dissipation rate and the calculation of a turbulentcontribution to the viscosity at each computational cell. The models of thisfamily are not optimized for strongly swirling flows typically found in cyclones.Turbulence may be stabilized or destabilized in parts of the flow domain where astrong streamline curvature is present. The Reynolds stress model requires thesolution of transport equations for each of the Reynolds stress components aswell as for dissipation transport without the necessity to calculate an isotropicturbulent viscosity field. This means that seven additional transport equationsare required in 3D flows. The Reynolds Stress turbulence model yields an ac-curate prediction of swirl flow pattern, axial velocity, tangential velocity andpressure drop on cyclone simulations.
In the present study, some turbulence models are tested. Axial and radialvelocity profiles illustrate that the RSMmodels resulted in a better solution thanthe others. Figure(5.5) compares the different turbulence models’ performancefor flow in our cyclone.
5.3.3 Mesh Generation and Grid Independence Study
Industrial leading software ICEM-CFD has been used to discrete the fluid do-main to generate the control volumes over which the governing equations aresolved. A total number of 34 blocks are used to fill the entire cyclone domain togenerate a body-fitted mesh. Blocking technique facilitates easy mesh genera-tion with full control over the mesh density at appropriate locations. Figure(5.2)illustrates the hexahedral mesh of the cyclone. After grid generation, the meshis imported and simulated using Fluent commercial finite volume solver.
The grid in the dependency study has been performed by comparing axial ve-locity profile for different grids. Three levels of grid fineness for the cyclonehave been tested, to be sure that the obtained results are grid-independent.Table(5.1) depicts the generated grid information. Axial velocity profiles are
1Re-Normalisation Group2Shear Stress Transport3Baseline4Reynolds Stress Model
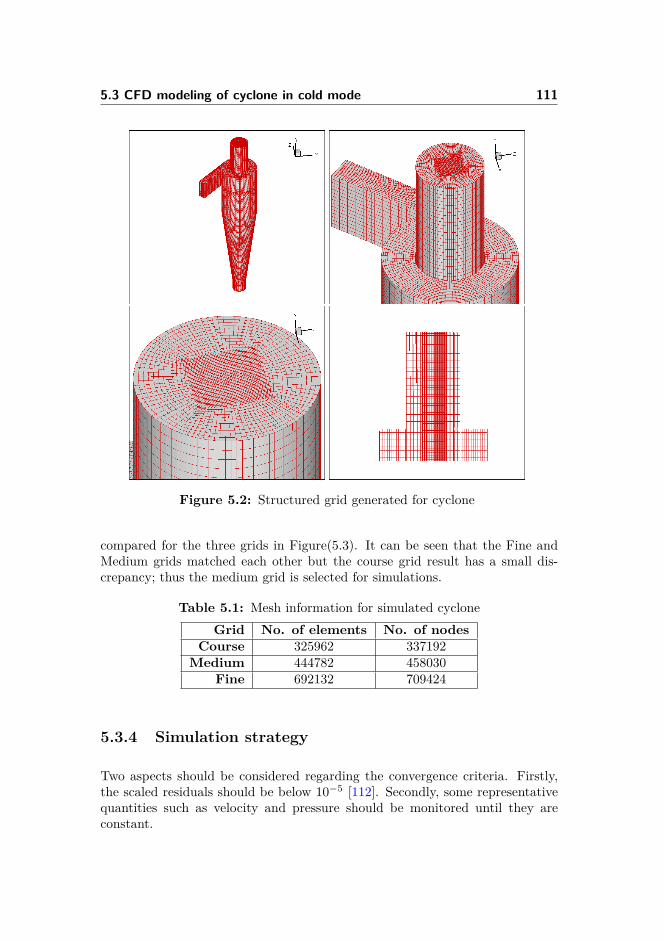
5.3 CFD modeling of cyclone in cold mode 111
Figure 5.2: Structured grid generated for cyclone
compared for the three grids in Figure(5.3). It can be seen that the Fine andMedium grids matched each other but the course grid result has a small dis-crepancy; thus the medium grid is selected for simulations.
Table 5.1: Mesh information for simulated cycloneGrid No. of elements No. of nodes
Course 325962 337192Medium 444782 458030
Fine 692132 709424
5.3.4 Simulation strategy
Two aspects should be considered regarding the convergence criteria. Firstly,the scaled residuals should be below 10−5 [112]. Secondly, some representativequantities such as velocity and pressure should be monitored until they areconstant.
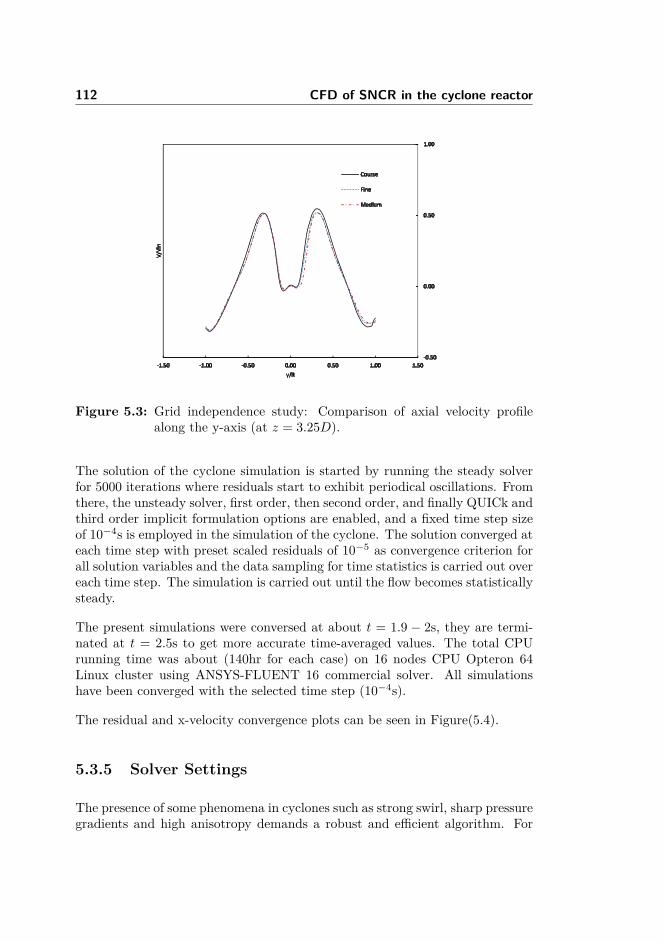
112 CFD of SNCR in the cyclone reactor
Figure 5.3: Grid independence study: Comparison of axial velocity profilealong the y-axis (at z = 3.25D).
The solution of the cyclone simulation is started by running the steady solverfor 5000 iterations where residuals start to exhibit periodical oscillations. Fromthere, the unsteady solver, first order, then second order, and finally QUICk andthird order implicit formulation options are enabled, and a fixed time step sizeof 10−4s is employed in the simulation of the cyclone. The solution converged ateach time step with preset scaled residuals of 10−5 as convergence criterion forall solution variables and the data sampling for time statistics is carried out overeach time step. The simulation is carried out until the flow becomes statisticallysteady.
The present simulations were conversed at about t = 1.9 − 2s, they are termi-nated at t = 2.5s to get more accurate time-averaged values. The total CPUrunning time was about (140hr for each case) on 16 nodes CPU Opteron 64Linux cluster using ANSYS-FLUENT 16 commercial solver. All simulationshave been converged with the selected time step (10−4s).
The residual and x-velocity convergence plots can be seen in Figure(5.4).
5.3.5 Solver Settings
The presence of some phenomena in cyclones such as strong swirl, sharp pressuregradients and high anisotropy demands a robust and efficient algorithm. For
5.3 CFD modeling of cyclone in cold mode 113
Figure 5.4: Residual and x-velocity v.s. iteration.
pressure-velocity coupling, SIMPLEC5 algorithm of van Doormaal and Raithby[163] is used.
PRESTO6 interpolation scheme as suggested by Shukla et al. [164] is usedfor pressure, QUICK7 (2nd order) and MUSCL8 (3rd order) for momentum-k−ε equations, and Reynolds stresses equations scheme gives better predictionswhen compared with the experimental data. Solver residual set-point for all theconservation equations is set to 10−5. In the near-wall region, the fluid flow ismodeled using the standard wall function.
5.3.6 Results
In the present study, some turbulence models are tested. Figure(5.5) comparesthe different turbulence models performance compared to experimental data ofHoekstra’s experiments [121].
The axial and radial velocity profiles show that the RSM–2nd order QUICKmodels resulted in better solutions than the other selected turbulence models.
For the next step of the simulation, the validated results (by Hokestra’s Experi-mental results) of the developed model for cold mode will be used. Consideringdimension difference, geometry in CFD modeling is scaled down from 29cm to11cm. In the present geometry, a similar number of grids are generated, andturbulence model and solver settings are used as it is obtained from cold mode
5Semi-Implicit Method Pressure-Linked Equations Consistent6PREssure STaggered Option7Quadratic Upstream Interpolation for Convective Kinetics8Monotone Upstream-Centered Schemes for Conservation Laws
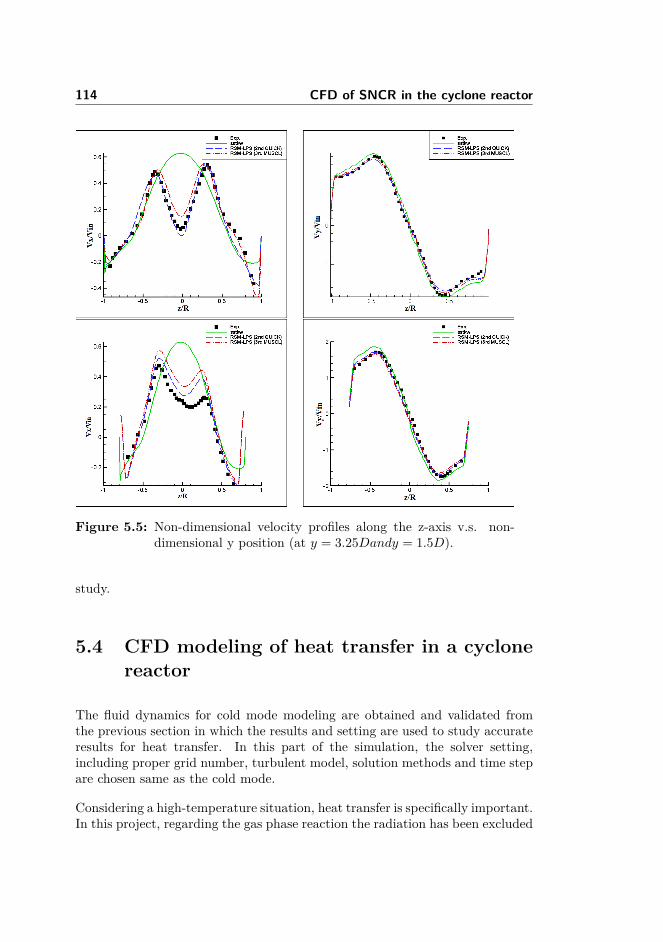
114 CFD of SNCR in the cyclone reactor
Figure 5.5: Non-dimensional velocity profiles along the z-axis v.s. non-dimensional y position (at y = 3.25Dandy = 1.5D).
study.
5.4 CFD modeling of heat transfer in a cyclonereactor
The fluid dynamics for cold mode modeling are obtained and validated fromthe previous section in which the results and setting are used to study accurateresults for heat transfer. In this part of the simulation, the solver setting,including proper grid number, turbulent model, solution methods and time stepare chosen same as the cold mode.
Considering a high-temperature situation, heat transfer is specifically important.In this project, regarding the gas phase reaction the radiation has been excluded
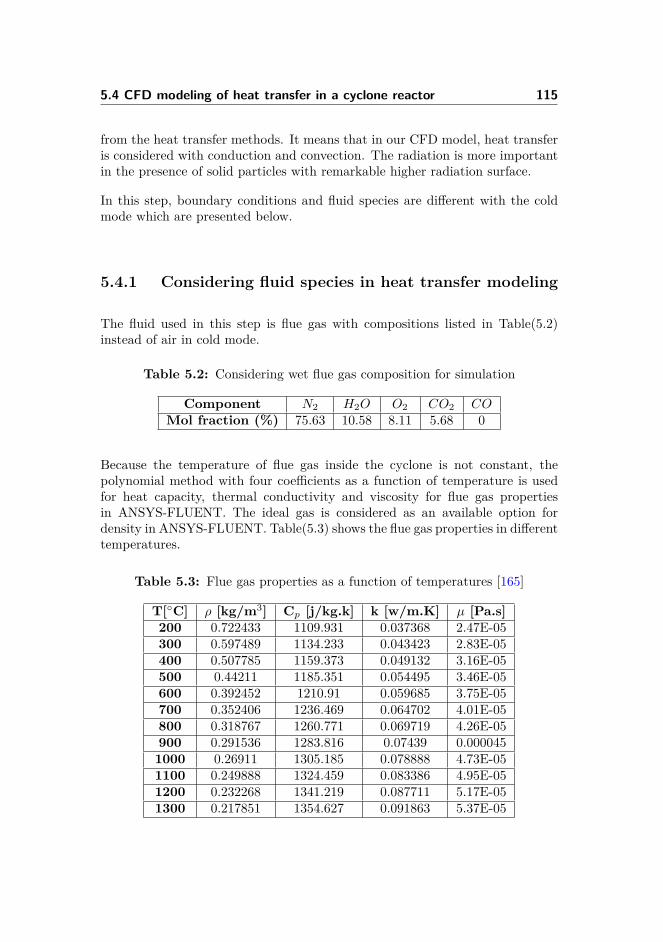
5.4 CFD modeling of heat transfer in a cyclone reactor 115
from the heat transfer methods. It means that in our CFD model, heat transferis considered with conduction and convection. The radiation is more importantin the presence of solid particles with remarkable higher radiation surface.
In this step, boundary conditions and fluid species are different with the coldmode which are presented below.
5.4.1 Considering fluid species in heat transfer modeling
The fluid used in this step is flue gas with compositions listed in Table(5.2)instead of air in cold mode.
Table 5.2: Considering wet flue gas composition for simulation
Component N2 H2O O2 CO2 COMol fraction (%) 75.63 10.58 8.11 5.68 0
Because the temperature of flue gas inside the cyclone is not constant, thepolynomial method with four coefficients as a function of temperature is usedfor heat capacity, thermal conductivity and viscosity for flue gas propertiesin ANSYS-FLUENT. The ideal gas is considered as an available option fordensity in ANSYS-FLUENT. Table(5.3) shows the flue gas properties in differenttemperatures.
Table 5.3: Flue gas properties as a function of temperatures [165]
T[C] ρ [kg/m3] Cp [j/kg.k] k [w/m.K] µ [Pa.s]200 0.722433 1109.931 0.037368 2.47E-05300 0.597489 1134.233 0.043423 2.83E-05400 0.507785 1159.373 0.049132 3.16E-05500 0.44211 1185.351 0.054495 3.46E-05600 0.392452 1210.91 0.059685 3.75E-05700 0.352406 1236.469 0.064702 4.01E-05800 0.318767 1260.771 0.069719 4.26E-05900 0.291536 1283.816 0.07439 0.0000451000 0.26911 1305.185 0.078888 4.73E-051100 0.249888 1324.459 0.083386 4.95E-051200 0.232268 1341.219 0.087711 5.17E-051300 0.217851 1354.627 0.091863 5.37E-05
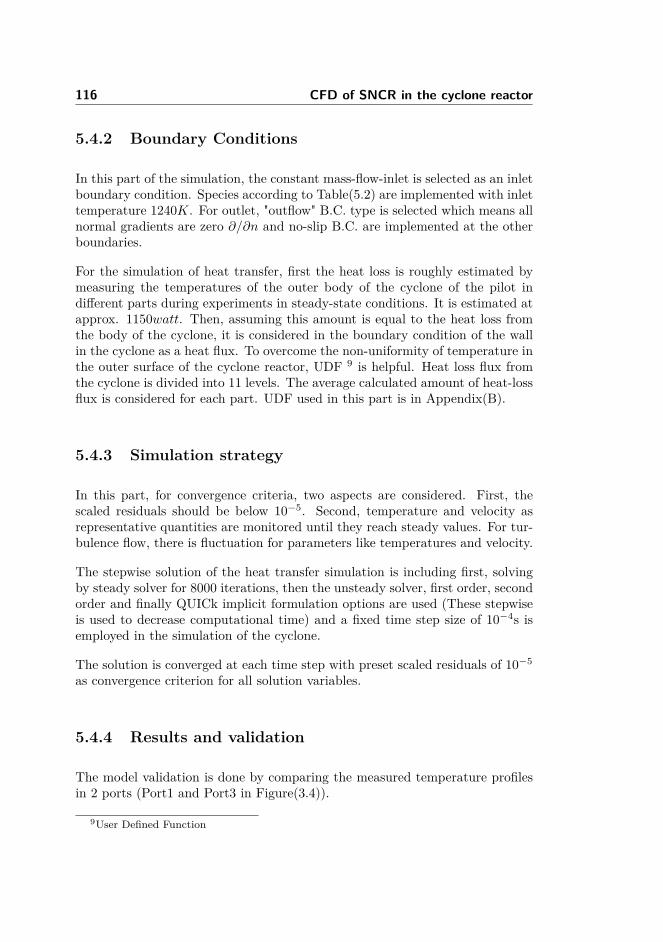
116 CFD of SNCR in the cyclone reactor
5.4.2 Boundary Conditions
In this part of the simulation, the constant mass-flow-inlet is selected as an inletboundary condition. Species according to Table(5.2) are implemented with inlettemperature 1240K. For outlet, "outflow" B.C. type is selected which means allnormal gradients are zero ∂/∂n and no-slip B.C. are implemented at the otherboundaries.
For the simulation of heat transfer, first the heat loss is roughly estimated bymeasuring the temperatures of the outer body of the cyclone of the pilot indifferent parts during experiments in steady-state conditions. It is estimated atapprox. 1150watt. Then, assuming this amount is equal to the heat loss fromthe body of the cyclone, it is considered in the boundary condition of the wallin the cyclone as a heat flux. To overcome the non-uniformity of temperature inthe outer surface of the cyclone reactor, UDF 9 is helpful. Heat loss flux fromthe cyclone is divided into 11 levels. The average calculated amount of heat-lossflux is considered for each part. UDF used in this part is in Appendix(B).
5.4.3 Simulation strategy
In this part, for convergence criteria, two aspects are considered. First, thescaled residuals should be below 10−5. Second, temperature and velocity asrepresentative quantities are monitored until they reach steady values. For tur-bulence flow, there is fluctuation for parameters like temperatures and velocity.
The stepwise solution of the heat transfer simulation is including first, solvingby steady solver for 8000 iterations, then the unsteady solver, first order, secondorder and finally QUICk implicit formulation options are used (These stepwiseis used to decrease computational time) and a fixed time step size of 10−4s isemployed in the simulation of the cyclone.
The solution is converged at each time step with preset scaled residuals of 10−5
as convergence criterion for all solution variables.
5.4.4 Results and validation
The model validation is done by comparing the measured temperature profilesin 2 ports (Port1 and Port3 in Figure(3.4)).
9User Defined Function
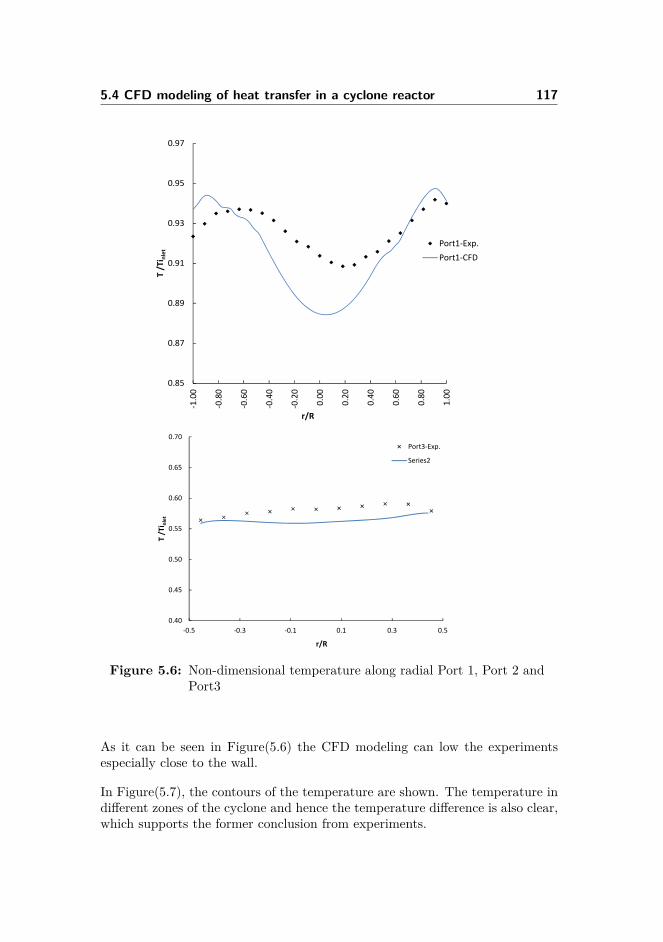
5.4 CFD modeling of heat transfer in a cyclone reactor 117
0.85
0.87
0.89
0.91
0.93
0.95
0.97
‐1.00
‐0.80
‐0.60
‐0.40
‐0.20
0.00
0.20
0.40
0.60
0.80
1.00
T /Ti nl
et
r/R
Port1‐Exp.Port1‐CFD
0.40
0.45
0.50
0.55
0.60
0.65
0.70
‐0.5 ‐0.3 ‐0.1 0.1 0.3 0.5
T /Ti nl
et
r/R
Port3‐Exp.
Series2
Figure 5.6: Non-dimensional temperature along radial Port 1, Port 2 andPort3
As it can be seen in Figure(5.6) the CFD modeling can low the experimentsespecially close to the wall.
In Figure(5.7), the contours of the temperature are shown. The temperature indifferent zones of the cyclone and hence the temperature difference is also clear,which supports the former conclusion from experiments.
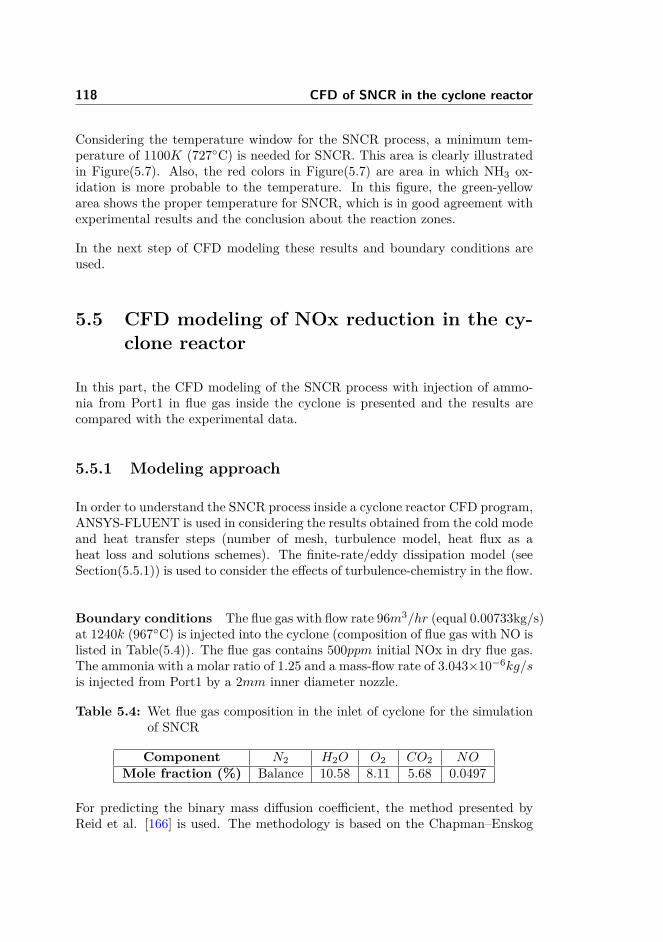
118 CFD of SNCR in the cyclone reactor
Considering the temperature window for the SNCR process, a minimum tem-perature of 1100K (727C) is needed for SNCR. This area is clearly illustratedin Figure(5.7). Also, the red colors in Figure(5.7) are area in which NH3 ox-idation is more probable to the temperature. In this figure, the green-yellowarea shows the proper temperature for SNCR, which is in good agreement withexperimental results and the conclusion about the reaction zones.
In the next step of CFD modeling these results and boundary conditions areused.
5.5 CFD modeling of NOx reduction in the cy-clone reactor
In this part, the CFD modeling of the SNCR process with injection of ammo-nia from Port1 in flue gas inside the cyclone is presented and the results arecompared with the experimental data.
5.5.1 Modeling approach
In order to understand the SNCR process inside a cyclone reactor CFD program,ANSYS-FLUENT is used in considering the results obtained from the cold modeand heat transfer steps (number of mesh, turbulence model, heat flux as aheat loss and solutions schemes). The finite-rate/eddy dissipation model (seeSection(5.5.1)) is used to consider the effects of turbulence-chemistry in the flow.
Boundary conditions The flue gas with flow rate 96m3/hr (equal 0.00733kg/s)at 1240k (967C) is injected into the cyclone (composition of flue gas with NO islisted in Table(5.4)). The flue gas contains 500ppm initial NOx in dry flue gas.The ammonia with a molar ratio of 1.25 and a mass-flow rate of 3.043×10⁻⁶kg/sis injected from Port1 by a 2mm inner diameter nozzle.
Table 5.4: Wet flue gas composition in the inlet of cyclone for the simulationof SNCR
Component N2 H2O O2 CO2 NOMole fraction (%) Balance 10.58 8.11 5.68 0.0497
For predicting the binary mass diffusion coefficient, the method presented byReid et al. [166] is used. The methodology is based on the Chapman–Enskog
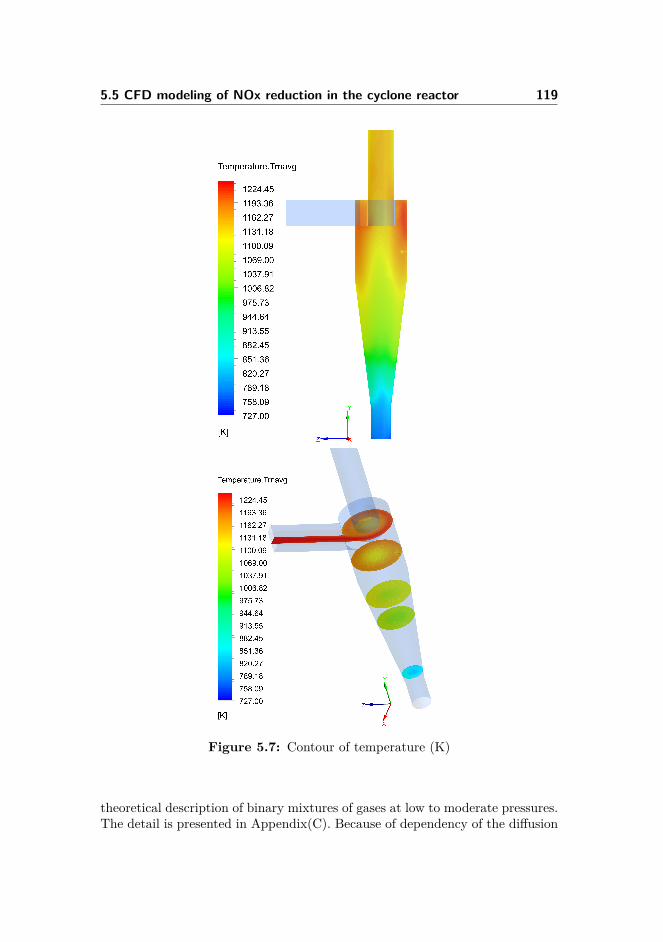
5.5 CFD modeling of NOx reduction in the cyclone reactor 119
Figure 5.7: Contour of temperature (K)
theoretical description of binary mixtures of gases at low to moderate pressures.The detail is presented in Appendix(C). Because of dependency of the diffusion
120 CFD of SNCR in the cyclone reactor
coefficient on temperature, the mass diffusion coefficient is defined as a func-tion of temperature by the polynomial function of the temperature by threecoefficients in ANSYS-FLUENT.
Kinetics: Mathematical modeling of reaction, especially fast reactions, in tur-bulent flow is the problem of modeling turbulent flow and chemical kinetics aswell as the interaction between the flow and the chemical reactions. In systemswhere reactions take place in bulk with turbulence flow, the flow descriptionbecomes more complicated due to the coupling between the fluid dynamics andthe chemical kinetics. In this kind of systems, chemical kinetics is not enoughto study the reactions. Turbulent fluctuations may change the apparent chem-ical production rate. On the other hand, the change in the local mole fractionis thus due to both the mixing and conversion of the reactant. So the mix-ing of the reactant plays a major role in the reaction rate of the reactant. Inmathematical modeling, to simulate the systems, including the reactions, thenumber of reacting species and thus the number of partial differential equationsthat describe the change of the mole fraction becomes large, and furthermorethe wide spread in length and time scales makes the PDEs stiff, which requiresan increased solution time. Therefore, in this kind of system, using a reducedmechanism is recommended to simplify the total model. Also, a link betweenflow and chemical kinetics needs to be established. Among different approaches,Eddy Dissipation model developed by Magnussen and Hjertager [167] is widelyused.
Among several proposed models for the SNCR process, to obtain an acceptablecomputational time, a simple, practical application of an empirical model pro-posed by Duo et al. [168] and reduced chemical kinetics mechanism proposed byBrouwer et al. [94] are used. The reaction rates are calculated from Arrheniusrate expressions.
The two-reaction mechanism proposed by Duo et al. [168] includes the followingoverall reactions: one leading to a reduction (R29) and the other to a formation(R30).
NO +NH3 + 14O2 → N2 + 3
2H2O (R29)
NH3 + 54O2 → NO + 3
2H2O (R30)
5.5 CFD modeling of NOx reduction in the cyclone reactor 121
Duo et al. [168] developed a simple kinetic model in a constant O2 concentration(4% O2). The rate of reactions are:
rred. = kr [NO] [NH3] (5.18)
rox. = kox [NH3] (5.19)
This model did not include the influence of the O2 concentration. Kasuya etal. [169] observed that Duo et al.’s [168] model is valid for the range of 1–20%oxygen concentration. The rate of reaction for NO and NH3 are:
rNO = kox. [NH3]− kred. [NH3] [NO] (5.20)
rNH3 = −kox. [NH3]− kred. [NH3] [NO] (5.21)
The other kinetics model that is considered was developed by Brouwer et al.[94].The kinetic model is solved for ammonia by considering the two following reac-tions:
NO +NH3 → N2 +H2O +H (R31)
NH3 +O2 → NO +H2O +H (R32)
The rate of reactions for NO reduction and NH3 oxidation are:
rNO = kox. [NH3] [O2]− kred. [NH3] [NO] (5.22)
rNH3 = −kox. [NH3] [O2]− kred. [NH3] [NO] (5.23)
The rate constant is modeled by the Arrhenius equation in Fluent:
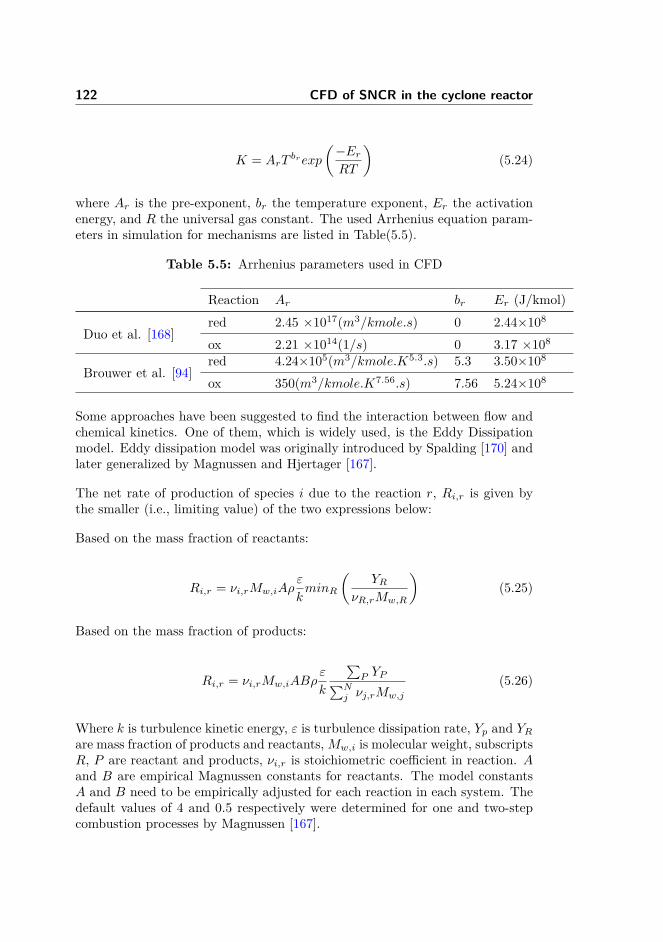
122 CFD of SNCR in the cyclone reactor
K = ArTbrexp
(−ErRT
)(5.24)
where Ar is the pre-exponent, br the temperature exponent, Er the activationenergy, and R the universal gas constant. The used Arrhenius equation param-eters in simulation for mechanisms are listed in Table(5.5).
Table 5.5: Arrhenius parameters used in CFD
Reaction Ar br Er (J/kmol)
Duo et al. [168]red 2.45 ×10¹⁷(m3/kmole.s) 0 2.44×108
ox 2.21 ×1014(1/s) 0 3.17 ×10⁸
Brouwer et al. [94]red 4.24×10⁵(m3/kmole.K5.3.s) 5.3 3.50×108
ox 350(m3/kmole.K7.56.s) 7.56 5.24×10⁸
Some approaches have been suggested to find the interaction between flow andchemical kinetics. One of them, which is widely used, is the Eddy Dissipationmodel. Eddy dissipation model was originally introduced by Spalding [170] andlater generalized by Magnussen and Hjertager [167].
The net rate of production of species i due to the reaction r, Ri,r is given bythe smaller (i.e., limiting value) of the two expressions below:
Based on the mass fraction of reactants:
Ri,r = νi,rMw,iAρε
kminR
(YR
νR,rMw,R
)(5.25)
Based on the mass fraction of products:
Ri,r = νi,rMw,iABρε
k
∑P YP∑N
j νj,rMw,j
(5.26)
Where k is turbulence kinetic energy, ε is turbulence dissipation rate, Yp and YRare mass fraction of products and reactants,Mw,i is molecular weight, subscriptsR, P are reactant and products, νi,r is stoichiometric coefficient in reaction. Aand B are empirical Magnussen constants for reactants. The model constantsA and B need to be empirically adjusted for each reaction in each system. Thedefault values of 4 and 0.5 respectively were determined for one and two-stepcombustion processes by Magnussen [167].
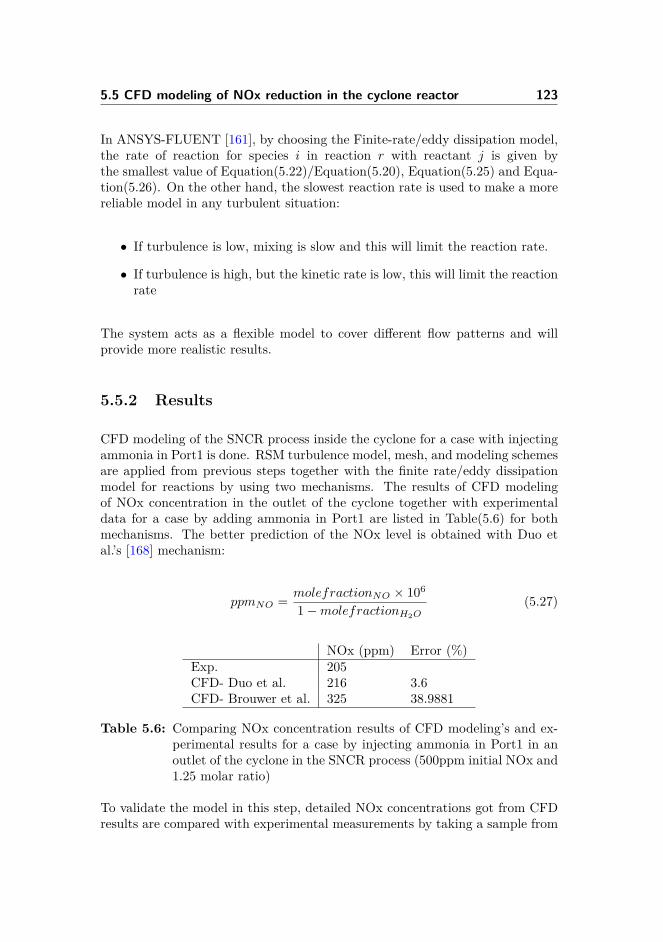
5.5 CFD modeling of NOx reduction in the cyclone reactor 123
In ANSYS-FLUENT [161], by choosing the Finite-rate/eddy dissipation model,the rate of reaction for species i in reaction r with reactant j is given bythe smallest value of Equation(5.22)/Equation(5.20), Equation(5.25) and Equa-tion(5.26). On the other hand, the slowest reaction rate is used to make a morereliable model in any turbulent situation:
• If turbulence is low, mixing is slow and this will limit the reaction rate.
• If turbulence is high, but the kinetic rate is low, this will limit the reactionrate
The system acts as a flexible model to cover different flow patterns and willprovide more realistic results.
5.5.2 Results
CFD modeling of the SNCR process inside the cyclone for a case with injectingammonia in Port1 is done. RSM turbulence model, mesh, and modeling schemesare applied from previous steps together with the finite rate/eddy dissipationmodel for reactions by using two mechanisms. The results of CFD modelingof NOx concentration in the outlet of the cyclone together with experimentaldata for a case by adding ammonia in Port1 are listed in Table(5.6) for bothmechanisms. The better prediction of the NOx level is obtained with Duo etal.’s [168] mechanism:
ppmNO = molefractionNO × 106
1−molefractionH2O(5.27)
NOx (ppm) Error (%)Exp. 205CFD- Duo et al. 216 3.6CFD- Brouwer et al. 325 38.9881
Table 5.6: Comparing NOx concentration results of CFD modeling’s and ex-perimental results for a case by injecting ammonia in Port1 in anoutlet of the cyclone in the SNCR process (500ppm initial NOx and1.25 molar ratio)
To validate the model in this step, detailed NOx concentrations got from CFDresults are compared with experimental measurements by taking a sample from
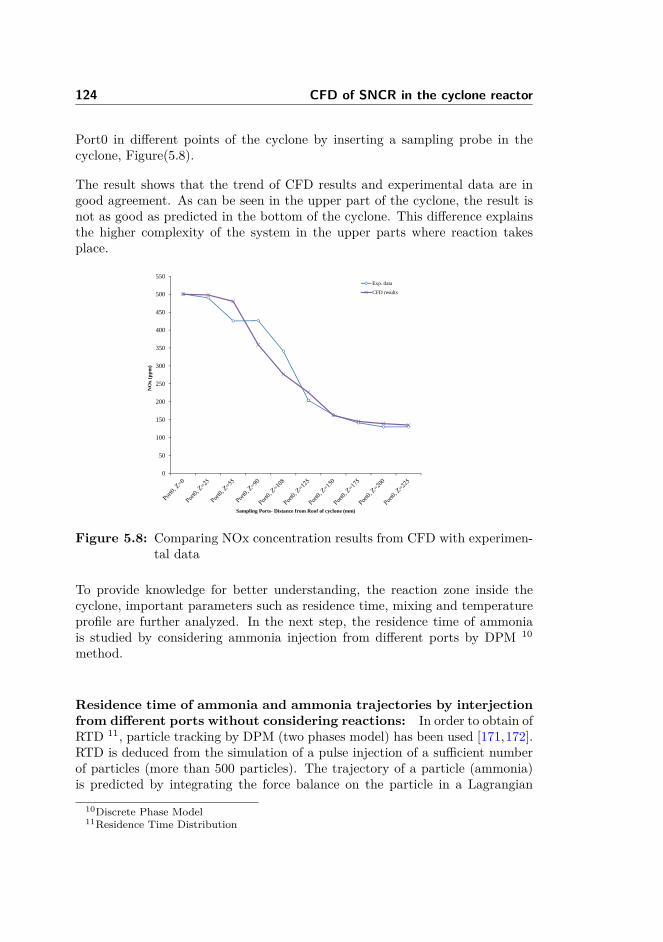
124 CFD of SNCR in the cyclone reactor
Port0 in different points of the cyclone by inserting a sampling probe in thecyclone, Figure(5.8).
The result shows that the trend of CFD results and experimental data are ingood agreement. As can be seen in the upper part of the cyclone, the result isnot as good as predicted in the bottom of the cyclone. This difference explainsthe higher complexity of the system in the upper parts where reaction takesplace.
0
50
100
150
200
250
300
350
400
450
500
550
NO
x (p
pm)
Sampling Ports- Distance from Roof of cyclone (mm)
Exp. data
CFD results
Figure 5.8: Comparing NOx concentration results from CFD with experimen-tal data
To provide knowledge for better understanding, the reaction zone inside thecyclone, important parameters such as residence time, mixing and temperatureprofile are further analyzed. In the next step, the residence time of ammoniais studied by considering ammonia injection from different ports by DPM 10
method.
Residence time of ammonia and ammonia trajectories by interjectionfrom different ports without considering reactions: In order to obtain ofRTD 11, particle tracking by DPM (two phases model) has been used [171,172].RTD is deduced from the simulation of a pulse injection of a sufficient numberof particles (more than 500 particles). The trajectory of a particle (ammonia)is predicted by integrating the force balance on the particle in a Lagrangian
10Discrete Phase Model11Residence Time Distribution
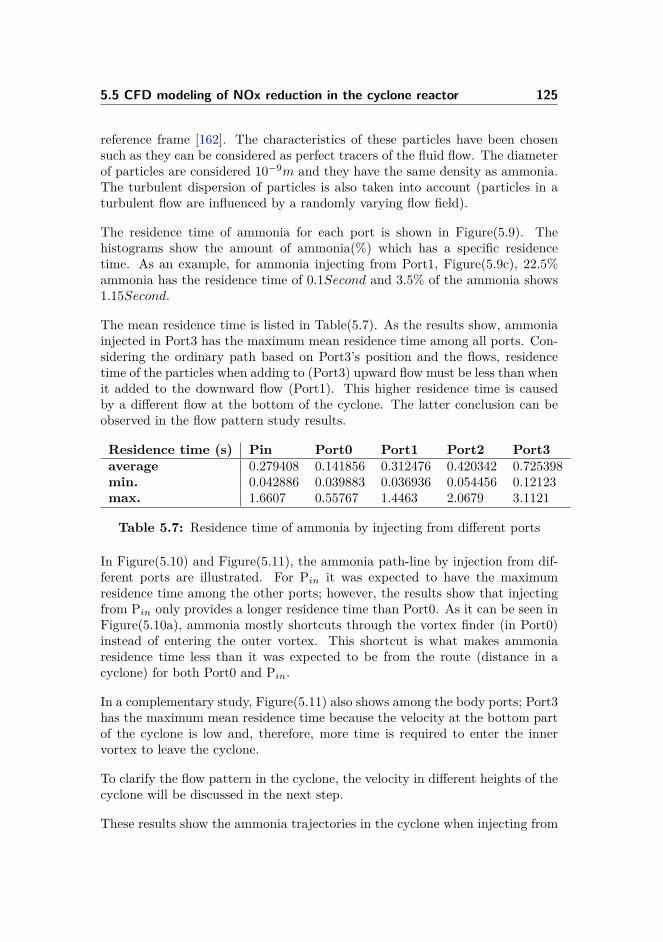
5.5 CFD modeling of NOx reduction in the cyclone reactor 125
reference frame [162]. The characteristics of these particles have been chosensuch as they can be considered as perfect tracers of the fluid flow. The diameterof particles are considered 10−9m and they have the same density as ammonia.The turbulent dispersion of particles is also taken into account (particles in aturbulent flow are influenced by a randomly varying flow field).
The residence time of ammonia for each port is shown in Figure(5.9). Thehistograms show the amount of ammonia(%) which has a specific residencetime. As an example, for ammonia injecting from Port1, Figure(5.9c), 22.5%ammonia has the residence time of 0.1Second and 3.5% of the ammonia shows1.15Second.
The mean residence time is listed in Table(5.7). As the results show, ammoniainjected in Port3 has the maximum mean residence time among all ports. Con-sidering the ordinary path based on Port3’s position and the flows, residencetime of the particles when adding to (Port3) upward flow must be less than whenit added to the downward flow (Port1). This higher residence time is causedby a different flow at the bottom of the cyclone. The latter conclusion can beobserved in the flow pattern study results.
Residence time (s) Pin Port0 Port1 Port2 Port3average 0.279408 0.141856 0.312476 0.420342 0.725398min. 0.042886 0.039883 0.036936 0.054456 0.12123max. 1.6607 0.55767 1.4463 2.0679 3.1121
Table 5.7: Residence time of ammonia by injecting from different ports
In Figure(5.10) and Figure(5.11), the ammonia path-line by injection from dif-ferent ports are illustrated. For Pin it was expected to have the maximumresidence time among the other ports; however, the results show that injectingfrom Pin only provides a longer residence time than Port0. As it can be seen inFigure(5.10a), ammonia mostly shortcuts through the vortex finder (in Port0)instead of entering the outer vortex. This shortcut is what makes ammoniaresidence time less than it was expected to be from the route (distance in acyclone) for both Port0 and Pin.
In a complementary study, Figure(5.11) also shows among the body ports; Port3has the maximum mean residence time because the velocity at the bottom partof the cyclone is low and, therefore, more time is required to enter the innervortex to leave the cyclone.
To clarify the flow pattern in the cyclone, the velocity in different heights of thecyclone will be discussed in the next step.
These results show the ammonia trajectories in the cyclone when injecting from
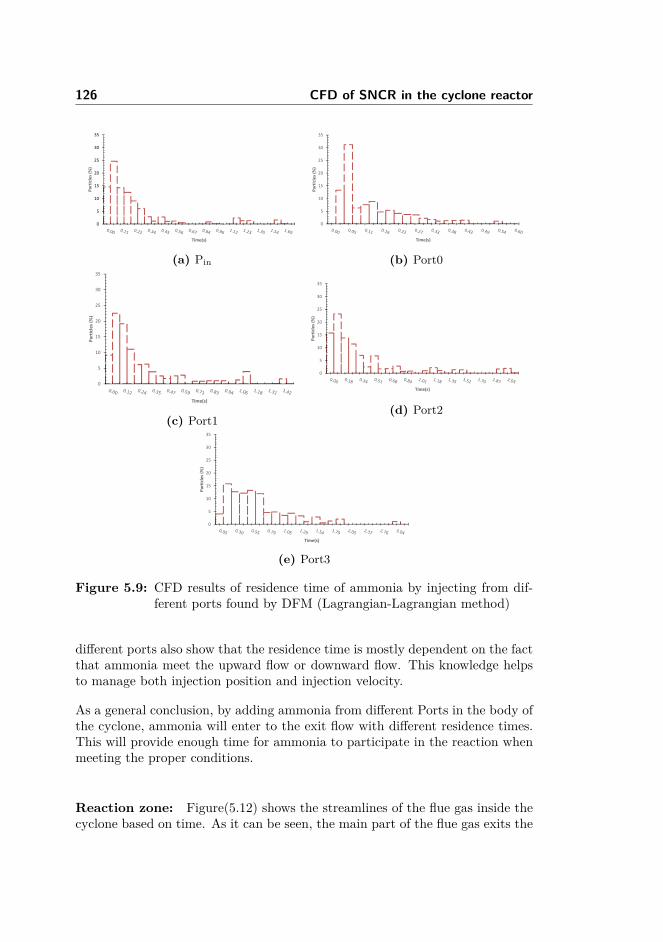
126 CFD of SNCR in the cyclone reactor
0
5
10
15
20
25
30
35
Particles (%
)
Time(s)
(a) Pin
0
5
10
15
20
25
30
35
Particles (%
)
Time(s)
(b) Port0
0
5
10
15
20
25
30
35
Particles (%
)
Time(s)
(c) Port1
0
5
10
15
20
25
30
35
Particles (%
)
Time(s)
(d) Port2
0
5
10
15
20
25
30
35
Particles (%
)
Time(s)
(e) Port3
Figure 5.9: CFD results of residence time of ammonia by injecting from dif-ferent ports found by DFM (Lagrangian-Lagrangian method)
different ports also show that the residence time is mostly dependent on the factthat ammonia meet the upward flow or downward flow. This knowledge helpsto manage both injection position and injection velocity.
As a general conclusion, by adding ammonia from different Ports in the body ofthe cyclone, ammonia will enter to the exit flow with different residence times.This will provide enough time for ammonia to participate in the reaction whenmeeting the proper conditions.
Reaction zone: Figure(5.12) shows the streamlines of the flue gas inside thecyclone based on time. As it can be seen, the main part of the flue gas exits the
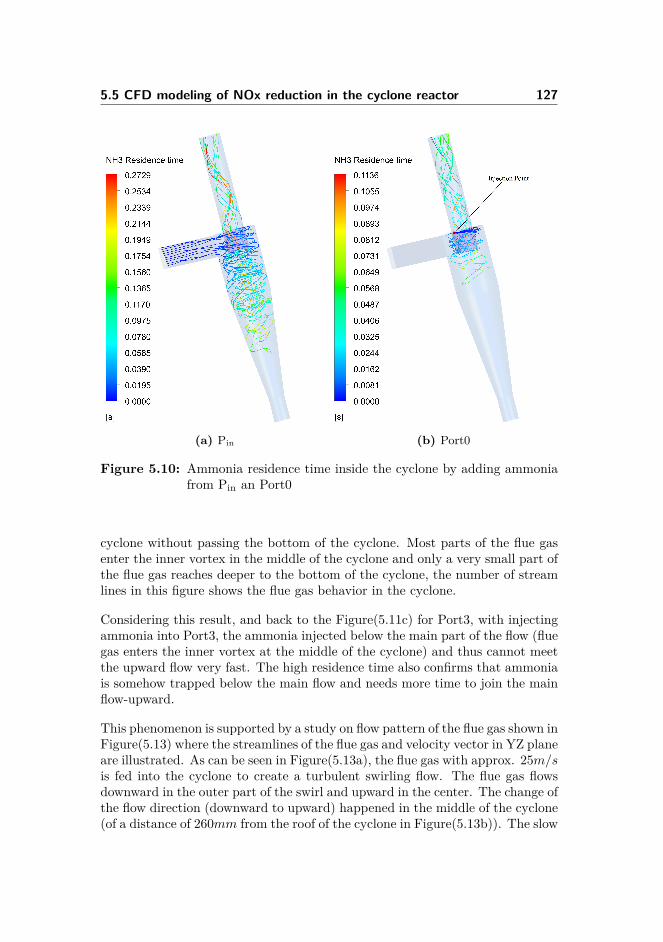
5.5 CFD modeling of NOx reduction in the cyclone reactor 127
(a) Pin (b) Port0
Figure 5.10: Ammonia residence time inside the cyclone by adding ammoniafrom Pin an Port0
cyclone without passing the bottom of the cyclone. Most parts of the flue gasenter the inner vortex in the middle of the cyclone and only a very small part ofthe flue gas reaches deeper to the bottom of the cyclone, the number of streamlines in this figure shows the flue gas behavior in the cyclone.
Considering this result, and back to the Figure(5.11c) for Port3, with injectingammonia into Port3, the ammonia injected below the main part of the flow (fluegas enters the inner vortex at the middle of the cyclone) and thus cannot meetthe upward flow very fast. The high residence time also confirms that ammoniais somehow trapped below the main flow and needs more time to join the mainflow-upward.
This phenomenon is supported by a study on flow pattern of the flue gas shown inFigure(5.13) where the streamlines of the flue gas and velocity vector in YZ planeare illustrated. As can be seen in Figure(5.13a), the flue gas with approx. 25m/sis fed into the cyclone to create a turbulent swirling flow. The flue gas flowsdownward in the outer part of the swirl and upward in the center. The change ofthe flow direction (downward to upward) happened in the middle of the cyclone(of a distance of 260mm from the roof of the cyclone in Figure(5.13b)). The slow
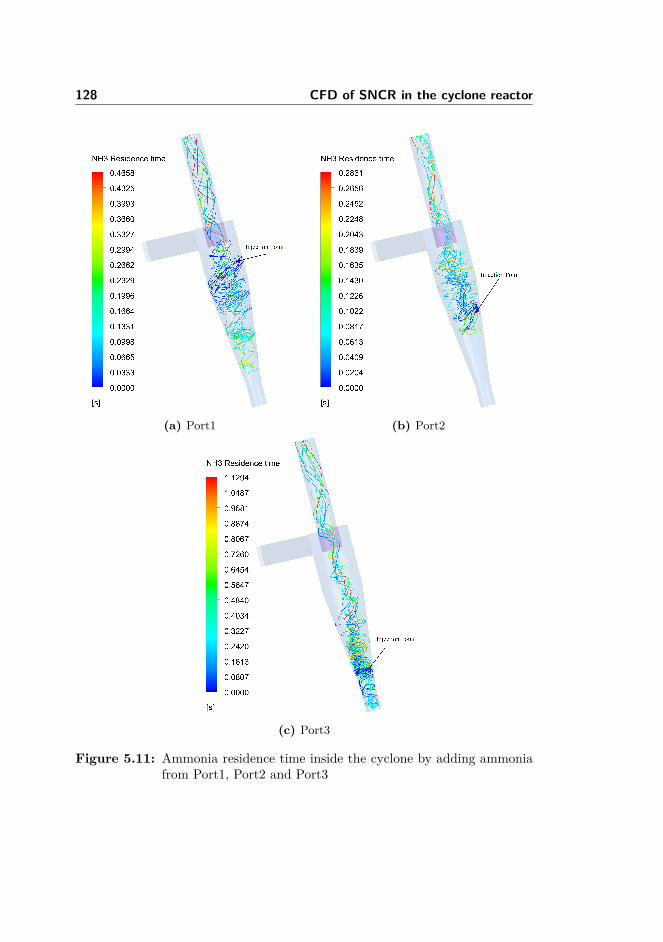
128 CFD of SNCR in the cyclone reactor
(a) Port1 (b) Port2
(c) Port3
Figure 5.11: Ammonia residence time inside the cyclone by adding ammoniafrom Port1, Port2 and Port3
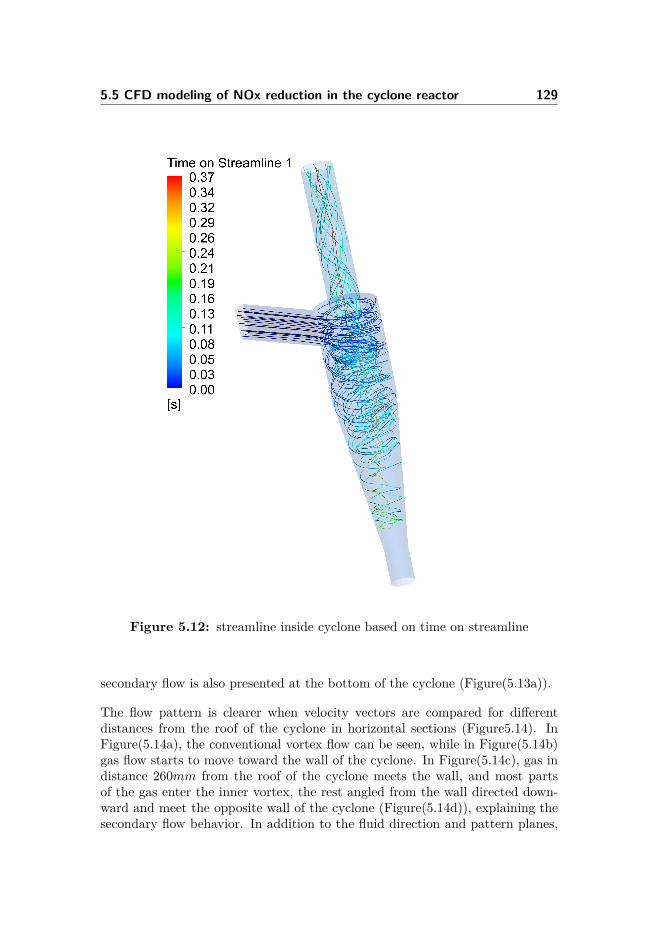
5.5 CFD modeling of NOx reduction in the cyclone reactor 129
Figure 5.12: streamline inside cyclone based on time on streamline
secondary flow is also presented at the bottom of the cyclone (Figure(5.13a)).
The flow pattern is clearer when velocity vectors are compared for differentdistances from the roof of the cyclone in horizontal sections (Figure5.14). InFigure(5.14a), the conventional vortex flow can be seen, while in Figure(5.14b)gas flow starts to move toward the wall of the cyclone. In Figure(5.14c), gas indistance 260mm from the roof of the cyclone meets the wall, and most partsof the gas enter the inner vortex, the rest angled from the wall directed down-ward and meet the opposite wall of the cyclone (Figure(5.14d)), explaining thesecondary flow behavior. In addition to the fluid direction and pattern planes,
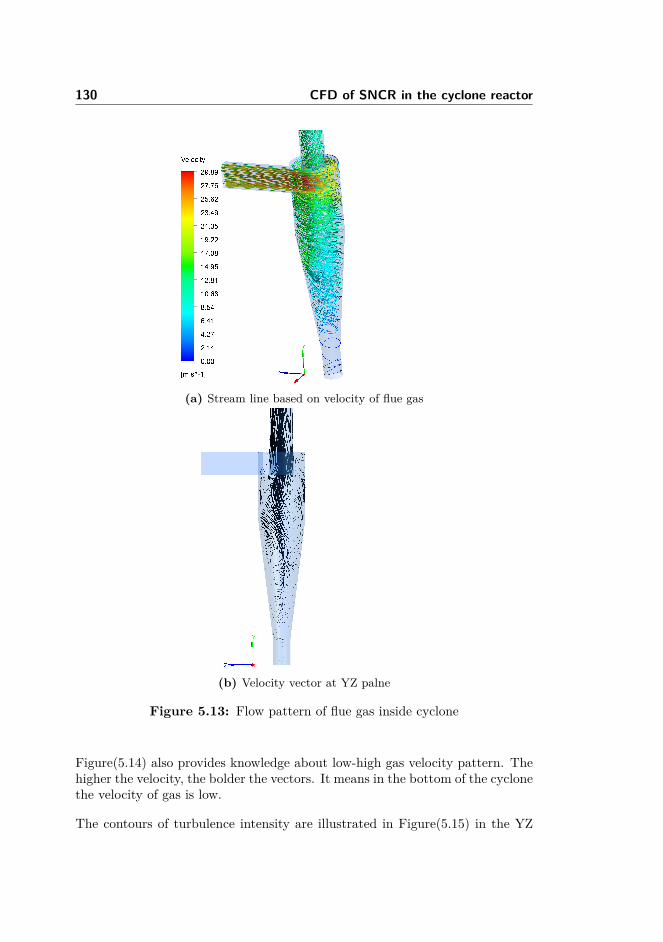
130 CFD of SNCR in the cyclone reactor
(a) Stream line based on velocity of flue gas
(b) Velocity vector at YZ palne
Figure 5.13: Flow pattern of flue gas inside cyclone
Figure(5.14) also provides knowledge about low-high gas velocity pattern. Thehigher the velocity, the bolder the vectors. It means in the bottom of the cyclonethe velocity of gas is low.
The contours of turbulence intensity are illustrated in Figure(5.15) in the YZ
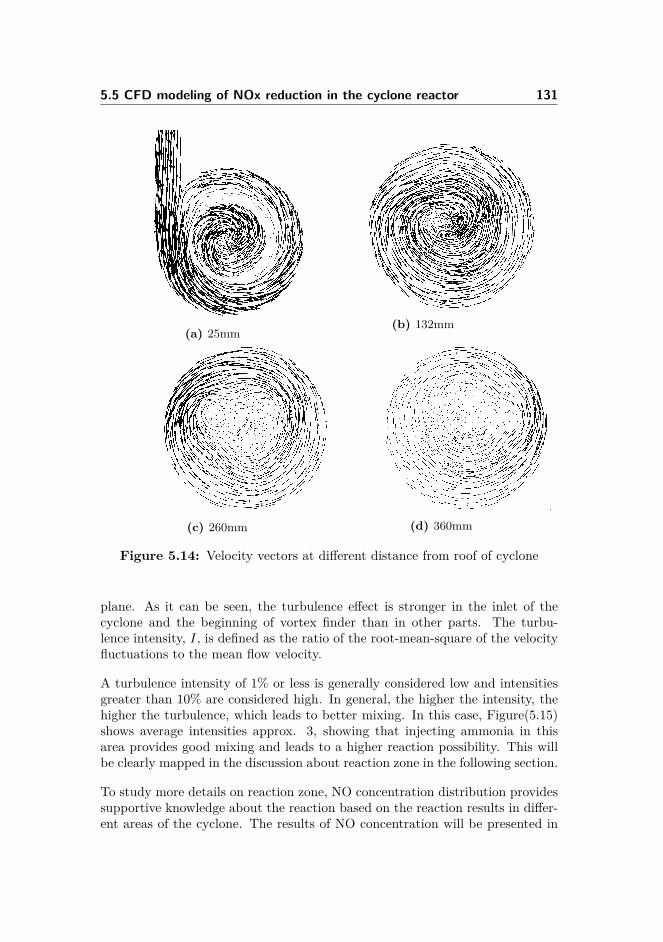
5.5 CFD modeling of NOx reduction in the cyclone reactor 131
(a) 25mm(b) 132mm
(c) 260mm (d) 360mm
Figure 5.14: Velocity vectors at different distance from roof of cyclone
plane. As it can be seen, the turbulence effect is stronger in the inlet of thecyclone and the beginning of vortex finder than in other parts. The turbu-lence intensity, I, is defined as the ratio of the root-mean-square of the velocityfluctuations to the mean flow velocity.
A turbulence intensity of 1% or less is generally considered low and intensitiesgreater than 10% are considered high. In general, the higher the intensity, thehigher the turbulence, which leads to better mixing. In this case, Figure(5.15)shows average intensities approx. 3, showing that injecting ammonia in thisarea provides good mixing and leads to a higher reaction possibility. This willbe clearly mapped in the discussion about reaction zone in the following section.
To study more details on reaction zone, NO concentration distribution providessupportive knowledge about the reaction based on the reaction results in differ-ent areas of the cyclone. The results of NO concentration will be presented in
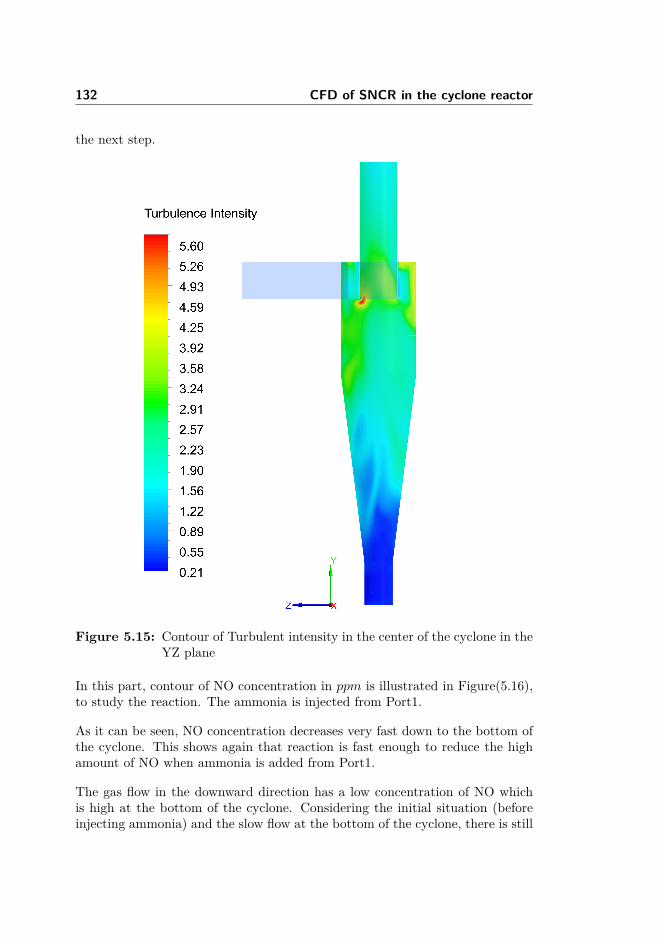
132 CFD of SNCR in the cyclone reactor
the next step.
Figure 5.15: Contour of Turbulent intensity in the center of the cyclone in theYZ plane
In this part, contour of NO concentration in ppm is illustrated in Figure(5.16),to study the reaction. The ammonia is injected from Port1.
As it can be seen, NO concentration decreases very fast down to the bottom ofthe cyclone. This shows again that reaction is fast enough to reduce the highamount of NO when ammonia is added from Port1.
The gas flow in the downward direction has a low concentration of NO whichis high at the bottom of the cyclone. Considering the initial situation (beforeinjecting ammonia) and the slow flow at the bottom of the cyclone, there is still
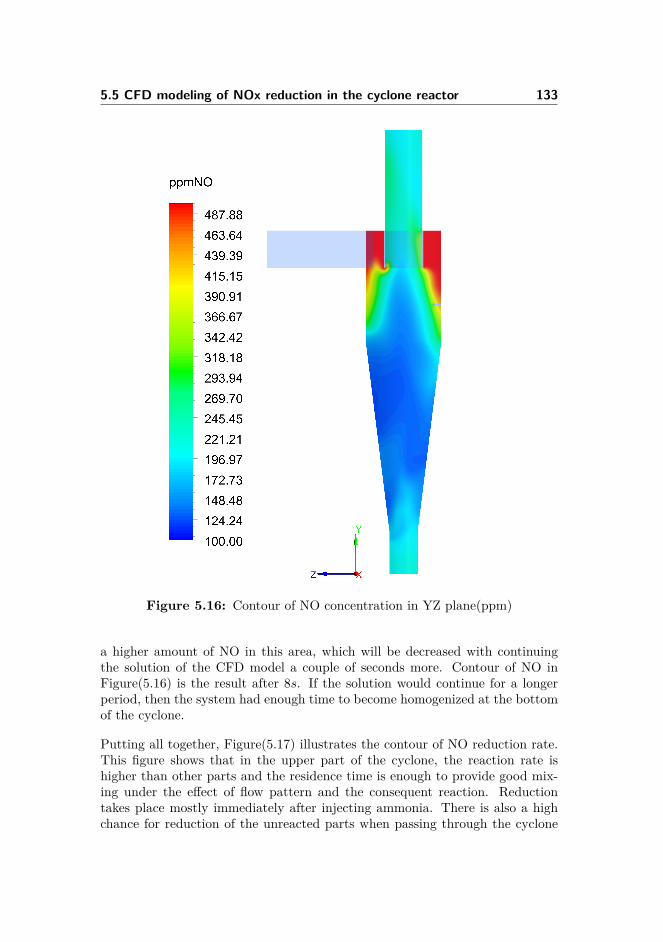
5.5 CFD modeling of NOx reduction in the cyclone reactor 133
Figure 5.16: Contour of NO concentration in YZ plane(ppm)
a higher amount of NO in this area, which will be decreased with continuingthe solution of the CFD model a couple of seconds more. Contour of NO inFigure(5.16) is the result after 8s. If the solution would continue for a longerperiod, then the system had enough time to become homogenized at the bottomof the cyclone.
Putting all together, Figure(5.17) illustrates the contour of NO reduction rate.This figure shows that in the upper part of the cyclone, the reaction rate ishigher than other parts and the residence time is enough to provide good mix-ing under the effect of flow pattern and the consequent reaction. Reductiontakes place mostly immediately after injecting ammonia. There is also a highchance for reduction of the unreacted parts when passing through the cyclone
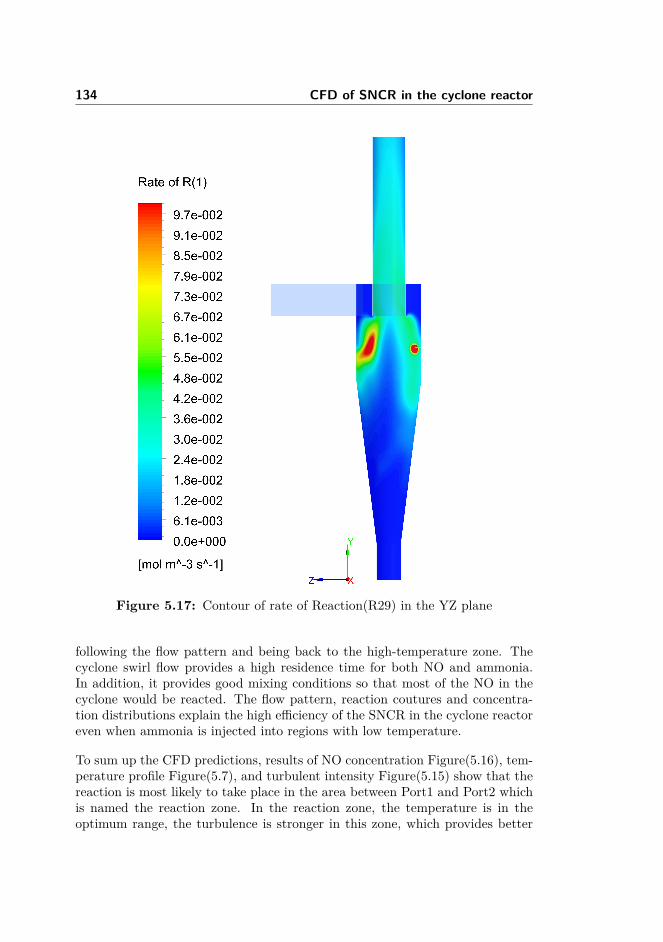
134 CFD of SNCR in the cyclone reactor
Figure 5.17: Contour of rate of Reaction(R29) in the YZ plane
following the flow pattern and being back to the high-temperature zone. Thecyclone swirl flow provides a high residence time for both NO and ammonia.In addition, it provides good mixing conditions so that most of the NO in thecyclone would be reacted. The flow pattern, reaction coutures and concentra-tion distributions explain the high efficiency of the SNCR in the cyclone reactoreven when ammonia is injected into regions with low temperature.
To sum up the CFD predictions, results of NO concentration Figure(5.16), tem-perature profile Figure(5.7), and turbulent intensity Figure(5.15) show that thereaction is most likely to take place in the area between Port1 and Port2 whichis named the reaction zone. In the reaction zone, the temperature is in theoptimum range, the turbulence is stronger in this zone, which provides better
5.6 Conclusion 135
mixing, and the residence time in this zone with adding ammonia from Port1 islonger (reactants meet the reaction zone both downward and upward). Further-more, even with adding ammonia from other ports in the body of the cyclone,the reactants still have the chance of meeting the reaction zone following theflow pattern.
Comparing the results of the CFDmodel with experiments, the model accuratelypredicted the experimental results. The experiment results also provide thesame conclusion about the reaction zone. The CFD model explains the swirlflow effect on both mixing and residence time in detail and maps the flow patternof the reactants and the reaction detail.
According to the CFD results, the reduction mainly takes place in the zonebetween Port1 and Port2, where the temperature is in the optimum range ofthe temperature window for reduction and reactants have the high probabilityto react due to the mixing effect and residence time.
5.6 Conclusion
The CFDmodel presented is a part of the study carried out to develop a practicalmethod to provide knowledge about flow patterns and reaction inside a cyclonereactor. CFD simulations have been carried out for simplified reactions and twomechanisms of Duo et al. [168] and Brouwer et al. [94] have been considered.Duo et al.’s mechanism predicts the SNCR reaction in this system better.
The CFD model was first developed for the cold mode. The first step has beenvalidated with the former experiments from the literature.
This first step simulation has been further developed for high temperatures toexplain the heat transfer phenomenon inside the cyclone and find the tempera-ture profile as the cyclone reactor is non-isothermal.
CFD results of this step are validated by the experimental results and showgood agreement with the experiments.
Afterwards, the SNCR reactions are added to the calculation and all the reactionparameters are discussed and explained.
For the considered reactions, the results of calculations have been verified withthe results of experimental measurements presented in the section on experi-ments performed in a pilot-scale cyclone reactor.
The results have been further employed in the parametric analysis of the reaction
136 CFD of SNCR in the cyclone reactor
inside the cyclone to study the effect of flow on the reaction in cyclone reactorand recognize the reaction zone, location in which reaction has the most chanceof happening.
The results could be applied to optimization, scale-up and design projects con-sidering the importance of fluid dynamics in cyclone reactor.
The developed CFD model provides reasonable results for flow pattern of fluegas, heat transfer, residence time, NO concentration distribution and reaction.With this comprehensive study, the CFD provides a detailed explanation of howswirl flow produces a higher residence time/better mixing in the cyclone.
Results show that the reaction mostly takes place in the upper part of thecyclone which also has proper temperature.
It is also concluded that even when ammonia is injected from the low-temperaturezone, reactants still find a chance to be in the high-temperature zone under theeffect of swirl flow. So it is expected to have a high SNCR efficiency in thecyclone reactor.
All the stepwise results provide a detailed understanding of the SNCR reactionsand flow patterns inside the cyclone reactor which can be used in many differentapplications. According to the results, the cyclone reactor provides a goodmixing and high residence time for reactants mixing together with mapping areaction zone with the proper temperature.
The CFD model has the potential of being developed further for more focusedtargets such as design, scale-up and optimization purposes.
Chapter 6General conclusions and
suggestion for future work
6.1 Conclusions
The main objective of this thesis was to provide science-based knowledge regard-ing the transport phenomenon inside the cyclone reactor for SNCR. In order toachieve this objective, studies were carried out in different steps to understandthe process systemically. The three steps are: 1. Design and construction ofpilot set-up, 2. Experiments in pilot scale, 3. CFD modeling.
The pilot set-up is designed considering all the practical and theoretical demandsof this study. The system can support measurements from many different partsof the cyclone. This flexible measurement potential provides the ability of adetailed experimental study on SNCR in the cyclone reactor.
A large series of experiments are performed to provide a detailed study onboth temperature profile and reaction inside the cyclone. Results from theseexperiments provide practical knowledge about SNCR in a cyclone reactor andcould also be used in the validation of our developed CFD model.
A CFD model is then developed to map the flow pattern inside the cyclonereactor and provide a reliable base for a more detailed discussion on mixing and
138 General conclusions and suggestion for future work
residence time which has a key role in SNCR. The model is initiated for the coldmode and developed stepwise for supporting all details of the SNCR process inthe cyclone reactor considering fluid dynamics. CFD is then validated with pilotscale experiments.
Based on systematic investigations, the main conclusions are summarized asfollows:
This cyclone reactor works as a non-isothermal reactor. From both experimentsand CFD results, it can be concluded that, in the upper part of the cyclone,the temperature is high enough for NOx reduction. The SNCR process is verysensitive to temperature. At high temperatures, the selectivity of chemicalreactions desires oxidation of ammonia to form NOx, and at low temperaturesselectivity desires a reduction of NOx. The area which is called reaction zonein this thesis has an optimum temperature range for NOx reduction and avoidsammonia oxidation.
Results show that the reaction mostly takes place in the upper part of thecyclone. In general, in cyclone reactor, wherever the swirl flow plays the mainrole, the mixing effect is extensively good. With regard to the temperatureprofile and NOx distribution, the swirl flow is well-generated in the area betweenPort1 and Port2. This mixing function of swirl flow together with temperatureconditions provides a potential reaction zone in this area (between Port1 andPort2).
Adding to the flow effect and temperature, with the high residence time ofreactants inside the cyclone, it is highly probable for the reactants to meetthis reaction zone even when ammonia is injected from the lower temperaturezones, which altogether provides high reduction efficiency and flexible designavailability for real case studies.
In the reaction zone, there is a high chance of reaction even for the unreactedreactants which are on the way out of the cyclone (upward flow). Reductionefficiency in different conditions is obtained 54-60%. The higher reduction ef-ficiency (60%) is obtained when ammonia gets injected from the upper part ofthe cyclone (reaction zone).
Following the parametric experimental investigation, with increasing initial NOx(constant molar ratio) or increase in the molar ratio (constant initial NOx),reduction efficiency will increase.
An investigation in injection velocity is also provided. The effect of injectionvelocity on reduction efficiency has been chosen as an indicator of mixing. Themixing effect is highly important in SNCR reaction in high temperature toavoid ammonia accumulation and decrease the chance of ammonia oxidation.
6.1 Conclusions 139
Ammonia, therefore, must have dispersed fast into the cross flow (cyclonic flow)and pass through the cyclone downward.
In this part of the study, different ammonia injection velocities have been studiedin 3 different injection ports. It is necessary to mention that in all of thesethree ports ammonia is injected into the high-temperature zone of the cyclone.Adding ammonia into the port inlet, ammonia first meets the inlet cross flowexperiments and show no significant effect with increasing injection velocity.There is a chance of ammonia accumulation and hence ammonia oxidation ininlet port which concurred with the reduction and, therefore, no significantincrease in reduction efficiency can be seen.
Adding ammonia to Port0 is the most important example to show the relativeimportance of mixing and interaction of the jet flow and cross flow in the generalcyclone efficiency. In this port, ammonia is injected into the upper part of thehot zone of the cyclone. Considering temperature, there is a chance of ammoniaoxidation in this area; therefore, it is important that ammonia mixed withcyclonic flow fast and moves to the lower zones where the temperature is lowerand oxidation has no chance to take place. Results show that by an increase inammonia jet velocity, the efficiency is increased significantly until a certain levelof velocity, confirming that by increasing the injection velocity the ammonia ismixed fast enough to avoid oxidation and the effect of cyclonic flow to carryammonia down through the cyclone. Results of the same study with injectingammonia to Port1 shows no significant effect with the studied jet flows. Theefficiency is still slightly increased with increasing ammonia jet flow. Resultsshow that by adding ammonia to Port1, jet flow is distributed into crossfloweven with low ammonia injection velocity because the reduction efficiency is ata high level compared to the other experiments. The effect of injection velocitycan practically explain the importance of cyclonic flow in providing fast mixingin the cyclone reactor; however, the former Droplet diffusion model [93] andthe Damkohler number cannot explain this phenomenon (finding characteristictime scales for mixing) in the presence of the swirl flow. This, of course, needsa comprehensive theoretical study on the importance of mixing in the cyclonereactor which is suggested in future work section.
A complementary experiment on adding particles to the cyclone shows that thesystem works as a non-isothermal reactor but the temperature difference up-down the cyclone is 100C lower in the presence of particles. A comparativestudy on a molar ratio with and without particles shows a lower reductionefficiency in the presence of particles. Results also show that by adding higheramounts of ammonia, the efficiency will increase. This part is also added asa step toward a more realistic approach for an industrial application, whichalmost always involves particles inside the cyclone. Although it is, in general,concluded that the cyclone reactor is an effective reactor for the SNCR reaction
140 General conclusions and suggestion for future work
in the presence of inert particles, there is still need for a detailed study on thecyclone reactor in the presence of different particle types which is recommendedfor future studies in the next section.
The developed CFD model is predictive for flow pattern (residence time, stream-lines, velocity vectors, velocity streamline), turbulent intensity, NO concentra-tion distribution and reaction. Results of CFD model is in good agreement withexperimental study. The reaction zone is more clearly investigated with CFDresults.
With this comprehensive study, CFD provides a detailed explanation of howswirl flow provides a higher residence time/better mixing in the cyclone. CFDmodel also has the potential of being further developed for more focused targetssuch as design, scale-up and optimization purposes.
As a general conclusion, results of experiments and CFD study show that allthe stepwise results provide detailed knowledge about the SNCR reactions andflow pattern inside the cyclone reactor which can be a support to any furtherdevelopment study on cyclone reactors. The developed model together withexperimental results can be applied to different industrial and research applica-tions.
6.2 Future work
In the current study, the focus was mainly put on the experimental challengesof using cyclone as a reactor and providing flexible measurements to follow thereaction condition in different reaction conditions and injection conditions. Thestudy is also supported by a CFD modeling part which applied to describe therole of the fluid dynamics in providing good reaction conditions and to mapmore details in the cyclone reactor. The study concluded that cyclone as areactor has a comparable efficiency for the selected reaction. Different reactionconditions and injection positions have been discussed in detail, which could beused for more practical industrial applications. However, further theoretical,experimental and modeling studies could be targeted specifically to developmore practical theories for the cyclone reactor. Based on the challenges in thisstudy and following the current results, a list of suggestions is provided here.These suggestions are valuable and have a direct focus upon:
• A theoretical study of the cyclonic flow and the importance of the mixingthrough the cyclone under different conditions of injected gas and cycloniccrossflow is highly recommended because the current theories cannot ex-plain the cyclone reactor situation due to its specific flow. This should be
6.2 Future work 141
included as a part explaining both when the gas is injected vertically intothe cyclonic flow and radial to the cyclonic flow. There are also possibili-ties of creating a side flow, distortion or tunneling, which is an interestingsubject for discussion. This theoretical study can be sufficiently supportedby doing experiments in the presented pilot in its current situation.
• It is also recommended to provide a targeted CFD study to extract mixingtime in different conditions. The CFD results could also be validatedwith some experiments in this pilot. Having a more realistic mixing timeestimations is highly beneficial for design purposes.
• As a complementary study with an experimental scope, a study on chang-ing the length of the vortex finder which is expected to affect the flowpattern and temperature profile is suggested. This suggested study isbeneficial to carry the injected gas to a more determined temperaturezone and practice the changes precisely. This suggested study is morehelpful to cover complicated reaction conditions, e.g., in the presence ofmore reactant spices.
• CFD modeling of SNCR with particle-loaded cyclone and investigation offluid dynamics under different particle loading situations.
• Study on a gas-solid reaction inside cyclone considering particle flow pat-tern and the effect of fluid dynamics in cyclone reactor for a gas-solidreaction.
• Application of CFD modeling for scale-up purposes to provide support-ive knowledge for SNCR of NOx reduction in large-scale cyclone reactorswhich can potentially be applied in design and developments in emissioncontrol industries.
• CFD study on cyclone geometry for further design studies, this can provideknowledge to be used in designing the new plant (pilot, real scale) andconsidering the parameters in a preliminary study.
• Industrial application of SNCR in cyclone reactor and investigation ofthe reaction efficiency, this could be definitely done together with CFDmodeling for optimization of the effective parameters and experimentalplan.
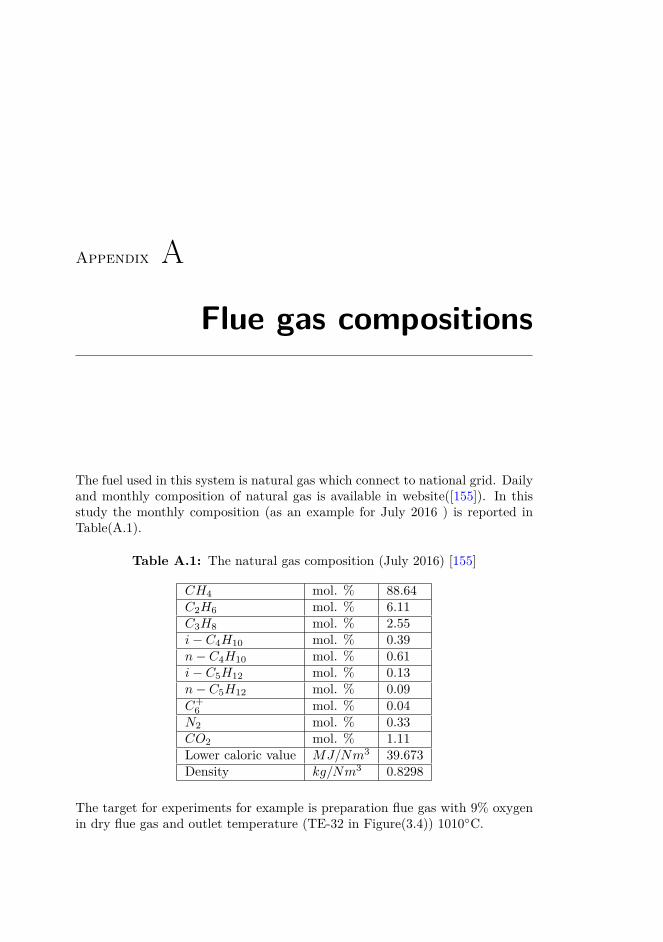
Appendix A
Flue gas compositions
The fuel used in this system is natural gas which connect to national grid. Dailyand monthly composition of natural gas is available in website([155]). In thisstudy the monthly composition (as an example for July 2016 ) is reported inTable(A.1).
Table A.1: The natural gas composition (July 2016) [155]
CH4 mol. % 88.64C2H6 mol. % 6.11C3H8 mol. % 2.55i− C4H10 mol. % 0.39n− C4H10 mol. % 0.61i− C5H12 mol. % 0.13n− C5H12 mol. % 0.09C+
6 mol. % 0.04N2 mol. % 0.33CO2 mol. % 1.11Lower caloric value MJ/Nm3 39.673Density kg/Nm3 0.8298
The target for experiments for example is preparation flue gas with 9% oxygenin dry flue gas and outlet temperature (TE-32 in Figure(3.4)) 1010C.
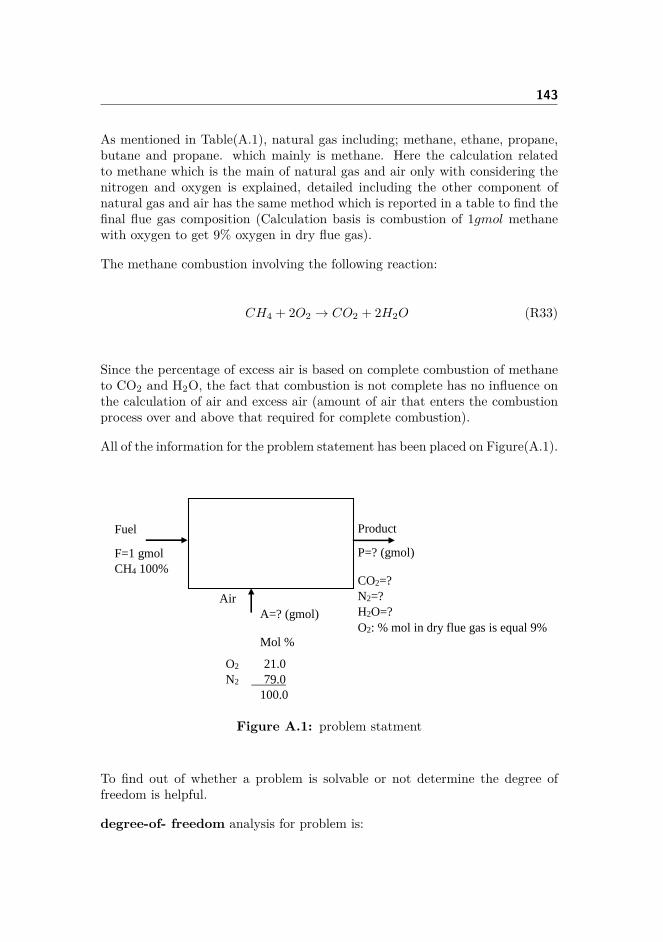
143
As mentioned in Table(A.1), natural gas including; methane, ethane, propane,butane and propane. which mainly is methane. Here the calculation relatedto methane which is the main of natural gas and air only with considering thenitrogen and oxygen is explained, detailed including the other component ofnatural gas and air has the same method which is reported in a table to find thefinal flue gas composition (Calculation basis is combustion of 1gmol methanewith oxygen to get 9% oxygen in dry flue gas).
The methane combustion involving the following reaction:
CH4 + 2O2 → CO2 + 2H2O (R33)
Since the percentage of excess air is based on complete combustion of methaneto CO2 and H2O, the fact that combustion is not complete has no influence onthe calculation of air and excess air (amount of air that enters the combustionprocess over and above that required for complete combustion).
All of the information for the problem statement has been placed on Figure(A.1).
Air
A=? (gmol)
Mol %
O2 21.0
N2 79.0
100.0
Product
P=? (gmol)
CO2=?
N2=?
H2O=?
O2: % mol in dry flue gas is equal 9%
Fuel
F=1 gmol
CH4 100%
Figure A.1: problem statment
To find out of whether a problem is solvable or not determine the degree offreedom is helpful.
degree-of- freedom analysis for problem is:
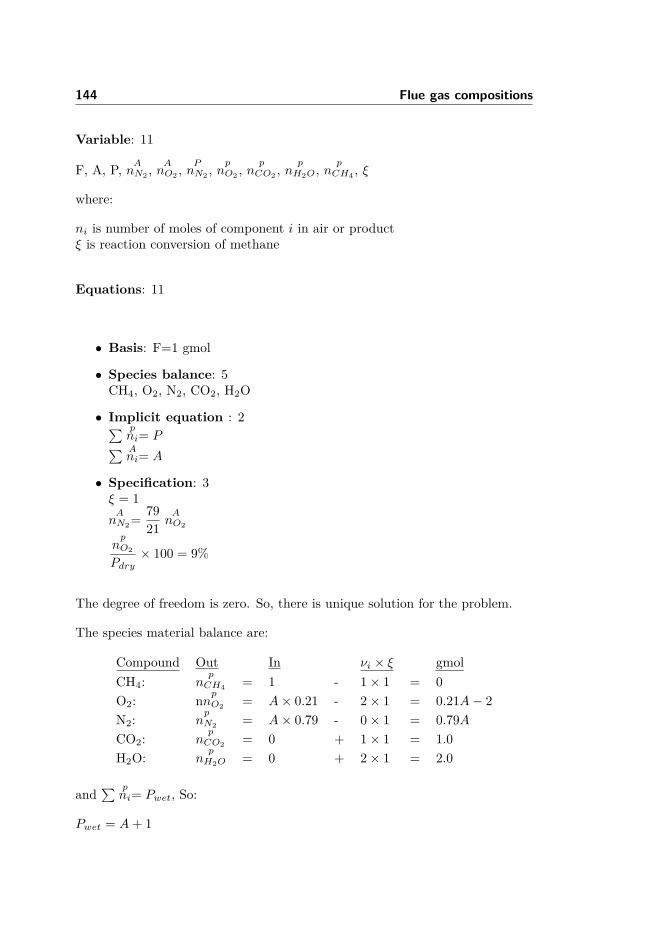
144 Flue gas compositions
Variable: 11
F, A, P, AnN2 ,
AnO2 ,
PnN2 ,
pnO2 ,
pnCO2 ,
pnH2O,
pnCH4 , ξ
where:
ni is number of moles of component i in air or productξ is reaction conversion of methane
Equations: 11
• Basis: F=1 gmol
• Species balance: 5CH4, O2, N2, CO2, H2O
• Implicit equation : 2∑ pni= P∑ Ani= A
• Specification: 3ξ = 1AnN2= 79
21AnO2
pnO2
Pdry× 100 = 9%
The degree of freedom is zero. So, there is unique solution for the problem.
The species material balance are:
Compound Out In νi × ξ gmolCH4:
pnCH4 = 1 - 1× 1 = 0
O2: n pnO2 = A× 0.21 - 2× 1 = 0.21A− 2
N2:pnN2 = A× 0.79 - 0× 1 = 0.79A
CO2:p
nCO2 = 0 + 1× 1 = 1.0H2O: p
nH2O = 0 + 2× 1 = 2.0
and∑ p
ni= Pwet, So:
Pwet = A+ 1
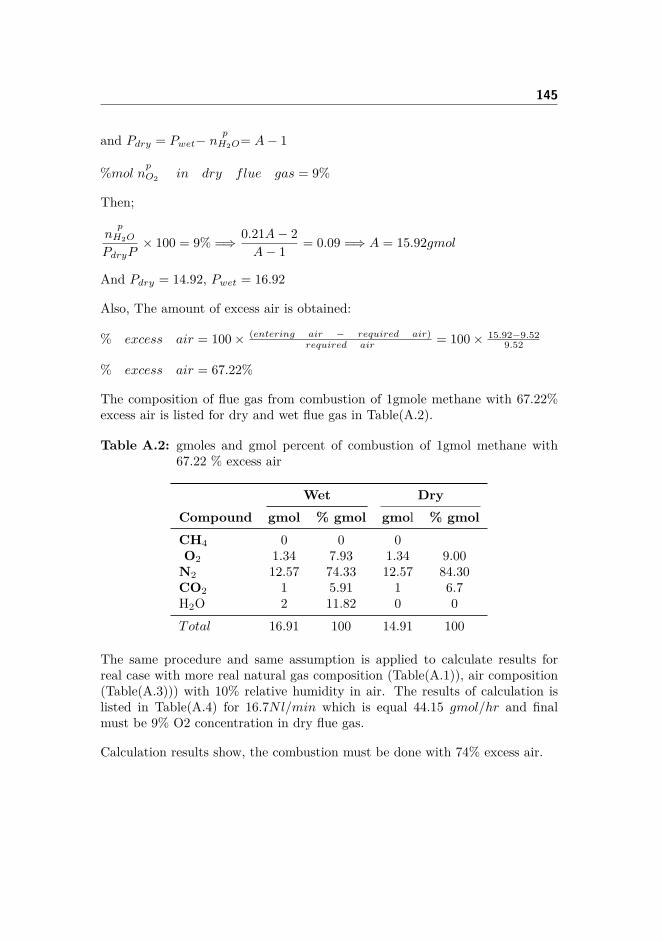
145
and Pdry = Pwet−p
nH2O= A− 1
%mol pnO2 in dry flue gas = 9%
Then;p
nH2O
PdryP× 100 = 9% =⇒ 0.21A− 2
A− 1 = 0.09 =⇒ A = 15.92gmol
And Pdry = 14.92, Pwet = 16.92
Also, The amount of excess air is obtained:
% excess air = 100× (entering air − required air)required air = 100× 15.92−9.52
9.52
% excess air = 67.22%
The composition of flue gas from combustion of 1gmole methane with 67.22%excess air is listed for dry and wet flue gas in Table(A.2).
Table A.2: gmoles and gmol percent of combustion of 1gmol methane with67.22 % excess air
Wet DryCompound gmol % gmol gmol % gmolCH4 0 0 0O2 1.34 7.93 1.34 9.00N2 12.57 74.33 12.57 84.30CO2 1 5.91 1 6.7H2O 2 11.82 0 0Total 16.91 100 14.91 100
The same procedure and same assumption is applied to calculate results forreal case with more real natural gas composition (Table(A.1)), air composition(Table(A.3))) with 10% relative humidity in air. The results of calculation islisted in Table(A.4) for 16.7Nl/min which is equal 44.15 gmol/hr and finalmust be 9% O2 concentration in dry flue gas.
Calculation results show, the combustion must be done with 74% excess air.
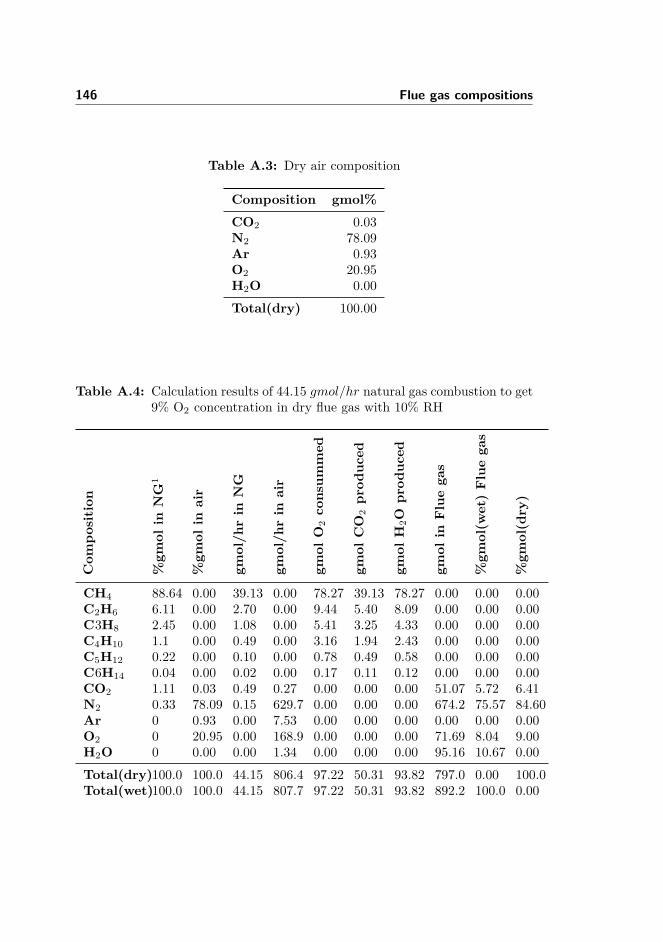
146 Flue gas compositions
Table A.3: Dry air composition
Composition gmol%CO2 0.03N2 78.09Ar 0.93O2 20.95H2O 0.00Total(dry) 100.00
Table A.4: Calculation results of 44.15 gmol/hr natural gas combustion to get9% O2 concentration in dry flue gas with 10% RH
Com
position
%gm
olin
NG
1
%gm
olin
air
gmol/h
rin
NG
gmol/h
rin
air
gmol
O2consum
med
gmol
CO
2prod
uced
gmol
H2O
prod
uced
gmol
inFluegas
%gm
ol(w
et)Fluegas
%gm
ol(dry)
CH4 88.64 0.00 39.13 0.00 78.27 39.13 78.27 0.00 0.00 0.00C2H6 6.11 0.00 2.70 0.00 9.44 5.40 8.09 0.00 0.00 0.00C3H8 2.45 0.00 1.08 0.00 5.41 3.25 4.33 0.00 0.00 0.00C4H10 1.1 0.00 0.49 0.00 3.16 1.94 2.43 0.00 0.00 0.00C5H12 0.22 0.00 0.10 0.00 0.78 0.49 0.58 0.00 0.00 0.00C6H14 0.04 0.00 0.02 0.00 0.17 0.11 0.12 0.00 0.00 0.00CO2 1.11 0.03 0.49 0.27 0.00 0.00 0.00 51.07 5.72 6.41N2 0.33 78.09 0.15 629.7 0.00 0.00 0.00 674.2 75.57 84.60Ar 0 0.93 0.00 7.53 0.00 0.00 0.00 0.00 0.00 0.00O2 0 20.95 0.00 168.9 0.00 0.00 0.00 71.69 8.04 9.00H2O 0 0.00 0.00 1.34 0.00 0.00 0.00 95.16 10.67 0.00Total(dry)100.0 100.0 44.15 806.4 97.22 50.31 93.82 797.0 0.00 100.0Total(wet)100.0 100.0 44.15 807.7 97.22 50.31 93.82 892.2 100.0 0.00
Appendix B
User Defined Function
A UDF 1 is a C function that can be dynamically loaded with the FLUENTsolver to enhance the standard features of the code. For example, a UDF canbe used to define specified boundary conditions, material properties, and sourceterms for flow regime, as well as specify customized model parameters (e.g.,DPM, multiphase models), initialize a solution, or enhance post-processing.
In this study, to over come the non-uniformity of temperature in outer surfaceof cyclone reactor, UDF (DEFINE-PROFILE-FLUX) is used to explicitly setthe heat flux along a wall. In y-direction heat flux is divided in 6 level withdifferent heat flux values.
The UDF presented below, generate a heat lost rate profile for a cyclone wall.Once interpreted or compiled, it can br activate this UDF in the Wall boundarycondition panel in ANSYS-FLUENT.
1User Defined Function
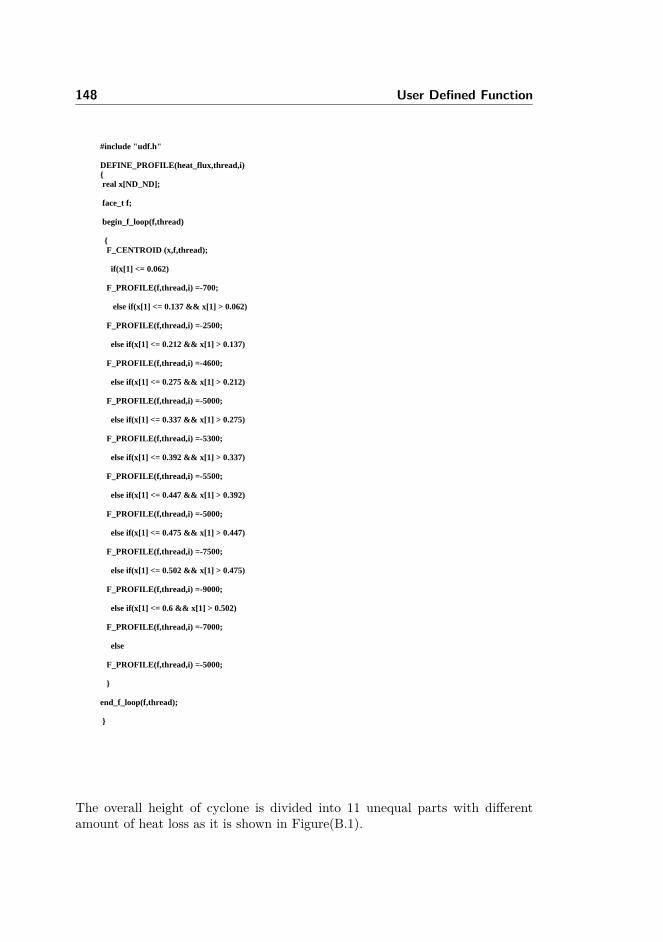
148 User Defined Function
#include "udf.h"
DEFINE_PROFILE(heat_flux,thread,i) real x[ND_ND];
face_t f;
begin_f_loop(f,thread)
F_CENTROID (x,f,thread);
if(x[1] <= 0.062)
F_PROFILE(f,thread,i) =-700;
else if(x[1] <= 0.137 && x[1] > 0.062)
F_PROFILE(f,thread,i) =-2500;
else if(x[1] <= 0.212 && x[1] > 0.137)
F_PROFILE(f,thread,i) =-4600;
else if(x[1] <= 0.275 && x[1] > 0.212)
F_PROFILE(f,thread,i) =-5000;
else if(x[1] <= 0.337 && x[1] > 0.275)
F_PROFILE(f,thread,i) =-5300;
else if(x[1] <= 0.392 && x[1] > 0.337)
F_PROFILE(f,thread,i) =-5500;
else if(x[1] <= 0.447 && x[1] > 0.392)
F_PROFILE(f,thread,i) =-5000;
else if(x[1] <= 0.475 && x[1] > 0.447)
F_PROFILE(f,thread,i) =-7500;
else if(x[1] <= 0.502 && x[1] > 0.475)
F_PROFILE(f,thread,i) =-9000;
else if(x[1] <= 0.6 && x[1] > 0.502)
F_PROFILE(f,thread,i) =-7000;
else F_PROFILE(f,thread,i) =-5000;
end_f_loop(f,thread);
1
The overall height of cyclone is divided into 11 unequal parts with differentamount of heat loss as it is shown in Figure(B.1).
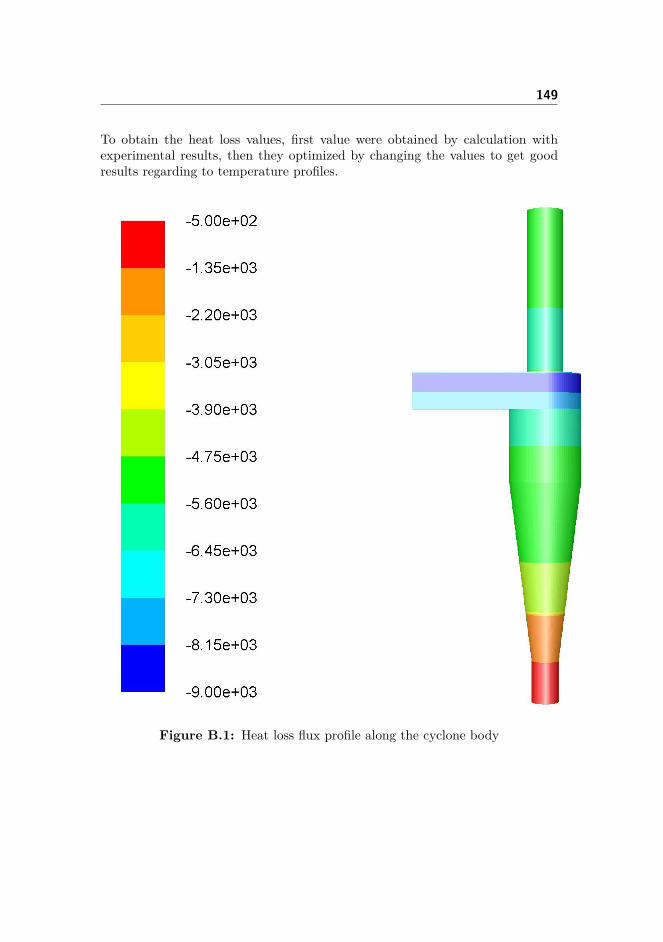
149
To obtain the heat loss values, first value were obtained by calculation withexperimental results, then they optimized by changing the values to get goodresults regarding to temperature profiles.
Figure B.1: Heat loss flux profile along the cyclone body
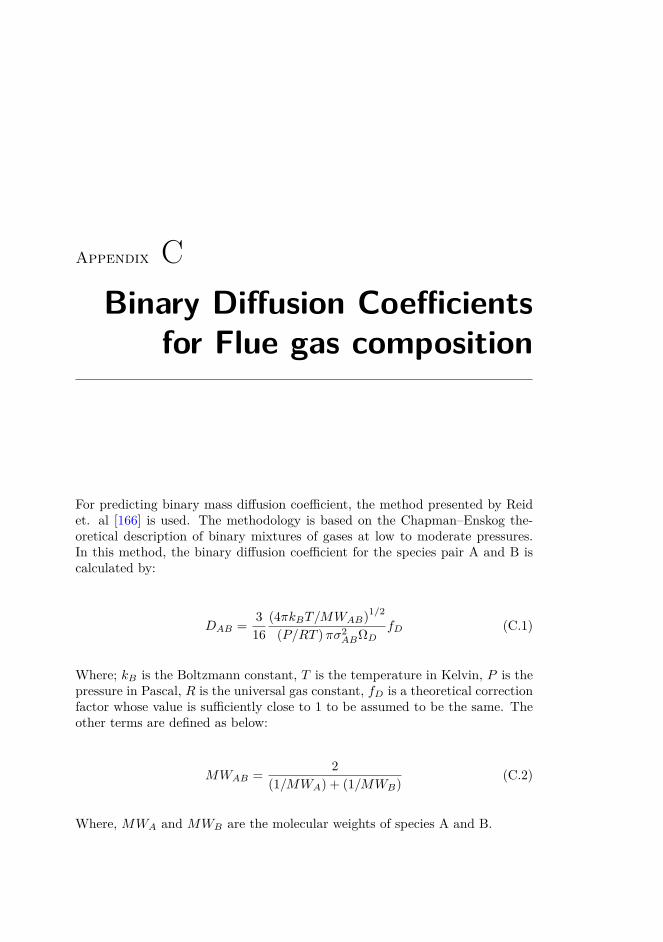
Appendix CBinary Diffusion Coefficients
for Flue gas composition
For predicting binary mass diffusion coefficient, the method presented by Reidet. al [166] is used. The methodology is based on the Chapman–Enskog the-oretical description of binary mixtures of gases at low to moderate pressures.In this method, the binary diffusion coefficient for the species pair A and B iscalculated by:
DAB = 316
(4πkBT/MWAB)1/2
(P/RT )πσ2ABΩD
fD (C.1)
Where; kB is the Boltzmann constant, T is the temperature in Kelvin, P is thepressure in Pascal, R is the universal gas constant, fD is a theoretical correctionfactor whose value is sufficiently close to 1 to be assumed to be the same. Theother terms are defined as below:
MWAB = 2(1/MWA) + (1/MWB) (C.2)
Where, MWA and MWB are the molecular weights of species A and B.
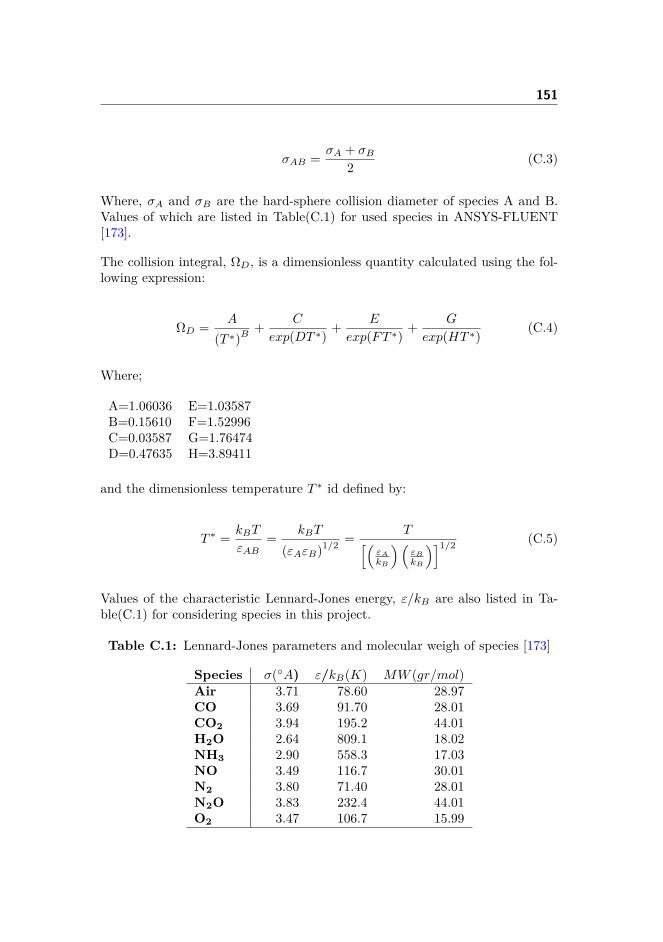
151
σAB = σA + σB2 (C.3)
Where, σA and σB are the hard-sphere collision diameter of species A and B.Values of which are listed in Table(C.1) for used species in ANSYS-FLUENT[173].
The collision integral, ΩD, is a dimensionless quantity calculated using the fol-lowing expression:
ΩD = A
(T ∗)B+ C
exp(DT ∗) + E
exp(FT ∗) + G
exp(HT ∗) (C.4)
Where;
A=1.06036 E=1.03587B=0.15610 F=1.52996C=0.03587 G=1.76474D=0.47635 H=3.89411
and the dimensionless temperature T ∗ id defined by:
T ∗ = kBT
εAB= kBT
(εAεB)1/2 = T[(εA
kB
)(εB
kB
)]1/2 (C.5)
Values of the characteristic Lennard-Jones energy, ε/kB are also listed in Ta-ble(C.1) for considering species in this project.
Table C.1: Lennard-Jones parameters and molecular weigh of species [173]
Species σ(A) ε/kB(K) MW (gr/mol)Air 3.71 78.60 28.97CO 3.69 91.70 28.01CO2 3.94 195.2 44.01H2O 2.64 809.1 18.02NH3 2.90 558.3 17.03NO 3.49 116.7 30.01N2 3.80 71.40 28.01N2O 3.83 232.4 44.01O2 3.47 106.7 15.99
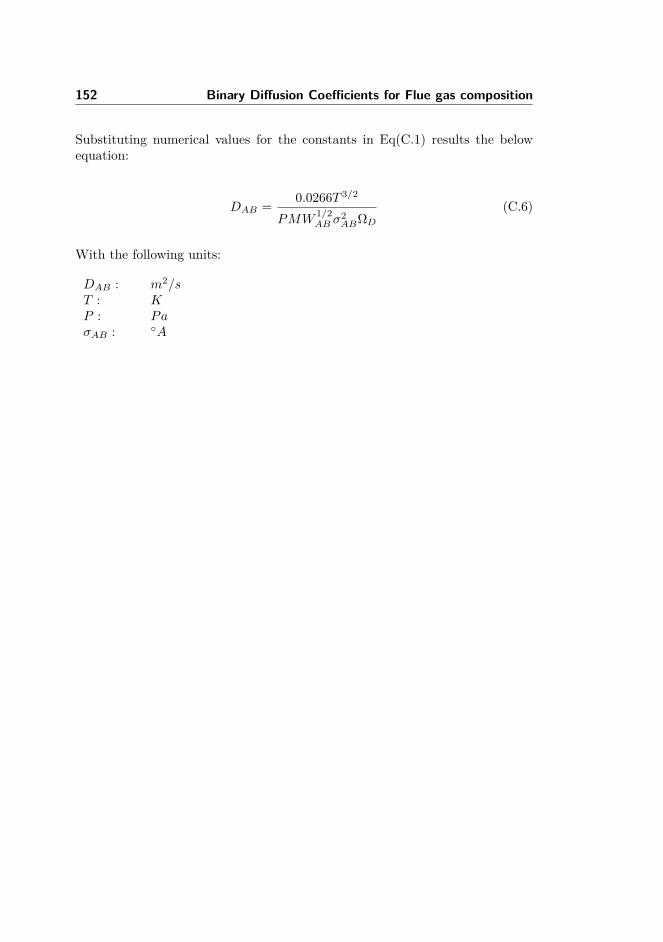
152 Binary Diffusion Coefficients for Flue gas composition
Substituting numerical values for the constants in Eq(C.1) results the belowequation:
DAB = 0.0266T 3/2
PMW1/2AB σ
2ABΩD
(C.6)
With the following units:
DAB : m2/sT : KP : PaσAB : A
Bibliography
[1] D. Leith and D. Mehta. Cyclone performance and design. Atmos. Environ.,7(5):527–549, May 1973.
[2] P.R. Taylor and R.W. Bartlett. Reduction of taconite concentrates in acyclone reactor. Minerals & metallurgical processing, 11(4):203–209, 1994.
[3] N.W. Green, K. Duraiswamy, and R.E. Lumpkin. Pyrolysis with cycloneburner, July 1978. US Patent 4,102,773.
[4] L. Araujo and J. Campos. Gasification of pine and cork suspensions in acyclone reactor. Combustion Technologies for a Clean Environment, 1:479,1995.
[5] J.S. Barnhart and N.M. Laurendeau. Pulverized coal combustion andgasification in a cyclone reactor. 1. Experiment. Ind. Eng. Chem. ProcessDes. Dev., 21(4):671–680, October 1982.
[6] Y.c. Zhang, Z.b. Wang, and Y.h. Jin. Simulation and experiment ofgas–solid flow field in short-contact cyclone reactors. Chem. Eng. Res.Des., 91(9):1768–1776, September 2013.
[7] V.V. Ranade. Computational Flow Modeling for Chemical Reactor Engi-neering. Process systems engineering. Academic Press, 2002.
[8] A.J. ter Linden. Investigations into cyclone dust collectors. Arch. Proc.Inst. Mech. Eng. 1847-1982 (vols 1-196), 160(1949):233–251, January1949.
[9] R. Parker, R. Jain, S. Calvert, D. Drehmel, and J. Abbott. Particlecollection in cyclones at high temperature and high pressure. Environ.Sci. Technol., 15(4):451–458, April 1981.
[10] J. Chen and M. Shi. Analysis on cyclone collection efficiencies at hightemperatures. China Particuology, 1(1):20–26, April 2003.
154 BIBLIOGRAPHY
[11] R. Dewil, J. Baeyens, and B. Caerts. CFB cyclones at high temperature:Operational results and design assessment. Particuology, 6(3):149–156,2008.
[12] M. Trefz and E. Muschelknautz. Extended cyclone theory for gas flowswith high solids concentrations. Chem. Eng. Technol., 16(3):153–160, June1993.
[13] J.L. Smith. An Analysis of the Vortex Flow in the Cyclone Separator. J.Basic Eng., 84(4):609, 1962.
[14] A.C. Hoffmann and L.E. Stein. Gas Cyclones and Swirl Tubes: Principles,Design, and Operation. Springer-Verlag Berlin Heidelberg, 2007.
[15] H. Mothes and F. Löffler. Motion and deposition of particles in cyclones.German chemical engineering, 8(4):223–233, 1985.
[16] J. Gimbun, T.G. Chuah, A. Fakhru’l-Razi, and T.S.Y. Choong. The in-fluence of temperature and inlet velocity on cyclone pressure drop: a CFDstudy. Chem. Eng. Process. Process Intensif., 44(1):7–12, January 2005.
[17] M. Azadi, M. Azadi, and A. Mohebbi. A CFD study of the effect of cyclonesize on its performance parameters. J. Hazard. Mater., 182(1-3):835–41,October 2010.
[18] K. Elsayed and C. Lacor. The effect of cyclone inlet dimensions on theflow pattern and performance. Appl. Math. Model., 35(4):1952–1968, April2011.
[19] J.J. Derksen, S. Sundaresan, and H.E.A. van den Akker. Simulation ofmass-loading effects in gas–solid cyclone separators. Powder Technol.,163(1-2):59–68, April 2006.
[20] W. Peng, A.C. Hoffmann, P.J.A.J. Boot, A. Udding, H.W.A. Dries,A. Ekker, and J. Kater. Flow pattern in reverse-flow centrifugal sepa-rators. Powder Technol., 127(3):212–222, November 2002.
[21] J. Szekely, J. Evans, and S. H.Y. Gas-solid reactions. Academic Press,1976.
[22] J. Lede, F. Verzaro, B. Antoine, and J. Villermaux. Flash pyrolysisof wood in a cyclone reactor. Chem. Eng. Process. Process Intensif.,20(6):309–317, November 1986.
[23] R. Galiasso, Y. González, and M. Lucena. New inverted cyclone reactorfor flash hydropyrolysis. Catal. Today, 220-222:186–197, 2014.
BIBLIOGRAPHY 155
[24] E. Bramer and G. Brem. A novel technology for fast pyrolysis of biomass:PyRos reactor. In Twelfth European Biomass Conference: Biomass forEnergy, Industry and Climate Protection, 2002.
[25] L.C. Lin, F.V. Hanson, A.G. Oblad, and J.D. Westhoff. The Pyrolysisof Bitumen-Impregnated Sandstone in Short Contact Time Reactors, I.Cyclone reactor. Fuel Process. Technol., 16(2):173–190, April 1987.
[26] S. Luidold, H. Antrekowitsch, and R. Ressel. Production of niobium pow-der by magnesiothermic reduction of niobium oxides in a cyclone reactor.Int. J. Refract. Met. Hard Mater., 25(5-6):423–432, September 2007.
[27] J.S. Barnhart, J.F. Thomas, and N.M. Laurendeau. Pulverized coal com-bustion and gasification in a cyclone reactor. 2. Model and comparisonwith experiment. Ind. Eng. Chem. Process Des. Dev., 21(4):681–689, Oc-tober 1982.
[28] G. Manenti and M. Masi. Simulation study of production of fine ceramicpowders in a cyclone reactor. Chemical Engineering and Processing: Pro-cess Intensification, 50(2):151–159, February 2011.
[29] W. Barth. Design and layout of the cyclone separator on the basis of newinvestigations. Brenn. Warme Kraft, 8(1), 1956.
[30] R.M. Alexander. Fundamentals of cyclone design and operation. Proc.Aus. Inst. Min. Met. NS, 152(3):152–153, 1949.
[31] E. Muschelknautz and W. Krambrock. Design of cyclone separators in theengineering practice. Staub-Reinhalt. Luft, 30(5):1–12, 1970.
[32] C.B. Shepherd and C.E. Lapple. Flow Pattern and Pressure Drop inCyclone Dust Collectors. Ind. Eng. Chem., 31(8):972–984, August 1939.
[33] C.B. Shepherd and C.E. Lapple. Flow Pattern and Pressure Drop inCyclone Dust Collectors Cyclone without Intel Vane. Ind. Eng. Chem.,32(9):1246–1248, September 1940.
[34] The collection efficiency of cyclone type particle collectors: a new theoret-ical approach, volume 68, 1972.
[35] D. Morgan, M. Biffin, S.Y. No, and N. Syred. An anlysis of the behaviourof non-slagging, coal fired, cyclone combustors using a phenomenologicalmodel. Symp. Combust., 22(1):175–182, January 1989.
[36] C.R. Brunner. National ambient air quality standards. In Hazardous AirEmissions from Incineration, pages 27–37. Springer, 1985.
156 BIBLIOGRAPHY
[37] Agency European Environment. European Union emission inventory re-port 1990–2014 under the UNECE Convention on Long-range Trans-boundary Air Pollution (LRTAP), 2014.
[38] Y.B. Zeldovich, D.A. Frank-Kamenetskii, and P. Sadovnikov. Oxidationof nitrogen in combustion. Publishing House of the Acad of Sciences ofUSSR, 1947.
[39] K.B. Schnelle and C.A. Brown. Air Pollution Control Technology Hand-book. Mechanical engineering handbook series. CRC Press, 2002.
[40] D.W. Pershing and J.O.L. Wendt. Relative Contributions of Volatile Ni-trogen and Char Nitrogen to NOx Emissions from Pulverized Coal Flames.Ind. Eng. Chem. Process Des. Dev., 18(1):60–67, January 1979.
[41] S. Mahmoudi, J. Baeyens, and J.P.K. Seville. NOx formation and selectivenon-catalytic reduction (SNCR) in a fluidized bed combustor of biomass.Biomass and Bioenergy, 34(9):1393–1409, September 2010.
[42] Elsevier. Reduction of sulfur trioxide and nitrogen oxides by secondaryfuel injection, volume 14, 1973.
[43] S.C. Wood. Select the Right NOx Control Technology. Chemical Engi-neering Progress, page 33, 1994.
[44] J.J. Van Eerden, C.F. Gottschlich, and W.C. Gensler. Low NOx burner,September 1991. US Patent 5,044,931.
[45] A. Garg. Specify better low-NOx burners for furnaces. Chemical Engi-neering Progress;(United States), 90(1), 1994.
[46] X. Hu, J.J. Zhang, S. Mukhnahallipatna, J. Hamann, M.J. Biggs, andP. Agarwal. Transformations and destruction of nitrogen oxides - NO,NO2 and N2O - In a pulsed corona discharge reactor. Fuel, 82(13):1675–1684, 2003.
[47] H. Lin, X. Gao, Z. Luo, K. Cen, and Z. Huang. Removal of NOx withradical injection caused by corona discharge. Fuel, 83(10):1349–1355, July2004.
[48] A.a. Basfar, O.I. Fageeha, N. Kunnummal, S. Al-Ghamdi, A.G.Chmielewski, J. Licki, A. Pawelec, B. Tyminski, and Z. Zimek. Electronbeam flue gas treatment (EBFGT) technology for simultaneous removalof SO2 and NOx from combustion of liquid fuels. Fuel, 87(8-9):1446–1452,2008.
[49] T.w. Chien and H. Chu. Removal of SO2 and NO from flue gas by wetscrubbing using an aqueous NaClO2 solution. J. Hazard. Mater., 80(1-3):43–57, December 2000.
BIBLIOGRAPHY 157
[50] D.S. Jin, B.R. Deshwal, Y.S. Park, and H.K. Lee. Simultaneous removalof SO2 and NO by wet scrubbing using aqueous chlorine dioxide solution.J. Hazard. Mater., 135(1-3):412–417, 2006.
[51] K. Chandrasekara Pillai, S.J. Chung, T. Raju, and I.S. Moon. Experi-mental aspects of combined NOx and SO2 removal from flue-gas mixturein an integrated wet scrubber-electrochemical cell system. Chemosphere,76(5):657–664, July 2009.
[52] G. Busca, L. Lietti, G. Ramis, and F. Berti. Chemical and mechanisticaspects of the selective catalytic reduction of NO<SUB align=right>x byammonia over oxide catalysts: A review. Applied Catalysis B: Environ-mental, 18(1):1–36, 1998.
[53] R.M. Heck. Catalytic abatement of nitrogen oxides–stationary applica-tions. Catalysis Today, 53(4):519–523, 1999.
[54] D. Yang, J. Li, M. Wen, and C. Song. Selective catalytic reduction ofNOx with methane over indium supported on tungstated zirconia. Catal.Commun., 8(12):2243–2247, December 2007.
[55] K.i. Shimizu and A. Satsuma. Hydrogen assisted urea-SCR and NH3-SCRwith silver–alumina as highly active and SO2-tolerant de-NOx catalysis.Appl. Catal. B: Environ., 77(1-2):202–205, November 2007.
[56] G. Carja, Y. Kameshima, K. Okada, and C.D. Madhusoodana.Mn–Ce/ZSM5 as a new superior catalyst for NO reduction with NH3.Appl. Catal. B: Environ., 73(1-2):60–64, April 2007.
[57] W. Xu, Y. Yu, C. Zhang, and H. He. Selective catalytic reduction ofNO by NH3 over a Ce/TiO2 catalyst. Catal. Commun., 9(6):1453–1457,March 2008.
[58] X. Wang, S. Zhang, Q. Yu, and H. Yang. Tungsten promoted HZSM-5in the SCR of NO by acetylene. Microporous Mesoporous Mater., 109(1-3):298–304, March 2008.
[59] Y. Li and Q. Zhong. The characterization and activity of F-doped vana-dia/titania for the selective catalytic reduction of NO with NH3 at lowtemperatures. J. Hazard. Mater., 172(2-3):635–640, December 2009.
[60] M. Fu, C. Li, P. Lu, L. Qu, M. Zhang, Y. Zhou, M. Yu, and Y. Fang. Areview on selective catalytic reduction of NOx by supported catalysts at100–300 C—catalysts, mechanism, kinetics. Catal. Sci. Technol., 4(1):14–25, 2014.
[61] K. Cheng, W. Song, Y. Cheng, J. Liu, Z. Zhao, and Y. Wei. Selectivecatalytic reduction over size-tunable rutile TiO2 nanorod microsphere-supported CeO2 catalysts. Catal. Sci. Technol., 2016.
158 BIBLIOGRAPHY
[62] R.K. Lyon. Method for the reduction of the concentration of NO in com-bustion effluence using ammonia, August 19 1975. US Patent 3,900,554.
[63] J.a. Caton and Z. Xia. The Selective Non-Catalytic Removal (SNCR)of Nitric Oxides From Engine Exhaust Streams: Comparison of ThreeProcesses. J. Eng. Gas Turbines Power, 126(2):234, 2004.
[64] J.A. Miller and C.T. Bowman. Mechanism and modeling of nitrogen chem-istry in combustion. Prog. Energy Combust. Sci., 16(4):347, January 1990.
[65] F. Birkhold, U. Meingast, P. Wassermann, and O. Deutschmann. Model-ing and simulation of the injection of urea-water-solution for automotiveSCR DeNOx-systems. Appl. Catal. B Environ., 70(1-4):119–127, 2007.
[66] R.K. Lyon. The NH3-NO-O2 reaction. Int. J. Chem. Kinet., 8(2):315–318,March 1976.
[67] R.k. Lyon. Kinetics and Mechanism of thermal DeNOx: A Review. 194thAnnu. ACS Meet. Div. Fuel Chem., (15):433–443, 1987.
[68] L.J. Muzio, J.K. Arand, and D.P. Teixeira. Gas phase decompositionof nitric oxide in combustion products. Symposium (International) onCombustion, 16(1):199–208, January 1977.
[69] D. Lucas and N.J. Brown. Characterization of the selective reduction ofNO by NH3. Combust. Flame, 47:219–234, January 1982.
[70] C.P. Fenimore. Destruction of NO by NH3 in lean burnt gas. Combust.Flame, 37(3):245–250, January 1980.
[71] M.A. Kimball-Linne and R.K. Hanson. Combustion-driven flow reactorstudies of thermal DeNOx reaction kinetics. Combust. Flame, 64(3):337–351, June 1986.
[72] L.J. Muzio, K.L. Maloney, and J.K. Arand. Reactions of NH3 with NO incoal-derived combustion products. Symposium (International) on Com-bustion, 17(1):89–96, January 1979.
[73] S.M. Banna and M.C. Branch. Mixing and reaction of NH3 with NO incombustion products. Combust. Flame, 42(2):173–181, January 1981.
[74] P. Lodder and J.B. Lefers. Effect of natural gas, C2H6 and CO on the ho-mogeneous gas phase reduction of NOx by NH3. Chem. Eng. J., 30(3):161–167, June 1985.
[75] M. Jødal, C. Nielsen, T. Hulgaard, and K. Dam-Johansen. Pilot-scale ex-periments with ammonia and urea as reductants in selective non-catalyticreduction of nitric oxide. Symp. Combust., 23(1):237–243, January 1991.
BIBLIOGRAPHY 159
[76] R.M. Iron, H.J. Price, and R.T. Squires. Tailoring Ammonia-based SNCRfor instalation on power station boilers. In Jt. Symp. Station. Combust.NOx Control, pages 99–118. Electronic Power Research Instiute, 1991.
[77] B. Leckner, M. Karlsson, K. Dam-Johansen, C.E. Weinell, P. Kilpinen,and M. Hupa. Influence of additives on selective noncatalytic reduction ofNO with NH3 in circulating fluidized bed boilers. Ind. Eng. Chem. Res.,30(11):2396–2404, November 1991.
[78] J.A. Caton, J.K. Narney, C. Cariappa, and W.R. Laster. The SelectiveNon-Catalytic Reduction of Nitric Oxide Using Ammonia at up to 15%Oxygen. Can. J. Chem. Eng., 73, 1995.
[79] M. Østberg, K. Dam-Johansen, and J.E. Johnsson. Influence of mixingon the SNCR process. Chem. Eng. Sci., 52(15):2511–2525, August 1997.
[80] M.U. Alzueta, H. Røjel, P.G. Kristensen, P. Glarborg, and K. Dam-Johansen. Laboratory Study of the CO/NH3/NO/O2 System: Implica-tions for Hybrid Reburn/SNCR Strategies. Energy & Fuels, 11(3):716–723, May 1997.
[81] L. Liang, S. Hui, S. Pan, T. Shang, C. Liu, and D. Wang. Influence ofmixing, oxygen and residence time on the SNCR process. Fuel, 120:38–45,March 2014.
[82] S. Salimian and R.K. Hanson. A Kinetic Study of NO Removal fromCombustion Gases by Injection of NHi-Containing Compounds. Combust.Sci. Technol., 23(5-6):225–230, September 1980.
[83] J. Miller, M. Branch, and R. Kee. A chemical kinetic model for theselective reduction of nitric oxide by ammonia. Combust. Flame, 43:81–98, 1981.
[84] A. Dean, J. Hardy, and R.K. Lyon. Kinetics and mechanism of NH3oxidation. Symp. Combust., 19(1):97–105, January 1982.
[85] J.A. Silver and C.E. Kolb. Kinetic measurements for the reaction of ami-dogen + nitric oxide over the temperature range 294-1215K. J. Phys.Chem., 86(16):3240–3246, August 1982.
[86] R.K. Lyon and J.E. Hardy. Discovery and development of the thermalDeNOx process. Ind. Eng. Chem. Fundam., 25(1):19–24, February 1986.
[87] W. Duo, K. Dam-Johansen, and K. Østergaard. Kinetics of the gas-phasereaction between nitric oxide, ammonia and oxygen. Can. J. Chem. Eng.,70(5):1014–1020, October 1992.
160 BIBLIOGRAPHY
[88] M.C. Branch, R.J. Kee, and J.A. Miller. A Theoretical Investigation ofMixing Effects in the Selective Reduction of Nitric Oxide by Ammonia.Combust. Sci. Technol., 29(3-6):147–165, December 1982.
[89] H. Røjel, A. Jensen, P. Glarborg, and K. Dam-Johansen. Mixing Effectsin the Selective Noncatalytic Reduction of NO. Ind. Eng. Chem. Res.,39(9):3221–3232, 2000.
[90] M. Oliva, M.U. Alzueta, A. Millera, and R. Bilbao. Theoretical study ofthe influence of mixing in the SNCR process. Comparison with pilot scaledata. Chem. Eng. Sci., 55(22):5321–5332, November 2000.
[91] E. Hampartsoumian and B. Gibbs. The influence of NH3 addition on theNO emissions from a coal fired fluidised bed combustor. Symp. Combust.,19(1):1253–1262, January 1982.
[92] M. Østberg and K. Dam-Johansen. Empirical modeling of the selectivenon-catalytic reduction of NO: comparison with large-scale experimentsand detailed kinetic modeling. Chem. Eng. Sci., 49(12):1897–1904, June1994.
[93] M. Østberg and K. Dam-Johansen. The droplet diffusion model—Anempirical model for micromixing in reacting gas phase systems. Chem.Eng. Sci., 50(13):2061–2067, July 1995.
[94] J. Brouwer, M. Heap, D. Pershing, and P. Smith. A model for predictionof selective noncatalytic reduction of nitrogen oxides by ammonia, urea,and cyanuric acid with mixing limitations in the presence of CO. Symp.Combust., 26(2):2117–2124, 1996.
[95] J.A. Caton and D.L. Siebers. Comparison of Nitric Oxide Removal byCyanuric Acid and by Ammonia. Combust. Sci. Technol., 65(4-6):277–293, June 1989.
[96] J.L. Lumley. Computational modeling of turbulent flows. Advances inapplied mechanics, 18:123–176, 1979.
[97] S. Jakirlic, K. Hanjalic, and C. Tropea. Modeling Rotating and SwirlingTurbulent Flows: A Perpetual Challenge. AIAA J., 40(10):1984–1996,October 2002.
[98] M.A. LESCHZINER and S. HOGG. Computation of highly swirling con-fined flow with a Reynolds stress turbulence model. AIAA J., 27(1):57–63,January 1989.
[99] F. Boysan, W.H. Ayers, and J. Swithenbank. A fundamental mathematicalmodelling approach to cyclone design. Trans. Inst. Chem. Eng., 60a:222–230, 1982.
BIBLIOGRAPHY 161
[100] F. Boysan, B.C.R. Ewan, J. Swithenbank, and W.H. Ayers. Experimentaland theoretical studies of cyclone separation aerodynamics. In Powtech’83 Part. Technol., number 69, pages 305–319. Elsevier, 1983.
[101] A.J. Hoekstra, J.J. Derksen, and H.E.A. Van Den Akker. An experimentaland numerical study of turbulent swirling flow in gas cyclones. Chem. Eng.Sci., 54(13-14):2055–2065, July 1999.
[102] K. Pant, C.T. Crowe, and P. Irving. On the design of miniature cyclonesfor the collection of bioaerosols. Powder Technol., 125(2-3):260–265, June2002.
[103] M. Sommerfeld and C.A. Ho. Numerical calculation of particle transportin turbulent wall bounded flows. Powder Technol., 131(1):1–6, March2003.
[104] H.F. Meier and M. Mori. Anisotropic behavior of the Reynolds stressin gas and gas–solid flows in cyclones. Powder Technol., 101(2):108–119,February 1999.
[105] R.B. Xiang and K.W. Lee. Numerical study of flow field in cyclones ofdifferent height. Chem. Eng. Process. Process Intensif., 44(8):877–883,August 2005.
[106] F. Qian, Z. Huang, G. Chen, and M. Zhang. Numerical study of the sepa-ration characteristics in a cyclone of different inlet particle concentrations.Comput. Chem. Eng., 31(9):1111–1122, September 2007.
[107] G. Wan, G. Sun, X. Xue, and M. Shi. Solids concentration simulation ofdifferent size particles in a cyclone separator. Powder Technol., 183(1):94–104, March 2008.
[108] F. Kaya and I. Karagoz. Numerical investigation of performance character-istics of a cyclone prolonged with a dipleg. Chem. Eng. J., 151(1-3):39–45,August 2009.
[109] H.M. El-Batsh. Improving cyclone performance by proper selection of theexit pipe. Appl. Math. Model., 37(7):5286–5303, April 2013.
[110] H. Safikhani, M.A. Akhavan-Behabadi, M. Shams, and M.H. Rahimyan.Numerical simulation of flow field in three types of standard cyclone sep-arators. Adv. Powder Technol., 21(4):435–442, July 2010.
[111] K. Elsayed and C. Lacor. The effect of the dust outlet geometry on theperformance and hydrodynamics of gas cyclones. Comput. Fluids, 68:134–147, September 2012.
162 BIBLIOGRAPHY
[112] S.K. Shukla, P. Shukla, and P. Ghosh. The effect of modeling of velocityfluctuations on prediction of collection efficiency of cyclone separators.Appl. Math. Model., 37(8):5774–5789, April 2013.
[113] H. Grotjans. Application of higher order turbulence models to cycloneflows. Vdi-Berichte, pages 175 – 182, 1999.
[114] G. Gronald and J.J. Derksen. Simulating turbulent swirling flow in a gascyclone: A comparison of various modeling approaches. Powder Technol.,205(1-3):160–171, January 2011.
[115] J.J. Derksen and H.E.A. Van den Akker. Simulation of vortex core pre-cession in a reverse-flow cyclone. AIChE J., 46(7):1317–1331, July 2000.
[116] H. Shalaby, K. Pachler, K. Wozniak, and G. Wozniak. Comparative studyof the continuous phase flow in a cyclone separator using different turbu-lence models. Int. J. Numer. Methods Fluids, 48(11):1175–1197, August2005.
[117] H. Shalaby, K. Wozniak, and G. Wozniak. Numerical Calculation ofParticle-Laden Cyclone Separator Flow Using LES. Eng. Appl. Comput.Fluid Mech., 2(4):382–392, January 2008.
[118] J.J. Derksen. Separation performance predictions of a Stairmand high-efficiency cyclone. AIChE J., 49(6):1359–1371, June 2003.
[119] F.J. de Souza, R. de Vasconcelos Salvo, and D.A. de Moro Martins. LargeEddy Simulation of the gas–particle flow in cyclone separators. Sep. Purif.Technol., 94:61–70, June 2012.
[120] H. Mikulčić, M. Vujanović, M.S. Ashhab, and N. Duić. Large eddy simu-lation of a two-phase reacting swirl flow inside a cement cyclone. Energy,75:89–96, October 2014.
[121] A.J. Hoekstra. Gas Flow Field and Collection Efficiency of Cyclone Sep-arators. Phd thesis, Delft University of Technology, 2000.
[122] S. Elghobashi. On predicting particle-laden turbulent flows. Appl. Sci.Res., 52(4):309–329, June 1994.
[123] M. Sommerfeld. Theoretical and Experimental Modelling of ParticulateFlows.-Lecture Series 2000-06, 2000.
[124] M. Chiesa, V. Mathiesen, J.a. Melheim, and B. Halvorsen. Numericalsimulation of particulate flow by the Eulerian–Lagrangian and the Eu-lerian–Eulerian approach with application to a fluidized bed. Comput.Chem. Eng., 29(2):291–304, January 2005.
BIBLIOGRAPHY 163
[125] E. Loth. Numerical approaches for motion of dispersed particles, dropletsand bubbles. Prog. Energy Combust. Sci., 26(3):161–223, June 2000.
[126] C. Anh Ho and M. Sommerfeld. Modelling of micro-particle agglomerationin turbulent flows. Chem. Eng. Sci., 57(15):3073–3084, August 2002.
[127] S.A. Morsi and A.J. Alexander. An investigation of particle trajectoriesin two-phase flow systems. J. Fluid Mech., 55(02):193, September 1972.
[128] S. Yuu, T. Jotaki, Y. Tomita, and K. Yoshida. The reduction of pressuredrop due to dust loading in a conventional cyclone. Chem. Eng. Sci.,33(12):1573–1580, January 1978.
[129] B. Wang, D.L. Xu, K.W. Chu, and A.B. Yu. Numerical study of gas–solidflow in a cyclone separator. Appl. Math. Model., 30(11):1326–1342, Novem-ber 2006.
[130] C.T. Crowe, M.P. Sharma, and D.E. Stock. The Particle-Source-In Cell(PSI-CELL) Model for Gas-Droplet Flows. J. Fluids Eng., 99(2):325,1977.
[131] J.J. Derksen, H.E.A. van den Akker, and S. Sundaresan. Two-way coupledlarge-eddy simulations of the gas-solid flow in cyclone separators. AIChEJ., 54(4):872–885, April 2008.
[132] D. Rong and M. Horio. Behavior of particles and bubbles around im-mersed tubes in a fluidized bed at high temperature and pressure: a DEMsimulation. Int. J. Multiph. Flow, 27(1):89–105, January 2001.
[133] M. Narasimha, R. Sripriya, and P.K. Banerjee. CFD modelling of hy-drocyclone—prediction of cut size. Int. J. Miner. Process., 75(1-2):53–68,January 2005.
[134] M.S. Brennan. Multiphase cfd simulations of dense medium and classify-ing hydrocyclones. In Proceedings of the 3rd International Conference onCFD in the Minerals and Process Industries, CSIRO Melbourne Australia,volume 10, pages 59–63, 2003.
[135] M. Narasimha, M.S. Brennan, and P.N. Holtham. Numerical simula-tion of magnetite segregation in a dense medium cyclone. Miner. Eng.,19(10):1034–1047, August 2006.
[136] M.S. Brennan, M. Narasimha, and P.N. Holtham. Multiphase modelling ofhydrocyclones – prediction of cut-size. Miner. Eng., 20(4):395–406, April2007.
[137] S.A. Grady, G.D. Wesson, M. Abdullah, and E.E. Kalu. Prediction of10-mm Hydrocyclone Separation Efficiency Using Computational FluidDynamics. Filtr. Sep., 40(9):41–46, November 2003.
164 BIBLIOGRAPHY
[138] H.F. Meier and M. Mori. Gas-solid flow in cyclones: The Eulerian-Eulerianapproach. Comput. Chem. Eng., 22(98):S641–S644, March 1998.
[139] J. Gao, Y. Zhao, S. Sun, H. Che, G. Zhao, and J. Wu. Experimentsand numerical simulation of sawdust gasification in an air cyclone gasifier.Chem. Eng. J., 213:97–103, December 2012.
[140] D.W.F. Michels, G. Gnaedig, and J.R. Comparato. The Application ofComputational Fluid Dynamics in the NOxOUT Process for ReducingNOx Emissions from Stationary Combustion Sources. In Am. Flame Res.Comm. 1990 Fall Int. Symp., San Francisco, California, 1990. Digitizedby: J. Willard Marriott Library, University of Utah.
[141] M.A. Cremer, C.J. Montgomery, D.H. Wang, M.P. Heap, and J.Y. Chen.Development and implementation of reduced chemistry for computionalfluid dynamics modeling of selective non-catalytic reduction. Proc. Com-bust. Inst., 28(2):2427–2434, January 2000.
[142] M.S. Skjøth-Rasmussen, O. Holm-Christensen, M. Østberg, T.S. Chris-tensen, T. Johannessen, A.D. Jensen, P. Glarborg, and H. Livbjerg. Post-processing of detailed chemical kinetic mechanisms onto CFD simulations.Comput. Chem. Eng., 28(11):2351–2361, October 2004.
[143] T.D.B. Nguyen, Y.I. Lim, S.J. Kim, W.H. Eom, and K.S. Yoo. Experimentand Computational Fluid Dynamics (CFD) Simulation of Urea-Based Se-lective Noncatalytic Reduction (SNCR) in a Pilot-Scale Flow Reactor.Energy & Fuels, 22(6):3864–3876, November 2008.
[144] J. Chen. Development of reduced mechanisms for numerical modelling ofturbulent combustion. In Workshop on Numerical Aspects of Reductionin Chemical Kinetics, France, 1997.
[145] W. Zhou, A. Marquez, D. Moyeda, S. Nareddy, J. Frato, G. Yu,S. Knarvik, and V. Froseth. Design and test of a selective noncatalyticreduction (SNCR) system for full-scale refinery CO boilers to achieve highNOx removal. Energy and Fuels, 24(7):3936–3941, 2010.
[146] N. Modlinski. Numerical simulation of SNCR (selective non-catalytic re-duction) process in coal fired grate boiler. Energy, 40:1–10, 2015.
[147] T. Blejchař and D. Dolníčková. Numerical Simulation of SNCR Technologywith Simplified Chemical Kinetics Model. EPJ Web Conf., 45:01015, 2013.
[148] A.A.B. Musa, X.W. Zeng, Q.Y. Fang, and H.C. Zhou. Numerical simula-tion on improving NOx reduction efficiency of SNCR by regulating the 3-Dtemperature field in a furnace. Adv. Mater. Res., 807-809(X):1505–1513,2013.
BIBLIOGRAPHY 165
[149] M. Ghamri, S. Vats, and A. Ratner. Numerical modeling of urea injectionand no emission in a stoker boiler. In 8th US national combustion meetingorganized by the western states section of the combustion Institute andhosted by the university of Utah (May 19–22, 2013), 2013.
[150] P.E. Burström, D. Antos, T.S. Lundström, and B.D. Marjavaara. A CFD-based evaluation of selective non-catalytic reduction of nitric oxide in ironore grate-kiln plants. Prog. Comput. Fluid Dyn. An Int. J., 15(1):32, 2015.
[151] Z. Xia, J. Li, T. Wu, C. Chen, and X. Zhang. CFD simulation ofMSW combustion and SNCR in a commercial incinerator. Waste Manag.,34(9):1609–1618, 2014.
[152] P.E. Burström, T.S. Lundstrom, B.D. Marjavaara, and S. Toyra. CFD-modelling of Selective Non-Catalytic Reduction of NOx in grate-kilnplants. Prog. Comput. Fluid Dyn. An Int. J., 10(5/6):284, 2010.
[153] B. Ljungdahl and J. Larfeldt. Optimised NH3 injection in CFB boilers.Powder Technol., 120(1-2):55–62, October 2001.
[154] W.G. Huang, J.J. Li, and H.R. Yang. DeNOx Technology Selection andOptimal Design of SNCR System for a 300MWe CFB Boiler. Appl. Mech.Mater., 492:7–12, 2014.
[155] ENERGINET/DK. https://energinet.dk/Gas/Gaskvalitet/Gaskvalitet-maaned-for-maaned.
[156] S. Sun, Y. Zhao, F. Ling, and F. Su. Experimental research on air stagedcyclone gasification of rice husk. Fuel Process. Technol., 90(4):465–471,2009.
[157] H.K. Versteeg and W. Malalasekera. An introduction to computationalfluid dynamics: the finite volume method. Pearson Education, 2007.
[158] R.B. Bird, W.E. Stewart, and E.N. Lightfoot. Transport phenomena, rev.Wiley, New York, 2007.
[159] G.K. Batchelor. An introduction to fluid dynamics. Cambridge UniversityPress., 1991.
[160] C.J. Stairmand. The design and performance of cyclone separators. Trans.Inst. Chem. Eng, 29:356–383, 1951.
[161] Ansys Fluent Theory’ Guide, Release 15.0. 2015.
[162] Ansys Fluent Users’ Guide, Release 15.0. 2015.
166 BIBLIOGRAPHY
[163] J.P. Van Doormaal and G.D. Raithby. ENHANCEMENTS OF THESIMPLE METHOD FOR PREDICTING INCOMPRESSIBLE FLUIDFLOWS. Numer. Heat Transf., 7(2):147–163, April 1984.
[164] S.K. Shukla, P. Shukla, and P. Ghosh. Evaluation of numerical schemesusing different simulation methods for the continuous phase modeling ofcyclone separators. Adv. Powder Technol., 22(2):209–219, March 2011.
[165] Increase Performance.
[166] R. Reid, J. Prausnitz, and T. Sherwood. The Properties of Gases andLiquids. McGraw-Hill„ 1977.
[167] B..F. Magnussen and B.H. Hjertager. On mathematical modeling of turbu-lent combustion with special emphasis on soot formation and combustion.Symp. Combust., 16(1):719–729, January 1977.
[168] D. Wenli, K. Dam-Johansen, and K. Øtergaard. Widening the tempera-ture range of the thermal DeNOx process. An experimental investigation.Symp. Combust., 23(1):297–303, 1991.
[169] F. Kasuya, P. Glarborg, J.E. Johnsson, and K. Dam-Johansen. Thethermal DeNOx process: Influence of partial pressures and temperature.Chem. Eng. Sci., 50(9):1455–1466, May 1995.
[170] D.B.. Spalding. Mixing and chemical reaction in steady confined turbulentflames. Symp. Combust., 13(1):649–657, January 1971.
[171] D. Stropky, K. Pougatch, P. Nowak, M. Salcudean, P. Pagoria,I. Gartshore, and J. Yuan. RTD (residence time distribution) predictionsin large mechanically aerated lagoons. Water Sci. Technol., 55(11):29,June 2007.
[172] Rtd prediction, modelling and measurement of gas flow in reactor. Nuk-leonika, 43(1):95–114, 1998.
[173] S. Turns. An Introduction to Combustion: Concepts and Applicationsw/Software. McGraw-Hill Companies,Incorporated, 1999.


![SACI [e]motion - V-NOX TWIN PUMP](https://static.fdokumen.com/doc/165x107/6334ac3db9085e0bf50921cd/saci-emotion-v-nox-twin-pump.jpg)