Selective inhibition of aragonite growth by citrate and isocitrate at moderate supersaturations, as...
12
Journal of Crystal Growth 310 (2008) 804–815 Selective inhibition of aragonite growth by citrate and isocitrate at moderate supersaturations, as measured by an optical-microscope flow-cell assay Michael H. Schmidt , Ian Ellison, Kiel Holliday, Martin Kubin, Francisco Trujillo Department of Chemistry and Biochemistry, California State University San Marcos, 333 S. Twin Oaks Valley Road, San Marcos, CA 92096, USA Received 30 May 2007; received in revised form 18 November 2007; accepted 4 December 2007 Communicated by J. de Yoreo Available online 8 December 2007 Abstract An optical flow-cell assay was developed which allowed for simultaneous measurement of calcite and aragonite growth under conditions of constant concentrations of constituent ions and growth-modifying additives. Using this assay, it was determined that L-citrate and D,L-isocitrate selectively inhibited the growth of aragonite crystal seeds, while having little or no effect on calcite growth rates at supersaturations in the range of s ¼ 2.570.4. Tricarballylate, which differs from citrate and isocitrate by the absence of a hydroxide functionality, had very little effect on calcite or aragonite growth. For citrate on aragonite, an effective surface binding constant of K ¼ 2.570.6 10 5 M 1 was derived from the kinetic data; for isocitrate, K ¼ 2.970.8 10 5 M 1 . The similarity of these effective binding constants argues against precise stereochemical recognition of the aragonite surface. r 2008 Elsevier B.V. All rights reserved. Keywords: A1. Adsorption; A1. Biocrystallization; B1. Calcium carbonate; B1. Polycarboxylates 1. Introduction The controlled synthesis of different polymorphs of calcium carbonate, especially calcite and aragonite, by mollusks and other organisms has interested scientists for many years. Such control in the laboratory or industry would be useful in the synthesis of novel biomimetic materials, some of which may have important conse- quences for treatment of human disease [1–3]. As yet, however, the molecular mechanisms by which organisms control which polymorph is formed are not fully under- stood. Much interest has been directed at proteins found in mineralized tissues or extrapallial space of mollusks [4–23], and careful study of the effect of such proteins in native and modified forms is needed to discern the mechanisms by which such proteins act. Because such proteins are often isolated from mineralized tissues [4,5,7–9,11,13,15,17,19, 21–23], it must be assumed that they are incorporated into the crystal matrix at some rate. Therefore, the ‘‘batch’’ crystal growth assays that are often performed with such proteins [5,10,11,14,16,21,24] have both declining super- saturations and declining protein or peptide concentrations as the study proceeds, complicating the interpretation of results. While autotitrator-based methods can be used to maintain supersaturations of constituent ions [25–28], these methods cannot maintain constant concentrations of proteins or other additives without a means of assessing the additive concentrations in real time. In this paper we present a relatively simple method for studying the effects of additives on crystal growth in which the concentrations both of constituent ions and growth- modifying additives are constant. This is achieved using a flow system, a strategy which has been used to good effect in atomic force microscopy (AFM) [27,29–33], vertical scanning interferometry (VSI) [33–36] and more primitive methods [37–41]. Sophisticated methods such as AFM and VSI can yield far more precise measurements of growth rates than the method described here, but there are limitations on the phases that can be examined with such ARTICLE IN PRESS www.elsevier.com/locate/jcrysgro 0022-0248/$ - see front matter r 2008 Elsevier B.V. All rights reserved. doi:10.1016/j.jcrysgro.2007.12.002 Corresponding author. Tel.: +1 760 750 4138. E-mail address: [email protected] (M.H. Schmidt).
-
Upload
independent -
Category
Documents
-
view
11 -
download
0
Transcript of Selective inhibition of aragonite growth by citrate and isocitrate at moderate supersaturations, as...

ARTICLE IN PRESS
0022-0248/$ - se
doi:10.1016/j.jc
�CorrespondE-mail addr
Journal of Crystal Growth 310 (2008) 804–815
www.elsevier.com/locate/jcrysgro
Selective inhibition of aragonite growth by citrate and isocitrateat moderate supersaturations, as measured by an optical-microscope
flow-cell assay
Michael H. Schmidt�, Ian Ellison, Kiel Holliday, Martin Kubin, Francisco Trujillo
Department of Chemistry and Biochemistry, California State University San Marcos, 333 S. Twin Oaks Valley Road, San Marcos, CA 92096, USA
Received 30 May 2007; received in revised form 18 November 2007; accepted 4 December 2007
Communicated by J. de Yoreo
Available online 8 December 2007
Abstract
An optical flow-cell assay was developed which allowed for simultaneous measurement of calcite and aragonite growth under
conditions of constant concentrations of constituent ions and growth-modifying additives. Using this assay, it was determined that
L-citrate and D,L-isocitrate selectively inhibited the growth of aragonite crystal seeds, while having little or no effect on calcite growth
rates at supersaturations in the range of s ¼ 2.570.4. Tricarballylate, which differs from citrate and isocitrate by the absence of a
hydroxide functionality, had very little effect on calcite or aragonite growth. For citrate on aragonite, an effective surface binding
constant of K ¼ 2.570.6� 105M�1 was derived from the kinetic data; for isocitrate, K ¼ 2.970.8� 105M�1. The similarity of these
effective binding constants argues against precise stereochemical recognition of the aragonite surface.
r 2008 Elsevier B.V. All rights reserved.
Keywords: A1. Adsorption; A1. Biocrystallization; B1. Calcium carbonate; B1. Polycarboxylates
1. Introduction
The controlled synthesis of different polymorphs ofcalcium carbonate, especially calcite and aragonite, bymollusks and other organisms has interested scientists formany years. Such control in the laboratory or industrywould be useful in the synthesis of novel biomimeticmaterials, some of which may have important conse-quences for treatment of human disease [1–3]. As yet,however, the molecular mechanisms by which organismscontrol which polymorph is formed are not fully under-stood. Much interest has been directed at proteins found inmineralized tissues or extrapallial space of mollusks [4–23],and careful study of the effect of such proteins in nativeand modified forms is needed to discern the mechanisms bywhich such proteins act. Because such proteins are oftenisolated from mineralized tissues [4,5,7–9,11,13,15,17,19,21–23], it must be assumed that they are incorporated into
e front matter r 2008 Elsevier B.V. All rights reserved.
rysgro.2007.12.002
ing author. Tel.: +1760 750 4138.
ess: [email protected] (M.H. Schmidt).
the crystal matrix at some rate. Therefore, the ‘‘batch’’crystal growth assays that are often performed with suchproteins [5,10,11,14,16,21,24] have both declining super-saturations and declining protein or peptide concentrationsas the study proceeds, complicating the interpretation ofresults. While autotitrator-based methods can be used tomaintain supersaturations of constituent ions [25–28], thesemethods cannot maintain constant concentrations ofproteins or other additives without a means of assessingthe additive concentrations in real time.In this paper we present a relatively simple method for
studying the effects of additives on crystal growth in whichthe concentrations both of constituent ions and growth-modifying additives are constant. This is achieved using aflow system, a strategy which has been used to good effectin atomic force microscopy (AFM) [27,29–33], verticalscanning interferometry (VSI) [33–36] and more primitivemethods [37–41]. Sophisticated methods such as AFM andVSI can yield far more precise measurements of growthrates than the method described here, but there arelimitations on the phases that can be examined with such

ARTICLE IN PRESS
Fig. 1. A schematic of the crystal growth monitoring apparatus, including
a top view and side view of the crystallization flow cell.
M.H. Schmidt et al. / Journal of Crystal Growth 310 (2008) 804–815 805
methods, and the cost, both in instrumentation and well-trained personnel, can be high. The method presented here,while giving less precise measurement of growth rates, canreliably provide effective binding constants for additivesthat fully inhibit crystal growth. The method takesadvantage of increasingly inexpensive digital image captureand processing, and may be useful in screening proteins,peptides, or other additives for phase-specific growthinhibition prior to studies with the more sophisticatedmethods.
In the method reported here, the projected area of bothcalcite and aragonite crystals is measured. With seedcrystals of multiple phases in the field of view of themicroscope, it is possible to simultaneously measuregrowth rates for two different phases under identicalconditions. With this apparatus we have studied the effectsof several small organic ions on the crystallization kineticsof calcite and aragonite. Effects of citrate and tricarbally-late on aragonite growth were first reported in 1978 [42],and effects on calcite growth were reported shortlythereafter [28]. More detailed kinetic studies of the effectsof citrate and tricarballylate on calcite [43] and of citrate onboth calcite and aragonite [44] have been published even asour studies were in progress. The results reported here wereobtained at higher supersaturations and ionic strengthsthan the previously published studies, and are therefore aninstructive complement to those studies. The similarity ofour results and those already published using differentmethods serve to validate our approach. We have alsoextended the studies to the closely related ion isocitrate,and to different calcium-to-carbonate activity ratios in aneffort to determine whether such ratios influence theinhibiting effect of anionic additives.
2. Methods
2.1. Overview of flow-cell method and apparatus
A schematic of the apparatus, and a detail of the cell, isshown in Fig. 1. The entire apparatus was enclosed in apolystyrene-foam insulated chamber, which was kept at2571 1C with the aid of an external thermostatted bathcirculating water through a copper coil inside the chamber.A multiple-syringe syringe pump (KD Scientific) was usedto deliver separate CaCl2 and NaHCO3 solutions from twosyringes to the flow cell at a constant rate. The flow fromthese syringes was led via 1/16 in polytetrafluoroethylenetubing to the flow cell, where they were mixed with arotating magnetic stirring bar. After mixing, the solutionflowed through a shallow 1/8 in wide channel under aborosilicate glass disk to which calcite and aragonite seedcrystals were attached, and then flowed into a wastecontainer. The growth of the seed crystals was monitoredthrough the borosilicate glass disk using a microscopefocused on the lower surface of the disk that was in contactwith the growth solution. In early experiments, the flow ratewas varied to determine a rate at which flow rate was not
rate-limiting; this rate was determined to be 0.5mLmin�1
for each reagent, for a combined flow through the cell of1.0mLmin�1. This flow rate is comparable to that used inflow AFM studies [31].Because the supersaturations used were below those
needed for spontaneous nucleation of new crystals, it wasnot necessary to mix the solutions in the flow cell, andpremixed solutions could be introduced to the cell. Growthrates measured with premixed solutions were indistinguish-able from those for solutions mixed in the flow cell (Section3), but mixing in the cell was utilized for all measurementswith additives, for the sake of convenience.Details of the construction of the flow cell and
preparation of the borosilicate glass disks is available insupplementary material.
2.2. Disk seeding
Seeding of disks was roughly based upon the conditionsused to synthesize aragonite needles in solution [45]; it wasfound that these conditions yielded a mixture of aragoniteand calcite crystals on the borosilicate glass disks. Thedisks were placed in a 25mm diameter test tube with 15mLof 0.20M Na2CO3 solution that was heated to 70–75 1C ina heating block. In a separate test tube, 1.0M CaCl2 wasalso maintained at 70–75 1C and ca. 0.5mL was allowed toflow into a 6mm borosilicate glass tube with a fine capillaryopening at the bottom end. When this tube is transferred tothe first test tube, the CaCl2 gradually flowed out throughthe capillary opening into the Na2CO3 solution to formaragonite crystals in the solution and a mixture of

ARTICLE IN PRESSM.H. Schmidt et al. / Journal of Crystal Growth 310 (2008) 804–815806
aragonite and calcite crystals on the borosilicate glass disk.The capillary-ended tube was moved back and forth duringthe dispensing of the CaCl2 solution to provide agitation ofthe crystal-seeding solution. The crystallization wasallowed to proceed for 60 s after the beginning of theintroduction of the CaCl2, at which point the solution anddisk were dumped into a funnel and the disk wasimmediately washed with methanol. After drying, the diskwas examined with a light microscope to ensure thatadequate seeding of calcite and aragonite had occurred.Calcite and aragonite crystals were identified based on thedistinctive morphology of the crystals, which was com-pared to bulk samples synthesized free in solution. Thephase of the bulk solution samples was verified by X-raypowder diffraction using a Rigaku Miniflex diffractometer.Calcite crystals were typically 4–10 m on edge and aragoniteneedles were typically 5–30 m in length.
The seeded disks were mounted in the flow cell that hadbeen rinsed with the supersaturated growth solution, andflow of the growth solution was initiated within 2min ofmounting the seeded disks.
2.3. Growth solutions
All solutions were formulated to contain 0.100M NaCl,and measured aliquots of standardized stock solutions ofCaCl2 and NaHCO3 were added to achieve the desiredsupersaturations. Activities of calcium and carbonate ions,supersaturations and ionic strength were calculated forthe control solutions with no organic additives using theprogram PHREEQC (for MacOS X) obtained from theUnited States Geological Survey [46], using the pitzer.datfile which implements the Pitzer equations for estimatingactivities in brines [47,48]. Activity differences caused bythe addition of citrate, and the speciation of citrate, weremore crudely estimated using the minteq.dat database,which does not incorporate the Pitzer equations.
2.4. Additives
Tricarballylic acid, as received (Lancaster Synthesis),contained a colored iron-containing impurity that had avery powerful inhibitory effect on aragonite growth, so theacid was recrystallized from acetonitrile, and neutralizedwith three equivalents of NaOH before use in theexperiments reported here. The effects and identity of theiron-containing impurity are currently under investigation.Recrystallization of citric acid did not change the growth-inhibitory effects of this additive at pH 8.50, and theseeffects were identical with citrate added as sodium citrate.Both trisodium citrate dihydrate (Fisher, Certified) andtrisodium D,L-isocitrate hydrate (Acros, 98%) were used asreceived.
Additives were added to solutions of the same overallcomposition as the control solutions; adjustments to thecalcium and bicarbonate concentrations were not made tocompensate for the changes in activity due to the presence
of additives. Estimates of the effects of citrate on theadditive activities were made using the minteq.dat file inPHREEQC and were determined to be less than 10% in allcases.
2.5. Data acquisition
Micrography was performed using either a Bausch &Lomb Model LA or Olympus Model BH petrographicmicroscope. A 10� objective was used in either case, andthe output focused directly onto a CCD detector that wasinterfaced with an Apple Macintosh computer runningScion Image 1.55 or NIH Image 1.63. Calibration of themicroscope/CCD combinations using a micrometer slideindicated a scale of 1.0 mm2 per pixel. NIH Image softwarewas used to collect serial images on a selected portion ofthe field of view, typically at 60 s intervals for 60min whilethe flow apparatus was running.
2.6. Data analysis
Serial images captured with the NIH Image softwarewere analyzed with the same software. Gray-scale images(Fig. 2a and d) were converted to black and white imagesusing the Threshold option (Fig. 2b and e). The thresholdwas adjusted so that the resulting silhouettes accuratelyreflected the size of the crystals when compared to thegray-scale image. Derived face velocities were found tobe quite insensitive to the exact threshold value used,provided the crystal shapes were well defined. For largercrystals, the threshold image gave only a black outline ofthe crystal; paint and drawing tools were used to blackenareas inside the outline before analysis (Fig. 2c and f). TheAnalyze/Measure tool of the software was then used torecord the number of black pixels enclosed by a givencrystal outline for each image in the series. Because of thefortuitous scale factor of 1.0 mm2 per pixel obtained withthe magnification used in our system, the result of thisanalysis could be directly plotted as mm2 as a functionof time.Crystals were selected for analysis only if they could
clearly be identified as calcite or aragonite by theirmorphology. Calcite crystals were chosen which hadorientations in which the rhombic shape was clearly visible,as the mathematics of estimating face velocities for thisprojection were worked out explicitly (Appendix A).Aragonite crystals were chosen which had little or noobvious twinning or branching, and had a distinct needle-like shape.‘‘Average derived face velocities’’ were determined by
fitting the projected area vs. time graphs with a quadraticgrowth function. This function describes the increase inprojected area of a cubic crystal growing isotropically inthe x- and y-directions (where z is the optical axis of themicroscope):
At ¼ b2þ 4bvtþ 4v2t2, (1)

ARTICLE IN PRESS
Fig. 2. Photomicrographs of calcite and aragonite crystals in the flow apparatus cell during an experiment. Rhombohedral crystals are calcite; needle-like
crystals are aragonite. (a), (b), and (c) are from the first frame of a 60-frame experiment; (d), (e), and (f) are from the 60th frame of the same experiment.
Photos (a) and (d) are as taken by the CCD camera, (b) and (e) show the application of the threshold filter, and (c) and (f) show how painting tools are
used to fill in the interior of crystals before computer analysis of the area by counting blackened pixels.
M.H. Schmidt et al. / Journal of Crystal Growth 310 (2008) 804–815 807
where At is the area as a function of time, b is the edgelength of the cubic crystal, v is the velocity of the faces inthe x- and y-directions, and t is the time. Of course, neitherthe calcite nor the aragonite crystals are cubic, but fitsusing equations derived more specifically for particularcrystal forms gave results for the face velocity v which arecomparable in magnitude to those obtained using Eq. (1)(Appendix B). It was estimated that actual face velocitiesmay be 4–5% lower than the cubic-fit values for calcite,and 5–7% lower for aragonite crystals. As the primaryinterest in this study is comparing growth rates of calciteand aragonite crystals under different solution conditions,the errors incurred by use of Eq. (1) do not detractmaterially from the conclusions of this study, especiallysince the variation in growth rates between crystals is ofeven greater magnitude. Additional errors in the facevelocity are likely to occur due to refraction effects of thecrystals as they grow in thickness.
The values of v that are determined from the fits arereferred to in this paper as ‘‘average derived facevelocities’’; they combine and average different facevelocities for different crystal faces, and thus should notbe interpreted as representing true face velocities for anygiven crystal face. As such, our analysis is most appropriatefor noting general inhibition of crystal growth rather thanmore subtle anisotropic growth effects noted by othermethods [32], and caution must be used in comparing our
average derived face velocities with the surface-normalgrowth rates described in other studies [31].
2.7. Scanning electron microscopy
Glass disks upon which seed crystals were grown weremounted on conductive carbon tape (Tedd Pella, Redding,CA), sputter-coated with gold using a DESK II system(Denton Vacuum, Moorestown, NJ) and examined with aVega TS 5130MM thermionic emission scanning electronmicroscope (Tescan, Brno, Czech Republic).
3. Results
3.1. Crystal growth in the absence of additives
Any attempt to measure crystal growth rates requiresthat crystal nuclei are not spontaneously formed in thesupersaturated solution. Other workers have expressedconcern that, at the supersaturations used in this study,spontaneous nucleation in solution or on apparatussurfaces may be a factor in the measured rates of crystalgrowth. This is especially a concern as the growth solutionis not premixed in many of our experiments, as it is in otherflow methods.There are several lines of evidence which reassure
us that spontaneous nucleation (beyond the expected

ARTICLE IN PRESS
Fig. 3. The projected area of calcite and aragonite crystals as a function of
time while mounted in the flow apparatus, as measured using NIH/Scion
Image software as described in the text. Flow solution is 0.100M NaCl,
0.0256M NaHCO3, 0.00570M CaCl2; flow rate is 1.0mLmin�1. The fitted
line is from Eq. (1), where b and v are adjustable parameters. For calcite,
v ¼ 0.0809mmmin–1 for calcite (1.35 nm s–1), b ¼ 10.1mm, and R ¼ 0.998;
for aragonite, v ¼ 0.0354mmmin�1 (0.059 nm s–1), b ¼ 9.7 mm, and
R ¼ 0.993.
M.H. Schmidt et al. / Journal of Crystal Growth 310 (2008) 804–815808
two-dimensional surface nucleation on the monitoredcrystals [31]) is not a significant factor in our experiments.Mixing of the parent CaCl2 and NaHCO3 solutions resultsin a solution whose pH is within 0.02 pH units of theoriginal NaHCO3 solution, and the pH of the mixedsolution does not change more than 0.02 pH units over thecourse of 48 h; spontaneous nucleation and subsequentcrystal growth would result in a measurable pH decrease.No crystallization is visible when the mixed solutions areleft for 48 h. Additionally, the effluent from our flow cellwhen performing a crystal growth experiment is within 0.02pH units of the NaHCO3 solution used, which alsosuggests that the only carbonate precipitation occurringis that which occurs on the small number of crystal seedsmounted on the glass disk. Finally, crystal growthexperiments performed using our apparatus with premixedgrowth solution gives average crystal growth rates that arestatistically indistinguishable from those obtained wherethe growth solution is mixed in the flow cell. There is noreason for performing our experiments by mixing at theflow cell other than habit and convenience.
Table 1 displays the solution conditions used in thisstudy and the calculated supersaturations and ionicstrengths.
Fig. 3 displays typical growth in area of calcite andaragonite crystals as a function of time under conditions of1.0mLmin�1 flow, ionic strength I ¼ 0.130, calcite super-saturation s ¼ 2.8, aragonite supersaturation s ¼ 2.4, andcalcium to carbonate activity ratio aCa2þ=aCO2�
3¼ 1:0. The
definition of supersaturation used in this study is thethermodynamic one:
s ¼ lnaCa2þ=aCO2�
3
K sp
!, (2)
with the activities being estimated by numerical applicationof the Pitzer equations [47,48]. The best fit of the quadraticprojected-area growth function (Eq. (1)) described inMethods is also displayed.
The mean of the average derived face velocity v for 14calcite crystals over 10 separate growth runs at theconditions listed above is 0.98 nm s–1 with a samplestandard deviation of 0.30 nm s–1 (31%). No correlation
Table 1
Calcite and aragonite average derived face velocities v as a function of supersat
crystals
Polymorph [CaCl2] (mM) [NaHCO3] (mM) s
Calcite 1.57 51.2 2.8
Calcite 1.40 46.0 2.6
Calcite 3.00 26.0 2.6
Aragonite 1.57 51.2 2.4
Aragonite 1.40 46.0 2.2
Aragonite 3.00 26.0 2.2
All solutions are 0.100M NaCl and pH 8.50.aErrors in v are the sample standard deviations.
could be found between the growth rates of crystals andtheir orientation relative to the direction of flow, theirposition on the substrate, or their proximity to othercrystals, suggesting that the rather large standard deviationin rates must reflect more fundamental differences in thecrystal seeds, such as the type and number of defects ordislocations.The rates are significantly higher than predicted by
previously reported results with autotitrator or AFMmethods. For example, the AFM study by Teng et al.[31] shows (Fig. 4) (Appendix B) a linear trend in surfacenormal growth rates at supersaturations greater than 0.8.This figure predicts a growth rate of ca. 0.097 nm s–1 for asupersaturation of 2.8, assuming that the linear trendevident from s ¼ 0.8 to 1.4 continues to the highersupersaturation. This linear estimate is an order ofmagnitude lower than the rates we observe. Part ofthis discrepancy may be due to the crudeness of the
uration s, activity ratios aCa2þ=aCO2�3, and ionic strength I, averaged over n
aCa2þ=aCO2�3
I v (nm s�1)a n
1.0 0.13 0.9870.30 14
1.0 0.13 0.8970.19 15
5.2 0.12 0.7170.21 8
1.0 0.13 0.6070.20 16
1.0 0.13 0.2370.14 17
5.2 0.12 0.4670.08 9

ARTICLE IN PRESS
Fig. 4. SEM micrographs of typical crystals before and after 1 h in the flow crystal-growth apparatus. Photos: (a and b) aragonite crystals before flow
experiment, (c) calcite crystal before flow experiment, (d and e) aragonite crystals after flow experiment, (f) calcite crystal after growth experiment. Note
that different crystals are shown in each of the six micrographs; similar crystals and orientations were chosen in the before and after pictures to illustrate
the likely progression of appearance for typical crystals.
Table 2
Apparent Langmuir isotherm binding constants K measured from the
inhibition of aragonite crystal growth for different organic ion additives at
different supersaturations s, ion activity ratios aCa2þ=aCO2�3, and ionic
strengths I
Additive sa aCa2þ=aCO2�3
a Ia K (M–1) Rb
Citrate 2.4 1.0 0.13 2.570.6� 105 0.87
Citrate 2.2 1.0 0.13 5.872.3� 105 0.57
Citrate 2.2 5.2 0.12 1.470.2� 106 0.93
Isocitrate 2.4 1.0 0.13 2.970.8� 105 0.74
aThe aragonite supersaturations s, activity ratios aCa2þ=aCO2�3, and ionic
strength I are given for the control solutions in the absence of additive;
because Langmuir constants were measured by adding additives to
solutions of the same composition, and activities and supersaturations
may be lower by up to 5% at high additive concentrations.bR represents the correlation coefficient for the fit to the data.
M.H. Schmidt et al. / Journal of Crystal Growth 310 (2008) 804–815 809
measurement technique employed in our study; thegrowing thickness of the calcite crystals, combined withthe high refractive index of calcite, may exaggeratethe actual growth to some degree by increasing thewidth of the apparent crystal outlines, and as notedabove, the quadratic equation used for the fit overesti-mates the growth rate by a few percent. These effects,however, cannot account for the full 10-fold differencein rates.
Our growth rates are also higher than those expectedfrom autotitrator-based studies, although it is difficult tojudge by how much, since no supersaturation-dependencehas been reported in the studies most relevant to this one.Reddy and Hoch, for example, report rates of calcitegrowth that average 1.41� 10–6molm–2 s–1, correspondingto an average face velocity of 0.052 nm s–1 at 25 1C. Thisrate was obtained at a supersaturation reported asaCa2þ=aCO2�
3=K sp ¼ 4:5, corresponding to s ¼ 1.50 [43].
Westin and Rasmuson report rates of 4.29�10–6molm�2 s�1 at 50 1C, which translates to an averageface velocity of 0.158 nm s�1 [44]; although they reportaCa2þ=aCO2�
3=K sp ¼ 4, corresponding to s ¼ 1.4, our calcu-
lation of the ion activities, based on their reportedconcentrations, suggests s ¼ 0.83.
The mean of the average derived face velocity v for 16aragonite crystals from 10 different crystal growth experi-ments is 0.60 nm s–1, with a sample standard deviationof 0.20 nm s–1, under the conditions described above(1.0mLmin�1 flow, ionic strength I ¼ 0.130, aragonitesupersaturation s ¼ 2.37, and calcium to carbonate activ-ity ratio aCa2þ=aCO2�
3¼ 1:00). These rates are also over an
order of magnitude faster than those observed using
autotitrator systems [44]. Table 2 summarizes all averagederived face velocities for crystals measured in the absenceof additives.
3.2. Crystal morphology by SEM
Seeded disks which had been briefly mounted in the flow-cell apparatus, flushed briefly with supersaturated solutionand rinsed with methanol were compared with disks whichhad been exposed to growth solutions for 1 h. As can beseen from Fig. 4, photos c and f show that calcite crystalsgrown in control conditions (no additives) had no notice-able change in morphology through the growth process.Aragonite crystals, as seeded (photos a and b) were highly
ARTICLE IN PRESS
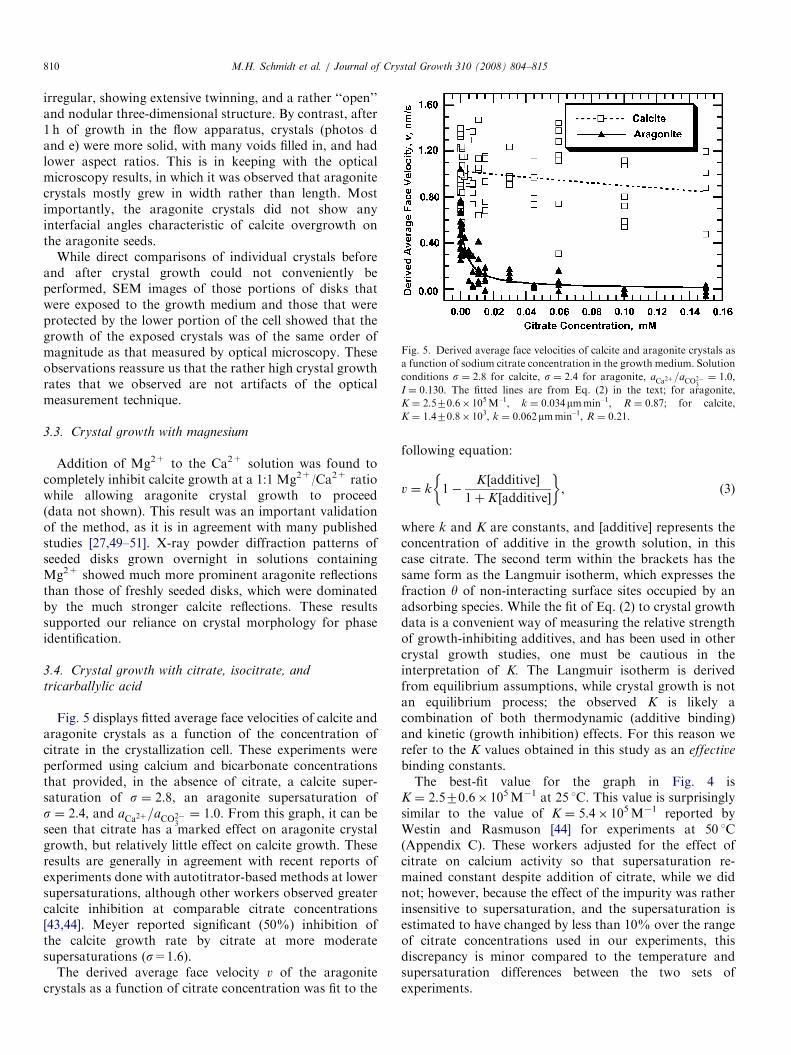
Fig. 5. Derived average face velocities of calcite and aragonite crystals as
a function of sodium citrate concentration in the growth medium. Solution
conditions s ¼ 2.8 for calcite, s ¼ 2.4 for aragonite, aCa2þ=aCO2�3¼ 1:0,
I ¼ 0.130. The fitted lines are from Eq. (2) in the text; for aragonite,
K ¼ 2.570.6� 105M–1, k ¼ 0.034mmmin–1, R ¼ 0.87; for calcite,
K ¼ 1.470.8� 103, k ¼ 0.062mmmin–1, R ¼ 0.21.
M.H. Schmidt et al. / Journal of Crystal Growth 310 (2008) 804–815810
irregular, showing extensive twinning, and a rather ‘‘open’’and nodular three-dimensional structure. By contrast, after1 h of growth in the flow apparatus, crystals (photos dand e) were more solid, with many voids filled in, and hadlower aspect ratios. This is in keeping with the opticalmicroscopy results, in which it was observed that aragonitecrystals mostly grew in width rather than length. Mostimportantly, the aragonite crystals did not show anyinterfacial angles characteristic of calcite overgrowth onthe aragonite seeds.
While direct comparisons of individual crystals beforeand after crystal growth could not conveniently beperformed, SEM images of those portions of disks thatwere exposed to the growth medium and those that wereprotected by the lower portion of the cell showed that thegrowth of the exposed crystals was of the same order ofmagnitude as that measured by optical microscopy. Theseobservations reassure us that the rather high crystal growthrates that we observed are not artifacts of the opticalmeasurement technique.
3.3. Crystal growth with magnesium
Addition of Mg2+ to the Ca2+ solution was found tocompletely inhibit calcite growth at a 1:1 Mg2+/Ca2+ ratiowhile allowing aragonite crystal growth to proceed(data not shown). This result was an important validationof the method, as it is in agreement with many publishedstudies [27,49–51]. X-ray powder diffraction patterns ofseeded disks grown overnight in solutions containingMg2+ showed much more prominent aragonite reflectionsthan those of freshly seeded disks, which were dominatedby the much stronger calcite reflections. These resultssupported our reliance on crystal morphology for phaseidentification.
3.4. Crystal growth with citrate, isocitrate, and
tricarballylic acid
Fig. 5 displays fitted average face velocities of calcite andaragonite crystals as a function of the concentration ofcitrate in the crystallization cell. These experiments wereperformed using calcium and bicarbonate concentrationsthat provided, in the absence of citrate, a calcite super-saturation of s ¼ 2.8, an aragonite supersaturation ofs ¼ 2.4, and aCa2þ=aCO2�
3¼ 1:0. From this graph, it can be
seen that citrate has a marked effect on aragonite crystalgrowth, but relatively little effect on calcite growth. Theseresults are generally in agreement with recent reports ofexperiments done with autotitrator-based methods at lowersupersaturations, although other workers observed greatercalcite inhibition at comparable citrate concentrations[43,44]. Meyer reported significant (50%) inhibition ofthe calcite growth rate by citrate at more moderatesupersaturations (s=1.6).
The derived average face velocity v of the aragonitecrystals as a function of citrate concentration was fit to the
following equation:
v ¼ k 1�K ½additive�
1þ K ½additive�
� �, (3)
where k and K are constants, and [additive] represents theconcentration of additive in the growth solution, in thiscase citrate. The second term within the brackets has thesame form as the Langmuir isotherm, which expresses thefraction y of non-interacting surface sites occupied by anadsorbing species. While the fit of Eq. (2) to crystal growthdata is a convenient way of measuring the relative strengthof growth-inhibiting additives, and has been used in othercrystal growth studies, one must be cautious in theinterpretation of K. The Langmuir isotherm is derivedfrom equilibrium assumptions, while crystal growth is notan equilibrium process; the observed K is likely acombination of both thermodynamic (additive binding)and kinetic (growth inhibition) effects. For this reason werefer to the K values obtained in this study as an effective
binding constants.The best-fit value for the graph in Fig. 4 is
K ¼ 2.570.6� 105M�1 at 25 1C. This value is surprisinglysimilar to the value of K ¼ 5.4� 105M�1 reported byWestin and Rasmuson [44] for experiments at 50 1C(Appendix C). These workers adjusted for the effect ofcitrate on calcium activity so that supersaturation re-mained constant despite addition of citrate, while we didnot; however, because the effect of the impurity was ratherinsensitive to supersaturation, and the supersaturation isestimated to have changed by less than 10% over the rangeof citrate concentrations used in our experiments, thisdiscrepancy is minor compared to the temperature andsupersaturation differences between the two sets ofexperiments.

ARTICLE IN PRESSM.H. Schmidt et al. / Journal of Crystal Growth 310 (2008) 804–815 811
Table 2 outlines the apparent K for citrate and isocitrateat different supersaturations and ion-activity ratios.A decrease of the supersaturation to s ¼ 2.6 for calciteand s ¼ 2.2 for aragonite, with ðaCa2þ=aCO2�
3¼ 1:0 and
ionic strength ¼ 0.13, increased the effective bindingconstant K somewhat, but due to the large error in thefits this increase is not significant. The greater error in K atthe lower supersaturation, and the low R-value of the fit, isin keeping with our general observations that at lowersupersaturations, that there is a greater variation amongstaragonite growth rates for concentrations that do notcompletely inhibit growth. In fact, attempts at measuring K
at so2 (aragonite) were abandoned because of the largevariation in growth rates encountered.
Altering the activity ratio to aCa2þ=aCO2�3¼ 5:2 (s ¼ 2.2)
increased the apparent binding constant K by more than afactor of two when compared to other experiments ats ¼ 2.2. Early experiments at aCa2þ=aCO2�
3¼ 0:5 suggested
that activity ratios less than one did not significantly alterthe effect of citrate compared to aCa2þ=aCO2�
3; however,
sufficient data for an estimate of K at such activity ratioswas not acquired.
The K measured for D,L-isocitrate was not significantlydifferent than obtained that for citrate, suggesting that theregiochemistry of the functional groups does not have asignificant effect on the organic ions’ actions at the growingcrystal interface. Because the isocitrate is used as a racemicmixture, the effective binding constant measured is in factan average of the K for both stereoisomers. It is possiblethat only one stereoisomer is active, with an effectivebinding constant twice as large as the measured K, but afactor of two is not large compared to the fairly large
Fig. 6. SEM micrographs of: (a–c) aragonite and (d–f) calcite. Crystals were
citrate, s ¼ 2.2; (b and e) 4.0� 10–6M sodium D,L isocitrate, s ¼ 2.4; and (c a
uncertainty in the measured K, so we did not pursuestudying the effects of a single stereoisomer.While the position of the hydroxide on the tricarbox-
ylates seems not to make much of a difference in themeasured K, its presence seems necessary for the stronginhibition of aragonite growth; tricarballylate had only avery weak effect on both calcite and aragonite growth inour study. Some workers have reported a mild effect oftricarballylate on both calcite and aragonite growth [42,43],while others have reported no effect [28]. In our experi-ments, aragonite crystals grown in the presence oftricarballylate at 0.34mM, more than twice the highestconcentration of citrate shown in Fig. 4, had growth ratesthat were as much as 85% of the average growth rate of thecontrols at the same supersaturation. From these observa-tions we concluded that any effect of tricarballylate wouldbe rather weak at best, and we did not collect sufficientdata to make statistically significant quantitative estimatesof the effect of this ion.Scanning electron micrographs of crystals grown in the
presence of additives do not show large morphologicalchanges (Fig. 6) when compared to crystals grown in theabsence of additives. In citrate and isocitrate solutions,some rounding of the vertices of calcite crystals can be seen(Fig. 6(d) and (e)), but this is not a feature of all calcitecrystals observed. Aragonite crystals at intermediateconcentrations of citrate and isocitrate (Fig. 6(a) and (b))were intermediate in appearance between crystal seeds andcrystals which had been grown in the control conditions ofpure solution without additive, consistent with no mor-phological modification of the crystals and an intermediategrowth rate. No change in crystal habit or morphology was
grown for 60min in solutions containing: (a and d) 5.0� 10–6M sodium
nd f) 6.8� 10�5M tricarballylic acid, s ¼ 2.2.

ARTICLE IN PRESSM.H. Schmidt et al. / Journal of Crystal Growth 310 (2008) 804–815812
seen in crystals grown in tricarballylate solutions (Fig. 6(c)and (f)).
4. Discussion
4.1. General comments on the method
Our data demonstrate that our optically monitored flowcrystallization assay can reproduce known effects ofmagnesium ions on the selective inhibition of calcitegrowth. Also, we have observed complete inhibition ofaragonite growth by citrate at concentrations similar tothose observed by another technique [44]. Although there isa fair amount of variation and uncertainty in the actualgrowth rates, the fits of the Langmuir isotherm to theconcentration-dependent inhibition of growth determinesthe effective Langmuir constant to within a factor of two inall cases. The most severe limitation of this method forstudying the effects of additives on calcite and aragonitegrowth is the rather narrow range of supersaturations thatgive reproducible growth rates. At low supersaturations,the variation in crystal growth rates is large, while at highsupersaturations, spontaneous nucleation occurs. Thislimitation prevents careful diagnosis of the growth inhibi-tion mechanisms of various additives in the absence of datafrom other methods.
Nevertheless, our method does show the effects of phase-specific crystal growth inhibitors, and can be used forscreening additives for phase-specific effects. Some criticshave suggested that morphology-modifying additiveswould render our method invalid, as we depend onmorphology for phase identification. This does not presenta significant problem for the current study, as there is littlemorphology change observed in either calcite or aragonitewith the additives used in our study. Even in instanceswhere significant morphology change occurs, however, ourmethod may still provide evidence for phase-specificgrowth inhibition. Because crystals are monitored con-tinuously, a crystal can be identified as calcite or aragonitebefore the additive is added and the crystal morphologychanges; if growth rate differences between crystalspreviously identified as calcite and aragonite persist evenas morphologies change, a reasonable working hypothesiswould be that the phase has not changed. Verification ofsurface phase on samples that have undergone morphologychanges in the growth apparatus would be difficult withtraditional X-ray diffraction, but electron backscatterdiffraction (EBSD) could be used for samples where thephase is in doubt and the results are sufficiently interestingto warrant further study.
Changes in morphology would, of course, also result inerrors in the derivation of face velocity similar to thosediscussed in Section 2, but we estimate these would be 10%or less, yielding sufficient accuracy for screening additives.Errors could be much larger in the event that growth wasconcentrated parallel to the optical axis of the microscope,but variable crystal orientations on the glass would likely
cause such anisotropic growth to be observed for somecrystals.Our method is unique in that it measures the growth
numerous crystals with each experiment, whereas AFMexperiments typically only monitor a single growth spiral,and VSI methods typically only view a single crystal.Autotitrator-based methods measure the average growthrate of a very large number of crystals. Thus, our method isuniquely positioned to observe variations in crystal growthrates between crystals, raising interesting questions aboutthe mechanism of such variations. The fairly high standarddeviation in crystal growth rates we observed may be theresult of our use of rapidly-formed crystal seeds, grownunder relatively high supersaturation, but such conditionsmay be relevant to scenarios in both the natural world andin manufacturing. Indeed, the average growth rates ofaragonite of ‘‘flat pearls’’ created in abalone [52] arecomparable to the average derived face velocities observedin this study.
4.2. Growth rates
As reported in Section 3, the crystal growth ratesobserved for calcite are an order of magnitude higher thanthose expected from linear extrapolation of AFM results. Itis possible that crystal growth rates increase above thelinear predictions as supersaturations approach those usedin our study, but other explanations for our high growthrates need to be considered.In comparing the AFM growth rates with those obtained
in this study, it is necessary to remember that the AFMrates are not average rates, but rates of single steps fromdislocations. One difference between our experiments andthose of both the autotitrator and AFM experiments is theorigin of the seed crystals being used for growth studies. Inthe AFM studies, optical-quality geological specimenswere freshly cleaved to obtain very flat faces for AFM.This enabled the measurement of isolated growth spiralsand the observation of spontaneous two-dimensionalsurface nucleation [31] on flat surfaces. In contrast,our microscopic growth substrates were synthesized athigh supersaturation and elevated temperatures in orderto achieve a mix of calcite and aragonite. The resultingcrystal seeds could exhibit high surface roughness and alarge number of defects that could serve as persistentgrowth nuclei. Variability of the number of defects indifferent crystal seeds could also account for the largestandard deviation in the measured rates of individualcrystals.One observation from our work in support of this
surface-roughness hypothesis is that crystal seeds left in asaturated solution for 10min or more before the flowsystem was started were more likely to have comparativelylow growth rates upon delivery of supersaturated solution.This could be due to ‘‘annealing’’ of some surface defects inthe saturated solution. It should be noted, however, thatbuildup of trace growth-blocking impurities in the cell

ARTICLE IN PRESSM.H. Schmidt et al. / Journal of Crystal Growth 310 (2008) 804–815 813
might also explain this observation. Indeed, bacterialcolonization of carbonate mineral surfaces has beenshown to have an effect on dissolution, although thecolonization typically occurs on longer timescales than ourexperiments [53,54]. Attempts to further characterize thewait-time dependence of the crystal growth did not yieldany clear functional form, as a fairly wide variation ingrowth rates at intermediate wait times was observed,suggesting that some crystals and types of defects weremore susceptible to ‘‘annealing’’ than others. Nevertheless,this quiescent-solution effect prompted us to not usedata when the flow of supersaturated solution was notachieved within 2min of mounting the seed crystals in theapparatus.
In an attempt to further test the hypothesis that surfaceroughness due to seeding conditions may have contributedto the high rates observed, calcite seeds were also grown atlower supersaturations (0.02M CaCl2, 0.02M NaHCO3)and room temperature. The resulting seeds still had similarhigh rates of growth, but it could be that these conditionsstill result in crystal seeds characterized by a high numberof surface defects.
4.3. Mechanistic interpretations
As other authors have stated [43,44], the inhibition ofcalcite and aragonite growth by citrate cannot be attributedto complexation of Ca2+; at the concentrations used inthese studies, the decrease in Ca2+ activity was less than10% as estimated by the program PHREEQC using theminteq.dat database.
Diagnosis of the mechanism of growth inhibition byadditives or impurities is customarily done by measuringgrowth rates as a function of supersaturation [55]. Ourmethod is not suited to measurement of rates over a widerange of supersaturations; at higher supersaturations,spontaneous nucleation occurs, while at lower super-saturations, a wide range in crystal growth rates areobserved. The differences in growth observed betweens ¼ 2.2 and 2.4 in this study are not significant comparedto the errors in the fits. The results obtained at othersupersaturations, by other methods [44], provide anopportunity to compare the effect of different super-saturations, but the differences in temperature between thetwo studies complicate any interpretation of these results.It is intriguing that similar effective Langmuir bindingconstants were obtained, despite the differences in super-saturation and temperature. It may be that the lowertemperature in our study yields a higher true bindingconstant of the inhibiting additives, but that the kineticeffect of the bound additive is smaller due to our highersupersaturation, leading to a comparable effective bindingconstant. This is what would be expected, for example, in astep-pinning mechanism [55], where a decreased distancebetween adsorbed additive molecules at lower temperaturewould be offset by a smaller critical radius at highersupersaturation.
4.4. Effect of ion activity ratios
The higher K observed for citrate at aCa2þ=aCO2�3¼ 5:2
points out the need to consider the effect of ion activitieson the effect of additives. Using PHREEQC with theminteq.dat database, we estimated the unscaled activity offree citrate (C6H5O7
3–) in our aCa2þ=aCO2�3¼ 1:0 growth
solutions containing 0.050mM citrate to be 1.9�10�6mol kg�1. This is a factor of approximately 1.8 timeshigher than the activity we estimate when we change theion ratio to be aCa2þ=aCO2�
3¼ 5:2. Because the use of
the minteq.dat database does not allow for use of thePitzer equations in calculating activities, the true ratioof activities in the two solutions may be somewhatdifferent; nevertheless, the difference in citrate activitiesin the two solutions could account for much, if not all, thedifference between the K values for the two ion activityratios.
4.5. Selective inhibition of aragonite growth by citrate
and isocitrate
The notion of ‘‘stereochemical recognition’’ of crystalsurfaces, steps and kinks has been widely discussed [56–60],and it is tempting to view the selective inhibition ofaragonite by citrate and isocitrate observed in this study tophase-specific binding to aragonite surface features. How-ever, the close similarity of the K values measured for theeffect of these two inhibiting ions on aragonite growth,despite their different regiochemistry, suggests that thestereochemical requirements for effective binding andinhibition of aragonite growth are not very stringent. Ofcourse, as noted above, there may be a difference betweenD and L stereoisomers of the isocitrate, but the maximumdifference between the more active stereoisomer ofisocitrate and citrate is a factor of 2.At lower supersaturations, other workers have measured
effective Langmuir constants for aragonite growthinhibition by such diverse polycarboxylates as diethylene-triaminepentaacetate, ethylenediaminetetraacetate, andpyromellitate; these were all found to be within a factorof 6 of that measured for citrate, and all were at least fivetimes, and as much as 170 times, larger as those measuredfor the inhibition of calcite growth [44]. These observa-tions, together with our own observations of littledifference between citrate and isocitrate in the inhibitionof aragonite, suggest that differential growth inhibition ofcalcite and aragonite depends far less on specific stereo-chemical recognition of phase-specific features, and farmore on gross differences between the growth features orgrowth inhibition mechanisms in the different phases.Without AFM data of aragonite growth, it is difficult todetermine just what these differences might be, butdifferences in step-edge geometry and roughness, criticalradius, or rates of two-dimensional nucleation [55]might make aragonite more susceptible to inhibition bypolycarboxylates.

ARTICLE IN PRESSM.H. Schmidt et al. / Journal of Crystal Growth 310 (2008) 804–815814
If a wide variety of polycarboxylates are known toinhibit aragonite growth, one might well ask whytricarballylic acid was not shown in this study to be aneffective inhibitor of aragonite at comparable concentra-tions. It may be that at least four potential oxygen donorgroups (hydroxyls or carboxylates) are necessary foreffective binding to the active sites of the aragonite surface,and tricarballylic acid has but three carboxylates.
All previously published accounts show some inhibitionof calcite by citrate [28,43,44]. Our own observations showa rather weak inhibition of calcite growth with citrate, lessthan was observed by other workers. We show noinhibition of calcite growth with isocitrate. Although wefit the citrate data to a Langmuir isotherm with K as theonly adjustable parameter, the wide variation in growthrates between individual crystals mitigate any significanceone might attach to the functional form of this fit. Thesmaller inhibitory effect of citrate observed in this studymay be due to the higher supersaturation, especially if astep-pinning mechanism is responsible for inhibition [55].
Acknowledgments
The authors thank the College of Arts and Sciences, andthe Office of Graduate Studies, Research and InternationalPrograms, at California State University San Marcos, forfunding of this research. The authors also thank Daniel E.Morse, of the University of California Santa Barbara, forthe use of the scanning electron microscope, and JamesWeaver, also of UCSB, for his expertise in operating themicroscope and obtaining high-quality images.
Appendix A
For rhombohedral calcite crystals, isotropic growthwould yield the following equation:
At ¼ bhþ 2vtð0:978bþ 0:948hÞ þ 3:71v2t2, (A.1)
where b and h represent the base and height of theprojected parallelogram, and all other symbols are asabove. For comparison purposes, we can assume anequilateral parallelogram of edge length b, which simplifiesthe above expression to
At ¼ 0:968b2þ 3:79bvtþ 3:71v2t2. (A.2)
Comparing this value with Eq. (1), it can be seen that achange in geometry merely changes coefficients somewhat,and that the overall quadratic form is still present.
For a linear aragonite needle, elongated in the 001direction but growing only perpendicular to that direction(as is typically observed in these growth experiments), onecan derive the following:
At ¼ Rb2þ 2Rbvt, (A.3)
where R is the ratio of length to width of the aragoniteneedle, and b is the width of the needle. This equation islinear rather than quadratic with respect to time, but as the
quadratic term makes little contribution to the fit in theother equations (due to the smallness of v relative to b) thefit of b from Eq. (A.3) is similar to that of Eq. (1).
Appendix B
The units on the abscissa of this figure should be pm s�1,not nm s�1, as shown in Table 2 of the same reference.J.J. DeYoreo, personal communication.
Appendix C
Westin and Rasmuson fitted the data with an additional‘‘effectiveness factor’’ a; in the case of citrate on aragonite,a ¼ 1.01, making the fitted equation essentially equal toour Eq. (2). Using Kaleidagraph and our own Eq. (2)on the data presented in Ref. [30], we obtain K ¼ 8.272.5� 105M�1.
Appendix D. Supplementary materials
Supplementary data associated with this article can be foundin the online version at doi:10.1016/j.jcrysgro.2007.12.002.
References
[1] G. Atlan, O. Delattre, S. Berland, A. LeFaou, G. Nabias, D. Cot,
E. Lopez, Biomaterials 20 (1999) 1017–1022.
[2] G. Atlan, N. Balmain, S. Berland, B. Vidal, E. Lopez, Comptes
Rendus de L’Academie des Sciences, Series III, Sciences de la Vie 320
(1997) 253–258.
[3] P. Westbroek, F. Marin, Nature 392 (1998) 861–862.
[4] C.E. Bowen, H. Tang, Comp. Biochem. Physiol. 115A (1996)
269–275.
[5] G. Falini, S. Albeck, S. Weiner, L. Addadi, Science 271 (1996) 67–69.
[6] J. Aizenberg, G. Lambert, L. Addadi, S. Weiner, Adv. Mater. 8
(1996) 222–226.
[7] H. Miyamoto, T. Miyashita, M. Okushima, S. Nakano, T. Morita,
A. Matsushiro, Proc. Natl. Acad. Sci. USA 93 (1996) 9657–9660.
[8] H. Miyamoto, M. Yano, T. Miyashita, J. Molluscan Stud. 69 (2003)
87–89.
[9] X. Shen, A.M. Belcher, P.K. Hansma, G.D. Stucky, D.E. Morse,
J. Biol. Chem. 272 (1997) 33472–33481.
[10] D.A. Walters, B.L. Smith, A.M. Belcher, G.T. Paloczi, G.D. Stucky,
D.E. Morse, P.K. Hansma, Biophys. J. 72 (1997) 1425–1433.
[11] T. Samata, N. Hayashi, M. Kono, K. Hasegawa, C. Horita, S. Akera,
FEBS Lett. 462 (1999) 225–229.
[12] C.-S. Choi, Y.-W. Kim, Biomaterials 21 (2000) 213–222.
[13] Q.L. Feng, G. Pu, Y. Pei, F.Z. Cui, H.D. Li, T.N. Kim, J. Crystal
Growth 216 (2000) 459–465.
[14] M. Kono, N. Hayashi, T. Samata, Biochem. Biophys. Res. Commun.
269 (2000) 213–218.
[15] F. Marin, P. Corstjens, B. Gaulejac, E. deVrind-DeJong,
P. Westbroek, J. Biol. Chem. 275 (2000) 220675–260667.
[16] J.B. Thompson, G.T. Paloczi, J.H. Kindt, M. Michenfelder,
B.L. Smith, G.D. Stucky, D.E. Morse, P.K. Hansma, Biophys.
J. 79 (2000) 3307–3312.
[17] L. Bedouet, M.J. Schuller, F. Marin, C. Milet, E. Lopez, M. Giraud,
Comp. Biochem. Physiol. Part B 128 (2001) 389–400.
[18] S.J. Hattan, T.M. Laue, N.D. Chasteen, J. Biol. Chem. 276 (2001)
4330–4337.
[19] I. Sarashina, Mar. Biotechnol. 3 (2001) 362–369.

ARTICLE IN PRESSM.H. Schmidt et al. / Journal of Crystal Growth 310 (2008) 804–815 815
[20] T. Miyashita, R. Takagi, H. Miyamoto, A. Matsushiro, Veliger 45
(2002) 250–255.
[21] B.-A. Gotliv, L. Addadi, S. Weiner, ChemBioChem 4 (2003) 522–529.
[22] I.W. Kim, E. DiMasi, J.S. Evans, Cryst. Growth Design 4 (2004)
1113–1118.
[23] G. Fu, S. Valiyaveettil, B. Wopenka, D.E. Morse, Biomacromole-
cules 6 (2005) 1289–1298.
[24] Y. Levi, S. Albeck, A. Brack, S. Weiner, L. Addadi, Chem. Eur. J. 4
(1998) 389–396.
[25] M.B. Tomson, G.H. Nancollas, Science 200 (1978) 1059–1060.
[26] P. Koutsoukos, Z. Amjad, M.B. Tomson, G.H. Nancollas, J. Am.
Chem. Soc. 102 (1980) 1553–1557.
[27] K.J. Davis, P.M. Dove, J.J. DeYoreo, Science 290 (2000) 1134–1137.
[28] H.J. Meyer, J. Crystal Growth 66 (1984) 639–646.
[29] T.A. Land, J.J. DeYoreo, J.D. Lee, Surf. Sci. 384 (1997) 136–155.
[30] H.H. Teng, P.M. Dove, C.A. Orme, J.J. DeYoreo, Science 282 (1998)
724–727.
[31] H.H. Teng, P.M. Dove, J.J. DeYoreo, Geochim. Cosmochim. Acta
64 (2000) 2255–2266.
[32] H.H. Teng, P.M. Dove, J.J. DeYoreo, Geochim. Cosmochim. Acta
63 (1999) 2507–2512.
[33] M.D. Vinson, A. Luttge, Am. J. Sci. 305 (2005) 119–146.
[34] R.S. Arvidson, I.E. Ertan, J.E. Amonette, A. Luttge, Geochim.
Cosmochim. Acta 67 (2003) 1623–1634.
[35] A. Luttge, E.W. Bolton, A.C. Lasaga, Am. J. Sci. 299 (1999) 652–678.
[36] H. Ohmoto, K. Hayashi, K. Onuma, K. Tsukamoto, A. Kitakaze,
Y. Nakano, Y. Yamamoto, Nature 351 (1991) 634–636.
[37] J.W. Mullin, J. Garside, Trans. Inst. Chem. Eng. 45 (1967)
T285–T290.
[38] G.D. Botsaris, E.G. Denk Jr., Ind. Eng. Chem.: Fundam. 9 (1970)
276–283.
[39] E.G. Denk, G.D. Botsaris, J. Crystal Growth 6 (1970) 241–244.
[40] J. Garside, R. Janssen-Van Rosmalen, P. Bennema, J. Crystal
Growth 29 (1975) 353–366.
[41] G. Bliznakov, E. Kirkova, R. Nikolayeva, Kristall Technik 6 (1971)
33–38.
[42] R.A. Berner, J.T. Westrich, R. Graber, J. Smith, C.S. Martens, Am.
J. Sci. 278 (1978) 816–837.
[43] M.M. Reddy, A.R. Hoch, J. Colloid Interface Sci. 235 (2001)
365–370.
[44] K.-J. Westin, A.C. Rasmuson, J. Colloid Interface Sci. 282 (2005)
359–369.
[45] J.L. Wray, F. Daniels, J. Am. Chem. Soc. 79 (1957) 2031–2034.
[46] D.L. Parkhurst, C.A.J. Appelo, US Geological Survey Water-Resources
Investigations Report 99-4259, Washington, DC, 1999, p. 312.
[47] L.N. Plummer, D.L. Parkhurst, Chemical Modeling of Aqueous
Systems II, American Chemical Society, Washington, DC, 1990,
pp. 128–137.
[48] L.N. Plummer, D.L. Parkhurst, G.W. Fleming, S.A. Dunkle. US
Geological Survey Water-Resources Investigations Report 88-4153,
1988, p. 310.
[49] R.A. Berner, Geochim. Cosmochim. Acta 39 (1975) 489–504.
[50] K. DeGroot, E.M. Duyvis, Nature 212 (1966) 183–184.
[51] P. Moller, Rajagopalan, Zeitschrift Phys. Chem. Neue Folge 94
(1975) 294–314.
[52] M. Fritz, A.M. Belcher, M. Radmacher, D.A. Walters, P.K. Hansma,
G.D. Stucky, D.E. Morse, S. Mann, Nature 371 (1994) 49–51.
[53] K.J. Davis, K.H. Nealson, A. Luttge, Geobiology 5 (2007) 191–205.
[54] A. Luttge, P.G. Conrad, Appl. Environ. Microbiol. 70 (2004)
1627–1632.
[55] J.J. DeYoreo, P.G. Vekilov, in: P.M. Dove, J.J. DeYoreo, S. Weiner
(Eds.), Biomineralization, The Mineralogical Society of America,
Washington, DC, 2003, pp. 57–93.
[56] L. Addadi, S. Weiner, Proc. Natl. Acad. Sci. USA 82 (1985)
4110–4114.
[57] L.J.W. Shimon, M. Vaida, L. Addadi, M. Lahav, L. Leiserowitz,
J. Am. Chem. Soc. 112 (1990) 6215–6220.
[58] L. Addadi, S. Weiner, Angewandte Chem. Int. Ed. English 31 (1992)
153–169.
[59] S. Mann, Nature 332 (1988) 119–124.
[60] S. Mann, B.R. Heywood, S. Rajam, J.D. Birchall, Nature 334 (1988)
692–695.