Antimalarial Activity of Phenylthiazolyl-Bearing Hydroxamate-Based Histone Deacetylase Inhibitors
Upload
independentCategory
view
1download
0
nature CHeMICaL BIOLOGY | AdvAnce online publicAtion | www.nature.com/naturechemicalbiology 1
articlepuBLIsHed OnLIne: 24 MarCH 2013 | dOI: 10.1038/nCHeMBIO.1223
Class IIa HDACs are poorly understood as epigenetic metal-loenzymes, suffering both from a misnomer (histones are not their substrates, and they are not efficient deacetylases)
and a lack of pharmacological tools to specifically probe their activity1,2. In fact, despite rich characterizations of thousands of acetylation sites at the whole-cell level, the proposed substrates of class IIa HDACs have only been identified in engineered over-expression systems3–5. The field has come to accept a noncatalytic role for class IIa HDACs, where partnering with HDAC3 provides the deacetylase activity, and signal-dependent phosphorylation in the noncatalytic half of the protein regulates participation in co-repressor complexes2,6–9. Until a widely accepted, endogenous enzymatic substrate is discovered for class IIa HDACs, the pre-dominant hypothesis is that the catalytic domain serves an acetylly-sine ‘reader’ function analogous to bromodomains10. Interest in these proteins as drug targets persists owing to genetic approaches implicating class IIa HDACs in a diverse range of indications including alopecia, Huntington’s disease, glucose homeostasis, mus-cular dystrophies, autoimmunity and ischemic stroke11–16. However, targeted deletion and RNAi studies reported to date have not dis-tinguished the scaffolding function of the noncatalytic domain from the orphan catalytic activity or acetyllysine reader function. Furthermore, genome-wide association studies cannot determine whether there is a causal link between the gene and the risk of disease. Without the complementary pharmacological studies, class IIa HDAC enzymes remain intriguing but poorly validated targets for a variety of human diseases.
Although class I HDAC inhibitors (vorinostat and romidepsin) have advanced to clinical success in cutaneous T-cell lymphoma and have been closely followed by pan-HDAC inhibitors in late clinical trials, the toolbox of chemical probes is still devoid of potent and selective inhibitors of class IIa HDACs1. This gap partially stems from the debated catalytic activity of these enzymes but has most likely persisted because of the unfavorable pharmaceutical prop-erties of hydroxamate-containing compounds. Their poor phar-macokinetics (rapid clearance) and selectivity profiles (multiple off-target interactions, including the hERG cardiac ion channel) are red flags on the path of drug development, particularly in disease indications that are not life threatening. Additionally, owing to the strength of a hydroxamate–metal ion interaction, target selectivity becomes a considerable challenge in the ability to design potent inhibitors for metalloenzyme targets (such as HDACs, matrix metalloproteases and TNF-α–converting enzyme) when working with this metal-binding group (MBG)17,18.
In this study, we discovered a distinct series of class IIa HDAC inhibitors containing a trifluoromethyloxadiazolyl moiety as a nonchelating MBG, as verified through crystallographic methods. We then demonstrated the target specificity afforded by the TFMO using chemoproteomic approaches and used these cell-active chemical probes to identify the consequences of acutely inhibiting class IIa HDAC catalytic activity in primary human cells. These chemical probes are important tools in the HDAC inhibitor field, creating an opportunity for the precise dissection of class IIa HDAC catalytic and/or acetyllysine reader activity from the scaffolding
1tempero pharmaceuticals, cambridge, Massachusetts, uSA. 2GlaxoSmithKline pharmaceuticals, platform and technology Science, Research triangle park, north carolina, uSA. 3GlaxoSmithKline pharmaceuticals, platform and technology Science, collegeville, pennsylvania, uSA. 4epinova dpu, immuno-inflammation therapy Area, GlaxoSmithKline R&d, Medicines Research centre, Stevenage, uK. 5present addresses: verastem inc. cambridge, Massachusetts, uSA (Q.G.W.); Forma therapeutics, Watertown, Massachusetts, uSA (d.R.S.); Karyopharm therapeutics, natick, Massachusetts, uSA (e.b.); lilly china Research and development center, eli lilly and company, Shanghai, china (J.X.R.); pfizer center for therapeutic innovation, boston, Massachusetts, uSA (d.S.). *e-mail: [email protected].
selective class IIa histone deacetylase inhibition via a nonchelating zinc-binding groupMercedes Lobera1, Kevin p Madauss2, denise t pohlhaus2, Quentin G Wright1,5, Mark trocha1, darby r schmidt1,5, erkan Baloglu1,5, ryan p trump2, Martha s Head3, Glenn a Hofmann3, Monique Murray-thompson3, Benjamin schwartz3, subhas Chakravorty3, Zining Wu3, palwinder K Mander4, Laurens Kruidenier4, robert a reid2, William Burkhart2, Brandon J turunen2, James X rong2,5, Craig Wagner2, Mary B Moyer2, Carrow Wells2, Xuan Hong3, John t Moore2, Jon d Williams2, dulce soler1,5, shomir Ghosh1 & Michael a nolan1*
In contrast to studies on class I histone deacetylase (HDAC) inhibitors, the elucidation of the molecular mechanisms and therapeutic potential of class IIa HDACs (HDAC4, HDAC5, HDAC7 and HDAC9) is impaired by the lack of potent and selective chemical probes. Here we report the discovery of inhibitors that fill this void with an unprecedented metal-binding group, trifluoromethyloxadiazole (TFMO), which circumvents the selectivity and pharmacologic liabilities of hydroxamates. We confirm direct metal binding of the TFMO through crystallographic approaches and use chemoproteomics to demonstrate the superior selectivity of the TFMO series relative to a hydroxamate-substituted analog. We further apply these tool compounds to reveal gene regulation dependent on the catalytic active site of class IIa HDACs. The discovery of these inhibitors challenges the design process for targeting metalloenzymes through a chelating metal-binding group and suggests therapeutic potential for class IIa HDAC enzyme blockers distinct in mechanism and application compared to current HDAC inhibitors.
2 nature CHeMICaL BIOLOGY | AdvAnce online publicAtion | www.nature.com/naturechemicalbiology
article NATure CHeMICAl bIOlOgy dOI: 10.1038/nCHeMBIO.1223
function of the N-terminal half of the protein as a starting point to decipher the molecular activity and therapeutic potential of these enzymes.
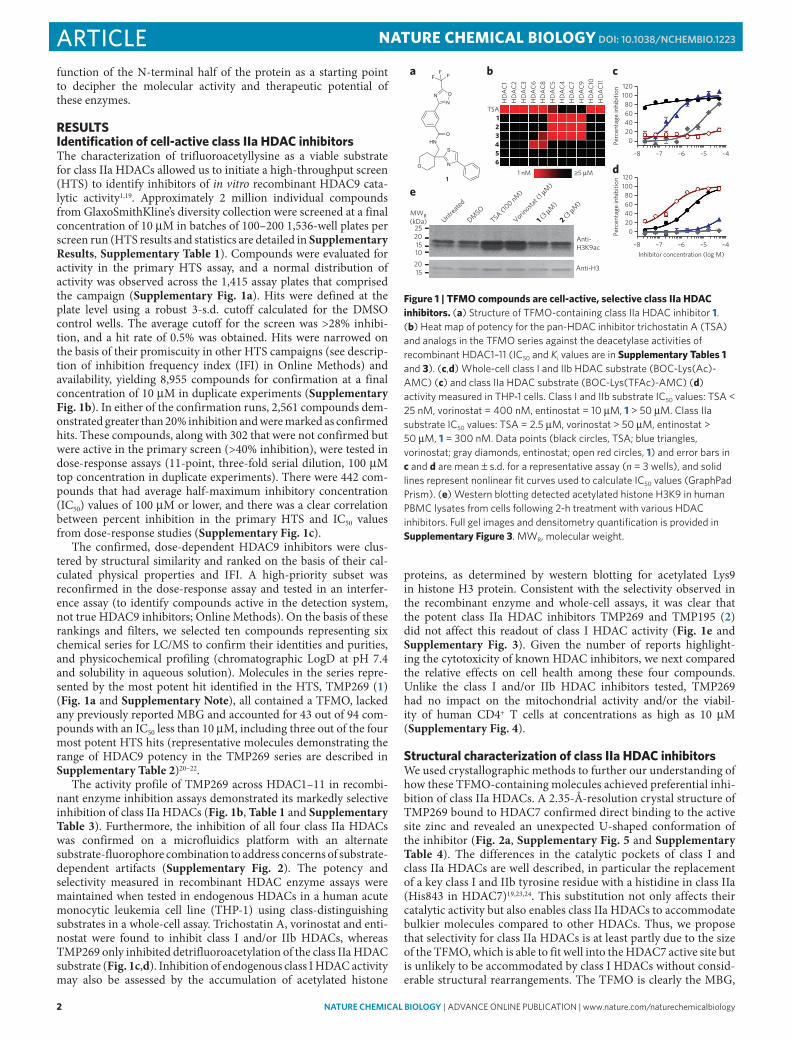
reSulTSIdentification of cell-active class IIa HDAC inhibitorsThe characterization of trifluoroacetyllysine as a viable substrate for class IIa HDACs allowed us to initiate a high-throughput screen (HTS) to identify inhibitors of in vitro recombinant HDAC9 cata-lytic activity1,19. Approximately 2 million individual compounds from GlaxoSmithKline’s diversity collection were screened at a final concentration of 10 μM in batches of 100–200 1,536-well plates per screen run (HTS results and statistics are detailed in Supplementary Results, Supplementary Table 1). Compounds were evaluated for activity in the primary HTS assay, and a normal distribution of activity was observed across the 1,415 assay plates that comprised the campaign (Supplementary Fig. 1a). Hits were defined at the plate level using a robust 3-s.d. cutoff calculated for the DMSO control wells. The average cutoff for the screen was >28% inhibi-tion, and a hit rate of 0.5% was obtained. Hits were narrowed on the basis of their promiscuity in other HTS campaigns (see descrip-tion of inhibition frequency index (IFI) in Online Methods) and availability, yielding 8,955 compounds for confirmation at a final concentration of 10 μM in duplicate experiments (Supplementary Fig. 1b). In either of the confirmation runs, 2,561 compounds dem-onstrated greater than 20% inhibition and were marked as confirmed hits. These compounds, along with 302 that were not confirmed but were active in the primary screen (>40% inhibition), were tested in dose-response assays (11-point, three-fold serial dilution, 100 μM top concentration in duplicate experiments). There were 442 com-pounds that had average half-maximum inhibitory concentration (IC50) values of 100 μM or lower, and there was a clear correlation between percent inhibition in the primary HTS and IC50 values from dose-response studies (Supplementary Fig. 1c).
The confirmed, dose-dependent HDAC9 inhibitors were clus-tered by structural similarity and ranked on the basis of their cal-culated physical properties and IFI. A high-priority subset was reconfirmed in the dose-response assay and tested in an interfer-ence assay (to identify compounds active in the detection system, not true HDAC9 inhibitors; Online Methods). On the basis of these rankings and filters, we selected ten compounds representing six chemical series for LC/MS to confirm their identities and purities, and physicochemical profiling (chromatographic LogD at pH 7.4 and solubility in aqueous solution). Molecules in the series repre-sented by the most potent hit identified in the HTS, TMP269 (1) (Fig. 1a and Supplementary Note), all contained a TFMO, lacked any previously reported MBG and accounted for 43 out of 94 com-pounds with an IC50 less than 10 μM, including three out of the four most potent HTS hits (representative molecules demonstrating the range of HDAC9 potency in the TMP269 series are described in Supplementary Table 2)20–22.
The activity profile of TMP269 across HDAC1–11 in recombi-nant enzyme inhibition assays demonstrated its markedly selective inhibition of class IIa HDACs (Fig. 1b, Table 1 and Supplementary Table 3). Furthermore, the inhibition of all four class IIa HDACs was confirmed on a microfluidics platform with an alternate substrate-fluorophore combination to address concerns of substrate- dependent artifacts (Supplementary Fig. 2). The potency and selectivity measured in recombinant HDAC enzyme assays were maintained when tested in endogenous HDACs in a human acute monocytic leukemia cell line (THP-1) using class-distinguishing substrates in a whole-cell assay. Trichostatin A, vorinostat and enti-nostat were found to inhibit class I and/or IIb HDACs, whereas TMP269 only inhibited detrifluoroacetylation of the class IIa HDAC substrate (Fig. 1c,d). Inhibition of endogenous class I HDAC activity may also be assessed by the accumulation of acetylated histone
proteins, as determined by western blotting for acetylated Lys9 in histone H3 protein. Consistent with the selectivity observed in the recombinant enzyme and whole-cell assays, it was clear that the potent class IIa HDAC inhibitors TMP269 and TMP195 (2) did not affect this readout of class I HDAC activity (Fig. 1e and Supplementary Fig. 3). Given the number of reports highlight-ing the cytotoxicity of known HDAC inhibitors, we next compared the relative effects on cell health among these four compounds. Unlike the class I and/or IIb HDAC inhibitors tested, TMP269 had no impact on the mitochondrial activity and/or the viabil-ity of human CD4+ T cells at concentrations as high as 10 μM (Supplementary Fig. 4).
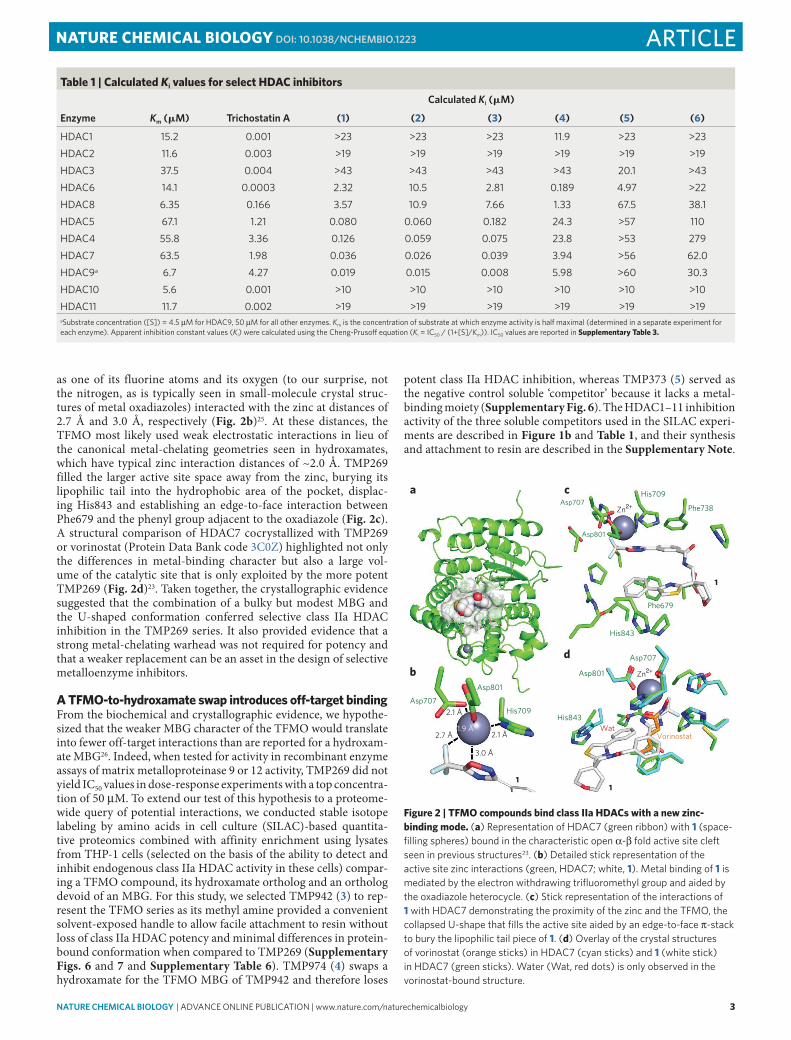
Structural characterization of class IIa HDAC inhibitorsWe used crystallographic methods to further our understanding of how these TFMO-containing molecules achieved preferential inhi-bition of class IIa HDACs. A 2.35-Å-resolution crystal structure of TMP269 bound to HDAC7 confirmed direct binding to the active site zinc and revealed an unexpected U-shaped conformation of the inhibitor (Fig. 2a, Supplementary Fig. 5 and Supplementary Table 4). The differences in the catalytic pockets of class I and class IIa HDACs are well described, in particular the replacement of a key class I and IIb tyrosine residue with a histidine in class IIa (His843 in HDAC7)19,23,24. This substitution not only affects their catalytic activity but also enables class IIa HDACs to accommodate bulkier molecules compared to other HDACs. Thus, we propose that selectivity for class IIa HDACs is at least partly due to the size of the TFMO, which is able to fit well into the HDAC7 active site but is unlikely to be accommodated by class I HDACs without consid-erable structural rearrangements. The TFMO is clearly the MBG,
TSA
ba
e
c
d
HD
AC
1H
DA
C2
HD
AC
3H
DA
C6
HD
AC
8H
DA
C5
HD
AC
4H
DA
C7
HD
AC
9H
DA
C10
HD
AC
11
1
120100806040
Perc
enta
ge in
hibi
tion
Perc
enta
ge in
hibi
tion
200
12010080604020
0
–8 –7
Inhibitor concentration (log M)
–6 –5 –4
–8 –7 –6 –5 –4
23456
Untreated
MWR(kDa)
25201510
2015
DMSO
TSA (100 nM
)
Vorinosta
t (1 µ
M)
1 (3 µM
)
2 (3 µM
)
Anti-H3K9ac
Anti-H3
1 nM ≥5 µM
O
HN
O
N
N
FF F
O
S
N
1
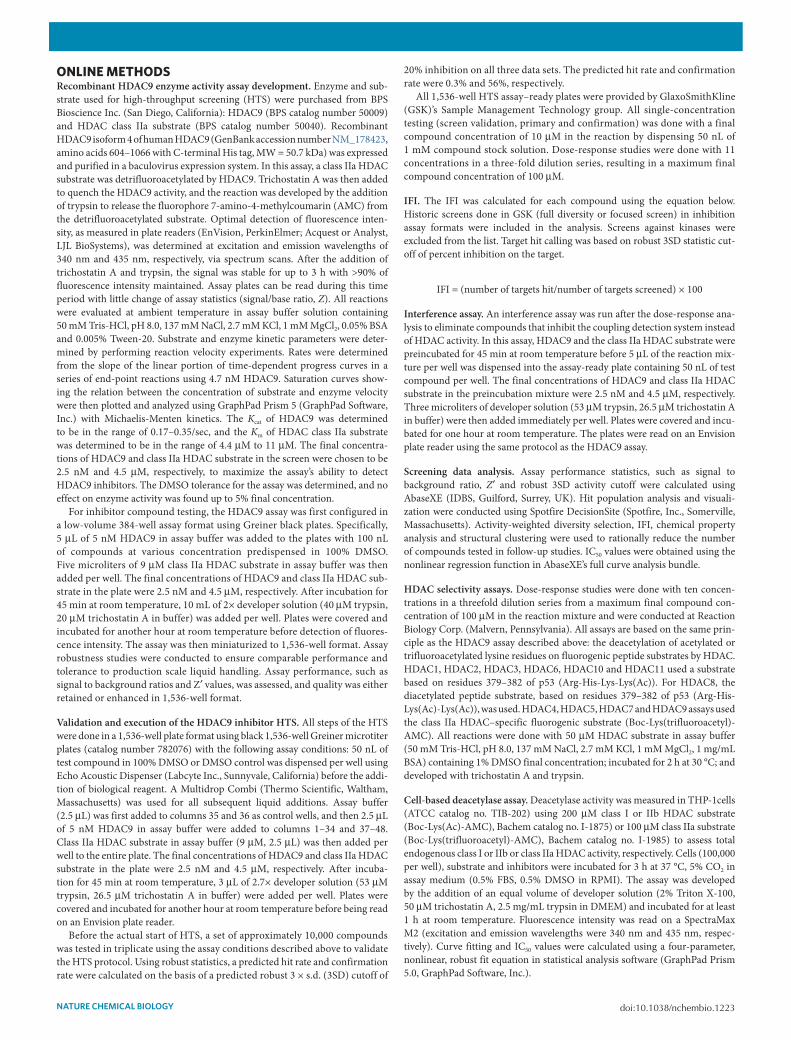
Figure 1 | TFMO compounds are cell-active, selective class IIa HDAC inhibitors. (a) Structure of tFMo-containing class iia HdAc inhibitor 1. (b) Heat map of potency for the pan-HdAc inhibitor trichostatin A (tSA) and analogs in the tFMo series against the deacetylase activities of recombinant HdAc1–11 (ic50 and Ki values are in Supplementary Tables 1 and 3). (c,d) Whole-cell class i and iib HdAc substrate (boc-lys(Ac)-AMc) (c) and class iia HdAc substrate (boc-lys(tFAc)-AMc) (d) activity measured in tHp-1 cells. class i and iib substrate ic50 values: tSA < 25 nM, vorinostat = 400 nM, entinostat = 10 μM, 1 > 50 μM. class iia substrate ic50 values: tSA = 2.5 μM, vorinostat > 50 μM, entinostat > 50 μM, 1 = 300 nM. data points (black circles, tSA; blue triangles, vorinostat; gray diamonds, entinostat; open red circles, 1) and error bars in c and d are mean ± s.d. for a representative assay (n = 3 wells), and solid lines represent nonlinear fit curves used to calculate ic50 values (Graphpad prism). (e) Western blotting detected acetylated histone H3K9 in human pbMc lysates from cells following 2-h treatment with various HdAc inhibitors. Full gel images and densitometry quantification is provided in Supplementary Figure 3. MWR, molecular weight.
nature CHeMICaL BIOLOGY | AdvAnce online publicAtion | www.nature.com/naturechemicalbiology 3
articleNATure CHeMICAl bIOlOgy dOI: 10.1038/nCHeMBIO.1223
as one of its fluorine atoms and its oxygen (to our surprise, not the nitrogen, as is typically seen in small-molecule crystal struc-tures of metal oxadiazoles) interacted with the zinc at distances of 2.7 Å and 3.0 Å, respectively (Fig. 2b)25. At these distances, the TFMO most likely used weak electrostatic interactions in lieu of the canonical metal-chelating geometries seen in hydroxamates, which have typical zinc interaction distances of ~2.0 Å. TMP269 filled the larger active site space away from the zinc, burying its lipophilic tail into the hydrophobic area of the pocket, displac-ing His843 and establishing an edge-to-face interaction between Phe679 and the phenyl group adjacent to the oxadiazole (Fig. 2c). A structural comparison of HDAC7 cocrystallized with TMP269 or vorinostat (Protein Data Bank code 3C0Z) highlighted not only the differences in metal-binding character but also a large vol-ume of the catalytic site that is only exploited by the more potent TMP269 (Fig. 2d)23. Taken together, the crystallographic evidence suggested that the combination of a bulky but modest MBG and the U-shaped conformation conferred selective class IIa HDAC inhibition in the TMP269 series. It also provided evidence that a strong metal-chelating warhead was not required for potency and that a weaker replacement can be an asset in the design of selective metalloenzyme inhibitors.
A TFMO-to-hydroxamate swap introduces off-target bindingFrom the biochemical and crystallographic evidence, we hypothe-sized that the weaker MBG character of the TFMO would translate into fewer off-target interactions than are reported for a hydroxam-ate MBG26. Indeed, when tested for activity in recombinant enzyme assays of matrix metalloproteinase 9 or 12 activity, TMP269 did not yield IC50 values in dose-response experiments with a top concentra-tion of 50 μM. To extend our test of this hypothesis to a proteome-wide query of potential interactions, we conducted stable isotope labeling by amino acids in cell culture (SILAC)-based quantita-tive proteomics combined with affinity enrichment using lysates from THP-1 cells (selected on the basis of the ability to detect and inhibit endogenous class IIa HDAC activity in these cells) compar-ing a TFMO compound, its hydroxamate ortholog and an ortholog devoid of an MBG. For this study, we selected TMP942 (3) to rep-resent the TFMO series as its methyl amine provided a convenient solvent-exposed handle to allow facile attachment to resin without loss of class IIa HDAC potency and minimal differences in protein-bound conformation when compared to TMP269 (Supplementary Figs. 6 and 7 and Supplementary Table 6). TMP974 (4) swaps a hydroxamate for the TFMO MBG of TMP942 and therefore loses
potent class IIa HDAC inhibition, whereas TMP373 (5) served as the negative control soluble ‘competitor’ because it lacks a metal-binding moiety (Supplementary Fig. 6). The HDAC1–11 inhibition activity of the three soluble competitors used in the SILAC experi-ments are described in Figure 1b and Table 1, and their synthesis and attachment to resin are described in the Supplementary Note.
Table 1 | Calculated Ki values for select HDAC inhibitors
enzyme Km (mM)
Calculated Ki (mM)
trichostatin a (1) (2) (3) (4) (5) (6)
HdAc1 15.2 0.001 >23 >23 >23 11.9 >23 >23HdAc2 11.6 0.003 >19 >19 >19 >19 >19 >19HdAc3 37.5 0.004 >43 >43 >43 >43 20.1 >43HdAc6 14.1 0.0003 2.32 10.5 2.81 0.189 4.97 >22HdAc8 6.35 0.166 3.57 10.9 7.66 1.33 67.5 38.1HdAc5 67.1 1.21 0.080 0.060 0.182 24.3 >57 110HdAc4 55.8 3.36 0.126 0.059 0.075 23.8 >53 279HdAc7 63.5 1.98 0.036 0.026 0.039 3.94 >56 62.0HdAc9a 6.7 4.27 0.019 0.015 0.008 5.98 >60 30.3HdAc10 5.6 0.001 >10 >10 >10 >10 >10 >10HdAc11 11.7 0.002 >19 >19 >19 >19 >19 >19aSubstrate concentration ([S]) = 4.5 μM for HdAc9, 50 μM for all other enzymes. Km is the concentration of substrate at which enzyme activity is half maximal (determined in a separate experiment for each enzyme). Apparent inhibition constant values (Ki) were calculated using the cheng-prusoff equation (Ki = ic50 / (1+[S]/Km)). ic50 values are reported in Supplementary Table 3.
Asp707
Asp801
His709
Phe738
Phe679
His843
Asp707
Asp801
Asp801
Asp707His709
WatVorinostat
His843
Zn2+
2.1 Å
2.1 Å
a c
bd
1.9 Å
1
3.0 Å
2.7 Å
Zn2+
1
1
Figure 2 | TFMO compounds bind class IIa HDACs with a new zinc-binding mode. (a) Representation of HdAc7 (green ribbon) with 1 (space-filling spheres) bound in the characteristic open α-β fold active site cleft seen in previous structures23. (b) detailed stick representation of the active site zinc interactions (green, HdAc7; white, 1). Metal binding of 1 is mediated by the electron withdrawing trifluoromethyl group and aided by the oxadiazole heterocycle. (c) Stick representation of the interactions of 1 with HdAc7 demonstrating the proximity of the zinc and the tFMo, the collapsed u-shape that fills the active site aided by an edge-to-face π-stack to bury the lipophilic tail piece of 1. (d) overlay of the crystal structures of vorinostat (orange sticks) in HdAc7 (cyan sticks) and 1 (white stick) in HdAc7 (green sticks). Water (Wat, red dots) is only observed in the vorinostat-bound structure.

4 nature CHeMICaL BIOLOGY | AdvAnce online publicAtion | www.nature.com/naturechemicalbiology
article NATure CHeMICAl bIOlOgy dOI: 10.1038/nCHeMBIO.1223
Excess (75 μM) unbound TMP942 specifically competed off HDAC4, HDAC5 and HDAC7 from TMP942 affinity resin treated with THP-1 lysates (Fig. 3a). HDAC10 was also displaced by TMP942; however, this interaction was most likely independent of the MBG as it was competed off by excess (75 μM) TMP373 (Supplementary Fig. 8) and is potentially allosteric because TMP942 did not inhibit HDAC10 catalytic activity. In contrast, 75 μM TMP974 specifically displaced nine proteins but no HDACs (consistent with the lack of activity in the biochemical assays) from immobilized TMP974, with a propensity for interacting with known metal ion–binding proteins (six out of nine binders; Fig. 3b). The data for TMP974 were consistent with reported off- target activities of hydroxamates, but the skewed distribution of protein fold changes for TMP974 led us to confirm the relative on- and off-target specificities for both MBGs in HEK293 cell lysates for targets present in that proteome (Supplementary Fig. 9). The cell lysates used in these experiments contained solubilized class I HDACs (HDAC1 and HDAC2 were detected by tandem MS in the resin washes from both THP-1 and HEK293 cell lysates; Supplementary Table 7), but they were not selectively competed off by TMP942. In contrast, this approach did not yield detectable class IIa HDAC peptides in washes of the HEK lysates (or HDAC9 in the THP-1 lysates), evidence that these proteins were in very low abundance in these extracts. Notably, we could not observe the dis-placement of any proteins reported to form complexes with class IIa HDACs (for example, HDAC3, despite also being detected by tandem MS in input lysates). This observation was consistent with recent chemoproteomic approaches where class IIa HDACs were absent from HDAC3 complexes specifically bound to class I or IIb inhibitor matrices26. Although the absence of any detectable off-target interactions from two separate proteomes cannot confirm that com-pounds in the TFMO series are entirely specific for class IIa HDACs, the data added a high degree of confidence when these chemical
probes were used to query the biological consequences of acute pharmacological occupancy of the class IIa HDAC active sites.
gene expression influenced by class IIa HDAC inhibitorsThe current models of class IIa HDAC–regulated gene expression are based entirely on the noncatalytic function of these proteins, bringing the epigenetic enzyme classification of these proteins into question8,27. For example, histone deacetylation–dependent activation of gene expression involving HDAC4, HDAC5, HDAC7 or HDAC9 has been shown to require the catalytic activity of HDAC3 (refs. 2,6). Furthermore, the phosphorylation-regulated 14-3-3 binding domains in the N-terminal portions (noncatalytic domains) of class IIa HDACs regulate their participation in co- repressor complexes7. Little is known about how the conserved catalytic or reader domain, particularly the acetyllysine-binding site, affects these interactions. Enabled by the potency and selec-tivity of the chemical tools described above, we pursued a pharma-cological approach to address the less-understood contributions of the class IIa HDAC catalytic domains’ acetyllysine-binding pocket or catalytic active site in regulating gene expression. We performed whole-genome transcriptional profiling on phytohemaggluti-nin (PHA)-activated human peripheral blood mononuclear cells (PBMCs) to identify genes affected by a class IIa HDAC inhibi-tor, TMP195 (Fig. 4a). This compound was selected to represent the TFMO series in the subsequent cell-based assays because of its activity in cell-based class IIa HDAC assays (IC50 = 300 nM) and low potency in recombinant class I and IIb HDAC assays, enabling full inhibition of class IIa HDAC activity without inhibi-tion of other HDACs. Only 16 and 60 genes were up- or downreg-ulated by a factor of ≥1.4, respectively, by TMP195 in the PBMCs of two unique donors, a marked contrast to the number of genes affected by vorinostat in this system (1,853 and 2,703 genes up- or downregulated by a factor of ≥1.4 in both specimens, respectively; Fig. 4b and Supplementary Data Sets 1 and 2). The majority of TFMO-affected genes (54 out of 76) were downregulated by vor-inostat, most likely because of this HDAC inhibitor’s effects on cell viability (and monocyte–B cell–T cell proportionality) that were not observed for TMP195 (Supplementary Fig. 10)28. The genes affected by class IIa HDAC inhibition are relevant in immune responses and include the altered expression of chemokines, complement pathway components and cell-surface interaction
4
2
0
–2HDAC4
HDAC10HDAC7
HDAC5
3a b 4
NT5DC1DCKCAT GLO1
HINT1NME4 FLAD1 FASN
APRT–4
–2 0 2 4–4 –2 0 2 4–4
log 2 H
/L ra
tio (fl
ip)
log2 H/L ratio (forward) log2 H/L ratio (forward)
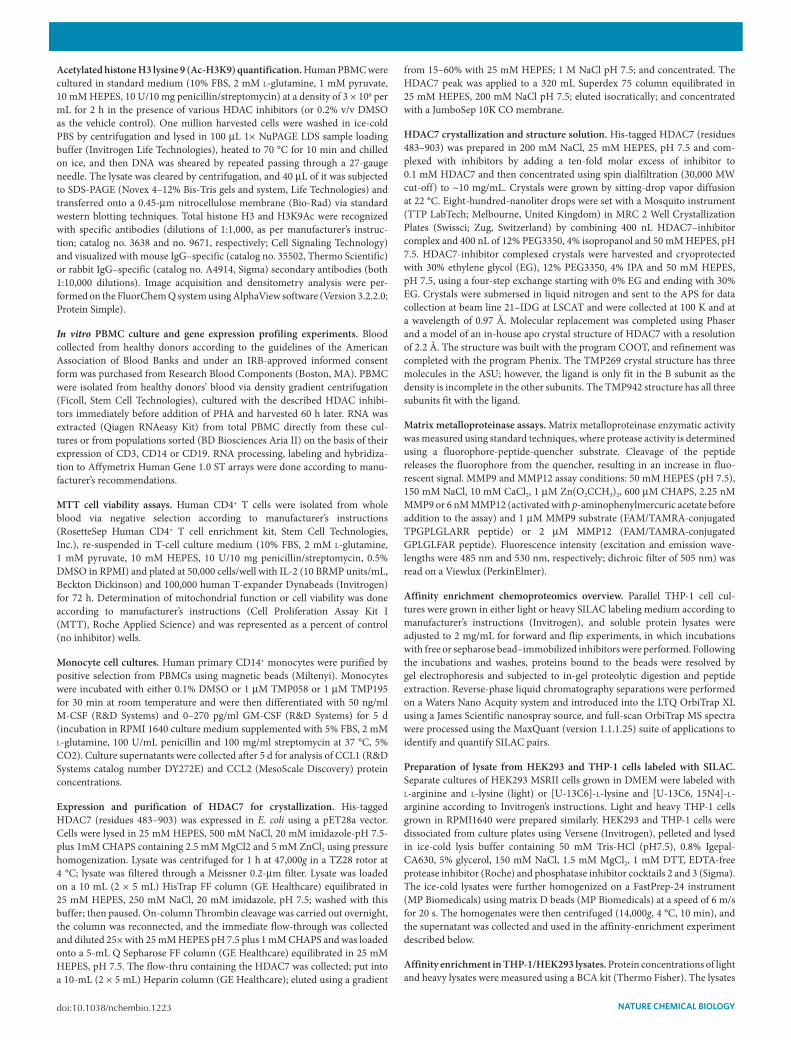
Figure 3 | Specific class IIa HDAC binding by a TFMO Mbg is lost when replaced with a hydroxamate. (a,b) Scatter plots depicting SilAc heavy/light (H/l) ratios for proteins identified in both the ‘forward’ (light lysates incubated with 75 μM competitor, heavy lysates incubated with dMSo) and ‘flip’ (light lysates incubated with dMSo, heavy lysates incubated with 75 μM competitor) versions of the pull-down experiments involving potent class ii HdAc inhibitor 3 (a) and its hydroxamate MbG analog 4 (b). each symbol (blue circles) represents an individual protein on the inhibitor-conjugated beads after incubation with tHp1 lysates. proteins with a ratio ≥ 2.0 in the forward and ≤ 0.5 in the flip experiment are considered specific compound binders (red circles). HdAc10 (purple circle) also bound the inactive nitrile analog 5, and its binding is considered to be independent of the MbG. nt5dc1, 5-nucleotidase domain-containing protein 1; dcK, deoxycytidine kinase; cAt, catalase; Glo1, lactoglutathione lyase; Hint1, histidine triad nucleotide-binding protein 1; FlAd1, FAd synthase; nMe4, nucleoside diphosphate kinase, mitochondrial; ApRt, adenine phosphoribosyltransferase; FASn, fatty acid synthase.
2a b
1
0
–1
–2
2
1
0
–1
–2
–2 –1 0 1 2
–9 –6 –3 0 3 6 9 –9 –6 –3 0 3 6 9
log2 fold change 2 versus DMSODonor A
Donor A Donor B
log2 fold change vorinostat versus DMSO
log 2 fo
ld c
hang
e 2
vers
us D
MSO
log 2 fo
ld c
hang
e 2
vers
us D
MSO
Don
or B
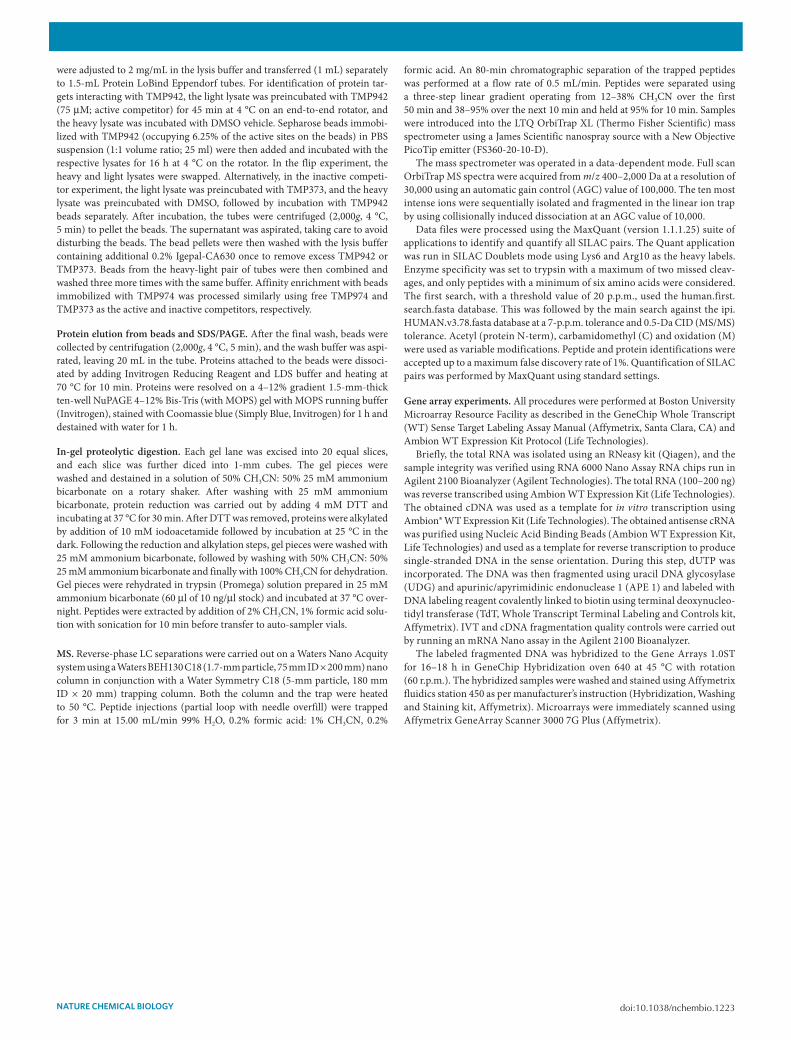
Figure 4 | Class IIa HDAC enzyme inhibitors alter gene expression unlike a class I and IIb HDAC inhibitor. (a,b) Fold change–fold change plots comparing differential gene expression in pHA-stimulated pbMcs caused by 3 μM compound treatment showing either 2 (tHp-1 whole-cell class iia HdAc, ic50 = 300 nM) versus dMSo in two unique donors (a) or vorinostat (whole-cell class i or iib HdAc, ic50 = 400 nM, inactive against class iia HdAc) versus 2 (y axis) (b) in the same two donors. Affymetrix probes above the minimum expression value are represented by symbols depending on their differential expression: gray circles, up- or downregulation by factor of < 1.4 by 2; pink and blue triangles, up- or downregulation by factor of > 1.4 by 2. dashed lines represent axis of equal differential expression.

nature CHeMICaL BIOLOGY | AdvAnce online publicAtion | www.nature.com/naturechemicalbiology 5
articleNATure CHeMICAl bIOlOgy dOI: 10.1038/nCHeMBIO.1223
molecules (Supplementary Fig. 11). Taken together, the restrained impact on gene expression and the absence of overt cytotoxicity in the TFMO class IIa HDAC inhibitors speak to the potential for limited target-related toxicities when inhibiting class IIa HDACs and a clear functional diversification of class IIa catalytic or reader activity from that of class I and IIb enzymes.
The subtle effects of TMP195 on gene expression in a hetero-geneous mixture of cells led us to question whether they reflected large changes in gene expression in an infrequent cell population or subtle changes in abundant cell types. To address this question, we purified T cell (CD3+), B cell (CD19+) and monocyte (CD14+) populations from the PHA-stimulated PBMC system via cell sort-ing (Supplementary Fig. 12) and subjected them to whole-genome expression profiling. This approach revealed that most of the 76 genes identified in the unfractionated PBMC are both highly expressed and remain differentially affected only in the CD14+ monocyte samples (Fig. 5a–c). TMP195 had minimal effects on PHA-stimulated gene expression in lymphocytes (CD3+ T cells, 4 and 13 genes; CD19+ B cells, 7 and 29 genes up- and downregulated by a factor of at least 1.4, respectively, in both donors; Supplementary Fig. 13 and Supplementary Data Sets 3 and 4). This unexpectedly low number of genes affected by class IIa HDAC inhibitors in lym-phocytes was echoed in human T-cell proliferation experiments, as no genes were detected as up- or downregulated by TMP269 treatment by more than a factor of two (Supplementary Fig. 14). In sharp contrast, CD14+ monocytes were clearly transcriptionally sensitive to inhibition of class IIa HDAC catalytic activity in the context of PHA stimulation (443 and 144 genes up- and downreg-ulated, respectively; Supplementary Data Set 5). This sensitivity was not easily reconciled by an obvious, highly expressed class IIa HDAC in monocytes, as HDAC4, HDAC5 and HDAC7 have similar transcript levels in this same data set (Supplementary Table 8). The most differentially expressed chemokine and cell-surface genes are more abundant in monocytes than in lymphocytes and are many of the same genes identified in the PBMC culture. However, purifying the CD14+ cells before transcriptional profiling enabled us to iden-tify genes affected by class IIa HDAC enzyme inhibitors missed in the mixed culture because of their high, TFMO-insensitive expres-sion in lymphocytes. These transcripts were mostly upregulated by TMP195 and had an over-representation of genes involved in cell proliferation and protein translation. These expression profiling results were the first clear identification of transcriptional read-outs influenced by endogenous class IIa HDAC enzyme activity and suggested that human monocytes are particular in their use of
this catalytic or acetyllysine reader function to modulate cellular responses to mitogenic stimulation.
Class IIa HDACs affect colony-stimulating factor responsesHaving identified monocytes as sensitive to class IIa HDAC inhibi-tors in the context of a nonspecific agglutination stimulus applied to a complex mixture of cells, we pursued their effects in a more spe-cific in vitro setting. Although TMP195 is among the most potent and selective class IIa HDAC inhibitors we have identified, TMP058 (6) is one of the weakest in the TFMO series and served as a control compound in the TFMO series in subsequent experiments (Fig. 1b, Table 1 and Supplementary Tables 2 and 3). Treatment of human peripheral blood monocytes with macrophage colony-stimulating factor (M-CSF, also known as CSF-1) leads to the well-characterized differentiation of these cells into monocyte-derived macrophages, expressing many tissue macrophage signature genes, including the monocyte and basophil chemoattractant chemokine ligand 2 (CCL2)29. TMP195, but not TMP058, blocked the accumulation of CCL2 protein in the supernatants of monocyte-derived macro-phage differentiation cultures (Fig. 6a). Recent studies demon-strate that when granulocyte/monocyte colony-stimulating factor (GM-CSF, also known as CSF2) is added to the monocyte culture with M-CSF, CCL2 expression is inhibited, and several other genes (including CCL1) are induced30. TMP195, but not TMP058, signi-ficantly (two-way analysis of variance, P < 0.0001) increased the amount of CCL1 protein secreted by the monocytes compared to vehicle (DMSO)-treated M-CSF plus GM-CSF cultures (Fig. 6b). The impact of class IIa HDAC inhibition on the expression of these chemokines was consistent with the transcriptional profiling data from the PHA-stimulated PBMC experiments, where CCL2 and CCL1 were respectively identified as down- or upregulated TMP195 (Supplementary Figs. 11 and 13).
log2 fold change(2 versus DMSO)
Expr
essi
on v
alue
(AU
)
10,0005,000
1,000500
10050
–2 –1 0 1 2
a
log2 fold change(2 versus DMSO)
–2 –1 0 1 2
b
log2 fold change(2 versus DMSO)
–2 –1 0 1 2
c
Figure 5 | Monocytes harbor transcriptional readouts of class IIa HDAC catalytic activity. (a–c) Fold change–expression value plots of 2-induced differential gene expression in cd3+ t cells (a), cd19+ b cells (b) or cd14+ monocytes (c) purified from the same pHA-stimulated pbMc cultures with or without 3 μM 2. Affymetrix probes above the minimum expression value within each cell type are represented by symbols (gray circles), with probes identified as tFMo responsive in the unsorted pbMc culture shown regardless of their expression value in the sorted populations; pink and blue triangles, up- or downregulation by factor of >1.4 by 2 in the pbMc culture. Au, arbitrary units.
16a
b
12
8
Con
cent
ratio
n of
CC
L2(n
g m
l–1)
Con
cent
ratio
n of
CC
L1(n
g m
l–1)
4
4
3
2
1
00
øøø øøø øø
5 10
Concentration of GM-CSF (pg ml–1)added to 50 ng ml–1 M-CSF culture
30 90 270
DMSO62
*
*
*
*
*
*0
Figure 6 | Class IIa HDACs influence monocyte responses to CSFs. Human cd14+ pbMcs were cultured in 50 ng ml−1 M-cSF with varied amounts of GM-cSF (0–270 pg ml−1) for 5 d. (a,b) extracellular concentrations of ccl2 (a) and ccl1 (b) were measured for cells in these conditions treated with either dMSo (black), 1 μM 6 (light gray) or 1 μM 2 (dark gray). data points represent mean ± s.d. for n = 6 (three wells per donor for two individual donors). the Ø symbols (color matched to treatment condition) indicate where ccl1 was below the lower limit of detection in every replicate. Asterisks indicate where comparison of 2 versus dMSo and 2 versus 6 by two-way analysis of variance yields P < 0.0001 in both comparisons.
6 nature CHeMICaL BIOLOGY | AdvAnce online publicAtion | www.nature.com/naturechemicalbiology
article NATure CHeMICAl bIOlOgy dOI: 10.1038/nCHeMBIO.1223
DISCuSSIONThe current study introduces an unprecedented series of class IIa HDAC inhibitors, from their identification in a HTS to their impact on activation phenotypes of human monocytes. A key aspect of this work is the discovery of the trifluoromethyloxadiazolyl moiety as a new MBG enabling target specificity and overcoming pharma-cologic limitations of zinc-chelating groups used in other metal-loenzyme inhibitors. This discovery exemplifies a new paradigm in the design of metalloenzyme inhibitors that challenges the dogma of establishing potency through a chelating warhead. Although the strength of a chelating interaction drives inhibitor binding, it becomes a disadvantage when considering strategies to engineer selectivity using other parts of the compound if only much weaker interactions with the target are available. TMP269 and its analogs demonstrate how the tempered approach of supporting a weaker MBG with multiple other compound-target interactions can be a successful strategy in the discovery of metalloenzyme inhibitors with exceptional selectivity. Furthermore, overcoming the need for a hydroxamate to achieve potency opens the door to explore human disease indications where off-target activities and pharmacologic liabilities of a chelating MBG outweigh the therapeutic benefit to the patient.
We were struck by the absence of apparent protein complexes co-eluting with class IIa HDACs. Not only are they reported to associate with HDAC3 in coimmunoprecipitations, but our lysate preparations were based on prior work in which class I and IIb HDAC inhibitor matrices clearly identify many HDAC interactors26. Perhaps com-plexes were absent because the TMP942 matrix is only able to bind ‘free’ class IIa HDACs—a scenario in which the acetyllysine-binding site is occupied when these proteins are in a stable complex. In con-trast, the absence of class IIa HDAC co-eluting proteins may have been predicted by the previous study, as class IIa HDACs were not identified as members of HDAC3-containing complexes. It remains possible that class IIa HDACs in complex with other proteins renders them unavailable (insoluble) in these lysis conditions. Clearly, further work is required to elucidate the endogenous part-ners of the class IIa HDACs in cells, as these independent studies have generated complementary data sets that do not demonstrate their participation in classical co-repressor complexes.
These inhibitors enable a precise pharmacological route to char-acterizing the biological relevance of class IIa HDAC catalytic or acetyllysine reader activity that builds upon the genetic approaches defining the field and leading many groups to propose that the catalytic activity of these proteins is vestigial6,8,31. Even without ‘de-orphaning’ the enzymatic activity of class IIa HDACs, this study serves to redefine these metalloenzyme or acetyllysine reader domains as distinct targets for pharmacologic intervention that are clearly differentiated from class I and/or IIb or pan-HDAC inhibi-tors. For instance, in all of the cell-based assays described above, the TFMO compounds lacked one of the hallmarks of class I and/or IIb HDAC inhibitor activity: cell death or apoptosis. For vorinostat, this activity is most likely a contributing factor to the therapeutic efficacy in cutaneous T-cell lymphoma, but it may also be associ-ated with dose-limiting adverse events32. Furthermore, unlike what is reported for class I and IIb HDAC inhibition, inhibiting class IIa HDAC activity had very little impact on gene expression in lympho-cytes33. These contrasts to the activity of vorinostat provide evidence that class IIa HDACs are not likely to be classical epigenetic enzymes affecting chromatin structure and gene expression in every cell type. However, the clear and consistent effects of TMP195 on monocyte responses to a mitogen (PHA), M-CSF and GM-CSF are evidence that the function performed by the catalytic or reader domain is not a vestige of evolution. We propose that TFMO inhibitors in the TMP269 series may be used as tools to identify the endogenous substrates of the class IIa HDAC enzymes, the loci whose regula-tion directly incorporates class IIa HDAC reader activity or both
and may be suitable for drug development efforts in immune dis-ease indications for which class I and/or IIb HDAC inhibitors are not appropriate.
received 31 august 2012; accepted 15 February 2013; published online 24 March 2013
MeTHODSMethods and any associated references are available in the online version of the paper.
Accession codes. Protein Data Bank: the crystal structure data for HDAC7 bound with TMP269 and with TFMO inhibitor TMP942 are deposited under accession codes 3ZNR and 3ZNS, respectively. Gene Expression Omnibus: the Affymetrix expression profiling data for PHA-stimulated PBMC (and the subpopulations of CD3+ T cells, CD19+ B cells or CD14+ monocytes) treated with TFMO inhibitor TMP195 are deposited under accession code GSE44621.
references1. Bradner, J.E. et al. Chemical phylogenetics of histone deacetylases.
Nat. Chem. Biol. 6, 238–243 (2010).2. Fischle, W. et al. Human HDAC7 histone deacetylase activity is associated
with HDAC3 in vivo. J. Biol. Chem. 276, 35826–35835 (2001).3. Choudhary, C. et al. Lysine acetylation targets protein complexes and
co-regulates major cellular functions. Science 325, 834–840 (2009).4. Kim, S.C. et al. Substrate and functional diversity of lysine acetylation
revealed by a proteomics survey. Mol. Cell 23, 607–618 (2006).5. Yuan, Z., Peng, L., Radhakrishnan, R. & Seto, E. Histone deacetylase 9
(HDAC9) regulates the functions of the ATDC (TRIM29) protein. J. Biol. Chem. 285, 39329–39338 (2010).
6. Fischle, W. et al. Enzymatic activity associated with class II HDACs is dependent on a multiprotein complex containing HDAC3 and SMRT/N-CoR. Mol. Cell 9, 45–57 (2002).
7. McKinsey, T.A., Zhang, C.L. & Olson, E.N. Activation of the myocyte enhancer factor-2 transcription factor by calcium/calmodulin-dependent protein kinase-stimulated binding of 14–3-3 to histone deacetylase 5. Proc. Natl. Acad. Sci. USA 97, 14400–14405 (2000).
8. Zhang, C.L. et al. Class II histone deacetylases act as signal-responsive repressors of cardiac hypertrophy. Cell 110, 479–488 (2002).
9. Verdin, E., Dequiedt, F. & Kasler, H.G. Class II histone deacetylases: versatile regulators. Trends Genet. 19, 286–293 (2003).
10. Arrowsmith, C.H., Bountra, C., Fish, P.V., Lee, K. & Schapira, M. Epigenetic protein families: a new frontier for drug discovery. Nat. Rev. Drug Discov. 11, 384–400 (2012).
11. Brockschmidt, F.F. et al. Susceptibility variants on chromosome 7p21.1 suggest HDAC9 as a new candidate gene for male-pattern baldness. Br. J. Dermatol. 165, 1293–1302 (2011).
12. Mielcarek, M. et al. SAHA decreases HDAC 2 and 4 levels in vivo and improves molecular phenotypes in the R6/2 mouse model of Huntington’s disease. PLoS One 6, e27746 (2011).
13. Quinti, L. et al. Evaluation of histone deacetylases as drug targets in Huntington’s disease models. Study of HDACs in brain tissues from R6/2 and CAG140 knock-in HD mouse models and human patients and in a neuronal HD cell model. PLoS Curr. 2, pii:RRN1172 (2010).
14. Berdeaux, R. et al. SIK1 is a class II HDAC kinase that promotes survival of skeletal myocytes. Nat. Med. 13, 597–603 (2007).
15. Tao, R. et al. Deacetylase inhibition promotes the generation and function of regulatory T cells. Nat. Med. 13, 1299–1307 (2007).
16. International Stroke Genetics Consortium (ISGC). et al. Genome-wide association study identifies a variant in HDAC9 associated with large vessel ischemic stroke. Nat. Genet. 44 , 328–333 (2012).
17. DasGupta, S., Murumkar, P.R., Giridhar, R. & Yadav, M.R. Current perspective of TACE inhibitors: a review. Bioorg. Med. Chem. 17, 444–459 (2009).
18. Nuti, E., Tuccinardi, T. & Rossello, A. Matrix metalloproteinase inhibitors: new challenges in the era of post broad-spectrum inhibitors. Curr. Pharm. Des. 13, 2087–2100 (2007).
19. Lahm, A. et al. Unraveling the hidden catalytic activity of vertebrate class IIa histone deacetylases. Proc. Natl. Acad. Sci, USA 104, 17335–17340 (2007).
20. Baloglu, E., Ghosh, S., Lobera, M. & Schmidt,, D.R. Compounds and Methods. US Provisional Patent Application PCT/US2011/021089 (2011).
21. Ma, X., Ezzeldin, H.H. & Diasio, R.B. Histone deacetylase inhibitors: current status and overview of recent clinical trials. Drugs 69, 1911–1934 (2009).
22. Dormán, G. et al. Matrix metalloproteinase inhibitors: a critical appraisal of design principles and proposed therapeutic utility. Drugs 70, 949–964 (2010).

nature CHeMICaL BIOLOGY | AdvAnce online publicAtion | www.nature.com/naturechemicalbiology 7
articleNATure CHeMICAl bIOlOgy dOI: 10.1038/nCHeMBIO.1223
23. Schuetz, A. et al. Human HDAC7 harbors a class IIa histone deacetylase–specific zinc binding motif and cryptic deacetylase activity. J. Biol. Chem. 283, 11355–11363 (2008).
24. Bottomley, M.J. et al. Structural and functional analysis of the human HDAC4 catalytic domain reveals a regulatory structural zinc-binding domain. J. Biol. Chem. 283, 26694–26704 (2008).
25. Allen, F.H. The Cambridge Structural Database: a quarter of a million crystal structures and rising. Acta Crystallogr. B 58, 380–388 (2002).
26. Bantscheff, M. et al. Chemoproteomics profiling of HDAC inhibitors reveals selective targeting of HDAC complexes. Nat. Biotechnol. 29, 255–265 (2011).
27. Bertos, N.R., Wang, A.H. & Yang, X.J. Class II histone deacetylases: structure, function, and regulation. Biochem. Cell Biol. 79, 243–252 (2001).
28. Emanuele, S., Lauricella, M. & Tesoriere, G. Histone deacetylase inhibitors: apoptotic effects and clinical implications (Review). Int. J. Oncol. 33, 637–646 (2008).
29. Fleetwood, A.J., Lawrence, T., Hamilton, J.A. & Cook, A.D. Granulocyte-macrophage colony-stimulating factor (CSF) and macrophage CSF–dependent macrophage phenotypes display differences in cytokine profiles and transcription factor activities: implications for CSF blockade in inflammation. J. Immunol. 178, 5245–5252 (2007).
30. Lacey, D.C. et al. Defining GM-CSF– and macrophage-CSF–dependent macrophage responses by in vitro models. J. Immunol. 188, 5752–5765 (2012).
31. Parra, M. & Verdin, E. Regulatory signal transduction pathways for class IIa histone deacetylases. Curr. Opin. Pharmacol. 10, 454–460 (2010).
32. Spiegel, S., Milstien, S. & Grant, S. Endogenous modulators and pharmacological inhibitors of histone deacetylases in cancer therapy. Oncogene 31, 537–551 (2012).
33. Kewitz, S., Bernig, T. & Staege, M.S. Histone deacetylase inhibition restores cisplatin sensitivity of Hodgkin’s lymphoma cells. Leuk. Res. 36, 773–778 (2012).
acknowledgmentsThe authors would like to thank A.Y. Rudensky, D. Mathis, C. Benoist and V.K. Kuchroo for their comments during manuscript preparation. We also thank M.S. Sundrud and J.A. Hill for discussions and insight through the execution of this work. We also thank Y. Alekseyev and A. LeClerc of the Boston University Medical Campus Microarray Core facility.
author contributionsM.L. and M.A.N. performed experiments, directed the research, and wrote the manuscript. D.S. and S.G. contributed to experimental design. D.R.S., E.B., C. Wells and R.P.T. contributed to chemical synthesis. Q.G.W., M.T., P.K.M. and L.K. contributed to the biological experiments. K.P.M. and D.T.P. performed the crystallographic and computational efforts, and X.H., R.A.R., W.B. and M.S.H. contributed to the crystallographic efforts. G.A.H., M.M.-T., B.S., S.C. and Z.W. contributed to the high-throughput screening efforts. R.P.T. designed and B.J.T., J.X.R., C. Wagner, M.B.M., J.T.M. and J.D.W. contributed to the chemoproteomics efforts.
Competing financial interestsThe authors declare competing financial interests: details accompany the online version of the paper.
additional informationSupplementary information and chemical compound information is available in the online version of the paper. Reprints and permissions information is available online at http://www.nature.com/reprints/index.html. Correspondence and requests for materials should be addressed to M.A.N.
nature CHeMICaL BIOLOGY doi:10.1038/nchembio.1223
ONlINe MeTHODSRecombinant HDAC9 enzyme activity assay development. Enzyme and sub-strate used for high-throughput screening (HTS) were purchased from BPS Bioscience Inc. (San Diego, California): HDAC9 (BPS catalog number 50009) and HDAC class IIa substrate (BPS catalog number 50040). Recombinant HDAC9 isoform 4 of human HDAC9 (GenBank accession number NM_178423, amino acids 604–1066 with C-terminal His tag, MW = 50.7 kDa) was expressed and purified in a baculovirus expression system. In this assay, a class IIa HDAC substrate was detrifluoroacetylated by HDAC9. Trichostatin A was then added to quench the HDAC9 activity, and the reaction was developed by the addition of trypsin to release the fluorophore 7-amino-4-methylcoumarin (AMC) from the detrifluoroacetylated substrate. Optimal detection of fluorescence inten-sity, as measured in plate readers (EnVision, PerkinElmer; Acquest or Analyst, LJL BioSystems), was determined at excitation and emission wavelengths of 340 nm and 435 nm, respectively, via spectrum scans. After the addition of trichostatin A and trypsin, the signal was stable for up to 3 h with >90% of fluorescence intensity maintained. Assay plates can be read during this time period with little change of assay statistics (signal/base ratio, Z). All reactions were evaluated at ambient temperature in assay buffer solution containing 50 mM Tris-HCl, pH 8.0, 137 mM NaCl, 2.7 mM KCl, 1 mM MgCl2, 0.05% BSA and 0.005% Tween-20. Substrate and enzyme kinetic parameters were deter-mined by performing reaction velocity experiments. Rates were determined from the slope of the linear portion of time-dependent progress curves in a series of end-point reactions using 4.7 nM HDAC9. Saturation curves show-ing the relation between the concentration of substrate and enzyme velocity were then plotted and analyzed using GraphPad Prism 5 (GraphPad Software, Inc.) with Michaelis-Menten kinetics. The Kcat of HDAC9 was determined to be in the range of 0.17–0.35/sec, and the Km of HDAC class IIa substrate was determined to be in the range of 4.4 μM to 11 μM. The final concentra-tions of HDAC9 and class IIa HDAC substrate in the screen were chosen to be 2.5 nM and 4.5 μM, respectively, to maximize the assay’s ability to detect HDAC9 inhibitors. The DMSO tolerance for the assay was determined, and no effect on enzyme activity was found up to 5% final concentration.
For inhibitor compound testing, the HDAC9 assay was first configured in a low-volume 384-well assay format using Greiner black plates. Specifically, 5 μL of 5 nM HDAC9 in assay buffer was added to the plates with 100 nL of compounds at various concentration predispensed in 100% DMSO. Five microliters of 9 μM class IIa HDAC substrate in assay buffer was then added per well. The final concentrations of HDAC9 and class IIa HDAC sub-strate in the plate were 2.5 nM and 4.5 μM, respectively. After incubation for 45 min at room temperature, 10 mL of 2× developer solution (40 μM trypsin, 20 μM trichostatin A in buffer) was added per well. Plates were covered and incubated for another hour at room temperature before detection of fluores-cence intensity. The assay was then miniaturized to 1,536-well format. Assay robustness studies were conducted to ensure comparable performance and tolerance to production scale liquid handling. Assay performance, such as signal to background ratios and Z′ values, was assessed, and quality was either retained or enhanced in 1,536-well format.
Validation and execution of the HDAC9 inhibitor HTS. All steps of the HTS were done in a 1,536-well plate format using black 1,536-well Greiner microtiter plates (catalog number 782076) with the following assay conditions: 50 nL of test compound in 100% DMSO or DMSO control was dispensed per well using Echo Acoustic Dispenser (Labcyte Inc., Sunnyvale, California) before the addi-tion of biological reagent. A Multidrop Combi (Thermo Scientific, Waltham, Massachusetts) was used for all subsequent liquid additions. Assay buffer (2.5 μL) was first added to columns 35 and 36 as control wells, and then 2.5 μL of 5 nM HDAC9 in assay buffer were added to columns 1–34 and 37–48. Class IIa HDAC substrate in assay buffer (9 μM, 2.5 μL) was then added per well to the entire plate. The final concentrations of HDAC9 and class IIa HDAC substrate in the plate were 2.5 nM and 4.5 μM, respectively. After incuba-tion for 45 min at room temperature, 3 μL of 2.7× developer solution (53 μM trypsin, 26.5 μM trichostatin A in buffer) were added per well. Plates were covered and incubated for another hour at room temperature before being read on an Envision plate reader.
Before the actual start of HTS, a set of approximately 10,000 compounds was tested in triplicate using the assay conditions described above to validate the HTS protocol. Using robust statistics, a predicted hit rate and confirmation rate were calculated on the basis of a predicted robust 3 × s.d. (3SD) cutoff of
20% inhibition on all three data sets. The predicted hit rate and confirmation rate were 0.3% and 56%, respectively.
All 1,536-well HTS assay–ready plates were provided by GlaxoSmithKline (GSK)’s Sample Management Technology group. All single-concentration testing (screen validation, primary and confirmation) was done with a final compound concentration of 10 μM in the reaction by dispensing 50 nL of 1 mM compound stock solution. Dose-response studies were done with 11 concentrations in a three-fold dilution series, resulting in a maximum final compound concentration of 100 μM.
IFI. The IFI was calculated for each compound using the equation below. Historic screens done in GSK (full diversity or focused screen) in inhibition assay formats were included in the analysis. Screens against kinases were excluded from the list. Target hit calling was based on robust 3SD statistic cut-off of percent inhibition on the target.
IFI = (number of targets hit/number of targets screened) × 100
Interference assay. An interference assay was run after the dose-response ana-lysis to eliminate compounds that inhibit the coupling detection system instead of HDAC activity. In this assay, HDAC9 and the class IIa HDAC substrate were preincubated for 45 min at room temperature before 5 μL of the reaction mix-ture per well was dispensed into the assay-ready plate containing 50 nL of test compound per well. The final concentrations of HDAC9 and class IIa HDAC substrate in the preincubation mixture were 2.5 nM and 4.5 μM, respectively. Three microliters of developer solution (53 μM trypsin, 26.5 μM trichostatin A in buffer) were then added immediately per well. Plates were covered and incu-bated for one hour at room temperature. The plates were read on an Envision plate reader using the same protocol as the HDAC9 assay.
Screening data analysis. Assay performance statistics, such as signal to background ratio, Z′ and robust 3SD activity cutoff were calculated using AbaseXE (IDBS, Guilford, Surrey, UK). Hit population analysis and visuali-zation were conducted using Spotfire DecisionSite (Spotfire, Inc., Somerville, Massachusetts). Activity-weighted diversity selection, IFI, chemical property analysis and structural clustering were used to rationally reduce the number of compounds tested in follow-up studies. IC50 values were obtained using the nonlinear regression function in AbaseXE’s full curve analysis bundle.
HDAC selectivity assays. Dose-response studies were done with ten concen-trations in a threefold dilution series from a maximum final compound con-centration of 100 μM in the reaction mixture and were conducted at Reaction Biology Corp. (Malvern, Pennsylvania). All assays are based on the same prin-ciple as the HDAC9 assay described above: the deacetylation of acetylated or trifluoroacetylated lysine residues on fluorogenic peptide substrates by HDAC. HDAC1, HDAC2, HDAC3, HDAC6, HDAC10 and HDAC11 used a substrate based on residues 379–382 of p53 (Arg-His-Lys-Lys(Ac)). For HDAC8, the diacetylated peptide substrate, based on residues 379–382 of p53 (Arg-His-Lys(Ac)-Lys(Ac)), was used. HDAC4, HDAC5, HDAC7 and HDAC9 assays used the class IIa HDAC–specific fluorogenic substrate (Boc-Lys(trifluoroacetyl)-AMC). All reactions were done with 50 μM HDAC substrate in assay buffer (50 mM Tris-HCl, pH 8.0, 137 mM NaCl, 2.7 mM KCl, 1 mM MgCl2, 1 mg/mL BSA) containing 1% DMSO final concentration; incubated for 2 h at 30 °C; and developed with trichostatin A and trypsin.
Cell-based deacetylase assay. Deacetylase activity was measured in THP-1cells (ATCC catalog no. TIB-202) using 200 μM class I or IIb HDAC substrate (Boc-Lys(Ac)-AMC), Bachem catalog no. I-1875) or 100 μM class IIa substrate (Boc-Lys(trifluoroacetyl)-AMC), Bachem catalog no. I-1985) to assess total endogenous class I or IIb or class IIa HDAC activity, respectively. Cells (100,000 per well), substrate and inhibitors were incubated for 3 h at 37 °C, 5% CO2 in assay medium (0.5% FBS, 0.5% DMSO in RPMI). The assay was developed by the addition of an equal volume of developer solution (2% Triton X-100, 50 μM trichostatin A, 2.5 mg/mL trypsin in DMEM) and incubated for at least 1 h at room temperature. Fluorescence intensity was read on a SpectraMax M2 (excitation and emission wavelengths were 340 nm and 435 nm, respec-tively). Curve fitting and IC50 values were calculated using a four-parameter, nonlinear, robust fit equation in statistical analysis software (GraphPad Prism 5.0, GraphPad Software, Inc.).
nature CHeMICaL BIOLOGYdoi:10.1038/nchembio.1223
Acetylated histone H3 lysine 9 (Ac-H3K9) quantification. Human PBMC were cultured in standard medium (10% FBS, 2 mM L-glutamine, 1 mM pyruvate, 10 mM HEPES, 10 U/10 mg penicillin/streptomycin) at a density of 3 × 10⁶ per mL for 2 h in the presence of various HDAC inhibitors (or 0.2% v/v DMSO as the vehicle control). One million harvested cells were washed in ice-cold PBS by centrifugation and lysed in 100 μL 1× NuPAGE LDS sample loading buffer (Invitrogen Life Technologies), heated to 70 °C for 10 min and chilled on ice, and then DNA was sheared by repeated passing through a 27-gauge needle. The lysate was cleared by centrifugation, and 40 μL of it was subjected to SDS-PAGE (Novex 4–12% Bis-Tris gels and system, Life Technologies) and transferred onto a 0.45-μm nitrocellulose membrane (Bio-Rad) via standard western blotting techniques. Total histone H3 and H3K9Ac were recognized with specific antibodies (dilutions of 1:1,000, as per manufacturer’s instruc-tion; catalog no. 3638 and no. 9671, respectively; Cell Signaling Technology) and visualized with mouse IgG–specific (catalog no. 35502, Thermo Scientific) or rabbit IgG–specific (catalog no. A4914, Sigma) secondary anti bodies (both 1:10,000 dilutions). Image acquisition and densitometry analysis were per-formed on the FluorChem Q system using AlphaView software (Version 3.2.2.0; Protein Simple).
In vitro PBMC culture and gene expression profiling experiments. Blood collected from healthy donors according to the guidelines of the American Association of Blood Banks and under an IRB-approved informed consent form was purchased from Research Blood Components (Boston, MA). PBMC were isolated from healthy donors’ blood via density gradient centrifugation (Ficoll, Stem Cell Technologies), cultured with the described HDAC inhibi-tors immediately before addition of PHA and harvested 60 h later. RNA was extracted (Qiagen RNAeasy Kit) from total PBMC directly from these cul-tures or from populations sorted (BD Biosciences Aria II) on the basis of their expression of CD3, CD14 or CD19. RNA processing, labeling and hybridiza-tion to Affymetrix Human Gene 1.0 ST arrays were done according to manu-facturer’s recommendations.
MTT cell viability assays. Human CD4+ T cells were isolated from whole blood via negative selection according to manufacturer’s instructions (RosetteSep Human CD4+ T cell enrichment kit, Stem Cell Technologies, Inc.), re-suspended in T-cell culture medium (10% FBS, 2 mM L-glutamine, 1 mM pyruvate, 10 mM HEPES, 10 U/10 mg penicillin/streptomycin, 0.5% DMSO in RPMI) and plated at 50,000 cells/well with IL-2 (10 BRMP units/mL, Beckton Dickinson) and 100,000 human T-expander Dynabeads (Invitrogen) for 72 h. Determination of mitochondrial function or cell viability was done according to manufacturer’s instructions (Cell Proliferation Assay Kit I (MTT), Roche Applied Science) and was represented as a percent of control (no inhibitor) wells.
Monocyte cell cultures. Human primary CD14+ monocytes were purified by positive selection from PBMCs using magnetic beads (Miltenyi). Monocytes were incubated with either 0.1% DMSO or 1 μM TMP058 or 1 μM TMP195 for 30 min at room temperature and were then differentiated with 50 ng/ml M-CSF (R&D Systems) and 0–270 pg/ml GM-CSF (R&D Systems) for 5 d (incubation in RPMI 1640 culture medium supplemented with 5% FBS, 2 mM L-glutamine, 100 U/mL penicillin and 100 mg/ml streptomycin at 37 °C, 5% CO2). Culture supernatants were collected after 5 d for analysis of CCL1 (R&D Systems catalog number DY272E) and CCL2 (MesoScale Discovery) protein concentrations.
Expression and purification of HDAC7 for crystallization. His-tagged HDAC7 (residues 483–903) was expressed in E. coli using a pET28a vector. Cells were lysed in 25 mM HEPES, 500 mM NaCl, 20 mM imidazole-pH 7.5-plus 1mM CHAPS containing 2.5 mM MgCl2 and 5 mM ZnCl2 using pressure homogenization. Lysate was centrifuged for 1 h at 47,000g in a TZ28 rotor at 4 °C; lysate was filtered through a Meissner 0.2-μm filter. Lysate was loaded on a 10 mL (2 × 5 mL) HisTrap FF column (GE Healthcare) equilibrated in 25 mM HEPES, 250 mM NaCl, 20 mM imidazole, pH 7.5; washed with this buffer; then paused. On-column Thrombin cleavage was carried out overnight, the column was reconnected, and the immediate flow-through was collected and diluted 25× with 25 mM HEPES pH 7.5 plus 1 mM CHAPS and was loaded onto a 5-mL Q Sepharose FF column (GE Healthcare) equilibrated in 25 mM HEPES, pH 7.5. The flow-thru containing the HDAC7 was collected; put into a 10-mL (2 × 5 mL) Heparin column (GE Healthcare); eluted using a gradient
from 15–60% with 25 mM HEPES; 1 M NaCl pH 7.5; and concentrated. The HDAC7 peak was applied to a 320 mL Superdex 75 column equilibrated in 25 mM HEPES, 200 mM NaCl pH 7.5; eluted isocratically; and concentrated with a JumboSep 10K CO membrane.
HDAC7 crystallization and structure solution. His-tagged HDAC7 (residues 483–903) was prepared in 200 mM NaCl, 25 mM HEPES, pH 7.5 and com-plexed with inhibitors by adding a ten-fold molar excess of inhibitor to 0.1 mM HDAC7 and then concentrated using spin dialfiltration (30,000 MW cut-off) to ~10 mg/mL. Crystals were grown by sitting-drop vapor diffusion at 22 °C. Eight-hundred-nanoliter drops were set with a Mosquito instrument (TTP LabTech; Melbourne, United Kingdom) in MRC 2 Well Crystallization Plates (Swissci; Zug, Switzerland) by combining 400 nL HDAC7–inhibitor complex and 400 nL of 12% PEG3350, 4% isopropanol and 50 mM HEPES, pH 7.5. HDAC7-inhibitor complexed crystals were harvested and cryoprotected with 30% ethylene glycol (EG), 12% PEG3350, 4% IPA and 50 mM HEPES, pH 7.5, using a four-step exchange starting with 0% EG and ending with 30% EG. Crystals were submersed in liquid nitrogen and sent to the APS for data collection at beam line 21–IDG at LSCAT and were collected at 100 K and at a wavelength of 0.97 Å. Molecular replacement was completed using Phaser and a model of an in-house apo crystal structure of HDAC7 with a resolution of 2.2 Å. The structure was built with the program COOT, and refinement was completed with the program Phenix. The TMP269 crystal structure has three molecules in the ASU; however, the ligand is only fit in the B subunit as the density is incomplete in the other subunits. The TMP942 structure has all three subunits fit with the ligand.
Matrix metalloproteinase assays. Matrix metalloproteinase enzymatic activity was measured using standard techniques, where protease activity is determined using a fluorophore-peptide-quencher substrate. Cleavage of the peptide releases the fluorophore from the quencher, resulting in an increase in fluo-rescent signal. MMP9 and MMP12 assay conditions: 50 mM HEPES (pH 7.5), 150 mM NaCl, 10 mM CaCl2, 1 μM Zn(O2CCH3)2, 600 μM CHAPS, 2.25 nM MMP9 or 6 nM MMP12 (activated with p-aminophenylmercuric acetate before addition to the assay) and 1 μM MMP9 substrate (FAM/TAMRA-conjugated TPGPLGLARR peptide) or 2 μM MMP12 (FAM/TAMRA-conjugated GPLGLFAR peptide). Fluorescence intensity (excitation and emission wave-lengths were 485 nm and 530 nm, respectively; dichroic filter of 505 nm) was read on a Viewlux (PerkinElmer).
Affinity enrichment chemoproteomics overview. Parallel THP-1 cell cul-tures were grown in either light or heavy SILAC labeling medium according to manufacturer’s instructions (Invitrogen), and soluble protein lysates were adjusted to 2 mg/mL for forward and flip experiments, in which incubations with free or sepharose bead–immobilized inhibitors were performed. Following the incubations and washes, proteins bound to the beads were resolved by gel electrophoresis and subjected to in-gel proteolytic digestion and peptide extraction. Reverse-phase liquid chromatography separations were performed on a Waters Nano Acquity system and introduced into the LTQ OrbiTrap XL using a James Scientific nanospray source, and full-scan OrbiTrap MS spectra were processed using the MaxQuant (version 1.1.1.25) suite of applications to identify and quantify SILAC pairs.
Preparation of lysate from HEK293 and THP-1 cells labeled with SILAC. Separate cultures of HEK293 MSRII cells grown in DMEM were labeled with L-arginine and L-lysine (light) or [U-13C6]-L-lysine and [U-13C6, 15N4]-L-arginine according to Invitrogen’s instructions. Light and heavy THP-1 cells grown in RPMI1640 were prepared similarly. HEK293 and THP-1 cells were dissociated from culture plates using Versene (Invitrogen), pelleted and lysed in ice-cold lysis buffer containing 50 mM Tris-HCl (pH7.5), 0.8% Igepal-CA630, 5% glycerol, 150 mM NaCl, 1.5 mM MgCl2, 1 mM DTT, EDTA-free protease inhibitor (Roche) and phosphatase inhibitor cocktails 2 and 3 (Sigma). The ice-cold lysates were further homogenized on a FastPrep-24 instrument (MP Biomedicals) using matrix D beads (MP Biomedicals) at a speed of 6 m/s for 20 s. The homogenates were then centrifuged (14,000g, 4 °C, 10 min), and the supernatant was collected and used in the affinity-enrichment experiment described below.
Affinity enrichment in THP-1/HEK293 lysates. Protein concentrations of light and heavy lysates were measured using a BCA kit (Thermo Fisher). The lysates
nature CHeMICaL BIOLOGY doi:10.1038/nchembio.1223
formic acid. An 80-min chromatographic separation of the trapped peptides was performed at a flow rate of 0.5 mL/min. Peptides were separated using a three-step linear gradient operating from 12–38% CH3CN over the first 50 min and 38–95% over the next 10 min and held at 95% for 10 min. Samples were introduced into the LTQ OrbiTrap XL (Thermo Fisher Scientific) mass spectrometer using a James Scientific nanospray source with a New Objective PicoTip emitter (FS360-20-10-D).
The mass spectrometer was operated in a data-dependent mode. Full scan OrbiTrap MS spectra were acquired from m/z 400–2,000 Da at a resolution of 30,000 using an automatic gain control (AGC) value of 100,000. The ten most intense ions were sequentially isolated and fragmented in the linear ion trap by using collisionally induced dissociation at an AGC value of 10,000.
Data files were processed using the MaxQuant (version 1.1.1.25) suite of applications to identify and quantify all SILAC pairs. The Quant application was run in SILAC Doublets mode using Lys6 and Arg10 as the heavy labels. Enzyme specificity was set to trypsin with a maximum of two missed cleav-ages, and only peptides with a minimum of six amino acids were considered. The first search, with a threshold value of 20 p.p.m., used the human.first.search.fasta database. This was followed by the main search against the ipi.HUMAN.v3.78.fasta database at a 7-p.p.m. tolerance and 0.5-Da CID (MS/MS) tolerance. Acetyl (protein N-term), carbamidomethyl (C) and oxidation (M) were used as variable modifications. Peptide and protein identifications were accepted up to a maximum false discovery rate of 1%. Quantification of SILAC pairs was performed by MaxQuant using standard settings.
Gene array experiments. All procedures were performed at Boston University Microarray Resource Facility as described in the GeneChip Whole Transcript (WT) Sense Target Labeling Assay Manual (Affymetrix, Santa Clara, CA) and Ambion WT Expression Kit Protocol (Life Technologies).
Briefly, the total RNA was isolated using an RNeasy kit (Qiagen), and the sample integrity was verified using RNA 6000 Nano Assay RNA chips run in Agilent 2100 Bioanalyzer (Agilent Technologies). The total RNA (100–200 ng) was reverse transcribed using Ambion WT Expression Kit (Life Technologies). The obtained cDNA was used as a template for in vitro transcription using Ambion® WT Expression Kit (Life Technologies). The obtained antisense cRNA was purified using Nucleic Acid Binding Beads (Ambion WT Expression Kit, Life Technologies) and used as a template for reverse transcription to produce single-stranded DNA in the sense orientation. During this step, dUTP was incorporated. The DNA was then fragmented using uracil DNA glycosylase (UDG) and apurinic/apyrimidinic endonuclease 1 (APE 1) and labeled with DNA labeling reagent covalently linked to biotin using terminal deoxynucleo-tidyl transferase (TdT, Whole Transcript Terminal Labeling and Controls kit, Affymetrix). IVT and cDNA fragmentation quality controls were carried out by running an mRNA Nano assay in the Agilent 2100 Bioanalyzer.
The labeled fragmented DNA was hybridized to the Gene Arrays 1.0ST for 16–18 h in GeneChip Hybridization oven 640 at 45 °C with rotation (60 r.p.m.). The hybridized samples were washed and stained using Affymetrix fluidics station 450 as per manufacturer’s instruction (Hybridization, Washing and Staining kit, Affymetrix). Microarrays were immediately scanned using Affymetrix GeneArray Scanner 3000 7G Plus (Affymetrix).
were adjusted to 2 mg/mL in the lysis buffer and transferred (1 mL) separately to 1.5-mL Protein LoBind Eppendorf tubes. For identification of protein tar-gets interacting with TMP942, the light lysate was preincubated with TMP942 (75 μM; active competitor) for 45 min at 4 °C on an end-to-end rotator, and the heavy lysate was incubated with DMSO vehicle. Sepharose beads immobi-lized with TMP942 (occupying 6.25% of the active sites on the beads) in PBS suspension (1:1 volume ratio; 25 ml) were then added and incubated with the respective lysates for 16 h at 4 °C on the rotator. In the flip experiment, the heavy and light lysates were swapped. Alternatively, in the inactive competi-tor experiment, the light lysate was preincubated with TMP373, and the heavy lysate was preincubated with DMSO, followed by incubation with TMP942 beads separately. After incubation, the tubes were centrifuged (2,000g, 4 °C, 5 min) to pellet the beads. The supernatant was aspirated, taking care to avoid disturbing the beads. The bead pellets were then washed with the lysis buffer containing additional 0.2% Igepal-CA630 once to remove excess TMP942 or TMP373. Beads from the heavy-light pair of tubes were then combined and washed three more times with the same buffer. Affinity enrichment with beads immobilized with TMP974 was processed similarly using free TMP974 and TMP373 as the active and inactive competitors, respectively.
Protein elution from beads and SDS/PAGE. After the final wash, beads were collected by centrifugation (2,000g, 4 °C, 5 min), and the wash buffer was aspi-rated, leaving 20 mL in the tube. Proteins attached to the beads were dissoci-ated by adding Invitrogen Reducing Reagent and LDS buffer and heating at 70 °C for 10 min. Proteins were resolved on a 4–12% gradient 1.5-mm-thick ten-well NuPAGE 4–12% Bis-Tris (with MOPS) gel with MOPS running buffer (Invitrogen), stained with Coomassie blue (Simply Blue, Invitrogen) for 1 h and destained with water for 1 h.
In-gel proteolytic digestion. Each gel lane was excised into 20 equal slices, and each slice was further diced into 1-mm cubes. The gel pieces were washed and destained in a solution of 50% CH3CN: 50% 25 mM ammonium bicarbonate on a rotary shaker. After washing with 25 mM ammonium bicarbonate, protein reduction was carried out by adding 4 mM DTT and incubating at 37 °C for 30 min. After DTT was removed, proteins were alkylated by addition of 10 mM iodoacetamide followed by incubation at 25 °C in the dark. Following the reduction and alkylation steps, gel pieces were washed with 25 mM ammonium bicarbonate, followed by washing with 50% CH3CN: 50% 25 mM ammonium bicarbonate and finally with 100% CH3CN for dehydration. Gel pieces were rehydrated in trypsin (Promega) solution prepared in 25 mM ammonium bicarbonate (60 μl of 10 ng/μl stock) and incubated at 37 °C over-night. Peptides were extracted by addition of 2% CH3CN, 1% formic acid solu-tion with sonication for 10 min before transfer to auto-sampler vials.
MS. Reverse-phase LC separations were carried out on a Waters Nano Acquity system using a Waters BEH130 C18 (1.7-mm particle, 75 mm ID × 200 mm) nano column in conjunction with a Water Symmetry C18 (5-mm particle, 180 mm ID × 20 mm) trapping column. Both the column and the trap were heated to 50 °C. Peptide injections (partial loop with needle overfill) were trapped for 3 min at 15.00 mL/min 99% H2O, 0.2% formic acid: 1% CH3CN, 0.2%
Copyright © 2022 FDOKUMEN