Seismological evidence for crustal-scale thrusting in the Zagros mountain belt (Iran
11
Geophys. J. Int. (2006) doi: 10.1111/j.1365-246X.2006.02920.x GJI Seismology Seismological evidence for crustal-scale thrusting in the Zagros mountain belt (Iran) Anne Paul, 1 Ayoub Kaviani, 1,2 Denis Hatzfeld, 1 J´ erˆ ome Vergne 3 and Mohammad Mokhtari 2 1 Laboratoire de G´ eophysique Interne et Tectonophysique, CNRS & Universit´ e Joseph Fourier, Maison des G´ eosciences, 38041 Grenoble Cedex, France. E-mail: [email protected] 2 International Institute of Earthquake Engineering and Seismology, Tehran, Iran 3 Laboratoire de g´ eologie, Ecole Normale Sup´ erieure, 75005 Paris, France Accepted 2006 January 17. Received 2006 January 17; in original form 2005 October 5 SUMMARY Crustal receiver functions (RFs) computed from the records of 45 temporary seismological stations installed on a 620-km-long profile across central Zagros provide the first direct evidence for crustal thickening in this mountain belt. Due to a rather short 14 km average station spacing, the migrated section computed from radial RFs displays the Moho depth variations across the belt with good spatial resolution. From the coast of the Persian Gulf to 25 km southwest of the Main Zagros Thrust (MZT), the Moho is almost horizontal with slight depth variations around 45 km. Crustal thickness then increases abruptly to a maximum of ∼70 km beneath the Sanandaj–Sirjan metamorphic zone, between 50 and 90 km northeast of the surface exposure of the MZT. Further northeast, the Moho depth decreases to ∼42 km beneath the Urumieh- Dokhtar magmatic assemblage and the southern part of the Central Iranian microcontinent. The region of thickest crust is located ∼75 km to the northeast of the Bouguer anomaly low at −220 mGals. Gravity modelling shows that the measured Moho depth variations can be reconciled with gravity observations by assuming that the crust of Zagros underthrusts the crust of central Iran along the MZT considered as a crustal-scale structure. This hypothesis is compatible with shortening estimates by balanced cross-sections of the Zagros folded belt, as well as with structural and petrological studies of the metamorphic Sanandaj–Sirjan zone. Key words: crustal structure, Iran, mountain belt, receiver functions, Zagros. INTRODUCTION The Zagros mountain belt results from the closure of the Neotethys oceanic domain and the collision of the northern margin of the Arabian platform with the microplates of central Iran, accreted to the southern margin of Eurasia during the Mesozoic (e.g. Besse et al. 1998). Estimates for the age of the initial collision between Arabia and Eurasia along the Zagros suture vary between Late Cretaceous (e.g. Berberian & King 1981) and Pliocene (see review in Allen et al. 2004). The latest plate motion reconstruction by McQuarrie et al. (2003) based on updated maps of seafloor magnetic anomalies in the North and Central Atlantic and reconstructions across the Red Sea shows that ocean closure occurred no later than 10 Ma. Such recent ages lead some authors to consider the Zagros as the archetype of a continent–continent collision belt at an initial stage of its evolution. For example, the pioneering thermomechanical models of a continental collision zone by Bird et al. (1975) and Bird (1978) relied on the Zagros case. Studying the Zagros belt could thus be of great help to better un- derstand the dynamics of mountain ranges. Nevertheless, published data on its crustal structure are very scarce, including Moho depth estimates. The only available profiles of crustal thickness variations have been computed from Bouguer anomaly modelling by Dehghani & Makris (1984) for whole Iran, and Snyder & Barazangi (1986) for Zagros. Only two reports of direct Moho depth measurements exist in the Zagros. Giese et al. (1984) provided questionable es- timates of crustal thickness based on a non-reversed poor-quality refraction profile from quarry blast sources. Hatzfeld et al. (2003) estimated a crustal thickness of 46 ± 2 km from receiver functions (RFs) computed at a single station close to the town of Ghir in cen- tral Zagros. The numerous seismic reflection profiles recorded for oil exploration do not penetrate the crust beyond the thick Hormuz salt layer at 9 to 12 km depth (see e.g. Blanc et al. 2003; McQuarrie 2004; Sherkati & Letouzey 2004). To improve our knowledge on crustal thickness variations across the Zagros, we deployed a temporary seismological network along a 620-km-long profile between Busher on the coast of the Persian gulf and Posht-e-Badam, 160 km northeast of Yazd (Fig. 1). The profile crosses all the morpho-tectonic units of the Zagros colli- sion zone. In the southwest, it first cuts the Zagros fold-and-thrust C 2006 The Authors 1 Journal compilation C 2006 RAS
-
Upload
independent -
Category
Documents
-
view
1 -
download
0
Transcript of Seismological evidence for crustal-scale thrusting in the Zagros mountain belt (Iran

May 24, 2006 7:58 Geophysical Journal International gji˙2920
Geophys. J. Int. (2006) doi: 10.1111/j.1365-246X.2006.02920.x
GJI
Sei
smol
ogy
Seismological evidence for crustal-scale thrusting in the Zagrosmountain belt (Iran)
Anne Paul,1 Ayoub Kaviani,1,2 Denis Hatzfeld,1 Jerome Vergne3
and Mohammad Mokhtari21Laboratoire de Geophysique Interne et Tectonophysique, CNRS & Universite Joseph Fourier, Maison des Geosciences, 38041 Grenoble Cedex, France.E-mail: [email protected] Institute of Earthquake Engineering and Seismology, Tehran, Iran3Laboratoire de geologie, Ecole Normale Superieure, 75005 Paris, France
Accepted 2006 January 17. Received 2006 January 17; in original form 2005 October 5
S U M M A R YCrustal receiver functions (RFs) computed from the records of 45 temporary seismologicalstations installed on a 620-km-long profile across central Zagros provide the first direct evidencefor crustal thickening in this mountain belt. Due to a rather short 14 km average station spacing,the migrated section computed from radial RFs displays the Moho depth variations across thebelt with good spatial resolution. From the coast of the Persian Gulf to 25 km southwest ofthe Main Zagros Thrust (MZT), the Moho is almost horizontal with slight depth variationsaround 45 km. Crustal thickness then increases abruptly to a maximum of ∼70 km beneath theSanandaj–Sirjan metamorphic zone, between 50 and 90 km northeast of the surface exposureof the MZT. Further northeast, the Moho depth decreases to ∼42 km beneath the Urumieh-Dokhtar magmatic assemblage and the southern part of the Central Iranian microcontinent.The region of thickest crust is located ∼75 km to the northeast of the Bouguer anomaly lowat −220 mGals. Gravity modelling shows that the measured Moho depth variations can bereconciled with gravity observations by assuming that the crust of Zagros underthrusts thecrust of central Iran along the MZT considered as a crustal-scale structure. This hypothesis iscompatible with shortening estimates by balanced cross-sections of the Zagros folded belt, aswell as with structural and petrological studies of the metamorphic Sanandaj–Sirjan zone.
Key words: crustal structure, Iran, mountain belt, receiver functions, Zagros.
I N T RO D U C T I O N
The Zagros mountain belt results from the closure of the Neotethys
oceanic domain and the collision of the northern margin of the
Arabian platform with the microplates of central Iran, accreted to
the southern margin of Eurasia during the Mesozoic (e.g. Besse et al.1998). Estimates for the age of the initial collision between Arabia
and Eurasia along the Zagros suture vary between Late Cretaceous
(e.g. Berberian & King 1981) and Pliocene (see review in Allen
et al. 2004). The latest plate motion reconstruction by McQuarrie
et al. (2003) based on updated maps of seafloor magnetic anomalies
in the North and Central Atlantic and reconstructions across the
Red Sea shows that ocean closure occurred no later than 10 Ma.
Such recent ages lead some authors to consider the Zagros as the
archetype of a continent–continent collision belt at an initial stage of
its evolution. For example, the pioneering thermomechanical models
of a continental collision zone by Bird et al. (1975) and Bird (1978)
relied on the Zagros case.
Studying the Zagros belt could thus be of great help to better un-
derstand the dynamics of mountain ranges. Nevertheless, published
data on its crustal structure are very scarce, including Moho depth
estimates. The only available profiles of crustal thickness variations
have been computed from Bouguer anomaly modelling by Dehghani
& Makris (1984) for whole Iran, and Snyder & Barazangi (1986)
for Zagros. Only two reports of direct Moho depth measurements
exist in the Zagros. Giese et al. (1984) provided questionable es-
timates of crustal thickness based on a non-reversed poor-quality
refraction profile from quarry blast sources. Hatzfeld et al. (2003)
estimated a crustal thickness of 46 ± 2 km from receiver functions
(RFs) computed at a single station close to the town of Ghir in cen-
tral Zagros. The numerous seismic reflection profiles recorded for
oil exploration do not penetrate the crust beyond the thick Hormuz
salt layer at 9 to 12 km depth (see e.g. Blanc et al. 2003; McQuarrie
2004; Sherkati & Letouzey 2004).
To improve our knowledge on crustal thickness variations across
the Zagros, we deployed a temporary seismological network along
a 620-km-long profile between Busher on the coast of the Persian
gulf and Posht-e-Badam, 160 km northeast of Yazd (Fig. 1). The
profile crosses all the morpho-tectonic units of the Zagros colli-
sion zone. In the southwest, it first cuts the Zagros fold-and-thrust
C© 2006 The Authors 1Journal compilation C© 2006 RAS
May 24, 2006 7:58 Geophysical Journal International gji˙2920
2 A. Paul et al.
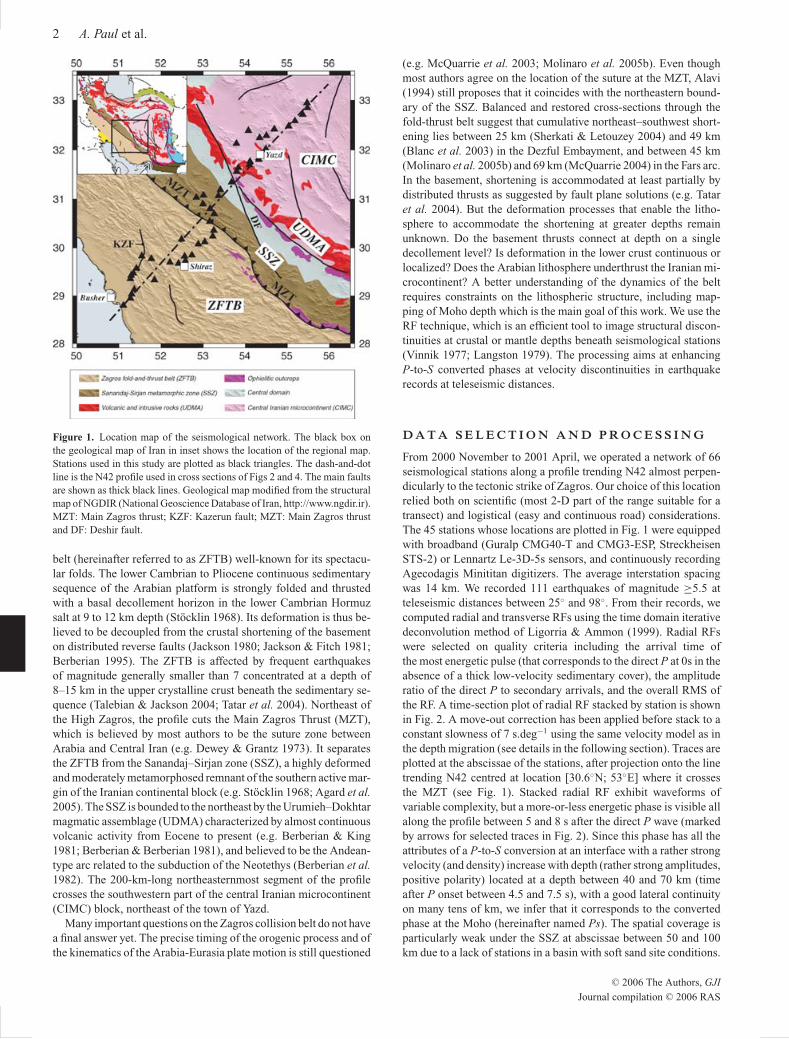
Figure 1. Location map of the seismological network. The black box on
the geological map of Iran in inset shows the location of the regional map.
Stations used in this study are plotted as black triangles. The dash-and-dot
line is the N42 profile used in cross sections of Figs 2 and 4. The main faults
are shown as thick black lines. Geological map modified from the structural
map of NGDIR (National Geoscience Database of Iran, http://www.ngdir.ir).
MZT: Main Zagros thrust; KZF: Kazerun fault; MZT: Main Zagros thrust
and DF: Deshir fault.
belt (hereinafter referred to as ZFTB) well-known for its spectacu-
lar folds. The lower Cambrian to Pliocene continuous sedimentary
sequence of the Arabian platform is strongly folded and thrusted
with a basal decollement horizon in the lower Cambrian Hormuz
salt at 9 to 12 km depth (Stocklin 1968). Its deformation is thus be-
lieved to be decoupled from the crustal shortening of the basement
on distributed reverse faults (Jackson 1980; Jackson & Fitch 1981;
Berberian 1995). The ZFTB is affected by frequent earthquakes
of magnitude generally smaller than 7 concentrated at a depth of
8–15 km in the upper crystalline crust beneath the sedimentary se-
quence (Talebian & Jackson 2004; Tatar et al. 2004). Northeast of
the High Zagros, the profile cuts the Main Zagros Thrust (MZT),
which is believed by most authors to be the suture zone between
Arabia and Central Iran (e.g. Dewey & Grantz 1973). It separates
the ZFTB from the Sanandaj–Sirjan zone (SSZ), a highly deformed
and moderately metamorphosed remnant of the southern active mar-
gin of the Iranian continental block (e.g. Stocklin 1968; Agard et al.2005). The SSZ is bounded to the northeast by the Urumieh–Dokhtar
magmatic assemblage (UDMA) characterized by almost continuous
volcanic activity from Eocene to present (e.g. Berberian & King
1981; Berberian & Berberian 1981), and believed to be the Andean-
type arc related to the subduction of the Neotethys (Berberian et al.1982). The 200-km-long northeasternmost segment of the profile
crosses the southwestern part of the central Iranian microcontinent
(CIMC) block, northeast of the town of Yazd.
Many important questions on the Zagros collision belt do not have
a final answer yet. The precise timing of the orogenic process and of
the kinematics of the Arabia-Eurasia plate motion is still questioned
(e.g. McQuarrie et al. 2003; Molinaro et al. 2005b). Even though
most authors agree on the location of the suture at the MZT, Alavi
(1994) still proposes that it coincides with the northeastern bound-
ary of the SSZ. Balanced and restored cross-sections through the
fold-thrust belt suggest that cumulative northeast–southwest short-
ening lies between 25 km (Sherkati & Letouzey 2004) and 49 km
(Blanc et al. 2003) in the Dezful Embayment, and between 45 km
(Molinaro et al. 2005b) and 69 km (McQuarrie 2004) in the Fars arc.
In the basement, shortening is accommodated at least partially by
distributed thrusts as suggested by fault plane solutions (e.g. Tatar
et al. 2004). But the deformation processes that enable the litho-
sphere to accommodate the shortening at greater depths remain
unknown. Do the basement thrusts connect at depth on a single
decollement level? Is deformation in the lower crust continuous or
localized? Does the Arabian lithosphere underthrust the Iranian mi-
crocontinent? A better understanding of the dynamics of the belt
requires constraints on the lithospheric structure, including map-
ping of Moho depth which is the main goal of this work. We use the
RF technique, which is an efficient tool to image structural discon-
tinuities at crustal or mantle depths beneath seismological stations
(Vinnik 1977; Langston 1979). The processing aims at enhancing
P-to-S converted phases at velocity discontinuities in earthquake
records at teleseismic distances.
D A T A S E L E C T I O N A N D P R O C E S S I N G
From 2000 November to 2001 April, we operated a network of 66
seismological stations along a profile trending N42 almost perpen-
dicularly to the tectonic strike of Zagros. Our choice of this location
relied both on scientific (most 2-D part of the range suitable for a
transect) and logistical (easy and continuous road) considerations.
The 45 stations whose locations are plotted in Fig. 1 were equipped
with broadband (Guralp CMG40-T and CMG3-ESP, Streckheisen
STS-2) or Lennartz Le-3D-5s sensors, and continuously recording
Agecodagis Minititan digitizers. The average interstation spacing
was 14 km. We recorded 111 earthquakes of magnitude ≥5.5 at
teleseismic distances between 25◦ and 98◦. From their records, we
computed radial and transverse RFs using the time domain iterative
deconvolution method of Ligorria & Ammon (1999). Radial RFs
were selected on quality criteria including the arrival time of
the most energetic pulse (that corresponds to the direct P at 0s in the
absence of a thick low-velocity sedimentary cover), the amplitude
ratio of the direct P to secondary arrivals, and the overall RMS of
the RF. A time-section plot of radial RF stacked by station is shown
in Fig. 2. A move-out correction has been applied before stack to a
constant slowness of 7 s.deg−1 using the same velocity model as in
the depth migration (see details in the following section). Traces are
plotted at the abscissae of the stations, after projection onto the line
trending N42 centred at location [30.6◦N; 53◦E] where it crosses
the MZT (see Fig. 1). Stacked radial RF exhibit waveforms of
variable complexity, but a more-or-less energetic phase is visible all
along the profile between 5 and 8 s after the direct P wave (marked
by arrows for selected traces in Fig. 2). Since this phase has all the
attributes of a P-to-S conversion at an interface with a rather strong
velocity (and density) increase with depth (rather strong amplitudes,
positive polarity) located at a depth between 40 and 70 km (time
after P onset between 4.5 and 7.5 s), with a good lateral continuity
on many tens of km, we infer that it corresponds to the converted
phase at the Moho (hereinafter named Ps). The spatial coverage is
particularly weak under the SSZ at abscissae between 50 and 100
km due to a lack of stations in a basin with soft sand site conditions.
C© 2006 The Authors, GJI
Journal compilation C© 2006 RAS

May 24, 2006 7:58 Geophysical Journal International gji˙2920
Seismological evidence for crustal-scale thrusting in the Zagros mountain belt 3
0
3
6
9
12
15
-300 -200 -100 0 100 200 300 400
F1
3
F11
A1
M1
F8
F1
0
F7
F5
A2
A3
M2
F1
B2
B1
P1
P2
M5
P4
S9
B3
P8
P9
M3
P6
M4
S7
S1
0
S11
C2
M6
S1
2
D3
S3
C1
S1
H4
D1
H5
D2
H1
M7
H1
0
M8
H1
1
Offset from MZT (km)
Tim
e a
fte
r P
(s)
-300 -200 -100 0 100 200 300 400
0
25
50
Nr
of tr
aces
ZFTB
MZT
SSZ UDMA CIMC
KZF
Figure 2. Time-section of radial RFs stacked by station after move-out correction to a ray parameter of 7 s deg−1. Each trace is plotted at the abscissa of the
projection of the corresponding station onto the N42 profile. Distances are measured relative to point [30.6N, 53.0E] where the N42 profile intersects the MZT.
Arrows point out pulses interpreted as the Ps phase converted at the Moho for selected traces with best signal-to-noise ratio. Phases are picked on different
criteria including amplitude (positive pulse of strong amplitude), time (last pulse of strong amplitude), and lateral continuity between neighbouring stations.
The top panel shows the number of RFs stacked at each station. The bar in the middle panel shows the locations of the main faults and of the boundaries of the
structural units intersected by the profile. ZFTB: Zagros fold-and-thrust belt; SSZ: Sanandaj–Sirjan zone; UDMA: Urumieh–Dokhtar magmatic assemblage;
CIMC: Central Iranian microcontinent; KZF: Kazerun fault and MZT: Main Zagros thrust.
However, the section documents clear lateral variations in the
Ps–P time difference with the latest Ps being observed beneath
the SSZ. The High Zagros region, between the Kazerun fault
(KZF in Figs 1 and 2) and the MZT, exhibits very strong and laterally
coherent Ps converted phases. The radial RF at station B2 (km −66)
plotted in Fig. 3(a) (left panel) display this converted pulse of very
strong amplitude. Fig. 3(b) shows the radial and transverse RF at
station M5 located at km 28 inside the SSZ. Although the distribu-
tion in backazimuth (centre panel) is roughly the same at stations
B2 and M5, the waveforms at M5 are less coherent than at B2. Nev-
ertheless, the largest amplitudes pulses at M5 clearly arrive at later
times than at B2. At both profile ends, southwest of the KZF and
northeast of the SSZ, the Ps conversion is less clear and less laterally
continuous, as documented by Figs 2 and 3(c) (station H1, km 285).
As a whole, the waveforms of the radial RF are much more compli-
cated in the Zagros than in other regions where we have experience
of similar recording conditions (e.g. in Tibet: Vergne et al. 2002;
Wittlinger et al. 2004). Moreover, signals of non-negligible ampli-
tude remain after deconvolution on the transverse RF as documented
by Fig. 3 (right panels). The coherency of the transverse RF for dif-
ferent backazimuths is an indication for departures from the basic
hypothesis that crustal layers are horizontal and isotropic. Indeed, a
close analysis of the transverse RF shows that there is no clear co-
herency from one station to its neighbours, indicating that possible
interface dips and/or anisotropy vary laterally at interstation scale.
However, locally dipping interfaces or anisotropy mostly change the
amplitudes of converted signals on the radial RF. They have very
small influences on the arrival times, which is the only information
we are using in forthcoming analyses.
M I G R A T E D D E P T H S E C T I O N
To image the crustal thickness variations, we performed a common
conversion point (CCP) depth migration of the radial RF using the
method described by Zhu (2000). It is based on the projection of
the amplitude vector of each radial RF along the corresponding ray
path computed in a particular velocity model. The volume beneath
the network is binned in the three directions of space (with very
wide bins in the direction perpendicular to the N42 profile) and the
amplitude of each bin is obtained by averaging amplitudes of radial
RF with ray paths crossing the bin.
The migrated image is highly dependent on the velocity model.
Here, we used a modified version of the IASP91 standard earth
model with a Moho at 75 km depth. This depth is chosen im-
mediately above the maximum Moho depth observed after mi-
gration to ensure that Ps–P traveltimes are converted to Moho
depths using crustal and not mantle velocities. For stations lo-
cated southwest of the MZT, we used the three-layer velocity model
computed by Hatzfeld et al. (2003) from the inversion of arrival
times of microearthquakes and radial RF in the Ghir region. It in-
cludes a 11-km-thick sedimentary layer with Vp = 4.7 km s−1 and
C© 2006 The Authors, GJI
Journal compilation C© 2006 RAS

May 24, 2006 7:58 Geophysical Journal International gji˙2920
4 A. Paul et al.
0
90
180
270
3600 2 4 6 8 10 12 14
0. 2
0
0.2
0.4
Ps/P
am
plit
ud
e Radial
stack
0 2 4 6 8 10 12 14
Time after P (s)
0 2 4 6 8 10 12 140. 2
0
0.2
0.4
Transverse
stack
0 2 4 6 8 10 12 14
Time after P (s)
0
90
180
270
3600 2 4 6 8 10 12 14
0. 2
0
0.2
0.4
Ps/P
am
plit
ud
e Radial
stack
0 2 4 6 8 10 12 14
Time after P (s)
0 2 4 6 8 10 12 140. 2
0
0.2
0.4
Transverse
stack
0 2 4 6 8 10 12 14
Time after P (s)
0
90
180
270
3600 2 4 6 8 10 12 14
0. 2
0
0.2
0.4
Ps/P
am
plit
ude Radial
stack
0 2 4 6 8 10 12 14
Time after P (s)
0 2 4 6 8 10 12 140. 2
0
0.2
0.4
Transverse
stack
0 2 4 6 8 10 12 14
Time after P (s)
Station B2
Station M5
Station H1
(a)
(c)
(b)
Figure 3. Examples of RFs computed at three stations located in differ-
ent parts of the profile. Radial (left) and transverse (right) RFs are sorted
by backazimuth. The backazimuth values are shown in the middle panels
on a linear scale. Note that most RF correspond to backazimuths between
10 and 120◦. The stack trace for both radial and transverse RF is plot-
ted in the top panel. (a) RF at station B2 located in the ZFTB; (b) RF
at station M5 located in the SSZ and (c) RF at station H1 located in the
CIMC.
Vp/Vs = 1.77, a 9-km-thick crystalline crust with Vp = 5.8 km s−1
and a lower crust with Vp = 6.5 km s−1, both with a normal Vp/Vsof 1.73. For stations northeast of the MZT where no information
on crustal velocities is available, we assumed that there was no
sedimentary layer and we increased the thickness of the upper crys-
talline crust to 20 km. The existence of a thick sedimentary se-
quence beneath the Zagros results in a Moho pull up of ∼4 km after
migration.
The Vp/Vs ratio has a critical influence on the time-to-depth con-
version of Ps converted phases. It can be evaluated together with
the crustal thickness from a grid-search stacking of the Ps and its
first multiple, the PPs phase, at each station where the epicentral
distance coverage is sufficient and the PPs is clear enough (Zhu
& Kanamori 2000). Since none of these two conditions is fulfilled
in our data set, it is impossible to estimate the Vp/Vs ratio in con-
junction with the crustal thickness by this method. Another way of
checking that the assumption of a laterally constant crustal Vp/Vsis not too crude is to stack the CCP migrated sections of the PPsand PSs multiples which are much more sensitive to Vp/Vs than the
primary Ps (e.g. Wittlinger et al. 2004). If the image obtained from
the migrated multiples displays a converted phase at the same depth
as the Moho in the Ps migrated section, the assumption of a later-
ally constant Vp/Vs of 1.73 is true. If the converted phases do not
coincide, their depth difference can be used to measure the actual
value of the crustal Vp/Vs ratio. We observe a converted phase in the
section computed from the multiple phases only between kilometres
−170 and 0, that is in the part of the profile with strong primary Psphases. In this region, the Moho depth obtained by migrating the
multiples is close enough to the one obtained with the Ps to ensure
that the assumption of a laterally constant Vp/Vs of 1.73 is reason-
able. Unfortunately, no inference on the Vp/Vs ratio in other parts
of the profile can be drawn from the multiples because they have
too weak amplitudes.
The raw and smoothed CCP migrated depth sections are shown
in Fig. 4. The CCP migration significantly improves the signal-to-
noise ratio and the spatial continuity of conversion interfaces. It is
particularly useful for this data set since the Ps pulse is hardly vis-
ible on a large number of individual radial RF. In the Moho depth
range, the rather dense station spacing guarantees a sufficient mul-
tifold coverage (number of RF stacked in each bin) except beneath
the SSZ (km 50–150) and at the southwestern end of the profile.
This is documented by the middle panel of Fig. 4 where empty
bins (crossed by no ray) filled in light grey are numerous beneath
the SSZ. Furthermore, this plot shows that rays do not criss-cross
enough above ∼30 km depth with this station spacing to image the
structure of the upper crust. The crust–mantle boundary appears as
the only strong-amplitude laterally continuous conversion interface.
Its lateral continuity is enhanced by horizontal smoothing of the raw
migrated section (bottom panel in Fig. 4) using a Gaussian operator
of half-width 10 km.
In the ZFTB, the image of the Moho changes at the Kazerun
fault (KZF). Beneath the lower-elevation southwestern Zagros, the
radial RF display strong waveform changes between neighbour sta-
tions, resulting in a laterally discontinuous conversion interface in
the depth section. This effect is reinforced by the rather poor cover-
age due to instrumental problems. However, the Moho can be picked
with a slight northeastward dip from a depth of 43 ± 2 km beneath
the coast of the Persian gulf (km −370, station F13) to 47 ± 2 km
beneath the region of Kazerun (km −155, station F5). A secondary
pulse gives the red patch at ∼20 km depth between km −240 and
−180 in Fig. 4. Hatzfeld et al. (2003) made a similar observation
C© 2006 The Authors, GJI
Journal compilation C© 2006 RAS

May 24, 2006 7:58 Geophysical Journal International gji˙2920
Seismological evidence for crustal-scale thrusting in the Zagros mountain belt 5
0
50
100
150
De
pth
(km
)
F1
3
F11
M1
F1
0
A1
F8
F7
A3
F5
A2
M2
F1
P1
B1
P2
B2
P4
B3
M3
P6
P8
M4
M5
P9
S9
S7
S1
0
S11
M6
S1
2
S3
C1
C2
S1
D1
D3
H4
H5
D2
H1
M7
H1
0
H11
M8
0
2000
Ele
vation (
m)
SW NE
ZFTB SSZ UDMA CIMC
MZTKZF
0
50
100
150
De
pth
(km
)
-300 -200 -100 0 100 200 300
Offset from MZT (km)
-0.06 -0.03 0.00 0.03 0.06
PS/P amplitude
?
?
Figure 4. Migrated depth section computed from radial RFs along the N42 profile. The blue-to-red colour map displays the average amplitude ratio of the P-to-Sconverted phase to the primary P for all rays crossing the bin. Top: average elevations along the N42 profile; inverted triangles show heights of seismological
stations. Middle: raw migrated depth section. Empty bins (without a single ray) are plotted in light grey. The dotted line is the Moho depth profile picked from
the smoothed depth section. Bottom: migrated depth section after filtering and smoothing.
on radial RF computed at a single station in central Zagros and in-
terpreted this pulse as a conversion on the top of the lower crust.
Unfortunately, the station spacing is too large and the ray coverage
is too poor in this depth range to precise the lateral extension of this
interface. The High Zagros region is characterized by a more lat-
erally continuous Ps phase of stronger amplitude. The Moho depth
seems to decrease slightly between 47 ± 2 km and 43 ± 2 km,
30 km southwest of the surface trace of the MZT.
From km −35, the Moho dip increases abruptly. As documented
in Fig. 2, rather clear Ps pulses at stations P6, P8, P9, M4 and M5
are convincing evidences of the rapidly increasing Moho depth be-
neath the southern part of the Sanandaj–Sirjan metamorphic zone.
Unfortunately, good-quality RFs are rare at stations further north-
east due to bad site conditions. The maximum Moho depth of 69 ±2 km is mainly documented by a few RF recorded at stations S9 and
S10. It is reached between 50 and 90 km northeast of the surface
exposure of the MZT. As mentioned above, we checked by migrat-
ing the multiples that the hypothesis of a laterally constant Vp/Vsratio of 1.73 is acceptable beneath the High Zagros. However, due
to the weak ray coverage beneath the SSZ where even observations
of the primary converted pulse are scarce, this hypothesis cannot
be checked in the region of thickened crust. Yet an underestimate
of the crustal average Vp/Vs and an overestimate of the crustal av-
erage P-wave velocity would induce an artificial pull down of the
Moho on the migrated depth section. Explaining the whole of the
observed 25 km pull down would require either a very high Vp/Vsratio larger than 2.1, which is impossible, or a P wave velocity of
5.2 km s−1 combined with a Vp/Vs ratio of 2.0. Such a low value
for the crustal average Vp is contradictory with petrological studies
that document exposures of obducted ophiolite remnants in the MZT
crush zone and metamorphosed phyllites and metavolcanics to-
gether with large-scale calc-alkaline plutons in the SSZ (e.g. Agard
et al. 2005). Moreover, it is incompatible with the high Vp/Vs ratio
of 2.0, which is even larger than the typical ratio of an oceanic crust
(1.89 by Christensen 1996). Therefore, the 25 km crustal thickening
cannot be entirely an artefact of the migration. Still, part of it could
be an artefact since an underestimate of 0.16 for Vp/Vs would result
in an artificial pull-down of ∼14 km. With an average Vp/Vs of 1.89,
the crust beneath the SSZ would have the composition of an oceanic
crust, quite far from the average continental crust of Christensen &
Mooney (1995) (Christensen 1996). Although this composition is
unrealistic, we consider that 0.16 is the upper bound for a possible
underestimate of the average crustal Vp/Vs ratio beneath the SSZ in
the migration, and that the observed maximum Moho depth could
be overestimated by ∼14 km at the maximum.
Most RFs computed at stations in the UDMA and central Iran
block display very complex waveforms with strong azimuthal vari-
ations and non-negligible energy on the transverse component
(e.g. Fig. 3c). Unfortunately, the azimuthal coverage is not suffi-
cient to allow any analysis of the RF in terms of crustal anisotropy
or dipping layers. We can only conclude on a complex crustal struc-
ture. However, good-quality records at stations S12 (km 140) display
an unambiguous Ps pulse giving a Moho depth at 45 ± 2 km. The
precise geometry of the crustal thinning beneath the northeastern
margin of the SSZ cannot be imaged due to the lack of ray cover-
age. At km 220, the Moho picked from the migrated depth section
displays a 8 km Moho step which is particularly clear on the un-
smoothed section (Fig. 4). Further northeastwards, between km 270
C© 2006 The Authors, GJI
Journal compilation C© 2006 RAS

May 24, 2006 7:58 Geophysical Journal International gji˙2920
6 A. Paul et al.
and the end of the profile, the crustal thickness decreases gently
from 50 ± 2 km to 42 ± 2 km.
G R A V I T Y M O D E L L I N G
Dehghani & Makris (1984) computed a coarse Moho depth map of
Iran from the conversion of the Bouguer anomaly map, and they
determined a maximum Moho depth of 52 to 53 km right beneath
the MZT along the profile considered in the present paper. A more
precise modelling of the Bouguer anomaly data in the Zagros region
has been conducted by Snyder & Barazangi (1986). Along a profile
transverse to the range located∼50 km to the southeast of our profile,
they proposed a crustal thickening from 40 km beneath the Persian
Gulf to 65 km beneath the MZT. The deepest Moho is located in
their model right beneath the surface trace of the MZT and the
Bouguer anomaly minimum of −200 mGals. This disagrees with
our results where the thickest crust is located beneath the SSZ, 50–
90 km northeast of the exposure of the MZT. Our direct observation
of the largest lapse times between the P and the Ps phases at stations
in the SSZ is a strong indication for a thickening of the crust beneath
the SSZ and not beneath the MZT. To reconcile seismological and
gravity observations, we computed the Bouguer anomalies produced
by a series of 2-D crustal models of the Zagros belt assuming the
Moho depth profile picked from the CCP migrated depth section of
Fig. 4, and compared them to observations.
To obtain the observed Bouguer anomaly along the N42 average
profile used in the migration of the RF, we first calculated a gravity
map of Zagros by smoothing and interpolating the gravity data re-
trieved from the world database of the BGI (Bureau Gravimetrique
International). The Bouguer anomaly map and the locations of the
measured points are displayed in Fig. 5. It shows that gravity mea-
surements are dense enough in the study region to ensure the quality
of the interpolation. The observed anomaly curve (thin continuous
line in the top panels of Figs 6 and 7) and its error bars (grey-shaded
zone within the dotted lines) result from a sliding-window average
of interpolated data points located in a 30-km-wide strip along the
N42 profile (see location in Fig. 5). We checked that the measured
data points located within the same strip do fall within the error
bars. The average topographic profile was computed in the same
way from the GTOPO30 world digital elevation model of the US
Geological survey.
We used the method derived by Talwani et al. (1959) to compute
the gravity field induced at the surface by buried polygons of arbi-
trary density and shape. The thick continuous line in Fig. 6(a) (top)
-250
-200
-150
-100
-50
0
Bouguer
anom
aly
(m
gal)
ObservedComputed
200 100 0 100 200 300
0
50
100
Offset from MZT (km)
Depth
(km
)
ZFTBMZT
SSZ UDMA CIMCKZF
-250
-200
-150
-100
-50
0
ObservedComputed
200 100 0 100 200 300
0
50
100
Offset from MZT (km)
ZFTBMZT
SSZ UDMA CIMCKZF
(a) (b)
Figure 6. Results of 2-D gravity modelling for: (a) a homogeneous crust model with thickness variations measured from the migrated depth section of Fig. 4,
(b) our preferred model with crustal-scale overthrusting of the SSZ on the ZFTB. Top: observed and computed Bouguer anomaly curves. The observed anomaly
is plotted as a thin black line. The grey zone bounded by dotted lines has a width of 2 standard deviations (see text). The thick line is the computed anomaly.
Bottom: crustal models. The density contrast between the crust of model (a) and the upper mantle is −250 kg m−3. See text for density values in model (b).
50 52 54 56
30
32
Seismol. station
Gravity station
-240 -200 -160 -120 -80mgal
Figure 5. Bouguer anomaly map showing locations of seismological sta-
tions (black triangles) and gravity stations (small black dots) of the BGI
database. The Bouguer anomaly map shown as grey-shaded contours was
obtained by interpolation and smoothing of the gravity measurements. The
dashed lines delimit the 30-km-wide strip used to compute the observed
Bouguer anomaly curve modelled in Figs 6 and 7.
is the Bouguer anomaly produced by a homogeneous crust of den-
sity 2950 kg m−3 overlying an upper mantle of density 3200 kg m−3
assuming the Moho depth profile picked from the CCP migrated
depth section of Fig. 4 (density model plotted in Fig. 6a, bottom).
It displays the gravity signature of the crustal thickness variations,
with a broad and strong gravity low in the SSZ and a much weaker
anomaly (both in amplitude and scale) over the Moho step beneath
central Iran. The computed anomaly does not fit the observations at
all.
In order to correct for the offset between the minima of the com-
puted and the observed anomalies, we need shallower and/or thicker
high-density material northeast of the MZT than southwest of it. A
possible crustal model fulfilling this condition is shown in Fig. 6(b).
It assumes that high-density rocks from the crystalline upper crust
and the lower crust of the SSZ are raised by crustal-scale under-
thrusting of the southern margin of the CIMC by the northern mar-
gin of the Arabian platform which holds the Zagros belt. A similar
C© 2006 The Authors, GJI
Journal compilation C© 2006 RAS

May 24, 2006 7:58 Geophysical Journal International gji˙2920
Seismological evidence for crustal-scale thrusting in the Zagros mountain belt 7
-250
-200
-150
-100
-50
0
Bouguer
anom
aly
(m
gal)
ObservedComputed
200 100 0 100 200 300
0
50
100
Offset from MZT (km)
Depth
(km
)
ZFTBMZT
SSZ UDMA CIMCKZF
-250
-200
-150
-100
-50
0
ObservedComputed
200 100 0 100 200 300
0
50
100
Offset from MZT (km)
ZFTBMZT
SSZ UDMA CIMCKZF
(b)(a)
Figure 7. Results of 2-D gravity modelling for: (a) a crustal model with the suture located at the boundary between the SSZ and the UDMA (Alavi, 1994), (b)
a crustal model with an Andean-type thickened margin beneath the SSZ. Same legend as Fig. 6.
hypothesis has been tested by Molinaro et al. (2005a) in a combined
modelling of gravity, geoid and topography data along a profile
across the Fars arc. Note however that the crustal thickening of their
model was totally hypothetical. Strong geological evidences suggest
that the SSZ overlaps the highly deformed rocks of the so-called
Crush zone in the MZT region, which in turn overthrust the Zagros
folded belt (e.g. Stocklin 1968; Ricou et al. 1977). Moreover, Agard
et al. (2005) suggest that the amount of shortening, the deformation
style and the lack of high-pressure metamorphic rocks along the
past oceanic suture zone in the Crush zone indicate that the thrust
branched onto the MZT at the surface is a major structure of crustal
scale, possibly rooted to Moho depths. Very few other geological
or geophysical data are available to constrain the density model.
Most authors agree on a crystalline basement depth between 8 and
12 km in the Zagros according to the fact that earthquakes inter-
preted as being related to reverse basement faults are concentrated
in depth between 8 and 12 or 15 km (e.g. Berberian 1995; Talebian &
Jackson 2004; Tatar et al. 2004). We used the estimate by Hatzfeld
et al. (2003) of an average lower crustal thickness of 25 km beneath
Zagros. As no data on the crustal structure is available for the region
northeast of the MZT, we assumed the depth to the basement to be
8 km and the thickness of the lower crust 25 km, exactly as beneath
the Zagros. We know that this assumption is probably wrong and that
the sediment layer is not that thick in the CIMC, if it exists. How-
ever, since we aim at comparing different hypotheses for the origin
of crustal thickening to gravity observations, this assumption can be
made for the sake of simplicity. All other geometric parameters of
the final model were set by trial-and-error modelling of the observed
Bouguer anomaly curve. We used the density values discussed
by Snyder & Barazangi (1986): 2610 kg m−3 for the sediments,
2800 kg m−3 for the upper crystalline crust, 2950 kg m−3 for the
lower crust, and 3200 kg m−3 for the upper mantle.
The top panel of Fig. 6(b) shows that the crustal density model
plotted in the bottom panel induces a Bouguer anomaly (thick con-
tinuous line) which satisfactorily fits the observations. We consider
the fit as correct when the overall shapes of the observed and com-
puted anomaly correspond, that is when the computed anomaly fits
within the error bars of the observations. The crustal-scale over-
thrusting onto the MZT compensates for the greater Moho depth
beneath the SSZ and shifts the anomaly minimum towards the MZT
by increasing the lower crustal thickness and raising higher-density
rocks. To improve the fit in the ZFTB, we assumed the existence of
three basement faults in the vicinity of the MZT and beneath the
KZF. However, as detailed modelling of the Bouguer anomaly is
beyond the scope of this paper, these faults will not be discussed
later. For the same reason, we did not try to improve the fit to the
slightly more negative anomaly observed in the UDMA.
This crustal model reconciles the Moho depth profile estimated
from the RF with the gravity observations. Note however that the
continuation of the thrust to the Moho is speculative since we have
no direct observation of this structure at depth.
D I S C U S S I O N
On the origin of crustal thickening
The average crustal thickness beneath the ZFTB (measured from
−300 to −25 km on the Moho depth profile of Fig. 4) is 45 ± 2 km,
very close to the crustal thickness measured for the undeformed part
of the Arabian platform, 45 km, from RF at Ryad (Sandvol et al.1998; Julia et al. 2000). As discussed by Hatzfeld et al. (2003), the
thickness of the crystalline crust beneath the Zagros (i.e. 35 ± 2 km
assuming 10 km of sediments) is about the same as the thickness of
the thinned crust of the pre-collisional Arabian platform, assuming
a stretching factor of 1.2 as estimated by Trowell (1995) from strati-
graphic data along the Zagros margin. Therefore, we confirm on a
much more complete data set the conclusion discussed in Hatzfeld
et al. (2003) that the crystalline basement of the ZFTB has not been
thickened much by the collision yet.
The most striking feature of the measured Moho depth profile is
the 25 km thickening of the crust in a rather narrow region (160 km)
beneath the northeasternmost Zagros, the MZT and the Sanandaj–
Sirjan metamorphic belt. The thickened crust is not located beneath
the high elevations of the so-called High Zagros (between the MZT
and the KZF, see the topographic profile in Fig. 4), but in the back
side of the Main Zagros thrust beneath the lower elevations of the
SSZ.
Alavi (1994) postulated that the suture is located between the
SSZ and the UDMA and redefined the SSZ as a zone of thrust faults
that have transported Phanerozoic units of the Arabian margin and
obducted ophiolites to the southwest. We compared this hypothesis
to our Moho depth profile and the Bouguer anomaly data in Fig. 7(a).
Fitting the gravity observations requires that the basement layer
reaches the surface in the SSZ, which sounds realistic, and that the
lower crust is twice thicker beneath the SSZ than beneath the ZFTB.
This requirement of a very thick lower crust is hardly compatible
with Alavi’s model, which assumes that the crust beneath the SSZ is
made of a stack of thrusted slices (see cross-section in Alavi 1004).
Moreover, such a lower crustal thickening requires a shortening of 50
C© 2006 The Authors, GJI
Journal compilation C© 2006 RAS

May 24, 2006 7:58 Geophysical Journal International gji˙2920
8 A. Paul et al.
to 100 per cent in the SSZ, whereas it would be almost null beneath
the ZFTB. Such a strong strain difference between two contiguous
parts of the same continental margin sounds unrealistic. Therefore,
we think that our Moho depth model is not compatible with the
hypothesis of Alavi (1994) and that the suture is located at the MZT.
In the following, the SSZ is considered as the southwesternmost
part of the Iranian margin. Still, two hypotheses can be proposed to
explain the thickening. In the first one, it is a remnant of an Andean-
type crustal thickening of the Iranian margin related to the subduc-
tion of the Neo-Tethys oceanic domain. The crustal thickening of the
SSZ would thus be due to volcanic intrusions, magmatic or metased-
iments underplating, and would predate the collision. Since the MZT
is the southern border of the SSZ, this hypothesis implies that the
suture is more or less vertical, as shown by Fig. 7(b) (bottom). Here
again, the lower crust beneath the SSZ has to be twice thicker than
beneath the UDMA or CIMC to reconcile the Moho depth model
and the Bouguer anomaly data (Fig. 7b). This is quite different from
the crustal structure of a typical Andean margin inferred from grav-
ity modelling since in the Andes, the Bouguer anomaly is inversely
correlated with the crustal thickness (e.g. Gotze & Kirchner 1997).
We think that this discrepancy argues against the hypothesis that
the SSZ crust was thickened during the phase of oceanic subduction
prior to the continental collision, as an Andean-type passive margin.
The second hypothesis explains the thickening by crustal-scale
underthrusting of the active margin of the Iranian microblock by
the passive margin of the Arabian continent. The MZT considered
as the thrust surface is rooted at Moho depth, as shown in the grav-
ity model of Fig. 6(b). We have no direct evidence of this thrust
cutting the whole crust in the migrated depth section of Fig. 4.
However, gravity modelling shows that the assumption of crustal-
scale thrusting of the margin of the Iranian microcontinent over the
ZFTB is compatible with Bouguer anomaly data. Two geological
arguments in favour of this hypothesis have been presented in the
previous section: (1) there are clear indications that the SSZ overlaps
the Crush zone which in turn overthrusts the ZFTB; (2) no high-
pressure metamorphic rocks are found along the suture (Agard et al.2005). Another positive element is the consistency between the total
shortening measured in the Zagros fold-thrust belt by balanced and
restored cross-sections (67 km by McQuarrie (2004) in the Fars, 49
km by Blanc et al. (2003) and 25 km by Sherkati & Letouzey (2004)
in the Dezful Embayment, and 45 km by Molinaro et al. (2005b)
in the eastern arc of Fars north of Bandar Abbas) and the one as-
sociated to the crustal-scale thrust in the cross-section of Fig. 6(b)
(∼30 km).
Present dynamics of the mountain belt
Although the Zagros belt as a whole is characterized by an impor-
tant seismic activity, the MZT region in central Zagros as well as the
SSZ are almost devoid of earthquakes (Jackson & McKenzie 1984).
Furthermore, no events at depth greater than 30 km have been re-
liably located in the ZFTB or northeast of the MZT (Maggi et al.2000; Talebian & Jackson 2004). These are clear indications that
the crustal-scale thrust coincident with the MZT, if it exists, is seis-
mically quiet which could mean that it is locked. Measurements of
surface displacements by satellite geodesy suggest that the present
shortening rate across the MZT in the Fars is almost negligible and
that deformation at a rate of 8 ± 2 mm.yr−1 is concentrated between
the Persian gulf and High Zagros (Tatar et al. 2002; Walpersdorf
et al., 2006). However, since deformation of the Zagros sediment
cover is decoupled from deformation in the basement by decolle-
ment levels including the Hormuz salt layer, the strain pattern at
the surface is not a reliable indication of the strain pattern in the
basement.
Anyhow, the hypothesized locking of the crustal thrust can be
explained in the evolution models of a convergent plate-boundary
proposed by Regard et al. (2003) and Bird (1978). In their laboratory
experiments of the closure of an oceanic basin and the transition to
continental collision, Regard et al. (2003) showed that oceanic sub-
duction is followed by an episode of continental subduction when
the passive margin of the ‘southern’ continent (here: Arabia) under-
thrusts the active margin of the ‘northern’ one (here: Iran). During
that phase, surface shortening of the subducting lithosphere remains
negligible and strain localizes at the trench. When the negative buoy-
ancy of the subducted continental material is not compensated any
more by downward driving forces such as slap pull, continental sub-
duction stops and it is followed by collision. The onset of collision
coincides with the onset of surface shortening of the ‘southern’ con-
tinent and the creation of a fold-thrust belt, close to the margin first,
and progressively extending further south. In the Zagros, the present
tectonics is characterized by (1) a well-developed fold-thrust belt,
(2) distributed shortening in the basement between the Persian Gulf
and the High Zagros on blind thrust faults and (3) the lack of de-
formation in the MZT region documented by seismic quiescence.
These observations match the results of the experiments by Regard
et al. (2003) and suggest that the phase when the mega-thrust coinci-
dent with the suture absorbs all the convergence has ceased and that
Zagros is currently undergoing distributed compressional deforma-
tion. If we could demonstrate that the mega-thrust also implies the
lithospheric mantle, we would write that the episode of continental
subduction has been replaced by continental collision.
Bird (1978) reached similar conclusions using 2-D finite ele-
ment modelling of lithospheric deformation in the Zagros assuming
pure anelastic rheology. He showed that shear stress concentrates on
the suture zone for all models with slap-pull boundary conditions,
whatever the densities and flow laws considered. To account for dis-
tributed deformation in the Zagros crustal wedge, the Neo-tethys
oceanic slab must be detached there, the Arabia-Iran convergence
now occurring in a compressive regime.
The question of slab break-off
Kadinsky-Cade & Barazangi (1982) considered that the occurrence
of a single intermediate-depth event at 107 km beneath the Urumieh–
Dokhtar volcanic belt might indicate that the slab is still attached to
the Arabian margin. However, the much bigger hypocentre database
of Maggi et al. (2000) clearly shows that the few deep-focus events
are related with the western edge of the Makran slab and have noth-
ing to do with anything that was once under the Zagros. Hypocentres
in the Zagros region are concentrated at depths shallower than 20 km,
precluding both the presence of an oceanic slab subducting beneath
central Zagros and active continental subduction at the MZT. Seis-
mic wave tomographies of the mantle from body wave traveltimes
(Kaviani 2004) and surface wave studies at regional scale (Maggi
& Priestley 2005; Bourova 2004) have failed to image any high-
velocity anomaly beneath UDMA and Central Iran. On the contrary,
the upper mantle north of the suture is characterized by lower veloci-
ties than beneath Zagros, both for P and S waves. However, the rather
poor lateral resolution of surface wave studies (Maggi & Priestley
2005) and the inhomogeneous azimuthal coverage of teleseismic
residual inversion (Kaviani 2004) preclude any final conclusion on
oceanic slab break-off.
C© 2006 The Authors, GJI
Journal compilation C© 2006 RAS

May 24, 2006 7:58 Geophysical Journal International gji˙2920
Seismological evidence for crustal-scale thrusting in the Zagros mountain belt 9
On flexural characteristics of the Arabian plate
Snyder & Barazangi (1986) concluded their work on Bouguer
anomaly modelling by a thorough discussion on the mechanisms
responsible for the strong Moho bend they had to consider beneath
the High Zagros to fit the gravity data. The Moho pull-down that
we find beneath the MZT surface exposure is even stronger, with
a maximum dip of 11 to 17◦ (corresponding to a minimum crustal
thickening of 15 km and a maximum of 25 km within 80 km dis-
tance), while it is 5◦ in their model. As noted by Snyder & Barazangi
(1986), the topographic load in the Zagros is by far insufficient to
explain such a Moho deepening within such a short distance by sim-
ple elastic flexure of the lithosphere. This is even more critical with
our Moho depth model where the thickest crust does not correspond
to the highest elevations as documented by the topographic profile
of Fig. 4. Snyder & Barazangi (1986) proposed that isostatic and
elastic flexure forces are acting together with hydraulic thickening of
the plastic lower crust due to horizontal compression to produce the
observed localized crustal thickening. The lower crust deforms plas-
tically due to high-temperature and high-pressure conditions. Since
it is confined between the rigid upper crust and upper mantle, it re-
sponds to horizontal compression like an incompressible hydraulic
fluid by thickening and bending the Moho down. Their hypothesis is
compatible with our observations. In particular, it could explain why
we have to consider a thickened lower crust beneath the MZT re-
gion in our density model of Fig. 6(b). However, this hypothesis still
has to be checked by thermomechanical modelling of lithospheric
deformation.
In their elastic flexure modelling of the Bouguer anomaly in the
Himalayas of Nepal, Lyon-Caen & Molnar (1983, 1985) showed that
the observed increase in gravity gradient requires a steeper Moho
(10–15◦) beneath the High Himalayas. They interpreted this steep-
ening as due to a lateral weakening of flexural rigidity of the equiva-
lent elastic plate. Later, Cattin et al. (2001) modelled denser gravity
data along the same profile with a more realistic 2-D thermomechan-
ical model taking petrological changes into account. They showed
that as the topographic load increases, the lithosphere is flexed down
and progressively weakened by strain and high temperatures of deep
rocks brought up along the Main Himalayan Thrust (MHT). This
flexural and temperature weakening explains why the rigidity of
the Indian plate decreases locally beneath the High Himalayas, in
agreement with the observed Moho steepening. A comparison be-
tween Zagros and Himalayas leads to the paradoxical conclusion
that, although the topographic load in the Zagros is much weaker,
the Arabian plate is as strongly bended beneath the MZT than the
Indian plate beneath the High Himalayas. As in Nepal, the local
steepening of the Moho could be partly due to a local weakening of
the Arabian lithosphere, either predating the collision and/or related
to strain and thermal weakening (Cattin et al. 2001). However, the
question of the force driving the flexure remains.
The Moho step northeast of Yazd
The last point of this discussion concerns the Moho step imaged in
the northeastern part of the profile, 30–35 km north of the town of
Yazd. As already noted in a previous section, such vertical Moho
steps have been imaged beneath the Tibetan plateau, often right
beneath surface traces of major faults or sutures between accreted
terranes. The Moho step discovered here does not correlate with
any of the major faults or sutures mapped on classical geological
maps of Iran. The Nain-Baft ophiolitic alignment, which follows the
boundary between the SSZ and the UDMA (see Fig. 1) suggests that
the Sanandaj–Sirjan microcontinent was separated from the Central
Iran block by a narrow ocean basin in Late Cretaceous time (Arvin
& Robinson 1994), but our Moho step is located more than 100 km
northeast of this suture. Nonetheless, a possible hypothesis is that
the step might correspond to an unmapped ancient suture between
two microblocks of the CIMC.
C O N C L U S I O N
From the records of a seismological network installed for 4.5 months
across central Zagros, we have imaged Moho depth variations with a
lateral resolution of a few km along a 620-km-long profile transverse
to the range. The average crustal thickness is 45 km beneath most
of the Zagros fold-and-thrust belt and 42 km beneath the Urumieh–
Dokhtar volcanic zone and the southern part of the Iranian micro-
continent. The region of the suture from the High Zagros to the
Sanandaj–Sirjan metamorphic zone is characterized by a marked
crustal thickening from ∼45 to ∼70 km in a narrow region ∼160
km wide centred 70 km to the northeast of the surface trace of the
MZT. The very steep northeastward dip of the Moho beneath the
High Zagros, the MZT Crush zone, and the southern part of the SSZ
is defined unambiguously by strong Ps converted phases. However,
due to the complex waveforms of the RF, the crustal multiples are
hardly visible even after CCP migration of the PPs and PSs mul-
tiples and stack of the migrated sections. This prevents from any
estimate of the crustal average Vp/Vs ratio, in particular beneath
the SSZ where the crustal thickness could be overestimated by ∼14
km at the maximum if the actual value of the average crustal Vp/Vsratio is 1.89 (typical of an oceanic crust) and not 1.73.
To reconcile the gravity and seismological data, we propose that
the Zagros wedge underthrusts the SSZ along a crustal-scale fault
linked at the surface to the MZT. The horizontal shortening of ∼30
km implied by this thrust agrees with the shortening measured from
balanced and restored cross-sections of the ZFTB. The existence of
this crustal thrust would also explain petro-structural observations
made in the Crush zone such as the lack of high-pressure metamor-
phic rocks along the suture.
Relying on the distribution of earthquake epicentres in central
Zagros and on published experimental and numerical models of
the transition from oceanic subduction to continental collision, we
propose that the MZT crustal thrust is presently locked and that con-
tinental subduction has ceased. The shortening of 8 ± 2 mm.yr−1
measured in central Zagros by satellite geodesy (Walpersdorf et al.2006) would thus be entirely accommodated by distributed shorten-
ing of the crust. A possible explanation for this change in tectonic
regime would be slab break-off. Indeed, none of the presently avail-
able tomographies of the upper mantle beneath Central Iran dis-
play the high-velocity anomaly that should be associated with the
subducting oceanic lithosphere. Their resolution can be questioned.
Nevertheless, this lack of high-velocity anomaly in the mantle north
of the MZT is particularly puzzling when we consider the unam-
biguous image of the same Neotethysian slab in the mantle beneath
the active Makran subduction zone, ∼700 km east of our profile
(Fig. 9a in Bijwaard et al. 1998). High-resolution tomographies of
the mantle beneath the SSZ and central Iran are needed to confirm
that continental collision has followed the initial stage of continental
subduction and slab-pull conditions in the Zagros belt.
A C K N O W L E D G M E N T S
We are grateful to all the people who made the seismological exper-
iment successful. In particular, we thank O. Coutant, G. Herquel, G.
C© 2006 The Authors, GJI
Journal compilation C© 2006 RAS

May 24, 2006 7:58 Geophysical Journal International gji˙2920
10 A. Paul et al.
Poupinet and the IIEES field teams for their assistance in the field
work, and the people of Zagros for their welcome. We acknowledge
C. Pequegnat’s work on the BDsis software for data preparation and
management, which was used for the first time on this experiment.
The interpretations presented here emerged after fruitful discussions
inside the team of French geoscientists working in Iran, in particu-
lar P. Agard, J. Lave, J. Martinod, M. Molinaro, and V. Regard. AK
received partial support from the French Embassy in Tehran for his
PhD thesis in Grenoble. The experiment was funded by IIEES, Iran,
and INSU-CNRS ‘Interieur de la Terre’ programme, France. Seis-
mological stations used in the experiment belong to the Lithoscope
and RLBM CNRS-INSU national pools.
R E F E R E N C E S
Agard, P., Omrani, J., Jolivet, L. & Mouthereau, F., 2005. Convergence
history across Zagros (Iran): constraints from collisional and earlier de-
formation, International Journal of Earth Sciences, doi:10.1007/s00531-
005-0481-4.
Alavi, M., 1994. Tectonics of the Zagros orogenic belt of Iran: new data and
interpretations, Tectonophysics, 229, 211–238.
Alavi, M., 2004. Regional stratigraphy of the Zagros fold-thrust belt of Iran
and its proforeland evolution, Am. J. Sci., 304, 1–20.
Allen, M., Jackson, J. & Walker, R., 2004. Late Cenozoic reor-
ganization of the Arabia-Eurasia collision and the comparison of
short-term and long-term deformation rates, Tectonics, 23, TC2008,
doi:10.1029/2003TC001530.
Arvin, M. & Robinson, P.T., 1994. The petrogenesis and tectonic setting of
lavas from the Baft ophiolitic melange, southwest of Kerman, Iran, Can.J. Earth Sci., 31, 824–834.
Berberian, M., 1995. Master blind thrust faults hidden under the Zagros folds:
active basement tectonics and surface morphotectonics, Tectonophysics,241, 193–224.
Berberian, F. & Berberian, M., 1981. Tectono-plutonic episodes in Iran,
in Zagros, Hindu Kush, Himalaya Geodynamic evolution, pp. 5–32, eds
Gupta, H.K. & Delany, F.M., Am. Geophys. Union, Geodyn. Ser.Berberian, M. & King, G.C.P., 1981. Towards a paleogeography and tectonic
evolution of Iran, Can. J. Earth Sci., 18, 210–65.
Berberian, F., Muir, I.D., Pankhurst, R.J. & Berberian, M., 1982. Late
Cretaceous and Early Miocene Andean-type plutonic activity in north-
ern Makran and Central Iran, J. Geol. Soc. London, 139, 605–
614.
Besse, J., Torcq, F., Gallet, Y., Ricou, L.E., Krystyn, L. & Saidi, A., 1998.
Late Permian to Late Triassic palaeomagnetic data from Iran: constraints
on the migration of the Iranian block through the Tethyan Ocean and initial
destruction of Pangaea, Geophys. J. Int., 135, 77–92.
Bijwaard, H., Spakman, W. & Engdahl, E.R., 1998. Closing the gap between
regional and global travel time tomography, J. geophys. Res., 103, 30 055–
30 078.
Bird, P., Toksoz, M.N. & Sleep, N.H., 1975. Thermal and mechanical models
of continent-continent convergence zones, J. geophys. Res., 32, 4405–
4416.
Bird, P., 1978. Finite element modeling of lithosphere deformation: the Za-
gros collision orogeny, Tectonophysics, 50, 307–336.
Blanc, E.J.P., Allen, M.B., Inger, S. & Hassani, H., 2003. Structural styles
in the Zagros simple folded zone, Iran, J. Struct. Geol., 160, 401–
412.
Bourova, E., 2004. Etude de la structure lithospherique par l’analyse d’ondes
de surface dans deux zones de convergence: la mer Egee et l’Iran, PhDthesis, Universite Joseph Fourier, Grenoble.
Cattin, R., Martelet, G., Henry, P., Avouac, J.-P., Diament, M. & Shakya,
T. R., 2001. Gravity anomalies, crustal structure and thermo-mechanical
support of the Himalaya of Central Nepal, Geophys. J. Int., 147(2), 381–
392.
Christensen, N.I., 1996. Poissons’s ratio and crustal seismology, J. geophys.Res., 101, 3139–3156.
Christensen, N.I. & Mooney, W.D., 1995. Seismic velocity structure and
composition of the continental crust: A global view, J. geophys. Res.,100, 9761–9788.
Dehghani, G.A. & Makris, J., 1984. The gravity field and crustal structure
of Iran, N. Jb. Geol. Palaeont. Abh., 168, 215–229.
Dewey, J.W. & Grantz, A., 1973. The Ghir earthquake of April 10, 1972 in
the Zagros mountains of southern Iran: seismotectonic aspects and some
results of a field reconnaissance, Bull. seism. Soc. Am., 63, 2071–2090.
Giese, P., Makris, J., Akashe, B., Rower, P., Letz, H. & Mostaanpour, M.,
1984. The crustal structure in Southern Iran derived from seismic explo-
sion data, N. Jb. Geol. Palaeont. Abh., 168, 230–243.
Gotze, H.-J. & Kirchner, A., 1997. Interpretation of gravity and geoid in
the central Andes between 20◦ and 29◦S, J. S. Am. Earth Sci., 10, 179–
188.
Hatzfeld, D., Tatar, M., Priestley, K. & Ghafory-Ashtyany, M., 2003. Seis-
mological constraints on the crustal structure beneath the Zagros mountain
belt (Iran), Geophys. J. Int., 155, 403–410.
Jackson, J., 1980. Errors in focal depth determination and the depth of
seismicity in Iran and Turkey, Geophys. J. R. astr. Soc., 61, 285–
301.
Jackson, J. & Fitch, T., 1981. Basement faulting and the focal depths of the
larger earthquakes in the Zagros mountains (Iran), Geophys. J. R. astr.Soc., 64, 561–86.
Jackson, J.A. & McKenzie, D.P., 1984. Active tectonics of the Alpine-
Himalayan belt between western Turkey and Pakistan, Geophys. J. R.astr. Soc., 77, 185–264.
Julia, J., Ammon, C.J., Herrmann, R.B. & Correig, A.M., 2000. Joint in-
version of receiver function and surface wave dispersion observations,
Geophys. J. Int., 143, 1–19.
Kadinsky-Cade, K. & Barazangi, M., 1982. Seismotectonics of southern
Iran: the Oman line, Tectonics, 1, 389–412.
Kaviani, A., 2004. La chaıne de collision continentale du Zagros (Iran):
structure lithospherique par analyse de donnees sismologiques, PhD the-sis, Universite Joseph Fourier, Grenoble.
Langston, C.A., 1979. Structure under Mount Rainier, Washington, inferred
from teleseismic body waves, J. geophys. Res., 84, 4749–4762.
Ligorria, J.P. & Ammon, C.J., 1999. Iterative deconvolution and receiver-
function estimation, Bull. seism. Soc. Am., 89, 1395–1400.
Lyon-Caen, H. & Molnar, P., 1983. Constraints on the structure of the
Himalaya from an analysis of gravity anomalies and a flexural model
of the lithosphere, J. geophys. Res., 88(B10), 8171–91.
Lyon-Caen, H. & Molnar, P., 1985. Gravity anomalies, flexure of the Indian
Plate, and the structure, support and evolution of the Himalaya and Ganga,
Tectonics, 4(6), 131–138.
McQuarrie, N., 2004. Crustal-scale geometry of the Zagros fold-thrust belt,
Iran, J. Struct. Geol., 26, 519–535.
McQuarrie, N., Stock, J.M., Verdel, C. & Wernicke, B.P., 2003. Cenozoic
evolution of Neotethys and implications for the causes of plate motions,
Geophys. Res. Lett., 30, 2036, doi:10.1029/2003GL017992.
Maggi, A., Jackson, J.A., Priestley, K. & Baker, C., 2000. A re-assessment
of focal depth distributions in southern Iran, the Tien Shan and northern
India: do earthquakes really occur in the continental mantle?, Geophys. J.Int., 143, 629–661.
Maggi, A. & Priestley, K., 2005. Surface waveform tomography of the
Turkish-Iranian plateau, Geophys. J. Int., 160, 1068–1080.
Molinaro, M., Zeyen, H. & Laurencin, X., 2005a. Lithospheric structure
beneath the south-eastern Zagros Mountains, Iran: recent slab break-off?
TerraNova, 17, 1–6.
Molinaro, M., Leturmy, P., Guezou, J.C. & Frizon de Lamotte, D., 2005b.
The structure and kinematics of the south-eastern fold-thrust belt, Iran:
from thin-skinned to thick-skinned tectonis, Tectonics, 24, TC3007,
doi:10.1029/2004TC001633.
Regard, V., Facenna, C., Martinod, J., Bellier, O. & Thomas, J.C., 2003.
From subduction to collision: control of deep processes on the evo-
lution of convergent plate boundary, J. geophys. Res., 108(B4), 2208,
doi:10.129/2002JB001943.
Ricou, L.E., Braud, J. & Brunn, J.H., 1977. Le Zagros, Mem. h. ser. Soc.Geol.. Fr., 8, 33–52.
C© 2006 The Authors, GJI
Journal compilation C© 2006 RAS
May 24, 2006 7:58 Geophysical Journal International gji˙2920
Seismological evidence for crustal-scale thrusting in the Zagros mountain belt 11
Sandvol, E., Seber, D., Barazangi, M., Vernon, F., Mellors, R. & Al-Amri, A.,
1998. Lithospheric seismic velocity discontinuities beneath the Arabian
Shield, Geophys. Res. Lett., 25, 2873–2876.
Sherkati, S. & Letouzey, J., 2004. Variation of structural style and basin
evolution in the central Zagros (Izeh zone and Dezful Embayment), Iran,
Marine and Petroleum Geology, 21, 535–554.
Snyder, D.B. & Barazangi, M., 1986. Deep crustal structure and flexure of
the Arabian plate beneath the Zagros collisional mountain belt as inferred
from gravity observations, Tectonics, 5, 361–373.
Stocklin, J., 1968. Structural history and tectonics of Iran: A review,
American Association of Petroleum Geologists Bulletin, 52, 1229–
1258.
Talebian, M. & Jackson, J., 2004. A reappraisal of earthquake focal mecha-
nisms and active shortening in the Zagros mountains of Iran, Geophys. J.Int., 156, 506–526.
Talwani, M., Worzel, J.L. & Landisman, M., 1959. Rapid gravity compu-
tations for two-dimensional bodies with application to the Mendocino
submarine fracture zone, J. geophys. Res., 64, 49–61.
Tatar, M., Hatzfeld, D., Martinod, J., Walpersdorf, A., Ghafori-Ashtiany,
M. & Chery, J., 2002. The present-day deformation of the central
Zagros from GPS measurements, Geophys. Res. Lett., 29(19), 1927,
doi:10.1029/2002GL015427.
Tatar, M., Hatzfeld, D. & Ghafory-Ashtiany, M., 2004. Tectonis of the central
Zagros (Iran) deduced from microearthquake seismicity, Geophys. J. Int.,156, 255–266.
Trowell, C.G., 1995. Lithospheric stretching, subsidence and magmatism in
Oman and the Middle East, PhD thesis, University of Cambridge.
Vergne, J., Wittlinger, G., Hui, Q., Tapponnier, P., Poupinet, G., Mei, J.,
Herquel, G. & Paul, A., 2002. Seismic evidence for stepwise thickening
of the crust across the NE Tibetan plateau, Earth planet. Sci. Lett., 203,25–33.
Vinnik, L.P., 1977. Detection of waves converted from P to SV in the mantle,
Phys. Earth planet. Inter., 15, 39–45.
Walpersdorf, A. et al., 2006. Difference in the GPS deformation pattern of
North and Central Zagros (Iran), Geophys. J. Int, in press.
Wittlinger, G., Vergne, J., Tapponnier, P., Farra, V., Poupinet, G., Jiang, M.,
Su, H., Herquel, G. & Paul, A., 2004. Teleseismic imaging of subducting
lithosphere and Moho offsets beneath Western Tibet, Earth planet. Sci.Lett., 6974, 1–14.
Zhu, L.P., 2000. Crustal structure across the San Andreas Fault, southern
California from teleseismic converted waves, Earth planet. Sci. Lett., 179,183–190.
Zhu, L.P. & Kanamori, H., 2000. Moho depth variation in southern California
from teleseismic receiver functions, J. geophys. Res., 105, 2969–2980.
C© 2006 The Authors, GJI
Journal compilation C© 2006 RAS