A study of erosion rates on salt diapir surfaces in the Zagros Mountains, SE Iran
11
ORIGINAL ARTICLE A study of erosion rates on salt diapir surfaces in the Zagros Mountains, SE Iran J. Bruthans N. Asadi M. Filippi Z. Vilhelm M. Zare Received: 20 May 2006 / Accepted: 6 March 2007 / Published online: 12 April 2007 ȑ Springer-Verlag 2007 Abstract Salt exposures and weathering residuum on several salt diapirs in different geographic/climatic settings were studied. Anhydrite, gypsum, hematite, calcite, dolo- mite, quartz, and clay minerals are the main constituents of the weathering residuum covering the salt diapirs in vari- ous thicknesses. Erosion rates of residuum as well as of rock salt exposures were measured at selected sites for a period of 5 years by plastic pegs as benchmarks. Recorded data were standardized to a horizontal surface and to long- term mean precipitation. For the rock salt exposures the following long-term denudation rates were determined of 30–40 mm a –1 for coastal diapirs and up to 120 mm a –1 for mountain salt diapirs. Long-term mean superficial denu- dation rate measured on weathering residuum of low thickness reached 3.5 mm a –1 on coastal diapirs. The total denudation rate estimated for the thin residuum is close to 4–7 mm a –1 based on apparent correlation with the uplift rate on Hormoz and Namakdan diapirs. Denudation of rock salt exposures is much faster compared to parts of diapirs covered by weathering residuum. The extent of salt expo- sures is an important factor in the morphological evolution of salt diapirs as it can inhibit further expansion of the diapir. Salt exposures produce huge amounts of dissolved and clastic load, thus affecting the surrounding of the diapir. Keywords Salt diapir Weathering residuum Erosion rate Rillenkarren Zagros Mountains Introduction Denudation rates in different catchments on a salt diapir were studied by Frumkin (1994) on Mt. Sedom, Israel, where precipitation reaches 50 mm a –1 . The calculated solutional denudation rate was about 0.5–0.75 mm a –1 . Frumkin (1994) demonstrated that a thin film of water could reach saturation with respect to NaCl along a path several tens of meters long over a wall of rock salt. Mottershead et al. (2005) recently measured erosion rate on a salt exposure in the Cardona diapir, Spain with a reflectorless total station. They observed erosion rates of up to 20 mm per 100 mm of rainfall. Rillenkarren as a typical karst form covering salt exposures were studied by Mottershead et al. (2000). Glew and Ford (1980) and Ford and Lundberg (1987) simulated evolution of gypsum and salt Rillenkarren and explained their development. Halite, the main constituent of the studied salt diapirs in SE Iran, is highly soluble. At 25ŶC, the solubility of halite is 360 g l –1 . Assuming NaCl density of 2.165 g cm –3 , 100 mm of rain water can dissolve 17 mm column of salt (Talbot and Jarvis 1984). Denudation rate can therefore potentially reach 17% of the annual precipitation total. The actual denudation rate could be much lower as the rock salt on diapirs in SE Iran is commonly covered by several meters to several tens of decimeters thick weathering J. Bruthans (&) Z. Vilhelm Faculty of Science, Department of Hydrogeology, Engineering Geology and Applied Geophysics, Charles University in Prague, Albertov 6, 128 43 Praha 2, Czech Republic e-mail: [email protected] N. Asadi M. Zare Department of Earth Sciences, Shiraz University, Shiraz, Iran M. Filippi Institute of Geology, Academy of Sciences of the Czech Republic, Rozvojova ´ 269, 165 00 Praha 6, Czech Republic 123 Environ Geol (2008) 53:1079–1089 DOI 10.1007/s00254-007-0734-6
-
Upload
independent -
Category
Documents
-
view
1 -
download
0
Transcript of A study of erosion rates on salt diapir surfaces in the Zagros Mountains, SE Iran

ORIGINAL ARTICLE
A study of erosion rates on salt diapir surfacesin the Zagros Mountains, SE Iran
J. Bruthans Æ N. Asadi Æ M. Filippi Æ Z. Vilhelm ÆM. Zare
Received: 20 May 2006 / Accepted: 6 March 2007 / Published online: 12 April 2007
� Springer-Verlag 2007
Abstract Salt exposures and weathering residuum on
several salt diapirs in different geographic/climatic settings
were studied. Anhydrite, gypsum, hematite, calcite, dolo-
mite, quartz, and clay minerals are the main constituents of
the weathering residuum covering the salt diapirs in vari-
ous thicknesses. Erosion rates of residuum as well as of
rock salt exposures were measured at selected sites for a
period of 5 years by plastic pegs as benchmarks. Recorded
data were standardized to a horizontal surface and to long-
term mean precipitation. For the rock salt exposures the
following long-term denudation rates were determined of
30–40 mm a–1 for coastal diapirs and up to 120 mm a–1 for
mountain salt diapirs. Long-term mean superficial denu-
dation rate measured on weathering residuum of low
thickness reached 3.5 mm a–1 on coastal diapirs. The total
denudation rate estimated for the thin residuum is close to
4–7 mm a–1 based on apparent correlation with the uplift
rate on Hormoz and Namakdan diapirs. Denudation of rock
salt exposures is much faster compared to parts of diapirs
covered by weathering residuum. The extent of salt expo-
sures is an important factor in the morphological evolution
of salt diapirs as it can inhibit further expansion of the
diapir. Salt exposures produce huge amounts of dissolved
and clastic load, thus affecting the surrounding of the
diapir.
Keywords Salt diapir � Weathering residuum � Erosion
rate � Rillenkarren � Zagros Mountains
Introduction
Denudation rates in different catchments on a salt diapir
were studied by Frumkin (1994) on Mt. Sedom, Israel,
where precipitation reaches 50 mm a–1. The calculated
solutional denudation rate was about 0.5–0.75 mm a–1.
Frumkin (1994) demonstrated that a thin film of water
could reach saturation with respect to NaCl along a path
several tens of meters long over a wall of rock salt.
Mottershead et al. (2005) recently measured erosion rate on
a salt exposure in the Cardona diapir, Spain with a
reflectorless total station. They observed erosion rates of up
to 20 mm per 100 mm of rainfall. Rillenkarren as a typical
karst form covering salt exposures were studied by
Mottershead et al. (2000). Glew and Ford (1980) and Ford
and Lundberg (1987) simulated evolution of gypsum and
salt Rillenkarren and explained their development.
Halite, the main constituent of the studied salt diapirs in
SE Iran, is highly soluble. At 25�C, the solubility of halite
is 360 g l–1. Assuming NaCl density of 2.165 g cm–3,
100 mm of rain water can dissolve 17 mm column of salt
(Talbot and Jarvis 1984). Denudation rate can therefore
potentially reach 17% of the annual precipitation total. The
actual denudation rate could be much lower as the rock salt
on diapirs in SE Iran is commonly covered by several
meters to several tens of decimeters thick weathering
J. Bruthans (&) � Z. Vilhelm
Faculty of Science, Department of Hydrogeology,
Engineering Geology and Applied Geophysics,
Charles University in Prague, Albertov 6,
128 43 Praha 2, Czech Republic
e-mail: [email protected]
N. Asadi � M. Zare
Department of Earth Sciences,
Shiraz University, Shiraz, Iran
M. Filippi
Institute of Geology, Academy of Sciences
of the Czech Republic, Rozvojova 269,
165 00 Praha 6, Czech Republic
123
Environ Geol (2008) 53:1079–1089
DOI 10.1007/s00254-007-0734-6

residuum and other sedimentary material, which is covered
by the terms ‘‘cap rock’’ or ‘‘gypcrust’’ in some previous
works (e.g., Bosak et al. 1998; Bruthans et al. 2000). There
are no measurements available of erosion rates on salt
diapirs in SE Iran. The main objectives of this paper are:
(1) to determine the erosion rate on salt exposures and
weathering residuum by direct measurement, (2) to com-
pare the erosion rates on various materials of surface cover
and (3) to estimate the long-term denudation rates of diapir
surfaces made up of different materials. Short comment on
the environmental impact of salt exposures on surroundings
of the diapirs is provided as well.
Geography and geology
The study area is in the southern part of the Islamic
Republic of Iran, in the eastern part of the Zagros Mountain
Range and the Persian Gulf Platform (Fig. 1). The Zagros
Fold Belt is composed of elongated whaleback or box-
shaped anticlinal mountains, which generally trend NW-
SE. The relief is relatively young; the principal folding
started in the Middle Pliocene. About 200 salt diapirs are
known in the Persian Gulf area (Kent 1970). The diameters
of salt diapirs usually vary between about 1 and 15 km
(Kent 1958). Rock salt belongs to the Hormoz Complex,
which was deposited during Upper Precambrian (Riphean-
Vendian) to Middle Cambrian times in extensive evaporitic
basins. Beds of salts and other evaporites (mainly gypsum
and anhydrite) alternate with carbonate, siliciclastic and
volcanosedimentary layers, which now form blocks and
impurities. Salt diapirs are found at many sites differing in
altitude (from sea level to more than 2,000 m a.s.l.) and
consequently in climates (precipitation between 170 mm a–1
on coastal diapirs and 550 mm a–1 at 1,750 m a.s.l.). The
following salt diapirs were visited and studied in the
field: Hormoz, Namakdan, Larak, Khurgu (Bandar Abbas
region), Jahani (near Firoozabad) and Namak (near Busher).
Detailed descriptions of the individual diapirs can be found
in Bosak et al. (1998) and in Talbot and Alavi (1996). Salt
diapirs in SE Iran are covered by various types of deposits
(Bosak et al. 1998).
Precipitation records were obtained from meteorological
stations that are close to diapirs at similar altitudes
(Table 1). The total of precipitation at Jahani in a 5-year
period (March 2000 to April 2005) was 1,474 mm, which
is nearly three times higher than the ca 500 mm of rain at
coastal salt diapirs over the same period. This is due to the
higher altitude and more northwestern location of the
Jahani diapir. Based on the data from Bandar Abbas
observatory, the precipitation reached only about 60% of a
long-term average (1961–1990) during the 5-year study
period (Table 1). The first part (March 2000 to February
2004) was extremely dry (45% of mean rainfall), while in
the second part (February 2004 to April 2005), the average
precipitation was above the long-term average (119%).
Precipitation in the SE Zagros Mountains occurs between
October and March, with a maximum between December
and February. Commonly, rains are of an intense nature (up
to 60 mm day–1 during the study period).
Methods
The extent of salt exposures and areas covered by weath-
ering residuum was determined from aerial images at a
Me hran river
Gowdar river
Kul riv
er
Kandrestan Bandar Abbas
Pe
rs
i
an
g u l f
KhamirQeshm
IR
AN
Namakdan salt diapir
Hormozsalt diapir
Hormoz Island
Qeshm Island Larak Island
Hengam IslandN
25 km
Afghanistan
Turkmenistan
Pakistan
I r a n
Saudi Arabia
Iraq
Oman
P ersia n gulf
Caspian
sea
Kuwait
Unated ArabEmirates
Turkey
Za g r o s
Mt s.
Tehran
12
1
2
Shur river
Kuh-e Jahanisalt diapir
Firoozabad
N
Kuh-e Khurgu salt diapir
3
3
Salt diapirSymbol: 10 km10 km
N
Kuh-e Namaksalt diapir
Mand
river
Fig. 1 Location of study areas
1080 Environ Geol (2008) 53:1079–1089
123

scale of 1:25,000 in combination with field mapping on
Namakdan, Hormoz and Jahani salt diapirs. Topographical
maps 1:25,000 were used for mapping.
A number of X-ray diffraction analyses (XRD) were
performed to identify individual minerals that form the
sedimentary material. The XRD analyses were carried out
using a PHILIPS X¢Pert PW 3710 diffractograph under the
following conditions: CuKa radiation, graphite secondary
monochromator, 35–40 kV, 30 mA, step scanning at 0.01�and 0.05� per 3 s in the range of 2�–60� or 2�–90� 2h.
Semi-quantitative bulk chemical composition was deter-
mined by X-ray fluorescence (XRF). XRF analysis data
were acquired with an ARL 9400 XP + spectrometer.
Finely milled samples of 0.8 g were compacted into
tablets and measured under the following conditions:
voltage 20–60 kV, probe current 40–80 mA, effective
area 490.6 mm2. UniQuant software was used for data
evaluation.
Erosion rates of weathering residuum and rock salt
exposures were measured directly by plastic pegs that were
fixed at selected sites for a period of 5 years as bench-
marks. A similar technique was used by Frumkin and Ford
(1995) in salt caves at Mt. Sedom in Israel for the mea-
surement of erosion rates of a cave stream channel.
Cylindrical pegs with flat tops and sharp tips, 1 cm in
diameter and 11 cm long were used. On rock salt expo-
sures, the plastic pegs were cemented into drilled holes.
The pegs were installed approximately perpendicular to the
exposed surface of salt. In the case of weathering residuum,
the pegs were impressed vertically to a mark imprinted on
each peg at a height of 23 mm below its flat top. Plastic
pegs were installed in salt and weathering residuum during
a dry period of the year 2000 (March and October). The
distance from the top of the peg to the surface of the salt
exposure was measured by calliper gauge with precision
better than 1 mm. Exposure inclination was measured by
inclinometer with precision of 1�. Because there is a var-
iation of the inclination of the slope even in close prox-
imity to many pegs, a range of values rather than a single
number is indicated. Close-up and broader views of the
plastic pegs were photographed during their installation in
2000 and during subsequent visits of the sites in 2004 and
2005 to determine any changes in Rillenkarren morphol-
ogy. Erosion at the pegs was first measured after 4 years
and then again 1 year later. Some new plastic pegs were
introduced in 2004. In this paper, the term ‘‘denudation’’ is
used only for denudation in a vertical direction. The term
‘‘erosion’’ is used in a more general sense for reduction of
salt mass or sedimentary cover regardless of the inclination
of the different surfaces.
On salt exposures, the plastic pegs were not placed
vertically, but perpendicular to the surface. Hence, the
denudation must be calculated from the erosion measured
at plastic pegs according to Eq. 1:
Dv ¼ R ðcos AÞ�1 ð1Þ
where Dv is (vertical) denudation (in mm), R is slope-
normal erosion measured at plastic pegs (in mm), A is the
inclination of exposure (in degrees) in relation to a hori-
zontal plane.
The measured values of denudation were finally stan-
dardized to the long-term precipitation average. For in-
stance, the denudation was multiplied by the coefficient of
2.2 for the period of 2000–2004 (45% of long-term pre-
cipitation amount).
Table 1 Precipitation totals recorded by observatories close to individual diapirs
Position of station with respect
to individual salt diapirs
Weather station
Bandar Abbas
18 km NW
from Hormoz
Compared to 30-years’
average (%)
(Bandar Abbas)
Queshm airport
51 km NE
from Namakdan
Dehrood
11 km W
from Jahani
Station altitude (m a.s.l.) 10 – 6 880
30-years’ average (1961–1990) (mm) 171 100 – –
9-years’ average (3.96–3.05) (mm) 155 91 136 –
Period 2000–2004 (mm) 310 45 283 1106
Period 2004–2005 (mm) 203 119 184 368a
Total 2000–2005 (mm) 513 60 467 1474
Annual number of rain days 2000–2005 16 – 14 20b
Source Iranian Meteorological Organization, Fars and Hormozgan Regional Water Organizations, 30-year average is based on WMO Clima-
tological normals (CLINO) for the period 1961–1990 (WMO 2006)
– Data not availablea Measured directly on Jahani diapirb Period 2000–2004
Environ Geol (2008) 53:1079–1089 1081
123
Results and discussion
Salt exposures
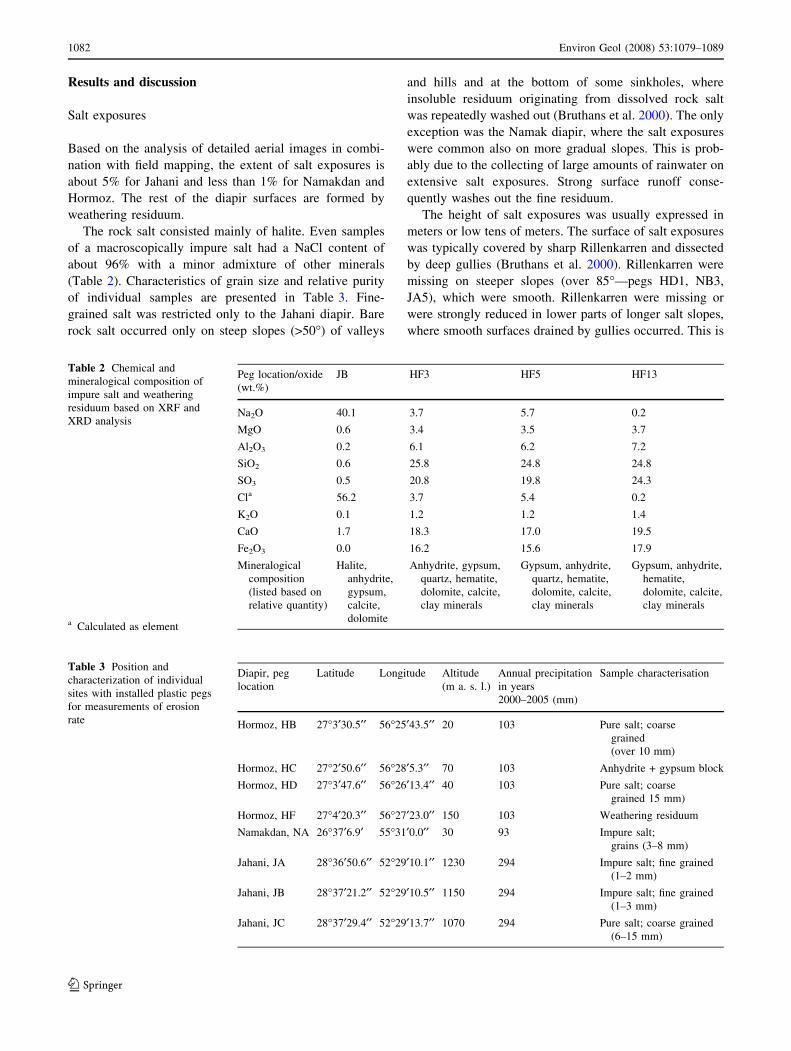
Based on the analysis of detailed aerial images in combi-
nation with field mapping, the extent of salt exposures is
about 5% for Jahani and less than 1% for Namakdan and
Hormoz. The rest of the diapir surfaces are formed by
weathering residuum.
The rock salt consisted mainly of halite. Even samples
of a macroscopically impure salt had a NaCl content of
about 96% with a minor admixture of other minerals
(Table 2). Characteristics of grain size and relative purity
of individual samples are presented in Table 3. Fine-
grained salt was restricted only to the Jahani diapir. Bare
rock salt occurred only on steep slopes (>50�) of valleys
and hills and at the bottom of some sinkholes, where
insoluble residuum originating from dissolved rock salt
was repeatedly washed out (Bruthans et al. 2000). The only
exception was the Namak diapir, where the salt exposures
were common also on more gradual slopes. This is prob-
ably due to the collecting of large amounts of rainwater on
extensive salt exposures. Strong surface runoff conse-
quently washes out the fine residuum.
The height of salt exposures was usually expressed in
meters or low tens of meters. The surface of salt exposures
was typically covered by sharp Rillenkarren and dissected
by deep gullies (Bruthans et al. 2000). Rillenkarren were
missing on steeper slopes (over 85�—pegs HD1, NB3,
JA5), which were smooth. Rillenkarren were missing or
were strongly reduced in lower parts of longer salt slopes,
where smooth surfaces drained by gullies occurred. This is
Table 2 Chemical and
mineralogical composition of
impure salt and weathering
residuum based on XRF and
XRD analysis
a Calculated as element
Peg location/oxide
(wt.%)
JB HF3 HF5 HF13
Na2O 40.1 3.7 5.7 0.2
MgO 0.6 3.4 3.5 3.7
Al2O3 0.2 6.1 6.2 7.2
SiO2 0.6 25.8 24.8 24.8
SO3 0.5 20.8 19.8 24.3
Cla 56.2 3.7 5.4 0.2
K2O 0.1 1.2 1.2 1.4
CaO 1.7 18.3 17.0 19.5
Fe2O3 0.0 16.2 15.6 17.9
Mineralogical
composition
(listed based on
relative quantity)
Halite,
anhydrite,
gypsum,
calcite,
dolomite
Anhydrite, gypsum,
quartz, hematite,
dolomite, calcite,
clay minerals
Gypsum, anhydrite,
quartz, hematite,
dolomite, calcite,
clay minerals
Gypsum, anhydrite,
hematite,
dolomite, calcite,
clay minerals
Table 3 Position and
characterization of individual
sites with installed plastic pegs
for measurements of erosion
rate
Diapir, peg
location
Latitude Longitude Altitude
(m a. s. l.)
Annual precipitation
in years
2000–2005 (mm)
Sample characterisation
Hormoz, HB 27�3¢30.5¢¢ 56�25¢43.5¢¢ 20 103 Pure salt; coarse
grained
(over 10 mm)
Hormoz, HC 27�2¢50.6¢¢ 56�28¢5.3¢¢ 70 103 Anhydrite + gypsum block
Hormoz, HD 27�3¢47.6¢¢ 56�26¢13.4¢¢ 40 103 Pure salt; coarse
grained 15 mm)
Hormoz, HF 27�4¢20.3¢¢ 56�27¢23.0¢¢ 150 103 Weathering residuum
Namakdan, NA 26�37¢6.9¢ 55�31¢0.0¢¢ 30 93 Impure salt;
grains (3–8 mm)
Jahani, JA 28�36¢50.6¢¢ 52�29¢10.1¢¢ 1230 294 Impure salt; fine grained
(1–2 mm)
Jahani, JB 28�37¢21.2¢¢ 52�29¢10.5¢¢ 1150 294 Impure salt; fine grained
(1–3 mm)
Jahani, JC 28�37¢29.4¢¢ 52�29¢13.7¢¢ 1070 294 Pure salt; coarse grained
(6–15 mm)
1082 Environ Geol (2008) 53:1079–1089
123
probably the result of a film of water, as even a minor rain
quickly wets the salt exposure and creates superficial run-
off, as the infiltration capacity of cracks in salt is com-
monly very low. The film gradually gains in thickness in
downslope direction and, from a certain point onward it
can hardly be penetrated by falling raindrops. This inhibits
the development of Rillenkarren (Glew and Ford 1980).
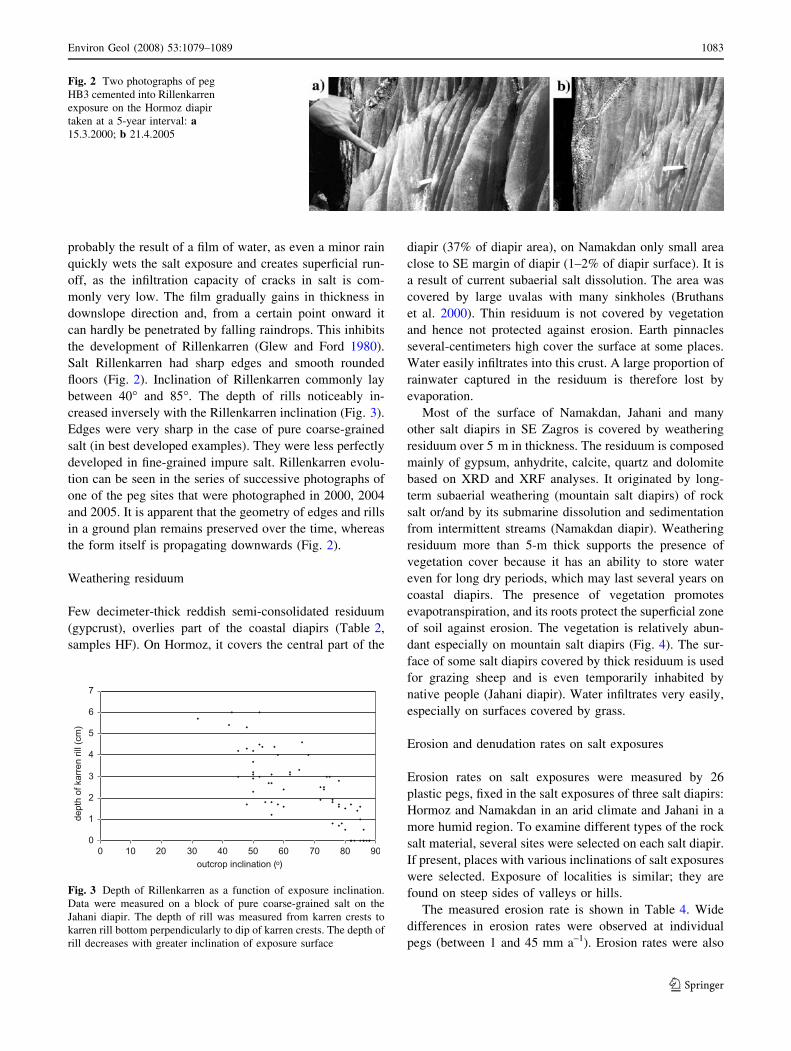
Salt Rillenkarren had sharp edges and smooth rounded
floors (Fig. 2). Inclination of Rillenkarren commonly lay
between 40� and 85�. The depth of rills noticeably in-
creased inversely with the Rillenkarren inclination (Fig. 3).
Edges were very sharp in the case of pure coarse-grained
salt (in best developed examples). They were less perfectly
developed in fine-grained impure salt. Rillenkarren evolu-
tion can be seen in the series of successive photographs of
one of the peg sites that were photographed in 2000, 2004
and 2005. It is apparent that the geometry of edges and rills
in a ground plan remains preserved over the time, whereas
the form itself is propagating downwards (Fig. 2).
Weathering residuum
Few decimeter-thick reddish semi-consolidated residuum
(gypcrust), overlies part of the coastal diapirs (Table 2,
samples HF). On Hormoz, it covers the central part of the
diapir (37% of diapir area), on Namakdan only small area
close to SE margin of diapir (1–2% of diapir surface). It is
a result of current subaerial salt dissolution. The area was
covered by large uvalas with many sinkholes (Bruthans
et al. 2000). Thin residuum is not covered by vegetation
and hence not protected against erosion. Earth pinnacles
several-centimeters high cover the surface at some places.
Water easily infiltrates into this crust. A large proportion of
rainwater captured in the residuum is therefore lost by
evaporation.
Most of the surface of Namakdan, Jahani and many
other salt diapirs in SE Zagros is covered by weathering
residuum over 5 m in thickness. The residuum is composed
mainly of gypsum, anhydrite, calcite, quartz and dolomite
based on XRD and XRF analyses. It originated by long-
term subaerial weathering (mountain salt diapirs) of rock
salt or/and by its submarine dissolution and sedimentation
from intermittent streams (Namakdan diapir). Weathering
residuum more than 5-m thick supports the presence of
vegetation cover because it has an ability to store water
even for long dry periods, which may last several years on
coastal diapirs. The presence of vegetation promotes
evapotranspiration, and its roots protect the superficial zone
of soil against erosion. The vegetation is relatively abun-
dant especially on mountain salt diapirs (Fig. 4). The sur-
face of some salt diapirs covered by thick residuum is used
for grazing sheep and is even temporarily inhabited by
native people (Jahani diapir). Water infiltrates very easily,
especially on surfaces covered by grass.
Erosion and denudation rates on salt exposures
Erosion rates on salt exposures were measured by 26
plastic pegs, fixed in the salt exposures of three salt diapirs:
Hormoz and Namakdan in an arid climate and Jahani in a
more humid region. To examine different types of the rock
salt material, several sites were selected on each salt diapir.
If present, places with various inclinations of salt exposures
were selected. Exposure of localities is similar; they are
found on steep sides of valleys or hills.
The measured erosion rate is shown in Table 4. Wide
differences in erosion rates were observed at individual
pegs (between 1 and 45 mm a–1). Erosion rates were also
Fig. 2 Two photographs of peg
HB3 cemented into Rillenkarren
exposure on the Hormoz diapir
taken at a 5-year interval: a15.3.2000; b 21.4.2005
0
1
2
3
4
5
6
7
0 10 20 30 40 50 60 70 80 90
o
depth
of karr
en r
ill (c
m)
outcrop inclination ( )
Fig. 3 Depth of Rillenkarren as a function of exposure inclination.
Data were measured on a block of pure coarse-grained salt on the
Jahani diapir. The depth of rill was measured from karren crests to
karren rill bottom perpendicularly to dip of karren crests. The depth of
rill decreases with greater inclination of exposure surface
Environ Geol (2008) 53:1079–1089 1083
123

observed to change over time (cf. locations HB3, JA5), due
to the downward migration of individual Rillenkarren
edges (Fig. 2).
The following two factors are most important for rock
salt erosion:
1. Erosion rate is inversely proportional to the inclination
of salt exposures (compare erosion at HD2 with HD4
and NA3 with NA4 pegs). This is explained by the fact
that subhorizontal exposures obtain the highest amount
of rainwater per unit area of surface, as the rain is
mainly subvertical. Conversely, subvertical exposures
get smaller amount of rainwater, which is spread over
a relatively larger surface of the exposure with rela-
tively more salt to dissolve.
2. Erosion rate through time is directly proportional to the
precipitation total (Jahani vs. coastal salt diapirs).
The purity of salt has probably only a minor effect on
the erosion rate. However, even the ‘‘impure’’ salt con-
tained only a very small amount of non-halite material
(sample JB, Table 2).
To filter out the effect of the inclination of the exposure,
the slope normal erosion rate was recalculated to vertical
denudation rate by Eq. 1. This calculation exaggerates the
uncertainty in measurements on steeper exposures (>75�),
as the coefficient (cos A)–1 rapidly rises with the inclination
of the exposure. Calculated values were compared with real
measurements of denudation on HB3 and JA11 pegs
(Table 4). Denudation on HB3 based on measurements and
photographs reached 120 mm during 5 years, a rate of
24 mm a–1, whereas the calculated value was 17–21 mm a–1.
Denudation measured above the JA11 peg reached 80 mm
compared to a calculated value of 110 mm. This means
that the calculated values of denudation can differ by tens
of percent values from the real values, especially for
steeper exposures.
At the Hormoz diapir, the denudation rate not stan-
dardized to precipitation was about 20 mm a–1 in the per-
iod of 2000–2004 and about 30–50 mm a–1 during years
2004–2005 (Table 4). At Namakdan, the calculated denu-
dation rate reached only 7–10 mm a–1 in the period of
2000–2004, and about 30–50 mm a–1 during years 2004–
2005. The two periods vary in precipitation average
(Table 1). The long-term mean denudation rate standar-
dised to mean precipitation was estimated to 40 mm a–1 for
salt exposures on the coastal salt diapirs.
Different results were obtained for Jahani diapir, where
the precipitation is higher and evaporation lower. The
majority of plastic pegs were washed out completely by
2004. Therefore, some new pegs were installed in 2004.
Only one peg has survived the whole period. The denu-
dation rate not standardized to precipitation ranged from 40
to 80 mm a–1 in the period 2000–2004 and about 60–
140 mm a–1 during the years 2004–2005. The long-term
mean denudation rate standardized to mean precipitation
was estimated to be 80–120 mm a–1 for salt exposures on
the Jahani diapir.
The 170 mm of the long-term mean precipitation on
coastal diapirs can theoretically dissolve 28 mm of salt. For
Jahani, the corresponding value is 50–80 mm of dissolved
salt. The mean calculated values of denudation rate are
higher than the maximum dissolution capacity of the cor-
responding amount of rainfall. The reason is probably the
inclined direction of some rains (strong wind during
storms), which can create surplus water on steep slopes.
Also the catchments above peg sites are partly covered by
weathering residuum and, as such, they yield additional
water for salt dissolution.
Erosion on an anhydrite/gypsum block was measured on
the Hormoz diapir, at the site marked HC, by two plastic
pegs (Table 4). The results showed negative erosion,
apparently due to an expansion of material during recrys-
tallization of anhydrite into gypsum (volume growth of
about 30%). Rillenkarren that covered the block were
dissected and rotated on places showing the expansion of
the superficial zone of the block.
Denudation rates on thin weathering residuum
The measuring of denudation rates was carried out on the
Hormoz salt diapir close to its center, on an area of 20 by
10 m. The thickness of weathering residuum covering the
salt varied between 0.5 and 2 m (Fig. 5). Chemical and
mineral compositions of the residuum are shown in
Table 2. The material is cemented by gypsum to the crust
on places. After rains, this hard crust becomes soft and can
be much easily washed away, promoting erosion.
Fig. 4 Thick-weathering residuum covering the southern part of the
Jahani diapir. Almost continuous vegetation cover slows down
erosion. The picture was taken in May 2005
1084 Environ Geol (2008) 53:1079–1089
123

Ta
ble
4E
rosi
on
mea
sure
men
tso
nro
cksa
ltan
dg
yp
sum
(Gy
p)/
anh
yd
rite
(An
h)
exp
osu
res
Lit
ho
log
yF
orm
An
nu
al
pre
cip
itat
ion
20
00
–2
00
5
(mm
)
Lo
cali
ty/
Peg
loca
tio
n
Dat
eo
f
inst
alla
tio
n
Incl
inat
ion
of
exp
osu
re
surf
ace
(deg
rees
)
Co
effi
cien
t
(co
sA
)–1
Ero
sio
n
20
00
–
20
04
(mm
)
Av
erag
e
ero
sio
n
20
00
–
20
04
(mm
a–1)
Ero
sio
n
20
04
–
20
05
(mm
)
Cal
cula
ted
aver
age
den
ud
atio
n
20
00
–2
00
4
(mm
a–1)
Cal
cula
ted
den
ud
atio
n
20
04
–
20
05
(mm
a–1)
No
rmal
ized
den
ud
atio
n
20
00
–2
00
4
(mm
per
10
0m
m
of
rain
fall
)
No
rmal
ized
den
ud
atio
n
20
04
–2
00
5
(mm
per
10
0m
m
of
rain
fall
)
Sal
tR
ille
nk
arre
n1
03
HB
3II
I-2
00
06
0–
65
1.9
–2
.33
69
21
7–
21
(24
)a4
–5
22
–2
72
Sal
tR
ille
nk
arre
n1
03
HB
4II
-20
04
70
–7
52
.9–
3.8
––
15
–4
4–
57
–2
2–
28
Sal
tR
ille
nk
arre
n1
03
HD
2X
I-2
00
08
2–
85
7.1
–1
1.4
11
34
21
–3
42
8–
46
27
–4
41
4–
23
Sal
tR
ille
nk
arre
n1
03
HD
4X
I-2
00
04
5–
50
1.3
–1
.54
41
1–
14
–1
7–
18
–2
2–
Sal
tR
ille
nk
arre
n9
3N
A3
III-
20
00
84
9.5
41
51
04
81
42
6
Sal
tR
ille
nk
arre
n9
3N
A4
III-
20
00
65
2.3
11
31
27
28
10
15
Sal
tR
ille
nk
arre
n2
94
JA1
X-2
00
08
0–
82
5.7
–7
.14
41
1–
63
–7
8–
23
–2
8–
Sal
tR
ille
nk
arre
n2
94
JA2
X-2
00
07
2–
80
3.2
–5
.76
01
5–
48
–8
6–
17
–3
1–
Sal
tR
ille
nk
arre
n2
94
JA5
X-2
00
06
8–
76
2.6
–4
.13
81
03
02
6–
41
78
–1
23
9–
15
21
–3
3
Sal
tR
ille
nk
arre
n2
94
JA6
X-2
00
00
(pea
k)
1.0
>7
5>
19
–>
19
–>
7–
Sal
tR
ille
nk
arre
n2
94
JA7
X-2
00
00
(pea
k)
1.0
>7
0>
18
–>
18
–>
7–
Sal
tR
ille
nk
arre
n2
94
JA8
II-2
00
47
5–
80
3.8
–5
.7–
–3
3–
12
5–
18
8–
34
–5
1
Sal
tR
ille
nk
arre
n2
94
JA9
II-2
00
46
52
.3–
–4
5–
10
4–
28
Sal
tR
ille
nk
arre
n2
94
JA1
0II
-20
04
50
1.5
––
38
–5
7–
15
Sal
tR
ille
nk
arre
n2
94
JA1
1II
-20
04
70
2.9
––
38
–1
10
(80
)a–
30
Sal
tR
ille
nk
arre
n2
94
JB1
X-2
00
06
0–
72
1.9
–3
.2>
80
>2
0–
>(3
8–
64
)–
>(1
4–
23
)–
Sal
tR
ille
nk
arre
n2
94
JB2
X-2
00
06
0–
70
1.9
–2
.9>
71
>1
8–
>(3
4–
52
)–
>(1
2–
23
)–
Sal
tR
ille
nk
arre
n2
94
JB4
X-2
00
00
(pea
k)
1.0
>6
7>
17
–>
17
–>
6–
Sal
tR
ille
nk
arre
n2
94
JC1
X-2
00
06
5–
75
2.3
–3
.8>
59
>1
5–
>(3
5–
57
)–
>(1
3–
21
)–
Sal
tR
ille
nk
arre
n2
94
JC2
X-2
00
06
5–
75
2.3
–3
.87
51
9–
44
–7
2–
16
–2
6–
Sal
tS
haf
t1
03
HB
5II
-20
04
85
–9
0>
11
.4–
–7
–>
80
–>
39
Sal
tG
ull
y9
3N
A2
III-
20
00
80
5.7
41
17
69
78
52
Sal
tG
ull
y2
94
JA3
X-2
00
02
0–
30
1.0
–1
.1>
80
>2
0–
>2
0–
>7
–
Sal
tG
ull
y2
94
JA4
X-2
00
03
01
.1>
80
>2
0–
>2
0–
>7
–
Sal
tG
ull
y2
94
JB3
X-2
00
05
5–
65
1.7
–2
.3>
80
>2
0–
>(3
4–
46
);4
0a
–>
(12
–1
7)
–
Sal
tG
ull
y2
94
JB5
X-2
00
04
0–
50
1.3
–1
.5>
80
>2
0–
>(2
6–
30
)–
>(9
–1
1)
–
Gy
p/A
nh
Ril
len
kar
ren
10
3H
C1
XI-
20
00
65
–7
52
.3–
3.8
–4
b–
1b
––
––
–
Gy
p/A
nh
Ril
len
kar
ren
10
3H
C2
XI-
20
00
15
–2
51
.00
0–
––
––
Peg
sw
ere
mea
sure
din
Jan
uar
y/F
ebru
ary
20
04
and
Ap
ril/
May
20
05
–N
ot
mea
sure
da
Mea
sure
dv
alu
esb
Neg
ativ
ev
alu
ed
ue
toex
pan
sio
no
fan
hy
dri
tein
tog
yp
sum
(rec
ryst
alli
zati
on
)
Environ Geol (2008) 53:1079–1089 1085
123

For a period of 5 years, 15 plastic pegs were placed in
different parts of sinkholes: ridges, slopes and drainage
channels (Table 5; Fig. 6a, b). The average denudation rate
reached 2 mm a–1 (10 mm total during the whole period).
The maximum denudation rate was 5 mm a–1 on the slopes
and in the drainage channel. No erosion was detected at
two plastic pegs and aggradation occurred on one peg
(4 mm in 5 years). However, the zero or even negative
erosion value does not necessarily mean the absence of
erosion, but it rather points towards transport of sediment
down the slope. Eroded material is being instantly replaced
by new material from upslope positions.
No significant correlation was found between denuda-
tion and the catchment area above the peg site (rxy 0.38) or
between denudation and surface inclination (rxy –0.06).
Likewise, no apparent relationship was found between
morphology (ridges, slopes, channels) and the denudation
rate (Table 5). The average denudation rate on slopes
compared to ridges was nearly the same (2.2 and
1.9 mm a–1, respectively), but values within individual
types of morphology varied significantly (Table 5). The
main factor affecting the erosion rate at individual pegs is
probably the resistance of the surface crust. This factor
cannot be quantified due to total loss of resistance of the
crust during and after rains.
Calculated long-term mean denudation rates normalized
to mean precipitation are about 1.7-times higher than the
measured values (mean value of 2 mm a–1; Table 5), as in
the period 2000–2005, the precipitation amount was only
60% of long-term mean. The long-term mean denudation
rate can be thus estimated to 3.5 mm a–1. Denudation of
the surface is, however, only a portion of the total denu-
dation. Rainwater infiltrates through the weathering resid-
uum and dissolves the underlying salt. Additionally, some
of the rainwater after intensive rains is drained by overland
flow into sinks in doline bottoms. It creates shafts and
Table 5 Erosion measurements on weathering residuum
Position of peg Slope
inclination
(degrees)
Catchment area
upslope
to individual
pegs (m2)
Peg mark Erosion over 5 years Normalized
erosion (mm
per 100 mm
of rainfall)
Minimum
(mm)
Maximum
(mm)
Average
(mm)
Average
per year
(mm a–1)
Ridge between sinkholes 0 0.1 HF11 3 5 4 0.8 0.8
Ridge between sinkholes 0–10 0.01 HF01 5 6 6 1.2 1.2
Ridge between sinkholes 10 0.01 HF15 14 17 15 3.3 3.2
Ridge between sinkholes 0–15 0.01 HF08 4 11 8 1.6 1.6
Ridge between sinkholes 5–15 0.01 HF07 3 12 7 1.5 1.5
Ridge between sinkholes 10–15 0.1 HF12 13 16 15 3.2 3.1
Sinkhole slope 0–10 0.2 HF03 22 27 24 5.3 5.1
Sinkhole slope 15 1 HF14 –6 –3 –4 –0.9 –0.9
Sinkhole slope 30 1 HF09 2 8 6 1.2 1.2
Sinkhole slope 25–40 1 HF10 21 29 24 5.2 5.0
Sinkhole slope 40–50 0.1 HF13 –10 8 1 0.1 0.1
Channel bed 2–5 200 HF05 20 23 22 4.8 4.7
Abandoned channel 5 0.2 HF04 –2 3 0 0.0 0
Total average 10 2.1 2.0
Total maximum 24 5.3 5.1
Total minimum –4 –0.9 –0.9
Minima, maxima and averages of four values gauged at each peg (upslope, downslope, left and right sides) are presented
Fig. 5 Thin-weathering residuum with no vegetation cover in the
central part of the Hormoz diapir (close to HF locality). Rock salt
exposures are developed only on steep slopes where the weathering
residuum is washed off
1086 Environ Geol (2008) 53:1079–1089
123

hollows in salt that become partly filled with eroded
material (Bosak et al. 1999). The total denudation rate is
therefore higher than the measured erosion rate on plastic
pegs.
At many places covered by thin weathering residuum,
downcutting of uvala-like depressions progresses at rates
comparable to those of a salt mass uplift (Bosak et al.
1999). Due to rapid lowering of their floors, the base of the
uvala-like forms reached the water table, and the cave
drainage system was consequently replaced by superficial
streams on the Hormoz diapir. The long-term uplift rate of
the Hormoz and Namakdan diapirs was calculated using
the age of Holocene marine terraces and their current
altitude. The uplift rate for the areas covered by thin
weathering residuum was calculated at 4–7 mm a–1 on the
two diapirs during Holocene (Bruthans et al. 2006).
Assuming a constant uplift rate of the salt diapirs, the long-
term mean incision rate of uvala bottoms is close to
4–7 mm a–1 to keep pace with the uplift rate.
Denudation rate on weathering residuum and sediments
of moderate and large thickness
Surface denudation rate on weathering residuum and sedi-
ments with thickness exceeding 5 m is too slow to be
measured by pegs within a 5-year period. Places, where thin
and moderately thick residuum exist together, show clearly
more rapid surface denudation rate on thin residuum.
Broader consequences
Rock salt exposures are very rapidly evolving surface
environments. Denudation of larger exposures will not
surpass the 17% of the column of mean annual precipita-
tion. The maximum denudation rate was estimated as 30 m
per 1,000 years for coastal diapirs and about 90 m per
1,000 years for Jahani and other inland diapirs in similar
climate. The erosion rate of salt exposures is strongly
dependant on surface gradient of exposures. Vertical salt
walls protected by capping sediment show nearly no
erosion and can hence survive for very long time periods.
Indeed, it was observed in the field that the more thick and
resistant the residuum capping of the salt exposure is, the
steeper salt exposure develops. Inclined walls (common
slope about 70�) will propagate horizontally at a rate of
about 10 m per 1,000 years for coastal diapirs and about
30 m per 1,000 years for the Jahani diapir. On very
extensive salt exposures the erosion rate is markedly lower,
mainly because the dissolved salt precipitates back in the
form of salt sinters after minor rainfalls and thus avoids
being washed out (c.f. Talbot and Jarvis 1984).
The extent of salt exposures is therefore an important
factor in the morphological evolution of a salt diapir.
Salt exposures occur only on steep slopes (>50�), where
insoluble residuum has been washed off. On gentle
slopes the residuum will accumulate, which bury the salt
and protects it from rapid dissolution (Fig. 5). This is
because the presence of the cover promotes the evapo-
ration of rainwater captured in the pore spaces, and thus
less water can infiltrate and dissolve the underlying salt.
The relative abundance of vegetation, especially on
mountain salt diapirs, effectively protects the surface
against erosion and hence considerably decreases the
denudation rate (Fig. 4).
The origin of extensive salt exposures is a consequence
of the elevation of a diapir into a distinct area of high relief
with consequent erosion of the protective cover (e.g., the
Namak diapir). Climatic changes affecting the vegetation
cover could play an important role as well. The extent of
salt exposures has also strong implications for the sur-
roundings of a salt diapir, since catchment areas formed on
salt exposures produce large amounts of residual material
from the dissolved salt. Large and quickly aggradating
alluvial fans are consequently developed below these
catchments (e.g., the Jahani diapir, see Fig. 7).
In addition, the extent of the salt exposures to a great
degree determines the total amount of salt that is dissolved
by rain and carried off the diapir. A salt exposure of area
1 km2 with precipitation of 300 mm a–1 can annually
produce about 110,000 tons of dissolved NaCl. For areas
covered by residuum this number would be many times
lower as most of water is lost by evaporation. On the
Fig. 6 a Peg site marked HF on
Hormoz diapir covered by thin
weathering residuum. This
surface is typical of high
number of smaller sinkholes
(several meters in diameter)
separated by narrow ridges,
b Peg HF3 installed in the thin
weathering residuum on a slope
of a sinkhole on a
Environ Geol (2008) 53:1079–1089 1087
123

contrary a markedly lower amount of dissolved solids can
be expected in the vicinity of diapirs covered by thick
residuum, where superficial drainage occurs but sinks in
salt are not present. Low TDS waters (4 g l–1) drain from
such areas on Mt. Sedom diapir (Frumkin 1994).
Solutional denudation rates of 0.5–0.75 mm a–1 re-
ported by Frumkin (1994) on Mt. Sedom diapir, Israel, are
rather low compared to the data provided in this study. The
reason is probably a very low amount of precipitation on
Mt. Sedom (50 mm a–1
) compared to Iranian sites.
Conclusion
Erosion rates of various types of salt exposures and
weathering residuum were measured. Long-term denuda-
tion rates on salt exposures are estimated between 30 and
40 mm a–1 for coastal salt diapirs and up to 120 mm a–1
for mountain salt diapirs. Erosion rates are proportional to
the volume of precipitation and inversely proportional to
the inclination of salt exposure.
The long-term mean superficial denudation rate on thin
weathering residuum on coastal diapirs is estimated as
3.5 mm a–1. The average denudation rate on slopes of
dolines compared to ridges was nearly the same, but values
within individual types of morphology varied significantly.
Total denudation rate on thin residuum is close to
4–7 mm a–1 based on similar rates of denudation and uplift
on Hormoz and Namakdan diapirs. The denudation rate of
salt exposures is much faster than parts of diapirs covered
by weathering residuum. The extent of salt exposures is an
important factor in the morphological evolution of salt
diapirs as it can inhibit the further expansion of diapir.
The extent of salt exposures also strongly affects the
surroundings of salt diapirs, as catchment areas developed
on salt exposures produce large amount of clastic material,
which may aggradate as large alluvial fans below these
catchments. Salt exposures can be delineated on large-scale
aerial photographs. This may help to distinguish areas with
a lower probability of contamination of groundwaters
by dissolved NaCl, in this region of very scarce water
supplies.
Acknowledgments Many thanks to the staff of the Department of
Earth Sciences of Shiraz University, F. Anwar and B. Dareshouri,
from Qeshm Free Zone Organization and S. Zebarjad from the Shiraz
University in Qeshm Island for their support during the field work.
The authors also thanks to O. Jager, M. Kolcava, J. Kukacka, L.
Palatinus, T. Svoboda, and J. Smıd for assistance with field mea-
surements. Precipitation data were kindly provided by Iranian Mete-
orological Organization, Fars and Hormozgan Regional Water
Organizations. Research was supported by project no. KJB301110501
of the Grant Agency of the Academy of Sciences of the Czech
Republic, by Institutional Research Plan no. AV0Z30130516 (Insti-
tute of Geology, AS CR) and research project MSM0021620855
(Charles University in Prague). Authors are indebted to D. Motters-
head and A. Frumkin for valuable suggestions and improvement of
the manuscript. The authors appreciate very much the financial sup-
port from Ceskomoravsky cement Co. (Heidelberger Cement Group).
References
Bosak P, Jaros J, Spudil J, Sulovsky P, Vaclavek V (1998) Salt plugs
in the Eastern Zagros, Iran: results of regional geological
reconnaissance. GeoLines 7:1–174
Bosak P, Bruthans J, Filippi M, Svoboda T, Smıd J (1999) Karst and
saves in the salt diapirs, SE Zagros Mts., Iran. Acta Carsol
28(2):41–75
Bruthans J, Smıd J, Filippi M, Zeman O (2000) Thickness of caprock
and other important factors affecting morphogenesis of salt karst.
Acta Carsol 29(2):51–64
Bruthans J, Filippi M, Gersl M, Zare M, Melkova J, Pazdur A, Bosak
P (2006) Holocene marine terraces on two salt diapirs in Persian
Gulf (Iran): age, depositional history and uplift rates. J Quater
Sci 21(8):843–857
Frumkin A (1994) Hydrology and denudation rates of halite karst.
J Hydrol 162:171–189
Frumkin A, Ford DC (1995) Rapid entrenchment of stream profiles in
the salt caves of Mount Seldom. Earth Surf Process Landf
20:139–152
Ford DC, Lundberg J (1987) A review of dissolutional rills in
limestone and other soluble rocks. Catena Suppl 8:119–140
Glew JR, Ford DC (1980) A simulation study of the development of
Rillenkarren. Earth Surf Process 5:25–36
Kent PE (1958) Recent studies of south Persian salt plugs. Am Assoc
Petrol Geol Bull 42(12):2951–2979
Kent PE (1970) The salt of the Persian Gulf region. Trans Leics Lit
Philos Soc 64:56–88
Mottershead DN, Moses CA, Lucas GR (2000) Lithological control of
solution flute form: a comparative study. Zeit Geomorph NF
44(4):491–512
Fig. 7 Example of a salt diapir impact on the surrounding
environment (Jahani diapir near Firoozabad). Small-size salt expo-
sures on SW edge of diapir are producing huge amount of eroded
material in contrast to large areas caped by thick weathering
residuum. Photo characteristics: Landsat TM true color composite,
converted to grey scale, acquisition date 6.6.1990 (USGS 2006)
1088 Environ Geol (2008) 53:1079–1089
123

Mottershead DN, Duane W, Inkpen RJ, Wright JS (2005) Subaerial
karstic erosion of small-scale saltrock terrains. In: Gutierrez F,
Gutierrez M, Desir G, Guerrero J, Lucha P, Marın C, Garcıa-
Ruiz JM (eds) 6th International conference on Geomorphology
Zaragosa, Cardona, Spain, Abstract volume, pp 453
Talbot CJ, Jarvis RJ (1984) Age, budget and dynamics of an active
salt extrusion in Iran. J Struct Geol 6:521–533
Talbot CJ, Alavi M (1996) The past of a future syntaxis across the
Zagros, in Alsop. In: Alsop GI, Blundell DJ, Davison I (eds) Salt
tectonics, geol. soc. Amer. spec. paper, vol 100, pp 89–109
USGS Center for Earth Resources Observation & Science (EROS)
(2006) Global visualization viewer. http://www.glovis.usgs.gov/
ImgViewer/Java2ImgViewer.html
WMO (2006) World Meteorological Organization, http://www.world-
weather.org. Cited 2 August 2005
Environ Geol (2008) 53:1079–1089 1089
123