Superimposed folding and thrusting by two phases of mutually orthogonal or oblique shortening in...
42
Superimposed folding and thrusting by two phases of mutually orthogonal or oblique shortening in analogue models Hongling Deng*, Hemin A Koyi, Faramarz Nilfouroushan Hans Ramberg Tectonic Laboratory, Department of Earth Sciences, Uppsala University, Villavagen 16, SE-752 36 Uppsala, Sweden *Corresponding author. Fax: +46 (0) 18 471 25 91. E-mail addresses: [email protected] Abstract Orogens may suffer more than one phase shortening resulting in superposition of structures of different generations. Superimposition of orthogonal or oblique shortening is studied using sandbox and centrifuge modelling. Results of sand models show that in orthogonal superimposition, the two resulting structural trends are approximately orthogonal to each other. In oblique superimposition, structures trend obliquely to each other in the relatively thin areas of the model (foreland), and mutually orthogonal in areas where the model is thickened during the first phase of shortening (i.e. the hinterland). Thrusts formed during the first shortening phase may be reactivated during the later shortening phase. Spacing of the later phase structures is not as wide as expected, considering they across the pre-existing thickened wedge. Superposition of structures results in formation of type 1 fold interference pattern. Bedding is curved outwards both in the dome and basin structures. Folded layers are dipping and plunging outwards in a dome, while they are dipping and plunging inwards in a basin. In the areas between two adjacent domes or basins (i.e. where an anticline is superimposed by a syncline or a syncline is superimposed by an anticline), bedding is curved inwards, and the anticlines plunge inwards and the synclines outwards. The latter feature could be helpful to determine the age relationship for type 2 fold interference pattern. In tectonic regions where multiple phases of shortening have occurred, the orogenic-scale dome-and basin and arrowhead-shaped interference patterns are commonly formed, as in the models. However, in some areas, the fold interference pattern might be modified by a later phase of thrusting. Similar to models results, superimposition of two and/or even more deformation phases may not be recorded by structures all over the tectonic area. Keywords: multiple orthogonal/oblique shortening, superimposed deformation, structure spacing, fold interference patterns Citaion: Deng H. et al., 2015; Superimposed folding and thrusting by two phases of mutually orthogonal or oblique shortening in analogue models, Journal of Structural Geology, in press.
Transcript of Superimposed folding and thrusting by two phases of mutually orthogonal or oblique shortening in...

Superimposed folding and thrusting by two phases of mutually orthogonal or oblique shortening in analogue models
Hongling Deng*, Hemin A Koyi, Faramarz Nilfouroushan
Hans Ramberg Tectonic Laboratory, Department of Earth Sciences, Uppsala
University, Villavagen 16, SE-752 36 Uppsala, Sweden
*Corresponding author. Fax: +46 (0) 18 471 25 91. E-mail addresses: [email protected]
Abstract Orogens may suffer more than one phase shortening resulting in superposition of structures of different generations. Superimposition of orthogonal or oblique shortening is studied using sandbox and centrifuge modelling. Results of sand models show that in orthogonal superimposition, the two resulting structural trends are approximately orthogonal to each other. In oblique superimposition, structures trend obliquely to each other in the relatively thin areas of the model (foreland), and mutually orthogonal in areas where the model is thickened during the first phase of shortening (i.e. the hinterland). Thrusts formed during the first shortening phase may be reactivated during the later shortening phase. Spacing of the later phase structures is not as wide as expected, considering they across the pre-existing thickened wedge. Superposition of structures results in formation of type 1 fold interference pattern. Bedding is curved outwards both in the dome and basin structures. Folded layers are dipping and plunging outwards in a dome, while they are dipping and plunging inwards in a basin. In the areas between two adjacent domes or basins (i.e. where an anticline is superimposed by a syncline or a syncline is superimposed by an anticline), bedding is curved inwards, and the anticlines plunge inwards and the synclines outwards. The latter feature could be helpful to determine the age relationship for type 2 fold interference pattern. In tectonic regions where multiple phases of shortening have occurred, the orogenic-scale dome-and basin and arrowhead-shaped interference patterns are commonly formed, as in the models. However, in some areas, the fold interference pattern might be modified by a later phase of thrusting. Similar to models results, superimposition of two and/or even more deformation phases may not be recorded by structures all over the tectonic area. Keywords: multiple orthogonal/oblique shortening, superimposed deformation, structure spacing, fold interference patterns Citaion: Deng H. et al., 2015; Superimposed folding and thrusting by two phases of mutually orthogonal or oblique shortening in analogue models, Journal of Structural Geology, in press.
36
1. Introduction 37
Multiple phases of deformations are reported from different parts of the world where 38
early phase structures are modified by a later phase shortening (Steiger, 1964; Roy, 39
1995; Saha, 2002; Maxelon and Mancktelow, 2005; Roca et al., 2006; Weinberger et 40
al., 2009; Abdelsalam, 2010; Dario et al., 2010; Derryberry, 2011; Cashman et al., 41
2011; Li et al., 2012; Mescua and Giambiagi, 2012; Shah, 2012; Sen, 2013). For 42
example, Lim and Cho (2012) reported that two mutually orthogonal shortening 43
phases have occurred during the Daebo Orogeny in Chungnam Basin, Korea. In the 44
Mount Isa Inlier, Australia, four mutually oblique shortening phases have been 45
documented (Abu Sharib and Bell, 2011). Deng et al. (2005) suggested five 46
shortening phases to have occurred in the Yanshan Orogenic Belt, North China, 47
where both mutually parallel and oblique superimpositions are shown. 48
Experimental and case studies on multiple phases of shortening have mainly focused 49
on reactivation of pre-existing faults (Corredor, 2003; Ramon and Rosero, 2006; 50
Deng et al, 2014), and refolding of early phase folds (Derryberry, 2011). On outcrop- 51
and regional-scale, when a later phase of deformation overprints pre-existing 52
structures in an orthogonal or oblique way, fold interference pattern may form by 53
folding superimposition (Ramsey, 1962; Ghosh, 1992; Maloof, 2000; 54
Jayangondaperumal and Dubey, 2001; Grimes and Mosher, 2003; Lim et al., 2012; 55
Sen, et al., 2012). Transpressive deformation in a strike-slip fault zone and oblique 56
ramps of a thrusts system may be reactivated by oblique-slip movements during later 57
phase of shortening that is perpendicular to the trend of previous structures 58
(Jayangondaperumal and Dubey, 2001; Soto et al., 2007). 59
A number of analytical and experimental investigations have been conducted on fold 60
interference patterns that are resulted from superimposition of two phases of folds 61
trending mutually perpendicular. For example, four classical types of interference 62
patterns, type 0 to type 3 proposed by Ramsay (1962, 1967) based on shear folding 63
are widely known and referenced. Grasemann et al. (2004) have extended this 64
nomenclature to six types (type 1-3 and type 01-03). In order to investigate the 65
effects of early folded layers on formation of the later phase folds during buckling 66
superimposition, a number of experimental and natural case studies have been 67
conducted (e.g. Ghosh and Ramberg, 1968; Skjernaa, 1975; Watkinson, 1981; 68
Ghosh et al., 1992, 1993, 1995, 1996; Grujic, 1993; Aller and Gallastegui, 1995; 69
Grujic et al., 2002; Simon, 2004; Sengupta et al., 2005; Pastor-Galan et al., 2012; 70
Tian et al., 2013; Bose et al., 2014). Ghosh et al. (1992) proposed four modes of 71
interference pattern for buckling superimposition based on a series of experiments 72
with increase in tightness of the early phase of folding. However, superimposition of 73
thrust-related folding is also documented by some authors (e.g., Crespo-Blanc, 2007; 74
Abu Sharib and Bell, 2011; Lim and Cho, 2012; Shah, 2012). 75

In this study, a series of sandbox models were conducted to simulate superimposition 76
of folding and thrusting resulted from two phases of mutually orthogonal and oblique 77
shortening. Horizontal sections were taken at different levels in each model to follow 78
the 3D geometry of the superimposed structures. Based on model results, we 79
discuss several problems related to these structures: general characteristics of 80
superimposed folds and thrusts in map-view; features of superimposed structures 81
shown in different levels; comparison of superimposed folds and thrusts between 82
orthogonal and oblique superimposed shortening and effect of superimposition on 83
spacing of the phase-2 structures. In addition to sandbox model results, two 84
centrifuge models which examined the buckling superimposition formed by two 85
phases of orthogonal shortening are shown in this study. The reason for conducting 86
centrifuge models and illustrating the results here is to help investigating fold 87
interference patterns by excluding the effect of thrusting, which is not possible in 88
sandbox models where both fold and thrust develop. Three natural examples are 89
shown and compared with the model results. They are from the Chungnam Basin, 90
Korea, Mount Isa Inlier, Australia, and the central part of the Yanshan Orogenic Belt, 91
North China, where multiple mutually orthogonal or oblique shortening phases have 92
occurred. 93
94
2. Model setup and procedure 95
The sandbox models were built up with a uniform initial dimension, length of 52 cm, 96
width of 48 cm and thickness of 1.5 cm. In these models, dry loose quartz sand with 97
grain size of 80-120 µm, density of 1.53 g/cm3, and internal friction angle of 30-33° 98
(Maillot and Koyi, 2006) was used to simulate the brittle deformation in the upper 99
crustal rocks. Sand layers were about 2 mm thick and interstratified by thin marker 100
horizons of coloured sand (less than 1 mm) that acted as passive makers. A length 101
ratio of 10-5 was applied to scale the models to natural prototype, i.e. 1 cm in the 102
models represents 1 km in nature. All the models were shortened above an 103
aluminium plate with a relatively low basal friction coefficient of µ = 0.23 (Liu et al., 104
2013; Deng et al., 2014) in order to form a wide wedge. Models shortened above a 105
high-friction (µ= 0.55) produce narrower wedges (Koyi and Vendeville, 2003). 106
Superimposed shortening on a regional scale has been reported from some fold-107
thrust belts, for example the Chungnam Basin, Korea (Lim and Cho, 2012), Mount 108
Isa Inlier, Australia (Abu Sharib and Bell, 2011), and the central part of the Yanshan 109
Orogenic Belt, North China (Deng and Koyi, 2015). The shortening phases producing 110
the superimposed structures can be orthogonal or oblique to each other. In order to 111
recognize differences and similarities between structures developed during 112
orthogonal and oblique shortening scenarios, three kinds of set-up were used in the 113
modelling strategy (Table 1). One set-up was used to run two models (S1 and S2). In 114
model S1, two motors that were perpendicular to each other, separately pushed a 115
backstop forward during each phase to shorten the sand layers orthogonally (Fig. 1a). 116

In model S2, the same procedure was conducted as in model S1. However, after the 117
phase-1 shortening, the top of structural wedge was eroded by 6-8 mm and new 118
layers (6 mm) were sedimented. The second set-up was used in model S3, where 119
shortening directions in two phases were still mutually perpendicular. However, a 120
wooden right triangle with the interior angles of 45° was inbuilt to act as the backstop 121
during the phase-1 (Fig. 1b). This triangle backstop provided a compressive 122
component perpendicular to its hypotenuse, which formed a series of structures 123
trending parallel to the hypotenuse. During the phase-2, shortening direction was 45° 124
oblique to the strikes of the phase-1 structures. As such, a strict oblique 125
superimposed shortening could be achieved with this set-up. In the third set-up, an 126
aluminium plate was placed under the sand package in model S4. The model was 127
firstly shortened by a backstop and several structures were formed (Fig. 2a). After 128
that, a wooden wall has been placed in the model, which made an angle of 60° to the 129
trend of the phase-1 structures. Part of the model corner was removed to allow for an 130
oblique shortening, and the rest of the model was shortened against the wooden wall 131
during the second deformation phase. The shortening was achieved by pulling the 132
underlying metal plate at 60° angle (Fig. 2b). Consequently, with this set-up, the two 133
shortening directions were 60° oblique to each other in two sequential phases. 134
In addition to sandbox experiments, two centrifuge models were also run. The first 135
model (C1) consisted of 7 plasticine layers, with a dimension of 15 ×15 ×1 cm. The 136
second model (C2) consisted of 10 layers, 5 of plasticine and 5 of weaker material 137
(plasticine mixed with silicone putty and barite powder). Both the plasticine and the 138
mixture behave in non-Newtonian way where their effective viscosity is dependent on 139
the strain rate (Fig. 3). The two different types of layers were placed alternatively, 140
simulating a sequence with competence contrast. The model was initially 18 cm long, 141
16 cm wide and 1 cm thick. The plasticine material used in our models has a density 142
of 1.64-1.65 g/cm3, and the viscosities ranging from 2×10⁸ to 7×10⁸ Pa·s at strain 143
rates between 2×10⁻⁶ s-1 and 2×10⁻⁵ s-1. The mixture material has the density of 1.66-144
1.67 g/cm3, and the viscosity is 2×10⁷ to 2×10⁸ Pa·s at strain rates of 1-8×10⁻⁶ s-1. At 145
model strain rate of 10-6 to 10-5 s-1, the viscosity ratio between the plasticine and the 146
mixture layers was about one and half order of magnitude (Fig. 3). The dimension of 147
the models may be scaled to a natural prototype where 1 cm represents 1 km. The 148
models were initially shortened in one direction during spinning in the centrifuge at 149
700 G. After that, the models were shortened in the centrifuge in a direction 150
orthogonal to the first shortening direction. For each deformation phase, the models 151
were spun in the centrifuge for about 30 minutes. 152
Top surface of each model was scanned by a high-resolution Laser scanner at 153
regular interval during model deformation to monitor the change in topography. 154
Structure spacing was measured from the surface of the models using the method 155
introduced by Koyi et al. (2000). Structure spacing is the distance between the middle 156
lines of two sequential box folds in the sandbox models (Deng et al., 2014). Change 157
of the structure spacing was recorded at every 1 cm shortening. Lateral- and dip-slip 158

were monitored for the phase-1 thrusts during the second shortening phase, in order 159
to investigate their reactivation. In model S3, because the inbuilt triangle backstop 160
produces both compression and dextral shearing (Fig. 1b), we also measured 161
displacement along the phase-1 thrusts as they developed during the first shortening 162
phase. During the phase-1, four reference point-pairs were placed on either side of 163
thrusts traces on the top surface of model S3, in order to monitor movement along 164
the thrusts. Dip-slip was monitored by measuring the distance between the two points 165
along a line perpendicular to the trend of the thrust, whereas strike-slip was 166
monitored by measuring any lateral deviation of the points from this line. The 167
horizontal distance between two points of each pair was decreased with shortening. 168
We recorded the decrease of the horizontal distance which was converted them to 169
displacement along the thrust. During the second shortening phase, more reference 170
point-pairs were added on either side of the phase-1 thrusts traces on the top surface 171
of each model. The relative displacement of two points in each pair, either along 172
strike or in dip direction, was measured during the shortening phase-2 in order to 173
monitor any reactivation of the phase-1 structures. 174
175
3. Sandbox model results 176
3.1 Superimposition of folding and thrusting (models S1-S4) 177
After the first shortening phase a sand wedge formed close to the backstop, which is 178
the hinterland of the models (Figs. 4a, c and e). In the foreland, the sand layers 179
remain undeformed. Thickness of the model decreases from the hinterland towards 180
the foreland, reflected in surface topography (Figs. 4a, c and e). During the phase-2, 181
the shortening direction was either orthogonal or oblique to the trends of the phase-1 182
structures. Due to thickness change, deformation front did not propagate throughout 183
the entire model at the same time. The undeformed foreland of the phase-1 was 184
shortened to form a series of structures, which propagated laterally to the pre-existing 185
wedge, overprinting the phase-1 structures. As a result, highest topography was 186
shown in the superimposed hinterlands (Figs. 4b, d and f). 187
After shortening of the models in two directions, horizontal slices were taken and 188
analysed. The structural complexity of the models was described in two horizontal 189
sections for each model (Figs. 5-8). One slice is taken at a relatively shallow level (for 190
example in model S1, the shallow-level section was 3.4 cm above the basal plate), 191
and another slice at a deeper level (2.2 cm above the basal plate in model S1). 192
During both phases of shortening, all the models are characterized by a series of 193
box-folds bounded by fore-and back-thrusts formed in the limbs of folds. The models 194
were shortened above a metal base plate with low basal friction (µ = 0.23), which 195
formed a low angle taper wedge (ca. 8-10°). 196

In general, two structural areas are shown in map-view of each model. The first area 197
is located far away from the pushing walls, where the model experienced only one 198
shortening phase, either in the phase-1 or phase-2. In these areas the box-folds in 199
map-view are displayed by parallel bedding on either sides of the structures and 200
repetition of bedding across the structures (e.g. Figs. 5b and 6b). In the rest of the 201
model, superimposition of two phases’ box-folds commonly displays a rectangular 202
geometry. Generally, this rectangular geometry is characterized by bedding curved 203
outwards, which indicates the superimposition of a phase-2 anticline on a phase-1 204
anticline, or a phase-2 syncline on a phase-1 syncline (e.g. Figs. 5c and 7c). The 205
resulted interference pattern belongs to type 1 dome-and-basin structure (Ramsay, 206
1962, 1967). In the same horizontal section, the dome formed by an anticline 207
overprinting an anticline uplifts relatively deep structural level layers, compared with 208
its adjacent basins where the relatively shallow structural level is exposed (e.g. Figs. 209
5c and 7c). For each model, in the shallow horizontal section, a dome structure is 210
relatively wide. However, when the section is cut deeper, the same dome becomes 211
narrower (e.g. Figs. 6c and d). An opposite situation is observed in the basin formed 212
by a syncline on a syncline, where the area of the basin also becomes larger with 213
depth (e.g. Figs. 5 and 6). These changes are strongly controlled by the geometry of 214
box-folds. In other words, in a vertical section the hinge zone of the anticline is 215
narrowing with depth, whereas the syncline becomes wider. 216
This relationship is different when synclines and anticlines superimpose. When a 217
phase-2 anticline overprints a phase-1 syncline and/or a phase-2 syncline overprints 218
a phase-1 anticline, an axial depression forms in the anticline and an axial 219
culmination forms in the syncline (Ramsay, 1962). In such superimposition cases, the 220
resulting geometry displays bedding commonly curved inwards shown by closures of 221
anticlines and synclines (e.g. Figs. 5c, 6c, and 8c). Closures of the anticlines plunge 222
inwards, whereas closures of the synclines plunge outwards. 223
In map-view, the traces of fore-and back-thrusts are located in the limbs of kink folds, 224
and sub-parallel to their axes (Figs. 5-8). Both phase-1 and phase-2 thrusts cut 225
across the rectangular domes and basins (e.g. Figs. 5c and 8c). Since the box-folds 226
(pop-ups) are bounded by conjugate fore-and-back-thrusts in the models, the two 227
superimposed box-folds form a dome structure which is the shared pop-up structures 228
of both phases of folding. In contrast, the basin is the product of the shared pop-229
down structures. The superimposition of these pop-up and pop-down structures 230
dissects the surface of the model into rectangular blocks (Figs. 5-8). However, some 231
of these blocks are the surface expression of superimposition of an anticline 232
overprinting a syncline and/or syncline overprinting an anticline. In these cases, the 233
block is defined by superimposition of a pop-up on a pop-down, or a pop-down on a 234
pop-up (e.g. Figs. 5c and 7c). Several features shown by the models indicate the 235
sequence of two thrusting phases. The traces of the phase-2 thrusts are relatively 236
continuous, and some of them are branching in the superimposed areas (e.g. Figs. 237
5a and 8b). In contrast, the phase-1 thrusts are segmented by the phase-2 structures. 238

Most of these segments are displaced and bent during further shortening. 239
Dimensions of the phase-1 structures (folds and thrusts) change across the phase-2 240
structures. For example, in the eroded hanging wall of a phase-2 thrust, a narrow 241
hinge zone of the phase-1 anticline is shown, and its bounded thrusts in the two 242
limbs are close to each other (e.g. Fig. 5d). However, in the eroded footwall of this 243
phase-2 thrust, the exposed hinge zone of this anticline and the distance between 244
the bounded thrusts are wide. The situation is opposite in the phase-1 syncline 245
overprinted by a phase-2 thrust. A wide hinge zone (trough) of the phase-1 syncline 246
is exposed in the hanging wall of the phase-2 thrust, whereas in the footwall a 247
narrower hinge zone is shown and the bounded thrusts are closer. This situation is 248
governed by the geometry of box-folds and the bounding conjugate fore- and back-249
thrusts, where the hinge zone of the anticline is narrowing with depth, whereas the 250
syncline becomes wider. As such, displacement along the phase-2 thrust uplifts the 251
narrow hinge zones of the phase-1 anticline and relatively wide phase-1 synclines 252
from the originally deep level to the currently shallow level in the hanging wall. After 253
erosion, the phase-1 thrust is apparently offset along the strike of the phase-2 thrust 254
in map-view (e.g. Fig. 5d). 255
3.2 Superimposition with erosion and sedimentation after the phase-1 (model S2) 256
When erosion and sedimentation are included in the model after the first shortening 257
phase, i.e. forming an unconformity, structures display some characteristic 258
differences between shallow and deep horizontal sections (Fig. 6). At very shallow 259
levels, where the unconformity is not exposed yet, only the phase-2 folds and thrusts 260
are shown by the post-erosional sediments. When intermediate levels are exposed, 261
the unconformity boundary clearly separates two structural levels (Fig. 6a). Post-262
erosional sediments which have experienced only the second shortening phase are 263
folded to large synclines bounded by the phase-2 fore-and-back thrusts. In the 264
adjacent areas, structural levels below the unconformity are uplifted by the phase-2 265
of anticlines and their bounded thrusts. Therefore, the superimposed structures are 266
exposed. In these areas, the general trend of the phase-1 folds is easily recognized, 267
which is almost perpendicular to the trend of the phase-2 folds (Fig. 6c). 268
In the much deeper levels, where both the deformed and undeformed post-erosional 269
sediments are not seen anymore, the superimposed structures and the structures 270
from only the phase-1 are shown (Fig. 6b). In this deep level, superimposed folds 271
display map-view geometries similar to those shown in model S1, where orthogonal 272
superimposed shortening occurs without erosion and sedimentation (Fig. 5). The 273
rectangular dome-and-basin structures are shown. The phase-2 thrusts clearly cut 274
and displaced the phase-1 structures. 275
276
4. Centrifuge models (C1 and C2) 277

In the centrifuge models of two mutually orthogonal shortening phases, fold 278
superimposition produces type 1 dome-and-basin interference patterns, and type 2 279
mushroom-shape or arrowhead structure (Figs. 9 and 10) described by Ramsay 280
(1962, 1967). 281
In the centrifuge models, the two phases of shortening produce dome-and-basin 282
structures where folds have rounded hinge zone devoid of thrusts (Figs. 9 and 10). In 283
general, the domes and basins are outlined by outwards curved bedding. The deeper 284
layers are exposed within a dome, while the basins show the relatively shallower 285
layers. In some places, the domes and basins show crescent geometries, which 286
indicate a transition from type 1 to type 2 interference patterns, where the phase-1 287
and phase-2 folds can be distinguished (e.g. Figs. 9c and 10c). 288
In the areas where a phase-2 anticline overprints a phase-1 syncline and/or a phase-289
2 syncline overprints a phase-1 anticline, beddings are commonly curved inwards, 290
and closures of the anticlines plunge inwards while the synclines plunge outwards. 291
This feature is better observed in the phase-1 folds in the centrifuge models. For 292
example, after a phase-1 anticline is overprinted by a phase-2 syncline, the hinge of 293
the anticline is bent by the syncline. Therefore, two closures of the phase-1 anticline 294
are symmetric to the axis of the phase-2 syncline and plunge towards each other (Fig. 295
9c). In the case of the phase-2 anticline overprinting the phase-1 syncline, the two 296
closures of the syncline plunge away from each other (Fig. 10c). 297
298
5. Discussions 299
5.1. Comparison between orthogonal and oblique superimposition 300
Two types of superimpositions were experimented in this study, orthogonal (sandbox 301
models S1 and S2, and centrifuge models C1 and C2) and oblique (sandbox models 302
S3 and S4), respectively (Table 1). Basically, fold interference patterns formed by the 303
orthogonal and oblique superimposition do not have obvious differences. Dome-and-304
basin interference pattern (type1) is characterized by roughly rectangular geometry in 305
sandbox models, and more irregular shapes in the centrifuge models. The 306
rectangular geometry is distorted or apparently sheared in the models with oblique 307
superimposition. However, two phases of orthogonal shortening produce structures 308
trending orthogonally, both fold axial traces and thrusts (Figs. 5-6, and 9-10). This is 309
because the structures tend to be parallel to the mutually perpendicular pushing walls 310
during each phase, even though some curved traces are seen. For example, the 311
phase-1 fold axes are refolded and bent by the phase-2 folding (Fig. 10); trends of 312
the phase-2 structures are curved due to the lateral thickness variation (Figs. 5, for 313
more discussion about lateral thickness variation see later). In contrast, structures 314
formed by oblique superimposition may trend oblique to each other, but in some 315
areas of the model, they still could be approximately mutually perpendicular (Figs. 7-316

8). The latter situation can be clearly observed in model S4, where the phase-2 317
structural traces are parallel to the oblique pushing wall on the right side, thinner part 318
of the model, but gradually change trend to the direction perpendicular to the phase-1 319
structural traces on the left, thicker side and in the frontal part of the model away from 320
the pushing wall (Fig. 8). The reasons for this change in trend of structural traces is 321
possibly that the phase-2 structures advance more forwards on the left side of the 322
model where the sand package is thickened during the phase-1 shortening (Fig. 2). 323
5.2 Reactivation of the phase-1 structure during the oblique phase-2 shortening 324
In this study, oblique superimposition was conducted for two models (S3 and S4), in 325
which the phase-2 shortening was oblique to the trend of the phase-1 structures. As 326
such, reactivation of the phase-1 thrusts is expected to observe during the phase-2. 327
Reactivation of pre-existing structures during subsequential shortening phase has 328
been reported by Soto et al., (2007) who experimented an initial pure strike-slip 329
phase subsequently overprinted by shortening phase that is perpendicular to 330
shearing direction. They documented that a series of Riedel faults from the early pure 331
strike-slip were reactivated as oblique thrusts during the later shortening. 332
In model S3, both lateral- and dip-slip occurred along the thrusts during the first 333
shortening phase, due to the present of the inbuilt triangle backstop (Figs. 1b, 11 a 334
and b). Monitoring of the reference point-pairs show that both dextral- and dip-335
displacement along the thrusts increase with shortening, which indicates 336
transpression of the thrusts during the phase-1. The right triangle backstop makes a 337
45° with the direction of shortening, and results in similar amount of dip- and strike-338
slip movement along the thrusts (Figs. 11 a and b). During the phase-2, the fourteen 339
reference point-pairs that were monitored along the phase-1 structures (comparing 340
initial and final stages) showed relative sinistral- and dip-displacements. In other 341
words, a reversal in strike-slip has occurred from dextral during the phase-1 342
shortening to sinistral during the phase-2 (Figs. 11 c and d). During the second 343
shortening phase, displacement along strike of the thrusts is slightly larger than dip-344
displacement, along either the No.1 or the No.2 phase-1 thrusts. More amount of 345
displacement were measured along the segment of the No.1 phase-1 thrust that is 346
close to the phase-2 backstop (Figs. 4c and d; 11 c and d). However, along the No.2 347
phase-1 thrust, both sinistral- and dip-displacement do not show significant difference 348
along the whole thrust trace. We interpret that the segment of the No.1 phase-1 349
thrust had both large dip- and strike-slip because it is located in the area close to the 350
fixed and pushing boundaries (Figs. 4c and d, the backstops of the phase-1 and 351
phase-2). When the backstop pushed the sand layers forwards during the phase-2, 352
one side of the segment had less space to move forwards. Consequently, more 353
relative displacement has occurred between the two sides of the thrust during its 354
reactivation. 355
A slightly different scenario was observed in model S4 which also had an oblique 356
superimposition. During the second shortening phase, along the structure closest to 357

the deformable boundary, sinistral-slip and extension are observed (Figs. 3e and f; 358
11e). It is noticed that even though extension was measured by monitoring the 359
position of the reference point-pairs, it is not possible to determine whether extension 360
actually occurred along fault surface of the phase-1 structure or that the whole 361
imbricate underwent penetrative extension. Lateral escape towards the deformable 362
boundary during phase-2 deformation resulted in penetrative extension of the 363
imbricate that was close to the deformable boundary (Fig. 2b). The sinistral-slip 364
observed in this part is thus interpreted to be due to this lateral escape. Additionally, 365
the sinistral-slip can be due to the differential propagation of the phase-2 deformation 366
front, further in the thickened hinterland relative to the thinner foreland. In contrast, 367
towards the foreland of the phase-2, where oblique superimposition has occurred, 368
the phase-1 thrusts were reactivated by dextral-slip during the phase-2 shortening 369
(Fig. 11e). 370
Observations of models S3 and S4 indicate that pre-existing structures can be 371
reactivated either in dip direction or along strike during the later phase where 372
shortening direction is oblique to their trend. However, the amount of slip is different 373
in different segments of the thrusts. Along the segments that are relatively close to 374
the fixed boundary, more slip may occur during the reactivation of the thrusts. 375
5.3 Effect of superimposition on structure spacing 376
Experimental investigations indicate that structure spacing mainly depend on the 377
entire thickness of the deformed sand package (Ramsay and Huber, 1987; Marshak 378
and Wilkerson, 1992; Massoli et al., 2006), material properties (Jeng and Huang, 379
2008; Hudleston and Treagus; 2010), and friction along the basement above which 380
the sand package is shortened (Mulugeta, 1988; Liu et al., 1992). In general, 381
structure spacing increases with increasing the bulk thickness of sand package, 382
when deformation occurs above a low basal-friction. 383
In the sandbox models presented here, after the first shortening phase, formation of 384
a sand wedge produces a lateral thickness change (Figs. 4a, c and e). This thickened 385
sand wedge goes under the phase-2 shortening either perpendicular or oblique to the 386
strikes of the phase-1 structures (Figs. 4b, d and f). Therefore, in order to investigate 387
the effect of superimposition on the spacing of the phase-2 structures, the effect of 388
lateral thickness variation on the structure needs to be taken into account. As such, a 389
test model with lateral thickness tapering was run (Fig. 12). In this test model, initial 390
thickness of the sand package changes gradually from 3.5 to 1.3 cm parallel to the 391
pushing wall. This thickness change is comparable to the models, which have 392
undergone one shortening phase and have developed a wedge. These phase-1 393
wedges are usually around 3 cm thick in the hinterland and about 1.5 cm thick in the 394
undeformed foreland. 395
In the test model, thrusts generate from the thinner part, and then propagate laterally 396
into the thicker part with shortening. Traces of the thrusts are roughly continuous 397

from the thinner to the thicker part, which is not the same as the model results by 398
Soto et al, (2003), where much more closely spaced thrusts develop in the thinner 399
model part. Controlled by the thickness tapering, thrusts advance more forwards in 400
the thicker part of the model, and thus strikes of the thrusts are not parallel to the 401
pushing wall, but make an angle to it (Fig. 12). Older thrusts make a smaller angle 402
with the wall (ca. 5°) than the younger thrusts which make a larger angle (ca. 15°) 403
with the wall. Structure spacing also changes along strike from 6 cm where the initial 404
thickness is 1.5 cm, to 13 cm where the initial thickness is 3 cm (Fig. 13a). 405
In the models with two phases of shortening (e.g. model S1), when the initially 1.5 cm 406
thick sand package was shortened during the phase-1, structure spacing in the 407
beginning is similar to that measured in the thin part of the test model and decreased 408
by about 1.0 cm at the final stage (Fig. 13b). During the phase-2 shortening (e.g. 409
models S1 or S3) which is orthogonal or oblique to the direction of the phase-1 410
shortening, thrusts generate with different structural spacing in the thinner and thicker 411
parts. Spacing is larger in areas thickened during the phase-1 shortening, and 412
becomes smaller where such thickening is limited (Figs. 13c, e and f). However, 413
structure spacing in the thickened areas of these superimposed models is less 414
increasing than in the thick part of the test model where no earlier shortening had 415
taken place. In model S2, after eroding the upper part of the phase-1 wedge and 416
depositing new sediments, a uniform thick sand package (3.0 cm) was prepared to 417
be shortened during the phase-2. Structure spacing in this model is slightly smaller 418
than that taken in the test model within the 3.0 cm thick sand (Fig. 13d). 419
Structure spacing also changes with the amount of bulk shortening. In the test model 420
(in the thickest, intermediate and thinnest parts) structure spacing decreases by 1.1-421
1.4 cm from the initial to the final stage of shortening. However, in the superimposed 422
models, the change in structure spacing with shortening is different in the thinner and 423
thicker parts. Generally, the decrease in spacing with shortening is larger in the 424
thinner part than in the thicker part (Figs. 13c, e and f). 425
These analyses show that during two phases of shortening (models S1, S3 and S4), 426
spacing of the phase-2 structures is much less than structure spacing in the test 427
model whose initial thickness was similar to that of the models after the phase-1 428
shortening. This difference may be due to the fact that in the test model, thickness is 429
gradually tapering, whereas in the superimposed models thickness of the model 430
changed laterally in steps due to the formation of the phase-1 imbricates. In the latter 431
case, the thickness changes abruptly across each imbricate. During the second 432
shortening phase, the phase-2 thrusts propagate along strike from the thinner part 433
(phase-1 foreland) into the thicker part (phase-1 hinterland) of the model. The phase-434
2 thrusts are expected to advance more forwards and thus showing increasing 435
structure spacing, as they propagate into thickened hinterland areas. However, due 436
to the presence of the stepped imbricates, there seems to be a mechanical difficulty 437
for the phase-2 thrusts to either gradually propagate across or make a big jump cross 438

the steps of the phase-1 thrusts. As such, the thrusts advance closely to their trace in 439
the thinner parts when they propagate over the steps. Consequently, structure 440
spacing taken in the thicker part of each model is shorter than that in the model 441
where thickness changes gradually along strike than in steps. In model S2, after the 442
phase-1, erosion and sedimentation remove part of the wedge (i.e. topography) and 443
create a flat surface. During the second orthogonal shortening phase, the structure 444
spacing is significantly larger than in the other superimposed models with the phase-445
1 stepped imbricates. Difference of spacing between model S2 and the other models 446
imply that thickness changing in steps across the phase-1 imbricates has a 447
significant effect on spacing of the phase-2 structures. 448
5.4 Type 1 and modified Type 2 interference patterns 449
Fold interference patterns formed in the sandbox models are characterized by 450
rectangular dome-and-basin structures in map-view, i.e. type 1 interference pattern, 451
during orthogonal and/or oblique superimposition of box folds (Figs. 5-8). In theory, 452
each dome is surrounded by four basins, and each basin is surrounded by four 453
domes (Ramsay, 1962; Ramsay and Huber, 1987). The trend of the two phases of 454
folds can be found by joining the culminations of adjacent domes or the depressions 455
of adjacent basins (Ramsay, 1967; Ghosh, et al. 1992). However, Ghosh et al. (1992) 456
also suggested that when the two phases of folds have similar tightness and 457
curvature, the hinge lines of folds of both phases are not easy to recognize over the 458
domes and basins. As shown by model results, in the relatively deep sections fewer 459
layers are visible to display the rectangular geometry of the dome structure (e.g. Figs. 460
6a and d). Consequently, the ‘dome’ structure may disappear, and thus a basin is not 461
always surrounded by four domes (e.g. Figs. 9c and d). In this case, if part of the 462
superimposed structure has been eroded or been overlain by later sedimentation in 463
natural cases, it is more difficult to determine the original fold interference patterns 464
and the trend of each folding phase. 465
Several features for fold superimposition are shown by model results. These might 466
not be diagnostic, but could be helpful to recognize where dome-and-basin 467
interference pattern occurred. Generally, a dome structure that is formed by an 468
anticline superimposed on an existing anticline is characterized by bedding being 469
curved outwards in map-view, and outwards dip directions. Closures of anticlines 470
also plunge outwards (e.g. Figs. 7c, 8c, and 14a). In deep structural levels, this 471
outward curvature of bedding is not so obvious because beds are connected. At 472
these deeper levels the dome is recognized by to the dip directions outwards and 473
closures of the adjacent synclines plunging outwards in all directions (e.g. Fig. 9d). 474
Similarly, where a syncline overprints a syncline to form a basin, bedding is curved 475
outwards in map-view, but dip directions and plunges are inwards (e.g. Figs. 5c and 476
9d). In areas where an anticline overprints a syncline and/or a syncline overprints an 477
anticline, bedding is commonly curved inwards, and the anticline plunges inwards, 478
whereas the syncline plunges outwards. Dip directions are not all inwards or 479

outwards, but indicate two anticline closures in one direction and two syncline 480
closures in another direction (e.g. Figs. 5c, 9c, 10c and 14a). 481
Based on Ramsay’s model (1967), to form the type 2 interference pattern, the early 482
phase of folds usually has an overturned limb before superimposed by the 483
subsequential folding phase. However, some researchers (Watkinson, 1981; Ghosh 484
et al., 1992; Grujic, 1993; Sengupta et al., 2005) have suggested that when the early 485
phase of folds have an initial interlimb angle of less than 90° but are with no 486
overturned limb, type 2 interference pattern could still be formed during buckling 487
superimposition (Fig. 14b). In the centrifuge models, some phase-1 folds have 488
narrow hinge zones, relatively small interlimb angle and steep inclined axial plane but 489
no overturned limb. During the second orthogonal shortening phase, mushroom- or 490
arrowhead-shaped interference pattern was developed in map-view (Figs. 9 and 10). 491
In order to interpret the arrowhead-shaped structures and distinguish this interference 492
pattern from Ramsay’s model (1967), we introduce the modified type 2 interference 493
pattern here (Fig. 14b). In the modified type 2, the phase-1 folds have steeply 494
inclined axial plane and no overturned limb. After phase-2 orthogonal shortening, the 495
phase-1 anticlines and synclines still can be recognized. The arrowhead-shaped 496
structures represent either the superposition of a later anticline on an early anticline 497
or a syncline on an earlier syncline, whereas the neck of the arrow represents that an 498
anticline overprints an earlier syncline or a syncline overprinting an earlier anticline 499
(Figs. 9d, 10c and 14b). For clarifying the modified type 2 interference pattern, we 500
use the case of a later anticline overprinting an earlier anticline-syncline pair as an 501
example (Fig. 14b). The phase-2 anticline overprints the phase-1 anticline to form an 502
asymmetric dome in the shape of an arrowhead. In this arrowhead, in map-view, 503
bedding is curved outwards in faces of the arrowhead and inwards towards the neck 504
of the arrow, where the phase-2 syncline forms. The deformed layers are dipping 505
outwards, and the closures are also plunging outwards in different directions. In 506
contrast, in the neck of the arrow, where the phase-2 anticline overprints a phase-1 507
syncline, bedding is curved inwards in three directions and outwards in the forth 508
direction towards the arrowhead. In this zone, the phase-1 synclines plunge away 509
from each other and are generally mirror symmetric to the phase-2 anticline traces, 510
whereas, the phase-2 anticline and syncline plunge inwards. 511
As Ramsay and Huber (1987) had pointed out, in the typical dome-and-basin 512
interference pattern, the relative timing of the two folding phases is not easy to 513
deduce from geometric criteria alone, i.e. the relatively symmetric dome and basin 514
geometry. However, in many cases the superimposed structures formed by two 515
folding phases display intermediate situation between type 1and type 2 interference 516
patterns in map-view, i.e. more similar to modified type 2. In this case, the relative 517
timing of superimposition could be determined according to the map-view geometry 518
and the characteristics of layer dip and fold plunge. 519
5.5 Superimposition of two hinterlands and forelands 520

During the first shortening phase, the model was thickened by imbrication in the 521
hinterland and its thickness decreased towards the undeformed foreland (Figs. 4a, c 522
and e). The second shortening phase was orthogonal or oblique to the phase-1 and 523
formed its own hinterland and foreland which were superimposed on the phase-1 524
hinterland and foreland (Figs. 4b, d and f). Consequently, different structural regimes 525
were formed and show in map-view. In the area of the phase-2 hinterland 526
overprinting the phase-1 hinterland, highest topography was created and hence, 527
once eroded, the deepest lithologies in the core of the domes were exposed (Figs. 5, 528
6 and 8). On the contrary, the area where the forelands of the two shortening phases 529
superimpose remains undeformed as they are not affected by either of the shortening 530
phases (e.g. Fig. 5b). As a result, the lowest topography is formed in the area, where 531
the forelands of the two shortening phases were superimposed. In some parts of the 532
model, the phase-1 hinterland was not affected by the phase-2 shortening, or the 533
phase-2 structures were formed in the phase-1 foreland. In these two areas, either 534
the phase-1 or the phase-2 structures are seen (Figs. 5, 6 and 8). 535
As such, in a tectonic region with multiple phases of shortening, the relatively deep 536
lithologies and the multidirectional structure trends are exposed in some areas. In 537
contrast, in other places the relatively shallow lithologies can be seen, where 538
probably only one phase of structures is recorded. According to this, the hinterland 539
and foreland of each shortening phase might be determined. 540
541
5.6 Natural examples 542
5.6.1 The Chungnam Basin, Korea 543
Lim and Cho (2012) investigated the Early to Middle Jurassic low-grade metamorphic 544
strata (Nampo Group) in the Chungnam Basin, Korea (Fig. 15). They documented 545
two phases of shortening, roughly orthogonal to each other. In the first shortening 546
phase (Middle Jurassic to early Late Jurassic) the Nampo Group and the 547
Precambrian basement were folded and thrusted towards WNW. Reverse faults and 548
gentle folds, roughly trending E-W, were formed during the second phase which was 549
almost in an N-S direction. The phase-2 folds are north-verging. Lim and Cho (2012) 550
reported dome-and-basin interference pattern to have formed by the superimposed 551
two phases of shortening. 552
Deformation of the Chungnam Basin displays many map-view characteristics 553
(superimposition of folding and thrusting) similar to our model results which have 554
undergone two phases of orthogonal shortening (Figs. 5 and 15). The dome-and-555
basin structures are formed by the phase-2 anticlines overprinting phase-1 anticlines, 556
and phase-2 synclines overprinting phase-1 synclines. In the core of the dome, the 557
older and deeper strata are exposed, whereas the younger and shallower strata are 558
shown in the core of the basins (Figs. 5c vs. 15). Superimposed structures are mainly 559

observed in the central and southern part of the Chungnam Basin. However, the 560
northern part of the area is dominated by the phase-1 structures, even though some 561
effects from the phase-2 are observed (Lim and Cho, 2012). Distribution of different 562
phases of structures may indicate that the central and southern area of the 563
Chungnam Basin experienced superimposition of two hinterlands, which is coincident 564
to the transporting directions in each phase, i.e. WNW towards in the phase-1, and 565
north verging in the phase-2. Strike-slip during the phase-2 was observed in some 566
segments of the phase-1 thrusts, which imply these segments experienced 567
reactivation during the phase-2. In general, the reactivated segments are striking 568
slightly oblique to the shortening direction of the phase-2 (N-S direction). As such, 569
even though the two phases of shortening directions were orthogonal, some 570
segments of the phase-1 thrusts actually have undergone oblique superimposition. 571
This situation is similar to our observations from model S3, where during the phase-2 572
the model was shortened in a direction 45° oblique to the trend of the phase-1 573
structures. These pre-existing structures were reactivated during the second phase of 574
shortening (Figs. 7 and 11a-d). 575
5.6.2 The Central part of the Yanshan Orogenic Belt, North China 576
Another natural example of superposition of shortening is the central part of the 577
Yanshan Orogenic Belt (YOB), North China (Fig. 16). Investigations from many 578
researchers documented that the YOB has been shortened in multiple phases during 579
the Mesozoic (e.g. Davis et al., 2001; Deng et al., 2005; Cope et al., 2007). In the 580
geological map two kilometer-scale superimposed folds are shown in the central part 581
of the YOB, which are called Daheishan and Pingquan superimposed folds, 582
respectively. Our previous studies indicate that these two superimposed folds were 583
formed by two phases of orthogonal shortening, which were inferred to have occurred 584
earlier than Early Jurassic (Deng and Koyi, 2015). The early phase folds are roughly 585
trending NW-SE. They are refolded by later ENE-WSW folding. As a result, 586
arrowhead interference pattern can be seen in map-view (Fig. 16). Several thrusts 587
striking NE to ENE and NW to NNE cut the superimposed folds, which are interpreted 588
to postdate the folding phases. 589
The arrowhead-shaped map-view geometries of the Daheishan and Pingquan 590
superimposed folds are similar to the results of the centrifuge models (Figs. 9c, 10c 591
and 14b). These are interpreted to be modified type 2 interference patern (Ramsay, 592
1962, 1967; Deng and Koyi, 2015). Early NW-SE trending anticlines were overprinted 593
by a later NE-SW trending anticline, forming asymmetric domes. In the dome, 594
bedding is curved outwards, and the folds plunge outwards. The relatively deep and 595
old units are exposed in the core of the domes. In the Pingquan superimposed folds, 596
part of the early phase syncline can still be seen, which is shown by the inwards 597
(northwards) curved bedding and the outwards (southwards) plunging fold axis. This 598
feature indicates the superimposition of an early syncline by a later anticline (Figs. 9c 599
and 14b). In the Daheishan and Pingquan superimposed folds, thrusts were 600

developed later than the two folding phases, which differs from the sandbox models 601
where the box-folds and their bounded thrusts formed together during each 602
shortening phase. However, there are still some lessons we could learn by 603
comparing model results to the map-views of Daheishan and Pingquan 604
superimposed folds. In the sandbox models, because folds and thrusts were formed 605
simultaneously, the thrusts do not cut through the fold interference pattern. For 606
example, the phase-1 thrusts cut the limbs of the phase-1 folds, while the phase-2 607
thrusts cut the limbs of the phase-2 folds and all the early phase structures (e.g. Figs, 608
5c and 8c). However, none of the phase-2 thrusts cut across the hinge zone of the 609
phase-2 folds, and thus the dome-and-basin structures remain intact. In contrast, in 610
the Daheishan superimposed folds, a NE striking thrust (SPF) cuts the hinge zone of 611
the later phase NE-SW trending fold (Fig. 16). In both the Daheishan and Pingquan 612
superimposed folds, the NW striking faults (YSF and LLF) cut through the hinge zone 613
of the early NW-SE trending folds and trace from one limb of the structure to another 614
(Fig. 16). As such, the arrowhead interference patterns are modified by the thrusting. 615
This might be a hint that thrusting is later than formation of fold superimposition. 616
5.6.3 The Mount Isa Inlier, Australia 617
Abu Sharib and Bell (2011) recognized four distinct orogenic phases in the eastern 618
Mount Isa Inlier, Australia. Shortening direction changed from one phase to the next, 619
resulting in formation of folds with different trends (Fig. 17). As such, both orthogonal 620
and oblique superimposition can be seen in this area. In the phase-1, NW-SE 621
trending tight macroscopic folds were formed by NE-SW shortening. In general, the 622
folds are gently southeast plunging. Thrusts formed in the phase-1 were moving 623
towards SW. The phase-2 N-S shortening resulted in a series of micro to 624
macroscopic, E-W trending folds and thrusts verging towards north. This shortening 625
phase caused the pre-existing NW-SE trending phase-1 folds to rotate to E-W trends. 626
The subsequent phase-3 E-W shortening dominated the entire Mount Isa Inlier where 627
foliations are well developed. However, N-S trending regional folds were mainly 628
shown in the southern part of the area. During the phase-4, shortening direction was 629
NW-SE, which locally induced NE-SW trending folds (Abu Sharib and Bell, 2011). 630
As in the models, each phase of shortening did not overprint throughout the entire 631
Mount Isa Inlier area, i.e. folds of each phase formed only in some areas (Figs. 5b, 632
6b and 17). In the southern part, the N-S trending phase-3 folds are dominant, 633
whereas folds from other phases are not observed. As such, folding superimposition 634
between the phase-3 folds and the other phase folds is not seen. In the northern part, 635
three phases of folds are shown. The phase-1 folds are obliquely overprinted and 636
rotated by the second folding phase. They were subsequently refolded by the fourth 637
folding phase, where the first and forth shortening directions were mutually 638
orthogonal. The bent axial traces of the phase-1 folds have similar geometry as that 639
shown by the centrifuge model results (Figs. 9c and 17). Axial traces of the E-W 640
trending phase-2 folds were displaced by an N-S striking fault that has the same 641

trend as the phase-3 folds. It is also shown that the phase-2 folds were overprinted 642
by a later NNE-SSW trending fold that was probably formed during the fourth 643
shortening phase. This oblique superimposition is also responsible for the curved 644
map-view axial traces of the phase-2 folds. 645
646
6. Conclusions 647
Analogue models of two phases of mutually orthogonal or oblique shortening, 648
produce superimposed folding and thrusting. Model results show that in the 649
orthogonal superimposition trends of the later phase structures are roughly 650
orthogonal to those of the pre-existing structures. In the oblique superimposition, the 651
later phase structures may trend oblique to the pre-existing ones in the early phase 652
foreland area, while turn to orthogonally across the pre-existing structures in the 653
thickened hinterland of the first shortening phase. During the later shortening phase, 654
pre-existing phase-1 thrusts are reactivated in dip direction and along strike. Model 655
results show that spacing of the later phase structures is variable: spacing is larger in 656
the phase-1 hinterland (thickened area) and smaller where such thickening is limited 657
(in the foreland). However, the increase in spacing in the hinterland is less than in 658
thick models where no earlier shortening has taken place. 659
Dome-and-basin (type 1) and arrowhead-shaped (modified type 2 here) interference 660
patterns structures are observed in the models. Both in the dome and in the basin 661
structures, bedding is curved outwards in map-view. Layers are dipping and 662
anticlines are plunging outwards in the dome, whereas in the basin bed dip and fold 663
plunge are inwards. In the areas between two adjacent domes or basins, bedding is 664
curved inwards in map-view, while the anticlines plunge inwards and the synclines 665
outwards. Model results show that in the arrowhead-shaped interference pattern, the 666
relative timing of folding superimposition could be determined according to the map-667
view geometry. Early phase folds show the inward curved bedding and outward 668
plunging closures for an early syncline and inward plunging for an early anticline. 669
Model results show that superimposed structures are not necessarily observed 670
everywhere within an area that has suffered two phases of shortening. 671
Superimposition of two hinterlands produces highest topography and shows the 672
superimposed structures and deepest units after erosion. Model results also show 673
that an unconformity between two shortening phases in an area separates different 674
structures. Superimposition is only seen in the layers below the unconformity, 675
whereas in the layers above the unconformity only the later deformation phase 676
structures show. 677
Comparison between model results and natural examples shows that orogenic-scale 678
dome-and-basin, and arrowhead-shaped interference patterns are commonly formed 679
in area undergoing two phases of orthogonal shortening. In natural examples, similar 680

to model results, reactivation of the pre-existing early phase thrusts can be observed. 681
Map-view geometry of fold interference pattern might be modified by later phase 682
thrusting. In a tectonic region, structures might not be developed everywhere during 683
each deformation phase. As such, superimposition of two and/or even more 684
deformation phases may not be seen all over the area. 685
686
Acknowledgements: 687
Hongling Deng is funded by China Scholarship Council (Grant 2010640002) and 688
Swedish Research Council (VR) through Hemin Koyi, and Department of Earth 689
Sciences at Uppsala University for partial salary compensation. Hemin Koyi is funded 690
by the Swedish Research Council (VR). Faramarz Nilfouroushan is funded by 691
Swedish Research Council (VR) through Hemin Koyi. The authors thank Elena 692
Druguet and Marco Bonini for their constructive reviews, comments and suggestions, 693
which helped improving this manuscript, and also thank the editor Ian Alsop for his 694
suggestions and handling the manuscript. 695
696
References 697
Abdelsalam, M.G., 2010. Quantifying 3D post-accretionary tectonic strain in the 698 Arabian–Nubian Shield: Superimposition of the Oko Shear Zone on the Nakasib 699 Suture, Red Sea Hills, Sudan. Journal of African Earth Sciences 56, 167-178. 700
Abu Sharib, A.S.A.A., Bell, T.H., 2011. Radical changes in bulk shortening directions 701
during orogenesis: Significance for progressive development of regional folds and 702
thrusts. Precambrian Research 188, 1-20. 703
Aller, J., Gallastegui, J., 1995. Analysis of Kilometric-scale superposed folding in the 704
Central Coal Basin (Cantabrian zone, NW Spain). Journal of Structural Geology 17(7), 705
961-969. 706
Bose, S., Mandal, N., Acharyya, S.K., et al., 2014. Orogen-transverse tectonic 707
window in the Estern Himalayan fold belt: A superposed buckling model. Journal of 708
Structural Geology 66, 24-41. 709
Cashman, P.H., Villa D.E., Taylor W. J., Davydov V.I., and Trexler J.H., Jr., 2011. 710
Late Paleozoic contractional and extensional deformation at Edna Mountain, Nevada. 711
Geological Society of America Bulletin 123(3-4), 651-668. 712
Cope, T.D., Shultz, M.R. and Graham, S.A., 2007. Detrital record of Mesozoic 713
shortening in the Yanshan belt, NE China: testing structural interpretations with basin 714
analysis. Basin Research 19, 253-272. 715

Corredor, F., 2003. Eastward extent of the Late Eocene–Early Oligocene onse of 716
deformation across the northern Andes: constraints from the northern portion of the 717
Eastern Cordillera fold belt, Colombia. Journal of South American Earth Sciences 16, 718
445-457. 719
Crespo-Blanc, A., 2007. Superimposed folding and oblique structures in the 720
palaeomargin-derived units of the Central Betics (SW Spain). Journal of the 721
Geological Society, London 164, 621-636. 722
Dario, C., Claudio, M., Mossimo, Z., 2010. Contractional deformation and Neogene 723 tectonic evolution of the Pergola-Melandro Valley area (Southern Apennines). 724
GeoActa (Bologna), 9, 1-19. 725
David, G.A., Zheng Y., Wang C., et al., 2001. Mesozoic tectonic evolution of the 726
Yanshan fold and thrust belt, with emphasis on Hebei and Liaoning provinces, 727
northern China. Geological Society of America Memoir 194, 171-179. 728
Deng H., Koyi H.A., Froitzheim N., 2014. Modeling two sequential coaxial phases of 729 shortening in a foreland thrust belt. Journal of Structural Geology, 66, 400-415. 730
Deng H., Koyi H.A., 2015. Mega arrowhead interference patterns in the Central part 731 of the Yanshan Orogenic Belt, North China. Journal of Structural Geology, accepted. 732
Deng, J., Zhao, G., Su, S., et al., 2005. Structure overlap and tectonic setting of 733
Yanshan orogenic belt in Yanshan era (in Chinese with English abs.). Geotectonica 734
et Metallogenia 29(2), 157-165. 735
Derryberry P.M., 2011. Structural and stratigraphic relationships near the southern 736 terminus of the Pulaski fault, northeast Tennessee. A thesis presented for the Master 737 of Science Degree, The University of Tennessee, Knoxville. 738
Ghosh, S.K., Ramberg, H., 1968. Buckling experiments on intersecting fold patterns. 739
Tectonophysics 5, 89-105. 740
Ghosh, S.K., Sengupta, S., 1987. Progressive development of structures in aductile 741
shear zone. Journal of Structural Geology 9, 277-287. 742
Ghosh, S.K., Mandal, N., Khan, D., Deb, S.K., 1992. Modes of superposed folding in 743
single layers controlled by initial tightness of early folds. Journal of Structural Geology 744
14, 381-394. 745
Ghosh, S.K., Mandal, N., Sengupta, S., Deb, S.K., Khan, D., 1993. Superposed 746
buckling in multilayers. Journal of Structural Geology 15, 95-111. 747
Ghosh, S.K., Khan, D., Sengupta, S., 1995. Interfering folds in constructional 748
deformation. Journal of Structural Geology 17, 1361-1371. 749

Ghosh, S.K., Deb, S., Sengupta, S., 1996. Hinge migration and hinge replacement. 750
Tectonophysics 263, 319-337. 751
Ghosh, S.K., Hazra, S., Sengupta, S., 1999. Planar, nonplanar and refolded sheath 752
folds in the Phulad Shear zone, Rajasthan, India. Journal of Structural Geology 21, 753
1715-1720. 754
Grasemann, B., Wiesmayr, G., Draganits, E., Fusseis, F., 2004. Classification of 755
refold structures. The Journal of Geology 12(112), 119-125. 756
Grimes, S.W., Mosher, S., 2003. Structure of the Carrizo Mountain Group, 757
southeastern Carrizo Mountains, west Texas: A transpressional zone of the Grenville 758 orogen. Tectonics 22(1), doi:10.1029/2001TC001316. 759
Grujic, D., 1993. The influence of initial fold geometry on Type 1 and Type 2 760
interference pattern: an experimental approach. Journal of Structural Geology 15, 761
293-307. 762
Grujic, D., Walter, T.R., Gartner, H., 2002. Shape and structure of analogue models 763
of refolded layers. Journal of Structural Geology 24, 1313-1326. 764
Hebei Bureau of Geology, Second Geologic Survey Group (HBG-SGSG), 1976. 765
Pingquan 1:200000 geological map and mapping report (in Chinese). 766
Jayangondaperumal, R., Dubey, A.K., 2001. Superposed folding of a blind thrust and 767 formation of klippen: result of anisotropic magnetic susceptibility studies from the 768
Lesser Himalaya. Journal of Asian Earth Sciences 19, 713-725. 769
Koyi, H.A., Hessami, K., 2000. Epicenter distribution and magnitude of earthquakes 770 in fold-thrust belts: insights from sandbox models. Geophysical Research Letters 771
27(2), 273-276. 772
Koyi, H. A., Vendeville, B.C., 2003. The effect of décollement dip on geometry and 773
kinematics of model accretionary wedges. Journal of Structural Geology 25 (9), 1445-774 1450. 775
Li, P., Rosenbaum, G., Donchak, P.J.T., 2012. Structural evolution of the Texas 776 Orocline, eastern Australia. Gondwana Research 22, 279-289. 777
Lim, C., Cho, M., 2012. Two-phase contractional deformation of the Jurassic Daebo 778 Orogeny, Chungnam Basin, Korea, and its correlation with the early Yanshanian 779 movement of China. Tectonics 31, TC1004, doi:10.1029/2011TC002909. 780
Liu, H., McClay, K.R., Powell, D., 1992. Physical models of thrusts wedges. In Thrust 781 Tectonics (ed. K.R. McClay), pp. 71-81. London: Chapman & Hall. 782
Liu, Z., Koyi, H.A., Jan, O.H., et al., 2013. Kinematics and 3-D internal deformation of 783 granular slopes: Analogue models and natural landslides. Journal of Structural 784
Geology 53, 27-42. 785

Maillot, B., Koyi, H., 2006. Thrust dip and thrust refraction I fault-bend folds: analogue 786 models and theoretical predictions. Journal of Structural Geology 28, 36-39. 787
Maloof, A.C., 2000. Superposed folding at the junction of the inland and coastal belts; 788
Damara Orogen, NW Namibia (Abs.). Communications of the Geological Survey of 789 South West Africa/Namibia, 12, 89-98. 790
Marshak, S., Wilkerson, M.S., 1992. Effect of overburden thickness on thrust belt 791 geometry and development. Tectonics 11(3), 560-566. 792
Massoli, B., Koyi, H.A., Barchi, M.R., 2006. Structural evolution of a fold and thrust 793
belt generated by multiple décollements: analogue models and natural examples 794
from the Northern Apennines (Italy). Journal of Structural Geology 28, 185-199. 795
Maxelon, M., Mancktelow, N.S., 2005. Three-dimensional geometry and 796 tectonostratigraphy of the Pennine zone, Central Alps, Switzerland and Northern Italy. 797 Earth-Science Reviews 71, 171-227. 798
Mescua, J.F., Giambiagi, L.B., 2012. Fault in version vs. new thrust generation: A 799
case study in the Malargüe fold-and-thrust belt, Andes of Argentina. Journal of 800 Structural Geology 35, 51-63. 801
Misra, S., Gupta, S., 2014. Superposed deformation and inherited structures in an 802
ancient dilational step-over zone: Post-mortem of the Rengali Province, India. Journal 803 of Structural Geology 59, 1-17. 804
Pastor-Galan, D., Gutierrez-Alonso, G., Mulchrone, K.F., et al., 2012. Conical folding 805
in the core of an orocline. A geometric analysis from the Cantabian Arc (Variscan Belt 806
of NW Iberia). Journal of Structural Geology 39, 210-223. 807
Ramon, J.C., Rosero, A., 2006. Multiphase structural evolution of the western margin 808
of the Girardot subbasin, Upper Magdalena Valley, Colombia. Journal of South 809
American Earth Sciences 21, 493-509. 810
Ramsay, J.G., 1962. Interference pattern produced by the superposition of folds of 811
similar type. Journal of Geology 60, 466-481. 812
Ramsay, J.G., 1967. Folding and Fracturing of rocks. McGraw-Hill, New York. p. 518-813
534. 814
Ramsay, J.G., Huber, M.I., 1987. The techniques of modern structural geology 815
Volume 2: Folds and Fractures. ACADEMIC, London. Session 22 Superposed folding. 816
Roca, E., Sans M., Koyi, H.A., 2006. Polyphase deformation of diapiric areas in 817
models and in the eastern Prebetics (Spain). AAPG Bulletin 90(1), 115-136. 818
Roy, A.B., 1995. Geometry and evolution of superposed folding in the Zawar lead-819 zinc mineralised belt, Rajasthan. Proc. Indian Acad. Sci. (Earth Planet. Sci.) 104(3), 820 349-371. 821

Saha, D., 2002. Multi-Stage Deformation in the Nallamalai Fold Belt, Cuddapah 822 Basin, South India - Implications for Mesoproterozoic Tectonisrn Along Southeastern 823 Margin of India. Gondwana Reseach 5(3), 701-719. 824
Sen, K., Dubey, A.K., Tripathi, K., et al., 2012. Composite mesoscopic and magnetic 825 fabrics of the Paleo-Proterozoic Wangtu Gneissic Complex, Himachal Himalaya, 826 India: Implications for ductile deformation and superposed folding of the Himalayan 827 basement rocks. Journal of Geodynamics 61, 81-93. 828
Sen, K. and Pfander, J., 2013. Himalayan basement rocks experienced superposed 829
folding during the Orogeny: insights from integrated mesoscopic and magnetic fabric 830 analysis. Geophyscial Research Abstracts 15, EGU2013-6674. 831
Sengupta, S., Ghosh, S.K., Deb, S.K., et al., 2005. Opening and closing of folds in 832
superposed deformations. Journal of Structural Geology 27, 1282-1299. 833
Shah, Z.S., Sayab, M., Aerden, D., Iqbal, Q., 2013. Formation mechanism and 834
tectonic significance of millipede microstructures in the NW Himalaya. Journal of 835
Asian Earth Sciences 59, 3-13.Simon, J.L., 2004. Superposed buckle folding in the 836
eastern Iberian Chain, Spain. Journal of Structural Geology 26, 1447-1464. 837
Soto, R., Martinod, J., Odonne, F., 2007. Influence of early strike-slip deformation on 838
subsequent perpendicular shortening: An experimental approach. Journal of 839 Structural Geology 29, 59-72. 840
Steiger, R.H., 1964. Dating of Orogenic Phases in the Central Alps K-Ar Ages of 841 Hornblende. Journal of Geophysical Research, 69(24), 5407-5421. 842
Tian, Z., Xiao, W., Shan, Y., et al., 2013. Mega-fold interference patterns in the 843
Beishan orogen (NW China) created by change in plate configuration during Permo-844
Triassic termination of the Altaids. Journal of Structural Geology 52, 119-135. 845
Watkinson, A.J., 1981. Patterns of fold interference: influences of early fold shapes. 846
Journal of Structural Geology 3(1), 19-23. 847
Weinberger, R., Gross, M.R., Sneh, A., 2009. Evolving deformation along a transform 848
plate boundary: Example from the Dead Sea Fault in northern Israel. Tectonics 28, 849
TC5005, doi:10.1029/2008TC002316. 850
851
Figure captions: 852
Table 1. Model summary. Sandbox models S1, S2 and centrifuge models C1 and C2 853
experienced two phases of mutually orthogonal shortening. Sandbox models S3 and 854
S4 simulate two phases of oblique superimposed shortening. 855
Figure 1. a) Schematic drawing of the experimental setup for orthogonal model S1 856
and S2. b) Schematic drawing of the experimental setup for oblique model S3. 857

Figure 2. b) Schematic drawing of the experimental setup for model S4 after the 858
phase-1 shortening. A series of folds and thrusts are formed. b) Schematic drawing 859
of the experimental setup for model S4 during the phase-2 shortening. The inserted 860
wooden backstop is fixed on table and allows the pulled metal plate moving under it. 861
Figure 3. Viscosity vs. strain rate plot for the plasticine and the mixture materials. 862
Measurements were taken under room temparature, T=22℃. 863
Figure 4. Laser scanned images of the topography of the sandbox models. a), c) and 864
e) Topographies of the models after the phase-1 shortening. b), d) and f) 865
Topographies of the models after the phase-2 shortening. 866
Figure 5. Horizontal section of model S1 cut at the shallow a) and deep b) levels, 867
respectively. Two phases of fold and thrust traces are shown. The filled rhombus and 868
triangles represent the phase-1 folds and thrusts, respectively, and the open ones 869
represent the phase-2 structures. The same symbol system is applied to Figures 6-870
10 for distinguishing the phase-1 and phase-2 structures. Two marker layers are 871
highlighted to display the map-view geometry of superimposed structures (the same 872
in Figures 6-8). c) Line drawing showing close-up of details of fold and thrust 873
interference patterns. d) Line drawing showing phase-2 thrusts displacing phase-1 874
structures. 875
Figure 6. Horizontal section of model S2 cut at the shallow a) and deep b) levels, 876
respectively. Orthogonal superimposition occurs with the processes of erosion and 877
sedimentation after the phase-1. Fold and thrust traces are shown. The dashed line 878
shows the unconformity boundary. The dot line indicates the bottom layer of the post-879
erosional deposit. c) and d) Line drawings showing detailed close-up of fold 880
interference patterns and thrusts at the shallow and deep levels, respectively. The 881
insets are turned 90° clockwise. 882
Figure 7. Horizontal section of model S3 cut at the shallow a) and deep b) levels, 883
respectively. Two phases of fold and thrust traces are shown. The inbuilt triangle 884
backstop produces compression and dextral shearing during the phase-1. c) Line 885
drawing showing the detailed close-up of superimposed structures. The inset is 886
turned 45° anticlockwise. 887
Figure 8. Horizontal section of model S4 cut at the shallow a) and deep b) levels, 888
respectively. Two phases of fold and thrust traces are shown. c) Line drawing 889
showing close-up of superimposed structures in detailed. 890
Figure 9. Horizontal sections of the centrifuge model C1 cut at the shallow a) and 891
deep b) levels, respectively. The model was orthogonally shortened in two phases. c) 892
and d) Line drawings showing details of fold interference patterns at the shallow and 893
deep levels, respectively. 894

Figure 10. Horizontal sections of the centrifuge model C2 cut at the shallow a) and 895
deep b) levels, respectively. The model was orthogonally shortened in two phases. c) 896
Line drawings showing details of fold interference patterns. 897
Figure 11. a) and b) Dextral-slip and dip-slip along the phase-1 thrusts increases with 898
shortening in model S3 during the phase-1, respectively. c) Sinistral-slip and dip-slip 899
along the phase-1 thrusts during the phase-2 in model S3, respectively. e) From 900
hinterland to foreland, strike-slip changes from sinistral to dextral direction, extension 901
changes to shortening, which is observed along the phase-1 thrusts in model S4, 902
during the phase-2. 903
Figure 12. a) Laser scanned image of the topography of the test model, showing the 904
thickness tapering along strike. b) Line drawing (from map-view) of the test model. 905
After 29% bulk shortening, three structures were formed. 906
Figure 13. Structure spacing plotted against bulk shortening. Measurements were 907
taken from the topography reference points. a) Structure spacing was measured in 908
the test model with lateral thickness tapering, along the sand thickness of 1.5, 2, 2.5, 909
and 3 cm, respectively. b) Structure spacing was measured in model S1 during the 910
phase-1, along the middle line of the model. c)-f) Structure spacing of the phase-2 911
structures in models S1-S4 during the phase-2. Measurements were taken in 912
different part of the model with different thicknesses. 913
Figure 14. a) Fold interference patterns type 1 proposed by Ramsay (Ramsay, 1962, 914
1967; Ramsay and Huber, 1987). b) Suggested modified type 2, where the early 915
phase of folds have an asymmetric profile with a steeply inclined axial plane, but no 916
overturned limb. Arrows in the map-view sections show the plunges of fold closures. 917
Figure 15. A simplified geological map showing the main trends of structures in the 918
Chungnam Basin, Korea. Inset shows the location of the Chungnam Basin. Two 919
phases of orthogonal shortening induce dome-and-basin fold interference pattern, 920
which is highlighted by dotted-lines (after Lim and Cho, 2012, figures 2 and 9d). 921
Figure 16. Geological map of the central part of the Yanshan Orogenic Belt showing 922
the Daheishan folds and Pingquan folds. Proterozoic strata are shown as 923
stratigarphic Formations. The abbreviations, e.g. Chc, represent the name of the 924
Formation. NC-North China; CDF-Caoniangou-Dajikou fault; LLF-Lijialiangzi fault; 925
SPF- Sangyuan-Pingquan fault; WZF- Wanzhangzi fault; YSF-Yuzhangzi-Shangyuan 926
fault; XSF-Xiadianzi-Shangyuan fault (after HBG-SGSG, 1976). Inset shows the 927
location where the Daheishan folds and Pingquan folds exposed. 928
Figure 17. A simplified geological map showing the main trends of folds in the 929
eastern Mount Isa Inlier. The folding phases are labelled by the letters e.g. F1, F2 etc. 930
Inset shows the location of the eastern Mount Isa Inlier (after Abu Sharib and Bell, 931
2011, figure 1). 932

*Figure 1Click here to download high resolution image

*Figure 2Click here to download high resolution image

*Figure 3Click here to download high resolution image

*Figure 4Click here to download high resolution image

*Figure 5Click here to download high resolution image
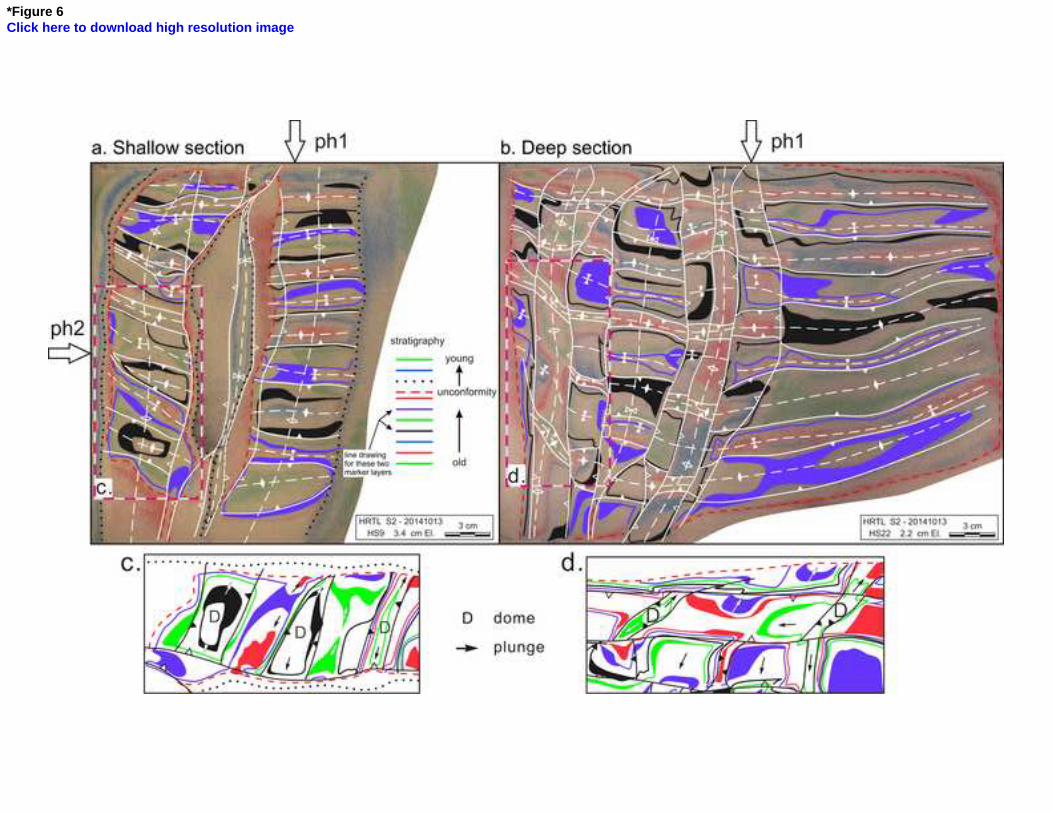
*Figure 6Click here to download high resolution image

*Figure 7Click here to download high resolution image

*Figure 8Click here to download high resolution image

*Figure 9Click here to download high resolution image

*Figure 10Click here to download high resolution image

*Figure 11Click here to download high resolution image

*Figure 12Click here to download high resolution image

*Figure 13Click here to download high resolution image

*Figure 14Click here to download high resolution image

*Figure 15Click here to download high resolution image

*Figure 16Click here to download high resolution image

*Figure 17Click here to download high resolution image

Table 1. Model summary
Models Model
numbers Analogue material
Angle between two phases of shortening
direction (°)
Angle between ph2 shortening and trend of
ph1 structure (°)
Bulk shortening in
ph1 (%)
Bulk shortening in
ph2 (%)
Additional information
sandbox
S1 Pure sand 90 90 19 31
S2 Pure sand 90 90 43 20 Erosion and
sedimentation after ph1
S3 Pure sand 90 45 45 19 Inbuilt triangle
backstop in ph1
S4 Pure sand 60 60 45 29 Deformable
sidewalls in ph2
centrifuge
C1 Pure plasticine 90 90 39 30
C2 Mixture (plasticine + silicone putty + barite powder)
90 90 42 39
Table