L’Aquila. La città evento del post terremoto. un punto di vista

Tenth U.S. National Conference on Earthquake Engineering Frontiers of Earthquake Engineering July 21-25, 2014 Anchorage, Alaska 10NCEE
SEISMIC GROUND RESPONSE ANALYSIS AT THE SITE OF SAN FELICE CHURCH IN
POGGIO PICENZE (L’AQUILA, ITALY)
N. Tarque1, F. Bozzoni2, C.G. Lai2,3, E. Miccadei4, T. Piacentini5, G. Camata5, E. Spacone6
ABSTRACT When the seismic waves travel from the bedrock to the ground surface a seismic amplification can occur due to the local conditions at a specific site. Lithostratigraphic amplification is typically evaluated using deterministic analyses, which do not allow assessing the uncertainty associated with the computed ground motion due to the aleatory nature of soil model parameters and the variability of seismic input. The ground motion amplification at the site of San Felice church, a historical stone structure located at Poggio Picenze (L’Aquila, Italy), has been investigated using a fully stochastic-based procedure. The seismic geotechnical characterization of the site was based on field geological mapping and drilling and geophysical tests from previous investigation campaigns. The lithostratigraphic amplification effects at San Felice church site was assessed through 1D stochastic site response analyses using for the object motion 7 real records, consistent with the regional seismotectonic setting and compatible to the Italian code-based spectrum referred to 475-year return period. The results obtained from 1000 numerical simulations have been expressed in terms of mean elastic acceleration response spectrum and its associated uncertainty and acceleration time histories computed at the basement of San Felice church.
1 Associate Professor, Civil Engineering Division, Pontificia Universidad Católica del Perú, Lima, Peru. 2 Researcher, European Centre for Training and Research in Earthquake Engineering, EUCENTRE, Pavia, Italy. 3 Associate Professor, Department of Civil Engineering and Architecture, University of Pavia, Pavia, Italy. 4 Associate Professor, Department of Engineering and Geology, University G. D’Annunzio, Pescara, Italy. 5 Assistant Professor, Department of Engineering and Geology, University G. D’Annunzio, Pescara, Italy. 6 Professor, Department of Engineering and Geology, University G. D’Annunzio, Pescara, Italy.

Seismic ground response analysis at the site of San Felice Church in Poggio Picenze (L’Aquila, Italy)
N. Tarque1, F. Bozzoni2, C.G. Lai2,3, E. Miccadei4, T. Piacentini5, G. Camata5, E. Spacone6
ABSTRACT When the seismic waves travel from the bedrock to the ground surface a seismic amplification can
occur due to the local conditions at a specific site. Lithostratigraphic amplification is typically evaluated using deterministic analyses, which do not allow assessing the uncertainty associated with the computed ground motion due to the aleatory nature of soil model parameters and the variability of seismic input. The ground motion amplification at the site of San Felice church, a historical stone structure located at Poggio Picenze (L’Aquila, Italy), has been investigated using a fully stochastic-based procedure. The seismic geotechnical characterization of the site was based on field geological mapping and drilling and geophysical tests from previous investigation campaigns. The lithostratigraphic amplification effects at San Felice church site was assessed through 1D stochastic site response analyses using for the object motion 7 real records, consistent with the regional seismotectonic setting and compatible to the Italian code-based spectrum referred to 475-year return period. The results obtained from 1000 numerical simulations have been expressed in terms of mean elastic acceleration response spectrum and its associated uncertainty and acceleration time histories computed at the basement of San Felice church.
Introduction The 6th April, 2009, a 6.3 Mw earthquake hit the L’Aquila region (Italy, see Fig. 1) and caused damage to structures over an area of approximately 600 km2. The number of fatalities was 308, more than 1500 people were injured and more than 65000 were evacuated. The macroseismic intensity value at L’Aquila center was reported varying between VIII and IX (MCS). Damages were even more significant in some villages located in the middle Aterno valley, where intensities as high as IX-X were experienced in Castelnuovo and Onna. In total, 14 municipalities experienced a MCS intensity between VIII and IX, whereas those characterized by MCS intensity I≥VII were altogether 45[1]. The results presented here, which are based on the full report at Tarque et al. [2], focuses on the assessment of possible amplification effects, through one-dimensional (1D) stochastic analysis, of the ground motion due to the specific lithostratigraphic conditions at San Felice church in Poggio Picenze, a small village located along an intermontane basin of the central eastern Apennines (Fig. 1), about 17 km far away from L’Aquila town (Abruzzo region). The procedure to carry out stochastic ground response analysis is explained in following sections. Each of these steps has
1 Associate Professor, Civil Engineering Division, Pontificia Universidad Católica del Perú, Lima, Peru. 2 Researcher, European Centre for Training and Research in Earthquake Engineering, EUCENTRE, Pavia, Italy 3 Associate Professor, Department of Civil Engineering and Architecture, University of Pavia, Pavia, Italy. 4 Associate Professor, Department of Engineering and Geology, University G. D’Annunzio, Chieti-Pescara, Italy. 5 Assistant Professor, Department of Engineering and Geology, University G. D’Annunzio, Chieti-Pescara, Italy. 6 Professor, Department of Engineering and Geology, University G. D’Annunzio, Chieti-Pescara, Italy.

been applied with reference to the San Felice church site and are explained as follows.
Figure 1. Location map of the study area (white square) within the Apennines chain.
Definition of the reference seismic input The reference seismic action at the site of San Felice church has been represented by uniform hazard acceleration spectra and natural acceleration time histories. In Italy, the probabilistic seismic hazard was assessed by the National Institute of Geophysics and Volcanology (http://esse1.mi.ingv.it/). The results of this study were adopted by the current Italian building code [3] to prescribe the design seismic action. However the definition of the level of severity of the seismic input (represented for instance by the return periods), to be used for ancient monumental structures, such as the San Felice church, is a rather tricky issue that is often debated by specialists worldwide. For this work, the 475-years return period has been selected. A set of 7 real, spectrum- and seismo- compatible accelerograms, recorded at outcropping rock sites with flat topographic surface, was downloaded from the SEISM-HOME web portal (http://www.eucentre.it/seismhome.html; [4]). Fig. 2 shows the elastic acceleration response spectra of the 7 selected natural accelerograms.
Figure 2. Elastic acceleration response spectra of the 7 natural accelerograms for the 475 year
return period (damping ratio 5%) obtained from SEISM-HOME.

These records are spectrum-compatible with the acceleration response spectrum prescribed by the Italian building code [3] at the site of San Felice church and are also consistent with the regional seismotectonic and seismogenic setting of the area, where the site under investigation is located. The selected accelerograms have magnitudes that range from 6 to 6.93, and epicentral distances that vary from 11 km to about 94 km. Their scaling factors range from 0.43 to 2.83, with a mean of 1.57.
Geological framework and seismic-geotechnical site characterization The Poggio Picenze village, within the Aterno River valley in the Central Apennines chain, is located in a very complex geological sector characterised by calcareous and calcareous-marly bedrock Meso-Cenozoic in age, and by widespread outcropping of Quaternary continental deposits (Fig. 3).
Figure 3. Simplified geological scheme of the L’Aquila area (modified from [5] [6] [7] [8]).
Geological and geomorphological setting of the study area have been studied since the beginning of last century, and recently after the 2009 earthquake, focusing on tectonics, stratigraphy and Quaternary continental deposits [9] [10] [11] [12]. The Poggio Picenze area is located at the boundary of the Paganica-San Demetrio basin, an intermontane basin filled with an up to >200 m thick Quaternary alluvial and lacustrine succession. Such tectonic basin is part of the middle Aterno River Valley, composed of a complex arrangement of several, laterally linked, NE-SE elongated fault-bounded sedimentary basins connected with a regional extension phase that affected the Central Apennines since Late Pliocene [8] [12] [13] . The area is affected by a strong seismicity as documented by several historical and early instrumental earthquakes [14], generally attributed to the main recent faults active in the area (and particularly to the Paganica faults [7]). Main earthquakes are: the 1461 event (Mw 6.4), the 1703 multiple event (Mw 6.7), and then the
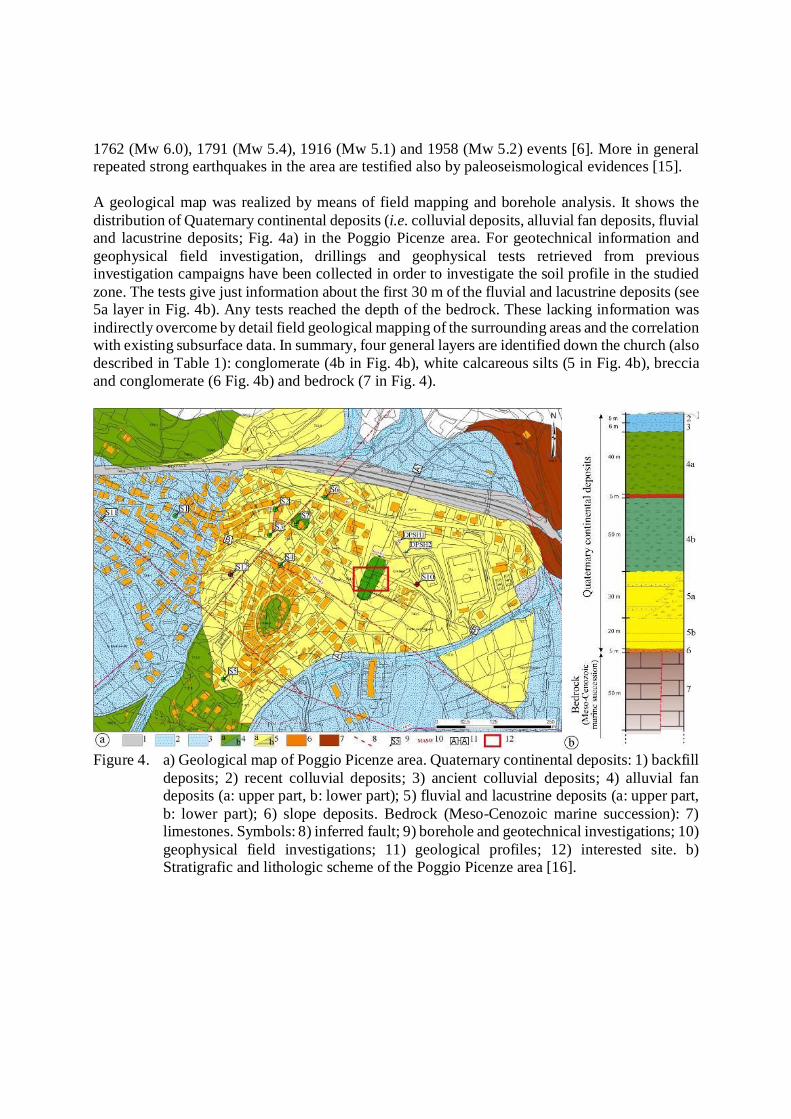
1762 (Mw 6.0), 1791 (Mw 5.4), 1916 (Mw 5.1) and 1958 (Mw 5.2) events [6]. More in general repeated strong earthquakes in the area are testified also by paleoseismological evidences [15]. A geological map was realized by means of field mapping and borehole analysis. It shows the distribution of Quaternary continental deposits (i.e. colluvial deposits, alluvial fan deposits, fluvial and lacustrine deposits; Fig. 4a) in the Poggio Picenze area. For geotechnical information and geophysical field investigation, drillings and geophysical tests retrieved from previous investigation campaigns have been collected in order to investigate the soil profile in the studied zone. The tests give just information about the first 30 m of the fluvial and lacustrine deposits (see 5a layer in Fig. 4b). Any tests reached the depth of the bedrock. These lacking information was indirectly overcome by detail field geological mapping of the surrounding areas and the correlation with existing subsurface data. In summary, four general layers are identified down the church (also described in Table 1): conglomerate (4b in Fig. 4b), white calcareous silts (5 in Fig. 4b), breccia and conglomerate (6 Fig. 4b) and bedrock (7 in Fig. 4).
Figure 4. a) Geological map of Poggio Picenze area. Quaternary continental deposits: 1) backfill
deposits; 2) recent colluvial deposits; 3) ancient colluvial deposits; 4) alluvial fan deposits (a: upper part, b: lower part); 5) fluvial and lacustrine deposits (a: upper part, b: lower part); 6) slope deposits. Bedrock (Meso-Cenozoic marine succession): 7) limestones. Symbols: 8) inferred fault; 9) borehole and geotechnical investigations; 10) geophysical field investigations; 11) geological profiles; 12) interested site. b) Stratigrafic and lithologic scheme of the Poggio Picenze area [16].

Statistical characterization of the soil profile Proper interpretation of the available data (as MASW, geo-electric tomography surveys, SPT and down hole tests, not reported here) led to the definition of a geotechnical model at the San Felice church site to be used for ground response analyses. To first approximation, the site under investigation was modelled as a sequence of constant thickness, plane and parallel layers corresponding to a 1D soil stratigraphy. To define such a geotechnical model for ground response analysis, it was necessary to define the number of layers and then, for each layer, the following parameters: thickness, shear wave velocity, total unit weight of soil and shear modulus and damping degradation curves. At last the values of shear wave velocity and of total unit weight for the half-space are required. The properties of the adopted soil profile are specified in Table 1. The log profile showed in Fig. 5 indicates the Quaternary continental deposits conformed by Conglomerates up to 5 m (alluvial fan deposits are present at top); calcareous silts pertaining to fluvial and lacustrine deposits up to 25-30 m; grey clayey silts up to 20 m; Calcareous breccia (5- 8 m); the bedrock at a not well defined depth (at least >60-70 m). Table 1. Proposal soil profile for the study zone and its mean values. Numbers of second column
refer to Fig. 4 and 5. Layer Type Depth
(m) Vs
(m/s) γ
(kN/m3) Mat
I Conglomerate (4b) 4 400 20 Mat1 II Sandy calcareous silt (upper 5) 21 341 19.8 Mat2 III Clayey calcareous silt (middle 5) 25 467 20.3 Mat2 IV Calcareous Silt (mid-lower 5) 31 413 20.3 Mat2 V Grey clayey silts (lower 5) 54 600 20.8 Mat2 VI Breccia-conglomerate (6) 59 800 21.0 Mat3 VII Calcareous bedrock (7) - 1250 22.0 Mat4
Figure 5. Soil profile of the interested zone which is formed basically by horizontal layers.
As the evaluation of the above parameters involves some level of uncertainty, an interval of variation has been associated to each input parameter in the litho-stratigraphic model used to

perform ground response analyses at the site. Since the gathered data did not directly give this information, it was necessary to compute basing on available data the standard deviation values (σ) taking into consideration some assumptions as illustrated in details in Tarque et al. [2]. The uncertainty associated to each geotechnical parameters has been quantified in terms of coefficient of variation (CoV). In the stochastic ground response analyses, the CoV was approximated to the value of 15% for the thickness (h) and the shear wave velocity (Vs) of each layer and 5% was assumed for the unit weight (γ). The degradation curves for shear module and damping were obtained from Table 4.1 of Working Group MS-AQ [17] where some soil tests were performed for Poggio Picenze.
Stochastic site response analysis In Matlab (http://www.mathworks.com), following a Monte Carlo simulation, 1000 soil profiles (Fig. 6) were generated for the area under investigation with the Latin Hypercube sampling technique. The soil properties used for the stochastic analysis (see Table 1) were assumed to follow a Normal distribution. The minimum and maximum value of Vs, thickness and unit weight were in the interval of ± three standard deviations. Then, an input file (*.txt) was automatically written to be used with Shake91 (software developed by Schnabel et al. [18]), which implements a linear-equivalent constitutive model for soils, coupled with a 1D soil stratigraphy. The input accelerograms for each of the 1000 analyses was randomly selected from the set of 7 natural accelerograms following a Uniform distribution.
Figure 6. 1000 random Vs profiles generated using the Latin Hypercube sampling technique; red line, mean profile (adapted from Tarque et al. [2]).
Fig. 7a e 7b show the results computed out of the numerical simulations of the 1000 Vs profiles plotted in Fig. 6. The 1000 acceleration response spectra computed at the ground surface and the mean spectrum (red line) are shown in Fig 7a. Fig. 7b shows the mean acceleration response

spectrum (black line) and its scatter (red area), compared to the spectra of Italian building code for soil category A (blue line) and B (green line).
(a)
(b)
Figure 7. Stochastic ground response analyses at San Felice church site (adapted from Tarque et al. [2]). a) 1000 elastic response spectra computed at the ground surface; red line, mean spectrum. b) Mean response spectrum (black line) plus and minus one standard deviation (red area) referred to 475-year. The spectra of Italian building code [3] for soil category A (blue line) and B (green line) are also shown.
The mean Peak Ground Acceleration (PGA) computed from stochastic analysis turned out to be 0.46g for 475 years return period, as shown in Table 2. According to the Italian building code [3] a PGA of 0.26g is prescribed for soil category A (rigid site, Vs30>800 m/s). Therefore, an amplification factor of 1.8 could be proposed for the interested zone.The PGA computed from ground response analysis are compared in Table 2 with the value of PGA obtained by using the simplified procedure of the Italian code for soil category B. With reference to the mean values, ground response analysis yielded mean PGA that is more conservative if compared with the PGA predicted using the simplified approach based on the soil factor. The response spectra computed at the free surface are the final results of the stochastic analysis at the site of San Felice Church. However, for structural dynamic analysis, the acceleration, velocity or displacement time history may be required. Thus, the definition of the seismic input at the San Felice church site was completed with a selection of a set of accelerograms computed at the ground surface and compatible to the mean spectrum shown in Fig. 7.
0 0.5 1 1.5 2 2.5 3 3.5 40
1
2
3
4
5
T (s)
Sa
(g)
0 0.5 1 1.5 2 2.5 3 3.5 40
0.5
1
1.5
2
T (s)
Sa
(g)

Table 2. Peak Ground Acceleration (PGA) predicted at the site under investigation from stochastic ground response analysis compared to the values prescribed by the Italian building code [3] for soil category A and B.
Return Period
(years) PGA (g) - stochastic analysis PGA (g)
Soil A PGA (g)
Soil B mean mean - 1 std.dev. mean + 1 std.dev. 475 0.46 0.39 0.53 0.26 0.30
Conclusions The Poggio Picenze village is located in a very complex geological sector within the L’Aquila tectonic basin. It is characterised by calcareous and calcareous-marly Meso-Cenozoic bedrock and by widespread Quaternary continental deposits, and it is affected by a strong seismicity documented by paleoseismological studies, historical earthquakes and instrumental seismicity. The integration of surface field geological and geomorphological mapping and subsurface geological, geotechnical and geophysical investigations allowed for the assessment of a complete soil profile below the Poggio Picenze area with particular reference to the San Felice church site. The features (type, thickness, Vs, γ) of the main layers was defined from the buried calcareous bedrock (at a depth of >60-70 m) to a thin layer of buried breccia and conglomerate, to a thick multiple layer of grey to whitish clayey to calcareous silts, with sandy and gravel lenses, to the top thin conglomerate layer. The stochastic procedure allowed analysing 1000 simulations, which means 1000 soil profiles with a random uniform selection of 7 input motions. The obtained results for 475-years return period were expressed in terms of expected PGA, mean acceleration response spectrum and its scatter and a set of acceleration time histories computed at the ground surface. The computed PGA indicated a clear amplification at the site of San Felice church due to the lithostratigrafic local conditions. As a matter of fact, the PGA for a soil type A is equal to 0.26g and the mean value computed at the ground surface is 0.46g. Furthermore, the results show that the soil response highly depends on the frequency content of the input record and on the frequency of the soil layer, so the applied stochastic approach, which takes into account the uncertainty associated with the soil model and the variability of seismic input, is recommended.
Acknowledgment The first author thanks to the Coimbra Group Universities for the financial support under the Scholarship Programme for Young Professors and Researchers from Latin American Universities 2012. E. Miccadei and T. Piacentini thanks the collaboration of the researcher T. Urbano during the developing of this work.
References
[1] Galli P, Camassi R. (eds.). Rapporto sugli effetti del terremoto aquilano del 6 aprile 2009 (in Italian), Report DPC-INGV (http://www.mi.ingv.it/eq/090406/). 2009.

[2] Tarque, N., Lai, C.G., Bozzoni, F., Miccadei, E., Piacentini, T., Camata, G., Spacone, E., Expected Ground Motion at the Historical Site of Poggio Picenze, Central Italy, with reference to current Italian Building Code, Engineering Geology Journal, November 2013, 166, 100-115.
[3] NTC 2008 - Norme Tecniche per le Costruzione, 2008. Norme Tecniche per le Costruzione, Ministero delle Infrastrutture e dei Trasporti, Decreto Ministeriale del 14 gennaio 2008, Suppl. ord. G.U. n. 29 del 4 febbraio 2008, Italy.
[4] Rota M, Zuccolo E, Taverna L, Corigliano M, Lai CG and Penna A. Mesozonation of the Italian territory for the definition of real spectrum-compatible accelerograms. Bulletin of Earthquake Engineering 2012, 10(5): 1357-1375.
[5] APAT. Foglio Geologico 359 L’Aquila. Progetto CARG,Carta Geologica d’Italia (scala 1:50.000). 2006. [6] Boncio P., Lavecchia G. and Pace B. Defining a model of 3D seismogenic sources for Seismic Hazard
Assessment applications: the case of central Apennines (Italy). Journal of Seismology 2004, 8: 407-425. [7] Martelli L., Boncio P., Baglione M., Cavuoto G., Mancini M., Scarascia Mugnozza G. and Tallini M. Main
geologic factors controlling site response during the 2009 L’Aquila earthquake. Italian Journal of Geoscience 2012, 131(3): 423-439.
[8] Santo A., Ascione A., Di Crescenzo G.,Miccadei E., Piacentini T., Valente E. Tectonic-geomorphological map of the middle Aterno river valley (Abruzzo, Central Italy), Journal of Maps 2013. (in press accepted).
[9] Bosi C., Bertini T. Geologia della media valle dell’Aterno (in Italian). Memorie della Società Geologica Italiana, 9, 719-777. 1970
[10] Bertini T., Bosi C. La tettonica quaternaria della conca di Fossa, L’Aquila (in Italian). Italian Journal of Quaternary Sciences 1993, 6(2): 293-314.
[11] Bagnaia R., D’Epifanio A., Labini S. Aquila and subsequent basins: an example of quaternary evolution in central Apennines, Italy. Quaternaria Nova 1992, II, 187-209.
[12] Giaccio B., Galli P., Messina P., Peronace E., Scardia G., Sottili G., Sposato A., Chiarini E., Jicha B., Silvestri S. Fault and basin depocentre migration over the last 2 Ma in the L’Aquila 2009 earthquake region, central Italian Apennines. Quaternary Science Reviews 2012, 56: 69-88.
[13] Boncio P., Pizzi A., Cavuoto G., Mancini M., Piacentini T., Miccadei E., Cavinato,G.P., Piscitelli S., Giocoli A., Ferretti G., De Ferrari R., Gallipoli R., Mucciarelli M., Di Fiore V., Naso G. Geological and geophysical characterization of the Paganica – San Gregorio area after the April 6, 2009 L’Aquila earthquake (Mw 6.3, central Italy): implications for site response. Bollettino di Geofisica Teorica e Applicata 2011, 52(3): 491-512.
[14] Working Group CPTI11. Catalogo Parametrico dei Terremoti Italiani, vers. 2004 (CPTI11). INGV, Bologna. 2011.
[15] Cinti F.R., Pantosti D., DE Martini P.M., Pucci S., Civico R., Pierdominici S., Cucci L., Brunori C.A., Pinzi S. and Patera A. Evidence for surface faulting events along the Paganica fault prior to the 6 April 2009 L’Aquila earthquake (central Italy). Journal of Geophysycal Research 2011, 116(B7).
[16] Miccadei E. Relazione geoloica. In Piano di ricostruzione del centro storico di Poggio Picenze (AQ). Baldassarri E., Fabietti V., Miccadei E., Pozzi C., Sepe V., Spacone E., Varagnoli C., Varazzo C. Comune di Poggio Picenze - Dipartimento di Ingegneria, Università degli Studi "G. D'Annunzio" Chieti-Pescara, 2010. Available at February 2013 from http://www.comunepoggiopicenze.it/sisma/ricostruzione/F1_0-Elaborati.pdf (In Italian).
[17] Working Group. La Microzonazione sismica dell’area aquilana. vol. 3 + dvd (in Italian). Dipartimento della Protezione Civile-Regione Abruzzo. Eds. Castenetto, S. and Naso, G. Italy,. 2010.
[18] Schnabel P. B., Lysmer J., Seed H. B. SHAKE: A Computer Program for Earthquake Response Analysis of Horizontally Layered Sites. Report No. UCB/EERC-72/12, Earthquake Engineering Research Center, University of California, Berkeley, 1972.
Copyright © 2022 FDOKUMEN