Sedimentology and Acoustic Mapping of Modern Rhodolith Facies on a Non-Tropical Carbonate Shelf...
13
Journal of Sedimentary Research, 2006, v. 76, 670–682 Research Article DOI: 10.2110/jsr.2006.053 SEDIMENTOLOGY AND ACOUSTIC MAPPING OF MODERN RHODOLITH FACIES ON A NON-TROPICAL CARBONATE SHELF (GULF OF CALIFORNIA, MEXICO) STEFFEN HETZINGER, 1 JOCHEN HALFAR, 2 BERNHARD RIEGL, 3 AND LUCIO GODINEZ-ORTA 4 1 Leibniz Institut fu ¨r Meereswissenschaften, IFM-GEOMAR, Wischhofstrasse 1-3, 24148 Kiel, Germany, 2 Institut fu ¨r Geologie und Pala ¨ontologie, Universita ¨t Stuttgart, Herdweg 51, 70174 Stuttgart, Germany, 3 National Coral Reef Institute, Nova Southeastern University Oceanographic Center, 8000 North Ocean Drive, Dania Beach, Florida 33004, U.S.A. 4 Centro Interdisciplinario de Ciencias Marinas, Av. IPN s/n Apartado, Postal 592, La Paz, B.C.S., 23096, Mexico e-mail: [email protected] ABSTRACT: Rhodolith facies are characterized by an abundance of free-living coralline red algae, and are a common feature of modern and ancient carbonate shelves worldwide. Rhodolith communities contribute significantly to the global calcium carbonate budget, and fossil rhodoliths are commonly used to obtain paleoecologic and paleoclimatic information. Few attempts have been made to quantify the spatial extent of modern rhodolith facies, despite their importance and common occurrence. Combining sediment sampling with acoustic facies mapping, this study provides the first set of quantitative data on rhodolith facies distribution in the warm-temperate southwestern Gulf of California, Mexico. Though rhodoliths were the main carbonate producers, other important calcareous biota were bivalves (19%), bryozoans (13%), and corals (6%). Based on cluster analysis, biota were grouped into a rhodolith, a rhodolith–bivalve–coral, and a bivalve– bryozoa biofacies. The acoustic seafloor classification distinguished four acoustic facies, which were confirmed by ground- truthing: an outer-shelf silt facies, a biogenic sand facies, a peripheral rhodolith facies, and a central rhodolith facies. Rhodolith facies covered approximately 40% of the surveyed seafloor (45 km 2 ). Results from quantitative analysis of sediment samples and acoustic mapping showed a significant correlation between grain size, biofacies, and acoustic seafloor facies. We successfully applied an acoustic device to provide highly resolved continuous coverage of the seafloor and discriminate modern rhodolith facies from surrounding sediment. This has important implications for quantifying rhodolith carbonate production in other regions, as well as for ecological and conservation studies. INTRODUCTION Shallow-marine, non-tropical carbonates may contribute about one- third to global present-day shelf carbonate production (Nelson 1988), and a significant amount of non-tropical carbonate is composed of both free- living and attached coralline red algae (Carannante et al. 1988; Nelson 1988). Studies on modern non-tropical carbonate shelves in the Mediterranean Sea, tropical shelves in Brazil, and their Miocene analogues led Carannante et al. (1988) to define a distinct rhodalgal lithofacies, dominated by encrusting coralline red algae, often occurring as rhodoliths. Even though rhodalgal sediments are found worldwide (Foster 2001), they are most commonly described from shelf areas located in a transitional position between the typical cold-water realm (the heterozoan assemblage of James 1997) and the tropical realm (the photozoan assemblage of James 1997) (Carannante et al. 1988). Well- studied modern rhodalgal carbonates are located on the New Zealand continental shelf (Gillespie and Nelson 1997), the Brazilian shelf (Carannante et al. 1988), along the Atlantic coastlines (Freiwald and Henrich 1994; Hall-Spencer 1998; Bosence and Wilson 2003; Hall- Spencer et al. 2003), in the Mediterranean Sea (Henrich et al. 1995; Barbera et al. 2003), and in the Gulf of California (Steller and Foster 1995; Foster et al. 1997; Halfar et al. 2000; Foster 2001). Even though fossil (mainly Pleistocene and Tertiary) rhodalgal carbonate sediments are encountered globally (e.g., Manker and Carter 1987; Bourrouilh-Le Jan and Hottinger 1988; Nelson 1988; Aguirre et al. 2000; Halfar and Mutti 2005), they are most widespread in the Paleotethys region (e.g., Bosence and Pedley 1979; Carannante et al. 1988; Esteban 1996; Betzler et al. 1997; Fornos and Ahr 1997; James et al. 1999; Pomar et al. 2004). A variety of aspects have been studied in fossil and modern rhodalgal systems, including paleoecology, paleoclimate, conservation, and rhodo- lith mining (Barbera et al. 2003; Bosence and Wilson 2003; Grall and Hall-Spencer 2003; Hall-Spencer et al. 2003; Steller et al. 2003; Hinojosa- Arango and Riosmena-Rodriguez 2004; Wilson et al. 2004). Despite this, only few attempts have been made to quantify spatial extent and map large-scale facies distribution of modern rhodolith-dominated areas (Davies and Hall-Spencer 1996; de Grave 1999; de Grave et al. 2000). Since rhodoliths often occur in water depth beyond resolution for passive optical sensors or SCUBA surveys, mapping is restricted to grab- sampling or acoustic methods. Acoustic ground discrimination systems (AGDS) are capable of detecting differences in sediment types (Hamilton et al. 1999; Preston et al. 2000; Morrison et al. 2001; Anderson et al. 2002; Ellingsen et al. 2002; Maushake and Collins 2002; Freitas et al. 2003a; Freitas et al. 2003b; White et al. 2003), and differentiating artifacts from sediments (Lawrence and Bates 2001), and have received increasing attention by geologists wishing to map facies (Moyer et al. 2005; Riegl and Purkis 2005). The goals of the present study are to (1) conduct a first quantitative acoustic mapping survey of a rhodolith-dominated shelf using an Copyright E 2006, SEPM (Society for Sedimentary Geology) 1527-1404/06/076-670/$03.00
-
Upload
independent -
Category
Documents
-
view
1 -
download
0
Transcript of Sedimentology and Acoustic Mapping of Modern Rhodolith Facies on a Non-Tropical Carbonate Shelf...

Journal of Sedimentary Research, 2006, v. 76, 670–682
Research Article
DOI: 10.2110/jsr.2006.053
SEDIMENTOLOGY AND ACOUSTIC MAPPING OF MODERN RHODOLITH FACIES ON A NON-TROPICALCARBONATE SHELF (GULF OF CALIFORNIA, MEXICO)
STEFFEN HETZINGER,1 JOCHEN HALFAR,2 BERNHARD RIEGL,3 AND LUCIO GODINEZ-ORTA4
1Leibniz Institut fur Meereswissenschaften, IFM-GEOMAR, Wischhofstrasse 1-3, 24148 Kiel, Germany,2Institut fur Geologie und Palaontologie, Universitat Stuttgart, Herdweg 51, 70174 Stuttgart, Germany,
3National Coral Reef Institute, Nova Southeastern University Oceanographic Center, 8000 North Ocean Drive, Dania Beach, Florida 33004, U.S.A.4Centro Interdisciplinario de Ciencias Marinas, Av. IPN s/n Apartado, Postal 592, La Paz, B.C.S., 23096, Mexico
e-mail: [email protected]
ABSTRACT: Rhodolith facies are characterized by an abundance of free-living coralline red algae, and are a common feature ofmodern and ancient carbonate shelves worldwide. Rhodolith communities contribute significantly to the global calciumcarbonate budget, and fossil rhodoliths are commonly used to obtain paleoecologic and paleoclimatic information. Fewattempts have been made to quantify the spatial extent of modern rhodolith facies, despite their importance and commonoccurrence. Combining sediment sampling with acoustic facies mapping, this study provides the first set of quantitative data onrhodolith facies distribution in the warm-temperate southwestern Gulf of California, Mexico.
Though rhodoliths were the main carbonate producers, other important calcareous biota were bivalves (19%), bryozoans(13%), and corals (6%). Based on cluster analysis, biota were grouped into a rhodolith, a rhodolith–bivalve–coral, and a bivalve–bryozoa biofacies. The acoustic seafloor classification distinguished four acoustic facies, which were confirmed by ground-truthing: an outer-shelf silt facies, a biogenic sand facies, a peripheral rhodolith facies, and a central rhodolith facies. Rhodolithfacies covered approximately 40% of the surveyed seafloor (45 km2). Results from quantitative analysis of sediment samplesand acoustic mapping showed a significant correlation between grain size, biofacies, and acoustic seafloor facies. Wesuccessfully applied an acoustic device to provide highly resolved continuous coverage of the seafloor and discriminate modernrhodolith facies from surrounding sediment. This has important implications for quantifying rhodolith carbonate production inother regions, as well as for ecological and conservation studies.
INTRODUCTION
Shallow-marine, non-tropical carbonates may contribute about one-third to global present-day shelf carbonate production (Nelson 1988), anda significant amount of non-tropical carbonate is composed of both free-living and attached coralline red algae (Carannante et al. 1988; Nelson1988). Studies on modern non-tropical carbonate shelves in theMediterranean Sea, tropical shelves in Brazil, and their Mioceneanalogues led Carannante et al. (1988) to define a distinct rhodalgallithofacies, dominated by encrusting coralline red algae, often occurringas rhodoliths. Even though rhodalgal sediments are found worldwide(Foster 2001), they are most commonly described from shelf areas locatedin a transitional position between the typical cold-water realm (theheterozoan assemblage of James 1997) and the tropical realm (thephotozoan assemblage of James 1997) (Carannante et al. 1988). Well-studied modern rhodalgal carbonates are located on the New Zealandcontinental shelf (Gillespie and Nelson 1997), the Brazilian shelf(Carannante et al. 1988), along the Atlantic coastlines (Freiwald andHenrich 1994; Hall-Spencer 1998; Bosence and Wilson 2003; Hall-Spencer et al. 2003), in the Mediterranean Sea (Henrich et al. 1995;Barbera et al. 2003), and in the Gulf of California (Steller and Foster1995; Foster et al. 1997; Halfar et al. 2000; Foster 2001). Even thoughfossil (mainly Pleistocene and Tertiary) rhodalgal carbonate sedimentsare encountered globally (e.g., Manker and Carter 1987; Bourrouilh-Le
Jan and Hottinger 1988; Nelson 1988; Aguirre et al. 2000; Halfar andMutti 2005), they are most widespread in the Paleotethys region (e.g.,Bosence and Pedley 1979; Carannante et al. 1988; Esteban 1996; Betzler etal. 1997; Fornos and Ahr 1997; James et al. 1999; Pomar et al. 2004).
A variety of aspects have been studied in fossil and modern rhodalgalsystems, including paleoecology, paleoclimate, conservation, and rhodo-lith mining (Barbera et al. 2003; Bosence and Wilson 2003; Grall andHall-Spencer 2003; Hall-Spencer et al. 2003; Steller et al. 2003; Hinojosa-Arango and Riosmena-Rodriguez 2004; Wilson et al. 2004). Despite this,only few attempts have been made to quantify spatial extent and maplarge-scale facies distribution of modern rhodolith-dominated areas(Davies and Hall-Spencer 1996; de Grave 1999; de Grave et al. 2000).Since rhodoliths often occur in water depth beyond resolution for passiveoptical sensors or SCUBA surveys, mapping is restricted to grab-sampling or acoustic methods. Acoustic ground discrimination systems(AGDS) are capable of detecting differences in sediment types (Hamiltonet al. 1999; Preston et al. 2000; Morrison et al. 2001; Anderson et al. 2002;Ellingsen et al. 2002; Maushake and Collins 2002; Freitas et al. 2003a;Freitas et al. 2003b; White et al. 2003), and differentiating artifacts fromsediments (Lawrence and Bates 2001), and have received increasingattention by geologists wishing to map facies (Moyer et al. 2005; Riegland Purkis 2005).
The goals of the present study are to (1) conduct a first quantitativeacoustic mapping survey of a rhodolith-dominated shelf using an
Copyright E 2006, SEPM (Society for Sedimentary Geology) 1527-1404/06/076-670/$03.00
AGDS, and (2) correlate acoustic mapping with sediment data.Results indicate a successful discrimination of rhodolith facies fromsurrounding sediment. The functioning of the applied acoustic mappingmethod has important implications for quantifying rhodolith carbonateproduction in other regions, as well as for ecological and conservationstudies.
REGIONAL SETTING
The Gulf of California is a narrow, semi-enclosed marginal sea with anaverage width of 150 km (Fig. 1A). Located between the peninsula ofBaja California and the mainland of Mexico (states of Sonora andSinaloa), it is positioned between mostly arid and mountainous land. Asthe only evaporative basin of the Pacific Ocean, the Gulf of Californiaexhibits surface salinities 1 to 2% higher than in the adjacent open Pacific(Bray 1988). Winds over the gulf show a distinct pattern, with northerlywinds in summer and southerly winds in winter (Bray 1988). Due to itsgeographical configuration and the described wind patterns, the Gulf isunder year-round influence of coastal upwelling and shows unusuallyhigh rates of biological productivity (Bray and Robles 1991). In
comparison to the Pacific Ocean, sea-surface temperatures for similarlatitudes of the Gulf are warmer between April and September and aboutequal during the rest of the year (Alvarez-Borrego 1983).
STUDY AREA
This study focuses on the Isla San Jose carbonate shelf in thesouthwestern Gulf of California, encompassing an area of 45 km2
surrounding Isla San Francisco, the southern part of Isla San Jose, andseveral small islands (Fig. 1). Isla San Jose and associated islands areseparated from the Baja California peninsula by the narrow San JoseChannel, which reaches water depths of up to 450 m. The study area itselfis shallow, reaching maximum depths of 75 m (mean depth of 28 m,Fig. 1B).
BACKGROUND AND METHODS
Acoustic Data Collection
Modern nearshore carbonate environments in the Arabian Gulf (Riegland Purkis 2005), off the Florida coast (Moyer et al. 2005; Riegl et al.
FIG. 1.—A) Map of Gulf of California with location of study site. Enlarged map displays transects of acoustic mapping survey. A–A9 indicates location of cross sectiondisplayed in Figure 10. B) Bathymetry map of Isla San Jose study site (maximum depth of mapped area is 75 m) and locations of sampling stations. All displayed samples(n 5 49) were used for sediment analysis.
SEDIMENTOLOGY AND ACOUSTIC MAPPING OF MODERN RHODOLITH FACIES 671J S R

2005), Australia (Hamilton et al. 1999; Legendre et al. 2002), andother marine habitats worldwide (Davies et al. 1997; Greenstreetet al. 1997; Morrison et al. 2001; Anderson et al. 2002; Ellingsenet al. 2002; Maushake and Collins 2002; Freitas et al. 2003a; Freitaset al. 2003b; White et al. 2003) have been investigated usingrecently developed AGDS. The shape of the returning sonar pulse(depending on the system, either the first or both the first and the secondecho) provides the basis for AGDS systems to convert acoustic tophysical seafloor properties. The acoustic response is a factor of the signalbeing absorbed or reflected by the seafloor, which determines the shapeand amplitude of the reflected acoustic waveform. The shape of thereturning echo signal is also strongly influenced by substrate roughness,which is related not only to the type of bottom substratum but also todifferent growth forms of benthic communities (Hamilton et al. 1999;Foster-Smith et al. 2001; Hamilton 2001; Moyer et al. 2005; Riegl andPurkis 2005).
In this study we used the QTC VIEWTM Series V system (QuesterTangent Corp.) operating on 200 kHz signal frequency for acousticmapping, which is based on single-beam echosounders and is well knownto discriminate sediment characteristics well (Preston et al. 2000; Freitaset al. 2003a; Freitas et al. 2003b; Moyer et al. 2005; Riegl and Purkis2005). Acoustic data acquisition was performed along a grid of transectlines at 200 m line spacing (Fig. 1A). Survey planning and execution usedthe software Hypack interfaced with a dGPS unit for real-timegeopositioning information during the survey. In QTC View, acousticreturns are converted into a digital time-stamped format which arethen joined with equally time-stamped positioning information from
a Trimble AgGPS 132, differentially correcting against coast-guardbeacons, whenever available. Average horizontal positioning accuracyduring the survey, as obtained by the NMEA GGA string, was 1.5 m.In QTC Impact software, the echoes were digitized, subjected to Fourieranalysis and wavelet analysis and were analyzed for kurtosis, areaunder the curve, spectral moments, and other variables by the acquisitionsoftware (Legendre et al. 2002). After being normalized to a rangebetween zero and unity, they were subjected to principal componentsanalysis (PCA) in order to eliminate redundancies and noise. Thefirst three principal components of each echo were retained (calledQ values), because these typically contain the majority of theinformation (Quester Tangent Corporation 2002). Datapoints wereprojected into pseudo-three-dimensional space along these three compo-nents, where they were then subjected to cluster analysis usinga Bayesian approach (Quester Tangent Corporation 2002). In cluster-ing, the user decides on the number of desirable clusters and alsochooses which cluster to split and how often. Clustering decisions wereguided by three statistics that are offered by the program called ‘‘CPI’’(Cluster Performance Index), ‘‘Chi2’’ and ‘‘Total Score.’’ The values ofthese indices were evaluated by Morrison et al. (2001) and Riegl andPurkis (2005). The class-categorized data was imported into a Geo-graphical Information System (GIS) (ESRIH ArcGISTM 8.2) with theobjective to map the distribution of the different clusters spatially over thesurveyed area. After regridding the irregular survey data to a regular grid,nearest-neighbor interpolation was used to provide full coverage ofacoustic data also in between survey lines (Johnston et al. 2001; Davis2002).
FIG. 2.—A) Average percentages of biogenic constituents of Isla San Jose study area and composition of rhodolith subcategories (. 2 mm fraction). B) Distribution ofbiogenic components in sand fraction (63 mm–2 mm).
672 S. HETZINGER ET AL. J S R
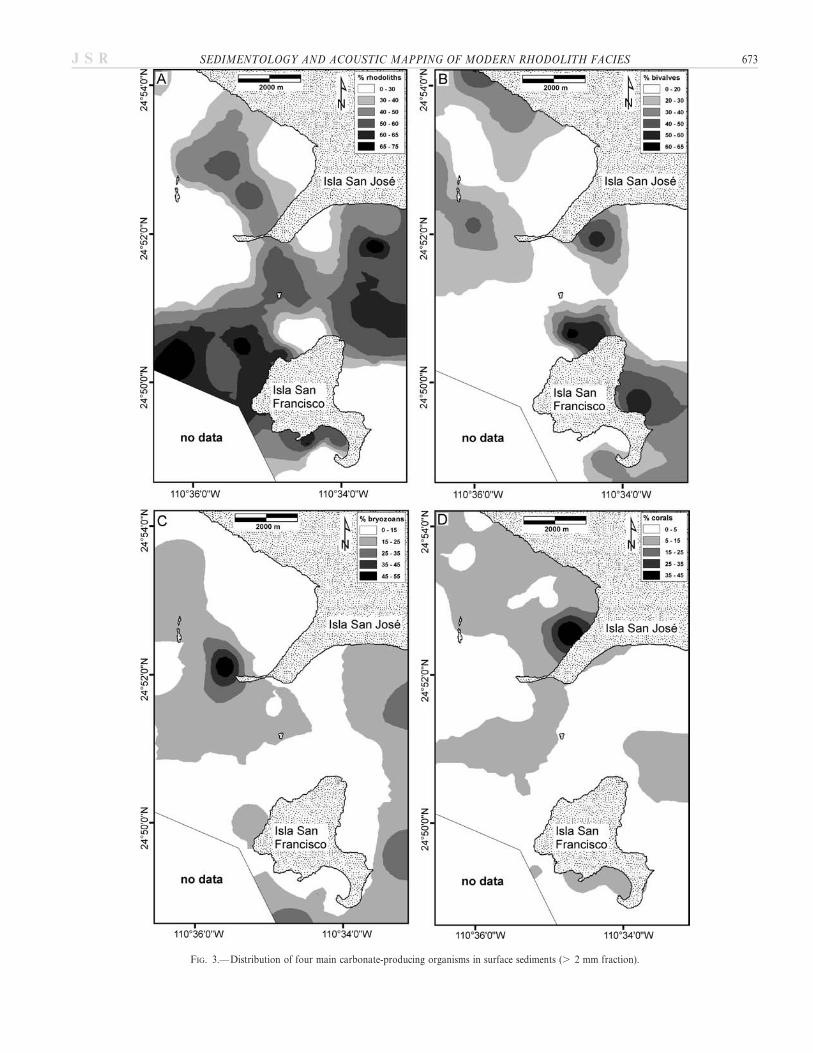
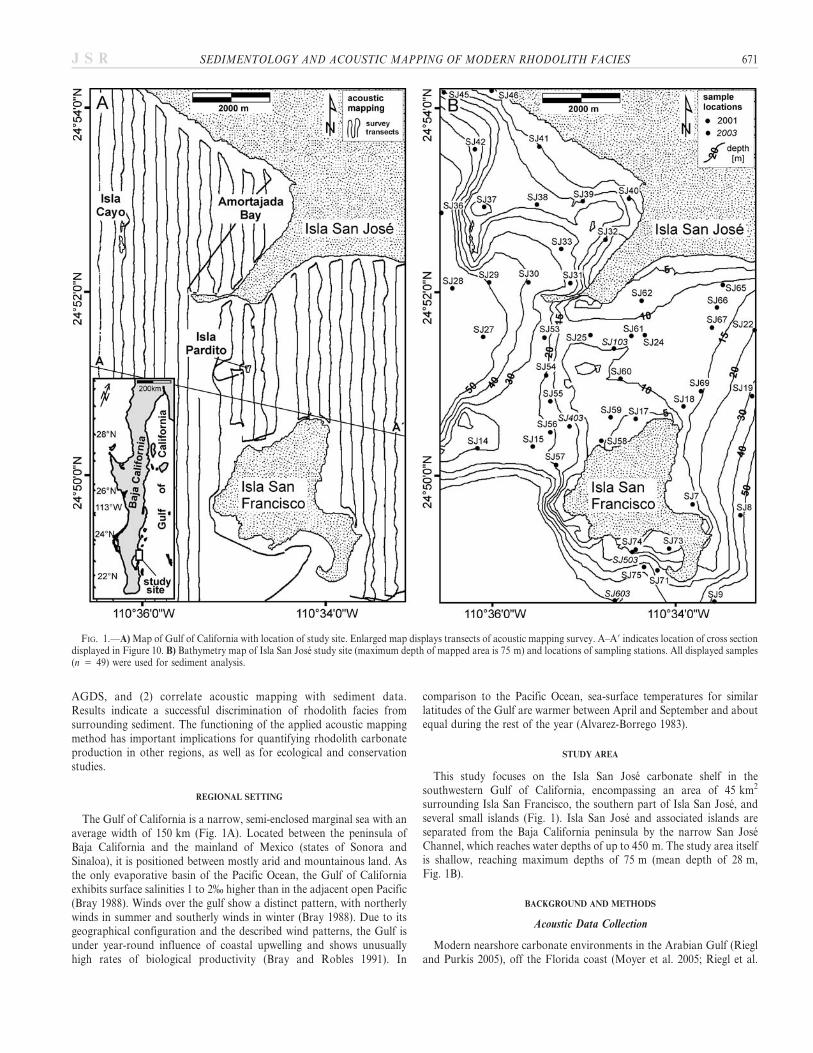
FIG. 3.— Distribution of four main carbonate-producing organisms in surface sediments (. 2 mm fraction).
SEDIMENTOLOGY AND ACOUSTIC MAPPING OF MODERN RHODOLITH FACIES 673J S R

Because these interpolated acoustic facies maps, showing the distribu-tion of benthic habitats and physical properties of the seafloor, are onlya statistical prediction of actual seafloor characteristics, a detailedcalibration of the interpreted facies distribution is essential. In this study,groundtruthing was performed by quantitative analysis of seafloorsediments (at least five samples studied per acoustic facies to giveunbiased results) and repeated qualitative on-site underwater videoimaging (at least two videos obtained per acoustic facies along shorttransects (approximately 50 m)).
Sediment Sampling and Analysis
During cruises in spring 2001 and 2003 the seafloor in the Isla San Josearea was sampled along transects using a Van Veen grab sampling device(sampling area 15 cm 3 15 cm, 5 cm penetration maximum) in waterdepths ranging from 6.50 to 50 m (Fig. 1). In 2003 ground-truthingsample sites were selected on the basis of preliminary interpolation mapsof acoustic survey data. A total of 49 samples were selected from 78samples on the basis of the amount of sample material present (minimumof 200 grains/sample). Samples were hand-counted under a binocularmicroscope for percent biogenic components in the . 2 mm fraction,with an average of 150 counts per sample. In addition, these 49 sampleswere analyzed for total inorganic carbon (TIC) using a coulometer.Thirty-two randomly chosen samples in the sand fraction (63 mm–2 mm)were fixed in epoxy for the production of thin sections. Four hundredbiogenic components in each slide were counted using a petrographicmicroscope. Because coarse material predominates in rhodolith facies, the. 2 mm fraction provided the most meaningful results and will thereforebe treated here in greater detail than the sand fraction. Constituents weredivided into 10 categories: rhodoliths, bryozoans, serpulids, gastropods,bivalves, echinoderms, corals, barnacles, non-carbonate particles, andunidentified grains. In addition, in the . 2 mm fraction main carbonate
producers such as rhodoliths, corals, and bryozoans were subdividedaccording to sizes, growth form, and, in the case of corals, intozooxanthellate, azooxanthellate, and free-living. Rhodoliths were identi-fied and grouped according to a classification scheme introduced byWoelkerling et al. (1993). Data obtained in biogenic component analysiswere subjected to a Q-mode cluster analysis in order to differentiatebiogenic assemblages of main carbonate producers.
RESULTS
Sediment and Biogenic Components
Coralline Red Algae.—Rhodoliths (free-living coralline red algae)constitute the most abundant category of carbonate-producing organismsin the study area (average 42% in the . 2 mm fraction, range 0–75%;average 25% in the sand fraction, range 0–58%) (Fig. 2). Highestabundances of rhodoliths occur on the western side of Isla San Francisco,northeast of that island and south of Isla San Jose (Fig. 3A). Coralline redalgae also predominate along the western and southern coastline of IslaSan Francisco. Generally, rhodolith communities inhabit the sea floor ofthe sampled area in water depths between 5 m and 35 m, with maximumabundances in depths from 10 m to 25 m.
Rhodolith specimens were grouped into three basic forms: entirerhodolith specimens , 1 cm, entire rhodolith specimens . 1 cm, andrhodolith-derived fragments. Each group was further divided into threesubcategories according to branch morphology. The grouping includesthe categories: fine fruticose (branched), massive fruticose (branched),and foliose (leafy). Figure 2A compares the percentages of differentrhodolith subcategories. Rhodolith samples are largely dominated byfragments (99%); entire rhodolith specimens with diameters greater than1 cm make up only 1% of the analyzed samples in the . 2 mm fraction,which might be related to a sampling bias due to the size of the grab
FIG. 4.— Results from cluster analysis ofsediment samples (. 2 mm fraction, onlyorganisms which constitute more than 5% ofthe biogenic components were used) indicatingthree biofacies. Symbols represent samplelocations and type of biofacies.
674 S. HETZINGER ET AL. J S R

sampler used. Rhodolith fragments of the fine fruticose category form themost abundant type of rhodolith material in the sampled area (Fig. 2A);massive fruticose fragments make up the second most abundant rhodolithconstituent (maximum of 26%), and are larger in size than fine fragments.Foliose rhodolith fragments make up less than 11%, and are thereforeonly a minor constituent.
Bivalves.—Bivalves constitute the second most abundant category inthe study area (average 19% in the . 2 mm fraction, range 1–65%;average 15% in the sand fraction, range 4–31%) (Fig. 2). Bivalves arefound in water depths between 0 m and 65 m. The distribution mapshows maximum values in the shallow intertidal and subtidal areabetween 5 m and 10 m depth, as well as in the deeper regions of thesampled area (Fig. 3B). Areas dominated by bivalves generally exhibitlow rhodolith numbers.
Bryozoans.—Samples contain an average of 13% bryozoans in the. 2 mm fraction (range 0–54%, Fig. 3C) and an average of 7% in thesand fraction (range 0–19%) (Fig. 2B). Distribution of bryozoans is
uniform throughout the study area, showing few extreme values (Fig. 3C).Bryozoans were divided into seven subcategories based on their growthmorphology. Free-living bryozoans constitute an average of 2% of thesampled material (. 2 mm fraction) and preferentially inhabit deepersubtidal waters (approximately 20–60 m). Encrusting bryozoans make upthe major part of bryozoans (7.5%) and constitute between 5% and 25%of the sampled material in regions dominated by rhodoliths. Theremaining subcategories (branched, unilaminar, bilaminar, and undiffer-entiated specimens) together make up 3.9%.
Corals.—Coral fragments constitute 6% of the sampled material. 2 mm (Fig. 3D), with maximum values of 45%, and average 8% insediment sand fractions (range 0–19%).
Corals were differentiated into zooxanthellate, azooxanthellate, andfree-living forms. Zooxanthellate corals generally constitute up to 10% ofthe sampled material, except for sample SJ32 (located in AmortajadaBay), which contains 43% zooxanthellate corals (Fig. 3D). Samplescontaining maximum values of Fungia distorta were found in waterdepths of 20–30 m. Azooxanthellate corals were present in the samplesbut constitute less than 1% of the sampled coral material.
Others.—Other important calcareous biota include, in orderof abundance, serpulids (5.2%), echinoderms (2.6%), and gastropods(2.1%) in the . 2 mm fraction (Fig. 2A), and foraminifera(7%), echinoderms (5%), and serpulids (3%) in the sand fraction(Fig. 2B).
Cluster Analysis of Biogenic Components
Q-mode cluster analysis of biogenic components . 2 mm wasconducted using SPSS 9.0.1 (SPSS Inc.) statistical software package byapplying Ward’s method with Euclidean distances as a similarity index(Swan and Sandilands 1995). Only carbonate-producing organisms whichconstitute more than 5% of the biogenic components were used in theclustering process. This grouping includes the four main carbonate-producing organisms listed above. Three biogenic assemblages can bedifferentiated: a rhodolith biofacies, a rhodolith–bivalve–coral biofacies,and a bivalve–bryozoa biofacies (Fig. 4).
The rhodolith biofacies consists of samples containing between 55% and79% coralline red algal fragments (average 67%), and dominates theshallow area between Isla San Francisco and Isla San Jose with theexception of an area at the northern end of Isla San Francisco, where thebivalve–bryozoa biofacies prevails (Fig. 4). The rhodolith biofacies alsooccurs along the western and southern coastline of Isla San Francisco(Fig. 4); its northern extension is limited to a narrow belt located nearsouthern Isla San Jose and northeastern Isla Cayo. Samples included inthe rhodolith biofacies also contain considerable numbers of bryozoans(average 17%, between 3% and 39%).
The rhodolith–bivalve–coral biofacies consists of samples containingbetween 23% and 61% coralline red algal fragments (average 47%), anaverage of 28% bivalves (between 6% and 48%), and 16% corals (between1% and 48%). This facies is laterally restricted to Amortajada Bay,a shallow embayment located on the southwestern end of Isla San Jose(Fig. 4).
The bivalve–bryozoa biofacies occurs in shallow-water environmentsnorth of Isla San Francisco (maximum depth 10 m) and along thesouthern coastline of Isla San Jose, as well as in deeper regions of thestudy area (below approximately 20 m water depth), e.g., surroundingIsla Cayo (except on its northeastern side, Fig. 4). It is also found southand east of Isla San Francisco. The bivalve–bryozoa biofacies consists ofsamples containing between 19% and 94% bivalves (average 58%),whereas bryozoans (mainly free-living forms) contribute an average of23% (between 1% and 67%).
FIG. 5.— Carbonate content of samples (all fractions); average carbonatecontent is 76% (range 23–96%).
SEDIMENTOLOGY AND ACOUSTIC MAPPING OF MODERN RHODOLITH FACIES 675J S R

Carbonate Content and Grain Size
Coulometric analysis of all fractions showed that the maximum CaCO3
content of samples from the study site is as high as 96% (average 76%).Highest values of % carbonate were encountered at 10–25 m depth,primarily west of Isla San Francisco and in the shallow rhodolithdominated area between Isla San Jose and Isla San Francisco (Fig. 5).Sediments sampled southeast and east of Isla San Francisco, on thewestern side of Isla San Jose, and inside Amortajada Bay contain 30–70%carbonates. The nearshore environment in Amortajada Bay, which is
enclosed by a sandspit, is strongly affected by siliciclastic input, due toa nearby mangrove lagoon and perennial streams.
Grain-size analysis was conducted on sediment samples used inbiogenic component and cluster analysis (total of 49). Figure 6 displaysthe distribution of three major grain-size fractions (, 63 mm, 63 mm–2 mm, and . 2 mm fraction). The combined silt and clay fractionexhibits maximum values of 15% (Fig. 6A), whereas the sand (63 mm–2 mm) and gravel fractions commonly make up 99% of the samplematerial. The occurrence of high percentages of gravel corresponds tomaximum abundances (. 55%) of rhodoliths (Fig. 3). This is in contrast
FIG. 6.— Distribution of three analyzed grain-size fractions.
TABLE 1.— Main characteristics of acoustic facies based on comparison with sediment sample parameters (STD 5 standard deviation).
acoustic facies A B C D
water depth . 30 m shallow-65 m 5–35 m 15–25 mav. depth (based on sediment
sampling)49 m 19 m 14 m 18 m
location in the study area W + SE-corner throughout throughout and rhodolith-dominatedarea
rhodolith-dominated area
important constituents. 2 mm
bryozoans, bivalves,non-carbonatesgastropods,
bivalves, bryozoans,echinoderms, rhodoliths,corals
rhodoliths, bivalves, corals rhodoliths, bivalves, corals
biofacies analysis bivalve–bryozoa (100%) bivalve–bryozoa (64.3%),rhodolith–bivalve–coral(21.4%), rhodolith (14.3%)
rodolith (81.8%), rhodolith–bivalve–coral (13.6%), bivalve–bryozoa(4.6%)
rhodolith (80%), rhodolith–bivalve–coral (20%)
av. % carbonates 52% 72% 82% 88%grain size (sample analysis) silt and sand (, 63 mm–
2 mm)sand (63 mm–2 mm) sand and gravel sand and gravel
sorting (STD) very well–poorly well–poorly moderately–poorly poorlymedian size fine–medium sand medium–coarse sand coarse sand–granule very coarse sand–granuleareal extent [km2] 12.2 14.8 14.2 4.0proposed name outer-shelf silt facies biogenic sand facies peripheral rhodolith facies central rhodolith facies
676 S. HETZINGER ET AL. J S R

to areas with highest abundances of the sand fraction, which are found inbetween and surrounding main rhodolith facies (Fig. 4). Highestpercentages of the , 63 mm fraction (silt and clay fraction) are laterallyrestricted to the northwestern part of the study area around Isla Cayo(outer shelf, Fig. 6A).
Acoustic Data and Surface Sediments
In order to classify seafloor types, the acoustic data sets were clusteredand split into four acoustic facies. Table 1 summarizes the maincharacteristics of the four acoustic facies, based on the comparison withsediment parameters and biofacies of analyzed samples, which are locatedwithin the respective acoustic facies (Fig. 7).
1. Acoustic facies A is restricted to the western and southeasternmargins of the study area and can be correlated to sand- and silt-size material (Fig. 8). Size fractions . 2 mm are only a minorconstituent (commonly below 5%). The biogenic composition ofsamples included in acoustic facies A shows maximum abundancesof bryozoans (average 28%) and gastropods (average 6%), and highpercentages of bivalves (23%) (Fig. 7). Rhodoliths, which are maincarbonate producers in acoustic facies B, C, and D, are absent fromfacies A. Only samples from the bivalve–bryozoa biofacies lie withinacoustic facies A (Table 1). Compared to the other three acousticfacies, non-carbonate grains are abundant (average 21%). The lowabundance of carbonate-secreting organisms, together with theincreasing importance of siliciclastic particles (Figs. 5, 8) on theouter shelf, are responsible for facies A having the lowest carbonatecontents of the study area (average 52% in all fractions). Acousticfacies A is found only in water depths exceeding 30 m, and hencewas termed the ‘‘outer-shelf silt facies.’’
2. According to results from grain-size analysis, acoustic facies B
represents a medium to coarse carbonate sand facies, with bivalves(and bivalve fragments) (average 35%) being the most importantbiogenic component (Fig. 8). Due to the location of acoustic faciesB (flanking rhodolith facies), rhodolith-derived fragments are thesecond most important constituent (average 27%, Fig. 7B).Sediment samples of the bivalve–bryozoa biofacies (64.3%), therhodolith–bivalve–coral biofacies (21.4%, restricted to northern halfof the study area), and the rhodolith facies (14.3%) lie withinacoustic facies B (Table 1). This facies exhibits an average carbonatecontent of 72% (all fractions, range 26–93%). Facies B containsmainly carbonate-rich sand-size material (average 87%), andtherefore was called the ‘‘biogenic sand facies.’’
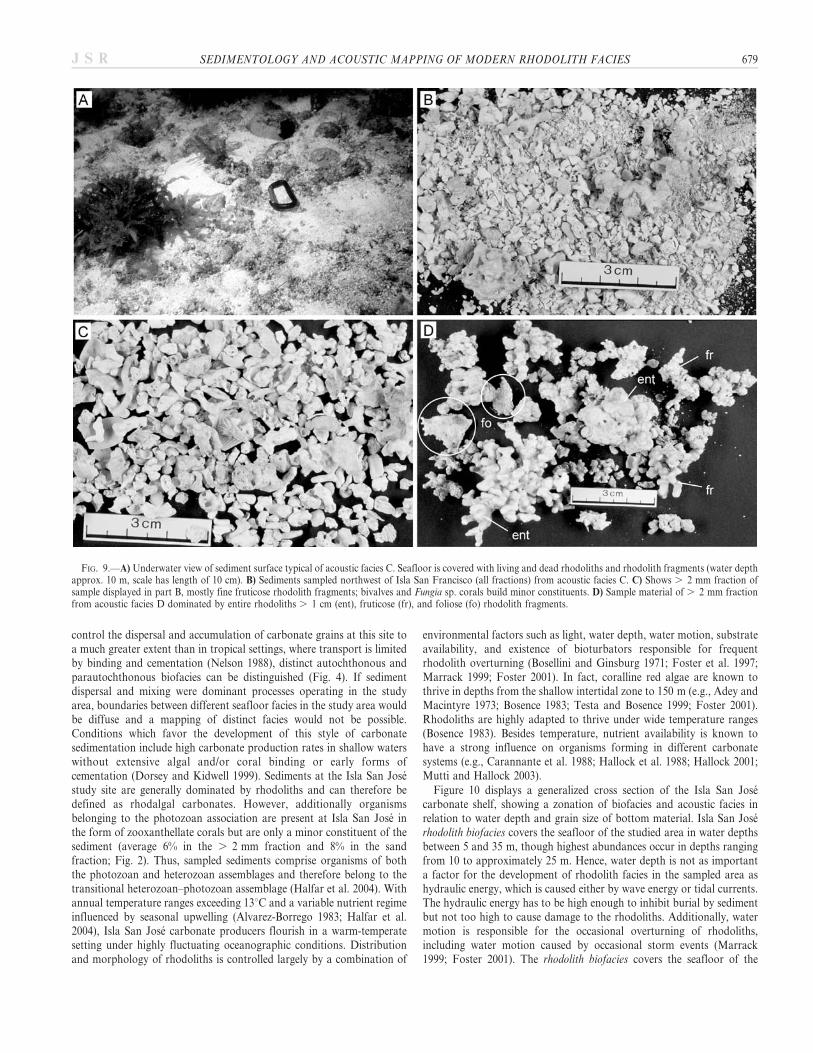
3. Acoustic facies C is present in water depths ranging between 5 mand 35 m. Samples within acoustic facies C contain medium tocoarse carbonate sand (Fig. 9). The biogenic composition ofacoustic facies C is characterized by high abundances of corallinered algae and rhodolith fragments (average 51%) and maximumabundances of corals (average 8%). Acoustic facies C is largelydominated by sediment samples belonging to the rhodolith (81.8%)and rhodolith–bivalve–coral biofacies (13.6%) but includes only4.6% of bivalve–bryozoa biofacies samples (Table 1). Together withacoustic facies D, this facies represents the areas dominated byrhodoliths located west and northeast of Isla San Francisco, andbetween Isla Cayo and Isla San Jose. Acoustic facies C isadditionally found along the southern coastline of Isla SanFrancisco, where rhodolith abundances reach up to 66%. Averagecarbonate content of facies C is 82% (all fractions, range 23–95%).Facies C corresponds to high contents of sand fraction (average62%) and coarse material (. 2 mm) (average 37%). Maximum
FIG. 7.— A) Distribution of acoustic faciesand locations of sampling stations. Acousticfacies C and D represent rhodolith-dominatedareas. B) Pie diagrams illustrating averagecomposition of biogenic components of eachacoustic facies (based on analysis of sedimentsamples in . 2 mm fraction).
SEDIMENTOLOGY AND ACOUSTIC MAPPING OF MODERN RHODOLITH FACIES 677J S R
abundances of the . 2 mm fraction reach values near 95% in thearea northeast of Isla San Francisco, where samples consist mostlyof rhodolith fragments. Hence, acoustic facies C was interpreted asthe ‘‘peripheral rhodolith facies.’’
4. Acoustic facies D exhibits the highest abundances of rhodoliths andrhodolith fragments (see Fig. 3A, Table 1, and Fig. 7) andconsequently a higher carbonate content than acoustic facies C(average 88%, Table 1). Additionally, statistical grain-size measuressuch as the median point to a coarsening of sediments inside theareas dominated by rhodoliths. Samples within facies D generallyexhibit more than 50% gravel-size material. The occurrence ofacoustic facies D is limited to a depth range between 15 m and 25 m(Table 1). The biogenic composition of facies D is similar to faciesC, but it contains higher percentages of rhodoliths (average 61%,Fig. 7B). A difference in abundance of rhodolith types or growthforms between both acoustic facies is not observable (Fig. 9). Onlysediment samples of the rhodolith (80%) and rhodolith–bivalve–coral biofacies (20%) are located within acoustic facies D (Table 1).Facies D is the laterally least extensive facies and represents thecentral parts of rhodolith-dominated areas and therefore wasdefined as the ‘‘central rhodolith facies.’’ Acoustic facies C and Dwere separated due to differences in grain size, water depth, andbiogenic and carbonate content (Table 1). Carbonate contentgradually decreases from acoustic facies D (average 88%) to facies
A (average 52%, Table 1), due to a decreasing abundance ofrhodolith fragments.
The biofacies analysis (Table 1) quantifies the degree of correlationbetween biofacies and acoustic facies by indicating the percentage ofsamples of a distinct biofacies which match the respective acoustic facies.For example, all samples within acoustic facies A (the ‘‘outer-shelf siltfacies’’) coincide with samples of the bivalve–bryozoa biofacies (100%).Samples assigned to the bivalve–bryozoa biofacies also predominate inmore than 60% of the samples located within acoustic facies B (the‘‘biogenic sand facies’’), the remaining samples located within acousticfacies B belong to the rhodolith–bivalve–coral biofacies (21.4%) and therhodolith biofacies (14.3%, Table 1). Both acoustic facies C and D showa significant correlation to the rhodolith biofacies. Acoustic facies C isdominated by 81.8% of the rhodolith biofacies, acoustic facies D by 80%of the rhodolith biofacies.
DISCUSSION
The Isla San Jose Rhodalgal Carbonates
The distribution of surface sediments and grain sizes in the study area islargely dependent on the growth and distribution of carbonate-secretingorganisms and the degree of siliciclastic input into the depositionalenvironment. Although currents driven by waves, tides, and storms
FIG. 8.—A) Sample material of , 2 mm fraction from acoustic facies A, siliciclastic fine-medium sand. B) View of . 2 mm fraction (acoustic facies A), typically a mixof bivalve shell fragments (b), non-carbonate particles (n), free-living bryozoa (f ) and gastropods (g). C) Underwater view of seafloor typical of acoustic facies B,characterized by a mixture of carbonate and siliciclastic medium–coarse sand; D) sample material of . 2 mm fraction from acoustic facies B, dominated by bivalve shellsand bivalve fragments.
678 S. HETZINGER ET AL. J S R
control the dispersal and accumulation of carbonate grains at this site toa much greater extent than in tropical settings, where transport is limitedby binding and cementation (Nelson 1988), distinct autochthonous andparautochthonous biofacies can be distinguished (Fig. 4). If sedimentdispersal and mixing were dominant processes operating in the studyarea, boundaries between different seafloor facies in the study area wouldbe diffuse and a mapping of distinct facies would not be possible.Conditions which favor the development of this style of carbonatesedimentation include high carbonate production rates in shallow waterswithout extensive algal and/or coral binding or early forms ofcementation (Dorsey and Kidwell 1999). Sediments at the Isla San Josestudy site are generally dominated by rhodoliths and can therefore bedefined as rhodalgal carbonates. However, additionally organismsbelonging to the photozoan association are present at Isla San Jose inthe form of zooxanthellate corals but are only a minor constituent of thesediment (average 6% in the . 2 mm fraction and 8% in the sandfraction; Fig. 2). Thus, sampled sediments comprise organisms of boththe photozoan and heterozoan assemblages and therefore belong to thetransitional heterozoan–photozoan assemblage (Halfar et al. 2004). Withannual temperature ranges exceeding 13uC and a variable nutrient regimeinfluenced by seasonal upwelling (Alvarez-Borrego 1983; Halfar et al.2004), Isla San Jose carbonate producers flourish in a warm-temperatesetting under highly fluctuating oceanographic conditions. Distributionand morphology of rhodoliths is controlled largely by a combination of
environmental factors such as light, water depth, water motion, substrateavailability, and existence of bioturbators responsible for frequentrhodolith overturning (Bosellini and Ginsburg 1971; Foster et al. 1997;Marrack 1999; Foster 2001). In fact, coralline red algae are known tothrive in depths from the shallow intertidal zone to 150 m (e.g., Adey andMacintyre 1973; Bosence 1983; Testa and Bosence 1999; Foster 2001).Rhodoliths are highly adapted to thrive under wide temperature ranges(Bosence 1983). Besides temperature, nutrient availability is known tohave a strong influence on organisms forming in different carbonatesystems (e.g., Carannante et al. 1988; Hallock et al. 1988; Hallock 2001;Mutti and Hallock 2003).
Figure 10 displays a generalized cross section of the Isla San Josecarbonate shelf, showing a zonation of biofacies and acoustic facies inrelation to water depth and grain size of bottom material. Isla San Joserhodolith biofacies covers the seafloor of the studied area in water depthsbetween 5 and 35 m, though highest abundances occur in depths rangingfrom 10 to approximately 25 m. Hence, water depth is not as importanta factor for the development of rhodolith facies in the sampled area ashydraulic energy, which is caused either by wave energy or tidal currents.The hydraulic energy has to be high enough to inhibit burial by sedimentbut not too high to cause damage to the rhodoliths. Additionally, watermotion is responsible for the occasional overturning of rhodoliths,including water motion caused by occasional storm events (Marrack1999; Foster 2001). The rhodolith biofacies covers the seafloor of the
FIG. 9.—A) Underwater view of sediment surface typical of acoustic facies C. Seafloor is covered with living and dead rhodoliths and rhodolith fragments (water depthapprox. 10 m, scale has length of 10 cm). B) Sediments sampled northwest of Isla San Francisco (all fractions) from acoustic facies C. C) Shows . 2 mm fraction ofsample displayed in part B, mostly fine fruticose rhodolith fragments; bivalves and Fungia sp. corals build minor constituents. D) Sample material of . 2 mm fractionfrom acoustic facies D dominated by entire rhodoliths . 1 cm (ent), fruticose (fr), and foliose (fo) rhodolith fragments.
SEDIMENTOLOGY AND ACOUSTIC MAPPING OF MODERN RHODOLITH FACIES 679J S R

sampled area predominantly in environments which are influenced bysufficient hydraulic energy, represented by both wave energy (rhodolithfacies between southwestern end of Isla San Jose and Isla Cayo) and tidalcurrents (shallow area between Isla San Jose and Isla San Francisco).
In an ecological study, Foster et al. (1997) described three individual‘‘rhodolith beds’’ at the Isla San Jose study site using SCUBA.‘‘Rhodolith beds’’ were defined on the basis of the presence of large,abundant, live rhodoliths. Because differences in acoustic signaturesbetween rhodoliths are based on their size, shape, and arrangement, butnot whether alive or dead, the acoustically derived maps presented heredo not differentiate between beds of living or dead rhodoliths. However,this survey, combining acoustic mapping and analysis of sedimentsamples as well as groundtruthing using video cameras, confirmed theoccurrence of ‘‘rhodolith biofacies’’ at the locations of ‘‘rhodolith beds’’described by Foster et al. (1997) (Fig. 4).
Acoustic Mapping of Rhodolith Facies
The application of an acoustic mapping technique in this study enablesus to map rhodolith facies over a large area, because seafloor covered byrhodolith facies corresponds to highest abundances of gravel-sizematerial. Therefore, rhodolith facies can be directly linked to distinctacoustic properties of the sediment, which are clearly distinguishable fromthe acoustic properties of seafloor covered by silt- and sand-size material.AGDS are based on the analysis of acoustic data to differentiate seafloorsediments (facies), which are characterized in terms of depth and physicalsediment properties (e.g., Hamilton et al. 1999), and facilitate large-scalegeological mapping of rhodolith facies, consisting of both living and deadrhodoliths and rhodolith fragments. Only few attempts have been madeto map large-scale facies distribution of modern rhodolith-dominatedareas (Davies and Hall-Spencer 1996; de Grave 1999; de Grave et al.2000). Because rhodoliths often occur in water depths beyond resolutionfor passive optical sensors or SCUBA surveys, mapping is restricted tograb-sampling or acoustic methods, such as AGDS (Davies et al. 1997;Morrison et al. 2001; Anderson et al. 2002), side-scan sonar (Brown et al.2000; Brown et al. 2001; Hewitt et al. 2004), and multi-beam sonar. TheAGDS used in this survey was recently applied in a broad spectrum ofdifferent marine habitats worldwide for acoustic facies mapping and isknown to discriminate the sediment characteristics well. Reviews of the
functioning of the QTC system and critiques can be found in Hamilton etal. (1999), Preston et al. (2000), Hamilton (2001), Ellingsen et al. (2002),Legendre et al. (2002), Maushake and Collins (2002), von Szalay andMcConnaughey (2002), Freitas et al. (2003a), Freitas et al. (2003b),Legendre (2003), Preston and Kirlin (2003), White et al. (2003), Hewitt etal. (2004), Moyer et al. (2005), and Riegl and Purkis (2005). Our resultsindicate a successful application of an acoustic device, in combinationwith analysis of sediment samples and video data, as a rapid approach todeliver high-resolution continuous coverage of the seafloor and discrim-inate rhodolith facies from surrounding sediment in a non-tropicalcarbonate setting.
CONCLUSIONS
The present-day Isla San Jose rhodalgal setting develops on a warm-temperate carbonate shelf with elevated nutrient conditions (Halfar et al.2004). Acoustic seafloor mapping revealed four distinct acoustic seafloorfacies, which were classified according to their biogenic content, grainsize, and depth range. Based on cluster analysis of sampled seafloorsediments, biota were grouped into a rhodolith, a rhodolith–bivalve–coral, and a bivalve–bryozoa biofacies. The rhodolith facies covers 40%of the surveyed area (45 km2) between 10 m and 35 m water depth andexhibits acoustic signatures which can be clearly distinguished from theacoustic properties of seafloor covered by silt- and sand-size material.
The acoustic facies were verified using two independent sources forgroundtruthing (analysis of sediment samples and qualitative (on-site)underwater video imaging of the seafloor sediment surface). Wesuccessfully applied acoustic mapping to provide high-resolution contin-uous coverage of the seafloor and discriminate modern rhodolith faciesfrom surrounding sediment. This has important implications forquantifying rhodolith carbonate production in other regions, as well asfor ecological and conservation studies.
ACKNOWLEDGMENTS
This study was supported by the VolkswagenStiftung, Federal Republic ofGermany (grant I/77446). Permission to collect sediment samples was grantedby SEMARNAT (permit 300702-613-03). BR was supported by NationalOceanic and Atmospheric Administration grant NA03NOS4260046 to
FIG. 10.—Generalized cross section showing facies zonations within the Isla San Jose carbonate environment.
680 S. HETZINGER ET AL. J S R
NCRI. We acknowledge G. Gutierrez, A.L. Manilla, and H. Torres for theirsupport during field work.
REFERENCES CITED
ADEY, W.H., AND MCINTYRE, I.G., 1973, Crustose coralline algae: A re-evaluationin the geological sciences: Geological Society of America, Bulletin, v. 84, p. 883–904.
AGUIRRE, J., RIDING, R., AND BRAGA, J.C., 2000, Diversity of coralline red algae:Origination and extinction patterns from the Early Cretaceous to the Pleistocene:Paleobiology, v. 26, p. 651–667.
ALVAREZ-BORREGO, S., 1983, Gulf of California, in Ketchum, B.H., ed., Ecosystems ofthe world 26: Estuaries and Enclosed Seas: Amsterdam, Elsevier, p. 427–449.
ANDERSON, J.T., GREGORY, R.S., AND COLLINS, W.T., 2002, Acoustic classification ofmarine habitats in coastal Newfoundland: ICES Journal of Marine Science, v. 59, p.156–167.
BARBERA, C., BORDEHORE, C., BORG, J.A., GLEMAREC, M., GRALL, J., HALL-SPENCER,J.M., DE LA HUZ, C., LANFRANCO, E., LASTRA, M., MOORE, P.G., MORA, J., PITA,M.E., RAMOS-ESPLA, A.A., RIZZO, M., SANCHEZ-MATA, A., SEVA, A., SCHEMBRI, P.J.,AND VALLE, C., 2003, Conservation and management of northeast Atlantic andMediterranean maerl beds: Aquatic Conservation: Marine and Freshwater Ecosys-tems, v. 13, p. 65–76.
BETZLER, C.B., BRACHERT, T.C., AND NEBELSICK, J., 1997, The warm temperatecarbonate province: a review of the facies, zonations, and delimitations: CourierForschungs-Institut Senckenberg, v. 201, p. 83–99.
BOSELLINI, A., AND GINSBURG, R.N., 1971, Form and internal structure of Recent algalnodules (Rhodolites) from Bermuda: Journal of Geology, v. 79, p. 669–682.
BOSENCE, D.W.J., 1983, The occurrence and ecology of Recent rhodoliths—a review, inPeryt, T.M., ed., Coated Grains: Berlin, Springer-Verlag, p. 225–242.
BOSENCE, D.W.J., AND PEDLEY, H.M., 1979, Palaeoecology of a Miocene coralline algalbioherm, Malta: Centres de Recherches Exploration–Production Elf-Aquitaine,Bulletin, v. 3, p. 463–470.
BOSENCE, N., AND WILSON, J., 2003, Maerl growth, carbonate production rates andaccumulation rates in the northeast Atlantic: Aquatic Conservation: Marine andFreshwater Ecosystems, v. 13, p. 21–31.
BOURROUILH-LE JAN, F.G., AND HOTTINGER, L.C., 1988, Occurrence of rhodolites in thetropical Pacific—a consequence of mid-Miocene paleo-oceanographic change:Sedimentary Geology, v. 60, p. 355–367.
BRAY, N.A., 1988, Water mass formation in the Gulf of California: Journal ofGeophysical Research, v. 93, p. 9223–9240.
BRAY, N.A., AND ROBLES, J.M., 1991, Physical oceanography of the Gulf of California,in Dauphin, J.P., and Simoneit, B.R.T., eds., The Gulf and Peninsular Province of theCalifornias: American Association of Petroleum Geologists, Memoir 47, p. 511–553.
BROWN, C.J., COOPER, K.M., MEADOWS, W.J., LIMPENNY, D.S., AND REES, H.L., 2000,An assessment of two acoustic techniques as a means of mapping seabed assemblagesin the Eastern English Channel: ICES CM 2000/T:02, Theme Session on Classificationand Mapping of Marine Habitats, International Council for the Exploration of theSea, 27 p.
BROWN, C.L., HEWER, A.J., MEADOWS, W.J., LIMPENNY, D.S., COOPER, K.M., REES,H.L., AND VIVIAN, C.M.G., 2001, Mapping of gravel biotopes and an examination ofthe factors controlling the distribution, type and diversity of their biologicalcommunities: Science Series Technical Report, CEFAS Lowestoft, v. 114, 43 p.
CARANNANTE, G., ESTEBAN, M., MILLIMAN, J.D., AND SIMONE, L., 1988, Carbonatelithofacies as paleolatitude indicators: problems and limitations: SedimentaryGeology, v. 60, p. 333–346.
DAVIS, J.C., 2002, Statistics and Data Analysis in Geology: Singapore, John Wiley &Sons, 638 p.
DAVIES, J., AND HALL-SPENCER, J., 1996, Mapping of the benthic biotopes in theproposed Sound of Arisaig Special Area of Conservation: Scottish Natural Heritag/Biomar Research Survey and Monitoring Report, n. 83., 20 p.
DAVIES, J., FOSTER-SMITH, R., AND SOTHERAN, I.S., 1997, Marine biological mapping forenvironment management using acoustic ground discrimination systems and geo-graphic information systems: Underwater Technology, v. 22, p. 167–172.
DE GRAVE, S., 1999, The influence of sedimentary heterogeneity on within maerl beddifferences in infaunal crustacean community: Estuarine, Coastal and Shelf Science,v. 49, p. 153–163.
DE GRAVE, S., FAZAKERLEY, H., KELLY, L., GUIRY, M.D., RYAN, M., AND WALSHE, J.,2000, A study of selected maerl beds in Irish waters and their potential for sustainableextraction: Dublin, The Marine Institute, 44 p.
DORSEY, R.J., AND KIDWELL, S.M., 1999, Mixed carbonate–siliciclastic sedimentation ona tectonically active margin: Example from the Pliocene of Baja California Sur,Mexico: Geology, v. 27, p. 935–938.
ELLINGSEN, K.E., GRAY, J.S., AND BJØRNBOM, E., 2002, Acoustic classification of seabedhabitats using the QTC VIEW system: ICES Journal of Marine Science, v. 59, p.825–835.
ESTEBAN, M., 1996, An overview of Miocene reefs from Mediterranean areas: Generaltrends and facies models, in Franseen, E.K., Esteban, M., Ward, W.C., and Rouchy,J.M., eds., Models for Carbonate Stratigraphy from Miocene Reef Complexes ofMediterranean Regions: SEPM, Concepts in Sedimentology and Paleontology, n. 5.,p. 3–51.
FORNOS, J.J., AND AHR, W.M., 1997, Temperate carbonates on a modern, low-energy,isolated ramp: the Balearic Platform, Spain: Journal of Sedimentary Research, v. 67,p. 364–373.
FOSTER, M.S., 2001, Rhodoliths: between rocks and soft places: Journal of Phycology,v. 37, p. 659–667.
FOSTER, M.S., RIOSMENA-RODRIGUEZ, R., STELLER, D.L., AND WOELKERLING, W.J., 1997,Living rhodolith beds in the Gulf of California and their implications forpaleoenvironmental interpretation, in Johnson, M.E., and Ledesma-Vazquez, J.,eds., Pliocene Carbonates and Related Facies Flanking the Gulf of California, BajaCalifornia, Mexico: Geological Society of America, Special Publication 318, p.127–139.
FOSTER-SMITH, B., BROWN, C., MEADOWS, B., AND REES, I., 2001, Seabed mapping usingacoustic ground discrimination interpreted with ground truthing. ProceduralGuideline 1–3, in Davies, J., Baxter, J., Bradley, M., Connor, D., Khan, J., Murray,E., Sanderson, W., Turnbull, C., and Vincent, M., eds., Marine MonitoringHandbook: U.K. Marine SACs Project, Peterborough, Joint Nature ConservationCommittee, p. 183–197.
FREITAS, R., SILVA, S., QUINTINO, V., RODRIGUES, A.M., RHYNAS, K., AND COLLINS, W.T.,2003a, Acoustic seabed classification of marine habitats: studies in the westerncoastal-shelf area of Portugal: ICES Journal of Marine Science, v. 60, p. 599–606.
FREITAS, R., RODRIGUES, A.M., AND QUINTINO, V., 2003b, Benthic biotopes remotesensing using acoustics: Journal of Experimental Marine Biology and Ecology, v. 285–286, p. 339–353.
FREIWALD, A., AND HENRICH, R., 1994, Reefal coralline algal build-ups within the ArcticCircle, morphology and sedimentary dynamics under extreme environmentalseasonality: Sedimentology, v. 41, p. 963–984.
GILLESPIE, J.L., AND NELSON, C.S., 1997, Mixed siliciclastic–skeletal carbonate facies onWanganui Shelf, New Zealand: A contribution to the temperate carbonate model, inJames, N.P., and Clarke, J.A.D. eds., Cool-Water Carbonates: SEPM, SpecialPublication 56, p. 127–140.
GRALL, J., AND HALL-SPENCER, J.M., 2003, Problems facing maerl conservation inBrittany: Aquatic Conservation: Marine and Freshwater Ecosystems, v. 13, p. 55–64.
GREENSTREET, S.P.R., TUCK, I.D., GREWAR, G.N., ARMSTRONG, E., REID, D.G., AND
WRIGHT, P.J., 1997, An assessment of the acoustic survey technique, RoxAnn, asa means of mapping seabed habitat: ICES Journal of Marine Science, v. 54, p.939–959.
HALFAR, J., AND MUTTI, M., 2005, Global dominance of coralline red-algal facies:A response to Miocene oceanographic events: Geology, v. 33, p. 481–484.
HALFAR, J., GODINEZ-ORTA, L., AND INGLE, J.C., 2000, Microfacies analysis of Recentcarbonate environments in the southern Gulf of California, Mexico: A model forwarm-temperate to subtropical carbonate formation: Palaios, v. 15, p. 323–342.
HALFAR, J., GODINEZ-ORTA, L., MUTTI, M., VALDEZ-HOLGUIN, J.E., AND BORGES, J.,2004, Nutrient and temperature controls on modern carbonate production: Anexample from the Gulf of California, Mexico: Geology, v. 32, p. 213–216.
HALLOCK, P., 2001, Coral reefs, carbonate sediments, nutrients, and global change, inStanley, G.D., JR., ed., The History and Sedimentology of Ancient Reef Systems: NewYork, Kluwer Academic/Plenum Publishers, p. 387–427.
HALLOCK, P., HINE, A.C., VARGO, G.A., ELROD, J.A., AND JAAP, W.C., 1988, Platformsof the Nicaraguan Rise: Examples of the sensitivity of carbonate sedimentation toexcess trophic resources: Geology, v. 16, p. 1104–1107.
HALL-SPENCER, J.M., 1998, Conservation issues relating to maerl beds as habitats formolluscs: Journal of Conchology, Special Publication, v. 2, p. 271–286.
HALL-SPENCER, J.M., GRALL, J., MOORE, P.G., AND ATKINSON, R.J.A., 2003, Bivalvefishing and maerl-bed conservation in France and the U.K.—retrospect and prospect:Aquatic Conservation: Marine and Freshwater Ecosystems, v. 13, p. 33–41.
HAMILTON, L.J., 2001, Acoustic Seabed Classification Systems: Australia, Departmentof Defense: Defense Science and Technology Organisation, 150 p.
HAMILTON, L.J., MULHEARN, P.J., AND POECKERT, R., 1999, Comparison of RoxAnn andQTC- view acoustic bottom classification system performance for the Cairns area,Great Barrier Reef, Australia: Continental Shelf Research, v. 19, p. 1577–1597.
HENRICH, R., FREIWALD, A., WEHRMANN, A., SCHAFER, P., SAMTLEBEN, C., AND ZANKL,H., 1995, Controls on modern carbonate sedimentation on warm-temperate to arcticcoasts, shelves and seamounts in the northern hemisphere: Implications for fossilcounterparts: Facies, v. 32, p. 17–23.
HEWITT, J.E., THRUSH, S.F., LEGENDRE, P., FUNNELL, G.A., ELLIS, J., AND MORRISON, M.,2004, Mapping of marine soft-sediment communities: integrated sampling forecological interpretation: Ecological Applications, v. 14, p. 1203–1216.
HINOJOSA-ARANGO, G., AND RIOSMENA-RODRIGUEZ, R., 2004, Influence of rhodolith-forming species and growth-form on associated fauna of rhodolith beds in the central-west Gulf of California, Mexico: Marine Ecology, v. 25, p. 1–20.
JAMES, N.P., 1997, The cool-water carbonate depositional realm, in James, N.P., andClarke, J.A.D., eds., Cool-Water Carbonates: SEPM, Special Publication 56, p. 1–22.
JAMES, N.P., COLLINS, L.B., BONE, Y., AND HALLOCK, P., 1999, Subtropical carbonates ina temperate realm: Modern sediments on the southwest Australian shelf: Journal ofSedimentary Research, v. 69, p. 1297–1321.
JOHNSTON, K., VER HOEF, J.M., KRIVORUCHKO, K., AND LUCAS, N., 2001, Using ArcGISGeostatistical Analyst: Redlands, California, ESRI, 300 p.
LAWRENCE, M.J., AND BATES, C.R., 2001, Acoustic ground discrimination techniques forsubmerged archeological site investigation: Marine Technology Society, Journal, v. 35,p. 65–73.
LEGENDRE, P., 2003, Reply to the comments by Preston and Kirlin on ‘‘Acoustic seabedclassification: improved statistical methods’’: Canadian Journal of Fisheries andAquatic Sciences, v. 60, p. 1299–1300.
SEDIMENTOLOGY AND ACOUSTIC MAPPING OF MODERN RHODOLITH FACIES 681J S R
LEGENDRE, P., ELLINGSEN, K.E., BJØRNBOM, E., AND CASGRAIN, P., 2002, Acoustic seabedclassification: improved statistical method: Canadian Journal of Fisheries andAquatic Sciences, v. 59, p. 1085–1089.
MANKER, J.P., AND CARTER, B.D., 1987, Paleoecology and Paleogeography of anextensive rhodolith facies from the lower Oligocene of South Georgia and NorthFlorida: Palaios, v. 2, p. 181–188.
MARRACK, E.C., 1999, The relationship between water motion and living rhodolith bedsin the southwestern Gulf of California, Mexico: Palaios, v. 14, p. 159–171.
MAUSHAKE, C., AND COLLINS, W.T., 2002, Acoustic classification and water injectiondredging: QTC view for assessment of dredging the Elbe River, Germany: HydroInternational, v. 6, p. 7–9.
MORRISON, M.A., THRUSH, S.F., AND BUDD, R., 2001, Detection of acoustic classboundaries in soft sediment systems using the seafloor acoustic discrimination systemQTC VIEW: Journal of Sea Research, v. 46, p. 233–243.
MOYER, R.P., RIEGL, B., BANKS, K.P., AND DODGE, R.E., 2005, Assessing the accuracy ofacoustic seabed classification for mapping coral reef environments in South Florida(Broward County, USA): Revista de Biologia Tropical, v. 53(Suppl. 1), p. 175–184.
MUTTI, M., AND HALLOCK, P., 2003, Carbonate systems along nutrient and temperaturegradients: Some sedimentological and geochemical constraints: International Journalof Earth Sciences, v. 92, p. 465–475.
NELSON, C.S., 1988, An introductory perspective on nontropical shelf carbonates:Sedimentary Geology, v. 60, p. 3–12.
POMAR, L., L BRANDANO, M., AND WESTPHAL, H., 2004, Environmental factorsinfluencing skeletal grain sediment associations: a critical review of Miocene examplesfrom the western Mediterranean: Sedimentology, v. 51, p. 627–651.
PRESTON, J.M., AND KIRLIN, T.L., 2003, Comment on ‘‘Acoustic seabed classification:improved statistical method’’: Canadian Journal of Fisheries and Aquatic Science,v. 60, p. 1299–1300.
PRESTON, J.M., ROSENBERGER, A., AND COLLINS, W.T., 2000, Bottom classification invery shallow water: Proceedings of the Ocean `00 Conference, Newport 2000.
Quester Tangent Corporation, 2002, QTC VIEW Series V User’s Manual andReference, DMN-QTC5-0001-R01: http://marine.questertangent.com/qtc/pdf/using_qtc5.pdf, 70 p.
REYES-BONILLA, H., RIOSMENA-RODRIGUEZ, R., AND FOSTER, M.S., 1997, Zooxanthellatecorals associated with rhodolith beds in the Gulf of California, Mexico: PacificScience, v. 51, p. 328–337.
RIEGL, B., AND PURKIS, S.J., 2005, Detection of shallow subtidal corals from IKONOSsatellite and QTC View (50, 200 kHz) single-beam sonar data (Arabian Gulf; Dubai,U.A.E.): Remote Sensing of Environment, v. 95, p. 96–114.
RIEGL, B., MOYER, R.P., VIRNSTEIN, R., AND DODGE, R.E., 2005, Determination ofthe distribution of shallow-water seagrass and drift algae communities withacoustic seafloor discrimination: Revista de Biologia Tropical, v. 53(Suppl. 1), p.165–174.
STELLER, D.L., AND FOSTER, M.S., 1995, Environmental factors influencing distributionand morphology of rhodoliths in Bahıa Concepcion, B.C.S., Mexico: Journal ofExperimental Marine Biology and Ecology, v. 194, p. 201–212.
STELLER, D.L., RIOSMENA-RODRIGUEZ, R., FOSTER, M.S., AND ROBERTS, C.A., 2003,Rhodolith bed diversity in the Gulf of California: the importance of rhodolithstructure and consequences of disturbance: Aquatic Conservation: Marine andFreshwater Ecosystems, v. 13, p. 5–20.
SWAN, A.R.H., AND SANDILANDS, M., 1995, Introduction to Geological Data Analysis:Oxford, U.K., Blackwell Science, 446 p.
TESTA, V., AND BOSENCE, D.W.J., 1999, Physical and biological controls on theformation of carbonate and siliciclastic bedforms on the northeast Brazilian shelf:Sedimentology, v. 46, p. 279–301.
vON SZALAY, P.G., AND MCCONNAUGHEY, R.A., 2002, The effect of slope and vesselspeed on the performance of a single beam acoustic seabed classification system:Fisheries Research, v. 54, p. 181–194.
WHITE, W.H., HARBORNE, A.R., SOTHERAN, I.S., WALTON, R., AND FOSTER-SMITH,R.L., 2003, Using an Acoustic Ground Discrimination System to map coralreef benthic classes: International Journal of Remote Sensing, v. 24, p. 2641–2660.
WILSON, S., BLAKE, C., BERGES, J.A., AND MAGGS, C.A., 2004, Environmental tolerancesof free-living coralline red algae (maerl): implications for European marineconservation: Biological Conservation, v. 120, p. 283–293.
WOELKERLING, W.J., IRVINE, L.M., AND HARVEY, A.S., 1993, Growth-forms in non-geniculate coralline red algae (Corallinales, Rhodophyta): Australian SystematicBotany, v. 6, p. 277–293.
Received 3 September 2004; accepted 7 November 2005.
682 S. HETZINGER ET AL. J S R