Calcium Carbonate Production on the Central - USF Digital ...
176
Calcium Carbonate Production on the Central West Florida Continental Shelf by Elizabeth Carlene Tyner A thesis submitted in partial fulfillment of the requirements for the degree of Master of Science College of Marine Science University of South Florida Co-Major Professor: Norman J. Blake, Ph.D. Co-Major Professor: Larry J. Doyle, Ph.D. Pamela Hallock Muller, Ph.D. Date of Approval: May 22,2003 Keywords: biogenic sediment production, Holocene sediments, foraminifera, mollusca, sedimentation rate © Copyright 2003, Elizabeth Carlene Tyner
-
Upload
khangminh22 -
Category
Documents
-
view
2 -
download
0
Transcript of Calcium Carbonate Production on the Central - USF Digital ...
Calcium Carbonate Production on the Central
West Florida Continental Shelf
by
Elizabeth Carlene Tyner
A thesis submitted in partial fulfillment of the requirements for the degree of
Master of Science College of Marine Science University of South Florida
Co-Major Professor: Norman J. Blake, Ph.D. Co-Major Professor: Larry J. Doyle, Ph.D.
Pamela Hallock Muller, Ph.D.
Date of Approval: May 22,2003
Keywords: biogenic sediment production, Holocene sediments, foraminifera, mollusca, sedimentation rate
© Copyright 2003, Elizabeth Carlene Tyner

ACKNOWLEDGEMENTS
I am appreciative of the United States Geological Survey for initial funding for
this research as part of the West-Central Florida Coastal Studies Project. Thanks also go
to John Edkins of the USF College of Marine Science Center for Ocean Technology for
his development of the production maps.
I especially thank my committee, Norman J. Blake, Ph.D., Larry J. Doyle, Ph.D.
and Pamela Hallock Muller, Ph.D., for all of their continued assistance, encouragement,
confidence and patience with both me and the research. I am honored to have them as
both mentor and friend.
And, finally, I am ever grateful to my family, Mom, Dad, and Layton, for their
constant support.
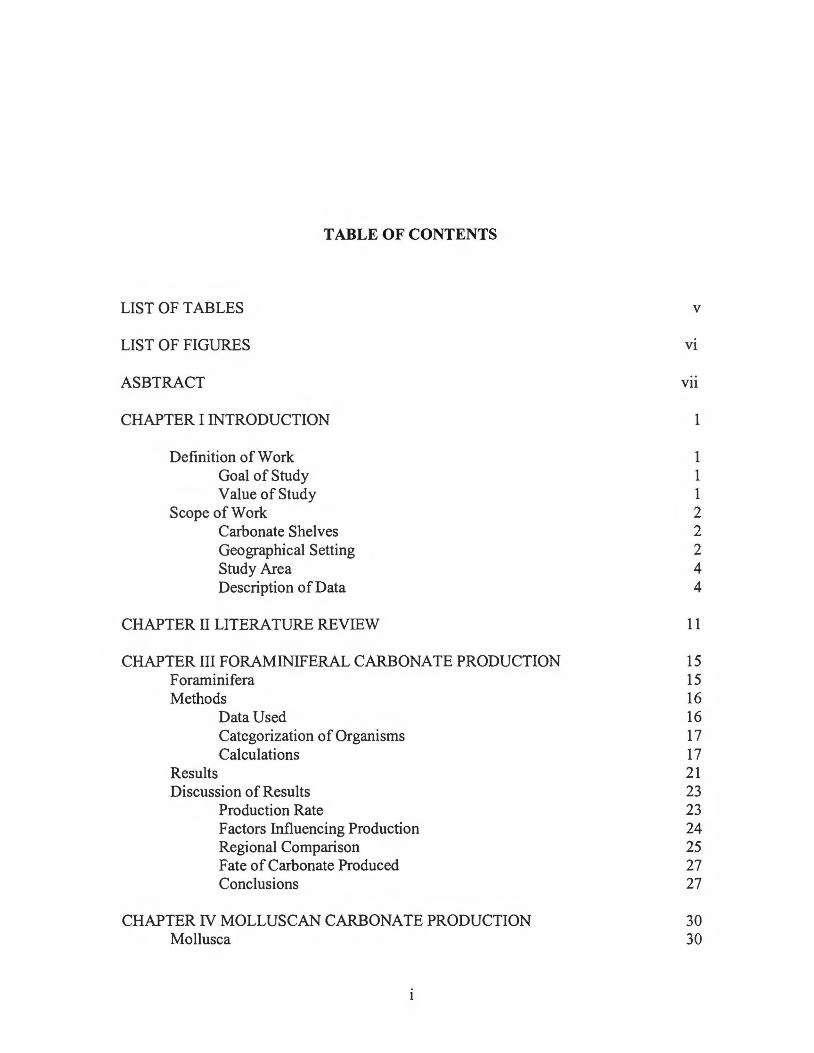
TABLE OF CONTENTS
LIST OF TABLES
LIST OF FIGURES
ASBTRACT
CHAPTER I INTRODUCTION
Definition of Work Goal of Study Value of Study
Scope of Work Carbonate Shelves Geographical Setting Study Area Description of Data
CHAPTER II LITERATURE REVIEW
CHAPTER III FORAMINIFERAL CARBONATE PRODUCTION Foraminifera Methods
Results
Data Used Categorization of Organisms Calculations
Discussion of Results Production Rate Factors Influencing Production Regional Comparison Fate of Carbonate Produced Conclusions
CHAPTER N MOLLUSCAN CARBONATE PRODUCTION Mollusca
v
Vl
Vll
1
1 1 1 2 2 2 4 4
11
15 15 16 16 17 17 21 23 23 24 25 27 27
30 30
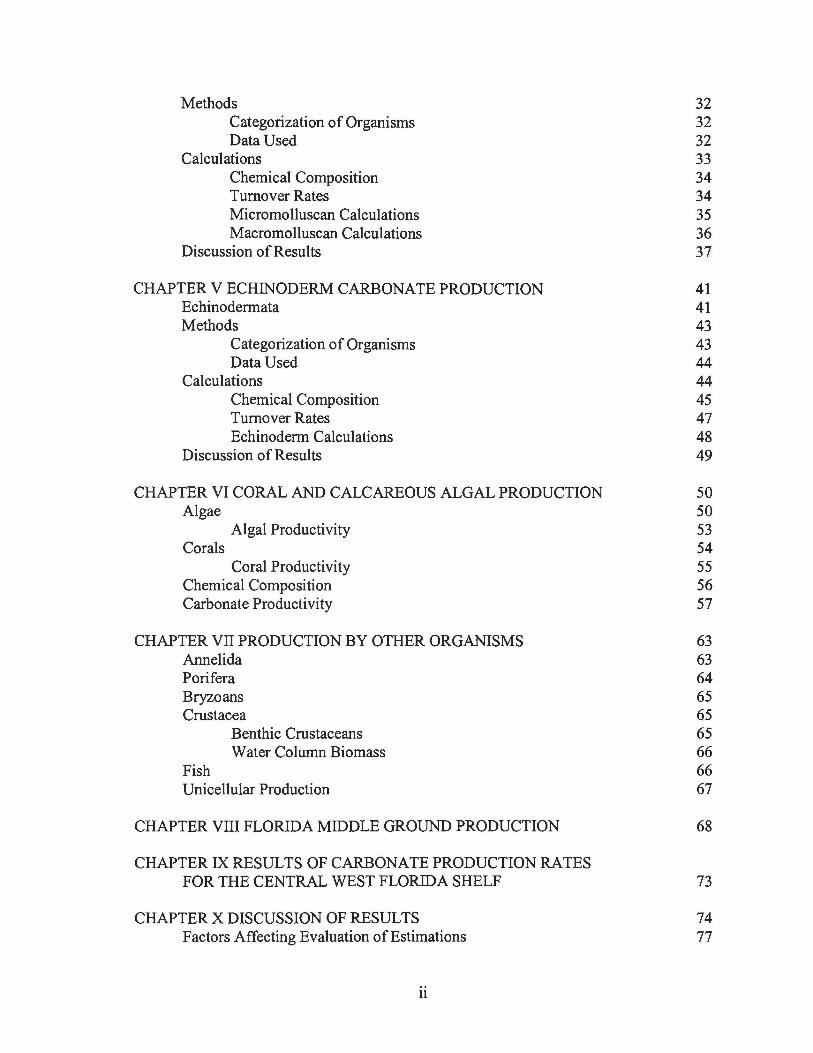
Methods Categorization of Organisms Data Used
Calculations Chemical Composition Turnover Rates Micromolluscan Calculations Macromolluscan Calculations
Discussion ofResults
CHAPTER V ECHINODERM CARBONATE PRODUCTION Echinodermata Methods
Categorization of Organisms Data Used
Calculations Chemical Composition Turnover Rates Echinoderm Calculations
Discussion ofResults
CHAPTER VI CORAL AND CALCAREOUS ALGAL PRODUCTION Algae
Algal Productivity Corals
Coral Productivity Chemical Composition Carbonate Productivity
CHAPTER VII PRODUCTION BY OTHER ORGANISMS Annelida Porifera Bryzoans Crustacea
Fish
Benthic Crustaceans Water Column Biomass
Unicellular Production
CHAPTER VIII FLORIDA MIDDLE GROUND PRODUCTION
CHAPTER IX RESULTS OF CARBONATE PRODUCTION RATES FOR THE CENTRAL WEST FLORIDA SHELF
CHAPTER X DISCUSSION OF RESULTS Factors Affecting Evaluation ofEstimations
11
32 32 32 33 34 34 35 36 37
41 41 43 43 44 44 45 47 48 49
50 50 53 54 55 56 57
63 63 64 65 65 65 66 66 67
68
73
74 77

Sampling Technique 77 Organisms Omitted 78 Unknown Factors 79 Evaluation of Assumptions Made 80
Future Research 81 Fate of Carbonate Produced 83
Depositional Environment 83 Sedimentation Rate 85 Sea Level Stand 86
Global Carbon Dioxide Budget 87 Benefit of Estimated Carbonate Production Rates 88 Uses of Calcium Carbonate 90 Production Rate Comparisons 90 Concluding Remarks 93
REFERENCES CITED 95
APPENDICES 106 Appendix 1: List of Stations on the Central West Florida Shelf 107 Appendix 2: Large Benthic Foraminiferal Production 1974 Transect II 109 Appendix 3: Large Benthic Foraminiferal Production 1974 Transect I 110 Appendix 4: Large Benthic Foraminiferal Production
Summer 1975 Transects I and II 111 Appendix 5: Large Benthic Foraminiferal Production
Summer 1975 Transect III and Averages 112 Appendix 6: Large Benthic Foraminiferal Production
Fall1975 Transects I and II 113 Appendix 7: Large Benthic Foraminiferal Production
Fall1975 Transect III and Averages 114 Appendix 8: Large Benthic Foraminiferal Production
Winter 1976 Transects I and II 115 Appendix 9: Large Benthic Foraminiferal Production
Winter 1976 Transects III and Averages 116 Appendix 10: Small Benthic Foraminiferal Production 1974 Transect II 117 Appendix 11: Small Benthic Foraminiferal Production 1974 Transect I 120 Appendix 12: Small Benthic Foraminiferal Production
Summer 1975 Transects I and II 123 Appendix 13: Small Benthic Foraminiferal Production
Summer 1975 Transect III and Averages 128 Appendix 14: Small Benthic Foraminiferal Production
Fall1975 Transects I, II, III and Averages 133 Appendix 15: Small Benthic Foraminiferal Production
Winter 1976 Transects I, II, III and Averages 138 Appendix 16: Foraminiferal Production Rates by Season 1975-1976 143 Appendix 17: Foraminiferal Production Rate Summary 144
111
Appendix 18: Micromolluscan Production and Species List 197 4 Transect II
Appendix 19: Micromolluscan Production and Species List 1974 Transect I
Appendix 20: Micromollusc Species List 1975-1976 Appendix 21 : Micromolluscan Production 1975-1976 Appendix 22: Archived Macromolluscs 1974 Appendix 23 : Archived Dominant Macromolluscs 1975-1976 Appendix 24: Macromolluscan Production 1974 Appendix 25: Macromolluscan Production 1975-1976 Appendix 26: Macromolluscan Production MMS 1992-1994 Appendix 27: Echinoderm Species List Appendix 28: Echinoderm Production 1974 and 1975-1976 Appendix 29: Echinoderm Production MMS 1992-1994 Appendix 30: Dominant Archived Calcareous Algae Appendix 31: Archived Hard and Soft Corals Appendix 32: Archived Serpulid Polychaetes Appendix 33: Florida Middle Ground Production Appendix 34: Total Carbonate Production on the Central
West Florida Shelf
IV
145
148 150 151 152 153 154 155 156 157 159 160 161 162 163 164
165

LIST OF TABLES
Table 1 Foraminiferal production rates for the central west Florida shelf 22
Table 2 Foraminiferal production summary by season 24
Table 3 Comparison of foraminiferal carbonate production rates 26
Table 4 Micromolluscan production rates for the central west Florida shelf 36
Table 5 Macromolluscan production rates for the central west Florida shelf 37
Table 6 Molluscan production rates for the central west Florida shelf 38
Table 7 Echinoderm chemical composition 47
Table 8 Echinoderm production rates for the central west Florida shelf 48
Table 9 Echinoderm production summary by depth range 49
Table 10 Summary of algal carbonate production rates 58
Table 11 Summary of coral carbonate production rates 59
Table 12 Coral and algal production rates for the central west Florida shelf 62
Table 13 Carbonate production rates for the Florida Middle Ground 70
Table 14 Sediment constituents modified from Brooks (1981) 71
Table 15 Calcium carbonate production rates 73
Table 16 Carbonate production rates for varied environments 92
v

LIST OF FIGURES
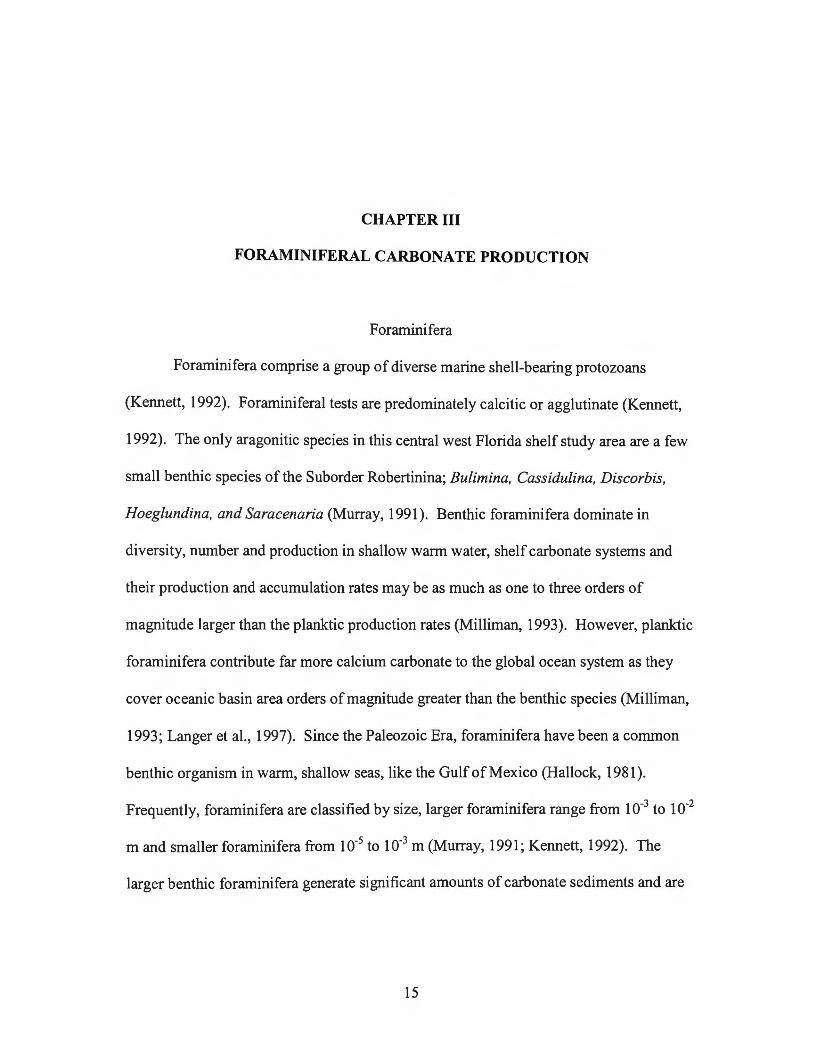
Figure 1. MAFLA Boxcore Stations 1974 Cruise 7
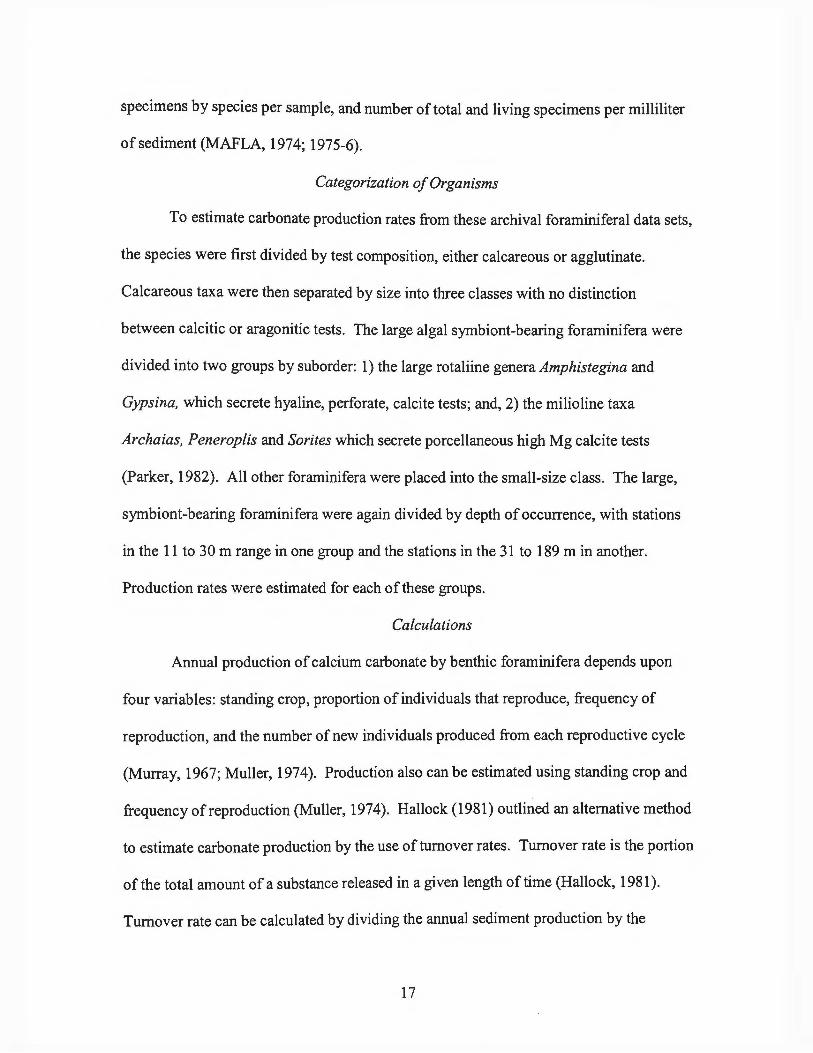
Figure 2. MAFLA Boxcore Stations 1975-1976 Cruises 8
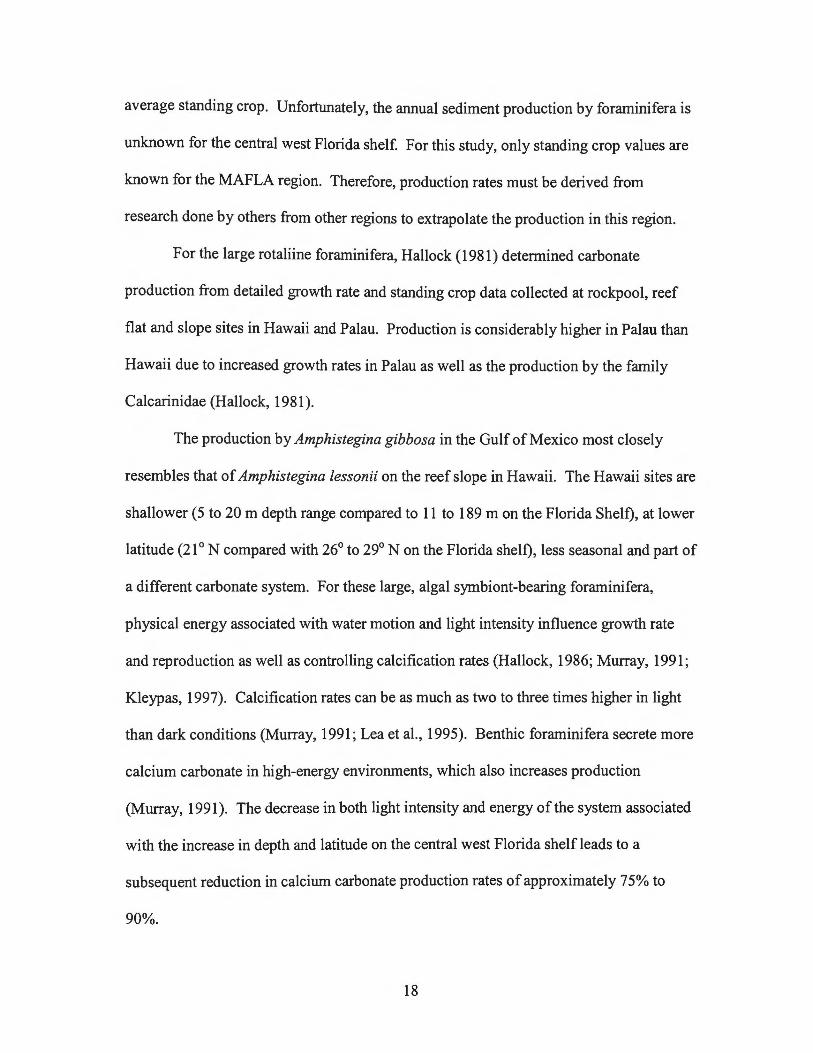
Figure 3. MMS Boxcore Stations 1992-1994 9
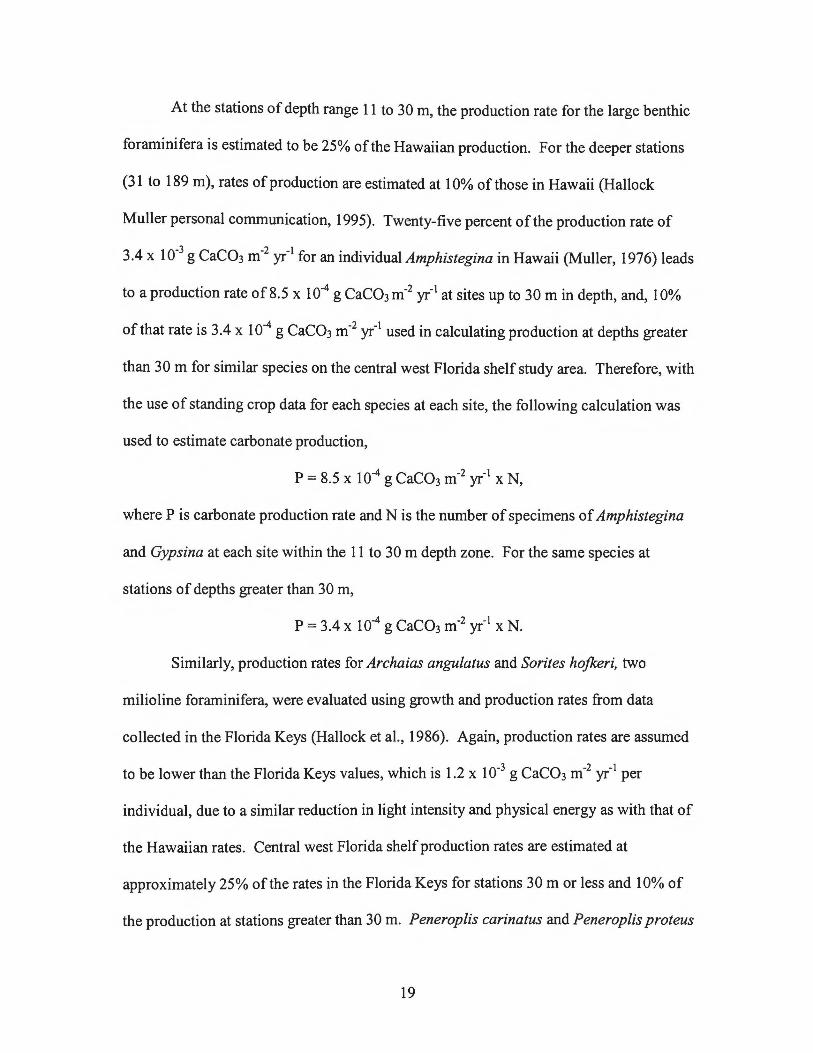
Figure 4. All Stations of the Central West Florida Shelf Study Region 10
Figure 5. Stations with Foraminiferal Production Rates 29
Figure 6. Stations with Molluscan Production Rates 40
Figure 7. Stations with Calcium Carbonate Production Rates 75
Vl
Calcium Carbonate Production on the Central West Florida Continental Shelf
Elizabeth C. Tyner
ABSTRACT
The central west Florida continental shelf is partially covered by an isolated
carbonate sand sheet. Biological production by calcium carbonate secreting organisms
provides the primary source of sediment to this shallow warm-water system. For the
west Florida shelf region between the Florida Middle Ground and Fort Myers, carbonate
production rates were estimated for the major taxa of carbonate-producing organisms.
Standing crop and biomass values for these organisms were obtained from boxcore
samples collected on three separate cruise surveys.
Calcium carbonate is produced in this region at a rate on the order of 102 g CaC03
m-2 yr1, with a sedimentation rate of approximately 1 o-1 mm yr-1
•
The mollusca, the dominant constituent of the sediments, produce 54% ofthe
calcium carbonate, 39% by the micromollusca and 15% by the macromollusca.
Foraminifera contribute 37% of the total carbonate produced across the shelf. Calcareous
algae provide 8% of the production. Echinoderms, coral and cirripedia all contribute less
than 1%.
Vll

Substrate plays an integral role in community composition and production rates
and is, in tum, shaped by the resident communities. Although the assemblages vary
greatly both spatially and temporally, the short-term patchiness contributes to long-term
stability of production rates across and along the shelf.
Vlll

CHAPTER I
INTRODUCTION
Definition of Work
Goal of Study
The goal of this study is to determine the rate of calcium carbonate production on
the central west Florida continental shelf. Calcium carbonate production is defined as the
mass of carbonate produced per year expressed in g CaC03 m-2 yr-1 (Hallock, 1981 ). The
rate of carbonate production can aid in determining sedimentation rates and sources of
deposition along the Florida coastal zone area, as well as predicting the productivity of
the region. Production rates also provide tools for interpretation of the fossil record. This
study focuses on the production by carbonate-secreting benthic organisms on the central
west Florida shelf.
Value of Study
The oil-rich northern Gulf of Mexico is among the most extensively explored
continental margins while the central west Florida shelf is among the least investigated
on the U.S. continental margin and what has been examined has been presented in
fragmented ways (MAFLA, 1974; Doyle and Sparks, 1980). Estimation ofthe carbonate
productivity for this region should be of interest to those managing the shelf, benthic
biologists, sedimentologists, paleoceanographers, modelers and those who derive income
1
and pleasure from its riches (Canals and Ballesteros, 1997). Knowledge of carbonate
production rates by benthic communities is important universally as well as locally as
production impacts diverse areas from the global carbon cycle to the economy of the west
coast of Florida. This synoptic presentation ofthe processes unique to the central west
Florida continental shelf offers a first glimpse at the rate of carbonate production.
Scope ofWork
Carbonate Shelves
Modem carbonate shelves are distinguished by their broad, shallow areas often
tropical and subtropical in nature; carbonate-dominated sediments ofbiogenic origin; low
terrigenous input; material primarily non-reefal or coral in derivation; and created,
influenced and altered by a set of processes unique to themselves (MacGinitie and
MacGinitie, 1968; Sellwood, 1978; Kennett, 1992; Canals and Ballesteros, 1997).
Continental shelves and slopes comprise 10% ofthe Earth's surface with 35% to 70% of
the Holocene carbonates deposited on the shelves (MacGinitie, and MacGinitie, 1968).
As important as they are, little of the energy transfer across the carbonate margins is
known and generally very few details exist of those benthic communities (MAFLA,
1974; Canals and Ballesteros, 1997).
Geographical Setting
A nearly classic example of a carbonate shelf is the central west Florida
continental shelf of the eastern Gulf of Mexico. This wide, shallow shelf of subtropical
affinities with smooth slope, little relief or framework and little terrigenous sediment
input, is ecologically rich, highly diverse and a relatively unknown scientific entity
2
(MAFLA, 1975-1976; Gorsline and Swift, 1977; Sellwood, 1978; Socci and Dinkelman,
1979; Doyle and Sparks, 1980; Murray 1991; Kennett, 1992).
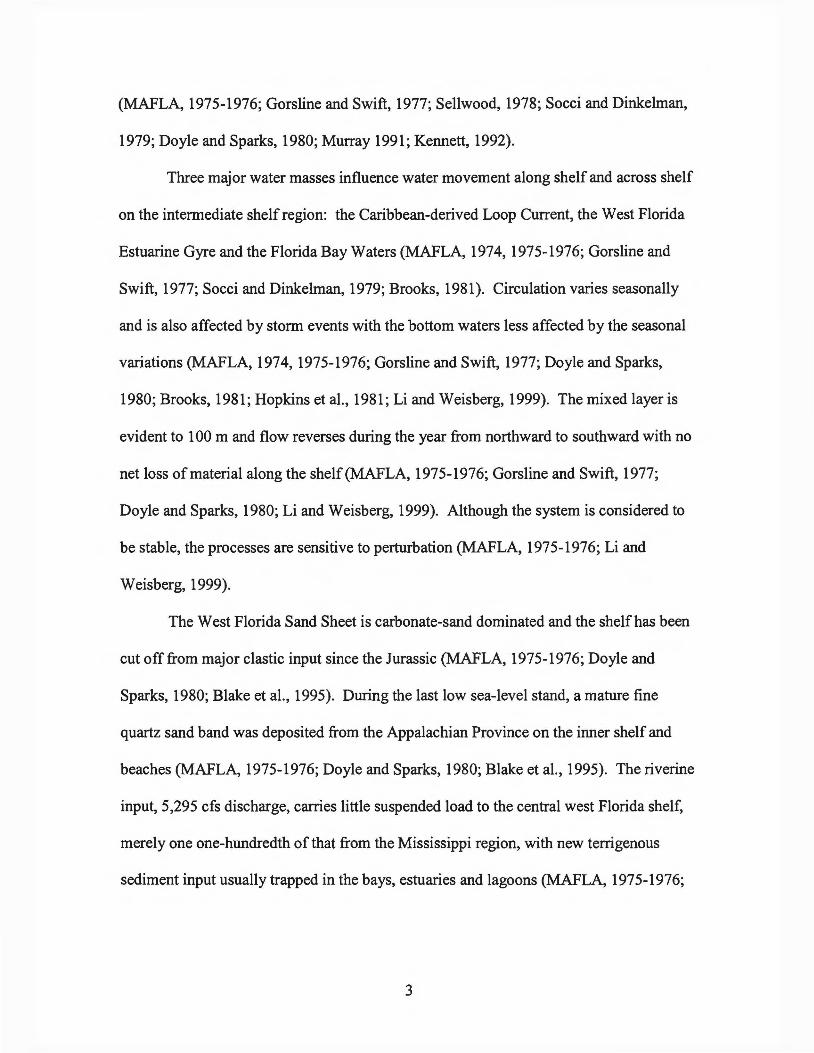
Three major water masses influence water movement along shelf and across shelf
on the intermediate shelf region: the Caribbean-derived Loop Current, the West Florida
Estuarine Gyre and the Florida Bay Waters (MAFLA, 1974, 1975-1976; Gorsline and
Swift, 1977; Socci and Dinkelman, 1979; Brooks, 1981 ). Circulation varies seasonally
and is also affected by storm events with the bottom waters less affected by the seasonal
variations (MAFLA, 1974, 1975-1976; Gorsline and Swift, 1977; Doyle and Sparks,
1980; Brooks, 1981; Hopkins et al., 1981; Li and Weisberg, 1999). The mixed layer is
evident to 100 m and flow reverses during the year from northward to southward with no
net loss of material along the shelf(MAFLA, 1975-1976; Gorsline and Swift, 1977;
Doyle and Sparks, 1980; Li and Weisberg, 1999). Although the system is considered to
be stable, the processes are sensitive to perturbation (MAFLA, 1975-1976; Li and
Weisberg, 1999).
The West Florida Sand Sheet is carbonate-sand dominated and the shelf has been
cut off from major clastic input since the Jurassic (MAFLA, 1975-1976; Doyle and
Sparks, 1980; Blake et al., 1995). During the last low sea-level stand, a mature fine
quartz sand band was deposited from the Appalachian Province on the inner shelf and
beaches (MAFLA, 1975-1976; Doyle and Sparks, 1980; Blake et al., 1995). The riverine
input, 5,295 cfs discharge, carries little suspended load to the central west Florida shelf,
merely one one-hundredth of that from the Mississippi region, with new terrigenous
sediment input usually trapped in the bays, estuaries and lagoons (MAFLA, 1975-1976;
3

Blake et al., 1995). The clear water often found in this region may be due in large part to
this lack of clay material in the sediments (MAFLA, 1975-1976).
Carbonate sedimentation is controlled by bioproduction and the sediment is
largely formed near the site of deposition (Bathurst, 1971; Gorsline and Swift, 1977).
The major source of new material into the west Florida system is carbonate in
composition (Blake et al., 1995).
Study Area
The surficial sediments of the central west Florida continental shelf offer a unique
study of a carbonate sand sheet isolated from clastic input. The area studied extends on
the continental west Florida shelf from the Florida Middle Ground area north ofTarpon
Springs southward to Fort Myers. In this stable environment in the eastern Gulf of
Mexico, no outstanding topographic features have been noted along the gentle sloping
shelfbottom; yet some distinct hydro-biological zones have been identified (MAFLA,
1975-1976). This region enjoys higher species diversity and a higher biomass than other
areas within the Gulf of Mexico. The modem sediment found in this carbonate
environment is ofbiogenic origin and no riverine sediment has come into this region
during the present high stand of sea level (MAFLA, 1975-1976).
Description of Data
The data used were collected from three separate cruises evaluating the shelf. The
Baseline Monitoring Studies, Mississippi, Alabama, Florida (MAFLA) Outer Continental
Shelf cruises conducted by Bureau of Land Management (BLM) on two series of cruises,
one in 1974 and one in 1975-1976, provided benchmark measurements of certain factors
4
affected by oil and gas exploitation (MAFLA, 1974). Transects were selected to
represent the different biotopes ofthe MAFLA region (MAFLA, 1975-1976).
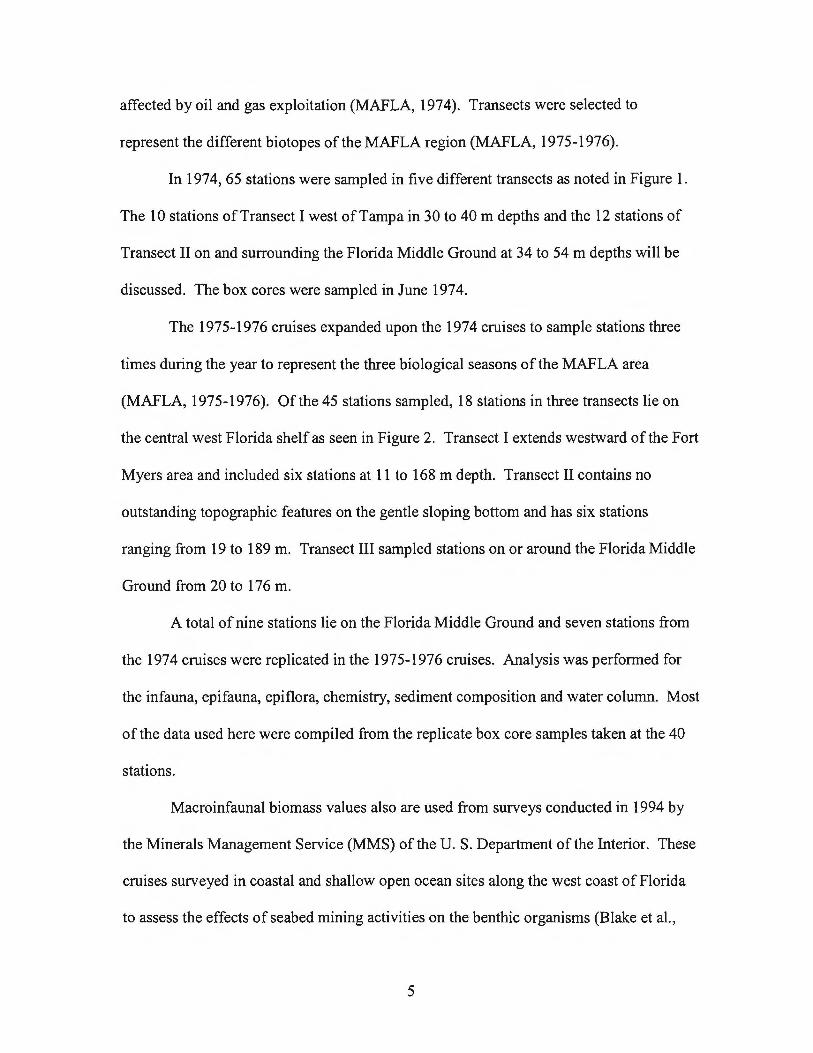
In 1974, 65 stations were sampled in five different transects as noted in Figure 1.
The 10 stations ofTransect I west ofTampa in 30 to 40 m depths and the 12 stations of
Transect II on and surrounding the Florida Middle Ground at 34 to 54 m depths will be
discussed. The box cores were sampled in June 1974.
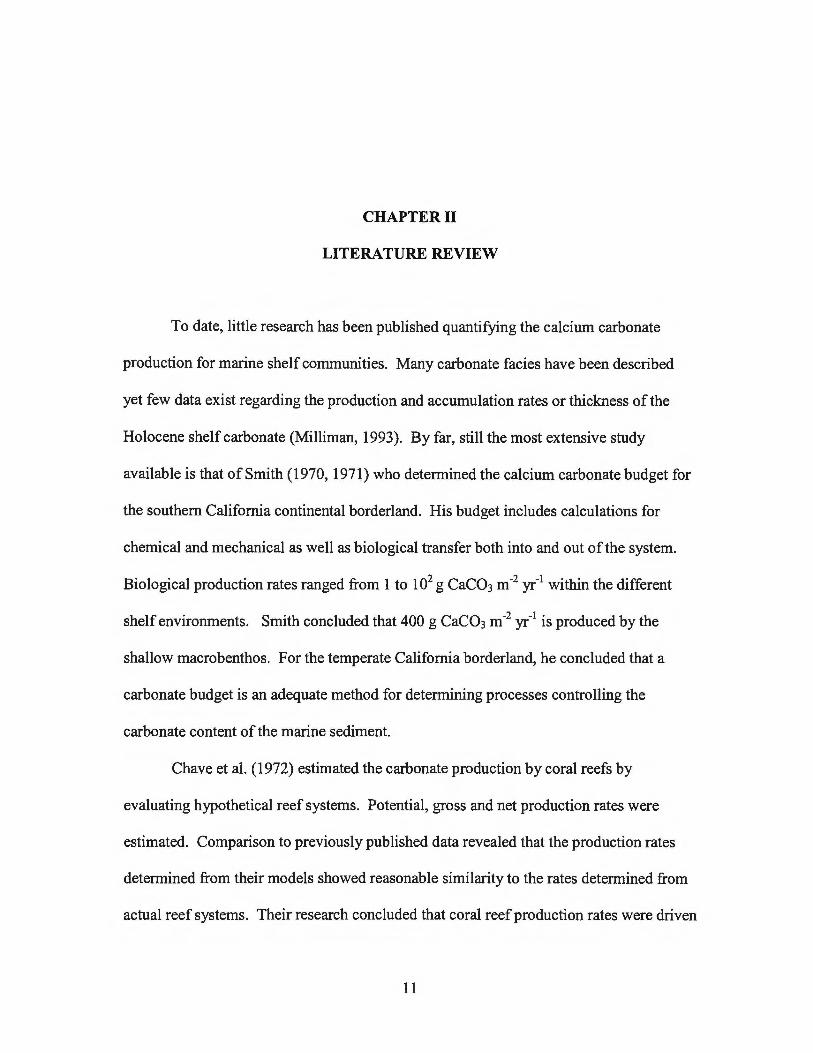
The 1975-1976 cruises expanded upon the 1974 cruises to sample stations three
times during the year to represent the three biological seasons of the MAFLA area
(MAFLA, 1975-1976). Ofthe 45 stations sampled, 18 stations in three transects lie on
the central west Florida shelf as seen in Figure 2. Transect I extends westward of the Fort
Myers area and included six stations at 11 to 168m depth. Transect II contains no
outstanding topographic features on the gentle sloping bottom and has six stations
ranging from 19 to 189 m. Transect III sampled stations on or around the Florida Middle
Ground from 20 to 176 m.
A total of nine stations lie on the Florida Middle Ground and seven stations from
the 1974 cruises were replicated in the 1975-1976 cruises. Analysis was performed for
the infauna, epifauna, epiflora, chemistry, sediment composition and water column. Most
of the data used here were compiled from the replicate box core samples taken at the 40
stations.
Macroinfaunal biomass values also are used from surveys conducted in 1994 by
the Minerals Management Service (MMS) of the U.S. Department of the Interior. These
cruises surveyed in coastal and shallow open ocean sites along the west coast of Florida
to assess the effects of seabed mining activities on the benthic organisms (Blake et al.,
5

1995). Four stations off Egmont Site I, three stations from Site II in Sarasota, one site off
Manasota Area III, and one west of Longboat in Site N were evaluated and shown in
Figure 3. The replicate box cores were taken from 6 and 13m depths.
From these three cruises, 48 stations lie on the central west Florida shelf and are
shown collectively in Figure 4 (Appendix 1). Data collected from these surveys are used
to calculate estimates of carbonate production rates. The data, although not uniformly
nor consistently presented, are among the most extensive yet available for the central
west Florida continental shelf and are comprehensive in many ways. Box core samples
and observations provide a picture of the benthic carbonate-producing community.
6

Figure 1.
t•" •
'
1.1A FLA Lo01:e Ar;,a
Dou:orfl Stotlona
MAFLA Box core Stations 197 4 Cruise
~(') o d'i.fo>..e e~
0
7

Figure 2. MAFLA Boxcore Stations 1975-1976 Cruises
••• ·~·
I I!
8

Figure 3. MMS Boxcore Stations 1992-1994
870 86° eso 840 830 820
PENSACOLA ~ v ;
JOO
FLO RIDA
290
270
ze~
- 25:
ocs GULF OF MEXICO REGION EASTERN
9

Figure 4. All Stations of the Central West Florida Shelf Study Region
-85" 00' -84"10' -83" 20' -82" 30'
29" 10' 29"10' • • •••
28" 20' • •i • 28" 20'
• • ·'·· • •'I
27" 30' 27" 30'
26" 40'
• • • • -85" 00' -84 "1 0' -83" 20' -82" 30'
10
CHAPTER II
LITERATURE REVIEW
To date, little research has been published quantifying the calcium carbonate
production for marine shelf communities. Many carbonate facies have been described
yet few data exist regarding the production and accumulation rates or thickness of the
Holocene shelf carbonate (Milliman, 1993). By far, still the most extensive study
available is that of Smith (1970, 1971) who determined the calcium carbonate budget for
the southern California continental borderland. His budget includes calculations for
chemical and mechanical as well as biological transfer both into and out of the system.
Biological production rates ranged from 1 to 102 g CaC03 m-2 yr-1 within the different
shelf environments. Smith concluded that 400 g CaC03 m-2 yr-1 is produced by the
shallow macrobenthos. For the temperate California borderland, he concluded that a
carbonate budget is an adequate method for determining processes controlling the
carbonate content of the marine sediment.
Chave et al. (1972) estimated the carbonate production by coral reefs by
evaluating hypothetical reef systems. Potential, gross and net production rates were
estimated. Comparison to previously published data revealed that the production rates
determined from their models showed reasonable similarity to the rates determined from
actual reef systems. Their research concluded that coral reef production rates were driven
11
by coral growth rates with gross production on the order of 104 g CaC03 m-2 yr-1 with a
net production of 103 g CaC03 m-2 yr-1 retained by the reef. Chave et al. (1972) also
determined that the production was dependent upon the type ofreefhabitat identified
from among four different habitat models.
Hubbard et al. (1990) examined the production of calcium carbonate for a shelf
edge reef system located in the U. S. Virgin Islands. Coral production dominated the
total reef production rates, providing 93% ofthe 1.2 x 10³ g CaC03 m-2 yr-1 carbonate
produced. They found production greater near the shelfbreak and did not find a direct
depth relationship. They estimated 75% retention within the reef fabric.
Milliman (1993) presented average carbonate production and accumulation on a
global scale. He presented average production values for the shallow-water environments
of coral reefs, banks and embayments, and continental shelves, as well as the production
for the deep sea. He estimated a carbonate production rate of 60 g CaC03 m-2 yr-1 for
carbonate-rich shelves dominated by benthic production. Production for non-carbonate
shelves may be as low as 25 g CaC03 m-2 yr-1; that of a coral reef complex is 1.5 x 10³ g
CaC03 m-2 yr-1; and production may reach a maximum of 3 x 10³ g CaC03 m-2 yr-1 for
production by Halimeda bioherms. Total production of CaC03 worldwide was calculated
to be 5 billion tons per year of which 60% is accumulating.
Langer et al. (1997) also estimated global ocean carbonate production and the role
played by reef foraminifera and found a range of 30 to 1000 g CaC03 m-2 yr-1. They
presented a novel method for production calculation by using a numerical transformation
to convert skeletal sediment percentages to foraminiferal production rates. They
calculated a rate of 1.2 g CaC03 m-2 yr-1 to 120 g CaC03 m-2 yr-1 for foraminiferal
12
production in low-productivity lagoonal areas and 230 g CaC03 m-2 yr·1 for high
productivity reefal areas. Light was the key factor in determining production rates for the
larger symbiont-bearing foraminifera. They also discussed the role of carbonate
production in the global C02 cycle.
Kleypas (1997) proposed a model estimating carbonate production for shallow,
tropical regions focusing on physical and chemical controls. Kleypas also found light to
be the primary control in calcification rates using corals as the dominant carbonate
producer.
Bosence (1989) reviewed previous works on production and calculated biogenic
carbonate production in Florida Bay. His estimates are 103 g CaC03 m-2 yr-1 for the
Buchanan Banks and 300 g CaC03 m-2 yr-1 for the Upper Cross Bank.
Canals and Ballesteros (1997) identified eight different benthic communities on
the Mallorca-Menorca shelf in the northwestern Mediterranean Sea and figured carbonate
production for each. ·Most are algal dominated in depths less than 90 m. They found
production higher on rocky bottoms than soft substrate. The range of rates was 91 g
CaC03 m-2 yr-1 to 124 g CaC03 m-2 yr-1 with a mean estimation of 100 g CaC03 m-2 yr-1•
Smith and Kinsey (1976) summarized and discussed calcium carbonate
production by coral reefs. They estimate that shallow, seaward coral reefs produce
around 4 x 10³ g CaC03 m-2 yr-1 and protected areas abo~t 8 x 10² g CaC03 m-2 yr-1• The
discussion included production in relation to sea level changes.
Moore (1972) explored carbonate production by subtropical soft-bottom
communities in Biscayne, Florida. From observations, a rate of 4 x 10² g CaC03 m-2 yr-1
13

was calculated for sublittoral communities and 103 g CaC03 m-2 yr-1 for one intertidal
area. Molluscs and echinoderms dominated production.
Frankovich and Zieman (1994) examined the seagrass Thalassia and its epibionts
in Florida Bay. Production estimates ranged from 2 g CaC03 m-2 yr-1 to 280 g CaC03 m-2
-1 yr.
Hallock (1981) estimated production by Pacific benthic foraminifera and
summarized, for comparison, the carbonate production rates for a variety of reef
carbonate producers and environments. Production by the foraminifera ranged from 1.5 x
102 g CaC03 m -2 yr-1 to 2. 8 x 1 03 g CaC03 m -2 yr-1•
Thus, much foundational work on production by carbonate-secreting organisms
has been published. Some of this research will be used to aid in estimating rates for the
central west Florida shelf. The results obtained by others will be compared to the
findings of this study in the discussion.
14
CHAPTER III
FORAMINIFERAL CARBONATE PRODUCTION
Foraminifera
Foraminifera comprise a group of diverse marine shell-bearing protozoans
(Kennett, 1992). Foraminiferal tests are predominately calcitic or agglutinate (Kennett,
1992). The only aragonitic species in this central west Florida shelf study area are a few
small benthic species of the Suborder Robertinina; Bulimina, Cassidulina, Discorbis,
Hoeg/undina, and Saracenaria (Murray, 1991). Benthic foraminifera dominate in
diversity, number and production in shallow warm water, shelf carbonate systems and
their production and accumulation rates may be as much as one to three orders of
magnitude larger than the planktic production rates (Milliman, 1993). However, planktic
foraminifera contribute far more calcium carbonate to the global ocean system as they
cover oceanic basin area orders of magnitude greater than the benthic species (Milliman,
1993; Langer et al., 1997). Since the Paleozoic Era, foraminifera have been a common
benthic organism in warm, shallow seas, like the Gulf of Mexico (Hallock, 1981 ).
Frequently, foraminifera are classified by size, larger foraminifera range from 10-3 to 10-2
m and smaller foraminifera from 10-5 to 10-3 m (Murray, 1991; Kennett, 1992). The
larger benthic foraminifera generate significant amounts of carbonate sediments and are
15

key producers of sand-sized carbonate sediments in reefal and shallow-water carbonate
systems (Hallock, 1981 ).
Methods
Data Used
The data collected and compiled for the MAFLA lease area studies of 1974 and
1975-1976 include very detailed analyses of the living benthic foraminifera on the central
west Florida shelf. Due to their small size, the foraminifera are not easily quantified by
biomass (wet weight) figures (Murray, 1973). Therefore, Bock (MAFLA, 1974; 1975-
1976) presented the living benthic foraminiferal data collected in 1974 by number and
species per sample area. The 1975-1976 data were listed by total foraminiferal density
per sample for three distinct seasons and by number and species per sample for the
summer.
Samples were extracted from 21.3 em x 30.5 em x 15 em box cores taken during
these two MAFLA studies. Results are presented from evaluation of samples from a total
of 40 sites within this study area. A 2.5 em diameter by 15 em plug was removed from
each of two cores. The upper 3 em of each sub core were preserved in glutaraldehyde for
the identification of living foraminifera by protoplasm content. The remaining sediment
was archived for fossil faunal analysis and comparison with the recent past to determine
natural changes in the environment (MAFLA, 1974; 1975-1976). The subcore samples
were wet-sieved through a 63 Jlm sieve to remove the finer sediment. Three hundred
specimens per sample were picked, mounted and identified by the MAFLA researchers.
Analysis included identification of planktic to benthic ratio, percentage of living
16
specimens by species per sample, and number of total and living specimens per milliliter
of sediment (MAFLA, 1974; 1975-6).
Categorization of Organisms
To estimate carbonate production rates from these archival foraminiferal data sets,
the species were first divided by test composition, either calcareous or agglutinate.
Calcareous taxa were then separated by size into three classes with no distinction
between calcitic or aragonitic tests. The large algal symbiont-bearing foraminifera were
divided into two groups by suborder: 1) the large rotaliine genera Amphistegina and
Gypsina, which secrete hyaline, perforate, calcite tests; and, 2) the milioline taxa
Archaias, Peneroplis and Sorites which secrete porcellaneous high Mg calcite tests
(Parker, 1982). All other foraminifera were placed into the small-size class. The large,
symbiont-bearing foraminifera were again divided by depth of occurrence, with stations
in the 11 to 30 m range in one group and the stations in the 31 to 189 m in another.
Production rates were estimated for each of these groups.
Calculations
Annual production of calcium carbonate by benthic foraminifera depends upon
four variables: standing crop, proportion of individuals that reproduce, frequency of
reproduction, and the number of new individuals produced from each reproductive cycle
(Murray, 1967; Muller, 1974). Production also can be estimated using standing crop and
frequency of reproduction (Muller, 1974). Hallock (1981) outlined an alternative method
to estimate carbonate production by the use of turnover rates. Turnover rate is the portion
of the total amount of a substance released in a given length of time (Hallock, 1981 ).
Turilover rate can be calculated by dividing the annual sediment production by the
17
average standing crop. Unfortunately, the annual sediment production by foraminifera is
unknown for the central west Florida shelf. For this study, only standing crop values are
known for the MAFLA region. Therefore, production rates must be derived from
research done by others from other regions to extrapolate the production in this region.
For the large rotaliine foraminifera, Hallock (1981) determined carbonate
production from detailed growth rate and standing crop data collected at rockpool, reef
flat and slope sites in Hawaii and Palau. Production is considerably higher in Palau than
Hawaii due to increased growth rates in Palau as well as the production by the family
Calcarinidae (Hallock, 1981 ).
The production by Amphistegina gibbosa in the Gulf of Mexico most closely
resembles that of Amphistegina lessonii on the reef slope in Hawaii. The Hawaii sites are
shallower (5 to 20m depth range compared to 11 to 189m on the Florida Shelf), at lower
latitude (21 ° N compared with 26° to 29° N on the Florida shelf), less seasonal and part of
a different carbonate system. For these large, algal symbiont-bearing foraminifera,
physical energy associated with water motion and light intensity influence growth rate
and reproduction as well as controlling calcification rates (Hallock, 1986; Murray, 1991;
Kleypas, 1997). Calcification rates can be as much as two to three times higher in light
than dark conditions (Murray, 1991; Lea et al., 1995). Benthic foraminifera secrete more
calcium carbonate in high-energy environments, which also increases production
(Murray, 1991). The decrease in both light intensity and energy of the system associated
with the increase in depth and latitude on the central west Florida shelfleads to a
subsequent reduction in calcium carbonate production rates of approximately 75% to
90%.
18
At the stations of depth range 11 to 30 m, the production rate for the large benthic
foraminifera is estimated to be 25% of the Hawaiian production. For the deeper stations
(31 to 189 m), rates of production are estimated at 10% of those in Hawaii (Hallock
Muller personal communication, 1995). Twenty-five percent ofthe production rate of
3.4 X 1 o-3
g CaC03 m-2 yr-1 for an individual Amphistegina in Hawaii (Muller, 1976) leads
to a production rate of 8.5 x 10⁴ g CaC03 m-2 yr-1 at sites up to 30 m in depth, and, 10%
of that rate is 3.4 x 10⁴ g CaC03 m-2 yr-1 used in calculating production at depths greater
than 30 m for similar species on the central west Florida shelf study area. Therefore, with
the use of standing crop data for each species at each site, the following calculation was
used to estimate carbonate production,
P = 8.5 x 10⁴ g CaC03 m-2 yr-1 x N,
where P is carbonate production rate and N is the number of specimens of Amphistegina
and Gypsina at each site within the 11 to 30 m depth zone. For the same species at
stations of depths greater than 30 m,
P = 3.4 x 10⁴ g CaC03 m-2 yr-1 x N.
Similarly, production rates for Archaias angulatus and Sorites hofkeri, two
milioline foraminifera, were evaluated using growth and production rates from data
collected in the Florida Keys (Hallock et al., 1986). Again, production rates are assumed
to be lower than the Florida Keys values, which is 1.2 x 10⁻³ g CaC03 m-2 yr-1 per
individual, due to a similar reduction in light intensity and physical energy as with that of
the Hawaiian rates. Central west Florida shelf production rates are estimated at
approximately 25% ofthe rates in the Florida Keys for stations 30m or less and 10% of
the production at stations greater than 30 m. Peneroplis carinatus and Peneroplis proteus
19
production rates were calculated at 10% of those obtained from the same study ofthe
Florida Keys.
The production rate for Archaias angulatus and Sorites hojkeri is
P = 3 x 10⁻⁴ g CaC03 m-2 yr-1 x N,
for depths 30 m or less. For Archaias angulatus and Sorites hojkeri for depths 30m and
greater and the Peneroplis species at all depths,
P = 1.2 x 10⁻⁴ g CaC03 m-2 yr-1 x N.
The larger symbiont-bearing foraminifera in the central west Florida shelf study
area range between 0% and 19% of the total carbonate producing foraminifera with
average standing crop values of 5.6 x 10⁴ specimens per m-2. The production rate
estimates for the larger foraminifera are found in Appendices 2 through 9.
Densities of the smaller benthic foraminifera are considerably higher, averaging
1.6 x 10⁶ specimens per m-2. Total carbonate production for the small benthic
foraminifera is estimated by multiplying the observed standing crop by an average
production rate derived from that of other warm, shallow, marine carbonate systems.
Muller (1976) determined a carbonate production rate of 8.5 x 10⁻⁵ g CaC03 m-2 yr-1 for
small benthic foraminifera at several sites in Hawaii. Wefer and Lutze (1978) calculated
a production rate of 1.2 x 10⁻⁵ g CaC03 m-2 yr-1 for small benthic species at depth of26 to
28m in the Baltic Sea. This value, averaged with 25% of the rate from Hawaii, gives a
carbonate production rate for the small benthic foraminifera of 1.7 x 10⁻⁵ g CaC03 m-2
yr-1 (Muller, 1976; Wefer and Lutze, 1978; Murray, 1991).
20
0.5 {(8.5 x 10⁻⁵ g CaC03 m-2 yr-1 x .25) + (1.2 x 10⁻⁵ g CaC03 m-2 yr-1)}
= 1.7 x 10⁻⁵ g CaC03 m-2 yr-1 for small foraminifera on the central West
Florida shelf. This production rate multiplied by the number of small foraminifera per m2
per site estimates the carbonate contribution of the small foraminifera. The production
estimates for the small benthic foraminifera are found in Appendices 10 through 15.
Langer et al. (1997) presented an alternative method for calculating carbonate
production rates of benthic reef foraminifera. They developed a simple mathematical
model converting the foraminiferal skeletal sediment component into a production rate
for the foraminifera. The skeletal sediment component is multiplied by an average value
of foraminiferal carbonate production. This upper limit of productivity ranges from a low
of 1.2 g m-2 yr-1 for areas of low productivity to a maximum of 6 g m-2 yr-1 in a modem
high-productivity reef area. They found that the larger symbiont-bearing foraminifera
produce nearly 80% ofthe total carbonate. Langer et al. (1997) assumes that all skeletal
components are carbonate.
Results
For the 1975-1976 MAFLA study, the production rates were calculated for each
station for a three-season period and a summary of seasonal rates may be found in
Appendix 16. Appendix 17lists production for each station. A summary of the total
foraminiferal production rates by transect can be found in Table 1.
21

Table 1 Foraminiferal production rates for the central west Florida shelf
1974 II 1974 I 1975-1976 I 1975-1976 II 1975-1976 III Florida Middle Ground
Large Production Range Average 0-48 17 0-86 22 1-33 12 0-12 5 2-8 5 2-22 10
Average for the shelf 0-86 14
Small Production Range Average 4-86 21 6-86 44 7-30 15 7-52 30 6-72 27 4-31 14
4-86 28
Total Production Range Average 12-86 38 6-124 66 16-63 27 14-63 34 9-77 31 9-53 24
6-124 42
Langer et al. (1997) Method
Shelf Florida Middle Ground
Average for the shelf
12-60 4-21
15 5
13
The average foraminiferal skeletal component of the sediments in the MAFLA
region is 3.4% in the Florida Middle Ground and 10% on the surrounding west Florida
shelf(Brooks, 1981). Using the Langer et al. (1997) equation, the foraminiferal
production could range from 4 to 21 g CaC03 m-2 yr-1 on the Florida Middle Ground and
from 12 to 60 g CaC03 m-2 yr-1 on the surrounding shelf. Ifwe continue to consider shelf
production as approximately 25% of that for a reef area, the Florida Middle Ground
foraminiferal carbonate productivity would be 5 g CaC03 m-2 yr-1 for the sediment
constituent model compared with an average of24 g CaC03 m-2 yr-1 from the above
calculations. The surrounding shelf area would then have foraminiferal carbonate
productivity of 15 g CaC03 m-2 yr-1 compared with the above shelf average of 42 g
CaC03 m·2 yr·1• The average for the region using this first-order skeletal-component
22
production estimate would then be 13 g CaC03 m-2 yr"1, compared with the 42 g CaC03
m-2 yr-1 previously calculated.
Discussion of Results
Production Rate
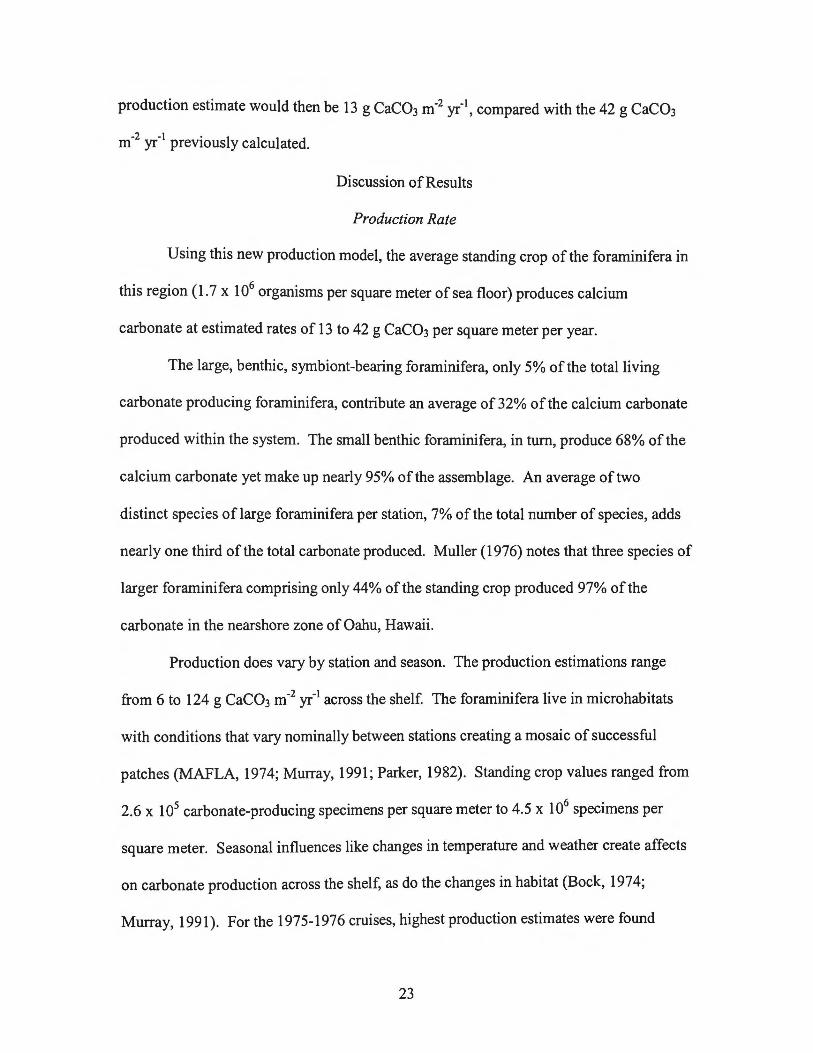
Using this new production model, the average standing crop of the foraminifera in
this region ( 1. 7 x 10⁶
organisms per square meter of sea floor) produces calcium
carbonate at estimated rates of 13 to 42 g CaC03 per square meter per year.
The large, benthic, symbiont-bearing foraminifera, only 5% of the total living
carbonate producing foraminifera, contribute an average of 32% of the calcium carbonate
produced within the system. The small benthic foraminifera, in turn, produce 68% of the
calcium carbonate yet make up nearly 95% ofthe assemblage. An average of two
distinct species of large foraminifera per station, 7% of the total number of species, adds
nearly one third of the total carbonate produced. Muller (1976) notes that three species of
larger foraminifera comprising only 44% of the standing crop produced 97% of the
carbonate in the nearshore zone of Oahu, Hawaii.
Production does vary by station and season. The production estimations range
from 6 to 124 g CaC03 m-2 yr-1 across the shelf. The foraminifera live in microhabitats
with conditions that vary nominally between stations creating a mosaic of successful
patches (MAFLA, 1974; Murray, 1991; Parker, 1982). Standing crop values ranged from
2.6 x 10⁵ carbonate-producing specimens per square meter to 4.5 x 10⁶
specimens per
square meter. Seasonal influences like changes in temperature and weather create affects
on carbonate production across the shelf, as do the changes in habitat (Bock, 1974;
Murray, 1991 ). For the 1975-1976 cruises, highest production estimates were found
23
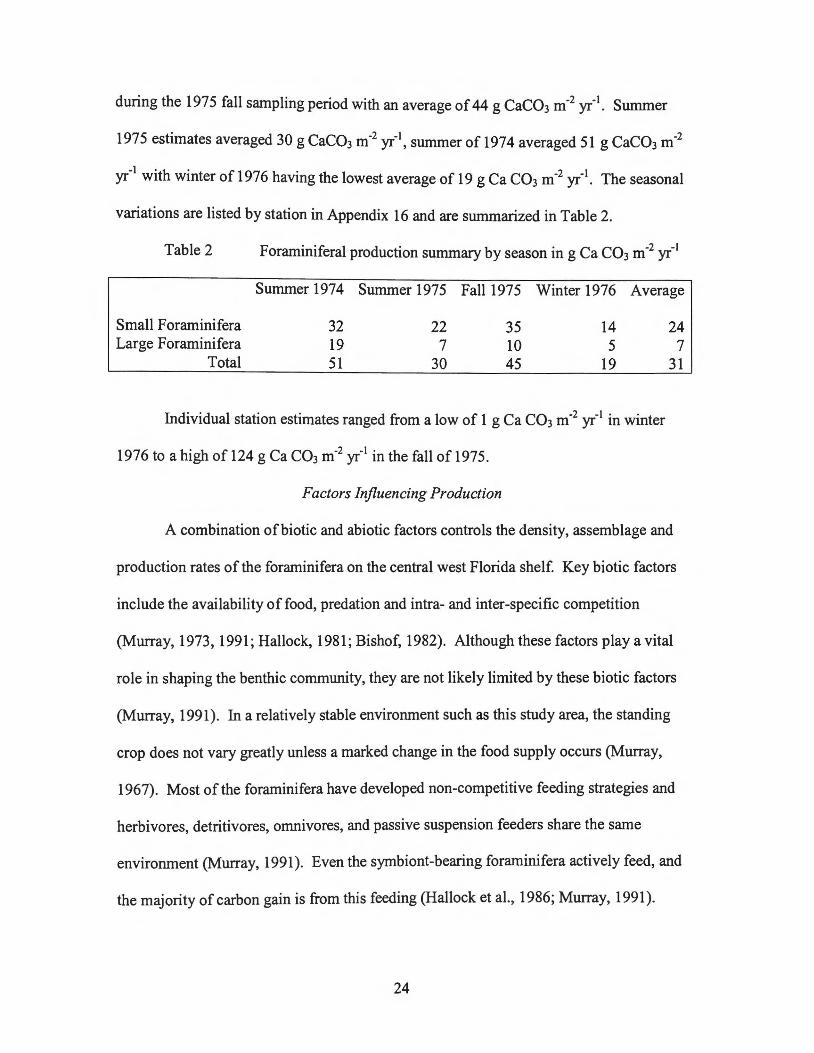
during the 1975 fall sampling period with an average of 44 g CaC03 m·2 yr·1• Summer
1975 estimates averaged 30 g CaC03 m·2 yr·1, summer of 1974 averaged 51 g CaC03 m·2
yr·1
with winter of 1976 having the lowest average of 19 g Ca C03 m-2 yr·1• The seasonal
variations are listed by station in Appendix 16 and are summarized in Table 2.
Table 2 Foraminiferal production summary by seasoning Ca C03 m·2 yr·1
Summer 1974 Summer 1975 Fall1975 Winter 1976 Average
Small Foraminifera Large Foraminifera
Total
32 19 51
22 7
30
35 10 45
14 5
19
Individual station estimates ranged from a low of 1 g Ca C03 m·2 yr-1 in winter
1976 to a high of 124 g Ca C03 m·2 yr·1 in the fall of 1975.
Factors Influencing Production
24 7
31
A combination ofbiotic and abiotic factors controls the density, assemblage and
production rates of the foraminifera on the central west Florida shelf. Key biotic factors
include the availability of food, predation and intra- and inter-specific competition
(Murray, 1973, 1991; Hallock, 1981; Bishof, 1982). Although these factors play a vital
role in shaping the benthic community, they are not likely limited by these biotic factors
(Murray, 1991). In a relatively stable environment such as this study area, the standing
crop does not vary greatly unless a marked change in the food supply occurs (Murray,
1967). Most of the foraminifera have developed non-competitive feeding strategies and
herbivores, detritivores, omnivores, and passive suspension feeders share the same
environment (Murray, 1991). Even the symbiont-bearing foraminifera actively feed, and
the majority of carbon gain is from this feeding (Hallock et al., 1986; Murray, 1991 ).
24

A greater role in shaping communities and production rates is played by the
abiotic factors oftemperature, salinity, dissolved oxygen, pH, depth, physical energy,
turbidity, terrigenous input and the nature ofthe substrate (Murray, 1973; Hallock, 1981;
Babashoff, 1982; Murray, 1991). Ofthese, salinity, pH·, and DO are fairly constant
across the shelf and very little terrigenous material is input into this region. An expected
correlation with depth does not always occur (Murray, 1991). The influence of depth on
distribution and standing crop is an indirect one as changes in depth are linked to more
important factors such as light and energy. Calculating the different depth zone divisions
for the large foraminifera at different carbonate production rates allows for compensation
for changes in production that occur with increasing depth. Babashoff (1982) found the
primary factor in controlling foraminiferal distribution on the shelf is the texture and
content of the surface sediment that an evaluation ofthis data supports. A definite
correlation exists between the nature of the substrate and carbonate production. An
inverse relationship between grain size and carbonate production occurs over the shelf
region (Fig. 4). The production rate model presented here does support the theory that
the abiotic physical-chemical setting (namely the nature of substrate, light and physical
energy) rather than the biological composition is the most important factor influencing
the calcification rate in this marine environment (Smith, 1970; Bock, 1974; Hallock,
1981; Babashof, 1982; Murray 1991; Kennett, 1992; Jayarahu andReddi, 1995).
Regional Comparison
Despite the abundance and importance of foraminifera to global oceanic
carbonate production, little is known of foraminiferal production for much ofthe marine
environment, especially on the central west Florida shelf (Parker, 1982; Murray, 1991;
25
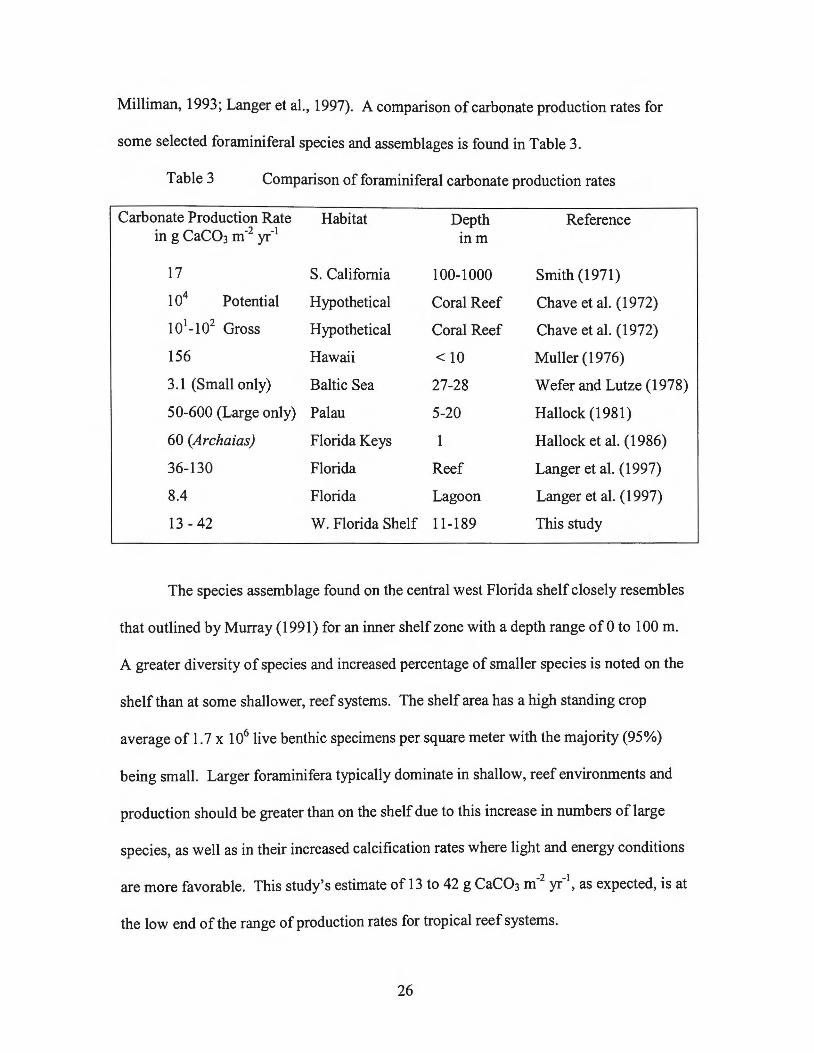
Milliman, 1993; Langer et al., 1997). A comparison of carbonate production rates for
some selected foraminiferal species and assemblages is found in Table 3.
Table 3 Comparison of foraminiferal carbonate production rates
Carbonate Production Rate Habitat Depth Reference in g CaC03 m-2 yr-1
inm
17 S. California 100-1000 Smith (1971)
104 Potential Hypothetical Coral Reef Chave et al. (1972)
101-102 Gross Hypothetical Coral Reef Chave et al. (1972)
156 Hawaii < 10 Muller (1976)
3.1 (Small only) Baltic Sea 27-28 Wefer and Lutze (1978)
50-600 (Large only) Palau 5-20 Hallock (1981)
60 (Archaias) Florida Keys 1 Hallock et al. (1986)
36-130 Florida Reef Langer et al. ( 1997)
8.4 Florida Lagoon Langer et al. (1997)
13-42 W. Florida Shelf 11-189 This study
The species assemblage found on the central west Florida shelf closely resembles
that outlined by Murray (1991) for an inner shelf zone with a depth range of 0 to 100 m.
A greater diversity of species and increased percentage of smaller species is noted on the
shelf than at some shallower, reef systems. The shelf area has a high standing crop
average of 1. 7 x 10⁶ live benthic specimens per square meter with the majority (95%)
being small. Larger foraminifera typically dominate in shallow, reef environments and
production should be greater than on the shelf due to this increase in numbers of large
species, as well as in their increased calcification rates where light and energy conditions
are more favorable. This study's estimate of 13 to 42 g CaC03 m-2 yr-1, as expected, is at
the low end of the range of production rates for tropical reef systems.
26
Fate of Carbonate Produced
The foraminifera are not the dominant constituent of the sediment on the central
west Florida shelf. Brooks (1981) presented the major sediment contributors for the
region with the foraminiferal component 3.4% of the sediment at the Florida Middle
Grounds and 1 0% on the surrounding central west Florida shelf. The carbonate content
of the sediment at the Florida Middle Ground resembles that of other continental shelves
and is typical of other deep water reef environments (Brooks, 1981 ). The rate of
deposition in the sediment is different at different locations (MAFLA, 1974). Certainly,
the small size and thin, fragile walls of these organisms enhance the opportunity for
breakdown, reworking and recycling back into the system as well as making it difficult to
recover the tests and identify all in the sediments. Larger foraminifera are less likely to
be sorted from the sediment (Muller, 1974). The smaller foraminifera or fragments of
dead foraminifera ( 1 0-4 m diameter or less) can be transported from the system in
suspended or bed load (Murray, 1991). Biological activity, breakdown of the fenestrated
tests after death, and destruction by burrowers, borers, grazers, browsers and predators all
greatly impact the fate ofthe foraminiferal tests (Brooks, 1981). The total sedimentation
rate for this region is low and the foraminifera may contribute as little as 1 0"2 mm per
year. An accurate sedimentation rate and constituent analysis would help in defining the
fate of the foraminiferal carbonate produced.
Conclusions
The calcium carbonate production rate for foraminifera on the central west
Florida shelf is estimated at 13 to 42 g Ca C03 m-2 yr-1. The large foraminifera comprise
5% of the standing crop and produce 32% of the foraminiferal carbonate. Greater
27
production occurs during the fall season. Production increases with decreasing sediment
grain size. A calcium carbonate production rate estimate for the foraminifera is
invaluable in understanding the processes on the central west Florida shelf as well as a
useful tool for evaluating such studies as productivity, ecology, life history, interpretation
of the fossil record, paleobiology, paleoenvironment, and sedimentation rate.
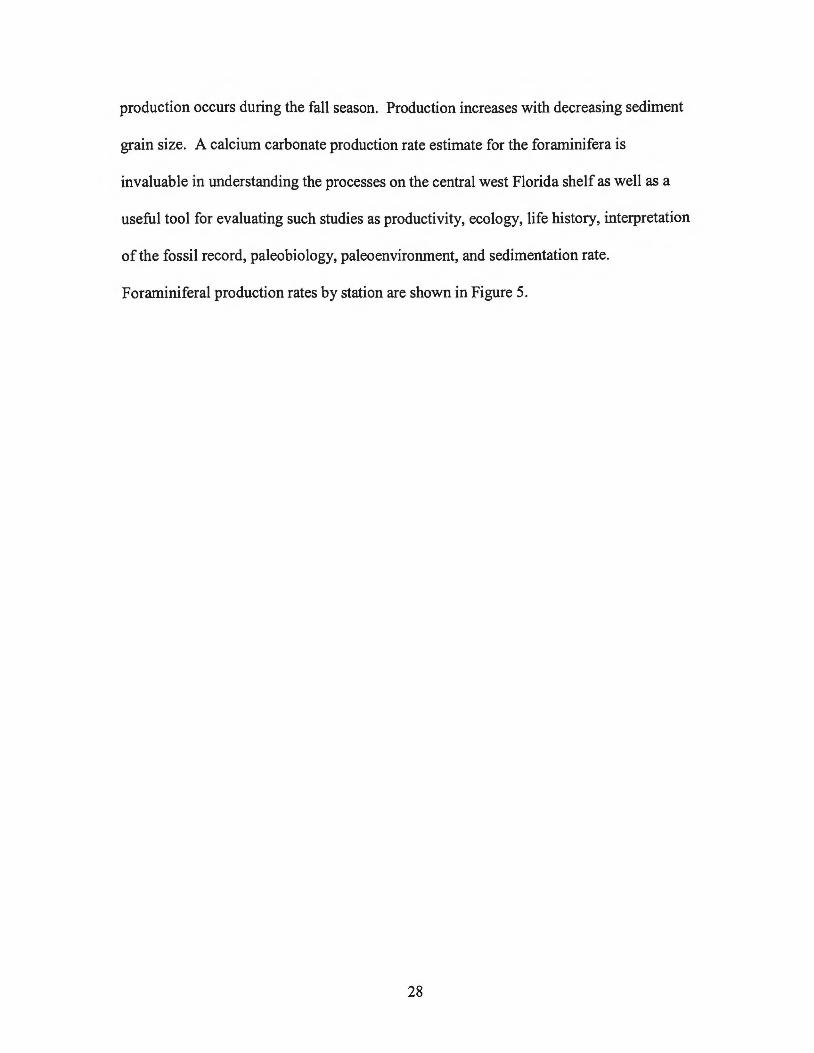
Foraminiferal production rates by station are shown in Figure 5.
28

Figure 5.
\;; lt. i r•ll ,,. lotrt II ill I 1'1'1 ru:-1t1111
l:!·an:~Ard TIM.I :::t.r 1r.
' ' • I
\ , Gl
·~ · I ' I I
1,
... ,. .. :,.
Ita: ·r;~
·· . . ·::\
Stations with Foraminiferal Production Rates
' ~!
I ' '
.....
I : ;.J"
29
\ ' I \ \.
:\~ \
0
I
\ t;
I "1 \
\~ 1""-. ~
, .1
~
\~ \~.
.~ .. , \~
\. '· '
,.
::a
'•!' ' '
g CaC~ a-2 yr-1
Foraminifera .... 6-10
1'· .;
II)
.~·-·
·::t
.... 11 -14
.... 15-19
20-26 .... 27-35
36-39
40-53 -65
.... 66-92
.... 93-124
~fi~ . c .... "" I ~ '· .. =•~
~~ ~ .•. .,. . ., ~ II~' ...... :10. ......
' .+. w 1:! /A · .. ~~ . ~~ . " · .. \ l 'i
,_.,:'' 1 .. ..
·~
~· t.·.;

CHAPTER IV
MOLLUSCAN CARBONATE PRODUCTION
Mollusca
The Mollusca are among the best-known groups of marine invertebrates found as
living members and in the fossil record (Vinogradov, 1953; Brusca and Brusca, 1990).
Although extensively studied since Aristotle, much of their life history and composition
is poorly known, especially for the smaller species, complicating the efforts to calculate
carbonate production (Vinogradov, 1953; MacGinitie and MacGinitie, 1968; Brusca and
Brusca, 1990; Moore, personal communication, 1995). With standing crop values,
average turnover rates, and chemical composition, annual carbonate production rates can
be estimated.
The MAFLA report of 1976 determined that the benthic molluscs in the MAFLA
region are patchy in distribution. Variations in species composition and abundance are
influenced by a variety of factors including season, sediment type, depth, geography,
year, and temperature. Populations are affected seasonally by recruitment and variation
in reproductive cycles and larval settlement induced by the Loop Current. Across the
central west Florida shelf, the observed increase in density of molluscs in shallower water
may indicate an increase in the availability of food. In general for this area, abiotic
30
factors exert greater influence on these populations than the biotic conditions. The report
concluded that the assemblages in the region are unique in both space and time.
The live molluscs identified in the MAFLA region belong to the classes
Gastropoda, Bivalvia, Scaphopoda, a few Polyplacophora and one Aplacophoran. The
mantle of these molluscs secretes a hard, calcareous skeleton as an internal or external
shell (Brusca and Brusca, 1990). The gastropods, known familiarly as the snails and
slugs, feed by herbivory, predation, parasitism, suspension feeding and browsing and are
rare in fine sediment and in depths over 50 meters (MAFLA, 1975-1976; Brusca and
Brusca, 1990). Bivalves, distinguished by two hinged shells, are microphagous or filter
feeders and suspension feeders (MAFLA, 1975-1976). Scaphopoda (tusk shells) and the
Polyplacophora (chitons) are less widely distributed in the benthic fauna of the region
(MAFLA, 1975-1976; Brusca and Brusca, 1990). Filter feeding bivalves and browsing
gastropods occur nearly equally in the stations sampled. Once settled, these organisms
may not move extensively and locomotion can primarily be a benefit in their search for
food (MAFLA, 1976).
Molluscs often contribute the largest biomass to carbonate rich-systems (Moore et
al., 1968). Although the study area is impoverished in live specimens, the samples are
rich in dead molluscan material. The shells and fragments of shells of the molluscs
comprise the dominant constituent ofthe sediment in this study area: 30% ofthe skeletal
fragments in the Florida Middle Ground and 4 7% of skeletal fragments of the
surrounding west Florida shelf (Brooks, 1981 ).
31

Methods
Categorization of Organisms
Molluscs of the MAFLA region are divided into two classes by size.
Micromolluscs are small molluscs, not exceeding 7 mm in size. No distinct taxonomic
division separates micromolluscs from the macromolluscs, although some species never
exceed this size (Fretter, 1948; MAFLA, 1974). Chave et al. (1972) also classified
micromolluscs as 1o-6 m2 or approximately 1 mm diameter. Of the 305 total species of
molluscs in the entire MAFLA region, 23 species are exclusively micromolluscan, 259
are exclusively macromolluscan and 23 species are common to both.
Data Used
Live samples of molluscs were collected and identified from the MAFLA region
in 1974, in a three-season study in 1975-1976, and in a two-year MMS study of
macroinfauna in 1992-1994 (MAFLA, 1974, 1975-1976; Blake et al., 1995). The
mollusca were sampled by box core. Live micromolluscs were obtained from a sediment
sample from each box core. For the 1974 cruise, the sample tube measured 3 em
diameter by 15 em deep, creating a sample size of 7.1 x 10⁻⁴ m2 per station (MAFLA,
1974). The MAFLA cruises in 1975-1976 used a 5.5 em diameter tube for sampling and
the two samples per station represent an area of 4.75 x 10⁻³ m2 (MAFLA, 1975-1976).
These small subsamples may be of inadequate size to represent the live micromollusc
assemblage, as the samples were very poor in live specimens (MAFLA, 1974, 1975-
1976). Micromolluscs species lists and density values (number of specimens per square
meter) for live specimens are presented for both cruises in Appendices 18 to 21.
32
Nine replicate box cores per station were used to determine the macromolluscan
biomass at each site. The macromolluscan wet weight biomass is expressed as grams per
square meter. The 1974 MAFLA cruise biomass represents 0.48 m2 of sea floor, the
1975-1976 MAFLA cruise 0.54 m2, and the MMS cruises of 1992-1994 0.57 m2• Due to
variations in bottom composition, the total penetration of each of the box cores changes
between stations. Gross biomass data could be affected by these differences as well as by
the chance recovery oflarge molluscs (MAFLA, 1974). Composition of the substrate
also may limit the use of the box core. Species lists are available for the macromolluscs
identified on the central west Florida shelf (Appendix 22 and 23).
Calculations
Carbonate production rates may be estimated using some combinations of
standing crop values, biomass figures, growth rates, turnover rates and chemical
composition. Growth rates of the molluscan species display considerable variation and
fluctuate widely (Coe and Fitch, 1950). Factors affecting growth rates include age, size,
sex, developmental or reproductive stage, annual changes, densities, temperature, species
type, availability of food, feeding strategy, geography, sediment type, seasonal changes,
year class, environmental competition and environmental conditions (Fretter, 1948; Coe
and Fitch, 1950; Comfort, 1957; Wilbur and Owen, 1964; Frank, 1965, 1969; Moore and
Lopez, 1975; Stevely, 1978; Vermeij, 1980). Shell growth rates are not continuous; they
may be periodic, episodic, determinate and also negative in periods of stress to the
organism (Frank, 1969; Milliman, 1974; Moore, 1975; Vermeij, 1980). The relative
growth rates may even vary among the different parts of a single organism (Wilbur and
Owen, 1964). Little has been published on molluscan shell production and the variable
33

growth rates for all molluscs make comparison between species or areas difficult
(Comfort, 1957; Craig, 1967; Frank, 1969; Bosence, 1989). This inability to quantify the
growth rates for most areas precludes the use of growth rate as a factor for carbonate
production rate calculation.
Chemical Composition
The chemical composition of molluscs varies widely by species as well as size
and age ofthe organism (Vinogradov, 1953; Milliman, 1974; Hammen, 1980). Little has
been published on the exact chemical compositions and discrepancies exist between the
methods of analysis and data presentation. Determinations of water content and weight
and composition ofthe shell can give only average values (Vinogradov, 1953).
Vinogradov (1953) calculated the composition of many molluscs by species.
Molluscan shells are nearly exclusively CaC03 (Vinogradov, 1953; Hyman, 1967). Using
Vinogradov's (1953) values for species collected in our study area, bivalve shells average
98.2% CaC03 of the shell weight and shell weight is 98.7% CaC03 for the gastropods
identified. Therefore, an average of 98.5% of total shell weight as calcium carbonate will
be used.
Turnover Rates
Turnover rates are also highly variable and can be affected by seasonal changes,
extent of predation, time to reach maximum size, and the maximum and average life span
of an organism (Fretter, 1948; Moore et al., 1968). For many mature communities,
turnover rates tend to be low, longevity is high and the ratio of productivity to biomass is
also low (Frank, 1969). The micromolluscs have faster turnover rates than the larger
molluscs due in part to the effects of predation and that maximum size is more quickly
34
reached. Average turnover can range from one to ten per year (Fretter, 1948; Chave et
al., 1972). Macromolluscs are longer lived and, although some gastropods can reach
more than 20 years of age and some pectinids have a lifespan of only one year, a more
realistic range would be a three to five year lifespan, with a turnover rate of 1 yr-1 (Coe
and Fitch, 1950; Frank, 1969; Chave et al., 1972; Stevely, 1978).
The 1974, 1975-1976 and MMS cruise surveys sampled the molluscs by box core
and data were presented by density or biomass. From the biomass or density values and
estimated turnover rates, production rates can be calculated for micromolluscs and
macromolluscs.
Micromolluscan Calculations
Carbonate production rates were calculated using micromollusc density data from
the 1974 and 1975-1976 cruises. The data were first converted from density in sample to
specimens per square meter. Live micromolluscan densities range from 0 to 7.8 x 10³
specimens per square meter. The 1974 cruises found an average of 1.6 x 10³ specimens
m-2, and, a 7.8 x 10² specimens m-2 average was found on the 1975-1976 cruises. Chave
et al. (1972) assumed 10-3 g CaC03 per 1 mm diameter organism. The micromolluscs in
the MAFLA study range in size from 0.25 mm to 7 mm diameter, with a mean size of 3.6
mm. Thus mass is estimated as follows:
Shell Mass = 10-3 g CaC03 mm-1 x 3.6 mm specimen = 3.6 x 10⁻³ g CaC03 per specimen.
Total calcium carbonate per standing crop may then be estimated from the
standing crop by:
Calcimass = No. of specimens m-2 x (3 .6 x 10-3 g CaC03 per specimen).
35

An average turnover rate of 10 yr"1 was used to calculate the production rate
(Chave, 1972). The results for the production rates are found in Table 4.
Table 4 Micromolluscan production rates for the central west Florida shelf
in g CaC03 m-2 yr-1
Range Average 197 4 Transect II 20-84 53 197 4 Transect I 20-103 62
197 4 Average 20-103 58
1975-1976 Transect I 8-38 17 1975-1976 Transect II 0 - 97 28 1975-1976 Transect Ill 5 - 130 39
1975-1976 Average 0-130 28
Florida Middle Ground 19-84 53 Shelf without Florida
Middle Ground 0 - 130 37
Average for shelf 0-130 40
Macromolluscan Calculations
Carbonate production rates for the macromolluscs of the MAFLA region were
calculated from wet weight biomass values. Macromolluscan biomass ranges from 0.4 g
m-2 to 630 g m-2 across the shelf. Weights ofthe molluscan shells as percent of total wet
weight range from over 50% to up to 73% of wet weight biomass (Hammen, 1980). This
was confirmed by observations with local species ofthe bivalves Donax, Mercenaria,
and Mytilus and the gastropod, Melon gena. An average shell weight of 63% of the total
molluscan wet weight will be used for the calculations. An average amount of calcium
carbonate per shell is 98.5% (Vinogradov, 1953). Therefore, 62% of the total biomass is
assumed to be calcium carbonate. An average life span for the molluscs of these
transects is three to five years for those that survive past the juvenile (Frank, 1969; Smith,
36

1971; Stevely, 1978). A turnover rate of 1 yr"1 for the macromolluscs will be used for
estimation.
Calcium carbonate content of the molluscs can be estimated from biomass figures
by:
Mass ofCaC03 ofMacromolluscs (g CaC03 m"2) =Molluscan biomass (g wet
weight m"2
) x 63% Mass of shell of Total Weight x 98.5% CaC03 mass. The production
rate estimates for the macromolluscs are found in Table 5.
Table 5 Macromolluscan production rates for the central west Florida shelf
Range Average 197 4 Transect II 0.2 - 26 6 197 4 Transect I 0.1 - 4 1
197 4 Average 0.1-26 4
1975-1976 Transect I 0.3-109 19 1975-1976 Transect II 0.5 - 5 2
1975-1976 Average 0.3 - 109 11
MMS Site I 2.5-5 4 MMS Site II 15-46 36 MMS Site III 3 - 390 132 MMS SiteN 0.5 - 2.4 1
MMS Site Average 0.5 - 390 58
Average for shelf 0.1-390 17
Discussion of Results
Molluscan carbonate production rates show some variability across the central
west Florida shelf. The range in estimated production rates is 0.1 g CaC03 m-2 yr-1 to 390
g CaC03 m-2 yr-1• The total production rate for the 0 to 60 m depth range and the Florida
Middle Ground shows a remarkable similarity of71 g CaC03 m-2 yr-1 yet with differences
37

in the dominant contributor. The micromolluscs show an increase in productivity at
depths greater than 20 m while the macromollusc show a decline. The combined rate
averages are compiled in Table 6.
Table 6 Molluscan production rates for the central west Florida shelf
In g CaC03 m·2 yr·1
Macromollusc Micromollusc Shelf Depth Range Average Average Average 6-20m 53 18 71 29-54 m 3 52 55 90 - 189m 0.4 6 6 Florida Middle Ground 8 53 61
Area Average 16 40 56
Molluscs of temperate, tropical and subtropical affinities have been identified on
the shelf (MAFLA, 1975-1976). Although the biotic and abiotic conditions will affect
each species type differently, some trends have been noted for both the micromolluscs
and the macromolluscs across the shelf. The molluscs do show some variability with
season, depth and bottom type (MAFLA, 1974,1975-1976).
Micromolluscan production rates are up to 2.5 times higher in winter than in the
fall and summer, which are remarkably similar. The macromolluscs as well show
increased production in the winter, especially among juveniles (MAFLA, 1975-1976).
These observations may be the result of a reduced predation pressure in the winter and
the likelihood of fall and winter recruitment for the molluscan species (MAFLA, 1974,
1975-1976).
Carbonate production rates also increase for all molluscs with an increase in firm
substrate and with coarse sand bottom types (MAFLA, 1974, 1975-1976). Trends in
38

depth also are noted which may be related to the change from fine quartz sand on the
inner shelf to the increase in coarse carbonate sand at greater depth or a change in food
supply or predation. Macromolluscan biomass is higher on the Florida Middle Ground
than the surrounding shelf as expected with the high relief, increase in hard substrate and
the tropical nature of the assemblage.
Estimated production rates vary between 0.1 g CaC03 m-2 yr-1 and 390 g CaC03
m-2
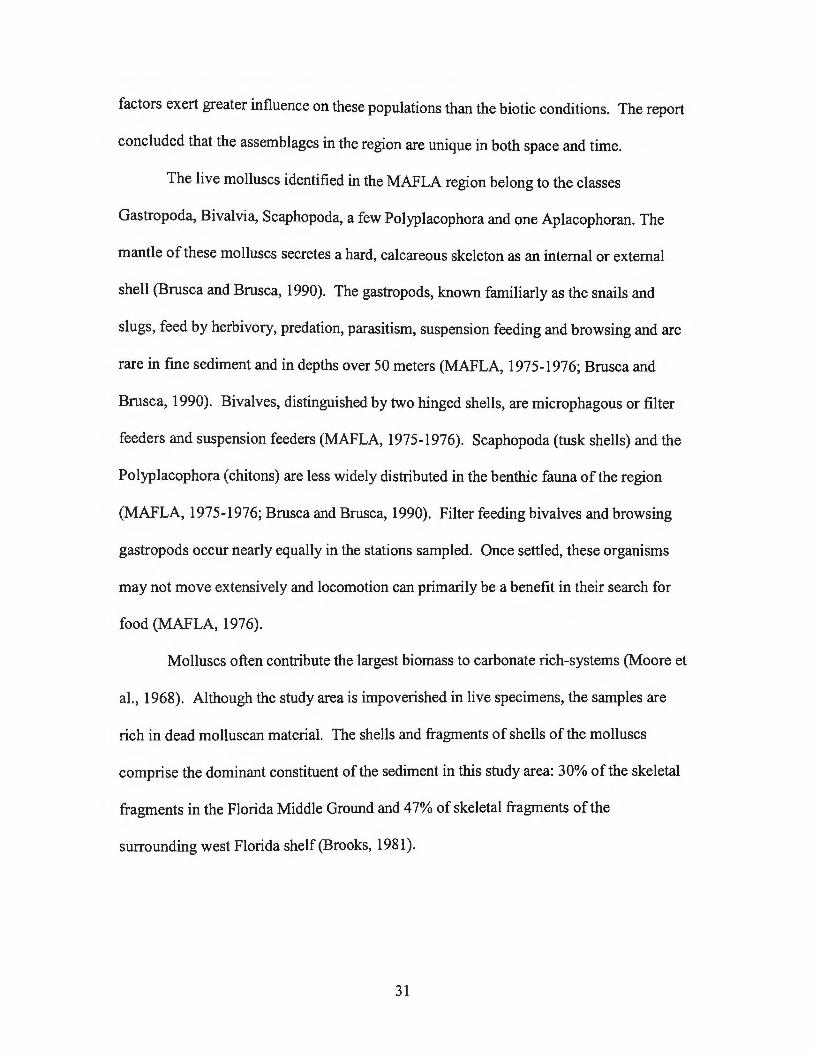
yr-1 across the shelf. The rates are graphically depicted in Figure 6. The question
must be asked whether this three order of magnitude range is truly that great or if
molluscs are underrepresented in the samples. Certainly, the limitations ofthe box core
allow for larger specimens to have been missed and penetration is less for the harder
substrates found on the shelf.
The macromolluscs are not all sessile and this mobility may contribute to the
variation in samples. Molluscan distribution is patchy on the shelf, species saturation
was never reached at some stations; and the patchiness could contribute to an over or an
under estimation. The chance recovery of large specimens also would skew the biomass
numbers. The micromolluscan samples were extremely impoverished in live specimens
and it was noted that some live micromolluscs were missed in the sample processing
(MAFLA, 1974, 1975-1976).
Molluscan production rates are significant on the central west Florida shelf. For
live material, the micromolluscs are second to the foraminifera in abundance and produce
carbonate at a rate similar to the low estimate of the foraminiferal production rate.
Molluscan skeletal fragments dominate the sediments (Brooks, 1981 ).
39
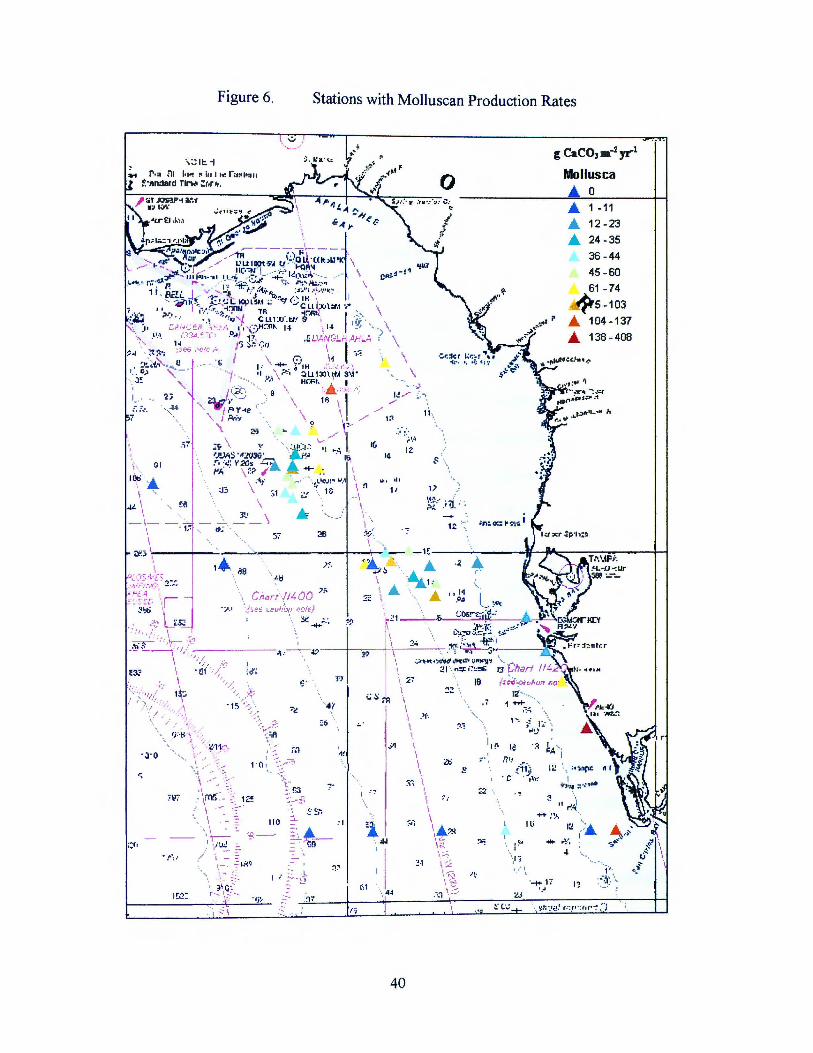
Figure 6.
\;;11:.1 r.: . .fit I·•~ ,. iu • It'! r.,,.,~ ...
f.·an:lard Tln.o ::::,r "·
' I . ~
\ ' ()I
I~ ' . ..... I ·.
-14 1 I,
-I-
._, ... : ..
. i. ~ ~' ·, ~~ c -.· r -.... 1 •• :---
·t
_.
Stations with Molluscan Production Rates
' ~~
I ' '
14
.. • :: ;.•:'1 12
()
::. ·-... ..
·. 1) \
~i:" _; ;j~ : -.
.>r·.
' I \ \
=-~ \ I
.~ .
\ ~ .. \ \ \+.~ \~ ·,_:...; \::< \~. .~
_,_, ,_::--::.
40
'" ... \ ;·· ,
~ .~ I
...... -;
It· ,_,.' ',
~
g CaCOJ m-2 yr-1
Mollusca ..... 0 ..... 1 -11
..... 12 -23
..... 24-35
36-44 45-60 61 -74
5 - 103
..... 104 -137
..... 138 - 408
... ~ ... ol
·- 17 ..
CHAPTERV
ECHINODERM CARBONATE PRODUCTION
Echinodermata
The Echinodermata play a minor role in calcium carbonate production on the
central west Florida shelf. These familiar, exclusively marine, benthic animals are
widely distributed at all depths, latitudes and temperatures in the Gulf of Mexico as well
as other oceans and are among the most abundant sea floor animals (MAFLA 1974,
1975-1976; Blake et al., 1995; Brusca and Brusca, 1990). The generally epifaunal,
ubiquitous echinoderms display remarkable continuity on the west Florida shelf
(MAFLA, 1974). They are intolerant of low salinity and are generally photonegative
(Macginitie and Macginitie, 1968; Blake et al., 1995).
The echinoderms are distinguished by their radially symmetric, calcitic
endoskeleton. This endoskeleton is composed of separate plates of calcium carbonate,
each plate a single crystal of calcite (Binyon, 1972; Brusca and Brusca, 1990). The fossil
record, both in sedimentary deposits and rock formations, indicates over 13,000 species
ofwell-preserved calcitic echinoderm skeletons (Vinogradov 1953; Raup, 1966).
The five classes of echinoderms, Asteroidea, Crinoidea, Echinoidea,
Holothuroidea and Ophiuroidea, contain approximately 7,000 living species, more than
74 of which are represented in the study region (Vinogradov, 1953; MAFLA 1974, 1975-
41

1976; Brusca and Brusca, 1990; Blake et al., 1995). These species include the feather
stars, basket stars, brittle stars, sea stars, sea urchins, sand dollars and sea cucumbers
(MAFLA 1975-1976; Brusca and Brusca, 1990). They may range in size from less than
one centimeter to more than one meter in diameter (Vinogradov, 1953; Brusca and
Brusca, 1990).
Echinoderms exhibit different feeding behaviors that vary by species, food
availability and bottom composition (Ebert, 1968). The carnivorous asteroids
continuously feed as opportunistic predators or scavengers primarily on calcareous
organisms and are abundant along the gulf coast of Florida (Giese, 1966; Macginitie and
Macginitie, 1968, Dehn, 1980; Brusca and Brusca, 1990). The less dominant crinoids are
suspension feeders (Brusca and Brusca, 1990).
The holothuroids, although capable of selective deposit feeding, often feed by
filter suspension and can be restricted to low-energy environments (Lawrence and Kafri,
1979; Brusca and Brusca, 1990). Both the crinoids and holothuroids tend to be inactive,
almost sessile, and may have a great effect on the sea floor by feeding upon the organic
content of the substrate, plankton and detritus (Macginitie and Macginitie, 1968).
The highly competitive, well-adapted echinoids, although primarily herbivores,
maximize their feeding strategy by being potential suspension feeders, deposit feeders,
detritivores, predators or facultative omnivores (Giese, 1966; Lawrence and Kafri, 1979;
Brusca and Brusca, 1990). The active ophiuroids feed by predation, selective deposit
feedings, as detritivores and by suspension feeding (Macginitie and Macginitie, 1968;
Brusca and Brusca, 1990). This variability among all the echinoderms allows adaptation
by many different species in different environments with variable food supplies.
42
The echinoderms of the west Florida shelf are highly patchy in distribution and
biomass, with biomass ranging from 0 g m-2 to 230 g m-2 among the stations sampled
(MAFLA, 1974, 1975-1976; Blake et al., 1995). This large range in distribution and
biomass is attributed to a combination of factors characteristic of such patchiness. These
factors include food supply and availability; feeding type; defensive tactics; substrate
type; migration; spawning; mobility; weather; competition for space, for food and with
other animals; size of animals; predation; aggregating behavior; and type and limitations
of sampling methods (Ebert, 1968; Lane, 1977; Lawrence, 1978). Most echinoderms are
gregarious in nature and many aggregations are composed of multiple species of
echinoderms (Reese, 1966). These adaptations and strategies among the echinoderms
likely optimize their survival, growth and reproduction rates, yet they limit the ability to
quantify the biomass of the echinoderms of the study region by the restriction of the box
core sample technique. The following production estimations should be considered a
range of the total contribution to sediments by the echinoderms in the region.
Methods
Categorization of Organisms
The five classes of echinoderms are all represented in the west Florida shelf
biomass yet with unequal distribution. None of the data sets provide a breakdown by
species or class of the macroinfauna sampled. Dominant taxa have been noted for the
1974 and 1975-1976 series ofMAFLA cruises and the MMS cruises. They are found in
Appendix 27.
43

Data Used
Biomass values from the macrofauna! samples are available for both transects
from the 1974 MAFLA cruises, two transects from the summer 1975 MAFLA cruise and
from the MMS cruises of 1992-1994. All samples were obtained from 21.3 em x 30.5 em
box cores with 32 em of maximum penetration. The box core penetration is limited by
the composition of the bottom and substrate and may vary between stations (MAFLA,
1974). As for the molluscs, a faunal list was prepared from the screened box core
samples for the dominant macroinfauna. Nine replicate box cores taken and analyzed per
station represent 0.48 m2 of sea floor of the 1974 cruises, 0.54 m2 of sea floor for the
1975-1976 MAFLA cruises, and 0.57 m2 from the MMS cruises of 1992-1994.
Echinoderm biomass figures are expressed in grams wet weight per square meter of sea
floor.
Calculations
To estimate the calcium carbonate contribution of the echinoderms, many factors
must be addressed. Growth rate information is not useful as it varies by area, season,
temperature, food supply, reproductive cycle, and size of the organism (Ebert, 1968;
Halpern, 1970; Crump and Emson, 1978; Dehn, 1980). Growth rates also are impacted
by regeneration in damaged animals and negative growth periods (Ebert, 1968; Binyon,
1972; Dehn, 1980). Annual carbonate production is evaluated by estimating the amount
of calcium carbonate in the echinoderm standing crop expressed as a percent of the wet
weight biomass multiplied by the turnover rate or mortality.
44
Chemical Composition
Of the 7,000 extant echinoderm species, less than 10% have been chemically
analyzed (Vinogradov, 1953; Raup, 1966). Chemical composition maintains a certain
unity for the echinoderms with all the Echinodermata possessing a magnesium-calcium
skeleton that comprises the majority of the organism's dry weight (Vinogradov, 1953).
For calcium carbonate production rates, the amount ofCaC03 content ofthe organism as
a percent of the biomass must be estimated.
Chemical composition is a function of many factors including species, position in
the skeleton, sea water temperature, season, size of individual and reproductive cycle
(Vinogradov, 1953; Raup, 1966; Binyon, 1972). Control ofresource allocation allows
better adaptation for each organism during periods of somatic growth, reproductive
growth, and regeneration with components varying considerably in size and composition
during these life cycles (Giese, 1966; Lawrence and Ellwood, 1991). Therefore, no true
correlation exists between body size or age or geography, and the organic composition of
the body wall and carbonate composition are not constant within the animal (Binyon,
1972; Sibuet and Lawrence, 1981; Lawrence and Guille, 1982).
Carbonate dominates the skeletal material, the majority is calcium carbonate and
5% to 15% is magnesium carbonate (Vinogradov, 1953; Binyon, 1972). The average
echinoderm contains between 65% and 75% water with the holothuroids containing much
more (Vinogradov, 1953; Binyon, 1972). The water content within the body does vary
greatly between components with an average of 40% water content of the body wall
(Giese, 1966).
45
The body wall varies between 30% and 88% of the total wet weight for most
species analyzed. Of the dry weight, echinoids contain the higher percentage of ash, up
to 89%, the ophiuroids around 70%, asteroids 67% and holothuroids 3 7% ash for the
species analyzed (Vinogradov, 1953; Giese, 1966; Binyon, 1972; Moore, 1972; Ebert,
1973, 1975; Lane, 1977; Lawrence and Guille, 1982; Lawrence and Bazhin, 1998).
Again, these values are merely averages of available data for a multiple number of
species, some identified within the MAFLA area and some that were not.
The amount ofCaC03 in the ash is derived from Vinogradov's (1953) extensive
compilation of chemical composition for a large number of species. An estimate of
CaC03 as percent of the total wet weight biomass was calculated as the product of
percent dry weight of the organism and the percent ash of that dry weight multiplied by
the percent CaC03 in the ash. These values were then averaged by species identified in
the sampled areas. For the dominant species, 41% were asteroids, 38% echinoids, and
21% ophiuroids.
A lack of consistency in the presentation of the available chemical analyses and
the lack of chemical analyses on many species complicates comparisons. Some analyses
present body wall weight in percent dry weight, some in ash residue. If the water content
is not also provided it does not allow for a reliable method to evaluate the carbonate
content. The estimations made here and summarized in Table 7, therefore, are broad
averages incorporating a wide range of composition values for many organisms in
different environments.
46
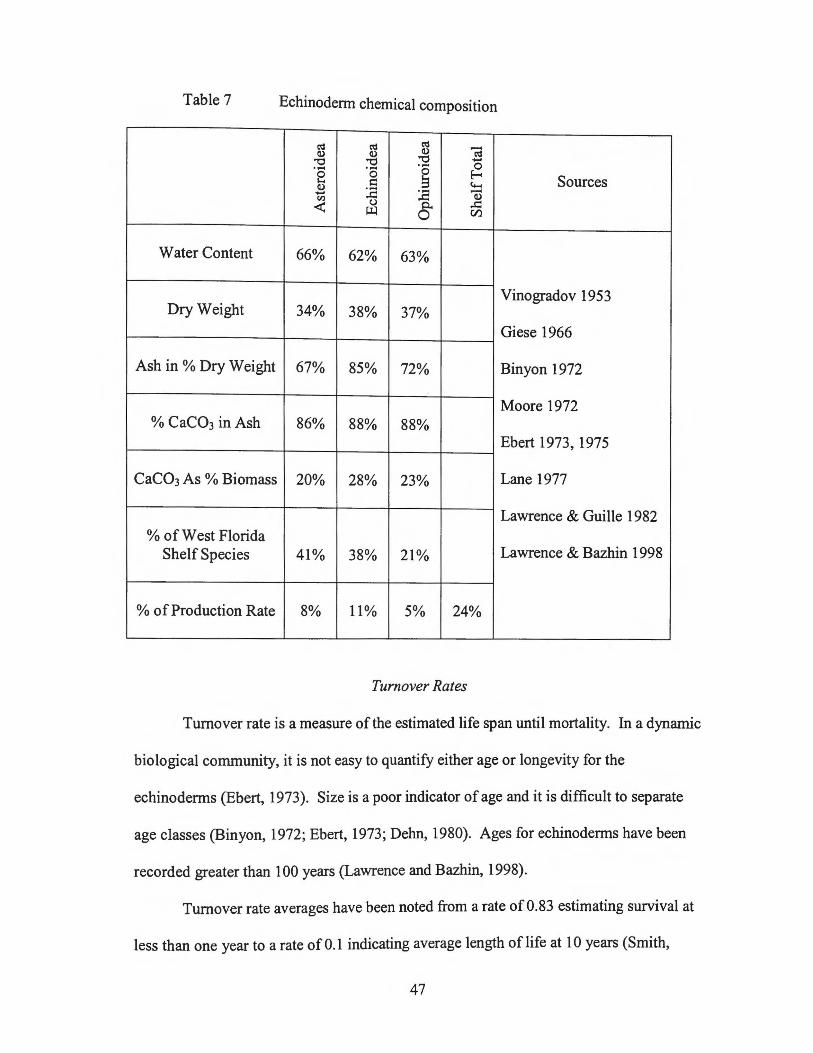
Table 7 Echinodenn chemical composition
t':S t':S t':S -Q) Q) Q) t':S "'t:: "'t:: "'t:: ......
'8 ...... ...... 0 0 0 E-<
Q) s:: !:l to-. Sources ...... :.a :.a -Cll Q)
< (,)
8" ..!:: ~ Cl)
Water Content 66% 62% 63%
Dry Weight 34% Vinogradov 1953
38% 37% Giese 1966
Ash in % Dry Weight 67% 85% 72% Binyon 1972
Moore 1972 % CaC03 in Ash 86% 88% 88%
Ebert 1973, 1975
CaC03 As % Biomass 20% 28% 23% Lane 1977
Lawrence & Guille 1982 % ofWest Florida
Shelf Species 41% 38% 21% Lawrence & Bazhin 1998
% ofProduction Rate 8% 11% 5% 24%
Turnover Rates
Turnover rate is a measure of the estimated life span until mortality. In a dynamic
biological community, it is not easy to quantify either age or longevity for the
echinoderms (Ebert, 1973 ). Size is a poor indicator of age and it is difficult to separate
age classes (Binyon, 1972; Ebert, 1973; Dehn, 1980). Ages for echinoderms have been
recorded greater than 100 years (Lawrence and Bazhin, 1998).
Turnover rate averages have been noted from a rate of0.83 estimating survival at
less than one year to a rate of 0.1 indicating average length of life at 10 years (Smith,
47

1971; Binyon, 1972, Chave et al., 1972; Ebert, 1973; Ebert, 1975; Lawrence and Bazhin,
1998). An average for the west Florida shelf region is 0.26 yr-1, approximately four
years.
Echinoderm Calculations
Wet weight biomass values from the three different series of cruises were
multiplied by the percent of calcium carbonate of the biomass and then by the turnover
rate. Thus, carbonate production rates were estimated as:
Echinoderm Biomass Wet Weighting m-2 x 24% CaC03 x .26 yr-1
=Calcium Carbonate Production Rate in g CaC03 m-2 yr-1•
The rates are summarized in Table 8.
Table 8 Echinoderm production rates for the central west Florida shelf
Range Average 197 4 Transect II 0.01-2.2 0.4 197 4 Transect I 0-14.4 1.6
197 4 Average 0-14.4 1.0
1975-1976 Transect I 0-9.1 1.9 197 4-197 6 Transect II 0-3.2 0.6
1975-1976 Average 0-9.1 1.2
MMS Site I 0-4.2 1.0 MMS Site II 0.01-6.5 1.3 MMS Site III 0.05- 0.15 0.1 MMS Site IV 0.2-13 6.6
MMS Site Average 0-13 2.2
Florida Middle Ground 0.01-2.2 0.6
Average for shelf 0- 14.4 1.3
48

Discussion of Results
The echinoderms, like the molluscs, show variability among the stations sampled.
The total production estimation, 1.3 g CaC03 m-2 yr-1, is low compared with the other
contributors, yet consistent across the shelf. The echinoderms are not a prominent
constituent of the sediments (Brooks, 1981). Some trends have been noted with depth
and a summary is found in Table 9.
Table 9 Echinoderm production summary by depth range
Depth Range
6-20m 29 - 54m
90 - 189m
Florida Middle Ground
Total for Shelf
Shelf Average
3.01 0.83 0.02
0.62
1.3
The estimated production rates decrease with increasing depth. Production by
echinoderms appears to be less for the Florida Middle Ground than the surrounding shelf.
Observations and data have shown an increase in food availability on the Florida Middle
Ground, which should affect an increase in echinoderm abundance. The biomass
numbers for the echinoderms may be underreported for the region again owing in part to
the limitations of the box core sampling method, the nature of their patchy distribution,
and cryptic species hiding in holes in the hard substrate.
49

CHAPTER VI
CORAL AND CALCAREOUS ALGAL PRODUCTION
Coral and calcareous algae are known to be prominent carbonate producers in reef
environments (Chave et al., 1972; Land, 1979; Bosence, 1989; Hubbard et al., 1990;
Milliman, 1993). On the central west Florida shelf, they also contribute to the carbonate
produced, yet not in large reef-building communities. The species identified are of West
Indian- Caribbean affinities (Cheney and Dyer, 1974; MAFLA, 1974). The factors
influencing distribution, growth and calcification rates are intricately connected for these
flora and fauna.
Algae
Calcium carbonate secreting algae are widely distributed in all seas, including this
study area in the eastern GulfofMexico (Vinogradov, 1953). The calcareous algae
found in warm tropical seas concentrate calcium carbonate quite intensively
(Vinogradov, 1953). The benthic calcareous algae produce significant amounts of
carbonate in marine systems in both recent and ancient times (Stockman et al., 1967;
Chave et al., 1972; Neumann and Land, 1975; Milliman, 1993; Freile et al., 1995). In
addition to the production of substantial amounts of carbonate and sediment, calcareous
algae also help to shape the benthic environment as skeletal framework builders and by
integration of organism and sediment through trapping, binding, baffling, cementing and
encrusting ofthe substrate (Ginsburg et al., 1971; Milliman, 1993; Freile et al., 1995).
50
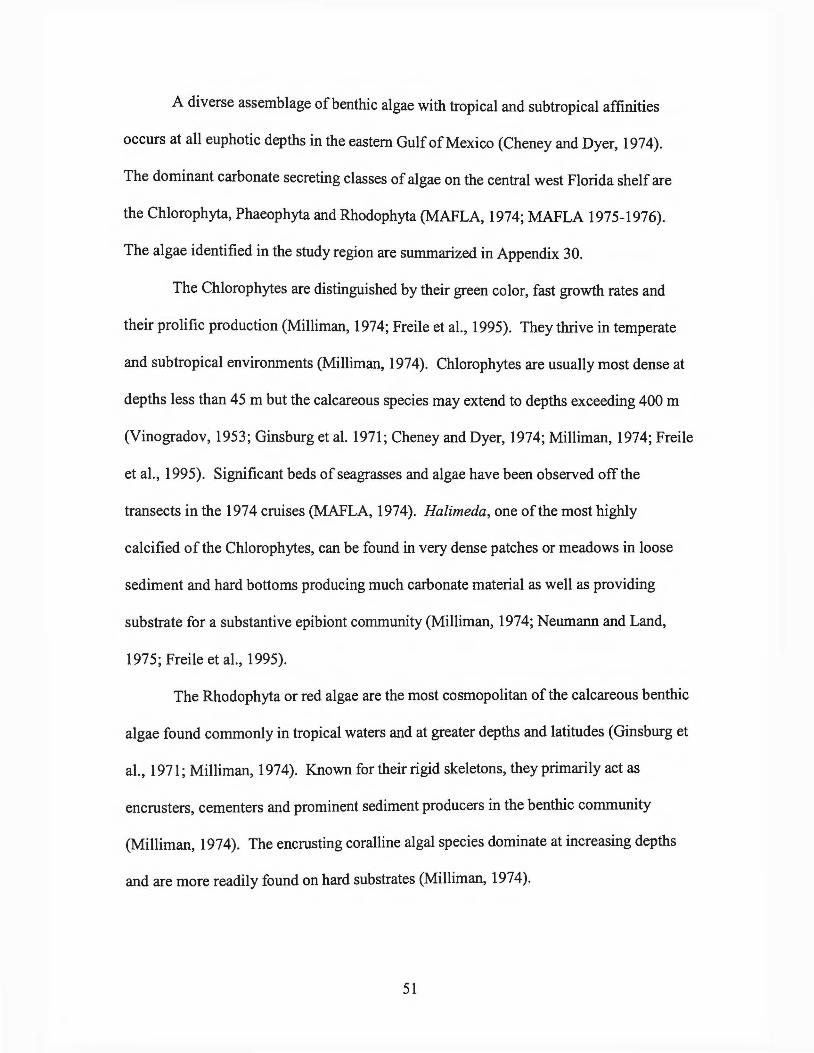
A diverse assemblage of benthic algae with tropical and subtropical affinities
occurs at all euphotic depths in the eastern GulfofMexico (Cheney and Dyer, 1974).
The dominant carbonate secreting classes of algae on the central west Florida shelf are
the Chlorophyta, Phaeophyta and Rhodophyta (MAFLA, 1974; MAFLA 1975-1976).
The algae identified in the study region are summarized in Appendix 30.
The Chlorophytes are distinguished by their green color, fast growth rates and
their prolific production (Milliman, 1974; Freile et al., 1995). They thrive in temperate
and subtropical environments (Milliman, 1974). Chlorophytes are usually most dense at
depths less than 45 m but the calcareous species may extend to depths exceeding 400 m
(Vinogradov, 1953; Ginsburg et al. 1971; Cheney and Dyer, 1974; Milliman, 1974; Freile
et al., 1995). Significant beds of sea grasses and algae have been observed off the
transects in the 1974 cruises (MAFLA, 1974). Halimeda, one ofthe most highly
calcified of the Chlorophytes, can be found in very dense patches or meadows in loose
sediment and hard bottoms producing much carbonate material as well as providing
substrate for a substantive epibiont community (Milliman, 1974; Neumann and Land,
1975; Freile et al., 1995).
The Rhodophyta or red algae are the most cosmopolitan of the calcareous benthic
algae found commonly in tropical waters and at greater depths and latitudes (Ginsburg et
al., 1971; Milliman, 1974). Known for their rigid skeletons, they primarily act as
encrusters, cementers and prominent sediment producers in the benthic community
(Milliman, 1974). The encrusting coralline algal species dominate at increasing depths
and are more readily found on hard substrates (Milliman, 1974).
51
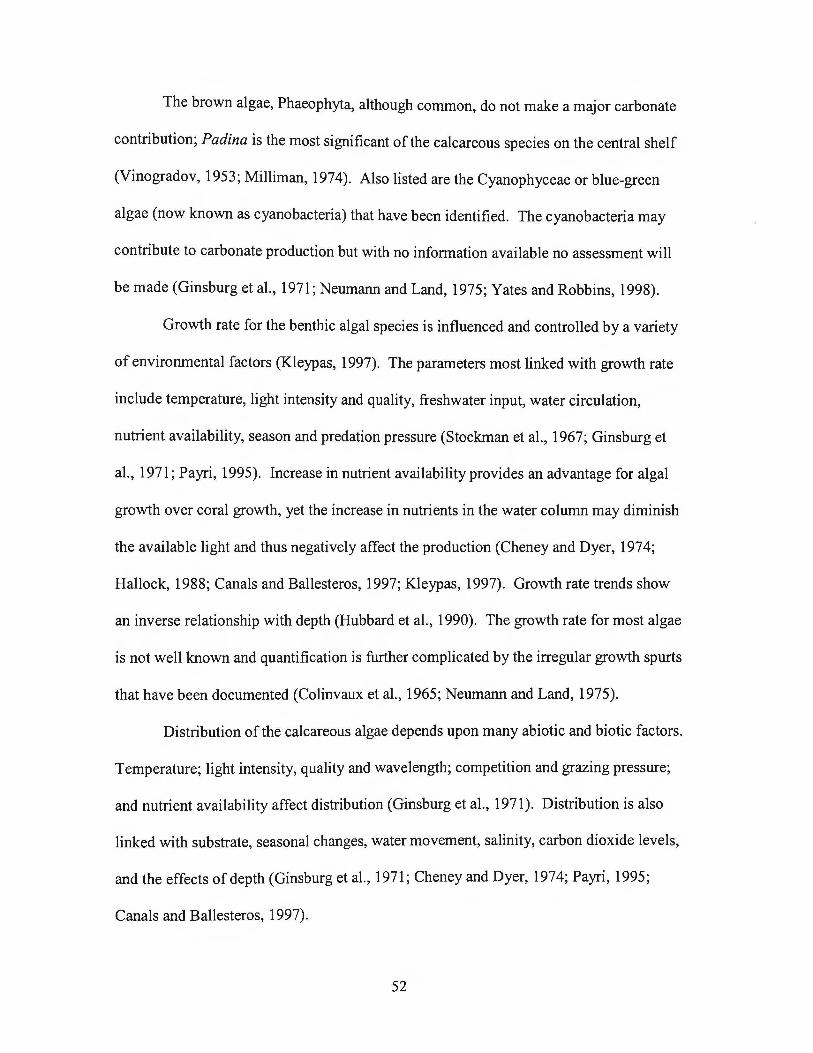
The brown algae, Phaeophyta, although common, do not make a major carbonate
contribution; Pad ina is the most significant of the calcareous species on the central shelf
(Vinogradov, 1953; Milliman, 1974). Also listed are the Cyanophyceae or blue-green
algae (now known as cyanobacteria) that have been identified. The cyanobacteria may
contribute to carbonate production but with no information available no assessment will
be made (Ginsburg et al., 1971; Neumann and Land, 1975; Yates and Robbins, 1998).
Growth rate for the benthic algal species is influenced and controlled by a variety
of environmental factors (Kleypas, 1997). The parameters most linked with growth rate
include temperature, light intensity and quality, freshwater input, water circulation,
nutrient availability, season and predation pressure (Stockman et al., 1967; Ginsburg et
al., 1971; Payri, 1995). Increase in nutrient availability provides an advantage for algal
growth over coral growth, yet the increase in nutrients in the water column may diminish
the available light and thus negatively affect the production (Cheney and Dyer, 1974;
Hallock, 1988; Canals and Ballesteros, 1997; Kleypas, 1997). Growth rate trends show
an inverse relationship with depth (Hubbard et al., 1990). The growth rate for most algae
is not well known and quantification is further complicated by the irregular growth spurts
that have been documented (Colinvaux et al., 1965; Neumann and Land, 1975).
Distribution of the calcareous algae depends upon many abiotic and biotic factors.
Temperature; light intensity, quality and wavelength; competition and grazing pressure;
and nutrient availability affect distribution (Ginsburg et al., 1971 ). Distribution is also
linked with substrate, seasonal changes, water movement, salinity, carbon dioxide levels,
and the effects of depth (Ginsburg et al., 1971; Cheney and Dyer, 1974; Payri, 1995;
Canals and Ballesteros, 1997).
52
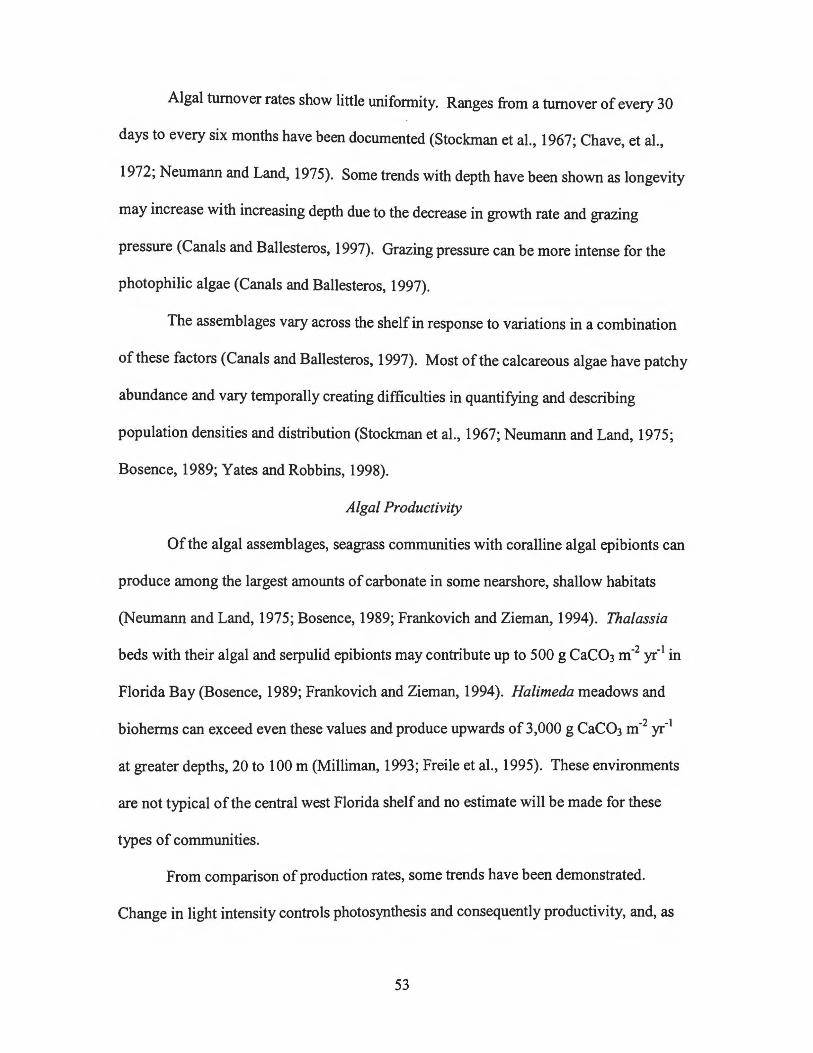
Algal turnover rates show little uniformity. Ranges from a turnover of every 30
days to every six months have been documented (Stockman et al., 1967; Chave, et al.,
1972; Neumann and Land, 1975). Some trends with depth have been shown as longevity
may increase with increasing depth due to the decrease in growth rate and grazing
pressure (Canals and Ballesteros, 1997). Grazing pressure can be more intense for the
photophilic algae (Canals and Ballesteros, 1997).
The assemblages vary across the shelf in response to variations in a combination
of these factors (Canals and Ballesteros, 1997). Most of the calcareous algae have patchy
abundance and vary temporally creating difficulties in quantifying and describing
population densities and distribution (Stockman et al., 1967; Neumann and Land, 1975;
Bosence, 1989; Yates and Robbins, 1998).
Algal Productivity
Of the algal assemblages, seagrass communities with coralline algal epibionts can
produce among the largest amounts of carbonate in some nearshore, shallow habitats
(Neumann and Land, 1975; Bosence, 1989; Frankovich and Zieman, 1994). Thalassia
beds with their algal and serpulid epibionts may contribute up to 500 g CaC03 m-2 yr-1 in
Florida Bay (Bosence, 1989; Frankovich and Zieman, 1994). Halimeda meadows and
bioherms can exceed even these values and produce upwards of 3,000 g CaC03 m-2 yr-1
at greater depths, 20 to 100m (Milliman, 1993; Freile et al., 1995). These environments
are not typical of the central west Florida shelf and no estimate will be made for these
types of communities.
From comparison of production rates, some trends have been demonstrated.
Change in light intensity controls photosynthesis and consequently productivity, and, as
53
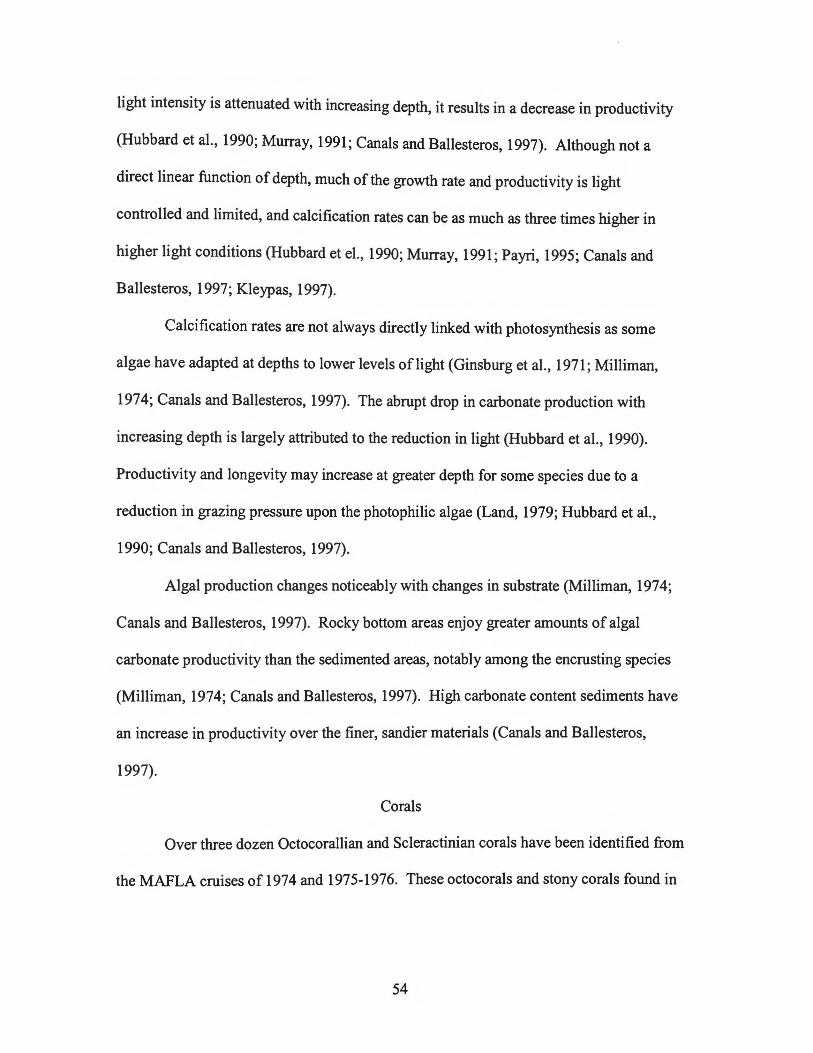
light intensity is attenuated with increasing depth, it results in a decrease in productivity
(Hubbard et al., 1990; Murray, 1991; Canals and Ballesteros, 1997). Although not a
direct linear function of depth, much of the growth rate and productivity is light
controlled and limited, and calcification rates can be as much as three times higher in
higher light conditions (Hubbard et el., 1990; Murray, 1991; Payri, 1995; Canals and
Ballesteros, 1997; Kleypas, 1997).
Calcification rates are not always directly linked with photosynthesis as some
algae have adapted at depths to lower levels oflight (Ginsburg et al., 1971; Milliman,
197 4; Canals and Ballesteros, 1997). The abrupt drop in carbonate production with
increasing depth is largely attributed to the reduction in light (Hubbard et al., 1990).
Productivity and longevity may increase at greater depth for some species due to a
reduction in grazing pressure upon the photophilic algae (Land, 1979; Hubbard et al.,
1990; Canals and Ballesteros, 1997).
Algal production changes noticeably with changes in substrate (Milliman, 1974;
Canals and Ballesteros, 1997). Rocky bottom areas enjoy greater amounts of algal
carbonate productivity than the sedimented areas, notably among the encrusting species
(Milliman, 1974; Canals and Ballesteros, 1997). High carbonate content sediments have
an increase in productivity over the finer, sandier materials (Canals and Ballesteros,
1997).
Corals
Over three dozen Octocorallian and Scleractinian corals have been identified from
the MAFLA cruises of 1974 and 1975-1976. These octocorals and stony corals found in
54

Appendix 31 were archived and listed by transect only, with a large number found in
Transect II of 1974 and Transect III of 1975-1976, the Florida Middle Ground area.
The colonial Octocorallia include the sea fans, sea whips and sea rods and their
polyps are comprised of eight calcareous sclerite tentacles. The also colonial
Scleractinians, with abundant symbiotic zooxanthellae, have delicate to massive
calcareous exoskeletons capable of tremendous reef formations (Brusca and Brusca,
1990; Allaby, 1992; Humann, 1994).
Coral Productivity
Within the central shelf region, corals are not evenly distributed. They are
common in the Florida Middle Ground and very rare and patchy in the other shelf areas
(MAFLA, 1974, 1975-1976). The eggs and larvae of these tropical and sub-tropical coral
species likely are transported on to the shelfby the loop waters (MAFLA, 1974). Light,
effects of depth, turbidity, sedimentation rate, temperature, water motion, seasonal
effects, substrate and geography, all control growth rates and distribution (Vaughan,
1911, 1915, 1917; Goreau, 1959; Shinn, 1966; Smith and Kinsey, 1976; Smith, 1978;
Land, 1979; Gladfelter, 1984; Hubbard and Scaturo, 1985; Hubbard et al., 1990; Heiss,
1995). One benefit to coral growth on the shelf is the lack of sediment load (Vaughan,
1917; Hallock, 1997).
As depth increases, growth rate and calcification rates both decrease for coral.
Most coral reef formation occurs in depths ofO to 30m, some coral grow in the 30 to 74
m range and a few species grow at greater than 75 m depth but at a dramatically lowered
rate and occurrence (Vaughan, 1917; Shinn, 1966; Smith and Kinsey, 1976; Smith, 1978;
Hubbard and Scaturo, 1985; Heiss, 1995).
55

Turbidity and water motion play roles in coral growth. Production rates decline
with a decrease in water energy. Storm events and currents change light, nutrient
availability, and sedimentation rate and may effect temperature and salinity (Vaughan,
1911, 1915; Smith and Kinsey, 1976; Hubbard and Scaturo, 1985). Vaughan (1911,
1915, 1917) noted comparatively lower growth rates in Gulf of Mexico - West Indian
species of coral than in the Pacific assemblages, as well as an increase in coral growth on
firm or rocky substrates.
Temperature controls much of the coral growth and calcification with an ideal
range of 26°C to 28°C, average minimum of 18°C, and death at a sudden drop below
13°C (Vaughan, 1911; Shinn, 1966; Gladfelter, 1984). The bottom temperatures in this
central west Florida shelf region average 17°C to 29°C in summer, 17°C to 27°C in fall,
and 12°C to 21°C in the winter (MAFLA, 1975-1976).
Seasonal changes affect most of the growth rate parameters like temperature,
water motion, nutrient availability and change in light intensity and length of light
exposure. Most agree that light is the key control in coral distribution and growth and an
increase in depth exponentially decreases coral productivity (Vaughan, 1911; Goreau,
1959; Land, 1979; Gladfelter, 1984; Hubbard and Scaturo, 1985; Hubbard et al., 1990).
Chemical Composition
Chemical and water content of the calcareous algae and coral vary by species and
class, with the season of the year, age ofthe organism and vertical distribution
(Vinogradov, 1953). From the available data, water content ranges from 58% to 85% for
most ofthe benthic algae (Vinogradov, 1953). Some species'· calcium carbonate content
averages 25% ofthe wet weight of the plants (Bosence, 1989). For the coralline red
56
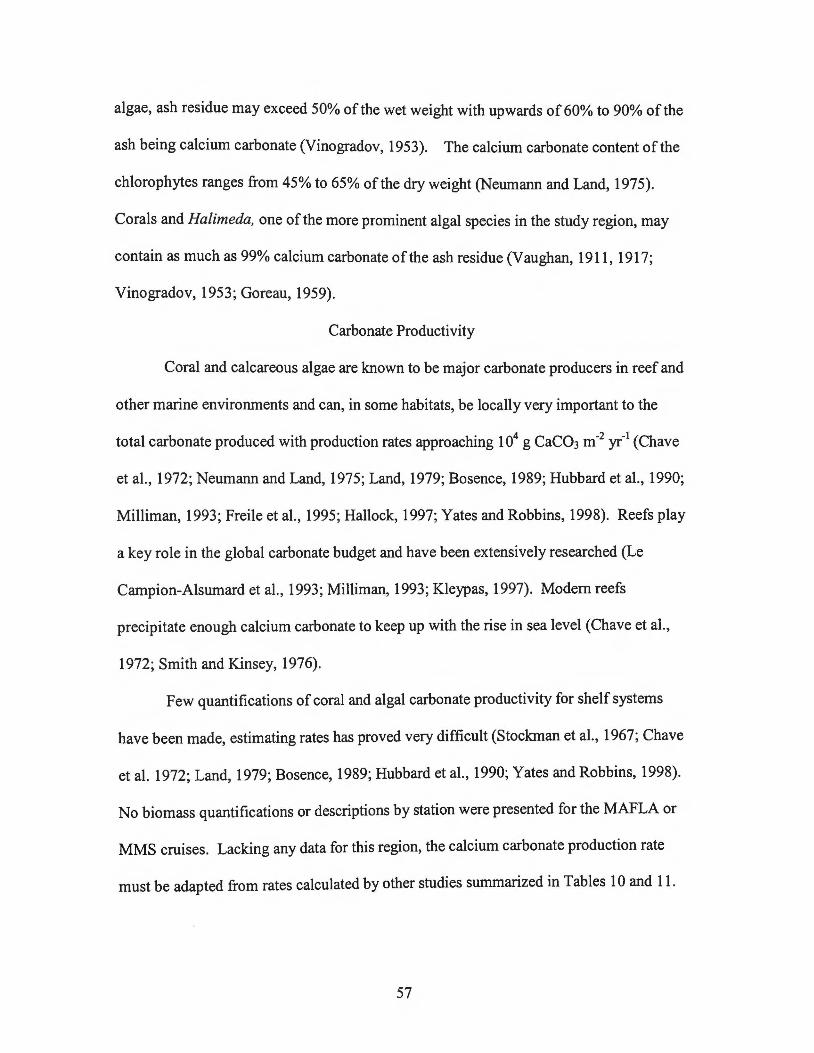
algae, ash residue may exceed 50% of the wet weight with upwards of 60% to 90% of the
ash being calcium carbonate (Vinogradov, 1953). The calcium carbonate content of the
chlorophytes ranges from 45% to 65% of the dry weight (Neumann and Land, 1975).
Corals and Halimeda, one of the more prominent algal species in the study region, may
contain as much as 99% calcium carbonate ofthe ash residue (Vaughan, 1911, 1917;
Vinogradov, 1953; Goreau, 1959).
Carbonate Productivity
Coral and calcareous algae are known to be major carbonate producers in reef and
other marine environments and can, in some habitats, be locally very important to the
total carbonate produced with production rates approaching 104 g CaC03 m-2 yr-1 (Chave
et al., 1972; Neumann and Land, 1975; Land, 1979; Bosence, 1989; Hubbard et al., 1990;
Milliman, 1993; Freile et al., 1995; Hallock, 1997; Yates and Robbins, 1998). Reefs play
a key role in the global carbonate budget and have been extensively researched (Le
Carnpion-Alsumard et al., 1993; Milliman, 1993; Kleypas, 1997). Modem reefs
precipitate enough calcium carbonate to keep up with the rise in sea level (Chave et al.,
1972; Smith and Kinsey, 1976).
Few quantifications of coral and algal carbonate productivity for shelf systems
have been made, estimating rates has proved very difficult (Stockman et al., 1967; Chave
et al. 1972; Land, 1979; Bosence, 1989; Hubbard et al., 1990; Yates and Robbins, 1998).
No biomass quantifications or descriptions by station were presented for the MAFLA or
MMS cruises. Lacking any data for this region, the calcium carbonate production rate
must be adapted from rates calculated by other studies summarized in Tables 10 and 11 .
57

Table 10 Summary of algal production rates
Assemblage Production Depth Location Source g CaC03 m·2 yr-1
m
Predominant Red and 100 <100 Mallorca-Menorca Canals and Green Algae shelf Ballesteros 1997
Northwestern Mediterranean Sea
Coralline Algae 20 <40 Shelf-Edge Reef Hubbard et al. No Halimeda (1.65% of total System 1990
production) U.S. Virgin Islands
Halimeda 2400 20-40 Grand Bahama Bank Freile et al. 1995 100% Coverage Slope
Benthic Algal Community 500 <50 Bank-Embayment Milliman 1993 Halimeda 3000 30-100 Bioherm
Thalassia Epibionts 1.9 - 282.7 3 Florida Bay Frankovich and Coralline Red Algae Zieman 1994 dominant
Thalassia Epibionts 81 Florida Bay - Inner Bosence 1989 Penicillus 4.83 Halimeda Trace
Thalassia Epibionts 482 Florida Bay - Open Penicillus 29.25 Halimeda 11
Red Coralline Algae 500-2500 Hawaii Littler 1971 0 - 7000 St. Croix A dey and Vassar
1974
Marine Lagoon 90-100 7 Abaco, Bahamas Neumann and Land 1975
Green Algae 100 Sand Reef Model Chave et al. 1972 Red Algae 1000 Algal
ridge
Red Algal dominant 400 Subtidal California Borderland Smith 1971 Community
Penicillus 3.23 Florida Bay Stockman et al. 25 Inner Reef Tract 1967
58

For purposes of estimation, carbonate productivity is assumed to be inversely
related to depth with the majority of production in less than 90 m; productivity increases
on hard substrates and also carbonate-dominated sediments; and overall productivity will
be higher in more oligotrophic waters.
Table 11 Summary of coral production rates
Assemblage Production Depth Location Source g CaC03 m"2 yr·1 m
Corals 1210 <40 Shelf-Edge Reef Hubbard et al. (93% of total System 1990 production) U.S. Virgin Islands
Coral Reefs 1500 Milliman 1993
Porites 513.2 Florida Bay Bosence 1989
Fore-Reef Slope 600 20-60 N. Jamaican Island Land 1979 (33% of total Slope production)
Shallow, sand flat with 410 Sand Reef Model Chave et al. 1972 calcareous algae
Coral Reefs 800 5-6 Protected Smith and Environments Kinsey 1976
The central west Florida shelf varies in depth and substrate. Change occurs across
the shelf from low and high relief rocks to sediments high in carbonate material to hard
compacted sand to soft silt, shell rubble or fine sand (MAFLA, 1974).
In an attempt to address as many ofthe variables as possible, the shelf region is
divided into four different depth and sediment composition zones: 6 to 29 m depths; 30
to 54 m depths; 90 m and greater depths; and the Florida Middle Ground. The shallowest
zone with 14 stations, 12m average depth, has the lowest average percent calcium
59

carbonate in the sediment, 37%, and is sand-dominated. The sediments of the 22 stations
of the 30 to 54 m zone average 40 m in depth and 94% CaC03 in the sediments and are a
mixed community of carbonate sediments and Halimeda. The four stations greater than
90 m have sediments of94% CaC03 with an average depth of 156m. The nine stations
of the Florida Middle Ground range from 34 to 44 m, 39m average, and have an average
sediment carbonate content of 77%. A combination of rocky substrate, hard bottom and
carbonate sediments makes up the Florida Middle Ground. No stations are between 55
and 89 m.
Sediment constituency can indicate benthic community composition (Land,
1979). The sediments of the Florida Middle Ground show 1.5% coralline algae skeletal
fragments, a trace amount of Halimeda and 2.2% coral skeletal fragments, and, the
surrounding shelf contains merely a trace of each (Brooks, 1981 ). The sediment analysis
identified Halimeda fragments in each ofthe stations sampled for the 1974 MAFLA
cruises, coralline algae in 66% of the stations sampled and coral fragments in 11% ofthe
stations in this study region (MAFLA, 1974). Thus, algal productivity seems more
consistent over the shelf area.
The study area of the central west Florida shelf should have a lower rate of
carbonate production than other coral and algal rich environments with similar
assemblages for a variety of reasons, namely: a decreased amount and quality of light;
lower average temperatures, greater depth; an increase in eutrophication; higher latitude;
a lack of much firm and rocky substrate; a low energy environment; and patchy coverage.
The rate of coral and algal production on the Florida Middle Ground is assumed to be
higher than on the surrounding shelfbecause of the increased number and abundance of
60
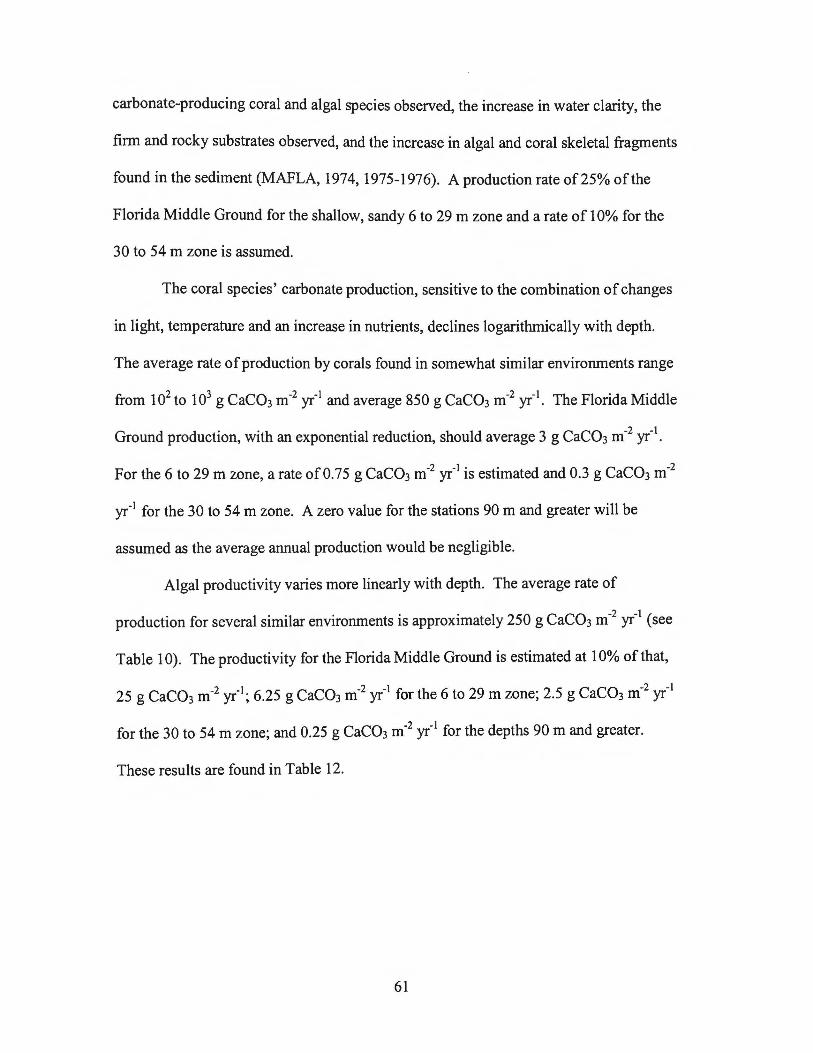
carbonate-producing coral and algal species observed, the increase in water clarity, the
firm and rocky substrates observed, and the increase in algal and coral skeletal fragments
found in the sediment (MAFLA, 1974, 1975-1976). A production rate of25% ofthe
Florida Middle Ground for the shallow, sandy 6 to 29m zone and a rate of 10% for the
30 to 54 m zone is assumed.
The coral species' carbonate production, sensitive to the combination of changes
in light, temperature and an increase in nutrients, declines logarithmically with depth.
The average rate of production by corals found in somewhat similar environments range
from 102 to 103 g CaC03 m-2 yr-1 and average 850 g CaC03 m-2 yr-1• The Florida Middle
Ground production, with an exponential reduction, should average 3 g CaC03 m-2 yr-1•
For the 6 to 29m zone, a rate of0.75 g CaC03 m-2 yr-1 is estimated and 0.3 g CaC03 m-2
yr-1 for the 30 to 54 m zone. A zero value for the stations 90 m and greater will be
assumed as the average annual production would be negligible.
Algal productivity varies more linearly with depth. The average rate of
production for several similar environments is approximately 250 g CaC03 m-2 yr-1 (see
Table 1 0). The productivity for the Florida Middle Ground is estimated at 10% of that,
25 g CaC03 m-2 yr-1; 6.25 g CaC03 m-2 yr-1 for the 6 to 29 m zone; 2.5 g CaC03 m-2 yr-1
for the 30 to 54 m zone; and 0.25 g CaC03 m-2 yr-1 for the depths 90 m and greater.
These results are found in Table 12.
61

Table 12 Coral and algal production rates for the central west Florida shelf
In g CaC03 m-2 yr-1
Zone Coral Algal Total
Florida Middle Grounds 3 25 28
6 to 29m 0.75 6.25 7
30 to 54 m 0.3 2.5 2.8
~90m 0 0 0
62

CHAPTER VII
PRODUCTION BY OTHER ORGANISMS
Several other types of calcium carbonate secreting organisms are worthy of
mention. These locally may make a significant contribution yet do not contribute in a
major way to the total shelf production rate (Milliman, 1993).
Annelida
Of the annelids, the polychaete class is extremely abundant across the central west
Florida shelf(MAFLA, 1975-1976). The Family Serpulidae, tube worms, build hard,
calcareous tubes into which the worm retreats (Brusca and Brusca, 1990; Humann, 1992;
Aliani et al., 1995). The tubes make up an average of96% CaC03 ofthe ash residue
(Vinogradov, 1953). These sedentary animals are suspension feeders (Brusca, and
Brusca, 1990). Many of the serpulids are found on the shelf including the well-known
Christmas tree worm, Spirobranchus giganteus, and are listed in Appendix 32 (MAFLA,
1974, 1975-1976; Humann, 1992; Blake et al., 1995).
Polychaetes have been identified at every station of the MAFLA, MMS and the
Project Hourglass 1965-1967 cruises. They range from 91 to 4,240 individuals per
square meter and average over 1,000 individuals per square meter, with biomass ranging
from 0.2 to 25 grams per square meter, averaging 5.5 grams per square meter wet weight
63
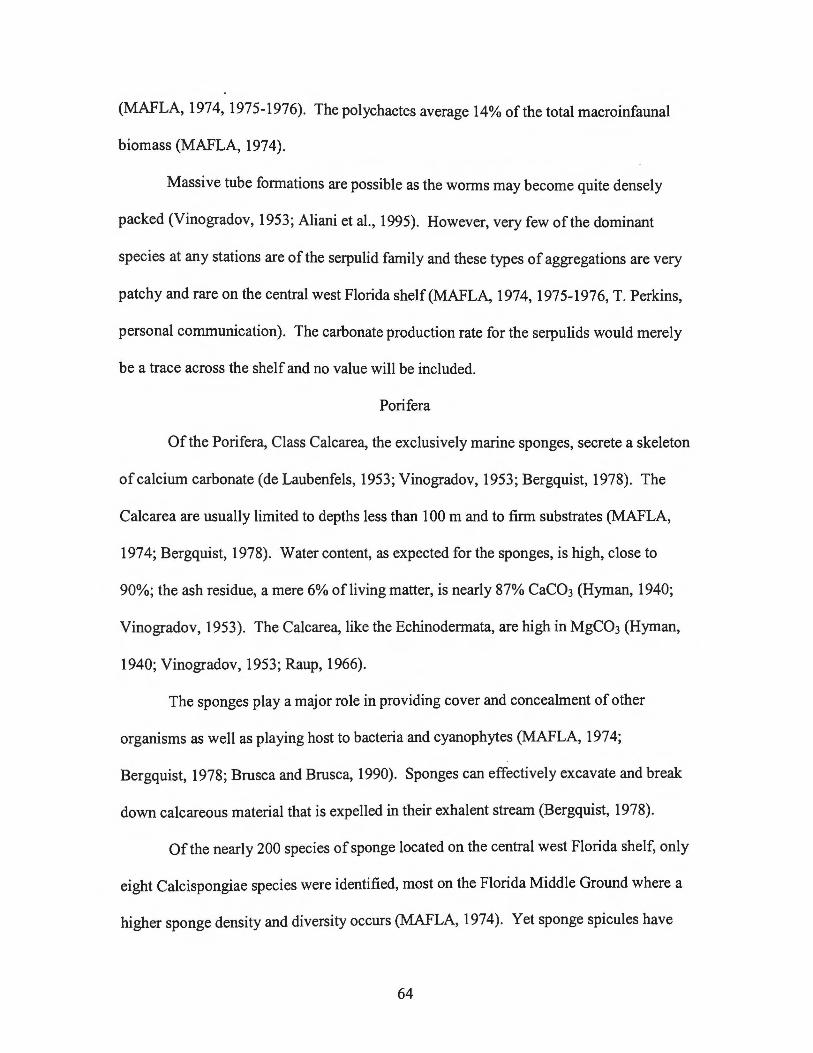
(MAFLA, 1974, 1975-1976). The polychaetes average 14% of the total macroinfaunal
biomass (MAFLA, 1974).
Massive tube formations are possible as the worms may become quite densely
packed (Vinogradov, 1953; Aliani et al., 1995). However, very few of the dominant
species at any stations are of the serpulid family and these types of aggregations are very
patchy and rare on the central west Florida shelf(MAFLA, 1974, 1975-1976, T. Perkins,
personal communication). The carbonate production rate for the serpulids would merely
be a trace across the shelf and no value will be included.
Porifera
Of the Porifera, Class Calcarea, the exclusively marine sponges, secrete a skeleton
of calcium carbonate (de Laubenfels, 1953; Vinogradov, 1953; Bergquist, 1978). The
Calcarea are usually limited to depths less than 100 m and to firm substrates (MAFLA,
1974; Bergquist, 1978). Water content, as expected for the sponges, is high, close to
90%; the ash residue, a mere 6% ofliving matter, is nearly 87% CaC03 (Hyman, 1940;
Vinogradov, 1953). The Calcarea, like the Echinodermata, are high in MgC03 (Hyman,
1940; Vinogradov, 1953; Raup, 1966).
The sponges play a major role in providing cover and concealment of other
organisms as well as playing host to bacteria and cyanophytes (MAFLA, 1974;
Bergquist, 1978; Brusca and Brusca, 1990). Sponges can effectively excavate and break
down calcareous material that is expelled in their exhalent stream (Bergquist, 1978).
Of the nearly 200 species of sponge located on the central west Florida shelf, only
eight Calcispongiae species were identified, most on the Florida Middle Ground where a
higher sponge density and diversity occurs (MAFLA, 1974). Yet sponge spicules have
64

been recorded in the sediment analysis at every site (MAFLA, 1974). Again, none are
dominant on the shelf and they probably contribute only a trace amount of carbonate to
the system.
Bryozoans
The colonial bryozoans or ectoprocts found on the shelf also are calcified (Brusca
and Brusca, 1990; Humann, 1992). Skeletal portions ofbryozoans are found in the
sediments of the shelf in trace amounts. The contributions by the bryozoans are usually
disregarded (Neumann and Land, 1975; Bosence, 1989).
Crustacea
Benthic Crustaceans
The ubiquitous crustaceans are found at all stations on the central west Florida
shelf from benthic community to the water column. These communities' composition
changes across the shelf (Hopkins et al., 1981 ).
The most highly calcified of the crustaceans are the Cirripedia, whose shells are
chiefly CaC03, 97% (Vinogradov, 1953; Brusca and Brusca, 1990). These animals are
the sole significant sediment constituent found only on the Florida Middle Ground and
not the surrounding shelf(Brooks, 1981). Sediment analysis reveals over 8% barnacle
skeletal fragments on the Florida Middle Ground and a trace amount elsewhere (Brooks,
1981 ). The sessile barnacles may produce measurable amounts of carbonate to the
system and should not be ignored. Lacking any data other than sediment constituency, a
gross estimation for the Florida Middle Ground stations is 25% of the production of the
molluscs, which comprise 36% of the skeletal fragments in the sediment in the region.
65

Thus an additional 0.5 g CaC03 m-2 yr-1 is added to the nine stations of the Florida
Middle Ground.
Water Column Biomass
The MAFLA cruise identified 104 different zooplankton species of copepods,
cladocerans, amphipods, ostracods, mysids, isopods, decapods, euphausids, and
thalliaceans (MAFLA, 1975-1976). Zooplankton biomass averaged 0.04 g m-3 dry matter
over the cruise periods (MAFLA, 1974; MAFLA, 1975-1976). Many of the crustaceans
have a predominantly chitinous, as opposed to calcitic, carapace (Vinogradov, 1953;
Brusca and Brusca, 1990; Gunthorpe et al., 1990; Gore, 1992). For the carbonate
secreting species, just over 15% of the dry matter is CaC03 (Vinogradov, 1953; Johnson
and Hopkins, 1978). With no information regarding the species composition ofthe
biomass, the distribution in the water column, the distribution across the shelf, the
residence time in the region, or the turnover rate of the zooplankton, no attempt to
quantify this contribution to the production rate should be made.
Fish
Fish otoliths are comprised of concentric layers of calcium carbonate and organic
material, as are a small percentage ofthe bone and scales (Vinogradov, 1953; Pannella,
1980; Kingsmill, 1993). The approximate otolith weight to fish biomass weight ratio is
1 o-8, with 1 o-5 maximum (R. Wilson, personal communication). For the observed fish
biomass of 6, 700 g wet weight and an annual turnover rate of 12% to 15%, the 1 o-3 to 1 o-
6 g CaC03 m-2 yr-1 is a negligible value for the shelf production rate. The calcification
rates vary with temperature, salinity, pH, and feeding activity (Pannella, 1980).
66
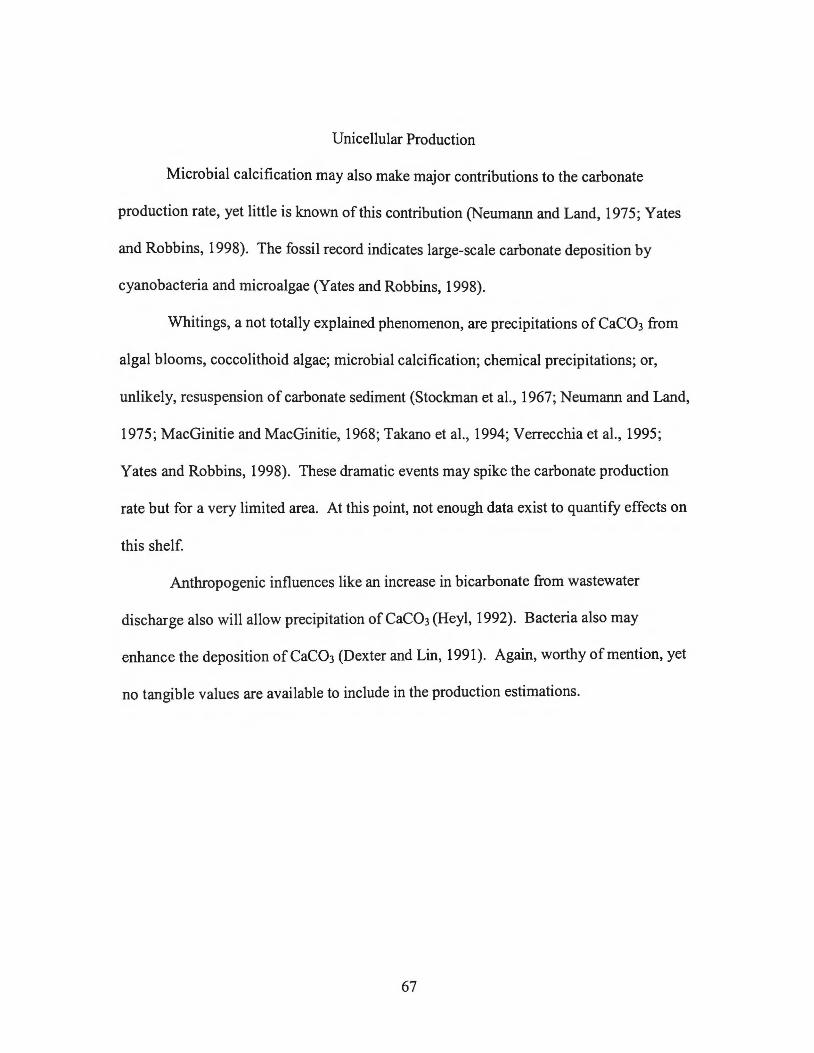
Unicellular Production
Microbial calcification may also make major contributions to the carbonate
production rate, yet little is known ofthis contribution (Neumann and Land, 1975; Yates
and Robbins, 1998). The fossil record indicates large-scale carbonate deposition by
cyanobacteria and microalgae (Yates and Robbins, 1998).
Whitings, a not totally explained phenomenon, are precipitations of CaC03 from
algal blooms, coccolithoid algae; microbial calcification; chemical precipitations; or,
unlikely, resuspension of carbonate sediment (Stockman et al., 1967; Neumann and Land,
1975; MacGinitie and MacGinitie, 1968; Takano et al., 1994; Verrecchia et al., 1995;
Yates and Robbins, 1998). These dramatic events may spike the carbonate production
rate but for a very limited area. At this point, not enough data exist to quantify effects on
this shelf.
Anthropogenic influences like an increase in bicarbonate from wastewater
discharge also will allow precipitation of CaC03 (Heyl, 1992). Bacteria also may
enhance the deposition ofCaC03 (Dexter and Lin, 1991). Again, worthy of mention, yet
no tangible values are available to include in the production estimations.
67
CHAPTER VIII
FLORIDA MIDDLE GROUND PRODUCTION
The Florida Middle Ground is the northernmost hermatypic coral community in
the eastern GulfofMexico (MAFLA, 1975-1976; Brooks, 1981; GMFMC, 1982). This
reef community is recognized as an area of unique biological sensitivity (MAFLA, 1975-
1976; Brooks, 1981 ). The nearly 700 km2, located 160 km north-northwest of Tampa,
Florida, consists of discontinuous limestone outcroppings with relief of 2 to 10 m over
depths of 25 to 65 m (Cheney and Dyer, 1974; Brooks, 1981 ). Two major parallel ridges
are evident with broad valleys between them (Brooks, 1981 ).
The Florida Middle Ground lies in the midst of a complex mixing area between
the three significant water masses, the Loop Current, the West Florida Estuarine Gyre,
and the Florida Bay Waters, with upwelling common in the area (Cheney and Dyer,
1974; MAFLA, 1974; Brooks, 1981). The Florida Middle Ground enjoys steady
conditions of clear water, stable salinity and light penetration, and a temperature range of
16° to 26°C with some thermal stratification (Cheney and Dyer, 1974; Brooks, 1981 ).
The flora and fauna on the Florida Middle Ground are displaced far north of their
usual limits. The outcroppings are covered with shell rock and living and dead corals of
the north tropical, Caribbean affinities (Cheney and Dyer, 1974). The diverse
assemblages are rich in algal species, and hard and soft coral occur in patchy abundances
with few species found on the loose sand or shell (MAFLA, 1974).
68
The carbonate content of the sediments is typical of other continental shelves and
the sediment constituents resemble those of the central west Florida shelf, not a typical
coral reef environment (Brooks, 1981 ). Carbonate content decreases away from the
Florida Middle Ground indicating a decline in carbonate production, with no significant
relationship with depth noted (Brooks, 1981 ). Molluscan fragments dominate and the
notable difference between the Florida Middle Ground and the surrounding shelf is the
presence of Cirripedia due to the abundance of hard substrate for attachment (Brooks,
1981 ).
Production for the Florida Middle Ground is summarized in Table 13, totals by
station are found in Appendix 33. The range and average production for the nine stations
of the Florida Middle Ground are included with the production for six stations
immediately surrounding the Florida Middle Ground, as well as the average for all the
stations of the central west Florida shelf except those of the Florida Middle Ground, and
the entire shelf.
The two distinct differences between the production on the Florida Middle
Ground and the rest of the shelf are the increase in molluscan, algal, coral and barnacle
production, and the decrease in the production for the foraminifera. The Florida Middle
Ground's carbonate-producing adv~tage over the surrounding area is the hard, elevated
substrate and increase in water motion (Brooks, 1981 ). This allows favorable conditions
for the tropical coral and algal species likely recruited from the Loop Current yet no
active reef growth has been observed and coral and algal contribution is minimal (See
Table 14) (Brooks, 1981).
69

An anticipated dramatic change in calcium carbonate production rates for the
Florida Middle Ground is not observed. Production is higher but similar for the Florida
Middle Ground and the central west Florida shelf. These production values may be
largely underestimated partially due to the limitations of the box core. The rugged
bathymetry likely includes more surface area upon which calcareous organisms may live,
increasing production rates but hampering the ability to quantify those rates. The
overhangs, crevices and holes should host a variety of organisms that may be
inadequately represented here (MAFLA, 1974). The patchy distribution of the organisms
may also affect the biomass values.
Table 13 Carbonate production rates for the Florida Middle Ground
Florida Middle Surrounding Shelf without Central West Ground Shelf Florida Middle Florida Shelf
Ground Range Avg Range Avg Range Avg Range Avg
Foraminifera 9-53 24 32-86 52 6-124 41 6-124 38
Micromollusca 19-84 53 20-73 42 0-130 37 0-130 40 Macro mollusca 0.2-26 8 0.6-9 3 0.1-391 18 0.1-391 16
Mollusca 27-98 61 23-74 45 0.5-408 55 0.5-408 56
Echinodermata 0.01-2 1 0-0.83 0.3 0-14 1 0-14 1 Algae 25-25 25 3-3 3 0.3-6 4 0.3-25 8 Coral 3-3 3 0-0.3 0.3 0-1 0.4 0-3 1 Cirripedia 0.5 0.5 0 0 0 0 0-0.5 0.1
Total 82-165 114 73-123 100 25-434 101 25-434 103
Depth in m 34-44 39 37-54 46 6-189 42 6-189 42
Carb. In Sed. 10-98 77 78-92 86 10-98 71 10-98 72
70

The sediments, summarized in Table 14, more closely resemble a carbonate
continental shelf than a coral reef (Brooks, 1981 ). Production and deposits in the
sediment are very similar to those on the shelf, molluscs dominated with significant
amounts ofbamacle fragments (Brooks, 1981). The Florida Middle Ground has every
indication of a transitional environment. This fossil reef system may be approaching
assimilation into the central west Florida shelf (Brooks, 1981 ).
Table 14 Sediment constituents modified from Brooks ( 1981)
Skeletal Fragments Florida Middle Ground Surrounding West Florida Shelf
Molluscs 30% 47%
Foraminifera 3% 10%
Coral 2% Trace
Coralline Algae 1% Trace
Halimeda Trace Trace
Cirripedia 8% Trace
Misc. Skeletal 15%
The Florida Middle Ground is known to be an exceptional and productive fishing
ground for commercial and sport fishing, as well as a dive destination (Cheney and Dyer,
1974; MAFLA, 1974; Brooks, 1981). Potentially, small changes in the environment
could create significant impact upon this biological system. However, carbonate
production may not be severely impacted as production, at 114 g CaC03 m-2 yr-1, is
estimated to be around 10% greater for the Florida Middle Ground than for the other sites
on the central west Florida shelf, calculated at 103 g CaC03 m -2 yr-1
• The stations
71

immediately surrounding the Middle Ground enjoy nearly the same productivity as the
reef system itself, 100 g CaC03 m-2 yr-1, albeit by a different assemblage of organisms.
72
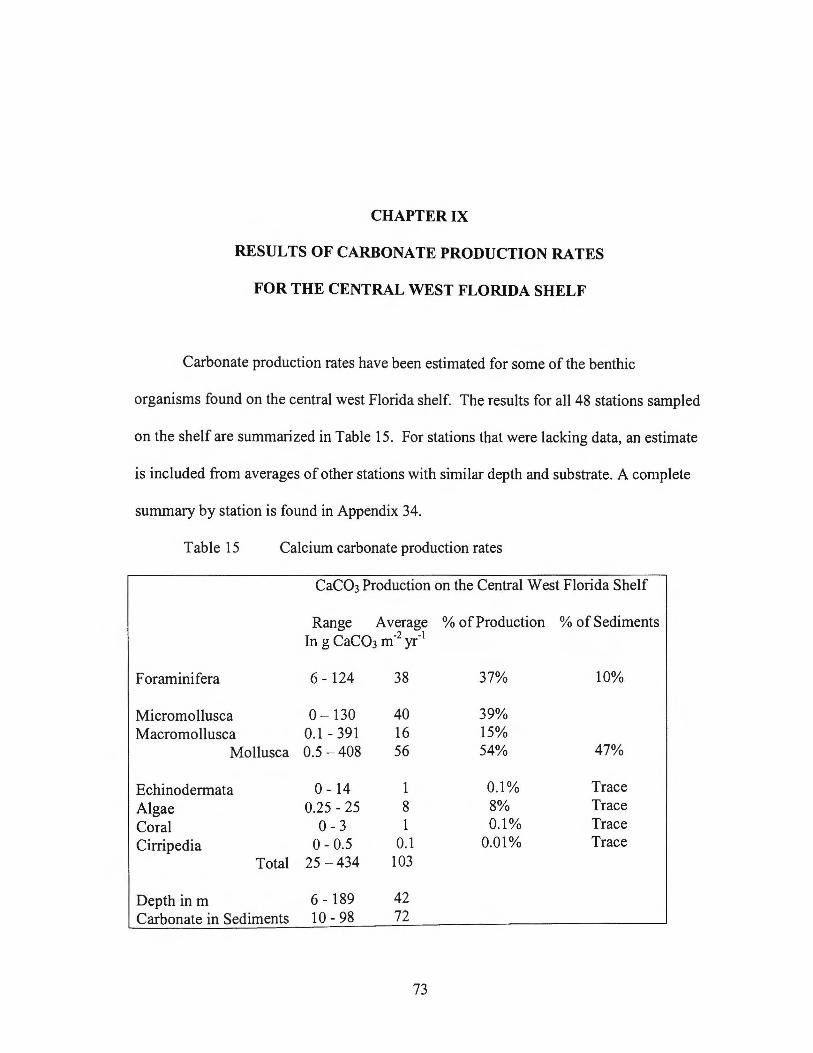
CHAPTER IX
RESULTS OF CARBONATE PRODUCTION RATES
FOR THE CENTRAL WEST FLORIDA SHELF
Carbonate production rates have been estimated for some of the benthic
organisms found on the central west Florida shelf. The results for all 48 stations sampled
on the shelf are summarized in Table 15. For stations that were lacking data, an estimate
is included from averages of other stations with similar depth and substrate. A complete
summary by station is found in Appendix 34.
Table 15 Calcium carbonate production rates
CaC03 Production on the Central West Florida Shelf
Range Average In g CaC03 m-2 yr-1
% of Production % of Sediments
Foraminifera 6- 124 38 37% 10%
Micromollusca 0-130 40 39% Macro mollusca 0.1 - 391 16 15%
Mollusca 0.5-408 56 54% 47%
Echinodermata 0 - 14 1 0.1% Trace
Algae 0.25-25 8 8% Trace
Coral 0 - 3 1 0.1% Trace
Cirripedia 0-0.5 0.1 0.01% Trace
Total 25 - 434 103
Depth in m 6- 189 42 Carbonate in Sediments 10 - 98 72
73
CHAPTER X
DISCUSSION OF RESULTS
The average carbonate production rate is estimated at 103 g CaC03 m-2 yr-1 for
the central west Florida continental shelf. This represents estimations obtained from 48
stations of diverse environments. The rates range in value from 25 to 434 g CaC03 m-2
yr-1• Carbonate production rates vary between stations, by season, by year and with each
different assemblage of carbonate-secreting organisms. Regrettably, few definite trends
are noted. The rates are graphically depicted in Figure 7 and no predictable patterns are
delineated by depth, sediment-facies change or latitude.
Several biotopes were identified within the study region including areas of hard
compacted sand with silt, shell rubble, high-relief and low-relief rock ridges, coarse and
hard packed sand, and soft and silty sand (MAFLA, 1974). Complex biotope changes
occur over short distances and each zone intergrades into neighboring zones lacking any
sharply defined boundaries (MAFLA, 1974; Lyons and Collard, 1974). Each change in
biotope brings a consequent change in substrate, the infaunal benthic community
composition, species distribution and species density.
The communities across the shelf respond to a multitude of abiotic, biotic and
chemical factors including: light intensity, quality and wavelength; substrate type;
temperature; water clarity and movement; salinity; carbon dioxide; available nutrients;
74
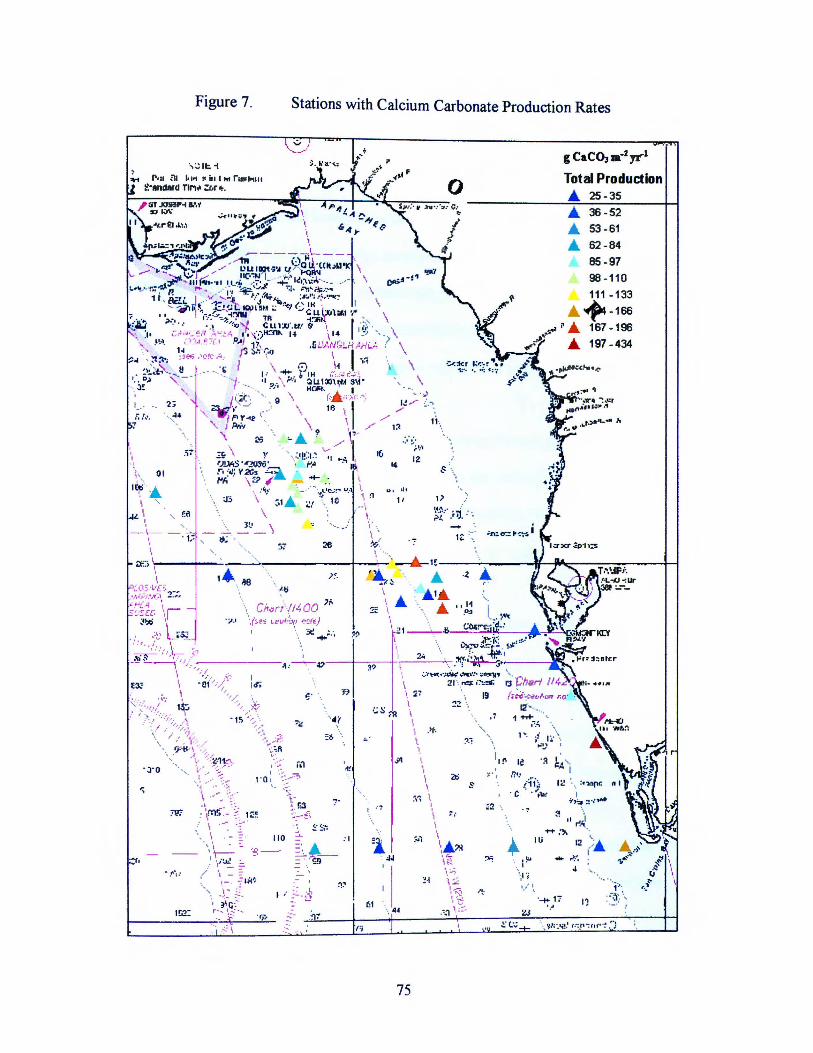
Figure 7.
\;.:: 11:.-i r .u <11 ~ ... • iu . ... r. ........ ,
' I • I
l'-"lllldard TIM" :t,r "·
.\\ (ll
lc,i·._ I '
L I II
-\-
Stations with Calcium Carbonate Production Rates
0
·, l )
~ .. · rti. : ·. ,.. .... . •J.
75
g CaC~•-2 11'"1
Total Production ... 25 - 35
... 36 - 52
... 53 - 61 ... 62-84
85 - 97 98 - 110
111 - 133
£. + - 166 .... ~ ... 167 - 196
~.,-· .... t ... 197 - 434
season; year; depth; species type; competition and predation; disease; and age of
organism (Ginsburg et al. , 1971; Lawrence, 1978; Bishof, 1980). Different areas
precipitate calcium carbonate at different rates (Langer et al., 1997). With a suite of
bathymetric, geographic and seasonal variables influencing community structure, species
abundance, diversity and density varied greatly between stations (MAFLA, 1974;
MAFLA, 1975-1976). Assemblage composition, standing crop, turnover rates and
growth rates are largely habitat-type dependent (Bishof, 1980; Ivany et al., 1994).
Difficulties arise in even attempting to assign a species to a specific habitat (Buzas et al. ,
1993).
Yet, a healthy, diverse infaunal benthic community is composed of just such a
spectrum of species that do vary greatly in habitat, modes of feeding and tolerance of
environmental stresses (Blake et al., 1995). The highly patchy, mobile and relatively
long-lived benthic organisms are considered good indicator organisms (Blake et al. ,
1995).
Buzas et al. (2002) also observed significant differences among stations, years
and seasons for foraminiferal densities in the Indian River Lagoon, Florida, and
determined environmental variables offered little illumination to the variability in
densities. The observed variability of foraminiferal densities between stations was quite
large with changes by station, season and year with every possible variation occurring.
They concluded that the variations in densities are as complicated as possible.
The Buzas et al. (2002) model suggests asynchronous or aperiodic pulsating
patches that vary in space and time. However, no overall trend of density increase or
decrease was observed. Long-term stability is thus achieved through short-term
76
variability both spatially and temporally. They also suggest that foraminifera and most
other marine organisms exhibit the same patterns and the concept of pulsating patches is
relevant for benthic macrofauna} organisms as well (Buzas, 1995; Buzas et al., 2002).
Therefore, although the data show differences between stations, this variability
should be expected and indicative of a healthy, stable carbonate-producing system. The
pulsating patches observed across the shelf suggest long-term stability and the carbonate
production rate of 103 g CaC03 m-2 yr-1 may provide a reasonable long-term average for
a first estimation. Carbonate-producing assemblages vary significantly between most
stations in species composition and dominance as well as species densities yet the
estimated carbonate production rates remain within an order of magnitude reflecting a
remarkable uniformity. This also might indicate a cyclical continuity and stability across
the shelf.
Factors Affecting Evaluation of Estimations
An evaluation of the first-order estimated production rates presented must address
the many sources of error possible for such analysis.
Sampling Technique
The first consideration that arises is in the selection of stations. Care was taken to
choose a representative grouping of stations across several transects and the inclusion of
the Florida Middle Ground. However, it is yet unknown if the 48 stations are indeed
representative of the complete central west Florida shelf environment.
The box core technique introduces error in several ways. A bow wave is created
that may wash away fauna from the edge of the core (Bishof, 1980). The box core is
unable to penetrate hard substrates and depth of penetration if dependent upon the type of
77

substrate (MAFLA, 1974; Bishof, 1980). The box core omits areas of great topography
as it is unable to sample regions of relief, crevices, holes and overhangs, often areas of
increased carbonate productivity.
The data are greatly affected by the chance recovery of large, heavy specimens
(MAFLA, 1974). The aggregation behavior of the large benthic organisms may lead to
both underestimation if the patches are missed and overestimations should the box core
collect an entire patch. The mobile benthic organisms may move into or out of the study
area and may exhibit escape behavior from the box cores.
Error may occur in the sorting of samples, live between dead; the processing of
the samples; chemical analysis; depth of sample from the cores; classification and size
sorting of the organisms; and in the identification of the organisms. Difficulties exist in
the ability to collect live sample and the techniques used hampered recovery of some live
specimens, especially of the micromollusca (Moore, 1972; MAFLA, 1974; MAFLA,
1975-1976).
Organisms Omitted
Due to a lack ofbiomass figures or densities available, several groups of
carbonate-producing organisms are omitted from the production estimations. Planktonic
production rates were not factored into the rates presented. Also, no value for production
by the serpulid worms was calculated. Although very patchy in nature, their contribution
could be locally important. The Porifera, sponges, are identified in the sediment analysis
but not in the biomass figures. Therefore, evidence exists of a contribution of carbonate
but no live specimen data from which to estimate it.
78

Cyanobacteria may produce significant amounts of calcium carbonate yet remain
an elusive subject (Neumann and Land, 1975). No estimation of the production or
biomass value for the cyanophytes is available for these stations in the Gulf of Mexico.
Therefore, as Neumann and Land (1975) have reported, if the contribution is minimized,
it is only because of our ignorance of its importance.
In addition to these organisms that have been intentionally neglected in the
estimations, there may be some organisms inadvertently overlooked as they were not
identified at the stations sampled.
Unknown Factors
To date, little data from the complex living benthic carbonate-producing shelf
environments have been published, leaving much information yet unknown (MacGinitie
and MacGinitie, 1968; Moore, 1972; Murray, 1991; Milliman, 1993; Blake et al., 1995).
The unknowns encompass many areas especially the fields of biology, geology,
chemistry, and climatology.
Certainly, an increased knowledge of the biology of the carbonate-secreting
organisms would enhance the estimations for production. To better locate and identify all
organisms present and to know the biomass, life history, recruitment strategies, growth
and turnover rates and standing crops would improve production rates and pave the way
for determining the sensitivity to how changes in their environment affect the ability to
precipitate calcium carbonate.
Geologically, the complete composition of the sediments, sedimentation and
accumulation rates, and the age ofthe sediments have yet to be determined for the central
west Florida shelf. Further analysis of the chemical composition of carbonate organisms
79
also is required to improve production rate estimations. Data of changes in the seawater
chemistry would provide additional information as would the effects of carbonate
dissolution at the sediment seawater interface.
Missing, also, are the spatial and temporal effects of weather, storm events, and
seasonal cycles on the benthos. Any efforts to fill in these blanks will doubtless advance
the study of carbonate shelf production.
Evaluation of Assumptions Made
To complete an estimation for carbonate production across the shelf, many
assumptions were made. The assumptions are somewhat data dependent as a different set
of station data would have required different assumptions. The classification of the
foraminifera by size mirrored the standards for the species presented. The micromollusc
to macromollusc boundary is less clearly defined. Some have preferred to choose a 5 mm
maximum for the micromolluscs rather than the 7 mm. The samples were impoverished
with live material of any size so it may have not created a large source of error.
Average chemical composition and growth rates are largely habitat dependent.
Using archival data from many species located in many different environments at
different latitudes likely only provides a range of composition and rates that might be
found and was not specific to the Gulf of Mexico region.
The grouping of species may also have been too broad. Although species
composition and density within phylums were taken into consideration, the production
rates should be more species-specific with better biomass analysis from the original
samples.
80
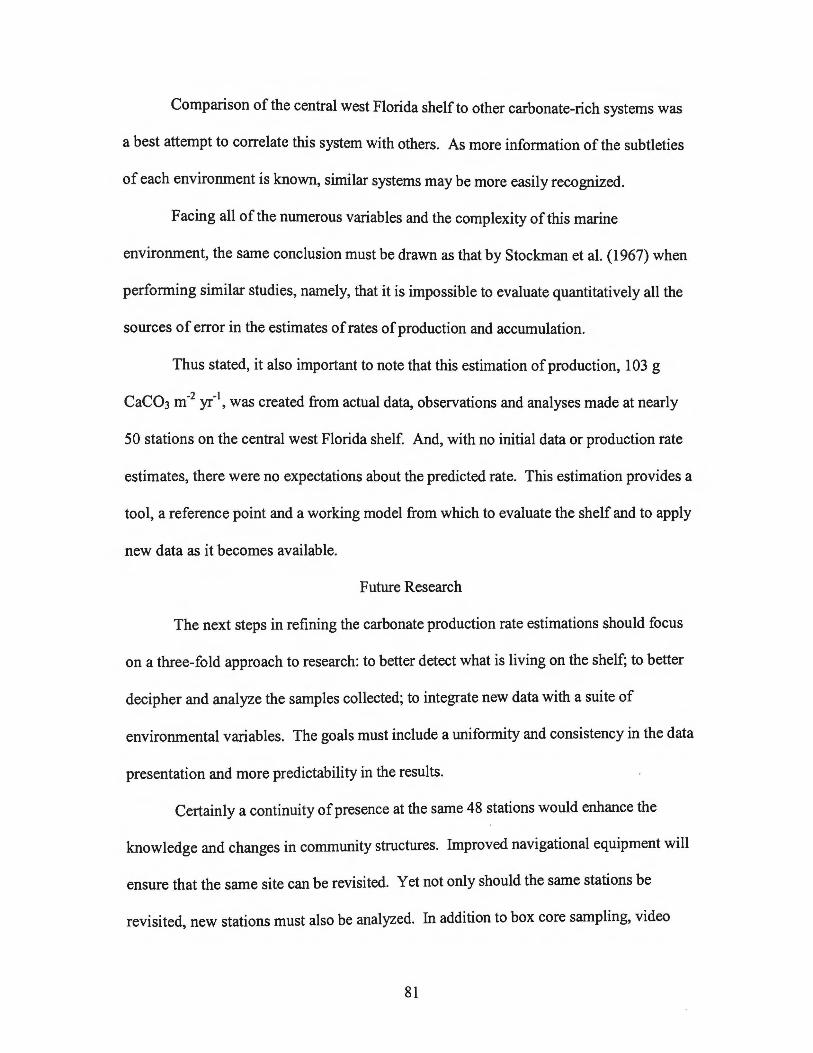
Comparison of the central west Florida shelf to other carbonate-rich systems was
a best attempt to correlate this system with others. As more information of the subtleties
of each environment is known, similar systems may be more easily recognized.
Facing all of the numerous variables and the complexity of this marine
environment, the same conclusion must be drawn as that by Stockman et al. (1967) when
performing similar studies, namely, that it is impossible to evaluate quantitatively all the
sources of error in the estimates of rates of production and accumulation.
Thus stated, it also important to note that this estimation of production, 103 g
CaC03 m·2 yr-1, was created from actual data, observations and analyses made at nearly
50 stations on the central west Florida shelf. And, with no initial data or production rate
estimates, there were no expectations about the predicted rate. This estimation provides a
tool, a reference point and a working model from which to evaluate the shelf and to apply
new data as it becomes available.
Future Research
The next steps in refining the carbonate production rate estimations should focus
on a three-fold approach to research: to better detect what is living on the shelf; to better
decipher and analyze the samples collected; to integrate new data with a suite of
environmental variables. The goals must include a uniformity and consistency in the data
presentation and more predictability in the results.
Certainly a continuity of presence at the same 48 stations would enhance the
knowledge and changes in community structures. Improved navigational equipment will
ensure that the same site can be revisited. Yet not only should the same stations be
revisited, new stations must also be analyzed. In addition to box core sampling, video
81
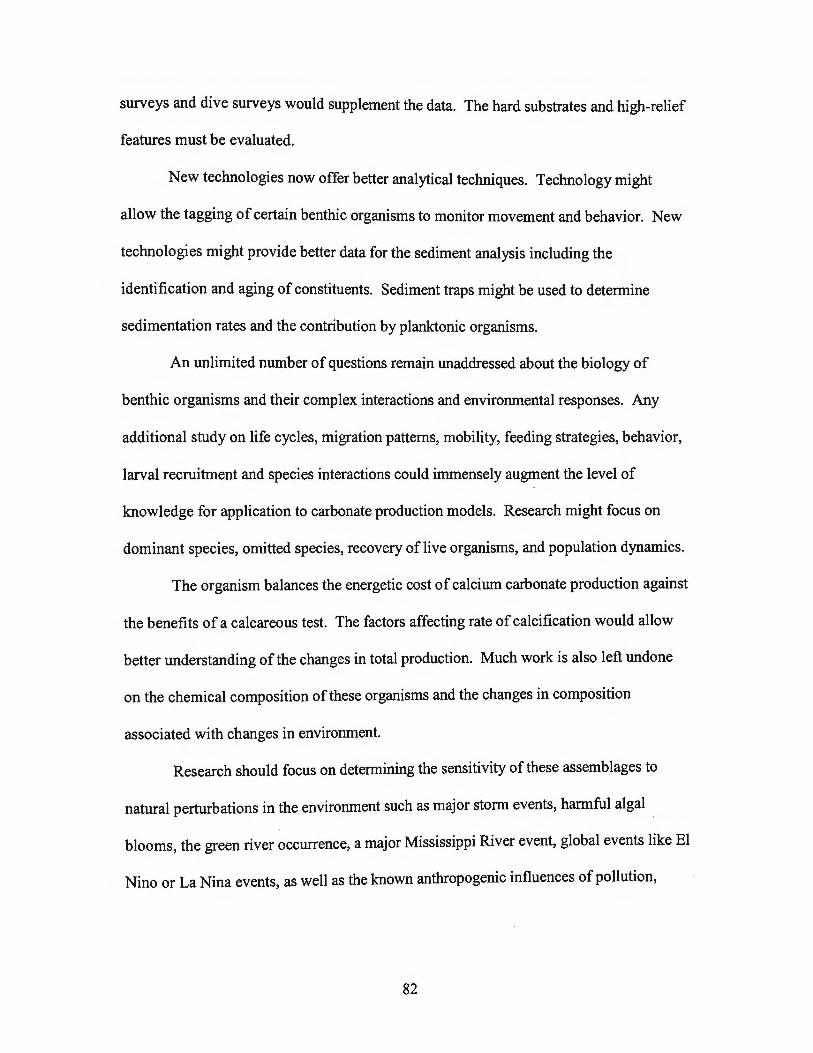
surveys and dive surveys would supplement the data. The hard substrates and high-relief
features must be evaluated.
New technologies now offer better analytical techniques. Technology might
allow the tagging of certain benthic organisms to monitor movement and behavior. New
technologies might provide better data for the sediment analysis including the
identification and aging of constituents. Sediment traps might be used to determine
sedimentation rates and the contribution by planktonic organisms.
An unlimited number of questions remain unaddressed about the biology of
benthic organisms and their complex interactions and environmental responses. Any
additional study on life cycles, migration patterns, mobility, feeding strategies, behavior,
larval recruitment and species interactions could immensely augment the level of
knowledge for application to carbonate production models. Research might focus on
dominant species, omitted species, recovery of live organisms, and population dynamics.
The organism balances the energetic cost of calcium carbonate production against
the benefits of a calcareous test. The factors affecting rate of calcification would allow
better understanding of the changes in total production. Much work is also left undone
on the chemical composition of these organisms and the changes in composition
associated with changes in environment.
Research should focus on determining the sensitivity of these assemblages to
natural perturbations in the environment such as major storm events, harmful algal
blooms, the green river occurrence, a major Mississippi River event, global events like El
Nino or La Nina events, as well as the known anthropogenic influences of pollution,
82
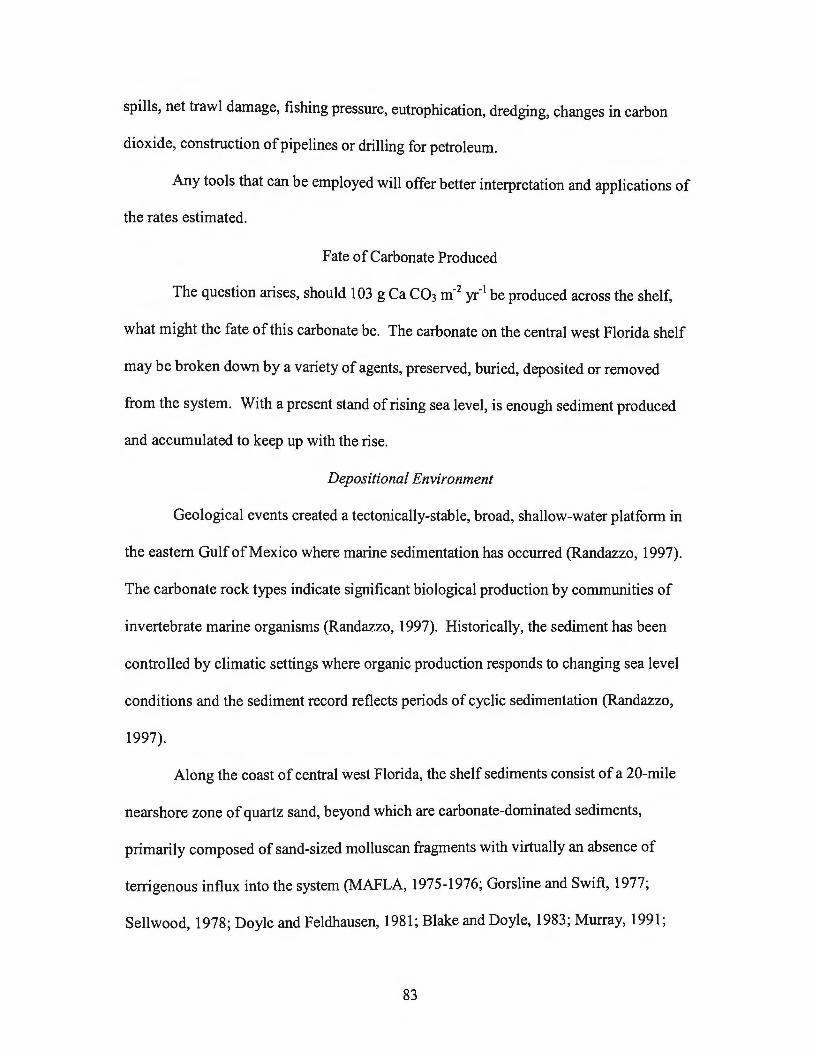
spills, net trawl damage, fishing pressure, eutrophication, dredging, changes in carbon
dioxide, construction of pipelines or drilling for petroleum.
Any tools that can be employed will offer better interpretation and applications of
the rates estimated.
Fate of Carbonate Produced
The question arises, should 103 g Ca C03 m-2 yr-1 be produced across the shelf,
what might the fate of this carbonate be. The carbonate on the central west Florida shelf
may be broken down by a variety of agents, preserved, buried, deposited or removed
from the system. With a present stand of rising sea level, is enough sediment produced
and accumulated to keep up with the rise.
Depositional Environment
Geological events created a tectonically-stable, broad, shallow-water platform in
the eastern Gulf of Mexico where marine sedimentation has occurred (Randazzo, 1997).
The carbonate rock types indicate significant biological production by communities of
invertebrate marine organisms (Randazzo, 1997). Historically, the sediment has been
controlled by climatic settings where organic production responds to changing sea level
conditions and the sediment record reflects periods of cyclic sedimentation (Randazzo,
1997).
Along the coast of central west Florida, the shelf sediments consist of a 20-mile
nearshore zone of quartz sand, beyond which are carbonate-dominated sediments,
primarily composed of sand-sized molluscan fragments with virtually an absence of
terrigenous influx into the system (MAFLA, 1975-1976; Gorsline and Swift, 1977;
Sellwood, 1978; Doyle and Feldhausen, 1981; Blake and Doyle, 1983; Murray, 1991;
83
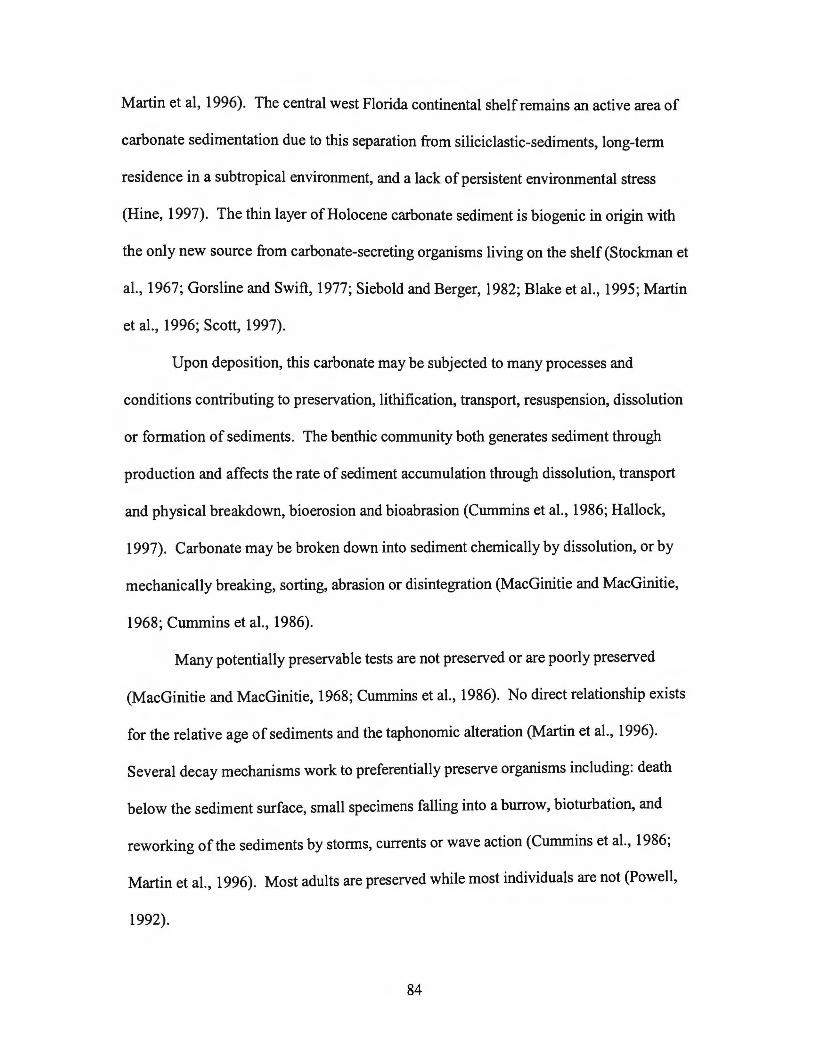
Martinet al, 1996). The central west Florida continental shelf remains an active area of
carbonate sedimentation due to this separation from siliciclastic-sediments, long-term
residence in a subtropical environment, and a lack of persistent environmental stress
(Hine, 1997). The thin layer of Holocene carbonate sediment is biogenic in origin with
the only new source from carbonate-secreting organisms living on the shelf (Stockman et
al., 1967; Gorsline and Swift, 1977; Siebold and Berger, 1982; Blake et al., 1995; Martin
et al., 1996; Scott, 1997).
Upon deposition, this carbonate may be subjected to many processes and
conditions contributing to preservation, lithification, transport, resuspension, dissolution
or formation of sediments. The benthic community both generates sediment through
production and affects the rate of sediment accumulation through dissolution, transport
and physical breakdown, bioerosion and bioabrasion (Cummins et al., 1986; Hallock,
1997). Carbonate may be broken down into sediment chemically by dissolution, or by
mechanically breaking, sorting, abrasion or disintegration (MacGinitie and MacGinitie,
1968; Cummins et al., 1986).
Many potentially preservable tests are not preserved or are poorly preserved
(MacGinitie and MacGinitie, 1968; Cummins et al., 1986). No direct relationship exists
for the relative age of sediments and the taphonomic alteration (Martin et al., 1996).
Several decay mechanisms work to preferentially preserve organisms including: death
below the sediment surface, small specimens falling into a burrow, bioturbation, and
reworking of the sediments by storms, currents or wave action (Cummins et al., 1986;
Martin et al., 1996). Most adults are preserved while most individuals are not (Powell,
1992).
84

The biogenic accumulation provides carbonate debris for diagenesis (MacGinitie
and MacGinitie, 1968). Carbonate dissolution by microbial communities may assist in
early diagenesis (Freiwald, 1995). Yet, only a small fraction of the total production will
be permanently buried in the sediment (MacGinitie and MacGinitie, 1968).
These coarse carbonate sediments have little mean transport or net sediment drift
across or along the shelf(MAFLA, 1974; Gorsline and Swift, 1977; Doyle and Sparks;
1978). Most sediments are formed near the site of deposition (Bathurst, 1971; Murray,
1991).
The Gulf of Mexico surface waters are supersaturated with calcium carbonate and
well above the calcite compensation depth of 4,000 m or the lysocline at 3,000 m (Chave,
1965; MacGinitie and MacGinitie, 1968; Smith, 1971; Kennett, 1992). Thus, the
carbonate-secreting organisms are neither limited by calcium carbonate nor do
undersaturated surface waters dissolve them (Gladfelter, 1984). Some dissolution does
occur in the interstices of the sediment at the sediment-sea water interface (MacGinitie
and MacGinitie, 1968; Kennett, 1992).
Death assemblages do not accumulate at the rate at which organisms die
(Cummins et al., 1986). Organisms are added into the community in pulses, usually from
larval recruitment events, followed by discrete pulses into the death assemblage
(Cummins et al., 1986). The bottom sediments reflect this patchy nature and seasonal
variations (Bishof, 1981; Doyle and Feldhausen, 1981; Cummins et al., 1986).
Sedimentation Rate
The central west Florida shelf is not overwhelmed by sedimentation and several
estimates for the sedimentation rate of the eastern Gulf of Mexico and similar carbonate
85

systems have been made (Murray, 1991 ). They range from 0.01 m 1000 yr·1 to 2.5 m
1,000 yr·1
, or, 0.01 mm yr"1 to 2.5 mm yr"1 with an average rate of0.1 mm yr"1 (Moore,
1972; Blake and Doyle, 1983; Brooks, 1986; Hallock, 1986; Murray, 1991; Kennett,
1992; Powell, 1992). Approximately 101 g CaC03 m"2 yr"1 would need to be produced
and accumulated to maintain a sedimentation rate of0.01 mm yr-1• At least 20% of the
carbonate produced is removed through dissolution, erosion or transport from the shelf
(MacGinitie and MacGinitie, 1968; Langer et al., 1997).
A production rate of 102 g CaC03 ~-2 yr"1 on the shelf produces a sedimentation
rate of 0.1 mm yr·1• And, although biological populations and sediment pulses will
fluctuate, sedimentation rates linked to production rates should remain fairly constant,
slow and stable (MacGinitie and MacGinitie, 1968; Gorsline and Swift, 1977; Doyle and
Feldhausen, 1981; Hallock, 1981; Kennett, 1982; Blake and Doyle, 1983). The Holocene
sediments are approximately 8,000 to 10,000 years old. Thus, a layer of carbonate
sediments approximately one meter in depth would be expected. The thin, molluscan
sand sheet shows a depth of approximately one meter in thickness deposited within the
previous 8,000 to 10,000 years (Brooks, 1981; Davis, Jr., 1997; Hine, 1997).
Sea Level Stand
After the sea level regression in the Pleistocene, sea level has risen during the
Holocene (Scott, 1997). During the late Holocene, sea level rose roughly 25 em per 100
years from 8,000 to 3,000 years before present (Davis, Jr., 1997). Since that time, the
rate of sea level rise has slowed to about 4 em per 100 years or 0.4 mm yr-1
(Figure 6)
(Davis, Jr., 1997). Shallow-water tropical carbonate-producing environments can keep
pace with sea level rise at even faster geo- and glacioeustatic rates (Hine, 1997). With a
86
sedimentation rate of 0.1 mm yr·1, the eastern Gulf of Mexico is not keeping up with the
sea level rise.
Global Carbon Dioxide Budget
Production of calcium carbonate is intimately connected to discussions of global
carbon dioxide cycling and the classification of a carbonate-producing environment as a
net source or sink of carbon dioxide. Many researchers label reefs and carbonate systems
as a net source of atmospheric carbon dioxide from the one to one relationship of a mole
of calcium carbonate produced to a mole of carbon dioxide released into the atmosphere
(Langer et al., 1997). Others have proposed that reefs, carbonate systems and carbonate
sediments are sinks for carbon dioxide through fixation by photosynthesis or calcification
(MacGinitie and MacGinitie, 1968; Smith, 1978; Sundquist, 1993; Takano et al., 1994;
Kayanne et al., 1995; Kleypas, 1997). Actually, both approaches are true when placed in
context of time scale.
In terms of biological scales, diurnal changes in the carbon dioxide cycling have
been noted (Le Campion-Alsumard et al., 1993; Kayanne et al., 1995). On the shorter
time span of thousands of years during our current interglacial period, carbonate and
reefal systems may be considered sources of atmospheric carbon dioxide (Broecker and
Peng, 1987; Hallock, 1997). And, on geologic scales, limestones and carbonate
environments are net sinks as they store large quantities of carbon dioxide, especially in a
tectonically-stable shelf system with little transport or recycling (Hallock, 1997).
To relate this to the current time frame and interest in the effects of carbon
dioxide cycling on global warming, it should be noted that the estimate of carbonate
produced on the central west Florida shelf would be negligible to the story. Fossil fuel
87
burning has contributed more carbon dioxide into the atmosphere in the last 100 years
than the reef-building communities have in 15,000 years (Hallock, 1997: Langer, et al.,
1997). However, the importance of carbonate production in global cycles should not be
overlooked as the benthic communities are very sensitive to environmental changes and
the delicate balance between the assemblages and their environment forces their
participation as mediators of climate change and responders to it (Hallock, 1997;
Hubbard, 1997).
Benefit of Estimated Carbonate Production Rates
A picture of the calcium carbonate production rate on the central west Florida
shelf concerns all who study, manage and enjoy the region and should engage the
biologist, modeler, geologist, paleoceanograper, climatologist, legislator, ecologist and
economist alike. The impacts of carbonate production across the eastern Gulf of Mexico
are far reaching, the scope of which is nearly limitless.
All aspects of resource management from fisheries, to petroleum and mineral
exploration and mining, to the harvesting of sand are, at some point, influenced by and
create impacts to carbonate production. A carbonate production rate can aid biologists in
their research on living assemblages, dominant species, species interactions, food supply
and organisms as food supply, predation pressure, overharvesting issues, seasonality,
stability, sensitivity to perturbations, effects of habitat alteration, fate of the Florida
Middle Ground, potential productivity of a system, and the response to episodic events
like harmful algal blooms.
Of interest to the geologists are the net production, sedimentation and
accumulation rates, record of geochemical cycles, sea level change response and the
88

record of evolutionary history as told by the carbonate-producing organisms.
Climatologists might learn of productivity changes in relation to storm events, global
climatic events and carbon dioxide cycling.
A multitude of anthropogenic influences affect carbonate productivity including:
pollution, runoff, spills, water quality degradation, effects of nets, trawls and dredge
scars, introduction of exotic species, pipelines, the gulf as transportation, biofouling,
eutrophication, creation of artificial reefs and fishery pressure. Knowledge of the
consequences of these activities will greatly assist in management and directing policy
for the shelf. Coastal construction and vessels increase the surface area of hard substrates
for carbonate-secreting organisms. Carbonate productivity may be enhanced nearshore
with these types of additions.
Coastal communities continuously deal with shoreline sand issues and are
constantly addressing renourishment of the beach. With all modern shelf sands of
biogenic origin and thus calcium carbonate in nature, the future ofthe fine quartz beach
sand is in question. The sand used for renourishment likely will have a higher
concentration of less desirable carbonate material and shell hash. Important to learn, as
well, is at what rate the quartz sand sheet will be overcome by carbonate sedimentation.
The litany of issues outlined accentuates the extent to which the carbonate
productivity is integral to the health of a system and what a marvelous key to
understanding these processes it can become. The implications reach from to local, to
regional to global environments.
89
Uses of Calcium Carbonate
Applications utilizing calcium carbonate range from biotechnology to building to
manufacturing to food production. Calcium carbonate may assist in enzyme
immobilization, medicine, and ceramics and provide a source for fine chemicals (Takano
et al., 1994). Calcium carbonate materials are used in building and ornamental stones,
road material, cements, flux for steel smelting, lithography, optical polarizing prisms,
enhancing film, pharmaceutical production like antacids and antibiotics, glass, rubber,
white paint, cleaning powder and papermaking (Gaines, 1989; Burke, 1993; Callari,
1993). Calcium carbonate is found in candy, chewing gum, food fillers and toothpaste
(Gaines, 1989).
Therefore, demand for carbonate material is high and shortages of calcium
carbonate within the world markets have been documented (Sherman, 1994). The
amount produced on the central west Florida shelf is likely irrelevant, yet at some time in
the future it may not be so.
Production Rate Comparisons
The calcium carbonate production rate estimated is compared to other shelf and
carbonate producing systems in Table 16. Production rates vary from 10° to 104
g CaC03
m-2 yr-1 for the varied environments. The highest rates are found in coral-dominated
habitats. Shelf production rates range from 60 to 400 g CaC03 m·2
yr-1
, with the central
west Florida shelf production estimate of 103 g CaC03 m·2
yr-1
.
Caution must be exercised when comparing the rate calculated in this study to
those listed in Table 16 as many of the other sources were used to develop the model
presented here. Therefore, trends noted might be artificial as they were created in the
90
calculations. Having noted that, the production rate estimated appears to parallel
production in other carbonate shelf systems.
Comparisons do not extend beyond the central west Florida shelf. Westward of
the study region approaches a different region of productivity at the shelf-slope break and
beyond to the slope (Blake and Doyle, 1993). Farther north of the region the shelf is
influenced by the Mississippi River and the influx of terrigenous material. South of the
area, the environment changes to a tropical and more reef-dominated environment. And,
west of the sites is coastal Florida with a beach system of unknown productivity.
91
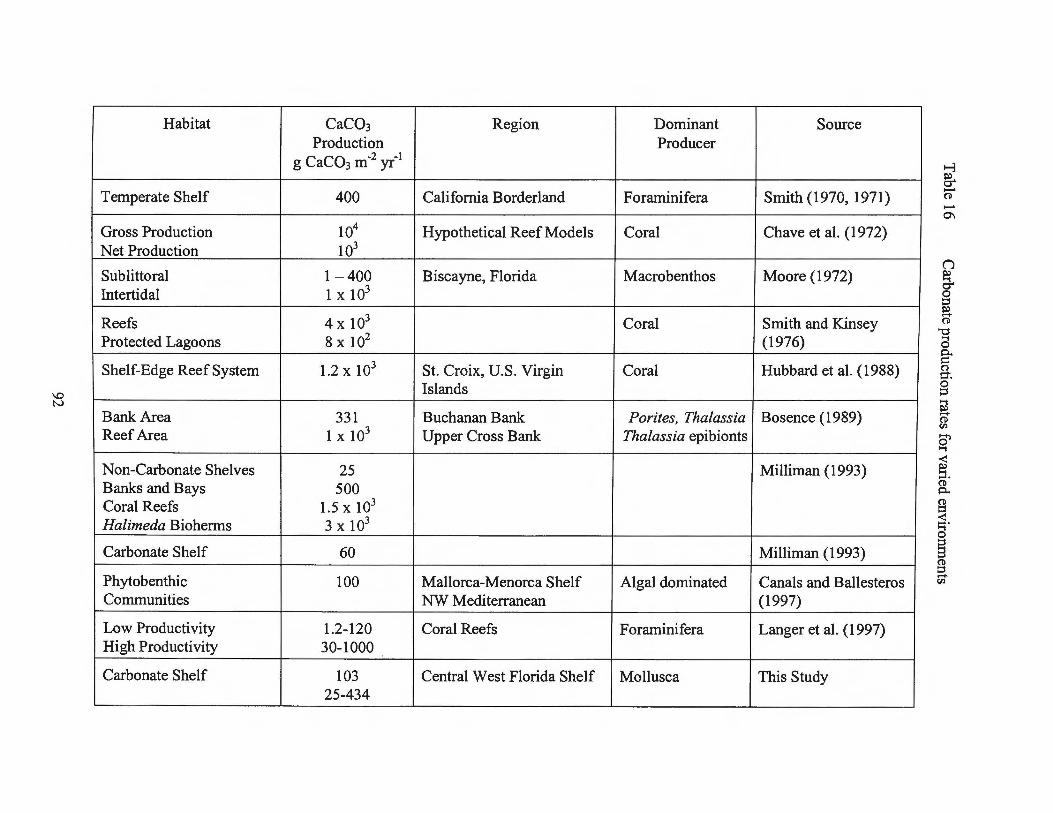
Habitat CaC03 Region Dominant Source Production Producer
g CaC03 m-2 yr-1
Temperate Shelf 400 California Borderland Foraminifera Smith (1970, 1971)
Gross Production 104 Hypothetical Reef Models Coral Chave et al. (1972) Net Production 103
Sublittoral 1 - 400 Biscayne, Florida Macrobenthos Moore (1972) Intertidal 1 X 10³
Reefs 4 X 10³ Coral Smith and Kinsey Protected Lagoons 8 X 10² (1976)
Shelf-Edge Reef System 1.2 X 10³ St. Croix, U.S. Virgin Coral Hubbard et al. (1988) Islands
Bank Area 331 Buchanan Bank Porites, Thalassia Bosence (1989) Reef Area 1 X 10³ Upper Cross Bank Thalassia epibionts
Non-Carbonate Shelves 25 Milliman (1993) Banks and Bays 500 Coral Reefs 1.5 X 10³
Halimeda Bioherms 3 X 10³
Carbonate Shelf 60 Milliman (1993)
Phytobenthic 100 Mallorca-Menorca Shelf Algal dominated Canals and Ballesteros Communities NW Mediterranean (1997)
Low Productivity 1.2-120 Coral Reefs Foraminifera Langer et al. ( 1997) High Productivity 30-1000
Carbonate Shelf 103 Central West Florida Shelf Mollusca This Study 25-434
Concluding Remarks
The goal of this study was to describe the benthic carbonate-producing
communities and to quantify the calcium carbonate production rate for the central west
Florida shelf. Benthic communities represent good indicator organisms, both as
bioindicator and geoindicator (Blake et al., 1995; Lidz and Hallock, 2000). They provide
a basis upon which to monitor ecosystems, note the reality of environmental and
anthropogenic perturbations and assess living and relict communities (Blake et al., 1995;
Lidz and Hallock, 2000).
The previous discussion has demonstrated the complexity of this type of system
and, with little data available and incomplete research, the difficulty in developing a
production rate. Non-linear biological systems demand a complete look at many
variables, both in space and in time.
This preliminary work provides the foundation for a dynamic working model for
quantitatively representing production rates on the shelf. Using extensive though not
comprehensive data from assemblages found on the central west Florida shelf, a model
for calcium carbonate production was designed and presented.
Few patterns have been noted for production rates as a function of depth, latitude
or biotopes. However, substrate may play the major role in community distribution,
composition, larval recruitment and productivity on the shelf (MAFLA, 1974; Babashoff,
1982; Blake and Doyle, 1983; Blake et al., 1995; Canals and Ballesteros, 1997). The
benthic community thus both shapes the substrate and is shaped by it. Understanding
these interactions will aid in refining the production processes and rates for the shelf.
93

The assemblages and community composition varied temporally yet the
production values did not vary dramatically. The short-term changes of pulsating patches
do not appear to affect long-term stability of the system nor the stability of the production
rates.
Although the communities vary spatially across the shelf and reside in dissimilar
hydro-biological zones, the production rates for the stations are similar. To illustrate,
compare the production rates for the Florida Middle Ground at 114 g CaC03 m-2 yr-1 and
the surrounding shelf estimated to be 101 g CaC03 m-2 yr-1• Production rates are quite
close in value but the biotope and populations of organisms within the assemblage varied
greatly and secreted carbonate at different rates.
This ecologically rich shelf environment shows remarkable stability while still
sensitive to perturbations (MAFLA, 1975-1976). The results reflect healthy, responsive
benthic communities producing calcium carbonate at a rate of 102 g CaC03 m-2 yr-1
•
94
REFERENCES CITED
Adey, W. H. and Vassar, J. M., 1975, Colonization succession, and growth rates of tropical crustose coralline algae (Rhodophyta, Cryptanimiales): Phycologia, v. 14, p. 55-69.
Aliani, S., Bianchi, C. N., Deasmundis, C., and Meloni, R., 1995, Scanning electronmicroscope observations on the tube of the reef-forming serpulid Ficopomatus enigmaticus (Fauvel) (Annelida, Polychaeta): Bollettino di Zoologia, v. 62, no. 4, p. 363-367.
Babashoff, Jr., G., 1982, Temporal and spatial distribution ofbenthic foraminifera in the northeastern Gulf of Mexico. (Master' s Thesis). University of Miami.
Bathurst, R. G. C., 1971, Carbonate sediments and their diagenesis: Developments in Sedimentology 12, Elsevier, New York, 658 pp.
Bergquist, P. R ., 1978, Sponges: University of California Press, Berkeley, 268 pp.
Bin yon, J ., 1972, Physiology of Echinoderms: A. Brown & Sons Ltd., Oxford, Great Britain, 264 pp.
Bishof, D. E., 1980, The ecology of molluscan infauna on the southwestern continental shelf of Florida. (Master's Thesis). University of South Florida, 150 pp.
Blake, N. J. and Doyle, L. J. , 1983, Infaunal-sediment relationships at the shelf-slope break: SEPM Special Publication, no. 33, p. 381-389.
Blake, N.J., Doyle, L. J. , and Culter, J. J. , 1995, Impacts and direct effects of sand dredging for beach renourishment on the benthic organisms and geology of the West Florida Shelf, Final Report - Executive Summary: OCS Report MMS 95-0004, U. S. Department of the Interior, Minerals Management Service, Office of International Activities and Marine Minerals, Herndon, Va., 23 pp.
Bosence, D., 1989, Biogenic carbonate production in Florida Bay: Bulletin of Marine Science, v. 44, no. 1, p. 419-433.
95

Broecker, W. S., and Peng, T.-H., 1987, The role ofCaC03 in the glacial to interglacial atmospheric C02 change: Global Biogeochemical Cycles, v. 1, no. 1, p. 15-29.
Brooks, G. R., 1981, Recent carbonate sediments of the Florida Middle Ground reef system; Northeastern Gulf of Mexico. (Master's thesis). University of South Florida, 164 pp.
Brusca, R. C. and Brusca, G. J., 1990, Invertebrates: Sinauer Associates, Inc., Sunderland, Mass., 922 pp.
Burke, D. J ., 1993, Calcium carbonate and the evolution of alkaline papermaking in North America: Journal, v. 76, p. 40A-40G.
Buzas, M. A., 1995, Diversity, distribution and density monitoring of Foraminifera in the Indian River: Bulletin ofMarine Science, v. 57, no. 1, p. 279-285.
Buzas, M.A., Culver, S. J. and Jorissen, F. J., 1993, A statistical evaluation of the microhabitats of living (stained) infaunal benthic foraminifera: Marine Micropaleontology, v. 20, no. 3-4, p. 311-320.
Buzas, M.A., Hayek, L.-A. C., Reed, S. A. and Jett, J. A., 2002, Foraminiferal densities over five years in the Indian River Lagoon, Florida: A model of pulsating patches: Journal ofForaminiferal Research, v. 32, no. 1, p. 68-93.
Callari, J ., 1993, Boost output, film properties with calcium carbonate filler: Plastics World, v. 51, p. 10.
Canals, M. and Ballesteros, E., 1997, Production of carbonate particles by phytobenthic communities on the Mallorca-Menorca shelf, northwestern Mediterranean Sea: Deep-Sea Research II, v. 44, no. 3-4, p. 611-629.
Chave, K. E., 1965, Carbonates: Association with organic matter in surface seawater: Science, v. 148, p. 1723-1724.
Chave, K. E., Smith, S. V., and Roy, K. J., 1972, Carbonate production by coral reefs: Marine Geology, v. 12, p. 123-140.
Chen, C.-P., 1985, The role of carbonic anhydrase in the calcification ofthe tooth ofthe sea urchin Lytechinus variegatus (Lamarck). (Doctoral dissertation). University of
South Florida.
Cheney, D. P. and Dyer ill, J.P., 1974, Deep-water benthic algae of the Florida Middle Ground: Marine Biology, v. 27, p. 185-190.
96

Coe, W. R. and Fitch, J. E., 1950, Population studies, local growth and reproduction of the pismo clam (Tivela stultorum): Journal of Marine Research, v. IX, no. 3. p. 188-210.
Colinvaux, L. H., Wilbur, K. M., and Watabe, N., 1965, Tropical marine algae: Growth in laboratory culture: Journal ofPhycology, v. 1, p. 69-78.
Comfort, A., 1957, The duration of life in mollusks: Proceedings of the Malacologica1 Society of London, v. 32, p. 219-241.
Craig, G. Y., 1967, Size-frequency distributions ofliving and dead populations of pelecypods from Bimini, Bahamas, B.W.I.: Journal of Geology, v. 75, p. 34-45.
Crump, R. G., and Emson, R. H., 1978, Some aspects of the population dynamics of Asterina gibbosa (Asteroidea): Journal ofMarine Biological Association of the United Kingdom, v. 58, p. 451-466.
Cummins, H., Powell, E. N., Stanton, Jr., R. J. and Staff, G., 1986, The rate of taphonomic loss in modem benthic habitats: How much of the potentially preservable community is preserved?: Palaeogeography, Palaeoclimatology, Palaeoecology, v. 52, p. 291-320.
Davis, Jr., R. A., 1997, Geology of the Florida Coast, in Randazzo, A.F. and Jones, D.S. (ed), The Geology of Florida: University ofFlorida Press, Gainesville, p. 155-168.
Dehn, P. F., 1980, Growth and reproduction in Luidia clathrata (Say): (Echinodermata: Asteroidea). (Ph D. Thesis). University of South Florida. 183 pp.
De Laubenfels, M. W., 1953, A Guide to the Sponges of Eastern North America: University of Miami Press, 32 pp.
Dexter, S. C., and Lin, S.-H., 1991, Effect of marine bacteria on calcareous deposition: Materials Performance, v. 30, p. 16-21.
Doyle, L. J., and Feldhausen, P. H., 1981, Bottom sediments ofthe Eastern Gulf of Mexico examined with traditional and multivariate statistical methods: Mathematical Geology, v. 13, no. 2, p. 93-117.
Doyle, L. J., and Sparks, T. N., 1980, Sediments of the Mississippi, Alabama, and Florida (MAFLA) continental shelf: Journal of Sedimentary Petrology, v. 50, no. 3 p.
905-915.
Ebert, T. A., 1968, Growth rates of the sea urchin Strongylocentrotus purpuratus related to food availability and spine abrasion: Ecology, v. 49, no. 6, p. 1075-1091.
97
Ebert, T. A., 1973, Estimating growth and mortality rates from size data: Oecologia (Berlin), v. 11, p. 281-298.
Ebert, T. A., 1975, Growth and mortality of post-larval echinoids: American Zoology, v. 15, p. 755-778.
Frank, P. W., 1965, Growth ofthree species ofAcmaea: The Veliger, v. 7, no. 3, p. 201-202.
Frank, P. W ., 1969, Growth rates and longevity of some gastropod mollusks on the coral reef at Heron Island: Oecologia (Berl.), v. 2, p. 232-250.
Frankovich, T. A., and Zieman, J. C., 1994, Total epiphyte and epiphytic carbonate production on Thalassia testudinum across Florida Bay: Bulletin of Marine Science, v. 54, no. 3, p. 679-695.
Freile, D., Milliman, J. D., and Hillis, L., 1995, Leeward bank margin Halimeda meadows and draperies and their sedimentary importance on the western Great Bahama Bank slope: Coral Reefs, v. 14, p. 27-33.
Freiwald, A. 1995, Bacteria-induced carbonate degradation: A taphonomic case-study of Cibicides lobatulus from a high-boreal carbonate setting: Palaios, v. 10, n. 4, p. 337-346.
Fretter, V ., 1948, The structure and life history of some minute prosobranchs of rock pools: Skeneopsis planorbis (Fabricius), Omalogyra atomus (Philippi), Rissoel/a diaphana (Alder) and Rissoel/a opalina (Jeffreys): Journal Marine Biological Association, v. 27, p. 597-632.
Gaines, A.M., 1989, Minerals and rocks, carbonates: The New Encyclopaedia Britannica, 15th ed., v. 24, Chicago, p. 132-133.
Giese, A. C., 1966, On the biochemical constitution of some echinoderms, in Physiology of Echinodermata, Boolootian, R. A., Academic Press, New York, p. 757-796.
Ginsburg, R.N., Rezak, R., and Wray, J. L., 1971, Geology of calcareous algae: notes for a short course: University of Miami, Miami, FL, 54 pp.
Gladfelter, E. H., 1984, Skeletal development in Acropora cervicornis: Coral Reefs, v. 3,
p. 51-57.
Gore, R. H., 1992, The Gulf of Mexico. Pineapple Press, Inc., Sarasota, FL, 384 pp.
Goreau, T. F., 1959, The physiology of skeleton formation in cora~s. I. A meth~~ for measuring the rate of calcium deposition by corals under dtfferent conditions: The Biological Bulletin, v. 166, no. 1, p. 59-75.
98
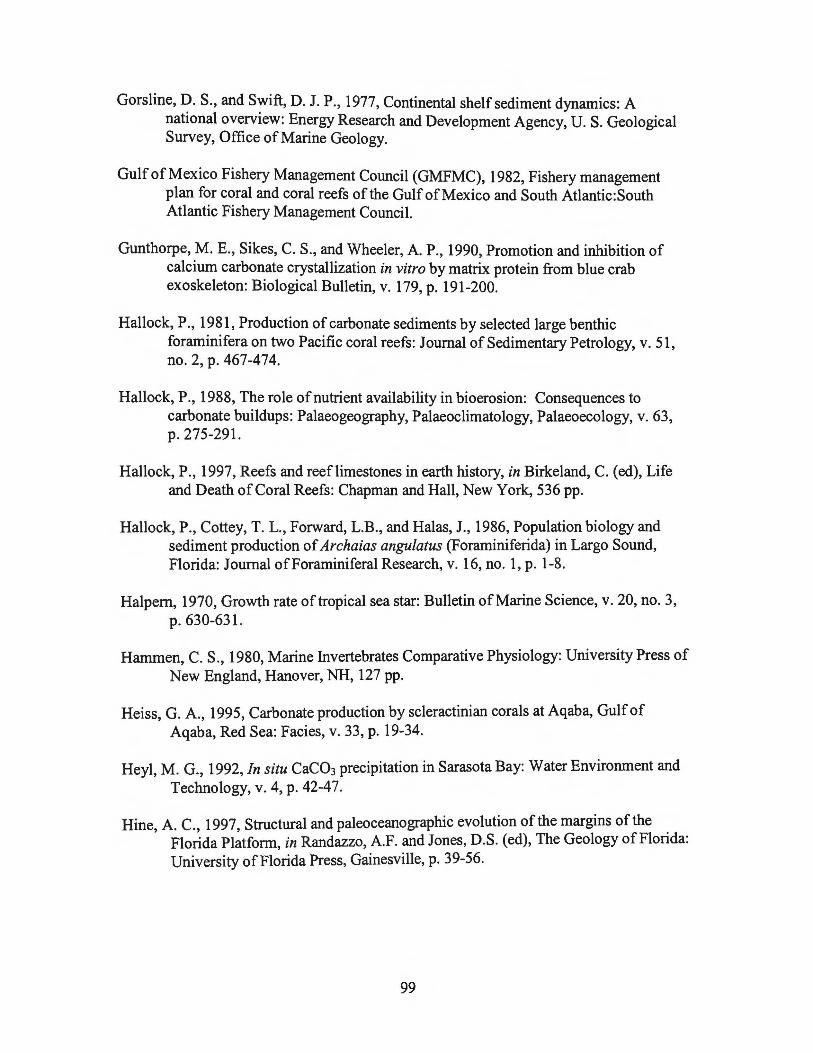
Gorsline, D. S., and Swift, D. J.P., 1977, Continental shelf sediment dynamics: A national overview: Energy Research and Development Agency, U. S. Geological Survey, Office of Marine Geology.
Gulf of Mexico Fishery Management Council (GMFMC), 1982, Fishery management plan for coral and coral reefs of the Gulf of Mexico and South Atlantic:South Atlantic Fishery Management Council.
Gunthorpe, M. E., Sikes, C. S., and Wheeler, A. P., 1990, Promotion and inhibition of calcium carbonate crystallization in vitro by matrix protein from blue crab exoskeleton: Biological Bulletin, v. 179, p. 191-200.
Hallock, P ., 1981, Production of carbonate sediments by selected large benthic foraminifera on two Pacific coral reefs: Journal of Sedimentary Petrology, v. 51, no. 2, p. 467-474.
Hallock, P., 1988, The role ofnutrient availability in bioerosion: Consequences to carbonate buildups: Palaeogeography, Palaeoclimatology, Palaeoecology, v. 63, p. 275-291.
Hallock, P., 1997, Reefs and reeflimestones in earth history, in Birkeland, C. (ed), Life and Death of Coral Reefs: Chapman and Hall, New York, 536 pp.
Hallock, P., Cottey, T. L., Forward, L.B., and Halas, J., 1986, Population biology and sediment production of Archaias angulatus (Foraminiferida) in Largo Sound, Florida: Journal ofForaminiferal Research, v. 16, no. 1, p. 1-8.
Halpern, 1970, Growth rate of tropical sea star: Bulletin of Marine Science, v. 20, no. 3, p. 630-631.
Hammen, C. S., 1980, Marine Invertebrates Comparative Physiology: University Press of New England, Hanover, NH, 127 pp.
Heiss, G. A., 1995, Carbonate production by scleractinian corals at Aqaba, Gulf of Aqaba, Red Sea: Facies, v. 33, p. 19-34.
Heyl, M.G., 1992, In situ CaC03 precipitation in Sarasota Bay: Water Environment and Technology, v. 4, p. 42-47.
Hine, A. C., 1997, Structural and paleoceanographic evolution ofthe margins of the Florida Platform, in Randazzo, A.F. and Jones, D.S. (ed), The Geology of Florida: University of Florida Press, Gainesville, p. 39-56.
99

Hopkins, T. L., Milliken, D. M., Bell, L. M., McMichael, E. J., Heffernan, J. J., and Cano, R. V ., 1981, The landward distribution of oceanic plankton and micronekton over the west Florida continental shelf as related to their vertical distribution: Journal ofPlankton Research, v. 3, no. 4, p. 645-658.
Hubbard, D. K. and Scaturo, D., 1985, Growth rates of seven species ofscleractinean corals from Cane Bay and Salt River, St. Croix, USVI: Bulletin of Marine Science, v. 36, no. 2, p. 325-338.
Hubbard, D. K., Miller, A. I., and Scaturo, D., 1990, Production and cycling of calcium carbonate in a shelf-edge reef system (St. Croix, U.S. Virgin Islands): Applications to the nature of reef systems in the fossil record: Journal of Sedimentary Petrology, vol. 60, no. 2, p. 355-360.
Humann, P., 1992, Reef Creature Identification: New World Publications, Inc., Jacksonville, FL, 239 pp.
Humann, P., 1994, Reef Coral Identification: New World Publications, Inc., Jacksonville, FL, 320 pp.
Hyman, L. H., 1940, The Invertebrates, Volume I, Protozoa through Ctenophora: McGraw-Hill Book Co., NY.
Hyman, L. H., 1967, The Invertebrates, Volume VI, Mollusca 1: McGraw-Hill Book Co., NY.
Ivany, L. C., Newton, C. R., and Mullins, H. T., 1994, Benthic invertebrates of a modem carbonate ramp: A preliminary survey: Journal of Paleontology, v. 38, no. 3, p. 417-433.
Jayaraju, N. and Reddi, K. R., 1995, Foraminiferal ecosystem in relation to coastal and estuarine sediments ofKovalam Tuticorin, South-India: Journal of the Geological Society of India, v. 46, no. 5, p. 565-573.
Johnson, J. T., and Hopkins, T. L., 1978, Biochemical components of the mysid shrimp Taphromysis bowmani Bacescu: Journal of Experimental Marine Biology and Ecology, v. 31, p. 1-9.
Kayanne, H., Suzuki, A. and Saito, H., 1995, Diurnal changes in the partial-pressure of carbon-dioxide in coral-reefwater: Science, v. 269, no., 5221, p. 214-216.
Kennett, J.P., 1992, Marine Geology. M.G. Prentice-Hall, Englewood Cliffs, N.J., 813
pp. 813 .
Kingsmill, S., 1993, Ear stones speak volumes to fish researchers: Science, v. 260, p.
1233-4.
100
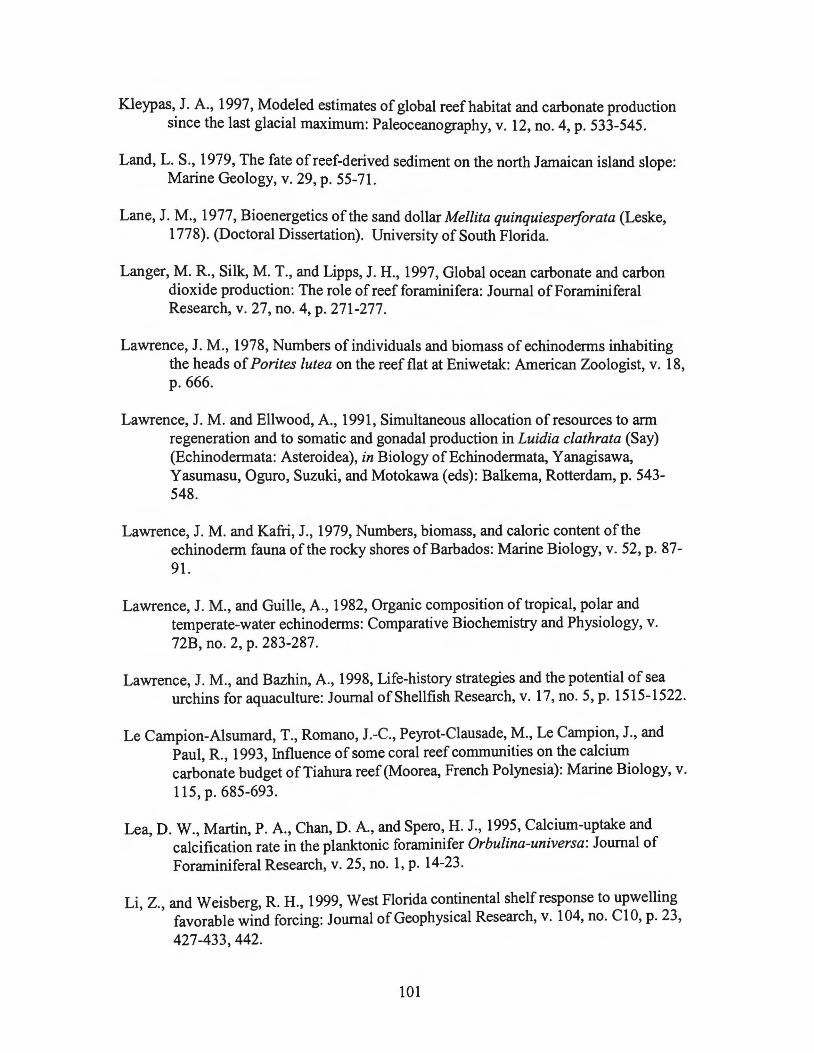
K.leypas, J. A., 1997, Modeled estimates of global reef habitat and carbonate production since the last glacial maximum: Paleoceanography, v. 12, no. 4, p. 533-545.
Land, L. S., 1979, The fate of reef-derived sediment on the north Jamaican island slope: Marine Geology, v. 29, p. 55-71.
Lane, J. M., 1977, Bioenergetics of the sand dollar Mel/ita quinquiesperforata (Leske, 1778). (Doctoral Dissertation). University of South Florida.
Langer, M. R., Silk, M. T., and Lipps, J. H., 1997, Global ocean carbonate and carbon dioxide production: The role of reef foraminifera: Journal of Foraminiferal Research, v. 27, no. 4, p. 271-277.
Lawrence, J. M., 1978, Numbers of individuals and biomass of echinoderms inhabiting the heads of Porites /utea on the reef flat at Eniwetak: American Zoologist, v. 18, p. 666.
Lawrence, J. M. and Ellwood, A., 1991, Simultaneous allocation of resources to arm regeneration and to somatic and gonadal production in Luidia c/athrata (Say) (Echinodermata: Asteroidea), in Biology of Echinodermata, Y anagisawa, Yasumasu, Oguro, Suzuki, and Motokawa (eds): Balkema, Rotterdam, p. 543-548.
Lawrence, J. M. and Kafri, J., 1979, Numbers, biomass, and caloric content ofthe echinoderm fauna of the rocky shores of Barbados: Marine Biology, v. 52, p. 87-91.
Lawrence, J. M., and Guille, A., 1982, Organic composition of tropical, polar and temperate-water echinoderms: Comparative Biochemistry and Physiology, v. 72B, no. 2, p. 283-287.
Lawrence, J. M., and Bazhin, A., 1998, Life-history strategies and the potential of sea urchins for aquaculture: Journal ofShellfish Research, v. 17, no. 5, p. 1515-1522.
Le Campion-Alsumard, T., Romano, J.-C., Peyrot-Clausade, M., Le Campion, J., and Paul, R., 1993, Influence of some coral reef communities on the calcium carbonate budget ofTiahura reef(Moorea, French Polynesia): Marine Biology, v. 115, p. 685-693.
Lea, D. W., Martin, P. A., Chan, D. A., and Spero, H. J., 1995, Calcium-uptake and calcification rate in the planktonic foraminifer Orbulina-universa: Journal of Foraminiferal Research, v. 25, no. 1, p. 14-23.
Li, Z., and Weisberg, R. H., 1999, West Florida continental shelf response to upwelling favorable wind forcing: Journal of Geophysical Research, v. 104, no. ClO, p. 23,
427-433, 442.
101
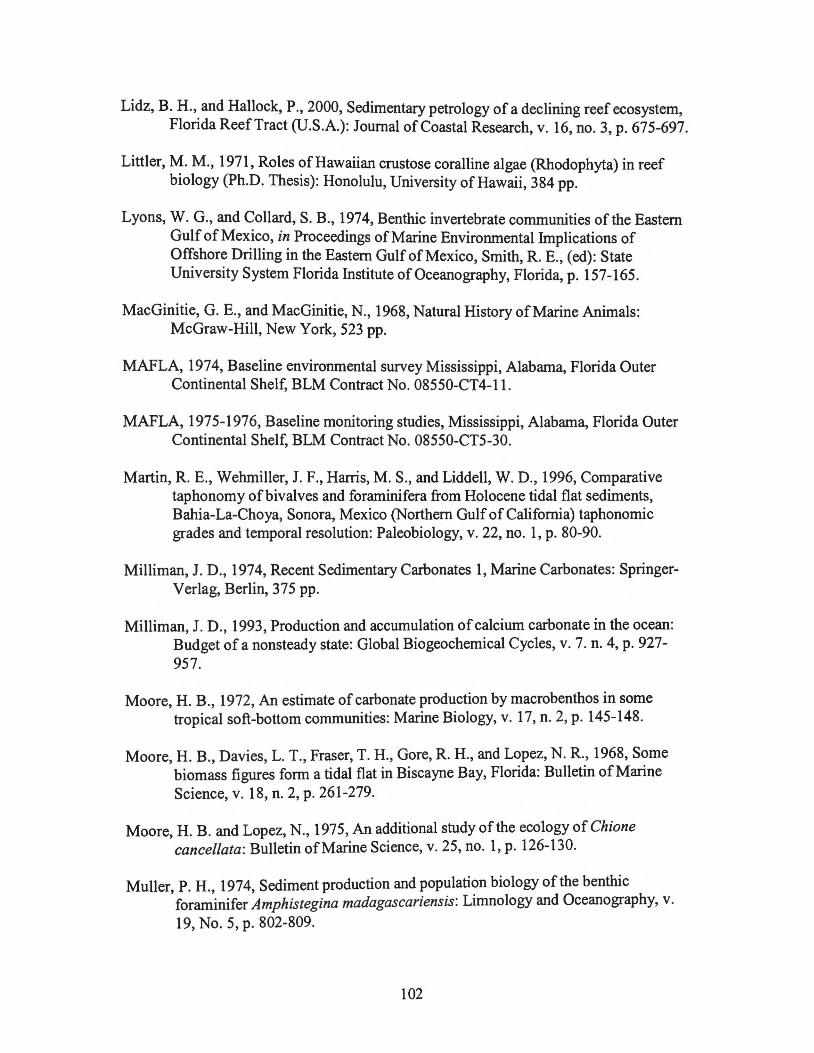
Lidz, B. H., and Hallock, P ., 2000, Sedimentary petrology of a declining reef ecosystem, Florida Reef Tract (U.S.A.): Journal of Coastal Research, v. 16, no. 3, p. 675-697.
Littler, M. M., 1971, Roles ofHawaiian crustose coralline algae (Rhodophyta) in reef biology (Ph.D. Thesis): Honolulu, University of Hawaii, 384 pp.
Lyons, W. G., and Collard, S. B., 1974, Benthic invertebrate communities of the Eastern Gulf of Mexico, in Proceedings of Marine Environmental hnplications of Offshore Drilling in the Eastern Gulf of Mexico, Smith, R. E., (ed): State University System Florida Institute of Oceanography, Florida, p. 157-165.
MacGinitie, G. E., and MacGinitie, N., 1968, Natural History of Marine Animals: McGraw-Hill, New York, 523 pp.
MAFLA, 1974, Baseline environmental survey Mississippi, Alabama, Florida Outer Continental Shelf, BLM Contract No. 08550-CT4-ll.
MAFLA, 197 5-197 6, Baseline monitoring studies, Mississippi, Alabama, Florida Outer Continental Shelf, BLM Contract No. 08550-CT5-30.
Martin, R. E., Wehmiller, J. F., Harris, M.S., and Liddell, W. D., 1996, Comparative taphonomy ofbivalves and foraminifera from Holocene tidal flat sediments, Bahia-La-Choya, Sonora, Mexico (Northern Gulf of California) taphonomic grades and temporal resolution: Paleobiology, v. 22, no. 1, p. 80-90.
Milliman, J. D., 1974, Recent Sedimentary Carbonates 1, Marine Carbonates: SpringerVerlag, Berlin, 375 pp.
Milliman, J.D., 1993, Production and accumulation of calcium carbonate in the ocean: Budget of a nonsteady state: Global Biogeochemical Cycles, v. 7. n. 4, p. 927-957.
Moore, H. B., 1972, An estimate of carbonate production by macrobenthos in some tropical soft-bottom communities: Marine Biology, v. 17, n. 2, p. 145-148.
Moore, H. B., Davies, L. T., Fraser, T. H., Gore, R. H., and Lopez, N. R., 1968, Some biomass figures form a tidal flat in Biscayne Bay, Florida: Bulletin ofMarine Science, v. 18, n. 2, p. 261-279.
Moore, H. B. and Lopez, N., 1975, An additional study of the ecology of Chione cancellata: Bulletin of Marine Science, v. 25, no. 1, p. 126-130.
Muller, P. H., 1974, Sediment production and population biology ofthe benthic foraminifer Amphistegina madagascariensis: Limnology and Oceanography, v.
19, No.5, p. 802-809.
102

Muller, P. H., 1976, Sediment production by shallow-water benthic formaninfera at selected sites on Oahu, Hawaii: Maritime Sediments Special Publication, v. 1, p. 263-265.
Murray, J. W., 1967, Production in benthic foraminiferids: Journal ofNatural History, v. 1, p. 61-68.
Murray, J. W., 1973, Distribution and Ecology of Living Benthic Foraminiferids~ Crane, Russak & Company, Inc., New York, New York, 274 pp.
Murray, J. W., 1991, Ecology and Palaeoecology of Benthic Foraminifera.! Wiley, Essex, England, 397 pp.
Neumann, A. C. and Land, L. S., 1975, Lime mud deposition and calcareous algae in the Bight of Abaco, Bahamas: A Budget: Journal of Sedimentary Petrology, v. 45, no. 4, p. 763-786.
Opdyke, B. N. and Walker, J. C. G., 1992, Return ofthe coral reefhypothesis: Basin to shelfpartitioning ofCaC03 and its effect on atmospheric C02: Geology, v. 20, p. 733-736.
Pannella, G., 1980, Growth patterns in fish sagittae, in Rhoads, D. C., and Lutz, R. A. (eds), Skeletal Growth of Aquatic Organisms Biological Records of Environmental Change: Plenum Press, New York, p. 519-560.
Parker, D. M., 1982, A Comparison ofDeep Reef Foraminiferal Assemblages in the Eastern Gulf of Mexico. (Master's thesis). University of South Florida, 152 pp.
Payri, C. E., 1995, Carbonate production of some calcifying algae in a French Polynesia coral reef: Bulletin de la Societe Geologique de France, v. 166, no.l, p. 77-84.
Powell, E. N., 1992, A model for death assemblage formation: Can sediment shelliness be explained?: Journal of Marine Research, v. 50, no. 2, p. 229-265.
Randazzo, A. F., 1997, The sedimentary platform of Florida: Mesozoic to Cenozoic, in Randazzo, A.F. and Jones, D.S. (ed), The Geology ofFlorida: University of Florida Press, Gainesville, p. 39-56.
Raup, D. M., 1966, The Endoskeleton, in Boolootian, R. A. (ed), Physiology of Echinodermata: Interscience Publishers, New York, p. 379-395.
Scott, T. M., 1997, Miocene to Holocene history or Florida, in Randazzo, A.F. and Jones, D.S. (ed), The Geology of Florida: University of Florida Press, Gainesville, p. 57-68.
103

Sellwood, B. W., 1978, Shallow water carbonate environments, in Reading, H. G. (ed), Sedimentary Environments and Facies: Elsevier, New York, p. 259-313.
Sherman, L. M., 1994, CaC03 supply crunch eases, but not price pressures: Plastics Technology, v. 40, p. 61-63.
Shinn, E. A., 1966, Coral growth-rate, an environmental indicator: Journal of Paleontology, v. 40, no. 2, p. 233-241.
Sibuet, M., and Lawrence, J. M., 1981, Organic content and biomass of abyssal holothuroids (Echinodermata) form the Bay of Biscay: Marine Biology, v. 65, p. 143-147.
Siebold and Berger, 1982, The Sea Floor: Springer-Verlager, New York, p. 54-66.
Smith, S. V., 1970, Calcium Carbonate Budget of the Southern California Continental Borderland. (Doctoral dissertation). University of Hawaii.
Smith, S.V., 1971, Budget of calcium carbonate, Southern California Continental Borderland: Journal of Sedimentary Petrology, v. 41, no. 3, p. 798-808.
Smith, S. V ., 1978, Coral-reef area and the contributions of reefs to processes and resources of the world's oceans: Nature, v. 273, p. 225-226.
Smith, S. V., and Kinsey, D. W., 1976, Calcium carbonate production, coral reef growth, and sea level change: Science, v. 194, p. 937-939.
Socci, A. and Dinkelman, M.G., 1979, Sediments and sedimentation in the Gulf of Mexico: A Review, Prepared for the GOMEX Workshop, NOAA Lab Oct. 1-5, 1979.
Stevely, J. M., 1978, The effects ofheated effluent ofthe infaunal bivalve, Chione cancellata (Linne). (Master's thesis). University of South Florida, 61 pp.
Stockman, K. W., Ginsburg, R.N., and Shinn, E. A., 1967, The production oflime mud by algae in south Florida: Journal of Sedimentary Petrology, v. 37, no. 2, p. 633-648.
Sundquist, E. T., 1993, The global carbon dioxide budget: Science, v. 259, p. 934-941.
Takano, H., Jeon, J., Burgess, J. G., Manabe, E., Izumi, Y., Okazaki, M., and Matsunaga, T., 1994, Continuous production of extracellular ultrafine calcite particles by the marine coccolithophorid alga Pleurochrysis carterae: Applied Microbiology and Biotechnology, v. 40, p. 946-950.
104
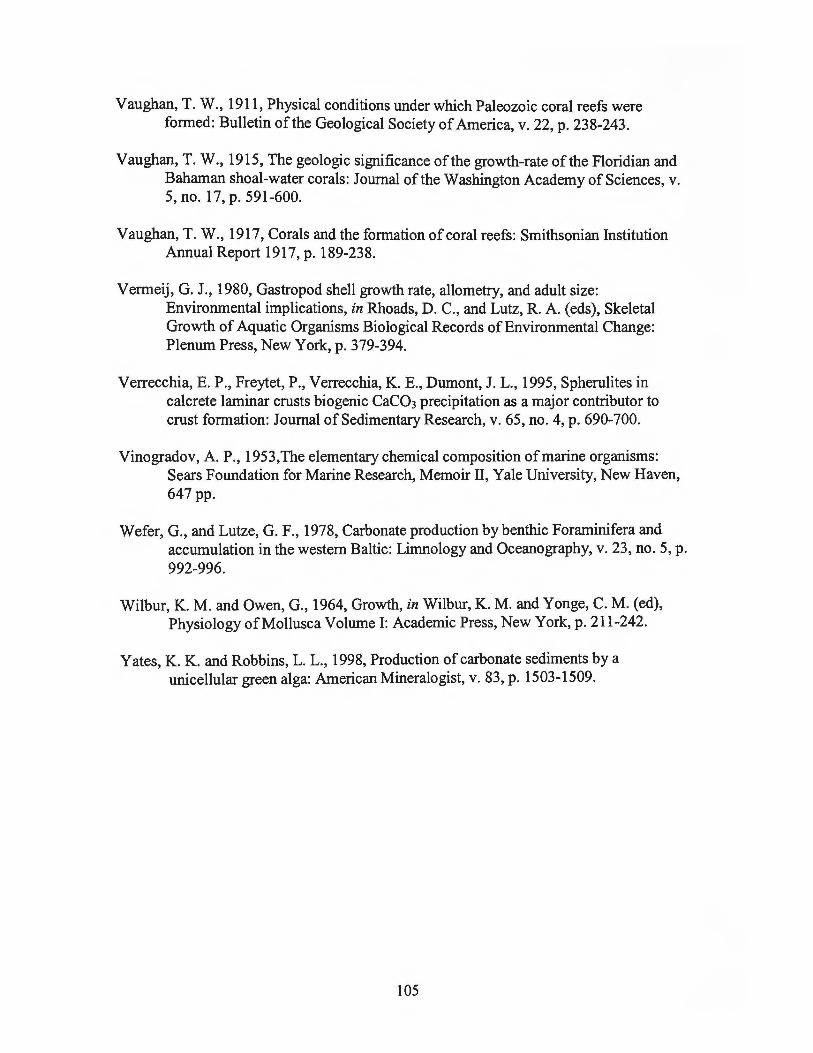
Vaughan, T. W., 1911, Physical conditions under which Paleozoic coral reefs were formed: Bulletin of the Geological Society of America, v. 22, p. 238-243.
Vaughan, T. W., 1915, The geologic significance ofthe growth-rate of the Floridian and Bahaman shoal-water corals: Journal of the Washington Academy of Sciences, v. 5, no. 17, p. 591-600.
Vaughan, T. W ., 1917, Corals and the formation of coral reefs: Smithsonian Institution Annual Report 1917, p. 189-238.
Vermeij, G. J., 1980, Gastropod shell growth rate, allometry, and adult size: Environmental implications, in Rhoads, D. C., and Lutz, R. A. (eds), Skeletal Growth of Aquatic Organisms Biological Records of Environmental Change: Plenum Press, New York, p. 379-394.
Verrecchia, E. P., Freytet, P., Verrecchia, K. E., Dumont, J. L., 1995, Spherulites in calcrete laminar crusts biogenic CaC03 precipitation as a major contributor to crust formation: Journal of Sedimentary Research, v. 65, no. 4, p. 690-700.
Vinogradov, A. P ., 1953, The elementary chemical composition of marine organisms: Sears Foundation for Marine Research, Memoir II, Yale University, New Haven, 647pp.
Wefer, G., and Lutze, G. F., 1978, Carbonate production by benthic Foraminifera and accumulation in the western Baltic: Limnology and Oceanography, v. 23, no. 5, p. 992-996.
Wilbur, K. M. and Owen, G., 1964, Growth, in Wilbur, K. M. and Yonge, C. M. (ed), Physiology ofMollusca Volume 1: Academic Press, New York, p. 211-242.
Yates, K. K. and Robbins, L. L., 1998, Production of carbonate sediments by a unicellular green alga: American Mineralogist, v. 83, p. 1503-1509.
105
APPENDICES
106

Appendix 1: List of Stations on the Central West Florida Shelf
Station MAFLNMMS Transect Depth Longitude Latitude Date of No. Sta. No. inm Sample
1 42 II 37 -842630 28 41 59 6/9/1974 2 43 II 45 -842800 28 30 00 6/14/1974 3 44 II 44 -842321 28 26 29 6/15/1974 4 45 II 53 -842359 28 21 00 6/15/1974 5 46 II 37 -842001 28 41 59 6/9/1974 6 47 II 36 -842012 28 34 00 6/10/1974 7 48 II 40 -842100 28 29 00 6/14/1974 8 49 II 42 -842100 28 24 00 6/15/1974 9 50 II 48 -842058 28 19 00 6/15/1974 10 52 II 54 -841732 28 13 59 6/15/1974 11 53 II 37 -841301 28 41 59 6/10/1974 12 54 II 34 -841059 28 29 00 6/10/1974 13 55 I 44 -835256 27 56 33 6/14/1974 14 56 I 38 -834449 28 00 38 6/16/1974 15 57 I 37 -834229 27 57 30 6/16/1974 16 58 I 43 -834132 27 47 58 6/13/1974 17 60 I 31 -833530 28 01 00 6/16/1974 18 61 I 33 -833356 27 52 31 6/17/1974 19 62 I 34 -833059 27 50 01 6117/1974 20 63 I 30 -832729 27 56 00 6/17/1974 21 64 I 30 -832500 27 50 00 6/1711974 22 65 I 42 -832530 27 45 30 6/13/1974 23 2101 I 11 -821508 26 24 59.6 6/75-2/76 24 2102 I 18 -822459.6 26 24 59.6 6/75-2/76
25 2103 I 37 -825759.7 26 25 00.0 6/75-2/76
26 2104 I 53 -832300.8 26 25 00.0 6/75-2/76
27 2105 I 90 -834957.6 26 24 59.5 6/75-2/76
28 2106 I 168 -841500 26 24 56.8 6175-2176 29 2207 II 19 -830900.3 27 57 00.4 6/75-2/76
30 2208 II 31 -832729.6 27 56 00.5 6/75-2/76
31 2209 II 34 -833359 27 52 30.5 6/75-2/76
32 2210 II 37 -834229.2 27 57 28.8 6/75-2/76
33 2211 II 43 -835259.5 27 56 29.5 6/75-2/76
34 2212 II 189 -844759.6 27 57 00.0 6/75-2/76
107

Appendix 1: (Continued)
Station MAFLA/MMS Transect Depth Longitude Latitude Date of No. Sta. No. inm Sample 35 2313 m 176 -851503 28 23 59.3 6/75-2/76 36 2314 m 29 -842059 28 29 58.6 6/75-2/76 37 2315 m 38 -842009.1 28 33 59.1 6/75-2/76 38 2316 m 35 -842000.7 28 42 00.3 6/75-2/76 39 2317 m 29 -840559.9 28 56 00.3 6/75-2/76 40 2318 m 20 -834500.5 29 05 00.8 6/75-2/76
41 IC I 13 -824945 273791 7/92-5/94 42 ID I 13 -824945 273791 7/92-5/94 43 nc n 6 -823562 271562 7/92-5/94 44 llD n 6 -823562 271562 7/92-5/94 45 me m 6 -822588 265966 7/14/1992 46 IDD m 6 -822588 265966 7/14/1992 47 IVC IV 6 -824180 272627 10/29/1993
48 IVD IV 6 -824180 272627 10/29/1993
108
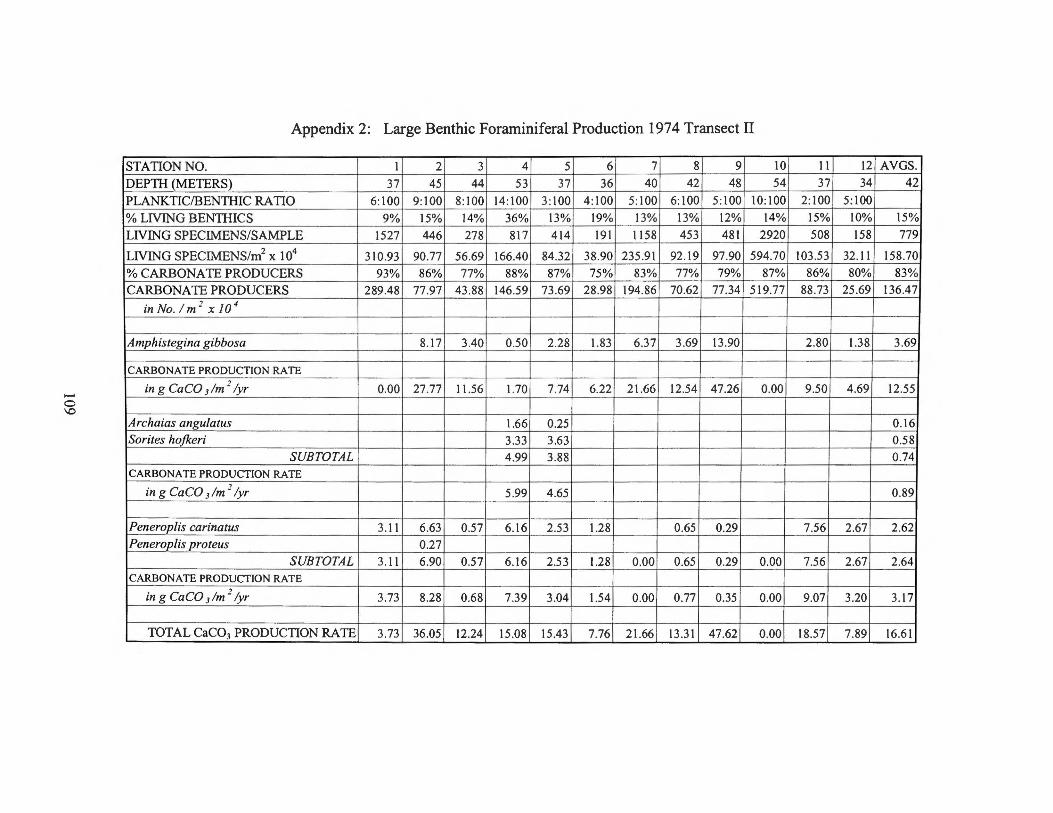
Appendix 2: Large Benthic Foraminiferal Production 1974 Transect II
STATION NO. I 2 3 4 5 6 7 8 9 10 II 12 AVGS.
DEPTII (METERS) 37 45 44 53 37 36 40 42 48 54 37 34 42
PLANKTIC!BENTIIIC RA 110 6:100 9:100 8:100 14:100 3:100 4:100 5:100 6:100 5:100 10:100 2:100 5:100
% LIVING BENTIIICS 9% 15% 14% 36% 13% 19% 13% 13% 12% 14% 15% 10% 15%
LNING SPECIMENS/SAMPLE 1527 446 278 817 414 191 1158 453 481 2920 508 158 779
LIVING SPECIMENS/m2 x 104 310.93 90.77 56.69 166.40 84.32 38.90 235.91 92.19 97.90 594.70 103.53 32.11 158.70
%CARBONATE PRODUCERS 93% 86% 77% 88% 87% 75% 83% 77% 79% 87% 86% 80% 83% CARBONATE PRODUCERS 289.48 77.97 43.88 146.59 73.69 28.98 194.86 70.62 77.34 519.77 88.73 25.69 136.47
in No. I m 2 x 10 4
Amphistegina gibbosa 8.17 3.40 0.50 2.28 1.83 6.37 3.69 13.90 2.80 1.38 3.69
CARBONATE PRODUCTION RATE
- in g CaCO 3 /m 2 lyr 0.00 27.77 11 .56 1.70 7.74 6.22 21 .66 12.54 47.26 0.00 9.50 4.69 12.55 0 \0
Archaias angulatus 1.66 0.25 0.16 Sorites hofkeri 3.33 3.63 0.58
SUBTOTAL 4.99 3.88 0.74 CARBONATE PRODUCTION RATE
in g CaCO 3 /m 2 lyr 5.99 4.65 0.89
Peneroplis carinatus 3.11 6.63 0.57 6.16 2.53 1.28 0.65 0.29 7.56 2.67 2.62 Penerop/is proteus 0.27
SUBTOTAL 3.11 6.90 0.57 6.16 2.53 1.28 0.00 0.65 0.29 0.00 7.56 2.67 2.64 CARBONATE PRODUCTION RATE
in g CaCO 3 /m 2 lyr 3.73 8.28 0.68 7.39 3.04 1.54 0.00 0.77 0.35 0.00 9.07 3.20 3.17
TOTAL CaC03 PRODUCTION RATE 3.73 36.05 12.24 15.08 15.43 7.76 21.66 13.31 47.62 0.00 18.57 7.89 16.61

Appendix 3: Large Benthic Foraminiferal Production 1974 Transect I
STATION NO. 13 14 15 16 17 18 19 20 21 22 AVGS. DEPTH (METERS) 44 38 37 43 31 33 34 30 30 42 36 PLANKTIC/BENTHIC RATIO 12:160 3:100 4:100 4:100 2:100 1:100 1:100 2:100 0:100 1:100 % LIVING BENTHICS 16% 12% 6% 12% 15% 6% 13% 8% 7% 10% 11%
NO. LIVING SPECIMENS/m2 x 104 467.21 295.66 242.57 42.23 642.43 372.84 63.00 309.57 235.98 469.52 314.10 %CARBONATE PRODUCERS 87% 94% 93% 86% 85% 85% 95% 86% 93% 85% 89% CARBONATE PRODUCERS 408.34 278.51 225.59 36.15 547.99 316.55 59.91 265.61 218.99 400.03 275.77
in No. /m 2 X /0 4
Amphistegina gibbosa 4.67 7.08 1.18 Gypsina vesicularis 1.93 0.19
SUBTOTAL 4.67 1.93 7.08 1.37 CARBONATE PRODUCTION RATE
in g CaCO 3 /m 2 lyr 15.89 6.55 60.1 8 8.26 --0 Archaias angulatus 4.70 0.47 Sorites hojkeri 3.27 8.87 1.70 17.35 5.26 8.73 10.80 5.60
SUBTOTAL 3.27 8.87 1.70 17.35 5.26 8.73 15.49 6.07 CARBONATE PRODUCTION RATE
in g CaCO 3 /m 2 lyr 3.92 10.64 2.04 20.81 15.79 26.19 18.59 9.80
Peneroplis carinatus 1.40 5.91 8.35 6.19 7.98 2.98 Peneroplis proteus 1.41 0.14
SUBTOTAL 1.40 5.91 8.35 6.19 9.39 3.12 CARBONATE PRODUCTION RATE
in g CaCO 3 /m 2 /yr 1.68 7.10 10.02 7.43 11.27 3.75
TOTAL LARGE FORAMINIFERA 9.34 14.78 1.70 0.00 27.62 0.00 0.00 11.45 15.81 24.88 10.56 %OF CARBONATE PRODUCERS 2% 5% 1% 0% 5% 0% 0% 4% 7% 6% 3%
TOTAL CaC03 PRODUCTION RATE 21.49 17.74 2.04 0.00 37.39 0.00 0.00 23.22 86.37 29.86 21.81

...... ...... ......
Appendix 4: Large Benthic Foraminiferal Production Summer 1975 Transects I and II
STATION NO. 23 24 25 26 27 28 I 29 30 31 32 AVG.
DEPTH (METERS) 11 18 37 53 90 168 63 19 31 34 37 % LIVING BENTHICS 2.90 11.50 6.00 12.30 4.40 17.20 9.05 12.80 12.60 . 7.50 14.10
TOTAL LIVING/m2 x 10 5 1.67 0.748 0.95 3.48 1.71 28.35 6.15 13.25 38.10 22.70 3.74 %CARBONATE PRODUCERS 88% 96% 95% 82% 83% 94% 90% 98% 89% 89% 86% CARBONATE PRODUCERS
in No. l m 2 X /0 5 1.46 0.718 0.90 2.85 1.42 26.64 5.67 13.03 34.04 20.12 3.22
Amphistegina gibbosa 0.12 0.09 1.32 0.25 0.01
CARBONATE PRODUCTION RATE in g CaCO Jim 2 lyr 4.03 2.90 44.98 8.65 0.42
Archaias angulatus O.Ql 0.017 0.00 0.13 Sorites hofkeri orbitolitoides 0.008 O.Ql 0.00 0.38 0.45 O.Ql
SUBTOTAL O.Ql 0.025 0.01 O.Ql 0.51 0.45 O.Ql CARBONATE PRODUCTION RATE
in g CaCO Jim 2 lyr 0.17 0.752 0.07 0.16 6.10 5.45 0.15
Peneroplis bradyi 0.01 0.00 Peneroplis carinatus 0.004 0.04 0.13 0.09 0.04 0.15 0.05 Peneroplis proteus 0.00
SUBTOTAL 0.004 0.04 0.14 0.09 0.05 0.15 0.05 CARBONATE PRODUCTION RATE
in g CaCO Jim 2 lyr 0.05 0.45 1.70 1.13 0.56 1.82 0.60
CARBONATE PRODUCTION RATE BY LARGE BENTHICS Summer 1975
in g CaCO 3 Im 2 lyr 0.17 0.802 0.45 5.73 2.97 46.11 9.37 0.00 6.10 7.26 1.17
33 34 II AVG.
43 189 59 13.90 27.80 14.78
1.99 45.06 20.81 85% 98% 91%
1.70 44.31 19.40
0.07 0.01
2.25 0.45
0.02 0.15 0.17 0.15 0.19
1.80 2.25
0.00 0.03 0.00 0.03
0.40
2.25 1.80 3.10

Appendix 5: Large Benthic Foraminiferal Production Summer 1975 Transect III and Averages
STATION NO. 35 36 37 38 39 40 III SUMMER 1975 AVG. AVERAGE
DEPTH (METERS) 176 43 38 35 29 20 57 60 % LIVING BENTHICS 37.60 2.60 10.60 21.90 12.12 11.98
TOTAL LIVING/m2 x 10 5 29.89 23.59 3.89 10.39 33.31 5.67 17.79 14.92 %CARBONATE PRODUCERS 99% 90% 90% 90% 92% 98% 93% 91 % CARBONATE PRODUCERS
in No. 1m 2 x 10 5 29.69 21.15 3.49 9.32 30.54 5.58 16.63 13.90
Amphistegina gibbosa 0.10 0.31 0.05 0.14 0.10 0.12
CARBONATE PRODUCTION RATE in g CaCO 3 /m 2 lyr 3.39 10.69 1.76 4.71 3.43 4.1 7
--N Archaias angulatus 0.04 0.01 0.01 Sorites hojkeri orbitolitoides 0.22 0.06 0.05 0.07
SUBTOTAL 0.22 0.09 0.05 0.08 CARBONATE PRODUCTION RATE
in g CaCO 3 /m 2 lyr 6.64 2.84 1.58 1.33
Peneroplis bradyi 0.11 0.02 0.01 Peneroplis carinatus 0.16 0.03 0.07 0.44 0.04 0.12 0.07 Peneroplis proteus 0.08 0.01 0.03 0.11 0.02 0.04 0.01
SUBTOTAL 0.24 0.04 0.10 0.66 0.06 0.18 0.09 CARBONATE PRODUCTION RATE
in g CaCO 3 /m 2 lyr 2.83 0.47 1.25 7.97 0.68 2.20 1.05
CARBONATE PRODUCTION RATE BY LARGE BENTHICS Summer 1975
in g CaCO 3 /m 2 lyr 3.39 13.52 2.23 5.96 14.61 3.52 7.20 6.56
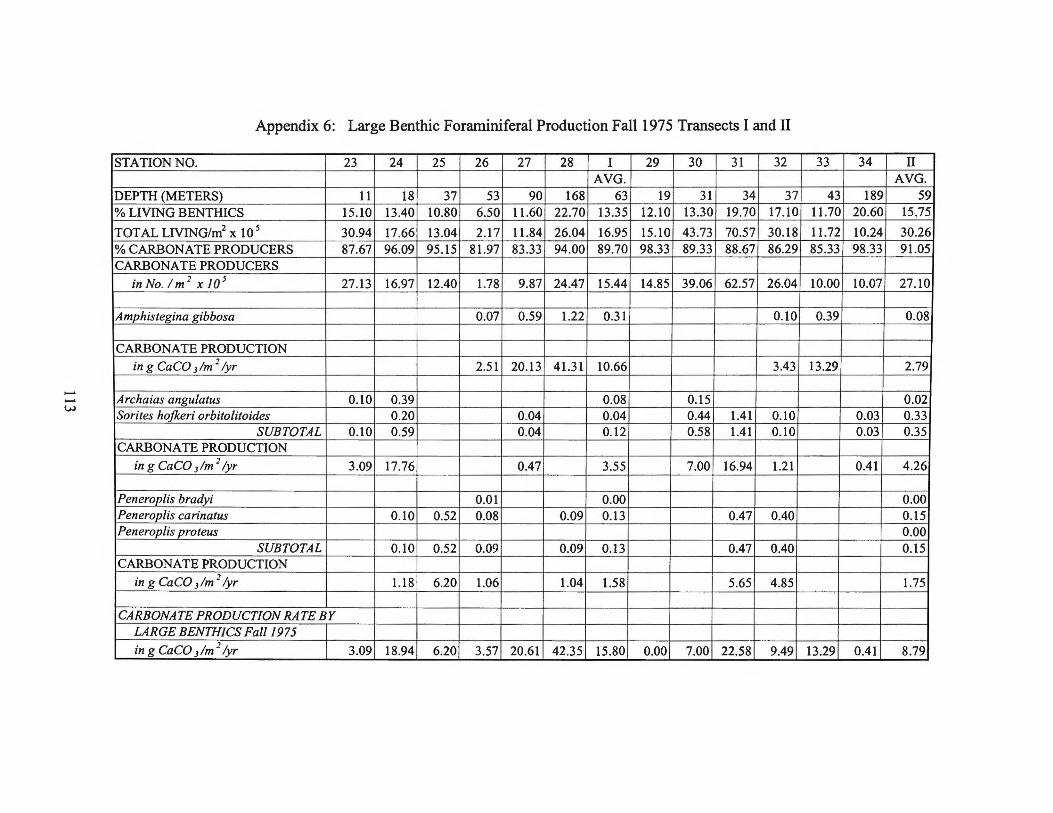
Appendix 6: Large Benthic Foraminiferal Production Fal11975 Transects I and II
STATION NO. 23 24 25 26 27 28 I 29 30 31 32 33 34 II AVG. AVG.
DEPTH (METERS) 11 18 37 53 90 168 63 19 31 34 37 43 189 59 % LIVING BENTHICS 15.10 13.40 10.80 6.50 11.60 22.70 13.35 12.10 13.30 19.70 17.10 11.70 20.60 15.75
TOTAL LIVING/m2 x 10 5 30.94 17.66 13.04 2.17 11.84 26.04 16.95 15.10 43.73 70.57 30.18 11.72 10.24 30.26 %CARBONATE PRODUCERS 87.67 96.09 95.15 81.97 83.33 94.00 89.70 98.33 89.33 88.67 86.29 85.33 98.33 91.05 CARBONATE PRODUCERS
in No. I m 2 x 10 5 27.13 16.97 12.40 1.78 9.87 24.47 15.44 14.85 39.06 62.57 26.04 10.00 10.07 27.10
Amphistegina gibbosa 0.07 0.59 1.22 0.31 0.10 0.39 0.08
CARBONATE PRODUCTION
in g CaCO Jim 1 lyr 2.51 20.13 41 .31 10.66 3.43 13.29 2.79
Archaias angulatus 0.10 0.39 0.08 0.15 0.02 Sorites hofkeri orbitolitoides 0.20 0.04 0.04 0.44 1.41 0.10 0.03 0.33
SUBTOTAL 0.10 0.59 0.04 0.12 0.58 1.41 0.10 0.03 0.35 CARBONATE PRODUCTION
in g CaCO Jim 2 lyr 3.09 17.76 0.47 3.55 7.00 16.94 1.21 0.41 4.26
Peneroplis bradyi 0.01 0.00 0.00 Peneroplis carinatus 0.10 0.52 0.08 0.09 0.13 0.47 0.40 0.15 Peneroplis proteus 0.00
SUBTOTAL 0.10 0.52 0.09 0.09 0.13 0.47 0.40 0.15 CARBONATE PRODUCTION
in g CaCO Jim 1 lyr 1.18 6.20 1.06 1.04 1.58 5.65 4.85 1.75
CARBONATE PRODUCTION RATE BY LARGE BENTHICS Fall 1975
in g CaCO Jim 2 lyr 3.09 18.94 6.20 3.57 20.61 42.35 15.80 0.00 7.00 22.58 9.49 13.29 0.41 8.79
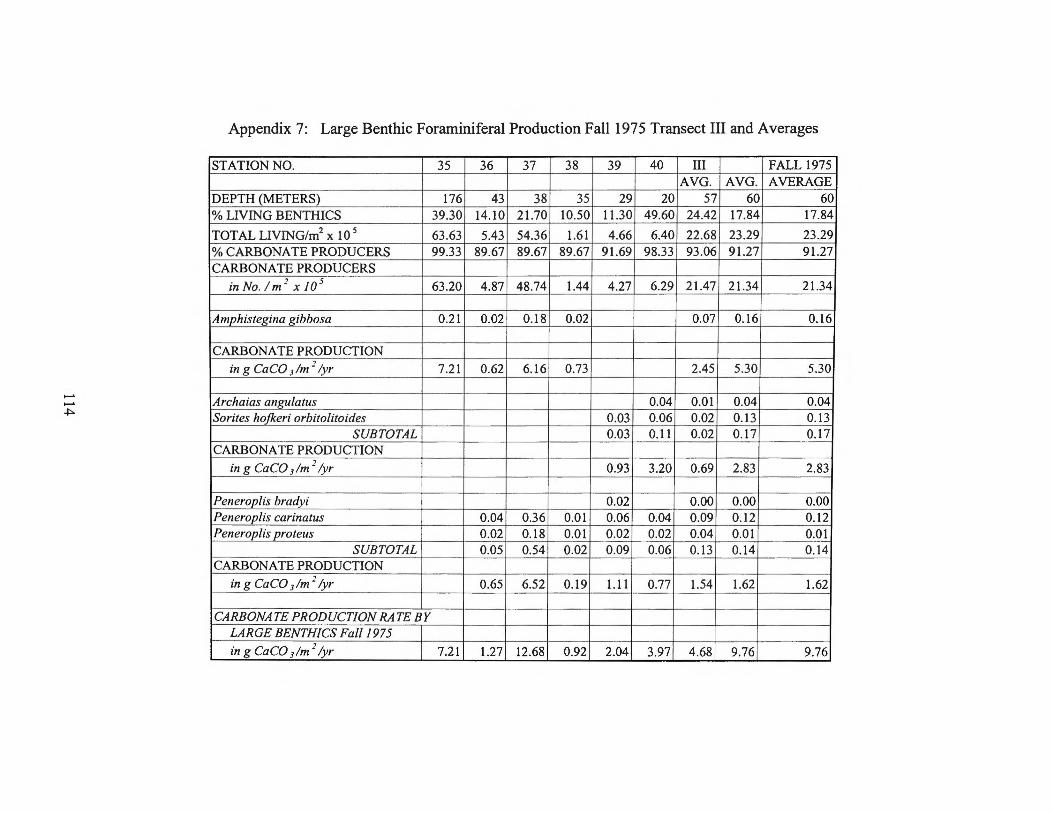
Appendix 7: Large Benthic Foraminiferal Production Fall1975 Transect III and Averages
STATION NO. 35 36 37 38 39 40 III FALL 1975 AVG. AVG. AVERAGE
DEPTH (METERS) 176 43 38 35 29 20 57 60 60 % LIVING BENTHICS 39.30 14.10 21.70 10.50 11.30 49.60 24.42 17.84 17.84
TOTAL LIVING/m2 x 10 5 63.63 5.43 54.36 1.61 4.66 6.40 22.68 23.29 23.29 %CARBONATE PRODUCERS 99.33 89.67 89.67 89.67 91.69 98.33 93.06 91.27 91.27 CARBONATE PRODUCERS
in No. 1m 2 x 10 5 63.20 4.87 48.74 1.44 4.27 6.29 21.47 21.34 21.34
Amphistegina gibbosa 0.21 0.02 0.18 0.02 0.07 0.16 0.16
CARBONATE PRODUCTION in g CaCO 3 /m 2 lyr 7.21 0.62 6.16 0.73 2.45 5.30 5.30
Archaias angulatus 0.04 0.01 0.04 0.04 Sorites hojkeri orbitolitoides 0.03 0.06 0.02 0.13 0.13
SUBTOTAL 0.03 0.11 0.02 0.17 0.17 CARBONATE PRODUCTION
in g CaCO 3 /m 2 /yr 0.93 3.20 0.69 2.83 2.83
Peneroplis bradyi 0.02 0.00 0.00 0.00 Peneroplis carinatus 0.04 0.36 O.Ql 0.06 0.04 0.09 0.12 0.12 Peneroplis proteus 0.02 0.18 O.Ql 0.02 0.02 0.04 O.ot O.Ql
SUBTOTAL 0.05 0.54 0.02 0.09 0.06 0.13 0.14 0.14 CARBONATE PRODUCTION
in g CaCO 3 /m 2 /yr 0.65 6.52 0.19 1.11 0.77 1.54 1.62 1.62
CARBONATE PRODUCTION RATE BY LARGE BENTHJCS Fal/1975
in g CaCO 3 /m 2 !yr 7.21 1.27 12.68 0.92 2.04 3.97 4.68 9.76 9.76

Appendix 8: Large Benthic Foraminiferal Production Winter 1976 Transects I and II
STATION NO. 23 24 25 26 27 28 I 29 30 31 32 33 34 II AVG. AVG.
DEPTH (METERS) 11 18 37 53 90 168 63 19 31 34 37 43 189 59 % LIVING BENTHICS i5.4 17.8 6.7 18.8 6.9 9.7 12.6 9.5 9.7 9.1 16.0 13.4 24.3 13.7
TOTALLIVING/m2 x 10 5 4.28 11.13 11.42 15.81 2.24 6.94 8.63 6.96 15.63 14.77 9.04 2.36 6.27 9.17 %CARBONATE PRODUCERS 87.67 96.09 95.15 81.97 83.33 94.00 89.70 98.33 89.33 88.67 86.29 85.33 98.33 91.05 CARBONATE PRODUCERS
in No. / m 2 X J0 5 3.75 10.69 10.86 12.96 1.86 6.52 7.77 6.85 13.96 13.10 7.80 2.01 6.16 8.31
Amphistegina gibbosa 0.54 0.11 0.32 0.16 0.03 0.08 0.02
CARBONATE PRODUCTION RATE
- ing CaCO 3 1m 2 /yr 18.28 3.80 11.00 5.51 1.03 2.67 0.62 -VI
Archaias angulatus 0.01 0.25 0.04 0.05 Sorites hofkeri orbitolitoides 0.12 0.01 0.02 0.16 0.30 0.03 0.02 0.08
SUBTOTAL 0.01 0.37 0.01 0.07 0.21 0.30 0.03 0.02 0.09 CARBONATE PRODUCTION RATE
in g CaCO 3 /m 2 /yr 0.43 11.19 0.09 1.95 2.50 3.54 0.36 0.25 1.11 0.00
Peneroplis bradyi 0.05 0.01 0.00 Peneroplis carinatus 0.06 0.45 0.59 0.02 0.19 0.10 0.12 0.04 Penerop/is proteus 0.00 0.00
SUBTOTAL 0.06 0.45 0.65 0.02 0.20 0.10 0.12 0.04 CARBONATE PRODUCTION RATE
in g CaCO 3 /m 2 lyr 0.75 5.43 7.74 0.28 2.37 1.18 1.45 0.44
CARBONATE PRODUCTION RATE BY LARGE BENTHICS Winter 1975
in g CaCO 3 /m 2 lyr 0.43 11.93 5.43 26.03 3.89 11.28 9.83 0.00 2.50 4.73 2.84 2.67 0.25 2.17
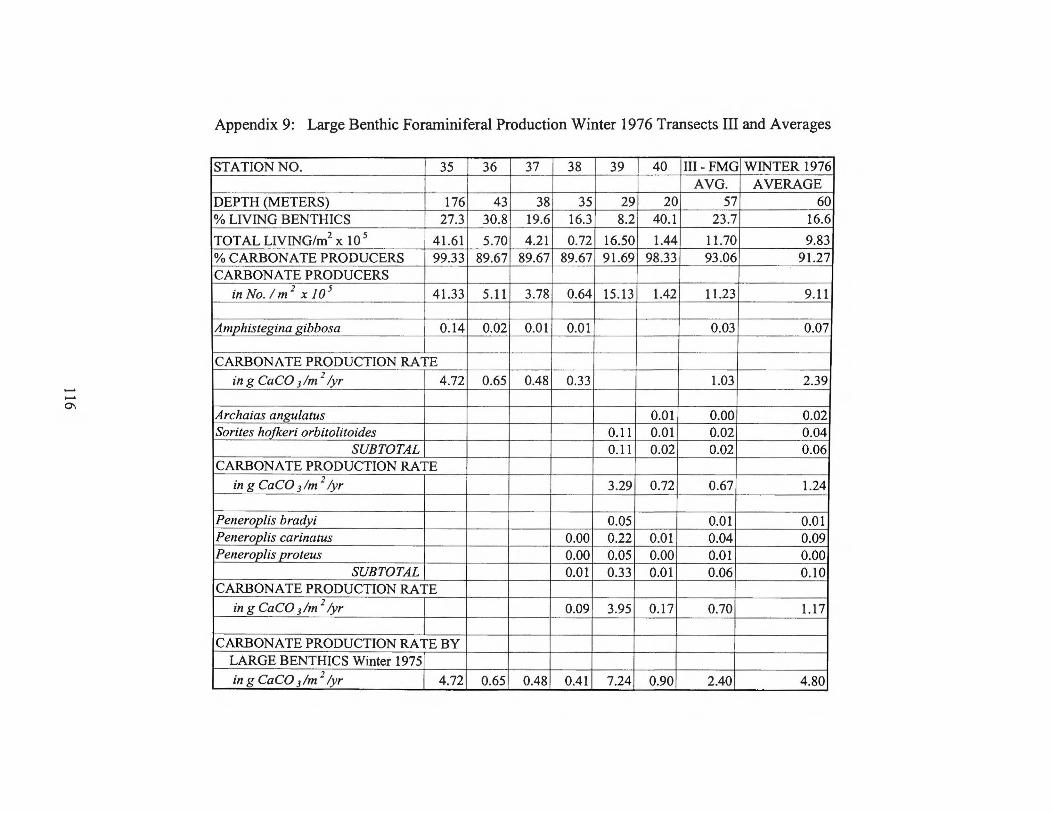
Appendix 9: Large Benthic Foraminiferal Production Winter 1976 Transects III and Averages
STATION NO. 35 36 37 38 39 40 III- FMG WINTER 1976 AVG. AVERAGE
DEPTH (METERS) 176 43 38 35 29 20 57 60 % LIVING BENTHICS 27.3 30.8 19.6 16.3 8.2 40.1 23.7 16.6
TOTAL LIVING/m2 x 10 5 41.61 5.70 4.21 0.72 16.50 1.44 11.70 9.83 %CARBONATE PRODUCERS 99.33 89.67 89.67 89.67 91.69 98.33 93.06 91.27 CARBONATE PRODUCERS
in No./m 2 X /0 5 41.33 5.11 3.78 0.64 15.13 1.42 11.23 9.11
Amphistegina gibbosa 0.14 0.02 0.01 0.01 0.03 0.07
CARBONATE PRODUCTION RATE in g CaCO 3 /m 2 /yr 4.72 0.65 0.48 0.33 1.03 2.39 --0\
Archaias angulatus 0.01 0.00 0.02 Sorites hojkeri orbitolitoides 0.11 0.01 0.02 0.04
SUBTOTAL 0.11 0.02 0.02 0.06 CARBONATE PRODUCTION RATE
in g CaCO 3 /m 2 /yr 3.29 0.72 0.67 1.24
Peneroplis bradyi 0.05 0.01 0.01 Peneroplis carinatus 0.00 0.22 0.01 0.04 0.09 Peneroplis proteus 0.00 0.05 0.00 0.01 0.00
SUBTOTAL 0.01 0.33 0.01 0.06 0.10 CARBONATE PRODUCTION RATE
in g CaCO 3 /m 2 lyr 0.09 3.95 0.17 0.70 1.17
CARBONATE PRODUCTION RATE BY LARGE BENTHICS Winter 1975 in g CaCO 3 /m 2 /yr 4.72 0.65 0.48 0.41 7.24 0.90 2.40 4.80
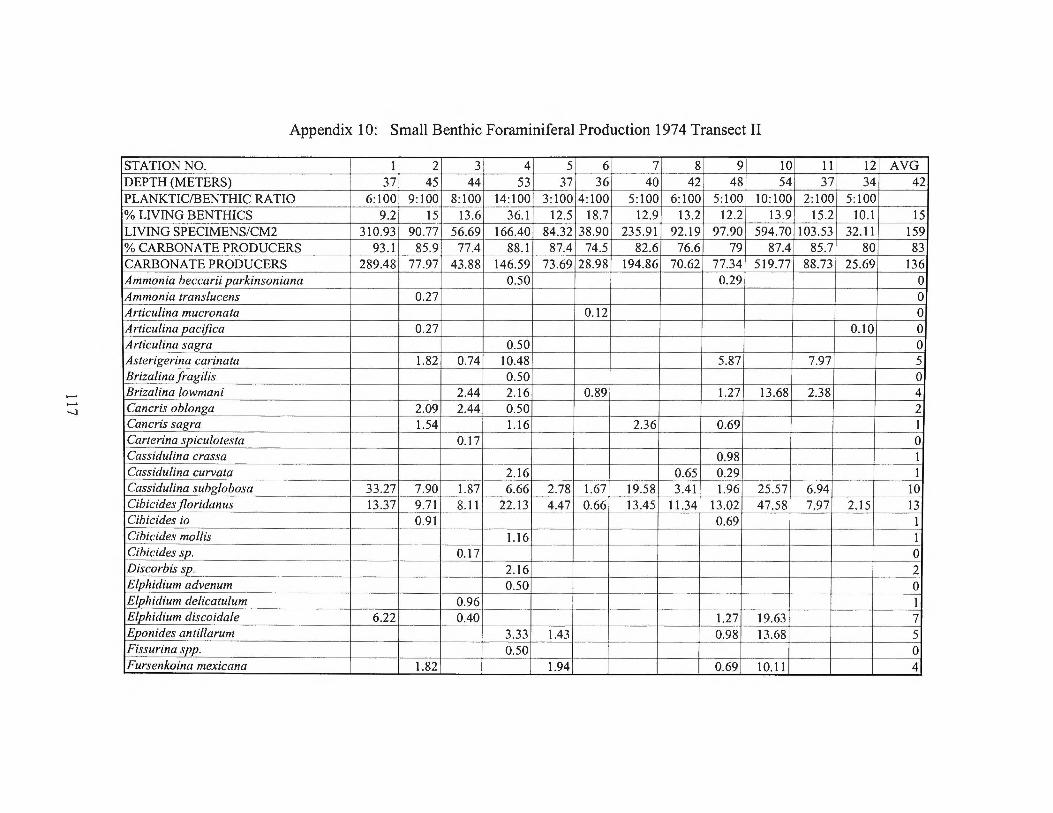
Appendix 10: Small Benthic Foraminiferal Production 1974 Transect II
STATION NO. 1 2 3 4 5 6 7 8 9 10 11 12 AVG DEPTH (METERS) 37 45 44 53 37 36 40 42 48 54 37 34 42 PLANKTIC/BENTHIC RATIO 6:100 9:100 8:100 14:100 3:100 4:100 5: 100 6:100 5:100 10:100 2:100 5:100 % LIVING BENTHICS 9.2 15 13.6 36.1 12.5 18.7 12.9 13.2 12.2 13.9 15.2 10.1 15 LIVING SPECIMENS/CM2 310.93 90.77 56.69 166.40 84.32 38.90 235.91 92.19 97.90 594.70 103.53 32.11 159 %CARBONATE PRODUCERS 93.1 85.9 77.4 88.1 87.4 74.5 82.6 76.6 79 87.4 85.7 80 83 CARBONATE PRODUCERS 289.48 77.97 43.88 146.59 73.69 28.98 194.86 70.62 77.34 519.77 88.73 25.69 136 Ammonia beccarii parkinsoniana 0.50 0.29 0 Ammonia translucens 0.27 0 Articulina mucronata 0.12 0 Articulina pacifica 0.27 0.10 0 Articu/ina sa~ra 0.50 0 Asterigerina carinata 1.82 0.74 10.48 5.87 7.97 5 Brizalina fragi/is 0.50 0 Brizalina /owmani 2.44 2.16 0.89 1.27 13.68 2.38 4 Cancris oblonga 2.09 2.44 0.50 2 Cancris sagra 1.54 1.16 2.36 0.69 1 Carterina spiculotesta 0.17 0 Cassidulina crassa 0.98 1 Cassidulina curvata 2.16 0.65 0.29 1 Cassidulina subglobosa 33.27 7.90 1.87 6.66 2.78 1.67 19.58 3.41 1.96 25.57 6.94 10 Cibicidesfloridanus 13.37 9.71 8.11 22.13 4.47 0.66 13.45 11.34 13.02 47.58 7.97 2.15 13
·--Cibicides io 0.91 0.69 1 Cibicides mol/is 1.16 1 Cibicides :.p. 0.17 0 Discorbis sp. 2.16 2 Elphidium advenum 0.50 0 Elphidium delicatulum 0.96 1 Elphidium discoidale 6.22 0.40 1.27 19.63 7 Eponides antillarum 3.33 1.43 0.98 13.68 5 Fissurina :.pp. 0.50 0 Fursenkoina mexicana 1.82 1.94 0.69 10.11 4

Appendix 10: (Continued)
Fursenkoina pontoni 0.9I 1.13 2.83 2.28 7.08 2.49 0.69 0.87 2 Glabratella ? sp. 0.29 0 Guttu/ina australis 0.84 I Guttu/ina laevis 1.16 0.98 I Hanzawaia strattoni 32.03 3.90 1.30 28.29 I2.39 1.17 26.66 4.89 6.56 136.78 20.40 3.2I 23 Lenticulina orbicularis 0.69 I Loxostomum truncatum 0.7I I Marginu/ina planata 0.29 0 Miliolinel/a circularis 5.29 0.64 1.13 2.83 2.28 2.06 6.37 3.69 0.69 5.95 0.22 3 Miliolinella sp. Neoconorbina orbicularis 9.08 5.67 6.I6 7.34 4.67 37.04 4.89 4.2I II7.I6 I4.49 5.88 20 Nodobaculariella cassis 1.66 0.25 0.29 I Nonion depressulum 0.27 0.74 0.50 0.84 0.7I I
matagordanum
- Nonionel/a atlantica 0.93 O.I7 0.50 4.22 1.56 0.7I 2.I2 0.29 13.68 3 -00 Oo/ina melo 0.17 0 Planorbulina mediterranensis I4.6I 1.66 2.28 1.95 8.73 II.34 0.69 6 Planulina exorna 8.40 3.36 3.57 8.82 6.49 1.67 IO.I4 5.53 4.60 7.73 0.96 6 Poroeponides latera/is 0.50 1.10 1.17 1.66 I Pseudonodosaria mayori O.I2 0 Pyrgo nasutus 3.83 0.39 2 Pyrgo subsphaerica 0.93 O.I2 I Quing_uelocu/ina bicostata 5.29 5 Quinquelocu/ina bicarinata 0.50 0 Quinquelocu/ina bosciana 0.50 0.59 0.27 0 Quinqueloculina cultrata 1.16 I Quinquelocu/ina horrida 0.29 0 Quinquelocu/ina lamarckiana I20.33 5.I7 4.36 3.83 6.75 1.44 I7.22 2.49 0.69 61.25 I0.04 2.99 20 Quinquelocu/ina laevigata 1.65 2 Quinqueloculina polygona 0.50 0 Quinqueloculina seminulum 1.78 0.3I I IQ_uinquelocu/ina subpoeyana 1.16 I

Appendix 10: (Continued)
Quinqueloculina spp. 0.91 2.16 0.25 0.39 0.71 0.29 1.78 1 Reussella atlantica 5.29 2.72 2.10 2.83 6.37 1.84 2.64 0.55 3 Rosa/ina columbiensis 31.09 7.26 1.53 3.33 4.22 4.55 25.95 10.42 6.85 39.85 7.56 3.76 12 Rosa/ina concinna 0.29 0 Rosa/ina jloridana 0.27 3.33 0.39 1 Rosa/ina jloridensis 0.27 0.69 0 Rosa/ina suezensis 0.50 0 Rosa/ina sp. 0.17 0.29 0 Sawina pulchella primitiva 0.17 0.29 0 Sigmoilina distorta Siphonina pu/chra 0.29 0 Spirillina vivipara 0.12 0 Spiroloculina wata 0.28 1.78 1 Spiroloculina soldanii 0.27 0.50 0 Spiroloculina sp. 0.71 1 Tretomphalus planus Trlfarina bella 0.50 0.29 0 Trifarina bradyi 0.29 0 Trilarina Jamaicensis 0.12 0 Triloculina brevidentata 0.71 1 Triloculina rotunda 0.50 0 Triloculina tricarinata Triloculina trigonula 0.40 0.50 0.31 0 Triloculina sp. 1.78 2 Wiesnerella auriculata 9.33 1.54 2.28 0.39 1.65 0.92 0.96 2 TOTAL SPECIMENS 286.37 62.90 39.91 134.95 65.01 25.87 188.49 66.29 63.15 519 .. 77 78.38 21.64 129
%OF CARBONATE PRODUCERS 98.93 80.68 90.96 92.05 88.22 89.26 96.73 93.86 81.66 100.00 88.34 84.25 90 NO. SPECIES 14 23 23 42 20 22 20 15 37 17 10 11 21 % OF NO. 0 SPECIES 93.33 88.46 92.00 91.30 83.33 91.67 95.24 88.24 94.87 100.00 83.33 84.62 91
TOTAL CARBONATE PRODUCTION
ingCaC0 3 m -2 yr -I 47.46 10.42 6.61 22.36 10.77 4.29 31.24 10.99 10.465 86.14 12.99 3.59 21

...... N 0
Appendix 11: Small Benthic Foraminiferal Production 1974 Transect I
STATION NO. 13 14 15 16 17 18 19 20 DEPTH (METERS) 44 38 37 43 31 33 34 30 PLANKTIC/BENTHIC RATIO 12:160 3:100 4:100 4:100 2:100 1:100 1:100 2:100 % LIVING BENTHICS 16.3 11.5 6.2 12 15.1 6.2 13.3 8.3 NO. LIVING SPECIMENS/CM2 SEDIMENT 467.21 295.66 242.57 42.23 642.43 372.84 63.00 309.57 %OF CARBONATE PRODUCERS 87.40 94.20 93.00 85.60 85.30 84.90 95.10 85.80 CARBONATE PRODUCERS 408.34 278.51 225.59 36.15 547.99 316.55 59.91 265.61 Ammonia beccarii tepida 5.91 0.30 1.93 0.19 Amphicoryne scalaris 0.89 Asterigerina carina/a 1.40 1.70 0.42 14.78 11.78 Brizalina fragilis 1.40 Brizalina goessii 1.40 Brizalina lowmani 1.40 1.93 Brizalina sp. Buliminella elegantissima 1.40 Cancris oblonga 7.94 Cancris sagra 3.27 1.93 Cassidulina subglobosa 7.94 19.81 3.15 Cibicides floridanus 34.11 7.98 21.10 5.19 59.75 24.98 Cibicides io 4.50 Cibicides mollis 9.34 Cibicides sp. Cribroe/phidium poeyanum 6.42 Discorbis sp. 10.75 Elphidium advenum 0.89 Elphidium delicatu/um 10.75 0.19 Elphidium discoidale 4.67 9.76 5.58 3.08 19.27 12.30 Elphidium galvestonense 3.27 Eponides antillarum 10.75 2.43 10.92 7.12 Fissurina spp. 4.67 Fursenkoina comp/anata 1.40 0.89 Fursenkoina mexicana 3.27 2.07 Fursenkoina pontoni 40.65 3.84 10.92
21 22 AVG 30 42 36
0:100 1:100 7.1 9.7
235.98 469.52 314.10 92.80 85.20 88.93
218.99 400.03 275.77 3.29 1.16
0.09 32.87 6.29
0.14 0.14
1.41 0.47 1.41 0.14
0.14 0.79
1.41 0.66 3.09
51.65 20.48 0.71 0.52
3.29 1.26 1.41 0.14 6.10 1.25
1.07 1.41 0.23
1.09 31.46 8.61
1.41 0.47 6.37 9.39 4.70
0.47 1.41 0.37 1.41 0.67 7.98 6.34

Appendix 11 : (Continued)
Fursenkoina pontoni 40.65 3.84 10.92 7.98 6.34 Fursenkoina spinicostata 4.67 0.47 Guttulina australis 3.27 6.42 4.70 1.44 Guttulina hirsuta 1.93 0.19 Guttulina laevis 3.27 6.42 0.93 4.70 1.53 Hanzawaia strattoni 49.99 79.83 58.94 4.22 100.86 120.43 8.19 103.09 54.28 87.80 66.76 Lagena spp. 1.40 0.14 Miliolinella circularis 1.40 13.90 11.40 1.14 1.93 0.19 1.41 3.14 Neoconorbina orbicularis 35.98 16.98 6.33 66.17 12.30 8.82 13.31 16.52 26.76 20.32 Nodobaculariella cassis 1.40 4.50 1.41 0.73 Nonion depressulum matagordanum 3.27 0.93 0.42 Nonionella atlantica 12.61 5.03 0.72 19.27 11.19 2.71 8.36 6.10 6.60 Pavonina atlantica 1.40 0.14 Planorbulina mediterranensis 15.42 16.25 8.35 10.15 5.02 Planulina exorna 31.30 8.00 14.78 11.19 1.41 6.67
...... N Poroeponides latera/is 3.27 0.33 ...... Pseudonodosaria mayori 0.89 0.09
Pyrgo denticulata 1.41 0.14 Pyrgo depressa 0.71 0.07 Pyrgo nasutus 6.07 0.42 1.93 1.12 3.10 4.70 1.73 Quinqueloculina bicostata 4.50 0.71 1.41 0.66 Quinqueloculina bicarinata 1.93 0.19 Quinqueloculina bosciana 0.71 0.07 Quinqueloculina cultrata 1.40 0.14 Quinqueloculina dutemplei 1.41 0.14 Quinqueloculina lamarckiana 7.94 91.65 53.36 6.46 4.50 84.64 8.82 40.24 59.00 20.19 37.68 Quinqueloculina /aevigata 0.89 0.13 1.93 0.19 0.71 0.38 Quinqueloculina polygona 0.13 1.12 2.17 0.34 Quinqueloculina seminulum 1.93 1.41 0.33 Quinqueloculina subpoeyana 3.27 1.12 0.44 Quinqueloculina spp. 3.27 0.93 0.42 Reussella atlantica 17.29 0.30 25.70 1.70 4.70 4.97

...... N N
Rosa/ina bulbosa Rosa/ina columbiensis Rosa/ina concinna Rosa/ina jloridana Rosa/ina jloridensis Rosa/ina suezensis Rosa/ina sp. Sagrina pu/chella primitiva Spiroloculina sp. Trifarina bella Trilocu/ina brevidenta Triloculina trigonula Triculina sp. Valvulineria mexicana Wiesnerella auriculata TOTALSMALLCARBONATEPRODUCERS
%OF TOTAL CARBONATE PRODUCERS NO. SPECIES
TOTAL CARBONATE PRODUCTION ingCaC0 3 m ·2 .J
yr
Appendix 11: (Continued)
0.13 18.63 24.98 6.33 59.75
32.12 14.02 8.35
0.89 3.27
4.50 4.67 0.30 6.42
1.93 1.40 0.55
1.93
3.27 4.67 3.15
399.00 263.72 223.89 36.15 520.37
97.71 94.69 99.25 100.00 94.96 45 17 12 17 34
66.12 43.70 37.10 5.99 86.24
0.19 0.93 0.71 0.20 36.17 12.41 65.94 52.62 37.56 31.44
5.26 3.74 6.10 2.85
0.19 0.11 0.33 0.45
0.19 0.93 3.29 1.58 0.19
0.19 0.21 0.19 0.93 0.11
0.19 1.41 0.14
0.33 0.63 0.85
316.55 59.91 254.16 203.18 375.14 2652.1
100.00 100.00 95.69 92.78 93.78 96.89 11 18 15 12 35 21.6
52.46 9.93 42.12 33.67 62.17 43.95

Appendix 12: Small Benthic Foraminiferal Production Summer 1975 Transects I and II
STATION NO. 23 24 25 26 27 28 I 29 30 31 32 33 34 II DEPTH (METERS) 11 18 37 53 90 168 63 19 31 34 37 43 189 59 % LIVING BENTHICS 2.90 11.50 6.00 12.30 4.40 17.20 9.05 12.80 12.60 7.50 14.10 13.90 27.80 14.78
TOTAL LIVING/m2 x 10 5 1.67 0.75 0.95 3.48 1.71 28.35 6.15 13.25 38.10 22.70 3.74 1.99 45.06 20.81 %CARBONATE PRODUCERS 87.67 96.09 95.15 81.97 83.33 94.00 89.70 98.33 89.33 88.67 86.29 85.33 98.33 91.05 CARBONATE PRODUCERS
in No. /m 2 X 10 5 1.46 0.72 0.90 2.85 1.42 26.64 5.67 13.03 34.04 20.12 3.22 1.70 44.31 19.40
Following small species presented in percent of total specimens
Ammonia beccarii parkinsoniana 6.00 1.68 1.28 0.00 Ammonia beccarii tepida 13.00 1.12 2.35 0.67 1.33 0.67 0.33 0.50 Amphicoryne intercellularis 0.00 0.00 Amphicoryne sp. 0.00 0.33 0.06 Amphicoryne sublineata 0.33 0.06 0.00 Articulina sulcata 0.34 0.33 0.33 0.17 0.00 Astacolus crepidulus 0.33 0.06 0.33 0.06 Asterigerina carinata 8.94 9.69 0.33 3.16 30.67 2.00 1.33 5.35 6.56 Brizalina albatrossi 0.00 0.00 Brizalina barbata 0.00 0.00 Brizalina fragilis 0.33 0.06 0.33 0.06 Brizalina goessii 0.33 5.67 1.00 1.67 0.28 Brizalina lanceolata 1.67 2.00 0.61 0.67 0.67 0.22 Brizalina lowmani 1.67 0.28 1.00 0.67 2.67 1.33 0.94 Brizalina minima 1.33 0.22 0.33 0.06 Brizalina paula 2.00 0.33 1.33 0.22 Brizalina sp. 0.00 0.00 Brizalina subaenariensis mexicana 0.00 0.33 0.06 Brizalina subspinescens 1.67 0.28 0.67 0.11 Buccella hannai 0.00 0.33 0.06 Bulimina affinis 0.00 1.67 0.28 Bulimina spicata 0.33 0.06 0.00 Buliminella elegantissima 0.33 0.06 0.00

Appendix 12: (Continued)
Cancris oblonga 0.44 0.07 0.67 2.33 1.00 0.67 Cancris sagra 0.44 1.02 0.24 0.33 3.67 0.33 0.72 Carpenteria proteiformis 0.33 0.06 0.00 Cassidulina carinata 1.67 0.28 0.67 0.11 Cassidulina crassa 0.33 0.06 1.67 0.28 Cassidulina curvata 1.02 5.33 1.33 1.28 0.33 7.33 1.28 Cassidulina subglobosa 2.72 6.67 4.00 2.23 0.67 6.00 1.67 1.39 Chrysalidinella miocenica 0.00 0.33 0.06 Cibicides aff C. floridanus 3.91 14.98 11.56 25.33 22.67 13.08 18.00 10.00 4.00 8.36 11.00 13.00 10.73 Cibicides concentricus 0.00 6.33 1.06 Cibicides corpulentus 0.00 1.67 0.28 Cibicides deprimus 3.00 8.94 5.73 1.70 0.67 1.00 3.51 2.33 2.67 1.00 0.33 1.06 Cibicides sp. 0.56 0.09 0.00 Cribroelphidium poeyanum 3.91 0.88 0.80 2.67 2.67 2.33 0.67 1.00 1.56 Cyc/ogyra invo/vens 0.00 0.33 0.06 Cyc/ogyra planorbis 0.34 0.06 0.00 Dentalina advena 0.00 0.67 0.11 Dentalina filiform is 0.00 0.00 Ehrenbergina spinea 1.33 0.22 0.00 Elphidium advenum 0.44 0.07 0.33 0.33 0.11 Elp_hidium discoidale 2.00 1.12 0.44 0.68 0.33 0.76 0.67 1.33 2.33 1.00 0.33 0.95 Elphidium sp. 4.47 0.34 0.33 0.86 1.67 1.33 0.67 0.61 Eponides antillarum 0.44 0.67 0.18 2.33 3.33 1.00 1.11 Eponides regularis 0.33 0.06 0.00 Eponides turgidus 1.67 0.28 0.33 0.06 Eponides umbonatus 0.00 0.00 Fissurina formosa 0.33 0.06 0.00 Fissurina /ongispina 0.33 0.06 0.00 Fissurina sp. 0.00 0.33 1.33 0.28 Florilus grateloupi 0.56 0.44 0.17 0.33 0.33 0.11 Fursenkoina complanata 0.00 0.00 Fursenkoina compressa 0.88 2.72 0.33 0.66 1.67 2.01 4.33 1.33 Fursenkoina mexicana 0.00 0.67 1.67 2.00 0.72

Appendix 12: (Continued)
Fursenkoina pontoni 1.32 0.34 0.28 0.33 0.33 0.67 0.22 Globulina caribaea 0.44 0.07 0.33 0.33 0.11 Guttulina australis 1.12 0.88 0.68 0.45 0.33 0.33 1.67 0.39 Guttulina laevis 0.00 0.33 0.33 0.11 Gyroidina orbicularis 0.00 2.33 0.39 Hanzawaia strattoni 11.67 25.70 10.13 5.78 5.33 1.00 9.94 2.00 10.00 9.33 8.03 2.00 5.33 6.12 Hoeglundina elegans 0.67 0.11 2.33 0.39 Lenticulina calcar 0.67 0.11 1.67 0.28 Lenticulina gibba 0.33 1.67 0.33 1.33 0.22 Lenticulina orbicularis 1.33 0.22 2.00 0.33 Loxostomum abruptum 0.00 0.33 0.06 Loxostomum sp. 0.34 0.06 0.33 0.67 0.17 Marginulina glabra 0.00 0.67 0.1 1 Marginulina planata 0.33 0.06 0.00 Marginulopsis bradyi 0.33 0.06 0.00 Miliolids (abnormal) 0.67 0.11 0.00 Miliolinella circularis 0.00 0.00 Miliolinel/a obliquinoda 0.33 0.06 0.00 Miliolinel/a subrotunda 0.88 0.33 2.33 0.59 0.33 1.00 0.33 0.28 Neoconorbina orbicularis 1.68 2.20 19.05 0.33 3.88 0.67 3.67 1.00 1.00 6.33 2.11 Nodobaculariella cassis 1.00 0.17 0.33 0.33 0.33 0.17 Nonion affinis 0.34 0.06 0.33 0.06 Nonion formosum 0.00 0.33 0.06 Nonion sp. 0.33 0.33 0.11 0.67 0.67 0.22 Nonionella atlantica 0.44 1.02 0.33 0.30 1.00 3.00 1.33 1.34 1.67 0.33 1.45 Nonionella opima 0.00 0.33 0.06 Planorbulina acervalis 0.56 0.68 0.21 0.67 0.33 0.17 Planorbulina mediterranensis 0.67 0.56 0.44 1.02 0.67 2.00 0.89 0.33 0.33 1.33 0.33 Planulina ariminensis 5.33 0.89 9.67 1.61 Planulina exorna 1.00 1.76 3.74 0.67 1.67 1.47 4.33 4.33 3.34 4.00 2.67 Poroeponides latera/is 0.33 1.70 0.33 0.39 0.67 1.33 0.33 Pullenia bulloides 0.00 0.67 0.11 Pullenia quinqueloba 0.67 0.11 0.00

........ N 0'\
Pyrgo denticulata Pyrgo depressa Pyrgo elongata Pyrgo nasutus Pyrgo subsphaerica Quinqueloculina bicostata Quinqueloculina bidentata Quinqueloculina bosciana Quinqueloculina compta Quinqueloculina funafutiensis Quinqueloculina horrida Quinqueloculina laevigata Quinqueloculina lamarckiana Quinqueloculina parkeri occidenta/is Quinqueloculina poeyana Quinqueloculina polygona Quinqueloculina seminulum Quinqueloculina sp. Quinqueloculina tenagos Quinqueloculina venusta Quinqueloculina vulgaris Reussella atlantica Rosa/ina bulbosa Rosa/ina columbiensis Rosa/ina concinna Rosa/ina jloridana Rosa/ina jloridensis Rotamorphina laevigata Sagrina pulchel/a primitiva Saracenaria italica Saracenaria latifrons Seabrookia earlandi Sigmavirgu/ina tortuosa
0.33
6.67 6.15
1.00 0.56 0.33 0.67 0.56
0.56
15.67 4.47 12.00 10.61 10.67 3.91
Appendix 12: (Continued)
0.00 0.33 0.06
0.44 0.33 0.13 1.67 2.00 0.61
0.00 0.88 0.15
0.00 1.32 0.33 0.33 0.33
0.00 0.44 0.13
0.67 0.11 0.44 0.07
10.13 2.38 8.33 2.33 6.00 0.00 0.26
0.67 0.17 0.44 0.67 0.33 0.44 0.44 1.02 0.33 0.30
0.09 0.34 0.33 0.11
0.00 0.44 1.70 0.33 2.67 0.86
0.00 12.33 6.12 3.00 0.33 6.99 7.05 3.74 0.33 5.62 0.88 1.02 0.33 2.80
0.34 1.67 0.33 3.00 0.50
0.44 0.07 0.33 0.06
0.00 0.67 0.11
0.00
0.33 0.06 0.00 0.00
1.00 3.33 0.33 0.33 0.83 0.33 0.33 0.33 0.17
0.33 2.34 0.45 0.00
0.67 0.67 0.22 0.67 0.11 0.33 0.06
0.33 0.06 0.00
0.67 6.33 7.67 11.04 2.33 1.33 4.90 0.00
0.33 0.33 0.11 0.33 0.33 0.67 0.33 0.28
0.67 0.11 1.00 0.33 0.22
0.00 0.33 0.33 0.11 0.33 0.06 1.67 3.00 6.35 1.00 1.67 2.28
0.67 0.33 4.00 3.01 0.33 1.39 29.67 17.00 20.67 10.37 13.00 1.33 15.34
2.67 6.67 4.00 2.34 2.33 3.00 1.33 3.33 0.67 2.01 2.00 1.56 1.67 0.67 1.00 0.33 0.61
0.00 0.67 1.67 1.00 0.33 0.61
0.67 0.11 0.00 0.00
0.33 0.06
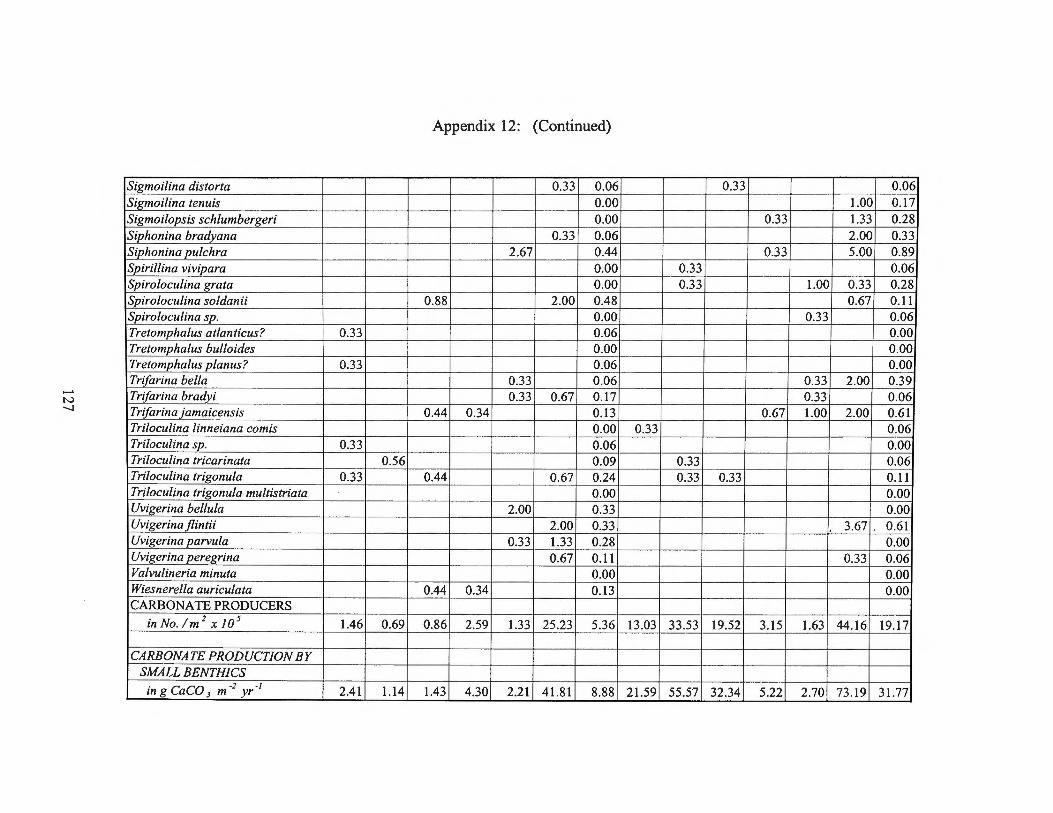
Appendix 12: (Continued)
Sigmoilina distorta 0.33 0.06 0.33 0.06 Sigmoilina tenuis 0.00 1.00 0.17 Sigmoilopsis schlumbergeri 0.00 0.33 1.33 0.28 Siphonina bradyana 0.33 0.06 2.00 0.33 Siphon ina pulchra 2.67 0.44 0.33 5.00 0.89 Spirillina vivipara 0.00 0.33 0.06 Spirolocu/ina grata 0.00 0.33 1.00 0.33 0.28 Spiroloculina soldanii 0.88 2.00 0.48 0.67 0.11 Spirolocu/ina sp. 0.00 0.33 0.06 Tretomphalus at/anticus? 0.33 0.06 0.00 Tretomphalus bulloides 0.00 0.00 Tretomphalus planus? 0.33 0.06 0.00 Trifarina bella 0.33 0.06 0.33 2.00 0.39 -N Trifarina bradyi 0.33 0.67 0.1 7 0.33 0.06
-.....) Trifarina jamaicensis 0.44 0.34 0.13 0.67 1.00 2.00 0.61 Trilocu/ina linneiana comis 0.00 0.33 0.06 Trilocu/ina sp. 0.33 0.06 0.00 Triloculina tricarinata 0.56 0.09 0.33 0.06 Triloculina trigonula 0.33 0.44 0.67 0.24 0.33 0.33 0.11 Triloculina trigonula multistriata 0.00 0.00 Uvigerina bellula 2.00 0.33 0.00 Uvigerina jlintii 2.00 0.33 3.67 . 0.61 Uvigerina parvula 0.33 1.33 0.28 0.00 Uvigerina peregrina 0.67 0.11 0.33 0.06 Valvulineria minuta 0.00 0.00 Wiesnerella auriculata 0.44 0.34 0.13 0.00 CARBONATE PRODUCERS
in No. / m 2 X 10 5
1.46 0.69 0.86 2.59 1.33 25.23 5.36 13.03 33.53 19.52 3.15 1.63 44.16 19.17
CARBONATE PRODUCTION BY SMALL BENTHICS
in g CaCO 3 m -2 yr-1 2.41 1.14 1.43 4.30 2.21 41.81 8.88 21.59 55.57 32.34 5.22 2.70 73. 19 31.77
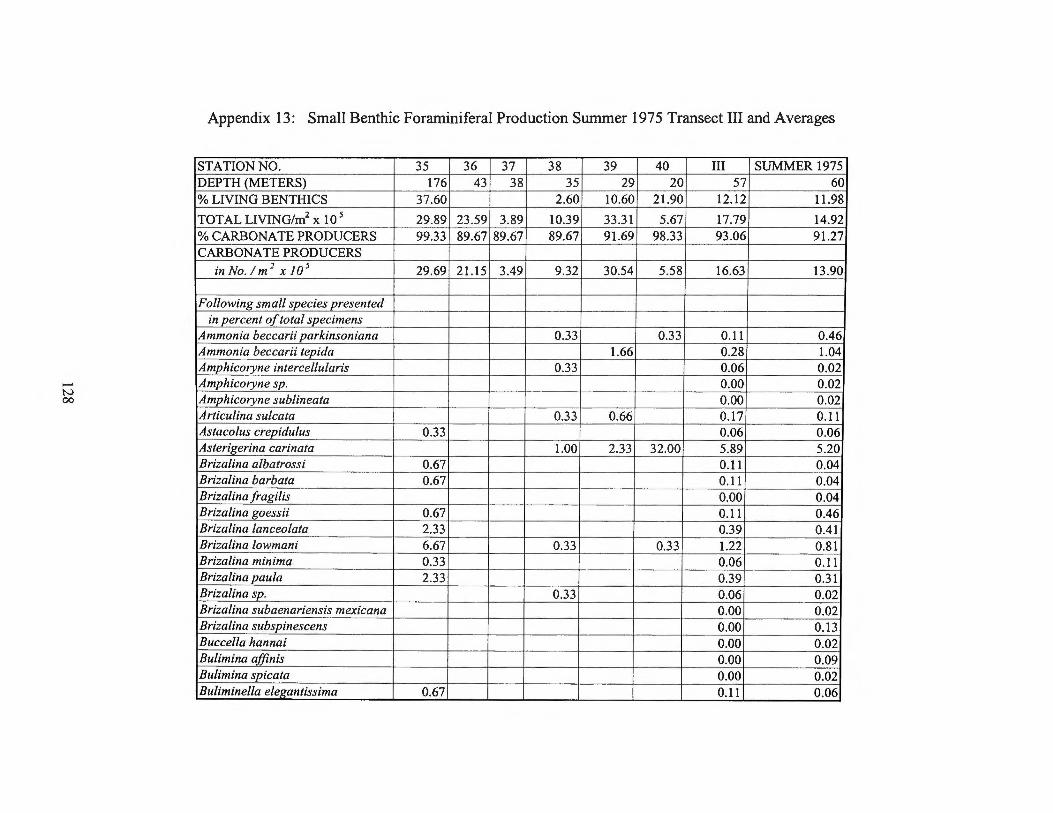
........ N 00
Appendix 13: Small Benthic Foraminiferal Production Summer 1975 Transect III and Averages
STATION NO. 35 36 37 38 39 40 III SUMMER 1975 DEPTH (METERS) 176 43 38 35 29 20 57 60 % LIVING BENTHICS 37.60 2.60 10.60 21.90 12.12 11.98
TOTAL LIVING/m2 x 10 5 29.89 23.59 3.89 10.39 33.31 5.67 17.79 14.92 %CARBONATE PRODUCERS 99.33 89.67 89.67 89.67 91.69 98.33 93.06 91.27 CARBONATE PRODUCERS
in No. I m 2 x 10 5 29.69 21.15 3.49 9.32 30.54 5.58 16.63 13.90
Following small species presented in percent of total specimens
Ammonia beccarii parkinsoniana 0.33 0.33 0.11 0.46 Ammonia beccarii tepida 1.66 0.28 1.04 Amphicoryne intercellularis 0.33 0.06 0.02 Amphicoryne sp. 0.00 0.02 Amphicoryne sublineata 0.00 0.02 Articulina sulcata 0.33 0.66 0.17 0.11 Astacolus crepidulus 0.33 0.06 0.06 Asterigerina carinata 1.00 2.33 32.00 5.89 5.20 Brizalina albatrossi 0.67 0.11 0.04 Brizalina barbata 0.67 0.11 0.04 Brizalina fragilis 0.00 0.04 Brizalina goessii 0.67 0.11 0.46 Brizalina lanceolata 2.33 0.39 0.41 Brizalina lowmani 6.67 0.33 0.33 1.22 0.81 Brizalina minima 0.33 0.06 0.11 Brizalina paula 2.33 0.39 0.31 Brizalina sp. 0.33 0.06 0.02 Brizalina subaenariensis mexicana 0.00 0.02 Brizalina subspinescens 0.00 0.13 Buccella hannai 0.00 0.02 Bulimina ajjinis 0.00 0.09 Bulimina spicata 0.00 0.02 Buliminella elegantissima 0.67 0.11 0.06

Appendix 13: (Continued)
Cancris oblonga 0.00 0.25 Cancris sagra 0.33 0.06 0.34 Carpenteria proteiformis 0.00 0.02 Cassidulina carinata 1.00 0.33 0.33 0.28 0.22 Cassidulina crassa 0.00 0.11 Cassidulina curvata 8.33 0.33 1.44 1.33 Cassidulina subglobosa 7.33 1.33 1.44 1.69 Chrysalidine/la miocenica 0.00 0.02 Cibicides aff. C. jloridanus 11.00 5.67 7.97 13.00 6.27 10.03 Cibicides concentricus 4.00 0.33 0.72 0.59 Cibicides corpulentus 3.00 0.50 0.26 Cibicides deprimus 0.33 2.00 3.32 8.33 2.33 2.30 Cibicides sp. 0.00 0.03
-N 10
Cribroelphidium poeyanum 1.00 0.67 0.28 0.88 CyclogJ!!a involvens 0.00 0.02 Cyclogyra planorbis 0.00 0.02 Dentalina advena 0.00 0.04 Dentalina filiformis 0.33 0.06 0.02 Ehrenbergina spinea 0.00 0.07 Elphidium advenum 0.00 0.06 Elphidium discoidale 3.67 1.66 0.89 0.86 Elphidium sp. 0.33 0.06 0.51 Eponides antil/arum 1.33 2.33 0.61 0.64 Eponides regularis 0.00 0.02 Eponides turgidus 0.00 0.11 Eponides umbonatus 0.33 0.06 0.02 Fissurina formosa 0.00 0.02 Fissurina longispina 0.00 0.02 Fissurina sp. 1.00 0.33 0.33 0.28 0.19 Florilus grateloupi 0.00 0.09 Fursenkoina complanata 0.33 0.06 0.02 Fursenkoina compressa 0.67 0.33 0.17 0.72 Fursenkoina mexicana 0.33 0.33 0.33 0.17 0.30

_. w 0
Fursenkoina pontoni Globulina caribaea Guttulina australis Guttulina laevis Gyroidina orbicularis Hanzawaia strattoni Hoeglundina elegans Lenticulina calcar Lenticulina gibba Lenticulina orbicularis . Loxostomum abruptum Loxostomum sp. Marginu/ina glabra Marginulina planata Marginulopsis bradyi Miliolids (abnormal) Miliolinella circularis Miliolinella obliquinoda Miliolinella subrotunda Neoconorbina orbicularis Nodobaculariella cassis Nonion affinis Nonion formosum Nonion sp. Nonionel/a atlantica Nonionel/a opima Planorbulina acervalis Planorbulina mediterranensis Planulina ariminensis Planulina exorna Poroeponides latera/is Pullenia bulloides Pullenia quinqueloba
Appendix 13: (Continued)
0.33 0.33
0.67 0.33 1.00
0.33 4.33 8.00 11.30 1.67 2.33 2.00 2.33
0.33
0.33
1.00 1.00 4.67 2.33
0.33
0.67 0.33 3.00
3.33 1.00 7.33
10.33 1.00
0.33
0.06 0.18 0.06 0.08 0.11 0.32 0.22 0.11 0.06 0.15
3.67 4.55 6.87 0.28 0.26 0.39 0.26 0.33 0.30 0.39 0.31 0.00 0.02 0.06 0.09 0.00 0.04 0.00 0.02 0.00 0.02 0.00 0.04 0.06 0.02 0.00 0.02
0.33 0.39 0.42 2.33 1.55 2.51
0.06 0.13 0.00 0.04 0.11 0.06 0.06 0.13
3.00 1.00 0.91 0.00 0.02 0.00 0.12 0.72 0.65 1.22 1.24 1.89 2.01 0.00 0.24 0.00 0.04 0.06 0.06
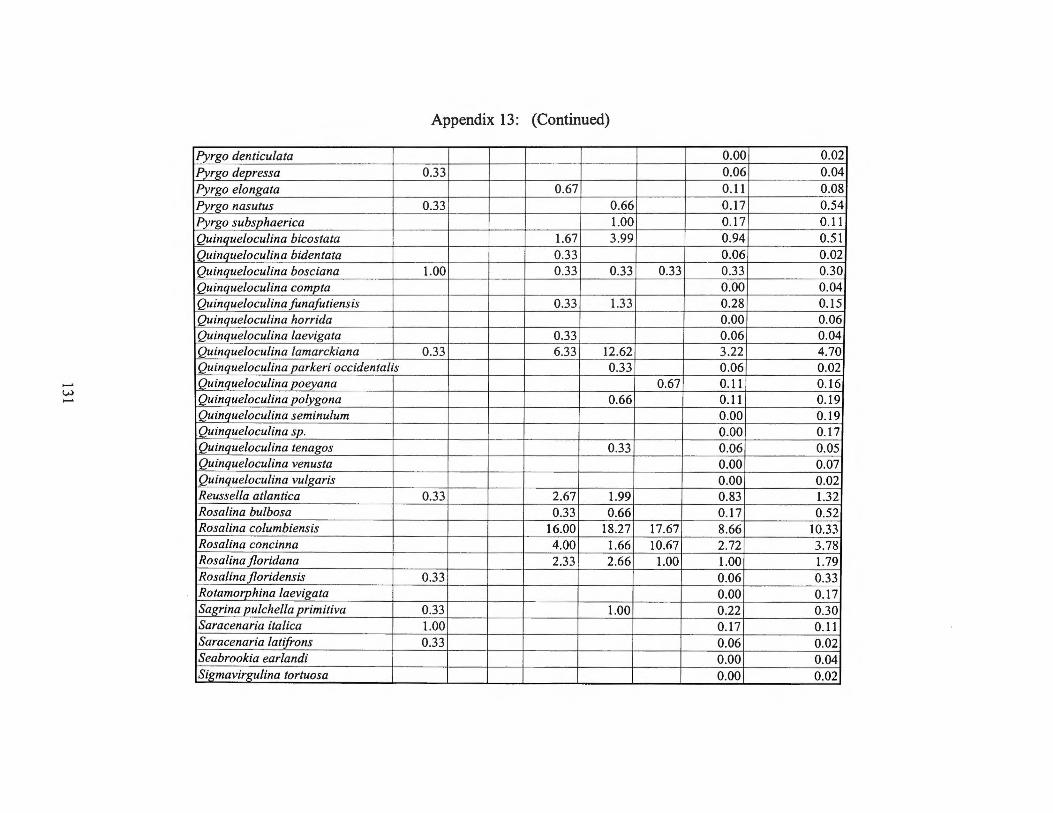
Appendix 13: (Continued)
Pyrgo denticulata 0.00 0.02 Pyrgo depressa 0.33 0.06 0.04 Pyrgo elongata 0.67 0.11 0.08 Pyrgo nasutus 0.33 0.66 0.17 0.54 Pyrgo subsphaerica 1.00 0.17 0.11 Quinqueloculina bicostata 1.67 3.99 0.94 0.51 Quinqueloculina bidentata 0.33 0.06 0.02 Quinqueloculina bosciana 1.00 0.33 0.33 0.33 0.33 0.30 Quinqueloculina compta 0.00 0.04 Quinqueloculina funafutiensis 0.33 1.33 0.28 0.15 Quinqueloculina horrida 0.00 0.06 Quinqueloculina laevigata 0.33 0.06 0.04 Quinqueloculina lamarckiana 0.33 6.33 12.62 3.22 4.70 Quinqueloculina parkeri occidentalis 0.33 0.06 0.02 Quinqueloculina poeyana 0.67 0.11 0.16 Quinqueloculina polygona 0.66 0.11 0.19 Quinqueloculina seminulum 0.00 0.19 Quinqueloculina sp. 0.00 0.17 Quinqueloculina tenagos 0.33 0.06 0.05 Quinqueloculina venusta 0.00 0.07 Quinque/oculina vulgaris 0.00 0.02 Reussel/a atlantica 0.33 2.67 1.99 0.83 1.32 Rosa/ina bulbosa 0.33 0.66 0.17 0.52 Rosa/ina columbiensis 16.00 18.27 17.67 8.66 10.33 Rosa/ina concinna 4.00 1.66 10.67 2.72 3.78 Rosa/ina jloridana 2.33 2.66 1.00 1.00 1.79 Rosa/ina jloridensis 0.33 0.06 0.33 Rotamorphina laevigata 0.00 0.17 Sagrina pulchel/a primitiva 0.33 1.00 0.22 0.30 Saracenaria italica 1.00 0.17 0.11 Saracenaria latifj(Jns 0.33 0.06 0.02 Seabrookia earlandi 0.00 0.04 Sigmavirgulina tortuosa 0.00 0.02

........ w N
Sigmoilina distorta Sigmoilina tenuis Sigmoilopsis schlumbergeri Siphonina bradyana Siphon ina pulchra Spirillina vivipara Spirolocu/ina grata Spiro/oculina soldanii Spiroloculina sp. Tretomphalus at/anticus? Tretomphalus bulloides Tretomphalus planus? Trifarina bella Trifarina bradyi Trifarina jamaicensis Triloculina linneiana comis Triloculina sp. Triloculina tricarinata Triloculina trigonula Triloculina trigonula multistriata Uvigerina bellula Uvigerina flintii Uvigerina parvula Uvigerina peregrina Valvu/ineria minuta Wiesnerella auriculata CARBONATE PRODUCERS
in No. I m 2 x I 0 5
CARBONATE PRODUCTION BY SMALL BENTHICS
ingCaC0 3 m -2 -1 yr
Appendix 13: (Continued)
0.33
10.33
0.33
0.33 0.33 0.33
0.33 0.33
0.67
0.33 0.33 0.66
6.33
1.00 0.67
29.59 20.60 3.40 9.08 29.65
49.04 34.14 5.63 15.04 49.14
0.00 0.04 0.06 0.07 0.00 0.09 0.00 0.13 1.72 1.02 0.00 0.02 0.06 0.11 0.00 0.20 0.00 0.02 0.06 0.04 0.06 0.02 0.06 0.04 0.11 0.19 0.00 0.07 0.11 0.28 0.00 0.02 0.00 0.02 0.06 0.07
0.33 0.22 0.19 0.33 0.06 0.02
0.00 0.11 1.06 0.67 0.00 0.09 0.17 0.11 0.11 0.04 0.00 0.04
5.43 16.29 13.61
8.99 27.00 22.55

..... w w
Appendix 14: Small Benthic Foraminiferal Production Falll975 Transects I, II, III and Averages
STATION NO. 23 24 25 26 27 28 29 30 3I 32 33 34 35 36 37 38 DEPTH (METERS) II I8 37 53 90 I68 I9 3I 34 37 43 I89 I76 43 29 35 % LIVING BENTHICS I5.I 13.4 I0.8 6.5 I1.6 22.7 I2.I I3.3 I9.7 I7.I Il.7 20.6 39.3 I4.I 21.7 I0.5
TOTAL LIVING/m2 x I0 5 30.9 I7.7 I3.0 2.2 Il.8 26.0 I5.I 43.7 70.6 30.2 Il.7 I0.2 63.6 5.4 54.4 1.6 %CARBONATE PRODUCER 87.7 96.I 95.2 82.0 83.3 94.0 98.3 89.3 88.7 86.3 85.3 98.3 99.3 91.5 91.5 89.7 CARBONATE PRODUCERS 27.I I7.0 12.4 1.8 9.9 24.5 I4.8 39.I 62.6 26.0 IO.O IO.I 63.2 5.0 49.7 I.4
in No. 1m 2 x 10 5
Ammonia beccarii parkinsonian 6.0 1.7 0.3 Ammonia beccarii tepida 13.0 1.1 0.7 1.3 0.7 0.3 Amphicoryne intercel/ularis 0.3 Amphicoryne sp. 0.3 Amphicoryne sublineata 0.3 Articulina su/cata 0.3 0.3 0.3 0.3 Astacolus crepidulus 0.3 0.3 0.3 Asterigerina carinata 8.9 9.7 0.3 30.7 2.0 1.3 5.4 1.0 Brizalina a/batrossi 0.7 Brizalina barbata 0.7 Brizalina fragilis 0.3 0.3 Brizalina goessii 0.3 5.7 1.7 0.7 Brizalina /anceolata 1.7 2.0 0.7 0.7 2.3 Brizalina lowmani 1.7 1.0 0.7 2.7 1.3 6.7 0.3 Brizalina minima 1.3 0.3 0.3 Brizalina y_aula 2.0 1.3 2.3 Brizalina sp. 0.3 Brizalina subaenariensis mexicana 0.3 Brizalina subspinescens 1.7 0.7 Buccel/a hannai 0.3 Bulimina affinis 1.7 Bulimina spicata 0.3 Buliminella elegantissima 0.3 0.7 Cancris oblonga 0.4 0.7 2.3 1.0 Cancris sagra 0.4 1.0 0.3 3.7 0.3 0.3
39 40 29 20 59
Il.3 49.6 I7.8
4.7 6.4 23.3 91.7 98.3 91.5 4.3 6.3 21.4
0.3 1.7
0.7
2.3 32.0
0.3

Appendix 14: (Continued)
Carpenteria proteiformis 0.3 Cassidulina carinata 1.7 0.7 1.0 0.3 0.3 Cassidulina crassa 0.3 1.7 Cassidulina curvata 1.0 5.3 1.3 0.3 7.3 8.3 0.3 Cassidulina subglobosa 2.7 6.7 4.0 0.7 6.0 1.7 7.3 1.3 Chrysalidinella miocenica 0.3 Cibicides aff. C. floridanus 3.9 15.0 11.6 25.3 22.7 18.0 10.0 4.0 8.4 11.0 13.0 11.0 5.7 8.0 13.0 Cibicides concentricus 6.3 4.0 0.3 Cibicides corpulentus 1.7 3.0 Cibicides deprimus 3.0 8.9 5.7 1.7 0.7 1.0 2.3 2.7 1.0 0.3 0.3 2.0 3.3 8.3 Cibicides sp. 0.6 Cribroelphidium poeyanum 3.9 0.9 2.7 2.7 2.3 0.7 1.0 1.0 0.7 Cyclogyra involvens 0.3 Cyclogyra planorbis 0.3 Dentalina advena 0.7 Dentalina filiformis 0.3 Ehrenbergina spinea 1.3 Elphidium advenum 0.4 0.3 0.3 Elphidium discoida/e 2.0 1.1 0.4 0.7 0.3 0.7 1.3 2.3 1.0 0.3 3.7 1.7 Elp_hidium sp. 4.5 0.3 0.3 1.7 1.3 0.7 0.3 Eponides antillarum 0.4 0.7 2.3 3.3 1.0 1.3 2.3 Eponides regu/aris 0.3 Eponides turgidus 1.7 0.3 Eponides umbonatus 0.3 Fissurina formosa 0.3 Fissurina longispina 0.3 Fissurina sp. 0.3 1.3 1.0 0.3 0.3 Florilus grateloupi 0.6 0.4 0.3 0.3 Fursenkoina comp/anata 0.3 Fursenkoina compressa 0.9 2.7 0.3 1.7 2.0 4.3 0.7 0.3 Fursenkoina mexicana 0.7 1.7 2.0 0.3 0.3 0.3 Fursenkoina pontoni 1.3 0.3 0.3 0.3 0.7 0.3 Globulina caribaea 0.4 0.3 0.3 0.3
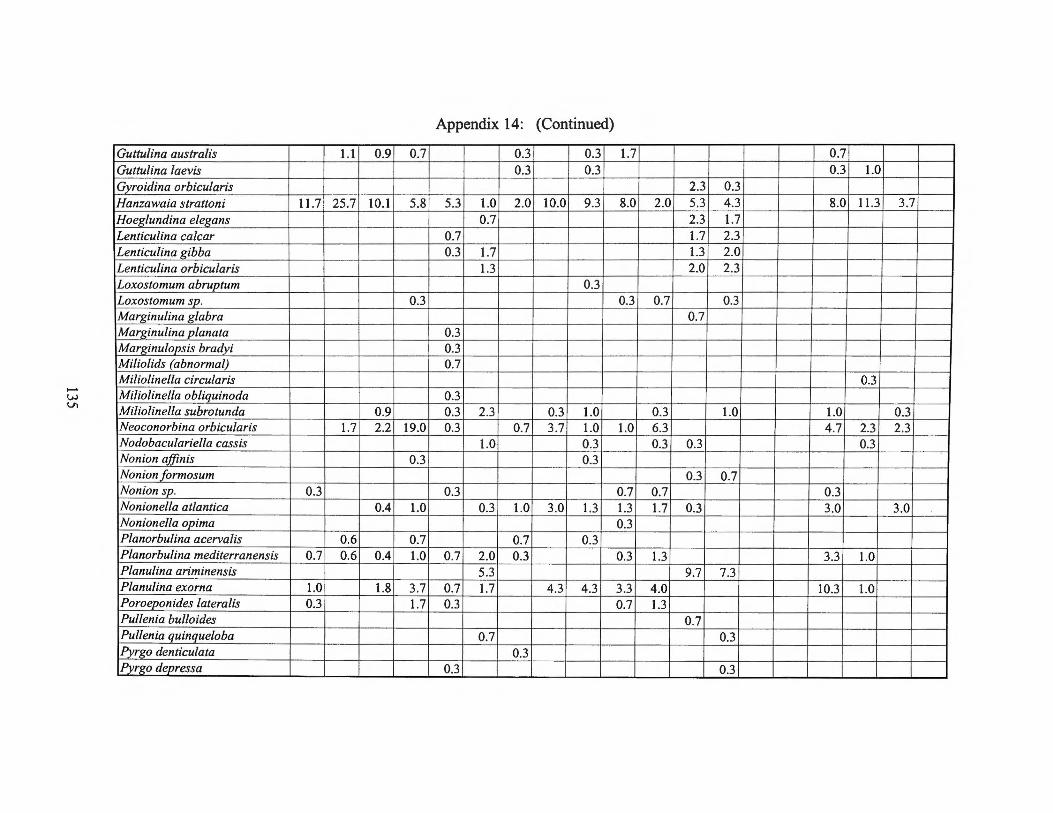
Appendix 14: (Continued)
Guttu/ina australis 1.1 0.9 0.7 0.3 0.3 1.7 0.7 Guttulina laevis 0.3 0.3 0.3 1.0 Gy roidina orbicularis 2.3 0.3 Hanzawaia strattoni 11.7 25.7 10.1 5.8 5.3 1.0 2.0 10.0 9.3 8.0 2.0 5.3 4.3 8.0 11.3 3.7 Hoeglundina elegans 0.7 2.3 1.7 Lenticulina calcar 0.7 1.7 2.3 Lenticulina gibba 0.3 1.7 1.3 2.0 Lenticulina orbicularis 1.3 2.0 2.3 Loxostomum abruptum 0.3 Loxostomum sp . 0.3 0.3 0.7 0.3 Marginulina glabra 0.7 Marginulina planata 0.3 Marginulopsis bradyi 0.3 Milio/ids (abnormal) 0.7 Miliolinella circularis 0.3 -w
VI Miliolinel/a obliquinoda 0.3 Miliolinella subrotunda 0.9 0.3 2.3 0.3 1.0 0.3 1.0 1.0 0.3 Neoconorbina orbicularis 1.7 2.2 19.0 0.3 0.7 3.7 1.0 1.0 6.3 4.7 2.3 2.3 Nodobaculariella cassis 1.0 0.3 0.3 0.3 0.3 Nonion a./finis 0.3 0.3 Non ion formosum 0.3 0.7 Nonion sp. 0.3 0.3 0.7 0.7 0.3 Nonione/la atlantica 0.4 1.0 0.3 1.0 3.0 1.3 1.3 1.7 0.3 3.0 3.0 Nonionel/a opima 0.3 Planorbu/ina acerva/is 0.6 0.7 0.7 0.3 Planorbulina mediterranensis 0.7 0.6 0.4 1.0 0.7 2.0 0.3 0.3 1.3 3.3 1.0 Planulina ariminensis 5.3 9.7 7.3 Planu/ina exorna 1.0 1.8 3.7 0.7 1.7 4.3 4.3 3.3 4.0 10.3 1.0 Poroeponides latera/is 0.3 1.7 0.3 0.7 1.3 Pullenia bulloides 0.7 Pullenia quinqueloba 0.7 0.3 IPyrgo denticulata 0.3 IPvrR"O depressa 0.3 0.3

Appendix 14: (Continued)
Pyrgo elongata 0.4 0.3 0.7 IPyrgo nasutus 1.7 2.0 1.0 3.3 0.3 0.3 0.3 0.7 Pyrgo subsphaerica 0.3 0.3 0.3 1.0 Quinqueloculina bicostata 0.9 0.3 2.3 1.7 4.0 Quinqueloculina bidentata 0.3 Quinqueloculina bosciana 1.3 0.3 0.3 0.7 0.7 1.0 0.3 0.3 0.3 Quinqueloculina compta 0.7 Quinqueloculina funafutiensis 0.3 0.4 0.3 0.3 1.3 Quinqueloculina horrida 0.7 0.3 Quinqueloculina laevigata 0.4 0.3 Quinqueloculina lamarckiana 6.7 6.1 10.1 2.4 8.3 2.3 0.7 6.3 7.7 11.0 2.3 1.3 0.3 6.3 12.6 Quinqueloculina parkeri occidentalis 0.3 Quinqueloculina poeyana 1.0 0.6 0.3 0.3 0.7 Quinqueloculina polygona 0.3 0.7 0.3 0.3 0.7 0.3 0.7 Quinqueloculina seminulum 0.7 0.6 0.4 0.7 0.3 0.7 Quinqueloculina sp. 0.4 1.0 0.3 1.0 0.3 Quinqueloculina tenagos 0.6 0.3 Quinqueloculina venusta 0.3 0.3 0.3 0.3 Quinqueloculina vulgaris 0.3 Reussella atlantica 0.4 1.7 0.3 2.7 1.7 3.0 6.4 1.0 1.7 0.3 2.7 2.0 Rosa/ina bulbosa 0.7 0.3 4.0 3.0 0.3 0.3 0.7 Rosa/ina columbiensis 15.7 4.5 12.3 6.1 3.0 0.3 29.7 17.0 20.7 10.4 13.0 1.3 16.0 18.3 17.7 Rosa/ina concinna 12.0 10.6 7.0 3.7 0.3 2.7 6.7 4.0 2.3 2.3 4.0 1.7 10.7 Rosa/ina floridana 10.7 3.9 0.9 1.0 0.3 1.3 3.3 0.7 2.0 2.0 2.3 2.7 1.0 Rosa/ina florid ens is 0.3 1.7 1.7 0.7 1.0 0.3 0.3 Rotamorphina laevigata 3.0 Sagrina pulchella primitiva 0.4 0.7 1.7 1.0 0.3 0.3 1.0 Saracenaria italica 0.3 0.7 1.0 Saracenaria latifrons 0.3 Seabrookia earlandi 0.7 Sigmavirgulina tortuosa 0.3 Sigmoilina distorta 0.3 0.3 Sigmoilina tenuis 1.0 0.3
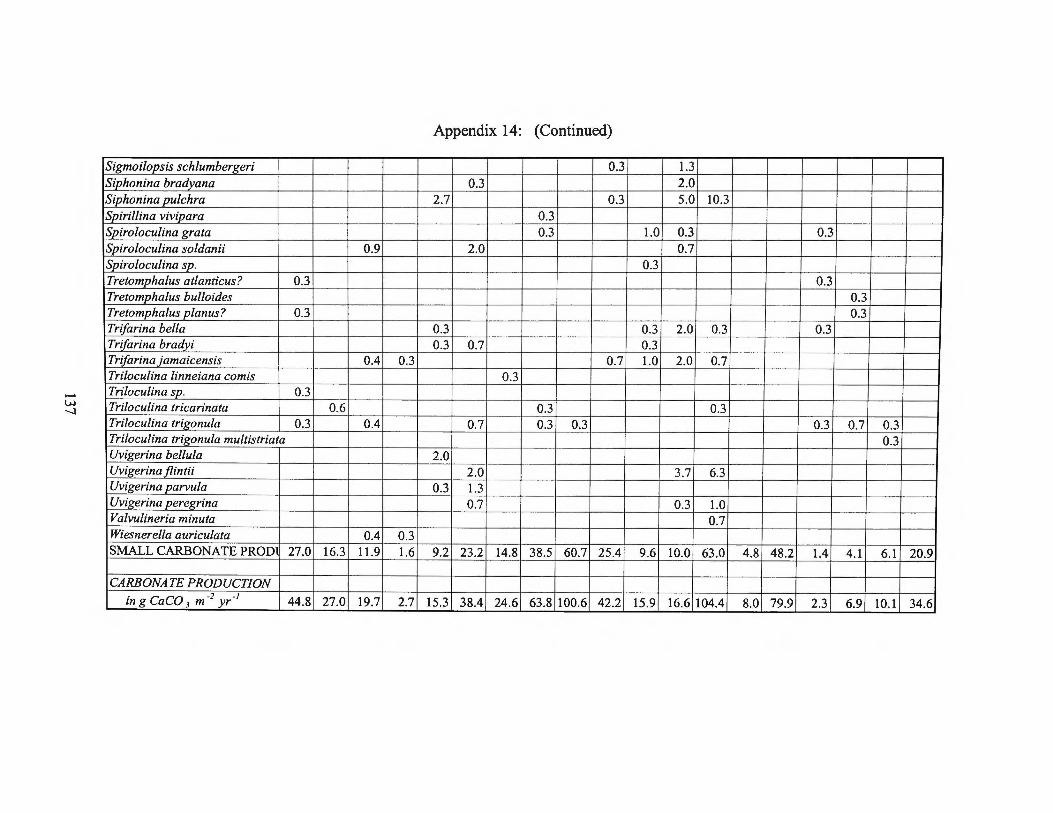
Appendix 14: (Continued)
Sigmoilopsis schlumbergeri 0.3 1.3 Siphonina bradyana 0.3 2.0 Siphon ina pulchra 2.7 0.3 5.0 10.3 Spirillina vivipara 0.3 Spiroloculina grata 0.3 1.0 0.3 0.3 Spiroloculina soldanii 0.9 2.0 0.7 Spiroloculina sp. 0.3 Tretomphalus at/anticus? 0.3 0.3 Tretomphalus bulloides 0.3 Tretomphalus planus? 0.3 0.3 Trifarina bella 0.3 0.3 2.0 0.3 0.3 Trifarina bradyi 0.3 0.7 0.3 Trifarina jamaicensis 0.4 0.3 0.7 1.0 2.0 0.7 Triloculina linneiana comis 0.3 Triloculina sp. 0.3 Triloculina tricarinata 0.6 0.3 0.3 Triloculina trigonula 0.3 0.4 0.7 0.3 0.3 0.3 0.7 0.3 Triloculina trigonula multistriata 0.3 Uvigerina bellula 2.0 Uvigerina flintii 2.0 3.7 6.3 Uvigerina parvula 0.3 1.3 Uvigerina peregrina 0.7 0.3 1.0 Valvulineria minuta 0.7 Wiesnerella auriculata 0.4 0.3 SMALL CARBONATE PROD 27.0 16.3 11.9 1.6 9.2 23.2 14.8 38.5 60.7 25.4 9.6 10.0 63.0 4.8 48.2 1.4 4.1 6.1 20.9
CARBONATE PRODUCTION ing CaC0 3 m -2 -1 44.8 27.0 19.7 2.7 15.3 38.4 24.6 63.8 yr 100.6 42.2 15.9 16.6 104.4 8.0 79.9 2.3 6.9 10.1 34.6
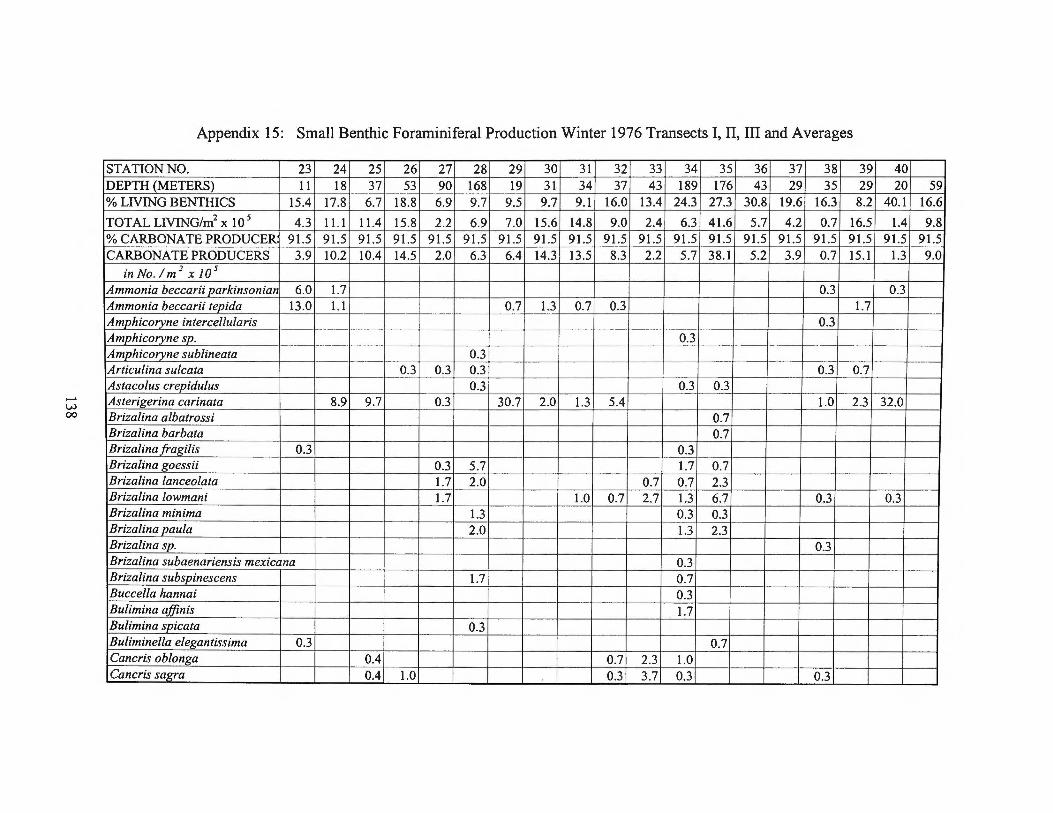
...... w 00
Appendix 15: Small Benthic Foraminiferal Production Winter 1976 Transects I, II, III and Averages
STATION NO. 23 24 25 26 27 28 29 30 31 32 33 34 35 36 37 38 39 DEPTH (METERS) 11 18 37 53 90 168 19 31 34 37 43 189 176 43 29 35 29 % LIVING BENTHICS 15.4 17.8 6.7 18.8 6.9 9.7 9.5 9.7 9.1 16.0 13.4 24.3 27.3 30.8 19.6 16.3 8.2
TOTAL LIVING/m2 x 10 5 4.3 11.1 11.4 15.8 2.2 6.9 7.0 15.6 14.8 9.0 2.4 6.3 41.6 5.7 4.2 0.7 16.5 %CARBONATE PRODUCER 91.5 91.5 91.5 91.5 91.5 91.5 91.5 91.5 91.5 91.5 91.5 91.5 91.5 91.5 91.5 91.5 91.5 CARBONATE PRODUCERS 3.9 10.2 10.4 14.5 2.0 6.3 6.4 14.3 13.5 8.3 2.2 5.7 38.1 5.2 3.9 0.7 15.1
in No. I m 2 x 10 5
Ammonia beccarii parkinsonian 6.0 1.7 0.3 Ammonia beccarii tepida 13.0 1.1 0.7 1.3 0.7 0.3 1.7 Amphicoryne intercellularis 0.3 Amphicoryne sp. 0.3 Amphicoryne sublineata 0.3 Articulina sulcata 0.3 0.3 0.3 0.3 0.7 Astacolus crepidulus 0.3 0.3 0.3 Asterigerina carinata 8.9 9.7 0.3 30.7 2.0 1.3 5.4 1.0 2.3 Brizalina albatrossi 0.7 Brizalina barbata 0.7 Brizalina fragilis 0.3 0.3 Brizalina goessii 0.3 5.7 1.7 0.7 Brizalina lanceolata 1.7 2.0 0.7 0.7 2.3 Brizalina lowmani 1.7 1.0 0.7 2.7 1.3 6.7 0.3 Brizalina minima 1.3 0.3 0.3 Brizalina paula 2.0 1.3 2.3 Brizalina sp. 0.3 Brizalina subaenariensis mexicana 0.3 Brizalina subspinescens 1.7 0.7 Buccella hannai 0.3 Bulimina affinis 1.7 Bulimina spicata 0.3 Buliminella elegantissima 0.3 0.7 Cancris oblonga 0.4 0.7 2.3 1.0 Cancris sagra 0.4 1.0 0.3 3.7 0.3 0.3
40 20 59
40.1 16.6
1.4 9.8 91.5 91.5
1.3 9.0
0.3
32.0
0.3
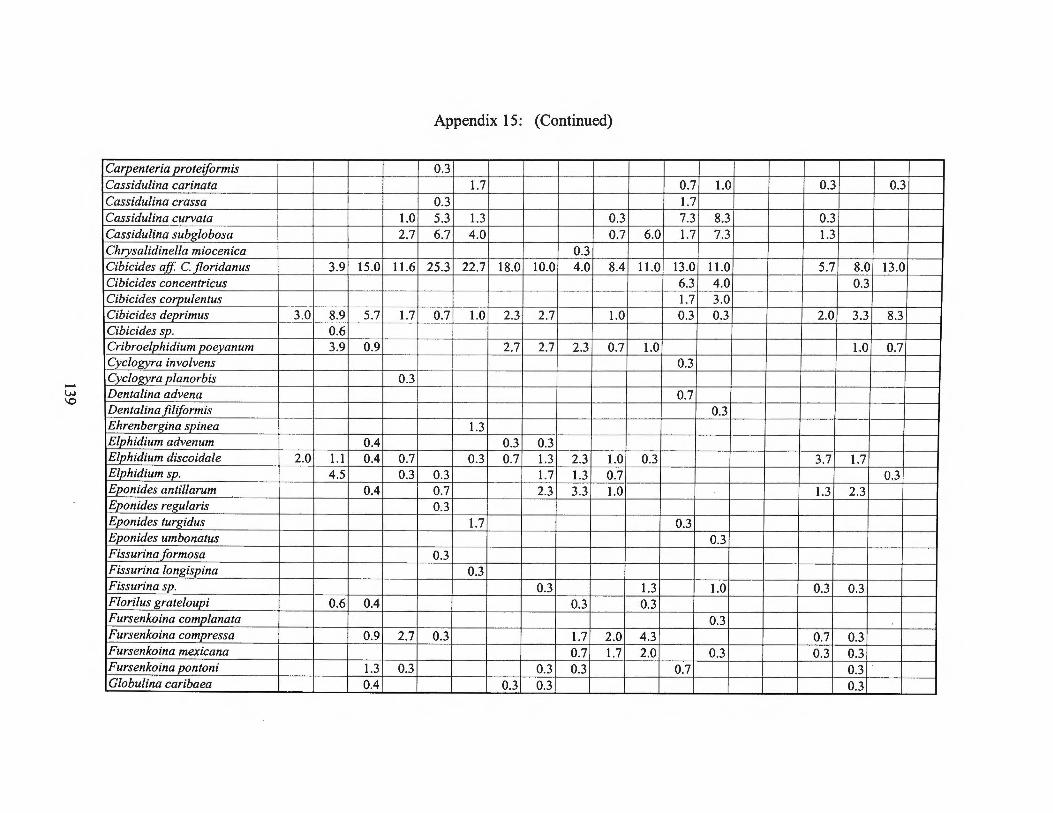
Appendix 15: (Continued)
Carpenteria proteiformis 0.3 Cassidulina carinata 1.7 0.7 1.0 0.3 0.3 Cassidulina crassa 0.3 1.7 Cassidulina curvata 1.0 5.3 1.3 0.3 7.3 8.3 0.3 Cassidulina sub~lobosa 2.7 6.7 4.0 0.7 6.0 1.7 7.3 1.3 Chrysalidinella miocenica 0.3 Cibicides aff. C. jloridanus 3.9 15.0 11.6 25.3 22.7 18.0 10.0 4.0 8.4 11.0 13.0 11.0 5.7 8.0 13.0 Cibicides concentricus 6.3 4.0 0.3 Cibicides corpulentus 1.7 3.0 Cibicides deprimus 3.0 8.9 5.7 1.7 0.7 1.0 2.3 2.7 1.0 0.3 0.3 2.0 3.3 8.3 Cibicides sp. 0.6 Cribroe/phidium poeyanum 3.9 0.9 2.7 2.7 2.3 0.7 1.0 1.0 0.7 Cyclogyra involvens 0.3 Cyclogyra planorbis 0.3 Dentalina advena 0.7 Dentalina filiformis 0.3 Ehrenbergina spinea 1.3 E/phidium advenum 0.4 0.3 0.3 Elphidium discoidale 2.0 1.1 0.4 0.7 0.3 0.7 1.3 2.3 1.0 0.3 3.7 1.7 Elphidium sp. 4.5 0.3 0.3 1.7 1.3 0.7 0.3 Eponides antillarum 0.4 0.7 2.3 3.3 1.0 1.3 2.3 Eponides regularis 0.3 Eponides turgidus 1.7 0.3 Eponides umbonatus 0.3 Fissurina formosa 0.3 Fissurina lon~ispina 0.3 Fissurina sp. 0.3 1.3 1.0 0.3 0.3 Florilus grateloupi 0.6 0.4 0.3 0.3 Fursenkoina complanata 0.3 Fursenkoina compressa 0.9 2.7 0.3 1.7 2.0 4.3 0.7 0.3 Fursenkoina mexicana 0.7 1.7 2.0 0.3 0.3 0.3 Fursenkoina pontoni 1.3 0.3 0.3 0.3 0.7 0.3 Globulina caribaea 0.4 0.3 0.3 0.3

Appendix 15: (Continued)
Guttulina australis 1.1 0.9 0.7 0.3 0.3 1.7 0.7 Guttulina laevis 0.3 0.3 0.3 1.0 Gyroidina orbicularis 2.3 0.3 Hanzawaia strattoni 11.7 25.7 10.1 5.8 5.3 1.0 2.0 10.0 9.3 8.0 2.0 5.3 4.3 8.0 11.3 3.7 Hoeglundina elegans 0.7 2.3 1.7 Lenticulina calcar 0.7 1.7 2.3 Lenticulina gibba 0.3 1.7 1.3 2.0 Lenticulina orbicularis 1.3 2.0 2.3 Loxostomum abruptum 0.3 Loxostomum sp. 0.3 0.3 0.7 0.3 Marginulina glabra 0.7 Marginulina planata 0.3 Marginulopsis bradyi 0.3 Miliolids (abnormal) 0.7 Miliolinella circularis 0.3 Miliolinella obliquinoda 0.3 Miliolinella subrotunda 0.9 0.3 2.3 0.3 1.0 0.3 1.0 1.0 0.3 Neoconorbina orbicularis 1.7 2.2 19.0 0.3 0.7 3.7 1.0 1.0 6.3 4.7 2.3 2.3 Nodobaculariella cassis 1.0 0.3 0.3 0.3 0.3 Nonion affinis 0.3 0.3 Nonion formosum 0.3 0.7 Nonionsp. 0.3 0.3 0.7 0.7 0.3 Nonionella atlantica 0.4 1.0 0.3 1.0 3.0 1.3 1.3 1.7 0.3 3.0 3.0 Nonionella opima 0.3 Planorbulina acervalis 0.6 0.7 0.7 0.3 Planorbulina mediterranensis 0.7 0.6 0.4 1.0 0.7 2.0 0.3 0.3 1.3 3.3 1.0 Planulina ariminensis 5.3 9.7 7.3 Planulina exorna 1.0 1.8 3.7 0.7 1.7 4.3 4.3 3.3 4.0 10.3 1.0 Poroeponides latera/is 0.3 1.7 0.3 0.7 1.3 Pullenia bulloides 0.7 Pullenia quinqueloba 0.7 0.3 Pyrgo denticulata 0.3 IPyrgo depressa 0.3 0.3
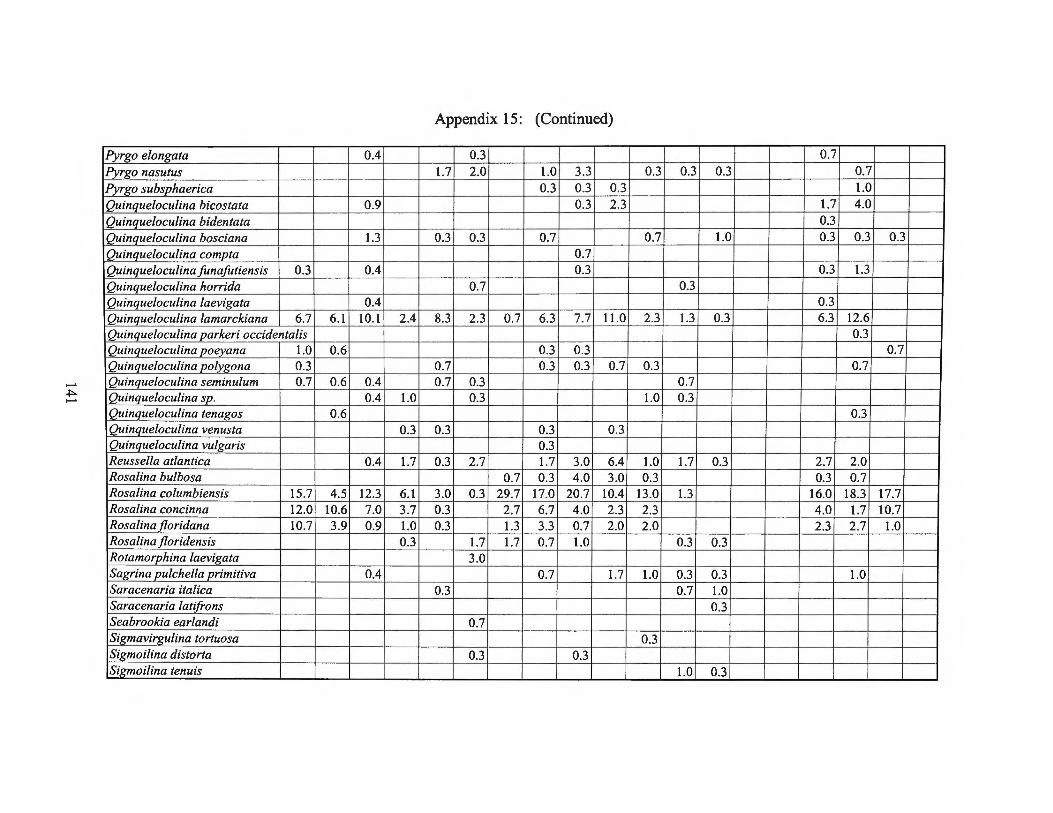
Appendix 15: (Continued)
Pyrgo elongata 0.4 0.3 0.7 Pyrgo nasutus 1.7 2.0 1.0 3.3 0.3 0.3 0.3 0.7 Pyrgo subsphaerica 0.3 0.3 0.3 1.0 Quinqueloculina bicostata 0.9 0.3 2.3 1.7 4.0 Quinqueloculina bidentata 0.3 Quinquelocu/ina bosciana 1.3 0.3 0.3 0.7 0.7 1.0 0.3 0.3 0.3 Quinquelocu/ina compta 0.7 Quinquelocu/ina funafutiensis 0.3 0.4 0.3 0.3 1.3 Quinqueloculina horrida 0.7 0.3 Quinqueloculina laevigata 0.4 0.3 Quinqueloculina lamarckiana 6.7 6.1 10.1 2.4 8.3 2.3 0.7 6.3 7.7 11.0 2.3 1.3 0.3 6.3 12.6 Quinqueloculina parkeri occidentalis 0.3 Quinqueloculina poeyana 1.0 0.6 0.3 0.3 0.7 Quinqueloculina polygona 0.3 0.7 0.3 0.3 0.7 0.3 0.7 Quinqueloculina seminulum 0.7 0.6 0.4 0.7 0.3 0.7 Quinqueloculina sp. 0.4 1.0 0.3 1.0 0.3 Quinquelocu/ina tenagos 0.6 0.3 Quinqueloculina venusta 0.3 0.3 0.3 0.3 Quinqueloculina vulgaris 0.3 Reussella atlantica 0.4 1.7 0.3 2.7 1.7 3.0 6.4 1.0 1.7 0.3 2.7 2.0 Rosa/ina bulbosa 0.7 0.3 4.0 3.0 0.3 0.3 0.7 Rosa/ina columbiensis 15.7 4.5 12.3 6.1 3.0 0.3 29.7 17.0 20.7 10.4 13.0 1.3 16.0 18.3 17.7 Rosa/ina concinna 12.0 10.6 7.0 3.7 0.3 2.7 6.7 4.0 2.3 2.3 4.0 1.7 10.7 Rosa/ina floridana 10.7 3.9 0.9 1.0 0.3 1.3 3.3 0.7 2.0 2.0 2.3 2.7 1.0 Rosa/ina floridensis 0.3 1.7 1.7 0.7 1.0 0.3 0.3 Rotamorphina laevigata 3.0 Sagrina pulchel/a primitiva 0.4 0.7 1.7 1.0 0.3 0.3 1.0 Saracenaria italica 0.3 0.7 1.0 Saracenaria latifrons 0.3 Seabrookia earlandi 0.7 Sigmavir_gulina tortuosa 0.3 Sigmoilina distorta 0.3 0.3 Sigmoilina tenuis 1.0 0.3
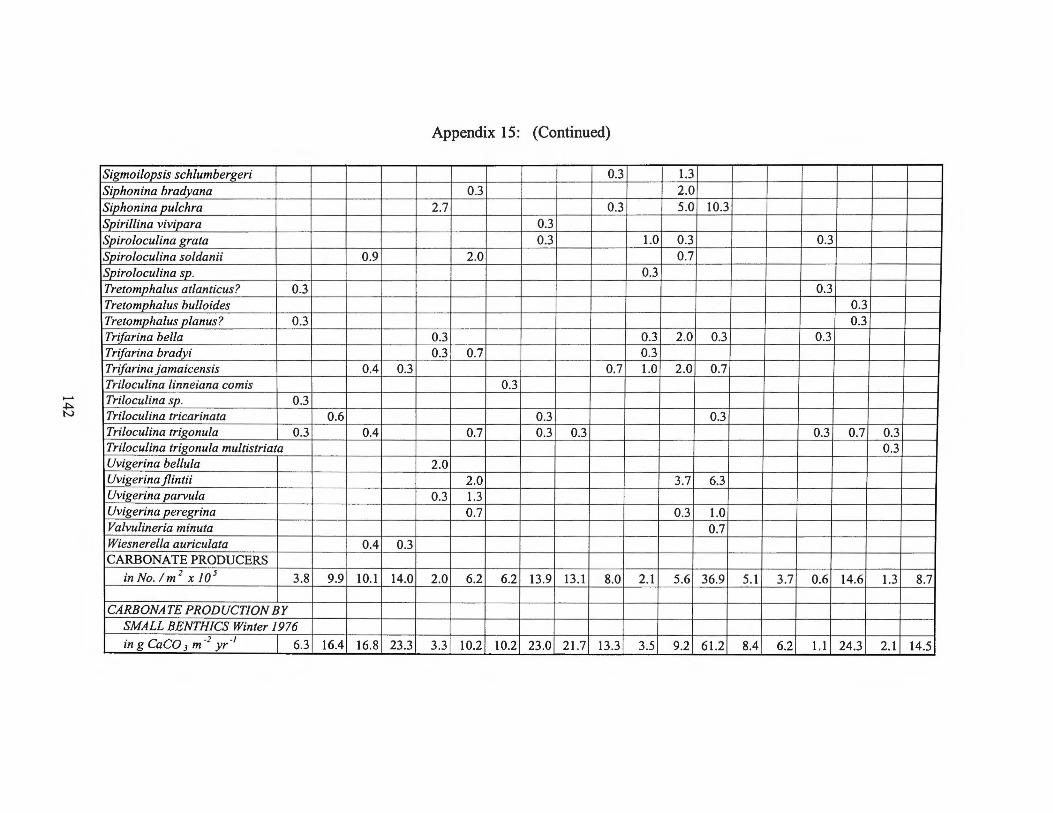
Appendix 15: (Continued)
Sigmoilopsis schlumbergeri 0.3 1.3 Siphonina bradyana 0.3 2.0 Siphonina pulchra 2.7 0.3 5.0 10.3 Spirillina vivipara 0.3 Sp_jrolocu/ina grata 0.3 1.0 0.3 0.3 Spirolocu/ina soldanii 0.9 2.0 0.7 Spiroloculina sp. 0.3 Tretomphalus at/anticus? 0.3 0.3 Tretomphalus bulloides 0.3 Tretomphalus planus? 0.3 0.3 Trifarina bella 0.3 0.3 2.0 0.3 0.3 Trifarina bradyi 0.3 0.7 0.3 Trifarina jamaicensis 0.4 0.3 0.7 1.0 2.0 0.7 Triloculina linneiana comis 0.3 -.J::. Triloculina sp. 0.3
N Triloculina tricarinata 0.6 0.3 0.3 Triloculina trigonula 0.3 0.4 0.7 0.3 0.3 0.3 0.7 0.3 Triloculina trigonula multistriata 0.3 Uvigerina bellula 2.0 Uvigerina flintii 2.0 3.7 6.3 Uvigerina parvula 0.3 1.3 Uvigerina peregrina 0.7 0.3 1.0 Valvulineria minuta 0.7 Wiesnerella auriculata 0.4 0.3 CARBONATE PRODUCERS
in No. 1m 2 x 10 5 3.8 9.9 10.1 14.0 2.0 6.2 6.2 13.9 13.1 8.0 2.1 5.6 36.9 5.1 3.7 0.6 14.6 1.3 8.7
CARBONATE PRODUCTION BY SMALL BENTHICS Winter 1976
ingCaC0 3 m -2 yr -1 6.3 16.4 16.8 23.3 3.3 10.2 10.2 23.0 21.7 13.3 3.5 9.2 61.2 8.4 6.2 1.1 24.3 2.1 14.5
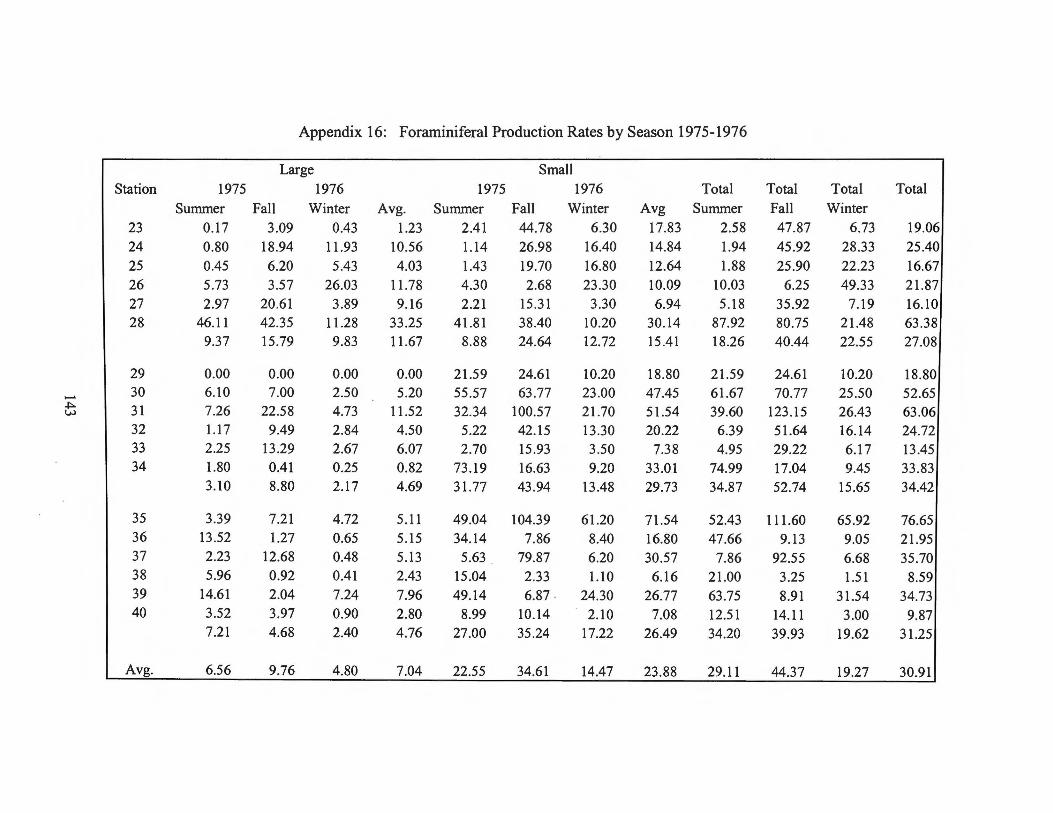
Appendix 16: Foraminiferal Production Rates by Season 1975-1976
Large Small Station 1975 1976 1975 1976 Total Total Total Total
Summer Fall Winter Avg. Summer Fall Winter Avg Summer Fall Winter 23 0.17 3.09 0.43 1.23 2.41 44.78 6.30 17.83 2.58 47.87 6.73 19.06 24 0.80 18.94 11.93 10.56 1.14 26.98 16.40 14.84 1.94 45.92 28.33 25.40 25 0.45 6.20 5.43 4.03 1.43 19.70 16.80 12.64 1.88 25.90 22.23 16.67 26 5.73 3.57 26.03 11.78 4.30 2.68 23.30 10.09 10.03 6.25 49.33 21.87 27 2.97 20.61 3.89 9.16 2.21 15.31 3.30 6.94 5.18 35.92 7.19 16.10 28 46.11 42.35 11.28 33.25 41.81 38.40 10.20 30.14 87.92 80.75 21.48 63.38
9.37 15.79 9.83 11.67 8.88 24.64 12.72 15.41 18.26 40.44 22.55 27.08
29 0.00 0.00 0.00 0.00 21.59 24.61 10.20 18.80 21.59 24.61 10.20 18.80 30 6.10 7.00 2.50 5.20 55.57 63.77 23.00 47.45 61.67 70.77 25.50 52.65 31 7.26 22.58 4.73 11.52 32.34 100.57 21.70 51.54 39.60 123.15 26.43 63.06 32 1.17 9.49 2.84 4.50 5.22 42.15 13.30 20.22 6.39 51.64 16.14 24.72 33 2.25 13.29 2.67 6.07 2.70 15.93 3.50 7.38 4.95 29.22 6.17 13.45 34 1.80 0.41 0.25 0.82 73.19 16.63 9.20 33.01 74.99 17.04 9.45 33.83
3.10 8.80 2.17 4.69 31.77 43.94 13.48 29.73 34.87 52.74 15.65 34.42
35 3.39 7.21 4.72 5.11 49.04 104.39 61.20 71.54 52.43 111.60 65.92 76.65 36 13.52 1.27 0.65 5.15 34.14 7.86 8.40 16.80 47.66 9.13 9.05 21.95 37 2.23 12.68 0.48 5.13 5.63 79.87 6.20 30.57 7.86 92.55 6.68 35.70 38 5.96 0.92 0.41 2.43 15.04 2.33 1.10 6.16 21.00 3.25 1.51 8.59 39 14.61 2.04 7.24 7.96 49.14 6.87 . 24.30 26.77 63.75 8.91 31.54 34.73 40 3.52 3.97 0.90 2.80 8.99 10.14 2.10 7.08 12.51 14.11 3.00 9.87
7.21 4.68 2.40 4.76 27.00 35.24 17.22 26.49 34.20 39.93 19.62 31.25
Avg. 6.56 9.76 4.80 7.04 22.55 34.61 14.47 23.88 29.11 44.37 19.27 30.91

Avg.
1 2 3 4 5 6 7 8 9
10 11 12 13 14 15 16 17 18 19 20 21 22 23 24 25 26 27 28 29 30 31 32 33 34 35 36 37 38 39 40
37 45 44 53 37 36 40 42 48 54 37 34 44 38 38 43 31 33 34 30 30 42 11 18 37 53 90 168 19 31 34 37 43 189 176 29 38 35 29 20 48
Appendix 17: Foraminiferal Production Rate Summary
Large Foraminifera
1 7 19 12 9 8 8 9
12 17 11 8 3 5 6 12
18 5 0 0
12 17 16 15 2 6 5 11 1 8 0 0 5 8 0 0 0 0 4 12 7 14 6 10 0 4 4 12 4 3 9 9 6 4 5 4 0 0 1 5 3 5 2 7 4 3 0 2 0 2 3 7 3 7 3 7 3 9 3 17 5 7
3.7 36.1 12.2 15.1 15.4 7.8
21.7 13.3 47.6
0.0 18.6 7.9
21.5 17.7 2.0 0.0
37.4 0.0 0.0
23 .2 86.4 29.9
1.2 10.6 4.0
11 .8 9.2
33.3 0.0 5.2
11.5 4.5 6.1 0.8 5.1 5.2 5.1 2.4 8.0 2.8
13.6
Small Foraminifera
99 81 91 92 88 89 97 94 82
100 88 84 98 95 99
100 95
100 100 96 93 94
100 96 96 91 94 95
100 99 97 98 96
100 100 97 97 97 97 97 95
144
93 47.5 88 10.4 92 6.6 91 22.4 83 10.8 92 4.3 95 31.2 88 11.0 95 10.5
100 86.1 83 13.0 85 3.6 94 66.1 89 43.7 92 37.1
100 6.0 92 86.2
100 52.5 100 9.9 88 42.1 86 33.7 90 62.2 96 17.8 88 14.8 97 12.6 91 10.1 96 6.9 96 30.1
100 18.8 95 47.5 95 51.5 93 20.2 98 7.4 98 33.0 98 71.5 93 16.8 93 30.6 93 6.2 91 26.8 83 7.1 93 28.2
Total Foraminifera
51.2 46.5 18.9 37.4 26.2 12.1 52.9 24.3 58.1 86.1 31.6 11.5 87.6 61.4 39.1
6.0 123.6 52.5 9.9
65.3 120.0 92.0 19.1 25.4 16.7 21.9 16.1 63.4 18.8 52.7 63.1 24.7 13.5 33.8 76.7 22.0 35.7
8.6 34.7 9.9
41.8
7.3 77.6 64.9 40.3 58.9 64.4 40.9 54.8 82.0 0.0
58.8 68.7 24.5 28.9
5.2 0.0
30.2 0.0 0.0
35.5 72.0 32.4
6.5 41.6 24.2 53.9 56.9 52.5 0.0 9.9
18.3 18.2 45.1
2.4 6.7
23.5 14.4 28.3 22.9 28.3 32.5
92.7 22.4 35.1 59.7 41.1 35.6 59.1 45 .2 18.0
100.0 41.2 31.3 75 .5 71.1 94.8
100.0 69.8
100.0 100.0 64.5 28.0 67.6 93 .5 58.4 75.8 46.1 43.1 47.5
100.0 90.1 81.7 81.8 54.9 97.6 93.3 76.5 85.6 71.7 77.1 71.7 67.5
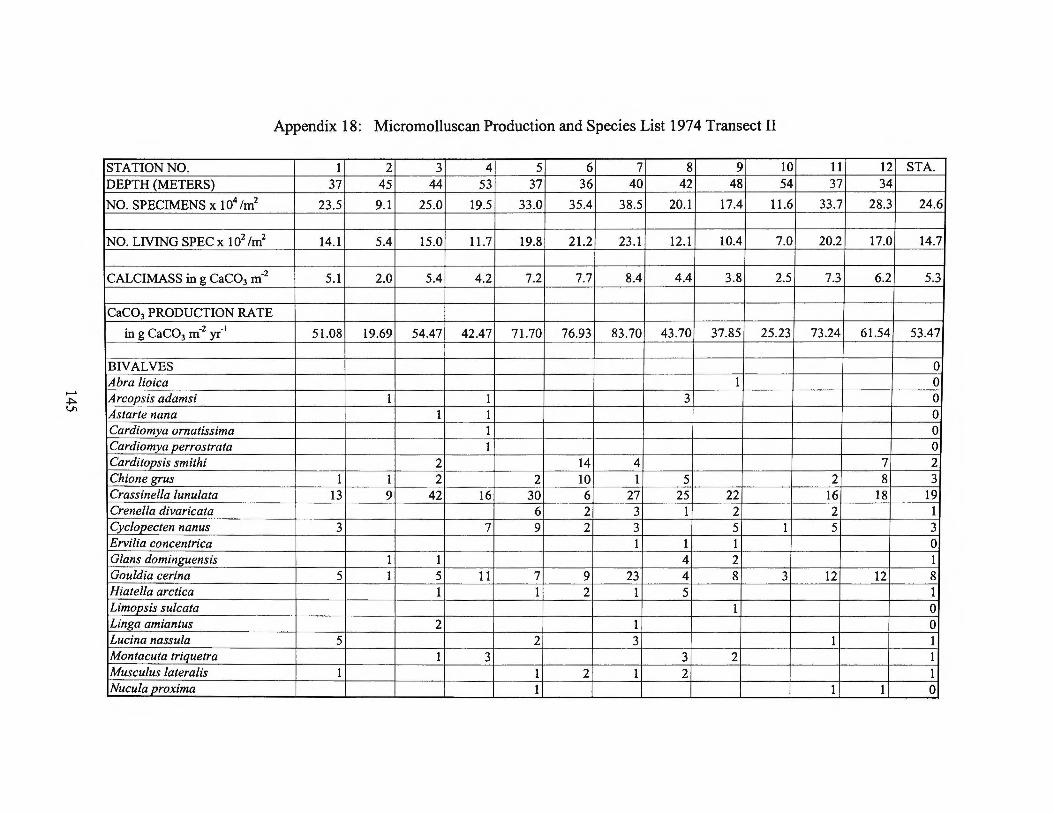
Appendix 18: Micromolluscan Production and Species List 1974 Transect II
STATION NO. 1 2 3 4 5 6 7 8 9 10 11 12 STA. DEPTH (METERS) 37 45 44 53 37 36 40 42 48 54 37 34
NO. SPECIMENS x 104 /m2 23.5 9.1 25.0 19.5 33.0 35.4 38.5 20.1 17.4 11.6 33.7 28.3 24.6
NO. LIVING SPEC x 102 /m2 14.1 5.4 15.0 11.7 19.8 21.2 23.1 12.1 10.4 7.0 20.2 17.0 14.7
CALCIMASS in g CaC03 m-2 5.1 2.0 5.4 4.2 7.2 7.7 8.4 4.4 3.8 2.5 7.3 6.2 5.3
CaC03 PRODUCTION RATE
in g CaC03 m-2 yr·1 51.08 19.69 54.47 42.47 71.70 76.93 83.70 43.70 37.85 25.23 73.24 61.54 53.47
BIVALVES 0 Abra lioica 1 0 Arcopsis adamsi 1 1 3 0 Astarte nana 1 1 0 Cardiomya ornatissima 1 0 Cardiomya perrostrata 1 0 Carditopsis smithi 2 14 4 7 2 Chione grus 1 1 2 2 10 I 5 2 8 3 Crassinella lunulata 13 9 42 I6 30 6 27 25 22 I6 I8 I9 Crenella divaricata 6 2 3 1 2 2 1 Cyclopecten nanus 3 7 9 2 3 5 1 5 3 Ervilia concentrica 1 I 1 0 Glans dominguensis 1 1 4 2 1 Gouldia cerina 5 I 5 11 7 9 23 4 8 3 12 12 8 Hiatella arctica 1 1 2 1 5 1 Limopsis sulcata I 0 Linga amiantus 2 1 0 Lucina nassula 5 2 3 1 1 Montacuta triquetra I 3 3 2 1 Musculus latera/is 1 1 2 1 2 1 Nucula proxima I 1 1 0
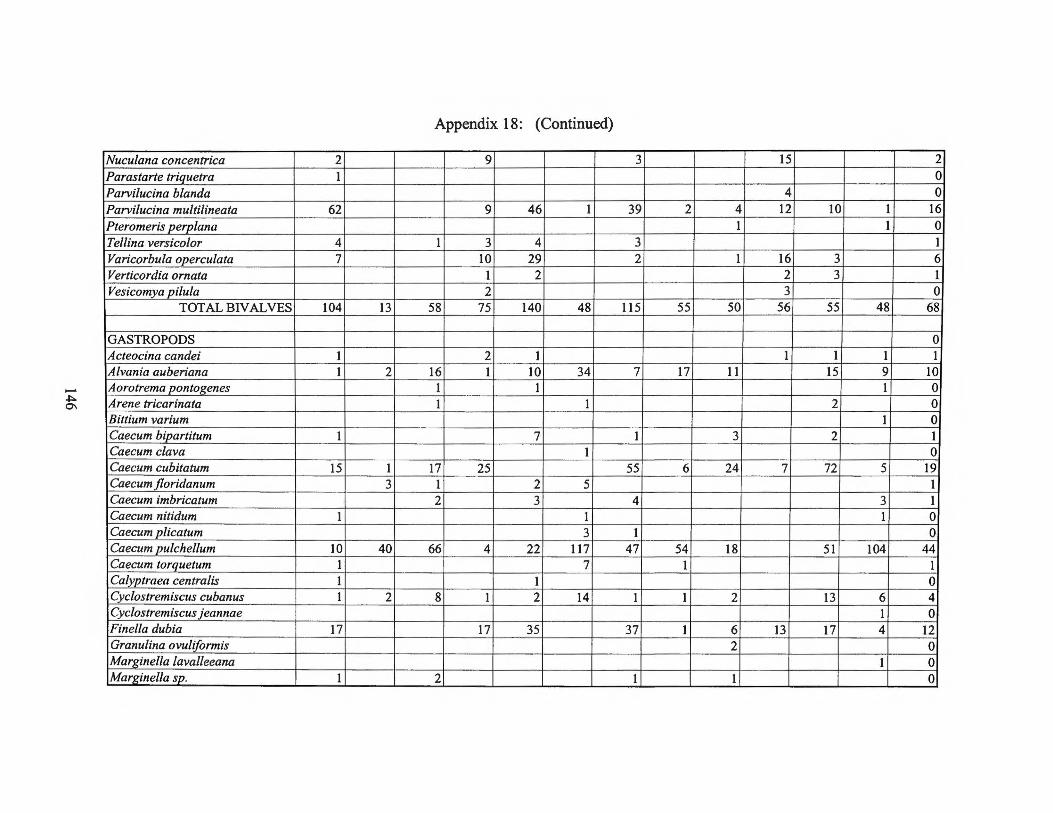
Appendix 18: (Continued)
Nuculana concentrica 2 9 3 15 2 Parastarte triquetra 1 0 Parvilucina blanda 4 0 Parvilucina multilineata 62 9 46 1 39 2 4 12 10 1 16 Pteromeris perplana 1 1 0 Tel/ina versicolor 4 1 3 4 3 1 Varicorbula operculata 7 10 29 2 1 16 3 6 Verticordia ornata 1 2 2 3 1 Vesicomya pilula 2 3 0
TOTAL BIVALVES 104 13 58 75 140 48 115 55 50 56 55 48 68
GASTROPODS 0 Acteocina candei 1 2 1 1 1 1 1 Alvania auberiana 1 2 16 1 10 34 7 17 11 15 9 10 Aorotrema pontogenes 1 1 1 0 Arene tricarinata 1 1 2 0 Bittium varium 1 0 Caecum bipartitum 1 7 1 3 2 1 Caecum clava 1 0 Caecum cubitatum 15 1 17 25 55 6 24 7 72 5 19 Caecum floridanum 3 1 2 5 1 Caecum imbricatum 2 3 4 3 1 Caecum nitidum 1 1 1 0 Caecum plicatum 3 1 0 Caecum pulchellum 10 40 66 4 22 117 47 54 18 51 104 44 Caecum torquetum 1 7 1 1 Ca/yptraea centra/is 1 1 0 Cyc/ostremiscus cubanus 1 2 8 1 2 14 1 1 2 13 6 4 Cyclostremiscus jeannae 1 0 Finella dubia 17 17 35 37 1 6 13 17 4 12 Granulina ovuliformis 2 0 Mar_ginella /avalleeana 1 0 Margine/la sp. 1 2 1 1 0

Appendix 18: (Continued)
Natica pusi/la 5 4 3 I 2 3 2 2 Odostomia didyma 6 2 I 4 I Parviturboides interruptus I 0 Pyrunculus caelatus 2 I I 0 Retusa sulcata 3 I 3 I 2 I I Rissoina sp. 6 3 I Rissoina striatocostata 2 0 Seila adamsi I 0 Teinostoma biscaynense I 0 Teinostoma incertum 2 I 4 3 I I I Trico/ia thalassico/a I 2 I I 3 I Volvulella persimi/is 3 2 5 2 I 2 4 1 2
TOTAL GASTROPODS 62 51 119 61 93 202 157 87 70 26 183 152 105
SCAPHOPODS Cadulus iota 2 3 0
TOTAL SPECIMENS/SAMPLE 166 64 177 138 233 250 272 142 123 82 238 200 174
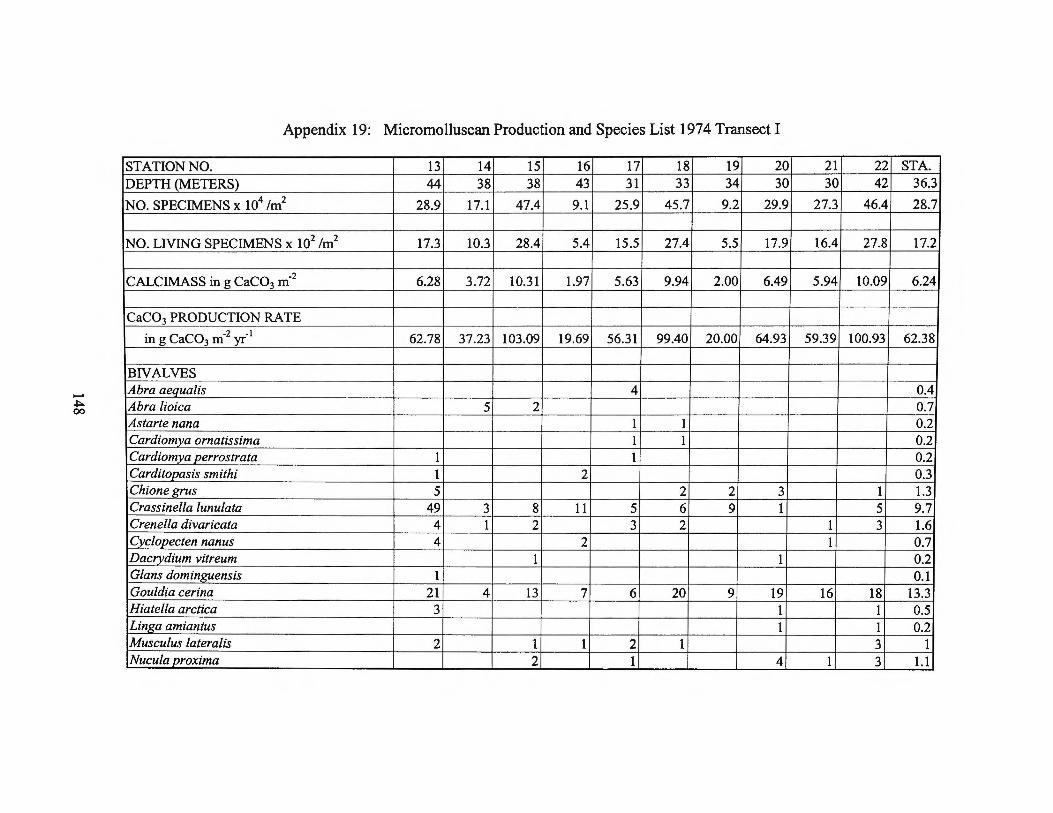
.......
.;:. 00
Appendix 19: Micromolluscan Production and Species List 1974 Transect I
STATION NO. 13 14 15 16 17 18 19 20 DEPTH (METERS) 44 38 38 43 31 33 34 30
NO. SPECIMENS x 104 /m2 28.9 17.1 47.4 9.1 25.9 45.7 9.2 29.9
NO. LIVING SPECIMENS x 102 /m2 17.3 10.3 28.4 5.4 15.5 27.4 5.5 17.9
CALCIMASS in g CaC03 m-2 6.28 3.72 10.31 1.97 5.63 9.94 2.00 6.49
CaC03 PRODUCTION RATE
in g CaC03 m-2 yr-1 62.78 37.23 103.09 19.69 56.31 99.40 20.00 64.93
BIVALVES Abra aequalis 4 Abra lioica 5 2 Astarte nana 1 1 Cardiomya ornatissima 1 1 Cardiomya perrostrata 1 1 Carditopasis smithi 1 2 Chionegrus 5 2 2 3 Crassinella lunulata 49 3 8 11 5 6 9 1 Crenella divaricata 4 1 2 3 2 CJ!clopecten nanus 4 2 Dacrydium vitreum 1 1 Glans dominf(Uensis 1 Gouldia cerina 21 4 13 7 6 20 9 19 Hiatella arctica 3 1 Linga amiantus 1 Musculus latera/is 2 1 1 2 1 Nucula proxima 2 1 4
21 22 STA. 30 42 36.3
27.3 46.4 28.7
16.4 27.8 17.2
5.94 10.09 6.24
59.39 100.93 62.38
0.4 0.7 0.2 0.2 0.2 0.3
1 1.3 5 9.7
1 3 1.6 1 0.7
0.2 0.1
16 18 13.3 1 0.5 1 0.2 3 1
1 3 1.1
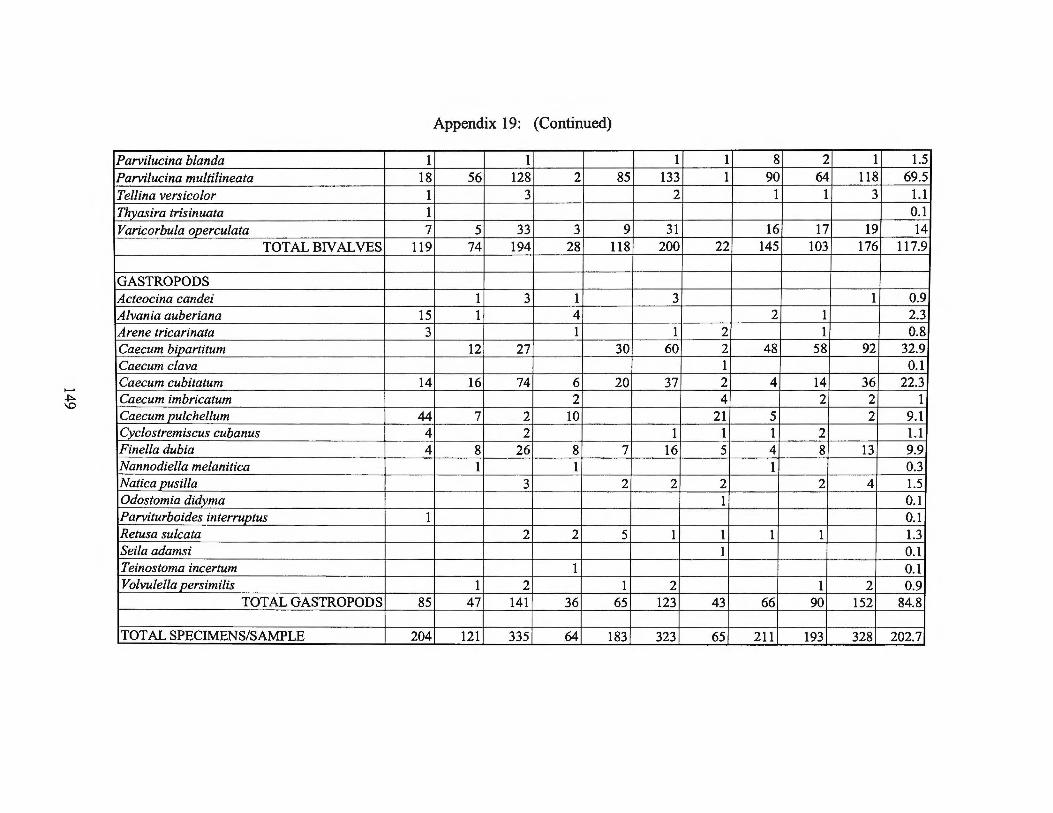
Appendix 19: (Continued)
Parvilucina blanda 1 1 1 1 8 2 1 1.5 Parvilucina multilineata 18 56 128 2 85 133 1 90 64 118 69.5 Tel/ina versicolor 1 3 2 1 1 3 1.1 Thyasira trisinuata 1 0.1 Varicorbula opercula/a 7 5 33 3 9 31 16 17 19 14
TOTAL BIV AL YES 119 74 194 28 118 200 22 145 103 176 117.9
GASTROPODS Acteocina candei 1 3 1 3 1 0.9 Alvania auberiana 15 1 4 2 1 2.3 Arene tricarinata 3 1 1 2 1 0.8 Caecum bipartitum 12 27 30 60 2 48 58 92 32.9 Caecum clava 1 0.1 Caecum cubitatum 14 16 74 6 20 37 2 4 14 36 22.3 Caecum imbricatum 2 4 2 2 1 Caecum pulchellum 44 7 2 10 21 5 2 9.1 C)lclostremiscus cubanus 4 2 1 1 1 2 1.1 Finella dubia 4 8 26 8 7 16 5 4 8 13 9.9 Nannodiella melanitica 1 1 1 0.3 Natica pus ilia 3 2 2 2 2 4 1.5 Odostomia didyma 1 0.1 Parviturboides interruptus 1 0.1 Retusa sulcata 2 2 5 1 1 1 1 1.3 Seila adamsi 1 0.1 Teinostoma incertum 1 0.1 Volvulella persimilis 1 2 1 2 1 2 0.9
TOTAL GASTROPODS 85 47 141 36 65 123 43 66 90 152 84.8
TOTAL SPECIMENS/SAMPLE 204 121 335 64 183 323 65 211 193 328 202.7
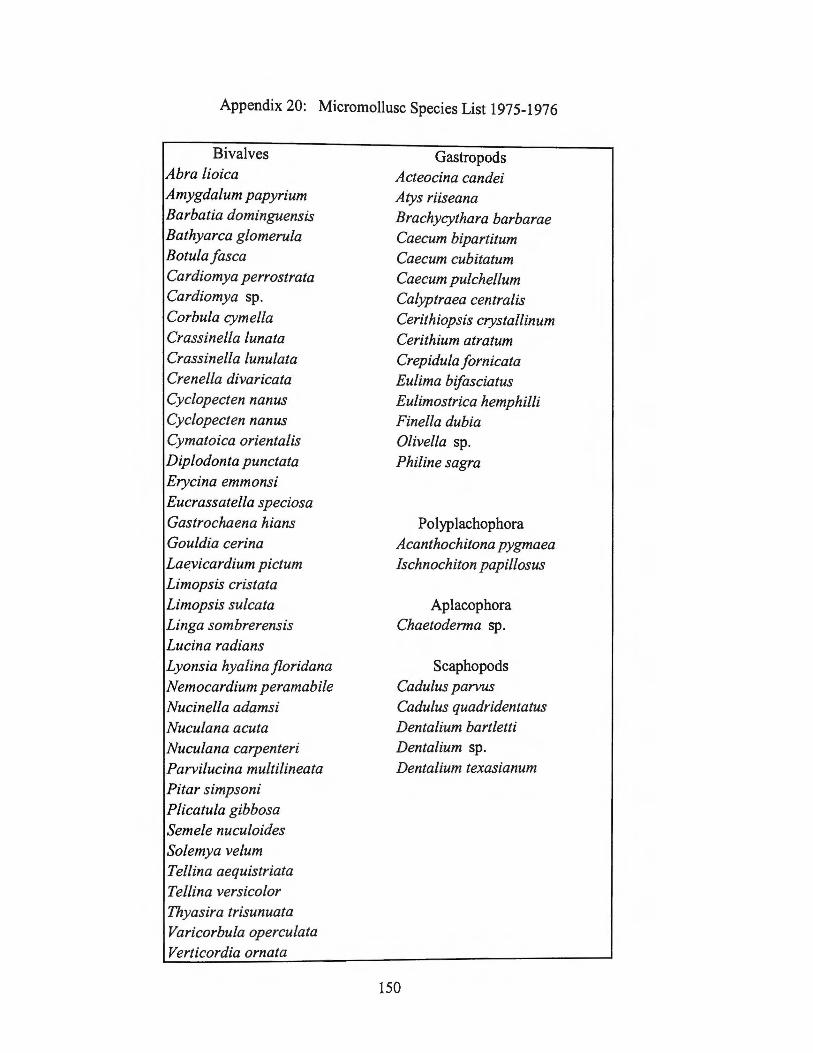
Appendix 20: Micromollusc Species List 1975-1976
Bivalves Abra lioica Amygdalum papyrium Barbatia dominguensis Bathyarca glomerula Botula fasca Cardiomya perrostrata Cardiomya sp. Corbula cymella Crassinella lunata Crassinella lunulata Crenella divaricata Cyc/opecten nanus Cyc/opecten nanus Cymatoica orienta/is Diplodonta punctata Erycina emmonsi Eucrassatel/a speciosa Gastrochaena hians Gouldia cerina Laevicardium pictum Limopsis cristata Limopsis sulcata Linga sombrerensis Lucina radians Lyonsia hyalina jloridana Nemocardium peramabile Nucinella adamsi Nuculana acuta Nuculana carpenteri Parvilucina multilineata Pitar simpsoni Plicatula gibbosa Semele nuculoides Solemya velum Tel/ina aequistriata Tel/ina versicolor Thyasira trisunuata Varicorbula operculata Verticordia ornata
Gastropods Acteocina candei Atys riiseana Brachycythara barbarae Caecum bipartitum Caecum cubitatum Caecum pulchel/um Calyptraea centra/is Cerithiopsis crystal/inurn Cerithium atratum Crepidula fornicata Eulima bifasciatus Eulimostrica hemphilli Finella dubia 0/ive//a sp. Philine sagra
Polyplachophora Acanthochitona pygmaea Ischnochiton papillosus
Aplacophora Chaetoderma sp.
Scaphopods Cadulus parvus Cadulus quadridentatus Dentalium bartletti Dentalium sp. Dentalium texasianum
150
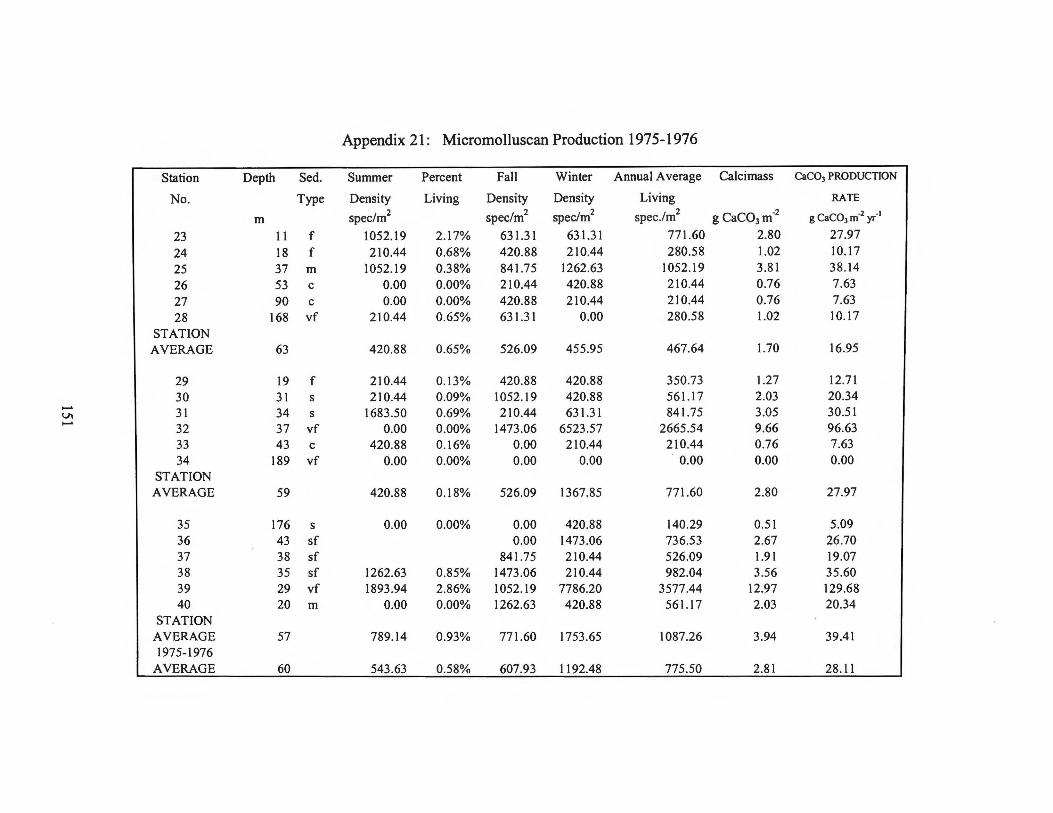
Appendix 21: Micromolluscan Production 1975-1976
Station Depth Sed. Summer Percent Fall Winter Annual Average Calcimass CaC03 PRODUCTION
No. Type Density Living Density Density Living RATE
m spec/m2 spec/m2 spedm2 spec .1m2 g CaC03 m·2 g CaC03 m·2 yr·•
23 11 f 1052.19 2.17% 631.31 631.31 771.60 2.80 27.97
24 18 f 210.44 0.68% 420.88 210.44 280.58 1.02 10.17
25 37 m 1052.19 0.38% 841.75 1262.63 1052.1 9 3.81 38.14
26 53 c 0.00 0.00% 210.44 420.88 210.44 0.76 7.63
27 90 c 0.00 0.00% 420.88 210.44 210.44 0.76 7.63
28 168 vf 210.44 0.65% 631.31 0.00 280.58 1.02 I 0.17
STATION AVERAGE 63 420.88 0.65% 526.09 455.95 467.64 1.70 16.95
29 19 f 210.44 0.13% 420.88 420.88 350.73 1.27 12.71 30 31 s 210.44 0.09% 1052.19 420.88 561.17 2.03 20.34
...... 31 34 1683.50 0.69% 210.44 631.31 841.75 3.05 30.51 Vl s ...... 32 37 vf 0.00 0.00% 1473.06 6523.57 2665.54 9.66 96.63 33 43 c 420.88 0.16% 0.00 210.44 210.44 0.76 7.63 34 189 vf 0.00 0.00% 0.00 0.00 0.00 0.00 0.00
STATION AVERAGE 59 420.88 0.18% 526.09 1367.85 771.60 2.80 27.97
35 176 s 0.00 0.00% 0.00 420.88 140.29 0.51 5.09 36 43 sf 0.00 1473.06 736.53 2.67 26.70 37 38 sf 841.75 210.44 526.09 1.91 19.07 38 35 sf 1262.63 0.85% 1473.06 210.44 982.04 3.56 35.60 39 29 vf 1893.94 2.86% 1052.19 7786.20 3577.44 12.97 129.68 40 20 m 0.00 0.00% 1262.63 420.88 561.17 2.03 20.34
STATION AVERAGE 57 789.14 0.93% 771.60 1753.65 1087.26 3.94 39.41 1975-1976
AVERAGE 60 543.63 0.58% 607.93 1192.48 775.50 2.81 28.11
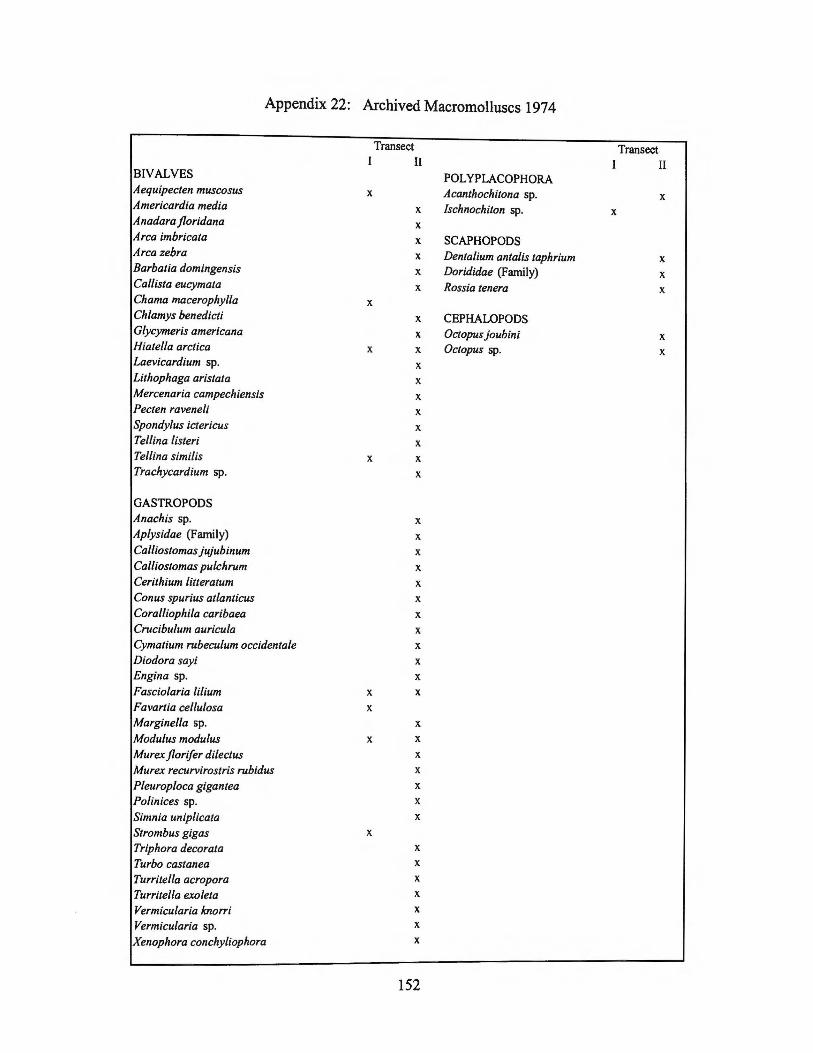
Appendix 22: Archived Macromolluscs 1974
BIVALVES Aequipecten muscosus Americardia media A nadara jloridana Area imbricata Area zebra Barbatia domingensis Callista eucymata Chama macerophylla Chlamys benedicti Glycymeris americana Hiatella arctica Laevicardium sp.
Lithophaga aristata Mercenaria campechiensis Pecten ravenel; Spondylus ictericus Tel/ina listeri Tel/ina simi/is
Trachycardium sp.
GASTROPODS Anachis sp.
Aplysidae (Family)
Calliostomas jujubinum Calliostomas pulchrum Cerithium litteratum Conus spurius at/anticus Coralliophila caribaea Crucibulum auricula Cymatium rubeculum occidentale Diodora sayi Engina sp.
Fascia/aria /ilium Favartia cellulosa Marginella sp.
Modulus modulus Murex jlorifer dilectus Murex recurvirostris rubidus Pleuroploca gigantea Polinices sp.
Simnia uniplicata Strombus gigas Triphora decorata Turbo castanea Turritella acropora Turritella exoleta Vermicularia lcnorri Vermicularia sp. Xenophora conchyliophora
Transect I II
X
X
X
X
X
X
X
X
X
X
X
X
X
X
X
X
X
X
X
X
X
X
X
X
X
X
X
X
X
X
X
X
X
X
X
X
X
X
X
X
X
X
X
X
X
X
X
X
X
X
X
152
POLYPLACOPHORA Acanthochitona sp. Ischnochiton sp.
SCAPHOPODS Dentalium antalis taphrium Dorididae (Family)
Rossia tenera
CEPHALOPODS Octopus joubini Octopus sp.
Transect I II
X
X
X
X
X
X
X

Appendix 23: Archived Dominant Macromolluscs 1975-1976
Transect Transect I IIIli I IIIli
Bivalves Gastropods Abra /ioica X X X Acteocina candei X X Amygdalum papyrium X X Atys riiseana X X Barbatia dominguensis X X Brachycythara barbarae X Bathyarca glomerula X Caecum bipartitum X X Botula fasca X Caecum pulchellum X X Calyptraea centra/is X Cerithiopsis crystal/inurn X X Cardiomya perrostrata X Cerithium atratum X Cardiomya sp. X Crepidula fornicata X Corbula cymella X X Eulima bifasciatus X Crassinella lunulata X X X Eulimostrica hemphilli X
Crenella divaricata X Finella dubia X X Cyclopecten nanus X X 0/ivella sp. X
Cymatoica orienta/is X Philine sagra X
Diplodonta punctata X X
Erycina emmonsi X Scaphopods Eucrassatella speciosa X Cadulus cubitatum X
Gastrochaena hians X X Cadulus parvus X
Gouldia cerina X Cadulus quadridentatus X
Laevicardium pictum X Dentalium bartletti X
Limopsis cristata X Dentalium sp. X X
Limopsis sulcata X Dentalium texasianum X
Linga sombrerensis X Tel/ina aequistriata X
Lucina radians X
Lyonsia hyalina jloridana X X
Nemocardium peramabile X
Nucinella adamsi X
Nuculana acuta X X
Nuculana carpenteri X
Parvilucina multilineata X X X
Pitar simpsoni X X
Plicatula gibbosa X
Semele nuculoides X X
Solemya velum X X
Tel/ina versicolor X X X
Thyasira trisinuata X X X
Varicorbula operculata X X X
Verticordia ornata X
Polyplacophora Acanthochitona pygmaea X
Chaetoderma sp. X X
Ishnochiton papillosus X X
153
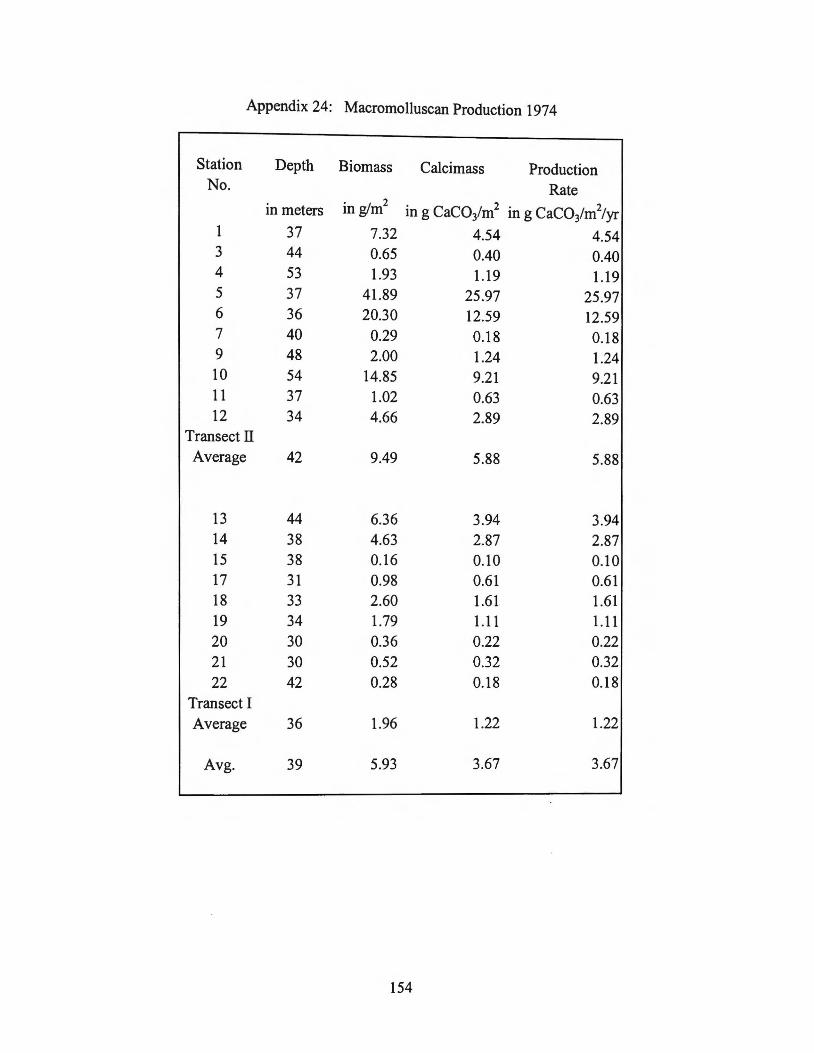
Appendix 24: Macromolluscan Production 1974
Station Depth Biomass Calcimass Production No. Rate
in meters . gl 2 m m in g CaCOim2
in g CaC03/m2/yr
1 37 7.32 4.54 4.54 3 44 0.65 0.40 0.40 4 53 1.93 1.19 1.19 5 37 41.89 25.97 25.97 6 36 20.30 12.59 12.59 7 40 0.29 0.18 0.18 9 48 2.00 1.24 1.24 10 54 14.85 9.21 9.21 11 37 1.02 0.63 0.63 12 34 4.66 2.89 2.89
Transect II Average 42 9.49 5.88 5.88
13 44 6.36 3.94 3.94 14 38 4.63 2.87 2.87 15 38 0.16 0.10 0.10 17 31 0.98 0.61 0.61 18 33 2.60 1.61 1.61 19 34 1.79 1.11 1.11 20 30 0.36 0.22 0.22 21 30 0.52 0.32 0.32 22 42 0.28 0.18 0.18
Transect I
Average 36 1.96 1.22 1.22
Avg. 39 5.93 3.67 3.67
154

Appendix 25: Macromolluscan Production 1975-1976
Station Depth Biomass Calcimass Production Density No. Rate
meters . g! 2 2 m m in g CaCOim g CaCO/m2/yr Spec/m 2
23 11 175.11 108.57 108.57 293 24 18 0.96 0.60 0.60 143 25 37 3.13 1.94 1.94 185 26 53 3.24 2.01 2.01 111 27 90 0.96 0.60 0.60 70 28 168 0.41 0.25 0.25 76
Transect I Average 63 30.64 18.99 18.99 146
29 19 6.29 3.90 3.90 311 30 31 3.29 2.04 2.04 313 31 34 1.69 1.05 1.05 348 32 37 8.02 4.97 4.97 880 33 43 2.02 1.25 1.25 148 34 189 0.74 0.46 0.46 72
Transect II Average 59 3.68 2.28 2.28 382
Average 61 17.16 10.64 10.64 264
155
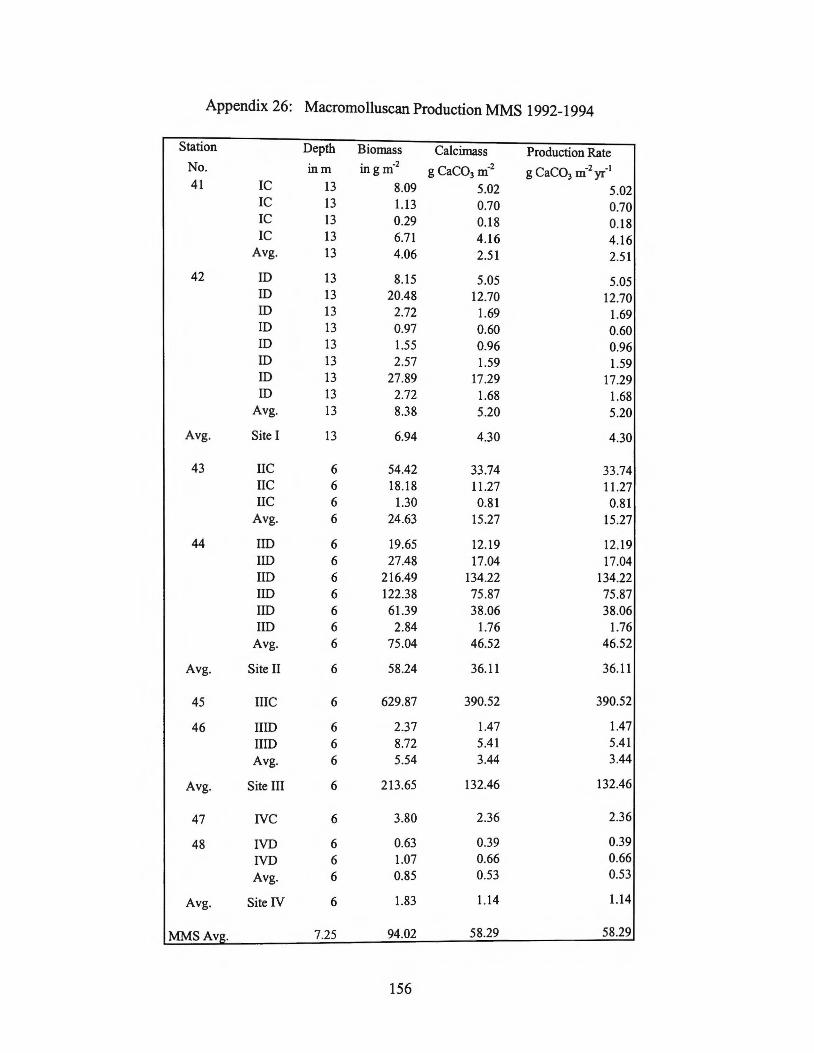
Appendix 26: Macromolluscan Production MMS 1992-1994
Station Depth Biomass Calcirnass Production Rate No. • -2
g CaC03 m·2 g CaC03 m"2 yr"1 mm mgm 41 IC 13 8.09 5.02 5.02
IC 13 1.13 0.70 0.70 IC 13 0.29 0.18 0.18 IC 13 6.71 4.16 4.16
Avg. 13 4.06 2.51 2.51
42 ID 13 8.15 5.05 5.05 ID 13 20.48 12.70 12.70 ID 13 2.72 1.69 1.69 ID 13 0.97 0.60 0.60 ID 13 1.55 0.96 0.96 ID 13 2.57 1.59 1.59 ID 13 27.89 17.29 17.29 ID 13 2.72 1.68 1.68
Avg. 13 8.38 5.20 5.20
Avg. Site I 13 6.94 4.30 4.30
43 IIC 6 54.42 33.74 33.74 IIC 6 18.18 11.27 11.27 IIC 6 1.30 0.81 0.81
Avg. 6 24.63 15.27 15.27
44 IID 6 19.65 12.19 12.19 liD 6 27.48 17.04 17.04 liD 6 216.49 134.22 134.22 liD 6 122.38 75.87 75.87 liD 6 61.39 38.06 38.06 liD 6 2.84 1.76 1.76
Avg. 6 75.04 46.52 46.52
Avg. Site II 6 58.24 36.1 1 36.11
45 IIIC 6 629.87 390.52 390.52
46 IIID 6 2.37 1.47 1.47
HID 6 8.72 5.41 5.41 Avg. 6 5.54 3.44 3.44
Avg. Site III 6 213.65 132.46 132.46
47 NC 6 3.80 2.36 2.36
48 ND 6 0.63 0.39 0.39
ND 6 1.07 0.66 0.66
Avg. 6 0.85 0.53 0.53
Avg. SiteN 6 1.83 1.14 1.14
MMSAvg. 7.25 94.02 58.29 58.29
156
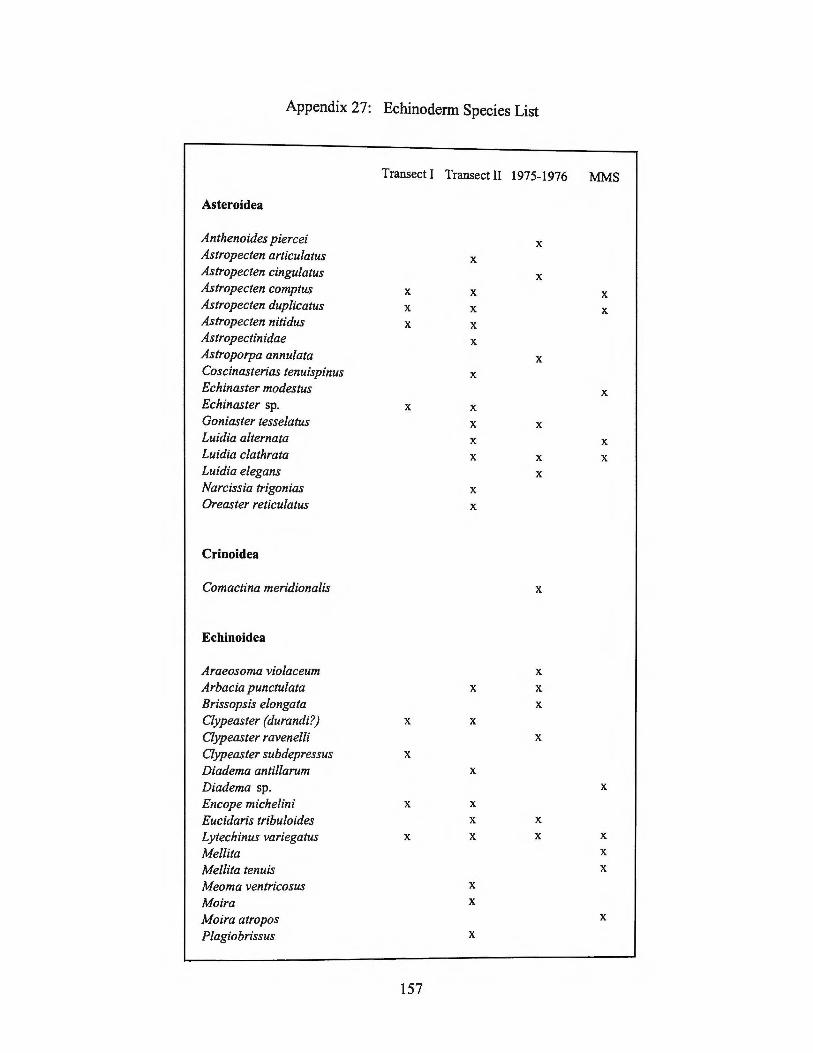
Appendix 27: Echinoderm Species List
Transect I Transect II 1975-1976 MMS
Asteroidea
Anthenoides piercei X Astropecten articulatus X
Astropecten cingulatus X Astropecten comptus X X X Astropecten duplicatus X X X Astropecten nitidus X X
Astropectinidae X
Astroporpa annulata X
Coscinasterias tenuispinus X
Echinaster modestus X
Echinaster sp. X X
Goniaster tesselatus X X
Luidia alternata X X
Luidia clathrata X X X
Luidia elegans X
Narcissia trigonias X
Oreaster reticulatus X
Crinoidea
Comactina meridiana/is X
Echinoidea
Araeosoma violaceum X
Arbacia punctulata X X
Brissopsis elongata X
Clypeaster (durandi?) X X
Clypeaster ravenelli X
Clypeaster subdepressus X
Diadema antillarum X
Diadema sp. X
Encope michelini X X
Eucidaris tribuloides X X
Lytechinus variegatus X X X X
Mel/ita X
Mel/ita tenuis X
Meoma ventricosus X
Moira X
Moira atropos X
Plagiobrissus X
157
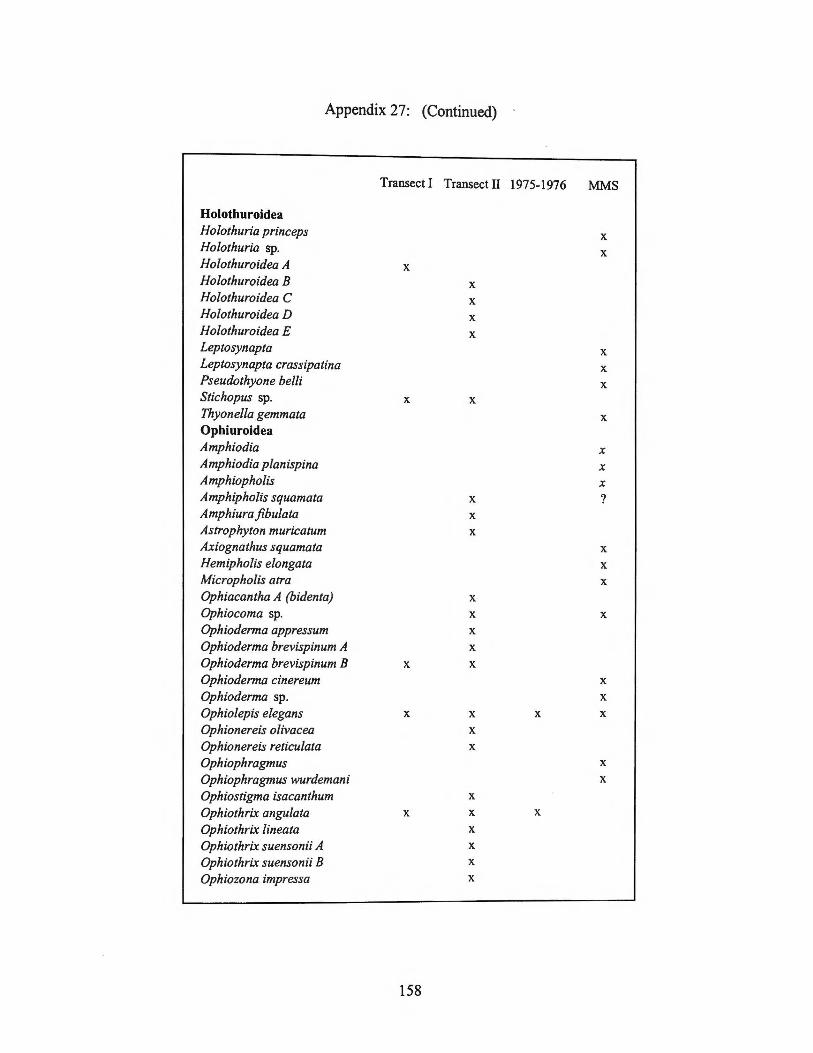
Appendix 27: (Continued)
Transect I Transect II 1975-1976 MMS
Holothuroidea Holothuria princeps X Holothuria sp. X Holothuroidea A X
Holothuroidea B X
Holothuroidea C X
Holothuroidea D X
Holothuroidea E X
Leptosynapta X
Leptosynapta crassipatina X
Pseudothyone belli X
Stichopus sp. X X
Thyonella gemmata X
Ophiuroidea Amphiodia X
Amphiodia planispina X
Amphiopholis X
Amphipholis squamata X ? Amphiura fibulata X
Astrophyton muricatum X
Axiognathus squamata X
Hemipholis elongata X
Micropholis atra X
Ophiacantha A (bidenta) X
Ophiocoma sp. X X
Ophioderma appressum X
Ophioderma brevispinum A X
Ophioderma brevispinum B X X
Ophioderma cinereum X
Ophioderma sp. X
Ophiolepis elegans X X X X
Ophionereis olivacea X
Ophionereis reticulata X
Ophiophragmus X
Ophiophragmus wurdemani X
Ophiostigma isacanthum X
Ophiothrix angulata X X X
Ophiothrix lineata X
Ophiothrix suensonii A X
Ophiothrix suensonii B X
Ophiozona impressa X
158

Appendix 28: Echinoderm Production 1974 and 1975-1976
Biomass Carbonate Station Depth Wet Weight Calcirnass Production
inm in g m-2 gCaC03 m-2 g CaC03 m-2 yr-1
1 37 5.56 1.33 0.35 3 44 34.79 8.35 2.17 4 53 2.25 0.54 0.14 5 37 0.74 0.18 0.05 6 36 13.47 3.23 0.84 7 40 0.56 0.13 0.03 9 48 0.30 0.07 0.02 10 54 0.60 0.14 0.04 11 37 5.37 1.29 0.34 12 34 0.19 0.04 O.Ql
Transect II A vg. 42 6.38 1.53 0.40
13 44 0.18 0.04 0.01 14 38 230.45 55.31 14.38 15 38 1.12 0.27 0.07 17 31 2.29 0.55 0.14 18 33 0.10 0.02 O.Ql 19 34 0.02 O.Ql 0.00 20 30 0.00 0.00 0.00 21 30 0.04 O.Ql 0.00 22 42 0.04 O.ol 0.00
Transect I A vg. 36 26.03 6.25 1.62
1974 Avg. 39 15.69 3.77 0.98
24 18 145.04 34.81 9.05 25 37 3.99 0.96 0.25 26 53 5.23 1.26 0.33 27 90 0.46 0.11 0.03 28 168 0.07 0.02 0.00
Transect I A vg. 73 30.96 7.43 1.93
29 19 51.16 12.28 3.19
30 31 0.07 0.02 0.00
31 34 0.07 0.02 0.00
32 37 4.88 1.17 0.30
33 43 3.60 0.86 0.22
34 189 0.29 0.07 0.02
Transect II A vg. 59 10.01 2.40 0.62
1975-1976 65 19.53 4.69 1.22
Avg. Shelf 49 17.10 4.10 1.07
159
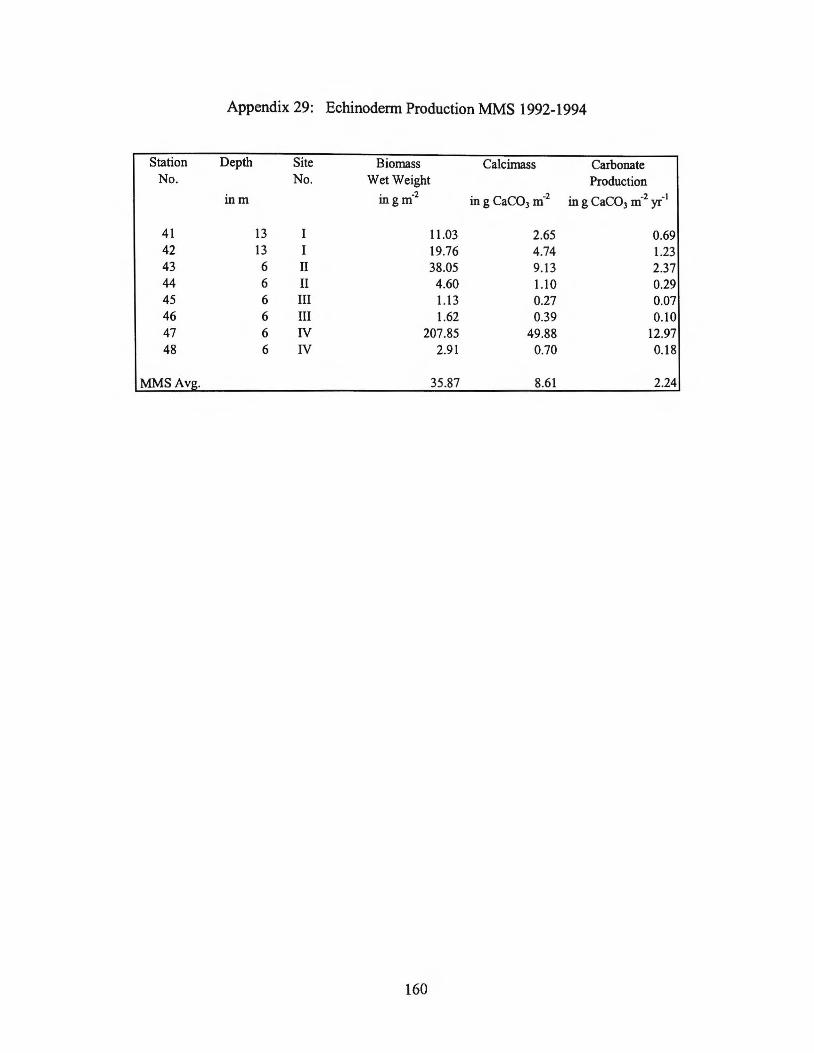
Appendix 29: Echinoderm Production MMS 1992-1994
Station Depth Site Biomass Calcimass Carbonate No. No. Wet Weight Production
inm . ·2 mgm in g CaC03 m-2 in g CaC03 m-2 yr-1
41 13 I 11.03 2.65 0.69 42 13 I 19.76 4.74 1.23 43 6 II 38.05 9.13 2.37 44 6 II 4.60 1.10 0.29 45 6 III 1.13 0.27 0.07 46 6 III 1.62 0.39 0.10 47 6 IV 207.85 49.88 12.97 48 6 IV 2.91 0.70 0.18
MMS Avg. 35.87 8.61 2.24
160

Appendix 30: Dominant Archived Calcareous Algae
I II FMG I II m Chlorophyta
Avrainvillea asarifolia X X
Halimeda discoidea X X
Halimeda favulosa X X Halimeda opuntia X X
Halimeda sp.
Halimeda tuna X X
Udotea conglutinata X
Udotea cyathiformis X
Udotea flabellum X X
Phaeophyta Padina profunda X
Padina vickersiae X
Rhodophyta
Amphiroa fragillisima X
Fosliella atlantica X X
Fosliella farinosa X
Galaxaura obtusata X X
Galaxaura sp. X
Galaxaura squalida X
Jania adherens X
Jania capillacea X X
Lithothamnion incertum X X
Lithothamnion occidentale X X
Lithothamnion sejunctum X
Lithothamnion syntrophicum X
Cyanophyta
Anacystis acruginosa X
Calothrix crustacea X
Entophysalis conferta X
Microcoleus lyngbyaceus X
Microcoleus vaginatus X
Schizothrix calcicola X
Spirulina subsalsa X
161

Appendix 31: Archived Hard and Soft Corals
1974 Transects 1975-6 Transects I II II III
Octocorallia Bebryce grandis X X Bebryce parastellata X X X Diodogorgia nodulifera X X
Ellisel/a barbadensis X
Eunicea ca!ycu!ata X X Eunicea knighti X
Leptogorgia eurya/e X
Leptogorgia medusa X
Lophogorgia cardinalis X
Lophogorgia hebes X
Muricea e/ongata X X
Muricea laxa X X
Neospongodes agassizii X
Paramuricea sp. X
Plexaura flexuosa X
Plexaurella fusifera X
Pseudop/exaura porosa X
Renilla mulleri X
Villogorgia nigrescens X
Scleractinia Agaricia agaricites X
Cladocora arbuscula X X X X
Cladocora debilis X X
Dichacaenia stellaris X X
Dichacaenia stokesii X
Isophyllia sinuosa X
Madracis asperula X
Madracis decactis X X X
Manicina areolata X
Millepora alciconzis X
Oculina diffusa X X X
Ocu/ina tenella X X
Parac\·athus dejilippi X X X
Phyllangia americana X X
Porites branneri X
Porites divaricata X X
Scolym ia cubensis X
Sco/ymia lacera X
Siderastrea radians X
So/enastrea hyades X X
Steplzanocoenia miclzelini X X X
162

Appendix 32: Archived Serpulid Polychaetes
Family: Serpulidae
(Calcareous Tube Worms)
Apomatus similes Apomatus sp. Crucigera websteri Dexiospira spieillum Ditrupa arietina Ficopomatus n macrodon Filograna huxleyi Filograna implexa Filograna sp. Hydroides bandaensis Hydroides bispinosus Hydroides caribensis Hydroides crucigera Hydroides dianthus Hydroides elegans Hydro ides floridanus Hydroides gairacensis Hydroides heteroceros Hydroides lunulifera Hydroides microtis Hydroides norvegica Hydroides parvus Hydroides protulicola Hydroides sceptrifer Hydroides sp. nov. Hydroides spongicola Hydroides uncinata Josephella marenzellerei Metavermilia multecristata Metavermilia sp. A
163
Neovermilia capensis Placostegus incomptus Placostegus tridentatus Pomatoceros americanus Pomatoleios caerulescens Pomatoleios sp. nov. Pomatostegus Protula balbaoensis Protula diomedae Protula sp. Protula tubularia Pseudovermilia fuscostriata Pseudovermilia multispinosa Pseudovermilia occidentalis Pseudovermilia sp. Rhodopsis pusilla Salmacine dysteri Sclerostyla ctenactis Serpula lobiancoi Serpula c.f. massiliensis Serpula sp. Serpula vermicularis Spirobranchus giganteus Spirorbis corrogatum Vermiliopsis annulata Vermiliopsis biformis Vermiliopsis infundibulum Vermiliopsis multiannulatum
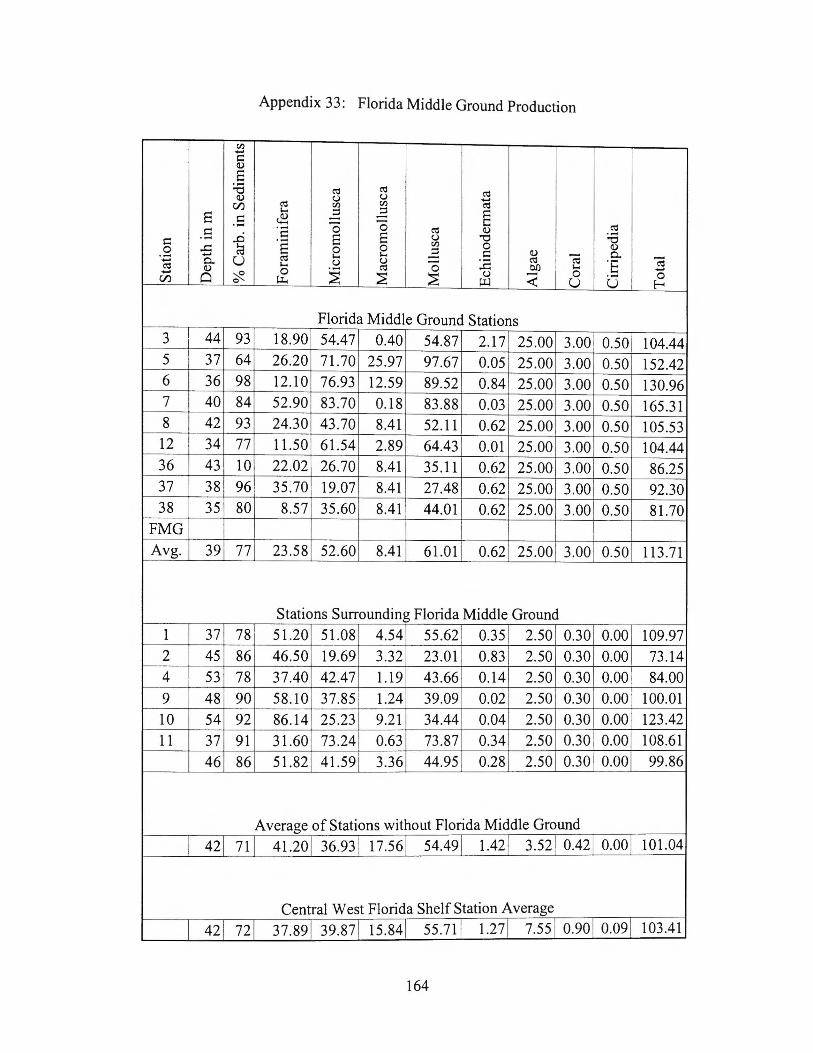
Appendix 33: Florida Middle Ground Production
C/.) .......
= Q)
E :.a ell ell ell Q) (.) (.) ....... (/.) ell C/.) C/.) ell
E 1-o ::l ::l § ·= ~ -
.5 ·a 0 0 ell Q) ell
~ E E (.) "0 :.a = ...c "§ 0 C/.) 0 Q) .9 0 ::l = Q) 0.. ......
ell 1-o 1-o ell Cil Cil ....... 0.. u (.) (.) :.a :§ ell Q) 1-o ell 0 ..::fl 1-o ...... .......
Cl ~ 0 :§ ::E ::E (.) 0 0 (/.) ~ ~ --< u u f-c
Florida Middle Ground Stations 3 44 93 18.90 54.47 0.40 54.87 2.17 25.00 3.00 0.50 104.44 5 37 64 26.20 71.70 25.97 97.67 0.05 25.00 3.00 0.50 152.42 6 36 98 12.10 76.93 12.59 89.52 0.84 25 .00 3.00 0.50 130.96 7 40 84 52.90 83 .70 0.18 83 .88 0.03 25 .00 3.00 0.50 165.31 8 42 93 24.30 43 .70 8.41 52.11 0.62 25 .00 3.00 0.50 105.53 12 34 77 11.50 61.54 2.89 64.43 0.01 25 .00 3.00 0.50 104.44 36 43 10 22.02 26.70 8.41 35.11 0.62 25 .00 3.00 0.50 86.25 37 38 96 35.70 19.07 8.41 27.48 0.62 25 .00 3.00 0.50 92.30 38 35 80 8.57 35.60 8.41 44.01 0.62 25 .00 3.00 0.50 81 .70
FMG I
Avg. 39 77 23.58 52.60 8.41 61.01 0.62 25 .00 3.00 0.50 113.71
Stations Surrounding Florida Middle Ground 1 37 78 51.20 51.08 4.54 55 .62 0.35 2.50 0.30 0.00 109.97 2 45 86 46.50 19.69 3.32 23 .01 0.83 2.50 0.30 0.00 73.14 4 53 78 37.40 42.47 1.19 43.66 0.14 2.50 0.30 0.00 84.00 9 48 90 58. 10 37.85 1.24 39.09 0.02 2.50 0.30 0.00 100.01 10 54 92 86.14 25.23 9.21 34.44 0.04 2.50 0.30 0.00 123.42 11 37 91 31.60 73 .24 0.63 73 .87 0.34 2.50 0.30 0.00 108.61
46 86 51.82 41 .59 3.36 44.95 0.28 2.50 0.30 0.00 99.86
Average of Stations without Florida Middle Ground 42 71 41.20 36.93 17.56 54.49 1.42 3.52 0.42 0.00 101.04
Central West Florida Shelf Station Average
42 72 37.89 39.87 15.84 55.71 1.27 7.55 0.90 0.09 103.41
164

Appendix 34: Total Carbonate Production on the Central West Florida Shelf
~ ]
"' "' s u u u tl) ~ "' "' "' e .s 1
..= ..= § .s 0 ] "' u .~
= 8 e u '"0 '"0 .;3 8 "' 0 u
0 0 ..= .s u ] :§ ·.:: 0.. "' .... u 0 "' 3 s .... .~ "' ..c: ~ u 0 u 0 0 tl) 0 :::R j;.I., ~ ~ ~ l:.t.l < u u E-< 0
1 37 78 51.20 51.08 4.54 55.62 0.35 2.50 0.30 0.00 109.97 2 45 86 46.50 19.69 3.32 23.01 0.83 2.50 0.30 0.00 73.14 3 44 93 18.90 54.47 0.40 54.87 2.17 25.00 3.00 0.50 104.44 4 53 78 37.40 42.47 1.19 43.66 0.14 2.50 0.30 0.00 84.00 5 37 64 26.20 71.70 25.97 97.67 0.05 25.00 3.00 0.50 152.42 6 36 98 12.10 76.93 12.59 89.52 0.84 25.00 3.00 0.50 130.96 7 40 84 52.90 83.70 0.18 83.88 0.03 25 .00 3.00 0.50 165.31 8 42 93 24.30 43.70 8.41 52.11 0.62 25.00 3.00 0.50 105.53 9 48 90 58.10 37.85 1.24 39.09 0.02 2.50 0.30 0.00 100.01
10 54 92 86.14 25.23 9.21 34.44 0.04 2.50 0.30 0.00 123.42 11 37 91 31.60 73.24 0.63 73.87 0.34 2.50 0.30 0.00 108.61 12 34 77 11.50 61.54 2.89 64.43 0.01 25.00 3.00 0.50 104.44
42 85 38.07 53.47 5.88 59.35 0.45 13.75 1.65 0.25 113.52
13 44 92 87.61 62.78 3.94 66.72 0.01 2.50 0.30 0.00 157.14
14 38 90 61.44 37.23 2.87 40.10 14.38 2.50 0.30 0.00 118.72
15 37 89 39.14 103.09 0.10 103.19 0.07 2.50 0.30 0.00 145.20
16 43 97 5.99 19.69 3.32 23.01 0.83 2.50 0.30 0.00 32.63
17 31 63 123.63 56.31 0.61 56.92 0.14 2.50 0.30 0.00 183.49
18 33 88 52.46 99.40 1.61 101.01 0.01 2.50 0.30 0.00 156.28
19 34 96 9.93 20.00 1.11 21.11 0.00 2.50 0.30 0.00 33.84
20 30 84 65 .34 64.93 0.22 65.15 0.00 2.50 0.30 0.00 133.29
21 30 84 120.04 59.39 0.32 59.71 0.00 2.50 0.30 0.00 182.55
22 42 81 92.03 100.93 0.18 101.11 0.00 2.50 0.30 0.00 195.94
36 86 65 .76 62.38 1.43 63.80 1.54 2.50 0.30 0.00 133.91
165
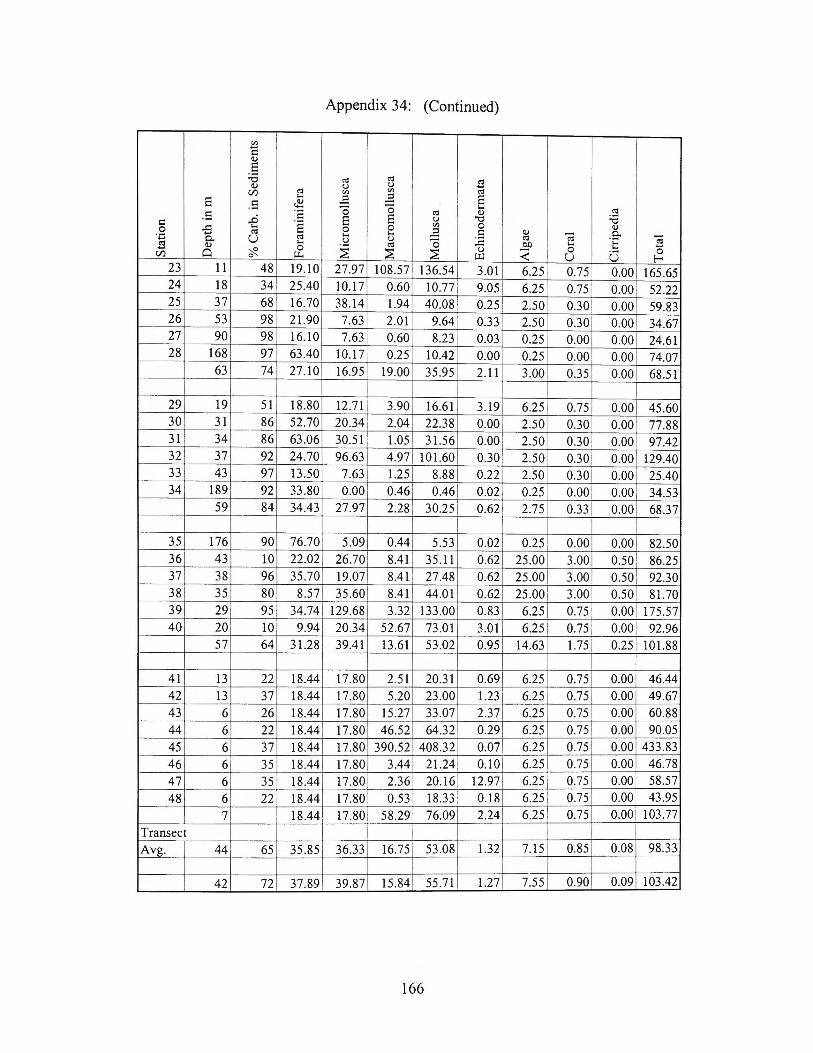
Appendix 34: (Continued)
.l!l s:: ~
s ;a "' "' .s ~ u u
til ~ "' "' "' s .s ~ .2 .2 E .5 ·a 0 0 "' ~ "' .e s s u "0 ;a s:: ·a "' 0 0 ;S 0 0 .2 dJ
"' .... ·§ dJ 0.. ·~ c.. u "' .... u "' c;j .E c;j .s .... - ~ 0 bO .... dJ 0 "' u 0 0 til 0 "<f2. (.I., ~ ~ ~ t..Ll ~ u a f-<
23 I I 48 19.10 27.97 108.57 136.54 3.01 6.25 0.75 0.00 165.65 24 18 34 25.40 10.17 0.60 10.77 9.05 6.25 0.75 0.00 52.22 25 37 68 16.70 38.14 1.94 40.08 0.25 2.50 0.30 0.00 59.83 26 53 98 21.90 7.63 2.01 9.64 0.33 2.50 0.30 0.00 34.67 27 90 98 16.10 7.63 0.60 8.23 0.03 0.25 o.oo l 0.00 24.6 1 28 168 97 63.40 10. 17 0.25 10.42 0.00 0.25 o.oo l 0.00 74.07
63 74 27.10 16.95 19.00 35 .95 2.11 3.00 0.35 0.00 68.51
I 29 19 51 18.80 12.71 3.90 16.61 3.19 6.25 0.75 0.00 45 .60 30 31 86 52.70 20.34 2.04 22.38 0.00 2.50 0.30 0.00 77.88 31 34 86 63.06 30.51 1.05 31.56 0.00 2.50 0.30 0.00 97.42 32 37 92 24.70 96.63 4.97 101.60 0.30 2.50 0.30 0.00 129.40 33 43 97 13.50 7.63 1.25 8.88 0.22 2.50 0.30 0.00 25.40 34 189 92 33.80 0.00 0.46 0.46 0.02 0.25 o.oo l 0.00 34.53
59 84 34.43 27.97 2.28 30.25 0.62 2.75 0.33 1 0.00 68.37
I I I
35 176 90 76.70 5.09 0.44 5.53 0.02 0.25 0.00 0.00 82.50 36 43 10 22.02 26.70 8.41 35 .111 0.62 25.00 3.00 1 0.50 86.25 37 38 96 35.70 19.07 8.41 1 27.48 0.62 25 .00 3.00 0.50 92.30 38 35 80 8.57 35 .60 8.41 44.01 0.62 25.00 1 3.00 0.50 81.70 39 29 95 34.74 129.68 3.32 133.00 0.83 6.25 0.75 0.00 175 .57 40 20 10 9.94 20.34 52.67 73 .01 3.01 6.25 1 0.75 o.oo l 92.96
57 64 31.28 39.41 13.61 53 .02 0.95 1 14.63 1.75 1 0.25 101.88
41 13 22 18.44 17.80 2.51 20.31 0.69 1 6.25 0.75 0.00 46.44 42 13 37 18.44 17.80 5.20 23.00 1.23 6:25 0.75 0.00 49.67 43 6 26 18.44 17.80 15 .27 33 .07 2.37 6.25 0.75 0.00 60.88 44 6 22 18.44 17.80 46.52 64.32 0.29 6.25 0.75 0.00 90.05 45 6 37 18.44 17.80 390.52 408.32 0.07 6.25 0.75 0.00 433.83 46 6 35 18.44 17.80 3.44 21.24 0.101 6.25 0.75 0.00 46.78
47 6 35 18.44 17.80 2.36 20.16 12.97 6.25 0.751 0.00 58.57
48 6 22 18.44 17.80 0.53 18.33 0.1 8 6.25 0.75 0.00 43.95
7 18.44 17.80 58.29 76.09 2.24 1 6.25 0.75 0.00 103.77
Transect I Avg. 44 65 35.85 36.33 16.75 53 .08 1.32 7.15 0.85 0.08 98.33
42 72 37.89 39.87 15 .84 55 .71 1.27 7.55 0.90 0.09 103.42
166