Nanolubricant Oil Additives for Performance Improvement of ...
Upload
independentCategory
view
2download
0
Consequences of the crayfish gastrolith layered
growth: about the stability of amorphous calcium
carbonate and role of additives
Wouter J.E.M. Habrakena, Admir Masica, Luca Bertinettia, Ali Al-Sawalmihb, Lilah Glazerc,
Shmuel Bentovc, Peter Fratzla, Amir Sagid , Barbara Aichmayer a, Amir Bermane
a Max Planck Institute of Colloids and Interfaces, Department of
Biomaterials, 14424 Potsdam, Germany.
b Marine Science Station (MSS), The University of Jordan/Aqaba
Campus, 77110 Aqaba, Jordan.
c Life Sciences Dept., Ben-Gurion University of the Negev, 84105
Beer-Sheva, Israel.
d Life Sciences Dept. and the National Institute for Biotechnology in
the Negev, Ben-Gurion University, 84105 Beer-Sheva, Israel.
e Biotechnology Engineering Dept., Ben-Gurion University of the
Negev, 84105 Beer Sheva, Israel .
Abstract
Previous studies on pre-molt gastroliths have shown a typical onion-
like morphology of radially distributed layers of amorphous mineral
(mostly calcium carbonate) and chitin, resulting from the continuous1

deposition and densification of amorphous mineral spheres on a
chitin-matrix during time. To investigate the consequences of this
layered growth on the local structure and composition of the
gastrolith, we performed spatially-resolved Raman, X-ray and SEM-EDS
analysis on complete pre-molt gastrolith cross-sections. Results
show that especially the abundance of inorganic phosphate,
phosphoenolpyruvate (PEP)/citrate and proteins is not uniform
throughout the organ but change from layer-to-layer. Based on these
results we can conclude that ACC stabilization in the gastrolith
takes place by more than one compound and not by only one of these
additives.
Introduction
Only recently it was discovered that Nature uses amorphous materials
as precursor phases preceding the formation of elaborate crystalline
structures and tissues, like the spicules of sea-urchins (Beniash et
al.; Politi et al., 2004), zebrafish bone (Mahamid et al., 2011) and
in many more cases (Addadi et al. 2003). In those examples the
formation of an eventual crystalline material (i.e. calcite,
aragonite, or apatite) proceeds via an amorphous precursor state
that under in vitro conditions is often only present as a kinetically
stabilized intermediate (Sawada, 1997).
2

In the biological environment, the amorphous phase can be much more
stable against thermodynamic pressure. This phenomenon is speculated
to result from the presence of molecular agents that stabilize the
amorphous phase and delay crystal formation. From studies on
skeletons of marine organisms a wide scale of such stabilizing
agents is proposed. Examples are highly charged and/or
phosphorylated proteins, small organic molecules, foreign ions
(especially Mg2+ (Politi et al., 2010)) and specialized
macromolecules (Aizenberg et al., 1996). Comparative studies on
synthetically grown calcium carbonate or calcium phosphate have
shown that highly charged polymers like poly(aspartic acid) are able
to stabilize a so-called Polymer-Induced Liquid Precursor (PILP)
phase (Olszta et al., 2007). PILP represents a highly hydrated non-
crystalline mineral phase, which is believed to resemble amorphous
precursors in many biological systems. Additionally, the influence
of (small) organic molecules as well as foreign ions on in vitro calcium
carbonate/calcium phosphate growth has been studied already since
the 1970’s. These studies show that it is possible to delay the
reaction kinetics (and thereby increase the stability of the
amorphous phase) quite radically by only introducing a small amount
of mostly acidic agents or polyvalent ions (f.e. pyrophosphate,
casein, Mg2+, SO42-) (Termine et al., 1970; Ihli et al., 2013). Non-
3

acidic agents or monovalent ions (f.e. Na+, gelatin), in general,
leave the reaction unaffected.
In this study we investigated the stable amorphous calcium carbonate
(ACC) in the crayfish temporary mineral storage, the gastrolith.
Crayfish need a large amount of mineral during the molting cycle.
Therefore, some species of fresh-water crayfish have a specialized
storage -the gastrolith, first described by Huxley (T.H. Huxley,
1880). Gastroliths are located between the endocuticle and epidermis
of the gastrolith disks (Travis, 1963), organs dedicated to the
production of the gastrolith, which are situated on both sides of
the stomach. The growth of the gastroliths involves first the
deposition of a poorly ordered lamellar α-chitin matrix, with
orthogonally directed shorter chitin fibers. Accordingly, the
amorphous mineral attaches on this matrix as nanometer-sized spheres
(Travis, 1963). In this process, both the chitin matrix and the
mineral particles are secreted by the epidermal cells of the
gastrolith disk. As the gastrolith matures, new mineral is deposited
on the external layer, while the earlier deposited mineral densifies
into "blocky" prismatic structures, directed parallel to the growth
direction. In time, the composite of the lamellar chitin and the
mineral forms an ordered structure of concentric layers (Travis,
1963), which is finally resorbed through collapse of the tissue into
the crayfish stomach during ecdysis (Shechter et al., 2008a).
4

It is postulated that certain proteins found in the crayfish
gastroliths take part in the mineralization of the chitin scaffold
by playing different roles in modulating mineralization (i.e.
stabilizing ACC) and attaching the chitin with the mineral. These
proteins include the gastrolith matrix protein (GAMP) (Takagi et
al., 2000), gastrolith protein 65 + 75 (GAP65 + GAP75) (Shechter et
al., 2008b; Glazer and Sagi, 2012), CqCDA1 (Yudkovski et al., 2010)
and gastrolith protein 10 (GAP10) (Glazer et al., 2010)).
Conversely, a recent ss-NMR study (Akiva-Tal et al., 2011) indicates
that small organic molecules like phosphoenol-pyruvate (PEP, see
also (Sato et al., 2011)) and citrate but most of all inorganic
phosphate, present in gastroliths up to an average of maximally 18
wt%, are the most likely candidates to stabilize ACC in the
gastrolith. Note that unlike Mg2+, inorganic phosphate is not a
substitutional impurity in any crystalline calcium carbonate.
Furthermore, the chemical environment of the phosphate elucidated in
ss-NMR (Akiva-Tal et al., 2011) indicates that it is well dispersed
inside the ACC structure. These observations, however, don’t rule
out that a combination of several factors (proteins, inorganic
phosphate, small organic molecules) could act cooperatively to
enhance the stability of gastrolithic ACC. Additionally, all
analyses performed so far have regarded the gastrolith as a uniform
structure, ignoring compositional differences throughout the organ.
5

Taking into account the prospected layer-by-layer deposition,
especially local differences in structure and composition can
provide vital clues for the stabilization mechanism of ACC.
In order to better understand the thermodynamic stability and
structure of gastrolith mineral in relationship to its biological
formation history and purpose, in this study we performed spatially-
resolved analysis on whole pre-molt gastrolith slices or cross-
sections. To obtain a complete chemical, structural and
morphological description of the gastrolith at different length
scales, Raman spectroscopy and synchrotron small-and wide angle X-
ray scattering (SAXS/WAXS) were combined with light microscopy
imaging, high-resolution scanning electron microscopy (SEM) and EDS
analysis. Results show that the structure as well as the content of
inorganic phosphate, chitin, protein and citrate or PEP show layer-
to-layer variations. Such a distribution indicates that the
remarkable stability of the ACC is not governed by only one of these
compounds, but that depending on the specific layer investigated,
different stabilizing agents are involved.
Materials and Methods
Preparation of the gastrolith cross-sections
6

Pre-molt gastroliths were extracted from the animals reared at BGU,
and cleaned using distilled water. For SAXS/WAXS and light
microscopy, samples were embedded in epoxy-resin (EPOFIX™) and
sectioned using a diamond knife producing 0.7-1.0 mm thick slides,
concomitantly cooled by ethylene glycol to prevent crystallization.
Additionally, for chemical and structural characterization by Raman
and SEM, gastrolith cross-sections were prepared by cutting the
gastrolith with a scalpel blade while frozen by liquid nitrogen.
Light microscopy
Light microscopy images of gastrolith slides were taken by a Leica
DM RXA2 microscope at a magnification of 2.5X. For visualization of
the total gastrolith, images of different (overlapping) regions were
combined afterwards using Microsoft Powerpoint™.
Scanning Electron Microscopy + Energy Dispersive X-ray Spectroscopy
Scanning electron micrographs were obtained with a Jeol JSM7500F.
Images were acquired at an acceleration voltage of 2 kV and a
working distance (WD) of about 8 mm, using a through-the-lens
secondary electron detector. The freshly exposed surfaces of the
samples were coated with a layer of 2-3 nm of Pt prior to the
7

investigations. Analytical information was obtained at 15 kV and at
the same WD used for imaging through an Oxford Inca Energy
Dispersive Spectroscopy System (EDS) using an X-Max™ silicon drift
detector. Particle size measurements on SEM-images were performed
using ImageJTM software.
Raman Spectroscopy
Raman spectra were collected with a confocal Raman microscope (α300;
WITec) equipped with a Nikon objective (100×) and a laser excitation
wavelength of 532 nm. Spectra were acquired with a CCD camera
(DV401-BV; Andor) behind a spectrometer (UHTS 300; WITec) with a
spectral resolution of 3 cm−1. For the line scans, light microscopy
images and corresponding spectra were taken every 50 µm. Data
analysis (subtracting background, fitting area beneath specificated
peaks) was done using WITecTM software.
Synchrotron Small- and Wide Angle X-ray Scattering and X-ray diffraction measurements
Small and Wide-angle X-ray scattering (SAXS+WAXS) measurements on
embedded gastrolith slices were performed at the μ-Spot beamline
(BESSY II storage ring, Helmholtz-Zentrum Berlin) (Paris et al.,
2007) using a multilayer monochromator and spot size of 100 µm.
8

Radially averaged scattering patterns were obtained using FIT2DTM
software and corrected for sample thickness (transmission),
intensity of X-ray beam and background. For quantitative peak area
determination of the WAXS patterns, the two amorphous signals of ACC
(AMO1 at q 22 nm-1, AMO2 at q 32 nm-1) and the α-chitin (110) at
q 14 nm-1 were fitted by gaussian curves using OriginTM Software.
Results
Structural differences due to layered growth of gastrolith
The epoxy-embedded slices, cut in two different modes (parallel to
the growth direction (Fig. 1 A+C) and perpendicular to this (Fig.
1B), see also inset Fig. 1), are transparent to transmission light
microscopy, revealing concentric rings with lighter and darker
regions starting from the earlier deposited innermost layers (i) to
the later deposited external (e) parts. An additional feature is
the presence of columns orthogonal to these concentric rings (see
arrows in Fig. 1A and 1C), indicating stacked prismatic mineral
(Travis, 1963). As a consequence, where the slice is completely
perpendicular to the growth direction (inner part of Fig. 1B), the
layered structure is not apparent and the prismatic organization
appears as elongated dots. These structural features can be seen
independent of the size of the gastrolith (compare Fig. 1A with Fig.
9

1C), indicating a similar structural organization between
gastroliths extracted from crayfish of different ages.
As the slice thickness is uniform, changes in opacity may be caused
by the different densities of the mineral layers. It might also be
due to a submicron-sized porosity within the sample that changes
from layer to layer, or due to intermittent deposition of organic
compounds absorbing in the visible light range (390-700 nm). These
changes can be quite dramatic as radial integration of the indicated
region in Fig. 1A shows, causing 4- fold variation (10-40 AU) in
scattered light intensity (Fig. 1D). The chemical variation in P,
also shown in Fig. 1D, will be described later on.
10

Figure 1: Transmission light microscopy on gastrolith sections, A+B) Large gastrolith cut in
two different modes (see also inset): A) parallel to the growth direction showing distinct
growth lines from the earlier deposited innermost layers (indicated by i) to the later
deposited external parts (indicated by e), B) perpendicular to A, due to the curved shape
especially at the external parts of the gastrolith the growth lines are also visible here. C) A
smaller gastrolith (size ~ 2x smaller), cut parallel to the growth direction, D) Light
transmission (in Arbitrary Units) and relative amount of P as measured by EDS as a function
of the distance from the external layer (e) after integrating the square area as indicated in
Figure 1A. The light transmission graph is cut at the outer 100 µm on both sides due to
interference with embedding material. Peaks 1, 2 and 3 correspond to regions with low
11

transmission as indicated in A and B. Arrows indicate the stacking of columnar features,
corresponding to the presence of prismatic ACC structures.
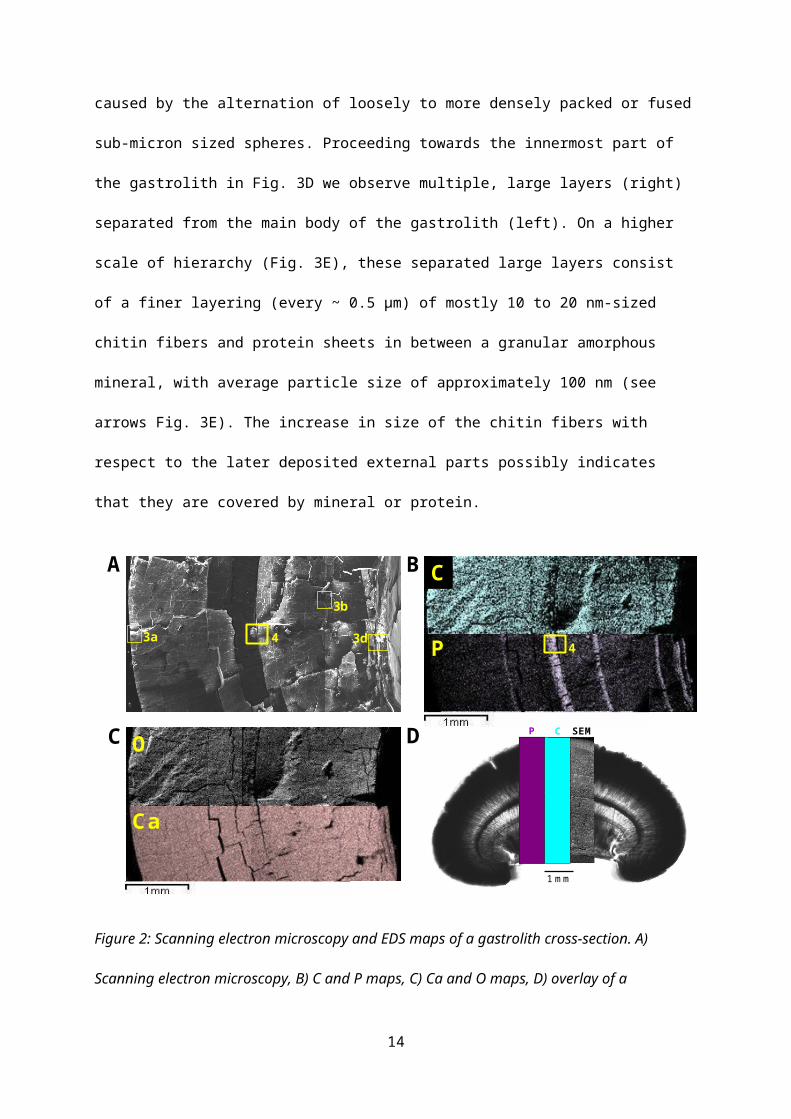
To investigate the source of this opacity, high-resolution SEM was
performed on a non-embedded gastrolith cross-section that was cut
after quenching in liquid nitrogen. As amorphous calcium carbonate
is ductile, the cutting process itself interferes with the correct
structural characterization, as small pores/structures get smeared
at the surface. By quenching the material in liquid nitrogen, the
cold mineral hardens thereby retaining more of its original
structural features. Corresponding to the structures observed in
transmission light microscopy, initial SEM investigation of the
whole cross-section (Fig. 2A) shows radially distributed cracks in
the middle and oldest layers of the gastrolith, as well as smaller
orthogonal cracks. Though possibly created by the drying or freezing
processes, these cracks indicate mechanically weak regions or
materials with different thermal expansion coefficients inside the
gastrolith structure. The cracks also partially follow the
positions of the darker layers in the middle of the gastrolith in
transmission light microscopy images (see Fig. 2D). Here they seem
to be associated with the interface between the darker layers and
surrounding transparent regions, as will be even clearer by chemical
analysis discussed in the following paragraphs (see Fig. 2B). As the
dimensions of the cracks are much smaller than the darker regions in
12

light microscopy, and only a part of these regions are associated
with cracks in SEM, this excludes the cracks as being the cause for
this difference in opacity.
At a higher magnification (Figs. 3 + 4), except for the innermost
layers, through the whole gastrolith sub-micron-sized spherical
features are observed. As expected from literature (Travis, 1963;
Schechter et al., 2008a), in the later deposited external layers of
the gastrolith these spheres are more loosely packed and less fused
(Fig. 3A) than in earlier deposited inner parts (Fig. 3B), with a
sphere-size ranging from 150 nm (Fig. 3A) to 190 nm (Fig. 3B) in
most regions. Here, what appears to be loose chitin fibers with a
diameter of about 5 nm can be observed around the spheres and
sticking out of cracks (Fig. 3C). Also around the cracks in the
middle of the gastrolith (Fig. 4), the spheres show an exceptional
loose packing and particle sizes ranging from slightly smaller than
average (region a, ~140 nm) to exceptionally large spherical
particles (b: ~265 nm, c: ~440 nm). The lower amount of
interconnections between the large separate spheres could explain
why the gastrolith is broken at this position. Additionally, between
regions a and b we see a high amount of organic material, containing
chitin fibers, which seem to separate both sizes of spheres. Up to
this point, comparing the SEM data with the transmission light
microscopy images, we can deduce that the light-dark layering is
13
caused by the alternation of loosely to more densely packed or fused
sub-micron sized spheres. Proceeding towards the innermost part of
the gastrolith in Fig. 3D we observe multiple, large layers (right)
separated from the main body of the gastrolith (left). On a higher
scale of hierarchy (Fig. 3E), these separated large layers consist
of a finer layering (every ~ 0.5 µm) of mostly 10 to 20 nm-sized
chitin fibers and protein sheets in between a granular amorphous
mineral, with average particle size of approximately 100 nm (see
arrows Fig. 3E). The increase in size of the chitin fibers with
respect to the later deposited external parts possibly indicates
that they are covered by mineral or protein.
A C
P 4
O
Ca
C D
3a
3b
3d4
B
P C
1 m m
SEM
Figure 2: Scanning electron microscopy and EDS maps of a gastrolith cross-section. A)
Scanning electron microscopy, B) C and P maps, C) Ca and O maps, D) overlay of a
14
transmission light microscopy image with SEM and P+C maps. The squares in A and B
indicate the positions of Figs. 3 and 4.
Also in the main body of the gastrolith (left of Fig. 3D) we observe
the alternate layering indicated by the changes in scattered
electron intensity, where spacing between the layers is in between 2
to 3 µm (see also inset Fig.3D). This data indicates a periodic
deposition of chitin and mineral, which is very dense at these early
deposited layers and less obvious at the late deposited parts,
probably as a result of the densification of the mineral upon aging
(Travis, 1963). Furthermore, though only observed in embedded slices
of the smaller gastrolith (in Fig. 1C), synchrotron small-angle X-
ray scattering (SAXS) at the inner, dense, parts of the sample shows
a slope of -2 up to q = 0.3 nm-1. Despite the very close packing, a
slope of -2 indicates a more plate-like structure (Glatter and
Kratky, 1982) and would correspond to such an ordered distribution
of thin chitin layers (fitted by plates with a thickness of 4.7 nm),
inside a dense calcium carbonate (Fig. 5), under the presumption of
a large enough density difference between the chitin and the
mineral. Interestingly, the SAXS-pattern of the external layers
shows a hump at around 0.9 nm-1, which can be fitted by cylinders
with a diameter of 4.6 nm (see Fig. 5). This structure corresponds
to the presence of single chitin fibers in these regions, and
therefore is in line with our SEM observations.
15

Figure 3: High-resolution SEM imaging A) loose packing of spheres (153 ± 20 nm), B)
compaction of spheres (190 ± 27 nm) showing a high degree of agglomeration, C) single
chitin fibers (d ~ 5 nm) sticking out of a crack, D+E) early deposited inner parts showing
ordered layers with higher contrast in SEM (D, see inset). These layers contain aligned chitin
bundles (E, ~10-20 nm thick), coated by a dense or fine granular mineral (size granules 99 ±
11 nm, see arrows). Size is presented as mean diameter standard deviation. The position
of the layer visualized in E is indicated by the -sign in D.
16

Figure 4: Close up of the phosphate rich (I) and phosphate poor (II) regions in the middle of
the gastrolith by EDS and high-resolution SEM. (I) and (II) indicate regions left and right of
the crack. Size of the spheres in sub-regions a-d: a) 137 ± 17 nm, b) 265 ± 49 nm, c) 437 ± 68
nm and d) 243 ± 31 nm. Sphere size is presented as mean diameter standard deviation.
Scale bar in I and II is 1 µm.
17

q (nm -1)1 10
Intensity
(AU)
0,1
1
10
100
1000
external layer (1)fit 4.6 nm cylinder
fit 4.7 nm platesinternal layer (2)
-2
12
Figure 5: SAXS analysis on a small gastrolith. Radially integrated SAXS data from a late
deposited external and earlier deposited inner part of the gastrolith (numbers (1 and 2,
respectively) are taken at positions shown in inset) fitted with the form factor of 4.6-nm
cylinders (i.e. chitin fibers) and 4.7-nm thick plate-like structures (i.e. layers of chitin fibers).
Compositional changes due to layered growth of gastrolith
To spatially resolve the composition of the gastrolith, first an
elemental analysis was performed using Energy dispersive X-ray
18

spectroscopy (EDS). Maps for carbon (C), phosphorous (P), calcium
(Ca) and oxygen (O) are given in Figs. 2B-C. Most striking here is
the distribution of phosphorous (Fig. 2B), showing distinct maxima
in concentration in some radial distributed layers of the
gastrolith, which correspond to the darker layers in transmission
light microscopy (see also Figs. 1D+2D). Together with the loose
packing of spherical features in the middle of the gastrolith, where
P-content seems to be highest (Fig. 4), this indicates a direct
correlation between the phosphorous content and nanosphere stability
against aggregation. However, also the age of the layers seems to
play a role here, where in the later deposited external layers the
spheres are loosely packed, although here P-contents are very low.
Fig. 4, further, tells us that in the gastrolith there is no direct
correlation between sphere size and phosphate content as sizes in
the phosphate-rich area (especially a, b and c) range from slightly
smaller than average (~140 nm, a) to extremely large particles (~440
nm, c). Finally, the abrupt change in P as seen between region II
and the phosphate bulk, indicates a step-wise change in composition,
corresponding to the layered deposition of the mineral.
The other EDS-maps (Fig. 2 B-D) tell us that the maxima in P seem to
correspond to minima in C, whereas Ca and O are more evenly
distributed throughout the gastrolith. Such a trend indicates that
at these positions there is a high concentration of inorganic
19
phosphate (replacing C by P), whereas the presence of high amounts
of phosphorylated proteins or small organic molecules, rather would
cause an increase in C and a decrease in Ca2+.
To investigate the composition in greater detail, Raman spectroscopy
line scans were performed on the same gastrolith cross-sections
(Fig. 6A-B). Detailed spectroscopy data are shown every 50 µm (Fig.
6A). Integration of some of the peaks (Fig. 6B) reveals a trend in
composition going from the later deposited external layers (spectrum
nr. 3) to the earlier deposited inner layers (spectrum nr 80).
Detailed analysis of the Raman spectra suggest that the P-rich
regions are in fact containing a predominantly basic inorganic
phosphate (PO43-), as can be derived from the positions of the main
signal at 960 cm-1 (ν1 PO43-), as well as the presence of less intense
vibrations at 440 cm-1 (ν2 PO43-) and 600 cm-1 (ν4 PO4
3)(Fig. 6B). Indeed
the distribution of the PO43- follows very well the P-distribution in
EDS, where the most intense signals are coinciding with a decrease
in inorganic carbonate. Furthermore, the broadness of the main
phosphate (width ν1 PO43- 30 cm-1) and carbonate (width ν1 CO3
2- 28
cm-1) signals confirms the amorphous nature. This can also be
concluded from synchrotron wide-angle X-ray scattering (WAXS) data
of the embedded samples (Fig. 7). Here, independent of the position
in the gastrolith, all mineral shows a very similar, amorphous
diffraction pattern consisting of two broad Gaussian-shaped bands
20

(AMO1 and AMO2) with maxima at around 22 nm-1 and 31 nm-1. However,
after careful fitting the bands with Gaussians we can observe that
the position of the fitted peak at 22 nm-1 shifts to lower values at
the same places in the gastrolith where EDS shows a higher P-
concentration (Fig. 7B, left axis and Fig. 7C, right axis). At the
same time the ratio in area between AMO2 and AMO1 moves towards
lower values (Figure 7B, right axis). This behavior, where the
shape of the WAXS pattern depends on the P-concentration, can be
explained by comparing the WAXS patterns of the gastrolith with the
WAXS-patterns of synthetically pure ACC and ACP (Inset, Fig. 7A*).
Here, both the positions of AMO1 and AMO2 as well as the ratio in
area between both peaks are distinctly different between ACC and
ACP. For example, the AMO1 of ACP has a maximum (~21.6 nm-1) at a
lower q than the AMO 1 of ACC (~22.2 nm-1). Furthermore, the AMO2 of
ACP is much less prominent than the AMO2 of ACC, resulting in an
AMO2/AMO1 ratio of ~0.6 for ACP and ~1.2 for ACC. As for the
gastrolith, the shifts in the WAXS pattern from a P-poor region to a
P-rich region correspond to shifts from a more ACC-like pattern to a
more ACP-like pattern, this also indicates that this is caused by
the increase of inorganic P inside the sample.
21

0 20 40 60 80
100 600 1100 1600 2100 2600 3100 3600W avenum ber(cm -1)
1 2
34
5
6 8 10 13 15 161112 14 17 18
7
3
1832416080
0
200
400
600
800
1000
1200
0 20 40 60 80
Intens
ity(AU)
Spectra num ber(=distance(m m )*20)
4 (PEP + citrate)6 (chitin)14 (chitin + proteins)/218 (arom aticproteins)
0
500
1000
1500
2000
2500
3000
3500
4000
0 20 40 60 80
Intensity
(AU)
Spectra num ber(=distance(m m )*20)
16+17 (proteins+ chitin)5 (protein)
Assignm entPeaks1,2,7 = orthophosphate3,9,13,15 = carbonate4 = PEP + citricacid5 = non-aromatic protein6,11 = chitin8,18 = aromatic protein10 = protein (betasheets)12,14,16,17 = chitin + proteins
A
B
-200
-100
0
100
200
0
2000
4000
6000
8000
10000
0 20 40 60 80
P-Intensity
(EDX
)
Intensity
(AU)
Spectra num ber(= distance(m m )*20)
1 (orthophosphate)2 (orthophosphate)7 (orthophosphate)P (EDX)
-100
0
100
0
1000
2000
3000
4000
5000
6000
0 20 40 60 80
C-Intensity
(EDX
)
Intensity
(AU)
Spectra num ber(=distance(m m )*20)
3 (carbonate) 9 (carbonate)/1015 (carbonate)*4
Figure 6: Raman-line scans, A) Raman spectra taken at six different coordinates (3-80) as
indicated in the picture (left top) + assignments of the various peaks, B) Intensity of the
Raman peaks as a function of spectra number for orthophosphate and corresponding P-EDS
data (left top), carbonate and corresponding C-EDS data (right top), chitin + aromatic protein
+ PEP/citrate (left bottom) and non-aromatic protein+chitin (right bottom).
22

Raman also reveals multiple signals of organic components. Here,
chitin signals are most intense in the late external layers of the
gastrolith, decreasing stepwise when approaching the earlier
deposited inner parts. Its trend is similar to signals that can be
appointed to aromatic amino acids (phenylalanine, tryptophan,
tyrosine), which is not surprising as α-chitin fibers in crayfish
are described to be coated by these protein residues (Iconomidou et
al., 2001). Furthermore, its trend seems to be opposite to the
inorganic phosphate, but this doesn’t hold for all samples. Using
the WAXS data on the embedded samples, we are able to qualitatively
follow the amount of chitin at different positions in the gastrolith
by measuring the intensity of the chitin (110) peak throughout the
gastrolith cross-section, and dividing it by the total area of
scattering intensity (Fig. 7C). Also from these results we can
observe that the gastrolith consists of chitin-rich and chitin-poor
regions, but not necessarily increasing in chitin content from the
inner to the external regions, or following changes in phosphate
concentration.
In the Raman spectrum of the external layers, a small signal at 786
cm-1 was observed. This signal can be assigned to either the main
peak of PEP and/or citrate (De Gelder et al., 2007), both components
that were described to be possible candidates for ACC stabilization
in gastroliths (Sato et al., 2011; Akiva-Tal et al., 2011).
23

Corresponding to this research (Akiva-Tal et al., 2011), the
concentration of PEP and/or citrate seems to be very small;
additionally our study shows that their distribution has only
limited overlap with inorganic phosphate. A signal at 851 cm-1 can be
assigned to a non-aromatic amino acid like serine. Looking at its
trend, and at the trend of the alkyl region between 2880 cm-1 and
2940 cm-1, they seem to coincide completely in the oldest deposited,
innermost parts of the gastrolith.
10 20 30 400
2000
4000
Intensity(AU
)
q (nm -1)
chitin (110)
AM O 1AM O 2
1,15
1,2
1,25
1,3
1,35
1,4
1,45
21,5
21,6
21,7
21,8
21,9
0 1 2 3 4
Area
AMO2/ A
MO 1
Positio
nAMO1(q,nm -1)
0
50
100
150
200
250
0,03
0,04
0,05
0,06
0,07
0,08
0 1 2 3 4
P-Intensity
(EDX
)
Area
(Chitin
110)/TotalArea
Distance from external later (m m )
Gastrolith 1
10 20 30 400
1000
2000
3000
Intensity(AU
)
q (nm-1)
Gastrolith 2
chitin (110)
AM O 1
AM O 2
0,8
0,9
1
1,1
1,2
21,4
21,5
21,6
21,7
21,8
21,9
22
0 0,5 1 1,5 2
Area
AMO2 /A
MO1
PositionAM
O1(nm-1)
0
100
200
300
400
0
0,02
0,04
0,06
0,08
0 0,5 1 1,5 2
P-intensity
(EDX
)
Area (C
hitin
110)/T
otal Area
Distance from externallayer(m m )
A
B
C
A*
20 30 40
0
200
400
AM O 1
AMO 2
AM O 2
Intensity
(AU)
q (nm
Figure 7: WAXS analysis on two cross-sections of embedded gastroliths showing, A) the
radially integrated WAXS pattern where the inset (A*) shows the XRD diffraction pattern of a
24

synthetic ACC and ACP, B) the position of AMO1 (black) and ratio between AMO2/AMO1 (red)
as a function of the distance from the outermost external layer and C) the corrected area of
the chitin (110) signal and P-intensity as measured by EDS as a function of the distance from
the outermost external layer. Dashed lines show the correlation between the P-rich regions in
EDS and the decrease in AMO 1 position and AMO2/AMO1 ratio in both samples.
Discussion
When analyzing biological samples like gastroliths, there is a large
variation between individual specimens. Therefore, the utmost
attention must be taken when drawing general conclusions out of this
data, irrespective of the sample size analyzed. However, there is
something to be learned from this sample variation itself. As
explained in the introduction, the gastrolith is built up by
deposition of a chitin matrix and subsequent mineralization of this
matrix by spherical mineral particles, which are excreted by
neighboring epithelial cells. This process repeats itself over and
over, resulting in the observed layered structure (Travis, 1963).
Whereas the way the gastrolith is formed seems similar throughout
the growth process, the composition of the deposited mineral
particles changes in different manners. A prime example is the
inorganic phosphate content, where depending on the layer
investigated, sometimes higher and sometimes lower amounts are
25

present inside the ACC. The reason for this phenomenon could be
different; however, while the gastrolith develops in 14 days
(Shechter et al., 2008a) growing ~ 500 µm a day, this seems too fast
for fluctuations in phosphate availability by a changing diet, or by
resorbing different parts of the old exoskeleton. As phosphate is
found to be a necessary constituent of the crayfish’ exoskeleton,
used for the production of the enamel-like teeth (Bentov et al.,
2012), a more sophisticated signaling strategy that controls the
amount of phosphate inside the gastrolith could also be an option.
However, this might over interpret the role of the gastrolith as it
represents only a fraction of the total amount of mineral used for
molding (Travis, 1963). Nevertheless, as a result of these
compositional changes within a single gastrolith, differences
between individual gastroliths may be huge. This is especially true
when taking into account differences caused by the age of the
crayfish (molt cycles are much shorter with young crayfish), and its
diet. What is most remarkable here is that despite of this huge
variation, the mineral inside the gastrolith in all cases is a very
stable amorphous mineral. Other than concluding that, obviously, a
wide range of phosphate concentrations lead to a similar stability,
our Raman results show that even without a detectable amount of
phosphate in the external layers of the gastrolith, there still is a
stable amorphous calcium carbonate. However, here we do see evidence
26

for the presence of phosphoenolpyruvate (PEP) and/or citrate, also
discussed to be stabilizing agents for ACC in gastroliths (Sato et
al., 2011; Akiva-Tal et al., 2011). This result indicates that from
layer to layer the amorphous calcium carbonate can be stabilized
using a different stabilizing agent. Furthermore, it is quite
understandable that 100 nm to 200 nm-sized granules do not
crystallize due to a combination of size restriction and presence of
phosphate or citrate/PEP. However, in the gastrolith we observe that
even at places where these granules are agglomerated into µm-sized
prismatic features, and at the same time phosphate amounts are low,
the mineral is still amorphous. In these, predominantly early
deposited inner regions, we do see a dense layering of chitin
fibers/protein by SEM and SAXS. Such a structure doesn’t only
correspond to the GAMP-rich layers described in literature (Takagi
et al., 2000), but possibly opens the well-discussed pathway of
gastrolith proteins forming a link between the mineral and the
chitin matrix and/or stabilizing the amorphous mineral (Glazer et
al., 2010; Glazer and Sagi, 2012; Shechter et al., 2008b; Takagi et
al., 2000; Yudkovski et al., 2010). Additionally, the described
correlation between these proteins and the chitin scaffold could be
an explanation for the observed increase in apparent chitin fiber
size in SEM to 10-20 nm (Fig 3E) in the earlier deposited inner
27

layers, as well as the increase in protein content in Raman
proceeding towards these layers (Fig. 6B).
Conclusion
By the use of spatially-resolved analysis we have shown that the
crayfish gastrolith has a large variation in composition between
different radially distributed layers, reflecting changes in amounts
of inorganic phosphate, protein content, chitin or small molecules
like citrate or PEP. As everywhere in the gastrolith a stable
amorphous mineral is present, the absence or presence of some of
these additives in specific layers, in addition to the ACC bulk,
indicates that there is not one but multiple strategies involved in
stabilizing the gastrolithic ACC.
Acknowledgements
We thank Stefan Siegel and Chenghao Li for support during the SAXS
+WAXS measurements at the μ-Spot beamline at BESSY II, Helmholtz-
Zentrum Berlin, Ingrid Zenke for support with XRD measurements and
Matthew A. Hood for editing the paper. We acknowledge financial
support from the German Israeli Foundation (GIF), Research Grant No.
950-9.5/2007.
28

References
Addadi, L., Raz, S., Weiner, S., 2003. Taking Advantage of Disorder:
Amorphous Calcium Carbonate and Its Roles in Biomineralization.
Advanced Materials 15(12), 959-970.
Aizenberg, J., Lambert, G., Addadi, L., and Weiner, S. ,1996.
Stabilization of amorphous calcium carbonate by specialized
macromolecules in biological and synthetic precipitates. Adv. Mater.
8:222–226
Akiva-Tal, A., Kababya, S., Balazs, Y.S., Glazer, L., Berman, A.,
Sagi, A., Schmidt, A., 2011. In situ molecular NMR picture of
bioavailable calcium stabilized as amorphous CaCO3 biomineral in
crayfish gastroliths. Proceedings of the National Academy of
Sciences USA 108, 14763-14768.
Beniash, E., Aizenberg, J., Addadi, L., Weiner, S., 1997. Amorphous
calcium carbonate transforms into calcite during sea urchin larval
spicule growth. Proceedings of the Royal Society of London, Section
B 264, 461-465.
Bentov, S., Zaslansky, P., Al-Sawalmih, A., Masic, A., Fratzl, P.,
Sagi, A., Berman, A., Aichmayer, B., 2012. Enamel-like apatite crown
29

covering amorphous mineral in a crayfish mandible. Nature
Communications 3, 839.
De Gelder, J., De Gussem, K., Vandenabeele, P., Moens, L., 2007.
Reference database of Raman spectra of biological molecules. Journal
of Raman Spectroscopy 38, 1133-1147.
Glatter, O., Kratky, O., 1982. Small angle X-ray scattering.
Academic Press Inc, London, p 35-36.
Glazer, L., Sagi, A., 2012. On the involvement of proteins in the
assembly of the crayfish gastrolith extracellular matrix.
Invertebrate Reproduction & Development 56, 57-65.
Glazer, L., Schechter, A., Tom, M., Yudkovski, Y., Well, S., Aflalo,
E.D., Pamuru, R.R., Khalaila, I., Bentov, S., Berman, A., Sagi, A.,
2010. A protein involved in the assembly of an extracellular calcium
storage matrix. The Journal of Biological Chemistry 285, 12831-
12839.
Huxley, T.H., 1880. The Crayfish. An Introduction to the Study of
Zoology. Appleton and Company, New York.
Iconomidou, V.A., Chryssikos, G.D., Gionis, V., Willis, J.H.,
Hamodrakas, S.J., 2001. “Soft”-cuticle protein secondary structure
as revealed by FT-Raman, ATR-FTIR and CD spectroscopy. Insect
Biochemistry and Molecular Biology 31(9), 877-885.
30

Ihli, J., Kim, Y-Y, Noel, E.H., Meldrum, F.C., 2013. The Effect of
Additives on Amorphous Calcium Carbonate (ACC): Janus Behavior in
Solution and the Solid State. Advanced Functional Materials 23,
1575-1585.
Mahamid, J., Sharir, A., Gur, D., Zelzer, E., Addadi, L., Weiner,
S., 2011. Bone mineralization proceeds through intracellular calcium
phosphate loaded vesicles; a cryo-electron microscopy study. Journal
of Structural Biology 174, 527-535.
Olszta, M.J., Cheng, X., Jee, S.S., Kumar, R., Kim, Y., Kaufman,
M.J., Douglas, E.P., Gower, L.B., 2007. Bone structure and
formation: a new perspective. Materials Science and Enigneering: R:
Reports 58, 77-116.
Paris, O., Li, C., Siegel, S., Weseloh, G., Emmerling, F.,
Riesemeier, H., Erko, A., Fratzl, P., 2007. A new experimental
station for simultaneous X-ray microbeam scanning for small- and
wide-angle scattering and fluorescence at BESSY II. Journal of
Applied Crystallography 40, s466-s470.
Politi, Y., Arad, T., Klein, E., Weiner, S., Addadi, L., 2004. Sea
urchin spine forms via a transient amorphous calcium carbonate
phase. Science 306, 1161-1164.
31

Politi, Y., Batchelor, D.R., Zaslansky, P., Chmelka, B.F., Weaver,
J., Sagi, I., Weiner, S., Addadi, L., 2010. Role of magnesium ion in
the stabilization of biogenic amorphous calcium carbonate; a
structure-function investigation. Chemistry of Materials 22, 161-
166.
Sato, A., Nagasaka, S., Furihata, K., Nagata, S., Arai, I.,
Saruwatari, K., Kogure, T., Sakuda, S., Nagasawa, H., 2011.
Glycolitic intermediates induce amorphous calcium carbonate
formation in crustaceans. Nature Chemical Biology 7, 197-199.
Sawada, K., 1997. The mechanisms of crystallization and
transformation of calcium carbonates. Pure & Applied Chemistry 69,
921-928.
Shechter, A., Berman, A., Singer, A., Freiman, A., Grinstein, M.,
Erez, J., Aflato, E.D., Sagi, A., 2008a. Reciprocal changes in
calcification of the gastrolith and cuticle during the molt cycle of
the red claw crayfish cherax quadricarinatus. Biological Bulletin 214,
122-134.
Shechter, A., Glazer, L., Cheled, S., Mor, E., Weil, S., Berman, A.,
Bentov, S., Aflalo, E.D., Khalaila, I., Sagi, A., 2008b. A
gastrolith protein serving a dual role in the formation of amorphous
mineral containing extracellular matrix. Proceedings of the National
Academy of Sciences USA 105, 7129-7134.
32

Takagi, Y., Ishii, K., Ozaki, N., Nagasawa, H., 2000.
Immunolocalization of gastrolith matrix protein (GAMP) in the
gastroliths and the exoskeleton of crayfish, procambarus clarkii.
Zoological Science 17, 179-184.
Termine, J.D., Peckauskas, R.A., Posner, A.S., 1970. Calcium
phosphate formation in vitro II. Effects of environment on
amorphous-crystalline transformation. Archives of Biochemistry and
Biophysics 140, 318-328.
Travis, D.F., 1963. Structural features of mineralization from
tissue to macromolecular levels of organization in the decapod
crustacean. Annals New York Academy of Sciences 109, 177-245.
Yudkovski, Y., Glazer, L., Schechter, A., Reinhardt, R., Chalfa-
Caspi, V., Sagi, A., Tom, M., 2010. Multi-transcript expression
patterns in the gastrolith and the hypodermis of the crayfish cherax
quadricarinatus at premolt. Comparative Biochemistry and Physiology Part
D 5, 171-177.
33
Copyright © 2022 FDOKUMEN