
Secured Perimeter with Electromagnetic Detection and ... - MDPI
28
sensors Article Secured Perimeter with Electromagnetic Detection and Tracking with Drone Embedded and Static Cameras Pedro Teixidó 1 , Juan Antonio Gómez-Galán 2, * , Rafael Caballero 3 , Francisco J. Pérez-Grau 3 , José M. Hinojo-Montero 4 , Fernando Muñoz-Chavero 4 and Juan Aponte 1 Citation: Teixidó, P.; Gómez-Galán, J.A.; Caballero, R.; Pérez-Grau, F.J.; Hinojo-Montero, J.M.; Muñoz-Chavero, F.; Aponte, J. Secured Perimeter with Electromagnetic Detection and Tracking with Drone Embedded and Static Cameras. Sensors 2021, 21, 7379. https://doi.org/10.3390/s21217379 Academic Editor: Zhiyuan (Thomas) Tan Received: 22 September 2021 Accepted: 4 November 2021 Published: 6 November 2021 Publisher’s Note: MDPI stays neutral with regard to jurisdictional claims in published maps and institutional affil- iations. Copyright: © 2021 by the authors. Licensee MDPI, Basel, Switzerland. This article is an open access article distributed under the terms and conditions of the Creative Commons Attribution (CC BY) license (https:// creativecommons.org/licenses/by/ 4.0/). 1 OnTech Security LLC, C/Hispano Aviación, 7-9, 41300 Seville, Spain; [email protected] (P.T.); [email protected] (J.A.) 2 Departamento de Ingeniería Electrónica, Sistemas Informáticos y Automática, Universidad de Huelva, 21007 Huelva, Spain 3 Advanced Center for Aerospace Technologies, C/Wilbur y Orville Wright 17-19-21, 41300 Seville, Spain; [email protected] (R.C.); [email protected] (F.J.P.-G.) 4 Departamento de Ingeniería Electrónica, ETS Ingenieros, Universidad de Sevilla, 41092 Seville, Spain; [email protected] (J.M.H.-M.); [email protected] (F.M.-C.) * Correspondence: [email protected] Abstract: Perimeter detection systems detect intruders penetrating protected areas, but modern solutions require the combination of smart detectors, information networks and controlling software to reduce false alarms and extend detection range. The current solutions available to secure a perimeter (infrared and motion sensors, fiber optics, cameras, radar, among others) have several problems, such as sensitivity to weather conditions or the high failure alarm rate that forces the need for human supervision. The system exposed in this paper overcomes these problems by combining a perimeter security system based on CEMF (control of electromagnetic fields) sensing technology, a set of video cameras that remain powered off except when an event has been detected. An autonomous drone is also informed where the event has been initially detected. Then, it flies through computer vision to follow the intruder for as long as they remain within the perimeter. This paper covers a detailed view of how all three components cooperate in harmony to protect a perimeter effectively, without having to worry about false alarms, blinding due to weather conditions, clearance areas, or privacy issues. The system also provides extra information of where the intruder is or has been, at all times, no matter whether they have become mixed up with more people or not during the attack. Keywords: perimeter; detector; preventive; intrusion; alarm; cameras; drone; CEMF 1. Introduction In recent years, intrusion detection sensing systems have expanded significantly to meet the growing demand for improved security. Increasing investments for infrastructure development have widened the scope for the growth of the perimeter security market. Between 2014 and 2025, around 78 trillion USD is projected to be spent on infrastructure development worldwide [1]. Reducing the vulnerabilities of critical infrastructure and increasing its resilience is one of the primary objectives of the European Union (EU). The European Programme for Critical Infrastructure Protection (EPCIP) sets the overall framework for activities to improve the protection of critical infrastructures in Europe—across all EU States and in all relevant sectors of economic activity [2]. With increasing security threats in Europe and worldwide, organizations managing critical infrastructures such as hydroelectric, solar, nuclear, or thermal power plants and oil refineries or wastewater treatment plants have a growing need for enhanced perimeter protection systems with reduced false alarm rates and preventive detection capabilities. Modern integrated surveillance and security management systems require the im- plementation of smart detectors, information networks and controlling software. While Sensors 2021, 21, 7379. https://doi.org/10.3390/s21217379 https://www.mdpi.com/journal/sensors
-
Upload
khangminh22 -
Category
Documents
-
view
2 -
download
0
Transcript of Secured Perimeter with Electromagnetic Detection and ... - MDPI
sensors
Article
Secured Perimeter with Electromagnetic Detection and Trackingwith Drone Embedded and Static Cameras
Pedro Teixidó 1, Juan Antonio Gómez-Galán 2,* , Rafael Caballero 3, Francisco J. Pérez-Grau 3,José M. Hinojo-Montero 4 , Fernando Muñoz-Chavero 4 and Juan Aponte 1
�����������������
Citation: Teixidó, P.; Gómez-Galán,
J.A.; Caballero, R.; Pérez-Grau, F.J.;
Hinojo-Montero, J.M.;
Muñoz-Chavero, F.; Aponte, J.
Secured Perimeter with
Electromagnetic Detection and
Tracking with Drone Embedded and
Static Cameras. Sensors 2021, 21, 7379.
https://doi.org/10.3390/s21217379
Academic Editor: Zhiyuan
(Thomas) Tan
Received: 22 September 2021
Accepted: 4 November 2021
Published: 6 November 2021
Publisher’s Note: MDPI stays neutral
with regard to jurisdictional claims in
published maps and institutional affil-
iations.
Copyright: © 2021 by the authors.
Licensee MDPI, Basel, Switzerland.
This article is an open access article
distributed under the terms and
conditions of the Creative Commons
Attribution (CC BY) license (https://
creativecommons.org/licenses/by/
4.0/).
1 OnTech Security LLC, C/Hispano Aviación, 7-9, 41300 Seville, Spain; [email protected] (P.T.);[email protected] (J.A.)
2 Departamento de Ingeniería Electrónica, Sistemas Informáticos y Automática, Universidad de Huelva,21007 Huelva, Spain
3 Advanced Center for Aerospace Technologies, C/Wilbur y Orville Wright 17-19-21, 41300 Seville, Spain;[email protected] (R.C.); [email protected] (F.J.P.-G.)
4 Departamento de Ingeniería Electrónica, ETS Ingenieros, Universidad de Sevilla, 41092 Seville, Spain;[email protected] (J.M.H.-M.); [email protected] (F.M.-C.)
* Correspondence: [email protected]
Abstract: Perimeter detection systems detect intruders penetrating protected areas, but modernsolutions require the combination of smart detectors, information networks and controlling softwareto reduce false alarms and extend detection range. The current solutions available to secure aperimeter (infrared and motion sensors, fiber optics, cameras, radar, among others) have severalproblems, such as sensitivity to weather conditions or the high failure alarm rate that forces the needfor human supervision. The system exposed in this paper overcomes these problems by combining aperimeter security system based on CEMF (control of electromagnetic fields) sensing technology, a setof video cameras that remain powered off except when an event has been detected. An autonomousdrone is also informed where the event has been initially detected. Then, it flies through computervision to follow the intruder for as long as they remain within the perimeter. This paper covers adetailed view of how all three components cooperate in harmony to protect a perimeter effectively,without having to worry about false alarms, blinding due to weather conditions, clearance areas, orprivacy issues. The system also provides extra information of where the intruder is or has been, at alltimes, no matter whether they have become mixed up with more people or not during the attack.
Keywords: perimeter; detector; preventive; intrusion; alarm; cameras; drone; CEMF
1. Introduction
In recent years, intrusion detection sensing systems have expanded significantly tomeet the growing demand for improved security. Increasing investments for infrastructuredevelopment have widened the scope for the growth of the perimeter security market.Between 2014 and 2025, around 78 trillion USD is projected to be spent on infrastructuredevelopment worldwide [1].
Reducing the vulnerabilities of critical infrastructure and increasing its resilience isone of the primary objectives of the European Union (EU). The European Programmefor Critical Infrastructure Protection (EPCIP) sets the overall framework for activities toimprove the protection of critical infrastructures in Europe—across all EU States and in allrelevant sectors of economic activity [2]. With increasing security threats in Europe andworldwide, organizations managing critical infrastructures such as hydroelectric, solar,nuclear, or thermal power plants and oil refineries or wastewater treatment plants have agrowing need for enhanced perimeter protection systems with reduced false alarm ratesand preventive detection capabilities.
Modern integrated surveillance and security management systems require the im-plementation of smart detectors, information networks and controlling software. While
Sensors 2021, 21, 7379. https://doi.org/10.3390/s21217379 https://www.mdpi.com/journal/sensors

Sensors 2021, 21, 7379 2 of 28
only “real” alarms, representing threats, should be detected by the sensors in an idealcase, the reality is that the devices generate many unnecessary warnings. These events canbe classified as false alarms or as nuisance alarms. False alarms are produced by eventsthat should not trigger an alarm. On the other hand, nuisance alarms are generated by alegitimate cause, but without it representing a real threat. In electronic security systemsfor critical facilities and infrastructure protection, the sensors most frequently used bythe intrusion detection subsystems are the passive and active infrared, accelerometer, mi-crowave, ultrasonic, optical fiber (FBG) sensors and perimeter protection based on buriedsensors [3–8]. Infrared and motion sensors suffer severe range reduction in rain and fog.They are limited to direct line of sight detection and can be triggered by any kind of movingobject. Fiber-optic and microphonic cable detection systems suffer from elevated faultalarm rates. Ground radar systems, microwave barriers and buried systems require alarge clearance area free of vegetation and obstacles to operate properly. Camera-basedsystems usually require human supervision, and they are often in conflict with the GDPR.Electrostatic field disturbance sensors have a nearly zero fault alarm rate but cannot trackthe intruder once inside the property. Therefore, the efficacy of most of them is oftenlimited by high false alarm rates (>40% false alarms, on average) and the detection range.
Regarding the electrostatic field sensors, it is a known approach of capacitive sensingbased on the disturbance in the electric field created between a driving electrode and asensing electrode [9,10]. Capacitive sensing has gained increasing importance in the lastdecades and is successfully employed in various applications in industrial and automotivetechnologies because it involves low-cost, design simplicity, high sensitivity, no directcontact with the measured object, and frequency stability [11]. Several works have beenreported on this detection principle [12–16]. Seat occupancy detection for air-bag controlin vehicles based on electrostatic field sensing has been presented in [12], providinginformation about the presence, type and position of an occupant using eleven transmittingelectrodes and a common receiving electrode. In [14], a capacitive proximity sensor basedon the transmit mode for the application of human−computer interaction is presented. Acombination of inductive and capacitive sensing modes can help to distinguish differentobjects and obtain distance information [15], since inductive sensors are a recognizedtechnology for sensing metallic objects, yet their sensitivity to materials that possess lowconductivities or are nonmagnetic, such as the human body, are much lower [16].
The integration of multiple intrusion-detection technologies into a given sensing so-lution provides it with better robustness and reliability when compared with approachesbased on a single technology. However, attempting to reduce false alarms can be detrimen-tal to detection probability. On the other hand, camera systems tend to be the preferredsolution for the security systems of critical facilities. They present high costs in both op-eration and maintenance, while having a low probability of preventing threats. This lowprobability is related to the system dependency of threat identification on the operator’srecognition of the camera images presented on various screens and the cabling needs ofthe devices, which can generate restrictions on the areas that can be monitored. Somesolutions propose a multiple-sensor platform with video analysis to detect and classifymobile objects [17–20]. These technologies are not power efficient in operation becausesensors and cameras must always be operational to be prepared for a possible intrusion(resulting in a 60–80% energy inefficiency).
The proposed approach aims to achieve a scalable and cost-effective security solutionto be deployed on large perimeters of critical infrastructure with reduced operational costssince it can reduce the amount of video monitoring data to be processed and decrease theworkforce costs to the automatic intruder tracking. The CEMF technology comes into playwith a more extended detection range (20 m/sensor) and reduced false alarms (<10%) whilebeing able to work on all terrains and independent of weather conditions. This technologycan differentiate between different types of events, objects, animals, or persons. This abilityenables a preventive feature that allows it to generate an alarm before an intrusion occurs.Finally, as cameras remain inoperative except when an event is detected in its field of

Sensors 2021, 21, 7379 3 of 28
view, the system decreases power consumption by reducing the use of video surveillanceby around 95.8% in comparison to other systems (none of them can deactivate the videosurveillance), as well as the amount of data that has to be saved in data centers.
Across this study, a detailed view on how the disruptive CEMF technology works isobtained, and how the usage of an ensemble that joins traditional algorithms, a randomforest and a neuronal network, can provide a great level of discrimination between events.Such achievement allows for a sophisticated video tracking system to be triggered on anydangerous alarm. This complementary video tracking system combines fixed camerasand a drone embarked camera to provide a continuous stream of video showing wherethe intruder is at all times, no matter whether they have moved away from the fixedcameras. This paper also describes the different techniques used to analyze video, andhow the algorithms used for fixed cameras differ from the ones used for the drone camera.This combination of the novel CEMF discriminative perimeter technology, plus a highlyinnovative camera system presents an unprecedented security system.
2. System Overview
The proposed system integrates three main parts. A high-performance perimetersensing network based on CEMF and capable of detecting and differentiating preventiveand intrusive events. A fixed camera network, installed along the perimeter that remainsoff at all times except when the sensing network detects an event, a moment in whichonly the camera/s covering that location turn on to send the video data to the server.An unmanned aerial vehicle (UAV) reacts to the detection of an event by flying to theintruder’s location and follows the intruder during the attack, providing video data evenwhen the intruder has walked away from the perimeter. The rest of the necessary parts tocomplete the system: a local server in charge of processing the video streams to perform theintruder tracking and request cameras to switch on/off to maintain the maximum numberof cameras powered off while ensuring video coverage of the intruder at all times; a cloudserver to store a large dataset from which to supply information to a machine learningalgorithm; a monitoring station to communicate events to the operator and provide videodata of the active cameras.
In Figure 1, the six main elements of the proposed solution are represented. Althoughonly three CEMF units are drawn, there can be as many units as required to cover theentire perimeter in a real installation. The electrodes are arranged at two different heightsto cover the entire perimeter. The top-level expands its electromagnetic field over thefence, while the low level covers the lower part. The active detection zone extends 1.5 maway from both electrode levels. The units are separated, 20 m from each other (10 mper electrode), and a camera can be optionally installed with each perimeter unit. Thecameras and the UAV are activated with the location of the CEMF sensor triggered by theintruder. Both systems provide video streaming of the intruder to the local server andthe monitoring station that can be located at any place where an intranet connection isavailable. In contrast, a connection to the internet is required to connect to the remotecloud server.
Sensors 2021, 21, 7379 3 of 29
This ability enables a preventive feature that allows it to generate an alarm before an in-
trusion occurs. Finally, as cameras remain inoperative except when an event is detected
in its field of view, the system decreases power consumption by reducing the use of video
surveillance by around 95.8% in comparison to other systems (none of them can deactivate
the video surveillance), as well as the amount of data that has to be saved in data centers.
Across this study, a detailed view on how the disruptive CEMF technology works is
obtained, and how the usage of an ensemble that joins traditional algorithms, a random
forest and a neuronal network, can provide a great level of discrimination between events.
Such achievement allows for a sophisticated video tracking system to be triggered on any
dangerous alarm. This complementary video tracking system combines fixed cameras and
a drone embarked camera to provide a continuous stream of video showing where the
intruder is at all times, no matter whether they have moved away from the fixed cameras.
This paper also describes the different techniques used to analyze video, and how the
algorithms used for fixed cameras differ from the ones used for the drone camera. This
combination of the novel CEMF discriminative perimeter technology, plus a highly inno-
vative camera system presents an unprecedented security system.
2. System Overview
The proposed system integrates three main parts. A high-performance perimeter
sensing network based on CEMF and capable of detecting and differentiating preventive
and intrusive events. A fixed camera network, installed along the perimeter that remains
off at all times except when the sensing network detects an event, a moment in which only
the camera/s covering that location turn on to send the video data to the server. An un-
manned aerial vehicle (UAV) reacts to the detection of an event by flying to the intruder’s
location and follows the intruder during the attack, providing video data even when the
intruder has walked away from the perimeter. The rest of the necessary parts to complete
the system: a local server in charge of processing the video streams to perform the intruder
tracking and request cameras to switch on/off to maintain the maximum number of cam-
eras powered off while ensuring video coverage of the intruder at all times; a cloud server
to store a large dataset from which to supply information to a machine learning algorithm;
a monitoring station to communicate events to the operator and provide video data of the
active cameras.
In Figure 1, the six main elements of the proposed solution are represented. Although
only three CEMF units are drawn, there can be as many units as required to cover the
entire perimeter in a real installation. The electrodes are arranged at two different heights
to cover the entire perimeter. The top-level expands its electromagnetic field over the
fence, while the low level covers the lower part. The active detection zone extends 1.5 m
away from both electrode levels. The units are separated, 20 m from each other (10 m per
electrode), and a camera can be optionally installed with each perimeter unit. The cameras
and the UAV are activated with the location of the CEMF sensor triggered by the intruder.
Both systems provide video streaming of the intruder to the local server and the monitor-
ing station that can be located at any place where an intranet connection is available. In
contrast, a connection to the internet is required to connect to the remote cloud server.
Figure 1. System overview. Figure 1. System overview.

Sensors 2021, 21, 7379 4 of 28
3. CEMF Secured Perimeter
The basics of the CEMF sensing technology are the simultaneous generation, control,and monitoring of an electromagnetic field. This characteristic has been developed in ahighly innovative technology capable of sensing tiny changes within its electromagneticfield lines. This technology can be easily adapted to work on industrial security, explicitlytargeting critical infrastructures, enabling the surveillance of large perimeters.
The principle of operation relies on the fact that the human body exhibits its ownelectrical characteristics like any other existing object. Electromagnetic charge migratesfrom one object to another when they interact, causing changes in the field. Thus, theCEMF technology continuously measures these differences. It can distinguish and classifydifferent types of events and discriminate between the presence of humans, animals orobjects by analyzing the profile generated by the event. This property enables the systemto detect intruders while ignoring animals or other inoffensive events. In the same way,the system can distinguish whether a human is standing next to the fence or is climbing it,creating a truly preventive and intrusive perimeter sensor.
The proposed solution has specific characteristics that make this device a unique one:
(a) Invisibility: The electromagnetic field generated crosses objects and walls (the fre-quency of operation is in the range of kHz), allowing the sensor to be hiddenbehind or even inside a wall, which is not possible with the conventional IR ormicrowave sensors.
(b) Long Range: The sensor can detect an object up to 10−20 m along the length of a walland 1.5 m beyond the breadth of it.
(c) Discriminative: The technology can detect the perturbation corresponding to a person’sdisruption in the electromagnetic field, different from an object or even an animalperturbation. As a result, the sensor can distinguish between a person and any othertype of intruder, thus reducing false alarms from 40% (other technologies) to 10%.
(d) Preventive detection: Threats are detected even before any harmful actions occur,responding with different alarm levels. The grade of the threat can be measured bydistinguishing between loitering, touching, or climbing the fence without the needof cameras.
(e) Tracking and identifying the intruders: As an intruder moves along the wall, the unitstrack its route along the perimeter.
(f) Personal data protection law-friendly: The cameras can remain switched off most of thetime and switch back on in the event of an alarm.
3.1. Architecture
The hardware was developed according to its size efficiency, low cost, and low powerusage requirements. Power consumption is critical because the intrusion system regulationUNE 50,131 requires devices to have a battery life of at least 30 h. Lowering the powerconsumption reduces the battery capacity, which results in a smaller device size and alower cost. Figure 2 shows the hardware overview diagram of the system.
The system board has four independent CEMF channels, and it performs field genera-tion, data acquisition, signal conditioning, algorithm, communications (both wired andwireless), data storage and power management. A 32-bit PIC32MZ2048 microprocessorfrom Microchip governs the system, capable of running up to 200 MHz and with 120 I/Opins (48 analog), UART, SPI, I2C and USB as well as an embedded real-time clock (RTC).The usage of the Microchip PIC32 was decided in order to reuse the know-how, tooling anda set of stable libraries already developed and validated. Then, within the PIC32 family, alarge memory (flash and ram) and DSP core were required, as neuronal networks had tobe executed. A large number of GPIOs were also required to control all the devices andacquire four CEMF channels as well as an Ethernet MAC to provide connectivity. At thetime of the architectural design, when all the microcontroller’s requirements were applied,the PIC32MZ2048 was the clear choice taking into account the lead time, compatible partsas well as pricing.

Sensors 2021, 21, 7379 5 of 28Sensors 2021, 21, 7379 5 of 29
Figure 2. CEMF sensor architecture.
The system board has four independent CEMF channels, and it performs field gen-
eration, data acquisition, signal conditioning, algorithm, communications (both wired and
wireless), data storage and power management. A 32-bit PIC32MZ2048 microprocessor
from Microchip governs the system, capable of running up to 200 MHz and with 120 I/O
pins (48 analog), UART, SPI, I2C and USB as well as an embedded real-time clock (RTC).
The usage of the Microchip PIC32 was decided in order to reuse the know-how, tooling
and a set of stable libraries already developed and validated. Then, within the PIC32 fam-
ily, a large memory (flash and ram) and DSP core were required, as neuronal networks
had to be executed. A large number of GPIOs were also required to control all the devices
and acquire four CEMF channels as well as an Ethernet MAC to provide connectivity. At
the time of the architectural design, when all the microcontroller’s requirements were ap-
plied, the PIC32MZ2048 was the clear choice taking into account the lead time, compatible
parts as well as pricing.
The communications have been designed in a redundant way to avoid losing con-
nectivity, and thus, the mainboard incorporates the following interfaces: Ethernet, Wi-Fi,
mobile data (3G/4G), USB and Bluetooth. The first three provide connectivity to the lo-
cal/cloud server. Ethernet is the preferred method, followed by Wi-Fi and 3G/4G. The
other two interfaces are designed to provide in situ maintenance, so that a technician can
connect and configure/debug the unit during installation or failure analysis. The board
also has an SD card that can be used for data recording and firmware upgrades on isolated
units. A group of four relays with latch functions is used to communicate with legacy
security systems. The user can configure their behavior in terms of NO/NC output and
concept mapped to each relay.
The system is supplied with AC voltage converted into 5 V DC by a flyback power
supply. Several DC/DC converters have been used to achieve the 3.3 V required to supply
most digital circuits, 18V for the operation of the CEMF sensors, 1.2 V for the Ethernet
switch and 3.8 V for the 3G communications. The power management module also incor-
porates a battery charger able to handle a large LiPo battery of 10 Ah and 3.7 V calculated
to provide enough energy to continue operating for up to 30 h. This battery ensures the
unit never loses connection and sends alerts even if the power grid is disconnected in a
power outage.
Finally, the device includes several tamper sensors to detect manipulation attempts.
An accelerometer to detect position changes, a standard switch to detect the enclosure
Figure 2. CEMF sensor architecture.
The communications have been designed in a redundant way to avoid losing con-nectivity, and thus, the mainboard incorporates the following interfaces: Ethernet, Wi-Fi,mobile data (3G/4G), USB and Bluetooth. The first three provide connectivity to the lo-cal/cloud server. Ethernet is the preferred method, followed by Wi-Fi and 3G/4G. Theother two interfaces are designed to provide in situ maintenance, so that a technician canconnect and configure/debug the unit during installation or failure analysis. The boardalso has an SD card that can be used for data recording and firmware upgrades on isolatedunits. A group of four relays with latch functions is used to communicate with legacysecurity systems. The user can configure their behavior in terms of NO/NC output andconcept mapped to each relay.
The system is supplied with AC voltage converted into 5 V DC by a flyback powersupply. Several DC/DC converters have been used to achieve the 3.3 V required tosupply most digital circuits, 18V for the operation of the CEMF sensors, 1.2 V for theEthernet switch and 3.8 V for the 3G communications. The power management modulealso incorporates a battery charger able to handle a large LiPo battery of 10 Ah and3.7 V calculated to provide enough energy to continue operating for up to 30 h. Thisbattery ensures the unit never loses connection and sends alerts even if the power grid isdisconnected in a power outage.
Finally, the device includes several tamper sensors to detect manipulation attempts.An accelerometer to detect position changes, a standard switch to detect the enclosureaperture, and a hall sensor to detect detachment from its mounting plate with an inte-grated magnet.
Figure 3 shows the CEMF sensor board where the main blocks have been highlightedto provide a clear understanding of block size and complexity. Figure 4 shows the sameboard installed inside its enclosure (enclosure open, see a part of the lid on the left ofthe picture).

Sensors 2021, 21, 7379 6 of 28
Sensors 2021, 21, 7379 6 of 29
aperture, and a hall sensor to detect detachment from its mounting plate with an inte-
grated magnet.
Figure 3 shows the CEMF sensor board where the main blocks have been highlighted
to provide a clear understanding of block size and complexity. Figure 4 shows the same
board installed inside its enclosure (enclosure open, see a part of the lid on the left of the
picture).
Figure 3. CEMF sensor board.
Figure 4. CEMF sensor inside its enclosure.
Figure 3. CEMF sensor board.
Sensors 2021, 21, 7379 6 of 29
aperture, and a hall sensor to detect detachment from its mounting plate with an inte-
grated magnet.
Figure 3 shows the CEMF sensor board where the main blocks have been highlighted
to provide a clear understanding of block size and complexity. Figure 4 shows the same
board installed inside its enclosure (enclosure open, see a part of the lid on the left of the
picture).
Figure 3. CEMF sensor board.
Figure 4. CEMF sensor inside its enclosure.
Figure 4. CEMF sensor inside its enclosure.
3.2. Algorithms
The performance of the CEMF technology relies on both hardware and algorithms. Thealgorithms are responsible for setting the resolution, sample rate, power consumption, rawsignal noise, compensation, filtering, feature extraction, event classification, and applicationprofiling to fulfil the application policies such as the enable, disable, arm or guard times.Figure 5 shows how the data flows across the different blocks of the algorithm to generatethe algorithm output; this section covers, one by one, each of the blocks here stated.

Sensors 2021, 21, 7379 7 of 28
Sensors 2021, 21, 7379 7 of 29
3.2. Algorithms
The performance of the CEMF technology relies on both hardware and algorithms.
The algorithms are responsible for setting the resolution, sample rate, power consump-
tion, raw signal noise, compensation, filtering, feature extraction, event classification, and
application profiling to fulfil the application policies such as the enable, disable, arm or
guard times. Figure 5 shows how the data flows across the different blocks of the algo-
rithm to generate the algorithm output; this section covers, one by one, each of the blocks
here stated.
Figure 5. CEMF algorithm diagram.
The most critical CEMF configuration settings are resolution and sample rate. These
define the sensitivity, noise and power consumption of the system. Other parameters,
such as start and stop times, can be adjusted to fine tune the result.
A thorough characterization has been performed to ensure the correct value of these
parameters to fit the application requirements. This characterization considers a large
number of different approximations of an object for calibration to the electrode. With the
data collected throughout the experiments, a statistical study is conducted to understand
the performance of the raw CEMF technology. These steps have been repeated several
times until the best performance has been found.
Figure 6 shows the CEMF signal along with one of these iterations. The top graph
represents raw sensitivity in CEMF units vs. distance. The second graph is the SNR sensi-
tivity vs. distance, and the last one represents the noise vs. distance in the CEMF units.
Figure 5. CEMF algorithm diagram.
The most critical CEMF configuration settings are resolution and sample rate. Thesedefine the sensitivity, noise and power consumption of the system. Other parameters, suchas start and stop times, can be adjusted to fine tune the result.
A thorough characterization has been performed to ensure the correct value of theseparameters to fit the application requirements. This characterization considers a largenumber of different approximations of an object for calibration to the electrode. With thedata collected throughout the experiments, a statistical study is conducted to understandthe performance of the raw CEMF technology. These steps have been repeated severaltimes until the best performance has been found.
Figure 6 shows the CEMF signal along with one of these iterations. The top graphrepresents raw sensitivity in CEMF units vs. distance. The second graph is the SNRsensitivity vs. distance, and the last one represents the noise vs. distance in the CEMF units.
Sensors 2021, 21, 7379 8 of 29
Figure 6. CEMF characterization.
As shown on the diagram, the CEMF data starts its journey through the Compensation
block. It uses temperature and humidity information plus some of the CEMF data to com-
pensate for the CEMF readings. This process guarantees that data from any sensor look
approximately the same regardless of whether it is installed in a rainy, cold or dry loca-
tion. The same applies to fast and irregular changes due to direct sun and shadow transi-
tions or rain, or any environmental change that could occur to the sensor.
An exponential weighted moving average (EWMA) low-pass filter was chosen to
eliminate undesired noise and focus on the recent past as shown in Figure 7. The magic of
this filter is assigning a weight to each acquired sample, the weight decreases in an expo-
nential way for previous samples. This feature not only gives greater importance to recent
events, but also removes the necessity of storing infinite values, as at some point their
weight is so small that they can be just ignored, as a result, the EWMA can be calculated
with a fixed buffer size.
Figure 7. CEMF compensated signal.
The EWMA can be obtained from the SMA formula (see Equation (1)). The SMA can
be expressed as shown in (1) where 𝜇𝑖 symbolizes the moving average at point 𝑥𝑖. The
variance of the SMA is shown in (2).
𝜇𝑖𝑆𝑀𝐴 =
1
𝑛∑ 𝑥𝑖
𝑛
𝑖=0 (1)
𝜎2 =1
𝑛∑ (𝑥𝑖 − 𝜇)2
𝑛
𝑖=1 (2)
To obtain a weighted moving average (WMA) from the SMA, weights (𝑤) can be
given to previous points used to obtain the mean. Equation (3) shows the formulation of
WMA, where 𝑤𝑖 express the weight at point 𝑥𝑖. The variance of the WMA is shown in
(4).
𝜇𝑖𝑊𝑀𝐴 =
𝑤𝑖𝑥𝑖 + 𝑤𝑖−1𝑥𝑖−1 + 𝑤𝑖−2𝑥𝑖−2 +⋯+ 𝑤𝑖−𝑛𝑥𝑖−𝑛∑ 𝑤𝑖𝑛𝑖=0
=∑ 𝑤𝑖𝑥𝑖𝑛𝑖=0
∑ 𝑤𝑖𝑛𝑖=0
(3)
Figure 6. CEMF characterization.

Sensors 2021, 21, 7379 8 of 28
As shown on the diagram, the CEMF data starts its journey through the Compensationblock. It uses temperature and humidity information plus some of the CEMF data tocompensate for the CEMF readings. This process guarantees that data from any sensorlook approximately the same regardless of whether it is installed in a rainy, cold or drylocation. The same applies to fast and irregular changes due to direct sun and shadowtransitions or rain, or any environmental change that could occur to the sensor.
An exponential weighted moving average (EWMA) low-pass filter was chosen toeliminate undesired noise and focus on the recent past as shown in Figure 7. The magicof this filter is assigning a weight to each acquired sample, the weight decreases in anexponential way for previous samples. This feature not only gives greater importance torecent events, but also removes the necessity of storing infinite values, as at some point theirweight is so small that they can be just ignored, as a result, the EWMA can be calculatedwith a fixed buffer size.
Sensors 2021, 21, 7379 8 of 29
Figure 6. CEMF characterization.
As shown on the diagram, the CEMF data starts its journey through the Compensation
block. It uses temperature and humidity information plus some of the CEMF data to com-
pensate for the CEMF readings. This process guarantees that data from any sensor look
approximately the same regardless of whether it is installed in a rainy, cold or dry loca-
tion. The same applies to fast and irregular changes due to direct sun and shadow transi-
tions or rain, or any environmental change that could occur to the sensor.
An exponential weighted moving average (EWMA) low-pass filter was chosen to
eliminate undesired noise and focus on the recent past as shown in Figure 7. The magic of
this filter is assigning a weight to each acquired sample, the weight decreases in an expo-
nential way for previous samples. This feature not only gives greater importance to recent
events, but also removes the necessity of storing infinite values, as at some point their
weight is so small that they can be just ignored, as a result, the EWMA can be calculated
with a fixed buffer size.
Figure 7. CEMF compensated signal.
The EWMA can be obtained from the SMA formula (see Equation (1)). The SMA can
be expressed as shown in (1) where 𝜇𝑖 symbolizes the moving average at point 𝑥𝑖. The
variance of the SMA is shown in (2).
𝜇𝑖𝑆𝑀𝐴 =
1
𝑛∑ 𝑥𝑖
𝑛
𝑖=0 (1)
𝜎2 =1
𝑛∑ (𝑥𝑖 − 𝜇)2
𝑛
𝑖=1 (2)
To obtain a weighted moving average (WMA) from the SMA, weights (𝑤) can be
given to previous points used to obtain the mean. Equation (3) shows the formulation of
WMA, where 𝑤𝑖 express the weight at point 𝑥𝑖. The variance of the WMA is shown in
(4).
𝜇𝑖𝑊𝑀𝐴 =
𝑤𝑖𝑥𝑖 + 𝑤𝑖−1𝑥𝑖−1 + 𝑤𝑖−2𝑥𝑖−2 +⋯+ 𝑤𝑖−𝑛𝑥𝑖−𝑛∑ 𝑤𝑖𝑛𝑖=0
=∑ 𝑤𝑖𝑥𝑖𝑛𝑖=0
∑ 𝑤𝑖𝑛𝑖=0
(3)
Figure 7. CEMF compensated signal.
The EWMA can be obtained from the SMA formula (see Equation (1)). The SMA canbe expressed as shown in (1) where µi symbolizes the moving average at point xi. Thevariance of the SMA is shown in (2).
µSMAi =
1n ∑ n
i=0xi (1)
σ2 =1n ∑ n
i=1(xi − µ)2 (2)
To obtain a weighted moving average (WMA) from the SMA, weights (w) can be givento previous points used to obtain the mean. Equation (3) shows the formulation of WMA,where wi express the weight at point xi. The variance of the WMA is shown in (4).
µWMAi =
wixi + wi−1xi−1 + wi−2xi−2 + . . . + wi−nxi−n
∑ni=0 wi
=∑n
i=0 wixi
∑ni=0 wi
(3)
σ2 =∑n
i=1 wi(xi − µ)2
∑ni=0 wi
(4)
If the weights are defined as (5), we get the EWMA where the weights decrease in anexponential way for previous values. Thus, the EWMA is presented in (6).
wn = (1 − α)n (5)
µEWMAi =
xi + xi−1(1 − α) + xi−2(1 − α)2 + . . . + xi−n(1 − α)n
∑ni=0(1 − α)i =
∑ni=0 xi(1 − α)i
∑ni=0(1 − α)i (6)

Sensors 2021, 21, 7379 9 of 28
In addition, the variance for the EWMA is shown in (7).
σ2 =∑n
i=1(1 − α)i(xi − µ)2
∑ni=0(1 − α)2 (7)
As can be seen, the weights are defined by α, which defines the depth of the filter. Thevalue of alpha will result in an hyperparameter for the implementation, that needs to beadjusted. As a rule of thumb, the value of alpha that gives a high weight to n number ofprevious samples can be obtained using (8).
α =2
n + 1(8)
Figure 8 demonstrates the performance of the filter implementation with actual datacaptured and filtered on the device. The green represents raw data and is the input ofthe filter, while the yellow represents the filtered data delivered at the output of the filter.Observe how the high frequency changes produced on the input signal are not present onthe output.
Sensors 2021, 21, 7379 9 of 29
𝜎2 =∑ 𝑤𝑖(𝑥𝑖 − 𝜇)
2𝑛𝑖=1
∑ 𝑤𝑖𝑛𝑖=0
(4)
If the weights are defined as (5), we get the EWMA where the weights decrease in an
exponential way for previous values. Thus, the EWMA is presented in (6).
𝑤𝑛 = (1 − 𝛼)𝑛 (5)
𝜇𝑖𝐸𝑊𝑀𝐴 =
𝑥𝑖 + 𝑥𝑖−1(1 − 𝛼) + 𝑥𝑖−2(1 − 𝛼)2 +⋯+ 𝑥𝑖−𝑛(1 − 𝛼)𝑛
∑ (1 − 𝛼)𝑖𝑛𝑖=0
=∑ 𝑥𝑖(1 − 𝛼)𝑖𝑛𝑖=0
∑ (1 − 𝛼)𝑖𝑛𝑖=0
(6)
In addition, the variance for the EWMA is shown in (7).
𝜎2 =∑ (1 − 𝛼)𝑖(𝑥𝑖 − 𝜇)2𝑛𝑖=1
∑ (1 − 𝛼)2𝑛𝑖=0
(7)
As can be seen, the weights are defined by α, which defines the depth of the filter.
The value of alpha will result in an hyperparameter for the implementation, that needs to
be adjusted. As a rule of thumb, the value of alpha that gives a high weight to 𝑛 number
of previous samples can be obtained using (8).
𝛼 =2
𝑛 + 1
(8)
Figure 8 demonstrates the performance of the filter implementation with actual data
captured and filtered on the device. The green represents raw data and is the input of the
filter, while the yellow represents the filtered data delivered at the output of the filter.
Observe how the high frequency changes produced on the input signal are not present on
the output.
Figure 8. EWMA filter performance.
The following stage extracts features from all CEMF channels and their relationships.
These features help the classifier to separate events that may appear similar by looking
only at the CEMF signals directly:
• Correlation for left−left, right−right, top−top, bottom−bottom and all channels;
• Maximum and minimum for all channels;
• Skewness for all channels;
• Standard deviation envelope for all channels;
• Variance for all channels;
• Derivative signal for all channels (differentiation).
Figure 9 shows an example of the skewness analysis. Observe how this analysis helps
to separate classes 1 and 2 from classes 3 and 4. Other features help separate different
classes, providing different points of view to help the classifier increase its performance.
Figure 8. EWMA filter performance.
The following stage extracts features from all CEMF channels and their relationships.These features help the classifier to separate events that may appear similar by lookingonly at the CEMF signals directly:
• Correlation for left−left, right−right, top−top, bottom−bottom and all channels;• Maximum and minimum for all channels;• Skewness for all channels;• Standard deviation envelope for all channels;• Variance for all channels;• Derivative signal for all channels (differentiation).
Figure 9 shows an example of the skewness analysis. Observe how this analysis helpsto separate classes 1 and 2 from classes 3 and 4. Other features help separate differentclasses, providing different points of view to help the classifier increase its performance.
All these features are continuously extracted and feed into the classifier for moreaccurate detection. The classifier has been implemented as an ensemble of three differenttechniques. All of them contribute to increase the number of true positives and reduce thenumber of false negatives. The techniques used are random forest, artificial neural network(ANN) and traditionally based on thresholds.
A multiclass random forest has been implemented to distinguish between four classes:idle, prowling, intrusion and cars. The number of trees in the model has been optimizedto reduce the memory footprint as much as possible. For this, the OOB (out of bag)classification error of the model with respect to the number of trees has been used. Asshown in Figure 10, the OOB remains constant from 100 trees onwards. In the right graph,a representation of the final separation made by the random forest is shown.

Sensors 2021, 21, 7379 10 of 28Sensors 2021, 21, 7379 10 of 29
Figure 9. Example of feature extraction (skewness).
All these features are continuously extracted and feed into the classifier for more ac-
curate detection. The classifier has been implemented as an ensemble of three different
techniques. All of them contribute to increase the number of true positives and reduce the
number of false negatives. The techniques used are random forest, artificial neural net-
work (ANN) and traditionally based on thresholds.
A multiclass random forest has been implemented to distinguish between four clas-
ses: idle, prowling, intrusion and cars. The number of trees in the model has been opti-
mized to reduce the memory footprint as much as possible. For this, the OOB (out of bag)
classification error of the model with respect to the number of trees has been used. As
shown in Figure 10, the OOB remains constant from 100 trees onwards. In the right graph,
a representation of the final separation made by the random forest is shown.
Figure 10. Random forest OOB analysis and final class separation.
The second classifier is an ANN network. The input and output layer are fixed to
input parameters and output values, respectively. As output can take four values only
(idle, prowling, intrusion and car), four neurons were used. The input layer takes the com-
pensated and filtered signal plus the six features mentioned above for each one of the four
Figure 9. Example of feature extraction (skewness).
Sensors 2021, 21, 7379 10 of 29
Figure 9. Example of feature extraction (skewness).
All these features are continuously extracted and feed into the classifier for more ac-
curate detection. The classifier has been implemented as an ensemble of three different
techniques. All of them contribute to increase the number of true positives and reduce the
number of false negatives. The techniques used are random forest, artificial neural net-
work (ANN) and traditionally based on thresholds.
A multiclass random forest has been implemented to distinguish between four clas-
ses: idle, prowling, intrusion and cars. The number of trees in the model has been opti-
mized to reduce the memory footprint as much as possible. For this, the OOB (out of bag)
classification error of the model with respect to the number of trees has been used. As
shown in Figure 10, the OOB remains constant from 100 trees onwards. In the right graph,
a representation of the final separation made by the random forest is shown.
Figure 10. Random forest OOB analysis and final class separation.
The second classifier is an ANN network. The input and output layer are fixed to
input parameters and output values, respectively. As output can take four values only
(idle, prowling, intrusion and car), four neurons were used. The input layer takes the com-
pensated and filtered signal plus the six features mentioned above for each one of the four
Figure 10. Random forest OOB analysis and final class separation.
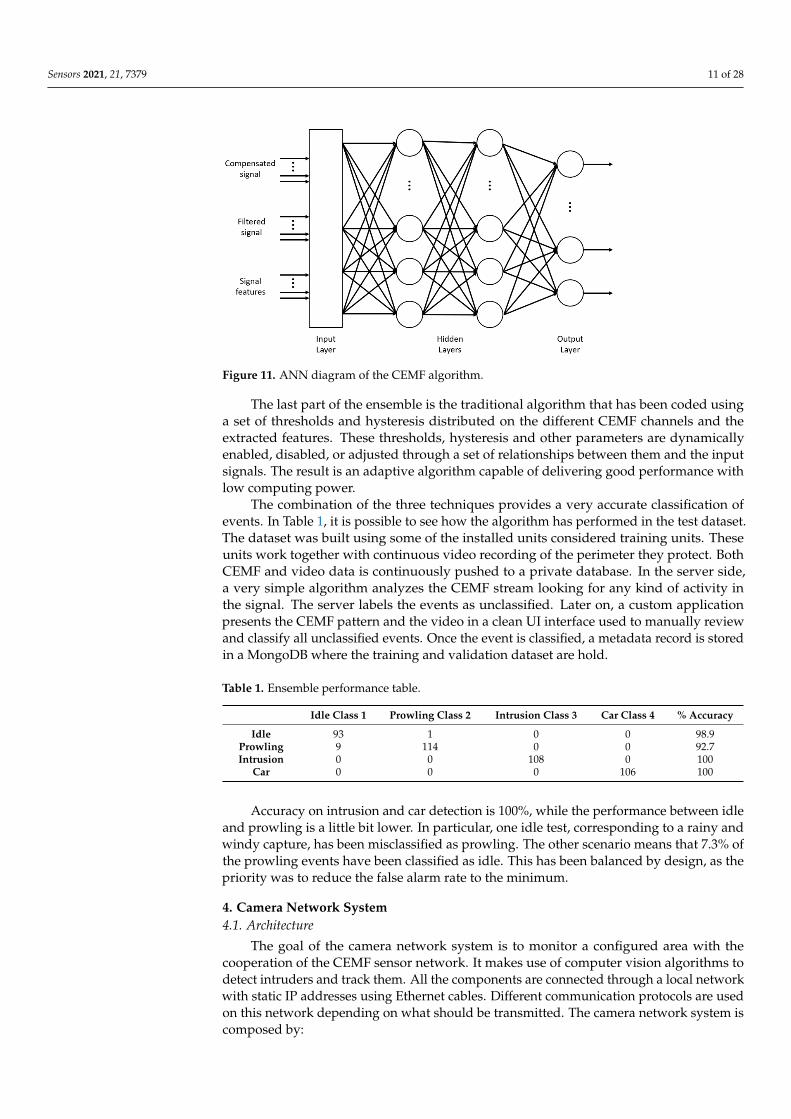
The second classifier is an ANN network. The input and output layer are fixed toinput parameters and output values, respectively. As output can take four values only(idle, prowling, intrusion and car), four neurons were used. The input layer takes thecompensated and filtered signal plus the six features mentioned above for each one of thefour channels. The signals are passed through a max-pooling process in order to down-sample the vectors to four values each. Therefore, the input layer has 56 inputs (plus bias).As input and output are fixed, the number of hidden neurons is the main hyperparameterto optimize. It was important to consider that the complexity of the algorithm growsexponentially with the number of neurons and layers, but its accuracy also increases with it.In this case, the best obtained tradeoff was considering only one dense hidden layer withseven neurons. This number is small enough to be used in real time in the PIC32, whichwas the hardest restriction for this block. The outputs are softmax nodes, as many workshave demonstrated that it offers the best performance for categorical classification, whereonly one output neuron has to be active for each input pattern. The rest of the neurons ofthe network use tanh function. Figure 11 represents the diagram of the described ANN.
Sensors 2021, 21, 7379 11 of 28
Sensors 2021, 21, 7379 11 of 29
channels. The signals are passed through a max-pooling process in order to down-sample
the vectors to four values each. Therefore, the input layer has 56 inputs (plus bias). As
input and output are fixed, the number of hidden neurons is the main hyperparameter to
optimize. It was important to consider that the complexity of the algorithm grows expo-
nentially with the number of neurons and layers, but its accuracy also increases with it. In
this case, the best obtained tradeoff was considering only one dense hidden layer with
seven neurons. This number is small enough to be used in real time in the PIC32, which
was the hardest restriction for this block. The outputs are softmax nodes, as many works
have demonstrated that it offers the best performance for categorical classification, where
only one output neuron has to be active for each input pattern. The rest of the neurons of
the network use tanh function. Figure 11 represents the diagram of the described ANN.
Figure 11. ANN diagram of the CEMF algorithm.
The last part of the ensemble is the traditional algorithm that has been coded using a
set of thresholds and hysteresis distributed on the different CEMF channels and the ex-
tracted features. These thresholds, hysteresis and other parameters are dynamically ena-
bled, disabled, or adjusted through a set of relationships between them and the input sig-
nals. The result is an adaptive algorithm capable of delivering good performance with low
computing power.
The combination of the three techniques provides a very accurate classification of
events. In Table 1, it is possible to see how the algorithm has performed in the test dataset.
The dataset was built using some of the installed units considered training units. These
units work together with continuous video recording of the perimeter they protect. Both
CEMF and video data is continuously pushed to a private database. In the server side, a
very simple algorithm analyzes the CEMF stream looking for any kind of activity in the
signal. The server labels the events as unclassified. Later on, a custom application presents
the CEMF pattern and the video in a clean UI interface used to manually review and clas-
sify all unclassified events. Once the event is classified, a metadata record is stored in a
MongoDB where the training and validation dataset are hold.
Accuracy on intrusion and car detection is 100%, while the performance between idle
and prowling is a little bit lower. In particular, one idle test, corresponding to a rainy and
windy capture, has been misclassified as prowling. The other scenario means that 7.3% of
the prowling events have been classified as idle. This has been balanced by design, as the
priority was to reduce the false alarm rate to the minimum.
Figure 11. ANN diagram of the CEMF algorithm.
The last part of the ensemble is the traditional algorithm that has been coded usinga set of thresholds and hysteresis distributed on the different CEMF channels and theextracted features. These thresholds, hysteresis and other parameters are dynamicallyenabled, disabled, or adjusted through a set of relationships between them and the inputsignals. The result is an adaptive algorithm capable of delivering good performance withlow computing power.
The combination of the three techniques provides a very accurate classification ofevents. In Table 1, it is possible to see how the algorithm has performed in the test dataset.The dataset was built using some of the installed units considered training units. Theseunits work together with continuous video recording of the perimeter they protect. BothCEMF and video data is continuously pushed to a private database. In the server side,a very simple algorithm analyzes the CEMF stream looking for any kind of activity inthe signal. The server labels the events as unclassified. Later on, a custom applicationpresents the CEMF pattern and the video in a clean UI interface used to manually reviewand classify all unclassified events. Once the event is classified, a metadata record is storedin a MongoDB where the training and validation dataset are hold.
Table 1. Ensemble performance table.
Idle Class 1 Prowling Class 2 Intrusion Class 3 Car Class 4 % Accuracy
Idle 93 1 0 0 98.9Prowling 9 114 0 0 92.7Intrusion 0 0 108 0 100
Car 0 0 0 106 100
Accuracy on intrusion and car detection is 100%, while the performance between idleand prowling is a little bit lower. In particular, one idle test, corresponding to a rainy andwindy capture, has been misclassified as prowling. The other scenario means that 7.3% ofthe prowling events have been classified as idle. This has been balanced by design, as thepriority was to reduce the false alarm rate to the minimum.
4. Camera Network System4.1. Architecture
The goal of the camera network system is to monitor a configured area with thecooperation of the CEMF sensor network. It makes use of computer vision algorithms todetect intruders and track them. All the components are connected through a local networkwith static IP addresses using Ethernet cables. Different communication protocols are usedon this network depending on what should be transmitted. The camera network system iscomposed by:

Sensors 2021, 21, 7379 12 of 28
• Cameras: IP cameras were selected since they are a very extended surveillance solution(almost a standard) and also for the characteristics that they may offer. Specifically, thechosen camera is the HIKVISION Network Cam Model DS-2CD2055FWD. Among allits features, it is important to highlight its capacity of changing resolution and othercharacteristics such as the wide range of supported protocols (HTTP, RTSP . . . ). Itis waterproof, making it compatible with an outdoor system. It has a graphical webinterface via HTTP where all the parameters can be set. For this work, a resolution of640p has been set. The frame rate was set to 12 fps to reduce the network load and therequired processing. Regarding the installation position, it is advisable to place themat a minimum height of 3 m and point them slightly downwards to help the computervision algorithm perform its task.
• Data processing unit: The data processing unit is where all the information is pro-cessed. Due to the high computing needs required by computer vision algorithms, anIntel NUC was used. Of course, just one Intel NUC does not have enough computingpower to process the video stream of many cameras simultaneously. Because of this,the system is scalable with extra processing units to distribute the load. Currently,each Intel NUC can simultaneously handle the load of five cameras.
• External monitoring unit: Basically, it is a PC connected to the network to receive theoutput video broadcast by the data processing units. This device must be configured inthe same IP domain range and have some generic software (such as a web browser . . . )that can reproduce HTTP streams.
The general system scheme explained above is shown in Figure 12. As can be seen,every device is connected with each other through the Ethernet fabric. The dashed linesbetween IP cameras, processing units and subsystems represent the possibility of introduc-ing new devices of the same type. The dashed line connecting the Ethernet fabric with themonitoring unit indicates that the system can perfectly operate without it, making it anoptional complement that does not impact the system if, for any reason, it fails.
Sensors 2021, 21, 7379 13 of 29
Figure 12. Video-tracking system scheme.
4.2. Algorithms
As mentioned in 4.1, the processing units are in charge of managing the entire video
stream and alarms generated by the CEMF perimeter, tracking the intruder, and extract-
ing the video stream of the camera with the best view of the intruder. Each processing
unit uses Ubuntu version 16.04 LTS as the operating system. The development is carried
out using C++ and Python programming languages. In addition, specific external libraries
and frameworks were used to facilitate the development and tuning of the system. Among
them, the most important are OpenCV and ROS (Robot Operating System).
The software system was developed with a multiprocessing concurrent pattern in
which each process has a specific function. This pattern helps optimize the processor load
and improves overall performance. Each process is known as a node and uses the ROS
framework to deploy and communicate with others. Figure 13 shows a diagram with the
primary nodes of the system.
Figure 13. Camera network system—overview.
Only one System manager runs in the main data processing unit, while the Camera
subsystem is replicated once per camera and can be instantiated in any data processing
unit. The function of each node is as follows:
Figure 12. Video-tracking system scheme.
4.2. Algorithms
As mentioned in 4.1, the processing units are in charge of managing the entire videostream and alarms generated by the CEMF perimeter, tracking the intruder, and extractingthe video stream of the camera with the best view of the intruder. Each processing unituses Ubuntu version 16.04 LTS as the operating system. The development is carried outusing C++ and Python programming languages. In addition, specific external libraries andframeworks were used to facilitate the development and tuning of the system. Amongthem, the most important are OpenCV and ROS (Robot Operating System).
The software system was developed with a multiprocessing concurrent pattern inwhich each process has a specific function. This pattern helps optimize the processor load

Sensors 2021, 21, 7379 13 of 28
and improves overall performance. Each process is known as a node and uses the ROSframework to deploy and communicate with others. Figure 13 shows a diagram with theprimary nodes of the system.
Sensors 2021, 21, 7379 13 of 29
Figure 12. Video-tracking system scheme.
4.2. Algorithms
As mentioned in 4.1, the processing units are in charge of managing the entire video
stream and alarms generated by the CEMF perimeter, tracking the intruder, and extract-
ing the video stream of the camera with the best view of the intruder. Each processing
unit uses Ubuntu version 16.04 LTS as the operating system. The development is carried
out using C++ and Python programming languages. In addition, specific external libraries
and frameworks were used to facilitate the development and tuning of the system. Among
them, the most important are OpenCV and ROS (Robot Operating System).
The software system was developed with a multiprocessing concurrent pattern in
which each process has a specific function. This pattern helps optimize the processor load
and improves overall performance. Each process is known as a node and uses the ROS
framework to deploy and communicate with others. Figure 13 shows a diagram with the
primary nodes of the system.
Figure 13. Camera network system—overview.
Only one System manager runs in the main data processing unit, while the Camera
subsystem is replicated once per camera and can be instantiated in any data processing
unit. The function of each node is as follows:
Figure 13. Camera network system—overview.
Only one System manager runs in the main data processing unit, while the Camerasubsystem is replicated once per camera and can be instantiated in any data processing unit.The function of each node is as follows:
4.2.1. Camera Subsystem
a. IP Stream Converter. This node is responsible for establishing a connection withits associated IP camera. The camera sends the frames to this node through theRTSP protocol, converting them to a format suitable for processing by the rest of thenodes. If the connection between the camera and the node is interrupted or cannot beestablished, the process keeps trying to establish the connection.
b. Image Detection. It receives frames from the IP Stream Converter and processes them toextract the detections. This process with the heaviest load is performed by a pipelinewith the algorithm stages shown in Figure 14.
Preprocessing. The first step is the preprocessing stage. It uses an edge-preservingsmoothing technique to reduce resolution, accelerate the image process, and clean up theimage to avoid pixel noise impacting the next pipeline stage (Figure 15).
Background subtraction. After preprocessing has been done, a foreground object detec-tion technique is used to remove static parts of the image. The technique used is MOG(mixture of Gaussians) [21,22]. This algorithm aims to apply background subtraction to de-tect shadows and just background and foreground pixels (Figure 16). It creates a Gaussianmodel for each one of them. As it considers small object movements as part of the model, alonger training time is required. This tolerance to small changes makes it more reliable in arange of more realistic situations, such as changes in light or movements of branches ofa tree.

Sensors 2021, 21, 7379 14 of 28
Sensors 2021, 21, 7379 14 of 29
4.2.1. Camera Subsystem
a. IP Stream Converter. This node is responsible for establishing a connection with its
associated IP camera. The camera sends the frames to this node through the RTSP
protocol, converting them to a format suitable for processing by the rest of the nodes.
If the connection between the camera and the node is interrupted or cannot be estab-
lished, the process keeps trying to establish the connection.
b. Image Detection. It receives frames from the IP Stream Converter and processes them
to extract the detections. This process with the heaviest load is performed by a pipe-
line with the algorithm stages shown in Figure 14.
Figure 14. Image detection pipeline.
Preprocessing. The first step is the preprocessing stage. It uses an edge-preserving
smoothing technique to reduce resolution, accelerate the image process, and clean up the
image to avoid pixel noise impacting the next pipeline stage (Figure 15).
Figure 15. Image detection—preprocessing.
Background subtraction. After preprocessing has been done, a foreground object de-
tection technique is used to remove static parts of the image. The technique used is MOG
(mixture of Gaussians) [21,22]. This algorithm aims to apply background subtraction to
detect shadows and just background and foreground pixels (Figure 16). It creates a Gauss-
ian model for each one of them. As it considers small object movements as part of the
model, a longer training time is required. This tolerance to small changes makes it more
reliable in a range of more realistic situations, such as changes in light or movements of
branches of a tree.
Figure 14. Image detection pipeline.
Sensors 2021, 21, 7379 14 of 29
4.2.1. Camera Subsystem
a. IP Stream Converter. This node is responsible for establishing a connection with its
associated IP camera. The camera sends the frames to this node through the RTSP
protocol, converting them to a format suitable for processing by the rest of the nodes.
If the connection between the camera and the node is interrupted or cannot be estab-
lished, the process keeps trying to establish the connection.
b. Image Detection. It receives frames from the IP Stream Converter and processes them
to extract the detections. This process with the heaviest load is performed by a pipe-
line with the algorithm stages shown in Figure 14.
Figure 14. Image detection pipeline.
Preprocessing. The first step is the preprocessing stage. It uses an edge-preserving
smoothing technique to reduce resolution, accelerate the image process, and clean up the
image to avoid pixel noise impacting the next pipeline stage (Figure 15).
Figure 15. Image detection—preprocessing.
Background subtraction. After preprocessing has been done, a foreground object de-
tection technique is used to remove static parts of the image. The technique used is MOG
(mixture of Gaussians) [21,22]. This algorithm aims to apply background subtraction to
detect shadows and just background and foreground pixels (Figure 16). It creates a Gauss-
ian model for each one of them. As it considers small object movements as part of the
model, a longer training time is required. This tolerance to small changes makes it more
reliable in a range of more realistic situations, such as changes in light or movements of
branches of a tree.
Figure 15. Image detection—preprocessing.Sensors 2021, 21, 7379 15 of 29
Figure 16. Image detection—background subtraction.
Postprocessing. The result of the background removal step is far from ideal. Different
morphological operations can be performed on the image, such as dilation or erosion. The
dilation operation looks for white areas in the image and expands their edges to group
regions of interest. On the other hand, the erosion performs the inverse operation, reduc-
ing the small regions that do not provide relevant information (Figure 17).
Figure 17. Image detection—postprocessing.
Segmentation. Contour detection is the technique [23] that has been applied to the
output of the postprocessing to detect and locate where activity is taking place. Over the
image, a previous black and white image are used, and a process is applied to find the
contours and frame them in identifying rectangles (Figure 18).
Figure 18. Image detection—segmentation.
c. Tracker. This process is in charge of processing the events generated by the image
detection node and establish a relationship between them. This node has to make de-
cisions based on different characteristics such as the lifetime, size and position of the
detections or their speed. When a detection vanishes (e.g., such as the intruder walk-
ing behind a column), a Kalman filter is used to estimate the current position of the
Figure 16. Image detection—background subtraction.
Postprocessing. The result of the background removal step is far from ideal. Differentmorphological operations can be performed on the image, such as dilation or erosion. Thedilation operation looks for white areas in the image and expands their edges to groupregions of interest. On the other hand, the erosion performs the inverse operation, reducingthe small regions that do not provide relevant information (Figure 17).
Sensors 2021, 21, 7379 15 of 29
Figure 16. Image detection—background subtraction.
Postprocessing. The result of the background removal step is far from ideal. Different
morphological operations can be performed on the image, such as dilation or erosion. The
dilation operation looks for white areas in the image and expands their edges to group
regions of interest. On the other hand, the erosion performs the inverse operation, reduc-
ing the small regions that do not provide relevant information (Figure 17).
Figure 17. Image detection—postprocessing.
Segmentation. Contour detection is the technique [23] that has been applied to the
output of the postprocessing to detect and locate where activity is taking place. Over the
image, a previous black and white image are used, and a process is applied to find the
contours and frame them in identifying rectangles (Figure 18).
Figure 18. Image detection—segmentation.
c. Tracker. This process is in charge of processing the events generated by the image
detection node and establish a relationship between them. This node has to make de-
cisions based on different characteristics such as the lifetime, size and position of the
detections or their speed. When a detection vanishes (e.g., such as the intruder walk-
ing behind a column), a Kalman filter is used to estimate the current position of the
Figure 17. Image detection—postprocessing.
Sensors 2021, 21, 7379 15 of 28
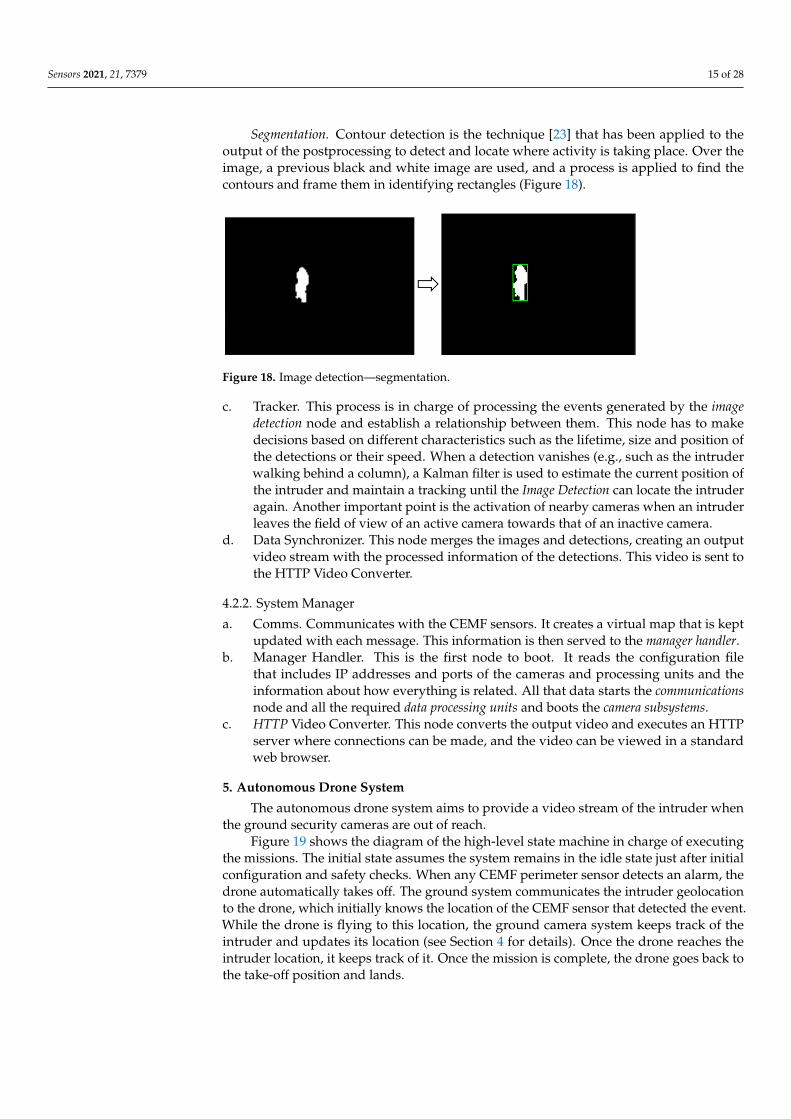
Segmentation. Contour detection is the technique [23] that has been applied to theoutput of the postprocessing to detect and locate where activity is taking place. Over theimage, a previous black and white image are used, and a process is applied to find thecontours and frame them in identifying rectangles (Figure 18).
Sensors 2021, 21, 7379 15 of 29
Figure 16. Image detection—background subtraction.
Postprocessing. The result of the background removal step is far from ideal. Different
morphological operations can be performed on the image, such as dilation or erosion. The
dilation operation looks for white areas in the image and expands their edges to group
regions of interest. On the other hand, the erosion performs the inverse operation, reduc-
ing the small regions that do not provide relevant information (Figure 17).
Figure 17. Image detection—postprocessing.
Segmentation. Contour detection is the technique [23] that has been applied to the
output of the postprocessing to detect and locate where activity is taking place. Over the
image, a previous black and white image are used, and a process is applied to find the
contours and frame them in identifying rectangles (Figure 18).
Figure 18. Image detection—segmentation.
c. Tracker. This process is in charge of processing the events generated by the image
detection node and establish a relationship between them. This node has to make de-
cisions based on different characteristics such as the lifetime, size and position of the
detections or their speed. When a detection vanishes (e.g., such as the intruder walk-
ing behind a column), a Kalman filter is used to estimate the current position of the
Figure 18. Image detection—segmentation.
c. Tracker. This process is in charge of processing the events generated by the imagedetection node and establish a relationship between them. This node has to makedecisions based on different characteristics such as the lifetime, size and position ofthe detections or their speed. When a detection vanishes (e.g., such as the intruderwalking behind a column), a Kalman filter is used to estimate the current position ofthe intruder and maintain a tracking until the Image Detection can locate the intruderagain. Another important point is the activation of nearby cameras when an intruderleaves the field of view of an active camera towards that of an inactive camera.
d. Data Synchronizer. This node merges the images and detections, creating an outputvideo stream with the processed information of the detections. This video is sent tothe HTTP Video Converter.
4.2.2. System Manager
a. Comms. Communicates with the CEMF sensors. It creates a virtual map that is keptupdated with each message. This information is then served to the manager handler.
b. Manager Handler. This is the first node to boot. It reads the configuration filethat includes IP addresses and ports of the cameras and processing units and theinformation about how everything is related. All that data starts the communicationsnode and all the required data processing units and boots the camera subsystems.
c. HTTP Video Converter. This node converts the output video and executes an HTTPserver where connections can be made, and the video can be viewed in a standardweb browser.
5. Autonomous Drone System
The autonomous drone system aims to provide a video stream of the intruder whenthe ground security cameras are out of reach.
Figure 19 shows the diagram of the high-level state machine in charge of executingthe missions. The initial state assumes the system remains in the idle state just after initialconfiguration and safety checks. When any CEMF perimeter sensor detects an alarm, thedrone automatically takes off. The ground system communicates the intruder geolocationto the drone, which initially knows the location of the CEMF sensor that detected the event.While the drone is flying to this location, the ground camera system keeps track of theintruder and updates its location (see Section 4 for details). Once the drone reaches theintruder location, it keeps track of it. Once the mission is complete, the drone goes back tothe take-off position and lands.

Sensors 2021, 21, 7379 16 of 28
Sensors 2021, 21, 7379 16 of 29
intruder and maintain a tracking until the Image Detection can locate the intruder
again. Another important point is the activation of nearby cameras when an intruder
leaves the field of view of an active camera towards that of an inactive camera.
d. Data Synchronizer. This node merges the images and detections, creating an output
video stream with the processed information of the detections. This video is sent to
the HTTP Video Converter.
4.2.2. System Manager
a. Comms. Communicates with the CEMF sensors. It creates a virtual map that is kept
updated with each message. This information is then served to the manager handler.
b. Manager Handler. This is the first node to boot. It reads the configuration file that
includes IP addresses and ports of the cameras and processing units and the infor-
mation about how everything is related. All that data starts the communications node
and all the required data processing units and boots the camera subsystems.
c. HTTP Video Converter. This node converts the output video and executes an HTTP
server where connections can be made, and the video can be viewed in a standard
web browser.
5. Autonomous Drone System
The autonomous drone system aims to provide a video stream of the intruder when
the ground security cameras are out of reach.
Figure 19 shows the diagram of the high-level state machine in charge of executing
the missions. The initial state assumes the system remains in the idle state just after initial
configuration and safety checks. When any CEMF perimeter sensor detects an alarm, the
drone automatically takes off. The ground system communicates the intruder geolocation
to the drone, which initially knows the location of the CEMF sensor that detected the
event. While the drone is flying to this location, the ground camera system keeps track of
the intruder and updates its location (see Section 4 for details). Once the drone reaches the
intruder location, it keeps track of it. Once the mission is complete, the drone goes back to
the take-off position and lands.
The ground system is always updated with the geolocation of the drone itself and
the intruder’s location when available.
Figure 19. High-level mission state machine.
5.1. Architecture
One critical point to guarantee the success of this block was the right selection of the
drone. Therefore, one of these leading players had to be chosen:
• DJI;
• Parrot;
• Yuneec;
• Others: 3dRobotics, senseFly, Intel…
By 2015, DJI already had 50% of the market share, rapidly rising to 74% [24], by 2017
it had more than 75% of the nonhobbyist drones [25] as shown in Figure 20.
Figure 19. High-level mission state machine.
The ground system is always updated with the geolocation of the drone itself and theintruder’s location when available.
5.1. Architecture
One critical point to guarantee the success of this block was the right selection of thedrone. Therefore, one of these leading players had to be chosen:
• DJI;• Parrot;• Yuneec;• Others: 3dRobotics, senseFly, Intel . . .
By 2015, DJI already had 50% of the market share, rapidly rising to 74% [24], by 2017it had more than 75% of the nonhobbyist drones [25] as shown in Figure 20.
Sensors 2021, 21, 7379 17 of 29
Figure 20. Drone market share.
For this reason, DJI was the preferred brand, and among all commercial drones of-
fered by this maker, only the Matrice family offered direct access to the video stream. The
200 series was the only one of all the Matrice family members capable of flying under rain.
As custom autonomous navigation and rain support were mandatory, the DJI Matrice 210
was the chosen one.
The DJI M210 is an 887 × 880 × 378 mm drone complemented with a powerful
Zenmuse 4XS camera installed on its 3-axis gimbal (Figure 21).
Figure 21. DJI Matrice 210 and Zenmuse 4XS.
As mentioned before, the autonomous drone system is based on a DJI Matrice 210
and a Zenmuse 4XS camera, but another important component completes the architecture
(Figure 22). It is the embedded computer responsible for processing the video stream and
control the pilotage.
The embedded computer chosen for the project was an NVIDIA Jetson Tx2—BOXER-
8110AI. It provides the required IO connectivity and processing power (thanks to an
NVIDIA CUDA) in a compact size. This computer has been equipped with Wi-Fi and
3G/4G interfaces to maintain reliable communication with the ground station.
Figure 20. Drone market share.
For this reason, DJI was the preferred brand, and among all commercial drones offeredby this maker, only the Matrice family offered direct access to the video stream. The200 series was the only one of all the Matrice family members capable of flying under rain.As custom autonomous navigation and rain support were mandatory, the DJI Matrice 210was the chosen one.
The DJI M210 is an 887 × 880 × 378 mm drone complemented with a powerfulZenmuse 4XS camera installed on its 3-axis gimbal (Figure 21).
Sensors 2021, 21, 7379 17 of 29
Figure 20. Drone market share.
For this reason, DJI was the preferred brand, and among all commercial drones of-
fered by this maker, only the Matrice family offered direct access to the video stream. The
200 series was the only one of all the Matrice family members capable of flying under rain.
As custom autonomous navigation and rain support were mandatory, the DJI Matrice 210
was the chosen one.
The DJI M210 is an 887 × 880 × 378 mm drone complemented with a powerful
Zenmuse 4XS camera installed on its 3-axis gimbal (Figure 21).
Figure 21. DJI Matrice 210 and Zenmuse 4XS.
As mentioned before, the autonomous drone system is based on a DJI Matrice 210
and a Zenmuse 4XS camera, but another important component completes the architecture
(Figure 22). It is the embedded computer responsible for processing the video stream and
control the pilotage.
The embedded computer chosen for the project was an NVIDIA Jetson Tx2—BOXER-
8110AI. It provides the required IO connectivity and processing power (thanks to an
NVIDIA CUDA) in a compact size. This computer has been equipped with Wi-Fi and
3G/4G interfaces to maintain reliable communication with the ground station.
Figure 21. DJI Matrice 210 and Zenmuse 4XS.

Sensors 2021, 21, 7379 17 of 28
As mentioned before, the autonomous drone system is based on a DJI Matrice 210and a Zenmuse 4XS camera, but another important component completes the architecture(Figure 22). It is the embedded computer responsible for processing the video stream andcontrol the pilotage.
Sensors 2021, 21, 7379 18 of 29
Figure 22. Autonomous drone architecture diagram.
The Jetson Tx2 is assembled in the drone and connected to it through only three ca-
bles, as shown in Figure 23:
- Power cable is a standard power cord running from the external power connector
provided by the drone to the power supply connector of the computer.
- Video cable is a standard USB cable running from the USB provided by the drone to
one of the USB host ports of the computer.
- Control cable is a USB to UART TTL cable used to control the drone through DJI’s
SDK, and it runs from the TTL port of the drone to any USB host port of the computer.
Figure 23. Drone and onboard computer assembly.
5.2. Algorithm
The embedded computer is running an Ubuntu OS, and its communications are se-
cured with SSH to prevent hackers from manipulating the navigation system or even tak-
ing control of the drone.
The system also has the standard remote control supplied by DJI. This allows the
change to manual control if required by the security guards at the monitoring stations.
There is also a return to home possibility to cancel the flight at any time.
As mentioned, the Jetson TX2 is in charge of running the entire software for the drone
system, establishing continuous communication with both the drone autopilot and the
Figure 22. Autonomous drone architecture diagram.
The embedded computer chosen for the project was an NVIDIA Jetson Tx2—BOXER-8110AI. It provides the required IO connectivity and processing power (thanks to anNVIDIA CUDA) in a compact size. This computer has been equipped with Wi-Fi and3G/4G interfaces to maintain reliable communication with the ground station.
The Jetson Tx2 is assembled in the drone and connected to it through only three cables,as shown in Figure 23:
- Power cable is a standard power cord running from the external power connectorprovided by the drone to the power supply connector of the computer.
- Video cable is a standard USB cable running from the USB provided by the drone toone of the USB host ports of the computer.
- Control cable is a USB to UART TTL cable used to control the drone through DJI’sSDK, and it runs from the TTL port of the drone to any USB host port of the computer.
Sensors 2021, 21, 7379 18 of 29
Figure 22. Autonomous drone architecture diagram.
The Jetson Tx2 is assembled in the drone and connected to it through only three ca-
bles, as shown in Figure 23:
- Power cable is a standard power cord running from the external power connector
provided by the drone to the power supply connector of the computer.
- Video cable is a standard USB cable running from the USB provided by the drone to
one of the USB host ports of the computer.
- Control cable is a USB to UART TTL cable used to control the drone through DJI’s
SDK, and it runs from the TTL port of the drone to any USB host port of the computer.
Figure 23. Drone and onboard computer assembly.
5.2. Algorithm
The embedded computer is running an Ubuntu OS, and its communications are se-
cured with SSH to prevent hackers from manipulating the navigation system or even tak-
ing control of the drone.
The system also has the standard remote control supplied by DJI. This allows the
change to manual control if required by the security guards at the monitoring stations.
There is also a return to home possibility to cancel the flight at any time.
As mentioned, the Jetson TX2 is in charge of running the entire software for the drone
system, establishing continuous communication with both the drone autopilot and the
Figure 23. Drone and onboard computer assembly.

Sensors 2021, 21, 7379 18 of 28
5.2. Algorithm
The embedded computer is running an Ubuntu OS, and its communications aresecured with SSH to prevent hackers from manipulating the navigation system or eventaking control of the drone.
The system also has the standard remote control supplied by DJI. This allows thechange to manual control if required by the security guards at the monitoring stations.There is also a return to home possibility to cancel the flight at any time.
As mentioned, the Jetson TX2 is in charge of running the entire software for the dronesystem, establishing continuous communication with both the drone autopilot and theground station. Furthermore, other processes related to intruder detection and tracking,mission control or autonomous movement simultaneously run in the onboard computer.
To provide a clean and effective implementation of the navigation system, the softwarehas been written using the following set of programming languages and libraries:
- CUDA—This library provides access to the parallel execution capabilities of theNVIDIA GPU of the onboard computer.
- ROS Kinetic—This library provides an easy framework and executes concurrentprocesses in a coordinated and synchronous way.
- OpenCV—Library for image processing (works with CUDA).- DJI SDK—Library to stable communications with the autopilot of the drone.
The software blocks deployed on the onboard computer can be synthesized in Figure 24.
Sensors 2021, 21, 7379 19 of 29
ground station. Furthermore, other processes related to intruder detection and tracking,
mission control or autonomous movement simultaneously run in the onboard computer.
To provide a clean and effective implementation of the navigation system, the soft-
ware has been written using the following set of programming languages and libraries:
- CUDA—This library provides access to the parallel execution capabilities of the
NVIDIA GPU of the onboard computer.
- ROS Kinetic—This library provides an easy framework and executes concurrent pro-
cesses in a coordinated and synchronous way.
- OpenCV—Library for image processing (works with CUDA).
- DJI SDK—Library to stable communications with the autopilot of the drone.
The software blocks deployed on the onboard computer can be synthesized in Figure
24.
Figure 24. Software blocks.
- DJI SDK. This node works as a communication bridge, deserializing the autopilot
messages (flight data, images, drone status), converting them into a format manage-
able by the rest of the blocks. It also sends the action commands from the onboard
system to the autopilot.
- Vision. This block receives all the images and flight data, processes them and detects
the intruder. It also reports to the mission manager.
- Mission manager. It implements the high-level state machine previously shown in Fig-
ure 19, controlling the operation of the mission at all times and taking the appropriate
actions in case a pilot is required to take over and manually control the aircraft.
- Movement control. This node is in charge of the control, calculating the action com-
mands that must be sent to the autopilot depending on the state of the mission in
which the system is at a specific moment.
- Communications. It establishes and maintains communications with the ground sta-
tion. It processes external alarm signals and activates the entire system when re-
quired. In parallel, it encodes the images and flight data to send it to the ground to
monitor accordingly.
The computer vision algorithm runs the pipeline shown in Figure 25.
Figure 25. Drone vision algorithm diagram.
The input data is the flight and image data, and the output is images plus location
information relative to the image and absolute.
The process involved in the algorithm are:
- Preprocessing: It receives the images from the autopilot. These images are way too
large to be processed by the onboard computer at the frame rate provided. Therefore,
Figure 24. Software blocks.
- DJI SDK. This node works as a communication bridge, deserializing the autopilotmessages (flight data, images, drone status), converting them into a format manage-able by the rest of the blocks. It also sends the action commands from the onboardsystem to the autopilot.
- Vision. This block receives all the images and flight data, processes them and detectsthe intruder. It also reports to the mission manager.
- Mission manager. It implements the high-level state machine previously shown inFigure 19, controlling the operation of the mission at all times and taking the appro-priate actions in case a pilot is required to take over and manually control the aircraft.
- Movement control. This node is in charge of the control, calculating the action com-mands that must be sent to the autopilot depending on the state of the mission inwhich the system is at a specific moment.
- Communications. It establishes and maintains communications with the ground sta-tion. It processes external alarm signals and activates the entire system when re-quired. In parallel, it encodes the images and flight data to send it to the ground tomonitor accordingly.
The computer vision algorithm runs the pipeline shown in Figure 25.

Sensors 2021, 21, 7379 19 of 28
Sensors 2021, 21, 7379 19 of 29
ground station. Furthermore, other processes related to intruder detection and tracking,
mission control or autonomous movement simultaneously run in the onboard computer.
To provide a clean and effective implementation of the navigation system, the soft-
ware has been written using the following set of programming languages and libraries:
- CUDA—This library provides access to the parallel execution capabilities of the
NVIDIA GPU of the onboard computer.
- ROS Kinetic—This library provides an easy framework and executes concurrent pro-
cesses in a coordinated and synchronous way.
- OpenCV—Library for image processing (works with CUDA).
- DJI SDK—Library to stable communications with the autopilot of the drone.
The software blocks deployed on the onboard computer can be synthesized in Figure
24.
Figure 24. Software blocks.
- DJI SDK. This node works as a communication bridge, deserializing the autopilot
messages (flight data, images, drone status), converting them into a format manage-
able by the rest of the blocks. It also sends the action commands from the onboard
system to the autopilot.
- Vision. This block receives all the images and flight data, processes them and detects
the intruder. It also reports to the mission manager.
- Mission manager. It implements the high-level state machine previously shown in Fig-
ure 19, controlling the operation of the mission at all times and taking the appropriate
actions in case a pilot is required to take over and manually control the aircraft.
- Movement control. This node is in charge of the control, calculating the action com-
mands that must be sent to the autopilot depending on the state of the mission in
which the system is at a specific moment.
- Communications. It establishes and maintains communications with the ground sta-
tion. It processes external alarm signals and activates the entire system when re-
quired. In parallel, it encodes the images and flight data to send it to the ground to
monitor accordingly.
The computer vision algorithm runs the pipeline shown in Figure 25.
Figure 25. Drone vision algorithm diagram.
The input data is the flight and image data, and the output is images plus location
information relative to the image and absolute.
The process involved in the algorithm are:
- Preprocessing: It receives the images from the autopilot. These images are way too
large to be processed by the onboard computer at the frame rate provided. Therefore,
Figure 25. Drone vision algorithm diagram.
The input data is the flight and image data, and the output is images plus locationinformation relative to the image and absolute.
The process involved in the algorithm are:
- Preprocessing: It receives the images from the autopilot. These images are way toolarge to be processed by the onboard computer at the frame rate provided. Therefore,the preprocessing performs downscaling to 416 × 416 pixels and provides one imageeach 50 ms approximately. It also applies the image correction required, with theparameters obtained with the calibration tool, to make sure all image distortion goesaway.
- Detection: Unlike the video from the static camera network, the drone camera re-mains in constant motion during the intruder detection and tracking process, so thealgorithm based on background subtraction cannot be applied. Given the recentdevelopments in object recognition, which are outperforming classic approaches, suchas [26,27], the use of a deep neural network that analyzes each video frame has beenchosen. Specifically, the YOLO V3-Tiny [28] architecture was implemented and theretraining of the network from the initial weights provided by the author was done.To work with this network, we used Darknet, which is an environment created bythe original authors of YOLO. It is implemented in C language and uses the CUDAlibrary, which uses graphics card resources to operate quickly and efficiently. YOLOV3-Tiny is made up of a total of 23 layers, 13 of them being convolutional. As input, itreceives an image of size 416 × 416 × 3, which is a color image with three channels.In the output layer, a vector is generated indicating the regions of interest where thepeople detected are located and the probability associated with each one.
- Tracking: In this stage, images are synchronized with the flight data so that eachframe can be associated with its flight height and position. Once the intruder hasbeen detected and the image pixels where it is located are known, a tracking stageis performed so that the drone continuously keeps the intruder in the center of theacquired image. A proportional controller is used, which continuously calculates thedistance in pixels between the intruder and image center. The output of that controlleris converted into speed commands for the drone, which is moved accordingly. Ahysteresis cycle was implemented to avoid continuous drone movements when theintruder is very close to the center of the image.
6. Experimental Results6.1. CEMF Results
A set of marauding or intrusion events were carried out to create a dictionary of realdata. This data was organized and fed to a virtual environment used to validate eachversion of the algorithm. It was run through real data just acquired by a real sensor asif the event was happening. Thanks to this approach, hundreds of hours of maraudingand jumping over a fence were saved. This fact also allowed us to benchmark differentimplementations over precisely the same circumstances.
Figure 26 shows the detail of one of the tests included in the test dictionary. Red showsraw CEMF signal, light blue shows filtered signal, green shows the baseline signal, whilethe other two are internal threshold limits used by the traditional algorithm. To flag wherereal events occurred, a color code of vertical background bands was used. In the currentimage, grey bands indicated noisy fragments and an orange band indicated preventive.

Sensors 2021, 21, 7379 20 of 28Sensors 2021, 21, 7379 21 of 29
Figure 26. Event sample from the CEMF dataset.
A JSON file associated with each of the events identifies what type of event should
be detected at each sample of the associated stream of CEMF data (and what should not
be detected). This is used to launch all tests with a simple command, and so the verifica-
tion framework can automatically calculate how accurate each implementation is. In Fig-
ure 27, the representation of the execution run displaying over 250 individual test plots
like the one displayed in Figure 26. This image does not aim to provide details of the result
execution but to provide a sense of the magnitude of the validation library.
Figure 27. Overview of the CEMF sensor validation’s library.
Once the implementation passed all test cases, the system was deployed in the field.
At this point, the proposed algorithm needs to be executed on a low-power microcontrol-
ler with reduced computational capabilities. Therefore, the processing task needs to be
very optimized, especially if the execution of these tasks is performed in real-time.
In order to validate that the units were operating as expected, a healthcare service
was programmed so that the data and the algorithm debug information is permanently
Figure 26. Event sample from the CEMF dataset.
A JSON file associated with each of the events identifies what type of event should bedetected at each sample of the associated stream of CEMF data (and what should not bedetected). This is used to launch all tests with a simple command, and so the verificationframework can automatically calculate how accurate each implementation is. In Figure 27,the representation of the execution run displaying over 250 individual test plots like the onedisplayed in Figure 26. This image does not aim to provide details of the result executionbut to provide a sense of the magnitude of the validation library.
Once the implementation passed all test cases, the system was deployed in the field.At this point, the proposed algorithm needs to be executed on a low-power microcontrollerwith reduced computational capabilities. Therefore, the processing task needs to be veryoptimized, especially if the execution of these tasks is performed in real-time.
In order to validate that the units were operating as expected, a healthcare servicewas programmed so that the data and the algorithm debug information is permanentlyrecorded in an Influx DB. An automated process was created to help validate the system.It was executed every day to analyze the detected events of the previous day. It gener-ated an image with a data slice that showed how the CEMF signal evolved around eachdetected event.
Figure 28 shows two captures corresponding to prowling events. Blue and green areraw and filtered CEMF signals, pink is a preventive threshold of the traditional algorithm,and the yellow rectangle highlights the time while the device detected the threat.
These images are precisely labeled with sensor ID, CEMF channel and timestamped.This fact allows for a manual cross-verification using the video system to validate the causeof the event.
Figure 29 shows the signal of a person jumping over the fence (green) as well asthe filtered (blue) and a traditional threshold (pink). As a result, an intrusion event wasdetected and highlighted within a red rectangle in the automatically generated images.

Sensors 2021, 21, 7379 21 of 28Sensors 2021, 21, 7379 2 of 3
Figure 27. Overview of the CEMF sensor validation’s library.
Sensors 2021, 21, 7379 22 of 29
recorded in an Influx DB. An automated process was created to help validate the system.
It was executed every day to analyze the detected events of the previous day. It generated
an image with a data slice that showed how the CEMF signal evolved around each de-
tected event.
Figure 28 shows two captures corresponding to prowling events. Blue and green are
raw and filtered CEMF signals, pink is a preventive threshold of the traditional algorithm,
and the yellow rectangle highlights the time while the device detected the threat.
Figure 28. Validation events on the field.
These images are precisely labeled with sensor ID, CEMF channel and timestamped.
This fact allows for a manual cross-verification using the video system to validate the
cause of the event.
Figure 29 shows the signal of a person jumping over the fence (green) as well as the
filtered (blue) and a traditional threshold (pink). As a result, an intrusion event was de-
tected and highlighted within a red rectangle in the automatically generated images.
Figure 28. Validation events on the field.
An important part of this field validation was to estimate the performance of theCEMF sensors system. Figure 30 shows the sensitivity and specificity diagram. In order todo so, two different units and three different days were chosen:
- Day 1—This was a windy day that caused the signal of these devices to be altered byexternal agents such as vegetation in the area. None of these phenomena should bedetected by either of the two units. The system should only issue an alarm message ifa person is in the perimeter. Therefore, this day will be used to see the robustness ofthe system against external agents.
- Day 2—During this day a rain shower fell on the site. The CEMF signal is sensitiveto rain, so it is crucial to observe the response of each unit under rain conditions. Aswith the agents mentioned above, rain is also an external agent that should not triggerany alarm.
- Day 3—This was a test day where several persons were asked to perform prowlingand intrusion events on each of these two units. This day will be used to validate thesuccess rate of each system against real events.

Sensors 2021, 21, 7379 22 of 28
In summary, the first two days were used to validate the robustness of the systemagainst external agents that may generate false positives, and the last day to assess whetherit was able to detect all the events that take place and whether, once detected, it classifiedthem correctly.
As a result of the above analysis, the following statistics and quality indices were obtained:
• True positives (TP): the number of ranges of the ground truth in which a certain eventwas required and it was effectively detected.
• True negatives (TN): the number of ranges of the ground truth in which a certain eventwas restricted and it coincided that it was not detected.
• False positives (FP): the number of ranges of the ground truth in which a certain eventwas restricted and, instead, it was detected.
• False negatives (FN): the number of ranges of the ground truth in which a certainevent was required and, instead, it was not detected.
• Sensitivity (Sen): was the proportion of ground truth event ranges that were correctlyclassified as detected from among all those that were required.
• Specificity (Spec): is the proportion of ground truth event ranges that were correctlyclassified as undetected from among all those that were restricted.
• Accuracy (Acc): is the proportion of total hits, without distinguishing between truepositives and true negatives.
Sensors 2021, 21, 7379 22 of 29
recorded in an Influx DB. An automated process was created to help validate the system.
It was executed every day to analyze the detected events of the previous day. It generated
an image with a data slice that showed how the CEMF signal evolved around each de-
tected event.
Figure 28 shows two captures corresponding to prowling events. Blue and green are
raw and filtered CEMF signals, pink is a preventive threshold of the traditional algorithm,
and the yellow rectangle highlights the time while the device detected the threat.
Figure 28. Validation events on the field.
These images are precisely labeled with sensor ID, CEMF channel and timestamped.
This fact allows for a manual cross-verification using the video system to validate the
cause of the event.
Figure 29 shows the signal of a person jumping over the fence (green) as well as the
filtered (blue) and a traditional threshold (pink). As a result, an intrusion event was de-
tected and highlighted within a red rectangle in the automatically generated images.
Sensors 2021, 21, 7379 23 of 29
Figure 29. Image validating of a CEMF event in the field.
An important part of this field validation was to estimate the performance of the
CEMF sensors system. Figure 30 shows the sensitivity and specificity diagram. In order
to do so, two different units and three different days were chosen:
- Day 1—This was a windy day that caused the signal of these devices to be altered by
external agents such as vegetation in the area. None of these phenomena should be
detected by either of the two units. The system should only issue an alarm message
if a person is in the perimeter. Therefore, this day will be used to see the robustness
of the system against external agents.
- Day 2—During this day a rain shower fell on the site. The CEMF signal is sensitive
to rain, so it is crucial to observe the response of each unit under rain conditions. As
with the agents mentioned above, rain is also an external agent that should not trig-
ger any alarm.
- Day 3—This was a test day where several persons were asked to perform prowling
and intrusion events on each of these two units. This day will be used to validate the
success rate of each system against real events.
In summary, the first two days were used to validate the robustness of the system
against external agents that may generate false positives, and the last day to assess
whether it was able to detect all the events that take place and whether, once detected, it
classified them correctly.
As a result of the above analysis, the following statistics and quality indices were
obtained:
• True positives (TP): the number of ranges of the ground truth in which a certain event
was required and it was effectively detected.
• True negatives (TN): the number of ranges of the ground truth in which a certain
event was restricted and it coincided that it was not detected.
• False positives (FP): the number of ranges of the ground truth in which a certain event
was restricted and, instead, it was detected.
• False negatives (FN): the number of ranges of the ground truth in which a certain
event was required and, instead, it was not detected.
• Sensitivity (Sen): was the proportion of ground truth event ranges that were correctly
classified as detected from among all those that were required.
• Specificity (Spec): is the proportion of ground truth event ranges that were correctly
classified as undetected from among all those that were restricted.
• Accuracy (Acc): is the proportion of total hits, without distinguishing between true
positives and true negatives.
The respective formulas that allow the calculation of the quality indices described
above are:
Figure 29. Image validating of a CEMF event in the field.
Sensors 2021, 21, 7379 24 of 29
𝑆𝑒𝑛 =𝑇𝑃
𝑇𝑃 + 𝐹𝑁
(9)
𝑆𝑝𝑒𝑐 =𝑇𝑁
𝑇𝑁 + 𝐹𝑃
(10)
𝐴𝑐𝑐 =𝑇𝑃 + 𝑇𝑁
𝑇𝑃 + 𝑇𝑁 + 𝐹𝑃 + 𝐹𝑁
(11)
Figure 30. Sensitivity and specificity diagram.
As can be seen in Table 2, the closer these quality indices are to 100%, the more reli-
able the algorithm is, since it means that it allows better discrimination between the two
populations of required and restricted events. In particular, the overall performance of the
system across the validation days was very good. With a sensitivity, specificity and accu-
racy over the 95% it proved that the system is very robust against false alarms and very
accurate for true alarms.
Table 2. Sensitivity and specificity of the CEMF system.
Day 1 Day 2 Day 3
− True negative 19 26 20
Prowling
True positive 5 2 29
False negative 0 0 0
False positive 1 2 0
Intrusion
True positive 0 0 14
False negative 0 0 0
False positive 0 0 0
Car
True positive 3 4 5
False negative 0 1 0
False positive 0 0 0
Total
True negative 65
True positive 62
False negative 1
Figure 30. Sensitivity and specificity diagram.

Sensors 2021, 21, 7379 23 of 28
The respective formulas that allow the calculation of the quality indices describedabove are:
Sen =TP
TP + FN(9)
Spec =TN
TN + FP(10)
Acc =TP + TN
TP + TN + FP + FN(11)
As can be seen in Table 2, the closer these quality indices are to 100%, the morereliable the algorithm is, since it means that it allows better discrimination between thetwo populations of required and restricted events. In particular, the overall performanceof the system across the validation days was very good. With a sensitivity, specificity andaccuracy over the 95% it proved that the system is very robust against false alarms andvery accurate for true alarms.
Table 2. Sensitivity and specificity of the CEMF system.
Day 1 Day 2 Day 3
− True negative 19 26 20
Prowling
True positive 5 2 29
False negative 0 0 0
False positive 1 2 0
Intrusion
True positive 0 0 14
False negative 0 0 0
False positive 0 0 0
Car
True positive 3 4 5
False negative 0 1 0
False positive 0 0 0
Total
True negative 65
True positive 62
False negative 1
False Positive 3
Sensitivity 98%
Specificity 96%
Accuracy 97%
6.2. Vision Results
In order to work with neural networks, an initial training step is required for thenetwork to learn the features of the objects that need to be detected. To perform the trainingmost optimally, a large number of images that correctly represent the target problem thatthe network must solve are required for this process. In this project, we counted on alarge number of aerial images in which people were present. In addition, to carry out thetraining with these images, they had to have the associated metadata to flag the pixelswhere persons appeared in each frame.
For training the network, a data set was created using a combination of downloadedpublic datasets and multiple images of people acquired by our drone at different heights,with a camera tilt of approximately 45◦ pointing towards the ground. The ratio of publicimages to own images was approximately 85/15. In the case of the public dataset, the Oku-tama Action dataset [29] was used. Approximately 60,000 images were used, separating48,000 images for training and 12,000 images for validation (checking that the network
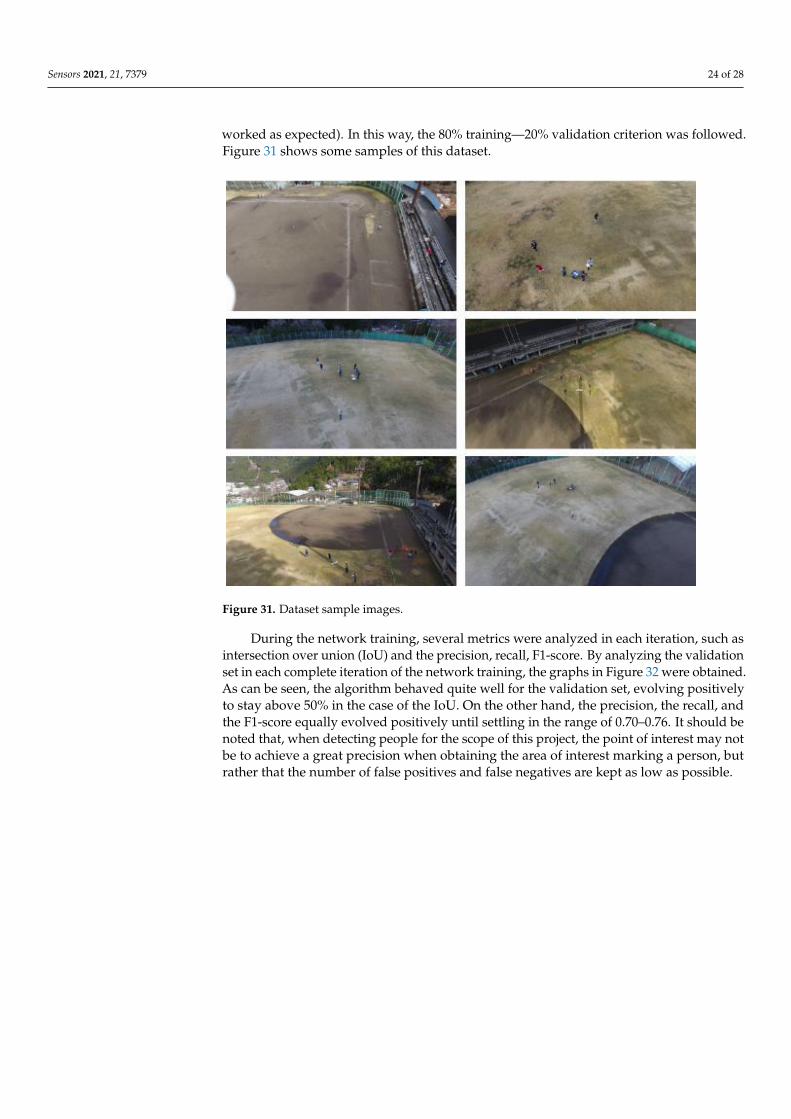
Sensors 2021, 21, 7379 24 of 28
worked as expected). In this way, the 80% training—20% validation criterion was followed.Figure 31 shows some samples of this dataset.
Sensors 2021, 21, 7379 25 of 29
False Positive 3
Sensitivity 98%
Specificity 96%
Accuracy 97%
6.2. Vision Results
In order to work with neural networks, an initial training step is required for the
network to learn the features of the objects that need to be detected. To perform the train-
ing most optimally, a large number of images that correctly represent the target problem
that the network must solve are required for this process. In this project, we counted on a
large number of aerial images in which people were present. In addition, to carry out the
training with these images, they had to have the associated metadata to flag the pixels
where persons appeared in each frame.
For training the network, a data set was created using a combination of downloaded
public datasets and multiple images of people acquired by our drone at different heights,
with a camera tilt of approximately 45° pointing towards the ground. The ratio of public
images to own images was approximately 85/15. In the case of the public dataset, the
Okutama Action dataset [29] was used. Approximately 60,000 images were used, separat-
ing 48,000 images for training and 12,000 images for validation (checking that the network
worked as expected). In this way, the 80% training—20% validation criterion was fol-
lowed. Figure 31 shows some samples of this dataset.
Figure 31. Dataset sample images.
During the network training, several metrics were analyzed in each iteration, such as
intersection over union (IoU) and the precision, recall, F1-score. By analyzing the valida-
tion set in each complete iteration of the network training, the graphs in Figure 32 were
obtained. As can be seen, the algorithm behaved quite well for the validation set, evolving
positively to stay above 50% in the case of the IoU. On the other hand, the precision, the
recall, and the F1-score equally evolved positively until settling in the range of 0.70–0.76.
It should be noted that, when detecting people for the scope of this project, the point of
Figure 31. Dataset sample images.
During the network training, several metrics were analyzed in each iteration, such asintersection over union (IoU) and the precision, recall, F1-score. By analyzing the validationset in each complete iteration of the network training, the graphs in Figure 32 were obtained.As can be seen, the algorithm behaved quite well for the validation set, evolving positivelyto stay above 50% in the case of the IoU. On the other hand, the precision, the recall, andthe F1-score equally evolved positively until settling in the range of 0.70–0.76. It should benoted that, when detecting people for the scope of this project, the point of interest may notbe to achieve a great precision when obtaining the area of interest marking a person, butrather that the number of false positives and false negatives are kept as low as possible.

Sensors 2021, 21, 7379 25 of 28
Sensors 2021, 21, 7379 26 of 29
interest may not be to achieve a great precision when obtaining the area of interest mark-
ing a person, but rather that the number of false positives and false negatives are kept as
low as possible.
Figure 32. (Top) Average IoU and precision (bottom).
Several flights were made at different heights between 15 and 30 m above the ground
to validate the implementation. People appeared and moved in realistic situations, as can
be seen in Figures 33 and 34. It can be seen how the detected people are marked with a
purple region of interest.
Figure 32. (Top) Average IoU and precision (bottom).
Several flights were made at different heights between 15 and 30 m above the groundto validate the implementation. People appeared and moved in realistic situations, as canbe seen in Figures 33 and 34. It can be seen how the detected people are marked with apurple region of interest.

Sensors 2021, 21, 7379 26 of 28Sensors 2021, 21, 7379 27 of 29
Figure 33. Inference results sequence for one person.
Figure 34. Inference results sequence for two people.
Figure 33. Inference results sequence for one person.
Sensors 2021, 21, 7379 27 of 29
Figure 33. Inference results sequence for one person.
Figure 34. Inference results sequence for two people. Figure 34. Inference results sequence for two people.
Sensors 2021, 21, 7379 27 of 28
7. Conclusions
A complete perimeter electronic security system has been proposed to identify dan-gerous intrusions based on disruptive CEMF sensor technology and video information.The surveillance system exhibits long-distance monitoring, high sensitivity, and reducedfalse alarms since the CEMF technology has a high detection range and can discriminatebetween animals, humans, and objects. The technology is developed to accurately detectthe motion of people in a protected area in an outdoor environment. It provides intelligentmechanisms for reducing false alarms and improving the security system’s effectivenessin detecting and preventing potential intrusions. The system also includes cameras andvideo content analytics for automatic intruder tracking. Additionally, the advantageousproperties of the CEMF sensors provide reduced false alarms and allow for the cameras tobe deactivated most of the time. A mobile camera on an autonomous drone system allowsbetter intruder detection and tracking when the threat is out of range of the perimeter unitsand the static ground cameras.
Author Contributions: Conceptualization, F.M.-C., J.A.G.-G. and J.A.; methodology, F.M.-C., J.A.G.-G. and J.A.; software, P.T., R.C. and F.J.P.-G.; validation P.T., J.M.H.-M., R.C. and F.J.P.-G.; formalanalysis, P.T. and J.M.H.-M.; investigation, P.T., J.A.G.-G., R.C. and F.J.P.-G.; resources, P.T. and J.A.;data curation, P.T., R.C. and F.J.P.-G.; writing—original draft preparation, J.A.G.-G., F.M.-C., and P.T.;writing—review and editing, J.A.G.-G., F.M.-C., P.T., R.C. and F.J.P.-G.; visualization, P.T., R.C. andF.J.P.-G.; supervision, J.A., F.M.-C. and J.A.G.-G. All authors have read and agreed to the publishedversion of the manuscript.
Funding: This research received no external funding.
Institutional Review Board Statement: Not applicable.
Informed Consent Statement: Not applicable.
Data Availability Statement: Not applicable.
Conflicts of Interest: The authors declare no conflict of interest.
References1. Oxford Economics. Capital Project and Infrastructure Spending, Outlook to 2025; PricewaterhouseCoopers: London, UK, 2014;
Available online: https://www.pwc.com/gx/en/capital-projects-infrastructure/publications/cpi-outlook/assets/cpi-outlook-to-2025.pdf (accessed on 20 October 2021).
2. Commission of the European Communities. Communication from the Commission on a European Programme for Critical InfrastructureProtection; European Comission: Brussels, Belgium, 2006; Available online: https://eur-lex.europa.eu/LexUriServ/LexUriServ.do?uri=COM:2006:0786:FIN:EN:PDF (accessed on 20 October 2021).
3. Elvik, R.; Vaa, T. The Handbook of Road Safety Measures, 1st ed.; Elsevier Science: Amsterdam, The Netherlands, 2004.4. Catalano, A.; Antonio Bruno, F.; Galliano, C.; Pisco, M.; Vito Persiano, G.; Cutolo, A.; Cusano, A. An optical fiber intrusion
detection system for railway security. Sens. Actuators A 2017, 253, 91–100. [CrossRef]5. Nan, Q.; Li, S.; Yao, Y.; Li, Z.; Wang, H.; Wang, L.; Sun, L. A Novel monitoring approach for train tracking and incursion detection
in underground structures based on ultra-weak FBG sensing array. Sensors 2019, 19, 2666. [CrossRef] [PubMed]6. Allwood, G.; Wild, G.; Hinckley, S. Optical fiber sensors in physical intrusion detection systems: A Review. IEEE Sens. J. 2016, 16,
5497–5509. [CrossRef]7. Inomata, K.; Tsujita, W.; Hirai, T.; Hirai, T. Two-frequency surveillance technique for intrusion-detection sensor with Leaky
Coaxial Cables. In Proceedings of the 2014 IEEE Sensors Applications Symposium (SAS), Queenstown, New Zealand, 18–20February 2014; pp. 103–106.
8. Bhavani, M.S.S.; Babulu, K. Design and implementation of low cost microwave motion sensor based security system. Int. J. Eng.Res. Technol. (IJERT) 2013, 2, 1696–1700.
9. Zimmerman, T.G.; Smith, J.R.; Paradiso, J.A.; Allport, D.; Gershenfeld, N. Applying Electric Field Sensing to Human-ComputerInterfaces. In Proceedings of the CHI’95, Denver, CO, USA, 7–11 May 1995; ACM Press: New York, NY, USA, 1995.
10. Smith, J.; White, T.; Dodge, C.; Paradiso, J.; Gershenfeld, N.; Allport, D. Electric field sensing for graphical interfaces. IEEE Eng.Med. Boil. Mag. 1998, 18, 54–60. [CrossRef]
11. Ye, Y.; Deng, J.; Shen, S.; Hou, Z.; Liu, Y. A Novel method for proximity detection of moving targets using a large-scale planarcapacitive sensor system. Sensors 2016, 16, 699. [CrossRef]
12. George, B.; Zangl, H.; Bretterklieber, T.; Brasseur, G. Seat occupancy detection based on capacitive sensing. IEEE Trans. Instrum.Meas. 2009, 58, 1487–1494. [CrossRef]

Sensors 2021, 21, 7379 28 of 28
13. Satz, A.; Hammerschmidt, D.; Tumpold, D. Capacitive passenger detection utilizing dielectric dispersion in human tissues. Sens.Actuators A Phys. 2009, 152, 1–4. [CrossRef]
14. Ye, Y.; He, C.; Liao, B.; Qian, G. Capacitive Proximity sensor array with a simple high sensitivity capacitance measuring circuit forhuman–Computer Interaction. IEEE Sens. J. 2018, 18, 5906–5914. [CrossRef]
15. Kan, W.; Huang, Y.; Zeng, X.; Guo, X.; Liu, P. A dual-mode proximity sensor with combination of inductive and capacitive sensingunits. Sens. Rev. 2018, 38, 199–206. [CrossRef]
16. Zitouni, A.; Beheim, L.; Huez, R.; Belloir, F. Smart electromagnetic sensor for buried conductive targets identification. IEEE Sens.J. 2006, 6, 1580–1591. [CrossRef]
17. Frejlichowski, D.; Gosciewska, K.; Forczmanski, P.; Hofman, R. Smart monitor—An intelligent security system for the protectionof individuals and small properties with the possibility of home automation. Sensors 2014, 14, 9922–9948. [CrossRef] [PubMed]
18. Kim, S.H.; Lim, S.C.; Kim, D.Y. Intelligent intrusion detection system featuring a virtual fence, active intruder detection,classification, tracking, and action recognition. Ann. Nucl. Energy 2018, 112, 845–855. [CrossRef]
19. Jeon, E.S.; Choi, J.-S.; Lee, J.H.; Shin, K.Y.; Kim, Y.G.; Le, T.T.; Park, K.R. Human Detection Based on the Generation of aBackground Image by Using a Far-Infrared Light Camera. Sensors 2015, 15, 6763–6788. [CrossRef]
20. Castro, J.; Delgado, M.; Medina, J.; Lozano, M.D.R. Intelligent surveillance system with integration of heterogeneous informationfor intrusion detection. Expert Syst. Appl. 2011, 38, 11182–11192. [CrossRef]
21. Zivkovic, Z.; Van Der Heihden, F. Efficient adaptive density estimation per image pixel for the task of background subtraction.Pattern Recognit. Lett. 2006, 27, 773–780. [CrossRef]
22. Zivkovic, Z. Improved adaptive Gaussian mixture model for background subtraction. In Proceedings of the 17th InternationalConference on Pattern Recognition (ICPR), Cambridge, UK, 26 August 2004.
23. Suzuki, S.; Abe, K. Topological structural analysis of digitized binary images by border following. Comput. Vis. Graph. ImageProcess. 1985, 30, 32–46. [CrossRef]
24. Skylogic Research. Drone Market Sector Report; Skylogic Research: San Francisco, CA, USA, 2018.25. Gettinger, D.; Holland Michel, A. Drone Registrations; Center for the Study of the Drone at Bard College: Annandale-On-Hudson,
NY, USA, 2017.26. Viola, P.; Jones, M. Rapid object detection using a boosted cascade of simple features. In Proceedings of the IEEE Computer
Society Conference on Computer Vision and Pattern Recognition, CVPR 2001, Kauai, HI, USA, 8–14 December 2001.27. Dalal, N.; Triggs, B. Histograms of oriented gradients for human detection. In Proceedings of the IEEE Computer Society
Conference on Computer Vision and Pattern Recognition (CVPR’05), San Diego, CA, USA, 20–25 June 2005; pp. 886–893.28. Redmon, J.; Divvala, S.; Girshick, R.; Farhadi, A. You only look once: Unified, real-time object detection. In Proceedings of the
IEEE Conference on Computer Vision and Pattern Recognition (CVPR), Las Vegas, NV, USA, 27–30 June 2016.29. Barekatain, M.; Martí, M.; Shih, H.F.; Murray, S.; Nakayama, K.; Matsuo, Y.; Prendinger, H. Okutama-action: An aerial view
video dataset for concurrent human action detection. In Proceedings of the IEEE Conference on Computer Vision and PatternRecognition Workshops (CVPRW), Honolulu, HI, USA, 21–26 July 2017.