SECTION 02.05.02 - VIBRATORY GROUND MOTION
247
2.5.2-i Revision 2 Clinch River Nuclear Site Early Site Permit Application Part 2, Site Safety Analysis Report SUBSECTION 2.5.2 TABLE OF CONTENTS Section Title Page 2.5.2 Vibratory Ground Motion ............................................................ 2.5.2-1 2.5.2.1 Seismicity ................................................................ 2.5.2-1 2.5.2.2 Geologic and Tectonic Characteristics of the Site and Region ........................................................... 2.5.2-17 2.5.2.3 Correlation of Seismicity with Seismic Sources .... 2.5.2-34 2.5.2.4 Probabilistic Seismic Hazard Analysis and Controlling Earthquakes ....................................... 2.5.2-38 2.5.2.5 Seismic Wave Transmission Characteristics of the Site ........................................................................ 2.5.2-43 2.5.2.6 2D Sensitivity Analysis .......................................... 2.5.2-66 2.5.2.7 References ........................................................... 2.5.2-69
-
Upload
khangminh22 -
Category
Documents
-
view
1 -
download
0
Transcript of SECTION 02.05.02 - VIBRATORY GROUND MOTION

2.5.2-i Revision 2
Clinch River Nuclear SiteEarly Site Permit Application
Part 2, Site Safety Analysis Report
SUBSECTION 2.5.2 TABLE OF CONTENTSSection Title Page
2.5.2 Vibratory Ground Motion ............................................................ 2.5.2-12.5.2.1 Seismicity ................................................................ 2.5.2-12.5.2.2 Geologic and Tectonic Characteristics of the Site
and Region ........................................................... 2.5.2-172.5.2.3 Correlation of Seismicity with Seismic Sources .... 2.5.2-342.5.2.4 Probabilistic Seismic Hazard Analysis and
Controlling Earthquakes ....................................... 2.5.2-382.5.2.5 Seismic Wave Transmission Characteristics of the
Site ........................................................................ 2.5.2-432.5.2.6 2D Sensitivity Analysis .......................................... 2.5.2-662.5.2.7 References ........................................................... 2.5.2-69

Clinch River Nuclear SiteEarly Site Permit Application
Part 2, Site Safety Analysis Report
SUBSECTION 2.5.2 LIST OF TABLES
Number Title2.5.2-1 Original and Updated CEUS SSC Earthquake Catalog Summary2.5.2-2 Earthquakes Within 320 km (200 mi) of the Clinch River Nuclear Site from the Updated CEUS SSC Earthquake Catalog for Mainshock (Independent) Earthquakes with Magnitudes E[M] ≥ 2.9
2.5.2-3 Comparison of Some Reported Moment Magnitudes in the CEUS SSC Report and Those from the Preferred SLU NAMT Catalog
2.5.2-4 Distributed Seismicity Sources in CEUS SSC Model
2.5.2-5 Alternative Maximum Magnitude Zonation Models
2.5.2-6 Alternative Maximum Magnitude Zonation Model Weights
2.5.2-7 Assessment of Default Characteristics of Future Earthquakes in the CEUS
2.5.2-8 Characteristics of Future Earthquakes for Individual Seismic Sources
2.5.2-9 Maximum Magnitude Distributions for Seismotectonic Distributed Seismicity Sources
2.5.2-10 Maximum Magnitude Distribution for Charleston Repeated Large Magnitude Earthquake Source
2.5.2-11 Maximum Magnitude Distribution for New Madrid Repeated Large Magnitude Earthquake Source
2.5.2-12 Maximum Magnitude Distribution for Wabash Valley Repeated Large Magnitude Earthquake Source
2.5.2-13 Maximum Magnitude Distribution for ERM-S, ERM-N, Marianna Zone, and Commerce Fault Zone Repeated Large Magnitude Earthquake Sources
2.5.2-14 Updated Distribution of Maximum Magnitude for ECC-AM Source Zone
2.5.2-15 Corrections to Maximum Magnitude Distributions Published in CEUS SSC 2012
2.5.2-16 Total Mean Rock Hazard for Seven Spectral Frequencies
2.5.2-17 Mean Rock Uniform Hazard Response Spectra for Mean Annual Frequency of Exceedance of 10-4, 10-5, and 10-6
2.5.2-18 Mean Magnitude and Distance for Low Frequency and High Frequency Response Spectra for Three Mean Annual Frequency Exceedances
2.5.2-19 High Frequency and Low Frequency Rock Spectra for Mean Annual Frequency Exceedance of 10-4, 10-5, and 10-6
2.5.2-20 Inputs and Weights for Site Response Analyses
2.5.2-21 Midcontinent Crustal Model
2.5.2-22 Weights Used for Site Response Analysis Based on Deaggregations at Two Return Periods
2.5.2-23 Horizontal Uniform Hazard Response Spectra for Location A
2.5.2-ii Revision 2

Clinch River Nuclear SiteEarly Site Permit Application
Part 2, Site Safety Analysis Report
SUBSECTION 2.5.2 LIST OF TABLES (CONTINUED)
Number Title2.5.2-24 Horizontal Uniform Hazard Response Spectra for Location B2.5.2-25 Vertical Uniform Hazard Response Spectra for Location A
2.5.2-26 Vertical Uniform Hazard Response Spectra for Location B
2.5.2-27 Horizontal Ground Motion Response Spectra for Locations A and B and Envelope
2.5.2-28 Vertical Ground Motion Response Spectra for Locations A and B and Envelope
2.5.2-29 Enveloped Ground Motion Response Spectra With and Without Overburden
2.5.2-30 Unit Weights
2.5.2-31 Processed Earthquake Data Used at Tellico Dam Site
2.5.2-32 Kappa Estimates (Range) for the CRN Site
2.5.2-iii Revision 2

Clinch River Nuclear SiteEarly Site Permit Application
Part 2, Site Safety Analysis Report
SUBSECTION 2.5.2 LIST OF FIGURESNumber Title
2.5.2-1 Plot of Regional Seismicity from the CEUS SSC Earthquake Catalog
2.5.2-2 Plot of Regional Seismicity from the Updated Earthquake Catalog (Through September 2013)
2.5.2-3 Plot of Seismicity Within 320 km (200 mi) of the Clinch River Nuclear Site
2.5.2-4 Plot of Seismicity Within 80 km (50 mi) of the Clinch River Nuclear Site
2.5.2-5 Estimated Affected Area Map for the North Carolina/Southwestern Virginia Earthquake on August 31, 1861
2.5.2-6 Isoseismal Map for the Waynesville, North Carolina, Earthquake on February 21, 1916
2.5.2-7 Isoseismal Map for the Sharpsburg, Kentucky, Earthquake on July 27, 1980
2.5.2-8 Focal Mechanism Solutions of 26 Earthquakes in the Eastern Tennessee Seismic Zone
2.5.2-9 Logic Tree for the Conceptual Approach of the CEUS SSC 2012 Model
2.5.2-10 Maps Showing Maximum Magnitude Zones and Seismicity
2.5.2-11 CEUS SSC 2012 Model Logic Tree Showing the Full Characterization of Maximum Magnitude Zones
2.5.2-12 Seismotectonic Zones with PEZ-N Geometry
2.5.2-13 Seismotectonic Zones with PEZ-W Geometry
2.5.2-14 Logic Tree Showing the Full Characterization of Seismotectonic Zones
2.5.2-15 Logic Tree for Seismotectonic Zone PEZ-N
2.5.2-16 Logic Tree for Seismotectonic Zone PEZ-W
2.5.2-17 Repeated Large Magnitude Earthquake Source Zones in the CEUS SSC Model
2.5.2-18 Maximum Magnitude and Repeated Large Magnitude Earthquake Source Zones
2.5.2-19 Seismotectonic and Repeated Large Magnitude Earthquake Source Zones
2.5.2-20 Seismotectonic Zones with Bouguer Gravity (Left) and Total Intensity Aeromagnetic Anomaly Data (Right)
2.5.2-21 Seismicity Through Mid-September 2013 from the Updated CEUS SSC Earthquake Catalog
2.5.2-22 Repeated Large Magnitude Earthquake Sources within 640 km (400 mi) of the Clinch River Nuclear Site
2.5.2-23 (Sheet 1 of 2) Charleston Repeated Large Magnitude Earthquake Logic Tree
2.5.2-23 (Sheet 2 of 2) Charleston Repeated Large Magnitude Earthquake Logic Tree
2.5.2-iv Revision 2

Clinch River Nuclear SiteEarly Site Permit Application
Part 2, Site Safety Analysis Report
SUBSECTION 2.5.2 LIST OF FIGURES (CONTINUED)Number Title
2.5.2-24 Fault Sources within the New Madrid Fault System Repeated Large Magnitude Earthquake
2.5.2-25 Logic Tree of New Madrid Fault System Repeated Large Magnitude Earthquake
2.5.2-26 (Sheet 1 of 2) Map Showing the Eastern Tennessee Seismic Zone Geometry Defined by the U.S. Geological Survey
2.5.2-26 (Sheet 2 of 2) Map Showing the Location of the Douglas Reservoir Relative to the CRN Site and Site Vicinity
2.5.2-27 Comparison of Earthquake Recurrence Rates for Quarter-Degree Cells Contained (Wholly or Partially) within the PEZ_N Source and Located Near the Clinch River Nuclear Site
2.5.2-28 Mean and Fractile Rock Hazard for 0.5 Hz
2.5.2-29 Mean and Fractile Rock Hazard for 1 Hz
2.5.2-30 Mean and Fractile Rock Hazard for 2.5 Hz
2.5.2-31 Mean and Fractile Rock Hazard for 5 Hz
2.5.2-32 Mean and Fractile Rock Hazard for 10 Hz
2.5.2-33 Mean and Fractile Rock Hazard for 25 Hz
2.5.2-34 Mean and Fractile Rock Hazard for Peak Ground Acceleration
2.5.2-35 1 Hz Mean Rock Hazard from Background and Repeated Large Magnitude Earthquake Sources
2.5.2-36 10 Hz Mean Rock Hazard from Background and Repeated Large Magnitude Earthquake Sources
2.5.2-37 1 Hz Mean Rock Hazard from Individual Weighted Background Sources
2.5.2-38 10 Hz Mean Rock Hazard from Individual Weighted Background Source
2.5.2-39 1 Hz Mean Rock Hazard from Individual Weighted New Madrid Fault System Sources
2.5.2-40 10 Hz Mean Rock Hazard from Individual Weighted New Madrid Fault System sources
2.5.2-41 Unweighted Sensitivity to the Nine EPRI (Background) Ground Motion Prediction Equations at 1 Hz
2.5.2-42 Unweighted Sensitivity to the Nine EPRI (Background) Ground Motion Prediction Equations at 10 Hz
2.5.2-43 Unweighted Sensitivity to the 12 EPRI Repeated Large Magnitude Earthquake Ground Motion Prediction Equations at 1 Hz
2.5.2-44 Unweighted Sensitivity to the 12 EPRI Repeated Large Magnitude Earthquake Ground Motion Prediction Equations at 10 Hz
2.5.2-v Revision 2

Clinch River Nuclear SiteEarly Site Permit Application
Part 2, Site Safety Analysis Report
SUBSECTION 2.5.2 LIST OF FIGURES (CONTINUED)Number Title
2.5.2-45 Mean Total Rock Hazard Curves for Seven Spectral Frequencies
2.5.2-46 Combined Deaggregation of Mean Rock Hazard for 10-4 Magnitude-Distance-ɛ Deaggregation for 1 and 2.5 Hz. (Low Frequency)
2.5.2-47 Combined Deaggregation of Mean Rock Hazard for 10-4 Magnitude-Distance-ɛ Deaggregation for 5 and 10 Hz (High Frequency)
2.5.2-48 Combined Deaggregation of Mean Rock Hazard for 10-5 Magnitude-Distance-ɛ Deaggregation for 1 and 2.5 Hz (Low Frequency)
2.5.2-49 Combined Deaggregation of Mean Rock Hazard for 10-5 Magnitude-Distance-ɛ Deaggregation for 5 and 10 Hz (High Frequency)
2.5.2-50 Combined Deaggregation of Mean Rock Hazard for 10-6 Magnitude-Distance-ɛ Deaggregation for 1 and 2.5 Hz (Low Frequency)
2.5.2-51 Combined Deaggregation of Mean Rock Hazard for 10-6 Magnitude-Distance-ɛ Deaggregation for 5 and 10 Hz (High Frequency)
2.5.2-52 High and Low Frequency Spectra for Mean Annual Frequencies of Exceedance of 10-4, 10-5and 10-6
2.5.2-53 Mean Rock Uniform Hazard Response Spectra for Mean Annual Frequencies of Exceedance of 10-4, 10-5, and 10-6
2.5.2-54 Median Rock Uniform Hazard Response Spectra for Mean Annual Frequencies of Exceedance of 10-4, 10-5, and 10-6
2.5.2-55 Example Comparison of Median Amplification Factor (60 Realization)
2.5.2-56 Shear Modulus Reduction and Damping Curves for Firm Rock
2.5.2-57 Shallow Randomized Velocity Profiles for Best-Estimate Basecase for Location A
2.5.2-58 Randomized Velocity Profiles for Best-Estimate Basecase for Location A
2.5.2-59 Shallow Randomized Velocity Profiles for Best-Estimate Basecase for Location B
2.5.2-60 Randomized Velocity Profiles for Best-Estimate Basecase for Location B
2.5.2-61 Example Randomization of Shear Modulus Reduction and Damping Curves for Firm Rock
2.5.2-62 Horizontal Amplification Factors, 5 Percent-Damped Pseudo-Absolute Spectra, Profile P1, EPRI Rock Curves M1, M 5.5, 0.01 to 0.40 g for Location A
2.5.2-63 Horizontal Amplification Factors, 5 Percent-Damped Pseudo-Absolute Spectra, Profile P1, EPRI Rock Curves M1, M 5.5, 0.50 to 1.5 g for Location A
2.5.2-64 Horizontal Amplification Factors, 5 Percent-Damped Pseudo-Absolute Spectra, Profile P1, Linear Analysis M2, M 5.5, 0.01 to 0.40 g for Location A
2.5.2-65 Horizontal Amplification Factors, 5 Percent-Damped Pseudo-Absolute Spectra, Profile P1, Linear Analysis M2, M 5.5, 0.5 to 1.5 g for Location A
2.5.2-vi Revision 2

Clinch River Nuclear SiteEarly Site Permit Application
Part 2, Site Safety Analysis Report
SUBSECTION 2.5.2 LIST OF FIGURES (CONTINUED)Number Title
2.5.2-66 Horizontal Amplification Factors, 5 Percent-Damped Pseudo-Absolute Spectra, Profile P1, EPRI Rock Curves M1, M 5.5, 0.01 to 0.40 g for Location B
2.5.2-67 Horizontal Amplification Factors, 5 Percent-Damped Pseudo-Absolute Spectra, Profile P1, EPRI Rock Curves M1, M 5.5, 0.5 to 1.5 g for Location B
2.5.2-68 Horizontal Amplification Factors, 5 Percent-Damped Pseudo-Absolute Spectra, Profile P1, EPRI Rock Curves M1, Single Corner, M 7.5, 0.01 to 0.40 g for Location A
2.5.2-69 Horizontal Amplification Factors, 5 Percent-Damped Pseudo-Absolute Spectra, Profile P1, EPRI Rock Curves M1, Single Corner, M 7.5, 0.5 to 1.5 g for Location A
2.5.2-70 Horizontal Amplification Factors, 5 Percent-Damped Pseudo-Absolute Spectra, Profile P2, EPRI Rock Curves M1, M 5.5, 0.01 to 0.40 g for Location A
2.5.2-71 Horizontal Amplification Factors, 5 Percent-Damped Pseudo-Absolute Spectra, Profile P2, EPRI Rock Curves M1, M 5.5, 0.50 to 1.5 g for Location A
2.5.2-72 Horizontal Amplification Factors, 5 Percent-Damped Pseudo-Absolute Spectra, Profile P3, EPRI Rock Curves M1, M 5.5, 0.01 to 0.40 g for Location A
2.5.2-73 Horizontal Amplification Factors, 5 Percent-Damped Pseudo-Absolute Spectra, Profile P3, EPRI Rock Curves M1, M 5.5, 0.50 to 1.5 g for Location A
2.5.2-74 Horizontal and Vertical Uniform Hazard Response Spectra for Location A
2.5.2-75 Horizontal and Vertical Uniform Hazard Response Spectra for Location B
2.5.2-76 Ground Motion Response Spectra and Uniform Hazard Response Spectra for Location A
2.5.2-77 Ground Motion Response Spectra and Uniform Hazard Response Spectra for Location B
2.5.2-78 Ground Motion Response Spectra for Locations A and B and Envelope
2.5.2-79 Enveloped Ground Motion Response Spectra With and Without Overburden
2.5.2-80 Schematic of 2D SASSI Model
2.5.2-81 Fine Mesh Sample, 50 Hz Transmission Capability
2.5.2-82 Clinch River Nuclear Site 2D-Mesh Regions
2.5.2-83 Basement Outcrop Time Histories
2.5.2-84 Five Percent Damped Spectra Basement Horizontal Input ComputedUsing CARES and RASCALS
2.5.2-85 Location A – 2D 5 Percent Damped Horizontal Surface Response Spectra
2.5.2-86 Location B – 2D 5 Percent Damped Horizontal Surface Response Spectra
2.5.2-87 Location A – 2D and 1D 5 Percent Damped Horizontal Surface Response Spectra
2.5.2-vii Revision 2

Clinch River Nuclear SiteEarly Site Permit Application
Part 2, Site Safety Analysis Report
SUBSECTION 2.5.2 LIST OF FIGURES (CONTINUED)Number Title
2.5.2-88 Location B – 2D and 1D 5 Percent Damped Horizontal Surface Response Spectra
2.5.2-89 Location A – Smoothed 1D and 2D 5 Percent Horizontal Damped Spectra
2.5.2-90 Location B – Smoothed 1D and 2D 5 Percent Horizontal Damped Spectra
2.5.2-91 Location A and B 2D/1D Response Spectral Ratios
2.5.2-92 Clinch River VS Profile Sigma for Each Chickamauga Subunit and Newala
2.5.2-93 Clinch River VS Profile COV for Each Chickamauga Subunit and Newala
2.5.2-94 TVA Damsite VS Profile Sigma for Each Rock Type
2.5.2-95 TVA Damsite VS Profile COV for Each Rock Type
2.5.2-96 Clinch River and TVA Damsite VS Profile Sigmas
2.5.2-97 Clinch River and TVA Damsite VS Profile COVs
2.5.2-98 Location of Tellico Dam
2.5.2-99 Geological Sections Through Tellico Dam and Vicinity
2.5.2-100 Tellico Dam Suspension PS Log
2.5.2-101 Interpreted Shear-Wave Velocity at Tellico Dam
2.5.2-102 Smoothed Tellico Dam Crustal Transfer Functions
2.5.2-103 Response Spectral Shapes (5% Damping) Computed for M 2.0
2.5.2-104 Response Spectral Shapes (5% Damping) Computed for M 6.5
2.5.2-105 (Sheet 1 of 2) Vector Average Fourier Amplitude Spectra Computed from Windowed Shear-Wave Recordings of the Twenty Earthquakes Analyzed at Tellico Dam
2.5.2-105 (Sheet 2 of 2) Vector Average Fourier Amplitude Spectra Computed from Windowed Shear-Wave Recordings of the Twenty Earthquakes Analyzed at Tellico Dam
2.5.2-106 (Sheet 1 of 12) Vector Average Fourier Amplitude Spectra for the Twelve Earthquakes Analyzed at Tellico Dam
2.5.2-106 (Sheet 2 of 12) Vector Average Fourier Amplitude Spectra for the Twelve Earthquakes Analyzed at Tellico Dam
2.5.2-106 (Sheet 3 of 12) Vector Average Fourier Amplitude Spectra for the Twelve Earthquakes Analyzed at Tellico Dam
2.5.2-106 (Sheet 4 of 12) Vector Average Fourier Amplitude Spectra for the Twelve Earthquakes Analyzed at Tellico Dam
2.5.2-106 (Sheet 5 of 12) Vector Average Fourier Amplitude Spectra for the Twelve Earthquakes Analyzed at Tellico Dam
2.5.2-viii Revision 2

Clinch River Nuclear SiteEarly Site Permit Application
Part 2, Site Safety Analysis Report
SUBSECTION 2.5.2 LIST OF FIGURES (CONTINUED)Number Title
2.5.2-106 (Sheet 6 of 12) Vector Average Fourier Amplitude Spectra for the Twelve Earthquakes Analyzed at Tellico Dam
2.5.2-106 (Sheet 7 of 12) Vector Average Fourier Amplitude Spectra for the Twelve Earthquakes Analyzed at Tellico Dam
2.5.2-106 (Sheet 8 of 12) Vector Average Fourier Amplitude Spectra for the Twelve Earthquakes Analyzed at Tellico Dam
2.5.2-106 (Sheet 9 of 12) Vector Average Fourier Amplitude Spectra for the Twelve Earthquakes Analyzed at Tellico Dam
2.5.2-106 (Sheet 10 of 12) Vector Average Fourier Amplitude Spectra for the Twelve Earthquakes Analyzed at Tellico Dam
2.5.2-106 (Sheet 11 of 12) Vector Average Fourier Amplitude Spectra for the Twelve Earthquakes Analyzed at Tellico Dam
2.5.2-106 (Sheet 12 of 12) Vector Average Fourier Amplitude Spectra for the Twelve Earthquakes Analyzed at Tellico Dam
2.5.2-107 Comparison of 1D (Base-Case Profile) and 2D Amplification Factors (PSA, 5% Damping) for Location A
2.5.2-108 Comparison of 1D (Base-Case, Upper-, Lower-Range Profiles) and 2D Amplification Factors (PSA, 5% Damping) for Location A
2.5.2-109 Comparison of 1D (Base-Case Profile) and 2D Amplification Factors (PSA, 5% Damping) for Location B
2.5.2-110 Comparison of 1D (Base-Case, Upper-, Lower-Range Profiles) and 2D Amplification Factors (PSA, 5% Damping) for Location B
2.5.2-ix Revision 2

Clinch River Nuclear SiteEarly Site Permit Application
Part 2, Site Safety Analysis Report
2.5.2 Vibratory Ground Motion
This subsection provides a detailed description of vibratory ground motion assessments that were carried out for the Clinch River Nuclear (CRN) Site. The purpose of Subsection 2.5.2 is to determine the site-specific ground motion response spectrum (GMRS) and the Safe Shutdown Earthquake (SSE) at the site. The GMRS is defined as the free-field horizontal and vertical ground motion response spectra at the site and must satisfy the requirements of 10 CFR 100.23. The SSE represents the design earthquake ground motion at the site and is the vibratory ground motion for which certain systems, structures, and components are designed to remain functional. The GMRS was developed with consideration of the guidance provided in NUREG-0800, Standard Review Plan for the Review of Safety Analysis Reports for Nuclear Power Plants: LWR Edition (SRP), Section 2.5.2, as well as the appropriate sections of Regulatory Guides (RGs) referenced within that SRP section.
Development of the ground motions for the SSAR begins with implementation of the provisions of RG 1.208, A Performance-Based Approach to Define the Site-Specific Earthquake. Ground Motion, This regulatory guide describes acceptable methods to conduct geological, seismological, and geophysical investigations of the CRN Site and region around the site, identify and characterize seismic sources, perform a probabilistic seismic hazards analysis (PSHA), perform site response analysis, and determine the GMRS using a performance-based approach. Significant to the investigations and seismic hazard analyses presented in Subsection 2.5.2 is the publication of the Central and Eastern United States Seismic Source Characterization (CEUS SSC) Report by the Electric Power Research Institute (EPRI) et al. (Reference 2.5.2-1). The CEUS SSC Report includes several geological, seismological, and geophysical databases – including a catalog of CEUS earthquakes through 2008 and a fully detailed seismic source model for use in a CEUS PSHA.
Subsection 2.5.2.1 describes the seismicity of the site by providing detailed information on the CEUS SSC earthquake catalog, including an update of this catalog with seismic events occurring through mid-September 2013, and a discussion of significant historical earthquakes within 320 kilometers (km) (200 miles [mi]) of the CRN Site. Subsection 2.5.2.2 describes the CEUS SSC report’s seismic source characterization model for the central and eastern United States and the sources within the model that are used in the PSHA for the CRN Site. Subsection 2.5.2.3 presents the discussion of correlation of seismicity with seismic sources contributing to the seismic hazard of the site. Subsection 2.5.2.4 details the PSHA for the CRN Site, resulting in hard rock ground motion hazard curves, the relative contribution by the various seismic sources, and hard rock uniform hazard response spectra (UHRS). Subsection 2.5.2.5 describes the development of the site amplification factors that result from the transmission of the seismic waves through the site-specific geologic columns above the hard rock horizon and summarizes basic information about the seismic wave transmission characteristics of the CRN Site with reference to more detailed information in Subsection 2.5.4. Subsection 2.5.2.5.8 describes the development of the horizontal and vertical GMRS for the CRN Site.
2.5.2.1 Seismicity
In the mid- to late-1980’s the EPRI-Seismicity Owners Group (EPRI-SOG) sponsored a detailed study of the geological, seismological, and geophysical information pertaining to the central and eastern United States (CEUS) (References 2.5.2-2, 2.5.2-3, 2.5.2-4, 2.5.2-6, and 2.5.2-7). The purpose of the EPRI-SOG study was to develop the databases, procedures, and seismic source characterization necessary to perform a robust PSHA evaluation of earthquake ground motions and their uncertainties. Although performed before the promulgation of RG 1.208, the EPRI-SOG study anticipated and satisfied its guidance.
2.5.2-1 Revision 2

Clinch River Nuclear SiteEarly Site Permit Application
Part 2, Site Safety Analysis Report
Since the early 2000’s several electric power utilities have used the EPRI-SOG models and databases (References 2.5.2-2, 2.5.2-3, 2.5.2-4, 2.5.2-6, and 2.5.2-7) as a starting point to develop updated models and databases for PSHA analyses required for new nuclear units planned in the CEUS. One of the required database update activities has been updating the EPRI-SOG earthquake catalog, which covers the time interval from the earliest available historical records through the end of 1984 (References 2.5.2-3 and 2.5.2-4).
In January 2012 the CEUS SSC Project published, in what is referred to here as the CEUS SSC Report (Reference 2.5.2-1), a newly developed regional SSC to replace the existing regional seismic source models, such as the EPRI-SOG SSC (References 2.5.2-2, 2.5.2-3, 2.5.2-4, 2.5.2-6, and 2.5.2-7). The CEUS SSC Project was conducted over the period from April 2008 to December 2011. The CEUS SSC Report includes a new historical and instrumental earthquake catalog with spatial coverage over a similar CEUS region as the EPRI-SOG catalog (Reference 2.5.2-3 and 2.5.2-4), an area of approximately latitudes 22.5°N to 53°N by longitudes 50°W to 110°W, including earthquakes of an expected uniform moment magnitude E[M] 2.2 and larger for the time period of 1568 through the end of 2008 (Figure 2.5.2-1). RG 1.208, whose purpose is to provide guidance on the development of the site-specific GMRS, details guidance for performance of comprehensive geological, seismological, geophysical, and geotechnical engineering investigations of the site area and region. An important element of the site-specific investigations is incorporation of any new data or interpretations that are not adequately incorporated into the earlier, existing PSHA databases. The seismicity catalog is one of the potentially significant data sets requiring an update. While the CEUS SSC Report was published in 2012, its seismicity characterization is based on data only through the end of 2008, therefore, a review of more recent seismicity is warranted and is undertaken in this subsection.
To evaluate the potential significance of any re-interpretation of past earthquakes and to consider the impact of more recent seismicity, the CEUS SSC earthquake catalog has been reviewed and updated for the CEUS for the time period from the beginning of 2009 through mid-September 2013.
Subsection 2.5.2.1.1 summarizes the data and methodologies that were used in the development of the CEUS regional earthquake catalog as part of the CEUS SSC Report (Reference 2.5.2-1). Beyond the focused narrative of this subsection, more extensive details of the catalog development, including more explicit reference and database information, may be obtained from Reference 2.5.2-1. The only CRN site-specific information presented in this subsection is at the end in a discussion of a tabulation of earthquake counts as a function of magnitude and distance from the CRN Site.
Subsection 2.5.2.1.2 presents a temporal update of the published earthquake catalog from the CEUS SSC Report to extend the record of seismicity through mid-September 2013. Again, the only CRN site-specific information presented in this subsection is a discussion of an updated tabulation of earthquake counts as a function of magnitude and distance from the CRN Site.
Subsection 2.5.2.1.3 presents available information on the three cataloged earthquakes of E[M] 5.0 or greater occurring within 320 km (200 miles) from the CRN Site. While located about 615 km (380 miles) from the CRN Site, the M 5.8 (E[M] 5.71) Mineral earthquake, which occurred on August 23, 2011 at 17:51 UTC at a distance of about 8 km (5 miles) from Mineral, Virginia, is also briefly discussed due to its significance to recent CEUS seismicity.
2.5.2.1.1 Regional Earthquake Catalog Developed for the CEUS SSC Study
Two primary sources of information for the evaluation of earthquake ground motion hazard are, first, the historical and instrumental record of the occurrence of earthquakes (the earthquake catalog) and second, the geologic, geophysical, and geodetic evidence of not only past,
2.5.2-2 Revision 2

Clinch River Nuclear SiteEarly Site Permit Application
Part 2, Site Safety Analysis Report
pre-historic crustal deformation or event-specific after-effects, but also evidence of on-going, quantifiable, near-surface stresses. Given that the oldest historical records in an earthquake catalog are based on spatially and temporally sporadic written documentation of qualitative felt or damage effects, the geologic, geophysical, and geodetic evidence is critical since the occurrence rate or repeat times of major earthquakes is often longer than the temporal coverage of the earthquake catalog. Further, such evidence may supplement the historic earthquake catalog when estimating the potential of maximum earthquake size (e.g., magnitude) for a given tectonic structure or region. In tectonically active regions, such as the western United States (WUS), both of these elements are readily available and used in a PSHA. In stable continental regions (SCR) like the CEUS, the geologic, geophysical, and geodetic evidence of past earthquakes is not as widely available. The causative source mechanisms and structures for the occurrence of damaging earthquakes are generally poorly understood, and the rates of crustal deformation are low such that surface and near-surface indications of stress in the crust and the buildup and release of crustal strains are difficult to quantify. The CEUS SSC Report identifies several tectonic structures showing evidence of repeated large magnitude earthquake (RLME) sources, as discussed in Subsection 2.5.2.2. While these sources are notable contributors to seismic hazard, they are sparsely distributed throughout the CEUS (Figure 2.5.2-17). Therefore, the catalog of past earthquakes that have occurred in the CEUS is a particularly important source of information for the quantification of future seismic hazards. Developing an earthquake catalog for the study region was an important focus of the CEUS SSC Project and the update of that catalog has been an important focus of this subsection.
2.5.2.1.1.1 Goals for the CEUS SSC Earthquake Catalog Development
As detailed in Chapter 3 of the CEUS SSC Report, the specific goals for the development of the CEUS SSC earthquake catalog included the following elements:
Completeness, Uniformity of Catalog Processing, and Catalog Review
2.5.2.1.1.1.1 Completeness
The goal of compiling an earthquake catalog in the context of this subsection is to record the occurrence of all known earthquakes in the magnitude range considered important to the characterization of future earthquake hazards. Significant effort in the United States has been made toward this goal. The NCEER-91 CEUS earthquake catalog by Seeber and Armbruster (Reference 2.5.2-8), an update of the EPRI-SOG earthquake catalog (References 2.5.2-3 and 2.5.2-4), was the primary source for the CEUS earthquake catalog used by the U.S. Geological Survey (USGS) for its National Seismic Hazards Mapping Program (NSHMP) (References 2.5.2-9 and 2.5.2-10). Similarly, work by the Geological Survey of Canada (GSC) to develop an earthquake catalog for seismic hazard analysis (Reference 2.5.2-11) provides an equally important source catalog for earthquakes in the northern portion of the CEUS SSC study region. The CEUS SSC Project relied on the work underlying the USGS (References 2.5.2-9 and 2.5.2-10) and GSC catalogs (Reference 2.5.2-11) to form the backbone of the updated project earthquake catalog.
The USGS (Reference 2.5.2-9) and GSC catalogs (Reference 2.5.2-11) each represent a synthesis of catalog information from many sources into simple one-line catalog entries of date, time, location, and selected estimate(s) of earthquake size. In that process, some information important to the use of the earthquake catalog for the CEUS SSC Project may not have been retained. Therefore, during the development of the CEUS SSC earthquake catalog an extensive review of original catalog sources was performed as part of the catalog compilation. In addition, numerous special studies of individual earthquakes, earthquake sequences, and specific
2.5.2-3 Revision 2

Clinch River Nuclear SiteEarly Site Permit Application
Part 2, Site Safety Analysis Report
geographic areas were reviewed and the information compiled as part of the CEUS SSC earthquake catalog development. A number of these studies included information on important parameters (e.g., moment magnitudes) that are not included in the more regional catalogs.
In the process of catalog compilation from multiple sources, close attention was paid to the identification of duplicate entries for some earthquakes. Attention was also paid to the exclusion of nontectonic events (e.g., quarry blasts, collapses, explosions, and fluid injection-induced earthquakes) that had been already identified and excluded from other catalogs. See Subsection 2.5.2.1.3 for additional discussion on induced earthquakes.
2.5.2.1.1.1.2 Uniformity of Catalog Processing
An important goal of catalog compilation is to use an earthquake size measure that is consistent with the ground motion prediction equations (GMPEs) that are used to compute seismic hazards. Most recent GMPEs applicable to the CEUS, such as EPRI’s, CEUS Ground Motion Project Final Report, (Reference 2.5.2-12), use the moment magnitude scale, M, as the earthquake size measure, and it is expected that the next generation of ground motion models (GMMs) will continue to use the moment magnitude scale. Unfortunately, however, this is not the magnitude scale that has been used for routine earthquake monitoring and catalog compilation in the CEUS. The recent practice for many seismic hazard analyses in the CEUS – including EPRI-SOG (References 2.5.2-2, 2.5.2-3, 2.5.2-4, 2.5.2-6, and 2.5.2-7) and NSHMP (References 2.5.2-9 and 2.5.2-10) – has been to estimate earthquake occurrence rates in terms of body-wave magnitude, mb, and then use magnitude conversion relationships to convert to M as part of the ground motion estimation. This magnitude conversion introduces an additional source of magnitude uncertainty, particularly since many of the catalog magnitude entries are themselves converted from other size measures, such as the shaking intensity that must be used for pre-instrumental earthquakes.
The EPRI-SOG project (References 2.5.2-2, 2.5.2-3, 2.5.2-4, 2.5.2-6, and 2.5.2-7) developed techniques to produce a catalog with a uniform size measure that is appropriate for an unbiased estimation of earthquake occurrence rates for use in a seismic hazard assessment. These techniques were used in the EPRI-SOG study to develop a uniform catalog of the mb scale. Recent use of the EPRI-SOG SSC has been combined with a GMPE model based on M (i.e., Reference 2.5.2-12), requiring magnitude conversion within a PSHA. During the CEUS SSC Project, a goal of the catalog development effort was to use the same techniques to produce a catalog of uniform M values that have properly accounted for the uncertainty in size estimation. As M-based GMPEs have become more routinely developed and used for estimating earthquake ground motions in all tectonic environments, development of M-based seismicity and source recurrence rates eliminates the need for magnitude conversion as part of the hazard calculation and avoids propagation of unnecessary conversion-associated uncertainty through the hazard analysis. To achieve this goal, the CEUS SSC Report presented the updated magnitude scale conversions, which are developed from a variety of earthquake size measures to moment magnitude (see CEUS SSC Report, Table 3.3-1).
An equally important task was to obtain the original size measures for catalog entries in order to use a direct conversion to moment magnitude, rather than introduce additional uncertainty by converting previously converted size estimates. For example, the GSC catalog contained a number of magnitudes designated as local magnitude (ML) implying amplitudes measured consistent with or calibrated to Richter's early magnitude measures of ML on a particular seismograph within a given tectonic environment, yet many of these GSC records are for earthquakes that occurred in the pre-instrumental period, and in a much different tectonic setting. (Reference 2.5.2-13). Therefore, the original source for the catalog of intensity data was obtained from W.E.T Smith, 1962 and 1966 (References 2.5.2-14 and 2.5.2-15, respectively), and the
2.5.2-4 Revision 2

Clinch River Nuclear SiteEarly Site Permit Application
Part 2, Site Safety Analysis Report
maximum intensity, I0, values for these earthquakes were considered in order to make a direct conversion from I0 to M for the development of the earthquake catalog.
2.5.2.1.1.1.3 Catalog Review
An important element of the CEUS SSC earthquake catalog development was the review by seismologists with extensive knowledge and experience in catalog compilation. The result of the review enhanced the development of the final CEUS SSC earthquake catalog. One result of the review was the recommendation to use original earthquake information sources as much as possible in general preference to relying only on catalog compilations, while still recognizing that some compilations, like the CEUS SSC earthquake catalog itself, have been developed with a high degree of seismological rigor already. Another notable result of the review was the recognition that potential differences in common magnitude scales (e.g., body-wave magnitude and duration magnitude) may exist due to differences in the approaches used by various organizations or agencies to calculate magnitude. This resulted in looking at magnitude conversion relations that might be a function of time and/or location.
2.5.2.1.1.2 Development of the CEUS SSC Earthquake Catalog
The CEUS SSC earthquake catalog development consisted of four main steps:
Compilation of the catalog, Assessment of a uniform size measure to apply to each earthquake, Identification of independent and dependent earthquakes (catalog declustering), and Assessment of the completeness of the catalog as a function of location, time, and
earthquake size.
These four steps are discussed in the following subsections.
2.5.2.1.1.2.1 Catalog Compilation
The compilation of the earthquake records for the CEUS SSC earthquake catalog comprised several types of sources as described below.
Continental-Scale Catalogs:
These catalogs are primarily compilations of earthquake information from regional sources (see Regional Catalogs described below), as well as information gathered directly or analyzed by a national organization itself, such as the USGS or the GSC. In these continental-scale compilations, the national organizations often receive information from a variety of regional sources, as well as information developed from their own resources (e.g., seismic recording stations), for a given earthquake. Some of the national organizations employ their staff seismologists to review the available information and evaluate the most accurate, consistent, and up-to-date information to present in their catalogs. This is the case for the catalogs from the USGS and the GSC. For the CEUS SSC earthquake catalog compilation, a version of the USGS earthquake catalog created for the NSHMP (Reference 2.5.2-9) was obtained from the USGS and updated through 2008 using the Preliminary Determination of Epicenters (PDE) catalog from the National Earthquake Information Center (NEIC). Similarly, a version of the GSC catalog was obtained and updated through 2008 using the GSC’s National Earthquake Database (NEDB) of Canada.
As is noted in the CEUS SSC Report, the Advanced National Seismic System (ANSS) catalog is also a continental-scale catalog, although the level of review is not as complete and the amount of information is not as broad as with the USGS’s NSHMP catalog (Reference 2.5.2-9).
2.5.2-5 Revision 2

Clinch River Nuclear SiteEarly Site Permit Application
Part 2, Site Safety Analysis Report
Regional Catalogs:
These catalogs are prepared by state geological surveys or universities. They are focused on a given local region of interest. While they often acquire primary information and perform the primary data analyses (e.g., determination of time, location, and magnitude), which is commonly passed along to the caretakers of the continental-scale catalogs, the caretakers of a regional catalog do not routinely compare their reports of earthquakes with other regional or continental-scale catalogs, and, therefore, do not have the opportunity for more in-depth quality assurance from information comparison, as is available to the caretakers of continental-scale catalogs.
The following regional catalogs, generally available at the web sites of the indicated source, were included in the CEUS SSC earthquake catalog compilation:
Center for Earthquake Research and Information (CERI) catalog Saint Louis University (Nuttli, microearthquake, and moment magnitude catalogs) Lamont-Doherty Cooperative Seismographic Network catalog (LDO) Weston Observatory catalog (WES) Ohio Seismic Network catalog Department of Conservation and Natural Resources of Pennsylvania catalog Reinbold and Johnston (Reference 2.5.2-16) Oklahoma Geological Survey catalog (OKO) South Carolina Seismic Network (SCSN) catalog Southeastern United States Network (SUSN) catalog (Virginia Tech)
Catalogs from Special Studies:
Several published studies that contained information on specific earthquakes in limited geographical areas were reviewed during the CEUS SSC Project. These often provided seismic moment or moment magnitude values and revised locations and/or depths. Some of these studies were the source of original information considered in the continental-scale compiled catalogs, while others offered alternative information that could be considered in the assessment of magnitude uncertainties. Still others of these special studies assisted in indicating events of nontectonic origin.
Centroid Moment Tensor Catalogs:
These earthquake catalogs, such as the Harvard Global Centroid Moment Tensor (GCMT) catalog and the Saint Louis University (SLU) North America Moment Tensor (NAMT) catalog, are limited catalogs of generally larger magnitude events that present detailed analyses of the earthquake source characteristics such as the fault style (strike-slip, normal, reverse, or oblique slip) and the three-dimensional moment tensor of the fault slip occurring during the earthquake. From the moment tensor analysis, an estimate of the scalar moment magnitude results. The moment magnitude determined in this fashion is generally considered to be the most accurate measure of magnitude that can be determined for an earthquake, where magnitude is intended to represent the seismic energy associated with an earthquake. This latter observation is not only why the moment magnitude is the magnitude scale of choice in the CEUS SSC Report when defining a uniform magnitude — and converting all other magnitude scales to the moment magnitude scale — but also why the centroid moment tensor catalogs are worth considering for their direct reporting of moment magnitudes, while their date, time, location, and depth information is used only for correlating to other catalogs’ information, which present the preferred data on date, time, location, and depth.
2.5.2-6 Revision 2

Clinch River Nuclear SiteEarly Site Permit Application
Part 2, Site Safety Analysis Report
Moment magnitude estimates were also obtained by approximate means in the studies of Atkinson (References 2.5.2-17 and 2.5.2-18), Boatwright (Reference 2.5.2-19), and Moulis (Reference 2.5.2-20). These approximate moment magnitudes were corrected for minor biases, as discussed in the CEUS SSC Report, before being used to augment the CEUS SSC M data set.
Final Catalog Compilation:
Part of the CEUS SSC Report database is the master compilation of all earthquake records, including the duplicates from multiple catalogs or studies reporting the same event. Among the duplicate records for each given event, it was necessary to assess a prioritization or preference order among the various catalog sources for specifying the earthquake parameters to be presented in the final catalog. Unless suggested otherwise by recent special studies, the date, time, location, and depth for a given event were taken preferably from the USGS or GSC catalogs. Otherwise (for events not in USGS and GSC catalogs) this information was taken from the regional catalog closest to the event. As discussed below, the measures of magnitude for a given event as reported in multiple catalogs were considered in the assessment of the uniform moment magnitude and its uncertainty.
2.5.2.1.1.2.2 Development of a Uniform Moment Magnitude Earthquake Catalog
An important goal of the development of the CEUS SSC earthquake catalog was to provide an earthquake catalog that could be used to develop unbiased estimates of the recurrence of earthquakes as a function of moment magnitude, as defined by Hanks and Kanamori (1979) (Reference 2.5.2-21), consistent with modern GMPEs for the CEUS. Because the size measures available for most of the earthquakes in the project catalog are not moment magnitudes, a process for converting from a variety of magnitude and shaking intensity measures to moment magnitude was needed. In addition, it has been shown by Tinti and Mulargia (Reference 2.5.2-22) and EPRI (Reference 2.5.2-3) that uncertainty in the magnitudes reported in an earthquake catalog can lead to bias in the estimation of earthquake recurrence rates unless appropriate adjustments are applied.
The EPRI-SOG project (References 2.5.2-2, 2.5.2-3, 2.5.2-4, 2.5.2-6, and 2.5.2-7) developed an approach for assigning a uniform magnitude measure to earthquakes in an earthquake catalog and producing unbiased recurrence parameters from that catalog. The EPRI-SOG approach was updated for application in the CEUS SSC Project.
The CEUS SSC Report presents the results of extensive analysis of the compiled earthquake catalog to develop relationships for conversion to moment magnitude of the magnitude scales presented in the various catalogs. Table 3.3-1 in the CEUS SSC Report presents several conversion relationships to determine the uniform moment magnitude estimate E[M|X] and its standard deviation or measure of uncertainty σ[M|X] given the observed magnitude scale, X. These magnitude conversion relationships are not only a function of magnitude scale, but also of epicentral location and parent catalog.
If the reported magnitude is already a directly measured moment magnitude (e.g., see Subsection 2.5.2.1.1.2.1 above on centroid moment tensor catalogs), there is uncertainty in that measure, as well. As presented in the CEUS SSC Report (Equation 3.3.1-5):
Where β is b*ln(10) and M^ is a reported moment magnitude. The σ value for the reported moment magnitudes, which varies as a function of time period, has a value of 0.10 after 1984,
E[M] = E[M|M^] = M^ – βσ2[M|M^] Equation 2.5.2-1
2.5.2-7 Revision 2

Clinch River Nuclear SiteEarly Site Permit Application
Part 2, Site Safety Analysis Report
and a b-value of 0.95 was determined from the initial CEUS SSC Project analyses of the catalog (see Chapter 3 of the CEUS SSC Report).
Different catalogs commonly report different magnitudes (in value, as well as scale) for the same event. Further, some catalogs report more than one measure of magnitude for a given earthquake. Considering the multiple measures of magnitude for a given event in a compiled catalog, the CEUS SSC Report uses the following formulation (CEUS SSC Report [Equations 3.3.1-9 and 3.3.1-10]) to assess the single uniform moment magnitude estimate and its total uncertainty:
where X^i is the ith member of the vector X^ of magnitudes of varying scale and E[M|X^
i] is an estimated moment magnitude for X^
i using the relationships in the CEUS SSC Report’s Table 3.3-1 for reported non-moment magnitudes or Equation 2.5.2-1 for reported moment magnitudes. R is the number of original and independent measures of magnitude X^. That is, the vector X^ of magnitudes should not include converted magnitudes or duplicates (as may occur when one source catalog reports a magnitude from another catalog). If one or more reported magnitudes are directly measured moment magnitudes, then the application of Equations 2.5.2-2 and 2.5.2-3 is done only for the reported moment magnitudes (first adjusted per Equation 2.5.2.1-1), and other non-moment reported magnitudes (albeit, previously converted to moment magnitudes) are ignored. This latter procedure allows that directly determined moment magnitudes, though they may differ and represent uncertainties within those determinations, should not have their estimates and uncertainties impacted or unduly biased by moment magnitudes developed from conversions from non-moment magnitude estimates.
Once the preferred and duplicate records of a given event have been used to evaluate uniform moment magnitude, E[M], and its total uncertainty, σ2[M], the duplicate records are discarded.
It is noted that in the literature a reported moment magnitude M^ [or just M] is commonly cited rather than the CEUS SSC Report-defined uniform moment magnitude, E[M], as given in Equation 2.5.2-1 or Equation 2.5.2-3. Therefore, ‘M’ will often be cited in this SSAR for the common moment magnitude as given in the literature, as distinguished from the uniform moment magnitude value ‘E[M]’.
A detailed discussion on the use of an earthquake catalog for earthquake recurrence rate or frequency-magnitude analysis is provided in Chapter 3 of the CEUS SSC Report. As the typical processing entails counting numbers of earthquakes using bins of magnitude- and time-intervals, the CEUS SSC Report addresses the issue of the impact of uncertainties in magnitude values on the magnitude binning procedure.
EPRI presented a methodology whereby an earthquake’s estimate of a given magnitude, mb or Emb, (as noted in References 2.5.2-3, EPRI used body-wave magnitudes, rather than moment magnitudes) is modified to a value referred to as mb* or Rmb, where the standard deviation of σmb or Smb is considered. EPRI (Reference 2.5.2-3) used mb* magnitudes for earthquake recurrence rate analysis. The CEUS SSC Report reviews the EPRI 1988 methodology of adjusting the magnitudes (Reference 2.5.2-3), and demonstrates that better recurrence rate statistics can be developed by using a factor for adjusting the bin counts, rather than the magnitudes. Following the CEUS SSC Report, for each event the equivalent count factor N*, as defined in the CEUS SSC Report (Equation 3.3.1-12), is calculated:
σ2[M] = σ2[M|X^] = { Σi {1 / σ2[M|X^i]} }-1 Equation 2.5.2-2
E[M] = E[M|X^]= { Σi (σ2[M|X^] / σ2[M|X^
i]) x E[M|X^i] } + (R-1)βσ2[M|X^] Equation 2.5.2-3
2.5.2-8 Revision 2

Clinch River Nuclear SiteEarly Site Permit Application
Part 2, Site Safety Analysis Report
For subsequent recurrence rate analysis, when earthquakes are counted as they are distributed among magnitude-interval and time-interval bins, each event counts as its N* value, rather than unity.
2.5.2.1.1.2.3 Identification of Independent and Dependent Earthquakes
The PSHA methodology, which is typically used to model the occurrence of distributed seismicity, uses the Poisson model for the random occurrence in time of independent earthquakes. Therefore, dependent earthquakes (foreshocks and aftershocks) must be identified and discarded before developing estimates of recurrence rates. This process is referred to as catalog declustering.
Identification of dependent events is, however, valuable when considering postulated spatially and/or temporally clustered/episodic behavior of large magnitude earthquakes, such as at New Madrid. Non-Poissonian clustering of this type can have potentially significant hazard implications that could be inappropriately incorporated into PSHA studies. Many seismic sources, especially those within SCRs, display evidence of clustering through time such that the earthquake recurrence rates may be elevated for several seismic cycles during a cluster, followed by much longer time intervals of relative quiescence. This behavior can be modeled by identifying two rates: the within-cluster rate and the out-of-cluster rate. The SSC model resulting from the CEUS SSC Project is intended to be useful for engineering applications for the next 50 years or so. For this reason, it is important to assess whether the source is currently (i.e., over approximately the next 50 years) within or out of a cluster such that the within-cluster or out-of-cluster rate is applicable. This is an assessment made for the RLME sources in the CEUS SSC model, as discussed later.
Dependent events, along with the related mainshock event, are also valuable in assisting to image the rupture area of large earthquakes, as discussed in North Anna Unit 3 FSAR Subsection 2.5.2.2 (Reference 2.5.2-23) regarding the 2011 M 5.8 Mineral earthquake.
The CEUS SSC Report discusses multiple methods of earthquake catalog declustering. While the EPRI method (Reference 2.5.2-3) was used in the declustering analysis for the CEUS SSC earthquake catalog, the CEUS SSC Report notes that similar results would have been obtained using the method of Gardner and Knopoff (Reference 2.5.2-24) without a significant difference in earthquake recurrence rates computed from the declustered catalog.
2.5.2.1.1.2.4 Catalog Completeness
For input to a PSHA, the mean annual recurrence rate of earthquakes as a function of size must be evaluated for each seismic source feature or defined source area. For distinct features, such as the RLME seismic sources discussed in Subsection 2.5.2.2, the recurrence rate is often established from geologic and paleoseismic evidence pre-dating the earthquake catalog. However, when using the observed seismicity as given in an earthquake catalog and adjusted for completeness, as discussed below, the recurrence rate of independent earthquakes generally follows a Poisson distribution, where the frequency of occurrence of different magnitude earthquakes follows the frequency-magnitude relationship of Gutenberg and Richter (Reference 2.5.2-25):
N* = exp{β2σ2[M|X]/2} Equation 2.5.2-4
Log10ν(M) = a - b M Equation 2.5.2-5
2.5.2-9 Revision 2

Clinch River Nuclear SiteEarly Site Permit Application
Part 2, Site Safety Analysis Report
where ν(M) is the mean annual number of earthquakes of magnitude M and larger, and a and b are the log-linear regression coefficients or recurrence parameters for the frequency function determined by analysis of historical earthquakes associated with the given seismic source. The earthquake data used in the determination of recurrence parameters a and b will range between a given minimum magnitude (m0) and maximum magnitude (Mmax).
In analyzing an earthquake catalog for the purpose of developing the recurrence parameters, it is necessary to recognize that the reporting of earthquakes is not perfect or complete through the duration of the available data. With the current instrumentation within the CEUS, the detectability of events of even small magnitude (e.g., 2’s and 3’s) in much of the CEUS is relatively high compared to 10 to 30 years ago and the detectability of moderate size events (5 and greater) is now effectively 100 percent. The detectability and reporting of earthquakes notably decreases, however, especially for small to moderate-size events, the older the event is within the earthquake catalog, particularly for time periods when seismic instrumentation did not exist and earthquake records are based on personal accounts or as sporadically recorded in newspapers and other written records. In assessing stable estimates of recurrence parameters (a and b in Equation 2.5.2-5), it is necessary to assess the completeness of the earthquake catalog to develop reliable estimates of those statistics. The time-period of completeness is defined as that time-period portion of the catalog, as a function of magnitude, for which it can be reliably held that all events above a certain threshold size have been recorded, or, the equivalent time-period for which at least the effect of expected number of missing events are somehow compensated. Equation 2.5.2-5 can only be used for a robust estimate of the assumed constant annual rate of independent events when the time-period of completeness has been assessed. The state of completeness is not only a function of the capability of effective or accurate earthquake recording by instrument or personal account, but also by the spatial distribution of the recorders. Hence, the completeness is not only a function of the size and date of the event, but also a function of the demographics of location or region.
A common approach of defining the portion of the earthquake catalog that is complete has been the use of the general technique first proposed by Stepp (Reference 2.5.2-26). This approach evaluates the catalog completeness for specific magnitude ranges by starting at the present and moving back in time and counting the total number of earthquakes in the catalog in each magnitude interval. At each point in time when an earthquake in the specified magnitude interval occurred, the rate of earthquakes in the magnitude interval is computed by dividing the sum of the number of earthquakes from that point in time to the end of the catalog by the length in time from that point to the end of the catalog. Assuming that the rate of earthquakes is constant in time, plotting these values versus date for the complete portion of the catalog will show an approximately horizontal line representing a relatively constant rate for events in the specified magnitude range. Moving further back in time, eventually the plotted line will start to trend downward, indicating that not all earthquakes are being reported (again assuming stationarity in time of the true rate). The point at which this downward trend begins indicates the beginning of the complete period of catalog reporting for the specific magnitude interval. These plots are commonly referred to as Stepp plots, after their originator.
The mean annual rate of earthquakes occurring within a given magnitude interval, λi, is given as
where NiC is the number of earthquakes in magnitude interval i observed during the period of
complete recording TiC in years (Reference 2.5.2-1, Equation 3.5-1). Note that ν(M) in
Equation 2.5.2-5 is a cumulative form of λi.. In the Stepp approach (Reference 2.5.2-26), all earthquake data prior to the beginning of the complete period of catalog reporting for the specific magnitude interval are ignored.
λi = NiC / Ti
C Equation 2.5.2-6
2.5.2-10 Revision 2

Clinch River Nuclear SiteEarly Site Permit Application
Part 2, Site Safety Analysis Report
The EPRI-SOG project (References 2.5.2-2, 2.5.2-3, 2.5.2-4, 2.5.2-6, and 2.5.2-7) developed an approach for incorporating the previously ignored catalog data in the partially complete period into the assessment of earthquake recurrence parameters. Within this approach, if a probability of detecting and reporting an earthquake as a function of magnitude and calendar time can be estimated, then the mean annual rate of earthquakes occurring within a given magnitude interval, λi, is given as
where Nij is the number of earthquakes in magnitude interval (i) observed during the period interval of recording, Tj in years, and Pij
D is the probability of detecting earthquakes within magnitude interval i during the period interval of recording Tj (Reference 2.5.2-1, Equation 3.5-4). If it is assumed that the larger magnitudes are complete at present and that Pij
D should decrease more or less monotonically with increasing time into the past and should increase monotonically with magnitude at each point in time, then, again invoking stationarity, the parameters λi (or a and b of Equation 2.5.2-5) and Pij
D can be estimated jointly through a maximum likelihood solution from the earthquake catalog data assuming a Poisson distribution of the earthquake data. In developing these estimates from its earthquake catalog, EPRI (Reference 2.5.2-3) used no spatial smoothing on the rate parameter, medium smoothing on the b-value, and no prior on the b-value (see Section 3.5 in Volume 1, Part 1 and Section 4.5 in Volume 1, Part 2 of Reference 2.5.2-3).
Through analysis of the history of population growth and earthquake recording, EPRI (Reference 2.5.2-3) defined 13 completeness regions covering most of the CEUS. These regions represent portions of the CEUS where catalog completeness as a function of time and magnitude is assessed to be sufficiently similar such that it can be treated as homogeneous. That is, for each of the 13 regions, EPRI developed a single probability detection matrix of Pij
D
(Reference 2.5.2-3).
In looking at various issues of earthquake record coverage as presented in the EPRI-SOG earthquake catalog (References 2.5.2-3 and 2.5.2-4), the CEUS SSC Report made modifications to the EPRI-SOG completeness regions, including adding a fourteenth region. Figure 3.5-2 and Tables 3.5-1 through 3.5-3 in the CEUS SSC Report (Reference 2.5.2-1) provide the three sets of matrices of probability of detection for each of the 14 regions, one set for each of the recurrence smoothing cases (A, B and E), as discussed further in Subsection 2.5.2.4.3.1.
2.5.2.1.1.3 CEUS SSC Earthquake Catalog
The CEUS SSC Report (Reference 2.5.2-1) earthquake catalog, covering the period from 1568 through 2008, is tabulated in Table B-1 and plotted in Figure A-2 of the report and shown here in Figure 2.5.2-1. As indicated in Chapter 3 of the CEUS SSC Report, this catalog contains 3,298 individual earthquakes of uniform moment magnitude E[M] 2.9 and larger and 10,984 earthquakes of uniform moment magnitude E[M] 2.2 and larger within the entire CEUS SSC study area. Table 2.5.2-1 presents additional statistical details of the published CEUS SSC earthquake catalog, including 331 of the 3,298 events of uniform moment magnitude E[M] 2.9 and larger that are within 320 km (200 miles) of the CRN Site.
2.5.2.1.2 Updated CEUS SSC Earthquake Catalog
With the occurrence of the M 5.8 August 23, 2011, Mineral, Virginia, earthquake, it was recognized that this event comprised significant new data that needed to be evaluated under Regulatory Position 1 of RG 1.208. Therefore, a chronological update of the CEUS SSC
λi = Σj Nij / Σj PijDTj Equation 2.5.2-7
2.5.2-11 Revision 2

Clinch River Nuclear SiteEarly Site Permit Application
Part 2, Site Safety Analysis Report
earthquake catalog for the time period of all 2009 through mid-September 2013 was performed for a rectangular area encompassing the entire CEUS SSC study area. The same primary input data sources and analysis procedures as were used to develop the published CEUS SSC Report, as specifically described in its Chapter 3, Earthquake Catalog and summarized above, were used in this update. As with the original CEUS SSC earthquake catalog, the focus of the earthquake catalog update was on events of uniform moment magnitude E[M] 2.2 and larger.
Table 2.5.2-1 summarizes the update to the original CEUS SSC earthquake catalog, as well as the total earthquake catalog, now including earthquakes from 1568 through mid-September 2013. The total updated earthquake catalog contains 3982 individual earthquakes of uniform moment magnitude E[M] 2.9 and larger within the entire CEUS SSC study area, including 340 of these events that are within 320 km (200 mi) of the CRN Site. Forty-one of these have been identified as dependent (foreshocks or aftershocks). Table 2.5.2-2 lists the remaining 299 mainshock (independent) earthquakes with uniform moment magnitude E[M] 2.9 and larger that are within 320 km (200 mi) of the CRN Site.
Note that while Modified Mercalli Intensities (MMI), a standard measure of the qualitative site-specific effects of an earthquake, were considered in the development of the published CEUS SSC earthquake catalog, notably for the determination of corresponding magnitudes of historical, pre-instrumental earthquakes, the published CEUS SSC earthquake catalog did not include a tabulation of the maximum MMI values for the earthquakes. As maximum MMI values were not required for the determination of magnitude for the more recent events from 2009 to mid-September 2013, maximum MMI has also not been tabulated for the catalog update.
Figure 2.5.2-2 is a plot of the updated CEUS SSC earthquake catalog for the entire CEUS. Earthquakes shown are for mainshock (independent) earthquakes with E[M] ≥ 2.9. Figures 2.5.2-3 and 2.5.2-4 are similar plots focusing on the areas within approximately 320 km (200 mi) and 80 km (50 mi), respectively, of the CRN Site.
In the CEUS SSC Report, the SLU NAMT catalog was a primary source of reported moment magnitudes. Tables B-2 and B-3 in the CEUS SSC Report list the moment magnitudes that were used in the development of correlation relationships to convert reported non-moment magnitudes to an estimate of uniform moment magnitude. In Table B-2 the data from the SLU NAMT catalog are indicated with “WEB” in the ‘Source’ field. For evaluations of the SLU data made during both the CEUS SSC study and the CEUS SSC earthquake catalog update performed herein, the SLU web site had multiple ways of obtaining earthquake magnitudes, some of which were moment magnitudes, while others were some unspecified magnitude type. During the process of updating the CEUS SSC earthquake catalog, it was determined that a few of the values of the moment magnitudes tabulated in the CEUS SSC Report were incorrect, primarily due to a brief period of manual processing of the earthquake data at St. Louis University. Upon consulting Dr. Robert Herrmann at SLU, it was determined that the preferred manner to obtain an estimate of moment magnitude was to inquire of the site’s moment tensor Mechanism Files, rather than either of the two tabulations of earthquakes also available at the SLU Internet site. Table 2.5.2-3 compares the moment magnitudes in the CEUS SSC Report and the corresponding magnitudes obtained by investigating the individual Mechanism Files. In most cases the differences are small, resulting in a negligible impact on any of the analyses performed in the CEUS SSC Report. The one case where it is recommended that a correction is warranted is that of the earthquake in Texas on April 7, 2008 with a reported moment magnitude M^ 3.86 from the Mechanism Files, tabulated in Table B-2 of the CEUS SSC Report as M^ 4.86. Given Equation 2.5.2-1, the appropriate M^ 3.86 for this event would have a uniform moment magnitude of E[M] 3.84.
2.5.2-12 Revision 2

Clinch River Nuclear SiteEarly Site Permit Application
Part 2, Site Safety Analysis Report
2.5.2.1.3 Induced Earthquakes
As discussed in Subsection 2.5.2.1.1.1.1, earthquakes identified as of nontectonic origin, such as ground motions from quarry blasts, collapses, and explosions, are excluded from an earthquake catalog used for input to a PSHA, where mainshock (independent) events of natural origin are usually considered for vibratory ground motion hazard evaluation. Since about 2009 there has been a notable increase in the number of small to moderate magnitude earthquakes in several regions of the CEUS, including parts of Arkansas, Oklahoma, Kansas, and Texas, largely attributed to human activities involving subsurface fluid injection—the largest of which occurred in November 2011 with a magnitude of 5.6 (Petersen and others, 2015) (Reference 2.5.2-5). While natural tectonic earthquakes are certainly not unexpected in these areas, even of these magnitudes, the sheer number of the events in spatially limited locations and their apparent correlation with fluid injection activities is cause to suspect many of these events as triggered. The investigation of these events is still very preliminary, and, as presented in USGS Open-File Report 2015-1070 (Reference 2.5.2-5), the USGS has been questioning whether or how induced events (once identified as distinct from the natural tectonic events occurring at rates consistent with expected stationary background seismicity) should be included in the development of national seismic hazard maps.
USGS Open-File Report 2015-1070 (Reference 2.5.2-5) identifies 17 sites of apparent induced seismicity over the past 50 years. It is stated, “patterns of increased seismicity vary considerably between the different areas. Some areas show pulses of increased activity interspersed between periods with little or no activity (for example, Cogdell, Texas, and Rangely, Colorado). Other areas (such as central Oklahoma and southern Kansas) show exponential growth patterns of seismicity that are continuing today (2015). In a few places, seismic activity increased as pumping began, but diminished or ceased when the pumping stopped, sometimes with a lag time before the earthquake activity terminated (for example, Rocky Mountain Arsenal, Colorado). It is important to recognize that the induced seismicity behavior differs substantially between zones, so these rate characteristics need to be evaluated for each zone separately.”
In the review and update of the CEUS SSC earthquake catalog, no specific action was intentionally made to try to identify induced earthquakes not already identified as such. While it may be expected that catalog declustering would identify and remove some of these events (see Subsection 2.5.2.1.1.2.3) some would likely remain in the mainshock catalog. Nevertheless, none of the 17 sites investigated by the USGS (Reference 2.5.2-5) are within 200 mi of the CRN Site, therefore, there are no currently recognized locations within the site region (200 mi) at which induced seismicity has been noted.
2.5.2.1.4 Significant Site Region Earthquakes
RG 1.206, Part I, Subsection C.I.2.5.2.1 specifies that “for each earthquake, information, whenever available, on the epicenter coordinates, depth of focus, date, origin time, highest intensity, magnitude, seismic moment, source mechanism, source dimensions, distance from the site, and any strong-motion records, should be provided.” This subsection presents available information on the three cataloged earthquakes of E[M] 5.0 or greater occurring within 320 km (200 mi) from the CRN Site.
The M 5.8 (E[M] 5.71) Mineral earthquake occurred on August 23, 2011, at 17:51 UTC at a distance of about 8 km (5 mi) from Mineral, Virginia. While located about 615 km (380 mi) from the CRN Site, the Mineral earthquake is also briefly discussed due to its significance to CEUS seismicity not included in the published CEUS SSC report.
Within the vicinity of the CRN Site, the Eastern Tennessee Seismic Zone (ETSZ), is a well-defined, northeasterly trending belt of seismicity, 300 km (186 mi) long by less than 100 km
2.5.2-13 Revision 2

Clinch River Nuclear SiteEarly Site Permit Application
Part 2, Site Safety Analysis Report
(62 mi) wide, within the Valley and Ridge and Blue Ridge physiographic provinces of eastern Tennessee and parts of North Carolina, Georgia, and Alabama (Figure 2.5.2-3; Subsection 2.5.2.2.5.1; Reference 2.5.2-1, Subsection 7.3.4.1.2). This area is one of the most active seismic regions in eastern North America in terms of the rate of small earthquakes. Within the characterization of ETSZ by the USGS (Figure 2.5.2-26) the earthquakes cataloged have magnitudes less than E[M] 5.00. In this section the largest ETSZ earthquake of magnitude E[M] 4.57 and the event of E[M] > 4.00 nearest to the CRN Site are briefly discussed.
In the discussion of significant earthquakes in this section, emphasis is made on the locations of maximum reported shaking effects, and may not indicate a best estimate location of the epicenter.
August 31, 1861 E[M] 5.63
Wilkes County, North Carolina/Southwestern Virginia
Distance to CRN Site = 140 km (87 mi)
The August 31, 1861 earthquake occurred about 5 a.m. (local time). The actual epicentral location of this event is unknown, but the distribution of the felt data strongly suggests that the epicenter was probably in extreme southwestern Virginia or western North Carolina. The CEUS SSC catalog locates the epicenter near Hot Springs, North Carolina, near the North Carolina/Tennessee border. The most severe shaking was reported at Wilkesboro, North Carolina, where bricks were shaken from chimneys, doors jarred open, and clocks stopped, consistent with MMI VI as given in MacCarthy (Reference 2.5.2-27).
This earthquake was felt over an area of at least 280,000 square mi along the Atlantic Coast from Washington to Charleston, South Carolina, and westward into Cincinnati, Ohio; Louisville, Kentucky; Gallatin, Tennessee; and Columbus, Georgia. Reports from about 25 different localities have been found, see Figure 2.5.2-5 (from Reference 2.5.2-27).
MacCarthy (Reference 2.5.2-27) notes that, although this earthquake was felt at points north, west, and south of Virginia, curiously no specific statements that it was actually felt within Virginia have been found. The lack of felt reports in Virginia may be attributed to the fact that the Civil War was under way and there was rather heavy fighting in Virginia at the time.
February 21, 1916 E[M] 5.13
Waynesville, North Carolina
Distance to CRN Site = 175 km (109 mi)
The USGS report assigned (unspecified) magnitude 5.2 to this event and described it as the largest earthquake in North Carolina with the maximum intensity, MMI VII (Figure 2.5.2-6). As reported in Stover and Coffman (Reference 2.5.2-28) tops of chimneys were thrown to the ground, windowpanes were broken in many houses, and people rushed into the streets in Waynesville (Reference 2.5.2-28).
There were reports of damage consistent with MMI VI to VII in several towns in Tennessee and North Carolina (Reference 2.5.2-29). Shaken bricks from chimneys were reported in Sevierville, 70 km (44 mi) northwest of Waynesville. There were observations of increases of the flow of water and some muddying of the water in springs in Wear’s Cave, 16 km (10 mi) southwest of Waynesville. There were minor damage reports in eastern Tennessee at Athens, Knoxville, Maryville, Morristown, and Newport. Minor damage was also reported at Tryon, North Carolina,
2.5.2-14 Revision 2

Clinch River Nuclear SiteEarly Site Permit Application
Part 2, Site Safety Analysis Report
and at Bristol, Virginia. There are also felt reports in Alabama, Georgia, Kentucky, South Carolina, and West Virginia (Reference 2.5.2-28).
July 27, 1980 E[M] 5.01
Sharpsburg, Kentucky
Distance to CRN Site = 258 km (160 mi)
This northeast Kentucky earthquake with mbLg of 5.3 was observed with MMI V-VI near the epicentral area of Sharpsburg (Reference 2.5.2-28) (Figure 2.5.2-7). At a distance of 52 km (32 mi) from the epicenter, the city of Maysville reported a higher intensity of VII, but this may be due to local higher shaking effects attributable to 30 m of underlying Late Quaternary Ohio River flood plain alluvium per Woolery et al. (Reference 2.5.2-30). Herrmann et al. (Reference 2.5.2-31) estimated a slightly smaller magnitude of mb = 5.2 and a depth around 12 km. This event caused in excess of three million dollars’ worth of property damage (at the time of the earthquake) to private residencies, business, schools, churches, and a state park in north-central Kentucky as reported in Street (Reference 2.5.2-32).
The earthquake was followed by around 70 aftershocks, the largest among them having a magnitude of mblg = 2.2 (Reference 2.5.2-31). Using the evaluation of both surface-wave focal mechanisms and P-wave first motions, Herrmann et al. (Reference 2.5.2-31) determined a fault plane striking N30ºE, dipping 50ºSE with east-west pressure axes, consistent with the regional stress field.
Street et al. (Reference 2.5.2-33) reported a preliminary observation that the seismic P-wave velocity of the Precambrian basement rock in the immediate vicinity of the Sharpsburg earthquake may change abruptly from 6.15 to 6.9 km/s, suggesting that the geological feature responsible for the localization of this earthquake may be associated with the seismic velocity discontinuity in the basement. They suggested that the location of the earthquake was either caused by a zone of weakness between the two rock types, as indicated by the existence of the P-wave discontinuity, or was a result of local stress concentration within the regional stress field due to differing elastic moduli between the rock types in contact.
August 23, 2011 E[M] 5.71
Mineral, Virginia
Distance to CRN Site = 615 km (382 mi)
While it occurred more than 320 km (200 mi) from the CRN Site, the recent M 5.8 (E[M] 5.71) Mineral, Virginia, earthquake was felt throughout a large portion of the eastern US, and it is of interest to mention some details of this significant recent CEUS earthquake. Greater details are available in the FSAR Subsection 2.5.2 for North Anna Unit 3 (Reference 2.5.2-23).
The M 5.8 Mineral, Virginia earthquake epicentral region lies within the Appalachian Piedmont, about 130 km (81 mi) southwest of Washington, D.C., and within or near the Central Virginia Seismic Zone (CVSZ), a previously recognized zone of seismicity that has produced numerous small and moderate historical earthquakes. The Mineral earthquake mainshock hypocenter originated at a depth of about 8.0 km with relatively large uncertainty stemming from the sparse P-wave recordings (References 2.5.2-34 and 2.5.2-96). The rupture was complex and involved a relatively small rupture area (Reference 2.5.2-96). Cramer et al. indicates that this earthquake was the largest historical event in the CVSZ region and the largest instrumentally recorded
2.5.2-15 Revision 2

Clinch River Nuclear SiteEarly Site Permit Application
Part 2, Site Safety Analysis Report
earthquake in eastern North America since the 1988 M 5.9 (E[M] 5.84) Saguenay, Canada, earthquake (Reference 2.5.2-35).
Shaking caused by the M 5.8 Mineral earthquake was widely felt in several major metropolitan areas, including the greater Washington, D.C. region, Philadelphia, and parts of New York State. The overall felt area of the earthquake was significant, with perceptible shaking reported as far west as Minnesota and as far south as Florida. To the northeast it was felt as far as Fredericton, New Brunswick, Canada as provided in Hough (Reference 2.5.2-36).
The focal mechanism solutions for this earthquake indicate primarily a reverse sense of slip on a north or northeast-striking plane within the CVSZ region of diffuse seismicity (Reference 2.5.2-34). Despite several field investigations for the North Anna Unit 3 FSAR (Reference 2.5.2-23), no surface rupture or deformation has been found. While the numerous aftershocks did image a subsurface plane that is likely the result of Coulomb stress transfer, there was insufficient information to assess a specific local seismic source (RLME or otherwise) associated with this event that could be modeled for the North Anna Unit 3 PSHA. Nevertheless, the occurrence of this event did require a re-evaluation of the Mmax distribution for the ECC-AM Seismotectonic Zone source, as discussed in North Anna Unit 3 FSAR Subsection 2.5.2.2.
November 30, 1973 E[M] 4.01
Maryville, Tennessee
Distance to CRN Site = 35 km (22 mi)
April 29, 2003 E[M] 4.57
Fort Payne, Alabama, near the Georgia border
Distance to CRN Site = 192 km (119 mi)
The significance of these small (i.e., M < 5) earthquakes is that they are the largest recorded earthquakes associated with the Eastern Tennessee Seismic Zone (ETSZ), a well-defined, northeasterly trending belt of seismicity, 300 km (186 mi) long by less than 100 km (62 mi) wide, within the Valley and Ridge and Blue Ridge physiographic provinces of eastern Tennessee and parts of North Carolina, Georgia, and Alabama (Figure 2.5.2-3; Subsection 2.5.2.2.5.1; Reference 2.5.2-1, Subsection 7.3.4.1.2). This area is one of the most active seismic regions in eastern North America in terms of the rate of small earthquakes.
Subsection 7.3.4.1.2 of the CEUS SSC Report (Reference 2.5.2-1) and Subsection 2.5.2.2.5.1 summarize the seismotectonic characteristics of the ETSZ. Chapman (Reference 2.5.2-37) and Chapman et al., (Reference 2.5.2-38) present detailed analyses of the pattern and focal mechanisms of earthquakes in the ETSZ (Figure 2.5.2-8). Using a revised velocity structure model (Reference 2.5.2-40), focal mechanisms and hypocentral locations were updated. Statistical analysis of trends in the earthquake focal mechanisms suggests that earthquakes occur primarily by left-lateral strike-slip on east-west-trending faults, and to a lesser degree by right-lateral slip on north- and northeast-trending faults. The hypocenters suggest that possible east-west-trending fault sources are up to 50 to 100 km (31 to 62 mi) long and lie east of, but adjacent to, the New York-Alabama lineament (Subsection 2.5.2.2.3.3).
Cooley and Powell (Reference 2.5.2-39) present a new set of focal mechanisms under study for ETSZ earthquakes of magnitude 2.5 and greater occurring after 1999. They conclude (at the time of publication) that the approximately 40 new solutions will supplement the set of 26 previously calculated focal mechanisms and are expected to be consistent with these solutions.
2.5.2-16 Revision 2

Clinch River Nuclear SiteEarly Site Permit Application
Part 2, Site Safety Analysis Report
Acknowledging that the ETSZ of elevated seismicity in the historical period of observation likely represents a diffuse region of future elevated rates of earthquake occurrence, the methodology implemented in the CEUS SSC model to capture this elevated seismic activity is through the use of spatial smoothing of gridded a- and b-values, rather than drawing discrete source zone boundaries. The focal mechanism solutions presented by Chapman (Reference 2.5.2-37) and Chapman et al., (Reference 2.5.2-38) were considered in the CEUS SSC report in the specification of characteristics of future earthquakes (Tables 2.5.2-7 and 2.5.2-8).
2.5.2.2 Geologic and Tectonic Characteristics of the Site and Region
This subsection describes the SSC for the CEUS (Reference 2.5.2-1) and the sources within the CEUS SSC model that are used in the PSHA for the CRN Site. As described in Subsection 2.5.1, a comprehensive review of available geological, seismological, and geophysical data has been performed for the site region, as well as for portions of seismic sources that extend beyond the site region. Detailed descriptions of known geologic structures are provided in Subsection 2.5.1. As described in RG 1.208, the seismic sources used in a PSHA may be identified based on existing databases and models, with the provision that new information relevant to a seismic source must be evaluated and incorporated as appropriate (see Subsection 2.5.2.4). The starting point for the CRN Site PSHA is the regional seismic source model developed by the CEUS SSC Project (Reference 2.5.2-1). The CEUS SSC model is the most recent regional SSC specifically designed for PSHAs of nuclear facilities in the CEUS, replacing the EPRI-SOG model (References 2.5.2-2 and 2.5.2-7) and the Lawrence Livermore National Laboratory model (NUREG/CR-5250, Reference 2.5.2-41). The CEUS SSC model also incorporates new data gathered during the 2008 iteration of the USGS NSHMP (Reference 2.5.2-10). The CEUS SSC model is accepted by the NRC as a starting point for performing PSHAs for nuclear sites in the CEUS (NUREG-0800).
The CEUS SSC model was developed using Senior Seismic Hazard Analysis Committee (SSHAC) Study Level 3 methodology (References 2.5.2-42, 2.5.2-43, and 2.5.2-44), ensuring that uncertainty is represented in a manner consistent with NRC regulatory guidance. Toward this end, scientists involved in the development of the NSHMP, a modern regional SSC, were included in the evaluation process of the CEUS SSC model.
2.5.2.2.1 Overview of CEUS SSC
The CEUS SSC model was created to provide a regionally consistent model of seismic hazard for nuclear facilities throughout the CEUS (Reference 2.5.2-1). The CEUS SSC focuses on regionally significant elements, with the understanding that site-specific PSHAs would need to refine the CEUS SSC model with site-specific and updated data as necessary.
In the CEUS SSC model, the spatial and temporal distribution of future earthquakes is modeled by two types of seismic sources. The first type is a distributed seismicity source, which is based on observed seismicity. These sources (also referred to as background sources) cover the entire CEUS region. The second type is a RLME source, which is based on the paleo- and historical earthquake record. The RLME sources cover the much more localized phenomenon of RLME at specific locations. While notably considering distinct tectonic characteristics, the CEUS SSC model places less importance on specific discrete or localized tectonic features, which were emphasized in the older EPRI-SOG model (References 2.5.2-2 and 2.5.2-7).
Distributed seismicity sources are defined in the CEUS SSC model according to two conceptual approaches (Figure 2.5.2-9). The first approach smoothly varies seismicity rates throughout the entire CEUS; distributed seismicity sources are only differentiated by maximum magnitude (Mmax) potential. These sources are modeled as Mmax Zones (Subsection 2.5.2.2.2). Figure 2.5.2-10 shows the locations and extents of the Mmax zones, and Figure 2.5.2-11 shows
2.5.2-17 Revision 2

Clinch River Nuclear SiteEarly Site Permit Application
Part 2, Site Safety Analysis Report
the logic tree for the Mmax zones. The second approach to distributed seismicity sources considers a wider array of seismotectonic properties in order to define distributed seismicity sources. These sources are modeled as Seismotectonic Zones (Subsection 2.5.2.2.3). Figures 2.5.2-12 and 2.5.2-13 show the location and extent of the seismotectonic zones, and Figure 2.5.2-14 shows the logic tree for the seismotectonic zones. The CRN Site is located in the Paleozoic Extended Crust Narrow (PEZ-N) and Paleozoic Extended Crust Wide (PEZ-W) seismotectonic zones; the logic trees for PEZ-N and PEZ-W are shown in Figures 2.5.2-15 and 2.5.2-16, respectively. RLME sources are included on each of the Mmax and seismotectonic branches of the logic tree (Figure 2.5.2-9). Subsection 2.5.2.2.4 provides additional discussion of the RLME sources.
Table 2.5.2-4 lists all distributed seismic sources defined in the CEUS SSC model, and Table 2.5.2-5 clarifies alternative Mmax zonation models. Figure 2.5.2-17 shows the locations of all RLME sources in the CEUS SSC model.
2.5.2.2.1.1 CEUS SSC Methodology
The CEUS SSC model was created following SSHAC Level 3 guidelines (References 2.5.2-42, 2.5.2-43, and 2.5.2-44), ensuring that uncertainty is represented in a manner consistent with RG 1.208. The SSHAC process calls for a Technical Integration (TI) Team, headed by a TI Lead, to evaluate and integrate all available data, models, and methods into the hazard model. These evaluation and integration steps are performed with the aid of the informed technical community, members of which serve as resource and proponent experts for the TI Team. Technical assessment and regulatory adherence are reviewed throughout the course of the project by the Participatory Peer Review Panel (PPRP). The intended result of the SSHAC process is to create a hazard model that represents the center, body, and range of technically defensible interpretations.
As stated above, one of the parameters the CEUS SSC model accounts for is the likely spatial distribution of future earthquakes using observed seismicity, the paleo-earthquake record, and other geologic and geophysical data. Specifically, the model depends on the theory that the spatial pattern of small to moderate magnitude earthquakes is indicative of the likely future locations of moderate to large magnitude earthquakes (Reference 2.5.2-1). This idea is generally accepted by the scientific community, and thus forms the basis for the spatial distribution of seismicity sources in the CEUS SSC model. Similarly, the average rate and periodicity of future earthquakes in the distributed seismicity sources are governed by the spacial distribution of earthquakes in the instrumental (recorded) and historical catalog. Given their rarity and general lack of coverage in the instrumental and historical seismicity record, RLMEs are not dependent on the earthquake catalog, but are defined by the paleoseismic record.
2.5.2.2.1.2 CEUS SSC Earthquake Recurrence Rate
The earthquake recurrence rate within each distributed seismicity source is assessed by dividing each seismotectonic source into one-quarter-degree cells and each Mmax source into half-degree cells (Reference 2.5.2-1). The rate and b-value in each cell is calculated using the likelihood function of the data in that cell (which addresses catalog completeness, magnitude uncertainty, and adjustment for magnitude binning) along with penalty functions that smooth out large variations in rate and b-value between cells (Reference 2.5.2-1). Earthquakes associated with RLME sources are excluded from these calculations. The full earthquake recurrence calculation in each zone produces the following results (Reference 2.5.2-1):
The recurrence rate of earthquakes of moment magnitude (M)>m (where m = 2.9 is the lowest magnitude considered in the recurrence analysis) per equatorial degree
2.5.2-18 Revision 2

Clinch River Nuclear SiteEarly Site Permit Application
Part 2, Site Safety Analysis Report
The b-value, expressed in log base-10 units
The area of each cell in equatorial degrees
This is a simplified overview of the method for calculating and smoothing earthquake recurrence rates in distributed seismicity sources. A complete discussion of the smoothing approach is provided in Subsection 5.3.2 of the CEUS SSC Report (Reference 2.5.2-1).
The calculation of earthquake recurrence rates in RLME sources is more straightforward, since RLME sources tend to have a more narrowly defined Mmax distribution and geographical extent. Earthquake recurrence rates for RLME sources are based on data in the paleo- and historical earthquake record, and modeled using either a Poisson model or a renewal model. In the Poisson model, the time between RLME earthquakes is modeled by an exponential distribution with a standard deviation that equals the mean earthquake recurrence interval. This model is favored for RLME sources that exhibit a higher degree of aperiodic RLME occurrence. The renewal model is better suited to RLME sources in which RLME earthquakes appear to be more periodic. The time between RLME earthquakes in this model is based on the Brownian Passage Time (BPT) model, which represents the physical process of strain buildup and release per Ellsworth and Mathews (References 2.5.2-45 and 2.5.2-46, respectively). Full details related to the estimation of earthquake recurrence in RLME sources is provided in Subsection 5.3.3 of the CEUS SSC Report (Reference 2.5.2-1).
2.5.2.2.1.3 CEUS SSC Maximum Magnitude
The Mmax potential in the CEUS SSC distributed seismicity sources is assessed through two alternative approaches. A complete description of these approaches for assessing Mmax is provided in Subsection 5.2 of the CEUS SSC Report (Reference 2.5.2-1).
In the Bayesian approach, the prior Mmax distribution is determined by grouping SCRs worldwide, according to their age of last extension, per Johnston and Schulte and Mooney (References 2.5.2-47 and 2.5.2-48, respectively), evaluating the distribution of Mmax-observed for each group, and then adjusting it to account for the difference between Mmax-observed and Mmax. The prior distribution for the appropriate SCR is then updated based on site-specific magnitude observations for each source, which take the form of an Mmax likelihood function. The prior distribution is multiplied by the likelihood function to create a posterior Mmax distribution for use in the hazard analysis, truncated at M 5.5 and M 8.25.
In the Kijko approach (Reference 2.5.2-49), Mmax is based solely on the observed seismicity. The CEUS SSC model utilizes the Kijko-Sellevoll-Bayes (K-S-B) estimator, which includes uncertainty in the b-value (Subsection 5.2.1.2 in Reference 2.5.2-1). Mmax distributions computed according to the Kijko approach (Reference 2.5.2-49) are truncated at M 5.5 and M 8.25.
Whereas the instrumental and historical record of small-to-moderate earthquakes is primarily used to determine hazard in the distributed seismicity sources, historical and pre-historical data in some places point to the repeated occurrence of large-magnitude (M ≥ 6.5) earthquakes. Where data are sufficient, these zones are modeled as RLME sources, and earthquakes associated with these zones are excluded from the earthquake catalog prior to calculation of Mmax and recurrence statistics for the distributed seismicity sources. The distribution of magnitudes used to model the characteristic earthquake size in RLME sources is narrower than that in the distributed seismicity sources, and is based on the amount and quality of data available for each RLME (Chapter 6 of Reference 2.5.2-1).
2.5.2-19 Revision 2

Clinch River Nuclear SiteEarly Site Permit Application
Part 2, Site Safety Analysis Report
2.5.2.2.2 CEUS SSC Mmax Zones Included in the Clinch River Nuclear Site PSHA
In the CEUS SSC model, Mmax zones are sources of distributed seismicity distinguished from one another solely by differences in potential Mmax. Seismotectonic zones are also zones of distributed seismicity, and are discussed in Subsection 2.5.2.2.3. Based on a statistical analysis of the global SCR database (References 2.5.2-47 and 2.5.2-48), alternative sets of Mmax zones are considered in the CEUS SSC. In the first alternative, which is given a slightly stronger weight, the CEUS is divided into two zones of unique prior Mmax distributions as described in Subsections 2.5.2.2.2.1 and 2.5.2.2.2.2. In the second alternative, the seismic hazard of the entire CEUS region is modeled as a single Mmax zone with a single prior distribution as described in Subsection 2.5.2.2.2.3. In both alternatives, Mmax and recurrence are determined according to the methods described in Subsection 2.5.2.2.1.1. The full logic tree for the Mmax zones model alternative is shown in Figure 2.5.2-11. All Mmax zones, or portions thereof, within 640 km (400 mi) from the CRN Site (double the site region) are included in the hazard calculation (see Figure 2.5.2-18). A sensitivity study was done to show the effect of distant background source contribution to hazard at the CRN Site, which concluded that the CRN Site is not sensitive to sources beyond a 640 km (400 mi) radius. Mmax distributions for Mmax zones are described in Table 2.5.2-6. Expected future rupture characteristics are shown in Tables 2.5.2-7 and 2.5.2-8. On the Mmax zones branch of the logic tree, three alternative zones (Study Region, NMESE-N, and MESE-W) represent host zones to the CRN Site (Figures 2.5.2-10 and 2.5.2-11).
2.5.2.2.2.1 MESE (Wide and Narrow)
As discussed in Subsection 2.5.1.1.2, rifting of the African and North American plates created a series of Mesozoic basins that trend parallel to the Appalachian orogenic belt (e.g., Reference 2.5.2-50). Those portions of the CEUS that exhibit Mesozoic and younger extension (MESE) are included in the MESE Mmax zone (Figure 2.5.2-10). Although Mesozoic basins occur in the Piedmont, Coastal Plain, and Continental Shelf physiographic provinces, the western termination of Mesozoic extension is poorly constrained. To account for this uncertainty, two alternatives for the geometry of the MESE Mmax zone are modeled: a “narrow” MESE (MESE-N), which only includes the portion of the CEUS that exhibits clear Mesozoic and younger extension, and a “wide” MESE (MESE-W) that extends further west to capture areas of more questionable Mesozoic and younger extension (Figures 2.5.2-10 and 2.5.2-18). The MESE-N zone is the more heavily weighted alternative (Figure 2.5.2-11; evidence that supports this alternative is more technically defensible (Subsection 6.2.2 in Reference 2.5.2-1).
The largest historical earthquake in both the MESE-N and MESE-W zones that is not associated with an RLME source is the 1732 E[M] 6.25 St. Lawrence region earthquake (Subsection 6.3.1 in Reference 2.5.2-1). Modeled Mmax values and weights for the MESE-N and MESE-W zones are listed in Table 2.5.2-6. The minimum Mmax for the MESE-W Mmax zone is based on paleo earthquake data. A full description of the MESE-N and MESE-W zones is provided in Sections 6.2, 6.3 and 6.4 of the CEUS SSC Report (Reference 2.5.2-1).
2.5.2.2.2.2 NMESE (Wide and Narrow)
The portion of the CEUS that is interpreted to have not experienced Mesozoic and younger extension (NMESE) is modeled by the NMESE Mmax zone. As is the case for the MESE, the geometry of the NMESE is modeled by “narrow” and “wide” alternatives (Figure 2.5.2-11). These alternatives, however, are labeled according to their corresponding MESE zone. The result is that the NMESE-N zone is actually wider than the NMESE-W zone, since the “-N” and “-W” designators for the NMESE refer to the width of the MESE zone (Figure 2.5.2-18).
The largest historical earthquakes in the NMESE-N and NMESE-W zones that are not associated with an RLME source are the 1897 E[M] 5.91 Giles County, Virginia, earthquake and
2.5.2-20 Revision 2

Clinch River Nuclear SiteEarly Site Permit Application
Part 2, Site Safety Analysis Report
the 1909 E[M] 5.72 earthquake of eastern Montana, respectively (Reference 2.5.2-1). Modeled Mmax values and weights for the NMESE-N and NMESE-W zones are listed in Table 2.5.2-6. The minimum Mmax for the NMESE-N Mmax zone is based on paleo earthquake data. A full description of the NMESE-N and NMESE–W zones is provided in Sections 6.2, 6.3, and 6.4 of the CEUS SSC Report (Reference 2.5.2-1).
2.5.2.2.2.3 Study Region
The statistical analysis conducted for the CEUS SSC model concluded that there is only a marginally significant probability the MESE and NMESE could be characterized by unique prior distributions. As such, an alternative model was developed in which the entire study region is treated as a single Mmax zone, labeled as the Study Region zone (Figure 2.5.2-10). This is indicated on the Mmax Zones logic tree as the “No” branch of the “Separation of Mesozoic Extended and Non-extended” node, which is assigned a weight of 0.4 (Figure 2.5.2-11).
The largest historical earthquake attributed to the Study Region Mmax zone that is not associated with an RLME source is the 1732 E[M] 6.25 St. Lawrence region earthquake (Reference 2.5.2-1). Modeled Mmax values and weights for the Study Region zone are listed in Table 2.5.2-6. The minimum Mmax for the Study Region Mmax zone is based on paleo earthquake data.
2.5.2.2.3 CEUS SSC Seismotectonic Zones Included in the CRN Site PSHA
In contrast to the Mmax zones, seismotectonic zones in the CEUS SSC model (Figures 2.5.2-12 and 2.5.2-13) are distinguished from one another based on a variety of crustal properties and characteristics (Tables 2.5.2-7 and 2.5.2-8). In all seismotectonic zones, recurrence rate and Mmax are calculated according to the procedures detailed in Subsections 2.5.2.2.1.2 and 2.5.2.2.1.3. The full logic tree for the seismotectonic zones model alternative is shown in Figure 2.5.2-14.
The seismotectonic zones included in the hazard calculation for the CRN Site are the Extended Continental Crust-Atlantic Margin (ECC-AM), Extended Continental Crust-Gulf Coast (ECC-GC), Paleozoic Extended Crust Narrow (PEZ-N) and Paleozoic Extended Crust Wide (PEZ-W), Midcontinent-Craton (MidC) model alternatives MidC-A though MidC-D, Reelfoot Rift (RR), Reelfoot Rift Rough Creek Graben (RR-RCG), and Illinois Basin Extended Basement (IBEB) zones. Each zone is truncated at a distance of 640 km (400 mi) from the site. On the seismotectonic zones branch of the logic tree, two alternative geometries of both the PEZ (PEZ-N and PEZ-W) and RR, RR-RCG represent host zones to the CRN Site (Figures 2.5.2-12 and 2.5.2-13).
2.5.2.2.3.1 ECC-AM
The ECC-AM seismotectonic zone encompasses the portions of the Piedmont, Coastal Plain, and Continental Shelf physiographic provinces that have experienced Mesozoic and younger extension (see Figure 2.5.2-19). The rationale for defining this zone is primarily based on the observation that all worldwide M>7 earthquakes in SCR crust occur within Mesozoic and younger extended crust (Reference 2.5.2-12). In addition, the continental crust outside the ECC-AM is characterized by a different structural grain and reactivation history, suggesting a difference in future earthquake rupture characteristics. In the vicinity of the site, the boundaries of the ECC-AM zone are the Piedmont gravity gradient to the west, the western boundary of the East Coast Magnetic Anomaly (ECMA) to the east, and the Brunswick magnetic anomaly to the south (Figure 2.5.2-20).
2.5.2-21 Revision 2

Clinch River Nuclear SiteEarly Site Permit Application
Part 2, Site Safety Analysis Report
The primary structural feature of the ECC-AM zone is an east-dipping Paleozoic basal thrust (loosely termed “master Appalachian detachment”) that juxtaposes Laurentian, peri-Laurentian, and peri-Gondwanan Appalachian terranes against the underlying North American craton (see Subsection 2.5.1.1.2). The Appalachian terranes in the ECC-AM host a number of Paleozoic thrust and strike-slip faults that were reactivated during Mesozoic extension (e.g., Reference 2.5.2-51). Possible Pleistocene activity has been proposed for the Everona-Mountain Run fault system in Virginia and is based on faulted gravel deposits of questionable age (e.g., References 2.5.2-52, 2.5.2-53, and 2.5.2-54); however, no faults within the ECC-AM show direct evidence for Quaternary activity. Expected future earthquake characteristics within the ECC-AM zone are summarized in Table 2.5.2-8.
Seismicity within the ECC-AM zone is spatially variable. For example, in the region of the site, notable clusters of earthquakes occur in central Virginia (Central Virginia Seismic Zone, CVSZ), and Charleston, South Carolina (Figure 2.5.2-21). The largest non-RLME historical earthquake to have occurred within the ECC-AM zone is the 1755 E[M] 6.10 Cape Ann, Massachusetts, earthquake. Given location uncertainty for this event, however, it was assigned in the CEUS SSC Report a 60 percent probability of having occurred within the ECC-AM, leaving a 40 percent probability that the largest earthquake within the ECC-AM is instead the June 11, 1638 E[M] 5.32 earthquake (Reference 2.5.2-1). The recent 2011 E[M] 5.71 Mineral earthquake occurred after the development of the CEUS SSC earthquake catalog. This earthquake now represents the second largest earthquake in the ECC-AM that is not associated with an RLME source. Further discussion of this earthquake is included in Subsection 2.5.2.1, and its impact on Mmax and earthquake rate assessments is discussed in Subsection 2.5.2.2.5.2. Mmax values and weights for the ECC-AM zone as originally modeled by EPRI et al. (Reference 2.5.2-1) are listed in Table 2.5.2-9.
2.5.2.2.3.2 Extended Continental Crust-Gulf Coast Zone
Similar to the ECC-AM, the Extended Continental Crust-Gulf Coast (ECC-GC) represents continental crust that was thinned during the Mesozoic Era as supercontinent Pangea broke up (Subsection 2.5.1.1.2). Crustal thickness in the ECC-GC ranges between 13 and 22 km. The northern boundary of this zone is the Brunswick magnetic anomaly (Figure 2.5.2-20). This zone is distinguished from the ECC-AM zone based on differences in expected future earthquake characteristics (see Table 2.5.2-8. In particular, the ECC-GC does not display a well-defined structural grain, and the orientation of the structures that accommodated the opening of the Gulf of Mexico is both variable and uncertain (Subsection 7.3.9 in Reference 2.5.2-1; Table 2.5.2-8).
The largest historical earthquake in the ECC-GC zone is the October 22, 1882 E[M] 5.58 event, although the largest instrumentally recorded earthquake in the zone is the October 24, 1997 E[M] 4.88 earthquake (Subsection 7.3.9.3 in Reference 2.5.2-1). Due to the sparse seismicity of the ECC-GC zone, the Kijko (Reference 2.5.2-49) methods of Mmax calculation (which depend on observed seismicity) are not used in the calculation of Mmax. Modeled Mmax values and weights for the ECC-GC zone are listed in Table 2.5.2-9.
2.5.2.2.3.3 PEZ (Wide and Narrow)
As described in Subsection 2.5.1.1.2, the eastern margin of North America experienced several phases of rifting and collision during the late Proterozoic Eon through the Mesozoic Era. The Mesozoic phase of rifting opened the Atlantic Ocean, and associated continental extension partially overprinted structures formed during an earlier, more extensive phase of late Proterozoic to early Paleozoic rifting during the opening of the Iapetan Ocean (e.g., Reference 2.5.2-55) (Figure 2.5.1-10). The portion of the North American craton containing all known and inferred normal faulting associated with the opening of the Iapetus Ocean has been termed the Iapetan rifted margin (IRM) (Reference 2.5.2-56). The western boundary of the IRM is poorly defined,
2.5.2-22 Revision 2

Clinch River Nuclear SiteEarly Site Permit Application
Part 2, Site Safety Analysis Report
since Neoproterozoic to early Paleozoic rift structures irregularly decrease in size and abundance to the west.
In the CEUS SSC model, the IRM is divided into three seismotectonic zones: the Northern Appalachian (NAP), Saint Lawrence rift zone (SLR), and PEZ zones (see Figures 2.5.2-12 and 2.5.2-13). The PEZ zone is the easternmost portion of the IRM and adjacent to the ECC-AM zone. The boundary between the PEZ and ECC-AM zones is marked by the Piedmont gravity gradient (see Figure 2.5.2-20). Due to the uncertainty associated with the western boundary of the IRM, two alternative geometries of the PEZ zone are modeled in the CEUS SSC. In the PEZ Narrow (PEZ-N) geometry, the western boundary of the zone is formed by the Birmingham basement fault system of Alabama and the New York-Alabama lineament. This zone geometry encompasses the most well-defined set of Iapetan faults and rift sediments in the North American craton, and is heavily favored (with a weight of 0.8) in the CEUS SSC model (Reference 2.5.2-1). The PEZ Wide (PEZ-W) geometry includes more tentative evidence of Iapetan rifting, and extends to the Rome trough of Kentucky and West Virginia. Expected future earthquake characteristics for both zones are summarized in Table 2.5.2-8.
In the region of the site, concentrated zones of seismicity of the PEZ zones occur in the Eastern Tennessee seismic zone (ETSZ) and in the Giles County, Virginia seismic zone (GCVSZ) (Figure 2.5.2-21). The GCVSZ produced the 1897 Giles County earthquake (MMI = VIII, m= 5.7, E[M] 5.91), the largest observed earthquake in the PEZ seismotectonic zones (Reference 2.5.2-1). Modeled Mmax values and weights for the PEZ-N and PEZ-W zones are listed in Table 2.5.2-9.
2.5.2.2.3.4 Midcontinent Craton (A, B, C, and D)
The portion of the CEUS SSC model that did not experience Mesozoic and younger extension is represented by the MidC seismotectonic zone (Figures 2.5.2-12, 2.5.2-13, and 2.5.2-19). The seismotectonic character of this zone is instead shaped by Paleoproterozoic plate collisions that formed the core of the North American continent (see Subsections 2.5.1.1.2 and 2.5.1.1.4). These collisions resulted in deeply buried Precambrian crustal structures that overlie a thick, strong, and compositionally depleted lithosphere (i.e., lithosphere from which certain dense minerals have been extracted via partial melting, resulting in a relatively buoyant, thick, and anhydrous composition). The absence of Mesozoic and younger extension, as described by Johnston et al. (Reference 2.5.2-47) and in Subsection 2.5.2.2.3.1, lowers the Mmax potential of the MidC seismotectonic zone. In addition, Mooney and Ritsema (Reference 2.5.2-57) show that high lithospheric S-wave velocities (which serve as a proxy for high lithospheric strength) are correlated with lower Mmax potential. The MidC zone is further differentiated from other midcontinental sources based on the expectation that neighboring zones will have different future earthquake rupture characteristics (Table 2.5.2-8), in part due to differences in structural grain.
The northern and western boundaries of the MidC zone terminate at the CEUS study region boundary (Figures 2.5.2-12 and 2.5.2-13). The location of the southern and eastern boundaries of the MidC zone, however, vary based on the alternative geometries of neighboring seismotectonic zones, which results in four alternative MidC zone geometries: (1) MidC-A; (2) MidC-B; (3) MidC-C; and (4) MidC-D (Figures 2.5.2-12 and 2.5.2-13). Although only MidC-A and MidC-B intersect the 320-km (200-mi) site region, all four model alternatives (A, B, C, and D) are included in the hazard calculations.
As is the case throughout the CEUS region, seismicity in the MidC seismotectonic zone is spatially variable. Although several concentrated areas of seismicity occur in the MidC zone (e.g., the Anna, Ohio seismic zone and Northeast Ohio seismic zone [Figure 2.5.2-21]), there is not enough evidence to suggest that any of these areas produce RLMEs. The largest earthquake in this zone that is not associated with an RLME source is the 1909 E[M] 5.72 earthquake of
2.5.2-23 Revision 2

Clinch River Nuclear SiteEarly Site Permit Application
Part 2, Site Safety Analysis Report
eastern Montana (Reference 2.5.2-1). Modeled Mmax values and weights for all MidC seismotectonic zones are listed in Table 2.5.2-9.
2.5.2.2.3.5 Illinois Basin Extended Basement
The IBEB seismotectonic zone represents seismicity associated with the Illinois basin, an area of structural complexity within the midcontinent, per McBride et al. (Reference 2.5.2-58). The primary rationale for defining this zone is the observation of an elevated rate of instrumental seismicity compared to the neighboring craton, as well as evidence for moderate-magnitude earthquakes in the paleoearthquake record. Additionally, the structural complexity of the IBEB zone suggests that its crust is distinct from that in adjacent zones.
The boundaries of the IBEB zone are based on the oval shape of the Illinois basin and the spatial distribution of underlying Precambrian basement structures. The extent of these basement structures, however, is poorly constrained. Only a small portion of the IBEB zone lies within the site region (Figure 2.5.2-12).
Seismicity within the IBEB zone is concentrated at its southern end, adjacent to the Reelfoot Rift. Although McBride et al. (Reference 2.5.2-58) note that seismicity tends not to be clearly associated with mapped structures in the IBEB zone, the location of some moderate-magnitude earthquakes suggests that Precambrian basement faults and Paleozoic faults are being reactivated. The largest historical non-RLME event in the IBEB seismotectonic zone is the September 27, 1891 E[M] 5.52 earthquake in southern Illinois. Paleoliquefaction studies, however, suggest that the IBEB zone has one approximately M 6.3 event and three approximately M 6.2 events (Reference 2.5.2-1). Modeled Mmax values for this seismotectonic zone are provided in Table 2.5.2-9.
2.5.2.2.3.6 Reelfoot Rift-Rough Creek Graben
The Reelfoot Rift (RR) seismotectonic zone represents the Cambrian aulacogen beneath the northern Mississippi embayment (e.g., References 2.5.2-59, 2.5.2-60, and 2.5.2-61). There are two alternative geometries of the RR seismotectonic zone, reflecting uncertainty about whether the Rough Creek graben should be included in the RR or in the MidC seismotectonic zone. The Rough Creek graben represents the eastward extension of extensional deformation related to formation of the intracontinental rift system during Precambrian to earliest Cambrian rifting of North America (References 2.5.2-62, 2.5.2-63, and 2.5.2-64) (Figures 2.5.2-12 and 2.5.2-13). Some suggest that this graben should be considered part of the RR, which is characterized by Mesozoic reactivation of faults, higher rates of seismicity, the occurrence of multiple Quaternary-active faults, and identified RLME sources (Reference 2.5.2-1). Although there is some evidence for Mesozoic activity on faults in the Rough Creek graben, the lack of clearly associated alkaline igneous rocks of Mesozoic age in the Rough Creek graben suggests that Mesozoic reactivation of deep-penetrating faults was limited, and seismicity rates are lower than the RR. Hence, a lower weight of 0.33 is applied to the alternative RR-RCG zone than the RR zone. Expected future earthquake characteristics within the RR and RR-RCG zones are summarized in Table 2.5.2-8.
The two largest historical earthquakes in the RR-RCG zone are the January 5, 1843 and October 31, 1895 events, both interpreted as E[M] 6.0 earthquakes (Subsection 7.3.6.4 in Reference 2.5.2-1). Modeled Mmax values and weights for the RR and RR-RCG zones are listed in Table 2.5.2-9.
2.5.2-24 Revision 2

Clinch River Nuclear SiteEarly Site Permit Application
Part 2, Site Safety Analysis Report
2.5.2.2.4 CEUS SSC RLME Sources Included in the CRN Site PSHA
In several places throughout the CEUS, historical and paleoearthquake records point to the repeated occurrence of large-magnitude (M ≥ 6.5) earthquakes in specific locations (Figure 2.5.2-17) (Reference 2.5.2-1). These events are most often interpreted from the paleoearthquake record. This inherently results in a bias in the location of RLMEs throughout the model, as the spatial coverage of the paleoearthquake record is more limited than that of the historical record. This limitation is recognized in the CEUS SSC model, and is accounted for by allowing significant earthquake potential in the distributed seismicity sources.
All RLME sources that lie within 640 km (400 mi) of the CRN Site were included in the PSHA. These include the New Madrid Fault System (NMFS), Charleston, Wabash Valley, East Rift Margin-South (ERM-S), East Rift Margin-North (ERM-N), Commerce, and Marianna (Figure 2.5.2-22). Mmax distributions for these RLME sources are shown in Tables 2.5.2-10 through 2.5.2-13. The only RLME sources that contribute significantly to hazard at the site are New Madrid and Charleston and are described below.
2.5.2.2.4.1 New Madrid Fault System
The three largest historical earthquakes in the CEUS region all occurred in the New Madrid area. These earthquakes occurred on December 16, 1811, January 23, 1812, and February 7, 1812; considerable uncertainty exists regarding their exact magnitudes. Additionally, a number of paleoliquefaction studies document multiple major prehistoric earthquakes in the New Madrid area (e.g., References 2.5.2-65, 2.5.2-66, 2.5.2-67, and 2.5.2-68). Based on these observations, the CEUS SSC model defines the NMFS as an RLME to account for large prehistoric earthquakes and the three large events that occurred in 1811–1812 (Subsection 6.1.5 in Reference 2.5.2-1). At its closest approach, this RLME is approximately 400 km (250 mi) from the site (Figure 2.5.2-17).
Modern seismic activity within the New Madrid area closely aligns with the three fault segments that constitute the NMFS (also occasionally referred to as Reelfoot Rift Central Fault System in the CEUS SSC Report) (Figure 2.5.2-22). These individual fault segments (New Madrid North, New Madrid South, and Reelfoot Thrust) have been associated with the earthquakes of the 1811–1812 sequence (see discussion in Subsection 6.1.5 of the CEUS SSC Report, Reference 2.5.2-1, and sources therein). Consequently, the geometry of the NMFS RLME source is narrowly defined, with alternative geometries for long and short interpretations of the New Madrid North fault and the Reelfoot thrust (Figure 2.5.2-24). Alternative geometries for the New Madrid South fault either combine the Blytheville arch with the Bootheel lineament or the Blytheville fault zone (Figure 2.5.2-24).
Seismic reflection data (e.g., References 2.5.2-69 and 2.5.2-70) and geomorphic observations (e.g., Reference 2.5.2-71) suggest that the Holocene Epoch represents a period of temporally clustered earthquake activity along the NMFS that is not representative of the long-term rate of activity. Additionally, geodetic studies suggest that the present rate of strain accumulation is much too small to account for the Holocene rate of paleoseismicity per Calais et al. and Smalley et al. (References 2.5.2-72 and 2.5.2-73, respectively). To account for uncertainty in the future rate of earthquakes in the NMFS RLME, the CEUS SSC model allows for alternatives (at very low weights) in which some or all of the fault segments of the NMFS are inactive. A detailed discussion of the recurrence of large earthquakes in the NMFS RLME source is presented in Subsection 6.1.5.4 of the CEUS SSC Report (Reference 2.5.2-1).
The Mmax distribution for the NMFS RLME source is based on the estimated magnitudes of the earthquakes in the 1811–1812 sequence. The CEUS SSC model equally weights the estimates from Bakun and Hopper (Reference 2.5.2-74), Johnston (as cited in Subsection 6.1.5 in
2.5.2-25 Revision 2

Clinch River Nuclear SiteEarly Site Permit Application
Part 2, Site Safety Analysis Report
Reference 2.5.2-1), and Hough and Page (Reference 2.5.2-75), which are M 7.2–7.8, M 7.5–7.9, and M 6.5–6.9, respectively. The resulting Mmax distribution for the NMFS RLME source in the CEUS SSC model ranges from M 6.7–7.9 (Table 2.5.2-11).
All other uncertainties identified in the NMFS logic tree (Figure 2.5.2-25) are included in the CRN Site hazard calculation exactly as detailed in the CEUS SSC Report, with the exception of seismogenic depth, which is simplified from the distribution listed in Table 2.5.2-8 to a single value of 15 km. Given the distance of the NMFS RLME source to the site, this simplification is judged to be adequate for the PSHA.
2.5.2.2.4.2 Charleston
The largest historical earthquake along the eastern U.S. seaboard occurred in Charleston, South Carolina in 1886. Estimates of the magnitude of this earthquake are based on liquefaction data and isoseismal area regressions, and vary from the high-6 to mid-7 range (Reference 2.5.2-1). In addition, a number of geologic investigations have documented evidence for large pre-1886 earthquakes in the Charleston area based on sand blows and paleoliquefaction features (e.g., References 2.5.2-76, 2.5.2-77, 2.5.2-78, 2.5.2-79, 2.5.2-80, and 2.5.2-81). Based on the quality and quantity of the available data, Charleston is modeled as an RLME source in the CEUS SSC model. At its closest approach, the Charleston RLME source is approximately 420 km (260 mi) from the site (Figures 2.5.2-17 and 2.5.2-22).
The fault that produced the 1886 earthquake has not been definitively identified. In addition, although a number of faults have been postulated in the Charleston area, none have been shown to be tectonically active. In order to account for the spatial uncertainty associated with Charleston RLME source, three alternative geometries are modeled (Figures 2.5.2-22 and 2.5.2-23) (Subsection 6.1.2.3 in Reference 2.5.2-1). The Charleston Local geometry encompasses the area with the densest concentration of liquefaction associated with the 1886 earthquake and prehistoric earthquakes, the meizoseismal area of the 1886 earthquake, and the majority of local tectonic features. This alternative is the most heavily weighted of the three. The Charleston Narrow geometry is based on the location and orientation of postulated faults and tectonic features in the Charleston area, resulting in a relatively narrow, north-northeast oriented source geometry. The Charleston Regional geometry encompasses the Local and Narrow zones, along with outlying paleoliquefaction sites and other tectonic features. In all cases, future earthquakes in the Charleston RLME source are modeled as occurring on pseudo faults with the properties listed in Table 2.5.2-8.
Geologic and geomorphic studies have suggested that the seismic activity of the Charleston RLME source since the mid-Holocene may not be indicative of the long-term recurrence rate (e.g., References 2.5.2-82 and 2.5.2-83). Models of temporal clustering used to account for this uncertainty are discussed in detail in Subsection 5.1.2 of the CEUS SSC Report, and further uncertainties associated with the earthquake recurrence rate are discussed in Subsection 6.1.2.5 of the CEUS SSC Report (Reference 2.5.2-1).
The CEUS SSC earthquake catalog assigns E[M] 6.90 to the 1886 Charleston earthquake. Geotechnical studies in the Charleston, South Carolina area suggest that prehistoric large earthquakes were in the high-5 to high-7 range (e.g., References 2.5.2-84, 2.5.2-85, 2.5.2-86 and 2.5.2-87). Based on the assumption that future earthquakes in the Charleston RLME source will be similar to previous large earthquakes in the Charleston area, the CEUS SSC model assigns Mmax values of between M 6.7 and M 7.5 (Table 2.5.2-10).
2.5.2-26 Revision 2

Clinch River Nuclear SiteEarly Site Permit Application
Part 2, Site Safety Analysis Report
2.5.2.2.5 Post-CEUS SSC Studies
A Senior Seismic Hazard Analysis Committee (SSHAC) Level 2 study was implemented to evaluate new data, methods, and models developed since publication of the 2012 CEUS SSC model and to assess whether this new information warrants any update or revision to the model. The Technical Integration (TI) Team reviewed scientific literature published since 2012 (and earlier), contacted experts who have developed data and/or interpretations of seismic sources in the site region, reviewed an updated seismicity catalog developed for this project, and performed site-specific studies, as needed, to assess the quality of data and uncertainty associated with recently published studies. Specifically, the TI Team assessed: (1) recent and ongoing geologic/paleoseismic studies within the Eastern Tennessee Seismic Zone (ETSZ); (2) ongoing investigations of the Mineral, Virginia earthquake that occurred in or near the Central Virginia Seismic Zone (CVSZ); and (3) revisions to the maximum magnitude distributions for seismic zones in the CEUS SSC model.
The published CEUS SSC earthquake catalog extends through 2008 (Chapter 3 of Reference 2.5.2-1). For the CRN Site PSHA, this catalog was updated through mid-September, 2013, as described in Subsection 2.5.2.1. Updating the catalog added 157 events of E(M) > 2.2, of which 9 events are E(M) > 2.9, to the site region (Table 2.5.2-1). The largest event added to the catalog is the August 23, 2011 M 5.8 Mineral, Virginia earthquake (E(M) 5.7), which occurred beyond the Site Region but which lies within areal source zones of the CEUS SSC model that extend into the Site Region. The Mineral earthquake is the largest instrumentally recorded earthquake in eastern North America since the 1988 E(M) 5.84 Saguenay earthquake.
The TI Team reviewed the updated catalog, evaluated recent studies performed in the ETSZ by Dr. Robert Hatcher at the University of Tennessee and his colleagues, and performed several sensitivity analyses to evaluate the hazard significance of various seismic source parameters. The TI Team conducted interviews with Dr. Hatcher and Mr. James Vaughn regarding their data and interpretations of paleoseismic features in the Douglas Reservoir area (Reference 2.5.2-88, 2.5.2-92, 2.5.2-93, and 2.5.2-94), and visited several of the Douglas Reservoir paleoseismic sites with Dr. Hatcher and Mr. Vaughn. Selected paleoseismic trenches described in Hatcher et al. (Reference 2.5.2-88) were re-excavated, logged, and analyzed by members of the TI Team. Detailed results of the TI Team assessment are provided in Subsection 2.5.3.2.6 and a summary is given in Subsection 2.5.2.2.5.1 below. A late-stage review of the TI Team assessment of the Douglas Reservoir paleoseismic features was provided by the Participatory Peer Review Panel (PPRP).
Several sensitivity analyses were performed to assist the TI Team in their assessment. These sensitivity analyses are provided in Subsection 2.5.2.2.6 and included evaluating the effect of the updated seismicity catalog on rates and maximum magnitude (Mmax) for areal source zones within 640 km (400 mi) of the CRN site, and the degree of consistency of the Douglas Reservoir paleoseismic features and their postulated rates to the rate and Mmax of earthquakes in the ETSZ.
Results from the TI Team assessment of the Douglas Reservoir paleoseismic features (Subsections 2.5.2.2.5.1 and 2.5.3.2.6) indicate that the features are likely the result of nontectonic processes and, therefore, do not represent paleo-earthquakes. Results from the sensitivity analyses (Subsection 2.5.2.2.6.1.3) show that, even if the Douglas Reservoir features represent paleo-earthquakes, the rate (frequency), general location, and Mmax distribution of these paleo-earthquakes are captured in the existing CEUS SSC model.
In summary, the SSHAC Level 2 assessment of the CEUS SSC model shows that the existing model adequately and accurately captures new data, methods, and models published since 2012. The only revision to the model is to revise slightly the Mmax distribution for the ECC-AM
2.5.2-27 Revision 2
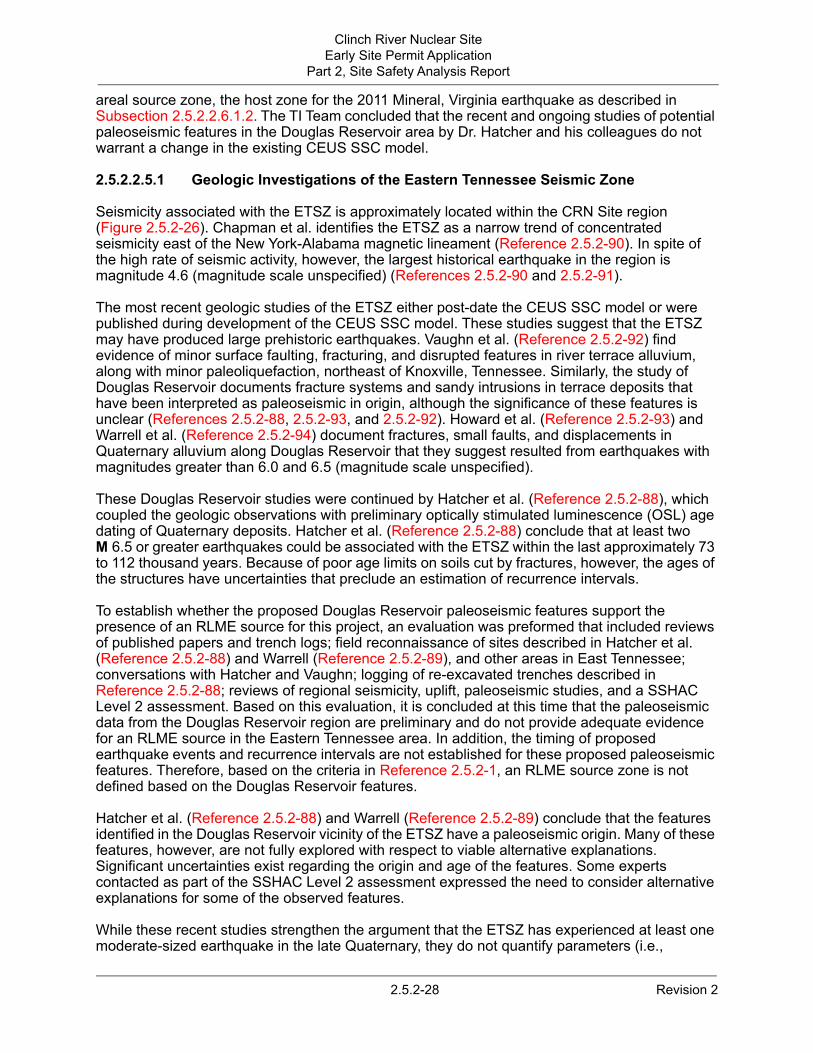
Clinch River Nuclear SiteEarly Site Permit Application
Part 2, Site Safety Analysis Report
areal source zone, the host zone for the 2011 Mineral, Virginia earthquake as described in Subsection 2.5.2.2.6.1.2. The TI Team concluded that the recent and ongoing studies of potential paleoseismic features in the Douglas Reservoir area by Dr. Hatcher and his colleagues do not warrant a change in the existing CEUS SSC model.
2.5.2.2.5.1 Geologic Investigations of the Eastern Tennessee Seismic Zone
Seismicity associated with the ETSZ is approximately located within the CRN Site region (Figure 2.5.2-26). Chapman et al. identifies the ETSZ as a narrow trend of concentrated seismicity east of the New York-Alabama magnetic lineament (Reference 2.5.2-90). In spite of the high rate of seismic activity, however, the largest historical earthquake in the region is magnitude 4.6 (magnitude scale unspecified) (References 2.5.2-90 and 2.5.2-91).
The most recent geologic studies of the ETSZ either post-date the CEUS SSC model or were published during development of the CEUS SSC model. These studies suggest that the ETSZ may have produced large prehistoric earthquakes. Vaughn et al. (Reference 2.5.2-92) find evidence of minor surface faulting, fracturing, and disrupted features in river terrace alluvium, along with minor paleoliquefaction, northeast of Knoxville, Tennessee. Similarly, the study of Douglas Reservoir documents fracture systems and sandy intrusions in terrace deposits that have been interpreted as paleoseismic in origin, although the significance of these features is unclear (References 2.5.2-88, 2.5.2-93, and 2.5.2-92). Howard et al. (Reference 2.5.2-93) and Warrell et al. (Reference 2.5.2-94) document fractures, small faults, and displacements in Quaternary alluvium along Douglas Reservoir that they suggest resulted from earthquakes with magnitudes greater than 6.0 and 6.5 (magnitude scale unspecified).
These Douglas Reservoir studies were continued by Hatcher et al. (Reference 2.5.2-88), which coupled the geologic observations with preliminary optically stimulated luminescence (OSL) age dating of Quaternary deposits. Hatcher et al. (Reference 2.5.2-88) conclude that at least two M 6.5 or greater earthquakes could be associated with the ETSZ within the last approximately 73 to 112 thousand years. Because of poor age limits on soils cut by fractures, however, the ages of the structures have uncertainties that preclude an estimation of recurrence intervals.
To establish whether the proposed Douglas Reservoir paleoseismic features support the presence of an RLME source for this project, an evaluation was preformed that included reviews of published papers and trench logs; field reconnaissance of sites described in Hatcher et al. (Reference 2.5.2-88) and Warrell (Reference 2.5.2-89), and other areas in East Tennessee; conversations with Hatcher and Vaughn; logging of re-excavated trenches described in Reference 2.5.2-88; reviews of regional seismicity, uplift, paleoseismic studies, and a SSHAC Level 2 assessment. Based on this evaluation, it is concluded at this time that the paleoseismic data from the Douglas Reservoir region are preliminary and do not provide adequate evidence for an RLME source in the Eastern Tennessee area. In addition, the timing of proposed earthquake events and recurrence intervals are not established for these proposed paleoseismic features. Therefore, based on the criteria in Reference 2.5.2-1, an RLME source zone is not defined based on the Douglas Reservoir features.
Hatcher et al. (Reference 2.5.2-88) and Warrell (Reference 2.5.2-89) conclude that the features identified in the Douglas Reservoir vicinity of the ETSZ have a paleoseismic origin. Many of these features, however, are not fully explored with respect to viable alternative explanations. Significant uncertainties exist regarding the origin and age of the features. Some experts contacted as part of the SSHAC Level 2 assessment expressed the need to consider alternative explanations for some of the observed features.
While these recent studies strengthen the argument that the ETSZ has experienced at least one moderate-sized earthquake in the late Quaternary, they do not quantify parameters (i.e.,
2.5.2-28 Revision 2

Clinch River Nuclear SiteEarly Site Permit Application
Part 2, Site Safety Analysis Report
recurrence interval, magnitude) necessary to demonstrate that the ETSZ produces RLMEs. As such, the ETSZ is modeled within the MESE Mmax zone and the PEZ seismotectonic zone using spatially smoothed seismicity, which retains the high local rate of seismicity. No RLME source is defined for the ETSZ in the CEUS SSC Model (Reference 2.5.2-1). See Subsection 2.5.2.2.6 for discussions of several sensitivity studies, including the consideration of conclusions by Hatcher et al. (Reference 2.5.2-88) and Warrell (Reference 2.5.2-89) that two M 6.5 or larger earthquakes occurred in the ETSZ region during the past 73 to 112 thousand years.
2.5.2.2.5.2 Investigations of the 2011 Mineral, Virginia Earthquake
The Mineral earthquake occurred on August 23, 2011 at 17:51 UTC near Mineral, Louisa County, Virginia (Reference 2.5.2-95) (Figure 2.5.2-21). The epicentral region lies within the Appalachian Piedmont, about 130 km (80 mi) southwest of Washington, D.C., and within or near the CVSZ (Reference 2.5.2-95). The M 5.8 mainshock hypocenter originated at about 8 km depth, with most of the moment release between 6 and 8 km depth (References 2.5.2-95 and 2.5.2-96), with an epicentral uncertainty of 2.3 km that stems from sparse P-wave recordings (References 2.5.2-34 and 2.5.2-95). The rupture was complex and involved a relatively small rupture area (Reference 2.5.2-96). Chapman (Reference 2.5.2-96) notes that only four stations within 150 km (93 mi) of the epicentral area recorded mainshock arrival times. The earthquake has been given various names and assigned magnitudes in the M 5.7 to 5.8 range. Following the CEUS SSC methodology (Reference 2.5.2-1), this earthquake is assigned an expected moment magnitude of E[M] 5.71 in the updated project catalog (Subsection 2.5.2.1). The Mineral earthquake was the largest historical event in the region and the largest instrumentally recorded earthquake in eastern North America since the 1988 M 5.84 Saguenay earthquake (Reference 2.5.2-35). Most researchers attribute the 2011 Mineral earthquake to the CVSZ (e.g., References 2.5.2-96 and 2.5.2-97).
A series of aftershocks highlighted a southeast-dipping, northeast-striking rupture plane that represents the orientation of the Coulomb stress field perturbation caused by the mainshock, of the Mineral earthquake, which was previously unrecognized at the surface or in the subsurface. Aftershocks ranged in depth from 1 to 7.5 km and included events up to M 3.9 per Horton and VTSO (References 2.5.2-98 and 2.5.2-99, respectively). The majority of 2011 Mineral, Virginia earthquake aftershock hypocenters define a surface suggesting a rupture plane oriented approximately north-northeast with a moderate dip of about 45 to 51 degrees to the southeast (References 2.5.2-34, 2.5.2-96, 2.5.2-98, 2.5.2-100, 2.5.2-101, and 2.5.2-102). Focal mechanisms of the mainshock indicate a primarily reverse sense of slip (Reference 2.5.2-95).
The Mineral earthquake caused moderate damage in the epicentral region, although felt intensity at close distances (less than 100 km [62 mi]) was less than predicted by Atkinson and Wald relations (References 2.5.2-103 and 2.5.2-104). Ground motions at larger distances were in relatively close agreement with the Atkinson and Wald relations (Reference 2.5.2-103), and the earthquake was felt by more people than any other earthquake in U.S. history per Carter el al (Reference 2.5.2-105). At short periods (0.2 s), ground motions agreed well with eastern GMPEs, but were less than expected at longer periods (1.0 s) (Reference 2.5.2-35).
Geologic evidence of the Mineral earthquake was sparse, although some coseismic features were observed. Rock falls were identified over a wide region covering most of mountainous Virginia and parts of Maryland and West Virginia (References 2.5.2-105, 2.5.2-106, and 2.5.2-107) and locations that lie within the approximate vertical surface projection of the rupture plane (References 2.5.2-106, 2.5.2-107, and 2.5.2-108).
Dominion Virginia Power investigated the Mineral earthquake and its potential impacts on the CEUS SSC model and concluded that the most appropriate way to incorporate the Mineral earthquake source in the PSHA is with distributed seismicity (background) zones
2.5.2-29 Revision 2

Clinch River Nuclear SiteEarly Site Permit Application
Part 2, Site Safety Analysis Report
(Reference 2.5.2-23). The updated seismicity catalog, which includes the Mineral earthquake, provided the basis to include updated seismicity rates to the host zones of the earthquake (ECC-AM, MESE-N, MESE-W, and Study Region) and a slight increase in the Mmax distribution to the ECC-AM zone. The CRN Site PSHA adopts the updated Mmax distribution for the ECC-AM zone (Table 2.5.2-14).
The 2011 Mineral earthquake is not included as a new fault or RLME source in the CRN Site PSHA. Without slip-rate, recurrence, or Mmax constraints for the structure defined by the distribution of aftershock hypocenters that likely produced the Mineral earthquake, it is most appropriate to consider this earthquake as an event captured by the host zones (ECC-AM, MESE-N, MESE-W, and Study Region) in the CEUS SSC model framework (Reference 2.5.2-23).
2.5.2.2.6 Updated Seismic Source Parameters
Based on the new information discussed in Subsection 2.5.2.2.5, earthquake recurrence rates and maximum magnitudes are updated for CEUS SSC sources as described below.
2.5.2.2.6.1 Maximum Magnitude Updates
2.5.2.2.6.1.1 CEUS SSC Mmax Errors
Minor errors in some maximum magnitude (Mmax) distributions have recently been discovered in the CEUS SSC model (Reference 2.5.2-1) as described in an EPRI memo (Reference 2.5.2-109). EPRI has since issued a letter addressing the impacts of these errors (Reference 2.5.2-110). The methodology used for these calculations is documented in Section 5.2 of the CEUS SSC Report (Reference 2.5.2-1). The distribution of Mmax is obtained as the weighted combination of two Mmax distributions: a Bayesian approach (with a variety of prior distributions) and a Kijko K-S-B approach (uses no prior, relying on the earthquake statistics), (Reference 2.5.2-1).
With the exception of eight sources, all Mmax values for distributed seismicity sources are identical to the values in Reference 2.5.2-1. Table 2.5.2-15 lists the incorrect and correct values for these eight sources, which include PEZ-N, PEZ-W, MidC-A, Midc-B, Midc-C, Midc-D, IBEB, and SLR. The corrected Mmax values are used in this Application.
2.5.2.2.6.1.2 Impact of Updated Seismicity Catalog
The assessment of Mmax was made for the distributed seismicity sources within 640 km (400 mi) of the CRN Site by comparing the maximum the maximum observed historical event for each source listed in CEUS SSC 2012 with the updated seismicity for the period of January 1, 2009, through mid-September, 2013 (Subsection 2.5.2.1). This assessment resulted in the decision to update only the ECC-AM source and this was based on the occurrence of the 2011 E[M] 5.71 Mineral, VA earthquake within that zone.
Dominion Virginia Power has updated the Mmax distribution for the ECC-AM, the host zone of the M 5.8 Mineral, Virginia, earthquake (Reference 2.5.2-23). The Mmax assessment resulted in a minor revision to the lower bound of the Mmax distribution for ECC-AM seismotectonic source zone (see Table 2.5.2-14). No other Mmax values are affected in the other three zones (MESE-W, MESE-N, and Study Region) in which the Mineral earthquake occurred (Reference 2.5.2-23). This Application has adopted this minor update for consistency. However, it can be argued that the 0.1 change in magnitude may be an artifact of a one-decimal round-off and that actual changes are much smaller (Reference 2.5.2-23), which would in turn suggest that a 0.1 magnitude shift in a single value of the distribution may not be hazard significant.
2.5.2-30 Revision 2

Clinch River Nuclear SiteEarly Site Permit Application
Part 2, Site Safety Analysis Report
While the updated earthquake catalog found no new earthquakes (post-2008) greater than E[M] 5.0 in the site region, there were a total of four events (including the 2011 Mineral earthquake) exceeding E[M] 5.0 east of longitude -105 degrees and within the CEUS SSC Study Region. The largest was the E[M] 5.71 2011 Mineral earthquake in Central Virginia and the smallest was an E[M] 5.06 2010 Ottawa Canada earthquake located in the distant GMH source (too distant for consideration in the CRN Site PSHA. The other two events are the E[M] 5.62 (November 6, 2011) and E[M] 5.27 (August 23, 2011) events in Oklahoma and Colorado, respectively. Both these events occurred in the MidC and the NMESE-W sources. The Mmax calculation for MidC-A (the most significant MidC variant in terms of its contribution to hazard at the site) was updated to include these two earthquakes, and it was determined that the Mmax distribution is unchanged. The distribution for NMESE-W was not updated because this source makes a negligible contribution to hazard at the site.
2.5.2.2.6.1.3 ETSZ Mmax Sensitivity Studies
As described in Subsection 2.5.3.1.2, recent work by Hatcher et al. (Reference 2.5.2-88), and Warrell (Reference 2.5.2-89) in the Douglas Reservoir area of Tennessee document potential paleoseismic and paleoliquefaction features interpreted to result from prehistoric, large magnitude earthquakes in the ETSZ. The results of the SSHAC Level 2 study described in Subsection 2.5.2.2.5, which included discussions with the authors, field observations of features, mapping of river terraces, and discussions with other researchers, show that many of these proposed paleoseismic features may have viable alternative origins and that significant uncertainties exist regarding their age. Two sensitivity studies were performed to assess the potential impact of the authors’ conclusions that two M 6.5 or larger earthquakes occurred in the ETSZ region during the past 73 to 112 thousand years.
The first sensitivity study was designed to test the impact on Mmax distributions by assuming that two M~6.5 earthquakes occurred during the prehistorical period and assess the Mmax distributions for all the sources that contain the ETSZ (namely, PEZ-N, PEZ-W, MESE-W, NMESE-N, and STUDY_R). For this sensitivity analysis, it is assumed that the largest paleoseismic observed earthquake (Mmax-observed) in the ETSZ, according to the interpretation by Hatcher et al. (Reference 2.5.2-88) can be represented by a distribution having the following magnitudes and weights: 5.5 (0.1), 6.0 (0.3), 6.5 (0.4), 7.0 (0.1), 7.5 (0.1) and that the associated number of earthquakes is 2.
The weights are assigned to indicate the uncertainty in the assigned Mmax distributions. The majority of features described in Hatcher et al. (Reference 2.5.2-88) are primarily associated with either strong ground shaking (extensional ground surface cracking) or paleoliquefaction. A weight of 0.1 is given for M 5.5 because this is the smallest magnitude that may produce localized liquefaction-induced features. Weights of 0.3 and 0.4 are given for M 6.0 and M 6.5 respectively, because these reflect magnitudes that are likely to produce localized liquefaction features. The observed Douglas Reservoir features are not widespread throughout a large area and would likely be produced by a relatively smaller local event. The distribution’s lower bound of M 5.5 is based on a general magnitude threshold for liquefaction of about M 5. The distribution’s two upper bound values of M 7.0 and M 7.5 allow for: (1) the uncertainty in earthquake location, such that a large, distant event might have produced the interpreted paleoseismic features in the Douglas Reservoir area; and (2) the possibility of a more widespread distribution of features beyond the Douglas Reservoir area. The weights of 0.1 assigned to M 7.0 and M 7.5 reflect the lack of evidence for widespread distribution of features. The greatest weight assigned to M 6.5 partially reflects conclusions proposed by Hatcher et al. (Reference 2.5.2-88) that the paleoearthquakes are M 6.5 or larger. These conclusions regarding magnitude from Hatcher et al. (Reference 2.5.2-88) are based on the Wells and Coppersmith (Reference 2.5.2-112) displacement relations for an apparent 1 m reverse fault near Douglas Reservoir. However, the Wells and Coppersmith (Reference 2.5.2-112) rupture length to magnitude regressions are
2.5.2-31 Revision 2

Clinch River Nuclear SiteEarly Site Permit Application
Part 2, Site Safety Analysis Report
based on slip along the seismogenic fault, and their application to secondary faults or features produced from ground shaking may not be appropriate. This magnitude distribution was developed as part of the SSHAC Level 2 study summarized in Subsection 2.5.2.2.5.
The Hatcher et al. (Reference 2.5.2-88) interpretation is incorporated by giving 10 percent weight to a Mmax distribution derived from these paleoearthquakes and 90 percent weight to a distribution derived using the historical- and instrumental-earthquake data used in the CEUS-SSC study. Following the procedures described in the CEUS SSC report (Reference 2.5.2-1) a 10 percent weight is given using the potential paleoearthquake data as the largest observed in the PEZ to be used in updating the Mmax prior distribution.
The weight of 10 percent was developed as part of the SSHAC Level 2 study. The SSHAC evaluation process was based on reviews of published papers and trench logs; geologic field reconnaissance of sites described in Hatcher et al. (Reference 2.5.2-88) and Warrell (Reference 2.5.2-89), and other areas in eastern Tennessee; conversations with Hatcher and other proponent experts; logging of re-excavated trenches; mapping of river terraces; and discussions with resource experts. Based on this evidence, the SSHAC TI Team concluded that nearly all the features interpreted as paleoseismic in origin can also be explained by other plausible, non-seismic processes. A number of the SSHAC Resource Experts agree with this interpretation. Also, some of the early field interpretations of the features in the Douglas Reservoir area were available for consideration by the CEUS SSC TI Team during their evaluation, but were not included in the calculation of Mmax for PEZ (i.e., they were given zero weight). The 10 percent weight also reflects considerable uncertainty in the relative and numerical ages of terraces containing these features.
To put this 10 percent value in perspective, it is useful to consider the CEUS SSC treatment of suspected paleoseismic features in southeastern Arkansas, northeastern Louisiana, and western Mississippi (collectively known as the ALM features), identified by Cox and other researchers (see Reference 2.5.2-1 for references). According to Cox and others, these features consist of: (1) roughly circular sandy deposits in aerial photographs along river valleys, which were interpreted as seismically induced sand blows; (2) trenched sandy deposits at seven locations, within which multiple sand-venting episodes can be identified and correlated between trench sites based on stratigraphic relationships and dating; and (3) evidence of Quaternary fault rupture in the Saline River area. The CEUS SSC study assigned a 20 percent weight to the ALM features in the calculation of Mmax for the ECC-GC source zone (which contains the ALM features). In the CRN SSHAC Level 2 deliberations, the paleoseismic evidence for the ALM features was deemed significantly stronger than the evidence for the Hatcher et al. (Reference 2.5.2-88) interpretation of the Douglas Reservoir evidence.
The sensitivity calculation shows no change in the Mmax distributions of MESE-W, NMESE-N, and STUDY_R, and a very minor change in PEZ-N and PEZ-W. For PEZ-N, one magnitude in the distribution changes from M 7.4 to M 7.5. For PEZ-W, two magnitudes increase by 0.1; M 6.4 to M 6.5 and M 7.4 to M 7.5. These changes are largely an artifact of the discretization into 0.1 magnitude units. More importantly, the changes seen in the continuous distributions (i.e., shifts of approximately 0.02 magnitude units or less) are very small and much smaller than the standard deviations of these Mmax distributions. Therefore, the TI Team concluded that the introduction of the two M 6.5 or greater paleoearthquakes proposed by Hatcher et al. (Reference 2.5.2-88) and Warrell (Reference 2.5.2-89) has a negligible effect on the Mmax distributions of these affected seismic sources.
The second sensitivity study was performed to evaluate whether the existing CEUS SSC 2012 model produces earthquakes in the ETSZ of sufficient size and frequency to explain the interpretations of paleoearthquakes from Hatcher et al. (Reference 2.5.2-88). This sensitivity study utilized the original Mmax distributions and rates from CEUS SSC 2012 and does not
2.5.2-32 Revision 2

Clinch River Nuclear SiteEarly Site Permit Application
Part 2, Site Safety Analysis Report
reflect the corrections made to Mmax distributions (Section 6.1 of Reference 2.5.2-1). As described above, the CEUS SSC 2012 model does not explicitly define a separate seismic source for the ETSZ. For the purpose of this hazard sensitivity study, the boundary of the ETSZ as defined by the USGS NSHMP (Reference 2.5.2-10) was adopted (see Figure 2.5.2-26). Except for inputs developed by the CEUS SSC project, the choice of the ETSZ geometry defined by the USGS NSHMP is the only new input parameter required for this sensitivity analysis.
Magnitude frequency distributions were calculated for those portions (cell centers) of CEUS SSC 2012 sources (PEZ-N, PEZ-W, MESE-W, NMESE-N, and Study_R) that lie within the boundary of the NSHMP depiction of the ETSZ (Figure 2.5.2-26). Magnitude frequency distribution calculations used CEUS SSC 2012 annual seismicity rates, b-values, and extracted parameters of rate per cell area, cell-area, and values for each source. The final weighted magnitude frequency distribution was developed by applying CEUS SSC 2012 global logic tree weights to the calculated magnitude frequency distributions from each source.
Using the final weighted magnitude frequency distribution, the approximate return periods for earthquake magnitudes ranging from M 6 to 7.5 are as follows:
M 6.0 ~2,800 years
M 6.5 ~13,000 years
M 7.0 ~88,000 years
M 7.5 ~850,000 years
These results indicate that the CEUS SSC 2012 model generates moderate- to large-magnitude events (M > 6.5) with sufficient frequency in the ETSZ area to explain the Hatcher et al. (Reference 2.5.2-88) interpretation of field observations that implies the occurrence of two events of approximately M 6.5 or larger in the past 73 to 112 thousand years. Without any modification, the CEUS SSC 2012 model generates about seven M 6.5 events and one M 7.0 event in the ETSZ region every 100,000 years.
In summary, Mmax distributions for eight seismotectonic zones were corrected from the published values in Reference 2.5.2-1. The original CEUS SSC Mmax distributions and corrected Mmax distributions are shown in Table 2.5.2-15. The Mmax distribution for the ECC-AM was revised slightly to account for the occurrence of the 2011 M 5.8 Mineral, Virginia, earthquake (Table 2.5.2-14). These corrected and revised Mmax distributions were used in the CRN Site PSHA (Subsection 2.5.2.4). No other modifications were made to Mmax distributions.
Both of these sensitivity analyses, including the development of inputs, calculation procedures, and conclusions, were performed as part of the SSHAC Level 2 study summarized in Subsection 2.5.2.2.5 and were subjected to SSHAC Level 2 peer review.
2.5.2.2.6.2 Earthquake Recurrence Rates
Following the methodology of the CEUS SSC (Reference 2.5.2-1), earthquake recurrence rates and b-values were recalculated for significant sources using (1) the updated earthquake catalog, (2) corrected and updated Mmax distributions described in Subsection 2.5.2.2.6.1. The following 10 sources were selected as significant (in order of importance at 1 Hz): PEZ-N, NMESE-N, STUDY_R, PEZ-W, MESE-W, Mid-A, IBEB, RR, ECC-AM, and MESE-N. Updated recurrence parameters were used for these 10 seismic sources in the PSHA.
2.5.2-33 Revision 2

Clinch River Nuclear SiteEarly Site Permit Application
Part 2, Site Safety Analysis Report
Five of these background sources represent host zones to the CRN Site and the percent change in annual rate was calculated for the host cell in PEZ-N, PEZ-W, MESE-W, NMESE-N, and STUDY_R. The percent change in the host cells range from a 5.5 percent decrease to a 12.5 percent increase. The net change in host cell rate is a 3.3 percent increase, which takes into account the source weights from CEUS SSC 2012 logic trees and the weights for the three alternative recurrence models (cases A, B, and E) (Reference 2.5.2-1).
Figure 2.5.2-27 provides further insight into the difference between the original CEUS-SSC and recalculated recurrence rates for portions of the PEZ_N source (the source that contributes the most to hazard at the CRP site) in the vicinity of the site. This figure uses circles to display the original and recalculated rates per unit area in each quarter-degree cell within a portion of the PEZ_N source and shows that the changes in these rates are small. Changes in the b value are very small, typically lower than 0.02. Results for other source zones show a similar pattern. This figure also illustrates the different degrees of spatial smoothness produced by cases A, B, and E. Specifically, case A produces a tighter concentration of rate in cells containing high historical seismicity (mostly small earthquakes in the ETSZ), while case E produces a broader distribution.
The CEUS SSC study (Reference 2.5.2-1) investigated whether its zonation and recurrence-analysis methodology provide an adequate representation of the concentration of historical seismicity in the ETSZ. To this effect, that study compared the predicted and observed earthquake counts within the portion of the PEZ_N source contained within the ETSZ, using the ETSZ geometry defined by the USGS (see Figure 2.5.2-26). These comparisons are shown in Figures 2.5.2-27 through 5.3.2-29 of Reference 2.5.2-1, for cases A, B, and E, respectively. The comparisons for cases A and B show good agreement. The comparison for case E shows lower predicted counts, with the counts for the M 4.3-5 bin slightly below the 16 percent error bar. The CEUS SSC study concluded that the recurrence rates from the three cases, taken as an ensemble, are consistent with the observed ETSZ seismicity (Subsection 5.3.2.3.1 of Reference 2.5.2-1). More generally, the CEUS SSC study chose to use case E, and gave it slightly higher weight despite the fact that it does not match the spatial pattern of (mostly small) earthquakes as well as cases A and B, because case E gives more importance to the magnitude ranges of engineering interest. Because the differences between the CEUS SSC and updated rates are very small in this region (as shown in Figure 2.5.2-27), one can also conclude that the updated rates are also consistent with the ETSZ seismicity.
2.5.2.3 Correlation of Seismicity with Seismic Sources
The CEUS SSC earthquake catalog (Reference 2.5.2-1) includes earthquakes in the CEUS from 1568 through the end of 2008, and its development is discussed in Subsection 2.5.2.1. The entire CEUS SSC earthquake catalog comprises 10,984 independent and dependent earthquakes of uniform moment magnitude E[M] > 2.2, and 3,298 events of E[M] > 2.9. The catalog includes 6,965 and 2,563 independent events of magnitude E[M] > 2.2 and E[M] > 2.9, respectively. For seismicity rate calculations, dependent and small events are removed, which results in fewer earthquakes. However, patterns of seismicity are better illustrated when these events are included (e.g., as shown in Figures 2.5.2-18 and 2.5.2-19).
As described in Subsection 2.5.2.1, the catalog has been updated for the CRN Site to include events through mid-September 2013. Within the CRN site region (200-mi radius), 185 earthquakes (including dependent and small events down to magnitude E[M] 2.2) were added to the catalog. Of these post-2008 earthquakes, only 9 events were E[M] 2.9 or larger. The updated seismicity does not directly highlight or define seismogenic structures within the site region, but generally follows regional patterns of seismicity, such as the ETSZ. The approximately 5-year period of updated seismicity does not provide sufficient events to define new structures or suggest changes to the geometry of background seismotectonic source zones within the site region. Beyond the site region, however, the M 5.8 2011 Mineral, VA earthquake has highlighted
2.5.2-34 Revision 2

Clinch River Nuclear SiteEarly Site Permit Application
Part 2, Site Safety Analysis Report
a southeast-dipping fault based on the moment tensor solution and the distribution of aftershock hypocenters (Reference 2.5.2-23).
The uncertainty in the horizontal location of earthquakes included in the CEUS SSC earthquake catalog is the result of a combination of standard errors for instrumentally recorded earthquakes from the various catalog sources and estimates based on accounts of shaking intensity (Reference 2.5.2-1). In general, location uncertainties have improved through time, with horizontal uncertainties up to 50 km for less well-documented events in the earliest part of the catalog, to as little as 1 to 2 km for well-recorded events in the most recent part of the catalog (see CEUS SSC Report, Appendix B, Reference 2.5.2-1).
Earthquake depths are reported in the CEUS SSC earthquake catalog based on data from source catalogs, or depths documented in a variety of published sources. Many of the earthquake depths represent fixed crustal depths for either shallow or deep events. For example, the NEIC catalog uses fixed depths of 10 km for shallow events and 33 km for deep events (Reference 2.5.2-1). Additionally, many earthquakes in the CEUS SSC earthquake catalog are assigned a depth of 0 km when no data are available to provide a basis for an estimate. This is most common in the earlier years of the catalog. Alternative depth estimates are presented if more than one value was reported in source catalogs or published literature; however, depth uncertainties are not provided in the CEUS SSC earthquake catalog. Despite these horizontal and depth location uncertainties, gross regional patterns of seismicity are preserved and partially form the basis for defining some CEUS SSC seismic sources.
As described in Subsection 2.5.2.2, the CEUS SSC source model includes three types of seismic sources: Mmax zones, zones of repeated large-magnitude earthquakes (RLMEs), and seismotectonic zones. Mmax zones are defined on expected differences in Mmax (i.e., maximum magnitude) potential and are broad zones that are not defined on the basis of geologic structures or the spatial distribution of seismicity. The discussion of correlation of seismicity with seismic sources presented in this subsection is limited to seismotectonic sources within the site region and two RLMEs beyond the site region (NMFS and Charleston) (Subsections 2.5.2.2.3 and 2.5.2.2.4, respectively).
Paleozoic Extended Crust —The PEZ seismotectonic zone represents the western portion of the IRM and includes narrow (PEZ-N) and wide (PEZ-W) alternative geometries, as discussed in Subsection 2.5.2.2.3.3. Seismicity within the zone is spatially variable, ranging from diffuse to concentrated, occasionally defining trends. Relatively high spatial concentrations of seismicity are observed between Lake Ontario and Lake Erie (PEZ-W only) and at the southern end of the PEZ zone in Alabama. Additionally, the PEZ encompasses several well-studied areas of elevated seismicity including the ETSZ and the GCVSZ (Figures 2.5.2-19 and 2.5.2-21). Earthquakes within the ETSZ are generally deep, spatially associated with or limited in extent by geophysical anomalies including the Alabama-New York lineament, and define several northeast-oriented linear trends. Several studies have posited a variety of possible structures and processes associated with earthquakes in the ETSZ, including reactivated basement faults (Reference 2.5.2-90), depositional anisotropies in Steltenpohl (Reference 2.5.2-113), and heterogeneity in crustal strength in Chapman et al. (Reference 2.5.2-114).
The GCVSZ (Giles County in Figure 2.5.2-21) is similarly characterized by deep seismicity that defines a northeast-oriented, steeply southeast-dipping tabular zone. This zone of seismicity is located in the Precambrian basement beneath the Appalachian detachment per Bollinger and Wheeler 1983 and 1988 (References 2.5.2-115 and 2.5.2-116, respectively) and, therefore, the deep seismicity is not reflected in the geology of overlying thrust sheets. Several small-displacement faults and folds have been identified at the ground surface in terrace sands within the GCVSZ for example Law et al. (Reference 2.5.2-117). It is unclear whether this surface deformation is related to deep seismicity, or other processes such as karst development and
2.5.2-35 Revision 2

Clinch River Nuclear SiteEarly Site Permit Application
Part 2, Site Safety Analysis Report
collapse in underlying carbonate rocks (e.g., References 2.5.2-118, 2.5.2-119, and 2.5.2-120). The GCVSZ hosted the largest earthquake observed in the PEZ, the 1897 Giles County, Virginia E[M] 5.91 earthquake.
Extended Continental Crust-Atlantic Margin—As discussed in Subsection 2.5.2.2.3.1, the ECC-AM seismotectonic zone is defined primarily on the basis of Mesozoic rift-related extension. Seismicity within the ECC-AM is spatially variable, ranging from very diffuse to spatially concentrated. Higher concentrations of seismicity are observed near the southern end of the ECC-AM in South Carolina, as well as along the Atlantic Coast from New Jersey northward (Figures 2.5.2-19 and 2.5.2-21). Additionally, the ECC-AM encompasses the CVSZ, an area with an elevated rate of generally small-magnitude seismicity (Figure 2.5.2-21). Seismicity is generally shallow within the CVSZ, and interpreted to occur on Paleozoic and Mesozoic faults that lie above the Appalachian detachment per Keller et al. and de Witt and Bayer (References 2.5.2-121 and 2.5.2-122). An area of elevated concentration of seismicity with similar characteristics occurs in the New York-Philadelphia region. These areas lack evidence for repeated, large-magnitude earthquakes and discrete faults associated with seismicity are not mapped at the surface. Thus, these seismic zones do not meet the CEUS SSC criteria for inclusion as RLMEs. Outside of these more prominent zones of seismicity, earthquakes in the ECC-AM do not appear to correlate with known geologic structures or define linear trends.
The largest observed earthquake possibly within the ECC-AM seismotectonic zone is the 1755 Cape Ann, Massachusetts E[M] 6.10 earthquake. Due to the uncertainty associated with the horizontal location of the Cape Ann earthquake, it is assigned a 60 percent probability of having occurred within the ECC-AM and 40 percent probability of having occurred within the Northern Appalachian seismotectonic zone (NAP) (Reference 2.5.2-1). When the Cape Ann earthquake is considered to have occurred in the NAP, the 2011 Mineral, Virginia E[M] 5.71 earthquake is the largest event in the ECC-AM.
The 2011 Mineral, Virginia earthquake and associated aftershocks occurred within the ECC-AM on a previously unknown structure, oriented similar to many of the thrust faults in the region. As discussed in Subsection 2.5.2.2.5.1, the aftershocks define a southeast-dipping, northeast-striking plane that represents the orientation of the Coulomb stress field perturbation caused by the mainshock, that extends from about 7.5 to 1.0 km depth (References 2.5.2-34 and 2.5.2-98). Information in the technical community does not exist for this structure that would justify addition of an RLME to the CEUS SSC model. The CEUS SSC earthquake catalog was updated to include post-2008 seismicity, including the 2011 Mineral, Virginia earthquake, which resulted in local increases in the rate of seismicity in ECC-AM when rates (a-values) were calculated using the updated earthquake catalog.
Midcontinent-Craton Zone—The MidC seismotectonic zone comprises crust that has not been significantly deformed by Phanerozoic orogens. Seismicity of the MidC zone is generally diffuse with a few areas of spatially concentrated seismicity including the Anna (Ohio), northeast Ohio, and Nemaha Ridge-Humboldt fault (Oklahoma, Kansas, and Nebraska) seismic zones (Figures 2.5.2-19 and 2.5.2-21). Seismicity within the Anna seismic zone is spatially concentrated and tenuously associated with basement faults that comprise the Fort Wayne rift. A paleoseismic investigation by Obermeier (Reference 2.5.2-123) indicates a lack of large-magnitude, repeated earthquakes for several thousand years in the Anna seismic zone. Seismicity within the northeast Ohio seismic zone is defined by a northeast-trending zone of earthquakes. A 1986 E[M] 4.65 earthquake and aftershock sequence within the zone has been associated with northeast-trending geophysical anomalies, for example, Seeber and Armbruster and Dineva et al. (References 2.5.2-124 and 2.5.2-125). In a paleoseismic investigation, however, Obermeier (Reference 2.5.2-123) found a lack of evidence for large, repeated earthquakes in the zone. Seismicity within the Nemaha Ridge-Humboldt fault seismic zone is questionably associated with basement structures that are sub-parallel and west of the
2.5.2-36 Revision 2

Clinch River Nuclear SiteEarly Site Permit Application
Part 2, Site Safety Analysis Report
Proterozoic Midcontinent rift system (e.g., References 2.5.2-126 and 2.5.2-127). Outside of the seismic zones described above, spatially concentrated areas of seismicity within the MidC zone are observed in central Oklahoma and northern Alabama, and along the Nebraska-South Dakota border (Figures 2.5.2-19 and 2.5.2-21).
Illinois Basin Extended Basement Zone—The IBEB zone encompasses faults within Precambrian basement and the Paleozoic Illinois Basin as well as a zone of liquefaction features thought to be associated with four moderate paleoseismic events (approximately M 6.20 to 6.30; Subsection 7.3.5 in Reference 2.5.2-1). The largest cataloged event to have occurred in the IBEB zone was the 1891 E[M] 5.52 event in southern Illinois (Subsection 7.3.5.4 in Reference 2.5.2-1). Larger earthquakes have occurred in the zone (E[M] 6.5), but they are characterized by the Wabash Valley RLME (Subsection 6.1.9 in Reference 2.5.2-1). Seismicity is sparse in the northern part of the IBEB zone, increasing regularly to the south (Figure 2.5.2-19). Hypocentral depths range from shallow (less than 5 km) to deep (up to 27 km), with shallower earthquakes slightly more common. Earthquakes in the IBEB do not define linear trends or areas of concentrated seismicity. Seismicity is relatively evenly distributed and dense compared with surrounding regions not characterized as RLME sources. Several structures and processes have been posited as sources of earthquakes in the IBEB zone, but they remain poorly understood.
Reelfoot Rift-Rough Creek Graben Zone—The RR-RCG seismotectonic zone includes faults that developed during late Proterozoic to Cambrian Iapetan-phase rifting and were later reactivated in the late Paleozoic Era, and some were again reactivated in the Mesozoic Era. Seismicity rates are lower in the portions of the RR-RCG that are within the CRN Site study region (radius 640 km [400 mi]), relative to the rest of the RR or RR-RCG zones (Figure 2.5.2-19). Seismicity ranges from 13 to 17 km deep (Subsection 7.3.6.5 in Reference 2.5.2-1). The two largest earthquakes in the RR-RCG zone are the historical January 5, 1843, and October 31, 1895, events, both interpreted as E[M] 6.0 earthquakes (Subsection 7.3.6.4 in Reference 2.5.2-1). The 1811–1812 large magnitude earthquakes located within this zone are considered part of the NMFS RLME source.
New Madrid Fault System—The NMFS RLME lies within the broader New Madrid seismic zone and represents the source of the three largest historical earthquakes in the CEUS region in 1811 and 1812 (E[M] 7.60, 7.50, and 7.80), and several prehistoric large earthquakes (Figure 2.5.2-21) (Subsection 6.1.5 of Reference 2.5.2-1). A number of faults are identified in the New Madrid seismic zone. The NMFS RLME comprises three main fault sources, each with two alternative geometries to reflect uncertainty in their extent and/or location. The spatial distribution of seismicity defines clear, highly concentrated trends of earthquakes along these faults (Figure 2.5.2-24). Seismicity also occurs away from these faults, defining a roughly 250 km by 400 km concentration of earthquakes from the Marianna zone near the southern end, extending northeast along the Mississippi River to just south of northwest-trending basement structures in Illinois (Figure 2.5.2-22).
Charleston—The Charleston RLME is described in Subsection 2.5.2.2.4.1 and represents the Charleston, South Carolina seismic zone. This zone is the source of the largest recorded earthquake in the eastern U.S., the 1886 Charleston E[M] 6.90 earthquake (Figures 2.5.2-19 and 2.5.2-21). The Charleston seismic zone is characterized by sparse seismicity (in comparison to the Eastern Tennessee or New Madrid seismic zones) that is tightly concentrated, but lacking prominent linear trends. There is no conclusive evidence that indicates a correlation of well-documented prehistoric large earthquakes or historical earthquakes with a discrete structure. Therefore, three alternative zones are hypothesized for the Charleston RLME, based on locations of posited fault sources, damage, felt intensity, and/or density of liquefaction features (Subsection 6.1.2.3 in Reference 2.5.2-1).
2.5.2-37 Revision 2

Clinch River Nuclear SiteEarly Site Permit Application
Part 2, Site Safety Analysis Report
2.5.2.4 Probabilistic Seismic Hazard Analysis and Controlling Earthquakes
This subsection details the PSHA for the CRN Site. In accordance with the guidance of RG 1.206 and RG 1.208, Subsection 2.5.2.4.1 describes the implementation of the CEUS SSC model and simplifications made in the PSHA calculations. Relevant new geologic and seismic information that post-dates completion of the CEUS SSC model is discussed in Subsection 2.5.2.2.5. Related updates to the CEUS SSC model (see Subsection 2.5.2.2.6.1.1) based on this new information are discussed in Subsection 2.5.2.4.3. GMPEs used in the PSHA are detailed in Subsection 2.5.2.4.2. The results of the PSHA, including mean and fractile seismic hazard curves, the relative contribution of individual seismic sources, UHRS, and details on the controlling earthquakes are presented in Subsection 2.5.2.4.3.
2.5.2.4.1 CEUS SSC Model Implementation
The CEUS SSC model (Reference 2.5.2-1) is the starting point used for probabilistic seismic hazard calculations at the CRN Site. As discussed in Subsection 2.5.2.2, the CEUS SSC model is the most recent SSC specifically designed for PSHAs of nuclear facilities in the central and eastern U.S., developed using the SSHAC Study Level 3 methodology to ensure that uncertainty is represented in a manner consistent with NRC regulations. The computer software used in the rock hazard calculations described below has been used to reproduce the results for the seven test sites in the CEUS SSC model, obtaining a satisfactory agreement.
For the CRN Site, seismic hazard was calculated using source parameters from the CEUS SSC model. Simplifications to the CEUS SSC model were made for this calculation, and included:
The truncation of seismicity within distributed seismicity sources at 640 km (400 mi) from the site.
Collapsing seismogenic depth in the New Madrid RLME logic tree to a single value of 15 km (with a corresponding weight of 1.0).
The exclusion of sense of slip (described as a future rupture characteristic in Table 5.4-2 of the CEUS SSC Report [Reference 2.5.2-1] and Table 2.5.2-8), since current GMPEs (References 2.5.2-12, 2.5.2-128 and 2.5.2-129) do not consider this parameter.
Rupture strike and dip (described as a future rupture characteristic in Table 5.4-2 of the CEUS SSC Report [Reference 2.5.2-1] and Table 2.5.2-8) were included for the Charleston and New Madrid RLME sources, but were not considered for other sources. A sensitivity study performed for the CEUS SSC model (Reference 2.5.2-1, page 9–8) demonstrated that representing earthquakes as point sources, using EPRI (Reference 2.5.2-12) correction factors for rupture distance, is an acceptable approximation.
Depth distributions (described as a future rupture characteristic in the CEUS SSC Report (Reference 2.5.2-1), Appendix H; Table 2.5.2-8) were collapsed to a single value for background sources. This simplification is consistent with the modifications implemented within the seismic hazard calculations for the Reference 2.5.2-11 GMM and the Updated EPRI GMM (Reference 2.5.2-118) for earthquakes represented as a point.
Further modifications to the CEUS SSC model motivated by the updated earthquake catalog and site investigations are discussed in detail below.
2.5.2-38 Revision 2

Clinch River Nuclear SiteEarly Site Permit Application
Part 2, Site Safety Analysis Report
2.5.2.4.2 Ground Motion Models
Earthquake ground motion models for the CRN Site hard rock PSHA used ground motion relations developed by EPRI (Reference 2.5.2-129). These ground motion models represent alternative methods of estimating earthquake shaking and include estimates of variability in ground motion amplitudes. Weights on alternatives represent the relative credibility of each model. This representation of earthquake ground motion has been accepted by the NRC (Reference 2.5.2-130) as a valid model for use in PSHA for nuclear licensing applications in the CEUS.
These updated equations estimate median spectral acceleration and its uncertainty as a function of earthquake magnitude and distance. Epistemic uncertainty is modeled using multiple ground motion equations with weights, and multiple estimates of aleatory uncertainty, also with weights. Different sets of sources are recommended for seismic sources that represent rifted versus non-rifted regions of the earth’s crust. All of the background sources utilize the non-rift EPRI GMMs (Cluster 1-3) and the RLME sources utilize the non-general, rift EPRI GMMs (Clusters 1-4). Different equations are also recommended for the mid-continent region of the CEUS and for the Gulf region. All of the background and RLME sources utilize the mid-continent version of the EPRI GMMs because this region contains the majority of the seismic wave travel path from source to site. The CRN Site is located within the mid-continent region of the CEUS, approximately 330 km from the closest edge of the Gulf region border. Equations are available for spectral frequencies at hard rock sites of 100 Hz (which is assigned equivalence to peak ground acceleration, PGA), 25 Hz, 10 Hz, 5 Hz, 2.5 Hz, 1 Hz, and 0.5 Hz. No cumulative absolute velocity (CAV) filter, which accounts for the damageability of small magnitude earthquake ground motions, was applied. Integration of the ground motion equations for calculating hazard used a lower bound magnitude of E[M] 5.00 for all earthquake sources.
2.5.2.4.3 Probabilistic Seismic Hazard Analysis and Deaggregation
The following subsections describe the PSHA and the deaggregation results for the site. The calculation of rock seismic hazard used the CEUS SSC seismic source characterizations, the EPRI ground motion model (Reference 2.5.2-129), updated seismicity files that include the effect of recent seismicity on background sources, and corrected and updated Mmax distributions for some of the background sources. The CAV filter is not applied in this calculation and no site amplification factors are used, so the results are consistent with hard-rock conditions (shear-wave velocities of 9200 ft/s). The methodology for seismic hazard calculations is well established in the technical literature for example in McGuire (Reference 2.5.2-131).
2.5.2-39 Revision 2

Clinch River Nuclear SiteEarly Site Permit Application
Part 2, Site Safety Analysis Report
2.5.2.4.3.1 Seismic Sources
Seismic source inputs to the hazard calculations consist of background or distributed seismicity sources (large regions representing earthquakes not associated with specific tectonic structures, i.e., Mmax Zones and Seismotectonic Zones) and RLME sources (those representing the potential occurrence of RLMEs). Specific background sources that are documented in the CEUS SSC Report and that are included in the hazard calculations for the CRN Site consist of the following:
1. Non-Mesozoic and younger extended prior-narrow1
2. Mesozoic and younger extended prior-wide1
3. Study Region (STUDY_R)1
4. Paleozoic Extended Crust-narrow1,2
5. Paleozoic Extended Crust-wide1,2
6. Mesozoic and younger extended prior-narrow1
7. Non-Mesozoic and younger extended prior-wide
8. Midcontinent-Craton alternative A1,2
9. Midcontinent-Craton alternative B2
10. Midcontinent-Craton alternative C2
11. Midcontinent-Craton alternative D2
12. Reelfoot Rift including the Rough Creek Graben
13. Extended Continental Crust-Atlantic Margin1,3
14. Illinois Basin Extended Basement1,2
15. Reelfoot Rift1
16. Extended Continental Crust-Gulf Coast
This list includes all background sources that lie within 320 km (200 mi) of the site, which is consistent with the recommendation in RG 1.208, Subsection 1.1.1 regarding the identification of seismic sources. Two sources, RR and ECC-GC, lie beyond this 320 km (200 mi) distance, but were also included. Background sources are truncated so that only distributed seismicity within 640 km (400 mi) is considered in the analysis. All background sources are represented with gridded seismicity at 5 km depth consisting of 24 sets of annual activity rates and b-value parameters for each source. These parameters consist of eight equally likely realizations of parameters (Reference 2.5.2-1, pages 5-35 and 5-36) for each of three smoothing models (Reference 2.5.2-1, page 5-37 and cases A, B, and E in Table 5.3.2-1). Each background source
1. indicates seismicity parameters were updated for PSHA.2. indicates Mmax values were corrected (Table 2.5.2-15)3. indicates Mmax values were updated due to the 2011 Mineral earthquake (Table 2.5.2-14)
2.5.2-40 Revision 2
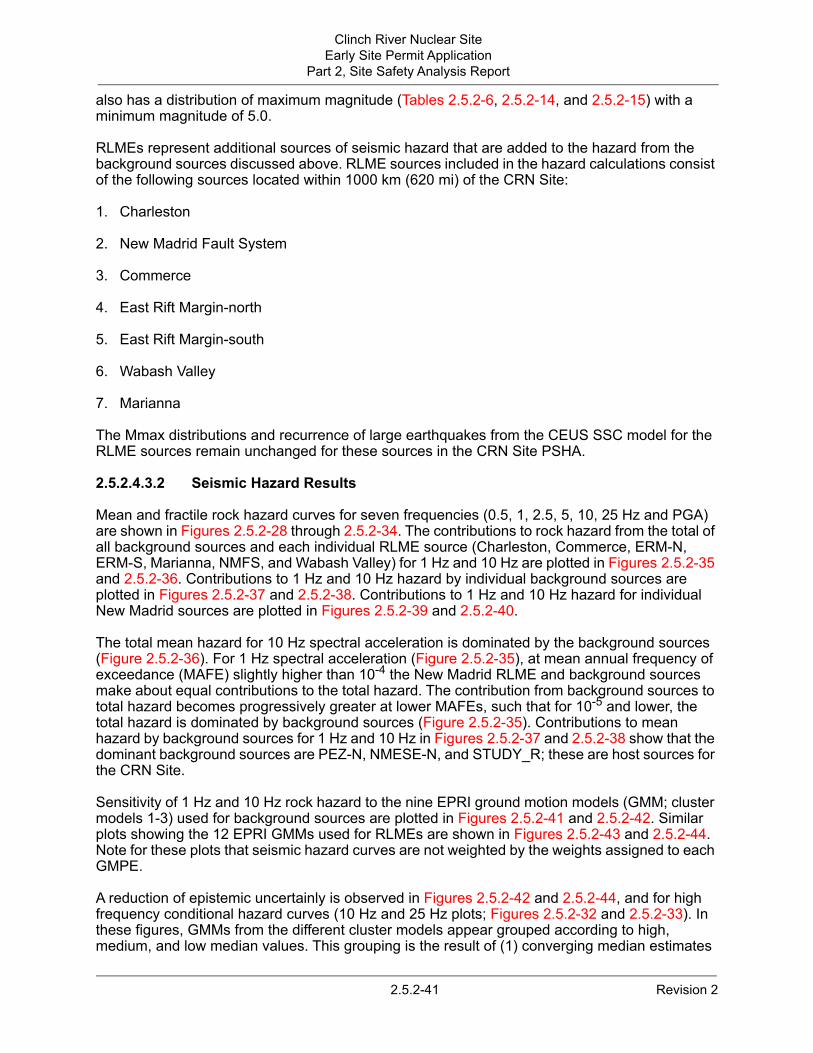
Clinch River Nuclear SiteEarly Site Permit Application
Part 2, Site Safety Analysis Report
also has a distribution of maximum magnitude (Tables 2.5.2-6, 2.5.2-14, and 2.5.2-15) with a minimum magnitude of 5.0.
RLMEs represent additional sources of seismic hazard that are added to the hazard from the background sources discussed above. RLME sources included in the hazard calculations consist of the following sources located within 1000 km (620 mi) of the CRN Site:
1. Charleston
2. New Madrid Fault System
3. Commerce
4. East Rift Margin-north
5. East Rift Margin-south
6. Wabash Valley
7. Marianna
The Mmax distributions and recurrence of large earthquakes from the CEUS SSC model for the RLME sources remain unchanged for these sources in the CRN Site PSHA.
2.5.2.4.3.2 Seismic Hazard Results
Mean and fractile rock hazard curves for seven frequencies (0.5, 1, 2.5, 5, 10, 25 Hz and PGA) are shown in Figures 2.5.2-28 through 2.5.2-34. The contributions to rock hazard from the total of all background sources and each individual RLME source (Charleston, Commerce, ERM-N, ERM-S, Marianna, NMFS, and Wabash Valley) for 1 Hz and 10 Hz are plotted in Figures 2.5.2-35 and 2.5.2-36. Contributions to 1 Hz and 10 Hz hazard by individual background sources are plotted in Figures 2.5.2-37 and 2.5.2-38. Contributions to 1 Hz and 10 Hz hazard for individual New Madrid sources are plotted in Figures 2.5.2-39 and 2.5.2-40.
The total mean hazard for 10 Hz spectral acceleration is dominated by the background sources (Figure 2.5.2-36). For 1 Hz spectral acceleration (Figure 2.5.2-35), at mean annual frequency of exceedance (MAFE) slightly higher than 10-4 the New Madrid RLME and background sources make about equal contributions to the total hazard. The contribution from background sources to total hazard becomes progressively greater at lower MAFEs, such that for 10-5 and lower, the total hazard is dominated by background sources (Figure 2.5.2-35). Contributions to mean hazard by background sources for 1 Hz and 10 Hz in Figures 2.5.2-37 and 2.5.2-38 show that the dominant background sources are PEZ-N, NMESE-N, and STUDY_R; these are host sources for the CRN Site.
Sensitivity of 1 Hz and 10 Hz rock hazard to the nine EPRI ground motion models (GMM; cluster models 1-3) used for background sources are plotted in Figures 2.5.2-41 and 2.5.2-42. Similar plots showing the 12 EPRI GMMs used for RLMEs are shown in Figures 2.5.2-43 and 2.5.2-44. Note for these plots that seismic hazard curves are not weighted by the weights assigned to each GMPE.
A reduction of epistemic uncertainly is observed in Figures 2.5.2-42 and 2.5.2-44, and for high frequency conditional hazard curves (10 Hz and 25 Hz plots; Figures 2.5.2-32 and 2.5.2-33). In these figures, GMMs from the different cluster models appear grouped according to high, medium, and low median values. This grouping is the result of (1) converging median estimates
2.5.2-41 Revision 2

Clinch River Nuclear SiteEarly Site Permit Application
Part 2, Site Safety Analysis Report
of spectral acceleration among cluster models 1–3 for an M=6, R=10–15 km scenario (Figure 7.12.1-3 of Reference 2.5.2-129), and (2) the fact that background sources at magnitudes and distances in this range tend to dominate hazard at higher spectral frequencies. The latter fact explains why GMMs 10–12 (cluster model 4) also follow similar grouping in Figure 2.5.2-44. Cluster model 4 only applies to RLME sources, which do not significantly contribute to high frequency hazard in this range. Therefore, because the curves in these plots indicated total hazard conditioned on a specific GMM, and because the GMMs in cluster model 4 are correlated with cluster models 1–3, GMMs 10–12 also group with the other cluster models.
Figure 2.5.2-45 plots mean total hazard curves for the seven spectral frequencies at which hazard calculations were conducted, capturing all frequencies to 10-8 annual frequency of exceedance. The individual hazard curves are tabulated in digital form in Table 2.5.2-16. The 10-4, 10-5, and 10-6 UHRS amplitudes are reported in Table 2.5.2-17.
2.5.2.4.3.3 Deaggregation and Uniform Hazard Response Spectra
Deaggregation of seismic hazard is calculated by determining the contribution by magnitude (M) and distance (R), and epsilon (ε - the number of standard deviations in the ground motion model), grouping the contributions by M, R, and ε bins. The contributions are calculated for individual seismic sources and are aggregated for all sources. The deaggregations are calculated by spectral frequency and by mean annual frequency of exceedance (MAFE) (10-4, 10-5, and 10-6), using the amplitudes indicated in Table 2.5.2-17.
The deaggregation and the determination of the controlling magnitudes and distances follow the methodology presented in RG 1.208. Specifically, log-distance is used in the calculation of the controlling distances and linear-magnitude is used in calculating the controlling magnitudes. If a substantial portion (> 5 percent) of the low frequency hazard (average of 1 and 2.5 Hz) is from distant sources (> 100 km), the controlling magnitude and distance are determined only from contributions from hazard at distances greater than 100 km.
Low-frequency (LF) and high-frequency (HF) deaggregation plots for each MAFE are shown in Figures 2.5.2-46 through 2.5.2-51. The LF plot represents the average deaggregation of the 1 and 2.5 Hz spectral acceleration hazard; the HF plot represents the average deaggregation of the 5 and 10 Hz spectral acceleration hazard.
For both high and low frequencies, the seismic hazard at the CRN Site is noticeably dominated by the background seismic sources within 100 km or less (Figures 2.5.2-47, 2.5.2-49, and 2.5.2-51). For the low frequencies, seismic sources located about 400 to 500 km from the site, likely the NMFS RLME, as suggested in Figure 2.5.2-35, are contributing about 25 percent and 5 percent of the hazard at MAFEs of 10-4 and 10-5, respectively, with negligible contribution at the MAFE of 10-6.
The ε deaggregation shows that the contributions from the New Madrid RLME are associated with motions greater than one standard deviation from the median with significant contributions greater than two standard deviations. In contrast, nearby local earthquakes are associated with ground motions near the median and are generally much less than two standard deviations from the median. These deaggregation results are consistent with the relationships shown in Figure 2.5.2-35, which show that the hazard at 1 Hz is dominated by local sources for both HF and LF at 10-4. In addition, the LF hazard contains contributions from distant sources, dominated by the NMFS (25 percent). In contrast, Figure 2.5.2-36 indicates the total hazard is dominated by background for 10 Hz spectral accelerations.
2.5.2-42 Revision 2

Clinch River Nuclear SiteEarly Site Permit Application
Part 2, Site Safety Analysis Report
Table 2.5.2-18 shows the controlling earthquake magnitudes and distances for mean annual frequencies of exceedance (MAFEs) of 10-4, 10-5, and 10-6 hazard levels at spectral frequencies of 1 and 2.5 Hz (low frequency) and 5 and 10 Hz (high frequency).
HF and LF response spectra for MAFEs of 10-4, 10-5, and 10-6 are plotted in Figure 2.5.2-52 and tabulated in Table 2.5.2-19. These spectra were developed following the guidelines in RG 1.208. The starting points were the 10-4, 10-5, and 10-6 spectral amplitudes for the seven spectral frequencies at which hazards were calculated, as shown in Table 2.5.2-17. In between these spectral frequencies, HF and LF spectra were constructed by interpolation, adopting the CEUS rock spectral shapes published in NUREG/CR-6728 (Reference 2.5.2-132). To apply these spectral shapes, the high-frequency magnitude and distance were used for 2.5 Hz and higher spectral frequencies, and the low-frequency magnitude and distance were used for 2.5 Hz and lower spectral frequencies. For spectral frequencies below 0.5 Hz, 1/T scaling was assumed (where T is spectral period). This is consistent with requirements for seismic building codes; for example, the Building Seismic Safety Counsel’s NEHRP Recommended Provisions for Seismic Regulations (Reference 2.5.2-133).
Finally, envelopes of HF and LF response spectra anchored to mean spectral amplitudes for MAFEs of 10-4, 10-5, and 10-6 were also created by selecting the maximum of the HF and LF spectra for each of the mean annual frequencies of exceedance. These envelopes represent UHRS and are plotted in Figure 2.5.2-53. Median UHRS were also constructed by scaling the same spectral shapes to median spectral amplitudes at each of the seven spectral frequencies at which hazard calculations were made. These median UHRS are plotted in Figure 2.5.2-54.
2.5.2.5 Seismic Wave Transmission Characteristics of the Site
This subsection describes the development of the site amplification factors that results from the transmission of the seismic waves through the site-specific geologic profile above the hard rock, which consists of various dipping rock formations as described in Subsections 2.5.4.2 and 2.5.4.7. The site amplification factors are used in determination of the UHRS and the GMRS for the site.
Due to the dipping stratigraphy beneath the CRN Site (about 33 degrees) potential two-dimensional (2D) effects on ground motions were evaluated using an expanded version of the computer code SASSI (System for Analysis of Soil Structure Interaction). The 2D effects were addressed through a sensitivity analysis (Subsection 2.5.2.6).
A geologic cross-section at the site that illustrates the depth to Precambrian rock, drawn perpendicular to the strike direction, is shown on Figure 2.5.1-63. Planned surface grade at the site is at Elevation 821 ft. The planned bottom of the foundation for Reactor Service Buildings (RSB) is taken at Elevation 683 ft. The top of competent rock varies across the areas of Locations A and B as shown on Figure 2.5.4-2. Based on the data to the top of unweathered rock from the suspension data, competent rock ranges from about Elevation 749 to 770 ft at Location A and Elevation 738 to 758 ft at Location B. Given that no specific technology has been selected, the elevation of the GMRS is chosen to be Elevation 683 ft corresponding to the bottom of the RSB foundations below the top of unweathered rock. All elevations cited in this subsection are based on the North American Vertical Datum of 1988 (NAVD88).
Recognizing the assessment of epistemic uncertainty must necessarily reflect a significant degree of judgment and the range in basecase shear-wave velocities (VS) at CRN Site must necessarily accommodate two separate aspects of the site conditions: (1) for the depth ranges for which measured velocities were available, the dipping structure (Figure 2.5.4-13) results in the same unit and associated dynamic material properties occurring at different depths across each site footprint; and (2) broad-band resonance or amplification effects due to the dipping
2.5.2-43 Revision 2

Clinch River Nuclear SiteEarly Site Permit Application
Part 2, Site Safety Analysis Report
structure, such as a basin edge. However, as discussed further, impedance contrasts beneath the CRN Site are small and so 2D resonance and amplification effects are not expected to significantly exceed one-dimensional (1D) resonances (Reference 2.5.2-169), particularly if they are broadened through the use of multiple basecases. Extending epistemic uncertainty through the shallow portion of the profile (approximately 300 ft) where sufficient measurements exist to constrain a single basecase profile was considered essential to accommodate both potential effects of the shallow dipping structure.
For the deeper structure (Knox Group and below, Figure 2.5.4-13) uncertainty in VS exists due principally to the limited site-specific measurements. Below the Knox group, 2D effects are expected to be less than the shallower structure, particularly at frequencies of interest (greater than 0.5 Hz), due to the smaller impedance contrasts and the shallowing of the dip and more uneven nature of the very deep structure (Figure 2.5.4-13) (Subsection 2.5.2.6). As a result the same relative factor expressing epistemic uncertainty was used for both the shallow structure with direct measurements as well as the deep structure lacking site-specific velocity measurements.
The hard rock UHRS described in Subsection 2.5.2.4 defines the seismic motion on the hard rock. Hard rock is characterized with a minimum VS of 2800 m/s (9200 ft/s). While the profiles for 1D site response analysis could have been truncated at shallower depths and placed on top of the full midcontinent crustal model with little effect at high-frequency, to consider the minimum depth at which the VS exceeds 9200 ft/s in all deeper strata and to accommodate amplification to at least the lowest frequency defined by the hard rock hazard (0.5 Hz), the profiles are truncated at depths of 12,644 ft and 12,601 ft for Locations A and B, respectively.
2.5.2.5.1 Basecase Site-Specific Geologic Profiles and Uncertainties
VS basecase profiles were developed for Locations A and B at the CRN Site (Figure 2.5.4-11) down to Precambrian basement rock. Although a thick layer of hard rock (Chickamauga and Knox Groups and Maynardville limestone) underlies the site to a depth of more than 1 km, there are layers of lower velocity rock (Conasauga shale and Pumpkin Valley shale) at greater depth beneath CRN Site extending nearly to basement rock (Figures 2.5.4-12 and 2.5.4-13). The data consisted of primarily VS profiles from OYO suspension logging as described in Subsection 2.5.4.4. OYO suspension data from similar lithologies as at CRN collected at several TVA dams were also reviewed in addition to spectral-analysis-of-surface-wave (SASW) data collected at WBN2 by the University of Texas at Austin (Reference 2.5.2-172).
Geologic profiles were estimated based on the stratigraphic cross-section C-C’ for the shallow units above the Knox Group as shown on Figure 2.5.4-12 and the cross-section developed by Hatcher (Reference 2.5.2-173) for the Knox Group and deeper units (Figure 2.5.4-13). With the stratigraphy dipping to the southeast, geologic profiles were developed at the northwest and southeast boundaries of both Locations A and B to assess the variability across the locations.
Based upon a review of the geologic profiles of Locations A and B, a single best-estimate (mean) basecase VS profile was developed for each area. The epistemic uncertainty in the mean basecase profile was addressed by developing lower-range and upper-range basecase profiles. The aleatory variability across the locations was addressed through the profile randomization used in the site response analysis. A compilation of all the VS profiles that were computed for each area provided a lognormal mean profile (Figures 2.5.4-14 and 2.5.4-15). The profiles utilized are indicated on Figures 2.5.4-14 and 2.5.4-15, those that were contained or just outside the locations (within 100 ft) as shown on Figures 2.5.4-11 and 2.5.4-12. The variation in the VS profiles was approximately ± 20 percent about the mean (Figures 2.5.4-14 and 2.5.4-15). The VS above unweathered rock was not included in the best-estimate profiles. The top of unweathered (competent) rock corresponds to the elevation of the GMRS. Table 2.5.4-3 provides the top of
2.5.2-44 Revision 2

Clinch River Nuclear SiteEarly Site Permit Application
Part 2, Site Safety Analysis Report
unweathered rock in each borehole. The top of unweathered rock in each profile was normalized to zero depth. The lognormal mean profiles are used to develop the shallow portion of the basecase profile. The lognormal mean profiles extend to depths of about 300 ft and 350 ft for Locations A and B, respectively. Note that the lognormal mean profiles were only used to depths where there were at least two VS profiles.
At depths below the shallow lognormal VS profiles where there are no measured VS data in the two locations, the geologic profiles shown in Figures 2.5.4-16 and 2.5.4-17 were used to extend the profiles. An average velocity was assigned to each geological unit down to and including the uppermost unit of the Knox Formation (Newala unit) based on the mean VS shown in Table 2.5.4-16. Examination of the VS profiles for each unit showed generally constant VS with depth, thereby a single mean VS value for each unit was utilized. The lower and upper range basecase profiles will account for the epistemic uncertainty in the mean basecase profile. The mean VS adopted for the Newala unit was used for the rest of the Knox unit (rounded up to 11,000 ft/s) due to their similar lithologies. Figures 2.5.4-16 to 2.5.4-17 show the two VS profiles down to the Newala unit.
Beneath the Knox unit, there are no data for the deeper units at the CRN Site, which include the Conasauga shale, Rome Formation sandstone, and Pumpkin Valley shale. These units repeat themselves with depth because of the overthrusting (Figure 2.5.4-13). VS data were available for all three formations from the deep SASW surveys that were performed at WBN2 (Reference 2.5.2-172). At a depth of 500 ft, the Conasauga shale and Pumpkin Valley shale have measured VS values of 6000 ft/s and 6000 to 7000 ft/s, respectively at WBN2. The Rome sandstone had measured values of 9000 to 10,000 ft/s at a depth of 1500 ft (Reference 2.5.2-172). An unconfined free-free resonant column (URC) test also measured a VS of almost 9000 ft/s for a sample of Rome Formation (Reference 2.5.2-172, Appendix B). Although these VS values are not site-specific, they likely are representative of the VS for these units beneath the CRN Site at depths below the OYO surveys based on regional stratigraphic relationships.
To estimate the VS of the units below depths of 500 to 1500 ft, a review was performed of the deep VS profiles available in the literature that went down several kilometers. Based on the review, the generic VS profile for CEUS hard rock developed by Boore and Joyner (Reference 2.5.2-174) was selected. No region-specific VS profile information was available. Examination of the central and eastern U.S. VS database compiled by PE&A support the use of the Boore and Joyner (Reference 2.5.2-174) generic profile. The generic profile was anchored to the value of 6000 ft/s at a depth of 500 ft for the Conasauga shale and 9000 ft/s at a depth of 1500 ft for the Rome Formation and the Pumpkin Valley shale (Figure 2.5.4-13). The adjusted Boore and Joyner (Reference 2.5.2-174) generic profiles were then used to estimate the VS for the deeper units (Figures 2.5.4-18 and 2.5.4-19). Once Precambrian rock was reached, the VS profiles were truncated at a VS of 11,000 ft/s.
For the site response analysis, the shallow suspension logging-measured portion of the VS profiles were smoothed to produce the mean basecase profiles. The lognormal mean VS profiles (Figures 2.5.4-14 and 2.5.4-15) were converted to a layered model with uniform velocities by preserving the travel time in each layer. Figures 2.5.4-18 and 2.5.4-19 show the final VS profiles for Locations A and B (Tables 2.5.4-30 and 2.5.4-31).
2.5.2.5.1.1 Epistemic Uncertainties in VS
To address the epistemic uncertainty in the mean basecase profile, the uncertainties in the 25 VS profiles measured within the CRN Site and at 18 TVA damsites (measured by Geovision Geophysical Services) were examined through a statistical analysis that looked at several aspects of the data. For the TVA dam VS profiles, the material above rock (embankment material,
2.5.2-45 Revision 2

Clinch River Nuclear SiteEarly Site Permit Application
Part 2, Site Safety Analysis Report
alluvium, etc.) was removed and not considered in the statistical analysis. All VS profiles were smoothed prior to performing the statistical analysis. First, the VS profiles for each of the subunits of the CRN Chickamauga Group were compiled and the sigmas and coefficients of variation (COVs) were computed (Figures 2.5.2-92 and 2.5.2-93). The right side of the figures show the number of profiles used to compute the statistics. The actual depths of the subunits were preserved. The sigmas and COVs average are relatively small and are fairly uniform with depth at about 0.08 and reflect within unit differences. In a similar fashion, the CRN Chickamauga Group was divided up by general rock type (dolomite, limestone, and siltstone) and Figures 2.5.2-94 and 2.5.2-95 show the trends. For the subunits that were a mix of dolomite and limestone, the dominant rock types were used. The dolomite and limestone showed smaller sigma and COVs than the shale (Figures 2.5.2-94 and 2.5.2-95). Finally, the sigmas and COV were computed for the CRN and TVA damsite VS profiles (Figures 2.5.2-96 and 2.5.2-97). The sigma and COV average about 0.15 and 0.30, respectively, from 50 to 200 ft where there were a sufficient number of profiles. Not surprisingly, the sigma and COV were higher for the TVA dams because they were located on a wider range of geology covering three Appalachian states compared to the CRN profiles.
Using these results as well as the sigma across units at the CRN Site in Figure 2.5.2-96 to inform judgment in developing depth-independent epistemic uncertainty, a standard deviation of 0.15 was selected. This standard deviation accommodates potential 2D effects in the top 300 ft where the effects of the dipping structure resulting in the same velocity at different depths may be expected to be the strongest, albeit still minor. The standard deviation also accommodates the lack of site-specific measurements below a depth of about 300 ft. Considering a three-point approximation to the distribution weights of 0.2, 0.6, and 0.2 for lower (P2)-, middle (P1)-, and upper (P3)- range estimates results in a velocity scale factor of approximately 1.25, a ± 25 percent variation about the mean (best estimate) basecase. The resulting base-case (P1) as well as lower-range (P2) and upper-range (P3) basecases are illustrated in Figure 2.5.4-20 and 2.5.4-21 for Locations A and B, respectively. The resulting range in VS from the lower- to upper- base-cases is about 1.6 and well within the range for such materials (Reference 2.5.2-208), acknowledging a portion of the range was taken to accommodate the dipping structure in terms of lateral variations in velocities. The lateral changes in velocities have been treated as epistemic uncertainty.
Basecase profiles (P1) for Locations A and B, illustrated in Figures 2.5.4-20 and 2.5.4-21, reflect high VS throughout, particularly within the Knox Group and below. The limestones as well as some of the shales exceed at depth the VS (2.83 km/s) of the top layer of the generic Midcontinent crustal model (Subsection 2.5.2.5.5). As a result, to accommodate a more realistic crustal profile, the roughly 12,000 ft (3.6 km) of the CRN Site profile was taken to replace the top layer of the Midcontinent crust, with the second layer at a VS of 3.52 km/s (11,550 ft/s) assumed to effectively reflect basement conditions (Figure 2.5.4-13). The assumed basement condition is depicted in Figures 2.5.4-20 and 2.5.4-21 as the deepest layer. The upper-range base-case profiles (P3) within the Knox Group and Rome and Pumpkin Valley Units were truncated at the assumed basement VS of 3.52 km/s.
2.5.2.5.1.2 Unit Weights
The unit weights for the rock units above the Newala Formation (Mascot and Kingsport the top two undifferentiated formations of the Knox Group) were taken from Table 2.5.4-21. It was assumed that the Newala and the deeper portions of the Knox Group had the same unit weight of 168 pcf (Figure 2.5.4-13). Ken Stokoe (Reference 2.5.2-172) measured unit weights for the Rome, Pumpkin Valley and Conasauga of 167.5, 167.4, and 166.8 pcf, respectively, for several core samples taken at shallow depths (less than 200 ft). We considered these unit weights to be minimums given their shallow depths and relied on their VS and the values given in Table 2.5.4-21 to estimate units weights for the Rome/Pumpkin Valley and Conasauga
2.5.2-46 Revision 2

Clinch River Nuclear SiteEarly Site Permit Application
Part 2, Site Safety Analysis Report
Formations (Table 2.5.2-30). Unit weights were converted to densities by dividing by 62.4. Densities play only a minor role in site-specific amplification (Reference 2.5.2-139).
2.5.2.5.2 Estimation of Kappa
For typical rock and deep soil sites that display an overall increase in stiffness with depth due primarily to increasing confining pressure, kappa reflects the major contribution to seismic energy dissipation through both intrinsic energy absorption as well as wave scattering that occurs over the top several kilometers of the crust at close rupture distances (less than about 50 km) (References 2.5.2-175 and 2.5.2-176). This observation was first recognized and subsequently characterized as a site parameter by Anderson and Hough (Reference 2.5.2-175), specifically as kappa at zero epicentral distance. At sites that reflect significant departures from an overall increase in stiffness with depth due to geology, such as layered basalt and sedimentary soil or rock sequences, significant contributions to kappa may occur at depths well beyond 1 to 2 km. This damping appears to be largely frequency-independent (hysteretic), occurs at low strains, and is the principal sit or path parameter controlling the limitation of high-frequency (greater than 5 Hz) strong ground motion at close-in sites (less than or equal to 50 km). As a result, its value or range of values is important in characterizing strong ground motions for engineering design, particularly in regions of sparse seismicity. Additionally, small local or regional earthquakes may be used to estimate its value or range in values because it is generally independent of the level of motion at rock or very stiff sites. As such kappa measures the cumulative low-strain damping over the top several kilometers of the crust and is clearly defined as the amplitude decay of seismic waves (Reference 2.5.2-155) rather than intrinsic damping which is a dynamic material property. This distinction is particularly relevant to site response as the “effective damping” (Reference 2.5.2-155) controls non-geometric frequency-independent energy loss and has contributions from both intrinsic damping as well as other mechanisms such as wave scattering. Because kappa reflects an observational parameter incorporating the above effects, it was used to constrain the total effective damping (Reference 2.5.2-155) throughout the CRN profile.
In this study, two methods were used to estimate kappa for use in the site response analysis of the CRN Site. They are: 1) evaluation of peak frequency and shape of normalized acceleration response spectrum (5 percent damped PSA [pseudo-spectral acceleration]/PGA) (References 2.5.2-176, 2.5.2-142, and 2.5.2-177) and 2) direct measurement of the high-frequency decay of the S-wave Fourier amplitude spectrum (FAS) (Reference 2.5.2-175).
The Tellico Dam site area is an analog to the CRN Site that has soft weathered rock overlying a thick sequence of Paleozoic rocks over crystalline basement. At this site, estimation of the damping in the Paleozoic sequence, a significant contributor to kappa, is important to assessing appropriate levels of high-frequency design motions.
2.5.2.5.2.1 Tellico Dam Site: Kappa Analog for the CRN Site
A strong motion recording site is located near Tellico Dam at 35.778° N, 84.261° W (Figure 2.5.2-98). The CRN Site is located only 10 miles (16.7 km) northwest of Tellico Dam. The geologic structure at the Tellico Dam site is shown in Figure 2.5.2-99. For comparison, the geologic structure at CRN is shown in Figure 2.5.4-13. Both of these sites are located in the Valley and Ridge physiographic province of the southern Appalachians. The Tellico Dam site is located on southeastward-dipping Paleozoic rocks of middle Ordovician age which correspond to sedimentary rocks of the same age and orientation at the CRN Site (Figure 2.5.2-99). Because the Tellico site is somewhat farther to the east than the CRN Site, the middle Ordovician rocks at Tellico are somewhat thicker and tend to have a higher percentage of clastic components. Both sites are believed to be underlain by Paleozoic sedimentary rock units of lower Cambrian to middle Ordovician age. Specifically, the Rome Formation and the Conasauga, Knox and Chickamauga Group rocks are believed to be present under both sites.
2.5.2-47 Revision 2

Clinch River Nuclear SiteEarly Site Permit Application
Part 2, Site Safety Analysis Report
An OYO P-S suspension log has been completed at the Tellico Dam strong motion site down to a depth of 56.7 m (186 ft) (Figure 2.5.2-100). With the exception of a relatively thin layer of soil and weathered rock near the surface (about 6.1 m, 20 ft), the suspension logging results indicate intact rock with consistently high VS of about 2700 m/s (9000 ft/s). Based on core log descriptions and projection of the rock units measured along strike at Tellico and Fort Loudoun Dams, the rock measured in the suspension logging borehole at Tellico Dam is assigned to a lower member of the middle Ordovician age Ottosee Formation.
The geologic structure beneath the Tellico Dam site is similar in style to that of the CRN Site (Figures 2.5.2-99 and 2.5.4-13); however, the geologic structure at Tellico Dam is somewhat simpler because only two major thrust sheets are shown under the Tellico Dam site. In contrast, the CRN Site is believed to be underlain by four significant thrust faults (Figure 2.5.4-13). Hatcher et al. (Reference 2.5.2-178) interprets a gradual deepening of the top of basement rock from northwest to southeast through eastern Tennessee and, therefore, the depth to basement is somewhat deeper at Tellico (approximately 4420 m [14,500 ft]) than at the CRN Site (approximately 3690 m [12,100 ft]). The average VS of the rocks from the surface to the interpreted top of basement at Tellico Dam (approximately 2865 m/s [approximately 9400 ft/s]) is essentially identical to the average VS estimated at the CRN Site. However, the sedimentary sequence underlying the CRN Site (Figure 2.5.4-13) has significantly more lower velocity shale than exists below the Tellico Dam site, whereas there is more high velocity limestone at the Tellico Dam site (Figure 2.5.2-99). The increased proportion of lower velocity shales would suggest an increased kappa value for CRN compared to Tellico Dam, providing the shales represent a significant contribution to the total effective kappa.
In summary, the geologic setting and expected dynamic response at Tellico Dam and the CRN Site are similar with differences mostly related to the depth of basement, extent of structural complexity beneath the two sites, and more shales beneath the CRN Site. Hence it was assumed in these analyses that kappa estimates at the Tellico Dam site may be used as a conservative estimate (analog) for kappa at the CRN Site due to proximity and similar geologic and VS structure beneath the two sites.
2.5.2.5.2.1.1 Tellico Dam Instrumentation
The Tellico Dam site is instrumented with a Kinemetrics K2 (Serial Number 2229) that has recorded several small, local earthquakes. The accelerograph recordings have a sampling rate of 200 samples per second with a high-frequency limit of 80 Hz defined by the frequency response of the K2 instrument from DC to 80 Hz. The high frequency limit is controlled by the low-pass anti-alias filter with a steep rolloff (120 dB down at 100 Hz Nyquist frequency). The recorder is mounted on a concrete pad that is within about 3 m (10 ft) of top of rock.
2.5.2.5.2.1.2 Linear Elastic Transfer Function
Figure 2.5.2-101 shows the smoothed and interpreted VS at the site based on the OYO suspension logging. The top 6.1 m (20 ft) of soil and weathered rock is represented as a single layer with a VS of 1524 m/s (5000 ft/s) overlying hard rock with a VS of 2830 m/s (9285 ft/s).
The presence of the relatively thin layer of shallow soil and weathered rock over hard rock was expected to dominate and distort the high-frequency amplification, resulting in a biased estimate of kappa (Reference 2.5.2-179). To correct for the presence of high-frequency distortion, amplification from the shallow crustal profile was estimated from the interpreted VS profile (Figure 2.5.2-101) from source depth to the surface. The relatively high VS and depths in the structure beneath the shallow soil and weathered rock, which reflect low-frequency resonances (Figure 2.5.2-99), was not expected to affect estimates of kappa (Subsection 2.5.2.5.4). The smoothed linear (damping 0.01 percent) transfer function as implemented
2.5.2-48 Revision 2

Clinch River Nuclear SiteEarly Site Permit Application
Part 2, Site Safety Analysis Report
(Subsection 2.5.2.5.2.3.1) is shown in Figure 2.5.2-102 and is dominated by a high-frequency (near 60 Hz) resonance caused by the 6.1 m (20 ft) soil and weathered rock layer over the hard rock layer. The peak amplification is around a factor of 2.5.
2.5.2.5.2.1.3 Earthquake Data Recorded at Tellico Dam
In total the dataset included 59 recordings from 2004 to 2008. A subset of these events that had been identified as earthquakes and had estimates of both magnitude and location were selected for processing. A further subset of the processed earthquake data with deep (greater than or equal to 5 km) hypocenters were selected for analysis based on a comparison of signal versus noise level (Table 2.5.2-31). The hypocentral depth criterion was implemented to both fully sample the Paleozoic sedimentary rocks and to avoid possible double paths in the Paleozoic section for downgoing paths at distant sites. Table 2.5.2-31 lists the magnitudes, hypocentral depths, and distances for the twenty selected earthquakes.
Data processing for the Tellico Dam time series generally followed the NGA-West2 process as described in Reference 2.5.2-180. The main differences are the selection of several windows for the calculation of Fourier amplitude spectra, including the S-wave window used for kappa estimation (Reference 2.5.2-181).
2.5.2.5.2.2 Methods Used for the Estimation of Kappa
The methods used to estimate kappa were: 1) evaluation of the peak frequency and shape of normalized acceleration response spectra (References 2.5.2-176, 2.5.2-142, and 2.5.2-179) and 2) direct measurement of the high-frequency decay of the S-wave FAS (Reference 2.5.2-175). Ktenidou et al. (Reference 2.5.2-179) provide a summary of these and additional methods to estimate kappa at a site.
Each method made use of either 5 percent damped acceleration response spectrum or FAS from the recordings at Tellico Dam (Table 2.5.2-31). Magnitude, distance and bandwidth were considered when selecting data appropriate for each method from Table 2.5.2-31. For example, robust estimates of the average response spectral shape require averaging data from earthquakes with similar magnitude and distance.
2.5.2.5.2.2.1 Response Spectral Shape
The approach of using response spectral shapes (5 percent damped PSA/PGA) computed from recordings made at rock sites at close distances to estimate kappa was developed in References 2.5.2-176 and 2.5.2-142. Differences in response spectral content or shape at sites are significant and may be interpreted as primarily resulting from differences in the VS (amplification) and damping (kappa) beneath the site along with crustal Q(f), especially at larger distances (greater than about 20 km for small M) (References 2.5.2-182, 2.5.2-183, 2.5.2-184, and 2.5.2-176). To approximately accommodate the effects of the K2 antialias filter in the response spectral shapes, a low-pass filter with a 7-pole rolloff was included in the model calculation. Figure 2.5.2-103 shows an example of response spectral shapes calculated with the point-source model (References 2.5.2-156 and 2.5.2-142) at a rock site for M 2 at a hypocentral distance of 20 km and unity amplification. The magnitude and distance were selected to be similar to the processed earthquake data at Tellico Dam used for the kappa analyses (Table 2.5.2-31). In this example, kappa was varied by a factor of 2 from 0.005, 0.010 to 0.020 s (Figure 2.5.2-103). The peak frequency and shape of the response spectra clearly shift to lower frequency as kappa increases.
Spectral shapes also show a strong magnitude dependence with smaller earthquakes (Figure 2.5.2-103) having a narrower bandwidth and higher frequency peaks than larger
2.5.2-49 Revision 2

Clinch River Nuclear SiteEarly Site Permit Application
Part 2, Site Safety Analysis Report
earthquakes (Figure 2.5.2-104). This is a consequence of lower corner frequencies for smaller magnitude earthquakes (References 2.5.2-156, 2.5.2-184, 2.5.2-185, and 2.5.2-176). Spectral shapes from multiple recordings at similar distances and magnitudes are averaged to reduce the frequency-to-frequency variability and provide additional stability in kappa estimates (References 2.5.2-184 and 2.5.2-176). These factors allow estimates of kappa to be made from response spectral shapes by visual comparison with spectrum computed using the point-source model (Reference 2.5.2-156), as validated in Reference 2.5.2-142.
2.5.2.5.2.2.2 Direct Measurement from the Slope of the FAS
Direct measurement of the high-frequency decay of the slope of the FAS computed for the S-wave portion of the recorded ground motion was proposed by Anderson and Hough (Reference 2.5.2-175). This original method to estimate kappa was first used on the as-recorded FAS of the S-wave portion of the ground motion. In these analyses, additional estimates of kappa are made on FAS that have been corrected for either crustal attenuation (Q[f]) or crustal amplification, or both. These additional estimates were used to ascertain the uncertainty (range) in the estimate of kappa.
2.5.2.5.2.3 Estimates of Kappa
The results from the two methods used to provide estimates of kappa at Tellico Dam for application to the CRN Site are presented in the following sections.
2.5.2.5.2.3.1 Response Spectral Shape
The analyses of response spectral shape for kappa are shown in Figures 2.5.4-22 through 2.5.4-25. On each figure, three curves show the average, maximum and minimum of the recorded 5 percent damped acceleration response spectral shape for several earthquakes with similar magnitude and hypocentral distance (Table 2.5.2-31). The fourth curve shows the point-source model fit to these data resulting from a best estimate for kappa.
The magnitude and distance parameters for the point-source model were taken as the average from the recorded data at Tellico Dam. The linear-elastic crustal transfer function used in the model has been discussed in Subsection 2.5.2.5.2.1.2. The attenuation model used Q(f) = 630 f0.5, which was developed from the inversion of FAS by Darragh et al. (Reference 2.5.2-186) using 1133 recordings from 53 earthquakes recorded at 241 unique sites in central eastern North America. As such the Q(f) model is appropriate for the CEUS and assumed consistent with those reflected in the ground motion prediction equations (GMPEs) used for developing the hard rock hazard.
Figure 2.5.4-22 shows the average, maximum, and minimum of the recorded 5 percent damped acceleration response spectral shapes computed for three earthquakes with magnitude between M 0.9 and M 1.3 and hypocentral distances between 17.6 and 24.5 km (Table 2.5.2-31). A kappa of 0.009 s in the point-source model provided the best fit with an average M of 1.1 and average hypocentral distance of 20 km. In general, the overall fit is good over a wide bandwidth with particular emphasis on the frequency of the peak. At lower frequencies (about 30 Hz and below) there is evidence of deeper amplification not accommodated in the simple shallow VS profile (Figure 2.5.2-101).
Figure 2.5.4-23 shows the average, maximum, and minimum of the recorded 5 percent damped acceleration response spectral shapes computed for seven earthquakes with magnitude between M 0.9 and M 1.6 and hypocentral distance between 16.4 and 24.5 km (Table 2.5.2-31). In this case four slightly larger earthquakes were added to the previous case, illustrating both the stability of the peak frequency (kappa) but also showing increased excitation of lower frequency
2.5.2-50 Revision 2

Clinch River Nuclear SiteEarly Site Permit Application
Part 2, Site Safety Analysis Report
amplification. As in Figure 2.5.4-22, the best fit kappa was 0.009 s and the point-source model used an average M of 1.3, and an average hypocentral distance of 20 km. Also the inclusion of the additional larger magnitude earthquakes broadens the peak as expected (Figure 2.5.2-103) and slightly improves the fit of the point-source model to the data.
Figure 2.5.4-24 shows the average, maximum, and minimum of the recorded 5 percent damped acceleration response spectral shapes computed for seven earthquakes with magnitude between M 1.4 and M 2.2 and hypocentral distance between 15.3 and 28.1 km (Table 2.5.2-31, note the M 2.1 earthquake at 37.6 km was not included due to significantly greater distance than the average). Average values of M 1.7 and hypocentral distance of 19 km were used in the point-source model. Figure 2.5.2-24 includes larger magnitudes than in Figure 2.5.4-23. In this case, a lower kappa estimate of 0.006 s provided a better fit around the peak frequency than the 0.009 s for the smaller magnitude earthquakes (Figures 2.5.4-22 and 2.5.4-23). Additionally, the larger magnitudes with higher source amplitudes at lower frequency result in larger motions at the site for frequencies below about 30 Hz. As was indicated with Figure 2.5.4-22, this effect may be due to un-modeled amplification at depth and/or too low of a magnitude assigned by the network (Table 2.5.2-31).
Figure 2.5.4-25 shows the average, maximum, and minimum of the recorded 5 percent damped acceleration response spectral shapes computed for six earthquakes with magnitude between M 2.4 and M 3.2 and hypocentral distance between 33.2 and 54.2 km. The point-source model used an average M 2.8 and an average hypocentral distance of 43 km. This Figure includes both larger magnitudes and greater distances than in the other figures. As with the previous suite of earthquakes (Figure 2.5.4-24), these larger magnitude shapes reflect the lower kappa estimate with a best fit estimate of about 0.006 s.
The response spectral shape analyses reflected analyses of 14 sets of recordings at the Tellico Dam recording site over the magnitude and hypocentral distance ranges of M 0.9 to M 3.2 and 15.3 to 54.2 km, respectively (Tables 2.5.2-31 and 2.5.4-32). The spectral shape analyses assumed a Q(f) model, based on inversions of central and eastern North America recordings, and a site-specific amplification factor based on a shallow suspension log survey. Based on these analyses, the best fit kappa values were 0.006 s and 0.009 s and are summarized on Table 2.5.2-32.
In all the comparisons with spectral shapes between recorded motions and model predictions, the model predicts the location and width of the peak well but consistently underpredicts the amplitude. This general underprediction is likely the result of too low a peak in the amplification factor (Figure 2.5.2-102) suggesting too much smoothing and/or too small of an impedance contrast in the shallow profile (Figure 2.5.2-101). Since the amplification of the peak is not strongly affected by kappa (Figures 2.5.2-103 and 2.5.2-104), the mismatch of the peak amplitude is not considered a significant issue.
2.5.2.5.2.3.2 Direct Measurement from the Slope of the FAS
The Anderson and Hough (Reference 2.5.2-175) method to estimate kappa was used on the as-recorded S-wave FAS for the 20 Tellico Dam earthquakes (Tables 2.5.2-31 and 2.5.4-32). In these analyses, the vector average (orientation independent) of the FAS was used. The vector average was also corrected for crustal amplification (Subsection 2.5.2.5.2.1.2). in order to avoid the site amplification from affecting kappa estimation (i.e., by distorting the slope of the spectrum). To avoid fitting the distant dependent kappa to estimate κ0 at zero distance, the FAS were corrected for crustal Q(f) (Reference 2.5.2-176). The identical Q(f) model used for the response spectral shapes 630 f0.5 (Reference 2.5.2-186) was used for the FAS correction to yield κ0 directly from the slope of the FAS.
2.5.2-51 Revision 2

Clinch River Nuclear SiteEarly Site Permit Application
Part 2, Site Safety Analysis Report
The main steps in applying this method have been summarized in Kishida et al. (Reference 2.5.2-187). The main considerations include using:
1. Frequencies above the earthquake source corner frequency,
2. Frequencies below the instrument anti-alias filter (high frequency limit of 80 Hz) for the Tellico Dam instrument (Subsection 2.5.2.5.2.1.1),
3. Frequencies with an acceptable signal to noise ratio (SNR) (greater than about 3). Table 2.5.2-31 lists the low-frequency limit where the SNR fell below 3 on either horizontal component while the high-frequency limit was 80 Hz for all the recordings,
4. An adequate frequency bandwidth (6 Hz or greater) to estimate the slope. This requirement led to the exclusion of several entries [denoted by (b) and (c)] in Table 2.5.2-32 from further analyses. The earthquake on 23 December 2004 was only recorded on a single horizontal component (Table 2.5.2-31) and this instrument at Tellico Dam was replaced before the next recording in March 2006. Also, the estimate of kappa from the single horizontal component is significantly larger than the other kappa estimates (Table 2.5.4-32). For less reasons this recording was also excluded from further analyses [denoted by (a) in Table 2.5.4-32].
5. Frequencies away from any strong site resonance (near 60 Hz) as discussed in Subsection 2.5.2.5.2.1.2 (Figure 2.5.2-102). Examination of each spectrum was conducted and the bandwidth (Table 2.5.4-32) was selected to ensure that the resonance was not significantly affecting the linear portion of the spectrum where the slope was estimated.
Following these considerations, the spectra were smoothed with a triangular window using a 2.0 Hz bandwidth. Kappa was estimated as the straight-line over the bandwidth, where attenuation is controlling the spectrum (Reference 2.5.2-175). The bandwidth was subjectively chosen on visual inspection of the smoothed spectrum. The lower limit was chosen to be above the resonance peak (near 60 Hz) and/or an estimate of the corner frequency of the source spectrum. The upper limit was selected where a change in slope indicated that noise is dominant, with an upper limit of 80 Hz set from the characteristics of the instrumentation at the Tellico Dam site. Once the frequency bandwidth (Table 2.5.4-32) was selected, the unsmoothed spectrum was subjected to a least-square fit routine which produced estimates of kappa as well as standard errors. The unsmoothed spectra were used in the fitting process, since the standard error would vary with the bandwidth chosen for smoothing.
To examine the FAS, Figure 2.5.2-105 shows the as-recorded vector sum FAS along with the spectra corrected for both Q(f) (630 f0.5) as well as shallow amplification (Figure 2.5.2-102). The FAS clearly shows the stable effects of the shallow structure with resonance near 60 Hz. For these small earthquakes with high corner frequencies, the FAS increases with increasing frequency with source corner frequencies likely exceeding 30 to 40 Hz in many cases. At lower frequencies there do not appear to be stable broadband resonances that may be expected from dipping structures such as basin edges (Reference 2.5.2-169). Figure 2.5.2-99 shows steeply dipping beds of sedimentary rock extending up to about 9,000 ft beneath the instrument. Provided the dipping interfaces are continuous with depth and of sufficient impedance contrast, such as basin edges, broadband resonances at low frequency (less than or equal to 10 Hz) may be expected from such structures. In this case, stable broadband resonances do not appear to be present in the recordings suggesting impedance between the dipping structures may not be large enough to generate significant 2D effects (Reference 2.5.2-169).
2.5.2-52 Revision 2

Clinch River Nuclear SiteEarly Site Permit Application
Part 2, Site Safety Analysis Report
The least-squares fits (Reference 2.5.2-188) to the twelve earthquakes meeting the criteria outlined in Subsection 2.5.2.5.2.3.2 are shown in Figure 2.5.2-106. The spectra shown reflect vector average (orientation independent) FAS with the fits shown over the frequency range judged to reflect where the FAS is controlled by kappa (Table 2.5.4-32). On these plots the FAS has been smoothed with a 1.0 Hz window so that the linear fit at high frequencies (kappa) can be seen. The slope method of estimating kappa, as with spectral shapes, is associated with uncertainty and judgement, particularly for small magnitude earthquakes and low kappa values (Figure 2.5.2-106) (References 2.5.2-176, 2.5.2-141, 2.5.2-177, and 2.5.2-179).
Using the base case Q(f) correction, 630 f0.5 (Reference 2.5.2-186) and the shallow amplification factors (Figure 2.5.2-102) the best estimate of kappa was a median 0.0098 s with an aleatory variability of σln = 0.8 over the 12 earthquakes listed in Table 2.5.4-32. For comparison, including the five earthquakes with limited bandwidth (but excluding the two earthquakes with negative kappa estimates) increases the estimate slightly to 0.011 s, σln = 0.5.
As a refinement, small earthquakes with M less than 1.6 were excluded from additional analyses due to concerns about estimating kappa below the source corner frequency (consideration 1, above). Again using the base case Q(f) correction, 630 f0.5 (Reference 2.5.2-186) and the shallow amplification factors (Figure 2.5.2-102), the best estimate of kappa was a median of 0.0095 s with an aleatory variability of σln = 0.8 over these 8 earthquakes (Table 2.5.4-32).
To provide an estimate of epistemic uncertainty in kappa, additional slope analyses were performed for the alternative Q(f) model (410 f0.5, Reference 2.5.2-189), as well as with and without the shallow amplification (Figure 2.5.2-102). The results are tabulated in Table 2.5.4-32 and show a general bimodal distribution at about 0.010s and 0.016s depending primarily on the presence or absence of shallow amplification. The range in kappa is also from about 0.010 s to 0.016 s from the 8 larger magnitude earthquakes that range from M 1.8 to M 3.0 (Table 2.5.4-32).
Certainly a limitation in the FAS slope analyses is the narrow bandwidth over which kappa was assumed to control the FAS. The narrow bandwidth is a consequence of the low magnitudes, shallow amplification, and anti-alias filters. Reasonable steps were taken to mitigate potential effects of the limited bandwidth on the results. While not ideal, the slope analyses for kappa are considered to reflect a positive contribution to characterizing kappa and its range at the site.
2.5.2.5.2.3.3 Kappa Based on (30 m)
Since kappa at rock site (30 m) (time-averaged VS in the top 30 m) greater than or equal to 500 m/s appears to be related in some manner to rock quality with poorer rock quality (softer) sites generally associated with larger kappa values than higher quality (stiffer) rock (Reference 2.5.2-176), attempts have been made to relate kappa to stiffness for cases where ground motion recordings are unavailable (References 2.5.2-190, 2.5.2-141, and 2.5.2-177). While the contributions to kappa are considered to occur over the top several kilometers, shallow shear-wave velocities in the context of
(30 m) are correlated with broadband site amplification (References 2.5.2-191 and 2.5.2-192) which in turn correlates well with deeper velocities (Reference 2.5.2-193). Since shallow stiffness can be an indicator of deeper rock quality through stiffness, the correlation of rock site kappa with
(30 m) has resulted in stable mean predictive relations, albeit with significant variation. Applying the kappa (30 m) relation from Silva et al. (Reference 2.5.2-190) using the simple profile (Figure 2.5.2-101) based on the suspension log (Figure 2.5.2-100) with a (30 m) of 2416 m/s (8000 ft/s) results in a kappa estimate of 0.009 s. This estimate is well within the range of the site-specific estimates of 0.006 s to 0.016 s and close to the median of 0.010 s, suggesting at least consistency with the spectral shape and FAS slope analyses of the recordings.
SV
SV
SV
SVSV
SV
2.5.2-53 Revision 2

Clinch River Nuclear SiteEarly Site Permit Application
Part 2, Site Safety Analysis Report
2.5.2.5.2.3.4 Summary
Kappa values ranging from 0.006 s to 0.016 s are supported for the CRN Site based on the analyses of response spectral shapes (5 percent damped) as well as slopes of the FAS at high frequency. Analyses of spectral shapes showed kappa values of 0.006 s, as well as 0.009 s with the larger magnitude shapes favoring the lower kappa estimate. For the FAS slope analyses the best estimate of kappa was 0.010 s using the regional Q(f) model (630 f0.5) and shallow crustal amplification. Alternative Q(f) model (410 f0.5) and no shallow crustal amplification resulted in an increase in kappa to about 0.016 s with the greatest dependence on the difference in shallow crustal amplification. The analyses support a range in kappa estimates for the CRN Site from 0.006 s to 0.016 s with a best-estimate value taken as the median at 0.010 s, as summarized in Table 2.5.2-32.
2.5.2.5.3 Dynamic Material Nonlinearity
Potential nonlinearity of rock materials ranging from soft to hard has a long history (Reference 2.5.2-167). Dynamic material properties of rock are as sensitive to strains as soils but, because of the much higher stiffness, loading levels must be very high to induce cyclic shear strains which result in discernable changes in VS and material damping (Reference 2.5.2-190). As a result little (if any) effects of nonlinearity have been observed due to earthquake loading at stiff sites (e.g., (30 m) greater than or equal to 760 m/s) (References 2.5.2-166 and 2.5.2-194). Additionally, results of laboratory testing are few, especially at cyclic shear strains exceeding about 0.02 percent, due to material stiffness and loading capability, particularly at higher confining pressures. As such, nonlinearity of rock materials is poorly quantified but is known to exist in laboratory conditions (Reference 2.5.2-167) at shear strains exceeding about 0.01 percent.
At high loading levels at low exceedance frequencies, which may exceed cyclic shear strains of about 0.01 percent, potential nonlinearity in rock response was accommodated in developing amplification factors. The consideration of nonlinear response with rock units, at least at shallow depths, is especially important in the context of hazard analyses using Approach 3 where each site-specific exceedance frequency is based on an integration of the reference site (hard rock) hazard across all exceedance frequencies, reflecting very low to very high loading levels.
For the CRN Site, neither site-specific modulus reduction and hysteretic damping curves nor dynamic testing results for similar materials of comparable stiffness were available. Additionally, because the uncertainty in degree of nonlinearity in rock materials is high, with very limited cyclic strain levels achieved in laboratory dynamic testing, particularly for stiff rock samples as well as high confining stresses, the epistemic uncertainty in the degree of nonlinearity was captured with a range of both nonlinear (M1) as well as linear (M2) models (Table 2.5.2-20).
To accommodate potential loading level dependencies on shear-wave velocities and hysteretic damping within the shallow sedimentary rock column at the CRN Site, a modified subset of the EPRI rock modulus reduction and hysteretic damping curves (Reference 2.5.2-142) was used (Figure 2.5.2-56) along with equivalent-linear site response analyses. The curves were implemented to characterize consideration for upper-range, highly nonlinear, rock response with a lower range nonlinearity defined by linear analyses.
The subset of the EPRI rock curves reflect the original depth-dependent suite but with 51 ft to 120 ft and 2001 ft to 5000 ft curves taken over revised depths of 0 to 20 ft and 21 ft to 500 ft, respectively. The revised depth distributions were based on modeling recorded motions at sites classified as rock (Reference 2.5.2-142). Below a depth of 500 ft linear analyses were assumed with low strain damping (in terms of Q) taken as proportional to shear-wave velocity with the kappa budget constrained by the total effective kappa defined at the profile surface. The 500 ft potential nonlinear zone was based on validation exercises with recorded motions that showed
SV
2.5.2-54 Revision 2

Clinch River Nuclear SiteEarly Site Permit Application
Part 2, Site Safety Analysis Report
an unconservative bias (underprediction) at high frequency at soil sites when nonlinearity was extended to a depth beyond 500 ft (Reference 2.5.2-142). The depth limitation was assumed to occur at rock sites as well.
An additional revision to the curves used involved reducing the low-strain hysteretic damping from about 3 percent to 2 percent (Q approximately equal to 25) to be more consistent with in-situ observations of shear-wave damping at shallow depths (less than 500 m) (Reference 2.5.2-195).
2.5.2.5.3.1 Linear Analyses
For the linear analyses (M2), shear-wave damping was not based on laboratory tests of similar materials as hysteretic damping determined from laboratory dynamic testing (e.g., resonant column, torsional shear, direct simple shear, cyclic triaxial, etc.) is typically based on “undisturbed” samples and performed at varying confining pressures from atmospheric to at or above estimates of in situ stresses at sample depths. Laboratory dynamic tests, sometimes employing approximate corrections for sample disturbance, measure predominately intrinsic damping as damping is not measured through a change in amplitude in wave propagation, for example, but rather through the width of a resonant peak or the phase delay between an applied force and a reaction. As such laboratory dynamic testing may underestimate the effective damping which occurs in situ.
In situ measurements of total effective damping within the frequency range of interest (1 to 50 Hz) is typically done with earthquake recordings from vertical arrays in soft to hard rock materials at low loading levels (References 2.5.2-196, 2.5.2-157, 2.5.2-197, 2.5.2-195, and 2.5.2-198). Typical damping ranges, in terms of Q (Q approximately equal to 50/D where D is percent critical damping), are about 10 to 100 with most values well below 50, even at significant depths (approximately equal to 300 to 3000 ft), as summarized by Campbell (Reference 2.5.2-155). The general trend with depth from in situ analyses shows damping decreasing (Q increasing) with increasing depth, likely as a result of decreased friction due to crack closure as confining pressure increases. Typically VS also increases with increasing confining pressure leading some to correlate Q with VS at both rock (Reference 2.5.2-176) and soil sites (Reference 2.5.2-155). It is likely that the primary causal mechanism affecting the depth dependency of damping is confining pressure (Reference 2.5.2-167) rather than shear-wave velocity and suggests damping may be quite high at shallow depth (hundreds of feet) perhaps decreasing significantly at great depth. The overall levels of damping along with its trends with depth are consistent with the primary contributions to kappa over the top several kilometers of the crust (References 2.5.2-175 and 2.5.2-176).
Observationally this indeed appears to be the case where in situ measurements of damping generally exceed laboratory based measurements of damping (Reference 2.5.2-155). Differences between in situ measurements of damping and laboratory-based damping either directly (References 2.5.2-199, 2.5.2-200, 2.5.2-136, 2.5.2-201, and 2.5.2-202) or inferred by generic material specific damping curves (References 2.5.2-203 and 2.5.2-204), reflect 50 percent to 100 percent higher damping occurring in situ than measured in the laboratory (Reference 2.5.2-205). While nearly all comparisons are for soil or soft rock conditions, it is reasonable to assume scattering mechanisms existing in wave propagation through soils may also be active in stiffer (higher velocity) materials such as firm and hard rock.
The differences between laboratory and in situ damping for stiff materials may not be as great as in soils due to the longer wavelengths, conditional on frequency and depending on fracture size and density. Reflecting this difference, there are laboratory measurements of damping for firm rock materials at the Comanche Peak nuclear power plant and the Los Alamos National Laboratory and these show a range in low-strain damping from about 0.5 percent to about 5.0 percent with a mean damping of 3 percent (Reference 2.5.2-142), similar to the low-strain value of the (Reference 2.5.2-136) rock curves. Conversely there are also laboratory dynamic
2.5.2-55 Revision 2

Clinch River Nuclear SiteEarly Site Permit Application
Part 2, Site Safety Analysis Report
measurements in rock materials which are much more consistent and average about 1 percent (Q = 50) (References 2.5.2-206 and 2.5.2-207). These measurements suggest that low-strain laboratory dynamic material testing show wide variability, perhaps strongly conditional on material type and fracturing, both related to shear-wave velocity. In situ hysteretic damping measurements in rock materials depend weakly on rock type, with an average Q of about 10 in the top 100 m, increasing with depth to about 30 at a depth of about 500 m (Reference 2.5.2-195). At deeper depths, well beyond 500 m, Q increases rapidly, likely contributing to the frequency-dependent crustal damping (References 2.5.2-156 and 2.5.2-176).
The apparent stability of in situ damping, albeit with few measurements, compared to the more variable laboratory-based measurements, suggest the laboratory measurements incorporate varying degrees of scattering damping with the lower range values perhaps principally measuring intrinsic damping.
Based on the observations of in situ low strain damping at rock sites with a range in shear-wave velocity from about 1500 m/s to 3000 m/s and rock type from sedimentary to crystalline, Q ranged from about 10 to about 60 (Reference 2.5.2-155) with most estimates well below 60 and an average value of about 30 over the upper 500 m (Reference 2.5.2-195). As a reasonable conservative estimate, a value of 40 (damping 1.25 percent) was adopted for total effective damping at the CRN Site over the top 500 ft. Below a depth of 500 ft, to accommodate the observational trends of decreasing damping with increasing depth, Q was taken proportional to VS (Reference 2.5.2-176). As with the nonlinear analyses, below 500 ft kappa was used to constrain the shear-wave damping.
2.5.2.5.3.2 Total Effective Kappa
To distribute damping throughout profiles P1, P2, and P3, the total effective kappa was used as a constraint for the sum of damping throughout the profiles. Low-strain damping for each profile was also constrained over the top 500 ft by revised EPRI rock curves for the nonlinear case (M1) at 2 percent and 1.25 percent for the linear case (M2), in keeping with the assumption damping is higher over the shallower portions of profiles, leaving the damping over the remaining profile to be defined. It is important to note the details of how the damping is distributed through the profiles, conditional on the total effective kappa, has a minor effect on the amplification (Reference 2.5.2-164). As such the damping (in terms of Q) may be made either constant with depth, increasing with depth due perhaps to increasing confining pressure (e.g. typical damping curves and Reference 2.5.2-167), or proportional to VS. Lacking a physical basis for preference, proportional to VS was used (References 2.5.2-168 and 2.5.2-155) as it accommodates confining pressure dependencies in a consistent manner.
The kappa budget, separating site-specific profile and crustal model (Table 2.5.2-21), would typically include 0.006 s nominally for the crustal model, with the remaining kappa (damping) distributed through the profile including low-strain damping from the damping curves. In this case, however, the site profiles to basement depths (Figures 2.5.4-20 and 2.5.4-21) were taken to replace the top 1 km thick layer in the Midcontinent crust (Table 2.5.2-21) and, as such, characterize the damping contributing to the total effective kappa. For Locations A and B, the fixed low-strain damping over the top 500 ft (150 m) is 2.00 percent and 1.25 percent for the nonlinear (M1) and linear (M2) cases, respectively. At depths greater than 500 ft, the damping is inversely proportional to VS. This results in decreasing damping with depth due to the VS increasing with depth. For Locations A and B, the sedimentary rock sections extending to depths of nearly 4 km, damping is assumed to occur throughout the profiles relatively high at shallow depths with relatively low damping for the deeper structure. However, because kappa is affected by travel time, the major contribution to the total effective kappa comes from the deeper part of the profiles, below 500 ft. Profile damping is listed in Tables 2.5.4-30 and 2.5.4-31 for Locations A
2.5.2-56 Revision 2
Clinch River Nuclear SiteEarly Site Permit Application
Part 2, Site Safety Analysis Report
and B, respectively. Table 2.5.2-20 shows the profile kappa estimates and relative weights for Locations A and B.
2.5.2.5.4 Capturing Site-Specific Geologic Column Properties, Uncertainties, and Correlations
To provide an objective means of smoothing resonances which tend to be overpredicted by the vertically propagating shear-wave model in a one-dimensional profile (Reference 2.5.2-136) and, to a far lesser extent, account for the aleatory variability in dynamic material properties that is expected to occur across a site at the scale of a typical nuclear facility, variability in the basecase VS profiles has been incorporated in the site response calculations. For the CRN Site, random VS profiles were developed about each basecase profile shown in Figures 2.5.4-20 and 2.5.4-21. Sixty random velocity profiles were generated for each of the best-estimate, upper-range, and lower-range profiles for each of Locations A (Figures 2.5.2-57 and 2.5.2-58) and B (Figures 2.5.2-59 and 2.5.2-60). In order to randomly vary the VS in each base-case profile, a profile randomization scheme was implemented which varies both layer velocity and thickness. However, in this case, layer thickness was not varied as it is: (1) generally equivalent to varying layer velocities, (2) tends to increase contributions to scattering kappa, and (3) can result in increased site variability which is already accommodated in the hard rock hazard. Rather layer thickness variation was accommodated in the variation of the total profile depth. The depth randomization to the effective basement, at a depth of about 12,000 ft, was taken as 15 percent of the depth at ± 1800 ft using a uniform distribution. The percentage was based on the rock unit thickness variability of about 10 percent across the site determined from boreholes and increased by 50 percent to reflect likely increases in unit thickness variability within the deep structure as well as provide a realistic broadening of the fundamental resonance for deep sites.
The random velocity profiles were generated using a natural log standard deviation of 0.25 over the upper 50 ft and 0.15 below that depth using the footprint correlation model (Reference 2.5.2-134). The correlation model was developed from an analysis of variance on about 500 measured VS velocity profiles (References 2.5.2-136 and 2.5.2-142). In the correlation model, a limit of ± 2 standard deviations about the median value in each layer was considered for the limits on random velocity fluctuations. For the upper-range profiles, the high VS depths where the velocity was limited to 3.52 km/s (Figures 2.5.4-20 and 2.5.4-21), bounds were necessarily placed on the random velocities of 3.4 to 3.6 km/s. The correlation model selected reflects a minimum variability while providing for a realistic variation across footprint dimensions (several hundred feet) resulting in an objective smoothing of narrow resonances while preserving broad resonances, yet not developing deep low velocity zones which introduce artificial damping through wave scattering (scattering kappa).
An example of the kappa budget to assess potential contributions from scattering in the randomization process is shown on Figure 2.5.2-55, which compares median amplification with that of a single analysis using the basecase profile. The example shows results for Location A, the P1 basecase profile, along with the basecase kappa (Table 2.5.2-20), with the median estimate closely matching the amplification of the basecase profile across frequency. The median estimate smoothes through narrow-band resonances and shows no bias, not falling below the basecase amplification, at high frequency (≥ 10 Hz) suggesting little contribution to kappa due to scattering. The similarity between the median estimate and the basecase amplification across frequency also indicates the median profile adequately replicates the basecase profile throughout its depth with the checks routinely performed for each profile.
While the effects on hazard of site variability through profile randomization are small (References 2.5.2-132 and 2.5.2-144), the full ergodic variability (References 2.5.2-158 and 2.5.2-159), which includes the site component, was used in developing the hard rock hazard. As
2.5.2-57 Revision 2

Clinch River Nuclear SiteEarly Site Permit Application
Part 2, Site Safety Analysis Report
such the inclusion of the variability about the median amplification in the site-specific Approach 3 analyses implies a conservative inclusion of site variability in development of the GMRS.
Associated with each of the 60 randomized profiles was also a set of randomized strain- dependent shear modulus and hysteretic damping curves. To accommodate aleatory variability in the modulus reduction and hysteretic damping curves on a generic basis, the curves were independently randomized about the basecase values (Figure 2.5.2-61). A log normal distribution was assumed with a logarithmic standard deviation (σln) of 0.15 and 0.30 at a cyclic shear strain of 3 x 10⁻² percent for modulus reduction and hysteretic damping, respectively (Reference 2.5.2-142) with upper and lower bounds of 2σln. The truncation was necessary to prevent modulus reduction or damping models that are not physically realizable. The distribution was based on an analysis of variance of measured G/Gmax and hysteretic damping curves and is considered appropriate for applications to generic (material type specific) nonlinear properties (Reference 2.5.2-142). The random curves were generated by sampling a transformed normal distribution with a σln of 0.15 and 0.30 as appropriate, computing the change in normalized modulus reduction or percent damping at 3 x 10⁻² percent cyclic shear strain, and applying this factor at all strains. The random perturbation factor was reduced or tapered near the ends of the strain range to preserve the general shape of the basecase curves (References 2.5.2-160 and 2.5.2-136). Also, damping was limited to a maximum value of 15 percent. For linear analyses, damping was not randomized as it is equivalent to randomizing kappa, the variability of which is included in the hard rock kappa.
Profile depth (depth to basement material) is also varied on a site-specific basis using a uniform distribution. The depth range is generally selected to reflect expected variability over the structural foundation as well as uncertainty in the estimation of depth to basement material. Individual layer thickness was not varied as it is: (1) generally equivalent to varying layer velocities, (2) tends to increase contributions to scattering kappa, and (3) can result in increased site variability which is already accommodated in the hard rock hazard. Rather layer thickness variation was accommodated in the variation of the total profile depth. The depth randomization to the effective basement, at a depth of about 12,000 ft, was taken as 15 percent of the depth at ± 1800 ft. The percentage was based on the rock unit thickness variability of about 10 percent across the site determined from boreholes and increased by 50 percent to reflect likely increases in unit thickness variability within the deep structure as well as provide a realistic broadening of the fundamental resonance at deep sites.
2.5.2.5.5 Site Response Analysis
Traditionally in the estimation of site-specific probabilistic ground motions for a soil site, a rock ground motion is calculated and modified by deterministic site response analyses derived for the soil column to arrive at the ground motions at the soil surface. This process can also be followed to obtain the ground motions at the ground surface atop firm rock. In doing so, the annual exceedance probability of that surface (either rock or soil) motion is generally unknown, varies with period, and may be of a higher probability than the control (rock) motion. If a risk analysis is desired, the surface motions (either rock or soil) must be hazard consistent, i.e., the annual exceedance probability of the surface ground motion should be the same as the input rock ground motion.
In NUREG/CR-6728 (Reference 2.5.2-132), several site response approaches are described that produce surface motions consistent with the rock outcrop hazard. The approaches also incorporate the aleatory variabilities in the site properties into the surface motions. The NUREG identifies four basic approaches for determining the ground motions at a site. They are in order of increasing accuracy.
Approach 1: Rock UHRS used as control motions
2.5.2-58 Revision 2

Clinch River Nuclear SiteEarly Site Permit Application
Part 2, Site Safety Analysis Report
Approach 2A: Develop transfer functions for 1 Hz and 10 Hz design earthquakes using a single magnitude for each frequency.
Approach 2B: Develop transfer functions for 1 Hz and 10 Hz design earthquakes accommodating magnitude distributions
Approach 3: Approximations to UHRS integrations
Approach 4: UHRS computed using site-specific ground motion prediction models
The approaches range from a PSHA using ground motion prediction models for the specific site or location of interest (Approach 4) to scaling the rock motion on the basis of a site response analysis using a broadband input motion (Approach 1).
To compute the ground motions at the top of unweathered rock for the CRN Site, Approach 3 was implemented. Approach 3 is a fully probabilistic analysis procedure which moves the site response, in an approximate way, into the hazard integral. The approach is described by Bazzurro and Cornell (Reference 2.5.2-143) and NUREG/CR-6769 (Reference 2.5.2-144). In this approach, the hazard at the surface is computed by integrating the site-specific hazard curve at generic rock level with the probability distribution of the transfer functions, i.e., amplification factors (References 2.5.2-145 and 2.5.2-146). The site-specific amplification, relative to a reference rock, in this case hard rock, is characterized by a suite of frequency-dependent amplification factors that can account for nonlinearity in soil/rock response. Approach 3 involves approximations to the hazard integration using suites of transfer functions, which result in complete hazard curves at the ground surface for specific ground motion parameters (e.g., spectral accelerations) and a range of frequencies.
The basis for Approach 3 is a modification of the standard PSHA integration:
where AS is the random ground-motion amplitude at the ground surface at a certain natural frequency; z is a specific level of AS; m is earthquake magnitude; r is distance; a is an amplitude level of the random rock ground motion, A, at the same frequency as AS; fA(a) is derived from the rock hazard curve for this same frequency (it is the absolute value of its derivative); and fM,R|A is the deaggregated hazard (i.e., the joint distribution of M and R, given that the rock amplitude is level a). AF is an amplification factor defined as:
where AF is a random variable with a distribution that can be a function of m, r, and a. To accommodate epistemic uncertainties in site dynamic material properties, multiple suites of AF may be used and the resulting hazard curves combined with weights to properly reflect mean hazard and fractiles.
The ground surface response is controlled primarily by the level of rock motion and m, so Equation 2.5.2-8 can be approximated by:
Equation 2.5.2-8
Equation 2.5.2-9
2.5.2-59 Revision 2

Clinch River Nuclear SiteEarly Site Permit Application
Part 2, Site Safety Analysis Report
where r is dropped because it has an insignificant effect in most applications (Reference 2.5.2-132). To implement Equation 2.5.2-10, only the conditional magnitude distribution for relevant amplitudes of a is needed. fM|A(m;a) can be represented (with successively less accuracy) by a continuous function, with three discrete values or with a single point, (e.g., m1(a), the mean magnitude given a). With the latter, Equation 2.5.2-10 can be simplified to:
where, fM|A(m;a) has been replaced with m1 derived from deaggregation. With this equation, one can integrate over the rock acceleration, a, to calculate P[AS>z] for a range of surface amplitudes, z.
2.5.2.5.5.1 Implementation of Approach 3
In Approach 3, the following steps are performed:
Randomization of basecase site-dynamic material properties to produce a suite of velocity profiles as well as G/Gmax and hysteretic damping curves that incorporate site randomness.
Computation of site amplification factors as characterized by a mean and distribution for each set of basecase site properties using the random vibration theory (RVT) based equivalent-linear site response model.
Full integration of the fractile and mean hazard curves for the generic site condition in this case hard rock and amplification factors to arrive at a distribution of site-specific hazard curves.
The computation of the amplification factors is the first phase of the calculations and is similar to what is done in other site-response approaches.
2.5.2.5.5.2 RVT-Based Equivalent-Linear Site Response Approach
To compute the horizontal ground motions at the ground surface, the results of the PSHA are modified using a site-response model. The conventional site response approach in quantifying the effects of soil and other unconsolidated sediments on strong ground motions involves the use of time histories compatible with the specified outcrop response spectra to serve as control (input) motions. The control motions are then used to drive a nonlinear computational formulation to transmit the motions through the profile.
The computational formulation that has been most widely employed to evaluate 1D site response assumes vertically-propagating plane S-waves. Departures of soil response from a linear constitutive relation are treated in an approximate manner through the use of the equivalent-linear formulation. The equivalent-linear formulation, in its present form, was introduced by Idriss and Seed (Reference 2.5.2-147). A stepwise analysis approach was formalized into a 1D, vertically propagating S-wave code called SHAKE (Reference 2.5.2-148).
Equation 2.5.2-10
Equation 2.5.2-11
2.5.2-60 Revision 2

Clinch River Nuclear SiteEarly Site Permit Application
Part 2, Site Safety Analysis Report
Subsequently, this code has become the most widely used and validated analysis package for 1D site response calculations.
The computational scheme employed to compute the amplification factors in this study uses an alternative approach employing RVT (References 2.5.2-156, 2.5.2-149, and 2.5.2-136). In this approach, as embodied in the computer program RASCALS, the control motion power spectrum is propagated through the 1D profile using the plane-wave propagators of Silva (Reference 2.5.2-150). In this formulation only shear waves (S-waves) polarized in the horizontal plane (SH-waves) are considered. Arbitrary angles of incidence may be specified. In this analysis, the standard approach of vertical incidence was used. Cyclic shear-strain iterated properties were developed using a constant effective strain ratio of 0.65, based on an extensive suite of validations (References 2.5.2-136 and 2.5.2-142).
Inputs to RASCALS are as follows:
Location of input and output motions within the site profile.
Input (control) motions characterized by earthquake power spectra.
Incidence angles of input motion.
A vertical profile consisting of uniform plane-layer layers with specified thickness, seismic velocity, low strain damping, and density as a function of depth.
Nonlinear dynamic properties of the material at the site, consisting of strain-dependent shear modulus and damping curves for each layer.
Control motions (power spectral density) must be calculated for input into the site response analysis that are representative of the earthquake magnitude and distance dominating the hazard at the desired rate of exceedance. The basis for the control motions are the magnitude and distances specified by the hazard deaggregation.
Evaluation of site-response using the equivalent-linear model is based on convolution of appropriate control motions through randomized velocity profiles combined with randomized G/Gmax and hysteretic damping curves. The randomized profiles and curves are generated from basecase velocity and nonlinear dynamic properties. The convolutions yield transfer functions for 5 percent-damped response spectra and peak ground velocity (PGV).
Consistent with the deaggregation of the hard rock hazard at the CRN Site, which showed contributions from events in the range of M 5.5 at short distances and at high frequency as well as contributions from larger magnitude earthquakes, M 7.5, at larger distances and low frequency, control motion Fourier amplitude spectra, as well as reference site response spectra (5 percent-damped PSA) were defined for representative earthquake magnitudes of M 5.5 and 7.5 and were generated with the point-source model for the Midcontinent crustal model listed in Table 2.5.2-21. This approach is similar to that used in adjusting ground motion prediction equations (GMPEs) for different regions having different crustal models, kappa, and crustal Q(f) (Reference 2.5.2-141). Modal magnitudes M 5.5 and 7.5 (single- and double-corner source models) were used to accommodate potential effects of control motion spectral shape on nonlinear response. Although differences in amplification factors due to control motion spectral shapes is expected to be small, the multiple shapes were used for completeness to accommodate random velocity excursions to lower velocities. Frequency-dependent weights for the relative contribution from the control motions (M 5.5 and 7.5), based on the deaggregation, are shown in Table 2.5.2-22. Two different assumptions regarding the shape of the seismic source spectrum (single-corner and double-corner, Reference 2.5.2-161) were used for M 7.5
2.5.2-61 Revision 2

Clinch River Nuclear SiteEarly Site Permit Application
Part 2, Site Safety Analysis Report
while only the single-corner was used for M 5.5. Equal weights were given to the single- and double-corner control motions. A range of 11 different reference site input amplitudes (median PGAs ranging from 0.01 to 1.5 g) with point-sources placed at a suite of hypocentral distances to produce expected median rock peak accelerations of 0.01, 0.05, 0.10, 0.20, 0.30, 0.40, 0.50, 0.75, 1.00, 1.25 and 1.50 g were used in the site response analyses. The characteristics of the seismic source and upper crustal attenuation properties used for the analysis of the CRN Site were typical values for hard rock sites in the Central and Eastern North America (CENA): stress parameter of 110 bars, Q(f) of 670 f0.33, a kappa value of 0.006 s, crustal model (Table 2.5.2-21), and source depth of 8 km. Because the reference motions were developed for a suite of median peak acceleration values by varying hypocentral distances, apart from kappa, the reference motions are not very sensitive to either the stress parameter or Q(f) model.
2.5.2.5.5.3 Horizontal Amplification Factors
Based on the RASCALS runs for the randomized VS profiles from each of the basecase profiles, probability distributions for horizontal amplification factors were calculated. RASCALS was used for horizontal spectra using normally-incident plane SH-waves. For each control motion, mean (log) and standard deviations were computed from each of the 60 response spectra. The mean (log) response spectrum from the 60 convolutions was divided by the mean (log) hard rock spectrum to produce the amplification factors. The amplification factors include the effects of the inherent aleatory variability (randomness) of the site properties about each basecase and any possible effects of source spectral shape (e.g. magnitude) of the control motions. Epistemic variability (uncertainty) was captured in consideration of alternate basecase (mean) profiles and properties. The horizontal amplification factors are a function of the reference (hard rock) peak acceleration, spectral frequency, and linear as well as nonlinear rock response.
The horizontal amplification factors (5 percent-damped PSA), computed from the source layer to the surface for both the site profiles and reference rock crustal model (Table 2.5.2-21), which describe the amplification (or de-amplification) of hard reference rock motion as a function of frequency and input reference rock amplitude. Site specific motions (5 percent-damped PSA) were computed with the point-source model using the same source parameters as in generating reference rock motions with the randomly generated site profiles replacing the first layer of the reference site crustal model (Table 2.5.2-21). The modeling approach is consistent with that used in validating the point source model (References 2.5.2-136, 2.5.2-142, and 2.5.2-156), developing amplification factors for generic site conditions (References 2.5.2-162 and 2.5.2-163), assessing crustal amplification (Reference 2.5.2-164), and in hazard analyses calculating VS-kappa corrections to translate ground motion prediction equations (GMPEs) backbone curves from one region to another (Reference 2.5.2-165).
The amplification factors are represented in terms of a median amplification value and an associated standard deviation (sigma) for each oscillator frequency (100 points per decade beginning at 0.1 Hz) and input rock amplitude. A minimum median amplification value of 0.5 was employed to accommodate potential limitations in equivalent-linear analyses at high loading levels due to overdamping.
Figures 2.5.2-62 and 2.5.2-63 illustrate, for M 5.5 single-corner control motion spectra, the median and ± 1 standard deviation in the predicted amplification factors developed for the eleven loading levels parameterized by the median reference (hard rock) peak acceleration (0.01 to 1.50 g) for profile P1 of Location A and revised EPRI (Subsection 2.5.2.5.1) rock G/Gmax and hysteretic damping curves (M1). The variability in the amplification factors results from variability in VS and depth to hard rock. To illustrate the effects of nonlinearity at the CRN Site, Figures 2.5.2-64 and 2.5.2-65 show the corresponding amplification factors developed assuming a linear analysis (M2). Little difference is seen over all loading levels for structural frequencies less than about 20 Hz. The amplification factors for Location B are similar to those developed for
2.5.2-62 Revision 2

Clinch River Nuclear SiteEarly Site Permit Application
Part 2, Site Safety Analysis Report
Location A as shown in Figures 2.5.2-66 and 2.5.2-67 for revised EPRI rock G/Gmax and hysteretic damping curves (M1). The results for M 7.5 single-corner control motion spectra are similar to those for M 5.5 as shown in Figures 2.5.2-68 and 2.5.2-69 for Location A and M1 curves.
For M 5.5 single-corner control motion spectra and the basecase P2 profile of Location A, Figures 2.5.2-70 and 2.5.2-71 illustrate, the median and ± 1 standard deviation of the amplification factors for revised EPRI rock G/Gmax and hysteretic damping curves (M1). Similarly, Figures 2.5.2-72 and 2.5.2-73 show the amplification factors developed for the basecase P3 profile of Location A.
2.5.2.5.6 Development of V/H Ratios
Given the firm to hard rock conditions at the CRN Site, with VS30 of 2351 m/s (7713 ft/s) and 2336 m/s (7664 ft/s) at Locations A and B, respectively, NUREG/CR-6728 (Reference 2.5.2-132) presents an appropriate suite of design vertical-to-horizontal (V/H) ratios. The NUREG/CR-6728 V/H ratios conservatively accommodate potential magnitude and distance dependencies that have been observed in recent empirical V/H ratios (References 2.5.2-151 and 2.5.2-137) using three intervals of horizontal peak ground acceleration (PGA) on rock as a proxy for the magnitude and distance dependence: < 0.2g, 0.2 to 0.5g, > 0.5g.
The methodology implemented to develop the vertical ground motions follows analogously to Approach 3 used to develop fully probabilistic site-specific horizontal motions. For application to the development of site-specific vertical hazard, the same fully probabilistic approach was used with V/H ratios (median and uncertainty estimates) substituted for horizontal amplification factors. In this case, the distributions of V/H ratios were applied to the site-specific horizontal hazard curves. As with the development of the site-specific horizontal hazard, epistemic uncertainty in median V/H ratios was incorporated in this case by including σμ, epistemic uncertainty about the median V/H ratio.
Since V/H ratios for firm to hard rock site conditions are not well constrained due to a lack of recordings at design magnitudes and distances, epistemic uncertainty (σμ) was accommodated in the V/H Approach 3 analyses. Epistemic uncertainty in V/H ratios was assessed by examining the range in available models for V/H ratios appropriate for firm to hard rock site conditions (Reference 2.5.2-138). The models considered include Bozorgnia and Campbell (Reference 2.5.2-151), Bommer et al. (Reference 2.5.2-152), Edwards et al. (Reference 2.5.2-153), and Gülerce and Abrahamson (Reference 2.5.2-137), with the range in models spanning a V/H factor of 1.5 to 1.8 depending on frequency. The range was taken to reflect 2σμ estimates with σμln taken as the average at 0.25 and used for epistemic uncertainty in the V/H ratios. In the Approach 3 analyses for the vertical component the three PGA dependent V/H ratios from NUREG/CR-6728 along with the σμln of 0.25 were implemented based on the site-specific horizontal hazard for peak acceleration with the bin boundaries preserved.
For the aleatory variability about the mean (log) V/H ratio, resulting in increased aleatory variability for the vertical component compared to the horizontal component, some attention is required as the contribution of site-specific aleatory variability to the hazard has already been accommodated in developing the site-specific horizontal component hazard. The site component of aleatory variability was included in developing the hard rock hazard in the variability about the hard rock GMPEs. Additionally, in the Approach 3 analyses to develop the site-specific horizontal hazard, the variability about the median amplification factors, treated as aleatory variability, was included as well. As a result there is some double-counting of site aleatory variability but, because the variability of the amplification factors is small, with σln ranging from 0.05 to 0.20 across structural frequency, the potential impacts on the site-specific hazard are not considered significant. However in the application of Approach 3 in developing the vertical hazard, care must
2.5.2-63 Revision 2
Clinch River Nuclear SiteEarly Site Permit Application
Part 2, Site Safety Analysis Report
be exercised in contributing additional unnecessary aleatory variability in the vertical component, with the implication that vertical motions reflect higher variability than horizontal motions. The recent development of NGA-West 2 vertical GMPEs (Reference 2.5.2-154) using the same suite of recordings as in the development of the horizontal GMPEs permits a straightforward assessment of the relative degrees of aleatory variability between horizontal and vertical components. The recent vertical GMPEs (Reference 2.5.2-154) indicate estimates of aleatory variability comparable to the corresponding horizontal GMPEs, suggesting adequate aleatory variability for the vertical component has been already accommodated in developing the horizontal hazard. As a result only epistemic uncertainty in firm to hard rock V/H ratios was incorporated in developing the vertical hazard.
2.5.2.5.7 Site-Specific Horizontal and Vertical UHRS
Implementing Approach 3, the hard rock hazard curves derived from the PSHA and the horizontal amplification factors relative to hard rock were integrated to produce at site-specific amplified horizontal hazard curves. The hazard curves calculated using the amplification factors from the M 5.5 and 7.5 controlling earthquakes were weighted based on their contributions to the hazard at each spectral frequency and hazard level. The epistemic uncertainty in seismic hazard is typically represented by a set of weighted hazard curves. Using these sets of curves as discrete probability distributions, they can be sorted by the frequency of exceedance at each ground-motion level and summed into a cumulative probability mass function. When the cumulative probability mass function for a particular exceedance frequency equals or exceeds fractile y, then the exceedance frequency represents the yth fractile. The weighted-mean hazard curve is the weighted average of the exceedance frequency values.
Analogously, the horizontal site-specific hazard curves themselves were convolved with the suite of median V/H factors from NUREG/CR-6728, considering the uncertainties discussed in Subsection 2.5.2.5.6, to derive the corresponding vertical site-specific hazard curves.
Horizontal and vertical UHRS for mean annual frequencies of exceedance (MAFE) of 10-4, 10-5, and 10-6 computed for Locations A and B are shown in Figures 2.5.2-74 and 2.5.2-75, respectively, and are tabulated in Tables 2.5.2-23 through 2.5.2-26. The spectra were interpolated between the seven frequencies specified in the hard rock reference site hazard curves (0.5, 1.0, 2.5, 5.0, 10.0, 25.0, and 100.0 Hz) by overlying response spectral shapes computed in the development of amplification factors on the UHRS and filling in spectral ordinates.
2.5.2.5.8 Site-Specific Ground Motion Response Spectra
The horizontal and vertical GMRS are developed following the RG 1.208 performance-based procedure for the assessment of a site-specific seismic design ground motion, satisfying the requirements of 10 CFR 100.23, paragraphs (c), (d)(1), and (d)(2), and leading to the establishment of an SSE to satisfy the design requirements of 10 CFR 50, Appendix S. The steps necessary to develop the design ground motions are described in NUREG-0800, Chapter 2, Site Characteristics and Site Parameters, and Chapter 3, Design of Structures, Components, Equipment and Systems.
The performance-based, site-specific design earthquake ground motion is developed using the method presented in RG 1.208, Section B, which is analogous to the development of the ASCE/SEI Standard 43-05 (Reference 2.5.2-135). The GMRS that achieves the annual first onset of significant inelastic deformation (FOSID) target performance goal with a performance factor (PF) of 10-5, and hazard exceedance probability (HD) of 10-4, is described in ASCE/SEI Standard 43-05, Chapters 1 and 2. To meet the performance goal, the performance-based methodology specifies the two parameters AR and DF:
2.5.2-64 Revision 2
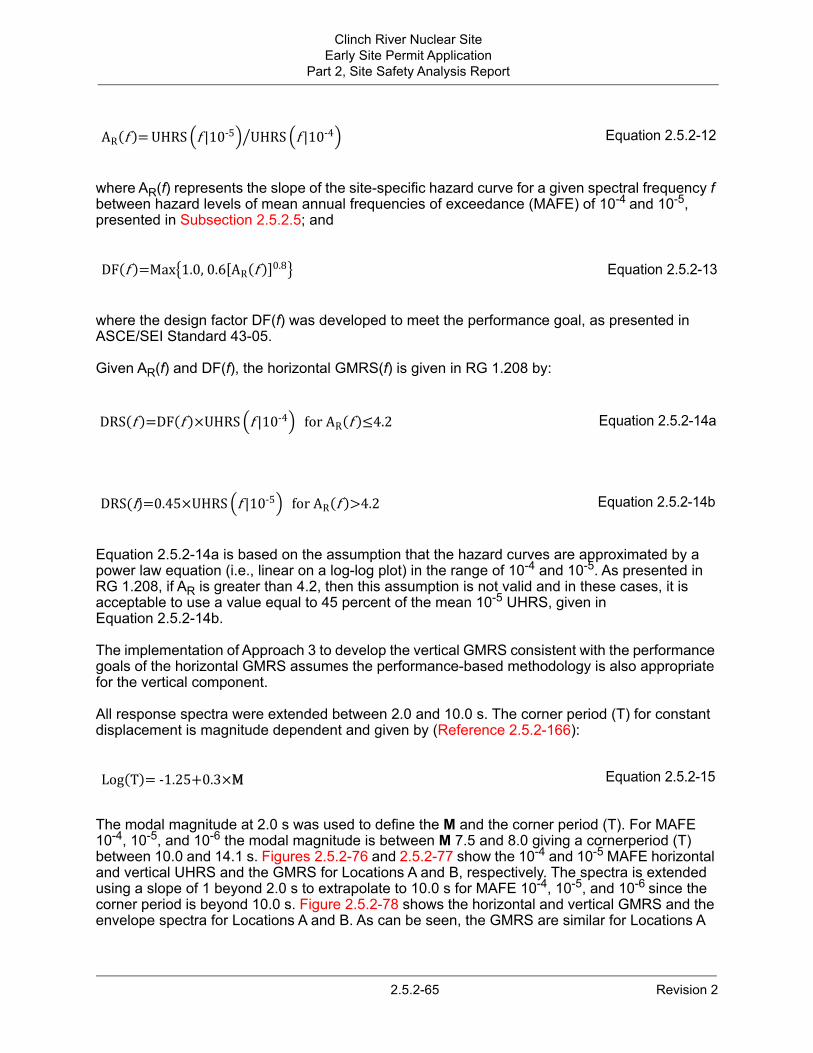
Clinch River Nuclear SiteEarly Site Permit Application
Part 2, Site Safety Analysis Report
where AR(f) represents the slope of the site-specific hazard curve for a given spectral frequency f between hazard levels of mean annual frequencies of exceedance (MAFE) of 10-4 and 10-5, presented in Subsection 2.5.2.5; and
where the design factor DF(f) was developed to meet the performance goal, as presented in ASCE/SEI Standard 43-05.
Given AR(f) and DF(f), the horizontal GMRS(f) is given in RG 1.208 by:
Equation 2.5.2-14a is based on the assumption that the hazard curves are approximated by a power law equation (i.e., linear on a log-log plot) in the range of 10-4 and 10-5. As presented in RG 1.208, if AR is greater than 4.2, then this assumption is not valid and in these cases, it is acceptable to use a value equal to 45 percent of the mean 10-5 UHRS, given in Equation 2.5.2-14b.
The implementation of Approach 3 to develop the vertical GMRS consistent with the performance goals of the horizontal GMRS assumes the performance-based methodology is also appropriate for the vertical component.
All response spectra were extended between 2.0 and 10.0 s. The corner period (T) for constant displacement is magnitude dependent and given by (Reference 2.5.2-166):
The modal magnitude at 2.0 s was used to define the M and the corner period (T). For MAFE 10-4, 10-5, and 10-6 the modal magnitude is between M 7.5 and 8.0 giving a cornerperiod (T) between 10.0 and 14.1 s. Figures 2.5.2-76 and 2.5.2-77 show the 10-4 and 10-5 MAFE horizontal and vertical UHRS and the GMRS for Locations A and B, respectively. The spectra is extended using a slope of 1 beyond 2.0 s to extrapolate to 10.0 s for MAFE 10-4, 10-5, and 10-6 since the corner period is beyond 10.0 s. Figure 2.5.2-78 shows the horizontal and vertical GMRS and the envelope spectra for Locations A and B. As can be seen, the GMRS are similar for Locations A
Equation 2.5.2-12
Equation 2.5.2-13
Equation 2.5.2-14a
Equation 2.5.2-14b
Equation 2.5.2-15
2.5.2-65 Revision 2

Clinch River Nuclear SiteEarly Site Permit Application
Part 2, Site Safety Analysis Report
and B. The horizontal and vertical GMRS and the envelope spectra are tabulated in Tables 2.5.2-27 and 2.5.2-28, respectively.
To examine the effects of accommodating increased confining pressure due to soil overburden on the free-surface outcrop GMRS, the distribution of firm rock shear modulus and hysteretic damping curves with depth was revised. Since the generic G/Gmax and hysteretic damping curves reflect confining pressure effects in an approximate manner through depth, the estimate of an soil overburden thickness of 42 ft was added to the depth of the nonlinear profiles with nonlinear zones extending in depth to 458 ft with the 21 to 500 ft suite of shear modulus and hysteretic damping curves implemented over the top 458 ft of the nonlinear profiles.
The final confining pressure adjusted GMRS reflects the hazard weighting of the original linear analyses along with the confining pressure adjusted nonlinear analyses, enveloped over the hazard developed for Locations A and B. The resulting GMRS is compared to the original GMRS on Figure 2.5.2-79 (Table 2.5.2-29) at the seven frequencies defined by the hard rock hazard. As Table 2.5.2-29 and Figure 2.5.2-79 indicate the effects of increased confining pressure due to overburden material on the firm to hard rock nonlinear properties are insignificant.
2.5.2.6 2D Sensitivity Analysis
Due to the dipping nature of the underlying stratigraphy beneath the CRN Site (approximately 33 degrees) (Figure 2.5.4-12), potential 2D effects on earthquake ground motions were evaluated. In the development of the GMRS using Approach 3 from NUREG/CR-6728, a 1D equivalent-linear site response approach was used. Potential 2D effects, due to the same geologic unit and associated velocity occurring at different depths across each site as well as broad-band amplification (basin edge) effects resulting from dipping impedance contrasts, were initially addressed by evaluating the epistemic uncertainty in VS beneath the CRN Site.
The objectives of the 2D sensitivity analysis were to: (1) evaluate how simplifying the dipping stratigraphy beneath the CRN Site to a 1D model for site response impacts the GMRS, and (2) assess whether sufficient epistemic uncertainty had been incorporated into the 1D analysis to address potential 2D effects. A 2D model of the site was developed which included both Locations A and B (Figure 2.5.4-13). The amplification between Precambrian basement rock (where VS exceeds about 11,500 ft/s) and the surface of the model was then computed. The influence of the dipping stratigraphy was evaluated by comparing the amplification computed by the 2D analysis with that from the 1D analysis. The 2D effects were analyzed at three points across Locations A and B to allow averaging across both locations. The three points at each location that were analyzed were center, left (updip of center), and right (downdip of center).
The computational zone for the 2D modeling, defined as the area shown in the geologic cross-section (Figure 2.5.4-12), and was approximately 20,000 ft wide by 14,800 ft deep and consisted of multiple layers having interfaces at various dip angles (Figure 2.5.2-80). The depth of the mesh to the top of the basement hardrock is about 12,600 ft with 2200 ft of basement rock included in the mesh. All properties of the rock layers were assumed to be linear-elastic. The computational zone was represented by a 2D finite element (FE) mesh, having the capability to transmit 50 Hz frequency response (Figure 2.5.2-81). This 50 Hz frequency requirement is consistent with the NRC recommendations provided in NUREG-0800 for site response analysis. The element sizes were determined using the standard criterion of f = VS/5d, where VS is the material shear-wave velocity, d is the largest dimension of the element and f is the passing frequency.
The 2D mesh included the Precambrian basement with a VS of about 11,500 ft/s, consistent with the VS used in the GMRS (Figure 2.5.2-82; Subsection 2.5.2.5.8). The VS values for the geologic formations represented in the mesh were adopted from the 1D VS profiles used in calculating the
2.5.2-66 Revision 2

Clinch River Nuclear SiteEarly Site Permit Application
Part 2, Site Safety Analysis Report
GMRS presented in Subsection 2.5.2.5.8. The damping was taken as the average of the six sets of profiles (Figure 2.5.2-82).
The 2D analyses were performed using SDE-SASSI Version 2.0. 1D analyses were performed to compare against the 2D model. The 1D analysis used the validated equivalent-linear site response analysis program CARES Version 2.0. SDE-SASSI is an expanded and fully validated version of the SASSI computer code, which includes a transmitting boundary at the base (Figure 2.5.2-80). The model also includes transmitting boundary elements on both vertical sides of the finite element mesh. The side transmitting boundary elements were located at each node of the mesh boundary and are defined by spring/dashpot elements for both normal and shear motions at the boundary node. The purpose of these boundary elements is to minimize the effects of the numerical boundaries on the computed response in the central region of the mesh. The input motion was assumed to be located at the top of the basement rock and is an outcrop motion (Figure 2.5.2-80).
The best estimate VS profile used in the GMRS was run in the 2D analysis. Other pertinent data on rock properties (Poisson’s ratio, unit weight, and hysteretic material damping ratio) used in the 2D computational zone were also adopted from the GMRS analysis. Poisson’s ratio was required in the 2D analysis. A value of 0.25 was used, which is a typical value for hard rock, and was measured in dynamic laboratory tests of rock samples from the same formation located approximately 30 mi southwest of the CRN Site. It was not necessary to run the lower-range and upper-range VS profiles considered in the GMRS 1D analysis in the 2D analysis because both profiles were developed to accommodate 2D effects.
A basement outcrop horizontal time history, spectrally-matched to the enveloped GMRS, was used as input to both the 1D and 2D calculations. Because the 2D analysis was a linear analysis, the results are not sensitive to control motion spectral shapes provided it has sufficient amplitude across spectral frequency to excite the 5 percent-damped oscillators. The smooth GMRS reflects design levels of motion over a wide bandwidth and was selected to reflect control motions for the 2D analyses. The seed time history was the Pacoima Kagel Canyon record of the 1994 M 6.7 Northridge, California earthquake (Figure 2.5.2-83). The spectral matching meets the applicable criteria from NUREG-0800. The 5-95 percent Arias intensity was 21.79 m/s. The 5 percent-damped response spectra for this time history record as computed by both the CARES and RASCALS programs are very similar (Figure 2.5.2-84).
The 1D site profiles (velocity and hysteric material damping) used in the 1D CARES calculations were then used in the 2D/1D spectral comparisons. The response calculations, 1D and 2D, were performed using linear properties, with no strain iteration considered in the computations.
Figure 2.5.2-80 presents a schematic diagram of the 2D SASSI model used to evaluate site effects. The CRN Site is represented by 2D triangular and quadrilateral finite elements generated throughout the zone of influence, considered from the surface down to and into the basement rock and from the left to right boundary (Figure 2.5.2-82). As previously stated, results were calculated at three points for both Locations A and B.
For the 2D calculations, the input horizontal time history is defined at the top of basement as a normally (vertical) incident outcrop motion applied in the plane of the figure; that is, the problem considered is SV wave (vertically-polarized shear-wave) transmission (Figure 2.5.2-80). Vertical input and corresponding surface output motions were not considered in the 2D analysis because potential effects on the vertical component are expected to be less than the horizontal as the compressional-wave velocities are significantly greater than the shear-wave velocities. No horizontal wave passage effects are considered in the calculations. Transmitting boundary conditions are assumed along the two vertical side boundaries in the form of both horizontal and vertical dashpots applied at each node along the vertical boundaries, which accommodate
2.5.2-67 Revision 2

Clinch River Nuclear SiteEarly Site Permit Application
Part 2, Site Safety Analysis Report
approximate normal wave incidence. The purpose of these boundary elements is to minimize the energy feedback off these computational boundaries back into the large 2D mesh. The lack of usage of such elements may lead to significant increase in mesh response, particularly at relative low frequency (between 1 and 5 Hz for such a site profile). The transmitting boundary formulation used in these calculations is based on the simple viscous Lysmer-Kuhlemeyer (References 2.5.2-170 and 2.5.2-171) model, and has been long used in such wave transmission calculations in both finite-element and finite-difference wave propagation.
The semi-infinite half-space at the base of the 2D SASSI model consists of two parts: (1) the addition of 20 layers having a total depth of 1.5 VSb / f (where ‘VSb’ is the VS of the basement half-space and ‘f’ is the frequency of the analysis) and (2) the addition of horizontal and vertical dashpots applied at the base of the extended layered site model. This modeling approach is inherent within the SASSI code and is intended to minimize any reflections off the bottom boundary of the model. The transmitting boundary models have been found to be an important component of these large half-space problems.
For the CRN Site calculations, two finite element meshes were developed for the 2D calculations, a fine and coarse mesh, established throughout the computational zone (20,000 ft wide by 14,800 ft deep) (Figure 2.5.2-80). The fine mesh described earlier with a 50 Hz transmission capability is computationally very large, resulting in a mesh having about 500,000 finite elements (with over 1,000,000 degrees-of-freedom, two at each node) and requires large computer capacity along with modern matrix solvers. Figure 2.5.2-81 presents a snapshot of the fine mesh in the CRN Site. For the firm and hard rocks in the fine mesh, the resulting element dimensions are on average about 28 ft.
A coarse mesh model was developed to have a transmission capability limited to about 10 Hz. The average element size for the coarse mesh is about five times larger than those of the fine mesh, or about 125 ft. The coarse mesh model results in a much smaller (as compared to the fine model) complex dynamic matrix to be solved at each frequency of interest, and allows the solutions to be obtained much more efficiently. The comparisons of results at low frequency (less than 10 Hz) are used to provide support and verification to the fine mesh solutions. This coarse mesh calculation is especially appropriate where the most significant 2D effects are expected to be most pronounced at low frequencies (below 10 Hz).
Figures 2.5.2-85 and 2.5.2-86 present the results of the horizontal surface response spectra for Locations A and B, respectively, from the 2D calculations for the fine mesh. The 2D spectra generated at the sites in Locations A and B span a distance of about 400 ft from the left to the right side. The lognormal mean of the three spectra for each site was also computed and is plotted in the figures. The three 2D spectral results show the scatter expected for three different locations in each area.
Figures 2.5.2-87 and 2.5.2-88 present the lognormal-mean horizontal 2D surface spectra for Locations A and B, respectively, as compared to the resulting 1D surface spectra. The 2D effect of the rock layering essentially eliminates the higher frequencies (above about 5 to 6 Hz) from the response; that is, the 2D response spectra fall off rapidly from the 1D response spectra at the higher frequencies. This is primarily due to the scattering of the high-frequency responses caused by the non-horizontal layer interfaces. Figures 2.5.2-89 and 2.5.2-90 present the same spectra as in Figures 2.5.2-87 and 2.5.2-88, but after smoothing with a seven-point averaging window. To achieve statistical stability of the spectral ratios, both the numerator (2D) and denominator (1D) were smoothed separately prior to taking the ratios.
Figure 2.5.2-91 presents the corresponding 2D/1D effect on smoothed surface spectral response for Locations A and B, in terms of response spectral ratios. The spectral ratios are all below 1 except for one small exceedances at Location B (less than 10 percent). The 2D scattering effect
2.5.2-68 Revision 2
Clinch River Nuclear SiteEarly Site Permit Application
Part 2, Site Safety Analysis Report
removes the higher frequency responses (above about 5 to 6 Hz). At lower frequencies, the 2D scattering effect can cause the response to increase but the ratios are still below 1 (Figure 2.5.2-91).
In calculating the GMRS, best-estimate base-case 1D profiles were developed representative of slices taken through the midpoints of Locations A and B extending to basement rock conditions (Subsection 2.5.2.5.1). To accommodate epistemic uncertainty in velocity, upper- and lower-range profiles and associated amplification factors were developed for Locations A and B for a total of six sets of profiles and associated amplification factors. For each location, hazard was developed as a weighted average of hazard computed for the best-estimate as well as lower- and upper-range profiles. The epistemic uncertainty in VS at each location was considered sufficient to accommodate both the occurrence of the same unit and dynamic material properties at different depths as well as broad-band amplification due to the dipping structure. The final GMRS was taken as an envelope of the hazard developed for Locations A and B (Subsection 2.5.2.5.8) (Reference 2.5.2-210).
Figure 2.5.2-107 compares the 1D amplification used in developing the GMRS with the 2D sensitivity analysis for Location A. In Figure 2.5.2-107 the 1D amplification factors shown are for the base-case profile and reflects the median estimate over 60 realizations. Since the 2D sensitivity calculation represents only a single analysis or realization, it has been smoothed using the Konno and Ohmachi algorithm (Reference 2.5.2-211) to reflect similar resolution as the 1D median estimate.
As Figure 2.5.2-107 illustrates, the 1D amplification factors significantly exceed the smoothed 2D factors computed in the sensitivity analysis across all frequencies except for a narrow frequency range around 2 Hz. Figure 2.5.2-108 illustrates the broadening of the 1D amplification by including the median amplification for the lower- and upper-range profiles.
For Location B, Figures 2.5.2-109 and 2.5.2-110 show the analogous plots comparing the 1D and 2D amplification factors. As with Location A, the 1D median estimate significantly exceeds the smoothed 2D factors except over a narrow frequency range near 2 Hz.
The 1D and 2D comparisons confirm that 2D effects were not expected to be a significant factor at the CRN Site due to the high VS and small impedance contrasts between dipping rock units.
In summary, in this sensitivity analysis, the resulting 2D response for the best-estimate profile properties indicates no significant exceedance of the 1D response. This is due to the site VS being high for this site and the differences in velocities between rock layers not being significant, reducing the magnitude of the 2D effects at lower frequencies of interest. As stated in Subsection 2.5.2.5.1, the use of multiple basescase velocity profiles in calculating the GMRS is expected to accommodate potential 2D effects from dipping layers. Also in examining the FAS of the small earthquakes recorded at Tellico Dam as part of the kappa evaluation, no broadband resonances were observed suggesting that 2D effects are not present at the site. Tellico Dam has a similar dipping structure beneath it as does the CRN Site. Hence no adjustment of the GMRS for 2D effects is required based on the implementation of multiple basecase VS profiles in the site response analysis and the results of the 2D sensitivity analysis.
2.5.2.7 References
2.5.2-1. Electric Power Research Institute, Department of Energy, and Nuclear Regulatory Commission, “Technical Report: Central and Eastern United States Seismic Source Characterization for Nuclear Facilities,” EPRI, Palo Alto, CA, DOE, and NRC, NUREG-2115, EPRI Report 1021097, 2012.
2.5.2-69 Revision 2

Clinch River Nuclear SiteEarly Site Permit Application
Part 2, Site Safety Analysis Report
2.5.2-2. Electric Power Research Institute, “Seismic Hazard Methodology for the Central and Eastern United States, Tectonic Interpretations,” Volumes 5-10, EPRI Report NP-4726, Palo Alto, California, July 1986.
2.5.2-3. Electric Power Research Institute, “Seismic Hazard Methodology for the Central and Eastern United States, Volume 1, Part 1: Theory; Volume 1, Part 2: Methodology (Revision 1),” EPRI Report NP-4726-A, Rev. 1, Palo Alto, California, November 1988.
2.5.2-4. Electric Power Research Institute, “Seismic Hazard Methodology for Central and Eastern United States, Volume 3: User’s Manual (Revision 1),” EPRI Report NP-4726-CCML-A, Palo Alto, California, February 1989.
2.5.2-5. Petersen, M.D., et al, “Incorporating Induced Seismicity in the 2014 United States National Seismic Hazard Model—Results of 2014 Workshop and Sensitivity Studies.” USGS Open-File Report 2015–1070, 69 pp., 2015.
2.5.2-6. Electric Power Research Institute, “Probabilistic Seismic Hazard Evaluations at Nuclear Power Plant Sites in the Central and Eastern United States: Resolution of the Charleston Earthquake Issue,” EPRI Report NP-6395-D, Project P101-53, Special Report, April 1989.
2.5.2-7. Electric Power Research Institute, “EQHAZARD Primer,” prepared by Risk Engineering for Seismicity Owners Group and EPRI, EPRI Report NP-6452-D, Palo Alto, California, June 1989.
2.5.2-8. Seeber, L., and J.G. Armbruster, “The NCEER-91 Earthquake Catalog: Improved Intensity-Based Magnitudes and Recurrence Relations for U.S. Earthquakes East of New Madrid,” Technical Report NCEER-91-0021, National Center for Earthquake Engineering Research, State University of New York at Buffalo, 1991.
2.5.2-9. Mueller, C., M. Hopper, and A. Frankel, “Preparation of Earthquake Catalogs for the National Seismic Hazard Maps—Contiguous 48 States,” U.S. Geological Survey Open-File Report 97-464, 36 pp., 1997.
2.5.2-10. Petersen, M.D., A. D. Frankel, S. C. Harmsen, C. S. Mueller, K. M. Haller, R. L. Wheeler, R. L. Wesson, Y. Zeng, O. S. Boyd, D. M. Perkins, N. Luco, E. H. Field, C. J. Wills, and K. S. Rukstales, “Documentation for the 2008 Update of the United States National Seismic Hazard Maps,” U.S. Geological Survey, Open-File Report 2008–1128, Vol. 1.1, 128 pp., 2008.
2.5.2-11. Adams, J., and S. Halchuk, “Fourth Generation Seismic Hazard Maps of Canada: Values for over 650 Canadian Localities Intended for the 2005 National Building Code of Canada,” Geological Survey of Canada, Open File 4459, 155 pp., 2003.
2.5.2-12. Electric Power Research Institute [EPRI], “CEUS Ground Motion Project Final Report,” Report TR-1009684, December 2004.
2.5.2-13. Gutenberg, B., and C.F. Richter, “Earthquake magnitude, intensity, energy and acceleration,” Bulletin of the Seismological Society of America, Vol. 46, No. 2, pp. 105–145, 1956.
2.5.2-14. Smith, W.E.T., “Earthquakes of eastern Canada and adjacent areas: 1534–1927,” Publications of the Dominion Observatory, Vol. XXVI, No. 5, pp. 271–302, 1962.
2.5.2-70 Revision 2

Clinch River Nuclear SiteEarly Site Permit Application
Part 2, Site Safety Analysis Report
2.5.2-15. Smith, W.E.T., “Earthquakes of eastern Canada and adjacent areas: 1928–1959,” Publications of the Dominion Observatory, Vol. XXXII, No. 3, pp. 87–121, 1966.
2.5.2-16. Reinbold, D.J., and A.C. Johnston, “Historical Seismicity in the Southern Appalachian Seismic Zone,” U.S. Geological Survey Open-File Report 87-433, 40 pp, 1987.
2.5.2-17. Atkinson, G.M., “Empirical attenuation of ground-motion spectral amplitudes in southeastern Canada and the northeastern United States,” Bulletin of the Seismological Society of America, Vol. 94, No. 3, pp. 1079–1095, 2004.
2.5.2-18. Atkinson, G.M., “Erratum to ―Empirical attenuation of ground-motion spectral amplitudes in southeastern Canada and the northeastern United States,” Bulletin of the Seismological Society of America, Vol. 94, No. 6, pp. 2419–2423, 2004.
2.5.2-19. Boatwright, J., “Regional propagation characteristics and source parameters of earthquakes in northeastern North America,” Bulletin of the Seismological Society of America, Vol. 84, No. 1, pp. 1–15, 1994.
2.5.2-20. Moulis, A., “The Development of a Moment-Magnitude Based Earthquake Catalog for the Northeastern United States,” M.S. thesis, Boston College, 2002.
2.5.2-21. Hanks, T.C., and H. Kanamori, “A moment magnitude scale,” Journal of Geophysical Research, Vol. 84, No. B5, pp. 2348–2350, 1979.
2.5.2-22. Tinti, S., and F. Mulargia, “Effects of magnitude uncertainties on estimating the parameters in the Gutenberg-Richter frequency-magnitude law,” Bulletin of the Seismological Society of America, Vol. 75, No. 6, pp. 1681–1697, 1985.
2.5.2-23. Dominion Virginia Power, “Final Safety Analysis Report (FSAR), Combined License Application Documents for North Anna, Unit 3 Application,” NRC Accession ML14007A479, FSAR Section 2.5.2 through Figure 2.5.2-225, 159 pp., Rev. 7, December 18, 2013.
2.5.2-24. Gardner, J. K. and L. Knopoff, “Is the sequence of earthquakes in Southern California, with aftershocks removed, Poissonian?” Bull. Seism. Soc. Am., Vol. 64, No. 5, 1363–1367, 1974.
2.5.2-25. Gutenberg, B. and C. F. Richter, “Frequency of earthquakes in California,” Bulletin of Seismological Society of America, Vol. 34, No. 4, pp. 185–188, 1944.
2.5.2-26. Stepp, J.C., “Analysis of completeness of the earthquake sample in the Puget Sound area and its effect on statistical estimates of earthquake hazard: Proceedings of the International Conference on Microzonation, Vol. 2, pp. 897–909, 1972.
2.5.2-27. MacCarthy, G.R., “Three forgotten earthquakes,” Bulletin of Seismological Society of America, Vol. 53, No. 3, pp. 687–692, 1963.
2.5.2-28. Stover, C.W., and J.L. Coffman, “Seismicity of the United States, 1568-1989,” U.S. Geological Survey Professional paper 1527, United States Government Printing Office, Washington, 1993.
2.5.2-71 Revision 2

Clinch River Nuclear SiteEarly Site Permit Application
Part 2, Site Safety Analysis Report
2.5.2-29. Taber, S. (1916). “The Earthquake in the Southern Appalachians, February 21, 1916,” Bull. Seism. Soc. Am., Vol. 6 No. 4 pp., 218–226.
2.5.2-30. Woolery, E., T. Lin, Z. Wang, and B. Shi, “The role of local soil-induced amplification in the 27 July 1980 northeastern Kentucky earthquake (abstract),” Environmental & Engineering Geoscience, Vol.14 No. 4, pp. 267–280, 2008.
2.5.2-31. Herrmann, R. B., C.A. Lanston, and J.E. Zoliweg, J. E. (1982). The Sharpsburg, Kentucky earthquake of July 27, 1980,” Bulletin of Seismological Society of America, Vol. 72, pp. 1219–1239, 1982.
2.5.2-32. Street, R., “Ground motion values obtained for the 27 July 1980 Sharpsburg, Kentucky, earthquake,” Bulletin of Seismological Society of America, Vol. 72, No. 4, pp. 1295–1307, 1982.
2.5.2-33. Street, R., A. Zekulin, M. Allsop, and D. Couch, “The Spatial Correlation Between a Lateral Seismic Velocity Discontinuity in the Precambrian Basement Rock and the Sharpsburg, Kentucky Earthquake of July 27, 1980,” Seismological Research Letters, Vol. 56, pp. 47–54, 1985.
2.5.2-34. Chapman, M.C., “The Rupture Process of the August 23, 2011 Louisa County, Virginia Earthquake,” Seismological Society of America Abstract, Seismological Research Letters, Vol. 83, p. 403, March/April 2012.
2.5.2-35. Cramer, C. H., J. R. Kutliroff, and D. T. Dangkua, “The 2011 M5.7 Mineral, VA and M5.6 Sparks, OK Earthquake Ground Motions and Stress Drops: An Important Contribution to the NGA East Ground Motion Database,” Seismological Society of America, Seismological Research Letters, Vol. 83, p. 420, March/April 2012.
2.5.2-36. Hough, S., “Initial Assessment of the Intensity Distribution of the 2011 Mw 5.8 Mineral, Virginia, Earthquake,” Seismological Research Letters, Vol. 83, No. 4, pp. 649–657, 2012.
2.5.2-37. Chapman, M.C., “Focal mechanisms and the geometry of basement faults in the eastern Tennessee seismic zone”, Seismological Research Letters, Vol. 67, No. 2, pp. 35, 1996.
2.5.2-38. Chapman, M.C., Powell, C.A., Vlahovic, G., and Sibol, M.S., “A statistical analysis of earthquake focal mechanisms and epicenter locations in the eastern Tennessee seismic zone”, Bulletin of the Seismological Society of America, Vol. 87, No. 6, pp. 1522–1536, 1997.
2.5.2-39. Cooley, M. T., C.A. Powell, “A New Set Of Focal Mechanisms For The Eastern Tennessee Seismic Zone,” Seismological Research Letters, Vol. 85, No. 2, p. 532, 2014.
2.5.2-40. Vlahovic, G., Powell, C., Chapman, M., and Sibol, M., “Joint hypocenter-velocity inversion for the Eastern Tennessee seismic zone”, Journal of Geophysical Research, Vol. 103, No. B3, pp. 4879–4896, 1998.
2.5.2-41. NUREG/CR-5250, “Seismic Hazard Characterization of 69 Nuclear Plant Sites East of the Rocky Mountains,” Vols. 1–8, 1989.
2.5.2-72 Revision 2

Clinch River Nuclear SiteEarly Site Permit Application
Part 2, Site Safety Analysis Report
2.5.2-42. NUREG/CR-6372, “Senior Seismic Hazard Analysis Committee (SSHAC), Recommendations for Probabilistic Seismic Hazard Analysis - Guidance on Uncertainty and Use of Experts,” 256 pp., 1997.
2.5.2-43. Hanks, T.C., Abrahamson, N.A., Boore, D.M., Coppersmith, K.J, and Knepprath, N.E., “Implementation of the SSHAC Guidelines for Level 3 and 4 PSHAs-Experience Gained from Actual Applications,” U.S. Geological Survey Open-File Report 2009-1093, 66 pp., 2009.
2.5.2-44. NRC, Practical Implementation Guidelines for SSHAC Level 3 and 4 Hazard Studies: Washington D.C., NRC, NUREG-2117, 227 pp., 2012.
2.5.2-45. Ellsworth, W.L., Matthews, M.V., Nadeau, R.M., Nishenko, S.P., Reasenberg, P.A., and Simpson, R.W., “A Physically-Based Earthquake Recurrence Model for Estimation of Long-Term Earthquake Probabilities,” U.S. Geological Survey Open-File Report 99-522, 1999.
2.5.2-46. Matthews, M.V., Ellsworth, W.L., and Reasenberg, P.A., “A Brownian Model for Recurrent Earthquakes,” Bulletin of the Seismological Society of America, 92:2233–2250, 2002.
2.5.2-47. Johnston, A.C., Coppersmith, K.J., Kanter, L.R., and Cornell, C.A., “The Earthquakes of Stable Continental Regions, Volume I: Assessment of Large Earthquake Potential,” EPRI Final Report TR-102261-V1, 1994.
2.5.2-48. Schulte, S.M., and Mooney, W.D., “An Updated Global Earthquake Catalog for Stable Continental Regions: Reassessing the Correlation with Ancient Rifts,” Geophysical Journal International, 161:707–721, 2005.
2.5.2-49. Kijko, A., “Estimation of the Maximum Earthquake Magnitude, Mmax,” Pure and Applied Geophysics, 161:1–27, 2004.
2.5.2-50. Manspeizer, W., DeBoer, J., Costain, J.K., Froelich, A.J., Ҫoruh, C., Olsen, P.E., McHone, G.J., Puffer, J.H., and Prowell, D.C., “Post Paleozoic activity,” in Hatcher, R.D., Jr., Thomas, W.A., and Viele, G.W., (editors), The Appalachian-Ouachita Orogen in the United States, Geological Society of America, The Geology of North America, v. F-2, Boulder, CO, pp. 319–374, 1989.
2.5.2-51. Swanson, M.T., “Preexisting fault control for Mesozoic basin formation in eastern North America,” Geology, 14:419–422, 1986.
2.5.2-52. Pavlides, L., Bobyarchick, A.B., Newell, W.L., and Pavich, M.J., “Late Cenozoic faulting along the Mountain Run fault zone, central Virginia Piedmont,” Geological Society of America Abstracts with Programs 15:55, 1983.
2.5.2-53. Prowell, D.C., “Cretaceous and Cenozoic tectonism on the Atlantic coastal margin” in Sheridan, R.E., and Grow, J. A., (editors), The Geology of North America, Volume I-2, The Atlantic Continental Margin, U.S., Geological Society of America, Boulder, CO, pp. 557–564, 1988.
2.5.2-54. Crone, A.J. and Wheeler, R.L., “Data for Quaternary Faults, Liquefaction Features, and Possible Tectonic Features in the Central and Eastern United States, East of the Rocky Mountain Front,” U.S. Geological Survey Open-File Report 00-260, 2000.
2.5.2-73 Revision 2

Clinch River Nuclear SiteEarly Site Permit Application
Part 2, Site Safety Analysis Report
2.5.2-55. Thomas, W.A., 2006, “Tectonic inheritance at a continental margin” GSA Today, 16(2): 4–11.
2.5.2-56. Wheeler, R.L., “Earthquakes and the Cratonward Limit of Iapetan faulting in eastern North America,” Geology, 23(2):105–108, 1995.
2.5.2-57. Mooney, W.D., and Ritsema, J., “Mmax and Lithospheric Structure in Central and Eastern North America,” Proceedings, Meeting of Central and Eastern U.S. (CEUS) Earthquake Hazards Program, October 28–29, 2009, Memphis, TN, 2009.
2.5.2-58. McBride, J.H., Leetaru, H.E., Bauer, R.A., Tingey, B.E., and Schmidt, S.E.A., “Deep faulting and structural reactivation beneath the southern Illinois basin” Precambrian Research, 157:289–313, 2007.
2.5.2-59. Ervin, C.P., and McGinnis, L.D., “Reelfoot rift: reactivated precursor to the Mississippi embayment,” Geological Society of America Bulletin, 86:1287–1295, 1975.
2.5.2-60. Thomas, W.A., 1991, The Appalachian-Ouachita rifted margin of southeastern North America: Geological Society of America Bulletin, Vol. 103, No. 3, pp. 415–431.
2.5.2-61. Csontos, R., Van Arsdale, R., Cox, R., and Waldron, B., “Reelfoot rift and its impact on Quaternary deformation in the central Mississippi River Valley,” Geosphere, 4(1):145–158, 2008.
2.5.2-62. Braile, L.W., Keller, G.R., Hinze, W.J., and Lidiak, E.G., “An ancient rift complex and its relation to contemporary seismicity in the New Madrid seismic zone,” Tectonics, 1:225–237, 1982.
2.5.2-63. Braile, L.W., Hinze, W.J., Keller, G.R., Lidiak, E.G., and Sexton, J.L., “Tectonic development of the New Madrid Rift Complex, Mississippi Embayment, North America,” Tectonophysics, 131:1–21, 1986.
2.5.2-64. Kolata, D.R., and Nelson, W.J., “Tectonic history of the Illinois Basin” in Leighton, M.W., Kolata, D.R., Oltz, D.F., and Eidel, J.J. (editors), Interior Cratonic Basins, AAPG Memoir 51, Chapter 18, pp. 263–285, 1991.
2.5.2-65. Saucier, R., “Geoarchaeological Evidence of Strong Prehistoric Earthquakes in the New Madrid (Missouri) Seismic Zone,” Geology, 19:296–298, 1991.
2.5.2-66. Tuttle, M.P., and Schweig, E.S., “Towards a Paleoearthquake Chronology of the New Madrid Seismic Zone” U.S. Geological Survey, Earthquake Hazards Program, Progress Report (99HQGR0022), 28 pp., 2001.
2.5.2-67. Tuttle, M.P., Schweig, E.G., Sims, J.D., Lafferty, R.H., Wolf, L.W., and Haynes, M.L., “The Earthquake Potential of the New Madrid Seismic Zone,” Bulletin of the Seismological Society of America 92(6):2080–2089, 2002.
2.5.2-68. Schweig, E., III, Campbell, J., Thomas, P.M., Sims, J.D., and Lafferty, R.H., III, “Evidence for New Madrid earthquakes in A.D. 300 and 2350 B.C.,” Seismological Research Letters, 76(4):489–501, 2005.
2.5.2-74 Revision 2

Clinch River Nuclear SiteEarly Site Permit Application
Part 2, Site Safety Analysis Report
2.5.2-69. Schweig, E.S., and Ellis, M.A., “Reconciling Short Recurrence Intervals with Minor Deformation in the New Madrid Seismic Zone,” Science, 264:1308–1311, 1994.
2.5.2-70. Van Arsdale, R.B., “Displacement History and Slip Rate on the Reelfoot Fault of the New Madrid Seismic Zone,” Engineering Geology, 55(4):219–226, 2000.
2.5.2-71. Holbrook, J., Autin, W.J., Rittenour, T.M., Marshak, S., and Goble, R.J., “Stratigraphic Evidence for Millennial-Scale Temporal Clustering of Earthquakes on a Continental-Interior Fault: Holocene Mississippi River Floodplain Deposits, New Madrid Seismic Zone, USA,” Tectonophysics 420:431–454, 2006.
2.5.2-72. Calais, E., Mattioli, G., DeMets, C., Nocquet, J.-M., Stein, S., Newman, A., and Rydelek, P., “Tectonic strain in plate interiors?” Nature, 438:89–90, 2005.
2.5.2-73. Smalley, R., Jr., Ellis, M.A., Paul, J., and VanArsdale, R.B., “Space Geodetic Evidence for Rapid Strain Rates in the New Madrid Seismic Zone of the Central USA,” Nature, 435:1088–1090, 2005.
2.5.2-74. Bakun, W.H. and Hopper, M.G., “Magnitudes and Locations of the 1811-1812 New Madrid, Missouri, and the 1886 Charleston, South Carolina, Earthquakes,” Bulletin of the Seismological Society of America 94 (1):64–75, 2004.
2.5.2-75. Hough, S.E., and Page, M., “Toward a Consistent Model for Strain Accrual and Release for the New Madrid, Central United States,” Journal of Geophysical Research, 116(B03311):1–17, 2011.
2.5.2-76. Obermeier, S.F., Weems, R.E., Jacobson, R.B., and Gohn, G.S., “Liquefaction Evidence for Repeated Holocene Earthquakes in the Coastal Region of South Carolina,” Annals of the New York Academy of Sciences 558:183–195, 1989.
2.5.2-77. Amick, D., Maurath, G., and Gelinas, R., “Characteristics of Seismically Induced Liquefaction Sites and Features Located in the Vicinity of the 1886 Charleston, South Carolina Earthquake,” Seismological Research Letters, 61 (2):117–130, 1990.
2.5.2-78. Weems, R.E., and Obermeier, S.F., “The 1886 Charleston earthquake-An Overview of Geological Studies,” in Proceedings of the NRC Seventeenth Water Reactor Safety Information Meeting, NUREG/CP-0105, Vol. 2, pp. 289–313, 1990.
2.5.2-79. NUREG/CR-5613, “Paleoliquefaction Features along the Atlantic Seaboard,” 1990.
2.5.2-80. Talwani, P. and Schaeffer, W.T., “Recurrence Rates of Large Earthquakes in the South Carolina Coastal Plain Based on Paleoliquefaction Data,” Journal of Geophysical Research, 106(B4):6621–6642, 2001.
2.5.2-81. Talwani, P., Dura-Gomez, I., Gassman, S., Hasek, M., and Chapman, A., “Studies related to the Discovery of a Prehistoric Sandblow in the Epicentral Area of the 1886 Charleston SC Earthquake: Trenching and Geotechnical Investigations” Program and Abstracts, Eastern Section of the Seismological Society of America, p. 50, 2008.
2.5.2-82. Chapman, M. C., and Beale, J. N., “Mesozoic and Cenozoic faulting imaged at the epicenter of the 1886 Charleston, South Carolina, Earthquake,” Bulletin of the Seismological Society of America, 98:2533–2542, 2008.
2.5.2-75 Revision 2

Clinch River Nuclear SiteEarly Site Permit Application
Part 2, Site Safety Analysis Report
2.5.2-83. Chapman, M. C., and Beale, J. N., “On the geologic structure at the epicenter of the 1886 Charleston, South Carolina, earthquake,” Bulletin of the Seismological Society of America, 100:1010–1030, 2010.
2.5.2-84. Hu, K., Gassman, S. L., Talwani, P., “In-situ properties of soils at paleoliquefaction sites in the South Carolina coastal plain,” Seismological Research Letters, 73:962–978, 2002.
2.5.2-85. Hu, K., Gassman, S. L., Talwani, P., “Magnitudes of Prehistoric earthquakes in the South Carolina Coastal Plain from geotechnical data,” Seismological Research Letters, 73:979–991, 2002.
2.5.2-86. Leon, E., Gassman, S. L., Talwani, P., “Effect of soil aging on assessing magnitudes and accelerations of prehistoric earthquakes,” Earthquake Spectra, 21:737-759, 2005.
2.5.2-87. Gassman, S., Talwani, P., Hasek, M., “Magnitudes of Charleston, South Carolina Earthquakes from in-situ geotechnical data,” presentation at CEUS Earthquake Hazards Program, USGS, October 28–29, Memphis, TN, 2009.
2.5.2-88. Hatcher, R.D., Vaughn, J.D., and Obermeier, S.F., “Large earthquake paleoseismology in the East Tennessee seismic zone: Results of an 18-month pilot study,” in Cox, R.T., Tuttle, M.P., Boyd, O.S., and Locat, J., (editors), Geological Society of America Special Paper 493, Boulder, CO, pp. 111–142, 2012.
2.5.2-89. Warrell, K.F., Detailed Geologic Studies of Paleoseismic Features Exposed at Sites in the East Tennessee Seismic Zone: Evidence for Large, Prehistoric Earthquakes, Master’s Thesis, University of Tennessee, 131 pp., 2013.
2.5.2-90. Chapman, M.C., Munsey, J.W., Powell, C.A., Whisner, S.C., and Whisner J., “The Eastern Tennessee Seismic Zone - Summary after 20 Years of Network Monitoring,” Seismological Research Letters 73 (2):245, 2002.
2.5.2-91. Obermeier, S.F., Vaughn, J.D., and Hatcher, R.D., “Field Trip Guide: Paleoseismic Features in and near Douglas Reservoir, East Tennessee Seismic Zone, Northeastern Tennessee,” 25 pp., 2010.
2.5.2-92. Vaughn, J. D., Obermeier, S. F., Hatcher, R. D., Howard, C. W., Mills, H. H., and Whisner, S. C., “Evidence for One or More Major Late Quaternary Earthquakes and Surface Faulting in the East Tennessee Seismic Zone,” Seismological Research Letters, 81(2):323, 2010.
2.5.2-93. Howard, C.W., Derryberry, P.M., Hatcher, R.D. Jr., Vaughn, J.D., and Obermeier, S.F., “Detailed geologic maps of two sites south of Dandridge, Tennessee, record evidence of polyphase paleoseismic activity in the East Tennessee seismic zone,” Geological Society of America Abstracts with Programs, 43(2):31, 2011.
2.5.2-94. Warrell, K.F., Hatcher, R.D. Jr., Blankenship, S.A., Howard, C.W., Derryberry, P.M., Wunderlich, A.L., Obermeier, S.O., Counts, R.C., and Vaughn, J.D., “Detailed geologic mapping of paleoseismic features: an added tool for seismic hazard assessment in the East Tennessee seismic zone,” Geological Society of America Abstracts with Programs, 44(4):19, 2012.
2.5.2-76 Revision 2

Clinch River Nuclear SiteEarly Site Permit Application
Part 2, Site Safety Analysis Report
2.5.2-95. U.S. Geological Survey (USGS) Earthquake Hazards Program, “Preliminary Earthquake Report: Magnitude 5.8 - Virginia, 2011 August 23 17:51:04 UTC,” Website: http://earthquake.usgs.gov/earthquakes/recenteqsww/Quakes/se082311a.php, accessed May 2, 2012.
2.5.2-96. Chapman, M. C., “On the rupture process of the 23 August 2011 Virginia earthquake,” Bulletin of the Seismological Society of America, 103(2a):613–628, 2013.
2.5.2-97. Burton, W.C., Spears, D.B., Harrison, R.W., Evans, N.H., Schindler, J.S., and Counts, R., “Geology and neotectonism in the epicentral area of the 2011 M5.8 Mineral, Virginia, earthquake,” Geological Society of America Field Guide, 35:103–127, 2014.
2.5.2-98. Horton, J.W., Chapman, M.C., Carter, A.M., Carter, M.W., Harrison, R.W., Herrmann, R.B., and Snyder, S.L., “Faults Delineated by Aftershocks Associated with the 2011 Central Virginia Earthquake and their Tectonic Setting,” Geological Society of America, Abstracts with Programs, 44(4):14, 2012.
2.5.2-99. Virginia Tech Seismological Observatory (VTSO), “Louisa County Earthquake: August 23, 2011,” Website: http://www.magma.geos.vt.edu/vtso/2011/0823-louisa, accessed February 16, 2012.
2.5.2-100. Ellsworth, W.L., Imanishi, K., Aist, T., Luetgert, J.H., and Pratt, T.L., “The Mw5.8 Virginia earthquake of August 23, 2011: A high stress drop event in a critically stressed crust,” 83rd Annual Meeting of the Eastern Section of the Seismological Society of America, October 16–18, Little Rock, AR, 2011.
2.5.2-101. Saint Louis University (SLU) Earthquake Center, “Aftershock monitoring (for the 2011 Virginia Earthquake), St. Louis University Earthquake Center,” Website: http://www.eas.slu.edu/eqc/eqcsignificant/2011_Virginia/aftershock.html, accessed May 8, 2012.
2.5.2-102. Saint Louis University (SLU) Earthquake Center, “August 23, 2011 Virginia,” Website: http://www.eas.slu.edu/eqc/eqcsignificant/2011_Virginia/aftershock.html, accessed December 16, 2013.
2.5.2-103. Atkinson, G.M., and Wald, D.J., “Did You Feel It?” intensity data-A surprisingly good measure of earthquake ground motion: Seismological Research Letters, 78 (3):362-368, 2007.
2.5.2-104. Assatourians, K., and Atkinson, G.M., Ground motion characteristics of the 2011 Virginia and 1988 Quebec M5.8 earthquakes, Abstract S14B-04 presented at 2011 Fall Meeting, AGU, San Francisco, CA, 2011.
2.5.2-105. Carter, M.W., Blanpied, M.L., Leeds, A.L., Harp, E.L., McNamara, D.E., Harrison, R.W., and Schindler, J.S., “USGS response to the Mineral, Virginia MW 5.8 earthquake of 23 August 2011,” Geological Society of America, Southeastern Section Annual Meeting, 1-2 April, Asheville, NC, 2012.
2.5.2-106. Earthquake Engineering Research Institute (EERI), “The Mw 5.8 Virginia earthquake of August 23, 2011,” EERI Special Earthquake Report, 2011.
2.5.2-77 Revision 2

Clinch River Nuclear SiteEarly Site Permit Application
Part 2, Site Safety Analysis Report
2.5.2-107. Geotechnical Extreme Events Reconnaissance (GEER), “Geotechnical quick report on the affected region of the 23 August 2011 M5.8 Central Virginia earthquake near Mineral, Virginia,” GEER Association Report No. GEER-026, 2011.
2.5.2-108. Green, R.A., and Lasley, S., “Liquefaction resulting from the 2011 Central Virginia earthquake,” Geological Society of America Abstracts with Programs, 44(4):14, 2012
2.5.2-109. Richards, J.M., Electric Power Research Institute (EPRI) Memorandum RSM-072814-085, July 28, 2014.
2.5.2-110. Richards, J.M., Electric Power Research institute (EPRI) Memorandum RSM-111414-090, December 1, 2014.
2.5.2-111. Somerville, P.G., N. Collins, N. Abrahamson, R. Graves and C. Saikia, “Earthquake source scaling and ground motion attenuation relations for the central and eastern United States,” Final Report to the U.S. Geological Survey, Contract No. 99HQGR0098, 2001.
2.5.2-112. Wells D.L., and Coppersmith, K.J., New empirical relationships among magnitude, rupture length, rupture width, rupture area, and surface displacement, Bulletin of the Seismological Society of America, Vol. 84, pp. 974–1002, 1994.
2.5.2-113. Steltenpohl, M.G., Zietz, I., Horton, J.W., Jr., and Daniels, D.L., New York-Alabama lineament: A buried right-slip fault bordering the Appalachians and mid-continent North America: Geology, Vol. 38, No. 6, pp. 571–574, 2010.
2.5.2-114. Chapman, M.C., Powell, C.A., Vlahovic, G., and Sibol, M.S., “A statistical analysis of earthquake focal mechanisms and epicenter locations in the eastern Tennessee seismic zone,” Bulletin of the Seismological Society of America, Vol. 87, No. 6, pp. 1522–1536, 1997.
2.5.2-115. Bollinger, G.A., and Wheeler, R.L., “The Giles County seismic zone,” Science, Vol. 219, pp. 1063–1065, 1983.
2.5.2-116. Bollinger, G.A., and Wheeler, R.L., “The Giles County, Virginia, Seismogenic Zone-Seismological Results and Geological Interpretations,” U.S. Geological Survey Professional Paper 1355, 85 pp., 1988.
2.5.2-117. Law, R.D., Pope, M.C., Wirgart, R.H., Eriksson, K.A., Carpenter, D., Robinson, E.S., and Bollinger, G.A., Geologically recent near surface folding and faulting in the Valley and Ridge Province: New exposures of extensional faults in alluvial sediments, Giles County, SW, 1993.
2.5.2-118. Chapman, M.C., and Krimgold, F., “Seismic Hazard Assessment for Virginia: report prepared for the Virginia Department of Emergency Services and the Federal Emergency Management Agency,” Virginia Tech Seismological Observatory, Blacksburg, VA, 62 pp., 1994.
2.5.2-119. Law, R.D., Pope, M.C., Wirgart, R.H., Eriksson, K.A., Robinson, E.S., Sayer, S., Phinney, E.J., and Bollinger, G.A., Geologically recent near-surface faulting and folding in Giles County, southwest Virginia: New exposures of extensional and apparent reverse faults in alluvial sediments between Pembroke and Pearisburg:
2.5.2-78 Revision 2

Clinch River Nuclear SiteEarly Site Permit Application
Part 2, Site Safety Analysis Report
Proceedings of the NRC for 1994, Twenty-First Water Reactor Safety Information Meeting, October 25-27, 1993, Bethesda, Maryland, NUREG/CP-0133, Vol. 3, pp. 415–432, 1994.
2.5.2-120. Law, R.D., Robinson, E.S., Cyrnak, J.S., Sayer, S., Williams, R.T., Callis, J., and Pope, M., Geologically-recent faulting and folding of alluvial sediments near Pearisburg, Giles County, Virginia-Tectonic faulting or karst subsidence in origin? [abstract]: Eos, Transactions of the American Geophysical Union, Vol. 78, No. 17 (supplement), p. S316, 1997.
2.5.2-121. Keller, M.R., Robinson, E.S., and Glover III, L., Seismicity, seismic reflection, gravity, and geology of the central Virginia seismic zone: Part 3. Gravity: Geological Society of America Bulletin, Vol. 96, pp. 1580–1584, 1985.
2.5.2-122. de Witt, W., and Bayer, K.C., “Seismicity, seismic reflection, gravity, and geology of the Central Virginia Seismic Zone: Part 3. Gravity: Discussion and reply,” Geological Society of America Bulletin, Vol. 97, Discussion, pp. 1285–1286, 1986.
2.5.2-123. Obermeier, S.F., Paleoseismic liquefaction studies-Central U.S. and Pacific Northwestern U.S.: in Jacobsen, M.L. (compiler), National Earthquake Hazards Reduction Program Annual Project Summaries: XXXVI, Vol. II, U.S. Geological Survey Open-File Report 95-210, pp. 606–609, 1995.
2.5.2-124. Seeber, L., and Armbruster, J.G., Natural and induced seismicity in the Lake Erie-Lake Ontario region: Reactivation of ancient faults with little neotectonic displacement: Géographie physique et Quaternaire, Vol. 47, No. 3, pp. 363–378, 1993.
2.5.2-125. Dineva, S., Eaton, D., and Mereu, R., “Seismicity of the southern Great Lakes: Revised earthquake hypocenters and possible tectonic controls,” Bulletin of the Seismological Society of America, Vol. 94, No. 5, pp. 1902–1918, 2004.
2.5.2-126. Wheeler, R.L., and A.J. Crone, “Known and suggested Quaternary faulting in the midcontinent United States: Engineering Geology,” 62: 51–78, 2001.
2.5.2-127. Niemi, T.M., Ferris, A.N., and Abers, G.A., 2004, Investigation of microearthquakes, macroseismic data, and liquefaction associated with the 1867 Wamego earthquake in eastern Kansas: Bulletin of the Seismological Society of America, Vol. 94, No. 6, pp. 2317–2329.
2.5.2-128. Electric Power Research Institute, “Program on Technology Innovation: Truncation of the Lognormal Distribution and Value of the Standard Deviation for Ground Motion Models in the Central and Eastern United States,” EPRI Report 1013105, Technical Update, February, Palo Alto, CA, 2006.
2.5.2-129. Electric Power Research Institute (Electric Power Research Institute (EPRI), “EPRI (2004, 2006) Ground-Motion Model (GMM) Review Project,” Elec. Power Res. Inst, Palo Alto, CA, Rept. 3002000717, 2 volumes, June 2013.
2.5.2-130. Nuclear Regulatory Commission, “Approval of Electrical Power Research Institute Ground Motion Model Review Project for Use by Central and Eastern United States Nuclear Power Plants,” ML13233A102, August 28, 2013.
2.5.2-79 Revision 2

Clinch River Nuclear SiteEarly Site Permit Application
Part 2, Site Safety Analysis Report
2.5.2-131. McGuire, R.K., “Seismic Hazard and Risk Analysis,” EERI Monograph MNO-10, Earthquake Engineering Research Institute, Oakland, CA, 2004.
2.5.2-132. McGuire, R.K., W. J. Silva, and C. J. Costantino, “Technical Basis for Revision of Regulatory Guidance on Design Ground Motions, Hazard- and Risk-consistent Ground Motion Spectra Guidelines,” prepared for Nuclear Regulatory Commission, NUREG/CR-6728, 2001.
2.5.2-133. Building Seismic Safety Council, “NEHRP Recommended Provisions for Seismic Regulations for New Buildings and Other Structures,” FEMA Rept. P-750, 2009 Ed., Washington DC.
2.5.2-134. Toro, G., Probabilistic Models of Site Velocity Profiles for Generic and Site-Specific Ground Motion Amplification Studies, Published as Appendix C in Silva, W.J., Abrahamson, N.A., Toro, G., and Constantino, C., Description and Validation of the Stochastic Ground Motion Model, Brookhaven National Laboratory, Upton, NY, Contract 770573, 1997.
2.5.2-135. American Society of Civil Engineers and Structural Engineering Institute. “Seismic Design Criteria for Structures, Systems, and Components in Nuclear Facilities.” ASCE/SEI Standard 43-05, 103 pp., January 1, 2005.
2.5.2-136. Electric Power Research Institute, “Guidelines for Determining Design Basis Ground Motions,” Vol. 1–5, EPRI TR-102293, Electric Power Research Institute, Palo Alto, CA, 1993.
2.5.2-137. Gülerce, Z, and N. Abrahamson, “Site-Specific Design Spectra for Vertical Ground Motion,” Earthquake Spectra, Vol. 27, No. 4, pp. 1023–1047, 2011.
2.5.2-138. Swissnuclear, Probabilistic seismic hazard analysis for Swiss Nuclear Power Plant Sites - PEGASOS Refinement Project. Final Report, Vol. 1–5. Volume 4: SP2 – Ground motion characterization – Evaluation Summaries and Hazard Input Documents, 2013.
2.5.2-139. Electric Power Research Institute, “Seismic Evaluation Guidance: Screening, Prioritization, and Implementation Details (SPID) for the Resolution of Fukushima Near-Term Task Force Recommendation 2.1: Seismic,” EPRI Report 1025287, Palo Alto, CA, February 2013.
2.5.2-140. Silva, W.J., Darragh, R., Gregor, N., Martin, G., Kircher, C., and Abrahamson N.,Reassessment of site coefficients and near-fault factors for building code provisions, Final Report USGS Grant award #98-HQ-GR-1010. 2000.
2.5.2-141. Van Houtte, C., Drouet, S., and Cotton, F., 2011, Analysis of the origins of κ (kappa) to compute hard rock to rock adjustment factors for GMPEs: Bulletin of the Seismological Society of America, Vol. 101, pp. 2926–2941.
2.5.2-142. Silva, W.J., Abrahamson, N., Toro, G., and Costantino, C., Description and Validation of the Stochastic Ground Motion Model. El Cerrito, CA: Pacific Engineering and Analysis,1996.
2.5.2-143. Bazzurro, P. and Cornell, C.A., Nonlinear soil-site effects in probabilistic seismic-hazard analysis: Bulletin of the Seismological Society of America, v. 94, pp. 2110–2123, 2004.
2.5.2-80 Revision 2

Clinch River Nuclear SiteEarly Site Permit Application
Part 2, Site Safety Analysis Report
2.5.2-144. McGuire, R.K., Silva, W.J., and Costantino, C.J., Technical Basis for Revision of Regulatory Guidance on Design Ground Motions: Development of Hazard- and Risk-consistent Seismic Spectra for Two Sites, NRC NUREG/CR-6769, 2002.
2.5.2-145. Lee, R., Silva, W.J., and Cornell, C.A., Alternatives in evaluating soil- and rock-site seismic hazard (abs.): Seismological Research Letters, Vol. 69, p. 81, 1998.
2.5.2-146. Lee, R., Maryak, M.E., and Kimball, J., A methodology to estimate site-specific seismic hazard for critical facilities on soil or soft-rock sites (abs.): Seismological Research Letters, Vol. 70, p. 230, 1999.
2.5.2-147. Idriss, I.M. and Seed, H.B., Seismic response of horizontal soil layers: Journal of the Soil Mechanics and Foundations Division, Vol. 94, pp. 1003–1031, 1968.
2.5.2-148. Schnabel, P.B., Lysmer, J. and Seed, H.B., SHAKE - A computer program for earthquake analysis of horizontally layered sites: Earthquake Engineering Research Center, University of California, Berkeley, Report No. EERC 72-12, 1972.
2.5.2-149. Silva, W.J. and Lee, K., WES RASCAL code for synthesizing earthquake ground motions: State-of-the-art for Assessing Earthquake Hazards in the United States, Report 24: U.S. Army Engineer Waterways Experiment Station Miscellaneous Paper S-73-1, 120 pp., 1987.
2.5.2-150. Silva, W.J., Body waves in a layered anelastic solid, Bulletin of the Seismological Society of America, Vol. 66, pp. 1539–1554, 1976.
2.5.2-151. Bozorgnia, Y. and Campbell, K.W., The vertical-to-horizontal response spectral ratio and tentative procedures for developing simplified V/H and vertical design spectra: Journal of Earthquake Engineering, Vol. 8, p. 175–207, 2004.
2.5.2-152. Bommer, J.J., Akkar, S., Kale, O., A model for vertical-to-horizontal response spectral ratios for Europe and the Middle East: Bulletin of Seismological Society of America, v. 101, Vol. 1783–1806, 2011.
2.5.2-153. Edwards, B., Poggi, V., and Fäh, D., A predictive equation for the vertical-to-horizontal ratio of ground-motion at rock sites based on shear wave velocity profiles from Japan to Switzerland: Bulletin of Seismological Society of America, Vol 101, pp. 2998–3019, 2011.
2.5.2-154. PEER (Pacific Earthquake Engineering Research), NGA-West2 ground motion prediction equations for vertical ground motions, PEER Report 2013/24, 2013.
2.5.2-155. Campbell, K.W., Estimates of shear-wave Q and κo for unconsolidated and semiconsolidated sediments in Eastern North America: Bulletin of the Seismological Society of America, Vol. 99, pp. 2365–2392, 2009.
2.5.2-156. Boore, D.M., 1983, Point-source simulation of high-frequency ground motions based on seismological models of the radiated spectra: Bulletin of the Seismological Society of America, Vol. 73, pp. 1865–1894.
2.5.2-157. Jongmans, D. and Malin, P.E., Microearthquake S-wave Observations from 0 To 1 km in the Varian Well at Parkfield, California: Bulletin of Seismological Society of America, Vol. 85, p. 1805–1820, 1995.
2.5.2-81 Revision 2

Clinch River Nuclear SiteEarly Site Permit Application
Part 2, Site Safety Analysis Report
2.5.2-158. Atkinson, G.M. Single-station sigma: Bulletin of the Seismological Society of America, 96, 446–455, 2006.
2.5.2-159. Al Atik, L., N.A. Abrahamson, J.J. Bommer, F. Scherbaum, F. Cotton, and N. Kuehn,, The variability of ground-motion prediction models and its components: Seismological Research Letters, 81, 794–801, 2010.
2.5.2-160. Silva, W.J., Factors controlling strong ground motions and their associated uncertainties, Seismic and Dynamic Analysis and Design Considerations for High Level Nuclear Waste Repositories, ASCE, pp. 132–161,1992.
2.5.2-161. Atkinson, G.M. and Boore, D.M., Ground motion relations for eastern North America: Bulletin of the Seismological Society of America, Vol. 85, pp. 17–30, 1995.
2.5.2-162. Walling, M.A., Silva, W. and Abrahamson, N.A., Nonlinear site amplification factors for constraining the NGA models: Earthquake Spectra, Vol. 24, p. 243–255, 2008.
2.5.2-163. Kamai, R., Abrahamson, N.A., and Silva, W.J., Nonlinear horizontal site amplification for constraining the NGA-West2 GMPEs, Earthquake Spectra, Vol. 30, pp. 1223-1240, 2014.
2.5.2-164. Boore, D.M., The uses and limitations of the square-root-impedance method for computing site amplification: Bulletin of the Seismological Society of America, 103, pp. 2356–2368, 2013.
2.5.2-165. Rodriguez-Marek, A., G.A. Montalva, F. Cotton, and F. Bonilla, 2011, Analysis of single-station standard deviation using the KiK-net data: Bulletin of Seismological Society of America, Vol. 101, pp. 1242–1258, 2011.
2.5.2-166. Abrahamson, N.A. and W.J.Silva, Summary of the Abrahamson and Silva NGA ground motion relations. Earthquake Spectra, Vol. 24, p. 67–97, 2008.
2.5.2-167. Johnston, D.H, and M.N. Toksoz, Thermal cracking and amplitude dependent attenuation: Journal of Geophysical Research, Vol. 85, p. 937–942, 1980.
2.5.2-168. Silva, W.J. and R. Darragh, Engineering characterization of strong ground motion recorded at rock sites: Electric Power Research Institute, EPRI TR-102262, 1995.
2.5.2-169. Bard, P.Y. and J. Gariel, The seismic response of two-dimensional sedimentary deposits with large vertical velocity gradients: Bulletin of the Seismological Society of America, Vol. 76, pp. 343–366, 1986.
2.5.2-170. Fattah, M., T. Schanz, and S. Dawood, The role of transmitting boundaries in modeling dynamic soil-structure interaction problems: International Journal of Engineering and Technology, Vol. 2, 2012.
2.5.2-171. Lysmer, J. and R.L. Kuhlemeyer, Finite-dynamic model for infinite media: ASCE, JEM Div., Vol. 95, p. 859, 1969.
2.5.2-172. URS Corporation, Site-specific probabilistic seismic hazard analysis and development of ground motion response spectra for Watts Bar Nuclear Plant Unit 2: unpublished report prepared for Tennessee Valley Authority, 2014.
2.5.2-82 Revision 2
Clinch River Nuclear SiteEarly Site Permit Application
Part 2, Site Safety Analysis Report
2.5.2-173. Hatcher, R.D., Jr., Report to accompany cross-sections through the proposed CRN Nuclear site, unpublished report prepared for TVA, 2015.
2.5.2-174. Boore, D.M. and Joyner, W.B., Site amplifications for generic rock sites: Bulletin of the Seismological Society of America, Vol. 87, p. 327-341, 1997.
2.5.2-175. Anderson, J.G. and S.E. Hough, A model for the shape of the Fourier amplitude spectrum of acceleration at high frequencies: Bulletin of the Seismological Society of America, Vol. 74, p. 1969-1993, 1984.
2.5.2-176. Silva, W.J. and R. Darragh, Engineering characterization of strong ground motion recorded at rock sites: Electric Power Research Institute, EPRI TR-102262, 1995.
2.5.2-177. Laurendeau, A., F. Cotton, O.-J. Ktenidou, L.-F. Bonilla, and F. Hollender, Rock and stiff-soil site amplification: Dependency on VS30 and kappa: Bulletin of Seismological Society of America, Vol. 103(6), p. 3131-3148, 2013.
2.5.2-178. Hatcher, R. D., Lemiszki, P. J., and Whisner, J. B., Character of rigid boundaries and internal deformation of the southern Appalachian foreland fold-thrust belt: Geological Society of America Special Papers 2007, Vol. 433, p. 243-276, 2007.
2.5.2-179. Ktenidou, O.-J., Cotton, F., Abrahamson, N.A., and Anderson, J.G., Taxonomy of kappa: a review of definitions and estimation methods targeted to applications: Seismological Research Letters, Vol. 85(1), p. 135-146, 2014.
2.5.2-180. Ancheta, T.D., Darragh, R.B., Stewart, J.P., Seyhan, E., Silva, W.J., Chiou, B.S.J., Woodell, K.E., Graves, R.W., Kottke, A.R., Boore, D.M., Kishida, T. and Donahue, J.L., PEER NGA-West2 Database: PEER Report 2013/03, Pacific Earthquake Engineering Research Center, Berkeley, CA, 2013.
2.5.2-181. Goulet, C. A., Kishida, T., Ancheta, T.D., Cramer, C. H. Darragh, R.B., Silva, W.J., Hashash, Y. M. A., Harmon, J., Stewart, J.P., Woodell, K.E., and Youngs, R. R., PEER NGA-East Database: PEER Report 2014/17, Pacific Earthquake Engineering Research Center, Berkeley, CA., 2014
2.5.2-182. Boore, D.M. and Atkinson, G. M., Point-source prediction of ground motion and spectral response parameters at hard-rock sites in eastern North America: Bulletin of Seismological Society of America, Vol. 77(2), p. 440-467, 1987.
2.5.2-183. Toro, G.R. and McGuire, R.K., An investigation into earthquake ground motion characteristics in eastern North America: Bulletin of Seismological Society of America, Vol. 77(2), p. 468-489, 1987.
2.5.2-184. Silva, W.J., and Green, R.K., Magnitude and distance scaling of response spectral shapes for rock sites with applications to North American tectonic environment: Earthquake Spectra, Vol. 5(3), p. 591-624, 1989.
2.5.2-185. Silva, W.J., Global characteristics and site geometry: Chapter 6 in Proceedings NSF/EPRI Workshop of Dynamic Soil Properties and Site Characterization. Palo Alto, CA. Electric Power Research Institute, EPRI NP-7337, 1991.
2.5.2-186. Darragh, B. Abrahamson, N.A., Silva, W.J. and Gregor, N., Development of hard rock ground-motion models for Region 2 of Central and Eastern North America: in Goulet, C. A., Kishida, T., Ancheta, T.D., Cramer, C. H. Darragh, R.B., Silva, W.J.,
2.5.2-83 Revision 2

Clinch River Nuclear SiteEarly Site Permit Application
Part 2, Site Safety Analysis Report
Hashash, Y. M. A., Harmon, J., Stewart, J.P., Woodell, K.E., and Youngs, R. R. (2014). PEER NGA-East Database, PEER Report 2014/17, Pacific Earthquake Engineering Research Center, Berkeley, CA, 2014.
2.5.2-187. Kishida, T., Kayen, R. E., Ktenidou, O-J., Silva, W.J., Darragh, R.B., and Watson-Lamprey, J., PEER Arizona Strong-Motion Database and GMPEs Evaluation: PEER Report 2014/09, Pacific Earthquake Engineering Research Center, Berkeley, CA, 2014.
2.5.2-188. Press, W.H., Flannery, B.P., Teukolsky, S.A., Vetterling, W.T., Numerical Recipes: Cambridge University Press, Cambridge, 1986.
2.5.2-189. Boatwright, J and L. Seekins, Regional spectral analysis of three moderate earthquakes in northeastern North America: Bulletin of Seismological Society of America, Vol. 101(4), p. 1769-1782, 2011.
2.5.2-190. Silva, W.J., R. Darragh, N. Gregor, G. Martin, C. Kircher, N. Abrahamson, Reassessment of site coefficients and near-fault factors for building code provisions: Final Report USGS Grant award #98-HQ-GR-1010., 1999.
2.5.2-191. Power, M., B. Chiou, N. Abrahamson, Y. Bozorgnia, T. Shantz, C. Roblee, An overview of the NGA project: Earthquake Spectra, Vol. 24(1), p. 3-21., 2008.
2.5.2-192. Bozorgnia et al., NGA-West2 Research Project: Earthquake Spectra, Vol. 30(3), p. 973-988., 2014.
2.5.2-193. Boore, D.M., Thompson, E.M., and Cadet, H., Regional correlations of VS30 and velocities averaged over depths less than and greater than 30 m: Bulletin of the Seismological Society of America, Vol. 101, p. 3046-3059, 2011.
2.5.2-194. Abrahamson, N.A., Silva, W.J., and Kamai, R., Summary of the ASK14 ground-motion relation for active crustal regions: Earthquake Spectra, Vol. 30, p. 1025-1055, 2014.
2.5.2-195. Abercrombie, R.E., A summary of attenuation measurements from borehole recordings of earthquakes: the 10 Hz transition problem: Pure and Applied Geophysics, Vol. 153, p. 475-487, 1998.
2.5.2-196. Hauksson, E., Teng, T.L., and Henyey, T.L., Results from a 1500m deep, three level downhole seismometer array: site response, low Q values, and fmax: Bulletin of the Seismological Society of America, Vol. 77, p. 1883-1904, 1987.
2.5.2-197. Fukushima, Y., J-Chris. Gariel, and R. Tanaka, Site-dependent attenuation relations of seismic motion parameters at depth using borehole data: Bulletin of the Seismological Society of America, Vol. 85(6), p. 1790-1804, 1995.
2.5.2-198. Bonilla, L. F., J. H. Steidl, J.C. Gariel, and R. J. Archuleta, Borehole response studies at the Garner Valley downhole array, southern California: Bulletin of the Seismological Society of America, Vol. 92, p. 3165-3179, 2002.
2.5.2-199. Redpath, B.B., R.B. Edwards, R.J. Hale, F.C. Kintzer, Development of field techniques to measure damping values for near-surface rocks and soils: Report prepared for the NSF earthquake hazards mitigation. Grant No. PFR-7900192: URS/John A. Blume & Associates, 1982.
2.5.2-84 Revision 2

Clinch River Nuclear SiteEarly Site Permit Application
Part 2, Site Safety Analysis Report
2.5.2-200. Redpath, B.B., and C. Lee, In-situ measurements of shear-wave attenuation at a strong motion recording site: Report prepared for U.S.G.S. contract No. 14-08-001-21823: John A. Blume and Associates, 1986.
2.5.2-201. Field, E. H. and K. H. Jacob, Monte-Carlo simulation of the theoretical site response variability at Turkey Flat, California, given the uncertainty in the geotechnically derived input parameters: Earthquake Spectra, Vol. 9(4), 1993.
2.5.2-202. Rix, G., C. Lai, and A. Spang Jr., In-situ measurement of damping ratio using surface waves: Journal of Geotechnical and Geoenvironmental Engineering, Vol. 126(5), p. 472-480, 2000.
2.5.2-203. Assimaki, D., W. Li, J. H. Steidl, and K. Tsuda, Site amplification and attenuation via downhole array seismogram inversion: A comparative study of the 2003 Miyagi-oki aftershock sequence: Bulletin of the Seismological Society of America, Vol. 98, No. 1, p. 301-330, 2008.
2.5.2-204. Zalachoris, G. Dipl., M.S.E., Evaluation of one-dimensional site response methodologies using borehole arrays: Dissertation Presented to the faculty of the graduate school of The University of Texas at Austin in Partial Fulfillment of the Requirements for the Degree of Doctor of Philosophy, The University of Texas at Austin, 2014.
2.5.2-205. Assimaki, D., W. Li, J. H. Steidl, and K. Tsuda, Site amplification and attenuation via downhole array seismogram inversion: A comparative study of the 2003 Miyagi-oki aftershock sequence: Bulletin of the Seismological Society of America, Vol. 98, No. 1, p. 301-330, 2008.
2.5.2-206. Choi, W. K., Dynamic properties of ash-flow tuffs: Dissertation Presented to the faculty of the graduate school of The University of Texas at Austin in Partial Fulfillment of the Requirements for the Degree of Doctor of Philosophy, The University of Texas at Austin, 2008.
2.5.2-207. Jeon, S.Y., Dynamic and cyclic properties in shear of tuff specimens from Yucca Mountain, Nevada: Dissertation Presented to the faculty of the graduate school of The University of Texas at Austin in Partial Fulfillment of the Requirements for the Degree of Doctor of Philosophy, The University of Texas at Austin, 2008.
2.5.2-208. Mavko, G., Mukerji, T., and Dvorkin, J., The Rock Physics Handbook: Cambridge University Press, 1998.
2.5.2-209. Electric Power Research Institute (EPRI), Seismic Evaluation Guidance: Screening, Prioritization, and Implementation Details (SPID) for the Resolution of Fukishima Near-Term Task For Recommendation 2.1: Seismic, 2013.
2.5.2-210. Silva, W., Darragh, B., and Wong, I., “Comparison of 2D and 1D Site Response Analyses at the Clinch River Nuclear Site,” December 6, 2016.
2.5.2-211. Konno, K. and T. Ohmachi, “Ground motion characteristics estimated from spectral ratio between horizontal and vertical components of microtremor,” Bulletin of the Seismological Society of America, Vol. 88, pp. 228-241, February 1998.
2.5.2-85 Revision 2

Clinch River Nuclear SiteEarly Site Permit Application
Part 2, Site Safety Analysis Report
(a) CEUS SSC Report (Reference 2.5.2-1); See Subsection 2.5.2.1.1(b) See Subsection 2.5.2.1.2Notes:CEUS =Central and Eastern United StatesSSC = Seismic Source CharacterizationCRN = Clinch River Nuclear
Table 2.5.2-1Original and Updated CEUS SSC Earthquake Catalog Summary
Number of All EarthquakesNumber of Mainshock (Independent)
EarthquakesCEUS SSC(a) Update(b)
Total Catalog
CEUS SSC(a) Update(b)
Total Catalog
E[M] ≥ 2.2All Distances from CRN Site 10,984 5,427 16,411 6,965 1,675 8,640Dist ≤ 320 km (200 mi) 1,276 185 1,461 990 157 1,147Dist ≤ 80 km (50 mi) 399 76 475 317 67 384E[M] ≥ 2.9All Distances from CRN Site 3,298 684 3,982 2,563 308 2,871Dist ≤ 320 km (200 mi) 331 9 340 290 9 299Dist ≤ 80 km (50 mi) 95 3 98 83 3 86
2.5.2-86 Revision 2

Revision 2
Clinch River Nuclear Site
he Updated es with
* sigM EQNO Flag Dist (km)
TM 0 0.371 188 0 118
TM 2 0.512 190 0 32
TM 2 0.512 215 0 320
TM 3 0.220 219 0 287
TM 7 0.513 222 0 294
TM 3 0.193 245 0 309
TM 1 0.191 282 0 247
TM 7 0.513 284 0 307
TM 0 0.371 290 0 51
TM 1 0.191 347 0 192
TM 3 0.220 403 0 251
TM 7 0.206 405 0 128
TM 5 0.260 409 0 140
TM 6 0.223 446 0 255
TM 1 0.363 456 0 244
TM 6 0.515 528 0 221
TM 1 0.210 542 0 181
TM 2 0.145 547 0 298
TM 8 0.224 573 0 182
TM 5 0.149 576 0 55
TM 6 0.517 581 0 201
TM 7 0.513 612 0 280
TM 4 0.212 667 0 53
TM 9 0.167 681 0 230
TM 9 0.155 689 0 257
TM 8 0.207 717 0 307
TM 7 0.206 721 0 224
TM 7 0.206 971 0 279
TM 2 0.211 1287 0 289
2.5.2-87
Early Site Permit ApplicationPart 2, Site Safety Analysis Report
Table 2.5.2-2 (Sheet 1 of 11)Earthquakes Within 320 km (200 mi) of the Clinch River Nuclear Site from t
CEUS SSC Earthquake Catalog for Mainshock (Independent) EarthquakMagnitudes E[M] ≥ 2.9
TID
Coordinated Universal Time (UTC) Epicentral Location
Depth (km) ERH (km) E[M] NYear Month Day Hour Minute Second Lat. (+N°) Long. (+E°)
P00672 1817 12 11 0 0 0.00 35.730 -83.090 0 30 4.53 1.39
P00678 1818 8 14 14 36 0.00 36.091 -84.131 0 38 3.31 1.87
P00714 1824 8 22 0 0 0.00 34.828 -87.665 0 38 3.31 1.87
P00723 1827 5 11 0 0 0.00 36.100 -81.200 0 30 3.11 1.12
P00726 1827 8 7 7 0 0.00 38.300 -85.800 0 30 3.98 1.87
P00767 1834 11 20 19 40 0.00 38.650 -83.800 0 38 3.47 1.09
P00824 1843 8 9 0 0 0.00 35.600 -87.100 0 30 3.58 1.09
P00828 1843 10 30 3 0 0.00 38.630 -83.780 0 38 2.98 1.87
P00836 1844 11 28 8 0 0.00 35.950 -83.820 0 30 4.41 1.39
P00988 1854 2 28 0 0 0.00 37.600 -84.000 0 30 3.61 1.09
P01100 1860 10 22 5 0 0.00 34.130 -82.640 0 30 2.99 1.12
P01105 1861 1 3 16 30 0.00 35.090 -83.360 0 30 4.23 1.10
P01114 1861 8 31 5(a) 0 0.00 35.910 -82.820 0 30 5.63 1.17
P01174 1868 2 22 11 0 0.00 36.780 -81.750 0 30 3.05 1.12
P01190 1869 2 20 0 0 0.00 38.100 -84.500 0 30 3.27 1.37
P01322 1874 3 1 0 0 0.00 35.929 -86.842 0 34 4.30 1.88
P01340 1875 4 10 0 0 0.00 35.290 -82.510 0 30 3.35 1.11
P01354 1875 11 1 22 30 0.00 33.490 -82.900 0 30 4.30 1.05
P01414 1877 10 9 1 0 0.00 35.300 -82.500 13 38 3.03 1.12
P01420 1877 11 16 7 38 0.00 35.500 -84.000 0 30 3.48 1.05
P01431 1878 5 18 0 0 0.00 35.500 -82.200 0 34 4.63 1.89
P01516 1881 9 18 4 0 0.00 33.379 -84.788 0 34 3.98 1.87
P01622 1884 8 24 19 45 0.00 36.070 -83.830 0 30 3.29 1.11
P01663 1885 8 6 9 0 0.00 36.120 -81.830 0 30 3.15 1.06
P01682 1886 2 5 2 0 0.00 35.930 -81.520 0 30 3.41 1.05
P01731 1886 9 1 6 0 0.00 33.910 -82.020 0 38 4.54 1.10
P01739 1886 9 1 9 45 0.00 34.300 -82.860 0 30 4.17 1.10
P02019 1886 10 22 5 0 0.00 34.710 -81.660 0 30 4.13 1.10
P02425 1888 9 17 21 30 0.00 33.420 -83.350 0 30 3.43 1.11

Revision 2
Clinch River Nuclear Site
TM 1 0.210 1332 0 105
TM 7 0.513 1334 0 187
TM 3 0.220 1335 0 207
TM 1 0.363 1348 0 36
TM 7 0.513 1371 0 217
TM 6 0.205 1387 0 121
TM 1 0.363 1389 0 291
TM 3 0.193 1461 0 294
TM 7 0.513 1530 0 207
TM 1 0.191 1546 0 262
TM 7 0.206 1549 0 67
TM 7 0.206 1550 0 168
TM 6 0.517 1570 0 50
TM 1 0.363 1600 0 121
TM 5 0.213 1607 0 129
TM 1 0.363 1613 0 142
TM 5 0.149 1629 0 82
TM 7 0.513 1667 0 320
TM 7 0.206 1696 0 296
TM 6 0.151 1712 0 123
TM 2 0.512 1728 0 135
TM 6 0.137 1742 0 175
TM 0 0.316 1762 0 276
TM 5 0.149 1764 0 70
TM 3 0.147 1765 0 67
TM 3 0.364 1774 0 284
TM 4 0.194 1776 0 34
TM 2 0.146 1783 0 276
TM 5 0.230 1806 0 152
TM 0 0.316 1812 0 175
he Updated es with
* sigM EQNO Flag Dist (km)
2.5.2-88
Early Site Permit ApplicationPart 2, Site Safety Analysis Report
P02486 1889 9 29 5 0 0.00 35.030 -84.870 0 30 3.46 1.11
P02488 1889 10 16 3 0 0.00 35.260 -82.460 0 34 3.98 1.87
P02489 1889 10 24 10 0 0.00 34.720 -82.600 0 30 3.11 1.12
P02511 1890 12 23 11 0 0.00 35.800 -84.000 0 38 3.27 1.37
P02541 1891 11 17 0 0 0.00 36.728 -86.574 0 38 2.98 1.87
P02582 1892 12 12 8 4 0.00 35.350 -85.550 0 38 3.96 1.10
P02591 1893 1 11 20 0 0.00 38.300 -85.700 0 38 3.27 1.37
P02784 1895 8 19 15 0 0.00 38.500 -83.700 0 38 3.40 1.09
P02937 1897 9 29 0 0 0.00 34.941 -82.411 0 34 3.98 1.87
P02973 1898 6 6 8 0 0.00 38.250 -84.050 0 34 3.75 1.09
P02979 1898 6 19 15 0 0.00 36.070 -83.670 0 30 3.69 1.10
P02981 1898 7 23 21 30 0.00 36.750 -82.830 0 30 3.54 1.10
P03017 1899 10 5 10 15 0.00 35.556 -83.999 0 34 4.63 1.89
P03088 1902 5 29 7 30 0.00 35.100 -85.300 0 20 3.27 1.37
P03101 1902 10 18 22 0 0.00 35.000 -85.300 0 20 3.15 1.11
P03116 1903 3 15 9 0 0.00 34.650 -84.800 0 25 3.44 1.37
P03150 1904 3 5 0 30 0.00 35.700 -83.500 0 20 3.46 1.05
P39338 1907 1 26 6 0 0.00 37.270 -81.223 0 25 2.98 1.87
P39339 1908 12 27 21 15 0.00 36.800 -87.500 0 25 3.97 1.10
P03390 1909 10 8 10 0 0.00 34.900 -85.000 0 20 3.13 1.05
P03419 1910 6 8 23 0 0.00 34.769 -84.976 0 25 3.31 1.87
P03440 1911 4 20 22 0 0.00 35.100 -82.700 0 25 3.21 1.04
P03469 1913 1 1 18 28 0.00 34.700 -81.700 0 22 4.54 1.27
P03474 1913 3 28 21 50 0.00 36.200 -83.700 0 22 3.65 1.05
P03476 1913 4 17 16 30 0.00 35.300 -84.200 0 20 3.59 1.05
P03487 1913 11 11 14 0 0.00 38.200 -85.800 0 22 3.61 1.37
P03495 1914 1 24 3 24 0.00 35.600 -84.500 0 20 3.43 1.09
P03504 1914 3 5 20 5 0.00 33.500 -83.500 0 25 4.43 1.05
P03543 1915 10 29 5 23 0.00 35.800 -82.700 0 20 2.94 1.13
P03555 1916 2 21 22 39 0.00 35.500 -82.500 0 20 5.13 1.27
Table 2.5.2-2 (Sheet 2 of 11)Earthquakes Within 320 km (200 mi) of the Clinch River Nuclear Site from t
CEUS SSC Earthquake Catalog for Mainshock (Independent) EarthquakMagnitudes E[M] ≥ 2.9
TID
Coordinated Universal Time (UTC) Epicentral Location
Depth (km) ERH (km) E[M] NYear Month Day Hour Minute Second Lat. (+N°) Long. (+E°)

Revision 2
Clinch River Nuclear Site
TM 8 0.154 1820 0 304
TM 0 0.316 1821 0 312
TM 3 0.183 1833 0 82
TM 0 0.200 1848 0 43
TM 4 0.148 1855 0 34
TM 8 0.216 1896 0 57
TM 1 0.363 1904 0 202
TM 8 0.216 1913 0 22
TM 9 0.126 1954 0 189
TM 7 0.513 1956 0 210
TM 2 0.243 2019 0 205
TM 1 0.157 2048 0 197
TM 2 0.219 2052 0 121
TM 7 0.197 2070 0 238
TM 9 0.109 2087 0 141
TM 8 0.154 2092 0 187
TM 7 0.197 2144 0 2
TM 3 0.364 2151 0 45
TM 6 0.151 2171 0 316
TM 3 0.202 2210 0 305
TM 0 0.128 2249 0 112
TM 4 0.212 2274 0 94
TM 1 0.191 2324 0 86
TM 0 0.218 2364 0 275
TM 3 0.160 2370 0 240
TM 4 0.148 2417 0 147
TM 0 0.156 2425 0 133
TM 8 0.166 2449 0 129
TM 8 0.153 2564 0 99
TM 7 0.215 2624 0 129
he Updated es with
* sigM EQNO Flag Dist (km)
2.5.2-89
Early Site Permit ApplicationPart 2, Site Safety Analysis Report
P03574 1916 8 26 19 36 0.00 36.000 -81.000 0 20 3.55 1.05
P03577 1916 10 18 22 3 40.00 33.500 -86.200 0 22 4.98 1.27
P39345 1917 3 27 20 0 0.00 36.100 -83.500 0 20 3.33 1.08
P03631 1918 1 16 15 45 0.00 35.900 -83.900 0 20 3.27 1.10
P03641 1918 6 22 1 0 0.00 36.100 -84.100 0 20 3.48 1.05
P03697 1920 12 24 7 30 0.00 36.000 -85.000 0 20 3.30 1.11
P03723 1921 7 15 0 0 0.00 36.600 -82.300 0 20 3.93 1.37
P03740 1921 12 15 13 20 0.00 35.800 -84.600 0 20 3.30 1.11
P03808 1924 10 20 8 30 0.00 35.000 -82.600 0 20 4.21 1.03
P03810 1924 11 13 10 30 0.00 36.600 -82.200 0 20 2.98 1.87
P03952 1926 7 8 9 50 0.00 35.900 -82.100 0 22 3.23 1.15
P04013 1927 6 16 12 0 0.00 34.700 -86.000 0 20 3.41 1.06
P04019 1927 10 8 4 30 0.00 35.100 -85.300 0 20 3.01 1.12
P04044 1928 3 7 2 45 0.00 35.600 -87.000 0 20 2.99 1.09
P04091 1928 11 3 4 2 49.80 36.110 -82.830 0 39 4.43 1.02
P04099 1928 11 20 3 45 0.00 35.800 -82.300 0 28 3.57 1.05
P04195 1930 8 30 9 28 0.00 35.900 -84.400 0 20 3.18 1.09
P04212 1930 10 16 21 50 0.00 36.000 -83.900 0 20 3.11 1.37
P04256 1931 5 5 12 18 0.00 33.700 -86.600 0 22 3.86 1.05
P04338 1933 5 28 15 10 0.00 38.600 -83.700 0 20 3.22 1.10
P04404 1935 1 1 8 15 0.00 35.100 -83.600 0 39 3.59 1.04
P04495 1936 1 1 8 0 0.00 35.100 -84.000 0 25 3.20 1.11
P04616 1938 3 31 10 10 0.00 35.600 -83.500 0 20 3.59 1.09
P04764 1939 5 5 2 45 0.00 33.700 -85.800 0 20 3.25 1.12
P04785 1939 6 24 10 27 0.00 34.700 -86.600 0 20 3.27 1.06
P04876 1940 10 19 5 54 0.00 34.700 -85.100 0 20 3.27 1.05
P04889 1940 12 25 6 50 0.00 35.900 -82.900 0 20 3.45 1.06
P04930 1941 9 8 9 45 0.00 35.000 -85.300 0 20 3.03 1.06
P05142 1945 6 14 3 25 0.00 35.000 -84.500 0 20 3.57 1.05
P05238 1947 12 27 19 0 0.00 35.000 -85.300 0 20 3.21 1.11
Table 2.5.2-2 (Sheet 3 of 11)Earthquakes Within 320 km (200 mi) of the Clinch River Nuclear Site from t
CEUS SSC Earthquake Catalog for Mainshock (Independent) EarthquakMagnitudes E[M] ≥ 2.9
TID
Coordinated Universal Time (UTC) Epicentral Location
Depth (km) ERH (km) E[M] NYear Month Day Hour Minute Second Lat. (+N°) Long. (+E°)

Revision 2
Clinch River Nuclear Site
TM 8 0.188 2637 0 62
TM 3 0.220 2663 0 152
TM 2 0.146 2675 0 36
TM 1 0.363 2731 0 192
TM 6 0.231 2783 0 45
TM 8 0.125 2790 0 99
TM 6 0.214 2796 0 65
TM 4 0.212 2826 0 210
TM 3 0.202 2834 0 45
TM 5 0.150 2854 0 287
TM 6 0.151 2891 0 81
TM 2 0.145 2892 0 55
TM 6 0.151 2915 0 317
TM 7 0.152 2919 0 202
TM 4 0.221 2921 0 26
TM 0 0.128 2923 0 155
TM 2 0.146 2937 0 127
TM 2 0.512 2977 0 217
TM 8 0.154 3003 0 232
TM 5 0.222 3011 0 205
TM 3 0.244 3015 0 182
TM 2 0.158 3018 0 36
TM 1 0.129 3157 0 315
TM 9 0.233 3170 0 187
TM 5 0.135 3176 0 163
TM 3 0.244 3177 0 301
TM 6 0.137 3178 0 314
TM 3 0.244 3283 0 294
TM 3 0.172 3316 0 317
TM 4 0.173 3345 0 317
he Updated es with
* sigM EQNO Flag Dist (km)
2.5.2-90
Early Site Permit ApplicationPart 2, Site Safety Analysis Report
P05256 1948 2 10 0 4 0.00 36.400 -84.100 0 20 3.53 1.08
P05310 1949 9 17 9 30 0.00 36.700 -83.000 0 20 3.10 1.12
P05331 1950 6 19 4 19 0.00 35.800 -84.000 0 20 3.62 1.05
P05414 1952 6 11 20 20 0.00 36.300 -82.300 0 20 3.27 1.37
P05488 1953 11 10 15 45 0.00 36.000 -83.900 0 20 2.94 1.13
P05495 1954 1 2 3 25 0.00 36.600 -83.700 0 28 4.12 1.03
P05523 1954 1 23 1 0 0.00 35.300 -84.400 0 20 3.05 1.11
P05571 1955 1 6 20 30 0.00 36.600 -82.200 0 20 3.30 1.11
P05582 1955 1 25 19 34 0.00 36.000 -83.900 0 20 3.23 1.10
P05618 1955 9 28 7 1 41.50 36.600 -81.300 0 28 3.48 1.05
P05669 1956 9 7 13 35 50.80 36.440 -83.790 5 39 3.88 1.05
P05670 1956 9 7 13 49 29.00 35.500 -84.000 0 17 3.88 1.05
P05704 1957 4 23 9 23 39.00 33.770 -86.720 5 39 4.00 1.05
P05710 1957 5 13 14 24 51.10 35.800 -82.140 5 39 3.79 1.05
P05712 1957 6 23 6 34 16.00 35.950 -84.100 5 39 3.20 1.12
P05714 1957 7 2 9 33 1.00 35.600 -82.700 0 22 3.63 1.04
P05731 1957 11 24 20 6 17.00 35.000 -83.500 0 39 3.63 1.05
P05782 1958 10 20 6 16 0.00 34.500 -82.700 0 20 3.31 1.87
P05817 1959 8 12 18 6 1.40 34.790 -86.560 5 39 3.61 1.05
P05833 1960 1 3 7 30 0.00 35.900 -82.100 0 25 3.07 1.12
P05839 1960 2 9 14 0 6.00 35.300 -82.500 0 20 2.92 1.15
P05844 1960 4 15 10 10 10.00 35.800 -84.000 0 28 3.37 1.06
P06076 1963 10 28 22 38 0.30 36.700 -81.000 0 20 3.48 1.04
P06093 1964 1 20 13 37 52.00 35.900 -82.300 0 20 2.91 1.13
P06102 1964 2 18 9 31 10.40 34.670 -85.390 15 6 3.72 1.04
P06105 1964 3 7 18 2 58.60 33.720 -82.390 5 39 2.98 1.15
P06106 1964 3 13 1 20 17.50 33.190 -83.310 1 39 3.66 1.04
P06271 1965 4 26 15 26 19.70 37.320 -81.600 5 6 3.18 1.15
P06328 1965 9 9 14 42 20.00 34.700 -81.200 0 20 3.40 1.07
P06370 1965 11 8 12 58 1.00 33.200 -83.200 0 39 2.90 1.07
Table 2.5.2-2 (Sheet 4 of 11)Earthquakes Within 320 km (200 mi) of the Clinch River Nuclear Site from t
CEUS SSC Earthquake Catalog for Mainshock (Independent) EarthquakMagnitudes E[M] ≥ 2.9
TID
Coordinated Universal Time (UTC) Epicentral Location
Depth (km) ERH (km) E[M] NYear Month Day Hour Minute Second Lat. (+N°) Long. (+E°)
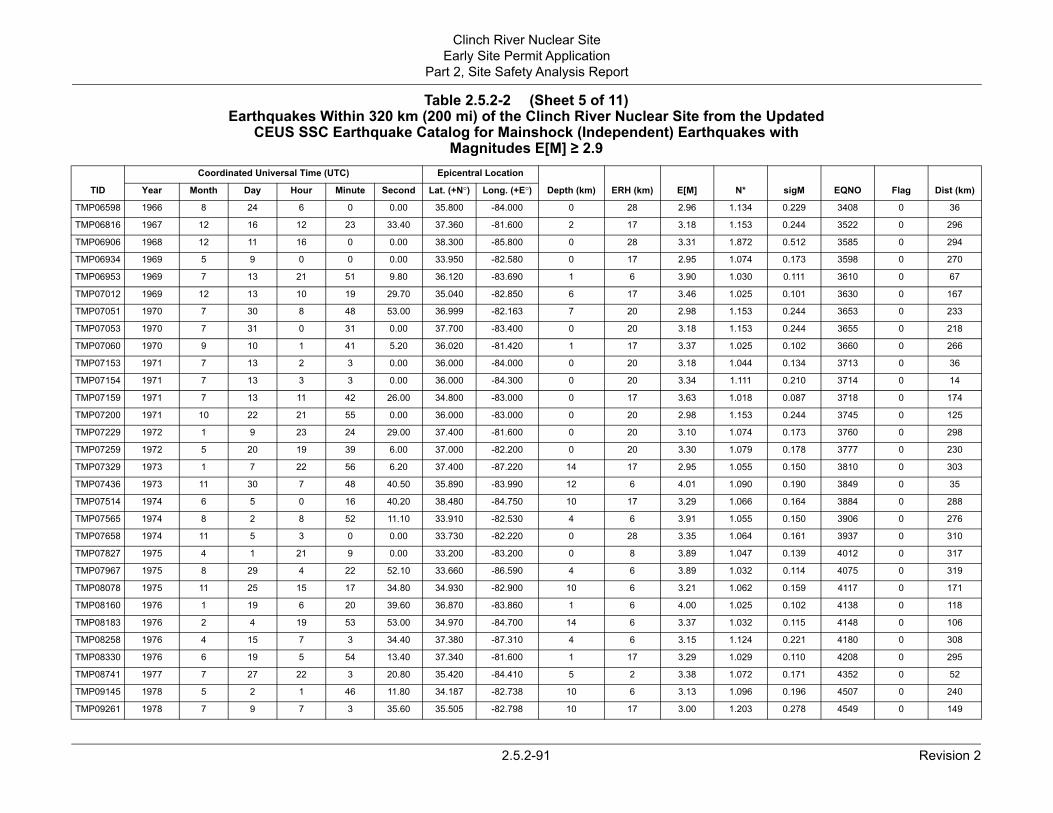
Revision 2
Clinch River Nuclear Site
TM 4 0.229 3408 0 36
TM 3 0.244 3522 0 296
TM 2 0.512 3585 0 294
TM 4 0.173 3598 0 270
TM 0 0.111 3610 0 67
TM 5 0.101 3630 0 167
TM 3 0.244 3653 0 233
TM 3 0.244 3655 0 218
TM 5 0.102 3660 0 266
TM 4 0.134 3713 0 36
TM 1 0.210 3714 0 14
TM 8 0.087 3718 0 174
TM 3 0.244 3745 0 125
TM 4 0.173 3760 0 298
TM 9 0.178 3777 0 230
TM 5 0.150 3810 0 303
TM 0 0.190 3849 0 35
TM 6 0.164 3884 0 288
TM 5 0.150 3906 0 276
TM 4 0.161 3937 0 310
TM 7 0.139 4012 0 317
TM 2 0.114 4075 0 319
TM 2 0.159 4117 0 171
TM 5 0.102 4138 0 118
TM 2 0.115 4148 0 106
TM 4 0.221 4180 0 308
TM 9 0.110 4208 0 295
TM 2 0.171 4352 0 52
TM 6 0.196 4507 0 240
TM 3 0.278 4549 0 149
he Updated es with
* sigM EQNO Flag Dist (km)
2.5.2-91
Early Site Permit ApplicationPart 2, Site Safety Analysis Report
P06598 1966 8 24 6 0 0.00 35.800 -84.000 0 28 2.96 1.13
P06816 1967 12 16 12 23 33.40 37.360 -81.600 2 17 3.18 1.15
P06906 1968 12 11 16 0 0.00 38.300 -85.800 0 28 3.31 1.87
P06934 1969 5 9 0 0 0.00 33.950 -82.580 0 17 2.95 1.07
P06953 1969 7 13 21 51 9.80 36.120 -83.690 1 6 3.90 1.03
P07012 1969 12 13 10 19 29.70 35.040 -82.850 6 17 3.46 1.02
P07051 1970 7 30 8 48 53.00 36.999 -82.163 7 20 2.98 1.15
P07053 1970 7 31 0 31 0.00 37.700 -83.400 0 20 3.18 1.15
P07060 1970 9 10 1 41 5.20 36.020 -81.420 1 17 3.37 1.02
P07153 1971 7 13 2 3 0.00 36.000 -84.000 0 20 3.18 1.04
P07154 1971 7 13 3 3 0.00 36.000 -84.300 0 20 3.34 1.11
P07159 1971 7 13 11 42 26.00 34.800 -83.000 0 17 3.63 1.01
P07200 1971 10 22 21 55 0.00 36.000 -83.000 0 20 2.98 1.15
P07229 1972 1 9 23 24 29.00 37.400 -81.600 0 20 3.10 1.07
P07259 1972 5 20 19 39 6.00 37.000 -82.200 0 20 3.30 1.07
P07329 1973 1 7 22 56 6.20 37.400 -87.220 14 17 2.95 1.05
P07436 1973 11 30 7 48 40.50 35.890 -83.990 12 6 4.01 1.09
P07514 1974 6 5 0 16 40.20 38.480 -84.750 10 17 3.29 1.06
P07565 1974 8 2 8 52 11.10 33.910 -82.530 4 6 3.91 1.05
P07658 1974 11 5 3 0 0.00 33.730 -82.220 0 28 3.35 1.06
P07827 1975 4 1 21 9 0.00 33.200 -83.200 0 8 3.89 1.04
P07967 1975 8 29 4 22 52.10 33.660 -86.590 4 6 3.89 1.03
P08078 1975 11 25 15 17 34.80 34.930 -82.900 10 6 3.21 1.06
P08160 1976 1 19 6 20 39.60 36.870 -83.860 1 6 4.00 1.02
P08183 1976 2 4 19 53 53.00 34.970 -84.700 14 6 3.37 1.03
P08258 1976 4 15 7 3 34.40 37.380 -87.310 4 6 3.15 1.12
P08330 1976 6 19 5 54 13.40 37.340 -81.600 1 17 3.29 1.02
P08741 1977 7 27 22 3 20.80 35.420 -84.410 5 2 3.38 1.07
P09145 1978 5 2 1 46 11.80 34.187 -82.738 10 6 3.13 1.09
P09261 1978 7 9 7 3 35.60 35.505 -82.798 10 17 3.00 1.20
Table 2.5.2-2 (Sheet 5 of 11)Earthquakes Within 320 km (200 mi) of the Clinch River Nuclear Site from t
CEUS SSC Earthquake Catalog for Mainshock (Independent) EarthquakMagnitudes E[M] ≥ 2.9
TID
Coordinated Universal Time (UTC) Epicentral Location
Depth (km) ERH (km) E[M] NYear Month Day Hour Minute Second Lat. (+N°) Long. (+E°)

Revision 2
Clinch River Nuclear Site
TM 8 0.281 4690 0 280
TM 0 0.276 4724 0 83
TM 1 0.169 4736 0 75
TM 4 0.259 4737 0 277
TM 6 0.151 4744 0 168
TM 9 0.269 4749 0 122
TM 2 0.171 4750 0 55
TM 0 0.263 4762 0 215
TM 2 0.158 4775 0 319
TM 2 0.171 4828 0 284
TM 4 0.221 4869 0 36
TM 8 0.125 4888 0 258
TM 3 0.278 4976 0 65
TM 3 0.278 5004 0 64
TM 6 0.137 5013 0 214
TM 4 0.221 5034 0 245
TM 5 0.273 5078 0 157
TM 5 0.162 5129 0 201
TM 3 0.278 5212 0 39
TM 5 0.273 5288 0 221
TM 9 0.241 5354 0 310
TM 5 0.273 5385 0 169
TM 2 0.171 5389 0 78
TM 1 0.113 5398 0 26
TM 8 0.281 5400 0 8
TM 8 0.281 5450 0 139
TM 7 0.197 5545 0 252
TM 8 0.140 5585 0 184
TM 8 0.140 5656 0 43
TM 9 0.126 5686 0 318
he Updated es with
* sigM EQNO Flag Dist (km)
2.5.2-92
Early Site Permit ApplicationPart 2, Site Safety Analysis Report
P09822 1979 5 4 12 13 8.90 34.330 -81.950 1 8 2.93 1.20
P09965 1979 7 19 10 27 3.90 35.229 -84.825 10 4 3.08 1.20
P10004 1979 8 13 5 18 56.80 35.210 -84.360 10 1 3.63 1.07
P39373 1979 8 13 5 19 25.20 33.900 -82.540 23 6 3.99 1.17
P10034 1979 8 26 1 31 45.00 34.916 -82.956 1 22 3.64 1.05
P10050 1979 9 6 20 38 16.30 35.300 -83.240 10 8 3.31 1.18
P10054 1979 9 12 6 24 4.00 35.580 -83.910 12 2 3.20 1.07
P10103 1979 10 8 8 53 52.80 36.440 -82.080 5 17 3.61 1.18
P10151 1979 11 9 21 29 59.80 38.490 -82.810 1 6 3.49 1.06
P10337 1980 3 23 21 38 16.20 37.600 -86.760 9 17 3.17 1.07
P10453 1980 6 25 18 2 1.60 35.730 -84.030 1 2 3.03 1.12
P10504 1980 7 27 18 52 21.40 38.190 -83.890 16 6 5.01 1.03
P10851 1981 2 3 14 26 50.00 35.312 -84.539 4 1 3.00 1.20
P10940 1981 4 2 6 32 39.10 35.319 -84.524 5 1 3.00 1.20
P10960 1981 4 9 7 10 31.20 35.510 -82.050 0 1 3.28 1.04
P11061 1981 6 3 20 54 22.40 36.180 -81.670 1 8 2.91 1.12
P11310 1981 9 4 17 21 44.50 34.630 -85.170 3 15 3.16 1.19
P11484 1982 1 2 2 0 26.20 35.180 -86.430 13 1 3.07 1.06
P11606 1982 1 30 12 39 12.90 35.800 -83.960 20 15 3.00 1.20
P11787 1982 4 13 13 4 13.30 36.510 -82.040 3 15 3.16 1.19
P12002 1982 7 16 14 16 2.90 34.320 -81.550 2 17 3.09 1.14
P12114 1982 9 2 21 52 45.50 34.960 -82.900 3 8 3.16 1.19
P12122 1982 9 5 10 11 9.40 35.190 -84.510 13 25 2.96 1.07
P12170 1982 9 24 21 57 42.50 35.680 -84.240 13 25 3.28 1.03
P39919 1982 9 24 22 19 21.50 35.860 -84.460 10 15 2.93 1.20
P12312 1982 11 14 10 31 59.10 36.210 -82.880 10 15 2.93 1.20
P12510 1983 1 31 23 41 1.40 34.302 -82.394 8 2 3.08 1.09
P12633 1983 3 25 2 47 11.10 35.330 -82.460 12 25 3.21 1.04
P12796 1983 7 8 19 29 5.90 35.550 -84.150 10 25 3.14 1.04
P12879 1983 8 17 14 3 15.00 38.470 -82.770 10 2 3.49 1.03
Table 2.5.2-2 (Sheet 6 of 11)Earthquakes Within 320 km (200 mi) of the Clinch River Nuclear Site from t
CEUS SSC Earthquake Catalog for Mainshock (Independent) EarthquakMagnitudes E[M] ≥ 2.9
TID
Coordinated Universal Time (UTC) Epicentral Location
Depth (km) ERH (km) E[M] NYear Month Day Hour Minute Second Lat. (+N°) Long. (+E°)

Revision 2
Clinch River Nuclear Site
TM 6 0.163 5691 0 101
TM 8 0.281 5759 0 156
TM 9 0.109 5831 0 63
TM 2 0.181 5870 0 30
TM 1 0.157 5960 0 224
TM 3 0.132 5981 0 36
TM 8 0.125 6018 0 146
TM 2 0.171 6031 0 248
TM 8 0.281 6044 0 238
TM 3 0.278 6059 0 53
TM 5 0.273 6182 0 104
TM 6 0.267 6289 0 63
TM 1 0.191 6305 0 46
TM 8 0.281 6336 0 67
TM 3 0.172 6351 0 180
TM 5 0.273 6389 0 128
TM 3 0.278 6414 0 43
TM 0 0.276 6450 0 42
TM 8 0.108 6460 0 119
TM 1 0.201 6481 0 45
TM 0 0.276 6494 0 72
TM 7 0.197 6530 0 309
TM 5 0.273 6567 0 175
TM 3 0.278 6613 0 53
TM 4 0.118 6634 0 38
TM 8 0.281 6694 0 169
TM 9 0.110 6718 0 56
TM 5 0.162 6760 0 30
TM 8 0.255 6779 0 8
TM 8 0.281 6788 0 154
he Updated es with
* sigM EQNO Flag Dist (km)
2.5.2-93
Early Site Permit ApplicationPart 2, Site Safety Analysis Report
P12900 1983 8 28 22 45 7.40 36.680 -83.820 18 1 3.00 1.06
P13080 1983 11 29 19 30 28.10 36.027 -82.653 7 15 2.93 1.20
P13291 1984 2 14 20 54 30.90 36.130 -83.740 10 1 3.57 1.02
P13442 1984 3 17 23 26 11.40 35.830 -84.050 7 1 3.24 1.08
P13680 1984 8 9 2 42 35.80 34.620 -86.300 8 1 3.29 1.06
P13717 1984 8 30 16 26 28.40 35.570 -84.340 13 15 3.26 1.04
P13790 1984 10 9 11 54 26.90 34.750 -85.200 12 1 4.20 1.03
P13826 1984 10 22 18 58 41.70 36.360 -81.680 11 1 3.18 1.07
P13872 1984 11 18 20 23 58.10 34.744 -86.600 1 31 2.93 1.20
P13931 1984 12 17 18 48 28.20 35.415 -84.309 14 15 3.00 1.20
P14282 1985 7 12 18 20 28.40 35.198 -85.156 3 1 3.16 1.19
P14583 1985 12 22 0 56 5.00 35.701 -83.720 13 5 3.38 1.18
P14623 1986 1 7 1 26 43.30 35.609 -84.762 22 5 3.35 1.09
P14699 1986 1 27 6 44 26.80 35.926 -83.636 20 5 2.93 1.20
P14740 1986 2 13 11 35 45.30 34.793 -82.907 5 2 3.32 1.07
P14850 1986 4 19 7 40 53.00 35.187 -85.510 27 5 3.16 1.19
P14908 1986 5 19 23 46 47.00 35.516 -84.529 11 5 3.00 1.20
P14989 1986 6 24 19 22 42.00 35.990 -83.931 24 5 3.08 1.20
P15024 1986 7 11 14 26 14.80 34.937 -84.987 13 22 3.65 1.02
P15079 1986 8 7 12 36 46.00 35.506 -84.561 20 5 2.94 1.10
P15118 1986 8 19 20 51 26.00 36.291 -85.020 30 5 3.08 1.20
P15251 1986 10 18 8 31 38.80 34.946 -81.172 23 5 3.09 1.09
P15373 1986 12 11 14 7 11.50 34.898 -82.880 9 2 3.16 1.19
P15524 1987 2 22 10 35 26.50 36.340 -84.186 19 5 3.00 1.20
P15601 1987 3 27 7 29 30.40 35.567 -84.229 19 22 4.03 1.03
P15813 1987 6 19 1 5 14.10 36.431 -82.619 12 1 2.93 1.20
P15870 1987 7 11 0 4 29.40 36.103 -83.817 25 25 3.53 1.02
P16034 1987 9 22 17 23 50.10 35.623 -84.311 19 25 3.24 1.06
P16085 1987 10 20 22 49 55.90 35.841 -84.444 13 25 2.93 1.16
P16104 1987 11 4 20 30 45.80 34.699 -85.265 12 5 2.93 1.20
Table 2.5.2-2 (Sheet 7 of 11)Earthquakes Within 320 km (200 mi) of the Clinch River Nuclear Site from t
CEUS SSC Earthquake Catalog for Mainshock (Independent) EarthquakMagnitudes E[M] ≥ 2.9
TID
Coordinated Universal Time (UTC) Epicentral Location
Depth (km) ERH (km) E[M] NYear Month Day Hour Minute Second Lat. (+N°) Long. (+E°)

Revision 2
Clinch River Nuclear Site
TM 0 0.200 6797 0 157
TM 8 0.281 6818 0 154
TM 0 0.276 6835 0 70
TM 1 0.144 6860 0 200
TM 5 0.120 6970 0 253
TM 8 0.281 6979 0 297
TM 8 0.281 7001 0 73
TM 2 0.170 7140 0 309
TM 2 0.181 7142 0 312
TM 0 0.276 7177 0 44
TM 3 0.278 7256 0 114
TM 9 0.141 7258 0 307
TM 8 0.281 7288 0 24
TM 8 0.281 7311 0 273
TM 0 0.276 7362 0 36
TM 0 0.276 7373 0 121
TM 6 0.121 7388 0 136
TM 2 0.170 7410 0 247
TM 0 0.276 7422 0 180
TM 3 0.278 7424 0 254
TM 3 0.278 7527 0 307
TM 0 0.276 7585 0 53
TM 8 0.281 7622 0 147
TM 2 0.170 7636 0 32
TM 2 0.271 7655 0 113
TM 0 0.168 7699 0 277
TM 8 0.281 7703 0 318
TM 5 0.273 7863 0 206
TM 1 0.144 7876 0 105
TM 8 0.281 7941 0 311
he Updated es with
* sigM EQNO Flag Dist (km)
2.5.2-94
Early Site Permit ApplicationPart 2, Site Safety Analysis Report
P16141 1987 11 27 18 58 20.80 36.850 -83.092 13 1 2.98 1.10
P16201 1987 12 18 23 20 17.40 35.104 -82.970 9 1 2.93 1.20
P16239 1988 1 9 0 16 55.40 35.274 -84.188 9 5 3.08 1.20
P16314 1988 2 16 15 26 54.50 36.561 -82.304 5 1 3.32 1.05
P16691 1988 9 7 2 28 8.60 38.142 -83.834 10 1 4.14 1.03
P16710 1988 9 18 16 16 1.00 37.310 -87.210 13 2 2.93 1.20
P16778 1988 11 1 16 34 16.30 36.266 -83.714 20 5 2.93 1.20
P17295 1989 7 15 0 8 2.60 38.607 -83.569 10 2 3.21 1.07
P17298 1989 7 15 18 58 28.80 34.448 -87.339 10 1 2.93 1.08
P17406 1989 9 7 5 18 6.20 35.493 -84.436 14 5 3.08 1.20
P17629 1990 1 19 17 36 52.70 34.956 -84.907 11 5 3.00 1.20
P17636 1990 1 24 18 20 24.40 38.133 -86.434 5 1 3.92 1.04
P17705 1990 2 17 16 30 32.00 35.716 -84.230 1 5 2.93 1.20
P17777 1990 3 21 9 11 39.40 38.142 -85.650 4 1 2.93 1.20
P17970 1990 7 11 18 41 10.70 35.799 -83.991 17 5 3.08 1.20
P18002 1990 7 28 11 9 39.00 34.919 -85.008 14 5 3.08 1.20
P18041 1990 8 17 21 1 17.90 36.794 -83.340 10 1 3.54 1.03
P18086 1990 9 8 0 3 57.40 38.061 -83.731 5 2 3.34 1.07
P18110 1990 9 19 21 56 45.00 34.539 -85.491 6 5 3.08 1.20
P18112 1990 9 20 10 36 18.80 34.989 -86.963 4 5 3.00 1.20
P18383 1991 1 28 11 43 55.70 37.350 -87.320 1 2 3.00 1.20
P18590 1991 5 29 2 47 18.90 35.415 -84.292 22 5 3.08 1.20
P18720 1991 8 17 17 59 9.20 34.914 -85.483 21 5 2.93 1.20
P18769 1991 9 24 7 21 6.40 35.711 -84.095 5 25 3.09 1.07
P18824 1991 10 30 14 54 12.60 34.904 -84.713 8 5 3.23 1.19
P18951 1992 1 3 4 21 22.20 33.946 -82.465 5 25 3.48 1.07
P18959 1992 1 7 11 48 40.10 33.835 -81.945 3 2 2.93 1.20
P19475 1993 1 1 5 8 5.30 35.877 -82.090 3 1 3.16 1.19
P19499 1993 1 15 2 2 51.80 35.075 -84.974 1 25 3.23 1.05
P19660 1993 4 23 17 36 53.90 33.376 -82.853 0 4 2.93 1.20
Table 2.5.2-2 (Sheet 8 of 11)Earthquakes Within 320 km (200 mi) of the Clinch River Nuclear Site from t
CEUS SSC Earthquake Catalog for Mainshock (Independent) EarthquakMagnitudes E[M] ≥ 2.9
TID
Coordinated Universal Time (UTC) Epicentral Location
Depth (km) ERH (km) E[M] NYear Month Day Hour Minute Second Lat. (+N°) Long. (+E°)

Revision 2
Clinch River Nuclear Site
TM 2 0.170 8121 0 144
TM 2 0.145 8143 0 316
TM 8 0.281 8154 0 80
TM 4 0.237 8309 0 71
TM 5 0.135 8367 0 278
TM 4 0.203 8374 0 60
TM 6 0.121 8378 0 235
TM 2 0.171 8639 0 156
TM 1 0.169 8677 0 100
TM 6 0.122 8684 0 99
TM 5 0.253 8734 0 75
TM 8 0.140 8863 0 5
TM 8 0.281 8865 0 149
TM 8 0.281 8897 0 125
TM 2 0.171 8968 0 123
TM 3 0.278 8996 0 321
TM 6 0.246 9014 0 255
TM 3 0.278 9145 0 160
TM 2 0.182 9196 0 51
TM 8 0.281 9239 0 158
TM 2 0.171 9319 0 57
TM 6 0.239 9328 0 149
TM 5 0.273 9340 0 117
TM 8 0.281 9354 0 52
TM 2 0.170 9399 0 73
TM 3 0.160 9499 0 212
TM 4 0.221 9741 0 279
TM 4 0.100 9767 0 192
TM 8 0.281 9960 0 72
TM 8 0.281 9973 0 214
he Updated es with
* sigM EQNO Flag Dist (km)
2.5.2-95
Early Site Permit ApplicationPart 2, Site Safety Analysis Report
P20209 1994 4 5 22 21 59.00 34.961 -85.493 5 25 3.29 1.07
P20284 1994 5 4 9 12 2.70 34.198 -87.174 5 1 3.15 1.05
P20313 1994 5 26 4 6 4.50 35.176 -84.500 13 1 2.93 1.20
P20769 1995 3 18 22 6 21.00 35.425 -84.922 17 1 3.35 1.14
P20952 1995 6 26 0 36 17.00 36.747 -81.452 5 4 3.29 1.04
P20969 1995 7 5 14 16 44.40 35.366 -84.212 10 3 3.54 1.10
P20974 1995 7 7 21 1 2.80 36.515 -81.873 11 2 3.03 1.03
P22251 1997 5 19 19 45 33.60 34.782 -85.444 5 25 2.98 1.07
P22378 1997 7 19 17 6 34.30 35.056 -84.808 10 25 3.46 1.07
P22404 1997 7 30 12 29 23.30 36.436 -83.509 5 25 3.70 1.03
P22595 1997 10 19 18 39 55.10 35.286 -84.753 15 22 3.15 1.16
P23124 1998 6 17 8 0 23.40 35.926 -84.405 10 25 3.38 1.04
P23127 1998 6 18 5 9 59.50 34.714 -85.194 3 5 2.93 1.20
P23201 1998 7 23 23 11 41.90 34.857 -84.947 7 5 2.93 1.20
P23570 1999 1 17 18 38 4.70 36.854 -83.691 5 1 2.96 1.07
P23742 1999 3 17 3 13 0.40 38.761 -83.832 0 12 3.00 1.20
P23888 1999 5 13 10 38 59.90 35.092 -87.026 22 25 2.91 1.15
P24812 2000 3 20 10 0 50.20 34.685 -85.362 4 5 3.00 1.20
P25320 2000 7 11 14 59 47.50 35.880 -83.810 5 25 3.12 1.08
P25626 2000 9 14 16 5 22.00 34.675 -85.296 0 5 2.93 1.20
P26409 2001 3 7 17 12 25.00 35.510 -84.810 6 25 3.09 1.07
P26482 2001 3 21 23 35 35.00 34.857 -85.439 3 25 3.16 1.14
P26588 2001 4 13 16 36 20.70 36.530 -83.340 0 1 3.16 1.19
P26813 2001 5 17 6 43 48.50 36.045 -83.838 0 5 2.93 1.20
P27286 2001 7 26 5 26 44.70 35.932 -83.575 5 1 3.12 1.07
P28136 2001 12 8 1 8 21.50 34.735 -86.245 5 2 3.68 1.06
P39403 2003 3 18 6 4 24.20 33.689 -82.888 5 2 3.19 1.12
P31104 2003 4 29 8 59 39.00 34.494 -85.629 19 22 4.57 1.02
P32103 2004 3 13 17 7 58.00 36.480 -84.030 9 3 2.93 1.20
P32131 2004 3 21 18 11 34.20 35.502 -82.053 9 5 2.93 1.20
Table 2.5.2-2 (Sheet 9 of 11)Earthquakes Within 320 km (200 mi) of the Clinch River Nuclear Site from t
CEUS SSC Earthquake Catalog for Mainshock (Independent) EarthquakMagnitudes E[M] ≥ 2.9
TID
Coordinated Universal Time (UTC) Epicentral Location
Depth (km) ERH (km) E[M] NYear Month Day Hour Minute Second Lat. (+N°) Long. (+E°)

Revision 2
Clinch River Nuclear Site
TM 7 0.139 10096 0 120
TM 5 0.273 10131 0 123
TM 0 0.242 10144 0 53
TM 8 0.281 10161 0 263
TM 2 0.171 10175 0 27
TM 0 0.276 10185 0 68
TM 3 0.278 10190 0 53
TM 4 0.100 10268 0 142
TM 6 0.122 10287 0 44
TM 4 0.245 10376 0 182
TM 6 0.239 10410 0 40
TM 2 0.170 10433 0 112
TM 0 0.276 10453 0 143
TM 3 0.244 10516 0 263
TM 4 0.237 10528 0 59
TM 0 0.200 10537 0 39
TM 7 0.176 10636 0 89
TM 3 0.172 10663 0 211
TM 3 0.278 10720 0 42
TM 2 0.182 10909 0 115
TM 3 0.244 10964 0 37
UP 1 0.250 11000 0 100
UP 4 0.173 11059 0 318
UP 1 0.250 11097 0 39
UP 1 0.250 11190 0 26
UP 8 0.240 11504 0 39
UP 1 0.250 11833 0 247
UP 1 0.250 14125 0 135
UP 2 0.071 15157 0 182
he Updated es with
* sigM EQNO Flag Dist (km)
2.5.2-96
Early Site Permit ApplicationPart 2, Site Safety Analysis Report
P33025 2004 9 17 15 21 43.60 36.933 -84.004 1 2 3.60 1.04
P39406 2004 11 30 23 59 34.20 36.936 -83.893 10 2 3.16 1.19
P33590 2004 12 23 6 54 21.00 35.430 -84.200 7 2 3.04 1.15
P33796 2005 2 8 11 42 53.00 37.220 -81.930 9 2 2.93 1.20
P33974 2005 3 18 1 2 16.00 35.720 -84.160 9 2 2.91 1.07
P34061 2005 4 5 20 37 42.60 36.147 -83.693 10 3 3.08 1.20
P34101 2005 4 14 15 38 16.00 35.470 -84.090 15 1 3.00 1.20
P34631 2005 8 25 3 9 42.00 35.880 -82.800 8 1 3.63 1.02
P34800 2005 10 12 6 27 30.00 35.510 -84.540 8 1 3.54 1.03
P35348 2006 3 6 10 28 2.00 35.895 -82.359 0 4 3.20 1.15
P35592 2006 5 10 12 17 29.00 35.530 -84.400 24 25 3.16 1.14
P35729 2006 6 16 0 57 27.70 35.515 -83.229 4 1 3.17 1.07
P35930 2006 8 7 8 44 28.00 34.940 -85.460 12 1 3.08 1.20
P36410 2006 11 2 17 53 2.11 37.200 -81.920 1 2 3.98 1.15
P36586 2006 12 18 8 34 27.00 35.360 -84.350 17 25 3.35 1.14
P36651 2007 1 3 23 5 45.00 35.920 -83.950 15 2 2.98 1.10
P37341 2007 6 19 18 16 27.00 35.790 -85.360 1 2 3.50 1.07
P37480 2007 8 4 10 4 46.00 35.490 -82.090 9 2 3.00 1.07
P37804 2007 10 23 5 16 12.00 35.590 -84.100 21 2 3.00 1.20
P38741 2008 6 23 23 30 20.00 34.920 -84.840 9 2 3.12 1.08
P39088 2008 10 31 16 37 34.00 35.770 -84.000 7 25 2.97 1.15
D00016 2009 1 27 11 20 12.00 36.777 -84.132 25 -- 3.31 1.16
D00075 2009 4 4 20 45 32.00 33.183 -83.209 7 -- 3.06 1.07
D00113 2009 5 23 1 3 31.00 35.588 -84.159 6 -- 2.93 1.16
D00206 2009 8 31 14 7 10.00 35.778 -84.127 14 -- 3.38 1.16
D00520 2010 4 20 9 28 20.04 35.725 -84.001 2 -- 2.98 1.14
D00849 2010 8 30 16 31 3.00 36.490 -81.724 10 -- 2.93 1.16
D03141 2011 11 9 16 44 34.40 34.773 -84.982 5 -- 2.93 1.16
D04173 2012 11 10 17 8 14.29 37.139 -83.054 17 4.17 1.01
Table 2.5.2-2 (Sheet 10 of 11)Earthquakes Within 320 km (200 mi) of the Clinch River Nuclear Site from t
CEUS SSC Earthquake Catalog for Mainshock (Independent) EarthquakMagnitudes E[M] ≥ 2.9
TID
Coordinated Universal Time (UTC) Epicentral Location
Depth (km) ERH (km) E[M] NYear Month Day Hour Minute Second Lat. (+N°) Long. (+E°)

Revision 2
Clinch River Nuclear Site
UP 1 0.250 16326 0 245
(a)NoTID mbering of earthquakes in uniform magnitude catalog is
YeHo clear that other times were present among the various
to verify that the time was UTC for the individual sources.
La ong the source catalogs. Variability in the precision in degree longitude and latitude.
DeER values represent a mixture of reported standard errors in
d on felt effects (shaking intensity). Note: ERH does not e earthquake catalog. Dashes indicate no data.
E[N* ke recurrence parameters.sigEQFla pendent earthquake with the value of flag indicating the
DiCE
he Updated es with
* sigM EQNO Flag Dist (km)
2.5.2-97
Early Site Permit ApplicationPart 2, Site Safety Analysis Report
D05342 2013 8 25 19 50 40.29 36.165 -81.667 9 3.08 1.16
Local time; corresponding UTC hour should be “10.”tes:
Unique identification number assigned in the project to each earthquake. These values are not necessarily sequential. Sequential nuprovided by the EQNO field.
ar, Month, Day Date of Earthquakeur, Minute, Second Time of Earthquake. The times are assumed to be UTC times. During assembly of the catalog, UTC time was selected when it was
catalog sources. However, the reported times are based primarily on those reported in the source catalog and no attempt was made The master catalog database contains all of the individual catalog entries with their individual times.
t., Long. Location of Earthquake (degrees). The precision of the reported location represents the precision reported for the preferred entry amlocation among the earthquake entries is not an issue as the earthquake recurrence rates are computed using grid sizes of ¼ or ½
pth Earthquake Depth (km) or Depth of Focus; 0 indicates no measured or estimated depth.H Estimated Horizontal Location Uncertainty (km). This entry provides a measure of the uncertainty in location of the earthquake. The
location of instrumentally located earthquakes from various catalog sources and estimates of location uncertainty for locations baseappear to be used in specific analyses presented in the CEUS SSC Report, so this parameter was not estimated in the update of th
M] Expected value of moment magnitude.Equivalent earthquake count. This value is used to account for the effects of magnitude uncertainty in computing unbiased earthqua
M Standard deviation in the estimated moment magnitude, E[M]. It is used to compute N*NO Earthquake number in the uniform moment magnitude CEUS SSC Project catalog.g Flag for dependent earthquakes, where a value of 0 indicates an independent earthquake and a value greater than 0 indicates a de
EQNO of the mainshock of the cluster.st Epicentral distance (from epicenter to project site) in kilometers.US SSC Central and Eastern United States Seismic Source Characterization for Nuclear Facilities
Table 2.5.2-2 (Sheet 11 of 11)Earthquakes Within 320 km (200 mi) of the Clinch River Nuclear Site from t
CEUS SSC Earthquake Catalog for Mainshock (Independent) EarthquakMagnitudes E[M] ≥ 2.9
TID
Coordinated Universal Time (UTC) Epicentral Location
Depth (km) ERH (km) E[M] NYear Month Day Hour Minute Second Lat. (+N°) Long. (+E°)

Clinch River Nuclear SiteEarly Site Permit Application
Part 2, Site Safety Analysis Report
(a) Reference 2.5.2-1, Table B-2(b) Saint Louis University (SLU) North America Moment Tensor (NAMT) catalog “Mechanism Files” at
http://www.eas.slu.edu/eqc/eqc_mt/MECH.NA/Notes:Records are only shown when differences in the magnitudes occur.CEUS SSC = Central and Eastern United States Seismic Source Characterization for Nuclear FacilitiesM^ = Moment magnitude
Table 2.5.2-3Comparison of Some Reported Moment Magnitudes in the CEUS SSC Report and Those
from the Preferred SLU NAMT Catalog
Year Month Day Hour MinuteLatitude
(+N°)Longitude
(+E°)CEUS SSC
Report M^(a)Mechanism File M^(b)
2002 6 18 17 37 38.100 -87.700 4.50 4.572002 11 3 20 41 42.768 -98.896 4.14 4.152004 8 19 23 51 33.199 -86.934 3.63 3.622005 6 2 11 35 36.140 -89.460 3.89 3.982008 4 7 9 51 28.920 -98.040 4.86 3.862008 11 15 10 52 47.740 -69.710 3.60 3.57
2.5.2-98 Revision 2

Clinch River Nuclear SiteEarly Site Permit Application
Part 2, Site Safety Analysis Report
(a) Source area within 640 km (400 mi) included in Clinch River Nuclear Site Probabilistic Seismic Hazard Analysis.Source: Reference 2.5.2-1
Table 2.5.2-4Distributed Seismicity Sources in CEUS SSC Model
Zone Acronym Zone Name CommentsMmax Zones
MESE-N* and MESE-W(a) Mesozoic and Younger Extended Crust,narrow and wide geometries
NMESE-N* and NMESE-W(a) Non-Mesozoic and Younger Extended Crust,narrow and wide geometries
NMESE-N is paired with MESE-N, and
NMESE-W is paired with MESE-WSTUDY_R(a) CEUS Study Region Exclusive with MESE and NMESE
Seismotectonic Source ZonesAHEX Atlantic Highly Extended Crust
ECC-AM(a) Extended Continental Crust-Atlantic MarginECC-GC(a) Extended Continental Crust-Gulf Coast
GHEX Gulf Coast Highly Extended CrustGMH Great Meteor Hotspot
IBEB(a) Illinois Basin Extended Basement
MidC-A(a), B(a), C(a), D(a) Midcontinent-Craton Alternative geometries depend on PEZ and RR/ RR-RCG
NAP Northern AppalachianOKA Oklahoma Aulacogen
PEZ-N(a) and PEZ- W(a) Paleozoic Extended Crust narrow andPaleozoic Extended Crust wide
PEZ-N is modeled either with MidC-A and RR, or MidC- B and RR-RCG.
PEZ-W is modeled with MidC-C and RR, or MidC-D and RR-RCG
RR and RR-RCG(a) Reelfoot Rift, Reelfoot Rift with Rough Creek Graben
RR and RR-RCG are mutually exclusive
SLR St. Lawrence Rift, including the Ottawa and Saguenay grabens
2.5.2-99 Revision 2

Clinch River Nuclear SiteEarly Site Permit Application
Part 2, Site Safety Analysis Report
(a) Source used in Clinch River Nuclear Site Probabilistic Seismic Hazard Analysis with an inclusion distance of 640 km (400 mi)Notes:Mmax = Maximum magnitudeZone acronyms are defined in Table 2.5.2-4.Source: Reference 2.5.2-1, Table 6.2-1
(a) Source used in Clinch River Nuclear Site Probabilistic Seismic Hazard Analysis with an inclusion distance of 640 km (400 mi)Notes:Mmax = Maximum magnitudeZone acronyms are defined in Table 2.5.2-4.Source: Reference 2.5.2-1, Table H-3-3.
Table 2.5.2-5Alternative Maximum Magnitude Zonation Models
Mesozoic Extended-Narrow Model Mesozoic Extended-Wide Model
Mmax Zone MESE-N(a) NMESE-N(a) MESE-W(a) NMESE-W(a)
Corresponding Seismotectonic Zones
AHEX MidC-A(a), -B(a) AHEX MidC-C(a), -D(a)
ECC-AM(a) IBEB(a) ECC-AM(a) OKA
ECC-GC(a) OKA ECC-GC(a)
GHEX GHEX
RR(a) RR-RCG(a)
SLR SLR
NAP NAP
GMH GMH
PEZ-N(a) PEZ-W(a)
IBEB(a)
Table 2.5.2-6Alternative Maximum Magnitude Zonation Model Weights
Weight Assigned to Mmax
Maximum MagnitudeStudy
Region(a) MESE-N(a) NMESE-N(a) MESE-W(a) NMESE-W(a)
0.101 6.5 6.4 6.4 6.5 5.7
0.244 6.9 6.8 6.8 6.9 6.1
0.310 7.2 7.2 7.1 7.3 6.6
0.244 7.7 7.7 7.5 7.7 7.2
0.101 8.1 8.1 8.0 8.1 7.9
2.5.2-100 Revision 2

Clinch River Nuclear SiteEarly Site Permit Application
Part 2, Site Safety Analysis Report
Reproduced from Reference 2.5.2-1, Table 5.4-1.
Table 2.5.2-7Assessment of Default Characteristics
of Future Earthquakes in the CEUSTectonic Stress Regime Compressional
Sense of Slip/Style of Faulting Treat as aleatory (relative frequency):• 2:1 strike-slip:reverse
Strike and Dip of Ruptures Aleatory distribution:• N50W (0.2)• N-S (0.2)• N35E (0.4)• N60E (0.1)• E-W (0.1)
Dip is a function of sense of slip:• Strike-slip (90°-60°) (uniform)• Reverse (30°-60°) (uniform)• Either direction (50:50)
Seismogenic Crustal Thickness Epistemic distribution:• 13 km (0.4)• 17 km (0.4)• 22 km (0.2)
Fault Rupture Area Function of magnitude;• Use Reference 2.5.2-111 relation for Eastern North America
Rupture Length-to-Width Aspect Ratio Function of rupture area:• 1:1 for smaller ruptures• With progressively larger areas, when rupture width equals seismogenic
crustal thickness, extend only the lengthRelationship of Rupture to Source Zone Boundaries
Epicenter is at center of rupture length (map view)All boundaries are “leaky”; rupture is allowed to extend beyond boundary. (Note: if boundary is “strict,” rupture cannot extend beyond boundary, although epicenter can be near boundary)
2.5.2-101 Revision 2

Clinch River Nuclear SiteEarly Site Permit Application
Part 2, Site Safety Analysis Report
Table 2.5.2-8 (Sheet 1 of 3)Characteristics of Future Earthquakes for Individual Seismic Sources
SourceSource
Boundaries
Seismogenic Crustal
Thickness(a) Rupture Strike(b) Sense of Slip(c) Rupture Dip(d)
RLME Sources
Charlevoix Leaky 25 km (0.5)30 km (0.5) Uniform 0°–360° Reverse Uniform 40°–60°
Charleston-Regional Strict15 km (0.2)20 km (0.4)25 km (0.4)
NE parallel to the long axis (0.8)
NW parallel to the short axis (0.2)
Strike-slip 90°
Charleston-Local Strict15 km (0.2)20 km (0.4)25 km (0.4)
NE parallel to the long axis Strike-slip 90°
Charleston-Narrow Leaky at ends
15 km (0.2)20 km (0.4)25 km (0.4)
NE parallel to the long axis Strike-slip 90°
Cheraw Strict13 km (0.4)17 km (0.4)22 km (0.2)
On fault trace (NE) Normal-oblique 50° NW (0.6)
65° NW (0.4)
Commerce Leaky at ends
13 km (0.3)15 km (0.5)17 km (0.2)
NE parallel to long axis of zone Strike-slip 90°
ERM-N Leaky at ends
13 km (0.3)15 km (0.5)17 km (0.2)
NE parallel to long axis of zone Strike-slip 90°
ERM-S Leaky at ends
13 km (0.3)15 km (0.5)17 km (0.2)
NE parallel to long axis of zone Strike-slip 90°
Marianna Leaky at ends
13 km (0.3)15 km (0.5)17 km (0.2)
NE 45° (0.5)NW 45° (0.5) Strike-slip 90°
Meers-Fault Strict 15 km (0.5)20 km (0.5) On fault
Oblique (0.5) 90°Reverse-
Oblique (0.5) 40° SW
Meers-Random in OKA Strict 15 km (0.5)20 km (0.5)
Parallel tolong axis of zone Reverse-oblique Uniform 40°–90° SW
NMFS Strict13 km (0.3)15 km (0.5)17 km (0.2)
On faultNMN,NMS:Strike-slip 90°
RFT: Reverse 40° SW
Wabash Valley Leaky 17 km (0.7)22 km (0.3)
Strike parallel to the long axis of the zone (0.8)
Strike-slip(2/3 of 0.8) 90°
Reverse(1/3 of 0.8) Uniform 40°–60° W
N50°W (0.1) Strike-slip (0.1) 90°N20°W (0.1) Reverse (0.1) Uniform 40°–60° W
2.5.2-102 Revision 2
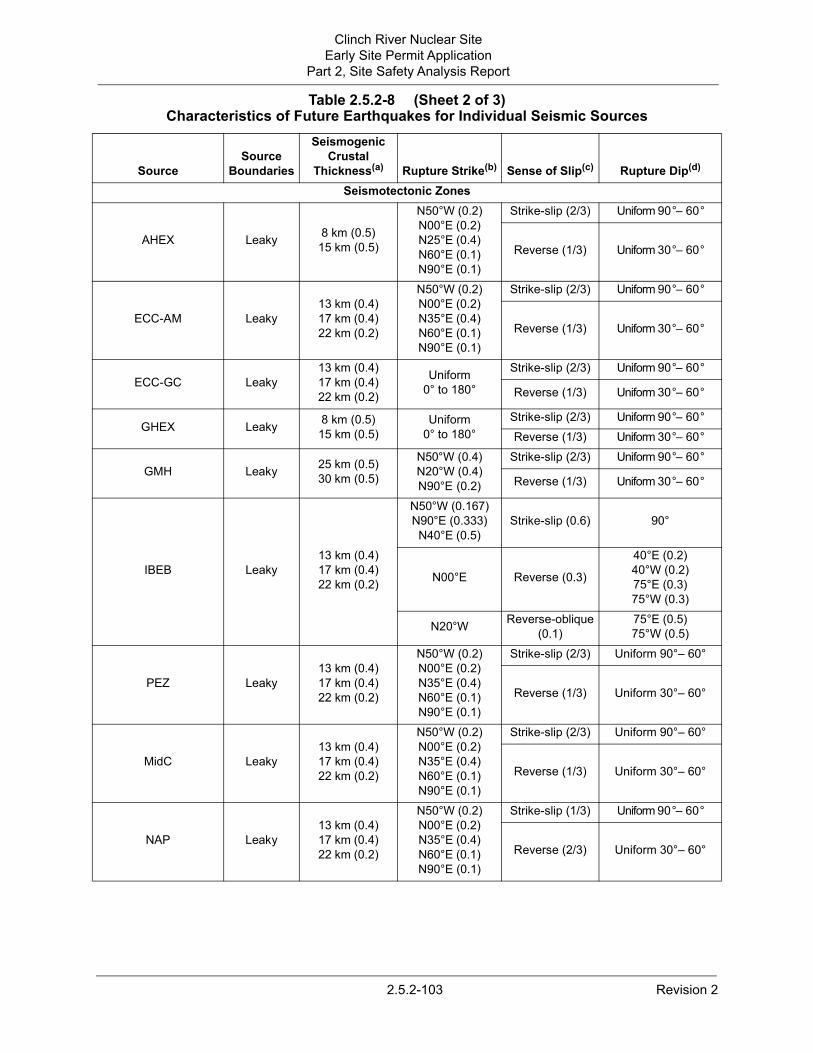
Clinch River Nuclear SiteEarly Site Permit Application
Part 2, Site Safety Analysis Report
Seismotectonic Zones
AHEX Leaky 8 km (0.5)15 km (0.5)
N50°W (0.2)N00°E (0.2)N25°E (0.4)N60°E (0.1)N90°E (0.1)
Strike-slip (2/3) Uniform 90°– 60°
Reverse (1/3) Uniform 30°– 60°
ECC-AM Leaky13 km (0.4)17 km (0.4)22 km (0.2)
N50°W (0.2)N00°E (0.2)N35°E (0.4)N60°E (0.1)N90°E (0.1)
Strike-slip (2/3) Uniform 90°– 60°
Reverse (1/3) Uniform 30°– 60°
ECC-GC Leaky13 km (0.4)17 km (0.4)22 km (0.2)
Uniform0° to 180°
Strike-slip (2/3) Uniform 90°– 60°
Reverse (1/3) Uniform 30°– 60°
GHEX Leaky 8 km (0.5)15 km (0.5)
Uniform0° to 180°
Strike-slip (2/3) Uniform 90°– 60°
Reverse (1/3) Uniform 30°– 60°
GMH Leaky 25 km (0.5)30 km (0.5)
N50°W (0.4)N20°W (0.4)N90°E (0.2)
Strike-slip (2/3) Uniform 90°– 60°
Reverse (1/3) Uniform 30°– 60°
IBEB Leaky13 km (0.4)17 km (0.4)22 km (0.2)
N50°W (0.167)N90°E (0.333)N40°E (0.5)
Strike-slip (0.6) 90°
N00°E Reverse (0.3)
40°E (0.2)40°W (0.2)75°E (0.3)75°W (0.3)
N20°W Reverse-oblique (0.1)
75°E (0.5)75°W (0.5)
PEZ Leaky13 km (0.4)17 km (0.4)22 km (0.2)
N50°W (0.2)N00°E (0.2)N35°E (0.4)N60°E (0.1)N90°E (0.1)
Strike-slip (2/3) Uniform 90°– 60°
Reverse (1/3) Uniform 30°– 60°
MidC Leaky13 km (0.4)17 km (0.4)22 km (0.2)
N50°W (0.2)N00°E (0.2)N35°E (0.4)N60°E (0.1)N90°E (0.1)
Strike-slip (2/3) Uniform 90°– 60°
Reverse (1/3) Uniform 30°– 60°
NAP Leaky13 km (0.4)17 km (0.4)22 km (0.2)
N50°W (0.2)N00°E (0.2)N35°E (0.4)N60°E (0.1)N90°E (0.1)
Strike-slip (1/3) Uniform 90°– 60°
Reverse (2/3) Uniform 30°– 60°
Table 2.5.2-8 (Sheet 2 of 3)Characteristics of Future Earthquakes for Individual Seismic Sources
SourceSource
Boundaries
Seismogenic Crustal
Thickness(a) Rupture Strike(b) Sense of Slip(c) Rupture Dip(d)
2.5.2-103 Revision 2

Clinch River Nuclear SiteEarly Site Permit Application
Part 2, Site Safety Analysis Report
(a) Seismogenic thickness values and weights for RLME sources from logic trees in the “June 27, 2012 Updates file” and Chapter 6. Values and weights for seismotectonic sources from Table 5.4-1 (default values) and Table 5.4-2. Weights reflect epistemic uncertainty (scientific uncertainty); weights are therefore relative credibility that the given thickness is correct.
(b) Rupture strike from Table 5.4-2 for RLME sources and Table H-4-3 for seismotectonic sources. Weights reflect aleatory uncertainty (natural randomness); weights are therefore relative frequencies.
(c) Sense of slip from Table 5.4-2 (and HID text in the case of Meers – fault) for RLME sources and Table H-4-3 for seismotectonic sources. Weights reflect aleatory uncertainty (natural randomness); weights are therefore relative frequencies.
(d) Rupture dip from Table 5.4-2 and “June 27, 2012 Updates file” for RLME sources and Table H-4-3 for seismotectonic sources. Unless a dip direction is specified, it is assumed that there is an equal likely dip direction. “Uniform” indicates a uniform distribution of dip values within the range specified. Weights reflect aleatory uncertainty (natural randomness); weights are therefore relative frequencies.
Notes:Parameter values or weights for each source are reported in different locations within the CEUS SSC report and files (Reference 2.5.2-1): (1) the “June 27, 2012 Updates file,” (2) Table H-4-3 in Appendix H, (3) Tables 5.4-1 and 5.4-2 from Chapter 5, and (4) text descriptions in the HID, Chapter 6 (for RLME sources) and Chapter 7 (for seismotectonic sources). Note that there are some differences in a few values and weights as reported in Reference 2.5.2-1 for a given source and this table indicates the location of parameters for each column heading. Simplifications in implementing the CEUS SSC model in PSHA, such as modeling ruptures as point sources in source zones, negate the use of rupture strike and dip for some sources. The June 27, 2012 Updates file is maintained on the CEUS SSC Report web site (http://www.ceus-ssc.org).NMFS = New Madrid Fault SystemSources are defined in Table 2.5.2-4.
Seismotectonic Zones (continued)
OKA Leaky 15 km (0.5)20 km (0.5)
Parallel to the long axis of zone Reverse-oblique Uniform 45° to 75°
RR and RR-RCG Leaky13 km (0.4)15 km (0.4)17 km (0.2)
N50°W (0.3)N30°E (0.3)N55°E (0.3)N90°E (0.1)
Strike-slip (0.65) 90°
N10°W Reverse (0.35)
40°E (0.25)40°W (0.25)70°E (0.25)70°W (0.25)
SLR Leaky 25 km (0.5)30 km (0.5)
N25°E (0.2)N40°E (0.2)N70°E (0.2)
N50°W (0.15)N70°W (0.15)N00°E (0.05)N90°E (0.05)
Strike-slip (1/3) Uniform 90° - 60°
Reverse (2/3) Uniform 30° - 60°
Table 2.5.2-8 (Sheet 3 of 3)Characteristics of Future Earthquakes for Individual Seismic Sources
SourceSource
Boundaries
Seismogenic Crustal
Thickness(a) Rupture Strike(b) Sense of Slip(c) Rupture Dip(d)
2.5.2-104 Revision 2

Revision 2
Clinch River Nuclear Site
(a) ic Hazard Analysis (PSHA) (see
(b)SoRe
ity Sources
WZ-N(b) and
PEZ-W(b) RR(b) RR-RCG(b) SLR5.9 6.2 6.1 6.26.4 6.7 6.6 6.86.8 7.2 7.1 7.37.2 7.7 7.6 7.77.9 8.1 8.1 8.1
2.5.2-105
Early Site Permit ApplicationPart 2, Site Safety Analysis Report
Based on 2011 Mineral, Virginia earthquake, this value of 6.0 is updated to 6.1 for the Clinch River Nuclear Site (CRN) Probabilistic SeismSubsection 2.5.2.2.5.2).Source used in CRN Site PSHA with an inclusion distance of 640 km. (400 mi)
urce:ference 2.5.2-1 Table H-4-4.
Table 2.5.2-9Maximum Magnitude Distributions for Seismotectonic Distributed Seismic
eight AHEX ECC-AM(b) ECC-GC(b) GHEX GMH IBEB(b)
MidC-A(b),MidC-B(b),MidC-C(b),
and MidC-D(b) NAP OKAPE
0.101 6.0 6.0(a) 6.0 6.0 6.0 6.5 5.6 6.1 5.80.244 6.7 6.7 6.7 6.7 6.7 6.9 6.1 6.7 6.40.310 7.2 7.2 7.2 7.2 7.2 7.4 6.6 7.2 6.90.244 7.7 7.7 7.7 7.7 7.7 7.8 7.2 7.7 7.40.101 8.1 8.1 8.1 8.1 8.1 8.1 8.0 8.1 8.0

Clinch River Nuclear SiteEarly Site Permit Application
Part 2, Site Safety Analysis Report
Notes:RLME = Repeated Large Magnitude EarthquakeSource:Reference 2.5.2-1, Table H-5.2-1.
(a) NMS: New Madrid South; RFT: Reelfoot Thrust; NMN: New Madrid North.Notes:RLME = Repeated Large Magnitude EarthquakeSource:Reference 2.5.2-1, Table H-5.5-1.
Notes:RLME = Repeated Large Magnitude EarthquakeSource:Reference 2.5.2-1, Table H-5.9-1
Table 2.5.2-10Maximum Magnitude Distribution for Charleston Repeated Large Magnitude Earthquake
SourceExpected Charleston
RLME Magnitude Weight6.7 0.106.9 0.257.1 0.307.3 0.257.5 0.10
Table 2.5.2-11Maximum Magnitude Distribution for New Madrid Repeated Large Magnitude Earthquake
SourceExpected NMFS RLME Magnitude for:
NMS(a) RFT(a) NMN(a) Weight7.9 7.8 7.6 0.1677.8 7.7 7.5 0.1677.6 7.8 7.5 0.2507.2 7.4 7.2 0.0836.9 7.3 7.0 0.2506.7 7.1 6.8 0.083
Table 2.5.2-12Maximum Magnitude Distribution for Wabash Valley Repeated Large Magnitude
Earthquake SourceExpected Wabash Valley RLME
Magnitude Weight6.75 0.057.0 0.257.25 0.357.5 0.35
2.5.2-106 Revision 2

Clinch River Nuclear SiteEarly Site Permit Application
Part 2, Site Safety Analysis Report
(a) ERM-S – Eastern rift margin-south ; ERM-N – Eastern rift margin-north.Notes:RLME = Repeated Large Magnitude EarthquakeDash (–) = Magnitude not included in the weight distribution for the listed sourceSource:Reference 2.5.2-1, including June 27, 2012 Updates, Tables H-5.6-1, H-5.6-2, H-5.7-1, and H-5.8-1.
(a) From Table H-4-4 of Reference 2.5.2-1(b) From Table 2.5.2-211 of North Anna 3 FSAR Rev 7 (Reference 2.5.2-23)
Table 2.5.2-13Maximum Magnitude Distribution for ERM-S, ERM-N, Marianna Zone, and Commerce Fault
Zone Repeated Large Magnitude Earthquake SourcesExpected RLME
MagnitudeERM-S(a), Marianna, and
Commerce Weight ERM-N(a) Weight6.7 0.15 0.306.9 0.20 0.307.1 0.20 0.307.3 0.20 –7.4 – 0.107.5 0.20 –7.7 0.05 –
Table 2.5.2-14Updated Distribution of Maximum Magnitude for ECC-AM Source Zone
Probability(a) Original Magnitude(a)Updated
Magnitude(b)
0.101 6.0 6.10.244 6.7 6.70.310 7.2 7.20.244 7.7 7.70.101 8.1 8.1
2.5.2-107 Revision 2

Clinch River Nuclear SiteEarly Site Permit Application
Part 2, Site Safety Analysis Report
(a) From Table H-4-4 of Reference 2.5.2-1Notes:Values that have been updated per Richards (2014; Reference 2.5.2-110) are indicated by bold italicsMmax = Maximum magnitude
Table 2.5.2-15Corrections to Maximum Magnitude Distributions Published in CEUS SSC 2012
Wei
ght
IBEBMidC-A, MidC-B, MidC-C, MidC-D PEZ-N PEZ-W SLR
Inco
rrec
t Mm
ax V
alue
s(a)
Cor
rect
Mm
ax V
alue
s
Inco
rrec
t Mm
ax V
alue
s(a)
Cor
rect
Mm
ax V
alue
s
Inco
rrec
t Mm
ax V
alue
s(a)
Cor
rect
Mm
ax V
alue
s
Inco
rrec
t Mm
ax V
alue
s(a)
Cor
rect
Mm
ax V
alue
s
Inco
rrec
t Mm
ax V
alue
s(a)
Cor
rect
Mm
ax V
alue
s
0.101 6.5 6.4 5.6 5.6 5.9 6.0 5.9 6.0 6.2 6.40.244 6.9 6.7 6.1 6.1 6.4 6.5 6.4 6.4 6.8 6.80.310 7.4 7.1 6.6 6.6 6.8 6.9 6.8 6.9 7.3 7.30.244 7.8 7.5 7.2 7.2 7.2 7.4 7.2 7.4 7.7 7.70.101 8.1 8.0 8.0 7.9 7.9 8.0 7.9 8.0 8.1 8.1
2.5.2-108 Revision 2

Clinch River Nuclear SiteEarly Site Permit Application
Part 2, Site Safety Analysis Report
Notes:PGA = Peak Ground Acceleration
Table 2.5.2-16Total Mean Rock Hazard for Seven Spectral Frequencies
Spectral Acceleration (g)
Mean Annual Frequencies of Exceedance
0.5 Hz 1 Hz 2.5 Hz 5 Hz 10 Hz 25 HzPGA
(100 Hz)0.0005 3.55E-02 7.11E-02 1.11E-01 1.18E-01 1.17E-01 1.07E-01 9.48E-020.001 2.08E-02 4.57E-02 8.71E-02 9.86E-02 9.78E-02 8.39E-02 6.79E-020.005 5.05E-03 1.11E-02 2.78E-02 3.72E-02 3.86E-02 3.16E-02 2.14E-020.01 2.35E-03 5.29E-03 1.38E-02 2.01E-02 2.24E-02 1.94E-02 1.19E-020.015 1.35E-03 3.19E-03 8.73E-03 1.35E-02 1.59E-02 1.43E-02 8.07E-030.03 3.95E-04 1.07E-03 3.49E-03 6.15E-03 8.25E-03 7.94E-03 3.81E-030.05 1.24E-04 3.74E-04 1.52E-03 3.11E-03 4.68E-03 4.79E-03 2.09E-030.075 4.42E-05 1.45E-04 7.24E-04 1.72E-03 2.84E-03 3.08E-03 1.28E-030.1 2.06E-05 7.18E-05 4.14E-04 1.10E-03 1.94E-03 2.21E-03 8.85E-04
0.15 7.08E-06 2.70E-05 1.86E-04 5.73E-04 1.11E-03 1.35E-03 5.14E-040.3 1.29E-06 5.49E-06 4.58E-05 1.74E-04 3.98E-04 5.41E-04 1.82E-040.5 3.83E-07 1.67E-06 1.53E-05 6.58E-05 1.73E-04 2.57E-04 7.47E-05
0.75 1.40E-07 6.07E-07 5.94E-06 2.80E-05 8.27E-05 1.34E-04 3.32E-051 6.54E-08 2.81E-07 2.89E-06 1.45E-05 4.67E-05 8.07E-05 1.75E-05
1.5 2.08E-08 8.72E-08 9.60E-07 5.22E-06 1.93E-05 3.67E-05 6.42E-063 2.28E-09 8.99E-09 1.10E-07 6.92E-07 3.23E-06 7.49E-06 8.30E-075 3.52E-10 1.32E-09 1.68E-08 1.20E-07 6.71E-07 1.83E-06 1.33E-07
7.5 6.82E-11 2.43E-10 3.17E-09 2.50E-08 1.61E-07 5.03E-07 2.49E-0810 1.94E-11 6.69E-11 8.79E-10 7.44E-09 5.31E-08 1.83E-07 6.64E-0915 2.89E-12 9.48E-12 1.25E-10 1.16E-09 9.54E-09 3.79E-08 8.62E-1030 7.56E-14 2.28E-13 3.06E-12 3.38E-11 3.39E-10 1.73E-09 1.84E-11
2.5.2-109 Revision 2

Clinch River Nuclear SiteEarly Site Permit Application
Part 2, Site Safety Analysis Report
Table 2.5.2-17Mean Rock Uniform Hazard Response Spectra for Mean Annual Frequency of Exceedance
of 10-4, 10-5, and 10-6
Ground Motion Frequency (Hz)Spectral Acceleration (g)
mean 10-4 mean 10-5 mean 10-6
PGA (100) 0.423 1.26 2.8225 0.885 2.65 6.0410 0.675 1.94 4.395 0.401 1.16 2.64
2.5 0.204 0.600 1.481 0.0873 0.231 0.614
0.5 0.0545 0.132 0.334Notes:Values represent 5% critically-damped spectral acceleration (g)PGA = Peak Ground Acceleration
Table 2.5.2-18Mean Magnitude and Distance for Low Frequency and High Frequency Response Spectra
for Three Mean Annual Frequency Exceedances
mean 10-4 mean 10-5 mean 10-6
Low Frequency M 7.5* 7.6* 6.7Low Frequency R (km) 380* 330* 13
High Frequency M 5.9 6.1 6.3High Frequency R (km) 16 12 11
Notes:Low Frequency = 1 to 2.5 Hz (per RG 1.208)High Frequency = 5 to 10 Hz (per RG 1.208)M = MagnitudeR = Distance*M and R calculated for R>100 km per RG 1.208, because the contribution to hazard for R>100 km is more than 5% of the total hazard.
2.5.2-110 Revision 2

Clinch River Nuclear SiteEarly Site Permit Application
Part 2, Site Safety Analysis Report
Table 2.5.2-19 (Sheet 1 of 2)High Frequency and Low Frequency Rock Spectra for Mean Annual Frequency
Exceedance of 10-4, 10-5, and 10-6
Frequency (Hz)
Spectral Acceleration (g)10-4 HF 10-4 LF 10-5 HF 10-5 LF 10-6 HF 10-6 LF
100 4.23E-01 1.80E-01 1.26E+00 5.30E-01 2.82E+00 2.06E+0090 4.58E-01 1.96E-01 1.36E+00 5.76E-01 3.06E+00 2.24E+0080 5.19E-01 2.23E-01 1.55E+00 6.55E-01 3.47E+00 2.55E+0070 6.11E-01 2.64E-01 1.82E+00 7.77E-01 4.10E+00 3.02E+0060 7.27E-01 3.16E-01 2.17E+00 9.29E-01 4.88E+00 3.61E+0050 8.33E-01 3.65E-01 2.48E+00 1.07E+00 5.61E+00 4.17E+0045 8.71E-01 3.84E-01 2.60E+00 1.13E+00 5.87E+00 4.38E+0040 8.97E-01 3.98E-01 2.68E+00 1.17E+00 6.06E+00 4.53E+0035 9.08E-01 4.07E-01 2.71E+00 1.19E+00 6.15E+00 4.62E+0030 9.05E-01 4.11E-01 2.71E+00 1.21E+00 6.15E+00 4.64E+0025 8.85E-01 4.10E-01 2.65E+00 1.20E+00 6.04E+00 4.59E+0020 8.64E-01 4.04E-01 2.56E+00 1.19E+00 5.80E+00 4.44E+0015 8.04E-01 3.89E-01 2.35E+00 1.14E+00 5.31E+00 4.11E+00
12.5 7.51E-01 3.76E-01 2.17E+00 1.10E+00 4.92E+00 3.84E+0010 6.75E-01 3.57E-01 1.94E+00 1.05E+00 4.39E+00 3.47E+009 6.29E-01 3.47E-01 1.81E+00 1.02E+00 4.09E+00 3.29E+008 5.78E-01 3.36E-01 1.66E+00 9.82E-01 3.77E+00 3.09E+007 5.23E-01 3.22E-01 1.51E+00 9.41E-01 3.42E+00 2.87E+006 4.64E-01 3.06E-01 1.34E+00 8.92E-01 3.04E+00 2.62E+005 4.01E-01 2.85E-01 1.16E+00 8.33E-01 2.64E+00 2.35E+004 3.28E-01 2.60E-01 9.53E-01 7.59E-01 2.22E+00 2.04E+003 2.48E-01 2.26E-01 7.26E-01 6.62E-01 1.75E+00 1.69E+00
2.5 2.04E-01 2.04E-01 6.00E-01 6.00E-01 1.48E+00 1.48E+002 1.60E-01 1.74E-01 4.79E-01 5.00E-01 1.20E+00 1.25E+00
1.5 1.12E-01 1.36E-01 3.41E-01 3.78E-01 8.71E-01 9.68E-011.25 8.71E-02 1.13E-01 2.68E-01 3.07E-01 6.92E-01 7.98E-01
1 6.30E-02 8.73E-02 1.96E-01 2.31E-01 5.12E-01 6.14E-010.9 5.39E-02 8.25E-02 1.68E-01 2.15E-01 4.41E-01 5.69E-010.8 4.51E-02 7.68E-02 1.41E-01 1.97E-01 3.73E-01 5.19E-010.7 3.67E-02 7.02E-02 1.16E-01 1.77E-01 3.07E-01 4.62E-010.6 2.88E-02 6.28E-02 9.14E-02 1.55E-01 2.44E-01 4.01E-010.5 2.15E-02 5.45E-02 6.86E-02 1.32E-01 1.84E-01 3.34E-010.4 1.72E-02 4.36E-02 5.49E-02 1.06E-01 1.48E-01 2.67E-010.3 1.29E-02 3.27E-02 4.12E-02 7.92E-02 1.11E-01 2.00E-010.2 8.58E-03 2.18E-02 2.74E-02 5.28E-02 7.38E-02 1.34E-01
0.167 7.17E-03 1.82E-02 2.29E-02 4.41E-02 6.16E-02 1.12E-010.125 5.37E-03 1.36E-02 1.72E-02 3.30E-02 4.61E-02 8.35E-02
2.5.2-111 Revision 2

Clinch River Nuclear SiteEarly Site Permit Application
Part 2, Site Safety Analysis Report
0.1 4.29E-03 1.09E-02 1.37E-02 2.64E-02 3.69E-02 6.68E-02Notes:LF: Low Frequency, 1 to 2.5 HzHF: High Frequency, 5 to 10 Hz
Table 2.5.2-19 (Sheet 2 of 2)High Frequency and Low Frequency Rock Spectra for Mean Annual Frequency
Exceedance of 10-4, 10-5, and 10-6
Frequency (Hz)
Spectral Acceleration (g)10-4 HF 10-4 LF 10-5 HF 10-5 LF 10-6 HF 10-6 LF
2.5.2-112 Revision 2

Clinch River Nuclear SiteEarly Site Permit Application
Part 2, Site Safety Analysis Report
Notes:G/Gmax = Shear modulus reductionP1, P2, P3, M1, and M2 are defined in Subsection 2.5.2.5.1.
(a) Source layerNotes:Dash (–) = No damping is consideredSource: Reference 2.5.2-136
Table 2.5.2-20Inputs and Weights for Site Response Analyses
Velocity Profile Kappa (s)P1 0.010P2 0.016P3 0.006
WeightsP1 0.6P2 0.2P3 0.2
G/Gmax and Hysteretic Damping CurvesM1 0.5M2 0.5
Table 2.5.2-21Midcontinent Crustal Model
Layer Thickness (km) VS (km/s) Density (g/cm3) Damping (% critical)1.0 2.83 2.52 0.8311.0 3.52(a) 2.71 —
28.0 3.75 2.78 —
Half-space 4.62 3.35 —
2.5.2-113 Revision 2

Clinch River Nuclear SiteEarly Site Permit Application
Part 2, Site Safety Analysis Report
Notes:PGA = Peak Ground Acceleration
Table 2.5.2-22Weights Used for Site Response Analysis Based
on Deaggregations at Two Return Periods10,000-year Return Period M 5.5 M 7.5
PGA (100 Hz) 0.873 0.12725 Hz 0.879 0.12110 Hz 0.871 0.1295 Hz 0.837 0.163
2.5 Hz 0.753 0.2471 Hz 0.421 0.579
0.5 Hz 0.178 0.822100,000-year Return Period M 5.5 M 7.5
PGA (100 Hz) 0.784 0.21625 Hz 0.798 0.20210 Hz 0.784 0.2165 Hz 0.727 0.273
2.5 Hz 0.657 0.3431 Hz 0.484 0.516
0.5 Hz 0.247 0.753
2.5.2-114 Revision 2

Clinch River Nuclear SiteEarly Site Permit Application
Part 2, Site Safety Analysis Report
Notes:Location A is shown on Figure 2.5.4-2.
Table 2.5.2-23Horizontal Uniform Hazard Response Spectra for Location A
Frequency (Hz) Horizontal 10-4 (g) Horizontal 10-5 (g) Horizontal 10-6 (g)0.100 0.0105 0.0240 0.06200.125 0.0131 0.0301 0.07760.150 0.0156 0.0363 0.09330.200 0.0208 0.0487 0.1250.300 0.0309 0.0736 0.1880.400 0.0410 0.0986 0.2510.500 0.0511 0.124 0.3140.600 0.0640 0.159 0.4090.700 0.0774 0.197 0.5110.800 0.0912 0.237 0.6200.900 0.105 0.278 0.7361.000 0.120 0.322 0.8571.250 0.134 0.367 0.9561.500 0.146 0.408 1.0462.000 0.168 0.483 1.2052.500 0.188 0.550 1.3453.000 0.227 0.663 1.5894.000 0.307 0.888 2.0685.000 0.388 1.115 2.5366.000 0.457 1.312 2.9817.000 0.524 1.505 3.4198.000 0.591 1.696 3.8499.000 0.657 1.884 4.273
10.000 0.723 2.070 4.69212.500 0.755 2.222 4.79815.000 0.744 2.223 4.84820.000 0.718 2.150 4.81525.000 0.673 2.016 4.68230.000 0.638 1.913 4.34035.000 0.601 1.804 4.03840.000 0.558 1.675 3.74745.000 0.514 1.540 3.43650.000 0.472 1.409 3.20160.000 0.389 1.174 2.61970.000 0.356 1.063 2.36180.000 0.342 1.017 2.27390.000 0.337 1.002 2.248
100.000 0.343 1.001 2.245
2.5.2-115 Revision 2
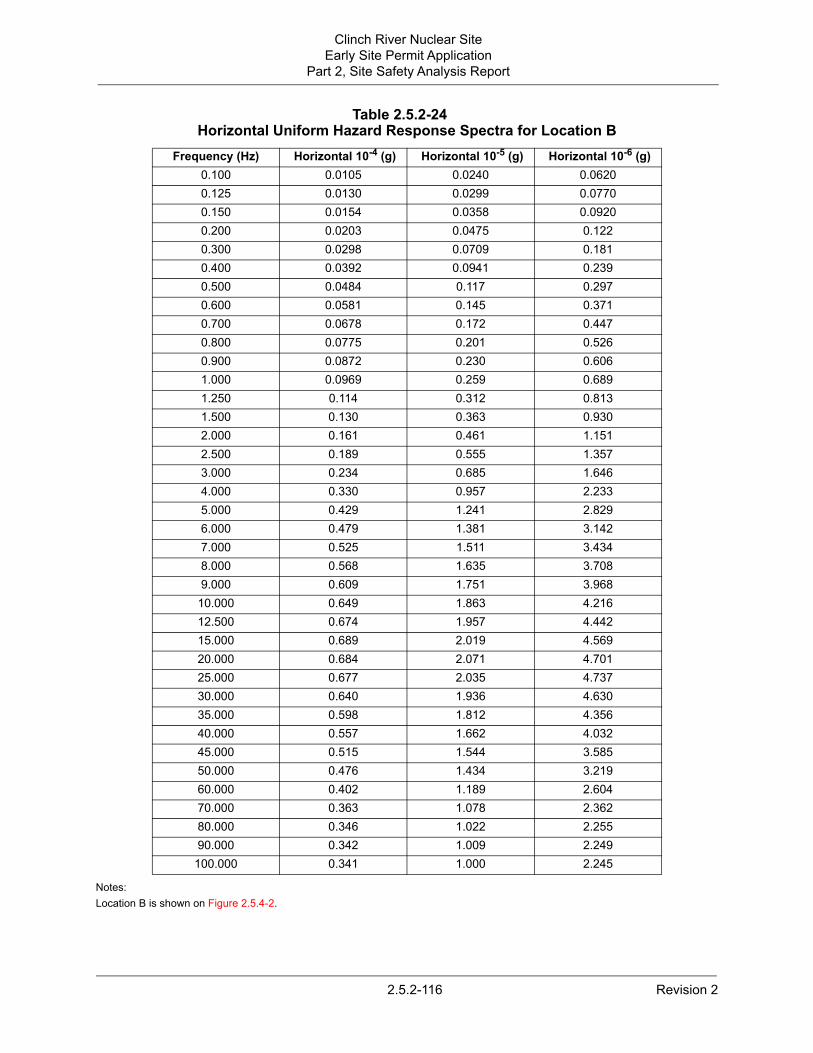
Clinch River Nuclear SiteEarly Site Permit Application
Part 2, Site Safety Analysis Report
Notes:Location B is shown on Figure 2.5.4-2.
Table 2.5.2-24Horizontal Uniform Hazard Response Spectra for Location B
Frequency (Hz) Horizontal 10-4 (g) Horizontal 10-5 (g) Horizontal 10-6 (g)0.100 0.0105 0.0240 0.06200.125 0.0130 0.0299 0.07700.150 0.0154 0.0358 0.09200.200 0.0203 0.0475 0.1220.300 0.0298 0.0709 0.1810.400 0.0392 0.0941 0.2390.500 0.0484 0.117 0.2970.600 0.0581 0.145 0.3710.700 0.0678 0.172 0.4470.800 0.0775 0.201 0.5260.900 0.0872 0.230 0.6061.000 0.0969 0.259 0.6891.250 0.114 0.312 0.8131.500 0.130 0.363 0.9302.000 0.161 0.461 1.1512.500 0.189 0.555 1.3573.000 0.234 0.685 1.6464.000 0.330 0.957 2.2335.000 0.429 1.241 2.8296.000 0.479 1.381 3.1427.000 0.525 1.511 3.4348.000 0.568 1.635 3.7089.000 0.609 1.751 3.968
10.000 0.649 1.863 4.21612.500 0.674 1.957 4.44215.000 0.689 2.019 4.56920.000 0.684 2.071 4.70125.000 0.677 2.035 4.73730.000 0.640 1.936 4.63035.000 0.598 1.812 4.35640.000 0.557 1.662 4.03245.000 0.515 1.544 3.58550.000 0.476 1.434 3.21960.000 0.402 1.189 2.60470.000 0.363 1.078 2.36280.000 0.346 1.022 2.25590.000 0.342 1.009 2.249
100.000 0.341 1.000 2.245
2.5.2-116 Revision 2

Clinch River Nuclear SiteEarly Site Permit Application
Part 2, Site Safety Analysis Report
Notes:Location A is shown on Figure 2.5.4-2.
Table 2.5.2-25Vertical Uniform Hazard Response Spectra for Location A
Frequency (Hz) Vertical 10-4 (g) Vertical 10-5 (g) Vertical 10-6 (g)0.100 0.00815 0.0192 0.05460.125 0.0101 0.0240 0.06810.150 0.0121 0.0288 0.08160.200 0.0159 0.0384 0.1090.300 0.0235 0.0577 0.1620.400 0.0311 0.0770 0.2160.500 0.0386 0.0963 0.2690.600 0.0484 0.127 0.3670.700 0.0587 0.160 0.4770.800 0.0694 0.196 0.5980.900 0.0804 0.235 0.7311.000 0.0917 0.275 0.8741.250 0.103 0.323 0.9781.500 0.113 0.368 1.0732.000 0.132 0.453 1.2402.500 0.148 0.531 1.3883.000 0.184 0.649 1.6434.000 0.259 0.891 2.1445.000 0.337 1.138 2.6366.000 0.411 1.339 3.1007.000 0.486 1.537 3.5568.000 0.562 1.731 4.0049.000 0.638 1.923 4.447
10.000 0.715 2.113 4.88412.500 0.788 2.332 5.45015.000 0.807 2.434 5.76420.000 0.835 2.541 6.01325.000 0.825 2.548 6.02230.000 0.787 2.518 5.89735.000 0.754 2.466 5.72440.000 0.714 2.370 5.44645.000 0.682 2.256 5.20650.000 0.656 2.161 4.98360.000 0.584 1.999 4.59770.000 0.529 1.864 4.19380.000 0.472 1.751 3.88190.000 0.424 1.630 3.599
100.000 0.391 1.475 3.384
2.5.2-117 Revision 2

Clinch River Nuclear SiteEarly Site Permit Application
Part 2, Site Safety Analysis Report
Notes:Location B is shown on Figure 2.5.4-2.
Table 2.5.2-26Vertical Uniform Hazard Response Spectra for Location B
Frequency (Hz) Vertical 10-4 (g) Vertical 10-5 (g) Vertical 10-6 (g)0.100 0.00815 0.0192 0.05460.125 0.0100 0.0238 0.06750.150 0.0119 0.0284 0.08040.200 0.0156 0.0375 0.1060.300 0.0227 0.0555 0.1560.400 0.0297 0.0734 0.2050.500 0.0365 0.0910 0.2530.600 0.0440 0.114 0.3300.700 0.0514 0.139 0.4130.800 0.0589 0.164 0.5010.900 0.0664 0.190 0.5951.000 0.0738 0.217 0.6931.250 0.0877 0.270 0.8231.500 0.101 0.324 0.9472.000 0.126 0.430 1.1812.500 0.149 0.536 1.4013.000 0.191 0.672 1.7024.000 0.284 0.959 2.3145.000 0.384 1.264 2.9376.000 0.438 1.410 3.2647.000 0.490 1.546 3.5698.000 0.539 1.674 3.8569.000 0.587 1.796 4.128
10.000 0.633 1.912 4.38812.500 0.717 2.094 4.97115.000 0.763 2.245 5.37120.000 0.796 2.513 5.96025.000 0.830 2.572 6.07730.000 0.830 2.546 6.13035.000 0.791 2.459 6.00340.000 0.758 2.367 5.74545.000 0.710 2.281 5.33050.000 0.667 2.188 5.04460.000 0.592 2.037 4.56170.000 0.525 1.879 4.21880.000 0.472 1.726 3.87290.000 0.428 1.574 3.558
100.000 0.388 1.471 3.384
2.5.2-118 Revision 2

Clinch River Nuclear SiteEarly Site Permit Application
Part 2, Site Safety Analysis Report
Notes:Locations A and B are shown on Figure 2.5.4-2.
Table 2.5.2-27Horizontal Ground Motion Response Spectra for Locations A and B and Envelope
Frequency (Hz)Area A Horizontal
GMRS (g)Area B Horizontal
GMRS (g)Envelope Horizontal
GMRS (g)0.100 0.0120 0.0120 0.01200.125 0.0151 0.0150 0.01510.150 0.0182 0.0179 0.01820.200 0.0244 0.0238 0.02440.300 0.0369 0.0356 0.03690.400 0.0495 0.0473 0.04950.500 0.0623 0.0590 0.06230.600 0.0796 0.0723 0.07960.700 0.0980 0.0858 0.09800.800 0.117 0.100 0.1170.900 0.138 0.114 0.1381.000 0.159 0.128 0.1591.250 0.180 0.153 0.1801.500 0.199 0.177 0.1992.000 0.235 0.224 0.2352.500 0.266 0.268 0.2683.000 0.321 0.332 0.3324.000 0.431 0.464 0.4645.000 0.541 0.602 0.6026.000 0.637 0.670 0.6707.000 0.731 0.734 0.7348.000 0.824 0.794 0.8249.000 0.916 0.851 0.916
10.000 1.006 0.905 1.00612.500 1.040 0.952 1.04015.000 1.035 0.970 1.03520.000 1.010 0.990 1.01025.000 0.971 0.980 0.98030.000 0.920 0.935 0.93535.000 0.867 0.881 0.88140.000 0.807 0.831 0.83145.000 0.733 0.768 0.76850.000 0.674 0.700 0.70060.000 0.563 0.571 0.57170.000 0.515 0.518 0.51880.000 0.499 0.494 0.49990.000 0.486 0.489 0.489
100.000 0.485 0.484 0.485
2.5.2-119 Revision 2

Clinch River Nuclear SiteEarly Site Permit Application
Part 2, Site Safety Analysis Report
Notes:Locations A and B are shown on Figure 2.5.4-2.
Table 2.5.2-28Vertical Ground Motion Response Spectra for Locations A and B and Envelope
Frequency (Hz)Area A Vertical
GMRS (g)Area B Vertical
GMRS (g)Envelope Vertical
GMRS (g)0.100 0.00953 0.00953 0.009530.125 0.0119 0.0118 0.01190.150 0.0143 0.0141 0.01430.200 0.0191 0.0187 0.01910.300 0.0288 0.0277 0.02880.400 0.0384 0.0366 0.03840.500 0.0481 0.0455 0.04810.600 0.0628 0.0567 0.06280.700 0.0787 0.0683 0.07870.800 0.0957 0.0802 0.09570.900 0.114 0.092 0.1141.000 0.133 0.105 0.1331.250 0.154 0.130 0.1541.500 0.175 0.154 0.1752.000 0.212 0.202 0.2122.500 0.247 0.249 0.2493.000 0.303 0.314 0.3144.000 0.417 0.451 0.4515.000 0.535 0.598 0.5986.000 0.634 0.670 0.6707.000 0.732 0.737 0.7378.000 0.829 0.801 0.8299.000 0.925 0.861 0.925
10.000 1.021 0.920 1.02112.500 1.115 1.015 1.11515.000 1.178 1.100 1.17820.000 1.219 1.190 1.21925.000 1.220 1.231 1.23130.000 1.212 1.220 1.22035.000 1.190 1.190 1.19040.000 1.164 1.144 1.16445.000 1.127 1.103 1.12750.000 1.091 1.057 1.09160.000 1.011 0.985 1.01170.000 0.918 0.880 0.91880.000 0.822 0.800 0.82290.000 0.756 0.730 0.756
100.000 0.679 0.676 0.679
2.5.2-120 Revision 2

Clinch River Nuclear SiteEarly Site Permit Application
Part 2, Site Safety Analysis Report
Table 2.5.2-29Enveloped Ground Motion Response Spectra With and Without Overburden
With Overburden No Overburden
Period (s) Frequency (hz)Spectral
Acceleration (g)Spectral
Acceleration (g)0.01 100.0 0.487 0.4850.04 25.0 0.976 0.9800.10 10.0 1.008 1.0060.20 5.0 0.605 0.6020.40 2.5 0.273 0.2681.00 1.0 0.159 0.1592.00 0.5 0.062 0.062
2.5.2-121 Revision 2

Clinch River Nuclear SiteEarly Site Permit Application
Part 2, Site Safety Analysis Report
Table 2.5.2-30Unit Weights
Geologic Unit Unit Weight (pcf)Benbolt 168Rockdell 168Fleanor 168Eidson 168
Blackford 168Newala 168Knox 168
Conasauga 170Pumpkin Valley 175
Rome 175
2.5.2-122 Revision 2

Revision 2
Clinch River Nuclear Site
mment
Low Frequency
LimitSNR ≤ 3
nly one rizontal
5.01.61.51.02.57.05.06.0
15.03.06.03.04.07.08.02.04.06.0
15.0
2.5.2-123
Early Site Permit ApplicationPart 2, Site Safety Analysis Report
Table 2.5.2-31Processed Earthquake Data Used at Tellico Dam Site
Earthquake Date
(YrMoDy)Time (UTC) Mag Latitude Longitude
Depth (km)
Epicentral Distance
(km)
Hypocentral Distance
(km) Co
041223 6:54 3.0 35.4293 -84.2042 7.68 39 39.8 Oho
060317 15:20 1.0 35.7100 -84.1600 13 12 18.8060411 3:29 3.3 35.3600 -84.4800 19.81 50.4 54.2060413 6:26:35 2.2 35.6000 -84.3500 12.1 21.3 24.5060510 12:17 3.2 35.5330 -84.3960 24.7 30.2 39.0061218 8:34 3.0 35.3560 -84.3508 17.69 46.8 49.9061226 11:25 1.8 35.7610 -84.3180 14.3 5.4 15.3070103 23:06 2.8 35.9080 -83.9420 14.7 32.2 35.4070210 18:43 1.3 35.6730 -84.2767 12.07 11.8 17.6070221 6:38 1.4 35.6722 -84.2772 11.56 11.6 16.4070412 1:37 2.1 35.4700 -84.3800 11.4 35.8 37.6070608 9:11 1.6 35.7000 -84.1500 20.0 13.2 24.0070614 17:06 2.4 35.5400 -84.1300 7.0 28.9 29.7070811 21:24 2.0 35.7200 -84.1000 10.2 15.9 16.4070910 18:01 1.6 35.6700 -84.5400 14.6 27.9 28.1070916 13:10 1.4 35.7900 -84.1700 15.1 8.3 17.2071023 5:15 2.8 35.5900 -84.1000 21.0 25.3 33.2071123 5:48 2.4 35.5300 -84.3000 17.0 27.7 32.5071209 6:58 2.4 36.2500 -84.3700 21.0 53.5 57.5080111 2:11 0.9 35.6200 -84.3300 15.99 18.5 24.5

Clinch River Nuclear SiteEarly Site Permit Application
Part 2, Site Safety Analysis Report
Table 2.5.2-32Kappa Estimates (Range) for the CRN Site
Method Lower Kappa Values (s) Upper Kappa Values (s)Response Spectral Shape
(Reference 2.5.2-176) 0.006 0.009
Anderson and Hough(Reference 2.5.2-175) 0.010 0.016
2.5.2-124 Revision 2

Revision 2
Clinch River Nuclear Site
No EUS SSC study area.So
ke Catalog
2.5.2-125
Early Site Permit ApplicationPart 2, Site Safety Analysis Report
te: Earthquakes shown are mainshock (independent) earthquakes with E[M] ≥ 2.2. Black line is the spatial coverage of the Curce: Reference 2.5.2-1, Figure A-2
Figure 2.5.2-1. Plot of Regional Seismicity from the CEUS SSC Earthqua

Revision 2
Clinch River Nuclear Site
No E[M] ≥ 2.9.
ough September 2013)
2.5.2-126
Early Site Permit ApplicationPart 2, Site Safety Analysis Report
te: Earthquakes shown are from the updated CEUS SSC earthquake catalog for mainshock (independent) earthquakes with
Figure 2.5.2-2. Plot of Regional Seismicity from the Updated Earthquake Catalog (Thr

Revision 2
Clinch River Nuclear Site
No E[M] ≥ 2.9.
Nuclear Site
2.5.2-127
Early Site Permit ApplicationPart 2, Site Safety Analysis Report
te: Earthquakes shown are from the updated CEUS SSC earthquake catalog for mainshock (independent) earthquakes with
Figure 2.5.2-3. Plot of Seismicity Within 320 km (200 mi) of the Clinch River

Revision 2
Clinch River Nuclear Site
No E[M] ≥ 2.9
Nuclear Site
2.5.2-128
Early Site Permit ApplicationPart 2, Site Safety Analysis Report
te: Earthquakes shown are from the updated CEUS SSC earthquake catalog for mainshock (independent) earthquakes with
Figure 2.5.2-4. Plot of Seismicity Within 80 km (50 mi) of the Clinch River

Clinch River Nuclear SiteEarly Site Permit Application
Part 2, Site Safety Analysis Report
Reference 2.5.2-27
Figure 2.5.2-5. Estimated Affected Area Map for the North Carolina/Southwestern Virginia Earthquake on August 31, 1861
2.5.2-129 Revision 2

Clinch River Nuclear SiteEarly Site Permit Application
Part 2, Site Safety Analysis Report
Reference 2.5.2-28
Figure 2.5.2-6. Isoseismal Map for the Waynesville, North Carolina, Earthquake on February 21, 1916
2.5.2-130 Revision 2

Clinch River Nuclear SiteEarly Site Permit Application
Part 2, Site Safety Analysis Report
Reference 2.5.2-28
Figure 2.5.2-7. Isoseismal Map for the Sharpsburg, Kentucky, Earthquake on July 27, 1980
2.5.2-131 Revision 2

Clinch River Nuclear SiteEarly Site Permit Application
Part 2, Site Safety Analysis Report
Reference 2.5.2-38
Notes: Circles indicate the epicenters of 474 earthquakes located by joint hypocenter/velocity inversion. Lower hemisphere focal mechanism solutions for 26 earthquakes (listed in Table 2 of Reference 2.5.2-38) occurring in the period 1983 to 1993 are shown. Compressional quadrants are shaded.
Figure 2.5.2-8. Focal Mechanism Solutions of 26 Earthquakes in the Eastern Tennessee Seismic Zone
2.5.2-132 Revision 2

Clinch River Nuclear SiteEarly Site Permit Application
Part 2, Site Safety Analysis Report
Notes: Modified after Figure H-2-1 from Reference 2.5.2-1
Figure 2.5.2-9. Logic Tree for the Conceptual Approach of the CEUS SSC 2012 Model
2.5.2-133 Revision 2

Revision 2
Clinch River Nuclear Site
No -1 of EPRI et al. [Reference 2.5.2-1]). Right pa 1)). Both panels show independent ea
micity
2.5.2-134
Early Site Permit ApplicationPart 2, Site Safety Analysis Report
tes: Left panel shows Study Region, NMESE-N, and MESE-N Maximum Magnitude (Mmax) zones (modified from Figure 6.2nel shows Study Region, NMESE-W, and MESE-W Mmax zones (modified from Figure 6.2-2 of EPRI et al. (Reference 2.5.2-rthquakes E[M]>2.2 from the project earthquake catalog – see Subsection 2.5.2.1
Figure 2.5.2-10. Maps Showing Maximum Magnitude Zones and Seis

Revision 2
Clinch River Nuclear Site
No
acterization
2.5.2-135
Early Site Permit ApplicationPart 2, Site Safety Analysis Report
te: From Figure H-3-1 in Reference 2.5.2-1
Figure 2.5.2-11. CEUS SSC 2012 Model Logic Tree Showing the Full Charof Maximum Magnitude Zones

Revision 2
Clinch River Nuclear Site
No , and RR-RCG. Modified after Figures H-4-2 an
2.5.2-136
Early Site Permit ApplicationPart 2, Site Safety Analysis Report
tes: Modified from Reference 2.5.2-1. Left panel shows PEZ-N with MidC-A, and RR. Right panel shows PEZ-N with MidC-Bd H-4-3 in Reference 2.5.2-1. Zone acronyms are defined in Table 2.5.2-4.
Figure 2.5.2-12. Seismotectonic Zones with PEZ-N Geometry

Revision 2
Clinch River Nuclear Site
No , and RR-RCG. Modified after Figures H-4-4 an
2.5.2-137
Early Site Permit ApplicationPart 2, Site Safety Analysis Report
tes: Modified from Reference 2.5.2-1. Left panel shows PEZ-W with MidC-C, and RR. Right panel shows PEZ-W with MidC-Dd H-4-5 in Reference 2.5.2-1. Zone acronyms are defined in Table 2.5.2-4.
Figure 2.5.2-13. Seismotectonic Zones with PEZ-W Geometry

Clinch River Nuclear SiteEarly Site Permit Application
Part 2, Site Safety Analysis Report
Note: From Figure H-4-1 in Reference 2.5.2-1. Zone acronyms are defined in Table 2.5.2-4.
Figure 2.5.2-14. Logic Tree Showing the Full Characterization of Seismotectonic Zones
2.5.2-138 Revision 2

Revision 2
Clinch River Nuclear Site
No
2.5.2-139
Early Site Permit ApplicationPart 2, Site Safety Analysis Report
te: From Figure H-4-1(a) in Reference 2.5.2-1. Zone acronyms are defined in Table 2.5.2-4.
Figure 2.5.2-15. Logic Tree for Seismotectonic Zone PEZ-N

Revision 2
Clinch River Nuclear Site
No
2.5.2-140
Early Site Permit ApplicationPart 2, Site Safety Analysis Report
te: From Figure H-4-1(b) in Reference 2.5.2-1. Zone acronyms are defined in Table 2.5.2-4.
Figure 2.5.2-16. Logic Tree for Seismotectonic Zone PEZ-W

Revision 2
Clinch River Nuclear Site
No
EUS SSC Model
2.5.2-141
Early Site Permit ApplicationPart 2, Site Safety Analysis Report
te: Modified after Figure 6.1-1 in Reference 2.5.2-1.
Figure 2.5.2-17. Repeated Large Magnitude Earthquake Source Zones in the C

Revision 2
Clinch River Nuclear Site
NoTh CRN Site. The project earthquake catalog is plo vents E[M]>2.2 – see Subsection 2.5.2.1.
ke Source Zones
2.5.2-142
Early Site Permit ApplicationPart 2, Site Safety Analysis Report
tes: Modified from Reference 2.5.2-1. Zone acronyms are defined in Table 2.5.2-4.e Study Region Mmax (maximum magnitude) source zone is not explicitly shown, but is taken as a radius of 640 km from thetted in both panels with left panel showing independent events E[M]>2.9 (used to calculate rates) and right panel shows all e
Figure 2.5.2-18. Maximum Magnitude and Repeated Large Magnitude Earthqua

Revision 2
Clinch River Nuclear Site
NoTh rates) and right panel shows all events E[M
Source Zones
2.5.2-143
Early Site Permit ApplicationPart 2, Site Safety Analysis Report
tes: Modified from Reference 2.5.2-1. Zone acronyms are defined in Table 2.5.2-4.e project earthquake catalog is plotted in both panels with left panel showing independent events E[M]>2.9 (used to calculate
]>2.2 – see Subsection 2.5.2.1.
Figure 2.5.2-19. Seismotectonic and Repeated Large Magnitude Earthquake

Revision 2
Clinch River Nuclear Site
No
agnetic Anomaly Data (Right)
2.5.2-144
Early Site Permit ApplicationPart 2, Site Safety Analysis Report
te: Modified from the GIS Database in Reference 2.5.2-1. Zone acronyms are defined in Table 2.5.2-4.
Figure 2.5.2-20. Seismotectonic Zones with Bouguer Gravity (Left) and Total Intensity Aerom

Revision 2
Clinch River Nuclear Site
No
C Earthquake Catalog
2.5.2-145
Early Site Permit ApplicationPart 2, Site Safety Analysis Report
te: Refer to Subsection 2.5.2.1.
Figure 2.5.2-21. Seismicity Through Mid-September 2013 from the Updated CEUS SS

Revision 2
Clinch River Nuclear Site
No earthquake catalog – se
the Clinch River Nuclear Site
2.5.2-146
Early Site Permit ApplicationPart 2, Site Safety Analysis Report
tes: Modified from Figure 6.1-2b of Reference 2.5.2-1. Both panels show independent earthquakes E[M]>2.9 from the projecte Subsection 2.5.2.1.
Figure 2.5.2-22. Repeated Large Magnitude Earthquake Sources within 640 km (400 mi) of
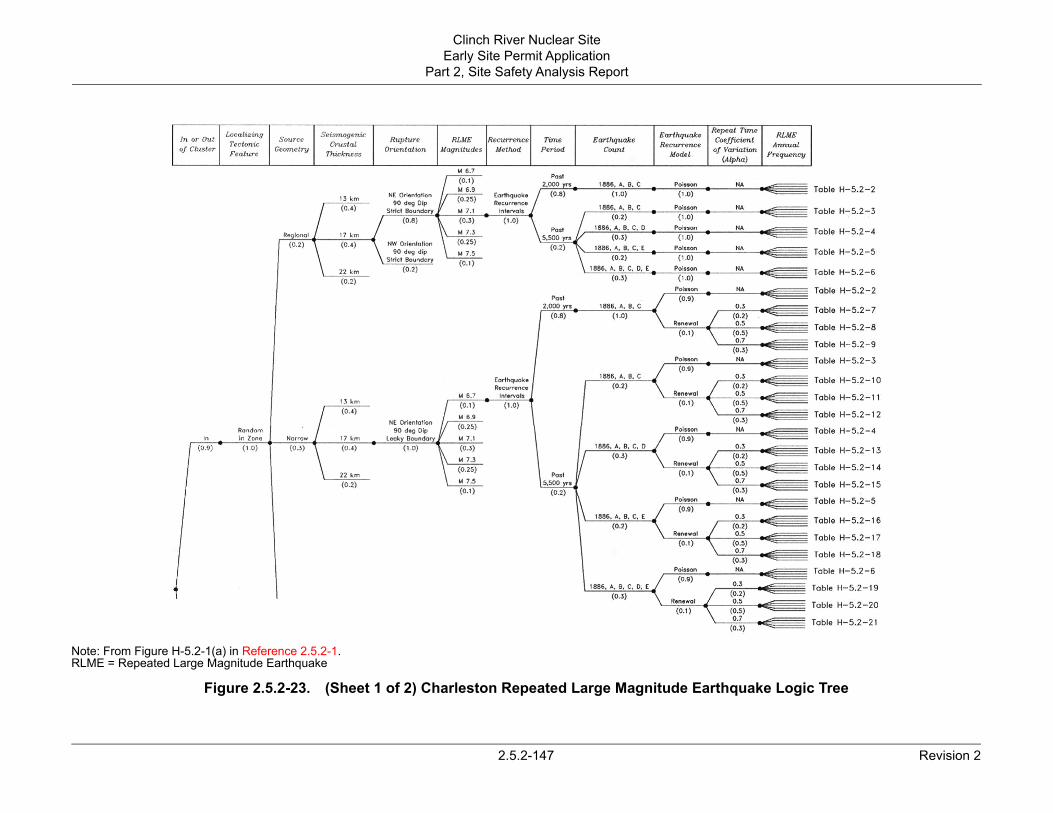
Revision 2
Clinch River Nuclear Site
NoRL
ake Logic Tree
2.5.2-147
Early Site Permit ApplicationPart 2, Site Safety Analysis Report
te: From Figure H-5.2-1(a) in Reference 2.5.2-1.ME = Repeated Large Magnitude Earthquake
Figure 2.5.2-23. (Sheet 1 of 2) Charleston Repeated Large Magnitude Earthqu

Revision 2
Clinch River Nuclear Site
NoRL
ake Logic Tree
2.5.2-148
Early Site Permit ApplicationPart 2, Site Safety Analysis Report
te: From Figure H-5.2-1(b) in Reference 2.5.2-1ME = Repeated Large Magnitude Earthquake
Figure 2.5.2-23. (Sheet 2 of 2) Charleston Repeated Large Magnitude Earthqu

Clinch River Nuclear SiteEarly Site Permit Application
Part 2, Site Safety Analysis Report
Notes: Modified from Reference 2.5.2-1.New Madrid South (NMS) is comprised of two alternatives: BA-BL – Blytheville Arch-Bootheel Lineament and BA-BFZ – Blytheville Arch-Blytheville fault zone RFT – Reelfoot Thrust NMN – New Madrid North
Figure 2.5.2-24. Fault Sources within the New Madrid Fault System Repeated Large Magnitude Earthquake
2.5.2-149 Revision 2

Revision 2
Clinch River Nuclear Site
NoRL
tude Earthquake
2.5.2-150
Early Site Permit ApplicationPart 2, Site Safety Analysis Report
te: From Figure H-5.5-1 in Reference 2.5.2-1ME = Repeated Large Magnitude Earthquake
Figure 2.5.2-25. Logic Tree of New Madrid Fault System Repeated Large Magni

Revision 2
Clinch River Nuclear Site
NoET
Fi ned by the U.S. Geological Survey
2.5.2-151
Early Site Permit ApplicationPart 2, Site Safety Analysis Report
te:SZ geometry from Reference 2.5.2-10
gure 2.5.2-26. (Sheet 1 of 2) Map Showing the Eastern Tennessee Seismic Zone Geometry Defi

Revision 2
Clinch River Nuclear Site
NoET
the CRN Site and Site Vicinity
2.5.2-152
Early Site Permit ApplicationPart 2, Site Safety Analysis Report
te:SZ geometry from Reference 2.5.2-10
Figure 2.5.2-26. (Sheet 2 of 2) Map Showing the Location of the Douglas Reservoir Relative to

Clinch River Nuclear SiteEarly Site Permit Application
Part 2, Site Safety Analysis Report
Notes:• The diameter of the circles is proportional to the rate per unit area in the corresponding cell. • Blue circles indicate rates calculated by the CEUS SSC study, red circles indicate rates recalculated using the
updated earthquake catalog and the corrected and updated Mmax distributions.
Figure 2.5.2-27. Comparison of Earthquake Recurrence Rates for Quarter-Degree Cells Contained (Wholly or Partially) within the PEZ_N Source and Located Near the Clinch
River Nuclear Site
2.5.2-153 Revision 2

Clinch River Nuclear SiteEarly Site Permit Application
Part 2, Site Safety Analysis Report
Figure 2.5.2-28. Mean and Fractile Rock Hazard for 0.5 Hz
Figure 2.5.2-29. Mean and Fractile Rock Hazard for 1 Hz
1E-6
1E-5
1E-4
1E-3
0.01 0.1 1
Annu
al fr
eque
ncy
of e
xcee
denc
e
0.5 Hz spectral acceleration (g)
0.95
0.84
MEAN
0.5
0.16
0.05
1E-6
1E-5
1E-4
1E-3
0.01 0.1 1
Annu
al fr
eque
ncy
of e
xcee
denc
e
1 Hz spectral acceleration (g)
0.95
0.84
MEAN
0.5
0.16
0.05
2.5.2-154 Revision 2

Clinch River Nuclear SiteEarly Site Permit Application
Part 2, Site Safety Analysis Report
Figure 2.5.2-30. Mean and Fractile Rock Hazard for 2.5 Hz
Figure 2.5.2-31. Mean and Fractile Rock Hazard for 5 Hz
1E-6
1E-5
1E-4
1E-3
0.01 0.1 1 10
Annu
al fr
eque
ncy
of e
xcee
denc
e
2.5 Hz spectral acceleration (g)
0.95
0.84
MEAN
0.5
0.16
0.05
1E-6
1E-5
1E-4
1E-3
0.1 1 10
Annu
al fr
eque
ncy
of e
xcee
denc
e
5 Hz spectral acceleration (g)
0.95
0.84
MEAN
0.5
0.16
0.05
2.5.2-155 Revision 2

Clinch River Nuclear SiteEarly Site Permit Application
Part 2, Site Safety Analysis Report
Figure 2.5.2-32. Mean and Fractile Rock Hazard for 10 Hz
Figure 2.5.2-33. Mean and Fractile Rock Hazard for 25 Hz
1E-6
1E-5
1E-4
1E-3
0.1 1 10
Annu
al fr
eque
ncy
of e
xcee
denc
e
10 Hz spectral acceleration (g)
0.95
0.84
MEAN
0.5
0.16
0.05
1E-6
1E-5
1E-4
1E-3
0.1 1 10
Annu
al fr
eque
ncy
of e
xcee
denc
e
25 Hz spectral acceleration (g)
0.95
0.84
MEAN
0.5
0.16
0.05
2.5.2-156 Revision 2

Clinch River Nuclear SiteEarly Site Permit Application
Part 2, Site Safety Analysis Report
Figure 2.5.2-34. Mean and Fractile Rock Hazard for Peak Ground Acceleration
1E-6
1E-5
1E-4
1E-3
0.1 1 10
Annu
al fr
eque
ncy
of e
xcee
denc
e
Peak ground acceleration (g)
0.95
0.84
MEAN
0.5
0.16
0.05
2.5.2-157 Revision 2

Clinch River Nuclear SiteEarly Site Permit Application
Part 2, Site Safety Analysis Report
Figure 2.5.2-35. 1 Hz Mean Rock Hazard from Background and Repeated Large Magnitude Earthquake Sources
Figure 2.5.2-36. 10 Hz Mean Rock Hazard from Background and Repeated Large Magnitude Earthquake Sources
1E-6
1E-5
1E-4
1E-3
0.01 0.1 1.
Annu
al fr
eque
ncy
of e
xcee
denc
e
1 Hz spectral acceleration (g)
Total
Background
NMFS
Charleston
Wabash
ERM-S
Marianna
Commerce
ERM-N
1E-6
1E-5
1E-4
1E-3
0.01 0.1 1. 10.
Annu
al fr
eque
ncy
of e
xcee
denc
e
10 Hz spectral acceleration (g)
Total
Background
NMFS
Charleston
Wabash
ERM-S
ERM-N
Commerce
Marianna
2.5.2-158 Revision 2

Clinch River Nuclear SiteEarly Site Permit Application
Part 2, Site Safety Analysis Report
Figure 2.5.2-37. 1 Hz Mean Rock Hazard from Individual Weighted Background Sources
Figure 2.5.2-38. 10 Hz Mean Rock Hazard from Individual Weighted Background Source
1E-6
1E-5
1E-4
1E-3
0.01 0.1 1.
Annu
al fr
eque
ncy
of e
xcee
denc
e
1 Hz spectral acceleration (g)
PEZ_N
STUDY_R
NMESE-N
PEZ_W
MESE-W
IBEB
RR
MESE-N
ECC_AM
MIDC_A
RR_RCG
MIDC_B
MIDC_C
NMESE-W
MIDC_D
ECC_GC
1E-6
1E-5
1E-4
1E-3
0.01 0.1 1. 10.
Annu
al fr
eque
ncy
of e
xcee
denc
e
10 Hz spectral acceleration (g)
PEZ_N
NMESE-N
STUDY_R
PEZ_W
MESE-W
MIDC_A
IBEB
RR
MESE-N
ECC_AM
RR_RCG
MIDC_B
MIDC_C
NMESE-W
MIDC_D
ECC_GC
2.5.2-159 Revision 2

Clinch River Nuclear SiteEarly Site Permit Application
Part 2, Site Safety Analysis Report
Figure 2.5.2-39. 1 Hz Mean Rock Hazard from Individual Weighted New Madrid Fault System Sources
Figure 2.5.2-40. 10 Hz Mean Rock Hazard from Individual Weighted New Madrid Fault System sources
1E-6
1E-5
1E-4
1E-3
0.01 0.1 1.
Annu
al fr
eque
ncy
of e
xcee
denc
e
1 Hz spectral acceleration (g)
NMSZ
NMR-ONLY
1E-6
1E-5
1E-4
1E-3
0.01 0.1 1.
Annu
al fr
eque
ncy
of e
xcee
denc
e
10 Hz spectral acceleration (g)
NMSZ
NMR-ONLY
2.5.2-160 Revision 2

Clinch River Nuclear SiteEarly Site Permit Application
Part 2, Site Safety Analysis Report
Note: GMPE = Ground Motion Prediction Equations
Figure 2.5.2-41. Unweighted Sensitivity to the Nine EPRI (Background) Ground Motion Prediction Equations at 1 Hz
1E-6
1E-5
1E-4
1E-3
0.01 0.1 1
Annu
al fr
eque
ncy
of e
xcee
denc
e
1 Hz spectral acceleration (g)
GMPE 1
GMPE 2
GMPE 3
GMPE 4
GMPE 5
GMPE 6
GMPE 7
GMPE 8
GMPE 9
2.5.2-161 Revision 2

Clinch River Nuclear SiteEarly Site Permit Application
Part 2, Site Safety Analysis Report
Note: GMPE = Ground Motion Prediction Equations
Figure 2.5.2-42. Unweighted Sensitivity to the Nine EPRI (Background) Ground Motion Prediction Equations at 10 Hz
1E-6
1E-5
1E-4
1E-3
0.1 1 10
Annu
al fr
eque
ncy
of e
xcee
denc
e
10 Hz spectral acceleration (g)
GMPE 1
GMPE 2
GMPE 3
GMPE 4
GMPE 5
GMPE 6
GMPE 7
GMPE 8
GMPE 9
2.5.2-162 Revision 2

Clinch River Nuclear SiteEarly Site Permit Application
Part 2, Site Safety Analysis Report
Note: GMPE = Ground Motion Prediction Equations
Figure 2.5.2-43. Unweighted Sensitivity to the 12 EPRI Repeated Large Magnitude Earthquake Ground Motion Prediction Equations at 1 Hz
1E-6
1E-5
1E-4
1E-3
0.01 0.1 1
Annu
al fr
eque
ncy
of e
xcee
denc
e
1 Hz spectral acceleration (g)
GMPE 1GMPE 2GMPE 3GMPE 4GMPE 5GMPE 6GMPE 7GMPE 8GMPE 9GMPE 10GMPE 11GMPE 12
2.5.2-163 Revision 2

Clinch River Nuclear SiteEarly Site Permit Application
Part 2, Site Safety Analysis Report
Note: GMPE = Ground Motion Prediction Equations
Figure 2.5.2-44. Unweighted Sensitivity to the 12 EPRI Repeated Large Magnitude Earthquake Ground Motion Prediction Equations at 10 Hz
1E-6
1E-5
1E-4
1E-3
0.1 1 10
Annu
al fr
eque
ncy
of e
xcee
denc
e
10 Hz spectral acceleration (g)
GMPE 1GMPE 2GMPE 3GMPE 4GMPE 5GMPE 6GMPE 7GMPE 8GMPE 9GMPE 10GMPE 11GMPE 12
2.5.2-164 Revision 2

Clinch River Nuclear SiteEarly Site Permit Application
Part 2, Site Safety Analysis Report
Figure 2.5.2-45. Mean Total Rock Hazard Curves for Seven Spectral Frequencies
2.5.2-165 Revision 2

Clinch River Nuclear SiteEarly Site Permit Application
Part 2, Site Safety Analysis Report
Figure 2.5.2-46. Combined Deaggregation of Mean Rock Hazard for 10-4 Magnitude-Distance-ɛ Deaggregation for 1 and 2.5 Hz. (Low Frequency)
Figure 2.5.2-47. Combined Deaggregation of Mean Rock Hazard for 10-4 Magnitude-Distance-ɛ Deaggregation for 5 and 10 Hz (High Frequency)
2.5.2-166 Revision 2

Clinch River Nuclear SiteEarly Site Permit Application
Part 2, Site Safety Analysis Report
Figure 2.5.2-48. Combined Deaggregation of Mean Rock Hazard for 10-5 Magnitude-Distance-ɛ Deaggregation for 1 and 2.5 Hz (Low Frequency)
Figure 2.5.2-49. Combined Deaggregation of Mean Rock Hazard for 10-5 Magnitude-Distance-ɛ Deaggregation for 5 and 10 Hz (High Frequency)
2.5.2-167 Revision 2

Clinch River Nuclear SiteEarly Site Permit Application
Part 2, Site Safety Analysis Report
Figure 2.5.2-50. Combined Deaggregation of Mean Rock Hazard for 10-6 Magnitude-Distance-ɛ Deaggregation for 1 and 2.5 Hz (Low Frequency)
Figure 2.5.2-51. Combined Deaggregation of Mean Rock Hazard for 10-6 Magnitude-Distance-ɛ Deaggregation for 5 and 10 Hz (High Frequency)
2.5.2-168 Revision 2

Clinch River Nuclear SiteEarly Site Permit Application
Part 2, Site Safety Analysis Report
Figure 2.5.2-52. High and Low Frequency Spectra for Mean Annual Frequencies of Exceedance of 10-4, 10-5and 10-6
Figure 2.5.2-53. Mean Rock Uniform Hazard Response Spectra for Mean Annual Frequencies of Exceedance of 10-4, 10-5, and 10-6
0.01
0.1
1.
10.
0.1 1 10 100
Spec
tral
acc
eler
atio
n, g
Frequency, Hz
10-6 HF10-6 LF10-5 HF10-5 LF10-4 HF10-4 LF
0.01
0.1
1.
10.
0.1 1 10 100
Spec
tral
acc
eler
atio
n, g
Frequency, Hz
1E-6
1E-5
1E-4
2.5.2-169 Revision 2

Clinch River Nuclear SiteEarly Site Permit Application
Part 2, Site Safety Analysis Report
Figure 2.5.2-54. Median Rock Uniform Hazard Response Spectra for Mean Annual Frequencies of Exceedance of 10-4, 10-5, and 10-6
0.01
0.1
1.
10.
0.1 1 10 100
Spec
tral
acc
eler
atio
n, g
Frequency, Hz
1E-6
1E-5
1E-4
2.5.2-170 Revision 2

Clinch River Nuclear SiteEarly Site Permit Application
Part 2, Site Safety Analysis Report
Note: Amplification factor is based on random profiles with a single amplification factor using the basecase profile for Location A, linear analysis, and basecase kappa.
Figure 2.5.2-55. Example Comparison of Median Amplification Factor (60 Realization)
2.5.2-171 Revision 2

Clinch River Nuclear SiteEarly Site Permit Application
Part 2, Site Safety Analysis Report
Figure 2.5.2-56. Shear Modulus Reduction and Damping Curves for Firm Rock
2.5.2-172 Revision 2
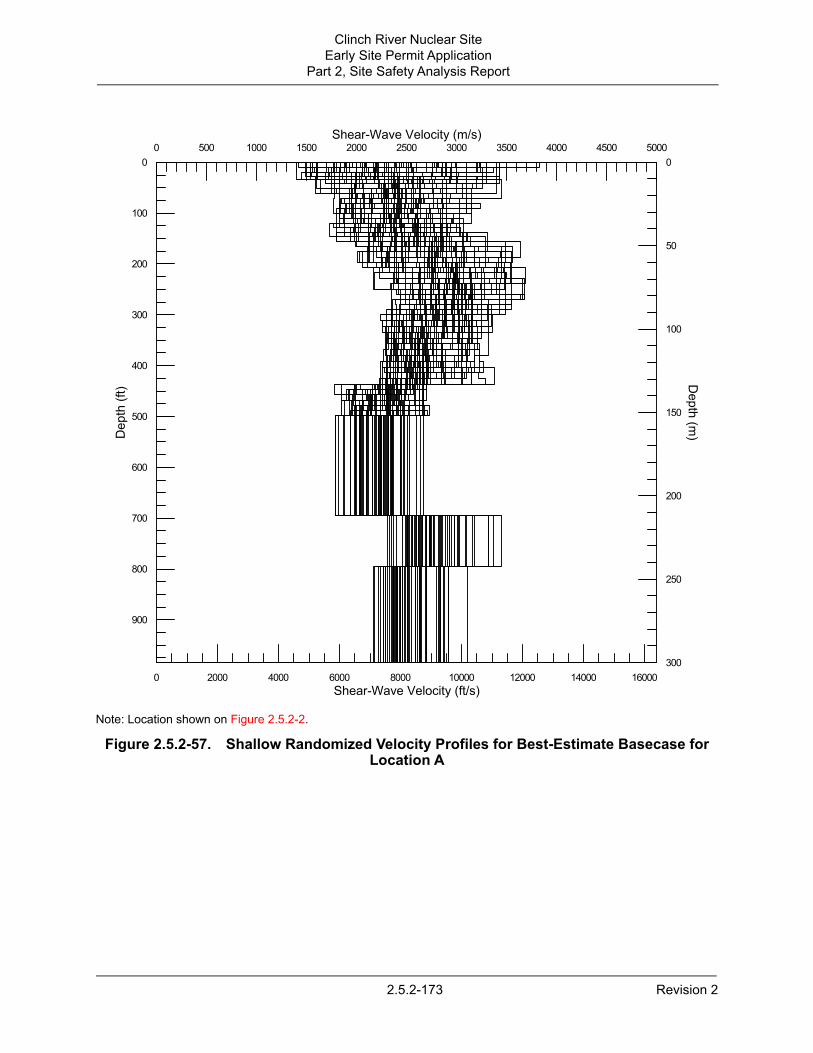
Clinch River Nuclear SiteEarly Site Permit Application
Part 2, Site Safety Analysis Report
Note: Location shown on Figure 2.5.2-2.
Figure 2.5.2-57. Shallow Randomized Velocity Profiles for Best-Estimate Basecase for Location A
0 2000 4000 6000 8000 10000 12000 14000 16000Shear-Wave Velocity (ft/s)
0 500 1000 1500 2000 2500 3000 3500 4000 4500 5000Shear-Wave Velocity (m/s)
900
800
700
600
500
400
300
200
100
0
Depth(ft)
300
250
200
150
100
50
0
Depth
(m)
2.5.2-173 Revision 2

Clinch River Nuclear SiteEarly Site Permit Application
Part 2, Site Safety Analysis Report
Note: Location shown on Figure 2.5.2-2.
Figure 2.5.2-58. Randomized Velocity Profiles for Best-Estimate Basecase for Location A
0 2000 4000 6000 8000 10000 12000 14000 16000Shear-Wave Velocity (ft/s)
0 500 1000 1500 2000 2500 3000 3500 4000 4500 5000Shear-Wave Velocity (m/s)
16000
15000
14000
13000
12000
11000
10000
9000
8000
7000
6000
5000
4000
3000
2000
1000
0
Depth(ft)
5000
4500
4000
3500
3000
2500
2000
1500
1000
500
0
Depth
(m)
2.5.2-174 Revision 2

Clinch River Nuclear SiteEarly Site Permit Application
Part 2, Site Safety Analysis Report
Note: Location shown on Figure 2.5.2-2.
Figure 2.5.2-59. Shallow Randomized Velocity Profiles for Best-Estimate Basecase for Location B
0 2000 4000 6000 8000 10000 12000 14000 16000Shear-Wave Velocity (ft/s)
0 500 1000 1500 2000 2500 3000 3500 4000 4500 5000Shear-Wave Velocity (m/s)
900
800
700
600
500
400
300
200
100
0
Depth(ft)
300
250
200
150
100
50
0
Depth
(m)
2.5.2-175 Revision 2

Clinch River Nuclear SiteEarly Site Permit Application
Part 2, Site Safety Analysis Report
Note: Location shown on Figure 2.5.2-2.
Figure 2.5.2-60. Randomized Velocity Profiles for Best-Estimate Basecase for Location B
0 2000 4000 6000 8000 10000 12000 14000 16000Shear-Wave Velocity (ft/s)
0 500 1000 1500 2000 2500 3000 3500 4000 4500 5000Shear-Wave Velocity (m/s)
16000
15000
14000
13000
12000
11000
10000
9000
8000
7000
6000
5000
4000
3000
2000
1000
0
Depth(ft)
5000
4500
4000
3500
3000
2500
2000
1500
1000
500
0
Depth
(m)
2.5.2-176 Revision 2

Clinch River Nuclear SiteEarly Site Permit Application
Part 2, Site Safety Analysis Report
Figure 2.5.2-61. Example Randomization of Shear Modulus Reduction and Damping Curves for Firm Rock
10-4 10-3 10-2 10-1 1000.0
0.2
0.4
0.6
0.8
1.0ShearMod/ShearModatE-04%
10-4 10-3 10-2 10-1 100Shear Strain - Percent
0
4
8
12
16
DampingRatio-Percent
2.5.2-177 Revision 2

Clinch River Nuclear SiteEarly Site Permit Application
Part 2, Site Safety Analysis Report
Note: Location shown on Figure 2.5.2-2.
Figure 2.5.2-62. Horizontal Amplification Factors, 5 Percent-Damped Pseudo-Absolute Spectra, Profile P1, EPRI Rock Curves M1, M 5.5, 0.01 to 0.40 g for Location A
2.5.2-178 Revision 2

Clinch River Nuclear SiteEarly Site Permit Application
Part 2, Site Safety Analysis Report
Note: Location shown on Figure 2.5.2-2.
Figure 2.5.2-63. Horizontal Amplification Factors, 5 Percent-Damped Pseudo-Absolute Spectra, Profile P1, EPRI Rock Curves M1, M 5.5, 0.50 to 1.5 g for Location A
2.5.2-179 Revision 2

Clinch River Nuclear SiteEarly Site Permit Application
Part 2, Site Safety Analysis Report
Note: Location shown on Figure 2.5.2-2.
Figure 2.5.2-64. Horizontal Amplification Factors, 5 Percent-Damped Pseudo-Absolute Spectra, Profile P1, Linear Analysis M2, M 5.5, 0.01 to 0.40 g for Location A
2.5.2-180 Revision 2

Clinch River Nuclear SiteEarly Site Permit Application
Part 2, Site Safety Analysis Report
Note: Location shown on Figure 2.5.2-2.
Figure 2.5.2-65. Horizontal Amplification Factors, 5 Percent-Damped Pseudo-Absolute Spectra, Profile P1, Linear Analysis M2, M 5.5, 0.5 to 1.5 g for Location A
2.5.2-181 Revision 2

Clinch River Nuclear SiteEarly Site Permit Application
Part 2, Site Safety Analysis Report
Note: Location shown on Figure 2.5.2-2.
Figure 2.5.2-66. Horizontal Amplification Factors, 5 Percent-Damped Pseudo-Absolute Spectra, Profile P1, EPRI Rock Curves M1, M 5.5, 0.01 to 0.40 g for Location B
2.5.2-182 Revision 2

Clinch River Nuclear SiteEarly Site Permit Application
Part 2, Site Safety Analysis Report
Note: Location shown on Figure 2.5.2-2.
Figure 2.5.2-67. Horizontal Amplification Factors, 5 Percent-Damped Pseudo-Absolute Spectra, Profile P1, EPRI Rock Curves M1, M 5.5, 0.5 to 1.5 g for Location B
2.5.2-183 Revision 2

Clinch River Nuclear SiteEarly Site Permit Application
Part 2, Site Safety Analysis Report
Note: Location shown on Figure 2.5.2-2.
Figure 2.5.2-68. Horizontal Amplification Factors, 5 Percent-Damped Pseudo-Absolute Spectra, Profile P1, EPRI Rock Curves M1, Single Corner, M 7.5, 0.01 to 0.40 g for
Location A
2.5.2-184 Revision 2

Clinch River Nuclear SiteEarly Site Permit Application
Part 2, Site Safety Analysis Report
Note: Location shown on Figure 2.5.2-2.
Figure 2.5.2-69. Horizontal Amplification Factors, 5 Percent-Damped Pseudo-Absolute Spectra, Profile P1, EPRI Rock Curves M1, Single Corner, M 7.5, 0.5 to 1.5 g for Location A
2.5.2-185 Revision 2

Clinch River Nuclear SiteEarly Site Permit Application
Part 2, Site Safety Analysis Report
Note: Location shown on Figure 2.5.2-2.
Figure 2.5.2-70. Horizontal Amplification Factors, 5 Percent-Damped Pseudo-Absolute Spectra, Profile P2, EPRI Rock Curves M1, M 5.5, 0.01 to 0.40 g for Location A
2.5.2-186 Revision 2

Clinch River Nuclear SiteEarly Site Permit Application
Part 2, Site Safety Analysis Report
Note: Location shown on Figure 2.5.2-2.
Figure 2.5.2-71. Horizontal Amplification Factors, 5 Percent-Damped Pseudo-Absolute Spectra, Profile P2, EPRI Rock Curves M1, M 5.5, 0.50 to 1.5 g for Location A
2.5.2-187 Revision 2

Clinch River Nuclear SiteEarly Site Permit Application
Part 2, Site Safety Analysis Report
Note: Location shown on Figure 2.5.2-2.
Figure 2.5.2-72. Horizontal Amplification Factors, 5 Percent-Damped Pseudo-Absolute Spectra, Profile P3, EPRI Rock Curves M1, M 5.5, 0.01 to 0.40 g for Location A
2.5.2-188 Revision 2

Clinch River Nuclear SiteEarly Site Permit Application
Part 2, Site Safety Analysis Report
Note: Location shown on Figure 2.5.2-2.
Figure 2.5.2-73. Horizontal Amplification Factors, 5 Percent-Damped Pseudo-Absolute Spectra, Profile P3, EPRI Rock Curves M1, M 5.5, 0.50 to 1.5 g for Location A
2.5.2-189 Revision 2

Clinch River Nuclear SiteEarly Site Permit Application
Part 2, Site Safety Analysis Report
Note: Location shown on Figure 2.5.2-2. UHRS = Uniform Hazard Response Spectra
Figure 2.5.2-74. Horizontal and Vertical Uniform Hazard Response Spectra for Location A
0.1 1 10 100Frequency (Hz)
0
1
2
3
4
5
6
7SpectralAcceleration(g)
10-4 Horizontal UHRS10-4 Vertical UHRS10-5 Horizontal UHRS10-5 Vertical UHRS10-6 Horizontal UHRS10-6 Vertical UHRS
2.5.2-190 Revision 2

Clinch River Nuclear SiteEarly Site Permit Application
Part 2, Site Safety Analysis Report
Note: Location shown on Figure 2.5.2-2.UHRS = Uniform Hazard Response Spectra
Figure 2.5.2-75. Horizontal and Vertical Uniform Hazard Response Spectra for Location B
0.1 1 10 100Frequency (Hz)
0
1
2
3
4
5
6
7SpectralAcceleration(g)
10-4 Horizontal UHRS10-4 Vertical UHRS10-5 Horizontal UHRS10-5 Vertical UHRS10-6 Horizontal UHRS10-6 Vertical UHRS
2.5.2-191 Revision 2

Clinch River Nuclear SiteEarly Site Permit Application
Part 2, Site Safety Analysis Report
Note: Location shown on Figure 2.5.2-2.UHRS = Uniform Hazard Response SpectraGMRS = Ground Motion Response Spectra
Figure 2.5.2-76. Ground Motion Response Spectra and Uniform Hazard Response Spectra for Location A
0.1 1 10 100Frequency (Hz)
0
1
2
3SpectralAcceleration(g)
10-4 Horizontal UHRS10-4 Vertical UHRS10-5 Horizontal UHRS10-5 Vertical UHRSHorizontal GMRSVertical GMRS
2.5.2-192 Revision 2

Clinch River Nuclear SiteEarly Site Permit Application
Part 2, Site Safety Analysis Report
Note: Location shown on Figure 2.5.2-2. UHRS = Uniform Hazard Response SpectraGMRS = Ground Motion Response Spectra
Figure 2.5.2-77. Ground Motion Response Spectra and Uniform Hazard Response Spectra for Location B
0.1 1 10 100Frequency (Hz)
0
1
2
3SpectralAcceleration(g)
10-4 Horizontal UHRS10-4 Vertical UHRS10-5 Horizontal UHRS10-5 Vertical UHRSHorizontal GMRSVertical GMRS
2.5.2-193 Revision 2

Clinch River Nuclear SiteEarly Site Permit Application
Part 2, Site Safety Analysis Report
Note: Location shown on Figure 2.5.2-2. GMRS = Ground Motion Response Spectra
Figure 2.5.2-78. Ground Motion Response Spectra for Locations A and B and Envelope
��� � �� ���������� ���
�
�
���
�����
����
����
����
�
�
��������� ���� ���� ��������� ���� ���� ���������� ���� ���� ��������� ���� ���� ���������� ���� !"������������� ���� !"�����
2.5.2-194 Revision 2
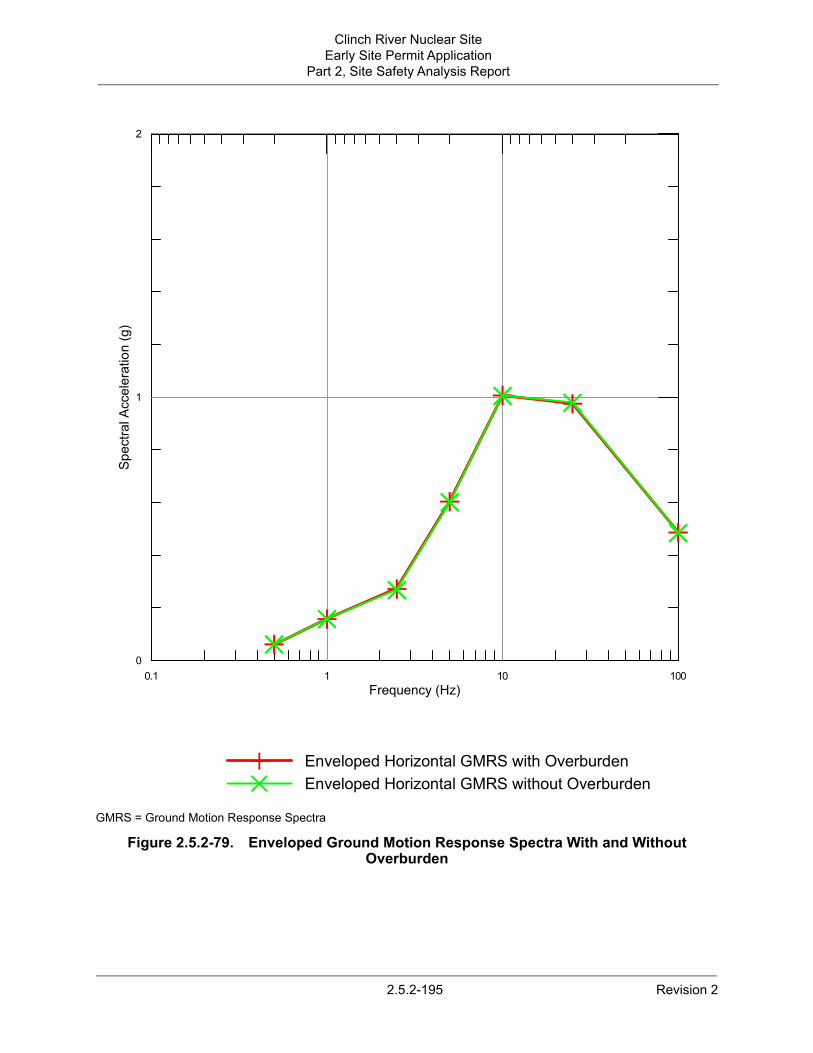
Clinch River Nuclear SiteEarly Site Permit Application
Part 2, Site Safety Analysis Report
GMRS = Ground Motion Response Spectra
Figure 2.5.2-79. Enveloped Ground Motion Response Spectra With and Without Overburden
��� � �� ���������� ���
�
�
�������������������� ��
�������� ��������� �� � !��" #���$����������� ��������� �� � !��"�� #���$���
2.5.2-195 Revision 2

Clinch River Nuclear SiteEarly Site Permit Application
Part 2, Site Safety Analysis Report
Figure 2.5.2-80. Schematic of 2D SASSI Model
2.5.2-196 Revision 2

Clinch River Nuclear SiteEarly Site Permit Application
Part 2, Site Safety Analysis Report
Figure 2.5.2-81. Fine Mesh Sample, 50 Hz Transmission Capability
2.5.2-197 Revision 2

Clinch River Nuclear SiteEarly Site Permit Application
Part 2, Site Safety Analysis Report
Figure 2.5.2-82. Clinch River Nuclear Site 2D-Mesh Regions
2.5.2-198 Revision 2

Clinch River Nuclear SiteEarly Site Permit Application
Part 2, Site Safety Analysis Report
Note: Displ. = Displacement; Vel. = Velocity; Acc. = Acceleration
Figure 2.5.2-83. Basement Outcrop Time Histories
0 10 20 30 40
-0.4
-0.2
0.0
0.2
0.4
Acc.(g)
0 10 20 30 40
-15
-10
-5
0
5
10
15
Vel.(cm/s)
0 10 20 30 40-10
-5
0
5
10
Displ.(cm
)
2.5.2-199 Revision 2
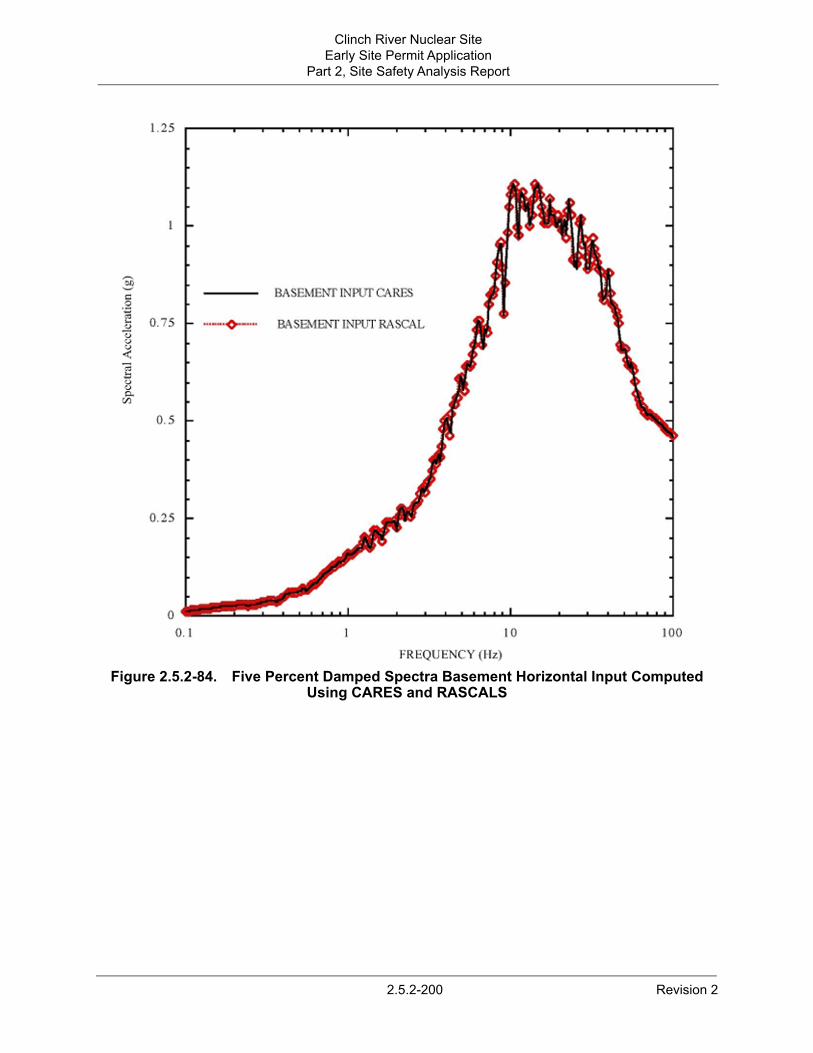
Clinch River Nuclear SiteEarly Site Permit Application
Part 2, Site Safety Analysis Report
Figure 2.5.2-84. Five Percent Damped Spectra Basement Horizontal Input ComputedUsing CARES and RASCALS
2.5.2-200 Revision 2

Clinch River Nuclear SiteEarly Site Permit Application
Part 2, Site Safety Analysis Report
Note: Location shown on Figure 2.5.2-2.
Figure 2.5.2-85. Location A – 2D 5 Percent Damped Horizontal SurfaceResponse Spectra
2.5.2-201 Revision 2

Clinch River Nuclear SiteEarly Site Permit Application
Part 2, Site Safety Analysis Report
Note: Location shown on Figure 2.5.2-2.
Figure 2.5.2-86. Location B – 2D 5 Percent Damped Horizontal SurfaceResponse Spectra
2.5.2-202 Revision 2

Clinch River Nuclear SiteEarly Site Permit Application
Part 2, Site Safety Analysis Report
Note: Location shown on Figure 2.5.2-2.
Figure 2.5.2-87. Location A – 2D and 1D 5 Percent Damped Horizontal SurfaceResponse Spectra
2.5.2-203 Revision 2

Clinch River Nuclear SiteEarly Site Permit Application
Part 2, Site Safety Analysis Report
Note: Location shown on Figure 2.5.2-2.
Figure 2.5.2-88. Location B – 2D and 1D 5 Percent Damped Horizontal SurfaceResponse Spectra
2.5.2-204 Revision 2

Clinch River Nuclear SiteEarly Site Permit Application
Part 2, Site Safety Analysis Report
Note: Location shown on Figure 2.5.2-2.
Figure 2.5.2-89. Location A – Smoothed 1D and 2D 5 Percent HorizontalDamped Spectra
2.5.2-205 Revision 2

Clinch River Nuclear SiteEarly Site Permit Application
Part 2, Site Safety Analysis Report
Note: Location shown on Figure 2.5.2-2.
Figure 2.5.2-90. Location B – Smoothed 1D and 2D 5 Percent HorizontalDamped Spectra
2.5.2-206 Revision 2

Clinch River Nuclear SiteEarly Site Permit Application
Part 2, Site Safety Analysis Report
Note: Location shown on Figure 2.5.2-2.
Figure 2.5.2-91. Location A and B 2D/1D Response Spectral Ratios
2.5.2-207 Revision 2

Clinch River Nuclear SiteEarly Site Permit Application
Part 2, Site Safety Analysis Report
Note: At recorded depths
Figure 2.5.2-92. Clinch River VS Profile Sigma for Each Chickamauga Subunit and Newala
2.5.2-208 Revision 2

Clinch River Nuclear SiteEarly Site Permit Application
Part 2, Site Safety Analysis Report
Note: At recorded depths
Figure 2.5.2-93. Clinch River VS Profile COV for Each Chickamauga Subunit and Newala
2.5.2-209 Revision 2

Clinch River Nuclear SiteEarly Site Permit Application
Part 2, Site Safety Analysis Report
Figure 2.5.2-94. TVA Damsite VS Profile Sigma for Each Rock Type
2.5.2-210 Revision 2

Clinch River Nuclear SiteEarly Site Permit Application
Part 2, Site Safety Analysis Report
Figure 2.5.2-95. TVA Damsite VS Profile COV for Each Rock Type
2.5.2-211 Revision 2

Clinch River Nuclear SiteEarly Site Permit Application
Part 2, Site Safety Analysis Report
Figure 2.5.2-96. Clinch River and TVA Damsite VS Profile Sigmas
2.5.2-212 Revision 2

Clinch River Nuclear SiteEarly Site Permit Application
Part 2, Site Safety Analysis Report
Figure 2.5.2-97. Clinch River and TVA Damsite VS Profile COVs
2.5.2-213 Revision 2

Revision 2
Clinch River Nuclear Site
2.5.2-214
Early Site Permit ApplicationPart 2, Site Safety Analysis Report
Figure 2.5.2-98. Location of Tellico Dam

Clinch River Nuclear SiteEarly Site Permit Application
Part 2, Site Safety Analysis Report
Figure 2.5.2-99. Geological Sections Through Tellico Dam and Vicinity
2.5.2-215 Revision 2

Clinch River Nuclear SiteEarly Site Permit Application
Part 2, Site Safety Analysis Report
Figure 2.5.2-100. Tellico Dam Suspension PS Log
2.5.2-216 Revision 2

Clinch River Nuclear SiteEarly Site Permit Application
Part 2, Site Safety Analysis Report
Figure 2.5.2-101. Interpreted Shear-Wave Velocity at Tellico Dam
2.5.2-217 Revision 2

Clinch River Nuclear SiteEarly Site Permit Application
Part 2, Site Safety Analysis Report
Note:For local crustal model with a surface shear-wave velocity of 1524 m/s in the top 6.1 m (20 ft) over hard rock (2830 m/s)
Figure 2.5.2-102. Smoothed Tellico Dam Crustal Transfer Functions
2.5.2-218 Revision 2

Clinch River Nuclear SiteEarly Site Permit Application
Part 2, Site Safety Analysis Report
Figure 2.5.2-103. Response Spectral Shapes (5% Damping) Computed for M 2.0
2.5.2-219 Revision 2

Clinch River Nuclear SiteEarly Site Permit Application
Part 2, Site Safety Analysis Report
Figure 2.5.2-104. Response Spectral Shapes (5% Damping) Computed for M 6.5
2.5.2-220 Revision 2
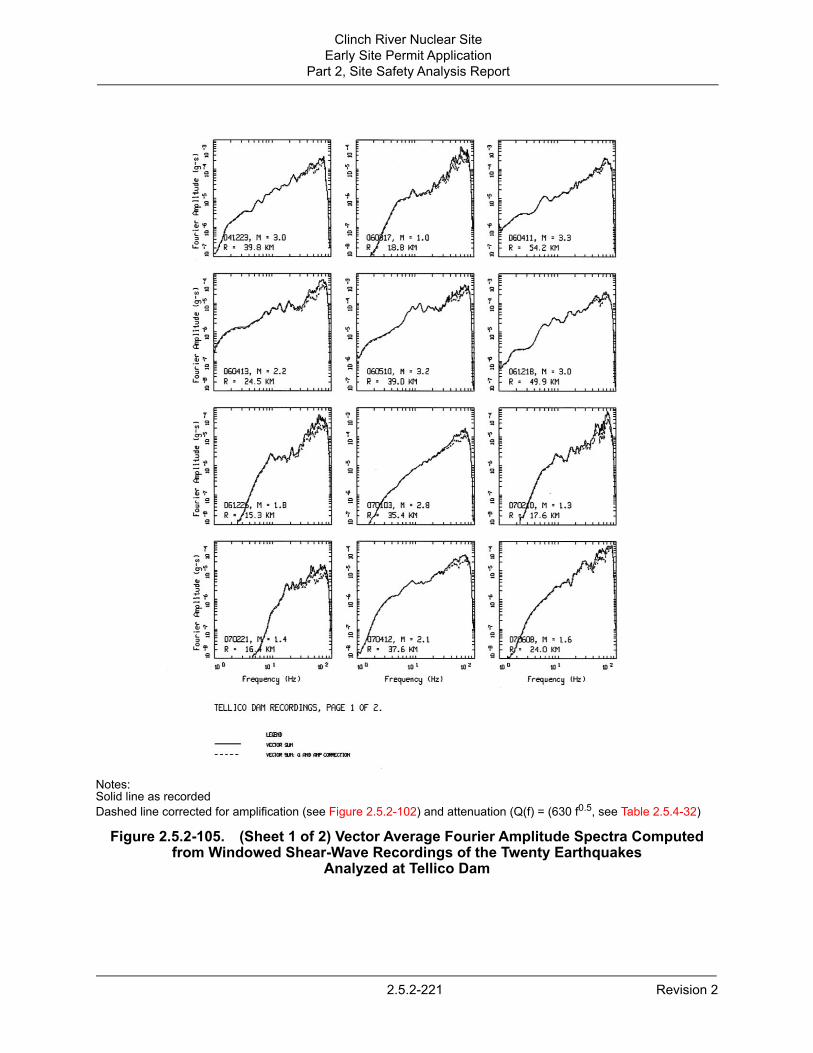
Clinch River Nuclear SiteEarly Site Permit Application
Part 2, Site Safety Analysis Report
Notes:Solid line as recordedDashed line corrected for amplification (see Figure 2.5.2-102) and attenuation (Q(f) = (630 f0.5, see Table 2.5.4-32)
Figure 2.5.2-105. (Sheet 1 of 2) Vector Average Fourier Amplitude Spectra Computed from Windowed Shear-Wave Recordings of the Twenty Earthquakes
Analyzed at Tellico Dam
2.5.2-221 Revision 2

Clinch River Nuclear SiteEarly Site Permit Application
Part 2, Site Safety Analysis Report
Notes:Solid line as recordedDashed line corrected for amplification (see Figure 2.5.2-102) and attenuation (Q(f) = (630 f0.5, see Table 2.5.4-32)
Figure 2.5.2-105. (Sheet 2 of 2) Vector Average Fourier Amplitude Spectra Computed from Windowed Shear-Wave Recordings of the Twenty Earthquakes
Analyzed at Tellico Dam
2.5.2-222 Revision 2

Clinch River Nuclear SiteEarly Site Permit Application
Part 2, Site Safety Analysis Report
Note:Corrected for amplification (see Figure 2.5.2-102) and attenuation (Q(f) = 630 f0.5, see Table 2.5.4-32), along with kappa fits over the bandwidths considered reliable
Figure 2.5.2-106. (Sheet 1 of 12) Vector Average Fourier Amplitude Spectra for the Twelve Earthquakes Analyzed at Tellico Dam
2.5.2-223 Revision 2
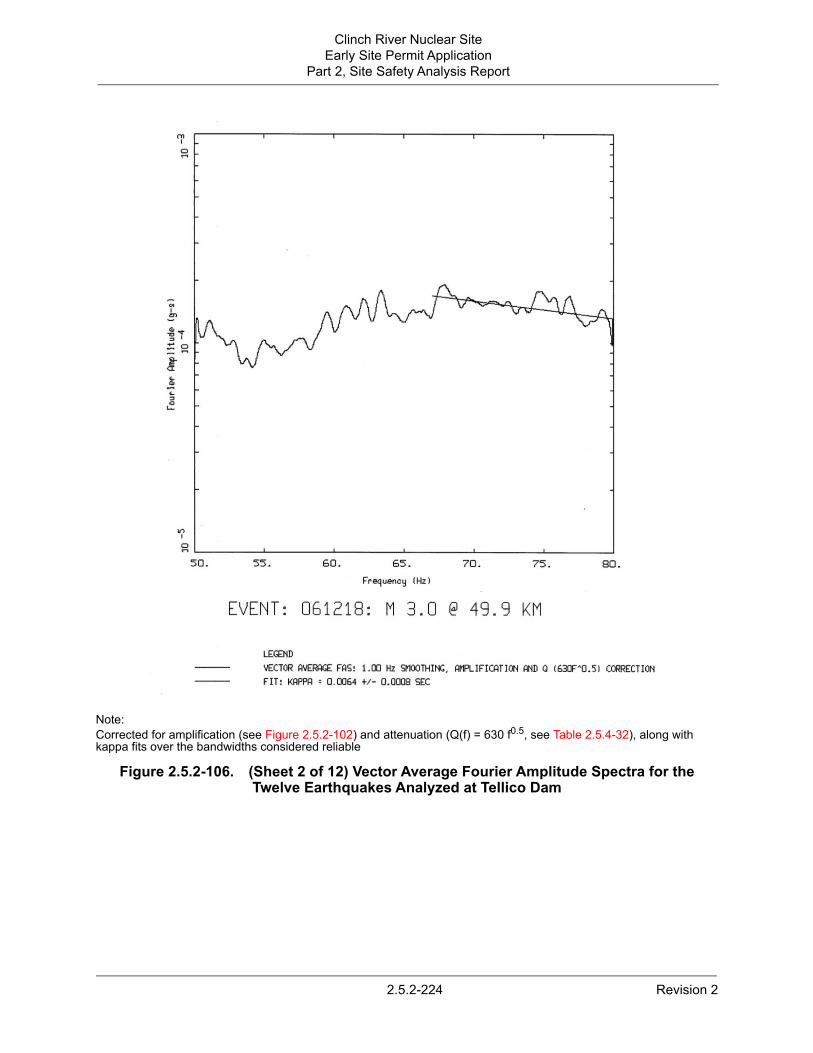
Clinch River Nuclear SiteEarly Site Permit Application
Part 2, Site Safety Analysis Report
Note:Corrected for amplification (see Figure 2.5.2-102) and attenuation (Q(f) = 630 f0.5, see Table 2.5.4-32), along with kappa fits over the bandwidths considered reliable
Figure 2.5.2-106. (Sheet 2 of 12) Vector Average Fourier Amplitude Spectra for the Twelve Earthquakes Analyzed at Tellico Dam
2.5.2-224 Revision 2

Clinch River Nuclear SiteEarly Site Permit Application
Part 2, Site Safety Analysis Report
Note:Corrected for amplification (see Figure 2.5.2-102) and attenuation (Q(f) = 630 f0.5, see Table 2.5.4-32), along with kappa fits over the bandwidths considered reliable
Figure 2.5.2-106. (Sheet 3 of 12) Vector Average Fourier Amplitude Spectra for the Twelve Earthquakes Analyzed at Tellico Dam
2.5.2-225 Revision 2

Clinch River Nuclear SiteEarly Site Permit Application
Part 2, Site Safety Analysis Report
Note:Corrected for amplification (see Figure 2.5.2-102) and attenuation (Q(f) = 630 f0.5, see Table 2.5.4-32), along with kappa fits over the bandwidths considered reliable
Figure 2.5.2-106. (Sheet 4 of 12) Vector Average Fourier Amplitude Spectra for the Twelve Earthquakes Analyzed at Tellico Dam
2.5.2-226 Revision 2

Clinch River Nuclear SiteEarly Site Permit Application
Part 2, Site Safety Analysis Report
Note:Corrected for amplification (see Figure 2.5.2-102) and attenuation (Q(f) = 630 f0.5, see Table 2.5.4-32), along with kappa fits over the bandwidths considered reliable
Figure 2.5.2-106. (Sheet 5 of 12) Vector Average Fourier Amplitude Spectra for the Twelve Earthquakes Analyzed at Tellico Dam
2.5.2-227 Revision 2

Clinch River Nuclear SiteEarly Site Permit Application
Part 2, Site Safety Analysis Report
Note:Corrected for amplification (see Figure 2.5.2-102) and attenuation (Q(f) = 630 f0.5, see Table 2.5.4-32), along with kappa fits over the bandwidths considered reliable
Figure 2.5.2-106. (Sheet 6 of 12) Vector Average Fourier Amplitude Spectra for the Twelve Earthquakes Analyzed at Tellico Dam
2.5.2-228 Revision 2

Clinch River Nuclear SiteEarly Site Permit Application
Part 2, Site Safety Analysis Report
Note:Corrected for amplification (see Figure 2.5.2-102) and attenuation (Q(f) = 630 f0.5, see Table 2.5.4-32), along with kappa fits over the bandwidths considered reliable
Figure 2.5.2-106. (Sheet 7 of 12) Vector Average Fourier Amplitude Spectra for the Twelve Earthquakes Analyzed at Tellico Dam
2.5.2-229 Revision 2

Clinch River Nuclear SiteEarly Site Permit Application
Part 2, Site Safety Analysis Report
Note:Corrected for amplification (see Figure 2.5.2-102) and attenuation (Q(f) = 630 f0.5, see Table 2.5.4-32), along with kappa fits over the bandwidths considered reliable
Figure 2.5.2-106. (Sheet 8 of 12) Vector Average Fourier Amplitude Spectra for the Twelve Earthquakes Analyzed at Tellico Dam
2.5.2-230 Revision 2

Clinch River Nuclear SiteEarly Site Permit Application
Part 2, Site Safety Analysis Report
Note:Corrected for amplification (see Figure 2.5.2-102) and attenuation (Q(f) = 630 f0.5, see Table 2.5.4-32), along with kappa fits over the bandwidths considered reliable
Figure 2.5.2-106. (Sheet 9 of 12) Vector Average Fourier Amplitude Spectra for the Twelve Earthquakes Analyzed at Tellico Dam
2.5.2-231 Revision 2

Clinch River Nuclear SiteEarly Site Permit Application
Part 2, Site Safety Analysis Report
Note:Corrected for amplification (see Figure 2.5.2-102) and attenuation (Q(f) = 630 f0.5, see Table 2.5.4-32), along with kappa fits over the bandwidths considered reliable
Figure 2.5.2-106. (Sheet 10 of 12) Vector Average Fourier Amplitude Spectra for the Twelve Earthquakes Analyzed at Tellico Dam
2.5.2-232 Revision 2

Clinch River Nuclear SiteEarly Site Permit Application
Part 2, Site Safety Analysis Report
Note:Corrected for amplification (see Figure 2.5.2-102) and attenuation (Q(f) = 630 f0.5, see Table 2.5.4-32), along with kappa fits over the bandwidths considered reliable
Figure 2.5.2-106. (Sheet 11 of 12) Vector Average Fourier Amplitude Spectra for the Twelve Earthquakes Analyzed at Tellico Dam
2.5.2-233 Revision 2

Clinch River Nuclear SiteEarly Site Permit Application
Part 2, Site Safety Analysis Report
Note:Corrected for amplification (see Figure 2.5.2-102) and attenuation (Q(f) = 630 f0.5, see Table 2.5.4-32), along with kappa fits over the bandwidths considered reliable
Figure 2.5.2-106. (Sheet 12 of 12) Vector Average Fourier Amplitude Spectra for the Twelve Earthquakes Analyzed at Tellico Dam
2.5.2-234 Revision 2

Clinch River Nuclear SiteEarly Site Permit Application
Part 2, Site Safety Analysis Report
Reference 2.5.2-210, Figure 1
Figure 2.5.2-107. Comparison of 1D (Base-Case Profile) and 2D Amplification Factors (PSA, 5% Damping) for Location A
2.5.2-235 Revision 2

Clinch River Nuclear SiteEarly Site Permit Application
Part 2, Site Safety Analysis Report
Reference 2.5.2-210, Figure 2
Figure 2.5.2-108. Comparison of 1D (Base-Case, Upper-, Lower-Range Profiles) and 2D Amplification Factors (PSA, 5% Damping) for Location A
2.5.2-236 Revision 2

Clinch River Nuclear SiteEarly Site Permit Application
Part 2, Site Safety Analysis Report
Reference 2.5.2-210, Figure 3
Figure 2.5.2-109. Comparison of 1D (Base-Case Profile) and 2D Amplification Factors (PSA, 5% Damping) for Location B
2.5.2-237 Revision 2

Clinch River Nuclear SiteEarly Site Permit Application
Part 2, Site Safety Analysis Report
Reference 2.5.2-210, Figure 4
Figure 2.5.2-110. Comparison of 1D (Base-Case, Upper-, Lower-Range Profiles) and 2D Amplification Factors (PSA, 5% Damping) for Location B
2.5.2-238 Revision 2