
Aerosol composition and sources in the central Arctic Ocean during ASCOS
Upload
khangminh22Category
view
1download
0
1
Secondary Organic Aerosol Formation and
Composition from the Photo-oxidation of Methyl
Chavicol (Estragole)
K. L. Pereira1, J. F. Hamilton
1*, A. R. Rickard
1,2, W. J. Bloss
3, M. S. Alam
3, M. Camredon
4,
A. Muñoz5, M. Vázquez
5, E. Borrás
5, M. Ródenas
5
1Wolfson Atmospheric Chemistry Laboratory, Department of Chemistry, University of York,
York, UK. 2National Centre for Atmospheric Science, University of York, UK.
3School of
Geography, Earth & Environmental Sciences, University of Birmingham, Birmingham, UK.
4LISA, UMR CNRS/INSU 7583, University of Paris-Est Créteil, Paris, France.
5CEAM-
UMH, EUPHORE, Valencia, Spain.
* Corresponding author; e-mail: [email protected], Phone: +44 (0) 1904 324076,
Fax: +44 (0) 1904 322516
Keywords; methyl chavicol, estragole, oil palm, secondary organic aerosol, tandem mass
spectrometry.

2
Abstract. The increasing demand for palm oil for uses in biofuel and food products is leading 1
to rapid expansion of oil palm agriculture. Methyl chavicol (also known as estragole and 1-2
allyl-4-methoxybenzene) is an oxygenated biogenic volatile organic compound that was 3
recently identified as the main floral emission from an oil palm plantation in Malaysian 4
Borneo. The emissions of methyl chavicol observed may impact regional atmospheric 5
chemistry, but little is known of its ability to form secondary organic aerosol (SOA). The 6
photo-oxidation of methyl chavicol was investigated at the European Photoreactor chamber 7
as a part of the atmospheric chemistry of methyl chavicol (ATMECH) project. Aerosol 8
samples were collected using a particle into liquid sampler (PILS) and analysed offline using 9
an extensive range of instruments including; high performance liquid chromatography mass 10
spectrometry (HPLC-ITMS), high performance liquid chromatography quadrupole time-of-11
flight mass spectrometry (HPLC-QTOFMS) and Fourier transform ion cyclotron resonance 12
mass spectrometry (FTICR-MS). The SOA yield was determined as 18 and 29 % for an 13
initial VOC mixing ratio of 212 and 460 ppbv respectively; using a VOC:NOx ratio of ~ 5:1. 14
In total, 59 SOA compounds were observed and the structures of 10 compounds have been 15
identified using high resolution tandem mass spectrometry. The addition of hydroxyl and/or 16
nitro functional groups to the aromatic ring appears to be an important mechanistic pathway 17
for aerosol formation. This results in the formation of compounds with both low volatility 18
and high O:C ratios, where functionalisation rather than fragmentation is mainly observed as 19
a result of the stability of the ring. The SOA species observed can be characterized as semi-20
volatile to low volatile oxygenated organic aerosol (SVOOA and LVOOA) components and 21
therefore may be important in aerosol formation and growth. 22
23
24

3
1. Introduction. The atmospheric oxidation of volatile organic compounds (VOCs) in the 25
presence of NOx results in the formation of tropospheric ozone and secondary organic aerosol 26
(SOA). Whilst SOA formation is known to have adverse effects on climate and human health 27
(Solomon et al., 2007; Bernstein et al., 2004; Davidson et al., 2005; Pöschl, 2005), the VOC 28
oxidation pathways leading to SOA formation are poorly understood (Hallquist et al., 2009). 29
It has been estimated that as many as 104 - 10
5 VOCs have been detected in the atmosphere, 30
all of which may undergo atmospheric oxidation and contribute to SOA formation (Goldstein 31
and Galbally, 2007). Approximately 90% of all global VOC emissions are from biogenic 32
sources (Guenther et al., 1995). The most abundant biogenic emissions are attributed to 33
isoprene (35-40 %), monoterpenes (11-25 %) and oxygenated VOCs (reactive other VOCs 34
and other VOCs, 20-30%) (Guenther et al., 2000; Guenther et al., 1995). The largest source 35
of biogenic VOC emissions are from vegetation; including trees (which account for ~ 71 % 36
of emissions (Guenther et al., 1995), shrubs and crops, with a small emission source from 37
grasslands and soils (Guenther et al., 1995; Zimmerman, 1979; Wiedinmyer et al., 2004; 38
Guenther et al., 2000). Oxygenated VOCs (OVOCs) have received more attention recently 39
due to the advances in instrumentation to detect and quantify these compounds in the ambient 40
atmosphere. Despite this, significant uncertainties still remain in our knowledge of the 41
sources, chemical composition and atmospheric oxidation mechanisms of OVOCs, in 42
particular higher molecular weight species (> C5) (Singh et al., 2000; Steiner et al., 2008; 43
Taipale et al., 2012; Schade and Goldstein, 2001; Bouvier-Brown, 2008). 44
45
Methyl chavicol (C10H12O), also known as estragole and 1-allyl-4-methoxybenzene, is a C10 46
aromatic biogenic OVOC emitted from a variety of pine trees (including ponderosa pine), 47
shrubs (clausena dunniana, straggley baeckea) and common herbs (basil, fennel, tarragon) 48
(Werker et al., 1994; Simon et al., 1990; Southwell et al., 2003; Mirov, 1961; Bouvier-Brown 49

4
et al., 2009; De Vincenzi et al., 2000; Barazani et al., 2002; Adams, 2007; Holzinger et al., 50
2010; Holzinger et al., 2005). A recent publication identified significant methyl chavicol 51
emissions above the canopy of an oil palm plantation in Malaysian Borneo, with a mean 52
midday flux of 0.81 mg m-2
h-1
and a mean mixing ratio of 3.0 ppbv (maximum mixing ratio 53
observed ~ 7.0 ppbv) (Misztal et al., 2010). Methyl chavicol emissions from palm oil 54
plantations were estimated to result in a global emission of ~ 0.5 Tg y-1
(Misztal et al., 2010). 55
There are currently 43 oil palm producing countries, with the majority of oil palm plantations 56
concentrated in Indonesia and Malaysia (FAOSTAT, 2012). In 2011, there were 57
approximately 7.7 million hectares (Mha) of oil palm plantations in Indonesia (USDA, 2013) 58
and 5.0 Mha in Malaysia (MPOB, 2012). The increasing demand for palm oil for uses in food 59
products and biofuels is resulting in the rapid expansion of oil palm agriculture (Fitzherbert et 60
al., 2008). Consequently, methyl chavicol emissions are likely to have a considerable effect 61
on regional chemistry in locations where oil palm plantations are significant. Despite this, 62
there have been few literature reports which have investigated the atmospheric fate of methyl 63
chavicol, including gas-phase degradation, SOA formation, composition and yields. 64
65
The gas phase products formed from the oxidation of methyl chavicol with hydroxyl radicals 66
(•OH), and ozone (O3) has been investigated by Lee et al. (2006a); Lee et al. (2006b), and 67
more recently by Bloss et al. (2012), who reported measurements of the gas-phase reactivity 68
of methyl chavicol with •OH and O3, and by Gai et al. (2013) who in addition investigated the 69
oxidation of methyl chavicol with NO3. In the study performed by Lee et al., (2006b) the 70
photo-oxidation of methyl chavicol resulted in significant SOA formation (yield 40 %) and 71
the formation of two abundant structurally unidentified gas phase compounds, MW 136 72
(C8H8O2, yield 42 ± 9 %) and MW 150 (C9H10O2, yield 23 ± 5 %), detected using proton 73
transfer reaction mass spectrometry (PTR-MS). Bouvier-Brown et al. (2009) identified MW 74
5
136 as 4-methoxybenzaldhyde in the aerosol phase at Blodgett forest (California, US) and 75
suggested the identification of pinonaldehyde (MW 150) (Holzinger et al., 2005) could be in 76
part attributed to 4-methoxybenzene acetaldehyde (MW 150) identified in Lee et al. (2006b). 77
In addition, Cahill et al. (2006) tentatively identified 4-methoxybenzene acetaldehyde in 78
aerosol samples collected in the Sierra Nevada Mountains. More recently, Gai et al. (2013) 79
identified a futher two abundant gas phase products, MW 122 4-methoxytoluene, and MW 80
166 4-methoxybenzeneacteic acid, and identified MW 136 and MW 150 as 4-81
methoxybenzaldhyde and 4-methoxybenzene acetaldhyde, respectively, in support of the 82
literature. To our knowledge, however, the aerosol phase composition and mechanisms of 83
formation from the photo-oxidation of methyl chavicol has largely been unexplored. 84
85
The aim of this study is to characterize the SOA oxidation products formed from the photo-86
oxidation of methyl chavicol and determine their formation mechanisms. Experiments were 87
performed at the European Photoreactor chamber in Valencia, Spain, as a part of the 88
atmospheric chemistry of methyl chavicol (ATMECH) project. Aerosol samples were 89
collected using a particle into liquid sampler (PILS). SOA composition was investigated 90
using an extensive range of instruments, including; high performance liquid chromatography 91
ion trap mass spectrometry (HPLC-ITMS), high performance liquid chromatography 92
quadrupole time-of-flight mass spectrometry (HPLC-QTOFMS) and Fourier transform ion 93
cyclotron resonance mass spectrometry (FTICR-MS). 94
95
2. Materials and methods 96
2.1 Chamber simulation experiments. Experiments were performed at the European 97
Photoreactor (EUPHORE) in Valencia, Spain. The EUPHORE facility comprises of two 200 98
m3 hemispheric reaction chambers made of fluorinated ethyl propylene foil, with housings 99
6
which may be closed to exclude sunlight. Chamber temperature is near ambient and chamber 100
pressure is maintained at approximately 100 Pa above ambient. Dry scrubbed air is used 101
within the chamber and two large fans ensure homogenous mixing. Further technical 102
information regarding the chamber design and installation can be found in the literature 103
(Becker, 1996; Klotz et al., 1998; Volkamer et al., 2001; Bloss et al., 2005). A series of 104
experiments were performed during May 2012 and the initial mixing ratios, chamber 105
temperatures and relative humidities are presented in Table 1. 106
107
The chamber was cleaned before each experiment by flushing with scrubbed dry air 108
overnight. Methyl chavicol was introduced into the chamber through a heated air stream. 109
“Classical” photo-oxidation experiments were performed, where no additional •OH source 110
was added into the chamber. The initial source of •OH in these experiments was from the 111
photolysis of HONO, formed from the heterogeneous reaction of NO2 and H2O on the 112
chamber walls (cf. (Sakamaki et al., 1983; Pitts et al., 1984; Svensson et al., 1987; Carter et 113
al., 1981, 1982)). An extensive range of monitors were used to measure chamber temperature 114
(temperature sensor, model PT100), pressure (Barometer, model AIR-DB-VOC), humidity 115
(Hygrometer Watz, model Walz-TS2), solar intensity (JNO2 Filter Radiometer), ozone 116
(Monitor Labs, model 9810) and NOx (Teledyne API, model NOX_API-T200UP; photolytic 117
converter). PTR-MS (Ionikon Analytik) and Fourier transform infra red (FTIR Nicolet 118
Magna, model 550), coupled to a white-type mirror system with an optical path length of 616 119
m, were used to monitor methyl chavicol decay and product formation. The chamber dilution 120
rate was calculated by measuring the decay of an inert tracer gas, sulphur hexafluoride (SF6), 121
using FTIR; typical pseudo-first-order rate constants of 210-5
s-1
were obtained, 122
corresponding to a dilution lifetime around 14 hours. The formation and evolution of 123
secondary organic aerosol (SOA) was measured using a scanning mobility particle sizer (TSI 124

7
Incorporated, model 3080) consisting of a differential mobility analyzer (model 3081) and a 125
condensation particle counter (model 3775). 126
127
2.2 Aerosol sampling & sample preparation. 128
A Brechtel Manufacturing Inc (California, US) model 4002 PILS was used for aerosol 129
collection. The PILS inlet was connected to the chamber outlet using approximately 1.5 130
meters of ¼” stainless steel tubing. Aerosol samples were collected using a PM1 impactor, 131
with an average flow rate of 13 L min-1
. Acidic, basic and organic gases were removed from 132
the sampled air through the use of denuders, prepared as per manufacture instructions. The 133
wash flow rate was set at 240 µL min-1
and consisted of optima LC-MS grade water (Fisher 134
Scientific, UK). The sample flow rate transferred the aerosol water mixture (optima LC-MS 135
grade water) into sealed vials at a flow rate of 200 µL min-1
for 30 minutes per sample. 136
Samples were collected before the addition of methyl chavicol or NO into the chamber and 137
continued sampling until after the chamber was closed. After sample collection, punctured 138
vial caps were replaced and securely sealed with parafilm. All vials were wrapped in foil to 139
minimise potential degradation from photolysis and were stored at -20 °C until analysis. 140
Collected PILS samples were evaporated to dryness using a V10 vacuum solvent evaporator 141
(Biotage, USA) and redissolved in 300 µL of 50:50 methanol:water (optima LC-MS grade, 142
Fisher, UK), with the exception of experiment MChigh, which was redissolved in 500 µL. 143
144
The PILS dilutes the sampled aerosol through the transfer of grown particles from the quartz 145
impactor plate into sealed vials, condensation of steam and water uptake during particle 146
growth; see Orsini et al. (2003) for further information. The sample dilution amount is 147
usually determined by spiking a known concentration of lithium fluoride into the sample 148
flow. However, no internal standard was used due to the potential effects on the analytical 149
8
method (e.g. adduct formation, ion suppression) and SOA composition. PILS samples were 150
evaporated to dryness to eliminate the unknown sample dilution amount. The re-suspension 151
of samples into a smaller volume, concentrated the aerosol compounds, almost certainly 152
allowing more SOA species to be observed. The re-suspension of the PILS samples into 153
50:50 methanol:water was performed to be more compatible with the high performance liquid 154
chromatography (HPLC) mobile phase and to increase the electrospray ionisation (ESI) 155
efficiency (cf. (Kebarle and Verkerk, 2009)). The PILS collection efficiency has previously 156
been determined, where no appreciable loss has been found for the particle diameter range 157
investigated (30 nm to 1 µm) (Orsini et al., 2003). 158
159
2.3 HPLC-ITMS. SOA composition was investigated using an Agilent 1100 series HPLC 160
(Berkshire, UK) coupled to a HTC Plus ion trap mass spectrometer (IT-MS, Bruker 161
Daltonics, Bremen, Germany). A reversed phase Pinnacle C18 150 mm x 4.6 mm, 5 µm 162
particle size column (Thames Resteck, UK) was used. The HPLC mobile phase composition 163
consisted of (A) water (optima LC-MS grade, Fisher, UK) with 0.1 % formic acid (Sigma 164
Aldrich, UK) and (B) methanol (optima LC-MS grade, Fisher, UK). Gradient elution was 165
used, starting at 90 % (A) 10 % (B), moving to 0 % (A) 100 % (B) over 60 minutes, returning 166
to the initial starting conditions at 65 minutes. A 5 minute pre-run consisting of the starting 167
mobile phase composition was performed before each sample injection. The flow rate was set 168
at 0.6 mL min-1
with a sample injection volume of 60 µL. ESI was used, with a dry gas flow 169
rate of 12 L min-1
, a dry gas temperature of 365 ºC and nebuliser gas pressure of 70 psi 170
(oxygen free nitrogen, OFN, BOC, UK). The MS was operated in alternating polarity mode, 171
scanning from m/z 50 to 600. Tandem MS was achieved through the automated MS2
function 172
within the Esquire software (Bruker Daltonics, software version 5.2). 173
174
9
2.4 FTICR-MS. A solariX Fourier transform ion cyclotron resonance mass spectrometer 175
with a 9.4-T superconducting magnet (Bruker Daltonics, Coventry, UK) was used and 176
externally calibrated using L-Arginine (Sigma Aldrich, UK, purity 98 %). Samples were 177
introduced into the ESI source through direct infusion, using a Hamilton 50 µL syringe 178
(Hamilton, Switzerland) at a flow rate of 120 µL min-1
. Spectra were acquired in both 179
positive and negative ionisation modes over a scan range of m/z 50 – 800. The ESI 180
parameters were set to a dry gas flow rate of 3.7 L min-1
, dry gas temperature of 220 °C, and 181
a nebulizer gas pressure of 1.2 bar (nitrogen, BOC, UK). Broadband detection mode was 182
used, with 64 spectra averages obtained for each spectrum. Ion accumulation in the ICR cell 183
was set to 0.5 seconds with a source accumulation time of 0.002 seconds. The collision RF 184
and ion cooler time was set to favour lower masses at 1300 Vpp and 0.010 seconds, 185
respectively. An approximate resolution of 38,000 at m/z 400 was obtained for both 186
ionisation modes. The spectral analysis was performed using DataAnalysis 4.0 software 187
(Bruker Daltonics, Breman, Germany). Monoisotopic elemental formulae were calculated 188
using the following restrictions; unlimited C, H and O were allowed and up to 3 N atoms, 189
O:C < 3, H:C > 0.5, DBE < 20, and in positive mode, Na and K adducts were also allowed. 190
The accuracy of the molecular formulae (elemental composition) assignment in shown by the 191
error; where the error equals the difference between the exact and measured mass for the 192
assigned molecular formula. The mass error (also referred to as mass accuracy) is displayed 193
in ppm and is calculated by dividing the mass error by the exact mass for the assigned 194
molecular formula and multiplying by 106. The molecular formula score refers to the fit of 195
the theoretical and measured isotopic distribution and abundance for the assigned molecular 196
formula, and is displayed in percentage. The molecular formula score is not calculated for a 197
signal to noise (S/N) ratio below 5. The combination of a high score and low mass accuracy 198
will result in few potential molecular formula assignments for a compound at a given m/z. A 199

10
compound with an m/z below 300, with a high score (100%) and low mass accuracy (< 5 200
ppm) results in only one potential molecular formula (Kind and Fiehn, 2006). 201
202
2.5 HPLC-QTOFMS. A Dionex ultimate 3000 HPLC (Thermo Scientific Inc, UK) was 203
coupled with an ultra high resolution quadrupole time-of-flight mass spectrometer (HPLC-204
QTOFMS) (maXis 3G, Bruker Daltonics, Coventry, UK). The HPLC utilised the same 205
reverse phase Pinnacle C18 column and mobile phase composition as described in the HPLC-206
ITMS analysis. The gradient elution runtime was shortened, starting at 90 % (A) 10 % (B), 207
moving to 0 % (A) 100 % (B) over 50 minutes and returning to the initial starting conditions 208
at 55 minutes. A 5 minute pre-run was performed before each sample injection using the 209
starting mobile phase composition. The flow rate was set to 0.6 mL min-1
and the column 210
temperature controlled at 20 °C. A user defined autosampler method was created, drawing 58 211
µL of sample into the sample loop, followed by 2 µL of a 10 ppm external standard mix and 212
20 µL of 50:50 methanol:water (optima LC-MS grade, Fisher, UK). The HPLC-QTOFMS 213
was externally calibrated using ESI-L low concentration tuning mix (Agilent Technologies, 214
UK). ESI was used and the parameters were set to a dry gas flow rate of 10 L min-1
, dry gas 215
temperature of 350 °C and a nebulizer pressure of 4 bar (nitrogen, BOC, UK). Tandem mass 216
spectra were acquired for a mass range of m/z 50 to 800 using the auto MS2 function within 217
the Compass 1.3 micrOTOF-SR3 software, control version 3.0 (Bruker Daltonics, UK). The 218
three most abundant precursor ions per spectrum were automatically selected by the software 219
and subjected to collision induced dissociation (CID). The collision energy for CID 220
fragmentation was set at 8.0 eV at a collision RF of 800.0 Vpp. The spectral analysis was 221
performed using DataAnalysis 4.0 software (Bruker Daltonics, Breman, Germany). The 222
molecular formula error and score was automatically calculated by the DataAnalysis software 223
using the same methods as described in the FTICR-MS analysis. 224
11
225
2.6 Standards & calibrations. A 10 ppm external standard (ES) mix was used to monitor the 226
ITMS detector variation over the course of the sample analysis. The ES mix was also used for 227
the optimisation of the HPLC-QTOFMS method, internal mass calibration and to determine 228
the retention time shift of the SOA compounds due to the shortening of the gradient elution. 229
The ES mix consisted of 5 compounds, 4-methoxybenzoic acid (Sigma Aldrich, UK, purity 230
99 %), hexanedioic acid (Sigma Aldrich, UK, purity 99 %), cis-pinonic acid (Sigma Aldrich, 231
UK, purity 99 %), 2-hydroxyhexanoic acid (Acros Organics, Belgium, purity 95 %) and 2,6-232
dimethyl-3-nitrophenol (synthesized by University College Cork). These compounds were 233
selected based on their range of retention times, stability, variety of functional groups and 234
ionisation efficiency in both positive and negative ionisation modes. Calibrations were 235
performed using the HPLC-ITMS for any structurally identified SOA compounds where 236
standards were commercially available. Calibrations ranged in concentration from 0.02 to 2 237
ppm and consisted of a minimum of 5 concentrations, with 3 replicate measurements. 238
239
3. Results & discussion. Three experiments carried out as part of the ATMECH campaign 240
are discussed here: (i) MC(0); a chamber background experiment, where no VOCs or NOx 241
were added to the chamber and the chamber housing was opened to expose the chamber to 242
light. None of the methyl chavicol SOA compounds identified were observed in this 243
experiment. (ii) MChigh; a photo-oxidation experiment with high initial mixing ratios of 244
methyl chavicol (460 ppbv) and NO (92 ppbv) and, (iii) MClow; a photo-oxidation experiment 245
with lower mixing ratios of methyl chavicol (212 ppbv) and NO (38 ppbv), with a similar 246
initial VOC:NOx ratio (~5:1) to MChigh. The VOC/NOx ratio represents the lower MC/NOx 247
ratio of an agro-industrialized oil palm plantation site in northern Borneo (Hewitt et al., 2009; 248
MacKenzie et al., 2011); where the boundary layer (500-800 m) NOx concentration (75th
249
12
percentile) was ~ 0.6 ppbv (Hewitt et al., 2009), with a methyl chavicol abundance of ~ 3 250
ppbv at midday (MacKenzie et al., 2011), corresponding to a MC/NOx ratio of 5. The 251
temporal evolution of NOx, O3, methyl chavicol and SOA growth are shown in Figure 1 and 252
show similar profiles to previous aromatic photo-oxidation experiments, with initiation of 253
aerosol formation occurring when the photo-chemical system enters into a relatively “low 254
NO” state (cf. (Rickard et al., 2010)). The maximum SOA mass observed, corrected for wall 255
loss and chamber dilution, was 420 µg m-3
and 126 µg m-3
in MChigh and MClow, respectively. 256
The SOA yield (Y) was calculated using the equation given in Odum et al. (1996), where the 257
amount of aerosol mass formed [∆M0, µg m-3
] was divided by the amount of methyl chavicol 258
reacted [∆MC, µg m-3
], assuming spherical aerosol shape with a density of 1.4 g cm-3
. The 259
SOA yield was determined as 18 % and 29 % for experiments MClow and MChigh, 260
respectively, showing a larger yield at higher initial mixing ratios as seen previously (Song et 261
al., 2005; Odum et al., 1996; Pankow, 1994a, b). 262
263
3.1 SOA composition. The PILS samples were analysed using a series of complementary 264
analytical techniques. Initially, the HPLC-ITMS was used to screen the PILS samples for 265
SOA species. Any compounds observed in the PILS samples before the introduction of 266
methyl chavicol and NO into the chamber in MChigh and MClow were excluded from further 267
analysis. Compounds which displayed changes in their chromatographic peak areas (and thus 268
concentration) were investigated further. In the MChigh experiment, 59 SOA compounds were 269
observed in the PILS samples using HPLC-ITMS. Of these compounds, 56 were observed 270
with matching retention times and/or fragmentation patterns in the MClow experiment. Three 271
compounds at a MW of 214, 226 and 250 g mol-1
were not observed in the lower 272
concentration experiment, MClow. In MChigh, the intensities of these compounds in the HPLC-273
ITMS analysis were observed just above the limit of detection (defined as 3 x S/N). The 274
13
similarity of the oxidation products formed, but the lower initial mixing ratio in MClow, 275
suggests these compounds were not observed in the MClow experiment due to a decrease in 276
the formation yields at lower initial mixing ratios and/or decrease in the gas-particle 277
absorption due to the smaller amount of aerosol mass formed (Pankow, 1994a, b; Odum et 278
al., 1996; Kroll and Seinfeld, 2008). In MChigh, fragmentation data was obtained for 56 of the 279
59 SOA compounds using HPLC-ITMS2. In many cases it was not possible to identify the 280
compound structures of the SOA species due to the low mass resolution of the ITMS and lack 281
of commercially available standards. This resulted in the use of the FTICR-MS to aid in the 282
identification of the SOA molecular formulae and compound structures. The use of FTICR-283
MS significantly aided in compound identification, providing the molecular formulae for 49 284
of the 59 SOA compounds with average error of 0.89 ppm for negative ionisation mode and 285
4.75 ppm for positive ionisation mode. FTICR-MS2 could not be performed due to the lack of 286
prior chromatographic separation and the low concentration of the SOA compounds. Instead, 287
HPLC-QTOFMS2 was used to obtain high mass resolution compound fragmentation data for 288
the SOA compounds. The HPLC-QTOFMS identified the molecular formulae of 55 of the 59 289
SOA compounds with an average error of 4.13 ppm for negative ionisation mode and 18.34 290
ppm for positive ionisation mode. The use of the HPLC-QTOFMS was complementary to the 291
FTICR-MS, allowing the comparison of two high mass resolution data sets to determine the 292
molecular formulae of the SOA compounds, as shown in Table 2 and SI Table 1 & 2. The use 293
of prior chromatographic separation with the QTOFMS was advantageous and allowed the 294
molecular formulae of the 10 low concentration SOA compounds not identified using 295
FTICR-MS to be determined. Of the 59 SOA compounds, the FTICR-MS and the HPLC-296
QTOFMS were in agreement of the molecular formulae for 40 SOA compounds. Only one 297
high resolution mass spectrometric technique provided the molecular formulae for 14 SOA 298
compounds and for 5 SOA compounds the molecular formulae provided by the HPLC-299
14
QTOFMS and FTICR-MS were not in agreement. A complete list of the identified SOA 300
species including the molecular formulae identification and associated errors can be found in 301
the supplementary information, SI Tables 1 and 2. 302
303
A Van Krevelen plot of the 59 SOA compounds is shown in SI Figure 1. The average O:C 304
and H:C ratio was determined as 0.46 and 1.37, respectively. Of the 59 SOA compounds, the 305
structures of 10 have been assigned and are shown in Table 2. The structures of (4-306
methoxyphenyl)acetic acid and 4-methoxybenzoic acid have been confirmed using the 307
retention time and fragmentation patterns of commercially available standards. All other 308
compound structures have been determined from the deprotonated or protonated molecular 309
species fragmentations obtained from the HPLC-ITMS2 and HPLC-QTOFMS
2. Calibrations 310
were performed for 4-methoxybenzoic acid and (4-methoxyphenyl)acetic using the 311
commercially available standards. Detector variation during sample analysis was determined 312
for both compounds by measuring the peak area of 4-methoxybenzoic acid in the 10 ppm ES 313
mix. A 6 % standard deviation is shown and includes a detector variation of 5.14 % (based on 314
4 replicate measurements) plus a negligible amount for the PILS collection efficiency (see 2.2 315
Aerosol sampling & sample preparation). The concentration of 4-methoxybenzoic acid and 316
(4-methoxyphenyl)acetic acid in MChigh was determined as 1.26 ± 0.08 and 0.41 ± 0.02 µg m-
317
3; representing a total percentage SOA mass of 0.44 ± 0.03 and 0.14 ± 0.01 %, respectively. 318
In MClow, the concentration of 4-methoxybenzoic acid was determined as 0.23 ± 0.01 µg m-3
, 319
corresponding to a percentage SOA mass of 0.26 ± 0.02 %. The HPLC-ITMS intensity of (4-320
methoxyphenyl)acetic acid in the MClow experiment was observed below the limit of 321
quantification (defined as 5 x S/N) and thus the concentration and total percentage SOA mass 322
for this compound could not be determined. 323
324
15
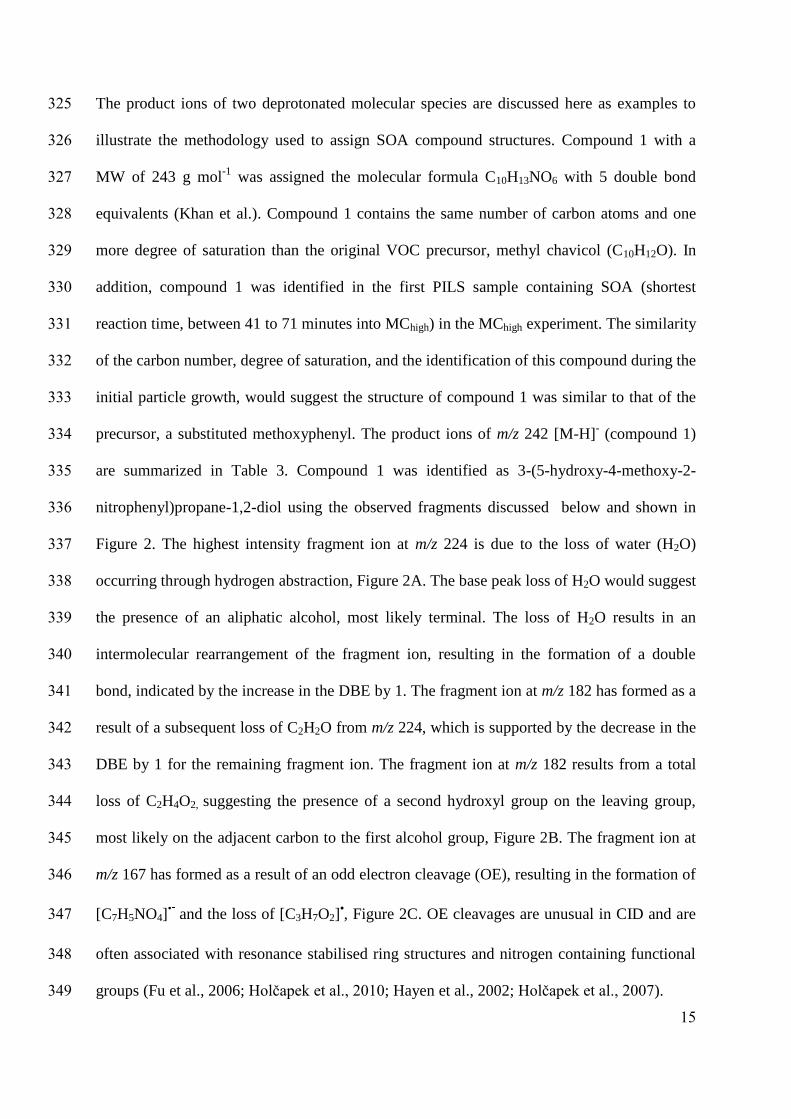
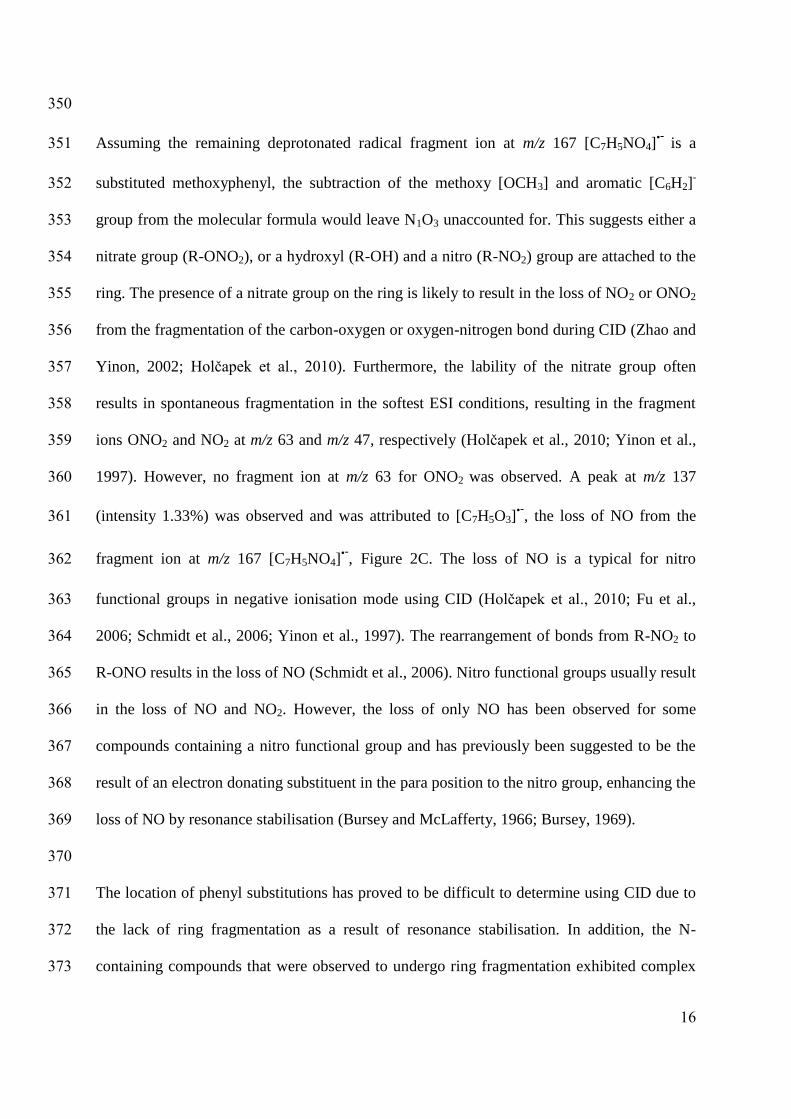
The product ions of two deprotonated molecular species are discussed here as examples to 325
illustrate the methodology used to assign SOA compound structures. Compound 1 with a 326
MW of 243 g mol-1
was assigned the molecular formula C10H13NO6 with 5 double bond 327
equivalents (Khan et al.). Compound 1 contains the same number of carbon atoms and one 328
more degree of saturation than the original VOC precursor, methyl chavicol (C10H12O). In 329
addition, compound 1 was identified in the first PILS sample containing SOA (shortest 330
reaction time, between 41 to 71 minutes into MChigh) in the MChigh experiment. The similarity 331
of the carbon number, degree of saturation, and the identification of this compound during the 332
initial particle growth, would suggest the structure of compound 1 was similar to that of the 333
precursor, a substituted methoxyphenyl. The product ions of m/z 242 [M-H]- (compound 1) 334
are summarized in Table 3. Compound 1 was identified as 3-(5-hydroxy-4-methoxy-2-335
nitrophenyl)propane-1,2-diol using the observed fragments discussed below and shown in 336
Figure 2. The highest intensity fragment ion at m/z 224 is due to the loss of water (H2O) 337
occurring through hydrogen abstraction, Figure 2A. The base peak loss of H2O would suggest 338
the presence of an aliphatic alcohol, most likely terminal. The loss of H2O results in an 339
intermolecular rearrangement of the fragment ion, resulting in the formation of a double 340
bond, indicated by the increase in the DBE by 1. The fragment ion at m/z 182 has formed as a 341
result of a subsequent loss of C2H2O from m/z 224, which is supported by the decrease in the 342
DBE by 1 for the remaining fragment ion. The fragment ion at m/z 182 results from a total 343
loss of C2H4O2, suggesting the presence of a second hydroxyl group on the leaving group, 344
most likely on the adjacent carbon to the first alcohol group, Figure 2B. The fragment ion at 345
m/z 167 has formed as a result of an odd electron cleavage (OE), resulting in the formation of 346
[C7H5NO4]•-
and the loss of [C3H7O2]•, Figure 2C. OE cleavages are unusual in CID and are 347
often associated with resonance stabilised ring structures and nitrogen containing functional 348
groups (Fu et al., 2006; Holčapek et al., 2010; Hayen et al., 2002; Holčapek et al., 2007). 349
16
350
Assuming the remaining deprotonated radical fragment ion at m/z 167 [C7H5NO4]•-
is a 351
substituted methoxyphenyl, the subtraction of the methoxy [OCH3] and aromatic [C6H2]- 352
group from the molecular formula would leave N1O3 unaccounted for. This suggests either a 353
nitrate group (R-ONO2), or a hydroxyl (R-OH) and a nitro (R-NO2) group are attached to the 354
ring. The presence of a nitrate group on the ring is likely to result in the loss of NO2 or ONO2 355
from the fragmentation of the carbon-oxygen or oxygen-nitrogen bond during CID (Zhao and 356
Yinon, 2002; Holčapek et al., 2010). Furthermore, the lability of the nitrate group often 357
results in spontaneous fragmentation in the softest ESI conditions, resulting in the fragment 358
ions ONO2 and NO2 at m/z 63 and m/z 47, respectively (Holčapek et al., 2010; Yinon et al., 359
1997). However, no fragment ion at m/z 63 for ONO2 was observed. A peak at m/z 137 360
(intensity 1.33%) was observed and was attributed to [C7H5O3]•-, the loss of NO from the 361
fragment ion at m/z 167 [C7H5NO4]•-, Figure 2C. The loss of NO is a typical for nitro 362
functional groups in negative ionisation mode using CID (Holčapek et al., 2010; Fu et al., 363
2006; Schmidt et al., 2006; Yinon et al., 1997). The rearrangement of bonds from R-NO2 to 364
R-ONO results in the loss of NO (Schmidt et al., 2006). Nitro functional groups usually result 365
in the loss of NO and NO2. However, the loss of only NO has been observed for some 366
compounds containing a nitro functional group and has previously been suggested to be the 367
result of an electron donating substituent in the para position to the nitro group, enhancing the 368
loss of NO by resonance stabilisation (Bursey and McLafferty, 1966; Bursey, 1969). 369
370
The location of phenyl substitutions has proved to be difficult to determine using CID due to 371
the lack of ring fragmentation as a result of resonance stabilisation. In addition, the N-372
containing compounds that were observed to undergo ring fragmentation exhibited complex 373
17
re-arrangements making the identification of these compound structures a difficult task. The 374
most likely locations of phenyl substitutions can be identified however, by considering the 375
formation mechanisms of these compounds in the gas phase (Ziemann and Atkinson, 2012; 376
Calvert et al., 2002). Methyl chavicol has two phenyl substituents, a methoxy group and an 377
hydrocarbon (HC) chain, both of which are ortho, para directing (March, 1992). The stronger 378
activating group of the two phenyl substituents, the methoxy group, will determine the most 379
energetically favoured and resonance stabilised position of an addition to the ring (March, 380
1992). The para position to the methoxy group is occupied by the HC chain and therefore the 381
initial oxidation of a hydroxyl radical to the ring of methyl chavicol would be most 382
energetically favoured at the ortho position to the methoxy group (Ziemann and Atkinson, 383
2012). The location of the nitro group on the ring is more difficult to assign. Assuming the 384
hydroxyl radical is already attached to the ring, the most strongly activating group would now 385
be the hydroxyl group, which is also ortho, para directing (March, 1992). The ortho position 386
to the hydroxyl group is more sterically hindered by the adjacent HC chain and hydroxyl 387
group, compared to the para position, which is only sterically hindered by the HC chain. It is 388
therefore suggested that the nitro group is located in the para position to the hydroxyl group. 389
The suggested location of the nitro and hydroxyl group on the ring is also supported by the 390
mechanism suggested in (Bursey, 1969; Bursey and McLafferty, 1966), where the loss of 391
only NO is observed for a nitro functional group during CID when an activating group is 392
located in the para position to the nitro group. 393
394
Compound 5, with a MW of 198 g mol-1
was assigned the molecular formula C10H14O4 with 4 395
DBE. The product ions of m/z 197 [M-H]- (compound 5) are summarized in Table 4. 396
Compound 5 was identified as 3-(3-hydroxy-4-methoxyphenyl)propane-1,2-diol from the 397
product ions discussed here and shown in Figure 3. Both compounds 1 and 5 exhibit similar 398
18
HC chain fragmentation, with the loss of 18 Da (H2O) and 42 Da (C2H2O2), Figure 3A & B. 399
The product ion [C7H7O2]- at m/z 123 resulted from an even electron (EE) loss of C3H6O2, 400
unlike the OE loss of [C3H7O2]• observed for compound 1, Figure 3C. Compound 5 does not 401
have a nitro group present on the ring and as a result the resonance stabilization of the 402
aromatic ring is lower than in compound 1. The decrease in resonance stabilisation results in 403
an EE cleavage and the abstraction of a hydrogen from the leaving group to the aromatic ring. 404
Hydrogen abstraction from the loss group results in an intermolecular re-arrangement and the 405
loss of C3H6O2. Therefore, the same HC chain has been suggested for both compounds 1 and 406
5. Assuming a methoxyphenyl sub-structure, the deprotonated product ion would leave 407
[C6H3O]- from product ion [C7H7O2]
- at m/z 123, suggesting a hydroxyl group is attached to 408
the aromatic ring. 409
410
3.2. Mechanism of formation. A proposed mechanism for the formation of compounds 1, 5, 411
8, 9 and 10 is shown in Figures 4a and b. The formation of these compounds can be 412
rationalised as the products of methyl chavicol oxidation by considering typical gas phase 413
oxidation mechanisms (Ziemann and Atkinson, 2012; Calvert et al., 2002). The reaction rate 414
constants of methyl chavicol with •OH and O3 have previously been determined as 5.20 ± 415
0.78 x 10⁻¹¹
and 1.03 ± 0.23 x 10⁻¹⁷
cm3 molecule
-1 s
-1, respectively (Gai et al., 2013). The 416
proportion of methyl chavicol reacting with •OH and O3 during MClow and MChigh is shown in 417
SI, Figures 2 and 3, respectively; where throughout both experiments the reaction of methyl 418
chavicol with •OH is observed to dominate over the reaction with O3. The initial oxidation of 419
methyl chavicol will proceed mainly through the •OH radical addition mechanism (Atkinson, 420
1997a; Calvert et al., 2002; Ziemann and Atkinson, 2012) and can attack the ring and/or the 421
HC chain. •OH radical addition can occur on either carbon of the double bond of the HC 422
chain, resulting in the formation of primary and secondary β-hydroxyalkyl radicals, with the 423
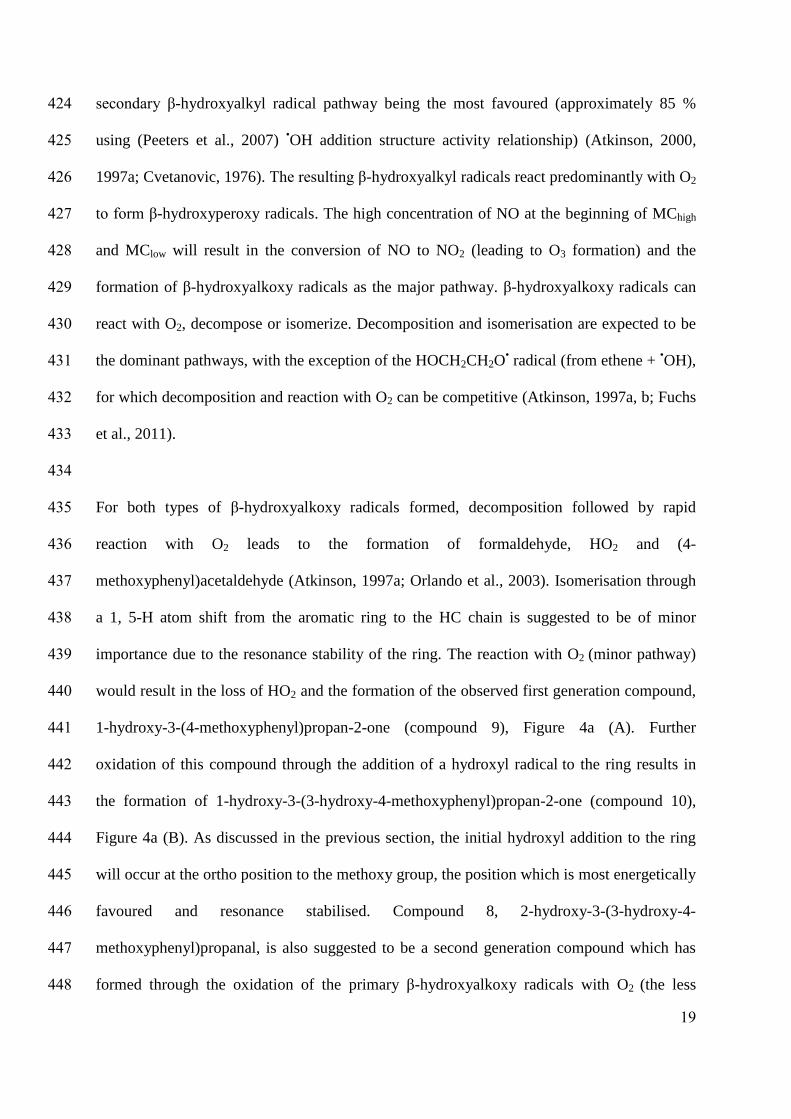
19
secondary β-hydroxyalkyl radical pathway being the most favoured (approximately 85 % 424
using (Peeters et al., 2007) •OH addition structure activity relationship) (Atkinson, 2000, 425
1997a; Cvetanovic, 1976). The resulting β-hydroxyalkyl radicals react predominantly with O2 426
to form β-hydroxyperoxy radicals. The high concentration of NO at the beginning of MChigh 427
and MClow will result in the conversion of NO to NO2 (leading to O3 formation) and the 428
formation of β-hydroxyalkoxy radicals as the major pathway. β-hydroxyalkoxy radicals can 429
react with O2, decompose or isomerize. Decomposition and isomerisation are expected to be 430
the dominant pathways, with the exception of the HOCH2CH2O• radical (from ethene +
•OH), 431
for which decomposition and reaction with O2 can be competitive (Atkinson, 1997a, b; Fuchs 432
et al., 2011). 433
434
For both types of β-hydroxyalkoxy radicals formed, decomposition followed by rapid 435
reaction with O2 leads to the formation of formaldehyde, HO2 and (4-436
methoxyphenyl)acetaldehyde (Atkinson, 1997a; Orlando et al., 2003). Isomerisation through 437
a 1, 5-H atom shift from the aromatic ring to the HC chain is suggested to be of minor 438
importance due to the resonance stability of the ring. The reaction with O2 (minor pathway) 439
would result in the loss of HO2 and the formation of the observed first generation compound, 440
1-hydroxy-3-(4-methoxyphenyl)propan-2-one (compound 9), Figure 4a (A). Further 441
oxidation of this compound through the addition of a hydroxyl radical to the ring results in 442
the formation of 1-hydroxy-3-(3-hydroxy-4-methoxyphenyl)propan-2-one (compound 10), 443
Figure 4a (B). As discussed in the previous section, the initial hydroxyl addition to the ring 444
will occur at the ortho position to the methoxy group, the position which is most energetically 445
favoured and resonance stabilised. Compound 8, 2-hydroxy-3-(3-hydroxy-4-446
methoxyphenyl)propanal, is also suggested to be a second generation compound which has 447
formed through the oxidation of the primary β-hydroxyalkoxy radicals with O2 (the less 448

20
favoured pathway) and has been further oxidised by the addition of a hydroxyl radical to the 449
ring, Figure 4b (A). 450
451
As a relatively “low NOx state” is entered in MChigh and MClow the RO2 + RO2 or HO2 452
reaction will begin to dominate over the competing reaction with NO (Atkinson, 1997a; 453
Stockwell et al., 1990). The cross/self reaction of β-hydroxyperoxy radicals will proceed 454
mainly through two pathways; the radical pathway and non-radical pathway (hydrogen 455
abstraction), with the radical pathway accounting for approximately 30 - 80 % of the RO2 + 456
RO2 reaction (Atkinson, 1997a; Madronich and Calvert, 1990). The radical pathway (major 457
pathway) will result in the formation of β-hydroxyalkoxy radicals with the loss of O2. The β-458
hydroxyalkoxy radicals can then undergo oxidation through the same mechanisms as 459
discussed above, resulting in a secondary pathway for the formation of compounds 8, 9 and 460
10, Figure 4b (B), Figure 4a (C) and (D), respectively. A third minor pathway to the 461
formation of compounds 8, 9 and 10 can also occur through the RO2 + RO2 non radical 462
pathway; where one peroxy radical abstracts a hydrogen atom from another peroxy radical, 463
resulting in the formation of an alcohol and carbonyl, respectively, with the loss of O2 464
(Madronich and Calvert, 1990; Howard and Ingold, 1968). The hydrogen atom is abstracted 465
from the carbon bonded to the peroxy radical, thus the abstraction of a hydrogen atom from a 466
secondary β-hydroxyperoxy radical will result in the formation of 1-hydroxy-3-(4-467
methoxyphenyl)propan-2-one (compound 9), Figure 4a (E). The further oxidation of this 468
compound though the reaction with •OH will result in the formation of 1-hydroxy-3-(3-469
hydroxy-4-methoxyphenyl)propan-2-one (compound 10), Figure 4a (F). Moreover, the 470
abstraction of a hydrogen from a primary β-hydroxyperoxy radical followed by the further 471
oxidation of an •OH radical to the ring, will result in the formation of 2-hydroxy-3-(3-472
hydroxy-4-methoxyphenyl)propanal (compound 8), Figure 4b (C). 473
21
474
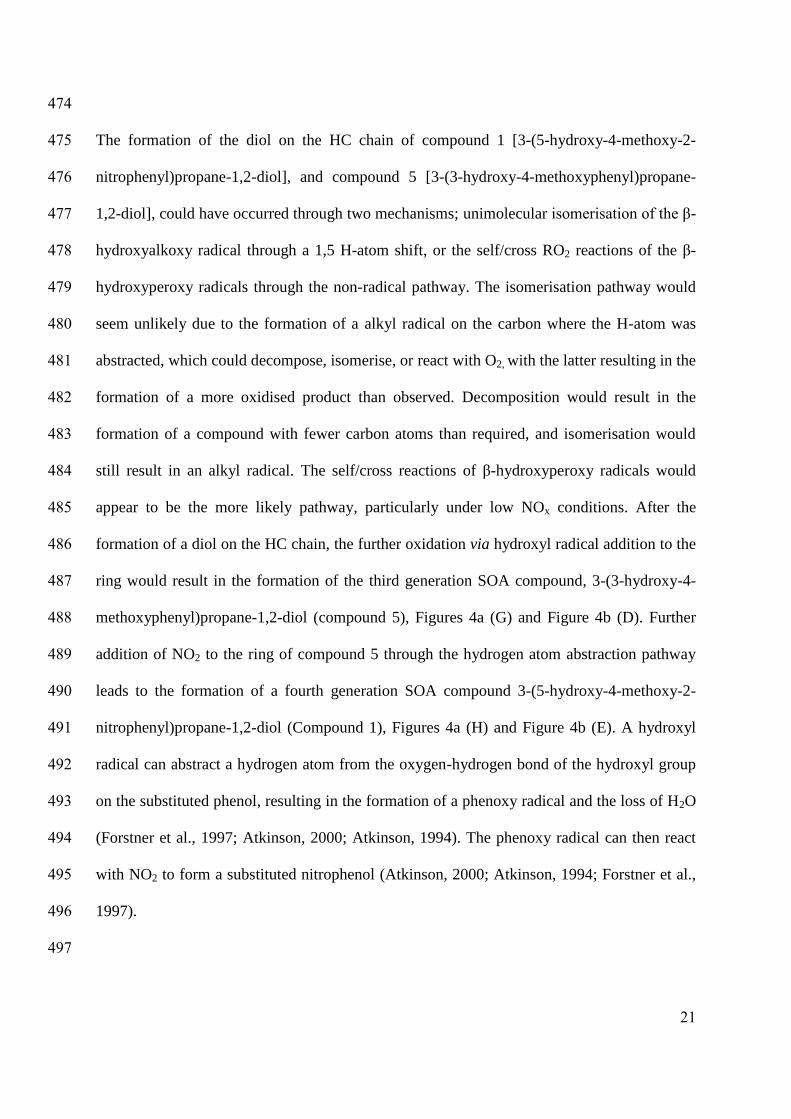
The formation of the diol on the HC chain of compound 1 [3-(5-hydroxy-4-methoxy-2-475
nitrophenyl)propane-1,2-diol], and compound 5 [3-(3-hydroxy-4-methoxyphenyl)propane-476
1,2-diol], could have occurred through two mechanisms; unimolecular isomerisation of the β-477
hydroxyalkoxy radical through a 1,5 H-atom shift, or the self/cross RO2 reactions of the β-478
hydroxyperoxy radicals through the non-radical pathway. The isomerisation pathway would 479
seem unlikely due to the formation of a alkyl radical on the carbon where the H-atom was 480
abstracted, which could decompose, isomerise, or react with O2, with the latter resulting in the 481
formation of a more oxidised product than observed. Decomposition would result in the 482
formation of a compound with fewer carbon atoms than required, and isomerisation would 483
still result in an alkyl radical. The self/cross reactions of β-hydroxyperoxy radicals would 484
appear to be the more likely pathway, particularly under low NOx conditions. After the 485
formation of a diol on the HC chain, the further oxidation via hydroxyl radical addition to the 486
ring would result in the formation of the third generation SOA compound, 3-(3-hydroxy-4-487
methoxyphenyl)propane-1,2-diol (compound 5), Figures 4a (G) and Figure 4b (D). Further 488
addition of NO2 to the ring of compound 5 through the hydrogen atom abstraction pathway 489
leads to the formation of a fourth generation SOA compound 3-(5-hydroxy-4-methoxy-2-490
nitrophenyl)propane-1,2-diol (Compound 1), Figures 4a (H) and Figure 4b (E). A hydroxyl 491
radical can abstract a hydrogen atom from the oxygen-hydrogen bond of the hydroxyl group 492
on the substituted phenol, resulting in the formation of a phenoxy radical and the loss of H2O 493
(Forstner et al., 1997; Atkinson, 2000; Atkinson, 1994). The phenoxy radical can then react 494
with NO2 to form a substituted nitrophenol (Atkinson, 2000; Atkinson, 1994; Forstner et al., 495
1997). 496
497

22
Compounds 2, 3, 4, 6 and 7, contain acid functional groups and less carbon atoms than the 498
original VOC precursor, methyl chavicol. These compounds appear to be later generation 499
SOA species and could have formed through a number of potential mechanisms, such as 500
reactions with ozone (O'Neal and Blumstein, 1973; Orzechowska and Paulson, 2005; Neeb et 501
al., 1996; Calvert et al., 2000), and/or with hydroxyl radicals (Forstner et al., 1997; Gai et al., 502
2013), although the detailed reaction mechanisms for the formation of organic acids from 503
hydroxyl radicals has not been properly established (Carlton et al., 2009). Compounds 4 and 504
7 appear to be the further oxidation products of compounds 2 and 6, through the addition of a 505
hydroxyl radical to ring. In addition, compound 3 appears to be the further oxidation product 506
of compound 7, through a second addition of a hydroxyl radical to the ring. Here we suggest 507
the second addition of the hydroxyl radical to the ring of compound 7 is in the para position 508
to the hydroxyl group, the most resonance stabilised and least sterically hindered position. 509
510
3.3 Atmospheric relevance. The SOA yield obtained in this study for the photo-oxidation of 511
methyl chavicol, in MClow (18 %) and MChigh (29 %) are comparatively lower than the 40 % 512
SOA yield reported previously (Lee et al., 2006b), although there are a number of key 513
difference between the two studies. Lee et al. (2006b) used ammonium sulfate seed 514
(compared to the nucleation only experiments presented here), which has been shown to 515
increase the SOA yields of aromatic precursors (Kroll et al., 2007; Huang et al., 2013; Lu et 516
al., 2009). In addition, the percentage relative humidity (% RH) was approximately 5 times 517
greater in the study performed by Lee et al. (2006b). Recent publications have shown that the 518
SOA mass formed from a substituted aromatic compound (p-xylene), increases with 519
increasing % RH, approximately by a factor of 2 over a % RH range of 5 to 75 % (Zhou et 520
al., 2011; Healy et al., 2009). Nevertheless, it is clear the photo-oxidation of methyl chavicol 521
results in significant SOA formation. Recent literature has shown oxygenated biogenic VOCs 522

23
containing 10 carbon atoms (including eucalyptol, verbenone, linalool) resulted in an SOA 523
yield between 16 to 20 %, with the use of neutral (Iinuma et al., 2008; Varutbangkul et al., 524
2006; Lee et al., 2006b) or acidic (Iinuma et al., 2008) seed. It is difficult to directly compare 525
SOA yields from the oxidation of a similar VOC precursors in the literature due to the 526
limitations of using chamber derived data (Camredon et al., 2007). However, reported SOA 527
yields of methyl chavicol were the highest of all oxygenated VOCs investigated (SOA yield 528
26 – 40 %) (Lee et al., 2006b; Varutbangkul et al., 2006). Although these experiments are at 529
concentrations higher than the real atmosphere, they suggest that methyl chavicol can act as 530
an important SOA precursor in regions where methyl chavicol emissions are significant, such 531
as downwind from pine forests and oil palm plantations. 532
533
Aerosol loadings where methyl chavicol emissions are significant, such as northern Borneo, 534
have been found to range from 5 µg m-3
(800 meters above the oil palm plantation) to 100 µg 535
m-3
(in a chimney plume of an near-source oil palm processing plant) (MacKenzie et al., 536
2011). The aerosol loadings formed in these experiments are considerably higher (MClow 126 537
and MChigh 430 µg m-3
) than the aerosol loadings observed in ambient conditions. It is 538
therefore likely that more compounds are observed in the aerosol phase in this study than 539
would be at atmospherically relevant conditions; due to more higher volatility species 540
partitioning into the aerosol phase at higher mass loadings (Pankow, 1994a, b; Odum et al., 541
1996). However, the structurally identified compounds were characterized as semi- to low-542
volatility oxygenated organic aerosol; where at atmospherically relevant conditions a sizable 543
fraction of these compounds would be expected to exist in the aerosol phase (cf. (Donahue et 544
al., 2012)). 545
546

24
The SOA compounds identified in this study will be representative of methyl chavicol 547
oxidation products formed in polluted environments (high NOx) and downwind of pollution 548
sources (low NOx, high O3). At the start of the chamber experiments, the high NO 549
concentrations will be representative of methyl chavicol emissions directly next to a high NO 550
source, such as a processing plant (MacKenzie et al., 2011). Here, the peroxy radicals (ROO•) 551
will preferentially react with NO forming alkoxy radicals (RO•) and NO2 (leading to O3 552
formation). As a relatively low NO environment in the chamber is entered (i.e. the majority 553
of NO has been converted to NO2), the RO2 radicals will increasingly react with RO2 or 554
(primarily) HO2; instead of NO. The oxidation products formed whilst the NO concentration 555
is relatively low but the NO2 concentration is near maximum, will be representative of the 556
methyl chavicol oxidation products formed in polluted environments, i.e. agro-industrialized 557
oil palm plantation site (MacKenzie et al., 2011). As the chamber experiment progresses, the 558
NO2 concentration decreases, approaching zero (as the NOx is not replenished in the 559
chamber) and the O3 concentration increases from the photolysis of NO2. This chamber 560
scenario then corresponds to an environment representative of the products formed 561
downwind of an agro-industrialized oil palm plantation; where there is less pollution (low 562
NOx), but O3 is present. 563
564
Four compounds with a MW of 122, 136, 150 and 166 g mol-1
were observed in the gas phase 565
using PTR-MS and may be attributed to 4-methoxytoluene, 4-methoxybenzaldhyde, 4-566
methoxybenzene acetaldehyde and (4-methoxyphenyl)acetic acid, respectively, in agreement 567
with Lee et al. (2006b), Spada et al. (2008) and Gai et al. (2013). These compounds are 568
formed as a result of decomposition leading to higher volatility species and are therefore not 569
included in Figures 4a and b. The gas phase oxidation mechanisms of these compounds can 570
be observed in Gai et al. (2013). In contrast to Cahill et al. (2006) and Bouvier-Brown et al. 571

25
(2009) 4-methoxybenzaldhyde (MW 136) and 4-methoxybenzene acetaldehyde (MW 150) 572
were not identified in the aerosol phase in this study. Compound vapour pressures were 573
calculated using the UManSysProp website (http://ratty.cas.manchester.ac.uk/informatics/) at 574
298.15 K, using the Nannoolal vapour pressure and boiling point extrapolation method 575
(Nannoolal et al., 2008; Nannoolal et al., 2004) and the saturation concentration (C*, µg m-3
) 576
determined (Donahue et al., 2006a). The calculated volatility of these compounds suggests 577
they are intermediate VOCs (4-methoxybenzaldehyde, C* = 4.96 x 10
5 µg m
-3 and 4-578
methoxybenzene acetaldehyde, C* = 3.02 x 10
5 µg m
-3). The use of gas phase scrubbers for 579
organics in the PILS sampler used in this study may indicate that previous ambient 580
observations are due to positive artifacts from gas phase absorption to filters. 581
582
The saturation concentration (C*, µg m-3
) (Donahue et al., 2006a) and O:C ratio were 583
determined for all the identified compounds and plotted in a O:C /log C*, µg m-3
volatility 584
basis set space (Donahue et al., 2013; Jimenez et al., 2009), as shown in Figure 5. All of the 585
identified SOA compounds retained the aromatic ring, with O:C ratios between 0.30 to 0.63 586
and H:C ratios between 1.00 and 1.40. The oxidation of methyl chavicol and its early 587
generation products resulted in the formation of low vapour pressure and a high O:C ratio 588
species, due to the lack of ring fragmentation. This resulted in the movement of the SOA 589
compounds to lower volatilities and higher O:C ratios, thus functionalisation rather than 590
fragmentation was mainly observed. The majority of the structurally identified SOA species 591
underwent oxidation on the aromatic ring, through the addition of •OH and/or NO2. The 592
formation of compound 1 (3-(5-hydroxy-4-methoxy-2-nitrophenyl)propane-1,2-diol) through 593
the addition of a NO2 group on the aromatic ring resulted in the movement of this species to 594
the low volatility oxygenated organic aerosol region (LVOOA), and just outside the 595
extremely low volatility oxygenated organic aerosol (ELVOOA) nucleator region proposed 596
26
by Donahue et al. (2013). Ring addition appears to be an important pathway, resulting in the 597
formation of low volatility species with high O:C ratios, which may also be important for 598
other aromatic compounds. Only structures for 8 of the 59 compounds detected could be 599
tentatively identified; however, 2 structures were confirmed with authentic standards. Further 600
work is required to characterize the SOA formed from methyl chavicol oxidation at different 601
mixing ratios and with different oxidants (O3, NO3), NOx levels, RHs and seed aerosol 602
compositions. 603
604
Acknowledgements. The assistance of scientists at EUPHORE and the York Centre of 605
Excellence in Mass Spectrometry is gratefully acknowledged. This work was supported by 606
EUROCHAMP-2 (TA Project E2-2011-04-19-0059). ARR acknowledgements the support of 607
the National Centre for Atmospheric Science. The York Centre of Excellence in Mass 608
Spectrometry was created thanks to a major capital investment through Science City York, 609
supported by Yorkshire Forward with funds from the Northern Way Initiative. KEP 610
acknowledges support of a NERC PhD studentship (NE106026057). 611
References.
Adams, R. P.: Identification of essential oil components by gas chromatography/mass
spectrometry, Ed. 4, Allured Publishing Corporation, Carol Stream, 2007.
Atkinson, R.: Gas-phase trosposheric chemistry of organic compounds., Journal of Physical
and Chemical Reference Data, Monograph, 2, 1-216, 1994.
Atkinson, R.: Gas-phase tropospheric chemistry of volatile organic compounds .1. Alkanes
and alkenes, J Phys Chem Ref Data, 26, 215-290, 1997a.
27
Atkinson, R.: Atmospheric reactions of alkoxy and beta-hydroxyalkoxy radicals, Int J Chem
Kinet, 29, 99-111, Doi 10.1002/(Sici)1097-4601(1997)29:2<99::Aid-Kin3>3.0.Co;2-F,
1997b.
Atkinson, R.: Atmospheric chemistry of VOCs and NOx, Atmospheric Environment, 34,
2063-2101, Doi 10.1016/S1352-2310(99)00460-4, 2000.
Barazani, O., Cohen, Y., Fait, A., Diminshtein, S., Dudai, N., Ravid, U., Putievsky, E., and
Friedman, J.: Chemotypic differentiation in indigenous populations of Foeniculum vulgare
var. vulgare in Israel, Biochem Syst Ecol, 30, 721-731, Pii S0305-1978(02)00019-4
Doi 10.1016/S0305-1978(02)00019-4, 2002.
Becker, K.: EUPHORE: Final report to the European commission, Contract# EV5V-CT92-
0059, Bergische Universität Wuppertal, Germany, 1996.
Bernstein, J. A., Alexis, N., Barnes, C., Bernstein, I. L., Bernstein, J. A., Nel, A., Peden, D.,
Diaz-Sanchez, D., Tarlo, S. M., and Williams, P. B.: Health effects of air pollution, The
Journal of allergy and clinical immunology, 114, 1116-1123, 10.1016/j.jaci.2004.08.030,
2004.
Bloss, C., Wagner, V., Bonzanini, A., Jenkin, M. E., Wirtz, K., Martin-Reviejo, M., and
Pilling, M. J.: Evaluation of detailed aromatic mechanisms (MCMv3 and MCMv3.1) against
environmental chamber data, Atmos. Chem. Phys., 5, 623-639, 10.5194/acp-5-623-2005,
2005.
Bloss, W. J., Alam, M. S., Rickard, A. R., Hamilton, J. F., Pereira, K. L., Camredon, M.,
Muñoz, A., Vázquez, M., Alacreu, P., Ródenas, M., and Vera, T.: Atmospheric Chemistry of
Methyl Chavicol (Estragole), AGU Fall Meeting, San Francisco, Fall meeting 3 to 7
December 2012, A33L-0313, 2012.
Bouvier-Brown, N., Goldstein, A., Worton, D., Matross, D., Gilman, J., Kuster, W., Welsh-
Bon, D., Warneke, C., de Gouw, J., and Cahill, M.: Methyl chavicol: characterization of its
28
biogenic emission rate, abundance, and oxidation products in the atmosphere, Atmos Chem
Phys, 9, 2061-2074, 2009.
Bouvier-Brown, N. C.: Quantifying reactive biogenic volatile organic compounds:
Implications for gas-and particle-phase atmospheric chemistry, ProQuest, University of
California, Berkeley, CA, 2008.
Bursey, M. M., and McLafferty, F. W.: Rearrangements and “Flat-Topped Metastable Ions”
in the Mass Spectra of Substituted Nitrobenzenes1, J Am Chem Soc, 88, 5023-5025,
10.1021/ja00973a047, 1966.
Bursey, M. M.: Influence of steric inhibition of resonance on ion intensities in mass spectra, J
Am Chem Soc, 91, 1861-1862, 10.1021/ja01035a053, 1969.
Cahill, T. M., Seaman, V. Y., Charles, M. J., Holzinger, R., and Goldstein, A. H.: Secondary
organic aerosols formed from oxidation of biogenic volatile organic compounds in the Sierra
Nevada Mountains of California, Journal of geophysical research, 111, D16312, doi:
10.1029/2006JD007178, 2006.
Calvert, J. G., Atkinson, R., Kerr, J., Madronich, S., Moortgat, G., Wallington, T. J., and
Yarwood, G.: The mechanisms of atmospheric oxidation of the alkenes, Oxford University
Press New York, 2000.
Calvert, J. G., Atkinson, R., Becker, K. H., Kamens, R. M., Seinfeld, J. H., Wallington, T. J.,
and Yarwood, G.: The mechanisms of atmospheric oxidation of aromatic hydrocarbons,
Oxford University Press New York, 2002.
Camredon, M., Aumont, B., Lee-Taylor, J., and Madronich, S.: The SOA/VOC/NOx system:
an explicit model of secondary organic aerosol formation, Atmos. Chem. Phys., 7, 5599-
5610, 10.5194/acp-7-5599-2007, 2007.
Carlton, A., Wiedinmyer, C., and Kroll, J.: A review of Secondary Organic Aerosol (SOA)
formation from isoprene, Atmos Chem Phys, 9, 4987-5005, 2009.

29
Carter, W., Atkinson, R., Winer, A., and Pitts, J.: Evidence for chamber‐dependent radical
sources: Impact on kinetic computer models for air pollution, Int J Chem Kinet, 13, 735-740,
1981.
Carter, W., Atkinson, R., Winer, A., and Pitts, J.: Experimental investigation of
chamber‐dependent radical sources, Int J Chem Kinet, 14, 1071-1103, 1982.
Cvetanovic, R.: Chemical kinetic studies of atmospheric interest, 12th International
Symposium on Free Radicals, 4-9 January, Laguna Beach, CA, 1976,
Davidson, C. I., Phalen, R. F., and Solomon, P. A.: Airborne particulate matter and human
health: A review, Aerosol Science and Technology, 39, 737-749, 2005.
De Vincenzi, M., Silano, M., Maialetti, F., and Scazzocchio, B.: Constituents of aromatic
plants: II. Estragole, Fitoterapia, 71, 725-729, 2000.
Donahue, N., Robinson, A., Stanier, C., and Pandis, S.: Coupled partitioning, dilution, and
chemical aging of semivolatile organics, Environmental science & technology, 40, 2635-
2643, 2006a.
Donahue, N., Kroll, J., Pandis, S., and Robinson, A.: A two-dimensional volatility basis set–
Part 2: Diagnostics of organic-aerosol evolution, Atmos Chem Phys, 12, 615-634, 2012.
Donahue, N., Chuang, W., Ortega, I. K., Riipinen, I., Riccobono, F., Schobesberger, S.,
Dommen, J., Kulmala, M., Worsnop, D., and Vehkamaki, H.: How Do Organic Vapors
Contribute to New-Particle Formation?, Faraday discussions., 165, 1-13, doi:
10.1039/c3fd00046j, 2013.
Donahue, N. M., Robinson, A. L., Stanier, C. O., and Pandis, S. N.: Coupled Partitioning,
Dilution, and Chemical Aging of Semivolatile Organics, Environmental science &
technology, 40, 2635-2643, 10.1021/es052297c, 2006b.
Food and Agriculture Organization of the United Nations: http://faostat3.fao.org/faostat-
gateway/, (last access: 11 August 2013), 2012.

30
Fitzherbert, E. B., Struebig, M. J., Morel, A., Danielsen, F., Brühl, C. A., Donald, P. F., and
Phalan, B.: How will oil palm expansion affect biodiversity?, Trends in Ecology &
Evolution, 23, 538-545, 10.1016/j.tree.2008.06.012, 2008.
Forstner, H. J., Flagan, R. C., and Seinfeld, J. H.: Secondary organic aerosol from the
photooxidation of aromatic hydrocarbons: Molecular composition, Environmental science &
technology, 31, 1345-1358, 1997.
Fu, X., Zhang, Y., Shi, S., Gao, F., Wen, D., Li, W., Liao, Y., and Liu, H.: Fragmentation
study of hexanitrostilbene by ion trap multiple mass spectrometry and analysis by liquid
chromatography/mass spectrometry, Rapid Communications in Mass Spectrometry, 20,
2906-2914, 2006.
Fuchs, H., Bohn, B., Hofzumahaus, A., Holland, F., Lu, K. D., Nehr, S., Rohrer, F., and
Wahner, A.: Detection of HO2 by laser-induced fluorescence: calibration and interferences
from RO2 radicals, Atmos. Meas. Tech., 4, 1209-1225, 10.5194/amt-4-1209-2011, 2011.
Gai, Y., Wang, W., Ge, M., Kjaergaard, H. G., Jørgensen, S., and Du, L.: Methyl chavicol
reactions with ozone, OH and NO3 radicals: Rate constants and gas-phase products,
Atmospheric Environment, 77, 696-702, http://dx.doi.org/10.1016/j.atmosenv.2013.05.041,
2013.
Goldstein, A. H., and Galbally, I. E.: Known and unexplored organic constituents in the
earth's atmosphere, Environmental science & technology, 41, 1514-1521, 2007.
Guenther, A., Hewitt, C. N., Erickson, D., Fall, R., Geron, C., Graedel, T., Harley, P.,
Klinger, L., Lerdau, M., and McKay, W.: A global model of natural volatile organic
compound emissions, Journal of geophysical research, 100, 8873-8892, 1995.
Guenther, A., Geron, C., Pierce, T., Lamb, B., Harley, P., and Fall, R.: Natural emissions of
non-methane volatile organic compounds, carbon monoxide, and oxides of nitrogen from
North America, Atmospheric Environment, 34, 2205-2230, 2000.
31
M. Hallquist, J. C. Wenger, U. Baltensperger, Y. Rudich, D. Simpson, M. Claeys, J.
Dommen, N. M. Donahue, C. George, A. H. Goldstein, J. F. Hamilton, H. Herrmann, T.
Hoffmann, Y. Iinuma, M. Jang, M. E. Jenkin, J. L. Jimenez, A. Kiendler-Scharr, W.
Maenhaut, G. McFiggans, Th. F. Mentel, A. Monod, A. S. H. Prévôt, J. H. Seinfeld, J. D.
Surratt, R. Szmigielski, and Wildt, J.: The formation, properties and impact of secondary
organic aerosol: current and emerging issues, Atmos Chem Phys, 9, 5155-5236, 2009.
Hayen, H., Jachmann, N., Vogel, M., and Karst, U.: LC-Electron capture APCI-MS for the
determination of nitroaromatic compounds, Analyst, 127, 1027-1030, 2002.
Healy, R. M., Temime, B., Kuprovskyte, K., and Wenger, J. C.: Effect of relative humidity
on gas/particle partitioning and aerosol mass yield in the photooxidation of p-xylene,
Environmental science & technology, 43, 1884-1889, 2009.
Hewitt, C. N., MacKenzie, A. R., Di Carlo, P., Di Marco, C. F., Dorsey, J. R., Evans, M.,
Fowler, D., Gallagher, M. W., Hopkins, J. R., Jones, C. E., Langford, B., Lee, J. D., Lewis,
A. C., Lim, S. F., McQuaid, J., Misztal, P., Moller, S. J., Monks, P. S., Nemitz, E., Oram, D.
E., Owen, S. M., Phillips, G. J., Pugh, T. A. M., Pyle, J. A., Reeves, C. E., Ryder, J., Siong,
J., Skiba, U., and Stewart, D. J.: Nitrogen management is essential to prevent tropical oil
palm plantations from causing ground-level ozone pollution, Proceedings of the National
Academy of Sciences, 106, 18447-18451, 10.1073/pnas.0907541106, 2009.
Holčapek, M., Lísa, M., Volná, K., Almonasy, N., and Přikryl, J.: Occurrence of radical
molecular ions in atmospheric pressure chemical ionization mass spectra of heterocyclic
compounds, J Mass Spectrom, 42, 1645-1648, 10.1002/jms.1318, 2007.
Holčapek, M., Jirásko, R., and Lísa, M.: Basic rules for the interpretation of atmospheric
pressure ionization mass spectra of small molecules, Journal of Chromatography A, 1217,
3908-3921, 2010.
32
Holzinger, R., Lee, A., Paw, K., and Goldstein, U.: Observations of oxidation products above
a forest imply biogenic emissions of very reactive compounds, Atmos Chem Phys, 5, 67-75,
2005.
Holzinger, R., Kasper-Giebl, A., Staudinger, M., Schauer, G., and Röckmann, T.: Analysis of
the chemical composition of organic aerosol at the Mt. Sonnblick observatory using a novel
high mass resolution thermal-desorption proton-transfer-reaction mass-spectrometer (hr-TD-
PTR-MS), Atmos Chem Phys, 10, 10111-10128, 2010.
Howard, J. A., and Ingold, K. U.: Self-reaction of sec-butylperoxy radicals. Confirmation of
the Russell mechanism, J Am Chem Soc, 90, 1056-1058, 10.1021/ja01006a037, 1968.
Huang, M., Hao, L., Gu, X., Hu, C., Zhao, W., Wang, Z., Fang, L., and Zhang, W.: Effects of
inorganic seed aerosols on the growth and chemical composition of secondary organic
aerosol formed from OH-initiated oxidation of toluene, J Atmos Chem, 70, 151-164,
10.1007/s10874-013-9262-9, 2013.
Iinuma, ., ge, O., Keywood, M., Gnauk, T., and Herrmann, H.: Diaterebic Acid Acetate
and Diaterpenylic Acid Acetate: Atmospheric Tracers for Secondary Organic Aerosol
Formation from 1,8-Cineole Oxidation, Environmental science & technology, 43, 280-285,
10.1021/es802141v, 2008.
Jacobson, M., Hansson, H., Noone, K., and Charlson, R.: Organic atmospheric aerosols:
Review and state of the science, REVIEWS OF GEOPHYSICS-RICHMOND VIRGINIA
THEN WASHINGTON-, 38, 267-294, 2000.
Jimenez, J. L., Canagaratna, M. R., Donahue, N. M., Prevot, A. S. H., Zhang, Q., Kroll, J. H.,
DeCarlo, P. F., Allan, J. D., Coe, H., Ng, N. L., Aiken, A. C., Docherty, K. S., Ulbrich, I. M.,
Grieshop, A. P., Robinson, A. L., Duplissy, J., Smith, J. D., Wilson, K. R., Lanz, V. A.,
Hueglin, C., Sun, Y. L., Tian, J., Laaksonen, A., Raatikainen, T., Rautiainen, J., Vaattovaara,
P., Ehn, M., Kulmala, M., Tomlinson, J. M., Collins, D. R., Cubison, M. J., E., Dunlea, J.,
33
Huffman, J. A., Onasch, T. B., Alfarra, M. R., Williams, P. I., Bower, K., Kondo, Y.,
Schneider, J., Drewnick, F., Borrmann, S., Weimer, S., Demerjian, K., Salcedo, D., Cottrell,
L., Griffin, R., Takami, A., Miyoshi, T., Hatakeyama, S., Shimono, A., Sun, J. Y., Zhang, Y.
M., Dzepina, K., Kimmel, J. R., Sueper, D., Jayne, J. T., Herndon, S. C., Trimborn, A. M.,
Williams, L. R., Wood, E. C., Middlebrook, A. M., Kolb, C. E., Baltensperger, U., and
Worsnop, D. R.: Evolution of Organic Aerosols in the Atmosphere, Science, 326, 1525-1529,
10.1126/science.1180353, 2009.
Kebarle, P., and Verkerk, U. H.: Electrospray: From ions in solution to ions in the gas phase,
what we know now, Mass Spectrometry Reviews, 28, 898-917, 10.1002/mas.20247, 2009.
Khan, S., Zhang, Q., and Broadbelt, L.: Automated mechanism generation. Part 1:
mechanism development and rate constant estimation for VOC chemistry in the atmosphere,
J Atmos Chem, 63, 125-156, 10.1007/s10874-010-9164-z, 2009.
Kind, T., and Fiehn, O.: Metabolomic database annotations via query of elemental
compositions: mass accuracy is insufficient even at less than 1 ppm, BMC bioinformatics, 7,
234, doi: 10.1186/1471-2105-7-234, 2006.
Klotz, B., Sørensen, S., Barnes, I., Becker, K. H., Etzkorn, T., Volkamer, R., Platt, U., Wirtz,
K., and Martín-Reviejo, M.: Atmospheric oxidation of toluene in a large-volume outdoor
photoreactor: In situ determination of ring-retaining product yields, The Journal of Physical
Chemistry A, 102, 10289-10299, 1998.
Kroll, J. H., Chan, A. W. H., Ng, N. L., Flagan, R. C., and Seinfeld, J. H.: Reactions of
Semivolatile Organics and Their Effects on Secondary Organic Aerosol Formation,
Environmental science & technology, 41, 3545-3550, 10.1021/es062059x, 2007.
Kroll, J. H., and Seinfeld, J. H.: Chemistry of secondary organic aerosol: Formation and
evolution of low-volatility organics in the atmosphere, Atmospheric Environment, 42, 3593-
3624, http://dx.doi.org/10.1016/j.atmosenv.2008.01.003, 2008.

34
Lee, A., Goldstein, A. H., Keywood, M. D., Gao, S., Varutbangkul, V., Bahreini, R., Ng, N.
L., Flagan, R. C., and Seinfeld, J. H.: Gas-phase products and secondary aerosol yields from
the ozonolysis of ten different terpenes, J. Geophys. Res, 111, D07302, doi:
10.1029/2005JD006437, 2006a.
Lee, A., Goldstein, A. H., Kroll, J. H., Ng, N. L., Varutbangkul, V., Flagan, R. C., and
Seinfeld, J. H.: Gas-phase products and secondary aerosol yields from the photooxidation of
16 different terpenes, J. Geophys. Res, 111, D17305, doi: 10.1029/2006JD007050, 2006b.
Lu, Z., Hao, J., Takekawa, H., Hu, L., and Li, J.: Effect of high concentrations of inorganic
seed aerosols on secondary organic aerosol formation in the m-xylene/NOx photooxidation
system, Atmospheric Environment, 43, 897-904, 2009.
MacKenzie, A. R., Langford, B., Pugh, T. A. M., Robinson, N., Misztal, P. K., Heard, D. E.,
Lee, J. D., Lewis, A. C., Jones, C. E., Hopkins, J. R., Phillips, G., Monks, P. S., Karunaharan,
A., Hornsby, K. E., Nicolas-Perea, V., Coe, H., Gabey, A. M., Gallagher, M. W., Whalley, L.
K., Edwards, P. M., Evans, M. J., Stone, D., Ingham, T., Commane, R., Furneaux, K. L.,
McQuaid, J. B., Nemitz, E., Seng, Y. K., Fowler, D., Pyle, J. A., and Hewitt, C. N.: The
atmospheric chemistry of trace gases and particulate matter emitted by different land uses in
Borneo, Philosophical Transactions of the Royal Society B: Biological Sciences, 366, 3177-
3195, 10.1098/rstb.2011.0053, 2011.
Madronich, S., and Calvert, J. G.: Permutation reactions of organic peroxy radicals in the
troposphere, Journal of Geophysical Research: Atmospheres, 95, 5697-5715,
10.1029/JD095iD05p05697, 1990.
March, J.: Advanced organic chemistry: reactions, mechanisms, and structure, John Wiley &
Sons, New York, 1992.
Mirov, N. T.: Composition of gum turpentines of pines, USDA forest service, Technical
Bulletin No. 1239, 158 pp, 1961.
35
Misztal, P. K., Owen, S., Guenther, A. B., Rasmussen, R., Geron, C., Harley, P., Phillips, G.,
Ryan, A., Edwards, D. P., and Hewitt, C. N.: Large estragole fluxes from oil palms in
Borneo, Atmos. Chem. Phys, 10, 4343-4358, 2010.
Offical Portal Of Malaysian Palm Oil Board: http://bepi.mpob.gov.my/, (last access: 11 April
2013), 2012.
Nannoolal, Y., Rarey, J., Ramjugernath, D., and Cordes, W.: Estimation of pure component
properties: Part 1. Estimation of the normal boiling point of non-electrolyte organic
compounds via group contributions and group interactions, Fluid Phase Equilibria, 226, 45-
63, http://dx.doi.org/10.1016/j.fluid.2004.09.001, 2004.
Nannoolal, Y., Rarey, J., and Ramjugernath, D.: Estimation of pure component properties:
Part 3. Estimation of the vapor pressure of non-electrolyte organic compounds via group
contributions and group interactions, Fluid Phase Equilibria, 269, 117-133, 2008.
Neeb, P., Horie, O., and Moortgat, G. K.: Gas-phase ozonolysis of ethene in the presence of
hydroxylic compounds, Int J Chem Kinet, 28, 721-730, 10.1002/(sici)1097-
4601(1996)28:10<721::aid-kin2>3.0.co;2-p, 1996.
O'Neal, H. E., and Blumstein, C.: A new mechanism for gas phase ozone–olefin reactions, Int
J Chem Kinet, 5, 397-413, 1973.
Odum, J. R., Hoffmann, T., Bowman, F., Collins, D., Flagan, R. C., and Seinfeld, J. H.:
Gas/Particle Partitioning and Secondary Organic Aerosol Yields, Environmental science &
technology, 30, 2580-2585, 10.1021/es950943+, 1996.
Orlando, J. J., Tyndall, G. S., and Wallington, T. J.: The atmospheric chemistry of alkoxy
radicals, Chemical reviews, 103, 4657-4690, 2003.
Orsini, D. A., Ma, Y., Sullivan, A., Sierau, B., Baumann, K., and Weber, R. J.: Refinements
to the particle-into-liquid sampler (PILS) for ground and airborne measurements of water
soluble aerosol composition, Atmospheric Environment, 37, 1243-1259, 2003.

36
Orzechowska, G. E., and Paulson, S. E.: Photochemical Sources of Organic Acids. 1.
Reaction of Ozone with Isoprene, Propene, and 2-Butenes under Dry and Humid Conditions
Using SPME, The Journal of Physical Chemistry A, 109, 5358-5365, 10.1021/jp050166s,
2005.
Pankow, J. F.: An absorption model of the gas/aerosol partitioning involved in the formation
of secondary organic aerosol, Atmospheric Environment, 28, 189-193, 1994a.
Pankow, J. F.: An absorption model of gas/particle partitioning of organic compounds in the
atmosphere, Atmospheric Environment, 28, 185-188, 1994b.
Peeters, J., oullart, W., Pultau, V., Vandenberk, S., and Vereecken, L.: Structure−Activity
Relationship for the Addition of OH to (Poly)alkenes: Site-Specific and Total Rate
Constants, The Journal of Physical Chemistry A, 111, 1618-1631, 10.1021/jp066973o, 2007.
Pellegrin, V.: Molecular formulas of organic compounds: the nitrogen rule and degree of
unsaturation, Journal of Chemical Education, 60, 626, doi: 10.1021/ed060p626, 1983.
Pitts, J. N., Biermann, H. W., Atkinson, R., and Winer, A. M.: Atmospheric implications of
simultaneous nighttime measurements of NO3 radicals and HONO, Geophysical Research
Letters, 11, 557-560, 10.1029/GL011i005p00557, 1984.
Pöschl, U.: Atmospheric Aerosols: Composition, Transformation, Climate and Health
Effects, Angewandte Chemie International Edition, 44, 7520-7540, 10.1002/anie.200501122,
2005.
Rickard, A. R., Wyche, K. P., Metzger, A., Monks, P. S., Ellis, A. M., Dommen, J.,
Baltensperger, U., Jenkin, M. E., and Pilling, M. J.: Gas phase precursors to anthropogenic
secondary organic aerosol: Using the Master Chemical Mechanism to probe detailed
observations of 1,3,5-trimethylbenzene photo-oxidation, Atmospheric Environment, 44,
5423-5433, http://dx.doi.org/10.1016/j.atmosenv.2009.09.043, 2010.
37
Sakamaki, F., Hatakeyama, S., and Akimoto, H.: Formation of nitrous acid and nitric oxide in
the heterogeneous dark reaction of nitrogen dioxide and water vapor in a smog chamber, Int J
Chem Kinet, 15, 1013-1029, 10.1002/kin.550151006, 1983.
Schade, G. W., and Goldstein, A. H.: Fluxes of oxygenated volatile organic compounds from
a ponderosa pine plantation, Journal of geophysical research, 106, 3111-3123, 2001.
Schmidt, A.-C., Herzschuh, R., Matysik, F.-M., and Engewald, W.: Investigation of the
ionisation and fragmentation behaviour of different nitroaromatic compounds occurring as
polar metabolites of explosives using electrospray ionisation tandem mass spectrometry,
Rapid Communications in Mass Spectrometry, 20, 2293-2302, 10.1002/rcm.2591, 2006.
Singh, H., Chen, Y., Tabazadeh, A., Fukui, Y., Bey, I., Yantosca, R., Jacob, D., Arnold, F.,
Wohlfrom, K., Atlas, E., Flocke, F., Blake, D., Blake, N., Heikes, B., Snow, J., Talbot, R.,
Gregory, G., Sachse, G., Vay, S., and Kondo, Y.: Distribution and fate of selected
oxygenated organic species in the troposphere and lower stratosphere over the Atlantic,
Journal of Geophysical Research: Atmospheres, 105, 3795-3805, 10.1029/1999jd900779,
2000.
Solomon, S., Qin, D., Manning, M., Chen, Z., Marquis, M., Averyt, K., Tignor, M., and
Miller, H.: Climate change 2007: the physical science basis: working Group I contribution to
the fourth assessment report of the IPCC, Cambridge University Press: Cambridge, 2007.
Song, C., Na, K., and Cocker, D. R.: Impact of the Hydrocarbon to NOx Ratio on Secondary
Organic Aerosol Formation, Environmental science & technology, 39, 3143-3149,
10.1021/es0493244, 2005.
Southwell, I. A., Russell, M. F., Smith, R. L., and Vinnicombe, A.: Ochrosperma lineare, a
new source of methyl chavicol, Journal of Essential Oil Research, 15, 329-330, 2003.

38
Spada, N., Fujii, E., and Cahill, T. M.: Diurnal Cycles of Acrolein and Other Small
Aldehydes in Regions Impacted by Vehicle Emissions, Environmental science & technology,
42, 7084-7090, 10.1021/es801656e, 2008.
Steiner, A. L., Cohen, R. C., Harley, R. A., Tonse, S., Millet, D. B., Schade, G. W., and
Goldstein, A. H.: VOC reactivity in central California: comparing an air quality model to
ground-based measurements, Atmos. Chem. Phys., 8, 351-368, 10.5194/acp-8-351-2008,
2008.
Stockwell, W. R., Middleton, P., Chang, J. S., and Tang, X.: The second generation regional
acid deposition model chemical mechanism for regional air quality modeling, Journal of
Geophysical Research, 95, 16343-16316,16367, 1990.
Svensson, R., Ljungström, E., and Lindqvist, O.: Kinetics of the reaction between nitrogen
dioxide and water vapour, Atmospheric Environment (1967), 21, 1529-1539, 1987.
Taipale, R., Rantala, P., Kajos, M., Patokoski, J., Ruuskanen, T., Aalto, J., Kolari, P., Bäck,
J., Hari, P., Kulmala, M., and Rinne, J.: Oxygenated VOC and monoterpene emissions from a
boreal coniferous forest, EGU General Assembly Conference Abstracts, 9735, 2012.
United States Department of Agriculture, Global Crop Production Analysis:
http://www.pecad.fas.usda.gov, access: 04/11/2013, 2013.
Varutbangkul, V., Brechtel, F., Bahreini, R., Ng, N., Keywood, M., Kroll, J., Flagan, R.,
Seinfeld, J., Lee, A., and Goldstein, A.: Hygroscopicity of secondary organic aerosols formed
by oxidation of cycloalkenes, monoterpenes, sesquiterpenes, and related compounds, Atmos
Chem Phys, 6, 2367-2388, 2006.
Werker, E., Putievsky, E., Ravid, U., Dudai, N., and Katzir, I.: Glandular Hairs, Secretory
Cavities, and the Essential Oil in the Leaves of Tarragon (Artemisia dracunculus L.), Journal
of Herbs, Spices & Medicinal Plants, 2, 19-32, 1994.
39
Wiedinmyer, C., Guenther, A., Harley, P., Hewitt, N., Geron, C., Artaxo, P., Steinbrecher, R.,
and Rasmussen, R.: Global Organic Emissions from Vegetation, in: Emissions of
Atmospheric Trace Compounds, edited by: Granier, C., Artaxo, P., and Reeves, C., Advances
in Global Change Research, Springer Netherlands, 115-170, 2004.
Yinon, J., McClellan, J. E., and Yost, R. A.: Electrospray ionization tandem mass
spectrometry collision-induced dissociation study of explosives in an ion trap mass
spectrometer, Rapid Communications in Mass Spectrometry, 11, 1961-1970,
10.1002/(sici)1097-0231(199712)11:18<1961::aid-rcm99>3.0.co;2-k, 1997.
Zhao, X., and Yinon, J.: Identification of nitrate ester explosives by liquid chromatography–
electrospray ionization and atmospheric pressure chemical ionization mass spectrometry,
Journal of Chromatography A, 977, 59-68, http://dx.doi.org/10.1016/S0021-9673(02)01349-
3, 2002.
Zhou, Y., Zhang, H., Parikh, H. M., Chen, E. H., Rattanavaraha, W., Rosen, E. P., Wang, W.,
and Kamens, R. M.: Secondary organic aerosol formation from xylenes and mixtures of
toluene and xylenes in an atmospheric urban hydrocarbon mixture: Water and particle seed
effects (II), Atmospheric Environment, 45, 3882-3890,
http://dx.doi.org/10.1016/j.atmosenv.2010.12.048, 2011.
Ziemann, P. J., and Atkinson, R.: Kinetics, products, and mechanisms of secondary organic
aerosol formation, Chemical Society Reviews, 41, 6582-6605, 10.1039/c2cs35122f, 2012.
Zimmerman, P. R.: Testing of hydrocarbon emissions from vegetation, leaf litter and aquatic
surfaces, and development of a methodology for compiling biogenic emission
inventories[Final Report], Washington State University Pullman, Washington 99164, 1979.
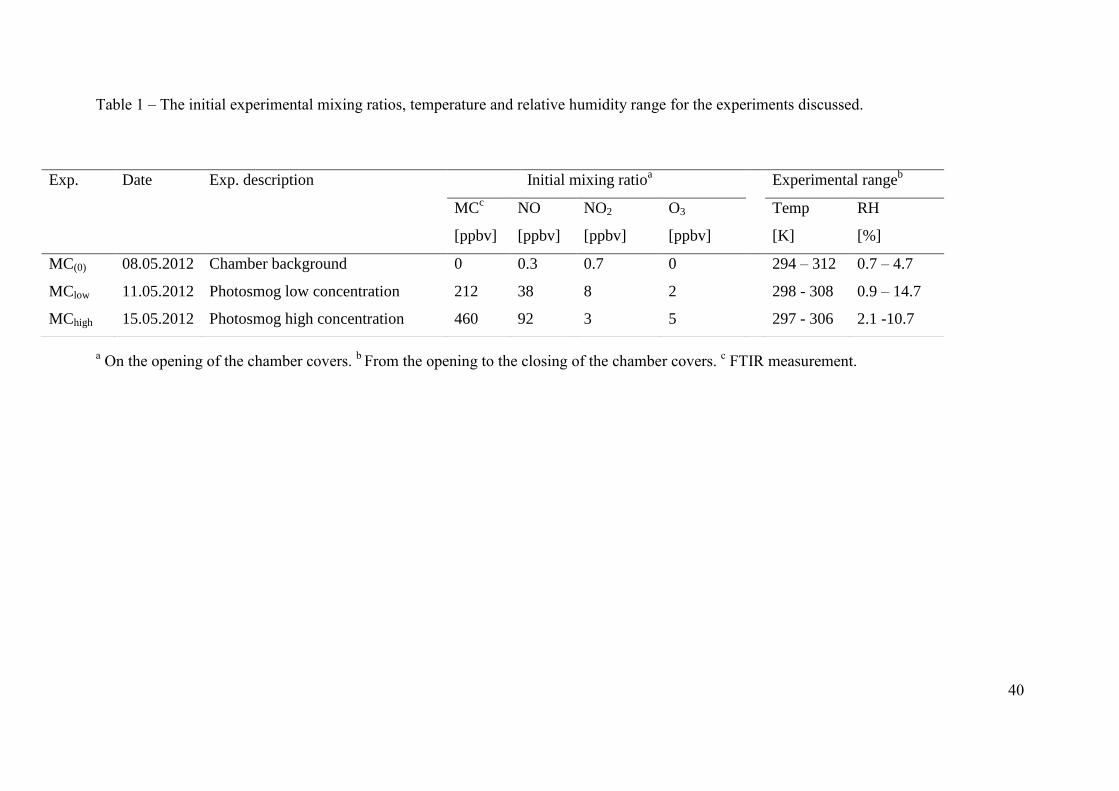
40
Table 1 – The initial experimental mixing ratios, temperature and relative humidity range for the experiments discussed.
a On the opening of the chamber covers.
b From the opening to the closing of the chamber covers.
c FTIR measurement.
Exp. Date Exp. description Initial mixing ratioa Experimental range
b
MCc
[ppbv]
NO
[ppbv]
NO2
[ppbv]
O3
[ppbv]
Temp
[K]
RH
[%]
MC(0) 08.05.2012 Chamber background 0 0.3 0.7 0 294 – 312 0.7 – 4.7
MClow 11.05.2012 Photosmog low concentration 212 38 8 2 298 - 308 0.9 – 14.7
MChigh 15.05.2012 Photosmog high concentration 460 92 3 5 297 - 306 2.1 -10.7
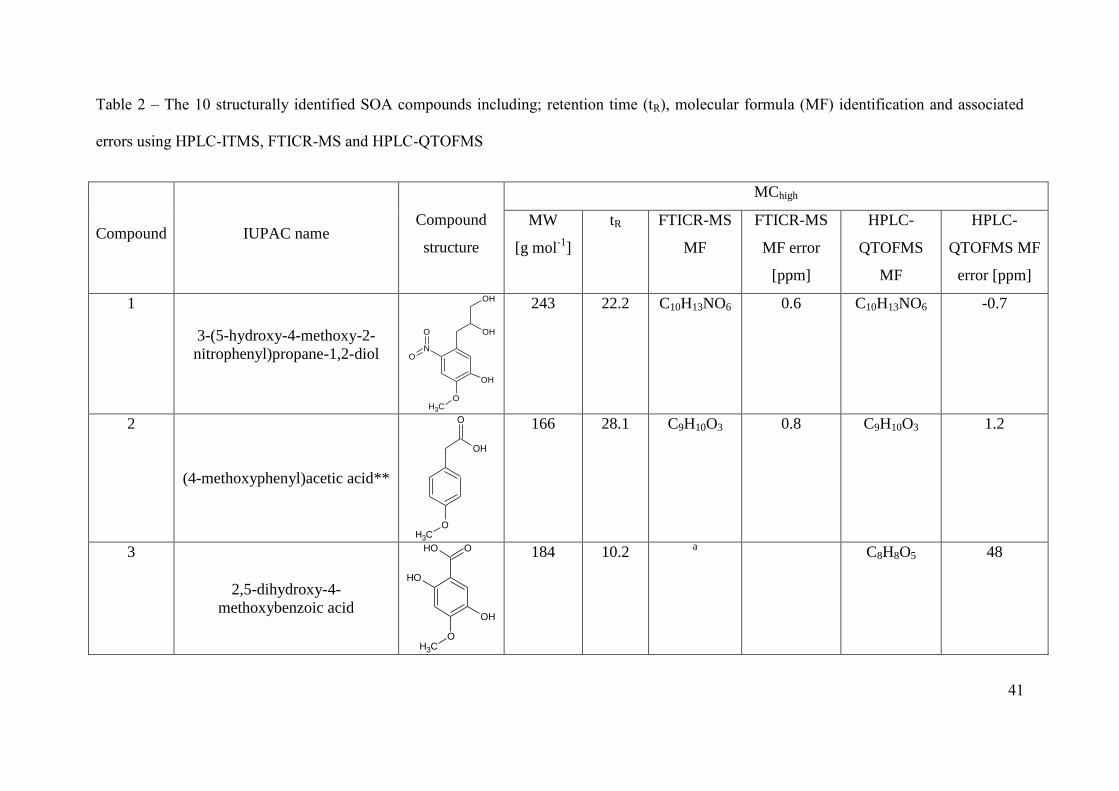
41
Table 2 – The 10 structurally identified SOA compounds including; retention time (tR), molecular formula (MF) identification and associated
errors using HPLC-ITMS, FTICR-MS and HPLC-QTOFMS
Compound IUPAC name Compound
structure
MChigh
MW
[g mol-1
]
tR FTICR-MS
MF
FTICR-MS
MF error
[ppm]
HPLC-
QTOFMS
MF
HPLC-
QTOFMS MF
error [ppm]
1
3-(5-hydroxy-4-methoxy-2-
nitrophenyl)propane-1,2-diol
OCH3
N
O
O
OH
OH
OH
243 22.2 C10H13NO6 0.6 C10H13NO6 -0.7
2
(4-methoxyphenyl)acetic acid**
OCH3
O
OH
166 28.1 C9H10O3
0.8 C9H10O3
1.2
3
2,5-dihydroxy-4-
methoxybenzoic acid
OCH3
OOH
OH
OH
184 10.2 a
C8H8O5 48
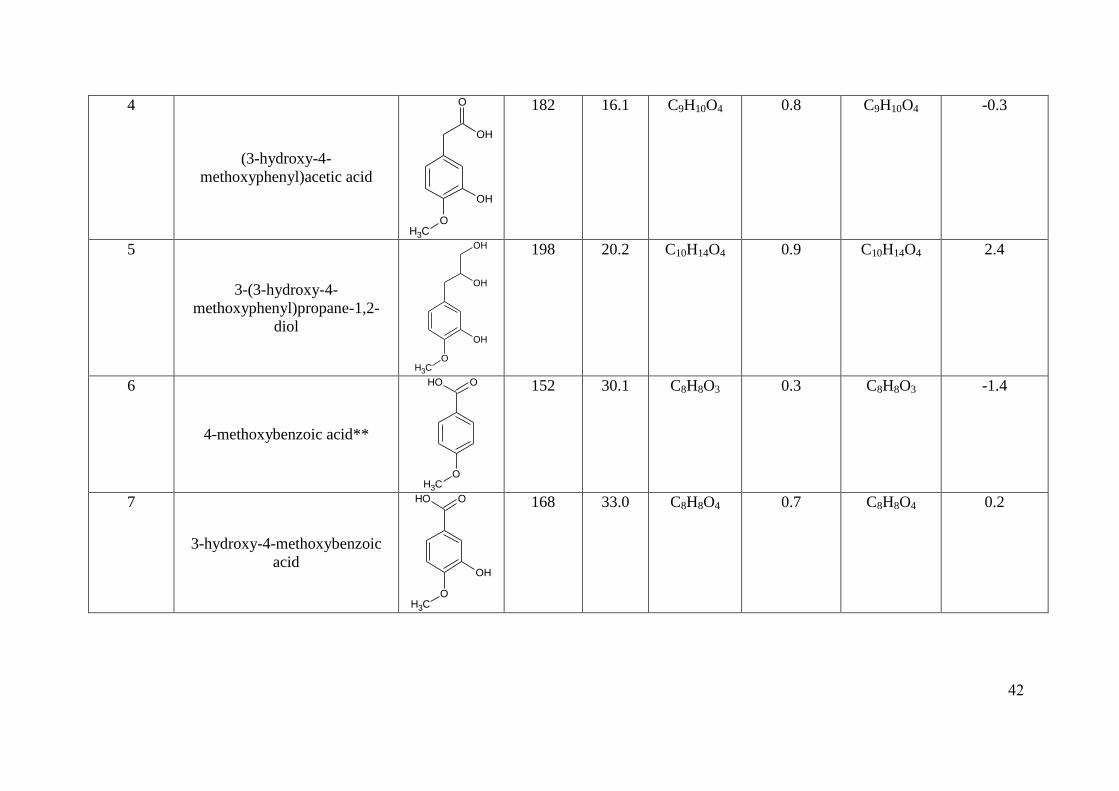
42
4
(3-hydroxy-4-
methoxyphenyl)acetic acid
OCH3
O
OH
OH
182 16.1 C9H10O4 0.8 C9H10O4 -0.3
5
3-(3-hydroxy-4-
methoxyphenyl)propane-1,2-
diol OH
OCH3
OH
OH
198 20.2 C10H14O4 0.9 C10H14O4 2.4
6
4-methoxybenzoic acid**
OCH3
OOH
152 30.1 C8H8O3
0.3
C8H8O3
-1.4
7
3-hydroxy-4-methoxybenzoic
acid OH
OCH3
OOH
168 33.0 C8H8O4
0.7 C8H8O4 0.2

43
8
2-hydroxy-3-(3-hydroxy-4-
methoxyphenyl)propanal
OH
O
OCH3
OH
196 25.2 C10H12O4
1 C10H12O4
2.5
9
1-hydroxy-3-(4-
methoxyphenyl)propan-2-one
OCH3
O
OH
180 27.6 a
C10H12O3
-7.8
10
1-hydroxy-3-(3-hydroxy-4-
methoxyphenyl)propan-2-one
OH
OCH3
OH
O
196 19.8 C10H12O4*
5 C10H12O4*
9.4
a = Deprotonated or protonated molecular species not observed in FTICR-MS spectra due to low concentration. * Identified as [M+Na]
+, the Na
adduct has been removed from molecular formula and molecular weight corrected. ** Compound structures confirmed using the commercially
available standards.
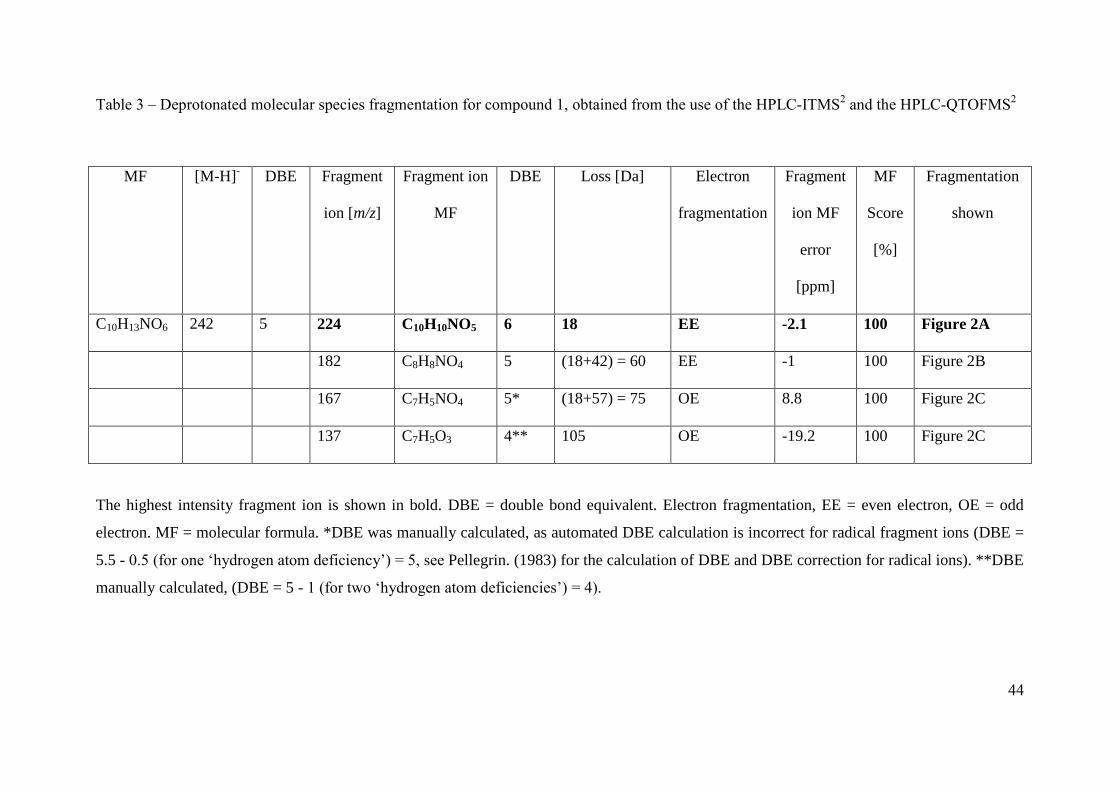
44
Table 3 – Deprotonated molecular species fragmentation for compound 1, obtained from the use of the HPLC-ITMS2 and the HPLC-QTOFMS
2
The highest intensity fragment ion is shown in bold. DBE = double bond equivalent. Electron fragmentation, EE = even electron, OE = odd
electron. MF = molecular formula. *DBE was manually calculated, as automated DBE calculation is incorrect for radical fragment ions (DBE =
5.5 - 0.5 (for one ‘hydrogen atom deficiency’) = 5, see Pellegrin. (1983) for the calculation of DBE and DBE correction for radical ions). **DBE
manually calculated, (DBE = 5 - 1 (for two ‘hydrogen atom deficiencies’) = 4).
MF [M-H]- DBE Fragment
ion [m/z]
Fragment ion
MF
DBE Loss [Da] Electron
fragmentation
Fragment
ion MF
error
[ppm]
MF
Score
[%]
Fragmentation
shown
C10H13NO6 242 5 224 C10H10NO5 6 18 EE -2.1 100 Figure 2A
182 C8H8NO4 5 (18+42) = 60 EE -1 100 Figure 2B
167 C7H5NO4 5* (18+57) = 75 OE 8.8 100 Figure 2C
137 C7H5O3 4** 105 OE -19.2 100 Figure 2C
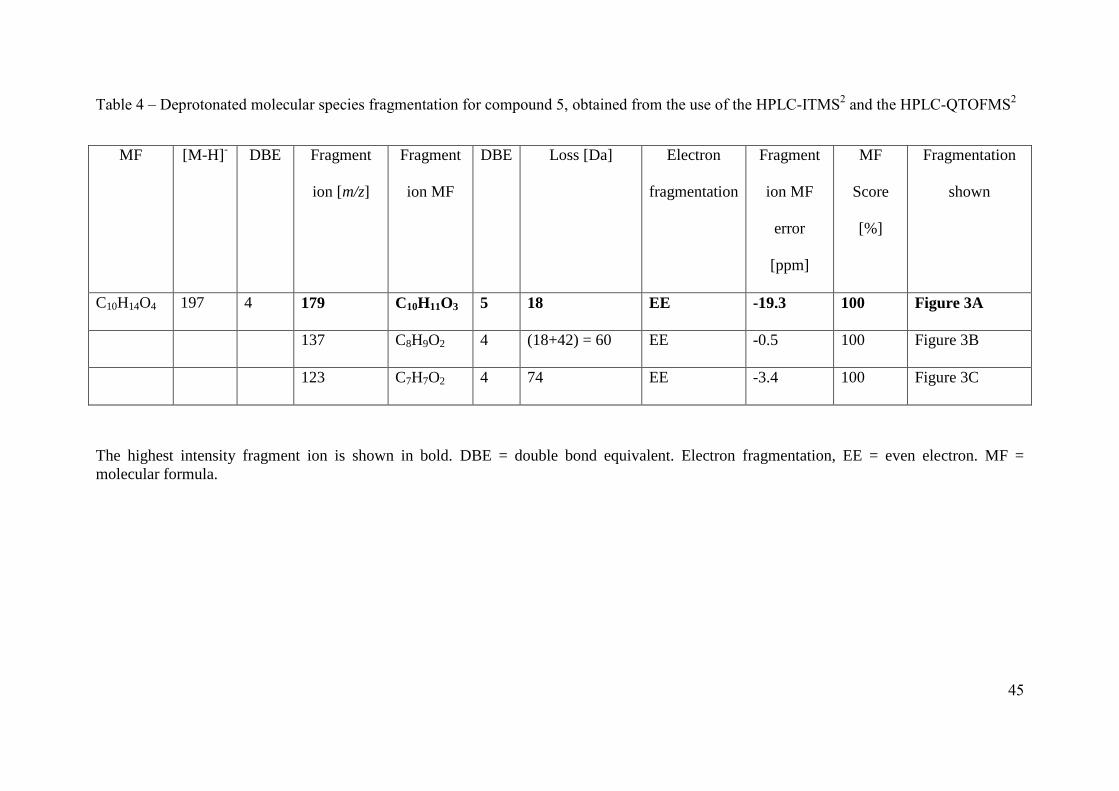
45
Table 4 – Deprotonated molecular species fragmentation for compound 5, obtained from the use of the HPLC-ITMS2 and the HPLC-QTOFMS
2
MF [M-H]- DBE Fragment
ion [m/z]
Fragment
ion MF
DBE Loss [Da] Electron
fragmentation
Fragment
ion MF
error
[ppm]
MF
Score
[%]
Fragmentation
shown
C10H14O4 197 4 179 C10H11O3 5 18 EE -19.3 100 Figure 3A
137 C8H9O2 4 (18+42) = 60 EE -0.5 100 Figure 3B
123 C7H7O2 4 74 EE -3.4 100 Figure 3C
The highest intensity fragment ion is shown in bold. DBE = double bond equivalent. Electron fragmentation, EE = even electron. MF =
molecular formula.
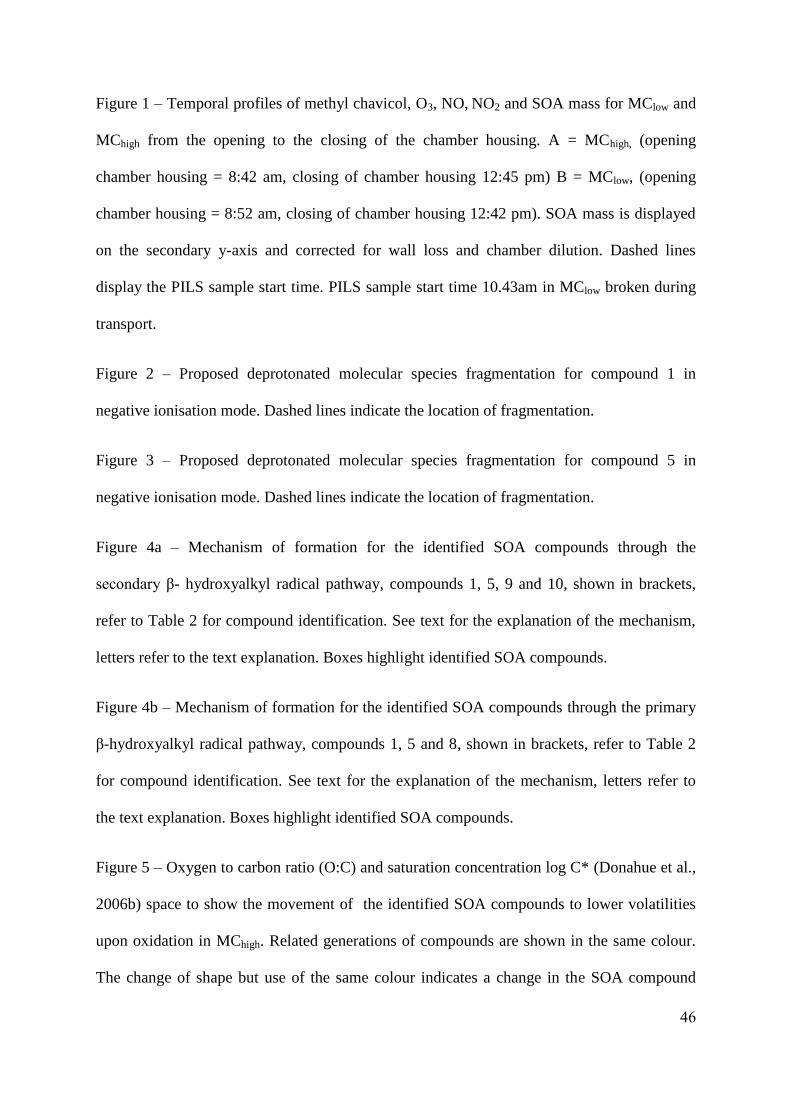
46
Figure 1 – Temporal profiles of methyl chavicol, O3, NO, NO2 and SOA mass for MClow and
MChigh from the opening to the closing of the chamber housing. A = MChigh, (opening
chamber housing = 8:42 am, closing of chamber housing 12:45 pm) B = MClow, (opening
chamber housing = 8:52 am, closing of chamber housing 12:42 pm). SOA mass is displayed
on the secondary y-axis and corrected for wall loss and chamber dilution. Dashed lines
display the PILS sample start time. PILS sample start time 10.43am in MClow broken during
transport.
Figure 2 – Proposed deprotonated molecular species fragmentation for compound 1 in
negative ionisation mode. Dashed lines indicate the location of fragmentation.
Figure 3 – Proposed deprotonated molecular species fragmentation for compound 5 in
negative ionisation mode. Dashed lines indicate the location of fragmentation.
Figure 4a – Mechanism of formation for the identified SOA compounds through the
secondary β- hydroxyalkyl radical pathway, compounds 1, 5, 9 and 10, shown in brackets,
refer to Table 2 for compound identification. See text for the explanation of the mechanism,
letters refer to the text explanation. Boxes highlight identified SOA compounds.
Figure 4b – Mechanism of formation for the identified SOA compounds through the primary
β-hydroxyalkyl radical pathway, compounds 1, 5 and 8, shown in brackets, refer to Table 2
for compound identification. See text for the explanation of the mechanism, letters refer to
the text explanation. Boxes highlight identified SOA compounds.
Figure 5 – Oxygen to carbon ratio (O:C) and saturation concentration log C* (Donahue et al.,
2006b) space to show the movement of the identified SOA compounds to lower volatilities
upon oxidation in MChigh. Related generations of compounds are shown in the same colour.
The change of shape but use of the same colour indicates a change in the SOA compound
B A

47
structure through the reaction with •OH radicals or NO2. See legend for SOA compound
identification and refer to Table 2. O:C/log C* space with associated volatilities have been
redrawn from Donahue et al. (2013) and Jimenez et al. (2009).
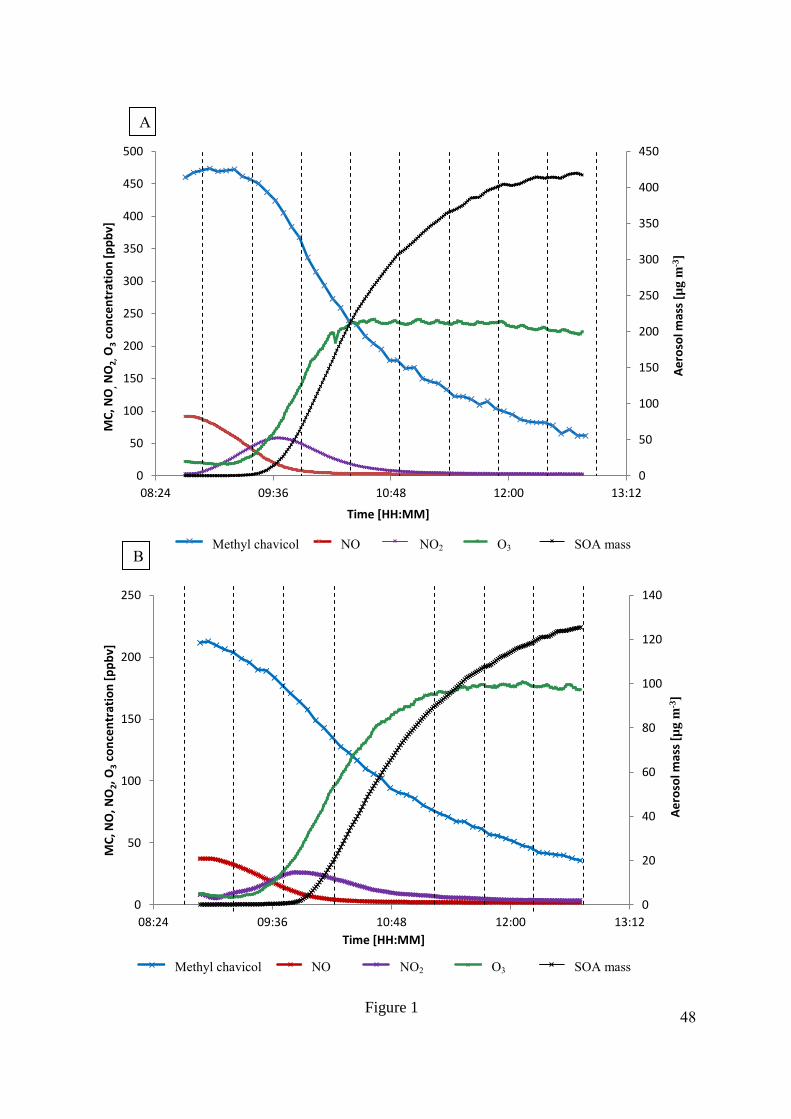
48
0
50
100
150
200
250
300
350
400
450
0
50
100
150
200
250
300
350
400
450
500
08:24 09:36 10:48 12:00 13:12
Ae
roso
l mas
s [µ
g m
-3]
MC
, NO
,N
O2
,O
3co
nce
ntr
atio
n [
pp
bv]
Time [HH:MM]
MeChav FTIR NO NO2 O3 Aerosol conc
0
20
40
60
80
100
120
140
0
50
100
150
200
250
08:24 09:36 10:48 12:00 13:12
Ae
roso
l mas
s [µ
g m
-3]
MC
, NO
, NO
2, O
3co
nce
ntr
atio
n [
pp
bv]
Time [HH:MM]
MeChav FTIR NO NO2 O3 Aerosol mass
B
A
Methyl chavicol NO NO2 O3 SOA mass
Methyl chavicol NO NO2 O3 SOA mass
Figure 1

49
OH
OH
OCH3
O-
N+
O
O-
18
42
57
OCH3
O-
CH3
N+
O
O-
OCH3
N+
O
O-
C
O-
CH2
OH
OCH3
O-
N+
O
O-
OH
OCH3
O-
CH2
N+
O
O-
- H2O
H+
H+
- C2H
2O
- H2O
- C3H
6O
OH
OH
OCH3
OH
N+
O
O-
- H+m/z 224 m/z 182
m/z 167m/z 224
m/z 242
OCH3
C
O-
O- NO
m/z 137
- C3H7O•
A
B
C
Figure 2

50
OH
OH
OCH3
O-
18
42
74
OCH3
O-
CH3
OCH3
O-
CH2
OH
OCH3
O-
- H2O
H+
H+
- C2H
2O
- C3H
6O
2
OH
OH
OCH3
OH
- H+
m/z 197 m/z 137m/z 179
OH
OH
OCH3
O-
- H+
H+
m/z 197 m/z 123
C
A B
Figure 3
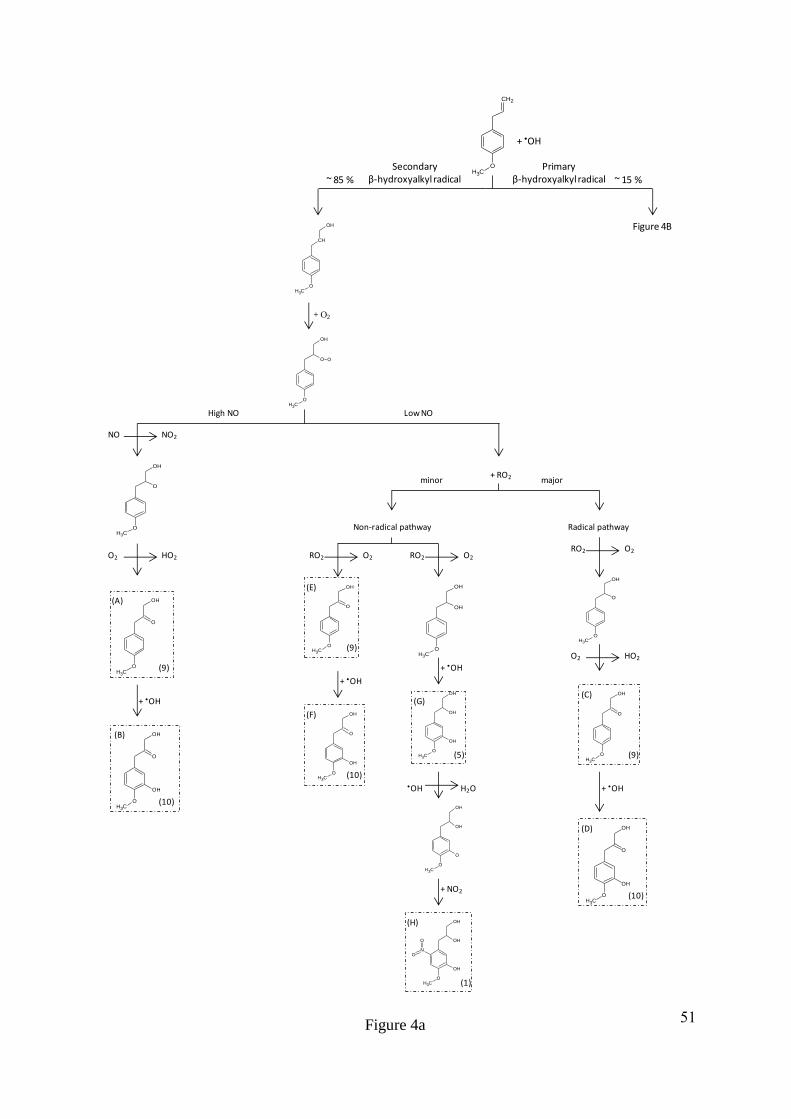
51
NO NO2
O
OH
OCH3
O
+ O2
OCH3
CH
OH
HO2
Low NOHigh NO
O2
(A)
(B)
OH
OCH3
O
OCH3
O
OH
+ •OH
OH
OCH3
O
OH
(9)
(10)
+ RO2minor major
RO2 O2
O2 HO2
(10)
OH
OCH3
O
Radical pathway
OCH3
O
OH
OH
OCH3
O
OH
+ •OH
(9)
(C)
(D)
Non-radical pathway
(10)
+ •OH
O2
(F)
RO2
OH
OCH3
O
OH
OCH3
O
OH
(9)
(E)
O2
H2O
RO2
•OH
(5)
(1)
+ •OH
+ NO2
OH
OCH3
OH
OH
OCH3
OH
OH
OH
OCH3
OH
O
OH
OCH3
OH
OH
N
O
O
(G)
(H)
Primary β-hydroxyalkyl radical
CH2
OCH3
+ •OH
~ 15 %
Secondary β-hydroxyalkyl radical~ 85 %
Figure 4B
Figure 4a
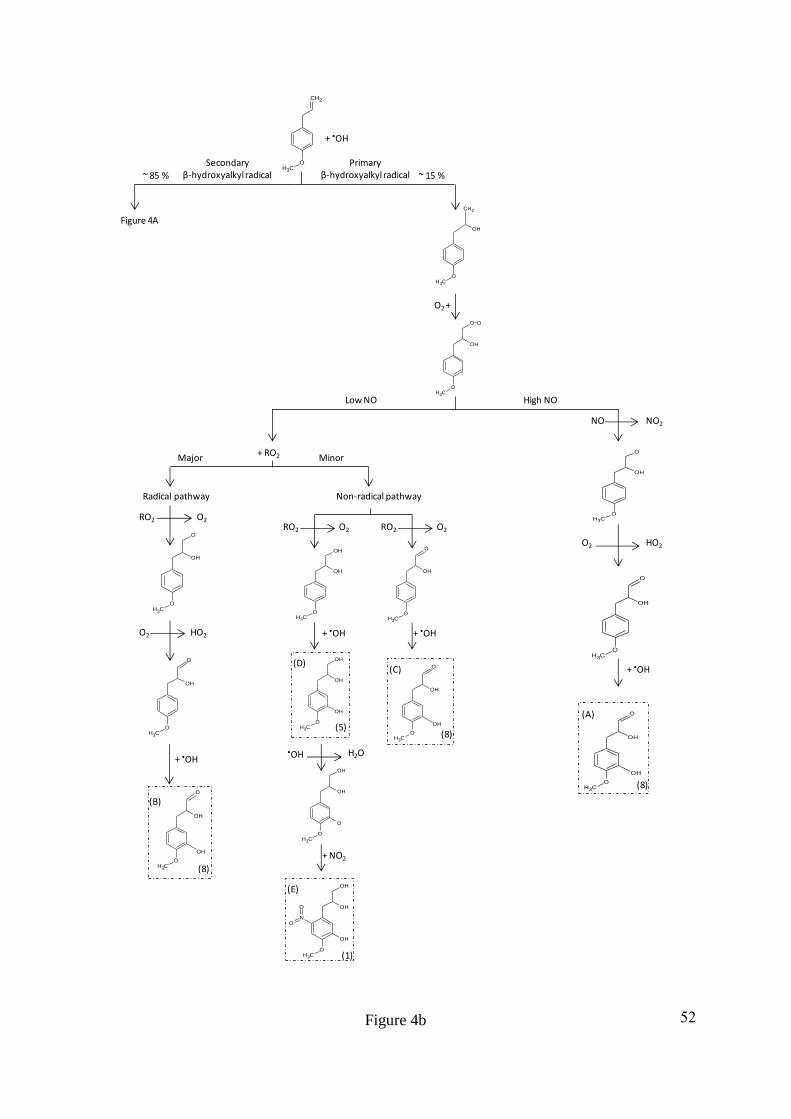
52
OH
O
OCH3
O
OCH3
CH2
OH
O2 +
RO2
O2
Radical pathway
NO2
(A)
O2 HO2
+ •OH
OH
O
OCH3
OH
OCH3
O
OH
OCH3
O
OH
(8)
+ RO2 MinorMajor
Non-radical pathway
•OH
(E)
RO2
(D)
(8)
RO2 O2
(C)
O2
+ •OH
OH
OCH3
OH OH
OCH3
O
OH
OCH3
O
OH
+ •OH
H2O
+ NO2
OH
OCH3
OH
OH
OH
OCH3
OH
O
OH
OCH3
OH
OH
N
O
O
(1)
(5)
O2
HO2
+ •OH
OH
O
OCH3
OH
OCH3
O
OH
OCH3
O
OH
(B)
(8)
NO
High NOLow NO
Figure 4A
Primary β-hydroxyalkyl radical
CH2
OCH3
+ •OH
~ 15 %
Secondary β-hydroxyalkyl radical~ 85 %
Figure 4b
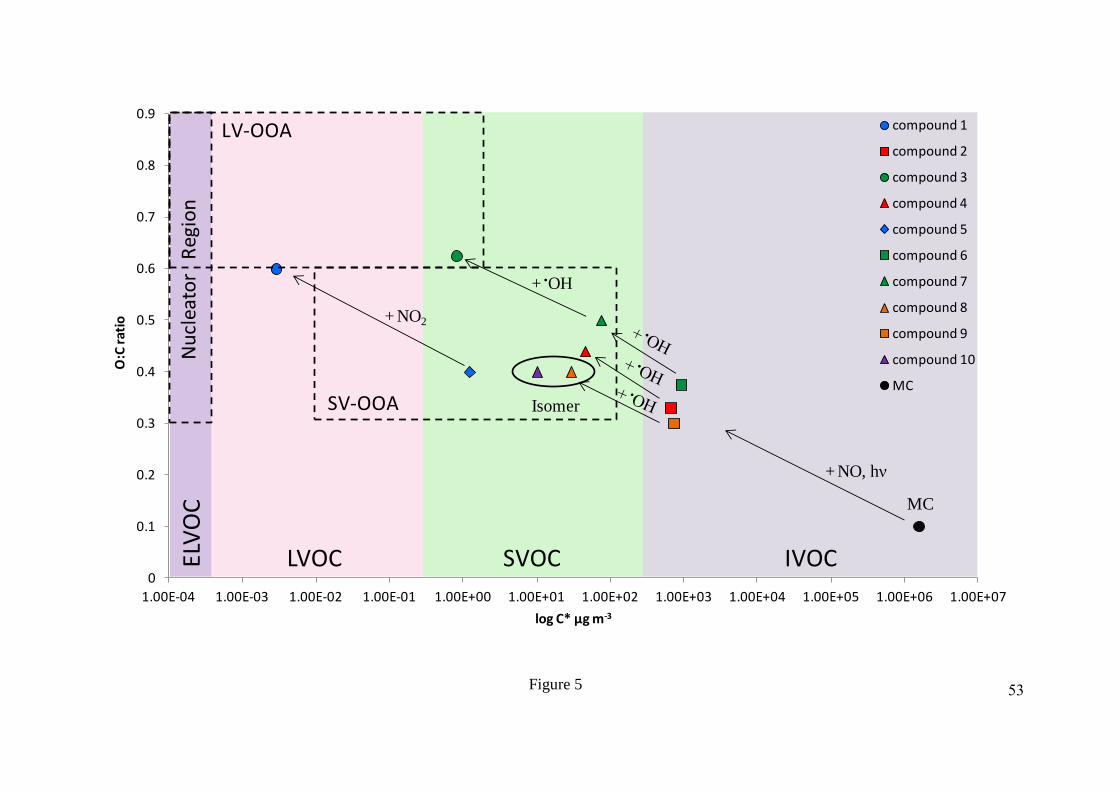
53
0
0.1
0.2
0.3
0.4
0.5
0.6
0.7
0.8
0.9
1.00E-04 1.00E-03 1.00E-02 1.00E-01 1.00E+00 1.00E+01 1.00E+02 1.00E+03 1.00E+04 1.00E+05 1.00E+06 1.00E+07
O:C
rat
io
log C* µg m-3
compound 1
compound 2
compound 3
compound 4
compound 5
compound 6
compound 7
compound 8
compound 9
compound 10
MC
LV-OOA
SV-OOA
Nu
clea
tor
Reg
ion
Isomer
+ •OH
+ NO2
IVOCSVOCLVOCELV
OC MC
+ NO, hν
Figure 5
Copyright © 2022 FDOKUMEN