Composition and major sources of organic compounds of aerosol particulate matter sampled during the...
22
Composition and major sources of organic compounds of aerosol particulate matter sampled during the ACE-Asia campaign Bernd R. T. Simoneit, 1,2 Minoru Kobayashi, 2 Michihiro Mochida, 2 Kimitaka Kawamura, 2 Meehye Lee, 3 Ho-Jin Lim, 4 Barbara J. Turpin, 4 and Yuichi Komazaki 5,6 Received 3 February 2004; revised 26 April 2004; accepted 17 May 2004; published 17 September 2004. [1] The organic compound tracers of atmospheric particulate matter, as well as organic carbon (OC) and elemental carbon (EC), have been characterized for samples acquired during the Asian Pacific Regional Aerosol Characterization Experiment (ACE-Asia) from Gosan, Jeju Island, Korea, from Sapporo, Japan, and from Chichi-jima Island in the western North Pacific, as well as on the National Oceanic and Atmospheric Administration R/V Ronald H. Brown. Total extracts were analyzed by gas chromatography – mass spectrometry to determine both polar and aliphatic compounds. Total particles, organic matter, and lipid and saccharide compounds were high during the Asian dust episode (early April 2001) compared to levels at other times. The organic matter can be apportioned to seven emission sources and to significant oxidation- producing secondary products during long-range transport. Terrestrial natural background compounds are vascular plant wax lipids derived from direct emission and as part of desert sand dust. Fossil fuel utilization is obvious and derives from petroleum product and coal combustion emissions. Saccharides are a major polar (water-soluble) carbonaceous fraction derived from soil resuspension (agricultural activities). Biomass-burning smoke is evident in all samples and seasons. It contributes up to 13% of the total compound mass as water-soluble constituents. Burning of refuse is another source of organic particles. Varying levels of marine-derived lipids are superimposed during aerosol transport over the ocean. Secondary oxidation products increase with increasing transport distance and time. The ACE-Asia aerosols are composed not only of desert dust but also of soil dust, smoke from biomass and refuse burning, and emissions from fossil fuel use in urban areas. INDEX TERMS: 0305 Atmospheric Composition and Structure: Aerosols and particles (0345, 4801); 0322 Atmospheric Composition and Structure: Constituent sources and sinks; 0365 Atmospheric Composition and Structure: Troposphere—composition and chemistry; 1055 Geochemistry: Organic geochemistry; 3339 Meteorology and Atmospheric Dynamics: Ocean/atmosphere interactions (0312, 4504); KEYWORDS: levoglucosan, glucose, organic aerosols, OC/EC, carboxylic acids, n-alkanes Citation: Simoneit, B. R. T., M. Kobayashi, M. Mochida, K. Kawamura, M. Lee, H.-J. Lim, B. J. Turpin, and Y. Komazaki (2004), Composition and major sources of organic compounds of aerosol particulate matter sampled during the ACE-Asia campaign, J. Geophys. Res., 109, D19S10, doi:10.1029/2004JD004598. 1. Introduction [2] Long-range atmospheric transport of continentally derived particulate matter is an active area of research [e.g., Andreae, 1996; Griffin et al. , 2002; Prospero, 1996a, 1996b]. Aerosol particles have relevance for radia- tive forcing of climate and pollution transport [Wilkening et al., 2000]. The direct radiative effect of aerosols is strongly influenced by particle size and composition. Radiative effects of anthropogenic aerosols are relatively large com- pared to their mass contribution because they are in the size range that is radiatively most active [Seinfeld and Pandis, 1998]. Particles of source emissions from biological organic matter also contribute significantly to the total particle burden in the atmosphere, either directly [e.g., Arpino et al., 1972; Cox et al., 1982; Gagosian et al., 1981, 1982, 1987; Mazurek and Simoneit, 1997; Simoneit and Mazurek, 1982] or indirectly by burning of biomass [e.g., Abas et al., 1995; Crutzen and Andreae, 1990; Levine, 1991, 1996; Simoneit, 2002]. [3] Dust fallout and haze were first described for the North Atlantic Ocean off West Africa [Darwin, 1846; Ehrenberg, 1847] and has been studied most extensively JOURNAL OF GEOPHYSICAL RESEARCH, VOL. 109, D19S10, doi:10.1029/2004JD004598, 2004 1 College of Oceanic and Atmospheric Sciences, Oregon State University, Corvallis, Oregon, USA. 2 Institute of Low Temperature Science, Hokkaido University, Sapporo, Japan. 3 Department of Earth and Environmental Sciences, Korea University, Seoul, South Korea. 4 Department of Environmental Sciences, Rutgers University, New Brunswick, New Jersey, USA. 5 Tokyo Dylec Corporation, Tokyo, Japan. 6 Now at Research Center for Advanced Science and Technology, University of Tokyo, Tokyo, Japan. Copyright 2004 by the American Geophysical Union. 0148-0227/04/2004JD004598$09.00 D19S10 1 of 22
-
Upload
independent -
Category
Documents
-
view
0 -
download
0
Transcript of Composition and major sources of organic compounds of aerosol particulate matter sampled during the...
Composition and major sources of organic compounds of aerosol
particulate matter sampled during the ACE-Asia campaign
Bernd R. T. Simoneit,1,2 Minoru Kobayashi,2 Michihiro Mochida,2 Kimitaka Kawamura,2
Meehye Lee,3 Ho-Jin Lim,4 Barbara J. Turpin,4 and Yuichi Komazaki5,6
Received 3 February 2004; revised 26 April 2004; accepted 17 May 2004; published 17 September 2004.
[1] The organic compound tracers of atmospheric particulate matter, as well as organiccarbon (OC) and elemental carbon (EC), have been characterized for samples acquiredduring the Asian Pacific Regional Aerosol Characterization Experiment (ACE-Asia) fromGosan, Jeju Island, Korea, from Sapporo, Japan, and from Chichi-jima Island in thewestern North Pacific, as well as on the National Oceanic and AtmosphericAdministration R/V Ronald H. Brown. Total extracts were analyzed by gaschromatography–mass spectrometry to determine both polar and aliphatic compounds.Total particles, organic matter, and lipid and saccharide compounds were high during theAsian dust episode (early April 2001) compared to levels at other times. The organicmatter can be apportioned to seven emission sources and to significant oxidation-producing secondary products during long-range transport. Terrestrial natural backgroundcompounds are vascular plant wax lipids derived from direct emission and as part of desertsand dust. Fossil fuel utilization is obvious and derives from petroleum product and coalcombustion emissions. Saccharides are a major polar (water-soluble) carbonaceousfraction derived from soil resuspension (agricultural activities). Biomass-burning smoke isevident in all samples and seasons. It contributes up to 13% of the total compound mass aswater-soluble constituents. Burning of refuse is another source of organic particles.Varying levels of marine-derived lipids are superimposed during aerosol transport over theocean. Secondary oxidation products increase with increasing transport distance and time.The ACE-Asia aerosols are composed not only of desert dust but also of soil dust, smokefrom biomass and refuse burning, and emissions from fossil fuel use in urbanareas. INDEX TERMS: 0305 Atmospheric Composition and Structure: Aerosols and particles (0345,
4801); 0322 Atmospheric Composition and Structure: Constituent sources and sinks; 0365 Atmospheric
Composition and Structure: Troposphere—composition and chemistry; 1055 Geochemistry: Organic
geochemistry; 3339 Meteorology and Atmospheric Dynamics: Ocean/atmosphere interactions (0312, 4504);
KEYWORDS: levoglucosan, glucose, organic aerosols, OC/EC, carboxylic acids, n-alkanes
Citation: Simoneit, B. R. T., M. Kobayashi, M. Mochida, K. Kawamura, M. Lee, H.-J. Lim, B. J. Turpin, and Y. Komazaki (2004),
Composition and major sources of organic compounds of aerosol particulate matter sampled during the ACE-Asia campaign,
J. Geophys. Res., 109, D19S10, doi:10.1029/2004JD004598.
1. Introduction
[2] Long-range atmospheric transport of continentallyderived particulate matter is an active area of research[e.g., Andreae, 1996; Griffin et al., 2002; Prospero,
1996a, 1996b]. Aerosol particles have relevance for radia-tive forcing of climate and pollution transport [Wilkening etal., 2000]. The direct radiative effect of aerosols is stronglyinfluenced by particle size and composition. Radiativeeffects of anthropogenic aerosols are relatively large com-pared to their mass contribution because they are in the sizerange that is radiatively most active [Seinfeld and Pandis,1998]. Particles of source emissions from biological organicmatter also contribute significantly to the total particleburden in the atmosphere, either directly [e.g., Arpino etal., 1972; Cox et al., 1982; Gagosian et al., 1981, 1982,1987; Mazurek and Simoneit, 1997; Simoneit and Mazurek,1982] or indirectly by burning of biomass [e.g., Abas etal., 1995; Crutzen and Andreae, 1990; Levine, 1991, 1996;Simoneit, 2002].[3] Dust fallout and haze were first described for the
North Atlantic Ocean off West Africa [Darwin, 1846;Ehrenberg, 1847] and has been studied most extensively
JOURNAL OF GEOPHYSICAL RESEARCH, VOL. 109, D19S10, doi:10.1029/2004JD004598, 2004
1College of Oceanic and Atmospheric Sciences, Oregon StateUniversity, Corvallis, Oregon, USA.
2Institute of Low Temperature Science, Hokkaido University, Sapporo,Japan.
3Department of Earth and Environmental Sciences, Korea University,Seoul, South Korea.
4Department of Environmental Sciences, Rutgers University, NewBrunswick, New Jersey, USA.
5Tokyo Dylec Corporation, Tokyo, Japan.6Now at Research Center for Advanced Science and Technology,
University of Tokyo, Tokyo, Japan.
Copyright 2004 by the American Geophysical Union.0148-0227/04/2004JD004598$09.00
D19S10 1 of 22
in terms of long-range transport. Initial research wasconcerned primarily with the inorganic chemical composi-tion and mineralogy of the atmospheric particles [e.g., Astonet al., 1973; Chester et al., 1972; Delany et al., 1967;Glaccum and Prospero, 1980; Parkin et al., 1972; Prosperoet al., 1970]. The effects of long-range transport of aerosolparticles on direct radiative forcing, on ultimate receptorareas, and on oceanic nutrient deposition are continuing to beinvestigated [e.g., Artaxo et al., 1994; Charlson et al., 1992;Husar et al., 1997; Intergovernmental Panel on ClimateChange, 1995; Li et al., 1996; Moulin et al., 1997; Penner,1995; Penner et al., 1994; Prospero et al., 1996; Sokolik andToon, 1996; Swap et al., 1992; Tegen et al., 1996]. Anothermajor concern is the potential detrimental human healtheffects of fine aerosol particulate matter with the associatedmicrobes, spores, and toxic organic compounds (e.g., PAHs)[Abelson, 1998;Hannigan et al., 1998; Prospero, 2001]. Theprimary study area has been the North Atlantic Ocean and theexport of Saharan dust over the ocean has been estimated tobe about 109 ton/year [D’Almeida, 1986]. However, theIndian and northwestern Pacific Oceans are currently alsoactive research areas under the auspices of the AerosolCharacterization Experiments (ACE) projects. This is acompanion paper of Simoneit et al. [2004a], where wereported on the same compound classes using an identicaltechnique for the aerosol particles collected over the westernNorth Pacific rim using the C-130 aircraft.[4] The atmospheric input of terrigenous organic carbon
to the world ocean is about equivalent to the organiccarbon washed out by the rivers and is estimated to be 2 �107 ton/year [Buat-Menard et al., 1989]. Most of this carbonis of a contemporary biological origin and is associated withtransport of mineral dust by major wind systems seasonallyactive from the continents to the oceans [e.g., Gagosian andPeltzer, 1986; Kawamura and Gagosian, 1990; Kawamuraand Usukura, 1993; Kawamura et al., 2004; Prospero,1996b, 2001; Simoneit, 1977; Simoneit et al., 1988]. Theincreasing atmospheric burden of urban particulate matterintermingles with the natural and anthropogenic emissions in
the continental rural areas and the total mixture is eventuallytransported to the oceanic atmosphere. Major oxidative-photochemical reactions alter the organic matter compositionduring transport, forming derivative products with higheroxygen contents, i.e., greater polarity, which are ideal ascloud condensation nuclei (complementing the inorganicspecies such as SOx, NOx). Thus molecular characterizationand provision of mass balance closure of the initial anddownwind aerosols continues to be of interest.[5] One aspect of the ACE-Asia project in the northwest-
ern Pacific region is to determine the organic compoundsand their sources in the aerosol particles [Huebert et al.,2003]. The Asian continent has been inferred as a source ofoceanic dust [e.g., Gagosian et al., 1981] and that was thecase during the sampling campaign in April–May 2001 asconfirmed by satellite and other observations. The proposedsource regions for the Asian dusts are the deserts and loessregions of northern China and Mongolia. Preliminaryorganic compound compositions of samples of desert sandsfrom northern China have been presented [Simoneit et al.,2001] and one organic tracer analysis has been reported fora sample from Beijing taken on a 290 m tower, downwindfrom the sources [Simoneit et al., 1991b]. Here we present ageneral assessment of the organic tracer composition ofaerosols from ground stations at Gosan (also Kosan) on Jeju(also Cheju) Island, Korea, in Sapporo on Hokkaido Island,Japan, and in Chichi-jima Island in the western NorthPacific, as well as from the North Pacific on the R/VRonald H. Brown during the ACE-Asia project. One-yearobservation at Gosan site [Kawamura et al., 2004] and4-year observation at Chichi-jima [Mochida et al., 2003a]for water-soluble dicarboxylic acids (C2–C10) in aerosolshave been reported elsewhere.
2. Materials and Methods
2.1. Samples
[6] Atmospheric particles were collected on quartz fiberfilters using high-volume air samplers during the ACE-Asia
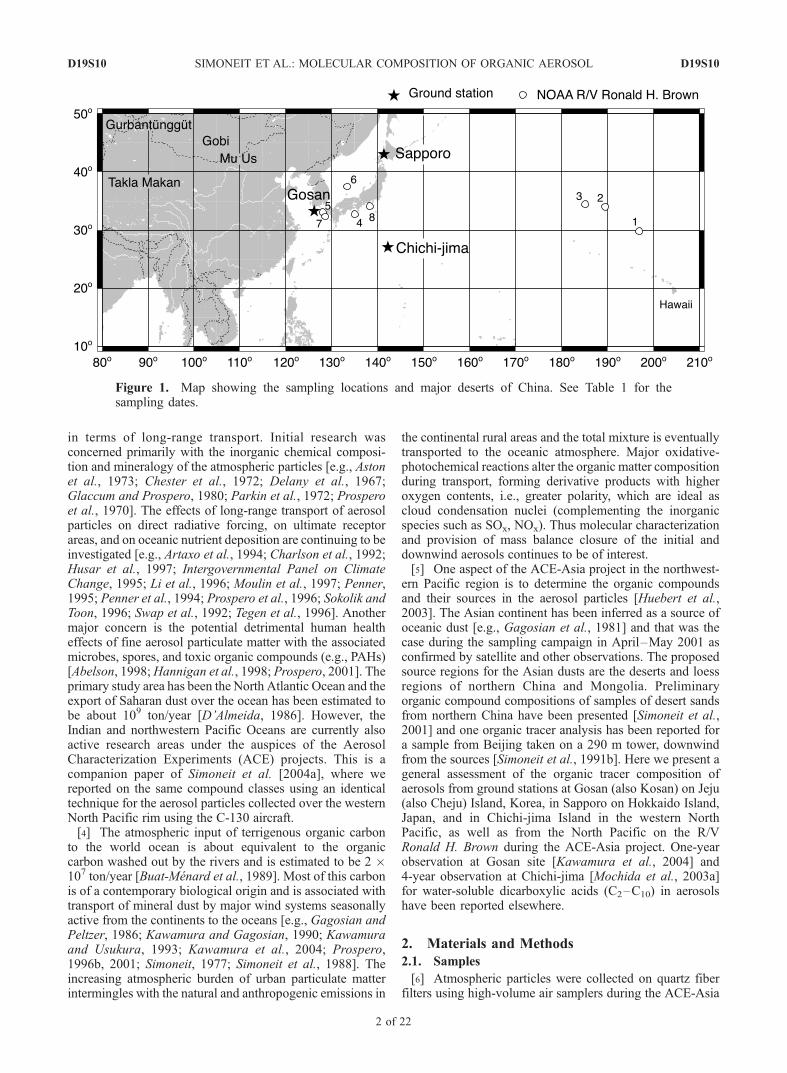
Figure 1. Map showing the sampling locations and major deserts of China. See Table 1 for thesampling dates.
D19S10 SIMONEIT ET AL.: MOLECULAR COMPOSITION OF ORGANIC AEROSOL
2 of 22
D19S10
campaign in 2001 spring to autumn at island sites: Gosan onCheju (Jeju) Island (Korea), and Sapporo on HokkaidoIsland (Figure 1). Aerosol samples from Chichi-jima (Japan)were collected in 1990 to 1991. Marine aerosol samples werealso collected over the western North Pacific, the East ChinaSea and the Sea of Japan during the cruise of the R/V RonaldH. Brown in the same time period (Figure 1). Aliquots offilters were prepared for high-molecular-weight organiccompound characterization, organic carbon analyses, anddicarboxylic acid analyses.
2.2. Extraction and Derivatization
[7] The samples of filter aliquots were sonicated threetimes for 10 min each with dichloromethane/methanol(2:1; v/v). The solvent extract was filtered through quartzwool packed in a Pasteur pipette, and concentrated by use ofa rotary evaporator and then under blow-down with drynitrogen gas. Aliquots of the total extracts were reacted withN, O-bis-(trimethylsilyl)trifluoroacetamide (BSTFA) with1% trimethylsilyl chloride and pyridine for 3 h at 70�C toderive the trimethylsilyl derivatives of carboxylic acids,alcohols and sugars. This procedure derivatizes COOHand OH groups to the corresponding trimethylsilyl (TMS)esters and ethers, respectively.
2.3. Gas Chromatography--Mass Spectrometry
[8] Gas chromatography–mass spectrometry (GC-MS)analyses of the derivatized total extracts were performedon a Hewlett-Packard model 6890 GC coupled to a Hewlett-Packard model 5973 MSD. Separation was achieved on afused silica capillary column coated with DB-5 (30 m �0.25 mm i.d., 0.25 mm film thickness). The GC operatingconditions were as follows: temperature hold at 50�C for2 min, increase from 50� to 300�C at a rate of 6�C min�1
with final isothermal hold at 300�C for 20 min. Helium wasused as carrier gas. The sample was injected splitless withthe injector temperature at 300�C. The silylated extracts
were diluted (to 1:1) with n-hexane prior to injection. Themass spectrometer was operated in the electron impactmode (EI) at 70 eV and scanned from 50 to 650 dalton.Data were acquired and processed with the Chemstationsoftware. Individual compounds were identified by compar-ison of mass spectra with literature and library data,comparison with authentic standards, and interpretationof mass spectrometric fragmentation patterns. GC-MSresponse factors were determined using authentic standards.Recoveries of levoglucosan, glucose, sucrose, palmitic acid,and stearic acid were better than 80%.
2.4. OC and EC Measurements
[9] The amounts of organic carbon (OC) and elementalcarbon (EC) on the filter punches (2 cm2) were determinedusing a thermal-optical OC/EC analyzer from Sunset Lab-oratory (Tigard, OR). OC was evolved under a stream ofultrahigh-purity He while heating the sample in four tem-perature steps to 870�C. To evolve EC and pyrolyzed OC,the sample was first cooled to 550�C and then heated undera mixture of 2% O2 + 98% He in six temperature steps to afinal temperature of 900�C. The transmittance through thefilter was monitored with a He-Ne laser throughout theanalysis to correct for the pyrolytic conversion of OC to EC.
3. Results and Discussion
[10] The samples for this study, locations, and ambientconditions are summarized in Table 1 and the generallocations are shown in Figure 1. Ground stations werelocated in Gosan, Sapporo and Chiji-jima. Marine aerosolsover the North Pacific (see locations 1–8 in Figure 1) weresampled during the cruise of the R/V Ronald H. Brown. Thesampling periods covered the ACE-Asia dust event in April2001 and extended to fall of 2001 and winter of 2002 for thestations in Sapporo. The concentrations of the organiccompounds in the samples considered here are listed and
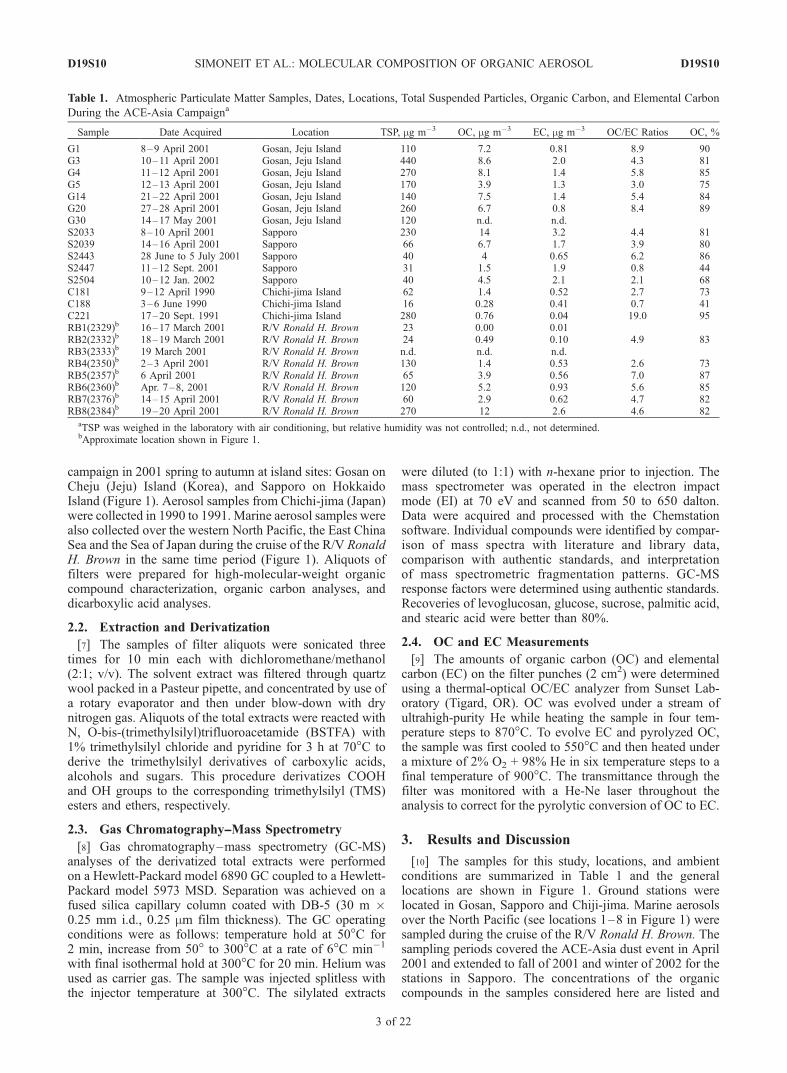
Table 1. Atmospheric Particulate Matter Samples, Dates, Locations, Total Suspended Particles, Organic Carbon, and Elemental Carbon
During the ACE-Asia Campaigna
Sample Date Acquired Location TSP, mg m�3 OC, mg m�3 EC, mg m�3 OC/EC Ratios OC, %
G1 8–9 April 2001 Gosan, Jeju Island 110 7.2 0.81 8.9 90G3 10–11 April 2001 Gosan, Jeju Island 440 8.6 2.0 4.3 81G4 11–12 April 2001 Gosan, Jeju Island 270 8.1 1.4 5.8 85G5 12–13 April 2001 Gosan, Jeju Island 170 3.9 1.3 3.0 75G14 21–22 April 2001 Gosan, Jeju Island 140 7.5 1.4 5.4 84G20 27–28 April 2001 Gosan, Jeju Island 260 6.7 0.8 8.4 89G30 14–17 May 2001 Gosan, Jeju Island 120 n.d. n.d.S2033 8–10 April 2001 Sapporo 230 14 3.2 4.4 81S2039 14–16 April 2001 Sapporo 66 6.7 1.7 3.9 80S2443 28 June to 5 July 2001 Sapporo 40 4 0.65 6.2 86S2447 11–12 Sept. 2001 Sapporo 31 1.5 1.9 0.8 44S2504 10–12 Jan. 2002 Sapporo 40 4.5 2.1 2.1 68C181 9–12 April 1990 Chichi-jima Island 62 1.4 0.52 2.7 73C188 3–6 June 1990 Chichi-jima Island 16 0.28 0.41 0.7 41C221 17–20 Sept. 1991 Chichi-jima Island 280 0.76 0.04 19.0 95RB1(2329)b 16–17 March 2001 R/V Ronald H. Brown 23 0.00 0.01RB2(2332)b 18–19 March 2001 R/V Ronald H. Brown 24 0.49 0.10 4.9 83RB3(2333)b 19 March 2001 R/V Ronald H. Brown n.d. n.d. n.d.RB4(2350)b 2–3 April 2001 R/V Ronald H. Brown 130 1.4 0.53 2.6 73RB5(2357)b 6 April 2001 R/V Ronald H. Brown 65 3.9 0.56 7.0 87RB6(2360)b Apr. 7–8, 2001 R/V Ronald H. Brown 120 5.2 0.93 5.6 85RB7(2376)b 14–15 April 2001 R/V Ronald H. Brown 60 2.9 0.62 4.7 82RB8(2384)b 19–20 April 2001 R/V Ronald H. Brown 270 12 2.6 4.6 82
aTSP was weighed in the laboratory with air conditioning, but relative humidity was not controlled; n.d., not determined.bApproximate location shown in Figure 1.
D19S10 SIMONEIT ET AL.: MOLECULAR COMPOSITION OF ORGANIC AEROSOL
3 of 22
D19S10
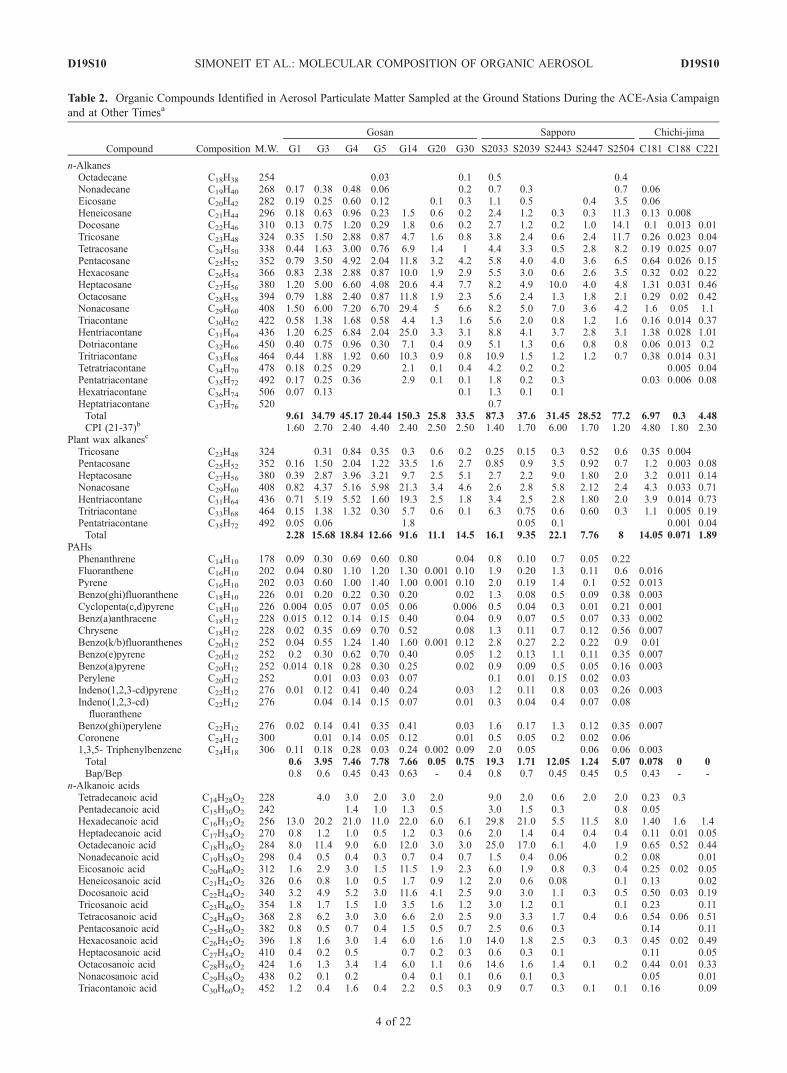
Table 2. Organic Compounds Identified in Aerosol Particulate Matter Sampled at the Ground Stations During the ACE-Asia Campaign
and at Other Timesa
Compound Composition M.W.
Gosan Sapporo Chichi-jima
G1 G3 G4 G5 G14 G20 G30 S2033 S2039 S2443 S2447 S2504 C181 C188 C221
n-AlkanesOctadecane C18H38 254 0.03 0.1 0.5 0.4Nonadecane C19H40 268 0.17 0.38 0.48 0.06 0.2 0.7 0.3 0.7 0.06Eicosane C20H42 282 0.19 0.25 0.60 0.12 0.1 0.3 1.1 0.5 0.4 3.5 0.06Heneicosane C21H44 296 0.18 0.63 0.96 0.23 1.5 0.6 0.2 2.4 1.2 0.3 0.3 11.3 0.13 0.008Docosane C22H46 310 0.13 0.75 1.20 0.29 1.8 0.6 0.2 2.7 1.2 0.2 1.0 14.1 0.1 0.013 0.01Tricosane C23H48 324 0.35 1.50 2.88 0.87 4.7 1.6 0.8 3.8 2.4 0.6 2.4 11.7 0.26 0.023 0.04Tetracosane C24H50 338 0.44 1.63 3.00 0.76 6.9 1.4 1 4.4 3.3 0.5 2.8 8.2 0.19 0.025 0.07Pentacosane C25H52 352 0.79 3.50 4.92 2.04 11.8 3.2 4.2 5.8 4.0 4.0 3.6 6.5 0.64 0.026 0.15Hexacosane C26H54 366 0.83 2.38 2.88 0.87 10.0 1.9 2.9 5.5 3.0 0.6 2.6 3.5 0.32 0.02 0.22Heptacosane C27H56 380 1.20 5.00 6.60 4.08 20.6 4.4 7.7 8.2 4.9 10.0 4.0 4.8 1.31 0.031 0.46Octacosane C28H58 394 0.79 1.88 2.40 0.87 11.8 1.9 2.3 5.6 2.4 1.3 1.8 2.1 0.29 0.02 0.42Nonacosane C29H60 408 1.50 6.00 7.20 6.70 29.4 5 6.6 8.2 5.0 7.0 3.6 4.2 1.6 0.05 1.1Triacontane C30H62 422 0.58 1.38 1.68 0.58 4.4 1.3 1.6 5.6 2.0 0.8 1.2 1.6 0.16 0.014 0.37Hentriacontane C31H64 436 1.20 6.25 6.84 2.04 25.0 3.3 3.1 8.8 4.1 3.7 2.8 3.1 1.38 0.028 1.01Dotriacontane C32H66 450 0.40 0.75 0.96 0.30 7.1 0.4 0.9 5.1 1.3 0.6 0.8 0.8 0.06 0.013 0.2Tritriacontane C33H68 464 0.44 1.88 1.92 0.60 10.3 0.9 0.8 10.9 1.5 1.2 1.2 0.7 0.38 0.014 0.31Tetratriacontane C34H70 478 0.18 0.25 0.29 2.1 0.1 0.4 4.2 0.2 0.2 0.005 0.04Pentatriacontane C35H72 492 0.17 0.25 0.36 2.9 0.1 0.1 1.8 0.2 0.3 0.03 0.006 0.08Hexatriacontane C36H74 506 0.07 0.13 0.1 1.3 0.1 0.1Heptatriacontane C37H76 520 0.7Total 9.61 34.79 45.17 20.44 150.3 25.8 33.5 87.3 37.6 31.45 28.52 77.2 6.97 0.3 4.48CPI (21-37)b 1.60 2.70 2.40 4.40 2.40 2.50 2.50 1.40 1.70 6.00 1.70 1.20 4.80 1.80 2.30
Plant wax alkanesc
Tricosane C23H48 324 0.31 0.84 0.35 0.3 0.6 0.2 0.25 0.15 0.3 0.52 0.6 0.35 0.004Pentacosane C25H52 352 0.16 1.50 2.04 1.22 33.5 1.6 2.7 0.85 0.9 3.5 0.92 0.7 1.2 0.003 0.08Heptacosane C27H56 380 0.39 2.87 3.96 3.21 9.7 2.5 5.1 2.7 2.2 9.0 1.80 2.0 3.2 0.011 0.14Nonacosane C29H60 408 0.82 4.37 5.16 5.98 21.3 3.4 4.6 2.6 2.8 5.8 2.12 2.4 4.3 0.033 0.71Hentriacontane C31H64 436 0.71 5.19 5.52 1.60 19.3 2.5 1.8 3.4 2.5 2.8 1.80 2.0 3.9 0.014 0.73Tritriacontane C33H68 464 0.15 1.38 1.32 0.30 5.7 0.6 0.1 6.3 0.75 0.6 0.60 0.3 1.1 0.005 0.19Pentatriacontane C35H72 492 0.05 0.06 1.8 0.05 0.1 0.001 0.04Total 2.28 15.68 18.84 12.66 91.6 11.1 14.5 16.1 9.35 22.1 7.76 8 14.05 0.071 1.89
PAHsPhenanthrene C14H10 178 0.09 0.30 0.69 0.60 0.80 0.04 0.8 0.10 0.7 0.05 0.22Fluoranthene C16H10 202 0.04 0.80 1.10 1.20 1.30 0.001 0.10 1.9 0.20 1.3 0.11 0.6 0.016Pyrene C16H10 202 0.03 0.60 1.00 1.40 1.00 0.001 0.10 2.0 0.19 1.4 0.1 0.52 0.013Benzo(ghi)fluoranthene C18H10 226 0.01 0.20 0.22 0.30 0.20 0.02 1.3 0.08 0.5 0.09 0.38 0.003Cyclopenta(c,d)pyrene C18H10 226 0.004 0.05 0.07 0.05 0.06 0.006 0.5 0.04 0.3 0.01 0.21 0.001Benz(a)anthracene C18H12 228 0.015 0.12 0.14 0.15 0.40 0.04 0.9 0.07 0.5 0.07 0.33 0.002Chrysene C18H12 228 0.02 0.35 0.69 0.70 0.52 0.08 1.3 0.11 0.7 0.12 0.56 0.007Benzo(k/b)fluoranthenes C20H12 252 0.04 0.55 1.24 1.40 1.60 0.001 0.12 2.8 0.27 2.2 0.22 0.9 0.01Benzo(e)pyrene C20H12 252 0.2 0.30 0.62 0.70 0.40 0.05 1.2 0.13 1.1 0.11 0.35 0.007Benzo(a)pyrene C20H12 252 0.014 0.18 0.28 0.30 0.25 0.02 0.9 0.09 0.5 0.05 0.16 0.003Perylene C20H12 252 0.01 0.03 0.03 0.07 0.1 0.01 0.15 0.02 0.03Indeno(1,2,3-cd)pyrene C22H12 276 0.01 0.12 0.41 0.40 0.24 0.03 1.2 0.11 0.8 0.03 0.26 0.003Indeno(1,2,3-cd)fluoranthene
C22H12 276 0.04 0.14 0.15 0.07 0.01 0.3 0.04 0.4 0.07 0.08
Benzo(ghi)perylene C22H12 276 0.02 0.14 0.41 0.35 0.41 0.03 1.6 0.17 1.3 0.12 0.35 0.007Coronene C24H12 300 0.01 0.14 0.05 0.12 0.01 0.5 0.05 0.2 0.02 0.061,3,5- Triphenylbenzene C24H18 306 0.11 0.18 0.28 0.03 0.24 0.002 0.09 2.0 0.05 0.06 0.06 0.003Total 0.6 3.95 7.46 7.78 7.66 0.05 0.75 19.3 1.71 12.05 1.24 5.07 0.078 0 0Bap/Bep 0.8 0.6 0.45 0.43 0.63 - 0.4 0.8 0.7 0.45 0.45 0.5 0.43 - -
n-Alkanoic acidsTetradecanoic acid C14H28O2 228 4.0 3.0 2.0 3.0 2.0 9.0 2.0 0.6 2.0 2.0 0.23 0.3Pentadecanoic acid C15H30O2 242 1.4 1.0 1.3 0.5 3.0 1.5 0.3 0.8 0.05Hexadecanoic acid C16H32O2 256 13.0 20.2 21.0 11.0 22.0 6.0 6.1 29.8 21.0 5.5 11.5 8.0 1.40 1.6 1.4Heptadecanoic acid C17H34O2 270 0.8 1.2 1.0 0.5 1.2 0.3 0.6 2.0 1.4 0.4 0.4 0.4 0.11 0.01 0.05Octadecanoic acid C18H36O2 284 8.0 11.4 9.0 6.0 12.0 3.0 3.0 25.0 17.0 6.1 4.0 1.9 0.65 0.52 0.44Nonadecanoic acid C19H38O2 298 0.4 0.5 0.4 0.3 0.7 0.4 0.7 1.5 0.4 0.06 0.2 0.08 0.01Eicosanoic acid C20H40O2 312 1.6 2.9 3.0 1.5 11.5 1.9 2.3 6.0 1.9 0.8 0.3 0.4 0.25 0.02 0.05Heneicosanoic acid C21H42O2 326 0.6 0.8 1.0 0.5 1.7 0.9 1.2 2.0 0.6 0.08 0.1 0.13 0.02Docosanoic acid C22H44O2 340 3.2 4.9 5.2 3.0 11.6 4.1 2.5 9.0 3.0 1.1 0.3 0.5 0.50 0.03 0.19Tricosanoic acid C23H46O2 354 1.8 1.7 1.5 1.0 3.5 1.6 1.2 3.0 1.2 0.1 0.1 0.23 0.11Tetracosanoic acid C24H48O2 368 2.8 6.2 3.0 3.0 6.6 2.0 2.5 9.0 3.3 1.7 0.4 0.6 0.54 0.06 0.51Pentacosanoic acid C25H50O2 382 0.8 0.5 0.7 0.4 1.5 0.5 0.7 2.5 0.6 0.3 0.14 0.11Hexacosanoic acid C26H52O2 396 1.8 1.6 3.0 1.4 6.0 1.6 1.0 14.0 1.8 2.5 0.3 0.3 0.45 0.02 0.49Heptacosanoic acid C27H54O2 410 0.4 0.2 0.5 0.7 0.2 0.3 0.6 0.3 0.1 0.11 0.05Octacosanoic acid C28H56O2 424 1.6 1.3 3.4 1.4 6.0 1.1 0.6 14.6 1.6 1.4 0.1 0.2 0.44 0.01 0.33Nonacosanoic acid C29H58O2 438 0.2 0.1 0.2 0.4 0.1 0.1 0.6 0.1 0.3 0.05 0.01Triacontanoic acid C30H60O2 452 1.2 0.4 1.6 0.4 2.2 0.5 0.3 0.9 0.7 0.3 0.1 0.1 0.16 0.09
D19S10 SIMONEIT ET AL.: MOLECULAR COMPOSITION OF ORGANIC AEROSOL
4 of 22
D19S10
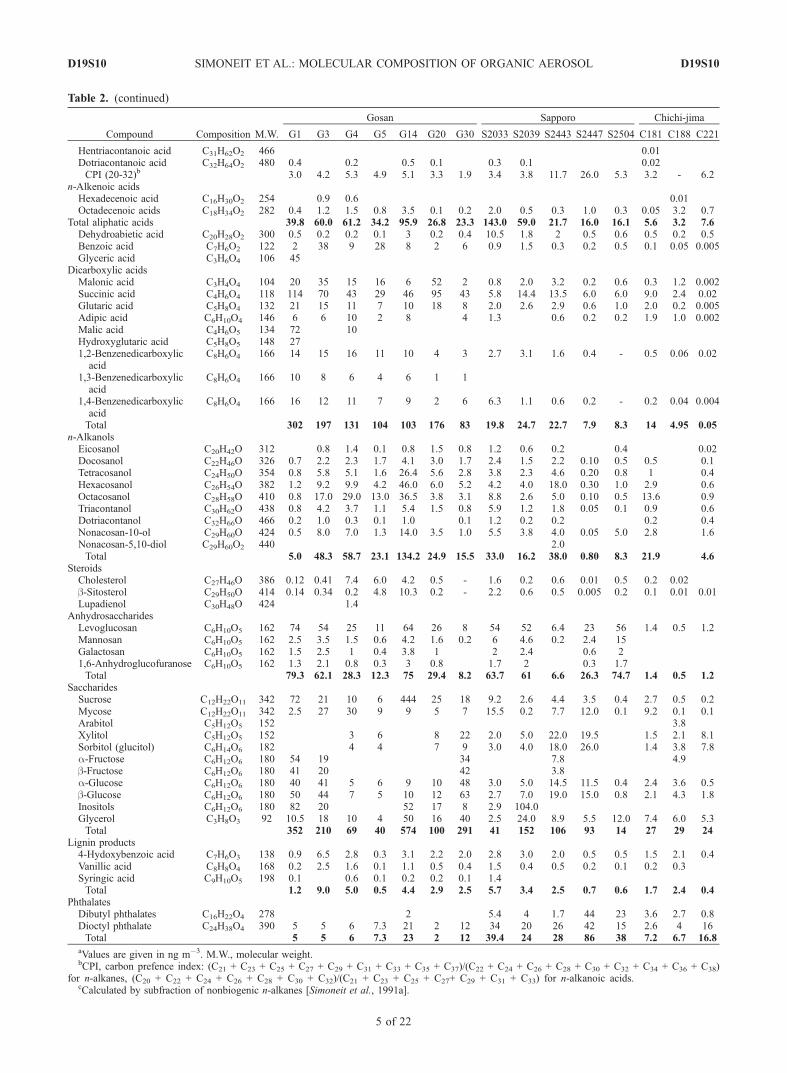
Table 2. (continued)
Compound Composition M.W.
Gosan Sapporo Chichi-jima
G1 G3 G4 G5 G14 G20 G30 S2033 S2039 S2443 S2447 S2504 C181 C188 C221
Hentriacontanoic acid C31H62O2 466 0.01Dotriacontanoic acid C32H64O2 480 0.4 0.2 0.5 0.1 0.3 0.1 0.02CPI (20-32)b 3.0 4.2 5.3 4.9 5.1 3.3 1.9 3.4 3.8 11.7 26.0 5.3 3.2 - 6.2
n-Alkenoic acidsHexadecenoic acid C16H30O2 254 0.9 0.6 0.01Octadecenoic acids C18H34O2 282 0.4 1.2 1.5 0.8 3.5 0.1 0.2 2.0 0.5 0.3 1.0 0.3 0.05 3.2 0.7
Total aliphatic acids 39.8 60.0 61.2 34.2 95.9 26.8 23.3 143.0 59.0 21.7 16.0 16.1 5.6 3.2 7.6Dehydroabietic acid C20H28O2 300 0.5 0.2 0.2 0.1 3 0.2 0.4 10.5 1.8 2 0.5 0.6 0.5 0.2 0.5Benzoic acid C7H6O2 122 2 38 9 28 8 2 6 0.9 1.5 0.3 0.2 0.5 0.1 0.05 0.005Glyceric acid C3H6O4 106 45
Dicarboxylic acidsMalonic acid C3H4O4 104 20 35 15 16 6 52 2 0.8 2.0 3.2 0.2 0.6 0.3 1.2 0.002Succinic acid C4H6O4 118 114 70 43 29 46 95 43 5.8 14.4 13.5 6.0 6.0 9.0 2.4 0.02Glutaric acid C5H8O4 132 21 15 11 7 10 18 8 2.0 2.6 2.9 0.6 1.0 2.0 0.2 0.005Adipic acid C6H10O4 146 6 6 10 2 8 4 1.3 0.6 0.2 0.2 1.9 1.0 0.002Malic acid C4H6O5 134 72 10Hydroxyglutaric acid C5H8O5 148 271,2-Benzenedicarboxylicacid
C8H6O4 166 14 15 16 11 10 4 3 2.7 3.1 1.6 0.4 - 0.5 0.06 0.02
1,3-Benzenedicarboxylicacid
C8H6O4 166 10 8 6 4 6 1 1
1,4-Benzenedicarboxylicacid
C8H6O4 166 16 12 11 7 9 2 6 6.3 1.1 0.6 0.2 - 0.2 0.04 0.004
Total 302 197 131 104 103 176 83 19.8 24.7 22.7 7.9 8.3 14 4.95 0.05n-Alkanols
Eicosanol C20H42O 312 0.8 1.4 0.1 0.8 1.5 0.8 1.2 0.6 0.2 0.4 0.02Docosanol C22H46O 326 0.7 2.2 2.3 1.7 4.1 3.0 1.7 2.4 1.5 2.2 0.10 0.5 0.5 0.1Tetracosanol C24H50O 354 0.8 5.8 5.1 1.6 26.4 5.6 2.8 3.8 2.3 4.6 0.20 0.8 1 0.4Hexacosanol C26H54O 382 1.2 9.2 9.9 4.2 46.0 6.0 5.2 4.2 4.0 18.0 0.30 1.0 2.9 0.6Octacosanol C28H58O 410 0.8 17.0 29.0 13.0 36.5 3.8 3.1 8.8 2.6 5.0 0.10 0.5 13.6 0.9Triacontanol C30H62O 438 0.8 4.2 3.7 1.1 5.4 1.5 0.8 5.9 1.2 1.8 0.05 0.1 0.9 0.6Dotriacontanol C32H66O 466 0.2 1.0 0.3 0.1 1.0 0.1 1.2 0.2 0.2 0.2 0.4Nonacosan-10-ol C29H60O 424 0.5 8.0 7.0 1.3 14.0 3.5 1.0 5.5 3.8 4.0 0.05 5.0 2.8 1.6Nonacosan-5,10-diol C29H60O2 440 2.0Total 5.0 48.3 58.7 23.1 134.2 24.9 15.5 33.0 16.2 38.0 0.80 8.3 21.9 4.6
SteroidsCholesterol C27H46O 386 0.12 0.41 7.4 6.0 4.2 0.5 - 1.6 0.2 0.6 0.01 0.5 0.2 0.02b-Sitosterol C29H50O 414 0.14 0.34 0.2 4.8 10.3 0.2 - 2.2 0.6 0.5 0.005 0.2 0.1 0.01 0.01Lupadienol C30H48O 424 1.4
AnhydrosaccharidesLevoglucosan C6H10O5 162 74 54 25 11 64 26 8 54 52 6.4 23 56 1.4 0.5 1.2Mannosan C6H10O5 162 2.5 3.5 1.5 0.6 4.2 1.6 0.2 6 4.6 0.2 2.4 15Galactosan C6H10O5 162 1.5 2.5 1 0.4 3.8 1 2 2.4 0.6 21,6-Anhydroglucofuranose C6H10O5 162 1.3 2.1 0.8 0.3 3 0.8 1.7 2 0.3 1.7Total 79.3 62.1 28.3 12.3 75 29.4 8.2 63.7 61 6.6 26.3 74.7 1.4 0.5 1.2
SaccharidesSucrose C12H22O11 342 72 21 10 6 444 25 18 9.2 2.6 4.4 3.5 0.4 2.7 0.5 0.2Mycose C12H22O11 342 2.5 27 30 9 9 5 7 15.5 0.2 7.7 12.0 0.1 9.2 0.1 0.1Arabitol C5H12O5 152 3.8Xylitol C5H12O5 152 3 6 8 22 2.0 5.0 22.0 19.5 1.5 2.1 8.1Sorbitol (glucitol) C6H14O6 182 4 4 7 9 3.0 4.0 18.0 26.0 1.4 3.8 7.8a-Fructose C6H12O6 180 54 19 34 7.8 4.9b-Fructose C6H12O6 180 41 20 42 3.8a-Glucose C6H12O6 180 40 41 5 6 9 10 48 3.0 5.0 14.5 11.5 0.4 2.4 3.6 0.5b-Glucose C6H12O6 180 50 44 7 5 10 12 63 2.7 7.0 19.0 15.0 0.8 2.1 4.3 1.8Inositols C6H12O6 180 82 20 52 17 8 2.9 104.0Glycerol C3H8O3 92 10.5 18 10 4 50 16 40 2.5 24.0 8.9 5.5 12.0 7.4 6.0 5.3Total 352 210 69 40 574 100 291 41 152 106 93 14 27 29 24
Lignin products4-Hydoxybenzoic acid C7H6O3 138 0.9 6.5 2.8 0.3 3.1 2.2 2.0 2.8 3.0 2.0 0.5 0.5 1.5 2.1 0.4Vanillic acid C8H8O4 168 0.2 2.5 1.6 0.1 1.1 0.5 0.4 1.5 0.4 0.5 0.2 0.1 0.2 0.3Syringic acid C9H10O5 198 0.1 0.6 0.1 0.2 0.2 0.1 1.4Total 1.2 9.0 5.0 0.5 4.4 2.9 2.5 5.7 3.4 2.5 0.7 0.6 1.7 2.4 0.4
PhthalatesDibutyl phthalates C16H22O4 278 2 5.4 4 1.7 44 23 3.6 2.7 0.8Dioctyl phthalate C24H38O4 390 5 5 6 7.3 21 2 12 34 20 26 42 15 2.6 4 16Total 5 5 6 7.3 23 2 12 39.4 24 28 86 38 7.2 6.7 16.8
aValues are given in ng m�3. M.W., molecular weight.bCPI, carbon prefence index: (C21 + C23 + C25 + C27 + C29 + C31 + C33 + C35 + C37)/(C22 + C24 + C26 + C28 + C30 + C32 + C34 + C36 + C38)
for n-alkanes, (C20 + C22 + C24 + C26 + C28 + C30 + C32)/(C21 + C23 + C25 + C27+ C29 + C31 + C33) for n-alkanoic acids.cCalculated by subfraction of nonbiogenic n-alkanes [Simoneit et al., 1991a].
D19S10 SIMONEIT ET AL.: MOLECULAR COMPOSITION OF ORGANIC AEROSOL
5 of 22
D19S10

Table 3. Organic Compounds Identified in Aerosol Particulate Matter Sampled on Board the R/V Ronald H. Browna
Compound Composition M.W.RB1(2329)
RB2(2332)
RB3(2333)
RB4(2350)
RB5(2357)
RB6(2360)
RB7(2376)
RB8(2384)
n-AlkanesNonadecane C19H40 268 0.09Eicosane C20H42 282 0.09 0.20 0.08 0.96Heneicosane C21H44 296 0.03 0.18 0.47 0.14 0.08 0.54 0.08 2.52Docosane C22H46 310 0.04 0.20 0.46 0.26 0.10 0.56 0.40 3.00Tricosane C23H48 324 0.06 0.19 0.50 0.30 0.20 1.28 0.72 3.24Tetracosane C24H50 338 0.11 0.22 0.60 0.62 0.24 1.39 0.64 2.16Pentacosane C25H52 352 0.18 0.35 0.87 0.86 0.34 2.89 1.04 2.76Hexacosane C26H54 366 0.19 0.37 0.83 0.84 0.30 1.93 0.64 1.80Heptacosane C27H56 380 0.19 0.40 0.83 1.02 0.35 3.21 1.28 2.88Octacosane C28H58 394 0.12 0.28 0.67 0.84 0.26 1.50 0.56 1.68Nonacosane C29H60 408 0.10 0.30 0.76 1.20 0.50 3.00 1.60 3.60Triacontane C30H62 422 0.07 0.17 0.67 0.96 0.28 1.07 0.40 1.44Hentriacontane C31H64 436 0.07 0.23 0.70 1.10 0.33 2.14 1.04 2.16Dotriacontane C32H66 450 0.04 0.09 0.43 0.52 0.18 0.86 0.16 0.96Tritriacontane C33H68 464 0.03 0.08 0.40 0.60 0.19 0.86 0.28 0.96Tetratriacontane C34H70 478 0.17 0.12 0.06 0.43 0.08 0.36Total 1.3 3.2 8.6 9.4 3.4 21.6 9.1 30.5CPI (19-34)b 1.1 1.2 1.2 1.3 1.4 1.7 2.1 1.6
Squalene C30H50 410 2Plant Wax Alkanesc
Tricosane C23H48 324 0.04 0.31 0.66Pentacosane C25H52 352 0.03 0.06 0.16 0.13 0.05 1.23 0.40 0.80Heptacosane C27H56 380 0.03 0.08 0.08 0.18 0.05 1.50 0.68 1.14Nonacosane C29H60 408 0.01 0.08 0.11 0.30 0.23 1.72 1.02 2.09Hentriacontane C31H64 436 0.02 0.10 0.15 0.36 0.10 1.18 0.76 0.96Tritriacontane C33H68 464 0.01 0.04 0.10 0.28 0.07 0.22 0.16 0.30Total 0.10 0.38 0.60 1.29 0.50 6.16 3.02 5.95
PAHFluoranthene C16H10 202 - - - 0.012 - 0.10 0.50 -Pyrene C16H10 202 - - - 0.008 - 0.08 0.40 -Benzo(ghi)fluoranthene C18H10 226 - - - - - 0.02 0.15 -Benz(a)anthracene C18H12 228 - - - 0.003 - - 0.10 -Chrysene C18H12 228 - - - - - 0.02 0.25 -Benzo(b/k)fluoranthene C20H12 252 - - - 0.007 - 0.06 0.40 -Benzo(e)pyrene C20H12 252 - - - - - 0.04 0.20 -Benzo(a)pyrene C20H12 252 - - - - - - 0.10 -Indeno(1,2,3-cd)pyrene C22H12 276 - - - - - - 0.20 -Benzo(ghi)perylene C22H12 276 - - - - - - 0.20 -1,3,5-Triphenylbenzene C24H18 306 - - - - - 0.02 0.05 -Total 0.03 0.34 2.4
n-Alkanoic acidsDodecanoic acid C12H24O2 200 0.08 0.9 4.6 8.82 4.05Tetradecanoic acid C14H28O2 228 0.21 1.5 5.8 1 1.56 3.20 20.16 4.56Pentadecanoic acid C15H30O2 242 0.07 0.6 2.5 0.3 0.63 1.50 8.40 2.03Hexadecanoic acid C16H32O2 256 1.2 3.2 15.2 2.4 2.50 11.50 42.00 22.80Heptadecanoic acid C17H34O2 270 0.01 0.08 0.4 0.23 0.69 2.10 0.51Octadecanoic acid C18H36O2 284 0.13 0.6 3.9 0.7 1.03 4.26 7.14 6.59Nonadecanoic acid C19H38O2 298 0.08 0.12 0.02Eicosanoic acid C20H40O2 312 0.03 0.05 0.1 0.27 1.15 0.63 0.76Heneicosanoic acid C21H42O2 326 0.13 0.58 0.04Docosanoic acid C22H44O2 340 0.03 0.05 0.1 0.42 1.96 0.08 1.01Tricosanoic acid C23H46O2 354 0.30 1.04 0.04Tetracosanoic acid C24H48O2 368 0.05 0.07 l2 0.55 2.30 0.13 1.01Pentacosanoic acid C25H50O2 382 0.11 0.46 0.02Hexacosanoic acid C26H52O2 396 0.02 0.02 0.1 0.28 1.04 0.04 0.51Heptacosanoic acid C27H54O2 410 0.08 0.35Octacosanoic acid C28H56O2 424 0.22 0.81 0.04 0.25Nonacosanoic acid C29H58O2 438 0.12Triacontanoic acid C30H60O2 452 0.46CPI (12-30)b 10 9.3 10.1 11 4.5 5.8 7.2 14.2
n-Alkenoic acidsHexadecenoic acid C16H30O2 254 0.04 0.8 2.07 0.2 1.15 12 1.01Octadecenoic acids C18H34O2 282 0.02 0.38 1.84 0.2 1.04 9 2.03Total aliphatic acids 11.8 17.5 46.6 16.1 12.9 39.5 117.9 61.3
Glyceric acid C3H6O4 106 0.3 2.2 1.7 15 18 5 21Benzoic acid C7H6O2 122 0.2 0.2 0.3 3.2 2 1.2 0.8 3.9Dicarboxylic acids
Malonic acid C3H4O4 104 0.1 1.5 3.8 5.6 21 23 2.5 16Succinic acid C4H6O4 118 0.6 7 3.3 2.2 70 58 11 50Glutaric acid C5H8O4 132 0.1 2.2 2.4 14 13 3 11Adipic acid C6H10O4 146 8 22 2.5 10
D19S10 SIMONEIT ET AL.: MOLECULAR COMPOSITION OF ORGANIC AEROSOL
6 of 22
D19S10
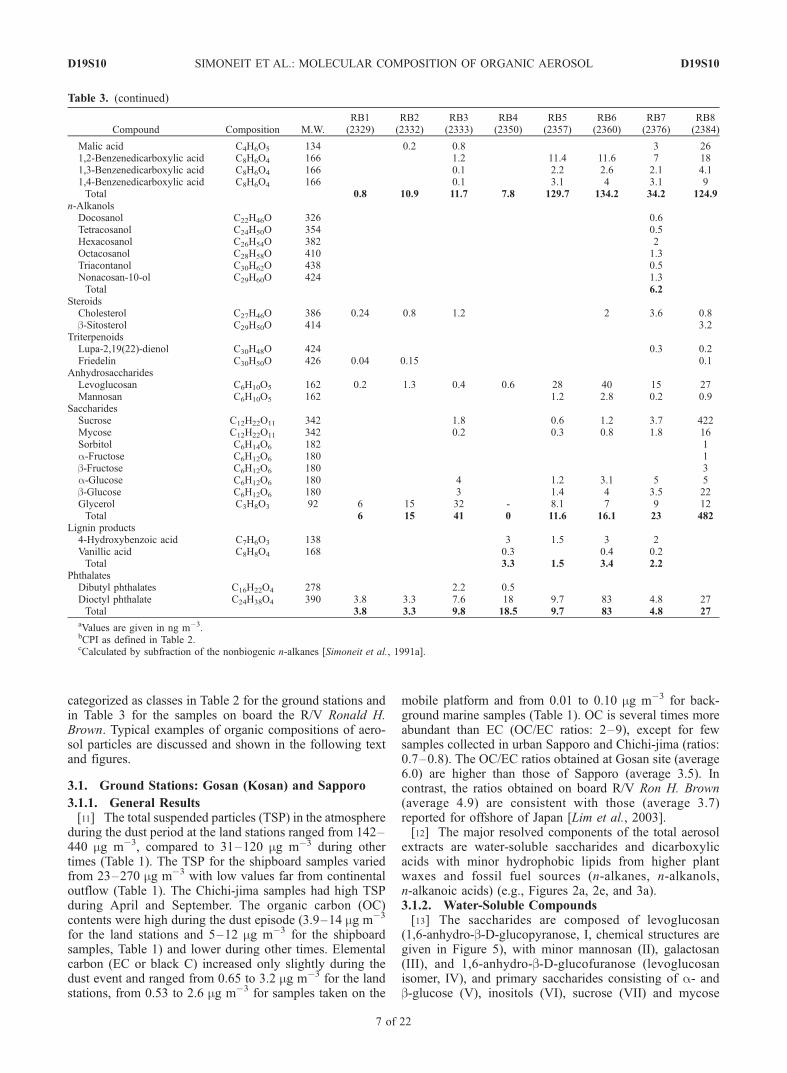
categorized as classes in Table 2 for the ground stations andin Table 3 for the samples on board the R/V Ronald H.Brown. Typical examples of organic compositions of aero-sol particles are discussed and shown in the following textand figures.
3.1. Ground Stations: Gosan (Kosan) and Sapporo
3.1.1. General Results[11] The total suspended particles (TSP) in the atmosphere
during the dust period at the land stations ranged from 142–440 mg m�3, compared to 31–120 mg m�3 during othertimes (Table 1). The TSP for the shipboard samples variedfrom 23–270 mg m�3 with low values far from continentaloutflow (Table 1). The Chichi-jima samples had high TSPduring April and September. The organic carbon (OC)contents were high during the dust episode (3.9–14 mg m�3
for the land stations and 5–12 mg m�3 for the shipboardsamples, Table 1) and lower during other times. Elementalcarbon (EC or black C) increased only slightly during thedust event and ranged from 0.65 to 3.2 mg m�3 for the landstations, from 0.53 to 2.6 mg m�3 for samples taken on the
mobile platform and from 0.01 to 0.10 mg m�3 for back-ground marine samples (Table 1). OC is several times moreabundant than EC (OC/EC ratios: 2–9), except for fewsamples collected in urban Sapporo and Chichi-jima (ratios:0.7–0.8). The OC/EC ratios obtained at Gosan site (average6.0) are higher than those of Sapporo (average 3.5). Incontrast, the ratios obtained on board R/V Ron H. Brown(average 4.9) are consistent with those (average 3.7)reported for offshore of Japan [Lim et al., 2003].[12] The major resolved components of the total aerosol
extracts are water-soluble saccharides and dicarboxylicacids with minor hydrophobic lipids from higher plantwaxes and fossil fuel sources (n-alkanes, n-alkanols,n-alkanoic acids) (e.g., Figures 2a, 2e, and 3a).3.1.2. Water-Soluble Compounds[13] The saccharides are composed of levoglucosan
(1,6-anhydro-b-D-glucopyranose, I, chemical structures aregiven in Figure 5), with minor mannosan (II), galactosan(III), and 1,6-anhydro-b-D-glucofuranose (levoglucosanisomer, IV), and primary saccharides consisting of a- andb-glucose (V), inositols (VI), sucrose (VII) and mycose
Table 3. (continued)
Compound Composition M.W.RB1(2329)
RB2(2332)
RB3(2333)
RB4(2350)
RB5(2357)
RB6(2360)
RB7(2376)
RB8(2384)
Malic acid C4H6O5 134 0.2 0.8 3 261,2-Benzenedicarboxylic acid C8H6O4 166 1.2 11.4 11.6 7 181,3-Benzenedicarboxylic acid C8H6O4 166 0.1 2.2 2.6 2.1 4.11,4-Benzenedicarboxylic acid C8H6O4 166 0.1 3.1 4 3.1 9Total 0.8 10.9 11.7 7.8 129.7 134.2 34.2 124.9
n-AlkanolsDocosanol C22H46O 326 0.6Tetracosanol C24H50O 354 0.5Hexacosanol C26H54O 382 2Octacosanol C28H58O 410 1.3Triacontanol C30H62O 438 0.5Nonacosan-10-ol C29H60O 424 1.3Total 6.2
SteroidsCholesterol C27H46O 386 0.24 0.8 1.2 2 3.6 0.8b-Sitosterol C29H50O 414 3.2
TriterpenoidsLupa-2,19(22)-dienol C30H48O 424 0.3 0.2Friedelin C30H50O 426 0.04 0.15 0.1
AnhydrosaccharidesLevoglucosan C6H10O5 162 0.2 1.3 0.4 0.6 28 40 15 27Mannosan C6H10O5 162 1.2 2.8 0.2 0.9
SaccharidesSucrose C12H22O11 342 1.8 0.6 1.2 3.7 422Mycose C12H22O11 342 0.2 0.3 0.8 1.8 16Sorbitol C6H14O6 182 1a-Fructose C6H12O6 180 1b-Fructose C6H12O6 180 3a-Glucose C6H12O6 180 4 1.2 3.1 5 5b-Glucose C6H12O6 180 3 1.4 4 3.5 22Glycerol C3H8O3 92 6 15 32 - 8.1 7 9 12Total 6 15 41 0 11.6 16.1 23 482
Lignin products4-Hydroxybenzoic acid C7H6O3 138 3 1.5 3 2Vanillic acid C8H8O4 168 0.3 0.4 0.2Total 3.3 1.5 3.4 2.2
PhthalatesDibutyl phthalates C16H22O4 278 2.2 0.5Dioctyl phthalate C24H38O4 390 3.8 3.3 7.6 18 9.7 83 4.8 27Total 3.8 3.3 9.8 18.5 9.7 83 4.8 27
aValues are given in ng m�3.bCPI as defined in Table 2.cCalculated by subfraction of the nonbiogenic n-alkanes [Simoneit et al., 1991a].
D19S10 SIMONEIT ET AL.: MOLECULAR COMPOSITION OF ORGANIC AEROSOL
7 of 22
D19S10
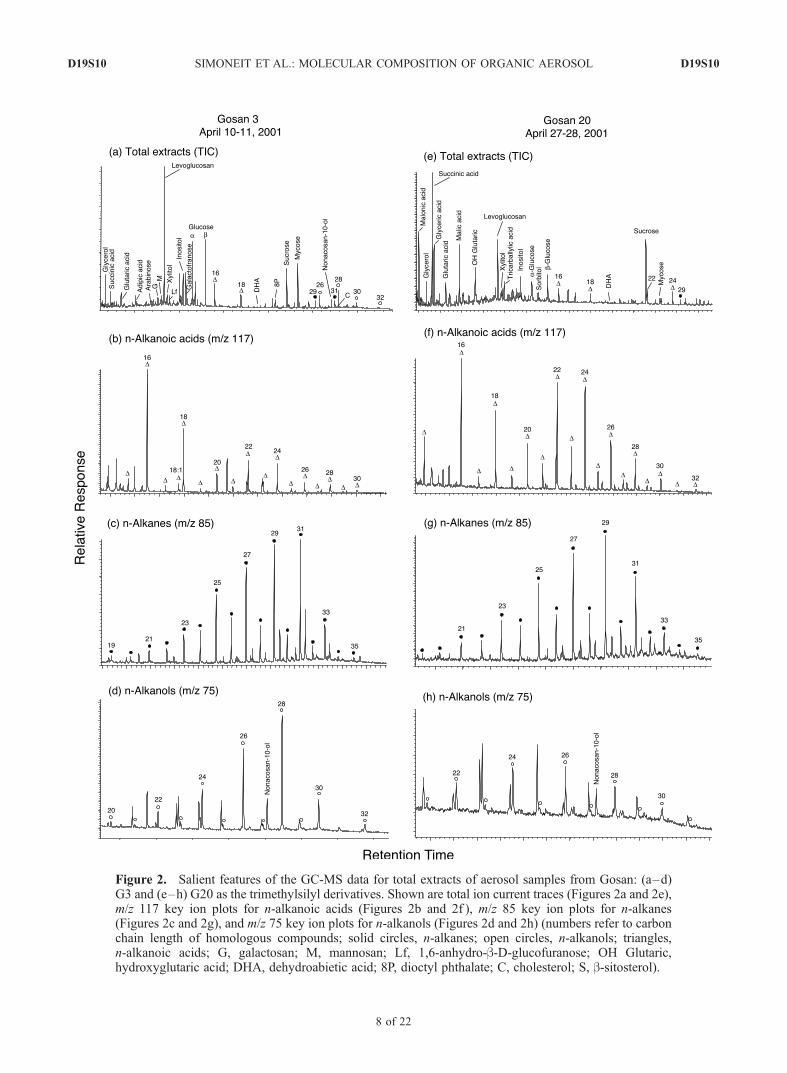
Figure 2. Salient features of the GC-MS data for total extracts of aerosol samples from Gosan: (a–d)G3 and (e–h) G20 as the trimethylsilyl derivatives. Shown are total ion current traces (Figures 2a and 2e),m/z 117 key ion plots for n-alkanoic acids (Figures 2b and 2f ), m/z 85 key ion plots for n-alkanes(Figures 2c and 2g), and m/z 75 key ion plots for n-alkanols (Figures 2d and 2h) (numbers refer to carbonchain length of homologous compounds; solid circles, n-alkanes; open circles, n-alkanols; triangles,n-alkanoic acids; G, galactosan; M, mannosan; Lf, 1,6-anhydro-b-D-glucofuranose; OH Glutaric,hydroxyglutaric acid; DHA, dehydroabietic acid; 8P, dioctyl phthalate; C, cholesterol; S, b-sitosterol).
D19S10 SIMONEIT ET AL.: MOLECULAR COMPOSITION OF ORGANIC AEROSOL
8 of 22
D19S10
(trehalose VIII). In addition there is the series of saccharidepolyols (alditols, i.e., reduced sugars) ranging from sorbitol(D-glucitol, IX), xylitol (X), to glycerol (XI). Minor amountsof other monosaccharides (e.g., arabinose, a- and b-fructose,
galactofuranose) are found in some samples. Levoglucosan,with mannosan, galactosan, and 1,6-anhydro-b-D-gluco-furanose (I–IV) are the key tracers for smoke particulatematter from burning of biomass (i.e., thermal alterationproducts from cellulose [Simoneit et al., 1999]) and haveconcentrations from 7 to 78 ng m�3 (Table 2). Thesecompounds have been found in aerosols over the oceanand thus are stable during long-range transport [Simoneit andElias, 2000; Fraser and Lakshmanan, 2000]. The primarysaccharides (e.g., glucose, sucrose, trehalose, etc.) and thesaccharide polyols (e.g., sorbitol, xylitol, etc.) have concen-trations ranging from 14 to 574 ng m�3 (Table 2) and arecandidate tracers for surface soil dust. Saccharides are amajor fraction of soil organic matter [Gleixner et al., 2002]and have been characterized in riverine particulate matter [daCunha et al., 2002]. These compounds are present atrelatively low atmospheric concentrations during the earlyspring and become dominant into the summer season,paralleling the agricultural tilling practices on the Asiancontinent that resuspend soil dust into the passing aerosols.The characterization, atmospheric chemistry, and implica-tions of these sugars are under further study.[14] Secondary oxidation products of organic compounds
are found mainly as short-chain dicarboxylic acids rangingfrom oxalic acid to adipic acid and aromatic acids(e.g., benzoic, benzenedicarboxylic acids) [Kawamura andSakaguchi, 1999; Mochida et al., 2003b]. The dicarboxylicacids detected in these total extracts are malonic, succinic,glutaric, and adipic acids (C3-C6) and the aromatic acids(e.g., 1,2-, 1,3- and 1,4-benzenedicarboxylic acids), withconcentration ranges from 8 to 302 ng m�3 (Table 2).Malonic and succinic acids are somewhat depleted becauseof the volatility of the trimethylsilyl esters used in thismethod compared to the data from the direct analyses,where the C2-C6 dicarboxylic acids were determined byseparate specific analyses [e.g., Mochida et al., 2003b;Kawamura et al., 2004]. Some aerosol samples also containhydroxydicarboxylic acids, mainly malic, and hydroxyglu-taric acids (C4-C5), which may be secondary oxidationproducts from the saccharides. Thus the saccharides anddicarboxylic acids comprise the major water-soluble organiccompounds of these aerosols.3.1.3. Aliphatic Lipids[15] The lipid components, secondary in concentration in
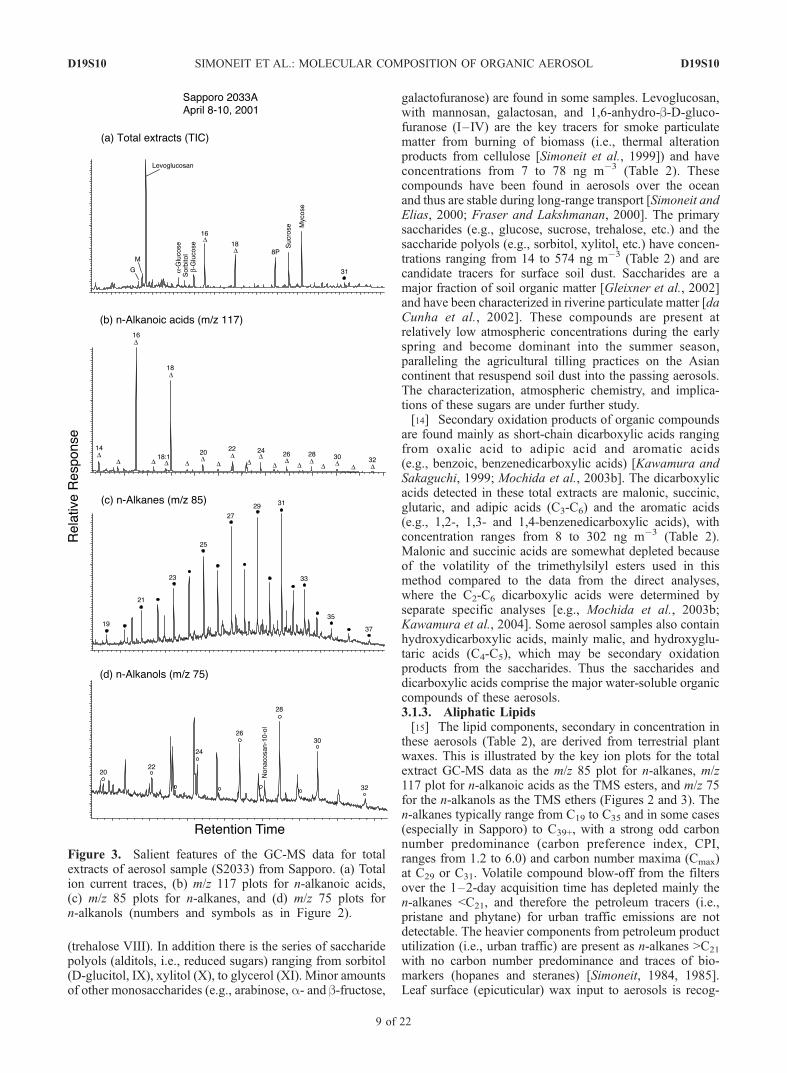
these aerosols (Table 2), are derived from terrestrial plantwaxes. This is illustrated by the key ion plots for the totalextract GC-MS data as the m/z 85 plot for n-alkanes, m/z117 plot for n-alkanoic acids as the TMS esters, and m/z 75for the n-alkanols as the TMS ethers (Figures 2 and 3). Then-alkanes typically range from C19 to C35 and in some cases(especially in Sapporo) to C39+, with a strong odd carbonnumber predominance (carbon preference index, CPI,ranges from 1.2 to 6.0) and carbon number maxima (Cmax)at C29 or C31. Volatile compound blow-off from the filtersover the 1–2-day acquisition time has depleted mainly then-alkanes <C21, and therefore the petroleum tracers (i.e.,pristane and phytane) for urban traffic emissions are notdetectable. The heavier components from petroleum productutilization (i.e., urban traffic) are present as n-alkanes >C21
with no carbon number predominance and traces of bio-markers (hopanes and steranes) [Simoneit, 1984, 1985].Leaf surface (epicuticular) wax input to aerosols is recog-
Figure 3. Salient features of the GC-MS data for totalextracts of aerosol sample (S2033) from Sapporo. (a) Totalion current traces, (b) m/z 117 plots for n-alkanoic acids,(c) m/z 85 plots for n-alkanes, and (d) m/z 75 plots forn-alkanols (numbers and symbols as in Figure 2).
D19S10 SIMONEIT ET AL.: MOLECULAR COMPOSITION OF ORGANIC AEROSOL
9 of 22
D19S10
nized by the n-alkanes from C21-C35 with a strong oddcarbon number predominance, and n-alkanoic acids fromC20-C32 and n-alkanols from C22–C30, both with strongeven carbon number predominances [Simoneit, 1989]. Thecontribution of epicuticular wax to the total n-alkanes hasbeen estimated by the subtraction of the smooth alkaneenvelope from the total alkanes [Simoneit et al., 1991a], andthe wax alkane concentrations are listed in Table 2 andplotted in a separate figure as discussed below.[16] The n-alkanoic acids (fatty acids) range mainly from
C12 to C32, with Cmax at 16, 18 and minor Cmax at 22 or 24
and strong even carbon number predominances (CPI range1.9 to 2.6 for C20-C32, Table 2) (Figures 2b, 2f, and 3b).There are only traces of alkenoic acids (e.g., C18:1) indicat-ing that the organic matter of these aerosols is aged and hasbeen transported over significant distances. There is also nopalmitoleic acid (C16:1) detectable as it is found in themarine aerosols discussed below. The alkenoic acids arerapidly oxidized once in the atmosphere [e.g., Kawamuraand Gagosian, 1987]. The n-alkanoic acids <C20 havemultiple sources and thus only indicate a biogenic input.The n-alkanoic acids from C20 to C32 are interpreted to
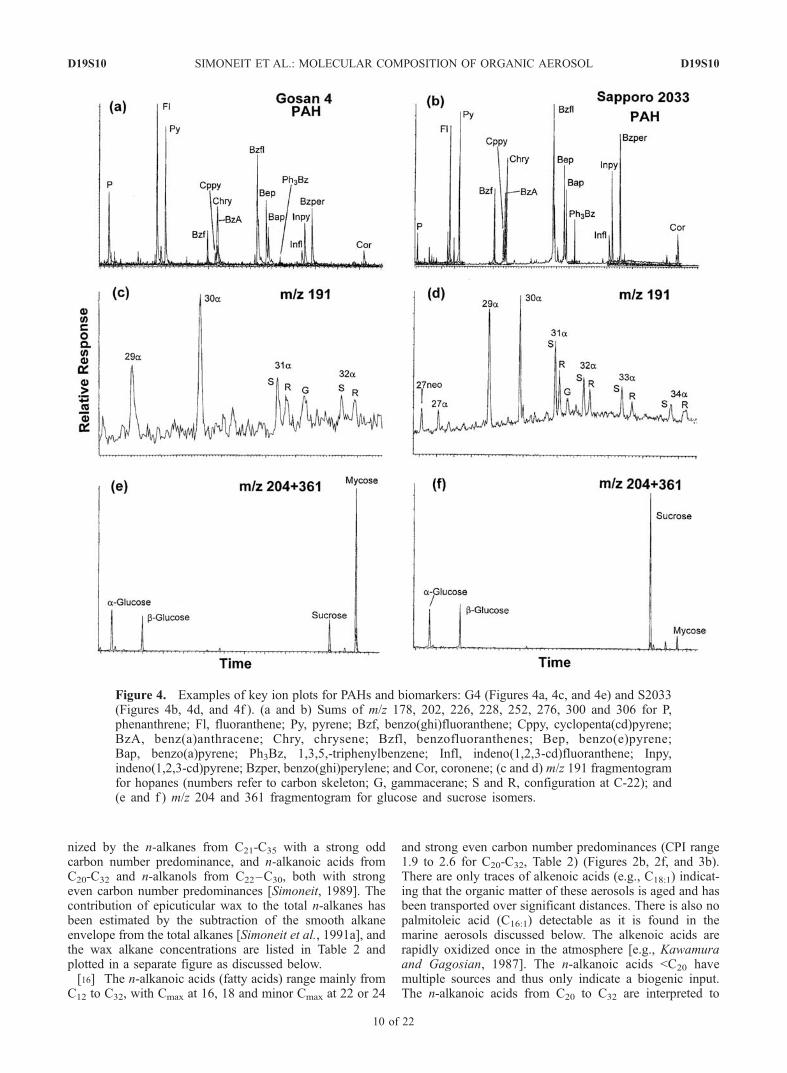
Figure 4. Examples of key ion plots for PAHs and biomarkers: G4 (Figures 4a, 4c, and 4e) and S2033(Figures 4b, 4d, and 4f ). (a and b) Sums of m/z 178, 202, 226, 228, 252, 276, 300 and 306 for P,phenanthrene; Fl, fluoranthene; Py, pyrene; Bzf, benzo(ghi)fluoranthene; Cppy, cyclopenta(cd)pyrene;BzA, benz(a)anthracene; Chry, chrysene; Bzfl, benzofluoranthenes; Bep, benzo(e)pyrene;Bap, benzo(a)pyrene; Ph3Bz, 1,3,5,-triphenylbenzene; Infl, indeno(1,2,3-cd)fluoranthene; Inpy,indeno(1,2,3-cd)pyrene; Bzper, benzo(ghi)perylene; and Cor, coronene; (c and d) m/z 191 fragmentogramfor hopanes (numbers refer to carbon skeleton; G, gammacerane; S and R, configuration at C-22); and(e and f ) m/z 204 and 361 fragmentogram for glucose and sucrose isomers.
D19S10 SIMONEIT ET AL.: MOLECULAR COMPOSITION OF ORGANIC AEROSOL
10 of 22
D19S10
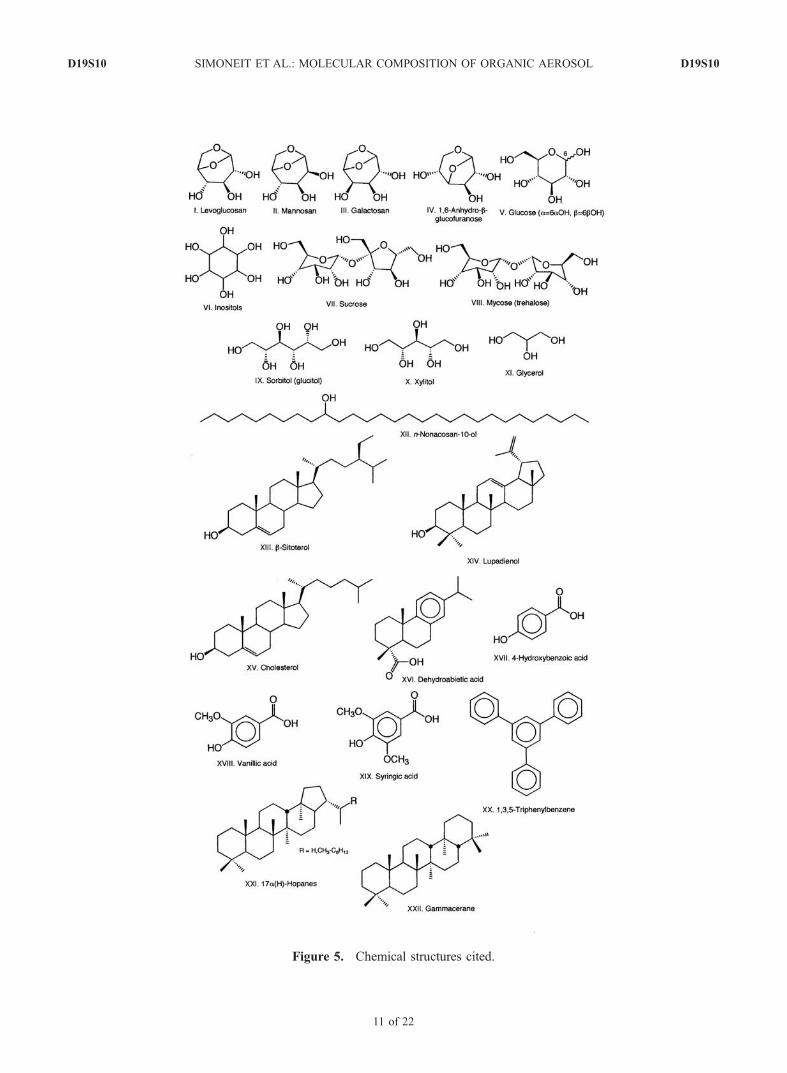
Figure 5. Chemical structures cited.
D19S10 SIMONEIT ET AL.: MOLECULAR COMPOSITION OF ORGANIC AEROSOL
11 of 22
D19S10
derive from higher plant waxes and they have very similardistributions of C22 � C24 > C26 < C28 for most of theground station samples during the same time interval(compare Figures 2b, 2f, and 3b). This distribution changeslater in the season (e.g., Figure 2).[17] The n-alkanols (fatty alcohols) range from C20 to C32,
with strong even carbon number predominances (essentiallyno odd numbered alkanols, CPI all >4, Table 2) and Cmax atC28 during the dust event and at C26 afterward (Figures 2d,2h, and 3d). All aerosol samples contain n-nonacosan-10-ol(XII) at unusually high levels (Table 2). The normalalkanols indicate an input of plant waxes and noncosan-10-ol indicates an input of waxes from forests consisting ofboth soft and hardwoods [Oros and Simoneit, 2001a,2001b]. Some of these alkanols may also be injected intothe atmosphere by smoke from biomass burning [Oros andSimoneit, 2001a, 2001b; Simoneit, 2002], which is sup-ported by the presence of b-sitosterol (XIII) and in somesamples lupadienol (XIV) (Table 2). The latter lupadienol isan altered natural product and its precursor and b-sitosteroloccur as internal lipids, which can become airborne byvolatilization during burning [Simoneit, 2002]. Cholesterol(XV) is found in most of these samples (Table 2) andindicates an input from marine (algal) sources and possiblyfrom emissions from cooking in urban areas [e.g., Rogge etal., 1991; Schauer et al., 1999; Simoneit et al., 1983].3.1.4. Biomass-Burning Tracers[18] Biomass burning injects numerous organic com-
pounds from the fuels directly into the atmosphere, andon the basis of the major tracers detected, both the processand the types of fuels can be assessed [Simoneit, 2002]. Themajor markers for burning of anything that contains cellu-lose are levoglucosan (I) with lesser amounts of the otheranhydrosaccharides (II–IV) mentioned above. Levogluco-san is found in all aerosol samples analyzed here (range0.2–74 ng m�3, Table 2), often as the major organiccompound, and indicates that biomass burning is impactingthe whole western Pacific region.[19] The secondary tracers for biomass burning are
various natural product compounds or their derivatives[Simoneit, 2002]. b-Sitosterol (XIII) is a directly emittedphytosterol present in all vegetation and is thus not fuelspecific but indicates biomass burning. High concentrationsof b-sitosterol (XIII) were reported in the marine aerosolsfrom the western North Pacific during the 1991 El Ninoforest fire event occurred in Indonesia and other SoutheastAsian countries [Kawamura et al., 2003]. Lupadienol (XIV)is indicative for burning of hardwood. Another secondarytracer from biomass-burning emissions is dehydroabieticacid (XVI), the key marker for smoke from burning ofconifer wood [Standley and Simoneit, 1994; Oros andSimoneit, 2001a; Rogge et al., 1998; Simoneit, 1999].Dehydroabietic acid is present as a minor component inthese samples (Table 2), indicating significant softwoodburning during winter-spring in the aerosol source regions.Lignin is the other major biopolymer of wood and uponburning yields phenolic tracers in the smoke characteristicof the fuel type [Hawthorne et al., 1988; Simoneit et al.,1993, 1996]. The major tracers for lignin burning productsin oxidized aerosols are 4-hydroxybenzoic acid (XVII)indicative of grasses and other nonwoody vegetation, vanil-lic acid (XVIII) indicative of mainly softwood but also
hardwood, and syringic acid (XIX) indicative of hardwood[Simoneit et al., 1993]. These three phenolic compounds arefound in most of the aerosol samples analyzed here (Table 2)and the concentrations are similar for Gosan and Sapporoindicating an upwind source on the Asian continent. Thesecompounds are also present in the marine aerosol samplestaken near land (Table 3). The predominance of 4-hydroxy-benzoic acid in all cases supports the interpretation that thebiomass fuels being burned are primarily grasses (e.g.,dung, agricultural refuse, bamboo, etc.) [e.g., Sheesley etal., 2003].3.1.5. PAHs[20] Examples of typical PAH compositions and confirm-
ing biomarkers are shown in Figure 4. The PAHs range fromphenanthrene to coronene (Figures 4a and 4b) and their totalconcentrations are significant, ranging from 0.005 to7.8 ng m�3 in Gosan and 1.7 to 19.3 ng m�3 in Sapporo(Table2).Their distributionpatterns are similarduring thedustevent, indicating common sources. 1,3,5-Triphenylbenzene(XX) is present at significant concentrations indicating amajor input source of PAHs from incineration of refuse [Fuet al., 1997]. 1,3,5-Triphenylbenzene has been detected inparticles from solid waste incinerators and from burning ofplastics [Tong et al., 1984; Karasek and Tong, 1985]. Itmay be a useful urban tracer. Similar PAH distributionshave also been reported for various cities in China[Simoneit et al., 1991b; Fu et al., 1997; Okuda et al.,2002] with total PAH concentrations of 8–450 ng m�3.Retene from burning conifer wood is not detectable in anyof these samples. PAHs are of health concerns because oftheir carcinogenicity, genotoxicity, and endocrine disrupt-ing potential. The benzopyrenes and cyclopenta[c,d]pyreneare found at high concentrations in these aerosols andthe ratio of benzo[a]pyrene to benzo[e]pyrene (Bap/Bep)ranges from 0.4 to 0.8, which is high (Table 2). The Bap/Bep values for samples from urban areas of China rangedfrom 0.1 to 1.0 [Simoneit et al., 1991b; Okuda et al.,2002]. Benzo[a]pyrene has a shorter atmospheric lifetimethan benzo[e]pyrene because of photochemical degradation[Lane, 1989]. Thus the high concentrations of benzo[a]py-rene indicate that these PAHs reside in tar particulatematter of coal smoke emissions (small fire type burning)and are thus protected from secondary reactions duringtransport [Oros and Simoneit, 2000].[21] The urban aerosols of China also contained equiva-
lent concentrations of oxy-PAHs as the PAHs, both primaryemissions (e.g., benzo[a]fluoren-11-one), as well as second-ary oxidation products from the PAHs (e.g., 9,10-anthra-quinone) [Simoneit et al., 1991b]. Oxy-PAHs are notsignificant components of these samples, probably reflect-ing their greater reactivity toward further atmosphericoxidation upon emission to for example the benzenedicar-boxylic acids and/or entrapment in coal tar emissions.3.1.6. Biomarker Confirmations[22] The compositions of the hopane biomarkers charac-
teristic of petroleum utilization are shown for two examples inFigures 4c and 4d. They are present at trace levels (Table 2)and are thus utilized for confirmation of urban traffic emis-sions. The hopanes consist of only the 17a(H) series (XXI),ranging from C27 to C35 (no C28) with the fully matureconfiguration for the homologs >C30. Gammacerane (XXII)is present and these compositionsmatch those reported earlier
D19S10 SIMONEIT ET AL.: MOLECULAR COMPOSITION OF ORGANIC AEROSOL
12 of 22
D19S10
for some urban areas of China [Simoneit et al., 1991b].Steranes and carotane detected in urban aerosols of Chinaduring the 1980’s were below the detection limit in thesesamples.[23] Examples of key ion traces (m/z 204 + 361) for GC-
MS confirmation of the glucose and sucrose anomers areshown in Figures 4e and 4f. Although these compounds aredominant resolved peaks in most of the total ion currenttraces (e.g., Figures 2a, 2e, and 3a), such key ion plots allowconfirmation of trace levels of an anomer. The interconver-sion of sucrose to its suspected aldol anomer duringatmospheric transport is still under investigation.3.1.7. Wax Alkanes[24] The n-alkane distributions attributable to vascular
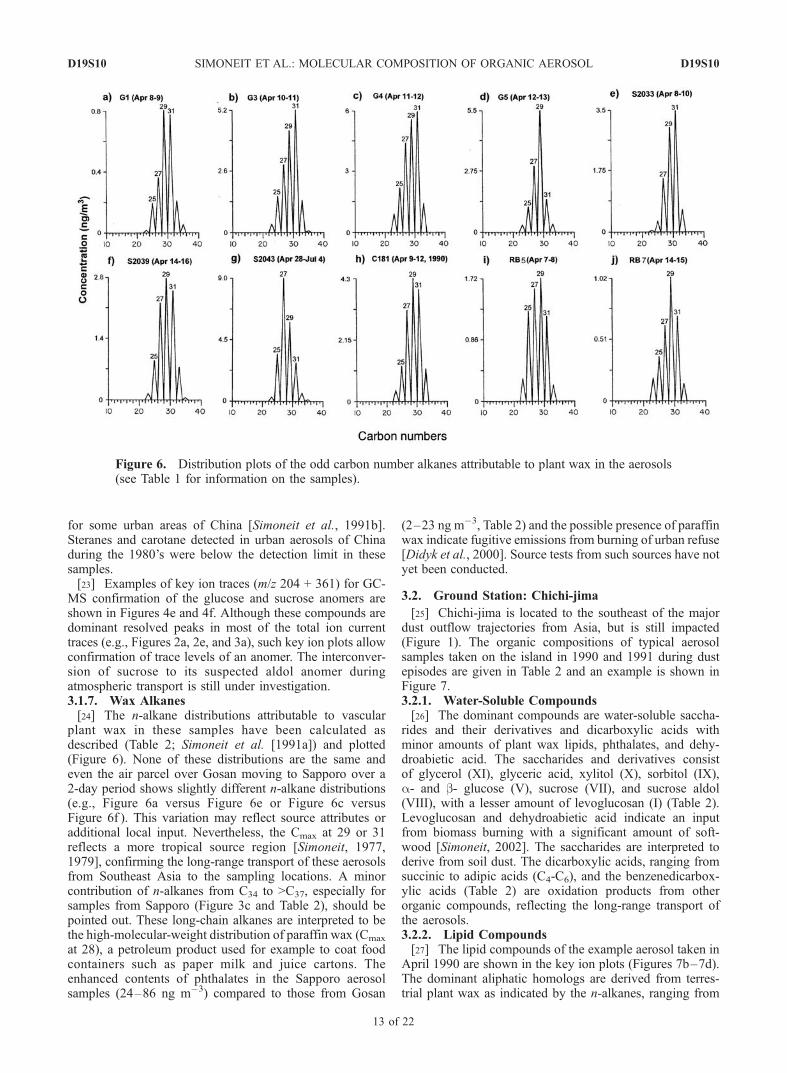
plant wax in these samples have been calculated asdescribed (Table 2; Simoneit et al. [1991a]) and plotted(Figure 6). None of these distributions are the same andeven the air parcel over Gosan moving to Sapporo over a2-day period shows slightly different n-alkane distributions(e.g., Figure 6a versus Figure 6e or Figure 6c versusFigure 6f ). This variation may reflect source attributes oradditional local input. Nevertheless, the Cmax at 29 or 31reflects a more tropical source region [Simoneit, 1977,1979], confirming the long-range transport of these aerosolsfrom Southeast Asia to the sampling locations. A minorcontribution of n-alkanes from C34 to >C37, especially forsamples from Sapporo (Figure 3c and Table 2), should bepointed out. These long-chain alkanes are interpreted to bethe high-molecular-weight distribution of paraffin wax (Cmax
at 28), a petroleum product used for example to coat foodcontainers such as paper milk and juice cartons. Theenhanced contents of phthalates in the Sapporo aerosolsamples (24–86 ng m�3) compared to those from Gosan
(2–23 ng m�3, Table 2) and the possible presence of paraffinwax indicate fugitive emissions from burning of urban refuse[Didyk et al., 2000]. Source tests from such sources have notyet been conducted.
3.2. Ground Station: Chichi-jima
[25] Chichi-jima is located to the southeast of the majordust outflow trajectories from Asia, but is still impacted(Figure 1). The organic compositions of typical aerosolsamples taken on the island in 1990 and 1991 during dustepisodes are given in Table 2 and an example is shown inFigure 7.3.2.1. Water-Soluble Compounds[26] The dominant compounds are water-soluble saccha-
rides and their derivatives and dicarboxylic acids withminor amounts of plant wax lipids, phthalates, and dehy-droabietic acid. The saccharides and derivatives consistof glycerol (XI), glyceric acid, xylitol (X), sorbitol (IX),a- and b- glucose (V), sucrose (VII), and sucrose aldol(VIII), with a lesser amount of levoglucosan (I) (Table 2).Levoglucosan and dehydroabietic acid indicate an inputfrom biomass burning with a significant amount of soft-wood [Simoneit, 2002]. The saccharides are interpreted toderive from soil dust. The dicarboxylic acids, ranging fromsuccinic to adipic acids (C4-C6), and the benzenedicarbox-ylic acids (Table 2) are oxidation products from otherorganic compounds, reflecting the long-range transport ofthe aerosols.3.2.2. Lipid Compounds[27] The lipid compounds of the example aerosol taken in
April 1990 are shown in the key ion plots (Figures 7b–7d).The dominant aliphatic homologs are derived from terres-trial plant wax as indicated by the n-alkanes, ranging from
Figure 6. Distribution plots of the odd carbon number alkanes attributable to plant wax in the aerosols(see Table 1 for information on the samples).
D19S10 SIMONEIT ET AL.: MOLECULAR COMPOSITION OF ORGANIC AEROSOL
13 of 22
D19S10
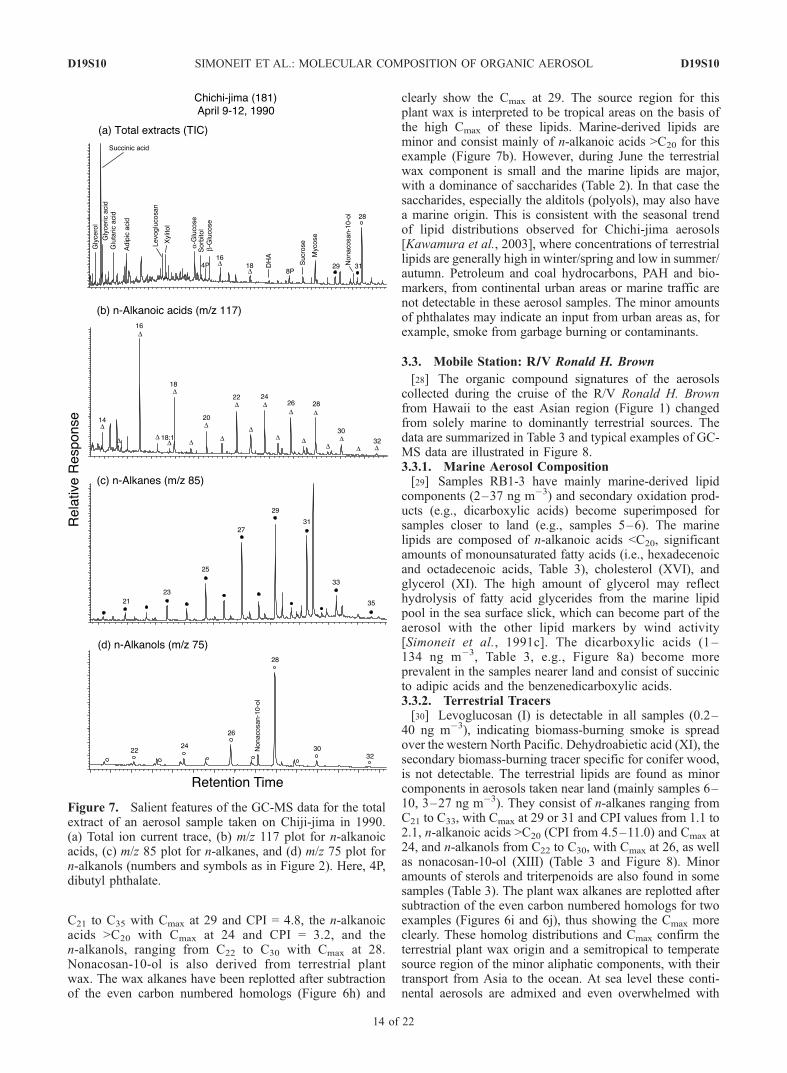
C21 to C35 with Cmax at 29 and CPI = 4.8, the n-alkanoicacids >C20 with Cmax at 24 and CPI = 3.2, and then-alkanols, ranging from C22 to C30 with Cmax at 28.Nonacosan-10-ol is also derived from terrestrial plantwax. The wax alkanes have been replotted after subtractionof the even carbon numbered homologs (Figure 6h) and
clearly show the Cmax at 29. The source region for thisplant wax is interpreted to be tropical areas on the basis ofthe high Cmax of these lipids. Marine-derived lipids areminor and consist mainly of n-alkanoic acids >C20 for thisexample (Figure 7b). However, during June the terrestrialwax component is small and the marine lipids are major,with a dominance of saccharides (Table 2). In that case thesaccharides, especially the alditols (polyols), may also havea marine origin. This is consistent with the seasonal trendof lipid distributions observed for Chichi-jima aerosols[Kawamura et al., 2003], where concentrations of terrestriallipids are generally high in winter/spring and low in summer/autumn. Petroleum and coal hydrocarbons, PAH and bio-markers, from continental urban areas or marine traffic arenot detectable in these aerosol samples. The minor amountsof phthalates may indicate an input from urban areas as, forexample, smoke from garbage burning or contaminants.
3.3. Mobile Station: R///V Ronald H. Brown
[28] The organic compound signatures of the aerosolscollected during the cruise of the R/V Ronald H. Brownfrom Hawaii to the east Asian region (Figure 1) changedfrom solely marine to dominantly terrestrial sources. Thedata are summarized in Table 3 and typical examples of GC-MS data are illustrated in Figure 8.3.3.1. Marine Aerosol Composition[29] Samples RB1-3 have mainly marine-derived lipid
components (2–37 ng m�3) and secondary oxidation prod-ucts (e.g., dicarboxylic acids) become superimposed forsamples closer to land (e.g., samples 5–6). The marinelipids are composed of n-alkanoic acids <C20, significantamounts of monounsaturated fatty acids (i.e., hexadecenoicand octadecenoic acids, Table 3), cholesterol (XVI), andglycerol (XI). The high amount of glycerol may reflecthydrolysis of fatty acid glycerides from the marine lipidpool in the sea surface slick, which can become part of theaerosol with the other lipid markers by wind activity[Simoneit et al., 1991c]. The dicarboxylic acids (1–134 ng m�3, Table 3, e.g., Figure 8a) become moreprevalent in the samples nearer land and consist of succinicto adipic acids and the benzenedicarboxylic acids.3.3.2. Terrestrial Tracers[30] Levoglucosan (I) is detectable in all samples (0.2–
40 ng m�3), indicating biomass-burning smoke is spreadover the western North Pacific. Dehydroabietic acid (XI), thesecondary biomass-burning tracer specific for conifer wood,is not detectable. The terrestrial lipids are found as minorcomponents in aerosols taken near land (mainly samples 6–10, 3–27 ng m�3). They consist of n-alkanes ranging fromC21 to C33, with Cmax at 29 or 31 and CPI values from 1.1 to2.1, n-alkanoic acids >C20 (CPI from 4.5–11.0) and Cmax at24, and n-alkanols from C22 to C30, with Cmax at 26, as wellas nonacosan-10-ol (XIII) (Table 3 and Figure 8). Minoramounts of sterols and triterpenoids are also found in somesamples (Table 3). The plant wax alkanes are replotted aftersubtraction of the even carbon numbered homologs for twoexamples (Figures 6i and 6j), thus showing the Cmax moreclearly. These homolog distributions and Cmax confirm theterrestrial plant wax origin and a semitropical to temperatesource region of the minor aliphatic components, with theirtransport from Asia to the ocean. At sea level these conti-nental aerosols are admixed and even overwhelmed with
Figure 7. Salient features of the GC-MS data for the totalextract of an aerosol sample taken on Chiji-jima in 1990.(a) Total ion current trace, (b) m/z 117 plot for n-alkanoicacids, (c) m/z 85 plot for n-alkanes, and (d) m/z 75 plot forn-alkanols (numbers and symbols as in Figure 2). Here, 4P,dibutyl phthalate.
D19S10 SIMONEIT ET AL.: MOLECULAR COMPOSITION OF ORGANIC AEROSOL
14 of 22
D19S10
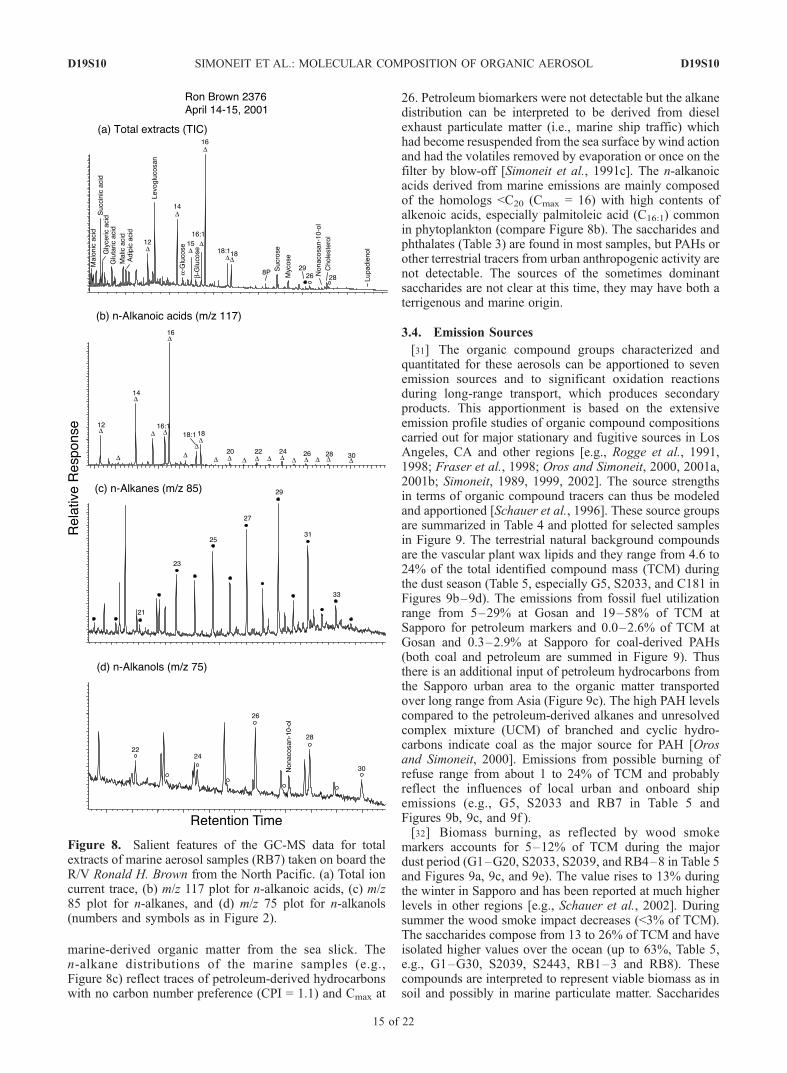
marine-derived organic matter from the sea slick. Then-alkane distributions of the marine samples (e.g.,Figure 8c) reflect traces of petroleum-derived hydrocarbonswith no carbon number preference (CPI = 1.1) and Cmax at
26. Petroleum biomarkers were not detectable but the alkanedistribution can be interpreted to be derived from dieselexhaust particulate matter (i.e., marine ship traffic) whichhad become resuspended from the sea surface by wind actionand had the volatiles removed by evaporation or once on thefilter by blow-off [Simoneit et al., 1991c]. The n-alkanoicacids derived from marine emissions are mainly composedof the homologs <C20 (Cmax = 16) with high contents ofalkenoic acids, especially palmitoleic acid (C16:1) commonin phytoplankton (compare Figure 8b). The saccharides andphthalates (Table 3) are found in most samples, but PAHs orother terrestrial tracers from urban anthropogenic activity arenot detectable. The sources of the sometimes dominantsaccharides are not clear at this time, they may have both aterrigenous and marine origin.
3.4. Emission Sources
[31] The organic compound groups characterized andquantitated for these aerosols can be apportioned to sevenemission sources and to significant oxidation reactionsduring long-range transport, which produces secondaryproducts. This apportionment is based on the extensiveemission profile studies of organic compound compositionscarried out for major stationary and fugitive sources in LosAngeles, CA and other regions [e.g., Rogge et al., 1991,1998; Fraser et al., 1998; Oros and Simoneit, 2000, 2001a,2001b; Simoneit, 1989, 1999, 2002]. The source strengthsin terms of organic compound tracers can thus be modeledand apportioned [Schauer et al., 1996]. These source groupsare summarized in Table 4 and plotted for selected samplesin Figure 9. The terrestrial natural background compoundsare the vascular plant wax lipids and they range from 4.6 to24% of the total identified compound mass (TCM) duringthe dust season (Table 5, especially G5, S2033, and C181 inFigures 9b–9d). The emissions from fossil fuel utilizationrange from 5–29% at Gosan and 19–58% of TCM atSapporo for petroleum markers and 0.0–2.6% of TCM atGosan and 0.3–2.9% at Sapporo for coal-derived PAHs(both coal and petroleum are summed in Figure 9). Thusthere is an additional input of petroleum hydrocarbons fromthe Sapporo urban area to the organic matter transportedover long range from Asia (Figure 9c). The high PAH levelscompared to the petroleum-derived alkanes and unresolvedcomplex mixture (UCM) of branched and cyclic hydro-carbons indicate coal as the major source for PAH [Orosand Simoneit, 2000]. Emissions from possible burning ofrefuse range from about 1 to 24% of TCM and probablyreflect the influences of local urban and onboard shipemissions (e.g., G5, S2033 and RB7 in Table 5 andFigures 9b, 9c, and 9f ).[32] Biomass burning, as reflected by wood smoke
markers accounts for 5–12% of TCM during the majordust period (G1–G20, S2033, S2039, and RB4–8 in Table 5and Figures 9a, 9c, and 9e). The value rises to 13% duringthe winter in Sapporo and has been reported at much higherlevels in other regions [e.g., Schauer et al., 2002]. Duringsummer the wood smoke impact decreases (<3% of TCM).The saccharides compose from 13 to 26% of TCM and haveisolated higher values over the ocean (up to 63%, Table 5,e.g., G1–G30, S2039, S2443, RB1–3 and RB8). Thesecompounds are interpreted to represent viable biomass as insoil and possibly in marine particulate matter. Saccharides
Figure 8. Salient features of the GC-MS data for totalextracts of marine aerosol samples (RB7) taken on board theR/V Ronald H. Brown from the North Pacific. (a) Total ioncurrent trace, (b) m/z 117 plot for n-alkanoic acids, (c) m/z85 plot for n-alkanes, and (d) m/z 75 plot for n-alkanols(numbers and symbols as in Figure 2).
D19S10 SIMONEIT ET AL.: MOLECULAR COMPOSITION OF ORGANIC AEROSOL
15 of 22
D19S10
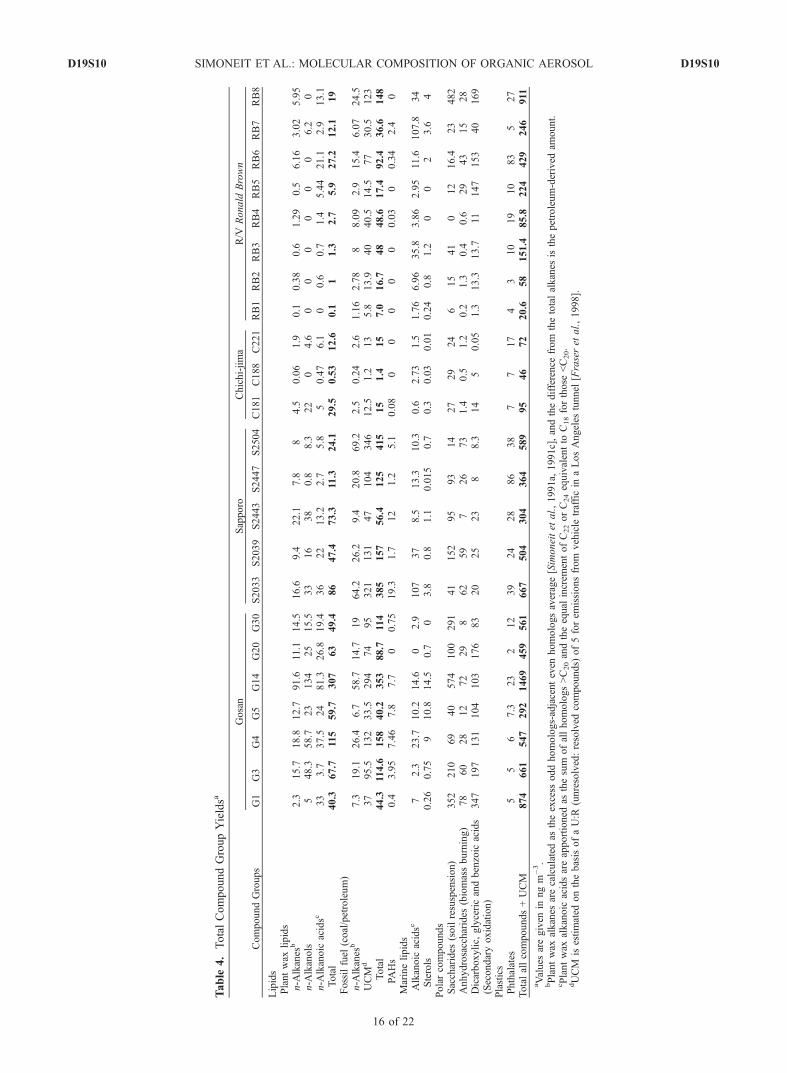
Table
4.TotalCompoundGroupYieldsa
CompoundGroups
Gosan
Sapporo
Chichi-jima
R/V
Ronald
Brown
G1
G3
G4
G5
G14
G20
G30
S2033
S2039
S2443
S2447
S2504
C181
C188
C221
RB1
RB2
RB3
RB4
RB5
RB6
RB7
RB8
Lipids
Plantwax
lipids
n-A
lkanes
b2.3
15.7
18.8
12.7
91.6
11.1
14.5
16.6
9.4
22.1
7.8
84.5
0.06
1.9
0.1
0.38
0.6
1.29
0.5
6.16
3.02
5.95
n-A
lkanols
548.3
58.7
23
134
25
15.5
33
16
38
0.8
8.3
22
04.6
00
00
00
6.2
0n-A
lkanoic
acidsc
33
3.7
37.5
24
81.3
26.8
19.4
36
22
13.2
2.7
5.8
50.47
6.1
00.6
0.7
1.4
5.44
21.1
2.9
13.1
Total
40.3
67.7
115
59.7
307
63
49.4
86
47.4
73.3
11.3
24.1
29.5
0.53
12.6
0.1
11.3
2.7
5.9
27.2
12.1
19
Fossilfuel
(coal/petroleum)
n-A
lkanes
b7.3
19.1
26.4
6.7
58.7
14.7
19
64.2
26.2
9.4
20.8
69.2
2.5
0.24
2.6
1.16
2.78
88.09
2.9
15.4
6.07
24.5
UCM
d37
95.5
132
33.5
294
74
95
321
131
47
104
346
12.5
1.2
13
5.8
13.9
40
40.5
14.5
77
30.5
123
Total
44.3
114.6
158
40.2
353
88.7
114
385
157
56.4
125
415
15
1.4
15
7.0
16.7
48
48.6
17.4
92.4
36.6
148
PAHs
0.4
3.95
7.46
7.8
7.7
00.75
19.3
1.7
12
1.2
5.1
0.08
00
00
00.03
00.34
2.4
0Marinelipids
Alkanoic
acidsc
72.3
23.7
10.2
14.6
02.9
107
37
8.5
13.3
10.3
0.6
2.73
1.5
1.76
6.96
35.8
3.86
2.95
11.6
107.8
34
Sterols
0.26
0.75
910.8
14.5
0.7
03.8
0.8
1.1
0.015
0.7
0.3
0.03
0.01
0.24
0.8
1.2
00
23.6
4Polarcompounds
Saccharides
(soilresuspension)
352
210
69
40
574
100
291
41
152
95
93
14
27
29
24
615
41
012
16.4
23
482
Anhydrosaccharides
(biomassburning)
78
60
28
12
72
29
862
59
726
73
1.4
0.5
1.2
0.2
1.3
0.4
0.6
29
43
15
28
Dicarboxylic,
glycericandbenzoic
acids
347
197
131
104
103
176
83
20
25
23
88.3
14
50.05
1.3
13.3
13.7
11
147
153
40
169
(Secondaryoxidation)
Plastics
Phthalates
55
67.3
23
212
39
24
28
86
38
77
17
43
10
19
10
83
527
Totalallcompounds+UCM
874
661
547
292
1469
459
561
667
504
304
364
589
95
46
72
20.6
58
151.4
85.8
224
429
246
911
aValues
aregiven
inngm
�3.
bPlantwax
alkanes
arecalculatedas
theexcess
oddhomologs-adjacenteven
homologsaverage[Simoneitet
al.,1991a,
1991c],andthedifference
from
thetotalalkanes
isthepetroleum-derived
amount.
cPlantwax
alkanoic
acidsareapportioned
asthesum
ofallhomologs>C20andtheequal
increm
entofC22orC24equivalentto
C18forthose
<C20.
dUCM
isestimated
onthebasisofaU:R
(unresolved:resolved
compounds)
of5forem
issionsfrom
vehicle
trafficin
aLosAngeles
tunnel
[Fraseret
al.,1998].
D19S10 SIMONEIT ET AL.: MOLECULAR COMPOSITION OF ORGANIC AEROSOL
16 of 22
D19S10
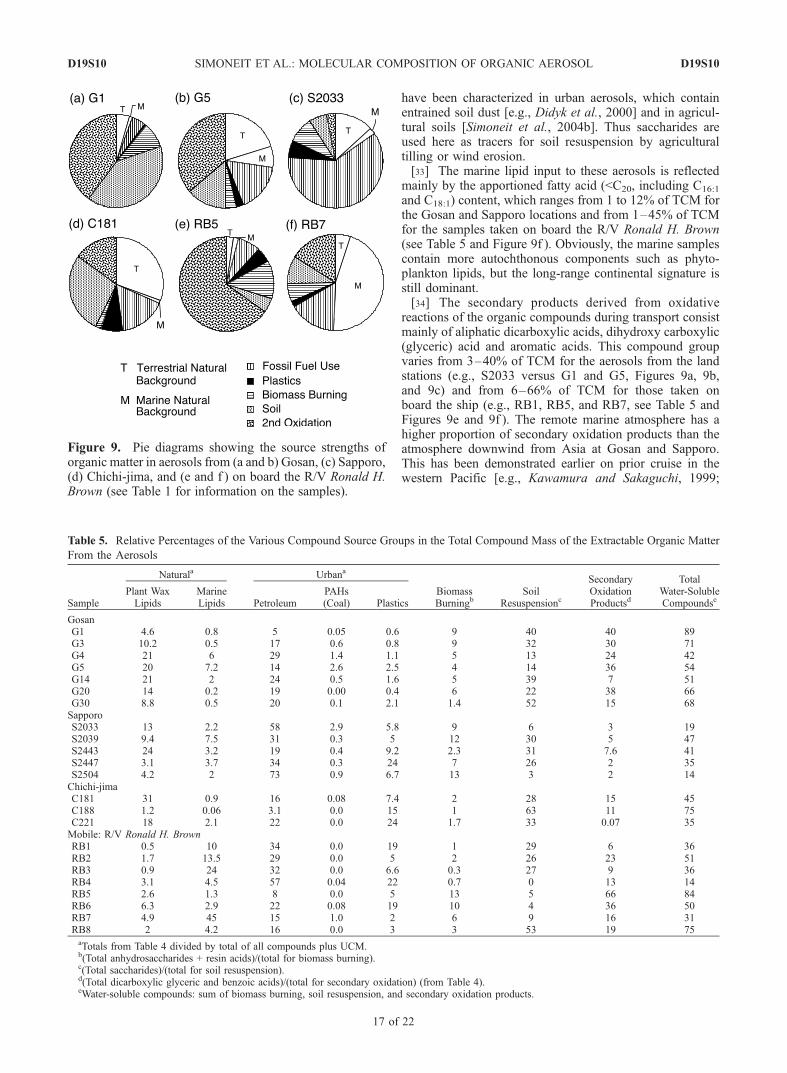
have been characterized in urban aerosols, which containentrained soil dust [e.g., Didyk et al., 2000] and in agricul-tural soils [Simoneit et al., 2004b]. Thus saccharides areused here as tracers for soil resuspension by agriculturaltilling or wind erosion.[33] The marine lipid input to these aerosols is reflected
mainly by the apportioned fatty acid (<C20, including C16:1
and C18:1) content, which ranges from 1 to 12% of TCM forthe Gosan and Sapporo locations and from 1–45% of TCMfor the samples taken on board the R/V Ronald H. Brown(see Table 5 and Figure 9f ). Obviously, the marine samplescontain more autochthonous components such as phyto-plankton lipids, but the long-range continental signature isstill dominant.[34] The secondary products derived from oxidative
reactions of the organic compounds during transport consistmainly of aliphatic dicarboxylic acids, dihydroxy carboxylic(glyceric) acid and aromatic acids. This compound groupvaries from 3–40% of TCM for the aerosols from the landstations (e.g., S2033 versus G1 and G5, Figures 9a, 9b,and 9c) and from 6–66% of TCM for those taken onboard the ship (e.g., RB1, RB5, and RB7, see Table 5 andFigures 9e and 9f ). The remote marine atmosphere has ahigher proportion of secondary oxidation products than theatmosphere downwind from Asia at Gosan and Sapporo.This has been demonstrated earlier on prior cruise in thewestern Pacific [e.g., Kawamura and Sakaguchi, 1999;
Figure 9. Pie diagrams showing the source strengths oforganic matter in aerosols from (a and b) Gosan, (c) Sapporo,(d) Chichi-jima, and (e and f ) on board the R/V Ronald H.Brown (see Table 1 for information on the samples).
Table 5. Relative Percentages of the Various Compound Source Groups in the Total Compound Mass of the Extractable Organic Matter
From the Aerosols
Sample
Naturala Urbana
BiomassBurningb
SoilResuspensionc
SecondaryOxidationProductsd
TotalWater-SolubleCompoundse
Plant WaxLipids
MarineLipids Petroleum
PAHs(Coal) Plastics
GosanG1 4.6 0.8 5 0.05 0.6 9 40 40 89G3 10.2 0.5 17 0.6 0.8 9 32 30 71G4 21 6 29 1.4 1.1 5 13 24 42G5 20 7.2 14 2.6 2.5 4 14 36 54G14 21 2 24 0.5 1.6 5 39 7 51G20 14 0.2 19 0.00 0.4 6 22 38 66G30 8.8 0.5 20 0.1 2.1 1.4 52 15 68SapporoS2033 13 2.2 58 2.9 5.8 9 6 3 19S2039 9.4 7.5 31 0.3 5 12 30 5 47S2443 24 3.2 19 0.4 9.2 2.3 31 7.6 41S2447 3.1 3.7 34 0.3 24 7 26 2 35S2504 4.2 2 73 0.9 6.7 13 3 2 14Chichi-jimaC181 31 0.9 16 0.08 7.4 2 28 15 45C188 1.2 0.06 3.1 0.0 15 1 63 11 75C221 18 2.1 22 0.0 24 1.7 33 0.07 35Mobile: R/V Ronald H. BrownRB1 0.5 10 34 0.0 19 1 29 6 36RB2 1.7 13.5 29 0.0 5 2 26 23 51RB3 0.9 24 32 0.0 6.6 0.3 27 9 36RB4 3.1 4.5 57 0.04 22 0.7 0 13 14RB5 2.6 1.3 8 0.0 5 13 5 66 84RB6 6.3 2.9 22 0.08 19 10 4 36 50RB7 4.9 45 15 1.0 2 6 9 16 31RB8 2 4.2 16 0.0 3 3 53 19 75aTotals from Table 4 divided by total of all compounds plus UCM.b(Total anhydrosaccharides + resin acids)/(total for biomass burning).c(Total saccharides)/(total for soil resuspension).d(Total dicarboxylic glyceric and benzoic acids)/(total for secondary oxidation) (from Table 4).eWater-soluble compounds: sum of biomass burning, soil resuspension, and secondary oxidation products.
D19S10 SIMONEIT ET AL.: MOLECULAR COMPOSITION OF ORGANIC AEROSOL
17 of 22
D19S10
Sempere and Kawamura, 2003]. The terrestrial compoundshave been subjected to thorough oxidation during transportas also supported by low concentrations of unsaturatedfatty acids.
3.5. Water-Soluble Organic Compounds
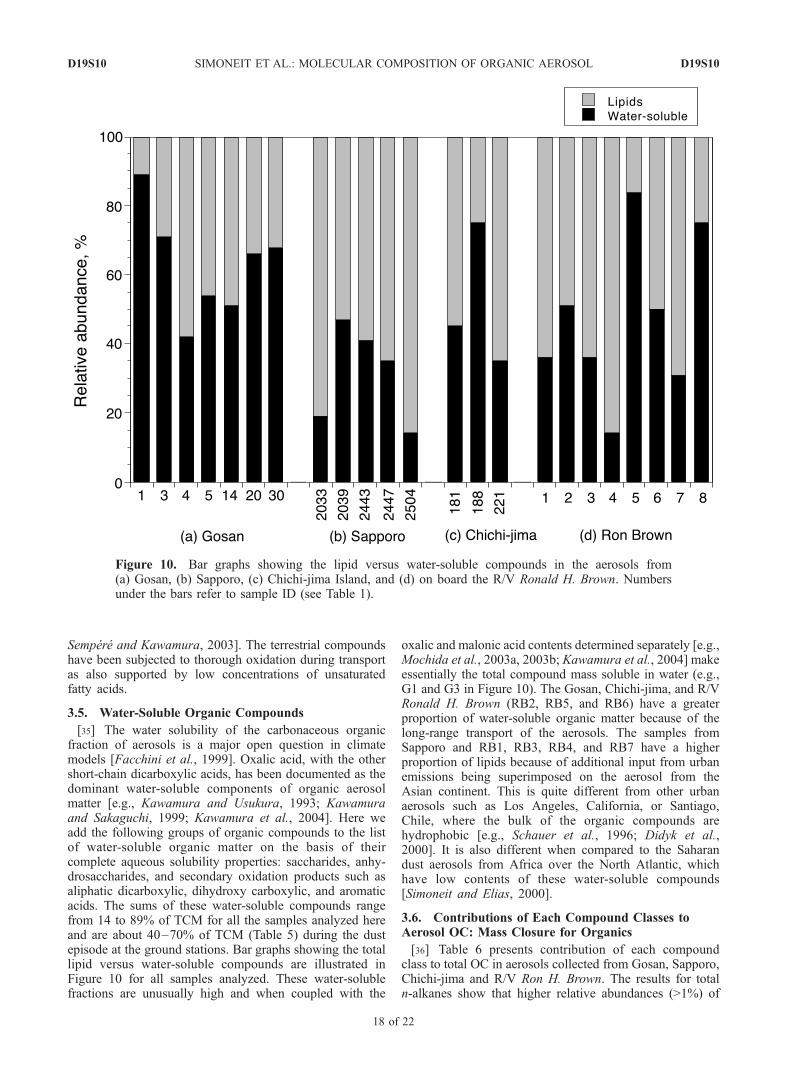
[35] The water solubility of the carbonaceous organicfraction of aerosols is a major open question in climatemodels [Facchini et al., 1999]. Oxalic acid, with the othershort-chain dicarboxylic acids, has been documented as thedominant water-soluble components of organic aerosolmatter [e.g., Kawamura and Usukura, 1993; Kawamuraand Sakaguchi, 1999; Kawamura et al., 2004]. Here weadd the following groups of organic compounds to the listof water-soluble organic matter on the basis of theircomplete aqueous solubility properties: saccharides, anhy-drosaccharides, and secondary oxidation products such asaliphatic dicarboxylic, dihydroxy carboxylic, and aromaticacids. The sums of these water-soluble compounds rangefrom 14 to 89% of TCM for all the samples analyzed hereand are about 40–70% of TCM (Table 5) during the dustepisode at the ground stations. Bar graphs showing the totallipid versus water-soluble compounds are illustrated inFigure 10 for all samples analyzed. These water-solublefractions are unusually high and when coupled with the
oxalic and malonic acid contents determined separately [e.g.,Mochida et al., 2003a, 2003b; Kawamura et al., 2004] makeessentially the total compound mass soluble in water (e.g.,G1 and G3 in Figure 10). The Gosan, Chichi-jima, and R/VRonald H. Brown (RB2, RB5, and RB6) have a greaterproportion of water-soluble organic matter because of thelong-range transport of the aerosols. The samples fromSapporo and RB1, RB3, RB4, and RB7 have a higherproportion of lipids because of additional input from urbanemissions being superimposed on the aerosol from theAsian continent. This is quite different from other urbanaerosols such as Los Angeles, California, or Santiago,Chile, where the bulk of the organic compounds arehydrophobic [e.g., Schauer et al., 1996; Didyk et al.,2000]. It is also different when compared to the Saharandust aerosols from Africa over the North Atlantic, whichhave low contents of these water-soluble compounds[Simoneit and Elias, 2000].
3.6. Contributions of Each Compound Classes toAerosol OC: Mass Closure for Organics
[36] Table 6 presents contribution of each compoundclass to total OC in aerosols collected from Gosan, Sapporo,Chichi-jima and R/V Ron H. Brown. The results for totaln-alkanes show that higher relative abundances (>1%) of
Figure 10. Bar graphs showing the lipid versus water-soluble compounds in the aerosols from(a) Gosan, (b) Sapporo, (c) Chichi-jima Island, and (d) on board the R/V Ronald H. Brown. Numbersunder the bars refer to sample ID (see Table 1).
D19S10 SIMONEIT ET AL.: MOLECULAR COMPOSITION OF ORGANIC AEROSOL
18 of 22
D19S10

OC were found in the aerosols from ground stations atGosan and Sapporo, whereas those of Chichi-jima and RonBrown samples are less than 0.6%. UCM hydrocarbons offossil fuel combustion origin are found to compose 0.4–6.6% of aerosol OC, where the highest value (6.6%) wasobtained in Sapporo and the lowest value (0.4%) was inChichi-jima. The values from Sapporo are similar withthose (1–6%, average 4%) reported for the aerosols fromTokyo [Kawamura et al., 1995]. This indicates that localemissions of UCM hydrocarbons from fossil fuel combus-tion sources largely contribute to OC in the urban atmo-sphere. Relatively high UCM/OC ratios were also obtainedat Gosan and the offshore of Japanese Islands during thecruise of R/V Ron Brown. This indicates that anthropogeniccombustion sources also affect on the organic composition ofremote aerosols. Other class of compounds that importantlycontribute to OC includes biogenic fatty acids (0.2–1.6%),photochemically derived diacids (0.003–1.7%), n-alcohols(0.04–1.5%), anhydrosaccharides (0.003–0.78%), saccha-rides (0.1–2.5%) and phthalates (0.02–4.1%). However,sum of these organic compounds determined account foronly less than 16% of OC.[37] Although oxalic acid that is the most abundant diacid
species was not determined in this study and malonic acid ispossibly underestimated as stated above, optimal contribu-tion of these diacids to OC should be less than 10%[Kawamura and Ikushima, 1993;Kawamura and Sakaguchi,1999]. With the consideration of oxalic and malonic acids,the maximum total amounts of identifiable organic com-pounds are at most 26% of OC. This indicates that majorportion (three quarters) of organic aerosols studied in theAsian Pacific region is unknown in terms of chemicalstructures. They may include amino acids, peptides, amines,and fulvic and humic acids, etc. Our organic analyticalstudy demonstrates that soil-derived organic materials aresometimes detected as major species in aerosols (seeFigures 9a and 9d), suggesting that humic substances maysubstantially be present in atmospheric particles and signif-icantly contribute to the aerosol OC. Humic and fulvic acidsare one of the most abundant organic fractions of soilorganic matter as well as humin (kerogen) [e.g., Schnitzerand Khan, 1972; Stevenson, 1982]. Thus humic materialsmay be emitted to the atmosphere during strong winds,
followed by uplift process of air mass and be subjected tolong-range atmospheric transport. It is of interest to notethat organic carbon is enriched in fine aerosol fraction whensoil particles are emitted to the air under a strong windcondition [Zenchelsky et al., 1976].[38] Matsumoto et al. [2001] isolated fatty acids collected
in June 1999 from Sapporo and conducted compound-specific radiocarbon analysis of individual fatty acids usingaccelerator mass spectrometry (AMS). They found that 14Cages of C24 plus C26 fatty acids to be 5860 (±200) years,suggesting that these terrestrial fatty acids had been storedin geochemical reservoirs such as soils at least for hundredsto thousands of years and then emitted to the atmospherefollowed by long-range atmospheric transport from theAsian continent. They also analyzed the humic-like sub-stances for 14C, which were left in the acidified fraction ofthe CH2Cl2/methanol extracts of the aerosols after the fattyacids were removed. The humic-like substances are insol-uble in acidified solution and nonextractable with CH2Cl2.They were isolated, converted to CO2, and then subjected toAMS measurement. The humic-like substances showed anage of ca. 5000 years, again suggesting that aerosol particlescontain fairly old carbons probably derived from aged soilorganic matter transported long distances from the Asiancontinent.
4. Conclusions
[39] The primary inputs of organic compounds to ACE-Asia aerosols are as follows: (1) natural emissions ofterrestrial plant wax and marine lipids based on the alkanoicacid, alkanol, and alkane distributions; (2) smoke frombiomass burning (mainly nonconifer fuels) using levoglu-cosan and dehydroabietic acid as the tracers; (3) soilresuspension due to spring agricultural activity as inferredfrom major primary and reduced sugars (e.g., sucrose,glucose, sorbitol); and (4) urban/industrial emissions fromfossil fuel use based on the biomarkers in this case fromcoal and petroleum. Significant secondary products derivefrom the oxidation of atmospheric organic matter duringlong-range transport and consist of dicarboxylic acids,aromatic acids, and hydroxy carboxylic acids (e.g., glycericacid).
Table 6. Contribution of Each Organic Compound Class to Total Organic Carbon in Aerosolsa
Compound ClassbGosan Sapporo Chichi-jima R/V Ron H. Brown
Range Average Range Average Range Average Range Average
Total n-alkanes 0.1–1.7 0.57 0.53–1.6 1.0 0.09–0.50 0.34 0.07–0.57 0.34UCM hydrocarbons (fossil fuel)c 0.44–3.3 1.3 1.0–6.6 3.4 0.37–1.5 0.86 0.87–2.5 1.4Wax alkanes (higher plant) 0.03–1.0 0.31 0.10–0.47 0.26 0.02–0.86 0.36 0.01–0.10 0.06PAHs (combustion) 0.00–0.20 0.07 0.02–0.29 0.13 0.005 0.005 0.002–0.09 0.03Fatty acids (biogenic) 0.31–0.98 0.58 0.27–1.0 0.62 0.31–1.6 0.78 0.16–1.1 0.82Diacids (C3-C8) 0.60–1.7 0.96 0.07–0.24 0.15 0.003–0.43 0.39 0.20–1.1 0.79n-Alcohols (higher plant) 0.06–1.5 0.56 0.04–0.77 0.27 0.04–1.3 0.89 0.34 0.34Anhydrosaccharides (biomass burning) 0.14–0.49 0.29 0.07–0.78 0.44 0.04–0.08 0.06 0.003–0.37 0.18Other saccharides 0.3–2.0 1.2 0.12–2.5 0.94 0.80–1.2 2.1 0.1–1.7 0.69Lignin products 0.01–0.06 0.03 0.01–0.04 0.03 0.03–0.52 0.21 0.02–0.14 0.06Phthalates (plasticizer) 0.02–0.23 0.09 0.21–4.1 1.1 0.31–1.7 1.2 0.12–1.2 0.52Total compounds 3.8–12 6.0 4.3–16 8.1 4.5–9.3 6.6 2.8–5.7 4.9
aValues are given in percent. Results for minor species such as steroidal alcohols, benzoic acid, glyceric acid, and dehydroabietic acid are not presentedhere. However, they are all included in total compounds as shown above.
bCompound concentrations (ngC m�3) were calculated for each species and then divided by OC (mgC m�3).cUCM hydrocarbon-carbon was calculated assuming that UCM carbon/mass ratio is equivalent to that of C28 alkane. See Table 4 for UCM data.
D19S10 SIMONEIT ET AL.: MOLECULAR COMPOSITION OF ORGANIC AEROSOL
19 of 22
D19S10
[40] The organic compound compositions of these sam-ples are very different from those reported for aerosolparticles of the Atlantic Ocean [Simoneit and Elias, 2000]and from the data reported earlier for the Pacific [e.g.,Gagosian et al., 1981]. The major external sources recog-nized in these samples are: (1) the plant wax compositionwhich fits with an origin from the deserts of northwesternChina; (2) high levels of tracers from biomass-burningsmoke and from agricultural soil resuspension; and (3) highlevels of PAHs mainly from coal combustion. The water-soluble fraction of the total organic matter is high andconsists of the saccharides, anhydrosaccharides, and thesecondary dicarboxylic acids. The organic source apportion-ment needs to be coupled with the inorganic/mineralogicalcomposition data to provide the appropriate weighting ofdesert dust versus soil dust.[41] Comparison of each compound class to OC further
supported the source strength and source apportionmentobtained by the molecular signature and concentrations.Although measured compound classes in the aerosolsexplained up to 16% of OC, a mass closure approach fororganic compounds demonstrated that we still have asignificant fraction (>80% of OC) whose chemical struc-tures are unknown. Our molecular analyses of organicaerosols suggest that this fraction may contain soil-derivedorganic geopolymers such as humic and fulvic acids that areabundantly present in soil reservoirs and can be emitted tothe atmosphere by wind motions.
[42] Acknowledgments. We thank N. Tsubonuma, G. Lee, and T. M.Bates for sample acquisition and technical assistance. We also acknowledgetwo anonymous reviewers for their useful comments. Financial support forthis work from the Ministry of Education, Culture, Sports, Science andTechnology (grants-in-aid 01470041 and 14204055 to K. Kawamura) andthe U.S. National Science Foundation (grant ATM-0002075) to B. R. T.Simoneit is gratefully acknowledged. This research is a contribution to theInternational Global Atmospheric Chemistry (IGAC) Core Project of theInternational Geosphere Biosphere Program (IGBP) and is part of the IGACAerosol Characterization Experiments (ACE).
ReferencesAbas, M., B. R. T. Simoneit, V. Elias, J. A. Cabral, and J. N. Cardoso (1995),Composition of higher molecular weight organic matter in smoke aerosolfrom biomass combustion in Amazonia, Chemosphere, 30, 995–1015.
Abelson, P. H. (1998), Airborne particulate matter, Science, 281, 1609.Andreae, M. O. (1996), Raising dust in the greenhouse, Nature, 380, 389–390.
Arpino, P., A. van Dorsselaer, K. D. Sevier, and G. Ourisson (1972), Ciresaeriennes dans une foret de Pins, C. R. Seances Acad. Sci., Ser. D, 275,2837–2840.
Artaxo, P., F. Gerab, M. A. Yamasoe, and J. V. Martins (1994), Fine modeaerosol composition at three long-term atmospheric monitoring sites inthe Amazon Basin, J. Geophys. Res., 99, 22,857–22,868.
Aston, S. R., R. Chester, L. R. Johnson, and R. C. Padgham (1973), Eoliandust from the lower atmosphere of the eastern Atlantic and IndianOceans, China Sea and Sea of Japan, Mar. Geol., 14, 15–28.
Buat-Menard, P., H. Cachier, and R. Chesselet (1989), Sources of particu-late carbon in the marine atmosphere, in Chemical Oceanography,vol. 10, edited by J. P. Riley, R. Chester, and R. A. Duce, pp. 252–279,Academic, San Diego, Calif.
Charlson, R. J., S. E. Schwartz, J. M. Hales, R. D. Cess, J. A. Coakley Jr.,J. E. Hansen, and D. J. Hofmann (1992), Climate forcing by anthropo-genic aerosols, Science, 255, 423–430.
Chester, R., H. Elderfield, J. J. Griffin, L. R. Johnson, and R. C. Padgham(1972), Eolian dust along the eastern margins of the Atlantic Ocean, Mar.Geol., 13, 91–105.
Cox, R. E., M. A. Mazurek, and B. R. T. Simoneit (1982), Lipids inHarmattan aerosols of Nigeria, Nature, 296, 848–849.
Crutzen, P. J., and M. O. Andreae (1990), Biomass burning in the tropics:Impact on atmospheric chemistry and biogeochemical cycles, Science,250, 1669–1678.
da Cunha, L. C., L. Serve, and J.-L. Blazi (2002), Neutral sugars as bio-markers in the particulate organic matter of a French Mediterranean river,Org. Geochem., 33, 953–964.
D’Almeida, G. A. (1986), A model for Saharan dust transport, J. Clim.Appl. Meteorol., 24, 903–916.
Darwin, C. (1846), An account of the fine dust which often falls on vesselsin the Atlantic Ocean, Q. J. Geol. Soc. London, 2, 26–30.
Delany, A. C., A. C. Delany, D. W. Parkin, J. J. Griffin, E. D. Goldberg, andB. E. F. Reimann (1967), Airborne dust collected at Barbados, Geochim.Cosmochim. Acta, 31, 885–909.
Didyk, B. M., B. R. T. Simoneit, L. A. Pezoa, M. L. Riveros, and A. A.Flores (2000), Urban aerosol particles of Santiago, Chile: Organic contentand molecular characterization, Atmos. Environ., 34, 1167–1179.
Ehrenberg, C. (1847), Passatstaub und Blutregen, Abh. K. Akad. Wiss.Berlin, 32, 269–460.
Facchini, M. C., M. Mircea, S. Fuzzi, and R. J. Charlson (1999), Cloudalbedo enhancement by surface-active organic solutes in growing droplets,Nature, 400, 257–259.
Fraser, M. P., and K. Lakshmanan (2000), Using levoglucosan as a mole-cular marker for the long-range transport of biomass combustion aero-sols, Environ. Sci. Technol., 34, 4560–4564.
Fraser, M. P., G. R. Cass, and B. R. T. Simoneit (1998), Gas-phase andparticle-phase organic compounds emitted from motor vehicle traffic ina Los Angeles roadway tunnel, Environ. Sci. Technol., 32, 2051–2060.
Fu, J. M., G. Y. Sheng, Y. Chen, X. M. Wang, Y. S. Min, P. A. Peng,S. C. Lee, L. Y. Chan, Z. S. Wang (1997), Preliminary study oforganic pollutants in air of Guangzhou, Hong Kong, and Macao, inMolecular Markers in Environmental Geochemistry, Am. Chem. Soc.Symp. Ser., vol. 671, edited by R. P. Eganhouse, pp. 164–176, Am.Chem. Soc., Washington, D. C.
Gagosian, R. B., and E. T. Peltzer (1986), The importance of atmosphericinput of terrestrial organic material to deep sea sediments, Org. Geo-chem., 10, 661–669.
Gagosian, R. B., E. T. Peltzer, and O. C. Zafiriou (1981), Atmospherictransport of continentally derived lipids to the tropical North Pacific,Nature, 291, 321–324.
Gagosian, R. B., O. C. Zafiriou, E. T. Peltzer, and J. B. Alford (1982),Lipids in aerosols from the tropical North Pacific: Temporal variability,J. Geophys. Res., 87, 11,133–11,144.
Gagosian, R. B., E. T. Peltzer, and J. T. Merrill (1987), Long-range trans-port of terrestrially derived lipids in aerosols from the South Pacific,Nature, 325, 800–803.
Glaccum, R. A., and J. M. Prospero (1980), Saharan aerosols over thetropical North Atlantic-mineralogy, Mar. Geol., 37, 295–321.
Gleixner, G., N. Poirier, R. Bol, and J. Balesdent (2002), Molecular dy-namics of organic matter in a cultivated soil, Org. Geochem., 33, 357–366.
Griffin, D. W., C. A. Kellogg, V. H. Garrison, and E. A. Shinn (2002), Theglobal transport of dust, Am. Sci., 90, 228–235.
Hannigan, M. P., G. R. Cass, B. W. Penman, C. L. Crespi, A. L. Lafleur,W. F. Busby Jr., W. G. Thilly, and B. R. T. Simoneit (1998), Bioassay-directed chemical analysis of Los Angeles airborne particulate matterusing a human cell mutagenicity assay, Environ. Sci. Technol., 32,3502–3514.
Hawthorne, S. B., D. J. Miller, R. M. Barkley, and M. S. Krieger (1988),Identification of methoxylated phenols as candidate tracers for atmo-spheric wood smoke pollution, Environ. Sci. Technol., 22, 1191–1196.
Huebert, B. J., T. Bates, P. B. Russell, G. Shi, Y. J. Kim, K. Kawamura,G. Carmichael, and T. Nakajima (2003), An overview of ACE-Asia:Strategies for quantifying the relationships between Asian aerosols andtheir climatic impacts, J. Geophys. Res., 108(D23), 8633, doi:10.1029/2003JD003550.
Husar, R. B., J. M. Prospero, and L. L. Stowe (1997), Characterization oftropospheric aerosols over the oceans with the NOAA advanced veryhigh resolution radiometer optical thickness operational product, J. Geo-phys. Res., 102, 16,889–16,909.
Intergovernmental Panel on Climate Change (1995), Climate Change,1994: Radiative Forcing of Climate Change and an Evaluation of theIPCC IS92 Emission Scenarios, edited by J. T. Houghton et al., Cam-bridge Univ. Press, New York.
Karasek, F. W., and H. Y. Tong (1985), Semi-preparative high-performanceliquid chromatographic analysis of complex organic mixtures, J. Chro-matogr., 332, 169–179.
Kawamura, K., and R. B. Gagosian (1987), Implication of w-oxocarboxylicin the remote marine atmosphere for photo-oxidation of unsaturated fattyacids, Nature, 325, 330–332.
Kawamura, K., and R. B. Gagosian (1990), Atmospheric transport of soil-derived dicarboxylic acids over the North Pacific Ocean, Naturwis-senschaften, 77, 25–27.
D19S10 SIMONEIT ET AL.: MOLECULAR COMPOSITION OF ORGANIC AEROSOL
20 of 22
D19S10
Kawamura, K., and K. Ikushima (1993), Seasonal changes in the distribu-tion of dicarboxylic acids in the urban atmosphere, Environ. Sci. Tech-nol., 27, 2227–2235.
Kawamura, K., and F. Sakaguchi (1999), Molecular distributions of watersoluble dicarboxylic acids in marine aerosols over the Pacific Oceanincluding tropics, J. Geophys. Res., 104, 3501–3509.
Kawamura, K., and K. Usukura (1993), Distributions of low molecularweight dicarboxylic acids in the North Pacific aerosol samples, J. Ocean-ogr., 49, 271–283.
Kawamura, K., M. Kosaka, and R. Sempere (1995), Distributions andseasonal changes of hydrocarbons in urban aerosols and rainwaters (inJapanese), Geochemistry (Tokyo), 29, 1–15.
Kawamura, K., Y. Ishimura, and K. Yamazaki (2003), Four year observa-tion of terrestrial lipid class compounds in marine aerosols from thewestern North Pacific, Global Biogeochem. Cycles, 17(1), 1003,doi:10.1029/2001GB001810.
Kawamura, K., M. Kobayashi, N. Tsubonuma, M. Mochida, T. Watanabe,and M. Lee (2004), Organic and inorganic compositions of marine aero-sols from east Asia: Seasonal variations of water-soluble dicarboxylicacids, major ions, total carbon and nitrogen, and stable C and N isotopiccomposition, in Geochemical Investigations in Earth and Space Science:A Tribute to Isaac R. Kaplan, Geochem. Soc. Spec. Publ. Ser., vol. 6,edited by R. J. Hill et al., pp. 243–265, Elsevier Sci., New York.
Lane, D. A. (1989), The fate of polycyclic aromatic compounds in theatmosphere and during sampling, in Chemical Analysis of PolycyclicAromatic Compounds, Chem. Anal., vol. 101, edited by T. Vo-Dinh,pp. 31–58, John Wiley, Hoboken, N. J.
Levine, J. S. (Ed.) (1991), Global Biomass Burning: Atmospheric, Cli-matic, and Biospheric Implications, MIT Press, Cambridge, Mass.
Levine, J. S. (Ed.) (1996), Biomass Burning and Global Change, MITPress, Cambridge, Mass.
Li, X., H. Maring, D. Savoie, K. Voss, and J. M. Prospero (1996), Dom-inance of mineral dust in aerosol light-scattering in the North Atlantictrade winds, Nature, 380, 416–419.
Lim, J.-J., B. J. Turpin, L. M. Russell, and T. S. Bates (2003), Organic andelemental carbon measurements during ACE-Asia suggest a long atmo-spheric lifetime for elemental carbon, Environ. Sci. Technol., 37, 3055–3061.
Matsumoto, K., K. Kawamura, M. Uchida, Y. Shibata, and M. Yoneda(2001), Compound specific radiocarbon and d13C measurements of fattyacids in a continental aerosol sample,Geophys. Res. Lett., 28, 4587–4590.
Mazurek, M. A., and B. R. T. Simoneit (1997), Higher molecular weightterpenoids as indicators of organic emissions from terrestrial vegetation,in Molecular Markers in Environmental Geochemistry, Am. Chem. Soc.Symp. Ser., vol. 671, edited by R. P. Eganhouse, pp. 92–108, Am. Chem.Soc., Washington, D. C.
Mochida, M., A. Kawabata, K. Kawamura, H. Hatsushika, and K. Yamazaki(2003a), Seasonal variation and origins of dicarboxylic acids in the marineatmosphere over the western North Pacific, J. Geophys. Res., 108(D6),4193, doi:10.1029/2002JD002355.
Mochida, M., N. Umemoto, M. Kobayashi, S. Matsunage, K. Kawamura,T. S. Bates, and B. R. T. Simoneit (2003b), Spatial distribution of oxyge-nated organic compounds (dicarboxylic acids, fatty acids and levogluco-san) in marine aerosols over the western Pacific and off the coast of eastAsia: Continental outflow of organic aerosols during the ACE-Asia cam-paign, J. Geophys. Res., 108(D23), 8638, doi:10.1029/2002JD003249.
Moulin, C., C. E. Lambert, F. Dulac, and U. Dayan (1997), Control ofatmospheric export of dust from North Africa by the North AtlanticOscillation, Nature, 387, 691–694.
Okuda, T., H. Kumata, H. Naraoka, and H. Takada (2002), Origin of atmo-spheric polycyclic aromatic hydrocarbons (PAHs) in Chinese citiessolved by compound-specific stable carbon isotopic analyses, Org. Geo-chem., 33, 1737–1745.
Oros, D. R., and B. R. T. Simoneit (2000), Identification and emission ratesof molecular tracers in coal smoke particulate matter, Fuel, 79, 515–536.
Oros, D. R., and B. R. T. Simoneit (2001a), Identification and emissionfactors of molecular tracers in organic aerosols from biomass burning:Part 1. Temperate climate conifers, Appl. Geochem., 16, 1513–1544.
Oros, D. R., and B. R. T. Simoneit (2001b), Identification and emissionfactors of molecular tracers in organic aerosols from biomass burning:Part 2. Deciduous trees, Appl. Geochem., 16, 1513–1544.
Parkin, D. W., D. R. Phillips, R. A. L. Sullivan, and L. R. Johnson (1972),Airborne dust collections down the Atlantic, Q. J. R. Meteorol. Soc., 75,375–400.
Penner, J. E. (1995), Carbonaceous aerosols influencing atmospheric radia-tion: Black and organic carbon, in Aerosol Forcing of Climate, Environ.Sci. Res. Rep., vol. 17, edited by R. Charlson and J. Heintzenberg,pp. 91–108, John Wiley, Hoboken, N. J.
Penner, J. E., R. J. Charlson, J. M. Hales, N. Laulainen, R. Leifer,T. Novakov, J. Ogren, L. F. Radke, S. E. Schwartz, and L. Travis
(1994), Quantifying and minimizing uncertainty of climate forcing byanthropogenic aerosols, Bull. Am. Meteorol. Soc., 75, 375–400.
Prospero, J. M. (1996a), The atmospheric transport of particles to theOcean, in Particle Flux in the Ocean, edited by V. Ittekot et al.,pp. 19–56, John Wiley, Hoboken, N. J.
Prospero, J. M. (1996b), Saharan dust transport over the North AtlanticOcean and Mediterranean: An overview, in The Impact of Desert DustAcross the Mediterranean, edited by S. Guerzoni and R. Chester, pp.133–151, Kluwer Acad., Norwell, Mass.
Prospero, J. M. (2001), African dust in America, Geotimes, 46(11), 24–27.Prospero, J. M., E. Bonatti, C. Schubert, and T. N. Carlson (1970), Dust inthe Caribbean atmosphere traced to an African dust storm, Earth Planet.Sci. Lett., 9, 287–293.
Prospero, J. M., K. Barrett, T. Church, F. Dentener, R. A. Duce, J. N.Galloway, H. Levy II, J. Moody, and P. Quinn (1996), Atmosphericdeposition of nutrients to the North Atlantic Basin, Biogeochem., 35,27–73.
Rogge, W. F., L. M. Hildemann, M. A. Mazurek, G. R. Cass, and B. R. T.Simoneit (1991), Sources of fine organic aerosol: 1. Charbroilers andmeat cooking operations, Environ. Sci. Technol., 25, 1112–1125.
Rogge, W. F., L. M. Hildemann, M. A. Mazurek, G. R. Cass, and B. R. T.Simoneit (1998), Sources of fine organic aerosol: 9. Pine, oak and syn-thetic log combustion in residential fireplaces, Environ. Sci. Technol., 32,13–22.
Schauer, J. J., W. F. Rogge, L. M. Hildemann, M. A. Mazurek, G. R. Cass,and B. R. T. Simoneit (1996), Source apportionment of airborne particu-late matter using organic compounds as tracers, Atmos. Environ., 30,3837–3855.
Schauer, J. J., M. J. Kleeman, G. R. Cass, and B. R. T. Simoneit (1999),Measurement of emissions from air pollution sources: 1. C1 through C29
organic compounds from meat charbroiling, Environ. Sci. Technol., 33,1566–1577.
Schauer, J. J., M. P. Fraser, G. R. Cass, and B. R. T. Simoneit (2002),Source reconciliation of atmospheric gas-phase and particle-phase pollu-tants during a severe photochemical smog episode, Environ. Sci. Tech-nol., 36, 3806–3814.
Schnitzer, M., and S. U. Khan (1972), Humic Substances in the Environ-ment, 327 pp., Marcel Dekker, New York.
Seinfeld, J. H., and S. N. Pandis (1998), Atmospheric Chemistry andPhysics, John Wiley, Hoboken, N. J.
Sempere, R., and K. Kawamura (2003), Trans-hemispheric contribution ofC2-C10 a,w-dicarboxylic acids and related polar compounds to watersoluble organic carbon in the western Pacific aerosols in relation tophotochemical oxidation reactions, Global Biogeochem. Cycles, 17(2),1069, doi:10.1029/2002GB001980.
Sheesley, R. J., J. J. Schauer, Z. Chowdhury, G. R. Cass, and B. R. T.Simoneit (2003), Characterization of organic aerosols emitted from thecombustion of biomass indigenous to South Asia, J. Geophys. Res.,108(D9), 4285, doi:10.1029/2002JD002981.
Simoneit, B. R. T. (1977), Organic matter in eolian dusts over the AtlanticOcean, Mar. Chem., 5, 443–464.
Simoneit, B. R. T. (1979), Biogenic lipids in eolian particulatescollected over the ocean, in Carbonaceous Particles in the Atmosphere,edited by T. Novakov, pp. 233–244, Natl. Sci. Found., Washington,D. C.
Simoneit, B. R. T. (1984), Organic matter of the troposphere: III. Charac-terization and sources of petroleum and pyrogenic residues in aerosolsover the western United States, Atmos. Environ., 18, 51–67.
Simoneit, B. R. T. (1985), Application of molecular marker analysis tovehicular exhaust for source reconciliations, Int. J. Environ. Anal. Chem.,22, 203–233.
Simoneit, B. R. T. (1989), Organic matter of the troposphere: V. Applica-tion of molecular marker analysis to biogenic emissions into the tropo-sphere for source reconciliations, J. Atmos. Chem., 8, 251–275.
Simoneit, B. R. T. (1999), A review of biomarker compounds as sourceindicators and tracers for air pollution, Environ. Sci. Pollut. Res., 6, 153–163.
Simoneit, B. R. T. (2002), Biomass burning: A review of organic tracersfrom smoke from incomplete combustion, Appl. Geochem., 17, 129–162.
Simoneit, B. R. T., and V. O. Elias (2000), Organic tracers from biomassburning in atmospheric particulate matter over the ocean,Mar. Chem., 69,231–243.
Simoneit, B. R. T., and M. A. Mazurek (1982), Organic matter of thetroposphere: II. Natural background of biogenic lipid matter in aero-sols over the rural western United States, Atmos. Environ., 16, 2139–2159.
Simoneit, B. R. T., M. A. Mazurek, and W. E. Reed (1983), Characteriza-tion of organic matter in aerosols over rural sites: Phytosterols, inAdvances in Organic Geochemistry 1981, edited by M. Bjorøy et al.,pp. 355–361, John Wiley, Hoboken, N. J.
D19S10 SIMONEIT ET AL.: MOLECULAR COMPOSITION OF ORGANIC AEROSOL
21 of 22
D19S10
Simoneit, B. R. T., R. E. Cox, and L. J. Standley (1988), Organic matter ofthe troposphere: IV. Lipids in Harmattan aerosol particles of Nigeria,Atmos. Environ., 22, 983–1004.
Simoneit, B. R. T., P. T. Crisp, M. A. Mazurek, and L. J. Standley(1991a), Composition of extractable organic matter of aerosols fromthe Blue Mountains and southeast coast of Australia, Environ. Int.,17, 405–419.
Simoneit, B. R. T., G.-Y. Sheng, X.-J. Chen, J.-M. Fu, J. Zhang, and Y.-P.Xu (1991b), Molecular marker study of extractable organic matter inaerosols from urban areas of China, Atmos. Environ., Part A, 25,2111–2129.
Simoneit, B. R. T., J. N. Cardoso, and N. Robinson (1991c), An assessmentof terrestrial higher molecular weight lipid compounds in air particulatematter over the South Atlantic from about 30–70�S, Chemosphere, 23,447–465.
Simoneit, B. R. T., W. F. Rogge, M. A. Mazurek, L. J. Standley, L. M.Hildemann, and G. R. Cass (1993), Lignin pyrolysis products, lignansand resin acids as specific tracers of plant classes in emissions frombiomass combustion, Environ. Sci. Technol., 27, 2533–2541.
Simoneit, B. R. T., M. Radzi bin Abas, G. R. Cass, W. F. Rogge, M. A.Mazurek, L. J. Standley, and L. M. Hildemann (1996), Natural com-pounds as tracers for biomass combustion in aerosols, in Biomass Burn-ing and Global Change, edited by J. S. Levine, vol. 1, pp. 504–518, MITPress, Cambridge, Mass.
Simoneit, B. R. T., J. J. Schauer, C. G. Nolte, D. R. Oros, V. O. Elias, M. P.Fraser, W. F. Rogge, and G. R. Cass (1999), Levoglucosan: A tracer forcellulose in biomass burning and atmospheric particles, Atmos. Environ.,33, 173–182.
Simoneit, B. R. T., A. I. Rushdi, and J. J. Schauer (2001), Organiccomposition of sands and aerosols from the deserts of China, paperpresented at First ACE-Asia Data Workshop, Calif. Inst. of Technol.,Pasadena, 28 Oct. to 1 Nov.
Simoneit, B. R. T., M. Kobayashi, M. Mochida, K. Kawamura, and B. J.Huebert (2004a), Aerosol particles collected on aircraft flights over thenorthwestern Pacific region during the ACE-Asia campaign: Composi-tion and major sources of the organic compounds, J. Geophys. Res., 109,D19S09, doi:10.1029/2004JD004565, in press.
Simoneit, B. R. T., V. O. Elias, M. Kobayashi, K. Kawamura, A. I. Rushdi,P. M. Medeiros, W. F. Rogge, and B. M. Didyk (2004b), Sugars: Domi-
nant water soluble organic compounds in soils and characterization astracers in atmospheric particulate matter, Environ. Sci. Technol., in press.
Sokolik, I., and O. B. Toon (1996), Direct radiative forcing by anthropo-genic airborne mineral aerosols, Nature, 381, 681–683.
Standley, L. J., and B. R. T. Simoneit (1994), Resin diterpenoids as tracersfor biomass combustion aerosols, J. Atmos. Chem., 18, 1–15.
Stevenson, F. J. (1982), Humus Chemistry, 443 pp., John Wiley, Hoboken,N. J.
Swap, R., M. Garstang, S. Greco, R. Talbot, and P. Kallberg (1992), Saharandust in the Amazon basin, Tellus, Ser. B, 44, 133–149.
Tegen, I., A. A. Lacis, and I. Fung (1996), The influence on climate forcingof mineral aerosols from disturbed soils, Nature, 380, 419–422.
Tong, H. Y., D. L. Shore, F. W. Karasek, P. Helland, and E. Jellum (1984),Identification of organic compounds obtained from incineration of muni-cipal waste by high-performance liquid chromatographic fractionation andgas chromatography–mass spectrometry, J. Chromatogr., 285, 423–441.
Wilkening, K. E., L. A. Barrie, and M. Engle (2000), Trans-Pacific airpollution, Science, 290, 65–66.
Zenchelsky, S. T., A. C. Delany, and R. A. Pickett (1976), The organiccomponents of wind-blown soil aerosol as a function of wind velocity,Soil Sci., 122, 129–132.
�����������������������K. Kawamura, M. Kobayashi, and M. Mochida, Institute of Low
Temperature Science, Hokkaido University, Kita-ku, Sapporo 060-0819,Japan. ([email protected]; [email protected])Y. Komazaki, Research Center for Advanced Science and Technology,
University of Tokyo, Komaba, Meguro, Tokyo 153-8904, Japan.([email protected])M. Lee, Department of Earth and Environmental Sciences, Korea
University, Anam-dong, Sungbuk-gu, Seoul 136-701, South Korea.([email protected])H.-J. Lim and B. J. Turpin, Department of Environmental Sciences,
Rutgers University, 14 College Farm Road, New Brunswick, NJ 08901,USA. ([email protected])B. R. T. Simoneit, College of Oceanic and Atmospheric Sciences, Oregon
State University, 104 Ocean Administration Building, Corvallis, OR 97331,USA. ([email protected])
D19S10 SIMONEIT ET AL.: MOLECULAR COMPOSITION OF ORGANIC AEROSOL
22 of 22
D19S10