ACE Limited - AnnualReports.com
259
ACE Limited Annual Report 2009
-
Upload
khangminh22 -
Category
Documents
-
view
1 -
download
0
Transcript of ACE Limited - AnnualReports.com

ACE Limited Annual Report 2009
ACE Limited
Barengasse 32
CH-8001 Zurich
Switzerland
acelimited.com
blackcyan 376 CG10_1
MA
C
CG10_2
AC
E L
imite
dA
nn
ua
l Rep
ort 2
00
9
92811IMPO.B Cover (CS3)(PRNTD) TBC492811IMPO.B Cover (CS3)(PRNTD) TBC4 4/8/10 10:28 AM4/8/10 10:28 AM

This Annual Report contains
trademarks, trade names and service
marks owned by ACE Limited and
its subsidiaries. In addition, this
report contains trademarks, trade
names or service marks of compa-
nies other than us, which belong to
their respective owners.
This report is printed on recycled
paper containing 10% and 50%
post-consumer waste. These papers
are certified to the international
standards of the Forest Stewardship
Council (FSC), which promotes
responsible management of the
world’s forests. It was printed by
Allied Printing, an FSC-certified
printer.
Design and art direction:
Rob Frankle
for Leo Burnett Business
The ACE Group is a global leader in insurance and
reinsurance serving a diverse group of clients. Headed
by ACE Limited, the ACE Group conducts its business
on a worldwide basis with operating subsidiaries in
more than 50 countries.
Insuring Progress
We take on the responsibility of risk so our clients can
take on the responsibility of making things happen.
We call this insuring progress.
Contents
Financial Summary 1
To My Fellow Shareholders 2
2009 Highlights 10
The World of ACE 18
Business Segments
Insurance – North American 24
Insurance – Overseas General 28
Global Reinsurance 32
Life 36
Form 10K
Report of Group Auditors
Swiss Statutory Financial Statements
Corporate Governance at ACE Limited 40
Corporate Information 43
Shareholder Information 44
MA
C
CG10_1 CG10_2
92811IMPO.B Cover (CS3)(PRNTD) TBC292811IMPO.B Cover (CS3)(PRNTD) TBC2 4/8/10 10:28 AM4/8/10 10:28 AM

1
Financial Summary
Gross premiums written
Net premiums written
Net premiums earned
Income excluding net realized gains (losses)1
Net income
Diluted earnings per share
Diluted earnings per share excluding net realized gains (losses)1
Combined ratio2
Total assets
Shareholders’ equity
Book value per share
Tangible book value per share
Return on equity3
$19,242
13,080
13,203
2,591
1,197
3.50
7.67
89.6%
72,057
14,446
43.30
32.07
16.8%
$19,164
13,299
13,240
2,759
2,549
7.55
8.17
88.3%
77,980
19,667
58.44
46.76
16.2%
0%
2%
0%
6%
113%
116%
7%
NM
8%
36%
35%
46%
NM
(in millions of U.S. dollars except per share data and ratios) December 31, 2008December 31, 2009
Years Ended PercentageChange
Five-Year Financial Performance
Compound annual growth rates and averages, 2005-2009
Income excluding net realized gains (losses)1
Shareholders’ equity
Book value per share
Tangible book value per share
Average return on equity3
Average combined ratio2
22.5%
14.8%
12.3%
15.1%
15.7%
90.6%
(1) Income excluding net realized gains (losses) and the related income tax is a non-GAAP measure. We have chosen to make this disclosure
because it enhances the understanding of our results from operations as distinct from the fl uctuations in the market value of invested
assets. The latter is infl uenced by external economic factors such as changes in interest rates or in equity prices and by internal factors
such as the timing recognition of realized gains or losses.
(2) The combined ratio is the sum of the loss and loss expense ratio, policy acquisition cost ratio, and administrative expense ratio.
(3) Calculated using income excluding net realized gains (losses).
NM – not meaningful

2
To My Fellow Shareholders
ACE performed exceptionally well in 2009, recording almost $2.8 billion in after-tax operat-
ing income, an all-time high for our company. Our operating results, a 6% increase over 2008,
were an excellent outcome in one of the most diffi cult business environments in several
generations. During the year we grew our balance sheet to record size and strength and took
advantage of market dislocation in our industry by further enhancing our capabilities and
acquiring many new customers for our products. These accomplishments – the result of
focusing on the business we know, excellence in execution and a conservative approach to un-
derwriting, investing and risk management – further distinguished ACE as a company built
to do well in both good times and bad. Without a doubt, we ended the year stronger and
better positioned than when the year began, emerging among the strongest global insurance
companies in the world.
At the beginning of 2009, individuals and businesses alike faced a deep and worsening global
recession, rising unemployment and fi nancial market instability. The property and casualty
insurance industry, while generally in better shape than its fi nancial services peers,
especially banks, was under stress due to a capital position weakened by unprecedented
investment losses and natural catastrophes. As a result, insurance prices, which on balance
had become marginal, were beginning to rise. But by the third quarter, fi nancial markets had
recovered in stunning fashion, industry capital returned to comfortable levels, and what was
a promising outlook for prices reverted to a softening trend. The capital markets’ recovery
positively impacted book values across the insurance industry as previously unrealized
marked-to-market losses reversed themselves and investment marks turned positive. For ACE,
the markets’ recovery combined with our strong operating results produced extraordinary
book value growth of 36% for the year, while tangible book value grew at an even greater
rate, 47%. This standout performance not only erased last year’s book value losses but set new
records for the company, furthering ACE’s stated long-term shareholder value objective of
building book value. For the last fi ve years, we have grown book value and tangible book
value at compound annual rates of 15% and 17%, respectively.
ACE is predominantly a global commercial property and casualty insurance company with
a strong emphasis on specialty products. We write many of the risks others shy away from.
We are also a major writer of personal accident and supplemental health insurance
products globally, and we have young but growing life and personal lines insurance
businesses. One-half of our business is in the United States with the balance conducted locally
in more than 50 countries around the world. All of our insurance and reinsurance businesses
have a common approach to risk-taking, which is the essence of what we do. Whenever we
consider a risk, our objectives are to understand it, structure it in a satisfactory way for both
the client and ourselves, and get paid adequately to take it. If these conditions cannot be met,
we walk away from that risk and move on to the next. We are an underwriting company – it’s
embedded in our ethos. In 2009, we produced $1.6 billion in underwriting income while
our P&C combined ratio, which measures our underwriting profi t margin on each dollar of
premium we collect from our customers, was 88.3%. This is simply an excellent result that ex-
tends our track record of producing a cumulative underwriting profi t since we were founded
25 years ago. Few insurance companies can match that performance.
Our other primary source of operating income is from investing our reserves and capital.
Here on the asset side of the balance sheet, we also follow a conservative strategy because

3
we recognize the substantial risk and inherent exposure-related leverage we assume on the
liability side of our business. We are principally a fi xed-income investor, and our portfolio has
an average credit rating of AA, with one-half invested in AAA securities of a straightforward
nature. We have never had an appetite for synthetic, non-transparent investments. A low in-
terest rate environment pressured investment yields during the year, but a modest reposition-
ing of our investment portfolio and positive cash fl ow from operations largely offset
the effect of lower rates, producing $2 billion in net investment income. Compared to the
realized and unrealized losses we experienced in 2008 that resulted from indiscriminate
price declines across almost all asset classes, our investment portfolio last year captured real-
ized and unrealized gains of $2.5 billion after tax. Invested assets, which grew during the year
from both price appreciation and strong positive cash fl ow from our operations, increased by
$6.6 billion and now stand at $47 billion.
Balance sheet strength and capital
While the industry’s balance sheet went from a stressed position at the beginning of the year,
having lost in excess of $100 billion in capital in 2008, to a comfortable one by the end of the
year, ACE’s balance sheet also grew stronger, with total capital increasing 29% to $23.3 billion
at December 31. Capital is a measure of a com-
pany’s wherewithal to take risk, capital preserva-
tion is a paramount goal of risk management,
and the return on that capital speaks to its
effi cient use. ACE’s operating return on equity
for 2009 was 16.2% and our average operating
ROE for the last fi ve years is 15.7%.
Some shareholders believe at a given moment in
time that the best way to increase earnings per
share and book value per share is by buying
back stock. We recognize the validity of that
option, but it’s not applicable to all companies at all times. While it might be the right strat-
egy for some companies sometimes, it’s not for this company at this time. We believe that
the more strategic way to increase EPS and book value per share is by growing the company,
not shrinking it, which essentially is what share buybacks do. ACE is a well-diversifi ed, global
company, and it’s a big world out there with plenty of opportunity to grow our company over
time – both organically and through acquisitions – even if one cannot see the opportunity at
the moment.
On the other side of the coin, we believe it is prudent to also hold capital for risk – we are,
after all, in the risk business. For example, where would we be today if we had encountered a
major risk event and needed to raise capital during the market upheaval of last year? Just-in-
time capital management sounds great in concept but it ignores reality. For both good times
and bad, therefore, we have a long-term, patient view in managing our capital, yet we are
always mindful of our responsibility to be good stewards of our shareholders’ money. If we
“ Without a doubt, we ended the year
stronger and better positioned than when
the year began, emerging among the
strongest global insurance companies
in the world.”

4
build up what we consider to be surplus capital that cannot be put to work productively over
a reasonable period, we will consider employing tactical strategies to return that capital to
our shareholders, including buybacks.
Market conditions and insurance prices
I said earlier that at the beginning of the year we thought the market had entered the early
stages of fi rming prices due to prevailing conditions. The industry balance sheet had weak-
ened substantially due to extreme fi nancial asset defl ation and faced signs of further stress.
But the rapid recovery of the fi nancial markets in the second and third quarters due to the
tremendous liquidity that governments pumped into the fi nancial system, government sup-
port of weakened insurers, and lack of substantial catastrophe losses all combined to refl ate
asset values, and by mid-summer insurance prices fl attened out and began to once again
soften.
To earn a reasonable risk-adjusted return, insurance prices needed to rise then and, frankly,
they still do today. From an underwriting risk-reward perspective, prices are inadequate in
many classes and industry profi tability is under pressure. On a
published basis, the industry’s ROEs are in the mid-single digits. In
fact, there is a distinct possibility that the published industry num-
bers and results will prove worse, and that the reserves established
for the business earned in 2008 and 2009 will be defi cient. This is
the lagging nature and inherent risk of a business where the true
price of your goods sold is not fully known until years later.
However, given the current reasonable health of the industry’s
balance sheet – and insurance industry cycles, at least until now,
have turned on the balance sheet and cash fl ow – we are planning
for soft market conditions for the foreseeable future. We are now
at that point of the underwriting cycle where some companies
are growing at the expense of an underwriting profi t. They may
appear strong and thriving, but time will reveal what happens
when underwriting discipline is traded for market share – they
will ultimately pay a bitter price in terms of future reserve charges.
Our management team has been through soft markets before and
we have seen fi rsthand what happens when companies espouse
underwriting discipline but in reality are not willing to make the needed sacrifi ces in terms
of market share and volume. It’s so easy at the transaction level to write the business – what’s
fi ve more points on this risk or broader terms and conditions on that one? But it all adds up.
We are witnessing which companies are willing to make the hard choices, and which ones are
not. At ACE, we will not knowingly forfeit future profi tability for short-term benefi t. We have
demonstrated this in the past and have doubled our resolve to remain vigilant in terms of
underwriting discipline. There simply is not a lot of room for error, and we as management
have made it clear we would rather write less business than kid ourselves about price or
Evan G. GreenbergChairman and
Chief Executive Offi cer

5
reserve adequacy. We strive to always be consistent in our approach to the market and in our
underwriting standards. We accept that we might get less payback for our efforts in a soft
market, but that does not change who we are or how we conduct our business.
Soft market conditions notwithstanding, our diversifi ed global presence and broad product
capabilities with an emphasis on specialty lines continued to afford us many opportunities dur-
ing the year to fi nd and write profi table business, and they still do today. In fact, the market-
place, distancing itself from damaged companies and attracted to a company with the size
and skills of ACE, presented us with far more business opportunities during 2009 than we
chose to write given our underwriting discipline.
Premium growth challenged by recession
Total company net written premiums for the year were $13.3 billion, up 2% compared with
2008. Our premium growth in 2009 was impacted by the competitive insurance market con-
ditions just described, global recession and a strong U.S. dollar.
While the recession may have technically ended in the third quarter, economic activity
remained sluggish in the U.S. and Europe for the balance of the year, although it turned more
robust in Asia and Latin America. In 2009, with global business activity generally suppressed,
the insurance industry experienced recession-related declines in exposure, which translated
into less revenue – fewer workers, fewer trips taken, less product manufactured, sold and
shipped, etc. In addition, many commercial P&C clients had less ability to pay premiums
and sought more affordable alternatives such as higher deductibles or reduced limits.
For the year, we estimate recession had at least a three-to-fi ve-point impact on our premium
revenue growth for our business globally. Despite massive government stimulus programs,
the western economies of North America and Europe are still fragile and we anticipate
business activity and employment will recover slowly. Also, because our industry lags in its
recognition of exposure reductions, we will likely continue to experience the revenue impact
of exposure reductions through the fi rst half of 2010.
On the other hand, we experienced good growth from our increased geographic and prod-
uct presence, attracted continued fl ight to quality and safety from weakened companies to
a company of our profi le, especially in lines of business or risk layers where more than price
mattered, and took advantage of market opportunity for certain distressed classes of busi-
ness where underwriting conditions had turned favorable. We also had the strength and the
vision to continue investing in our global capabilities, fi lling gaps created by the stress of the
industry’s market dislocation and the weakness of others. Where we saw opportunity, we
expanded rapidly to take advantage of it, and by the end of the year we had added more than
120 specialty underwriters globally, focusing in particular on middle market and large
account clients in the U.S., Europe and Latin America. We also expanded our ability to
service multinational clients locally in countries around the world. Our North American P&C
insurance business, for example, signifi cantly improved its presence in D&O, E&O, excess
casualty, energy casualty, construction, environmental risk and high net worth personal
lines. Internationally, our retail P&C insurance business expanded its capabilities in
professional lines, general casualty, multinational underwriting and specialty personal lines.

6
From the Mideast to the Midwest, from the East Coast to East Asia, from professional lines to
personal lines, our company gained ground in 2009 in its ability to better underwrite, service
and market to our existing and prospective customers. In 2010, we plan to continue our
building efforts, adding product and service capability, opening new offi ces and enhancing
our distribution.
For the year, retail net insurance premiums in North America increased 3% while overseas
they were down 1% (although up 5% on a constant-dollar basis) – still a good performance all
things considered. Due to competition, wholesale net premiums for our excess and surplus
lines businesses in the U.S. and London shrank 9%. After several years of shrinking due to
market conditions, our global reinsurance business, ACE Tempest Re, performed very well,
with premiums up 14% over the prior year.
Global A&H: Consumers crimped their spending
Our global accident and health insurance business, an important and signifi cant franchise
for our company, continued to benefi t from the underlying long-term trends of a growing
middle class in Latin America and Asia, where we have presence and capability. This
business, however, was impacted last year by the global economic downturn as companies
around the world reduced their employee populations and cut back on expenses like group
travel accident programs. In addition, consumers crimped their spending and, for many,
insurance became a dispensable item so they lapsed on payments or canceled their policies.
Yet, even with these headwinds, our global A&H premiums were up 6% compared to 2008.
We used the time last year to better position this business for the future. We secured more
distribution, particularly in retail travel; more customers, particularly in corporate; and more
talent for our organization. We also tactically shifted our strategy to emphasize our corporate
and travel segments without neglecting our direct response distribution, and we believe this
will ultimately result in a better balanced portfolio.
In a recession, middle and lower income consumers suffer the most – and those are our
A&H customers. But the impact is not permanent. Our A&H business is solid and a good
performer, all things considered, and it will recover to higher growth as the effects of
recession diminish.
We have a number of other, newer businesses that are coming along nicely such as our inter-
national life insurance business, which is focused predominantly on emerging markets in
Asia, Latin America and the Middle East. One of our largest life operations is in China, where
we have a unique joint venture in Huatai Life. We also have growing operations in Vietnam,
Thailand, Brazil and Mexico, to name just a few countries, while our newest location in
Indonesia opened last year. Life insurance is a long-term business requiring patience, and
we are on track. We expect this business, which now has more than 30,000 exclusive life
agents and produced more than $1 billion in premium and deposits, will begin positively
contributing to earnings in 2012.
We are also building personal lines property and casualty businesses in both the U.S. and
international markets. In the U.S., ACE Private Risk Services provides insurance coverage
to affl uent and high net worth customers for their high-value homes, autos, boats and
valuables as well as personal umbrella liability protection. This business is doing well and we

7
are rapidly establishing a strong reputation in the marketplace. In Europe, Latin America and
Asia, we are offering a variety of personal lines products – from auto and home insurance for
consumers to innovative plans that cover personal property such as cell phones. Our personal
lines businesses are now producing more than $800 million in premiums globally, growing
rather quickly and earning an underwriting profi t according to plan, and we are encouraged
by their development.
While the economy played havoc on global business conditions, the fact that ACE experienced
reasonable growth in many areas of the organization while other parts were fl at or down
once again highlights the truly global nature of our company and the diversifi cation benefi ts
derived from broad geographic and product reach. Today, approximately 30% of our premiums
and 20% of our earnings come from our A&H, life and personal lines businesses.
Our local presence globally differentiates us
competitively and enables us to offer cross-
border product and servicing capabilities that
few companies anywhere in the world can
match. We are capitalizing on the ground
in places of opportunity as diverse as Brazil,
Mexico, Korea, Thailand, Russia, Saudi Arabia
and the UAE. As I have said before, it’s a big
world and our broad, global operations enable
us to identify profi table growth opportunities
when certain areas of the world are experiencing
more challenging business conditions. Taking together both our product and geographic
capabilities, ACE is a mile wide and an inch deep – meaning there is so much more for us to
build and considerably more market share for us to win everywhere we operate. To do it right
takes time, patience and a long-term vision. In a cyclical business such as ours, you have to
pick your moments for growth.
The political and regulatory challenges ahead
There are a number of political and regulatory challenges of signifi cance facing our
industry today.
The magnitude of the global fi nancial and economic crisis and the government bailout and
stimulus programs that followed sowed the seeds for today’s anti-fi nancial services/anti-busi-
ness populism. The images of perceived greed and arrogance on the part of a few fi nancial
institutions have not helped matters. Lost by many in the hostility is a clear understanding
of the problems that converged to create what essentially was a banking-led fi nancial crisis.
These include government’s failure to enforce current regulation; excessive leverage and
concentration of risk on bank and investment bank balance sheets; too little capital to support
certain risk-taking activities; poor risk selection driven by private sector and government objec-
tives (e.g., housing for all); a failure of the risk-taker to retain a portion of the risk; a lack of
appreciation for liquidity risk; and pro-cyclical accounting as embodied in one-size-fi ts-all fair
value rules. In my judgment, any regulatory changes should fi rst recognize these root causes
in the fi nancial industry, particularly banking.
“ Our diversifi ed global presence and broad
product capabilities continued to afford
us many opportunities during the year to
fi nd and write profi table business, and
they still do today.”

8
Closer to home, however, is the danger that the insurance industry will be swept up in a wave
of regulatory reform that does not distinguish between fi nancial services sectors. The basic
business of our industry has always been anchored to the real economy. We assume risk
from individuals and businesses and pool capital for long-term investment that supports
fundamental economic growth and prosperity. From a solvency perspective, our industry
has also been relatively well-regulated. Many of the reform ideas being advocated for banks
concerning capital and leverage, segregated capital and retaining a portion of the risk, to
name a few, are well-established practice in the insurance industry.
Unfortunately, much of the current dialogue in Washington and European capitals is driven
substantially by senior fi nancial services regulators who are bankers by background and at
times do not seem to recognize the differences between our industries. For example, in the
U.S., legislators and federal regulators are advocating a federal role for solvency oversight
and future bailout costs for P&C insurers on top of our existing state system – a bad idea that
would duplicate cost and add redundant bureaucracy. Let us not confuse the important
differences between P&C insurers and banks. We are not systemic: 1) we don’t pose signifi cant
fi nancial market counterparty risk or provide direct credit to consumers or businesses; 2) we
cannot be highly leveraged due to strict statutory capital requirements; 3) we do not face the
same liquidity threats as banks – a run on the bank – because our liabilities are contractual
and depend on an insured loss occurring. In my judgment, this is true for life insurers, too,
because their contracts are intended more for long-term savings than funds for day-to-day
living, and any liquidity crisis would likely result in an orderly unwinding rather than a
short-term run on the bank; and 4) even when an insurance company enters receivership,
there is a system in place that provides for its orderly disposition – a system that has been tested
and works.
That’s not to say the U.S. P&C industry – a national and global industry regulated on a state-
by-state basis – would not benefi t from a proper federal role. The industry certainly would
benefi t if the federal role provided for uniformity of regulation and represented the industry
in the international community, which is why we are supportive of efforts such as the Offi ce
of National Insurance. Until recently, we have also supported the adoption of global regulatory
standards and reciprocity among regulators to streamline oversight, as represented by the
Solvency II directive, because these proposals promised substantial effi ciencies for regulators
and insurers alike while increasing regulatory rigor. This E.U. framework, however, has taken
an alarming turn in reaction to the banking crisis and is now focused on excessive regula-
tory requirements, particularly concerning the amount and fl exibility of required capital,
and a huge amount of overly detailed information reporting standards, while at the same
time deferring until some vague point in the future the originally contemplated effi ciencies.
Solvency II now appears more reactive than thoughtful, more academic than practical, and
is creating chaos. If implemented as currently conceived, Solvency II will substantially and
needlessly increase costs to insurers and society.
Enterprise risk management
ACE is in the business of taking the risk of others, and we can only do so effectively to the
extent of our balance sheet. So, the other side of the coin for an insurance company is
managing its own risk. Enterprise risk management at ACE is fi rst and foremost about

9
reserve adequacy and capital – its preservation, fl exibility and liquidity. We explained last
year that ERM at ACE is not a bureaucratic process that management delegates to others.
Rather, all levels of management, starting with me, are actively engaged with ERM, which is
designed to support the substance of our basic business of taking risk – understanding
concentrations and types of risks, the interactions between those and the amount of and
return on required capital.
In 2009, ERM loomed large once again for our company and our industry as the fi nancial
markets’ instability in the fi rst half of the year proved to be a major test. In fact, we were
given a pretty good look at how our ERM systems performed and how our balance sheet
behaved during the fi nancial crisis, and we were gratifi ed with the results. Nonetheless,
there are lessons to be learned. We have been making major investments in our ERM capability
the last few years, including enhancements to our credit and counterparty risk policies and
practices as well as operational risk management priorities. In 2009, we also formed a risk
committee of the board of directors to enhance the governance process over risk and
ensure ERM is a consistent management priority across our organization. We expect ERM
will continue to be an even greater area of focus in the coming years given the evolving
regulatory environment.
Eagerness, professionalism, focus and drive
The year 2009 was diffi cult, but as I said at the beginning of this letter, I believe we emerged
stronger both operationally and fi nancially and are well positioned for the challenges ahead.
We put our face into the wind last year and continued to invest in our company, with advances
on all fronts. This success can be attributed to our outstanding employees and management
team. As I travel around the world, I see the eagerness, professionalism, focus and drive they
all have in common – these are the characteristics of an ACE employee and I believe ours are
the best in the business. We also have an active and engaged board of directors for whose
counsel I am especially thankful, and this includes Dermot Smurfi t, who announced he is
not standing for reelection to the board. We are all grateful to Dermot for his wit and wisdom
during more than 12 years of service with ACE.
It is now 2010 and our company will celebrate its 25th birthday this year. We have the opti-
mism and energy of youth while acquiring the maturity of age. While others see threats from
today’s evolving megatrends – globalization, consumerism, climate change, aging – we see
opportunity because of who we are and what we have accomplished to date. We are anxious to
continue building this great company and are confi dent that our best days lie ahead.
Sincerely,
Evan G. Greenberg
Chairman and Chief Executive Offi cer

10
Leaders of ACE USA’s
Professional Risk team in New
York include (l-r) Carol
Zacharias, Sr. Vice President &
Counsel; Keith Lavigne, Vice
President; Scott Meyer, Executive
Vice President; Rob Wolfe, Sr.
Vice President.
20
09
Hig
hli
gh
ts Enhancing our capabilities to meet clients’ liability coverage needs
In late 2008, as the effects of the global fi nancial crisis spread
to the insurance markets, ACE’s leaders recognized that many
insurance buyers and brokers would be seeking a more fi nan-
cially stable place for their business in certain coverage areas in
which ACE already had solid capabilities. Underwriting heads
in these ACE areas quickly drew up plans to not only manage
the waves of business submissions that would result, but to
strengthen ACE’s capabilities through strategic investments
in talent, new products and services that would position these
lines for the long term.
In the climate of fi nancial uncertainty that gripped businesses
in late 2008 and early 2009 and created instability in the
insurance marketplace, nowhere were ACE’s advantages more
apparent than in coverage areas in which the combination
of fi nancial strength and underwriting
expertise made a difference. Management
and professional liability lines of busi-
ness, including directors and offi cers
liability (D&O) and errors and omissions
(E&O), were a prime example. With the
long-tailed nature of the risk involved
and the personal interest that company
executives and board members take
in the quality of their D&O coverage,
working with carriers of enduring
fi nancial strength and stability is
critical. As uncertainty took hold
in these insurance markets, they
increasingly turned to ACE to fi ll
the resulting gap.
“Since the fourth quarter of 2008, we’ve
increased our staff in D&O and E&O lines by some 40% while
investing in technology and product development,” notes
Tim O’Donnell, President, Professional Risk, ACE USA. “As an
example, we signifi cantly expanded our offerings to private
companies and not-for-profi t entities. And while we were already
providing meaningful capacity, we stepped up for Fortune 500
companies as well, fulfi lling their needs for additional capacity
through the combined resources of our global network.”

11
Leaders of ACE’s Financial Insti-
tutions practice include (top, l-r) in
London, Jane Bennett, Financial
Institutions Product Head, ACE
Overseas General, and Clive
Hassett, Director of Operations,
Major Risks, U.K. & Ireland; and
(above) in New York, Steven
Goldman, Sr. Vice President,
Professional Risk, ACE USA.
While North America saw the greatest surge in D&O, in Europe,
where the implosion of the world’s largest Ponzi scheme had a
spreading impact on fi nancial institutions, there was a strong
uptick in demand for E&O coverage as well. “The Madoff debacle
on top of the subprime crisis was really a perfect storm,” says
Jane Bennett, Financial Institutions
Product Head, ACE Overseas General.
“Financial institutions had a lot of
challenges, and we had a scared
insurance market in this sector.”
In addition to its fi nancial stabil-
ity, a key advantage ACE offered
fi nancial institutions was its
strong coordination among busi-
ness units around the world. ACE
is one of only a few insurers that
can provide global fi nancial institutions
with D&O and E&O coverage in most coun-
tries where they operate. “Before this crisis,
the breadth and depth of ACE’s international
capabilities were not that well understood by
multinational fi nancial institutions,” explains
Clive Hassett, Director of Operations for Major
Risks, U.K. and Ireland. “That changed in 2009.
The fact that we were able to step up with a
global network that has been tried and tested for many different
industries had a very positive effect in the market.”
Despite the spike in D&O and E&O submissions during 2009,
ACE was able to respond in an orderly fashion. “While we saw
a large number of new-business opportunities,” says Steven
Goldman, Sr. Vice President, Professional Risk, ACE USA,
“we never compromised our core underwriting standards.”
Dislocation in the insurance industry created opportunities for
ACE in other lines as well, including excess casualty, construc-
tion and environmental (see pages 14 and 15). “We had been
building out these capabilities since 2002, and we already had
claims and underwriting talent in these lines,” notes Christopher
Maleno, President of ACE USA’s Casualty Risk unit. “We had the
balance sheet and the infrastructure in place, and we were the
fi rst in the industry to react to the market disruption.”
Gains in one type of coverage often fed gains in others. For example,
as ACE built its excess casualty business in the energy sector,
In lines of business where a strong balance sheet and underwriting expertise mattered, ACE had the strength and vision to invest in capabilities to fi ll immediate gaps created by insurance market uncer-tainty, and position these businesses for long-term growth.
L d f ACE’ Fi i l I ti
s
r
9.
f diff t
tions
t
s
l.

12
additional property, construction and D&O business fl owed in.
“In all business segments – national accounts, corporate risk,
small business – we made progress, whether measured by policy
count or by premiums written,” Maleno adds.
By late 2009, in response to the increased market demand, ACE
had deepened its expertise by adding more than 120 experienced
underwriters globally, upgraded its risk profi le by winning
high-quality business, and achieved gains in market position
that would have taken years under normal circumstances. ACE’s
advance in the North American liability marketplace was recog-
nized in November when it was named Best Liability Insurer in
Business Insurance magazine’s Readers’ Choice Awards.
Claims -- delivering on a promise when clients need us most
Claims professionals play a critical role in an insurance
company, one that shoulders the ultimate responsibility for
delivering on the company’s promise to pay. When a loss occurs,
it’s the moment of truth – when that promise comes to life,
and the company’s relationship with the client often hinges on
this claim experience. ACE’s claims professionals have a duty
to the company’s policyholders to pay all covered claims fairly,
promptly and prudently. In doing so they sometimes must navi-
gate through coverage terms and complex laws and regulations
that impact claims in as seamless a manner as possible.
While acknowledging the challenge of managing competing
interests, Frank Lattal, ACE’s Chief Claims Offi cer, keeps ACE’s
Claims organization focused on the basics. “First, we keep in
mind that clients buy a promise from us, and we’re in the busi-
ness of paying their claims,” he notes. That ACE did in 2009, by
paying out $11 billion on more than 800,000 claims around the
world. “And we want to make sure that every claim is resolved
in the right way at the right time for the right cost. Our goal is
to make the claims experience at ACE a competitive advantage,
one that makes a diffi cult situation for our clients as positive as
possible.”
Whether the client is an individual with a $200 supplemental
health claim or a corporation with a $20 million casualty claim,
ACE aims to deliver a claims experience with a consistent level
of service and satisfaction.

13
Top (l-r): Frank Lattal, ACE’s Chief
Claims Offi cer, and John Lenzen,
Deputy General Counsel, Litiga-
tion. Below: Catherine Murphy,
Claims Client Relationship
Manager for the U.K.
An insurance company’s promise to pay meets reality when a loss occurs, and the relationship with the client hangs in the balance. ACE and its partners successfully managed more than 800,000 such claim situations around the world in 2009.
“All clients should feel they are engaging with a professional
who has a depth of claims experience and who cares about
them,” says Doug Poetzsch, Executive Vice President of Claims
for ACE USA. “Clients and brokers should feel respected and
know that we view them as partners.”
ACE has sharpened its focus on claims service in recent years as
it has moved into product lines – and increased its participation
in the primary layers of client risk programs – where claims are
more frequent. This has required ACE to expand its claims team
and locate representatives closer to customers. For example,
a new regionalized claims force has been established for ACE
Private Risk Services, the company’s personal lines business for
high net worth clients. ACE has also automated many non-core
aspects of servicing high-frequency claims, creating greater
effi ciency, speedier payments for clients, and freeing its own
professionals to focus on more complex claims management.
In 2009, ACE enhanced service to its largest clients in the U.S. and
the U.K. by introducing the new role of claims client executive –
a critical point of contact for involving the right ACE resources
in resolving a claim issue. Larger commercial clients already rec-
ognize the value of ACE’s claims expertise in specialty coverage
areas, as well as its sophisticated claims legal team, which offers
experience reaching successful outcomes in major
litigation and helping clients
manage their legal costs.
Beyond enhancing relation-
ships with clients, ACE’s
Claims organization is also
working to improve the com-
pany’s competitive advantage
in the marketplace. Making sure
that claims professionals and
underwriters within ACE share
information and learn more
about clients from one another
will enable more precise under-
writing. And by becoming more
involved in product and business develop-
ment efforts, ACE’s claims service can be a
differentiator in winning new business.

14
ACE’s construction underwriting
leaders in the U.S. include (l-r)
Dean Andrighetto, President,
Casualty, ACE Westchester, and
Geoffrey Hall, Sr. Vice President,
Construction, ACE USA.
Construction practice builds astrong reputation in the market
As the recession took hold in 2009, many construction projects
could not obtain fi nancing and were canceled, leading to a
decline of 10% in construction activity across the U.S. However,
uncertainty in the insurance markets enabled ACE’s construc-
tion business to win a higher percentage of projects and grow
premium volume through its combination of products, services,
expertise, proximity to clients and fi nancial stability. A strong,
stable balance sheet such as ACE’s is critical in the construction
markets, where coverage programs typically last for a decade
or more.
While the fl ight to safety contributed to ACE’s growth, it would
not have been possible without years of development work.
“Over the past four years, we’ve expanded our capabilities in
preparation for future opportunities,” says Geoffrey Hall, Sr.
Vice President, Construction at ACE USA.
“When the opportunity came, we had a
full suite of capabilities to write primary
practice programs, owner- and contractor-
controlled programs, and a full range
of coverages, including builders risk,
environmental, excess, professional
liability and surety.” ACE USA’s capa-
bilities include underwriting,
account management, risk engi-
neering and claims professionals
dedicated to construction.
ACE Westchester has been known as a construction market
much longer than ACE USA, and its dedicated construction
underwriting expertise is a point of differentiation. “Wholesale
brokers and insureds look at us as a company that really under-
stands construction exposure,” notes Dean Andrighetto,
President, Casualty, at ACE Westchester. “We can evaluate it
and price it. If the situation is unique, we have the technical
capabilities and the underwriters to put together a program
that solves the problems.”
With the construction sector’s increased recognition of ACE’s
capabilities and fi nancial strength, ACE USA and ACE Westchester
are fi nding more opportunities to create complete coverage
solutions for clients, solidifying ACE’s reputation in the market.
“When projects are on the drawing board and they’re assessing
insurance options, ACE is going to the top of the list,”
says Andrighetto.
Vice P
“Wh
full
prac
con
of
en
lia
b
a
AACACACEE WWestchester has be
much longer than ACE USA

15
ACE’s environmental underwrit-
ing leaders include (l-r) Barbara
Deas, President, Environmental,
ACE Westchester; Karl Russek,
Sr. Vice President, Environmental
Risk, ACE Overseas General; and
Bill Hazelton, Sr. Vice President,
Environmental Risk, ACE USA.
Meeting the growing challenges ofclimate change and the environment
ACE takes a broad view of the opportunities and responsibilities
presented by the environment. On one hand, there is a grow-
ing opportunity to help clients manage the economic impact
of environmental and climate change risks. On the other, with
15,000 employees in 250 offi ces around the world, ACE recog-
nizes its responsibility to reduce its own environmental impact
and contribute to environmental causes.
ACE saw a great deal of opportunity in the environmental busi-
ness in 2009. After the fi nancial crisis created uncertainty in the
environmental insurance arena, the marketplace turned to ACE
for its products, capabilities and fi nancial stability. ACE USA add-
ed 10 professionals to its environmental group’s national staff
and launched multiline products that were in strong demand.
One in particular was the ACE Green Contractors Pollution Liability
program, which combines insurance with technical support
to help contractors reduce their environmental exposures.
This unique program earned a Risk Innovator Award from
Risk & Insurance magazine.
ACE Westchester added environmental specialists to handle the
increase in submissions and the steady growth in its core pollu-
tion casualty policies. It, too, launched new
products, including coverage for hazardous
material transporters. ACE International
also saw business increase signifi cantly
in Europe, where the European Union’s
Environmental Liability Directive con-
tributed to market growth, and added
capability in several cities. ACE’s core
environmental products were launched
through ACE Global Markets, our
international wholesale channel, and
demand for ACE’s offerings also began
to turn up in Asia and Latin America.
As a result, although the recession sapped demand for
environmental coverage, ACE’s business grew globally in 2009.
Several features distinguish ACE in the environmental market.
“We have a very broad suite of products, highly experienced
underwriters and an unmatched online service that allows
brokers to rate, quote and bind certain policies electronically,”
ed demand for
grew globally in 2009.
new
ous
l
The environment represents several challenges for ACE – it calls for a commitment to provide solutions to help clients manage environmental risks as well as to reduce the environmental impact of its operations around the world and contribute to environment-related philanthropic causes.

16
ACE’s North American headquarters
in Philadelphia’s Historic District
earned green building status in
2009, and is currently the only
LEED-certifi ed existing building
in the city.
notes Bill Hazelton, Sr. Vice President of ACE USA’s
Environmental Risk unit. In addition, ACE is also the only
insurer to own an environmental consulting fi rm, Hygienetics,
which helps evaluate environmental risks and provides insureds
with value-added services.
The environment isn’t only a business priority at ACE. The com-
pany is also doing its part to make its operations more green and
direct its philanthropy toward the environment as well.
As one of only a few insurers in the U.S. Environmental Pro-
tection Agency’s Climate Leaders program, ACE set a global
greenhouse gas reduction target of 8% per employee by 2012.
Achieving this goal requires annual measurement and sustained
action, such as controlling offi ce energy consumption, consoli-
dating offi ce space, reducing business travel and improving fuel
effi ciency of fl eet vehicles.
Culminating several years of energy saving
improvements and efforts to conserve water and
recycle materials, ACE’s North American headquar-
ters building in Philadelphia earned LEED (Leader-
ship in Energy and Environmental Design) Silver
certifi cation as a “green” building in 2009. Cur-
rently, it is the only LEED-certifi ed existing building
in Philadelphia.
At many of ACE’s 250 offi ces around the world, local
employee committees are taking steps to reduce envi-
ronmental impact and energy use, such as installing
energy-effi cient lighting and equipment, eliminating
plastic water bottles and Styrofoam cups, recycling
paper, batteries and cell phones, and organizing “green”
community volunteer projects. For example, through a partner-
ship established by the Los Angeles ACE Green committee, ACE
made a donation to support environmental research projects at
the Bren School of the University of California, Santa Barbara.
The environment is also a global focus area for ACE’s philan-
thropy. In 2009, the ACE Charitable Foundation provided major
grants to improve sustainable agriculture in Peru through a
three-year CARE program, to stabilize and diversify crops in
Indonesia through the World Food Program, and to preserve
sensitive lands throughout the U.S. through the Foundation’s
Land Legacy Fund of the Conservation Fund. In addition, for the
second year, ACE’s Environmental Risk business contributed to
American Forests to plant over 5,000 trees – one for each policy
the unit wrote.

Th
e W
orl
d o
f A
CE

18
ACE Business Overview
The ACE Group is one of the world’s leading providers of commercial property and casualty
(P&C) insurance and reinsurance. The company also has a major presence in the accident
and health (A&H) business as well as a young and growing life insurance operation and
specialty personal lines business. ACE is represented around the world by a collection of
market-leading franchises:
ACE USA is the company’s retail broker-distributed business serving North America with an
extensive portfolio of traditional and specialty commercial P&C and A&H insurance products.
Headquartered in Philadelphia, ACE USA has a strong corporate customer franchise with both
Fortune 1000 corporations and growing middle-market and small businesses.
ACE International is the company’s retail broker-distributed business serving territories
outside North America, offering both commercial P&C insurance and personal accident
lines. This franchise gives ACE a presence in all of the major developed markets as well as the
fastest-growing economies in the world. ACE International and ACE USA are the successor
franchises to the Insurance Company of North America, or INA – one of America’s earliest
insurance companies, dating back to 1792.
ACE Westchester is the company’s Atlanta-based wholesale broker-distributed business special-
izing in excess and surplus commercial P&C lines in North America. The storied Westchester
Fire Insurance Company was founded in 1837.
ACE Global Markets is a leading wholesale broker-distributed P&C business that operates in
the greater London market while also maintaining an established syndicate on the Lloyd’s
trading fl oor.
ACE Bermuda is the company’s original P&C insurance franchise dating back to 1985. This
market leader writes high-limit excess liability, property, political risk and directors and
offi cers insurance worldwide, including the standard-setting Corporate Offi cers & Directors
Assurance program (CODA).
ACE Tempest Re is the company’s global reinsurance brand, with operations in both P&C
and life reinsurance. The ACE Tempest Re Group has offi ces in Bermuda, London, Montreal,
São Paulo, Stamford and Zurich, and maintains an underwriting presence at Lloyd’s China Re
in Shanghai and Lloyd’s Brazil in Rio de Janeiro.
ACE Life is the company’s international life insurance franchise, which distributes individual
and group life and savings products through its own agents and telemarketing centers, as
well as banks, brokers and a variety of sponsors. This business operates predominantly in the
developing markets of Asia, Latin America and the Middle East.
ACE Private Risk Services is the company’s personal lines P&C business serving high net
worth individuals and families in North America. Its coverages, which include homeowners,
automobile, valuables, umbrella and recreational marine insurance, are distributed through
independent agents and brokers.
Combined Insurance provides specialty individual accident and supplemental health insur-
ance coverage to middle-income consumers in North America, Europe, Latin America and
Asia Pacifi c through a dedicated agency sales force. The company was founded in 1919 and is
headquartered in Glenview, Illinois.
19
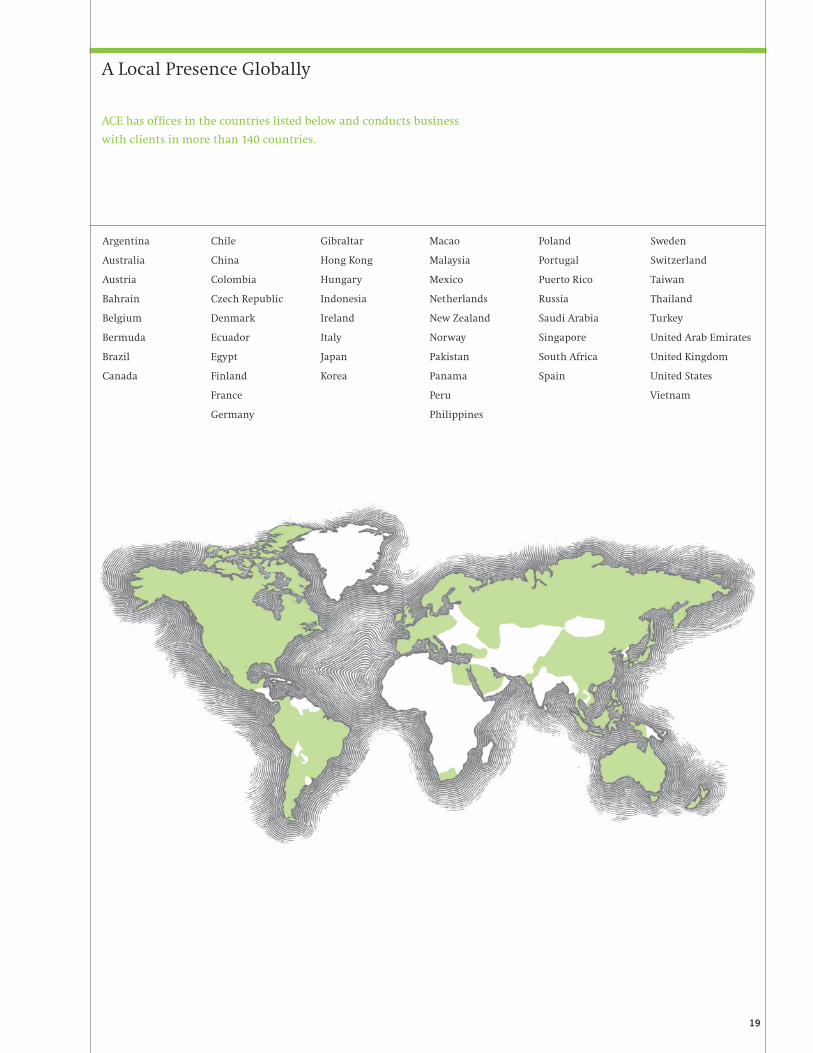
A Local Presence Globally
ACE has offi ces in the countries listed below and conducts business
with clients in more than 140 countries.
Argentina Chile Gibraltar Macao Poland Sweden
Australia China Hong Kong Malaysia Portugal Switzerland
Austria Colombia Hungary Mexico Puerto Rico Taiwan
Bahrain Czech Republic Indonesia Netherlands Russia Thailand
Belgium Denmark Ireland New Zealand Saudi Arabia Turkey
Bermuda Ecuador Italy Norway Singapore United Arab Emirates
Brazil Egypt Japan Pakistan South Africa United Kingdom
Canada Finland Korea Panama Spain United States
France Peru Vietnam
Germany Philippines

20
Energy and infrastructure development drives business in Middle East and North Africa region
ACE believes the developing regions of the world will make substantial contributions to its
profi table growth over the long term. With its high economic growth rate and relatively
low exposure to natural catastrophes, the Middle East and North Africa region, which for
ACE extends from Morocco to Pakistan, represents a compelling opportunity for ACE to
continue to invest capital.
Despite a well-publicized halt in Dubai’s building boom, ACE grew P&C net premiums written
in the region substantially in 2009 – in part through product diversifi cation. After expanding
its regional P&C base in Bahrain in 2007, ACE initially focused on the petrochemical indus-
try – the dominant economic force in the Gulf region – which opened the door for ACE’s
business focus on the energy sector. The company has extended its success in the region by
establishing itself as a capable underwriter of power generation and construction projects in
key markets, and has expanded its product offerings to include fi nancial lines and casualty
coverages.
“Having expertise on the ground here is a key point of differentiation for our company,” says
Giles Ward, Regional Managing Director, Middle East and North Africa. “ACE has based highly
qualifi ed decision makers in the region – underwriters,
engineers and claims professionals – who are able to
assess risk and respond quickly. Our team is small in
headcount, but it is very skilled.”
Saudi Arabia, the region’s economic powerhouse,
recently fi nalized a legal and regulatory framework
for insurance companies. ACE and one of its pre-
decessor fi rms, working in close partnership with
the El Khereiji family, have written insurance in
Saudi Arabia for more than 30 years. This rela-
tionship continued with the 2009 establishment
of ACE Arabia Cooperative Insurance Company,
a joint venture that was licensed as a domestic
Saudi insurer and approved to write products in
early 2010. “We’re grateful that ACE has a very cordial relationship with Sheikh
Abdul Karim El Khereiji, the Chairman of ACE Arabia, who brings a deep understanding of
the Saudi business world,” Ward explains. “The combination of our partner’s perspective with
ACE’s technical knowledge and global reach is very powerful.”
ACE plans to further expand its product line in the region and capitalize on its already
strong position in the power generation market, as many planned projects advance in
several countries.
From left, Sheikh Abdul Karim
El Khereiji, Chairman, ACE
Arabia; Abdul Aziz El Khereiji,
Director, ACE Arabia; and Giles
Ward, ACE Regional Managing
Director, Middle East and North
Africa.
rs,
o
n
l relationship with Sheikh

21
Brazil’s expanding economy presents ACE with a range of insurance and reinsurance opportunities
Over the past decade, Brazil’s economy has vaulted to the eighth largest in the world, thanks
to a host of reforms that have stabilized and strengthened a once-volatile business climate.
ACE’s operations in Brazil have benefi ted from this environment, expanding from a focused
effort serving the local property and casualty needs of multinational companies into a
multiline insurance and reinsurance provider with a broad range of products to match the
dynamic development of Brazil’s own commercial sector and burgeoning middle class.
“We have invested in many new products, including management and
professional liability and technical lines on the commercial side, and
homeowners, credit card theft and electronic equipment coverages for
individuals,” notes Marcos Couto, ACE’s P&C Country Manager in
Brazil. As a result, ACE has grown its business in Brazil to 10 times its
1999 size, and now holds top-three market positions in several lines,
all while maintaining strong underwriting results.
Over the past two years, Brazil’s insurance regulators have opened a
sizable portion of the country’s previously monopolistic reinsurance
market to competition, providing ACE an opportunity to add
another capability for meeting client needs in this rapidly expanding
market. Late in 2009, ACE received approval as a local reinsurer—
one of only six in Brazil. Local reinsurers must be incorporated
in the country and dedicated solely to reinsurance. ACE now has
licenses to operate under all three legal reinsurance statuses in
Brazil, after having registered admitted and eventual reinsurance
operations in 2008.
“The strength of Brazil’s economy has helped us achieve great organic growth in recent years,
and we see tremendous potential over the long term,” says Jorge Luis Cazar, regional CEO
for ACE’s business in Latin America. “ACE is the only company that can offer a full spectrum
of insurance and reinsurance capabilities in Brazil, which enables us to meet the emerging
needs of clients, and provides a strong platform for expanding our franchise throughout
Latin America.”
Having these capabilities is well timed. On the horizon, massive infrastructure projects are
planned for the 2014 World Cup soccer tournament and 2016 Summer Olympics, as well as
for the continued development of the nation’s natural resources sector. With its strong brand
and broad range of property and casualty, personal accident and life insurance solutions for
businesses and individuals, ACE is in prime position to benefi t from the continued expansion
of the Brazilian economy in the coming years.
Marcos Couto, ACE’s P&C
Country Manager in Brazil, in
the São Paulo business district.
We
profe
hom
indi
Bra
199
all
Ov
siz
m
an
m
o
i
“The strength of Brazil’s eco

22
ACE Life launches operations in Indonesia
ACE continues to expand into fast-growing emerging economies around the world. In April
2009, the company launched a new life insurance business in Indonesia, joining existing
P&C and A&H businesses in the country.
“ACE Life Indonesia enhances our presence in an important emerging market that is rich in
promise,” says David Wolf, President of ACE Life. Indonesia offers particularly good long-term
growth potential for the life insurance business. Out of a population of 225 million people,
fewer than eight million own individual life policies, and total life insurance premiums equal
less than 1% of the country’s GDP.
In its fi rst year of operation, the new company is off to
a good start, having already recruited more than 1,500
agents, established branches in fi ve major cities and
developed products for the local market. “Our strategy
is to offer life insurance products that will meet the
specifi c protection and savings-oriented needs of Indo-
nesian customers,” says Tham Chee Kong, ACE Life’s
Country Manager in Indonesia. “We are providing both
traditional life insurance products and variable life
products with a comprehensive range of riders.”
The company places a high priority on the quality of
its agency distribution, with a strong emphasis on ethical sales
practices and compliance. In a highly competitive life insurance market, ACE Life Indonesia
believes this focus on high standards can differentiate it in the marketplace. To this end, it
has developed a rigorous and thorough training program for agents. In 2010, it intends to
enlarge its branch network – both in Jakarta and throughout the country – and to double
its agency force to 3,000. It also has plans to expand distribution into the bancassurance and
direct marketing channels, taking advantage of ACE’s established P&C and A&H relationships.
Getting started in Indonesia marked another milestone in the development of ACE Life’s
franchise in the Asia Pacifi c region. “While the business is small right now, we are optimistic
about our growth in Indonesia because of our ability to develop a strong, sustainable operat-
ing platform across the region and around the world,” Wolf concludes.
From left, Liany Kurniawan,
Vice President of Operations,
and Tham Chee Kong, ACE
Life’s Indonesia Country
Manager, at the company’s
offi ces in Jakarta.
l sales
urance market, ACE Life Indonesia

Bu
sin
ess
Seg
men
ts

24
Insurance – North American
Brian E. DowdVice Chairman, ACE Limited;
Chief Executive Offi cer,
Insurance – North America
The four operating businesses of the Insurance – North American segment serve clients
ranging from the largest multinationals to midsize and small businesses to high net worth
individuals. ACE USA, which distributes its coverage through retail brokers, provides a
broad array of specialty property, casualty, and accident and health insurance products and
risk management services to corporate clients across the United States and Canada. ACE
Westchester specializes in excess and surplus lines specialty products, including property,
inland marine, casualty, professional lines, agriculture and environmental liability products,
which it distributes through wholesale brokers. ACE Bermuda, the original insurance com-
pany of the ACE Group, writes high-level excess liability, property, political risk and directors
and offi cers insurance worldwide. ACE Private Risk Services provides high net worth individuals
and families with homeowners, automobile, valuables, umbrella and recreational
marine insurance.
In the aftermath of the fi nancial crisis, a deep recession contracted the overall insurance
market in the U.S., and the absence of major catastrophes added downward pricing pressure.
Despite these market conditions, ACE’s North American businesses
delivered impressive fi nancial results in 2009, maintaining net
written premiums at $5.6 billion and increasing operating income
by 11% to more than $1.2 billion while holding their combined ratio
just under 90%.
ACE USA improved its position in several key markets during the
year. With the balance sheets of some competitors weakened, ACE’s
fi nancial strength stood out in vivid contrast. The uncertainty in
the marketplace drove brokers and clients toward ACE’s strong bal-
ance sheet and excellent product and service capabilities. In spite
of the headwind from the recession, which reduced aggregate risk
exposures and affected buying behavior at many client companies,
submission activity reached an all-time high for ACE, and the volume
of bound business rose as well, although tempered in part by the
company’s inherent underwriting discipline.
Starting late in 2008, ACE USA laid the groundwork for prudent growth by identifying
specifi c lines where the need for coverage was likely to be most intense. ACE quickly added
experienced underwriters to its management and professional liability, environmental, excess
casualty and construction teams, and doubled available capacity in several liability lines from
$25 million to $50 million. This nimble response enabled the company to increase premiums
written at a double-digit pace in these lines while maintaining high underwriting standards
and an orderly operating environment. Even in construction, where the market shrank over-
all, ACE was able to grow.
f

Net Premiums Written, 2005 to 2009
(in millions of U.S. dollars)
25
In 2009, ACE Private Risk
Services enlarged its footprint
to 45 states in the U.S., where
99% of potential high net worth
and affl uent clients reside, and
doubled its distribution force to
over 600 independent agents
and brokers. Helping to drive
this expansion were Regional
Vice Presidents (l-r) Annmarie
Camp (Northeast), Steven
LoCascio (Western) and David
Spencer (Central/Southern).
Combined Ratio, 2005 to 2009
2009 89.8%
2008 91.1%
2007 88.5%
2006 88.4%
2005 96.1%
2009 $5,641
2008 $5,636
2007 $5,833
2006 $5,940
2005 $5,803
As clients spread their coverage over a larger number of carriers, ACE’s strong balance sheet
and capabilities reaffi rmed client confi dence and enabled ACE to move lower in their insur-
ance programs – in some cases insuring the primary layer, where premium volume and profi t
margins are typically higher.
Competition was sharper in the wholesale market, and prices
generally continued on the downward path of the last three
years. ACE Westchester once again shrank its top line, but
through disciplined underwriting, produced a solid combined
ratio. One area of growth was the company’s small commer-
cial initiative, which provides small businesses with property,
professional risk, environmental and inland marine coverage
through an effi cient online system. With this client group, ACE
Westchester’s technology can process information from a whole-
sale broker and then rate, quote, bind and issue policies directly
from the website. The company also introduced new products that
responded to the year’s economic climate, such as a construction
wrap for banks and buyers wanting to refi t or revamp partially
completed projects.
ACE Bermuda delivered excellent fi nancial performance in 2009, boosted by positive loss
development from prior years and good contributions from all of its product lines. Retentions
typically range between 85% and 95% of ACE Bermuda’s business on a renewable basis, and
2009 was no exception. Thanks to information technology investments made in prior years,
ACE Bermuda now issues all excess casualty and CODA D&O policies at inception. It remains
one of the few insurers to offer this high level of service to clients.
ACE Private Risk Services continued to build out its nationwide infrastructure, establish
its brand in the high net worth insurance marketplace and reach new clients in 2009.
ACE’s recreational marine business also had an excellent year, particularly in the mega-yacht
sector of the market.
For the businesses of Insurance – North American, 2009 was a year marked by excellent fi nan-
cial performance, the expansion of underwriting, product and service capabilities, and the
enhancement of ACE’s reputation for fi nancial strength. All of these investments position
ACE’s North American business for continued profi table growth in the years to come.
I 2009 ACE P i t Ri k
g yp y g
y
t
r
c
p
th
W
sa
fro
res
wra
com
Net Premiums Written, 2005 to 2009
(in millions of U.S. dollars)

26
GE and ACE bring imagination to multinational insurance programs
Regularly ranked among the world’s most
admired and innovative businesses, GE is a
diversifi ed company serving customers in
more than 100 countries and employing
more than 320,000 people worldwide. GE
was among the 34 companies that came
together in 1985 to establish ACE as a source
of then-scarce excess liability coverage, and
has been a major client ever since.
Especially in the past decade, ACE’s global
relationship management approach has
been critical in helping to deepen and
expand GE’s involvement with ACE around
the world to now encompass more than 150
policies in over 80 countries. “ACE plays a
strategic role in most of our programs,” says
Stacey Regan, Deputy Treasurer, who heads
insurance at GE. ACE provides fronting for
GE’s master programs – issuing primary
property and casualty policies in most of the
countries where GE operates, and assuring
compliance with tax and regulatory rules.
ACE also supplies signifi cant capacity to all
of GE’s core programs and plays a lead role
in areas such as international property and
specialty liability. “ACE is known as an un-
derwriting company,” Regan explains, “and
it has a lot of credibility in the insurance
marketplace. When ACE takes the lead,
it facilitates our placements.”
As a global innovator in varied businesses,
and a highly sophisticated insurance buyer,
GE often has unique and complex insur-
ance needs. Regan especially values ACE’s
dedication to developing multinational
solutions involving all of ACE’s major global
operating entities. “ACE has a very high level
of commitment to fi nding a way to meet
our needs. I think that’s the essence of the
relationship. ACE is, by far, one of the most
fi nancially secure and capable insurance
companies out there. I can’t imagine there’s
a risk manager on the planet that wouldn’t
want to work closely with them.”

27
Stacey Regan, GE’s Deputy Treasurer, at the GE Renewable Energy
global headquarters in Schenectady, N.Y.

28
John KeoghChief Executive Offi cer,
ACE Overseas General
Insurance – Overseas General
Insurance – Overseas General comprises ACE International, the company’s retail broker-
distributed business outside of North America, and ACE Global Markets, a London-based
excess and surplus business that includes a syndicate on the Lloyd’s trading fl oor. These busi-
nesses write a variety of coverage, including property, casualty, professional lines, marine,
energy, aviation, political risk, construction risk, A&H and specialty consumer-oriented
products. ACE’s A&H business is mainly personal accident, with some supplemental medical
coverage. Since 2008, Insurance – Overseas General also includes the international operations
of Combined Insurance, which provides specialty accident, supplemental health and life
insurance products to middle-income consumers in Europe, Latin America and Asia Pacifi c.
In 2009 strong economic crosscurrents roiled many of the world’s insurance markets, weaken-
ing a number of large insurance companies and provoking a fl ight to quality and capability
on the part of multinational and domestic corporate insurance buyers. Against this backdrop,
ACE stood out with its strong ratings and broad product and service capabilities. The challeng-
ing economic conditions and a strong U.S. dollar contributed to a 4% decline in net premiums
written, although on a constant-dollar basis premiums grew 3%. For
the year, the businesses of Insurance – Overseas General maintained
strong underwriting discipline, as evidenced by a combined ratio of
89% for the year, and produced operating income in excess of $800
million.
The global fi nancial crisis and disruptions in insurance markets
provided opportunities for ACE International to build capabilities
in specifi c product areas. It invested heavily to strengthen its online
A&H distribution systems so that when global travel rebounds, ACE
will be ready to deliver quick and effi cient service to its distribution
partners and end consumers. In Latin America and Asia, ACE added
underwriting, claims and engineering capabilities in construction
and energy, where demand for insurance was driven particularly by
fl ight to quality. To better serve large corporations doing business
across the globe, ACE International also added to its European direc-
tors and offi cers liability teams.
In Latin America, ACE grew overall business volume through its diversity of product offerings
and with the varying economic conditions of countries in the region. Growth in Colombia
and Chile offset a slowdown in Mexico, while personal lines and small and medium enter-
prise business provided new sources of income. Investments in energy and D&O capabilities
yielded new-business gains in 2009, while new sponsor signings contributed to growth in

29
Around the world, ACE
operates telemarketing centers
that primarily support the
company’s A&H business.
They can fl exibly adjust
capacity with outside staff to
match the needs of marketing
campaigns. The largest contact
center, in Bangkok (above), has
capacity for 700 telemarketers.
The centers employ the latest
technology, including predictive
dialer systems that can increase
productivity up to 30% com-
pared to manual dialing.
A new data warehouse will
help ACE more accurately target
product offers to specifi c market
segments.
Net Premiums Written, 2005 to 2009
(in millions of U.S. dollars)
Combined Ratio, 2005 to 2009
2009 $5,145
2008 $5,332
2007 $4,568
2006 $4,266
2005 $4,195
2009 89.0%
2008 87.6%
2007 87.7%
2006 86.2%
2005 94.0%
A&H. After gaining approval as a local reinsurer, ACE is now the only company in Brazil that
can offer full insurance and reinsurance capabilities (see page 21).
In Europe, casualty and D&O business came to ACE in greater volume as
buyers sought insurers stable enough to pay claims many years hence.
ACE raised its profi le among multinational corporations as well, win-
ning important new accounts and gaining wider recognition for the
quality and breadth of its global service. ACE also opened online portals
where multinational clients and their brokers can easily track claims.
In the U.K., ACE restructured its branch offi ces serving both large and
midsize companies and grew this business despite an industry-wide
decline. In continental Europe, the P&C business was fl at for the year,
but there were pockets of growth, including gains in Russia and a
strong launch in Turkey. Pricing in the wholesale market remained
soft, and ACE Global Markets again shrank its business. However, as
prices rebounded for aviation coverage, a class of business impacted by losses
during the year, ACE Global Markets wrote new accounts and increased participation
on existing ones.
Asian insurance markets were challenging in 2009. Reductions in consumer spending in cat-
egories such as travel impacted ACE’s A&H business, while competition was very aggressive in
many P&C lines. In China, where economic growth quickly resumed, ACE offered increased
expertise including product liability and D&O. ACE’s investment in Huatai Insurance Com-
pany was profi table for the eighth year in a row. In preparation for when credit cards will be
more prevalent, ACE continued to build its A&H franchise.
ACE saw continued growth opportunities in the Middle East and North Africa, where the
energy, power and construction industries are key economic drivers (see page 20).
For Combined Insurance, which has 3,300 agents in 10 countries outside North America,
the recession presented a challenge, especially in mature markets such as the U.K. and Spain.
Australia, on the other hand, experienced good growth in the year, and the company
continued to invest in developing markets such as Chile and Mexico where it is planting
the seeds for future growth.
In a year when growth was generally diffi cult to achieve, the businesses of Insurance – Over-
seas General maintained underwriting discipline, strengthened capabilities in selected lines
and extended their geographic reach to prepare for a future when market conditions are
more favorable.

30
GDF SUEZ and ACE demonstrate the power of cross-border partnership
Formed through the merger of Gaz de France
and SUEZ in 2008, GDF SUEZ is one of the
leading utility companies in the world. It is
active across the entire energy chain, from
natural gas production to power generation.
Headquartered in Paris, GDF SUEZ employs
200,000 people at its operations on all conti-
nents. The company offers unique expertise
in four key sectors: liquefi ed natural gas,
energy effi ciency services, independent power
production and environmental services.
After the merger, the company opted to
centralize its insurance buying wherever it
made sense and undertook a rigorous review
of the placement process. ACE, which
already had strong ties to the company’s
Latin American, European and Middle Eastern
programs, was chosen to supply property
damage coverage in 28 countries world-
wide. ACE now leads and fronts the overall
property and business interruption coverage
for almost all GDF SUEZ power-generation
activities. It is also fronting the company’s
reinsurance captive unit and leading the risk
transfer placements with a signifi cant share.
“ACE has signifi cant capacity and expertise
that we value highly,” says Denis Waerseggers,
Property Insurance Manager at GDF SUEZ.
“We also appreciate the great commitment
of senior management to remain involved
in our program – in leading ACE’s troops
on the account, asking questions, getting to
know more about us.” GDF SUEZ also places
a premium on ACE’s risk engineering capa-
bilities, Waerseggers adds.
Sharing a common purpose has helped the
new relationship get off to a smooth start.
“I strongly insist that we view our insurer as
a partner,” Waerseggers concludes. “We and
ACE are looking in the same direction, with
the same aim of managing risk. Whenever
we accomplish that aim, it’s a win-win situa-
tion for both parties.”

31
Denis Waerseggers, Property Insurance Manager,
GDF SUEZ, in the Grand Place in Brussels.

32
Jacques Q. BonneauPresident and Chief Executive Offi cer,
ACE Tempest Re Group
Marketing its coverage worldwide under the ACE Tempest Re brand, the businesses of the
Global Reinsurance segment provide a broad range of property and casualty reinsurance
products to a diverse array of primary insurers. Business units include ACE Tempest Re
Bermuda, ACE Tempest Re USA, ACE Tempest Re Canada, and ACE Tempest Re Europe, which
encompasses P&C reinsurance operations based in London, São Paulo and Zurich. ACE Tempest
Re also has operations in China and Brazil through Lloyd’s.
The fi nancial crisis that began in late 2008 put pressure on the balance sheets of many insur-
ance and reinsurance companies and severely restricted their access to sources of additional
capital. Indeed, insurers’ depressed capital levels and fl ight to fi nancially strong reinsurance
partners combined to increase demand and harden pricing for reinsurance in the fi rst half
of 2009, which resulted in premium growth at ACE Tempest Re. This reversed a decrease in
writings over the last two years due to increased competition across many lines of business. In
response to primary insurers’ acute need for capital-based solutions, ACE Tempest Re stepped
up to respond to the needs of these clients. Both customers and intermediaries turned to ACE
Tempest Re as a “safe port” – a reinsurer with a strong balance sheet.
In addition, insurers seeking to diversify their reinsurance programs
found ACE Tempest Re, a relatively young global reinsurer, an attrac-
tive alternative to those with whom they had accumulated signifi -
cant levels of counterparty exposure.
In this environment, after contracting its business more than 40%
over the previous two years, ACE Tempest Re increased overall
premium volume 21% in 2009, growing its portfolio in virtually
all product lines and regions. Thanks in part to a benign year for
catastrophes, ACE Tempest Re also delivered strong fi nancial results,
producing $633 million in operating income and a combined ratio
of 59.2%.
In addition to acquiring the security they needed, buyers of reinsurance
and their brokers also looked to ACE Tempest Re for tailored solu-
tions and superior service. Through a number of initiatives in 2009,
ACE Tempest Re strengthened its ability to deliver both. To assure timely responses to submis-
sions and claims, it added underwriting, actuarial and claims experts. With the demand for
structured underwriting expected to increase when the European Union launches Solvency
II, a new regulatory framework for measuring insurance risk and establishing capital require-
ments, and with clients looking for creative solutions, ACE Tempest Re added capabilities in
the structured underwriting area. ACE Tempest Re also expanded its global client relationship
manager program, which provides global buyers of reinsurance with a senior executive point
Global Reinsurance

33
Net Premiums Written, 2005 to 2009
(in millions of U.S. dollars)
2009 59.2%
2008 75.8%
2007 75.1%
2006 76.0%
2005 115.1%
2009 $1,038
2008 $914
2007 $1,197
2006 $1,550
2005 $1,546
Property (short-tail) Casualty (long-tail) Other (specialty)
Members of the ACE Tempest
Re USA team in Stamford,
Conn., include (l-r) Victoria
Gomez, Vice President, Property
Treaty Underwriting; Michael
O’Donnell, Vice President,
Casualty Treaty Underwriting; and
David Blake, Vice President,
Professional Treaty Underwriting.
Combined Ratio, 2005 to 2009
person to assure that they receive consistently excellent service whenever and wherever they
make contact with the company. The program, launched in 2008, has met with a positive
response from clients.
During the year, ACE Tempest Re also made further
progress in its alternative risk initiative – a drive to
meet the unique and often complex needs of captives,
pools and risk retention groups. ACE Tempest Re has
developed a dedicated team of underwriters for these
clients that blends treaty and individual risk underwrit-
ing approaches. ACE Tempest Re sources this business
both through large reinsurance brokerages and through
a set of newer relationships with consultants, captive
managers and small specialist reinsurance brokers.
ACE Tempest Re further expanded its geographic reach
in 2009. In Brazil, following the deregulation of the
insurance market, the company obtained all the licenses
it needed to write reinsurance in this important and growing market. Recently opened offi ces
in Zurich and Montreal continue to gain traction in the continental European and Canadian
markets, respectively. In China, the company identifi ed areas where it can differentiate itself
in responding to client needs and began to selectively write reinsurance programs in a com-
petitive market.
To support this drive into new regions, ACE Tempest Re’s research and development team and
underwriters collaborated with its broker partners to develop property catastrophe pricing
models for areas such as China and Brazil, where historical catastrophe data is scarce. From
its origins, ACE Tempest Re has invested heavily in technical underwriting capabilities while
enhancing its ability to temper the output of computer risk models with the judgment of
experienced professionals.
As insurers face generally weak global economic conditions and declining prices in 2010, ACE
Tempest Re, with its combination of fi nancial strength, innovative solutions, enhanced service
capabilities and expanding international reach, is well positioned to deliver high value to
reinsurance clients around the world.

34
United America Indemnity and ACE Tempest Re protect small businesses from large property losses
United America Indemnity (UAI) is one of
the leading specialty property and casualty
insurance groups with operating subsidiar-
ies in the United States and Bermuda. UAI’s
primary operating company, Penn-America
Group, based in the Philadelphia suburb
of Bala Cynwyd, Pennsylvania, provides
general liability, commercial property and
multi-peril insurance for small businesses
located in suburban and rural areas. This
excess and surplus coverage is distributed
through a network of about 100 wholesale
general agents.
Since 2008, ACE Tempest Re has provided
quota share reinsurance protection to Penn-
America on a segment of its property and
property catastrophe business. “Over the
years, I have had dealings with ACE Tem-
pest Re across a number of lines – casualty,
professional liability and environmental
liability, to name a few,” says Larry Frakes,
President and CEO of UAI. “Their under-
writing approach and handling of claims
have been consistent across all lines. Their
service, and more importantly their claims
payment, have been excellent. That’s why
I’ve specifi cally asked our broker to show
ACE Tempest Re all of our treaty business.”
UAI also has an insurance relationship with
ACE USA’s Professional Risk unit, which pro-
vides excess directors and offi cers liability
coverage for UAI.
From a security perspective, ACE Tempest
Re is one of the few reinsurers UAI will con-
sider, but Frakes looks to ACE for more than
just security. “Part of what you buy with a
reinsurer is expertise and market knowl-
edge to help you grow your business. That’s
a major area where we’ll continue to look to
ACE Tempest Re to help us.”

35
Larry Frakes, President & CEO of United America Indemnity, Ltd., in front of the
former Second Bank of the United States building in Philadelphia’s Historic District.

36
Life
ACE Life provides traditional life insurance protection and savings products to meet the
needs of individuals and groups in a growing number of countries throughout Asia, Latin
America and the Middle East. The North American accident and health and life businesses of
Combined Insurance have also been included in this segment’s results since 2008. Combined
Insurance distributes specialty individual accident and supplemental health and life insur-
ance products targeted to middle-income consumers in the U.S. and Canada. ACE Tempest
Life Re Bermuda provides solutions to the complex risk and capital management challenges
facing life insurers around the globe.
In 2009, the businesses of the Life segment generated $283 million in operating income, up
from $168 million in 2008, and accounted for 11% of consolidated net premiums earned for ACE.
Building on the foundation it has established in developing economies around the globe,
ACE Life continued on its growth trajectory in 2009 by adding branch offi ces and agents
to new and existing markets, introducing innovative products, entering new distribution
agreements and enhancing the training and key drivers of its agency
forces. Today, ACE Life operates in over 25 countries and has an exclu-
sive agency sales force of over 30,000.
In 2009, Huatai Life Insurance Co., Ltd., ACE’s joint venture in China
with Huatai Insurance Group, was one of the country’s top three
foreign invested insurance companies. The joint venture has more
than 150 sales locations and 19,000 captive agents, as well as distri-
bution partnerships with many of the country’s leading banks. ACE
owes its success in China in large part to combining the knowledge
and relationships of the local management team with the insurance
expertise that ACE brings to the venture.
Growth was also very good in Vietnam, where ACE Life continued to
be ranked as the third leading life insurer as measured by fi rst-year
premium, led by strong agency distribution. In 2009, ACE Life again
played a pioneering role in the market, becoming the fi rst insurer
to gain approval for group life products. In addition to its sales force of 6,000 captive agents,
ACE Life began marketing through Vietnam’s nascent bancassurance channel by establishing
relationships with several banks.
Elsewhere in Asia, ACE Life made a strong start in Indonesia, where it opened for business
in April 2009 (see page 22). In Thailand, where products are distributed through captive
agents, banks, affi nity marketing and telemarketing, ACE is adding new branches in cities
6 000 iDavid WolfPresident, ACE Life

37
Net Premiums Written, 2005 to 2009
(in millions of U.S. dollars)
2009 $344
2008 $218
2007 $160
2006 $132
2005 $98
2009 $1,475
2008 $1,198
2007 $381
2006 $274
2005 $248
ACE Life sees continued strong
growth potential in the Asia
Pacifi c region, where it currently
operates in fi ve countries and
has the majority of its captive
agents globally. ACE Life’s leaders
in the region include (l-r) Saloon
Tham, Asia Pacifi c Regional
CEO, and Alan Fieldus, Global
Chief Actuary.
Underwriting Income, 2005 to 2009
(in millions of U.S. dollars)
outside Bangkok. In Taiwan’s highly competitive market, ACE Life successfully pursued
a niche strategy focused on universal life products and variable annuities without
performance guarantees.
Brazil and Mexico again delivered the strongest growth in Latin America. Throughout the
region, ACE Life utilizes the sponsor distribution network built by ACE’s international A&H
business and relationships developed by dedicated life
resources. Distribution channels include brokers, banks,
department stores and credit card companies. ACE Life’s
main product lines in Latin America are group life,
credit life and specialty life (one-year term life sold
through direct marketing). All three lines grew, with
group life leading the way.
ACE Life continued to build its business in the Middle
East. Products in the region include individual life
insurance distributed through agents, brokers and
telemarketing, and group life and medical insurance
distributed primarily through brokers.
The North American operations of Combined Insurance
have a large captive agency sales force of over 2,000 agents operating in small towns and rural
locations in the U.S. and Canada that has achieved success through a unique face-to-face
approach. During the year, Combined Insurance continued to roll out its new needs-based
sales model across the U.S., which has met with early success and is laying the groundwork
for future growth. All in all, Combined Insurance’s revenue and earnings in 2009 were solid.
On the reinsurance side of the business, due primarily to improvements in the global macro-
economic environment, ACE’s existing variable annuity reinsurance business generated
considerable operating and net income in 2009. In January 2010, a strategic decision was
made to discontinue writing new traditional life mortality reinsurance business from its U.S.-
domiciled life reinsurance company, as it did not represent a signifi cant growth opportunity
for ACE.
Despite a challenging economic climate in many regions of the globe, ACE Life delivered good
growth in 2009. ACE Life anticipates further growth in 2010 as it continuously strives to
improve key business drivers, risk management and operational excellence in order to best
meet the life insurance needs of its diverse customer base.

38
UniVida and ACE give life to insurance marketing venture in Brazil
UniVida is a life insurance intermediary
organization that currently distributes life
products to employees of small and medium-
size companies in São Paulo, Brazil, a city of
20 million. Over the next 10 years, it plans
to expand throughout the State of São Paulo
and across the rest of Brazil. UniVida’s Man-
aging Partner, Leoncio de Arruda, is a widely
respected fi gure in the Brazilian insurance
market who hosts a national prime-time
television program about the importance
of insurance.
In 2009, UniVida chose ACE Life as its exclu-
sive provider of both individual and group
life insurance products. “ACE recognizes the
value of providing its coverages through pro-
fessional brokers,” says Arruda in explaining
the choice. “UniVida and ACE agree that
when insurance is sold by skilled and ethical
professionals, it benefi ts the client, the insur-
ance industry and the economy as a whole.”
The partnership with ACE has enabled
UniVida to create new insurance products
and develop new marketing campaigns. At
present, UniVida can combine 38 different
types of coverage with a range of more than
40 services and accessory warranties. It offers
tailored products and solutions to each of its
key business segments: individuals, corpora-
tions, associations, unions and cooperatives.
With support from ACE, UniVida has been
able to develop these solutions and bring
them to market more rapidly and effi ciently
than they could previously.
In a country where the value of life insur-
ance is not yet widely understood, trusted
insurance brokers have a critical role to
play in educating the general population.
“In partnership with ACE Life, we’ve improved
the quality of our broker training and brought
it to the desired level,” Arruda concludes.

39
UniVida leaders Leoncio de Arruda (left) and David do Nascimento in the
Viaduto do Chá area of downtown São Paulo, Brazil.

U N I T E D S T A T E S S E C U R I T I E S A N D E X C H A N G E C O M M I S S I O NWashington, D.C. 20549
F O R M 1 0 - KÈ Annual Report Pursuant to Section 13 or 15(d) of the Securities Exchange Act of 1934
For the fiscal year ended December 31, 2009OR
‘ Transition Report Pursuant to Section 13 or 15(d) of the Securities Exchange Act of 1934For the transition period from to
Commission File No. 1-11778
A C E L I M I T E D(Exact name of registrant as specified in its charter)
Switzerland 98-0091805(State or other jurisdiction of incorporation or organization) (I.R.S. Employer Identification No.)
Bärengasse 32
Zurich, Switzerland CH-8001(Address of principal executive offices, Zip Code)
+41 (0)43 456 76 00(Registrant’s telephone number, including area code)
Securities registered pursuant to Section 12(b) of the Act:
Title of each class Name of each exchange on which registered
Common Shares, par value CHF 31.88 per share New York Stock Exchange
Securities registered pursuant to Section 12(g) of the Act: None
Indicate by check mark if the registrant is a well-known seasoned issuer, as defined in Rule 405 of the SecuritiesAct. YES È NO ‘
Indicate by check mark if the registrant is not required to file reports pursuant to Section 13 or Section 15(d) of theAct. YES ‘ NO È
Indicate by check mark whether the registrant (1) has filed all reports required to be filed by Section 13 or 15(d) of the SecuritiesExchange Act of 1934 during the preceding 12 months (or for such shorter periods that the registrant was required to file suchreports), and (2) has been subject to such filing requirements for the past 90 days. YES È NO ‘
Indicate by checkmark whether the registrant has submitted electronically and posted on its corporate Web site, if any, every Inter-active Data File required to be submitted and posted pursuant to Rule 405 of Regulation S-T (§232.405 of this chapter) during thepreceding 12 months (or for such shorter period that the registrant was required to submit and post such files). YES È NO ‘
Indicate by check mark if disclosure of delinquent filers pursuant to Item 405 of Regulation S-K is not contained herein, and will notbe contained, to the best of the registrant’s knowledge, in definitive proxy or information statements incorporated by reference intoPart III of this Form 10-K or any amendment to this Form 10-K. ‘
Indicate by check mark whether the registrant is a large accelerated filer, an accelerated filer, a non-accelerated filer, or a smallerreporting company. See the definitions of “large accelerated filer,” “accelerated filer” and “smaller reporting company” in Rule 12b-2of the Exchange Act. (Check one):Large accelerated filer È Accelerated filer ‘
Non-accelerated filer ‘ (Do not check if a smaller reporting company) Smaller reporting company ‘
Indicate by check mark whether the registrant is a shell company (as defined in Rule 12b-2 of the Exchange Act) YES ‘ NO È
The aggregate market value of voting stock held by non-affiliates as of June 30, 2009 (the last business day of the registrant’s mostrecently completed second fiscal quarter), was approximately $15 billion. For the purposes of this computation, shares held by direc-tors and officers of the registrant have been excluded. Such exclusion is not intended, nor shall it be deemed, to be an admission thatsuch persons are affiliates of the registrant.As of February 23, 2010, there were 336,557,967 Common Shares par value CHF 31.88 of the registrant outstanding.
Documents Incorporated By Reference
Certain portions of the registrant’s definitive proxy statement relating to its 2010 Annual General Meeting of Shareholders areincorporated by reference in Part III of this report.

ACE LIMITED INDEX TO 10-K
PART I Page
ITEM 1. Business 3
ITEM 1A. Risk Factors 19
ITEM 1B. Unresolved Staff Comments 30
ITEM 2. Properties 30
ITEM 3. Legal Proceedings 30
ITEM 4. Submission of Matters to a Vote of Security Holders 31
PART II
ITEM 5. Market for Registrant’s Common Equity, Related Stockholder Matters and Issuer Purchases of Equity
Securities
32
ITEM 6. Selected Financial Data 34
ITEM 7. Management’s Discussion and Analysis of Financial Condition and Results of Operations 35
ITEM 7A. Quantitative and Qualitative Disclosures About Market Risk 89
ITEM 8. Financial Statements and Supplementary Data 94
ITEM 9. Changes in and Disagreements With Accountants on Accounting and Financial Disclosure 94
ITEM 9A. Controls and Procedures 94
ITEM 9A(T). Controls and Procedures 94
ITEM 9B. Other Information 94
PART III
ITEM 10. Directors, Executive Officers and Corporate Governance 95
ITEM 11. Executive Compensation 95
ITEM 12. Security Ownership of Certain Beneficial Owners and Management and Related Stockholder Matters 95
ITEM 13. Certain Relationships and Related Transactions, and Director Independence 95
ITEM 14. Principle Accounting Fees and Services 95
PART IV
ITEM 15. Exhibits, Financial Statement Schedules 96
1

F O R W A R D - L O O K I N G S T A T E M E N T S
The Private Securities Litigation Reform Act of 1995 provides a “safe harbor” for forward-looking statements. Any written ororal statements made by us or on our behalf may include forward-looking statements that reflect our current views with respectto future events and financial performance. These forward-looking statements are subject to certain risks, uncertainties, andother factors that could, should potential events occur, cause actual results to differ materially from such statements. Theserisks, uncertainties, and other factors (which are described in more detail elsewhere herein and in other documents we filewith the SEC) include but are not limited to:• developments in global financial markets, including changes in interest rates, stock markets, and other financial markets,increased government involvement or intervention in the financial services industry, the cost and availability of financing, andforeign currency exchange rate fluctuations (which we refer to in this report as foreign exchange), which could affect ourstatement of operations, investment portfolio, financial position, and financing plans;• general economic and business conditions resulting from volatility in the stock and credit markets and the depth and dura-tion of recession;• losses arising out of natural or man-made catastrophes such as hurricanes, typhoons, earthquakes, floods, climate change(including effects on weather patterns, greenhouse gases, sea, land and air temperatures, sea levels, rain and snow), or terror-ism which could be affected by:
•the number of insureds and ceding companies affected;•the amount and timing of losses actually incurred and reported by insureds;•the impact of these losses on our reinsurers and the amount and timing of reinsurance recoverable actually received;•the cost of building materials and labor to reconstruct properties following a catastrophic event; and•complex coverage and regulatory issues such as whether losses occurred from storm surge or flooding and related law-suits;
•infection rates and severity of pandemics and their effects on our business operations and claims activity;• actions that rating agencies may take from time to time, such as financial strength or credit ratings downgrades or placingthese ratings on credit watch negative or the equivalent;• global political conditions, the occurrence of any terrorist attacks, including any nuclear, radiological, biological, or chemicalevents, or the outbreak and effects of war, and possible business disruption or economic contraction that may result from suchevents;• the ability to collect reinsurance recoverable, credit developments of reinsurers, and any delays with respect thereto andchanges in the cost, quality, or availability of reinsurance;• actual loss experience from insured or reinsured events and the timing of claim payments;• the uncertainties of the loss-reserving and claims-settlement processes, including the difficulties associated with assessingenvironmental damage and asbestos-related latent injuries, the impact of aggregate-policy-coverage limits, and the impact ofbankruptcy protection sought by various asbestos producers and other related businesses and the timing of loss payments;• judicial decisions and rulings, new theories of liability, legal tactics, and settlement terms;• the effects of public company bankruptcies and/or accounting restatements, as well as disclosures by and investigations ofpublic companies relating to possible accounting irregularities, and other corporate governance issues, including the effects ofsuch events on:
• the capital markets;• the markets for directors and officers and errors and omissions insurance; and• claims and litigation arising out of such disclosures or practices by other companies;
• uncertainties relating to governmental, legislative and regulatory policies, developments, actions, investigations and treaties,which, among other things, could subject us to insurance regulation or taxation in additional jurisdictions or affect our currentoperations;• the actual amount of new and renewal business, market acceptance of our products, and risks associated with theintroduction of new products and services and entering new markets, including regulatory constraints on exit strategies;• the competitive environment in which we operate, including trends in pricing or in policy terms and conditions, which maydiffer from our projections and changes in market conditions that could render our business strategies ineffective or obsolete;• acquisitions made by us performing differently than expected, our failure to realize anticipated expense-related efficiencies orgrowth from acquisitions, or the impact of acquisitions on our pre-existing organization;• risks associated with our re-domestication to Switzerland, including reduced flexibility with respect to certain aspects of capi-tal management and the potential for additional regulatory burdens;• the potential impact from government-mandated insurance coverage for acts of terrorism;• the availability of borrowings and letters of credit under our credit facilities;
1

• the adequacy of collateral supporting funded high deductible programs;• changes in the distribution or placement of risks due to increased consolidation of insurance and reinsurance brokers;• material differences between actual and expected assessments for guaranty funds and mandatory pooling arrangements;• the effects of investigations into market practices in the property and casualty (P&C) industry;• changing rates of inflation and other economic conditions, for example, recession;• the amount of dividends received from subsidiaries;• loss of the services of any of our executive officers without suitable replacements being recruited in a reasonable time frame;• the ability of our technology resources to perform as anticipated; and• management’s response to these factors and actual events (including, but not limited to, those described above).
The words “believe,” “anticipate,” “estimate,” “project,” “should,” “plan,” “expect,” “intend,” “hope,”, “feel”, “will likelyresult,” or “will continue,” and variations thereof and similar expressions, identify forward-looking statements. You arecautioned not to place undue reliance on these forward-looking statements, which speak only as of their dates. We under-take no obligation to publicly update or review any forward-looking statements, whether as a result of new information,future events or otherwise.
2

P A R T I
ITEM 1. Business
General Development of Business
ACE Limited is the Swiss-incorporated holding company of the ACE Group of Companies. ACE opened its business office inBermuda in 1985 and continues to maintain operations in Bermuda. ACE Limited, which is headquartered in Zurich, Switzer-land, and its direct and indirect subsidiaries (collectively, the ACE Group of Companies, ACE, the Company, we, us, or our) isa global insurance and reinsurance organization, serving the needs of commercial and individual customers in more than 140countries and jurisdictions. We serve the P&C insurance needs of businesses of all sizes in a broad range of industries. Wealso provide specialized insurance products – such as personal accident, supplemental health, and life insurance to individualsin select countries. Our reinsurance operations include both P&C and life companies. At December 31, 2009, ACE had totalassets of $78 billion and shareholders’ equity of $19.7 billion.
We have grown our business through increased premium volume, expansion of product offerings and geographic reach,and acquisition of other companies. On April 1, 2008, ACE acquired all of the outstanding shares of Combined InsuranceCompany of America (Combined Insurance) and certain of its subsidiaries from Aon Corporation for $2.56 billion. CombinedInsurance is an underwriter and distributor of specialty supplemental accident and health insurance products targeted tomiddle-income consumers and small businesses in North America, Europe, Asia Pacific, and Latin America. ACE recorded theCombined Insurance acquisition using the purchase method of accounting. Our consolidated operating results include theresults of Combined Insurance from April 1, 2008.
Employees
At December 31, 2009, there were approximately 15,000 employees in the ACE Group of Companies. We believe thatemployee relations are satisfactory.
Customers
For most of the commercial lines of business that we offer, insureds typically use the services of an insurance broker or agent.An insurance broker acts as an agent for the insureds, offering advice on the types and amount of insurance to purchase andalso assisting in the negotiation of price and terms and conditions. We obtain business from the local and major internationalinsurance brokers and typically pay a commission to brokers for any business accepted and bound. Loss of all or a substantialportion of the business provided by one or more of these brokers could have a material adverse effect on our business. In ouropinion, no material part of our business is dependent upon a single insured or group of insureds. We do not believe that theloss of any one insured would have a material adverse effect on our financial condition or results of operations and no oneinsured or group of affiliated insureds account for as much as 10 percent of our consolidated revenues.
Competition
Competition in the insurance and reinsurance marketplace is substantial. Competition varies by type of business and geo-graphic area. Competitors include other stock companies, mutual companies, alternative risk sharing groups (such as groupcaptives and catastrophe pools), and other underwriting organizations. These companies sell through various distributionchannels and business models, across a broad array of product lines, and with a high level of variation regarding geographic,marketing, and customer segmentation. We compete for business not only on the basis of price, but also on the basis of avail-ability of coverage desired by customers and quality of service. Our ability to compete is dependent on a number of factors,particularly our ability to maintain the appropriate financial strength ratings as assigned by independent rating agencies. Ourstrong capital position and global platform affords us opportunities for growth not available to smaller, less diversified, ordamaged insurance companies. Refer to “Segment Information” for competitive environment by segment.
3

Trademarks and Trade Names
We use various trademarks and trade names in our business. These trademarks and trade names protect names of certainproducts and services we offer and are important to the extent they provide goodwill and name recognition in the insuranceindustry. We use commercially reasonable efforts to protect these proprietary rights, including various trade secret and trade-mark laws. One or more of the trademarks and trade names could be material to our ability to sell our products and services.We have taken appropriate steps to protect our ownership of key names and we believe it is unlikely that anyone would beable to prevent us from using names in places or circumstances material to our operations.
Available Information
We make available free of charge through our website (www.acelimited.com, under Investor Information / Financial Reports orInvestor Information / SEC – Section 16 Filings) our annual report on Form 10-K, quarterly reports on Form 10-Q, currentreports on Form 8-K, and amendments to those reports filed or furnished pursuant to Section 13 (a) or 15 (d) of the ExchangeAct (15 U.S.C. 78m(a) or 78o(d)) as soon as reasonably practicable after we electronically file such material with, or furnish itto, the SEC.
We also make available free of charge through our website (under Investor Information / Corporate Governance) our Corpo-rate Governance Guidelines, our Code of Conduct, and Charters for the Committees of our Board of Directors (the Board).These documents are also available in print to any shareholder who requests them from our Investor Relations Department by:Telephone: (441) 299-9283Facsimile: (441) 292-8675E-mail: [email protected]
We also use this website as a means of disclosing material, non-public information and for complying with our disclosureobligations under SEC Regulation FD (Fair Disclosure). Accordingly, investors should monitor the Investor Relations portion ofour website, in addition to following our press releases, SEC filings, and public conference calls and webcasts. The informationcontained on, or that may be accessed through, our website is not incorporated by reference into, and is not a part of, thisreport.
Segment Information
We operate through the following business segments: Insurance – North American, Insurance – Overseas General, GlobalReinsurance, and Life.
The following table sets forth an analysis of net premiums earned by segment for the years ended December 31, 2009,2008, and 2007.
Additional financial information about our segments, including net premiums earned by geographic area, is included inNote 17 to the Consolidated Financial Statements, under Item 8.
(in millions of U.S. dollars)
2009 NetPremiums
Earned % of Total
2008 NetPremiums
Earned % of Total
2007 NetPremiums
Earned
Insurance – North American $ 5,684 43% $ 5,679 43% $ 6,007Insurance – Overseas General 5,147 39% 5,337 40% 4,623Global Reinsurance 979 7% 1,017 8% 1,299Life 1,430 11% 1,170 9% 368
$ 13,240 100% $ 13,203 100% $ 12,297
Insurance – North American
OverviewThe Insurance – North American segment comprises our operations in the U.S., Canada, and Bermuda. This segment, whichaccounted for 43 percent of our 2009 consolidated net premiums earned, includes the operations of ACE USA (including ACECanada), ACE Westchester, ACE Bermuda, ACE Private Risk Services, and various run-off operations:• ACE USA, our retail operating division, provides a broad array of P&C, accident and health (A&H), and risk managementproducts and services to a diverse group of commercial and non-commercial enterprises and consumers. ACE USA is thissegment’s largest operation and represented approximately 69 percent of Insurance – North American’s net premiums earnedin 2009.
4

• ACE Westchester specializes in the North American wholesale distribution of excess and surplus P&C, environmental, pro-fessional, and inland marine products in addition to crop insurance in the U.S.• ACE Bermuda provides commercial insurance products on an excess basis to a global client base, covering exposures thatare generally low in frequency and high in severity.• ACE Private Risk Services provides personal lines coverages (e.g. homeowners and automobile) for high net worthindividuals and families in North America, as well as provides recreational marine coverage for yachts and boats.• The run-off operations include Brandywine Holdings Corporation (Brandywine), Commercial Insurance Services, residualmarket workers’ compensation business, pools and syndicates not attributable to a single business group, and other exitedlines of business. Run-off operations do not actively sell insurance products, but are responsible for the management of exist-ing policies and settlement of related claims.
Products and DistributionACE USA primarily distributes its insurance products through a limited number of retail brokers. In addition to using brokers,certain products are also distributed through channels such as general agents, independent agents, managing general agents(MGA), managing general underwriters, alliances, affinity groups, and direct marketing operations. These products includegeneral liability, excess liability, property, workers’ compensation, commercial marine, automobile liability, professional lines(D&O and E&O), medical liability, aerospace, and A&H coverages, as well as claims and risk management products and serv-ices. ACE USA has also established internet distribution channels for some of its products.
ACE USA’s on-going operations are organized into distinct business units, each offering specialized products and servicestargeted at specific niche markets:• ACE Risk Management offers a wide range of customized casualty products to respond to the needs of mid-size to largecompanies, including national accounts, irrespective of industry. These programs are designed to help insureds address thesignificant costs of financing and managing risk for workers’ compensation and general and auto liability coverages. A varietyof program structures are offered to support each client’s risk financing needs including: large deductible, captives, third-partyrent-a-captives, funded deductibles, paid or incurred loss retrospective plans, and net present value and other risk financingstructures, including a prospective close-out product. We also underwrite assumed loss portfolio contracts in which insuredloss events have occurred prior to the inception of the contract when the contract carries the requisite amount of insurance risktransfer. These contracts can cause significant variances to premiums, losses and loss expenses, and expense ratios in theyears in which they are written.• ACE Global Underwriting Group, specializing in global programs and specialty coverages, provides comprehensive riskmanagement programs and services to mid-size to large U.S.-based companies, not-for-profit, and government entities. Thegroup’s key products include global property, corporate risk property, inland marine, foreign casualty, commercial marine,energy, and aerospace.• ACE Casualty Risk offers specialty casualty products to a broad range of customers, ranging from small, local businesses tothe large, multinational clients. Key coverages offered by ACE Casualty Risk include umbrella and excess liability, environ-mental risk for commercial and industrial risks, and wrap-up programs written on a loss-sensitive basis, protecting contractorsand project sponsors with multi-risk coverage on large single- and multi-location construction projects. Small to mid-size busi-nesses can purchase workers’ compensation coverage through this unit’s internet-based ACE Completesm product.• ACE Professional Risk provides management liability and professional liability (D&O and E&O), as well as, surety and kid-nap & extortion products that are designed to meet the needs of our insureds.• ACE Canada (ACE USA’s Canadian operations) offers a broad range of P&C products as well as life and A&H coverage. ACECanada specializes in providing customized products to commercial and industrial clients as well as to groups and associa-tions, operating nationally or internationally.• ACE Accident & Health works with employers, travel agencies, and affinity groups to offer a variety of accident and othersupplemental insurance programs. Key products include Employee Benefit Plans (basic and voluntary accidental death anddismemberment, limited medical insurance for vision, dental and prescription drugs), occupational accident, student accident,and worldwide travel accident and global medical programs. With respect to products that include supplemental medical andhospital indemnity coverages, we typically pay fixed amounts for claims and are therefore, insulated from rising health carecosts. ACE Accident & Health also provides specialty personal lines products, including credit card enhancement programs(identity theft, rental car collision damage waiver, trip travel, and purchase protection benefits), and disaster recovery programsdistributed through affinity groups.• ACE Medical Risk offers a wide range of liability products for the healthcare industry only through licensed excess and sur-plus lines brokers. Products include primary coverages for professional liability and general liability for selected types of
5

medical facilities, excess/umbrella liability for medical facilities, primary and excess coverages for products liability for bio-technology and specialty pharmaceutical companies, and liability insurance for human clinical trials.• ESIS Inc. (ESIS), ACE USA’s in-house third-party claims administrator, performs claims management and risk control serv-ices for domestic and international organizations that self-insure P&C exposures. These services include comprehensivemedical managed care, integrated disability services, and pre-loss control and risk management services. Additional insurance-related services are offered by ESIS’s Recovery Services International, which provides salvage and subrogation and health carerecovery services. ESIS’s services are available through a preferred relationship with ACE Risk Management or separately forthose clients that select insurance and claims management services independently. The operating results for ESIS are includedin Insurance – North American’s administrative expenses.
ACE Westchester offers wholesale distribution of excess and surplus property, inland marine, casualty, professional lines,and environmental liability products. Through its Program division, ACE Westchester also provides coverage for agriculturebusiness and specialty programs, writing a variety of commercial coverages through program agents, including sports/leisureactivities, farm, and crop/hail insurance. We write crop insurance business throughout the U.S. through Rain and Hail L.L.C.,an MGA. For more information, refer to “Crop Insurance”, under Item 7.
ACE Bermuda targets Fortune 1000 companies and underwrites exposures that are generally low-frequency, high-severityon an excess of loss basis. Its principal lines of business are excess liability, professional lines, excess property, and politicalrisk, the latter being written on a subscription basis by Sovereign Risk Insurance Ltd. (Sovereign), a wholly owned managingagent. ACE Bermuda accesses its clients primarily through the Bermuda offices of major, internationally recognized insurancebrokers.
ACE Private Risk Services provides specialty coverages including homeowners, automobile, valuables, umbrella liability,and recreational marine insurance for affluent individuals and families in North America. ACE Private Risk Services’ productsare distributed through independent regional agents and brokers.
Competitive EnvironmentACE USA and ACE Westchester compete against a number of large, national carriers as well as regional competitors in certainterritories. The markets in which they compete are subject to significant cycles of fluctuating capacity and wide disparities inprice adequacy. We strive to offer superior service, which we believe has differentiated us from our competitors. The ACE USAand ACE Westchester operations pursue a specialist strategy and focus on market opportunities where we can compete effec-tively based on service levels and product design, while still achieving an adequate level of profitability. A competitiveadvantage is also achieved through ACE USA’s innovative product offerings and our ability to provide multiple products to asingle client due to our nationwide local presence. An additional competitive strength of all our domestic commercial units isthe ability to deliver global products and coverage to customers in concert with our Insurance – Overseas General segment.ACE USA has grown, in part, from the leveraging of cross-marketing opportunities with our other operations to take advantageof our organization’s global presence. ACE Bermuda competes against international commercial carriers writing business on anexcess of loss basis. ACE Private Risk Services competes against insurance companies of varying sizes that sell productsthrough various distribution channels, including through the Internet.
Insurance – Overseas General
OverviewThe Insurance – Overseas General segment, which accounted for 39 percent of 2009 consolidated net premiums earned,writes a variety of insurance coverage including P&C, professional lines, marine, energy, aviation, political risk, specialtyconsumer-oriented products, and A&H. Insurance – Overseas General comprises ACE International, our retail business servingterritories outside the U.S., Bermuda, and Canada; the international A&H and life business of Combined Insurance; and thewholesale insurance business of ACE Global Markets, our London-based excess and surplus lines business that includesLloyd’s Syndicate 2488 (Syndicate 2488). The reinsurance operation of ACE Global Markets is included in the GlobalReinsurance segment. ACE provides funds at Lloyd’s to support underwriting by Syndicate 2488, which is managed by ACEUnderwriting Agencies Limited and has an underwriting capacity of £400 million for 2010.
Products and DistributionACE International maintains a presence in every major insurance market in the world and is organized geographically alongproduct lines that provide dedicated underwriting focus to customers. ACE International’s P&C business is generally written, onboth a direct and assumed basis, through major international, regional, and local brokers and agents. A&H and other
6

consumer lines products are distributed through brokers, agents, direct marketing programs, and sponsor relationships. Prop-erty insurance products include traditional commercial fire coverage as well as energy industry-related, construction, and othertechnical coverages. Principal casualty products are commercial primary and excess casualty, environmental, and generalliability. ACE International also provides D&O, and professional indemnity coverages. Marine cargo and hull coverages are writ-ten in the London market as well as in marine markets throughout the world. The A&H operations design products to meet theinsurance needs of individuals and groups outside of U.S. insurance markets. These products have represented an increasingportion of ACE International’s business in recent years and include, but are not limited to, accidental death, disability, medicaland hospital indemnity, and income protection coverages. We are not in the primary health care business. With respect to oursupplemental medical and hospital indemnity products, we typically pay fixed amounts for claims and are therefore, insulatedfrom rising health care costs. ACE International’s personal lines operations provide specialty products and services designed tomeet the needs of specific target markets and include, but are not limited to, property damage, auto, homeowners, andpersonal liability.
The following is a discussion of Insurance – Overseas General’s five areas of operations: ACE European Group (which iscomprised of ACE Europe and ACE Global Markets branded business), ACE Asia Pacific, ACE Far East, ACE Latin America, andCombined Insurance.• ACE European Group is headquartered in London and offers a broad range of P&C, A&H, and specialty coverages. ACEEuropean Group’s diversified product portfolio and geographical spread throughout the European Union enables it to poten-tially reduce earnings volatility. Commercial products are principally distributed through brokers while consumer products(mainly A&H) are distributed through brokers as well as through direct marketing programs. Certain ACE Europe brandedproducts can also be offered via an e-commerce platform, ACE Online, that allows brokers to quote, bind, and issue specialtypolicies online. ACE European Group has operations in South Africa, Central and Eastern Europe, the Commonwealth ofIndependent States (the CIS), and the Middle East and North Africa. Our operations in these regions underwrite P&C and A&Hbusiness. ACE operations within Central and Eastern Europe and the CIS markets include insurance subsidiaries and branchesin Czech Republic, Hungary, Poland, Russia, and Turkey. The Middle East and North Africa region includes insurance sub-sidiaries and joint ventures in Bahrain, Egypt, Pakistan, Saudi Arabia, and the United Arab Emirates. ACE Global Marketsoffers products through its parallel distribution network via ACE European Group Limited (AEGL) and Syndicate 2488. ACEGlobal Markets utilizes Syndicate 2488 to underwrite P&C business on a global basis through Lloyd’s worldwide licenses. ACEGlobal Markets utilizes AEGL to underwrite similar classes of business through its network of U.K. and Continental Europelicenses, and in the U.S. where it is eligible to write excess & surplus business. Factors influencing the decision to place busi-ness with Syndicate 2488 or AEGL include licensing eligibilities, capitalization requirements, and client/broker preference. Allbusiness underwritten by ACE Global Markets is accessed through registered brokers. The main lines of business include avia-tion, property, energy, professional lines, marine, political risk, and A&H.• ACE Asia Pacific is headquartered in Singapore and has an extensive network of operations serving Australia, Hong Kong,Indonesia, Korea, Macau, Malaysia, New Zealand, the Philippines, Singapore, Taiwan, Thailand, and Vietnam. ACE AsiaPacific offers a broad range of P&C, A&H, and specialty coverages principally directed at large and mid-sized corporations aswell as individual consumers. This region also provides management, underwriting, reinsurance protection and administrativesupport to our equity investee, Huatai Insurance Company of China, Limited.• ACE Far East is based in Tokyo and offers a broad range of P&C, A&H, and personal lines insurance products and services tobusinesses and consumers in Japan, principally delivered through an extensive agency network.• ACE Latin America includes business operations throughout Latin America and the Caribbean, including offices in Argentina,Brazil, Chile, Colombia, Ecuador, Mexico, Panama, Peru, and Puerto Rico. ACE Latin America focuses on providing P&C,A&H, and specialty personal lines insurance products and services to both large and small commercial clients as well asindividual consumers. ACE Latin America distributes its products through brokers (for its commercial business) and directmarketing and sponsored programs (for its consumer business).• Combined Insurance uses an international sales force of approximately 3,300 independent contractor agents to distribute awide range of supplemental accident and health products, including personal accident, short-term disability, critical conditionsand cancer aid, and hospital confinement/recovery. Most of these products are primarily fixed-indemnity obligations and arenot subject to escalating medical cost inflation.
Competitive EnvironmentACE International’s primary competitors include U.S.-based companies with global operations, as well as non-U.S. global car-riers and indigenous companies in regional and local markets. For the A&H lines of business, including those offered byCombined Insurance, locally-based competitors include financial institutions and bank-owned insurance subsidiaries. Our
7

international operations have the distinct advantage of being part of one of the few international insurance groups with a globalnetwork of licensed companies able to write policies on a locally admitted basis. The principal competitive factors that affectthe international operations are underwriting expertise and pricing, relative operating efficiency, product differentiation, pro-ducer relations, and the quality of policyholder services. A competitive strength of our international operations is our globalnetwork and breadth of insurance programs, which assist individuals and business organizations to meet their risk manage-ment objectives, while also giving us the advantage of accessing local technical expertise, accomplishing a spread of risk, andoffering a global network to service multi-national accounts.
ACE Global Markets is one of the preeminent international specialty insurers in London and is an established lead under-writer on a significant portion of the risks underwritten for all lines of business. This leadership position allows ACE GlobalMarkets to set the policy terms and conditions of many of the policies written. All lines of business face competition, depend-ing on the business class, from Lloyd’s syndicates, the London market, and other major international insurers and reinsurers.Competition for international risks is also seen from domestic insurers in the country of origin of the insured. ACE Global Mar-kets differentiates itself from competitors through long standing experience in its product lines, its multiple insurance entities(Syndicate 2488 and AEGL), and the quality of its underwriting and claims service.
Global Reinsurance
OverviewThe Global Reinsurance segment, which accounted for seven percent of 2009 consolidated net premiums earned, representsACE’s reinsurance operations comprising ACE Tempest Re Bermuda, ACE Tempest Re USA, ACE Tempest Re Europe, andACE Tempest Re Canada. Global Reinsurance markets its reinsurance products worldwide under the ACE Tempest Re brandname and provides a broad range of coverages to a diverse array of primary P&C insurers. The Global Reinsurance segmentalso includes the reinsurance operations of ACE Global Markets.
Products and DistributionGlobal Reinsurance services clients globally through all of its major units. Major international brokers submit business to oneor more of these units’ underwriting teams who have built strong relationships with both key brokers and clients by providing aresponsive, client-focused approach to risk assessment and pricing.
ACE Tempest Re Bermuda principally provides property catastrophe reinsurance, on an excess of loss per occurrencebasis globally to insurers of commercial and personal property. Property catastrophe reinsurance on an occurrence basis pro-tects a ceding company against an accumulation of losses covered by its issued insurance policies, arising from a commonevent or occurrence. ACE Tempest Re Bermuda underwrites reinsurance principally on an excess of loss basis, meaning thatits exposure only arises after the ceding company’s accumulated losses have exceeded the attachment point of the reinsurancepolicy. ACE Tempest Re Bermuda also writes other types of reinsurance on a limited basis for selected clients. Examplesinclude proportional property (the reinsurer shares a proportional part of the premiums and losses of the ceding company) andper risk excess of loss treaty reinsurance (coverage applies on a per risk basis rather than per event or aggregate basis),together with casualty and specialty lines (catastrophe workers’ compensation and terrorism). ACE Tempest Re Bermuda’sbusiness is produced through reinsurance intermediaries.
ACE Tempest Re USA writes all lines of traditional and specialty P&C reinsurance for the North American market, princi-pally on a treaty basis, with a focus on writing property per risk and casualty reinsurance, including medical malpractice, auto,and professional lines. This unit’s diversified portfolio is produced through reinsurance intermediaries.
ACE Tempest Re Europe provides treaty reinsurance of P&C business of insurance companies worldwide, with emphasison non-U.S. and London market risks. ACE Tempest Re Europe writes all lines of traditional and specialty reinsurance includ-ing property, casualty, marine, motor, aviation, and medical malpractice through our London- and Zurich-based divisions. TheLondon-based divisions of ACE Tempest Re Europe focus on the development of business sourced through London marketbrokers and, consequently, write a diverse book of international business utilizing Lloyd’s Syndicate 2488 and AEGL. TheZurich-based division focuses on providing reinsurance to continental European insurers via continental European brokers.ACE Tempest Re Europe also includes our Shanghai office which provides reinsurance coverage for Chinese-based risks andour new Sao Paulo, Brazil office which provides reinsurance for Brazilian-based risks.
ACE Tempest Re Canada offers a full array of P&C reinsurance to the Canadian market. ACE Tempest Re Canada providesits coverage through its Canadian company platform and also offers its clients access to Lloyd’s Syndicate 2488.
8

Competitive EnvironmentThe Global Reinsurance segment competes worldwide with major U.S. and non-U.S. reinsurers as well as reinsurance depart-ments of numerous multi-line insurance organizations. Global Reinsurance is considered a lead reinsurer and is typicallyinvolved in the negotiation and quotation of the terms and conditions of the majority of the contracts in which it participates.Global Reinsurance competes effectively in P&C markets worldwide because of its strong capital position, the quality of serviceprovided to customers, the leading role it plays in setting the terms, pricing, and conditions in negotiating contracts, and itscustomized approach to risk selection. The key competitors in our markets vary by geographic region and product line. Further,over the last several years, capital markets participants have developed financial products intended to compete with traditionalreinsurance. In addition, government sponsored or backed catastrophe funds can affect demand for reinsurance.
Life
OverviewLife, which accounted for 11 percent of 2009 consolidated net premiums earned, includes ACE’s international life operations(ACE Life), ACE Tempest Life Re (ACE Life Re), and from April 1, 2008, the North American supplemental A&H and life busi-ness of Combined Insurance. ACE Life provides individual and group life insurance through multiple distribution channelsprimarily in emerging markets, including Indonesia, Taiwan, Thailand, Vietnam, Egypt, the United Arab Emirates, throughoutLatin America, selectively in Europe, as well as China through a partially-owned insurance company. ACE Life Re helps clients(ceding companies) manage mortality, morbidity, and lapse risks embedded in their books of business. ACE Life Re comprisestwo operations. The first is a Bermuda-based operation which provides reinsurance to primary life insurers, focusing onguarantees included in certain fixed and variable annuity products and also on more traditional mortality reinsurance pro-tection. The second is a U.S.-based traditional life reinsurance company licensed in 49 states and the District of Columbia. InJanuary 2010, a strategic decision was made to discontinue writing new traditional life mortality reinsurance business fromthe U.S.-based company. Although the traditional life reinsurance business was profitable in 2009, it does not represent asignificant future opportunity to generate profitability that justifies the use of our capital. Net premiums written for traditionallife reinsurance was $41 million in 2009. Combined Insurance distributes specialty individual accident and supplementalhealth and life insurance products targeted to middle income consumers in the U.S. and Canada.
Products and DistributionACE Life offers a broad portfolio of protection and savings products including whole life, endowment plans, individual term life,group term life, group medical, personal accident, universal life, and unit linked contracts. The policies written by ACE Lifegenerally provide funds to beneficiaries of insureds after death and/or protection and/or savings benefits while the contractowner is living. ACE Life sells to consumers through a variety of distribution channels including agency, bancassurance, brok-ers, and telemarketing. We continue to expand this business with a focus on opportunities in emerging markets that webelieve will result in strong and sustainable operating profits as well as favorable return on capital commitments after an initialgrowth period.
Our dedicated agency distribution channel, whereby agents sell ACE Life products exclusively, enables us to maintaindirect contact with the individual consumer, promote quality sales practices, and exercise greater control over the future of thebusiness. ACE Life is developing agency distribution in those countries in which we believe we can achieve sustainable growthas well as a favorable return on our investment. As of December 31, 2009, ACE Life, excluding China, has developed a salesforce of over 9,000 agents principally located in Asia-Pacific countries, including a leadership position in Vietnam and growingagency forces in Indonesia and Thailand. ACE Life manages its agency business through key performance indicators, amongother things, that monitor the retention and productivity of its agents and persistency of our business.
ACE maintains approximately 37 percent direct and indirect ownership interest in Huatai Life Insurance Co., Ltd. (“HuataiLife”), which commenced operations in 2005. Huatai Life offers a broad portfolio of insurance products through a variety ofdistribution channels in eight provinces within China. Based on 2009 premium volume as defined by China regulations,which include investment deposits, Huatai Life was ranked among the top 15 of 50 life insurers in China and the third largestforeign invested life insurer. Huatai Life has developed a sales force of approximately 19,000 agents as of December 31,2009, and maintains distribution agreements with many large banks within China.
Since 2007, ACE Life Re has not quoted on new opportunities in the variable annuity reinsurance marketplace. A sig-nificant percentage of our total revenue and income/losses in Bermuda derives from our core line of business, which is thereinsurance of variable annuity guarantees, including both death and living benefit guarantees. This business is managed witha long-term perspective and short-term earnings volatility is expected. Our primary focus in the Bermuda operation is to suc-cessfully manage the current portfolio of risk in the variable annuity line of business.
9

Combined Insurance uses a North American sales force of over 2,000 agents to distribute a wide range of supplementalaccident and sickness insurance products, including personal accident, short-term disability, critical illness, Medicare supple-ment products, and hospital confinement/recovery. Most of these products are primarily fixed-indemnity obligations and arenot subject to escalating medical cost inflation.
Competitive EnvironmentACE Life’s competition differs by location but generally includes multi-national insurers, and in some locations, local insurers,joint ventures, or state-owned insurers. ACE’s financial strength and reputation as an entrepreneurial organization with a globalpresence give ACE Life a strong base from which to compete. While ACE Life Re is not currently quoting on new opportunitiesin the variable annuity reinsurance marketplace, we continue to monitor developments in this market. ACE Life Re has writtentraditional mortality reinsurance from both its Bermuda and U.S. companies. The life reinsurance market for traditional mortal-ity risk is highly competitive as most of the reinsurance companies are well established, have significant operating histories,strong claims-paying ability ratings, and long-standing client relationships through existing treaties with ceding companies.
Combined Insurance competes for A&H business in the U.S. against numerous A&H and life insurance companies acrossvarious industry segments.
Underwriting
ACE is an underwriting company and we strive to emphasize quality of underwriting rather than volume of business or marketshare. Our underwriting strategy is to employ consistent, disciplined pricing and risk selection in order to maintain a profitablebook of business throughout market cycles. Clearly defined underwriting authorities, standards, and guidelines are in place ineach of our local operations and global profit centers. Global product boards ensure consistency of approach and theestablishment of best practices throughout the world. Our priority is to help ensure adherence to criteria for risk selection bymaintaining high levels of experience and expertise in our underwriting staff. In addition, we employ a business review struc-ture that helps ensure control of risk quality and conservative use of policy limits and terms and conditions.
Qualified actuaries in each region work closely with the underwriting teams to provide additional expertise in the under-writing process. We use sophisticated catastrophe loss and risk modeling techniques designed to ensure appropriate spread ofrisk and to analyze correlation of risk across different product lines and territories. This helps to ensure that losses are con-tained within our risk tolerance and appetite for individual products lines, businesses, and ACE as a whole. We also purchasereinsurance as a tool to diversify risk and limit the net loss potential of catastrophes and large or unusually hazardous risks,refer to “Reinsurance Protection”. For more information refer to “Insurance and Reinsurance Markets”, under Item 1A,“Catastrophe Exposure Management” and “Natural Catastrophe Reinsurance Program”, under Item 7, and Note 5 to the Con-solidated Financial Statements, under Item 8.
Reinsurance Protection
As part of our risk management strategy, we purchase reinsurance protection to mitigate our exposure to losses, includingcatastrophes, to an acceptable level. Although reinsurance agreements contractually obligate our reinsurers to reimburse us foran agreed-upon portion of our gross paid losses, this reinsurance does not discharge our primary liability to our insureds and,thus, we ultimately remain liable for the gross direct losses. In certain countries, reinsurer selection is limited by local laws orregulations. In those areas where there is more freedom of choice, the counterparty is selected based upon its financialstrength, management, line of business expertise, and its price for assuming the risk transferred. In support of this process, wemaintain an ACE authorized reinsurer list that stratifies these authorized reinsurers by classes of business and acceptable lim-its. This list is maintained by our Reinsurance Security Committee (RSC), a committee comprised of senior managementpersonnel and a dedicated reinsurer security team. Changes to the list are authorized by the RSC and recommended to theChair of the Enterprise Risk Management Board. The reinsurers on the authorized list and potential new markets are regularlyreviewed and the list may be modified following these reviews. In addition to the authorized list, there is a formal exceptionprocess that allows authorized reinsurance buyers to use reinsurers already on the authorized list for higher limits or differentlines of business, for example, or other reinsurers not on the authorized list if their use is supported by compelling businessreasons for a particular reinsurance program.
A separate policy and process exists for captive reinsurance companies. Generally, these reinsurance companies are estab-lished by our clients or our clients have an interest in them. It is generally our policy to obtain collateral equal to the expectedlosses that may be ceded to the captive. Where appropriate, exceptions to the collateral requirement are granted but only aftersenior management review. Specific collateral guidelines and an exception process are in place for ACE USA andInsurance – Overseas General, both of which have credit management units evaluating the captive’s credit quality and that of
10

their parent company. The credit management units, working with actuarial, determine reasonable exposure estimates(collateral calculations), ensure receipt of collateral in a form acceptable to the Company, and coordinate collateral adjust-ments as and when needed. Currently, financial reviews and expected loss evaluations are performed annually for activecaptive accounts and as needed for run-off exposures. In addition to collateral, parental guarantees are often used to enhancethe credit quality of the captive.
In general, we seek to place our reinsurance with highly rated companies with which we have a strong trading relation-ship. For more information refer to “Catastrophe Exposure Management” and “Natural Catastrophe Reinsurance Program”,under Item 7, and Note 5 to the Consolidated Financial Statements, under Item 8.
Unpaid Losses and Loss Expenses
We establish reserves for unpaid losses and loss expenses, which are estimates of future payments on reported and unreportedclaims for losses and related expenses, with respect to insured events that have occurred. The process of establishing loss andloss expense reserves for P&C claims can be complex and is subject to considerable uncertainty as it requires the use ofinformed estimates and judgments based on circumstances known at the date of accrual. These estimates and judgments arebased on numerous factors, and may be revised as additional experience and other data become available and are reviewed,as new or improved methodologies are developed, or as laws change. We have actuarial staff in each of our operating seg-ments who regularly analyze the levels of loss and loss expense reserves, taking into consideration factors that may impact theultimate settlement value of the unpaid losses and loss expenses. These analyses could result in future changes in the esti-mates of loss and loss expense reserves or reinsurance recoverables and any such changes would be reflected in our results ofoperations in the period in which the estimates are changed. Losses and loss expenses are charged to income as incurred. Thereserve for unpaid losses and loss expenses represents the estimated ultimate losses and loss expenses less paid losses andloss expenses, and comprises case reserves and incurred but not reported (IBNR) loss reserves. With the exception of certainstructured settlements, for which the timing and amount of future claim payments are reliably determinable, our loss reservesare not discounted for the time value of money. In connection with these structured settlements, we carried net reserves of$76 million, net of discount, at December 31, 2009.
During the loss settlement period, which can be many years in duration, additional facts regarding individual claims andtrends often will become known. As these become apparent, case reserves may be adjusted by allocation from IBNR withoutany change in the overall reserve. In addition, the circumstances of individual claims or the application of statistical and actua-rial methods to loss experience data may lead to the adjustment of the overall reserves upward or downward from time to time.Accordingly, the ultimate settlement of losses may be significantly greater than or less than reported loss and loss expensereserves.
We have considered asbestos and environmental (A&E) claims and claims expenses in establishing the liability for unpaidlosses and loss expenses and have developed reserving methods which consider historical experience as well as incorporatenew sources of data to estimate the ultimate losses arising from A&E exposures. The reserves for A&E claims and claimsexpenses represent management’s best estimate of future loss and loss expense payments and recoveries that are expected todevelop over the next several decades. We continuously monitor evolving case law and its effect on environmental and latentinjury claims, we monitor A&E claims activity quarterly, and we perform a full reserve review annually.
For each product line, management, in conjunction with internal actuaries, develops a “best estimate” of the ultimate set-tlement value of the unpaid losses and loss expenses that it believes provides a reasonable estimate of the required reserve.We evaluate our estimates of reserves quarterly in light of developing information. While we are unable at this time todetermine whether additional reserves may be necessary in the future, we believe that our reserves for unpaid losses and lossexpenses are adequate at December 31, 2009. Future additions to reserves, if needed, could have a material adverse effectupon our financial condition, results of operations, and cash flows.
For more information refer to “Critical Accounting Estimates—Unpaid losses and loss expenses”, under Item 7 and Note 7to the Consolidated Financial Statements, under Item 8.
The “Analysis of Losses and Loss Expenses Development” table shown below presents, for each balance sheet date overthe period 1999-2009, the gross and net loss and loss expense reserves recorded at the balance sheet date and subsequentnet payments on the associated liabilities. The reserves represent the amount required for the estimated future settlement valueof liabilities incurred at or prior to the balance sheet date and those estimates may change subsequent to the balance sheetdate as new information emerges regarding the ultimate settlement value of the liability. Accordingly, the table also presentsthrough December 31, 2009, for each balance sheet date, the cumulative impact of subsequent valuations of the liabilitiesincurred at the original balance sheet date. The data in the table is presented in accordance with reporting requirements of the
11

SEC. This table should be interpreted with care by those not familiar with its format or those who are familiar with other trian-gulations arranged by origin year of loss such as accident or underwriting year rather than balance sheet date, as shownbelow. To clarify the interpretation of the table, we use the reserves established at December 31, 1999, in the followingexample.
The top two lines of the table show, for successive balance sheet dates, the gross and net unpaid losses and lossexpenses recorded as provision for liabilities incurred at or prior to each balance sheet date. It can be seen that atDecember 31, 1999, a reserve of $9.244 billion net of reinsurance had been established.
The upper (paid) triangulation presents the net amounts paid as of periods subsequent to the balance sheet date. Hencein the 2000 financial year, $2.717 billion of payments were made on liabilities contemplated in the December 31, 1999,reserve balance. At the end of the 2009 financial year, there were cumulative net payments of $7.671 billion on this block ofliabilities.
The lower triangulation within the table shows the revised estimate of the net liability originally recorded at each balancesheet date as of the end of subsequent financial years. With the benefit of actual loss emergence and hindsight over the inter-vening period, the net liabilities incurred as of December 31, 1999, are now estimated to be $10.909 billion, rather than theoriginal estimate of $9.244 billion. One of the key drivers of this change has been adverse development on latent claims thatwe categorize as A&E covered under the National Indemnity Company (NICO) reinsurance treaties. Of the cumulative defi-ciency of $1.665 billion recognized in the ten years since December 31, 1999, $464 million relates to non-latent claims and$1.201 billion relates to latent claims. The deficiency of $1.665 billion was identified and recorded as follows; $16 millionredundant in 2000, $4 million deficient in 2001, $526 million deficient in 2002, $155 million deficient in 2003, $875 mil-lion deficient in 2004, $120 million redundant in 2005, $41 million deficient in 2006, $28 million redundant in 2007,$108 million deficient in 2008, and $120 million deficient in 2009.
Importantly, the cumulative deficiency or redundancy for different balance sheet dates are not independent and, therefore,should not be added together. In the last year, we revised our estimate of the December 31, 1999, liabilities from $10.789billion to $10.909 billion. This adverse development of $120 million will also be included in each column to the right of theDecember 31, 1999, column to recognize that this additional amount was also required in the reserves established for eachannual balance sheet date from December 31, 2000, to December 31, 2009.
The loss development table shows that our original estimate of the net unpaid loss and loss expense requirement atDecember 31, 2008, of $24.241 billion has, with the benefit of actual loss emergence and hindsight, been revised to$23.653 billion at December 31, 2009. This favorable movement of $588 million is referred to as prior period developmentand is the net result of a number of underlying movements both favorable and adverse. (See note 3 to table below). The keyunderlying movements are discussed in more detail within the “Prior Period Development” section of Item 7.
The bottom lines of the table show the re-estimated amount of previously recorded gross liabilities at December 31,2009, together with the change in reinsurance recoverable. Similar to the net liabilities, the cumulative redundancy or defi-ciency on the gross liability is the difference between the gross liability originally recorded and the re-estimated gross liability atDecember 31, 2009. For example, with respect to the gross unpaid loss and loss expenses of $16.713 billion forDecember 31, 1999, this gross liability was re-estimated to be $23.274 billion at December 31, 2009, resulting in the cumu-lative deficiency on the gross liability originally recorded for the 1999 balance sheet year of $6.561 billion. This deficiencyrelates primarily to U.S. liabilities, including A&E liabilities for 1995 and prior. The gross deficiency results in a net deficiencyof $1.665 billion after consideration of substantial reinsurance coverage that reduces the gross loss; approximately $2.2 bil-lion was covered by reinsurance placed when the risks were originally written and $1.25 billion of the remaining liability hasbeen ceded to NICO.
We do not consider it appropriate to extrapolate future deficiencies or redundancies based upon the table, as conditionsand trends that have affected development of the liability in the past may not necessarily recur in the future. We believe thatour current estimates of net liabilities appropriately reflect our current knowledge of the business profile and the prevailingmarket, social, legal, and economic conditions while giving due consideration to historical trends and volatility evidenced inour markets over the longer term. The key issues and considerations involved in establishing our estimate of the net liabilitiesare discussed in more detail within the “Critical Accounting Estimates—Unpaid losses and loss expenses” section of Item 7.
On July 2, 1999, we changed our fiscal year-end from September 30 to December 31. As a result, the information pro-vided for the 1999 year is actually for the 15-month period from October 1, 1998, through December 31, 1999. On July 2,1999, we acquired ACE INA (CIGNA’s P&C business) and on April 1, 2008, we acquired Combined Insurance. The unpaidloss information has been included in the table commencing in the year of acquisition. As a result, 1999 includes net reservesof $6.8 billion related to ACE INA at the date of acquisition and subsequent development thereon.
12

Analysis of Losses and Loss Expenses Development
Years Ended December 31
(in millions of U.S.dollars) 1999(1) 2000 2001 2002 2003 2004 2005 2006 2007 2008 2009
Gross unpaidlosses $16,713 $ 17,603 $ 20,941 $24,597 $27,083 $31,483 $35,055 $35,517 $ 37,112 $37,176 $ 37,783
Net unpaid losses 9,244 9,437 10,617 11,988 14,674 17,517 20,458 22,008 23,592 24,241 25,038Net paid losses(cumulative)As Of:
1 year later 2,717 2,425 2,667 2,702 2,855 3,293 3,711 4,038(2) 3,628 4,4552 years later 4,119 3,850 4,640 4,379 4,878 5,483 6,487 6,356 6,0923 years later 5,181 5,165 5,568 5,817 6,427 7,222 7,998 8,0624 years later 6,217 5,515 6,688 7,009 7,819 8,066 9,2695 years later 6,364 6,204 7,496 8,032 8,416 8,9206 years later 6,880 6,638 8,014 8,390 9,0497 years later 7,231 6,959 8,226 8,8518 years later 7,448 7,036 8,5849 years later 7,495 7,23910 years later 7,671
Net liabilityre-estimatedAs Of:
End of year $ 9,244 $ 9,437 $ 10,617 $11,988 $14,674 $17,517 $20,458 $22,008 $ 23,592 $24,241 $ 25,0381 year later 9,228 9,596 11,344 12,170 15,221 17,603 20,446 21,791 22,778 23,6532 years later 9,232 10,172 11,552 13,215 15,468 17,651 20,366 21,188 22,1583 years later 9,758 10,417 12,541 13,477 15,732 17,629 19,926 20,6504 years later 9,913 11,297 12,725 13,790 16,015 17,509 19,5895 years later 10,788 11,231 12,880 14,152 16,086 17,2766 years later 10,668 11,395 13,013 14,201 15,9947 years later 10,709 11,419 13,099 14,2108 years later 10,681 11,520 13,1109 years later 10,789 11,48910 years later 10,909
Cumulativeredundancy/(deficiency) onnet unpaidlosses (1,665) (2,052) (2,493) (2,222) (1,320) 241 869 1,358 1,434 588(3)
Cumulativedeficiencyrelated to A&E (1,201) (1,201) (1,196) (680) (680) (215) (215) (163) (134) (83)
Cumulativeredundancy/(deficiency)excluding A&E (464) (851) (1,297) (1,542) (640) 456 1,084 1,521 1,568 671
Gross unpaidlosses end ofyear $16,713 $ 17,603 $ 20,941 $24,597 $27,083 $31,483 $35,055 $35,517 $ 37,112 $37,176 $ 37,783
Reinsurancerecoverable onunpaid losses 7,469 8,166 10,324 12,609 12,409 13,966 14,597 13,509 13,520 12,935 12,745
Net unpaid losses 9,244 9,437 10,617 11,988 14,674 17,517 20,458 22,008 23,592 24,241 25,038
Gross liabilityre-estimated 23,274 24,287 28,392 29,552 30,729 31,767 33,408 33,800 35,086 36,415
Reinsurancerecoverable onunpaid losses 12,365 12,798 15,282 15,342 14,735 14,491 13,819 13,150 12,928 12,762
Net liabilityre-estimated 10,909 11,489 13,110 14,210 15,994 17,276 19,589 20,650 22,158 23,653
Cumulativeredundancy/(deficiency) ongross unpaidlosses $ (6,561) $ (6,684) $ (7,451) $ (4,955) $ (3,646) $ (284) $ 1,647 $ 1,717 $ 2,026 $ 761
The reference to “losses” in the table above refers to losses and loss expenses.(1) The 1999 year is for the 15-month period ended December 31, 1999.(2) This amount does not agree to the reconciliation of unpaid losses and loss expenses for the 2007 year in the table below due to the accounting treatment of a novationof a retroactive assumed loss portfolio transfer from 2002 resulting in the elimination of deferred assets of $79 million and the reduction of the related reserve.(3) This amount does not agree to the reconciliation of unpaid losses and loss expenses for the 2009 year in the table below due to the accounting treatment of Crop profitcommission resulting in the reduction of $9 million in the related net losses and loss expenses incurred in respect of losses occurring in prior years. Note that there is acorresponding increase of $9 million in net losses and loss expenses incurred in respect of losses occurring in the current year.
13

Reconciliation of Unpaid Losses and Loss Expenses
Year Ended December 31(in millions of U.S. dollars) 2009 2008 2007
Gross unpaid losses and loss expenses at beginning of year $ 37,176 $ 37,112 $ 35,517Reinsurance recoverable on unpaid losses(1) (12,935) (13,520) (13,509)
Net unpaid losses and loss expenses at beginning of year 24,241 23,592 22,008Acquisition of subsidiaries – 353 –
Total 24,241 23,945 22,008
Net losses and loss expenses incurred in respect of losses occurring in:Current year 8,001 8,417 7,568Prior years (579) (814) (217)
Total 7,422 7,603 7,351
Net losses and loss expenses paid in respect of losses occurring in:Current year 2,493 2,699 1,975Prior years 4,455 3,628 3,959
Total 6,948 6,327 5,934
Foreign currency revaluation and other 323 (980) 167
Net unpaid losses and loss expenses at end of year 25,038 24,241 23,592Reinsurance recoverable on unpaid losses(1) 12,745 12,935 13,520
Gross unpaid losses and loss expenses at end of year $ 37,783 $ 37,176 $ 37,112
(1) Net of provision for uncollectible reinsurance
Net losses and loss expenses incurred for 2009 were $7.4 billion, compared with $7.6 billion in 2008, and $7.4 billion in2007. Net losses and loss expenses incurred for 2009, 2008, and 2007, include $579 million, $814 million, and $217million of net favorable prior period development, respectively. For more information, refer to the “Prior Period Development”section of Item 7.
Investments
Our principal investment objective is to ensure that funds will be available to meet our primary insurance and reinsuranceobligations. Within this broad liquidity constraint, the investment portfolio’s structure seeks to maximize return subject tospecifically-approved guidelines of overall asset classes, credit quality, liquidity, and volatility of expected returns. As such, ourinvestment portfolio is invested primarily in investment-grade fixed-income securities as measured by the major rating agen-cies.
The management of our investment portfolio is the responsibility of ACE Asset Management, an indirect wholly-ownedsubsidiary of ACE. ACE Asset Management operates principally to guide and direct our investment process. In this regard, ACEAsset Management:• conducts formal asset allocation modeling for each of the ACE subsidiaries, providing formal recommendations for the portfo-lio’s structure;• establishes recommended investment guidelines that are appropriate to the prescribed asset allocation targets;• provides the analysis, evaluation, and selection of our external investment advisors;• establishes and develops investment-related analytics to enhance portfolio engineering and risk control;• monitors and aggregates the correlated risk of the overall investment portfolio; and• provides governance over the investment process for each of our operating companies to ensure consistency of approachand adherence to investment guidelines.
For the portfolio, we determine allowable, targeted asset allocation and ranges for each of the operating segments. Theseasset allocation targets are derived from sophisticated asset and liability modeling that measures correlated histories of returnsand volatility of returns. Allowable investment classes are further refined through analysis of our operating environment, includ-ing expected volatility of cash flows, overall capital position, regulatory, and rating agency considerations.
14

The Finance and Investment Committee of the Board approves asset allocation targets and reviews our investment policyto ensure that it is consistent with our overall goals, strategies, and objectives. Overall investment guidelines are reviewed andapproved by the Finance and Investment Committee to ensure that appropriate levels of portfolio liquidity, credit quality,diversification, and volatility are maintained. In addition, the Finance and Investment Committee systematically reviews theportfolio’s exposures including any potential violations of investment guidelines. We have long-standing global credit limits forour entire portfolio across the organization. Exposures are aggregated, monitored, and actively managed by our Global CreditCommittee, comprised of senior executives, including our Chief Financial Officer, our Chief Risk Officer, our Chief InvestmentOfficer, and our Treasurer. Additionally, the Board has established a Risk Committee which helps execute the Board’s super-visory responsibilities pertaining to enterprise risk management including investment risk.
Within the guidelines and asset allocation parameters established by the Finance and Investment Committee, individualinvestment committees of the operating segments determine tactical asset allocation. Additionally, these committees review allinvestment-related activity that affects their operating company, including the selection of outside investment advisors, pro-posed asset allocations changes, and the systematic review of investment guidelines.
For additional information regarding the investment portfolio, including breakdowns of the sector and maturity dis-tributions, refer to Note 4 to the Consolidated Financial Statements, under Item 8.
Regulation
Our insurance and reinsurance subsidiaries conduct business globally, including in all 50 states of the United States and theDistrict of Columbia. Our businesses in each of these jurisdictions are subject to varying degrees of regulation and supervision.The laws and regulations of the jurisdictions in which our insurance and reinsurance subsidiaries are domiciled require amongother things that these subsidiaries maintain minimum levels of statutory capital, surplus and liquidity, meet solvency stan-dards, and submit to periodic examinations of their financial condition. The complex regulatory environments in which ACEoperates are subject to change and are regularly monitored. The following is an overview discussion of regulations for ouroperations in Switzerland, the U.S., Bermuda, and other international locations.
Swiss Operations
The Swiss Financial Market Supervisory Authority, which we refer to as “FINMA” has the discretion to supervise our groupactivities. Under so-called “group supervision,” FINMA has the right to supervise the Company on a group-wide basis. Theregulatory power of FINMA covers in particular the following areas:• reporting on organization;• reporting on structure;• reporting on internal transactions;• solvency;• group/conglomerate report; and• corporate governance/risk management/internal control system.
In 2008, we received written confirmation from the Federal Office of Private Insurance (FOPI), a FINMA predecessorinsurance supervising authority, that it does not intend to subject us to group supervision so long as certain business parame-ters within Switzerland are not exceeded. While we currently intend to operate within these parameters, we cannot assure youthat our future business needs may not require that we exceed these parameters or that FINMA will not change these parame-ters or otherwise determine to exercise group supervision over us. The costs and administrative burdens of group supervisioncould be substantial. Late in 2008, we formed ACE Insurance (Switzerland) Limited which offers various insurance covers tosmall and mid-sized Swiss companies, as well as A&H solutions to individuals. We have also formed a reinsurance subsidiarynamed ACE Reinsurance (Switzerland) Limited which we operate as primarily a provider of reinsurance to other ACE entities.Both new companies are licensed and governed by FINMA.
U.S. Operations
Our U.S. insurance subsidiaries are subject to extensive regulation and supervision by the states in which they do business.The laws of the various states establish departments of insurance with broad authority to regulate, among other things: thestandards of solvency that must be met and maintained, the licensing of insurers and their producers, approval of policy formsand rates, the nature of and limitations on investments, restrictions on the size of the risks which may be insured under a sin-gle policy, deposits of securities for the benefit of policyholders, requirements for the acceptability of reinsurers, periodicexaminations of the affairs of insurance companies, the form and content of reports of financial condition required to be filed,and the adequacy of reserves for unearned premiums, losses, and other purposes.
15

Our U.S. insurance subsidiaries are required to file detailed annual and quarterly reports with state insurance regulators ineach of the states in which they do business. In addition, our U.S. insurance subsidiaries’ operations and financial records aresubject to examination at regular intervals by state regulators.
All states have enacted legislation that regulates insurance holding companies. This legislation provides that eachinsurance company in the system is required to register with the insurance department of its state of domicile and furnishinformation concerning the operations of companies within the holding company system that may materially affect the oper-ations, management, or financial condition of the insurers within the system. All transactions within a holding companysystem must be fair and equitable. Notice to the insurance departments is required prior to the consummation of transactionsaffecting the ownership or control of an insurer and of certain material transactions between an insurer and an entity in itsholding company system; in addition, certain transactions may not be consummated without the department’s prior approval.
Statutory surplus is an important measure utilized by the regulators and rating agencies to assess our U.S. insurancesubsidiaries’ ability to support business operations and provide dividend capacity. Our U.S. insurance subsidiaries are subjectto various state statutory and regulatory restrictions that limit the amount of dividends that may be paid without prior approvalfrom regulatory authorities. These restrictions differ by state, but are generally based on calculations incorporating statutorysurplus, statutory net income, and/or investment income.
The National Association of Insurance Commissioners (NAIC) has a risk-based capital requirement for P&C insurancecompanies. This risk-based capital formula is used by many state regulatory authorities to identify insurance companies thatmay be undercapitalized and which merit further regulatory attention. These requirements are designed to monitor capitaladequacy using a formula that prescribes a series of risk measurements to determine a minimum capital amount for aninsurance company, based on the profile of the individual company. The ratio of a company’s actual policyholder surplus to itsminimum capital requirement will determine whether any state regulatory action is required. There are progressive risk-basedcapital failure levels that trigger more stringent regulatory action. If an insurer’s policyholders’ surplus falls below the Man-datory Control Level (70 percent of the Authorized Control Level, as defined by the NAIC), the relevant insurance commissioneris required to place the insurer under regulatory control. However, an insurance commissioner may allow a P&C companyoperating below the Mandatory Control Level that is writing no business and is running off its existing business to continue itsrun-off. Brandywine is running off its liabilities consistent with the terms of an order issued by the Insurance Commissioner ofPennsylvania. This includes periodic reporting obligations to the Pennsylvania Insurance Department.
Government intervention has also occurred in the insurance and reinsurance markets in relation to terrorism coverage inthe U.S. (and through industry initiatives in other countries). The U.S. Terrorism Risk Insurance Act (TRIA), which wasenacted in 2002 to ensure the availability of insurance coverage for certain types of terrorist acts in the U.S., was extended in2007 for seven years, through 2014, and applies to certain of our operations.
From time to time, ACE and its subsidiaries and affiliates receive inquiries from state agencies and attorneys general, withwhich we generally comply, seeking information concerning business practices, such as underwriting and non-traditional orloss mitigation insurance products. Moreover, many recent factors, such as consequences of and reactions to industry andeconomic conditions as well as a change in the presidential administration and focus on domestic issues, have contributed tothe potential for change in the legal and regulatory framework applicable to ACE’s U.S. operations and businesses. We cannotassure you that changes in laws or investigative or enforcement activities in the various U.S states will not have a materialadverse impact on our financial condition, results, or business practices. More information on insurance industry inves-tigations, including settlement agreements and related matters, is set forth in Note 10 to the Consolidated FinancialStatements, under Item 8.
Bermuda Operations
In Bermuda, our insurance subsidiaries are principally regulated by the Insurance Act 1978 (as amended) and related regu-lations (the Act). The Act imposes solvency and liquidity standards as well as auditing and reporting requirements, and grantsthe Bermuda Monetary Authority (the Authority) powers to supervise, investigate, and intervene in the affairs of insurancecompanies. Significant requirements include the appointment of an independent auditor, the appointment of a loss reservespecialist, and the filing of the Annual Statutory Financial Return with the Executive Member responsible for Insurance (theExecutive). We must comply with provisions of the Companies Act 1981 regulating the payment of dividends and dis-tributions. A Bermuda company may not declare or pay a dividend or make a distribution out of contributed surplus if there arereasonable grounds for believing that: (a) the company is, or would after the payment be, unable to pay its liabilities as theybecome due; or (b) the realizable value of the company’s assets would thereby be less than the aggregate of its liabilities andits issued share capital and share premium accounts. Further, an insurer may not declare or pay any dividends during anyfinancial year if it would cause the insurer to fail to meet its relevant margins, and an insurer which fails to meet its relevant
16

margins on the last day of any financial year may not, without the approval of the Minister of Finance, declare or pay any divi-dends during the next financial year. In addition, some of ACE’s Bermuda subsidiaries qualify as “Class 4” insurers and maynot in any financial year pay dividends which would exceed 25 percent of their total statutory capital and surplus, as shownon their statutory balance sheet in relation to the previous financial year, unless they file a solvency affidavit at least sevendays in advance.
The Executive may appoint an inspector with extensive powers to investigate the affairs of an insurer if he or she believesthat an investigation is required in the interest of the insurer’s policyholders or persons who may become policyholders. If itappears to the Executive that there is a risk of the insurer becoming insolvent, or that the insurer is in breach of the Act or anyconditions of its registration under the Act, the Executive may direct the insurer not to take on any new insurance business, notto vary any insurance contract if the effect would be to increase the insurer’s liabilities, not to make certain investments, torealize certain investments, to maintain in, or transfer to the custody of a specified bank certain assets, not to declare or payany dividends or other distributions, or to restrict the making of such payments and/or to limit its premium income.
The Act also requires the Authority to supervise persons carrying on insurance business, insurance managers, and inter-mediaries with the aim of protecting the interests of clients and potential clients of such persons. The Act requires every insurerto appoint a principal representative resident in Bermuda and to maintain a principal office in Bermuda. The principal repre-sentative must be knowledgeable in insurance and is responsible for arranging the maintenance and custody of the statutoryaccounting records and for filing the annual Statutory Financial Return.
Other International Operations
The extent of insurance regulation varies significantly among the countries in which the non-U.S. ACE operations conductbusiness. While each country imposes licensing, solvency, auditing, and financial reporting requirements, the type and extentof the requirements differ substantially. For example:• in some countries, insurers are required to prepare and file quarterly financial reports, and in others, only annual reports;• some regulators require intermediaries to be involved in the sale of insurance products, whereas other regulators permitdirect sales contact between the insurer and the customer;• the extent of restrictions imposed upon an insurer’s use of foreign reinsurance vary;• policy form filing and rate regulation vary by country;• the frequency of contact and periodic on-site examinations by insurance authorities differ by country; and• regulatory requirements relating to insurer dividend policies vary by country.
Significant variations can also be found in the size, structure, and resources of the local regulatory departments that over-see insurance activities. Certain regulators prefer close relationships with all subject insurers and others operate a risk-basedapproach.
ACE operates in some countries through subsidiaries and in some countries through branches of those subsidiaries. Localcapital requirements applicable to a subsidiary generally include its branches. Certain ACE companies are jointly owned withlocal companies to comply with legal requirements for local ownership. Other legal requirements include discretionary licens-ing procedures, compulsory cessions of reinsurance, local retention of funds and records, data privacy and protection programrequirements, and foreign exchange controls. ACE’s international companies are also subject to multinational application ofcertain U.S. laws.
Moreover, there are various regulatory bodies and initiatives that impact ACE in multiple international jurisdictions and thepotential for significant impact on ACE could be heightened as a result of recent industry and economic developments. In par-ticular, the European Union’s (EU) executive body, the European Commission, is implementing new capital adequacy and riskmanagement regulations for the European insurance industry, known as Solvency II, which aims to establish a revised set ofEU-wide capital requirements and risk management standards that will replace the current Solvency I requirements. Oncefinalized, Solvency II is expected to set out new, strengthened requirements applicable to the entire EU relating to capitaladequacy and risk management for insurers. Other jurisdictions such as Bermuda and Switzerland are likely to strengthen theirrespective capital and risk management requirements.
Enterprise Risk Management
As an insurer, ACE is in the business of risk management for profit. As a result, enterprise risk management, or ERM, is a partof the day-to-day management of the Company and its operations. Because risk management must permeate an organizationconducting insurance businesses around the world, we have established an ERM process that is integrated into managementof our businesses and is led by ACE’s senior management.
17

Our global ERM framework is broadly multi-disciplinary and its objectives include:• support core risk management responsibilities at division and corporate levels through the identification and management ofrisks that aggregate and/or correlate across divisions;• identify, analyze, and mitigate significant external risks that could impair the financial condition of ACE and/or hinder itsbusiness objectives;• coordinate accumulation guidelines and actual exposure relative to guidelines, risk codes, and other risk processes;• provide analysis and maintain accumulation and economic capital and information systems that enable business leaders tomake appropriate and consistent risk/return decisions;• identify and assess emerging risk issues; and• develop and communicate to the Company’s business lines consistent risk management processes.
The Company’s Enterprise Risk Management Board (ERMB) reports to and assists the Chief Executive Officer in the over-sight and review of ACE’s ERM framework. The ERMB is chaired by the Company’s Chief Risk Officer and Chief Actuary. TheERMB oversees and monitors the processes and guidelines used to manage insurance risk, financial risk, strategic risk, andoperational risk. The ERMB governance framework relies in part on establishment and maintenance of risk limits and a riskmatrix through which inherent and residual risks across the organization are cataloged. The ERMB meets at least monthly, andis comprised of the Company’s most senior executives, in addition to the Chair: the Chief Executive Officer, Chief FinancialOfficer, Chief Investment Officer, Chief Claims Officer, General Counsel, Chief Executive Officer for Insurance – North America,Chief Executive Officer for ACE Overseas General, and our Assumed Reinsurance Officer.
The ERMB is provided support from various sources, including the Enterprise Risk Unit (ERU) and Product Boards. TheERU is responsible for the collation and analysis of two types of information. First, external information that provides insight tothe ERMB on risks that might imperil ACE’s key objectives and second, internal information on single named, product, andcross-product accumulations. The ERU is independent of the operating units and reports to our Chief Risk Officer and ChiefActuary. The Product Boards exist to provide oversight for products that the Company offers globally. A Product Board currentlyexists for each of the following products; property/energy, marine, casualty, financial lines, aviation, and political risk. EachProduct Board is responsible for ensuring consistency in underwriting and pricing standards, identification of emerging issues,and single name accumulation guidelines.
The Company’s Chief Risk Officer and Chief Actuary also reports to the Board’s Risk Committee, which helps execute theBoard’s supervisory responsibilities pertaining to ERM. The role of the Risk Committee includes evaluation of the integrity andeffectiveness of the Company’s ERM procedures and systems and information; oversight of policy decisions pertaining to riskaggregation and minimization, including credit risk; and assessment of the Company’s major decisions and preparedness lev-els pertaining to perceived material risks. The Audit Committee, which regularly meets jointly with the Risk Committee,provides oversight of the financial reporting process and safeguarding of assets.
Others within the ERM structure contribute toward accomplishing ACE’s ERM objectives, including regional management,Internal Audit, Compliance, external consultants, and managers of our internal control processes and procedures.
Tax Matters
Refer to “Risk Factors”, under Item 1A below, and Note 2 m) to the Consolidated Financial Statements, under Item 8.
18

ITEM 1A. Risk Factors
Factors that could have a material impact on our results of operations or financial condition are outlined below. Additional risksnot presently known to us or that we currently deem insignificant may also impair our business or results of operations as theybecome known facts or as facts and circumstances change. Any of the risks described below could result in a significant ormaterial adverse effect on our results of operations or financial condition.
Business
U.S. and global economic and financial industry events and their consequences could harm our business, our liquidity and
financial condition, and our stock price.
Global market and economic conditions have been severely disrupted over the past three years which included widespreadrecession. These conditions and their consequences may affect (among other aspects of our business) the demand for andclaims made under our products, the ability of customers, counterparties, and others to establish or maintain their relation-ships with us, our ability to access and efficiently use internal and external capital resources, the availability of reinsuranceprotection, the risks we assume under reinsurance programs covering variable annuity guarantees, and our investmentperformance. Continued volatility in the U.S. and other securities markets may adversely affect our stock price.
Our financial condition could be adversely affected by the occurrence of natural and man-made disasters.
We have substantial exposure to losses resulting from natural disasters, man-made catastrophes, and other catastrophicevents. Catastrophes can be caused by various events, including hurricanes, typhoons, earthquakes, hailstorms, explosions,severe winter weather, fires, war, acts of terrorism, political instability, and other natural or man-made disasters, including aglobal or other wide-impact pandemic. The incidence and severity of catastrophes are inherently unpredictable and our lossesfrom catastrophes could be substantial. In addition, climate conditions may be changing, primarily through changes in globaltemperatures, which may in the future increase the frequency and severity of natural catastrophes and the resulting losses.The occurrence of claims from catastrophic events could result in substantial volatility in our results of operations or financialcondition for any fiscal quarter or year. Increases in the values and concentrations of insured property may also increase theseverity of these occurrences in the future. Although we attempt to manage our exposure to such events through the use ofunderwriting controls and the purchase of third-party reinsurance, catastrophic events are inherently unpredictable and theactual nature of such events when they occur could be more frequent or severe than contemplated in our pricing and riskmanagement expectations. As a result, the occurrence of one or more catastrophic events could have a material adverse effecton our results of operations or financial condition.
If actual claims exceed our loss reserves, our financial results could be adversely affected.
Our results of operations and financial condition depend upon our ability to assess accurately the potential losses associatedwith the risks that we insure and reinsure. We establish reserves for unpaid losses and loss expenses, which are estimates offuture payments of reported and unreported claims for losses and related expenses, with respect to insured events that haveoccurred at or prior to the date of the balance sheet. The process of establishing reserves can be highly complex and is subjectto considerable variability as it requires the use of informed estimates and judgments.
We have actuarial staff in each of our operating segments who analyze insurance reserves and regularly evaluate the lev-els of loss reserves. Any such evaluations could result in future changes in estimates of losses or reinsurance recoverable andwould be reflected in our results of operations in the period in which the estimates are changed. Losses and loss expenses arecharged to income as incurred. Reserves for unpaid losses and loss expenses represent the estimated ultimate losses and lossexpenses less paid losses and loss expenses, and is comprised of case reserves and IBNR. During the loss settlement period,which can be many years in duration for some of our lines of business, additional facts regarding individual claims and trendsoften will become known. As these become apparent, case reserves may be adjusted by allocation from IBNR without anychange in overall reserves. In addition, application of statistical and actuarial methods may require the adjustment of overallreserves upward or downward from time to time.
Included in our liabilities for losses and loss expenses are liabilities for latent claims such as A&E. At December 31,2009, these A&E liabilities represented approximately 6.7 percent of our liabilities for losses and loss expenses. These claimsare principally related to claims arising from remediation costs associated with hazardous waste sites and bodily-injury claimsrelated to exposure to asbestos products and environmental hazards. The estimation of these liabilities is subject to manycomplex variables including: the current legal environment; specific settlements that may be used as precedents to settle future
19

claims; assumptions regarding multiple recoveries by claimants against various defendants; the ability of a claimant to bring aclaim in a state in which they have no residency or exposure; the ability of a policyholder to claim the right to non-productscoverage; whether high-level excess policies have the potential to be accessed given the policyholder’s claim trends andliability situation; payments to unimpaired claimants; and, the potential liability of peripheral defendants.
Accordingly, the ultimate settlement of losses, arising from either latent or non-latent causes, may be significantly greateror less than the loss and loss expense reserves held at the date of the balance sheet. If our loss reserves are determined to beinadequate, we will be required to increase loss reserves at the time of such determination and our net income will bereduced. If the increase in loss reserves is large enough, we could incur a net loss and a net reduction of our capital.
The effects of emerging claim and coverage issues on our business are uncertain.
As industry practices and legislative, regulatory, judicial, social, financial, and other environmental conditions change,unexpected and unintended issues related to claims and coverage may emerge. These issues may adversely affect our busi-ness by either extending coverage beyond our underwriting intent or by increasing the frequency and severity of claims. Insome instances, these changes may not become apparent until some time after we have issued insurance or reinsurance con-tracts that are affected by the changes. As a result, the full extent of liability under our insurance or reinsurance contracts maynot be known for many years after a contract is issued.
The failure of any of the loss limitation methods we employ could have an adverse effect on our results of operations or financial
condition.
We seek to limit our loss exposure by writing a number of our insurance and reinsurance contracts on an excess of loss basis.Excess of loss insurance and reinsurance indemnifies the insured against losses in excess of a specified amount. In addition,we limit program size for each client and purchase third-party reinsurance for our own account. In the case of our assumedproportional reinsurance treaties, we seek per occurrence limitations or loss and loss expense ratio caps to limit the impact oflosses ceded by the client. In proportional reinsurance, the reinsurer shares a proportional part of the premiums and losses ofthe reinsured. We also seek to limit our loss exposure by geographic diversification. Geographic zone limitations involve sig-nificant underwriting judgments, including the determination of the area of the zones and the inclusion of a particular policywithin a particular zone’s limits. Various provisions of our policies, such as limitations or exclusions from coverage or choice offorum negotiated to limit our risks, may not be enforceable in the manner we intend. As a result, one or more catastrophic orother events could result in claims that substantially exceed our expectations, which could have an adverse effect on ourresults of operations or financial condition.
We may be unable to purchase reinsurance, and if we successfully purchase reinsurance, we are subject to the possibility of
non-payment.
We purchase reinsurance to protect against catastrophes, to increase the amount of protection we can provide our clients, andas part of our overall risk management strategy. Our reinsurance business also purchases some retrocessional protection. Aretrocessional reinsurance agreement allows a reinsurer to cede to another company all or part of the reinsurance that wasoriginally assumed by the reinsurer. A reinsurer’s or retrocessionaire’s insolvency or inability or unwillingness to make timelypayments under the terms of its reinsurance agreement with us could have an adverse effect on us because we remain liableto the insured. From time to time, market conditions have limited, and in some cases have prevented, insurers and reinsurersfrom obtaining the types and amounts of reinsurance or retrocessional reinsurance that they consider adequate for their busi-ness needs.
There is no guarantee our desired amounts of reinsurance or retrocessional reinsurance will be available in the market-place in the future. In addition to capacity risk, the remaining capacity may not be on terms we deem appropriate oracceptable or with companies with whom we want to do business. Finally, we face some degree of counterparty risk wheneverwe purchase reinsurance or retrocessional reinsurance. Consequently, the insolvency, inability, or unwillingness of any of ourpresent or future reinsurers to make timely payments to us under the terms of our reinsurance or retrocessional agreementscould have an adverse effect on us. At December 31, 2009, we had $13.6 billion of reinsurance recoverables, net of reservesfor uncollectible recoverables.
As part of the restructuring of INA Financial Corporation and its subsidiaries that occurred in 1996, Insurance Companyof North America (INA) was divided into two separate corporations: an active insurance company that retained the INA nameand continued to write P&C business and an inactive run-off company, now called Century Indemnity Company (Century). TheA&E exposures of substantially all of INA’s U.S. P&C companies, now our subsidiaries, were either allocated to Century (as aresult of the restructuring) or reinsured to subsidiaries of Brandywine, primarily Century. Certain of our subsidiaries are primar-
20

ily liable for A&E and other exposures they have reinsured to Century. As at December 31, 2009, the aggregate reinsurancebalances ceded by our active subsidiaries to Century were $1.2 billion. Should Century experience adverse loss reserve devel-opment in the future and should Century be placed into rehabilitation or liquidation, the reinsurance recoverables due toCentury’s affiliates would be payable only after the payment in full of certain expenses and liabilities, including administrativeexpenses and direct policy liabilities. Thus, the intercompany reinsurance recoverables would be at risk to the extent of theshortage of assets remaining to pay these recoverables. While we believe the intercompany reinsurance recoverables fromCentury are not impaired at this time, we cannot assure you that adverse development with respect to Century’s loss reserves,if manifested, will not result in Century’s insolvency, which could result in our recognizing a loss to the extent of anyuncollectible reinsurance from Century.
Our net income may be volatile because certain products offered by our Life business expose us to reserve and fair value liability
changes that are directly affected by market and other factors and assumptions.
Our pricing and valuation of life insurance and annuity products, including reinsurance programs, are based upon variousassumptions, including but not limited to market changes, mortality rates, morbidity rates, and policyholder behav-ior. Significant deviations in actual experience from our pricing assumptions could have an adverse effect on the profitability ofour products and our business.
Under reinsurance programs covering variable annuity guarantees, we assume the risk of guaranteed minimum deathbenefits (GMDB) and guaranteed minimum income benefits (GMIB) associated with variable annuity contracts. Our netincome is directly impacted by changes in the reserves calculated in connection with the reinsurance of GMDB and GMIBliabilities. In addition, our net income is directly impacted by the change in the fair value of the GMIB liability. The reserve andfair value liability calculations are directly affected by market factors, including equity levels, interest rate levels, credit risk, andimplied volatilities. The reserve and fair value liability calculations are also affected by assumptions about policyholder mortal-ity and changes in policyholder behavior, most significantly withdrawal and annuitization. Significant changes in behavior as aresult of policyholder reactions to market or economic conditions could be material. ACE views our variable annuityreinsurance business as having a similar risk profile to that of catastrophe reinsurance, with the probability of long-term eco-nomic loss relatively small at the time of pricing. Adverse changes in market factors and policyholder behavior will have animpact on both life underwriting income and net income. When evaluating these risks, we expect to be compensated for takingboth the risk of a cumulative long-term economic net loss, as well as the short-term accounting variations caused by thesemarket movements. Therefore, we evaluate this business in terms of its long-term economic risk and reward. Refer to the“Critical Accounting Estimates – Guaranteed minimum income benefits derivatives”, under Item 7 and “Quantitative and Qual-itative Disclosures about Market Risk – Reinsurance of GMIB and GMDB guarantees”, under Item 7A for more information.
A failure in our operational systems or infrastructure or those of third parties could disrupt business, damage our reputation, and
cause losses.
ACE’s operations rely on the secure processing, storage, and transmission of confidential and other information in its computersystems and networks. ACE’s business depends on effective information systems and the integrity and timeliness of the data ituses to run its business. Our ability to adequately price products and services, to establish reserves, to provide effective andefficient service to our customers, and to timely and accurately report our financial results also depends significantly on theintegrity of the data in our information systems. Although we take protective measures and endeavor to modify them ascircumstances warrant, our computer systems, software, and networks may be vulnerable to unauthorized access, computerviruses or other malicious code, and other events that could have security consequences. If one or more of such events occur,this potentially could jeopardize ACE’s or our clients’ or counterparties’ confidential and other information processed and storedin, and transmitted through, our computer systems and networks, or otherwise cause interruptions or malfunctions in ACE’s,its clients’, its counterparties’, or third parties’ operations, which could result in significant losses or reputational damage. ACEmay be required to expend significant additional resources to modify our protective measures or to investigate and remediatevulnerabilities or other exposures, and we may be subject to litigation and financial losses that are either not insured against ornot fully covered by insurance maintained.
Despite the contingency plans and facilities we have in place, our ability to conduct business may be adversely affectedby a disruption of the infrastructure that supports our business in the communities in which we are located, or of outsourcedservices or functions. This may include a disruption involving electrical, communications, transportation, or other services usedby ACE. These disruptions may occur, for example, as a result of events that affect only the buildings occupied by ACE or as aresult of events with a broader effect on the cities where those buildings are located. If a disruption occurs in one location andACE employees in that location are unable to occupy its offices and conduct business or communicate with or travel to other
21

locations, our ability to service and interact with clients may suffer and we may not be able to successfully implement con-tingency plans that depend on communication or travel.
Employee error and misconduct may be difficult to detect and prevent and could adversely affect our business, results of
operations, and financial condition.
Losses may result from, among other things, fraud, errors, failure to document transactions properly, failure to obtain properinternal authorization, or failure to comply with regulatory requirements. It is not always possible to deter or prevent employeemisconduct and the precautions ACE takes to prevent and detect this activity may not be effective in all cases. Resultant lossescould adversely affect our business, results of operations, and financial condition.
The integration of acquired companies may not be as successful as we anticipate.
Acquisitions involve numerous risks, including operational, strategic, and financial risks such as potential liabilities associatedwith the acquired business. Difficulties in integrating an acquired company may result in the acquired company performingdifferently than we currently expect or in our failure to realize anticipated expense-related efficiencies. Our existing businessescould also be negatively impacted by acquisitions.
Financial Strength and Debt Ratings
A decline in our financial strength ratings could affect our standing among brokers and customers and cause our premiums and
earnings to decrease. A decline in our debt ratings could increase our borrowing costs and impact our ability to access capital
markets.
Ratings have become an increasingly important factor in establishing the competitive position of insurance and reinsurancecompanies. The objective of these rating systems is to provide an opinion of an insurer’s financial strength and ability to meetongoing obligations to its policyholders. Our financial strength ratings reflect the rating agencies’ opinions of our claims payingability, are not evaluations directed to investors in our securities, and are not recommendations to buy, sell, or hold our secu-rities. If our financial strength ratings are reduced from their current levels by one or more of these rating agencies, ourcompetitive position in the insurance industry could suffer and it would be more difficult for us to market our products. Adowngrade, therefore, could result in a substantial loss of business as insureds, ceding companies, and brokers move to otherinsurers and reinsurers with higher ratings. If one or more of our debt ratings were downgraded, we could also incur higherborrowing costs, and our ability to access the capital markets could be impacted. Additionally, we could be required to postcollateral or be faced with the cancellation of premium in certain circumstances. Refer to “Ratings”, under Item 7.
We cannot give any assurance regarding whether or to what extent any of the rating agencies may downgrade our ratingsin the future.
Loss of Key Executives
We could be adversely affected by the loss of one or more key executives or by an inability to attract and retain qualified
personnel.
Our success depends on our ability to retain the services of our existing key executives and to attract and retain additional quali-fied personnel in the future. The loss of the services of any of our key executives or the inability to hire and retain other highlyqualified personnel in the future could adversely affect our ability to conduct our business. This risk may be particularly acutefor us relative to some of our competitors because many of our senior executives work in countries where they are not citizens,such as Bermuda, and work permit and immigration issues could adversely affect the ability to retain or hire key persons. Wedo not maintain key person life insurance policies with respect to our employees.
Brokers and Customers
Since we depend on a few brokers for a large portion of our revenues, loss of business provided by any one of them could
adversely affect us.
We market our insurance and reinsurance worldwide primarily through insurance and reinsurance brokers. Marsh, Inc. and itsaffiliates and Aon Corporation and its affiliates provided approximately 13 percent and 11 percent, respectively, of our grosspremiums written in 2009. Loss of all or a substantial portion of the business provided by one or more of these brokers couldhave a material adverse effect on our business.
22

Our reliance on brokers subjects us to credit risk.
In accordance with industry practice, we generally pay amounts owed on claims under our insurance and reinsurance con-tracts to brokers, and these brokers, in turn, pay these amounts over to the clients that have purchased insurance orreinsurance from us. Although the law is unsettled and depends upon the facts and circumstances of the particular case, insome jurisdictions, if a broker fails to make such a payment, we might remain liable to the insured or ceding insurer for thedeficiency. Conversely, in certain jurisdictions, when the insured or ceding insurer pays premiums for these policies to brokersfor payment over to us, these premiums might be considered to have been paid and the insured or ceding insurer will no lon-ger be liable to us for those amounts, whether or not we have actually received the premiums from the broker. Consequently,we assume a degree of credit risk associated with brokers with whom we transact business. However, due to the unsettled andfact-specific nature of the law, we are unable to quantify our exposure to this risk. To date, we have not experienced any mate-rial losses related to these credit risks.
Certain of our policies subject us to credit risk from customers.
We offer high-deductible policies which are primarily provided in the workers’ compensation and certain general liability pro-tection lines of our business. Under the terms of these policies, our customers are responsible for a set dollar amount per claimand/or an aggregate amount for all covered claims before we are ultimately liable. However, we may be required under suchpolicies to pay third party claimants directly and then seek reimbursement for losses within the deductible from our customers.This subjects us to credit risk from these customers. While we generally seek to mitigate this risk through collateral agreementsand maintain a provision for uncollectible accounts associated with this credit exposure, an increased inability of customers toreimburse us in this context could have a material adverse effect on our financial condition and results of operations. In addi-tion, a lack of credit available to our customers could impact our ability to collateralize this risk to our satisfaction, which inturn, could reduce the amount of high-deductible policies we could offer.
Liquidity and Investments
Our investment performance may affect our financial results and ability to conduct business.
Our funds are invested by professional investment management firms under the direction of our management team in accord-ance with investment guidelines approved by the Finance and Investment Committee of the Board of Directors. Although ourinvestment guidelines stress diversification of risks and conservation of principal and liquidity, our investments are subject tomarket risks, as well as risks inherent in individual securities. The volatility of our loss claims may force us to liquidate secu-rities, which may cause us to incur capital losses. Realized and unrealized losses in our investment portfolio could significantlydecrease our book value, thereby affecting our ability to conduct business. Recent investment market volatility, stock marketdeclines, and fluctuations in credit spreads resulted in some cases in significant realized and unrealized losses in our invest-ment portfolio. We experienced $2.9 billion of pre-tax realized and unrealized gains on our investment portfolio in 2009. Thecarrying value of our investment portfolio was $46.5 billion at December 31, 2009.
Financial markets events create greater risks relating to impairment of investments.
As a part of our ongoing analysis of our investment portfolio, we are required to assess whether the debt and equity securitieswe hold for which we have recorded an unrealized loss have been “other-than-temporarily impaired”. Refer to Note 4 underItem 8 and our disclosure for details and results of our analysis. This analysis requires a high degree of judgment and requiresus to make certain assessments about the potential for recovery of the assets we hold. Declines in relevant stock and otherfinancial markets could adversely affect our net income and other financial results, and may result in additional impairments.
We may be adversely affected by interest rate changes.
Our operating results are affected by the performance of our investment portfolio. Our investment portfolio contains fixedincome investments and may be adversely affected by changes in interest rates. Volatility in interest rates could also have anadverse effect on our investment income and operating results. For example, if interest rates decline, funds reinvested will earnless than the maturing investment. Interest rates are highly sensitive to many factors, including inflation, monetary and fiscalpolicies, and domestic and international political conditions. Although we take measures to manage the risks of investing in achanging interest rate environment, we may not be able to effectively mitigate interest rate sensitivity. Our mitigation effortsinclude maintaining a high quality portfolio with a relatively short duration to reduce the effect of interest rate changes on bookvalue. A significant increase in interest rates could have an adverse effect on our book value.
23

We may require additional capital or financing sources in the future, which may not be available or may be available only on
unfavorable terms.
Our future capital and financing requirements depend on many factors, including our ability to write new business successfullyand to establish premium rates and reserves at levels sufficient to cover losses, as well as our investment performance. Wemay need to raise additional funds through financings or access funds through existing or new credit facilities. We also fromtime to time seek to refinance debt or credit as amounts become due or commitments expire. Any equity or debt financing orrefinancing, if available at all, may be on terms that are not favorable to us. In the case of equity financings, dilution to ourshareholders could result, and in any case, such securities may have rights, preferences, and privileges that are senior to thoseof our Common Shares. Our access to funds under existing credit facilities is dependent on the ability of the banks that areparties to the facilities to meet their funding commitments. Also, recent consolidation in the banking industry could lead toincreased reliance on and exposure to particular institutions. If we cannot obtain adequate capital or sources of credit onfavorable terms, or at all, we could be forced to utilize assets otherwise available for our business operations, and our busi-ness, operating results, and financial condition could be adversely affected. It is possible that, in the future, one or more of therating agencies may reduce our existing ratings. If one or more of our ratings were downgraded, we could incur higher borrow-ing costs and our ability to access the capital markets could be impacted.
We may be required to post additional collateral because of changes in our reinsurance liabilities to regulated insurance
companies.
If our reinsurance liabilities increase, we may be required to post additional collateral for insurance company clients. In addi-tion, regulatory changes sometimes affect our obligations to post collateral. Several such regulatory changes have beenimplemented or are currently under consideration, including changes related to variable annuity contracts. The need to postthis additional collateral, if significant enough, may require us to sell investments at a loss in order to provide securities of suit-able credit quality or otherwise secure adequate capital at an unattractive cost. This could adversely impact our net incomeand liquidity and capital resources.
Our investment portfolio includes below investment-grade securities that have a higher degree of credit or default risk which
could adversely affect our results of operations and financial condition.
Our fixed income portfolio is primarily invested in high quality, investment-grade securities. However, we invest a smaller por-tion of the portfolio in below investment-grade securities. At December 31, 2009, below investment-grade securitiescomprised approximately 13 percent of our fixed income portfolio. These securities, which pay a higher rate of interest, alsohave a higher degree of credit or default risk. These securities may also be less liquid in times of economic weakness or mar-ket disruptions. While we have put in place procedures to monitor the credit risk and liquidity of our invested assets, it ispossible that, in periods of economic weakness (such as recession), we may experience default losses in our portfolio. Thismay result in a reduction of net income and capital.
Exchange Rates
Our operating results and shareholders’ equity may be adversely affected by currency fluctuations.
Our reporting currency is the U.S. dollar. Many of our non-U.S. companies maintain both assets and liabilities in local curren-cies. Therefore, foreign exchange risk is generally limited to net assets denominated in those foreign currencies. Foreignexchange risk is reviewed as part of our risk management process. Locally required capital levels are invested in home curren-cies in order to satisfy regulatory requirements and to support local insurance operations. The principal currencies creatingforeign exchange risk are the British pound sterling, the euro, and the Canadian dollar. At December 31, 2009, approximately19.8 percent of our net assets were denominated in foreign currencies. We may experience losses resulting from fluctuationsin the values of non-U.S. currencies, which could adversely impact our results of operations and financial condition.
Regulatory and Other Governmental Developments
The regulatory and political regimes under which we operate, and their volatility, could have an adverse effect on our business.
Our insurance and reinsurance subsidiaries conduct business globally. Our businesses in each jurisdiction are subject to vary-ing degrees of regulation and supervision. The laws and regulations of the jurisdictions in which our insurance and reinsurancesubsidiaries are domiciled require, among other things, maintenance of minimum levels of statutory capital, surplus, andliquidity, various solvency standards, and periodic examinations of their financial condition. In some jurisdictions, laws and
24

regulations also restrict payments of dividends and reductions of capital. Applicable statutes, regulations, and policies may alsorestrict the ability of these subsidiaries to write insurance and reinsurance policies, to make certain investments, and todistribute funds. The purpose of insurance laws and regulations generally is to protect insureds and ceding insurance compa-nies, not our shareholders.
The insurance industry is affected by political, judicial, and legal developments that may create new and expanded regu-lations and theories of liability. The current economic climate, the recent financial crisis, and in the U.S. the change inpresidential administration in January 2009, present additional uncertainties and risks relating to increased regulation and thepotential for increased involvement of the U.S. and other governments in the financial services industry. Efforts are underwayin Washington, D.C. to create a new regulatory regime for financial services companies, and while it is not expected that theU.S. will adopt a fully functional federal regulator for insurance companies at this time, some proposed reforms regarding sys-temic risk oversight and resolution authority could impact the P&C industry. Moreover, the European Union’s executive body,the European Commission, is implementing new capital adequacy and risk management regulations called Solvency II thatwould apply to our businesses across the European Union. In addition, regulators in countries where we have operations areworking with the International Association of Insurance Supervisors (and in the U.S., with the NAIC) to consider changes toinsurance company supervision, including solvency requirements and group supervision.
We may not be able to comply fully with, or obtain appropriate exemptions from, applicable statutes and regulationswhich could have an adverse effect on our business; as could changes in the laws and regulations that apply to us. Failure tocomply with or to obtain appropriate authorizations and/or exemptions under any applicable laws and regulations could resultin restrictions on our ability to do business or undertake activities that are regulated in one or more of the jurisdictions in whichwe conduct business and could subject us to fines and other sanctions.
Current legal and regulatory activities relating to insurance brokers and agents, contingent commissions, and certain finite-risk
insurance products could adversely affect our business, results of operations, and financial condition.
Beginning in 2004, ACE received numerous regulatory inquiries, subpoenas, interrogatories, and civil investigative demandsfrom regulatory authorities in connection with pending investigations of insurance industry practices. ACE is cooperating andwill continue to cooperate with such inquiries. We cannot assure you that we will not receive any additional requests forinformation or subpoenas or what actions, if any, any of these governmental agencies will take as a result of these inves-tigations. Additionally, at this time, we are unable to predict the potential effects, if any, that these actions may have upon theinsurance and reinsurance markets and industry business practices or what, if any, changes may be made to laws and regu-lations regarding the industry and financial reporting. Any of the foregoing could adversely affect our business, results ofoperations, and financial condition.
Our operations in developing nations expose us to political developments that could have an adverse effect on our business,
liquidity, results of operations, and financial condition.
Our international operations include operations in various developing nations. Both current and future foreign operations couldbe adversely affected by unfavorable political developments including law changes, tax changes, regulatory restrictions, andnationalization of ACE operations without compensation. Adverse actions from any one country could have an adverse effecton our business, liquidity, results of operations, and financial condition depending on the magnitude of the event and ACE’snet financial exposure at that time in that country.
We may become subject to additional Swiss regulation.
The Swiss Financial Market Supervisory Authority, which we refer to as “FINMA,” has the discretion to supervise our groupactivities. Under so-called “group supervision,” FINMA has the right to supervise the Company on a group-wide basis. InMarch 2008, we received written confirmation from the Federal Office of Private Insurance (FOPI), a FINMA predecessorinsurance supervising authority, that it does not intend to subject us to group supervision so long as certain business parame-ters within Switzerland are not exceeded. While we currently intend to operate within these parameters, we cannot assure youthat our future business needs may not require that we exceed these parameters or that FINMA will not change these parame-ters or otherwise determine to exercise group supervision over us. The costs and administrative burdens of such groupsupervision could be substantial.
25

Company Structure
Our ability to pay dividends and to make payments on indebtedness may be constrained by our holding company structure.
ACE Limited is a holding company and does not have any significant operations or assets other than its ownership of theshares of its operating insurance and reinsurance subsidiaries. Dividends and other permitted distributions from our insurancesubsidiaries are our primary source of funds to meet ongoing cash requirements, including any future debt service paymentsand other expenses, and to pay dividends to our shareholders. Some of our insurance subsidiaries are subject to significantregulatory restrictions limiting their ability to declare and pay dividends. The inability of our insurance subsidiaries to pay divi-dends in an amount sufficient to enable us to meet our cash requirements at the holding company level could have an adverseeffect on our operations and our ability to pay dividends to our shareholders and/or meet our debt service obligations.
ACE Limited is a Swiss company; it may be difficult for you to enforce judgments against it or its directors and executive officers.
ACE Limited is incorporated pursuant to the laws of Switzerland. In addition, certain of our directors and officers reside outsidethe United States and all or a substantial portion of our assets and the assets of such persons are located in jurisdictions out-side the United States. As such, it may be difficult or impossible to effect service of process within the United States uponthose persons or to recover against us or them on judgments of U.S. courts, including judgments predicated upon civil liabilityprovisions of the U.S. federal securities laws.
ACE has been advised by Niederer Kraft & Frey AG, its Swiss counsel, that there is doubt as to whether the courts inSwitzerland would enforce:• judgments of U.S. courts based upon the civil liability provisions of the U.S. Federal securities laws obtained in actionsagainst it or its directors and officers, who reside outside the United States; or• original actions brought in Switzerland against these persons or ACE predicated solely upon U.S. Federal securities laws.
ACE has also been advised by Niederer Kraft & Frey AG that there is no treaty in effect between the United States andSwitzerland providing for this enforcement and there are grounds upon which Swiss courts may not enforce judgments ofUnited States courts. Some remedies available under the laws of United States jurisdictions, including some remedies avail-able under the U.S. Federal securities laws, would not be allowed in Swiss courts as contrary to that nation’s public policy.
As a result of the increase in par value of our shares that occurred in connection with our Continuation to Switzerland, wewill have less flexibility with respect to certain aspects of capital management than previously.
In connection with our Continuation to Switzerland, we increased the par value of our shares. As of December 31, 2009,our par value is CHF 31.88 per share. Under Swiss law, we generally may not issue registered shares below their par value.In the event there is a need to raise common equity capital at a time when the trading price of our registered shares is belowour par value, we will need to obtain approval of our shareholders to decrease the par value of our registered shares. Wecannot assure you that we would be able to obtain such shareholder approval. Furthermore, obtaining shareholder approvalwould require filing a preliminary proxy statement with the SEC and convening a meeting of shareholders which would delayany capital raising plans. Furthermore, any reduction in par value would decrease our ability to pay dividends as a repaymentof share capital which is not subject to Swiss withholding tax. See “Taxation – Shareholders may be subject to Swiss with-holding taxes on the payment of dividends.”
Insurance and Reinsurance Markets
Competition in the insurance and reinsurance markets could reduce our margins.
Insurance and reinsurance markets are highly competitive. We compete on an international and regional basis with majorU.S., Bermuda, European, and other international insurers and reinsurers and with underwriting syndicates, some of whichhave greater financial, marketing, and management resources than we do. We also compete with new companies that con-tinue to be formed to enter the insurance and reinsurance markets. In addition, capital market participants have createdalternative products that are intended to compete with reinsurance products. Increased competition could result in fewer sub-missions, lower premium rates, and less favorable policy terms and conditions, which could reduce our margins.
Insurance and reinsurance markets are historically cyclical, and we expect to experience periods with excess underwriting
capacity and unfavorable premium rates.
The insurance and reinsurance markets have historically been cyclical, characterized by periods of intense price competitiondue to excessive underwriting capacity as well as periods when shortages of capacity permitted favorable premium levels. Anincrease in premium levels is often offset by an increasing supply of insurance and reinsurance capacity, either by capital
26

provided by new entrants or by the commitment of additional capital by existing insurers or reinsurers, which may cause pricesto decrease. Any of these factors could lead to a significant reduction in premium rates, less favorable policy terms, and fewersubmissions for our underwriting services. In addition to these considerations, changes in the frequency and severity of lossessuffered by insureds and insurers may affect the cycles of the insurance and reinsurance markets significantly, as could peri-ods of economic weakness (such as recession).
Charter Documents and Applicable Law
There are provisions in our charter documents that may reduce the voting rights of our Common Shares.
Our Articles of Association generally provide that shareholders have one vote for each Common Share held by them and areentitled to vote at all meetings of shareholders. However, the voting rights exercisable by a shareholder may be limited so thatcertain persons or groups are not deemed to hold 10 percent or more of the voting power conferred by our Common Shares.Moreover, these provisions could have the effect of reducing the voting power of some shareholders who would not otherwisebe subject to the limitation by virtue of their direct share ownership. Our Board of Directors may refuse to register holders ofshares as shareholders with voting rights based on certain grounds, including if the holder would, directly or indirectly, for-mally, constructively or beneficially own (as described in Articles 8 and 14 of our Articles of Association) or otherwise controlvoting rights with respect to 10 percent or more of the registered share capital recorded in the commercial register. In addition,the Board of Directors shall reject entry of holders of registered shares as shareholders with voting rights in the share register orshall decide on their deregistration when the acquirer or shareholder upon request does not expressly state that she/he hasacquired or holds the shares in her/his own name and for her/his account.
Applicable laws may make it difficult to effect a change of control of our company.
Before a person can acquire control of a U.S. insurance company, prior written approval must be obtained from the insurancecommissioner of the state where the domestic insurer is domiciled. Prior to granting approval of an application to acquire con-trol of a domestic insurer, the state insurance commissioner will consider such factors as the financial strength of theapplicant, the integrity and management of the applicant’s Board of Directors and executive officers, the acquirer’s plans forthe future operations of the domestic insurer, and any anti-competitive results that may arise from the consummation of theacquisition of control. Generally, state statutes provide that control over a domestic insurer is presumed to exist if any person,directly or indirectly, owns, controls, holds with the power to vote, or holds proxies representing 10 percent or more of thevoting securities of the domestic insurer. Because a person acquiring 10 percent or more of our Common Shares wouldindirectly control the same percentage of the stock of our U.S. insurance subsidiaries, the insurance change of control laws ofvarious U.S. jurisdictions would likely apply to such a transaction. Laws of other jurisdictions in which one or more of ourexisting subsidiaries are, or a future subsidiary may be, organized or domiciled may contain similar restrictions on the acquis-ition of control of ACE.
While our Articles of Association limit the voting power of any shareholder to less than 10 percent, we cannot assure youthat the applicable regulatory body would agree that a shareholder who owned 10 percent or more of our Common Shares didnot, because of the limitation on the voting power of such shares, control the applicable insurance subsidiary.
These laws may discourage potential acquisition proposals and may delay, deter, or prevent a change of control of theCompany, including transactions that some or all of our shareholders might consider to be desirable.
U.S. persons who own our Common Shares may have more difficulty in protecting their interests than U.S. persons who are
shareholders of a U.S. corporation.
Swiss corporate law, which applies to us, differs in certain material respects from laws generally applicable to U.S. corpo-rations and their shareholders. These differences include the manner in which directors must disclose transactions in whichthey have an interest, the rights of shareholders to bring class action and derivative lawsuits, and the scope of indemnificationavailable to directors and officers.
Anti-takeover provisions in our charter and corporate documents could impede an attempt to replace our directors or to effect a
change of control, which could diminish the value of our Common Shares.
Our Articles of Association contain provisions that may make it more difficult for shareholders to replace directors and coulddelay or prevent a change of control that a shareholder might consider favorable. These provisions include a staggered Boardof Directors and voting restrictions. These provisions may prevent a shareholder from receiving the benefit from any premiumover the market price of our Common Shares offered by a bidder in a potential takeover. Even in the absence of an attempt to
27

effect a change in management or a takeover attempt, these provisions may adversely affect the prevailing market price of ourCommon Shares if they are viewed as discouraging takeover attempts in the future.
Shareholder voting requirements under Swiss law may limit the Company’s flexibility with respect to certain aspects of capital
management compared to what it had as a Cayman Islands company.
Swiss law allows our shareholders to authorize share capital which can be issued by our Board of Directors without share-holder approval but this authorization must be renewed by the shareholder every two years. Swiss law also does not provide asmuch flexibility in the various terms that can attach to different classes of stock as permitted in other jurisdictions. Swiss lawalso reserves for approval by shareholders many corporate actions over which our Board of Directors previously had authority.For example, dividends must be approved by shareholders. While we do not believe that Swiss law requirements relating toour capital management will have an adverse effect on the Company, we cannot assure you that situations will not arise wheresuch flexibility would have provided substantial benefits to our shareholders.
Taxation
Shareholders may be subject to Swiss withholding taxes on the payment of dividends.
Our dividends will generally be subject to a Swiss federal withholding tax at a rate of 35 percent. The tax must be withheldfrom the gross distribution, and be paid to the Swiss Federal Tax Administration. A U.S. holder that qualifies for benefits underthe Convention between the United States of America and the Swiss Confederation for the Avoidance of Double Taxation withRespect to Taxes on Income, (U.S.-Swiss Tax Treaty), may apply for a refund of the tax withheld in excess of the 15 percenttreaty rate (or for a full refund in the case of qualifying retirement arrangements). Payment of a dividend in the form of a parvalue reduction or qualifying paid-in capital reduction is not subject to Swiss withholding tax. We have previously obtainedshareholder approval for dividends to be paid in the form of a reduction of our par value or qualifying paid-in capital and, sub-ject to the requirements of our business and applicable law, we currently intend to continue to annually recommend toshareholders that they approve the payment of dividends in such form. We estimate we would be able to pay dividends in theform of a reduction of par value or qualifying paid-in capital, and thus exempt from Swiss withholding tax, for approximately15-20 years after the Continuation. This range may vary depending upon changes in annual dividends, special dividends,fluctuations in U.S. dollar/Swiss franc exchange rates, increases/decreases in par value or qualifying paid-in capital, orchanges or new interpretations to Swiss tax law or regulations. However, we cannot assure you that our shareholders willapprove a reduction in par value or qualifying paid-in capital each year, that we will be able to meet the other legal require-ments for a reduction in par value, or that Swiss withholding rules will not be changed in the future.
We may become subject to taxes in Bermuda after March 28, 2016, which may have an adverse effect on our results of
operations and your investment.
The Bermuda Minister of Finance, under the Exempted Undertakings Tax Protection Act 1966 of Bermuda, as amended, hasgiven ACE Limited and its Bermuda insurance subsidiaries a written assurance that if any legislation is enacted in Bermudathat would impose tax computed on profits or income, or computed on any capital asset, gain, or appreciation, or any tax inthe nature of estate duty or inheritance tax, then the imposition of any such tax would not be applicable to those companies orany of their respective operations, shares, debentures, or other obligations until March 28, 2016, except insofar as such taxwould apply to persons ordinarily resident in Bermuda or is payable by us in respect of real property owned or leased by us inBermuda. Given the limited duration of the Minister of Finance’s assurance, we cannot be certain that we will not be subject toany Bermuda tax after March 28, 2016.
ACE Limited, our Bermuda-based management and holding company and our non-U.S. subsidiaries may become subject to U.S.
tax, which may have an adverse effect on our results of operations and your investment.
ACE Limited, ACE Group Management & Holdings Ltd. and our non-U.S. subsidiaries, including ACE Bermuda Insurance Ltd.,and ACE Tempest Life Reinsurance Ltd., operate in a manner so that none of these companies should be subject to U.S. tax(other than U.S. excise tax on insurance and reinsurance premium income attributable to insuring or reinsuring U.S. risks andU.S. withholding tax on some types of U.S. source investment income), because none of these companies should be treatedas engaged in a trade or business within the United States. However, because there is considerable uncertainty as to the activ-ities that constitute being engaged in a trade or business within the United States, we cannot be certain that the InternalRevenue Service (IRS) will not contend successfully that ACE Limited or its non-U.S. subsidiaries are engaged in a trade orbusiness in the United States. If ACE Limited or any of its non-U.S. subsidiaries were considered to be engaged in a trade or
28

business in the United States, such entity could be subject to U.S. corporate income and branch profits taxes on the portion ofits earnings effectively connected to such U.S. business, in which case our results of operations and your investment could beadversely affected.
If you acquire 10 percent or more of ACE Limited’s shares, you may be subject to taxation under the “controlled foreign
corporation” (the CFC) rules.
Under certain circumstances, a U.S. person who owns 10 percent or more of the voting power of a foreign corporation that isa CFC (a foreign corporation in which 10 percent U.S. shareholders own more than 50 percent of the voting power or value ofthe stock of a foreign corporation or more than 25 percent of a foreign insurance corporation) for an uninterrupted period of30 days or more during a taxable year must include in gross income for U.S. federal income tax purposes such “10 percentU.S. Shareholder’s” pro rata share of the CFC’s “subpart F income”, even if the subpart F income is not distributed to such 10percent U.S. Shareholder if such 10 percent U.S. Shareholder owns (directly or indirectly through foreign entities) any of ourshares on the last day of our fiscal year. Subpart F income of a foreign insurance corporation typically includes foreignpersonal holding company income (such as interest, dividends, and other types of passive income), as well as insurance andreinsurance income (including underwriting and investment income) attributable to the insurance of risks situated outside theCFC’s country of incorporation.
We believe that because of the dispersion of our share ownership, provisions in our organizational documents that limitvoting power, and other factors, no U.S. person or U.S. partnership who acquires shares of ACE Limited directly or indirectlythrough one or more foreign entities should be required to include our subpart F income in income under the CFC rules of UStax law. It is possible, however, that the IRS could challenge the effectiveness of these provisions and that a court could sus-tain such a challenge, in which case your investment could be adversely affected if you own 10 percent or more of ACELimited’s stock.
U.S. persons who hold shares may be subject to U.S. federal income taxation at ordinary income tax rates on their proportionate
share of our Related Person Insurance Income (RPII).
If the RPII of any of our non-U.S. insurance subsidiaries (each a “Non-U.S. Insurance Subsidiary”) were to equal or exceed 20percent of that company’s gross insurance income in any taxable year and direct or indirect insureds (and persons related tothose insureds) own directly or indirectly through foreign entities 20 percent or more of the voting power or value of ACE Lim-ited, then a U.S. person who owns any shares of ACE Limited (directly or indirectly through foreign entities) on the last day ofthe taxable year would be required to include in its income for U.S. federal income tax purposes such person’s pro rata shareof such company’s RPII for the entire taxable year. This amount is determined as if such RPII were distributed proportionatelyonly to U.S. persons at that date regardless of whether such income is distributed. In addition, any RPII that is includible inthe income of a U.S. tax-exempt organization may be treated as unrelated business taxable income. We believe that the grossRPII of each Non-U.S. Insurance Subsidiary did not in prior years of operation and is not expected in the foreseeable future toequal or exceed 20 percent of each such company’s gross insurance income. Likewise, we do not expect the direct or indirectinsureds of each Non-U.S. Insurance Subsidiary (and persons related to such insureds) to directly or indirectly own 20 percentor more of either the voting power or value of our shares. However, we cannot be certain that this will be the case becausesome of the factors which determine the extent of RPII may be beyond our control. If these thresholds are met or exceeded andif you are an affected U.S. person, your investment could be adversely affected.
U.S. persons who hold shares will be subject to adverse tax consequences if we are considered to be a Passive Foreign
Investment Company (PFIC) for U.S. federal income tax purposes.
If ACE Limited is considered a PFIC for U.S. federal income tax purposes, a U.S. person who owns any shares of ACE Limitedwill be subject to adverse tax consequences, including subjecting the investor to a greater tax liability than might otherwiseapply and subjecting the investor to tax on amounts in advance of when tax would otherwise be imposed, in which case yourinvestment could be adversely affected. In addition, if ACE Limited were considered a PFIC, upon the death of any U.S.individual owning shares, such individual’s heirs or estate would not be entitled to a “step-up” in the basis of the shares whichmight otherwise be available under U.S. federal income tax laws. We believe that we are not, have not been, and currently donot expect to become, a PFIC for U.S. federal income tax purposes. We cannot assure you, however, that we will not bedeemed a PFIC by the IRS. If we were considered a PFIC, it could have adverse tax consequences for an investor that is sub-ject to U.S. federal income taxation. There are currently no regulations regarding the application of the PFIC provisions to aninsurance company. New regulations or pronouncements interpreting or clarifying these rules may be forthcoming. We cannotpredict what impact, if any, such guidance would have on an investor that is subject to U.S. federal income taxation.
29

U.S. tax-exempt organizations who own our shares may recognize unrelated business taxable income.
A U.S. tax-exempt organization may recognize unrelated business taxable income if a portion of our insurance income is allo-cated to the organization. This generally would be the case if either we are a CFC and the tax-exempt shareholder is a 10percent U.S. shareholder or there is RPII, certain exceptions do not apply, and the tax-exempt organization, directly orindirectly through foreign entities, owns any shares of ACE Limited. Although we do not believe that any U.S. persons or U.S.partnerships should be allocated such insurance income, we cannot be certain that this will be the case. Potential U.S.tax-exempt investors are advised to consult their tax advisors.
The Organization for Economic Cooperation and Development and the European Union are considering measures that might
encourage countries to increase our taxes.
A number of multilateral organizations, including the European Union and the Organization for Economic Cooperation andDevelopment (OECD) have, in recent years, expressed concern about some countries not participating in adequate taxinformation exchange arrangements and have threatened those that do not agree to cooperate with punitive sanctions bymember countries. It is as yet unclear what these sanctions might be, which countries might adopt them, and when or if theymight be imposed. We cannot assure you, however, that the Tax Information Exchange Agreements (TIEAs) that have been orwill be entered into by Switzerland and Bermuda will be sufficient to preclude all of the sanctions described above, which, ifultimately adopted, could adversely affect us or our shareholders.
Changes in U.S. federal income tax law could adversely affect an investment in our shares.
Legislation is periodically introduced in the U.S. Congress intended to eliminate some perceived tax advantages of companies(including insurance companies) that have legal domiciles outside the United States but have certain U.S. connections. Forexample, HR 3424 has been introduced during the current 111th House, (although a companion bill has not been introducedin the Senate), that would effectively render cross border affiliate reinsurance by foreign-owned U.S. insurance/reinsurancecompanies uneconomical regardless of whether or not it is properly priced under the internationally accepted arms-lengthstandard. If enacted, such a law could have an adverse impact on us or our shareholders. It is possible that other legislativeproposals could emerge in the future that could have an adverse impact on us or our shareholders, including a tax proposalregarding affiliate reinsurance that has been included in the President’s budget proposal.
ITEM 1B. Unresolved Staff Comments
There are currently no unresolved SEC staff comments regarding our periodic or current reports.
ITEM 2. Properties
We maintain office facilities around the world including in North America, Europe (including our principal executive offices inSwitzerland), Bermuda, Latin America, Asia, and the Far East. Most of our office facilities are leased, although we own majorfacilities in Hamilton, Bermuda and Philadelphia, U.S. Management considers its office facilities suitable and adequate for thecurrent level of operations.
ITEM 3. Legal Proceedings
Our insurance subsidiaries are subject to claims litigation involving disputed interpretations of policy coverages and, in somejurisdictions, direct actions by allegedly-injured persons seeking damages from policyholders. These lawsuits, involving claimson policies issued by our subsidiaries which are typical to the insurance industry in general and in the normal course of busi-ness, are considered in our loss and loss expense reserves which are discussed in the P&C loss reserves discussion. Inaddition to claims litigation, we and our subsidiaries are subject to lawsuits and regulatory actions in the normal course ofbusiness that do not arise from or directly relate to claims on insurance policies. This category of business litigation typicallyinvolves, among other things, allegations of underwriting errors or misconduct, employment claims, regulatory activity, ordisputes arising from our business ventures.
While the outcomes of the business litigation involving us cannot be predicted with certainty at this point, we are disput-ing and will continue to dispute allegations against us that are without merit and believe that the ultimate outcomes of thematters in this category of business litigation will not have a material adverse effect on our financial condition, future operatingresults, or liquidity, although an adverse resolution of a number of these items could have a material adverse effect on ourresults of operations in a particular quarter or fiscal year.
More information relating to legal proceedings is set forth in Note 10 f) to the Consolidated Financial Statements, underItem 8, which is hereby incorporated herein by reference.
30

ITEM 4. Submission of Matters to a Vote of Security Holders
No matters were submitted to a vote of stockholders during the fourth quarter of the fiscal year covered by this report.
E X E C U T I V E O F F I C E R S O F T H E C O M P A N Y
The table below sets forth the names, ages, positions, and business experience of the Executive Officers of the Company.
Name Age Position
Evan G. Greenberg 55 Chairman, President, Chief Executive Officer, and DirectorBrian E. Dowd 47 Vice Chairman; Chief Executive Officer, Insurance – North AmericaJohn W. Keogh 45 Chief Executive Officer, ACE Overseas GeneralPhilip V. Bancroft 50 Chief Financial OfficerRobert F. Cusumano 53 General Counsel and SecretaryPaul B. Medini 52 Chief Accounting Officer
Evan G. Greenberg has been a director of ACE since August 2002. Mr. Greenberg was elected Chairman of the Board of Direc-tors in May 2007. Mr. Greenberg was appointed to the position of President and Chief Executive Officer of ACE in May 2004,and in June 2003, was appointed President and Chief Operating Officer of ACE. Mr. Greenberg was appointed to the positionof Chief Executive Officer of ACE Overseas General in April 2002. He joined ACE as Vice Chairman, ACE Limited, and ChiefExecutive Officer of ACE Tempest Re in November 2001. Prior to joining ACE, Mr. Greenberg was most recently President andChief Operating Officer of American International Group (AIG), a position he held from 1997 until 2000.
Brian E. Dowd was appointed Vice Chairman of ACE Limited and ACE Group Holdings in May 2009. Mr. Dowd wasappointed Chief Executive Officer of Insurance – North America in May 2006. In January 2005, Mr. Dowd was namedChairman and Chief Executive Officer of ACE USA, Chairman of ACE Westchester and President of ACE INA HoldingsInc. From 2002 until 2005, Mr. Dowd was President and Chief Executive Officer of ACE Westchester. In January 2004, hewas elected to the position of Office of the Chairman of ACE INA Holdings Inc. – a position which Mr. Dowd currently holdsalong with that of President. Mr. Dowd served as Executive Vice President, ACE USA Property Division from 1999 through2001 when he was appointed President, ACE Specialty P&C Group. Mr. Dowd joined ACE in 1995.
John W. Keogh joined ACE as Chief Executive Officer of ACE Overseas General in April 2006. Prior to joining ACE,Mr. Keogh served as Senior Vice President, Domestic General Insurance of AIG, and President and Chief Executive Officer ofNational Union Fire Insurance Company, AIG’s member company that specializes in D&O and fiduciary liability coverages.Mr. Keogh joined AIG in 1986, and he had served in a number of senior positions there including as Executive Vice Presidentof AIG’s Domestic Brokerage Group, and as President and Chief Operating Officer of AIG’s Lexington Insurance Company unit.
Philip V. Bancroft was appointed Chief Financial Officer of ACE in January 2002. For nearly twenty years, Mr. Bancroftworked for PricewaterhouseCoopers LLP. Prior to joining ACE, he served as partner-in-charge of the New York RegionalInsurance Practice. Mr. Bancroft had been a partner with PricewaterhouseCoopers LLP for 10 years.
Robert F. Cusumano was appointed General Counsel and Secretary of ACE in March 2005. Mr. Cusumano joined ACEfrom the international law firm of Debevoise & Plimpton LLP, where he was a partner and a member of the firm’s LitigationDepartment from 2003 to 2005. From 1990 to 2003, Mr. Cusumano was a partner with the law firm of Simpson Thatcherand Bartlett.
Paul B. Medini was appointed Chief Accounting Officer of ACE in October 2003. For twenty-two years, Mr. Mediniworked for PricewaterhouseCoopers LLP. Prior to joining ACE, he served as a partner in their insurance industry practice.
31

PART II
ITEM 5. Market for Registrant’s Common Equity, Related Stockholder Matters and Issuer Purchases of Equity Securities
(a) Our Common Shares (previous to the Continuation, known as Ordinary Shares), with a current par value of CHF 31.88 pershare, have been listed on the New York Stock Exchange since March 25, 1993.
The following table sets forth the high and low closing sales prices of our Common Shares per fiscal quarter, as reportedon the New York Stock Exchange Composite Tape for the periods indicated:
2009 2008
High Low High Low
Quarter ending March 31 $ 53.03 $ 31.84 $ 61.65 $ 53.66Quarter ending June 30 $ 47.51 $ 40.82 $ 62.67 $ 55.06Quarter ending September 30 $ 53.46 $ 41.76 $ 66.00 $ 45.30Quarter ending December 31 $ 55.14 $ 48.18 $ 57.36 $ 37.97
The last reported sale price of the Common Shares on the New York Stock Exchange Composite Tape on February 23, 2010,was $50.29.(b) The approximate number of record holders of Common Shares as of February 23, 2010, was 3,697.(c) The following table represents dividends paid per Common Share to shareholders of record on each of the following dates:
Shareholders of Record as of: Shareholders of Record as of:
March 31, 2009 $0.26 (CHF 0.30) March 31, 2008 $0.27July 28, 2009 $0.31 (CHF 0.33) June 30, 2008 $0.29October 1, 2009 $0.31 (CHF 0.31) September 30, 2008 $0.26 (CHF 0.30)December 17, 2009 $0.31 (CHF 0.32) December 17, 2008 $0.27 (CHF 0.30)
ACE Limited is a holding company whose principal source of income is investment income and dividends from its operatingsubsidiaries. The ability of the operating subsidiaries to pay dividends to us and our ability to pay dividends to our share-holders are each subject to legal and regulatory restrictions. The declaration and payment of future dividends will be at thediscretion of the Board of Directors and will be dependent upon the profits and financial requirements of ACE and other fac-tors, including legal restrictions on the payment of dividends and such other factors as the Board of Directors deems relevant.Refer to Item 1A and Item 7.(d) The following table provides information with respect to purchases by the Company of its Common Shares during the threemonths ended December 31, 2009:
Issuer’s Purchases of Equity Securities
Period
Total Numberof Shares
Purchased*
Average PricePaid per
Share
Total Numberof Shares
Purchased asPart of Publicly
Announced Plan**
Approximate DollarValue of Shares
that May Yetbe Purchased
Under the Plan**
October 1 through October 31 3,049 $53.75 – $250 millionNovember 1 through November 30 1,534 $51.30 – $250 millionDecember 1 through December 31 6,569 $49.91 – $250 million
Total 11,152
* For the three months ended December 31, 2009, this column represents the surrender to the Company of 11,152 Common Shares to satisfy tax withholding obligationsin connection with the vesting of restricted stock issued to employees.
** As part of ACE’s capital management program, in November 2001, the Company’s Board of Directors authorized the repurchase of any ACE issued debt or capital secu-rities, including Common Shares, up to $250 million. At December 31, 2009, this authorization had not been utilized.
32

(e) Set forth below is a line graph comparing the dollar change in the cumulative total shareholder return on the Company’sCommon Shares from December 31, 2004, through December 31, 2009, as compared to the cumulative total return of theStandard & Poor’s 500 Stock Index and the cumulative total return of the Standard & Poor’s Property-Casualty InsuranceIndex. The chart depicts the value on December 31, 2005, 2006, 2007, 2008, and 2009, of a $100 investment made onDecember 31 2004, with all dividends reinvested.
$130
$102
$89
ACE Limited S&P 500 Index S&P 500 P&C Index
12/31/2004 12/31/2005 12/31/2006 12/31/2007 12/31/2008 12/31/2009$0
$25
$50
$75
$100
$125
$175
$150
$100
$100
$100
$127
$115
$105
$147
$121
$130
$153
$113
$128$133
$81
$80
ACE Limited
S&P 500 index
S&P 500 P&C index
$100
$100
$100
$127
$105
$147
$121
$130
$153 $133 $130
$102
$89
$81
$80
$128
$113$115
33

ITEM 6. Selected Financial Data
The following table sets forth selected consolidated financial data of the Company as of and for the years ended December 31,2009, 2008, 2007, 2006, and 2005. These selected financial and other data should be read in conjunction with the Con-solidated Financial Statements and related notes, under Item 8, and with Item 7. “Management’s Discussion and Analysis ofFinancial Condition and Results of Operations”.
(in millions of U.S. dollars) 2009 2008 2007 2006 2005
Operations data:Net premiums earned $ 13,240 $ 13,203 $ 12,297 $ 11,825 $ 11,748Net investment income 2,031 2,062 1,918 1,601 1,264Net realized gains (losses):Net OTTI losses recognized in income (397) (1,064) (141) (214) (88)Net realized gains (losses) excluding OTTI losses 201 (569) 80 116 164
Total net realized gains (losses) (196) (1,633) (61) (98) 76Losses and loss expenses 7,422 7,603 7,351 7,070 8,571Policy benefits 325 399 168 123 143Policy acquisition costs and administrative
expenses 3,941 3,872 3,226 3,171 2,924Interest expense 225 230 175 176 174Other (income) expense 85 (39) 81 (35) (25)Income tax expense 528 370 575 522 273
Income before cumulative effect 2,549 1,197 2,578 2,301 1,028Cumulative effect of change in accounting
principles (net of income tax) – – – 4 –
Net income 2,549 1,197 2,578 2,305 1,028Dividends on Preferred Shares – (24) (45) (45) (45)
Net income available to holders of Common Shares $ 2,549 $ 1,173 $ 2,533 $ 2,260 $ 983
Diluted earnings per share before cumulative effectof a change in accounting principle $ 7.55 $ 3.50 $ 7.63 $ 6.87 $ 3.29
Diluted earnings per share(1) $ 7.55 $ 3.50 $ 7.63 $ 6.88 $ 3.29Balance sheet data (at end of period):Total investments $ 46,515 $ 39,715 $ 41,779 $ 36,601 $ 31,842Cash 669 867 510 565 512Total assets 77,980 72,057 72,090 67,135 62,440Net unpaid losses and loss expenses 25,038 24,241 23,592 22,008 20,458Net future policy benefits 2,710 2,645 537 508 510Long-term debt 3,158 2,806 1,811 1,560 1,811Trust preferred securities 309 309 309 309 309Total liabilities 58,313 57,611 55,413 52,857 50,628Shareholders’ equity 19,667 14,446 16,677 14,278 11,812Book value per share $ 58.44 $ 43.30 $ 48.89 $ 42.03 $ 34.81Selected dataLoss and loss expense ratio(2) 58.8% 60.6% 61.6% 61.2% 74.5%Underwriting and administrative expense ratio (3) 29.5% 29.0% 26.3% 26.9% 25.0%
Combined ratio(4) 88.3% 89.6% 87.9% 88.1% 99.5%
Net loss reserves to capital and surplus ratio(5) 141.1% 186.1% 144.7% 157.7% 177.5%Weighted-average shares outstanding – diluted 337,539,294 334,606,237 331,989,064 328,617,569 298,586,600Cash dividends per share $ 1.19 $ 1.09 $ 1.06 $ 0.98 $ 0.90
(1) Diluted earnings per share is calculated by dividing net income available to holders of Common Shares by weighted-average shares outstanding – diluted.(2) The loss and loss expense ratio is calculated by dividing the losses and loss expenses by net premiums earned excluding the Life segment premiums. Net premiumsearned for the Life segment were $1.4 billion, $1.2 billion, $368 million, $274 million, and $248 million, for the years ended December 31, 2009, 2008, 2007, 2006,and 2005, respectively.(3) The underwriting and administrative expense ratio is calculated by dividing the policy acquisition costs and administrative expenses by net premiums earned, excludingthe Life segment.(4) The combined ratio is the sum of the loss and loss expense ratio and the underwriting and administrative expense ratio.(5) The net loss reserves to capital and surplus ratio is calculated by dividing the sum of the net unpaid losses and loss expenses and net future policy benefits for life andannuity contracts by shareholders’ equity.
34

ITEM 7. Management’s Discussion and Analysis of Financial Condition and Results of Operations
The following is a discussion of our results of operations, financial condition, and liquidity and capital resources as of and forthe year ended December 31, 2009. This discussion should be read in conjunction with the Consolidated Financial State-ments and related notes, under Item 8 of this Form 10-K.
Overview
ACE Limited is the holding company of the ACE Group of Companies. ACE opened its business office in Bermuda in 1985 andcontinues to maintain operations in Bermuda. ACE Limited, which is headquartered in Zurich, Switzerland, and its direct andindirect subsidiaries (collectively, the ACE Group of Companies, ACE, the Company, we, us, or our) are a global insurance andreinsurance organization, with operating subsidiaries in more than 50 countries serving the needs of commercial andindividual customers in more than 140 countries. We serve the property and casualty (P&C) insurance needs of businesses ofall sizes in a broad range of industries. We also provide specialized insurance products – such as personal accident, supple-mental health and life insurance – to individuals in select countries. At December 31, 2009, ACE had total assets of $78billion and shareholders’ equity of $19.7 billion.
Our product and geographic diversification differentiates us from the vast majority of our competitors and has been asource of stability during periods of industry volatility. Our long-term business strategy focuses on sustained growth in bookvalue achieved through a combination of underwriting and investment income. By doing so, we provide value to our clientsand shareholders through the utilization of our substantial capital base in the insurance and reinsurance markets.
We are organized along a profit center structure by line of business and territory that does not necessarily correspond tocorporate legal entities. Profit centers can access various legal entities, subject to licensing and other regulatory rules. Profitcenters are expected to generate underwriting income and appropriate risk-adjusted returns. This corporate structure has facili-tated the development of management talent by giving each profit center’s senior management team the necessary autonomywithin underwriting authorities to make operating decisions and create products and coverages needed by its target customerbase. We are an underwriting organization and senior management is focused on delivering underwriting profit. We strive toachieve underwriting income by only writing policies which we believe adequately compensate us for the risk we accept.
As an insurance and reinsurance company, we generate gross revenues from two principal sources: premiums and invest-ment income. Cash flow is generated from premiums collected and investment income received less paid losses and lossexpenses, policy acquisition costs, and administrative expenses. Invested assets are substantially held in liquid, investmentgrade fixed income securities of relatively short duration. During the second quarter of 2009, we liquidated the majority of ourpublicly traded equity holdings and invested the proceeds in corporate bonds. A small portion of our assets are held in lessliquid or higher risk assets in an attempt to achieve higher risk-adjusted returns. Claims payments in any short-term period arehighly unpredictable due to the random nature of loss events and the timing of claims awards or settlements. The value ofinvestments held to pay future claims is subject to market forces such as the level of interest rates, stock market volatility, andcredit events such as corporate defaults. The actual cost of claims is also volatile based on loss trends, inflation rates, courtawards, and catastrophes. We believe that our cash balance, our highly liquid investments, credit facilities, and reinsuranceprotection provide sufficient liquidity to meet unforeseen claim demands that might occur in the year ahead. Refer to “Liquidityand Capital Resources”.
Redomestication to Zurich, Switzerland
In July 2008, we transferred our domicile from the Cayman Islands to Zurich, Switzerland, our new jurisdiction ofincorporation (the Continuation). In connection with the Continuation, we changed the currency in which the par value of ourOrdinary Shares was stated from U.S. dollars to Swiss francs. Upon the effectiveness of the Continuation, our Ordinary Sharesbecame Common Shares. All Common Shares are registered shares with a current par value of CHF 31.88 each.
Notwithstanding the change of the currency in which the par value of Common Shares is stated, we continue to use U.S.dollars as our reporting currency for preparing our Consolidated Financial Statements. For the foreseeable future, we expect topay dividends as a repayment of share capital in the form of a reduction in par value or qualified paid-in capital, which is notsubject to Swiss withholding tax. Refer to “Liquidity” for more information.
The Combined Insurance Acquisition
On April 1, 2008, ACE acquired all of the outstanding shares of Combined Insurance Company of America (CombinedInsurance) and certain of its subsidiaries from Aon Corporation for $2.56 billion. Combined Insurance is an underwriter anddistributor of specialty individual accident and supplemental health insurance products targeted to middle-income consumers
35

and small businesses in North America, Europe, Asia Pacific, and Latin America. ACE recorded the Combined Insuranceacquisition using the purchase method of accounting. Our consolidated operating results include the results of CombinedInsurance from April 1, 2008.
Investment in Assured Guaranty Ltd.
Assured Guaranty Ltd. (AGO), a Bermuda-based holding company, provides, through its operating subsidiaries, creditenhancement products to the public finance, structured finance, and mortgage markets. On July 1, 2009, AGO acquiredFinancial Security Assurance Holdings Ltd. from Dexia Holdings Inc., a subsidiary of Dexia S.A. The purchase price includedapproximately $546 million in cash and approximately 22.3 million AGO common shares, according to AGO’s public filings.AGO financed the cash portion of the purchase price partly through a June 2009 issuance of 38.5 million common sharesbefore the exercise of any overallotment option (June 2009 issuance), according to AGO’s public filings. Prior to the June2009 issuance, ACE included its investment in AGO in Investments in partially-owned insurance companies using the equitymethod of accounting. Effective with the June 2009 issuance, ACE was deemed to no longer exert significant influence overAGO for accounting purposes and accounts for the investment in AGO as an available-for-sale equity security. ACE accountedfor AGO’s June 2009 issuance, and resulting dilutive effect, as if we had sold a proportionate share of the investment. ACErecognized a realized loss of $57 million related to AGO’s dilutive common share issuance. During the fourth quarter of 2009,ACE further reduced its ownership in AGO to approximately seven percent. At December 31, 2009, the fair value of ACE’sinvestment in AGO was $283 million and $56 million of unrealized gain on this investment was reflected in Accumulatedother comprehensive income. During the first quarter of 2010, we again reduced our interest in AGO and our current share ofownership is approximately three percent.
Market Conditions
The improvement in industry capital during 2009 as a result of greater financial markets stability and lower catastrophe losseshas resulted in more competitive market conditions. From a risk-reward perspective, we believe prices to be inadequate froman underwriting perspective in a number of lines of business and therefore industry profitability is under pressure. At ACE, wecontinue efforts to maintain strict underwriting discipline in order to ensure profitability currently and in the future. We arefocused on continuing to build our capabilities – expanding our product offerings, our underwriting and geographic presence,and special initiatives centered on certain customer segments and our distribution. We believe our financial strength, globalpresence and broad product offering, and our technical underwriting capability continue to attract business to our company.Policies submitted to us for quote were significantly higher in 2009, compared with 2008, as existing and prospectivecustomers sought ACE’s financial strength and underwriting capability. As a result, the number of accounts we bound weresubstantially higher in 2009, however because of our underwriting discipline, we wrote less new business. We are emphasiz-ing renewal retention rates. Policy terms and conditions were relatively stable for the business we wrote, although there wereincreased requests for terms and conditions we found unacceptable.
Despite favorable foreign exchange movements in the fourth quarter of 2009, our revenues were adversely impacted by astrong U.S. dollar for the year. On a constant dollar basis, net premiums written increased three percent in our P&C business in2009, primarily driven by growth in our North American and international retail franchises. These businesses benefited from ourincreased local and global presence which allowed us to take advantage of competitors’ weakness, despite the recession’s impacton pricing and demand for coverage. We reported growth in lines where we believe more than price matters – our relative finan-cial strength compared to competitors continued to produce business gains, and we have also benefited from growth in thoseareas of the market that have experienced underwriting losses and prices have risen adequately thus creating opportunity for ACE.
Our Global Reinsurance business grew in 2009, with increases in both long-tail and short-tail lines, and benefited partic-ularly from business written in the first half of the year when pricing was more favorable. With respect to market conditions atthe January 1, 2010, renewal period, we observed a reduction in client demand and more supply as reinsurers were generallywell capitalized as a result of the recovery of the financial markets and partly as a result of a lack of major catastrophes in2009. As such, pricing decreased but continued to be sufficiently profitable, particularly for U.S. peak exposure. Pricing innon-catastrophe areas or lines of business continued to decrease moderately, creating greater pressure on already stressedprofit margins. We wrote modestly less business during the January 1 renewal period in 2009, compared with 2008.
Our A&H business continues to be impacted by recession, although it stabilized in the fourth quarter on a constant dollarbasis. The underlying long-term trends of a growing middle class in Latin America and Asia, where we have substantial pres-ence and capability, will continue to favor this business. We believe that the impact of recession on our A&H business istransient and we expect it to diminish as we progress through 2010. During 2009, we focused on increasing our A&H dis-tribution capabilities, particularly in the retail travel and corporate customer segments, without neglecting our direct responsedistribution network, in order for our product portfolio to remain balanced.
36

Critical Accounting Estimates
Our Consolidated Financial Statements include amounts that, either by their nature or due to requirements of accounting princi-ples generally accepted in the U.S. (GAAP), are determined using best estimates and assumptions. While we believe that theamounts included in our Consolidated Financial Statements reflect our best judgment, actual amounts could ultimately materi-ally differ from those currently presented. We believe the items that require the most subjective and complex estimates are:• unpaid loss and loss expense reserves, including long-tail asbestos and environmental (A&E) reserves;• future policy benefits reserves;• valuation of value of business acquired (VOBA) and amortization of deferred policy acquisition costs and VOBA;• the assessment of risk transfer for certain structured insurance and reinsurance contracts;• reinsurance recoverable, including a provision for uncollectible reinsurance;• the valuation of our investment portfolio and assessment of other-than-temporary impairments (OTTI);• the valuation of deferred tax assets;• the valuation of derivative instruments related to guaranteed minimum income benefits (GMIB) ; and• the valuation of goodwill.
We believe our accounting policies for these items are of critical importance to our Consolidated Financial Statements.The following discussion provides more information regarding the estimates and assumptions required to arrive at theseamounts and should be read in conjunction with the sections entitled: Prior Period Development, Asbestos and Environmentaland Other Run-off Liabilities, Reinsurance Recoverable on Ceded Reinsurance, Investments, Net Realized Gains (Losses), andOther Income and Expense Items.
Unpaid losses and loss expenses
Overview and key dataAs an insurance and reinsurance company, we are required, by applicable laws and regulations and GAAP, to establish lossand loss expense reserves for the estimated unpaid portion of the ultimate liability for losses and loss expenses under the termsof our policies and agreements with our insured and reinsured customers. The estimate of the liabilities includes provisions forclaims that have been reported but are unpaid at the balance sheet date (case reserves) and for future obligations on claimsthat have been incurred but not reported (IBNR) at the balance sheet date (IBNR may also include a provision for additionaldevelopment on reported claims in instances where the case reserve is viewed to be potentially insufficient). Loss reserves alsoinclude an estimate of expenses associated with processing and settling unpaid claims (loss expenses). At December 31,2009, our gross unpaid loss and loss expense reserves were $37.8 billion and our net unpaid loss and loss expense reserveswere $25 billion. With the exception of certain structured settlements, for which the timing and amount of future claim pay-ments are reliably determinable, our loss reserves are not discounted for the time value of money. In connection with suchstructured settlements, we carry net reserves of $76 million, net of discount.
The table below presents a roll-forward of our unpaid losses and loss expenses for the years ended December 31, 2009and 2008.
2009 2008
(in millions of U.S. dollars) Gross LossesReinsurance
Recoverable(1) Net Losses Gross LossesReinsurance
Recoverable(1) Net Losses
Balance, beginning of year $ 37,176 $ 12,935 $ 24,241 $ 37,112 $ 13,520 $ 23,592Losses and loss expenses incurred 11,141 3,719 7,422 10,944 3,341 7,603Losses and loss expenses paid (11,093) (4,145) (6,948) (9,899) (3,572) (6,327)Other (including foreign exchange revaluation) 559 236 323 (1,367) (387) (980)Losses and loss expenses acquired – – – 386 33 353
Balance, end of year $ 37,783 $ 12,745 $ 25,038 $ 37,176 $ 12,935 $ 24,241
(1) Net of provision for uncollectible reinsurance
37

The process of establishing loss reserves for property and casualty claims can be complex and is subject to considerableuncertainty as it requires the use of informed estimates and judgments based on circumstances known at the date of accrual.The following table shows our total reserves segregated between case reserves (including loss expense reserves) and IBNRreserves at December 31, 2009 and 2008.
2009 2008
(in millions of U.S. dollars) Gross Ceded Net Gross Ceded Net
Case reserves $17,307 $ 6,664 $10,643 $16,583 $ 6,539 $10,044IBNR reserves 20,476 6,081 14,395 20,593 6,396 14,197
Total $37,783 $12,745 $25,038 $37,176 $12,935 $24,241
The following table segregates loss reserves by line of business including property and all other, casualty, and personal acci-dent (A&H) at December 31, 2009 and 2008. In the table, loss expenses are defined to include unallocated and allocatedloss adjustment expenses. For certain lines, in particular ACE International and ACE Bermuda products, loss adjustmentexpenses are partially included in IBNR and partially included in loss expenses.
2009 2008
(in millions of U.S. dollars) Gross Ceded Net Gross Ceded Net
Property and all other
Case reserves $ 3,149 $ 1,600 $ 1,549 $ 3,180 $ 1,367 $ 1,813Loss expenses 260 81 179 264 92 172IBNR reserves 2,028 815 1,213 2,456 1,084 1,372
Subtotal 5,437 2,496 2,941 5,900 2,543 3,357
Casualty
Case reserves 9,506 3,177 6,329 8,700 3,178 5,522Loss expenses 3,773 1,661 2,112 3,871 1,779 2,092IBNR reserves 17,777 5,110 12,667 17,455 5,144 12,311
Subtotal 31,056 9,948 21,108 30,026 10,101 19,925
A&H
Case reserves 588 144 444 536 121 415Loss expenses 31 1 30 32 2 30IBNR reserves 671 156 515 682 168 514
Subtotal 1,290 301 989 1,250 291 959
Total
Case reserves 13,243 4,921 8,322 12,416 4,666 7,750Loss expenses 4,064 1,743 2,321 4,167 1,873 2,294IBNR reserves 20,476 6,081 14,395 20,593 6,396 14,197
Total $ 37,783 $ 12,745 $ 25,038 $37,176 $12,935 $24,241
The judgments used to estimate unpaid loss and loss expense reserves require different considerations depending upon theindividual circumstances underlying the insured loss. For example, the reserves established for high excess casualty claims,A&E claims, claims from major catastrophic events, or the IBNR for our various product lines each require different assump-tions and judgments to be made. Necessary judgments are based on numerous factors and may be revised as additionalexperience and other data become available and are reviewed, as new or improved methods are developed, or as laws change.Hence, ultimate loss payments may differ from the estimate of the ultimate liabilities made at the balance sheet date. Changesto our previous estimates of prior period loss reserves impact the reported calendar year underwriting results by worsening ourreported results if the prior year reserves prove to be deficient or improving our reported results if the prior year reserves proveto be redundant. The potential for variation in loss reserves is impacted by numerous factors, which we discuss below.
We establish loss and loss expense reserves for our liabilities from claims for all of the insurance and reinsurance busi-ness that we write. For those claims reported by insureds or ceding companies to us prior to the balance sheet date, and
38

where we have sufficient information, our claims personnel establish case reserves as appropriate based on the circumstancesof the claim(s), standard claim handling practices, and professional judgment. In respect of those claims that have beenincurred but not reported prior to the balance sheet date, there is, by definition, limited actual information to form the casereserve estimate and reliance is placed upon historical loss experience and actuarial methods to project the ultimate lossobligations and the corresponding amount of IBNR. Furthermore, for our assumed reinsurance operation, Global Reinsurance,an additional case reserve may be established above the amount notified by the ceding company if the notified case reserve isjudged to be insufficient by Global Reinsurance’s claims department (refer to “Assumed reinsurance” below).
We have actuarial staff within each of our operating segments who analyze loss reserves and regularly project estimates ofultimate losses and the required IBNR reserve. IBNR reserve estimates are generally calculated by first projecting the ultimateamount of expected claims for a product line and subtracting paid losses and case reserves for reported claims. The judgmentsinvolved in projecting the ultimate losses may include the use and interpretation of various standard actuarial reserving meth-ods that place reliance on the extrapolation of actual historical data, loss development patterns, and industry data as needed.The estimate of the IBNR reserve also requires judgment by actuaries and management to reflect the impact of more con-temporary, qualitative, and subjective factors. Among some of these factors that might be considered are changes in businessmix or volume, changes in ceded reinsurance structures, reported and projected loss trends, inflation, the legal environment,and the terms and conditions of the contracts sold to our insured parties.
Typically, for each product line, one or more standard actuarial reserving methods may be used to estimate ultimatelosses and loss expenses, and from these estimates a single actuarial central estimate is selected. Exceptions to the use ofstandard actuarial projection methods occur for individual claims of significance that require complex legal, claims, and actua-rial analysis and judgment (for example, A&E account projections or high excess casualty accounts in litigation) or productlines where the nature of the claims experience and/or availability of the data prevent application of such methods. In addition,claims arising from catastrophic events require evaluations that do not utilize standard actuarial loss projection methods butare based upon our exposure at the time of the event and the circumstances of the catastrophe and its post-event impact.
Standard actuarial reserving methods
The standard actuarial reserving methods may include, but are not necessarily limited to, paid and reported loss development,expected loss ratio, and Bornhuetter-Ferguson methods. A general description of these methods is provided below. In thesubsequent discussion on short- and long-tail business, reference is also made, where appropriate, to how consideration inmethod selection impacted 2009 results. In addition to these standard methods, we may use other recognized actuarial meth-ods and approaches depending upon the product line characteristics and available data. To ensure that the projections offuture loss emergence based on historical loss development patterns are representative of the underlying business, the histor-ical loss and premium data is required to be of sufficient homogeneity and credibility. For example, to improve datahomogeneity, we may group product line data further by similar risk attribute (e.g., geography, coverage such as propertyversus liability exposure, or origin year), project losses for these homogenous groups and then combine these results to providethe overall product line estimate. The premium and loss data are aggregated by origin year (e.g., the year in which the losseswere incurred – “accident year” or “report year”, for example) and annual or quarterly development periods. Implicit in thestandard actuarial methods that we generally utilize is the need for two fundamental assumptions: first, the expected loss ratiofor each origin year (i.e., accident, report, or underwriting) and second, the pattern by which losses are expected to emergeover time for each origin year.
The expected loss ratio for any particular origin year is selected after consideration of a number of factors, including histor-ical loss ratios adjusted for intervening premium and loss trends, industry benchmarks, the results of policy level loss modelingat the time of underwriting, and other more subjective considerations for the product line and external environment as notedabove. The expected loss ratio for a given origin year is initially established at the start of the origin year as part of the planningprocess. This analysis is performed in conjunction with underwriters and management. The expected loss ratio method arrivesat an ultimate loss estimate by multiplying the expected ultimate loss ratio by the corresponding premium base. This method ismost commonly used as the basis for the actuarial central estimate for immature origin periods on product lines where theactual paid or reported loss experience is not yet deemed sufficiently credible to warrant consideration in the selection of ulti-mate losses. The expected loss ratio for a given origin year may be modified over time if the underlying assumptions such asloss trend or premium rate changes differ from the original assumptions.
Our assumed paid and reported development patterns provide a benchmark against which the actual emerging loss experi-ence can be monitored. Where possible, development patterns are selected based on historical loss emergence by origin yearwith appropriate allowance for changes in business mix, claims handling process, or ceded reinsurance that are likely to leadto a discernible difference between the rate of historical and future loss emergence. For product lines where the historical data
39

is viewed to have low statistical credibility, the selected development patterns also reflect relevant industry benchmarks and/orexperience from similar product lines written elsewhere within ACE. This typically arises for relatively new product lines thathave limited historical data or for high severity/low frequency portfolios where our historical experience exhibits considerablevolatility and/or lacks credibility. The paid and reported loss development methods convert the assumed loss emergence pat-tern to a set of multiplicative factors which are then applied to actual paid or reported losses to arrive at an estimate of ultimatelosses for each period. Due to their multiplicative nature, the paid and reported loss development methods magnify differencesbetween actual and expected loss emergence. These methods tend to be utilized for more mature origin periods and for thoseportfolios where the loss emergence has been relatively consistent over time.
The Bornhuetter-Ferguson method is essentially a combination of the expected loss ratio method and the loss develop-ment method, under which the loss development method is given more weight as the origin year matures. This approachallows a logical transition between the expected loss ratio method which is generally utilized at earlier maturities and the lossdevelopment methods which are typically utilized at latter maturities. We usually apply this method using reported loss dataalthough paid data may be used.
The applicability of actuarial methods will also be impacted by the attachment point of the policy or contract with theinsured or ceding company. In the case of low attachment points typical of primary or working layer reinsurance, the experiencetends to be more frequency driven. These product types allow for the standard actuarial methods to be used in determining lossreserve levels, as they often have a sufficient history and volume of claims experience to be credible. In the case of high attach-ment points typical of excess insurance or excess of loss reinsurance, the experience tends to be severity driven, as only a loss ofsignificant size will enter the layer. For structured or unique contracts, most common to the financial solutions business (whichwe have considerably curtailed) and, to a lesser extent, our reinsurance business, we typically supplement the standard actua-rial methods with an analysis of each contract’s terms, original pricing information, subsequent internal and external analyses ofthe ongoing contracts, market exposures and history, and qualitative input from claims managers.
Determining management’s best estimate
Our recorded reserves represent management’s best estimate of the provision for unpaid claims as of the balance sheet date.We perform an actuarial reserve review for each product line and establish an actuarial central estimate at the review’s con-clusion. The process to select the actuarial central estimate, when more than one estimate is available, may differ acrossproduct lines. For example, an actuary may base the central estimate on loss projections developed using an incurred lossdevelopment approach instead of a paid loss development approach when reported losses are viewed to be a more credibleindication of the ultimate loss compared with paid losses. The availability of estimates by different projection techniques willdepend upon the product line, the underwriting circumstances, and the maturity of the loss emergence. For a well-establishedproduct line with sufficient volume and history, the actuarial central estimate may be drawn from a weighting of paid andreported loss development and/or Bornhuetter-Ferguson methods. However, for a new long-tail product line for which we havelimited data and experience or a rapidly growing line, the emerging loss experience may not have sufficient credibility to allowselection of loss development or Bornhuetter-Ferguson methods and reliance may be placed upon the expected loss ratiomethod until the experience matures.
Management’s best estimate is developed from the actuarial central estimate after collaboration with actuaries, under-writing, claims, legal, and finance departments and culminates with the input of reserve committees. Each business unitreserve committee includes the participation of the relevant parties from actuarial, finance, claims, and unit senior manage-ment and has the responsibility for finalizing and approving the estimate to be used as management’s best estimate. Reservesare further reviewed by ACE Limited’s Chief Actuary and its senior management. The objective of such a process is todetermine a single estimate that we believe represents a better estimate than any other. Such an estimate is viewed by man-agement to be the best estimate of ultimate loss settlements and is determined based on several factors including, but notlimited to:• segmentation of data to provide sufficient homogeneity and credibility for loss projection methods;• extent of internal historical loss data, and industry information where required;• historical variability of actual loss emergence compared with expected loss emergence;• perceived credibility of emerged loss experience; and• nature and extent of underlying assumptions.
Management does not build in any specific provision for uncertainty.We do not calculate ranges of loss reserve estimates for our individual loss reserve studies. Such ranges are generally not a
true reflection of the potential difference between loss reserves estimated at the balance sheet date and the ultimate settlementvalue of losses. This is due to the fact that an actuarial range is developed based on known events as of the valuation date
40

whereas actual prior period development reported in subsequent consolidated financial statements relates in part to events andcircumstances that were unknown as of the original valuation date. While we believe that our recorded reserves are reasonableand represent management’s best estimate for each product line as of the current valuation date, future changes to our view ofthe ultimate liabilities are possible. A five percent change in our net loss reserves equates to $1.3 billion and represents sixpercent of shareholders’ equity at December 31, 2009. Historically, including A&E reserve charges, our reserves, at times, havedeveloped in excess of 10 percent of recorded amounts. Refer to “Analysis of Losses and Loss Expense Development”, underItem 1, for a summary of historical volatility between estimated loss reserves and ultimate loss settlements.
We perform internal loss reserve studies for all product lines at least once a year; the timing of such studies varies through-out the year. Additionally, each quarter for most product lines, we review the emergence of actual losses relative toexpectations. If warranted from findings in loss emergence tests, we will accelerate the timing of our product line reserve stud-ies. Finally, loss reserve studies are performed annually by external third-parties and the findings are used to test thereasonability of our internal findings.
The time period between the date of loss occurrence and the final payment date of the ensuing claim(s) is referred to asthe “claim-tail”. The following is a discussion of specific reserving considerations for both short-tail and long-tail product lines.In this section, we reference the nature of recent prior period development to give a high-level understanding of how theseconsiderations translate through the reserving process into financial decisions. Refer to “Consolidated Operating Results” formore information on prior period development.
Short-tail and long-tail business
Short-tail businessShort-tail business generally describes product lines for which losses are usually known and paid shortly after the loss actuallyoccurs. This would include, for example, most property, personal accident, aviation hull, and automobile physical damagepolicies that are written by ACE. There are some exceptions on certain product lines or events (e.g., major hurricanes) wherethe event has occurred, but the final settlement amount is highly variable and not known with certainty for a potentiallylengthy period. Due to the short reporting and development pattern for these product lines, our estimate of ultimate losses fromany particular accident period responds quickly to the latest loss data. We typically assign credibility to methods thatincorporate actual loss emergence, such as the paid and reported loss development and Bornhuetter-Ferguson methods,sooner than would be the case for long-tail lines at a similar stage of development for a given origin year. The reserving proc-ess for short-tail losses arising from catastrophic events typically involves the determination by the claims department, inconjunction with underwriters and actuaries, of our exposure and estimated losses immediately following an event and thensubsequent revisions of the estimated losses as our insureds provide updated actual loss information.
For the 2009 origin year, the short-tail line loss reserves were typically established using the expected loss ratio methodfor the non-catastrophe exposures. Reserves were also established for losses arising on catastrophe activity during 2009. Theunderlying calculation for the non-catastrophe losses requires initial expected loss ratios by product line adjusted for actualexperience during the 2009 calendar year. As previously noted, the derivation of initial loss ratios incorporates actuarial projec-tions of prior years’ losses, past and expected future loss and exposure trends, rate adequacy for new and renewal business,and ceded reinsurance coverage and costs. We also considered our view of the impact of terms and conditions and the marketenvironment, which by their nature tend to be more subjective relative to other factors. For our short-tail businesses taken as awhole, overall loss trend assumptions did not differ significantly relative to prior years. Because there is some degree of ran-dom volatility of non-catastrophe loss experience from year to year, we considered average loss experience over several yearswhen developing loss estimates for the current accident year. Therefore, while there has been favorable loss development inrecent years on non-catastrophe exposures, the effect of this favorable development on expected loss ratios for the currentaccident year is relatively small. Further, other considerations, such as rate reductions and broadening of terms and conditionsin a competitive market somewhat offset the impact of recent favorable loss development.
In terms of prior accident years, the bulk of the changes made in the 2009 calendar year arose from origin years 2004-2008. Specifically, the Insurance – North American, Insurance – Overseas General, Global Reinsurance, and Life segmentsexperienced $105 million, $115 million, $49 million, and $3 million of favorable prior period development, respectively,primarily due to lower than anticipated loss emergence on the 2004-2008 origin years. In the Insurance – North Americanand Insurance – Overseas General segments, these prior period movements were primarily the result of changes to the ulti-mate loss estimates for the 2004-2008 origin years in response to the latest reported loss data rather than any significantchanges to underlying actuarial assumptions such as loss development patterns. In the Global Reinsurance segment, the priorperiod movements were primarily the result of changes to the ultimate loss estimates for the 2004-2007 origin years princi-
41

pally in response to the latest reported loss data, rather than any significant changes to underlying actuarial assumptions suchas loss development patterns.
For a detailed analysis of changes in assumptions related to short-tail prior accident year reserves during calendar year2009, refer to “Prior Period Development”.
Long-tail businessLong-tail business describes lines of business for which specific losses may not be known for some period and claims can takesignificant time to report and settle/close. This includes most casualty lines such as general liability, D&O, and workers’ com-pensation. There are many factors contributing to the uncertainty and volatility of long-tail business. Among these are:• Our historical loss data and experience is sometimes too immature and lacking in credibility to rely upon for reserving pur-poses. Where this is the case, in our reserve analysis we rely on industry loss ratios or industry benchmark developmentpatterns that we believe reflect the nature and coverage of the underwritten business and its future development, where avail-able. For such product lines, actual loss experience may differ from industry loss statistics as well as loss experience forprevious underwriting years;• The inherent uncertainty around loss trends, claims inflation (e.g., medical and judicial) and underlying economic con-ditions;• The inherent uncertainty of the estimated duration of the paid and reporting loss development patterns beyond the historicalrecord requires that professional judgment be used in the determination of the length of the patterns based on the historicaldata and other information;• The inherent uncertainty of assuming that historical paid and reported loss development patterns for older origin years willbe representative of subsequent loss emergence on recent origin years. For example, changes over time in the processes andprocedures for establishing case reserves can distort reported loss development patterns or changes in ceded reinsurance struc-tures by origin year can alter the development of paid and reported losses;• Loss reserve analyses typically require loss or other data be grouped by common characteristics in some manner. If data from twocombined lines of business exhibit different characteristics, such as loss payment patterns, the credibility of the reserve estimatecould be affected. Additionally, since casualty lines of business can have significant intricacies in the terms and conditions affordedto the insured, there is an inherent risk as to the homogeneity of the underlying data used in performing reserve analyses; and• The applicability of the price change data used to estimate ultimate loss ratios for most recent origin years.
As can be seen from the above, various factors are considered when determining appropriate data, assumptions, andmethods used to establish the loss reserve for the long-tail product lines. These factors will also vary by origin year for givenproduct lines. The derivation of loss development patterns from data and the selection of a tail factor to project ultimate lossesfrom actual loss emergence require considerable judgment, particularly with respect to the extent to which historical lossexperience is relied upon to support changes in key reserving assumptions. Examples of the relationship between changes inhistorical loss experience and key reserving assumptions are provided below.
For those long-tail product lines that are less claim frequency and more claim severity oriented, such as professional linesand high excess casualty, we placed more reliance upon expert legal and claims review of the specific circumstance underlyingreported cases rather than loss development patterns. The assumptions used for these lines of business are updated over timeto reflect new claim and legal advice judged to be of significance.
For the 2009 origin year, loss reserves were typically established through the application of individual product lineexpected loss ratios that contemplated assumptions similar in nature to those noted in the short-tail line discussion. Ourassumptions on loss trend and development patterns reflect reliance on our historical loss data provided the length of historyand homogeneity afford credibility. Given the recent growth on a number of product lines, such as general casualty and finan-cial lines, our historical loss data is less extensive and our assumptions require judgmental use of industry loss trends anddevelopment patterns. We note that industry patterns are not always available to match the nature of the business being writ-ten; this issue is particularly problematic for non-U.S. exposed lines. Given the underlying volatility of the long-tail productlines and the lengthy period required for full paid and reported loss emergence, we typically assign little to no credibility toactual loss emergence in the early development periods. Accordingly, we generally used the expected loss ratio method for the2009 and immediately preceding origin years to establish reserves by product line. We monitor actual paid and reported lossemergence relative to expected loss emergence for most individual product lines. Recent experience has generally been favor-able relative to our expectations. While we do not yet believe that this favorable experience is sufficiently credible to be fullyreflected in our booked ultimate losses for immature years, we have been giving increasing weight to emerging experience asorigin years mature and the loss emergence gains credibility.
42

Given the nature of long-tail casualty business and related reserving considerations, for the major long-tail lines inInsurance – North American, Insurance – Overseas General, and Global Reinsurance, no changes of significance were made tothe key actuarial assumptions for the loss trend (aside from changes to inflation assumptions), exposure trend, and loss devel-opment patterns used to establish the 2009 accident year reserves relative to prior accident years.
To the extent that actual loss emergence in calendar year 2009 differed from our expectation for the more recent origin years,the deviation was not typically seen as sufficiently credible, particularly given the volatility and lengthy period for full loss emergence,to fully reflect in our booked ultimate loss selections or the actuarial assumptions underlying the reserve reviews. Such judgmentswere made with due consideration to the factors impacting reserve uncertainty as discussed above. However, for some product lines,credibility was assigned to emerging loss experience and this is discussed further below and in the section entitled “Prior PeriodDevelopment”. Our booked reserves for origin years 2007-2009 include reserves for what we believe to be our exposure to claimsrelated to the credit-crunch and recent financial frauds (primarily E&O and D&O) based on information received to date.
For more mature accident years, typically 2005 and prior, we relied upon paid and reported loss development patterns forolder origin years where sufficient credibility existed. For those lines where the historical experience lacked credibility, weplaced reliance upon the latest benchmark patterns (where available) from external industry bodies such as Insurance ServicesOffice (ISO) or the National Council on Compensation Insurance, Inc. (NCCI). Accordingly, the assumptions used to projectloss estimates will not fully reflect our own actual loss experience until our data is deemed sufficiently credible.
The prior period development in 2009 for long-tail lines of business arose across a number of origin years in all seg-ments. While there were a number of reasons for the 2009 development, the movements were generally the result of actualloss emergence in calendar year 2009 that differed notably from the expected loss emergence and where such deviations weredeemed significant enough to warrant revising the projections for certain product lines. The nature of the changes to bookedultimate losses, and the associated impact on the prior origin years, varies by product line. For example, in Insurance – NorthAmerican, the changes to recorded estimates for foreign casualty products lines and ACE Financial Solutions business princi-pally related to actual loss emergence that was lower than anticipated. This resulted in $42 million and $33 million offavorable development, respectively. Insurance North American also experienced $52 million of favorable development innational accounts loss sensitive business that resulted from a reduction in the estimates of retrospectively rated premiums andtherefore resulted in corresponding decreases to premium-based estimates of ultimate losses. There was also $47 million ofunfavorable development in Insurance – North American Brandywine operations for accident years prior to 1999 in assumedreinsurance pools that resulted from the receipt of updated information on pool reserves, the adverse impact of recent activityon a litigated claim, and a 2009 audit finding. There was $211 million of favorable development in Insurance – OverseasGeneral for accident years 2005 and prior, primarily in casualty and financial lines. This development was principally due toactual loss experience that was lower than expected and an increase in the weight given experience based methods as theseyears mature. There was $93 million of favorable development in long-tail lines in Global Reinsurance mainly on treaty years2003-2005. This development was principally due to actual loss experience that was lower than expected and an increase inthe weight given experience based methods as these years mature.
For a detailed analysis of changes in assumptions related to long-tail prior accident year reserves during calendar year2009, refer to “Prior Period Development”.
Sensitivity to underlying assumptions
While we believe that our reserve for unpaid losses and loss expenses at December 31, 2009, is adequate, new information oremerging trends that differ from our assumptions may lead to future development of losses and loss expenses significantlygreater or less than the reserve provided, which could have a material effect on future operating results. As noted previously,our best estimate of required loss reserves for most portfolios is judgmentally selected for each origin year after considering theresults from any number of reserving methods and is not a purely mechanical process. Therefore, it is difficult to convey, in asimple and quantitative manner, the impact that a change to a single assumption will have on our best estimate. In the exam-ples below, we attempt to give an indication of the potential impact by isolating a single change for a specific reserving methodthat would be pertinent in establishing the best estimate for the product line described. We consider each of the followingsensitivity analyses to represent a reasonably likely deviation in the underlying assumption.
Insurance – North AmericanGiven the long reporting and paid development patterns, the tail factors used to project actual current losses to ultimate lossesfor claims covered by four portfolios that represent the majority of our first dollar workers’ compensation exposure requiresconsiderable judgment that could be material to consolidated loss and loss expense reserves. Specifically, when applying thereported loss development method, a one percent change in the tail factor (i.e., 1.04 changed to either 1.05 or 1.03) would
43

cause a change of approximately $100 million, either positive or negative, for the projected net loss and loss expense reserves.This is relative to recorded net loss and loss expense reserves of approximately $1 billion.
Our ACE Bermuda operations write predominantly high excess liability coverage on an occurrence-first-reported basis(typically with attachment points in excess of $325 million and gross limits of up to $150 million) and D&O and other pro-fessional liability coverage on a claims-made basis (typically with attachment points in excess of $125 million and gross limitsof up to $50 million). Due to the layer of exposure covered, the expected frequency for this book is very low. As a result of thelow frequency/high severity nature of the book, a small difference in the actual vs. expected claim frequency, either positive ornegative, could result in a material change to the projected ultimate loss if such change in claim frequency was related to apolicy where close to maximum limits were deployed.
Insurance – Overseas GeneralCertain long-tail lines, such as casualty and professional lines, are particularly susceptible to changes in loss trend and claiminflation. Heightened perceptions of tort and settlement awards around the world are increasing the demand for these productsas well as contributing to the uncertainty in the reserving estimates. Our reserving methods rely on loss development patternsestimated from historical data and while we attempt to adjust such factors for known changes in the current tort environment,it is possible that such factors may not entirely reflect all recent trends in tort environments. For example, when applying thereported loss development method, the lengthening by six months of our selected loss development patterns would increasereserve estimates on long-tail casualty and professional lines for accident years 2001-2007 by approximately $221 million.This movement is relative to recorded net IBNR reserves of approximately $1.4 billion for these years.
Global ReinsuranceTypically, there is inherent uncertainty around the length of paid and reported development patterns, especially for certaincasualty lines such as excess workers’ compensation or general liability, which may take up to 30 years to fully develop. Thisuncertainty is accentuated by the need to supplement client development patterns with industry development patterns due tothe sometimes low credibility of the data. The underlying source and selection of the final development patterns can thus havea significant impact on the selected ultimate net losses and loss expenses. For example, a twenty percent shortening or length-ening of the development patterns used for U.S. long-tail lines would cause the loss reserve estimate derived by the reportedBornhuetter-Ferguson method for these lines to change by approximately $256 million. This movement is relative to recordednet loss and loss expense reserves of approximately $1.4 billion.
Assumed reinsurance
At December 31, 2009, net unpaid losses and loss expenses for the Global Reinsurance segment aggregated to $2.4 billion,consisting of $788 million of case reserves and $1.6 billion of IBNR. In comparison, at December 31, 2008, net unpaidlosses and loss expenses for the Global Reinsurance segment aggregated to $2.5 billion, consisting of $836 million of casereserves and $1.7 billion of IBNR.
For catastrophe business, we principally estimate unpaid losses and loss expenses on an event basis by considering vari-ous sources of information, including specific loss estimates reported by our cedants, ceding company and overall industry lossestimates reported by our brokers, and our internal data regarding reinsured exposures related to the geographical location ofthe event. Our internal data analysis enables us to establish catastrophe reserves for known events with more certainty at anearlier date than would be the case if we solely relied on reports from third parties to determine carried reserves.
For our casualty reinsurance business, we generally rely on ceding companies to report claims and then use that data asa key input to estimate unpaid losses and loss expenses. Due to the reliance on claims information reported by ceding compa-nies, as well as other factors, the estimation of unpaid losses and loss expenses for assumed reinsurance includes certain risksand uncertainties that are unique relative to our direct insurance business. These include, but are not necessarily limited to,the following:• The reported claims information could be inaccurate;• Typically, a lag exists between the reporting of a loss event to a ceding company and its reporting to us as a reinsuranceclaim. The use of a broker to transmit financial information from a ceding company to us increases the reporting lag. Becausemost of our reinsurance business is produced by brokers, ceding companies generally first submit claim and other financialinformation to brokers, who then report the proportionate share of such information to each reinsurer of a particular treaty. Thereporting lag generally results in a longer period of time between the date a claim is incurred and the date a claim is reportedcompared with direct insurance operations. Therefore, the risk of delayed recognition of loss reserve development is higher forassumed reinsurance than for direct insurance lines; and
44

• The historical claims data for a particular reinsurance contract can be limited relative to our insurance business in that theremay be less historical information available. Further, for certain coverages or products, such as excess of loss contracts, theremay be relatively few expected claims in a particular year so the actual number of claims may be susceptible to significantvariability. In such cases, the actuary often relies on industry data from several recognized sources.
We mitigate the above risks in several ways. In addition to routine analytical reviews of ceding company reports to ensurereported claims information appears reasonable, we perform regular underwriting and claims audits of certain ceding compa-nies to ensure reported claims information is accurate, complete, and timely. As appropriate, audit findings are used to adjustclaims in the reserving process. We also use our knowledge of the historical development of losses from individual cedingcompanies to adjust the level of adequacy we believe exists in the reported ceded losses.
On occasion, there will be differences between our carried loss reserves and unearned premium reserves and the amountof loss reserves and unearned premium reserves reported by the ceding companies. This is due to the fact that we receiveconsistent and timely information from ceding companies only with respect to case reserves. For IBNR, we use historical expe-rience and other statistical information, depending on the type of business, to estimate the ultimate loss. We estimate ourunearned premium reserve by applying estimated earning patterns to net premiums written for each treaty based upon thattreaty’s coverage basis (i.e., risks attaching or losses occurring). At December 31, 2009, the case reserves reported to us byour ceding companies were $768 million, compared with the $788 million we recorded. Our policy is to post additional casereserves in addition to the amounts reported by our cedants when our evaluation of the ultimate value of a reported claim isdifferent than the evaluation of that claim by our cedant.
Within the Insurance – North American segment, we also have exposure to certain liability reinsurance lines that havebeen in run-off since 1994. Unpaid losses and loss expenses relating to this run-off reinsurance business resides within theBrandywine Division of our Insurance – North American segment. Most of the remaining unpaid loss and loss expensereserves for the run-off reinsurance business relate to A&E claims. (Refer to “Asbestos and Environmental and Other Run-offLiabilities” for more information.)
Asbestos and environmental reserves
Included in ACE’s liabilities for losses and loss expenses are amounts for A&E (A&E liabilities). The A&E liabilities principallyrelate to claims arising from bodily-injury claims related to asbestos products and remediation costs associated with hazardouswaste sites. The estimation of these liabilities is particularly sensitive to the recent legal environment, including specific settle-ments that may be used as precedents to settle future claims.
During 2009, ACE conducted its annual internal, ground-up review of its consolidated A&E liabilities as at December 31,2008. As a result of the internal review, the Company increased its net loss reserves for the Brandywine operations, including A&E,by $44 million (net of reinsurance provided by National Indemnity Company (NICO)), while the gross loss reserves increased by$198 million. In addition, the Company decreased gross loss reserves for Westchester Specialty’s A&E and other liabilities by $64million, while the net loss reserves did not change. Our A&E reserves are not discounted for GAAP reporting and do not reflect anyanticipated future changes in the legal, social or economic environment, or any benefit from future legislative reforms.
There are many complex variables that we consider when estimating the reserves for our inventory of asbestos accountsand these variables may directly impact the predicted outcome. We believe the most significant variables relating to our A&Ereserves include assumptions regarding trends with respect to claim severity and the frequency of higher severity claims, theability of a claimant to bring a claim in a state in which they have no residency or exposure, the ability of a policyholder toclaim the right to non-products coverage, whether high-level excess policies have the potential to be accessed given thepolicyholders claim trends and liability situation, and payments to unimpaired claimants and the potential liability of peripheraldefendants. Based on the policies, the facts, the law, and a careful analysis of the impact that these factors will likely have onany given account, we estimate the potential liability for indemnity, policyholder defense costs, and coverage litigationexpense.
The results in asbestos cases announced by other carriers may well have little or no relevance to us because coverageexposures are highly dependent upon the specific facts of individual coverage and resolution status of disputes among carriers,policyholders, and claimants.
For more information refer to “Asbestos and Environmental and Other Run-off Liabilities” and to Note 7 to the Con-solidated Financial Statements, under Item 8, for more information.
Future policy benefits reserves
We issue contracts in our Insurance – Overseas General and Life segments that are classified as long-duration. These contractsgenerally include accident and supplemental health products, term and whole life products, endowment products, andannuities. In accordance with GAAP, we establish reserves for contracts determined to be long-duration based on approved
45

actuarial methods that include assumptions related to expenses, mortality, morbidity, persistency, and investment yields with afactor for adverse deviation. These assumptions are “locked in” at the inception of the contract meaning we use our originalassumptions throughout the life of the policy and do not subsequently modify them unless we deem the reserves to beinadequate. The future policy benefit reserve balance is regularly evaluated for a premium deficiency. If experience is lessfavorable than assumptions, additional liabilities may be required, resulting in a charge to policyholder benefits and claims.
Valuation of value of business acquired (VOBA) and amortization of deferred policy acquisition costs and VOBA
As part of the Combined Insurance acquisition, we established an intangible asset related to VOBA, which represented the fairvalue of the future profits of the in-force contracts. The valuation of VOBA is derived from similar assumptions to those used toestablish the associated future policy benefit reserve. The most significant input in this calculation is the discount rate used toarrive at the present value of the net cash flows. We amortize deferred policy acquisition costs associated with long-durationcontracts and VOBA (collectively policy acquisition costs) over the estimated life of the contracts in proportion to premiumrevenue recognized. The estimated life is established at the inception of the contracts or upon acquisition and is based oncurrent persistency assumptions. Policy acquisition costs are reviewed to determine if they are recoverable from future income,including investment income. If such costs are unrecoverable, they are expensed in the period this determination is made.
Risk transfer
In the ordinary course of business, we both purchase (or cede) and sell (or assume) reinsurance protection. In 2002, as amatter of policy, we discontinued the purchase of all finite reinsurance contracts. For both ceded and assumed reinsurance,risk transfer requirements must be met in order to use reinsurance accounting, principally resulting in the recognition of cashflows under the contract as premiums and losses. If risk transfer requirements are not met, a contract is to be accounted for asa deposit, typically resulting in the recognition of cash flows under the contract through a deposit asset or liability and not asrevenue or expense. To meet risk transfer requirements, a reinsurance contract must include both insurance risk, consisting ofunderwriting and timing risk, and a reasonable possibility of a significant loss for the assuming entity. We also apply similarrisk transfer requirements to determine whether certain commercial insurance contracts should be accounted for as insuranceor a deposit. Contracts that include fixed premium (i.e., premium not subject to adjustment based on loss experience underthe contract) for fixed coverage generally transfer risk and do not require judgment.
Reinsurance and insurance contracts that include both significant risk sharing provisions, such as adjustments to pre-miums or loss coverage based on loss experience, and relatively low policy limits as evidenced by a high proportion ofmaximum premium assessments to loss limits, can require considerable judgment to determine whether or not risk transferrequirements are met. For such contracts, often referred to as finite or structured products, we require that risk transfer bespecifically assessed for each contract by developing expected cash flow analyses at contract inception. To support risk trans-fer, the cash flow analyses must demonstrate that a significant loss is reasonably possible, such as a scenario in which theratio of the net present value of losses divided by the net present value of premiums equals or exceeds 110 percent. For pur-poses of cash flow analyses, we generally use a risk-free rate of return consistent with the expected average duration of losspayments. In addition, to support insurance risk, we must prove the reinsurer’s risk of loss varies with that of the reinsuredand/or support various scenarios under which the assuming entity can recognize a significant loss.
To ensure risk transfer requirements are routinely assessed, qualitative and quantitative risk transfer analyses and memo-randa supporting risk transfer are developed by underwriters for all structured products. We have established protocols forstructured products that include criteria triggering an accounting review of the contract prior to quoting. If any criterion is trig-gered, a contract must be reviewed by a committee established by each of our operating segments with reporting oversight,including peer review, from our global Structured Transaction Review Committee.
With respect to ceded reinsurance, we entered into a few multi-year excess of loss retrospectively-rated contracts, princi-pally in 2002. These contracts principally provided severity protection for specific product divisions. Because traditionalone-year reinsurance coverage had become relatively costly, these contracts were generally entered into to secure a more cost-effective reinsurance program. All of these contracts transferred risk and were accounted for as reinsurance. In addition, wemaintain a few aggregate excess of loss reinsurance contracts that were principally entered into prior to 2003, such as theNICO contracts referred to in the section entitled, “Asbestos and Environmental and Other Run-off Liabilities”. Subsequent tothe ACE INA acquisition, we have not purchased any retroactive ceded reinsurance contracts.
With respect to assumed reinsurance and insurance contracts, products giving rise to judgments regarding risk transferwere primarily sold by our financial solutions business. Although we have significantly curtailed writing financial solutionsbusiness, several contracts remain in-force and principally include multi-year retrospectively-rated contracts and loss portfoliotransfers. Because transfer of insurance risk is generally a primary client motivation for purchasing these products, relatively
46

few insurance and reinsurance contracts have historically been written for which we concluded that risk transfer criteria hadnot been met. For certain insurance contracts that have been reported as deposits, the insured desired to self-insure a risk butwas required, legally or otherwise, to purchase insurance so that claimants would be protected by a licensed insurance com-pany in the event of non-payment from the insured.
A significant portion of ACE Tempest Re USA’s business is written through quota share treaties (approximately $424 mil-lion of net premiums earned in 2009, comprised of $299 million of first dollar quota share treaties and $125 million of excessquota share treaties), a small portion of which are categorized as structured products. Structured quota share treaties typicallycontain relatively low aggregate policy limits, a feature that reduces loss coverage in some manner and a profit sharing provi-sion. These have been deemed to have met risk transfer requirements.
Reinsurance recoverable
Reinsurance recoverable includes the balances due to us from reinsurance companies for paid and unpaid losses and lossexpenses and is presented net of a provision for uncollectible reinsurance. The provision for uncollectible reinsurance isdetermined based upon a review of the financial condition of the reinsurers and other factors. Ceded reinsurance contracts donot relieve our primary obligation to our policyholders. Consequently, an exposure exists with respect to reinsurance recover-able to the extent that any reinsurer is unable or unwilling to meet its obligations or disputes the liabilities assumed under thereinsurance contracts. We determine the reinsurance recoverable on unpaid losses and loss expenses using actuarial estimatesas well as a determination of our ability to cede unpaid losses and loss expenses under existing reinsurance contracts.
The recognition of a reinsurance recoverable asset requires two key judgments. The first judgment involves our estimationbased on the amount of gross reserves and the percentage of that amount which may be ceded to reinsurers. Ceded IBNR,which is a major component of the reinsurance recoverable on unpaid losses and loss expenses, is generally developed as partof our loss reserving process and, consequently, its estimation is subject to similar risks and uncertainties as the estimation ofgross IBNR (refer to “Critical Accounting Estimates – Unpaid losses and loss expenses”). The second judgment involves ourestimate of the amount of the reinsurance recoverable balance that we may ultimately be unable to recover from reinsurersdue to insolvency, contractual dispute, or for other reasons. Amounts estimated to be uncollectible are reflected in a provisionthat reduces the reinsurance recoverable asset and, in turn, shareholders’ equity. Changes in the provision for uncollectiblereinsurance are reflected in net income.
Although the contractual obligation of individual reinsurers to pay their reinsurance obligations is based on specific con-tract provisions, the collectability of such amounts requires estimation by management. The majority of the balance we haveaccrued as recoverable will not be due for collection until sometime in the future, and the duration of our recoverables may belonger than the duration of our direct exposures. Over this period of time, economic conditions and operational performance ofa particular reinsurer may impact their ability to meet these obligations and while they may continue to acknowledge theircontractual obligation to do so, they may not have the financial resources or willingness to fully meet their obligation to us.
To estimate the provision for uncollectible reinsurance, the reinsurance recoverable must first be determined for eachreinsurer. This determination is based on a process rather than an estimate, although an element of judgment must beapplied. As part of the process, ceded IBNR is allocated to reinsurance contracts because ceded IBNR is not generally calcu-lated on a contract by contract basis. The allocations are generally based on premiums ceded under reinsurance contracts,adjusted for actual loss experience and historical relationships between gross and ceded losses. If actual experience variesmaterially from historical experience, including that used to determine ceded premium, the allocation of reinsurance recover-able by reinsurer will change. While such change is unlikely to result in a large percentage change in the provision foruncollectible reinsurance, it could, nevertheless, have a material effect on our net income in the period recorded.
Generally, we use a default analysis to estimate uncollectible reinsurance. The primary components of the default analysisare reinsurance recoverable balances by reinsurer, net of collateral, and default factors used to estimate the probability that thereinsurer may be unable to meet its future obligations in full. The definition of collateral for this purpose requires some judg-ment and is generally limited to assets held in an ACE-only beneficiary trust, letters of credit, and liabilities held by us with thesame legal entity for which we believe there is a right of offset. We do not currently include multi-beneficiary trusts. However,we have several reinsurers that have established multi-beneficiary trusts for which certain of our companies are beneficiaries.The determination of the default factor is principally based on the financial strength rating of the reinsurer and a correspondingdefault factor applicable to the financial strength rating. Default factors require considerable judgment and are determinedusing the current financial strength rating, or rating equivalent, of each reinsurer as well as other key considerations andassumptions. Significant considerations and assumptions include, but are not necessarily limited to, the following:• For reinsurers that maintain a financial strength rating from a major rating agency, and for which recoverable balances areconsidered representative of the larger population (i.e., default probabilities are consistent with similarly rated reinsurers and
47

payment durations conform to averages), the judgment exercised by management to determine the provision for uncollectiblereinsurance of each reinsurer is typically limited because the financial rating is based on a published source and the defaultfactor we apply is based on a default factor of a major rating agency applicable to the particular rating class. Default factorsapplied for financial ratings of AAA, AA, A, BBB, BB, B, and CCC, are 0.5 percent, 1.2 percent, 1.9 percent, 4.7 percent, 9.6percent, 23.8 percent, and 49.7 percent, respectively. Because the model we use is predicated on the default factors of amajor rating agency, we do not generally consider alternative factors. However, when a recoverable is expected to be paid in abrief period of time by a highly-rated reinsurer, such as certain property catastrophe claims, a default factor may not beapplied;• For balances recoverable from reinsurers that are both unrated by a major rating agency and for which management isunable to determine a credible rating equivalent based on a parent, affiliate, or peer company, we determine a rating equiv-alent based on an analysis of the reinsurer that considers an assessment of the creditworthiness of the particular entity,industry benchmarks, or other factors as considered appropriate. We then apply the applicable default factor for that ratingclass. For balances recoverable from unrated reinsurers for which our ceded reserve is below a certain threshold, we generallyapply a default factor of 25 percent;• For balances recoverable from reinsurers that are either insolvent or under regulatory supervision, we establish a defaultfactor and resulting provision for uncollectible reinsurance based on specific facts and circumstances surrounding each com-pany. Upon initial notification of an insolvency, we generally recognize expense for a substantial portion of all balancesoutstanding, net of collateral, through a combination of write-offs of recoverable balances and increases to the provision foruncollectible reinsurance. When regulatory action is taken on a reinsurer, we generally recognize a default factor by estimatingan expected recovery on all balances outstanding, net of collateral. When sufficient credible information becomes available, weadjust the provision for uncollectible reinsurance by establishing a default factor pursuant to information received; and• For captives and other recoverables, management determines the provision for uncollectible reinsurance based on thespecific facts and circumstances.
The following table summarizes reinsurance recoverables and the provision for uncollectible reinsurance for each type ofrecoverable balance at December 31, 2009.
(in millions of U.S. dollars)
ReinsuranceRecoverables
on Lossesand LossExpenses
Recoverables(net of Usable
Collateral)
Provision forUncollectibleReinsurance
Type
Reinsurers with credit ratings $ 10,762 $ 9,735 $ 259Reinsurers not rated 460 386 136Reinsurers under supervision and insolvent reinsurers 191 181 112Captives 1,686 390 30Other – structured settlements and pools 1,078 1,078 45
Total $ 14,177 $ 11,770 $ 582
At December 31, 2009, the use of different assumptions within our approach could have a material effect on the provision foruncollectible reinsurance reflected in our Consolidated Financial Statements. To the extent the creditworthiness of ourreinsurers were to deteriorate due to an adverse event affecting the reinsurance industry, such as a large number of majorcatastrophes, actual uncollectible amounts could be significantly greater than our provision for uncollectible reinsurance. Suchan event could have a material adverse effect on our financial condition, results of operations, and our liquidity. Given thevarious considerations used to estimate our uncollectible provision, we cannot precisely quantify the effect a specific industryevent may have on the provision for uncollectible reinsurance. However, based on the composition (particularly the averagecredit quality) of the reinsurance recoverable balance at December 31, 2009, we estimate that a ratings downgrade of onenotch for all rated reinsurers (i.e., from A to A- or A- to BBB+) could increase our provision for uncollectible reinsurance byapproximately $167 million or approximately one percent of the reinsurance recoverable balance, assuming no other changesrelevant to the calculation. While a ratings downgrade would result in an increase in our provision for uncollectible reinsuranceand a charge to earnings in that period, a downgrade in and of itself does not imply that we will be unable to collect all of theceded reinsurance recoverable from the reinsurers in question. Refer to Note 5 to the Consolidated Financial Statements,under Item 8, for more information.
48

Other-than-temporary impairments (OTTI)
Our fixed maturity investments are classified as either available for sale or held to maturity. Our available for sale portfolio isreported at fair value, refer to Note 15 to the Consolidated Financial Statements, under Item 8, for more information. The effectof market movements on our available for sale investment portfolio impacts net income (through net realized gains (losses))when securities are sold or when we record an OTTI charge in net income (as discussed below).
We adopted provisions included in ASC Topic 320, Investments-Debt and Equity Securities, related to the recognitionand presentation of OTTI as at April 1, 2009. Under these provisions, if we have the intent to sell an impaired fixed maturitysecurity or it is more likely than not that we will be required to sell the security, an OTTI is considered to have occurred, andwe are required to record the OTTI in net income. Further, in cases where we do not intend to sell the security and it is morelikely than not that we will not be required to sell the security, we must evaluate the security to determine the portion of theimpairment, if any, related to credit losses. If a credit loss is indicated, an OTTI is considered to have occurred and any portionof the OTTI related to credit losses must be reflected in net income while the portion of OTTI related to all other factors isincluded in other comprehensive income. For fixed maturities held to maturity, OTTI recognized in other comprehensiveincome is accreted from accumulated other comprehensive income to the amortized cost of the fixed maturity prospectivelyover the remaining term of the securities. These newly adopted provisions do not have any impact on the accounting for OTTIfor any other type of investment.
Each quarter, we review our securities in an unrealized loss position (impaired securities), including fixed maturity secu-rities, securities lending collateral, equity securities, and other investments, to identify those impaired securities to bespecifically evaluated for a potential OTTI.
For impaired fixed maturities, if we have the intent to sell the security or it is more likely than not that we will be requiredto sell the security, an OTTI is considered to have occurred. In cases where we do not intend to sell the security and it is morelikely than not that we will not be required to sell the security, we evaluate the security to determine if a credit loss hasoccurred based on a combination of qualitative and quantitative factors including a discounted cash flow model, where neces-sary. If a credit loss is indicated, an OTTI is considered to have occurred. Prior to the adopted provisions when evaluating fixedmaturities for OTTI, we principally considered our ability and intent to hold the impaired security to the expected recovery peri-od, the issuer’s financial condition, and our assessment (using available market information such as credit ratings) of theissuer’s ability to make future scheduled principal and interest payments on a timely basis. The factors that we now considerwhen determining if a credit loss exists related to a fixed maturity security are discussed in Note 4 d) to the ConsolidatedFinancial Statements. All significant assumptions used in determining credit losses are subject to change as market conditionsevolve.We review all non-fixed maturity investments for OTTI based on the following:• the amount of time a security has been in a loss position and the magnitude of the loss position;• the period in which cost is expected to be recovered, if at all, based on various criteria including economic conditions andother issuer-specific developments; and• our ability and intent to hold the security to the expected recovery period.
As a general rule, we also consider that equity securities in an unrealized loss position for twelve consecutive months areimpaired.
Because our investment portfolio is the largest component of consolidated assets and a multiple of shareholders’ equity,adverse changes in economic conditions subsequent to the balance sheet date could result in OTTI that are material to ourfinancial condition and operating results. Such economic changes could arise from overall changes in the financial marketsand specific changes to industries, companies, or foreign governments in which we maintain relatively large investment hold-ings.
Deferred tax assets
Many of our insurance businesses operate in income tax-paying jurisdictions. Our deferred tax assets and liabilities primarilyresult from temporary differences between the amounts recorded in our Consolidated Financial Statements and the tax basis ofour assets and liabilities. We determine deferred tax assets and liabilities separately for each tax-paying component (anindividual entity or group of entities that is consolidated for tax purposes) in each tax jurisdiction. The realization of deferred taxassets depends upon the existence of sufficient taxable income within the carryback or carryforward periods under the tax lawin the applicable tax jurisdiction.
At December 31, 2009, our net deferred tax asset was $1.2 billion. (Refer to Note 8 to the Consolidated Financial State-ments, under Item 8, for more information). At each balance sheet date, management assesses the need to establish avaluation allowance that reduces deferred tax assets when it is more likely than not that all, or some portion, of the deferred
49

tax assets will not be realized. The valuation allowance is based on all available information including projections of futuretaxable income from each tax-paying component in each tax jurisdiction, principally derived from business plans and availabletax planning strategies. Projections of future taxable income incorporate several assumptions of future business and operationsthat are apt to differ from actual experience. The valuation allowance is also based on maintaining our ability and intent tohold our U.S. fixed maturities to recovery. If, in the future, our assumptions and estimates that resulted in our forecast of futuretaxable income for each tax-paying component prove to be incorrect, or future market events occur that prevent our ability tohold our U.S. fixed maturities to recovery, an additional valuation allowance could become necessary. This could have a mate-rial adverse effect on our financial condition, results of operations, and liquidity. At December 31, 2009, the valuationallowance of $34 million (including $24 million with respect to foreign tax credits) reflects management’s assessment that it ismore likely than not that a portion of the deferred tax asset will not be realized due to the inability of certain foreign sub-sidiaries to generate sufficient taxable income and the inability of ACE Group Holdings and its subsidiaries to utilize foreign taxcredits.
Fair value measurements
We partially adopted the provisions (specific provisions described below) included in ASC Topic 820, Fair Value Measure-
ments and Disclosures, on January 1, 2008. We fully adopted the provisions effective January 1, 2009. These provisionsdefine fair value as the price to sell an asset or transfer a liability in an orderly transaction between market participants andestablishes a three – level valuation hierarchy in which inputs into valuation techniques used to measure fair value are classi-fied.
The fair value hierarchy gives the highest priority to quoted prices in active markets and the lowest priority tounobservable data. Inputs in Level 1 are unadjusted quoted prices for identical assets or liabilities in active markets. Level 2includes inputs other than quoted prices included within Level 1 that are observable for assets or liabilities either directly orindirectly. Level 2 inputs include, among other items, quoted prices for similar assets and liabilities in active markets, quotedprices for identical or similar assets and liabilities in markets that are not active, and inputs other than quoted prices that areobservable for the asset or liability such as interest rates and yield curves. Level 3 inputs are unobservable and reflect ourjudgments about assumptions that market participants would use in pricing an asset or liability. A financial instrument’s cate-gorization within the valuation hierarchy is based upon the lowest level of input that is significant to the fair valuemeasurement.
While the Company obtains values for the majority of the investment securities it holds from one or more pricing services,it is ultimately management’s responsibility to determine whether the values obtained and recorded in the financial statementsare representative of fair value. We periodically update our understanding of the methodologies used by our pricing services inorder to validate that the prices obtained from those services are consistent with the GAAP definition of fair value as an exitprice. Based on our understanding of the methodologies used by our pricing services, all applicable investments have beenvalued in accordance with GAAP valuation principles. We do not typically adjust prices obtained from pricing services.
At December 31, 2009, our Level 3 assets represented four percent of our assets that are measured at fair value and twopercent of our total assets. Our Level 3 liabilities represented 13 percent of our liabilities that are measured at fair value andone percent of our total liabilities at December 31, 2009. During 2009, we transferred $55 million out of our Level 3 assets.Refer to Note 15 to the Consolidated Financial Statements for a description of the valuation measurements used for our finan-cial instruments carried or disclosed at fair value by valuation hierarchy (Levels 1, 2, and 3) as well as a roll-forward of Level3 financial instruments for the years ended December 31, 2009 and 2008.
Guaranteed minimum income benefits (GMIB) derivatives
Under life reinsurance programs covering living benefit guarantees, we assume the risk of GMIBs associated with variableannuity (VA) contracts. Our GMIB reinsurance product meets the definition of a derivative for accounting purposes and is there-fore carried at fair value. We believe that the most meaningful presentation of these derivatives is to reflect cash inflows orrevenue as net premiums earned, and to record estimates of the average modeled value of future cash outflows as incurredlosses. Accordingly, we recognize benefit reserves consistent with the provisions of ASC Topic 944, Financial Services-
Insurance, related to accounting and reporting by insurance enterprises for certain non-traditional long-duration contracts andfor separate accounts. Changes in the benefit reserves are reflected as policy benefits expense, which is included in life under-writing income. The incremental difference between fair value and benefit reserves is reflected in Accounts payable, accruedexpenses, and other liabilities in the consolidated balance sheet and related changes in fair value are reflected in Net realizedgains (losses) in the consolidated statement of operations. We intend to hold these derivative contracts to maturity (i.e., theexpiration of the underlying annuities through lapses, annuitization, or death). At maturity, the cumulative gains and losses will
50

net to zero (excluding cumulative hedge gains or losses) because, over time, the insurance liability will be increased ordecreased to equal our obligation. For a sensitivity discussion of the effect of changes in interest rates, equity indices and otherassumptions on the fair value of GMIBs, and the resulting impact on our net income, refer to Item 7A. Refer to Note 2 j) to theConsolidated Financial Statements, under Item 8, for further description of this product and related accounting treatment.
The fair value of GMIB reinsurance is estimated using an internal valuation model which includes current marketinformation and estimates of policyholder behavior from the perspective of a theoretical market participant. All of our treatiescontain claim limits, which are factored into the valuation model. The fair value depends on a number of factors, includinginterest rates, current account value, market volatility, expected annuitization rates and other policyholder behavior, and changesin policyholder mortality. The model and related assumptions are continuously re-evaluated by management and enhanced, asappropriate, based upon additional experience obtained related to policyholder behavior and availability of more timely marketinformation, such as market conditions and demographics of in-force annuities. Due to the inherent uncertainties of theassumptions used in the valuation models to determine the fair value of these derivative products, actual experience may differfrom the estimates reflected in our Consolidated Financial Statements, and the differences may be material.
The most significant policyholder behavior assumptions include lapse rates and annuitization rates using the guaranteedbenefit (GMIB annuitization rate). Assumptions regarding lapse rates and GMIB annuitization rates differ by treaty but theunderlying methodology to determine rates applied to each treaty is comparable. The assumptions regarding lapse and GMIBannuitization rates determined for each treaty are based on a dynamic calculation that uses several underlying factors.
A lapse rate is the percentage of in-force policies surrendered in a given calendar year. All else equal, as lapse ratesincrease, ultimate claim payments will decrease. The GMIB annuitization rate is the percentage of policies for which thepolicyholder will elect to annuitize using the guaranteed benefit provided under the GMIB. All else equal, as GMIB annuitiza-tion rates increase, ultimate claim payments will increase, subject to treaty claim limits.
Key factors affecting the lapse rate assumption include investment performance and policy duration. We generally assumethat lapse rates increase with policy duration with a significant increase in rates after the end of the surrender charge period.As investment performance of underlying fund investments declines, and guarantees become more valuable, lapse rates areanticipated to decrease thereby increasing the expected value of claims on minimum guarantees and thus, benefit reservesand the incremental fair value liability.
Key factors affecting the GMIB annuitization rate include investment performance and the level of interest rates after theGMIB waiting period. As investment performance of underlying fund investments declines, the monthly income available to apolicyholder who annuitizes their account value falls; this makes the GMIB more valuable. As the GMIB becomes more val-uable, our modeling assumes that annuitization rates will increase, resulting in higher benefit reserves and fair value liability.The same is true in an environment where long-term interest rates are decreasing.
Based on our quarterly reserve review, we increased our assumed GMIB annuitization rates for policies with deepin-the-money guarantees. In the aggregate, this change along with certain refinements of our model, increased our fair valueliability by $28 million, which decreased net income accordingly.
During 2009, we recorded $368 million of realized gains for GMIB reinsurance, primarily due to a rising equity marketand increased interest rate levels, partially offset by narrowing A-rated credit spreads (A-rated credit spreads are a proxy forACE’s own credit spreads) and the receipt of premium (which increases the fair value). This excludes realized losses of $363million during 2009 on derivative instruments held to partially offset the risk in the variable annuity guarantee reinsuranceportfolio. These derivatives do not receive hedge accounting treatment. Refer to “Net Realized Gains (Losses)” for a breakdownof the realized gains on GMIB reinsurance and the realized losses on the derivatives for 2009 and 2008.
ACE Tempest Life Re employs a strategy to manage the financial market and policyholder behavior risks embedded in thereinsurance of variable annuity guarantees. Risk management begins with underwriting a prospective client and guaranteedesign, with particular focus on protecting ACE’s position from policyholder options that, because of anti-selective behavior,could adversely impact our obligation.
A second layer of risk management is the structure of the reinsurance contracts. All variable annuity guaranteereinsurance contracts include some form of annual or aggregate claim limit(s). The exact limits vary by contract but someexamples of typical contract provisions include:• annual claim limits, as a percentage of reinsured account or guaranteed value, for GMDBs and GMIBs; and• annual annuitization rate limits, as a percentage of annuitization eligible account or guaranteed value, for GMIBs.
A third layer of risk management is the hedging strategy which is focused on mitigating long-term economic losses at aportfolio level. ACE Tempest Life Re owned financial market instruments as part of the hedging strategy with a fair value of$47 million and $280 million at December 31, 2009 and 2008, respectively. The instruments are substantially collateralizedby our counterparties, on a daily basis.
51
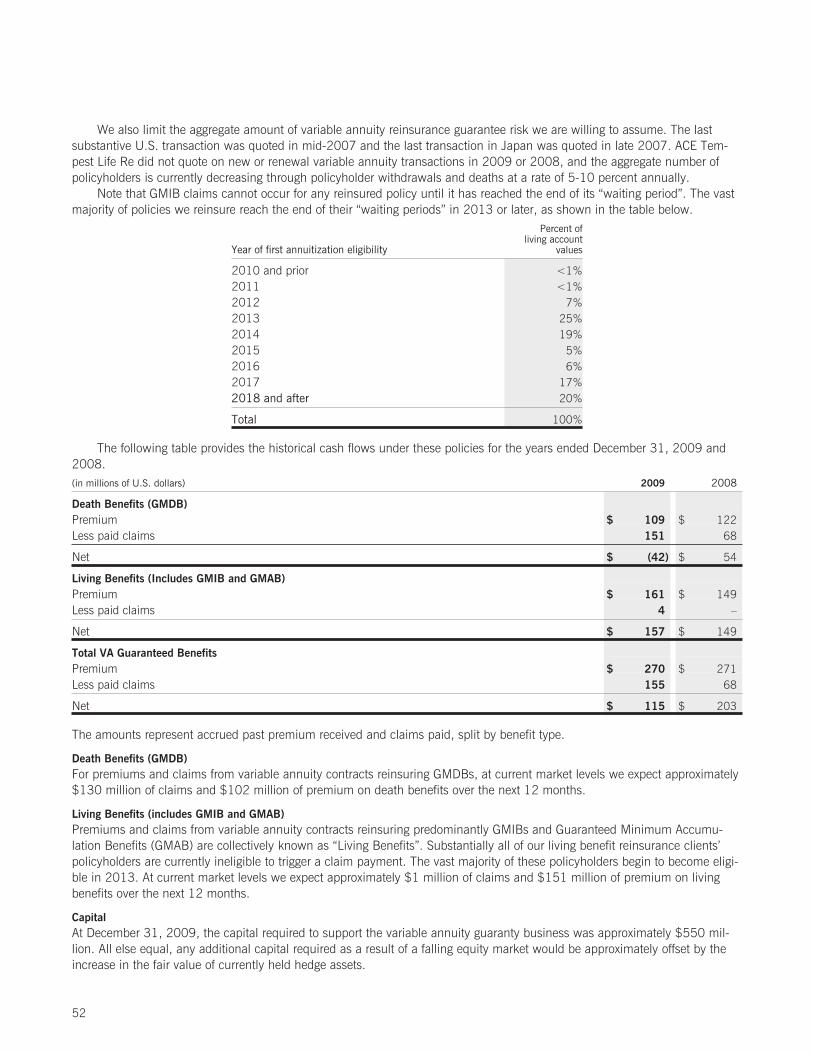
We also limit the aggregate amount of variable annuity reinsurance guarantee risk we are willing to assume. The lastsubstantive U.S. transaction was quoted in mid-2007 and the last transaction in Japan was quoted in late 2007. ACE Tem-pest Life Re did not quote on new or renewal variable annuity transactions in 2009 or 2008, and the aggregate number ofpolicyholders is currently decreasing through policyholder withdrawals and deaths at a rate of 5-10 percent annually.
Note that GMIB claims cannot occur for any reinsured policy until it has reached the end of its “waiting period”. The vastmajority of policies we reinsure reach the end of their “waiting periods” in 2013 or later, as shown in the table below.
Year of first annuitization eligibility
Percent ofliving account
values
2010 and prior <1%2011 <1%2012 7%2013 25%2014 19%2015 5%2016 6%2017 17%2018 and after 20%
Total 100%
The following table provides the historical cash flows under these policies for the years ended December 31, 2009 and2008.(in millions of U.S. dollars) 2009 2008
Death Benefits (GMDB)
Premium $ 109 $ 122Less paid claims 151 68
Net $ (42) $ 54
Living Benefits (Includes GMIB and GMAB)
Premium $ 161 $ 149Less paid claims 4 –
Net $ 157 $ 149
Total VA Guaranteed Benefits
Premium $ 270 $ 271Less paid claims 155 68
Net $ 115 $ 203
The amounts represent accrued past premium received and claims paid, split by benefit type.
Death Benefits (GMDB)
For premiums and claims from variable annuity contracts reinsuring GMDBs, at current market levels we expect approximately$130 million of claims and $102 million of premium on death benefits over the next 12 months.
Living Benefits (includes GMIB and GMAB)
Premiums and claims from variable annuity contracts reinsuring predominantly GMIBs and Guaranteed Minimum Accumu-lation Benefits (GMAB) are collectively known as “Living Benefits”. Substantially all of our living benefit reinsurance clients’policyholders are currently ineligible to trigger a claim payment. The vast majority of these policyholders begin to become eligi-ble in 2013. At current market levels we expect approximately $1 million of claims and $151 million of premium on livingbenefits over the next 12 months.
Capital
At December 31, 2009, the capital required to support the variable annuity guaranty business was approximately $550 mil-lion. All else equal, any additional capital required as a result of a falling equity market would be approximately offset by theincrease in the fair value of currently held hedge assets.
52

Collateral
In order for its U.S.-domiciled clients to obtain statutory reserve credit, ACE Tempest Life Re holds collateral on behalf of itsclients in the form of qualified assets in trust or letters of credit, in an amount sufficient for them to obtain statutory reservecredit. On December 31, 2009, a new statutory reserve guideline adopted by the National Association of Insurance Commis-sioners took effect in the U.S. called Actuarial Guideline 43 that governs statutory reserve calculation for variable annuityguarantees. In many cases this resulted in an increase to ceded statutory reserves from our U.S.-domiciled clients and thecollateral ACE Tempest Life Re holds on their behalf. ACE Tempest Life Re has access to both letter of credit capacity andtrustable assets that are sufficient (based on current estimates) to meet the funding requirements. The timing and amount ofthe calculation of the collateral varies by client according to the particulars of the reinsurance treaty and the statutory reserveguidelines of the client’s state of domicile.
Claim limits
Approximately 64 percent of the GMDB guaranteed value has an annual claim limit expressed as two percent of the aggregatetotal account value reinsured. The remainder of the GMDB guaranteed value is covered under treaties with limits calculated onother bases – either annual, aggregate, or at an individual policy level. The majority of this remainder has an annual limitcalculated as a percentage of the total guaranteed value reinsured, with the percentage varying by contract from 0.22 percentto 1.8 percent.
Goodwill Impairment
Goodwill, which represents the excess of acquisition cost over the estimated fair value of net assets acquired, was $3.8 billionat December 31, 2009. The ACE INA and Combined Insurance acquisitions represent the majority of this balance. During2009, our goodwill balance was increased by approximately five percent, primarily due to foreign exchange movements at thelegal entity level. Goodwill is not amortized but is subject to a periodic evaluation for impairment at least annually, or earlier ifthere are any indications of possible impairment. The impairment evaluation involves a two-step process in which an initialassessment for potential impairment is performed and, if a potential impairment is present, the amount of impairment ismeasured and recorded. We performed our impairment testing for 2009 and determined that no impairment was required.Impairment is tested at the reporting unit level. Goodwill is assigned to applicable reporting units of acquired entities at acquis-ition. The most significant reporting units are the North American and international divisions of Combined Insurance acquiredin 2008; domestic and international divisions of ACE INA acquired in 1999; ACE Tempest Re’s catastrophe businessesacquired in 1996 and 1998; and Tarquin Limited acquired in 1998. There are other reporting units that resulted from smalleracquisitions that are also assessed annually.
To estimate the fair value of a reporting unit, we consistently applied a combination of the following models: an earningsmultiple, a book value multiple, a discounted cash flow or an allocated market capitalization. The earnings and book valuemodels apply multiples of comparable publicly traded companies to forecasted earnings or book value of each reporting unitand consider current market transactions. The discounted cash flow model applies a discount to estimated cash flows includ-ing a terminal value calculation. The market capitalization model allocates our market capitalization to each reporting unit. Wemust assess whether the current fair value of our reporting units is at least equal to the fair value used in the determination ofgoodwill. In doing this, we make assumptions and estimates about the profitability attributable to our reporting units, includ-ing:• short-term and long-term growth rates;• estimated cost of equity and changes in long-term risk-free interest rates;• selection of appropriate earnings and book value market multiples to be utilized in various multiple approaches; and• risk premium applied in determining discount rate for calculating net present value of estimated future cash flows.
If, in the future, our assumptions and estimates made in assessing the fair value of acquired entities change, goodwillcould be materially adjusted. This would cause us to write-down the carrying value of goodwill and could have a materialadverse effect on our results of operations in the period the charge is taken.
53

Consolidated Operating Results – Years Ended December 31, 2009, 2008, and 2007
Our consolidated operating results include the results of Combined Insurance from April 1, 2008.
% Change
(in millions of U.S. dollars) 2009 2008 20072009 vs.
20082008 vs.
2007
Net premiums written $ 13,299 $ 13,080 $ 11,979 2% 9%Net premiums earned 13,240 13,203 12,297 0% 7%Net investment income 2,031 2,062 1,918 (2)% 8%Net realized gains (losses) (196) (1,633) (61) 88% NM
Total revenues $ 15,075 $ 13,632 $ 14,154 11% (4)%
Losses and loss expenses 7,422 7,603 7,351 (2)% 3%Policy benefits 325 399 168 (19)% 138%Policy acquisition costs 2,130 2,135 1,771 (0)% 21%Administrative expenses 1,811 1,737 1,455 4% 19%Interest expense 225 230 175 (2)% 31%Other (income) expense 85 (39) 81 NM NM
Total expenses $ 11,998 $ 12,065 $ 11,001 (1)% 10%
Income before income tax 3,077 1,567 3,153 96% (50)%Income tax expense 528 370 575 43% (36)%
Net income $ 2,549 $ 1,197 $ 2,578 113% (54)%
NM – not meaningful
Net premiums written, which reflect the premiums we retain after purchasing reinsurance protection, increased in 2009,compared with 2008, primarily due to the inclusion of Combined Insurance for the full year (the prior year period included theresults of Combined Insurance from April 1, 2008) and increased assumed loss portfolio business. We also reported increasedretained premium from P&C reinsurance, increased retail specialty casualty production and benefitted from the annual firstquarter crop settlement (refer to Crop Insurance), partially offset by unfavorable foreign exchange impact, and lower productionin wholesale P&C, retail national accounts, property, and personal lines. With respect to the personal lines business which weacquired in early 2008, we recorded a one-time portfolio assumption of $76 million in net premiums written as part of theacquisition. Excluding the impact of this one-time portfolio assumption, the personal lines business reported growth in 2009,compared with 2008. Refer to the table below for the impact of foreign exchange on net premiums written and earned. Netpremiums written increased in 2008, compared with 2007, primarily due to the inclusion of the acquired CombinedInsurance, which added $1.1 billion. Excluding the impact of acquired businesses, net premiums written declined two percentin 2008, reflecting the competitive conditions we experienced across most lines of business and regions of operation, as wellas recession-related exposure reductions. The year ended December 31, 2007, included a one-time assumed loss portfoliotransfer program which produced approximately $170 million of net premiums written and earned.
Net premiums earned reflect the portion of net premiums written that were recorded as revenues for the period as theexposure period expires. Net premiums earned for 2009 were stable compared with 2008, as declines in wholesale P&C, andretail national accounts and property business, as well as an unfavorable foreign exchange impact were offset by growth inassumed loss portfolio business, crop business, and retail specialty casualty and included Combined Insurance’s results for thefull period. The increase in 2008 net premiums earned, compared with 2007, was primarily related to the inclusion of Com-bined Insurance which added $1.1 billion. As discussed above, the one-time assumed loss portfolio transfer program addedapproximately $170 million to net premiums earned in 2007.
54

The following table summarizes the approximate effect of changes in foreign currency exchange rates on the growth of netpremiums written and earned for the years ended December 31, 2009 and 2008.
2009 2008
Net premiums written:Growth in original currency 4.8% 8.3%Foreign exchange effect (3.1)% 0.9%
Growth as reported in U.S. dollars 1.7% 9.2%
Net premiums earned:Growth in original currency 3.5% 6.5%Foreign exchange effect (3.2)% 0.9%
Growth as reported in U.S. dollars 0.3% 7.4%
The following table provides a consolidated breakdown of net premiums earned by line of business for the years endedDecember 31, 2009, 2008, and 2007.
(in millions of U.S. dollars) 2009 2008 2007
% Change
2009 vs.2008
2008 vs.2007
Property and all other $ 4,023 $ 3,954 $ 3,811 2% 4%Casualty 5,587 5,838 6,464 (4)% (10)%
Subtotal 9,610 9,792 10,275 (2)% (5)%Personal accident (A&H) 3,103 2,949 1,654 5% 78%Life 527 462 368 14% 26%
Net premiums earned $ 13,240 $ 13,203 $ 12,297 0% 7%
2009% of total
2008% of total
2007% of total
Property and all other 30% 30% 31%Casualty 42% 44% 53%
Subtotal 72% 74% 84%Personal accident (A&H) 24% 22% 13%Life 4% 4% 3%
Net premiums earned 100% 100% 100%
Net investment income decreased in 2009, compared with 2008, primarily due to lower yields on new investments, partiallyoffset by an increase in average invested assets. Net investment income was also adversely impacted by unfavorable foreignexchange rate movements in 2009. Net investment income increased in 2008, compared with 2007, primarily due toinvestment of positive operating cash flows which have resulted in a higher overall average invested asset base. Refer to “NetInvestment Income” and “Investments”.
In evaluating our segments excluding Life, we use the combined ratio, the loss and loss expense ratio, the policy acquis-ition cost ratio, and the administrative expense ratio. We calculate these ratios by dividing the respective expense amounts bynet premiums earned. We do not calculate these ratios for the Life segment as we do not use these measures to monitor ormanage that segment. The combined ratio is determined by adding the loss and loss expense ratio, the policy acquisition costratio, and the administrative expense ratio. A combined ratio under 100 percent indicates underwriting income and a com-bined ratio exceeding 100 percent indicates underwriting loss.
55

The following table shows our consolidated loss and loss expense ratio, policy acquisition ratio, administrative expenseratio, and combined ratio for the years ended December 31, 2009, 2008, and 2007.
2009 2008 2007
Loss and loss expense ratio 58.8% 60.6% 61.6%
Policy acquisition cost ratio 16.2% 16.2% 14.5%
Administrative expense ratio 13.3% 12.8% 11.8%
Combined ratio 88.3% 89.6% 87.9%
The following table shows our adjusted loss and loss expense ratio for the years ended December 31, 2009, 2008, and2007.
2009 2008 2007
Loss and loss expense ratio, as reported 58.8% 60.6% 61.6%Catastrophe losses (1.2)% (4.7)% (1.3)%Prior period development 4.9% 6.8% 1.8%Large assumed loss portfolio transfers (0.8)% 0.0% (0.5)%
Loss and loss expense ratio, adjusted 61.7% 62.7% 61.6%
We recorded $137 million in net catastrophe losses in 2009, compared with $567 million and $159 million in 2008 and2007, respectively. The catastrophe losses for 2009 were primarily related to an earthquake in Asia, floods in Europe, severalweather-related events in the U.S., and a European windstorm. For 2008, our catastrophe losses were primarily related toHurricanes Gustav and Ike and floods in the U.S.
We experienced $579 million of net favorable prior period development in 2009. This compares with $814 million of netfavorable prior period development in 2008, and $217 million of net favorable prior period development in 2007. The priorperiod development was the net result of several underlying favorable and adverse movements. Prior period developmentarises from changes to loss estimates recognized in the current year that relate to loss reserves first reported in previous calen-dar years and excludes the effect of losses from the development of earned premium from previous accident years. Refer to“Prior Period Development” for more information.
Our policy acquisition costs include commissions, premium taxes, underwriting, and other costs that vary with, and areprimarily related to, the production of premium. Administrative expenses include all other operating costs. Our policy acquis-ition cost ratio was stable in 2009, compared with 2008, as increases in our Combined Insurance operations were offset bymore favorable final crop year settlement of profit share commissions. Administrative expenses increased in 2009, primarilydue to the inclusion of administrative expenses related to Combined Insurance for the full year and costs associated with newproduct expansion in our domestic retail operation and in our personal lines business. Our policy acquisition cost ratioincreased significantly in 2008, compared with 2007, primarily due to the growth in A&H business, including the CombinedInsurance business, which is predominantly A&H. A&H business typically requires higher commission rates than traditionalP&C business. Our administrative expenses increased in 2008, primarily due to the inclusion of administrative expensesrelated to the acquired businesses.
Our effective income tax rate, which we calculate as income tax expense divided by income before income tax, is depend-ent upon the mix of earnings from different jurisdictions with various tax rates. A change in the geographic mix of earningswould change the effective income tax rate. Our effective tax rate on net income was 17 percent in 2009, compared with 24percent and 18 percent in 2008 and 2007, respectively. For 2008, our effective tax rate was adversely impacted by a higherproportion of our earnings being generated in higher tax-paying jurisdictions due to the impact of catastrophe losses experi-enced in lower tax-paying jurisdictions.
Net realized losses were significant in 2008, and were primarily related to widening credit spreads in our high qualitycorporate bond portfolio and changes in reported liabilities on GMIB reinsurance reported at fair value.
Prior Period Development
The favorable prior period development of $579 million on net unpaid losses and loss expenses during 2009 was the netresult of several underlying favorable and adverse movements. Prior period development arises from changes to loss estimates
56

recognized in the current year that relate to loss reserves first reported in previous calendar years and excludes the effect oflosses from the development of earned premium from previous accident years. With respect to ACE’s crop business, ACE regu-larly receives reports from its MGA relating to the previous crop year(s) in subsequent calendar quarters and this typicallyresults in adjustments to the previously reported premiums, losses and loss expenses, and profit share commis-sion. Commencing in the third quarter of 2009, prior period development for ACE’s crop business includes adjustments toboth crop losses and loss expenses, and the related crop profit share commission. In the sections following the table below,significant prior period movements within each reporting segment by claim-tail attribute are discussed in more detail. Long-taillines include lines such as workers’ compensation, general liability, and professional liability, while short-tail lines include linessuch as most property lines, energy, personal accident, aviation, and marine. The following table summarizes prior perioddevelopment, (favorable) and adverse, by segment and claim-tail attribute for the years ended December 31, 2009 and 2008.
(in millions of U.S. dollars, except for percentages) Long-tail Short-tail Total
% of netunpaid
reserves*
2009
Insurance – North American $ (74) $ (105) $ (179) 1.2%
Insurance – Overseas General (140) (115) (255) 4.2%
Global Reinsurance (93) (49) (142) 5.6%
Life – (3) (3) 1.4%
Total $ (307) $ (272) $ (579) 2.4%
2008 `Insurance – North American $ (131) $ (220) $ (351) 2.4%Insurance – Overseas General (131) (173) (304) 4.7%Global Reinsurance (17) (142) (159) 5.9%
Total $ (279) $ (535) $ (814) 3.5%
* Calculated based on the segment beginning of period net unpaid loss and loss expenses reserves.
Insurance – North American
Insurance – North American experienced net favorable prior period development of $179 million in 2009, which was the netresult of several underlying favorable and adverse movements, driven by the following principal changes:• Net favorable development of $74 million on long-tail business, including:
• Favorable development of $42 million in our foreign casualty product lines where both paid and reported incurred lossand allocated loss adjustment expense activity was favorable relative to the expected activity implied in our prior review,particularly for workers’ compensation and general liability coverages. One portfolio typically includes high volume, lowaverage premium business covering overseas exposures with shorter development patterns than typically found for largercommercial risks. For this portfolio, the favorable development was concentrated in the 2006 accident year. The otherportfolios represent large, risk management accounts. For these exposures, the favorable development was primarilyassociated with the 2004 and 2005 accident years;• Adverse development totaling $13 million on excess liability coverage in report year 2005 in response to a court deci-sion made during 2009;• Adverse development of $19 million in our small and middle market guaranteed cost workers’ compensation portfolios.The development affected accident periods in the late 1980’s and the 2007 and 2008 accident years. The deteriorationon the older accident periods was due to higher than expected incurred claims activity in 2009. The development on2007 and 2008 was largely a function of higher allocated claims expenses than forecast. A possible trend in higher allo-cated costs was first observed in mid-2008. A study of these costs was completed early in 2009, leading to an increasein our estimates for these accident years;• Favorable development of $15 million in our commercial surety business, primarily associated with the 2007 accidentyear. Our estimates of ultimate losses anticipated higher than historical levels of incurred loss development due to theimpact of the recession. However, the actual loss activity for the 2007 accident year in calendar year 2008 was in linewith historical levels despite the downturn in the economy;• Favorable development of $52 million in our national accounts loss sensitive accounts unit impacting the 2005-2007accident years. This development represents the reduction in premium-based loss reserves that resulted from a $96 mil-lion reduction in our estimate of retrospectively rated premiums for the 2004-2007 policy years due to a refinement in
57

our estimation process. The change in estimate of retrospectively rated premiums was triggered by a ground-up, policylevel review conducted by ACE during 2009. The policy level review relies on more disaggregated policy data than ourprior estimation process;• Favorable development of $15 million in our medical risk business unit with the favorable activity concentrated in the2004 and 2005 report years for hospital professional liability business. Our portfolio includes both primary and excessfacilities business written primarily on a claims-made basis. Loss activity in 2009 for this business was lower thanexpected. In addition, all open claims for the 2005 and prior report years were reviewed in 2009, and updated using themost recent available information. This review led to a revision in our estimate of ultimate losses for the portfolio;• Favorable development of $33 million in our ACE Financial Solutions business unit concentrated in policies issued inthe 2004-2006 years. This favorable development was a function of a continuation of lower than expected loss develop-ment, first observed in 2008, on a small number of large risks with predominantly workers’ compensation exposure;• Favorable development of $10 million in our management liability product line, associated with the 2004 and prioraccident years. A large portion of this favorable development was the result of savings on a large claims settlement in2009;• Favorable development of $17 million for long-tail lines in our programs division, primarily attributable to the 2005 and2006 accident years. Reported and paid loss experience in the general liability and auto liability sub-lines continued todevelop lower than expected in our prior review and our pricing assumptions; and• Adverse development of $80 million in our Brandywine operations, impacting accident years 1999 and prior compris-ing several components. First, adverse development of $47 million in assumed reinsurance pools which was thecombined impact from receipt of updated information on pool reserves, adverse impact of recent activity on a litigatedclaim and a 2009 audit finding that assumed losses payable had not been registered, thereby causing an understatementof required reserves in prior quarters. Second, adverse development of $18 million on assumed reinsurance reserves fol-lowing review of the adequacy of certain retrocessional reinsurance protections. Third, adverse development of $28million on workers’ compensation business due to higher than expected case incurred loss development since the lastreview. Finally, favorable development of $13 million on asbestos and pollution reserves, primarily due to higher thanexpected ceded reinsurance billings on paid losses.
• Net favorable development of $105 million on short-tail business, including:• Adverse development of $3 million on property business comprising two main components. First, there was adversedevelopment of $25 million in our retail property and energy portfolios, primarily impacting the 2005-2008 accidentyears as a result of adverse development on known claims and our share of a reinsurance pool. Second, there was favor-able development of $22 million in another unit, principally arising on the 1997 and 2005-2008 accident years fromfavorable development on known claims and a lack of emergence of newly reported claims;• Favorable development of $24 million on political risk business relating to the 2006-2008 accident years as a result ofa lack of claims emergence and favorable development in the 2005 accident year related to closure of a claim withoutpayment;• Favorable development of $13 million in our crop/hail business associated with recording the most recent bordereaux,primarily for the 2008 crop year;• Favorable development of $17 million in our Canadian A&H business affecting the 2008 and prior accident years. Thisresulted from a reconciliation of statutory and GAAP ledger balances completed in 2009;• Favorable development of $17 million for short-tail lines in our programs division, primarily attributable to the 2005and 2006 accident years. Reported and paid loss experience in the general liability, property, auto liability, and autophysical damage sub-lines continued to develop lower than expected in our prior review and relative to our pricingassumptions;• Favorable development of $8 million in our recreational marine portfolio, primarily affecting accident years 2004-2008.Reported loss activity for these accident years was lower than expected during 2009; and• Favorable development of $29 million across a number of short-tail lines in a number of accident years for a variety ofreasons.
Insurance – North American experienced net favorable prior period development of $351 million in 2008, which was the netresult of several underlying favorable and adverse movements, driven by the following principal changes:• Net favorable development of $131 million on long-tail business, including:
• Adverse development of $15 million in ACE’s national accounts workers’ compensation portfolios comprised two itemsof significance. First, favorable development of $47 million arising on accident year 2007, due to the absence of multi-claimant events such as industrial accidents. The majority of ACE’s exposure for these perils falls under ACE’s national
58

accounts high deductible and excess product lines. ACE evaluates this exposure on an annual basis, after the accidentyear has closed, allowing for the late reporting or identification of significant losses and for an initial assessment of theaccident year. ACE’s review in 2008 of potential 2007 events, coupled with ACE’s initial assessment of the accident yearhas led to a decrease in ACE’s estimate of the required provision for these claims. Second, adverse development of $62million relating to 2003 and prior accident years. This development was the direct result of reported loss activity greaterthan expected in ACE’s prior review. During 2008 a targeted open case reserve review was conducted by ACE’s claimsstaff which resulted in a number of material case reserve increases that were not anticipated in ACE’s prior estimates ofultimate loss;• Favorable development of $32 million in ACE’s national accounts commercial auto and general liability product linescomprised two items of significance. First, favorable development of $19 million was mainly from accident years 2003and prior for exposures written on an excess basis. The combination of continued lower than expected reported incurredloss activity for the 2001-2003 accident years as well as increased weighting on loss development reserving methods, asthese years mature, has driven the majority of the improvement in projected ultimate losses. Second, favorable develop-ment of $13 million relating to the 1999-2002 accident years, primarily on a block of run-off programs comprisinggeneral liability, auto liability, and workers’ compensation product coverages. This favorable development was a result oflower than expected paid and case incurred development observed in the most recent reserve review which resulted inlower selected ultimate loss projections;• Adverse development of $10 million related to higher than expected loss and allocated loss adjustment expense activityon reported claims in ACE’s small and middle market guaranteed cost workers’ compensation portfolios, primarily affect-ing the 2005 and 2006 accident years. Case activity on these portfolios through calendar year 2007 and into 2008 washigher than expectations and ACE adjusted its estimates of ultimate loss accordingly. Prior estimates relied heavily onindustry benchmarks including average severity trends;• Adverse development of $29 million on a portfolio of primary casualty business written by the wholesale division andimpacting the 2002-2004 accident years. This adverse activity was a function of higher than expected loss and allocatedexpenses on business that has a heavy concentration of exposure to commercial contractors. In the past few quarters,both paid and incurred development patterns for the tail period beyond 60 months have developed worse than industrybenchmark factors which formed the basis for ACE’s projections in prior analyses;• Favorable development of $19 million on excess casualty and umbrella business in ACE’s wholesale unit, primarilyimpacting accident years 2002-2004. This favorable activity was a function of a shift in weighting from expected lossbased reserving methods to direct projections of ultimate losses as this long-tailed exposure begins to mature for theseaccident periods;• Adverse development of $10 million on a professional lines claim in accident year 2001 as a result of a review in2008, that identified significant erosion below ACE’s attachment;• Adverse development of $29 million on ACE’s portfolio of Defense Base Acts workers’ compensation coverage (coversemployees of U.S. government contractors overseas). ACE experienced higher than expected incurred loss developmentsince the last reserve study concentrated in the 2006 and 2007 accident years. The majority of the development wasrelated to increases in case reserves on known claims for these accident years, and recorded in 2008. These increaseswere judged to be more than claim acceleration and resulted in significant increases in the 2006 and 2007 accident yearultimate loss projections given the immaturity of the impacted accident years and long-tail nature of the portfolio;• Favorable development of $46 million on ACE’s medical risk business, primarily in its hospital professional liability port-folio for the 2004 and 2005 accident years. Coverage is provided on a claims-made basis and both paid and caseincurred loss activity since ACE’s last review have been favorable relative to expected. As these accident periods havematured, ACE has gradually increased the weight applied to experience-based methods, including the Bornhuetter-Ferguson method, and placed less weight on the initial expected loss ratio method;• Favorable development of $34 million in ACE’s management and professional liability product lines. This developmentwas the net result of favorable development totaling $117 million associated with the 2005 and prior accident years andadverse development of $81 million with respect to the 2007 accident year. The favorable prior period development wasa function of a review of all open claims in ACE’s retail management liability operation and a reassessment of the poten-tial ultimate exposure on these claims. This reassessment of exposure and the maturation of these accident periodssupported increasing the weight given to experience based loss projections. The adverse development relating to the 2007accident year is due solely to a claim-by-claim review of exposures impacted by the ongoing credit crisis including but notlimited to sub-prime mortgages. These claim file reviews occurred during the 2008 calendar year as facts and circum-stances surrounding these exposures continued to emerge and develop;
59
• Favorable development of $51 million on long-tail exposures in ACE’s Canadian P&C operations, principally arising inthe 2005 accident year on excess casualty, umbrella, and D&O product lines. Actual paid and case incurred loss activityhas been lower than expected since ACE’s prior analysis. In addition, ACE has increased the weighting given toexperience-based methods from the initial expected loss ratio method as these accident years mature;• Favorable development of $68 million for accident years 2003-2006 due to the expiration of a large, multi-yearinsurance contract written in the ACE Financial Solutions business unit. This contract included a significant per occur-rence limit excess of a high attachment point. Coverage was provided on an integrated occurrence basis requiring noticeof an event during the policy period. ACE completed a detailed claims audit in the fourth quarter of 2008 which led to anadjustment to the booked loss and loss expense reserves;• Adverse development of $51 million on run-off casualty reserves, including asbestos and environmental, in the Brandy-wine and ACE Westchester business units following completion of ACE’s internal ground-up review of asbestos andenvironmental liabilities for the most significant policyholders identified to date. This adverse development arose fromseveral sources; the principal one was as a result of increased defense costs in litigating traditional tort defenses on asbes-tos cases; and• Favorable development of $16 million relating to the completion of account reconciliations that identified duplicate lossprocessing, over processed coinsurance, and unregistered reinsurance recoveries.
• Net favorable development of $220 million on short-tail business, including:• Favorable development of $116 million on the wholesale division’s crop/hail business relating to the recording of the2007 crop year bordereau received in 2008;• Adverse development totaling $33 million relating to increases in ACE’s estimates of losses for the 2005 hurricanes,primarily in wholesale property ($23 million) and ACE Financial Services International (ACE FSI) ($10 million). Thewholesale property development was due primarily to settlement on several excess policies above ACE’s prior casereserves, resulting in higher estimates of ultimate loss. The claims handling associated with the 2005 hurricanes involvedcomplex and unique causation and coverage issues. The ACE FSI development was due to adverse development on aretrocessional program following a review of the program’s claim circumstances;• Favorable development of $13 million relating to lower than expected paid claims for the 2007 accident year on arun-off portfolio of warranty business, mostly automobile extended warranty contracts. The change was driven primarilyby recognition of recent paid claim experience, as a percentage of earned premiums, which has been lower than the his-torical averages used in ACE’s prior analyses;• Favorable development of $27 million on wholesale property and inland marine businesses. This change was dueprimarily to the fact that the reported incurred and paid loss activity for the 2007 accident year non-catastrophe lossesproved lower than anticipated based on historical loss development patterns;• Favorable settlements of $15 million on property claims mainly in accident years 2005-2007 as a result of favorableclaims experience. A review of all open claims was performed in the fourth quarter of 2008, which concluded that actualexperience to date had been more favorable than the assumptions used to establish the reserves for the open claims;• Favorable development of $9 million mainly in accident years 2006 and 2007 on political risk business. This line issubject to review twice a year; during the fourth quarter 2008 review, ACE reflected the limited paid and case incurredloss activity relative to ACE’s assumptions and known events by releasing $9 million of IBNR;• Favorable development of $29 million on the retail division’s property business, primarily associated with the 2007accident year and a portfolio of diverse global exposures written on an excess basis. Reported loss activity during the2008 year, has been lower than anticipated in ACE’s prior review;• Favorable development of $6 million in ACE’s Canadian P&C operations short-tail lines concentrated in the 2006 and2007 accident years, covering multiple product lines including property and auto physical damage. Reported loss activityon these product lines was lower than expected;• Favorable development of $6 million on the retail division’s commercial marine product lines, primarily with respect tothe 2002-2005 accident years. The favorable development was concentrated in the marine hull product line where lossdevelopment and/or emergence during the 2008 calendar year were lower than expected; and• Favorable development of $14 million on the retail division’s recreational marine business, primarily associated with the2007 accident year. Loss emergence and/or development during the 2008 calendar year were lower than historical aver-ages used in ACE’s prior projections.Insurance – North American incurred net adverse prior period development of $9 million in 2007, representing 0.1 per-
cent of the segment’s net unpaid loss and loss expense reserves at December 31, 2006.
60

Insurance – Overseas General
Insurance – Overseas General experienced net favorable prior period development of $255 million in 2009, which was the netresult of several underlying favorable and adverse movements, driven by the following principal changes:• Net favorable development of $140 million on long-tail business, including:
• Favorable development of $211 million on the 2005 and prior accident years in casualty (primary and excess) andfinancial lines. Detailed reviews completed in 2009 noted improvements in experience relative to the expectations of theprior detailed analyses, including case-specific savings on several significant 2001-2003 bankers’ professional indemnityclaims. Due to the greater level of maturity of these years, increasing weight has been given to the emerged loss experi-ence;• Adverse development of $60 million relating to the 2008 accident year for financial lines in connection with exposureto recent financial frauds. This amount was based on a claims review conducted during 2009 of notifications and poten-tial exposure. During this review, we obtained assessments from external legal counsel of the governing law on eachpotential claim and assessed all other claimant information to arrive at the provision for each case;• Adverse development of $10 million for sub-prime claims in the 2008 accident year for financial lines. This increasereflects an updated claims review conducted during 2009 of all notified claims; and• Adverse development of $10 million driven predominantly by a recent court ruling in a major Continental Europeancountry on “quality of life” damages that is expected to increase casualty claim severities. The increases were focused inthe 2006-2008 accident years.
• Net favorable development of $115 million on short-tail business, including:• Favorable development of $48 million in the property and energy lines of business, spread across many geographicregions. Specific case reserve reductions on previously reported claims and lower than anticipated development on otherclaims led to a release of prior year reserves, mainly in accident years 2006-2008;• Favorable development of $35 million in A&H lines following lower than expected loss development across accidentyears 2003-2008 and arose relatively evenly across geography and distribution channels;• Favorable development of $14 million on aviation. In combination with the detailed review in 2009 on all of aviation,case-specific reductions on products liability claims, primarily in the 2005 and prior accident years, led to a $19 millionreserve release, while adverse airline liability experience on the 2006-2008 accident years led to a $6 million reservestrengthening; and• Favorable development of $11 million in the marine line. This reduction was focused in accident years 2006 and prior,where loss development has been less than expected and increased weight was given to experienced based indicationsfor these more mature years. Accident years 2007 and 2008 experienced offsetting movements, with favorable emer-gence in the retail book offset by case specific increases in the wholesale book.
Insurance – Overseas General experienced net favorable prior period development of $304 million in 2008, which was the netresult of several underlying favorable and adverse movements, driven by the following principal changes:• Net favorable development of $131 million on long-tail business including:
• Favorable development of $159 million from accident years 2005 and prior in financial lines and casualty (primary andexcess) portfolios within the international retail operation. Most of the reduction was in accident years 2002-2005 onfinancial lines, primary casualty, and supported casualty excess. Additional excess releases were made in accident years2001 and prior. Actual paid and case incurred loss activity has been lower than expected since the prior year’s analysis.In addition, ACE has increased the weighting given to experience-based methods from the initial expected loss ratiomethod as these accident periods mature;• Favorable development of $11 million in ACE Global Market financial lines. This was across a number of accidentyears. The decrease was driven by a reliance on experience based methods which reflected favorable development in2008 in the quicker developing financial lines of crime and professional indemnity; and• Adverse development of $39 million on accident years 2006-2007, mainly in the international retail casualty portfoliosfollowing heavier than expected loss emergence. Actual major claim notices received in 2008 caused loss estimates onU.K. excess casualty and Continental Europe financial lines to be increased. Loss projections for the Continental Europecasualty portfolios also increased following adverse attritional claim activity (i.e. excluding catastrophes and large losses)in one country and a large loss in another country.
• Net favorable development of $173 million on short-tail business including:• Net favorable development of $113 million in international retail property lines. This activity was focused mainly in acci-dent years 2003-2007 and the U.K. and Continental Europe regions. The releases in accident years 2003-2005 werepartially due to case specific reserve reductions driven by new information obtained in 2008. Accident years 2006-2007
61

were driven by favorable emergence relative to the expected development pattern as of the prior year end and reliance onexperience based methods for this short-tailed line;• Favorable development on A&H business in the international retail operation of $44 million. This was mainly from theU.K., Continental Europe, and Latin America regions in accident years 2003-2007. The decrease was driven by acombination of favorable development in 2008 across all segments of this book and greater reliance on experience-basedmethods as the accident years mature;• Favorable development of $30 million for the international retail marine book. This was mainly in accident years 2005-2007 and in the Continental Europe and Latin America regions. Given the short-tailed nature of this line, experience-based methods are the primary basis of carried reserves. Given the favorable loss emergence in 2008, reserves werereduced to reflect this experience; and• Adverse development of $14 million due to several major energy losses within the wholesale division, primarily foraccident years 2006 and 2007. First notice for one of these losses was received in 2008, while the remainder of theincrease arose on previously notified claims that were subject in 2008 to a detailed claims review of individual event cir-cumstances and their associated coverages.
Insurance – Overseas General experienced net favorable prior period development of $192 million in 2007, representing 3.2percent of the segment’s net unpaid loss and loss expense reserves at December 31, 2006.
Global Reinsurance
Global Reinsurance experienced net favorable prior period development of $142 million in 2009, which was the net result ofseveral underlying favorable and adverse movements, driven by the following principal changes:• Net favorable development of $93 million on long-tail business, including:
• Net favorable prior period development of $93 million principally in treaty years 2003-2005 across a number of portfo-lios (professional liability, D&O, casualty, and medical malpractice), offset by $13 million adverse development in treatyyears 2007 and 2008. The lower loss estimates arose from the combined impact of continued favorable paid and caseincurred loss trends and increased weighting given to experience-based methods and away from expectations as thesetreaty periods mature. The adverse development on the 2007 and 2008 treaty years arose from large loss development inauto (treaty year 2007) and professional liability and D&O (treaty years 2007 and 2008).
• Net favorable development of $49 million on short-tail business, including:• Favorable prior period development of $35 million, primarily in treaty years 2005-2007 across several portfolios. Thedevelopment arose on property lines, including property catastrophe, principally as a result of lower than anticipated lossemergence; and• Favorable prior period development of $9 million in treaty years 2004 and prior on the trade credit book. The develop-ment arose as a result of a detailed reserve analysis of this line of business and the continued favorable development ofcase incurred losses relative to the assumptions used to establish the reserves.
Global Reinsurance experienced net favorable prior period development of $159 million in 2008, which was the net result ofseveral underlying favorable and adverse movements, driven by the following principal changes:• Net favorable development of $17 million on long-tail business across a number of lines and years including:
• Net favorable prior period development of $30 million principally in treaty years 2003 and 2004 across a number ofportfolios (professional liability, D&O, casualty, workers’ compensation catastrophe, and medical malpractice), offset by$16 million adverse development in treaty year 2007. The lower loss estimates arose from the combined impact of con-tinued favorable paid and case incurred loss trends and increased weighting given to experience-based methods awayfrom expectations as these treaty periods mature, while the 2007 treaty year development resulted from adverse incurredlosses due to large loss development in casualty lines of business.
• Net favorable development of $142 million on short-tail business across a number of lines and years including:• Favorable prior period development of $43 million primarily, on treaty years 2006 and prior across several portfolios.The development arose principally on property and the credit & surety line following completion of reserve reviews in2008. The property portfolio benefited from better than expected claim emergence, while the release in the credit & suretyline followed a detailed review of claims and associated recoveries, together with favorable loss emergence;• Favorable prior period development of $28 million primarily on treaty years 2006 and prior across several portfolios,principally property, marine, and energy. This included $16 million reserve release on property exposures and reflectedlower than anticipated loss emergence; and• Net favorable development of $71 million primarily, on accident years 2002-2006 in the property catastrophe portfoliofor claims from prior catastrophe events. The reserve release followed a detailed review during the 2008 year of eachevent and each cedant’s coverage terms and reflected lower reported claim development than previously anticipated.
62

Global Reinsurance experienced net favorable prior period development of $34 million in 2007, representing 1.3 percent ofthe segment’s net unpaid loss and loss expense reserves at December 31, 2006.
Life
Life experienced net favorable prior period development of $3 million in 2009 on short-tail A&H business. The reserve releasefollowed a detailed review during 2009 and reflected lower reported claim development than previously anticipated. Lifeexperienced no net prior period development in 2008 or 2007.
Segment Operating Results
The discussions that follow include tables that show our segment operating results for the three years ended December 31,2009, 2008, and 2007.
We operate through the following business segments: Insurance – North American, Insurance – Overseas General, GlobalReinsurance, and Life. As discussed previously, we completed the acquisition of all of the outstanding shares of CombinedInsurance and certain of its subsidiaries on April 1, 2008. As such, our segment operating results include the results of Com-bined Insurance from April 1, 2008. Results from Combined Insurance’s North American operations are included in ACE’s Lifesegment and results from Combined Insurance’s international operations are included in ACE’s Insurance – Overseas Generalsegment. For more information on each of our segments refer to “Segment Information”, under Item 1.
Insurance – North American
The Insurance – North American segment comprises our operations in the U.S., Canada, and Bermuda. This segment includesour retail division ACE USA (including ACE Canada), ACE Westchester which is our wholesale division in the U.S., ACEBermuda, ACE Private Risk Services, and various run-off operations, including Brandywine Holdings Corporation(Brandywine).
% Change
(in millions of U.S. dollars) 2009 2008 20072009 vs.
20082008 vs.
2007
Net premiums written $ 5,641 $ 5,636 $ 5,833 0% (3)%Net premiums earned 5,684 5,679 6,007 0% (5)%Losses and loss expenses 4,013 4,080 4,269 (2)% (4)%Policy acquisition costs 517 562 515 (8)% 9%Administrative expenses 572 536 530 7% 1%
Underwriting income $ 582 $ 501 $ 693 16% (28)%
Net investment income 1,094 1,095 1,034 (0)% 6%Net realized gains (losses) 10 (709) 125 NM NMInterest expense 1 1 – 0% NMOther (income) expense 36 7 11 414% (36)%Income tax expense 384 315 468 22% (33)%
Net income $ 1,265 $ 564 $ 1,373 124% (59)%
Loss and loss expense ratio 70.6% 71.8% 71.1%Policy acquisition cost ratio 9.1% 9.9% 8.6%Administrative expense ratio 10.1% 9.4% 8.8%
Combined ratio 89.8% 91.1% 88.5%
Insurance – North American reported stable net premiums written in 2009, compared with 2008. We experienced growth inour retail specialty casualty, professional risk business, A&H, and assumed loss portfolio businesses. We also experienced anincrease in the annual crop settlement (refer to Crop Insurance). These increases were offset by declines in wholesale pro-fessional and casualty lines, as well as lower personal lines, retail property and national accounts production, and unfavorableforeign exchange impact from our Canadian operations. With respect to the personal lines business which we acquired in early2008, we recorded a one-time portfolio assumption of $76 million in net premiums written as part of the acquisition. Exclud-ing the impact of this one-time portfolio assumption, the personal lines business reported growth in 2009, compared with
63

2008. Net premiums written and earned in 2009 included $221 million ($31 million in the first quarter and $95 million inthe second and fourth quarters) related to assumed loss portfolio business, compared with Nil in 2008. Net premiums writtenfor the Insurance – North American segment decreased in 2008, primarily due to lower new and renewal business due tocompetitive conditions in our retail and wholesale divisions, partially offset by higher crop production and the inclusion ofacquired personal lines business. Included in 2007 was a one-time assumed loss portfolio transfer program which producedapproximately $170 million of net premiums written and earned.
The following two tables provide a line of business breakdown of Insurance – North American’s net premiums earned forthe years ended December 31, 2009, 2008, and 2007.
% Change
(in millions of U.S. dollars) 2009 2008 20072009 vs.
20082008 vs.
2007
Property and all other $ 1,690 $ 1,576 $ 1,486 7% 6%Casualty 3,734 3,857 4,298 (3)% (10)%Personal accident (A&H) 260 246 223 6% 10%
Net premiums earned $ 5,684 $ 5,679 $ 6,007 0% (5)%
2009 2008 2007
% of Total % of Total % of Total
Property and all other 30% 28% 25%Casualty 66% 68% 71%Personal accident (A&H) 4% 4% 4%
Net premiums earned 100% 100% 100%
Insurance – North American reported stable net premiums earned for 2009, compared with 2008. We reported increases inthe annual crop settlement, retail specialty casualty and professional lines, as well as higher assumed loss portfolio business.These increases were offset by 2009 declines in wholesale property, casualty, and professional risk business, as well as lowerretail national accounts and property business, and an unfavorable foreign exchange impact. As discussed above, 2009included $221 million in net premiums earned related to assumed loss portfolio business, compared with Nil in 2008. For2008, the decrease in net premiums earned was primarily driven by the decrease in financial solutions business, as 2007included approximately $170 million related to a one-time assumed loss portfolio transfer program. We also reported lower netpremiums earned in our wholesale unit in 2008, primarily due to declines in casualty and inland marine business, whichresulted from competitive market conditions. This trend was partially offset by crop business growth, which benefited fromgenerally higher commodity prices for most of 2008.
The following table shows our adjusted loss and loss expense ratio for the years ended December 31, 2009, 2008, and2007.
2009 2008 2007
Loss and loss expense ratio, as reported 70.6% 71.8% 71.1%Catastrophe losses (1.0)% (5.4)% (0.3)%Prior period development 3.1% 6.2% (0.2)%Large assumed loss portfolio transfers (1.2)% 0.0% (0.8)%
Loss and loss expense ratio, adjusted 71.5% 72.6% 69.8%
Insurance – North American’s net catastrophe losses were $58 million in 2009, compared with $298 million in 2008, and$16 million in 2007. The catastrophe losses for 2009 were related to an earthquake in Asia and several weather-relatedevents in the U.S. Catastrophe losses in 2008 were primarily related to Hurricanes Gustav and Ike. Insurance – North Ameri-can experienced net favorable prior period development of $179 million in 2009. This compares with net favorable priorperiod development of $351 million in 2008, and net adverse prior period development of $9 million in 2007. Refer to “PriorPeriod Development” for more information.
Insurance – North American’s policy acquisition cost ratio decreased in 2009, compared with 2008, primarily due tomore favorable final crop year settlement of profit share commissions. In addition, in 2009 we experienced a higher cedingcommission benefit and we reported increased assumed loss portfolio business, which typically generates minimal acquisitioncosts. The policy acquisition cost ratio increased in 2008, compared with 2007, due in part to the inclusion of our personal
64

lines business in 2008, which generates a higher acquisition cost ratio than our commercial P&C business. The increase in2008 also reflects higher acquisition costs on crop business, as 2008 included more profitable results on the first quarter finalsettlement than in 2007, as well as increased crop/hail production for 2008. As discussed above, 2007 included a large lossportfolio transfer which had a favorable impact on the 2007 policy acquisition cost ratio.
Insurance – North American’s administrative expense ratio increased in 2009, compared with 2008, primarily due tohigher administrative expenses in our retail division to support growth in certain businesses, from both new and existing prod-ucts, as well as higher spending to support growth in the personal lines business. The administrative expense ratio increasedin 2008, compared with 2007, reflecting the impact of the inclusion of the personal lines business, which generates higheradministrative expense ratios than our commercial P&C business, and the reduction in net premiums earned.
Insurance – Overseas General
The Insurance – Overseas General segment consists of ACE International, which comprises our network of indigenous retailinsurance operations, the wholesale insurance operations of ACE Global Markets, our London market underwriting unit includ-ing Lloyd’s Syndicate 2488, and the international A&H and life business of Combined Insurance. This segment has fourregions of operations: Europe, Asia Pacific, Far East, and Latin America. Combined Insurance distributes specialty individualaccident and supplemental health insurance products targeted to middle income consumers in Europe, Asia Pacific, and LatinAmerica. The following results include Combined Insurance from April 1, 2008.
% Change
(in millions of U.S. dollars) 2009 2008 20072009 vs.
20082008 vs.
2007
Net premiums written $ 5,145 $ 5,332 $ 4,568 (4)% 17%Net premiums earned 5,147 5,337 4,623 (4)% 15%Losses and loss expenses 2,597 2,679 2,420 (3)% 11%Policy benefits 4 12 – (67)% NMPolicy acquisition costs 1,202 1,193 963 1% 24%Administrative expenses 783 793 669 (1)% 19%
Underwriting income $ 561 $ 660 $ 571 (15)% 16%
Net investment income 479 521 450 (8)% 16%Net realized gains (losses) (20) (316) (69) 94% (358)%Other (income) expense 20 (11) (20) NM 45%Income tax expense 186 100 183 86% (45)%
Net income $ 814 $ 776 $ 789 5% (2)%
Loss and loss expense ratio 50.5% 50.4% 52.4%Policy acquisition cost ratio 23.3% 22.4% 20.8%Administrative expense ratio 15.2% 14.8% 14.5%
Combined ratio 89.0% 87.6% 87.7%
Insurance – Overseas General’s net premiums written decreased in 2009, compared with 2008, primarily due to a strengthen-ing of the U.S. dollar relative to major currencies. Refer to the table below for the impact of foreign exchange on net premiumswritten and earned. On a constant dollar basis, our international retail operations experienced P&C growth in all regions, withthe exception of the Far East, and reported increased A&H business in Europe, Asia, and Latin America. In addition to theunfavorable foreign exchange impact, our London wholesale business unit reported lower constant dollar production withinmost product lines. Insurance – Overseas General’s net premiums written increased in 2008, compared with 2007, primarilydue to the inclusion of Combined Insurance, which added $370 million of net premiums written.
Insurance – Overseas General’s net premiums earned decreased in 2009, compared with 2008, primarily due to anunfavorable foreign exchange impact. On a constant dollar basis, net premiums earned increased due to growth in P&C pro-duction in our international retail operations. Our London wholesale operations reported a decline in net premiums earned dueto lower production. Insurance – Overseas General’s net premiums earned increased in 2008, compared with 2007, primarilydue to the added premiums from Combined Insurance, growth in A&H production, and favorable foreign exchange impact.Combined Insurance added $371 million to this segment’s 2008 net premiums earned.
65

Insurance – Overseas General conducts business internationally and in most major foreign currencies. The following tablesummarizes the approximate effect of changes in foreign currency exchange rates on the growth of net premiums written andearned for the years ended December 31, 2009 and 2008.
2009 2008
Net premiums written:Growth in original currency 2.9% 14.1%Foreign exchange effect (6.4)% 2.6%
Growth as reported in U.S. dollars (3.5)% 16.7%
Net premiums earned:Growth in original currency 3.2% 12.9%Foreign exchange effect (6.8)% 2.5%
Growth as reported in U.S. dollars (3.6)% 15.4%
The following two tables provide a line of business and regional breakdown of Insurance – Overseas General’s net premiumsearned for the years ended December 31, 2009, 2008, and 2007.
% Change
(in millions U.S. dollars) 2009 2008 20072009 vs.
20082008 vs.
2007
Line of Business
Property and all other $ 1,787 $ 1,855 $ 1,697 (4)% 9%Casualty 1,420 1,487 1,495 (5)% (1)%Personal accident (A&H) 1,940 1,995 1,431 (3)% 39%
Net premiums earned $ 5,147 $ 5,337 $ 4,623 (4)% 15%
Region
Europe $ 2,348 $ 2,420 $ 1,999 (3)% 21%Asia Pacific 754 791 631 (5)% 25%Far East 451 425 365 6% 16%Latin America 772 778 633 (1)% 23%
4,325 4,414 3,628 (2)% 22%ACE Global Markets 822 923 995 (11)% (7)%
Net premiums earned $ 5,147 $ 5,337 $ 4,623 (4)% 15%
2009
% of
Total
2008% ofTotal
2007% ofTotal
Line of Business
Property and all other 34% 35% 37%Casualty 28% 28% 32%Personal accident (A&H) 38% 37% 31%
Net premiums earned 100% 100% 100%
Region
Europe 45% 45% 43%Asia Pacific 15% 15% 14%Far East 9% 8% 8%Latin America 15% 15% 14%
84% 83% 79%ACE Global Markets 16% 17% 21%
Net premiums earned 100% 100% 100%
66

The following table shows our adjusted loss and loss expense ratio for the years ended December 31, 2009, 2008, and2007.
2009 2008 2007
Loss and loss expense ratio, as reported 50.5% 50.4% 52.4%Catastrophe losses (1.0)% (1.6%) (2.1)%Prior period development 5.0% 5.7% 4.1%
Loss and loss expense ratio, adjusted 54.5% 54.5% 54.4%
Net catastrophe losses for 2009 were $51 million, compared with $83 million and $94 million in 2008 and 2007,respectively. The catastrophe losses for 2009 were primarily related to floods and windstorms in Europe. Catastrophe losses in2008 were primarily related to Hurricanes Gustav and Ike, tornadoes in the U.S., and an earthquake in China. Insurance –Overseas General experienced net favorable prior period development of $255 million, $304 million, and $192 million in2009, 2008, and 2007, respectively. Refer to “Prior Period Development” for more information.
Insurance – Overseas General’s policy acquisition cost ratio increased in 2009, compared with 2008, primarily due tolower net premiums earned in the retail A&H business, without a commensurate reduction in advertising costs, which aregenerally deferred and amortized over a longer period than the related premium. The policy acquisition cost ratio increased in2008 compared with 2007, primarily due to growth in A&H business and the impact of the acquired Combined Insurancebusiness, which is predominantly A&H business. A&H business typically attracts higher commission rates than traditional P&Cbusiness. Insurance – Overseas General’s administrative expense ratio increased in 2009, primarily due to the inclusion ofCombined Insurance for the full year. For 2008, administrative expenses increased primarily due to unfavorable foreignexchange impact and the inclusion of administrative expenses related to Combined Insurance.
Global Reinsurance
The Global Reinsurance segment represents ACE’s reinsurance operations, comprising ACE Tempest Re Bermuda, ACE Tem-pest Re USA, ACE Tempest Re Europe, and ACE Tempest Re Canada. Global Reinsurance markets its reinsurance productsworldwide under the ACE Tempest Re brand name and provides a broad range of coverage to a diverse array of primary P&Ccompanies.
% Change
(in millions of U.S. dollars) 2009 2008 20072009 vs.
20082008 vs.
2007
Net premiums written $ 1,038 $ 914 $ 1,197 14% (24)%Net premiums earned 979 1,017 1,299 (4)% (22)%Losses and loss expenses 330 524 664 (37)% (21)%Policy acquisition costs 195 192 248 2% (23)%Administrative expenses 55 56 64 (2)% (13)%
Underwriting income $ 399 $ 245 $ 323 63% (24)%
Net investment income 278 309 274 (10)% 13%Net realized gains (losses) (17) (163) 21 90% NMOther (income) expense 2 2 4 0% (50)%Income tax expense 46 30 32 53% (6)%
Net income $ 612 $ 359 $ 582 70% (38)%
Loss and loss expense ratio 33.7% 51.5% 51.1%Policy acquisition cost ratio 19.9% 18.8% 19.1%Administrative expense ratio 5.6% 5.5% 4.9%
Combined ratio 59.2% 75.8% 75.1%
67

Global Reinsurance reported increased net premiums written in 2009, compared with 2008, primarily due to P&C productiongrowth in U.S., Canada and Bermuda. Net premiums written declined in 2008, compared with 2007, as Global Reinsurancereported intense competition across a majority of its regions of operations, which resulted in significant declines in production.In 2008 and 2007, our clients increased their own risk retention and we adhered to our strict underwriting standards, whichmeant not renewing several large policies.
The following tables provide a line of business breakdown of Global Reinsurance’s net premiums earned for the yearsended December 31, 2009, 2008, and 2007.
% Change
(in millions of U.S. dollars) 2009 2008 20072009 vs.
20082008 vs.
2007
Line of Business
Property and all other $ 262 $ 229 $ 285 14% (20)%Casualty 433 494 671 (12)% (26)%Property catastrophe 284 294 343 (3)% (14)%
Net premiums earned $ 979 $ 1,017 $ 1,299 (4)% (22)%
2009% of Total
2008% of Total
2007% of Total
Property and all other 27% 22% 22%Casualty 44% 49% 52%Property catastrophe 29% 29% 26%
Net premiums earned 100% 100% 100%
Global Reinsurance’s net premiums earned decreased in 2009, compared with 2008 primarily because the prior yearincluded non-recurring inward reinstatement premiums related to Hurricanes Gustav and Ike. In addition, we experiencedlower production in 2008, which had an adverse impact on net premiums earned in 2009. The decrease in net premiumsearned in 2008, compared with 2007, was primarily due to reduced production caused by competitive conditions.
The following table shows our adjusted loss and loss expense ratio for the years ended December 31, 2009, 2008, and2007.
2009 2008 2007
Loss and loss expense ratio, as reported 33.7% 51.5% 51.1%Catastrophe losses (2.8)% (17.6)% (3.7)%Prior period development 14.5% 16.0% 2.6%
Loss and loss expense ratio, adjusted 45.4% 49.9% 50.0%
Global Reinsurance recorded net catastrophe losses of $28 million in 2009, primarily related to various Canadian storms andHurricane Klaus. This compares with net catastrophe losses of $186 million and $49 million in 2008 and 2007, respectively.Net catastrophe losses in 2008 were mainly due to Hurricanes Gustav and Ike.
Global Reinsurance experienced net favorable prior period development of $142 million in 2009. This compares with netfavorable prior period development of $159 million and $34 million in 2008 and 2007, respectively. Refer to “Prior PeriodDevelopment” for more information. The decrease in the adjusted loss and loss expense ratio was due to a change in businessmix which resulted in a greater proportion of property and other business production, which typically generates lower lossratios than casualty business.
Global Reinsurance’s policy acquisition costs ratio increased in 2009, compared with 2008, primarily due to the impactof the prior year inward reinstatement premiums, which generate minimal acquisition costs. Policy acquisition costs decreasedin 2008, compared with 2007, primarily due to the increase in inward reinstatement premiums. Administrative expenses werestable for 2009, compared with 2008, as additional expense accruals were offset by lower staffing costs as a result of reducedheadcount. In 2008, administrative expenses decreased compared with 2007, primarily due to lower staffing costs. Theadministrative expense ratio increased over the last three years primarily due to the decrease in net premiums earned, partiallyoffset by reduced staffing costs.
68
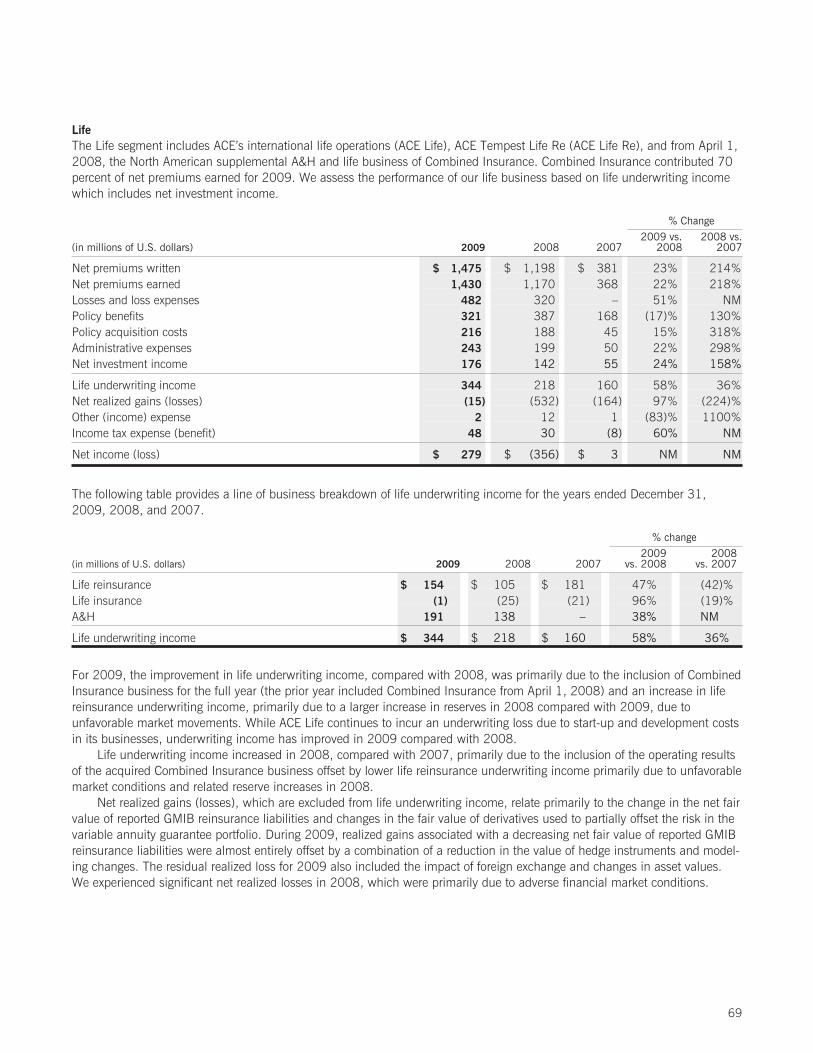
Life
The Life segment includes ACE’s international life operations (ACE Life), ACE Tempest Life Re (ACE Life Re), and from April 1,2008, the North American supplemental A&H and life business of Combined Insurance. Combined Insurance contributed 70percent of net premiums earned for 2009. We assess the performance of our life business based on life underwriting incomewhich includes net investment income.
% Change
(in millions of U.S. dollars) 2009 2008 20072009 vs.
20082008 vs.
2007
Net premiums written $ 1,475 $ 1,198 $ 381 23% 214%Net premiums earned 1,430 1,170 368 22% 218%Losses and loss expenses 482 320 – 51% NMPolicy benefits 321 387 168 (17)% 130%Policy acquisition costs 216 188 45 15% 318%Administrative expenses 243 199 50 22% 298%Net investment income 176 142 55 24% 158%
Life underwriting income 344 218 160 58% 36%Net realized gains (losses) (15) (532) (164) 97% (224)%Other (income) expense 2 12 1 (83)% 1100%Income tax expense (benefit) 48 30 (8) 60% NM
Net income (loss) $ 279 $ (356) $ 3 NM NM
The following table provides a line of business breakdown of life underwriting income for the years ended December 31,2009, 2008, and 2007.
% change
(in millions of U.S. dollars) 2009 2008 20072009
vs. 20082008
vs. 2007
Life reinsurance $ 154 $ 105 $ 181 47% (42)%Life insurance (1) (25) (21) 96% (19)%A&H 191 138 – 38% NM
Life underwriting income $ 344 $ 218 $ 160 58% 36%
For 2009, the improvement in life underwriting income, compared with 2008, was primarily due to the inclusion of CombinedInsurance business for the full year (the prior year included Combined Insurance from April 1, 2008) and an increase in lifereinsurance underwriting income, primarily due to a larger increase in reserves in 2008 compared with 2009, due tounfavorable market movements. While ACE Life continues to incur an underwriting loss due to start-up and development costsin its businesses, underwriting income has improved in 2009 compared with 2008.
Life underwriting income increased in 2008, compared with 2007, primarily due to the inclusion of the operating resultsof the acquired Combined Insurance business offset by lower life reinsurance underwriting income primarily due to unfavorablemarket conditions and related reserve increases in 2008.
Net realized gains (losses), which are excluded from life underwriting income, relate primarily to the change in the net fairvalue of reported GMIB reinsurance liabilities and changes in the fair value of derivatives used to partially offset the risk in thevariable annuity guarantee portfolio. During 2009, realized gains associated with a decreasing net fair value of reported GMIBreinsurance liabilities were almost entirely offset by a combination of a reduction in the value of hedge instruments and model-ing changes. The residual realized loss for 2009 also included the impact of foreign exchange and changes in asset values.We experienced significant net realized losses in 2008, which were primarily due to adverse financial market conditions.
69

Net Investment Income
(in millions of U.S. dollars) 2009 2008 2007
Fixed maturities $1,985 $1,972 $1,773Short-term investments 38 109 130Equity securities 54 93 68Other 48 (20) 25
Gross investment income 2,125 2,154 1,996Investment expenses (94) (92) (78)
Net investment income $2,031 $2,062 $1,918
Net investment income is influenced by a number of factors, including the amounts and timing of inward and outward cashflows, the level of interest rates, and changes in overall asset allocation. Net investment income decreased two percent in2009, compared with 2008, and increased eight percent in 2008, compared with 2007. The average market yield on fixedmaturities was 4.3 percent at December 31, 2009, compared with 6.4 percent and 5.3 percent at December 31, 2008 and2007, respectively. Average market yield represents our net investment income divided by average cost of fixed maturities andother investments and average market value of equity securities. Net investment income decreased in 2009, compared with2008, primarily due to lower yields on new investments and unfavorable foreign exchange impact during 2009, partially offsetby higher average invested assets. Net investment income for 2009, was also adversely impacted because we increased cashand short-term investments relative to debt and equity securities during the fourth quarter of 2008 and the first quarter of2009. During the second quarter of 2009, we deployed accumulated cash primarily into high-grade fixed-income securitiesand liquidated the majority of our publicly traded equity holdings and invested the proceeds in corporate bonds. Net invest-ment income increased in 2008, compared with 2007, primarily due to several years of positive operating cash flows whichresulted in a higher overall average invested asset base.
The following table shows the return on average invested assets for the years ended December 31, 2009, 2008, and2007.
(in millions of U.S. dollars, except for percentages) 2009 2008 2007
Average invested assets $43,767 $41,502 $38,798Net investment income $ 2,031 $ 2,062 $ 1,918Return on average invested assets 4.6% 5.0% 4.9%
Net Realized and Unrealized Gains (Losses)
We take a long-term view with our investment strategy and our investment managers manage our investment portfolio tomaximize total return within certain specific guidelines designed to minimize risk. The majority of our investment portfolio isavailable for sale and reported at fair value. Our held to maturity investment portfolio is reported at amortized cost. Refer to“Investments”, below, for information on fixed maturities we transferred from available for sale to held to maturity during thequarter ended June 30, 2009.
The effect of market movements on our available for sale investment portfolio impacts net income (through net realizedgains (losses)) when securities are sold or when we record an OTTI charge in net income (as discussed below). Additionally,net income is impacted through the reporting of changes in the fair value of derivatives, including financial futures, options,swaps, and GMIB reinsurance. Changes in unrealized appreciation and depreciation on available for sale securities whichresult from the revaluation of securities held, are reported as a separate component of accumulated other comprehensiveincome in shareholders’ equity.
We adopted the provisions of ASC Topic 320, Investments-Debt and Equity Securities related to the recognition and pre-sentation of OTTI as at April 1, 2009 (the adopted provisions). Under the adopted provisions, if we have the intent to sell animpaired fixed maturity security or it is more likely than not that we will be required to sell the security, an OTTI is consideredto have occurred, and we are required to record the OTTI in net income. Further, in cases where we do not intend to sell thesecurity and it is more likely than not that we will not be required to sell the security, we must evaluate the security todetermine the portion of impairment, if any, related to credit losses. If a credit loss is indicated, an OTTI is considered to have
70

occurred and any portion of the OTTI related to credit losses must be reflected in net income, while the portion of OTTI relatedto all other factors is included in other comprehensive income.
For fixed maturities, prior to the adopted provisions, ACE was required to record OTTI in net income unless we had theintent and ability to hold the impaired security to the expected recovery period. The adopted provisions do not have any impacton the accounting for OTTI for any other type of investment.
The cumulative effect of the adopted provisions resulted in a reduction to Accumulated other comprehensive income andan increase to Retained earnings of $242 million as at April 1, 2009. These adjustments reflect the net of tax amount ($305million pre-tax) of OTTI recognized in net income prior to the adoption related to fixed maturities held at the adoption date thathave not suffered a credit loss, we do not intend to sell, and it is more likely than not that we will not be required to sell beforethe recovery of their amortized cost.
Retained earnings and Deferred tax assets as at April 1, 2009, were also reduced by $47 million as a result of anincrease in our valuation allowance against deferred tax assets, which is a direct effect of the adopted provisions. Specifically,as a result of the reassessment of credit losses required by the adopted provisions, we determined that certain previouslyimpaired fixed maturity securities had suffered credit losses in excess of previously estimated amounts, which may give rise toadditional future capital losses for tax purposes. Given the amount of available capital gains against which such additionalcapital losses could be offset, at the date of adoption, we expected that a portion of capital loss carry forwards would expireunused. Accordingly, we determined that an additional valuation allowance was necessary given that it is more likely than notthat a portion of deferred tax assets related to previously impaired fixed income securities would not be realized.
Each quarter, we review our securities in an unrealized loss position (impaired securities), including fixed maturity secu-rities, securities lending collateral, equity securities, and other investments, to identify those impaired securities to bespecifically evaluated for a potential OTTI.
For impaired fixed maturities, if we have the intent to sell the security or it is more likely than not that we will be requiredto sell the security, an OTTI is considered to have occurred. In cases where we do not intend to sell the security and it is morelikely than not that we will not be required to sell the security, we evaluate the security to determine if a credit loss hasoccurred based on a combination of qualitative and quantitative factors including a discounted cash flow model, where neces-sary. If a credit loss is indicated, an OTTI is considered to have occurred. Prior to the adopted provisions, when evaluatingfixed maturities for OTTI, we principally considered our ability and intent to hold the impaired security to the expected recoveryperiod, the issuer’s financial condition, and our assessment (using available market information such as credit ratings) of theissuer’s ability to make future scheduled principal and interest payments on a timely basis. The factors that we now considerwhen determining if a credit loss exists related to a fixed maturity security are discussed in Note 4 d) to the ConsolidatedFinancial Statements. All significant assumptions used in determining credit losses are subject to change as market conditionsevolve.
We review all non-fixed maturity investments for OTTI based on the following:• the amount of time a security has been in an unrealized loss position and the magnitude of the loss position;• the period in which cost is expected to be recovered, if at all, based on various criteria including economic conditions andother issuer-specific developments; and• our ability and intent to hold the security to the expected recovery period.
As a general rule, we also consider that equity securities in an unrealized loss position for twelve consecutive months areimpaired.
71

The following tables present our pre-tax net realized and unrealized gains (losses), as well a breakdown of our OTTI andother net realized gains (losses) on investments for the years ended December 31, 2009 and 2008.
2009 2008
(in millions of U.S. dollars)
NetRealized
Gains(Losses)
NetUnrealized
Gains(Losses)
NetImpact
NetRealized
Gains(Losses)
NetUnrealized
Gains(Losses)
NetImpact
Fixed maturities and short-term investments $ (41) $ 2,717 $ 2,676 $ (846) $ (2,091) $ (2,937)Equity securities (145) 213 68 (349) (363) (712)Other 31 162 193 (55) (305) (360)
Subtotal (155) 3,092 2,937 (1,250) (2,759) (4,009)
DerivativesEquity and fixed income derivatives 68 – 68 (3) – (3)Fair value adjustment on insurance derivatives 368 – 368 (650) – (650)S&P put option and futures (363) – (363) 164 – 164Fair value adjustment on other derivatives (93) – (93) 83 – 83
Subtotal derivatives (20) – (20) (406) – (406)
Foreign exchange gains (losses) (21) – (21) 23 – 23
Total gains (losses) $ (196) $ 3,092 $ 2,896 $ (1,633) $ (2,759) $ (4,392)
2009 2008
(in millions of U.S. dollars) OTTI
Other NetRealized
Gains(Losses)
NetRealized
Gains(Losses) OTTI
Other NetRealized
Gains(Losses)
NetRealized
Gains(Losses)
Fixed maturities and short-term investments $ (234) $ 193 $ (41) $ (760) $ (86) $ (846)Equity securities (26) (119) (145) (248) (101) (349)Other (137) 168 31 (56) 1 (55)
Total investment portfolio gains (losses) $ (397) $ 242 $ (155) $(1,064) $ (186) $(1,250)
Our net realized losses in 2009, included write-downs of $397 million as a result of conditions which caused us to concludethat the decline in fair value of certain securities was other-than-temporary. This compares with write-downs of $1.1 billionand $214 million in 2008 and 2007, respectively. The impairments recorded in 2009 related to fixed maturities were primar-ily due to securities with below investment grade credit ratings and intent to sell securities in an unrealized loss position.Impairments related to all other investments were primarily due to duration and severity of decline below cost. Included inother net realized gains (losses) is a realized gain of $193 million on the fourth quarter sale of our interest in Verisk Analytics,Inc., a holding company that includes Insurance Services Office Inc. (ISO), offset by a realized loss on AGO and private equi-ties.
At December 31, 2009, our investment portfolios held by U.S. legal entities included approximately $414 million of grossunrealized losses on fixed income investments. Our tax planning strategy related to these losses is based on our view that wewill hold our fixed income investments until they recover their cost. As such, we have recognized a deferred tax asset ofapproximately $145 million related to these fixed income investments. This strategy allows us to recognize the associateddeferred tax asset related to these fixed income investments as we do not believe these losses will ever be realized. In addition,management decreased the valuation allowance by $47 million during 2009, as a result of improvement in the unrealizedgains and losses in the overall U.S. portfolio.
We engage in a securities lending program which involves lending investments to other institutions for short periods oftime. ACE invests the collateral received in short-term funds of high credit quality with the objective of maintaining a stableprincipal balance. Certain investments in the money market mutual funds purchased with the securities lending collateraldeclined in value resulting in an unrealized loss of $42 million. The unrealized loss is attributable to fluctuations in marketvalues of the underlying performing debt instruments held by the respective mutual funds, rather than default of a debtissuer. We concluded that the decline in value was temporary.
72

Other Income and Expense Items
(in millions of U.S. dollars) 2009 2008 2007
Equity in net (income) loss of partially-owned entities $ 39 $ (52) $ 39Noncontrolling interest expense 3 11 7Federal excise and capital taxes 16 16 18Other 27 (14) 17
Other (income) expense $ 85 $ (39) $ 81
Other (income) expense primarily comprises our equity in net income of AGO prior to the June 2009 issuance and HuataiInsurance Company of China, Limited, which is included in equity in net income of partially-owned entities. As discussed pre-viously, prior to AGO’s June 2009 issuance, we included our investment in AGO in Investments in partially-owned insurancecompanies and reflected our portion of its net income (loss) under equity in net income of partially-owned entities. Effectivewith the June 2009 issuance, we now account for the investment as an available-for-sale equity security. Refer to“Overview—Investment in Assured Guaranty Ltd”.
Other (income) expense also includes certain federal excise and capital taxes incurred as a result of capital managementinitiatives. These transactions are considered capital in nature and are excluded from underwriting results.
Investments
Our investment portfolio is invested primarily in publicly traded, investment grade fixed income securities with an averagecredit quality of AA (with one half invested in AAA securities), as rated by the independent investment rating service S&P. Theportfolio is externally managed by independent, professional investment managers. The average duration of our fixed incomesecurities, including the effect of options and swaps, was 3.7 years at December 31, 2009, compared with 3.6 years atDecember 31, 2008. We estimate that a 100 basis point (bps) increase in interest rates would reduce our book value byapproximately $1.6 billion at December 31, 2009.
We experienced net unrealized gains of $3.1 billion in 2009 primarily due to tightening of credit spreads, particularlyduring the second and third quarters of 2009. In addition, greater global demand-driven purchases of fixed income invest-ments and a greater demand for risk-based assets contributed to the unrealized gains. The fixed maturities in an unrealizedloss position at December 31, 2009, were comprised of both investment grade and below investment grade securities forwhich fair value declined primarily due to widening credit spreads since the date of purchase.
As part of our fixed income diversification strategy, we decided to hold to maturity certain commercial mortgage-backedsecurities that have shorter term durations. Because we have the intent to hold such securities to maturity, a transfer of suchsecurities with a fair value of $704 million was made during 2009 from Fixed maturities available for sale to Fixed maturitiesheld to maturity. The $4 million unrealized depreciation at the date of the transfer continues to be reported as a component ofAccumulated other comprehensive income and is being amortized over the remaining life of the securities as an adjustment ofyield in a manner consistent with the amortization of any premium or discount.
Our Other investments principally comprise direct investments, investment funds, and limited partnerships. Our exposureto sub-prime asset backed securities was $54 million at December 31, 2009, which represented less than one percent of ourinvestment portfolio. We do not expect any material investment loss from our exposure to sub-prime mortgages. Our invest-ment portfolio is broadly diversified across geographies, sectors, and issuers. We hold no collateralized debt obligations orcollateralized loan obligations in our investment portfolio and we provide no credit default protection.
We have long-standing global credit limits for our entire portfolio across the organization. Exposures are aggregated, moni-tored, and actively managed by our Global Credit Committee, comprised of senior executives, including our Chief FinancialOfficer, our Chief Risk Officer, our Chief Investment Officer, and our Treasurer. We also have well-established, strict contractualinvestment rules requiring managers to maintain highly diversified exposures to individual issuers and closely monitor invest-ment manager compliance with portfolio guidelines.
73

The following table shows the fair value and cost/amortized cost of our invested assets at December 31, 2009 and 2008.
2009 2008
(in millions of U.S. dollars) Fair Value
Cost/Amortized
Cost Fair Value
Cost/Amortized
Cost
Fixed maturities available for sale $ 39,525 $ 38,985 $ 31,155 $ 33,109Fixed maturities held to maturity 3,561 3,481 2,865 2,860Short-term investments 1,667 1,667 3,350 3,350
44,753 44,133 37,370 39,319Equity securities 467 398 988 1,132Other investments 1,375 1,258 1,362 1,368
Total investments $ 46,595 $ 45,789 $ 39,720 $ 41,819
The fair value of our total investments increased $6.9 billion during 2009. The increase was primarily due to unrealized appre-ciation and the investing of operating cash flows.
The following tables show the market value of our fixed maturities and short-term investments at December 31, 2009and 2008. The first table lists investments according to type and the second according to S&P credit rating.
2009 2008
(in millions of U.S. dollars, except for percentages) Market ValuePercentage
of Total Market ValuePercentage
of Total
Treasury $ 2,068 5% $ 1,018 3%Agency 2,698 6% 2,027 5%Corporate 13,166 29% 8,744 23%Mortgage-backed securities 11,311 25% 10,986 29%Asset-backed securities 371 1% 709 2%Municipal 2,300 5% 2,124 6%Non-U.S. 11,172 25% 8,412 23%Short-term investments 1,667 4% 3,350 9%
Total $ 44,753 100% $ 37,370 100%
AAA $ 22,884 51% $ 22,960 61%AA 4,021 9% 3,374 9%A 7,461 17% 5,497 15%BBB 4,910 11% 3,388 9%BB 2,866 6% 1,119 3%B 2,029 5% 934 3%Other 582 1% 98 0%
Total $ 44,753 100% $ 37,370 100%
74

The table below summarizes our largest exposures to corporate bonds by market value and S&P credit rating at December 31,2009.
December 31, 2009
(in millions of U.S. dollars) Market Value Rating
General Electric Co $ 454 AA+
JP Morgan Chase & Co 401 A+
Bank of America Corp 387 A
Wells Fargo & Co 317 AA-
Citigroup Inc 275 A
Verizon Communications Inc 267 A
Morgan Stanley 244 A
AT&T INC 236 A
Goldman Sachs Group Inc 230 A
HSBC Holdings Plc 176 AA-
Comcast Corp 173 BBB+
Credit Suisse Group 151 A
Barclays PLC 126 A+
ConocoPhillips 125 A
Telecom Italia SpA 125 BBB
Lloyds Banking Group Plc 121 A
Time Warner Cable Inc 118 BBB
XTO Energy Inc 112 BBB
Banco Santander SA 109 AA
American Express Co 106 BBB+
Pfizer Inc 103 AA
News Corp Ltd 91 BBB+
Deutsche Telekom AG 88 BBB+
Dominion Resources Inc/VA 86 A-
Roche Holding AG 84 BBB+
Total $ 4,705
75
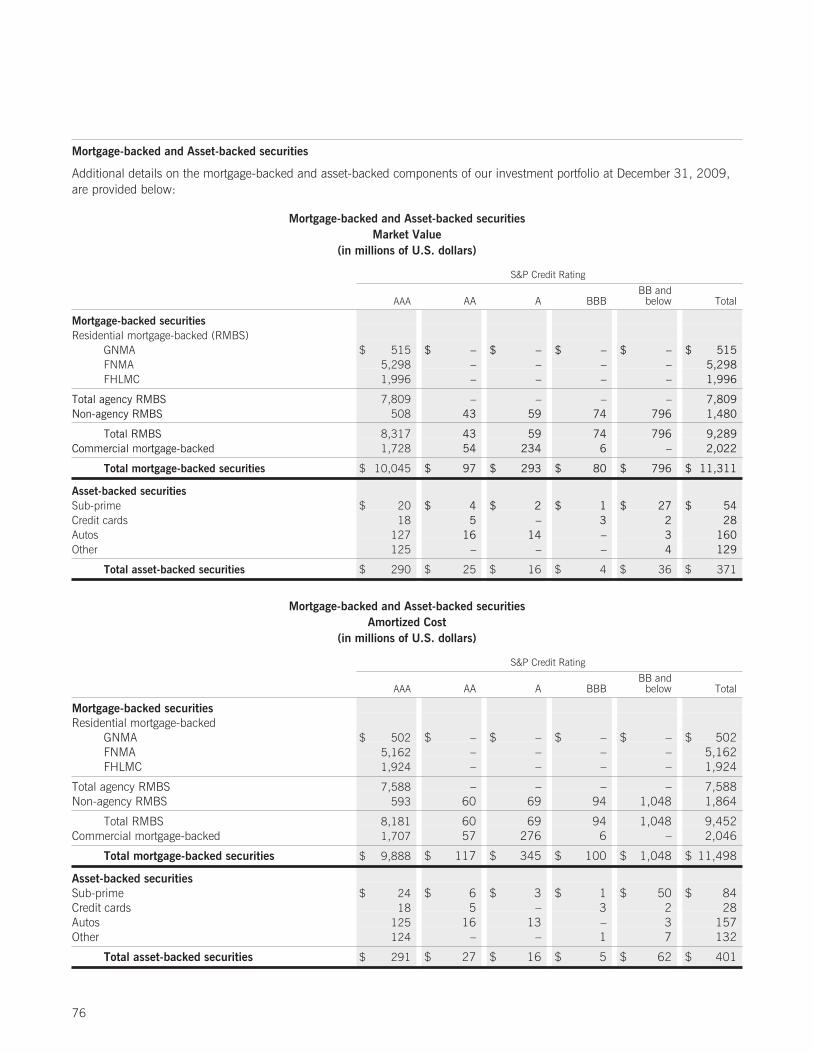
Mortgage-backed and Asset-backed securities
Additional details on the mortgage-backed and asset-backed components of our investment portfolio at December 31, 2009,are provided below:
Mortgage-backed and Asset-backed securities
Market Value
(in millions of U.S. dollars)
S&P Credit Rating
AAA AA A BBBBB and
below Total
Mortgage-backed securities
Residential mortgage-backed (RMBS)GNMA $ 515 $ – $ – $ – $ – $ 515FNMA 5,298 – – – – 5,298FHLMC 1,996 – – – – 1,996
Total agency RMBS 7,809 – – – – 7,809Non-agency RMBS 508 43 59 74 796 1,480
Total RMBS 8,317 43 59 74 796 9,289Commercial mortgage-backed 1,728 54 234 6 – 2,022
Total mortgage-backed securities $ 10,045 $ 97 $ 293 $ 80 $ 796 $ 11,311
Asset-backed securities
Sub-prime $ 20 $ 4 $ 2 $ 1 $ 27 $ 54Credit cards 18 5 – 3 2 28Autos 127 16 14 – 3 160Other 125 – – – 4 129
Total asset-backed securities $ 290 $ 25 $ 16 $ 4 $ 36 $ 371
Mortgage-backed and Asset-backed securities
Amortized Cost
(in millions of U.S. dollars)
S&P Credit Rating
AAA AA A BBBBB and
below Total
Mortgage-backed securities
Residential mortgage-backedGNMA $ 502 $ – $ – $ – $ – $ 502FNMA 5,162 – – – – 5,162FHLMC 1,924 – – – – 1,924
Total agency RMBS 7,588 – – – – 7,588Non-agency RMBS 593 60 69 94 1,048 1,864
Total RMBS 8,181 60 69 94 1,048 9,452Commercial mortgage-backed 1,707 57 276 6 – 2,046
Total mortgage-backed securities $ 9,888 $ 117 $ 345 $ 100 $ 1,048 $ 11,498
Asset-backed securities
Sub-prime $ 24 $ 6 $ 3 $ 1 $ 50 $ 84Credit cards 18 5 – 3 2 28Autos 125 16 13 – 3 157Other 124 – – 1 7 132
Total asset-backed securities $ 291 $ 27 $ 16 $ 5 $ 62 $ 401
76

Our mortgage-backed securities are rated predominantly AAA and comprise approximately 25 percent of our fixed income port-folio. This compares with a 40 percent mortgage-backed weighting in representative indices of the U.S. fixed income market atthe end of 2009. The minimum rating for our initial purchases of mortgage and asset backed securities is AAA.
Agency RMBS represent securities which have been issued by Federal agencies (Government National Mortgage Associa-tion, Federal National Mortgage Association, and Federal Home Loan Mortgage Corporation) with implied or explicitgovernment guarantees. These represent 84 percent of our total RMBS portfolio. With respect to our non-agency RMBS, theseare backed by prime collateral and are broadly diversified over 260,000 loans. This portfolio’s loan-to-value ratio is approx-imately 70 percent with an average Fair Isaac Corporation (FICO) score of 730. With this conservative loan-to-value ratio andsubordinated collateral of 13 percent, the cumulative 5-year foreclosure rate would have to rise to 20 percent (the historicalcumulative foreclosure rates is eight percent for prime mortgages) and real estate values would have to fall 30 percent fromtheir levels at the end of 2009, before principal is impaired. Within the portfolio of prime non-agency RMBS are $146 millionof holdings classified as alternative A-paper (ALT-A). These ALT-A holdings are broadly diversified with over 60 percent issuedprior to 2006, possess an average FICO score of 712, and have a relatively conservative loan-to-value ratio of 72 percent.With subordinated collateral of 21 percent, the cumulative 5-year foreclosure rate would have to rise to 32 percent and realestate values would have to fall more than 27 percent from their levels at the end of 2009, before principal is impaired. Thecomparable cumulative market foreclosure rate was approximately 30 percent at the end of 2009. New investments in ALT-Awere suspended in the first quarter of 2008. Our commercial mortgage-backed securities (CMBS) are rated predominantlyAAA, broadly diversified over 23,000 loans, and 73 percent of the portfolio was issued before 2006. The averageloan-to-value ratio is approximately 67 percent with a debt service coverage ratio in excess of 1.6 and weighted-average sub-ordinated collateral of 27 percent. The cumulative foreclosure rate would have to rise to 42 percent and commercial real estatevalues would have to fall more than 10 percent from their levels at the end of 2009, before principal is impaired. The marketdelinquency rate at the end of 2009 was nine percent. We suspended new investments in CMBS in the first quarter of 2009.
The sub-prime asset-backed securities are broadly diversified in over 86,000 loans with an average loan-to-value ratio ofapproximately 81 percent and an average FICO score of 600. With subordinated collateral of 30 percent, the cumulative5-year foreclosure rate would have to rise to 35 percent and real estate values would have to fall more than 18 percent fromtheir levels at the end of 2009, before principal is impaired. The comparable historical cumulative 5-year foreclosure rate is 32percent. ACE suspended new investments in sub-prime backed securities in the third quarter of 2007. Our auto loan asset-backed securities are rated predominantly AAA with a short duration of approximately six months and average subordinatedcollateral of 20 percent. Annual default rates would have to rise to 17 times the level at the end of 2009 of about 2.4 percentbefore principal is impaired. New investments in credit card and auto backed securities were suspended in the first quarter of2008.
Below-investment grade corporate fixed income portfolio
We invest in below-investment grade securities through investment portfolios managed by external managers, specifically dedi-cated to this asset class. Below-investment grade securities have different characteristics than investment grade corporate debtsecurities. Risk of loss from default by the borrower is greater with below-investment grade securities. Below-investment gradesecurities are generally unsecured and are often subordinated to other creditors of the issuer. Also, issuers of below-investmentgrade securities usually have higher levels of debt and are more sensitive to adverse economic conditions, such as recession orincreasing interest rates, than are investment grade issuers. At December 31, 2009, our fixed income investment portfolioincluded below-investment grade and non-rated securities which, in total, comprised approximately 13 percent of our fixedincome portfolio. Our below-investment grade and non-rated portfolio includes approximately 500 issuers, with the greatestsingle exposure being $72 million.
We manage high yield bonds as a distinct and separate asset class from investment grade bonds. The allocation to highyield bonds is explicitly set by internal management and is targeted to securities in the upper tier of credit quality (BB/B). Ourminimum rating for initial purchase is BB/B. Four external investment managers are responsible for high yield securityselection and portfolio construction. Our high yield managers have a conservative approach to credit selection and very lowhistorical default experience. Holdings are highly diversified across industries and subject to a 1.5 percent issuer limit as apercentage of high yield allocation (approximately 0.1 percent of the total investment portfolio). We monitor position limitsdaily through an internal compliance system. Derivative and structured securities (e.g. credit default swaps and collateralizedmortgage obligations) are not permitted in the high-yield portfolio.
77

Reinsurance Recoverable on Ceded Reinsurance
The composition of our reinsurance recoverable at December 31, 2009, and December 31, 2008, is as follows:(in millions of U.S. dollars) 2009 2008
Reinsurance recoverable on unpaid losses and loss expenses, net of a provision for uncollectiblereinsurance $ 12,745 $ 12,935
Reinsurance recoverable on paid losses and loss expenses, net of a provision for uncollectiblereinsurance 850 982
Net reinsurance recoverable on losses and loss expenses $ 13,595 $ 13,917
Reinsurance recoverable on policy benefits $ 298 $ 259
We evaluate the financial condition of our reinsurers and potential reinsurers on a regular basis and also monitor concen-trations of credit risk with reinsurers. The provision for uncollectible reinsurance is required principally due to the failure ofreinsurers to indemnify us, primarily because of disputes under reinsurance contracts and insolvencies. The decline in netreinsurance recoverable in 2009 was primarily related to a higher level of crop loss payments on the 2008 crop year, as wellas NICO payments related to Brandywine. Reinsurance recoverable on policy benefits increased primarily due to a loss portfo-lio cession of Combined Insurance’s long-term care business.
Asbestos and environmental (A&E) and other run-off liabilities
Included in ACE’s liabilities for losses and loss expenses are amounts for A&E (A&E liabilities). The A&E liabilities principallyrelate to claims arising from bodily-injury claims related to asbestos products and remediation costs associated with hazardouswaste sites. The estimation of ACE’s A&E liabilities is particularly sensitive to future changes in the legal, social, and economicenvironment. ACE has not assumed any such future changes in setting the value of its A&E reserves, which include provisionsfor both reported and IBNR claims. Refer to Note 7 to the Consolidated Financial Statements, under Item 8, for moreinformation.
Reserving considerations
For asbestos, ACE faces claims relating to policies issued to manufacturers, distributors, installers, and other parties in thechain of commerce for asbestos and products containing asbestos. Claims can be filed by individual claimants or groups ofclaimants with the potential for hundreds of individual claimants at one time. Claimants will generally allege damages acrossan extended time period which may coincide with multiple policies for a single insured.
Environmental claims present exposure for remediation and defense costs associated with the contamination of propertyas a result of pollution. It is common, especially for larger defendants, to be named as a potentially responsible party at multi-ple sites.
The table below summarizes count information for asbestos and environmental claims for the years ended December 31,2009 and 2008, for direct policies only, and excludes claims from assumed reinsurance.
2009 2008
Asbestos (by causative agent)
Open at the beginning of year 1,198 1,169Newly reported 54 75Closed or otherwise disposed 229 46
Open at end of year 1,023 1,198
Environmental (by site)
Open at the beginning of year 4,704 5,132Newly reported 196 250Closed or otherwise disposed 1,529 678
Open at end of year 3,371 4,704
Closed or otherwise disposed claims were significantly higher in 2009, compared with 2008, due to a review of inactive filesthat revealed that payment was no longer sought on the files; therefore, the files were closed.
78

The following table shows our gross and net survival ratios for our A&E loss reserves and allocated loss adjustmentexpense (ALAE) reserves at December 31, 2009 and 2008.
2009 Survival Ratios 2008 Survival Ratios
3 Year 1 Year 3 Year 1 Year
Gross Net Gross Net Gross Net Gross Net
Asbestos 7.1 8.1 6.0 5.3 8.3 9.6 8.3 18.2Environmental 2.9 4.4 3.1 4.0 3.5 5.3 2.7 4.5Total 6.2 6.9 5.5 5.0 7.2 8.2 6.8 11.2
The net ratios reflect third party reinsurance other than the aggregate excess reinsurance provided under the NICO contracts.These survival ratios are calculated by dividing the asbestos or environmental loss and ALAE reserves by the average asbestosor environmental loss and ALAE payments for the three most recent calendar years (3 year survival ratio), and by asbestos orenvironmental loss and ALAE payments in 2008 (1 year survival ratio). The survival ratios provide only a very rough depictionof reserves, and are significantly impacted by a number of factors such as aggressive settlement practices, variations in grossto ceded relationships within the asbestos or environmental claims, and levels of coverage provided. We, therefore, urge cau-tion in using these very simplistic ratios to gauge reserve adequacy and note that the 1 year survival ratios, particularly, arelikely to move considerably from year to year for the reasons just described.
The 1 year gross survival ratio for asbestos decreased from 2008 due to a number of large settlements in 2009. This hasresulted in a decline in the three year gross ratio as well, though to a lesser degree than seen in the 1 year ratio. The 1 yearnet asbestos ratio of 5.3 declined significantly from the prior 1 year ratio because of 2008’s unusually high level of cededreinsurance associated with asbestos payments in 2008.
Catastrophe Management
We continue to closely monitor our catastrophe accumulation around the world. The following modeled loss informationreflects ACE’s in-force portfolio at October 1, 2009, and reinsurance program at January 1, 2010.
The table below shows our modeled annual aggregate probable maximum loss (PML), net of reinsurance, for 100-yearand 250-year return periods for U.S. hurricanes and California earthquakes. The table also shows corresponding pre-taxindustry losses for each of the return periods for U.S. hurricanes and California earthquakes. For example, according to themodel, there is a one percent chance that ACE’s losses incurred in any year from U.S. hurricanes could be in excess of$1.128 billion (or six percent of our total shareholders’ equity at December 31, 2009). We estimate that at such hypotheticalloss levels, aggregate industry losses would be approximately $136.665 billion.
U.S. Hurricanes California Earthquakes
Modeled Annual Aggregate Net PML
% of TotalShareholders’
Equity
% of TotalShareholders’
Equity
(in millions of U.S. dollars, except for percentages) ACE Industry ACE Industry
1-in-100 $ 1,128 6% $136,665 $ 731 4% $ 36,4561-in-250 $ 1,439 7% $197,856 $ 895 5% $ 57,486
The modeling estimates of both ACE and industry loss levels are inherently uncertain owing to key assumptions. First, whilethe use of third-party catastrophe modeling packages to simulate potential hurricane and earthquake losses is prevalent withinthe insurance industry, the models are reliant upon significant meteorology, seismology, and engineering assumptions to esti-mate hurricane and earthquake losses. In particular, modeled hurricane and earthquake events are not always arepresentation of actual events and ensuing additional loss potential. Second, there is no universal standard in the preparationof insured data for use in the models and the running of the modeling software. Third, we are reliant upon third-party esti-mates of industry insured exposures and there is significant variation possible around the relationship between ACE’s loss andthat of the industry following an event. Fourth, we assume that our reinsurance recoveries following an event are fully collec-tible. These loss estimates do not represent ACE’s potential maximum exposures and it is highly likely that ACE’s actualincurred losses would vary materially from the modeled estimates.
79

Natural Catastrophe Reinsurance Program
ACE’s core catastrophe reinsurance program provides protection against natural catastrophes impacting its primary operations(i.e., excluding assumed reinsurance) and consists of two separate towers.
First, for losses arising out of North America, our core traditional program renewed on January 1, 2010, and we havepurchased reinsurance coverage in various layers that provide $450 million in excess of $500 million in all-risk coverage.Each layer of this core program has a single additional limit available for restatement post-loss event on the same terms as theoriginal limit. In addition to the foregoing, we have in place a multi-year, peril-specific program from a major reinsurer that isbacked by their credit worthiness and the issuance of fully collateralized catastrophe bonds. Under this coverage, we have $86million part of $200 million of U.S. hurricane coverage in excess of an attachment point of approximately $575 million. Whilethis coverage attaches at a level within our core program, any recoveries from this program shall be for ACE’s sole benefit andeffectively reduce the net loss under the retention. In addition, the catastrophe bonds also provide $86 million of U.S. earth-quake coverage with a territorial scope of California, the Pacific Northwest, and the central U.S. In addition, we purchasedanother $14 million of the same earthquake coverage as the catastrophe bonds to provide a full $100 million of earthquakecoverage excess of approximately $961 million. These multi-year programs do not have a reinstatement feature. To keep theexpected loss the same each year of these multi-year covers, the attachment point is adjusted annually, either up or down,based upon an independent modeling firm’s review of the exposure data underlying each program. Due to exposure reductionsand model change, the attachment for the catastrophe bonds declined from $712 million to $575 million for the $86 millionof wind protection and from $1.11 billion to approximately $960 million for earthquake protection. The catastrophe bondsprogram expires in June 2012.
While our modeled United States catastrophe exposure declined significantly in 2009, ACE did not reduce the catastrophelimits purchased at January 1, 2010, by the same amount. By way of comparison, the 2010 program has potentially approx-imately $37 million less in coverage for first event U.S. hurricane protection and $85 million less in first event Californiaearthquake protection than the expiring program. We consider our retention to be approximately $500 million but this willdepend upon the nature of the loss and the interplay between the underlying per risk programs and certain other catastropheprograms purchased by individual business units. These other catastrophe programs have the potential to reduce our effectiveretention below $500 million.
Second, for losses arising outside of the U.S. and effective July 1, 2009, our core program is made up of two layers. Ourfirst reinsurance layer remains $50 million in excess of a $50 million retention with two reinstatements. This layer was 67.75percent placed. Our second layer provides $150 million in protection in excess of $100 million with one reinstatement. Thislayer was 100 percent placed. There is further protection above this core program for specific geographic regions, being $100million in excess of $250 million for Asia Pacific and $150 million in excess of $250 million for Europe. The Asia Pacific toplayer has one free reinstatement and one at 100 percent of original premium. With respect to the top layer for Europe, themaximum restatement is one additional full limit. In addition, there are various underlying per risk and catastrophe treatiesunderlying the core program’s retention of $50 million. Finally, we purchased an additional treaty that provides $50 million ofprotection across the top of this catastrophe program with one reinstatement. However, this top layer may also be exhaustedby certain risk losses so it is not certain that it will be available to us in an event. In comparison to the prior year, the coreprogram and the specific layers for Asia Pacific and Europe provide the same amount of coverage except for the $16.1 millionretained in the $50 million excess of $50 million first layer.
Crop Insurance
We are, and have been since the 1980s, one of the leading writers of crop insurance in the U.S. and conduct that businessthrough Rain and Hail L.L.C., an MGA. We provide protection throughout the U.S. and are therefore geographically diversified,which reduces the risk of exposure to a single event or a heavy accumulation of losses in any one region.
Our crop insurance book comprises two components – multi-peril crop insurance (MPCI) and hail insurance.The MPCI program is a partnership with the U.S. Department of Agriculture (USDA). The policies cover revenue shortfalls
or production losses due to natural causes such as drought, excessive moisture, hail, wind, frost, insects, and disease. Gen-erally, policies have deductibles ranging from 10 percent to 50 percent of the insured’s risk. The USDA’s Risk ManagementAgency (RMA) sets the policy terms and conditions, rates and forms, and is also responsible for setting compliance standards.As a participating company, we report all details of policies underwritten to the RMA and are party to a Standard ReinsuranceAgreement (SRA), which sets out the relationship between private insurance companies and the federal government concern-ing the terms and conditions regarding the risks each will bear. In addition to the pro-rata and excess of loss reinsurance
80

protections inherent in the SRA, we cede business on a quota-share basis to third-party reinsurers and further protect our netretained position through the purchase of stop-loss reinsurance in the private market place. During the fourth quarter of 2009,the RMA released a first draft of a proposed new SRA, which was last negotiated in 2005 and expires in its current form onJune 30, 2010. The terms of the proposed new SRA are still being negotiated. However, this SRA change applies to the 2011Crop year and therefore, we expect no impact from a new agreement on 2010 financial results. It is still unclear what theimpact, if any, there will be on our business beyond 2010.
Our hail program is a private offering. We use industry data to develop our own rates and forms for the coverage offered.The policy primarily protects farmers against yield reduction caused by hail and/or fire, and related costs such as transit tostorage. We offer various deductibles to allow the grower to partially self-insure for a reduced premium cost. We limit our hailexposures through the use of township liability limits, quota-share reinsurance cessions, and stop-loss reinsurance on our netretained hail business.
On the MPCI business, we recognize net premiums written as we receive acreage reports from the policyholders on thevarious crops throughout the U.S. The program has specific timeframes as to when producers must report acreage to us.These reports allow us to determine the actual premium associated with the liability that is being planted. Once the net pre-mium written has been booked, the premium is then earned over the growing season for the crops. Given the major crops thatare covered in the program, we typically see a substantial written premium impact in the second and third quarter and theearned premium is also more concentrated in the second and third quarters. Premium is earned on the hail program over thecoverage period of the policy. Given the very short nature of the growing season, most hail business is typically written in thesecond and third quarters with the earned premium also more heavily occurring during this time frame. We regularly receivereports from our MGA relating to the previous crop year(s), resulting in adjustments to previously reported premiums, lossesand loss expenses and profit share commissions. The adjustments are typically more significant in the first quarter of the year(annual first quarter settlement), compared with other periods.
Political Risk, Trade Credit, and Structured Trade Credit
Political risk insurance is a specialized coverage that provides clients with protection against unexpected, catastrophic politicalor macroeconomic events, primarily in developing markets. We participate in this market through our wholly owned subsidiarySovereign Risk Insurance Ltd. (Sovereign), and through a unit of our London-based ACE Global Markets operation. Sovereignis one of the world’s leading underwriters of political risk insurance and has a global portfolio spread across more than 100countries. Its clients include financial institutions, national export credit agencies, leading multilateral agencies, and multina-tional corporations. ACE Global Markets writes political risk, trade credit, and structured trade credit business out ofunderwriting offices in London, Hamburg, New York, and Singapore.
Our political risk insurance provides protection to commercial lenders against defaults on cross border loans, insulatesinvestors against equity losses, and protects exporters against defaults on contracts. Commercial lenders, our largest clientsegment, are covered for missed scheduled loan repayments due to acts of confiscation, expropriation or nationalization by thehost government; currency inconvertibility or exchange transfer restrictions, or war or other acts of political violence. In addi-tion, in the case of loans to government-owned entities or loans that have a government guarantee, political risk policies coverscheduled payments against risks of nonpayment or non-honoring of government guarantees. Equity investors and corpo-rations receive similar coverage to that of lenders, except they are protected against financial losses, inability to repatriatedividends, and physical damage to their operations caused by covered events. Our export contracts protection provides cover-age for both exporters and their financing banks against the risk of contract frustration due to government actions, includingnon-payment by government entities.
ACE Global Markets’ trade credit and structured trade credit businesses cover losses due to insolvency, protracted default,and political risk perils including export and license cancellation. It provides trade credit coverage to larger companies thathave sophisticated credit risk management systems, with exposure to multiple customers and that have the ability to self-insure losses up to a certain level through excess of loss coverage. Its structured trade credit business provides coverage tofinance banks, exporters, and trading companies, with exposure to trade-related financing instruments (i.e., LOCs or pre-exportfinance).
We have implemented structural features in our policies in order to control potential losses within the political risk, tradecredit, and structured credit businesses. These include basic loss sharing features that include co-insurance and deductibles,and in the case of trade credit, the use of non-qualifying losses that drop smaller exposures deemed too difficult to assess.Ultimate loss severity is also limited by using waiting periods to enable the insurer and insured to agree on recovery strategies,and the subrogation of the rights of the lender/exporter to the insurer following a claim. We pay claims over the original loanpayment schedule, rather than in a lump sum in order to provide insureds and the insurer additional time to remedy problems
81
and work towards full recoveries. It is important to note that political risk, trade credit, and structured trade credit policies arenamed peril conditional contracts, not financial guarantees, and claims are only paid after conditions and warranties are ful-filled. Political risk, trade credit, and structured trade credit insurance do not cover currency devaluations, bond defaults, anyform of derivatives, movements in overseas equity markets, transactions deemed illegal, or situations where corruption ormisrepresentation has occurred, or debt that is not legally enforceable. In addition to assessing and mitigating potentialexposure on a policy-by-policy basis, we also have specific risk management measures in place to manage overall exposureand risk. These measures include placing country and individual transaction limits based on country risk and credit ratings,combined single loss limits on multi-country policies, the use of reinsurance protection, and regular modeling and stress-testing of the portfolio.
Liquidity
Liquidity is a measure of a company’s ability to generate cash flows sufficient to meet the short-term and long-term cashrequirements of its business operations. As a holding company, ACE Limited possesses assets that consist primarily of thestock of its subsidiaries and other investments. In addition to net investment income, ACE Limited’s cash flows currentlydepend primarily on dividends or other statutorily permissible payments. Historically, these dividends and other payments havecome from ACE’s Bermuda-based operating subsidiaries, which we refer to as our Bermuda subsidiaries. Our consolidatedsources of funds consist primarily of net premiums written, fees, net investment income, and proceeds from sales and matur-ities of investments. Funds are used at our various companies primarily to pay claims, operating expenses, and dividends andto service debt and purchase investments. After satisfying our cash requirements, excess cash flows from these underwritingand investing activities are invested.
Global market and economic conditions have been severely disrupted over the past three years, which included a wide-spread recession. These conditions and their consequences may affect (among other aspects of our business) the demand forand claims made under our products, the ability of customers, counterparties, and others to establish or maintain theirrelationships with us, our ability to access and efficiently use internal and external capital resources, the availability ofreinsurance protection, the risks we assume under reinsurance programs covering variable annuity guarantees, and ourinvestment performance. However, we believe that our present cash flows from operations, investing activities, and financingactivities are sufficient to fund our current working capital and debt obligation needs.
We anticipate that positive cash flows from operations (underwriting activities and investment income) should be suffi-cient to cover cash outflows under most loss scenarios through 2010. Should the need arise, we generally have access to thecapital markets and other available credit facilities. Refer to “Credit Facilities” below. Our access to funds under existing creditfacilities is dependent on the ability of the banks that are parties to the facilities to meet their funding commitments. Our exist-ing credit facilities have remaining terms expiring between 2012 and 2014. However, we may be required to replace creditsources in a difficult market should one of our existing credit providers experience financial difficulty. There has also beenrecent consolidation in the banking industry, which could lead to increased reliance on and exposure to particular institutions.If we cannot obtain adequate capital or sources of credit on favorable terms, or at all, our business, operating results, andfinancial condition could be adversely affected. To date, we have not experienced difficulty accessing any of our credit facili-ties. To further ensure the sufficiency of funds to settle unforeseen claims, we hold a certain amount of invested assets in cashand short-term investments. In addition, for certain insurance, reinsurance, or deposit contracts that tend to have relativelylarge and reasonably predictable cash outflows, we attempt to establish dedicated portfolios of assets that are duration-matched with the related liabilities. With respect to the duration of our overall investment portfolio, we manage asset durationsto both maximize return given current market conditions and provide sufficient liquidity to cover future loss payments. In a lowinterest rate environment, the overall duration of our fixed maturity investments tends to be shorter and in a high interest rateenvironment, such duration tends to be longer. Given the current low interest rate environment, at December 31, 2009, theaverage duration of our fixed maturity investments (3.7 years) is less than the average expected duration of our insuranceliabilities (4.1 years).
Despite our safeguards, if paid losses accelerated beyond our ability to fund such paid losses from current operating cashflows, we might need to either liquidate a portion of our investment portfolio or arrange for financing. Potential events causingsuch a liquidity strain could include several significant catastrophes occurring in a relatively short period of time or large scaleuncollectible reinsurance recoverables on paid losses (as a result of coverage disputes, reinsurers’ credit problems, decreasesin the value of collateral supporting reinsurance recoverables, or increases in collateral postings under our variable annuityreinsurance business). Because each subsidiary focuses on a more limited number of specific product lines than is collectivelyavailable from the ACE Group of Companies, the mix of business tends to be less diverse at the subsidiary level. As a result,the probability of a liquidity strain, as described above, may be greater for individual subsidiaries than when liquidity is
82

assessed on a consolidated basis. If such a liquidity strain were to occur in a subsidiary, we could be required to liquidate aportion of our investment, potentially at distressed prices, as well as be required to contribute capital to the particular sub-sidiary and/or curtail dividends from the subsidiary to support holding company operations.
The payments of dividends or other statutorily permissible distributions from our operating companies are subject to thelaws and regulations applicable to each jurisdiction, as well as the need to maintain capital levels adequate to support theinsurance and reinsurance operations, including financial strength ratings issued by independent rating agencies, which arediscussed below. During 2009, we were able to meet all of our obligations, including the payments of dividends declared onour Common Shares, with our net cash flows and dividends received.
We assess which subsidiaries to draw dividends from based on a number of factors. Considerations such as regulatoryand legal restrictions as well as the subsidiary’s financial condition are paramount to the dividend decision. The legalrestrictions on the payment of dividends from retained earnings by our Bermuda subsidiaries are currently satisfied by theshare capital and additional paid-in capital of each of the Bermuda subsidiaries. ACE Tempest Life Re paid dividends of $400million in 2009 and $1.2 billion in 2008. ACE Bermuda paid dividends of $502 million in 2008. A portion of the dividendsreceived in 2008 were used in connection with our April 1, 2008, acquisition of Combined Insurance.
The payment of any dividends from ACE Global Markets or its subsidiaries is subject to applicable U.K. insurance lawsand regulations. In addition, the release of funds by Syndicate 2488 to subsidiaries of ACE Global Markets is subject to regu-lations promulgated by the Society of Lloyd’s. The U.S. insurance subsidiaries of ACE INA may pay dividends, without priorregulatory approval, subject to restrictions set out in state law of the subsidiary’s domicile (or, if applicable, “commercialdomicile”). ACE INA’s international subsidiaries are also subject to insurance laws and regulations particular to the countries inwhich the subsidiaries operate. These laws and regulations sometimes include restrictions that limit the amount of dividendspayable without prior approval of regulatory insurance authorities.
ACE Limited did not receive any dividends from ACE Global Markets or ACE INA in 2009 or 2008. The debt issued byACE INA is serviced by statutorily permissible distributions by ACE INA’s insurance subsidiaries to ACE INA as well as othergroup resources.
Cash Flows
Our insurance and reinsurance operations provide liquidity in that premiums are received in advance, sometimes substantiallyin advance, of the time claims are paid. Generally, cash flows are affected by claim payments that, due to the nature of ouroperations, may be comprised of large loss payments on a limited number of claims and which can fluctuate significantly fromperiod to period. The irregular timing of these loss payments can create significant variations in cash flows from operationsbetween periods. Refer to “Contractual Obligations and Commitments” for our estimate of future claim payments by period.Sources of liquidity include cash from operations, routine sales of investments, and financing arrangements. The following is adiscussion of our cash flows for 2009 and 2008.
The operating cash flows reflect net income for each period, adjusted for non-cash items and changes in working capi-tal. Our consolidated net cash flows from operating activities were $3.3 billion in 2009, compared with $4.1 billion in2008. The largest contributors to the decline are net claim payments and collateral requirements. Net claim payments were$6.9 billion in 2009, compared with $6.3 billion in 2008. The collateral outflow was $397 million in 2009, compared withan inflow of $304 million in 2008. We made higher than typical net claim payments in 2009 in connection with prior yearcatastrophes and other individual large property related losses. The collateral outflow consisted of both the return of collateralwe had received from counterparties on hedging positions as the market has improved, and collateral requirements related tonew hedge positions established to protect us from the market moving lower.
Our consolidated net cash flows used for investing activities were $3.2 billion in 2009, compared with $4.1 billion in2008. Net investing activities for 2009 were related primarily to net purchases of fixed maturities. For 2008 net investingactivities were related primarily to net purchases and maturities on the fixed maturities portfolio and the acquisition of Com-bined Insurance for $2.56 billion.
Our consolidated net cash flows used for financing activities were $321 million in 2009, compared with net cash flowsfrom financing activities of $314 million in 2008. Net cash flows used for financing activities in 2009, included net proceedsfrom the issuance, in June 2009, of $500 million in long-term debt, net repayment of debt and reverse repurchase agree-ments of $466 million, and dividends paid on our Common Shares of $388 million. Net cash flows from financing activities in2008, included $1.2 billion of net proceeds from the issuance of long-term debt. This was partially offset by $575 million ofnet cash flows used for financing activities relating to the redemption of our Preferred Shares, and dividends paid on ourCommon and Preferred Shares.
83

Both internal and external forces influence our financial condition, results of operations, and cash flows. Claim settle-ments, premium levels, and investment returns may be impacted by changing rates of inflation and other economic conditions.In many cases, significant periods of time, ranging up to several years or more, may lapse between the occurrence of aninsured loss, the reporting of the loss to us, and the settlement of the liability for that loss. We believe that our cash balances,cash flow from operations, routine sales of investments, and the liquidity provided by our credit facilities, are adequate to meetexpected cash requirements.
In addition to cash from operations, routine sales of investments, and financing arrangements, we have agreements witha bank provider which implemented two international multi-currency notional cash pooling programs to enhance cashmanagement efficiency during periods of short-term timing mismatches between expected inflows and outflows of cash bycurrency. In each program, participating ACE entities establish deposit accounts in different currencies with the bank providerand each day the credit or debit balances in every account are notionally translated into a single currency (U.S. dollars) andthen notionally pooled. The bank extends overdraft credit to any participating ACE entity as needed, provided that the overallnotionally-pooled balance of all accounts in each pool at the end of each day is at least zero. Actual cash balances are notphysically converted and are not co-mingled between legal entities. ACE entities may incur overdraft balances as a means toaddress short-term timing mismatches, and any overdraft balances incurred under this program by an ACE entity would beguaranteed by ACE Limited (up to $150 million in the aggregate). Our revolving credit facility allows for same day drawings tofund a net pool overdraft should participating ACE entities withdraw contributed funds from the pool.
We also, from time to time, utilize reverse repurchase agreements as a low-cost alternative for short-term funding needs.Refer to “Short-term debt” below.
Capital Resources
Capital resources consist of funds deployed or available to be deployed to support our business operations. The following tablesummarizes the components of our capital resources at December 31, 2009 and 2008.
(in millions of U.S. dollars, except for percentages) 2009 2008
Short-term debt $ 161 $ 471Long-term debt 3,158 2,806
Total debt 3,319 3,277Trust preferred securities 309 309Total shareholders’ equity 19,667 14,446
Total capitalization $ 23,295 $ 18,032
Ratio of debt to total capitalization 14.2% 18.2%Ratio of debt plus trust preferred securities to total capitalization 15.6% 19.9%
Our ratios of debt to total capitalization and debt plus trust preferred securities to total capitalization have decreased due to thesignificant increase in shareholders’ equity, combined with stable levels of debt and trust-preferred securities.
We believe our financial strength provides us with the flexibility and capacity to obtain available funds externally throughdebt or equity financing on both a short-term and long-term basis. Our ability to access the capital markets is dependent on,among other things, market conditions and our perceived financial strength. We have accessed both the debt and equitymarkets from time to time.
The following table reports the significant movements in our shareholders’ equity for the year ended December 31, 2009.
(in millions of U.S. dollars) 2009
Total shareholders’ equity, beginning of year $ 14,446
Net income 2,549
Dividends declared on Common Shares (402)
Change in net unrealized appreciation (depreciation) on investments, net of tax 2,611
Cumulative translation, net of tax 401
Income tax valuation allowance on the adoption of new OTTI standard (47)
Pension liability (31)
Other movements, net 140
Total shareholders’ equity, end of year $ 19,667
84

Total shareholders’ equity increased $5.2 billion in 2009, primarily due to net income of $2.5 billion, and the change in netunrealized appreciation on investments of $2.6 billion. The change in net unrealized appreciation on investments was primar-ily due to the tightening of credit spreads. The cumulative translation increased as major currencies strengthened against theU.S. dollar.
Short-term Debt
At December 31, 2009, short-term debt consisted of a five-year term loan due in December 2010. Though none are out-standing at December 31, 2009, we had executed reverse repurchase agreements with certain counterparties under which weagreed to sell securities and repurchase them at a future date for a predetermined price. These included agreements bothexecuted and settled in 2008 totaling $1 billion as part of the financing of the Combined Insurance acquisition. Short-termdebt at December 31, 2008, included $250 million in reverse repurchase agreements. All reverse repurchase agreementswere settled during the second quarter of 2009. In September 2009, we repaid the ACE INA nine-month term loan ($16million), and in December 2009, we repaid the ACE INA subordinated notes ($200 million).
Long-term Debt
Our total long-term debt of $3.2 billion is described in detail in Note 9 to the Consolidated Financial Statements, under Item 8.In June 2009, our subsidiary, ACE INA Holdings Inc., issued $500 million of 5.9 percent senior notes due June 2019.
The notes are guaranteed by ACE Limited. The net proceeds from the issue of the senior notes were used to repay amountsowed to counterparties under reverse repurchase agreements as noted above, and were also used to refinance debt maturitiesand for general corporate purposes.
Trust Preferred Securities
The securities outstanding consist of $300 million of trust preferred securities due 2030, issued by a special purpose entity (atrust) that is wholly owned by us. The sole assets of the special purpose entity are debt instruments issued by one or more ofour subsidiaries. The special purpose entity looks to payments on the debt instruments to make payments on the preferredsecurities. We have guaranteed the payments on these debt instruments. The trustees of the trust include one or more of ourofficers and at least one independent trustee, such as a trust company. Our officers serving as trustees of the trust do notreceive any compensation or other remuneration for their services in such capacity. The full $309 million of outstanding trustpreferred securities (calculated as $300 million as discussed above plus our equity share of the trust) is shown on our con-solidated balance sheet as a liability. Additional information with respect to the trust preferred securities is contained in Note 9e) to the Consolidated Financial Statements, under Item 8.
Common Shares
Our Common Shares had a par value of CHF 31.88 each at December 31, 2009.For the foreseeable future, subject to shareholder approval, we expect to make distributions to shareholders as a repay-
ment of share capital in the form of a reduction in par value or qualified paid-in capital rather than through dividends. At the2009 Annual General Meeting, the Board proposed and shareholders approved the payment of a dividend by the Company inthe form of a distribution to shareholders (the Dividend Approval) through a Swiss franc par value reduction pursuant to aformula that has the effect of making the U.S. dollar value of distributions more consistent.
The Dividend Approval provides for an annual par value reduction of CHF 1.36 (the Base Annual Dividend), equal to$1.24 per share at the time of the Dividend Approval, payable in four installments prior to the 2010 Annual General Meeting;provided that each of the Swiss franc installments will be adjusted pursuant to the formula so that the actual Swiss franc parvalue reduction amount for each installment will equal $0.31, subject to an aggregate upward adjustment (the Dividend Cap)for the four installments of 50 percent of the Base Annual Dividend (i.e. CHF 0.68). Application of the formula will mean thatthe Swiss franc amount of each installment will be determined at the approximate time of distribution, while the U.S. dollarvalue of the installment will remain $0.31 unless and until the Dividend Cap is reached. A par value reduction that wouldotherwise exceed the Dividend Cap will be reduced to equal the Swiss franc amount remaining available under the DividendCap, and the U.S. dollar amount distributed will be the then-applicable U.S. dollar equivalent of that Swiss franc amount. Wepaid the third of the four installments of $0.31 per Common Share on January 11, 2010, and in connection with this divi-dend, the par value per share was reduced by CHF 0.32, based on the USD/CHF rate published on December 14, 2009.
Should we determine to pay dividends other than by a reduction in par value, under Swiss law, such dividends (otherthan by reductions in par value) may be paid out only if the corporation has sufficient distributable profits from previous busi-ness years, or if the reserves of the corporation are sufficient to allow distribution of a dividend. The board of directors of a
85

Swiss corporation may propose that a dividend be paid, but cannot itself set the dividend. The Company auditors must confirmthat the dividend proposal of the board of directors conforms with Swiss statutory law. Prior to the distribution of dividends,five percent of the annual profits must be allocated to the general reserve until the amount of general reserves has reachedtwenty percent of the paid-in nominal share capital. Our Swiss Articles of Association can provide for a higher general reserveor for the creation of further reserves setting forth their purpose and use. Once this level has been reached and maintained, theshareholders may approve a distribution of each year’s profit within the framework of applicable legal requirements. Dividendspaid from retained earnings are usually due and payable immediately after the shareholders’ resolution relating to the alloca-tion of profits has been passed. Under Swiss law, the statute of limitations in respect of claims for dividend payments is fiveyears. As noted above, for the foreseeable future, we expect to pay dividends as a repayment of share capital in the form of areduction in par value or qualified paid-in capital, which would not be subject to Swiss withholding tax.
Contractual Obligations and Commitments
The table below shows our contractual obligations and commitments including our payments due by period at December 31,2009.
Payments Due By Period
(in millions of U.S. dollars) TotalLess than 1
Year 1-3 Years 4-5 Years After 5 Years
Payment amounts determinable from the respective contracts
Deposit liabilities $ 332 $ 50 $ 84 $ 25 $ 173Purchase obligations 525 114 193 132 86Limited partnerships – funding commitments 695 285 338 60 12Operating leases 347 68 108 86 85Short-term debt 161 161 – – –Long-term debt 3,158 – 50 950 2,158Trust preferred securities 309 – – – 309Interest on debt obligations 2,264 218 417 366 1,263
Total obligations in which payment amounts are determinablefrom the respective contracts 7,791 896 1,190 1,619 4,086
Payment amounts not determinable from the respective
contracts
Estimated gross loss payments under insurance andreinsurance contracts 37,783 8,997 10,521 5,760 12,505
Estimated payments for future life and annuity policy benefits 3,694 272 427 321 2,674
Total contractual obligations and commitments $ 49,268 $ 10,165 $ 12,138 $ 7,700 $ 19,265
The above table excludes the following items:Pension Obligations: Minimum funding requirements for our pension obligations are immaterial. Subsequent funding
commitments are apt to vary due to many factors and are difficult to estimate at this time. Refer to Note 14 to the ConsolidatedFinancial Statements, under Item 8, for more information.
Liabilities for unrecognized tax benefits: The liability for unrecognized tax benefits, excluding interest, was $155 million atDecember 31, 2009. We recognize accruals for interest and penalties, if any, related to unrecognized tax benefits in incometax expense. At December 31, 2009 we had $20 million in liabilities for income tax-related interest in our consolidated bal-ance sheet. We are unable to make a reasonably reliable estimate for the timing of cash settlement with respect to theseliabilities. Refer to Note 8 to the Consolidated Financial Statements, under Item 8, for more information.
We have no other significant contractual obligations or commitments not reflected in the table above.
86

Deposit liabilities
Deposit liabilities include reinsurance deposit liabilities of $281 million and contract holder deposit funds of $51 million atDecember 31, 2009. The reinsurance deposit liabilities arise from contracts we sold for which there is not a significant trans-fer of risk. At contract inception, the deposit liability is equal to net cash received. An accretion rate is established based onactuarial estimates whereby the deposit liability is increased to the estimated amount payable over the term of the contract.The deposit accretion rate is the rate of return required to fund expected future payment obligations. We periodically reassessthe estimated ultimate liability and related expected rate of return. Any resulting changes to the amount of the deposit liabilityare reflected as an adjustment to earnings to reflect the cumulative effect of the period the contract has been in force, and byan adjustment to the future accretion rate of the liability over the remaining estimated contract term.
Additional information with respect to deposit liabilities is contained in Note 2 k) to the Consolidated Financial State-ments, under Item 8.
Purchase obligations
We are party to enforceable and legally binding agreements to purchase certain services. Purchase obligations in the tableprimarily comprise audit fees and agreements with vendors to purchase system software administration and maintenance serv-ices.
Limited partnerships – funding commitments
In connection with our investments in limited partnerships, we have commitments that may require funding over the nextseveral years. The timing of the payment of these commitments is uncertain and will differ from our estimated timing in thetable.
Operating lease commitments
We lease office space in most countries in which we operate under operating leases that expire at various dates throughDecember 2033. We renew and enter into new leases in the ordinary course of business as required.
Estimated gross loss payments under insurance and reinsurance contracts
We are obligated to pay claims under insurance and reinsurance contracts for specified loss events covered under those con-tracts. Such loss payments represent our most significant future payment obligation as a P&C insurance and reinsurancecompany. In contrast to other contractual obligations, cash payments are not determinable from the terms specified within thecontract. For example, we do not ultimately make a payment to our counterparty for many insurance and reinsurance con-tracts (i.e., when a loss event has not occurred) and if a payment is to be made, the amount and timing cannot be determinedfrom the contract. In the table above, we estimate payments by period relating to our gross liability for unpaid losses and lossexpenses included in the Consolidated Balance Sheet at December 31, 2009, and do not take into account reinsurancerecoverable. These estimated loss payments are inherently uncertain and the amount and timing of actual loss payments arelikely to differ from these estimates and the differences could be material. Given the numerous factors and assumptionsinvolved in both estimates of loss and loss expense reserves and related estimates as to the timing of future loss and lossexpense payments in the table above, differences between actual and estimated loss payments will not necessarily indicate acommensurate change in ultimate loss estimates.
Estimated payments for future life and annuity policy benefits
We establish reserves for future policy benefits for life and annuity contracts. The amounts in the table are gross of fees orpremiums due from the underlying contracts. The liability for future policy benefits for life and annuity contracts presented inour balance sheet is discounted and reflected net of fees or premiums due from the underlying contracts. Accordingly, theestimated amounts in the table exceed the liability for future policy benefits for life and annuity contracts presented in ourbalance sheet. Payment amounts related to these reserves must be estimated and are not determinable from the contract. Dueto the uncertainty with respect to the timing and amount of these payments, actual results could materially differ from theestimates in the table.
87

Credit Facilities
As our Bermuda subsidiaries are not admitted insurers and reinsurers in the U.S., the terms of certain U.S. insurance andreinsurance contracts require them to provide collateral, which can be in the form of LOCs. In addition, ACE Global Markets isrequired to satisfy certain U.S. regulatory trust fund requirements which can be met by the issuance of LOCs. LOCs may alsobe used for general corporate purposes and to provide underwriting capacity as funds at Lloyd’s.
The following table shows our main credit facilities by credit line, usage, expiry date, and purpose at December 31,2009.
(in millions of U.S. dollars)Credit
Line(1t) Usage Expiry Date
Unsecured Liquidity FacilityACE Limited(2) $ 500 $ 54 Nov. 2012
Unsecured Operational LOC FacilityACE Limited 1,000 554 Nov. 2012
Unsecured Capital FacilityACE Limited(3) 484 412 Dec. 2013
Unsecured Operational LOC FacilityACE Limited 500 500 Sept. 2014
Total $ 2,484 $ 1,520(1)Certain facilities are guaranteed by operating subsidiaries and/or ACE Limited.(2)May also be used for LOCs.(3)Supports ACE Global Markets underwriting capacity for Lloyd’s Syndicate 2488.
It is anticipated that the commercial facilities will be renewed on expiry but such renewals are subject to the availability ofcredit from banks utilized by ACE. In the event that such credit support is insufficient, we could be required to provide alter-native security to clients. This could take the form of additional insurance trusts supported by our investment portfolio or fundswithheld using our cash resources. The value of letters of credit required is driven by, among other things, statutory liabilitiesreported by variable annuity guarantee reinsurance clients, loss development of existing reserves, the payment pattern of suchreserves, the expansion of business, and loss experience of such business.
The facilities in the table above require that we maintain certain covenants, all of which have been met at December 31,2009. These covenants include:(i)Maintenance of a minimum consolidated net worth in an amount not less than the “Minimum Amount”. For the pur-
pose of this calculation, the Minimum Amount is an amount equal to the sum of the base amount (currently $12billion) plus 25 percent of consolidated net income for each fiscal quarter, ending after the date on which the currentbase amount became effective, plus 50 percent of any increase in consolidated net worth during the same period,attributable to the issuance of Common and Preferred Shares. The Minimum Amount is subject to an annual resetprovision.
(ii) Maintenance of a maximum debt to total capitalization ratio of not greater than 0.35 to 1. Under this covenant, debtdoes not include trust preferred securities or mezzanine equity, except where the ratio of the sum of trust preferredsecurities and mezzanine equity to total capitalization is greater than 15 percent. In this circumstance, the amountgreater than 15 percent would be included in the debt to total capitalization ratio.
At December 31, 2009, (a) the minimum consolidated net worth requirement under the covenant described in (i) abovewas $12.6 billion and our actual consolidated net worth as calculated under that covenant was $19.0 billion and (b) our ratioof debt to total capitalization was 0.142 to 1, which is below the maximum debt to total capitalization ratio of 0.35 to 1 asdescribed in (ii) above.
Our failure to comply with the covenants under any credit facility would, subject to grace periods in the case of certaincovenants, result in an event of default. This could require us to repay any outstanding borrowings or to cash collateralizeLOCs under such facility. A failure by ACE Limited (or any of its subsidiaries) to pay an obligation due for an amount exceeding$50 million would result in an event of default under all of the facilities described above.
88
Ratings
ACE Limited and its subsidiaries are assigned debt and financial strength (insurance) ratings from internationally recognizedrating agencies, including S&P, A.M. Best, Moody’s Investors Service, and Fitch. The ratings issued on our companies bythese agencies are announced publicly and are available directly from the agencies. Our Internet site, www.acelimited.com,also contains some information about our ratings, which can be found under the Investor Information tab.
Financial strength ratings reflect the rating agencies’ opinions of a company’s claims paying ability. Independent ratingsare one of the important factors that establish our competitive position in the insurance markets. The rating agencies considermany factors in determining the financial strength rating of an insurance company, including the relative level of statutory sur-plus necessary to support the business operations of the company. These ratings are based upon factors relevant topolicyholders, agents, and intermediaries and are not directed toward the protection of investors. Such ratings are not recom-mendations to buy, sell, or hold securities.
Debt ratings apply to short-term and long-term debt. These ratings are assessments of the likelihood that we will maketimely payments of principal, and interest.
It is possible that, in the future, one or more of the rating agencies may reduce our existing ratings. If one or more of ourratings were downgraded, we could incur higher borrowing costs and our ability to access the capital markets could beimpacted. In addition, our insurance and reinsurance operations could be adversely impacted by a downgrade in our financialstrength ratings, including a possible reduction in demand for our products in certain markets. For example, the ACE GlobalMarkets capital facility requires that collateral be posted if the S&P financial strength rating of ACE falls to BBB+ or lower.Also, we have insurance and reinsurance contracts which contain rating triggers. In the event the S&P or A.M. Best financialstrength ratings of ACE fall to BBB+ or lower, we may be faced with the cancellation of premium or be required to post collat-eral on our underlying obligation associated with this premium. We estimate that at December 31, 2009, a one-notchdowngrade of our S&P or A.M. Best financial strength ratings would result in an immaterial loss of premium or requirement forcollateral to be posted.
Recent Accounting Pronouncements
Refer to Note 2 to the Consolidated Financial Statements, for a discussion of new accounting pronouncements.
Item 7A. Quantitative and Qualitative Disclosures about Market Risk
Market Sensitive Instruments and Risk Management
Market risk represents the potential for loss due to adverse changes in the fair value of financial instruments. We are exposedto potential losses from various market risks including changes in interest rates, equity prices, and foreign currency exchangerates. Further, through writing the GMIB and GMDB products, we are exposed to volatility in the equity and credit markets, aswell as interest rates and the equity markets. Our investment portfolio consists primarily of fixed income securities, denomi-nated in both U.S. dollars and foreign currencies, which are sensitive to changes in interest rates and foreign currencyexchange rates. The majority of our fixed income portfolio is classified as available for sale. The effect of market movements onour available for sale investment portfolio impacts net income (through net realized gains (losses)) when securities are sold orwhen we record an OTTI charge in net income. Changes in interest rates and foreign currency exchange rates will have animmediate effect on comprehensive income and shareholders’ equity but will not ordinarily have an immediate effect on netincome. From time to time, we also use investment derivative instruments such as futures, options, swaps, and foreign cur-rency forward contracts to manage the duration of our investment portfolio and foreign currency exposures and also to obtainexposure to a particular financial market. At December 31, 2009 and 2008, our notional exposure to investment derivativeinstruments was $8.9 billion and $10.3 billion, respectively. In addition, as part of our investing activity, we purchase to beannounced mortgage backed securities (TBAs). Investment derivative instruments are recognized as assets or liabilities in ourConsolidated Financial Statements and are sensitive to changes in interest rates, foreign currency exchange rates, and equitysecurity prices. Changes in the fair value of TBAs are included in net realized gains (losses) and therefore, have an immediateeffect on both our net income and shareholders’ equity.
We seek to mitigate market risk using a number of techniques, including maintaining and managing the assets andliabilities of our international operations consistent with the foreign currencies of the underlying insurance and reinsurancebusinesses, thereby limiting exchange rate risk to net assets denominated in foreign currencies.
89

The following is a discussion of our primary market risk exposures at December 31, 2009. Our policies to address theserisks in 2009 were not materially different from 2008. We do not currently anticipate significant changes in our primary mar-ket risk exposures or in how those exposures are managed in future reporting periods based upon what is known or expectedto be in effect in future reporting periods.
Interest rate risk – fixed income portfolio and debt obligations
Our fixed income portfolio and debt obligations have exposure to interest rate risk. Changes in investment values attributable tointerest rate changes are mitigated by corresponding and partially offsetting changes in the economic value of our insurancereserves and debt obligations. We monitor this exposure through periodic reviews of our asset and liability positions.
The following table shows the impact at December 31, 2009 and 2008, on the market value of our fixed income portfolioof a hypothetical increase in interest rates of 100 bps applied instantly across the U.S. yield curve (an immediate time horizonwas used as this presents the worst case scenario).
(in millions of U.S. dollars, except for percentages) 2009 2008
Fair value of fixed income portfolio $ 44,753 $ 37,370Pre-tax impact of 100 bps increase in interest rates $ 1,623 $ 1,329Percentage of total fixed income portfolio at fair value 3.6% 3.6%
Changes in interest rates will have an immediate effect on comprehensive income and shareholders’ equity but will not ordina-rily have an immediate effect on net income. Variations in market interest rates could produce significant changes in the timingof prepayments due to prepayment options available. For these reasons, actual results could differ from those reflected in thetables.
Although our debt and trust preferred securities (collectively referred to as debt obligations) are reported at amortized valueand not adjusted for fair value changes, changes in interest rates could have a material impact on their fair value, albeit thereis no immediate impact on our Consolidated Financial Statements. The following table shows the impact at December 31,2009 and 2008, on the market value of our debt obligations of a hypothetical decrease in interest rates of 100 bps appliedinstantly across the U.S. yield curve (an immediate time horizon was used as this presents the worst case scenario).
(in millions of U.S. dollars, except for percentages) 2009 2008
Fair value of debt obligations $ 3,905 $ 3,334Impact of 100 bps decrease in interest rates $ 241 $ 179Percentage of total debt obligations at fair value 6.2% 5.3%
Equity price risk – equity portfolio
Our portfolio of equity securities, which we carry on our balance sheet at fair value, has exposure to price risk. This risk isdefined as the potential loss in fair value resulting from adverse changes in stock prices. In addition, we attain exposure to theequity markets through the use of derivative instruments, which also have exposure to price risk. Our U.S. equity portfolio iscorrelated with the S&P 500 index and changes in that index would approximate the impact on our portfolio. Our internationalequity portfolio has exposure to a broad range of non-U.S. equity markets. During the second quarter of 2009, we liquidatedthe majority of our publicly traded equity holdings and invested the proceeds in corporate bonds. The following table providesmore information on our exposure to equity price risk at December 31, 2009 and 2008.
(in millions of U.S. dollars) 2009 2008
Fair value of equity securities $ 467 $ 988Pre-tax impact of 10 percent decline in market prices for equity exposures $ 47 $ 99
Changes in the fair value of our equity portfolio are recorded as unrealized appreciation (depreciation) and are included as aseparate component of accumulated other comprehensive income in shareholders’ equity.
90

Foreign currency exchange rate risk
Many of our non-U.S. companies maintain both assets and liabilities in local currencies. Therefore, foreign exchange rate riskis generally limited to net assets denominated in those foreign currencies. Foreign exchange rate risk is reviewed as part of ourrisk management process. Locally required capital levels are invested in home currencies in order to satisfy regulatory require-ments and to support local insurance operations regardless of currency fluctuations. The principal currencies creating foreignexchange risk for us are the British pound sterling, the euro, and the Canadian dollar. The following table provides moreinformation on our exposure to foreign exchange rate risk at December 31, 2009 and 2008.
(in millions of U.S. dollars, except for percentages) 2009 2008
Fair value of net assets denominated in foreign currencies $ 3,895 $ 2,318Percentage of fair value of total net assets 19.8% 16.0%Pre-tax impact on shareholders’ equity of a hypothetical 10 percent strengthening of the U.S. dollar $ 336 $ 192
Reinsurance of GMDB and GMIB guarantees
Our net income is directly impacted by changes in the benefit reserves calculated in connection with the reinsurance of varia-ble annuity guarantees, primarily GMDB and GMIB. The benefit reserves are calculated in accordance with the provisions ofASC Topic 944, Financial Services-Insurance, related to accounting and reporting by insurance enterprises for certainnon-traditional long-duration contracts and for separate accounts (Topic 944). Changes in the benefit reserves are reflected aspolicy benefits expense, which is included in life underwriting income. In addition, our net income is directly impacted by thechange in the fair value of the GMIB liability (FVL), which is classified as a derivative for accounting purposes. The FVL estab-lished for a GMIB reinsurance contract represents the difference between the fair value of the contract and the benefit reserves.Changes in the FVL, net of associated changes in the calculated benefit reserves, are reflected as realized gains or losses.
ACE views its variable annuity reinsurance business as having a similar risk profile to that of catastrophe reinsurance,with the probability of long-term economic loss relatively small, at the time of pricing. Adverse changes in market factors andpolicyholder behavior will have an impact on both life underwriting income and net income. When evaluating these risks, weexpect to be compensated for taking both the risk of a cumulative long-term economic net loss, as well as the short-termaccounting variations caused by these market movements. Therefore, we evaluate this business in terms of its long-term eco-nomic risk and reward.
At December 31, 2009, management established benefit reserves based on the benefit ratio calculated using assump-tions reflecting management’s best estimate of the future performance of the variable annuity line of business. Management’sbest estimate reflected a judgment that the equity markets will exhibit sub-par growth over the next several years. Managementexercises judgment in determining the extent to which short-term market movements impact the benefit reserves. The benefitreserves are based on the calculation of a long-term benefit ratio (or loss ratio) for the variable annuity guarantee reinsurance.Despite the long-term nature of the risk, the benefit ratio calculation is impacted by short-term market movements that may bejudged by management to be temporary or transient. Management regularly examines both quantitative and qualitative analy-sis and for the quarter ended December 31, 2009, determined that no change to the benefit ratio was warranted. The benefitratio used to establish the benefit reserves at December 31, 2009, has averaged less than 3/4 standard deviation from thecalculated benefit ratios, averaging the periodic results from the time the benefit ratio was changed during the first quarter of2009 until December 31, 2009.
Topic 944 requires ACE to “regularly evaluate estimates used and adjust the liability balance… if actual experience orother evidence suggests that earlier assumptions should be revised.” ACE evaluates its estimates regularly and managementuses judgment to determine the extent to which the assumptions underlying the benefit ratio calculation used to establishbenefit reserves should be adjusted. The benefit ratio will be calculated based on management’s expectation for the short-termand long-term performance of the variable annuity guarantee liability. Management’s quantitative analysis includes a review ofthe differential between the benefit ratio used at the most recent valuation date and the benefit ratio calculated on subsequentdates. The differential is measured in terms of the standard deviation of the distribution of benefit ratios (reflecting 1,000 sto-chastic scenarios) calculated on subsequent dates. As an example, if, on average, the benefit ratio used at the most recentvaluation date falls within 1/2 a standard deviation of the mean of the distribution of benefit ratios calculated periodically sincethe most recent change in benefit ratio, management may elect not to adjust the benefit ratio used to generate the benefitreserves at the quarter-end valuation date.
91

Further, if due to changes in equity and credit market conditions, the benefit ratio used at the most recent valuation datediffers from the mean of the periodically calculated distribution of benefit ratios by less than 1 standard deviation, managementwill consider current market conditions when determining its expectations of future payout obligations, particularly as thosemarket conditions relate to shorter-term payout obligations.
Finally, if due to changes in equity and credit market conditions, the benefit ratio used at the most recent valuation datediffers from the mean of the periodically calculated distribution of benefit ratios by more than 1 standard deviation for a sus-tained and prolonged period of time, management will give substantial weight to prevailing market conditions whendetermining its expectations of future payout obligations. As an example, based on management’s current expectations as ofthe publication of this document, all else being equal, the S&P 500 index would need to remain below a level of 700 for aprolonged period of time in order for management to give substantial weight to current market conditions.
The benefit reserves and FVL calculations are directly affected by market factors, including equity levels, interest rate lev-els, credit risk, and implied volatilities, as well as policyholder behaviors, such as annuitization and lapse rates. The tablesbelow show the sensitivity, at December 31, 2009, of the benefit reserves and FVL associated with the variable annuity guar-antee reinsurance portfolio. In addition, the tables below show the sensitivity of the fair value of specific derivative instrumentsheld (hedge value), which includes only those instruments owned at the reporting date, to partially offset the risk in the varia-ble annuity guarantee reinsurance portfolio.
Worldwide Equity Shock
Interest Rate Shock +10% Flat -10% -20% -30% -40%
(in millions of U.S. dollars)
+100 bps (Increase)/decrease in benefit reserves $ 57 $ 16 $ (41) $ (120) $ (225) $ (362)(Increase)/decrease in FVL 215 121 15 (111) (255) (389)Increase/(decrease) in hedge value (111) (7) 97 203 311 421Increase/(decrease) in net income $ 161 $ 130 $ 71 $ (28) $ (169) $ (330)
Flat (Increase)/decrease in benefit reserves $ 42 $ – $(60) $ (143) $ (254) $ (400)(Increase)/decrease in FVL 122 – (152) (313) (478) (637)Increase/(decrease) in hedge value (104) – 105 212 321 431Increase/(decrease) in net income $ 60 $ – $ (107) $ (244) $ (411) $ (606)
-100 bps (Increase)/decrease in benefit reserves $ 12 $ (34) $ (100) $ (192) $ (315) $ (476)(Increase)/decrease in FVL (64) (228) (405) (597) (780) (933)Increase/(decrease) in hedge value (97) 8 114 222 331 442Increase/(decrease) in net income $ (149) $ (254) $ (391) $ (567) $ (764) $ (967)
Sensitivities to Other Economic Variables A-rated Credit Spreads Interest Rate Volatility Equity Volatility
(in millions of U.S. dollars) +100 -100 +2% -2% +2% -2%
(Increase)/decrease in benefit reserves $ – $ – $ – $ – $ – $ –(Increase)/decrease in FVL 48 (65) (46) 27 (14) 13Increase/(decrease) in hedge value – – – – 3 (4)Increase/(decrease) in net income $ 48 $ (65) $ (46) $ 27 $ (11) $ 9
Sensitivities to Actuarial Assumptions Mortality Lapses Annuitization
(in millions of U.S. dollars) +10% -10% +25% - 25% +25% -25%
(Increase)/decrease in benefit reserves $ (21) $ 22 $ 28 $ (35) $ (11) $ 12(Increase)/decrease in FVL 9 (8) 89 (127) (60) 49Increase/(decrease) in hedge value – – – – – –Increase/(decrease) in net income $ (12) $ 14 $ 117 $ (162) $ (71) $ 61
The above tables assume benefit reserves and FVL using the benefit ratio calculated at December 31, 2009. Additionally, theabove table assumes equity shocks impact all global equity markets equally and that the interest rate shock is a parallel shift
92

in the U.S. yield curve. Although our liabilities have sensitivity to global equity markets, we would suggest using the S&P 500as a proxy and although our liabilities have sensitivity to global interest rates at various points on the yield curve, we wouldsuggest using the 10-year U.S. Treasury yield as a proxy. A change in A-rated credit spreads (A-rated credit spreads are aproxy for ACE’s own credit spreads), impacts the rate used to discount cash flows in the fair value model. The hedge sensitivityis from December 31, 2009, market levels.
The above sensitivities are not directly additive because changes in one factor will affect the sensitivity to changes in otherfactors. Also, the sensitivities do not scale linearly and may be proportionally greater for larger movements in the market fac-tors. The calculation of the benefit reserves and FVL is based on internal models that include assumptions regarding futurepolicyholder behavior, including lapse, annuitization, and asset allocation. These assumptions impact both the absolute levelof the benefit reserves and the FVL as well as the sensitivities to changes in market factors shown above. Additionally, actualsensitivity of our benefit reserves, FVL, and net income may differ from those disclosed in the tables above due to differencesbetween short-term market movements and management judgment regarding the long-term assumptions implicit in our benefitratio.
93

ITEM 8. Financial Statements and Supplementary Data
The financial statements and supplementary data required by Regulation S-X are included in this report on Form 10-K com-mencing on page F-1.
ITEM 9. Changes in and Disagreements with Accountants on Accounting and Financial Disclosure
There have been no changes in, or any disagreements with, accountants on accounting and financial disclosure within the twoyears ended December 31, 2009.
ITEM 9A. Controls and Procedures
The Company’s management, with the participation of the Company’s Chief Executive Officer and Chief Financial Officer, eval-uated the effectiveness of the Company’s disclosure controls and procedures as defined in Rule 13(a)-15(e) andRule 15(d)-15(e) under the Securities Exchange Act of 1934 as of December 31, 2009. Based upon that evaluation, theCompany’s Chief Executive Officer and Chief Financial Officer concluded that the Company’s disclosure controls and proce-dures are effective in allowing information required to be disclosed in reports filed under the Securities and Exchange Act of1934 to be recorded, processed, summarized, and reported within time periods specified in the rules and forms of the SEC,and that such information is accumulated and communicated to the Company’s management, including its Chief ExecutiveOfficer and Chief Financial Officer, as appropriate to allow timely decisions regarding required disclosure.
There has been no change in the Company’s internal controls over financial reporting during the Company’s quarter endedDecember 31, 2009, that has materially affected, or is reasonably likely to materially affect, the Company’s internal controlsover financial reporting. The Company’s management report on internal control over financial reporting is included on page F-3and PricewaterhouseCoopers LLP’s audit report is included on page F-4.
ITEM 9A(T). Controls and Procedures
Item not applicable.
ITEM 9B. Other Information
Item not applicable.
94

PART III
ITEM 10. Directors, Executive Officers and Corporate Governance
Information pertaining to this item is incorporated by reference to the sections entitled “Agenda Item No. 1: Election ofDirectors”, “Corporate Governance – Did our Officers and Directors Comply with Section 16(a) Beneficial Ownership Reportingin 2009?”, “Corporate Governance – How are Directors Nominated?”, and “Corporate Governance – The Committees of theBoard – The Audit Committee” of the definitive proxy statement for the 2010 Annual General Meeting of Shareholders whichwill be filed with the SEC not later than 120 days after the close of the fiscal year pursuant to regulation 14A. Alsoincorporated herein by reference is the text under the caption “Executive Officers of the Company” appearing at the end of PartI of the Annual Report on Form 10-K.
Code of Ethics
The Company has adopted a Code of Conduct, which sets forth standards by which all ACE employees, officers, and directorsmust abide as they work for the Company. The Company has posted this Code of Conduct on its Internet site(www.acelimited.com, under Investor Information / Corporate Governance / Code of Conduct). The Company intends to dis-close on its Internet site any amendments to, or waivers from, its Code of Conduct that are required to be publicly disclosedpursuant to the rules of the SEC or the New York Stock Exchange.
ITEM 11. Executive Compensation
This item is incorporated by reference to the sections entitled “Executive Compensation” of the definitive proxy statement forthe 2010 Annual General Meeting of Shareholders which will be filed with the SEC not later than 120 days after the close ofthe fiscal year pursuant to regulation 14A.
ITEM 12. Security Ownership of Certain Beneficial Owners and Management and Related Stockholder Matters
This item is incorporated by reference to the sections entitled “Agenda Item 7: Approval of ACE Limited 2004 Long-TermIncentive Plan, as amended through the Fifth Amendment – Security Ownership of Certain Beneficial Owners and Manage-ment” and “Information About our Share Ownership” of the definitive proxy statement for the 2010 Annual General Meeting ofShareholders which will be filed with the SEC not later than 120 days after the close of the fiscal year pursuant to regulation14A.
ITEM 13. Certain Relationships and Related Transactions and Director Independence
This item is incorporated by reference to the sections entitled “Corporate Governance – What Is Our Related Party TransactionsApproval Policy and What Procedures Do We Use to Implement It?”, “Corporate Governance – What Related Person Trans-actions Do We Have?”, and “Corporate Governance – Director Independence and Other Information” of the definitive proxystatement for the 2010 Annual General Meeting of Shareholders which will be filed with the SEC not later than 120 days afterthe close of the fiscal year pursuant to regulation 14A.
ITEM 14. Principal Accounting Fees and Services
This item is incorporated by reference to the section entitled “Agenda Item No. 6.2: Election of Auditors – Ratification ofappointment of PricewaterhouseCoopers LLP (United States) as independent registered public accounting firm for purposes ofUnited States securities law reporting for the year ending December 31, 2010” of the definitive proxy statement for the 2010Annual General Meeting of Shareholders which will be filed with the SEC not later than 120 days after the close of the fiscalyear pursuant to regulation 14A.
95

PART IV
ITEM 15. Exhibits, Financial Statement Schedules
(a) Financial Statements, Schedules, and Exhibits
1. Consolidated Financial Statements Page
– Management’s Responsibility for Financial Statements and Internal Control over Financial Reporting F-3– Report of Independent Registered Public Accounting Firm F-4– Consolidated Balance Sheets at December 31, 2009 and 2008 F-5– Consolidated Statements of Operations and Comprehensive Income for the years ended December 31, 2009,
2008, and 2007 F-6– Consolidated Statements of Shareholders’ Equity for the years ended December 31, 2009, 2008, and 2007 F-7– Consolidated Statements of Cash Flows for the years ended December 31, 2009, 2008, and 2007 F-9– Notes to Consolidated Financial Statements F-10
2. Financial Statement Schedules
– Schedule I – Summary of Investments – Other Than Investments in Related Parties F-79– Schedule II – Condensed Financial Information of Registrant (Parent Company Only) F-80– Schedule IV – Supplemental Information Concerning Reinsurance F-83– Schedule VI – Supplementary Information Concerning Property and Casualty Operations F-84
Other schedules have been omitted as they are not applicable to ACE, or the required information has been included in theConsolidated Financial Statements and related notes.
3. Exhibits
Incorporated by Reference
ExhibitNumber Exhibit Description Form
OriginalNumber Date Filed
SEC FileReference
NumberFiled
Herewith
3.1 Articles of Association of the Company, asamended and restated
8-K 3 December 17, 2009 001-11778
3.2 Organizational Regulations of the Company, asamended and restated
8-K 3 November 20, 2009 001-11778
4.1 Articles of Association of the Company, asamended and restated
8-K 4 December 17, 2009 001-11778
4.2 Organizational Regulations of the Company, asamended and restated
8-K 4 November 20, 2009 001-11778
4.3 Specimen share certificate representing Com-mon Shares
8-K 4.3 July 18, 2008 000-11778
4.4 Indenture, dated March 15, 2002, betweenACE Limited and Bank One Trust Company,N.A.
8-K 4.1 March 22, 2002 001-11778
4.5 Senior Indenture, dated August 1, 1999, amongACE INA Holdings, Inc., ACE Limited and BankOne, N.A. (formerly The First National Bank ofChicago), as trustee
S-3 4.5 August 12, 1999 333-78841
4.6 Indenture, dated November 30, 1999, amongACE INA Holdings, Inc. and Bank One TrustCompany, N.A., as trustee
10-K 10.38 March 29, 2000 001-11778
4.7 Supplemental Indenture No. 1, datedDecember 6, 1999, among ACE INA Holdings,Inc. and Bank One Trust Company, N.A., astrustee
10-K 10.39 March 29, 2000 001-11778
96

Incorporated by Reference
ExhibitNumber Exhibit Description Form
OriginalNumber Date Filed
SEC FileReference
NumberFiled
Herewith
4.8 Supplemental Indenture No. 2 and waiver,dated February 16, 2000, among ACE INAHoldings, Inc. and Bank One Trust Company,N.A., as trustee
10-K 4.11 March 16, 2006 011-11778
4.9 Supplemental Indenture No. 3, dated December21, 2007, by and between ACE INA HoldingsInc., and The Bank of New York
10-K 4.12 February 29, 2008 001-11778
4.10 Indenture, dated December 1, 1999, amongACE INA Holdings, Inc., ACE Limited and BankOne Trust Company, National Association, astrustee
10-K 10.41 March 29, 2000 001-11778
4.11 Supplemental indenture and waiver, datedFebruary 16, 2000, between ACE US Holdings,Inc. and The Bank of New York, as successortrustee
10-K 4.14 March 16, 2006 011-11778
4.12 Supplemental indenture No. 2, dated June 1,2003, between ACE US Holdings, Inc. and TheBank of New York, as successor trustee
10-K 4.15 March 16, 2006 011-11778
4.13 Supplemental indenture No. 3, dated Sep-tember 1, 2004, between ACE US Holdings,Inc. and The Bank of New York, as successortrustee
10-K 4.16 March 16, 2006 011-11778
4.14 Supplemental indenture No. 4, datedDecember 21, 2007, made by and betweenACE US Holdings, Inc., and The Bank of NewYork
10-K 4.18 February 29, 2008 001-11778
4.15 Amended and Restated Trust Agreement, datedMarch 31, 2000, among ACE INA Holdings,Inc., Bank One Trust Company, NationalAssociation, as property trustee, Bank OneDelaware Inc., as Delaware trustee and theadministrative trustees named therein
10-K 4.17 March 16, 2006 011-11778
4.16 Common Securities Guarantee Agreement, datedMarch 31, 2000
10-K 4.18 March 16, 2006 011-11778
4.17 Capital Securities Guarantee Agreement, datedMarch 31, 2000
10-K 4.19 March 16, 2006 011-11778
10.1* Second Amended and Restated IndemnificationAgreement in the form executed between theCompany and directors (except for OlivierSteimer) and/or officers
10-Q 10.1 August 7, 2007 011-11778
10.2* Indemnification agreement between the Com-pany and Olivier Steimer, dated November 20,2008
10-K 10.2 February 27, 2009 011-11778
97

Incorporated by Reference
ExhibitNumber Exhibit Description Form
OriginalNumber Date Filed
SEC FileReference
NumberFiled
Herewith
10.3 Ninth Amendment Agreement dated as of10 July, 2008 to Letter of Credit Facility Agree-ment originally dated as of 19 November, 1999(as most recently amended pursuant to theSeventh Amendment and Restatement Agree-ment dated 17 November, 2006 and the EighthAmendment Agreement dated as of16 November, 2007) between, among others,the Company, as account party, certain sub-sidiaries thereof, as guarantors, various banksand Citibank International plc, as agent andsecurity trustee for the banks.
8-K 10.5 July 16, 2008 001-11778
10.4 Credit Agreement for £100,000,000 datedDecember 13, 2005, among ACE EuropeanHoldings NO.2 Limited, ACE Limited, and TheRoyal Bank of Scotland plc and HSBC Securities(USA) Inc. as lead arrangers and certain otherfinancial institutions
10-K 10.8 March 16, 2006 001-11778
10.5 First amendment dated June 22, 2007, amend-ing the Credit Agreement dated December 13,2005, among ACE European Holdings NO.2Limited, ACE Limited, various financialinstitutions and The Royal Bank of Scotland plcas agent
10-Q 10.5 August 7, 2007 001-11778
10.6 Second Amendment and Waiver dated as ofJuly 10, 2008, to the Credit Agreement for£100,000,000 dated December 13, 2005,among ACE European Holdings NO.2 Limited,ACE Limited, and The Royal Bank of Scotlandplc and HSBC Securities (USA) Inc. as leadarrangers and certain other financial institutions
8-K 10.4 July 16, 2008 001-11778
10.7 Second Amended and Restated ReimbursementAgreement for $1,000,000,000 UnsecuredLetter of Credit Facility, dated as of November 8,2007, among ACE Limited, certain subsidiaries,various lenders and Wachovia Capital Markets,LLC and Banc of America Securities LLC as jointlead arrangers and joint bookrunners
8-K 10.1 November 14, 2007 001-11778
10.8 First Amendment and Waiver dated as ofJuly 10, 2008, to the Second Amended andRestated Reimbursement Agreement for$1,000,000,000 Unsecured Letter of CreditFacility, dated as of November 8, 2007, amongACE Limited, certain subsidiaries, various lend-ers and Wachovia Capital Markets, LLC andBanc of America Securities LLC as joint leadarrangers and joint bookrunners
8-K 10.7 July 18, 2008 001-11778
98

Incorporated by Reference
ExhibitNumber Exhibit Description Form
OriginalNumber Date Filed
SEC FileReference
NumberFiled
Herewith
10.9 Second Amended and Restated Credit Agree-ment for $500,000,000 dated as ofNovember 8, 2007, among ACE Limited, cer-tain subsidiaries, various lenders and J.P.Morgan Securities Inc. and Barclays Capital asjoint lead arrangers and joint bookrunners
8-K 10.2 November 14, 2007 001-11778
10.10 First Amendment and Waiver dated July 10,2008, to the Second Amended and RestatedCredit Agreement for $500,000,000 dated as ofNovember 8, 2007, among ACE Limited, cer-tain subsidiaries, various lenders and J.P.Morgan Securities Inc. and Barc10.19lays Capi-tal as joint lead arrangers and joint bookrunners
8-K 10.6 July 16, 2008 001-11778
10.11 Term loan agreement dated April 1, 2008,among ACE Limited, certain subsidiaries, vari-ous lenders and Bank of America, N.A., asadministrative agent.
10-Q 10.5 May 8, 2008 001-11778
10.12 First Amendment and Waiver dated July 10,2008, to the Term loan agreement datedApril 1, 2008, among ACE Limited, certainsubsidiaries, various lenders and Bank of Amer-ica, N.A., as administrative agent.
8-K 10.8 July 16, 2008 001-11778
10.13 Letter of Credit Agreement for $500,000,000,dated June 16, 2009, among ACE Limited, andDeutsche Bank, New York Branch
10-Q 10.1 August 7, 2009 001-11778
10.14* Employment Terms dated October 29, 2001,between ACE Limited and Evan Greenberg
10-K 10.64 March 27, 2003 001-11778
10.15* Employment Terms dated November 2, 2001,between ACE Limited and Philip V. Bancroft
10-K 10.65 March 27, 2003 001-11778
10.16* Executive Severance Agreement between ACELimited and Philip Bancroft, effective January 2,2002
10-Q 10. 1 May 10, 2004 001-11778
10.17* Employment Terms dated February 25, 2005,between ACE Limited and Robert Cusumano
10-K 10.21 March 1, 2007 001-11778
10.18* Employment Terms dated April 10, 2006,between ACE and John Keogh
10-K 10.29 February 29, 2008 001-11778
10.19* Executive Severance Agreement between ACEand John Keogh
10-K 10.30 February 29, 2008 001-11778
10.20* ACE Limited Executive Severance Plan asamended and restated, effective January 1,2009
10-K 10.29 February 27, 2009 001-11778
99

Incorporated by Reference
ExhibitNumber Exhibit Description Form
OriginalNumber Date Filed
SEC FileReference
NumberFiled
Herewith
10.21* Form of employment agreement between theCompany (or subsidiaries of the Company) andexecutive officers of the Company to allocate apercentage of aggregate salary to the Company(or subsidiaries of the Company)
8-K 10.1 July 16, 2008 001-11778
10.22* Description of Executive Officer cash compensa-tion for 2009
10-Q 10.1 May 8, 2009 001-11778
10.23* Description of Directors compensation X
10.24* ACE Limited Annual Performance Incentive Plan S-1 10.13 January 21, 1993 33-57206
10.25* ACE Limited Elective Deferred CompensationPlan (as amended and restated effectiveJanuary 1, 2005)
10-K 10.24 March 16, 2006 001-11778
10.26* ACE USA Officer Deferred Compensation Plan(as amended through January 1, 2001)
10-K 10.25 March 16, 2006 001-11778
10.27* ACE USA Officer Deferred Compensation Plan(as amended and restated effective January 1,2009)
10-K 10.36 February 27, 2009 001-11778
10.28* First Amendment to the Amended and RestatedACE USA Officer Deferred Compensation Plan
X
10.29* ACE Limited Supplemental Retirement Plan (asamended and restated effective July 1, 2001)
10-Q 10.1 November 14, 2001 001-11778
10.30* Amendments to the ACE Limited SupplementalRetirement Plan and the ACE Limited ElectiveDeferred Compensation Plan
10-K 10.38 February 29, 2008 001-11778
10.31* ACE Limited Elective Deferred CompensationPlan (as amended and restated effectiveJanuary 1, 2009)
10-K 10.39 February 27, 2009 001-11778
10.32* Deferred Compensation Plan amendments, effec-tive January 1, 2009
10-K 10.40 February 27, 2009 001-11778
10.33* Amendment to the ACE Limited SupplementalRetirement Plan
10-K 10.39 February 29, 2008 001-11778
10.34* Amendment and restated ACE Limited Supple-mental Retirement Plan, effective January 1,2009
10-K 10.42 February 27, 2009 001-11778
10.35* ACE USA Supplemental Employee RetirementSavings Plan
10-Q 10.6 May 15, 2000 001-11778
10.36* ACE USA Supplemental Employee RetirementSavings Plan (as amended through the SecondAmendment)
10-K 10.30 March 1, 2007 001-11778
10.37* ACE USA Supplemental Employee RetirementSavings Plan (as amended through the ThirdAmendment)
10-K 10.31 March 1, 2007 001-11778
100

Incorporated by Reference
ExhibitNumber Exhibit Description Form
OriginalNumber Date Filed
SEC FileReference
NumberFiled
Herewith
10.38* ACE USA Supplemental Employee RetirementSavings Plan (as amended and restated)
10-K 10.46 February 27, 2009 001-11778
10.39* First Amendment to the Amended and RestatedACE USA Supplemental Employee RetirementSavings Plan
X
10.40* The ACE Limited 1995 Outside Directors Plan(as amended through the Seventh Amendment)
10-Q 10.1 August 14, 2003 001-11778
10.41* Board of Directors Resolution Amending OptionAwards for Gary Stuart
10-Q 10.2 May 8, 2009 001-11778
10.42* ACE Limited 1995 Long-Term Incentive Plan (asamended through the Third Amendment)
10-K 10.33 March 1, 2007 001-11778
10.43* ACE Limited 1998 Long-Term Incentive Plan (asamended through the Fourth Amendment)
10-K 10.34 March 1, 2007 001-11778
10.44* ACE Limited 1999 Replacement Long-TermIncentive Plan
10-Q 10.1 November 15, 1999 001-11778
10.45* ACE Limited Rules of the Approved U.K. StockOption Program
10-Q 10.2 February 13, 1998 001-11778
10.46* ACE Limited 2004 Long-Term Incentive Plan (asamended through the Fourth Amendment)
8-K 10.2 July 16, 2008 001-11778
10.47* Revised Form of Restricted Stock Award Termsunder the ACE Limited 2004 Long-TermIncentive Plan
10-Q 10.3 November 8, 2006 001-11778
10.48* Form of Restricted Stock Award Terms under theACE Limited 2004 Long-Term Incentive Plan
10-K 10.54 February 27, 2009 001-11778
10.49* Form of Restricted Stock Award Terms under theACE Limited 2004 Long-Term Incentive Plan
10-K 10.55 February 27, 2009 001-11778
10.50* Director Restricted Stock Award Terms under theACE Limited 2004 Long-Term Incentive Plan
10-Q 10.1 November 9, 2009 001-11778
10.51* Form of Restricted Stock Unit Award Termsunder the ACE Limited 2004 Long-TermIncentive Plan
8-K 10.3 September 13, 2004 001-11778
10.52* Form of Restricted Stock Unit Award Termsunder the ACE Limited 2004 Long-TermIncentive Plan
10-Q 10.4 November 8, 2006 001-11778
10.53* Form of Restricted Stock Unit Award Termsunder the ACE Limited 2004 Long-TermIncentive Plan
10-Q 10.1 May 8, 2008 001-11778
10.54* Form of Restricted Stock Unit Award Termsunder the ACE Limited 2004 Long-TermIncentive Plan
10-Q 10.2 May 8, 2008 001-11778
10.55* Form of Restricted Stock Unit Award Termsunder the ACE Limited 2004 Long-TermIncentive Plan
10-K 10.60 February 27, 2009 001-11778
101

Incorporated by Reference
ExhibitNumber Exhibit Description Form
OriginalNumber Date Filed
SEC FileReference
NumberFiled
Herewith
10.56* Form of Incentive Stock Option Terms under theACE Limited 2004 Long-Term Incentive Plan
8-K 10.4 September 13, 2004 001-11778
10.57* Form of Incentive Stock Option Terms under theACE Limited 2004 Long-Term Incentive Plan
10-Q 10.4 May 8, 2008 001-11778
10.58* Form of Incentive Stock Option Terms under theACE Limited 2004 Long-Term Incentive Plan
10-K 10.63 February 27, 2009 001-11778
10.59* Form of Non-Qualified Stock Option Termsunder the ACE Limited 2004 Long-TermIncentive Plan
8-K 10.5 September 13, 2004 001-11778
10.60* Form of Non-Qualified Stock Option Termsunder the ACE Limited 2004 Long-TermIncentive Plan
10-Q 10.3 May 8, 2008 001-11778
10.61* Form of Performance Based Restricted StockAward Terms under the ACE Limited 2004Long-Term Incentive Plan, as updated throughMay 4, 2006
10-Q 10.3 May 5, 2006 001-11778
10.62* Revised Form of Performance Based RestrictedStock Award Terms under the ACE Limited2004 Long-Term Incentive Plan
10-Q 10.2 November 8, 2006 001-11778
10.63* Form of Restricted Stock Unit Award Terms (foroutside directors) under the ACE Limited 2004Long-Term Incentive Plan
10-Q 10.2 November 7, 2007 001-11778
10.64* Form of Restricted Stock Unit Award Terms (foroutside directors) under the ACE Limited 2004Long-Term Incentive Plan
10-Q 10.2 August 7, 2009 001-11778
10.65* ACE Limited Employee Stock Purchase Plan (asamended effective March 1, 2007)
10-K 10.69 February 27, 2009 001-11778
12.1 Ratio of earnings to fixed charges and preferredshare dividends calculation
X
21.1 Subsidiaries of the Company X
23.1 Consent of PricewaterhouseCoopers LLP X
31.1 Certification Pursuant to Section 302 of TheSarbanes-Oxley Act of 2002
X
31.2 Certification Pursuant to Section 302 of TheSarbanes-Oxley Act of 2002
X
32.1 Certification Pursuant to 18 U.S.C. Section1350, As Adopted Pursuant to Section 906 ofThe Sarbanes-Oxley Act of 2002
X
32.2 Certification Pursuant to 18 U.S.C. Section1350, As Adopted Pursuant to Section 906 ofThe Sarbanes-Oxley Act of 2002
X
102

Incorporated by Reference
ExhibitNumber Exhibit Description Form
OriginalNumber Date Filed
SEC FileReference
NumberFiled
Herewith
101.1 The following financial information from ACELimited’s Annual Report on Form 10-K for theyear ended December 31, 2009, formatted inXBRL: (i) Consolidated Balance Sheets atDecember 31, 2009 and December 31, 2008;(ii) Consolidated Statements of Operations andComprehensive Income for the years endedDecember 31, 2009, 2008, and 2007;(iii) Consolidated Statements of Shareholders’Equity for the years ended December 31, 2009,2008, and 2007; (iv) Consolidated Statementsof Cash Flows for the years endedDecember 31, 2009, 2008, and 2007; and (v)Notes to the Consolidated Financial Statements,tagged as blocks of text.
X
* Management Contract or Compensation Plan
103

S I G N A T U R E S
Pursuant to the requirements of Section 13 or 15(d) of the Securities Exchange Act of 1934, the registrant has duly causedthis report to be signed on its behalf by the undersigned, thereunto duly authorized.
ACE Limited
By: /S/ PHILIP V. BANCROFT
Philip V. Bancroft
Chief Financial Officer
February 25, 2010
Pursuant to the requirements of the Securities Exchange Act of 1934, this report has been signed below by the following per-sons on behalf of the registrant and in the capacities and on the dates indicated.
Signature Title Date
/S/ EVAN G. GREENBERG
Evan G. Greenberg
Chairman, President, Chief ExecutiveOfficer; Director
February 25, 2010
/S/ PHILIP V. BANCROFT
Philip V. Bancroft
Chief Financial Officer(Principal Financial Officer)
February 25, 2010
/S/ PAUL B. MEDINI
Paul B. Medini
Chief Accounting Officer(Principal Accounting Officer)
February 25, 2010
/S/ MICHAEL G. ATIEH
Michael G. Atieh
Director February 25, 2010
/S/ MARY A. CIRILLO
Mary A. Cirillo
Director February 25, 2010
/S/ BRUCE L. CROCKETT
Bruce L. Crockett
Director February 25, 2010
/S/ ROBERT M. HERNANDEZ
Robert M. Hernandez
Director February 25, 2010
/S/ JOHN A. KROL
John A. Krol
Director February 25, 2010
/S/ PETER MENIKOFF
Peter Menikoff
Director February 25, 2010
/S/ LEO F. MULLIN
Leo F. Mullin
Director February 25, 2010
/S/ THOMAS J. NEFF
Thomas J. Neff
Director February 25, 2010
/S/ ROBERT RIPP
Robert Ripp
Director February 25, 2010
104

Signature Title Date
/S/ DERMOT F. SMURFIT
Dermot F. Smurfit
Director February 25, 2010
/S/ OLIVIER STEIMER
Olivier Steimer
Director February 25, 2010
105


ACE LIMITED AND SUBSIDIARIES
CONSOLIDATED FINANCIAL STATEMENTS
DECEMBER 31, 2009
F-1

ACE Limited
INDEX TO CONSOLIDATED FINANCIAL STATEMENTS
Page No.
Management’s Responsibility for Financial Statements and Internal Control over Financial Reporting F-3
Report of Independent Registered Public Accounting Firm F-4
Consolidated Financial Statements
Consolidated Balance Sheets F-5
Consolidated Statements of Operations and Comprehensive Income F-6
Consolidated Statements of Shareholders’ Equity F-7
Consolidated Statements of Cash Flows F-9
Notes to Consolidated Financial Statements
Note 1. General F-10
Note 2. Significant accounting policies F-10
Note 3. Acquisition F-20
Note 4. Investments F-22
Note 5. Reinsurance F-32
Note 6. Intangible assets F-34
Note 7. Unpaid losses and loss expenses F-35
Note 8. Taxation F-41
Note 9. Debt F-44
Note 10. Commitments, contingencies, and guarantees F-46
Note 11. Preferred shares F-53
Note 12. Shareholders’ equity F-53
Note 13. Share-based compensation F-55
Note 14. Pension plans F-58
Note 15. Fair value measurements F-59
Note 16. Other (income) expense F-65
Note 17. Segment information F-66
Note 18. Earnings per share F-69
Note 19. Related party transactions F-69
Note 20. Statutory financial information F-70
Note 21. Information provided in connection with outstanding debt of subsidiaries F-70
Note 22. Condensed unaudited quarterly financial data F-78
Note 23. Subsequent events F-78
Financial Statement Schedules
Schedule I Summary of Investments – Other Than Investments in Related Parties F-79
Schedule II Condensed Financial Information of Registrant F-80
Schedule IV Supplemental Information Concerning Reinsurance F-83
Schedule VI Supplementary Information Concerning Property and Casualty Operations F-84
F-2

M A N A G E M E N T ’ S R E S P O N S I B I L I T Y F O R F I N A N C I A L S T A T E M E N T S A N D
I N T E R N A L C O N T R O L O V E R F I N A N C I A L R E P O R T I N G
Financial Statements
The consolidated financial statements of ACE Limited were prepared by management, who are responsible for their reliabilityand objectivity. The statements have been prepared in conformity with accounting principles generally accepted in the UnitedStates of America and, as such, include amounts based on informed estimates and judgments of management. Financialinformation elsewhere in this annual report is consistent with that in the consolidated financial statements.
The Board of Directors, operating through its Audit Committee, which is composed entirely of directors who are not offi-cers or employees of the Company, provides oversight of the financial reporting process and safeguarding of assets againstunauthorized acquisition, use or disposition. The Audit Committee annually recommends the appointment of an independentregistered public accounting firm and submits its recommendation to the Board of Directors for approval.
The Audit Committee meets with management, the independent registered public accountants and the internal auditor;approves the overall scope of audit work and related fee arrangements; and reviews audit reports and findings. In addition, theindependent registered public accountants and the internal auditor meet separately with the Audit Committee, withoutmanagement representatives present, to discuss the results of their audits; the adequacy of the Company’s internal control; thequality of its financial reporting; and the safeguarding of assets against unauthorized acquisition, use or disposition.
The consolidated financial statements have been audited by an independent registered public accounting firm, Pricewa-terhouseCoopers LLP, who were given unrestricted access to all financial records and related data, including minutes of allmeetings of the Board of Directors and committees of the Board. The Company believes that all representations made to ourindependent registered public accountants during their audits were valid and appropriate.
Internal Control over Financial Reporting
The management of ACE Limited (ACE) is responsible for establishing and maintaining adequate internal control over financialreporting. Pursuant to the rules and regulations of the Securities and Exchange Commission, internal control over financialreporting is a process designed by, or under the supervision of our Chief Executive Officer and Chief Financial Officer to providereasonable assurance regarding the reliability of financial reporting and the preparation of our consolidated financial statementsfor external purposes in accordance with accounting principles generally accepted in the United States of America.
As of December 31, 2009, management has evaluated the effectiveness of ACE’s internal control over financial reportingbased on the criteria for effective internal control over financial reporting established in “Internal Control – IntegratedFramework,” issued by the Committee of Sponsoring Organizations of the Treadway Commission. Based on this evaluation, wehave concluded that ACE’s internal control over financial reporting was effective as of December 31, 2009.
PricewaterhouseCoopers LLP, the independent registered public accounting firm that audited the consolidated financialstatements of ACE included in this Annual Report, has issued a report on the effectiveness of the Company’s internal controlsover financial reporting as of December 31, 2009. The report, which expresses an unqualified opinion on the effectiveness ofACE’s internal control over financial reporting as of December 31, 2009, is included in this Item under “Report of IndependentRegistered Public Accounting Firm” and follows this statement.
/S/ EVAN G. GREENBERG
Evan G. GreenbergChairman and Chief Executive Officer
/S/ PHILIP V. BANCROFT
Philip V. BancroftChief Financial Officer
F-3

R E P O R T O F I N D E P E N D E N T R E G I S T E R E D P U B L I C A C C O U N T I N G F I R M
To the Board of Directors and Shareholders of ACE Limited:
In our opinion, the accompanying consolidated balance sheets and the related consolidated statements of operations andcomprehensive income, shareholders’ equity, and cash flows present fairly, in all material respects, the financial position ofACE Limited and its subsidiaries (the “Company”) at December 31, 2009 and December 31, 2008, and the results of theiroperations and their cash flows for each of the three years in the period ended December 31, 2009 in conformity withaccounting principles generally accepted in the United States of America. In addition, in our opinion, the financial statementschedules listed in the index appearing under Item 15 (2) present fairly, in all material respects, the information set forththerein when read in conjunction with the related consolidated financial statements. Also in our opinion, the Company main-tained, in all material respects, effective internal control over financial reporting as of December 31, 2009, based on criteriaestablished in Internal Control - Integrated Framework issued by the Committee of Sponsoring Organizations of the TreadwayCommission (COSO). The Company’s management is responsible for these financial statements and financial statementschedules, for maintaining effective internal control over financial reporting and for its assessment of the effectiveness ofinternal control over financial reporting, included in Management’s Responsibility for Financial Statements and Internal Con-trols Over Financial Reporting appearing under Item 15 (1). Our responsibility is to express opinions on these financialstatements, on the financial statement schedules, and on the Company’s internal control over financial reporting based on ourintegrated audits. We conducted our audits in accordance with the standards of the Public Company Accounting OversightBoard (United States). Those standards require that we plan and perform the audits to obtain reasonable assurance aboutwhether the financial statements are free of material misstatement and whether effective internal control over financial report-ing was maintained in all material respects. Our audits of the financial statements included examining, on a test basis,evidence supporting the amounts and disclosures in the financial statements, assessing the accounting principles used andsignificant estimates made by management, and evaluating the overall financial statement presentation. Our audit of internalcontrol over financial reporting included obtaining an understanding of internal control over financial reporting, assessing therisk that a material weakness exists, and testing and evaluating the design and operating effectiveness of internal control basedon the assessed risk. Our audits also included performing such other procedures as we considered necessary in the circum-stances. We believe that our audits provide a reasonable basis for our opinions.
A company’s internal control over financial reporting is a process designed to provide reasonable assurance regarding the reli-ability of financial reporting and the preparation of financial statements for external purposes in accordance with generallyaccepted accounting principles. A company’s internal control over financial reporting includes those policies and proceduresthat (i) pertain to the maintenance of records that, in reasonable detail, accurately and fairly reflect the transactions and dis-positions of the assets of the company; (ii) provide reasonable assurance that transactions are recorded as necessary to permitpreparation of financial statements in accordance with generally accepted accounting principles, and that receipts andexpenditures of the company are being made only in accordance with authorizations of management and directors of thecompany; and (iii) provide reasonable assurance regarding prevention or timely detection of unauthorized acquisition, use, ordisposition of the company’s assets that could have a material effect on the financial statements.
Because of its inherent limitations, internal control over financial reporting may not prevent or detect misstatements. Also,projections of any evaluation of effectiveness to future periods are subject to the risk that controls may become inadequatebecause of changes in conditions, or that the degree of compliance with the policies or procedures may deteriorate.
PricewaterhouseCoopers LLPPhiladelphia, PennsylvaniaFebruary 25, 2010
F-4
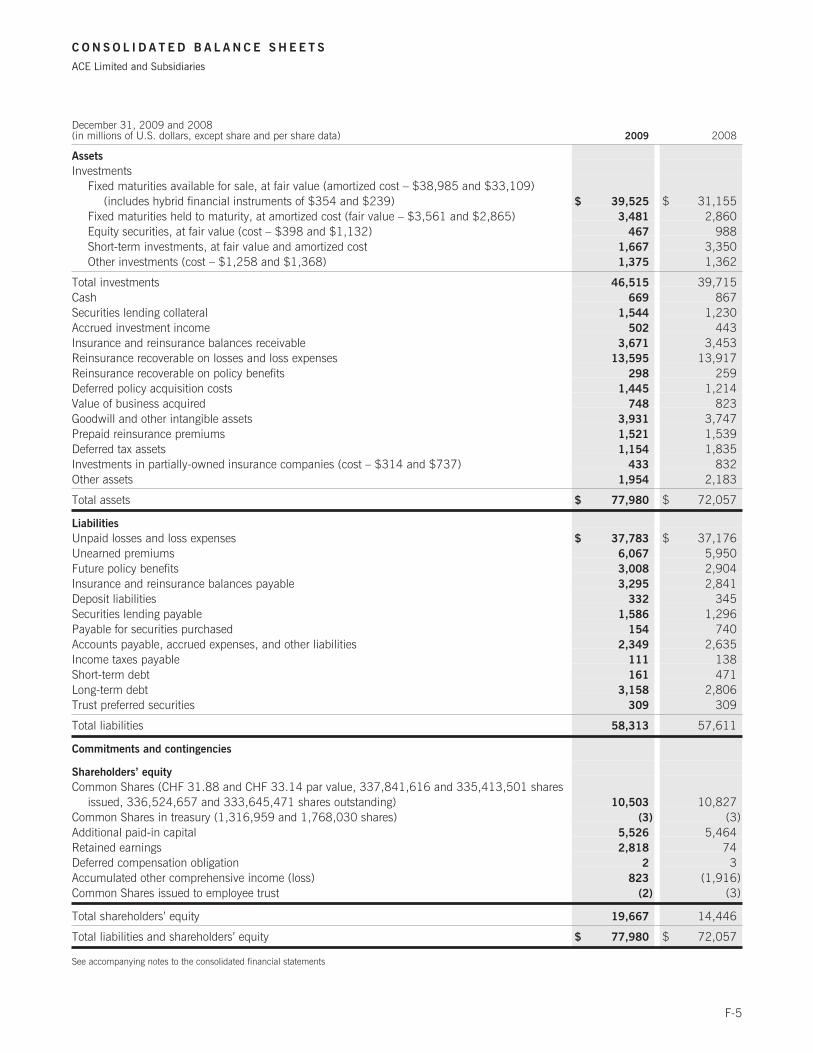
C O N S O L I D A T E D B A L A N C E S H E E T S
ACE Limited and Subsidiaries
December 31, 2009 and 2008(in millions of U.S. dollars, except share and per share data) 2009 2008
Assets
InvestmentsFixed maturities available for sale, at fair value (amortized cost – $38,985 and $33,109)
(includes hybrid financial instruments of $354 and $239) $ 39,525 $ 31,155Fixed maturities held to maturity, at amortized cost (fair value – $3,561 and $2,865) 3,481 2,860Equity securities, at fair value (cost – $398 and $1,132) 467 988Short-term investments, at fair value and amortized cost 1,667 3,350Other investments (cost – $1,258 and $1,368) 1,375 1,362
Total investments 46,515 39,715Cash 669 867Securities lending collateral 1,544 1,230Accrued investment income 502 443Insurance and reinsurance balances receivable 3,671 3,453Reinsurance recoverable on losses and loss expenses 13,595 13,917Reinsurance recoverable on policy benefits 298 259Deferred policy acquisition costs 1,445 1,214Value of business acquired 748 823Goodwill and other intangible assets 3,931 3,747Prepaid reinsurance premiums 1,521 1,539Deferred tax assets 1,154 1,835Investments in partially-owned insurance companies (cost – $314 and $737) 433 832Other assets 1,954 2,183
Total assets $ 77,980 $ 72,057
Liabilities
Unpaid losses and loss expenses $ 37,783 $ 37,176Unearned premiums 6,067 5,950Future policy benefits 3,008 2,904Insurance and reinsurance balances payable 3,295 2,841Deposit liabilities 332 345Securities lending payable 1,586 1,296Payable for securities purchased 154 740Accounts payable, accrued expenses, and other liabilities 2,349 2,635Income taxes payable 111 138Short-term debt 161 471Long-term debt 3,158 2,806Trust preferred securities 309 309
Total liabilities 58,313 57,611
Commitments and contingencies
Shareholders’ equity
Common Shares (CHF 31.88 and CHF 33.14 par value, 337,841,616 and 335,413,501 sharesissued, 336,524,657 and 333,645,471 shares outstanding) 10,503 10,827
Common Shares in treasury (1,316,959 and 1,768,030 shares) (3) (3)Additional paid-in capital 5,526 5,464Retained earnings 2,818 74Deferred compensation obligation 2 3Accumulated other comprehensive income (loss) 823 (1,916)Common Shares issued to employee trust (2) (3)
Total shareholders’ equity 19,667 14,446
Total liabilities and shareholders’ equity $ 77,980 $ 72,057
See accompanying notes to the consolidated financial statements
F-5

C O N S O L I D A T E D S T A T E M E N T S O F O P E R A T I O N S A N D C O M P R E H E N S I V E I N C O M E
ACE Limited and Subsidiaries
For the years ended December 31, 2009, 2008, and 2007(in millions of U.S. dollars, except per share data) 2009 2008 2007
Revenues
Net premiums written $ 13,299 $ 13,080 $ 11,979Change in unearned premiums (59) 123 318
Net premiums earned 13,240 13,203 12,297Net investment income 2,031 2,062 1,918Net realized gains (losses):Other-than-temporary impairment (OTTI) losses gross (699) (1,064) (141)Portion of OTTI losses recognized in other comprehensive income 302 – –
Net OTTI losses recognized in income (397) (1,064) (141)Net realized gains (losses) excluding OTTI losses 201 (569) 80
Total net realized gains (losses) (196) (1,633) (61)
Total revenues 15,075 13,632 14,154
Expenses
Losses and loss expenses 7,422 7,603 7,351Policy benefits 325 399 168Policy acquisition costs 2,130 2,135 1,771Administrative expenses 1,811 1,737 1,455Interest expense 225 230 175Other (income) expense 85 (39) 81
Total expenses 11,998 12,065 11,001
Income before income tax 3,077 1,567 3,153Income tax expense 528 370 575
Net income $ 2,549 $ 1,197 $ 2,578
Other comprehensive income (loss)
Unrealized appreciation (depreciation) $ 2,712 $ (3,948) $ (3)Reclassification adjustment for net realized (gains) losses included in net income 75 1,189 27
2,787 (2,759) 24Change in:
Cumulative translation adjustment 568 (590) 105Pension liability (48) 23 (4)
Other comprehensive income (loss), before income tax 3,307 (3,326) 125Income tax (expense) benefit related to other comprehensive income items (568) 647 (60)
Other comprehensive income (loss) 2,739 (2,679) 65
Comprehensive income (loss) $ 5,288 $ (1,482) $ 2,643
Basic earnings per share $ 7.57 $ 3.52 $ 7.70
Diluted earnings per share $ 7.55 $ 3.50 $ 7.63
See accompanying notes to the consolidated financial statements
F-6
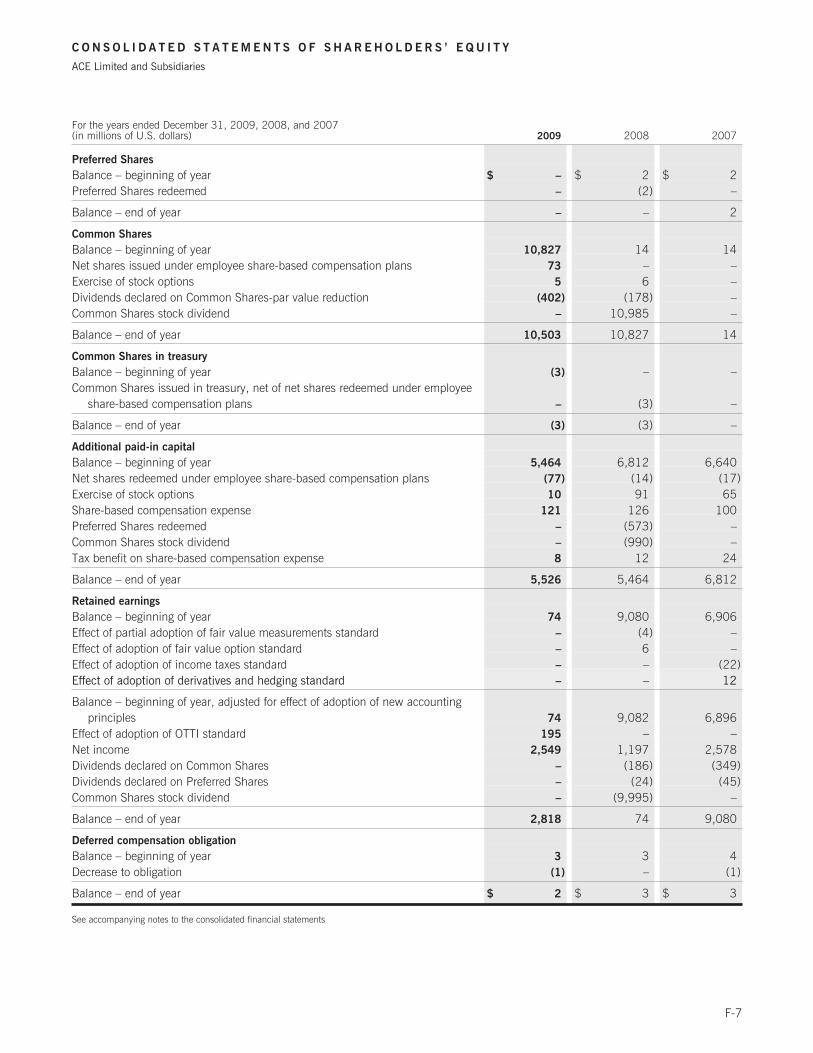
C O N S O L I D A T E D S T A T E M E N T S O F S H A R E H O L D E R S ’ E Q U I T Y
ACE Limited and Subsidiaries
For the years ended December 31, 2009, 2008, and 2007(in millions of U.S. dollars) 2009 2008 2007
Preferred Shares
Balance – beginning of year $ – $ 2 $ 2Preferred Shares redeemed – (2) –
Balance – end of year – – 2
Common Shares
Balance – beginning of year 10,827 14 14Net shares issued under employee share-based compensation plans 73 – –Exercise of stock options 5 6 –Dividends declared on Common Shares-par value reduction (402) (178) –Common Shares stock dividend – 10,985 –
Balance – end of year 10,503 10,827 14
Common Shares in treasury
Balance – beginning of year (3) – –Common Shares issued in treasury, net of net shares redeemed under employee
share-based compensation plans – (3) –
Balance – end of year (3) (3) –
Additional paid-in capital
Balance – beginning of year 5,464 6,812 6,640Net shares redeemed under employee share-based compensation plans (77) (14) (17)Exercise of stock options 10 91 65Share-based compensation expense 121 126 100Preferred Shares redeemed – (573) –Common Shares stock dividend – (990) –Tax benefit on share-based compensation expense 8 12 24
Balance – end of year 5,526 5,464 6,812
Retained earnings
Balance – beginning of year 74 9,080 6,906Effect of partial adoption of fair value measurements standard – (4) –Effect of adoption of fair value option standard – 6 –Effect of adoption of income taxes standard – – (22)Effect of adoption of derivatives and hedging standard – – 12
Balance – beginning of year, adjusted for effect of adoption of new accountingprinciples 74 9,082 6,896
Effect of adoption of OTTI standard 195 – –Net income 2,549 1,197 2,578Dividends declared on Common Shares – (186) (349)Dividends declared on Preferred Shares – (24) (45)Common Shares stock dividend – (9,995) –
Balance – end of year 2,818 74 9,080
Deferred compensation obligation
Balance – beginning of year 3 3 4Decrease to obligation (1) – (1)
Balance – end of year $ 2 $ 3 $ 3
See accompanying notes to the consolidated financial statements
F-7
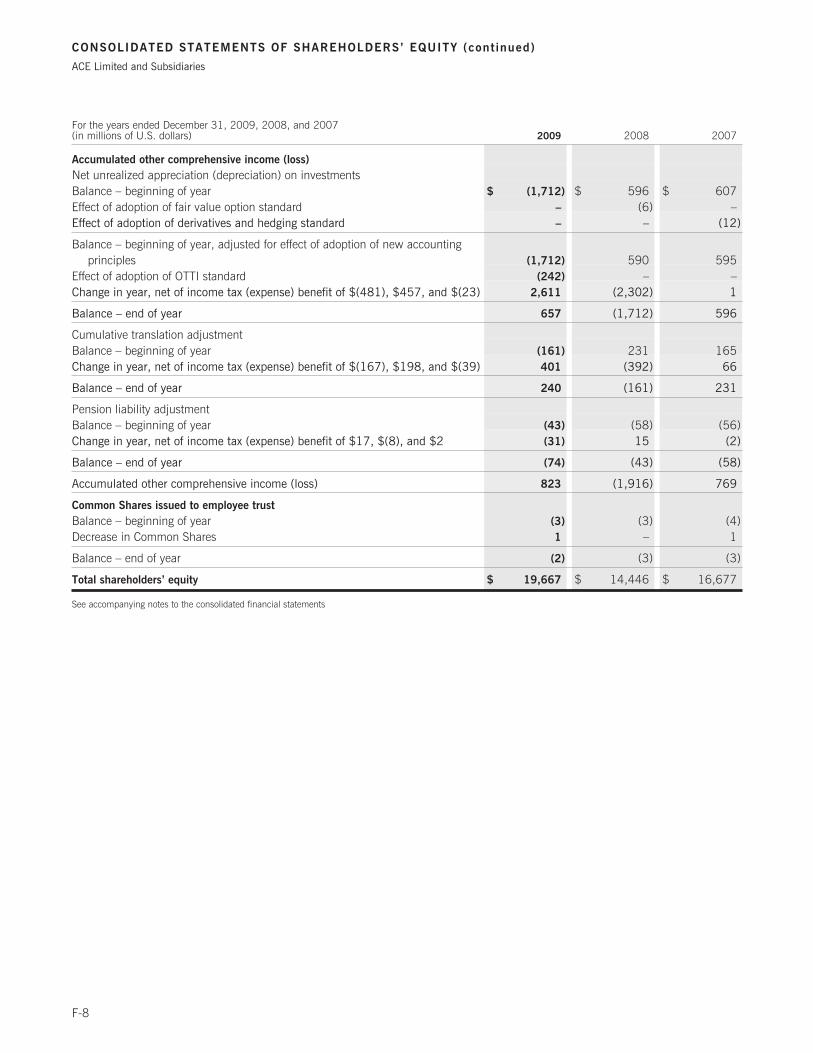
CONSOLIDATED STATEMENTS OF SHAREHOLDERS’ EQUITY (cont inued)
ACE Limited and Subsidiaries
For the years ended December 31, 2009, 2008, and 2007(in millions of U.S. dollars) 2009 2008 2007
Accumulated other comprehensive income (loss)
Net unrealized appreciation (depreciation) on investmentsBalance – beginning of year $ (1,712) $ 596 $ 607Effect of adoption of fair value option standard – (6) –Effect of adoption of derivatives and hedging standard – – (12)
Balance – beginning of year, adjusted for effect of adoption of new accountingprinciples (1,712) 590 595
Effect of adoption of OTTI standard (242) – –Change in year, net of income tax (expense) benefit of $(481), $457, and $(23) 2,611 (2,302) 1
Balance – end of year 657 (1,712) 596
Cumulative translation adjustmentBalance – beginning of year (161) 231 165Change in year, net of income tax (expense) benefit of $(167), $198, and $(39) 401 (392) 66
Balance – end of year 240 (161) 231
Pension liability adjustmentBalance – beginning of year (43) (58) (56)Change in year, net of income tax (expense) benefit of $17, $(8), and $2 (31) 15 (2)
Balance – end of year (74) (43) (58)
Accumulated other comprehensive income (loss) 823 (1,916) 769
Common Shares issued to employee trust
Balance – beginning of year (3) (3) (4)Decrease in Common Shares 1 – 1
Balance – end of year (2) (3) (3)
Total shareholders’ equity $ 19,667 $ 14,446 $ 16,677
See accompanying notes to the consolidated financial statements
F-8

C O N S O L I D A T E D S T A T E M E N T S O F C A S H F L O W S
ACE Limited and Subsidiaries
For the years ended December 31, 2009, 2008, and 2007(in millions of U.S. dollars) 2009 2008 2007
Cash flows from operating activities
Net income $ 2,549 $ 1,197 $ 2,578Adjustments to reconcile net income to net cash flows from operating activities
Net realized (gains) losses 196 1,633 61Amortization of premiums/discounts on fixed maturities 53 (1) (6)Deferred income taxes (19) (141) 25Unpaid losses and loss expenses 298 1,300 1,194Unearned premiums 102 (128) (356)Future policy benefits 67 212 27Insurance and reinsurance balances payable 434 (26) 298Accounts payable, accrued expenses, and other liabilities (206) 638 242Income taxes payable 13 46 (72)Insurance and reinsurance balances receivable (119) (6) 155Reinsurance recoverable on losses and loss expenses 518 (224) 341Reinsurance recoverable on policy benefits (51) (9) 2Deferred policy acquisition costs (309) (185) (10)Prepaid reinsurance premiums 24 (15) 35Other (215) (190) 187
Net cash flows from operating activities 3,335 4,101 4,701
Cash flows used for investing activities
Purchases of fixed maturities available for sale (31,789) (24,537) (25,195)Purchases of to be announced mortgage-backed securities (5,471) (18,969) (22,923)Purchases of fixed maturities held to maturity (472) (366) (324)Purchases of equity securities (354) (971) (929)Sales of fixed maturities available for sale 23,693 21,087 19,266Sales of to be announced mortgage-backed securities 5,961 18,340 21,550Sales of fixed maturities held to maturity 11 – –Sales of equity securities 1,272 1,164 863Maturities and redemptions of fixed maturities available for sale 3,404 2,780 3,232Maturities and redemptions of fixed maturities held to maturity 514 445 365Net derivative instruments settlements (92) 32 (16)Other 99 (608) (419)Acquisition of subsidiary (net of cash acquired of $19) – (2,521) –
Net cash flows used for investing activities (3,224) (4,124) (4,530)
Cash flows from (used for) financing activities
Dividends paid on Common Shares (388) (362) (341)Net repayment of short-term debt (466) (89) (465)Net proceeds from issuance of long-term debt 500 1,245 500Proceeds from exercise of options for Common Shares 15 97 65Proceeds from Common Shares issued under ESPP 10 10 9Tax benefit on share-based compensation expense 8 12 24Dividends paid on Preferred Shares – (24) (45)Redemption of Preferred Shares – (575) –
Net cash from (used for) financing activities (321) 314 (253)
Effect of foreign currency rate changes on cash and cash equivalents 12 66 27
Net increase (decrease) in cash (198) 357 (55)Cash – beginning of year 867 510 565
Cash – end of year $ 669 $ 867 $ 510
Supplemental cash flow informationTaxes paid $ 538 $ 403 $ 561Interest paid $ 228 $ 226 $ 177
See accompanying notes to consolidated financial statements
F-9

NOTES TO THE CONSOLIDATED FINANCIAL STATEMENTS
ACE Limited and Subsidiaries
1. General
ACE Limited (ACE or the Company) is a holding company which, until July 18, 2008, was incorporated with limited liabilityunder the Cayman Islands Companies Law. In March 2008, the Board of Directors (the Board) approved a proposal to movethe Company’s jurisdiction of incorporation from the Cayman Islands to Zurich, Switzerland (the Continuation). In July 2008,during ACE’s annual general meeting, the Company’s shareholders approved the Continuation and ACE became a Swisscompany effective July 18, 2008.
The Company, through its various subsidiaries, provides a broad range of insurance and reinsurance products to insuredsworldwide. ACE operates through the following business segments: Insurance – North American, Insurance – Overseas Gen-eral, Global Reinsurance, and Life. Refer to Note 17.
On April 1, 2008, ACE acquired all outstanding shares of Combined Insurance Company of America and certain of itssubsidiaries (Combined Insurance) from Aon Corporation for $2.56 billion. Combined Insurance is a leading underwriter anddistributor of specialty individual supplemental accident and health insurance products targeted to middle income consumersand small businesses in North America, Europe, Asia Pacific, and Latin America. ACE recorded the acquisition using the pur-chase method of accounting. Refer to Note 3.
2. Significant accounting policies
In June 2009, the Financial Accounting Standards Board (FASB) issued The FASB Accounting Standards CodificationTM
embodied in Accounting Standards Codification (ASC) Topic 105, Generally Accepted Accounting Principles (the Codification).The Codification, which was launched on July 1, 2009, became the single source of authoritative nongovernmental U.S.GAAP, superseding existing FASB, American Institute of Certified Public Accountants, Emerging Issues Task Force, and relatedliterature. The Codification establishes one level of authoritative guidance. All other literature is considered non-authoritative.The Codification was effective for financial statements issued for interim and annual periods ending after September 15, 2009.
a) Basis of presentation
The accompanying consolidated financial statements, which include the accounts of the Company and its subsidiaries, havebeen prepared in accordance with accounting principles generally accepted in the United States of America (GAAP) and, in theopinion of management, reflect all adjustments (consisting of normally recurring accruals) necessary for a fair statement of theresults and financial position for such periods. All significant intercompany accounts and transactions have been eliminated.Certain items in the prior year financial statements have been reclassified to conform to the current year presentation.
The preparation of financial statements in conformity with GAAP requires management to make estimates and assump-tions that affect the reported amounts of assets and liabilities, disclosure of contingent assets and liabilities at the date of thefinancial statements, and the reported amounts of revenues and expenses during the reporting period. The Company’s princi-pal estimates include:• unpaid loss and loss expense reserves, including asbestos and environmental (A&E) reserves;• future policy benefits reserves;• the valuation of value of business acquired (VOBA) and amortization of deferred policy acquisition costs and VOBA;• reinsurance recoverable, including a provision for uncollectible reinsurance;• the assessment of risk transfer for certain structured insurance and reinsurance contracts;• the valuation of the investment portfolio and assessment of other-than-temporary impairments (OTTI);• the valuation of deferred tax assets;• the valuation of derivative instruments related to guaranteed minimum income benefits (GMIB); and• the valuation of goodwill.
While the amounts included in the consolidated financial statements reflect the Company’s best estimates and assump-tions, these amounts could ultimately be materially different from the amounts recorded in the consolidated financialstatements.
b) Premiums
Premiums are generally recognized as written upon inception of the policy. For multi-year policies for which premiums writtenare payable in annual installments, only the current annual premium is included as written at policy inception due to the abil-ity of the insured/reinsured to commute or cancel coverage within the term of the policy. The remaining annual premiums areincluded as written at each successive anniversary date within the multi-year term.
F-10

N O T E S T O T H E C O N S O L I D A T E D F I N A N C I A L S T A T E M E N T S (continued)
ACE Limited and Subsidiaries
For property and casualty (P&C) insurance and reinsurance products, premiums written are primarily earned on a pro-ratabasis over the terms of the policies to which they relate. Unearned premiums represent the portion of premiums written appli-cable to the unexpired portion of the policies in force. For retrospectively-rated policies, written premiums are adjusted toreflect expected ultimate premiums consistent with changes to reported losses, or other measures of exposure as stated in thepolicy, and earned over the coverage period of the policy. For retrospectively-rated multi-year policies, the amount of premiumsrecognized in the current period is computed, using a with-and-without method, as the difference between the ceding enter-prise’s total contract costs before and after the experience under the contract as at the reporting date. Accordingly, forretrospectively-rated multi-year policies, additional premiums are generally written and earned when losses are incurred.
Mandatory reinstatement premiums assessed on reinsurance policies are earned in the period of the loss event that gaverise to the reinstatement premiums. All remaining unearned premiums are recognized over the remaining coverage period.
Premiums from long duration contracts such as traditional certain term life, whole life, endowment, and certain long dura-tion personal accident and health (A&H) policies are generally recognized as revenue when due from policyholders. Traditionallife policies include those contracts with fixed and guaranteed premiums and benefits. Benefits and expenses are matchedwith such income to result in the recognition of profit over the life of the contracts.
Retroactive loss portfolio transfer (LPT) contracts in which the insured loss events occurred prior to the inception of thecontract are evaluated to determine whether they meet the established criteria for reinsurance accounting. If reinsuranceaccounting is appropriate, written premiums are fully earned and corresponding losses and loss expenses recognized at theinception of the contract. The contracts can cause significant variances in gross premiums written, net premiums written, netpremiums earned, and net incurred losses in the years in which they are written. Reinsurance contracts sold not meeting theestablished criteria for reinsurance accounting are recorded using the deposit method as described below in Note 2 k).
Reinsurance premiums assumed are based on information provided by ceding companies supplemented by the Compa-ny’s own estimates of premium when the Company has not received ceding company reports. The information used inestablishing these estimates is reviewed and adjustments are recorded in the period in which they are determined. Thesepremiums are earned over the coverage terms of the related reinsurance contracts and range from one to three years.
c) Policy acquisition costs
Policy acquisition costs consist of commissions, premium taxes, and underwriting and other costs that vary with, and areprimarily related to, the production of premium. A VOBA intangible asset is established upon the acquisition of blocks of longduration contracts and represents the present value of estimated net cash flows for the contracts in force at the time of theacquisition. Acquisition costs and VOBA, collectively policy acquisition costs, are deferred and amortized over the period inwhich the related premiums are earned. For P&C contracts, this is generally ratably over the period in which premiums areearned. For long duration contracts, the Company amortizes policy acquisition costs over the estimated life of the contracts inproportion to premium revenue recognized. Policy acquisition costs are reviewed to determine if they are recoverable fromfuture income, including investment income. If such costs are unrecoverable, they are expensed in the period this determi-nation is made.
Advertising costs are expensed as incurred except for direct-response campaigns, principally related to A&H businessproduced by the Insurance – Overseas General segment, which are deferred and recognized over the expected future benefitperiod in accordance with the provisions of ASC Topic 720, Advertising Costs. For individual direct-response marketing cam-paigns that the Company can demonstrate have specifically resulted in incremental sales to customers and such sales haveprobable future economic benefits, incremental costs directly related to the marketing campaigns are capitalized. Deferredmarketing costs are reviewed regularly for recoverability and amortized over five years, the expected economic future benefitperiod. The expected future benefit period is evaluated periodically based on historical results and adjusted prospectively. Theamount of deferred marketing costs reported in deferred policy acquisition costs was $333 million, $300 million, and $282million at December 31, 2009, 2008, and 2007, respectively. The amortization expense for deferred marketing costs was$135 million, $124 million, and $91 million for the years ended December 31, 2009, 2008, and 2007, respectively.
d) Reinsurance
The Company assumes and cedes reinsurance with other insurance companies to provide greater diversification of businessand minimize the net loss potential arising from large risks. Ceded reinsurance contracts do not relieve the Company of itsprimary obligation to its policyholders.
For both ceded and assumed reinsurance, risk transfer requirements must be met in order to obtain reinsurance status foraccounting purposes, principally resulting in the recognition of cash flows under the contract as premiums and losses. To meet
F-11
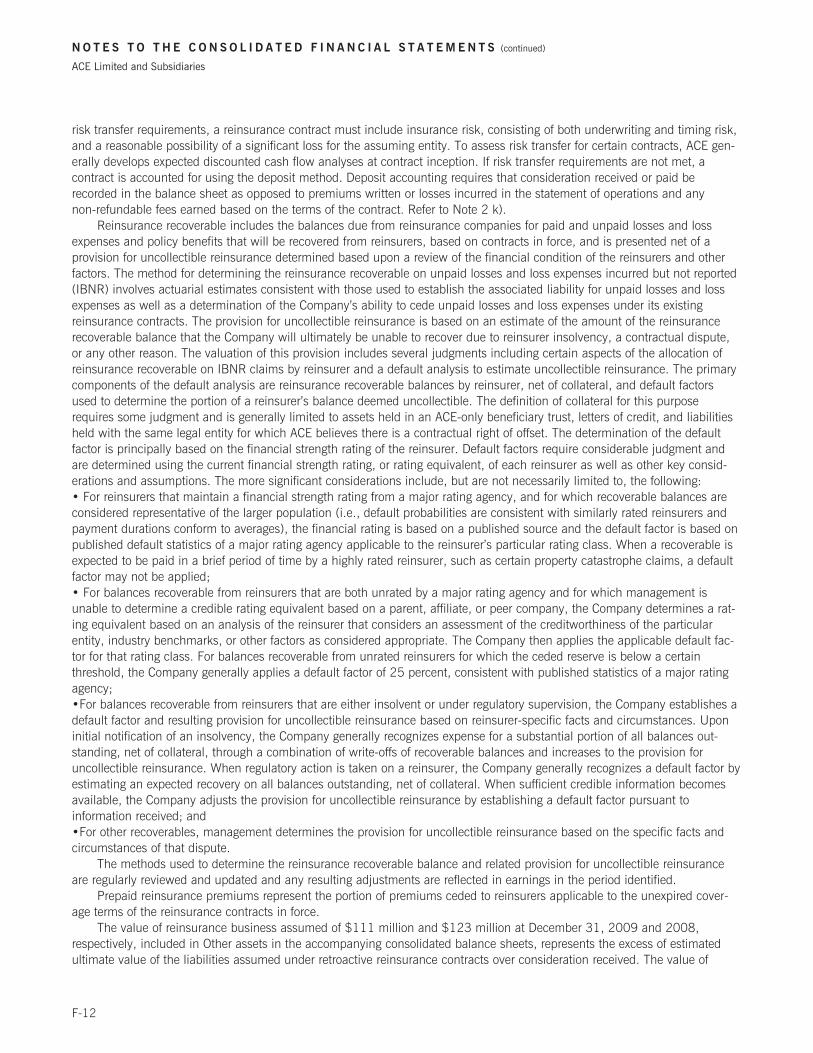
N O T E S T O T H E C O N S O L I D A T E D F I N A N C I A L S T A T E M E N T S (continued)
ACE Limited and Subsidiaries
risk transfer requirements, a reinsurance contract must include insurance risk, consisting of both underwriting and timing risk,and a reasonable possibility of a significant loss for the assuming entity. To assess risk transfer for certain contracts, ACE gen-erally develops expected discounted cash flow analyses at contract inception. If risk transfer requirements are not met, acontract is accounted for using the deposit method. Deposit accounting requires that consideration received or paid berecorded in the balance sheet as opposed to premiums written or losses incurred in the statement of operations and anynon-refundable fees earned based on the terms of the contract. Refer to Note 2 k).
Reinsurance recoverable includes the balances due from reinsurance companies for paid and unpaid losses and lossexpenses and policy benefits that will be recovered from reinsurers, based on contracts in force, and is presented net of aprovision for uncollectible reinsurance determined based upon a review of the financial condition of the reinsurers and otherfactors. The method for determining the reinsurance recoverable on unpaid losses and loss expenses incurred but not reported(IBNR) involves actuarial estimates consistent with those used to establish the associated liability for unpaid losses and lossexpenses as well as a determination of the Company’s ability to cede unpaid losses and loss expenses under its existingreinsurance contracts. The provision for uncollectible reinsurance is based on an estimate of the amount of the reinsurancerecoverable balance that the Company will ultimately be unable to recover due to reinsurer insolvency, a contractual dispute,or any other reason. The valuation of this provision includes several judgments including certain aspects of the allocation ofreinsurance recoverable on IBNR claims by reinsurer and a default analysis to estimate uncollectible reinsurance. The primarycomponents of the default analysis are reinsurance recoverable balances by reinsurer, net of collateral, and default factorsused to determine the portion of a reinsurer’s balance deemed uncollectible. The definition of collateral for this purposerequires some judgment and is generally limited to assets held in an ACE-only beneficiary trust, letters of credit, and liabilitiesheld with the same legal entity for which ACE believes there is a contractual right of offset. The determination of the defaultfactor is principally based on the financial strength rating of the reinsurer. Default factors require considerable judgment andare determined using the current financial strength rating, or rating equivalent, of each reinsurer as well as other key consid-erations and assumptions. The more significant considerations include, but are not necessarily limited to, the following:• For reinsurers that maintain a financial strength rating from a major rating agency, and for which recoverable balances areconsidered representative of the larger population (i.e., default probabilities are consistent with similarly rated reinsurers andpayment durations conform to averages), the financial rating is based on a published source and the default factor is based onpublished default statistics of a major rating agency applicable to the reinsurer’s particular rating class. When a recoverable isexpected to be paid in a brief period of time by a highly rated reinsurer, such as certain property catastrophe claims, a defaultfactor may not be applied;• For balances recoverable from reinsurers that are both unrated by a major rating agency and for which management isunable to determine a credible rating equivalent based on a parent, affiliate, or peer company, the Company determines a rat-ing equivalent based on an analysis of the reinsurer that considers an assessment of the creditworthiness of the particularentity, industry benchmarks, or other factors as considered appropriate. The Company then applies the applicable default fac-tor for that rating class. For balances recoverable from unrated reinsurers for which the ceded reserve is below a certainthreshold, the Company generally applies a default factor of 25 percent, consistent with published statistics of a major ratingagency;•For balances recoverable from reinsurers that are either insolvent or under regulatory supervision, the Company establishes adefault factor and resulting provision for uncollectible reinsurance based on reinsurer-specific facts and circumstances. Uponinitial notification of an insolvency, the Company generally recognizes expense for a substantial portion of all balances out-standing, net of collateral, through a combination of write-offs of recoverable balances and increases to the provision foruncollectible reinsurance. When regulatory action is taken on a reinsurer, the Company generally recognizes a default factor byestimating an expected recovery on all balances outstanding, net of collateral. When sufficient credible information becomesavailable, the Company adjusts the provision for uncollectible reinsurance by establishing a default factor pursuant toinformation received; and•For other recoverables, management determines the provision for uncollectible reinsurance based on the specific facts andcircumstances of that dispute.
The methods used to determine the reinsurance recoverable balance and related provision for uncollectible reinsuranceare regularly reviewed and updated and any resulting adjustments are reflected in earnings in the period identified.
Prepaid reinsurance premiums represent the portion of premiums ceded to reinsurers applicable to the unexpired cover-age terms of the reinsurance contracts in force.
The value of reinsurance business assumed of $111 million and $123 million at December 31, 2009 and 2008,respectively, included in Other assets in the accompanying consolidated balance sheets, represents the excess of estimatedultimate value of the liabilities assumed under retroactive reinsurance contracts over consideration received. The value of
F-12

N O T E S T O T H E C O N S O L I D A T E D F I N A N C I A L S T A T E M E N T S (continued)
ACE Limited and Subsidiaries
reinsurance business assumed is amortized and recorded to losses and loss expenses based on the payment pattern of thelosses assumed and ranges between 3 and 40 years. The unamortized value is reviewed regularly to determine if it is recover-able based upon the terms of the contract, estimated losses and loss expenses, and anticipated investment income.Unrecoverable amounts are expensed in the period identified.
e) Investments
Fixed maturity investments are classified as either available for sale or held to maturity. The available for sale portfolio isreported at fair value. The held to maturity portfolio includes securities for which the Company has the ability and intent tohold to maturity or redemption and is reported at amortized cost. Equity securities are classified as available for sale and arerecorded at fair value. Short-term investments comprise securities due to mature within one year of the date of purchase.Short-term investments include certain cash and cash equivalents, which are part of investment portfolios under the manage-ment of external investment managers.
Other investments principally comprise life insurance policies, policy loans, trading securities, other direct equity invest-ments, investment funds, and limited partnerships.• Life insurance policies are carried at policy cash surrender value.• Policy loans are carried at outstanding balance.• Trading securities are recorded on a trade date basis and carried at fair value. Unrealized gains and losses on trading secu-rities are reflected in net income.• Other investments over which ACE can exercise significant influence are accounted for using the equity method.• All other investments over which ACE cannot exercise significant influence are carried at fair value with changes in fair valuerecognized through other comprehensive income. For these investments, investment income and realized gains are recognizedas related distributions are received.• Partially-owned investment companies comprise entities in which the Company holds an ownership interest in excess ofthree percent. These investments as well as ACE’s investments in investment funds where its ownership interest is in excess ofthree percent are accounted for under the equity method as ACE exerts significant influence. These investments apply invest-ment company accounting to determine operating results, and ACE retains the investment company accounting in applying theequity method. This means that investment income, realized gains or losses, and unrealized gains or losses are included in theportion of equity earnings reflected in Other (income) expense.
Upon adopting the provisions of ASC Topic 815, Derivative and Hedging, (Topic 815) on January 1, 2007, ACE electedto apply the option related to hybrid financial instruments to $277 million of convertible bond investments that containembedded derivatives within ACE’s available for sale portfolio. Since the convertible bonds were previously carried at fair value,the election did not have an effect on shareholders’ equity. However, the election resulted in a reduction of accumulated othercomprehensive income and an increase in retained earnings of $12 million as at January 1, 2007. The Company recognizesthese hybrid financial instruments at fair value with changes in fair value reflected in Net realized gains (losses).
Investments in partially-owned insurance companies primarily represent direct investments in which the Company hassignificant influence and, as such, meet the requirements for equity accounting. The Company reports its share of the netincome or loss of the partially-owned insurance companies in Other (income) expense. Investments in partially-ownedinsurance companies over which the Company does not exert significant influence are carried at fair value.
Realized gains or losses on sales of investments are determined on a first-in, first-out basis. Unrealized appreciation(depreciation) on investments is included as a separate component of accumulated other comprehensive income in share-holders’ equity. The Company regularly reviews its investments for OTTI. Refer to Note 4.
With respect to securities where the decline in value is determined to be temporary and the security’s value is not writtendown, a subsequent decision may be made to sell that security and realize a loss. Subsequent decisions on security sales arethe result of changing or unforeseen facts and circumstances (e.g., arising from a large insured loss such as a catastrophe),deterioration of the credit-worthiness of the issuer or its industry, or changes in regulatory requirements. The Company believesthat subsequent decisions to sell such securities are consistent with the classification of the majority of the portfolio as avail-able for sale.
The Company utilizes derivative instruments including futures, options, swaps, and foreign currency forward contracts forthe purpose of managing certain investment portfolio risk and exposures. Refer to Note 10. Derivatives are reported at fairvalue and recorded in the accompanying consolidated balance sheets in Accounts payable, accrued expenses, and otherliabilities with changes in fair value included in Net realized gains (losses) in the consolidated statements of operations. Collat-eral held by brokers equal to a percentage of the total value of open futures contracts is included in Short-term investments.
F-13

N O T E S T O T H E C O N S O L I D A T E D F I N A N C I A L S T A T E M E N T S (continued)
ACE Limited and Subsidiaries
Net investment income includes interest and dividend income and amortization of fixed maturity market premiums anddiscounts and is net of investment management and custody fees. For mortgage-backed securities, and any other holdings forwhich there is a prepayment risk, prepayment assumptions are evaluated and revised as necessary. Any adjustments requireddue to the resultant change in effective yields and maturities are recognized prospectively. Prepayment fees or call premiumsthat are only payable when a security is called prior to its maturity are earned when received and reflected in Net investmentincome.
The Company participates in a securities lending program operated by a third party banking institution whereby certainassets are loaned to qualified borrowers and from which the Company earns an incremental return. Borrowers providecollateral, in the form of either cash or approved securities, of 102 percent of the fair value of the loaned securities. Each secu-rity loan is deemed to be an overnight transaction. Cash collateral is invested in a collateral pool which is managed by thebanking institution. The collateral pool is subject to written investment guidelines with key objectives which include the safe-guard of principal and adequate liquidity to meet anticipated redemptions. The fair value of the loaned securities is monitoredon a daily basis, with additional collateral obtained or refunded as the fair value of the loaned securities changes. Thecollateral is held by the third party banking institution, and the collateral can only be accessed in the event that the institutionborrowing the securities is in default under the lending agreement. As a result of these restrictions, the Company considers itssecurities lending activities to be non-cash investing and financing activities. An indemnification agreement with the lendingagent protects the Company in the event a borrower becomes insolvent or fails to return any of the securities on loan. The fairvalue of the securities on loan is included in fixed maturities and equity securities. The securities lending collateral is reportedas a separate line in total assets with a related liability reflecting the Company’s obligation to return the collateral plus interest.
Similar to securities lending arrangements, securities sold under reverse repurchase agreements are accounted for as col-lateralized investments and borrowings and are recorded at the contractual repurchase amounts plus accrued interest. Assetsto be repurchased are the same, or substantially the same, as the assets transferred and the transferor, through right of sub-stitution, maintains the right and ability to redeem the collateral on short notice. The fair value of the underlying securities isincluded in fixed maturities and equity securities. In contrast to securities lending programs, the use of cash received is notrestricted. The Company reports its obligation to return the cash as short-term debt. Refer to Note 9.
Refer to Note 15 for a discussion on the determination of fair value for the Company’s various investment securities.
f) Cash
Cash includes cash on hand and deposits with an original maturity of three months or less at time of purchase. Cash held byexternal money managers is included in Short-term investments.
g) Goodwill and other intangible assets
Goodwill represents the excess of the cost of acquisitions over the fair value of net assets acquired and is not amortized.Goodwill is assigned at acquisition to the applicable reporting unit of the acquired entities giving rise to the goodwill. Goodwillimpairment tests are performed annually, or more frequently if circumstances indicate a possible impairment. The Companyestimates a reporting unit’s fair value using a consistently applied combination of the following models: an earnings multiple, abook value multiple, a discounted cash flow or an allocated market capitalization model. The Company’s earnings and bookvalue models apply multiples of comparable publicly traded companies to forecasted earnings or book value of each reportingunit and consider current market transactions. The discounted cash flow model applies a discount to estimated cash flowsincluding a terminal value calculation. The market capitalization model allocates the Company’s market capitalization to eachreporting unit. Where appropriate, the Company considers the impact of a control premium. Goodwill recorded in connectionwith investments in partially-owned insurance companies is recorded in Investments in partially-owned insurance companiesand is also measured for impairment annually.
Indefinite lived intangible assets are not subject to amortization. Finite lived intangible assets are amortized over theiruseful lives, generally ranging from 5 to 15 years. The carrying amounts of intangible assets are regularly reviewed forindicators of impairment. Impairment is recognized if the carrying amount is not recoverable from its undiscounted cash flowsand is measured as the difference between the carrying amount and fair value.
h) Unpaid losses and loss expenses
A liability is established for the estimated unpaid losses and loss expenses under the terms of, and with respect to, the Compa-ny’s policies and agreements. These amounts include provision for both reported claims (case reserves) and IBNR claims. Themethods of determining such estimates and establishing the resulting liability are reviewed regularly and any adjustments arereflected in operations in the period in which they become known. Future developments may result in losses and lossexpenses materially greater or less than recorded amounts.
F-14

N O T E S T O T H E C O N S O L I D A T E D F I N A N C I A L S T A T E M E N T S (continued)
ACE Limited and Subsidiaries
Except for net loss and loss expense reserves of $76 million net of discount held at December 31, 2009, representingstructured settlements for which the timing and amount of future claim payments are reliably determinable, the Company doesnot discount its P&C loss reserves. Structured settlements represent contracts purchased from life insurance companies primar-ily to settle workers’ compensation claims, where payments to the claimant by the life insurance company are expected to bemade in the form of an annuity. The Company retains the liability to the claimant in the event that the life insurance companyfails to pay. At December 31, 2009, the Company has a gross liability of $659 million for the amount due to claimants andreinsurance recoverables of $583 million for amounts due from the life insurance companies. For structured settlement con-tracts where payments are guaranteed regardless of claimant life expectancy, the amounts recoverable from the life insurancecompanies are included in Other Assets, as they do not meet the requirements for reinsurance accounting. At December 31,2009, there was $76 million included in Other Assets relating to structured settlements.
Included in unpaid losses and loss expenses are liabilities for A&E claims and expenses. These unpaid losses and lossexpenses are principally related to claims arising from remediation costs associated with hazardous waste sites and bodily-injury claims related to asbestos products and environmental hazards. The estimation of these liabilities is particularly sensitiveto changes in the legal environment, including specific settlements that may be used as precedents to settle future claims.However, ACE does not anticipate future changes in laws and regulations in setting its A&E reserve levels.
Prior period development arises from changes to loss estimates recognized in the current year that relate to loss reservesfirst reported in previous calendar years and excludes the effect of losses from the development of earned premiums from pre-vious accident years. With respect to crop business, reports are regularly received from the Company’s managing general agentrelating to the previous crop year(s) in subsequent calendar years and this typically results in adjustments to the previouslyreported premiums, losses and loss expenses, and profit share commission. Commencing with the quarter ended Sep-tember 30, 2009, prior period development for the crop business includes adjustments to both crop losses and loss expensesand the related crop profit share commission. For purposes of analysis and disclosure, management views prior perioddevelopment to be changes in the nominal value of loss estimates from period to period and excludes changes in loss esti-mates that do not arise from the emergence of claims, such as those related to uncollectible reinsurance, interest, unallocatedloss adjustment expenses, or foreign currency. Accordingly, specific items excluded from prior period development include thefollowing: gains/losses related to foreign currency translation; losses recognized from the early termination or commutation ofreinsurance agreements that principally relate to the time value of money; changes in the value of reinsurance businessassumed reflected in losses incurred but principally related to the time value of money; and losses that arise from changes inestimates of earned premiums from prior accident years. Except for foreign currency revaluation, which is disclosed separately,these items are included in current year losses.
i) Future policy benefits
The development of long duration contract reserves requires management to make estimates and assumptions regardingexpenses, mortality, persistency, and investment yields. Such estimates are primarily based on historical experience andinformation provided by ceding companies and include a margin for adverse deviation. Interest rates used in calculatingreserves range from one percent to seven percent at December 31, 2009 and 2008. Actual results could differ materially fromthese estimates. Management monitors actual experience, and where circumstances warrant, will revise its assumptions andthe related reserve estimates. These revisions are recorded in the period they are determined.
j) Assumed reinsurance programs involving minimum benefit guarantees under annuity contracts
The Company reinsures various death and living benefit guarantees associated with variable annuities issued primarily in theUnited States and Japan. Each reinsurance treaty covers variable annuities written during a limited period, typically notexceeding two years. The Company generally receives a monthly premium during the accumulation phase of the coveredannuities (in-force) based on a percentage of either the underlying accumulated account values or the underlying accumulatedguaranteed values. Depending on an annuitant’s age, the accumulation phase can last many years. To limit the Company’sexposure under these programs, all reinsurance treaties include aggregate claim limits and many include an aggregate deduc-tible.
The guarantees which are payable on death, referred to as guaranteed minimum death benefits (GMDB), principally covershortfalls between accumulated account value at the time of an annuitant’s death and either i) an annuitant’s total deposits; ii)an annuitant’s total deposits plus a minimum annual return; or iii) the highest accumulated account value attained at anypolicy anniversary date. In addition, a death benefit may be based on a formula specified in the variable annuity contract thatuses a percentage of the growth of the underlying contract value. Liabilities for GMDBs are based on cumulative assessmentsor premiums to date multiplied by a benefit ratio that is determined by estimating the present value of benefit payments and
F-15

N O T E S T O T H E C O N S O L I D A T E D F I N A N C I A L S T A T E M E N T S (continued)
ACE Limited and Subsidiaries
related adjustment expenses divided by the present value of cumulative assessment or expected fees during the contract peri-od. In the event the Company was to anticipate an ultimate loss on the business over the in-force period of the underlyingannuities, an additional liability would be established to recognize such losses.
Under reinsurance programs covering living benefit guarantees, the Company assumes the risk of GMIBs associated withvariable annuity contracts. The GMIB risk is triggered if, at the time the contract holder elects to convert the accumulatedaccount value to a periodic payment stream (annuitize), the accumulated account value is not sufficient to provide a guaran-teed minimum level of monthly income. The Company’s GMIB reinsurance product meets the definition of a derivative foraccounting purposes and is carried at fair value with changes in fair value recognized in income and classified as describedbelow. As the assuming entity, the Company is obligated to provide coverage until the expiration of the underlying annuities.Premiums received under the reinsurance treaties are classified as premium. Expected losses allocated to premiums receivedare classified as policy benefits and valued similar to GMDB reinsurance. Other changes in fair value, principally arising fromchanges in expected losses allocated to expected future premiums, are classified as Net realized gains (losses). Fair valuerepresents exit price and thus includes a risk margin. The Company may recognize a realized loss for other changes in fairvalue due to adverse changes in the capital markets (i.e., declining interest rates and/or declining equity markets) and changesin policyholder behavior (i.e., increased annuitization or decreased lapse rates) although the Company expects the business tobe profitable. The Company believes this presentation provides the most meaningful disclosure of changes in the underlyingrisk within the GMIB reinsurance programs for a given reporting period. Refer to Note 5 c).
k) Deposit assets and liabilities
Deposit assets arise from ceded reinsurance contracts purchased that do not transfer significant underwriting or timing risk.Under deposit accounting, consideration received or paid, excluding non-refundable fees, is recorded as a deposit asset orliability in the balance sheet as opposed to ceded premiums and losses in the statement of operations. Interest income ondeposits, representing the consideration received or to be received in excess of cash payments related to the deposit contract,is earned based on an effective yield calculation. The calculation of the effective yield is based on the amount and timing ofactual cash flows as at the balance sheet date and the estimated amount and timing of future cash flows. The effective yield isrecalculated periodically to reflect revised estimates of cash flows. When a change in the actual or estimated cash flowsoccurs, the resulting change to the carrying amount of the deposit asset is reported as income or expense. Deposit assets of$55 million and $77 million at December 31, 2009 and 2008, respectively, are reflected in Other assets in the balancesheets and the accretion of deposit assets related to interest pursuant to the effective yield calculation is reflected in Netinvestment income in the statement of operations.
Non-refundable fees are earned based on contract terms. Non-refundable fees paid but unearned are reflected in Otherassets in the balance sheet and earned fees are reflected in Other (income) expense in the statement of operations.
Deposit liabilities include reinsurance deposit liabilities of $281 million and $310 million and contract holder depositfunds of $51 million and $35 million at December 31, 2009 and 2008, respectively. The reinsurance deposit liabilities arisefrom contracts sold for which there is not a significant transfer of risk. At contract inception, the deposit liability equals netcash received. An accretion rate is established based on actuarial estimates whereby the deposit liability is increased to theestimated amount payable over the contract term. The deposit accretion rate is the rate of return required to fund expectedfuture payment obligations. The Company periodically reassesses the estimated ultimate liability and related expected rate ofreturn. Changes to the amount of the deposit liability are reflected as an adjustment to earnings to reflect the cumulative effectof the period the contract has been in force, and by an adjustment to the future accretion rate of the liability over the remainingestimated contract term.
Contract holder deposit funds represent a liability for investment contracts sold that do not meet the definition of aninsurance contract and are sold with a guaranteed rate of return. The liability equals accumulated policy account values,which consist of the deposit payments plus credited interest, less withdrawals and amounts assessed through the end of theperiod.
l) Translation of foreign currencies
The Company determines the functional currency for each of its foreign operations, which are generally the currency of thelocal operating environment. Transactions in currencies other than a foreign operation’s functional currency are remeasuredinto the functional currency and the resulting foreign exchange gains and losses are reflected in Net realized gains (losses) inthe consolidated statements of operations. Functional currency assets and liabilities are translated into the reporting currency,U.S. dollars, using period end rates of exchange and the related translation adjustments are recorded as a separate component
F-16

N O T E S T O T H E C O N S O L I D A T E D F I N A N C I A L S T A T E M E N T S (continued)
ACE Limited and Subsidiaries
of accumulated other comprehensive income. Functional statement of operations amounts expressed in functional currenciesare translated using average exchange rates. Gains and losses resulting from foreign currency transactions are recorded in Netrealized gains (losses).
m) Income taxes
Income taxes have been provided for in accordance with the provisions of ASC Topic 740, Income Taxes, (Topic 740) forthose operations which are subject to income taxes. Deferred tax assets and liabilities result from temporary differencesbetween the amounts recorded in the consolidated financial statements and the tax basis of the Company’s assets andliabilities. Refer to Note 8. The effect on deferred tax assets and liabilities of a change in tax rates is recognized in income inthe period that includes the enactment date. A valuation allowance against deferred tax assets is recorded if it is more likelythan not that all, or some portion, of the benefits related to deferred tax assets will not be realized. The valuation allowanceassessment considers tax planning strategies, where applicable.
Beginning with the adoption of the provisions included in Topic 740 relating to uncertainty in income taxes, as at Jan-uary 1, 2007, the Company recognized uncertain tax positions deemed more likely than not of being sustained uponexamination. Recognized income tax positions are measured at the largest amount that is greater than 50 percent likely ofbeing realized. Changes in recognition or measurement are reflected in the period in which the change in judgment occurs.
n) Earnings per share
Basic earnings per share is calculated using the weighted-average shares outstanding including participating securities withnon-forfeitable rights to dividends such as unvested restricted stock. All potentially dilutive securities including stock optionsare excluded from the basic earnings per share calculation. In calculating diluted earnings per share, the weighted-averageshares outstanding is increased to include all potentially dilutive securities. Basic and diluted earnings per share are calculatedby dividing net income available to common shareholders by the applicable weighted-average number of shares outstandingduring the year.
o) Cash flow information
Purchases, sales, and maturities of short-term investments are recorded net for purposes of the consolidated statements ofcash flows and are classified with cash flows related to fixed maturities. Premiums received and losses paid associated withthe GMIB reinsurance product, which as discussed previously meets the definition of a derivative instrument for accountingpurposes, are included within cash flows from operating activities in the consolidated statement of cash flows. Cash flows,such as settlements and collateral requirements, associated with all other derivative instruments are included on a net basiswithin cash flows from investing activities in the consolidated statement of cash flows.
p) Derivatives
The Company recognizes all derivatives as either assets or liabilities in the consolidated balance sheets measured at fair value.The Company participates in derivative instruments in two principal ways:(i) To sell protection to customers as an insurance or reinsurance contract that meets the definition of a derivative under theprovisions of Topic 815. For 2009 and 2008, the reinsurance of GMIBs was the Company’s primary product falling into thiscategory; and(ii) To mitigate financial risks, principally arising from investment holdings, products sold, or assets and liabilities held in for-eign currencies. For these instruments, changes in assets or liabilities measured at fair value are recorded as realized gains orlosses in the consolidated statement of operations.
The Company did not designate any derivatives as accounting hedges during 2009, 2008, or 2007.
q) Share-based compensation
The Company measures and records compensation cost for all share-based payment awards at grant-date fair value. Compen-sation costs are recognized for share-based payment awards with only service conditions that have graded vesting scheduleson a straight-line basis over the requisite service period for each separately vesting portion of the award as if the award was, insubstance, multiple awards. Refer to Note 13.
F-17

N O T E S T O T H E C O N S O L I D A T E D F I N A N C I A L S T A T E M E N T S (continued)
ACE Limited and Subsidiaries
r) New accounting pronouncements
Adopted in 2009
Business combinationsASC Topic 805, Business Combinations, (Topic 805) contains certain provisions to be applied prospectively to businesscombinations for which the acquisition date is on or after the beginning of the first annual reporting period beginning on orafter December 15, 2008. These provisions establish standards that provide a definition of the “acquirer” and broaden theapplication of the acquisition method. They also establish how an acquirer recognizes and measures the assets, liabilities, andany noncontrolling interest in the “acquiree”; recognizes and measures goodwill or a gain from a bargain purchase; and requiredisclosures that enable users to evaluate the nature and financial effects of the business combination. The adoption of theseprovisions may have a material impact on any future business combinations consummated by ACE, but did not have anyeffect on previously consummated business acquisitions.
Topic 805 also contains certain provisions specifically related to accounting for assets acquired and liabilities assumed ina business combination that arise from contingencies that are effective for all business combinations for which the acquisitiondate is on or after the beginning of the first annual reporting period beginning on or after December 15, 2008. These provi-sions amend practices related to initial recognition and measurement, subsequent measurement, and disclosure of assets andliabilities arising from contingencies acquired in business combinations and require acquired contingencies to be recognized atacquisition date fair value if fair value can be reasonably estimated during the allocation period. Otherwise, acquired con-tingencies would typically be accounted for in accordance with ASC Topic 450, Contingencies. The adoption of theseprovisions may have a material impact on any future business combinations consummated by ACE, but did not have anyeffect on previously consummated business acquisitions.
ASC Topic 350, Intangibles-Goodwill and Other, (Topic 350) contains certain provisions related to accounting fordefensive intangible assets effective for intangible assets acquired on or after the beginning of the first annual reporting periodbeginning on or after December 15, 2008. These provisions require fair value be assigned to acquired defensive intangibleassets and a useful life be assigned to a defensive intangible asset based on the period over which the reporting entity expectsthe asset to contribute directly or indirectly to future cash flows. The adoption of these provisions may have a material impacton any future intangible assets acquired by ACE, but did not have any effect on any previously acquired intangible assets.
Noncontrolling interestsASC Topic 810, Consolidation, (Topic 810) contains certain provisions effective for fiscal years, and interim periods withinthose fiscal years, beginning on or after December 15, 2008. These provisions establish accounting and reporting standardsthat require that ownership interests in subsidiaries held by parties other than the parent be presented in the consolidatedstatement of shareholders’ equity separately from the parent’s equity; the consolidated net income attributable to the parentand noncontrolling interest be presented on the face of the consolidated statements of operations; changes in a parent’sownership interest while the parent retains controlling financial interest in its subsidiary be accounted for consistently; anddisclosure that identifies and distinguishes between the interests of the parent and noncontrolling owners. The adoption ofthese provisions did not have a material impact on ACE’s financial condition or results of operations.
Disclosures about derivative instruments and hedging activitiesTopic 815 contains certain provisions effective for fiscal years, and interim periods within those fiscal years, beginning on orafter November 15, 2008. These provisions establish reporting standards that require enhanced disclosures about how andwhy derivative instruments are used, how derivative instruments are accounted for, and how derivative instruments affect anentity’s financial position, financial performance, and cash flows. ACE adopted these provisions effective January 1, 2009.Refer to Note 10.
Determination of the useful life of intangible assetsTopic 350 contains certain provisions related to the determination of the useful life of intangible assets effective for financialstatements issued for fiscal years beginning after December 15, 2008, that must be applied prospectively to intangible assetsacquired after the effective date. These provisions amend the factors considered in developing assumptions used to determinethe useful life of an intangible asset with the intention of improving the consistency between the useful life of a recognizedintangible asset and the period of expected cash flows used to measure the fair value of the asset under Topic 805 and otherapplicable accounting literature. The adoption of these provisions may have a material impact on any future intangible assetsacquired by ACE, but did not have a material impact on the useful lives of any previously acquired intangible asset.
F-18

N O T E S T O T H E C O N S O L I D A T E D F I N A N C I A L S T A T E M E N T S (continued)
ACE Limited and Subsidiaries
Earnings per shareASC Topic 260, Earnings Per Share, (Topic 260) contains certain provisions effective for fiscal years, and interim periodswithin those fiscal years, beginning after December 15, 2008. These provisions provide additional guidance in the calculationof earnings per share and require unvested share-based payment awards that contain non-forfeitable rights to dividends ordividend equivalents (whether paid or unpaid) to be included in the computation of earnings per share pursuant to thetwo-class method. The adoption of these provisions did not have a material impact on ACE’s financial condition or results ofoperations.
Equity method accountingASC Topic 323, Investments-Equity Method and Joint Ventures, contains certain provisions effective for fiscal years, andinterim periods within those fiscal years, beginning on or after December 15, 2008. These provisions provide guidance forequity method accounting for specific topics and require an equity method investor account for share issuances, and resultingdilutive effect, by an investee as if the investor had sold a proportionate share of its investment with the resulting gain or lossrecognized in earnings. In connection with the adoption of these provisions, ACE recognized a $57 million pre-tax loss upon aJune 2009 share issuance by Assured Guaranty Ltd. (AGO). Refer to Note 4 e).
Fair value measurementsASC Topic 820, Fair Value Measurements and Disclosures, (Topic 820) includes provisions effective for interim and annualperiods ending after June 15, 2009. These provisions provide additional guidance for estimating fair value when the volumeand level of activity for the asset or liability have significantly decreased. The adoption of these provisions did not have a mate-rial impact on ACE’s financial condition or results of operations.
Fair value disclosuresASC Topic 825, Financial Instruments, (Topic 825) includes new provisions that require disclosures about fair value of finan-cial instruments for interim reporting periods as well as in annual financial statements. ACE adopted these provisions whichwere effective for interim and annual periods ending after June 15, 2009.
Fair value of alternative investmentsIn September 2009, the FASB issued Accounting Standards Update (ASU) No. 2009-12, Investments in Certain Entities That
Calculate Net Asset Value per Share (or Its Equivalent ) (ASU 2009-12). The provisions of ASU 2009-12 amend Topic 820to provide additional guidance on estimating the fair value of certain alternative investments. These provisions create a prac-tical expedient to measure the fair value of an alternative investment on the basis of the net asset value per share of theinvestment. These provisions also improve transparency by requiring additional disclosures about the attributes of alternativeinvestments to enable users of the financial statements to understand the nature and risks of the investments. ASU 2009-12was effective for interim and annual reporting periods beginning October 1, 2009. The adoption of these provisions did nothave an impact on ACE’s financial condition or results of operations.
Other-than-temporary impairmentsASC Topic 320, Investments-Debt and Equity Securities, (Topic 320) contains certain provisions effective for interim andannual periods ending after June 15, 2009, that amends OTTI guidance in existing GAAP for debt securities to make theguidance more operational and to improve the presentation and disclosure of OTTI on debt and equity securities in the finan-cial statements. The adoption of these provisions did not have a material impact on ACE’s financial condition. Refer to Note 4.
Subsequent eventsASC Topic 855, Subsequent Events, contains certain provisions effective for interim and annual periods ending after June 15,2009. These provisions set forth: 1) the period after the balance sheet date during which management of a reporting entityshould evaluate events or transactions that may occur for potential recognition or disclosure in the financial statements; 2) thecircumstances under which an entity should recognize events or transactions occurring after the balance sheet date in itsfinancial statements; and 3) the disclosures that an entity should make about events or transactions that occurred after thebalance sheet date. The adoption of these provisions did not impact ACE’s financial condition or results of operations.
F-19

N O T E S T O T H E C O N S O L I D A T E D F I N A N C I A L S T A T E M E N T S (continued)
ACE Limited and Subsidiaries
To be adopted after 2009
Consolidation of variable interest entities and accounting for transfers of financial assetsIn June 2009, the FASB issued Financial Accounting Standard (FAS) No. 166, Accounting for Transfers of Financial Assets –
an amendment of FASB Statement No. 140 (FAS 166) and FAS No. 167, Amendments to FASB Interpretation No. 46(R)
(FAS 167). FAS 166 amends ASC Topic 860, Transfers and Servicing, by removing the exemption from consolidation forQualifying Special Purpose Entities. This Statement also limits the circumstances in which a financial asset, or portion of afinancial asset, should be derecognized when the transferor has not transferred the entire original financial asset to an entitythat is not consolidated with the transferor in the financial statements being presented and/or when the transferor has continu-ing involvement with the transferred financial asset. FAS 167 amends Topic 810 to eliminate the quantitative approachpreviously required for determining the primary beneficiary of a variable interest entity and requires ongoing qualitativereassessments of whether an enterprise is the primary beneficiary of a variable interest entity. FAS 166 and FAS 167 are effec-tive for interim and annual reporting periods beginning on January 1, 2010. ACE does not expect the adoption of theseprovisions to have a material impact on ACE’s financial condition or results of operations.
Fair value measurements and disclosuresIn January 2010, the FASB issued ASU No. 2010-06, Improving Disclosures about Fair Value Measurements (ASU 2010-06). The provisions of ASU 2010-06 amend Topic 820 to require reporting entities to make new disclosures about recurringand nonrecurring fair value measurements including significant transfers into and out of Level 1 and Level 2 fair value meas-urements and information on purchases, sales, issuances, and settlements on a gross basis in the reconciliation of Level 3 fairvalue measurements. ASU 2010-6 was effective for annual reporting periods beginning after December 15, 2009, except forLevel 3 reconciliation disclosures which are effective for annual periods beginning after December 15, 2010.
3. Acquisition
On April 1, 2008, ACE acquired all outstanding shares of Combined Insurance from Aon Corporation for $2.56 billion. Theconsolidated financial statements include the results of Combined Insurance from April 1, 2008. Combined Insurance is aleading underwriter and distributor of specialty individual supplemental accident and health insurance products targeted tomiddle income consumers and small businesses in North America, Europe, Asia Pacific, and Latin America. This acquisitionhas diversified the Company’s A&H distribution capabilities by adding a significant agent base, while almost doubling the A&Hfranchise.
ACE recorded the acquisition using the purchase method of accounting. The acquisition generated $1 billion of VOBAwhich represented the fair value of the future profits of the in-force contracts. VOBA is the most significant intangible assetattributable to the acquisition and is amortized over a period of approximately 30 years in relation to the profit emergence ofthe underlying contracts, in a manner similar to deferred acquisition costs. The VOBA calculation was based on many factorsincluding mortality, morbidity, persistency, investment yields, expenses, and the discount rate with the discount rate being themost significant factor. The acquisition also generated $879 million of goodwill (all of which is expected to be deductible forincome tax purposes) and $43 million of other intangible assets based on ACE’s final purchase price allocation. Goodwill wasapportioned to the Life and Insurance – Overseas General segments in the amounts of $747 million and $132 million,respectively. Refer to Note 6. ACE financed the transaction through a combination of available cash ($811 million), reverserepurchase agreements ($1 billion), and new private and public long-term debt ($750 million). Refer to Note 9.
F-20

N O T E S T O T H E C O N S O L I D A T E D F I N A N C I A L S T A T E M E N T S (continued)
ACE Limited and Subsidiaries
The following table summarizes ACE’s best estimate of fair value of the assets acquired and liabilities assumed related tothe acquisition of Combined Insurance at April 1, 2008. Upon the adoption of the provisions (described in Note 15) of Topic820 on January 1, 2008, ACE elected to defer the fair value guidance applicable to valuing nonfinancial assets and non-financial liabilities that are not recognized or disclosed at fair value on a recurring basis. Accordingly, the provisions embodiedin that ASC topic were not used to determine the fair values of the nonfinancial assets acquired and the nonfinancial liabilitiesassumed in this business combination.
Condensed Balance Sheet of Combined Insurance at April 1, 2008(in millions of U.S. dollars)
Assets
Investments and cash $ 3,000Value of business acquired 1,040Goodwill and other intangible assets 922Other assets 536
Total assets $ 5,498
Liabilities and Shareholder’s Equity
Future policy benefits $ 2,272Other liabilities 686
Total liabilities 2,958
Total shareholder’s equity 2,540
Total liabilities and shareholder’s equity $ 5,498
The following table presents unaudited pro forma information for the years ended December 31, 2008 and 2007, assumingthe acquisition of Combined Insurance occurred on January 1st of each of the respective years. The pro forma financialinformation is presented for informational purposes only and is not necessarily indicative of the operating results that wouldhave occurred had the acquisition been consummated at the beginning of each period presented, nor is it necessarilyindicative of future operating results. Significant assumptions used to determine pro forma operating results include amor-tization of VOBA and other intangible assets and recognition of interest expense associated with debt financing used to effectthe acquisition. Earnings per share calculations have been amended due to the impact of the adoption of the previously dis-cussed new principles included within Topic 260.
(in millions of U.S. dollars, except per share data) (unaudited) 2008 2007
Pro forma:Net premiums earned $ 13,596 $ 13,823Total revenues $ 14,064 $ 15,830Net income $ 1,234 $ 2,767Diluted earnings per share $ 3.62 $ 8.20
F-21

N O T E S T O T H E C O N S O L I D A T E D F I N A N C I A L S T A T E M E N T S (continued)
ACE Limited and Subsidiaries
4. Investments
a) Fixed maturities
The following tables present the fair values and amortized costs of and the gross unrealized appreciation (depreciation) relatedto fixed maturities as well as OTTI recognized in Accumulated other comprehensive income.
December 31, 2009
(in millions of U.S. dollars)Amortized
Cost
GrossUnrealized
Appreciation
GrossUnrealized
Depreciation Fair Value
OTTIRecognized inAccumulated
OtherComprehensive
Income
Available for sale
U.S. Treasury and agency $ 3,680 $ 48 $ (19) $ 3,709 $ –
Foreign 10,960 345 (160) 11,145 (37)
Corporate securities 12,707 658 (150) 13,215 (41)
Mortgage-backed securities 10,058 239 (455) 9,842 (227)
States, municipalities, and political subdivisions 1,580 52 (18) 1,614 –
$ 38,985 $ 1,342 $ (802) $ 39,525 $ (305)
Held to maturity
U.S. Treasury and agency $ 1,026 $ 33 $ (2) $ 1,057 $ –
Foreign 26 1 – 27 –
Corporate securities 313 10 (1) 322 –
Mortgage-backed securities 1,440 39 (10) 1,469 –
States, municipalities, and political subdivisions 676 11 (1) 686 –
$ 3,481 $ 94 $ (14) $ 3,561 $ –
As discussed in Note 4 d), if a credit loss is indicated on an impaired fixed maturity investment, an OTTI is considered to haveoccurred and the portion of the impairment not related to credit losses (non-credit OTTI) is recognized in Other comprehensiveincome. Included in “OTTI Recognized in Accumulated Other Comprehensive Income” is the cumulative amount of non-creditOTTI recognized in comprehensive income adjusted for subsequent sales, maturities, and redemptions. “OTTI Recognized inAccumulated Other Comprehensive Income” does not include the impact of subsequent changes in fair value of the relatedsecurities. In periods subsequent to a recognition of OTTI in Other comprehensive income, changes in the fair value of therelated fixed maturity investments are reflected in Unrealized appreciation (depreciation) in the statement of comprehensiveincome. For the year ended December 31, 2009, $196 million of net unrealized appreciation related to such securities isincluded in Other comprehensive income. At December 31, 2009, Accumulated other comprehensive income includes netunrealized depreciation of $162 million related to securities remaining in the investment portfolio for which ACE has recog-nized a non-credit OTTI.
F-22

N O T E S T O T H E C O N S O L I D A T E D F I N A N C I A L S T A T E M E N T S (continued)
ACE Limited and Subsidiaries
December 31, 2008
(in millions of U.S. dollars)Amortized
Cost
GrossUnrealized
Appreciation
GrossUnrealized
Depreciation Fair Value
Available for sale
U.S. Treasury and agency $ 1,991 $ 133 $ (2) $ 2,122Foreign 8,625 278 (529) 8,374Corporate securities 10,093 89 (1,121) 9,061Mortgage-backed securities 10,958 221 (1,019) 10,160States, municipalities, and political subdivisions 1,442 38 (42) 1,438
$ 33,109 $ 759 $ (2,713) $ 31,155
Held to maturity
U.S. Treasury and agency $ 862 $ 61 $ – $ 923Foreign 38 1 (1) 38Corporate securities 405 2 (15) 392Mortgage-backed securities 877 11 (62) 826States, municipalities, and political subdivisions 678 9 (1) 686
$ 2,860 $ 84 $ (79) $ 2,865
Mortgage-backed securities issued by U.S. government agencies are combined with all other to be announced mortgagederivatives held (refer to Note 10 a) (iv)) and are included in the category, “Mortgage-backed securities”. Approximately 69percent and 63 percent of the total mortgage-backed securities at December 31, 2009 and 2008, respectively, are repre-sented by investments in U.S. government agency bonds. The remainder of the mortgage exposure consists of collateralizedmortgage obligations and nongovernment mortgage-backed securities, the majority of which provide a planned structure forprincipal and interest payments and carry a rating of AAA by the major credit rating agencies.
Fixed maturities at December 31, 2009 and 2008, by contractual maturity, are shown below. Expected maturities coulddiffer from contractual maturities because borrowers may have the right to call or prepay obligations, with or without call orprepayment penalties.
2009 2008
(in millions of U.S. dollars) Amortized Cost Fair Value Amortized Cost Fair Value
Available for sale; maturity period
Due in 1 year or less $ 1,354 $ 1,352 $ 1,047 $ 1,047Due after 1 year through 5 years 14,457 14,905 9,868 9,706Due after 5 years through 10 years 9,642 10,067 7,330 6,867Due after 10 years 3,474 3,359 3,906 3,375
28,927 29,683 22,151 20,995Mortgage-backed securities 10,058 9,842 10,958 10,160
$ 38,985 $ 39,525 $ 33,109 $ 31,155
Held to maturity; maturity period
Due in 1 year or less $ 755 $ 766 $ 325 $ 327Due after 1 year through 5 years 1,096 1,129 1,364 1,401Due after 5 years through 10 years 108 115 212 227Due after 10 years 82 82 82 84
2,041 2,092 1,983 2,039Mortgage-backed securities 1,440 1,469 877 826
$ 3,481 $ 3,561 $ 2,860 $ 2,865
F-23

N O T E S T O T H E C O N S O L I D A T E D F I N A N C I A L S T A T E M E N T S (continued)
ACE Limited and Subsidiaries
b) Transfers of securities
As part of the Company’s fixed income diversification strategy, ACE decided to hold to maturity certain commercial mortgage-backed securities that have shorter term durations. Because the Company has the intent to hold these securities to maturity,during the quarter ended June 30, 2009, a transfer of such securities with a fair value of $704 million was made from Fixedmaturities available for sale to Fixed maturities held to maturity. The $4 million unrealized depreciation at the date of the trans-fer continues to be reported as a component of Accumulated other comprehensive income and is being amortized over theremaining life of the securities as an adjustment of yield in a manner consistent with the amortization of any premium or dis-count.
c) Equity securities
The fair value, cost of, and gross unrealized appreciation (depreciation) on equity securities at December 31, 2009 and 2008,are as follows:
(in millions of U.S. dollars) 2009 2008
Equity securities – cost $ 398 $ 1,132Gross unrealized appreciation 70 74Gross unrealized depreciation (1) (218)
Equity securities – fair value $ 467 $ 988
d) Net realized gains (losses)
The Company adopted provisions included in Topic 320 related to the recognition and presentation of OTTI as at April 1,2009. Under these provisions, when an OTTI related to a fixed maturity security has occurred, ACE is required to record theOTTI in net income if the Company has the intent to sell the security or it is more likely than not that it will be required to sellthe security. Further, in cases where the Company does not intend to sell the security and it is more likely than not that it willnot be required to sell the security, ACE must evaluate the security to determine the portion of the impairment, if any, relatedto credit losses. If a credit loss is indicated, an OTTI is considered to have occurred and any portion of the OTTI related tocredit losses must be reflected in net income while the portion of OTTI related to all other factors is recognized in othercomprehensive income. For fixed maturities held to maturity, OTTI recognized in other comprehensive income is accreted fromaccumulated other comprehensive income to the amortized cost of the fixed maturity prospectively over the remaining term ofthe securities. For fixed maturities, prior to this adoption, ACE was required to record OTTI in net income unless the Companyhad the intent and ability to hold the impaired security to recovery. These newly adopted provisions do not have any impact onthe accounting for OTTI for any other type of investment.
The cumulative effect of the adoption resulted in a reduction to Accumulated other comprehensive income and anincrease to Retained earnings of $242 million as at April 1, 2009. These adjustments reflect the net of tax amount ($305million pre-tax) of OTTI recognized in net income prior to the adoption related to fixed maturities held at the adoption date thathave not suffered a credit loss, the Company does not intend to sell, and it is more likely than not that ACE will not be requiredto sell before the recovery of their amortized cost.
Retained earnings and Deferred tax assets as at April 1, 2009, were also reduced by $47 million as a result of anincrease in the Company’s valuation allowance against deferred tax assets, which is a direct effect of the adoption. Specifically,as a result of the reassessment of credit losses required by this adoption, ACE determined that certain previously impaired fixedmaturity securities had suffered credit losses in excess of previously estimated amounts, which may give rise to additionalfuture capital losses for tax purposes. Given the amount of available capital gains against which such additional capital lossescould be offset, at the date of adoption, the Company expected that a portion of capital loss carry forwards would expireunused. Accordingly, ACE determined that an additional valuation allowance was necessary given that it was considered morelikely than not that a portion of deferred tax assets related to previously impaired fixed income securities would not be real-ized.
Each quarter, the Company reviews its securities in an unrealized loss position (impaired securities), including fixedmaturity securities, securities lending collateral, equity securities, and other investments, to identify those impaired securitiesto be specifically evaluated for a potential OTTI.
For impaired fixed maturities, if the Company has the intent to sell the security or it is more likely than not that it will berequired to sell the security, an OTTI is considered to have occurred. In cases where the Company does not intend to sell thesecurity and it is more likely than not that it will not be required to sell the security, ACE evaluates the security to determine if
F-24

N O T E S T O T H E C O N S O L I D A T E D F I N A N C I A L S T A T E M E N T S (continued)
ACE Limited and Subsidiaries
a credit loss has occurred primarily based on a combination of qualitative and quantitative factors including a discounted cashflow model, where necessary. If a credit loss is indicated, an OTTI is considered to have occurred. Prior to the adoption, whenevaluating fixed maturities for OTTI, the Company principally considered its ability and intent to hold the impaired security tothe expected recovery period, the issuer’s financial condition, and the Company’s assessment (using available marketinformation such as credit ratings) of the issuer’s ability to make future scheduled principal and interest payments on a timelybasis. The factors that the Company now considers when determining if a credit loss exists related to a fixed maturity securityare discussed in “Evaluation of potential credit losses related to fixed maturities” below.The Company reviews all non-fixed maturity investments for OTTI based on the following:• the amount of time a security has been in a loss position and the magnitude of the loss position;• the period in which cost is expected to be recovered, if at all, based on various criteria including economic conditions andother issuer-specific developments; and• the Company’s ability and intent to hold the security to the expected recovery period.
ACE, as a general rule, also considers that equity securities in an unrealized loss position for twelve consecutive monthsare impaired.
Evaluation of potential credit losses related to fixed maturitiesACE reviews each fixed maturity security in an unrealized loss position to assess whether the security is a candidate for creditloss. Specifically, ACE considers credit rating, market price, and issuer specific financial information, among other factors, toassess the likelihood of collection of all principal and interest as contractually due. Securities for which ACE determines thatcredit loss is likely are subjected to further analysis to estimate the credit loss recognized in net income, if any. In general,credit loss recognized in net income equals the difference between the security’s amortized cost and the net present value of itsprojected future cash flows discounted at the effective interest rate implicit in the debt security. The specific methodologies andsignificant assumptions used by asset class are discussed below. All significant assumptions used in determining credit lossesare subject to change as market conditions evolve.
U.S. Treasury and agency obligations (including agency mortgage-backed securities), foreign government obligations, and states,municipalities, and political subdivisions obligationsU.S. Treasury and agency obligations (including agency mortgage-backed securities), foreign government obligations, andstates, municipalities, and political subdivisions obligations represent less than $80 million of gross unrealized loss atDecember 31, 2009. These securities were evaluated for credit loss primarily using qualitative assessments of the likelihood ofcredit loss considering credit rating of the issuers and level of credit enhancement, if any. ACE concluded that the high level ofcredit worthiness of the issuers coupled with credit enhancement, where applicable, supports recognizing no credit loss in netincome.
Corporate securitiesProjected cash flows for corporate securities (principally senior unsecured bonds) are driven primarily by assumptions regard-ing probability of default and also the timing and amount of recoveries associated with defaults. ACE develops these estimatesusing information based on market observable data, issuer specific information, and credit ratings. ACE developed its defaultassumption by using historical default data by Moody’s Investors Service (Moody’s) rating category to calculate a 1-in-100year probability of default, which results in a default assumption in excess of the historical mean default rate. ACE believesthat use of a default assumption in excess of the historical mean is reasonable in light of recent market conditions. Defaultassumptions by Moody’s rating category are as follows (historical mean default rate provided for comparison):
Moody’s Rating Category1-in-100 Year
Default RateHistorical Mean
Default Rate
Investment Grade:
Aaa-Baa 0.0%-1.4% 0.0%-0.3%Below Investment Grade:
Ba 4.8% 1.1%B 12.8% 3.4%Caa-C 51.6% 13.1%
F-25

N O T E S T O T H E C O N S O L I D A T E D F I N A N C I A L S T A T E M E N T S (continued)
ACE Limited and Subsidiaries
Consistent with management’s approach to developing default rate assumptions considering recent market conditions, ACEassumed a 25 percent recovery rate (the par value of a defaulted security that will be recovered) across all rating categoriesrather than using Moody’s historical mean recovery rate of 40 percent. ACE believes that use of a recovery rate assumptionlower than the historical mean is reasonable in light of recent market conditions.
Application of the methodology and assumptions described above resulted in credit losses recognized in net income forcorporate securities from the date of adoption to December 31, 2009, of $59 million, substantially all of which relates tobelow investment grade securities.
Mortgage-backed securities
For mortgage-backed securities, credit impairment is assessed using a cash flow model that estimates the cash flows on theunderlying mortgages, using the security-specific collateral and transaction structure. The model estimates cash flows from theunderlying mortgage loans and distributes those cash flows to various tranches of securities, considering the transaction struc-ture and any subordination and credit enhancements that exist in that structure. The cash flow model incorporates actual cashflows on the mortgage-backed securities through the current period and then projects the remaining cash flows using a num-ber of assumptions, including default rates, prepayment rates, and loss severity rates (the par value of a defaulted security thatwill not be recovered) on foreclosed properties.
ACE develops specific assumptions using market data, where available, and includes internal estimates as well as esti-mates published by rating agencies and other third-party sources. ACE projects default rates by mortgage sector consideringcurrent underlying mortgage loan performance, generally assuming:• lower loss severity for Prime sector bonds versus ALT-A, Sub-prime, and Option ARM sector bonds; and• lower loss severity for older vintage securities versus more recent vintage securities, which reflects the recent decline inunderwriting standards.
These estimates are extrapolated along a default timing curve to estimate the total lifetime pool default rate. Other assump-tions used contemplate the actual collateral attributes, including geographic concentrations, rating agency loss projections,rating actions, and current market prices. If cash flow projections indicate that losses will exceed the credit enhancement for agiven tranche, then the Company does not expect to recover its amortized cost basis and recognizes an estimated credit loss innet income.
F-26

N O T E S T O T H E C O N S O L I D A T E D F I N A N C I A L S T A T E M E N T S (continued)
ACE Limited and Subsidiaries
The significant assumptions used to estimate future cash flows for specific mortgage-backed securities evaluated for poten-tial credit loss at December 31, 2009, by sector and vintage are as follows:
Range of Significant Assumptions Used
Sector(1) Vintage Default Rate(2)Loss Severity
Rate(2)
Prime Fixed Rate 2004 and prior 10% 44%2005 7-13% 38-53%2006 20% 53%2007 26% 52-55%
Prime Hybrid/ARM 2004 and prior 16-44% 35-44%2005 22-35% 33-58%2006 14-41% 34-61%2007 10-80% 31-63%
ALT-A Fixed Rate 2004 and prior 15% 51%2005 13-38% 34-63%2006 46% 69%2007 43% 62%
Alt-A Hybrid/ARM 2004 and prior 31% 48%2005 44-46% 56-59%2006 21-72% 62-68%2007 7-71% 55-65%
Option ARM 2004 and prior 52% 48%2005 63-69% 58-64%2006 71-74% 63-67%2007 69-76% 67-69%
Sub-prime 2004 and prior 57% 60%2005 75% 72%2006 55-82% 75-79%2007 6-83% 75-78%
(1) Prime, ALT-A, and Sub-prime sector bonds are categorized based on credit worthiness of the borrower. Option ARM sector bonds are categorized based on the type ofmortgage product, rather than credit worthiness of the borrower.(2) Default rate and loss severity rate assumptions vary within a given sector and vintage depending upon the geographic concentration of the collateral underlying thebond and the level of serious delinquencies, among other factors.
Application of the methodology and assumptions described above resulted in credit losses recognized in net income formortgage-backed securities from the date of adoption to December 31, 2009, of $56 million. Given the variation in ratingsbetween major rating agencies for the securities for which a credit loss was recognized in net income, ACE does not believe itis useful to provide the credit loss split between investment grade and below investment grade.
F-27
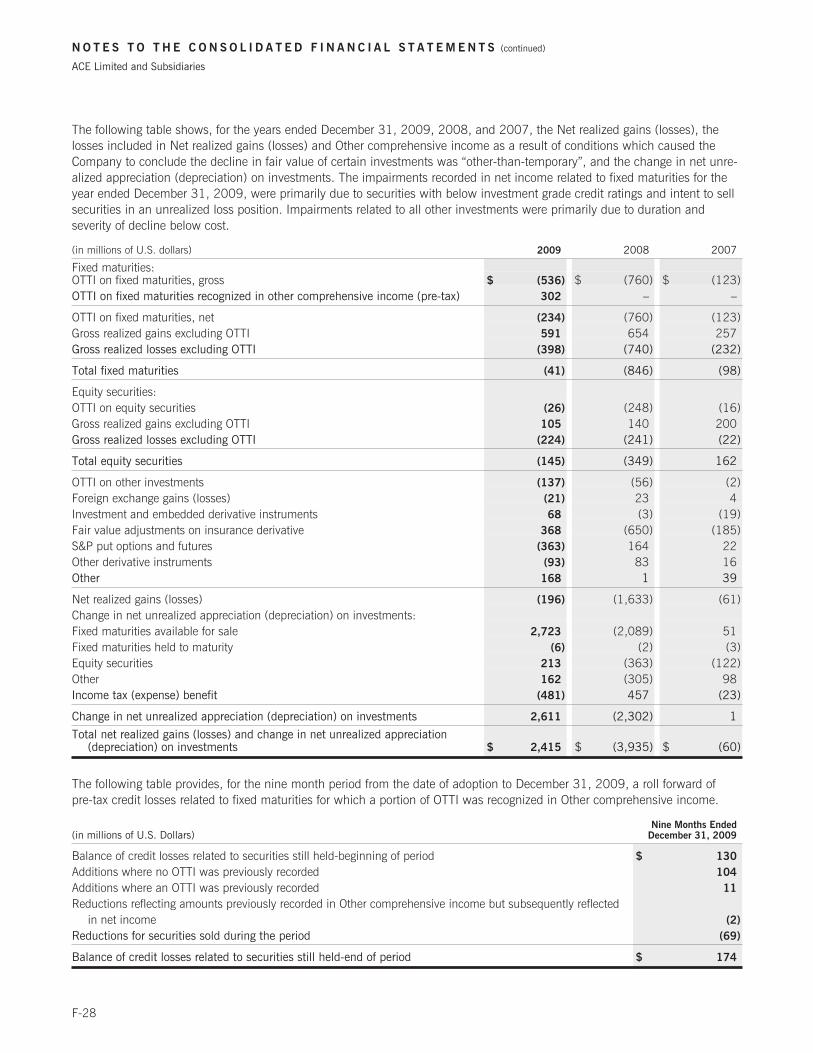
N O T E S T O T H E C O N S O L I D A T E D F I N A N C I A L S T A T E M E N T S (continued)
ACE Limited and Subsidiaries
The following table shows, for the years ended December 31, 2009, 2008, and 2007, the Net realized gains (losses), thelosses included in Net realized gains (losses) and Other comprehensive income as a result of conditions which caused theCompany to conclude the decline in fair value of certain investments was “other-than-temporary”, and the change in net unre-alized appreciation (depreciation) on investments. The impairments recorded in net income related to fixed maturities for theyear ended December 31, 2009, were primarily due to securities with below investment grade credit ratings and intent to sellsecurities in an unrealized loss position. Impairments related to all other investments were primarily due to duration andseverity of decline below cost.
(in millions of U.S. dollars) 2009 2008 2007
Fixed maturities:OTTI on fixed maturities, gross $ (536) $ (760) $ (123)OTTI on fixed maturities recognized in other comprehensive income (pre-tax) 302 – –
OTTI on fixed maturities, net (234) (760) (123)Gross realized gains excluding OTTI 591 654 257Gross realized losses excluding OTTI (398) (740) (232)
Total fixed maturities (41) (846) (98)
Equity securities:OTTI on equity securities (26) (248) (16)Gross realized gains excluding OTTI 105 140 200Gross realized losses excluding OTTI (224) (241) (22)
Total equity securities (145) (349) 162
OTTI on other investments (137) (56) (2)Foreign exchange gains (losses) (21) 23 4Investment and embedded derivative instruments 68 (3) (19)Fair value adjustments on insurance derivative 368 (650) (185)S&P put options and futures (363) 164 22Other derivative instruments (93) 83 16Other 168 1 39
Net realized gains (losses) (196) (1,633) (61)Change in net unrealized appreciation (depreciation) on investments:Fixed maturities available for sale 2,723 (2,089) 51Fixed maturities held to maturity (6) (2) (3)Equity securities 213 (363) (122)Other 162 (305) 98Income tax (expense) benefit (481) 457 (23)
Change in net unrealized appreciation (depreciation) on investments 2,611 (2,302) 1
Total net realized gains (losses) and change in net unrealized appreciation(depreciation) on investments $ 2,415 $ (3,935) $ (60)
The following table provides, for the nine month period from the date of adoption to December 31, 2009, a roll forward ofpre-tax credit losses related to fixed maturities for which a portion of OTTI was recognized in Other comprehensive income.
(in millions of U.S. Dollars)Nine Months Ended
December 31, 2009
Balance of credit losses related to securities still held-beginning of period $ 130
Additions where no OTTI was previously recorded 104
Additions where an OTTI was previously recorded 11
Reductions reflecting amounts previously recorded in Other comprehensive income but subsequently reflectedin net income (2)
Reductions for securities sold during the period (69)
Balance of credit losses related to securities still held-end of period $ 174
F-28
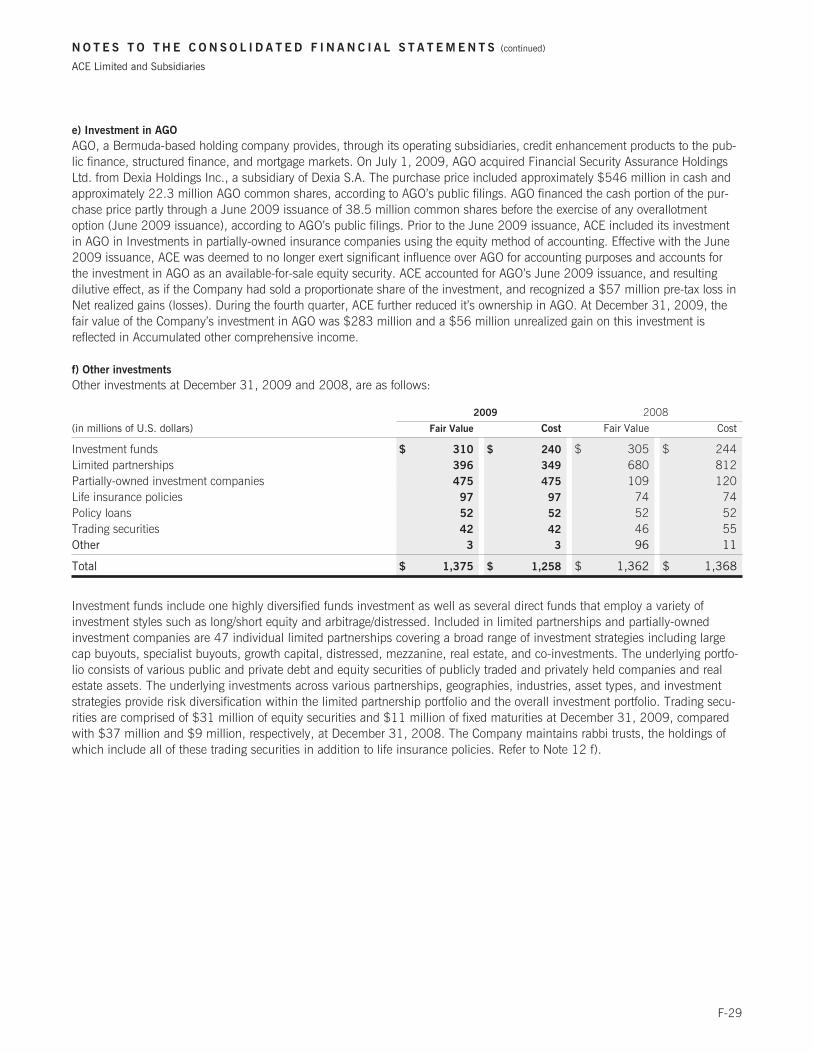
N O T E S T O T H E C O N S O L I D A T E D F I N A N C I A L S T A T E M E N T S (continued)
ACE Limited and Subsidiaries
e) Investment in AGO
AGO, a Bermuda-based holding company provides, through its operating subsidiaries, credit enhancement products to the pub-lic finance, structured finance, and mortgage markets. On July 1, 2009, AGO acquired Financial Security Assurance HoldingsLtd. from Dexia Holdings Inc., a subsidiary of Dexia S.A. The purchase price included approximately $546 million in cash andapproximately 22.3 million AGO common shares, according to AGO’s public filings. AGO financed the cash portion of the pur-chase price partly through a June 2009 issuance of 38.5 million common shares before the exercise of any overallotmentoption (June 2009 issuance), according to AGO’s public filings. Prior to the June 2009 issuance, ACE included its investmentin AGO in Investments in partially-owned insurance companies using the equity method of accounting. Effective with the June2009 issuance, ACE was deemed to no longer exert significant influence over AGO for accounting purposes and accounts forthe investment in AGO as an available-for-sale equity security. ACE accounted for AGO’s June 2009 issuance, and resultingdilutive effect, as if the Company had sold a proportionate share of the investment, and recognized a $57 million pre-tax loss inNet realized gains (losses). During the fourth quarter, ACE further reduced it’s ownership in AGO. At December 31, 2009, thefair value of the Company’s investment in AGO was $283 million and a $56 million unrealized gain on this investment isreflected in Accumulated other comprehensive income.
f) Other investments
Other investments at December 31, 2009 and 2008, are as follows:
2009 2008
(in millions of U.S. dollars) Fair Value Cost Fair Value Cost
Investment funds $ 310 $ 240 $ 305 $ 244Limited partnerships 396 349 680 812Partially-owned investment companies 475 475 109 120Life insurance policies 97 97 74 74Policy loans 52 52 52 52Trading securities 42 42 46 55Other 3 3 96 11
Total $ 1,375 $ 1,258 $ 1,362 $ 1,368
Investment funds include one highly diversified funds investment as well as several direct funds that employ a variety ofinvestment styles such as long/short equity and arbitrage/distressed. Included in limited partnerships and partially-ownedinvestment companies are 47 individual limited partnerships covering a broad range of investment strategies including largecap buyouts, specialist buyouts, growth capital, distressed, mezzanine, real estate, and co-investments. The underlying portfo-lio consists of various public and private debt and equity securities of publicly traded and privately held companies and realestate assets. The underlying investments across various partnerships, geographies, industries, asset types, and investmentstrategies provide risk diversification within the limited partnership portfolio and the overall investment portfolio. Trading secu-rities are comprised of $31 million of equity securities and $11 million of fixed maturities at December 31, 2009, comparedwith $37 million and $9 million, respectively, at December 31, 2008. The Company maintains rabbi trusts, the holdings ofwhich include all of these trading securities in addition to life insurance policies. Refer to Note 12 f).
F-29

N O T E S T O T H E C O N S O L I D A T E D F I N A N C I A L S T A T E M E N T S (continued)
ACE Limited and Subsidiaries
g) Investments in partially-owned insurance companies
Investments in partially-owned insurance companies at December 31, 2009 and 2008, are comprised of thefollowing:
2009 2008
(in millions of U.S. dollars, exceptpercentages)
CarryingValue
Issued Sharecapital
OwnershipPercentage
CarryingValue
Issued Sharecapital
OwnershipPercentage Domicile
Freisenbruch-Meyer $ 9 $ 5 40.0% $ 9 $ 5 40.0% BermudaIntrepid Re Holdings Limited – 0.2 38.5% 84 0.2 38.5% BermudaHuatai Insurance Company 220 202 21.3% 215 202 21.3% ChinaRain and Hail Insurance Services,
Inc. 126 613 20.7% 110 533 20.7%UnitedStates
Huatai Life Insurance Company 74 125 20.0% 13 88 11.3% ChinaIsland Heritage 4 27 10.8% 4 27 11.0% Cayman
IslandsAssured Guaranty Ltd. – – 0.0% 397 0.9 21.0% Bermuda
Total $ 433 $ 972.2 $ 832 $ 856.1
Huatai Insurance Company and Huatai Life Insurance Company are China-based entities which provide a range of P&C, life,and investment products.
h) Gross unrealized loss
At December 31, 2009, there were 3,925 fixed maturities out of a total of 18,398 fixed maturities in an unrealized loss posi-tion. The largest single unrealized loss in the fixed maturities was $26 million. The tightening of credit spreads for the year,particularly during the second and third quarters of 2009, resulted in a reduction to net unrealized losses. In addition, greaterglobal demand-driven purchases of fixed income investments and a greater demand for risk-based assets contributed to thisreduction. The fixed maturities in an unrealized loss position at December 31, 2009, were comprised of both investment gradeand below investment grade securities for which fair value declined primarily due to widening credit spreads since the date ofpurchase and included non-agency mortgage-backed securities that suffered a decline in value since their original date ofpurchase.
The following tables summarize, for all securities in an unrealized loss position at December 31, 2009 and 2008(including securities on loan), the aggregate fair value and gross unrealized loss by length of time the security has continuouslybeen in an unrealized loss position.
0 – 12 Months Over 12 Months Total
December 31, 2009(in millions of U.S. dollars) Fair Value
GrossUnrealized
Loss Fair Value
GrossUnrealized
Loss Fair Value
GrossUnrealized
Loss
U.S. Treasury and agency $ 1,952 $ (19.4) $ 21 $ (1.1) $ 1,973 $ (20.5)
Foreign 2,568 (124.0) 363 (36.4) 2,931 (160.4)
Corporate securities 1,222 (52.3) 865 (99.1) 2,087 (151.4)
Mortgage-backed securities 1,731 (54.8) 1,704 (409.7) 3,435 (464.5)
States, municipalities, andpolitical subdivisions 455 (13.9) 60 (5.0) 515 (18.9)
Total fixed maturities 7,928 (264.4) 3,013 (551.3) 10,941 (815.7)
Equity securities 111 (1.3) – – 111 (1.3)
Other investments 81 (16.4) – – 81 (16.4)
Total $ 8,120 $ (282.1) $ 3,013 $ (551.3) $ 11,133 $ (833.4)
Included in the “0 – 12 Months” and “Over 12 Months” aging categories at December 31, 2009, are fixed maturities held tomaturity with combined fair values of $353 million and $130 million, respectively. The associated gross unrealized lossesincluded in the “0 – 12 Months” and “Over 12 Months” aging categories are $4 million and $10 million, respectively. Fixed
F-30

N O T E S T O T H E C O N S O L I D A T E D F I N A N C I A L S T A T E M E N T S (continued)
ACE Limited and Subsidiaries
maturities in a gross unrealized loss position for over 12 months principally comprise non-credit losses on investment gradesecurities where management does not intend to sell and it is more likely than not that ACE will not be required to sell thesecurity before recovery. For mortgage-backed securities in a gross unrealized loss position for over 12 months, managementalso considered credit enhancement in concluding the securities were not other-than-temporarily impaired. Gross unrealizedgains at December 31, 2009, were $1.6 billion.
0 – 12 Months Over 12 Months Total
December 31, 2008(in millions of U.S. dollars) Fair Value
GrossUnrealized Loss Fair Value
GrossUnrealized Loss Fair Value
GrossUnrealized Loss
U.S. Treasury and agency $ 605 $ (2.5) $ – $ – $ 605 $ (2.5)Foreign 2,488 (335.7) 587 (194.4) 3,075 (530.1)Corporate securities 5,815 (884.2) 1,228 (251.3) 7,043 (1,135.5)Mortgage-backed securities 4,242 (880.0) 319 (200.1) 4,561 (1,080.1)States, municipalities, and
political subdivisions 331 (23.1) 109 (20.5) 440 (43.6)
Total fixed maturities 13,481 (2,125.5) 2,243 (666.3) 15,724 (2,791.8)Equity securities 694 (217.7) 13 (0.5) 707 (218.2)Other investments 508 (175.9) 58 (17.3) 566 (193.2)
Total $ 14,683 $ (2,519.1) $ 2,314 $ (684.1) $ 16,997 $ (3,203.2)
Included in the “0 – 12 Months” and “Over 12 Months” aging categories at December 31, 2008, are fixed maturities held tomaturity with combined fair values of $729 million and $105 million, respectively. The associated gross unrealized lossesincluded in the “0 – 12 Months” and “Over 12 Months” aging categories were $59 million and $20 million, respectively.Gross unrealized gains at December 31, 2008, were $1.1 billion.
i) Net investment income
Net investment income for the years ended December 31, 2009, 2008, and 2007, was derived from the following sources:
(in millions of U.S. dollars) 2009 2008 2007
Fixed maturities $ 1,985 $ 1,972 $ 1,773Short-term investments 38 109 130Equity securities 54 93 68Other 48 (20) 25
Gross investment income 2,125 2,154 1,996Investment expenses (94) (92) (78)
Net investment income $ 2,031 $ 2,062 $ 1,918
j) Restricted assets
The Company is required to maintain assets on deposit with various regulatory authorities to support its insurance andreinsurance operations. These requirements are generally promulgated in the statutory regulations of the individual juris-dictions. The assets on deposit are available to settle insurance and reinsurance liabilities. The Company also utilizes trustfunds in certain large reinsurance transactions where the trust funds are set up for the benefit of the ceding companies andgenerally take the place of letter of credit (LOC) requirements. The Company also has investments in segregated portfoliosprimarily to provide collateral or guarantees for LOCs and derivative transactions. Included in restricted assets at December 31,2009, are fixed maturities and short-term investments of $11.8 billion and cash of $180 million. The components of the fairvalue of the restricted assets at December 31, 2009 and 2008, are as follows:
(in millions of U.S. dollars) 2009 2008
Trust funds $ 8,047 $ 7,712Deposits with non-U.S. regulatory authorities 2,475 1,863Deposits with U.S. regulatory authorities 1,199 1,165Other pledged assets 245 805
$ 11,966 $ 11,545
F-31

N O T E S T O T H E C O N S O L I D A T E D F I N A N C I A L S T A T E M E N T S (continued)
ACE Limited and Subsidiaries
5. Reinsurance
a) Consolidated reinsurance
The Company purchases reinsurance to manage various exposures including catastrophe risks. Although reinsurance agree-ments contractually obligate the Company’s reinsurers to reimburse it for the agreed-upon portion of its gross paid losses, theydo not discharge the primary liability of the Company. The amounts for net premiums written and net premiums earned in theconsolidated statements of operations are net of reinsurance. Direct, assumed, and ceded premiums for the years endedDecember 31, 2009, 2008, and 2007, are as follows:
(in millions of U.S. dollars) 2009 2008 2007
Premiums writtenDirect $ 15,467 $ 15,815 $ 14,464Assumed 3,697 3,427 3,276Ceded (5,865) (6,162) (5,761)
Net $ 13,299 $ 13,080 $ 11,979
Premiums earnedDirect $ 15,415 $ 16,087 $ 14,673Assumed 3,768 3,260 3,458Ceded (5,943) (6,144) (5,834)
Net $ 13,240 $ 13,203 $ 12,297
For the years ended December 31, 2009, 2008, and 2007, the Company recorded reinsurance recoveries on losses and lossexpenses incurred of $3.7 billion, $3.3 billion, and $3.5 billion, respectively.
b) Reinsurance recoverable on ceded reinsurance
The composition of the Company’s reinsurance recoverable on losses and loss expenses at December 31, 2009 and 2008, isas follows:
(in millions of U.S. dollars) 2009 2008
Reinsurance recoverable on unpaid losses and loss expenses, net of a provision for uncollectiblereinsurance $ 12,745 $ 12,935
Reinsurance recoverable on paid losses and loss expenses, net of a provision for uncollectiblereinsurance 850 982
Net reinsurance recoverable on losses and loss expenses $ 13,595 $ 13,917
The Company evaluates the financial condition of its reinsurers and potential reinsurers on a regular basis and also monitorsconcentrations of credit risk with reinsurers. The provision for uncollectible reinsurance is required principally due to the failureof reinsurers to indemnify ACE, primarily because of disputes under reinsurance contracts and insolvencies. Provisions havebeen established for amounts estimated to be uncollectible. At December 31, 2009 and 2008, the Company recorded aprovision for uncollectible reinsurance of $582 million and $591 million, respectively.
The following tables provide a listing, at December 31, 2009, of the categories of the Company’s reinsurers. The firstcategory, largest reinsurers, represents all reinsurers where the gross recoverable exceeds one percent of ACE’s total share-holders’ equity. The provision for uncollectible reinsurance for the largest reinsurers, other reinsurers rated A- or better, andother reinsurers with ratings lower than A- is principally based on an analysis of the credit quality of the reinsurer andcollateral balances. Other pools and government agencies include amounts backed by certain state and federal agencies. Incertain states, insurance companies are required by law to participate in these pools. Structured settlements include annuitiespurchased from life insurance companies to settle claims. Since the Company retains the ultimate liability in the event that thelife company fails to pay, it reflects the amount as a liability and a recoverable/receivable for GAAP purposes. Other captivesinclude companies established and owned by the Company’s insurance clients to assume a significant portion of their directinsurance risk from the Company (they are structured to allow clients to self-insure a portion of their insurance risk). It is gen-erally the Company’s policy to obtain collateral equal to expected losses. Where appropriate, exceptions are granted but only
F-32

N O T E S T O T H E C O N S O L I D A T E D F I N A N C I A L S T A T E M E N T S (continued)
ACE Limited and Subsidiaries
with review and approval at a senior officer level. The final category, other, includes amounts recoverable that are in dispute orare from companies that are in supervision, rehabilitation, or liquidation. The Company establishes its provision foruncollectible reinsurance in this category based on a case by case analysis of individual situations including the merits of theunderlying matter, credit and collateral analysis, and consideration of the Company’s collection experience in similar situations.
(in millions of U.S. dollars except percentages) 2009 Provision % of Gross
Categories
Largest reinsurers $ 8,549 $ 151 1.8%
Other reinsurers balances rated A- or better 2,102 33 1.6%
Other reinsurers balances with ratings lower than A- or not rated 690 131 19.0%
Other pools and government agencies 147 9 6.1%
Structured settlements 583 21 3.6%
Other captives 1,685 29 1.7%
Other 421 208 49.4%
Total $ 14,177 $ 582 4.1%
Largest ReinsurersAGRI General Ins Co HDI Re Group (Hanover Re) Partner ReBerkshire Hathaway Insurance Group Lloyd’s of London Swiss Re GroupChubb Insurance Group Munich Re Group Transatlantic HoldingsEverest Re Group National Workers Compensation WR Berkeley GroupFederal Crop Insurance Corp Reinsurance Pool XL Capital Group
c) Assumed life reinsurance programs involving minimum benefit guarantees under annuity contracts
The presentation of income and expenses relating to GMDB and GMIB reinsurance for the years ended December 31, 2009,2008, and 2007, is as follows:
(in millions of U.S. dollars) 2009 2008 2007
GMDB
Net premiums earned $ 104 $ 124 $ 125Policy benefits $ 111 $ 183 $ 49
GMIB
Net premiums earned $ 159 $ 150 $ 107Policy benefits $ 20 $ 31 $ 27Realized gains (losses) $ 368 $ (650) $ (185)
Gain (loss) recognized in income $ 507 $ (531) $ (105)Effect of partial adoption of fair value measurements standard $ – $ 4 $ –Net cash received (disbursed) $ 156 $ 150 $ 107Net (increase) decrease in liability $ 351 $ (685) $ (212)
At December 31, 2009, reported liabilities for GMDB and GMIB reinsurance were $212 million and $559 million,respectively, compared with $248 million and $910 million, respectively, at December 31, 2008. The reported liability forGMIB reinsurance of $559 million at December 31, 2009, and $910 million at December 31, 2008, includes a fair valuederivative adjustment of $443 million and $811 million, respectively. Reported liabilities for both GMDB and GMIBreinsurance are determined using internal valuation models. Such valuations require considerable judgment and are subject tosignificant uncertainty. The valuation of these products is subject to fluctuations arising from, among other factors, changes ininterest rates, changes in equity markets, changes in credit markets, changes in the allocation of the investments underlyingannuitant’s account values, and assumptions regarding future policyholder behavior. These models and the relatedassumptions are continually reviewed by management and enhanced, as appropriate, based upon improvements in modelingassumptions and availability of more information, such as market conditions and demographics of in-force annuities.
F-33

N O T E S T O T H E C O N S O L I D A T E D F I N A N C I A L S T A T E M E N T S (continued)
ACE Limited and Subsidiaries
GMDB reinsurance
At December 31, 2009 and 2008, the Company’s net amount at risk from its GMDB reinsurance programs was $3.8 billionand $4.7 billion, respectively. For GMDB reinsurance programs, the net amount at risk is defined as the present value offuture claim payments under the following assumptions:• policy account values and guaranteed values are fixed at the valuation date (December 31, 2009, and December 31, 2008,respectively);• there are no lapses or withdrawals;• mortality according to 100 percent of the Annuity 2000 mortality table; and• future claims are discounted in line with the discounting assumption used in the calculation of the benefit reserve averagingbetween three to four percent.
At December 31, 2009, if all of the Company’s cedants’ policyholders covered under GMDB reinsurance agreementswere to die immediately, the total claim amount payable by the Company, taking into account all appropriate claims limits,would be approximately $1.2 billion. As a result of the annual claim limits on the GMDB reinsurance agreements, the claimspayable are lower in this case than if all the policyholders were to die over time, all else equal.
GMIB reinsurance
At December 31, 2009 and 2008, the Company’s net amount at risk from its GMIB reinsurance programs was $683 millionand $2.1 billion, respectively. For GMIB, the net amount at risk is defined as the present value of future claim payments underthe following assumptions:• policy account values and guaranteed values are fixed at the valuation date (December 31, 2009, and December 31, 2008,respectively);• there are no deaths, lapses, or withdrawals;• policyholders annuitize at a frequency most disadvantageous to ACE (in other words, annuitization at a level that maximizesclaims taking into account the treaty limits) under the terms of the Company’s reinsurance contracts;• for annuitizing policyholders, the GMIB claim is calculated using interest rates in line with those used in calculating thereserve; and• future claims are discounted in line with the discounting assumption used in the calculation of the benefit reserve averagingbetween two to three percent.
The average attained age of all policyholders under all benefits reinsured, weighted by the guaranteed value of eachreinsured policy, is approximately 65.
6. Intangible assets
Included in Goodwill and other intangible assets at December 31, 2009, are goodwill of $3.8 billion and other intangibleassets of $117 million.
The following table details movements in Goodwill by business segment for the years ended December 31, 2009 and2008. The purchase price allocation adjustments reflect the final allocation of goodwill generated on the Combined Insuranceacquisition between reporting segments.
(in millions of U.S. dollars)Insurance –
North AmericanInsurance –
Overseas GeneralGlobal
Reinsurance LifeACE
Consolidated
Balance at December 31, 2007 $ 1,192 $ 1,174 $ 365 $ – $ 2,731Acquisition of Combined Insurance – 197 – 686 883Foreign exchange revaluation and other 13 (5) – – 8
Balance at December 31, 2008 $ 1,205 $ 1,366 $ 365 $ 686 $ 3,622
Purchase price allocation adjustments – (65) – 61 (4)Foreign exchange revaluation and other – 196 – – 196
Balance at December 31, 2009 $ 1,205 $ 1,497 $ 365 $ 747 $ 3,814
F-34

N O T E S T O T H E C O N S O L I D A T E D F I N A N C I A L S T A T E M E N T S (continued)
ACE Limited and Subsidiaries
Included in the other intangible assets balance at December 31, 2009, are intangible assets subject to amortization of $33million and intangible assets not subject to amortization of $84 million. Intangible assets subject to amortization includetrademarks, agency relationships, software, client lists, and renewal rights, primarily attributable to the acquisition of Com-bined Insurance. The majority of the balance of intangible assets not subject to amortization relates to Lloyd’s of London(Lloyd’s) Syndicate 2488 capacity. Amortization expense related to other intangible assets amounted to $11 million, $12 mil-lion, and $2 million for the years ended December 31, 2009, 2008, and 2007, respectively. Other intangible assetsamortization expense is estimated to be between approximately $2 million and $8 million for each of the next five fiscal years.
The table below presents a roll forward of VOBA for the years ended December 31, 2009 and 2008.
(in millions of U.S. dollars) 2009 2008
Balance, beginning of year $ 823 $ –Acquisition of Combined Insurance – 1,040Amortization expense (130) (84)Foreign exchange revaluation 55 (133)
Balance, end of year $ 748 $ 823
Estimated amortization expense related to VOBA for the next five years is expected to be as follows:
(in millions of U.S. dollars)Year ending
December 31
2010 $ 1012011 742012 622013 532014 45
Total $ 335
7. Unpaid losses and loss expenses
Property and casualty
The Company establishes reserves for the estimated unpaid ultimate liability for losses and loss expenses under the terms of itspolicies and agreements. These reserves include estimates for both claims that have been reported and for IBNR, and includeestimates of expenses associated with processing and settling these claims. The process of establishing reserves for P&Cclaims can be complex and is subject to considerable variability as it requires the use of informed estimates and judgments.The Company’s estimates and judgments may be revised as additional experience and other data become available and arereviewed, as new or improved methodologies are developed, or as current laws change. The Company continually evaluates itsestimates of reserves in light of developing information and in light of discussions and negotiations with its insureds. While theCompany believes that its reserves for unpaid losses and loss expenses at December 31, 2009, are adequate, new informationor trends may lead to future developments in ultimate losses and loss expenses significantly greater or less than the reservesprovided. Any such revisions could result in future changes in estimates of losses or reinsurance recoverable, and would bereflected in the Company’s results of operations in the period in which the estimates are changed.
F-35

N O T E S T O T H E C O N S O L I D A T E D F I N A N C I A L S T A T E M E N T S (continued)
ACE Limited and Subsidiaries
The reconciliation of unpaid losses and loss expenses for the years ended December 31, 2009, 2008, and 2007, is asfollows:
(in millions of U.S. dollars) 2009 2008 2007
Gross unpaid losses and loss expenses, beginning of year $ 37,176 $ 37,112 $ 35,517Reinsurance recoverable on unpaid losses (1) (12,935) (13,520) (13,509)
Net unpaid losses and loss expenses, beginning of year 24,241 23,592 22,008Acquisition of subsidiaries – 353 –
Total 24,241 23,945 22,008
Net losses and loss expenses incurred in respect of losses occurring in:Current year 8,001 8,417 7,568Prior years (579) (814) (217)
Total 7,422 7,603 7,351
Net losses and loss expenses paid in respect of losses occurring in:Current year 2,493 2,699 1,975Prior years 4,455 3,628 3,959
Total 6,948 6,327 5,934
Foreign currency revaluation and other 323 (980) 167
Net unpaid losses and loss expenses, end of year 25,038 24,241 23,592Reinsurance recoverable on unpaid losses(1) 12,745 12,935 13,520
Gross unpaid losses and loss expenses, end of year $ 37,783 $ 37,176 $ 37,112
(1) Net of provision for uncollectible reinsurance
Net loss and loss expenses incurred include $579 million, $814 million, and $217 million, of net favorable prior period devel-opment for the years ended December 31, 2009, 2008, and 2007, respectively.
Insurance – North American
Insurance – North American experienced net favorable prior period development of $179 million in 2009 or 1.2 percent of netunpaid reserves at December 31, 2008. Net prior period development was the net result of several underlying favorable andadverse movements. Net favorable development of $74 million on long-tail business included favorable development of $52million on the national accounts loss sensitive accounts unit impacting the 2005-2007 accident years, $42 million of favor-able development in the foreign casualty product lines primarily in the 2004-2006 accident years, and $33 million offavorable development in the ACE Financial Solutions business unit concentrated in policies issued in 2004-2006. Partiallyoffsetting this favorable development was adverse development of $80 million in the Brandywine operations, impacting acci-dent years 1999 and prior, primarily related to losses associated with pool participations, workers’ compensation, andassumed reinsurance. Net favorable development of $105 million on short-tail business included favorable development of$24 million on political risk business relating to the 2005-2008 accident years, favorable development in the Canadian A&Hbusiness of $17 million impacting the 2008 and prior accident years, and favorable development in the programs division of$17 million, primarily attributable to the 2005 and 2006 accident years. The remaining net development for long-tail andshort-tail business is comprised of numerous favorable and adverse movements across lines and accident years.
Insurance – North American experienced net favorable prior period development of $351 million in 2008 or 2.4 percentof net unpaid reserves at December 31, 2007. Net favorable development of $131 million on long-tail business includedfavorable development of $68 million for accident years 2003-2006 in ACE Financial Solutions, favorable development of$51 million in the Canadian P&C operations principally arising in the 2005 accident year, favorable development of $46 mil-lion on medical risk business primarily for the 2004 and 2005 accident years, and favorable development of $34 million inmanagement and professional liability lines. Partially offsetting this favorable development was adverse development of $51million on runoff casualty reserves including asbestos and environmental and adverse development of $29 million related toACE’s portfolio of Defense Base Acts workers’ compensation coverage. Net favorable development of $220 million on short-tailbusiness included favorable development of $116 million on crop/hail business relating to the 2007 crop year, favorabledevelopment of $27 million on wholesale property and inland marine business for the 2007 accident year, and favorabledevelopment of $29 million on the retail division’s property business, primarily associated with the 2007 accident year.Adverse development on short-tail business included $33 million relating to increases in ACE’s estimates of losses for the
F-36

N O T E S T O T H E C O N S O L I D A T E D F I N A N C I A L S T A T E M E N T S (continued)
ACE Limited and Subsidiaries
2005 hurricanes. The remaining net development for long-tail and short-tail business is comprised of numerous favorable andadverse movements across lines and accident years.
Insurance – North American incurred net adverse prior period development of $9 million in 2007, representing 0.1 per-cent of the segment’s net unpaid loss and loss expense reserves at December 31, 2006.
Insurance – Overseas General
Insurance – Overseas General experienced net favorable prior period development of $255 million in 2009 or 4.2 percent ofnet unpaid reserves at December 31, 2008. Net prior period development was the net result of several underlying favorableand adverse movements. Net favorable development of $140 million on long-tail business included favorable development of$211 million on the 2005 and prior accident years in casualty and financial lines, partially offset by $80 million of adversedevelopment primarily relating to the 2008 accident year for financial lines. Net favorable development of $115 million onshort-tail business included favorable development of $48 million in the property and energy lines of business mainly in acci-dent years 2006-2008, and favorable development of $35 million on A&H business across accident years 2003-2008. Theremaining net development for long-tail and short-tail business is comprised of numerous favorable and adverse movementsacross lines and accident years.
Insurance – Overseas General experienced net favorable prior period development of $304 million in 2008 or 4.7 percentof net unpaid reserves at December 31, 2007. Net favorable development of $131 million on long-tail business included$170 million in financial lines and casualty portfolios primarily within the international retail operation for accident years 2005and prior, partially offset by adverse development of $39 million on accident years 2006-2007, mainly in the internationalretail casualty portfolios. Net favorable development of $173 million on short-tail business included $113 million of favorabledevelopment in international retail property lines mainly in accident years 2003-2007, favorable development of $44 millionon A&H business primarily in the international retail operation in accident years 2003-2007, and $30 million of favorabledevelopment on the international retail marine book mainly in accident years 2005-2007, partially offset by adverse develop-ment of $14 million due to several major energy losses within the wholesale division, primarily for accident years 2006 and2007. The remaining net development for long-tail and short-tail business is comprised of numerous favorable and adversemovements across lines and accident years.
Insurance – Overseas General experienced net favorable prior period development of $192 million in 2007, representing3.2 percent of the segment’s net unpaid loss and loss expense reserves at December 31, 2006.
Global Reinsurance
Global Reinsurance experienced net favorable prior period development of $142 million in 2009 or 5.6 percent of net unpaidreserves at December 31, 2008. Net prior period development was the net result of several underlying favorable and adversemovements. Net favorable development of $93 million on long-tail business was principally in treaty years 2003-2005 acrossa number of portfolios (professional liability, D&O, casualty and medical malpractice), partially offset by adverse developmentof $13 million in treaty years 2007 and 2008. Net favorable development of $49 million on short-tail business includedfavorable development of $35 million, primarily in treaty years 2005-2007 across several portfolios and favorable develop-ment of $9 million in treaty years 2004 and prior on the trade credit book. The remaining net development for long-tail andshort-tail business is comprised of numerous favorable and adverse movements across lines and accident years.
Global Reinsurance experienced net favorable prior period development of $159 million in 2008 or 5.9 percent of netunpaid reserves at December 31, 2007. Net favorable development of $17 million on long-tail business included $30 millionof net favorable development principally in treaty years 2003 and 2004, across a number of portfolios (professional liability,D&O, casualty, workers’ compensation catastrophe, and medical malpractice), offset by $16 million adverse development intreaty year 2007. Net favorable development of $142 million on short-tail business included favorable development of $43million primarily in treaty years 2006 and prior on property and the credit & surety lines, favorable development of $28 millionprimarily in treaty years 2006 and prior across several portfolios, principally property, marine and energy lines and $71 millionof net favorable development, primarily on accident years 2002-2006 in the property catastrophe portfolio. The remaining netdevelopment for long-tail and short-tail business is comprised of numerous favorable and adverse movements across lines andaccident years.
Global Reinsurance experienced net favorable prior period development of $34 million in 2007, representing 1.3 percentof the segment’s net unpaid loss and loss expense reserves at December 31, 2006.
Life
Life experienced net favorable prior period development of $3 million on short-tail A&H business in 2009, or 1.4 percent ofnet unpaid reserves at December 31, 2008. Life incurred no net prior period development in 2008 or 2007.
F-37

N O T E S T O T H E C O N S O L I D A T E D F I N A N C I A L S T A T E M E N T S (continued)
ACE Limited and Subsidiaries
Asbestos and environmental (A&E) and other run-off liabilities
Included in ACE’s liabilities for losses and loss expenses are amounts for A&E (A&E liabilities). The A&E liabilities principallyrelate to claims arising from bodily-injury claims related to asbestos products and remediation costs associated with hazardouswaste sites. The estimation of ACE’s A&E liabilities is particularly sensitive to future changes in the legal, social, and economicenvironment. ACE has not assumed any such future changes in setting the value of its A&E reserves, which include provisionsfor both reported and IBNR claims.
ACE’s exposure to A&E claims principally arises out of liabilities acquired when it purchased Westchester Specialty in1998 and the P&C business of CIGNA in 1999, with the larger exposure contained within the liabilities acquired in the CIGNAtransaction. In 1996, prior to ACE’s acquisition of the P&C business of CIGNA, the Pennsylvania Insurance Commissionerapproved a plan to restructure INA Financial Corporation and its subsidiaries (the Restructuring) which included the division ofInsurance Company of North America (INA) into two separate corporations:(1) an active insurance company that retained the INA name and continued to write P&C business and(2) an inactive run-off company, now called Century Indemnity Company (Century).
As a result of the division, predominantly all A&E and certain other liabilities of INA were allocated to Century andextinguished, as a matter of Pennsylvania law, as liabilities of INA.
As part of the Restructuring, most A&E liabilities of various U.S. affiliates of INA were reinsured to Century. Century andcertain other run-off companies having A&E and other liabilities were contributed to Brandywine Holdings. As part of the 1999acquisition of the P&C business of CIGNA, ACE acquired Brandywine Holdings and its various subsidiaries. For moreinformation refer to “Brandywine Run-Off Entities” below.
During 2009, ACE conducted its annual internal, ground-up review of its consolidated A&E liabilities as at December 31,2008. As a result of the internal review, the Company increased its net loss reserves for the Brandywine operations, includingA&E, by $44 million (net of reinsurance provided by NICO), while the gross loss reserves increased by $198 million. In addi-tion, the Company decreased gross loss reserves for Westchester Specialty’s A&E and other liabilities by $64 million, while thenet loss reserves did not change. An internal review was also conducted during 2008 of consolidated A&E liabilities as atDecember 31, 2007. As a result of that internal review, the Company increased net loss reserves for the Brandywine oper-ations, including A&E, by $65 million (net of reinsurance provided by NICO), while the gross loss reserves increased by$143 million. This review also resulted in the Company decreasing net loss reserves for Westchester Specialty’s A&E and otherliabilities by $13 million (net of NICO), while the gross loss reserves decreased by $10 million.
In 2008, in addition to ACE’s annual internal review, a team of external actuaries performed an evaluation as to theadequacy of the reserves of Century. This external review was conducted in accordance with the Brandywine RestructuringOrder, which requires that an independent actuarial review of Century’s reserves be completed every two years. Managementtakes full responsibility for the estimation of its A&E liabilities. The conclusions of the external review provided estimates ofultimate net Brandywine liabilities that were little changed from a comparable study conducted in 2006.
ACE’s A&E reserves are not discounted for GAAP reporting and do not reflect any anticipated future changes in the legal,social, or economic environment, or any benefit from future legislative reforms.
The table below presents a roll forward of ACE’s consolidated A&E loss reserves (excludes other run-off liabilities), allo-cated and unallocated loss expense reserves for A&E exposures, and the provision for uncollectible paid and unpaidreinsurance recoverables for the year ended December 31, 2009.
Asbestos Environmental Total
(in millions of U.S. dollars) Gross Net(1) Gross Net(1) Gross Net(1)
Balance at December 31, 2008 $ 2,629 $ 1,365 $ 310 $ 297 $ 2,939 $ 1,662Incurred activity 61 37 24 10 85 47Payment activity (415) (233) (83) (68) (498) (301)Foreign currency revaluation 18 6 1 – 19 6
Balance at December 31, 2009 $ 2,293 $ 1,175 $ 252 $ 239 $ 2,545 $ 1,414
(1) The net balances at December 31, 2008, were reduced by $21 million ($4 million Asbestos, and $17 million Environmental) to reflect final adjustments to theprovision for uncollectible reinsurance.
The A&E net loss reserves including allocated and unallocated loss expense reserves and provision for uncollectiblereinsurance at December 31, 2009, of $1.4 billion shown in the above table are comprised of $1.07 billion in reserves inrespect of Brandywine operations, $110 million of reserves held by Westchester Specialty, $123 million of reserves held byACE Bermuda and $111 million of reserves held by Insurance – Overseas General. The incurred activity of $47 million is the
F-38

N O T E S T O T H E C O N S O L I D A T E D F I N A N C I A L S T A T E M E N T S (continued)
ACE Limited and Subsidiaries
result of adverse activity in Brandywine and Westchester of $44 million and $10 million, respectively, offset by favorable activ-ity in Insurance – Overseas General of $7 million on the provision for uncollectible reinsurance.
The net figures in the above table reflect third-party reinsurance other than reinsurance provided by NICO under threeaggregate excess of loss contracts described below (collectively, the NICO contracts). ACE excludes the NICO contracts as theycover non-A&E liabilities as well as A&E liabilities. The split of coverage provided under the NICO contracts for A&E liabilitiesas compared to non-A&E liabilities is entirely dependant on the timing of the payment of the related claims. ACE’s ability tomake an estimate of this split is not practicable. ACE believes, instead, that the A&E discussion is best provided excluding theNICO contracts, while separately discussing the NICO contracts in relation to the total subject business, both A&E andnon-A&E, covered by those contracts. With certain exceptions, the NICO contracts provide coverage for the net A&E incurredlosses and allocated loss expenses within the limits of coverage and above ACE’s retention levels. These exceptions includelosses arising from certain operations of Insurance – Overseas General and participations by ACE Bermuda as a co-reinsurer orretrocessionaire in the NICO contracts.
Brandywine run-off – impact of NICO contracts on ACE’s run-off liabilitiesAs part of the acquisition of CIGNA’s P&C business, NICO provided $2.5 billion of reinsurance protection to Century on allBrandywine loss and allocated loss adjustment expense reserves and on the A&E reserves of various ACE INA insurance sub-sidiaries reinsured by Century (in each case, including uncollectible reinsurance). The benefits of this NICO contract (theBrandywine NICO Agreement) flow to the other Brandywine companies and to the ACE INA insurance subsidiaries throughagreements between those companies and Century. The Brandywine NICO Agreement was exhausted on an incurred basis inthe fourth quarter of 2002.
The following table presents a roll forward of net loss reserves, allocated and unallocated loss expense reserves, and provi-sion for uncollectible paid and unpaid reinsurance recoverables in respect of Brandywine operations only, including the impactof the Brandywine NICO Agreement. The table presents Brandywine incurred activity for the year ended December 31, 2009.
Brandywine NICOCoverage(3)
Net of NICOCoverage(in millions of U.S. dollars) A&E(1) Other(2) Total
Balance at December 31, 2008 $ 1,269 $ 1,016 $ 2,285 $ 1,430 $ 855Incurred activity(4) 44 69 113 – 113Paid activity (242) (138) (380) (290) (90)
Balance at December 31, 2009 $ 1,071 $ 947 $ 2,018 $ 1,140 $ 878
(1) The A&E balance was reduced by $21 million at December 31, 2008, to reflect final adjustments to the provision for uncollectible reinsurance.(2) Other consists primarily of workers’ compensation, non-A&E general liability losses, and provision for uncollectible reinsurance on non-A&E business. The Otherbalance was increased by $4 million at December 31, 2008, to reflect final adjustments to the provision for uncollectible reinsurance.(3) The balance at December 31, 2008, has been increased by $13 million to reflect final activity on the fourth quarter 2008 NICO bordereau.(4) The incurred activity includes $10 million of unallocated loss adjustment expenses and $23 million of provision for uncollectible reinsurance that are not reported asprior period development in accordance with the Company’s policy.
The incurred activity of $113 million was primarily related to $69 million in losses associated with pool participations,increased provision for uncollectible reinsurance, and unallocated loss adjustment expenses. In addition, the internal review ofconsolidated A&E liabilities resulted in a $44 million increase to net loss reserves for the Brandywine operations ($39 millionwhich we characterize as A&E and results primarily from adverse loss development from our participation in reinsurance poolsand the reclassification to A&E for charges from ULAE and uncollectible reinsurance, and $5 million of Other).
Westchester Specialty – impact of NICO contracts on ACE’s run-off liabilitiesAs part of the acquisition of Westchester Specialty in 1998, NICO provided a 75 percent pro-rata share of $1 billion ofreinsurance protection on losses and loss adjustment expenses incurred on or before December 31, 1996, in excess of aretention of $721 million (the 1998 NICO Agreement). NICO has also provided an 85 percent pro-rata share of $150 millionof reinsurance protection on losses and allocated loss adjustment expenses incurred on or before December 31, 1992, inexcess of a retention of $755 million (the 1992 NICO Agreement). At December 31, 2009, the remaining unused incurredlimit under the 1998 NICO Agreement was $529 million, which is only available for losses and loss adjustment expenses. The1992 NICO Agreement was exhausted on a paid basis in the third quarter of 2009.
F-39

N O T E S T O T H E C O N S O L I D A T E D F I N A N C I A L S T A T E M E N T S (continued)
ACE Limited and Subsidiaries
The following table presents a roll forward of net loss reserves, allocated and unallocated loss expense reserves, and provi-sion for uncollectible paid and unpaid reinsurance recoverables in respect of 1996 and prior Westchester Specialty operationsthat are the subject business of the NICO covers. The table presents incurred activity for the year ended December 31, 2009.
Westchester Specialty NICOCoverage
Net of NICOCoverage(in millions of U.S. dollars) A&E Other Total
Balance at December 31, 2008 $ 122 $ 125 $ 247 $ 216 $ 31Incurred activity 10 (10) – – –Paid activity (22) (8) (30) (28) (2)
Balance at December 31, 2009 $ 110 $ 107 $ 217 $ 188 $ 29
Brandywine run-off entitiesIn addition to housing a significant portion of ACE’s A&E exposure, the Brandywine operations include run-off liabilities relatedto various insurance and reinsurance businesses. The following companies comprise ACE’s Brandywine operations: Century (aPennsylvania insurer), Century Re (a Pennsylvania insurer, which was merged with Century effective December 31, 2009),and Century International Reinsurance Company Ltd. (a Bermuda insurer (CIRC)). All of the Brandywine companies are director indirect subsidiaries of Brandywine Holdings.
The U.S.-based ACE INA companies assumed two contractual obligations in respect of the Brandywine operations inconnection with the Restructuring: a dividend retention fund obligation and a surplus maintenance obligation in the form of anaggregate excess of loss reinsurance agreement. INA Financial Corporation established and funded a dividend retention fund(the Dividend Retention Fund) consisting of $50 million plus investment earnings. Pursuant to an interpretation of theBrandywine Restructuring Order, the full balance of the Dividend Retention Fund was contributed to Century as atDecember 31, 2002. Under the Restructuring Order, while any obligation to maintain the Dividend Retention Fund is in effect,to the extent dividends are paid by INA Holdings Corporation to its parent, INA Financial Corporation, and to the extent INAFinancial Corporation then pays such dividends to INA Corporation, a portion of those dividends must be withheld to replenishthe principal of the Dividend Retention Fund to $50 million within five years. In 2009, 2008, and 2007, no such dividendswere paid and, therefore, no replenishment of the Dividend Retention Fund occurred. The Dividend Retention Fund may notbe terminated without prior written approval from the Pennsylvania Insurance Commissioner.
In addition, an ACE INA insurance subsidiary provided reinsurance coverage to Century in the amount of $800 millionunder an aggregate excess of loss reinsurance agreement (the Aggregate Excess of Loss Agreement), triggered if the statutorycapital and surplus of Century falls below $25 million or if Century lacks liquid assets with which to pay claims as theybecome due, after giving effect to the contribution of the balance, if any, of the Dividend Retention Fund.
Effective December 31, 2004, ACE INA Holdings contributed $100 million to Century in exchange for a surplus note.After giving effect to the contribution and issuance of the surplus note, the statutory surplus of Century at December 31, 2009,was $25 million and approximately $191 million in statutory-basis losses have been ceded to the Aggregate Excess of LossAgreement on an inception-to-date basis. Century reports the amount ceded under the Aggregate Excess of Loss Agreement inaccordance with statutory accounting principles, which differ from GAAP by, among other things, allowing Century to discountits liabilities, including certain asbestos related and environmental pollution liabilities. For GAAP reporting purposes, inter-company reinsurance recoverables related to the Aggregate Excess of Loss Agreement are eliminated upon consolidation. Toestimate ACE’s remaining claim exposure under the Aggregate Excess of Loss Agreement on a GAAP basis, ACE adjusts thestatutory cession to exclude the discount embedded in statutory loss reserves and adjusts the statutory provision foruncollectible reinsurance to a GAAP basis amount. At December 31, 2009, approximately $493 million in GAAP basis losseswere ceded under the Aggregate Excess of Loss Agreement, leaving a remaining limit of coverage under that agreement ofapproximately $307 million. At December 31, 2008, the remaining limit of coverage under the agreement was $393 million.While ACE believes it has no legal obligation to fund losses above the Aggregate Excess of Loss Agreement limit of coverage,ACE’s consolidated results would nevertheless continue to include any losses above the limit of coverage for so long as theBrandywine companies remain consolidated subsidiaries of ACE.
F-40

N O T E S T O T H E C O N S O L I D A T E D F I N A N C I A L S T A T E M E N T S (continued)
ACE Limited and Subsidiaries
Uncertainties relating to ACE’s ultimate Brandywine exposureIn addition to the Dividend Retention Fund and Aggregate Excess of Loss Agreement commitments described above, certainACE entities are primarily liable for asbestos, environmental, and other exposures that they have reinsured to Century. Accord-ingly, if Century were to become insolvent and ACE were to lose control of Century, some or all of the recoverables due tothese ACE companies from Century could become uncollectible, yet those ACE entities would continue to be responsible to payclaims to their insureds or reinsureds. At December 31, 2009 and 2008, the aggregate reinsurance balances ceded by theactive ACE companies to Century were approximately $1.2 billion and $1.3 billion, respectively. At December 31, 2009 and2008, Century’s carried gross reserves (including reserves ceded by the active ACE companies to Century) were $2.8 billionand $3.1 billion, respectively. ACE believes the intercompany reinsurance recoverables, which relate to liabilities payable overmany years (i.e., 25 years or more), are not impaired at this time. A substantial portion of the liabilities ceded to Century by itsaffiliates have, in turn, been ceded by Century to NICO and, at December 31, 2009 and 2008, remaining cover on a paid lossbasis was approximately $1.1 billion and $1.4 billion, respectively. Should Century’s loss reserves experience adversedevelopment in the future and should Century be placed into rehabilitation or liquidation, the reinsurance recoverables duefrom Century to its affiliates would be payable only after the payment in full of certain expenses and liabilities, includingadministrative expenses and direct policy liabilities. Thus, the intercompany reinsurance recoverables would be at risk to theextent of the shortage of assets remaining to pay these recoverables. Losses ceded by Century to the active ACE companiesand other amounts owed to Century by the active ACE companies were, in the aggregate, approximately $629 million and$465 million at December 31, 2009 and 2008, respectively.
8. Taxation
Under Swiss law, a resident company is subject to income tax at the federal, cantonal, and communal levels that is levied onnet worldwide income. Income attributable to permanent establishments or real estate located abroad is excluded from theSwiss tax base. ACE Limited is a holding company and, therefore, is exempt from cantonal and communal income tax. As aresult, ACE Limited is subject to Swiss income tax only at the federal level. Furthermore, participation relief is granted to ACELimited at the federal level for qualifying dividend income and capital gains related to the sale of qualifying participations. It isexpected that the participation relief will result in a full exemption of participation income from federal income tax. ACE Limitedis resident in the Canton and City of Zurich and, as such, is subject to an annual cantonal and communal capital tax on thetaxable equity of ACE Limited in Switzerland.
The Company has two Swiss operating subsidiaries resident in the Canton and City of Zurich, an insurance company,ACE Insurance (Switzerland) Limited, which, in turn, owns a reinsurance company, ACE Reinsurance (Switzerland) Limited.Both are subject to federal, cantonal, and communal income tax and to annual cantonal and communal capital tax.
Under current Bermuda law, ACE Limited and its Bermuda subsidiaries are not required to pay any taxes on its income orcapital gains. If a Bermuda law were to be enacted that would impose taxes on income or capital gains, ACE Limited and theBermuda subsidiaries have received an undertaking from the Minister of Finance in Bermuda that would exempt such compa-nies from Bermudian taxation until March 2016.
Income from the Company’s operations at Lloyd’s is subject to United Kingdom corporation taxes. Lloyd’s is required topay U.S. income tax on U.S. connected income (U.S. income) written by Lloyd’s syndicates. Lloyd’s has a closing agreementwith the Internal Revenue Service (IRS) whereby the amount of tax due on this business is calculated by Lloyd’s and remitteddirectly to the IRS. These amounts are then charged to the accounts of the Names/Corporate Members in proportion to theirparticipation in the relevant syndicates. The Company’s Corporate Members are subject to this arrangement but, as U.K.domiciled companies, will receive U.K. corporation tax credits for any U.S. income tax incurred up to the value of the equiv-alent U.K. corporation income tax charge on the U.S. income.
ACE Group Holdings and its respective subsidiaries are subject to income taxes imposed by U.S. authorities and file aconsolidated U.S. tax return. Combined Insurance and its subsidiaries will file a separate consolidated U.S. tax return for taxyears prior to 2014. Should ACE Group Holdings pay a dividend to the Company, withholding taxes would apply. Currently,however, no withholding taxes are accrued with respect to such un-remitted earnings as management has no intention ofremitting these earnings. The cumulative amount that would be subject to withholding tax, if distributed, as well as thedetermination of the associated tax liability are not practicable to compute; however, such amount would be material to theCompany. Certain international operations of the Company are also subject to income taxes imposed by the jurisdictions inwhich they operate.
The Company is not subject to income taxation other than as stated above. There can be no assurance that there will notbe changes in applicable laws, regulations, or treaties which might require the Company to change the way it operates orbecome subject to taxation.
F-41
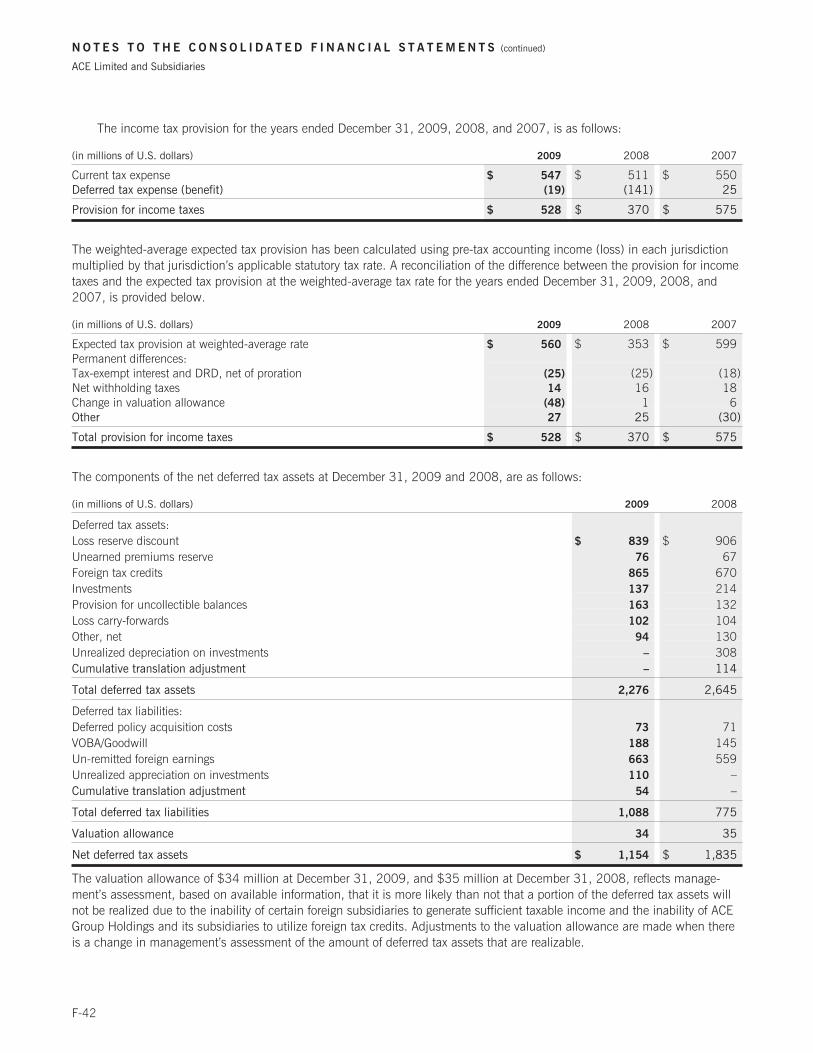
N O T E S T O T H E C O N S O L I D A T E D F I N A N C I A L S T A T E M E N T S (continued)
ACE Limited and Subsidiaries
The income tax provision for the years ended December 31, 2009, 2008, and 2007, is as follows:
(in millions of U.S. dollars) 2009 2008 2007
Current tax expense $ 547 $ 511 $ 550Deferred tax expense (benefit) (19) (141) 25
Provision for income taxes $ 528 $ 370 $ 575
The weighted-average expected tax provision has been calculated using pre-tax accounting income (loss) in each jurisdictionmultiplied by that jurisdiction’s applicable statutory tax rate. A reconciliation of the difference between the provision for incometaxes and the expected tax provision at the weighted-average tax rate for the years ended December 31, 2009, 2008, and2007, is provided below.
(in millions of U.S. dollars) 2009 2008 2007
Expected tax provision at weighted-average rate $ 560 $ 353 $ 599Permanent differences:Tax-exempt interest and DRD, net of proration (25) (25) (18)Net withholding taxes 14 16 18Change in valuation allowance (48) 1 6Other 27 25 (30)
Total provision for income taxes $ 528 $ 370 $ 575
The components of the net deferred tax assets at December 31, 2009 and 2008, are as follows:
(in millions of U.S. dollars) 2009 2008
Deferred tax assets:Loss reserve discount $ 839 $ 906Unearned premiums reserve 76 67Foreign tax credits 865 670Investments 137 214Provision for uncollectible balances 163 132Loss carry-forwards 102 104Other, net 94 130Unrealized depreciation on investments – 308Cumulative translation adjustment – 114
Total deferred tax assets 2,276 2,645
Deferred tax liabilities:Deferred policy acquisition costs 73 71VOBA/Goodwill 188 145Un-remitted foreign earnings 663 559Unrealized appreciation on investments 110 –Cumulative translation adjustment 54 –
Total deferred tax liabilities 1,088 775
Valuation allowance 34 35
Net deferred tax assets $ 1,154 $ 1,835
The valuation allowance of $34 million at December 31, 2009, and $35 million at December 31, 2008, reflects manage-ment’s assessment, based on available information, that it is more likely than not that a portion of the deferred tax assets willnot be realized due to the inability of certain foreign subsidiaries to generate sufficient taxable income and the inability of ACEGroup Holdings and its subsidiaries to utilize foreign tax credits. Adjustments to the valuation allowance are made when thereis a change in management’s assessment of the amount of deferred tax assets that are realizable.
F-42
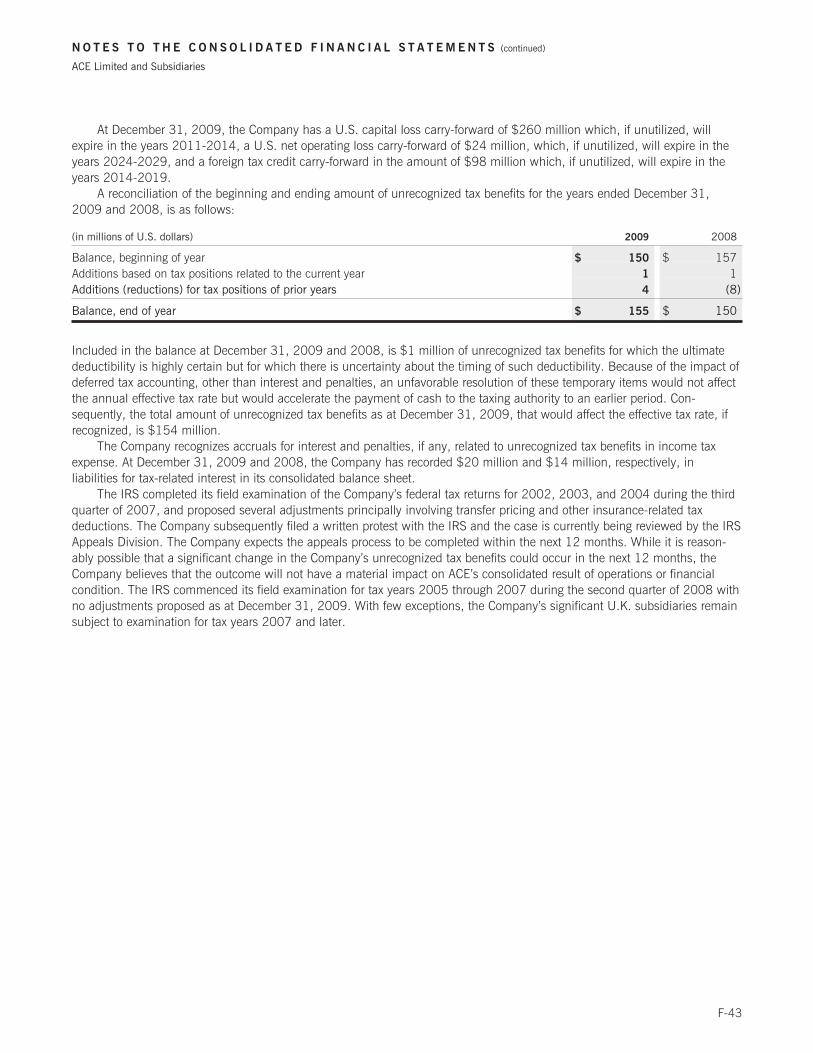
N O T E S T O T H E C O N S O L I D A T E D F I N A N C I A L S T A T E M E N T S (continued)
ACE Limited and Subsidiaries
At December 31, 2009, the Company has a U.S. capital loss carry-forward of $260 million which, if unutilized, willexpire in the years 2011-2014, a U.S. net operating loss carry-forward of $24 million, which, if unutilized, will expire in theyears 2024-2029, and a foreign tax credit carry-forward in the amount of $98 million which, if unutilized, will expire in theyears 2014-2019.
A reconciliation of the beginning and ending amount of unrecognized tax benefits for the years ended December 31,2009 and 2008, is as follows:
(in millions of U.S. dollars) 2009 2008
Balance, beginning of year $ 150 $ 157Additions based on tax positions related to the current year 1 1Additions (reductions) for tax positions of prior years 4 (8)
Balance, end of year $ 155 $ 150
Included in the balance at December 31, 2009 and 2008, is $1 million of unrecognized tax benefits for which the ultimatedeductibility is highly certain but for which there is uncertainty about the timing of such deductibility. Because of the impact ofdeferred tax accounting, other than interest and penalties, an unfavorable resolution of these temporary items would not affectthe annual effective tax rate but would accelerate the payment of cash to the taxing authority to an earlier period. Con-sequently, the total amount of unrecognized tax benefits as at December 31, 2009, that would affect the effective tax rate, ifrecognized, is $154 million.
The Company recognizes accruals for interest and penalties, if any, related to unrecognized tax benefits in income taxexpense. At December 31, 2009 and 2008, the Company has recorded $20 million and $14 million, respectively, inliabilities for tax-related interest in its consolidated balance sheet.
The IRS completed its field examination of the Company’s federal tax returns for 2002, 2003, and 2004 during the thirdquarter of 2007, and proposed several adjustments principally involving transfer pricing and other insurance-related taxdeductions. The Company subsequently filed a written protest with the IRS and the case is currently being reviewed by the IRSAppeals Division. The Company expects the appeals process to be completed within the next 12 months. While it is reason-ably possible that a significant change in the Company’s unrecognized tax benefits could occur in the next 12 months, theCompany believes that the outcome will not have a material impact on ACE’s consolidated result of operations or financialcondition. The IRS commenced its field examination for tax years 2005 through 2007 during the second quarter of 2008 withno adjustments proposed as at December 31, 2009. With few exceptions, the Company’s significant U.K. subsidiaries remainsubject to examination for tax years 2007 and later.
F-43

N O T E S T O T H E C O N S O L I D A T E D F I N A N C I A L S T A T E M E N T S (continued)
ACE Limited and Subsidiaries
9. Debt
The following table outlines the Company’s debt at December 31, 2009 and 2008.
(in millions of U.S. dollars) 2009 2008
Short-term debt
ACE European Holdings due 2010 $ 161 $ –ACE INA subordinated notes due 2009 – 205ACE INA term loan due 2009 – 16Reverse repurchase agreements – 250
$ 161 $ 471
Long-term debt
ACE INA term loan due 2011 $ 50 $ 50ACE INA term loan due 2013 450 450ACE INA senior notes due 2014 500 499ACE INA senior notes due 2015 446 446ACE INA senior notes due 2017 500 500ACE INA senior notes due 2018 300 300ACE INA senior notes due 2019 500 –ACE INA debentures due 2029 100 100ACE INA senior notes due 2036 298 298Other 14 14ACE European Holdings due 2010 – 149
$ 3,158 $ 2,806
Trust Preferred Securities
ACE INA capital securities due 2030 $ 309 $ 309
a) Short-term debt
At December 31, 2009, short-term debt consisted of the ACE European Holdings notes discussed further below. Though noneare outstanding at December 31, 2009, the Company had executed reverse repurchase agreements with certain counter-parties under which ACE agreed to sell securities and repurchase them at a future date for a predetermined price. Theseincluded agreements both executed and settled in 2008 totaling $1 billion as part of the financing of the Combined Insuranceacquisition. In September 2009, the Company repaid the ACE INA nine-month term loan. Further, in December 2009, ACErepaid the ACE INA subordinated notes.
b) ACE European Holdings notes
In December 2005, ACE European Holdings No. 2 Ltd. entered into a £100 million ($161 million) syndicated five-year termloan agreement due December 2010. The loan agreement is unsecured and repayable on maturity. The interest rate on theloan is 5.25 percent. The obligation of the borrower under the loan agreement is guaranteed by ACE Limited.
c) ACE INA subordinated notes
In 1999, ACE INA issued $300 million of 11.2 percent unsecured subordinated notes maturing in December 2009. Thesubordinated notes were callable subject to certain call premiums. Simultaneously, the Company entered into a notional $300million swap transaction that had the economic effect of reducing the cost of debt to the consolidated group, excluding feesand expenses, to 8.41 percent for ten years. During 2002, the Company repaid $100 million of these notes and swaps; thebalance was repaid in December 2009.
d) ACE INA notes, debentures, and term loans
In December 2008, ACE INA entered into a $66 million dual tranche floating interest rate term loan agreement. The first tran-che, a $50 million three-year term loan due December 2011, has a floating interest rate based on LIBOR. Simultaneously, theCompany entered into a swap transaction that has the economic effect of fixing the interest rate, excluding fees and expenses,
F-44

N O T E S T O T H E C O N S O L I D A T E D F I N A N C I A L S T A T E M E N T S (continued)
ACE Limited and Subsidiaries
at 5.61 percent for the full term of the loan. The swap counterparty is a highly-rated financial institution and the Companydoes not anticipate non-performance. The second tranche, a $16 million nine-month term loan, due and repaid in September2009, had a floating interest rate based on LIBOR. Simultaneously, the Company entered into a swap transaction that had theeconomic effect of fixing the interest rate, excluding fees and expenses, at 3.02 percent for the full term of the loan. The loanis unsecured and repayable on maturity and contains customary limitations on lien provisions as well as customary events ofdefault provisions which, if breached, could result in the accelerated maturity of such debt. The obligation of the borrowerunder the loan agreement is guaranteed by ACE Limited.
In April 2008, as part of the financing of the Combined Insurance acquisition, ACE INA entered into a $450 million float-ing interest rate syndicated term loan agreement due April 2013. The floating interest rate is based on LIBOR plus 0.65percent. Simultaneously, the Company entered into a $450 million swap transaction that has the economic effect of fixing theinterest rate at 4.15 percent for the term of the loan. The swap counterparty is a highly-rated financial institution and theCompany does not anticipate non-performance. The loan is unsecured and repayable on maturity and contains customarylimitations on lien provisions as well as customary events of default provisions which, if breached, could result in the accel-erated maturity of such debt. The obligation of the borrower under the loan agreement is guaranteed by ACE Limited.
In June 2004, ACE INA issued $500 million of 5.875 percent notes due June 2014. These notes are redeemable at anytime at ACE INA’s option subject to a “make-whole” premium plus 0.20 percent. The notes are also redeemable at par plusaccrued and unpaid interest in the event of certain changes in tax law. The notes do not have the benefit of any sinking fund.These senior unsecured notes are guaranteed on a senior basis by the Company and they rank equally with all of the Compa-ny’s other senior obligations. They also contain customary limitation on lien provisions as well as customary events of defaultprovisions which, if breached, could result in the accelerated maturity of such senior debt.
In May 2008, ACE INA issued $450 million of 5.6 percent senior notes due May 2015. These notes are redeemable atany time at ACE INA’s option subject to a “make-whole” premium plus 0.35 percent. The notes are also redeemable at parplus accrued and unpaid interest in the event of certain changes in tax law. The notes do not have the benefit of any sinkingfund. These senior unsecured notes are guaranteed on a senior basis by the Company and they rank equally with all of theCompany’s other senior obligations. They also contain customary limitations on lien provisions as well as customary events ofdefault provisions which, if breached, could result in the accelerated maturity of such senior debt.
In February 2007, ACE INA issued $500 million of 5.7 percent notes due February 2017. These notes are redeemable atany time at ACE INA’s option subject to a “make-whole” premium plus 0.20 percent. The notes are also redeemable at parplus accrued and unpaid interest in the event of certain changes in tax law. These notes do not have the benefit of any sinkingfund. These senior unsecured notes are guaranteed on a senior basis by the Company and they rank equally with all of theCompany’s other senior obligations. They also contain customary limitation on lien provisions as well as customary events ofdefault provisions which, if breached, could result in the accelerated maturity of such senior debt.
In February 2008, as part of the financing of the Combined Insurance acquisition, ACE INA issued $300 million of 5.8percent senior notes due March 2018. These notes are redeemable at any time at ACE INA’s option subject to a “make-whole”premium plus 0.35 percent. The notes are also redeemable at par plus accrued and unpaid interest in the event of certainchanges in tax law. These notes do not have the benefit of any sinking fund. These senior unsecured notes are guaranteed ona senior basis by the Company and they rank equally with all of the Company’s other senior obligations. They also containcustomary limitations on lien provisions as well as customary events of default provisions which, if breached, could result inthe accelerated maturity of such senior debt.
In June 2009, ACE INA issued $500 million of 5.9 percent senior notes due June 2019. These notes are redeemable atany time at ACE INA’s option subject to a “make-whole” premium plus 0.40 percent. The notes are also redeemable at parplus accrued and unpaid interest in the event of certain changes in tax law. The notes do not have the benefit of any sinkingfund. These senior unsecured notes are guaranteed on a senior basis by the Company and they rank equally with all of theCompany’s other senior obligations. They also contain customary limitations on lien provisions as well as customary events ofdefault provisions which, if breached, could result in the accelerated maturity of such senior debt.
In August 1999, ACE INA issued $100 million of 8.875 percent debentures due August 2029. Subject to certainexceptions, the debentures are not redeemable before maturity and do not have the benefit of any sinking fund. Theseunsecured debentures are guaranteed on a senior basis by the Company and they rank equally with all of ACE INA’s othersenior indebtedness.
In May 2006, ACE INA issued $300 million of 6.7 percent notes due May 2036. These notes are redeemable at anytime at ACE INA’s option subject to a “make-whole” premium plus 0.20 percent. The notes are also redeemable at par plusaccrued and unpaid interest in the event of certain changes in tax law. These notes do not have the benefit of any sinkingfund. These senior unsecured notes are guaranteed on a senior basis by the Company and they rank equally with all of the
F-45

N O T E S T O T H E C O N S O L I D A T E D F I N A N C I A L S T A T E M E N T S (continued)
ACE Limited and Subsidiaries
Company’s other senior obligations. They also contain customary limitation on lien provisions as well as customary events ofdefault provisions which, if breached, could result in the accelerated maturity of such senior debt.
e) ACE INA capital securities
In March 2000, ACE Capital Trust II, a Delaware statutory business trust, publicly issued $300 million of 9.7 percent CapitalSecurities (the Capital Securities). At the same time, ACE INA purchased $9.2 million of common securities of ACE CapitalTrust II.
The Capital Securities mature in April 2030. Distributions on the Capital Securities are payable semi-annually. ACE Capi-tal Trust II may defer these payments for up to ten consecutive semi-annual periods (but no later than April 1, 2030). Anydeferred payments would accrue interest compounded semi-annually if ACE INA defers interest on the SubordinatedDebentures due 2030 (as defined below).
The sole assets of ACE Capital Trust II consist of $309 million principal amount of 9.7 percent Junior Subordinated Defer-rable Interest Debentures (the Subordinated Debentures) issued by ACE INA. The Subordinated Debentures mature in April2030. Interest on the Subordinated Debentures is payable semi-annually. ACE INA may defer such interest payments (but nolater than April 1, 2030), with such deferred payments accruing interest compounded semi-annually. ACE INA may redeemthe Subordinated Debentures in the event certain changes in tax or investment company law occur at a redemption price equalto accrued and unpaid interest to the redemption date plus the greater of (i) 100 percent of the principal amount thereof, or(ii) the sum of the present value of scheduled payments of principal and interest on the debentures from the redemption dateto April 1, 2030. The Capital Securities and the ACE Capital Trust II Common Securities will be redeemed upon repayment ofthe Subordinated Debentures.
The Company has guaranteed, on a subordinated basis, ACE INA’s obligations under the Subordinated Debentures, anddistributions and other payments due on the Capital Securities. These guarantees, when taken together with the Company’sobligations under expense agreements entered into with ACE Capital Trust II, provide a full and unconditional guarantee ofamounts due on the Capital Securities.
f) Other long-term debt
In August 2005, due to favorable low-interest terms, ACE American borrowed $10 million from the Pennsylvania IndustrialDevelopment Authority (PIDA) at a rate of 2.75 percent due September 2020. The proceeds from PIDA were restricted forpurposes of defraying construction costs on a new office building. Principal and interest are payable on a monthly basis. Thecurrent balance outstanding is $8 million.
In addition, in 1999, ACE American assumed a CIGNA loan of $8 million borrowed from the City of Philadelphia underthe Urban Development Action Grant with an imputed rate of 7.1 percent due December 2019. The current amount out-standing is $6 million.
10. Commitments, contingencies, and guarantees
a) Derivative instruments
Derivative instruments employed
The Company maintains positions in derivative instruments such as futures, options, swaps, and foreign currency forwardcontracts for which the primary purposes are to manage duration and foreign currency exposure, yield enhancement, or toobtain an exposure to a particular financial market. Along with convertible bonds and to be announced mortgage-backed secu-rities, discussed below, these are the most numerous and frequent derivative transactions.
ACE maintains positions in certain convertible bond investments that contain embedded derivatives. In addition, theCompany purchases to be announced mortgage-backed securities (TBA) as part of its investing activities. These securities areincluded within the Company’s fixed maturities available for sale (FM AFS) portfolio.
Under reinsurance programs covering living benefit guarantees, the Company assumes the risk of GMIBs associated withvariable annuity contracts. The GMIB risk is triggered if, at the time the contract holder elects to convert the accumulatedaccount value to a periodic payment stream (annuitize), the accumulated account value is not sufficient to provide a guaran-teed minimum level of monthly income. The Company’s GMIB reinsurance product meets the definition of a derivativeinstrument. Benefit reserves in respect of GMIBs are classified as Future policy benefits (FPB) while the fair value derivativeadjustment is classified within Accounts payable, accrued expenses, and other liabilities (AP). The Company also maintainspositions in certain exchange-traded equity futures contracts and options on equity market futures to limit equity and interestrate exposure in the GMDB and GMIB block of business.
F-46

N O T E S T O T H E C O N S O L I D A T E D F I N A N C I A L S T A T E M E N T S (continued)
ACE Limited and Subsidiaries
In relation to certain long- and short-term debt issues, the Company has entered into interest rate swap transactions for thepurpose of either fixing or reducing borrowing costs. Although the use of these interest rate swaps has the economic effect of fix-ing or reducing borrowing costs on a net basis, gross interest expense on the related debt issues is included in Interest expensewhile the settlements related to the interest rate swaps are reflected in Net realized gains (losses) in the consolidated statementsof operations. ACE buys credit default swaps to mitigate global credit risk exposure, primarily related to reinsurance recoverable.
The Company carries all derivative instruments at fair value with changes in fair value recorded in Net realized gains (losses)in the consolidated statements of operations. None of the derivative instruments are used as hedges for accounting purposes.
The following table outlines the balance sheet locations, fair values in an asset or (liability) position, and notional values/payment provisions of the Company’s derivative instruments at December 31, 2009.
2009
(in millions of U.S. dollars)
ConsolidatedBalance Sheet
Location Fair Value
NotionalValue/
PaymentProvision
Investment and embedded derivative instruments
Foreign currency forward contracts AP $ 6 $ 393
Futures contracts on money market instruments AP 4 4,711
Futures contracts on notes and bonds AP (2) 500
Options on money market instruments AP – 200
Options on notes and bonds futures AP (1) 305
Convertible bonds FM AFS 354 725
TBAs FM AFS 11 10
$ 372 $ 6,844
Other derivative instruments
Futures contracts on equities AP $ (9) $ 960
Options on equity market futures AP 56 250
Interest rate swaps AP (24) 500
Credit default swaps AP 2 350
Other AP 12 37
$ 37 $ 2,097
GMIB(1) AP/FPB $ (559) $ 683
(1) Note that the payment provision related to GMIB is the net amount at risk. The concept of a notional value does not apply to the GMIB reinsurance contracts.
The following table outlines derivative instrument activity in the consolidated statement of operations for the year endedDecember 31, 2009. All amounts are reflected in Net realized gains (losses) in the consolidated statement of operations.
(in millions of U.S. dollars) 2009
Investment and embedded derivative instruments
Foreign currency forward contracts $ (14)
All other futures contracts and options 6
Convertible bonds 82
TBAs (6)
$ 68
GMIB and other derivative instruments
GMIB $ 368
Futures contracts on equities (268)
Options on equity market futures (95)
Interest rate swaps (22)
Credit default swaps (75)
Other 4
$ (88)
$ (20)
F-47

N O T E S T O T H E C O N S O L I D A T E D F I N A N C I A L S T A T E M E N T S (continued)
ACE Limited and Subsidiaries
Derivative instrument objectives
(i) Foreign currency exposure management
The Company uses foreign currency forward contracts (forwards) to minimize the effect of fluctuating foreign currencies. Theforwards purchased are not specifically identifiable against cash, any single security, or groups of securities denominated inthose currencies and, therefore, do not qualify as hedges for financial reporting purposes. All realized and unrealized contractgains and losses are reflected in Net realized gains (losses) in the consolidated statements of operations.
(ii) Duration management and market exposure
Futures
Exchange-traded bond and note futures contracts may be used in fixed maturity portfolios as substitutes for ownership of thebonds and notes without significantly increasing the risk in the portfolio. Investments in futures contracts may be made only tothe extent that there are assets under management not otherwise committed. Exchange-traded equity futures contracts may beused to limit exposure to a severe equity market decline, which would cause an increase in expected claims and therefore,reserves for GMDB and GMIB reinsurance business. Futures contracts give the holder the right and obligation to participate inmarket movements, determined by the index or underlying security on which the futures contract is based. Settlement is madedaily in cash by an amount equal to the change in value of the futures contract times a multiplier that scales the size of thecontract.
Options
Option contracts are used in the investment portfolio as protection against unexpected shifts in interest rates, which wouldaffect the duration of the fixed maturity portfolio. By using options in the portfolio, the overall interest rate sensitivity of theportfolio can be reduced. Option contracts may also be used as an alternative to futures contracts in the Company’s syntheticstrategy as described above. Another use for option contracts may be to limit exposure to a severe equity market decline,which would cause an increase in expected claims and therefore, reserves for GMDB and GMIB reinsurance business. Anoption contract conveys to the holder the right, but not the obligation, to purchase or sell a specified amount or value of anunderlying security at a fixed price. The price of an option is influenced by the underlying security, expected volatility, time toexpiration, and supply and demand.
The credit risk associated with the above derivative financial instruments relates to the potential for non-performance bycounterparties. Although non-performance is not anticipated, in order to minimize the risk of loss, management monitors thecredit worthiness of its counterparties. The performance of exchange-traded instruments is guaranteed by the exchange onwhich they trade. For non-exchange-traded instruments, the counterparties are principally banks which must meet certain cri-teria according to the Company’s investment guidelines.
Interest rate swaps
An interest rate swap is a contract between two counterparties in which interest payments are made based on a notional princi-pal amount, which itself is never paid or received. Under the terms of an interest rate swap, one counterparty makes interestpayments based on a fixed interest rate and the other counterparty’s payments are based on a floating rate. Interest rate swapcontracts are used occasionally in the investment portfolio as protection against unexpected shifts in interest rates, whichwould affect the fair value of the fixed maturity portfolio. By using interest rate swaps in the portfolio, the overall duration orinterest rate sensitivity of the portfolio can be reduced. The Company also employs interest rate swaps related to certain debtissues for the purpose of either fixing and/or reducing borrowing costs.
Credit default swaps
A credit default swap is a bilateral contract under which two counterparties agree to isolate and separately trade the credit riskof at least one third-party reference entity. Under a credit default swap agreement, a protection buyer pays a periodic fee to aprotection seller in exchange for a contingent payment by the seller upon a credit event (such as a default or failure to pay)related to the reference entity. When a credit event is triggered, the protection seller pays the protection buyer the differencebetween the fair value of assets and the principal amount. The Company has purchased a credit default swap to mitigate itsglobal credit risk exposure to one of its reinsurers.
F-48

N O T E S T O T H E C O N S O L I D A T E D F I N A N C I A L S T A T E M E N T S (continued)
ACE Limited and Subsidiaries
(iii) Convertible security investments
A convertible bond is a debt instrument that can be converted into a predetermined amount of the issuer’s equity at certaintimes prior to the bond’s maturity. The convertible option is an embedded derivative which is marked-to-market with changesin fair value recognized in Net realized gains (losses). The debt host instrument is classified in the investment portfolio asavailable for sale. The Company purchases convertible bonds for their total return and not specifically for the conversion fea-ture.
(iv) To be announced mortgage-backed securities (TBA)
By acquiring a TBA, the Company makes a commitment to purchase a future issuance of mortgage-backed securities. For theperiod between purchase of the TBA and issuance of the underlying security, the Company’s position is accounted for as aderivative in the consolidated financial statements. The Company purchases TBAs both for their total return and for the flexi-bility they provide related to ACE’s mortgage-backed security strategy.
(v) GMIB
Under the GMIB program, as the assuming entity, the Company is obligated to provide coverage until the expiration of theunderlying annuities. Premiums received under the reinsurance treaties are classified as premium. Expected losses allocated topremiums received are classified as future policy benefits and valued similar to GMDB reinsurance. Other changes in fair val-ue, principally arising from changes in expected losses allocated to expected future premiums, are classified as Net realizedgains (losses). Fair value represents exit price and thus, includes a risk margin. The Company may recognize a realized loss forother changes in fair value due to adverse changes in the capital markets (i.e., declining interest rates and/or declining equitymarkets) and changes in policyholder behavior (i.e., increased annuitization or decreased lapse rates) although the Companyexpects the business to be profitable. The Company believes this presentation provides the most meaningful disclosure ofchanges in the underlying risk within the GMIB reinsurance programs for a given reporting period.
b) Concentrations of credit risk
The investment portfolio is managed following prudent standards of diversification. Specific provisions limit the allowable hold-ings of a single issue and issuer. The Company believes that there are no significant concentrations of credit risk associatedwith its investments. The Company’s three largest exposures by issuer at December 31, 2009, were General Electric Com-pany, JP Morgan Chase & Co., and Bank of America Corp. The Company’s largest exposure by industry at December 31,2009, was financial services.
The Company markets its insurance and reinsurance worldwide primarily through insurance and reinsurance brokers. TheCompany assumes a degree of credit risk associated with brokers with whom it transacts business. During the year endedDecember 31, 2009, approximately 13 percent of the Company’s gross premiums written were generated from or placed byMarsh, Inc. and its affiliates and 11 percent by Aon Corporation and its affiliates. Both of these entities are large, well estab-lished companies and there are no indications that either of them is financially troubled at December 31, 2009. No otherbroker and no one insured or reinsured accounted for more than ten percent of gross premiums written in the three yearsended December 31, 2009, 2008, and 2007.
c) Other investments
Included in Other investments are investments in limited partnerships and partially-owned investment companies with a carry-ing value of $871 million. In connection with these investments, the Company has commitments that may require funding ofup to $695 million over the next several years.
d) Credit facilities
The Company has a $500 million unsecured revolving credit facility expiring in November 2012, available for general corpo-rate purposes and the issuance of LOCs. At December 31, 2009, the outstanding LOCs issued under this facility were $54million. There were no other drawings or LOCs issued under this facility. This facility requires that the Company and/or certainof its subsidiaries continue to maintain certain covenants, including a minimum consolidated net worth covenant and a max-imum leverage covenant, which have been met at December 31, 2009.
e) Letters of credit
The Company has a $1 billion unsecured operational LOC facility expiring in November 2012. This facility replaced two LOCfacilities permitting up to $1.5 billion of LOCs. On the effective date of the new LOC facility, all outstanding LOCs issued under
F-49

N O T E S T O T H E C O N S O L I D A T E D F I N A N C I A L S T A T E M E N T S (continued)
ACE Limited and Subsidiaries
the replaced facilities were deemed to have been issued under the new LOC facility and the replaced facilities terminated. AtDecember 31, 2009, $554 million of this facility was utilized.
To satisfy funding requirements of the Company’s Lloyd’s Syndicate 2488 through 2010, the Company has anuncollateralized LOC facility in the amount of £300 million ($484 million). LOCs issued under this facility will expire no earlierthan December 2013. At December 31, 2009, £256 million ($412 million) of this facility was utilized.
In June 2009, the Company entered into a $500 million unsecured operational LOC facility expiring in September2014. At December 31, 2009, this facility was fully utilized.
These facilities require that the Company and/or certain of its subsidiaries continue to maintain certain covenants, includinga minimum consolidated net worth covenant and a maximum leverage covenant, which have been met at December 31, 2009.
f) Legal proceedings
(i) Claims and other litigationThe Company’s insurance subsidiaries are subject to claims litigation involving disputed interpretations of policy coverage and,in some jurisdictions, direct actions by allegedly-injured persons seeking damages from policyholders. These lawsuits, involv-ing claims on policies issued by the Company’s subsidiaries, which are typical to the insurance industry in general and in thenormal course of business, are considered in the Company’s loss and loss expense reserves. In addition to claims litigation, theCompany and its subsidiaries are subject to lawsuits and regulatory actions in the normal course of business that do not arisefrom, or directly relate to, claims on insurance policies. This category of business litigation typically involves, amongst otherthings, allegations of underwriting errors or misconduct, employment claims, regulatory activity, or disputes arising from busi-ness ventures. In the opinion of ACE’s management, ACE’s ultimate liability for these matters is not likely to have a materialadverse effect on ACE’s consolidated financial condition, although it is possible that the effect could be material to ACE’s con-solidated results of operations for an individual reporting period.
(ii) Business practices litigationBeginning in 2004, ACE and its subsidiaries and affiliates received numerous subpoenas, interrogatories, and civil inves-tigative demands in connection with certain investigations of insurance industry practices. These inquiries were issued by anumber of attorneys general, state departments of insurance, and other authorities, including the New York Attorney General(NYAG) and the Pennsylvania Insurance Department. Such inquiries concerned underwriting practices and non-traditional orloss mitigation insurance products.
On April 25, 2006, ACE reached a settlement with the Attorneys General of New York, Illinois, and Connecticut and theNew York Insurance Department pursuant to which ACE received from these authorities an Assurance of Discontinuance. OnMay 9, 2007, ACE and the Pennsylvania Insurance Department (Department) and the Pennsylvania Office of Attorney General(OAG) entered into a settlement agreement. This settlement agreement resolved the issues raised by the Department and theOAG arising from their investigation of ACE’s underwriting practices and contingent commission payments. On October 24,2007, ACE entered into a settlement agreement with the Attorneys General of Florida, Hawaii, Maryland, Massachusetts,Michigan, Oregon, Texas, West Virginia, the District of Columbia, and the Florida Department of Financial Services and Officeof Insurance Regulation. The agreement resolved investigations of ACE’s underwriting practices and contingent commissionpayments.
In June 2008, in an action filed by the NYAG against another insurer, the New York Appellate Division, First Department,confirmed the legality of contingent commission agreements – one of the focal points of the NYAG’s investigation. “Contingentcommission agreements between brokers and insurers are not illegal, and, in the absence of a special relationship betweenparties, defendants[s] had no duty to disclose the existence of the contingent commission agreement.” New York v. Liberty
Mut. Ins. Co., 52 A.D. 3d 378, 379 (2008) (citing Hersch v. DeWitt Stern Group, Inc., 43 A.D. 3d 644, 645 (2007).ACE, ACE INA Holdings, Inc., and ACE USA, Inc., along with a number of other insurers and brokers, were named in a
series of federal putative nationwide class actions brought by insurance policyholders. The Judicial Panel on Multidistrict Liti-gation (JPML) consolidated these cases in the District of New Jersey. On August 1, 2005, plaintiffs in the New Jerseyconsolidated proceedings filed two consolidated amended complaints – one concerning commercial insurance and the otherconcerning employee benefit plans. The employee benefit plans litigation against ACE has been dismissed.
In the commercial insurance complaint, the plaintiffs named ACE, ACE INA Holdings, Inc., ACE USA, Inc., ACE AmericanInsurance Co., Illinois Union Insurance Co., and Indemnity Insurance Co. of North America. They allege that certain brokersand insurers, including certain ACE entities, conspired to increase premiums and allocate customers through the use of “B”quotes and contingent commissions. In addition, the complaints allege that the broker defendants received additional income
F-50
N O T E S T O T H E C O N S O L I D A T E D F I N A N C I A L S T A T E M E N T S (continued)
ACE Limited and Subsidiaries
by improperly placing their clients’ business with insurers through related wholesale entities that acted as intermediariesbetween the broker and insurer. Plaintiffs also allege that broker defendants tied the purchase of primary insurance to theplacement of such coverage with reinsurance carriers through the broker defendants’ reinsurance broker subsidiaries. Thecomplaint asserts the following causes of action against ACE: Federal Racketeer Influenced and Corrupt Organizations Act(RICO), federal antitrust law, state antitrust law, aiding and abetting breach of fiduciary duty, and unjust enrichment.
In 2006 and 2007, the Court dismissed plaintiffs’ first two attempts to properly plead a case without prejudice andpermitted plaintiffs one final opportunity to re-plead. The amended complaint, filed on May 22, 2007, purported to add sev-eral new ACE defendants: ACE Group Holdings, Inc., ACE US Holdings, Inc., Westchester Fire Insurance Company, INACorporation, INA Financial Corporation, INA Holdings Corporation, ACE Property and Casualty Insurance Company, andPacific Employers Insurance Company. Plaintiffs also added a new antitrust claim against Marsh, ACE, and other insurersbased on the same allegations as the other claims but limited to excess casualty insurance. On June 21, 2007, defendantsmoved to dismiss the amended complaint and moved to strike the new parties. The Court granted defendants’ motions anddismissed plaintiffs’ antitrust and RICO claims with prejudice on August 31, 2007, and September 28, 2007, respectively.The Court also declined to exercise supplemental jurisdiction over plaintiffs’ state law claims and dismissed those claims with-out prejudice. On October 10, 2007, plaintiffs filed a Notice of Appeal of the antitrust and RICO rulings to the United StatesCourt of Appeals for the Third Circuit. The parties fully briefed the appeal and argued before the Third Circuit on April 21,2009. The court took the case under advisement, but did not indicate when it would issue a decision.
There are a number of federal actions brought by policyholders based on allegations similar to the allegations in the con-solidated federal actions that were filed in, or transferred to, the United States District Court for the District of New Jersey forcoordination. All proceedings in these actions are currently stayed.• New Cingular Wireless Headquarters LLC et al. v. Marsh & McLennan Companies, Inc. et al. (Case No. 06-5120; D.N.J.),was originally filed in the Northern District of Georgia on April 4, 2006. ACE, ACE American Ins. Co., ACE USA, Inc., ACEBermuda Ins. Co. Ltd., Illinois Union Ins. Co., Pacific Employers Ins. Co., and Lloyd’s of London Syndicate 2488 AGM, alongwith a number of other insurers and brokers, are named.• Avery Dennison Corp. v. Marsh & McLennan Companies, Inc. et al. (Case No. 07-00757; D.N.J.) was filed on February 13,2007. ACE, ACE INA Holdings, Inc., ACE USA, Inc., and ACE American Insurance Co., along with a number of other insurersand brokers, are named.• Henley Management Co., Inc. et al v. Marsh, Inc. et al. (Case No. 07-2389; D.N.J.) was filed on May 27, 2007. ACE USA,Inc., along with a number of other insurers and Marsh, are named.• Lincoln Adventures LLC et al. v. Those Certain Underwriters at Lloyd’s, London Members of Syndicates 0033 et al. (CaseNo. 07-60991; D.N.J.) was originally filed in the Southern District of Florida on July 13, 2007. Supreme Auto Transport LLCet al. v. Certain Underwriters of Lloyd’s of London, et al. (Case No. 07-6703; D.N.J.) was originally filed in the Southern Dis-trict of New York on July 25, 2007. Lloyd’s of London Syndicate 2488 AGM, along with a number of other Lloyd’s of LondonSyndicates and various brokers, are named in both actions. The allegations in these putative class-action lawsuits are similarto the allegations in the consolidated federal actions identified above, although these lawsuits focus on alleged conduct withinthe London insurance market.• Sears, Roebuck & Co. et al. v. Marsh & McLennan Companies, Inc. et al. (Case No. 07-2535; D.N.J.) was originally filed inthe Northern District of Georgia on October 12, 2007. ACE American Insurance Co., ACE Bermuda Insurance Ltd., and West-chester Surplus Lines Insurance Co., along with a number of other insurers and brokers, are named.
Three cases have been filed in state courts with allegations similar to those in the consolidated federal actions describedabove.• Van Emden Management Corporation v. Marsh & McLennan Companies, Inc., et al. (Case No. 05-0066A; Superior Court ofMassachusetts), a class action in Massachusetts, was filed on January 13, 2005. Illinois Union Insurance Company isnamed. The Van Emden case has been stayed pending resolution of the consolidated proceedings in the District of New Jerseyor until further order of the Court.• Office Depot, Inc. v. Marsh & McLennan Companies, Inc. et al. (Case No. 502005CA004396; Circuit Court of the 15thJudicial Circuit in Palm Beach County Florida), a Florida state action, was filed on June 22, 2005. ACE American InsuranceCo. is named. The trial court originally stayed this case, but the Florida Court of Appeals later remanded and the trial courtdeclined to grant another stay. The court has denied motions to dismiss, and ACE American Ins. Co. has filed an answer.Discovery is ongoing. Trial is scheduled for January 2011.• State of Ohio, ex. rel. Marc E. Dann, Attorney General v. American Int’l Group, Inc. et al. (Case No. 07-633857; Court ofCommon Pleas in Cuyahoga County, Ohio) is an Ohio state action filed by the Ohio Attorney General on August 24, 2007.ACE INA Holdings, Inc., ACE American Insurance Co., ACE Property & Casualty Insurance Co., Insurance Company of North
F-51

N O T E S T O T H E C O N S O L I D A T E D F I N A N C I A L S T A T E M E N T S (continued)
ACE Limited and Subsidiaries
America, and Westchester Fire Insurance Co., along with a number of other insurance companies and Marsh, are named.Defendants filed motions to dismiss in November 2007. On July 2, 2008, the court denied all of the defendants’ motions.Discovery is ongoing. Trial will likely occur in early 2011.
ACE was named in four putative securities class action suits following the filing of a civil suit against Marsh by the NYAGon October 14, 2004. The suits were consolidated by the JPML in the Eastern District of Pennsylvania and the Courtappointed Sheet Metal Workers’ National Pension Fund and Alaska Ironworkers Pension Trust as lead plaintiffs. Lead plaintiffsfiled a consolidated amended complaint on September 30, 2005, naming ACE, Evan G. Greenberg, Brian Duperreault, andPhilip V. Bancroft as defendants. Plaintiffs allege that ACE’s public statements and securities filings should have revealed thatinsurers, including certain ACE entities, and brokers allegedly conspired to increase premiums and allocate customers throughthe use of “B” quotes and contingent commissions and that ACE’s revenues and earnings were inflated by these practices.Plaintiffs assert claims solely under Section 10(b) of the Securities Exchange Act of 1934 (the Exchange Act), Rule 10(b)-5promulgated thereunder, and Section 20(a) of the Securities Act (control person liability). In 2005, ACE and the individualdefendants filed a motion to dismiss. The Court heard oral argument on November 10, 2008, but did not rule on the motion.On December 16, 2008, the parties entered into a Stipulation of Settlement in which the parties agreed – contingent uponCourt approval – that ACE would pay the plaintiffs $1.95 million in exchange for a full release of all claims. On June 9, 2009,the Court approved the settlement and dismissed the multidistrict litigation (including the four underlying suits) with prejudice.
ACE, ACE USA, Inc., ACE INA Holdings, Inc., and Evan G. Greenberg, as a former officer and director of AIG and currentofficer and director of ACE, are named in one or both of two derivative cases brought by certain shareholders of AIG. One of thederivative cases was filed in Delaware Chancery Court, and the other was filed in federal court in the Southern District of NewYork. The allegations against ACE concern the alleged bid rigging and contingent commission scheme as similarly alleged inthe federal commercial insurance cases. Plaintiffs assert the following causes of action against ACE: breach of fiduciary duty,aiding and abetting breaches of fiduciary duties, unjust enrichment, conspiracy, and fraud. In Delaware, the shareholder plain-tiffs filed an amended complaint (their third pleading effort), on April 14, 2008, which drops Evan Greenberg as a defendant(plaintiffs in the New York action subsequently dismissed Evan Greenberg as well). On June 13, 2008, ACE filed a motion todismiss, and on April 20, 2009, the court heard oral argument on the motion. On June 17, 2009, the Court dismissed allclaims against ACE with prejudice; final judgment in favor of ACE was entered on July 13, 2009. The derivative plaintiffsappealed and argument was held before a three judge panel of the Delaware Supreme Court on February 17, 2010. OnFebruary 22, 2010, the three judge panel ordered further oral argument to the Court en banc without scheduling a date. TheNew York derivative action is currently stayed.
In all of the lawsuits described above, plaintiffs seek compensatory and in some cases special damages without specifyingan amount. As a result, ACE cannot at this time estimate its potential costs related to these legal matters and, accordingly, noliability for compensatory damages has been established in the consolidated financial statements.
ACE’s ultimate liability for these matters is not likely to have a material adverse effect on ACE’s consolidated financialcondition, although it is possible that the effect could be material to ACE’s consolidated results of operations for an individualreporting period.
(iii) Legislative activityThe State of New York, as part of the 2009-10 State budget, has adopted language that requires an insurer which (1) paid tothe Workers’ Compensation Board (WCB) various statutory assessments in an amount less than that insurer “collected” frominsured employers in a given year and (2) “has identified and held any funds collected but not paid to the WCB, as meas-urable and available, as of January 1, 2009” to pay retroactive assessments to the WCB. The language, and impact, of thisnew law is at present uncertain because it uses terms and dates that are not readily identifiable with respect to insurers’ stat-utory financial statements and because the State has not promulgated implementing regulations or other explanatory materials.The Company’s understanding is that the law is intended to address certain inconsistencies in the New York State lawsregulating the calculation of workers’ compensation assessments by insurance carriers and the remittance of those funds to theState. In July 2009, ACE received a subpoena from the NYAG requesting documents related to these issues, and in October2009, ACE received a request from the WCB asking ACE to explain whether or not it was an “affected carrier” under the newlaw. In addition, the New York State legislature, as part of the 2010-11 State budget, is considering language that, if enacted,would require an insurer who paid to the WCB various statutory assessments in an amount less than that insurer “collected”from insured employers for the period April 1, 2008, through March 31, 2009, to pay such “excess assessment funds” to theWCB. Although the Company cannot at this time predict the interpretation that will be afforded the language in the 2009-10State budget, and cannot predict the outcome of the legislative process with regard to the language in the proposed 2010-11State budget, ACE is confident that it has complied with the law governing workers’ compensation surcharges and assess-ments. ACE has established a contingency based on the Company’s best estimate of the potential liability that could result
F-52

N O T E S T O T H E C O N S O L I D A T E D F I N A N C I A L S T A T E M E N T S (continued)
ACE Limited and Subsidiaries
from the legislation or other events surrounding this topic, based on the facts and circumstances at this time. Such con-tingency will be increased or decreased as circumstances develop. The Company does not expect these events to have amaterial impact on its financial condition or results of operations.
g) Lease commitments
The Company and its subsidiaries lease office space in the countries in which they operate under operating leases whichexpire at various dates through December 2033. The Company renews and enters into new leases in the ordinary course ofbusiness as required. Total rent expense with respect to these operating leases was $84 million, $77 million, and $72 millionfor the years ended December 31, 2009, 2008, and 2007, respectively. Future minimum lease payments under the leasesare expected to be as follows:
(in millions of U.S. dollars)Year ending
December 31
2010 $ 682011 592012 492013 392014 47Later years 85
Total minimum future lease commitments $ 347
11. Preferred Shares
In 2003, the Company sold twenty million depositary shares in a public offering, each representing one-tenth of one of its 7.8percent Cumulative Redeemable Preferred Shares, for $25 per depositary share. Underwriters exercised their over-allotmentoption which resulted in the issuance of an additional three million depositary shares.
The shares had an annual dividend rate of 7.8 percent with the first quarterly dividend paid on September 1, 2003. Theshares were not convertible into or exchangeable for the Company’s Common Shares. The Company had the option to redeemthese shares at any time after May 30, 2008, at a redemption value of $25 per depositary share or at any time under certainlimited circumstances. On June 13, 2008, the Company redeemed all of the outstanding Preferred Shares for cash consid-eration of $575 million.
12. Shareholders’ equity
a) Continuation
In connection with the Continuation in July 2008, the Company changed the currency in which the par value of OrdinaryShares was stated from U.S. dollars to Swiss francs and increased the par value of Ordinary Shares from $0.041666667 toCHF 33.74 (the New Par Value) through a conversion of all issued Ordinary Shares into “stock” and re-conversion of the stockinto Ordinary Shares with a par value equal to the New Par Value (the Par Value Conversion). The Par Value Conversion wasfollowed immediately by a stock dividend, to effectively return shareholders to the number of Ordinary Shares held before thePar Value Conversion. The stock dividend did not therefore have the effect of diluting earnings per share. Upon the effective-ness of the Continuation, the Company’s Ordinary Shares became Common Shares. All Common Shares are registeredcommon shares under Swiss corporate law. Notwithstanding the change of the currency in which the par value of CommonShares is stated, the Company continues to use U.S. dollars as its reporting currency for preparing the consolidated financialstatements. For purposes of the consolidated financial statements, the increase in par value was accomplished by a corre-sponding reduction first to retained earnings and second to additional paid-in capital to the extent that the increase in parvalue exhausted retained earnings at the date of the Continuation.
Under Swiss corporate law, dividends, including distributions through a reduction in par value (par value distributions),must be declared by ACE in Swiss francs though dividend payments are made by the Company in U.S. dollars. For theforeseeable future, subject to shareholder approval, the Company expects to pay dividends as a repayment of share capital inthe form of a reduction in par value or qualified paid-in capital, which would not be subject to Swiss withholding tax.
F-53

N O T E S T O T H E C O N S O L I D A T E D F I N A N C I A L S T A T E M E N T S (continued)
ACE Limited and Subsidiaries
Under Swiss corporate law, the Company may not generally issue Common Shares below their par value. In the eventthere is a need to raise common equity at a time when the trading price of the Company’s Common Shares is below par value,the Company will need to obtain shareholder approval to decrease the par value of the Common Shares.
b) Shares issued, outstanding, authorized, and conditional
Following is a table of changes in Common Shares issued and outstanding for the years ended December 31, 2009, 2008,and 2007:
2009 2008 2007
Shares issued, beginning of year 335,413,501 329,704,531 326,455,468Shares issued, net 2,000,000 3,140,194 1,213,663Exercise of stock options 168,720 2,365,401 1,830,004Shares issued under Employee Stock Purchase Plan 259,395 203,375 205,396
Shares issued, end of year 337,841,616 335,413,501 329,704,531Common Shares in treasury, end of year (1,316,959) (1,768,030) –
Shares issued and outstanding, end of year 336,524,657 333,645,471 329,704,531
Common Shares issued to employee trustBalance, beginning of year (108,981) (117,231) (166,425)Shares redeemed 7,500 8,250 49,194
Balance, end of year (101,481) (108,981) (117,231)
In July 2008, prior to the Continuation, the Company issued and placed 2,000,000 Common Shares in treasury principallyfor issuance upon the exercise of employee stock options. At December 31, 2009, 1,316,959 Common Shares remain intreasury after net shares redeemed under employee share-based compensation plans.
Common Shares issued to employee trust are the shares issued by the Company to a rabbi trust for deferred compensa-tion obligations as discussed in Note 12 f) below.
Shares authorizedThe Board is currently authorized to increase the share capital from time to time through the issuance of up to 99,750,000fully paid up Common Shares with a par value of CHF 31.88 each.
Conditional share capital for bonds and similar debt instrumentsThe share capital of the Company may be increased through the issuance of a maximum of 33,000,000 Common Shares witha par value of CHF 31.88 each, payable in full, through the exercise of conversion and/or option or warrant rights granted inconnection with bonds, notes, or similar instruments, issued or to be issued by the Company, including convertible debtinstruments.
Conditional share capital for employee benefit plansThe share capital of the Company may be increased through the issuance of a maximum of 30,401,725 Common Shares witha par value of CHF 31.88 each, payable in full, in connection with the exercise of option rights granted to any employee of theCompany, and any consultant, director, or other person providing services to the Company.
c) ACE Limited securities repurchase authorization
In November 2001, the Board authorized the repurchase of any ACE issued debt or capital securities, which includes ACE’sCommon Shares, up to an aggregate total of $250 million. These purchases may take place from time to time in the openmarket or in private purchase transactions. At December 31, 2009, this authorization had not been utilized.
d) General restrictions
The holders of the Common Shares are entitled to receive dividends as proposed by the Board and approved by the share-holders. Holders of Common Shares are allowed one vote per share provided that, if the controlled shares of any shareholderconstitute ten percent or more of the outstanding Common Shares of the Company, only a fraction of the vote will be allowed
F-54

N O T E S T O T H E C O N S O L I D A T E D F I N A N C I A L S T A T E M E N T S (continued)
ACE Limited and Subsidiaries
so as not to exceed ten percent. Entry of acquirers of Common Shares as shareholders with voting rights in the share registermay be refused if it would confer voting rights with respect to ten percent or more of the registered share capital recorded inthe commercial register.
e) Dividends declared
Dividends declared on Common Shares amounted to CHF 1.26 ($1.19) for the year ended December 31, 2009, $1.09(including par value distributions of CHF 0.60) for the year ended December 31, 2008, and $1.06 per Common Share for theyear ended December 31, 2007. Par value distributions made in 2009 and 2008 have been reflected as such throughCommon Shares in the consolidated statement of shareholders’ equity. The par value per Common Share at December 31,2009, stands at CHF 31.88. Dividends declared on Preferred Shares amounted to $24 million and $45 million for the yearsended December 31, 2008 and 2007, respectively.
f) Deferred compensation obligation
The Company maintains rabbi trusts for deferred compensation plans principally for employees and former directors. Theshares issued by the Company to the rabbi trusts in connection with deferrals of share compensation are classified in share-holders’ equity and accounted for at historical cost in a manner similar to Common Shares in treasury. These shares arerecorded in Common Shares issued to employee trust and the obligations are recorded in Deferred compensation obligation.Changes in the fair value of the shares underlying the obligations are recorded in Accounts payable, accrued expenses, andother liabilities and the related expense or income is recorded in Administrative expenses.
The rabbi trust also holds other assets, such as fixed maturities, equity securities, and life insurance policies. These assetsof the rabbi trust are consolidated with those of the Company and reflected in Other investments. Except for life insurance poli-cies which are reflected at cash surrender value, these assets are classified as trading securities and reported at fair value withchanges in fair value reflected in Other (income) expense. Except for obligations related to life insurance policies which arecarried at cash surrender value, the related deferred compensation obligation is carried at fair value and included in Accountspayable, accrued expenses, and other liabilities with changes reflected as a corresponding increase or decrease to Other(income) expense.
13. Share-based compensation
The Company has share-based compensation plans which currently provide for awards of stock options, restricted stock, andrestricted stock units to its employees and members of the Board.
The Company principally issues restricted stock grants and stock options on a graded vesting schedule. The Companyrecognizes compensation cost for restricted stock and stock option grants with only service conditions that have a graded vest-ing schedule on a straight-line basis over the requisite service period for each separately vesting portion of the award as if theaward was, in-substance, multiple awards. An estimate of future forfeitures is incorporated into the determination ofcompensation cost for both grants of restricted stock and stock options.
During 2004, the Company established the ACE Limited 2004 Long-Term Incentive Plan (the 2004 LTIP), whichreplaced ACE’s prior incentive plans except as to outstanding awards. The 2004 LTIP will continue in effect until terminatedby the Board. Under the 2004 LTIP, a total of 19,000,000 Common Shares of the Company are authorized to be issuedpursuant to awards made as stock options, stock appreciation rights, performance shares, performance units, restricted stock,and restricted stock units. The maximum number of shares that may be delivered to participants and their beneficiaries underthe 2004 LTIP shall be equal to the sum of: (i) 19,000,000 shares; and (ii) any shares that are represented by awardsgranted under the Prior Plans that are forfeited, expired, or are canceled after the effective date of the 2004 LTIP, withoutdelivery of shares or which result in the forfeiture of the shares back to the Company to the extent that such shares would havebeen added back to the reserve under the terms of the applicable Prior Plan. At December 31, 2009, a total of 5,190,495shares remain available for future issuance under this plan.
Under the 2004 LTIP, 3,000,000 Common Shares are authorized to be issued under the Employee Stock Purchase Plan(ESPP). At December 31, 2009, a total of 730,337 Common Shares remain available for issuance under the ESPP.
The Company generally issues shares for the exercise of stock options, for restricted stock, and for shares under the ESPPfrom un-issued reserved shares and treasury shares.
Share-based compensation expense for stock options and shares issued under the ESPP amounted to $27 million ($25million after tax or $0.07 per basic and diluted share), $24 million ($22 million after tax or $0.07 per basic and dilutedshare), and $23 million ($21 million after tax or $0.06 per basic and diluted share) for the years ended December 31, 2009,
F-55

N O T E S T O T H E C O N S O L I D A T E D F I N A N C I A L S T A T E M E N T S (continued)
ACE Limited and Subsidiaries
2008, and 2007, respectively. For the years ended December 31, 2009, 2008, and 2007, the expense for the restrictedstock was $94 million ($68 million after tax), $101 million ($71 million after tax), and $77 million ($57 million after tax),respectively. Unrecognized compensation expense related to the unvested portion of the Company’s employee share-basedawards was $121 million at December 31, 2009, and is expected to be recognized over a weighted-average period of approx-imately 2 years.
Stock options
The Company’s 2004 LTIP provides for grants of both incentive and non-qualified stock options principally at an option priceper share of 100 percent of the fair value of the Company’s Common Shares on the date of grant. Stock options are generallygranted with a 3-year vesting period and a 10-year term. The stock options vest in equal annual installments over therespective vesting period, which is also the requisite service period.
Included in the Company’s share-based compensation expense in the year ended December 31, 2009, is the cost relatedto the unvested portion of the 2006-2009 stock option grants. The fair value of the stock options was estimated on the date ofgrant using the Black-Scholes option-pricing model that uses the assumptions noted in the following table. The risk-free inter-est rate is based on the U.S. Treasury yield curve in effect at the time of grant. The expected life (estimated period of time fromgrant to exercise date) was estimated using the historical exercise behavior of employees. Expected volatility was calculated asa blend of (a) historical volatility based on daily closing prices over a period equal to the expected life assumption, (b) long-term historical volatility based on daily closing prices over the period from ACE’s initial public trading date through the mostrecent quarter, and (c) implied volatility derived from ACE’s publicly traded options.
The fair value of the options issued is estimated on the date of grant using the Black-Scholes option-pricing model withthe following weighted-average assumptions used for grants for the years indicated:
2009 2008 2007
Dividend yield 2.8% 1.8% 1.78%Expected volatility 45.4% 32.2% 27.43%Risk-free interest rate 2.2% 3.15% 4.51%Forfeiture rate 7.5% 7.5% 7.5%Expected life 5.4 years 5.7 years 5.6 years
The following table presents a roll forward of the Company’s stock options for the years ended December 31, 2009, 2008,and 2007.
Number ofOptions
Weighted-AverageExercise Price
Options outstanding, December 31, 2006 11,752,521 $ 39.43Granted 1,549,091 $ 56.17Exercised (1,830,004) $ 35.73Forfeited (200,793) $ 51.66
Options outstanding, December 31, 2007 11,270,815 $ 42.12Granted 1,612,507 $ 60.17Exercised (2,650,733) $ 36.25Forfeited (309,026) $ 54.31
Options outstanding, December 31, 2008 9,923,563 $ 46.24Granted 2,339,036 $ 38.60Exercised (537,556) $ 27.71Forfeited (241,939) $ 50.48
Options outstanding, December 31, 2009 11,483,104 $ 45.46
Options exercisable, December 31, 2009 7,614,791 $ 44.76
The weighted-average remaining contractual term was 5.8 years for the stock options outstanding and 4.4 years for thestock options exercisable at December 31, 2009. The total intrinsic value was $57 million for stock options outstanding and
F-56
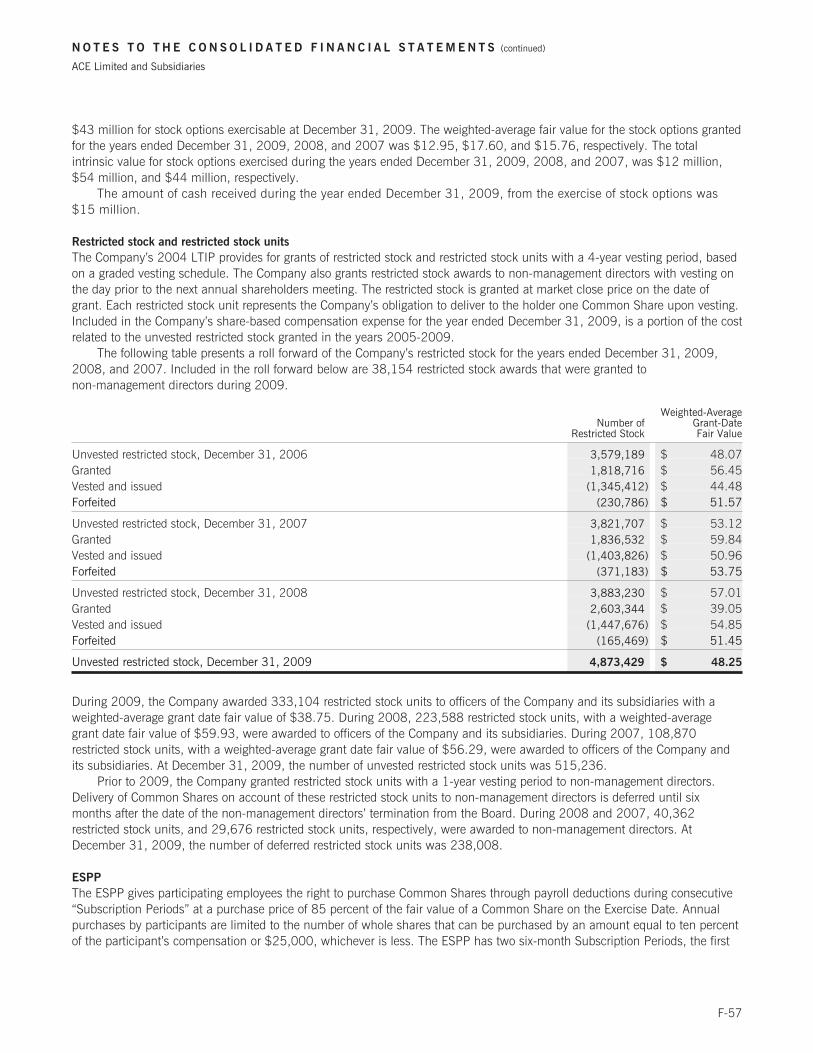
N O T E S T O T H E C O N S O L I D A T E D F I N A N C I A L S T A T E M E N T S (continued)
ACE Limited and Subsidiaries
$43 million for stock options exercisable at December 31, 2009. The weighted-average fair value for the stock options grantedfor the years ended December 31, 2009, 2008, and 2007 was $12.95, $17.60, and $15.76, respectively. The totalintrinsic value for stock options exercised during the years ended December 31, 2009, 2008, and 2007, was $12 million,$54 million, and $44 million, respectively.
The amount of cash received during the year ended December 31, 2009, from the exercise of stock options was$15 million.
Restricted stock and restricted stock units
The Company’s 2004 LTIP provides for grants of restricted stock and restricted stock units with a 4-year vesting period, basedon a graded vesting schedule. The Company also grants restricted stock awards to non-management directors with vesting onthe day prior to the next annual shareholders meeting. The restricted stock is granted at market close price on the date ofgrant. Each restricted stock unit represents the Company’s obligation to deliver to the holder one Common Share upon vesting.Included in the Company’s share-based compensation expense for the year ended December 31, 2009, is a portion of the costrelated to the unvested restricted stock granted in the years 2005-2009.
The following table presents a roll forward of the Company’s restricted stock for the years ended December 31, 2009,2008, and 2007. Included in the roll forward below are 38,154 restricted stock awards that were granted tonon-management directors during 2009.
Number ofRestricted Stock
Weighted-AverageGrant-DateFair Value
Unvested restricted stock, December 31, 2006 3,579,189 $ 48.07Granted 1,818,716 $ 56.45Vested and issued (1,345,412) $ 44.48Forfeited (230,786) $ 51.57
Unvested restricted stock, December 31, 2007 3,821,707 $ 53.12Granted 1,836,532 $ 59.84Vested and issued (1,403,826) $ 50.96Forfeited (371,183) $ 53.75
Unvested restricted stock, December 31, 2008 3,883,230 $ 57.01Granted 2,603,344 $ 39.05Vested and issued (1,447,676) $ 54.85Forfeited (165,469) $ 51.45
Unvested restricted stock, December 31, 2009 4,873,429 $ 48.25
During 2009, the Company awarded 333,104 restricted stock units to officers of the Company and its subsidiaries with aweighted-average grant date fair value of $38.75. During 2008, 223,588 restricted stock units, with a weighted-averagegrant date fair value of $59.93, were awarded to officers of the Company and its subsidiaries. During 2007, 108,870restricted stock units, with a weighted-average grant date fair value of $56.29, were awarded to officers of the Company andits subsidiaries. At December 31, 2009, the number of unvested restricted stock units was 515,236.
Prior to 2009, the Company granted restricted stock units with a 1-year vesting period to non-management directors.Delivery of Common Shares on account of these restricted stock units to non-management directors is deferred until sixmonths after the date of the non-management directors’ termination from the Board. During 2008 and 2007, 40,362restricted stock units, and 29,676 restricted stock units, respectively, were awarded to non-management directors. AtDecember 31, 2009, the number of deferred restricted stock units was 238,008.
ESPP
The ESPP gives participating employees the right to purchase Common Shares through payroll deductions during consecutive“Subscription Periods” at a purchase price of 85 percent of the fair value of a Common Share on the Exercise Date. Annualpurchases by participants are limited to the number of whole shares that can be purchased by an amount equal to ten percentof the participant’s compensation or $25,000, whichever is less. The ESPP has two six-month Subscription Periods, the first
F-57

N O T E S T O T H E C O N S O L I D A T E D F I N A N C I A L S T A T E M E N T S (continued)
ACE Limited and Subsidiaries
of which runs between January 1 and June 30 and the second of which runs between July 1 and December 31 of each year.The amounts that have been collected from participants during a Subscription Period are used on the “Exercise Date” to pur-chase full shares of Common Shares. An Exercise Date is generally the last trading day of a Subscription Period. The numberof shares purchased is equal to the total amount, as at the Exercise Date, that has been collected from the participants throughpayroll deductions for that Subscription Period, divided by the “Purchase Price”, rounded down to the next full share. Partic-ipants may withdraw from an offering before the exercise date and obtain a refund of the amounts withheld through payrolldeductions. Pursuant to the provisions of the ESPP, during 2009, 2008, and 2007, employees paid $10.6 million, $10.1million, and $9.7 million, respectively, to purchase 259,219 shares, 203,375 shares, and 205,396 shares, respectively.
14. Pension plans
The Company provides pension benefits to eligible employees and their dependents through various defined contribution plansand defined benefit plans sponsored by the Company. The defined contribution plans include a capital accumulation plan(401(k)) in the United States. The defined benefit plans consist of various plans offered in certain jurisdictions outside of theUnited States and Bermuda.
Defined contribution plans (including 401(k))
Under these plans, employees’ contributions may be supplemented by ACE matching contributions based on the level ofemployee contribution. These contributions are invested at the election of each employee in one or more of several investmentportfolios offered by a third party investment advisor. Expenses for these plans totaled $84 million, $77 million, and $76 mil-lion for the years ended December 31, 2009, 2008, and 2007, respectively.
Defined benefit plans
The Company maintains non-contributory defined benefit plans that cover certain employees, principally located in Europe andAsia. The Company does not provide any such plans to U.S.-based employees. The Company accounts for pension benefitsusing the accrual method. Benefits under these plans are based on employees’ years of service and compensation during finalyears of service. All underlying defined benefit plans are subject to periodic actuarial valuation by qualified local actuarial firmsusing actuarial models in calculating the pension expense and liability for each plan. The Company uses December 31 as themeasurement date for its defined benefit pension plans.
At December 31, 2009, the fair value of plan assets and the projected benefit obligation were $368 million and $471million, respectively. The fair value of plan assets and the projected benefit obligation were $250 million and $329 million,respectively, at December 31, 2008. The accrued pension liability of $103 million at December 31, 2009, and $79 millionat December 31, 2008, is included in Accounts payable, accrued expenses, and other liabilities.
The defined benefit pension plan contribution for 2010 is expected to be $18 million. The estimated net actuarial loss forthe defined benefit pension plans that will be amortized from accumulated other comprehensive income into net benefit costsover the next year is $3 million.
Benefit payments were $20 million and $16 million in 2009 and, 2008, respectively. Expected future payments are asfollows:
(in millions of U.S. dollars)Year ending
December 31
2010 $ 192011 202012 222013 222014 212015-2019 117
F-58

N O T E S T O T H E C O N S O L I D A T E D F I N A N C I A L S T A T E M E N T S (continued)
ACE Limited and Subsidiaries
15. Fair value measurements
a) Fair value hierarchy
The Company partially adopted the provisions (specific provisions described below) of Topic 820 on January 1, 2008, and thecumulative effect of the adoption resulted in a reduction to retained earnings of $4 million related to an increase in risk mar-gins included in the valuation of certain GMIB contracts. The Company fully adopted these provisions on January 1, 2009.The provisions define fair value as the price to sell an asset or transfer a liability in an orderly transaction between market par-ticipants and establishes a three-level valuation hierarchy in which inputs into valuation techniques used to measure fair valueare classified. The fair value hierarchy gives the highest priority to quoted prices in active markets and the lowest priority tounobservable data. Inputs in Level 1 are unadjusted quoted prices for identical assets or liabilities in active markets. Level 2includes inputs other than quoted prices included within Level 1 that are observable for assets or liabilities either directly orindirectly. Level 2 inputs include, among other items, quoted prices for similar assets and liabilities in active markets, quotedprices for identical or similar assets and liabilities in markets that are not active, and inputs other than quoted prices that areobservable for the asset or liability such as interest rates and yield curves. Level 3 inputs are unobservable and reflectmanagement’s judgments about assumptions that market participants would use in pricing an asset or liability. A financialinstrument’s categorization within the valuation hierarchy is based upon the lowest level of input that is significant to the fairvalue measurement.
The following is a description of the valuation measurements used for the Company’s financial instruments carried or dis-closed at fair value, as well as the general classification of such financial instruments pursuant to the valuation hierarchy.
Fixed maturities
Fixed maturities with active markets are classified within Level 1 as fair values are based on quoted market prices. For fixedmaturities that trade in less active markets, including most corporate and municipal securities in ACE’s portfolio, fair values arebased on the output of “pricing matrix models”, the significant inputs into which include, but are not limited to, yield curves,credit risks and spreads, measures of volatility, and prepayment speeds. These fixed maturities are classified within Level 2.Fixed maturities for which pricing is unobservable are classified within Level 3.
Equity securities
Equity securities with active markets are classified within Level 1 as fair values are based on quoted market prices. Fornon-public equity securities, fair values are based on market valuations and are classified within Level 2.
Short-term investments
Short-term investments, which comprise securities due to mature within one year of the date of purchase, that are traded inactive markets, are classified within Level 1 as fair values are based on quoted market prices. Securities such as commercialpaper and discount notes are classified within Level 2 because these securities are typically not actively traded due to theirapproaching maturity and, as such, their cost approximating par value.
Securities lending collateral
The underlying assets included in Securities lending collateral are fixed maturities which are classified in the valuation hier-archy on the same basis as the Company’s other fixed maturities. Excluded from the valuation hierarchy is the correspondingliability related to the Company’s obligation to return the collateral plus interest.
Other investments
Fair values for the majority of Other investments including investments in partially-owned investment companies, investmentfunds, and limited partnerships, are based on their respective net asset values, or equivalent (NAV). The majority of theseinvestments, for which the Company has used NAV as a practical expedient to measure fair value in accordance with theprovisions of ASU 2009-12, are classified within Level 3 because either ACE will never have the contractual option to redeemthe investment or will not have the contractual option to redeem the investments in the near term. The remainder of suchinvestments are classified within Level 2. Equity securities and fixed maturities held in rabbi trusts maintained by the Companyfor deferred compensation plans, and included in Other investments, are classified within the valuation hierarchy on the samebasis as the Company’s other equity securities and fixed maturities.
F-59

N O T E S T O T H E C O N S O L I D A T E D F I N A N C I A L S T A T E M E N T S (continued)
ACE Limited and Subsidiaries
Investments in partially-owned insurance companies
Fair values for investments in partially-owned insurance companies based on the financial statements provided by thosecompanies used for equity accounting are classified within Level 3.
Investment derivative instruments
For actively traded investment derivative instruments, including futures, options, and exchange-traded forward contracts, theCompany obtains quoted market prices to determine fair value. As such, these instruments are included within Level 1. For-ward contracts that are not exchange-traded are priced using a pricing matrix model principally employing observable inputsand, as such, are classified within Level 2. The Company’s position in interest rate swaps is typically classified within Level 3.
Guaranteed minimum income benefits
The liability for GMIBs arises from the Company’s life reinsurance programs covering living benefit guarantees whereby theCompany assumes the risk of GMIBs associated with variable annuity contracts. For GMIB reinsurance, ACE estimates fairvalue using an internal valuation model which includes current market information and estimates of policyholder behavior. Allof the treaties contain claim limits, which are factored into the valuation model. The fair value depends on a number of inputs,including changes in interest rates, changes in equity markets, credit risk, current account value, changes in market volatility,expected annuitization rates, changes in policyholder behavior, and changes in policyholder mortality. The model and relatedassumptions are continuously re-evaluated by management and enhanced, as appropriate, based upon additional experienceobtained related to policyholder behavior and availability of more information, such as market conditions and demographics ofin-force annuities. Based on the quarterly reserve review during the quarter ended December 31, 2009, the Companyincreased its assumed GMIB annuitization rates for policies with guaranteed values far in excess of their account values. In theaggregate, this change along with certain refinements of the model increased the Company’s fair value liability by $28 million,which decreased net income accordingly. The most significant policyholder behavior assumptions include lapse rates andannuitization rates using the guaranteed benefit (GMIB annuitization rate). Assumptions regarding lapse rates and GMIBannuitization rates differ by treaty but the underlying methodology to determine rates applied to each treaty is comparable. Theassumptions regarding lapse and GMIB annuitization rates determined for each treaty are based on a dynamic calculation thatuses several underlying factors. A lapse rate is the percentage of in-force policies surrendered in a given calendar year. All elseequal, as lapse rates increase, ultimate claim payments will decrease. The GMIB annuitization rate is the percentage of poli-cies for which the policyholder will elect to annuitize using the guaranteed benefit provided under the GMIB. All else equal, asGMIB annuitization rates increase, ultimate claim payments will increase, subject to treaty claim limits. The effect of changesin key market factors on assumed lapse and annuitization rates reflect emerging trends using data available from cedants. Fortreaties with limited experience, rates are established in line with data received from other ceding companies adjusted asappropriate with industry estimates. The Company views the variable annuity reinsurance business as having a similar riskprofile to that of catastrophe reinsurance, with the probability of a cumulative long-term economic net loss relatively small, atthe time of pricing. However, adverse changes in market factors and policyholder behavior will have an adverse impact on netincome, which may be material. Because of the significant use of unobservable inputs including policyholder behavior, GMIBreinsurance is classified within Level 3.
Short- and long-term debt and trust preferred securities
Where practical, fair values for short-term debt, long-term debt, and trust preferred securities are estimated using discountedcash flow calculations based principally on observable inputs including the Company’s incremental borrowing rates, whichreflect ACE’s credit rating, for similar types of borrowings with maturities consistent with those remaining for the debt beingvalued. As such, these instruments are classified within Level 2.
Other derivative instruments
The Company maintains positions in other derivative instruments including exchange-traded equity futures contracts andoption contracts designed to limit exposure to a severe equity market decline, which would cause an increase in expectedclaims and, therefore, reserves for GMDB and GMIB reinsurance business. The Company’s position in exchange-traded equityfutures contracts is classified within Level 1. The fair value of the majority of the Company’s remaining positions in otherderivative instruments is based on significant observable inputs including equity security and interest rate indices. Accordingly,these are classified within Level 2. The Company’s position in credit default swaps is typically included within Level 3.
F-60

N O T E S T O T H E C O N S O L I D A T E D F I N A N C I A L S T A T E M E N T S (continued)
ACE Limited and Subsidiaries
The following tables present, by valuation hierarchy, the financial instruments carried or disclosed at fair value, andmeasured on a recurring basis, at December 31, 2009 and 2008.
December 31, 2009(in millions of U.S. dollars)
Quoted Prices inActive Markets
for IdenticalAssets orLiabilities
Level 1
Significant OtherObservable
InputsLevel 2
SignificantUnobservable
Inputs Level 3 Total
Assets:Fixed maturities available for sale
U.S. Treasury and agency $ 1,611 $ 2,098 $ – $ 3,709
Foreign 207 10,879 59 11,145
Corporate securities 31 13,016 168 13,215
Mortgage-backed securities – 9,821 21 9,842
States, municipalities, and political subdivisions – 1,611 3 1,614
1,849 37,425 251 39,525
Fixed maturities held to maturity
U.S. Treasury and agency 414 643 – 1,057
Foreign – 27 – 27
Corporate securities – 322 – 322
Mortgage-backed securities – 1,424 45 1,469
States, municipalities, and political subdivisions – 686 – 686
414 3,102 45 3,561
Equity securities 453 2 12 467
Short-term investments 1,132 535 – 1,667
Other investments 31 195 1,149 1,375
Securities lending collateral – 1,544 – 1,544
Investments in partially-owned insurance companies – – 433 433
Investment derivative instruments 7 – – 7
Other derivative instruments (9) 32 14 37
Total assets at fair value $ 3,877 $ 42,835 $ 1,904 $ 48,616
Liabilities:GMIB $ – $ – $ 559 $ 559
Short-term debt – 168 – 168
Long-term debt – 3,401 – 3,401
Trust preferred securities – 336 – 336
Total liabilities at fair value $ – $ 3,905 $ 559 $ 4,464
F-61

N O T E S T O T H E C O N S O L I D A T E D F I N A N C I A L S T A T E M E N T S (continued)
ACE Limited and Subsidiaries
December 31, 2008(in millions of U.S. dollars)
Quoted Prices inActive Markets
for IdenticalAssets orLiabilities
Level 1
Significant OtherObservable
Inputs Level 2
SignificantUnobservableInputs Level 3 Total
Assets:Fixed maturities available for sale $ 872 $ 30,009 $ 274 $ 31,155Fixed maturities held to maturity 332 2,532 1 2,865Equity securities 962 5 21 988Short-term investments 2,668 682 – 3,350Other investments 37 226 1,099 1,362Investments in partially-owned insurance companies 218 – 435 653Other derivative instruments – 280 87 367
Total assets at fair value $ 5,089 $ 33,734 $ 1,917 $ 40,740
Liabilities:Investment derivative instruments $ 3 $ – $ – $ 3GMIB – – 910 910Short-term debt – 479 – 479Long-term debt – 2,635 – 2,635Trust preferred securities – 230 – 230
Total liabilities at fair value $ 3 $ 3,344 $ 910 $ 4,257
Fair value of alternative investments
Included in the Other investments in the fair value hierarchy at December 31, 2009, are investment funds, limited partner-ships, and partially-owned investment companies measured at fair value using NAV as a practical expedient as provided bythe provisions of ASU 2009-12. At December 31, 2009, there were no probable or pending sales related to any of theinvestments measured at fair value using NAV. The following table provides, by investment category, the fair value and max-imum future funding commitments related to these investments at December 31, 2009.
December 31, 2009(in millions of U.S. dollars) Fair Value
Maximumfuture fundingcommitments
Financial $ 173 $ 109
Real estate 89 150
Distressed 233 59
Mezzanine 102 75
Traditional 243 300
Vintage 31 2
Investment funds 310 –
$ 1,181 $ 695
FinancialFinancial primarily consists of investments in private equity funds targeting financial services companies such as financialinstitutions and insurance services around the world. It also includes an investment in a de novo commercial finance lendertargeting middle market companies. Included in this category are investments for which ACE will never have the contractualoption to redeem but receives distributions based on the liquidation of the underlying assets. The Company expects theseunderlying assets to be liquidated over the next 5 to 9 years. ACE does not have the ability to sell or transfer the investmentswithout the consent from the general partner of individual funds.
F-62

N O T E S T O T H E C O N S O L I D A T E D F I N A N C I A L S T A T E M E N T S (continued)
ACE Limited and Subsidiaries
Real EstateReal Estate consists of investments in private equity funds targeting global distress opportunities, value added U.S. propertiesand global mezzanine debt securities in the commercial real estate market. Included in this category are investments for whichACE will never have the contractual option to redeem but receives distributions based on the liquidation of the underlyingassets. The Company expects the majority of these underlying assets to be liquidated over the next 3 to 9 years. ACE does nothave the ability to sell or transfer the investments without the consent from the general partner of individual funds.
DistressedDistressed consists of investments in private equity funds targeting distressed debt/credit and equity opportunities in the U.S.Included in this category are investments for which ACE will never have the contractual option to redeem but receives dis-tributions based on the liquidation of the underlying assets. The Company expects these underlying assets to be liquidated overthe next 6 to 9 years. ACE does not have the ability to sell or transfer the investments without the consent from the generalpartner of individual funds.
MezzanineMezzanine consists of investments in private equity funds targeting private mezzanine debt of large cap and mid cap compa-nies in the U.S. and worldwide. Included in this category are investments for which ACE will never have the contractual optionto redeem but receives distributions based on the liquidation of the underlying assets. The Company expects the majority ofthese underlying assets to be liquidated over the next 6 to 9 years. ACE does not have the ability to sell or transfer the invest-ments without the consent from the general partner of individual funds.
TraditionalTraditional consists of investments in private equity funds employing traditional private equity investment strategies such asbuyout and venture with different geographical focuses including Brazil, India, Asia, Europe, and the U.S. Included in thiscategory are investments for which ACE will never have the contractual option to redeem but receives distributions based onthe liquidation of the underlying assets. The Company expects these underlying assets to be liquidated over the next 3 to 8years. ACE does not have the ability to sell or transfer the investments without the consent from the general partner ofindividual funds.
VintageVintage consists of investments in private equity funds made before 2002 and the where the funds’ commitment periods hadalready expired. Included in this category are investments for which ACE will never have the contractual option to redeem butreceives distributions based on the liquidation of the underlying assets. The Company expects these underlying assets to beliquidated over the next 1 to 3 years. ACE does not have the ability to sell or transfer the investments without the consent fromthe general partner of individual funds.
Investment FundsACE’s investment funds employ various investment strategies such as long/short equity and arbitrage/distressed. Included inthis category are investments for which ACE has the option to redeem at agreed upon value as described in each investmentfund’s subscription agreement. Depending on the terms of the various subscription agreements, the Company may redeeminvestment fund investments monthly, quarterly, semi-annually or annually. If the Company wishes to redeem an investmentfund investment, ACE must first determine if the investment fund is still in a lock-up period (a time when ACE cannot redeemits investment so that the investment fund manager has time to build the portfolio). If the investment fund is no longer in itslock-up period, ACE must then notify the investment fund manager of its intention to redeem by the notification date pre-scribed by the subscription agreement. Subsequent to notification, the investment fund can redeem ACE’s investment withinseveral months of the notification. Notice periods for redemption of ACE’s investment funds range between 5 and 120 days.ACE can redeem its investment funds without consent from the investment fund managers.
F-63

N O T E S T O T H E C O N S O L I D A T E D F I N A N C I A L S T A T E M E N T S (continued)
ACE Limited and Subsidiaries
Level 3 financial instruments
The following tables provide a reconciliation of the beginning and ending balances of financial instruments carried or disclosedat fair value using significant unobservable inputs (Level 3) for the years ended December 31, 2009 and 2008.
Year ended December 31, 2009(in millions of U.S. dollars)
Balance-Beginning
of Year
NetRealized
Gains/Losses
Change in NetUnrealized
Gains (Losses)Included in
OtherComprehensive
Income
Purchases,Sales,
Issuances,and
Settlements,Net
TransfersInto (Out
of) Level 3
Balance-End of
Year
Change inNet
UnrealizedGains
(Losses)Relating to
FinancialInstrumentsStill Held at
December 31,2009,
included inNet Income
Assets:Fixed maturities available for sale
Foreign $ 45 $ (1) $ 5 $ 6 $ 4 $ 59 $ 2
Corporate securities 117 1 17 25 8 168 1
Mortgage-backed securities 109 (2) 12 (61) (37) 21 –
States, municipalities, and politicalsubdivisions 3 – – – – 3 –
274 (2) 34 (30) (25) 251 3
Fixed maturities held to maturity
Mortgage-backed securities – – – 45 – 45 –
States, municipalities, and politicalsubdivisions 1 – – (1) – – –
1 – – 44 – 45 –
Equity securities 21 – 9 (18) – 12 –
Other investments 1,099 (149) 191 38 (30) 1,149 (149)
Investments in partially-owned insurancecompanies 435 8 13 (23) – 433 –
Other derivative instruments 87 (71) – (2) – 14 (71)
Total assets at fair value $ 1,917 $ (214) $ 247 $ 9 $ (55) $ 1,904 $ (217)
Liabilities:GMIB $ 910 $ (368) $ – $ 17 $ – $ 559 $ (368)
F-64

N O T E S T O T H E C O N S O L I D A T E D F I N A N C I A L S T A T E M E N T S (continued)
ACE Limited and Subsidiaries
Year ended December 31, 2008(in millions of U.S. dollars)
Balance-Beginning
of Year
NetRealized
Gains/Losses
Change in NetUnrealized
Gains(Losses)
Included inOther
ComprehensiveIncome
Purchases,Sales,
Issuances,and
Settlements,Net
TransfersInto (Out
of) Level 3
Balance-End of
Year
Change inNet
UnrealizedGains
(Losses)Relating to
FinancialInstrumentsStill Held at
December 31,2008,
included inNet Income
Assets:Fixed maturities available for sale $ 601 $ (29) $ (86) $ (8) $ (204) $ 274 $ (24)Fixed maturities held to maturity – (2) – – 3 1 (2)Equity securities 12 – (8) (8) 25 21 –Other investments 898 (56) (270) 527 – 1,099 (56)Investments in partially-owned insurance
companies 381 (6) 28 32 – 435 (8)Investment derivative instruments 6 5 – (11) – – –Other derivative instruments 17 47 – 23 – 87 73
Total assets at fair value $ 1,915 $ (41) $ (336) $ 555 $ (176) $ 1,917 $ (17)
Liabilities:GMIB $ 225 $ 650 $ – $ 35 $ – $ 910 $ 650
b) Fair value option
Effective January 1, 2008, the Company elected the fair value option provided within Topic 825 for certain of its available forsale equity securities valued and carried at $161 million on the election date. The Company elected the fair value option forthese particular equity securities to simplify the accounting and oversight of this portfolio given the portfolio management strat-egy employed by the external investment manager. The election resulted in an increase in retained earnings and a reduction toaccumulated other comprehensive income of $6 million as at January 1, 2008. This adjustment reflects the net of tax unreal-ized gains ($9 million pre-tax) associated with this particular portfolio at January 1, 2008. Subsequent to this election,changes in fair value related to these equity securities were recognized in Net realized gains (losses). During the three monthsended June 30, 2008, the Company sold the entire portfolio. Accordingly, the Company currently holds no assets for whichthis fair value option has been elected. For the six months ended June 30, 2008, the Company recognized net realized lossesrelated to changes in fair value of these equity securities $11 million in the consolidated statements of operations. Throughout2008 to the date of sale, all of these equity securities were classified within Level 1 in the fair value hierarchy.
16. Other (income) expense
The following table details the components of Other (income) expense as reflected in the consolidated statements of operationsfor the years ended December 31, 2009, 2008, and 2007.
(in millions of U.S. dollars) 2009 2008 2007
Equity in net (income) loss of partially-owned entities $ 39 $ (52) $ 39Noncontrolling interest expense 3 11 7Federal excise and capital taxes 16 16 18Other 27 (14) 17
Other (income) expense $ 85 $ (39) $ 81
In 2009, 2008, and 2007, equity in net (income) loss of partially-owned entities includes $18 million, $(28) million, and$68 million, respectively, of (income) loss related to AGO. As discussed previously, prior to AGO’s June 2009 issuance, theCompany’s investment in AGO was included in Investments in partially-owned insurance companies. Effective with the
F-65

N O T E S T O T H E C O N S O L I D A T E D F I N A N C I A L S T A T E M E N T S (continued)
ACE Limited and Subsidiaries
June 2009 issuance, the Company now accounts for the investment as an available-for-sale equity security. Accordingly, for2009, the equity in net income related to AGO reflects ACE’s portion of AGO’s net income to the date of the June 2009 issu-ance. Certain federal excise and capital taxes incurred as a result of capital management initiatives are included in Other(income) expense. As these are considered capital transactions, they are excluded from underwriting results.
17. Segment information
The Company operates through the following business segments, certain of which represent the aggregation of distinct operat-ing segments: Insurance – North American, Insurance – Overseas General, Global Reinsurance, and Life. These segmentsdistribute their products through various forms of brokers, agencies, and direct marketing programs. All business segmentshave established relationships with reinsurance intermediaries.
The Insurance – North American segment comprises the operations in the U.S., Canada, and Bermuda. This segmentincludes the operations of ACE USA (including ACE Canada), ACE Westchester, ACE Bermuda, ACE Private Risk Services, andvarious run-off operations. ACE USA is the North American retail operating division which provides a broad array of P&C, A&H,and risk management products and services to a diverse group of commercial and non-commercial enterprises and consum-ers. ACE Westchester specializes in the North American wholesale distribution of excess and surplus P&C, environmental,professional and inland marine products in addition to crop insurance in the U.S. ACE Bermuda provides commercialinsurance products on an excess basis to a global client base, covering exposures that are generally low in frequency and highin severity. ACE Private Risk Services provides personal lines coverages (such as homeowners and automobile) for high networth individuals and families in North America. The run-off operations include Brandywine Holdings Corporation, CommercialInsurance Services, residual market workers’ compensation business, pools and syndicates not attributable to a single busi-ness group, and other exited lines of business. Run-off operations do not actively sell insurance products, but are responsiblefor the management of existing policies and related claims.
The Insurance – Overseas General segment comprises ACE International, the wholesale insurance business of ACE GlobalMarkets, and the international A&H and life business of Combined Insurance. ACE International, the ACE INA retail businessserving territories outside the U.S., Bermuda, and Canada, maintains a presence in every major insurance market in the worldand is organized geographically along product lines that provide dedicated underwriting focus to customers. ACE Global Mar-kets, the London-based excess and surplus lines business that includes Lloyd’s Syndicate 2488, offers products through itsparallel distribution network via ACE European Group Limited (AEGL) and Lloyd’s Syndicate 2488. ACE provides funds atLloyd’s to support underwriting by Syndicate 2488, which is managed by ACE Underwriting Agencies Limited. ACE GlobalMarkets utilizes Syndicate 2488 to underwrite P&C business on a global basis through Lloyd’s worldwide licenses. ACE GlobalMarkets utilizes AEGL to underwrite similar classes of business through its network of U.K. and Continental Europe licenses,and in the U.S. where it is eligible to write excess & surplus business. The reinsurance operation of ACE Global Markets isincluded in the Global Reinsurance segment. Combined Insurance distributes a wide range of supplemental accident andhealth products. The Insurance – Overseas General segment has four regions of operations: the ACE European Group (whichcomprises ACE Europe and ACE Global Markets branded business), ACE Asia Pacific, ACE Far East, and ACE Latin America.Companies within the Insurance – Overseas General segment write a variety of insurance products including P&C, professionallines (directors & officers and errors & omissions), marine, energy, aviation, political risk, specialty consumer-oriented prod-ucts, and A&H (principally accident and supplemental health).
The Global Reinsurance segment represents ACE’s reinsurance operations comprising ACE Tempest Re Bermuda, ACETempest Re USA, ACE Tempest Re Europe, and ACE Tempest Re Canada. These divisions provide a broad range of propertycatastrophe, casualty, and property reinsurance coverages to a diverse array of primary P&C insurers. The Global Reinsurancesegment also includes ACE Global Markets’ reinsurance operations.
The Life segment includes ACE’s international life operations (ACE Life), ACE Tempest Life Re (ACE Life Re), and theNorth American supplemental A&H and life business of Combined Insurance. ACE Life provides individual and group lifeinsurance through multiple distribution channels primarily in emerging markets, including Egypt, Indonesia, Taiwan, Thailand,Vietnam, the United Arab Emirates, throughout Latin America, selectively in Europe, as well as China through a partially-owned insurance company. ACE Life Re helps clients (ceding companies) manage mortality, morbidity, and lapse risksembedded in their books of business. ACE Life Re comprises two operations. The first is a Bermuda-based operation whichprovides reinsurance to primary life insurers, focusing on guarantees included in certain fixed and variable annuity productsand also on more traditional mortality reinsurance protection. The second is a U.S.-based traditional life reinsurance companylicensed in 49 states and the District of Columbia. It was decided in January 2010 to discontinue writing new traditional lifemortality reinsurance business from the U.S.-based company. Combined Insurance distributes specialty individual accidentand supplemental health and life insurance products targeted to middle income consumers in the U.S. and Canada.
F-66

N O T E S T O T H E C O N S O L I D A T E D F I N A N C I A L S T A T E M E N T S (continued)
ACE Limited and Subsidiaries
Corporate and Other (Corporate) includes ACE Limited, ACE Group Management and Holdings Ltd., ACE INA Holdings,Inc., and intercompany eliminations. In addition, Corporate includes the Company’s proportionate share of AGO’s earningsreflected in Other (income) expense to the date that ACE was no longer deemed to exert significant influence over AGO.Included in Losses and loss expenses are losses incurred in connection with the commutation of ceded reinsurance contractsthat resulted from a differential between the consideration received from reinsurers and the related reduction of reinsurancerecoverable, principally related to the time value of money. Due to the Company’s initiatives to reduce reinsurance recoverablebalances and thereby encourage such commutations, losses recognized in connection with the commutation of cededreinsurance contracts are generally not considered when assessing segment performance and, accordingly, are directly allo-cated to Corporate. ACE also eliminates the impact of intersegment loss portfolio transfer transactions which are not reflectedin the results within the statements of operations by segment.
For segment reporting purposes, certain items have been presented in a different manner than in the consolidated finan-cial statements. Management uses underwriting income as the main measure of segment performance. ACE calculatesunderwriting income by subtracting losses and loss expenses, policy benefits, policy acquisition costs, and administrativeexpenses from net premiums earned. For the Life business, management also includes net investment income as a componentof underwriting income. The following tables summarize the operations by segment for the periods indicated.
Statement of Operations by Segment
For the year ended December 31, 2009(in millions of U.S. dollars)
Insurance –North
American
Insurance –OverseasGeneral
GlobalReinsurance Life
Corporate andOther
ACEConsolidated
Net premiums written $ 5,641 $ 5,145 $ 1,038 $ 1,475 $ – $ 13,299
Net premiums earned 5,684 5,147 979 1,430 – 13,240
Losses and loss expenses 4,013 2,597 330 482 – 7,422
Policy benefits – 4 – 321 – 325
Policy acquisition costs 517 1,202 195 216 – 2,130
Administrative expenses 572 783 55 243 158 1,811
Underwriting income (loss) 582 561 399 168 (158) 1,552
Net investment income 1,094 479 278 176 4 2,031
Net realized gains (losses) including OTTI 10 (20) (17) (15) (154) (196)
Interest expense 1 – – – 224 225
Other (income) expense 36 20 2 2 25 85
Income tax expense (benefit) 384 186 46 48 (136) 528
Net income (loss) $ 1,265 $ 814 $ 612 $ 279 $ (421) $ 2,549
Statement of Operations by Segment
For the year ended December 31, 2008(in millions of U.S. dollars)
Insurance –North
American
Insurance –OverseasGeneral
GlobalReinsurance Life
Corporateand Other
ACEConsolidated
Net premiums written $ 5,636 $ 5,332 $ 914 $ 1,198 $ – $ 13,080Net premiums earned 5,679 5,337 1,017 1,170 – 13,203Losses and loss expenses 4,080 2,679 524 320 – 7,603Policy benefits – 12 – 387 – 399Policy acquisition costs 562 1,193 192 188 – 2,135Administrative expenses 536 793 56 199 153 1,737
Underwriting income (loss) 501 660 245 76 (153) 1,329
Net investment income 1,095 521 309 142 (5) 2,062Net realized gains (losses) including OTTI (709) (316) (163) (532) 87 (1,633)Interest expense 1 – – – 229 230Other (income) expense 7 (11) 2 12 (49) (39)Income tax expense (benefit) 315 100 30 30 (105) 370
Net income (loss) $ 564 $ 776 $ 359 $ (356) $ (146) $ 1,197
F-67

N O T E S T O T H E C O N S O L I D A T E D F I N A N C I A L S T A T E M E N T S (continued)
ACE Limited and Subsidiaries
Statement of Operations by Segment
For the year ended December 31, 2007(in millions of U.S. dollars)
Insurance –North
American
Insurance –OverseasGeneral
GlobalReinsurance Life
Corporateand Other
ACEConsolidated
Net premiums written $ 5,833 $ 4,568 $ 1,197 $ 381 $ – $ 11,979Net premiums earned 6,007 4,623 1,299 368 – 12,297Losses and loss expenses 4,269 2,420 664 – (2) 7,351Policy benefits – – – 168 – 168Policy acquisition costs 515 963 248 45 – 1,771Administrative expenses 530 669 64 50 142 1,455
Underwriting income (loss) 693 571 323 105 (140) 1,552
Net investment income 1,034 450 274 55 105 1,918Net realized gains (losses) including OTTI 125 (69) 21 (164) 26 (61)Interest expense – – – – 175 175Other (income) expense 11 (20) 4 1 85 81Income tax expense (benefit) 468 183 32 (8) (100) 575
Net income (loss) $ 1,373 $ 789 $ 582 $ 3 $ (169) $ 2,578
Underwriting assets are reviewed in total by management for purposes of decision-making. Other than goodwill, the Companydoes not allocate assets to its segments.
The following tables summarize the net premiums earned for each segment by product offering for the periods indicated.
Year ended December 31, 2009(in millions of U.S. dollars)
Property &All Other Casualty
Life, Accident &Health
ACEConsolidated
Insurance – North American $ 1,690 $ 3,734 $ 260 $ 5,684
Insurance – Overseas General 1,787 1,420 1,940 5,147
Global Reinsurance 546 433 – 979
Life – – 1,430 1,430
$ 4,023 $ 5,587 $ 3,630 $ 13,240
Year ended December 31, 2008
Insurance – North American $ 1,576 $ 3,857 $ 246 $ 5,679Insurance – Overseas General 1,855 1,487 1,995 5,337Global Reinsurance 523 494 – 1,017Life – – 1,170 1,170
$ 3,954 $ 5,838 $ 3,411 $ 13,203
Year ended December 31, 2007
Insurance – North American $ 1,486 $ 4,298 $ 223 $ 6,007Insurance – Overseas General 1,697 1,495 1,431 4,623Global Reinsurance 628 671 – 1,299Life – – 368 368
$ 3,811 $ 6,464 $ 2,022 $ 12,297
F-68

N O T E S T O T H E C O N S O L I D A T E D F I N A N C I A L S T A T E M E N T S (continued)
ACE Limited and Subsidiaries
The following table summarizes the Company’s net premiums earned by geographic region. Allocations have been made onthe basis of location of risk.
Year Ended North America EuropeAsia
Pacific/Far East Latin America
2009 63% 20% 12% 5%
2008 61% 22% 12% 5%2007 62% 23% 10% 5%
18. Earnings per share
The following table sets forth the computation of basic and diluted earnings per share for the periods indicated. The currentand prior year calculations have been amended due to the impact of the adoption of the previously discussed new principlesincluded within Topic 260. The previously reported amounts for basic and diluted earnings per share for the year endedDecember 31, 2008, were $3.57 and $3.53, respectively. The previously reported amounts for basic and diluted earnings pershare for the year ended December 31, 2007, were $7.79 and $7.66, respectively.
(in millions of U.S. dollars, except share and per share data) 2009 2008 2007
Numerator:Net Income $ 2,549 $ 1,197 $ 2,578Dividends on Preferred Shares – (24) (45)
Net income available to holders of Common Shares $ 2,549 $ 1,173 $ 2,533
Denominator:Denominator for basic earnings per share:Weighted-average shares outstanding 336,725,625 332,900,719 328,990,291Denominator for diluted earnings per share:Share-based compensation plans 813,669 1,705,518 2,998,773
Adjusted weighted-average shares outstanding and assumed conversions 337,539,294 334,606,237 331,989,064
Basic earnings per share $ 7.57 $ 3.52 $ 7.70
Diluted earnings per share $ 7.55 $ 3.50 $ 7.63
Excluded from adjusted weighted-average shares outstanding and assumed conversions is the impact of securities that wouldhave been anti-dilutive during the respective periods. For the years ended December 31, 2009, 2008, and 2007, the poten-tial anti-dilutive share conversions were 1,230,881 shares, 638,401 shares, and 233,326 shares, respectively.
19. Related party transactions
The ACE Foundation – Bermuda is an unconsolidated not-for-profit organization whose primary purpose is to fund charitablecauses in Bermuda. The Trustees are principally comprised of ACE management. The Company maintains a non-interest bear-ing demand note receivable from the ACE Foundation – Bermuda, the balance of which was $31 million and $34 million, atDecember 31, 2009 and 2008, respectively. The receivable is included in Other assets in the accompanying consolidatedbalance sheets. The borrower has used the related proceeds to finance investments in Bermuda real estate, some of whichhave been rented to ACE employees at rates established by independent, professional real estate appraisers. The borroweruses income from the investments to both repay the note and to fund charitable activities. Accordingly, the Company reportsthe demand note at the lower of its principal value or the fair value of assets held by the borrower to repay the loan, includingthe real estate properties.
F-69

N O T E S T O T H E C O N S O L I D A T E D F I N A N C I A L S T A T E M E N T S (continued)
ACE Limited and Subsidiaries
20. Statutory financial information
The Company’s insurance and reinsurance subsidiaries are subject to insurance laws and regulations in the jurisdictions inwhich they operate. These regulations include restrictions that limit the amount of dividends or other distributions, such asloans or cash advances, available to shareholders without prior approval of the insurance regulatory authorities.
There are no statutory restrictions on the payment of dividends from retained earnings by any of the Bermuda subsidiariesas the minimum statutory capital and surplus requirements are satisfied by the share capital and additional paid-in capital ofeach of the Bermuda subsidiaries.
The Company’s U.S. subsidiaries file financial statements prepared in accordance with statutory accounting practicesprescribed or permitted by insurance regulators.
Statutory accounting differs from GAAP in the reporting of certain reinsurance contracts, investments, subsidiaries, acquis-ition expenses, fixed assets, deferred income taxes, and certain other items. The statutory capital and surplus of the U.S.subsidiaries met regulatory requirements for 2009, 2008, and 2007. The amount of dividends available to be paid in 2010,without prior approval from the state insurance departments, totals $733 million.
The combined statutory capital and surplus and statutory net income of the Bermuda and U.S. subsidiaries as at and forthe years ended December 31, 2009, 2008, and 2007, are as follows:
Bermuda Subsidiaries U.S. Subsidiaries
(in millions of U.S. dollars) 2009 2008 2007 2009 2008 2007
Statutory capital and surplus $ 9,299 $ 6,205 $ 8,579 $ 5,801 $ 5,368 $ 5,321Statutory net income $ 2,472 $ 2,196 $ 1,535 $ 870 $ 818 $ 873
As permitted by the Restructuring discussed previously in Note 7, certain of the Company’s U.S. subsidiaries discount certainA&E liabilities, which increased statutory capital and surplus by approximately $215 million, $211 million, and $140 millionat December 31, 2009, 2008, and 2007, respectively.
The Company’s international subsidiaries prepare statutory financial statements based on local laws and regulations.Some jurisdictions impose complex regulatory requirements on insurance companies while other jurisdictions impose fewerrequirements. In some countries, the Company must obtain licenses issued by governmental authorities to conduct localinsurance business. These licenses may be subject to reserves and minimum capital and solvency tests. Jurisdictions mayimpose fines, censure, and/or criminal sanctions for violation of regulatory requirements.
21. Information provided in connection with outstanding debt of subsidiaries
The following tables present condensed consolidating financial information at December 31, 2009, and December 31,2008, and for the years ended December 31, 2009, 2008, and 2007, for ACE Limited (the Parent Guarantor) and its“Subsidiary Issuer”, ACE INA Holdings, Inc. The Subsidiary Issuer is an indirect 100 percent-owned subsidiary of the ParentGuarantor. Investments in subsidiaries are accounted for by the Parent Guarantor under the equity method for purposes of thesupplemental consolidating presentation. Earnings of subsidiaries are reflected in the Parent Guarantor’s investment accountsand earnings. The Parent Guarantor fully and unconditionally guarantees certain of the debt of the Subsidiary Issuer.
F-70

N O T E S T O T H E C O N S O L I D A T E D F I N A N C I A L S T A T E M E N T S (continued)
ACE Limited and Subsidiaries
Condensed Consolidating Balance Sheet at December 31, 2009
(in millions of U.S. dollars)
ACE Limited(Parent
Guarantor)
ACE INAHoldings Inc.
(SubsidiaryIssuer)
Other ACELimited
Subsidiaries andEliminations(1)
ConsolidatingAdjustments(2)
ACE LimitedConsolidated
Assets
Investments $ 51 $ 24,125 $ 22,339 $ – $ 46,515
Cash (1) 400 270 – 669
Insurance and reinsurance balances receivable – 3,043 628 – 3,671
Reinsurance recoverable on losses and lossexpenses – 17,173 (3,578) – 13,595
Reinsurance recoverable on policy benefits – 681 (383) – 298
Value of business acquired – 748 – – 748
Goodwill and other intangible assets – 3,377 554 – 3,931
Investments in subsidiaries 18,714 – – (18,714) –
Due from (to) subsidiaries and affiliates, net 1,062 (669) 669 (1,062) –
Other assets 18 7,158 1,377 – 8,553
Total assets $ 19,844 $ 56,036 $ 21,876 $ (19,776) $ 77,980
LiabilitiesUnpaid losses and loss expenses $ – $ 30,038 $ 7,745 $ – $ 37,783
Unearned premiums – 4,944 1,123 – 6,067
Future policy benefits – 2,383 625 – 3,008
Short-term debt – 161 – – 161
Long-term debt – 3,158 – – 3,158
Trust preferred securities – 309 – – 309
Other liabilities 177 6,613 1,037 – 7,827
Total liabilities 177 47,606 10,530 – 58,313
Total shareholders’ equity 19,667 8,430 11,346 (19,776) 19,667
Total liabilities and shareholders’ equity $ 19,844 $ 56,036 $ 21,876 $ (19,776) $ 77,980
(1) Includes all other subsidiaries of ACE Limited and intercompany eliminations.(2) Includes ACE Limited parent company eliminations.
F-71

N O T E S T O T H E C O N S O L I D A T E D F I N A N C I A L S T A T E M E N T S (continued)
ACE Limited and Subsidiaries
Condensed Consolidating Balance Sheet at December 31, 2008
(in millions of U.S. dollars)
ACE Limited(Parent
Guarantor)
ACE INAHoldings Inc.
(SubsidiaryIssuer)
Other ACELimited
Subsidiaries andEliminations(1)
ConsolidatingAdjustments(2)
ACE LimitedConsolidated
Assets
Investments $ 143 $ 20,323 $ 19,249 $ – $ 39,715Cash (52) 442 477 – 867Insurance and reinsurance balances receivable – 2,944 509 – 3,453Reinsurance recoverable on losses and loss
expenses – 16,880 (2,963) – 13,917Reinsurance recoverable on policy benefits – 625 (366) – 259Value of business acquired – 823 – – 823Goodwill and other intangible assets – 3,199 548 – 3,747Investments in subsidiaries 13,697 – – (13,697) –Due from (to) subsidiaries and affiliates, net 784 (389) 389 (784) –Other assets 12 7,398 1,866 – 9,276
Total assets $ 14,584 $ 52,245 $ 19,709 $ (14,481) $ 72,057
Liabilities
Unpaid losses and loss expenses $ – $ 29,127 $ 8,049 $ – $ 37,176Unearned premiums – 4,804 1,146 – 5,950Future policy benefits – 2,249 655 – 2,904Short-term debt – 471 – – 471Long-term debt – 2,806 – – 2,806Trust preferred securities – 309 – – 309Other liabilities 138 5,932 1,925 – 7,995
Total liabilities 138 45,698 11,775 – 57,611
Total shareholders’ equity 14,446 6,547 7,934 (14,481) 14,446
Total liabilities and shareholders’ equity $ 14,584 $ 52,245 $ 19,709 $ (14,481) $ 72,057
(1) Includes all other subsidiaries of ACE Limited and intercompany eliminations.(2) Includes ACE Limited parent company eliminations.
F-72
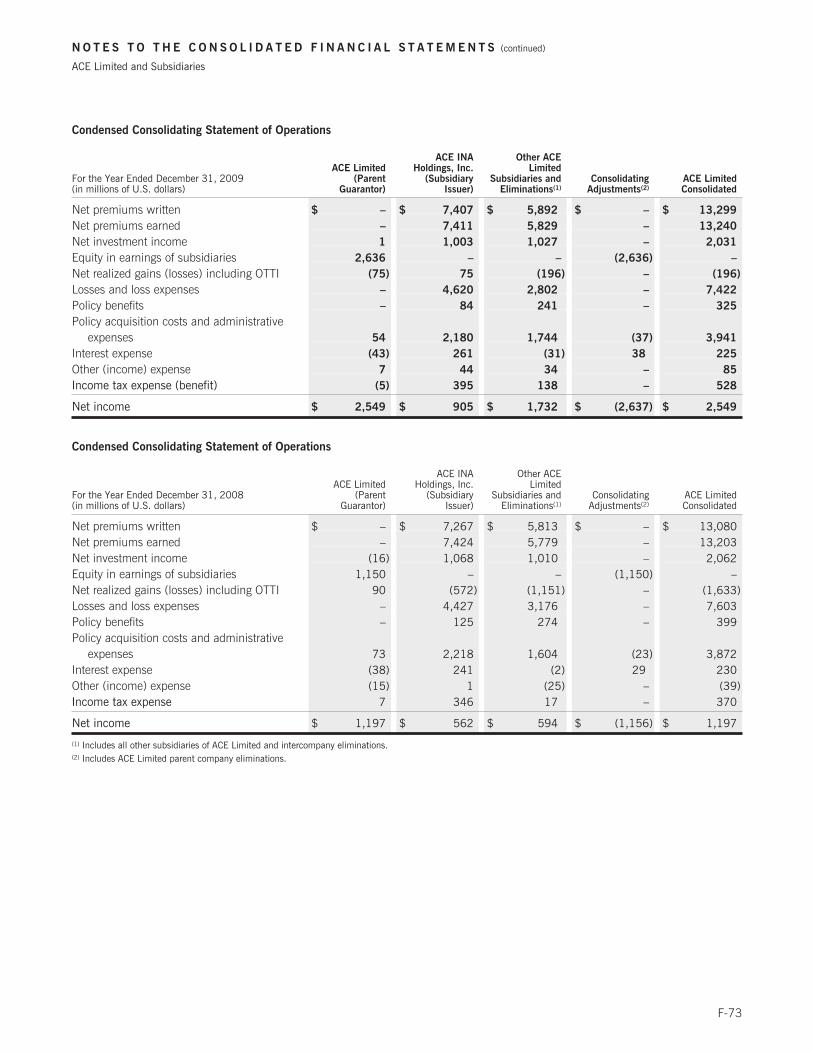
N O T E S T O T H E C O N S O L I D A T E D F I N A N C I A L S T A T E M E N T S (continued)
ACE Limited and Subsidiaries
Condensed Consolidating Statement of Operations
For the Year Ended December 31, 2009(in millions of U.S. dollars)
ACE Limited(Parent
Guarantor)
ACE INAHoldings, Inc.
(SubsidiaryIssuer)
Other ACELimited
Subsidiaries andEliminations(1)
ConsolidatingAdjustments(2)
ACE LimitedConsolidated
Net premiums written $ – $ 7,407 $ 5,892 $ – $ 13,299
Net premiums earned – 7,411 5,829 – 13,240
Net investment income 1 1,003 1,027 – 2,031
Equity in earnings of subsidiaries 2,636 – – (2,636) –
Net realized gains (losses) including OTTI (75) 75 (196) – (196)
Losses and loss expenses – 4,620 2,802 – 7,422
Policy benefits – 84 241 – 325
Policy acquisition costs and administrativeexpenses 54 2,180 1,744 (37) 3,941
Interest expense (43) 261 (31) 38 225
Other (income) expense 7 44 34 – 85
Income tax expense (benefit) (5) 395 138 – 528
Net income $ 2,549 $ 905 $ 1,732 $ (2,637) $ 2,549
Condensed Consolidating Statement of Operations
For the Year Ended December 31, 2008(in millions of U.S. dollars)
ACE Limited(Parent
Guarantor)
ACE INAHoldings, Inc.
(SubsidiaryIssuer)
Other ACELimited
Subsidiaries andEliminations(1)
ConsolidatingAdjustments(2)
ACE LimitedConsolidated
Net premiums written $ – $ 7,267 $ 5,813 $ – $ 13,080Net premiums earned – 7,424 5,779 – 13,203Net investment income (16) 1,068 1,010 – 2,062Equity in earnings of subsidiaries 1,150 – – (1,150) –Net realized gains (losses) including OTTI 90 (572) (1,151) – (1,633)Losses and loss expenses – 4,427 3,176 – 7,603Policy benefits – 125 274 – 399Policy acquisition costs and administrative
expenses 73 2,218 1,604 (23) 3,872Interest expense (38) 241 (2) 29 230Other (income) expense (15) 1 (25) – (39)Income tax expense 7 346 17 – 370
Net income $ 1,197 $ 562 $ 594 $ (1,156) $ 1,197
(1) Includes all other subsidiaries of ACE Limited and intercompany eliminations.(2) Includes ACE Limited parent company eliminations.
F-73

N O T E S T O T H E C O N S O L I D A T E D F I N A N C I A L S T A T E M E N T S (continued)
ACE Limited and Subsidiaries
Condensed Consolidating Statement of Operations
For the Year Ended December 31, 2007(in millions of U.S. dollars)
ACE Limited(Parent
Guarantor)
ACE INAHoldings, Inc.
(SubsidiaryIssuer)
Other ACELimited
Subsidiaries andEliminations(1)
ConsolidatingAdjustments(2)
ACE LimitedConsolidated
Net premiums written $ – $ 7,033 $ 4,946 $ – $ 11,979Net premiums earned – 7,193 5,104 – 12,297Net investment income 14 935 969 – 1,918Equity in earnings of subsidiaries 2,633 – – (2,633) –Net realized gains (losses) including OTTI 21 – (82) – (61)Losses and loss expenses – 4,724 2,627 – 7,351Policy benefits – 43 125 – 168Policy acquisition costs and administrative
expenses 87 1,835 1,324 (20) 3,226Interest expense (10) 165 12 8 175Other (income) expense 10 14 57 – 81Income tax expense 3 462 110 – 575
Net income $ 2,578 $ 885 $ 1,736 $ (2,621) $ 2,578
(1) Includes all other subsidiaries of ACE Limited and intercompany eliminations.(2) Includes ACE Limited parent company eliminations.
F-74

N O T E S T O T H E C O N S O L I D A T E D F I N A N C I A L S T A T E M E N T S (continued)
ACE Limited and Subsidiaries
Condensed Consolidating Statement of Cash Flows
For the Year Ended December 31, 2009(in millions of U.S. dollars)
ACE Limited(Parent
Guarantor)
ACE INAHoldings Inc.
(SubsidiaryIssuer)
Other ACELimited
Subsidiaries andEliminations(1)
ACE LimitedConsolidated
Net cash flows from operating activities $ 420 $ 1,888 $ 1,027 $ 3,335
Cash flows used for investing activities
Purchases of fixed maturities available for sale – (16,877) (20,383) (37,260)
Purchases of fixed maturities held to maturity – (457) (15) (472)
Purchases of equity securities – (186) (168) (354)
Sales of fixed maturities available for sale 88 12,650 16,916 29,654
Sales of fixed maturities held to maturity – 10 1 11
Sales of equity securities – 544 728 1,272
Maturities and redemptions of fixed maturities available for sale – 1,792 1,612 3,404
Maturities and redemptions of fixed maturities held to maturity – 410 104 514
Net derivative instruments settlements – (6) (86) (92)
Capitalization of subsidiary (90) – 90 –
Other (4) (14) 117 99
Net cash flows used for investing activities (6) (2,134) (1,084) (3,224)
Cash flows from (used for) financing activities
Dividends paid on Common Shares (388) – – (388)
Proceeds from exercise of options for Common Shares 15 – – 15
Proceeds from Common Shares issued under ESPP 10 – – 10
Net repayment of short-term debt – (466) – (466)
Net proceeds from issuance of long-term debt – 500 – 500
Advances (to) from affiliates – 156 (156) –
Tax benefit on share-based compensation expense – 6 2 8
Net cash flows from (used for) financing activities (363) 196 (154) (321)
Effect of foreign currency rate changes on cash and cashequivalents – 8 4 12
Net increase (decrease) in cash 51 (42) (207) (198)
Cash – beginning of year (52) 442 477 867
Cash – end of year $ (1) $ 400 $ 270 $ 669
(1) Includes all other subsidiaries of ACE Limited and intercompany eliminations.
F-75

N O T E S T O T H E C O N S O L I D A T E D F I N A N C I A L S T A T E M E N T S (continued)
ACE Limited and Subsidiaries
Condensed Consolidating Statement of Cash Flows
For the Year Ended December 31, 2008(in millions of U.S. dollars)
ACE Limited(Parent
Guarantor)
ACE INAHoldings Inc.
(SubsidiaryIssuer)
Other ACELimited
Subsidiaries andEliminations(1)
ACE LimitedConsolidated
Net cash flows from operating activities $ 1,613 $ 886 $ 1,602 $ 4,101
Cash flows used for investing activities
Purchases of fixed maturities available for sale (94) (15,535) (27,877) (43,506)Purchases of fixed maturities held to maturity – (351) (15) (366)Purchases of equity securities – (492) (479) (971)Sales of fixed maturities available for sale – 14,117 25,310 39,427Sales of equity securities – 749 415 1,164Maturities and redemptions of fixed maturities available for sale – 1,355 1,425 2,780Maturities and redemptions of fixed maturities held to maturity – 332 113 445Net derivative instruments settlements 11 – 21 32Capitalization of subsidiary (215) – 215 –Advances (to) from affiliates (475) – 475 –Acquisition of subsidiary (net of cash acquired of $19) – (2,521) – (2,521)Other 13 (150) (471) (608)
Net cash flows used for investing activities (760) (2,496) (868) (4,124)
Cash flows from (used for) financing activities
Dividends paid on Common Shares (362) – – (362)Dividends paid on Preferred Shares (24) – – (24)Net repayment of short-term debt (51) 196 (234) (89)Net proceeds from issuance of long-term debt – 1,245 – 1,245Redemption of Preferred Shares (575) – – (575)Proceeds from exercise of options for Common Shares 97 – – 97Proceeds from Common Shares issued under ESPP 10 – – 10Advances from (to) affiliates – 234 (234) –Tax benefit on share-based compensation expense – – 12 12
Net cash flows from (used for) financing activities (905) 1,675 (456) 314
Effect of foreign currency rate changes on cash and cashequivalents – 67 (1) 66
Net increase (decrease) in cash (52) 132 277 357Cash – beginning of year – 310 200 510
Cash – end of year $ (52) $ 442 $ 477 $ 867
(1) Includes all other subsidiaries of ACE Limited and intercompany eliminations.
F-76

N O T E S T O T H E C O N S O L I D A T E D F I N A N C I A L S T A T E M E N T S (continued)
ACE Limited and Subsidiaries
Condensed Consolidating Statement of Cash Flows
For the Year Ended December 31, 2007(in millions of U.S. dollars)
ACE Limited(Parent
Guarantor)
ACE INAHoldings Inc.
(SubsidiaryIssuer)
Other ACELimited
Subsidiaries andEliminations(1)
ACE LimitedConsolidated
Net cash flows from operating activities $ 241 $ 1,612 $ 2,848 $ 4,701
Cash flows from (used for) investing activities
Purchases of fixed maturities available for sale – (18,092) (30,026) (48,118)Purchases of fixed maturities held to maturity – (319) (5) (324)Purchases of equity securities – (603) (326) (929)Sales of fixed maturities available for sale 3 15,127 25,686 40,816Sales of equity securities – 456 407 863Maturities and redemptions of fixed maturities available for sale – 1,764 1,468 3,232Maturities and redemptions of fixed maturities held to maturity – 256 109 365Net derivative instruments settlements 14 – (30) (16)Advances (to) from affiliates 496 – (496) –Other (6) (166) (247) (419)
Net cash flows from (used for) investing activities 507 (1,577) (3,460) (4,530)
Cash flows from (used for) financing activities
Dividends paid on Common Shares (341) – – (341)Dividends paid on Preferred Shares (45) – – (45)Net repayment of short-term debt (449) – (16) (465)Net proceeds from issuance of long-term debt – 500 – 500Proceeds from exercise of options for Common Shares 65 – – 65Proceeds from Common Shares issued under ESPP 9 – – 9Advances from (to) affiliates – (483) 483 –Tax benefit on share-based compensation expense – 21 3 24
Net cash flows from (used for) financing activities (761) 38 470 (253)
Effect of foreign currency rate changes on cash and cashequivalents – 24 3 27
Net increase (decrease) in cash (13) 97 (139) (55)Cash – beginning of year 13 213 339 565
Cash – end of year $ – $ 310 $ 200 $ 510
(1) Includes all other subsidiaries of ACE Limited and intercompany eliminations.
F-77

N O T E S T O T H E C O N S O L I D A T E D F I N A N C I A L S T A T E M E N T S (continued)
ACE Limited and Subsidiaries
22. Condensed unaudited quarterly financial data
The current and prior year earnings per share calculations have been amended due to the impact of the adoption of the pre-viously discussed new principles included within Topic 260.
(in millions of U.S. dollars, except per share data)Quarter Ended
March 31, 2009Quarter EndedJune 30, 2009
Quarter EndedSeptember 30,
2009
Quarter EndedDecember 31,
2009
Net premiums earned $ 3,194 $ 3,266 $ 3,393 $ 3,387
Net investment income 502 506 511 512
Net realized gains (losses) including OTTI (121) (225) (223) 373
Total revenues $ 3,575 $ 3,547 $ 3,681 $ 4,272
Losses and loss expenses $ 1,816 $ 1,821 $ 1,885 $ 1,900
Policy benefits $ 99 $ 78 $ 79 $ 69
Net income $ 567 $ 535 $ 494 $ 953
Basic earnings per share $ 1.69 $ 1.58 $ 1.46 $ 2.82
Diluted earnings per share $ 1.69 $ 1.58 $ 1.46 $ 2.81
(in millions of U.S. dollars, except per share data)Quarter Ended
March 31, 2008Quarter Ended
June 30, 2008
Quarter EndedSeptember 30,
2008
Quarter EndedDecember 31,
2008
Net premiums earned $ 2,940 $ 3,428 $ 3,609 $ 3,226Net investment income 489 532 520 521Net realized gains (losses) including OTTI (353) (126) (510) (644)
Total revenues $ 3,076 $ 3,834 $ 3,619 $ 3,103
Losses and loss expenses $ 1,579 $ 1,895 $ 2,369 $ 1,760
Policy benefits $ 63 $ 89 $ 91 $ 156
Net income $ 377 $ 746 $ 54 $ 20
Basic earnings per share $ 1.11 $ 2.20 $ 0.16 $ 0.06
Diluted earnings per share $ 1.10 $ 2.18 $ 0.16 $ 0.06
23. Subsequent events
The Company has performed an evaluation of subsequent events through February 25, 2010, which is the date that the finan-cial statements were issued. No significant subsequent events were identified.
F-78

S C H E D U L E I
ACE Limited and Subsidiaries
S U M M A R Y O F I N V E S T M E N T S – O T H E R T H A N I N V E S T M E N T S I N R E L A T E D P A R T I E S
December 31, 2009(in millions of U.S. dollars)
Cost orAmortized Cost Fair Value
Amount at whichshown in the
balance sheet
Fixed maturities available for sale
U.S. Treasury and agency $ 3,680 $ 3,709 $ 3,709
Foreign 10,960 11,145 11,145
Corporate securities 12,707 13,215 13,215
Mortgage-backed securities 10,058 9,842 9,842
States, municipalities, and political subdivisions 1,580 1,614 1,614
Total fixed maturities 38,985 39,525 39,525
Fixed maturities held to maturity
U.S. Treasury and agency 1,026 1,057 1,026
Foreign 26 27 26
Corporate securities 313 322 313
Mortgage-backed securities 1,440 1,469 1,440
States, municipalities, and political subdivisions 676 686 676
Total fixed maturities 3,481 3,561 3,481
Equity securities
Industrial, miscellaneous, and all other 398 467 467
Short-term investments 1,667 1,667 1,667
Other investments 1,258 1,375 1,375
2,925 3,042 3,042
Total investments – other than investments in related parties $ 45,789 $ 46,595 $ 46,515
F-79

S C H E D U L E I I
ACE Limited and Subsidiaries
C O N D E N S E D F I N A N C I A L I N F O R M A T I O N O F R E G I S T R A N T
BALANCE SHEETS (Parent Company Only)
December 31, 2009 and 2008(in millions of U.S. dollars) 2009 2008
Assets
Investments in subsidiaries and affiliates on equity basis $ 18,714 $ 13,697Short-term investments 9 97Other investments, at cost 42 46
Total investments 18,765 13,840
Cash (1) (52)Due from subsidiaries and affiliates, net 1,062 784Other assets 18 12
Total assets $ 19,844 $ 14,584
Liabilities
Accounts payable, accrued expenses, and other liabilities $ 73 $ 47Dividends payable 104 91
Total liabilities 177 138
Shareholders’ equity
Common Shares 10,503 10,827Common Shares in treasury (3) (3)Additional paid-in capital 5,526 5,464Retained earnings 2,818 74Deferred compensation obligation 2 3Accumulated other comprehensive income (loss) 823 (1,916)Common Shares issued to employee trust (2) (3)
Total shareholders’ equity 19,667 14,446
Total liabilities and shareholders’ equity $ 19,844 $ 14,584
F-80

S C H E D U L E I I (continued)
ACE Limited and Subsidiaries
CONDENSED FINANCIAL INFORMATION OF REGISTRANT
STATEMENTS OF OPERATIONS (Parent Company Only)
For the years ended December 31, 2009, 2008, and 2007(in millions of U.S. dollars) 2009 2008 2007
Revenues
Investment income, including intercompany interest income $ 39 $ 14 $ 22Equity in net income of subsidiaries and affiliates 2,636 1,150 2,633Net realized gains (losses) (75) 90 21
2,600 1,254 2,676
Expenses
Administrative and other expenses 56 65 100Interest expense (income) (5) (8) (2)
51 57 98
Net income $ 2,549 $ 1,197 $ 2,578
F-81

S C H E D U L E I I (continued)
ACE Limited and Subsidiaries
CONDENSED FINANCIAL INFORMATION OF REGISTRANT
STATEMENTS OF CASH FLOWS (Parent Company Only)
For the years ended December 31, 2009, 2008, and 2007(in millions of U.S. dollars) 2009 2008 2007
Net cash flows from operating activities $ 420 $ 1,613 $ 241
Cash flows from (used for) investing activities
Purchases of fixed maturities available for sale – (94) –Sales of fixed maturities available for sale 88 – 3Net derivative instruments settlement – 11 14Capitalization of subsidiaries (90) (215) –Advances (to) from affiliates – (475) 496Other (4) 13 (6)
Net cash flows from (used for) investing activities (6) (760) 507
Cash flows used for financing activities
Dividends paid on Common Shares (388) (362) (341)Dividends paid on Preferred Shares – (24) (45)Proceeds from exercise of options for Common Shares 15 97 65Proceeds from Common Shares issued under ESPP 10 10 9Net repayment of short-term debt – (51) (449)Redemption of Preferred Shares – (575) –Net proceeds from issuance of Common Shares
Net cash flows used for financing activities (363) (905) (761)
Net increase (decrease) in cash 51 (52) (13)Cash – beginning of year (52) – 13
Cash – end of year $ (1) $ (52) $ –
F-82

S C H E D U L E I V
ACE Limited and Subsidiaries
S U P P L E M E N T A L I N F O R M A T I O N C O N C E R N I N G R E I N S U R A N C E
Premiums Earned
For the years ended December 31, 2009, 2008, and 2007(in millions of U.S. dollars, except for percentages)
DirectAmount
Ceded ToOther
Companies
AssumedFrom OtherCompanies Net Amount
Percentage ofAmount
Assumed toNet
2009 $ 15,415 $ 5,943 $ 3,768 $ 13,240 28%
2008 $ 16,087 $ 6,144 $ 3,260 $ 13,203 25%
2007 $ 14,673 $ 5,834 $ 3,458 $ 12,297 28%
F-83

S C H E D U L E V I
ACE Limited and Subsidiaries
S U P P L E M E N T A R Y I N F O R M A T I O N C O N C E R N I N G P R O P E R T Y A N D C A S U A L T Y O P E R A T I O N S
As of and for the years ended December 31, 2009, 2008, and 2007(in millions of U.S. dollars)
DeferredPolicy
AcquisitionCosts
Net Reservesfor Unpaid
Lossesand LossExpenses
UnearnedPremiums
NetPremiums
Earned
NetInvestment
Income
Net Losses and LossExpenses
Incurred Related to
Amortizationof Deferred
PolicyAcquisition
Costs
Net PaidLosses
and LossExpenses
NetPremiums
WrittenCurrent
YearPriorYear
2009 $ 1,396 $ 25,038 $ 6,034 $ 12,713 $ 1,940 $ 8,001 $ (579) $ 2,076 $ 6,948 $ 12,735
2008 $ 1,192 $ 24,241 $ 5,924 $ 12,742 $ 1,966 $ 8,417 $ (814) $ 2,087 $ 6,327 $ 12,594
2007 $ 1,109 $ 23,592 $ 6,215 $ 11,929 $ 1,863 $ 7,568 $ (217) $ 1,726 $ 5,934 $ 11,598
F-84

OTHER DISCLOSURES REQUIRED BY SWISS LAWACE LIMITED and Subsidiaries
Other selected information as required by Swiss Law
The following disclosures are required by Swiss Law and are included below as ACE Limited is a Swiss domesticated com-pany.
(i) Expenses
Total personnel expenses amounted to $1.4 billion for the years ended December 31, 2009 and 2008, and $1.1 billion forthe year ended December 31, 2007. Amortization expense related to tangible property amounted to $89 million, $90 million,and $77 million for the years ended December 31, 2009, 2008, and 2007, respectively.
(ii) Fire insurance values of property and equipment
Total fire insurance values of property and equipment amounted to $774 million and $680 million at December 31, 2009and 2008, respectively.
(iii) Remuneration of the Board of Directors and Group Executives and Common Share ownership of the Board of Directors and Group
Executives
Refer to the disclosures in the notes to the Swiss Statutory Financial Statements on pages S-7 to S-11 of this annual report.
(iv) Risk assessment and management
The management of ACE is responsible for assessing risks related to the financial reporting process and establishing and main-taining adequate internal controls over financial reporting. Internal control over financial reporting is a process designed by, orunder the supervision of the Chairman of the Board of Directors/Chief Executive Officer and Chief Financial Officer to providereasonable assurance regarding the reliability of financial reporting and the preparation of ACE's consolidated financial state-ments for external purposes in accordance with GAAP. In addition under Swiss Law, the Board of Directors of ACE has theultimate responsibility for establishing an internal control system on the financial statements.
The Board, operating through its Audit Committee comprised entirely of directors who are not officers or employees of theCompany, is ultimately responsible for oversight of the financial reporting process and safeguarding of assets againstunauthorized acquisition, use, or disposition. The Audit Committee meets with management, the independent registered publicaccountants and the internal auditor; approves the overall scope of audit work and related fee arrangements; and reviews auditreports and findings. In addition, the independent registered public accountants and the internal auditor meet separately withthe Audit Committee, without management representatives present, to discuss the results of their audits; the adequacy of theCompany’s internal control; the quality of its financial reporting; and the safeguarding of assets against unauthorized acquis-ition, use, or disposition.
ACE’s management is responsible for assessing operational risks facing the Company and sets policies designed toaddress such risks. Examples of key areas addressed by ACE’s risk management processes follow.
a) Underwriting
The Company’s underwriting strategy is to employ consistent, disciplined pricing and risk selection. Defined underwritingauthorities, standards, and guidelines are in place in each of the local operations and global profit centers. Global productboards ensure consistency of approach and the establishment of best practices throughout the world. ACE’s priority is to helpensure adherence to criteria for risk selection by maintaining experience and expertise in the underwriting staff. In addition,ACE employs a business review structure that helps ensure control of risk quality and use of policy limits and terms and con-ditions.
Actuaries in each region work closely with the underwriting teams to provide additional expertise in the underwriting proc-ess. The Company uses catastrophe loss and risk modeling techniques designed to ensure appropriate spread of risk and toanalyze correlation of risk across different product lines and territories.
b) Reinsurance protection
As part of the Company’s risk management strategy, ACE purchases reinsurance protection to mitigate exposure to losses,including catastrophes, to an acceptable level. In certain countries, reinsurer selection is limited by local laws or regulations. Inthose areas where there is more freedom of choice, the counterparty is selected based upon its financial strength, manage-ment, line of business expertise, and its price for assuming the risk transferred. In support of this process, the Companymaintains an ACE authorized reinsurer list that stratifies these authorized reinsurers by classes of business and acceptable lim-its. This list is maintained by the Reinsurance Security Committee (RSC), a committee comprised of senior managementpersonnel, and a dedicated reinsurer security team. Changes to the list are authorized by the RSC and recommended to the
F-85

OTHER DISCLOSURES REQUIRED BY SWISS LAW (continued)ACE LIMITED and Subsidiaries
Chair of the Enterprise Risk Management Board. The reinsurers on the authorized list and potential new markets are regularlyreviewed, and the list may be modified following these reviews. In addition to the authorized list, there is a formal exceptionprocess that allows authorized reinsurance buyers to use reinsurers already on the authorized list for higher limits or differentlines of business, for example, or other reinsurers not on the authorized list if their use is supported by compelling businessreasons for a particular reinsurance program.
c) Investments
ACE’s principal investment objective is to ensure that funds will be available to meet primary insurance and reinsurance obliga-tions. Within this broad liquidity constraint, the investment portfolio’s structure seeks to maximize return subject to specifically-approved guidelines of overall asset classes, credit quality, liquidity, and volatility of expected returns.
The management of the investment portfolio is the responsibility of ACE Asset Management. ACE Asset Management, anindirect wholly-owned subsidiary of ACE, operates principally to guide and direct the investment process. In this regard, ACEAsset Management:
• conducts formal asset allocation modeling for each of the ACE subsidiaries, providing formal recommendations forthe portfolio’s structure;
• establishes recommended investment guidelines that are appropriate to the prescribed asset allocation targets;• provides the analysis, evaluation, and selection of external investment advisors;• establishes and develops investment-related analytics to enhance portfolio engineering and risk control;• monitors and aggregates the correlated risk of the overall investment portfolio; and• provides governance over the investment process for each of the operating companies to ensure consistency of
approach and adherence to investment guidelines.
For the portfolio, ACE determines allowable, targeted asset allocation and ranges for each of the operating segments.These asset allocation targets are derived from asset and liability modeling that measures correlated histories of returns andvolatility of returns. Allowable investment classes are further refined through analysis of the Company’s operating environment,including expected volatility of cash flows, overall capital position, regulatory, and rating agency considerations.
The Finance and Investment Committee of the Board approves asset allocation targets and reviews investment policy toensure that it is consistent with overall goals, strategies, and objectives. Overall investment guidelines are reviewed andapproved by the Finance and Investment Committee to ensure that appropriate levels of portfolio liquidity, credit quality,diversification, and volatility are maintained. In addition, the Finance and Investment Committee systematically reviews theportfolio’s exposures including any potential violations of investment guidelines. ACE has long-standing global credit limits forthe entire portfolio across the organization. Exposures are aggregated, monitored, and actively managed by the Global CreditCommittee, comprised of senior executives, including the Chief Financial Officer, the Chief Risk Officer, the Chief InvestmentOfficer, and the Treasurer. Additionally, the Board has established a Risk Committee which helps execute the Board’s super-visory responsibilities pertaining to enterprise risk management including investment risk.
Within the guidelines and asset allocation parameters established by the Finance and Investment Committee, individualinvestment committees of the operating segments determine tactical asset allocation. Additionally, these committees review allinvestment-related activity that affects their operating company, including the selection of outside investment advisors, pro-posed asset allocations changes, and the systematic review of investment guidelines.
F-86

F-87
REPORT OF THE STATUTORY AUDITOR TO THE GENERAL MEETING OF ACE LIMITED, ZURICH ON THE
CONSOLIDATED (US GAAP) FINANCIAL STATEMENTS
Report of the statutory auditor on the consolidated financial statements
As statutory auditor, we have audited the consolidated financial statements of ACE Limited, which comprise the balancesheets, statements of operations and comprehensive income, statements of shareholders’ equity, statements of cash flows andnotes (pages F-5 to F-78 and F-85 to F-86), for the year ended December 31, 2009.
Board of Directors’ ResponsibilityThe Board of Directors is responsible for the preparation and fair presentation of the consolidated financial statements inaccordance with accounting principles generally accepted in the United States of America (US GAAP) and the requirements ofSwiss law. This responsibility includes designing, implementing and maintaining an internal control system relevant to thepreparation and fair presentation of consolidated financial statements that are free from material misstatement, whether due tofraud or error. The Board of Directors is further responsible for selecting and applying appropriate accounting policies andmaking accounting estimates that are reasonable in the circumstances.
Auditor’s ResponsibilityOur responsibility is to express an opinion on these consolidated financial statements based on our audit. We conducted ouraudit in accordance with Swiss law, Swiss Auditing Standards and auditing standards generally accepted in the United Statesof America. Those standards require that we plan and perform the audit to obtain reasonable assurance whether the con-solidated financial statements are free from material misstatement.
An audit involves performing procedures to obtain audit evidence about the amounts and disclosures in the consolidatedfinancial statements. The procedures selected depend on the auditor’s judgment, including the assessment of the risks ofmaterial misstatement of the financial statements, whether due to fraud or error. In making those risk assessments, the auditorconsiders the internal control system relevant to the entity’s preparation and fair presentation of the consolidated financialstatements in order to design audit procedures that are appropriate in the circumstances, but not for the purpose of expressingan opinion on the effectiveness of the entity’s internal control system. An audit also includes evaluating the appropriateness ofthe accounting policies used and the reasonableness of accounting estimates made, as well as evaluating the overall pre-sentation of the consolidated financial statements. We believe that the audit evidence we have obtained is sufficient andappropriate to provide a basis for our audit opinion.
OpinionIn our opinion, the consolidated financial statements for the year ended December 31, 2009 present fairly, in all materialrespects, the financial position of ACE Limited, the results of operations and the cash flows in accordance with accountingprinciples generally accepted in the United States of America (US GAAP) and comply with Swiss law.
Report on other legal requirements
We confirm that we meet the legal requirements on licensing according to the Auditor Oversight Act (AOA) and independence(article 728 CO and article 11 AOA) and that there are no circumstances incompatible with our independence.
In accordance with article 728a paragraph 1 item 3 CO and Swiss Auditing Standard 890, we confirm that an internalcontrol system exists which has been designed for the preparation of consolidated financial statements according to theinstructions of the Board of Directors.
We recommend that the consolidated financial statements submitted to you be approved.
PricewaterhouseCoopers AG
/S/ RICHARD BURGER /S/ PATRICK SHOUVLIN
Richard Burger Patrick ShouvlinAudit expertAuditor in charge
Audit expert
Zurich, February 25, 2010

ACE LIMITED
SWISS STATUTORY FINANCIAL STATEMENTS
December 31, 2009
S-1
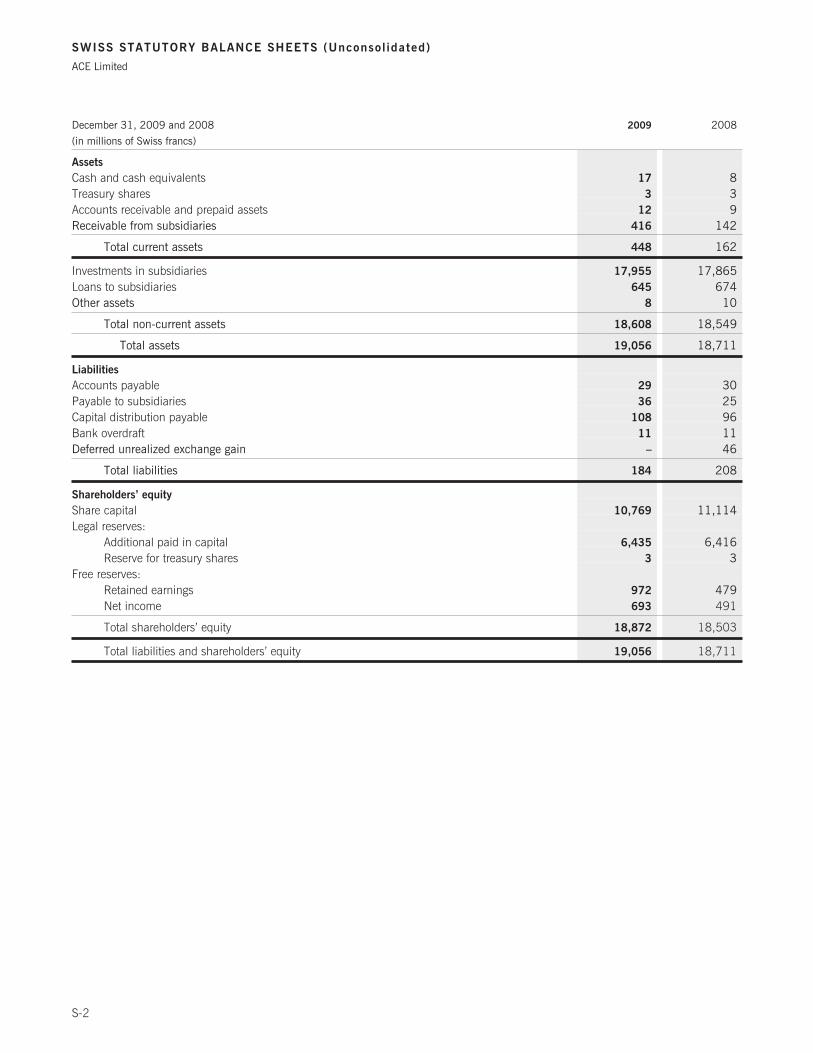
SWISS STATUTORY BALANCE SHEETS (Unconsol idated)
ACE Limited
December 31, 2009 and 2008 2009 2008
(in millions of Swiss francs)
Assets
Cash and cash equivalents 17 8Treasury shares 3 3Accounts receivable and prepaid assets 12 9Receivable from subsidiaries 416 142
Total current assets 448 162
Investments in subsidiaries 17,955 17,865Loans to subsidiaries 645 674Other assets 8 10
Total non-current assets 18,608 18,549
Total assets 19,056 18,711
Liabilities
Accounts payable 29 30Payable to subsidiaries 36 25Capital distribution payable 108 96Bank overdraft 11 11Deferred unrealized exchange gain – 46
Total liabilities 184 208
Shareholders’ equity
Share capital 10,769 11,114Legal reserves:
Additional paid in capital 6,435 6,416Reserve for treasury shares 3 3
Free reserves:Retained earnings 972 479Net income 693 491
Total shareholders’ equity 18,872 18,503
Total liabilities and shareholders’ equity 19,056 18,711
S-2

SWISS STATUTORY STATEMENTS OF INCOME (Unconsol idated)
ACE Limited
For the year ended December 31, 2009, and the period from July 10, 2008 to December 31, 2008(in millions of Swiss francs) 2009 2008
Revenues
Dividend income 705 506Interest income 47 23Net realized gains (losses) 4 14
Total revenues 756 543Expenses
Administrative and other expenses 59 51Tax expense 4 1
Total expenses 63 52
Net income 693 491
S-3
N O T E S T O S W I S S S T A T U T O R Y F I N A N C I A L S T A T E M E N T S
ACE Limited
1. Basis of presentation
ACE Limited (ACE or the Company) is the holding company of ACE Group with a listing on the New York Stock Exchange(NYSE). ACE Limited’s principal activity is the holding of subsidiaries. Revenues consist mainly of dividend and interestincome. On July 10, 2008, and July 14, 2008, during ACE Limited’s annual general meeting, the Company’s shareholdersapproved a proposal to move the Company’s jurisdiction of incorporation from the Cayman Islands to Zurich, Switzerland (theContinuation) and ACE became a Swiss company effective July 18, 2008. Accordingly, the accompanying comparativeincome statement reflects results of operations for the period from July 10, 2008, to December 31, 2008. The accompanyingfinancial statements comply with Swiss Law. The financial statements present the financial position of the holding companyon a standalone basis and do not represent the consolidated financial position of the holding company and its subsidiaries.
All amounts in the notes are shown in Swiss franc million, rounded to the nearest thousand unless otherwise stated.
2. Significant accounting policies
a) Cash and cash equivalents
Cash and cash equivalents includes cash on hand and deposits with an original maturity of three months or less at time ofpurchase.
b) Investments in subsidiaries
Investments in subsidiaries are equity interests, which are held on a long-term basis for the purpose of the holding company’sbusiness activities. They are carried at a value no higher than their cost less adjustments for impairment.
c) Translation of foreign currencies
Assets, other than Investments in subsidiaries, and liabilities denominated in foreign currencies are converted at year endexchange rates. Revenues and expenses denominated in foreign currencies are converted using an average exchange rate.Unrealized exchange losses are recorded in the statement of income and unrealized exchange gains are deferred until realized.
3. Commitments, contingencies, and guarantees
a) Credit facilities
The Company has a $500 million (CHF 517 million) unsecured revolving credit facility expiring in November 2012, availablefor general corporate purposes and the issuance of LOCs. At December 31, 2009 and 2008, the outstanding LOCs issuedunder this facility were $54 million (CHF 56 million) and $142 million (CHF 151 million), respectively. There were no otherdrawings or LOCs issued under this facility. This facility requires that the Company and/or certain of its subsidiaries continue tomaintain certain covenants, including a minimum consolidated net worth covenant and a maximum leverage covenant, whichwere met at December 31, 2009 and 2008.
b) Letters of credit
The Company has a $1 billion (CHF 1.034 billion) unsecured operational LOC facility expiring in November 2012. Thisfacility replaced two LOC facilities permitting up to $1.5 billion (CHF 1.55 billion) of LOCs. On the effective date of the newLOC facility, all outstanding LOCs issued under the replaced facilities were deemed to have been issued under the new LOCfacility and the replaced facilities terminated. At December 31, 2009 and 2008, $554 million (CHF 573 million) and $811million (CHF 863 million), respectively, of these facilities was utilized.
To satisfy funding requirements of the Company’s Lloyd’s of London (Lloyd’s) Syndicate 2488 through 2010, the Com-pany has an uncollateralized LOC facility in the amount of £300 million (CHF 500 million). LOCs issued under this facility willexpire no earlier than December 2013. At December 31, 2009 and 2008, £256 million (CHF 426 million) and £176 million(CHF 272 million), respectively, of this facility was utilized.
In June 2009, the Company entered into a $500 million (CHF 517 million) unsecured operational LOC facility expiring inJune 2014. At December 31, 2009, this facility was fully utilized.
These facilities require that the Company and/or certain of its subsidiaries continue to maintain certain covenants, includ-ing a minimum consolidated net worth covenant and a maximum leverage covenant, which were met at December 31, 2009and 2008.
S-4

N O T E S T O S W I S S S T A T U T O R Y F I N A N C I A L S T A T E M E N T S (continued)
ACE Limited
c) Lease commitments
The Company leases property under an operating lease which expires in 2018. Future minimum lease payments are expectedto be as follows:
(in millions of Swiss francs)
Year ending December 312010 1.732011 1.732012 1.732013 1.732014 1.73Later years 6.52
Total minimum future lease commitments 15.17
At December 31, 2008, the total minimum future leases commitments were CHF 16.9 million.
d) Guarantee of debt
At December 31, 2009 and 2008, the parent company had no direct debt outstanding other than a bank overdraft; however,it fully and unconditionally guarantees certain of the debt of its subsidiaries totaling $3.6 billion (CHF 3.8 billion) and $3.3billion (CHF 3.6 billion) at December 31, 2009 and 2008, respectively.
4. Significant investments
Share capital amounts are expressed in whole U.S. dollars or Swiss francs.
Country% of
Possession Currency Share Capital Purpose
ACE Group Holdings, Inc. U.S.A. 100% USD 11 Holding companyACE Insurance (Switzerland) Limited Switzerland 100% CHF 250,000,000 Insurance companyACE Group Management and Holdings Ltd. Bermuda 100% USD 100 Holding company
5. Shareholders’ equity
The following table details issued, authorized, and conditional share capital, at December 31, 2009 and 2008. Treasuryshares which are issued, but not outstanding and discussed in Note 5 c) below totaled 54,685 shares and 53,362 shares atDecember 31, 2009 and 2008, respectively.
2009 2008
Issued share capital 337,841,616 335,413,501Authorized share capital for general purposes 99,750,000 99,750,000Conditional share capital for bonds and similar debt instruments 33,000,000 33,000,000Conditional share capital for employee benefit plans 30,401,725 32,829,840
a) Shares authorized and issued
The following table presents changes in Common Shares issued for the year ended December 31, 2009, and for the periodfrom July 10, 2008, to December 31, 2008. All Common Shares are registered shares under Swiss corporate law.
2009 2008
Opening balance 335,413,501 335,243,341Conditional issuances 2,428,115 170,160
Ending balance 337,841,616 335,413,501
S-5

N O T E S T O S W I S S S T A T U T O R Y F I N A N C I A L S T A T E M E N T S (continued)
ACE Limited
The Company’s share capital at December 31, 2009 and 2008, consisted of 337,841,616 and 335,413,501 CommonShares, respectively, with par values of CHF 31.88 and CHF 33.14, respectively. The Board of Directors (the Board) is cur-rently authorized to increase the share capital from time to time by an amount not exceeding CHF 3.2 billion through the issueof up to 99,750,000 fully paid up registered shares with a par value of CHF 31.88 each.
b) Conditional share capital
(i) Conditional share capital for bonds and similar debt instruments
At December 31, 2009, the share capital of the Company may be increased by an amount not exceeding CHF 1.052 billionthrough the issue of a maximum of 33,000,000 registered shares, payable in full, each with a par value of CHF 31.88through the exercise of conversion and/or option or warrant rights granted in connection with bonds, notes, or similar instru-ments, issued or to be issued by the Company or by subsidiaries of the Company, including convertible debt instruments. AtDecember 31, 2008, the share capital of the Company could have been increased by an amount not exceeding CHF 1.094billion through the issue of a maximum of 33,000,000 registered shares, payable in full, each with a par value of CHF 33.14.
(ii) Conditional share capital for employee benefit plans
At December 31, 2009, the share capital of the Company may be increased by an amount not exceeding CHF 969 millionthrough the issue from time to time of a maximum of 30,401,725 registered shares, payable in full, each with a par value ofCHF 31.88, in connection with the exercise of option rights granted to any employee of the Company or a subsidiary, and anyconsultant, director, or other person providing services to the Company or a subsidiary. At December 31, 2008, the sharecapital of the Company could have been increased by an amount not exceeding CHF 1.088 billion through the issue from timeto time of a maximum of 32,829,840 registered shares, payable in full, each with a par value of CHF 33.14.
c) Treasury shares
Treasury shares are carried at the lower of cost or market. The following table presents a roll forward of treasury shares for theyear ended December 31, 2009, and for the period from July 10, 2008, to December 31, 2008:
2009 2008
(cost in millions of Swiss francs) Number of Shares Average Cost Number of Shares Average Cost
Opening balance 53,362 3 – –Additions during the period 630,769 27 168,980 9Redeemed under share-based compensation plans (629,446) (27) (115,618) (6)
Ending balance 54,685 3 53,362 3
d) Movements on retained earnings
The following table presents movements on retained earnings for the year ended December 31, 2009, and for the period fromJuly 10, 2008, to December 31, 2008:
(in millions of Swiss francs) 2009 2008
Opening balance 970 481
Par value reduction on treasury shares 2 1
Attribution to reserve for treasury shares – (3)
Net income 693 491
Ending balance 1,665 970
e) ACE Limited securities repurchase authorization
In November 2001, the Board authorized the repurchase of any ACE issued debt or capital securities, which includes ACE’sCommon Shares, up to an aggregate total of $250 million (CHF 258 million). These purchases may take place from time totime in the open market or in private purchase transactions. At December 31, 2009, this authorization had not been utilized.
S-6

N O T E S T O S W I S S S T A T U T O R Y F I N A N C I A L S T A T E M E N T S (continued)
ACE Limited
f) General restrictions
The holders of Common Shares are entitled to receive dividends as proposed by the Board and approved by the shareholders.The treasury shares held by the Company are not entitled to dividends. Holders of Common Shares are allowed one vote pershare provided that, if the controlled shares of any shareholder constitute ten percent or more of the outstanding CommonShares of the Company, only a fraction of the vote will be allowed so as not to exceed ten percent. Entry of acquirers ofCommon Shares as shareholders with voting rights in the share register may be refused if it would confer voting rights withrespect to 10 percent or more of the registered share capital recorded in the commercial register.
6. Remuneration of the Board of Directors and the Group Executives
a) Basis of presentation
The following information sets forth the compensation for the years ended December 31, 2009 and 2008, of the members ofthe Board and Group Executives for all of the functions that they have performed for the Company. Compensation of the Boardis paid by ACE Limited. Compensation of the Group Executives is paid by ACE Limited and the group entities where they areemployed. Compensation is paid as a combination of both U.S. dollars and Swiss francs though the following tables expressall remuneration details in Swiss francs with totals in both Swiss francs and U.S. dollars.
b) Remuneration of the Board of Directors
Unless indicated, remuneration under current Board compensation policy was unchanged from 2008. Where presented, 2008Swiss franc remuneration figures are disclosed at 2008 average exchange rates. Non-management directors received$220,000 (CHF 238,738) per year for their service as directors. The Company pays $140,000 (CHF 151,924) of this fee inthe form of restricted stock awards (RSA) (restricted stock units (RSU) in 2008), based on the fair value of the Company’sCommon Shares at the date of award. These 2009 stock awards were granted at the August Board meeting. ACE pays theremaining $80,000 (CHF 86,814) of the annual fee to directors in cash quarterly. Committee chairmen receive committeechair retainers as follows: Audit Committee—$25,000 (CHF 27,129); Compensation Committee—$15,000 (CHF 16,278);and other committees—$10,000 (CHF 10,852). Further, travel expenses of directors are paid by the Company.
The Lead Director received a retainer of $50,000 (CHF 54,259) for 2009 as compared with $25,000 (CHF 27,075) for2008, which is in addition to any retainer received as a committee chairman. All members of the Audit or Finance Commit-tees, other than the chairman, received a premium of $10,000 (CHF 10,852) per year and all members of the Compensation,Risk, or Nominating and Governance Committees, other than the chairman, received a premium of $5,000 (CHF 5,426) peryear. Directors are not paid fees for attending regular Board or committee meetings but, at the discretion of the Chairman ofthe Board and the Lead Director, ACE may pay an additional $2,000 (CHF 2,170) fee for each special meeting attended bytelephone and $3,000 (CHF 3,256) for each special meeting attended in person. The Company pays the retainers and pre-miums for committee service and special Board meeting fees quarterly in cash. Director fees are not pensionable.
Directors may elect to receive all of their compensation, other than compensation for special meetings, in the form ofRSAs (RSUs in 2008). RSAs and RSUs are awarded at the beginning of the plan year (i.e. the date of the Annual GeneralMeeting) and become non-forfeitable at the end of the plan year, provided that the grantee has remained an ACE director con-tinuously during that plan year.
In addition to the above described compensation, the Company has a matching contribution program fornon-management directors pursuant to which ACE will match director charitable contributions to registered charities, churches,and other places of worship or schools up to a maximum of $10,000 (CHF 10,852) per year.
The Company’s Corporate Governance Guidelines specify director equity ownership requirements. ACE awardsindependent directors’ RSAs. The Company mandates minimum equity ownership of $400,000 (CHF 413,494) for outsidedirectors (based on the stock price on the date of award). Each Director has until the fifth anniversary of his or her initial elec-tion to the Board to achieve this minimum. The previously granted RSUs (whether or not vested) and RSAs (whether or notvested) shall be counted toward achieving this minimum. Stock options shall not be counted toward achieving this minimum.
Once a Director has achieved the minimum equity ownership, such requirement shall remain satisfied going forward aslong as he or she retains the number of shares valued at the minimum amount based on the NYSE closing price for theCompany’s Common Shares as of the date such minimum threshold is initially met. Any vested shares held by a Director inexcess of the minimum share equivalent specified above may be sold at the Director’s discretion. Shares may be sold afterconsultation with General Counsel.
S-7

N O T E S T O S W I S S S T A T U T O R Y F I N A N C I A L S T A T E M E N T S (continued)
ACE Limited
No compensation was paid to former directors nor did any former director receive any benefits in kind or waivers of claimsduring the years ended December 31, 2009 and 2008. During 2009, Gary M. Stuart retired from the Board. BrianDuperreault received fees during the year ended December 31, 2008, totaling $4,950,000 (CHF 5,360,840);Mr. Duperreault stepped down from the Board during 2008. During the years ended December 31, 2009 and 2008, no cur-rent directors received benefits in kind or waivers of claims and no compensation had been paid to any related party of currentor former directors nor did any related party of current or former directors receive any benefits in kind or waivers of claims. AtDecember 31, 2009 and 2008, no current or former directors or any related party of current or former directors had out-standing loans or credits from the Company.
The following table sets forth information concerning director compensation paid or, in the case of RSAs or RSUs, earned in2009 and 2008. Although Evan G. Greenberg is Chairman of the Board, Mr. Greenberg had received no compensation inrespect of these duties. Details of Mr. Greenberg’s compensation in his capacity as a Group Executive are included in Note 6c) below.
Name YearBoard
FunctionFees Earned or
PaidStock
Awards(1) All Other(2) Total in CHF Total in USD
Michael G. Atieh 2009 Member 1,613 295,051 19,715 316,379 291,547
2008 Member — 274,140 10,830 284,970 263,131Mary A. Cirillo 2009 Member 1,512 258,575 10,852 270,939 249,673
2008 Member — 239,480 10,830 250,310 231,127Bruce L. Crockett 2009 Member 87,822 194,629 28,509 310,960 286,553
2008 Member 101,081 176,324 29,391 306,796 283,283Robert M. Hernandez 2009 Lead Director 140,393 177,214 13,283 330,890 304,919
2008 Lead Director 151,620 159,026 20,767 331,413 306,014John A. Krol 2009 Member 104,656 167,328 11,394 283,378 261,136
2008 Member 120,033 149,860 14,075 283,968 262,206Peter Menikoff 2009 Member 1,546 305,148 10,852 317,546 292,622
2008 Member — 282,872 10,830 293,702 271,193Leo F. Mullin 2009 Member 96,510 157,573 10,212 264,295 243,551
2008 Member 99,028 121,272 12,000 232,300 214,497Thomas J. Neff 2009 Member 1,512 291,234 11,931 304,677 280,763
2008 Member — 268,540 11,047 279,587 258,160Robert Ripp 2009 Member 116,133 180,960 11,335 308,428 284,220
2008 Member 132,667 162,491 14,883 310,041 286,281Dermot F. Smurfit 2009 Member 93,181 166,227 46,650 306,058 282,036
2008 Member 107,397 148,862 68,063 324,322 299,467Olivier Steimer 2009 Member 95,901 155,416 30,438 281,755 259,640
2008 Member 37,484 57,634 7,744 102,862 94,979Gary M. Stuart 2009 Member 37,461 80,688 13,017 131,166 120,871
2008 Member 113,715 163,882 15,984 293,581 271,081
Total 2009 778,240 2,430,043 218,188 3,426,471 3,157,531
2008 863,025 2,204,383 226,444 3,293,852 3,041,419
(1) This column reflects RSAs earned during 2009 and RSUs earned during 2008. These stock awards were granted in August 2009 and at the 2008 Annual GeneralMeeting, respectively, and vest at the subsequent year Annual General Meeting.
(2) Other annual compensation includes reimbursement of travel-related expenses for 2009 and 2008 totaling $103,282 (CHF 112,079) and $110,481 (CHF119,650), respectively, the Company’s matching contribution program for non-management directors pursuant to which the Company matches director charitablecontributions to registered charities, churches, and other places of worship or schools, and for 2009, personal use of Company aircraft totaling $295 (CHF 320) anda retirement gift totaling $1,995 (CHF 2,165).
c) Remuneration of Group Executives
There have been no changes in the composition of the executive committee during the year ended December 31, 2009, ascompared with the year ended December 31, 2008. During the years ended December 31, 2009 and 2008, no compensa-tion had been paid to former Group Executives or to any related party of current or former Group Executives nor had any such
S-8

N O T E S T O S W I S S S T A T U T O R Y F I N A N C I A L S T A T E M E N T S (continued)
ACE Limited
persons received benefits in kind or waivers of claims. At December 31, 2009 and 2008, no current or former Group Execu-tives or any related party of current or former Group Executives had outstanding loans or credits from the Company. Thefollowing table sets forth information concerning the Group Executives’ 2009 and 2008 compensation. During this period, noGroup Executive received waivers of claims other than as described in the footnotes to this table or benefits in kind.
Name andPrincipal Position Year Salary Bonus
StockAwards (1)
OptionAwards (2)
All OtherCompensation (3) Total in CHF Total in USD
Evan G. GreenbergPresident andChief ExecutiveOfficer, ACELimited (highestpaid 2009 1,302,209 3,906,626 5,694,308 2,897,543 1,136,815 14,937,501 13,765,075
executive) 2008 1,299,598 3,140,694 5,785,918 3,112,757 1,497,066 14,836,033 13,699,040Philip V. Bancroft
Chief FinancialOfficer, 2009 727,067 976,657 1,384,951 391,850 642,507 4,123,032 3,799,420
ACE Limited 2008 725,609 779,759 1,384,347 389,710 592,664 3,872,089 3,575,343Robert Cusumano
General Counseland Secretary, 2009 558,865 759,622 922,492 284,027 720,291 3,245,297 2,990,577
ACE Limited 2008 557,744 606,479 898,784 287,387 542,777 2,893,171 2,671,446Brian E. Dowd
Chief ExecutiveOfficer,Insurance— 2009 759,622 1,302,209 2,001,877 971,336 253,299 5,288,343 4,873,267
North America 2008 758,099 953,038 1,627,214 956,924 266,027 4,561,302 4,211,736John W. Keogh
Chief ExecutiveOfficer, ACEOverseas 2009 732,492 1,302,209 1,338,034 432,280 227,199 4,032,214 3,715,730
General 2008 731,024 812,249 1,144,639 381,956 239,819 3,309,687 3,056,042
Total 2009 4,080,255 8,247,323 11,341,662 4,977,036 2,980,111 31,626,387 29,144,069
2008 4,072,074 6,292,219 10,840,902 5,128,734 3,138,353 29,472,282 27,213,607
(1) This column discloses the expense recognized in 2009 and 2008 for RSAs in 2009 and 2008 and prior years. This column includes time-based and performance-based RSAs.
(2) This column discloses the expense recognized in 2009 and 2008 for stock options awarded in 2009 and 2008 and prior years.(3) This column includes:
• Perquisites and other personal benefits
o These consist of housing allowances, personal use of the Company aircraft and Company apartment, and miscellaneous other benefits, club memberships,private drivers, financial planning, executive medical cover, car allowance or car lease, car maintenance allowance, and cost of living allowance.
o Housing allowances are provided to Messrs. Greenberg, Bancroft, and Cusumano because these individuals are required to maintain a second residence inBermuda.
o Included in this table are amounts for personal use of corporate aircraft by all Group Executives who make personal use of the corporate aircraft, although theBoard has required Mr. Greenberg to use corporate aircraft for all travel whenever practicable for security reasons. For all other Group Executives, personal useof the corporate aircraft was limited to space available on normally scheduled management business flights.
• The Company reimburses the Group Executives for the following taxes:
o In the case of the Group Executives who received housing allowances, taxes incurred on housing allowances, except for Mr. Bancroft.
o In the case of certain of our Bermuda-based Group Executives (that is, Messrs. Bancroft and Cusumano), taxes incurred due to the Company’s payment of suchGroup Executive’s portion of Social Security and Medicare taxes, to which they are subject when they work within the United States.
• Contributions to retirement plans for 2009 and 2008 totaled CHF 1.25 million ($1.15 million) and CHF 1.56 million ($1.44 million), respectively.
• These consist of discretionary and non-discretionary employer contributions for 2009. The discretionary employer contributions for 2009 have beencalculated and will be paid in April 2010.
S-9

N O T E S T O S W I S S S T A T U T O R Y F I N A N C I A L S T A T E M E N T S (continued)
ACE Limited
7. Common Share ownership of the Board of Directors and Group Executives
a) Board of Directors
The following table sets forth information, at December 31, 2009 and 2008, with respect to the beneficial ownership ofCommon Shares by each of our directors. Although Evan G. Greenberg is Chairman of the Board, details of Mr. Greenberg’sCommon share ownership are included Note 7 b) below. Unless otherwise indicated, the named individual has sole votingand investment power over the Common Shares listed in the Common Shares Beneficially Owned column.
Name of Beneficial Owner Year
Common SharesBeneficially
Owned
CommonShares
Subject toOptions (1)
WeightedAverage OptionExercise Price
in CHF
OptionExercise
Years
RestrictedStock
Units (2)
Michael G. Atieh (3) 2009 13,089 14,000 37.43 2.22 28,128
2008 13,089 14,000 37.35 3.22 22,695Mary A. Cirillo 2009 — — — — 11,712
2008 — — — — 6,959Bruce L. Crockett 2009 14,654 14,000 37.43 2.22 26,394
2008 14,602 14,000 37.35 3.22 22,829Robert M. Hernandez 2009 54,230 14,000 37.43 2.22 20,553
2008 54,230 14,000 37.35 3.22 17,325John A. Krol 2009 5,666 11,030 37.29 2.53 12,519
2008 5,655 11,030 37.21 3.53 9,458Peter Menikoff (4) 2009 26,750 14,000 37.43 2.22 45,153
2008 26,576 14,000 37.35 3.22 39,533Leo Mullin 2009 1,845 — — — 4,591
2008 1,845 — — — 1,728Thomas J. Neff 2009 17,045 14,000 37.43 2.22 37,240
2008 16,971 14,000 37.35 3.22 31,904Robert Ripp 2009 24,154 14,000 37.43 2.22 23,597
2008 22,857 14,000 37.35 3.22 20,300Dermot F. Smurfit 2009 9,959 14,000 37.43 2.22 11,624
2008 9,959 14,000 37.35 3.22 8,601Olivier Steimer 2009 — — — — 2,837
2008 — — — — 15Gary M. Stuart 2009 N/A N/A N/A N/A N/A
2008 14,721 14,000 37.35 3.22 21,493
Total 2009 167,392 109,030 37.41 2.26 224,348
2008 180,505 123,030 37.34 3.25 202,840
(1) Represents Common Shares that the individual has the right to acquire within 60 days of December 31, 2009 and 2008, respectively, through option exercises (alloptions are vested).
(2) Represents Common Shares that will be issued to the director upon his or her termination from the Board. These Common Shares relate to stock units granted asdirector’s compensation and associated dividend reinvestment accruals.
(3) Mr. Atieh shares with other persons the power to vote and/or dispose of 1,535 of the Common Shares listed at December 31, 2009 and 2008.(4) Mr. Menikoff shares with other persons the power to vote and/or dispose of 4,800 of the Common Shares listed at December 31, 2009 and 2008.
S-10

N O T E S T O S W I S S S T A T U T O R Y F I N A N C I A L S T A T E M E N T S (continued)
ACE Limited
b) Group Executives
The following table sets forth information, at December 31, 2009 and 2008, with respect to the beneficial ownership ofCommon Shares by each of our Group Executives. Unless otherwise indicated, the named individual has sole voting andinvestment power over the Common Shares listed in the Common Shares Beneficially Owned column.
Name of Beneficial Owner Year
Common SharesBeneficially
Owned
CommonShares
Subject toOptions (1)
WeightedAverage OptionExercise Price
in CHF
OptionExercise
Years
RestrictedCommonStock (2)
Evan G. Greenberg (3)(4) 2009 255,232 1,196,120 45.80 4.83 268,571
2008 238,941 951,479 44.42 5.35 231,927Philip Bancroft 2009 85,378 198,663 44.89 4.36 68,421
2008 70,239 178,983 43.75 4.93 60,830Robert Cusumano (5) 2009 21,058 48,863 55.92 6.96 43,751
2008 12,493 34,326 56.34 7.41 35,482Brian E. Dowd 2009 53,294 232,209 48.69 4.24 101,338
2008 20,757 217,890 47.25 4.63 65,136John Keogh 2009 16,844 42,505 57.95 7.81 62,918
2008 8,826 18,667 62.16 8.43 42,973
Total 2009 431,806 1,718,360 46.67 4.83 544,999
2008 351,256 1,401,345 45.30 5.28 436,348
(1) Represents Common Shares that the individual has the right to acquire through option exercises, both vested and unvested.(2) Represents Common Shares with respect to which the individual has the power to vote (but not to dispose of).(3) Mr. Greenberg shares with other persons the power to vote and/or dispose of 20,116 and 8,190 of the Common Shares listed at December 31, 2009 and 2008,
respectively.(4) Mr. Greenberg has pledged 212,345 and 224,335 Common Shares in connection with a margin account at December 31, 2009 and 2008, respectively.(5) Mr. Cusumano shares with other persons the power to vote and/or dispose of 800 of the Common Shares listed at December 31, 2009 and 2008.
8. Significant shareholders
The following table sets forth information regarding each person, including corporate groups, known to the Company to ownbeneficially or of record more than five percent of the Company’s outstanding Common Shares at December 31, 2009 and2008.
2009 2008
Name of Beneficial Owner
Number of SharesBeneficially
OwnedPercentof Class
Number of SharesBeneficially
OwnedPercentof Class
Wellington Management Company, LLP 46,553,751 13.83% 46,502,309 13.94%Capital World Investors 25,230,800 7.50% N/A N/A
9. Risk assessment and management
The management of ACE is responsible for assessing risks related to the financial reporting process and establishing and main-taining adequate internal controls over financial reporting. Internal control over financial reporting is a process designed by, orunder the supervision of the Chairman of the Board of Directors/Chief Executive Officer and Chief Financial Officer to providereasonable assurance regarding the reliability of financial reporting and the preparation of ACE’s consolidated financial state-ments for external purposes in accordance with GAAP. In addition under Swiss Law, the Board of Directors of ACE has theultimate responsibility for establishing an internal control system on the financial statements.
The Board, operating through its Audit Committee comprised entirely of directors who are not officers or employees of theCompany, is ultimately responsible for oversight of the financial reporting process and safeguarding of assets againstunauthorized acquisition, use, or disposition. The Board usually meets four times per year in regularly scheduled meetings, butwill meet more often if necessary. The Board met six times during 2009, including one telephonic meeting. The Audit Commit-
S-11

N O T E S T O S W I S S S T A T U T O R Y F I N A N C I A L S T A T E M E N T S (continued)
ACE Limited
tee participated in five regularly scheduled meetings (one of which was telephonic), four telephonic earnings discussions andtwo training sessions, none of which was telephonic. The Audit Committee meets with management, the independent regis-tered public accountants and the internal auditor; approves the overall scope of audit work and related fee arrangements; andreviews audit reports and findings. In addition, the independent registered public accountants and the internal auditor meetseparately with the Audit Committee, without management representatives present, to discuss the results of their audits; theadequacy of the Company’s internal control; the quality of its financial reporting; and the safeguarding of assets againstunauthorized acquisition, use, or disposition.
10. Other disclosures required by Swiss law
a) Expenses
Total personnel expenses amounted to CHF 4.7 million for the year ended December 31, 2009, and CHF 859 thousand forthe period from July 10, 2008, to December 31, 2008.
Total amortization expense related to tangible property amounted to CHF 1.1 million for the year ended December 31,2009, and CHF 212 thousand for the period from July 10, 2008, to December 31, 2008.
b) Fire insurance values of property and equipment
Total fire insurance values of property and equipment amounted to CHF 8.917 million at December 31, 2009, and CHF8.293 million at December 31, 2008.
S-12

P R O P O S E D A P P R O P R I A T I O N O F A V A I L A B L E E A R N I N G S
ACE Limited
Proposed appropriation of available earnings
At December 31, 2009 and 2008,336,524,657 and 333,645,471, respectively, of the Company’s Common Shares wereeligible for dividends. The following table shows the appropriation of available earnings as proposed by the Board of Directors(the Board) for the year ended December 31, 2009, and for the period from July 10, 2008 to December 31, 2008.
(in millions of Swiss francs) 2009 2008
Net Income 693 491Balance brought forward 970 481Par value reduction on treasury shares 2 1Attribution to reserve for treasury shares — (3)Dividend — —
Balance carried forward 1,665 970
The Board proposes to the Annual General Meeting to appropriate the net income to the free reserve in accordance with thetable above.
For the foreseeable future, subject to shareholder approval, the Company expects to make distributions as a repayment ofshare capital in the form of a reduction in par value or qualified paid-in capital rather than through dividends.
The Board proposes distributions in 2010 totaling $1.32 per Common Share using the USD/CHF currency exchange rateas published in The Wall Street Journal on the fourth New York business day prior to the date of the 2010 annual generalmeeting (the Base Annual Distribution), payable in four installments; provided that each of the CHF installments will beadjusted pursuant to the formula so that the actual CHF par value reduction amount for each installment will equal $0.33,subject to an aggregate upward adjustment (the Distribution Cap) for the four installments of 50 percent of the Base AnnualDistribution. Application of the formula will mean that the CHF amount of each installment will be determined at the approx-imate time of distribution, while the U.S. dollar value of the installment will remain $0.33 unless and until the DistributionCap is reached. A par value reduction that would otherwise exceed the Distribution Cap will be reduced to equal the CHFamount remaining available under the Distribution Cap, and the U.S. dollar amount distributed will be the then-applicableU.S. dollar equivalent of that CHF amount.
At the 2009 annual general meeting, the Company’s shareholders approved a par value reduction of CHF 1.36 (the BaseAnnual Dividend), equal to $1.24 per share at the time of the Dividend Approval, payable in four installments prior to the2010 Annual General Meeting; provided that each of the Swiss franc installments will be adjusted pursuant to the formula sothat the actual Swiss franc par value reduction amount for each installment will equal $0.31, subject to an aggregate upwardadjustment (the Dividend Cap) for the four installments of 50 percent of the Base Annual Dividend (i.e., CHF 0.68). For theyear ended December 31, 2009, the Company declared distributions through a reduction in par value of Common Sharestotaling CHF 1.26 ($1.19) which has been reflected as a reduction to the balance of Share Capital in the accompanying bal-ance sheet; as such, no dividend has been reflected in the table above. The Swiss franc amount of each 2009 installmentdepended upon the currency exchange rate in effect at the approximate time of its payment, which caused the Swiss francvalue of each installment to vary.
S-13

REPORT OF THE STATUTORY AUDITOR TO THE GENERAL MEETING OF ACE LIMITED, ZURICH ON THE
(SWISS STATUTORY) FINANCIAL STATEMENTS
Report of the statutory auditor on the financial statements
As statutory auditor, we have audited the accompanying financial statements of ACE Limited, which comprise the balancesheet, statement of income and notes (pages S-2 to S-12), for the year ended December 31, 2009.
Board of Directors’ ResponsibilityThe Board of Directors is responsible for the preparation of the financial statements in accordance with the requirements ofSwiss law and the company’s articles of incorporation. This responsibility includes designing, implementing and maintainingan internal control system relevant to the preparation of financial statements that are free from material misstatement, whetherdue to fraud or error. The Board of Directors is further responsible for selecting and applying appropriate accounting policiesand making accounting estimates that are reasonable in the circumstances.
Auditor’s ResponsibilityOur responsibility is to express an opinion on these financial statements based on our audit. We conducted our audit in accord-ance with Swiss law and Swiss Auditing Standards. Those standards require that we plan and perform the audit to obtainreasonable assurance whether the financial statements are free from material misstatement.
An audit involves performing procedures to obtain audit evidence about the amounts and disclosures in the financialstatements. The procedures selected depend on the auditor’s judgment, including the assessment of the risks of material mis-statement of the financial statements, whether due to fraud or error. In making those risk assessments, the auditor considersthe internal control system relevant to the entity’s preparation of the financial statements in order to design audit proceduresthat are appropriate in the circumstances, but not for the purpose of expressing an opinion on the effectiveness of the entity’sinternal control system. An audit also includes evaluating the appropriateness of the accounting policies used and the reason-ableness of accounting estimates made, as well as evaluating the overall presentation of the financial statements. We believethat the audit evidence we have obtained is sufficient and appropriate to provide a basis for our audit opinion.
OpinionIn our opinion, the financial statements for the year ended December 31, 2009 comply with Swiss law and the company’sarticles of incorporation.
Report on other legal requirements
We confirm that we meet the legal requirements on licensing according to the Auditor Oversight Act (AOA) and independence(article 728 CO and article 11 AOA) and that there are no circumstances incompatible with our independence.
In accordance with article 728a paragraph 1 item 3 CO and Swiss Auditing Standard 890, we confirm that an internalcontrol system exists which has been designed for the preparation of financial statements according to the instructions of theBoard of Directors.
We further confirm that the proposed appropriation of available earnings complies with Swiss law and the company’sarticles of incorporation. We recommend that the financial statements submitted to you be approved.
PricewaterhouseCoopers AG
/S/ RICHARD BURGER /S/ PATRICK SHOUVLIN
Richard BurgerAudit expertAuditor in charge
Patrick ShouvlinAudit expert
Zurich, February 25, 2010
S-14

Co
rpo
rate
Go
vern
an
ce

40
Evan G. Greenberg
Chairman and
Chief Executive Offi cer,
ACE Limited
Prior experience:
President and Chief Operating
Offi cer, Vice Chairman, ACE
Limited; President and Chief
Operating Offi cer, American
International Group.
Board/Trustee memberships:
Director, National Committee on
U.S.-China Relations; Trustee,
New York Philharmonic; Trustee,
The Eisenhower Fellowships.
Michael G. Atieh
Executive Chairman, Eyetech, Inc.
Prior experience:
Executive Vice President and Chief
Financial Offi cer, OSI Pharmaceu-
ticals; Group President, Dendrite
International, Inc.; Senior Vice
President and Chief Financial Offi cer,
Dendrite International, Inc.; Vice
President, U.S. Human Health
(a division of Merck & Co., Inc.);
Senior Vice President, Merck-Medco
Managed Care L.L.C.; Treasurer,
Merck & Co., Inc.
Certifi ed Public Accountant
Board/Trustee memberships:
Executive Chairman, Eyetech, Inc.
Mary A. Cirillo
Advisor, Hudson Venture Partners L.P.
Prior experience:
Chairman, Opcenter LLC;
Chief Executive Offi cer, Global
Institutional Services, Deutsche
Bank North America; Executive Vice
President and Managing Director,
Bankers Trust Company; Senior
Vice President, Global Relationship
Banking Operations & Technology,
Citicorp (USA).
Board/Trustee memberships:
Director, Thomson Reuters Cor-
poration; Director, DealerTrack
Holdings; Advisory Board Member,
Hudson Venture Partners; Director,
Roundabout Theatre Company.
Bruce L. Crockett
Chairman, Crockett Technologies
Associates (CTA)
Prior experience:
President, Chief Executive Offi cer,
COMSAT Corporation.
Board/Trustee memberships:
Chairman, Invesco Aim Mutual
Funds; Life Trustee, University of
Rochester; Board of Visitors Mem-
ber, Vanderbilt Graduate Business
School; Board Member, Invest-
ment Company Institute.
Robert M. Hernandez
Chairman, RTI International
Metals, Inc.
Prior experience:
Vice Chairman, Director and Chief
Financial Offi cer, USX Corporation.
Board/Trustee memberships:
Chairman, RTI International
Metals, Inc; Chairman, BlackRock
Open-End Equity and Long Term
Bond Funds; Director, Eastman
Chemical Company; Director,
Tyco Electronics Ltd.
Mr. Hernandez is Lead Director
of the Board of Directors of ACE
Limited.
John A. Krol
Non-Executive Chairman, Delphi
Automotive, LLP
Prior experience:
Chairman and Chief Executive
Offi cer, E.I. du Pont de Nemours
and Company.
Board/Trustee memberships:
Director, Tyco International Ltd.;
Director, Norvax, Inc.; Director,
Pacolet Milliken Enterprises, Inc.
Corporate GovernanceACE Limited Directors

41
Peter Menikoff
P rivate Investor
Prior experience:
Interim Chief Financial Offi cer, Vlasic
Foods International Inc.; President and
Chief Executive Offi cer, CONEMSCO,
Inc.; Executive Vice President and Chief
Administrative Offi cer, Tenneco Energy
Corporation; Senior Vice President, Ten-
neco, Inc.; Executive Vice President, Case
Corporation; Treasurer, Tenneco, Inc.
Board/Trustee memberships:
Director, American Electric
Technologies, Inc.
Leo F. Mullin
Senior Advisor, Goldman Sachs
Capital Partners
Prior experience:
Chairman and Chief Executive
Offi cer, Delta Air Lines.
Board/Trustee memberships:
Director, Johnson & Johnson; Director,
Education Management Corporation;
Chairman, Juvenile Diabetes Research
Foundation.
Thomas J. Neff
Chairman, Spencer Stuart, U.S.
Prior experience:
President and Managing Partner,
Spencer Stuart.
Board/Trustee memberships:
Director, Hewitt Associates, Inc.;
Director, Various Lord Abbett Mutual
Funds; Trustee, Lafayette College.
Robert Ripp
Chairman, Lightpath Technologies Inc.
Prior experience:
Chairman, Director and Chief Execu-
tive Offi cer, AMP Incorporated; Vice
President and Chief Financial Offi cer,
AMP Incorporated; Vice President and
Treasurer, International Business
Machines Corporation.
Board/Trustee memberships:
Director, PPG Industries, Inc.;
Chairman, Lightpath Technologies Inc.
Dermot F. Smurfi t
Chairman, Powerfl ute OYJ
Prior experience:
Chairman, Federation Euro-
pean Fabrication Carton Ondule
(FEFCO); Chairman, Anker plc;
Chairman, Peach Holdings plc;
Chairman, Pankaboard Oy;
Chairman, Smurfi t Europe; Joint
Deputy Chairman, Jefferson
Smurfi t Group plc; Chairman and
Chief Executive Offi cer, Continen-
tal European Operations, Jefferson
Smurfi t Group plc; Director, Sales
and Marketing, Jefferson Smurfi t
Group plc.
Board/Trustee memberships:
Chairman, Eurolink Motorway
Operations Ltd.; Chairman, World
Containerboard Organisation;
Chairman, Powerfl ute OYJ; Chair-
man, Timber Capital Ltd.; Deputy
Chairman, The Forest Company
Ltd.; Member, Foundation Board,
Limerick University.
Mr. Smurfi t will retire from the
Board of Directors of ACE Limited
upon the expiration of his term at
the Annual General Meeting held
on May 19, 2010.
Olivier Steimer
Chairman of the Board, Banque
Cantonale Vaudoise
Prior experience:
Chief Executive Offi cer, Private
Banking International, Credit
Suisse Group.
Board/Trustee memberships:
Chairman, Banque Piguet &
Cie S.A.; Chairman, Foundation
Board, Swiss Finance Institute;
Chairman, Committee of the
Lausanne University Construction
offi ce; Member, Bank Council,
Swiss National Bank; Director,
Swiss Federal Railways SBB;
Director, Renault Finance S.A.;
Director, economiesuisse; Direc-
tor, Mont Olivet Institut; Director,
Center for Humanitarian Dialogue.

42
Audit Committee
The committee was established to assist the Board in its over-
sight of the integrity of the company’s fi nancial statements
and fi nancial reporting process, compliance with legal and
regulatory requirements, the system of internal controls, the
audit process, the performance of the company’s internal
auditors and the performance, qualifi cation and independence
of the company’s independent registered public accounting fi rm.
Robert Ripp, Chairman
Michael G. Atieh
Peter Menikoff
Nominating and Governance Committee
The committee was established to assist the Board in identifying
individuals qualifi ed to become Board members; to recommend
to the Board director nominees; and to develop and recommend
to the Board appropriate corporate governance guidelines.
In addition to general corporate governance matters, the
Nominating and Governance Committee assists the Board and
the Board committees in their self-evaluation.
Thomas J. Neff, Chairman
Mary A. Cirillo
Bruce L. Crockett
Robert M. Hernandez
John A. Krol
Leo F. Mullin
Dermot F. Smurfi t*
Olivier Steimer
Compensation Committee
The committee was established to discharge the
Board’s responsibilities relating to compensation of the
company’s employees.
John A. Krol, Chairman
Mary A. Cirillo
Thomas J. Neff
Dermot F. Smurfi t*
* Until retirement effective as of the Annual General Meeting
on May 19, 2010
Finance and Investment Committee
The committee was established to oversee management’s
investment of the company’s investable assets. The
committee also oversees the company’s capital structure
and fi nancing arrangements in support of the company’s
annual fi nancial plan and makes recommendations to
the Board with regard thereto.
Michael G. Atieh, Chairman
Peter Menikoff
Robert Ripp
Risk Committee
The committee was established to help execute the Board’s
supervisory responsibilities pertaining to enterprise risk
management. The goal of the committee is to assure that the
risk management process perceives risk well, has a reason-
able and sound set of policies for setting parameters on
risk, and, for specifi c material risks, has prepared itself to
avoid or mitigate outcomes that threaten the viability of the
company.
Olivier Steimer, Chairman
Bruce L. Crockett
Robert M. Hernandez
Leo F. Mullin
Executive Committee
The committee, which meets only in emergency situations,
was established to exercise all the powers and authority of
the Board in the management of the business and affairs of
the company between the meetings of the Board, except as
limited by the company’s Articles of Association and Organi-
zational Regulations, rules of the New York Stock Exchange
or applicable law or regulation, and matters that are specifi -
cally reserved for another committee of the Board.
Evan G. Greenberg, Chairman
Michael G. Atieh
Robert M. Hernandez
John A. Krol
Thomas J. Neff
Robert Ripp
Olivier Steimer
Corporate Governance ACE Limited Committees

43
ACE Limited Executive Offi cers*
Evan G. Greenberg
Chairman and Chief Executive Offi cer
Philip V. Bancroft
Chief Financial Offi cer
Robert Cusumano
General Counsel
Brian E. Dowd
Vice Chairman, ACE Limited;
Chief Executive Offi cer, Insurance – North America
John Keogh
Chief Executive Offi cer, ACE Overseas General
*Executive Offi cers for SEC reporting purposes.
ACE Group Executives
John Bassetto
President and Chief Executive Offi cer, ACE Asia Pacifi c
Jacques Q. Bonneau
President and Chief Executive Offi cer, ACE Tempest Re Group
Timothy Boroughs
Chief Investment Offi cer, ACE Group
Jorge Luis Cazar
President and Chief Executive Offi cer, ACE Latin America
Edward Clancy
President and Chief Operating Offi cer, ACE Overseas General;
Executive Vice President, Global Accident & Health
Phillip B. Cole
Global Human Resources Offi cer, ACE Group
Robert Courtemanche
Chief Executive Offi cer, ACE Private Risk Services
Steve Crouch
Chief Operating Offi cer, ACE Asia Pacifi c
Dennis Crosby
Chairman, ACE Commercial Risk Services; President and Chief
Executive Offi cer, ACE Westchester
Rees Fletcher
President and Chief Executive Offi cer, ACE Bermuda
Samantha Froud
Group Financial Controller, ACE Group
David Furby
President, ACE Continental Europe
Andrew Kendrick
Chairman and Chief Executive Offi cer, ACE European Group
Rainer Kirchgaessner
Global Corporate Development Offi cer, ACE Group
Ken Koreyva
Treasurer, ACE Group
Frank Lattal
Chief Claims Offi cer, ACE Group
Andreas Lewin
Managing Director, ACE Tempest Re Europe
John Lupica
Chief Operating Offi cer, Insurance – North America;
President and Chief Executive Offi cer, ACE USA
Patrick McGovern
Chief Communications Offi cer, ACE Group
Paul Medini
Chief Accounting Offi cer, ACE Group
Constantin Petalas
President, ACE Tempest Re Canada
Richard Pryce
President, ACE U.K.
Sean Ringsted
Chief Risk Offi cer and Chief Actuary, ACE Group
Ronald J. Rintala
Global Operations Offi cer, ACE Group
Audrey Samers
Global Compliance and Business Ethics Offi cer, ACE Group
Lori Samson
Chief Administration Offi cer, Bermuda Companies
Julie Schaekel
Chief Auditor, ACE Group
Kevin Shearan
Chief Information Offi cer, ACE Group
Erin Skala
President and Chief Operating Offi cer,
ACE Tempest Re Bermuda
Neil C. Smith
President, ACE Far East
Douglas Wendt
President and Chief Executive Offi cer, Combined Insurance
James E. Wixtead
Chief Executive Offi cer, ACE Tempest Re USA
David Wolf
President, ACE Life
Corporate Information

44
Shareholder Information
Visit the Investor Information section of acelimited.com, write
to the Investor Relations Department at ACE Limited
or e-mail [email protected] for copies of
the company’s reports to the Securities and Exchange Commis-
sion on Form 10-K, Form 10-Q or Form 8-K,
all of which are available without charge.
Address Investor Relations Inquiries to:
Investor Relations
ACE Limited
17 Woodbourne Avenue
Hamilton HM 08
Bermuda
Tel: 441 299 9283
Fax: 441 292 8675
E-mail: [email protected]
Transfer Agent & Registrar:
Mellon Investor Services LLC
480 Washington Boulevard
Jersey City, NJ 07310-1900 USA
Tel: 201 680 4637
Address Shareholder Inquiries to:
Mellon Investor Services LLC
P.O. Box 358015
Pittsburgh, PA 15252-8015 USA
E-mail: [email protected]
Website: www.bnymellon.com/shareowner/isd
Send Certifi cates for Transfer and
Address Changes to:
Mellon Investor Services LLC
Stock Transfer Department
P.O. Box 358010
Pittsburgh, PA 15252-8010 USA
Independent Auditors:
PricewaterhouseCoopers AG
Birchstrasse 160
8050 Zurich
Switzerland
Tel: 41 58 792 44 00
PricewaterhouseCoopers LLP
Two Commerce Square, Suite 1700
Philadelphia, PA 19103 USA
Tel: 267 330 3000
New York Stock Exchange Symbol:
ACE
ACE Cusip Number:
H0023R-10-5
CEO and CFO Certifi cations
In 2009, ACE Limited’s Chief Executive Offi cer (CEO)
provided to the New York Stock Exchange the annual
CEO certifi cation regarding ACE Limited’s compliance
with the New York Stock Exchange’s corporate governance
listing standards. In addition, in 2009, ACE Limited fi led
with the U.S. Securities and Exchange Commission all
certifi cations of its CEO and Chief Financial Offi cer
required by the Sarbanes-Oxley Act of 2002.
2009 2008
High Low Closing Cash
DividendsHigh Low Closing
Cash
Dividends
Quarter ending March 31 $53.03 $31.84 $40.40 $0.26 (CHF 0.30) $61.65 $53.66 $55.06 $0.27
Quarter ending June 30 $47.51 $40.82 $44.23 $0.31 (CHF 0.33) $62.67 $55.06 $55.09 $0.29
Quarter ending September 30 $53.46 $41.76 $53.46 $0.31 (CHF 0.31) $66.00 $45.30 $54.13 $0.26 (CHF 0.30)
Quarter ending December 31 $55.14 $48.18 $50.40 $0.31 (CHF 0.32) $57.36 $37.97 $52.92 $0.27 (CHF 0.30)
Price Range of Common Shares and Dividends
As of February 23, 2010, the company had 336,557,967 Common Shares outstanding with 3,697 registered holders of Common Shares.
The accompanying table sets forth the cash dividends declared, the high and low closing sales prices, and the closing sales price of the
company’s Common Shares, as reported on the NYSE Composite Tape for the periods indicated. Since third quarter 2008, ACE Limited has
paid dividends by way of par value reduction.
2009 2008

This Annual Report contains
trademarks, trade names and service
marks owned by ACE Limited and
its subsidiaries. In addition, this
report contains trademarks, trade
names or service marks of compa-
nies other than us, which belong to
their respective owners.
This report is printed on recycled
paper containing 10% and 50%
post-consumer waste. These papers
are certified to the international
standards of the Forest Stewardship
Council (FSC), which promotes
responsible management of the
world’s forests. It was printed by
Allied Printing, an FSC-certified
printer.
Design and art direction:
Rob Frankle
for Leo Burnett Business
The ACE Group is a global leader in insurance and
reinsurance serving a diverse group of clients. Headed
by ACE Limited, the ACE Group conducts its business
on a worldwide basis with operating subsidiaries in
more than 50 countries.
Insuring Progress
We take on the responsibility of risk so our clients can
take on the responsibility of making things happen.
We call this insuring progress.
Contents
Financial Summary 1
To My Fellow Shareholders 2
2009 Highlights 10
The World of ACE 18
Business Segments
Insurance – North American 24
Insurance – Overseas General 28
Global Reinsurance 32
Life 36
Form 10K
Report of Group Auditors
Swiss Statutory Financial Statements
Corporate Governance at ACE Limited 40
Corporate Information 43
Shareholder Information 44
MA
C
CG10_1 CG10_2
92811IMPO.B Cover (CS3)(PRNTD) TBC292811IMPO.B Cover (CS3)(PRNTD) TBC2 4/8/10 10:28 AM4/8/10 10:28 AM

ACE Limited Annual Report 2009
ACE Limited
Barengasse 32
CH-8001 Zurich
Switzerland
acelimited.com
blackcyan 376 CG10_1
MA
C
CG10_2A
CE
Lim
ited
An
nu
al R
ep
ort 2
00
9
92811IMPO.B Cover (CS3)(PRNTD) TBC492811IMPO.B Cover (CS3)(PRNTD) TBC4 4/8/10 10:28 AM4/8/10 10:28 AM