
Scour downstream hydraulic structures
26
Local scour downstream of hydraulic structures draft G.J.C.M. Hoffmans and K.W. Pilarczyk Road and Hydraulic Engineering Division P.O. Box 5044 2600 GA Delft december, 1993
-
Upload
independent -
Category
Documents
-
view
4 -
download
0
Transcript of Scour downstream hydraulic structures

Local scour downstream of hydraulic structures
draft
G.J.C.M. Hoffmans and K.W. Pilarczyk
Road and Hydraulic Engineering Division
P.O. Box 5044
2600 GA Delft
december, 1993

2
1 Introduction
Scour is a natural phenomenon caused by the flow of water in rivers and streams. Scour occurs naturally
as part of the morphological changes of rivers and as result of structures man-made. Several types of
scour can be distinguished.
Generally the scour process can be split up into different time phases. In the beginning the development
of scour is very fast, and eventually an equilibrium situation will be reached. During closing operations of
dams in estuaries or rivers (figure 1), which take place within a limited time, equilibrium will not be
attained. Not only during the construction, but also in the equilibrium phase it is vital to know both the
development of scour as function of time and whether the foundation of the hydraulic structure is under-
mined progressively.
Experience has shown that due to shear failures or flow slides or small scale shear failures at the end of
the bed protection, the scour process can progressively damage the bed protection, leading eventually to
the failure of the hydraulic structure for which the bed protection was meant.
In the scope of the Dutch Delta works, a systematical investigation of time scale for two and three-
dimensional local scour in loose sediments was conducted by Delft Hydraulics and 'Rijkswaterstaat'
(Department of Transport and Public Works). From model experiments on different scale and bed
materials, relations were derived between time-scale and scales for velocity, flow depth and material
density (Breusers, 1966). In addition empirical relations were found in order to predict the steepness of
the upstream scour slope (De Graauw and Pilarczyk, 1981).
Besides the systematical investigation, design criteria for the length of the bed protection were deduced
which were based on many hundred of shear failures and flow slides occurred along the coastline in the
south-western part of the Netherlands
(Pilarczyk, 1984).
In the earlier nineties a morphological model
for the development of scour holes behind
hydraulic structures was developed
(Hoffmans, 1992), based on the 2-D Navier-
Stokes and convection-diffusion equations.
The morphological model is a combination of a flow model DUCT (Vreugdenhil, 1982), based on a
parabolic boundary-layer technique using finite elements, and a sediment transport model SUSTRA (Van
Rijn and Meijer, 1986).
Since the predictability of the empirical relations for the steepness of the scour hole is poor compared to
measurements and computational results of the morphological model DUCT-SUSTRA, especially for
prototype conditions, a theoretical approach concerning upstream scour slopes is discussed. Based on
the mass-balance equation and a stochastical bed-load predictor (Van Rijn, 1985) both used in DUCT-
SUSTRA, a stability criterion is derived which is verified applying some prototype experiments (Delft
Hydraulics, 1979 and De Graauw & Pilarczyk, 1981).
Figure 1 Schematization of a storm surge barrier

2
2 Functional design of the bed protection
General
The bed in the direct neighbourhood of
hydraulic structures is generally protected
against current, waves and eddies to
ensure both the safety and durability
concerning the functioning of hydraulic
structures. The length of the bed protection
depends on the permissible amount of
scour (maximum scour depth and the
upstream scour slope) and the geotech-
nical structure of the soil involved (densily
or loosely packed sand).
When the length of the bed protection
increases, the scour process is less inten-
sive due to the decay of the turbulence
energy downstream of hydraulic structures.
However, the measures required for
protection against scouring are costly,
especially when the bed protection is
constructed under water. For example, the
total area of the bed protection necessary
for the stability of the stormsurge barrier in
the mouth of the Eastern Scheldt in the
Netherlands measured about 5*106 m2,
which stresses the importance of extensive
investigations.
The design process of the bed protection in relation to the expected (predicted) local scour is illustrated in
figure 2. Some design aspects will be discussed in more detail.
Boundary conditions
In order to design an optimal bed protection downstream of hydraulic structures, information with respect
to hydraulic and geotechnical parameters is indispensable.
Flow characteristics (flow velocities, water levels, discharges) and turbulence intensities determined by
the geometry of the hydraulic structure and bed roughness characterize the flow pattern in the vicinity of
Figure 2 Design phases of the bed protection

2
the hydraulic structure and are thus a measure for the erosion in the scour hole just downstream of the
end of the bed protection. On the other hand the scour process is also determined by the composition of
the bed material.
The flow pattern downstream of hydraulic
structures and in the scour hole is shown in
figure 3 in which the separated shear layer
appears to be much like an ordinary plane mix-
ing layer. The axis of the mixing layer is at the
very beginning slightly curved due to the
influence of the bed. The curvature increases
with the distance from the end of the bed pro-
tection, especially near the point of
reattachment. A reverse flow develops with a
flow direction opposite to the mean flow dir-
ection. Both in the mixing layer and in the
recirculation zone the standard deviation σu of
the instantaneous flow velocity is relatively large
compared to uniform flow conditions.
Vortices with a vertical axis occur when the flow pattern is influenced by abutments and/or vertical end
walls. Then the bed material is picked up by the rotating ascending current in the vortex and is thrown out
sideways. The intensity of such a Kármán Vortex Street may attain such a magnitude that it will endanger
the stability of the construction unless effective protective measures are taken.
Generally the magnitude of the maximum scour depth is not of importance as far as the geotechnical
stability of the upstream scour slope is assured. In the equilibrium of the scour process the upstream
scour slope as well as the maximum scour depth reach their maximum values. Then the instability of the
upstream scour slope, i.e. the consequences of that expressed by a shear failure or flow slide, is more
significant compared to the other scour phases. This stresses the importance of reliable predictions of
the maximum scour depth and the upstream scour slope.
Design criteria
Besides the sediment transport in the scour hole, soil particles in the filter construction below the bed
protection can be transported both in the vertical and horizontal direction (piping) when the groundwater
seepage flow becomes concentrated in narrow passages or pipes. To protect the particles from being
washed out through the coarser upper layer granular and synthetic filters are frequently applied in civil
engineering. In addition, the stability of both the upper layer and the end of the bed protection against
current, waves and eddies has to be safeguarded, so that the bed protection and thus the hydraulic
structure will not be undermined.
The form of the scour hole can be characterized roughly by the maximum scour depth expected during
Figure 3 Schematized flow pattern below a dam

2
the lifetime and the angle of the upstream scour slope, which must be less than the angle of internal
friction. Both hydraulic and geotechnical characteristics will influence these two design parameters and
will be treated in more detail in the subsequent sub-sections.
3 Time phases of the scour process
General
To give some insight into the scour process behind hydraulic structures, the flow pattern and the
sediment transport along the upstream slope of the scour hole are described for several phases in the
scour process. Based on experiments at scale model with small Froude numbers (Breusers, 1966 and
Dietz, 1969), Zanke (1978) distinguished
four phases in the evolution of a scour hole
(figure 4): an initial phase, a development
phase, a stabilization phase and an
equilibrium phase.
Initial phase
In the initial phase the flow in the scour
hole is nearly uniform in the longitudinal
direction. This phase of the scour process
can be characterized as the phase in which
the erosion capacity is most severe.
Experiments with fine sediments showed
(e.g. Breusers, 1966) that at the beginning
of the scour hole development a certain
amount of bed material near the upstream
scour slope goes into suspension. Most of
these suspended particles are convected with the main flow and remain in suspension due to the internal
balance between the upwards diffusive flux and the convective (downwards) flux. Some of these particles
will deposit and will go into suspension again due to the large bursts of the turbulent flow near the bed,
and some particles with a jump height smaller than a defined saltation or reference height are transported
as bed load.
Development phase
During the development phase the scour depth increases considerably, but the shape of the scour hole
remains similar. In this phase the ratio of the maximum scour depth and the distance from the end of the
bed to the point where the scour hole is at maximum is, more or less, constant.
Figure 4 Development of the scour process

2
Measurements by Hoffmans (1990) showed that the upper part of the upstream scour slope is in equili-
brium, whereas the lower part is still developing. In the recirculation zone the suspended load close to the
bed is decreased significantly compared to the conditions in the initial phase. This can mainly be ascribed
to the decrease of the flow velocities near the bed in time, despite the increase of the turbulence energy.
Though bed particles are picked up and convected by the flow, the time-averaged value of the sediment
transport in the upper part of the upstream scour slope is negligibly small, since the contribution of the
sediment transport due to the instantaneous flow-velocities in the downstream direction equals
approximately the transport due to the instantaneous flow-velocities in the upstream direction.
Stabilization phase
In the stabilization phase the rate of development of the maximum scour depth decreases. The erosion
capacity in the deepest part of the scour hole is very small compared to the erosion capacity downstream
of the point of reattachment, so that the dimensions of the scour hole increase more in the streamwise
direction than in the vertical direction.
The more the scour process continues, the more the flow velocities above the lower part of the upstream
scour slope decrease. In the stabilization phase the equilibrium situation for both the upstream scour
slope and the maximum scour depth is almost achieved.
Equilibrium phase
The equilibrium phase can be defined as the phase in which the dimensions of the scour hole do no
longer change significantly.
Generally in this phase of the scour process the bed particles at the upstream scour slope are only rolling
and sliding beneath a saltation height.
4 Transport mechanism
General
The transport of sediment by a flow can be divided into bed-load (transport) and suspended-load
(transport). Usually bed load is defined as the transport of particles of bed material which are sliding and
rolling immediately above the bed. If under given flow conditions sediment particles are jumping above a
defined saltation height, then these particles are assumed to be transported as suspended load.
The problem of defining critical flow conditions associated with initial instability and entrainment of bed
sediment particles is of fundamental importance to predict the sediment transport mechanism.
The first known treatise on initial bed grain instability using the concepts of Prandtl and Von Kármán on
boundary layer flow was produced by Shields (1936), who described the problem using the following
basic parameters: the fluid density, the sediment density, the kinematic viscosity, the mean particle size
and the bed shear-stress.

2
When the flow velocity over a bed of non-cohesive material has increased sufficiently, individual grains
begin to move in an intermittent and random fashion. Bed instability results from the interaction between
two statistically distributed random variables. At first every grain on the bed surface can be assumed to
be potentially susceptible to an instantaneous critical bed shear-stress. The grain becomes unstable if the
instantaneous bed shear-stress exceeds the critical one. Due to the random shape, weight and
placement of the individual grains, these critical shear stresses will have a probability distribution which
defines the initial movement characteristics of the bed material. The other random variables in the
process of initial bed instability result from the variations in the action of the instantaneous bed shear-
stresses generated by the flow. The probability that the instantaneous bed shear- stress is larger than a
characteristic critical shear stress is a measure for the transport of sediment.
Bed boundary condition
One of the most fundamental problems of sediment transport is the process that controls the exchange
of sediment particles between the bed load and suspended load layer (boundary condition). A particle
leaving the bed starts its trajectory by following a saltation. A particle can enter the suspension layer when
it is lifted to a level at which the upward turbulence-induced forces are comparable to or higher than the
submerged particle weight.
Although in a flow with solid transport no sharp distinction can be made between bed load and
suspended load, a suspension layer and a bed layer can be defined for reasons of simplicity. In the upper
layer sediment particles are conveyed in suspension due to the turbulent eddy-diffusivity, which is
prevailing over the vertical motion due to gravity. The bed load depends on the local composition of the
sediment and the local characteristics of the flow.
Mass-balance equation
The continuity equation per unit width for the total sediment transport s (i.e., the sum of bed load and
suspended load) in the scour hole can be expressed as:
in which zb is the bed level, t is time and x is the longitudinal coordinate.
In the equilibrium phase of the scour process when the bed in the recirculation zone is in equilibrium, the
sediment transport in the deceleration zone of the scour hole equals approximately the upstream
sediment supply.
Bed load
Several expressions, more or less empirical, have been suggested during the last century to compute
bed load as a function of flow characteristics and particle diameter. Here a bed load formula introduced
by Van Rijn (1985) and modified by Hoffmans (1992) is used to predict upstream scour slopes in the
0 = x
s +
t
zb
∂
∂
∂
∂ (1)

2
equilibrium phase of the scour process.
According to Van Rijn (1984) bed load is computed as the product of the saltation height, the particle
velocity and the bed-load concentration. The equations of motion for a solitary particle, as given by White
and Schulz (1977), are solved numerically to determine the saltation height and particle velocity. Simple
relations for the saltation height are proposed and calibrated by both a mathematical model and a large
number of flume experiments.
In the equilibrium phase of the scour process the (time-averaged) bed load at the upstream scour slope
is negligibly small, since the bed shear-stress is marginal in comparison with the critical one. However,
due to sweeps and ejections (Lu and Willmarth, 1973), which occur during burst, bed particles are lifted
up. Due to the acceleration of gravity the bed particles are deposited, so these particles are hopping
randomly at the upstream scour slope without moving significantly with the main flow.
Shear stresses
The standard deviation of the instantaneous bed shear-stress determines, together with the effective
(mean) bed shear-stress, the bed load to a large extent. In addition, the sediment transport is also
influenced by the sediment characteristics such as the density of the material, the sediment-size
distribution, the shape of the particle and the porosity of the (non-cohesive) material.
Generally the (mean) bed shear-stressτ 02
or the bed shear-velocity u* decreases
enormously from the more or less uniform
flow at the fixed bed to the erodible bed.
Downstream of the separation point the
absolute value of the bed shear-stress at
the upstream slope is relatively small com-
pared to the bed shear-stress in the new
wall-boundary layer. In the recirculation
zone the bed shear-stress is directed
against the main flow, and in the new wall-
boundary layer downstream of the point of
reattachment the bed shear-stress
increases gradually.
Applying a classical approach of sediment
mechanics, i.e. the sediment particles are
only moving and rolling along the bed
surface (no suspension), the following
relations can be given for a sediment
particle resting on a slope (figure 5):
Figure 5 Probability distribution of flow and material characteristics in non-uniform flow

2
in which τ̂ 1 5 and τ̂ 2 6 are characteristic critical bed shear-stresses, )1.5 ( cc ττ _ˆ 7 is the
characteristic critical bed shear-stress for uniform flow (De Ruiter, 1982, 1983), )u (= 2c*,c
ρτ 8 is the
(mean) critical bed shear-stress according to Shields, ρ is the fluid density, u*,c is the critical bed shear-
velocity, φ is the angle of repose and θ is the angle between the upstream scour slope and the horizontal.
The influence of turbulence on bed load has been investigated by several researchers in the past. As
given by Kalinske (1947) and Einstein (1950) the instantaneous flow-velocity varies according to a
Gaussian distribution. The idea of Kalinske was picked up by Van Rijn (1986) who postulated an instan-
taneous transport-parameter, which is an expression for the fluctuating mobility of the particles in terms
of the stage of the fluctuating movement relative to the critical stage for initiation of motion.
For reasons of simplicity Van Rijn assumed that the instantaneous bed shear-stress τ0 is normally
distributed. However, this distribution can be questioned, since measurements of Lu and Willmarth
(1973) show that the influence of sweeps and ejections, which contribution is larger than the contribution
of the inward and outward interaction, is not included in the Gaussian distribution. The phenomena
sweeps, which are directed to the bed, and ejections, which are moving away from the bed, contribute
most to the turbulent shear stresses. More details concerning sweeps and ejections can be found in Lu
and Willmarth (1973).
5 Maximum scour depth
Delft approach
The scour process is determined by flow and sediment characteristics. The sediment transport is mainly
dependent on the bed shear-stress and the turbulence condition near the bed on the one hand and the
density of the bed material, the sediment-size distribution and the porosity of the (non-cohesive) material
on the other hand. Generally experiments show (Breusers, 1966; Dietz, 1969; Van der Meulen & Vinjé,
1975 and Farhoudi and Smith, 1982) that for a given geometrical arrangement, the shape of the scour
hole is almost independent of flow velocity and bed material if compared at equivalent values of ym/h0 (ym
is the maximum scour depth and h0 is the initial flow depth). A general relation for both two and three-
dimensional scour reads:
)downwardsin
sinˆˆ (
) - ( = c1
φ
θφττ (2)
)upwardsin
sinˆˆ (
) + (- = c2
φ
θφττ (3)

2
where t is the time and t1 is the time at which
the maximum scour depth equals the initial
flow depth. Observations on scour with
various bed materials, flow velocities and
geometries upstream the scour hole showed
that the relation between the maximum scour
depth and time could be summarized in
(Breusers, 1966):
Based on an extensive analysis of the bed
levels measured at which the maximum
scour-depth was about 0.5h0, Breusers re-
ported that for two-dimensional scour the
averaged value of the coefficient γ in the
development phase amounted to 0.38 (figure 6). According to Dietz (1969) the coefficient γ lies in the
range of 0.34 to 0.40 which can be considered as a confirmation of the Breusers' results. In the
development phase the scour process can be simulated reasonably using equation (5), however, in the
remaining phases this relation no longer holds.
In three-dimensional situations, for example scour in a horizontal contraction, a Kármán Vortex Street
(vortices with vertical axis) occurs (figure 7). In this zone the flow is very turbulent, and large vortices
intermittently erode and transport bed material. For three-dimensional flow γ is strongly dependent on the
degree of turbulence generated by the Kármán Vortex Street. Figure 8 shows the results of about 110
tests from the systematical research (Van der Meulen and Vinjé, 1975), as a function of ym/h0 versus t/t1
for the deepest points of the scour hole in the cross sections (D/h0 = 0.0, 0.3 and 0.6). The scatter in the
results is generally within reasonable limits, so that similarity of scour hole shape can be satisfied. How-
ever, a different coefficient γ was required for the prediction of the maximum scour depth as a function
of time. For small scour depths the exponential function of the form of equation (5) gave a good fit if γ
values larger than 0.38 were used.
The dependence of the characteristic time on the hydraulic conditions and the material characteristics,
have been investigated by several researchers. Based on the original work of Breusers (1966) it could be
con-cluded that the influence of the various parameters could be described by the general relation both
for two and three-dimensional scour:
Figure 6 Maximum scour depth as function of time
_t
t_ f =
h
y
10
m (4)
_t
t_ =
h
y
10
m
γ
(5)

2
in which K = 17.1*106 is a coefficient, ( )BhQ/( = U 0012 is the mean flow velocity, Q is the discharge, B
is the width of the flow, U/U-=0cu αα 13, U c
14 is the depth-averaged critical velocity (Shields), α
is a turbulence coefficient, ∆ is the relative density, Fr is the Froude number and Re is the Reynolds
number.
The magnitude of the turbulence coefficient α depends largely upon the geometrical condition upstream
and can be interpreted as a measure for the
erosion capacity in the scour hole. For a storm
flood barrage the turbulence coefficient is
determined for the greater part by the height
of the sill (compared to the initial flow depth)
and for a dam with a spillway by the presence
or absence of energy dissipators. Also the
length and roughness of the bed protection
downstream of the structure plays an import-
ant role in the determination of α.
The value of α can be obtained from scale
models for complex hydraulic constructions.
Several expressions for α have been deduced
from the tests in the systematical series for
both two and three-dimensional scour (Van
der Wal et al., 1991). These empirical relation-
s include the hydraulic and geometrical para-
meters just upstream the scour hole.
Re Fr U
h K = t 0.432.87
0
4.3u
1.70
1
α
∆ (6)
Figure 7 Three-dimensional scour

2
According to Breusers (1966) the turbulence
in the scour hole which plays an important role
in the scour process depends on the flow
velocity and the turbulence level at the
transition of the fixed to the erodible bed. An
examination of more than 250 experiments
(Delft Hydraulics, 1972 and Buchko et al.,
1987) shows that the turbulence coefficient
can be related to the relative turbulence
intensity r0 at the transition of the fixed to the
erodible bed (Hoffmans and Booij, 1993a):
in which fC = C/C0 is a roughness function
including the displacement thickness (dis-
tribution of the flow velocities near the bed), C
is the Chézy coefficient (e.g. Thijsse, 1949)
and C0 = 45m½/s. For hydraulically-rough
conditions C < 45m½/s regarding the fixed bed before the scour hole fC = 0.9.
The value of α is based on the use of a local depth-averaged velocityU 0,l16in equation (6). If a three-
dimensional flow is considered and the mean
flow velocityU 017(figure 7) is used in
equation (6), the value of α has to be
multiplied by U/U 00,l18.
For two-dimensional flow UU 00,_
l19, wh-
ereas for three-dimensional flow U 0,l20
depends strongly on the geometry upstream
of the scour hole (presence of abutment on
sill).
It is remarked that for three-dimensional scour
the characteristic time is not constant at each
cross section due to the three-dimensional
flow pattern in the scour hole.
The definition of r0 is the ratio between the
standard deviation of the instantaneous flow
velocity averaged over the depth and the
depth-averaged flow velocity. For non-uniform
flow, measurements (e.g. Raudkivi, 1963) have shown that the turbulence energy in the centre of the
Figure 8a Maximum scour depth as function of time
fr5 + 1.5 = C0α (7)
Figure 8b Maximum scour depth as function of time

2
mixing layer (with horizontal axis) grows rapidly to a maximum. Downstream of the point of reattachment
the turbulence energy in the relaxation zone decreases gradually again and becomes small compared to
the turbulence energy generated by the bed in the developing new wall-boundary layer. The turbulence
energy generated in the mixing layer vanishes where the new wall-boundary is well developed. Then the
turbulence energy tends to an equilibrium value, which largely consists of turbulence generated at the
bed. To analyze the decay of the turbulence in the relaxation zone an analogy with the decay of the tur-
bulence energy and the dissipation in grid turbulence can be used (Launder and Spalding, 1972). If the
geometry of the tests consisted of a horizontal bed where the flow is subcritical above a sill, the following
relation for r0 can be deduced (Hoffmans and Booij, 1993a):
where D is the height of the sill and g is the
acceleration of gravity. The length L of the bed
protection will for safety reason always extend
beyond the point of reattachment.
Although some characteristics of three-di-
mensional flow and additional phenomena
such as vortices with a vertical axis in par-
ticular have not been taken into account in
equation (8) for the turbulence intensity, prom-
ising results for three-dimensional flow fields
are obtained. For example, in the centre of the
flow where the scour depth is about at maxi-
mum, the influence of the Kármán Vortex
Street on the scour process is marginal
compared to the influence of the maximum
flow velocities. However, prudence has to be called for complex hydraulic structures. It is recommended
in those cases to carry out experiments using a scale model to find detailed information about the devel-
opment of a scour hole.
Dietz approach
In the equilibrium phase the maximum scour depth tends to a limit. To obtain equilibrium conditions a
relative long time is needed, especially for experiments with small Froude numbers and no upstream
sediment supply. Therefore the equilibrium situation at scale models was not always achieved (Delft
Hydraulics, 1972).
Applying the equation of continuity for the section at the end of the bed protection and the section, where
the scour depth is at maximum, the following relation can be derived (Dietz, 1969):
Figure 8c Maximum scour depth as function of time
C
g1.45 + 1 +
h6.67
6D - L
h
D - 10.0225 = r 2
0
-1.08
0
-2
0
(8)

2
in which ym,e is the maximum scour depth in the equilibrium phase and ω is a coefficient depending on the
turbulence energy.
By varying the roughness and the length of the bed protection, it was experimentally proven that the ratio
between α and ω was nearly constant. It appeared that the ratio α/ω did not change either, if the hydraulic
conditions were varied. The laboratory results of Dietz (1969) and Delft Hydraulics (1972) showed that α
and ω had the same order of magnitude. For a primary estimation the coefficient ω can be taken equal to
ω = _ + 2r0 (Hoffmans, 1992).
It is remarked that sediment supply from upstream and/or the presence of more resistance layers will
reduce the maximum scour depth but results to quantify this process are not available.
Breusers-Dietz approach
Combining equations (5) and (9) a general scour relation is obtained. The scour process in the
development phase but also in the stabilization and equilibrium phase can be predicted with a reasonable
accuracy provided the coefficient ω is chosen correctly (figures 6 and 8).
6 Upstream scour slopes
General
The upstream scour slope determines the stability of the upstream part of the scour hole and the
adjacent bed protection. The upstream scour slope reaches an equilibrium and is usually defined as the
slope between x = h0/30 and x = ½h0.
Based on theoretical grounds a hydraulic and morphological stability criterion for upstream scour slopes
is derived. This criterion is calibrated using a large number of flume experiments, in which the material
properties and the hydraulic and geometrical conditions were varied.
Earlier investigations
Based on a thorough investigation of scour downstream of an apron, Dietz (1969, 1973) reported that the
upstream scour slope depends on a turbulence level, the form of the flow velocity profile and a dimensi-
onless parameter given by δ:
U
U - U = h
y
c
c0
0
em, ω (9)
__ln_expy
h - _1
t
t__ - 1 =
y
y
em,
0
1em,
m
γ
(10)
( )
w
DU - U = *c0δ (11)

2
which is related to the flow and sediment characteristics (w is the fall velocity of the bed material and D* is
the sedimentological diameter).
For nearly identical hydraulic structures, Dietz found a relation between the slope angle and δ. However,
this relation is not unambiguous, when the relative turbulence intensity is not constant but varies due to
different geometrical conditions.
As given by Breusers et al. (1977) many parameters that may influence the scour phenomenon can be
distinguished. Buchko et al. (1987) combined some of these parameters, resulting in:
The idea was that each parameter could be varied independently from the other ones. Though the
dimensionless parameters are important, the theoretical consideration can be questioned, since the
influence of turbulence in the recirculation zone is not taken into account.
Based on the research activities of Dietz, Buchko et al. (1987) and the systematical scour research (Delft
Hydraulics, 1972, 1979) the slope angle was represented by (De Graauw and Pilarczyk, 1981):
Later, after evaluating the enormous amount of data of the scour experiments De Graauw (Breusers and
Raudkivi, 1991) found that the upstream scour slope can be given by:
Hydraulic and morphological stability criterion
The stability of the upstream scour slope is the result of the interaction between fluid motion and material
properties. The equilibrium situation of upstream scour slopes for non-cohesive material is achieved here
by equating bed load due to the instantaneous bed shear-stresses sloping downward and bed load due
to the instantaneous bed shear-stresses sloping upward. Following van Rijn (1985) who assumed τ0 to
be Gaussian distributed and if only clear-water scour is considered, thus no upstream sediment transport
is present, the following relation can be derived, figure 5:
in which µ is an efficiency factor where the influence of the bed forms (dunes and ripples) is taken into
account (Van Rijn, 1984). Generally no ripples or other bed forms are present at the bed of the upstream
scour slope for which applies µ _ 1.
In order to include the influence of sweeps and ejections, it seems reasonable to assume that the
probability distribution of τ0 has long tails for extreme values for τ0 more upslope. The skewness of the
_dg
U ,h
d , ,
dgd_ f = cotan
50
0
0
505050
∆∆
∆
νθ (12)
_1.32 -
0.75 + 2.5_ _
g_
d
w5.5 = cotan 22
_
50 α
νθ
∆ (13)
1.3 -
1 + 2.3 = cotanα
θ (14)
0 = 2 - +
c
021
τ
τµττ
ˆ
ˆˆ (15)

2
probability distribution for τ0 could be expressed by, figure 5:
A further elaboration yields (Hoffmans, 1993b):
in which fτ is a shear stress factor, fγ is a measure for the skewness and d50 is the mean bed particle.
Though the effective mean bed shear-stress determines the slope angle, its influence on the steepness
of the upstream scour slope compared to the influence of sweeps and ejections is relatively small,
especially for experiments at scale model with small Reynolds numbers.
The gradual and dangerous undermining of the vertical edge of the bed protection results from the higher
turbulence energy and the larger erosion capacity of the flow in the recirculation zone due to the higher
turbulence energy directly upstream of the scour hole. When θ exceeds a critical value, i.e. for arcsin(fτ +
½fγ) > φ' with φ' is the angle of internal friction, the bed protection could be gradually undermined due to
small scale shear failures.
In addition to the gradual undermining, a sudden undermining may occur, leading to a possible failure of
the hydraulic structure upstream the scour hole. However, these phenomena are strongly dependent on
the geotechnical condition (e.g. De Groot et al., 1992).
From equation (17) it appears in particular that the turbulence is of importance for the development of the
upstream scour slope. With more turbulent upstream conditions, much steeper slopes are found. For the
design it is obvious that the value of θ has to be much less than the critical value of the natural slope of
sediment in water.
In the stability criterion for the slope angle (equation 17) the material properties are characterised by the
mean bed particle d50 and the relative density, so the influence of the density of the bed material
(polystyrene, bakelite, sand) is taken into account.
To optimize the function fγ the hydraulic parameters have to be known. Since the instantaneous bed
shear-stress is not unambiguously defined (Hoffmans, 1992), it is assumed for reasons of simplicity that
the parameter fγ is closely related to the relative turbulence intensity r0 just upstream of the scour hole
and the effective bed roughness of the bed protection.
More than 250 experiments (Delft Hydraulics, 1972, 1979 and Buchko et al., 1987) were used to find the
best compromise between the measured and calculated angle of the slope, resulting in (figure 9):
0 = f + 2 - +
c
021
γτ
τµττ
ˆ
ˆˆ (16)
( )dg
U10*2.9 _
ˆ- = f witharcsin
50
2
04-
c
0
∆τ
τµθ τγτ f‰ + f = (17)
( ) fr1.5 + 0.22 = fC0γ (18)

2
In these laboratory experiments not only
the hydraulic conditions (discharge and
initial flow-depth) were varied but also the
geometrical conditions (length of the bed
protection, height of the sill and the bed r-
oughness). Moreover, tests were executed
with an abutment in permanent flow
introducing three-dimensional flow fields.
Although the function fγ is not defined as
the skewness of the instantaneous bed-
shear stress, the order of magnitude of fγ
agrees with the order of magnitude of the
experimental skewness of the Reynold-
stress fluctuation close to the bed in open
channels and boundary layers (e.g. Nezu, 1977).
To determine the predictability of the aforementioned relations for upstream scour slopes, the dis-
crepancy ratio r (i.e. the ratio between the measured and calculated upstream scour slope) is computed
using experiments of Delft Hydraulics (1972, 1979) and Buchko et al. (1987). The measured upstream
scour slope was obtained directly from the measurements, whereas the calculated one (equations 13
and 14) was determined using a 'measured' turbulence coefficient.
This analysis, in which a distinction has been made between two and three-dimensional flow (figure 7),
shows that compared to the other empirical relations, upstream scour slopes can be calculated more
accurately with the model relation given in the present study (table 1).
Figure 9 Calculated and measured cotan θ

2
7 Shear failures and flow slides
General
Since 1880 many hundreds of shear failures
and flow slides have occurred along the
coastline in the south-western part of the
Netherlands. In a number of such cases
more than a million cubic metres of sand
was found to have shifted. As a side effect,
the nearby sea dyke was sometimes dam-
aged or disappeared completely in the area
affected. Such slides along the banks or
shores of the sea and estuaries in that part
of the country still occur from time to time,
but as a result of protection works there are
now fewer failures. When hydraulic
structures are planned in such areas, the
stability of these structures must be duly
safeguarded.
As regards the cause of the shear failures
and flow slides in the southwest Nether-
lands, it is generally supposed that there are
two major factors involved (Lindenberg and
Koning, 1981). Firstly, there is scour due to
the turbulence and the high flow velocities.
Secondly, there is the porosity of the sand.
It is assumed that small disturbances are able to initiate extensive flow slides only in loosely packed
sand. The slopes that establish themselves after a flow slide, apart from the steeper part, are nearly
always flatter than 1V:10H and in some cases may be only 1V:20H to 1V:25H.
investigators
0.90 < r < 1.11 0.80 < r < 1.25 0.67 < r < 1.50
2D
n = 201
3D
n = 65
2D
(201)
3D
(65)
2D
(201)
3D
(65)
De Graauw and Pilarczyk (1981) 15% 6% 34% 51% 58% 65%
Figure 10 Design criteria
2
De Graauw (1983) 50% 25% 85% 40% 97% 78%
Hoffmans (1993) 59% 37% 85% 71% 95% 78%
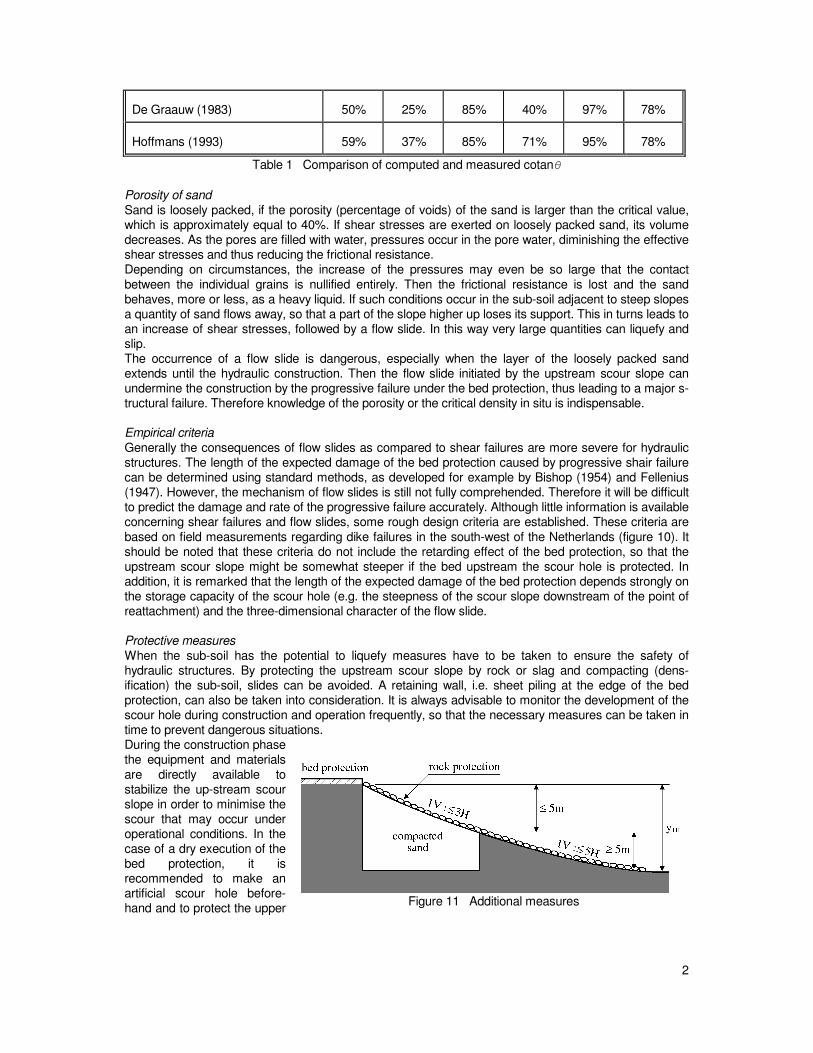
Table 1 Comparison of computed and measured cotanθ Porosity of sand Sand is loosely packed, if the porosity (percentage of voids) of the sand is larger than the critical value, which is approximately equal to 40%. If shear stresses are exerted on loosely packed sand, its volume decreases. As the pores are filled with water, pressures occur in the pore water, diminishing the effective shear stresses and thus reducing the frictional resistance. Depending on circumstances, the increase of the pressures may even be so large that the contact between the individual grains is nullified entirely. Then the frictional resistance is lost and the sand behaves, more or less, as a heavy liquid. If such conditions occur in the sub-soil adjacent to steep slopes a quantity of sand flows away, so that a part of the slope higher up loses its support. This in turns leads to an increase of shear stresses, followed by a flow slide. In this way very large quantities can liquefy and slip. The occurrence of a flow slide is dangerous, especially when the layer of the loosely packed sand extends until the hydraulic construction. Then the flow slide initiated by the upstream scour slope can undermine the construction by the progressive failure under the bed protection, thus leading to a major s-tructural failure. Therefore knowledge of the porosity or the critical density in situ is indispensable. Empirical criteria Generally the consequences of flow slides as compared to shear failures are more severe for hydraulic structures. The length of the expected damage of the bed protection caused by progressive shair failure can be determined using standard methods, as developed for example by Bishop (1954) and Fellenius (1947). However, the mechanism of flow slides is still not fully comprehended. Therefore it will be difficult to predict the damage and rate of the progressive failure accurately. Although little information is available concerning shear failures and flow slides, some rough design criteria are established. These criteria are based on field measurements regarding dike failures in the south-west of the Netherlands (figure 10). It should be noted that these criteria do not include the retarding effect of the bed protection, so that the upstream scour slope might be somewhat steeper if the bed upstream the scour hole is protected. In addition, it is remarked that the length of the expected damage of the bed protection depends strongly on the storage capacity of the scour hole (e.g. the steepness of the scour slope downstream of the point of reattachment) and the three-dimensional character of the flow slide. Protective measures When the sub-soil has the potential to liquefy measures have to be taken to ensure the safety of hydraulic structures. By protecting the upstream scour slope by rock or slag and compacting (dens-ification) the sub-soil, slides can be avoided. A retaining wall, i.e. sheet piling at the edge of the bed protection, can also be taken into consideration. It is always advisable to monitor the development of the scour hole during construction and operation frequently, so that the necessary measures can be taken in time to prevent dangerous situations. During the construction phase the equipment and materials are directly available to stabilize the up-stream scour slope in order to minimise the scour that may occur under operational conditions. In the case of a dry execution of the bed protection, it is recommended to make an artificial scour hole before-hand and to protect the upper
Figure 11 Additional measures
2
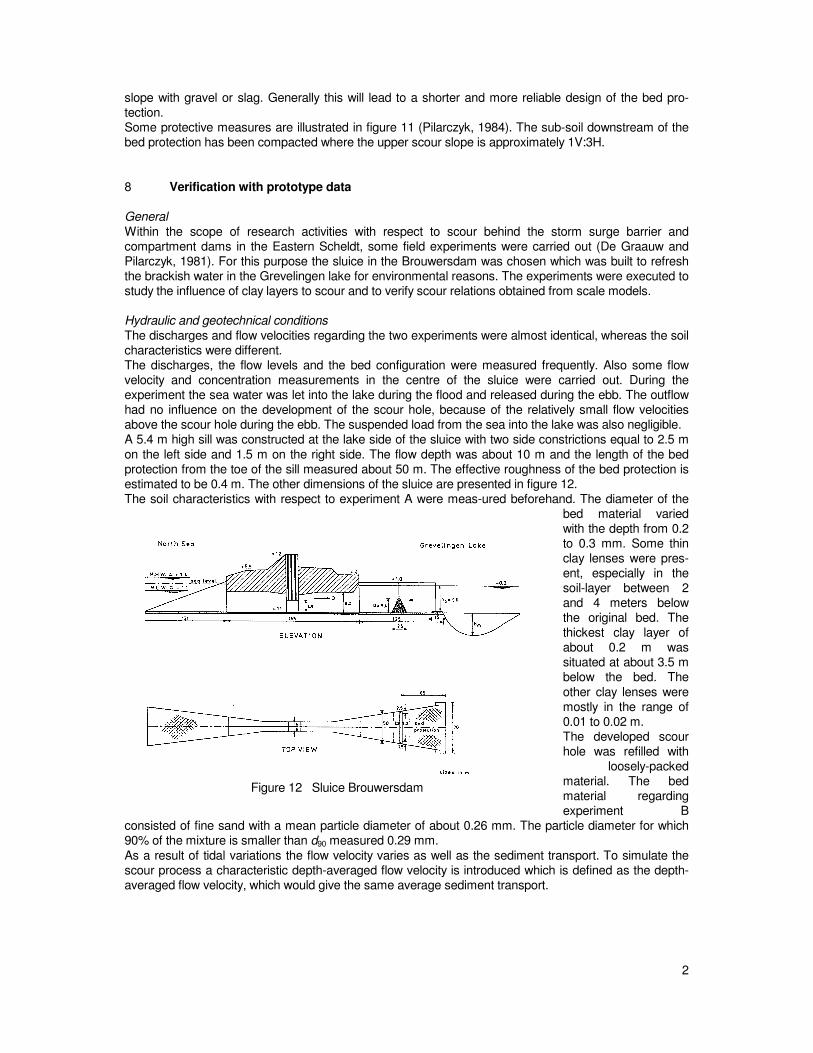
slope with gravel or slag. Generally this will lead to a shorter and more reliable design of the bed pro-tection. Some protective measures are illustrated in figure 11 (Pilarczyk, 1984). The sub-soil downstream of the bed protection has been compacted where the upper scour slope is approximately 1V:3H. 8 Verification with prototype data General Within the scope of research activities with respect to scour behind the storm surge barrier and compartment dams in the Eastern Scheldt, some field experiments were carried out (De Graauw and Pilarczyk, 1981). For this purpose the sluice in the Brouwersdam was chosen which was built to refresh the brackish water in the Grevelingen lake for environmental reasons. The experiments were executed to study the influence of clay layers to scour and to verify scour relations obtained from scale models. Hydraulic and geotechnical conditions The discharges and flow velocities regarding the two experiments were almost identical, whereas the soil characteristics were different. The discharges, the flow levels and the bed configuration were measured frequently. Also some flow velocity and concentration measurements in the centre of the sluice were carried out. During the experiment the sea water was let into the lake during the flood and released during the ebb. The outflow had no influence on the development of the scour hole, because of the relatively small flow velocities above the scour hole during the ebb. The suspended load from the sea into the lake was also negligible. A 5.4 m high sill was constructed at the lake side of the sluice with two side constrictions equal to 2.5 m on the left side and 1.5 m on the right side. The flow depth was about 10 m and the length of the bed protection from the toe of the sill measured about 50 m. The effective roughness of the bed protection is estimated to be 0.4 m. The other dimensions of the sluice are presented in figure 12. The soil characteristics with respect to experiment A were meas-ured beforehand. The diameter of the
bed material varied with the depth from 0.2 to 0.3 mm. Some thin clay lenses were pres-ent, especially in the soil-layer between 2 and 4 meters below the original bed. The thickest clay layer of about 0.2 m was situated at about 3.5 m below the bed. The other clay lenses were mostly in the range of 0.01 to 0.02 m. The developed scour hole was refilled with
loosely-packed material. The bed material regarding experiment B
consisted of fine sand with a mean particle diameter of about 0.26 mm. The particle diameter for which 90% of the mixture is smaller than d90 measured 0.29 mm. As a result of tidal variations the flow velocity varies as well as the sediment transport. To simulate the scour process a characteristic depth-averaged flow velocity is introduced which is defined as the depth-averaged flow velocity, which would give the same average sediment transport.
Figure 12 Sluice Brouwersdam

2
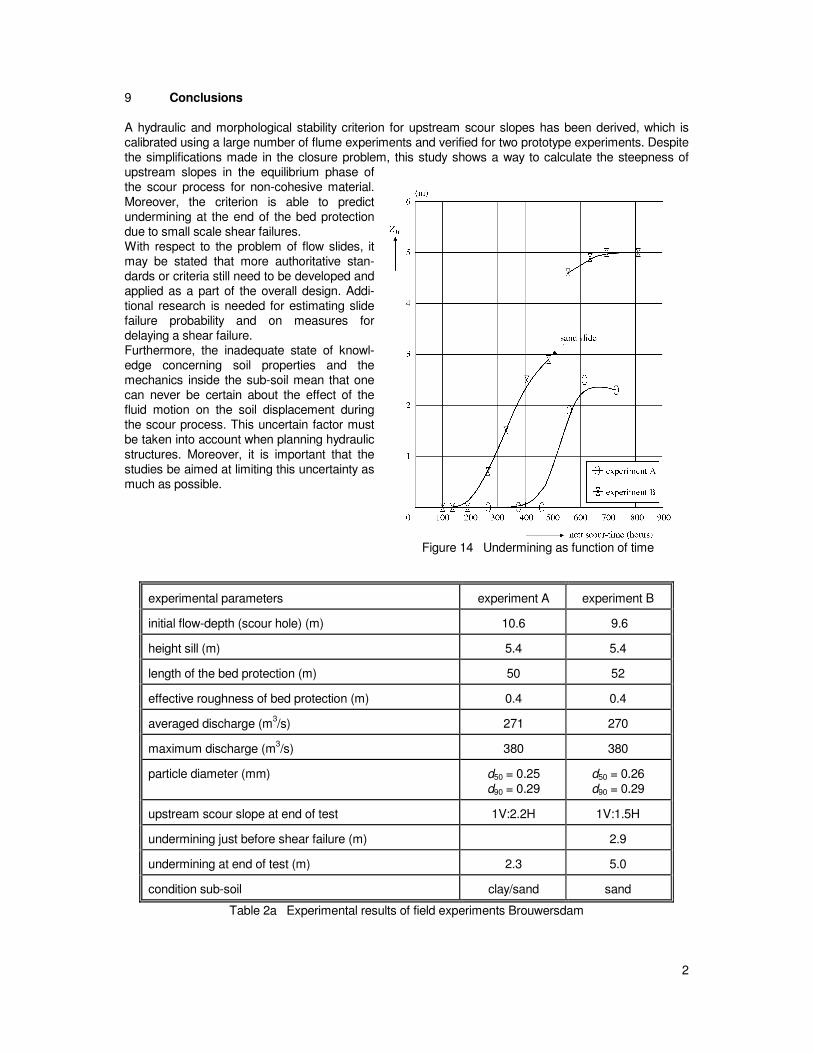
Discussion Figure 13 shows some measured bed profiles of the considered field experiments at different moments, while the gradual undermining including a shear failure is shown in figure 14. The calculated values of the upstream scour slopes cotan θ _ 2 agree with the measurements reasonably. The calculations are obtained with the stability criterion (equa-tion 17). More details of experimental and computational results can be found in table 2 and Delft Hydraulics, 1979. Due to the tidal influence the flow velocities vary in time. In experiment A and B the maxi-mum flow-velocities averaged over about 140 tides measured by approximation 1.2 m/s (Hoffmans, 1992). With this assumption and using the stability criterion it follows that cotan θ _ 1.8. Generally the angle of internal friction for sand lies in the range of 30 to 40 degrees and depends on the porosity, the particle diameter and the distribution of the mixture. Applying the stability criterion small scale shear failures can be expected when the flow velocities in the prototype situation are larger than 1.3 m/s (φ' = 300) or 1.9 m/s for (φ' = 400). During the experi-ments flow velocities were measured varying from 1.5 to 2.0 m/s. Since both small scale shear failures and a shear failure after approximately 450 hours (nett-scour time) were observed, the stability criterion seems to be feasible for practical engineering. When the subsoil consists of clay and sand layers the results obtained from equation (17) must be interpreted carefully, because the influence of the cohesion of the sub-soil is not taken into account.
Figure 13 Measured bed profiles (Brouwersdam)
2
9 Conclusions A hydraulic and morphological stability criterion for upstream scour slopes has been derived, which is calibrated using a large number of flume experiments and verified for two prototype experiments. Despite the simplifications made in the closure problem, this study shows a way to calculate the steepness of upstream slopes in the equilibrium phase of the scour process for non-cohesive material. Moreover, the criterion is able to predict undermining at the end of the bed protection due to small scale shear failures. With respect to the problem of flow slides, it may be stated that more authoritative stan-dards or criteria still need to be developed and applied as a part of the overall design. Addi-tional research is needed for estimating slide failure probability and on measures for delaying a shear failure. Furthermore, the inadequate state of knowl-edge concerning soil properties and the mechanics inside the sub-soil mean that one can never be certain about the effect of the fluid motion on the soil displacement during the scour process. This uncertain factor must be taken into account when planning hydraulic structures. Moreover, it is important that the studies be aimed at limiting this uncertainty as much as possible.
experimental parameters experiment A experiment B
initial flow-depth (scour hole) (m) 10.6 9.6
height sill (m) 5.4 5.4
length of the bed protection (m) 50 52
effective roughness of bed protection (m) 0.4 0.4
averaged discharge (m3/s) 271 270
maximum discharge (m3/s) 380 380
particle diameter (mm) d50 = 0.25 d90 = 0.29
d50 = 0.26 d90 = 0.29
upstream scour slope at end of test 1V:2.2H 1V:1.5H
undermining just before shear failure (m) 2.9
undermining at end of test (m) 2.3 5.0
condition sub-soil clay/sand sand
Table 2a Experimental results of field experiments Brouwersdam
Figure 14 Undermining as function of time

2
computational parameters experiment A experiment B
characteristic discharge (m2/s) 9.89 9.89
characteristic depth-averaged velocity (m/s) 0.93 1.03
critical depth-averaged velocity (m/s) 0.41 0.41
relative turbulence intensity (-) 0.28 0.29
turbulence coefficient (-) 2.91 2.92
roughness function (-) 1.13 1.12
parameter f τ 32 0.09 0.10
parameter f γ 33 1.03 1.04
upstream scour slope 1V:2.1H 1V:2.1H
Table 2b Computational results of prototype experiments Brouwersdam
Symbols b 34 length of abutment [L] B 35 width of flow [L] ci 36 coefficient [-]
C 37 Chézy coefficient [L½T-1]
C f 38 friction coefficient [-]
d 39 particle diameter [L] D 40 height of sill [L]
D* 41 sedimentological diameter; ( )ν2 1/3
50 g/d ∆ 42 [-]
f C43 roughness function [-]
f γ 44 skewness parameter [-]
f τ 45 dimensionless bed shear-stress; ττµ ˆc0/- 46 [-]
Fr 47 Froude number; hg/U 0048 [-]
g 49 acceleration of gravity [LT-2]
h 50 flow depth [L]
h0 51 initial flow depth [L]
K 52 coefficient [-] L 53 length of bed protection [L] k s 54 effective or equivalent bed roughness [L]
n 55 number (of experiments) [-] P 56 probability distribution [-] Q 57 discharge [L3T-1]
Re 58 Reynolds number; /vhU 0059 [-]
r 60 discrepancy ratio [-] r0 61 relative turbulence intensity [-]
s 62 sediment transport per unit width [L2T-1]

2
t 63 time [T]
t1 64 characteristic time at which the maximum scour-depth equals h0 65 [T]
u* 66 bed shear-velocity [LT-1]
u c*, 67 critical bed shear-velocity [LT-1]
U 068 initial depth-averaged flow velocity [LT-1]
U c69 critical depth-averaged flow velocity [LT-1]
w 70 fall velocity [LT-1] x 71 longitudinal coordinate [L]
ym72 maximum scour depth [L]
z 73 vertical coordinate [L] Symbols (continued) α 74 turbulence coefficient [-]
α u 75 coefficient; U/U - 0cα 76 [-]
γ 77 coefficient [-]
δ 78 dimensionless parameter; ( ) /wDU - U *c079 [-]
∆ 80 relative density; ( ) ρρρ / - s
81 [-]
θ 82 slope angle [-] θ 83 constant of Von Kármán [-] µ 84 efficiency factor [-]
ν 85 kinematic viscosity [L2T-1] ρ 86 fluid density [M3L-1]
ρ s87 material density [M3L-1]
σ u 88 standard deviation of the instantaneous longitudinal flow velocity [ML-1T-2]
τ 0 89 instantaneous bed shear-stress [ML-1T-2]
τ c90 critical bed shear-stress (Shields) [ML-1T-2]
τ̂ c 91 characteristic critical bed shear-stress; τα ccˆ 92 [ML-1T-2]
τ̂ 1 93 characteristic critical bed shear-stress; ( ) φθφτ sinsinˆ / - c 94 [ML-1T-2]
τ̂ 2 95 characteristic critical bed shear-stress; ( ) φθφτ sinsinˆ / + - c 96 [ML-1T-2]
τ 097 bed shear-stress [ML-1T-2]
φ 98 angle of repose [-]
φ ′ 99 angle of internal friction [-]
ω 100 turbulence coefficient [-] Subscripts b bed c critical e equilibrium m maximum or measured 0 initial or reference

2
References Bishop, A.W., 1954, The use of slip circle in the stability analysis of slopes, Proceedings of the Euro- pean Conference on Stability of Earth Slopes, Vol.I S.1-12, Stockholm. Breusers, H.N.C., 1966, Conformity and time scale in two-dimensional local scour, Proceedings Symposium on model and prototype conformity, Hydraulic Research Laboratory, Poona, p.1-8. Breusers, H.N.C., G. Nicollet and H.W. Shen, 1977, Local scour around cylindrical piers, Journal of Hydraulic Research, IAHR, Vol.15 No.3. Breusers, H.N.C. and A.J. Raudkivi, 1991, Scouring, Hydraulic structures design manual, IAHR, Balkema, Rotterdam. Buchko, M., Kolkman P. and K. Pilarczyk, 1987, Investigation of local scour in cohe-sionless sediments using a tunnel, 22nd IAHR-congress, Lausanne, pp.233-239. Delft Hydraulics, 1972, Systematical investigation of two and three-dimensional local scour, Investigation M648/M863/M847 (in dutch), Delft Hydraulics, Delft. Delft Hydraulics, 1979, Prototype scour hole 'Brouwersdam', Investigation M1533 Part I,II,III and IV (in
dutch), Delft Hydraulics, Delft. Dietz, J.W., 1969, Kolkbildung in feinen oder leichten Sohlmaterialien bei strömen dem Abfluß, Mit teilungen Heft 155, Universität Fridericiana Karlsruhe. Dietz, J.W., 1973, Sicherung der Flußsohle unterhalb von Wehren und Sperrwerken, Wasserwirtschaft 63, No.3. Einstein, H.A., 1950, The bed load function for sediment transportation in open channel flows, Tech-nical Bulletin, No.1026, US Department of Agriculture, Washington D.C.. Farhoudi, J. and K.V.H. Smith, Local scour profiles downstream of hydraulic jump, Journal of Hydraulic Research, Vol.23, 1985, No.4, p.343-358. Fellenius, W., 1947, Erdstatische Berechnungen mit Reibung und Kohäsion und unter Annahme kreis- zylindrischer Gleitflächen, W. Ernst und Sohn, Berlin. De Graauw, A.F.F., and K.W. Pilarczyk, 1981, Model-prototype conformity of local scour in non-cohesive sediments beneath overflow-dam, 19th IAHR-congress, New Delhi (also Delft Hydraulics, Publication No.242). De Groot, M., Den Adel, H., Stoutjesdijk, T.P. and K.J. van Westenbrugge, 1992, Risk analysis of flow slides, 23rd International Conference on Coastal Engineering, Venice. Hoffmans, G.J.C.M., 1990, Concentration and flow velocity measurements in a local scour hole, Report
No.4-90, Faculty of Civil Engineering, Hydraulic and Geotechnical Engineering Division, Delft University of Technology, Delft.
Hoffmans, G.J.C.M., 1992, Two-dimensional mathematical modelling of local-scour holes, Doctoral thesis, Faculty of Civil Engineering, Hydraulic and Geotechnical Engineering Division, Delft University of Technology, Delft. Hoffmans, G.J.C.M., 1993a, The influence of upstream turbulence on local-scour holes, 25th IAHR-congress, Tokyo, Japan (also Ministry of Transport, Public Works and Watermanagement, Road and Hydraulic Engineering Division, Delft, Report W-DWW-93-251) Hoffmans, G.J.C.M., 1993b, A hydraulic and morphological criterion for upstream slopes in local-scour holes, Report W-DWW-93-255, Ministry of Transport, Public Works and Watermanagement, Road and Hydraulic Engineering Division, Delft. Kalinske, A.A., 1947, Movement of sediment as bed load in rivers, Transactions, American Geophysical
Union, Vol.28, No.4. Launder, B.E., and D.B. Spalding, 1972, Mathematical models of turbulence, Academic Press, London. Lindenberg, J. and H.L. Koning, 1981, Critical density of sand, Geotechnique 31, No.2, pp.231-245. Lu, S.S. and W.W. Willmarth, 1973, Measurements of the structure of the Reynolds stress in a turbulent boundary layer, Journal of Fluid Mechanics, Vol.60, Part 3, p.481-511. Nezu, I., 1977, Turbulent structure in open-channel flows (translation of doctoral dissertation published
in japanese), Department of Civil Engineering, Kyoto University, Kyoto. Van der Meulen, T., and J.J. Vinjé, 1975, Three-dimensional local scour in non-cohesive sediments, 16th IAHR-congress, (also Delft Hydraulics, Publication No.180).

2
Pilarczyk, K.W., 1984, Interaction water motion and closing elements, The closure of tidal basins, p.387-405, Delft University Press, Delft. Raudkivi, A.J., 1963, Study of sediment ripple formation, Journal of Hydraulic Division, ASCE, Vol.HY6,
p.15-33. Van Rijn, L.C., 1984, Sediment Transport, Part I: Bed load transport, Journal of Hydraulic Engineering, ASCE, Vol.110, No.10, p.1431-1456. Van Rijn, L.C., 1985, Mathematical models for sediment concentration profiles in steady flow, Euromech 192, Munich/Neubiberg, Germany, (also Delft Hydraulics, Publication No.365). Van Rijn, L.C., 1986, Mathematical modelling of suspended sediment in non-uniform flows, Journal of Hydraulic Engineering, ASCE, Vol.112, No.6, (also Delft Hydraulics, Communication No.365). Van Rijn, L.C. and K. Meijer, 1986, Three-dimensional modelling of suspended sediment transport for current and waves, Report Q250/Q432/H461, Delft Hydraulics, Delft. De Ruiter, J.C.C., 1982, The mechanism of sediment transport on bed forms, Euromech 156, Mechanics of Sediment Transport, p.137-142, Istanbul. De Ruiter, J.C.C., 1983, Incipient motion and pick-up of sediment as function of local variables, unpublished notes, Delft Hydraulics, Delft. Shields, A., 1936, Anwendung der Ähnlichkeitsmechanik und der Turbulenzforschung auf die Geschie- bebewegung, Mitteilungen Preussischen Versuchsanstalt für Wasserbau und Schiffbau, Nr.26 Berlin. Thijsse, J.Th., 1949, Formulae for the friction head loss along conduit walls under turbulent flow, 3rd IAHR-congress, Grenoble, paper III-4. White, B.R. and J.C. Schulz, 1977, Magnus effect in saltation, Journal of Fluid Mechanics, Vol.81, Part 3, p.497-512. Van der Wal, M., G. van Driel and H.J. Verheij, 1991, Scour manual, Report Q647, Delft Hydraulics, Delft. Vreugdenhil, C.B., 1982, Boundary-layer flow over a sloping bottom, program DUCT, Mathematical investigation, Report S488, Part 2, Delft Hydraulics, Delft. Zanke, U., 1978, Zusammenhänge zwischen Strömung und Sedimenttransport Teil 2: Berechnung des Sedimenttransportes hinter befestigten Sohlenstrecken, Sonderfall zweidimensionaler Kolk, Mitteilungen des Franzius-Instituts der TU Hannover, Heft 48,