
Scleroglucan/borax: characterization of a novel hydrogel system suitable for drug delivery
10
Biomaterials 24 (2003) 2789–2798 Scleroglucan/borax: characterization of a novel hydrogel system suitable for drug delivery T. Coviello a, *, M. Grassi b , R. Lapasin b , A. Marino a , F. Alhaique a a Dipartimento di Studi di Chimica e Tecnologia delle Sostanze Biologicamente Attive, Universit " a ‘‘La Sapienza’’, Piazzale Aldo Moro 5, 00185 Rome, Italy b Dipartimento di Ingegneria Chimica, dell’Ambiente e delle Materie Prime, Universit " a di Trieste, P.zza Europa 1, 34127 Trieste, Italy Received 1 October 2002; accepted 27 January 2003 Abstract A new hydrogel, with scleroglucan using borax as a crosslinker, has been prepared. The physical gel has been loaded with a model molecule (theophylline) and the release of the drug from the gel was evaluated. The same system was used to prepare tablets and the delivery of theophylline in different environmental conditions (HCl and SIF) was determined. A recent theoretical approach has been applied to the dissolution profiles obtained from the tablets and a satisfactory agreement has been found with the experimental data. Furthermore, the diffusion coefficient of the model molecule was evaluated according to a suitable strategy that was tested on two set of data obtained with different set-ups (permeation and diffusion experiments). A simplified mathematical approach allows to reduce the two-dimensional problem of the Fick’s second law in a one-dimensional system leading to a much easier handling of the data without loosing the accuracy of the original problem in two dimensions. The characterization of the gel has been also carried out following the kinetics of swelling in terms of water uptake. r 2003 Elsevier Science Ltd. All rights reserved. Keywords: Scleroglucan; Borax; Hydrogel; Modified release; Physically crosslinked gels 1. Introduction Hydrogels are hydrophilic three-dimensional swella- ble networks that can be obtained by chemical and/or physical crosslinking of polymers. They show a wide variety of applications as medical devices and in the field of pharmaceutics [1]; in this sense, particular attention has been focused, since several years, to the use of hydrogels for modified release formulations [2,3]. This type of study requires, together with a more practical approach, also a careful and deep investigation on the structure and on the morphology of the rate-controlling polymeric network as well as an analysis of the diffusive behavior of the tested drugs through and from the hydrogel. We report here the results of our studies on the behavior of a new hydrogel prepared with scleroglucan and borax. Scleroglucan (Sclg) is a branched homopolysacchar- ide consisting of a main chain of (1-3)-linked b-d- glucopyranosyl units bearing, every third unit, a single b-d-glucopyranosyl unit linked (1-6) (Fig. 1). This polysaccharide is resistant to hydrolysis and its solutions show an interesting rheological behavior: viscosity remains practically constant, even at high ionic strength, up to pH=12 and to 90 C. Due to its peculiar properties, Sclg was extensively used for various commercial applications (secondary oil recovery, ceramic glazes, food, paints, cosmetics, etc.) [4]; it was also investigated for modified/sustained release formulations such as monolithic swellable matrices [5–9] and ophtalmic preparations [10]. Oxidized Sclg was proposed for pH-controlled delivery oral dosage forms [11,12] and several crosslinked derivatives have been prepared and studied for the same purposes [13–19]. Borax is a crosslinker used with polymers containing hydroxyl groups [20–31] that was previously studied for the preparation of complexes with guar gum suitable for colonic delivery purposes [32]. *Corresponding author. Tel.: +39-06-4991-3300; fax: +39-06-4991- 3133. E-mail address: [email protected] (T. Coviello). 0142-9612/03/$ - see front matter r 2003 Elsevier Science Ltd. All rights reserved. doi:10.1016/S0142-9612(03)00087-5
Transcript of Scleroglucan/borax: characterization of a novel hydrogel system suitable for drug delivery

Biomaterials 24 (2003) 2789–2798
Scleroglucan/borax: characterization of a novel hydrogel system
suitable for drug delivery
T. Covielloa,*, M. Grassib, R. Lapasinb, A. Marinoa, F. Alhaiquea
aDipartimento di Studi di Chimica e Tecnologia delle Sostanze Biologicamente Attive, Universit "a ‘‘La Sapienza’’,
Piazzale Aldo Moro 5, 00185 Rome, ItalybDipartimento di Ingegneria Chimica, dell’Ambiente e delle Materie Prime, Universit "a di Trieste, P.zza Europa 1, 34127 Trieste, Italy
Received 1 October 2002; accepted 27 January 2003
Abstract
A new hydrogel, with scleroglucan using borax as a crosslinker, has been prepared. The physical gel has been loaded with a model
molecule (theophylline) and the release of the drug from the gel was evaluated. The same system was used to prepare tablets and the
delivery of theophylline in different environmental conditions (HCl and SIF) was determined. A recent theoretical approach has
been applied to the dissolution profiles obtained from the tablets and a satisfactory agreement has been found with the experimental
data. Furthermore, the diffusion coefficient of the model molecule was evaluated according to a suitable strategy that was tested on
two set of data obtained with different set-ups (permeation and diffusion experiments). A simplified mathematical approach allows
to reduce the two-dimensional problem of the Fick’s second law in a one-dimensional system leading to a much easier handling of
the data without loosing the accuracy of the original problem in two dimensions. The characterization of the gel has been also
carried out following the kinetics of swelling in terms of water uptake.
r 2003 Elsevier Science Ltd. All rights reserved.
Keywords: Scleroglucan; Borax; Hydrogel; Modified release; Physically crosslinked gels
1. Introduction
Hydrogels are hydrophilic three-dimensional swella-
ble networks that can be obtained by chemical and/or
physical crosslinking of polymers. They show a wide
variety of applications as medical devices and in the field
of pharmaceutics [1]; in this sense, particular attention
has been focused, since several years, to the use of
hydrogels for modified release formulations [2,3]. This
type of study requires, together with a more practical
approach, also a careful and deep investigation on the
structure and on the morphology of the rate-controlling
polymeric network as well as an analysis of the diffusive
behavior of the tested drugs through and from the
hydrogel.
We report here the results of our studies on the
behavior of a new hydrogel prepared with scleroglucan
and borax.
Scleroglucan (Sclg) is a branched homopolysacchar-
ide consisting of a main chain of (1-3)-linked b-d-
glucopyranosyl units bearing, every third unit, a single
b-d-glucopyranosyl unit linked (1-6) (Fig. 1). This
polysaccharide is resistant to hydrolysis and its solutions
show an interesting rheological behavior: viscosity
remains practically constant, even at high ionic strength,
up to pH=12 and to 90�C.
Due to its peculiar properties, Sclg was extensively
used for various commercial applications (secondary oil
recovery, ceramic glazes, food, paints, cosmetics, etc.)
[4]; it was also investigated for modified/sustained
release formulations such as monolithic swellable
matrices [5–9] and ophtalmic preparations [10]. Oxidized
Sclg was proposed for pH-controlled delivery oral
dosage forms [11,12] and several crosslinked derivatives
have been prepared and studied for the same purposes
[13–19].
Borax is a crosslinker used with polymers containing
hydroxyl groups [20–31] that was previously studied for
the preparation of complexes with guar gum suitable for
colonic delivery purposes [32].
*Corresponding author. Tel.: +39-06-4991-3300; fax: +39-06-4991-
3133.
E-mail address: [email protected] (T. Coviello).
0142-9612/03/$ - see front matter r 2003 Elsevier Science Ltd. All rights reserved.
doi:10.1016/S0142-9612(03)00087-5

The characterization of the new hydrogel in the
present study was performed in terms of water uptake
and permeation experiments. Furthermore, the drug
release from the swollen hydrogel as well as from tablets
prepared with the freeze-dried product was determined;
in both cases theophylline (TPH) was used as a model
drug.
A suitable strategy, that allows to simplify the
mathematical procedure, was applied to the data
obtained from two different experimental procedures
in order to evaluate the diffusion coefficient of TPH and
the trend of the dissolution profiles from the tablets was
studied according to Dokoumetzidis–Macheras [33].
2. Materials and methods
2.1. Purification of scleroglucan
A given amount of Sclg (Actigum CS 11), provided by
Mero-Rousselot-Satia (France) (molecular weight=
1.4� 106 from viscometric measurements) was dissolved
in distilled water, then kept under magnetic and
mechanical stirring at room temperature for 24 h. The
solution was exhaustively dialyzed at 7�C against
distilled water and then freeze-dried.
2.2. Hydrogel preparation
The gel was obtained, in a beaker, by addition of a
calculated amount (i.e. moles of borax=moles of
repeating unit of Sclg) of 0.1m borax to a polymer
solution previously prepared; the mixture was magneti-
cally stirred for 5 min and then left overnight for gel
setting. The final polymer concentration (cp) was 0.7%
(w/v).
When needed the gel was loaded with TPH (Carlo
Erba product). For this purpose a given amount of drug
was dissolved in the polymer solution before the
addition of borax (Carlo Erba product).
All experiments were carried out in triplicate.
2.3. Release experiments from gels
The gel, freshly prepared in a beaker, was obtained
with the cylindrical shape of the glass vessel
(height=1.0 cm, diameter=2.2 cm) and it was tested
for the release of TPH, chosen as a model drug, at 7�
and 37 �C. For release experiments the gel was soaked in
an appropriate medium (V ¼ 200:0 cm3), i.e., distilled
water (pH=5.4), SIF (pH=7.4, phosphate buffer
according to USP. XXIV) or NaOH at different
concentrations (pH=10, 12, 13 and 14).
The gel was kept at a certain height from the bottom
of the container by a thin web, while the medium was
gently magnetically stirred. Three-milliliter samples were
withdrawn from the solution at appropriate time
intervals and replaced with the same amount of fresh
solvent.
TPH was spectrophotometrically detected at 272 nm
(Perkin-Elmer, lambda 3a, UV-Vis spectrometer) using
quartz cells with pathlengths of 1.0 or 0.1 cm.
The possible erosion of the gel, in terms of polymer
dissolution in the medium during the release experi-
ments, was quantitatively determined by a colorimetric
method [34], using phenol in the presence of sulfuric
acid.
2.4. Tablet preparation
For the preparation of the tablets about 160 mg of
Sclg and 20 mg of TPH were magnetically stirred in
water for 24 h. Then the calculated amount of 0.1m
borax was added and the system was kept under
magnetic stirring for 5min. The obtained gel
(cp ¼ 0:7%; r ¼ 1:0) was kept overnight at 7�C and then
freeze-dried.
Tablets were finally prepared from the freeze-dried
sample with an IR die (Perkin-Elmer hydraulic press)
using a force of 5.0 kN. The weight of tablets was
230710 mg, the diameter was 13.0070.05 mm and the
thickness was 1.4070.10 mm.
2.5. Release experiments from tablets
Release experiments from the model dosage forms
were carried out according to USP. XXIV, using the
rotating basket apparatus at 37.070.1�C, 100 rpm and
three different dissolution media: SGF (pH=2.0),
distilled water (pH=5.4) and SIF (pH=7.4).
Aliquots of the dissolution medium were taken at
fixed time intervals, released TPH was spectrophotome-
trically determined and the same amount of fresh
solvent was added.
Fig. 1. Repeating unit of Sclg.
T. Coviello et al. / Biomaterials 24 (2003) 2789–27982790

2.6. Water uptake and height increase studies
Water uptake was evaluated by the relative increase of
weight of the tablets in distilled water at 37�C. During
the experiment, the dimensional variations of the tablets
were evaluated with a caliper with appreciation to
0.2 mm.
2.7. Permeation experiments
Permeation experiments were carried out at constant
temperature (3770.5�C) under magnetic stirring using a
two-compartment diffusion cell (Fig. 2). The compart-
ment A (V ¼ 1:0 cm3), separated from the receptor
compartment B (V ¼ 14:5 cm3) by a cellophane mem-
brane (Visking tubing, cut-off 12.000), contained the gel
of Sclg/borax loaded with TPH. The diffusion of the
model drug from the gel to the receptor compartment B
containing distilled water was spectrophotometrically
evaluated. An appropriate blank, i.e., a TPH solution in
compartment A, was used as reference. The cellophane
membrane in no case was the rate-limiting step of the
overall diffusion mechanism through the gel.
2.8. Data analysis
A fundamental prerequisite for an appropriate
utilization of a swollen gel as a modified release system
is the knowledge of its diffusive characteristics, usually
represented by the diffusion coefficient exhibited by a
model drug moving through the network meshes.
Among the different experimental set-ups that can be
designed for the calculation of the diffusion coefficient
[35] we considered and compared two of them. Accord-
ingly, for the first case we studied the cylindrical gel
described in Section 2.3, not undergoing significant
erosion and/or further swelling (being the hydrogel
already in equilibrium conditions), that releases a model
drug into a stirred solution. For the second case a two-
compartment permeation cell was considered in order to
calculate the diffusion coefficient (see Fig. 2).
The first case requires the solution of Fick’s second
law at least in a two dimensions (2D) cylindrical
coordinates system, while the second one needs a Fick’s
second law solution in a one dimension (1D) rectangular
coordinates system.
Since in the first case a time consuming numerical
technique is required, we proposed, as reported
below, a possible way to overcome such a problem by
reducing the 2D problem to a much easier to handle 1D
problem without loosing the accuracy of the original 2D
solution.
2.8.1. Release from a cylinder
Supposing a constant drug diffusion coefficient D and
a negligible gel density variation due to the diffusion
process, Fick’s second law, in a 2D cylindrical coordi-
nates system, can be written as
qC
qt¼
D
R
q
qRRqC
qR
� �
þDq2C
qZ2; ð1Þ
where t is time, C is the drug concentration (mass/
volume) in the cylinder, R and Z are the radial and axial
axes, respectively. This equation must satisfy the
following initial and boundary conditions; initial condi-
tions:
CðZ;RÞ ¼ C0; �ZcpZpZc 0pRpRc; ð2Þ
Crel ¼ 0 ð3Þ
Fig. 2. Schematic representation of a two-compartment diffusion cell (a and b).
T. Coviello et al. / Biomaterials 24 (2003) 2789–2798 2791

boundary conditions:
CðZ;Rc; tÞ ¼ Cð7Zc;R; tÞ ¼ kpCrelðtÞ; ð4Þ
VrelCrelðtÞ ¼ pR2c2ZcC0 �
Z Zc
�Zc
Z Rc
�0
CðZ;R; tÞ2pR dR dZ;
ð5Þ
where 2Zc and Rc are, respectively, the cylinder height
and radius, C0 is the initial drug concentration in the
cylinder, Crel and Vrel are the drug concentration
and the volume of the release medium and kp is the
drug partition coefficient between the cylindrical gel
and the environmental release fluid. Eqs. (2) and (3)
state that the release environment is initially drug free,
while the cylinder is uniformly loaded by a drug
concentration C0: Eq. (4) expresses the partitioning
condition at the cylinder/release fluid interface, while
Eq. (5) is a drug mass balance for the cylinder/release
fluid system, that allows to state the relation between
Crel and CðZ;R; tÞ: The equations set (1)–(5) can be
numerically solved by means of the control volume
method [36].
Due to the fact that Eq. (1) data fitting can be very
heavy (if not impossible) in terms of calculation
time when the number of control volumes considered
increases (we noticed that, practically, on a Pentium IV
1.7 GHz personal computer, 225 (15� 15 grid)
control volume elements represents the upper limit
for data fitting), we propose a possible way to reduce
the 2D problem in a simpler 1D problem. Due to the
neatly lower calculation time, the 1D problem solution
can be simply embodied in an Excel macro (as user
defined function) to be used directly as one of the other
native Excel functions. In this manner, this could be a
useful tool also for researchers that are not so used to
handle mathematical equations.
The strategy adopted to perform the 2D–1D
transformation is based on the idea of finding
the correction factor to be applied to the 1D solution
to make it coincident with the 2D one, provided
the same boundary and initial conditions are con-
sidered. In order to optimize the numerical solution
procedure (control volume method [36]) of the 1D
problem, we suppose to divide the cylinder in
cylindrical shells (computational elements), character-
ized by the same ratio K between the height (2Z)
and the corresponding radius (R) (see Fig. 3).
Consequently, the volume of the generic cylindrical
shell is given by
dV ¼ dð2ZpR2Þ ¼ dðKpR3Þ ¼ 3pKR2 dR
K ¼2Zc
Rc
¼2Z
R: ð6Þ
Supposing a uniform drug concentration inside the
cylindrical shell, Fick’s second law reads
�dVqC
qt¼ 2pðRþ dRÞ2 Z þ dZð ÞNRþdR
� 4pRZNR þ 2pðRþ dRÞ2NZþdZ � 2pR2NZ;
ð7Þ
where NR and NRþdR are, respectively, the radial matter
fluxes evaluated in R and Rþ dR; while NZ and NZþdZ
are, respectively, the axial matter fluxes evaluated in Z
and Z+dZ (note that the factor 2 in the axial balance is
related to the fact that drug diffusion takes place
through both the two cylindrical shell bases). Recalling
that
NZ ¼ �DqC
qZ
�
�
�
�
Z
¼ �D2
K
qC
qR
�
�
�
�
R
¼2
KNR
NZþdZ ¼ �DqC
qZ
�
�
�
�
ZþdZ
¼ �D2
K
qC
qR
�
�
�
�
RþdR
¼2
KNRþdR
ð8Þ
we finally have the expression of Fick’s second law on
this particular kind of computational elements:
qC
qt¼
2
3
2 þ K2
K2
� �
1
R2
q
qRR2D
qC
qR
� �
: ð9Þ
Of course, the above-described mathematical treatment
makes Eq. (9) solution different from that of Eq. (1), as
we started from a 2D diffusion in a cylinder and,
basically, we get the equation describing the diffusion in
2Zc
2Rc
2(R+dR)
2Z
2R
2(Z+dZ)
Fig. 3. Schematic representation of the cylindrical shells used to solve
Fick’s second law in order to reduce the 2D diffusion problem in a 1D
diffusion problem.
T. Coviello et al. / Biomaterials 24 (2003) 2789–27982792

a sphere [37]. Our goal is to find out a correction factor
making the two solutions coincident, provided that
Eq. (9) satisfies the following initial and boundary
conditions:
initial conditions
CðRÞ ¼ C0; 0pRpRc; ð10Þ
Crel ¼ 0; ð11Þ
boundary conditions
CðRc; tÞ ¼ kpCrelðtÞ; ð12Þ
VrelCrelðtÞ ¼ pR2c2ZcC0 �
Z Rc
0
C R; tð Þ3pKR2 dR: ð13Þ
Obviously, these equations express the same conditions
set by Eqs. (2)–(5). Accordingly, the cylinder is, initially,
uniformly drug loaded (Eq. (10)), the release environ-
ment is initially drug free (Eq. (11)), partitioning
conditions hold at the gel/external fluid interface
(Eq. (12)) and a global mass balance is considered in
order to state the relation between Crel and CðRÞ:It is possible to numerically verify that Eqs. (1) and
(9) solutions are approximately equal if a proper
correcting factor f ðKÞ is introduced in Eq. (9):
f ðKÞ ¼ 0:797ð1 � e�ð0:677ðKþ0:993ÞÞÞ ð0:5oKo16Þ: ð14Þ
The f dependence on K has been determined by
considering the dimensionless expression of Eqs. (1)
and (9):
qCþ
qt¼
1
Rþ
q
qRþRþqC
þ
qRþ
� �
þq2Cþ
qðZþÞ2; ð10Þ
qCþ
qt¼ f Kð Þ
2
3
2 þ K2
K2
� �
1
ðRþÞ2q
qRþðRþÞ2
qCþ
qRþ
� �
; ð90Þ
where
t ¼ tD=R2c ; Cþ ¼ C=C0; Rþ ¼ R=Rc; Zþ ¼ Z=Rc:
ð15Þ
The solution of Eq. (10) for a discrete set of different K
values (0:5oKo16) and the choice, for each K value, of
the proper f value allow the overlapping of Eqs. (90) and
(10) solutions. Accordingly, Fig. 4 can be drawn, where
the correcting factor f (circles) is reported for the
discrete K set chosen. In order to generalize this result,
we successfully fit the f trend on K by means of the
following exponential equation (solid line in Fig. 4):
f ðKÞ ¼ a� 1 � e�ðb�ðKþgÞÞ� �
; ð16Þ
whose best fit parameter values (a; b and g) are those
shown in Eq. (14). It is evident that, for KX6; f
becomes constant and equal to 0.8, while, for lower K
values, it progressively decreases. We limited our
analysis to the above-mentioned K range because, for
Ko0:5 and K > 16; the 2D diffusion problem can be,
respectively, approximated to a 1D totally axial or
totally radial diffusion problem.
As an example, in the case of K ¼ 1 (fE0:7), Fig. 5
reports the trend of the ratio Crel=Crelinf (where Crelinf is
the Crel value at infinite time) vs. the dimensionless time
t for Eqs. (10) (open circles) and (90) (solid line). The
coincidence of the solutions is evident.
According to the above-reported speculations, it is
interesting to underline that, ultimately, we suggest an
empirical method for the acquisition of an approximate
analytical solution of Eq. (10), resorting to Eq. (90).
Thus, Eq. (9) solution will coincide with that of Eq. (1),
provided that the correcting factor f is considered in
Eq. (9):
qC
qt¼ f ðKÞ
2
3
2 þ K2
K2
� �
1
R2
q
qRR2D
qC
qR
� �
: ð900Þ
Interestingly, a different choice of the computational
shells shape would reflect only on the analytical
expression of the correcting factor f as the constant
factor multiplying the term ð1=R2Þðq=qRÞðR2DqC=qRÞ in
Eqs. (9) and (900) would be different.
0.4
0.5
0.6
0.7
0.8
0.9
0 2 4 6 8 10 12 14 16 18K
f(K
)
Fig. 4. Correcting factor f (circles) dependence on a discrete set of K
values necessary to ensure the equivalence of the Eqs. (10) and (90)
solution. This trend can be profitably fitted by Eq. (16) (solid line).
0.0
0.2
0.4
0.6
0.8
1.0
1.2
0 0.05 0.1 0.15 0.2
τ
Cre
l/C
rel
inf
eq.(1')
eq.(9')
Fig. 5. Comparison between the solution of Eq. (10) (open circles) and
Eq. (90) (solid line) when K ¼ 1:
T. Coviello et al. / Biomaterials 24 (2003) 2789–2798 2793
2.8.2. Permeation
In order to calculate the drug diffusion coefficient
from permeation data, it is necessary to solve the 1D
Fick’s second law inside the gel and the cellophane layer
(see Fig. 2b). For this purpose, we used a recently
proposed model [16,17] whose main characteristics are
here briefly recalled. Fick’s second law equations for the
gel and the cellophane layer read
qC
qt¼
q
qXDqC
qX
� �
; ð17Þ
qCc
qt¼
q
qXDc
qCc
qX
� �
; ð18Þ
where D; Dc; C and Cc are, respectively, the drug
diffusion coefficients and concentrations in the gel and
in the cellophane layer. The above-reported equations
must be solved with the following boundary conditions:
qC
qX
�
�
�
�
X¼0
¼ 0; ð19Þ
Dc
qCc
qX
�
�
�
�
X¼hg
¼ DqC
qX
�
�
�
�
X¼hg
; ð20Þ
Vr
dCr
dt¼ �DcS
qCc
qX
�
�
�
�
X¼hgþhc
; ð21Þ
C
Cc
¼ kpg;Cc
Cr
¼ kpc; ð22Þ
and the following initial conditions:
Cr ¼ 0; ð23Þ
Cc ¼ 0; hgoXohg þ hc; ð24Þ
C ¼ C0; 0oXohg; ð25Þ
where Vr represents the receptor volume, Cr is the drug
concentration in the receptor compartment at time t; Sis the permeation surface, hc and hg are the thicknesses
of the cellophane layer and that of the gel, while kpc and
kpg are the drug partition coefficients of the cellophane
layer and that of the gel with respect to the solution of
the receptor compartment. Eq. (19), zeroing the drug
concentration gradient, ensures that no matter flux can
exist at X ¼ 0 where a drug-impermeable layer is placed.
Eq. (20) imposes that the drug flux leaving the gel is
equal to that entering the cellophane (X ¼ hg); Eq. (21)
ensures that the drug entering in the receptor compart-
ment is equal to that leaving the cellophane layer, so
that no mass accumulation occurs at the cellophane/
receiver–fluid interface. Eq. (22) imposes the drug
partitioning conditions at the gel/cellophane and
at the cellophane/receptor fluid interfaces, respectively.
Eqs. (23) and (24) state that the receptor compartment
and the cellophane layer are initially drug free, while
Eq. (25) sets to C0 the drug concentration in the gel.
Eqs. (17)–(25) need a numerical solution [36].
3. Results and discussion
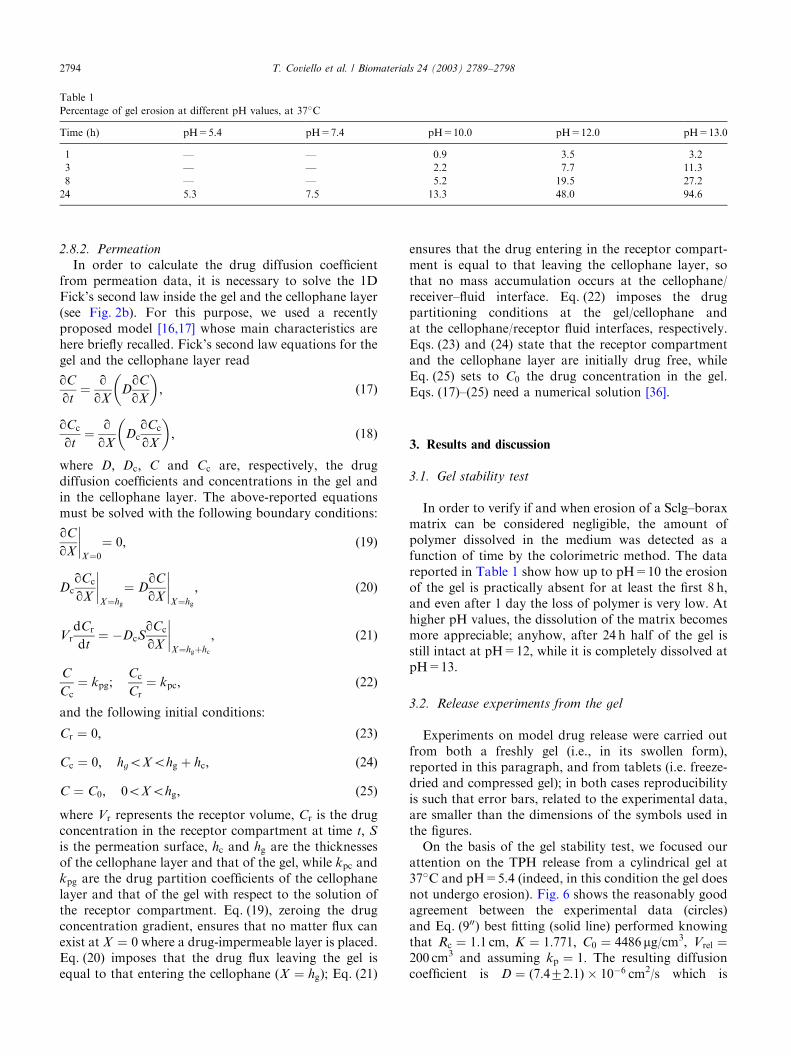
3.1. Gel stability test
In order to verify if and when erosion of a Sclg–borax
matrix can be considered negligible, the amount of
polymer dissolved in the medium was detected as a
function of time by the colorimetric method. The data
reported in Table 1 show how up to pH=10 the erosion
of the gel is practically absent for at least the first 8 h,
and even after 1 day the loss of polymer is very low. At
higher pH values, the dissolution of the matrix becomes
more appreciable; anyhow, after 24 h half of the gel is
still intact at pH=12, while it is completely dissolved at
pH=13.
3.2. Release experiments from the gel
Experiments on model drug release were carried out
from both a freshly gel (i.e., in its swollen form),
reported in this paragraph, and from tablets (i.e. freeze-
dried and compressed gel); in both cases reproducibility
is such that error bars, related to the experimental data,
are smaller than the dimensions of the symbols used in
the figures.
On the basis of the gel stability test, we focused our
attention on the TPH release from a cylindrical gel at
37�C and pH=5.4 (indeed, in this condition the gel does
not undergo erosion). Fig. 6 shows the reasonably good
agreement between the experimental data (circles)
and Eq. (900) best fitting (solid line) performed knowing
that Rc ¼ 1:1 cm, K ¼ 1:771; C0 ¼ 4486 mg/cm3, Vrel ¼
200 cm3 and assuming kp ¼ 1: The resulting diffusion
coefficient is D ¼ ð7:472:1Þ � 10�6 cm2/s which is
Table 1
Percentage of gel erosion at different pH values, at 37�C
Time (h) pH=5.4 pH=7.4 pH=10.0 pH=12.0 pH=13.0
1 — — 0.9 3.5 3.2
3 — — 2.2 7.7 11.3
8 — — 5.2 19.5 27.2
24 5.3 7.5 13.3 48.0 94.6
T. Coviello et al. / Biomaterials 24 (2003) 2789–27982794

practically coincident with the D value supplied by the
Eq. (1) fitting on the same data.
The determination of the TPH diffusion coefficient,
calculated by fitting Eqs. (17) and (18) on the permea-
tion data (Fig. 7), obtained considering S ¼ 1:77 cm2,
C0¼5546 mg/cm3, Vr¼14:5 cm3, hg¼0:6 cm, hc¼0:005 cm,
Dc ¼ 2:72 � 10�6 cm2/s [16], and assuming kpg ¼ kpc ¼
1; leads to D ¼ ð4:270:05Þ � 10�6 cm2/s. The discre-
pancy between the two values of D (in principle they
must be equal) can be explained considering the fact that
the geometrical hypothesis (perfectly cylindrical shape
of the delivery system) assumed in the first case is surely
less reliable than that occurring in the permeation case
where the system geometry is ensured by an outer
boundary (the permeation cell apparatus). This is
substantiated by the lower D standard deviation in the
permeation case (0.05� 10�6 cm2/s) with respect to the
cylinder case (2.1� 10�6 cm2/s) (standard errors have
been calculated performing data fitting on each of the
three experimental repetitions in order to get three
diffusion coefficient values. Then, mean value and
standard deviation have been determined). In this sense,
we believe that our findings are reasonably reliable in
both cases. Moreover, it is possible that, in the case of
release experiments from the gel, there is a little
convective contribution to TPH release, due to the
almost negligible gel erosion (see Table 1), that could
determine an apparent increase of the diffusion
coefficient. In Fig. 8 TPH release rates from the
hydrogel, collected at different pH values (from
pH=5.4 to 14.0), are reported as Mt=MN; where Mt
indicates the amount of TPH released at the time t
and MN indicates the amount of drug released at
infinite time (corresponding to the total amount
loaded in the formulation). It is possible to observe
that, while at pH=14.0 the sample is completely
dissolved within the first 30 min and all the loaded drug
is rapidly released, at lower pH values the presence of
the gel leads to a remarkably reduced release rate.
Furthermore, the shape of the profiles indicates that the
gel behavior is not appreciably influenced by environ-
mental pH variations.
This result allows us to suggest a connection bet-
ween the model drug release and a mechanism
of diffusion and/or relaxing of the polymeric chains
within the pH range 5.4–13.0. That points out that,
when erosion occurs, it does not affect significantly
the overall mechanism of release. On the contrary,
at pH=14, as expected from the gel stability test,
erosion becomes the predominant process which leads to
an almost immediate release of TPH (see Fig. 8) with a
Fig. 8. Release profiles of TPH from gels in different media at 37�C.
y = 3.884x - 0.536
r2 = 0.998
0
2
4
6
8
10
12
0.0 0.5 1.0 1.5 2.0 2.5 3.0
time0.5 (h0.5)
(w-w
0)/w
0
Fig. 9. Water uptake from tablets, at 37�C, reported as a function of
the square root of time.
0
100
200
300
400
0 5 10 15 20 25time (h)
C ( µ
g/cm
3 )
Fig. 7. Comparison between the experimental permeation data from
the two-compartment cell (circles) and the best fitting (Eqs. (16) and
(17), solid line).
0
10
20
30
40
50
60
70
80
90
0 5 10 15 20 25
time (h)
Cre
l (µg
/cm
3)
data
model
Fig. 6. Comparison between the experimental release data from
cylinders (circles) and the 1D model best fitting (Eq. (900), solid line).
T. Coviello et al. / Biomaterials 24 (2003) 2789–2798 2795

complete dissolution of the matrix within the first
30 min.
3.3. Water uptake and height increase studies
The increase of weight of the tablets (prepared from
freeze-dried gels loaded with TPH) was determined at
37�C as a function of time. After 2 days, equilibrium
was reached and a maximum relative increase of weight
equal to twenty was detected. The experimental values,
reported as a function of the square root of time (Fig. 9),
give a straight line, suggesting that solvent penetration
within the matrix occurs, macroscopically, according to
a Fickian process.
As it is possible to observe from Fig. 10, water uptake
leads to an anisotropic swelling of the matrix that takes
place essentially in the axial direction while it is almost
negligible in the radial direction. It is worth to underline
that, as far as we know, this is the first time that an
anomalous swelling of a polymeric matrix is found; thus
work is in progress to elucidate the mechanism of such
peculiar behavior. As the water uptake rate, also the
increase of height shows a linear trend when reported as
a function of the square root of time.
3.4. Release experiments from tablets
When the gels loaded with TPH and freeze-dried were
used as matrices for tablets, a release behavior similar to
that obtained with freshly prepared gels was observed.
Again no appreciable differences were detected ranging
from SGF (pH=2.0) to SIF (pH=7.4). The data,
reported in Fig. 11, show how the solvent pH does not
affect the model drug release from tablets.
Being the dissolution curves practically coincident, we
can assume that the solvent penetration rate into the
polymer rules out the TPH release both in SGF and in
SIF.
3.5. Modeling of dissolution from tablets
The problem of data modeling in the case of a
swelling tablet is not a trivial task because of the
numerous phenomena involved in the overall release
process. Moreover, the classical approach based on
Fick’s second law is not suitable for this purpose since
matrix continuity, fundamental prerequisite for a
classical diffusion analysis, cannot be accomplished,
especially at the beginning of the release process.
Fig. 10. Pictures of a tablet before (right) and after (left) swelling (a red dye was used for a better visualization).
0.0
0.2
0.4
0.6
0.8
1.0
1.2
0 1 2 3 4 5 6 7 8 9
Φ =
Mt/M
inf
experimental pH = 2model pH = 2experimental pH = 5.4model pH = 5.4experimetal pH = 7.4model pH = 7.4
time (h)
Fig. 11. Release profiles from tablets (symbols) and model best fitting
(Eq. (28)) of TPH at 37�C and at different pH values.
T. Coviello et al. / Biomaterials 24 (2003) 2789–27982796

Accordingly, a possible alternative is the approach
proposed by Dokoumetzidis–Macheras [33]; in his
model only discrete time intervals are considered and
what happens in between is ignored. Thus it is possible
to write an empirical expression where the amount of
drug that dissolves during the experiment is not any
more function of time but it is described in terms of
subsequent generations.
The authors, defining Xn and Yn as the population of
the drug molecules in the solid state and in solution in
the nth generation, respectively, describe the change of
Yn at the nþ 1 generation as follows:
Ynþ1 ¼ Yn þ RXn ¼ Yn þ RðX0 � YnÞ; ð26Þ
where R is a proportionality parameter and X0 is the
population of drug molecules in the solid state,
corresponding to the initial drug concentration in the
delivery system. Taking into account that the drug has a
solubility threshold in the release environment, Eq. (26)
becomes
Ynþ1 ¼ Yn þ RðX0 � YnÞ 1 �Yn
y
� �
; ð27Þ
where y is the saturation level of the population, i.e drug
solubility. If Eq. (27) is normalized in terms of dose (X0)
and if we define Fn ¼ ðYn=X0Þ; we obtain
Fnþ1 ¼ Fn þ Rð1 � FnÞ 1 �FnX0
y
� �
; ð28Þ
where Fn and Fnþ1 represent the drug mass fraction
dissolved at generation n and nþ 1; respectively. On the
basis of Eq. (28), knowing that X0=y is equal to
1.4� 10�3 and assuming that a new generation occurs
every 0.25 h, we fitted our experimental results as shown
in Fig. 11. Here it is possible to observe that, although a
systematic bias exists between data (symbols) and model
(solid lines), nevertheless the fitting is to be considered as
quite satisfactory. Although using Eq. (28) we a priori
renounced to any physical characterization of our
delivery system (we cannot estimate, for example, the
drug diffusion coefficient), Eq. (28) actually helps us to
compare the three different situations studied. The
calculated R values (R ¼ 0:162 pH=2.0; R ¼ 0:136
pH=5.4; R ¼ 0:143 pH=7.4) underline that, from the
Eq. (28) standpoint, the three situations do not appre-
ciably differ among each other.
4. Conclusions
The hydrogel, obtained with Sclg and borax, appears
to be suitable for a sustained drug delivery as indicated
by the results obtained when the hydrogel is loaded with
TPH. A similar behavior was observed when a swollen
gel was used and when the freeze-dried hydrogel was
used as matrix for tablets. A new theoretical approach,
to evaluate the diffusion coefficient of TPH, has been
applied to the data acquired by two different experi-
mental set-ups. The mathematical method allows to
solve the Fick’s second law in one dimension without
any loss of accuracy of the original system in two
dimensions.
The profiles release of TPH from tablets in different
media have been analyzed in term of the model
proposed by Dokoumetzidis–Macheras; a satisfactory
agreement was found between the model and the
experimental data in all the cases that were investigated.
The swelling of the hydrogel has been monitored,
leading to the assertion that the overall process obeys
to a Fickian mechanism.
Acknowledgements
This work was carried out with the financial support
of MIUR.
References
[1] Hoffman AS. Hydrogels for biomedical applications. Adv Drug
Delivery Rev 2002;43:3–12.
[2] Peppas NA, Bures P, Leobandung W, Ichikawa H. Hydrogels in
pharmaceutical formulations. Eur J Pharm Biopharm 2000;50:
27–46.
[3] Kikuchi A, Okano T. Pulsatile drug release control using
hydrogels. Adv Drug Delivery Rev 2002;43:53–77.
[4] Giavasis I, Harvey LM, McNeil B. Scleroglucan. In: De Baets S,
Vandamme EJ, Steinb .uchel A, editors. Biopolymers, polysac-
charides II, vol. 6. Weinheim: Wiley-VCH, 2002. p. 37–60.
[5] Touitou E, Alhaique F, Riccieri FM, Riccioni G, Santucci E.
Scleroglucan sustained release oral preparations. Part I. In vitro
experiments. Drug Des Delivery 1989;5:141–8.
[6] Alhaique F, Carafa M, Riccieri FM, Santucci E, Touitou E.
Studies on the release behaviour of a polysaccharide matrix.
Pharmazie 1993;48:432–5.
[7] Rizk S, Duru C, Gaudy D, Jacob M, Ferrari F, Bertoni M,
Caramella C. Physicochemical characterization and tableting
properties of Scleroglucan. Int J Pharm 1994;112:125–31.
[8] Alhaique F, Beltrami E, Riccieri FM, Santucci E, Touitou E.
Scleroglucan sustained release oral preparations Part II. Effects of
additives. Drug Des Delivery 1990;5:249–57.
[9] Alhaique F, Carafa M, Coviello T, Murtas E, Riccieri FM,
Santucci E. Release from a polysaccharide matrix: effect of the
molecular weight of the drug. Acta Technol Legis Med 1993;
4:21–30.
[10] Romanelli L, Alhaique F, Riccieri FM, Santucci E, Valeri P.
Investigation of the features of scleroglucan a polysaccharide of
fungin origin as a vehicle for ocular topical administration.
Pharmacol Res 1993;27(Suppl 1):127–8.
[11] Alhaique F, Riccieri FM, Santucci E, Crescenzi V, Gamini A. A
possible pH-modified drug delivery system based on a derivative
of the polysaccharide scleroglucan. J Pharm Pharmacol
1985;37:310–3.
[12] Alhaique F, Riccieri FM, Santucci E, Carafa M. Environmental
effects on the delivery of drugs from a pH-sensitive matrix. Acta
Technol Legis Med 1990;1:1–9.
T. Coviello et al. / Biomaterials 24 (2003) 2789–2798 2797

[13] Coviello T, Maeda H, Yuguchi Y, Urakawa H, Kajiwara K,
Dentini M, Crescenzi V. Conformational characteristics of
oxidized scleroglucan. Macromolecules 1998;31:1602–7.
[14] Coviello T, Dentini M, Rambone G, Desideri P, Carafa M,
Murtas E, Riccieri FM, Alhaique F. A novel co-crosslinked
polysaccharide: studies for a controlled delivery matrix. J Control
Release 1998;55:57–66.
[15] Maeda H, Coviello T, Yuguchi Y, Urakawa H, Rambone G,
Alhaique F, Kajiwara K. Structural characteristics of oxidized
scleroglucan and its network. Polym Gels Networks 1998;6:
355–66.
[16] Coviello T, Grassi M, Rambone G, Santucci E, Carafa M,
Murtas E, Riccieri FM, Alhaique F. Novel hydrogel system from
scleroglucan: synthesis and characterization. J Control Release
1999;60:367–78.
[17] Coviello T, Grassi M, Rambone G, Alhaique F. A crosslinked
system from scleroglucan derivative: preparation and character-
ization. Biomaterials 2001;22:1899–909.
[18] Maeda H, Rambone G, Coviello T, Yuguchi Y, Urakawa H,
Alhaique F, Kajiwara K. Low-Degree oxidized scleroglucan and
its hydrogel. Int J Biol Macromol 2001;28:351–8.
[19] Alhaique F, Casadei MA, Coviello T, Micheletti Moracci F.
Chemical gels of scleroglucan for controlled release formulations.
Acta Technol Legis Med 2001;12:185–90.
[20] Deuel H, Neukom H, Weber F. Reaction of boric acid with
polysaccharides. Nature 1948;161:96–7.
[21] Davis HB, Mott CJB. Interaction of boric acid and borates with
carbohydrates and related substances. J Chem Soc Faraday I
1980;76:1991–2002.
[22] Cheng ATY, Rodriguez F. Mechanical properties of borate
crosslinked poly(vinyl alcohol) Gels. J Appl Polym Sci 1981;26:
3895–908.
[23] Ochiai H, Shimizu S, Tadokoro Y, Murakami I. Complex
formation between poly(vinyl alcohol) and borate ion. Polym
Commun 1981;22:1456–8.
[24] Wing RE, Maiti S, Doane WM. Factors affecting release of
butylate from calcium ion-modiefied starch-borate matrices.
J Control Release 1987;5:79–89.
[25] Verchere JF, Hlaibi M. Stability constants of borate complexes of
oligosaccharides. Polyhedron 1987;6:1415–20.
[26] Shibayama M, Yoshizawa H, Kurokawa H, Fujiwara H, Nomura
S. Sol–gel transition of poly(vinyl alcohol)-borate complex.
Polymer 1988;29:2066–71.
[27] Shibayama M, Sato M, Rimura Y, Fujiwara H, Nomura S. 11B
n.m.r. study on the reaction of poly(vinylalcohol) with boric acid.
Polymer 1988;29:336–40.
[28] Pezron E, Leibler L, Lafuma F. Complex formation in polymer-
ion solutions. 2. Polyelectrolyte effects. Macromolecules 1989;
22:2656–62.
[29] van den Berg R, Peters JA, van Bekkum H. The structure and
(local) stability constants of borate esters of mono- and di-
saccharides as studied by 11B and 13C NMR spectroscopy.
Carbohydr Res 1994;253:1–12.
[30] Jasinski R, Redwine D, Rose G. Boron equilibria with high
molecular weight Guar: an nmr study. J Polym Sci: Part B: Polym
Phys 1996;34:1477–88.
[31] McLaughin KW, Wyffels NK, Jentz AB, Keenan MV. The
gelation of poly(vinyl alcohol) with Na2B4O7 10H2O: killing
slime. J Chem Educ 1997;74:97–9.
[32] Rubinstein A, Gliko-Kabir I. Synthesis and swelling-
dependent enzymatic degradation of borax-modified guar
gum for colonic delivery purposes. STP Pharma Sci 1995;
5:41–6.
[33] Dokoumetzidis A, Macheras P. A population growth model of
dissolution. Pharm Res 1997;14:1122–6.
[34] Dubois M, Gilles KA, Hamilton JK, Rebers PA, Smith F.
Colorimetric method for determination of sugars and related
substances. Anal Chem 1956;28:350–6.
[35] Westrin BA, Axelsson A, Zacchi G. Diffusion measurements in
gels. J Control Release 1994;30:189–99.
[36] Patankar SV. Numerical heat transfer and fluid flow. New
York: McGraw-Hill/Hemisphere Publishing Corporation,
1990.
[37] Crank J. Diffusion in a sphere. In: The mathematics of diffu-
sion. 2nd ed. Oxford: Clarendon Press, 1975. p. 89–103
[chapter 6].
T. Coviello et al. / Biomaterials 24 (2003) 2789–27982798