Ethanol from Babassu Coconut Starch Technical and Economical Aspects
Upload
khangminh22Category
view
1download
0
�����������������
Citation: Hebbar, K.B.; Abhin, P.S.;
Sanjo Jose, V.; Neethu, P.; Santhosh,
A.; Shil, S.; Prasad, P.V.V. Predicting
the Potential Suitable Climate for
Coconut (Cocos nucifera L.)
Cultivation in India under Climate
Change Scenarios Using the MaxEnt
Model. Plants 2022, 11, 731. https://
doi.org/10.3390/plants11060731
Academic Editor: Schmidt Dominik
Received: 2 January 2022
Accepted: 2 March 2022
Published: 9 March 2022
Publisher’s Note: MDPI stays neutral
with regard to jurisdictional claims in
published maps and institutional affil-
iations.
Copyright: © 2022 by the authors.
Licensee MDPI, Basel, Switzerland.
This article is an open access article
distributed under the terms and
conditions of the Creative Commons
Attribution (CC BY) license (https://
creativecommons.org/licenses/by/
4.0/).
plants
Article
Predicting the Potential Suitable Climate for Coconut(Cocos nucifera L.) Cultivation in India under Climate ChangeScenarios Using the MaxEnt ModelKukkehalli Balachandra Hebbar 1,* , Pulloott Sukumar Abhin 1, Veliyathukudy Sanjo Jose 2 ,Poonchalikundil Neethu 1, Arya Santhosh 1, Sandip Shil 3 and P. V. Vara Prasad 4
1 Indian Council of Agricultural Research—Central Plantation Crops Research Institute,Kasaragod 671124, Kerala, India; [email protected] (P.S.A.); [email protected] (P.N.);[email protected] (A.S.)
2 Forest Research Institute, Dehradun 248001, Uttarakhand, India; [email protected] Indian Council of Agricultural Research—Central Plantation Crops Research Institute Research Centre,
Mohit Nagar 735101, West Bengal, India; [email protected] Sustainable Intensification Innovation Lab, Kansas State University, Manhattan, KS 66506, USA; [email protected]* Correspondence: [email protected]; Tel.: +91-4994-232893
Abstract: Climate change and climate variability are projected to alter the geographic suitabilityof lands for crop cultivation. Early awareness of the future climate of the current cultivation areasfor a perennial tree crop like coconut is needed for its adaptation and sustainable cultivation invulnerable areas. We analyzed coconut’s vulnerability to climate change in India, based on climateprojections for the 2050s and the 2070s under two Representative Concentration Pathways (RCPs):4.5 and 8.5. Based on the current cultivation regions and climate change predictions from sevenensembles of Global Circulation Models, we predict changes in relative climatic suitability for coconutcultivation using the MaxEnt model. Bioclimatic variables Bio 4 (temperature seasonality, 34.4%)and Bio 7 (temperature annual range, 28.7%) together contribute 63.1%, which along with Bio 15(precipitation seasonality, 8.6%) determined 71.7% of the climate suitability for coconuts in India.The model projected that some current coconut cultivation producing areas will become unsuitable(plains of South interior Karnataka and Tamil Nadu) requiring crop change, while other areas willrequire adaptations in genotypic or agronomic management (east coast and the south interior plains),and yet in others, the climatic suitability for growing coconut will increase (west coast). The findingssuggest the need for adaptation strategies so as to ensure sustainable cultivation of coconut at least inpresently cultivated areas.
Keywords: coconut; high temperature; prediction; MaxEnt; vulnerability; climate change
1. Introduction
Coconut (Cocos nucifera L.) is an environmentally friendly smallholder palm of thetropical environment, cultivated in more than 94 countries in the world over 11.99 Mha, producing 67.04 billion nuts with a productivity of 5592 nuts ha−1 [1]. Indonesiais the largest coconut-producing country followed by the Philippines, while India, with2.1 million ha and 2.73 million t copra, occupies third place in area and second place inproduction. Around 80 million people depend directly on coconut for their livelihood [2].The coconut industry, which traditionally relied upon copra and coconut oil, and to someextent coir, is experiencing a tremendous transformation towards product diversification,high value product development, by-product utilization, and more importantly, is nowbeing used as health drink [3]. Of late, the nutraceutical and functional food properties oftender coconut water, virgin coconut oil [4], and inflorescence sap [5,6] are being harnessedfor a diversity of health products and preventive medicine applications [7–9]. The health
Plants 2022, 11, 731. https://doi.org/10.3390/plants11060731 https://www.mdpi.com/journal/plants
Plants 2022, 11, 731 2 of 23
benefits of coconut are driving its sales. As a result of this, since 2000, a steady annualincrement has been seen for coconut and coconut products and this is predicted to continueincreasing further [10].
To strike a balance between future demand and supply, production has to be aug-mented either through increased productivity or through cultivating a larger area. Theglobal cultivation area of coconut clearly indicates that no significant area expansion hastaken place during the 2010 to 2015 period. Meanwhile, during the last decade, coconutgrowing regions experienced frequent severe weather events like drought and flood andnumerous pests and diseases infestations, as a result productivity declined, and globalcoconut production stagnated [11]. Hence, it may be a great challenge to increase the ex-pected production unless adoptive measures against the predicted threat of climate changeare addressed.
Climate variables such as temperature, precipitation, and salinity have enormousimpacts on the growth and development of coconut as in other species, and these factorshad restricted its cultivation to southern geographical regions of India [12–15]. Thesevariables alter the physiology, phenology, behavior, and ecological interactions of thecrops [16–18] and affect the production faster than expected [19]. High temperature, toa large extent, had offset the otherwise positive effect of the rising atmospheric CO2 oncoconut seedlings, which occurs in many C3 crops [20]. This suggests that climate changevariables must be assessed together to ascertain how a changing climate will impactcoconut [21]. The type of combinatorial experiments that study the effects of both warmingand elevated CO2 on coconut at different stages of growth are very much limited. Coconutgrows well in north India, but when the summer temperature goes up (Tmax > 40 ◦C) underlow humidity nut production is severely dented. Pollen germination on stigma [22] andpollen tube growth through style [23] in coconut is highly sensitive to high temperatureresulting in poor fertilization and nut set. Similar to high temperature, water limitation isanother common limitation in coconut ecosystems; more than 60% of the crop is grownunder rainfed condition. The interaction effects of rising CO2, warming, and water deficitin coconut is not well studied, but is well studied in other perennials like grassland [24,25]or cocoa [26]. The lack of sufficient data on the response of coconut to climatic variables ledus to use the correlative model MaxEnt to assess the coconut suitability/unsuitability ofa region.
In order to predict resulting changes in the relative climatic suitability of crop-growingregions under future climate scenarios, MaxEnt is widely used and can run with presencedata alone [27]. MaxEnt is considered to be the best method among the species distributionmodeling (SDM) techniques [27,28] due to its higher success rate and excellent resultseven with a low sample size [29]. It is an important aid in understanding the influence ofclimate change on species distributions [30–32]. MaxEnt was used to predict the changein climate of some of the plantation growing areas like areas growing cocoa in Africancountries [33,34], coffee in Zimbabwe [35], and other agricultural crops [36–38]. Despite theimportant role of coconut in safeguarding the livelihood of millions of people in the southIndian region, the literature shows that there has been little research into the future climatesuitability of the region for coconut cultivation. The present study aims to evaluate thepotential impacts of climate change on the suitability of a habitat for coconut cultivationand fill this key research gap. We used the MaxEnt model with the kuenm framework inR software [39]. The specific objectives of this study were to (a) determine the potentialimpacts of environmental variables on coconut cultivation; (b) model the current and futuresuitability for coconut cultivation under two climate scenarios (RCP 4.5 and RCP 8.5) forthe years 2050 and 2070; and (c) identify the potential changes in the suitability of the landfor coconut cultivation. We also suggest adaptation measures to reduce the vulnerability ofcoconut to the projected changes.
Plants 2022, 11, 731 3 of 23
2. Methods2.1. Study Area
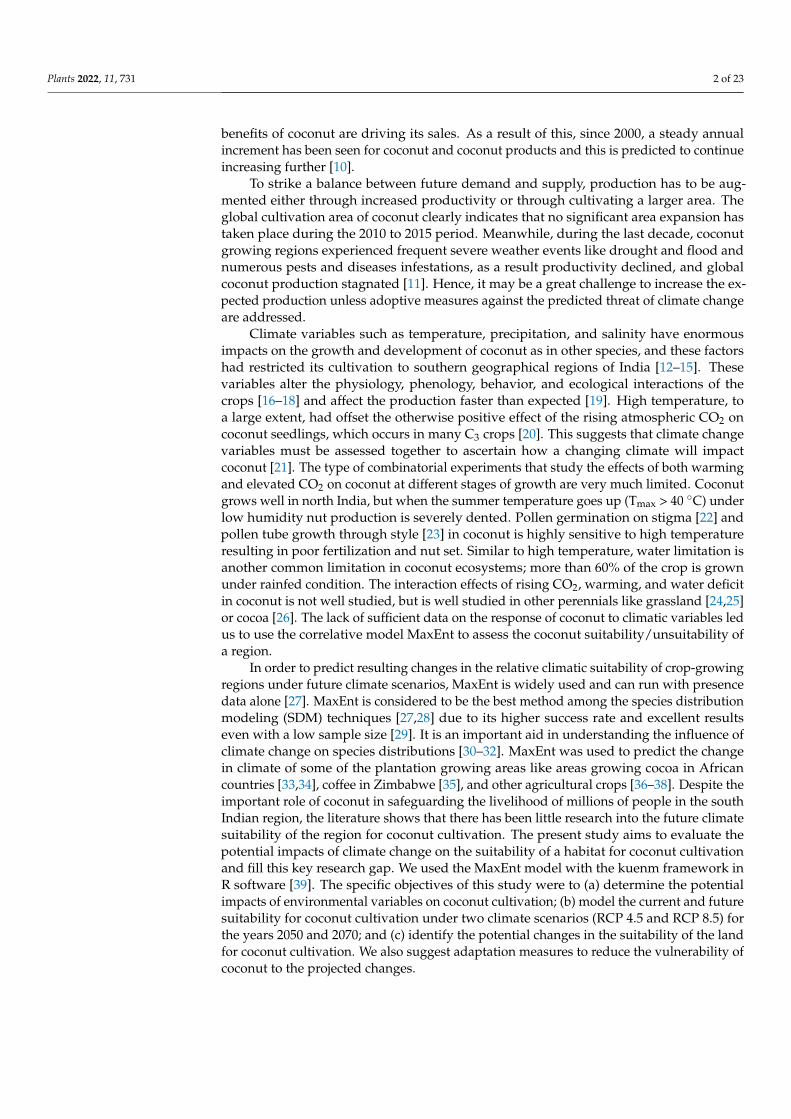
The coconut palm in India is grown under varying climatic and soil conditions mostlybetween 8◦4′ N and 20◦ N latitudes. The study area and coconut occurrence points areshown in Figure 1. Major coconut growing states and their district-wise area and climateand soil characteristics are presented in Table 1. During the 1960s, the west coast of India, i.e.,Kerala and coastal Karnataka, were the traditional coconut cultivation areas. Out of the totalarea, the major share of nearly 70% was in Kerala followed by 13.65% in Karnataka, only7.6% in TN (Tamil Nadu), and 4.8% in AP (Andhra Pradesh). Over the years, cultivationhas spread to the plains of Karnataka and TN, resulting in increase in the Karnataka andTN share to 28% and 20.3%, respectively, with only a marginal increase in AP (5.2%) and asharp decline in the Kerala share to 35% (CDB; https://www.coconutboard.gov.in, accessedon 22 June 2021). The west coast, with its high rainfall (annual rainfall is >2000 mm) andmoderate temperature (Tmax, maximum temperature of 34 to 36 ◦C), is ideal for coconutcultivation. However, on the east coast, the rainfall is low (around 1000 to 1200 mm) andTmax reaches a maximum of 40 to 42 ◦C in some of the coconut growing regions.
Plants 2022, 11, x FOR PEER REVIEW 2 of 24
Keywords: coconut; high temperature; prediction; MaxEnt; vulnerability; climate change
1. Introduction Coconut (Cocos nucifera L.) is an environmentally friendly smallholder palm of the
tropical environment, cultivated in more than 94 countries in the world over 11.99 M ha, producing 67.04 billion nuts with a productivity of 5592 nuts ha−1 [1]. Indonesia is the largest coconut-producing country followed by the Philippines, while India, with 2.1 million ha and 2.73 million t copra, occupies third place in area and second place in production. Around 80 million people depend directly on coconut for their livelihood [2]. The coconut industry, which traditionally relied upon copra and coconut oil, and to some extent coir, is experiencing a tremendous transformation towards product diversification, high value product development, by-product utilization, and more importantly, is now being used as health drink [3]. Of late, the nutraceutical and functional food properties of tender coconut water, virgin coconut oil [4], and inflorescence sap [5,6] are being harnessed for a diversity of health products and preventive medicine applications [7,8,9]. The health benefits of coconut are driving its sales. As a result of this, since 2000, a steady annual increment has been seen for coconut and coconut products and this is predicted to continue increasing further [10].
To strike a balance between future demand and supply, production has to be augmented either through increased productivity or through cultivating a larger area. The global cultivation area of coconut clearly indicates that no significant area expansion has taken place during the 2010 to 2015 period. Meanwhile, during the last decade, coconut
Figure 1. (a) Map showing the spatial distribution of coconut in different regions of India. State-wise and district-wise area data 2018-19 obtained from https://coconutboard.nic.in/Statistics.aspx,accessed on 7 January 2021 Numbers on the map show the coconut growing states viz. Kerala (1),Karnataka (2), Goa (3), Maharashtra (4), Gujarat (5), Tamil Nadu (6), Andhra Pradesh (7), Odisha (8),West Bengal (9), and Assam (10); and (b) the red point indicates the coconut occurrence points usedin model running.
Plants 2022, 11, 731 4 of 23
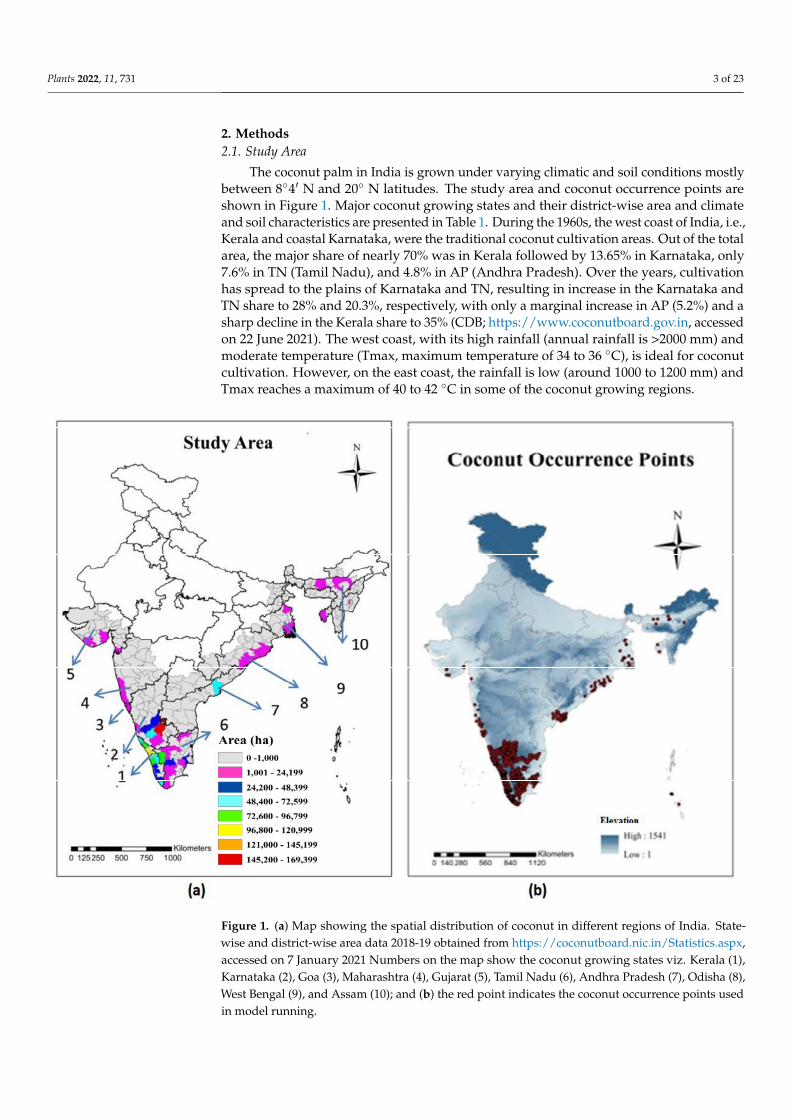
Table 1. Characteristics of some of the major coconut growing districts of India from which the occurrence data was collected as input to MaxEnt model. Humidityis the range shown for the summer months (March, April, and May). Occurrence points are the number of points for each location after model rarefaction.
State Area(000 ha)
MajorDistricts
Area(000 ha) Latitude Longitude Soil Type
Temperature Range (◦C) Humidity (%)(Range)
Precipitation(mm)
OccurrencePointsMinimum Maximum
Kerala 761
Kozhikode 112.80 11.2588◦ N 75.7804◦ E Alluvial, lateritic 16.9–24 28.2–36 46–92 3592 51
Malappuram 105.09 11.0510◦ N 76.0711◦ E Loamy 12–24.2 23.7–36 44–94 2877 60
Kannur 85.97 11.8745◦ N 75.3704◦ E Sandy loam to clay 18.1–23.8 30–36 45–95 3831 51
Thrissur 80.58 12.4996◦ N 74.9869◦ E Sandy loam to sandy 17–24.2 29.8–34 53–99 3162 44
Kasaragod 67.08 12.4996◦ N 74.9869◦ E Red sandy loam, sandy 20.2–23.8 31.5–36 36–93 4245 38
Karnataka 619
Tumkur 157.37 13.3379◦ N 77.1173◦ E Red loamy & black 15–17.4 31–37.1 11–90 554 89
Hassan 52.32 13.0033◦ N 76.1004◦ E -do- 14.8–17.7 30–36 34–94 1276 36
Chikkmagaluru 40.93 13.3161◦ N 75.7720◦ E Clay loam 11.8–18.3 28–36 33–93 2019 28
Chitradurga 40.80 14.2251◦ N 76.3980◦ E Red sandy loam 15.7–17.8 33.9–38 11–90 508 27
D. Kannada 20.39 12.8438◦ N 75.2479◦ E Laterite & sandy loam 13.9–23.2 28–35.2 36–93 4089 10
TamilNadu 436
Coimbatore 87.41 11.0168◦ N 76.9558◦ E Sandy loam 10.2–20.9 23.7–38 23–95 1149 48
Thiruppur 60.33 11.1085◦ N 77.3411◦ E Loamy & alluvial 10.2–20.9 23.7–38 23–95 1149 30
Thanjavur 37.33 10.7870◦ N 79.1378◦ E Sandy 21.1–23.3 34.4–41 30–91 850 24
Dindigul 29.22 10.3624◦ N 77.9695◦ E Loamy & Sandy loam 8.6–20.5 22.5–41 29–90 1015 25
Kanyakumari 24.10 8.0883◦ N 77.5385◦ E Saline & Coastal 16.4–24.2 25.7–36 47–95 1254 15
AndhraPradesh
111 E. Godavari 52.30 17.3213◦ N 82.0407◦ E Red clay & alluvial 13–22.2 31.3–42 30–93 1274 12
W. Godavari 22.09 16.9174◦ N 81.3399◦ E Alluvial & sandyalluvial 15.6–21.3 34.5–43 49–98 1166 36
Plants 2022, 11, 731 5 of 23
2.2. Coconut Occurrence Data
The data on major coconut growing states and districts was sourced from the CoconutDevelopment Board (CDB; https://www.coconutboard.gov.in, accessed on 7 January 2021)website. From the list, the districts with a large area under coconut cultivation were selectedfor the study. From each of these districts, the names and areas of the village with extensivecoconut cultivation were obtained from the agriculture/horticulture officer of the respectivedistrict. In addition to these, the district and village level data for the state of Karnatakawas sourced from the crop survey website (www.cropsurvey.karnataka.gov.in, accessedon 23 February 2021). In India, a village is a clustered human settlement or community,larger than a hamlet but smaller than a town, with a population typically ranging froma few hundred to a few thousand. Villages are the smallest unit for which the coconutcropped areas and production records are maintained by the agricultural or horticulturaloffices. Through this process, nearly 3000 coconut occurrence points were collected fromdifferent coconut growing regions, followed by manual verification using Google Earthmap. The Google Earth platform provides high-resolution images of coconut orchards andit is, therefore, suitable for identifying coconut cultivation areas. These data, along with thepoint data collected using Global Positioning System (GPS) in previous studies, constitutedthe occurrence points (Figure 1b). To reduce the issue of spatial sampling biases caused bymultiple autocorrelated locations, the coconut occurrence points were spatially rarefied at5 km using the SDM Toolbox 2.0 [40] in ArcGIS v. 10 (Registration Number EFL431708926).The final coconut occurrence dataset used for building SDMs included 1008 occurrencerecords. Figure 1b presents the final coconut records utilized for the modeling exercise.
2.3. Selection of Environmental Variables
As environmental predictors, we used 19 bioclimatic variables (Table 2) from Paleoclim.org [41] for historical (1979–2013) and current climate (baseline) data and from the WorldClim.v1.4 database (http://www.worldclim.org/download, accessed on 15 March 2020) [42]for the future climate data for the 2050s (average for 2041–2060) and 2070s (average for2061–2080). Variables representing the two future scenarios ((representative concentra-tion pathway RCP 4.5 (intermediate scenario) and RCP 8.5 (very high emission scenario))were an ensemble of 7 GCM Models (BCC-CSM1-1, GFDL-CM3, HadGEM2-ES, MIROC5,MIROC-CHEM, MIROC-ESM, NorESM1-M), because of their good predictive ability ofclimate for India [43,44]. Predictors were obtained at two-and-a-half-minute spatial resolu-tion (approximately 5 km2 per pixel), which is an adequate resolution for ecological nichemodels based only on climate variables [29].
It is recommended to include non-climatic variables to enhance the predictive perfor-mance of SDMs [45,46]. Hence, we included soil and two topographical variables elevationand land cover (Table 2), which have a considerable influence on coconut cultivation inIndia. Soil data were downloaded from FAO (http://www.fao.org/soils-portal/data-hub/soil-maps-anddatabases/harmonized-world-soil-database-v12/en/, accessed on 22 May2020), and elevation data were sourced from the shuttle radar topography mission dataset(https://cgiarcsi.community/data/srtm-90m-digital-elevation-database-v4-1/, accessed22 May 2020). The source of land cover data was Glob Cover 2009 (http://due.esrin.esa.int/page_globcover.php, accessed on 22 May 2020). All the data were converted intotwo-and-half minute spatial resolutions (approximately 5 km2 per pixel), the same as thatof climate variables.
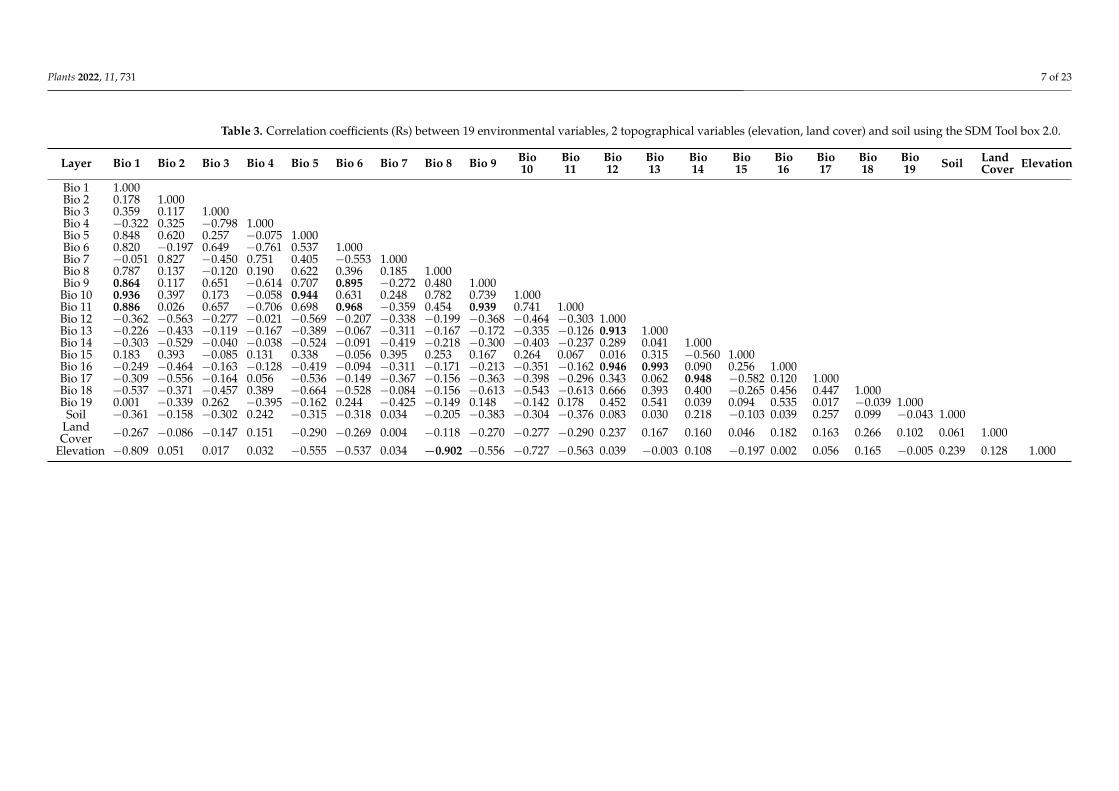
To select a distinct set of variables that contributed the most to the models, we usedthe correlation analysis of the SDM Toolbox 2.0 by eliminating one variable per pair withcorrelations of (r > 0.85) (Table 3). Seven highly correlated climate variables were eliminatedand the remaining 12 bioclimatic variables, along with 2 topographical variables and soilwere selected for the model calibration.
Plants 2022, 11, 731 6 of 23
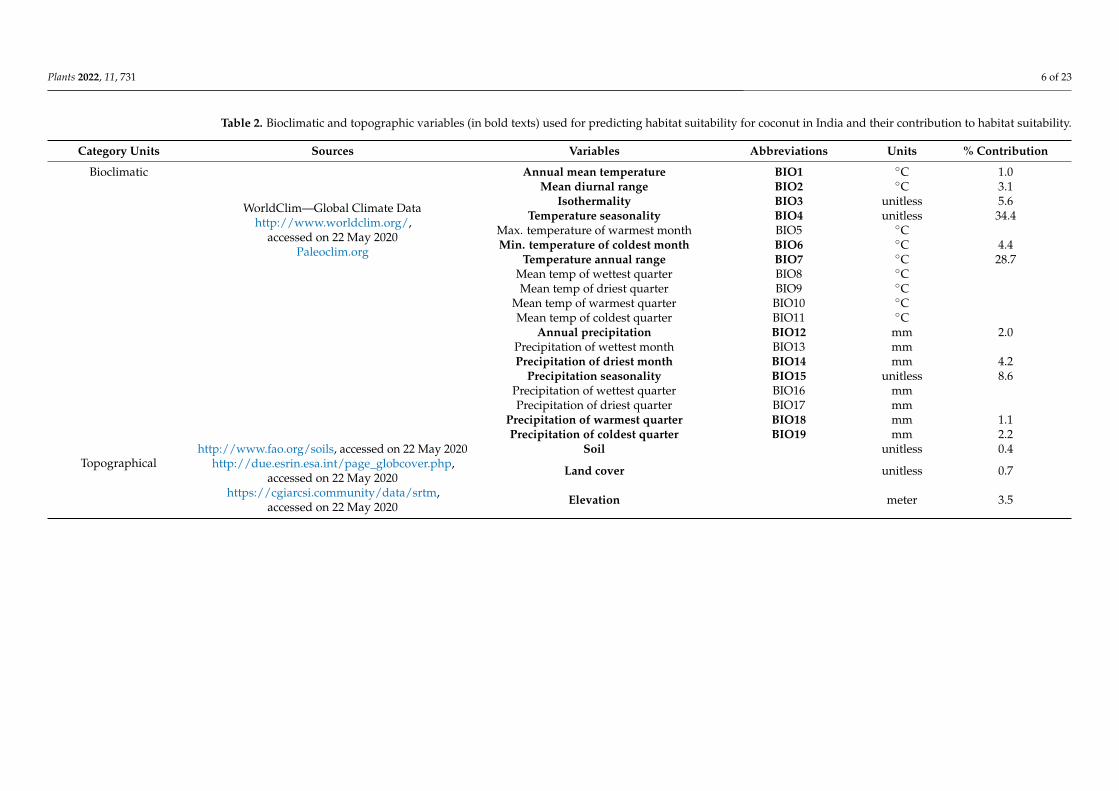
Table 2. Bioclimatic and topographic variables (in bold texts) used for predicting habitat suitability for coconut in India and their contribution to habitat suitability.
Category Units Sources Variables Abbreviations Units % Contribution
Bioclimatic
WorldClim—Global Climate Datahttp://www.worldclim.org/,
accessed on 22 May 2020Paleoclim.org
Annual mean temperature BIO1 ◦C 1.0Mean diurnal range BIO2 ◦C 3.1
Isothermality BIO3 unitless 5.6Temperature seasonality BIO4 unitless 34.4
Max. temperature of warmest month BIO5 ◦CMin. temperature of coldest month BIO6 ◦C 4.4
Temperature annual range BIO7 ◦C 28.7Mean temp of wettest quarter BIO8 ◦CMean temp of driest quarter BIO9 ◦C
Mean temp of warmest quarter BIO10 ◦CMean temp of coldest quarter BIO11 ◦C
Annual precipitation BIO12 mm 2.0Precipitation of wettest month BIO13 mmPrecipitation of driest month BIO14 mm 4.2
Precipitation seasonality BIO15 unitless 8.6Precipitation of wettest quarter BIO16 mmPrecipitation of driest quarter BIO17 mm
Precipitation of warmest quarter BIO18 mm 1.1Precipitation of coldest quarter BIO19 mm 2.2
Topographicalhttp://www.fao.org/soils, accessed on 22 May 2020 Soil unitless 0.4
http://due.esrin.esa.int/page_globcover.php,accessed on 22 May 2020 Land cover unitless 0.7
https://cgiarcsi.community/data/srtm,accessed on 22 May 2020 Elevation meter 3.5
Plants 2022, 11, 731 7 of 23
Table 3. Correlation coefficients (Rs) between 19 environmental variables, 2 topographical variables (elevation, land cover) and soil using the SDM Tool box 2.0.
Layer Bio 1 Bio 2 Bio 3 Bio 4 Bio 5 Bio 6 Bio 7 Bio 8 Bio 9 Bio10
Bio11
Bio12
Bio13
Bio14
Bio15
Bio16
Bio17
Bio18
Bio19 Soil Land
Cover Elevation
Bio 1 1.000Bio 2 0.178 1.000Bio 3 0.359 0.117 1.000Bio 4 −0.322 0.325 −0.798 1.000Bio 5 0.848 0.620 0.257 −0.075 1.000Bio 6 0.820 −0.197 0.649 −0.761 0.537 1.000Bio 7 −0.051 0.827 −0.450 0.751 0.405 −0.553 1.000Bio 8 0.787 0.137 −0.120 0.190 0.622 0.396 0.185 1.000Bio 9 0.864 0.117 0.651 −0.614 0.707 0.895 −0.272 0.480 1.000
Bio 10 0.936 0.397 0.173 −0.058 0.944 0.631 0.248 0.782 0.739 1.000Bio 11 0.886 0.026 0.657 −0.706 0.698 0.968 −0.359 0.454 0.939 0.741 1.000Bio 12 −0.362 −0.563 −0.277 −0.021 −0.569 −0.207 −0.338 −0.199 −0.368 −0.464 −0.303 1.000Bio 13 −0.226 −0.433 −0.119 −0.167 −0.389 −0.067 −0.311 −0.167 −0.172 −0.335 −0.126 0.913 1.000Bio 14 −0.303 −0.529 −0.040 −0.038 −0.524 −0.091 −0.419 −0.218 −0.300 −0.403 −0.237 0.289 0.041 1.000Bio 15 0.183 0.393 −0.085 0.131 0.338 −0.056 0.395 0.253 0.167 0.264 0.067 0.016 0.315 −0.560 1.000Bio 16 −0.249 −0.464 −0.163 −0.128 −0.419 −0.094 −0.311 −0.171 −0.213 −0.351 −0.162 0.946 0.993 0.090 0.256 1.000Bio 17 −0.309 −0.556 −0.164 0.056 −0.536 −0.149 −0.367 −0.156 −0.363 −0.398 −0.296 0.343 0.062 0.948 −0.582 0.120 1.000Bio 18 −0.537 −0.371 −0.457 0.389 −0.664 −0.528 −0.084 −0.156 −0.613 −0.543 −0.613 0.666 0.393 0.400 −0.265 0.456 0.447 1.000Bio 19 0.001 −0.339 0.262 −0.395 −0.162 0.244 −0.425 −0.149 0.148 −0.142 0.178 0.452 0.541 0.039 0.094 0.535 0.017 −0.039 1.000
Soil −0.361 −0.158 −0.302 0.242 −0.315 −0.318 0.034 −0.205 −0.383 −0.304 −0.376 0.083 0.030 0.218 −0.103 0.039 0.257 0.099 −0.043 1.000LandCover −0.267 −0.086 −0.147 0.151 −0.290 −0.269 0.004 −0.118 −0.270 −0.277 −0.290 0.237 0.167 0.160 0.046 0.182 0.163 0.266 0.102 0.061 1.000
Elevation −0.809 0.051 0.017 0.032 −0.555 −0.537 0.034 −0.902 −0.556 −0.727 −0.563 0.039 −0.003 0.108 −0.197 0.002 0.056 0.165 −0.005 0.239 0.128 1.000
Plants 2022, 11, 731 8 of 23
2.4. Model
The climate suitability for the cultivation of coconut under the future climate wasstudied using MaxEnt 3.4.1 [27]. This software is based upon the maximum entropyprinciple, which is freely available at (url:http://biodiversityinformatics.amnh.org/open_source/MaxEnt/, accessed on 21 November 2021), and holds anything with the maximumentropy closest to its real state under known conditions [47]. The MaxEnt model is usedto estimate the target probability distribution by finding the probability distribution ofthe maximum entropy (i.e., that which is most spread out or closest to uniform) that issubject to a set of constraints that represent our incomplete information regarding the targetdistribution [48,49].
2.5. Model Calibration
The kuenm R package is used for the detailed calibration of the MaxEnt model, its selec-tion, final model creation, and evaluation [39]. The occurrence data is split into 75–25 subsetsfor model calibration and internal testing, respectively, using the kuenm_occ_split function.The kuenm varComb function was used to generate 16 sets of environmental predictors forcalibration, with the minimum number of variables taken as 14. The model chose variablepredictor set 6 (which excluded Bio 5) for final model running. The variables used for thefinal model running with their description are listed in Table 2, and a detailed description ofeach variable is available in O’Donnell and Ignizio [50]. We created 2480 candidate modelsby combining 16 sets of environmental predictors, 5 values of regularization multiplier(0.1, 0.2, 0.3, 0.4, 0.5), and 31 combinations of feature classes (l, q, p, t, h, lq, lp, lt, lh, qp,qt, qh, pt, ph, th, lqp, lqt, lqh, lpt, lph, lth, qpt, qph, qth, pth, lqpt, lqph, lqth, lpth, qpth,lqpth). The candidate model performance was evaluated based on significance (partialROC, with 500 iterations and 50% of data for bootstrapping), omission rates (E = 5%), andmodel complexity (AICc). Final model selected is the one with the lowest omission rateand delta AICc values of ≤2. After the creation of the final model with the parameter setsselected as best, the model projections were made for RCP 4.5 and 8.5 for the years 2050and 2070 using the kuenm_mod function. The free extrapolation transfer was selected forfuture projections.
2.6. Model Evaluation
The area under the curve (AUC) or receiver operating characteristics (ROC) was usedas the MaxEnt predictive performance metric under the ROC curve. The AUC was aneffective threshold independent index that could evaluate a model’s ability to discriminatepresence from absence (or background) [51]. The MaxEnt output provides an AUC orsensitivity vs 1-specificity graph, which describes the accuracy and fit of the predictedmodel. An AUC value of 0.5 indicated that the model performance was no better thanrandom, while values close to 1.0 indicated better model performance [51]. The closer theAUC was to 1, the better the model performance.
2.7. Threshold Selection
The logistic output format ranging from 0 (unsuitable) to 1 (maximum suitability) wasadopted for the model results, which indicates climate suitability for the cultivation ofcoconut (probability of presence) [52]. Binary model predictions from each scenario wereoverlapped in Arc-GIS v. 10.0 to map the current climatic range and potential future expan-sion and contraction. The binary suitable/unsuitable area was calculated for each scenario(current, RCP 4.5, and RCP 8.5), using ‘maximum training sensitivity plus specificity’ asthe logistic threshold cut off value [53] to give an objective numerical overview of potentialclimatic suitability contraction and expansion. Maximizing the sum of the specificity andsensitivity logistic threshold was used to differentiate between presences and absences, asis recommended for models that use presence-only and background data (e.g., MaxEnt).It minimizes the mean of the error rate for positive observations and the error rate fornegative observations [54].
Plants 2022, 11, 731 9 of 23
The present and future suitability maps produced by the model ranged from 0 to 1.These maps were reclassified into five suitability classes, i.e., ‘Barely’ (0–0.05), ‘Very LowSuitability’ (0.05–0.25), ‘Low Suitability’ (0.25–0.45), ‘Moderate Suitability’ (0.45–0.65),‘High Suitability’ (0.65–0.85), and ‘Very High Suitability’ (0.85–1.0). Binary rasters wereused to analyze the predicted contraction and expansion areas using the SDM toolbox 2.0.‘Barely’ and ‘Very Low Suitability’ classes were considered to be unsuitable categoriesas per the threshold value, and remaining classifications are considered to be suitablecategories.
3. Results3.1. Outcome of Model Calibration
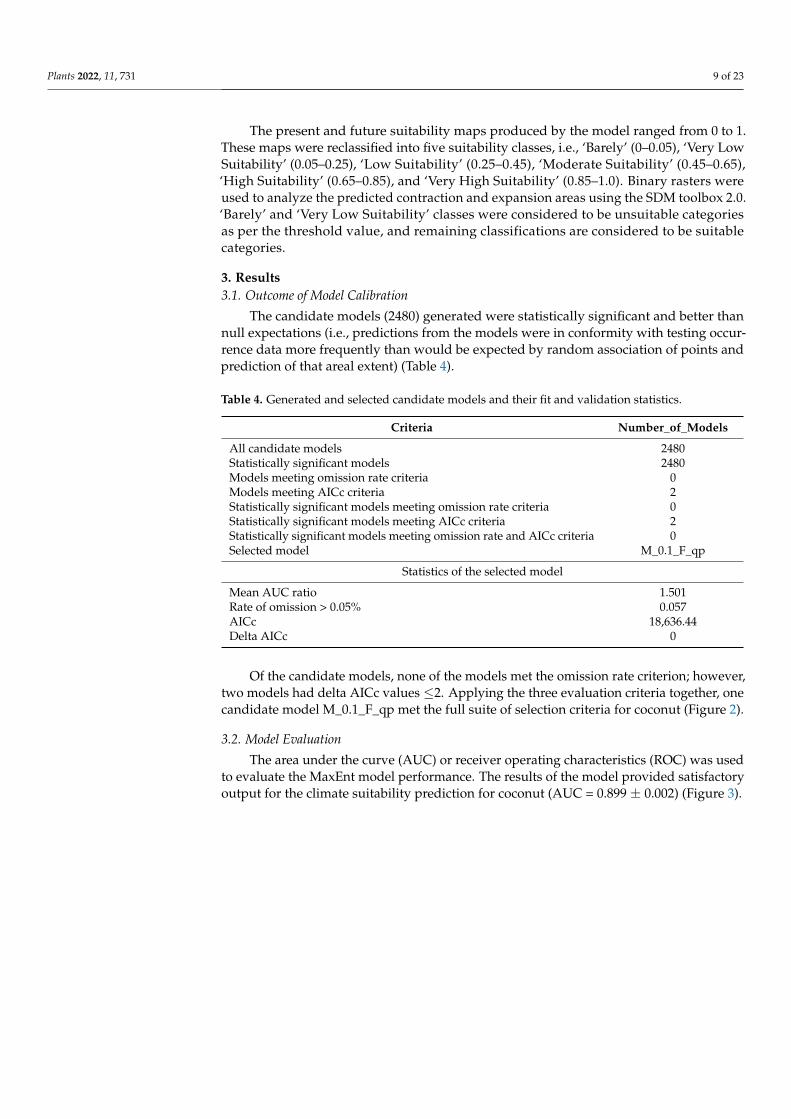
The candidate models (2480) generated were statistically significant and better thannull expectations (i.e., predictions from the models were in conformity with testing occur-rence data more frequently than would be expected by random association of points andprediction of that areal extent) (Table 4).
Table 4. Generated and selected candidate models and their fit and validation statistics.
Criteria Number_of_Models
All candidate models 2480Statistically significant models 2480Models meeting omission rate criteria 0Models meeting AICc criteria 2Statistically significant models meeting omission rate criteria 0Statistically significant models meeting AICc criteria 2Statistically significant models meeting omission rate and AICc criteria 0Selected model M_0.1_F_qp
Statistics of the selected model
Mean AUC ratio 1.501Rate of omission > 0.05% 0.057AICc 18,636.44Delta AICc 0
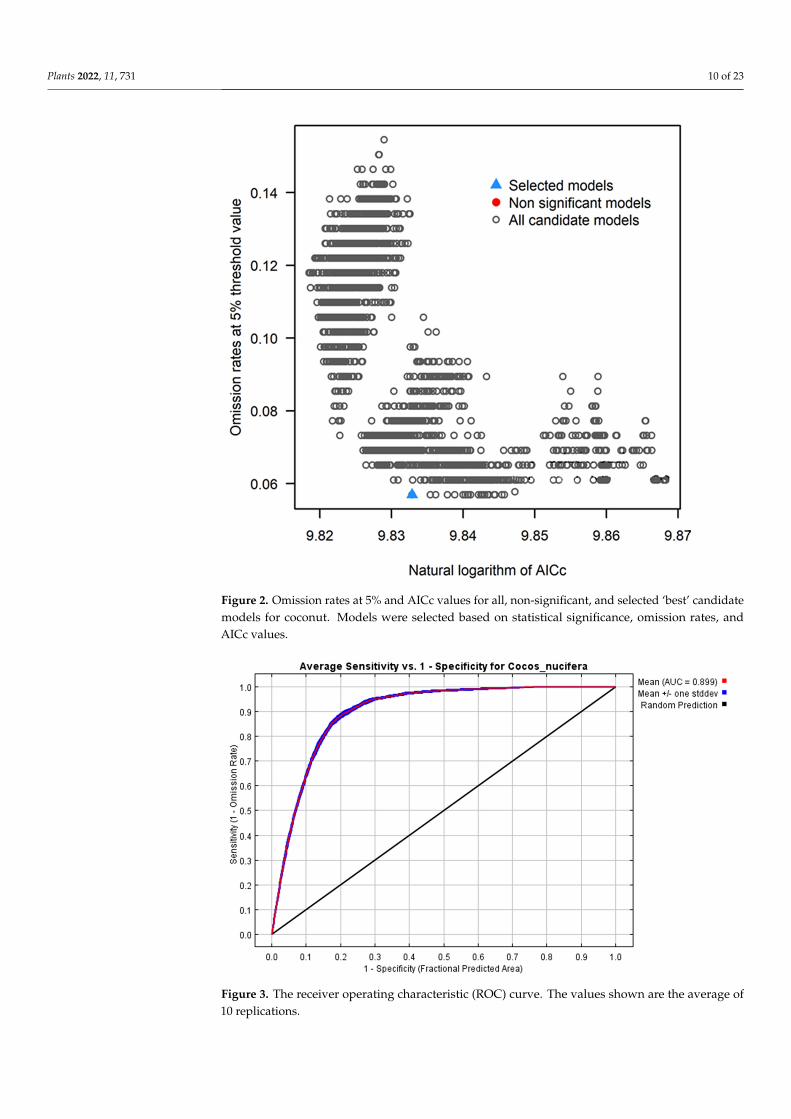
Of the candidate models, none of the models met the omission rate criterion; however,two models had delta AICc values ≤2. Applying the three evaluation criteria together, onecandidate model M_0.1_F_qp met the full suite of selection criteria for coconut (Figure 2).
3.2. Model Evaluation
The area under the curve (AUC) or receiver operating characteristics (ROC) was usedto evaluate the MaxEnt model performance. The results of the model provided satisfactoryoutput for the climate suitability prediction for coconut (AUC = 0.899 ± 0.002) (Figure 3).
Plants 2022, 11, 731 10 of 23Plants 2022, 11, x FOR PEER REVIEW 10 of 23
Figure 2. Omission rates at 5% and AICc values for all, non-significant, and selected ‘best’ candidate models for coconut. Models were selected based on statistical significance, omission rates, and AICc values.
Figure 3. The receiver operating characteristic (ROC) curve. The values shown are the average of 10 replications.
Figure 2. Omission rates at 5% and AICc values for all, non-significant, and selected ‘best’ candidatemodels for coconut. Models were selected based on statistical significance, omission rates, andAICc values.
Plants 2022, 11, x FOR PEER REVIEW 10 of 23
Figure 2. Omission rates at 5% and AICc values for all, non-significant, and selected ‘best’ candidate models for coconut. Models were selected based on statistical significance, omission rates, and AICc values.
Figure 3. The receiver operating characteristic (ROC) curve. The values shown are the average of 10 replications.
Figure 3. The receiver operating characteristic (ROC) curve. The values shown are the average of10 replications.
Plants 2022, 11, 731 11 of 23
3.3. Predictor Variable Influence
The importance level of predictor variables utilized in the MaxEnt model were iden-tified and highlighted in bold in Table 2. The potential distribution of coconut is morestrongly influenced by bioclimatic factors than soil and topographic factors. Bio 4 (tem-perature seasonality, 34.4%) had the greatest influence followed by Bio 7 (temperatureannual range, 28.7%). These two together contributed 63.1%, which along with Bio 15(precipitation seasonality, 8.6%), determined 71.7% of climate suitability for coconut inIndia (Table 2). Bio 3 (isothermality), Bio 6 (min. temperature of coldest month), and Bio14 (precipitation of driest month) are the other major environmental factors and had aninfluence of 5.6%, 4.4%, and 4.2% respectively. Topographical parameters like elevation,land cover, and soil did not have a marked influence on model prediction (<4%).
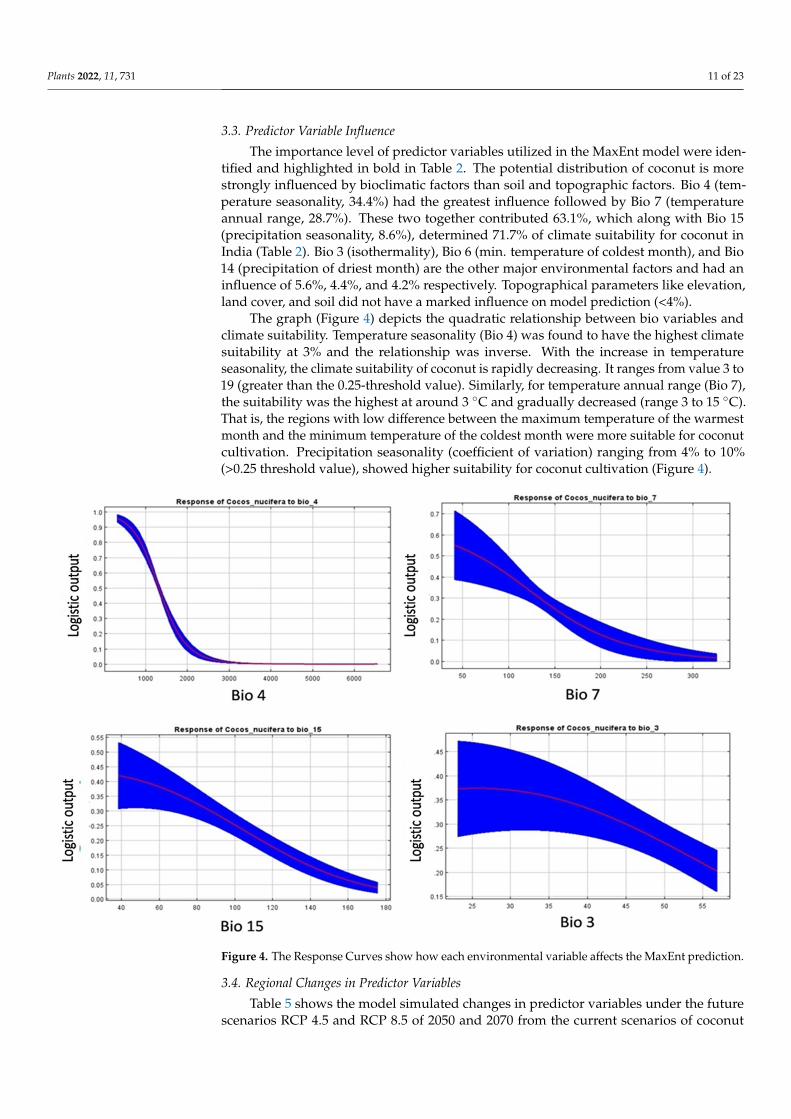
The graph (Figure 4) depicts the quadratic relationship between bio variables andclimate suitability. Temperature seasonality (Bio 4) was found to have the highest climatesuitability at 3% and the relationship was inverse. With the increase in temperatureseasonality, the climate suitability of coconut is rapidly decreasing. It ranges from value 3 to19 (greater than the 0.25-threshold value). Similarly, for temperature annual range (Bio 7),the suitability was the highest at around 3 ◦C and gradually decreased (range 3 to 15 ◦C).That is, the regions with low difference between the maximum temperature of the warmestmonth and the minimum temperature of the coldest month were more suitable for coconutcultivation. Precipitation seasonality (coefficient of variation) ranging from 4% to 10%(>0.25 threshold value), showed higher suitability for coconut cultivation (Figure 4).
Plants 2022, 11, x FOR PEER REVIEW 11 of 23
3.3. Predictor Variable Influence The importance level of predictor variables utilized in the MaxEnt model were
identified and highlighted in bold in Table 2. The potential distribution of coconut is more strongly influenced by bioclimatic factors than soil and topographic factors. Bio 4 (temperature seasonality, 34.4%) had the greatest influence followed by Bio 7 (temperature annual range, 28.7%). These two together contributed 63.1%, which along with Bio 15 (precipitation seasonality, 8.6%), determined 71.7% of climate suitability for coconut in India (Table 2). Bio 3 (isothermality), Bio 6 (min. temperature of coldest month), and Bio 14 (precipitation of driest month) are the other major environmental factors and had an influence of 5.6%, 4.4%, and 4.2% respectively. Topographical parameters like elevation, land cover, and soil did not have a marked influence on model prediction (<4%).
The graph (Figure 4) depicts the quadratic relationship between bio variables and climate suitability. Temperature seasonality (Bio 4) was found to have the highest climate suitability at 3% and the relationship was inverse. With the increase in temperature seasonality, the climate suitability of coconut is rapidly decreasing. It ranges from value 3 to 19 (greater than the 0.25-threshold value). Similarly, for temperature annual range (Bio 7), the suitability was the highest at around 3 °C and gradually decreased (range 3 to 15 °C). That is, the regions with low difference between the maximum temperature of the warmest month and the minimum temperature of the coldest month were more suitable for coconut cultivation. Precipitation seasonality (coefficient of variation) ranging from 4% to 10% (>0.25 threshold value), showed higher suitability for coconut cultivation (Figure 4).
Figure 4. The Response Curves show how each environmental variable affects the MaxEnt prediction.
Figure 4. The Response Curves show how each environmental variable affects the MaxEnt prediction.
3.4. Regional Changes in Predictor Variables
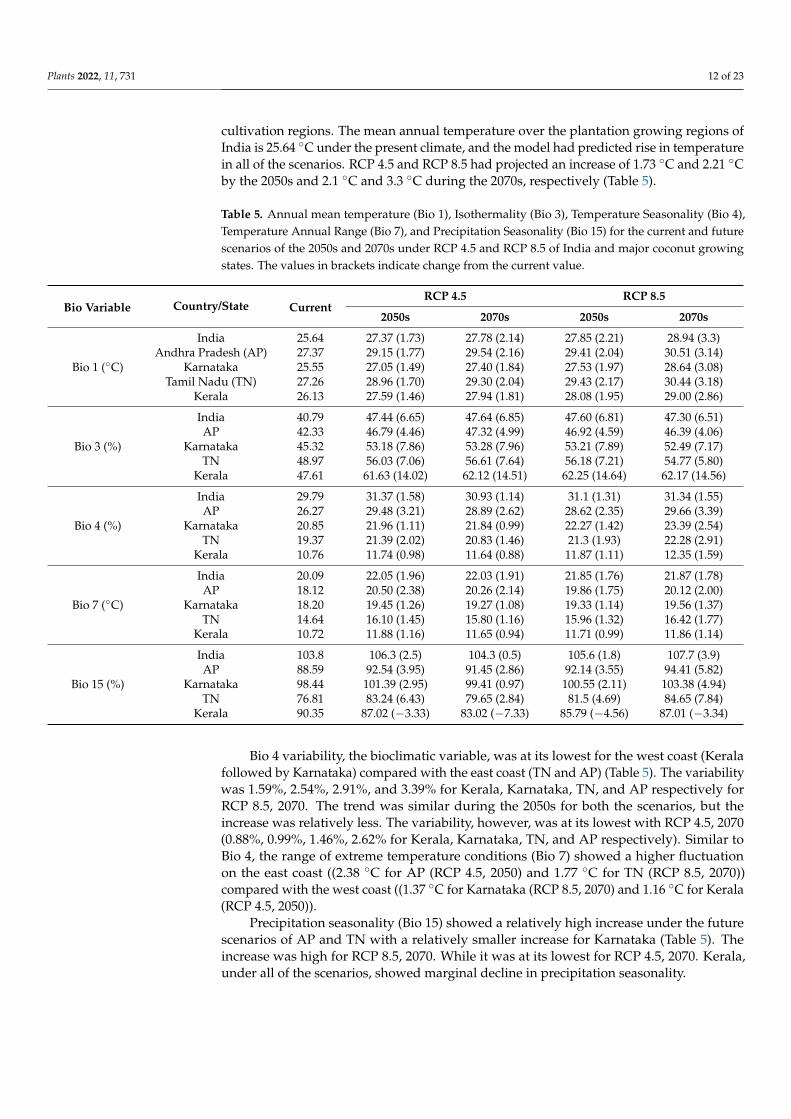
Table 5 shows the model simulated changes in predictor variables under the futurescenarios RCP 4.5 and RCP 8.5 of 2050 and 2070 from the current scenarios of coconut
Plants 2022, 11, 731 12 of 23
cultivation regions. The mean annual temperature over the plantation growing regions ofIndia is 25.64 ◦C under the present climate, and the model had predicted rise in temperaturein all of the scenarios. RCP 4.5 and RCP 8.5 had projected an increase of 1.73 ◦C and 2.21 ◦Cby the 2050s and 2.1 ◦C and 3.3 ◦C during the 2070s, respectively (Table 5).
Table 5. Annual mean temperature (Bio 1), Isothermality (Bio 3), Temperature Seasonality (Bio 4),Temperature Annual Range (Bio 7), and Precipitation Seasonality (Bio 15) for the current and futurescenarios of the 2050s and 2070s under RCP 4.5 and RCP 8.5 of India and major coconut growingstates. The values in brackets indicate change from the current value.
Bio Variable Country/State CurrentRCP 4.5 RCP 8.5
2050s 2070s 2050s 2070s
Bio 1 (◦C)
India 25.64 27.37 (1.73) 27.78 (2.14) 27.85 (2.21) 28.94 (3.3)Andhra Pradesh (AP) 27.37 29.15 (1.77) 29.54 (2.16) 29.41 (2.04) 30.51 (3.14)
Karnataka 25.55 27.05 (1.49) 27.40 (1.84) 27.53 (1.97) 28.64 (3.08)Tamil Nadu (TN) 27.26 28.96 (1.70) 29.30 (2.04) 29.43 (2.17) 30.44 (3.18)
Kerala 26.13 27.59 (1.46) 27.94 (1.81) 28.08 (1.95) 29.00 (2.86)
Bio 3 (%)
India 40.79 47.44 (6.65) 47.64 (6.85) 47.60 (6.81) 47.30 (6.51)AP 42.33 46.79 (4.46) 47.32 (4.99) 46.92 (4.59) 46.39 (4.06)
Karnataka 45.32 53.18 (7.86) 53.28 (7.96) 53.21 (7.89) 52.49 (7.17)TN 48.97 56.03 (7.06) 56.61 (7.64) 56.18 (7.21) 54.77 (5.80)
Kerala 47.61 61.63 (14.02) 62.12 (14.51) 62.25 (14.64) 62.17 (14.56)
Bio 4 (%)
India 29.79 31.37 (1.58) 30.93 (1.14) 31.1 (1.31) 31.34 (1.55)AP 26.27 29.48 (3.21) 28.89 (2.62) 28.62 (2.35) 29.66 (3.39)
Karnataka 20.85 21.96 (1.11) 21.84 (0.99) 22.27 (1.42) 23.39 (2.54)TN 19.37 21.39 (2.02) 20.83 (1.46) 21.3 (1.93) 22.28 (2.91)
Kerala 10.76 11.74 (0.98) 11.64 (0.88) 11.87 (1.11) 12.35 (1.59)
Bio 7 (◦C)
India 20.09 22.05 (1.96) 22.03 (1.91) 21.85 (1.76) 21.87 (1.78)AP 18.12 20.50 (2.38) 20.26 (2.14) 19.86 (1.75) 20.12 (2.00)
Karnataka 18.20 19.45 (1.26) 19.27 (1.08) 19.33 (1.14) 19.56 (1.37)TN 14.64 16.10 (1.45) 15.80 (1.16) 15.96 (1.32) 16.42 (1.77)
Kerala 10.72 11.88 (1.16) 11.65 (0.94) 11.71 (0.99) 11.86 (1.14)
Bio 15 (%)
India 103.8 106.3 (2.5) 104.3 (0.5) 105.6 (1.8) 107.7 (3.9)AP 88.59 92.54 (3.95) 91.45 (2.86) 92.14 (3.55) 94.41 (5.82)
Karnataka 98.44 101.39 (2.95) 99.41 (0.97) 100.55 (2.11) 103.38 (4.94)TN 76.81 83.24 (6.43) 79.65 (2.84) 81.5 (4.69) 84.65 (7.84)
Kerala 90.35 87.02 (−3.33) 83.02 (−7.33) 85.79 (−4.56) 87.01 (−3.34)
Bio 4 variability, the bioclimatic variable, was at its lowest for the west coast (Keralafollowed by Karnataka) compared with the east coast (TN and AP) (Table 5). The variabilitywas 1.59%, 2.54%, 2.91%, and 3.39% for Kerala, Karnataka, TN, and AP respectively forRCP 8.5, 2070. The trend was similar during the 2050s for both the scenarios, but theincrease was relatively less. The variability, however, was at its lowest with RCP 4.5, 2070(0.88%, 0.99%, 1.46%, 2.62% for Kerala, Karnataka, TN, and AP respectively). Similar toBio 4, the range of extreme temperature conditions (Bio 7) showed a higher fluctuationon the east coast ((2.38 ◦C for AP (RCP 4.5, 2050) and 1.77 ◦C for TN (RCP 8.5, 2070))compared with the west coast ((1.37 ◦C for Karnataka (RCP 8.5, 2070) and 1.16 ◦C for Kerala(RCP 4.5, 2050)).
Precipitation seasonality (Bio 15) showed a relatively high increase under the futurescenarios of AP and TN with a relatively smaller increase for Karnataka (Table 5). Theincrease was high for RCP 8.5, 2070. While it was at its lowest for RCP 4.5, 2070. Kerala,under all of the scenarios, showed marginal decline in precipitation seasonality.
Plants 2022, 11, 731 13 of 23
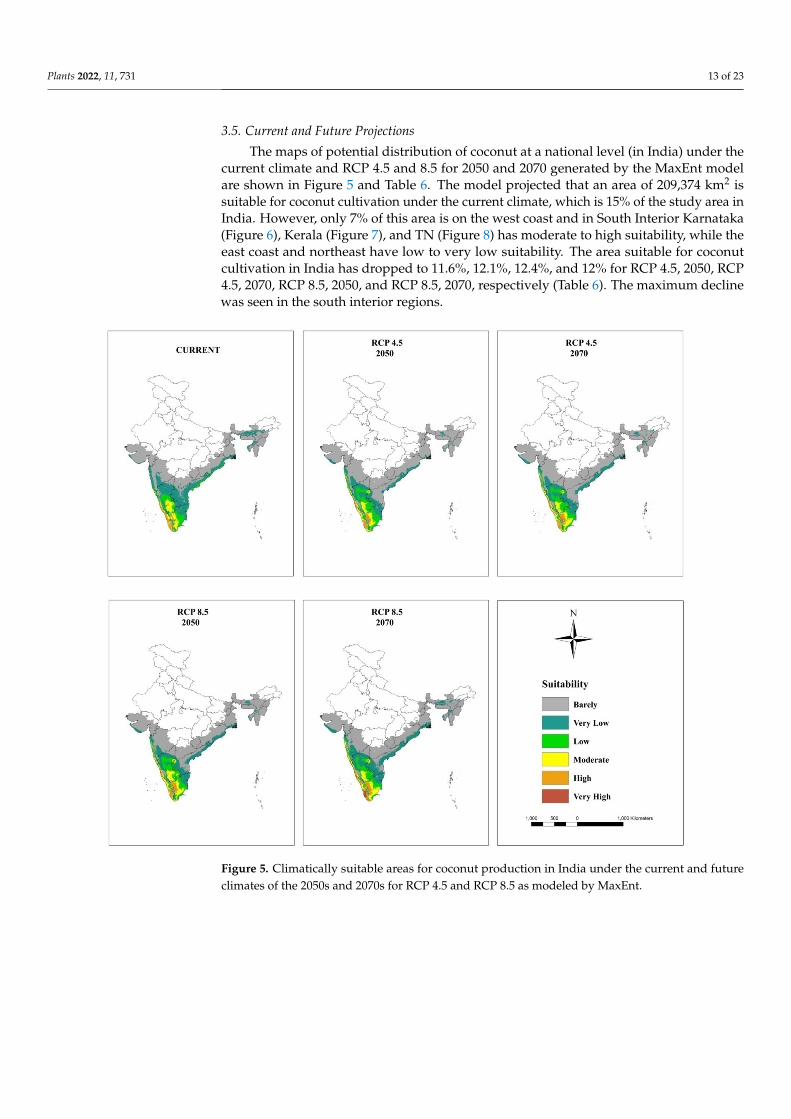
3.5. Current and Future Projections
The maps of potential distribution of coconut at a national level (in India) under thecurrent climate and RCP 4.5 and 8.5 for 2050 and 2070 generated by the MaxEnt modelare shown in Figure 5 and Table 6. The model projected that an area of 209,374 km2 issuitable for coconut cultivation under the current climate, which is 15% of the study area inIndia. However, only 7% of this area is on the west coast and in South Interior Karnataka(Figure 6), Kerala (Figure 7), and TN (Figure 8) has moderate to high suitability, while theeast coast and northeast have low to very low suitability. The area suitable for coconutcultivation in India has dropped to 11.6%, 12.1%, 12.4%, and 12% for RCP 4.5, 2050, RCP4.5, 2070, RCP 8.5, 2050, and RCP 8.5, 2070, respectively (Table 6). The maximum declinewas seen in the south interior regions.
Plants 2022, 11, x FOR PEER REVIEW 13 of 23
increase was high for RCP 8.5, 2070. While it was at its lowest for RCP 4.5, 2070. Kerala, under all of the scenarios, showed marginal decline in precipitation seasonality.
3.5. Current and Future Projections The maps of potential distribution of coconut at a national level (in India) under the
current climate and RCP 4.5 and 8.5 for 2050 and 2070 generated by the MaxEnt model are shown in Figure 5 and Table 6. The model projected that an area of 209,374 km² is suitable for coconut cultivation under the current climate, which is 15% of the study area in India. However, only 7% of this area is on the west coast and in South Interior Karnataka (Figure 6), Kerala (Figure 7), and TN (Figure 8) has moderate to high suitability, while the east coast and northeast have low to very low suitability. The area suitable for coconut cultivation in India has dropped to 11.6%, 12.1%, 12.4%, and 12% for RCP 4.5, 2050, RCP 4.5, 2070, RCP 8.5, 2050, and RCP 8.5, 2070, respectively (Table 6). The maximum decline was seen in the south interior regions.
Figure 5. Climatically suitable areas for coconut production in India under the current and future climates of the 2050s and 2070s for RCP 4.5 and RCP 8.5 as modeled by MaxEnt.
Figure 5. Climatically suitable areas for coconut production in India under the current and futureclimates of the 2050s and 2070s for RCP 4.5 and RCP 8.5 as modeled by MaxEnt.
Plants 2022, 11, 731 14 of 23
Table 6. Climatically suitable and unsuitable areas for growing coconut under the current and thefuture climate of RCP 4.5 and RCP 8.5 and the range expansion and contraction (the values in bracketsare the difference in percentage from total study area) as modeled by MaxEnt for India and majorcoconut growing states.
Country/State Category
Area (km2)
Current RCP 4.5 RCP 8.5
2050 2070 2050 2070
India(Studyarea)
Range expansion 52,617 (3.8%) 61,642 (4.4%) 75,383 (5.4%) 65,164 (4.7%)Unsuitable 1,184,077 (85%) 1,131,238 (81.2%) 1,122,212 (80.5%) 1,108,471 (79.6%) 1,118,691 (80.3%)
Suitable 209,374 (15%) 161,776 (11.6%) 168,738 (12.1%) 173,169 (12.4%) 172,036 (12%)Range contraction 47,578 (3.4%) 40,616 (2.9%) 36,184 (2.6%) 37,317 (2.7%)
Karnataka
Range expansion 27,956 (14.5%) 28,348 (14.7%) 38,858 (20.2%) 24,880 (12.9%)Unsuitable 11,4714 (60) 86,759 (45.1%) 86,366 (44.9%) 75,857 (39.4%) 89,835 (46.7%)
Suitable 77,591 (40) 60,723 (31.6%) 62,994 (32.8%) 67,846 (35.3%) 63,448 (33.0%)Range contraction 16,869 (8.8%) 14,597 (7.6%) 9745 (5.1%) 14,143 (7.4%)
Kerala
Range expansion 1051 (2.8%) 798 (2.2%) 1009 (2.7%) 1807 (4.9%)Unsuitable 7439 (20%) 6388 (17.3%) 6640 (17.9%) 6430 (17.4%) 5631 (15.2%)
Suitable 29,565 (80%) 28,599 (77.3%) 28,641 (77.4%) 28,536 (77.1%) 28,998 (78.4%)Range contraction 967 (2.6%) 925 (2.5%) 1030 (2.8%) 567 (1.5%)
TamilNadu
Range expansion 9804 (7.5%) 15,346 (11.8%) 15,283 (11.7%) 16,144 (12.4%)Unsuitable 54,141 (42%) 44,337 (34.0%) 38,795 (29.7%) 38,858 (29.8%) 37,998 (29.1%)
Suitable 76,289 (58%) 67,997 (52.1%) 71,356 (54.7%) 71,041 (54.5%) 72,531 (55.6%)Range contraction 8292 (6.4%) 4933 (3.8%) 5248 (4.0%) 3758 (2.9%)
Plants 2022, 11, x FOR PEER REVIEW 14 of 23
Table 6. Climatically suitable and unsuitable areas for growing coconut under the current and the future climate of RCP 4.5 and RCP 8.5 and the range expansion and contraction (the values in brackets are the difference in percentage from total study area) as modeled by MaxEnt for India and major coconut growing states.
Country/State Category Area (km2)
Current RCP 4.5 RCP 8.5
2050 2070 2050 2070
India (Study area)
Range expansion 52,617 (3.8%) 61,642 (4.4%) 75,383 (5.4%) 65,164 (4.7%) Unsuitable 1,184,077 (85%) 1,131,238 (81.2%) 1,122,212 (80.5%) 1,108,471 (79.6%) 1,118,691 (80.3%)
Suitable 209,374 (15%) 161,776 (11.6%) 168,738 (12.1%) 173,169 (12.4%) 172,036 (12%) Range contraction 47,578 (3.4%) 40,616 (2.9%) 36,184 (2.6%) 37,317 (2.7%)
Karnataka
Range expansion 27,956 (14.5%) 28,348 (14.7%) 38,858 (20.2%) 24,880 (12.9%) Unsuitable 11,4714 (60) 86,759 (45.1%) 86,366 (44.9%) 75,857 (39.4%) 89,835 (46.7%)
Suitable 77,591 (40) 60,723 (31.6%) 62,994 (32.8%) 67,846 (35.3%) 63,448 (33.0%) Range contraction 16,869 (8.8%) 14,597 (7.6%) 9745 (5.1%) 14,143 (7.4%)
Kerala
Range expansion 1051 (2.8%) 798 (2.2%) 1009 (2.7%) 1807 (4.9%) Unsuitable 7439 (20%) 6388 (17.3%) 6640 (17.9%) 6430 (17.4%) 5631 (15.2%)
Suitable 29,565 (80%) 28,599 (77.3%) 28,641 (77.4%) 28,536 (77.1%) 28,998 (78.4%) Range contraction 967 (2.6%) 925 (2.5%) 1030 (2.8%) 567 (1.5%)
Tamil Nadu
Range expansion 9804 (7.5%) 15,346 (11.8%) 15,283 (11.7%) 16,144 (12.4%) Unsuitable 54,141 (42%) 44,337 (34.0%) 38,795 (29.7%) 38,858 (29.8%) 37,998 (29.1%)
Suitable 76,289 (58%) 67,997 (52.1%) 71,356 (54.7%) 71,041 (54.5%) 72,531 (55.6%) Range contraction 8292 (6.4%) 4933 (3.8%) 5248 (4.0%) 3758 (2.9%)
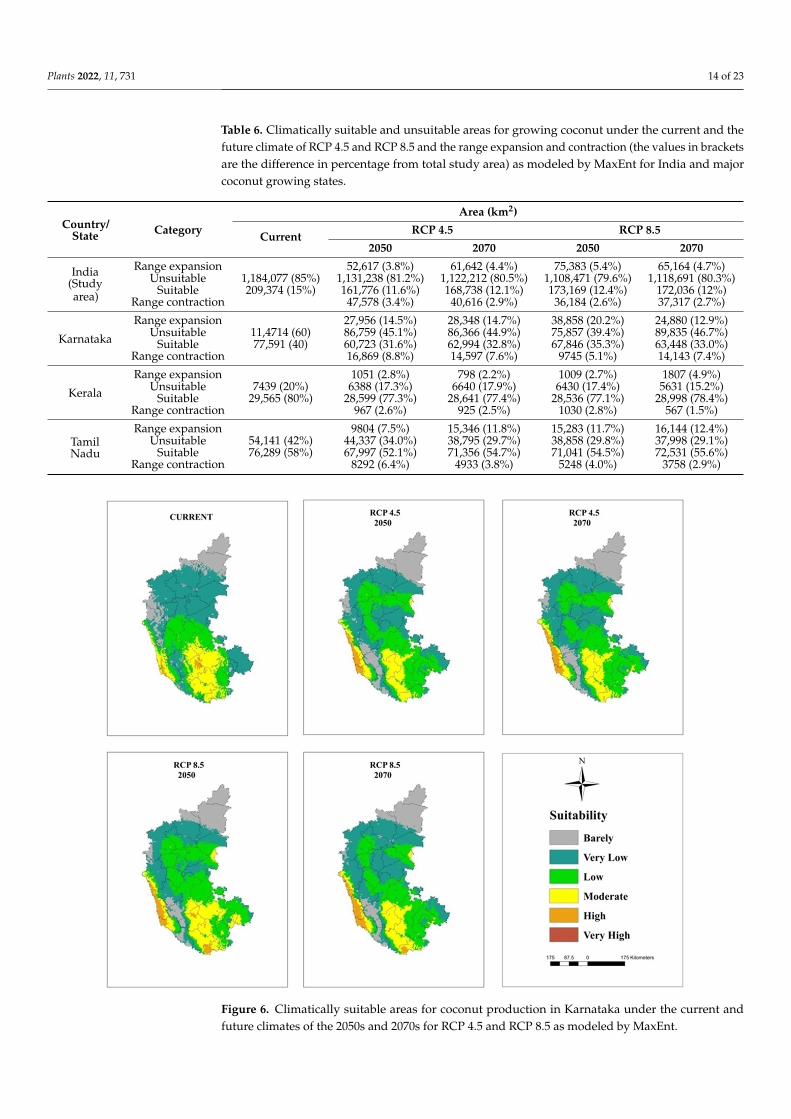
Figure 6. Climatically suitable areas for coconut production in Karnataka under the current and future climates of the 2050s and 2070s for RCP 4.5 and RCP 8.5 as modeled by MaxEnt. Figure 6. Climatically suitable areas for coconut production in Karnataka under the current andfuture climates of the 2050s and 2070s for RCP 4.5 and RCP 8.5 as modeled by MaxEnt.
Plants 2022, 11, 731 15 of 23Plants 2022, 11, x FOR PEER REVIEW 15 of 23
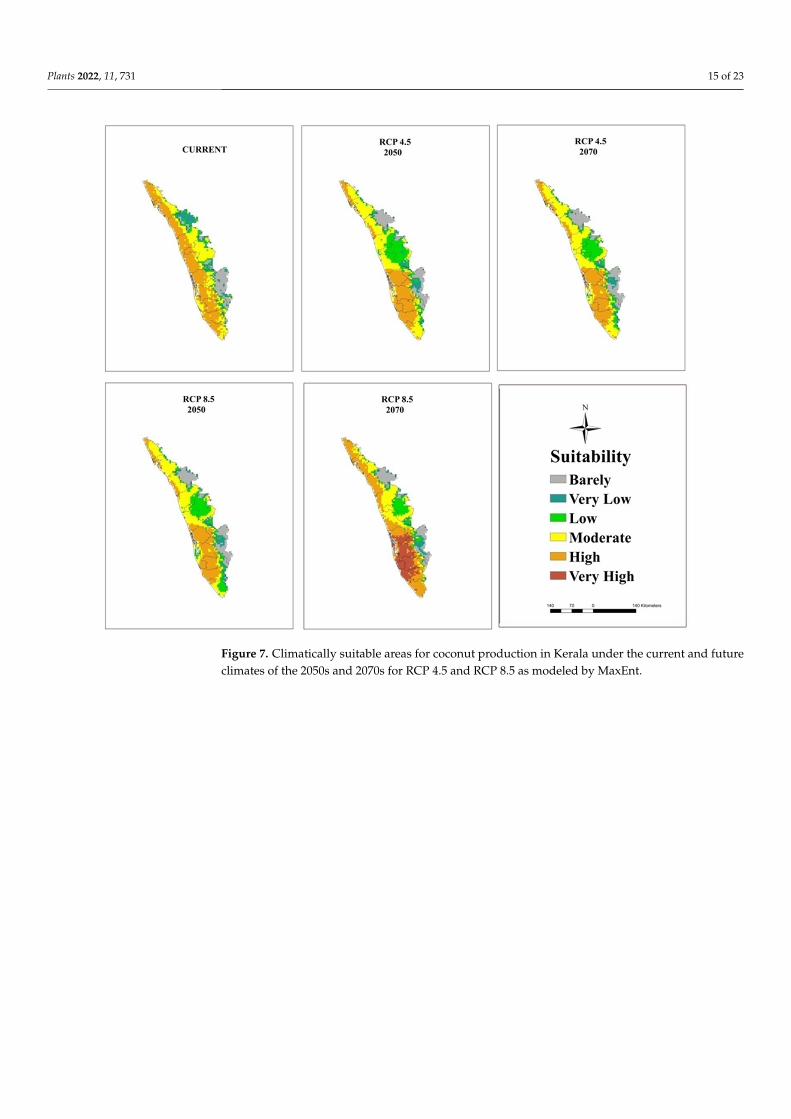
Figure 7. Climatically suitable areas for coconut production in Kerala under the current and future climates of the 2050s and 2070s for RCP 4.5 and RCP 8.5 as modeled by MaxEnt. Figure 7. Climatically suitable areas for coconut production in Kerala under the current and futureclimates of the 2050s and 2070s for RCP 4.5 and RCP 8.5 as modeled by MaxEnt.
Plants 2022, 11, 731 16 of 23Plants 2022, 11, x FOR PEER REVIEW 16 of 23
Figure 8. Climatically suitable areas for coconut production in Tamil Nadu under the current and future climates of the 2050s and 2070s for RCP 4.5 and RCP 8.5 as modeled by MaxEnt.
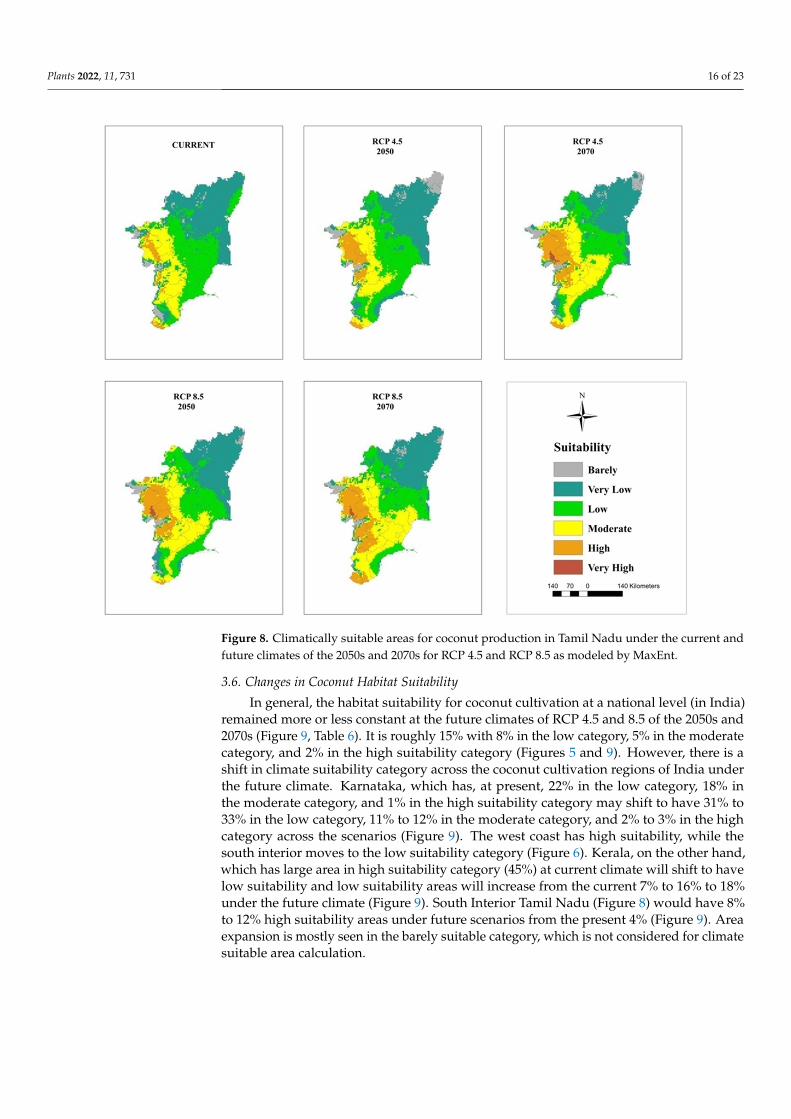
3.6. Changes in Coconut Habitat Suitability In general, the habitat suitability for coconut cultivation at a national level (in India)
remained more or less constant at the future climates of RCP 4.5 and 8.5 of the 2050s and 2070s (Figure 9, Table 6). It is roughly 15% with 8% in the low category, 5% in the moderate category, and 2% in the high suitability category (Figures 5 and 9). However, there is a shift in climate suitability category across the coconut cultivation regions of India under the future climate. Karnataka, which has, at present, 22% in the low category, 18% in the moderate category, and 1% in the high suitability category may shift to have 31% to 33% in the low category, 11% to 12% in the moderate category, and 2% to 3% in the high category across the scenarios (Figure 9). The west coast has high suitability, while the south interior moves to the low suitability category (Figure 6). Kerala, on the other hand, which has large area in high suitability category (45%) at current climate will shift to have low suitability and low suitability areas will increase from the current 7% to 16% to 18% under the future climate (Figure 9). South Interior Tamil Nadu (Figure 8) would have 8% to 12% high suitability areas under future scenarios from the present 4% (Figure 9). Area expansion is mostly seen in the barely suitable category, which is not considered for climate suitable area calculation.
Figure 8. Climatically suitable areas for coconut production in Tamil Nadu under the current andfuture climates of the 2050s and 2070s for RCP 4.5 and RCP 8.5 as modeled by MaxEnt.
3.6. Changes in Coconut Habitat Suitability
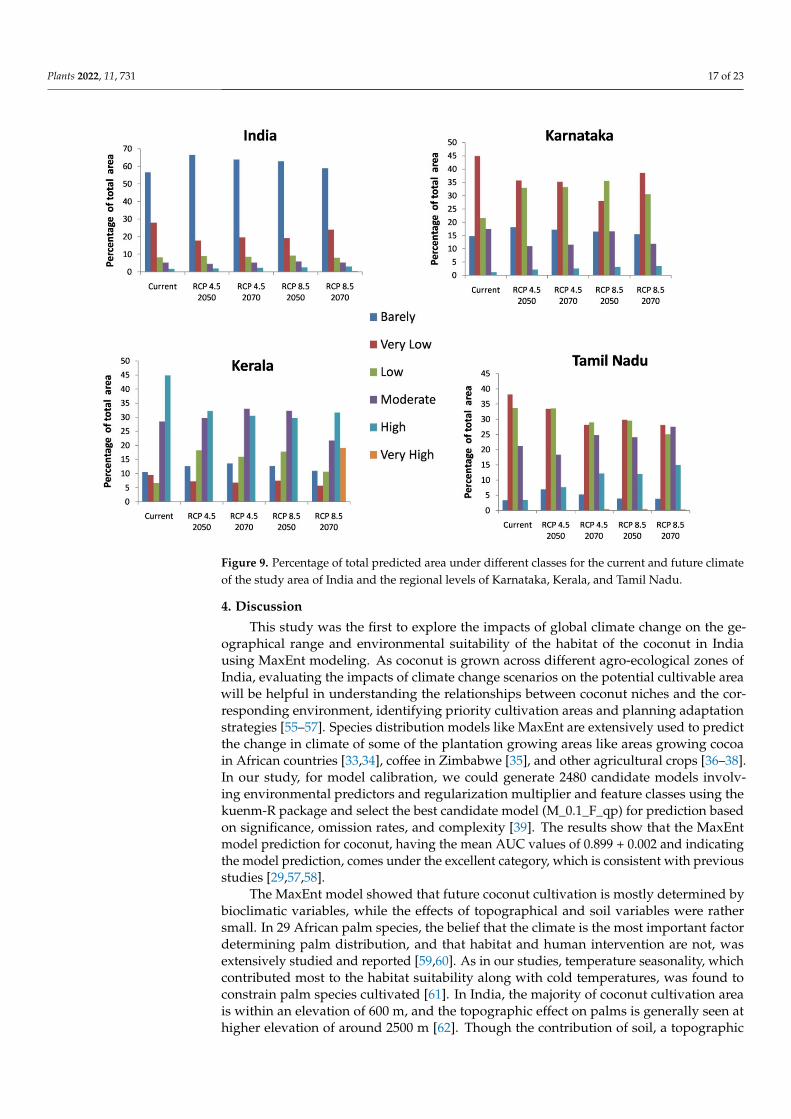
In general, the habitat suitability for coconut cultivation at a national level (in India)remained more or less constant at the future climates of RCP 4.5 and 8.5 of the 2050s and2070s (Figure 9, Table 6). It is roughly 15% with 8% in the low category, 5% in the moderatecategory, and 2% in the high suitability category (Figures 5 and 9). However, there is ashift in climate suitability category across the coconut cultivation regions of India underthe future climate. Karnataka, which has, at present, 22% in the low category, 18% inthe moderate category, and 1% in the high suitability category may shift to have 31% to33% in the low category, 11% to 12% in the moderate category, and 2% to 3% in the highcategory across the scenarios (Figure 9). The west coast has high suitability, while thesouth interior moves to the low suitability category (Figure 6). Kerala, on the other hand,which has large area in high suitability category (45%) at current climate will shift to havelow suitability and low suitability areas will increase from the current 7% to 16% to 18%under the future climate (Figure 9). South Interior Tamil Nadu (Figure 8) would have 8%to 12% high suitability areas under future scenarios from the present 4% (Figure 9). Areaexpansion is mostly seen in the barely suitable category, which is not considered for climatesuitable area calculation.
Plants 2022, 11, 731 17 of 23Plants 2022, 11, x FOR PEER REVIEW 17 of 23
Figure 9. Percentage of total predicted area under different classes for the current and future climate of the study area of India and the regional levels of Karnataka, Kerala, and Tamil Nadu.
4. Discussion This study was the first to explore the impacts of global climate change on the
geographical range and environmental suitability of the habitat of the coconut in India using MaxEnt modeling. As coconut is grown across different agro-ecological zones of India, evaluating the impacts of climate change scenarios on the potential cultivable area will be helpful in understanding the relationships between coconut niches and the corresponding environment, identifying priority cultivation areas and planning adaptation strategies [55–57]. Species distribution models like MaxEnt are extensively used to predict the change in climate of some of the plantation growing areas like areas growing cocoa in African countries [33,34], coffee in Zimbabwe [35], and other agricultural crops [36–38]. In our study, for model calibration, we could generate 2480 candidate models involving environmental predictors and regularization multiplier and feature classes using the kuenm-R package and select the best candidate model (M_0.1_F_qp) for prediction based on significance, omission rates, and complexity [39]. The results show that the MaxEnt model prediction for coconut, having the mean AUC values of 0.899 +0.002 and indicating the model prediction, comes under the excellent category, which is consistent with previous studies [29,57,58].
The MaxEnt model showed that future coconut cultivation is mostly determined by bioclimatic variables, while the effects of topographical and soil variables were rather small. In 29 African palm species, the belief that the climate is the most important factor determining palm distribution, and that habitat and human intervention are not, was extensively studied and reported [59,60]. As in our studies, temperature seasonality, which contributed most to the habitat suitability along with cold temperatures, was found to constrain palm species cultivated [61]. In India, the majority of coconut cultivation area is within an elevation of 600 m, and the topographic effect on palms is generally seen at higher elevation of around 2500 m [62]. Though the contribution of soil, a topographic
Figure 9. Percentage of total predicted area under different classes for the current and future climateof the study area of India and the regional levels of Karnataka, Kerala, and Tamil Nadu.
4. Discussion
This study was the first to explore the impacts of global climate change on the ge-ographical range and environmental suitability of the habitat of the coconut in Indiausing MaxEnt modeling. As coconut is grown across different agro-ecological zones ofIndia, evaluating the impacts of climate change scenarios on the potential cultivable areawill be helpful in understanding the relationships between coconut niches and the cor-responding environment, identifying priority cultivation areas and planning adaptationstrategies [55–57]. Species distribution models like MaxEnt are extensively used to predictthe change in climate of some of the plantation growing areas like areas growing cocoain African countries [33,34], coffee in Zimbabwe [35], and other agricultural crops [36–38].In our study, for model calibration, we could generate 2480 candidate models involv-ing environmental predictors and regularization multiplier and feature classes using thekuenm-R package and select the best candidate model (M_0.1_F_qp) for prediction basedon significance, omission rates, and complexity [39]. The results show that the MaxEntmodel prediction for coconut, having the mean AUC values of 0.899 + 0.002 and indicatingthe model prediction, comes under the excellent category, which is consistent with previousstudies [29,57,58].
The MaxEnt model showed that future coconut cultivation is mostly determined bybioclimatic variables, while the effects of topographical and soil variables were rathersmall. In 29 African palm species, the belief that the climate is the most important factordetermining palm distribution, and that habitat and human intervention are not, wasextensively studied and reported [59,60]. As in our studies, temperature seasonality, whichcontributed most to the habitat suitability along with cold temperatures, was found toconstrain palm species cultivated [61]. In India, the majority of coconut cultivation areais within an elevation of 600 m, and the topographic effect on palms is generally seen athigher elevation of around 2500 m [62]. Though the contribution of soil, a topographic
Plants 2022, 11, 731 18 of 23
factor, is rather small (0.4%); however, its inclusion in the model made the prediction moreaccurate as seen in other species [63], otherwise, the model would have predicted moresuitable area than currently exists for the actual current coconut distribution. Thus, as seenin previous studies, we have confirmed the dominant role of the climate in the naturalcultivation of coconut [29,58].
As coconut is a tropical plant, its cultivation is mainly determined by the temperature.Optimal temperature for its growth and yield is 27 ◦C ± 5 ◦C and optimum humidityof >60%. The plant grows well up to an elevation of 600 m above MSL. However, nearthe equator, productive coconut orchards can be established up to an elevation of about1000 m above MSL, providing that temperature is not a limitation. A well-distributedrainfall of about 200 cm per year is the best for proper growth and higher yield [64–67].South India, comprising the states of Kerala, Karnataka, Tamil Nadu, and Andhra Pradesh,occupies >90% of the total coconut cultivation area in the country. All along the west coastis relatively ideal for coconut cultivation where rainfall is >200 cm, humidity is high, andTmax reaches as high as 36 ◦C during the summer (March, April, May). In the south interior,where rainfall is around 60 cm, Tmax reaches as high as 40 ◦C, and summer humidity is low,coconut grows well wherever there are irrigation facilities. However, in this region, largeareas are under rainfed conditions. On the other hand, in the eastern region mostly, coconutis cultivated under irrigation conditions where the rainfall is around 100 cm and Tmaxreaches as high as 43 ◦C. A high temperature (Tmax > 34 ◦C) decreases the photosynthesisof the coconut seedlings [68] during the reproductive stage. This affects the progamicphase, i.e., causes poor pollen germination [22] and restricts pollen tube growth throughstyle [23]. As a result, there was poor fertilization and nut set. In the field condition, it wasobserved that a prevailing high temperature (Tmax ≥ 33 ◦C) during the first three months ofinflorescence opening severely reduced the nut set of an inflorescence during the summermonths both in India and Sri Lanka [69–71]. Furthermore, when water is limited, as iscommon in coconut ecosystems because more than 60% of the water supply is rainfed, theinteraction effects of rising CO2 and warming with water deficit are not known. Therefore,for a crop like coconut, temperature, water, CO2, and their interactions are the importantclimatic factors determining the suitability of a given region.
The MaxEnt model has predicted that the climate of the region between 8◦4′ northand 20◦ south of the equator under current the conditions is ideal for coconut palm inIndia, consistent with previous findings [67]. At a national level (in India), the model hadpredicted that 15% of the total area would be suitable for coconut cultivation under thecurrent climate with the climate being placed in the high suitability category all along thewest coast (Karnataka and Kerala), in the moderate suitability category in some parts ofSouth Interior Karnataka and TN, while the rest of the south interior would be placed inthe low suitability category and the eastern region (TN, AP, Odisha, West Bengal) andNortheastern states would be placed in the low to very low suitability category, which is inagreement with the actual spread of coconut as in Figure 1a.
Previous studies had concluded that global warming had greatly influenced theclimate of the region, thereby causing expansions, shifts, or contractions in the area undercultivation [72,73]. From Figure 9, it is clear that the majority of the area expansionis happening in the barely suitable category, which has <0.25 value of the maximumtraining sensitivity plus specificity and is, therefore, not taken into account for suitablearea calculation. Our predictions showed that under the future climate, at a national level(in India), the total area suitable for coconut cultivation would remain constant (15%).However, at the regional level, the areas with a potentially suitable climate for coconut willshift from different categories like low, moderate, and high suitability. The west coast willbe placed in the high suitability category, the south interior will be placed in the moderateto high suitability category, and the east coast will be placed in the low suitability categoryfor coconut cultivation. These results were consistent with previous studies showing thatthe habitat suitability of plant species was predicted to become vulnerable in some regionsunder climate change conditions [coffee could be replaced by cocoa in Mesoamerica [74],
Plants 2022, 11, 731 19 of 23
cocoa in Latin America [75], cocoa in West Africa [34], coffee in Zimbabwe [76], andC. tinctorius in China [73].
Even under high concentration scenarios, the model projection of high climate suit-ability for coconut all along the west coast showed a high probability of its cultivation. Inthe south interior, the climate of some of the current areas of high probable occurrencemay change to moderate suitability, moderate to low suitability, and low suitability tounsuitable. In the eastern region, the climate is less suitable, and the areas with a suitableclimate were found towards the west, especially in TN. Small changes in the temperatureand precipitation seasonality could be the reason for low climate vulnerability to climatechange for coconut in the west coast. The south interior regions are low rainfall areas, eventhough the predicted precipitation is less variable, still, the temperature-induced rise inevapotranspiration might subject the plants to drought in areas without irrigation facilities.This is further exasperated by the prevailing low humidity during the summer months.High temperature under low humidity is more detrimental to fertilization [23]. In theeastern region, where the summer temperature is already high (Tmax > 40 ◦C), the projectedtemperature rise of 2 ◦C to 3 ◦C would make the crop more vulnerable. These regionsshowed high variability in temperature (Bio 4) and precipitation seasonality (Bio 15) fromthe current climate. Therefore, the proposed contraction to the area with a suitable will be apotential threat to the increasing demand for coconut and coconut products worldwide.The market demand of coconut is rather great in India due to the rich nutrients and oilprovided the coconut, as well as the latest discoveries of its nutraceutical benefits [9].
The suitable area available for the cultivation of coconut will gradually decrease be-cause of urban development and other social causes. Furthermore, there is more areabecoming vulnerable under the future climate. Together, these factors add pressure toproduce more from each unit land area to meet the growing demand. Therefore, moreattention and additional protective measures should be given to extensive coconut cul-tivation areas in the south interior regions so as to ensure the sustainable cultivation ofcoconut, at least in presently cultivated areas. In these regions, high temperatures and lowhumidity are the major problem. The effect of high temperatures, to a certain extent, couldbe alleviated either by planting genotypes with wider adaptability for water deficit andhigh temperatures or by adopting some of the agro techniques of fertigation along withsoil moisture conservation practices like mulching, bunding, and cropping systems [77].Soil moisture retention, summer irrigation, drip irrigation, and fertilizer application areonly a few of the agronomic adaptations that can not only reduce losses but also boostproductivity in the majority of coconut-growing areas because the availability of water tothe palms can help them in canopy cooling by transpiration and can partially offset theadverse influences of high temperatures [67]. In the eastern regions, where Tmax is themajor issue, adopting genotypes with wider adaptability to high temperatures may sustainthe crop under the future climate.
5. Conclusions
Coconut, an important plantation crop grown in coastal belts and plains, is highlyvulnerable to climate change, and there is urgent need for its appropriate protection andmanagement. In this study, we used the MaxEnt model to evaluate the bioclimatic variablesdetermining the suitable habitat for coconut cultivation and to predict the regions with aclimate that is potentially suitable under the future climate conditions. The MaxEnt modelis popularly used for species-distribution due its prediction accuracy even with incompletedata and a small sample size, but it has some limitations, such as underestimating theinfluence of parameters and spatial bias in the occurrence data and the possibility of over-fitting and the lack of its capacity to generalize results from independent data. In addition,the MaxEnt outputs gives environmental suitability rather than predicted probability ofoccurrence. Considering that we have limited data on coconut, the MaxEnt model was usedto obtain an overall understanding of the suitability in different regions of India. Our resultshave shown that coconut will contract its suitable climate area size and will face a high risk
Plants 2022, 11, 731 20 of 23
of unfavorable climate in the southern interior and eastern regions of India in response toglobal climate change. There is shift in climate suitability from high to moderate, moderateto low and low to unsuitable under the future climate. Effective coordination amongst allstakeholders is essential to develop and implement adaptation strategies so as to ensuresustainable cultivation of coconut at least in presently cultivated areas. Future researchshould be focused on collecting robust data at more granular and complete datasets anduse them for modeling the impacts of climate change and their impact on crop yield withbetter mechanistic models. In addition, using an ensemble of models rather than one singlemodel will improve accuracy of predictions.
Author Contributions: Conceptualization, K.B.H.; methodology, K.B.H., P.S.A., V.S.J., A.S. and S.S.;formal analysis, K.B.H., P.S.A., A.S., S.S. and P.V.V.P.; investigation, K.B.H., P.S.A. and V.S.J.; resources,K.B.H.; writing—original draft preparation, V.S.J., P.N. and K.B.H.; writing—review and editing,P.V.V.P.; supervision, K.B.H.; project administration, K.B.H. All authors have read and agreed to thepublished version of the manuscript.
Funding: This research received no external funding.
Institutional Review Board Statement: Not applicable.
Informed Consent Statement: Not applicable.
Data Availability Statement: Data is available upon request from the corresponding author.
Acknowledgments: Authors thank Indian Council of Agricultural Research for supporting thisresearch. The senior author (K.B.H.) thanks the Borlaug Fellowship of the United States Departmentof Agriculture for providing opportunity to establish collaboration with Department of Agronomy atKansas State University.
Conflicts of Interest: The authors declare no conflict of interest.
References1. APCC. Coconut Statistical Yearbook; Asian and Pacific Coconut Community: Jakarta, Indonesia, 2015; 288p.2. Omont, H. Information Sheet-COCONUT; IPGRI—Commodity Chains; FAO: Rome, Italy, 2001.3. Rethinam, P. International Scenario of Coconut Sector. In The Coconut Palm (Cocos nucifera L.)—Research and Development Perspectives;
Nampoothiri, K.U.K., Krishnakumar, V., Thampan, P.K., Nair, M.A., Eds.; Springer: Singapore, 2018; pp. 21–56.4. Ramesh, S.V.; Pandiselvam, R.; Thushara, R.; Manikantan, M.R.; Hebbar, K.B.; Beegum, S.; Mathew, A.C.; Neenu, S.; Shil, S.
Engineering intervention for production of virgin coconut oil by hot process and multivariate analysis of quality attributes ofvirgin coconut oil extracted by various methods. J. Food Process Eng. 2020, 43, e13395. [CrossRef]
5. Hebbar, K.B.; Arivalagan, M.; Manikantan, M.R.; Mathew, A.C.; Thamban, C.; Thomas, G.V.; Chowdappa, P. Coconut inflorescencesap and its value addition as sugar—Collection techniques, yield, properties and market perspective. Curr. Sci. 2015, 109,1411–1417. [CrossRef]
6. Hebbar, K.B.; Arivalagan, M.; Pavithra, K.C.; Roy, T.K.; Gopal, M.; Shivashankara, K.S.; Chowdappa, P. Nutritional profiling ofcoconut (Cocos nucifera L.) inflorescence sap collected using novel coco-sap chiller method and its value added products. J. FoodMeas. Charact. 2020, 14, 2703–2712. [CrossRef]
7. Asghar, M.T.; Yusof, Y.A.; Mokhtar, M.N.; Ya’acob, M.E.; Mohd. Ghazali, H.; Chang, L.S.; Manaf, Y.N. Coconut (Cocos nucifera L.)sap as a potential source of sugar: Antioxidant and nutritional properties. Food Sci. Nutr. 2020, 8, 1777–1787. [CrossRef]
8. Joshi, S.; Kaushik, V.; Gode, V.; Mhaskar, S. Coconut Oil and Immunity: What do we really know about it so far? J. Assoc. Phys.India 2020, 68, 67–72.
9. Ramesh, S.V.; Krishnan, V.; Praveen, S.; Hebbar, K.B. Dietary prospects of coconut oil for the prevention and treatment ofAlzheimer’s disease (AD): A review of recent evidences. Trends Food Sci. Technol. 2021, 112, 201–211. [CrossRef]
10. Jose, T.K. Let’s ‘Make in India’ futuristic coconut products. Indian Coconut J. 2015, 28, 1.11. OECD-FAO. Agricultural Outlook 2017–2026; OECD: Paris, France, 2017.12. Pachauri, R.K.; Allen, M.R.; Barros, V.R.; Broome, J.; Cramer, W.; Christ, R.; Church, J.A.; Clarke, L.; Dahe, Q.; Dasgupta, P.; et al.
Climate Change 2014: Synthesis Report. Contribution of Working Groups I, II and III to the Fifth Assessment Report of the IntergovernmentalPanel on Climate Change; IPCC: Geneva, Switzerland, 2014; 151p.
13. Kumar, S.N.; Bai, K.V.K.; Rajagopal, V.; Aggarwal, P.K. Simulating coconut growth, development and yield with the InfoCrop-coconut model (Tree Physiology 28 (1049–1058)). Tree Physiol. 2009, 29, 751. [CrossRef]
14. Wilson, C.D.; Roberts, D.; Reid, N. Applying species distribution modelling to identify areas of high conservation value forendangered species: A case study using Margaritifera (L.). Biol. Conserv. 2011, 144, 821–829. [CrossRef]
Plants 2022, 11, 731 21 of 23
15. Hebbar, K.B.; Santhosh, A.; Sukumar, A.P.; Neethu, P.; Ramesh, S.V.; Selvamani, V. Effect of sea water substitution on growth,physiological and biochemical processes of coconut (Cocos nucifera L.) seedlings—A hydroponic study. Sci. Hortic. (Amst.) 2021,280, 109935. [CrossRef]
16. Walther, G.R.; Post, E.; Convey, P.; Menzel, A.; Parmesan, C.; Beebee, T.J.C.; Fromentin, J.M.; Hoegh-Guldberg, O.; Bairlein, F.Ecological responses to recent climate change. Nature 2002, 416, 389–395. [CrossRef] [PubMed]
17. Parmesan, C.; Yohe, G. A globally coherent fingerprint of climate change impacts across natural systems. Nature 2003, 421, 37–42.[CrossRef] [PubMed]
18. Bellard, C.; Bertelsmeier, C.; Leadley, P.; Thuiller, W.; Courchamp, F. Impacts of climate change on the future of biodiversity. Ecol.Lett. 2012, 15, 365–377. [CrossRef] [PubMed]
19. Staudinger, M.D.; Grimm, N.B.; Staudt, A.; Carter, S.F.; Chapin, F.S.; Kareiva, P.; Ruckelshaus, M.; Stein, B.A. Impacts of climatechange on biodiversity, ecosystems, and ecosystem services: Technical input to the 2013 National Climate Assessment. InCooperative Report to the 2013 National Climate Assessment; Global Change Research Program: Washington, DC, USA, 2012; 296p.
20. Hebbar, K.B.; Sheena, T.L.; Kumari, K.S.; Padmanabhan, S.; Balasimha, D.; Kumar, M.; Thomas, G.V. Response of coconutseedlings to elevated CO2 and high temperature in drought and high nutrient conditions. J. Plant. Crop. 2013, 41, 118–122.
21. Norby, R.J.; DeLucia, E.H.; Gielen, B.; Calfapietra, C.; Giardina, C.P.; Kings, J.S.; Ledford, J.; McCarthy, H.R.; Moore, D.J.P.;Ceulemans, R.; et al. Forest response to elevated CO2 is conserved across a broad range of productivity. Proc. Natl. Acad. Sci. USA2005, 102, 18052–18056. [CrossRef]
22. Hebbar, K.B.; Rose, H.M.; Nair, A.R.; Kannan, S.; Niral, V.; Arivalagan, M.; Gupta, A.; Samsudeen, K.; Chandran, K.P.; Chowdappa,P.; et al. Differences in In Vitro Pollen Germination and Pollen tube Growth of Coconut (Cocos nucifera L.) Cultivars in Response to HighTemperature Stress; Elsevier B.V.: Amsterdam, The Netherlands, 2018; Volume 153, ISBN 9149942328.
23. Hebbar, K.B.; Neethu, P.; Sukumar, P.A.; Sujithra, M.; Santhosh, A.; Ramesh, S.V.; Niral, V.; Hareesh, G.S.; Nameer, P.O.; Prasad,P.V.V. Understanding physiology and impacts of high temperature stress on the progamic phase of coconut (Cocos nucifera L.).Plants 2020, 9, 1651. [CrossRef]
24. Oren, R.; Ellsworth, D.S.; Johnsen, K.H.; Phillips, N.; Ewers, B.E.; Maier, C.; Schäfer, K.V.R.; McCarthy, H.; Hendrey, G.; McNulty,S.G.; et al. Soil fertility limits carbon sequestration by forest ecosystems in a CO2-enriched atmosphere. Nature 2001, 411, 469–472.[CrossRef]
25. Reich, P.B.; Luo, Y.; Bradford, J.B.; Poorter, H.; Perry, C.H.; Oleksyn, J. Temperature drives global patterns in forest biomassdistribution in leaves, stems, and roots. Proc. Natl. Acad. Sci. USA 2014, 111, 13721–13726. [CrossRef]
26. Hebbar, K.B.; Apshara, E.; Chandran, K.P.; Prasad, P.V.V. Effect of elevated CO2, high temperature, and water deficit on growth,photosynthesis, and whole plant water use efficiency of cocoa (Theobroma cacao L.). Int. J. Biometeorol. 2020, 64, 47–57. [CrossRef]
27. Phillips, S.J.; Dudík, M.; Schapire, R.E.; Internet. Maxent Software for Modeling Species Niches and Distributions (Version 3.4.1).Available online: http://biodiversityinformatics.amnh.org/open_source/maxent/ (accessed on 15 October 2020).
28. Elith, J.; Graham, C.H.; Anderson, R.P.; Dudík, M.; Ferrier, S.; Guisan, A.; Hijmans, R.J.; Huettmann, F.; Leathwick, J.R.; Lehmann,A.; et al. Novel methods improve prediction of species’ distributions from occurrence data. Ecography 2006, 29, 129–151. [CrossRef]
29. Pearson, R.G.; Dawson, T.P. Predicting the impacts of climate change on the distribution of species: Are bioclimate envelopemodels useful? Glob. Ecol. Biogeogr. 2003, 12, 361–371. [CrossRef]
30. Braunisch, V.; Coppes, J.; Arlettaz, R.; Suchant, R.; Schmid, H.; Bollmann, K. Selecting from correlated climate variables: A majorsource of uncertainty for predicting species distributions under climate change. Ecography 2013, 36, 971–983. [CrossRef]
31. Yang, X.-Q.; Kushwaha, S.P.S.; Saran, S.; Xi, J.; Roy, P.S. Maxent modeling for predicting the potential distribution of medicinalplant, Justicia adhatoda L. in Lesser Himalayan foothill. Ecol. Eng. 2013, 15, 83–87. [CrossRef]
32. Searcy, C.A.; Shaffer, H.B. Do ecological niche models accurately identify climatic determinants of species ranges? Am. Nat. 2016,187, 423–435. [CrossRef]
33. Läderach, P.; Martinez-Valle, A.; Schroth, G.; Castro, N. Predicting the future climatic suitability for cocoa farming of the world’sleading producer countries, Ghana and Côte d’Ivoire. Clim. Chang. 2013, 119, 841–854. [CrossRef]
34. Schroth, G.; Läderach, P.; Martinez-Valle, A.I.; Bunn, C.; Jassogne, L. Vulnerability to climate change of cocoa in West Africa:Patterns, opportunities and limits to adaptation. Sci. Total Environ. 2016, 556, 231–241. [CrossRef]
35. Pham, Y.; Reardon-Smith, K.; Mushtaq, S.; Cockfield, G. The impact of climate change and variability on coffee production: Asystematic review. Clim. Chang. 2019, 156, 609–630. [CrossRef]
36. Kogo, B.K.; Kumar, L.; Koech, R.; Kariyawasam, C.S. Modelling climate suitability for rainfed Maize cultivation in Kenya using aMaximum Entropy (MaxENT) approach. Agronomy 2019, 9, 727. [CrossRef]
37. He, Q.; Zhou, G. Climate-associated distribution of summer maize in China from 1961 to 2010. Agric. Ecosyst. Environ. 2016, 232,326–335. [CrossRef]
38. Jayasinghe, S.L.; Kumar, L. Modeling the climate suitability of tea [Camellia sinensis (L.) O. Kuntze] in Sri Lanka in response tocurrent and future climate change scenarios. Agric. For. Meteorol. 2019, 272, 102–117. [CrossRef]
39. Cobos, M.E.; Townsend Peterson, A.; Barve, N.; Osorio-Olvera, L. Kuenm: An R package for detailed development of ecologicalniche models using Maxent. PeerJ 2019, 7, e6281. [CrossRef] [PubMed]
40. Brown, J.L.; Bennett, J.R.; French, C.M. SDMtoolbox 2.0: The next generation Python-based GIS toolkit for landscape genetic,biogeographic and species distribution model analyses. PeerJ 2017, 5, e4095. [CrossRef] [PubMed]
Plants 2022, 11, 731 22 of 23
41. Brown, J.L.; Hill, D.J.; Dolan, A.M.; Carnaval, A.C.; Haywood, A.M. Paleoclim, high spatial resolution paleoclimate surfaces forglobal land areas. Sci. Data 2018, 5, 180254. [CrossRef]
42. Hijmans, R.J.; Cameron, S.E.; Parra, J.L.; Jones, P.G.; Jarvis, A. Very high resolution interpolated climate surfaces for global landareas. Int. J. Climatol. 2005, 25, 1965–1978. [CrossRef]
43. Remya, K.; Ramachandran, A.; Jayakumar, S. Predicting the current and future suitable habitat distribution of MyristicadactyloidesGaertn. Using MaxEnt model in the Eastern Ghats, India. Ecol. Eng. 2015, 82, 184–188. [CrossRef]
44. Jose, V.S.; Nameer, P.O. The expanding distribution of the Indian Peafowl (Pavocristatus) as an indicator of changing climate inKerala, southern India: A modelling study using MaxEnt. Ecol. Indic. 2020, 110, 105930. [CrossRef]
45. Mod, H.K.; Scherrer, D.; Luoto, M.; Guisan, A. What we use is not what we know: Environmental predictors in plant distributionmodels. J. Veg. Sci. 2016, 27, 1308–1322. [CrossRef]
46. Shabani, F.; Ahmadi, M.; Kumar, L.; Solhjouy-Fard, S.; Tehrany, M.S.; Shabani, F.; Kalantar, B.; Esmaeili, A. Invasive weed species’threats to global biodiversity: Future scenarios of changes in the number of invasive species in a changing climate. Ecol. Indic.2020, 116, 106436. [CrossRef]
47. Jaynes, E.T. Information Theory and Statistical Mechanics. Phys. Rev. 1957, 106, 620–630. [CrossRef]48. Phillips, S.J.; Anderson, R.P.; Schapire, R.E. Maximum entropy modeling of species geographic distributions. Ecol. Model. 2006,
190, 231–259. [CrossRef]49. Phillips, S.J.; Dudík, M. Modeling of species distribution with MaxEnt: New extensions and a comprehensive evaluation.
Ecography 2008, 31, 161–175. [CrossRef]50. O’Donnell, M.S.; Ignizio, D.A. Bioclimatic Predictors for Supporting Ecological Applications in the Conterminous United States.
US Geol. Surv. Data Ser. 2012, 691, 4–9.51. Merow, C.; Smith, M.J.; Silander, J.A. A practical guide to MaxEnt for modeling species’ distributions: What it does, and why
inputs and settings matter. Ecography 2013, 36, 1058–1069. [CrossRef]52. Phillips, S.J.; Dudík, M.; Schapire, R.E. A maximum entropy approach to species distribution modeling. In Proceedings of the
Twenty-First International Conference on Machine Learning, Banff, AB, Canada, 4–8 July 2004; ACM Press: New York, NY, USA,2004; pp. 655–662.
53. Al Ruheili, A.M.; Boluwade, A.; Al Subhi, A.M. Assessing the impact of climate change on the distribution of lime (16SRII-b) andalfalfa (16srii-d) phytoplasma disease using maxent. Plants 2021, 10, 460. [CrossRef] [PubMed]
54. Liu, C.; Newell, G.; White, M. On the selection of thresholds for predicting species occurrence with presence-only data. Ecol. Evol.2016, 6, 337–348. [CrossRef] [PubMed]
55. Davies, T.J.; Purvis, A.; Gittleman, J.L. Quaternary climate change and the geographic ranges of mammals. Am. Nat. 2009, 174,297–307. [CrossRef]
56. Zhang, L.; Cao, B.; Bai, C.; Li, G.; Mao, M. Predicting suitable cultivation regions of medicinal plants with Maxent modeling andfuzzy logics: A case study of Scutellaria baicalensis in China. Environ. Earth Sci. 2016, 75, 361. [CrossRef]
57. Xu, X.; Zhang, H.; Yue, J.; Xie, T.; Xu, Y.; Tian, Y. Predicting shifts in the suitable climatic distribution of walnut (Juglans regia L.) inChina: Maximum entropy model paves the way to forest management. Forests 2018, 9, 103. [CrossRef]
58. Kelly, A.E.; Goulden, M.L. Rapid shifts in plant distribution with recent climate change. Proc. Natl. Acad. Sci. USA 2008, 105,11823–11826. [CrossRef]
59. Blach-Overgaard, A.; Svenning, J.-C.; Balslev, H. Climate change sensitivity of the African ivory nut palm, Hyphaene petersianaKlotzsch ex Mart. (Arecaceae)—A keystone species in SE Africa. In IOP Conference Series: Earth and Environmental Science; IOPPublishing: Bristol, UK, 2009; Volume 8, p. 012014.
60. Blach-Overgaard, A.; Svenning, J.C.; Dransfield, J.; Greve, M.; Balslev, H. Determinants of palm species distributions across Africa:The relative roles of climate, non-climatic environmental factors, and spatial constraints. Ecography 2010, 33, 380–391. [CrossRef]
61. Lieberman, D.; Lieberman, M.; Peralta, R.; Hartshorn, G.S. Tropical forest structure and composition on a large-scale altitudinalgradient in Costa Rica. J. Ecol. 1996, 84, 137–152. [CrossRef]
62. Walther, G.R.; Gritti, E.S.; Berger, S.; Hickler, T.; Tang, Z.Y.; Sykes, M.T. Palms tracking climate change. Glob. Ecol. 2007, 16,801–809. [CrossRef]
63. Zuquim, G.; Costa, F.R.C.; Tuomisto, H.; Moulatlet, G.M.; Figueiredo, F.O.G. The importance of soils in predicting the future ofplant habitat suitability in a tropical forest. Plant Soil 2020, 450, 151–170. [CrossRef]
64. Child, R. Coconuts, 2nd ed.; Logman: London, UK, 1974; 355p.65. Persley, G.J. Replanting the Tree of Life towards an International Agenda for Coconut Palm Research; CAB International: Oxford, UK,
1992; p. 156.66. Rajagopal, V.; Parthasarathy, V.A.; Kumar, S.N.; Reddy, D.V.S.; Rohini, I. Coconut; Parthasarathy, V.A., Chattopadyay, P.K., Bose,
T.K., Eds.; Plantation Crops Naya Udyog Pub: Kolkata, India, 2006; Volume 2, pp. 1–178.67. Kumar, S.N.; Aggarwal, P.K. Climate change and coconut plantations in India Impacts and potential adaptation gains. Agric. Syst.
2013, 117, 45–54. [CrossRef]68. Hebbar, K.B.; Berwal, M.K.; Chaturvedi, V.K. Plantation crops: Climatic risks and adaptation strategies. Indian J. Plant Physiol.
2016, 21, 428–436. [CrossRef]69. Ranasinghe, C.S.; Silva, L.R.S.; Premasiri, R.D.N. Major determinants of fruit set and yield fluctuation in coconut (Cocos nucifera
L.). J. Natl. Sci. Found. Sri Lanka 2015, 43, 253–264. [CrossRef]
Plants 2022, 11, 731 23 of 23
70. Samanta, M.K.; Chattopadhyay, N.; Hore, J.K.; Alam, K. Associationship of weather parameters on the Floral characteristics ofcoconut. Acta Hortic. 2013, 975, 365–372. [CrossRef]
71. Samarasinghe, C.R.K.; Meegahakumbura, M.K.; Dissanayaka, H.D.M.A.C.; Kumarathunge, D.; Perera, L. Variation in yield andyield components of different coconut cultivars in response to within year rainfall and temperature variation. Sci. Hortic. (Amst.)2018, 238, 51–57. [CrossRef]
72. Thomas, C.D.; Cameron, A.; Green, R.E.; Bakkenes, M.; Beaumont, L.J.; Collingham, Y.C.; Erasmus, B.F.N.; De Siqueira, M.F.;Grainger, A.; Hannah, L.; et al. Letter to nature: Extinction risk from climate change. Nature 2004, 427, 145–148. [CrossRef]
73. Wei, B.; Wang, R.; Hou, K.; Wang, X.; Wu, W. Predicting the current and future cultivation regions of Carthamus tinctorius L.using MaxEnt model under climate change in China. Glob. Ecol. Conserv. 2018, 16, e00477. [CrossRef]
74. de Sousa, K.; van Zonneveld, M.; Holmgren, M.; Kindt, R.; Ordoñez, J.C. The future of coffee and cocoa agroforestry in a warmerMesoamerica. Sci. Rep. 2019, 9, 8823. [CrossRef] [PubMed]
75. Fernandez-Manjarrés, J. Using ecological modelling tools to inform policy makers of potential changes in crop distribution: Anexample with cacao crops in Latin America. In Economics Tools Methods Analysis of Global Change Impacts on Agriculture and FoodSecurity; Springer: Cham, Switzerland, 2019; pp. 11–23. [CrossRef]
76. Chemura, A.; Kutywayo, D.; Chidoko, P.; Mahoya, C. Bioclimatic modelling of current and projected climatic suitability of coffee(Coffea arabica) production in Zimbabwe. Reg. Environ. Chang. 2016, 16, 473–485. [CrossRef]
77. Subramanian, P.; Dhanapal, R.; Mathew, A.C.; Palaniswami, C.; Upadhyaya, A.K.; Naresh Kumar, S.; Reddy, D.V. Effect offertilizer application through micro-irrigation technique on nutrient availability and coconut productivity. J. Plant. Crops 2012, 40,168–173.
Copyright © 2022 FDOKUMEN