Horizontal subduction and truncation of the Cocos Plate beneath central Mexico
Upload
khangminh22Category
view
0download
0
Chromatography 2014, 1, 211-226; doi:10.3390/chromatography1040211
chromatography ISSN 2227-9075
www.mdpi.com/journal/chromatography
Article
Analyses of Phytohormones in Coconut (Cocos Nucifera L.) Water
Using Capillary Electrophoresis-Tandem Mass Spectrometry
Swee Ngin Tan 1, Jean Wan Hong Yong 2 and Liya Ge 3,*
1 Natural Sciences and Science Education Academic Group, Nanyang Technological University,
1 Nanyang Walk, Singapore 637616, Singapore; E-Mail: [email protected] 2 Singapore University of Technology and Design, 20 Dover Road, Singapore 279623, Singapore;
E-Mail: [email protected] 3 Residues and Resource Reclamation Centre, Nanyang Environment and Water Research Institute,
Nanyang Technological University, 1 Cleantech Loop, Singapore 637141, Singapore
* Author to whom correspondence should be addressed; E-Mail: [email protected];
Tel.: +65-6790-4100; Fax: +65-6792-7319.
External Editor: Gianni Galaverna
Received: 8 October 2014; in revised form: 8 December 2014 / Accepted: 12 December 2014 /
Published: 22 December 2014
Abstract: Capillary electrophoresis (CE) coupled with mass spectrometry (MS) or tandem
mass spectrometry (MS/MS) is reported as an alternative and potentially useful method for
the simultaneous analysis of various classes of phytohormones with diversified structures,
including indole-3-acetic acid (IAA), indole-3-butyric acid (IBA), abscisic acid (ABA),
gibberellic acid (GA), zeatin (Z), N6-benzyladenine (BA), α-naphthaleneacetic acid (NAA)
and 2,4-dichlorophenoxyacetic acid (2,4-D). The key to the CE-MS/MS analysis was based
on electroosmotic flow reversal using a cationic polymer-coated capillary. Under optimum
conditions, a baseline separation of eight phytohormones was accomplished within 30 min
using 60 mM ammonium formate/formic acid buffer of pH 3.8 with −20 kV as the separation
voltage. The accessibility of MS/MS together with the characterization by migration
properties obtained by CE allows for the development of CE-MS/MS as an emerging
potential method for the analysis of different classes of phytohormones in a single run. The
utility of the CE-MS/MS method was demonstrated by the comprehensive screening of
phytohormones in coconut (Cocos nucifera L.) water after pre-concentration and purification
through solid-phase extraction (SPE) cartridge. IAA, ABA, GA and Z were detected and
quantified in the purified coconut water extract sample.
OPEN ACCESS

Chromatography 2014, 1 212
Keywords: capillary electrophoresis; tandem mass spectrometry; phytohormones; cationic
polymer-coated capillary; solid-phase extraction
1. Introduction
Phytohormones are a group of naturally occurring organic compounds that play crucial roles in
mediating plant growth through a whole range of developmental processes. These structurally diverse
compounds mainly include auxins, cytokinins, abscisic acid, gibberellins and ethylene [1–3]. In addition
to the plant-related roles, some phytohormones show significant human health benefits and could
potentially be used for biomedical applications [4–6]. Thus, the rapid analyses of phytohormones are of
great importance to both plant physiologists, in understanding various physiological processes regulated
by phytohormones, and scientists from various disciplines (e.g., clinicians and molecular biologists),
especially in view of their potential role in medical applications.
Although gas and liquid chromatography combined with mass spectrometry (GC-MS, LC-MS) [7–10] as
well as enzyme-linked immunosorbent assay or radioimmunoassays (ELISA, RIA) [11,12] of the LC
fractionated samples are the most commonly utilized techniques in the field of phytohormone analysis,
capillary electrophoresis (CE) is steadily being used as an analytical technique particularly in the analysis
and separation of solutes within a biological matrix [13–15]. Compared with LC and GC, CE is a
separation technique with the following characteristics, namely simplicity in the method development,
high separation efficiency, and low consumption of sample and reagents that would result in a low
running cost. However, the complex nature of real plant extracts presents the main challenge for CE.
Mass spectrometry (MS) is a desirable mode of detection for CE, since it represents a higher
sensitivity and universal specificity than any other available CE detectors and it has the advantage of
positive analyte identification. Following the first investigation of Thomson (1912), the technologies
associated with MS have progressed extremely rapidly [16]. More recently, CE-MS has emerged as a
powerful tool for the characterization of charged species, and this technology has been successfully
applied for the analyses of phytohormones, such as cytokinins [17,18], and gibberellins [19,20].
However, to our knowledge, so far there are very limited reported works carried out using the CE-MS
approach to simultaneously separate or determine different classes of phytohormones in a single
experiment [21].
Previously, there were a few papers reported for the determination of phytohormones by CE with UV
detection [13–15]. Unfortunately, the CE methods could not be converted to CE-MS, due to the fact that
MS sensitivity may deteriorate as the bulk flow of non-volatile buffer (e.g., phosphate ions) and/or
surfactant enters the MS source region [22]. Chemically, most auxins (e.g., indole-3-acetic acid,
indole-3-butyric acid, α-naphthaleneacetic acid, 2,4-dichlorophenoxyacetic acid), gibberellins
(e.g., gibberellic acid) and abscisic acid contain a carboxylic group (Figure 1), which exist as anions at
a relatively high pH level, while cytokinins are amphoteric compounds (Figure 1), which are able to
ionize under different pH values. Analysis of anions by CE is usually performed in the negative mode,
in which polycationic polymers were added to the buffer solution to reverse the direction of
electroosmotic flow (EOF) [14]. However, it is quite difficult to transfer this methodology to CE-MS

Chromatography 2014, 1 213
experiments due to the experimental incompatibility of such a buffer modifier with MS. In the present
study, this problem was overcome by employing cationic polymer-coated capillary to reverse the
EOF [19]. By using these coated capillaries with positively charged surface, it was possible to create an
EOF constantly towards the anode (MS side) without adding any buffer modifiers.
Figure 1. Chemical structures of phytohormones.
Since free phytohormones present in plants are at very low concentrations (typically nanogram per
gram fresh weight or lower), the various problems associated with the isolation and identification of
phytohormones in plant extracts are challenging [23]. Our original methodology employed C18
solid-phase extraction (SPE) cartridges mainly for the pre-concentration of phytohormones [8].
However, mixed-phase SPE cartridges that combine reversed-phase and anion-exchange
chromatography separation were obviously the ideal pre-concentration and sample clean-up method for
phytohormones [24]. Therefore, in our current work, Mixed-Mode Anion-eXchange (MAX) SPE was
employed as an efficient approach to pre-concentrate and purify phytohormones within a
biological matrix.
As a further extension of our earlier works involving the analyses of cytokinins and gibberellins using
CE-MS [17–20], we would like to report on a simple CE-MS/MS methodology combined with SPE for
the simultaneous analysis of the major classes of phytohormones. The methodology could provide a
indole-3-acetic acid (IAA)
2,4-dichlorophenoxyacetic acid (2,4-D)
α-naphthaleneacetic acid (NAA)
gibberellic acid (GA) abscisic acid (ABA)
indole-3-butyric acid (IBA)
zeatin (Z) N6-benzyladenine (BA)

Chromatography 2014, 1 214
suitable approach for the analysis of the various classes of phytohormones, including indole-3-acetic acid
(IAA), indole-3-butyric acid (IBA), α-naphthaleneacetic acid (NAA), 2,4-dichlorophenoxyacetic acid
(2,4-D), zeatin (Z), N6-benzyladenine (BA), gibberellic acid (GA), and abscisic acid (ABA) in a single
analysis. The effects exerted by pH and concentration of buffer, applied voltage and sheath liquid on the
resolution of CE separation were systematically investigated and optimized. With the optimized
CE-MS/MS approach, selective identification and also structural elucidation of phytohormones were
achieved. The developed methodology was then used to screen for the presence of endogenous
phytohormones in coconut water after pre-concentration and sample clean-up using SPE. Four
phytohormones (IAA, ABA, GA and Z) in young coconut (Cocos nucifera L.) water were successfully
identified and quantified.
2. Experimental Section
2.1. Reagents and Materials
The phytohormone standards: IAA (PhytoTechnology Laboratories, Shawnee Mission, KS, USA),
IBA (Sigma-Aldrich, St. Louis, MO, USA), NAA (PhytoTechnology Laboratories), 2,4-D
(PhytoTechnology Laboratories), Z (Sigma-Aldrich), BA (Sigma-Aldrich), GA (Sigma-Aldrich) and
ABA (Sigma-Aldrich) were used in the analysis. Unless otherwise noted, all analytes were dissolved in
ultra-pure water. Methanol (HPLC grade) was from J.T. Baker (Phillipsburg, NJ, USA). All other
chemicals were of analytical reagent grade. Ammonium formate and ammonium acetate was purchased
from Hayashi Pure Chemical Ind. Ltd (Osaka, Japan); formic acid and acetic acid were purchased from
Fisher Scientific (Hanover Park, IL, USA); ammonia solution (28%) was purchased from APS Finechem
(Seven Hills, Australia); ethanol was purchased from Merck (Darmstadt, Germany). Ultra-pure water
(MilliQ, Waters, Milford, MA, USA) was used throughout the study. The pH value of the running buffer
solutions was adjusted by mixing an equal concentration of two solutions in different ratios, which was
monitored using a pH meter (CORNING 440, Corning Glass Works, Corning, NY, USA).
2.2. Instrumentation
All CE-MS experiments were performed with an Agilent capillary electrophoresis system in
conjunction with an Agilent Trap XCT mass spectrometer equipped with an Agilent CE-ESI-MS sprayer
kit (G1607A) and an Agilent CE-ESI-MS adapter kit (G1603A) (Agilent Technologies, Waldbronn,
Germany). The CE-ESI-MS adapter kit includes a capillary cassette, which facilitates thermostating the
capillary, and the CE-ESI-MS sprayer kit, which simplifies coupling the CE system with MS system
equipped with an electrospray source. The design of the sprayer consists of a triaxial flow arrangement,
in which the CE eluent is mixed with a sheath liquid at the sprayer tip, and then nebulized with nitrogen
gas. Sheath liquid with the flow rate of 4 μL min−1 was delivered using a Hewlett Packard 1100 series
isocratic pump equipped with a 1:100 splitter. All system control, data acquisition and data analysis were
performed with the Agilent CE ChemStation software (Agilent Technologies, 2004) and Agilent
LC/MSD Trap software (Agilent Technologies, 2004).

Chromatography 2014, 1 215
2.3. CE-ESI-MS Conditions
Separations were carried out on commercially available SMILE(+), a cationic capillary coated with
successive multiple ionic polymer layers [25], which was purchased from Nacalai Tesque (Kyoto,
Japan). The capillary dimensions were 50 μm i.d. × 100 cm total length. The capillary temperature was
thermostated to 20 °C. Prior to first use, a new capillary was pretreated with 50 mM acetic acid (pH 3.4)
for 20 min. Before each injection, the capillary was preconditioned for 6 min by flushing with the running
electrolyte. For sample injections, a small ultra-pure water plug was hydrodynamically injected into the
capillary with an injection time of 2 s at 50 mbar; the sample previously dissolved in ultra-pure water,
was then injected at a pressure of 50 mbar for 5 s; and finally the running electrolyte was injected at 50 mbar
for 2 s.
ESI-MS analysis was performed in the negative mode, and the ion trap was scanned at m/z 50–400 in
full scan mode. The maximum accumulation time for the ion trap was set at 200 ms and the target count
was set at 100,000. The actual accumulation time was controlled by ion charge control (ICC), which was
used to prevent ion saturation in the ion trap. The capillary voltage was set at 3500 V. The nebulizer gas
pressure, drying gas flow rate and drying gas temperature for the ESI source were set at 15 psi, 5 L min−1
and 350 °C, respectively. Other instrument parameters were optimized for generating the highest signal
intensities. For the CE-MS/MS experiments, helium was adopted as the collision gas, and product ion
scan was performed using the deprotonated molecular ion as the precursor ion. Negative product ion
mass spectra of all the phytohormones were shown in Figure 2. The multiple reaction monitoring (MRM)
mode was used to monitor the transitions from the precursor ions to the most abundant product ions.
Figure 2. The negative product spectra of (A) indole-3-acetic acid (IAA);
(B) α-naphthaleneacetic acid (NAA); (C) indole-3-butyric acid (IBA); (D) zeatin (Z);
(E) 2,4-dichlorophenoxyacetic acid (2,4-D); (F) N6-benzyladenine (BA); (G) abscisic acid
(ABA); and (H) gibberellic acid (GA) *, each with the deprotonated molecule ([M−H]−) as
a precursor ion. The chemical structures of the compounds are displayed and their cleavage
sites are indicated with arrows pointing to the most abundant product ions and their m/z.
Concentration of each analyte: 100 μM. For the CE-ESI-MS conditions, please refer to the
Experimental Section.* During the MS fragmentation, there were five fragmentation sites
for GA.
A
132.6
207.9 0
1
2
3
4 x10 Intens.
50 100 150 200 250 300 350 m/z
N
NN-
N
HN13
3
B
140.7
0
500
1000
1500
2000
2500
Intens.
50 100 150 200 250 300 350 m/z
O-
O
141

Chromatography 2014, 1 216
Figure 2. Cont.
2.4. Sample Preparation
Coconut water was obtained from fresh young coconut fruits of green variety (Emanate Agricultural
Industries Ltd., Selangor, Malaysia), and the analysis was performed within two weeks after harvest.
Before further pre-concentration and purification, the coconut water was spiked with 2% (v/v) formic
acid and gone through filter paper (Whatman, 12.5 cm, No. 542) to remove suspended matters. The
pre-concentration and purification of endogenous phytohormones using the SPE was performed
according to Dobrev et al. [24] with some further modification. As the reported SPE protocol [24] was
developed for extraction and purification of IAA and ABA, we further optimized and validated the
protocol for the eight phytohormones.
The pre-conditioning of the Oasis MAX extraction cartridge (3 mL, 60 mg, Waters) was as follows:
it was first washed with 5 mL of methanol and followed by 5 mL water. After 50 mL acidified eight
phytohormone standard solution or coconut water were applied, cartridges were washed with 5 mL 1 M
formic acid solution, then washed with 5 mL 1 M ammonia solution, and finally 5 mL 0.2 M ammonium
hydroxide in 80% methanol. The putative phytohormones were eluted with 5 mL of 1 M formic acid in
80% methanol.
m/z
A
115.6
157.7
183.8 0
2
4
6 4 x10
Intens.
50 100 150 200 250 300 350 m/z
NH
O-
O
158
C D
E
132.6
207.9 0
1
2
3
4 x10 Intens.
50 100 150 200 250 300 350 m/z
N
NN-
N
HN13
3
F
G
152.7
219.0
245.2 0
1
2
3
4 x10 Intens.
50 100 150 200 250 300 350 m/z
H3C
OH
CH3
CH3
COO-
O CH3
153
142.7
160.7
221.0
239.2
301.4
327.5 0.0
0.5
1.0
1.5 4 x10
Intens.
50 100 150 200 250 300 350 m/z
O
OC
CH3
HO
COO-
CH2
OH
H
239
H
B
140.7
0
500
1000
1500
2000
2500
Intens.
50 100 150 200 250 300 350 m/z
O-
O
141
Figure 2
m/z
m/zm/z
m/z
m/z
m/z
133.6
199.9
0.0
0.5
1.0
1.5
2.0
2.5
4 x10 Intens.
50 100 150 200 250 300 350 m/z
N
NN-
N
HN
OH
200
m/z
160.7
0
1
2
3
4
5
4 x10 Intens.
50 100 150 200 250 300 350 m/z
Cl
Cl
O-O
O161
129.6
0
1
2
3 4 x10
Intens.
50 100 150 200 250 300 350 m/z
NH
O-
O130
Chromatography 2014, 1 217
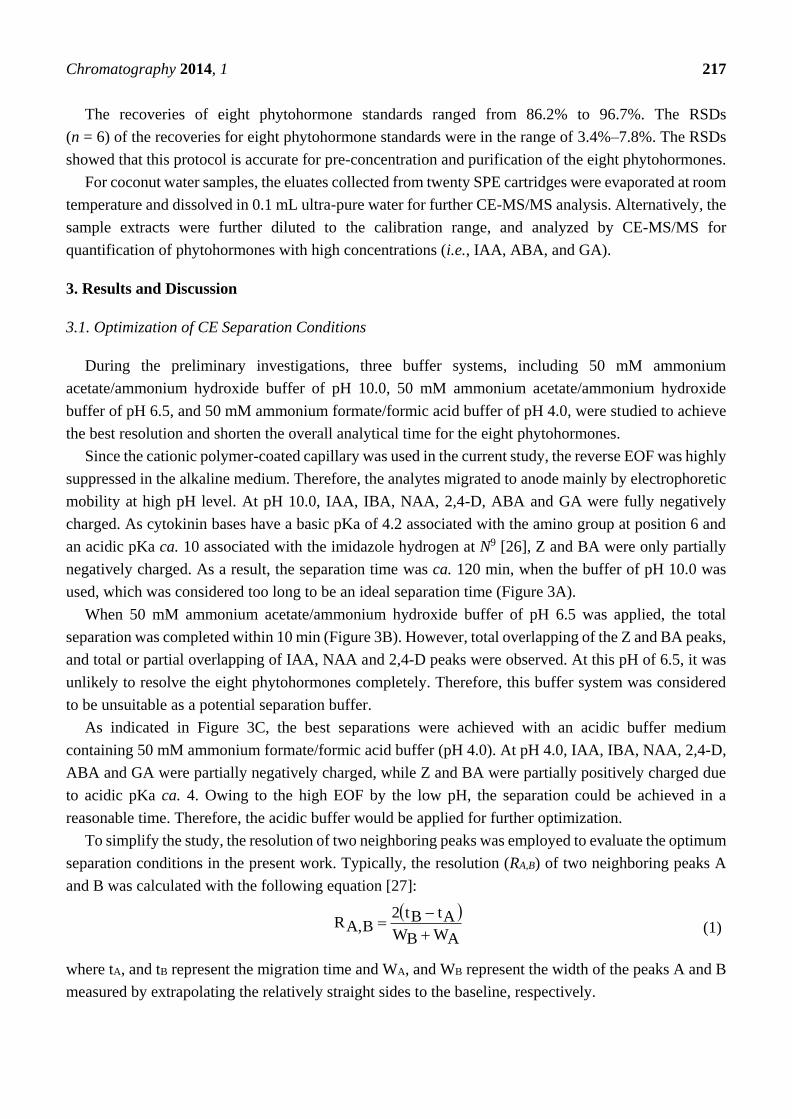
The recoveries of eight phytohormone standards ranged from 86.2% to 96.7%. The RSDs
(n = 6) of the recoveries for eight phytohormone standards were in the range of 3.4%–7.8%. The RSDs
showed that this protocol is accurate for pre-concentration and purification of the eight phytohormones.
For coconut water samples, the eluates collected from twenty SPE cartridges were evaporated at room
temperature and dissolved in 0.1 mL ultra-pure water for further CE-MS/MS analysis. Alternatively, the
sample extracts were further diluted to the calibration range, and analyzed by CE-MS/MS for
quantification of phytohormones with high concentrations (i.e., IAA, ABA, and GA).
3. Results and Discussion
3.1. Optimization of CE Separation Conditions
During the preliminary investigations, three buffer systems, including 50 mM ammonium
acetate/ammonium hydroxide buffer of pH 10.0, 50 mM ammonium acetate/ammonium hydroxide
buffer of pH 6.5, and 50 mM ammonium formate/formic acid buffer of pH 4.0, were studied to achieve
the best resolution and shorten the overall analytical time for the eight phytohormones.
Since the cationic polymer-coated capillary was used in the current study, the reverse EOF was highly
suppressed in the alkaline medium. Therefore, the analytes migrated to anode mainly by electrophoretic
mobility at high pH level. At pH 10.0, IAA, IBA, NAA, 2,4-D, ABA and GA were fully negatively
charged. As cytokinin bases have a basic pKa of 4.2 associated with the amino group at position 6 and
an acidic pKa ca. 10 associated with the imidazole hydrogen at N9 [26], Z and BA were only partially
negatively charged. As a result, the separation time was ca. 120 min, when the buffer of pH 10.0 was
used, which was considered too long to be an ideal separation time (Figure 3A).
When 50 mM ammonium acetate/ammonium hydroxide buffer of pH 6.5 was applied, the total
separation was completed within 10 min (Figure 3B). However, total overlapping of the Z and BA peaks,
and total or partial overlapping of IAA, NAA and 2,4-D peaks were observed. At this pH of 6.5, it was
unlikely to resolve the eight phytohormones completely. Therefore, this buffer system was considered
to be unsuitable as a potential separation buffer.
As indicated in Figure 3C, the best separations were achieved with an acidic buffer medium
containing 50 mM ammonium formate/formic acid buffer (pH 4.0). At pH 4.0, IAA, IBA, NAA, 2,4-D,
ABA and GA were partially negatively charged, while Z and BA were partially positively charged due
to acidic pKa ca. 4. Owing to the high EOF by the low pH, the separation could be achieved in a
reasonable time. Therefore, the acidic buffer would be applied for further optimization.
To simplify the study, the resolution of two neighboring peaks was employed to evaluate the optimum
separation conditions in the present work. Typically, the resolution (RA,B) of two neighboring peaks A
and B was calculated with the following equation [27]:
AWBW
AtBt2B,AR
(1)
where tA, and tB represent the migration time and WA, and WB represent the width of the peaks A and B
measured by extrapolating the relatively straight sides to the baseline, respectively.

Chromatography 2014, 1 218
Figure 3. Multiple reaction monitoring (MRM) mass electrophorograms of eight
phytohormones using the buffer containing (A) 50 mM ammonium acetate/ammonium
hydroxide buffer of pH 10.0; (B) 50 mM ammonium acetate/ammonium hydroxide buffer
of pH 6.5; and (C) 50 mM ammonium formate/formic acid buffer of pH 4.0. Applied voltage:
−20 kV; temperature: 20 °C; sheath liquid: 10 mM ammonium hydroxide in water–methanol
(50:50, v/v).
The concentration of the running buffer and its pH are important parameters for obtaining efficient
separations. The pH of the running buffer is a key parameter since it determines the extent of ionization
of each solute, while the ionic strength of the buffer has a significant effect on the solute mobility and
separation efficiency. Therefore, an attempt was made to optimize these conditions using a response
surface methodology (RSM) to provide a map of responses in the form of a three-dimensional (3D)
graph. RSM provides better results compared to classical optimization performed using one variable at
a time [28,29].
The RSM was obtained by 30 independent experiments, with each central point repeated three times.
The experiments indicated that there was no change in the migration order for the eight analytes
throughout the whole range of buffer pH and concentrations examined. The migration times for the
analytes increased in the order 2,4-D > GA > NAA > IAA > ABA > IBA > BA > Z. The effects of buffer
pH and concentration on resolutions of neighboring peaks were plotted in the response surface map in
Figure 4A–G. Although the resolution increased as ionic strength increase, it is at the cost of increased
migration time. As a result, the 60 mM formate buffer of pH 3.8 was found to be a suitable compromise
in resolving all the tested compounds.
0
2
4
6
8
Time [min]
1
2
3
4
5
4 x10
Intens.
IAA
GA ABA IBA
BA+Z
NAA 2,4D
0
0 5
10
15
20
Time [min]
Z
BA
IAA
GA
IBA
ABA
NAA
2,4D
0
1
2
3
4
5 4
x10
Intens.
20
40
60
80
Time [min]
Intens.
BA
ABA Z GA
IA A IBA
2,4 D
NAA
0
4
5 4
x10
0
1
2
3
A B
C

Chromatography 2014, 1 219
Figure 4. Simultaneous effects of pH and buffer concentration (mM) on the resolutions of
(A) 2,4-dichlorophenoxyacetic acid (2,4-D) and gibberellic acid (GA); (B) gibberellic acid
(GA) and α-naphthaleneacetic acid (NAA); (C) α-naphthaleneacetic acid (NAA) and indole-
3-acetic acid (IAA); (D) indole-3-acetic acid (IAA) and abscisic acid (ABA); (E) abscisic
acid (ABA) and indole-3-butyric acid (IBA); (F) indole-3-butyric acid (IBA) and
N6-benzyladenine (BA); and (G) N6-benzyladenine (BA) and zeatin (Z) at the applied
voltage −20 kV. For other experimental conditions, please refer to Figure 3C.
A B
C D
E F
30
40
50
60
70
1
2
3
3.4
3.6
3.8
4.0
4.2
4.4
Re
so
lutio
n
pH V
alue
Buffer Concentration
30
40
50
60
70
1
2
3
3.4
3.6
3.8
4.0
4.2
4.4
Re
so
lutio
n
pH V
alue
Buffer Concentration
30
40
50
60
70
1
2
3
3.4
3.6
3.8
4.0
4.2
4.4
Re
so
lutio
n
pH V
alue
Buffer Concentration
30
40
50
60
70
1
2
3
3.4
3.6
3.8
4.0
4.2
4.4
Re
so
lutio
n
pH V
alue
Buffer Concentration
30
40
50
60
70
1
2
3
3.4
3.6
3.8
4.0
4.2
4.4
Re
so
lutio
n
pH V
alue
Buffer Concentration
30
40
50
60
70
1
2
3
4
5
6
7
3.4
3.6
3.8
4.0
4.2
4.4
Reso
lutio
n
pH V
alueBuffer Concentration

Chromatography 2014, 1 220
Figure 4. Cont.
G
The effects of the voltage applied from 10 to 30 kV with reverse polarity were investigated using a
running buffer consisting of 60 mM ammonium formate/formic acid (pH 3.8). Generally, with the
increase of separation voltage, the migration time decreased and the peak shapes became sharper
accordingly. However, higher voltages also exhibited higher currents and increased Joule heating. A
voltage of −20 kV was considered to be the suitable voltage as the eight phytohormones were separated
within a reasonable analysis time and provided satisfactory resolution. The separation of eight
phytohormones under optimum conditions of 60 mM ammonium formate/formic acid buffer (pH 3.8)
with a separation voltage of −20 kV was achieved within 30 min.
3.2. Selection of Sheath Liquid
It is well known that the choice of sheath liquid has significant effects on the sensitivity for CE-MS
analysis [30]. Different concentrations (5–15 mM) of ammonium hydroxide were dissolved in
methanol–water (50:50, v/v), respectively, and the effect of each sheath liquid composition was
investigated. We discovered that the sheath liquid did not only influence the sensitivity of analyte
detection but also on the resolution of the separation [17]. A possible explanation for this phenomenon
is the formation of moving ionic boundary during separation [31]. As shown in Figure 5A, the best
resolutions for most neighboring peaks were obtained using 10 mM ammonium hydroxide in
methanol–water (50:50, v/v).
The effects of sheath liquid on the peak response sensitivity of the eight phytohormones were also
investigated. The peak intensity of analyte was calculated based on the peak area of each phytohormone
on the MRM mass electropherogram. As shown in Figure 5B, the maximum values for most peak
intensities were achieved with 10 mM or higher concentration of ammonium hydroxide in
water–methanol (50:50, v/v) solution used as the sheath liquid. Based on the results, the optimum sheath
liquid condition was 10 mM ammonium hydroxide in methanol–water (50:50, v/v), which resulted in
optimum resolutions and higher intensities of MS signals.
30
40
50
60
70
1
2
3
3.4
3.6
3.8
4.0
4.2
4.4R
eso
lutio
n
pH V
alue
Buffer Concentration

Chromatography 2014, 1 221
Figure 5. Effects of ammonium hydroxide concentration in sheath liquid on (A) resolution;
and (B) the sensitivity of phytohormones. The peak intensity of the analytes was calculated
based on the peak area of each phytohormone on the multiple reaction monitoring (MRM)
mass electropherograms. Experimental conditions: running buffer: 60 mM ammonium
formate/formic acid buffer of pH 3.8; applied voltage: −20 kV; normal sample injection;
flow rate of the sheath liquid: 4 µL min−1. For CE-ESI-MS conditions, please refer to the
Experimental Section.
A
B
As the ammonium hydroxide concentrations in sheath liquid affected both resolution and sensitivity
of the eight phytohormones, the effects of 9 mM, 10 mM and 11 mM ammonium hydroxide (triplicate
of each experiment) on resolutions for neighboring peaks and peak response sensitivity of eight
phytohormones were studied for robustness testing. The results indicated that the small change in the
conditions did not significantly (p > 0.05) affect the determination of phytohormones.
3.3. Validation of CE-MS/MS Method
Figure 6A shows the MRM mass electropherograms of the eight phytohormone standard mixture
obtained by CE-MS/MS under optimal conditions: 60 mM ammonium formate/formic acid buffer (pH 3.8).
Figure 6. Multiple reaction monitoring (MRM) mass electropherograms of (A) the eight
phytohormone standard mixtures; and (B) coconut water obtained by capillary
electrophoresis-tandem mass spectrometry (CE-MS/MS) under optimized conditions: a
running buffer consisting of 60 mM ammonium formate/formic acid (pH 3.8); applied
voltage: −20 kV; temperature: 20 °C; sheath liquid: 10 mM ammonium hydroxide in
water–methanol (50:50, v/v).
0
2
4
6
5 7.5 10 12.5 15
Ammonium Hydroxide concentration (mM)
Re
so
lutio
n
2,4-D - GA GA - NAA NAA - IAA IAA - ABA
ABA - IBA IBA - BA BA - Z
0
2
4
6
8
10
12
5 7.5 10 12.5 15
Ammonium Hydroxide concentration (mM)P
ea
k A
rea
(×
10
exp
6 In
ten
s.×
Se
c)
2,4-D GA NAA IAA ABA
IBA BA Z
Z
0 5 10 15 20 Time [min]
0
1
2
3
4
5
2,4D
GA
IAA
ABA
IBA
BA
Intens
×104
5
10
15
20
Time [min]
Z
IAA
GA
ABA
0
1
2
3
4
5 4
x10
Intens.
0
Intens
104
105
106
107
103
108
Z
Chromatography 2014, 1 222
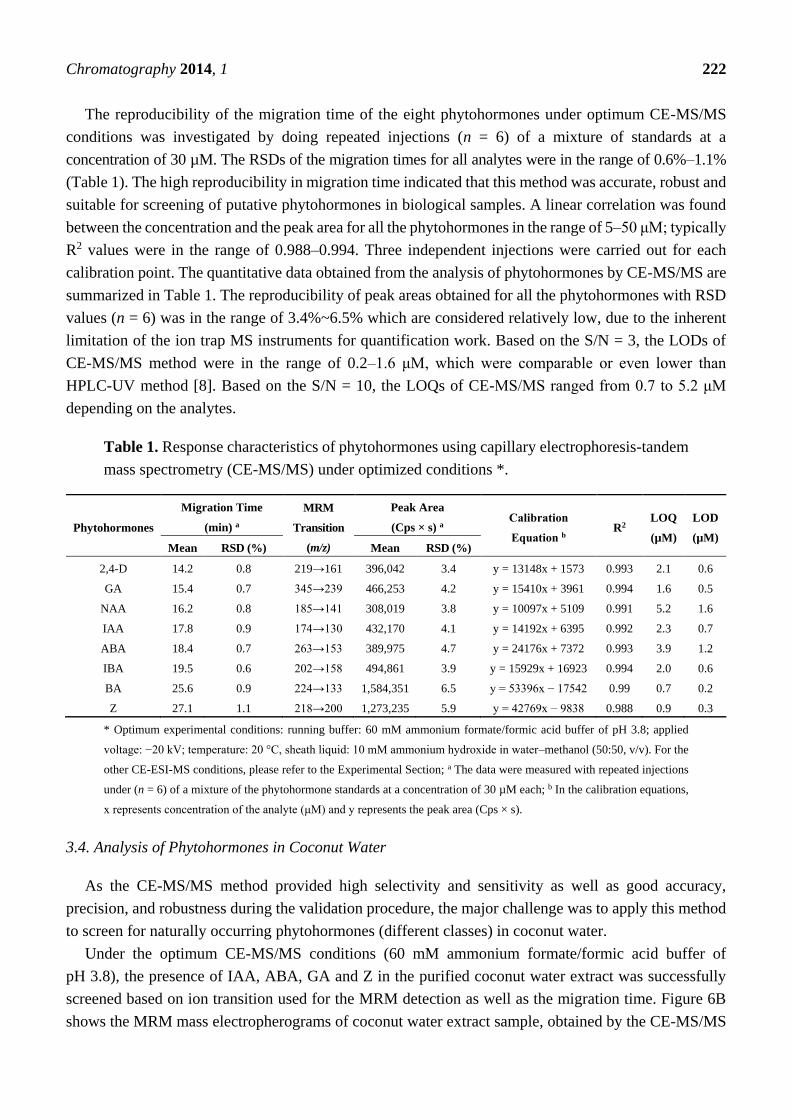
The reproducibility of the migration time of the eight phytohormones under optimum CE-MS/MS
conditions was investigated by doing repeated injections (n = 6) of a mixture of standards at a
concentration of 30 µM. The RSDs of the migration times for all analytes were in the range of 0.6%–1.1%
(Table 1). The high reproducibility in migration time indicated that this method was accurate, robust and
suitable for screening of putative phytohormones in biological samples. A linear correlation was found
between the concentration and the peak area for all the phytohormones in the range of 5–50 μM; typically
R2 values were in the range of 0.988–0.994. Three independent injections were carried out for each
calibration point. The quantitative data obtained from the analysis of phytohormones by CE-MS/MS are
summarized in Table 1. The reproducibility of peak areas obtained for all the phytohormones with RSD
values (n = 6) was in the range of 3.4%~6.5% which are considered relatively low, due to the inherent
limitation of the ion trap MS instruments for quantification work. Based on the S/N = 3, the LODs of
CE-MS/MS method were in the range of 0.2–1.6 μM, which were comparable or even lower than
HPLC-UV method [8]. Based on the S/N = 10, the LOQs of CE-MS/MS ranged from 0.7 to 5.2 μM
depending on the analytes.
Table 1. Response characteristics of phytohormones using capillary electrophoresis-tandem
mass spectrometry (CE-MS/MS) under optimized conditions *.
Phytohormones
Migration Time
(min) a
MRM
Transition
(m/z)
Peak Area
(Cps × s) a Calibration
Equation b R2
LOQ
(µM)
LOD
(µM)
Mean RSD (%) Mean RSD (%)
2,4-D 14.2 0.8 219→161 396,042 3.4 y = 13148x + 1573 0.993 2.1 0.6
GA 15.4 0.7 345→239 466,253 4.2 y = 15410x + 3961 0.994 1.6 0.5
NAA 16.2 0.8 185→141 308,019 3.8 y = 10097x + 5109 0.991 5.2 1.6
IAA 17.8 0.9 174→130 432,170 4.1 y = 14192x + 6395 0.992 2.3 0.7
ABA 18.4 0.7 263→153 389,975 4.7 y = 24176x + 7372 0.993 3.9 1.2
IBA 19.5 0.6 202→158 494,861 3.9 y = 15929x + 16923 0.994 2.0 0.6
BA 25.6 0.9 224→133 1,584,351 6.5 y = 53396x − 17542 0.99 0.7 0.2
Z 27.1 1.1 218→200 1,273,235 5.9 y = 42769x − 9838 0.988 0.9 0.3
* Optimum experimental conditions: running buffer: 60 mM ammonium formate/formic acid buffer of pH 3.8; applied
voltage: −20 kV; temperature: 20 °C, sheath liquid: 10 mM ammonium hydroxide in water–methanol (50:50, v/v). For the
other CE-ESI-MS conditions, please refer to the Experimental Section; a The data were measured with repeated injections
under (n = 6) of a mixture of the phytohormone standards at a concentration of 30 µM each; b In the calibration equations,
x represents concentration of the analyte (μM) and y represents the peak area (Cps × s).
3.4. Analysis of Phytohormones in Coconut Water
As the CE-MS/MS method provided high selectivity and sensitivity as well as good accuracy,
precision, and robustness during the validation procedure, the major challenge was to apply this method
to screen for naturally occurring phytohormones (different classes) in coconut water.
Under the optimum CE-MS/MS conditions (60 mM ammonium formate/formic acid buffer of
pH 3.8), the presence of IAA, ABA, GA and Z in the purified coconut water extract was successfully
screened based on ion transition used for the MRM detection as well as the migration time. Figure 6B
shows the MRM mass electropherograms of coconut water extract sample, obtained by the CE-MS/MS
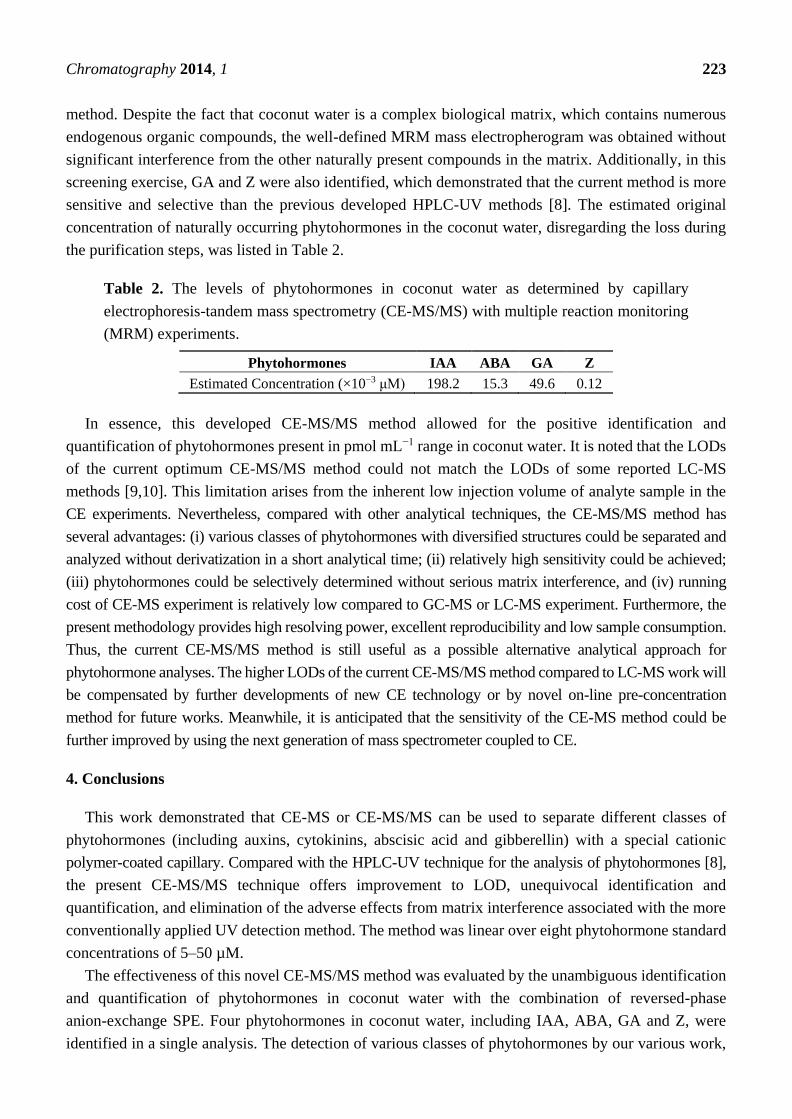
Chromatography 2014, 1 223
method. Despite the fact that coconut water is a complex biological matrix, which contains numerous
endogenous organic compounds, the well-defined MRM mass electropherogram was obtained without
significant interference from the other naturally present compounds in the matrix. Additionally, in this
screening exercise, GA and Z were also identified, which demonstrated that the current method is more
sensitive and selective than the previous developed HPLC-UV methods [8]. The estimated original
concentration of naturally occurring phytohormones in the coconut water, disregarding the loss during
the purification steps, was listed in Table 2.
Table 2. The levels of phytohormones in coconut water as determined by capillary
electrophoresis-tandem mass spectrometry (CE-MS/MS) with multiple reaction monitoring
(MRM) experiments.
Phytohormones IAA ABA GA Z
Estimated Concentration (×10−3 μM) 198.2 15.3 49.6 0.12
In essence, this developed CE-MS/MS method allowed for the positive identification and
quantification of phytohormones present in pmol mL−1 range in coconut water. It is noted that the LODs
of the current optimum CE-MS/MS method could not match the LODs of some reported LC-MS
methods [9,10]. This limitation arises from the inherent low injection volume of analyte sample in the
CE experiments. Nevertheless, compared with other analytical techniques, the CE-MS/MS method has
several advantages: (i) various classes of phytohormones with diversified structures could be separated and
analyzed without derivatization in a short analytical time; (ii) relatively high sensitivity could be achieved;
(iii) phytohormones could be selectively determined without serious matrix interference, and (iv) running
cost of CE-MS experiment is relatively low compared to GC-MS or LC-MS experiment. Furthermore, the
present methodology provides high resolving power, excellent reproducibility and low sample consumption.
Thus, the current CE-MS/MS method is still useful as a possible alternative analytical approach for
phytohormone analyses. The higher LODs of the current CE-MS/MS method compared to LC-MS work will
be compensated by further developments of new CE technology or by novel on-line pre-concentration
method for future works. Meanwhile, it is anticipated that the sensitivity of the CE-MS method could be
further improved by using the next generation of mass spectrometer coupled to CE.
4. Conclusions
This work demonstrated that CE-MS or CE-MS/MS can be used to separate different classes of
phytohormones (including auxins, cytokinins, abscisic acid and gibberellin) with a special cationic
polymer-coated capillary. Compared with the HPLC-UV technique for the analysis of phytohormones [8],
the present CE-MS/MS technique offers improvement to LOD, unequivocal identification and
quantification, and elimination of the adverse effects from matrix interference associated with the more
conventionally applied UV detection method. The method was linear over eight phytohormone standard
concentrations of 5–50 µM.
The effectiveness of this novel CE-MS/MS method was evaluated by the unambiguous identification
and quantification of phytohormones in coconut water with the combination of reversed-phase
anion-exchange SPE. Four phytohormones in coconut water, including IAA, ABA, GA and Z, were
identified in a single analysis. The detection of various classes of phytohormones by our various work,

Chromatography 2014, 1 224
namely auxins, gibberellin, abscisic acid and cytokinins in coconut water is important to plant scientists
and laboratories using coconut water routinely as a growth supplement in plant tissue culture, as it may
in part provide an adequate biochemical explanation to the effectiveness of coconut water as a
supplement in regulating plant growth and development. It is also plausible that there may be more
endogenous phytohormones (known and novel ones) present in the coconut water that we were unable
to detect due to the current LOD of our CE-MS/MS method.
Nevertheless, more work is still needed to further improve on the LOD of the present CE-MS
approach in measuring phytohormones present in biological samples, as we are well aware of the current
sensitivity of the various GC-MS and LC-MS approaches [7–10]. Also, we would like to evaluate our
CE-MS method on a wider range of biological samples including leaves, roots, etc.
Acknowledgments
The authors would like to acknowledge the financial support from Nanyang Technological University
(NTU), Singapore. Sample Oasis MAX and WAX SPE cartridges provided by Waters Asia Ltd for the
preliminary SPE experiments are also gratefully acknowledged.
Author Contributions
Swee Ngin Tan: experimental setup, data acquisition, and manuscript preparation. Jean Wan Hong
Yong: concept approval, data review and manuscript revision. Liya Ge: experimental design, data
analysis and interpretation, and manuscript improvement.
Conflicts of Interest
The authors declare no conflict of interest.
References
1. Davies, P.J. Plant Hormones: Biosynthesis, Signal Transduction, Action! 3rd ed.; Kluwer Academic
Publishers: Dordrecht, The Netherlands, 2010.
2. Tucker, G.A.; Roberts, J.A. Plant Hormone Protocols; Humana Press Inc.: Totowa, NJ, USA, 2000.
3. Chiwocha, S.D.S.; Abrams, S.R.; Ambrose, S.J.; Cutler, A.J.; Loewen, M.; Ross, A.R.S.;
Kermode, A.R. A method for profiling classes of plant hormones and their metabolites using liquid
chromatography-electrospray ionization tandem mass spectrometry: An analysis of hormone
regulation of thermodormancy of lettuce (Lactuca sativa L.) seeds. Plant J. 2003, 35, 405–417.
4. Slaugenhaupt, S.A.; Mull, J.; Leyne, M.; Cuajungco, M.P.; Gill, S.P.; Hims, M.M.; Quintero, F.;
Axelrod, F.B.; Gusella, J.F. Rescue of a human mRNA splicing defect by the plant cytokinin
kinetin. Hum. Mol. Genet. 2004, 13, 429–436.
5. Rattan, S.I.S.; Sodagam, L. Gerontomodulatory and youth-preserving effects of zeatin on
fibroblasts of human skin. Rejuv. Res. 2005, 8, 46–57.
6. Casati, S.; Ottria, R.; Baldoli, E.; Lopez, E.; Maier, J.A.; Ciuffreda, P. Effects of cytokinins,
cytokinin ribosides and their analogs on the viability of normal and neoplastic human cells.
Anticancer Res. 2011, 31, 3401–3406.

Chromatography 2014, 1 225
7. Birkemeyer, C.; Kolasa, A.; Kopka, J. Comprehensive chemical derivatization for gas
chromatography–mass spectrometry-based multi-targeted profiling of the major phytohormones.
J. Chromatogr. A 2003, 993, 89–102.
8. Ma, Z.; Ge, L.; Lee, A.S.Y.; Yong, J.W.H.; Tan, S.N.; Ong, E.S. Simultaneous analysis of different
classes of phytohormones in coconut (Cocos nucifera L.) water using high-performance liquid
chromatography and liquid chromatography–tandem mass spectrometry after solid-phase
extraction. Anal. Chim. Acta 2008, 610, 274–281.
9. Hou, S.J.; Zhu, J.; Ding, M.Y.; Lv, G.H. Simultaneous determination of gibberellic acid,
indole-3-acetic acid and abscisic acid in wheat extracts by solid-phase extraction and liquid
chromatography-electrospray tandem mass spectrometry. Talanta 2008, 76, 798–802.
10. Pan, X.Q.; Welti, R.; Wang, X.M. Quantitative analysis of major plant hormones in crude plant extracts
by high-performance liquid chromatography–mass spectrometry. Nat. Protoc. 2010, 5, 986–992.
11. Watanabe, E.; Tsuda, Y.; Watanabe, S.; Ito, S.; Hayashi, M.; Watanabe, T.; Yuasa, Y.;
Nakazana, H. Development of an enzyme immunoassay for the detection of plant growth regulator
inabenfide in rice. Anal. Chim. Acta 2000, 424, 149–160.
12. Linskens, H.F.; Jackson, J.F. Immunology in Plant Sciences. In Modern Methods of Plant Analysis;
Springer: Heidelberg, Berlin, Germany, 1986; Volume 4.
13. Liu, B.-F.; Zhong, X.-H.; Lu, Y.-T. Analysis of plant hormones in tobacco flowers by micelar
electrokinetic capillary chromatography coupled with on line large volume sample stacking.
J. Chromatogr. A 2002, 945, 257–265.
14. Jiang, T.-F.; Lv, Z.-H.; Wang, Y.-H.; Yue, M.-E. Separation of plant hormones from biofertilizer
by capillary electrophoresis using a capillary coated dynamically with polycationic polymers.
Anal. Sci. 2006, 22, 811–814.
15. Huang, L.; He, M.; Chen, B.; Hu, B. Membrane-supported liquid–liquid–liquid microextraction
combined with anion-selective exhaustive injection capillary electrophoresis-ultraviolet detection
for sensitive analysis of phytohormones. J. Chromatogr. A 2014, 1343, 10–17.
16. De Hoffmann, E.; Charette, J.; Stroobant, V. Mass Spectrometry: Principles and Applications;
Wiley: Paris, France, 1996; pp.1–8.
17. Ge, L.; Yong, J.W.H.; Tan, S.N.; Ong, E.S. Determination of cytokinins in coconut water
(Cocos nucifera L.) using capillary electrophoresis-tandem mass spectrometry. Electrophoresis
2006, 27, 2171–2181.
18. Ge, L.; Yong, J.W.H.; Tan, S.N.; Hua, H.; Ong, E.S. Analyses of gibberellins in coconut
(Cocos nucifera L.) water by partial filling-micellar electrokinetic chromatography-mass
spectrometry with reversal of electroosmotic flow. Electrophoresis 2008, 29, 2024–2032.
19. Ge, L.; Peh, C.Y.C.; Yong, J.W.H.; Tan, S.N.; Hua, H.; Ong, E.S. Analyses of gibberellins by
capillary electrophoresis-mass spectrometry combined with solid-phase extraction. J. Chromatogr. A
2007, 1159, 242–249.
20. Ge, L.; Yong, J.W.H.; Tan, S.N.; Hua, H.; Ong, E.S. Separation of cytokinin isomers with a partial
filling-micellar electrokinetic chromatography-mass spectrometry approach. Electrophoresis 2008,
29, 2126–2134.

Chromatography 2014, 1 226
21. Chen, M.L.; Huang, Y.Q.; Liu, J.Q.; Yuan, B.F.; Feng, Y.Q. Highly sensitive profiling assay of
acidic plant hormones using a novel mass probe by capillary electrophoresis-time of flight-mass
spectrometry. J. Chromatogr. B 2011, 879, 938–944.
22. Schmitt-Kopplin, P.; Frommberger, M. Capillary electrophoresis-mass spectrometry: 15 years of
developments and applications. Electrophoresis 2003, 24, 3837–3867.
23. Crozier, A.; Moritz, T. Physico-chemical methods of plant hormone analysis. In Biochemistry and
Molecular Biology of Plant Hormones; Hooykaas, P.J.J., Hall, M.A., Libbenga, K.R., Eds.;
Elsevier: Amsterdam, The Netherlands, 1999; Volume 33, pp. 23–60.
24. Dobrev, P.I.; Havlíček, L.; Vágner, M.; Malbeck, J.; Kamínek, M. Purification and determination
of plant hormones auxin and abscisic acid using solid phase extraction and two-dimensional high
performance liquid chromatography. J. Chromatogr. A 2005, 1075, 159–166.
25. Katayama, H.; Ishihama, Y.; Asakawa, N. Stable cationic capillary coating with successive multiple
ionic polymer layers for capillary electrophoresis. Anal. Chem. 1998, 70, 5272–5277.
26. Rivier, L.; Crozier, A. Principles and Practice of Plant Hormone Analysis; Academic Press:
London, UK, 1987; pp. 306–307.
27. The United States Pharmacopoeia, 25th Asian ed.; United States Pharmacopoeial Convention:
Rockville, MD, USA, 2002, pp. 1990–1991.
28. Myers, R.H.; Montgomery, D.C. Response Surface Methodology: Process and Product
Optimization using Designed Experiments; Wiley: New York, NY, USA, 2002.
29. Wang, J.; Mannino, S.; Camera, C.; Chatrathi, M.P.; Scampicchio, M.; Zima, J. Microchip capillary
electrophoresis with amperometric detection for rapid separation and detection of seleno amino
acids. J. Chromatogr. A 2005, 1091, 177–182.
30. Sawada, H.; Nogami, C. Capillary electrophoresis-electrospray ionization mass spectrometry using
uncoated fused-silica capillaries and alkaline buffer solution for the analysis of small carboxylic
acids. Anal. Chim. Acta 2004, 507, 195–202.
31. Foret, F.; Thompson, T.J.; Vouros, P.; Karger, B.L.; Gebauer, P.; Bocek, P. Liquid sheath
effects on the separation of proteins in capillary electrophoresis/electrospray mass spectrometry.
Anal. Chem. 1994, 66, 4450–4458.
© 2014 by the authors; licensee MDPI, Basel, Switzerland. This article is an open access article
distributed under the terms and conditions of the Creative Commons Attribution license
(http://creativecommons.org/licenses/by/4.0/).
Copyright © 2022 FDOKUMEN