philippine roadmap 2021-2040 - coconut industry
609
PHILIPPINE ROADMAP 2021-2040 COCONUT INDUSTRY
-
Upload
khangminh22 -
Category
Documents
-
view
1 -
download
0
Transcript of philippine roadmap 2021-2040 - coconut industry
PHILIPPINE
ROADMAP 2021-2040
COCONUTINDUSTRY

PHILIPPINE
ROADMAP 2021-2040
COCONUTINDUSTRY

i i
The Philippine Coconut Industry Roadmap (2021-2040)
Copyright 2022. All rights reserved.ISBN 978-971-94511-5-0
No part of this publication may be reproduced, distributed, or transmitted in any form or by any means, including photocopying, recording, or other electronic or mechanical methods, without the prior written permission of the Publisher, except in the case of brief quotations embodies in critical reviews and certain other noncommercial uses permitted by copyright law. Editorial correspondence and requests to publish, reproduce or translate this publication in part or in whole should be addressed to the authors and the publisher.
Published by
Philippine Coconut AuthorityDepartment of AgricultureElliptical Road, Diliman, Quezon City 1100, Philippines Tel Nos: 8928-4501 to 09Email address: [email protected]
Cover & Book Design:
Alphabet Communications Graphics & PrintQuezon City, [email protected]

i i i
PHILIPPINE COCONUT INDUSTRY ROADMAP DEVELOPMENT TEAM
Lead Authors
Edna A. Aguilar, Ph.D, Farming Systems Specialist, Program Leader
Ernesto P. Lozada, Ph.D., Post-harvest and Processing Engineering Specialist
Corazon T. Aragon, Ph.D., Agricultural Policy Specialist
Contributors
Leonardo A. Gonzales, Ph.D., Agricultural Policy Specialist
Julieane Camile Lacsina, MBS Global Agriculture
Enrico P. Supangco, Ph.D., Integrated Crop-Livestocks Farming Systems
Celia Medina, Ph.D., Entomologist / Insect and Pest Management Specialist
Concepcion L. Khan, Ms.C., Information systems, Databases, Mobile Computing and Artificial intelligence
Project Support Staff
Glaisa R. Garcia
Ebraim R. Ramos
Jhoana V. Alcade
Mar Jovette B. Laureta
Dara Maria A. Fabro
Felen A. Divina II

i v

v
TABLEOF CONTENTS
vxviixivxxxxxxvxxvixxviii
121273131
3334
34
3739395473757686
8990
TABLE OF CONTENTSLIST OF TABLESLIST OF FIGURESACRONYMSMESSAGEFOREWORDACKNOWLEDGEMENT EXECUTIVE SUMMARY INTRODUCTION METHODOLOGY Situational Analysis Stakeholders’ Consultations Strategies for Increasing Productivity, Income and Sustainability of the Coconut Farming Sector Strategies for Agribusinessizing the Coconut Industry Mapping and Analysis of Coconut Value Chain Clusters for Export Markets Enablers and Constraints to Achieving the Vision of the Coconut IndustryINDUSTRY SITUATION & OUTLOOK Coconut Farm Sector Coconut Processing Sector Coconut Trading Sector Product Forms Trend in Coconut Production Trend in Coconut Yield (nut/tree/year) 2009-201 Effects of Multiple Stresses in Coconut Production Trends (2009–2019) Consumption of Coconut Products

v i
ANALYSIS OF THE COCONUT INDUSTRY Value Chain Map of Coconut Industry Clusters Inputs Inbound Logistics Production Marketing and Trading Processing Costs and Returns Analysis and Relative Position of Different Value Chain Players Coconut Oil Value Chain Cluster Benchmarking (Production Sector) Local Benchmarking Benchmark Analysis for Processing: Domestic and International International/Global Competitiveness of Philippine Coconut ProductsMARKET TRENDS & PROSPECTS SWOT ANALYSIS OF THE COCONUT INDUSTRY TARGET SETTING RECOMMENDATIONS FOR POLICIES, STRATEGIES AND PROGRAMS INDUSTRY CLUSTER GOVERNANCE NETWORK MONITORING EVALUATION & IMPACT ASSESSMENT ANNEXESREFERENCES
151151152153153154156181
181206210218
222
229267271289
321333351558

v i i
116
117
118
119
121
123
125
126
129
130
131
133
134
LIST OF TABLESTable 3.41. Export volume and value of activated carbon, Philippines,
2009–2019
Table 3.42. Export volume and value of traditional oleochemicals in copra terms, 2009–2019
Table 3.43. Export volume and value of coco methyl ester (CME), 2009–2019
Table 3.44. Export volume and value of fatty acid, Philippines, 2009–2019
Table 3.45. Export volume and value of industrial fatty alcohol, Philippines, 2009–2019
Table 3.46. Export volume and value of virgin coconut oil, Philippines, 2009–2019
Table 3.47. Export volume and value of coconut water, Philippines, 2009–2019
Table 3.48. Export volume and value of coconut concentrates, Philippines, 2017–2019
Table 3.50. Export volume and value of coco honey/syrup, Philippines, 2009–2019
Table 3.51. Average annual volume and growth rate of coco coir by three leading country exporters in the world, 2009–2019
Table 3.52. Export volume and value of baled coir, Philippines, 2009–2019
Table 3.53. Exportvolumeandvalueofotherrawfibers,Philippines,2009–2019
Table 3.54. Export volume and value of coir peat/dust, Philippines, 2009–2019 During the period 2009–2019, the Philippines exported coco coir peat/dust to 50 countries. In 2009, the Republic of Korea used to be the leading export market for Philippine coconut peat/dust. However, since 2010 China

v i i i
replaced the Republic of Korea as the top export market for coir peat/dust. On the average, China’s export market share was 83% followed by the Republic of Korea with 7% market share. Other export markets were Japan, Taiwan, Hong Kong, Malaysia, Singapore, and USA (Figure 3.77).
Table 3.55. Export volume and value of coco twine, Philippines, 2010–2016. The country’s leading buyers of coco twine during the period 2010-2016 were USA (26%), United Kingdom (18%), Japan (5%), Republic of Korea (5%), and the United Arab Emirates (2%) (Figure 3.79).
Table 3.56. Export volume and value of husk cubes, Philippines, 2011–2019 Six countries imported husk cubes from the Philippines during the period 2011- 2019. The People’s Republic of China was the leading buyer of husk cubes with a market share of 61% (Figure 3.81). Other shipments of husk cubes went to different importing countries such as Canada, Czech Republic, Taiwan, Egypt, Hong Kong, Indonesia, Italy, Republic of Korea, New Zealand, the Netherlands, Portugal, Spain, Switzerland, Thailand, Turkey, United Kingdom, and USA.
Table 3.57. Export volume and value of coco pads/liner, Philippines, 2011–2016
Table 3.57. Domestic prices of copra in major trading centers, Philippines, 2015–2019
Table 3.58. Average annual growth rates in domestic and/or export prices of traditional coconut products and raw materials, Philippines, 2009–2019
Table 3.59. Export prices of coco methyl ester and all other oleochemicals, Philippines, 2009–2019
Table 3.60. Export prices of virgin coconut oil, coco sap sugar, coco syrup/coco honey, and coco water, Philippines, 2009-2019
Table 3.61. Export prices of coir products, Philippines, 2009-2019 Value Chain Map of Coconut Industry Clusters
136
137
138
140
148
148
149
151

i x
Table 4.2. Costs and returns analysis of copra trading, 1 sample copra trader, Philippines, 2019
Table 4.3. Costs and returns analysis of crude coconut oil processing expressed in copra terms, 1 sample coconut oil mill, Philippines, 2019
Table 4.4. Relativefinancialpositionofvaluechainplayersperkilogramof copra to produce crude coconut oil, farmers as the source ofcopratothewholesalerandfinallytothecoconutoilmill,Philippines, 2019
Table 4.5. Costs and returns analysis of coconut production, 8 husked nut farmers, Philippines, 2019
Table 4.6. Costs and returns analysis of nut trading, 1 sample trader, Philippines, 2019
Table 4.7. Costs and returns analysis of desiccated coconut processing, 1 sample desiccated coconut processor, Philippines, 2019
Table 4.8. Relativefinancialpositionofvaluechainplayersperkilogramof husked nut to produce desiccated coconut, farmers as thesourceofhuskednutstothenuttraderandfinallytothedesiccated coconut processor, Philippines, 2019
Table 4.9. Costs and returns analysis of coco shell charcoal making, 1 sample coconut farmer-charcoal
Table 4.10. Costs and returns analysis of coco shell charcoal trading, 1 sample coco shell charcoal trader, Philippines, 2019
Table 4.11. Costs and returns analysis of activated carbon manufacturing, 1 sample activated carbon processing company, Philippines, 2019
Table 4.12. Relativefinancialpositionofvaluechainplayersperkilogramof coco shell charcoal to produce activated carbon, farmer as the source of coco shell charcoal to the big charcoal trader andfinallytotheactivatedcarbonmanufacturingcompany,Philippines, 2019
Table 4.13. Annual costs and returns in coconut production, 1 sample coconut farmer, Philippines, 2019
Table 4.14. Annual costs and returns in virgin coconut oil processing, Philippines, 2019
183
184
185
186
187
188
189
190
191
192
193
194
195

x
Table 4.15. Relativefinancialpositionofthevaluechainplayersperkilogram of husked nuts to produce virgin coconut oil, farmer asthesourceofhuskednutandfinallytothevirgincoconutoil processor, Philippines, 2019
Table 4.16. Costs and returns analysis of coconut production, 5 sample coconut farmers selling young nuts to a wholesaler as market outlet, Philippines, 2019
Table 4.17. Costs and returns analysis of young nut trading, 1 sample wholesaler, Philippines, 2019
Table 4.18. Costs and returns analysis of pasteurized coconut water processing, 1 sample coconut water processor, Philippines, 2019
Table 4.19. Relativefinancialpositionofvaluechainplayersperkilogram of fresh young nut to produce pasteurized coconut water, from the farmers as the source of young nuts to the wholesalerandfinallytothecoconutwaterprocessingcompany, Philippines, 2019
Table 4.20. Costs and returns analysis of coconut farmer from selling coconut husk, Philippines, 2019
Table 4.21. Costs and returns analysis of coconut husk trading, 1 sample coconut husk trader, Philippines, 2019
Table 4.22. Costs and returns analysis of coco geotextile net processing, 1 sample coco coir processor, Philippines, 2019
Table 4.23. Relativefinancialpositionofvaluechainplayersperkilogramof coco husk, farmer as the source of coco husk to the wholesalerandfinallytothecoirprocessor,Philippines,2019
Table 4.24. Costs and returns analysis of coconut sugar processing, 11 farmer-processors, Philippines, 2019
Table 4.25. Nut productivity per hectare of the top ten coconut-producing countries in the world
Table 4.26. Range of income of corresponding number of farmers in different regions of the Philippines, 2018 (n=1.44 M)
Table 4.26.1. Netcashincomeoffarmerssellingspecificproductsfromcoconut
196
197
198
199
200
201
202
203
204
205
207
211
212

x i
Table 4.27. Benchmark and typical production practices 215
Table 4.28. Average retail prices of different types of cooking oil in supermarkets in Laguna, Philippines as of April 2021
Table 4.29. Price competitiveness of Philippine coconut oil under export trader scenario, Philippines, May2021
Table 4.30. DRC and RCR estimates of competitive advantage in producing and exporting Philippine crude coconut oil, Philippines
Table 4.31. Comparison of the RCA indices of different coconut products among major coconut-producing countries, based on previous studies
Table 4.32. Comparison of the RCA indices of different coconut products among major coconut-producing and exporting countries, based on the COCOFIRM study
Table 7.1. Program/strategies physical targets, responsibility matrix, 2021-2025
Table 7.2. Program/strategies,financialtargets,responsibilitymatrix,2021-2025
Table 7.3. Program/replanting, intercropping, livestock integration and organic targets for 2021-2025
Table 7.4. Program/strategiesandfinancialtargets,responsibilitymatrix, 2021-2025
Table 7.5. Program/strategies , target setting, responsibility matrix, 2021-2025
Table 9.1. Industry cluster governance network (implementation team)
Table 10.1. Proposed logical framework for COCOFIRM with indicative activities under each output
Table 3.62. Yield difference among regions between the Jan - June and July - Dec, 2015-2019, Philippines
Table 3.63. Regional coconut statistics, ranking and percent contribution to national production, Philippines, 2019
Table 3.64. Coconut regional and provincial statistics, Davao Region, 2019
215
221
221
223
224
225
272
278
282
284
288
322
336
358
359
361

x i i
Table 3.65. Coconut regional and provincial statistics, Northern Mindanao, 2019
Table 3.66. Coconut regional and provincial statistics, Zamboanga Peninsula, 2019
Table 3.67. Coconut regional and provincial statistics, BARMM, 2019
Table 3.68. Coconut regional and provincial statistics, SOCCSKSARGEN, 2019
Table 3.69. Coconut regional and provincial statistics, Caraga Region, 2019
Table 3.70. Coconut regional and provincial statistics, CALABARZON, 2019
Table 3.71. Coconut regional and provincial statistics, Bicol Region, 2019
Table 3.72. Coconut regional and provincial statistics, MIMAROPA, 2019
Table 3.73. Coconut regional and provincial statistics, Eastern Visayas, 2019
Table 3.74. Coconut regional and provincial statistics, Central Visayas, 2019
Table 3.75. Coconut regional and provincial statistics, Western Visayas, 2019
Table 3.76. Coconut regional and provincial statistics, CAR, 2019
Table 3.77. Coconut regional and provincial statistics, Ilocos Region, 2019
Table 3.78. Coconut regional and provincial statistics, Cagayan Valley, 2019
Table 3.79. Coconut regional and provincial statistics, Central Luzon, 2019 Newtech Industries, 2017)
Table 8.1. Discount table distributed by PCA
Table 8.2. Suggested participating oil mills
Table 8.3. Summary and Costs of WCC and CBS
370
375
380
384
388
393
398
402
406
411
416
422
422
422
468
482
489
490
x i i i
Table 8.1. Volume of coconut production (nut MT) and potential biomassofby-productsfromhusk(fiber,dustandshorts),shell, and coconut water
Table 8.2. Chemical composition of coconut husk (dry basis)
Table 8.3. Nutritive value of coir dust is increased by composting (with the addition of poultry manure at a rate of 200 kg manure per 1 ton of coir dust) as follows:
Table 8.2. Herd projection of dairy cattle production and total sales in 10 years
Table 8.3. Expenditures/Capital Outlay in equipment and supply in 10 years
Table 8.4. Feeds and labor expenses in 10 years
Table 8.1. Costs and returns analysis of Robusta coffee production in one (1) hectare area
Table 8.2. Costs and returns analysis of Arabica coffee production in one (1) hectare area
Table 8.3. Costs and returns of cacao in one hectare
Table 8.4. Costs and returns analysis of Lakatan in one (1) hectare area
Table 8.4. Costs and returns analysis of Lakatan in one (1) hectare area, continued
Table 8.5. Costs and returns analysis of Saba in one (1) hectare area
506
509
512
529
530
531
541
542
547
553
554
555

x i v
1
3
8
11
19
24
28
29
30
40
40
42
LIST OF FIGURESFigure 1. Theunifiedvaluechainforsegmentationpurposesmay
be divided into the following value chains: 1) copra-CNO-oleochemicals value chain; 2) DCN value chain; 3) VCO value chain; 4) coco coir value chain; 5) young coconut value chain; 6) coconut sap value chain; and 7) activated carbon value chain
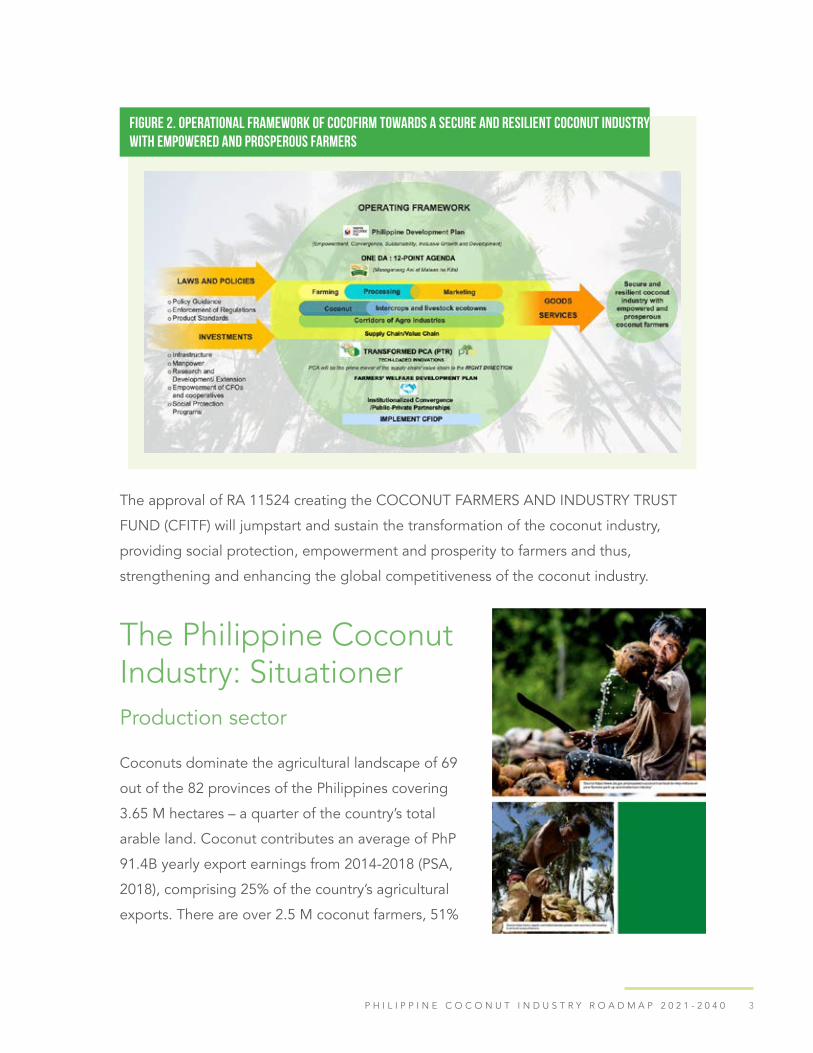
Figure 2. Operational Framework of COCOFIRM towards a secure and resilient coconut industry with empowered and prosperous farmers
Figure 3. Supply chain map of the coconut industry in the Philippines
Figure 4. Proposed transformation of copra processing and trading through coconut buying stations with re- drying facilities and white copra centrals
Figure 5. COCOFIRM overall framework
Figure 1.1. Theunifiedvaluechainforsegmentationpurposesmaybe divided into the following value chains: 1) copra-CNO-oleochemicals value chain; 2) DCN value chain; 3) VCO value chain; 4) coco coir value chain; 5) young coconut value chain; 6) coconut sap value chain; and 7) activated carbon value chain
Figure 2.1. Coconut industry roadmap analytical framework
Figure 2.2. Operational framework at the macro level
Figure 2.3. Operating framework at the sectoral level
Figure 3.1. Top seven coconut-producing regions in terms of hectarage planted to coconut in the Philippines
Figure 3.2. Volume of coconut production in top eight coconut producing regions in the Philippines
Figure 3.3. Coconut yields in nine regions with high coconut productivity levels in the Philippines

x v
Figure 3.4. Percent distribution of 2.54 M coconut farmers by farm tenure in the Philippines, 2018
Figure 3.5. Percent distribution of coconut farmers by tenure status in Luzon, Visayas, and Mindanao in the Philippines, 2018
Figure 3.6. Percent distribution of coconut farmers by tenurial status and by region in the Philippines, 2018
Figure 3.7. Distribution of coconut farms by farm size range, Philippines, 2018
Figure 3.8. Percent distribution of coconut farmers according to farm size range by major island group in the Philippines, 2018
Figure 3.9. Distribution of coconut farms by farm size range and region in the Philippines, 2018
Figure 3.10. Percent distribution of coconut farmers according to income range in the Philippines, 2018
Figure 3.11. Percent distribution of coconut farmers according to income range by major island group in the Philippines, 2018
Figure 3.12. Percent distribution of coconut farmers according to income range by administrative region in the Philippines, 2018.
Figure 3.13. Percent distribution of 60 coconut oil mills by region in the Philippines, 2018
Figure 3.14. Comparison of the annual rated capacity and the capacity utilization of Philippine coconut oil mills in copra terms from 2009 to 2019
Figure 3.15. Aggregate annual production capacity (MT) of oleochemical plants by region in the Philippines, 2018
Figure 3.16. Annual production capacities of 12 biodiesel manufacturers by region in the Philippines, March 2020
Figure 3.17. Annual nut production and growth rate (%) in the Philippines, 2009–2019
Figure 3.18. Percent contribution of major islands to total nut production, 2019
Figure 3.19. Total nut production in the Philippines, 2009–2019
42
43
45
45
46
48
48
50
52
55
57
66
67
76
77
78

x v i
Figure 3.20. Comparison of the total nut production during Jan-June and July-Dec averages of 2015-2019
Figure 3.21. Total area planted to coconuts and annual growth rate from 2009-2019
Figure 3.22. Area planted to coconuts by region from 2009–2019
Figure 3.23. Accelerated coconut planting/replanting project, Philippines, 2009–2019
Figure 3.24. Regional distribution of coconut lands applied for conversion, 2009–2019
Figure 3.25. Number of bearing coconut trees and annual growth rate, 2009–2019
Figure 3.26. Number of bearing coconut trees by region, 2009-2019
Figure 3.27. Number of trees cut, 2009-2019 based on RA 8048
Figure 3.28. Nut productivity per tree per year, Philippines, 2009-2019.
Figure 3.30. Area fertilized through the fertilization program of PCA, 2009–2019
Figure 3.31. Effect of the fertilization project on nut yield/tree a year after fertilizer application, Philippines
Figure 3.32. Typhoon track chart, occurrence, and damages of more than PHP 1 B, Philippines, 2009–2019.
Figure 3.33. Domestic consumption, export volume and total utilization of coconut, Philippines, 2009–2019
Figure 3.34. Average annual percent shares of manufactured oil, homemade oil, and food nuts in the total domestic consumption of coconut, Philippines, 2009–2019
Figure 3.35. Domestic consumption of manufactured coconut oil, home-made oil, and food nuts, Philippines, 2009–2019
Figure 3.36. Proportion of total coconut oil production exported and utilized domestically, Philippines, 2009-2019
Figure 3.37. Domestic sales and export volume of copra meal, Philippines, 2010–2019
Figure 3.38. Percent distribution of net disposable coconut supply according to domestic use, Philippines, 2019
79
80
81
82
83
83
84
85
87
87
88
90
91
93
93
94
96
97

x v i i
Figure 3.39. Annual per capita coconut consumption in the Philippines, Indonesia, and Sri Lanka
Figure 3.40. Export volume (MT) and value (FOB US$) of copra, 2009–2018
Figure 3.41. Market shares of importing countries in the Philippines’ copra volume, 2009–2018
Figure 3.42. Percent share of the total export volume of coconut oil by type, Philippines, 2009–2019
Figure 3.43. Export volume and value of crude coconut oil, 2009–2019
Figure 3.44. Market shares of importing countries in the Philippines’ export volume of crude coconut oil, 2009–2019
Figure 3.45. Exportvolumeandvalueofrefinedbleachedoil(cochinoil),Philippines, 2009–2019
Figure 3.46. Market shares of importing countries in the Philippines’ exportvolumeofrefinedbleachedoil(cochinoil),2009–2019
Figure 3.47. Exportvolumeandvalueofrefinedbleacheddeodorized(RBD) oil, Philippines, 2009–2019
Figure 3.48. Market shares of importing countries in the Philippines’ RBD oil export volume, 2009-2019
Figure 3.49. Export volume and value of copra meal, Philippines, 2009–2019
Figure 3.50. Market shares of importing countries in the Philippines’ export volume of copra meal, 2009 –2019
Figure 3.51. Export volume and value of desiccated coconut, Philippines, 2009–2019
Figure 3.52. Market shares of importing countries in the Philippines’ export volume of desiccated coconut, 2009–2019
Figure 3.53. Philippine export volume and value of coconut shell charcoal, 2009–2019
Figure 3.54. Market shares of importing countries in the Philippines’ export volume of coconut shell charcoal, 2009–2019
Figure 3.55. Philippine export volume and value of activated carbon, 2009–2019
98
100
101
102
103
104
105
105
107
107
108
109
111
111
113
113
116

x v i i i
Figure 3.56. Market shares of importing countries in the Philippines’ export volume of activated carbon, 2009–2019
Figure 3.57. Market shares of importing countries in the Philippines’ export volume of traditional oleochemicals, 2009–2019
Figure 3.58 Philippine export volume and value of coco methyl ester, 2009-2019
Figure 3.59. Market shares of importing countries in the Philippines’ export volume of coco methyl ester, 2009–2019
Figure 3.60. Philippine export volume and value of fatty acid, 2009–2019
Figure 3.61. Market shares of importing countries in the Philippines’ export volume of fatty acid, 2009– 2019
Figure 3.62. Philippine export volume and value of industrial fatty alcohol, 2009–2019
Figure 3.63. Market shares of importing countries in the Philippines’ export volume of industrial fatty alcohol, 2009–2019
Figure 3.64. Philippine export volume and value of VCO, 2009-2019
Figure 3.65. Market shares of importing countries in the Philippines’ export volume of VCO, 2009–2019
Figure 3.66. Philippine export volume and value of coconut water, 2009–2019
Figure 3.67. Market shares of importing countries in the Philippines’ export volume of coconut water, 2009–2019
Figure 3.68. Market shares of importing countries in the Philippines’ export volume of coconut concentrates, 2017–2019
Figure 3.69. Philippine export volume and value of coco sugar, 2017–2019
Figure 3.70. Market shares of importing countries in the Philippines’ export volume of coconut sugar, 2017–2019
Figure 3.71. Philippine export volume and value of coco honey/syrup, 2017–2019
Figure 3.72. Market shares of importing countries in the Philippines’ export volume of coconut concentrates, 2017–2019
116
118
118
119
120
120
121
122
123
124
125
125
127
127
128
129
130

x i x
Figure 3.74. Market shares of importing countries in the Philippines’ export volume of baled coir, 2009–-2019
Figure 3.75. Market shares of importing countries in the Philippines’ exportvolumeofotherrawfibers,2009-2019
Figure 3.76. Philippine export volume and value of coconut peat/dust, 2009–2019
Figure 3.77. Market shares of importing countries in the Philippines’ export volume of coconut peat/dust, 2009–2019
Figure 3.78. Philippine export volume and value of coco twine, 2010–2016
Figure 3.79. Market shares of importing countries in the Philippines’ export volume of coco twine, 2010-2016
Figure 3.80. Annual husk cubes export performance, Philippines, 2011-2019
Figure 3.81. Market shares of importing countries in the Philippines’ export volume of husk cubes, 2009–2019
Figure 3.82. Philippine export volume and value of coco pads/liner, 2011–2016
Figure 3.83. Market shares of importing countries in the Philippines’ export volume of coco pads/liners 2011–2016
Figure 3.84. Annual average domestic prices of copra by major trading area, Philippines, 2015–2019
Figure 3.85. Monthly average prices of copra, Philippines, 2009–2019
Figure 3.86. Monthly average prices of husked nuts, Philippines, 2009-2019
Figure 3.87. Comparative domestic price trends of copra, crude coconut oil, and RBD oil, Philippines, 2009–2019
Figure 3.88. Comparative export price trends of crude coconut oil, cochin 143 oil, and RBD oil, Philippines, 2009–2019
Figure 3.89. Comparative price (in US$/MT) trends of selected world oils, 2010–2018
Figure 3.90. Average annual percentage shares of selected major oils in the world total export volume of oils and fats, 2010–2019
132
133
134
135
135
136
137
138
139
139
141
142
142
143
143
144
145
x x
Figure 3.91. Comparative domestic price trends of husked nuts and copra, Philippines, 2009–2019
Figure 3.92. Export price of desiccated coconut, Philippines, 2009–2019
Figure 3.93. Export price of coco shell charcoal and activated carbon, Philippines, 2009–2019
Figure 4.1. Value Chain Map of the Coconut Oil Value Chain Cluster
Figure 4.2. Value Chain Map of the Desiccated Value Chain Cluster
Figure 4.3. Value Chain Map of the Coconut Charcoal/Activated Carbon Value Chain Cluster
Figure 4.4. Value Chain Map of the Virgin Coconut Oil Value Chain Cluster
Figure 4.5. Value Chain Map of the Coconut Water Value Chain Custer
Figure 4.6. Value Chain Map of the Coconut Coir Value Chain Cluster
Figure 4.7. Value Chain Map of the Coco Sap Sugar Sweetener Value Chain Cluster
Figure 4.8. SWOT Matrix of Coconut Oil Value Chain
Figure 4.9. SWOT Matrix of Desiccated Coconut (DCN) Value Chain
Figure 4.10. SWOT Matrix of Coco Shell Charcoal-Based Activated Carbon Value Chain
Figure 4.11. SWOT Matrix of Oleochemical Value Chain
Figure 4.12. SWOT Matrix of Virgin Coconut Oil (VCO) Value Chain
Figure 4.13. SWOT Matrix of Coco Coir Products Value Chain
Figure 4.14. SWOT Matrix of Coco Sugar Value Chain
Figure 4.15. SWOT Matrix of Coconut Water Value Chain
Figure 4.16. Income level of coconut registrants to the 2019 NCFRS
Figure 6.1. SWOT Matrix of the Philippine Coconut Industry, Farmers’ Welfare
Figure 6.2. SWOT Matrix of the Philippine Coconut Industry, Production
Figure 6.3. SWOT Matrix of the Philippine Coconut Industry, Processing
146
146
147
166
167
168
169
170
171
172
173
174
175
176
177
178
179
180
213
267
268
268
x x i
Figure 6.4. SWOT Matrix of the Philippine Coconut Industry, Marketing
Figure 6.5. SWOT Matrix of the Philippine Coconut Industry, Institutional
Figure 10.1. Proposed National Coconut Industry Program Monitoring Database (CIPMoD) for COCOFIRM
Figure 10.2. Proposed Systems Framework for Monitoring, Evaluation, and Impact Assessment of the Policies/Programs/Strategies Developed by the Coconut Farmers Industry Roadmap (COCOFIRM), 2021-2040
Figure 3.94. Area planted and volume of nut production in the Philippines, 2009–2019
Figure 3.95. Number of bearing trees and number of seedlings planted/ replanted under the PCA program, 2009–2019
Figure 3.96. Volume of nut production and area planted to coconut in Davao Region, 2009–2019
Figure 3.97. Coconut production growth rate in Davao Region, 2009–2019
Figure 3.98. Provincial nut production growth rate in Davao Region, 2009–2019
Figure 3.99. Coconut area planted/harvested and number of bearing trees in Davao Region, 2009–2019
Figure 3.100. Targets and accomplishments of the accelerated coconut planting/replanting project of PCA in Davao Region, 2011–2019
Figure 3.101. ProductflowmapofthecoconutindustryinDavaoRegion,2021
Figure 3.102. Volume of whole nut production and area planted to coconut in Northern Mindanao, 2009–2019
Figure 3.103. Volume of whole nut production per province in Northern Mindanao, 2009–2019
Figure 3.104. Targets and accomplishment of Planting/Replanting Program of PCA in Northern Mindanao, 2011–2019
269
269
334
335
357
357
360
361
362
363
363
365
367
368
368

x x i i
Figure 3.105.ProductflowmapofthecoconutindustryinNorthernMindanao, 2021
Figure 3.106. Volume of whole nut production and area planted to coconut in Zamboanga Peninsula, 2009–2019
Figure 3.107. Targets and accomplishments of the accelerated coconut planting/replanting project of PCA in Zamboanga Peninsula, 2009–2019
Figure 3.108. Volume of whole nut production per province in Zamboanga Peninsula, 2009–2019
Figure 3.109. Coconut area planted/harvested and number of bearing trees per province in Zamboanga Peninsula, 2009–2019
Figure 3.110. ProductflowmapofthecoconutindustryinZamboangaPeninsula, 2019
Figure 3.111. Volume of whole nut production and area planted to coconut in BARMM, 2009–2019
Figure 3.112. Volume of whole nut production per province of BARMM, 2009–2019
Figure 3.113. Targets and accomplishments of the accelerated coconut planting/replanting project of PCA in BARMM, 2009–2019
Figure 3.114. ProductflowmapofthecoconutindustryinBARMM,2021
Figure 3.115. Volume of whole nut production and area planted to coconuts in SOCCSKSARGEN, 2009–2019
Figure 3.116. Volume of whole nut production per province of SOCCSKSARGEN, 2009–2019
Figure 3.117. Targets and accomplishments of the accelerated coconut planting/replanting project of PCA in SOCCSKSARGEN, 2009–2019
Figure 3.118. ProductflowmapofthecoconutindustryinSOCCSKSARGEN, 2021
Figure 3.119. Volume of whole nut production (MT) and area planted to coconuts (ha) in Caraga, 2009–2019
Figure 3.120. Volume of whole nut production per province, Caraga Region, 2009–2019
370
371
372
373
373
375
377
377
378
379
381
382
382
383
386
386

x x i i i
Figure 3.121. Targets and accomplishments of the accelerated coconut planting/replanting project of PCA in Caraga, 2009–2019
Figure 3.122.ProductflowmapofthecoconutindustryinCaragaRegion, 2021
Figure 3.123. Volume of whole nut production and area planted to coconut in CALABARZON, 2009–2019
Figure 3.124. CALABARZON coconut production growth rate, 2009–2019
Figure 3.125. Targets and accomplishments of the accelerated coconut planting/replanting project of PCA in CALABARZON, 2009–2019
Figure 3.126. Volume of coconut production by province, CALABARZON (2009–2020)
Figure 3.127. ProductflowmapofthecoconutindustryinCALABARZON & MIMAROPA, 2021
Figure 3.128. Volume of whole nut production and area planted to coconut in Bicol Region, 2009–2019
Figure 3.129. Targets and accomplishments of the accelerated coconut planting/replanting project of PCA in Bicol Region, 2009–2019
Figure 3.130. Volume of whole nut production per province, Bicol Region, 2009–2019
Figure 3.131. Coconut area planted/harvested and number of bearing trees in Bicol Region, 2009–2019
Figure 3.132. ProductflowmapofthecoconutindustryinBicolRegion,2021
Figure 3.133. Volume of whole nut production and area planted to coconut in MIMAROPA, 2009–2019
Figure 3.134. Volume of whole nut production per province, MIMAROPA, 2009–2019
Figure 3.135. Targets and accomplishments of the accelerated coconut planting/replanting project of PCA in MIMAROPA, 2009–2019
387
388
390
390
391
391
394
396
396
397
398
399
400
401
401

x x i v
Figure 3.136. Volume of coconut production by province, Eastern Visayas, 2009–2019
Figure 3.137. Eastern Visayas coconut production growth rate, 2009–2019
Figure 3.138. Targets and accomplishments of the accelerated coconut planting/replanting project of PCA in Eastern Visayas, 2011-2019
Figure 3.139. ProductflowmapofthecoconutindustryinEasternVisayas,2021
Figure 3.140. Volume of whole nut production and area planted to coconut in Central Visayas, 2009–2019
Figure 3.141. Targets and accomplishments of the accelerated coconut planting/replanting project of PCA in Central Visayas, 2011–2019
Figure 3.142. Volume of whole nut production and area planted to coconut in Central Visayas, 2009-2019
Figure 3.143. ProductflowmapofthecoconutindustryinCentralVisayas,2021
Figure 3.144. Volume of whole nut production and area planted to coconut in Western Visayas, 2009-2019
Figure 3.145. Volume of coconut production by province, Western Visayas, 2009–2019
Figure 3.146. Targets and accomplishments of the accelerated coconut planting/replanting project of PCA in Western Visayas, 2011–2019
Figure 3.147. ProductflowmapofthecoconutindustryinWesternVisayas, 2021
Figure 3.148. Volume of nut produced in CAR, Cagayan Valley, Ilocos Region, and Central Luzon, 2009–2019
Figure 3.149. Volume of whole nut production and area planted to coconut in CAR, Cagayan Valley, Ilocos Region, and Central Luzon, 2009–2019
Figure 3.150. Area replanted/ planted by PCA program in CAR, Cagayan Valley, Ilocos Region, and Central Luzon from 2009 to 2019
403
404
404
406
408
408
409
411
413
413
414
415
417
417
418

x x v
Figure 3.151. ProductflowmapofthecoconutindustryinIlocosRegion,2019
Figure 3.152. ProductflowmapofthecoconutindustryinCagayanValleyRegion, 2021
Figure 8.1. Processes in the Copra-CNO Oleochemicals
Figure 8.2. Notches are cut on the tree trunk to step on
Figure 8.3. One of the climbing jigs
Figure 8.4. Another version of a climbing jig
Figure 8.5. The skilled manunungkit shown with his motorcycle is responsible for a 50 ha -farm
Figure 8.6. Harvesting pole
Figure 8.8. Nut characteristics and recommended uses
Figure 8.7. Harvesting with extended bamboo poles
Figure 8.9. (left) Dehusking is done by impaling the husk on a pointed object followed by a twisting movement of the wrists
Figure 8.10. (right) Dehusking done in the middle of a coconut farm (Masbate)
Figure 8.11. (left) The husks are piled separately from dehusked nuts (Brooke’s Point, Palawan)
Figure 8.12. (right) The horse can carry 4 times more dehusked nuts than whole nuts
Figure 8.13. (left) A promising model of manually operated dehusker
Figure 8.14. (right) A motorized coconut dehusking machine (Source: Newtech Industries, 2017)
Figure 8.17. (left) The ground is soaked with coconut water and smells of fermenting and spoiling material (Ozamis City)
Figure 8.18. (right) Drying of coconut halves into copra
Figure 8.19. Copra is dark when the fuel used is coconut husks (A) while copra is lighter when the fuel mostly coconut shell (B)
Figures 8.20 (a-e). A typical ‘tapahan’ dryers being used in the Philippines and Indonesia. Which are easy to construct and made of light materials. (sketches from WB 1987 report)
420
421
464
465
465
465
466
467
467
467
468
468
468
468
468
468
469
469
471
472

x x v i
Figures 8.21. Examples of smoke kilns or tapahan used in the Philippines
Figure 8.22. This ‘tapahan’ is featured by an external furnace where variouskindofbiomassfuelcanbeusedsuchasfirewood,coconut husk, etc., can be used. There are many users of this type of dryer in Negros Occidental.
Figure 8.23. This ‘tapahan’ is similar to that shown in Fig 2k except it is knock-down and is made of stainless steel body and a furnace lined with refractory.
Figure 8.24. ThisimprovedtapahanisidentifiedastheLosBanosCopraDryer. It has a burner that generates continuously for 2-3 hours without tending. Since coconut shell shards are used for fuel, the copra produced is white. Some 500 units of this dryer have been exported to PNG from between years 1990-2000.
Figure 8.25. The Kukum Dryer (Kukum, PNG) and Cocopugon (Zamboanga, PCA) have heat exchangers where fuel is also burned inside and the hot products of combustion go out through the chimney. The heat exchanger of Kukum Dryer is made of metal drums while Cocopugon is made of bricks. When ambient gets in contact with hot surface of the heat exchangers, it becomes hot and would rise through the load of coconut meat by natural draft. The resulting product is white copra. The downside is that both dryers consume a lot of fuel because most of the heat goes out through the chimney. (Figures from: Dippon K. and Villaruel R. Copra Dryers and Copra Drying Technologies).
Figure 8.26. The LMC and the Newtech belong to the same copra dryer classification:indirectlyheatedandforcedairdryers.TheLMC has a heat exchanger heated with hot water from a boiler and the Newtech has a heat exchanger heat by hot gases from a furnace. Both dryers can have large capacities of practical loads up to 4000-6000 kg-nut and could be viable for use in copra centrals. The product is white copra.
Figure 8.27. The CNO – copra – Coconut value chain
Figure 8.28. Images of copra transport, storage/warehouses, and other processes
474
474
474
474
475
475
476
477

x x v i i
Figure 8.29. (left) Bulk handling of copra. Hopper holds 5 tons of copra.
Figure 8.30. (right) A cargo ship that can handle 2000 tons of copra
Figure 8.31. A mountain-high copra inventory in a miller’s warehouse. The mc at this point is about 8%. The mold growth continues but at a lower rate. Infestation with insect pests has increased with the corresponding physical losses.
Figure 8.32. Weighing large copra deliveries using a truck scale (left)
Figure 8.33. The conventional but reliable balance for determining weight (right)
Figure 8.34. Coprainamiller’swarehouse.Itappearsthatthefirst-infirst-outmovementisdifficulttoexecute(left)
Figure 8.35. Weighing large copra deliveries using a truck scale (right)
Figure 8.36. Computation Method of Copra Mill gate price (Coconut Industry Yearbook, 1998)
Figure 8.37. Each oil has similar Copra Receiving Report forms
Figure 8.38. A hammer mill reduces the sizes of copra to small pieces.
Figure 8.39. Aflakerisusedtoflattenthepiecesofcopratissuesto mechanically break them further.
Figure 8.40. The main components of the oil mill are the expellers (Ozamis City)
Figure 8.41. The crude coconut oil are stored in these storages.
Figure 8.43. Flowchart of the by-products we get from coconut
Figure 8.42. A modern cost-effective drying system at Ivisan, Capiz
Figure 8.44. Farmer-owned White Copra Center (FWCC)
Figure 8.45. Farmer-owned Copra Buying Stations (FCBS)
Figure 8.46. Farmer-owned White Copra Central (FWCC)
Table 8.2. Suggested participating oil mills
Table 8.3. Summary and Costs of WCC and CBS
Figure 8.47. Location of oil mills and nautical highways superimposed on the coconut production density
Figure 8.48. ProcessflowinDCNfactory(FranklinBaker,Primex,etc.) Medium scale (10,000 nuts per day)
478
478
478
480
480
481
481
481
483
483
483
483
483
485
485
486
487
488
489
490
492
495

xxviii
Figure 8.49. ProcessflowusedatQuantumCoconutDiversifiedProducts Micro-scale (200-600 nuts per day)
Figure 8.50a. Small-scale Integrated Coconut Processing (Dry Process) 600-1000
Figure 8.50b. Integrated Coconut Processing (Wet Process). Micro-scale 200-600 kgnut/day VCO Processing
Figure 8.51. Processflowofcocosugarandcocosyrupmaking(Manohar, 2018)
Figure 8.52. Coconut trees inter-connected by tree-top bamboo walk –ways (LEFT)
Figure 8.53. Dwarf trees used for coconut sap production (RIGHT)
Figure 8.54. Anefflorescenceusedfortapping(left)
Figure 8.55. Asapcollectingvesselistiedtoanefflorescenceusedfortapping (RIGHT)
Figure 8.56. Demonstration of collecting coconut sap using sterile plastic tube and bags (Fabula, 2013)
Figure 8.57. Double jacketed kettle for better temperature control
Figure 8.58. Example packaging of coco sugars
Figure 8.59. The sequence of making lambanog in pictures (Peralta, et al of Sanghaya Inc, 2015)
Figure 8.60. An example of a distillation unit for vodka
Figure 8.1. Husk Utilization by farmers in Luzon, Visayas and Mindanao
Figure 8.1. Swine inventory by backyard and commercial farm type, Philippines (PSA, 2009-2019)
Figure 8.2. Pork volume of production (metric tons), Philippines (PSA, 2009-2019)
Figure 8.3. Community based native pig production (Dos Por Cinco Scheme)
496
497
497
500
502
502
502
502
502
503
503
504
505
507
522
522
523

x x i x
Figure 8.4. Chicken inventory by broiler, layer, and native type, Philippines (2009-2019)
Figure 8.5. Poultry and eggs volume of production (metric tons), Philippines (2009-2019)
Figure 8.6. Proposed CBO Model (e.g. Native Chicken)
Figure 8.7. Sample scheme for the native and egg production model
Figure 8.1. Robusta coffee area and volume of production, Philippines (2009-2019)
Figure 8.2. Total area of coconut (17,733 ha) intercropped with coffee under KEDP program of PCA (2013, 2015-2019)
Figure 8.3. Top coffee producing provinces (Coffee board)
Figure 8.4. Cacao area and volume of production, Philippines (2009-2019)
Figure 8.5. Cost of production and return on investment in cacao production as monocrop and as intercrop
Figure 8.6. Total area of coconut (18,740 ha; 9.37M seedlings) intercropped with cacao under KEDP program of PCA (2013, 2015-2019)
Figure 8. 7. Regional commitments to the 2022 Cacao challenge
Figure 8.10. Carbada/Saba banana production in the Philippines (2009-2019)
Figure 8.11. Percentage contribution of Luzon, Visayas and Mindanao to Saba/Cardaba banana area (ha) and volume of production (MT).
Figure 8.12. Total coconut area (8,882 ha ) intercropped with banana under the PCA intercropping programs CIP 2016-2020 and CDP1, CDP2 2020.
533
533
534
536
537
537
538
543
544
544
545
549
549
550

x x x
ACRONYMS
ACA Additional Compensation Allowance
ACBI Association of Coconut Brokers Incorporation
ACPC Agricultural Credit and Policy Council
AFMIS Agriculture and Fisheries Market Information System
AMAD Agribusiness and Marketing Assistance Service Division
AMS Agricultural Marketing Service
BAI Bureau of Animal Industry
BARMM Bangsamoro Autonomous Region of Muslim Mindanao
BETP Bureau of Export Trade Promotion
BSMED Bureau of Small and Medium Enterprise
CAGR Compound Annual Growth Rate
CALABARZON Cavite,Laguna,Batangas,Rizal,Quezon
CDOs CoconutDevelopmentOfficers
CIP Coconut Intercropping Project
CIPMoD National Coconut Industry Program Monitoring Database
CITEM Center for International Trade Expositions and Missions
COD CoconutDevelopmentOfficers
COO CertificateofOrigin
CRA Cost and Return Analysis
CREATE Corporate Recovery and Tax Incentives for Enterprises Act
DBM Department of Budget and Management
DOE Department of Energy
DOF Department of Finance
DOH Department of Health
DRRCCA Disaster Risk Reduction Climate Change Adaptation

x x x i
EFTA European Free Trade Agreement
EFTA European Free Trade
EU European union
FDA Food and Drug Authority
FOB Freight On Board
FSG Farm Service Groups
FTA Free Trade Agreement
FTSA Fair Trade Sustainability Alliance
GAA General Appropriation Act
GC Governing Council
GMO GeneticallyModifiedOrganism
GMP Good Management Practices
GSP Generalized System of Preferences
HACCP Hazard Analysis Critical Control Point
IPM Integrated Pest Management
IPOP Indigenous People Outreach Program
IRR Internal Rate of Return
ITDI Industrial Technology Development Institute
ITEMA Information Technology-Enabled Maturity Assessment
KAANIB Kasaganaan sa Niyugan ay Kaunlaran ng Bayan
KEDP Kaanib Enterprise Development Project
KEDP KAANIB Enterprise Development Project
LBP LandBank of the Philippines
LSFC Local Small Farmers Councils
LSU Leyte State University
MAP Management Association of the Philippines
MC Moisture Content
MGB Mines and Geoscience Bureau
MIMAROPA Mindoro, Marinduque, Romblon, Palawan
MIS Market Information System

x x x i i
MSME Micro, Small, and Medium Enterprises
MSME Micro, Small, Medium Enterprise
MT Metric Ton
NBB National Biodiesel Board
NBP National Biofuels Program
NCFRS National Coconut Farmers Registry System
NCPC National Crop Protection Center
NCRC National Coconut Research Center
NDA National Dairy Authority
NEDA National Economic and Development Authority
NGA National Government Agencies
NIA National Irrigation Administration
NSIC National Seed Industry Council
NTCP National Tobacco Control Programme
OFR On-Farm Projects
OPAFSAM OfficeofthePresidentialAssistantforFoodSecurityandAgricultural Modernization
OPV Open Pollinated Variety
OTAP One Town One Product program
PACMA Philippine Activated Carbon Manufacturers Association
PACMA Philippine Activated Carbon Manufacturers Association, Inc.
PAH Polycyclic Aromatic Hydrocarbons
PAH Polycyclic Aromatic Hydrocarbons
PCA Philippine Coconut Authority
PCA-RDB Philippine Coconut Authority – Research and Development Branch
PCC Philippine Carabao Center
PCHRD Philippine Council for Health Research and Development
PCIC Philippine Crop Insurance Corporation
PCOPA Philippine Coconut Oil Producers Association
PCOPA Philippine Coconut Oil Producers Association, Inc.

xxxiii
PCPP Participatory Coconut Planting Project
PCRDF Philippine Coconut R and D Foundation, Inc.
PDP Philippine Development Plan
PEZA Philippine Economic Zone Authority
PhilCoir Philippine Coconut Coir Exporters Association
PhilHealth Philippine Health Insurance Corporation
PhilMech Philippine Center for Postharvest Development and Mechanization
PKO Palm Kernel Oil
PM Particulate Matter
PNS Philippine National Standard
PNS/BAFS Philippine National Standards – Bureau of Agriculture and Fisheries Standards
POMA Philippine Oleochemical Manufacturers Association
POMA Philippine Oleochemical Manufacturers Association
PPA Philippine Ports Authority
PSA Philippine Statistics Authority
PSA Philippine Statistics Authority
PTR PCA Transformation Roadmap
R&D Research and Development
RBD Refined,BleachedandDeodorized
RBD Refined,Bleached,andDeodorized
RBO Refinedbleachedoil
RCR Resource Cost Ratio
RIARCS Regional Integrated Agricultural Research Center
ROO Region of Origin
SCFO Small Coconut Farmers Organization
SFDP Seed Farm Development Project
SFDP Small Farmer Development Program
SME Small and Mid-size Enterprise
SMPDP Smallholder Oil Palm Development Project

xxxiv
SOCSKSARGEN South Cotabato, Sultan Kudarat, Sarangani, General Santos
SPS Sanitary and Phytosanitary
SSF Shared Service Facilities
SSS Social Security System
SUCs State University and Colleges
SWOT Strength, Weakness, Opportunities and Threats
TESDA Technical Education and Skills Development Authority
TPD Tons of copra per day
TSA Trade Sustainability Alliance
UCAP United Coconut Associations of the Philippines Inc.
UCAP United Coconut Association of the Philippines
UCPB-CIIF United Coconut Planters Bank-Coconut IndustryInvestment Fund
UNICOM United Coconut Oil Mills
UPLB University of the Philippines Los Baños
USM University of Southern Mindanao
VC Value Chain
VCO Virgin Coconut Oil
VCO Virgin Coconut Oil
VCOP Virgin Coconut Oil Processors and Traders Association of the Philippines Inc.
VCOP Virgin Coconut Oil Producers and Traders Association of the Philippines
VCOPTAP Virgin Coconut Oil Producers and Traders Association of the Philippines
VSU Visayas State University
WCC White Copra Central

x x x v
MESSAGEThrough the years, the coconut industry has proven to be a sturdy pillar of the national economy, as coconut oil, desiccated coconut and copra oil cake remain three of the Philippines’ top agricultural export commodities. In 2019 alone, exports of these three coconut products reached $1.25 billion, providing income and livelihood opportunities for industry stakeholders.
However, the industry confronts a number of challenges, including low productivity due to underutilized and senile trees, and unorganized supply chain that affects the economies of scale in input supply, primary processing and marketing. Poverty incidence among coconut farmers is also one of the highest in the agriculture sector.
Given its enormous economic potential that we have yet to fully realize, the Philippine coconut industry is indeed one sleeping giant whose time to be awakened has come.
We at the Department of Agriculture therefore commend the Philippine Coconut Authority— led by its Administrator Benjamin Madrigal and Deputy Administrator for Research and Development, Erlene C. Manohar—for coming up with this Coconut Farmers and Industry Road Map (COCOFIRM) to guide the industry towards a more productive and sustainable future.
Likewise, we pay tribute to the technical experts from the University of the Philippines-Los Baños—namely Dr. Edna Aguilar, Dr. Corazon T. Aragon, Dr. Ernesto P. Lozada and Dr. Leo Gonzales—for their respective contributions in preparing this roadmap.
The interventions under this roadmap, coupled with the support and investments for the industry as part of the newly-minted Coco Levy Trust Fund Law (RA 11524), are our best hopes to sustain this industry.
We therefore call on all stakeholders — oil millers, refiners, copra traders, coconut processors, farmers, and local government officials — for us to unite and truly develop our coconut industry for the benefit of all, most especially our small farmers and their families.
Mabuhay ang industriya ng niyugan sa bansa!
WILLIAM D. DAR, Ph.D.SecretaryDepartment of Agriculture
x x x v

xxxvi
FOREWORDThe Philippine Coconut Industry has to transform
to achieve its vision of a globally competitive and
inclusive industry with ensured equitable gains to all
industry stakeholders, the coconut farmers in particular.
With the complex nature of the industry and the multi-
faceted value chain, the need to set the direction and
come up with holistic strategies to reinvigorate and
awaken this “sleeping giant” industry is not just apt but is a compelling need of the time.
Thus, it is imperative to have a guided pathway to navigate industry stakeholders on the
road towards the VISION of the industry. This is what the Coconut Farmers and Industry
Road Map or COCOFIRM is all about.
The crafting of the COCOFIRM is inevitable to have a unified and strategic missionary
plan for the industry. This industry has been historically tagged as the ‘milking cow of the
Philippine economy’ and has generated an average of US $ 2 billion from 2016 to 2018.
Definitely, there are a lot of challenges, but there are more opportunities that need to be
seized. Critical thinking and strategic planning are the key to attain the prospects of the
industry for the benefit of the marginalized 2.5M coconut farmers (NCFRS, 2018).
It is my ardent desire when I assumed the leadership of the Philippine Coconut Authority
to transform the agency to be responsive and proactive in developing the industry.
The PCA as mandated by law has to implement and promote the rapid integrated
development and growth of the industry in all its aspects and ensure that the coconut
farmers are direct participants and beneficiaries of such development and growth. Hence,
all outlooks and prospects have to be explored through appropriate formulation of
programs and projects based on our capability and available resources.
xxxvi

xxxvii
Proper planning and programming of the desired targets and the course of actions have
to be analyzed and ensured to be inclusively beneficial to all stakeholders.
The COCOFIRM has addressed the quest for aligning the industry direction to the
Philippine Development Plan and incorporating the pillars of the One-DA Strategies in
the New Thinking in Agriculture. The PCA as the prime mover of the industry has to set its
base camps in transforming into a premier agency that will lead the industry to its desired
goals.
Thus, this COCOFIRM will serve as the guidebook on where to go, what to do, and how
to get there. With such guidance, the coconut industry will be able to be firmed and
harnessed in setting directions and policies for the development of a forward-looking
industry to attain sustainability and global competitiveness. Through COCOFIRM, we
have provided the industry the pathway of change and guide the industry towards better
and well-planned industry development.
To the technical experts who relentlessly gathered information, analyzed, and assessed
every aspect of the industry, PCA salutes all of you for your significant contribution to the
industry. Likewise, to all stakeholders of the industry who served as direct key informants
and for the valuable support of the academe and other government agencies, PCA is
certainly grateful for all your contributions.
This COCOFIRM belongs to all coconut stakeholders, just as we belong into one unified
and solid force with a common goal of providing prosperous livelihood to the coconut
farmers that will eventually trigger global competitiveness. The COCOFIRM is the pathway
to prosperity, and herein are the ideas that emanated from all of you and intended for all of
you.
BENJAMIN R. MADRIGAL, JR.AdministratorPhilippine Coconut Authority
xxxvii

xxxviii
ACKNOWLEDGEMENTOn behalf of the PCA Management, RDB wishes to thank UPLB Chancellor Dr. Jose DV Camacho, Jr. for accepting the project entitled “Crafting the Coconut Farmers’ and Industry Roadmap (COCOFIRM)”. This document serves as the epitome of a unified and inclusive strategic plan that will set the industry direction. The first documentary in the long history of the coconut industry, the path to progress, and how to get there.
Sincerest gratitude goes to the Program Leader of this project entitled: and the lead author, Dr. Edna A. Aguilar, who despite the complexity of the coconut industry and short duration of the project, took the lead and conscientiously organized her team. The contributions of the major technical writers- Dr. Corazon T. Aragon, a high- calibre economist, and Dr. Ernesto P. Lozada, a seasoned engineer and coconut processing expert, for their invaluable insights in setting the forward-looking direction of the industry are gratefully acknowledged. Their ideas have given impetus in addressing the needs of the industry. To Dr. Leonardo Gonzales, a contributory writer, who provided the concept of Monitoring and Evaluation System, your share is highly appreciated.
Sincere thanks to the PCA Management, specifically, to Administrator Benjamin R. Madrigal, Jr. for his approval of funding and passionate guidance to this project. The undersigned would also like to recognize the assistance rendered by the PCA top management, - to the Deputy Administrators Roel Rosales of Operations Branch, Wally Partosa of the Administrative and Finance Branch, PCA COCOFIRM Committee, and to all the key officers of PCA who selflessly supported this research project. Moreover, to all the Field Regional Managers and their staff who provided the COCOFIRM Team the inputs for all the necessary data at the ground level, who took time to join the meeting to discuss important matters, and who connected us to the key players in the industry for interviews, your efforts are highly appreciated.
Acknowledgement is likewise extended to the farmers who actively participated in various Farmers’ Consultations conducted by PCA, in Luzon, Visayas, and Mindanao. The documentation and highlights of which were perused and consolidated by the COCOFIRM. The participants of the series of farmers’ consultations held in 2017, specifically for coconut levy concerns are acknowledged. Farmers and farmers’ representatives from Aurora, Batangas, Laguna, Quezon, Camarines Norte, Camarines Sur, Marinduque, Sorsogon, and Oriental Mindoro in Luzon. In the Visayas region, the 72 attendees which include 54 coconut farmers and representative that are part of small farmers’ organizations from Tacloban, Leyte, Cebu, Samar, Northern Samar Eastern Samar, Negros Oriental, Negros Occidental, Bohol, Antique, Capiz, Iloilo, and Aklan are greatly acknowledged. The participants in the Farmers’ Consultations from the provinces of Davao del Sur, Davao Oriental, Davao del Norte, Dinagat Islands, North Cotabato, Cotabato, Surigao del Sur and Agusan del Sur in Davao, the organizations like KAMMPIL, PAKISAMA, KATARUNGAN, AMMMA-KATIPUNAN, LAKAMBINI, PKMP, IRDF, KADAMO, Kilusang Pagbabago, and others, as well as various SCFOs, the farmers and farmers’ representatives from the provinces of Davao Oriental, Sulu, Zamboanga, Zamboanga del Norte, Zamboanga del Sur, Basilan, Maguindanao, Lanao del Norte, and Misamis Occidental in Zamboanga Islands are all recognized.
xxxviii

xxxix
Also, acknowledgement to the participants in the Technical Consultation with the Academe, The representatives from three universities: UPLB led by COCOFIRM team with Dr. Emil Q. Javier (AGAP/CAMP), the University of Southern Mindanao (USM) Coconut Experts, and lastly, Visayas State University (VSU) Experts, for the one-on-one discussion, thank you for your time and valuable inputs.
To the partner stakeholders, the representatives and members of the United Coconut Association of the Philippines (UCAP), and the coconut farmers who made themselves available for interviews and contributing insightful situations and ideas, providing figures for metrics and analysis of the coconut industry, we are truly grateful. Particularly, we would like to acknowledge Mr. Dean A. Lao, Jr. of Chemrez Technologies, Inc. as representative of Philippine Oleochemical Manufacturers Association (POMA), Engr. Bonifacio Fernandez Jr. of BF Industries Inc., a representative of Philippine Activated Carbon Manufacturers Association, Inc. (PACMA), Mr. Jesse
F. Cheng of Davao Bay Coconut Oil Mills, Inc., representing the Philippine Coconut Oil Producers Association, Inc. (PCOPA), Ms. Maureen Pasciolco of Pasciolco Agri Ventures representing the Virgin Coconut Oil Producers and Traders Association of the Philippines, Inc. (VCOP), Mr. Reynaldo Go of Rg Industries Inc. and the representative of Philippine Coco Coir Exporters Association, Mayor Fernando Mesa of Alabat, Quezon for sharing the convergence concept of the first PCA community-based coco sugar hub project, Ms. Maribeth Algodon of Mapecon Green Charcoal Philippines Inc., Mr. Jervis Jao and Ms. Juliet Maralit of JNJ Oil Industries, Inc., Ms. Evelina Patiño of United Coconut Chemicals, Inc. (COCOCHEM), Mr. Martial Beck of Eau de Coco, Ms. Noreen Joy F. Ehilla of Oriental Golden Coco Inc., Pauline Arjay of New Quezon Coconut Enterprises, and Mr. Rowee Daquis of Peter Paul.
Special thanks to all the farmers and traders who participated in the on-site and online interviews: those that were coordinated by Yakap at Halik Multi-Purpose Cooperative in Quezon headed by Mr. Armel Amparo, respondents interviewed in CALABARZON led by PCA IV Regional Office, the farmers and traders in Eastern Visayas coordinated by PCA VIII Regional Office, and the lastly those farmers and traders in Davao Region headed by the PCA XI Regional Office. Also, thank you to Mr. Arthur Abes, Mr. John Raphael Artates, and Mr. John Immanuel Pastor for their assistance in conducting online interviews.
The undersigned is also in gratitude to the major leaders of the National Coconut Farmers Organization spearheaded by former Agriculture Secretary Leonie Montemayor of the Free Farmers of the Philippines for their valuable ideas and inputs that were considered in the crafting of the road map. Special thanks to PCA RDB staff for the indulgence in multi-tasking, specifically to Ms. Kreisha Ainna Marielle L. Roque, for effective coordination with the field managers and esteemed stakeholders for helping out in the field data collection.
To everyone who has imparted their views, comments, recommendations, and inputs directly or indirectly to this project, our deepest and sincere appreciation, and gratitude. To the Almighty God for the realization of our aspiration, He made it possible.
ERLENE C. MANOHARDeputy Administrator and COCOFIRM Proponent & Coordinator Research and Development Branch
xxxix


1
EXECUTIVE SUMMARY
The Coconut Farmers and Industry Roadmap (COCOFIRM) aims to provide direction and
recommendations towards sustainable development of the coconut industry, focusing on: 1)
inclusive growth to lift the coconut farmers out of poverty and 2) improving the competitiveness
and expanding the market potential of traditional and non-traditional coconut products.
Mapping, baseline and benchmark analyses of the various coconut value chain clusters and
product streams (Figure 1) were used as bases for recommending improvements for a more
efficient supply and value chains. Stakeholders’ participation and inputs in previous PCA
consultations, summits and workshops were reviewed. Feedback meetings and consultations
through PCA were solicited to validate the baseline analytics and recommendations.
Figure 1. The unified value chain for segmentation purposes may be divided into the following value chains: 1) copra-CNO-oleochemicals value chain; 2) DCN value chain; 3) VCO value chain; 4) coco coir value chain; 5) young coconut value chain; 6) coconut sap value chain; and 7) activated carbon value chain

2 D E P A R T M E N T O F A G R I C U L T U R E P H I L I P P I N E C O C O N U T A U T H O R I T Y
The continuing restrictions on travel and face to face meetings due to the COVID-19
pandemic posed a great constraint and challenge to the team in primary and secondary
data sourcing, hence the heavy reliance on PCA support for secondary data gathering
and in coordinating online interviews, consultations, meetings for collecting primary data,
feedback and validation.
Analytics and recommendations were guided by the following operational framework
(Figure 2), grounded on the principles of empowerment, convergence , sustainability,
inclusive growth espoused by the Philippine Development Plan (PDP 2017-2022), the
first medium-term plan anchored on the national long- term vision of AmBisyon Natin
2040, which represents the vision and aspirations of the Filipino people for a Matatag,
Maginhawa at Panatag na Buhay (strongly-rooted, comfortable, and secure life) in the
next 25 years.
Inputs to support the COCOFIRM’s strategies and recommendations were enabling laws
and policies, investments including infrastructure, capable and sufficient manpower,
continuing research driven by industry needs and innovations, and efficient transfer
of technologies. COCOFIRM adopted the Department of Agriculture’s 12 paradigms
towards a ONE Department of Agriculture: A Holistic Approach to Agriculture & Fisheries
Transformation focusing on “Masaganang Ani at Mataas na Kita” for the small- scale
coconut farmers. Existing practices of small- and medium-sized enterprises (MSMEs)
and large-scale processing companies were benchmarked with best practices and new
technologies.
A transformed PCA (PTR) will be the major driver moving the supply chains to the right,
producing goods and services for inclusive growth and prosperity of all stakeholders,
harnessing convergence, and partnerships with NGAs, academe, industry, public private
partnerships to apply the 12 paradigms to lift the coconut farmers out of poverty and
improve the competitiveness, expand markets of traditional and non- traditional products,
and explore new products and markets.
3P H I L I P P I N E C O C O N U T I N D U S T R Y R O A D M A P 2 0 2 1 - 2 0 4 0
The approval of RA 11524 creating the COCONUT FARMERS AND INDUSTRY TRUST
FUND (CFITF) will jumpstart and sustain the transformation of the coconut industry,
providing social protection, empowerment and prosperity to farmers and thus,
strengthening and enhancing the global competitiveness of the coconut industry.
The Philippine Coconut Industry: SituationerProduction sector
Coconuts dominate the agricultural landscape of 69
out of the 82 provinces of the Philippines covering
3.65 M hectares – a quarter of the country’s total
arable land. Coconut contributes an average of PhP
91.4B yearly export earnings from 2014-2018 (PSA,
2018), comprising 25% of the country’s agricultural
exports. There are over 2.5 M coconut farmers, 51%
Figure 2. Operational Framework of COCOFIRM towards a secure and resilient coconut industry with empowered and prosperous farmers

4 D E P A R T M E N T O F A G R I C U L T U R E P H I L I P P I N E C O C O N U T A U T H O R I T Y
representing landless tenants and workers and the other 49% are owners. Income from
coconut farming is low and over 90% of coconut farmers live below poverty threshold of
PhP 125,775/ year (PSA, ref no. 2019-053). Majority of the coconut farmers in the 2018
National Coconut Farmers Registry (NCFRS) are food insecure and without any social
protection. Coconuts farms are small, 75% are 2.0 ha and below, fragmented and farms in
uplands have accessibility constraints.
The production sector, the lifeblood of the industry supplying the feedstock for the
various coconut value chains (Figure 1), is challenged by low and declining coconut
productivity, inspite of continuous expansion in land area. Thus, while some 15 B nuts are
harvested annually from 345 M bearing palms, coconut productivity in 2019 was only at
44 nuts per tree per year. This only represents 50% of the potential yield of the native
tall variety and 30% of the potential yield of local hybrids. While the Philippines has the
largest area planted to coconuts in the world, and is the 2nd top producer, the country’s
productivity per hectare remains the lowest among the top ten coconut producers of the
world at only 4.0 MT /ha nuts compared with the world’s best at 12.5 MT/ha.
Coconut population is dominated by 98% native talls with an average of 10% senility.
Around 1.78 M hectares or 50% of coconut areas are nutrient deficient. The typical
coconut farm is poorly managed, rainfed, unfertilized, and with no regular pest and
disease monitoring and control. There is much room for improvement of coconut
yield using already available production technologies and improved tall and hybrid
varieties. The low productivity, particularly in suitable with large coconut areas should be
addressed, according to their particular needs or constraints to increased yield.
The impact of climate change, which has caused great devastation to many regions,
including major production grids, is expected to remain a concern, given geographic
location of the country. The Philippines is ranked 4th in the long-term climate risk index
in 2021, having the highest number of events (2009-2019) among those in the top ten
countries. An analysis of the production trends revealed that the series of strong and
super typhoons, severe drought caused by intense and prolonged El Niño, and the exotic
pest cocolisap, have devastated coconut regions, reducing bearing trees and decreasing
tree productivity for several years. Major production grids including Davao, Eastern
5P H I L I P P I N E C O C O N U T I N D U S T R Y R O A D M A P 2 0 2 1 - 2 0 4 0
Visayas and CALABARZON have been severely affected and have not fully recovered.
Buffering the farmers and the industry from the severe impacts of climate related risks
and hazards needs to be considered in the design of programs and interventions.
Recalibration of targets and prioritization for rehabilitation, planting and replanting of
coconuts particularly of hybrids and the choice of intercrops and other enterprises should
consider this recurring extreme weather risks. Adopting climate resilient coconut-based
farming systems should be integrated in planning for agribusiness corridors both for
coconuts and intercrops. Continuing innovative and strong research and science-based
recommendations and strategies have to back-up national programs.
Sustainable growth and global competitiveness of the various coconut value chains
are dependent on the productivity of coconut farms, which provide the raw materials
and feedstocks for these industries. Additionally, the demands of the export market
for price competitiveness, reliability of supply, traceability of sustainable farm practices
and stricter quality standards, are dependent on the farmers adopting good agricultural
practices (GAP) or organic production systems that meet the standards of the market.
Thus, incentivizing the farmers to participate in improving the productivity, efficiency and
sustainability of coconut farms is at the core of this coconut industry roadmap.
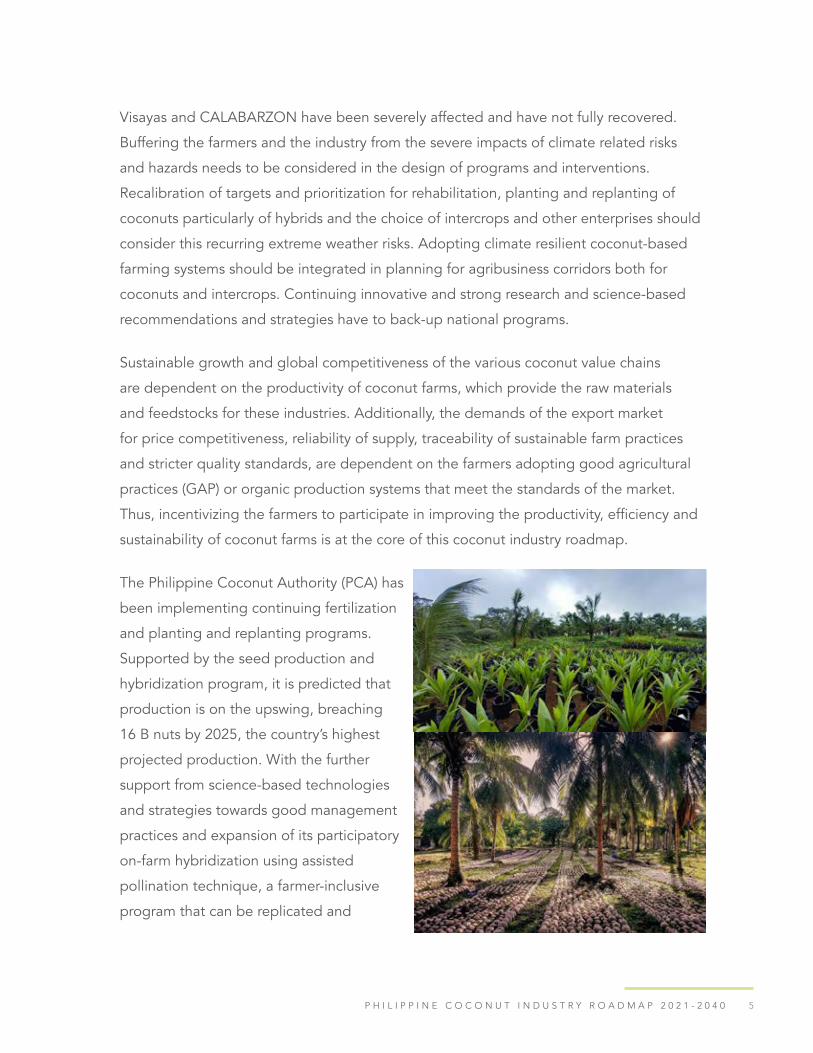
The Philippine Coconut Authority (PCA) has
been implementing continuing fertilization
and planting and replanting programs.
Supported by the seed production and
hybridization program, it is predicted that
production is on the upswing, breaching
16 B nuts by 2025, the country’s highest
projected production. With the further
support from science-based technologies
and strategies towards good management
practices and expansion of its participatory
on-farm hybridization using assisted
pollination technique, a farmer-inclusive
program that can be replicated and

6 D E P A R T M E N T O F A G R I C U L T U R E P H I L I P P I N E C O C O N U T A U T H O R I T Y
upscaled to increase utilization of good varieties and hybrids and further expand the
country’s nut production towards a target of 20 B nuts by 2030 and 30 B by 2040 should
be attainable, despite the challenges. Convergence of government agencies led by PCA
and private sector support are a key strategy to achieve this.
The farmers cannot depend on coconuts alone for their livelihood to attain food security
and reduce poverty. They need to diversify their income sources. The wide spaces in
between coconuts and its unique canopy architecture make it suitable for intercropping,
yet over 80% of the coconut farms are monocropped. Coconut areas can increase the
country’s agricultural output without opening new lands. Intercropping and livestock
integration under coconuts have been proven to increase farm productivity and income
many- folds and are a good strategy to significantly increase farmers’ income and
welfare. However, small hold coconut farmers lack capital and infrastructure, and have
no sustained access to formal credit sources. It is imperative that farmers’ organizations
should undertake collective action and policy advocacy activities to voice out their socio-
economic and other concerns. The lack of entrepreneurial and leadership skills of farmers’
organizations/cooperatives that will enable the association to successfully engage in
business enterprises needs to be addressed.
The KAANIB enterprise development
program of PCA (KEDP) has supported
numerous intercropping, livestock
integration and coconut processing
projects. There are existing best practices
for agro-industrial hubs, for major intercrops
such as coffee, cacao, banana, and high
value vegetables that can be replicated and
upscaled. The livestock industry has viable
commercial models of vertical integration
and specialized production, which can be
adopted to community-based models.
There are partnership models for CFOs
and private investors to create a backward
7P H I L I P P I N E C O C O N U T I N D U S T R Y R O A D M A P 2 0 2 1 - 2 0 4 0
integration system for coconut and intercrops processing hubs. Successful and promising
KAANIB projects are low lying fruits that maybe prioritized for support towards clustering
under a centralized management and linkage to a reliable market. Support should be
provided to enable them to do cooperative management from production to processing
and marketing, ensuring adherence to market standards of reliability and quality. This will
mainstream farmers’ participation in agro- industrial corridors of development.
Despite the backdrop of a struggling coconut industry, there are many very encouraging
developments. Infrastructure such as road networks and ports to support logistics for
distribution has improved, communication facilities and other support systems have
been modernized, and PEZA zones where a number of coconut processors are located
already exist. The private sector-led processing sector, a number of which are highly
efficient and among the world’s benchmark, are primed to increasing their processing
capacities given the reliable and quality supply of raw materials and feedstock and those
interviewed by COCOFIRM, whether in direct or indirect relationship with farmer growers
are one in expressing their willingness to support the farming sector towards planning
and replanting using improved varieties and hybrids, sustainable management practices,
diversification and getting certification, among others. On the market side, there is a
growing worldwide recognition of the medical, therapeutic, and nutritional values of
coconut products. Owing to the growing need of consumers for healthier products and
the global direction towards green products, the Philippine coconut industry must take
advantage of this growing market.

8 D E P A R T M E N T O F A G R I C U L T U R E P H I L I P P I N E C O C O N U T A U T H O R I T Y
The following figure presents the supply chain map of the coconut industry in the
Philippines indicating the flow of supply, the stakeholders, and their numbers at each
node. Regional supply chain maps are also presented in the report. Inputs from the farms
are linked to the processors through the intermediaries who are composed of traders
for different farm products. The manufacturers then transform the feedstock into a set of
products that reach the local or international market. Strategies and recommendations
generally apply to all regions addressing common problems on the production sector and
for each industry cluster or product stream. The regional road maps’ proposed regional
interventions can have specific recommendations and strategies based on their resources
and specialized products. There are 21,277 barangays that grow coconuts, representing
about 50% of the total number of barangays in the country. A total of 2.745 M farmers
registered in the (National Coconut Farmers Registry System, 2018) are directly involved
in the production sector. Around 4,138 intermediaries are part of the multi-layered
marketing system of the coconut industry, majority of whom are copra traders. Some of
these traders also serve as consolidators that ease the delivery of the coco farm produce
to manufacturers who need the supply in bulk. There are a total of 331 processors in
various coconut product lines who are operating in the country in small to large scale.
Coco coir producers are present in largest number followed by VCO manufacturers.
Figure 3. Supply chain map of the coconut industry in the Philippines

9P H I L I P P I N E C O C O N U T I N D U S T R Y R O A D M A P 2 0 2 1 - 2 0 4 0
Oil mills, refineries, and factories operate at a large
capacity. Products are channeled to the consumers in
domestic and international markets.
Processing sector
About 80% of the coconuts produced in the country
are processed into copra - the feedstock for coco oil
mills. There are 60 oil mills, with combined crushing
capacity of 3.4M MT/year operating at only 38-69% of
their capacities due to unreliability of coconut supply.
Majority of the oil mills are located in CALABARZON
and Davao Region. Thirteen of the oil mills are vertically
forward integrated into refining and value- added
processing (i.e., oleochemical and CME processing).
There are 39 oil refineries operating in 10 regions with
a total annual refining capacity of almost 2.0 M MT.
Most of these oil refineries are in Northern Mindanao,
Davao Region, CALABARZON, and NCR. There are
eight oleochemical companies (making intermediate
coconut-based chemicals like fatty alcohol, fatty
acids, methyl ester, and glycerin) operating in four
regions - CALABARZON, the National Capital Region,
Zamboanga Peninsula, and Northern Mindanao. Moreover, there are 12 operational coco-
biodiesel manufacturers with a total production capacity of about 0.61 M MT of CME per
year, clustered in the National Capital Region and CALABARZON, and Mindanao regions.
While the technology for oil mill processing is highly efficient and world class, the low
quality of copra supplied to oil mills increases the processing costs, significantly affecting
milling efficiency, refining recovery, and refining costs. Low quality of copra leads to a
high level of polycyclic aromatic hydrocarbons (PAH) and aflatoxin in the production of
crude coconut oil that could make these products unmarketable in the export market.

1 0 D E P A R T M E N T O F A G R I C U L T U R E P H I L I P P I N E C O C O N U T A U T H O R I T Y
Poor copra produced by smoke kilns at the farms and the multi-layered marketing that
could take small upland farmers to millers between 1-3 months, results to further physical
and quality losses. The Philippines stands to lose the export markets if the country cannot
comply with the stricter standards on allowable limits of aflatoxin and PAH in coconut oil
and copra cake. Radical transformation in the copra processing sector is an investment
that the industry cannot do without. COCOFIRM proposes the establishment of agro-
industrial corridors for a white copra central (WCC) owned and operated by coconut
farmers that will market directly to coco oils. The WCC will be supported by strategically
located coconut buying stations (CBSs) which will consolidate whole nuts for the WCC
or for the farmers still selling copra to oil mills. The buying stations will provide re-drying
facility to reduce copra moisture content to 6% thereby arresting the growth of aflatoxin.
The farmers organization-owned WCCs and farmers organization-owned CBS will be
established along a
supply chain that will efficiently supply the participating mills with high quality raw
materials. A generic prototype model is presented below (Figure 4). The farmers
organization-owned WCCs and farmers organization-owned CBSs will supply the mill with
white copra and high-quality smoked copra. The mill will produce cochin oil, premium
grade copra and high quality CNO. The mill will pay premiums on high quality.
Twenty percent (20%) of the 15 B nut production are used for the manufacture of
desiccated coconut (DCN), virgin coconut oil (VCO), coconut milk and other uses,
including for home consumption. The Philippines is the top producer and exporter of
DCN and VCO in the world. In 2018, there were 21 medium- scale DCN processing
plants operated by 19 companies with an aggregate annual production capacity of about
0.45 M MT. Three companies operate two desiccated coconut processing plants each
in different locations. Desiccated coconut processing companies in the Philippines have
become integrated producing multi-products from a whole nut such as low-fat desiccated
coconut, coconut flour, coconut cream/milk, coconut water, paring cakes, paring oil,
and virgin coconut oil. The DCN factories are models for large-scale integrated coconut
processing by recovering and processing coconut water into exportable concentrates.
By crushing DCN, virgin coconut oil (VCO) is produced at volumes attractive to global
players. The by-product is coconut flour. The market for coconut water has grown to the

1 1P H I L I P P I N E C O C O N U T I N D U S T R Y R O A D M A P 2 0 2 1 - 2 0 4 0
point where coconut water from DCN factories is not sufficient anymore. The proposed
WCC offers an opportunity to use the mature nuts brought into the white copra central
for processing into coco water concentrate.
There are 42 VCO processing plants operating in nine regions in the country and 14
coconut water processing plants spread out in six regions. Coco shell-based, coir and
coco sugar industries are dominantly operating in Mindanao with 15 small- to large- sized
coco shell charcoal with an aggregate annual production capacity of 0.32 M MT and 14
activated carbon processing plants with total annual production capacity of 85,585 MT.
There are also 161 coir and 33 coco sugar processing plants operating in Mindanao,
respectively.
Critical to supplying the volume and quality of raw materials in a timely manner rests
on the availability of tappers for sap harvest, nut harvesters, dehuskers, splitters,
and operators of the various machines and equipment in coconut processing plants.
Additionally, service crew who can manage, monitor crop health, and raise early
Figure 4. Proposed transformation of copra processing and trading through coconut buying stations with re- drying facilities and white copra centrals

1 2 D E P A R T M E N T O F A G R I C U L T U R E P H I L I P P I N E C O C O N U T A U T H O R I T Y
warning for pest and disease as well as render farm services such as farm harvesting
and dehusking are a critical support system in a modernized coconut industry.
Professionalizing this sector through certificate trainings and continuing education will
mainstream them into the formal workforce as wage earners and would qualify them for
SSS membership. For example, each farmer-organization-owned WCC would require 270
farm service crews so that harvesting can be scheduled in synchronized with the drying
schedules.
Coconut Utilization and Consumption
The coconut industry is export
oriented. The share of export of the
total utilization increased markedly
from 61% in 2009 to 74% in 2019.
Conversely, the proportion retained
for domestic consumption/utilization
decreased from 39% in 2009 to 26% in
2019.
Local consumption of manufactured
coconut oil (597,000 MT per year)
during the period 2009- 2019 accounted for the largest share (approximately 76%) of the
total domestic consumption of coconut, followed by food nuts (113,671 MT or 14.5%).
The biggest consumers of mature husked nuts are desiccated coconut manufacturers,
followed by coconut milk/cream producers, virgin coconut oil producers, and households.
Young coconuts are mainly utilized for salads and for its water as non-carbonated, healthy
beverage or sports drink. Home-made oil is mainly intended for home consumption and
its share was the lowest at approximately 10% in the same period.
PSA reported that the annual per capita consumption of coconut decreased from 6.96
kilograms (kg) per capita in 2018 to 6.88 kg per capita in 2019. However, FAO’s estimate
of Filipinos’ annual per capita consumption of coconut in 2018 was much lower compared
to PSA’s reported per capita coconut intake figure. Filipinos’ annual per capita intake

1 3P H I L I P P I N E C O C O N U T I N D U S T R Y R O A D M A P 2 0 2 1 - 2 0 4 0
of coconut was only 5.04 kg, much lower than the world’s largest coconut consumer,
Sri Lanka, at 74.67 kg and the world’s largest coconut producer, Indonesia, at 14.24 kg.
Multimedia information and market promotion campaign on the health and nutritional
benefits of coconut food products, its nutraceutical, beauty and wellness use as well as
the multifunctionality and ecosystem services of coconut palm can significantly increase
local consumption and teach Filipinos to value coconut more as a national heritage.
Research on new uses of coconuts, new processes, and technologies to improve
efficiencies of farm operations and processing to reduce costs are continuously needed.
Trade Performance and Prospects Per Product Stream
The total export revenue from traditional and the non-
traditional coconut products grew by an average rate
of 3.9% per year from 2015 to 2019. Revenues from
exports of traditional coconut products increased by
an average of 5.1%, but export earnings from non-
traditional coconut products declined by an average
of 1% per year.
The largest contribution to the country’s coconut
export earnings came from traditional coconut
products. Coconut oil (70%), desiccated coconut
(15%) and copra meal (4%) generated an aggregate
value of US$ 1.83 B per year and accounted for
2.86% of the country’s merchandise export earnings
from 2015-2019. Exports of non-traditional coconut
products only accounted for an average of 0.46%
(US$ 292 M) of the country’s total foreign exchange
earnings. A total of 43 non-traditional coconut
products were exported from 2009- 2019 with the following as top promising products:
virgin coconut oil, coco water, coconut concentrate, liquid coco milk, coco cream,
hydrogenated coconut oil, coco husk cubes, coco peat, baled coir, and glycerin.

1 4 D E P A R T M E N T O F A G R I C U L T U R E P H I L I P P I N E C O C O N U T A U T H O R I T Y
Coconut oil, as a lauric acid oil, constitutes a measly 2.2% of the world’s oil and fats market
in 2019. The Philippines supplies to 57 countries, approximately 45% of the total world
export volume of coconut oil from 2009 to 2019 with an average annual growth rate of
6.9%/year and 9.7%/year in export volume and export value, respectively. The Philippines
has the highest competitive advantage in the production and export of crude coconut oil
compared to its close competitors, Indonesia and India. The Philippines has a favorable
market prospect in exporting coconut oil owing to the negative advisory against the use
of palm oil in recent years. Palm oil imports for food consumption are dropping in Europe
and have stalled in the United States. In view of these recent developments, it is expected
that coconut oil’s position in the oil and fats trade in these countries will improve. In the
domestic market, local consumption of RBD coconut oil as cooking oil is projected to be
slow due to the proliferation of lower-priced imported palm oil, canola oil, corn oil, and
other vegetable oils in retail stores and supermarkets throughout the country.
The Philippines is the world’s top exporter of
desiccated coconut followed by Indonesia and Sri
Lanka. The country’s volume of exports increased
by 5.2% per year, while export earnings grew faster
at 11.1% per year from 2009-2019. Among the
coconut exports, DCN has the most diverse market
penetrating about 109 countries all over the world
and it also commands the highest price. The country
has a higher comparative advantage in producing
and exporting desiccated coconut than Indonesia
and Sri Lanka. The Philippines has the greatest
ability to compete in the global desiccated coconut
market particularly in the European Union, which is
the world’s largest importer of desiccated coconut.
Presently, the Philippine desiccated coconut fetches
a higher price compared to desiccated coconut
imported from Indonesia and Sri Lanka because
of our premium quality. The Philippines will stand
to benefit from the considerable growth in market

1 5P H I L I P P I N E C O C O N U T I N D U S T R Y R O A D M A P 2 0 2 1 - 2 0 4 0
demand for desiccated coconut by the food processing and confectionery industries in
the European market.
The Philippines is the world’s second major exporter of coco shell charcoal, next to
Indonesia. On the average, the country’s export of coconut shell charcoal in terms of
volume and value increased by 20.3% and 24.1% per year, respectively from 2009-2019.
Coco shell charcoal was dominantly shipped to China and Japan for further processing to
activated carbon. Rising volume of exports of raw coco shell charcoal has been depleting
the supply of this raw material for Filipino activated carbon manufacturers. The country
would benefit more if more activated carbon were produced and exported because it is a
high value-added product.
The Philippines used to be the top exporter of coco shell charcoal-based activated
carbon in the international market but was overtaken by India starting in 2016.
Nonetheless, from 2009-2019, the volume and earnings of coco shell-based activated
carbon exported in the international market Increased at an average of 17.6% and 20,8%
per year, respectively. The export market for coco shell-based activated carbon is more
diverse compared to coco shell charcoal, reaching 100 destinations in the international
market. India has the highest comparative advantage in producing and exporting coco
shell charcoal- based activated carbon, followed by the Philippines. The global demand
for coco shell charcoal-based activated carbon is growing because government regulatory
agencies in different countries have recommended coconut activated carbon as the best
available material for use in air purification, mercury absorption, and water treatment
applications owing to growing environmental concerns. The increasing applications of
activated carbon in the food and beverage industry and the pharmaceutical sectors have
also contributed to demand growth of activated carbon globally and are expected to
increase further the demand for coco shell-based activated carbon from the Philippines.
Coconut oil is used as feedstock in producing oleochemicals. The country’s export
earnings from traditional oleochemicals (coco fatty alcohol, coco fatty acid, and coco
methyl ester) increased by an average growth rate of 22.3% per year from approximately
US$ 12.68 M in 2009 to US$ 37.04 M in 2019. Coco methyl ester had the highest growth
rate at 102.6% in terms of export volume and 141.6% in terms of export revenue from

1 6 D E P A R T M E N T O F A G R I C U L T U R E P H I L I P P I N E C O C O N U T A U T H O R I T Y
2009 to 2019. Exports of coco fatty acid and coco fatty alcohol decreased from 2009 to
2019. The decrease in the volume of exports of coco fatty alcohol could be attributed to
the shutting down of three out of four oleochemical companies manufacturing coco fatty
alcohol because of the discontinuation of the implementation of EO 259. The Philippine
Coconut Authority has submitted a proposal to Congress for approval to increase the
CME blend from 2% (B2) to 5% (B5) based on Republic Act (RA) 9367 or the Philippine
Biofuels Act of 2006 for the purpose of increasing local biodiesel utilization and stabilizing
copra prices. The Philippine Oleochemical Manufacturers Association is also clamoring for
the revival of Executive Order 259 which required all detergent manufacturers to use fatty
alcohol in their detergent formulation. The environmental, health and economic benefits
to coconut farmers of using coco-based surfactant in the detergent industry justifies the
revival of the implementation of EO 259 and will provide the needed boost for the local
oleochemical industry. If these policy proposals will be approved, it is projected that the
domestic demand for crude coconut oil as feedstock for CME production will increase.
On the export side, the import ban on palm oil exports of three large Malaysian palm oil
companies by the United States will likely increase its imports of Philippine coco methyl
ester. Market Research reports that the global oleochemicals market size is anticipated to
reach US $ 31.4 B by 2027 registering a compounded annual growth rate (CAGR) of 5.8%.
The total volume of exports of VCO increased by an average annual growth rate of 45%
with a corresponding 55% increase in average export earnings per year from 2009-
2019. The American Heart Association (AHA) advisory against saturated fats continue to

1 7P H I L I P P I N E C O C O N U T I N D U S T R Y R O A D M A P 2 0 2 1 - 2 0 4 0
negatively affect the prospect of coconut oil - based food products in the export market.
The Philippines has a high comparative advantage in producing and exporting VCO.
The virgin coconut oil with its anti-microbial property, its appeal as a natural and green
product, and the wider application to beauty, cosmetics, and personal care products is
expected to stimulate further growth of VCO in the export market. The local consumption
of virgin coconut oil will remain high especially with the promising results of DOST’s
experiment on the health benefits of VCO intake on Covid-19 patients. More people
would be encouraged to purchase virgin coconut oil as an immune-health supplement for
faster recovery, the possibility of combating African Swine Flu, and other beneficial uses
of virgin coconut oil.
Coconut water ranked 2nd to VCO in terms of volume of exports of non-traditional coconut
products, increasing markedly from 593 MT worth approximately US$ 0.37 M in 2009 to
51,839 MT valued at US$ 57 M in 2019. The country shipped out an average of 39,065
MT of coconut water worth US$ 41 M annually during the 11-year period under review.
The Philippines has a comparative advantage in producing and exporting coconut water.
Coco water as a natural, organic, and healthy functional drink has been recognized globally.
Owners of Vita Coco, O.N.E., and Kirkland (Costco), the popular brands of coconut water
drink in the United States and/or Europe, source their coconut water from the Philippines,
among other countries. However, local consumption of coconut water may remain low,
since local consumers prefer to drink water from young nuts rather than the packaged one.
The annual export performance of coconut sugar showed an irregular trend. Coconut
sugar exports during from 2017-2019 averaged 344 MT and export earnings generated
amounted to US$ 1.1 M per year. The Philippines has very low comparative advantage
in producing and exporting coconut sap sugar. Philippine coconut sap sugar is not
price and cost competitive compared to Indonesia’s coconut sap sugar which is being
sold at a lower price due to higher labor cost incurred in tapping coconut sap in the
country. Technology to mechanize/automate tapping or planting of dwarf and hybrids
for sap production is recommended. Adulteration (i.e., mixing of sugarcane with coco
sugar and mixing Philippine coco sugar with low quality and lower-priced coco sugar
imported from Indonesia) is also a current threat to the coco sugar industry. The country
should capitalize on promoting coco sugar’s low glycemic index, given the rising cases
1 8 D E P A R T M E N T O F A G R I C U L T U R E P H I L I P P I N E C O C O N U T A U T H O R I T Y
of diseases such as diabetes, cardiovascular diseases (CVD), obesity rates as well as the
change in dietary patterns to increase global demand. For culinary purposes, coco sugar
could have unlimited application in food and drinks. As a non-food product, coco sugar is
used as body scrubs, shaving gels, facial and body creams, and for haircare products. The
growth in the local demand for coco sugar may be slow due to the continued reliance on
sugarcane-based sweeteners which are relatively cheaper.
Export performance of coir products was erratic. The major coconut coir products
exported by the Philippines were coconut peat/dust, husk cubes, baled coir, and coconut
pads. Export earnings from coco peat/dust increased from US$ 661,000 in 2009 to US$
3.9 M in 2019. The total value of husk cube exports from the Philippines reached as high
as US$ 5.6 M in 2019. Exports of baled coir decreased from 2,079 MT in 2009 to 544 MT
in 2019 but the total export earnings rose by 210% per year, on the average. China is the
major market for coco husk /coir/peat products. The Philippines has a lower comparative
advantage in producing and exporting coco coir products compared to India and Sri
Lanka. In 2019, India and Sri Lanka captured 94% of the global coco coir market. India
has larger mechanized coir processing plants with economies of scale and has lower coir
processing cost. For coir and coir products, the Philippines should ride on the global
trend of going green promoting products which are sustainable and environmentally
friendly. Application to horticulture, soil conditioning, gardening, and hydroponics
specifically the use of geotextiles to civil engineering, agriculture, and soil erosion are
some of the key drivers for growth for coir products. There are very large market demand
and opportunities for coir products. The Philippines can venture into coco chips and
coconut fiber, but the coco coir industry would require market development, market
intelligence, and intensive promotional efforts to realize the potential demand.
Industry SWOT Analysis RecommendationsSWOT analysis of the industry led to the development of recommendations to achieve
improvement in global competitiveness and increase domestic consumption, towards an
inclusive, market driven, innovative and sustainably growing coconut industry. Figure 5
presents the thematic of recommendations:

1 9P H I L I P P I N E C O C O N U T I N D U S T R Y R O A D M A P 2 0 2 1 - 2 0 4 0
Figure 5. COCOFIRM overall framework
The approval of RA 11524 creating the COCONUT FARMERS AND INDUSTRY TRUST
FUND will jumpstart substantial components of these recommendations supportive of
the following: Social protection and improved farmers welfare, agribusiness management
and skills enhancement of coconut farmers organizations, farm improvements including
hybridization, intercropping, livestock integration and integrated coconut processing
agro-enterprises, and provision of support systems including credit, shared facilities,
infrastructure and road networks. These COCOFIRM recommendations address major
concerns of the industry towards improving the competitiveness of traditional and non-
traditional coconut products for global and domestic markets.
The coconut is a Filipino legacy. It is a heritage crop that should be valued by all Filipinos
and provided full support for its sustainable and inclusive growth. The time to radically
reform and transform the sector towards a secure and resilient coconut industry with
empowered and prosperous farmers is HERE and NOW!


2 1
INTRODUCTION
The Philippine Coconut IndustryCoconut palms dominate the agricultural landscape of 69 out of the 82 provinces of the
Philippines covering 3.6 million ha—around a quarter of the country’s total arable land.
Coconut contributes 25% to the country’s agricultural exports, with an average of PHP
91.4 B yearly export earnings from 2014–2018 (PSA, 2018). There are over 2.5 million
coconut farmers, 51% represents the landless tenants and workers, the other 49% are
owners. Income from coconut farming is low and over 90% of coconut farmers live below
poverty threshold of PHP 125,775/year (PSA, Ref No.: 2019-053). Majority of coconut
farmers in the 2018 National Coconut Farmers’ Registry System (NCFRS) are food
insecure and without any social protection. Coconut farms are fragmented and small, 75%
are 2.0 ha and below; farms in uplands are accessibility constrained to roads and markets.
2 2 D E P A R T M E N T O F A G R I C U L T U R E P H I L I P P I N E C O C O N U T A U T H O R I T Y
The production sector, the lifeblood of the industry and the supplier of feedstock for the
various coconut value chains (Figure 1.1), is beset with problems arising from decades
of neglect and abuse. These problems include low priority and budget allocation for
the industry as well as low and unstable income of farmers who are marginalized and
unable to participate in/benefit from traditional and nontraditional coconut value chains.
Coconut population represents 98% native talls with an average of 10% senility. Around
1.78 million ha, or 50% of coconut areas, are nutrient deficient. The typical coconut farm
is poorly managed, rainfed, unfertilized, with no regular pest and disease monitoring and
control, even while improved tall and hybrid varieties and production technologies for
increased productivity are available. Thus, while some 14.7 B nuts are harvested annually
from 347 M bearing palms, tree productivity in 2019 was only 44 nuts per tree per year,
which is much lower compared with the potential of 80–150 nuts per tree per year. The
Philippines has the largest coconut area and is the 2nd top producer in the world, but
the country’s productivity per hectare remains the lowest among the top ten coconut
producers of the world.
The wide spaces in between coconuts and their unique canopy architecture make them
suitable for intercropping, yet over 80% of the coconut farms are monocropped. Coconut
areas can increase the country’s agricultural output without opening up new lands.
Intercropping and livestock integration under coconut have been proven to increase
farm productivity and income manyfold and are good strategies to significantly increase
farmers income and welfare. However, smallholder coconut farmers lack capital and
infrastructure and have no sustained access to formal credit sources. Coconut farmers’
organizations that should undertake collective action and policy advocacy activities, to
voice out their socio-economic and other concern are the exception rather than the norm.
The lack of entrepreneurial and leadership skills of farmers’ organizations/cooperatives
that will enable these associations to successfully engage in business enterprises needs
to be addressed. There are agribusiness models that coconut cooperatives can adopt
(clustering and cooperative management, processing and marketing that adheres to
market standards on reliability and quality) can mainstream farmers’ participation in
agro-industrial corridors of development. These models include clustering, cooperative
management, processing and marketing that will enable products to adhere to market
standards of supply reliability and product quality.
2 3P H I L I P P I N E C O C O N U T I N D U S T R Y R O A D M A P 2 0 2 1 - 2 0 4 0
Assurance of steady supply of good quality coconuts, the lifeblood of the various
coconut-based value chains industry clusters, is key to sustainable growth of the industry.
Supply reliability limits the utilization of full crushing capacities of oil mills. About 80%
of the coconuts produced in the country are processed into copra - the feedstock for
coconut oil mills. From 2009-2019, the estimated yearly utilization of the oil mills ranged
only from 38-69% of the total crushing capacity of 3.4 M MT/year of 60 oil mills. In
addition, there is an increasing demand for other coconut products coming from whole
nuts and sap, and the magnitude of supply deficit increases further.
Addressing the strict quality requirement for aflatoxin and PAH levels by the coconut
oil and copra cake export markets is critical for the sustained growth of the industry.
The traditional copra processing practiced by farmers, using smoke kilns, produces
undercooked copra at 15–20% moisture content, that is contaminated with aflatoxin with
high Polycyclic Aromatic Hydrocarbons (PAH). Multi-layered marketing that could take
one to three months from small upland farmers to millers, results in further physical and
quality losses. The Philippines stands to lose the export markets if the country cannot
comply with the stricter standards on allowable limits of aflatoxin and PAH in coconut oil
and copra cake. Radical transformation in the copra processing sector value chains is an
investment that the industry cannot do without.
Twenty percent (20%) of the 14.7 B nut production is used for the manufacture of
desiccated coconut (DCN), virgin coconut oil (VCO), coconut milk and other uses
including for home consumption. In 2018, there were 22 DCN processing plants with a
combined capacity of 841 MT. The DCN factories are models for large- scale integrated
coconut processing by recovering and processing coconut water into exportable
concentrates. By crushing DCN, virgin coconut oil (VCO) is produced at volumes
attractive to global players. The by-product of this process is coconut flour. The market
for coconut water has grown to the point where the coconut water from DCN factories is
no longer sufficient to meet the present demands.
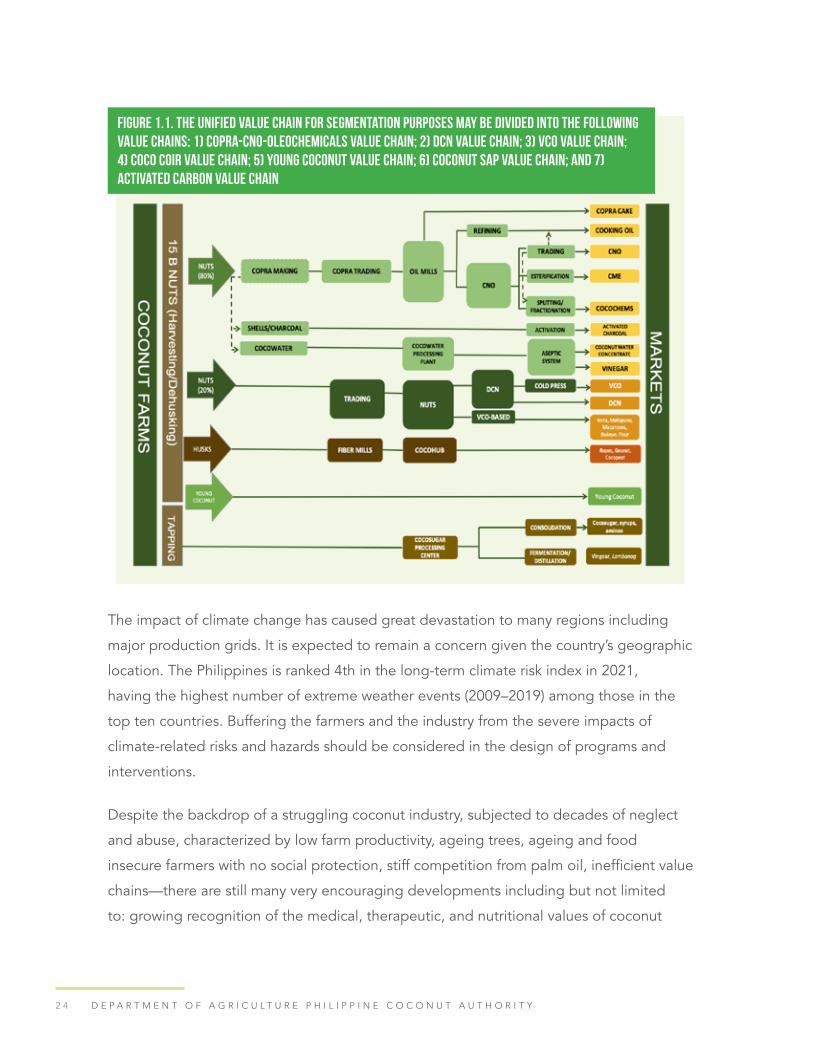
2 4 D E P A R T M E N T O F A G R I C U L T U R E P H I L I P P I N E C O C O N U T A U T H O R I T Y
The impact of climate change has caused great devastation to many regions including
major production grids. It is expected to remain a concern given the country’s geographic
location. The Philippines is ranked 4th in the long-term climate risk index in 2021,
having the highest number of extreme weather events (2009–2019) among those in the
top ten countries. Buffering the farmers and the industry from the severe impacts of
climate-related risks and hazards should be considered in the design of programs and
interventions.
Despite the backdrop of a struggling coconut industry, subjected to decades of neglect
and abuse, characterized by low farm productivity, ageing trees, ageing and food
insecure farmers with no social protection, stiff competition from palm oil, inefficient value
chains—there are still many very encouraging developments including but not limited
to: growing recognition of the medical, therapeutic, and nutritional values of coconut
Figure 1.1. The unified value chain for segmentation purposes may be divided into the following value chains: 1) copra-CNO-oleochemicals value chain; 2) DCN value chain; 3) VCO value chain; 4) coco coir value chain; 5) young coconut value chain; 6) coconut sap value chain; and 7) activated carbon value chain

2 5P H I L I P P I N E C O C O N U T I N D U S T R Y R O A D M A P 2 0 2 1 - 2 0 4 0
products particularly coconut water, VCO and coconut flour, and coconut cooking
oil; expanding markets for coco coir and coco dusts products; increasing demand for
activated carbon from coconut shell charcoal; maturing of technology packages for
producing white copra and VCO; and international recognition for lambanog. Important
factors that stimulate the worldwide demand for nontraditional coconut products (NTCPs)
are the growing need for healthier products, and coir products, and greener production
processes and products. The global demand for these NTCPs is expected to grow at a
compound annual growth rate (CAGR) of 5.86% to 10.04% in the future. There is still low
domestic consumption of coconut RBD oil as cooking oil due to the influx of imported
low-priced palm oil, canola oil, soybean oil, and corn oil, and low utilization of coconut oil
as raw material in oleochemical production. Policy to increase the biodiesel blend from
2% to 5% and reimplementation of EO 259 to allow local production of coco fatty alcohol
for the local detergent industry are expected to increase domestic utilization of coconut
oil. The domestic demand for VCO will remain high especially with the disclosure of the
DOST on the potential benefits of VCO on COVID-19 patients and the high possibility of
combating African Swine Flu. The same trend is expected for coir due to its wide range of
uses. However, the growth in the local demand for coco sugar may be slow-moving due
to the continued reliance on sugarcane-based sweeteners which are relatively cheaper.
The same is true for coconut water since local consumers prefer to drink the water from
fresh young nut rather than the packaged ones.
The continuing planting and replanting program, supported by the seed production and
hybridization program of the PCA is predicted to increase coconut production, breaching
16 B nuts by 2025, the country’s highest production. Participatory on-farm hybridization
using assisted pollination technique is a farmer- inclusive program that can be replicated
and upscaled to further increase our utilization of good varieties and hybrids, thus further
increasing the country’s nut production potential.
The approval of RA 11524 creating the COCONUT FARMERS AND INDUSTRY
TRUST FUND will jumpstart and sustain the process of transforming the industry (i.e.,
providing social protection and enhancing skills, streamlining farmers cooperatives
and organizations’ participation in the higher levels of the value chains, transforming
copra processing into a white copra agro-industry corridor owned and managed by
2 6 D E P A R T M E N T O F A G R I C U L T U R E P H I L I P P I N E C O C O N U T A U T H O R I T Y
farmers’ cooperatives, using hybrids and Open Pollinated Variety (OPVs) with selected
qualities, improving coconut farms through intercropping, livestock integration, and
integrated coconut processing agro-enterprises) that will eventually elevate the welfare
and income of Filipino coconut farmers while strengthening and enhancing the global
competitiveness of the coconut industry.
2 7
METHODOLOGY
The Coconut Farmers and Industry Roadmap focuses on two interlinked components -
the farmers in the production sector and the various coconut-based value chain industries
in the processing and marketing sectors. The roadmap is composed of situational
analyses, traditional and selected non-traditional products’ value chain mapping,
benchmarking, market trends analyses, SWOT analysis, and market analysis that explore
opportunities and constraints in penetrating new markets or expanding value chains of
selected products. The roadmap identifies corridors of development where farmers have
an opportunity to participate in a higher level of the value chain either by partnering
with other actors or participating as cocopreneur. It also identifies coconut technologies,
intensified farming systems, and diversified livelihood options of increasing whole farm
productivity. The roadmap’s analytical framework is schematically shown in Figure 2.1.
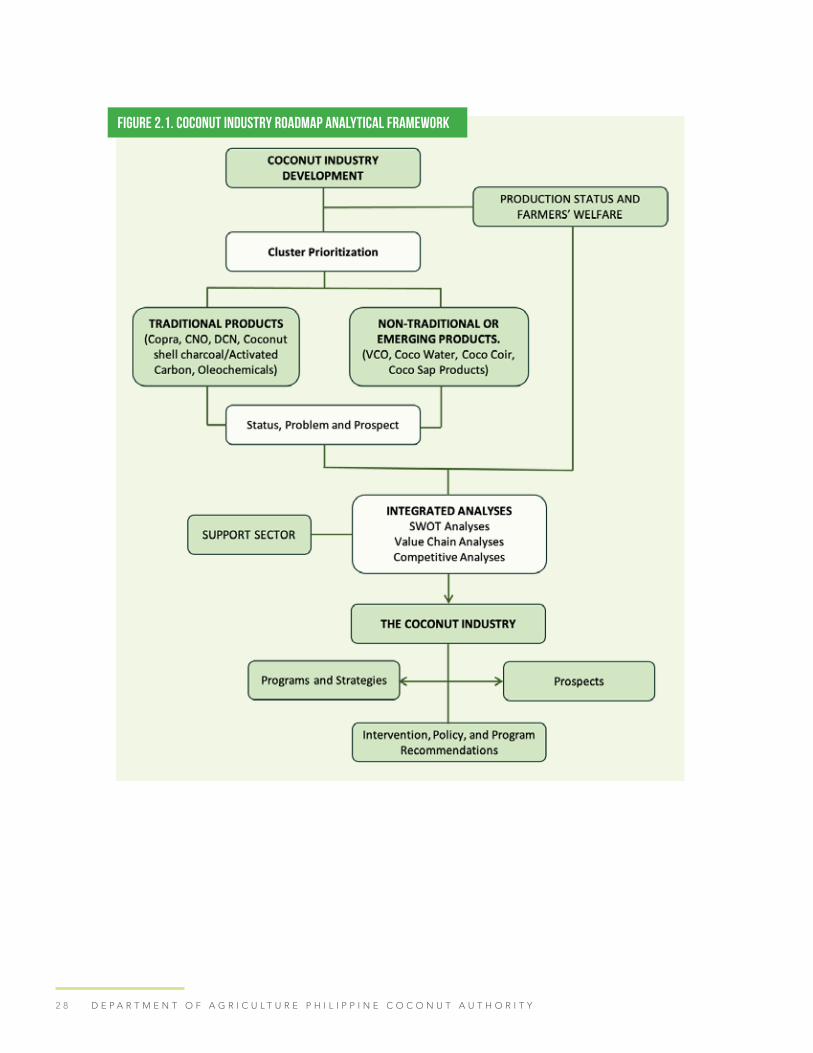
2 8 D E P A R T M E N T O F A G R I C U L T U R E P H I L I P P I N E C O C O N U T A U T H O R I T Y
Figure 2.1. Coconut industry roadmap analytical framework
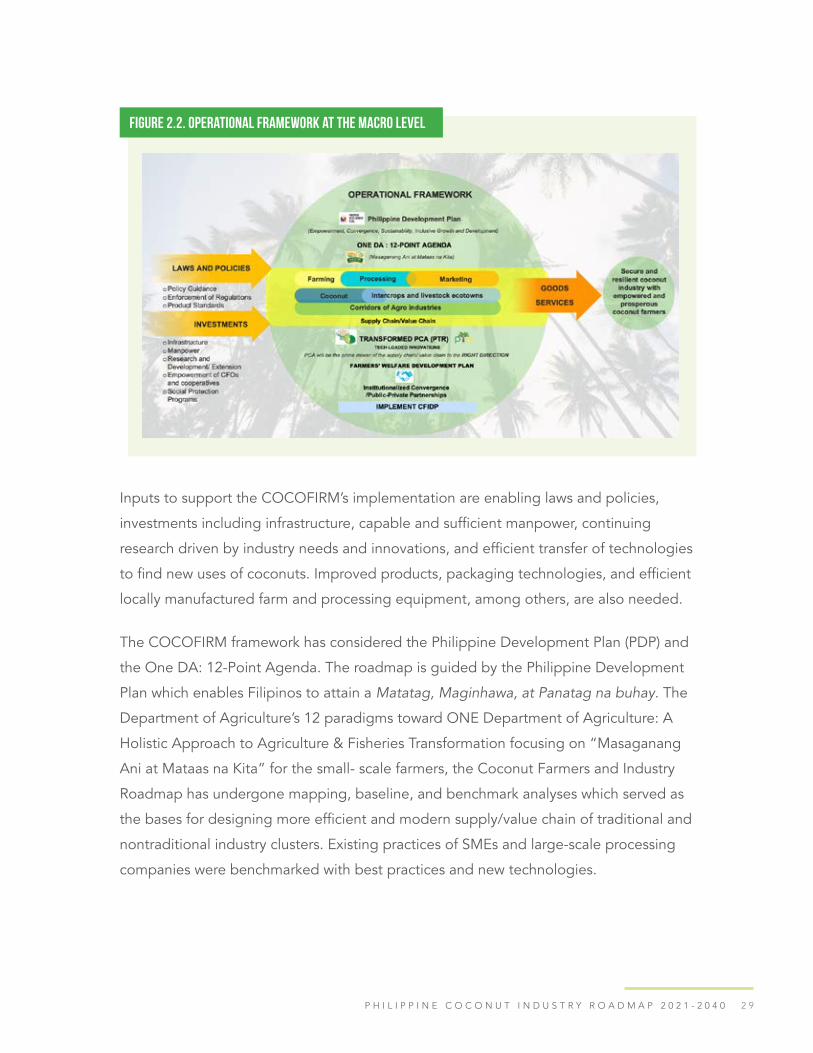
2 9P H I L I P P I N E C O C O N U T I N D U S T R Y R O A D M A P 2 0 2 1 - 2 0 4 0
Inputs to support the COCOFIRM’s implementation are enabling laws and policies,
investments including infrastructure, capable and sufficient manpower, continuing
research driven by industry needs and innovations, and efficient transfer of technologies
to find new uses of coconuts. Improved products, packaging technologies, and efficient
locally manufactured farm and processing equipment, among others, are also needed.
The COCOFIRM framework has considered the Philippine Development Plan (PDP) and
the One DA: 12-Point Agenda. The roadmap is guided by the Philippine Development
Plan which enables Filipinos to attain a Matatag, Maginhawa, at Panatag na buhay. The
Department of Agriculture’s 12 paradigms toward ONE Department of Agriculture: A
Holistic Approach to Agriculture & Fisheries Transformation focusing on “Masaganang
Ani at Mataas na Kita” for the small- scale farmers, the Coconut Farmers and Industry
Roadmap has undergone mapping, baseline, and benchmark analyses which served as
the bases for designing more efficient and modern supply/value chain of traditional and
nontraditional industry clusters. Existing practices of SMEs and large-scale processing
companies were benchmarked with best practices and new technologies.
Figure 2.2. Operational framework at the macro level

3 0 D E P A R T M E N T O F A G R I C U L T U R E P H I L I P P I N E C O C O N U T A U T H O R I T Y
A transformed PCA (PTR) will be the major driver moving the supply chains to the right,
producing goods and services for inclusive growth and prosperity of all stakeholders,
harnessing convergence, and partnerships with non-government agencies (NGAs),
academe, industry, and public-private partnerships (PPPs). The goal is to apply the 12
paradigms to lift the coconut farmers out of poverty and improve their competitiveness,
expand markets for traditional and nontraditional products, and explore new products
and markets.
Figure 2.3. Operating framework at the sectoral level
The Department of Agriculture’s 12 paradigms toward ONE Department of Agriculture:
A Holistic Approach to Agriculture & Fisheries Transformation focusing on “Masaganang
Ani at Mataas na Kita” for the small- scale farmers, the Coconut Farmers and Industry
Roadmap has undergone mapping, baseline, and benchmark analyses which served as
the bases for designing more efficient and modern supply/value chain of traditional and
nontraditional industry clusters. Existing practices of SMEs and large-scale processing
companies were benchmarked with best practices and new technologies.
A transformed PCA (PTR) will be the major driver moving the supply chains to the right,
producing goods and services for inclusive growth and prosperity of all stakeholders,
harnessing convergence and partnerships with non-government agencies (NGAs),

3 1P H I L I P P I N E C O C O N U T I N D U S T R Y R O A D M A P 2 0 2 1 - 2 0 4 0
academe, industry, and public-private partnerships (PPPs). The goal is to apply the 12
paradigms to lift the coconut farmers out of poverty and improve their competitiveness,
expand markets for traditional and nontraditional products, and explore new products
and markets.
Situational AnalysisThere are many studies on various coconut value chains and coconut industry situationer.
Consolidated baseline studies and information on production, utilization and markets,
and trends in supply- demand dynamics and trade were used for initial diagnostics from
which the core roadmap document was developed. This core document was used to
target outcomes for coconut farmers and coconut communities, to solicit inputs from
stakeholders in various value chain industry clusters, and to develop strategies for
increased and sustainable production and competitiveness of the various industry value
chains.
Secondary data from the United Coconut Association of the Philippines (UCAP), the
Philippine Statistics Authority (PSA) and the Philippine Coconut Authority (PCA) were
used to determine the national coconut production trend from 2009 – 2019. The data
and production trends were used to establish the current state of coconut farming in
the Philippines, and to evaluate the immediate outcome of several government projects
aimed at increasing coconut productivity. These projects include hybridization and
rehabilitation (planting and replanting) programs. Secondary data from past stakeholder
consultations were also reviewed and considered as solicited issues and concerns of
coconut farmers throughout the years.
Primary and secondary data were also collected from 2014 to 2019 Gawad Saka
Awardees. These data sets were used as benchmark for good agricultural practices (GAP)
in coconut farming.
Stakeholders’ ConsultationsPCA conducted farmers’ consultations in Luzon, Visayas, Davao Islands, and Zamboanga
Islands. For Luzon Island-wide consultation, the participants were composed of farmers

3 2 D E P A R T M E N T O F A G R I C U L T U R E P H I L I P P I N E C O C O N U T A U T H O R I T Y
and farmers’ representatives from Aurora, Batangas, Laguna, Quezon, Camarines
Norte, Camarines Sur, Marinduque, Sorsogon, and Oriental Mindoro. In the Visayas
region, the consultation was attended by 72 attendees including 54 coconut farmers
and representatives. Present also were members of small farmers’ organizations from
Tacloban, Leyte, Cebu, Samar, Northern Samar Eastern Samar, Negros Oriental, Negros
Occidental, Bohol, Antique,
Capiz, Iloilo, and Aklan. From the southern part of the country, in Davao Islands, the
participants in the farmers’ consultations were composed of farmers and farmers’
representatives from the provinces of Davao del Sur, Davao Oriental, Davao del Norte,
Dinagat Islands, North Cotabato, Cotabato, Surigao del Sur, and Agusan del Sur; from
organizations KAMMPIL, PAKISAMA, KATARUNGAN, AMMMA-KATIPUNAN, LAKAMBINI,
PKMP, IRDF, KADAMO, Kilusang Pagbabago, and others, as well as various small coconut
farmers organizations (SCFOs). On the other hand, farmers and farmers’ representatives
from the provinces of Davao Oriental, Sulu, Zamboanga, Zamboanga del Norte,
Zamboanga del Sur, Basilan, Maguindanao, Lanao del Norte, and Misamis Occidental
participated in the Zamboanga Islands consultation. Trends and relationship between the
solicited farmers’ issues and yearly production data were determined. Primary data from
interviews were used for data validation and cross-referencing. The study employed the
tracing method to identify the survey respondents. The sample processors identified their
coconut trader respondents. The farmers interviewed were identified by coconut traders
as their suppliers.
Technical consultation with the academe was conducted last May 18, 2021. Seven
officials from PCA attended, together with representatives from three universities in
the Philippines: University of the Philippines Los Baños (UPLB), University of Southern
Mindanao (USM), and Visayas State University (VSU). Five experts comprised the UPLB
team, one from USM, and two from VSU. The result of the consultation was beneficial to
the COCOFIRM Program.
Recommendation and Stakeholder Validation
The insights from all the gathered primary and secondary data were used to come up with
the recommendations and strategies for increasing the productivity, income, sustainability,

3 3P H I L I P P I N E C O C O N U T I N D U S T R Y R O A D M A P 2 0 2 1 - 2 0 4 0
and for ‘agribusinessizing’ of the coconut farming sector. The recommendations
and strategies were validated through stakeholders’ consultations. The validated
recommendations and strategies were then included in the Coconut Farmers and
Industry Roadmap.
Strategies for Increasing Productivity, Income and Sustainability of the Coconut Farming SectorFor the coconut-based industries to move forward, maintain viability and gain a
competitive advantage in the global market, there must be assurance of a steady supply
of high-quality raw materials from the production sector. No amount of improvement in
the efficiency of the other sectors would matter without an adequate volume of quality
nuts from the supply line. All efforts aimed at inclusive growth and sustained profitability
of the various value chains of the coconut industry should anchor on: (1) improving the
productivity, efficiency, profitability, and sustainability of coconut farms despite climatic
extremes and uncertainties and a highly volatile world vegetable oil market, and (2) uplifting
the welfare and alleviating poverty of the coconut farm households and communities.
Increasing coconut and total farm productivity can be achieved in three ways: (1) expansion
to new areas, (2) increasing yield through agronomic interventions, and (3) increasing land-
use efficiency through intensification and diversification. Good agricultural practices should
adhere to the ethical source and sustainable practices aligned with the Philippines’ major
export markets’ standards. Data on the KAANIB enterprise development program (KEDP)
of PCA were processed, disaggregated by enterprise (processing, crops, livestock) and
their combinations, then by crop for intercropping, by animal species for livestock, and
by-product for coconut processing to identify the best performing region/province and
community farmers organizations (CFOs).

3 4 D E P A R T M E N T O F A G R I C U L T U R E P H I L I P P I N E C O C O N U T A U T H O R I T Y
Strategies for Agribusinessizing the Coconut IndustryThe following strategies should be promoted and sufficiently supported technically and
financially, and managed professionally:
• identifying corridors for particular coconut agro-enterprises for rural development;
• capacitating farmers to be cocopreneurs; and
• networking farms into development clusters that will produce suitable and marketable
intercrops or value adding processes and services at a commercially viable scale
Successful and new coconut-based farming systems models from PCA’s KAANIB projects
were identified and recommended for replication and scaling up into agribusiness
corridors and demo learning sites for other farmers and CFOs. The recommendations
considered compatibility with the Philippine Development Plan and the 12 DA paradigms
to level up agriculture.
Mapping and Analysis of Coconut Value Chain Clusters for Expo rt MarketsThis section covers supply/value chain analyses, benchmarking, analysis of the
competitiveness, and market analyses (current global and domestic demand situation) of
the identified coconut products.
Separate value chain maps were prepared for copra/coconut oil, desiccated coconut,
activated carbon/coconut shell, virgin coconut oil, coco coir, coconut water, and coconut
sugar sub-sectors/clusters. The value chain maps of various industry clusters of coconut
cover five major components/segments: input supply, coconut production, processing,
and marketing for domestic consumption. Key participants involved the input suppliers,
farmers, local buyers, assemblers/consolidators, processors, brokers, exporters, and
consumers. Support service institutions or business service providers were also identified.

3 5P H I L I P P I N E C O C O N U T I N D U S T R Y R O A D M A P 2 0 2 1 - 2 0 4 0
The existing supply chains and value chains for different coconut products were assessed
through baseline and sectoral consultations. Survey questionnaires were prepared and
distributed for sectoral consultation with coconut processors, traders and consolidators,
farmers, coconut federations, and various industry associations. Endorsement from
the PCA administration was requested to solicit cooperation from key informants in
responding to the questionnaires/interview schedules. The total count of respondents
from Luzon, Visayas, and Mindanao consisted of 48 farmers, ten traders, two CNO
processors, two DCN processors, two activated carbon processors, one VCO processor,
two coir processors, 11 coco sugar processors, and one coconut water processor.
The COCOFIRM Program mapped out the different actors performing the various
processes along the value chain. The Program also estimated the value addition and
profit margin at each stage and stakeholders’
share in the total value of each coconut product. Cost and returns analyses for each
key player in the value chain for each coconut sub-sector/cluster were conducted.
Using the cost-build-up method, the build-up of total costs (or accumulated total costs)
at each stage of the value chain was determined. The unit added cost and the unit
added cost share (in %) of each player in the value chain were estimated. In addition,
the unit added profit and the unit added profit share (in %) of each key player in the
value chain were computed. The financial position of the different players in the value
chain of each coconut industry cluster was determined to ascertain who among the key
players benefitted the most. The constraints in specific segments of the value chain for
each coconut product were identified and analyzed for value chain development and
opportunities as entry points for introducing interventions or upgrading strategies to key
players. Strategies were recommended to address key constraints limiting the efficiencies
at each node of the value chain, and to upscale and modernize the processing sector.
The regional product supply chain maps were obtained from PCA’s regional offices.
Recognizing the potential and the magnitude of coconut resources endowed for each
region, the flow of coconut farm products at the regional level was tracked together
with the number of intermediaries present in the area. The processors for each coconut
product established in the region were tallied and the products’ market destinations

3 6 D E P A R T M E N T O F A G R I C U L T U R E P H I L I P P I N E C O C O N U T A U T H O R I T Y
were identified. The product supply chain maps, specifically the inventory of resources
and the number of operating processors, were linked with the proposed strategies and
interventions.
Local benchmarking of coconut farms was also conducted. At the farm level, the
benchmark/most efficient farms were compared with the typical/model farms using
performance indicators such as:
• Quantitative indicators – coconut productivity, material input usage, and labor use;
cost and returns and;
• Qualitative indicators – use of improved coconut varieties, improved farm practices.
For global benchmarking of coconut farms, comparison of coconut farm productivity, farm
practices, and government support between the Philippines and other major coconut
producing countries (e.g., Indonesia) was done. Moreover, global benchmarking with
competing countries was employed for selected traditional and non-traditional coconut
products. For coconut processed products, comparison in terms of best processing
practices/good manufacturing practices, market network, etc. was conducted.
Depending on the availability of data, the competitiveness of a given exportable
coconut product covered in this report was assessed and measured using a simple price
comparison approach, domestic resource cost analysis (DRC using financial prices), and
the revealed comparative advantage (RCA) analysis. In the simple price comparison
approach, a ratio greater than one between the export parity price (Px) and the domestic
wholesale price (Pd) implies that the traditional/nontraditional coconut product under
review is price competitive in the export market. Competitive advantage indicates
whether a country, like the Philippines, can successfully compete in the trading of a
commodity in the international markets. It shows the relative position of the Philippines
for a given coconut product against other countries. Previous studies which utilized the
DRC methodology in determining the comparative advantage of Philippine coconut oil
were adopted in this report. In the DRC approach, the estimated DRC was divided by
the official exchange rate (OER) to arrive at the Resource Cost Ratio (RCR), which is an
efficiency measure of competitive
3 7P H I L I P P I N E C O C O N U T I N D U S T R Y R O A D M A P 2 0 2 1 - 2 0 4 0
advantage. An RCR less than one implies that the country has a competitive advantage in
producing and exporting the coconut product under review (i.e., coconut oil). An estimated
RCA index greater than one indicates that the country has a comparative advantage in
exporting the coconut product under review.
The trends in production, prices, domestic utilization, and trade of traditional and selected
nontraditional coconut products were analyzed. Market analyses of the market potential/
prospects of coconut oil, desiccated coconut, activated carbon/coconut shell, oleochemicals,
virgin coconut oil, coco coir, coco water, and coconut sugar in the domestic and export
markets were also conducted. Market demand drivers and the factors that have a negative
effect on the growth in demand for the coconut product under review were also identified.
Market opportunities penetrating the coconut green export market were explored.
Enablers and Constraints to Achieving the Vision of the Coconut IndustryDifferent stakeholders in the Philippine coconut industry, consisting of coconut farmers’
groups, officers, and members of different coconut industry associations for traditional
and nontraditional coconut products included in the study, and other stakeholders in the
industry were consulted. The stakeholders identified the internal factors – strengths (S) and
weaknesses (W), and the external factors – opportunities (O), and threats (T) affecting the
performance of the industry as a whole and each specific sub-sector/cluster. These sub-
sectors consist of copra/coconut oil, desiccated coconut, coco coir, coco shell charcoal/
activated carbon, oleochemicals, virgin coconut oil, coco water, and coconut sap sugar.
SWOT analysis was useful in helping the coconut industry face and address its challenges.
The COCOFIRM Program identified the technical, socio-economic, cultural, environmental,
and institutional factors, as well as government policies, that constrain farmers/farmers’
groups from adopting new production and processing technologies that would limit their
transformation into cocopreneurs. These constraining factors were assessed to develop
strategies to overcome them.

3 8 D E P A R T M E N T O F A G R I C U L T U R E P H I L I P P I N E C O C O N U T A U T H O R I T Y
Existing coconut programs of PCA were reviewed to determine their alignment with
the Department of Agriculture’s thrust to provide Filipino farmers “Ani at Kita”. The
accomplishments and the problems encountered in the implementation of these
development programs were examined. Mechanism to provide continuity of support
to demand-driven and pro-active research, developing science-based technologies,
processes and systems were recommended.
Institutional analysis of the PCA structure was conducted to determine the agency’s
capability to carry out the new vision and mission of the industry. As the instrumentality
of the state in the coconut sector, the PCA must bridge the farming, manufacturing, and
trading sectors.
Relevant government legislations and policies that have either facilitated or hindered the
development of the Philippine coconut industry in general and its specific sub-sectors
were assessed. The hindering policies were recommended for reformulation or revision.

3 9
INDUSTRY SITUATION & OUTLOOK
Coconut Farm SectorThe Philippines, Indonesia, and India accounted for 74.6% of the world’s coconut
production of 62.46 M metric tons (MT) in nut terms in 2019 (Table 3.1). The Philippines
is the second largest producer of coconut in the world after Indonesia. Indonesia’s
volume of coconut production was 17.13 MMT in the same year, which was higher than
the Philippines’ coconut production volume of 14.77 MMT and India’s 14.68 MMT. The
world’s area planted to coconut in the same year was placed at 11.8 M hectares (ha), with
the Philippines having the largest coconut area (3.65 M ha), followed by Indonesia at 3.5
M ha, and India at 2.15 M ha.
Table 3.1. World coconut production and area by major producing countries, 2019 (FAOStat, 2019)
Coconut Production Coconut Area
Country Volume MMT % Share M ha % ShareIndonesia 17.13 27.4 3.50 29.7
Philippines 14.77 23.6 3.65 30.9
India 14.68 23.5 2.15 18.2
World 62.46 11.80

4 0 D E P A R T M E N T O F A G R I C U L T U R E P H I L I P P I N E C O C O N U T A U T H O R I T Y
Figure 3.1. Top seven coconut-producing regions in terms of hectarage planted to coconut in the Philippines
Source: PSA, 2019
Figure 3.2. Volume of coconut production in top eight coconut producing regions in the Philippines
Source: PSA, 2019

4 1P H I L I P P I N E C O C O N U T I N D U S T R Y R O A D M A P 2 0 2 1 - 2 0 4 0
Coconut occupies about 27% of the country’s arable land and dominates the landscape
of 69 out of 82 provinces with a total of 347 M bearing palms in 2019 (PSA, 2020). Among
the country’s 16 administrative regions, CALABARZON had the largest coconut hectarage
(485,197 ha with 13.3% share), followed by Zamboanga Peninsula, Bicol Region, Davao
Region, Eastern Visayas, BARMM, and Northern Mindanao (Figure 3.1). About 80% of
coconut lands are monocropped and 1.78 M ha or 50% of coconut areas are nutrient
deficient (Rosales, 2020).
Coconut production varies among regions. Davao Region posted the highest coconut
production of 1.93 M MT (13.08% share) in 2019 (Figure 3.2). Northern Mindanao ranked
second to Davao Region, followed by Zamboanga Peninsula, CALABARZON, BARMM,
Bicol Region, SOCCSKSARGEN, and Eastern Visayas (Figure 3.2).
The national average coconut yield was only 44 nuts/tree per year in 2019 (PSA, 2021).
This is considerably much lower than the coconut yield of 200-400 nuts per tree in
India and Brazil (Dar, 2019) and the potential yield of 150 nuts/tree obtainable from
hybrid coconut varieties. Low coconut productivity in the country could be attributed to
the slow adoption of recommended cultural management practices, persistent use of
unselected and genetically poor planting materials, and an increasing number of senile
and unproductive trees that need to be replaced. Based on data reported in the National
Coconut Farmers Registry System (NCFRS), about 10% of the total number of coconut
trees in the country are senile.
Coconut productivity also varies significantly among islands and coconut- producing
regions. The island of Mindanao registered the highest average coconut yield of 50
nuts per tree in 2019 compared with Luzon and Visayas with 34 and 36 nuts per tree,
respectively.
The high coconut yield in Mindanao could be explained by its highly sustainable rainfall
and their younger tree population and more optimal tree spacing than those in Luzon
and Visayas. A comparison of coconut productivity among regions showed that nine out
of the 16 administrative regions posted coconut yield levels above the national average
coconut yield. SOCCSKSARGEN registered the highest average coconut productivity at
66 nuts per tree, followed by Davao Region and Northern Mindanao at 57 nuts per tree

4 2 D E P A R T M E N T O F A G R I C U L T U R E P H I L I P P I N E C O C O N U T A U T H O R I T Y
Figure 3.3. Coconut yields in nine regions with high coconut productivity levels in the Philippines
Source: PSA, 2019
Figure 3.4. Percent distribution of 2.54 M coconut farmers by farm tenure in the Philippines, 2018
Source: NCFRS
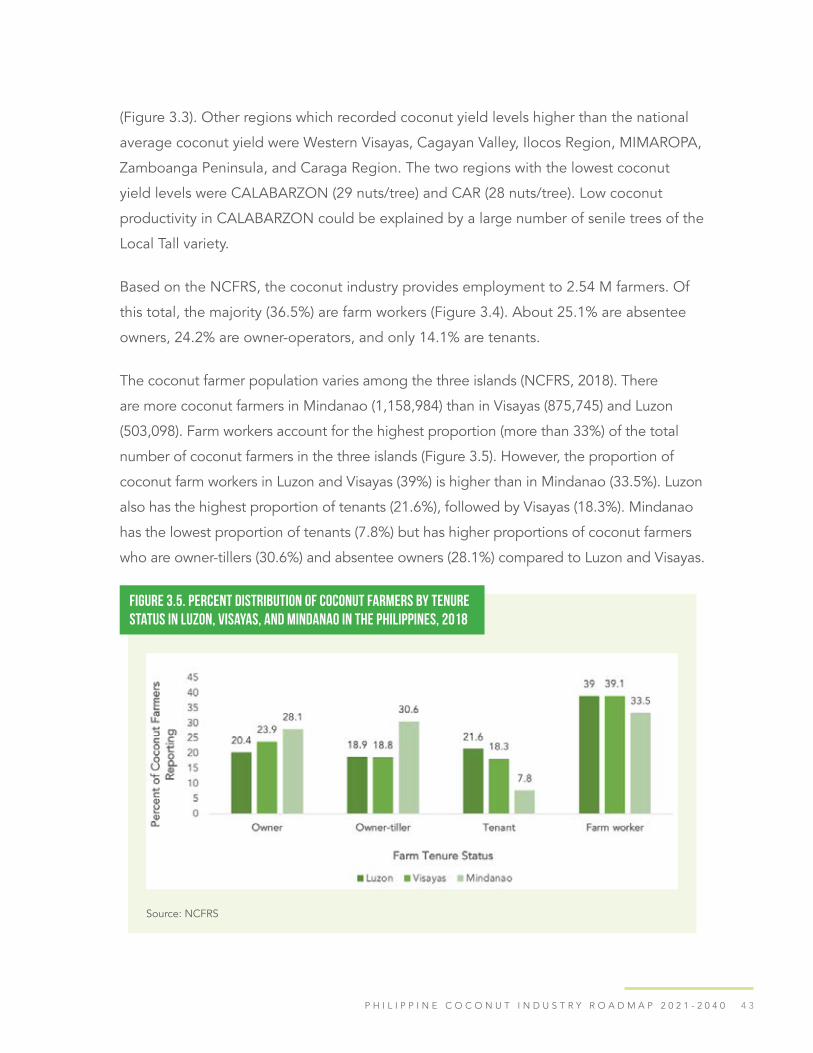
4 3P H I L I P P I N E C O C O N U T I N D U S T R Y R O A D M A P 2 0 2 1 - 2 0 4 0
(Figure 3.3). Other regions which recorded coconut yield levels higher than the national
average coconut yield were Western Visayas, Cagayan Valley, Ilocos Region, MIMAROPA,
Zamboanga Peninsula, and Caraga Region. The two regions with the lowest coconut
yield levels were CALABARZON (29 nuts/tree) and CAR (28 nuts/tree). Low coconut
productivity in CALABARZON could be explained by a large number of senile trees of the
Local Tall variety.
Based on the NCFRS, the coconut industry provides employment to 2.54 M farmers. Of
this total, the majority (36.5%) are farm workers (Figure 3.4). About 25.1% are absentee
owners, 24.2% are owner-operators, and only 14.1% are tenants.
The coconut farmer population varies among the three islands (NCFRS, 2018). There
are more coconut farmers in Mindanao (1,158,984) than in Visayas (875,745) and Luzon
(503,098). Farm workers account for the highest proportion (more than 33%) of the total
number of coconut farmers in the three islands (Figure 3.5). However, the proportion of
coconut farm workers in Luzon and Visayas (39%) is higher than in Mindanao (33.5%). Luzon
also has the highest proportion of tenants (21.6%), followed by Visayas (18.3%). Mindanao
has the lowest proportion of tenants (7.8%) but has higher proportions of coconut farmers
who are owner-tillers (30.6%) and absentee owners (28.1%) compared to Luzon and Visayas.
The distribution of coconut farmers by farm tenure likewise varies among administrative Figure 3.5. Percent distribution of coconut farmers by tenure status in Luzon, Visayas, and Mindanao in the Philippines, 2018
Source: NCFRS
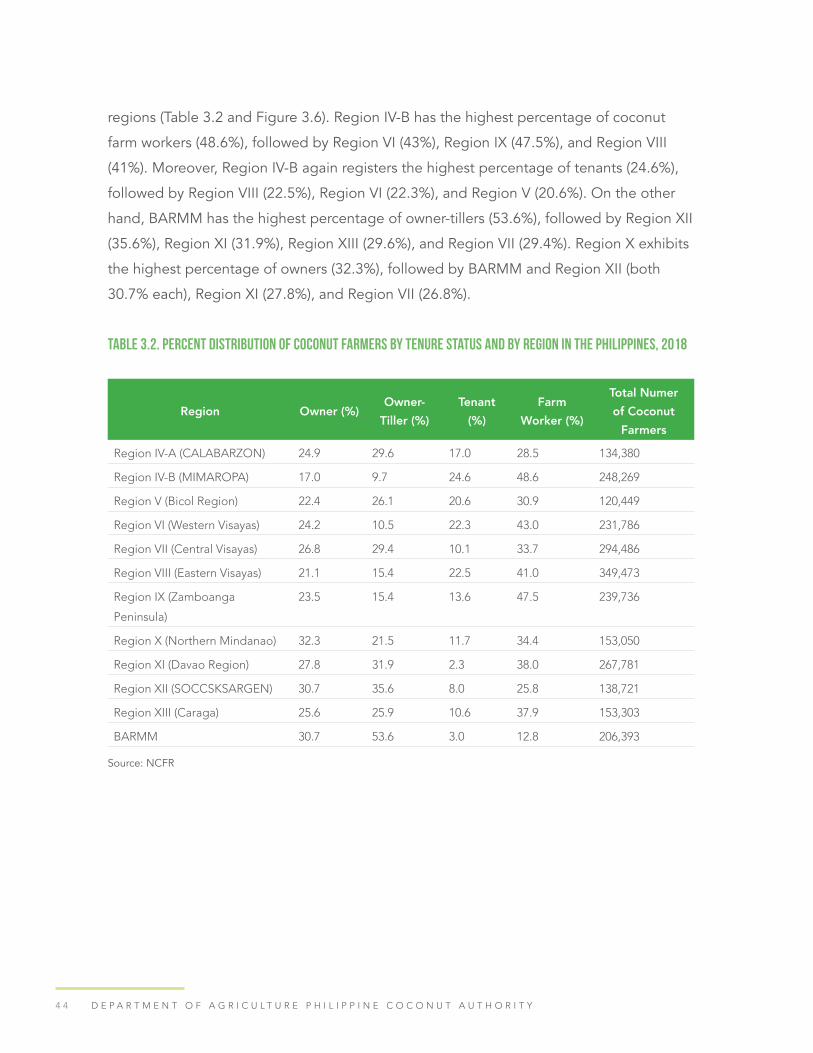
4 4 D E P A R T M E N T O F A G R I C U L T U R E P H I L I P P I N E C O C O N U T A U T H O R I T Y
regions (Table 3.2 and Figure 3.6). Region IV-B has the highest percentage of coconut
farm workers (48.6%), followed by Region VI (43%), Region IX (47.5%), and Region VIII
(41%). Moreover, Region IV-B again registers the highest percentage of tenants (24.6%),
followed by Region VIII (22.5%), Region VI (22.3%), and Region V (20.6%). On the other
hand, BARMM has the highest percentage of owner-tillers (53.6%), followed by Region XII
(35.6%), Region XI (31.9%), Region XIII (29.6%), and Region VII (29.4%). Region X exhibits
the highest percentage of owners (32.3%), followed by BARMM and Region XII (both
30.7% each), Region XI (27.8%), and Region VII (26.8%).
Table 3.2. Percent distribution of coconut farmers by tenure status and by region in the Philippines, 2018
Region Owner (%)Owner-
Tiller (%)Tenant
(%)Farm
Worker (%)
Total Numer of Coconut
Farmers
Region IV-A (CALABARZON) 24.9 29.6 17.0 28.5 134,380
Region IV-B (MIMAROPA) 17.0 9.7 24.6 48.6 248,269
Region V (Bicol Region) 22.4 26.1 20.6 30.9 120,449
Region VI (Western Visayas) 24.2 10.5 22.3 43.0 231,786
Region VII (Central Visayas) 26.8 29.4 10.1 33.7 294,486
Region VIII (Eastern Visayas) 21.1 15.4 22.5 41.0 349,473
Region IX (Zamboanga
Peninsula)
23.5 15.4 13.6 47.5 239,736
Region X (Northern Mindanao) 32.3 21.5 11.7 34.4 153,050
Region XI (Davao Region) 27.8 31.9 2.3 38.0 267,781
Region XII (SOCCSKSARGEN) 30.7 35.6 8.0 25.8 138,721
Region XIII (Caraga) 25.6 25.9 10.6 37.9 153,303
BARMM 30.7 53.6 3.0 12.8 206,393
Source: NCFR

4 5P H I L I P P I N E C O C O N U T I N D U S T R Y R O A D M A P 2 0 2 1 - 2 0 4 0
Based on the 2002 Census of Agriculture, the average coconut farm size in 2001 was 2.4
ha. Since the approval of the Comprehensive Agrarian Reform Program Extension with
Reforms (CARPER) in 2009, coconut farms appear to have further shrunk in size. As shown
in Figure 3.7, the majority (55%) of the coconut farmers in the Philippines operate very small
farms (≤1.0 ha). Only 7.2% of the coconut farmers in the country operate more than 4.0 ha.
Figure 3.6. Percent distribution of coconut farmers by tenurial status and by region in the Philippines, 2018
Source: NCFRS
Figure 3.7. Distribution of coconut farms by farm size range, Philippines, 2018
Source: NCFRS
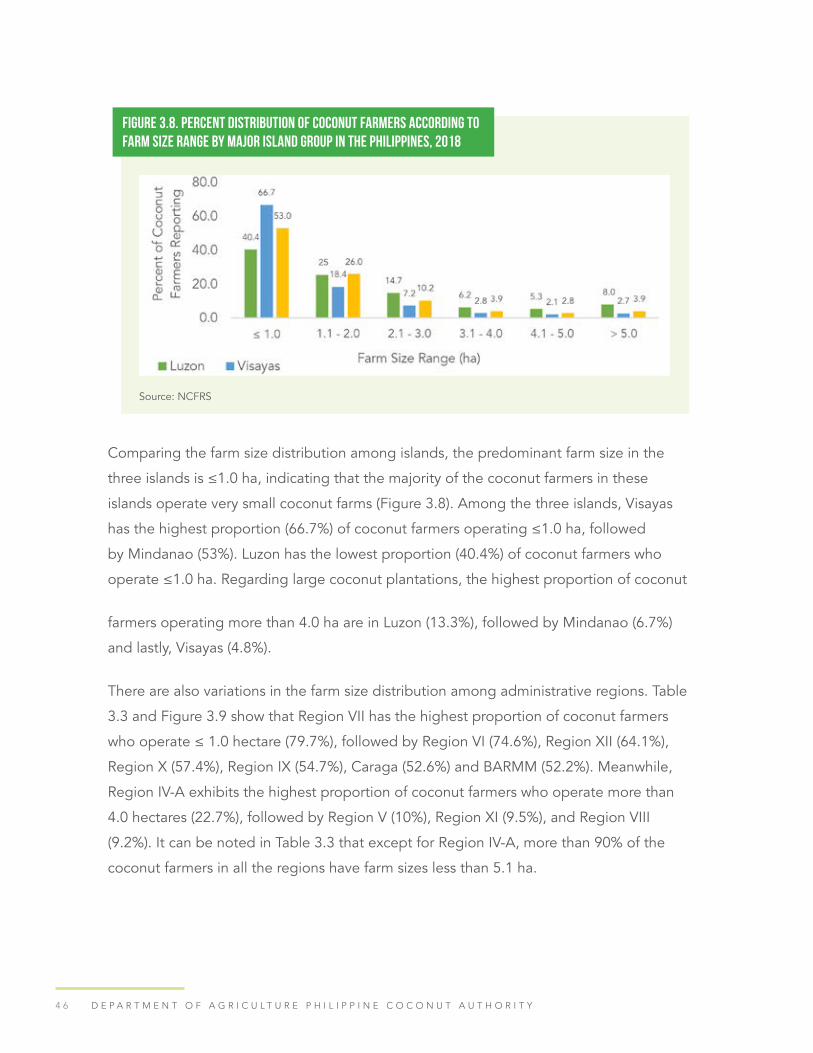
4 6 D E P A R T M E N T O F A G R I C U L T U R E P H I L I P P I N E C O C O N U T A U T H O R I T Y
Comparing the farm size distribution among islands, the predominant farm size in the
three islands is ≤1.0 ha, indicating that the majority of the coconut farmers in these
islands operate very small coconut farms (Figure 3.8). Among the three islands, Visayas
has the highest proportion (66.7%) of coconut farmers operating ≤1.0 ha, followed
by Mindanao (53%). Luzon has the lowest proportion (40.4%) of coconut farmers who
operate ≤1.0 ha. Regarding large coconut plantations, the highest proportion of coconut
farmers operating more than 4.0 ha are in Luzon (13.3%), followed by Mindanao (6.7%)
and lastly, Visayas (4.8%).
There are also variations in the farm size distribution among administrative regions. Table
3.3 and Figure 3.9 show that Region VII has the highest proportion of coconut farmers
who operate ≤ 1.0 hectare (79.7%), followed by Region VI (74.6%), Region XII (64.1%),
Region X (57.4%), Region IX (54.7%), Caraga (52.6%) and BARMM (52.2%). Meanwhile,
Region IV-A exhibits the highest proportion of coconut farmers who operate more than
4.0 hectares (22.7%), followed by Region V (10%), Region XI (9.5%), and Region VIII
(9.2%). It can be noted in Table 3.3 that except for Region IV-A, more than 90% of the
coconut farmers in all the regions have farm sizes less than 5.1 ha.
Figure 3.8. Percent distribution of coconut farmers according to farm size range by major island group in the Philippines, 2018
Source: NCFRS

4 7P H I L I P P I N E C O C O N U T I N D U S T R Y R O A D M A P 2 0 2 1 - 2 0 4 0
Table 3.3. Percent distribution of coconut farmers by farm size and by region in the Philippines, 2018
Region ≤1.0ha
1.1-2.0ha
2.1-3.0ha
3.1-4.0ha
4.1-5.0Ha
≥ 5.1ha
Total Number Coconut Farmers
Region IV-A
(CALABARZON)
30.9 23.5 15.2 7.8 7.5 15.2 248,269
Region IV-B
(MIMAROPA)
51.3 24.9 11.4 4.5 3.6 4.2 134,380
Region V (Bicol Region) 36.7 28.2 18.5 6.6 5.0 5.0 120,449
Region VI (Western
Visayas)
74.6 15.8 5.1 1.6 1.4 1.5 231,786
Region VII (Central
Visayas)
79.7 12.8 3.8 1.4 1.0 1.3 294,486
Region VIII (Eastern
Visayas)
46.2 27.0 12.4 5.2 4.0 5.2 349,473
Region IX (Zamboanga
Peninsula)
54.7 24.8 9.8 4.2 2.7 3.8 239,736
Region X (Northern
Mindanao)
57.4 23.5 9.0 3.7 2.7 3.8 153,050
Region XI (Davao
Region)
44.8 28.8 12.5 4.5 3.2 6.3 267,781
Region XII
(SOCCSKSARGEN)
64.1 21.1 7.6 2.9 2.0 2.3 138,721
Region XIII (Caraga) 52.6 26.6 10.7 3.9 3.1 3.2 153,303
BARMM 52.2 27.8 10.1 4 2.9 2.9 206,393
Source: NCFRS

4 8 D E P A R T M E N T O F A G R I C U L T U R E P H I L I P P I N E C O C O N U T A U T H O R I T Y
Figure 3.9. Distribution of coconut farms by farm size range and region in the Philippines, 2018
Source: NCFRS
Figure 3.10. Percent distribution of coconut farmers according to income range in the Philippines, 2018
Source: NCFRS
Coconut farmers are considered among the poorest in the country. They accounted for
about 60% of the rural poor and have an average annual income of PHP 20,000 per
hectare (DAR, 2019). The income distribution in the coconut farm sector would show a
better picture of the extent of poverty among the coconut farmer
4 9P H I L I P P I N E C O C O N U T I N D U S T R Y R O A D M A P 2 0 2 1 - 2 0 4 0
population than the average annual farm income figure. As shown in Figure 3.10,
most of the 2.54 M coconut farmers in the country earn less than PHP 10,000 per year.
Those who fall in this income range are largely farm workers and tenants. In 2019, the
prevailing wage rate in the coconut farm sector was only PHP 338.72 per day (PSA, 2020).
Approximately 26% of the coconut farmers in the country have low annual incomes
ranging from PHP 10,001 to PHP 30,000. Only 5.6% of the coconut farmers earn more
than PHP 100,000 per year.
This great inequality in the annual incomes among small coconut farmers has profound
policy implications on food security and the alleviation of poverty. As defined by NEDA,
the food threshold expenditure for a family of five is PHP 90,630 per annum (PSA, 2018).
This food expenditure is estimated to cover the minimum 2,200 kcal per capita per year
of household members to be able to perform their basic human functions (FNRI, 2000).
Using the economic carrying capacity ratio decision criteria developed by Gonzales et al.
(2000), the annual income range among small coconut farmers implies that 92% of the
coconut farmers in the NCFRS are food insecure with a carrying capacity ratio of less than
one, ranging from 0.11 to 0.88. The carrying capacity ratio refers to the annual income
divided by the food threshold. The farmers, therefore, need to enhance their current
household income from a range of 12% to 100% of their current annual income to be at
least neutrally food secure.
The baseline findings further showed that only 5.6% of the coconut farmers have annual
income levels that can cover their food subsistence requirement and may be close to
covering their poverty threshold expenditures of PHP 129,065 per year for a family of five
(Figure 3.10). The regional data discussed below show different levels of annual income
variability, but they support the national situation on coconut farmers’ annual income
variability.

5 0 D E P A R T M E N T O F A G R I C U L T U R E P H I L I P P I N E C O C O N U T A U T H O R I T Y
A comparison of the income distribution among the three major island groups shows
that Luzon exhibited the highest proportion (73%) of coconut farmers who earn less than
PHP 10,000 per year, followed by Visayas (51.3%). Mindanao posted the least proportion
(31.4%) of the coconut farmer population in that island who earn less than PHP 10,000
per year (Figure 3.11). This trend could be explained by the higher proportions of coconut
farm workers and tenants in Luzon and Visayas than in Mindanao. Conversely, a higher
proportion (7.5%) of the coconut farmer population in Mindanao reported an annual
income of more than PHP 100,000 compared with Visayas (4.3%) and Luzon (2.7%).
This could be attributed to the higher proportion of the coconut farmer population in
Mindanao who are owners. Farm owners can freely make decisions pertaining to their
practice of intercropping, livestock integration, and coconut processing and can easily
access credit support from formal institutions compared with farm workers and tenants.
The foregoing analysis reveals that coconut farmers in Luzon are the poorest in the
country’s coconut farm sector while the coconut farmers in Mindanao are the most better
off financially.
As shown in Table 3.4 and Figure 3.12, the distribution of income of coconut farmers
also varies among administrative regions. Region 6 has the highest percentage (83.8%)
of coconut farmers with less than PHP 10,000/year of coconut farm income, followed
Figure 3.11. Percent distribution of coconut farmers according to income range by major island group in the Philippines, 2018
Source: NCFRS

5 1P H I L I P P I N E C O C O N U T I N D U S T R Y R O A D M A P 2 0 2 1 - 2 0 4 0
by Region IV-B (78.9%), Region XII (69.4%), Region V (67.8%), Region VIII (54.6%), and
Region IV-A (46%). In contrast, Region X has the highest percentage (15.2%) of coconut
farmers with more than PHP 100,000/ year of coconut farm income followed by Region XI
(10.6%), Region VII (9.5%), and BARMM (8.6%).
Table 3.4. Percent distribution of coconut farmers by farm income range and by region in the Philippines, 2018
Percent of Coconut Farmers Reporting
Region <10,00010,0001 - 20,000
20,001 -
30,000
30,001 -
50,000
50,001 -
60,000
60,0001 - 80,000
80, 001 - 100,000
>1000,001
Region IV-A
(CALABAR-
ZON)
46.0 30.2 10.8 10.9 2.9 2.8 2.1 4.3
Region IV-B
(MIMAROPA)
48.9 6.7 4.2 4.3 1.3 1.6 1.0 1.9
Region V
(Bicol Region)
67.8 8.2 5.9 7.8 2.6 2.8 1.6 3.5
Region VI
(Western
Visayas)
83.8 4.3 3.3 4.4 0.9 1.5 0.4 1.5
Region VII
(Central
Visayas)
27.5 14.1 10.8 10.4 9.3 9.3 9.2 9.5
Region VIII
(Eastern
Visayas)
54.6 19.4 10.8 8.5 2.1 2.1 1.0 1.5
Region IX
(Zamboanga
Peninsula)
22.8 22.1 17.7 16.3 5.0 5.9 3.6 6.6
Region X
(Northern
Mindanao)
20.8 21.1 13.7 15.2 4.8 5.6 3.8 15.2
Region
XI (Davao
Region)
27.9 20.2 13.9 14.4 4.6 5.1 3.4 10.6
Region XII
(SOCCSKSAR-
GEN)
69.4 9.2 6.4 7.4 2.0 2.2 1.2 2.1

5 2 D E P A R T M E N T O F A G R I C U L T U R E P H I L I P P I N E C O C O N U T A U T H O R I T Y
Percent of Coconut Farmers Reporting
Region <10,00010,0001 - 20,000
20,001 -
30,000
30,001 -
50,000
50,001 -
60,000
60,0001 - 80,000
80, 001 - 100,000
>1000,001
Region XIII
(Caraga)
28.3 25.4 15.3 14.8 4.1 5.2 2.5 4.5 c
BARMM 9.2 16.1 22.4 24.9 6.2 7.8 4.8 8.6
Source: NCFRS
Figure 3.12. Percent distribution of coconut farmers according to income range by administrative region in the Philippines, 2018.
Source: NCFRS
Coconut farmers’ associations and cooperatives would play a major role in
“agribusinessizing” the coconut farm sector. It is deemed important to have adequate
information on the total number of small coconut farmers’ organizations (SCFOs),
cooperatives, and farmers’ federations in each region. Currently, there are about 10,505
SCFOs, 1,306 coconut farmers’ cooperatives, and 70 coconut farmers’ federations
covering 11,405 municipalities in the country (Table 3.5). Among the 16 administrative
regions, Central Visayas has the highest number of coconut farmers’ cooperatives
followed by Northern Mindanao and Eastern Visayas. Meanwhile, Eastern Visayas has the
highest number of SCFOs. There are also several SCFOs in Central Visayas, Zamboanga
Peninsula, Western Visayas, and Caraga. Moreover, Caraga has the highest number

5 3P H I L I P P I N E C O C O N U T I N D U S T R Y R O A D M A P 2 0 2 1 - 2 0 4 0
of coconut farmers’ federations, followed by Northern Mindanao and CALABARZON.
Landowners dominate the membership in these associations (Appendix Tables 1-3). Other
association members include tenants and farm workers.
Table 3.5. Number of coconut farmers’ cooperatives, small coconut farmers’ organizations and federation of coconut farmers’ organizations by region in the Philippines, 2019
RegionNo. of Coconut
Farmers Cooperatives
No. of Small Coconut Farmers
Organizations
No. of Federations of Coconut Farmers
Organizations
CAR 1 - -
Region I (Ilocos Region) 48 120 -
Region II (Cagayan Valley) 23 97 -
Region III (Central Luzon) 7 132 -
Region IV-A (CALABARZON) 39 336 8
Region IV-B (MIMAROPA) 63 183 -
Region V (Bicol Region) 57 758 4
Region VI (Western Visayas) 66 1,000 5
Region VII (Central Visayas) 486 1,747 3
Region VIII (Eastern Visayas) 128 1,902 2
Region IX (Zamboanga
Peninsula)
40 1,023 -
Region X (Northern
Mindanao)
141 559 13
Region XI (Davao Region) 42 778 3
Region XII
(SOCCSKSARGEN)
51 713 1
Region XIII (Caraga) 57 952 30
BARMM 57 206 -
PHILIPPINES 1,306 10,506 69
Source: PCA
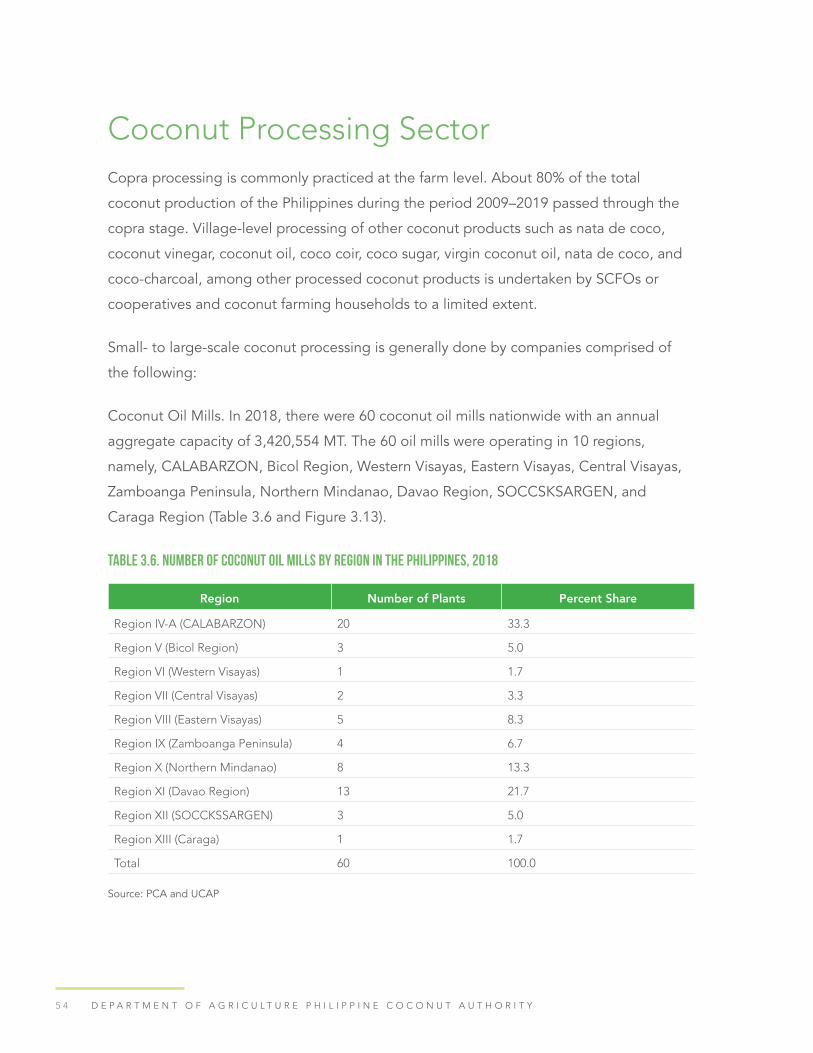
5 4 D E P A R T M E N T O F A G R I C U L T U R E P H I L I P P I N E C O C O N U T A U T H O R I T Y
Coconut Processing SectorCopra processing is commonly practiced at the farm level. About 80% of the total
coconut production of the Philippines during the period 2009–2019 passed through the
copra stage. Village-level processing of other coconut products such as nata de coco,
coconut vinegar, coconut oil, coco coir, coco sugar, virgin coconut oil, nata de coco, and
coco-charcoal, among other processed coconut products is undertaken by SCFOs or
cooperatives and coconut farming households to a limited extent.
Small- to large-scale coconut processing is generally done by companies comprised of
the following:
Coconut Oil Mills. In 2018, there were 60 coconut oil mills nationwide with an annual
aggregate capacity of 3,420,554 MT. The 60 oil mills were operating in 10 regions,
namely, CALABARZON, Bicol Region, Western Visayas, Eastern Visayas, Central Visayas,
Zamboanga Peninsula, Northern Mindanao, Davao Region, SOCCSKSARGEN, and
Caraga Region (Table 3.6 and Figure 3.13).
Table 3.6. Number of coconut oil mills by region in the Philippines, 2018
Region Number of Plants Percent Share
Region IV-A (CALABARZON) 20 33.3
Region V (Bicol Region) 3 5.0
Region VI (Western Visayas) 1 1.7
Region VII (Central Visayas) 2 3.3
Region VIII (Eastern Visayas) 5 8.3
Region IX (Zamboanga Peninsula) 4 6.7
Region X (Northern Mindanao) 8 13.3
Region XI (Davao Region) 13 21.7
Region XII (SOCCKSSARGEN) 3 5.0
Region XIII (Caraga) 1 1.7
Total 60 100.0
Source: PCA and UCAP

5 5P H I L I P P I N E C O C O N U T I N D U S T R Y R O A D M A P 2 0 2 1 - 2 0 4 0
Most of the oil mills are in CALABARZON (33.3%) and Davao Region (21.7%). The 13
oil mills operating in Davao Region and the 20 oil mills in CALABARZON accounted
for 20.6% and 17.7% of the total copra crushing capacity in the oil milling industry,
respectively (Table 3.7).
Table 3.7. Copra crushing capacities of coconut oil mills by region in the Philippines, 2018
RegionCrushing Capacity
(MT/Year)Percent Share
Region IV-A (CALABARZON) 606,250 17.7
Region V (Bicol Region) 222,000 6.5
Region VI (Western Visayas) 15,840 0.5
Region VII (Central Visayas) 81,000 2.4
Region VIII (Eastern Visayas) 333,600 9.8
Region IX (Zamboanga Peninsula) 504,300 14.7
Region X (Northern Mindanao) 476,364 13.9
Region XI (Davao Region) 705,600 20.6
Region XII (SOCCSKSARGEN) 444,000 13.0
Region XIII (Caraga) 31,600 0.9
Total 3,420,554 100.0
Source: PCA and UCAP
Figure 3.13. Percent distribution of 60 coconut oil mills by region in the Philippines, 2018
Source: PCA and UCAP
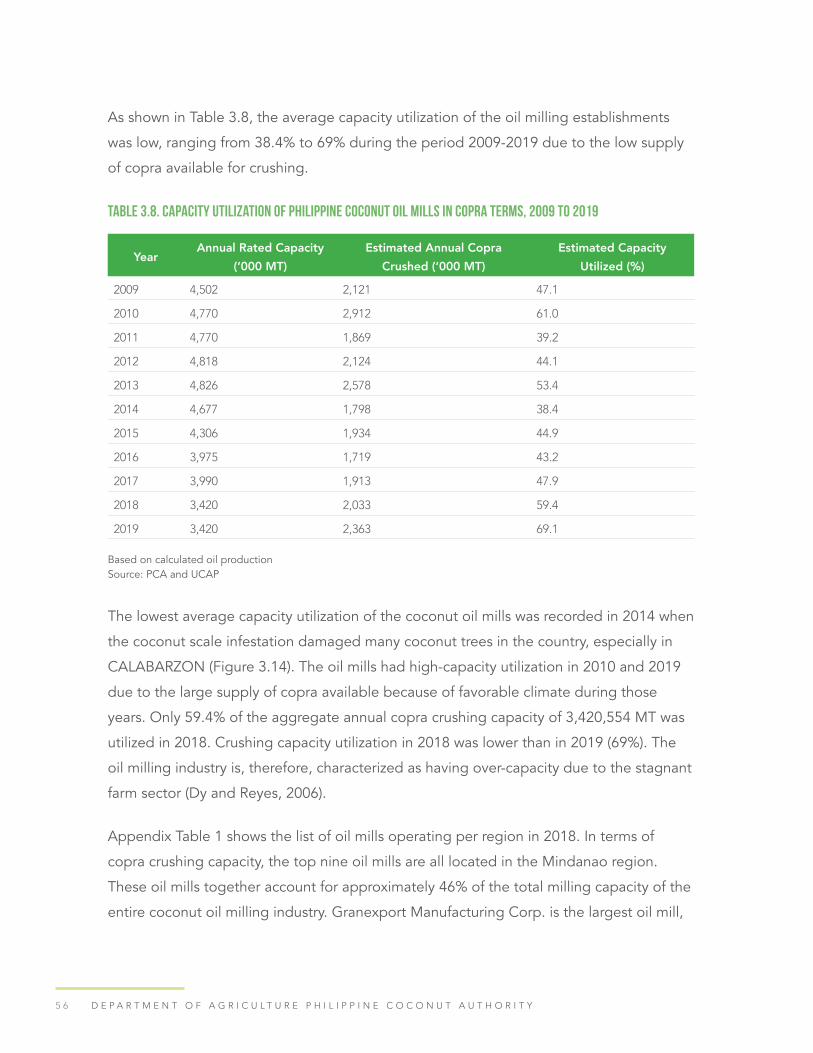
5 6 D E P A R T M E N T O F A G R I C U L T U R E P H I L I P P I N E C O C O N U T A U T H O R I T Y
As shown in Table 3.8, the average capacity utilization of the oil milling establishments
was low, ranging from 38.4% to 69% during the period 2009-2019 due to the low supply
of copra available for crushing.
Table 3.8. Capacity utilization of Philippine coconut oil mills in copra terms, 2009 to 2019
YearAnnual Rated Capacity
(‘000 MT)Estimated Annual Copra
Crushed (‘000 MT)Estimated Capacity
Utilized (%)
2009 4,502 2,121 47.1
2010 4,770 2,912 61.0
2011 4,770 1,869 39.2
2012 4,818 2,124 44.1
2013 4,826 2,578 53.4
2014 4,677 1,798 38.4
2015 4,306 1,934 44.9
2016 3,975 1,719 43.2
2017 3,990 1,913 47.9
2018 3,420 2,033 59.4
2019 3,420 2,363 69.1
Based on calculated oil productionSource: PCA and UCAP
The lowest average capacity utilization of the coconut oil mills was recorded in 2014 when
the coconut scale infestation damaged many coconut trees in the country, especially in
CALABARZON (Figure 3.14). The oil mills had high-capacity utilization in 2010 and 2019
due to the large supply of copra available because of favorable climate during those
years. Only 59.4% of the aggregate annual copra crushing capacity of 3,420,554 MT was
utilized in 2018. Crushing capacity utilization in 2018 was lower than in 2019 (69%). The
oil milling industry is, therefore, characterized as having over-capacity due to the stagnant
farm sector (Dy and Reyes, 2006).
Appendix Table 1 shows the list of oil mills operating per region in 2018. In terms of
copra crushing capacity, the top nine oil mills are all located in the Mindanao region.
These oil mills together account for approximately 46% of the total milling capacity of the
entire coconut oil milling industry. Granexport Manufacturing Corp. is the largest oil mill,

5 7P H I L I P P I N E C O C O N U T I N D U S T R Y R O A D M A P 2 0 2 1 - 2 0 4 0
followed by Interco, Davao Bay Coconut Oil Mills Inc., and Cargill Oil Mills Philippines Inc.
Other large companies are Wilmar Edible Oil Phils. Inc., International Copra Export Corp.,
Dipolog Oil Mill, Third Millennium Oil Mills Inc., and World Venture Commodities Inc.
Fourteen large oil milling companies are members of the Philippine Coconut Oil
Producers Association (PCOPA). These companies are Granexport Manufacturing
Corporation, Cargill Oil Mills Philippines Inc., Legaspi Oil Company Inc., Cagayan de
Oro Oil Company Inc., Ludo & Lu Ym Corp., New Asia Oil Inc., Philippine International
Development Inc., Samar Coco Products Manufacturing Corp., San Pablo Manufacturing
Corp., SC Global Coco Products Inc., Southern Luzon Coconut Oil Mill Inc., Tantuco
Enterprises Inc., Globe Coco Products Manufacturing Corp., and World Venture
Commodities Inc.
Aside from the unstable supply of copra, another problem encountered by coconut oil
mills is the low quality of copra due to the traditional tapahan method of processing
copra. The poor quality of copra has increased the processing cost of oil mills. The low
quality of copra has led also to a high level of Polycyclic Aromatic Hydrocarbons (PAH)
and aflatoxin in the production of crude coconut oil that could make these products
unmarketable in the export market (PCA, 2012).
Figure 3.14. Comparison of the annual rated capacity and the capacity utilization of Philippine coconut oil mills in copra terms from 2009 to 2019
Source: PCA and UCAP

5 8 D E P A R T M E N T O F A G R I C U L T U R E P H I L I P P I N E C O C O N U T A U T H O R I T Y
Coconut Oil Refineries. There were 39 oil refineries operating in the Philippines in 2018
with a total annual refining capacity of 1,993,400 MT (Tables 3.9 and 3.10). Of this total,
13 were also operating as coconut oil mills.
Table 3.9. Number of coconut oil refineries by region in the Philippines, 2018
Region Number of Plants Percent Share
Region IV-A (CALABARZON) 6 15.4
Region V (Bicol Region) 1 2.6
Region VII (Central Visayas) 3 7.7
Region VIII (Eastern Visayas) 1 2.6
Region IX (Zamboanga Peninsula) 2 5.1
Region X (Northern Mindanao) 9 23.0
Region XI (Davao Region) 9 23.0
Region XII (SOCCSKSARGEN) 1 2.6
Region XIII (Caraga) 1 2.6
Total 39 100.0
Source: PCA and UCAP
The 39 oil refineries are spread in 10 regions, namely, the National Capital Region,
CALABARZON, Bicol Region, Central Visayas, Eastern Visayas, Zamboanga Peninsula,
Northern Mindanao, Davao Region, SOCCSKSARGEN, and Caraga. Table 10 shows
that the most concentrated regions in terms of the number of oil refineries are Northern
Mindanao (23%), Davao Region (23%), CALABARZON (15%), and the National Capital
Region (15%).
The highest aggregate refining capacity of nine oil refineries (463,500 MT) was reported
in Northern Mindanao, accounting for 23% of the total refining capacity of all refineries in
the country (Table 3.10). This was followed by Davao Region with 431,000 MT, or 21.6%
share, and the National Capital Region, with 423,000 MT (21.2% share).

5 9P H I L I P P I N E C O C O N U T I N D U S T R Y R O A D M A P 2 0 2 1 - 2 0 4 0
Table 3.10. Refining capacities of coconut oil refineries by region in the Philippines, 2018
RegionRefining Capacity
(MT/Year)Percent Share
NCR (National Capital Region) 423,000 21.2
Region IV-A (CALABARZON) 153,000 7.7
Region V (Bicol Region) 12,000 0.6
Region VII (Central Visayas) 261,000 13.1
Region VIII (Eastern Visayas) 36,000 1.8
Region IX (Zamboanga Peninsula) 175,000 8.8
Region X (Northern Mindanao) 463,500 23.3
Region XI (Davao Region) 431,000 21.6
Region XII (SOCCSKSARGEN) 3,000 0.2
Region XIII (Caraga) 7,500 0.4
Total 1,993,400 100.0
Sources: PCA and UCAP
Based on refining capacity, the top seven refineries include Wilmar Edible Oils Philippines
with two refineries in Zamboanga Peninsula and Northern Mindanao, Lu Do & Lu Ym
Oleochem Corp. in Central Visayas, International Copra Export Corp. in Davao Region,
Malabon Soap & Oil Company and Tans-Asia (Phils.) Oil Mfg. in the National Capital
Region, and World Venture Commodities Inc. and Granexport Manufacturing Corp.,
both located in Northern Mindanao (Appendix Table 2). The aggregate refining capacity
of these companies accounted for 47.5% of the total annual refining capacity of all the
refineries operating in 2018.
Eleven large processing and exporting refiners are members of the Coconut Oil Refiners
Association (CORA). These refiners are the San Pablo Manufacturing Corporation,
Limketkai Manufacturing Inc., Lu Do & Lu Ym Oleochem. Corp., AFTA Corporation,
Malabon Soap & Oil Company, International Oil Factory, Licup Oil Mills Inc., Caraga Oil
Refining, Tantuco Enterprises Inc., Oleo Fats, and Agana Circle Enterprises.
Desiccated Coconut Processing Companies. In 2019, there were 21 medium-scale
desiccated coconut processing plants operated by 19 companies with an aggregate

6 0 D E P A R T M E N T O F A G R I C U L T U R E P H I L I P P I N E C O C O N U T A U T H O R I T Y
annual production capacity of 449,1546 MT (Table 3.11). Three of the 19 companies
operated two desiccated processing plants each in different locations. These companies
were Franklin Baker Company of the Philippines, Peter Paul Philippine Corp., and
Superstar Coconut Products Inc. Franklin Baker Company of the Philippines, with plants in
Laguna and Davao, is the largest desiccated coconut producer with a capacity of 61,800
MT per year (Appendix Table 3). The other two top producers of desiccated coconut are
Peter Paul Philippines Corp. and Superstar Coconut Products Inc. with plant capacities of
44,000 MT and 48,000 MT per year, respectively. The two desiccated coconut processing
plants of Peter Paul Philippines are in Quezon and Sorsogon, while the two desiccated
coconut processing plants of Superstar Coconut Products Inc. are situated in Quezon
and Davao. The aggregate production capacity of these three major desiccated coconut
processing companies accounted for 34.2% of the overall desiccated coconut industry’s
production capacity.
Table 3.11. Number of desiccated coconut plants by region in the Philippines, 2019
Region Number of Desiccated Coconut Plants Percent Share
Region IV-A (CALABARZON) 6 28.6
Region V (Bicol Region) 2 9.5
Region VII (Central Visayas) 1 4.8
Region VIII (Eastern Visayas) 1 4.8
Region X (Northern Mindanao) 3 14.3
Region XI (Davao Region) 6 28.6
Region XII (SOCCSKSARGEN) 1 4.8
Region XIII (Caraga) 1 4.8
Total 21 100.0
Source: PCA and UCAP
The 21 desiccated coconut processing plants are spread in eight regions, namely,
CALABARZON, Bicol Region, Central Visayas, Eastern Visayas, Northern Mindanao,
Davao Region, SOCCSKSARGEN, and Caraga Region. As regards the regional
distribution of the desiccated coconut processing plants, most of the plants are operating
in CALABARZON and Davao Region. About 57.2% of the 21 desiccated coconut
processing plants are found in these regions (Table 3.12).

6 1P H I L I P P I N E C O C O N U T I N D U S T R Y R O A D M A P 2 0 2 1 - 2 0 4 0
As shown in Table 3.12, the six desiccated coconut processing plants operating in Davao
Region posted the highest aggregate annual production capacity (147,880 MT), followed
by the same number of desiccated processing plants in CALABARZON at 114,900 MT.
Table 3.12. Aggregate annual production capacities of 21 desiccated coconut plants by region in the Philippines, 2019
RegionProduction Capacity
(MT/Year)Percent Share
Region IV-A (CALABARZON) 114,900 25.6
Region V (Bicol Region) 44,200 9.8
Region VII (Central Visayas) 324 0.1
Region VIII (Eastern Visayas) 25,000 5.6
Region X (Northern Mindanao) 64,850 14.4
Region XI (Davao Region) 147,880 32.9
Region XII (SOCCSKSARGEN) 22,000 4.9
Region XIII (Caraga) 30,000 6.7
Total 449,154 100.0
Source: PCA and UCAP
The desiccated coconut processing plants were initially established to produce
desiccated coconut only, but through time the processing plants have developed into
integrated multi-product plants (Costales, 2019). The desiccated coconut processing
companies found the integrated approach more profitable since they could utilize their
coconut wastes, such as coconut water, coconut cream, and coco shells, to produce more
value-added products and avoid wastage.
Franklin Baker Company of the Phils. and Superstar Coconut Products Inc. are two of the
three large, desiccated coconut processing companies that produce both desiccated
coconut and non-traditional coconut products. These firms are among the large
producers and exporters of coconut water, virgin coconut oil, and coco sugar.
Coco Shell Processing Companies. In 2019, there were 15 small - to large-sized coco
shell charcoal plants in the Philippines with an aggregate annual production capacity
of 321,114 MT (Tables 3.13 and 3.14). Most of the coco shell charcoal plants (47%) are

6 2 D E P A R T M E N T O F A G R I C U L T U R E P H I L I P P I N E C O C O N U T A U T H O R I T Y
operating in Davao Region (Table 3.13). However, the aggregate annual production
capacity (254,534 MT) of the three coco shell charcoal plants in Northern Mindanao
was much higher than the combined annual production capacity (44,430 MT) of seven
coco shell charcoal plants in the Davao Region (Table 3.14). This can be explained by
the fact that Jacobi Carbons Philippines Inc., the largest coco shell charcoal plant in the
country, is operating in Northern Mindanao. The production capacity of Jacobi Carbons
Philippines Inc. is 252,974 MT per year, which accounts for 78.8% of the total production
capacity of the coco shell charcoal industry (Appendix Table 4). Other major coco shell
charcoal producing companies are the Davao Central Inc. and Visayas Activated Carbon,
but the annual production capacities of these companies (20,000 MT and 11,500 MT
per year, respectively) were relatively much lower compared with that of Jacobi Carbons
Philippines Inc.
Table 3.13. Number of coco shell charcoal plants by region in the Philippines, 2019
Region Number of Plants Percent Share
Region IV-A (CALABARZON) 3 20
Region VIII (Eastern Visayas) 2 13
Region X (Northern Mindanao) 3 20
Region XI (Davao Region) 7 47
Total 15 100
Source: PCA and UCAP
Table 3.14. Aggregate annual production capacities of coco shell charcoal plants by region in the philippines, 2019
Region Production Capacity (MT/Year) Percent Share
Region IV-A (CALABARZON) 10,050 3.1
Region VIII (Eastern Visayas) 12,100 3.8
Region X (Northern Mindanao) 254,534 79.3
Region XI (Davao Region) 44,430 13.8
Total 321,114 100.0
Source: PCA and UCAP

6 3P H I L I P P I N E C O C O N U T I N D U S T R Y R O A D M A P 2 0 2 1 - 2 0 4 0
Eight coco shell charcoal plants are vertically forward integrated into activated carbon
processing. These are Jacobi Carbons Philippines Inc. (Misamis Oriental), Davao Central
Chemical Corp. (Davao City), BF Industries Inc. (Davao City), Industrial Carbon Technology
Corp. (Davao City), Philips Carbon Inc. (Davao City), Visayas Activated Carbon Inc. (Leyte),
Green Carbon Inc. (Leyte), and PJKMB Enterprise (Rizal).
In Davao, where most of the coco shell charcoal processing plants are located, the
manufacturers are in competition with one another for coco shell supplies and are
experiencing limited supply of raw materials. Firms are clustered in Davao Region
because Davao is the top coconut-producing region in the Philippines and it is also
a strategic place for exports as it has logistical capacities such as ports and airports
(Ordinario et al, 2019).
Coco Shell-Based Activated Carbon Manufacturing Companies. As of June 2020,
activated carbon was produced by 14 plants with a total annual production capacity of
85,585 MT (Tables 3.15 and 3.16). As mentioned earlier, eight of the 14 activated carbon
plants operating in the country are also manufacturing coco shell charcoal. The majority
of the activated carbon manufacturing plants are in Mindanao. Production of activated
carbon is highly concentrated in Davao Region. Approximately 43% are in Davao Region
while 21.4% are in Northern Mindanao (Table 3.15).
Table 3.15. Number of activated carbon plants by region in the Philippines, June 2020
Region Number of Plants Percent Share
Region IV-A (CALABARZON) 2 14.3
Region VII (Central Visayas) 1 7.1
Region VIII (Eastern Visayas) 1 7.1
Region IX (Zamboanga Peninsula) 1 7.1
Region X (Northern Mindanao) 3 21.4
Region XI (Davao Region) 6 42.9
Total 14 100.0
Source: PCA and UCAP

6 4 D E P A R T M E N T O F A G R I C U L T U R E P H I L I P P I N E C O C O N U T A U T H O R I T Y
Davao Region posted the highest aggregate annual production capacity (37,675 MT/year
with 44.0% share), followed by Central Visayas (24,000 MT or 28% share) and Northern
Mindanao (18,120 MT/year with 21.2% share) (Table 3.16).
The top four activated carbon manufacturing companies are Cenapro Chemical Corp.,
Philippine- Japan Active Carbon Corp., Premium AC Corporation, and Jacobi Carbons
Philippines Inc., (Appendix Table 5). Among the 14 activated carbon manufacturing
companies, Cenapro Chemical Corp., which is situated in Central Visayas, has the largest
production capacity (24,000 MT per year). Its production capacity accounts for 28% of the
total production capacity of the entire activated carbon industry. Philippine- Japan Active
Carbo Corp. and Premium AC Corporation, both the second largest activated carbon
manufacturers, are operating in Davao Region while the third one (i.e., Jacobi Carbons
Philippines Inc.) is situated in Northern Mindanao.
Table 3.16. Aggregate production capacities of 14 activated carbon plants by region in the Philippines, June 2020
Region Number of Plants Percent Share
Region IV-A (CALABARZON) 4,110 4.8
Region VII (Central Visayas) 24,000 28.0
Region VIII (Eastern Visayas) 600 0.7
Region IX (Zamboanga Peninsula) 1,080 1.3
Region X (Northern Mindanao) 18,120 21.2
Region XI (Davao Region) 37,675 44.0
Total 85,585 100.0
Source: PCA and UCAP
Jacobi Carbons’ activated carbon processing facility, with its size and sophistication,
represents the state-of-the-art in carbon activation technology (Jacobi Group, 2015).
Its facility is the world’s largest coconut shell activated carbon plant with a new level of
automation. The Jacobi Carbons Philippines Inc.’s facility includes a charcoal granulation
plant, multiple activation kilns with a nominal capacity of more than 20,000 MT per
year, grinding and pulverizing capacity, specialty impregnation and water/acid washing.
Cenapro Chemical Corp., a family-owned corporation, developed and concentrated its

6 5P H I L I P P I N E C O C O N U T I N D U S T R Y R O A D M A P 2 0 2 1 - 2 0 4 0
niche into manufacturing granulated charcoal mainly to produce activated carbon. It has
exported its products to Japan, Korea, and Europe. Philippine-Japan Active Carbon Corp.
is the only company granted by the Philippine government to operate at 100% Japanese
capitalization. The company is also one of the largest coconut-based activated carbon
manufacturers in the world. Meanwhile, Premium AC Corporation has four state of the art
activation kilns and has a plant capacity of 750 MT per month.
Nine activated carbon manufacturing companies are members of the Philippine Activated
Carbon Manufacturers Association (PACMA). These are composed of the BF Industries,
Inc., Davao Central Chemical Corporation, Green Carbon Inc., Golden Activated Carbon
Corporation, Jacobi Carbons Philippines,
MAPECON Green Charcoal Philippines Inc., Donau Carbon Philippines Corporation,
Philippine-Japan Activated Carbon Corp., and Premium AC Corporation.
Oleochemical Companies. There were eight oleochemical companies in the Philippines
making intermediate coconut-based chemicals like fatty alcohol, fatty acids, methyl ester,
and glycerin in 2018. The oleochemical companies are operating in only four regions in
the country, namely: CALABARZON, the National Capital Region, Zamboanga Peninsula,
and Northern Mindanao (Table 3.17). Most of the companies (53.3%) are concentrated in
CALABARZON. Twenty percent of the 15 oleochemical companies are operating in the
National Capital Region and another 20% are in Northern Mindanao.
Table 3.17. number of oleochemical plants by region in the philippines
Region Number of Plants Percent Share
Region IV-A (CALABARZON) 8 53.3
NCR (National Capital Region) 3 20.0
Region IX (Zamboanga Peninsula) 1 6.7
Region X (Northern Mindanao) 3 20.0
Total 15 100.0
Source: PCA and UCAP

6 6 D E P A R T M E N T O F A G R I C U L T U R E P H I L I P P I N E C O C O N U T A U T H O R I T Y
Of the 15 oleochemical manufacturers, nine are producing coco methyl ester (CME) while
11 are into glycerin production (Appendix Table 6). Other common oleochemical products
being produced by these companies are fatty alcohol, fatty acid, fatty acid distillate,
acid oil, soap noodles, sulfonates, esterquats, and amides. The total production capacity
of these oleochemical plants in 2018 was 1,573,030 MT per year (Figure 3.15). Almost
half (i.e., 679,500 MT or 43%) of the total annual production capacity was generated
from the National Capital Region, followed by CALABARZON (549,030 MT or 34.9%).
The largest oleochemical plant is Chemrez Technologies Inc., which is operating in the
National Capital Region. Chemrez’s annual production capacity at 600,000 MT accounts
for 38% of the overall production capacity of the oleochemical industry (Appendix Table
6). Other large oleochemical companies are Pilipinas Kao Inc. (Misamis Oriental), Tantuco
Enterprises (Quezon), Philippine International Development Inc. (Zamboanga City), and
United Coconut Chemicals Inc. (Batangas).
Figure 3.15. Aggregate annual production capacity (MT) ofoleochemical plants by region in the Philippines, 2018
Source: PCA and UCAP
Five oleochemical manufacturing companies organized the Philippine Oleochemical
Manufacturers Association (POMA). These companies include Chemrez Technologies Inc.,
JNJ Oleochemicals Inc., PAN Century Surfactants Inc., Sakamoto Orient Chemicals Corp.,
and the United Coconut Chemicals Inc. (COCOCHEM).

6 7P H I L I P P I N E C O C O N U T I N D U S T R Y R O A D M A P 2 0 2 1 - 2 0 4 0
Biodiesel Companies. As of March 2020, there were 12 operational Department of
Energy-accredited coco-biodiesel manufacturers in the country with a total production
capacity of 607,900 MT of CME per year (Table 3.18).
Table 3.18. Number of biodiesel manufacturers by region in the Philippines, March 2020
Region Number of Plants Percent Share
NCR (National Capital Region) 4 33.3
Region IV-A (CALABARZON) 3 25.0
Region X (Northern Mindanao) 2 16.7
Region XI (Davao Region) 2 16.7
Region XII (SOCCSKSARGEN) 1 18.3
Total 12 100.0
Source: Department of Energy (DOE)
While the country produces a substantial volume of coco biodiesel, investors find
it difficult to venture into large-scale production because of the huge capitalization
requirement. The biodiesel manufacturers are operating in five regions of the country.
Fifty-eight percent of these manufacturers are clustered in the National Capital Region
and CALABARZON. Five biodiesel plants are also located in Mindanao island (i.e.,
Northern Mindanao, Davao Region, and SOCCSKSARGEN).
Figure 3.16. Annual production capacities of 12 biodiesel manufacturers by region in the Philippines, March 2020
Source: DOE

6 8 D E P A R T M E N T O F A G R I C U L T U R E P H I L I P P I N E C O C O N U T A U T H O R I T Y
Figure 3.16 show that the highest aggregate annual CME production capacity is recorded
in the National Capital Region (262,000 MT or 43.1%), followed by CALABARZON
(213,300 MT or 35.1%) and Northern Mindanao (57,000 MT or 9.4%).
The largest biodiesel manufacturers in the country are Chemrez Technologies Inc., whose
plant is situated in Quezon City (National Capital Region), and Tantuco Enterprises Inc.
located in Quezon province (CALABARZON). Both companies have 90,000 MT per
year production capacity each. The aggregate annual production capacity of 180,000
MT of these companies accounts for 29.6% of the overall CME capacity of the industry
(Appendix Table 7). The other leading biodiesel companies are Pure Essence International
(NCR), JNJ Oleochemicals Inc. (CALABARZON), Golden Asia International Inc. (NCR),
and Mt. Holly Coco Industrial Inc. (CALABARZON). As of March 2020, the DOE issued
a notice to proceed construction to three new companies in Region IV-A and Region X.
Two of these new companies have large plant capacities. Bio Renewable Energy Ventures
(Misamis Oriental) has a production capacity of 150,000 MT per year while Greentech
Biodiesel Inc. (Quezon) has a production capacity of 100,000 MT/year.
Virgin Coconut Oil (VCO) Processing Companies. In 2018, 42 VCO processing plants
were operating in nine regions, namely: CALABARZON, Bicol Region, Central Visayas,
Eastern Visayas, Zamboanga Peninsula, Northern Mindanao, Davao Region, Caraga,
and BARMM. As shown in Table 3.19, the majority (40.5%) of the processing plants
are in CALABARZON while about 17% and 14% are processing in Central Visayas and
Davao Region, respectively. The top producing firms are Peter Paul Philippines, Franklin
Baker Company of the Philippines, Ica Translink Philippines, Primex Coco Products
Incorporated, Pacific Basic Foods Incorporated, Celebes Coconut Corporation, Muenster
Ingredients, Axelum Inc., Coco Davao Incorporated, and Superstar Coconut Products
Inc. Desiccated coconut processing plants, which have the flexibility to produce VCO,
are the main producers of VCO (Costales, 2019). The desiccated coconut route of VCO
processing uses the dry cold press process which is suited for mass production. There
are 12 desiccated coconut processing plants in the country with the potential capacity to
produce 831 MT/day of VCO. Of the country’s VCO export volume, 80% is supplied by
large, desiccated coconut processing companies.

6 9P H I L I P P I N E C O C O N U T I N D U S T R Y R O A D M A P 2 0 2 1 - 2 0 4 0
Table 3.19. Number of VCO processing plants by region in the Philippines, 2018
Region Number of Plants Percent Share
Region IV-A (CALABARZON) 17 40.5
Region V (Bicol Region) 2 4.8
Region VII (Central Visayas) 7 16.7
Region VIII (Eastern Visayas) 2 4.8
Region IX (Zamboanga Peninsula) 2 4.8
Region X (Northern Mindanao) 3 7.1
Region XI (Davao Region) 6 14.3
Region XIII (Caraga) 1 2.4
BARMM 2 4.8
Total 42 100.0
Sources of basic data: PCA and UCAP
Other VCO processors in the country are composed of micro, small and medium
enterprises (MSMEs). They use the wet process (i.e., fermentation and centrifuge) of
producing VCO (Costales, 2019). The MSMEs vary in terms of the volume processed,
or scale of production, and the equipment and accessories for extraction. The micro
enterprises use the traditional method of extraction while the small and medium scale
enterprises operating an integrated coconut processing facility use more mechanized and
automated processing lines. Moreover, the micro-VCO enterprises usually sell to the local
market while the small to medium scale enterprises are more export oriented.
Thirty-one VCO manufacturing companies organized the Virgin Coconut Oil Processors
and Traders Association of the Philippines Inc. (VCOPTAP). These companies include
Andy Albao Corporation, Ahya Coco
Organic Food Mfg. Corp., Amazing Foods Corp., Century Pacific Agricultural Ventures
Inc., Coco Asenso Corp., Cocoplus Aquarian Development Corp., Cocoveda Natural
Products Inc., Control Union Philippines Inc., CT Coco Wonders Inc., Dignity Products
& Services Inc., Filipina Organics Coconut Products, Franklin Baker Company of the
Phils., Fresh Consumer Trade & Logistics Inc., Galo Organic and Natural Ventures, Giga
Natural Products Specialist Corp., Green Life Coco Products, Hacienda Macalauan Inc.,
Hancole Corporation, Leyte Koko Oil Inc. Organix Solutions Inc., Pasciolco Agri-Ventures,
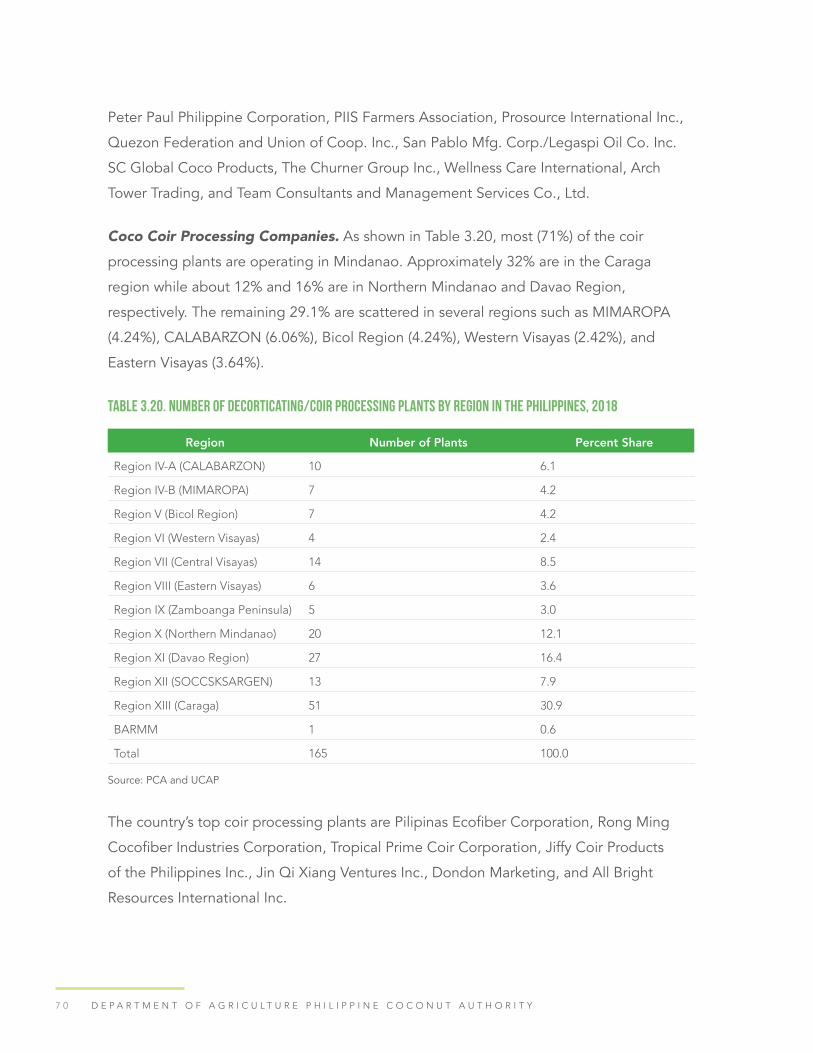
7 0 D E P A R T M E N T O F A G R I C U L T U R E P H I L I P P I N E C O C O N U T A U T H O R I T Y
Peter Paul Philippine Corporation, PIIS Farmers Association, Prosource International Inc.,
Quezon Federation and Union of Coop. Inc., San Pablo Mfg. Corp./Legaspi Oil Co. Inc.
SC Global Coco Products, The Churner Group Inc., Wellness Care International, Arch
Tower Trading, and Team Consultants and Management Services Co., Ltd.
Coco Coir Processing Companies. As shown in Table 3.20, most (71%) of the coir
processing plants are operating in Mindanao. Approximately 32% are in the Caraga
region while about 12% and 16% are in Northern Mindanao and Davao Region,
respectively. The remaining 29.1% are scattered in several regions such as MIMAROPA
(4.24%), CALABARZON (6.06%), Bicol Region (4.24%), Western Visayas (2.42%), and
Eastern Visayas (3.64%).
Table 3.20. Number of decorticating/coir processing plants by region in the Philippines, 2018
Region Number of Plants Percent Share
Region IV-A (CALABARZON) 10 6.1
Region IV-B (MIMAROPA) 7 4.2
Region V (Bicol Region) 7 4.2
Region VI (Western Visayas) 4 2.4
Region VII (Central Visayas) 14 8.5
Region VIII (Eastern Visayas) 6 3.6
Region IX (Zamboanga Peninsula) 5 3.0
Region X (Northern Mindanao) 20 12.1
Region XI (Davao Region) 27 16.4
Region XII (SOCCSKSARGEN) 13 7.9
Region XIII (Caraga) 51 30.9
BARMM 1 0.6
Total 165 100.0
Source: PCA and UCAP
The country’s top coir processing plants are Pilipinas Ecofiber Corporation, Rong Ming
Cocofiber Industries Corporation, Tropical Prime Coir Corporation, Jiffy Coir Products
of the Philippines Inc., Jin Qi Xiang Ventures Inc., Dondon Marketing, and All Bright
Resources International Inc.

7 1P H I L I P P I N E C O C O N U T I N D U S T R Y R O A D M A P 2 0 2 1 - 2 0 4 0
Costales (2019) reported that coco coir/peat processors in the country are mainly MSMEs.
Their processing plants are relatively small in scale or capacity and the level of technology
is relatively inferior compared to processors in India and Sri Lanka. Their basic product is
coco coir with some commercializing coco peat as a by-product. Aside from baled and
raw coco coir, some of the processors forward integrate into twine, geonets and biologs,
which are essential materials in soil erosion control.
Coconut Sugar. In 2018, there were 33 coconut sugar processing plants in the country.
The coconut sugar processing plants are operating in eight regions, namely: MIMAROPA,
CALABARZON, Central Visayas,
Northern Mindanao, Davao region, SOCCSKSARGEN, Caraga, and BARMM. Most of the
companies (75.7%) are concentrated in Mindanao. Eighteen percent of the 33 coconut
sugar companies are operating in MIMAROPA and CALABARZON, and another 6.1% are
in Central Visayas (Table 3.21).
Table 3.21. Number of operating coconut sugar processing plants by region in the Philippines, 2018
Region Number of Plants Percent Share
Region IV-A (CALABARZON) 5 15.2
Region IV-B (MIMAROPA) 1 3.0
Region VII (Central Visayas) 2 6.1
Region X (Northern Mindanao) 6 18.2
Region XI (Davao Region) 1 3.0
Region XII (SOCCSKSARGEN) 13 39.4
Region XIII (Caraga) 4 12.1
BARMM 1 3.0
Total 33 100.0
Source: PCA and UCAP
As described by Costales (2019), “most of the MSME coco sugar processor-exporters
are small and medium size based on capital assets. Generally, the level of processing
technology used is still based on the traditional method of coco sugar processing. There
are only a few processors like Benevelle Corporation and Treelife that are into mechanized
processing. They also produce other products since sap can be processed into other

7 2 D E P A R T M E N T O F A G R I C U L T U R E P H I L I P P I N E C O C O N U T A U T H O R I T Y
forms such as coco vinegar, coco balsamic, coco jam, coco cider, coco wine and coco
spirit (lambanog). Treelife and Benevelle corporations have an integrated coconut
processing plant located near the coconut farms which they manage and operate. Some
of the sugar processing enterprises, especially those that process intermediate products
such as coco syrup, locate their processing plants at the urban centers where there are
stable power and water utilities. Processors directly process the sap into coco sugar and/
or procure from village level processors coco syrup which is then processed into coco
sugar. The village level processors are micro- and small entrepreneurs and farmers who
forward integrate.”
Coconut Water Processing Companies. As of 2018, there are a total of 14 coconut
water processing plants in the Philippines (Table 3.22). The 14 coconut water processing
companies are spread in only six regions (i.e., CALABARZON, Central Visayas, Eastern
Visayas, Northern Mindanao, Davao Region, and SOCCSKSARGEN). Table 3.22 show that
the most concentrated regions in terms of the number of coconut water processing plants
are CALABARZON and Davao Region.
Table 3.22. Number of operating coconut water processing plants by region in the Philippines, 2018
Region Number of Plants Percent Share
Region IV-A (CALABARZON) 6 42.9
Region VII (Central Visayas) 2 14.3
Region VIII (Eastern Visayas) 1 7.1
Region X (Northern Mindanao) 1 7.1
Region XI (Davao Region) 3 21.4
Region XII (SOCCSKSARGEN) 1 7.1
Total 14 100.0
Source: PCA and UCAP
Seven large desiccated coconut processing companies produce coconut water and
coconut water concentrate as well as other coconut products for the export market.
These are Celebes Coconut Corp., Axelum Resources Corp., Primex Coco Products Inc.,
Ahya Coco Organic Food Manufacturing Corp., SC Global Food Products Inc., Franklin
Baker Company of the Phils., and Tropicana Food Products, Inc. Eight manufacturers

7 3P H I L I P P I N E C O C O N U T I N D U S T R Y R O A D M A P 2 0 2 1 - 2 0 4 0
process coconut water only either for the domestic or export market. These companies
include Ekayen Buko Juice, Damian’s Milky Way, Pepsi Cola Products Inc., Wetaniyah
Export Trading Inc., Foli Food Beverage Corp., Tolman Manufacturing Inc., and Superstar
Coconut Products Inc.
Coconut Trading SectorThe coconut trading system in the Philippines is multi-layered. Coconut raw materials
from farmers generally pass through several marketing channels before reaching the
processing plants. For example, copra passes through at least two to three market
intermediaries (i.e., barangay/village trader – municipal/secondary trader – lead/big
trader-trucker) before reaching the oil mill (Idrovo et al., 2006). The lead copra trader
provides their network of intermediaries with cash advance payment. Likewise, Costales
(2019) reported that desiccated coconut processing companies give financial advances to
preferred consolidators so the latter can provide interest-free and collateral credit to their
trader-agents and farmer- suppliers to ensure cornering future deliveries.
Coconut processors most often link with a network of traders and trader-assemblers
to procure their raw materials (e.g., copra, dehusked nuts, whole mature nuts, fresh
young nuts, coco shells, coco husks, and coco shell charcoal). The local traders have
direct contact with the farmers and usually have established long relationships with
them (Costales, 2019). The trader-assemblers consolidate the supply of raw materials
(e.g., copra for oil millers; whole dehusked nuts for desiccators and virgin coconut oil
processors, coco shells for coco shell charcoal processors, coco husks for decorticating
plants, and fresh young nuts for coconut water processors) from local traders. One
assembler with a network of local traders can secure the produce of 150 to 200 farmers
(Costales, 2019). Meanwhile, large assemblers can consolidate the output from more
than 2,000 farmers through small assemblers and a network of traders. The common
procurement practice of the traders and trader-assemblers/consolidators is to pick up the
raw coconut materials from different coconut farms or designated pick-up points using
their own or rented vehicles.

7 4 D E P A R T M E N T O F A G R I C U L T U R E P H I L I P P I N E C O C O N U T A U T H O R I T Y
As shown in Table 3.23, there are 2,285 PCA-registered domestic traders engaged in
buying and selling copra only and 94 domestic traders who handle both copra and
different kinds of processed coconut products. The total number of other traders
engaged in local trading of coconut raw materials is as follows: 706, whole nuts/mature
nuts; 178, fresh young nuts; 55, coconut shells; 325, coco shell charcoal; and 4, coco
husks and coir. In addition, there are 15 traders who sell fresh young nuts in domestic and
export markets, while there are 18 exporters of fresh young nuts. There are only seven
traders of coconut seedlings.
Table 3.23. Number of PCA-registered coconut domestic traders, processors, and exporters in the Philippines, 2019
Types of Traders Number
Domestic copra traders 2,285
Domestic traders of copra and multi-coconut products 94
Domestic traders of coconut shells 55
Domestic traders of whole nuts/mature nuts 706
Domestictradersofcoconutfiber,husk,coir,andpeat 4
Domestic traders of fresh young nuts 178
Domestic traders & exporters of fresh young nuts 15
1A processor producing and trading different coconut products is counted only once.Source: PCA
There are 365 processors of food and non-food coconut products who sell their products
locally and/or export their products directly to international markets. There are also some
small processors who indirectly export their coconut products through brokers such as the
E.U. Sons Trading Corporation, Eisellgen House of Trade, Lee Commodities International
Corp., Manuel Igual Inc., and Raco Commodities Philippines Inc., (Costales, 2019). These
are large and traditional brokers who organized themselves as the Association of Coconut
Brokers Inc. (ACBI).

7 5P H I L I P P I N E C O C O N U T I N D U S T R Y R O A D M A P 2 0 2 1 - 2 0 4 0
Product FormsTraditional coconut products refer to food and non-food products (derived from the meat,
shell, water, husk, and other parts of the coconut) that the country started to export as
early as 1979 (Boceta, 1999). These traditional products are copra, coconut oil, desiccated
coconut, copra meal, coco shell charcoal, activated carbon, and oleochemicals. Thus,
any coconut product and by-product other than the traditional coconut products are
considered nontraditional.
The Coconut Farmers and Industry Roadmap covers all the traditional coconut products
because these coconut products still dominate the export market and contribute 84%
to the country’s total revenue from coconut products exported. Moreover, selected
promising nontraditional coconut products such as virgin coconut oil, coco water, coco
coir, and coco sap products are covered in the roadmap because they are gaining
market shares in both the domestic and international market due to their health and
environmental benefits.
Sustainable growth and global competitiveness of the various coconut industry value
chains are dependent on the productivity of coconut farms which provide the coconut-
based industries’ feedstocks and raw materials. Thus, improving the productivity,
efficiency, profitability, and sustainability of coconut farms should be at the core of the
industry roadmap.
This chapter presents the trends in production, area, and nut productivity from 2009–
2019, including the production outlook and strategic interventions to sustain growth of
the production sector. Significant discrepancies were observed in the coconut statistics
between the PSA and PCA in the regional roadmap drafts submitted. The COCOFIRM
Program used the PSA data and strongly recommends PCA to harmonize their coconut
statistics data with that of PSA. PSA is the agency mandated to serve as the central
statistical authority of the Philippine government for statistics in agriculture and other
sectors of the economy.
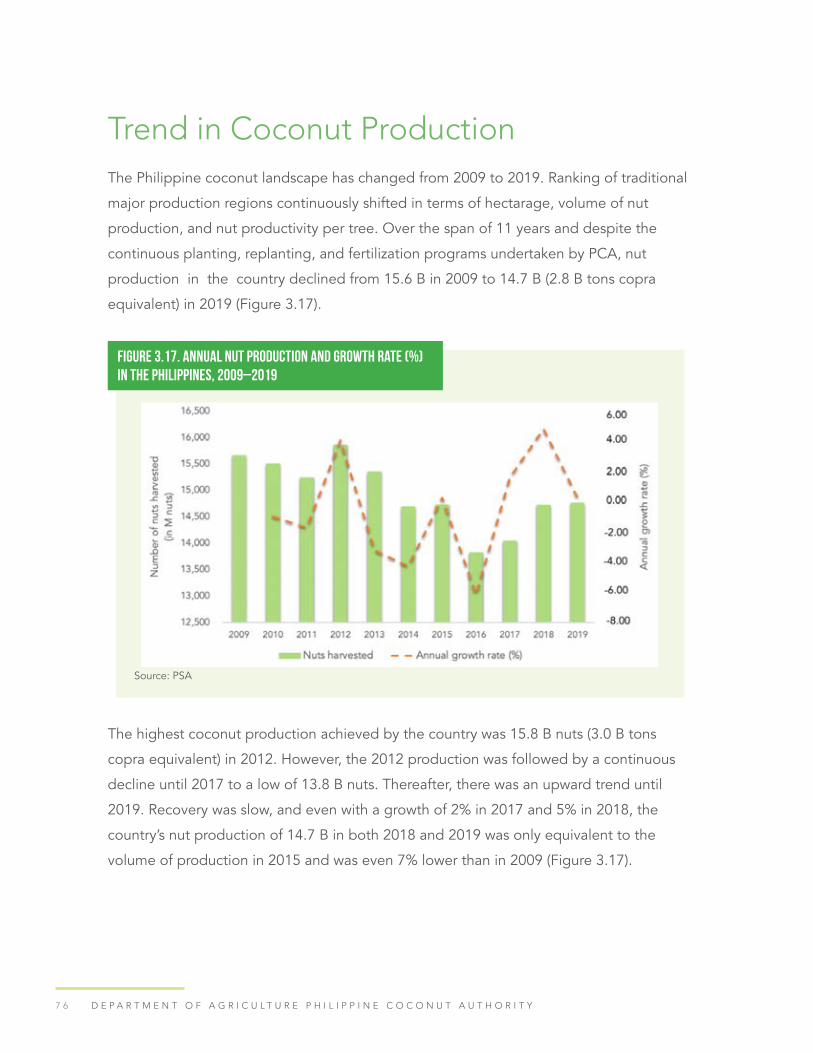
7 6 D E P A R T M E N T O F A G R I C U L T U R E P H I L I P P I N E C O C O N U T A U T H O R I T Y
Trend in Coconut ProductionThe Philippine coconut landscape has changed from 2009 to 2019. Ranking of traditional
major production regions continuously shifted in terms of hectarage, volume of nut
production, and nut productivity per tree. Over the span of 11 years and despite the
continuous planting, replanting, and fertilization programs undertaken by PCA, nut
production in the country declined from 15.6 B in 2009 to 14.7 B (2.8 B tons copra
equivalent) in 2019 (Figure 3.17).
Figure 3.17. Annual nut production and growth rate (%) in the Philippines, 2009–2019
Source: PSA
The highest coconut production achieved by the country was 15.8 B nuts (3.0 B tons
copra equivalent) in 2012. However, the 2012 production was followed by a continuous
decline until 2017 to a low of 13.8 B nuts. Thereafter, there was an upward trend until
2019. Recovery was slow, and even with a growth of 2% in 2017 and 5% in 2018, the
country’s nut production of 14.7 B in both 2018 and 2019 was only equivalent to the
volume of production in 2015 and was even 7% lower than in 2009 (Figure 3.17).

7 7P H I L I P P I N E C O C O N U T I N D U S T R Y R O A D M A P 2 0 2 1 - 2 0 4 0
Decline in nut production was evident during the years 2010, 2011, 2013–2016, and
2017. The average yearly growth rate of nut production from 2009–2019 was only 1.37
% (Figure 3.17). Possible factors causing the decline and the areas most affected will be
discussed in another section using regional and provincial data trends.
Percent contribution of each major island to total nut production showed that Mindanao
comprised almost 60% of the country’s total nut production both in 2009 and 2019.
Meanwhile, Luzon garnered 26.5% in 2009 but was reduced to 23.4% in 2019. Visayas
contributed only 13.95% in 2009 and 17.17% in 2019 (Figure 3.18).
Four regions in Mindanao are considered the top coconut producers, with Davao Region
as the highest nut producer both in 2009 and 2019 (Figure 3.19). This ranking was
attained despite the huge reduction in the volume of nuts produced by Davao Region
due to loss of bearing trees and decline of tree productivity. The contribution of Davao
Region to the national production declined from 17.2% in 2009 to only 13.1% in 2019.
Figure 3.18. Percent contribution of major islands to total nut production, 2019
Source: PSA, 2019

7 8 D E P A R T M E N T O F A G R I C U L T U R E P H I L I P P I N E C O C O N U T A U T H O R I T Y
Meanwhile, Zamboanga Peninsula maintained its steady production and remained 3rd
in rank, while Northern Mindanao jumped from 4th in 2009 to 2nd in 2019, and BARRM
from 7th to 5th from 2009 to 2019, respectively. CALABARZON improved its ranking from
5th to 4th while Eastern Visayas dropped from 2nd in 2009 to 8th in 2019. From 2009–
2019, Eastern Visayas suffered a net loss of 36.76% in production, equivalent to 124.7 M
nuts, more than a 3rd of its 2009 production of 1.78 B nuts.
Figure 3.19. Total nut production in the Philippines, 2009–2019
Source: PSA
All the top eight regions produced over a B nuts in 2019. The top four regions —three of
which are in Mindanao (Davao Region, Northern Mindanao, and Zamboanga Peninsula)
and CALABARZON in Luzon— produced over 1.5B nuts each (Figure 3.19). Meanwhile,
BARRM, Bicol Region, SOCCSKSARGEN, and Eastern Visayas were in the 2nd tier of top
producers, with more than 1 B but less than 1.5 B nut production in 2019 (Figure 3.19).
Seasonality of Volume of Coconut Production in the PhilippinesA trend of semestral variation in coconut production can be observed from 2015 to 2019.
Nut production was consistently higher by about 22% during the second half of the year
compared with the first half. More than 1.4B nut difference can be noted during the
aforementioned period (Figure 3.20) (PSA 2015–2019).

7 9P H I L I P P I N E C O C O N U T I N D U S T R Y R O A D M A P 2 0 2 1 - 2 0 4 0
Figure 3.20 presents the difference between January-June and July- December nut
production per region from 2015 to 2019. Among the top producers, Davao Region,
Zamboanga Peninsula, and SOCCSKSARGEN had less than 10% differences of -0.3%,
2.4%, 0.7%, respectively. Meanwhile, CALABARZON, Bicol Region, Eastern Visayas,
Northern Mindanao, and BARRM significantly had larger difference of -61.3%, -41.6%,
-36.5%, -16.2%, and -21.2%, respectively. Notably, MIMAROPA gained the highest
difference, as the second half of the year yielded 90.3% more than the first half. Among
the regions in Visayas, nut yield was more variable in Central Visayas (-17.3%) and Eastern
Visayas (36.5%) compared with Western Visayas ( - 8.3% difference).
Summer rains have been reported to have positive correlations with yield of the
succeeding year. About 60% of the variation in annual yield was reportedly due to the
changes in the duration of dry spell in the preceding two years (Matthew J et al., 1988).
Figure 3.20. Comparison of the total nut production during Jan-June and July-Dec averages of 2015-2019
Source: PSA

8 0 D E P A R T M E N T O F A G R I C U L T U R E P H I L I P P I N E C O C O N U T A U T H O R I T Y
Trend In Coconut Area and Number of Bearing Trees (2009–2019)In 2019, 13.3 M ha of land were devoted to agricultural production. Over the past 11
years (2009–2019), there was limited agricultural land expansion in the country with a net
increase of only 2.05% (PSA, 2020) and a notable decline of 0.2 M ha in the past three
years. Coconut occupied 27.4% (3.65 M ha) of the total agricultural areas in the country.
Coconut farms with wide spaces in between trees and unique frond architecture offer vast
potential for intercropping high-value crops and raising livestock without opening new
areas for expansion. About 80% of the coconut lands are monocropped (Rosales, 2020)
and utilizing the available land under coconuts for intercropping will greatly contribute to
increased agricultural production. If even just half of the 3 M ha of coconut lands could be
utilized for intercropping, at 70% effective intercropping area per hectare of coconut land,
then about 1 M ha will be added to agricultural production.
Areas planted to coconuts in 2009–2019 increased by 7.36%, (equivalent to 250,000
ha) from 3.40 M ha in 2009 to 3.65 M ha in 2019 (Figure 3.21). However, this increase in
Figure 3.21. Total area planted to coconuts and annual growth rate from 2009-2019
Source: PSA

8 1P H I L I P P I N E C O C O N U T I N D U S T R Y R O A D M A P 2 0 2 1 - 2 0 4 0
area with a corresponding increment in the number of bearing trees (Figure 3.22) failed
to increase nut production (Figures 3 and 4), resulting in a decline in 1 B nuts during the
same period.
Based on hectarage, the coconut-producing regions can be divided into three categories:
(1) regions with more than 300,000 ha planted to coconut; (2) regions with more than
100,000 ha but less than 250,000 ha; and (3) and regions with less than 50,000 ha.
Starting with the highest hectarage in 2019, regions belonging to the first category
(>300,000 ha) include CALABARZON, Zamboanga Peninsula, Bicol Region, Davao
Region, ARMM, Eastern Visayas, and Northern Mindanao. Meanwhile, MIMAROPA,
SOCCSKSARGEN, Caraga Region, Western Visayas, and Central Visayas fall under the
second category (>100,000 ha). Minor production areas such as Central Luzon, Cagayan
Valley, Ilocos Region, and CAR can be listed under the third category (<50,000ha).
Analyzing the trend in coconut hectarage, there has been a considerable increase of 5%
from 2009- 2010. This sharp increment can be attributed to the increase in hectarage at
CALABARZON (95,000 ha), Eastern Visayas (40,000 ha), and SOCCSKSARGEN (16,000
ha) (Figure 3.22). This additional hectarage amounts to about 86% or 175,000 ha increase
in the given one-year period.
Figure 3.22 Area planted to coconuts by region from 2009–2019
Source: PSA
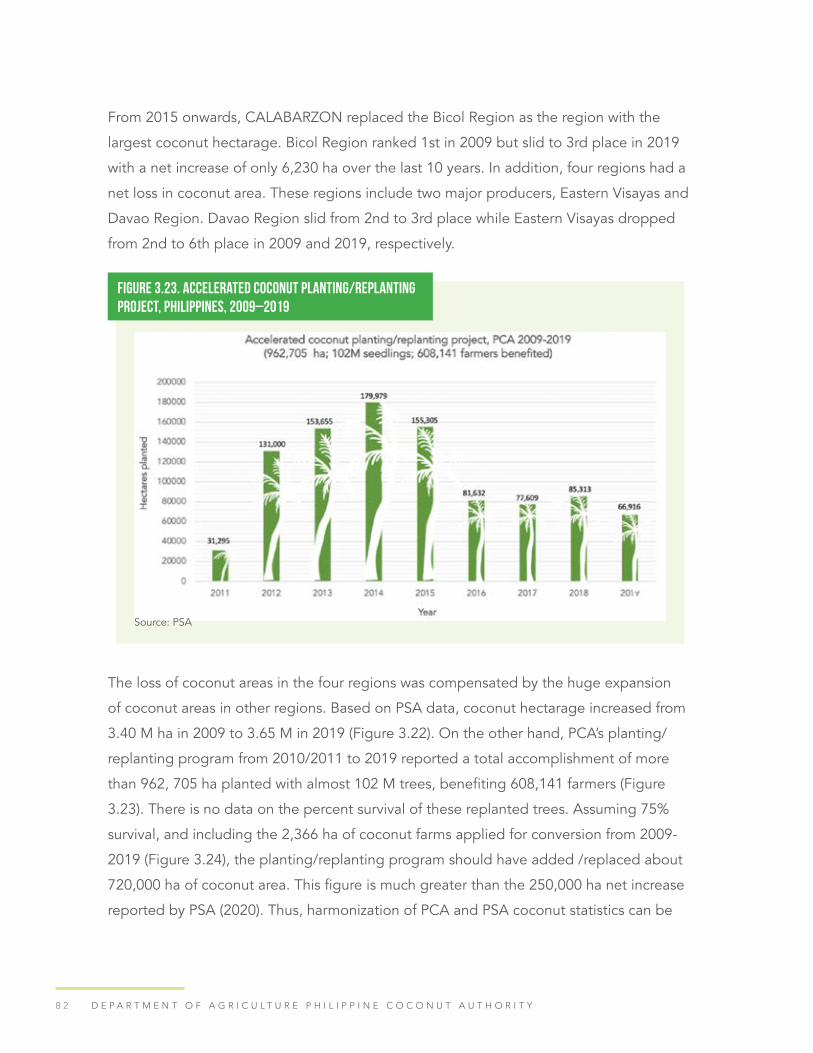
8 2 D E P A R T M E N T O F A G R I C U L T U R E P H I L I P P I N E C O C O N U T A U T H O R I T Y
From 2015 onwards, CALABARZON replaced the Bicol Region as the region with the
largest coconut hectarage. Bicol Region ranked 1st in 2009 but slid to 3rd place in 2019
with a net increase of only 6,230 ha over the last 10 years. In addition, four regions had a
net loss in coconut area. These regions include two major producers, Eastern Visayas and
Davao Region. Davao Region slid from 2nd to 3rd place while Eastern Visayas dropped
from 2nd to 6th place in 2009 and 2019, respectively.
Figure 3.23. Accelerated coconut planting/replanting project, Philippines, 2009–2019
Source: PSA
The loss of coconut areas in the four regions was compensated by the huge expansion
of coconut areas in other regions. Based on PSA data, coconut hectarage increased from
3.40 M ha in 2009 to 3.65 M in 2019 (Figure 3.22). On the other hand, PCA’s planting/
replanting program from 2010/2011 to 2019 reported a total accomplishment of more
than 962, 705 ha planted with almost 102 M trees, benefiting 608,141 farmers (Figure
3.23). There is no data on the percent survival of these replanted trees. Assuming 75%
survival, and including the 2,366 ha of coconut farms applied for conversion from 2009-
2019 (Figure 3.24), the planting/replanting program should have added /replaced about
720,000 ha of coconut area. This figure is much greater than the 250,000 ha net increase
reported by PSA (2020). Thus, harmonization of PCA and PSA coconut statistics can be

8 3P H I L I P P I N E C O C O N U T I N D U S T R Y R O A D M A P 2 0 2 1 - 2 0 4 0
Figure 3.24. Regional distribution of coconut lands applied forconversion, 2009–2019
Source: PSA
Figure 3.25. Number of bearing coconut trees and annual growth rate, 2009–2019
Source: PSA
considered an urgent concern, considering its importance for program planning, and
policy and decision making.

8 4 D E P A R T M E N T O F A G R I C U L T U R E P H I L I P P I N E C O C O N U T A U T H O R I T Y
The regional distribution of coconut lands that applied for conversion from 2009-
2019 is presented in Table 8. Bicol Region and Caraga Region had more than 300 ha
converted while CALABARZON, MIMAROPA, Eastern Visayas, Davao Region, and
SOCCSKSARGEN had more than 200 ha. Meanwhile, Western Visayas and Central
Visayas had also converted between 100-120 ha of coconut lands and the rest (except for
BARRM with no reported conversion) had converted less than 10 ha.
Consistent with the net increase in coconut hectarage, the number of bearing trees also
increased by 7.07 M palms from 2009-2019, or a total of about 348 M trees (Figure 3.25).
Ironically, this increase in the number of bearing trees was not able to offset the loss in
production. From a peak of 344 M bearing trees in 2012—which was also the year the
country attained its highest nut production—the number of bearing trees declined until
2015. This decline incurred losses amounting to 14.5 M trees. Recovery started from 2016
to 2018, thus increasing the number of bearing trees to 347 M. By 2019, the number of
bearing trees further increased to 348 M, the highest in the past 11 years. The recovery
in the number of bearing trees in the past four years suggests that there are 18 M new
productive trees, comprising 5% of the total number of bearing trees.
Figure 3.26. Number of bearing coconut trees by region, 2009-2019
Source: PSA

8 5P H I L I P P I N E C O C O N U T I N D U S T R Y R O A D M A P 2 0 2 1 - 2 0 4 0
Classifying the number of bearing coconut trees by region, CALABARZON, Zamboanga
Peninsula, Eastern Visayas, Davao Region, Bicol Region, BARRM, and Northern Mindanao
are part of the first cluster. These regions produce more than 30M bearing trees each.
The second cluster, with at least 10 M bearing trees, comprises Caraga, MIMAROPA,
SOCCSKSARGEN, Central Visayas, and Western Visayas (Figure 3.26). Lastly, the third
cluster which has 3 M or less bearing trees are Central Luzon, Cagayan Valley, Ilocos
Region, and CAR (data not presented).
Consistent with the significant increase in the area planted in CALABARZON, the number
of bearing trees in the region reached 53.7 M, comprising 16.5% of the total number
of bearing trees. A total of 15.6 M bearing trees had been added to CALABARZON
from 2011 to 2019. Zamboanga Peninsula also had consistently increased its number of
bearing trees starting 2012, gaining more than 8.3 M trees by 2019. Meanwhile, BARRM
had a slow but consistent increase in the number of bearing trees, at 1 M trees from
2009-2019. However, the increase in the number of bearing trees was partly offset by
the sharp decline of high-yielding trees in Davao Region (6 M bearing trees) and Eastern
Visayas (11.3 M bearing trees) in 2014.
Figure 3.27. Number of trees cut, 2009-2019 based on RA 8048
Source: PCA

8 6 D E P A R T M E N T O F A G R I C U L T U R E P H I L I P P I N E C O C O N U T A U T H O R I T Y
From 2010/2011-2014, the 37 M surviving trees (assuming 75% survival rate) planted
by PCA in 496,000 ha were projected to start producing by 2019. However, taking into
account the 5.1 M trees cut under RA 8048 for the same period (Figure 3.27), and the
net loss of 22.3 M bearing trees lost by Eastern Visayas (13.1 M), Davao Region (5.8 M),
Caraga Region (2.9 M), and Central Visayas (0.543 M), only about 9.9 M bearing trees
would have been added. Based on PSA data, there was still a net increase of 7.7 M of
bearing trees from 2009-2019 despite the incurred net losses of the four major producing
regions including Eastern Visayas and Mindanao.
Continuing the PCA initiative, an additional 466,775 ha were planted/replanted with
coconut trees by the PCA program from 2015-2019. Of the total number of trees
planted/replanted, 33 % of surviving trees would be productive in 2020 while 50.5% of
surviving trees would be productive in 2021. Projections of productivity of surviving trees
in succeeding years are as follows: 67.1 % in 2022, 85.3% in 2023, and 100% will be
productive by 2024. Assuming 75% survival for replanted/planted trees, there should be
an additional 720,000 ha or 7.2 B young bearing trees by 2024.
With good management and barring disasters that will severely reduce yield per tree, or
worse, reduce the number of bearing trees, nut production should pick up in the next few
years and increase significantly and sustainably. Monitoring of survival and field growth
of replanted/newly planted trees should be part of the program implementation and
evaluation. Further, the criteria for priority and targets of the planting/replanting program
should be reviewed.
Trend in Coconut Yield (nut/tree/year) 2009-2019Nut productivity per year fluctuated from 2009-2019, with a general downward trend,
from a national average of 46 nuts/tree/year in 2009 down to 44 nuts/tree/year in 2019
Figure 3.29. Maps of crop suitability (PCA, 2019) and average provincial yield
superimposed with volume of nut production, and regional yield per tree per year by
region (2009 and 2019)

8 7P H I L I P P I N E C O C O N U T I N D U S T R Y R O A D M A P 2 0 2 1 - 2 0 4 0
Coconut productivity varied across regions. Figure 3.29 presents the PCA suitability map,
2019 total nut production superimposed with computed nut yield per tee per province,
and regional computed nut yield/tree/year.
Figure 3.28 Nut productivity per tree per year, Philippines, 2009-2019.
Source: PSA
Figure 3.30. Area fertilized through the fertilization program of PCA, 2009–2019
Source: PSA

8 8 D E P A R T M E N T O F A G R I C U L T U R E P H I L I P P I N E C O C O N U T A U T H O R I T Y
Figure 3.31. Effect of the fertilization project on nut yield/tree a year afterfertilizer application, Philippines
Source: PSA, 2019
SOCCSKSARGEN, Davao Region and Northern Mindanao had the highest yield per tree in
2019, although Davao Region’s yield had declined from 68 nuts/tree in 2009 to 57 nuts/
tree in 2019. The rest of Mindanao regions, except BARRM, had average or above average
yields. In Visayas, only Western Visayas had higher than average yield of 53 nuts/tree.
Areas of high suitability do not always produce the highest yields. This observation is
evident from the low tree productivity particularly in the major coconut production grids
– CALABARZON, (Quezon in particular), Bicol Region, and Eastern Visayas. Yield per
tree in these production grids since 2009 to 2019 was below average and is continuously
declining. It is particularly concerning th at CALABARZON, which aggressively increased
its production area by almost 95,000 ha in the past 11 years, was the 2nd lowest yielder in
2009 and the lowest in 2019. Likewise, CAR, Central Visayas, and BARRM are in the same
category of below- average yield both in 2009 and 2019.
Yield gap analysis of these regions, on a provincial and even municipal level, will identify
strategic interventions that will delineate areas, where fertilization will have a high
response and replanting of damaged, old unproductive trees, and expansion planting
of selected open-pollinated varieties (OPVs) and hybrids, will be prioritized. BARRM,
which belongs to the tier of top producers and has increasing coconut hectarage (thus,
8 9P H I L I P P I N E C O C O N U T I N D U S T R Y R O A D M A P 2 0 2 1 - 2 0 4 0
relatively young coconut population), has to be given particular attention on promoting
the adoption of Good Agricultural Practices (GAP) to increase their tree productivity.
The fertilization program of PCA reported an accomplishment of 1.37 M ha fertilized from
2009– 2019 (Figure 3.30). The area covered by the program is equivalent to 37.6% of
the country’s coconut hectarage in 2019. PCA (June 2020) reported an average of 35%
increase in the yield of fertilized trees, ranging from 9% in Bicol Region to a high of 49%
in BARRM (Figure 37).
The impact of such yield increase on national production could have been significant.
However, PSA production statistics during the past 11 years do not reflect this trend, but
rather a net loss in production and a declining nut productivity per tree. A review and
recalibration of the fertilization program is strongly recommended to identify strategic
areas where fertilization can have a high and sustainable impact. Fertilization strategy
should be two-pronged: (1) using inorganic fertilizer for conventional production system
and (2) using organic fertilizers and other inputs to cater to the growing green and
organic markets for coconut and intercrops.
Effects of Multiple Stresses in Coconut Production Trends (2009–2019)Climate-related events, such as strong typhoons (Figure 38), not only cause more than a
billion pesos worth of damages but also affected tree growth and productivity.
Yield reduction due to loss of coconut areas and/or reduced nut productivity per tree
can be attributed to the numerous strong and super typhoons that occurred multiple
times a year since 2011, the severe El Niño that lasted for 18 months in 2015–2016, and
the cocolisap outbreak in CALABARZON and Basilan in 2014. Losses in coconut areas
and bearing trees could also be due to rampant illegal logging of coconuts and land
conversion. Climate-related risks and hazards are important considerations that should
be included in the criteria for identifying suitable areas and priorities for replanting and
expansion planting.

9 0 D E P A R T M E N T O F A G R I C U L T U R E P H I L I P P I N E C O C O N U T A U T H O R I T Y
Maintaining trees of varying growth stages could buffer the impact of typhoon and
drought, thus continuing and expanding the planting and replanting (with good
management practices) are important for sustainable growth of the production sector.
Regional and provincial targeting will be critical in the short term. Correspondingly,
strategically located regional and provincial seed gardens for both hybrids and selected
OPVs with sufficient capacity should limit long hauls in transporting planting materials
across regions.
Figure 3.32. Typhoon track chart, occurrence, and damages of more than PHP 1 B, Philippines, 2009–2019.
Source: PAG-ASA
Consumption of Coconut ProductsDuring the period 2009–2019, the country’s domestic consumption of coconut
products, on average, accounted for a lower share (31%) of the total coconut utilization
compared to coconut exports’ share of 69% (Table 3.24). While the country’s volume of
coconut exports grew at a much faster rate (6.5%/year, on average), domestic coconut
consumption appeared to exhibit a relatively flat trend. The average annual growth rate
was only 0.4%/year during the 11-year period under review (Table 3.24 and Figure 3.33).

9 1P H I L I P P I N E C O C O N U T I N D U S T R Y R O A D M A P 2 0 2 1 - 2 0 4 0
Table 3.24. Total exports, domestic consumption, and utilization of coconut products in copra terms, Philippines, 2009–2019
Year Export (MT)Domestic Consumption
(MT)Total Utilization (MT)
2009 1,514,941 913,000 2,427,941
2019 2,189,583 806,000 2,995,583
Annual Average (2009–2019) 1,770,310 786,398 2,556,708
% Share, 2009 62.0 38.0 100.0
% Share, 2019 73.0 27.0 100.0
% Share, 2009–2019 69.0 31.0 100.0
Annual Growth Rate (%) 6.5 0.4 3.9
1Includes coconut oil (CNO) for oleochemicals domestic consumption in copra termsSource of basic data: PCA, PSA and UCAP
Figure 3.33. Domestic consumption, export volume and total utilization of coconut, Philippines, 2009–2019
Source: PCA, PSA and UCAP
The domestic coconut consumption data published by UCAP classified local coconut
consumption into manufactured oil, homemade oil, and food nuts (i.e., mature husked
nuts and young nuts). On average, local consumption of manufactured coconut oil
(597,000 MT per year) during the period 2009-2019 accounted for the largest share
(approximately 76%) of the total domestic consumption of coconut, followed by food nuts
(113,671 MT or 14.5%) (Table 3.25 and Figure 3.34). Manufactured oil includes coconut
oil used for cooking, margarine, shortening, laundry soap, and filled milk formulation.

9 2 D E P A R T M E N T O F A G R I C U L T U R E P H I L I P P I N E C O C O N U T A U T H O R I T Y
The biggest consumers of mature husked nuts are desiccated coconut manufacturers,
followed by coconut milk/cream producers, virgin coconut oil producers, and households
(Agustin, 2012). Young coconuts are mainly utilized for salads and for their water as a
non-carbonated, healthy beverage, or sports drink. Home-made oil is mainly intended
for home consumption and its share was the lowest at approximately 10% in the same
period.
Table 3.25. Domestic consumption of coconut by type of product, Philippines, 2009–2019
Domestic Consumption (MT)
Year Manufactured Oil Home-made oil Food Nuts Total
2009 786,000 46,000 74,092 906,092
2019 497,000 126,500 182,500 806,000
Annual Average 597,000 75,277 113,671 786,398
% Share, 2009 86.7 5.1 8.2 100.0
% Share, 2019 61.7 15.7 22.6 100.0
% Share, 2009-2019 75.9 9.6 14.5 100.0
Annual Growth Rate (%) -1.9 11.2 11.6 0.4
1Includes CNO for oleochemicals domestic consumption in copra terms.
Source of basic data: PCA, PSA and UCAP
Domestic consumption of manufactured coconut oil in copra terms exhibited a
decreasing trend (-2.6%/year) from 786,000 MT in 2009 to 497,000 MT in 2019 (Table
3.25 and Figure 3.35). This decrease could be attributed to the increasing trend in
manufactured oil exports (5%/year) in the same period. Conversely, the domestic
consumption of homemade oil and food nuts was on the upswing at a rate of 12.5% and
14.0% per year in the same period. Local consumption of food nuts markedly increased
from 74,092 MT in 2009 to 182,500 MT in 2019. Similarly, consumption of homemade oil
expanded significantly from 46,000 MT in 2009 to 126,500 MT in 2019.
On average, 69% of coconut oil produced in the country during the period 2009-2019
was marketed in the world market (Table 3.26). Only a small proportion (31%) was
retained in the country for domestic consumption. The proportion of total coconut
oil production for the export market increased markedly from 61% in 2009 to 74% in

9 3P H I L I P P I N E C O C O N U T I N D U S T R Y R O A D M A P 2 0 2 1 - 2 0 4 0
2019 (Table 3.26 and Figure 3.36). Conversely, the proportion retained for domestic
consumption/utilization decreased from 39% in 2009 to 26% in 2019.
Figure 3.34. Average annual percent shares of manufactured oil, homemade oil, and food nuts in the total domestic consumption of coconut, Philippines, 2009–2019
Source of basic data: PCA, PSA and UCAP
Figure 3.35. Domestic consumption of manufactured coconut oil, home-made oil, and food nuts, Philippines, 2009–2019
Source of basic data: PCA, PSA and UCAP
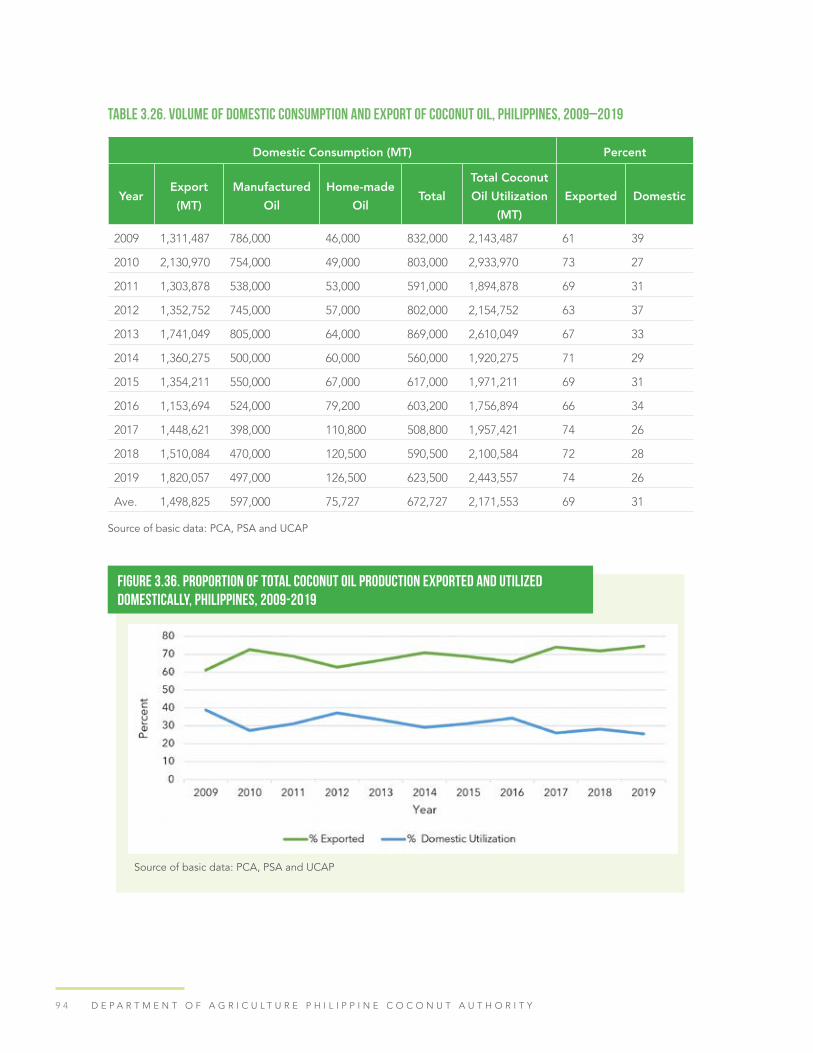
9 4 D E P A R T M E N T O F A G R I C U L T U R E P H I L I P P I N E C O C O N U T A U T H O R I T Y
Table 3.26. Volume of domestic consumption and export of coconut oil, Philippines, 2009–2019
Domestic Consumption (MT) Percent
YearExport (MT)
Manufactured Oil
Home-made Oil
TotalTotal Coconut Oil Utilization
(MT)Exported Domestic
2009 1,311,487 786,000 46,000 832,000 2,143,487 61 39
2010 2,130,970 754,000 49,000 803,000 2,933,970 73 27
2011 1,303,878 538,000 53,000 591,000 1,894,878 69 31
2012 1,352,752 745,000 57,000 802,000 2,154,752 63 37
2013 1,741,049 805,000 64,000 869,000 2,610,049 67 33
2014 1,360,275 500,000 60,000 560,000 1,920,275 71 29
2015 1,354,211 550,000 67,000 617,000 1,971,211 69 31
2016 1,153,694 524,000 79,200 603,200 1,756,894 66 34
2017 1,448,621 398,000 110,800 508,800 1,957,421 74 26
2018 1,510,084 470,000 120,500 590,500 2,100,584 72 28
2019 1,820,057 497,000 126,500 623,500 2,443,557 74 26
Ave. 1,498,825 597,000 75,727 672,727 2,171,553 69 31
Source of basic data: PCA, PSA and UCAP
Figure 3.36. Proportion of total coconut oil production exported and utilized domestically, Philippines, 2009-2019
Source of basic data: PCA, PSA and UCAP
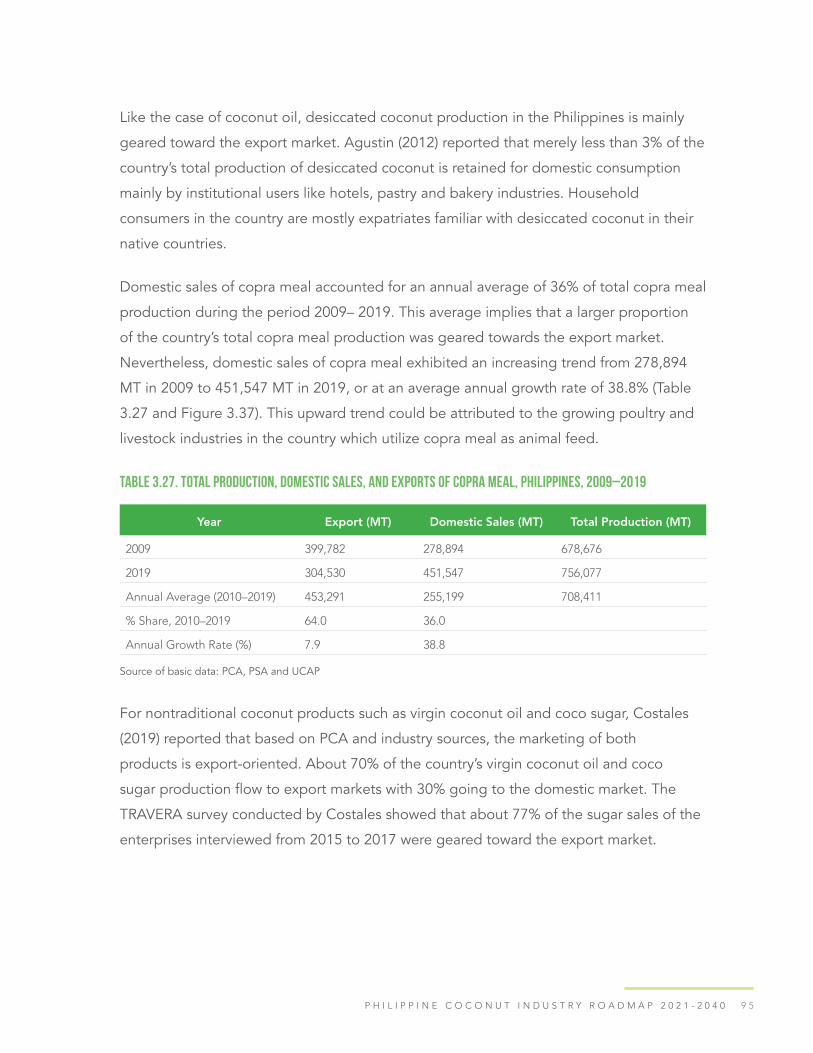
9 5P H I L I P P I N E C O C O N U T I N D U S T R Y R O A D M A P 2 0 2 1 - 2 0 4 0
Like the case of coconut oil, desiccated coconut production in the Philippines is mainly
geared toward the export market. Agustin (2012) reported that merely less than 3% of the
country’s total production of desiccated coconut is retained for domestic consumption
mainly by institutional users like hotels, pastry and bakery industries. Household
consumers in the country are mostly expatriates familiar with desiccated coconut in their
native countries.
Domestic sales of copra meal accounted for an annual average of 36% of total copra meal
production during the period 2009– 2019. This average implies that a larger proportion
of the country’s total copra meal production was geared towards the export market.
Nevertheless, domestic sales of copra meal exhibited an increasing trend from 278,894
MT in 2009 to 451,547 MT in 2019, or at an average annual growth rate of 38.8% (Table
3.27 and Figure 3.37). This upward trend could be attributed to the growing poultry and
livestock industries in the country which utilize copra meal as animal feed.
Table 3.27. Total production, domestic sales, and exports of copra meal, Philippines, 2009–2019
Year Export (MT) Domestic Sales (MT) Total Production (MT)
2009 399,782 278,894 678,676
2019 304,530 451,547 756,077
Annual Average (2010–2019) 453,291 255,199 708,411
% Share, 2010–2019 64.0 36.0
Annual Growth Rate (%) 7.9 38.8
Source of basic data: PCA, PSA and UCAP
For nontraditional coconut products such as virgin coconut oil and coco sugar, Costales
(2019) reported that based on PCA and industry sources, the marketing of both
products is export-oriented. About 70% of the country’s virgin coconut oil and coco
sugar production flow to export markets with 30% going to the domestic market. The
TRAVERA survey conducted by Costales showed that about 77% of the sugar sales of the
enterprises interviewed from 2015 to 2017 were geared toward the export market.

9 6 D E P A R T M E N T O F A G R I C U L T U R E P H I L I P P I N E C O C O N U T A U T H O R I T Y
Approximately 13.88 M MT of the country’s total net disposable coconut supply in
2019 was mostly used for food and nonfood processing (Table 3.28). The total volume
of coconut available for food consumption was estimated at 738,170 MT in the same
year. Coconut available for food consumption accounted for a miniscule share of only
five percent of the total net disposable coconut supply compared with the much larger
share (94%) of coconut for food and nonfood processing (Figure 3.38). Of the total net
disposable coconut supply, coconut seedlings’ share was the lowest at only one percent.
The domestic coconut demand for nonfood processing (7.97 M MT with 54% share) in 2019
was relatively higher than the domestic coconut demand for food processing (5.9 M MT
with 40% share) (Table 3.28 and Figure 3.38). This performance could be partly due to the
increasing local demand for crude coconut oil by the oleochemical/bio-diesel companies
that comply with the mandated 2% blend of coco methyl ester with petroleum diesel.
Table 3.28. Coconut supply utilization account, Philippines, 2019
Domestic Consumption (MT)
Production (MT)
Net Disposable Supply (MT)
Seeds Food ProcessingProcessing (Non
Food Use)Food
14,765,057 14,763,676 147,651 5,905,470 7,972,385 738,170
1Coconut production minus coconut exports (1,471 MT)Source: CountrySTAT Philippines and PSA
Figure 3.37. Domestic sales and export volume of copra meal, Philippines, 2010–2019
Source of basic data: PCA, PSA and UCAP
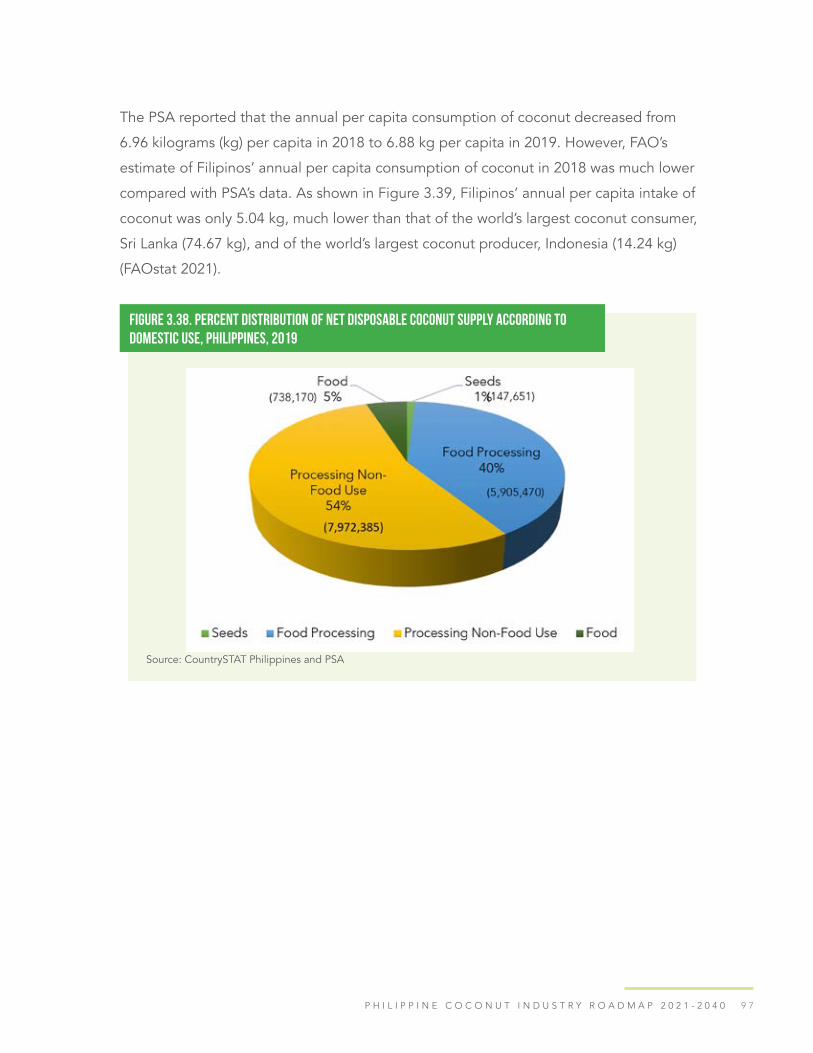
9 7P H I L I P P I N E C O C O N U T I N D U S T R Y R O A D M A P 2 0 2 1 - 2 0 4 0
The PSA reported that the annual per capita consumption of coconut decreased from
6.96 kilograms (kg) per capita in 2018 to 6.88 kg per capita in 2019. However, FAO’s
estimate of Filipinos’ annual per capita consumption of coconut in 2018 was much lower
compared with PSA’s data. As shown in Figure 3.39, Filipinos’ annual per capita intake of
coconut was only 5.04 kg, much lower than that of the world’s largest coconut consumer,
Sri Lanka (74.67 kg), and of the world’s largest coconut producer, Indonesia (14.24 kg)
(FAOstat 2021).
Figure 3.38. Percent distribution of net disposable coconut supply according to domestic use, Philippines, 2019
Source: CountrySTAT Philippines and PSA

9 8 D E P A R T M E N T O F A G R I C U L T U R E P H I L I P P I N E C O C O N U T A U T H O R I T Y
Trade Performance of PhilippineCoconut ProductsContribution of Coconut Products to the Philippines’ Export Earnings
Coconut oil, desiccated coconut, and copra cake are among the top ten agricultural
export products in the country. On the average, exports of coconut products generated
an aggregate value of US$ 1.83 billion per year during the period 2015–2019 (Table 3.29).
This amount accounted for 2.86% of the country’s merchandise export earnings in the
same period. The coconut export mix consists of traditional and nontraditional coconut
products. During the period 2009–2019, the country exported a total of 43 nontraditional
coconut products. The top promising nontraditional coconut products consist of
virgin coconut oil, coco water, coconut concentrate, liquid coco milk, coco cream,
hydrogenated coconut oil, coco husk cubes, coco peat, baled coir, and glycerin.
The largest contribution to the country’s export earnings from coconut products came
from traditional coconut products with an average of US$ 1.53 B (2.4%) per year during
Figure 3.39. Annual per capita coconut consumption in the Philippines, Indonesia, and Sri Lanka
Source: FAOstat 2021

9 9P H I L I P P I N E C O C O N U T I N D U S T R Y R O A D M A P 2 0 2 1 - 2 0 4 0
the period 2015–2019. Coconut oil had the biggest contribution (70%) while desiccated
coconut (15%) and copra meal (4%) trailed behind. In contrast, exports of nontraditional
coconut products accounted for only an average of 0.46% (US$ 292 M) of the country’s
total foreign exchange earnings. Revenues from exports of traditional coconut products
improved from 2015 to 2019 by an average of 5.1%. However, export earnings from
nontraditional coconut products declined from US $315 M in 2015 to US$ 287 M in 2019,
or by an average of 1% per year. The total export revenue from traditional and non-
traditional coconut products, on the other hand, grew by an average rate of 3.9% per
year during the period 2015–2019 (Table 3.39).
Table 3.29. Contribution of coconut products to the total value of Philippine merchandise exports, 2015- 2019
ItemValue of Philippines Exports (FOB US$ Million)
% Share2015 2016 2017 2018 2019 Average
Total Philippine Exports 58,827 57,406 62,875 69,307 70,927 63,868 100.00
Coconut Products 1,623 1,703 2,268 1,882 1,654 1,826 2.86
Traditional Coconut
Products:
1,308 1,432 1,959 1,604 1,367 1,534 2.40
Copra 1 a
Coconut oil 958 1,045 1,461 1,033 857 1,071 1.68
Desiccated coconut 154 195 264 283 249 229 0.36
Copra meal/cake 69 52 43 67 56 57 0.09
Oleochemicals 18 33 61 47 37 39 0.06
Coco shell charcoal 28 15 20 41 41 29 0.05
Activated Carbon 80 92 110 133 127 108 0.17
Nontraditional Coconut
Products
315 271 309 278 287 292 0.46
Less than one M.Source of basic data: PCA and PSA
Copra. The total export volume of copra increased from 84 MT in 2009 to 92 MT in 2018,
or by an average of 104% per year (Table 3.30 and Figure 3.40). The highest shipment of
copra was registered in 2014 due to the high volume of copra imports of Vietnam (1,400
MT valued at US$ 687,465) and the Republic of Korea (555 MT worth US$ 168,000). Total

1 0 0 D E P A R T M E N T O F A G R I C U L T U R E P H I L I P P I N E C O C O N U T A U T H O R I T Y
export earnings generated from copra rose from US$ 59,795 in 2009 to US$ 97,951 in
2018, or by 51% per year, on the average. The country stopped exporting copra in 2019
due to lack of supply.
Table 3.30. Export volume and value of copra, Philippines, 2009–2018
Year Export Volume (MT) Export Value (FOB US$)
2009 84 59,795.0
2018 92 97,951.0
Average (2009–2018) 259 297,468.0
Ave. Annual Growth Rate (2009–2018) 104% 51%
Source of basic data: PCA and PSA
Figure 3.40. Export volume (MT) and value (FOB US$) of copra, 2009–2018
Source of basic data: PCA and PSA
Eight countries imported copra from the Philippines. During the 11-year period under
review, the Philippines still exported limited amounts of copra mainly to the Republic
of Korea. The country’s export volume of copra to the Republic of Korea was erratic
but showed an increasing trend (39.4%/year). Of the total export volume of copra from
2009 to 2018, the Republic of Korea’s market share was 61.4% (Figure 3.41). Shipments
of copra to other importing countries such as Japan, Taiwan, USA, Vietnam, and Kuwait
were done only once during the period 2009– 2018.

1 0 1P H I L I P P I N E C O C O N U T I N D U S T R Y R O A D M A P 2 0 2 1 - 2 0 4 0
Coconut Oil. Coconut oil, as a lauric acid oil, constituted a measly 2.2% of the world’s
oil and fats market in 2019 (Oil World 2020). Nevertheless, coconut oil dominated the
international trade among coconut products. The Philippines predominantly captured
the world market by supplying approximately 45% of the total world export volume of
coconut oil from 2009 to 2018 (Table 3.31). In the international market, the Philippines
and Indonesia have maintained the lead by delivering about 76% of the total world
shipments averaging 2,098,443 MT per year from 2009 to 2018 (Table 3.31). The
Philippines posted a higher average annual growth rate (5.1%/year) than Indonesia,
the country’s closest competitor (4%/year). Malaysia trailed behind in export volume of
coconut oil and registered also the lowest average annual growth rate (1.1%/year) than
the Philippines and Indonesia.
Table 3.31. Average annual volume and growth rate of coconut oil exports of three leading country exporters in the world, 2009–2018
CountryTotal Export Volume (MT)
Percent Share
RankAve. Annual Export Volume
(MT)Ave. Annual Growth
Rate (%)
Philippines 9,396,627 45.0 1 939,663 5.1
Indonesia 6,466,902 31.0 2 646,690 4.0
Malaysia 1,352,114 6.0 3 135,211 1.1
Figure 3.41. Market shares of importing countries in the Philippines’ copra volume, 2009–2018
Source of basic data: PCA and PSA

1 0 2 D E P A R T M E N T O F A G R I C U L T U R E P H I L I P P I N E C O C O N U T A U T H O R I T Y
CountryTotal Export Volume (MT)
Percent Share
RankAve. Annual Export Volume
(MT)Ave. Annual Growth
Rate (%)
World 20,984,427 2,098,443 2.5
Source: FAOstat
Figure 3.42. Percent share of the total export volume of coconut oil by type, Philippines, 2009–2019
Source of basic data: PCA and UCAP
As mentioned earlier, the Philippines exports three types of coconut oil, namely: crude
coconut oil, refined bleached oil or cochin oil, and refined bleached deodorized oil.
During the period 2009-2019, crude coconut oil accounted for an average of 67% of the
country’s total coconut oil export volume per year (Figure 3.42). Refined bleached oil
(cochin oil) and refined, bleached deodorized oil accounted for 29% and 4%, respectively.
Historically, the country’s volume of coconut oil export was largely affected by fluctuations in
coconut production due to climatic changes, e.g., drought and series of typhoons. Despite
those year-to-year fluctuations in coconut production, the export volume of crude coconut
oil increased at an average rate of 9.3% annually over the period 2009– 2019 (Table 3.32).
Crude coconut oil exhibited a 15% increase in export revenue during the same period
despite the volatility in coconut oil prices. High export volumes of crude coconut oil were
registered in 2010 and 2019 while low export volumes were reported in 2015 and 2016
(Figure 3.43). On the other hand, high export earnings were recorded in 2011 and 2017 due
to the rising world price and tight world supply of coconut oil during these years.

1 0 3P H I L I P P I N E C O C O N U T I N D U S T R Y R O A D M A P 2 0 2 1 - 2 0 4 0
Table 3.32. Export volume and value of crude coconut oil, Philippines, 2009–2019
Year Export Volume (MT)Export Value (FOB
US$)
2009 570,570 399,746
2019 825,746 579,131,743
Annual Average (2009-2019) 606,456 662,998,863
Average Annual Growth Rate (2009-2019) 9.3% 15.0%
Source: PCA and UCAP
Figure 3.43. Export volume and value of crude coconut oil, 2009–2019
Source of basic data: PCA and UCAP
Among all coconut products, crude coconut oil has remained the biggest earner over the
period 2009–2019. Apart from palm kernel oil, coconut oil commands quite a high price
compared with other vegetable oils since it is the primary lauric oil among the vegetable
oils in the world.
During the period 2009–2019, 57 countries imported the Philippines. About 57% of the
Philippine exports of crude coconut oil were directed to the Netherlands, followed by the
USA at 23% (Figure 3.44). The remaining balance was absorbed by Italy (5%), Malaysia
(4%), Spain (4%), the People’s Republic of China (3%), and Indonesia (2%), among other

1 0 4 D E P A R T M E N T O F A G R I C U L T U R E P H I L I P P I N E C O C O N U T A U T H O R I T Y
importing countries. Crude coconut oil exported to the USA and the Netherlands is used
more for refining and production of raw materials for high-value personal care products
(Agustin 2012).
The country’s export volume of cochin oil increased from 228,606 MT in 2009 to 233,208
MT in 2019, or at an average annual growth rate of 2.3% per year (Table 3.33 and Figure
3.45). The growth in the country’s export earnings from cochin oil (7.1%/year) was higher
compared to the growth in its export volume during the same period because of the
increasing trend in the export price of this product. On average, the export volume of
cochin oil from the Philippines was 261,652 MT annually and earned US$ 315.02 M per
year in foreign exchange during the period 2009–2019.
Figure 3.44. Market shares of importing countries in the Philippines’ export volume of crude coconut oil, 2009–2019
Source of basic data: PCA and PSA

1 0 5P H I L I P P I N E C O C O N U T I N D U S T R Y R O A D M A P 2 0 2 1 - 2 0 4 0
Table 3.33. Export volume and value of refined bleached oil (cochin oil), Philippines, 2009–2018
Year Export Volume (MT)Export Value (FOB
US$)
2009 228,606 162,727,472
2019 233,208 189,943,566
Annual Average (2009-2019) 261,652 315,022,076
Average Annual Growth Rate (2009-2019) 2.3% 7.1%
Source: PCA and PSA
Figure 3.45. Export volume and value of refined bleached oil (cochin oil), Philippines, 2009–2019
Source: PCA and PSA
Figure 3.46. Market shares of importing countries in the Philippines’ export volume of refined bleached oil (cochin oil), 2009–2019
Source: PCA and PSA
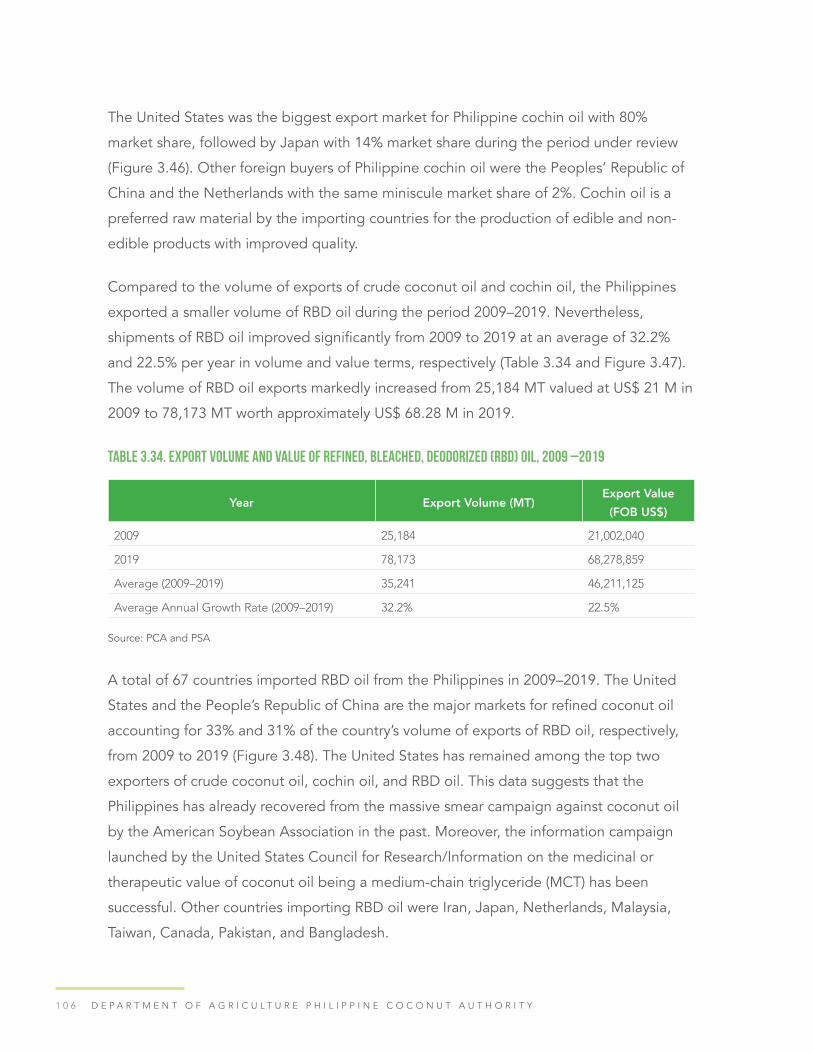
1 0 6 D E P A R T M E N T O F A G R I C U L T U R E P H I L I P P I N E C O C O N U T A U T H O R I T Y
The United States was the biggest export market for Philippine cochin oil with 80%
market share, followed by Japan with 14% market share during the period under review
(Figure 3.46). Other foreign buyers of Philippine cochin oil were the Peoples’ Republic of
China and the Netherlands with the same miniscule market share of 2%. Cochin oil is a
preferred raw material by the importing countries for the production of edible and non-
edible products with improved quality.
Compared to the volume of exports of crude coconut oil and cochin oil, the Philippines
exported a smaller volume of RBD oil during the period 2009–2019. Nevertheless,
shipments of RBD oil improved significantly from 2009 to 2019 at an average of 32.2%
and 22.5% per year in volume and value terms, respectively (Table 3.34 and Figure 3.47).
The volume of RBD oil exports markedly increased from 25,184 MT valued at US$ 21 M in
2009 to 78,173 MT worth approximately US$ 68.28 M in 2019.
Table 3.34. Export volume and value of refined, bleached, deodorized (RBD) oil, 2009 –2019
Year Export Volume (MT)Export Value
(FOB US$)
2009 25,184 21,002,040
2019 78,173 68,278,859
Average (2009–2019) 35,241 46,211,125
Average Annual Growth Rate (2009–2019) 32.2% 22.5%
Source: PCA and PSA
A total of 67 countries imported RBD oil from the Philippines in 2009–2019. The United
States and the People’s Republic of China are the major markets for refined coconut oil
accounting for 33% and 31% of the country’s volume of exports of RBD oil, respectively,
from 2009 to 2019 (Figure 3.48). The United States has remained among the top two
exporters of crude coconut oil, cochin oil, and RBD oil. This data suggests that the
Philippines has already recovered from the massive smear campaign against coconut oil
by the American Soybean Association in the past. Moreover, the information campaign
launched by the United States Council for Research/Information on the medicinal or
therapeutic value of coconut oil being a medium-chain triglyceride (MCT) has been
successful. Other countries importing RBD oil were Iran, Japan, Netherlands, Malaysia,
Taiwan, Canada, Pakistan, and Bangladesh.

1 0 7P H I L I P P I N E C O C O N U T I N D U S T R Y R O A D M A P 2 0 2 1 - 2 0 4 0
At export destinations, RBD oil is not consumed as cooking oil, but it is further processed
mainly as feedstock for oleochemicals. These oleochemicals, such as fatty alcohols, fatty
acids, and methyl ester are processed further into high-value consumer products such as
shampoos, detergents, surface-active agents, cosmetics, pharmaceuticals, plastics, and
synthetic resins (Agustin, 2012). Utilization in the food sector at importing countries is only
as specialty oil for specific uses. As confectionery fat, it is used in the preparation of ice
cream, in imitation chocolates where it is used in place of cocoa butter along with cocoa
powder, and as spray oil for crackers.
Figure 3.47. Export volume and value of refined bleached deodorized (RBD) oil, Philippines, 2009–2019
Source: PCA and PSA
Figure 3.48. Market shares of importing countries in the Philippines’ RBDoil export volume, 2009-2019
Source: PCA and PSA

1 0 8 D E P A R T M E N T O F A G R I C U L T U R E P H I L I P P I N E C O C O N U T A U T H O R I T Y
Copra Meal. During the period 2009 to 2019, the country’s export volume of copra meal
was erratic (Table 3.35 and Figure 3.49). The highest volume of copra meal exports was
recorded in 2013 at 751,962 MT valued at US$ 143.85 M while the lowest was registered
in 2019 at 304,531 MT, worth approximately US$
55.65 M. On average, the export volume of copra meal during the same period was
453,340 MT and export earnings generated amounted to US$ 76.58 M per year.
Table 3.35. Export volume and value of copra meal, Philippines, 2009–2019
Item Export Volume (MT)Export Value
(FOB US$)
2009 399,782 47,925,863
2019 304,531 55,647,689
Annual Average (2009–2019) 453,340 76,580,950
Ave. Annual Growth Rate (2009–2019) 8.7% 9.4%
Source: PCA and PSA
Figure 3.49. Export volume and value of copra meal, Philippines, 2009–2019
Source: PCA and PSA
Europe was once the leading export market for Philippine copra meal but due to more
stringent regulations imposed in the international copra market, export to this destination
has ceased. The country’s export market for copra meal thus shifted to Asia. For the
last 11 years, the Republic of Korea was the leading export market for copra meal with

1 0 9P H I L I P P I N E C O C O N U T I N D U S T R Y R O A D M A P 2 0 2 1 - 2 0 4 0
a 47% market share of the total copra meal export volume of the country (Figure 3.50).
Vietnam followed with a 23% market share. The Republic of Korea and Vietnam were the
two leading export markets for copra meal due to the growing livestock industry in these
countries. Other export markets for Philippine copra meal were the People’s Republic
of China, India, Japan, and Taiwan. Both the People’s Republic of China and India had
the same market share of 10%. Likewise, both Japan and Taiwan registered a miniscule
market share of 3%.
Desiccated Coconut. The Philippines is the world’s top exporter of desiccated coconut
with 31% market share, followed by Indonesia (20%) and Sri Lanka (10%) during the
period 2009–2019 (Table 3.36). These countries have long-established desiccated
coconut industries.
Table 3.36. Average annual volume and growth rate of desiccated coconut by leading country exporters in the world, 2009–2019
Country Total ExportVolume (MT)
PercentShare
RankAverage Annual
Export Volume (MT)Ave. Annual
Growth Rate (%)
Philippines 1,231,939 31 1 111,994 11
Indonesia 805,118 20 2 73,193 6
Sri Lanka 417,763 10 3 37,978 11
Figure 3.50. Market shares of importing countries in the Philippines’ exportvolume of copra meal, 2009 –2019
Source: PCA and PSA
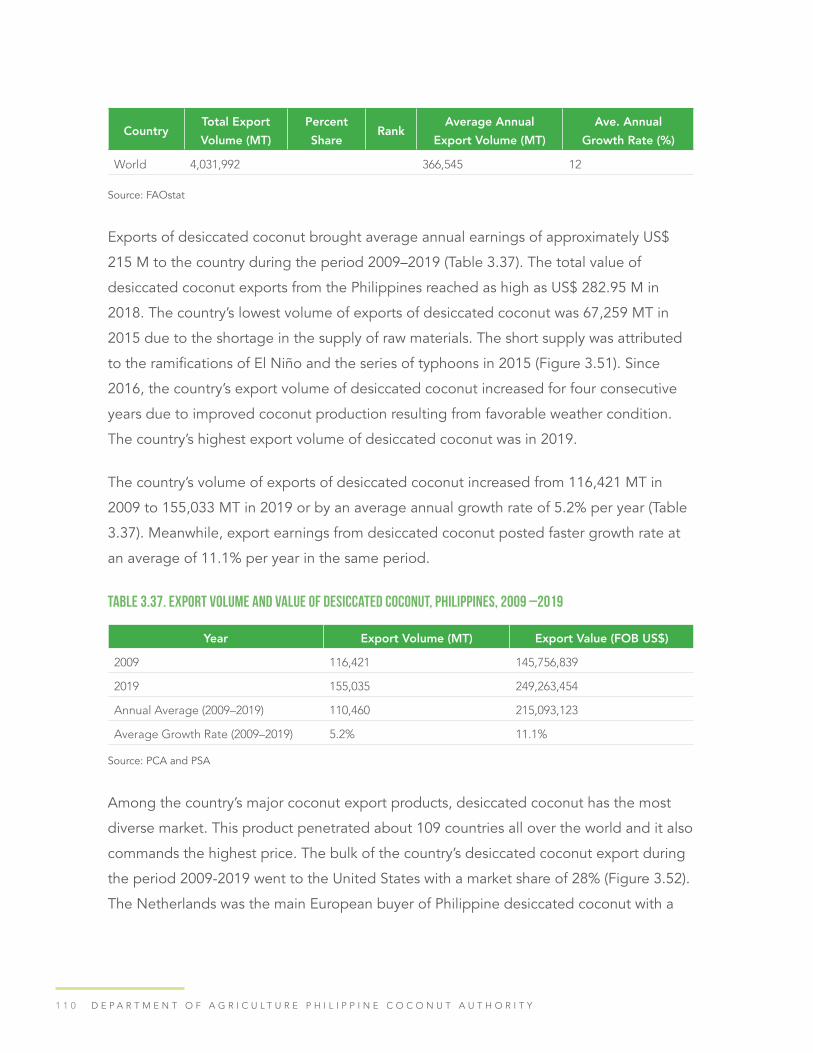
1 1 0 D E P A R T M E N T O F A G R I C U L T U R E P H I L I P P I N E C O C O N U T A U T H O R I T Y
Country Total ExportVolume (MT)
PercentShare
RankAverage Annual
Export Volume (MT)Ave. Annual
Growth Rate (%)
World 4,031,992 366,545 12
Source: FAOstat
Exports of desiccated coconut brought average annual earnings of approximately US$
215 M to the country during the period 2009–2019 (Table 3.37). The total value of
desiccated coconut exports from the Philippines reached as high as US$ 282.95 M in
2018. The country’s lowest volume of exports of desiccated coconut was 67,259 MT in
2015 due to the shortage in the supply of raw materials. The short supply was attributed
to the ramifications of El Niño and the series of typhoons in 2015 (Figure 3.51). Since
2016, the country’s export volume of desiccated coconut increased for four consecutive
years due to improved coconut production resulting from favorable weather condition.
The country’s highest export volume of desiccated coconut was in 2019.
The country’s volume of exports of desiccated coconut increased from 116,421 MT in
2009 to 155,033 MT in 2019 or by an average annual growth rate of 5.2% per year (Table
3.37). Meanwhile, export earnings from desiccated coconut posted faster growth rate at
an average of 11.1% per year in the same period.
Table 3.37. Export volume and value of desiccated coconut, Philippines, 2009 –2019
Year Export Volume (MT) Export Value (FOB US$)
2009 116,421 145,756,839
2019 155,035 249,263,454
Annual Average (2009–2019) 110,460 215,093,123
Average Growth Rate (2009–2019) 5.2% 11.1%
Source: PCA and PSA
Among the country’s major coconut export products, desiccated coconut has the most
diverse market. This product penetrated about 109 countries all over the world and it also
commands the highest price. The bulk of the country’s desiccated coconut export during
the period 2009-2019 went to the United States with a market share of 28% (Figure 3.52).
The Netherlands was the main European buyer of Philippine desiccated coconut with a
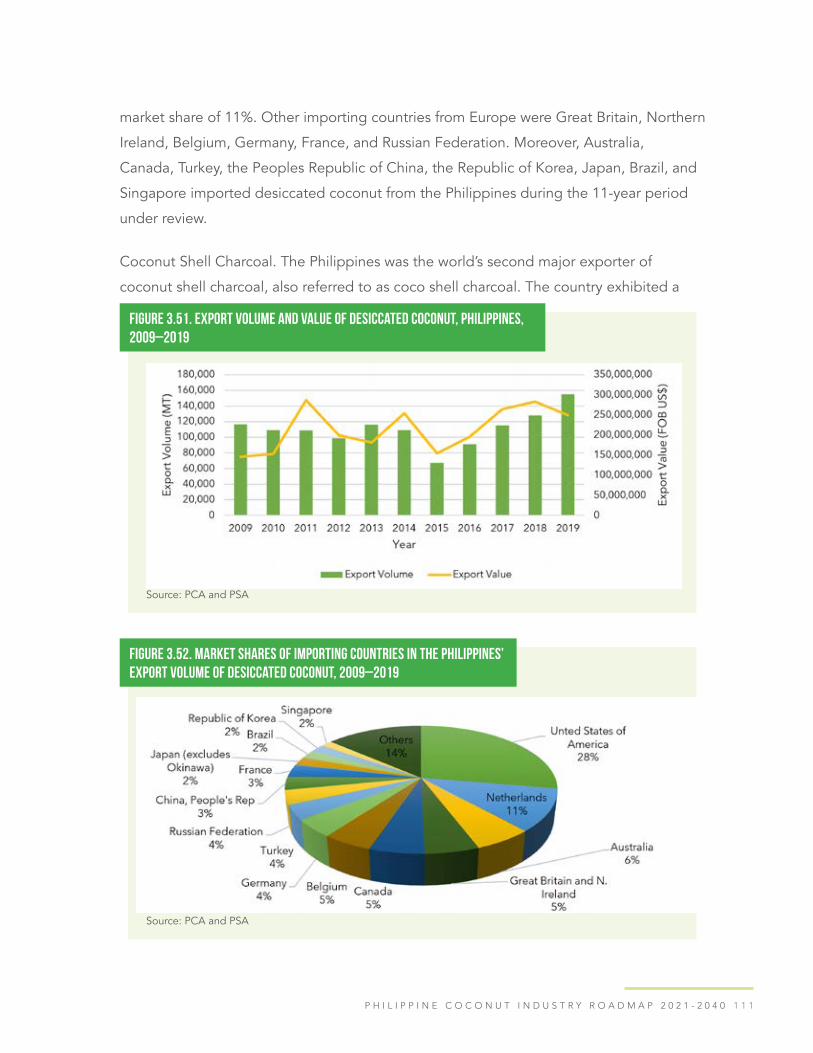
1 1 1P H I L I P P I N E C O C O N U T I N D U S T R Y R O A D M A P 2 0 2 1 - 2 0 4 0
market share of 11%. Other importing countries from Europe were Great Britain, Northern
Ireland, Belgium, Germany, France, and Russian Federation. Moreover, Australia,
Canada, Turkey, the Peoples Republic of China, the Republic of Korea, Japan, Brazil, and
Singapore imported desiccated coconut from the Philippines during the 11-year period
under review.
Coconut Shell Charcoal. The Philippines was the world’s second major exporter of
coconut shell charcoal, also referred to as coco shell charcoal. The country exhibited a
Figure 3.51. Export volume and value of desiccated coconut, Philippines, 2009–2019
Source: PCA and PSA
Figure 3.52. Market shares of importing countries in the Philippines’ export volume of desiccated coconut, 2009–2019
Source: PCA and PSA

1 1 2 D E P A R T M E N T O F A G R I C U L T U R E P H I L I P P I N E C O C O N U T A U T H O R I T Y
market share of 18%, next to Indonesia with a relatively much larger market share of 68%
during the period 2012–2017 (Table 3.38). India ranked third with 11% market share, but
it posted a faster growth in export volume (52%/year) compared with the Philippines
(11%/year).
During the period 2009–2019, the country’s export volume of coconut shell charcoal
averaged 51,594 MT annually valued at approximately US$ 23.57 M. The export volume
and value increased, on the average, by 20.3% and 24.1% per year, respectively, in the
same period (Table 3.39). It was in 2019 that the export volume and value of coconut shell
charcoal hit its peak at 87,879 MT earning approximately US$ 40.54 M compared with its
export volume of 34,746 MT and export receipts of US$ 11.18 M in 2009. (Figure 3.53).
The significant increase in the country’s shipments of coconut shell charcoal in recent
years could be due to the high demand from activated carbon manufacturers in Japan
and China since they consider Philippine coconuts as the best source of charcoal.
Table 3.38. Average annual volume and growth rate of coco shell charcoal by three leading country exporters in the world, 2012–2017
CountryTotal ExportVolume (MT)
PercentShare
RankAverage Annual
Export Volume (MT)Ave. Annual
Growth Rate (%)
Indonesia 1,299,823 68 1 216,637 30
Philippines 343,524 18 2 57,254 11
India 214,281 11 3 35,714 52
World 1,902,888 317,148 11
Source: International Coconut Community
Table 3.39. Export volume, value and price of coconut shell charcoal, Philippines, 2009–2019
Year Export Volume (MT) Export Value (FOB US$)
2009 34,746 11,181,943
2019 87,879 40,544,407
Average (2009–2019) 51,594 23,571,520
Ave. Annual Growth Rate (2009–2019) 20.3% 24.1%
Source: PCA and PSA

1 1 3P H I L I P P I N E C O C O N U T I N D U S T R Y R O A D M A P 2 0 2 1 - 2 0 4 0
A total of 32 countries imported coco shell charcoal from the Philippines. Japan, China, and
the Republic of Korea were the main importers. From 2009 to 2017, Japan was the country’s
leading export market for coconut shell charcoal. However, the People’s Republic of China
replaced Japan starting 2018. During the period 2009–2019, the average market share
of the People’s Republic of China in the total Philippine export volume of coconut shell
charcoal was 35%, followed closely by Japan at 34% (Figure 3.54).
Figure 3.53. Philippine export volume and value of coconut shell charcoal, 2009–2019
Source: PCA and PSA
Figure 3.54. Market shares of importing countries in the Philippines’ export volume of coconut shell charcoal, 2009–2019
Source: PCA and PSA

1 1 4 D E P A R T M E N T O F A G R I C U L T U R E P H I L I P P I N E C O C O N U T A U T H O R I T Y
India and the Republic of Korea—the third and fourth major export markets for Philippine
coconut shell charcoal, respectively—exhibited a market share of only 8% and 7%,
respectively. Other foreign buyers of coco shell charcoal were Sri Lanka, Vietnam,
Singapore, Turkey, USA, and Hong Kong. These importing countries use coconut shell
charcoal in the production of activated carbon and in other industries that utilize its
derivative products.
Activated Carbon. Coco shell charcoal-based activated carbon ranks third in generating
high export earnings among the country’s traditional coconut products. From 2012 to
2015, the Philippines was the top exporter of coco shell charcoal-based activated carbon
in the international market with a market share of 15% (Table 3.40). India ranked second,
posting an average market share of 13%. Other leading world exporters were Sri Lanka
(7%) and Indonesia (4%).
Table 3.40. Average annual export volume of activated carbon by leading country exporters in the world, 2012–2015 and 2016–2017
CountryAverage Annual
Export Volume (MT) (2012-2015)
Percent Share
RankAverage Annual
Export Volume (MT) (2012-2015)
Percent Share
Rank
Philippines 76,307 15 1 66,070 11 2
India 64,282 13 2 78,535 13 1
Sri Lanka 33,969 7 3 37,289 6 3
Indonesia 23,218 4 4 21,355 4 4
World 519,727 587,417
Source: International Coconut Community
Starting in 2016, however, India’s shipments of coco shell-based activated carbon
surpassed that of the Philippines (Table 3.41). During the period 2016–2017, India, with
a market share of 13%, dethroned the Philippines as the top exporter of coco shell
charcoal-based activated carbon in the world. The Philippines dropped to second rank
and exhibited a lower market share of 11% in this period.
During the 11-year period under review (2009–2019), the volume of coco shell-based
activated carbon exported to the international market showed an increasing trend from
20,027 MT in 2009 to approximately 78,252 MT in 2019, or by an average of 17.6% per
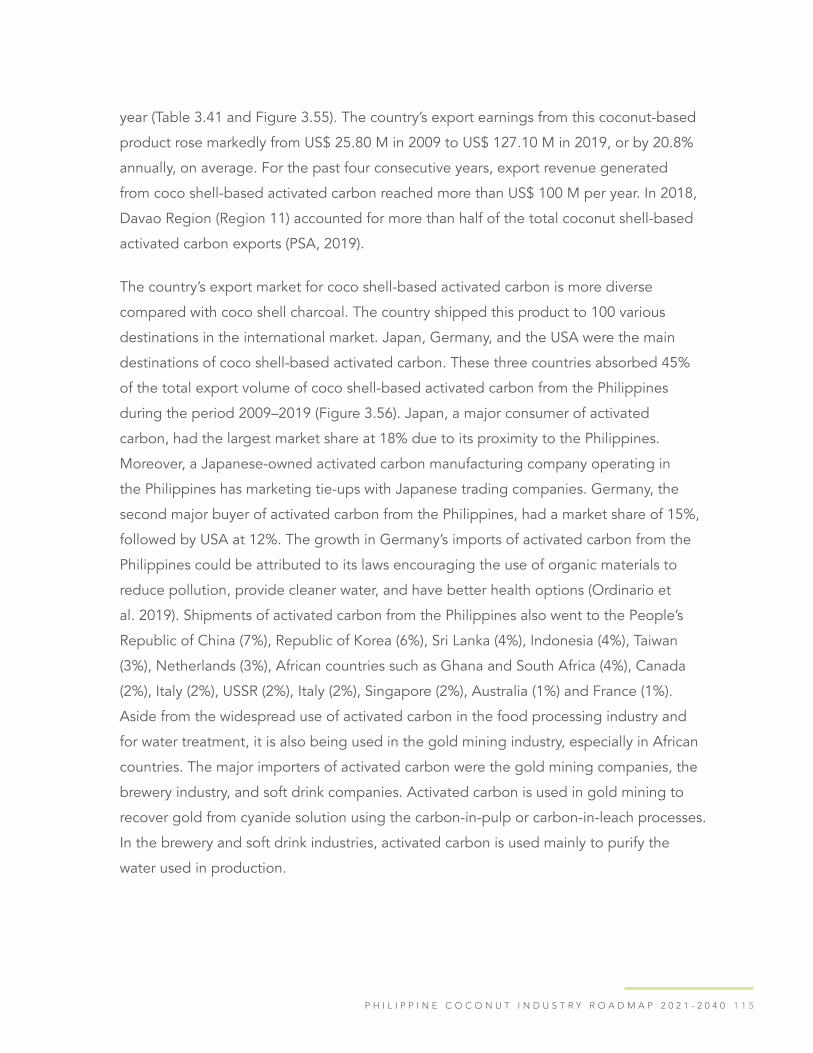
1 1 5P H I L I P P I N E C O C O N U T I N D U S T R Y R O A D M A P 2 0 2 1 - 2 0 4 0
year (Table 3.41 and Figure 3.55). The country’s export earnings from this coconut-based
product rose markedly from US$ 25.80 M in 2009 to US$ 127.10 M in 2019, or by 20.8%
annually, on average. For the past four consecutive years, export revenue generated
from coco shell-based activated carbon reached more than US$ 100 M per year. In 2018,
Davao Region (Region 11) accounted for more than half of the total coconut shell-based
activated carbon exports (PSA, 2019).
The country’s export market for coco shell-based activated carbon is more diverse
compared with coco shell charcoal. The country shipped this product to 100 various
destinations in the international market. Japan, Germany, and the USA were the main
destinations of coco shell-based activated carbon. These three countries absorbed 45%
of the total export volume of coco shell-based activated carbon from the Philippines
during the period 2009–2019 (Figure 3.56). Japan, a major consumer of activated
carbon, had the largest market share at 18% due to its proximity to the Philippines.
Moreover, a Japanese-owned activated carbon manufacturing company operating in
the Philippines has marketing tie-ups with Japanese trading companies. Germany, the
second major buyer of activated carbon from the Philippines, had a market share of 15%,
followed by USA at 12%. The growth in Germany’s imports of activated carbon from the
Philippines could be attributed to its laws encouraging the use of organic materials to
reduce pollution, provide cleaner water, and have better health options (Ordinario et
al. 2019). Shipments of activated carbon from the Philippines also went to the People’s
Republic of China (7%), Republic of Korea (6%), Sri Lanka (4%), Indonesia (4%), Taiwan
(3%), Netherlands (3%), African countries such as Ghana and South Africa (4%), Canada
(2%), Italy (2%), USSR (2%), Italy (2%), Singapore (2%), Australia (1%) and France (1%).
Aside from the widespread use of activated carbon in the food processing industry and
for water treatment, it is also being used in the gold mining industry, especially in African
countries. The major importers of activated carbon were the gold mining companies, the
brewery industry, and soft drink companies. Activated carbon is used in gold mining to
recover gold from cyanide solution using the carbon-in-pulp or carbon-in-leach processes.
In the brewery and soft drink industries, activated carbon is used mainly to purify the
water used in production.

1 1 6 D E P A R T M E N T O F A G R I C U L T U R E P H I L I P P I N E C O C O N U T A U T H O R I T Y
Table 3.41. Export volume and value of activated carbon, Philippines, 2009–2019
Figure 3.55. Philippine export volume and value of activated carbon, 2009–2019
Source: PCA and PSA
Figure 3.56. Market shares of importing countries in the Philippines’ export volume of activated carbon, 2009–2019
Source: PCA and PSA

1 1 7P H I L I P P I N E C O C O N U T I N D U S T R Y R O A D M A P 2 0 2 1 - 2 0 4 0
Oleochemicals. Oleochemicals using coconut oil as feedstock are sometimes referred
to as cocochemicals. The major traditional intermediate oleochemicals exported
by the Philippines are coco fatty alcohol, coco fatty acid, and coco methyl ester.
Nontraditional oleochemical exports include refined and crude glycerin, alkanolamide,
coco diethanolamide, coco acid oil, hydrogenated coconut oil, and fatty acid distillates.
Glycerin is the by-product of oleochemicals production.
On average, export earnings generated by traditional oleochemicals during the period
2009–2019 amounted to US$ 27.88 M (Table 3.42). The country’s export earnings from
traditional oleochemicals increased from approximately US$ 12.68 M in 2009 to US$ 37.04
M in 2019, or by an average growth rate of 22.3% per year (Table 3.42). The highest export
revenue from traditional oleochemicals amounting to US$ 61.42 M was posted in 2017.
Table 3.42. Export volume and value of traditional oleochemicals in copra terms, 2009–2019
During the period 2009–2019, the country’s major export markets for traditional
oleochemicals were Asia and the Pacific, Europe, and the United States of America.
The average market share of Asia and Pacific in the total Philippine export volume of
oleochemicals was 74%, followed by Europe (18%) and the USA trailing behind with only
4% average export market share (Figure 3.57).
Coconut oil-based biodiesel, which is also referred to as coco-biodiesel, is basically
coco methyl ester. Among the country’s traditional oleochemical products, coco methyl
ester exhibited the highest growth rate at 102.6% in export volume and 141.6% in
export revenue from 2009 to 2019 (Table 3.43). The volume of exports of coco methyl
ester increased markedly from 1,743.50 MT worth approximately US$ 1.86 M in 2009 to
23,956.50 MT in 2019 valued at US$ 32.43 M in 2019 (Table 3.43 and Figure 3.58). The
country shipped out an average of 7,996.50 MT of coco methyl ester worth the US $
12.83 M annually during the 11-year period under review.

1 1 8 D E P A R T M E N T O F A G R I C U L T U R E P H I L I P P I N E C O C O N U T A U T H O R I T Y
Table 3.43. Export volume and value of coco methyl ester (CME), 2009–2019
Figure 3.57. Market shares of importing countries in thePhilippines’ export volume of traditional oleochemicals, 2009–2019
Source: PCA and PSA
Figure 3.58 Philippine export volume and value of coco methyl ester, 2009-2019
Source: PCA and PSA

1 1 9P H I L I P P I N E C O C O N U T I N D U S T R Y R O A D M A P 2 0 2 1 - 2 0 4 0
Of the 10 countries that imported coco methyl ester from the Philippines, the leading
buyers during the period 2009–2019 were Thailand (15%), Malaysia (13%), Germany (11%),
Vietnam (9%), the Peoples Republic of China (9%), and Hong Kong (8%) (Figure 3.59).
Figure 3.59. Market shares of importing countries in the Philippines’ export volume of coco methyl ester, 2009–2019
Source: PCA and PSA
The country’s shipment of coco fatty acid during the period 2009–2019 was highly erratic
(Figure 3.60). The highest export volume of coco fatty acid was in 2013 at 30,380.97
MT worth approximately FOB US$ 193.92 M. Exports of coco fatty acid decreased from
2,140.23 MT valued at US$ 1.53 M in 2009 to
1.852.12 MT worth US$ 534,004 in 2019 (Table 3.44).
Table 3.44. Export volume and value of fatty acid, Philippines, 2009–2019

1 2 0 D E P A R T M E N T O F A G R I C U L T U R E P H I L I P P I N E C O C O N U T A U T H O R I T Y
Figure 3.61 shows that the bulk of coco fatty acid exports during the period 2009–2019
went to the People’s Republic of China (74%). Pakistan, Thailand, Spain, Indonesia, and
Germany were among 37 other countries that imported coco fatty acid from the Philippines.
Figure 3.60. Philippine export volume and value of fatty acid, 2009–2019
Source: PCA and PSA
Figure 3.61. Market shares of importing countries in the Philippines’export volume of fatty acid, 2009– 2019
Source: PCA and PSA

1 2 1P H I L I P P I N E C O C O N U T I N D U S T R Y R O A D M A P 2 0 2 1 - 2 0 4 0
The volume of exports of coco fatty alcohol declined drastically from 4,674.43 MT worth
US$ 5.48 M in 2009 to only 434.98 MT valued at US$ 638,337 in 2019 (Table 3.45 and
Figure 3.62). This could be attributed to the shutdown of three out of four oleochemical
companies manufacturing coco fatty alcohol because of the discontinued implementation
of EO 259 by the Board of Investments (BOI). There was pressure to remove non-tariff
barriers after the Philippines became a signatory to the General Agreement on Trade and
Tariffs (GATT). EO 259 required all local detergent manufacturers to use fatty alcohol in
their detergent formulation. The highest volume of export of coco fatty alcohol was in
2011 at 8,505.37 MT. It generated foreign exchange earnings amounting to US$ 22.46 M.
In 2017 and 2018, the country did not export coco fatty alcohol.
Table 3.45. Export volume and value of industrial fatty alcohol, Philippines, 2009–2019
Among 41 countries that imported coco fatty alcohol from the Philippines, the Republic
of Korea was the country’s major export market with 14% market share during the period
2009– 2019, followed by Taiwan (12%), Netherlands (11%), and USA (10%) (Figure 3.63).
Other foreign buyers of coco fatty alcohol were Iran, the Peoples Republic of China,
Germany, and Thailand.
Figure 3.62. Philippine export volume and value of industrial fatty alcohol, 2009–2019
Source: PCA and PSA

1 2 2 D E P A R T M E N T O F A G R I C U L T U R E P H I L I P P I N E C O C O N U T A U T H O R I T Y
Trend in the Export Volume andValue of Selected Nontraditional Coconut ProductsThe trade performance of VCO, coconut water, coco sugar, and coir products are
discussed in this section.
Virgin Coconut Oil. The Philippines is the top producer and exporter of VCO in the
world. The total volume of VCO exports increased from 2,297 MT in 2009 to 18,352MT
in 2019, or by an average of 45.2% per year (Table 3.46 and Figure 3.64). Similarly, the
total export earnings generated from VCO also increased from US$ 6.14 M in 2009 to
approximately US$ 50.67 M in 2019, or by an annual average of 55.3% per year. The
highest volume of export of this product was recorded in 2015 due to the high volume of
imports from the Netherlands (82,255 MT worth US$ 96.41 M) and the USA (43,544 MT
valued at US$ 109.20 M). The increase in the demand for VCO has been attributed to the
health benefits of coconut oil as a medium-chain triglyceride (Arancon, 2010). However,
from 2016 to 2019, the VCO industry recorded a drop in export volume because of the
Figure 3.63. Market shares of importing countries in the Philippines’export volume of industrial fatty alcohol, 2009–2019
Source: PCA and PSA
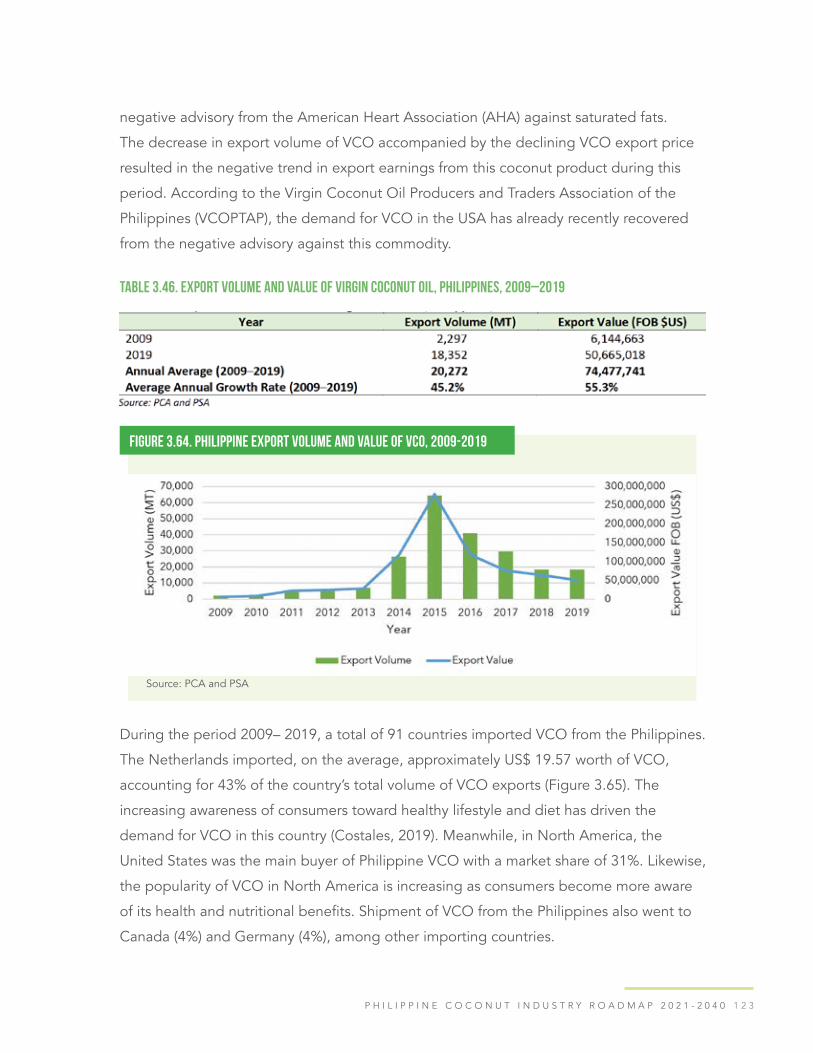
1 2 3P H I L I P P I N E C O C O N U T I N D U S T R Y R O A D M A P 2 0 2 1 - 2 0 4 0
negative advisory from the American Heart Association (AHA) against saturated fats.
The decrease in export volume of VCO accompanied by the declining VCO export price
resulted in the negative trend in export earnings from this coconut product during this
period. According to the Virgin Coconut Oil Producers and Traders Association of the
Philippines (VCOPTAP), the demand for VCO in the USA has already recently recovered
from the negative advisory against this commodity.
Table 3.46. Export volume and value of virgin coconut oil, Philippines, 2009–2019
During the period 2009– 2019, a total of 91 countries imported VCO from the Philippines.
The Netherlands imported, on the average, approximately US$ 19.57 worth of VCO,
accounting for 43% of the country’s total volume of VCO exports (Figure 3.65). The
increasing awareness of consumers toward healthy lifestyle and diet has driven the
demand for VCO in this country (Costales, 2019). Meanwhile, in North America, the
United States was the main buyer of Philippine VCO with a market share of 31%. Likewise,
the popularity of VCO in North America is increasing as consumers become more aware
of its health and nutritional benefits. Shipment of VCO from the Philippines also went to
Canada (4%) and Germany (4%), among other importing countries.
Figure 3.64. Philippine export volume and value of VCO, 2009-2019
Source: PCA and PSA

1 2 4 D E P A R T M E N T O F A G R I C U L T U R E P H I L I P P I N E C O C O N U T A U T H O R I T Y
Coconut Water. Coconut water is second to VCO as a major contributor to the country’s
total export earnings from nontraditional coconut products. The Philippine volume of
exports of coconut water increased markedly from 593 liters worth approximately US$
368,277 in 2009 to 51,839 liters valued at US$ 57.10 M in 2019 (Table 3.47 and Figure
3.66). The country shipped out annually an average of 39,065 liters of coconut water
worth US$ 41.06 M during the 11-year period under review. This positive trend could
be due to its growing popularity especially in the non-traditional markets because of its
beneficial properties as a healthy beverage and as a sports drink (Arancon, 2010). The
highest volume of export of this product was recorded in 2017 due to the high volume of
imports by the USA (53,864 liters worth US$ 60.89 M). Coconut water is now the fastest-
growing new beverage category in the United States and has also gained international
popularity in the Netherlands, Australia, Japan, and other countries. Coconut water has
caught on among athletes, health nuts, and urbanites in these countries.
During the period 2009–2019, 78 countries imported coconut water from the Philippines.
The country’s leading buyers of coconut water during this period were USA (61%),
Netherlands (4%), Australia (4%), Canada (3%), Japan (1%), and the United Arab Emirates
(1%) (Figure 3.67).
Figure 3.65. Market shares of importing countries in the Philippines’export volume of VCO, 2009–2019
Source: PCA and PSA

1 2 5P H I L I P P I N E C O C O N U T I N D U S T R Y R O A D M A P 2 0 2 1 - 2 0 4 0
Table 3.47. Export volume and value of coconut water, Philippines, 2009–2019
Figure 3.66. Philippine export volume and value of coconut water, 2009–2019
Source: PCA and PSA
Figure 3.67. Market shares of importing countries in thePhilippines’ export volume of coconut water, 2009–2019
Source: PCA and PSA

1 2 6 D E P A R T M E N T O F A G R I C U L T U R E P H I L I P P I N E C O C O N U T A U T H O R I T Y
Since 2017, desiccated coconut processing companies in the Philippines, such as Franklin
Baker Co., have started processing and exporting bulk concentrated coconut water to save
on transport and packaging costs. The concentrated product can be reconstituted with
water or used as a mixing ingredient in the importing countries. The volume of exports of
coconut concentrates increased significantly from 125.27 MT worth US$ 230,794 in 2017 to
37,368.68 MT valued at approximately US$ 41.60 M in 2019 (Table 3.48).
Table 3.48. Export volume and value of coconut concentrates, Philippines, 2017–2019
Thirty-six countries imported coconut concentrates during the period 2017-2019. USA was
the top export market for coconut concentrates accounting for almost 50% of the country’s
total export volume of this product (Figure 3.68). Other major countries importing coconut
concentrates from the Philippines were U.K of Great Britain and N. Ireland (7.9%), People’s
Republic of China (7.6%), Netherlands (5.7%), and Australia (5.0%).
Coconut Sap Products. The PCA started monitoring coco sugar exports only in 2017.
Thus, its export growth could not be ascertained because of the absence of historical
data (Costales, 2019). On average, the export volume of coconut sugar during the period
2017-2019 was344 MT, and export earnings amounted to US$ 1,186,514 per year. During
the three-year period under review, the country’s volume of exports of coconut sugar
showed an erratic trend (Table 3.49 and Figure 3.69). The volume of export decreased
from 404 MT in 2017 to 208 MT in 2018 and again increased to 420 MT in 2019 valued
approximately at US$ 1.28 M.
Table 3.49. Export volume and value of coco sugar, Philippines, 2017–2019

1 2 7P H I L I P P I N E C O C O N U T I N D U S T R Y R O A D M A P 2 0 2 1 - 2 0 4 0
Figure 3.68. Market shares of importing countries in thePhilippines’ export volume of coconut concentrates, 2017–2019
Source: PCA and PSA
Figure 3.69. Philippine export volume and value of coco sugar, 2017–2019
Source: PCA and PSA
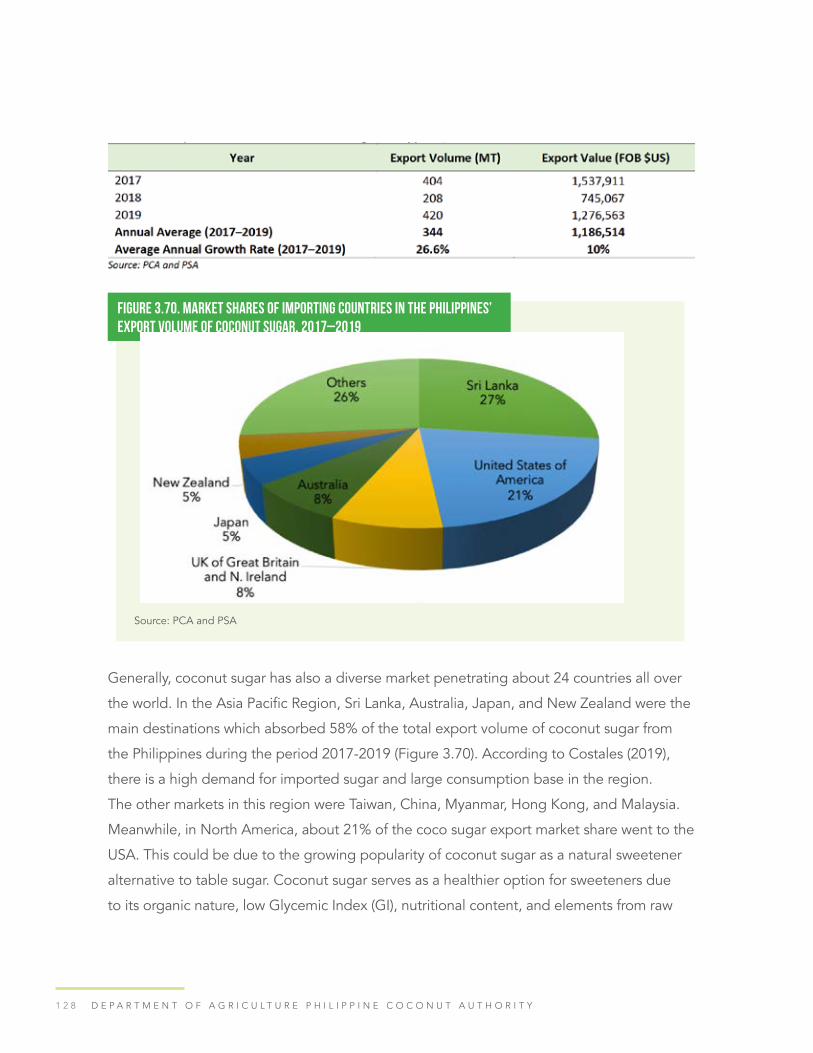
1 2 8 D E P A R T M E N T O F A G R I C U L T U R E P H I L I P P I N E C O C O N U T A U T H O R I T Y
Generally, coconut sugar has also a diverse market penetrating about 24 countries all over
the world. In the Asia Pacific Region, Sri Lanka, Australia, Japan, and New Zealand were the
main destinations which absorbed 58% of the total export volume of coconut sugar from
the Philippines during the period 2017-2019 (Figure 3.70). According to Costales (2019),
there is a high demand for imported sugar and large consumption base in the region.
The other markets in this region were Taiwan, China, Myanmar, Hong Kong, and Malaysia.
Meanwhile, in North America, about 21% of the coco sugar export market share went to the
USA. This could be due to the growing popularity of coconut sugar as a natural sweetener
alternative to table sugar. Coconut sugar serves as a healthier option for sweeteners due
to its organic nature, low Glycemic Index (GI), nutritional content, and elements from raw
Figure 3.70. Market shares of importing countries in the Philippines’ export volume of coconut sugar, 2017–2019
Source: PCA and PSA
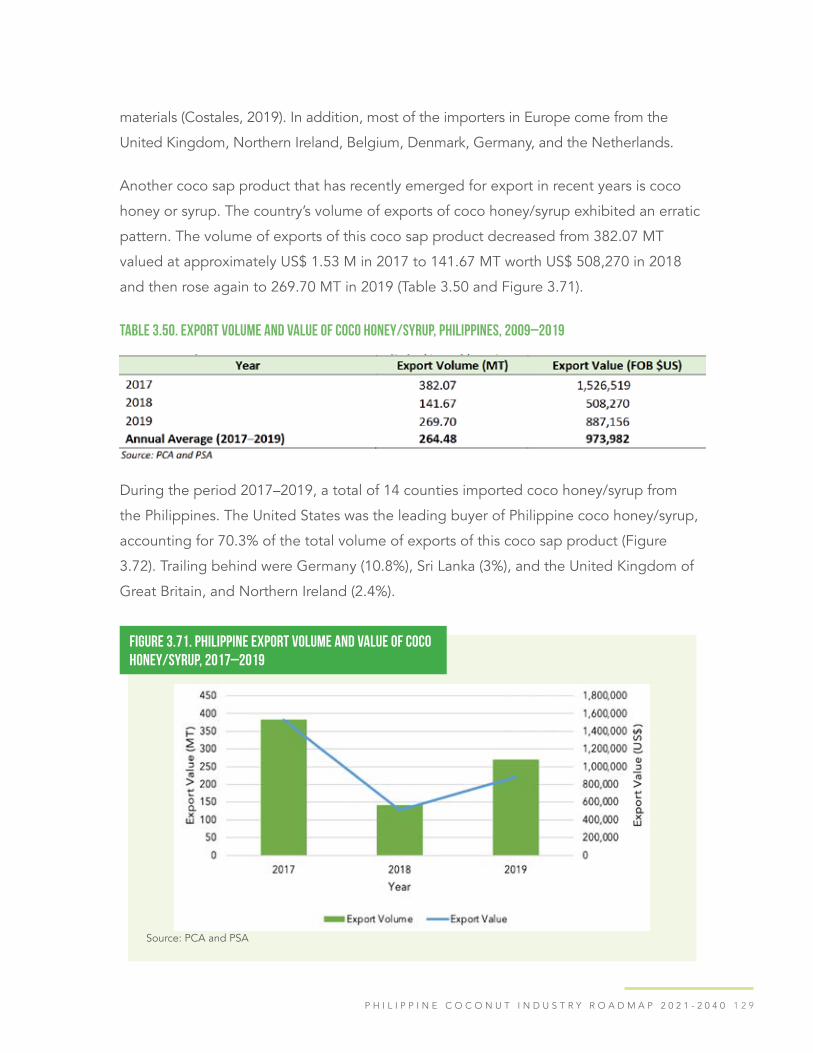
1 2 9P H I L I P P I N E C O C O N U T I N D U S T R Y R O A D M A P 2 0 2 1 - 2 0 4 0
materials (Costales, 2019). In addition, most of the importers in Europe come from the
United Kingdom, Northern Ireland, Belgium, Denmark, Germany, and the Netherlands.
Another coco sap product that has recently emerged for export in recent years is coco
honey or syrup. The country’s volume of exports of coco honey/syrup exhibited an erratic
pattern. The volume of exports of this coco sap product decreased from 382.07 MT
valued at approximately US$ 1.53 M in 2017 to 141.67 MT worth US$ 508,270 in 2018
and then rose again to 269.70 MT in 2019 (Table 3.50 and Figure 3.71).
Table 3.50. Export volume and value of coco honey/syrup, Philippines, 2009–2019
During the period 2017–2019, a total of 14 counties imported coco honey/syrup from
the Philippines. The United States was the leading buyer of Philippine coco honey/syrup,
accounting for 70.3% of the total volume of exports of this coco sap product (Figure
3.72). Trailing behind were Germany (10.8%), Sri Lanka (3%), and the United Kingdom of
Great Britain, and Northern Ireland (2.4%).
Figure 3.71. Philippine export volume and value of cocohoney/syrup, 2017–2019
Source: PCA and PSA
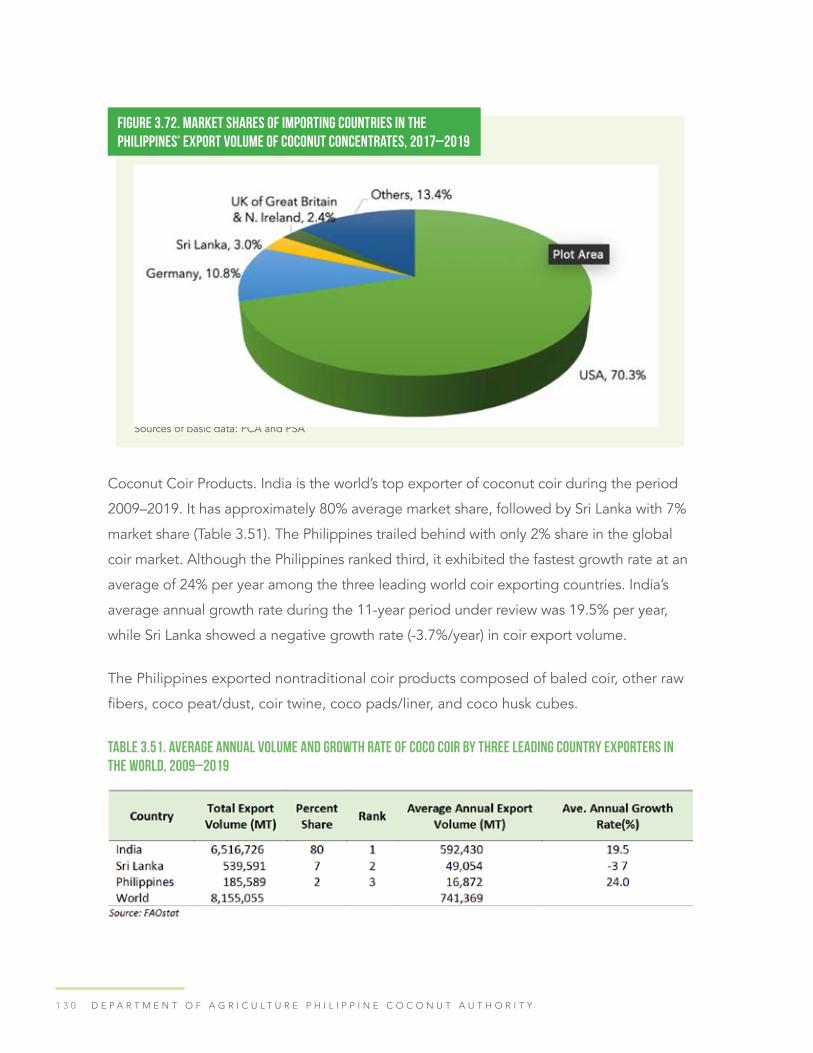
1 3 0 D E P A R T M E N T O F A G R I C U L T U R E P H I L I P P I N E C O C O N U T A U T H O R I T Y
Coconut Coir Products. India is the world’s top exporter of coconut coir during the period
2009–2019. It has approximately 80% average market share, followed by Sri Lanka with 7%
market share (Table 3.51). The Philippines trailed behind with only 2% share in the global
coir market. Although the Philippines ranked third, it exhibited the fastest growth rate at an
average of 24% per year among the three leading world coir exporting countries. India’s
average annual growth rate during the 11-year period under review was 19.5% per year,
while Sri Lanka showed a negative growth rate (-3.7%/year) in coir export volume.
The Philippines exported nontraditional coir products composed of baled coir, other raw
fibers, coco peat/dust, coir twine, coco pads/liner, and coco husk cubes.
Table 3.51. Average annual volume and growth rate of coco coir by three leading country exporters in the world, 2009–2019
Figure 3.72. Market shares of importing countries in thePhilippines’ export volume of coconut concentrates, 2017–2019
Sources of basic data: PCA and PSA

1 3 1P H I L I P P I N E C O C O N U T I N D U S T R Y R O A D M A P 2 0 2 1 - 2 0 4 0
The country’s volume of exports of baled coir decreased from 2,079 MT in 2009 to
544 MT in 2019 (Table 3.52 and Figure 3.73). The highest shipment of baled coir was
registered in 2016 due to the high volume of baled coir imports of China (1,139 MT
valued at US$ 481,171) and Japan (1,590 MT valued at US$ 2.40 M). The total export
earnings generated from baled coir rose from US$ 366,380 in 2009 to US$ 370,182 in
2019 despite the significant decrease in export volume in 2019. This could be attributed
to the higher export price in 2019 compared with that in 2009.
Table 3.52. Export volume and value of baled coir, Philippines, 2009–2019
During the period 2009– 2019, 13 countries imported baled coir from the Philippines,
but annual shipments to these countries were irregular. The People’s Republic of China
and Japan were the country’s major export markets for baled coir. The average market
share of People’s Republic of China in the total Philippine export volume of baled coir was
28%, followed by Japan with 26% (Figure 3.74). Other major importing countries were
Australia, Canada, Singapore, Russia, United Kingdom, and the Republic of Korea.
Apart from baled coir, the Philippines also exported other raw fibers, which showed an
increasing trend in export volume from 2,815.94 MT in 2009 to 16,011.70 MT in 2019,
or by an average of 43% per year (Table 3.53). Similarly, the earnings generated from
exporting other raw fibers rose from US $ 416,923 in 2009 to US $ 3.61 M in 2019, or by
an average of 60% per year.

1 3 2 D E P A R T M E N T O F A G R I C U L T U R E P H I L I P P I N E C O C O N U T A U T H O R I T Y
Figure 3.73. Philippine export volume and value of baled coir, 2009-2019
Source: PCA and PSA
Figure 3.74. Market shares of importing countries in the Philippines’ export volume of baled coir, 2009–-2019
Source: PCA and PSA
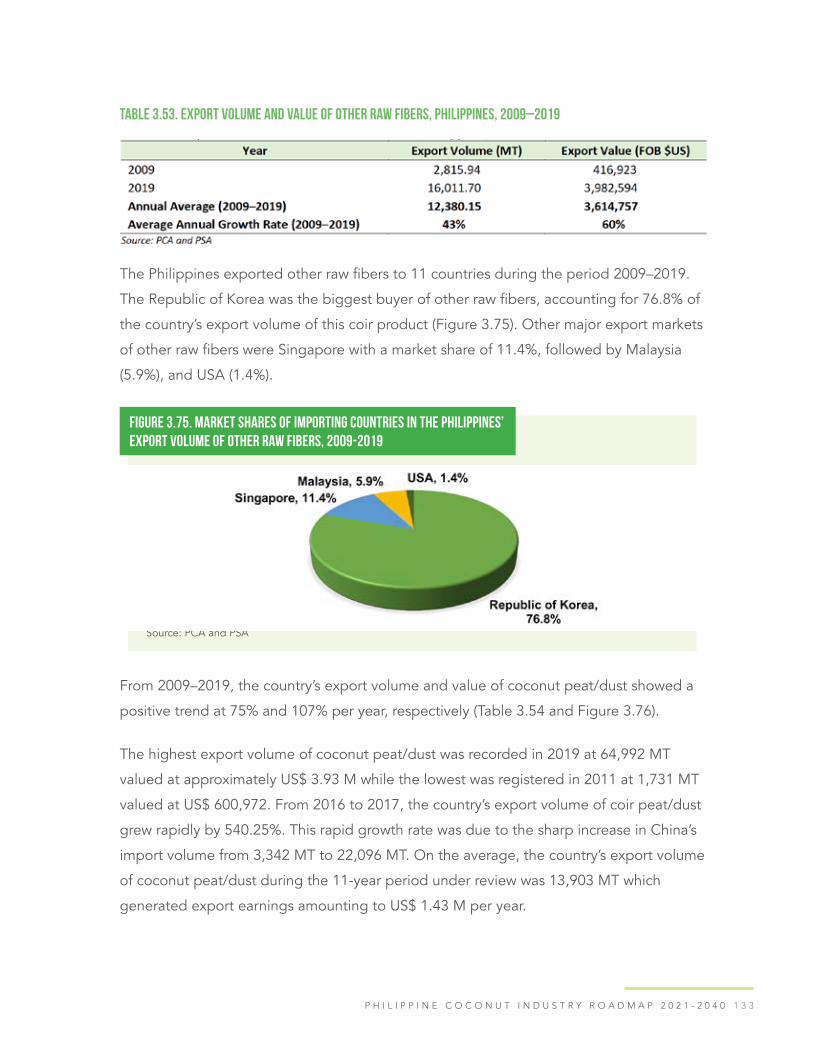
1 3 3P H I L I P P I N E C O C O N U T I N D U S T R Y R O A D M A P 2 0 2 1 - 2 0 4 0
Table 3.53. Export volume and value of other raw fibers, Philippines, 2009–2019
The Philippines exported other raw fibers to 11 countries during the period 2009–2019.
The Republic of Korea was the biggest buyer of other raw fibers, accounting for 76.8% of
the country’s export volume of this coir product (Figure 3.75). Other major export markets
of other raw fibers were Singapore with a market share of 11.4%, followed by Malaysia
(5.9%), and USA (1.4%).
Figure 3.75. Market shares of importing countries in the Philippines’ export volume of other raw fibers, 2009-2019
Source: PCA and PSA
From 2009–2019, the country’s export volume and value of coconut peat/dust showed a
positive trend at 75% and 107% per year, respectively (Table 3.54 and Figure 3.76).
The highest export volume of coconut peat/dust was recorded in 2019 at 64,992 MT
valued at approximately US$ 3.93 M while the lowest was registered in 2011 at 1,731 MT
valued at US$ 600,972. From 2016 to 2017, the country’s export volume of coir peat/dust
grew rapidly by 540.25%. This rapid growth rate was due to the sharp increase in China’s
import volume from 3,342 MT to 22,096 MT. On the average, the country’s export volume
of coconut peat/dust during the 11-year period under review was 13,903 MT which
generated export earnings amounting to US$ 1.43 M per year.

1 3 4 D E P A R T M E N T O F A G R I C U L T U R E P H I L I P P I N E C O C O N U T A U T H O R I T Y
Table 3.54. Export volume and value of coir peat/dust, Philippines, 2009–2019
Figure 3.76. Philippine export volume and value of coconutpeat/dust, 2009–2019
Source: PCA and PSA
During the period 2009–2019, the Philippines exported coco coir peat/dust to 50
countries. In 2009, the Republic of Korea used to be the leading export market for
Philippine coconut peat/dust. However, since 2010 China replaced the Republic of Korea
as the top export market for coir peat/dust. On the average, China’s export market share
was 83% followed by the Republic of Korea with 7% market share. Other export markets
were Japan, Taiwan, Hong Kong, Malaysia, Singapore, and USA (Figure 3.77).

1 3 5P H I L I P P I N E C O C O N U T I N D U S T R Y R O A D M A P 2 0 2 1 - 2 0 4 0
The country’s shipment of coco twine to 29 countries during the period 2010-2016 was
erratic (Figure 3.78). The highest export volume of coco twine was in 2013 at 2,058.2 MT
valued at approximately US$ 3.65 M. Exports of coconut twine increased from only 0.08
MT valued at US$ 167 in 2010 to 283.16 MT valued at US$ 899,053 in 2016 (Table 3.55).
The country ceased exporting coco twine since 2017.
Figure 3.77. Market shares of importing countries in the Philippines’ export volume of coconut peat/dust, 2009–2019
Source: PCA and PSA
Figure 3.78. Philippine export volume and value of coco twine,2010–2016
Source: PCA and PSA
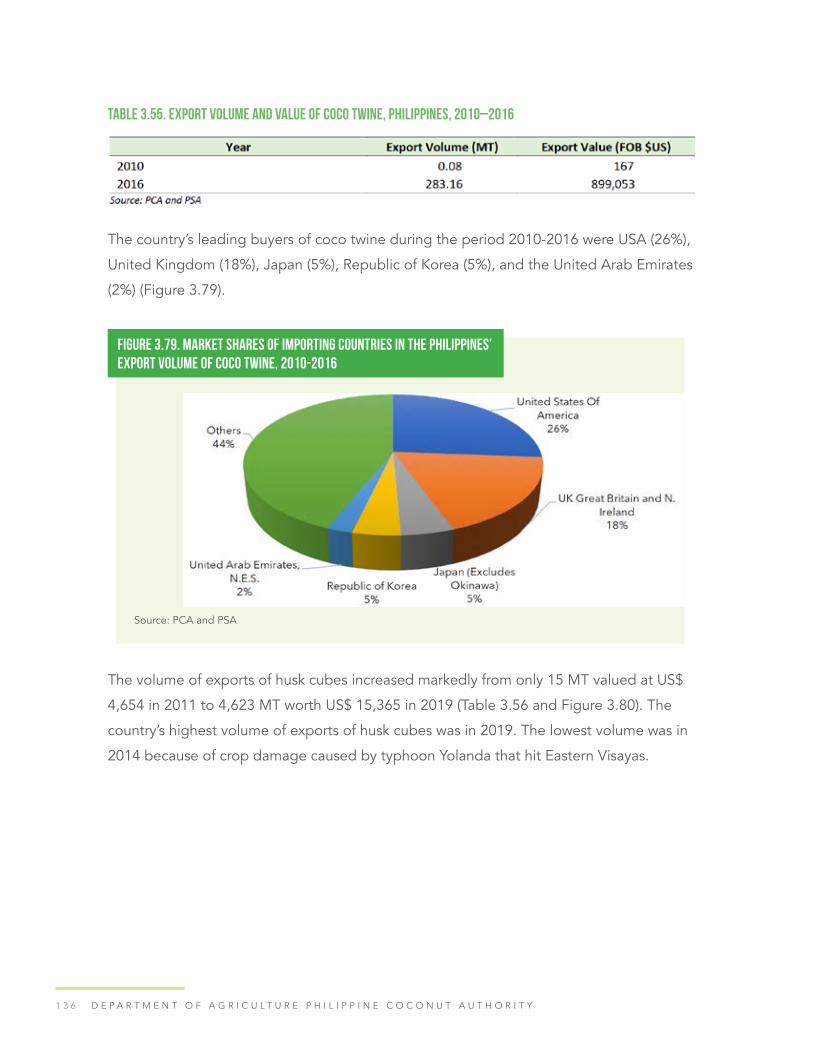
1 3 6 D E P A R T M E N T O F A G R I C U L T U R E P H I L I P P I N E C O C O N U T A U T H O R I T Y
Table 3.55. Export volume and value of coco twine, Philippines, 2010–2016
The country’s leading buyers of coco twine during the period 2010-2016 were USA (26%),
United Kingdom (18%), Japan (5%), Republic of Korea (5%), and the United Arab Emirates
(2%) (Figure 3.79).
Figure 3.79. Market shares of importing countries in the Philippines’ export volume of coco twine, 2010-2016
Source: PCA and PSA
The volume of exports of husk cubes increased markedly from only 15 MT valued at US$
4,654 in 2011 to 4,623 MT worth US$ 15,365 in 2019 (Table 3.56 and Figure 3.80). The
country’s highest volume of exports of husk cubes was in 2019. The lowest volume was in
2014 because of crop damage caused by typhoon Yolanda that hit Eastern Visayas.
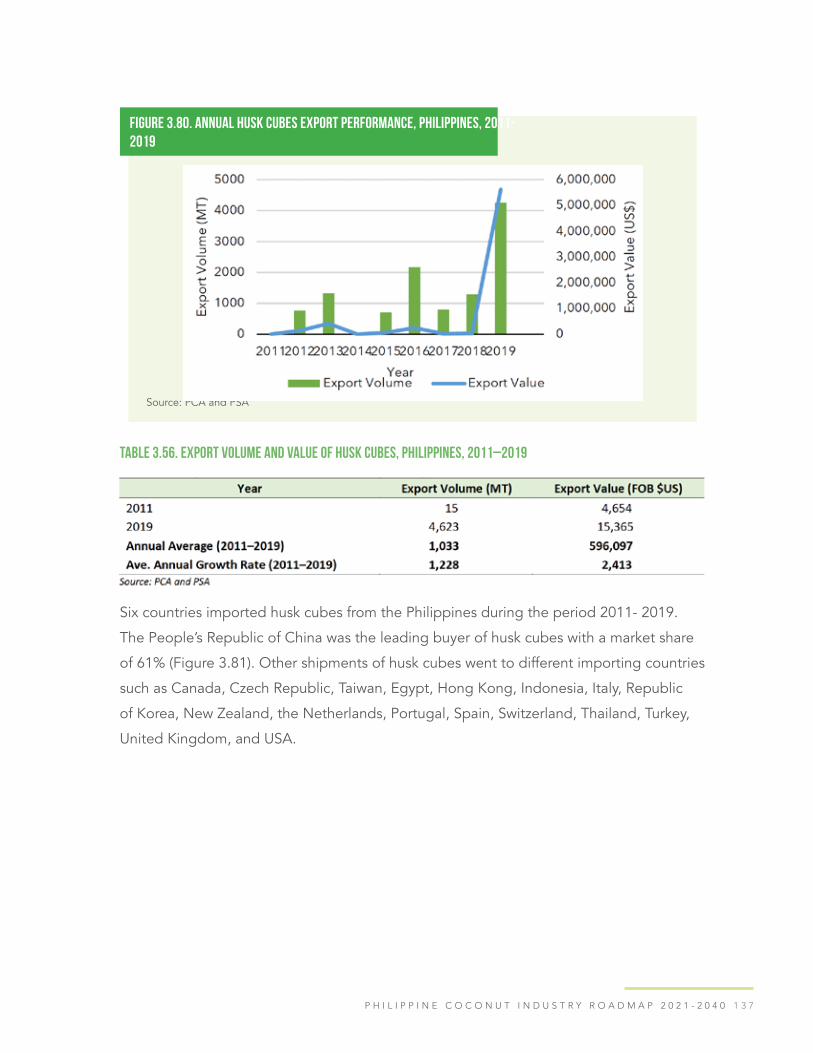
1 3 7P H I L I P P I N E C O C O N U T I N D U S T R Y R O A D M A P 2 0 2 1 - 2 0 4 0
Table 3.56. Export volume and value of husk cubes, Philippines, 2011–2019
Figure 3.80. Annual husk cubes export performance, Philippines, 2011-2019
Source: PCA and PSA
Six countries imported husk cubes from the Philippines during the period 2011- 2019.
The People’s Republic of China was the leading buyer of husk cubes with a market share
of 61% (Figure 3.81). Other shipments of husk cubes went to different importing countries
such as Canada, Czech Republic, Taiwan, Egypt, Hong Kong, Indonesia, Italy, Republic
of Korea, New Zealand, the Netherlands, Portugal, Spain, Switzerland, Thailand, Turkey,
United Kingdom, and USA.

1 3 8 D E P A R T M E N T O F A G R I C U L T U R E P H I L I P P I N E C O C O N U T A U T H O R I T Y
The volume of exports of coco pads/liners declined drastically from 11.60 MT worth
US$ 12,044 in 2011 to only 1.32 MT valued at US$ 9,144 in 2016 (Table 3.57 and Figure
3.82). The highest export volume of coco pads/liners was in 2014 at 399 MT US$ 10.64
M of earnings. Starting 2017, the country stopped shipments of coco pads/liners to other
countries.
Table 3.57. Export volume and value of coco pads/liner, Philippines, 2011–2016
Figure 3.81. Market shares of importing countries in the Philippines’ export volume of husk cubes, 2009–2019
Source: PCA and PSA

1 3 9P H I L I P P I N E C O C O N U T I N D U S T R Y R O A D M A P 2 0 2 1 - 2 0 4 0
From 2011 to 2016, the country exported coco pads/liners to 20 countries, but shipments
to some countries were not sustained. The United States was the country’s major export
market for coco pads/liners with 69% market share during the period 2011-2016 (Figure
3.83). The Netherlands (8%), Thailand (6%), People’s Republic of China (6%), Japan (3%),
Taiwan (2%), Singapore (1%), and the Republic of Korea (1%) trailed behind.
Figure 3.82. Philippine export volume and value of coco pads/liner, 2011–2016
Source: PCA and PSA
Figure 3.83. Market shares of importing countries in the Philippines’ export volume of coco pads/liners 2011–2016
Source: PCA and PSA

1 4 0 D E P A R T M E N T O F A G R I C U L T U R E P H I L I P P I N E C O C O N U T A U T H O R I T Y
Comparison of Domestic Copra Price among Major Trading CentersThe domestic price of copra varies among the country’s major copra trading centers
(Table 3.57 and Figure 3.84). During the period 2015–2019, the highest annual average
domestic price of copra was registered in Quezon (PHP 35.01/kg), followed by Legazpi
(PHP 33.65/kg), and Davao (PHP 33.34/kg). On the other hand, the lowest annual average
domestic copra price in the same period was posted in Iligan (PHP 27.80/kg), followed by
Zamboanga (PHP 29.76/kg). Meanwhile, the annual average domestic price of copra in
Dumaguete and Cebu were the same (PHP 31.11/kg). The presence of a larger number
of oil mills and refineries operating in the provinces of Quezon, Albay, and Davao that all
require bigger volumes of copra as raw material in oil milling than those in Cebu, Negros
Oriental, Lanao del Norte, and Zamboanga may account for the higher domestic price of
copra in the trading centers located in Quezon, Legazpi, and Davao.
Table 3.57. Domestic prices of copra in major trading centers, Philippines, 2015–2019

1 4 1P H I L I P P I N E C O C O N U T I N D U S T R Y R O A D M A P 2 0 2 1 - 2 0 4 0
Seasonal Price Trend of Copra and Husked Nuts
There is apparent monthly variation in the domestic prices of copra and husked nuts
during the period 2015-2019 (Figures 3.85 and 3.86). From June to October, which are
the rainy season months, the domestic prices of copra and husked nuts were very low
compared with other months. This drop in prices could be attributed to high coconut
production during the rainy season when there was sufficient water supply conducive for
attaining higher coconut yield levels compared with the dry season months. For copra,
the highest monthly average price during the five years under review was in January and
April. Other months with high monthly average prices of copra were February, May, and
December. For husked nuts, the highest monthly average price in the same period was in
February, followed by January, March, December, April, and May.
Figure 3.84. Annual average domestic prices of copra by major trading area, Philippines, 2015–2019
Source: UCAP

1 4 2 D E P A R T M E N T O F A G R I C U L T U R E P H I L I P P I N E C O C O N U T A U T H O R I T Y
Figure 3.85. Monthly average prices of copra, Philippines, 2009–2019
Source: UCAP
Figure 3.86. Monthly average prices of husked nuts, Philippines, 2009-2019
Source of basic data: UCAP

1 4 3P H I L I P P I N E C O C O N U T I N D U S T R Y R O A D M A P 2 0 2 1 - 2 0 4 0
Historical Price Trend of Coconut Products
The fluctuation of domestic copra prices from 2009 to 2019 is cyclical (Figure 3.87 and
Appendix Table 8) because the domestic copra price is dependent on the coconut oil
Figure 3.87. Comparative domestic price trends of copra, crude coconut oil,and RBD oil, Philippines, 2009–2019
Source of basic data: UCAP
Figure 3.88. Comparative export price trends of crude coconut oil, cochinoil, and RBD oil, Philippines, 2009–2019
Source of basic data: UCAP

1 4 4 D E P A R T M E N T O F A G R I C U L T U R E P H I L I P P I N E C O C O N U T A U T H O R I T Y
price in the global market. The domestic and export prices of crude coconut oil and RBD
oil follow the same cyclical trend for the same reason (Figure 3.88 and Appendix Table
29). The global coconut oil price, on the other hand, is determined or influenced by the
supply and demand situation of other vegetable oils (e.g., palm oil, soybean oil, rapeseed
oil, sunflower, palm kernel oil, etc.). Although the Philippines is the biggest exporter of
coconut oil in the world, coconut oil is just one of the many vegetable oils produced
and traded in the world market. Thus, its price is greatly affected by the movement of
prices of other vegetable oils, particularly palm oil, which has the largest share among the
internationally traded vegetable oils (Figures 3.89 and 3.90).
Coconut oil accounted for only 2.6% of the total world export volume of oil and fats
during the period 2010–2019 (Figure 3.90) and ranked 6th after palm oil (56.1%), soybean
oil (14.2%), sunflower seed oil (9.6%), rapeseed oil (5.1%), and palm kernel oil (4.2%).
Coconut oil is a minority in the world oils/fats trade and only a price taker. It takes cue
largely from price movements in the international market, notably in soybean oil and
palm oil futures markets which, in turn, are also influenced by external factors such as
the petroleum oil prices, financial markets, and global macroeconomic developments
(Agustin, 2012). An oversupply of palm oil and soybean oil in the international market,
which causes prices to drop, likewise leads to a fall in the price of crude coconut oil.
Figure 3.89. Comparative price (in US$/MT) trends of selected world oils,2010–2018
Source of basic data: UCAP

1 4 5P H I L I P P I N E C O C O N U T I N D U S T R Y R O A D M A P 2 0 2 1 - 2 0 4 0
The desiccated coconut industry is the country’s biggest consumer of husked nuts,
which are its raw material (Agustin, 2012). The price of desiccated coconut is influenced
largely by the price of husked nuts which, in turn, is affected by the price of copra.
The domestic price of husked nuts follows the same cyclical trend as the domestic price
of copra (Figure 3.91 and Appendix Table 8). Likewise, the trend in the export price of
desiccated coconut follows the same price pattern for domestic prices of husked nuts and
copra (Figure 3.92). As mentioned earlier, the price of copra tracks coconut oil prices.
According to Agustin (2012), desiccators also watch coconut oil price movements since
husked nuts account for over 75% of their processing cost.
Although the domestic and export prices of desiccated coconut exhibited a cyclical price
pattern, desiccated coconut posted positive average annual growth rates of 8.3% and
7.4% per year, respectively (Table 3.58).
Figure 3.90. Average annual percentage shares of selected major oils in the world total export volume of oils and fats, 2010–2019
Source of basic data: UCAP
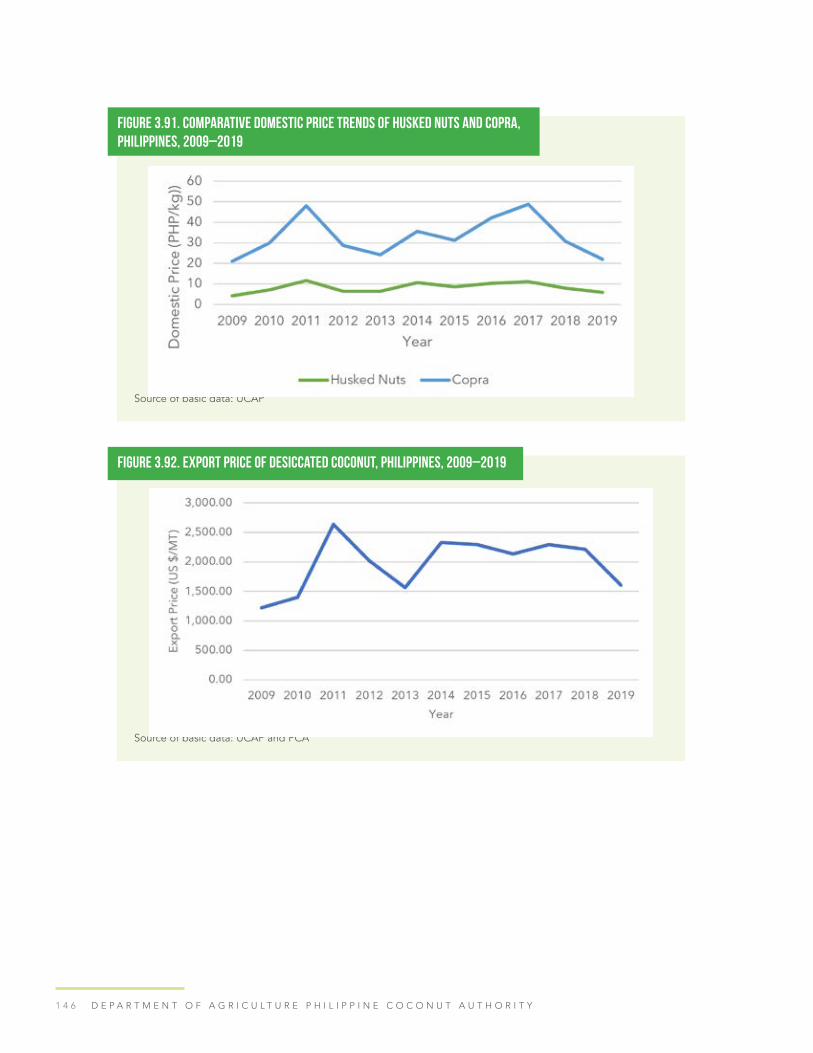
1 4 6 D E P A R T M E N T O F A G R I C U L T U R E P H I L I P P I N E C O C O N U T A U T H O R I T Y
Figure 3.91. Comparative domestic price trends of husked nuts and copra,Philippines, 2009–2019
Source of basic data: UCAP
Figure 3.92. Export price of desiccated coconut, Philippines, 2009–2019
Source of basic data: UCAP and PCA
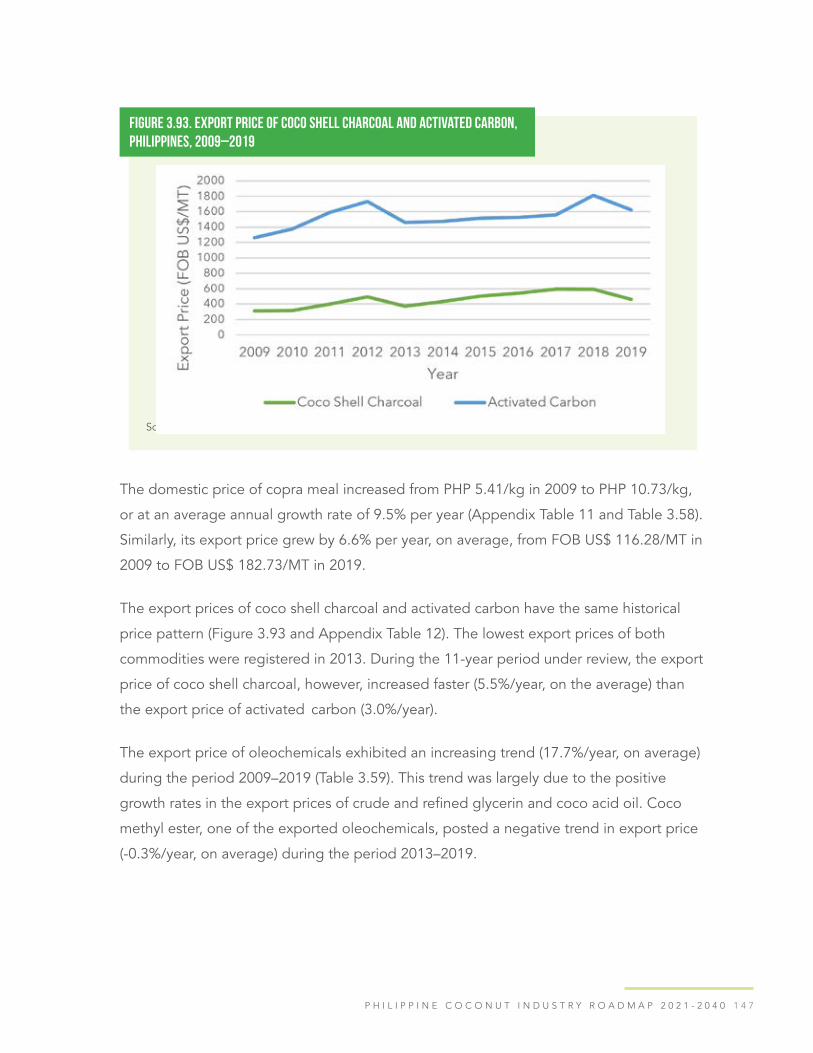
1 4 7P H I L I P P I N E C O C O N U T I N D U S T R Y R O A D M A P 2 0 2 1 - 2 0 4 0
The domestic price of copra meal increased from PHP 5.41/kg in 2009 to PHP 10.73/kg,
or at an average annual growth rate of 9.5% per year (Appendix Table 11 and Table 3.58).
Similarly, its export price grew by 6.6% per year, on average, from FOB US$ 116.28/MT in
2009 to FOB US$ 182.73/MT in 2019.
The export prices of coco shell charcoal and activated carbon have the same historical
price pattern (Figure 3.93 and Appendix Table 12). The lowest export prices of both
commodities were registered in 2013. During the 11-year period under review, the export
price of coco shell charcoal, however, increased faster (5.5%/year, on the average) than
the export price of activated carbon (3.0%/year).
The export price of oleochemicals exhibited an increasing trend (17.7%/year, on average)
during the period 2009–2019 (Table 3.59). This trend was largely due to the positive
growth rates in the export prices of crude and refined glycerin and coco acid oil. Coco
methyl ester, one of the exported oleochemicals, posted a negative trend in export price
(-0.3%/year, on average) during the period 2013–2019.
Figure 3.93. Export price of coco shell charcoal and activated carbon,Philippines, 2009–2019
Source of basic data: UCAP and PCA

1 4 8 D E P A R T M E N T O F A G R I C U L T U R E P H I L I P P I N E C O C O N U T A U T H O R I T Y
Table 3.58. Average annual growth rates in domestic and/or export prices of traditional coconut products and raw materials, Philippines, 2009–2019
Table 3.59. Export prices of coco methyl ester and all other oleochemicals, Philippines, 2009–2019
Among the non-traditional coconut products, virgin coconut oil commanded higher
export prices than coco water during the 11-year period under review (Table 3.60).
However, the export price of coco water increased much faster (7%/year, on average) than
the export price of virgin coconut oil (3.2%/year, on average) in the same period. The
country started exporting coco sap sugar and coco syrup/coco honey in 2013. The export
prices of coco sugar and coco syrup/honey showed a declining trend at -10.5%/year and
– 9.3%/year, on average, respectively (Table 3.60). This could be attributed to the practice
of some Filipino exporters who imported low-priced coco sugar from Indonesia, mixed

1 4 9P H I L I P P I N E C O C O N U T I N D U S T R Y R O A D M A P 2 0 2 1 - 2 0 4 0
the high-priced organically produced coco sugar from the Philippines with the imported
coco sugar and exported the repacked coco sugar at a lower price to other countries.
Table 3.60. Export prices of virgin coconut oil, coco sap sugar, coco syrup/coco honey, and coco water, Philippines, 2009-2019
Of the nine coir products that the country exported, only four were regularly shipped in
international markets. These were coco peat, baled coir, coir dust, and coir husk cubes.
The export price of baled coir rose from FOB US$ 176.23/MT in 2009 to FOB US$680.86/
MT in 2019, or at average annual growth rate of 7.3% (Table 3.61). Coir husk cubes
posted the highest average annual growth rate at 573.5% from FOB US$ 310.27/mt in
2011 to FOB US$ 1,317.71/MT in 2019. As regards coco peat, the export price of this
coir by- product has been declining since 2017 and its export price in 2019 was only one-
third of its previous export price at FOB US$ 184.53/MT in 2009. Similarly, the export
price of coir dust has been decreasing since 2016 or for four consecutive years and its
export price in 2019 (FOB US$ 224.02/MT) was 50% lower than its export price (FOB US$
514.41/MT) in 2010.

1 5 0 D E P A R T M E N T O F A G R I C U L T U R E P H I L I P P I N E C O C O N U T A U T H O R I T Y
Table 3.61. Export prices of coir products, Philippines, 2009-2019

1 5 1
ANALYSIS OF THE COCONUT INDUSTRY
Value Chain Map of Coconut Industry Clusters
The Value Chain (VC) map consists of the different segments and functions performed by
different players in the value chain. The value chain maps for different coconut industry
clusters i.e., coconut oil, desiccated coconut, activated carbon, virgin coconut oil, coconut
water, coconut sap sugar, and coco coir) shown in Figures 1 - 7 are made up of the
following three inter-linked components: (1) the different players (i.e., input suppliers,
inbound and outbound logistics service providers, coconut farmers, traders, and
processors and the functions that they perform; (2) the business enabling environment
(e.g., laws, regulations, and policies) that may facilitate or hinder the performance of
the value chain; and (3) support service providers (i.e., financial and non-financial service
providers) that support the operation of the value chain.
The functions of the key players in each coconut commodity value chain which cover
input provision, inbound logistics, production, marketing, processing, and outbound
logistics/distribution are described and discussed briefly below.

1 5 2 D E P A R T M E N T O F A G R I C U L T U R E P H I L I P P I N E C O C O N U T A U T H O R I T Y
InputsFarm inputs in coconut production include coconut seedlings, fertilizers, pesticides, and
farm tools and equipment. The coconut farmers’ sources of coconut seedlings are the
PCA, traders, and their own farms. Under its Coconut Seedlings Dispersal Project, the
PCA distributes good quality coconut seedlings to coconut farmers or groups of coconut
farmers for planting or replanting. Moreover, qualified farmer- participants are given by
PCA Php 40.00 for every good seedling produced, transplanted, and stabilized in their
own farms under the agency’s Participatory Coconut Planting Project. In addition, the
Agrikulturang Pantawid Pamilyang Pilipino Program (A4Ps) Coconut Planting Program,
which is a collaborative undertaking among DA, DSWD, and the PCA, is also being
implemented in some provinces in the country. In this program, PCA provides coconut
seedlings sourced from the nursery established solely for this purpose to the farmer-
participants previously identified by the DSWD field offices. The DSWD pays the farmers
Php 225.00 per day for a maximum of 11 days covering the period spent for land
preparation, holing, staking, transplanting, and initial care and maintenance activities
(PRDP 2013).
Currently, there are seven (7) coconut seedling traders operating in the country. Moreover,
the coconut farmers use coconut seedlings from their own farm for planting in their
expansion areas or for replanting to replace senile trees. They leave some of their harvested
mature nuts to grow into coconut seedlings to be used as their planting material. The PCA
also distributes agricultural grade salt fertilizer and coir-based organic fertilizer to coconut
farmers. Inorganic fertilizers and other farm chemicals such as insecticides are sourced from
agricultural input supply/general merchandise stores in their municipality. Few coconut
farmers apply inorganic fertilizers, and the latter are generally applied on the intercrops
planted under coconut. Insecticides are only applied whenever there is pest infestation.
Simple farm tools are sourced from the public market and input stores.
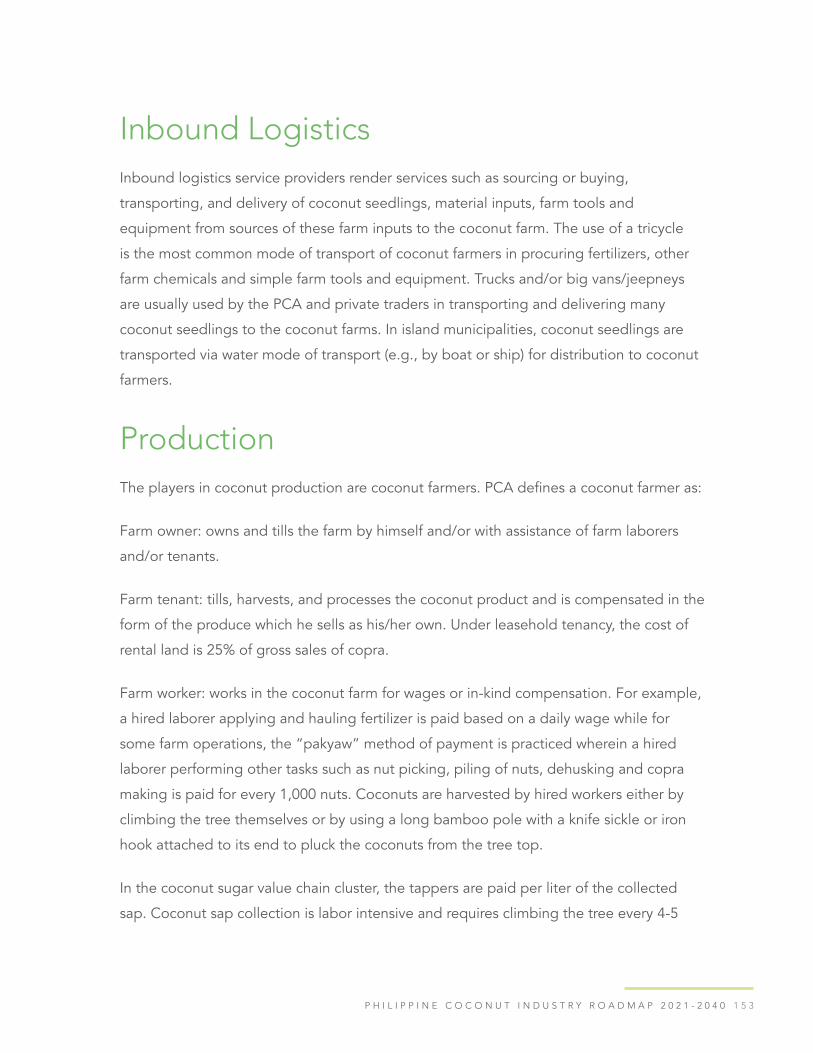
1 5 3P H I L I P P I N E C O C O N U T I N D U S T R Y R O A D M A P 2 0 2 1 - 2 0 4 0
Inbound LogisticsInbound logistics service providers render services such as sourcing or buying,
transporting, and delivery of coconut seedlings, material inputs, farm tools and
equipment from sources of these farm inputs to the coconut farm. The use of a tricycle
is the most common mode of transport of coconut farmers in procuring fertilizers, other
farm chemicals and simple farm tools and equipment. Trucks and/or big vans/jeepneys
are usually used by the PCA and private traders in transporting and delivering many
coconut seedlings to the coconut farms. In island municipalities, coconut seedlings are
transported via water mode of transport (e.g., by boat or ship) for distribution to coconut
farmers.
ProductionThe players in coconut production are coconut farmers. PCA defines a coconut farmer as:
Farm owner: owns and tills the farm by himself and/or with assistance of farm laborers
and/or tenants.
Farm tenant: tills, harvests, and processes the coconut product and is compensated in the
form of the produce which he sells as his/her own. Under leasehold tenancy, the cost of
rental land is 25% of gross sales of copra.
Farm worker: works in the coconut farm for wages or in-kind compensation. For example,
a hired laborer applying and hauling fertilizer is paid based on a daily wage while for
some farm operations, the “pakyaw” method of payment is practiced wherein a hired
laborer performing other tasks such as nut picking, piling of nuts, dehusking and copra
making is paid for every 1,000 nuts. Coconuts are harvested by hired workers either by
climbing the tree themselves or by using a long bamboo pole with a knife sickle or iron
hook attached to its end to pluck the coconuts from the tree top.
In the coconut sugar value chain cluster, the tappers are paid per liter of the collected
sap. Coconut sap collection is labor intensive and requires climbing the tree every 4-5

1 5 4 D E P A R T M E N T O F A G R I C U L T U R E P H I L I P P I N E C O C O N U T A U T H O R I T Y
hours interval depending on the height of the trees entailing higher cost (Manohar 2021).
A hired cook (i.e., usually the wife of the sap tapper) who processes coconut sap into
syrup is paid by the farm owner on per liter of the cooked syrup. Coconut sap sugar
processors are paid on a daily wage per kg of coconut sap sugar processed as workers in
the processing plant.
Coconut farmers produce copra for oil mills and/or sell husked mature nuts to processors
of desiccated coconut and virgin coconut oil as well as young nuts to processors of
pasteurized coconut water and to traders of consolidators of the coconut processing
companies. Some of these farmers sell coconut sap instead of nuts to coconut processors.
Farmers also sell coconut by-products such as husks and coconut shells/charcoal for coco
coir and activated carbon processing, respectively, to augment their household income.
Marketing and TradingIn the coconut oil value chain cluster, large assemblers/consolidators are contracted
by oil mills to consolidate the supply of copra through a network of traders/market
intermediaries to whom they give money for cash advances. Oil mills and the oil mills’
buying stations generally give price premium prices to large assemblers/consolidators
who have access to high volume of copra with good quality (Idrovo, et al. 2006).
Usually, the large assemblers/consolidators have short-lived contracts (i.e., 30 days) with
municipal/city copra traders. They usually set the price of copra for both the traders and
the farmers. The municipal/city traders, in turn, buy copra from village traders and do
further drying of copra purchased from the latter. Village traders buy low-grade copra
from the farmers which they subject to further drying. They adopt the “pasa” system of
copra buying where a discount on the copra price is based on moisture. A discounted
price is given to copra with 20-25% moisture content. The village traders determine the
moisture content visually or by cracking or splitting the copra by hand and feeling due to
lack of moisture meters. The farmers either deliver copra to a nearby warehouse near the
farm or sell copra on picked up method.
As regards the desiccated coconut value chain cluster, large desiccated coconut processing
plants have several strategically located trading or buying stations where farmers and

1 5 5P H I L I P P I N E C O C O N U T I N D U S T R Y R O A D M A P 2 0 2 1 - 2 0 4 0
independent traders can directly deliver the husked nuts. Most of the desiccated coconut
processing plants use a network of consolidators, traders, and farmers in husk nut
procurement (Costales 2019). The desiccated coconut processing companies give financial
advances to preferred consolidators so they can provide credit (interest free and collateral
free) to their trader-agents and farmer suppliers to ensure cornering future deliveries.
Moreover, the desiccated coconut processing plants only procure what is needed for a
particular day of operation because any delay in delivery will cause a shrinkage loss of 3.5%
of the weight of the nut per day and deterioration of coconut water.
In the coco shell charcoal-based activated carbon value chain cluster, coco charcoal
traders act as supply consolidators of coco charcoal. Their buying system is on per-
kilogram basis and on-the-spot cash transactions (Idrovo, et al. 2006). Big charcoal
traders maintain a network of smaller charcoal buyers from whom they source charcoal
for bulk trading. Big traders who supply charcoal to an activated processing plant impose
quality specifications and apply discount factors for the presence of moisture, ash, and
debris. Since activated carbon plants prefer charcoal with 80% or higher carbon content,
the traders’ buying price is dependent on their estimated recoverable carbon content
of the charcoal that they will purchase. Some traders use a rough system of classifying
charcoal: Class A for charcoal produced using the drum method or concrete pit, Class
B for charcoal produced from the traditional pit dug in the ground, and Class C for
charcoal produced using the open fire method. There are also some big charcoal traders
who provide the equipment such as drums or dehusking tools to its farmer-suppliers to
maintain stable volume supply and buy charcoal on a per kilo basis. The trader retrieves
these equipment if the farmer stops producing charcoal. Meanwhile, the coco shell
charcoal-based activated plants source their charcoal requirements directly from farmer-
charocal processots and charcoal traders.
The existing marketing system of husked mature nuts in the virgin coconut oil value chain
cluster is the same as that of the desiccated coconut value chain cluster considering that
the virgin coconut oil processors and the desiccated coconut processing plants have
the same suppliers of husked mature nuts. Aside from traders, the virgin coconut oil
processors directly buy husked mature nuts from farmers or procure nuts from their own
or leased farms, or purchase fermented virgin coconut oil from village intermendiate
processors as raw materials for further processing.
1 5 6 D E P A R T M E N T O F A G R I C U L T U R E P H I L I P P I N E C O C O N U T A U T H O R I T Y
In the coconut sap sugar value chain cluster, there are no traders nor consolidators
of coconut sap as raw materials because of the small volume of production, inherent
perishability of coconut sap, and the difficulty of coordinating sap harvesting and
processing (Costales 2019). Coconut sap cannot be traded because of the technical
requirement of maintaining a certain pH not lower than pH 5 (Manohar 2021). If the
required pH level is not met, coconut sap cannot not be processed into coconut sap
sugar since it will become acidic due to fermentation.
A big wholesaler with a network of small assemblers/traders from different provinces is
the major supplier of young nuts of the pasteurized coconut water processing company.
Marketing of mature nuts as a source of coconut water beverage has been previously
discussed under the desiccated value chain cluster.
As regards marketing/trading of raw materials (coconut husks) in the coco coir value chain
cluster, consolidators/integrators and traders are the sources of coconut husks of few coir
processors. The husk consolidators are the buying agents of a coir processing plant. Most of
the coir processing plants source out coconut husks primarily from individual farmers. There
are few coir processing plants which have its own coconut farms to supply coconut husks.
ProcessingOil Mills and Refineries. The major players in the coconut oil processing sector are oil
mills and refineries with different production capacities. There are 32 small oil mills that
have capacities ranging from 30 MT to 130 MT of copra per day and sell their outputs
(i.e., crude coconut oil and copra cake) to the domestic market (Costales 2019). They
procure their copra supply directly from small traders (e.g., village and municipal traders)
who buy directly from farmers (Ildrovo, et al. 2006). Large oil mills have capacities of more
than 130 MT of copra per day. These oil mills export crude coconut oil and/or supply the
crude coconut oil requirements of oil refineries, oleochemical plants, and CME companies
(Costales 2019). Some of the big oil mills are vertically forward integrated into refining
and oleochemical and biodiesel processing.

1 5 7P H I L I P P I N E C O C O N U T I N D U S T R Y R O A D M A P 2 0 2 1 - 2 0 4 0
Desiccated Coconut Companies. Desiccated processing companies in the Philippines
have become integrated producing multi-products from a whole nut such as low-fat
desiccated coconut, coconut flour, coconut cream/milk, coconut water, paring cakes,
paring oil, and virgin coconut oil (Costales 2019). Some desiccated coconut processing
companies produce charcoal and activated carbon from coconut shells which they also
use as fuel for their boilers. Bulk of their desiccated coconut outputs are shipped to the
export market.
Coconut Shell Charcoal Processors and Activated Carbon Manufacturing Companies. Coco shell charcoal processors operating in the country are composed of: (1) coconut
farmer-charcoal processors; (2) micro-scale charcoal processors; (3) cooperative charcoal
processors; and (4) small-to-large scale charcoal plants. Coconut farmer-charcoal
processors employ either the open pit or drum method to process coco shells into
charcoal which they sell to rural traders, transporters, and households in the locality. Some
farmers also sell charcoal directly to retailers in public markets, activated carbon plants,
and oil mills (Idrovo, et al. 2006). An example of a cooperative charcoal processor is the
Baybay Cooperative in Leyte which buys coco shells from its members and processes
the coco shells into charcoal in its concrete charcoal pits using improved procedures.
The cooperative also acts as buyer of coco shell charcoal from its members and non-
members. The coco shell charcoal that the cooperative produce and the coco shell
charcoal it purchases are sold to a local trader who is, in turn, a supplier of coco shell
charcoal to an activated carbon plant. Micro- scale charcoal processors are household
charcoal processors that typically employ the drum method in producing charcoal and
sell their charcoal output to public market outlets (Ildrovo, et al. 2006). Meanwhile, small-
to large-scale charcoal processing plants have production capacity ranging from 120
MT to 252,974 MT per year. As mentioned earlier, eight of the coconut shell charcoal
processing plants are vertically integrated and supply their coco shell charcoal outputs to
their activated carbon processing plants. Seven of the 15 coco shell charcoal processing
plants export their products abroad mostly to China and Japan. Three of the 14 activated
charcoal plants operating in the country are either fully or partially owned by Japanese
companies. The conventional method of activated carbon production is energy intensive
and requires large amount of capital including operating costs (Idrovo, et al. 2006). The
outputs of the coco shell charcoal- based activated carbon plants are mainly geared
towards the export market.

1 5 8 D E P A R T M E N T O F A G R I C U L T U R E P H I L I P P I N E C O C O N U T A U T H O R I T Y
Virgin Coconut Oil. Virgin coconut oil processors operating in the country are
comprised of: (1) village or micro-scale level intermediaries: (2) SME VCO processors;
(3) cooperative/association VCO processors; and (4) integrated DCN-VCO processing
companies. Village level intermediaries produce and sell raw fermented VCO to some
small- and medium-scale VCO processors who improve and standardize product quality
using the centrifuge technology to meet the high-quality standards of the export market
(Costales 2019). The small- to medium-scale enterprises who export their VCO products
practice backward linkaging to have an assured supply of raw VCO from village-level or
micro-scale VCO processors to comply with the volume requirements of foreign buyers.
The VCO products of the small- to medium-scale VCO processor- exporters are certified
organic and they operate their processing plants with food safety and traceability
certifications. As regards VCO produced by a cooperative/association, the members
participate in processing the product as a group. Currently, two of the six cooperative/
association-VCO processors operating in the country are exporting VCO abroad. The
integrated DCN-VCO processing companies have larger capacities for mass production
of good quality VCO using the wet-dry method and have product certifications such
as organic, non-GMO, and fair-trade. All the types of VCO processors also cater to the
domestic market.
Coconut Water Processing Companies. Coconut water processors are composed of
integrated desiccated coconut companies that process coconut water beverage and
coconut water concentrate using mature nuts and companies that produce pasteurized
coconut water using young coconuts.
Coconut Sugar Processors. Coconut sugar processors include integrated coconut
processing companies, cooperative/association-based coconut sugar processors,
independent MSME-processors, and LGU-led coconut sugar processors’ association.
Some MSMEs lease farms and source coco sap from their own farms to have control of
sap supply and get organic certification (Costales 2019).
There are two levels of processors, the sap to syrup processor and the syrup-to sap sugar
processor (Manohar 2021). The syrup is utilized for coco nectar and production of aminos
in some areas in Northern Mindanao and Davao del Sur or serves as the primary raw

1 5 9P H I L I P P I N E C O C O N U T I N D U S T R Y R O A D M A P 2 0 2 1 - 2 0 4 0
material for coconut sap sugar production which is a common practice in Southern Luzon.
Processors directly process the sap into coco sugar and/or procure coco syrup from village
level processors which is then processed into coco sugar (Costales 2021). The village level
processors are micro- and small-scale entrepreneurs and farmers who get their sap from
their own farm, other farmers and/or sap collectors and forward integrate by producing
coconut syrup. They supply coconut syrup to a processor-exporter for coconut sap sugar
production. There are also processors who backward integrate by operating their own farm
and leased lands from absentee landlords and farmers and hiring tappers to collect sap
from both farms. Currently, there are six cooperative-coconut sap sugar processors in the
country which are operating in Davao Oriental and South Cotabato, one of which is already
exporting coconut sap sugar abroad. An example of an LGU-led coconut sugar processors’
association is the Kaanib Association in Alabat Island wherein coconut sap sugar products
of individual members are consolidated by the association for packing and labeling, and
marketing is done with the help of the municipal LGU.
Coco Coir Processors. For basic coir processing, the major players are decorticators/
baled fiber producers. Regarding secondary coir processing, these include the following: (1)
twines and coconut nets/coco fascines producers; (2) twines and coconut nets producers;
(3) stitched mats producers; (4) rubberized mats producers; (3) Gifts, Decors and Houseware
(GDH) producers (coir pots, door mats, and tuffed mats); and (4) coco peat producers
(peat blocks, loose form grow bags and input to organic fertilizer). Medium-sized coco
coir processors in the country mainly process coconut husks into coco coir and coco peat
(Costales 2019). Most of the coir processing companies pass on the processing of coir
fiber into twine, geotextile nets, geo logs, and mats to micro-enterprises or village level
enterprises. Some of these companies, however, have in-plant twine making and weaving.
Outbound Logistics/Distribution and End Markets
Outbound logistics service providers render transportation, storage, and delivery services to
bring the coconut products of processors to their customers in the domestic and or export
market. These are companies that specialize in offering storage, warehousing packing, land
transport, and shipping services, among other outbound logistics services that will facilitate
product delivery to final customers. Usually, processor-exporters incur additional costs such
as trucking, handling, storage, and shipping costs as well port charges.

1 6 0 D E P A R T M E N T O F A G R I C U L T U R E P H I L I P P I N E C O C O N U T A U T H O R I T Y
Most of the oil mills, refineries, and desiccated coconut processing companies directly
export their coconut products. Some of them rely on trader-exporters and broker-
exporters to distribute and export their products abroad. Broker-exporters are responsible
for connecting the processors to and moving their products to export markets (Costales
2019). Trader-exporters buy from processors to consolidate deliveries to importers.
Regarding activated carbon processing companies, they generally take charge of
exporting their products abroad because their product is classified as a dangerous good
by shipping companies. In the domestic market, local distributors distribute RBD oil
as cooking oil to institutional buyers (i.e., supermarkets). Crude coconut oil is sold to
oleochemical/CME companies to produce more value-added products.
For VCO produced by MSMEs for the domestic market, local distributorship is common.
Their VCO products are sold in retail stores, drug stores, and “pasalubong” (souvenir)
centers in the local market. The DCN-VCO processors also directly export and at the
same time rely on trader-exporters and broker-exporters to distribute their products for
export. The trader-exporters usually buy raw VCO which are packed in bulk (Costales
2019). The broker-exporters, on the other hand, link with preferred processors who
produce VCO in private label and in bulk. In the private label export, the broker-exporter
relays to the VCO processor the quality specifications, packaging/ packing, certifications,
volume, and schedule of deliveries required by the buyer. Most small- to medium-scale
enterprises directly export their VCO products because their small processing capacity
limits their ability to transact with more buyers (Costales 2019).
Like the VCO processors, the coconut water processors directly export and/or indirectly
export their coconut water and/or coco water concentrate products. In the latter, they tap
broker-exporters who act as agents of importers (Costales 2019).
As regards the coconut sap value chain cluster, only a small proportion of the country’s
coconut sap sugar production is sold in the local market. Retailers serve as distributors
in the local market (Manohar 2021). Local brands of coconut sap sugar are available in
supermarkets, but its retail price is higher than that of muscovado sugar. Some retailers
buy unbranded coconut sap sugar, and they provide their own branding and labels.

1 6 1P H I L I P P I N E C O C O N U T I N D U S T R Y R O A D M A P 2 0 2 1 - 2 0 4 0
Coco sap sugar produced by members of a cooperative or KAANIB association is
consolidated by the association or the municipal LGU before marketing. Traders buy the
consolidated coco sap sugar products of the cooperatives/associations and the coco sap
sugar products from individual small-scale coconut sap sugar producers for consolidation
to comply with the exporters’ quality and volume requirements (Manohar 2021). Coconut
sap sugar is exported in retail packs with private label and seldom in bulk packed in
plastic or steel drums (Costales 2019). Most coconut sap sugar processors export their
own products because broker-exporters are discouraged to include coconut sap sugar in
their product portfolio due to the smallness of the size of the market. The trader-exporters
buy from coconut sugar processors to consolidate supply for large volumes. Meanwhile,
the broker-exporters act on behalf of importers and usually buy private label coconut sap
sugar. Bulk purchase of coconut sap sugar is not common.
As regards coir products, these products are traded locally and internationally. The
domestic market outlets in the domestic market are the Department of Public Works and
Highways (DPWH), the National Irrigation Administration (NIA), and mining companies
which make use of geotextile nets, rolls, mats, and geo logs as protective cover for soils
and slopes to prevent soil erosion; households for tufted mats, rubberized mats, and door
mats; and local farms, commercial gardens, and nurseries for coco peat products and coco
pots as growing medium for landscape plants and grasses. Sale of coir products intended
for the domestic market is done through local distributors who provide transport and
warehousing logistics services. For coco coir products (e.g., coco coir/peat products) that
are geared towards the export market, distribution is done by trader-exporters and traders/
consolidators/broker-exporters who act as agents in distributing the products to importing
countries. Some coir processors directly export their products to importing countries.
The business-enabling environment covers relevant government legislations and
government policies that have either facilitated or hindered the development of the
coconut industry. These government policies are discussed in detail in Chapter 10. From
the private sector, the different member associations of the United Coconut Association
of the Philippines promote policy advocacy related to important issues and problems
that need to be addressed by the government concerning their value chain commodity
cluster. These associations are the Philippine Coconut Oil Producers Association, Inc.

1 6 2 D E P A R T M E N T O F A G R I C U L T U R E P H I L I P P I N E C O C O N U T A U T H O R I T Y
(PCOPA), Coconut Oil Refiners Association (CORA), Association of Philippine Desiccators
(APCD), Virgin Coconut Oil Producers and Traders Association of the Philippines (VCOP),
Philippine Activated Carbon Manufacturers Association, Inc. (PACMA), and Philippine
Oleochemical Manufacturers Association (POMA).
Support services enable the different functions or vertical linkages in a value chain (e.g.,
financing, research, development and extension, marketing, financing, and other support
services). Support services are provided by the national and regional government agencies,
credit and research institutions, LGUs, SUCs and NGOs, among others aimed at assisting
value chain stakeholders to achieve their specific enterprise objectives and goals.
The following are the main agencies providing support services to the coconut sector:

1 6 3P H I L I P P I N E C O C O N U T I N D U S T R Y R O A D M A P 2 0 2 1 - 2 0 4 0

1 6 4 D E P A R T M E N T O F A G R I C U L T U R E P H I L I P P I N E C O C O N U T A U T H O R I T Y

1 6 5P H I L I P P I N E C O C O N U T I N D U S T R Y R O A D M A P 2 0 2 1 - 2 0 4 0
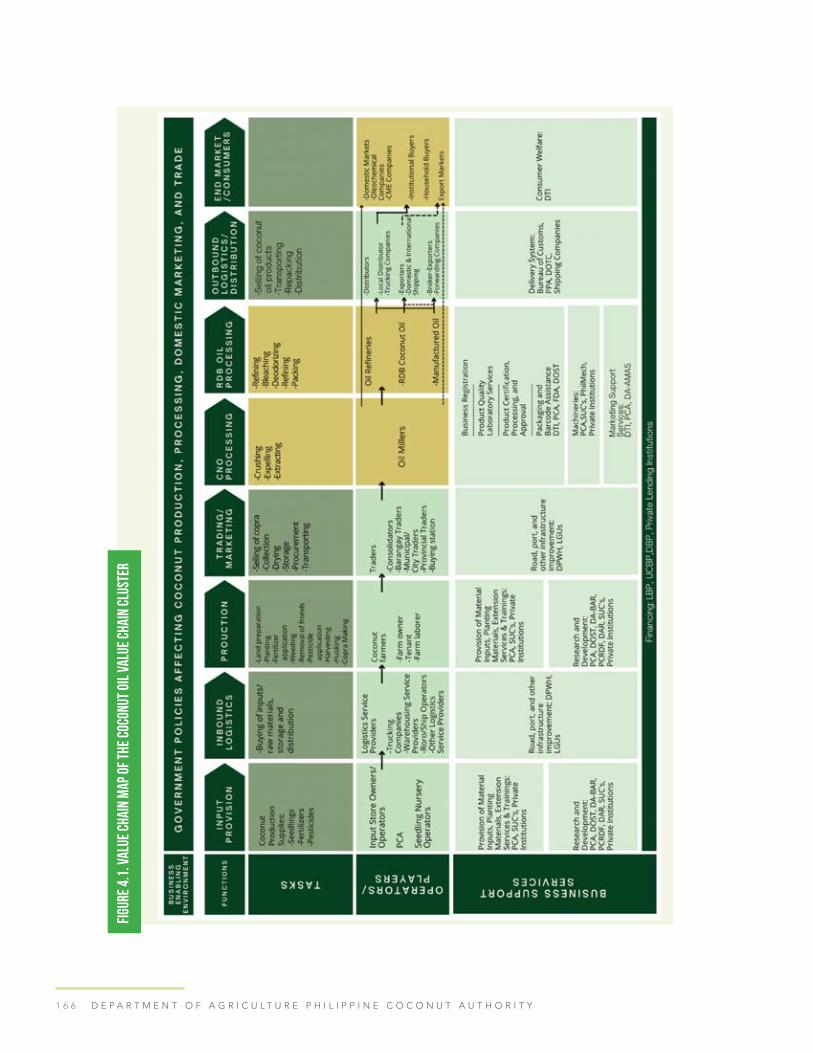
1 6 6 D E P A R T M E N T O F A G R I C U L T U R E P H I L I P P I N E C O C O N U T A U T H O R I T Y
Figu
re 4
.1. V
alue
Cha
in M
ap o
f the
Coc
onut
Oil
Val
ue C
hain
Clu
ster

1 6 7P H I L I P P I N E C O C O N U T I N D U S T R Y R O A D M A P 2 0 2 1 - 2 0 4 0
Figu
re 4
.2. V
alue
Cha
in M
ap o
f the
Des
icca
ted
Valu
e Ch
ain
Clus
ter

1 6 8 D E P A R T M E N T O F A G R I C U L T U R E P H I L I P P I N E C O C O N U T A U T H O R I T Y
Figu
re 4
.3. V
alue
Cha
in M
ap o
f the
Coc
onut
Cha
rcoa
l/Ac
tiva
ted
Carb
on V
alue
Cha
in C
lust
er

1 6 9P H I L I P P I N E C O C O N U T I N D U S T R Y R O A D M A P 2 0 2 1 - 2 0 4 0
Figu
re 4
.4. V
alue
Cha
in M
ap o
f the
Vir
gin
Coco
nut O
il
Valu
e Ch
ain
Clus
ter

1 7 0 D E P A R T M E N T O F A G R I C U L T U R E P H I L I P P I N E C O C O N U T A U T H O R I T Y
Figu
re 4
.5. V
alue
Cha
in M
ap o
f the
Coc
onut
Wat
er
Valu
e Ch
ain
Cust
er

1 7 1P H I L I P P I N E C O C O N U T I N D U S T R Y R O A D M A P 2 0 2 1 - 2 0 4 0
Figu
re 4
.6. V
alue
Cha
in M
ap o
f the
Coc
onut
Coi
r Va
lue
Chai
n Cl
uste
r
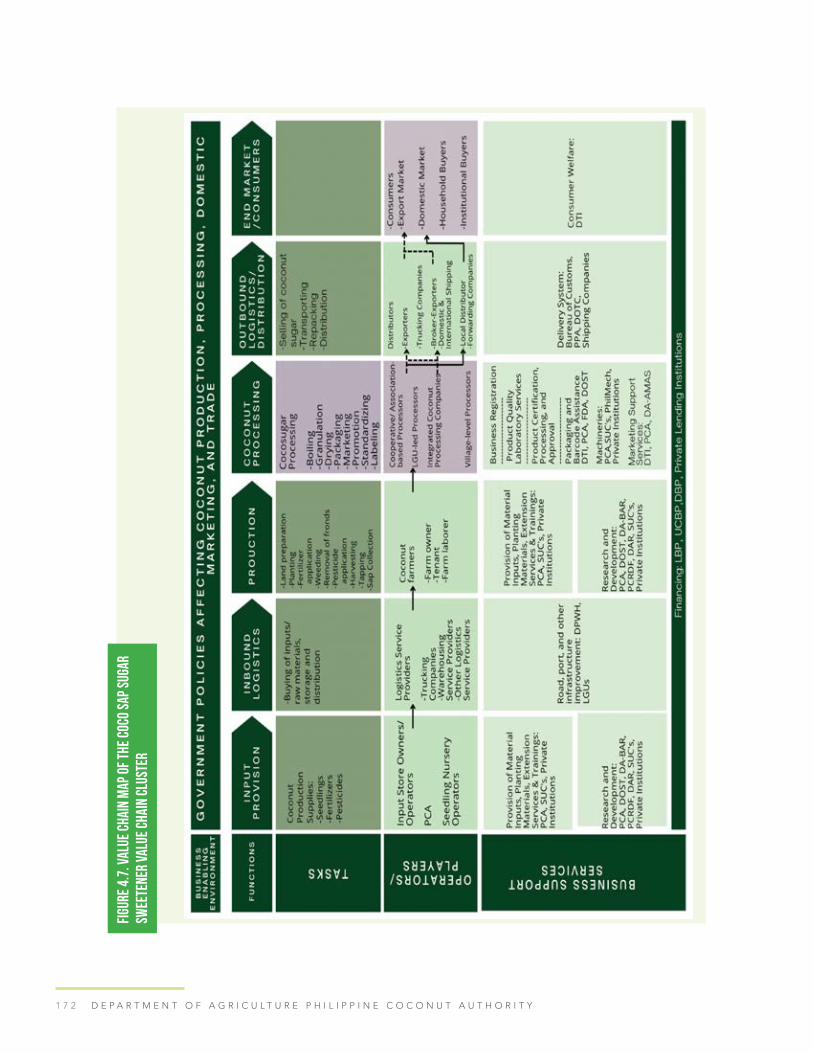
1 7 2 D E P A R T M E N T O F A G R I C U L T U R E P H I L I P P I N E C O C O N U T A U T H O R I T Y
Figu
re 4
.7. V
alue
Cha
in M
ap o
f the
Coc
o Sa
p Su
gar
Swee
tene
r Va
lue
Chai
n Cl
uste
r

1 7 3P H I L I P P I N E C O C O N U T I N D U S T R Y R O A D M A P 2 0 2 1 - 2 0 4 0
Figu
re 4
.8. S
WOT
Mat
rix
of C
ocon
ut O
il V
alue
Cha
in

1 7 4 D E P A R T M E N T O F A G R I C U L T U R E P H I L I P P I N E C O C O N U T A U T H O R I T Y
Figu
re 4
.9. S
WOT
Mat
rix
of D
esic
cate
d Co
conu
t (DC
N) V
alue
Cha
in

1 7 5P H I L I P P I N E C O C O N U T I N D U S T R Y R O A D M A P 2 0 2 1 - 2 0 4 0
Figu
re 4
.10.
SW
OT M
atri
x of
Coc
o Sh
ell C
harc
oal-
Base
d Ac
tiva
ted
Carb
on V
alue
Cha
in

1 7 6 D E P A R T M E N T O F A G R I C U L T U R E P H I L I P P I N E C O C O N U T A U T H O R I T Y
Figu
re 4
.11.
SW
OT M
atri
x of
Ole
oche
mic
al V
alue
Cha
in

1 7 7P H I L I P P I N E C O C O N U T I N D U S T R Y R O A D M A P 2 0 2 1 - 2 0 4 0
Figu
re 4
.12.
SW
OT M
atri
x of
Vir
gin
Coco
nut O
il (V
CO) V
alue
Cha
in
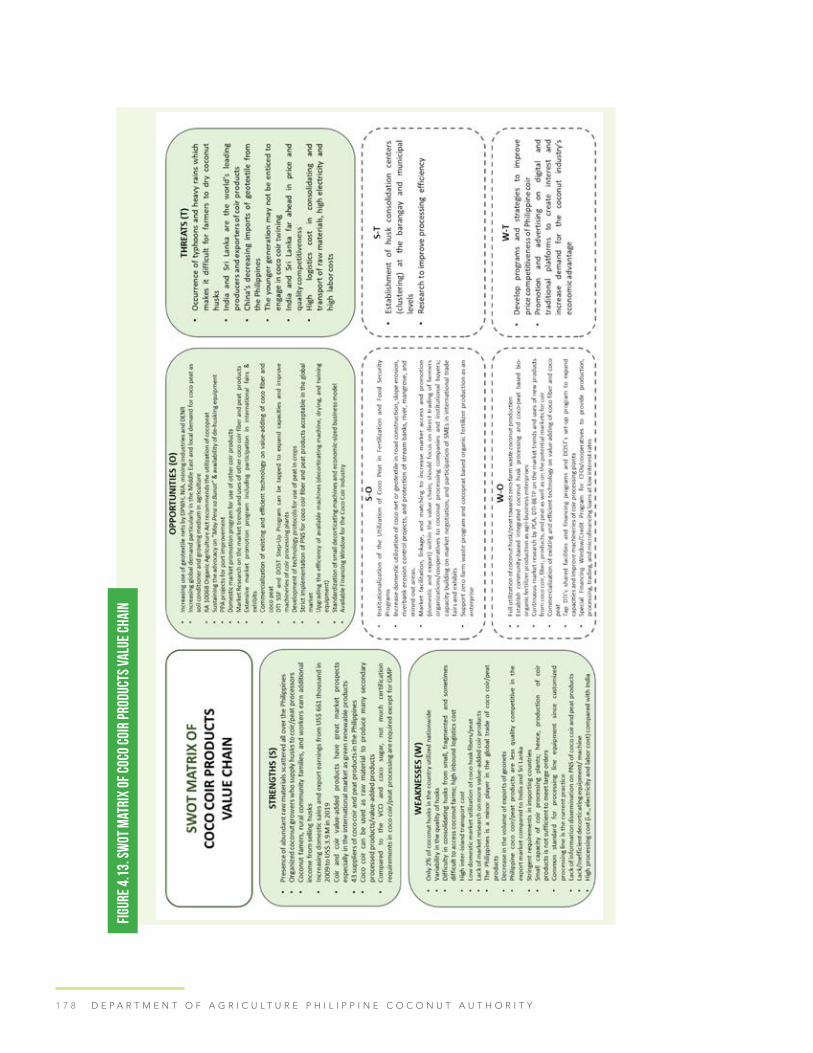
1 7 8 D E P A R T M E N T O F A G R I C U L T U R E P H I L I P P I N E C O C O N U T A U T H O R I T Y
Figu
re 4
.13.
SW
OT M
atri
x of
Coc
o Co
ir P
rodu
cts
Valu
e Ch
ain
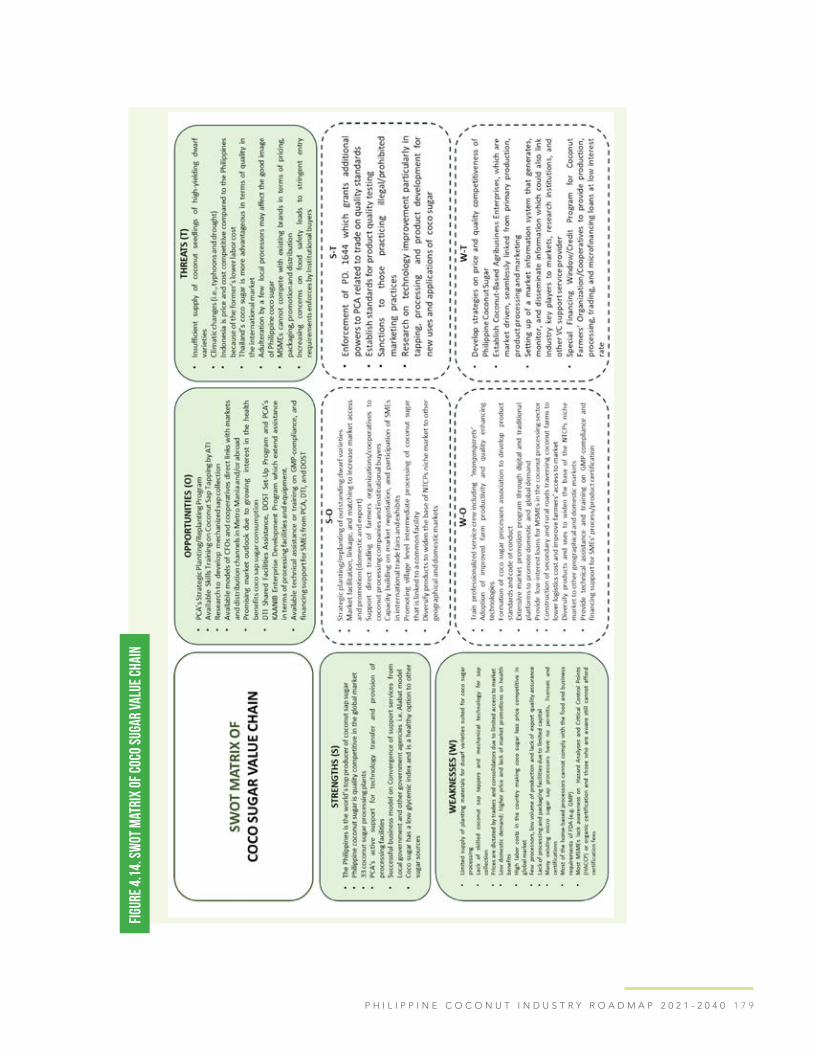
1 7 9P H I L I P P I N E C O C O N U T I N D U S T R Y R O A D M A P 2 0 2 1 - 2 0 4 0
Figu
re 4
.14.
SW
OT M
atri
x of
Coc
o Su
gar
Valu
e Ch
ain
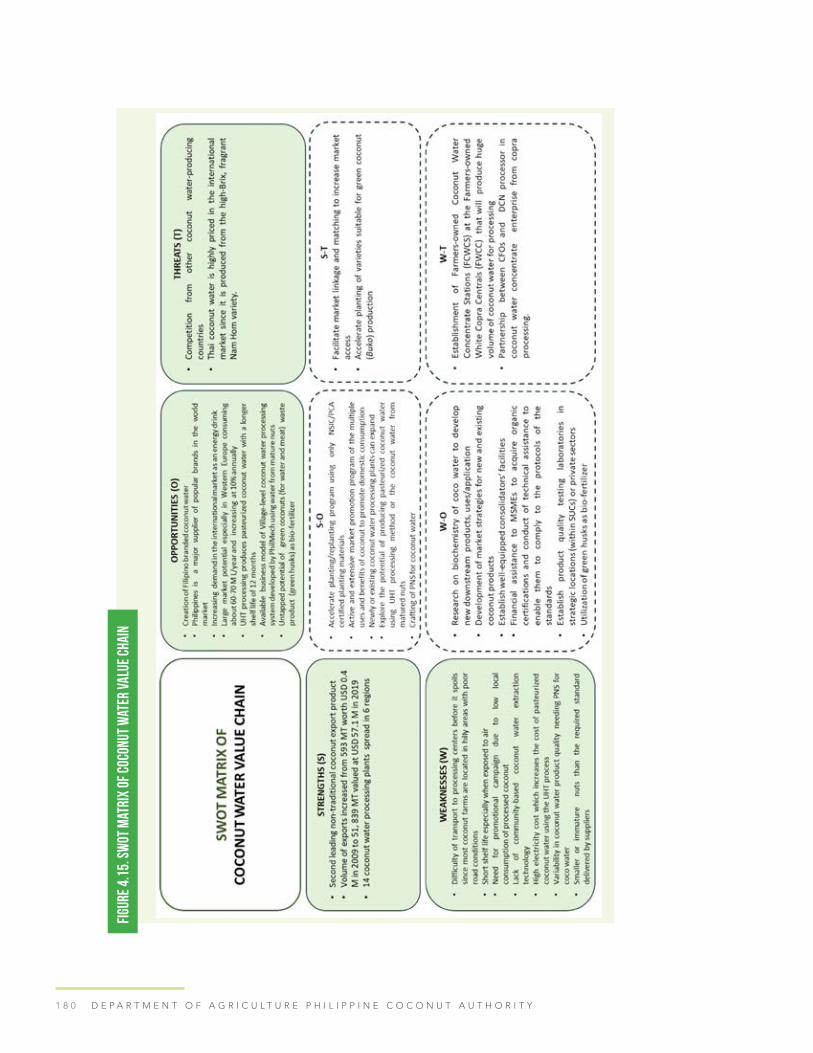
1 8 0 D E P A R T M E N T O F A G R I C U L T U R E P H I L I P P I N E C O C O N U T A U T H O R I T Y
Figu
re 4
.15.
SW
OT M
atri
x of
Coc
onut
Wat
er V
alue
Cha
in

1 8 1P H I L I P P I N E C O C O N U T I N D U S T R Y R O A D M A P 2 0 2 1 - 2 0 4 0
Costs and Returns Analysis and Relative Position of Different Value Chain PlayersNet income was used as a measure of profit and was computed by subtracting total cost
from gross income. The profit-cost ratio indicates the profit obtained from one peso spent
in producing/trading/processing one kilogram (kg) of a given coconut product. It was
derived by dividing the net income per kilogram of a given coconut product by the total
cost incurred in producing/trading/processing one kilogram of that coconut product.
Using buying and selling prices and production/trading/processing costs incurred in each
segment of the value chain, the progression of product value through the chain and value
shares (i.e., share in unit cost, share in added unit cost, share in unit profit, and share
in marketing margin) of the various market participants or players were determined for
each value chain cluster. Value shares reflect the participants’ contributions (including
the farmers’) in making the coconut product available to consumers as indicated by their
costs and profits for the activities they perform. Analysis of the relative financial position
of the key players in each coconut value chain cluster was done separately.
Coconut Oil Value Chain ClusterCosts and Returns Analysis of Different Players
On average, the copra processors are all farm owners who operate an average of 3.16
hectares planted to coconut. Their annual volume of production was 20,940 nuts in 2019.
They harvested three times per year. Each husked nut weighs 800 grams, on average.
Hence, the volume of nuts processed into copra was 16,752 kg per year. From one kg of
husked nuts, the copra processors produced 0.239 kg of copra. The total volume of copra
processed was 4,005 kg/year from the 3.16-ha farm. On a per hectare basis, the average
volume of copra production was 1,267 kg/ha.
The sample provincial trader buys copra directly from coconut farmers and small traders
operating at the municipal and barangay levels either on a picked-up or delivered
basis. The annual volume of copra handled by the big trader in 2019 was 600,000 kg.
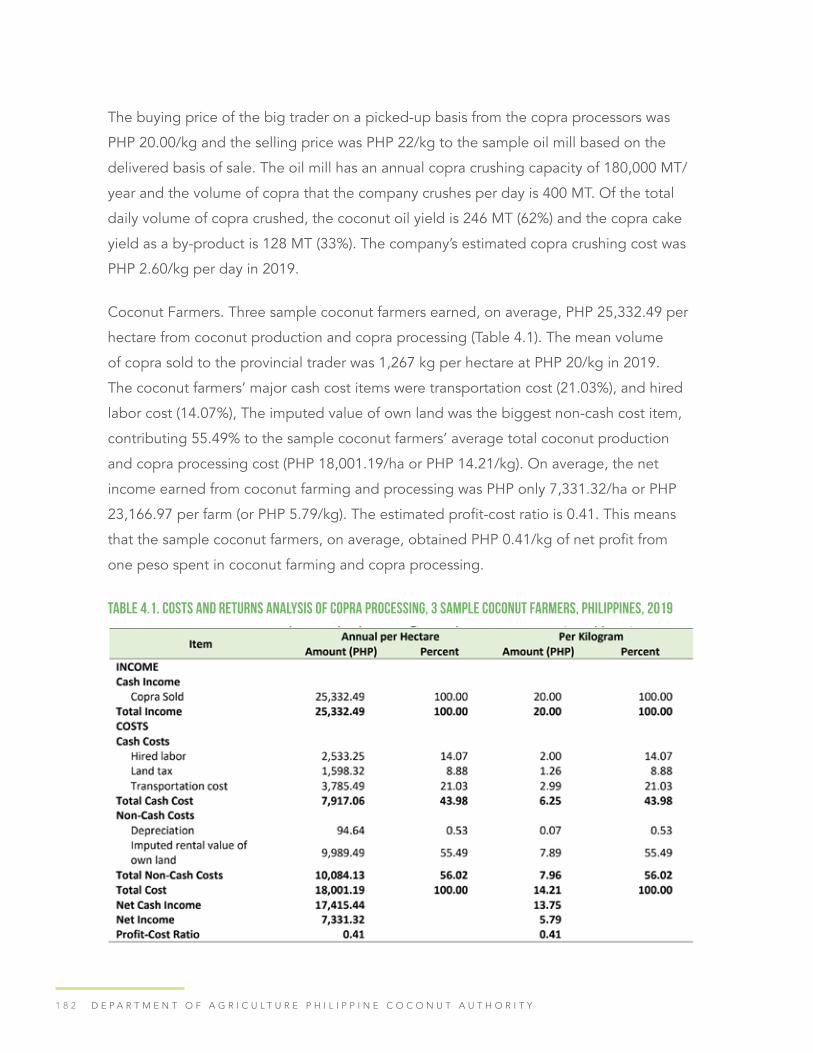
1 8 2 D E P A R T M E N T O F A G R I C U L T U R E P H I L I P P I N E C O C O N U T A U T H O R I T Y
The buying price of the big trader on a picked-up basis from the copra processors was
PHP 20.00/kg and the selling price was PHP 22/kg to the sample oil mill based on the
delivered basis of sale. The oil mill has an annual copra crushing capacity of 180,000 MT/
year and the volume of copra that the company crushes per day is 400 MT. Of the total
daily volume of copra crushed, the coconut oil yield is 246 MT (62%) and the copra cake
yield as a by-product is 128 MT (33%). The company’s estimated copra crushing cost was
PHP 2.60/kg per day in 2019.
Coconut Farmers. Three sample coconut farmers earned, on average, PHP 25,332.49 per
hectare from coconut production and copra processing (Table 4.1). The mean volume
of copra sold to the provincial trader was 1,267 kg per hectare at PHP 20/kg in 2019.
The coconut farmers’ major cash cost items were transportation cost (21.03%), and hired
labor cost (14.07%), The imputed value of own land was the biggest non-cash cost item,
contributing 55.49% to the sample coconut farmers’ average total coconut production
and copra processing cost (PHP 18,001.19/ha or PHP 14.21/kg). On average, the net
income earned from coconut farming and processing was PHP only 7,331.32/ha or PHP
23,166.97 per farm (or PHP 5.79/kg). The estimated profit-cost ratio is 0.41. This means
that the sample coconut farmers, on average, obtained PHP 0.41/kg of net profit from
one peso spent in coconut farming and copra processing.
Table 4.1. Costs and returns analysis of copra processing, 3 sample coconut farmers, Philippines, 2019
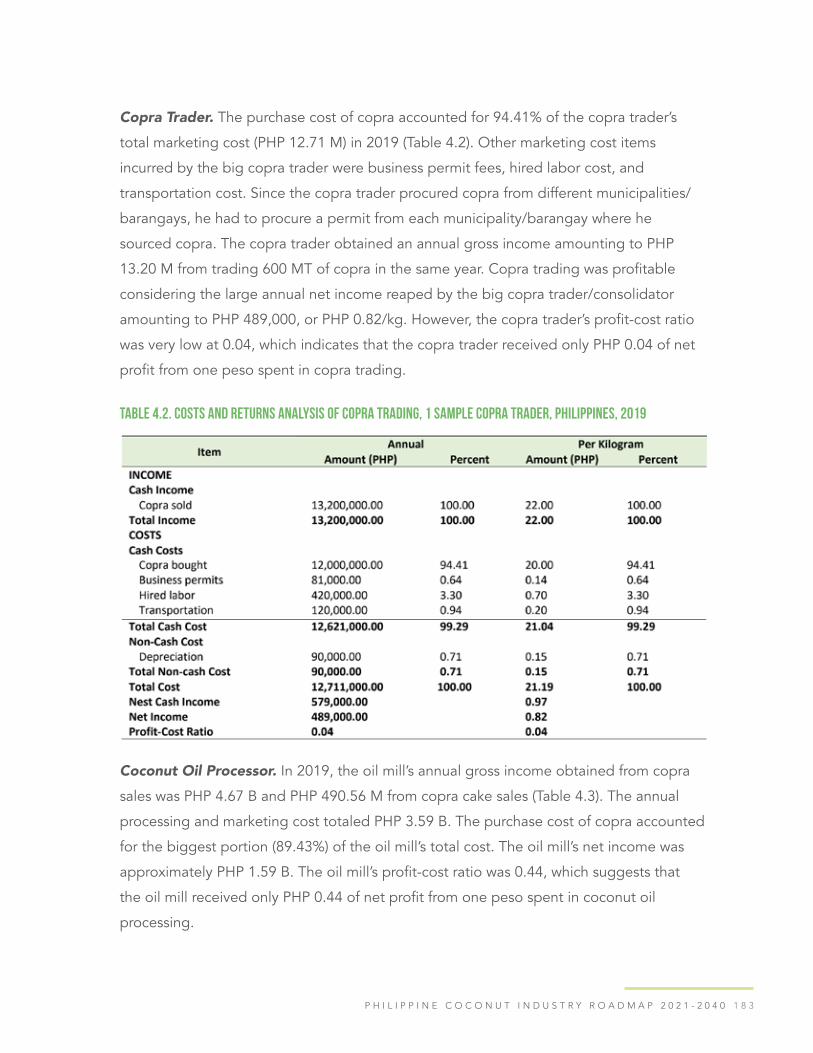
1 8 3P H I L I P P I N E C O C O N U T I N D U S T R Y R O A D M A P 2 0 2 1 - 2 0 4 0
Copra Trader. The purchase cost of copra accounted for 94.41% of the copra trader’s
total marketing cost (PHP 12.71 M) in 2019 (Table 4.2). Other marketing cost items
incurred by the big copra trader were business permit fees, hired labor cost, and
transportation cost. Since the copra trader procured copra from different municipalities/
barangays, he had to procure a permit from each municipality/barangay where he
sourced copra. The copra trader obtained an annual gross income amounting to PHP
13.20 M from trading 600 MT of copra in the same year. Copra trading was profitable
considering the large annual net income reaped by the big copra trader/consolidator
amounting to PHP 489,000, or PHP 0.82/kg. However, the copra trader’s profit-cost ratio
was very low at 0.04, which indicates that the copra trader received only PHP 0.04 of net
profit from one peso spent in copra trading.
Table 4.2. Costs and returns analysis of copra trading, 1 sample copra trader, Philippines, 2019
Coconut Oil Processor. In 2019, the oil mill’s annual gross income obtained from copra
sales was PHP 4.67 B and PHP 490.56 M from copra cake sales (Table 4.3). The annual
processing and marketing cost totaled PHP 3.59 B. The purchase cost of copra accounted
for the biggest portion (89.43%) of the oil mill’s total cost. The oil mill’s net income was
approximately PHP 1.59 B. The oil mill’s profit-cost ratio was 0.44, which suggests that
the oil mill received only PHP 0.44 of net profit from one peso spent in coconut oil
processing.
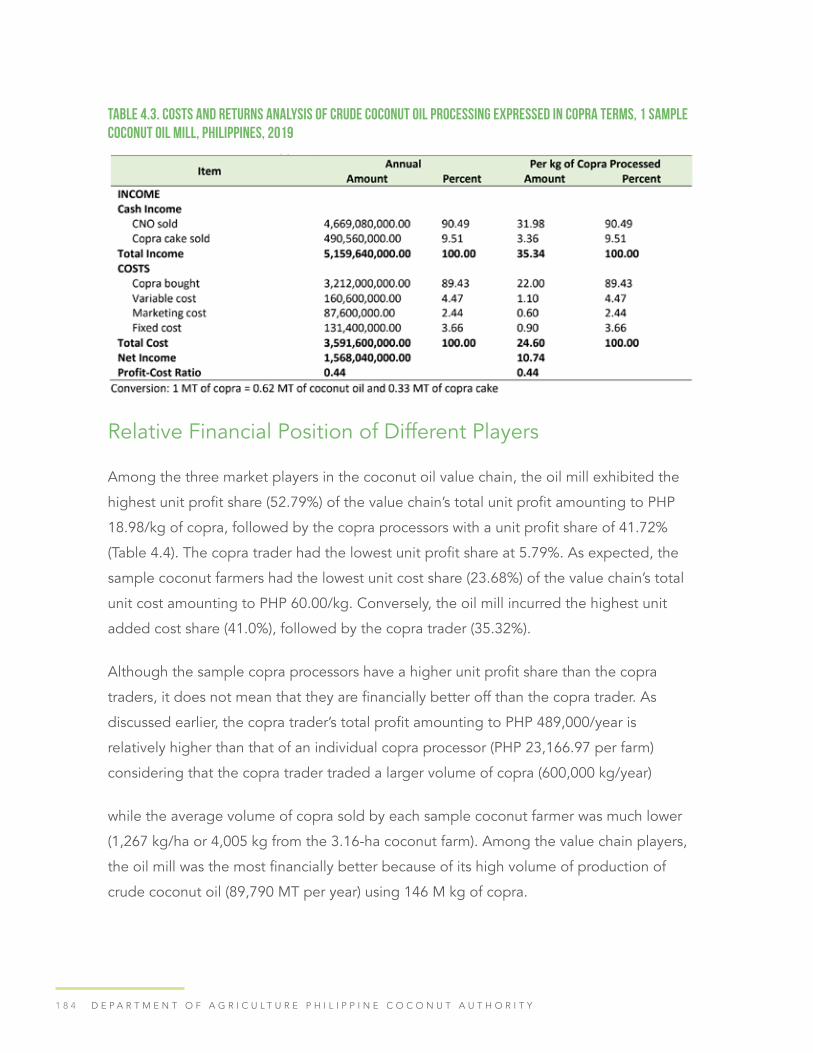
1 8 4 D E P A R T M E N T O F A G R I C U L T U R E P H I L I P P I N E C O C O N U T A U T H O R I T Y
Table 4.3. Costs and returns analysis of crude coconut oil processing expressed in copra terms, 1 sample coconut oil mill, Philippines, 2019
Relative Financial Position of Different Players
Among the three market players in the coconut oil value chain, the oil mill exhibited the
highest unit profit share (52.79%) of the value chain’s total unit profit amounting to PHP
18.98/kg of copra, followed by the copra processors with a unit profit share of 41.72%
(Table 4.4). The copra trader had the lowest unit profit share at 5.79%. As expected, the
sample coconut farmers had the lowest unit cost share (23.68%) of the value chain’s total
unit cost amounting to PHP 60.00/kg. Conversely, the oil mill incurred the highest unit
added cost share (41.0%), followed by the copra trader (35.32%).
Although the sample copra processors have a higher unit profit share than the copra
traders, it does not mean that they are financially better off than the copra trader. As
discussed earlier, the copra trader’s total profit amounting to PHP 489,000/year is
relatively higher than that of an individual copra processor (PHP 23,166.97 per farm)
considering that the copra trader traded a larger volume of copra (600,000 kg/year)
while the average volume of copra sold by each sample coconut farmer was much lower
(1,267 kg/ha or 4,005 kg from the 3.16-ha coconut farm). Among the value chain players,
the oil mill was the most financially better because of its high volume of production of
crude coconut oil (89,790 MT per year) using 146 M kg of copra.

1 8 5P H I L I P P I N E C O C O N U T I N D U S T R Y R O A D M A P 2 0 2 1 - 2 0 4 0
Table 4.4. Relative financial position of value chain players per kilogram of copra to produce crude coconut oil, farmers as the source of copra to the wholesaler and finally to the coconut oil mill, Philippines, 2019
Desiccated Coconut Value Chain Cluster
Costs and Returns Analysis of Different Players
The eight sample coconut farmers are all owner-operators. They operate, on average, 1.7
hectares and hire laborers to undertake fertilizer application, harvesting, collecting, piling,
husking, and handling operations. The hired laborers bring their own farm tools. In 2019,
the coconut farmers’ average volume of production of husked nuts was 7,375 per hectare.
The sample coconut farmers delivered 5,900 kg of husked nuts per hectare for sale to
the nut trader’s buying station. The coconut farmers’ selling price was PHP 8.00/kg. The
nut trader, in turn, traded 200,000 kg of husked nuts in the same year. The desiccated
coconut processing plant utilized 46,475,457 kg of husked nuts as raw materials that were
delivered by the nut trader at a selling price of PHP 9.70/kg. The company’s desiccated
coconut production (718,332 kg per year) is all geared toward the export market.
Coconut Farmers. Considering all the eight sample coconut farmers, the mean annual
gross income that they received from coconut farming amounted to PHP 47,198.53 per
hectare or PHP 8.00/kg (Table 4.5). The imputed cost of own farmland accounted for the
biggest proportion (42.09%) of the mean annual total cost (PHP 23,494.12 per hectare
or PHP 3.98/kg), followed by hired labor cost (29.48%), transportation cost (10.80%, and
fertilizer cost (9.95%). The sample coconut farmers earned a positive mean annual net
income (PHP 23,704.41 per hectare or PHP 4.02/kg) and profit-cost ratio (1.009) from
coconut farming, indicating that coconut production is profitable business enterprise
(Table 4.5). If cash costs are only considered in the analysis, the mean annual net cash

1 8 6 D E P A R T M E N T O F A G R I C U L T U R E P H I L I P P I N E C O C O N U T A U T H O R I T Y
income is PHP 33,594.12 per hectare or PHP 5.69/kg. Although positive, their profit-cost
ratio is only 1.009. This figure means that the sample farmers earned a mean profit of only
PHP 1.009 per kilogram of husked nut for every peso spent in coconut farming.
Table 4.5. Costs and returns analysis of coconut production, 8 husked nut farmers, Philippines, 2019
Husked Nut Trader. The major cost item in husked nut trading was the cost of nuts
purchased accounting for 86.35% of the trader’s total marketing cost (PHP 1,853,000
per year of PHP 9.27/kg) (Table 4.6). This item is followed by hired labor cost (9.71%).
The nut trader did not incur transportation costs in procuring nuts from the farmers
because the coconut farmers delivered the husked nuts to the nut trader’s buying station.
Transportation cost was only incurred in delivering husked nuts to the desiccated coconut
processing plant. Since the trader’s gross income (PHP 1,940,000 per year or PHP 9.70/
kg) in nut husk trading exceeded his total cost (PHP 1,853,000 per year or PHP 9.27/
kg), the nut trader obtained a net income of PHP 87,000 per year or PHP 0.43/kg. The
nut trader’s profit-cost ratio is positive but very low (0.04). This figure means that the nut
trader earned a profit of only PHP 0.04 per kilogram of husked nut traded for every peso
spent in trading this product.

1 8 7P H I L I P P I N E C O C O N U T I N D U S T R Y R O A D M A P 2 0 2 1 - 2 0 4 0
Table 4.6. Costs and returns analysis of nut trading, 1 sample trader, Philippines, 2019
Desiccated Coconut Processor. In 2019, the total cost of producing one kilogram of
desiccated coconut was PHP 105.68 (Table 4.7). Husked nuts used as one of the raw
materials in producing desiccated coconut accounted for 61.22% of the total processing
cost (approximately PHP 75.92 M/year), followed by hired labor (23.71%). Other cost
items were bunker fuel (4.74%), packaging materials (3.95%), and utilities (3.16%).
Given a gross income of PHP 125.29 per kilogram (or PHP 90 M/year), the net income
earned from desiccated coconut processing was PHP 19.61/kg (or PHP 14.08 M/year).
This amount indicates that desiccated coconut processing is a very profitable business
enterprise. The profit-cost ratio of 0.19 means that a net profit of PHP 0.19 per kilogram
was obtained by the desiccated coconut processor from one peso spent in processing
desiccated coconut.

1 8 8 D E P A R T M E N T O F A G R I C U L T U R E P H I L I P P I N E C O C O N U T A U T H O R I T Y
Table 4.7. Costs and returns analysis of desiccated coconut processing, 1 sample desiccated coconut processor, Philippines, 2019
Relative Financial Position of Different Players
The sample coconut farmers generated the highest unit profit share (54.40%) of the value
chain’s total unit profit amounting to PHP 7.39/kg among the three market players in the
desiccated coconut value chain cluster (Table 4.8). The desiccated coconut processor
ranked second, exhibiting a unit profit share of 39.78% The nut trader’s unit profit share
was the lowest (only 5.82%). The nut trader received the lowest unit profit share. In terms
of unit cost share, the sample coconut farmers had the lowest unit share (13.68%) of the
total unit cost-share amounting to PHP 29.09/kg among the value chain players, followed
by the nut trader (31.87%). On the other hand, the desiccated coconut processor
exhibited the highest unit added cost share (15.84%).
The foregoing analysis does not mean that the sample coconut farmers are financially
better off than the nut trader. The total profit of the nut trader is expected to be higher
than that of an individual coconut farmer because the nut trader handled a higher volume

1 8 9P H I L I P P I N E C O C O N U T I N D U S T R Y R O A D M A P 2 0 2 1 - 2 0 4 0
of husked nuts (200,000 kg/year) while the average volume of husked nuts sold by each
sample coconut farmer was much lower (5,990 kg/ha or 8,850 kg from 1.7-ha coconut
farm). Among the value chain players, the desiccated coconut processing company
was the most financially better because of its high volume of production of desiccated
coconut, a high value-added product (718,332 kg per year), using 46,475,457 kg of
husked nuts.
Table 4.8. Relative financial position of value chain players per kilogram of husked nut to produce desiccated coconut, farmers as the source of husked nuts to the nut trader and finally to the desiccated coconut processor, Philippines, 2019
Coco Shell Charcoal-Based Activated CarbonValue Chain Cluster
Costs and Returns Analysis of Different Players
The sample coconut farmer is a copra processor who utilized coconut shells in his farm to
process charcoal using the pit method. The charcoal that he produced (only 37.8 kilograms
per year) is picked up by a big charcoal consolidator/trader who granulated the coco shell
charcoal prior to delivery to the sample activated carbon processing plant in Davao City.
The trader’s buying system was on a per-kilogram basis and on-the-spot cash transactions.
The big charcoal trader buys directly from small charcoal producers and smaller charcoal
traders for bulk charcoal trading. In 2019, the big charcoal consolidator/trader bought a
total of 650,000 kg of coco shell charcoal at PHP 19.00/kg and sold the same quantity of
granulated coco shell charcoal to the activated carbon processing company at PHP 21.00/
kg. The activated carbon processing company used 1,500 MT per month or 18,000 MT
per year of coco shell charcoal to produce 600 MT per month or 7,200 MT per year of
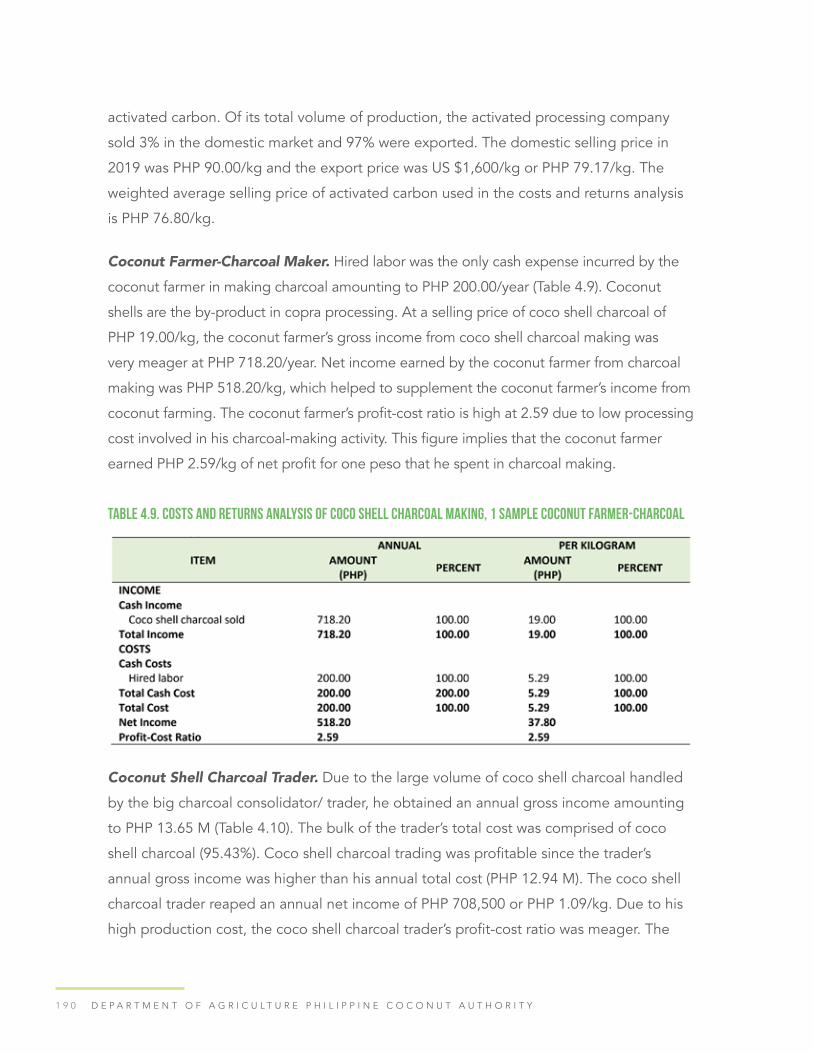
1 9 0 D E P A R T M E N T O F A G R I C U L T U R E P H I L I P P I N E C O C O N U T A U T H O R I T Y
activated carbon. Of its total volume of production, the activated processing company
sold 3% in the domestic market and 97% were exported. The domestic selling price in
2019 was PHP 90.00/kg and the export price was US $1,600/kg or PHP 79.17/kg. The
weighted average selling price of activated carbon used in the costs and returns analysis
is PHP 76.80/kg.
Coconut Farmer-Charcoal Maker. Hired labor was the only cash expense incurred by the
coconut farmer in making charcoal amounting to PHP 200.00/year (Table 4.9). Coconut
shells are the by-product in copra processing. At a selling price of coco shell charcoal of
PHP 19.00/kg, the coconut farmer’s gross income from coco shell charcoal making was
very meager at PHP 718.20/year. Net income earned by the coconut farmer from charcoal
making was PHP 518.20/kg, which helped to supplement the coconut farmer’s income from
coconut farming. The coconut farmer’s profit-cost ratio is high at 2.59 due to low processing
cost involved in his charcoal-making activity. This figure implies that the coconut farmer
earned PHP 2.59/kg of net profit for one peso that he spent in charcoal making.
Table 4.9. Costs and returns analysis of coco shell charcoal making, 1 sample coconut farmer-charcoal
Coconut Shell Charcoal Trader. Due to the large volume of coco shell charcoal handled
by the big charcoal consolidator/ trader, he obtained an annual gross income amounting
to PHP 13.65 M (Table 4.10). The bulk of the trader’s total cost was comprised of coco
shell charcoal (95.43%). Coco shell charcoal trading was profitable since the trader’s
annual gross income was higher than his annual total cost (PHP 12.94 M). The coco shell
charcoal trader reaped an annual net income of PHP 708,500 or PHP 1.09/kg. Due to his
high production cost, the coco shell charcoal trader’s profit-cost ratio was meager. The

1 9 1P H I L I P P I N E C O C O N U T I N D U S T R Y R O A D M A P 2 0 2 1 - 2 0 4 0
profit-cost ratio of 0.05 means that the coco shell trader received only PHP 0.05 of profit
for one peso spent in coco shell trading.
Table 4.10. Costs and returns analysis of coco shell charcoal trading, 1 sample coco shell charcoal trader, Philippines, 2019
Coco Shell Charcoal-based Activated Coconut Manufacturer. As expected, coco shell
charcoal was the major cost item in activated carbon processing, contributing 86.81%
to the total manufacturing cost (approximately PHP 435.43 M per year or PHP 60.48/kg)
(Table 4.11). Activated carbon processing is capital intensive. Depreciation cost of fixed
capital items accounted for 4.55% of the total cost, followed by utilities (3.31%), cost of
packaging materials and labels (2.38%), and marketing cost (2.20%). Other costs incurred
by the company were hired labor cost and the cost of product certification. The activated
carbon manufacturing company obtained an annual gross income and net income
amounting to PHP 552.96 M/year (or PHP 76.80/kg) and PHP 117.53 M/year (PHP 16.33/
kg), respectively. Although the company obtained very high net profit because of its large
volume of production, the company’s profit-cost ratio is very low at 0.27, which indicates
that only PHP 0.27/kg of net profit was derived from one peso spent in activated carbon
manufacturing.

1 9 2 D E P A R T M E N T O F A G R I C U L T U R E P H I L I P P I N E C O C O N U T A U T H O R I T Y
Table 4.11. Costs and returns analysis of activated carbon manufacturing, 1 sample activated carbon processing company, Philippines, 2019
Relative Financial Position of Different Players
The activated carbon manufacturing company exhibited the highest unit cost share of
the value chain’s total unit cost amounting to PHP 49.39/kg (Table 4.12). Conversely, the
sample coconut farmer had the lowest unit cost share (10.71%), followed by the coco
shell charcoal trader (40.31%). In terms of unit profit share, the sample coconut farmers
generated the highest percentage share (64.28%) of the value chain’s total profit of
PHP 21.33/kg among the three market players in the activated carbon value chain. The
activated carbon processing company ranked second, exhibiting a unit profit share of
30.61%. The coco shell charcoal trader’s unit profit share was the lowest (only 5.11%)
among the value chain players.
The foregoing analysis of the relative financial position of the different players in the coco
shell charcoal-based activated carbon value chain cluster does not imply that the sample
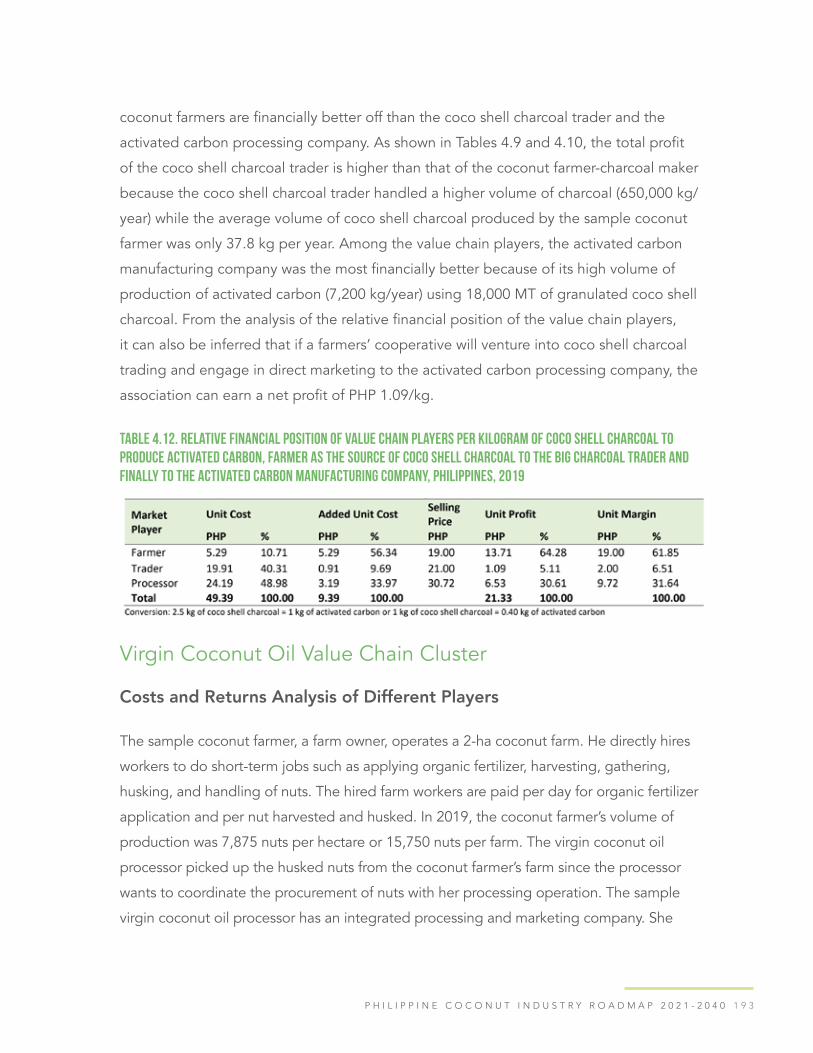
1 9 3P H I L I P P I N E C O C O N U T I N D U S T R Y R O A D M A P 2 0 2 1 - 2 0 4 0
coconut farmers are financially better off than the coco shell charcoal trader and the
activated carbon processing company. As shown in Tables 4.9 and 4.10, the total profit
of the coco shell charcoal trader is higher than that of the coconut farmer-charcoal maker
because the coco shell charcoal trader handled a higher volume of charcoal (650,000 kg/
year) while the average volume of coco shell charcoal produced by the sample coconut
farmer was only 37.8 kg per year. Among the value chain players, the activated carbon
manufacturing company was the most financially better because of its high volume of
production of activated carbon (7,200 kg/year) using 18,000 MT of granulated coco shell
charcoal. From the analysis of the relative financial position of the value chain players,
it can also be inferred that if a farmers’ cooperative will venture into coco shell charcoal
trading and engage in direct marketing to the activated carbon processing company, the
association can earn a net profit of PHP 1.09/kg.
Table 4.12. Relative financial position of value chain players per kilogram of coco shell charcoal to produce activated carbon, farmer as the source of coco shell charcoal to the big charcoal trader and finally to the activated carbon manufacturing company, Philippines, 2019
Virgin Coconut Oil Value Chain Cluster
Costs and Returns Analysis of Different Players
The sample coconut farmer, a farm owner, operates a 2-ha coconut farm. He directly hires
workers to do short-term jobs such as applying organic fertilizer, harvesting, gathering,
husking, and handling of nuts. The hired farm workers are paid per day for organic fertilizer
application and per nut harvested and husked. In 2019, the coconut farmer’s volume of
production was 7,875 nuts per hectare or 15,750 nuts per farm. The virgin coconut oil
processor picked up the husked nuts from the coconut farmer’s farm since the processor
wants to coordinate the procurement of nuts with her processing operation. The sample
virgin coconut oil processor has an integrated processing and marketing company. She

1 9 4 D E P A R T M E N T O F A G R I C U L T U R E P H I L I P P I N E C O C O N U T A U T H O R I T Y
operates her own and leased organically certified coconut farms and at the same time buys
husked nuts from contracted farmers. Her processing company pioneered virgin coconut
oil in 2002 using the fermentation process. In 2016, to resolve the issue of low moisture
content and sediments present using the fermentation process, the processing company
used centrifuge to filter the virgin coconut oil and increase the moisture content from 0.10
to 0.50-0.60. About 10% of the company’s total production of virgin coconut oil is exported
and the main bulk (90%) is sold in the domestic market. The company supplies virgin
coconut oil to 200 branches or outlets of Mercury Drug store nationwide.
Coconut Farmer. In 2019, the sample coconut farmer obtained a gross income of PHP
53,550 from selling 6,300 kg of husked nuts per hectare at PHP 8.50/nut (Table 4.13). The
imputed cost of his own land (21%) and hired labor (18%) were the coconut farmer’s major
cost items. Other production cost items were the cost of material inputs like organic
fertilizer (3.83%) and land tax (7.71%). On a per hectare basis, the coconut farmer’s annual
gross income far outweighed his annual total cost (PHP 20,759.09/year or PHP 3.30/
kg), resulting in an annual net income of PHP 32,790.90 (or PHP 5.20/kg). The coconut
farmer’s profit- cost ratio of 1.58 implies that the coconut farmer earns PHP 1.58 of profit
for every peso spent in producing one kilogram of husked nut.
Table 4.13. Annual costs and returns in coconut production, 1 sample coconut farmer, Philippines, 2019

1 9 5P H I L I P P I N E C O C O N U T I N D U S T R Y R O A D M A P 2 0 2 1 - 2 0 4 0
Virgin Coconut Oil Processor. The sample coconut processor produced 10,000 liters/
month or 120,000 liters/year of virgin coconut oil. Of the company’s total production, 68%
was sold in the domestic market and 32% was for export. The domestic selling price was
PHP 150/250-ml bottle or PHP 1,000/liter- bottle while the export selling price was PHP
200/liter. Hence, the average weighted price of virgin coconut oil was PHP 448/liter. In
2019, the virgin coconut oil processor earned an annual gross income amounting to PHP
53.76 M (PHP 448/liter of virgin coconut oil). Table 4.14 shows that the major cost items
were packaging and labelling (43.86%), marketing (25.22%), and husked nuts (23.30%).
The virgin coconut oil producer used five (5) kilograms of husked nuts to produce one
(1) liter of virgin coconut oil. The total cost incurred in virgin coconut oil processing was
PHP 21,890,000 per year or PHP 182.42/liter. The annual net income earned was PHP
31,870,000 or PHP 265.58/liter. The virgin coconut oil processor’s profit-cost ratio was
1.46, indicating that PHP1.46 per liter of virgin coconut oil was obtained from one peso
spent in processing this product.
Table 4.14. Annual costs and returns in virgin coconut oil processing, Philippines, 2019

1 9 6 D E P A R T M E N T O F A G R I C U L T U R E P H I L I P P I N E C O C O N U T A U T H O R I T Y
Relative Financial Position of Different Players
Table 4.15 shows that the virgin coconut oil processor is financially better off than the
coconut farmer in the VCO value chain cluster. The virgin coconut oil processor’s share
of the value chain’s total unit profit of PHP 58.32 is very high at 91.08% compared to
the coconut farmer’s unit profit share of only 8.92%. As expected, the virgin coconut oil
processor’s unit cost share (91.70%) is much higher than the coconut farmer’s unit cost
share of 8.30% of the total value chain’s unit cost share of PHP 39.78/kg.
Table 4.15. Relative financial position of the value chain players per kilogram of husked nuts to produce virgin coconut oil, farmer as the source of husked nut and finally to the virgin coconut oil processor, Philippines, 2019
Coconut Water Value Chain Cluster
Costs and Returns Analysis of Different Players
The sample coconut farmers are farm owners operating an average of 2.38 hectares.
Their mean annual volume of production in 2019 was 7,540 kg of young nuts per farm
(or 3,168 kg of young nuts per hectare) which were sold to a nut wholesaler/big nut
trader on picked-up basis at PHP 9.00/kg. The wholesaler handled a total of 100,000 kg
of young nuts in the same year. The wholesaler buys nuts from assemblers and directly
from coconut farmers in neighboring provinces that he delivers to the coconut water
processing company. The processing company produces pasteurized coconut water
using young nuts (7–8 months old) for the export market and frozen coconut meat for
the domestic market. For the first six months, the company produces 100,000 liters of
pasteurized coconut water per month using 222,222 young nuts as raw materials. For
the second half of the year, the company produces 500,000 liters of pasteurized coconut
water per month utilizing 1,111,111 young nuts. In 2019, the coconut water processing
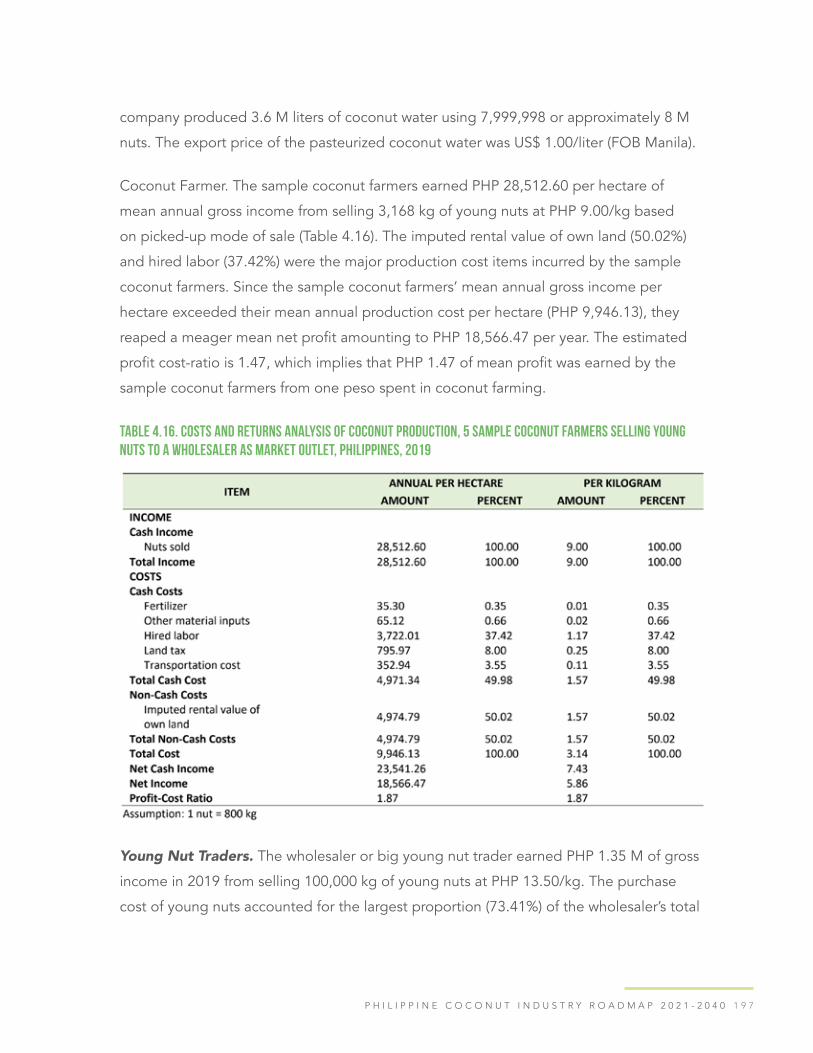
1 9 7P H I L I P P I N E C O C O N U T I N D U S T R Y R O A D M A P 2 0 2 1 - 2 0 4 0
company produced 3.6 M liters of coconut water using 7,999,998 or approximately 8 M
nuts. The export price of the pasteurized coconut water was US$ 1.00/liter (FOB Manila).
Coconut Farmer. The sample coconut farmers earned PHP 28,512.60 per hectare of
mean annual gross income from selling 3,168 kg of young nuts at PHP 9.00/kg based
on picked-up mode of sale (Table 4.16). The imputed rental value of own land (50.02%)
and hired labor (37.42%) were the major production cost items incurred by the sample
coconut farmers. Since the sample coconut farmers’ mean annual gross income per
hectare exceeded their mean annual production cost per hectare (PHP 9,946.13), they
reaped a meager mean net profit amounting to PHP 18,566.47 per year. The estimated
profit cost-ratio is 1.47, which implies that PHP 1.47 of mean profit was earned by the
sample coconut farmers from one peso spent in coconut farming.
Table 4.16. Costs and returns analysis of coconut production, 5 sample coconut farmers selling young nuts to a wholesaler as market outlet, Philippines, 2019
Young Nut Traders. The wholesaler or big young nut trader earned PHP 1.35 M of gross
income in 2019 from selling 100,000 kg of young nuts at PHP 13.50/kg. The purchase
cost of young nuts accounted for the largest proportion (73.41%) of the wholesaler’s total

1 9 8 D E P A R T M E N T O F A G R I C U L T U R E P H I L I P P I N E C O C O N U T A U T H O R I T Y
marketing cost (approximately PHP 1.23 M/year or PHP 12.26/kg), followed by hired
labor (16.31%), and transportation cost (PHP 4.89%). Owing to the large marketing cost
incurred by the wholesaler, the net income that he received from his trading business
was only PHP 124,000 per year (or PHP 1.24/kg). The estimated profit-cost ratio of 0.10
is much lower than that calculated for the sample coconut farmers. The estimated profit
cost-ratio of 0.10 means that only PHP 0.10 of profit was earned by the sample wholesaler
of young nuts from one peso spent in nut trading.
Table 4.17. Costs and returns analysis of young nut trading, 1 sample wholesaler, Philippines, 2019
Coconut Water Processing Company. The sample processing company obtained
PHP 180 M of annual gross income in 2019 from producing and exporting 3.6 M liters
of pasteurized coconut water (Table 4.18). The purchase cost of young nuts accounted
for 92.75% of the company’s total processing and marketing cost (approximately PHP
116.47 M/year). Hired labor was the second major cost item, contributing only 3.84% to
total processing and marketing cost. The company’s annual net income from processing
pasteurized coconut water amounted to PHP 63.56 M. The company’s profit-cost ratio of
0.55 indicates that PHP 0.55 of net profit was obtained by the company from one peso
spent in processing and exporting pasteurized coconut water.
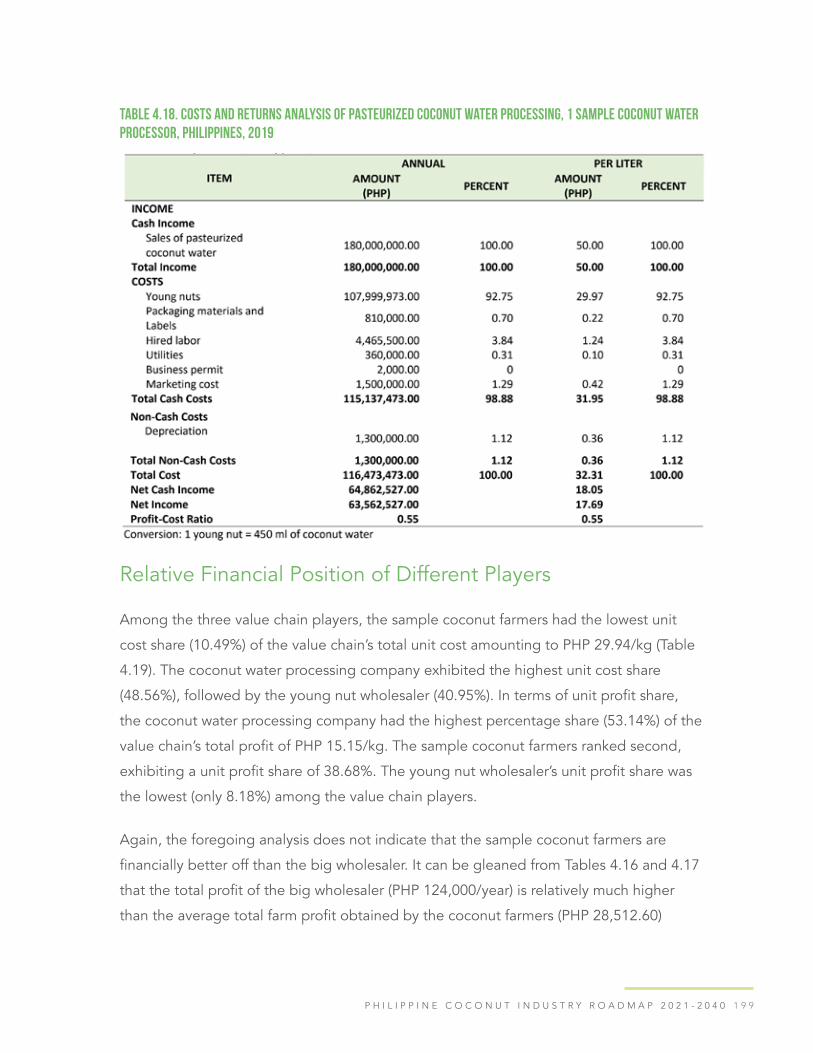
1 9 9P H I L I P P I N E C O C O N U T I N D U S T R Y R O A D M A P 2 0 2 1 - 2 0 4 0
Table 4.18. Costs and returns analysis of pasteurized coconut water processing, 1 sample coconut water processor, Philippines, 2019
Relative Financial Position of Different Players
Among the three value chain players, the sample coconut farmers had the lowest unit
cost share (10.49%) of the value chain’s total unit cost amounting to PHP 29.94/kg (Table
4.19). The coconut water processing company exhibited the highest unit cost share
(48.56%), followed by the young nut wholesaler (40.95%). In terms of unit profit share,
the coconut water processing company had the highest percentage share (53.14%) of the
value chain’s total profit of PHP 15.15/kg. The sample coconut farmers ranked second,
exhibiting a unit profit share of 38.68%. The young nut wholesaler’s unit profit share was
the lowest (only 8.18%) among the value chain players.
Again, the foregoing analysis does not indicate that the sample coconut farmers are
financially better off than the big wholesaler. It can be gleaned from Tables 4.16 and 4.17
that the total profit of the big wholesaler (PHP 124,000/year) is relatively much higher
than the average total farm profit obtained by the coconut farmers (PHP 28,512.60)
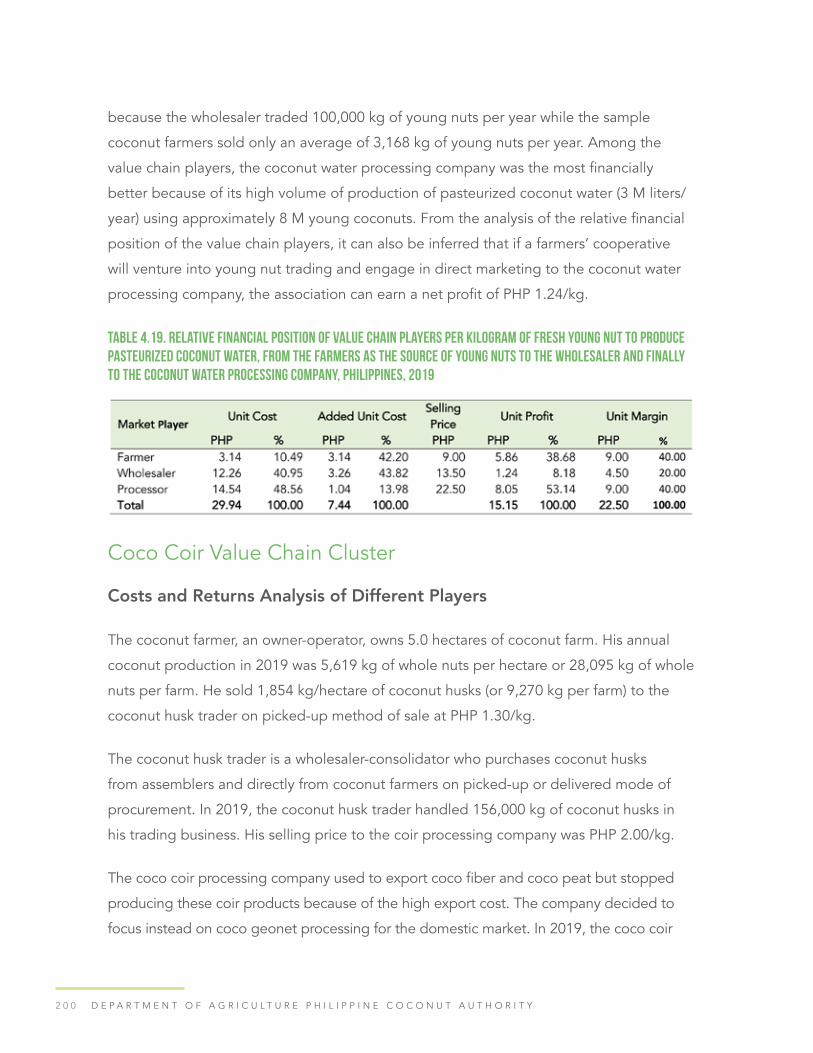
2 0 0 D E P A R T M E N T O F A G R I C U L T U R E P H I L I P P I N E C O C O N U T A U T H O R I T Y
because the wholesaler traded 100,000 kg of young nuts per year while the sample
coconut farmers sold only an average of 3,168 kg of young nuts per year. Among the
value chain players, the coconut water processing company was the most financially
better because of its high volume of production of pasteurized coconut water (3 M liters/
year) using approximately 8 M young coconuts. From the analysis of the relative financial
position of the value chain players, it can also be inferred that if a farmers’ cooperative
will venture into young nut trading and engage in direct marketing to the coconut water
processing company, the association can earn a net profit of PHP 1.24/kg.
Table 4.19. Relative financial position of value chain players per kilogram of fresh young nut to produce pasteurized coconut water, from the farmers as the source of young nuts to the wholesaler and finally to the coconut water processing company, Philippines, 2019
Coco Coir Value Chain Cluster
Costs and Returns Analysis of Different Players
The coconut farmer, an owner-operator, owns 5.0 hectares of coconut farm. His annual
coconut production in 2019 was 5,619 kg of whole nuts per hectare or 28,095 kg of whole
nuts per farm. He sold 1,854 kg/hectare of coconut husks (or 9,270 kg per farm) to the
coconut husk trader on picked-up method of sale at PHP 1.30/kg.
The coconut husk trader is a wholesaler-consolidator who purchases coconut husks
from assemblers and directly from coconut farmers on picked-up or delivered mode of
procurement. In 2019, the coconut husk trader handled 156,000 kg of coconut husks in
his trading business. His selling price to the coir processing company was PHP 2.00/kg.
The coco coir processing company used to export coco fiber and coco peat but stopped
producing these coir products because of the high export cost. The company decided to
focus instead on coco geonet processing for the domestic market. In 2019, the coco coir

2 0 1P H I L I P P I N E C O C O N U T I N D U S T R Y R O A D M A P 2 0 2 1 - 2 0 4 0
processing company bought a total of 2.4 M kg of coconut husks at PHP 2.00/kg which
were decorticated in the company’s processing plant. After decorticating the coconut
husks, 240,000 kg of coco fiber were produced which were used as raw materials in making
geotextile nets. The company produced 1 geotextile net per month using 20,000 kg of coir
fiber. The size of each geotextile net was 60,000 sq m. The selling price of geotextile net
was PHP 4.00/sq m. The company produced a total of 12 geotextile nets in 2019.
Coconut Farmer. The sample coconut farmer obtained PHP 2,410 per year from selling
1,854 kg of coconut husks at PHP 1.30/kg to augment his household income from
coconut farming (Table 4.20). Hired labor cost for collecting and assembling husks
amounting to PHP 1,709/ha (PHP 0.76/kg of coconut husk) was the only cost item that
the sample coconut farmer encountered from selling coconut husks. Hired labor cost for
dehusking was already included as a cost item in copra processing. Net income received
by the sample coconut farmer from coconut husk sales amounted to PHP 1,001.20/ha
per year or PHP 5,006 per farm per year (or PHP 0.54/kg of coconut husk). The profit-
cost ratio is 0.71 which means that PHP 0.71/kg of net profit was earned by the sample
coconut farmer from one peso spent in selling coconut husks.
Table 4.20. Costs and returns analysis of coconut farmer from selling coconut husk, Philippines, 2019
Coconut Husk Trader. The annual gross income earned by the coconut husk trader from
selling 156,000 kg of coconut husks at PHP 2.00/kg was PHP 312,000 in 2019 (Table
4.21). Hired labor was the husk trader’s major cost item, contributing 69.64% to the total
marketing cost amounting to PHP 291,200 per year, or PHP 1.87/kg of coconut husk,

2 0 2 D E P A R T M E N T O F A G R I C U L T U R E P H I L I P P I N E C O C O N U T A U T H O R I T Y
followed by hired labor (11.54%), and depreciation of storage area and vehicle (10.58%).
The coconut husk trader reaped PHP 20,800 per year of net income, or PHP 0.13/kg. The
profit-cost ratio from coconut husk trading is0.07. This figure indicates that PHP 0.07 of
net profit was received by the husk trader for one peso spent in coconut husk trading.
Table 4.21. Costs and returns analysis of coconut husk trading, 1 sample coconut husk trader, Philippines, 2019
Coco Geotextile Net Processor. In 2019, the coco coir processing company earned a
very high annual gross income from selling 12 coco geotextile nets amounting to PHP
28.80 M (Table 4.22). The company incurred PHP 7.71 M in geotextile net processing.
The major cost items were the husks (62.24%) and hired labor (14.67%). The company
reaped PHP 21.16 M as total cash income and PHP 21.08 M as net cash income. A high
profit-cost ratio was estimated for the coco geotextile net processing business. The profit-
cost ratio of 2.73 means that PHP 2.73 /kg was generated from one peso spent in making
geotextile net.

2 0 3P H I L I P P I N E C O C O N U T I N D U S T R Y R O A D M A P 2 0 2 1 - 2 0 4 0
Table 4.22. Costs and returns analysis of coco geotextile net processing, 1 sample coco coir processor, Philippines, 2019
Relative Financial Position of Different Players
Among the three value chain players, the sample coconut farmer had the lowest unit cost
share (13.01%) of the value chain’s total unit cost amounting to PHP 5.84/kg (Table 4.23).
The coco coir processing company exhibited the highest unit cost share (47.64), followed
by the coco husk wholesaler (32.02%). In terms of unit added cost share, the coco coir
processing company exhibited the highest share (47.64%), followed by the coconut
farmer with 29.92% unit added cost share. The coco husk wholesaler, on the other hand,
had the lowest unit added cost share of 22.44%. As expected, the coco coir processor
showed the highest unit profit share (92.92%). The sample coconut farmer ranked second
with unit profit share of 5.71%. The coco husk trader’s unit profit share (1.37%) was the
lowest among the value chain players.
The analysis presented above is in terms of unit cost and unit profit shares. However, if
the total volume of business is considered, the coconut farmer is at the bottom of the
income ladder having earned the lowest profit as shown in the costs and returns analysis
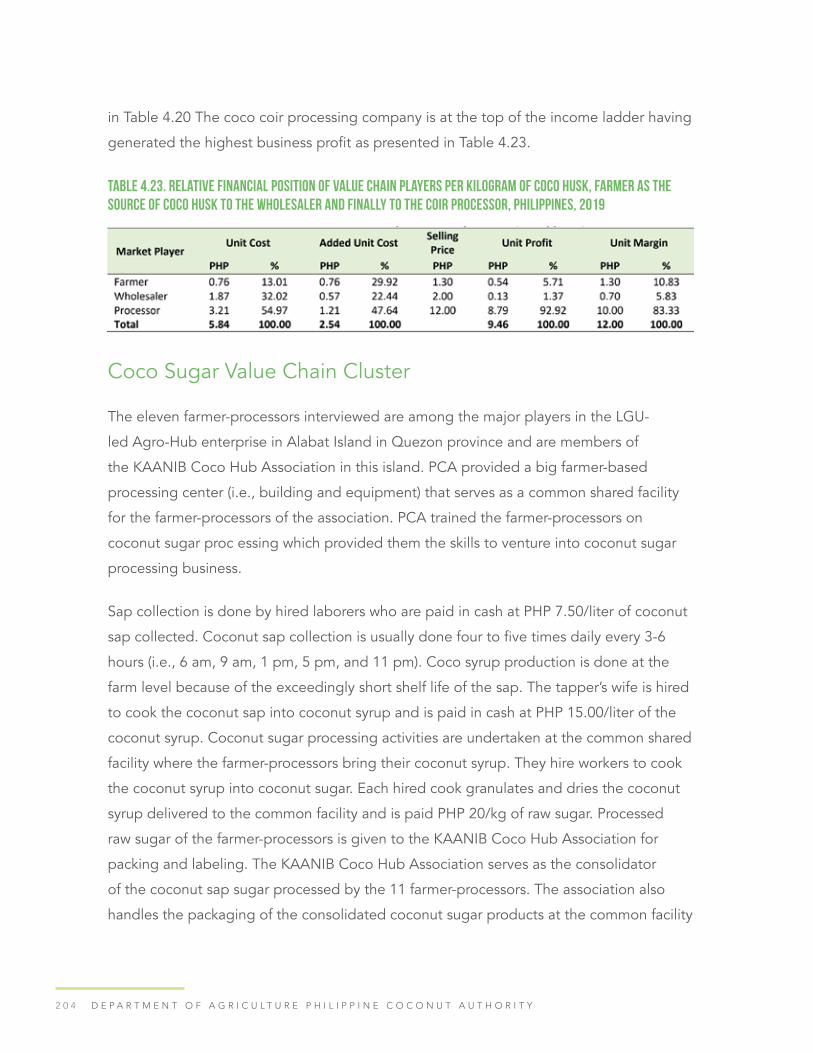
2 0 4 D E P A R T M E N T O F A G R I C U L T U R E P H I L I P P I N E C O C O N U T A U T H O R I T Y
in Table 4.20 The coco coir processing company is at the top of the income ladder having
generated the highest business profit as presented in Table 4.23.
Table 4.23. Relative financial position of value chain players per kilogram of coco husk, farmer as the source of coco husk to the wholesaler and finally to the coir processor, Philippines, 2019
Coco Sugar Value Chain Cluster
The eleven farmer-processors interviewed are among the major players in the LGU-
led Agro-Hub enterprise in Alabat Island in Quezon province and are members of
the KAANIB Coco Hub Association in this island. PCA provided a big farmer-based
processing center (i.e., building and equipment) that serves as a common shared facility
for the farmer-processors of the association. PCA trained the farmer-processors on
coconut sugar proc essing which provided them the skills to venture into coconut sugar
processing business.
Sap collection is done by hired laborers who are paid in cash at PHP 7.50/liter of coconut
sap collected. Coconut sap collection is usually done four to five times daily every 3-6
hours (i.e., 6 am, 9 am, 1 pm, 5 pm, and 11 pm). Coco syrup production is done at the
farm level because of the exceedingly short shelf life of the sap. The tapper’s wife is hired
to cook the coconut sap into coconut syrup and is paid in cash at PHP 15.00/liter of the
coconut syrup. Coconut sugar processing activities are undertaken at the common shared
facility where the farmer-processors bring their coconut syrup. They hire workers to cook
the coconut syrup into coconut sugar. Each hired cook granulates and dries the coconut
syrup delivered to the common facility and is paid PHP 20/kg of raw sugar. Processed
raw sugar of the farmer-processors is given to the KAANIB Coco Hub Association for
packing and labeling. The KAANIB Coco Hub Association serves as the consolidator
of the coconut sap sugar processed by the 11 farmer-processors. The association also
handles the packaging of the consolidated coconut sugar products at the common facility
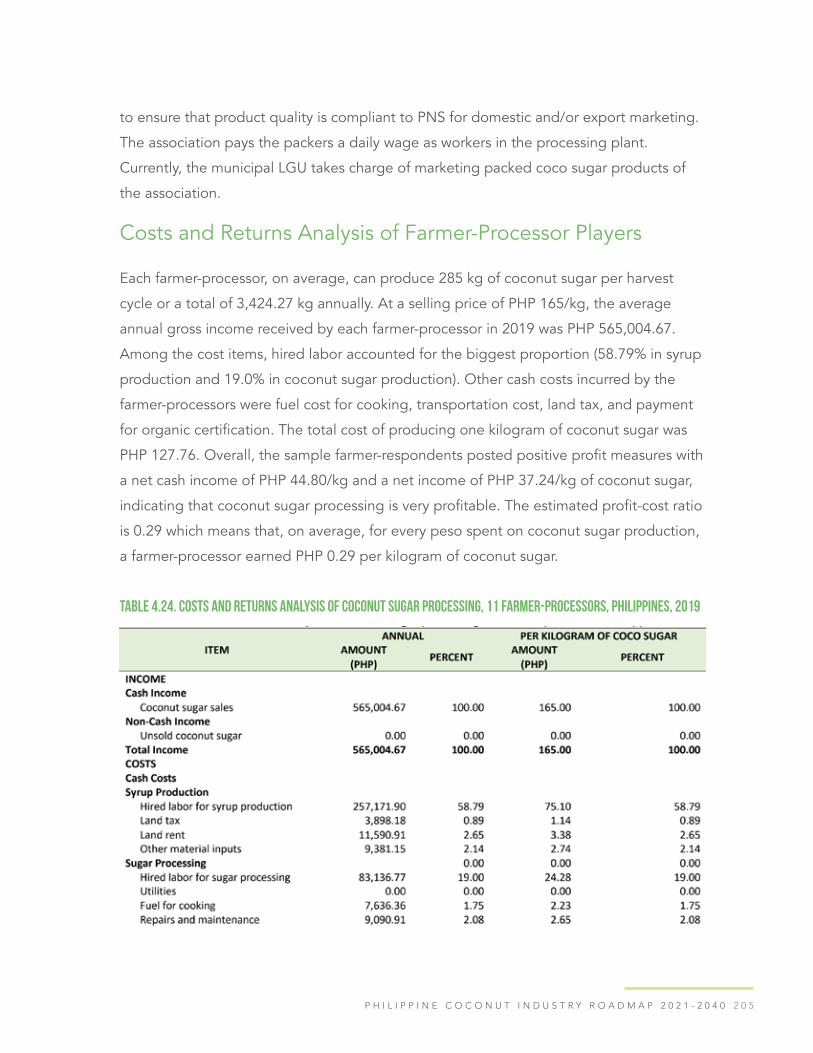
2 0 5P H I L I P P I N E C O C O N U T I N D U S T R Y R O A D M A P 2 0 2 1 - 2 0 4 0
to ensure that product quality is compliant to PNS for domestic and/or export marketing.
The association pays the packers a daily wage as workers in the processing plant.
Currently, the municipal LGU takes charge of marketing packed coco sugar products of
the association.
Costs and Returns Analysis of Farmer-Processor Players
Each farmer-processor, on average, can produce 285 kg of coconut sugar per harvest
cycle or a total of 3,424.27 kg annually. At a selling price of PHP 165/kg, the average
annual gross income received by each farmer-processor in 2019 was PHP 565,004.67.
Among the cost items, hired labor accounted for the biggest proportion (58.79% in syrup
production and 19.0% in coconut sugar production). Other cash costs incurred by the
farmer-processors were fuel cost for cooking, transportation cost, land tax, and payment
for organic certification. The total cost of producing one kilogram of coconut sugar was
PHP 127.76. Overall, the sample farmer-respondents posted positive profit measures with
a net cash income of PHP 44.80/kg and a net income of PHP 37.24/kg of coconut sugar,
indicating that coconut sugar processing is very profitable. The estimated profit-cost ratio
is 0.29 which means that, on average, for every peso spent on coconut sugar production,
a farmer-processor earned PHP 0.29 per kilogram of coconut sugar.
Table 4.24. Costs and returns analysis of coconut sugar processing, 11 farmer-processors, Philippines, 2019

2 0 6 D E P A R T M E N T O F A G R I C U L T U R E P H I L I P P I N E C O C O N U T A U T H O R I T Y
Benchmarking (Production Sector)The Philippines has the largest coconut area in the world at 3.65 M in 2019—about a M
ha. more than Indonesia, and 1.5 M ha more than India. Combined, the three countries
account for almost 75% of the global coconut production in 2019 (FAOStat). In terms of
volume of production, Indonesia is the largest producer at 17.13 MMT nuts, followed
by the Philippines (14.77 M MT), and India (14.68 MMT). However, the Philippines’ nut
productivity per hectare is the lowest among the top 10 coconut-producing countries,
in all years from 2015–2019 (Table 4.25), with a negative 0.8% average annual growth
rate. Both Indonesia and India have positive average annual growth rates for the same
period at 1.46% and 8.27%, respectively. Without short- to long-term interventions,
the Philippines stands to lose its 2nd rank as highest nut producer to India in the near
future while Indonesia can further increase its lead as the top coconut supplier. Brazil
and Vietnam, each with less than 200,000 ha of coconut area, produce 125,000 (12.5MT)
and 105,000 nuts hg/ha (10.5 MT), respectively. On the low extreme are Sri Lanka and
the Philippines at 49,000 and 40,000 hg/ha nuts, respectively. The other top producing
countries have yields between 61,000 and almost 70,000 hg/ha nut yield (Table 4.25).

2 0 7P H I L I P P I N E C O C O N U T I N D U S T R Y R O A D M A P 2 0 2 1 - 2 0 4 0
Table 4.25. Nut productivity per hectare of the top ten coconut-producing countries in the world
Coconut production in the top three producing countries— Indonesia, Philippines and
India—are all dominated by smallholder coconut production. About 6.6 M farmers in
Indonesia, 2.5 M in the Philippines, and 12 M in India rely on coconut for their main
source of income
Coconut in Indonesia is widespread, planted in 3.4 M ha throughout 34 provinces, of
which six occupy 47.7% of the totalarea. The provincewiththe largest coconutarea(12.14%)
is the Riau in Sumatera Island in North Sulawesi, followed by East Java, Central Java,
North Maluku and Central Sulawesi. Coconuts in Riau are concentrated in Indragiri Hilir,
which shares 12.12% of the coconut area (Alouw, JC and S Wulandari, 2020).
Similarly, in the Philippines, 3.65 M ha of coconuts are spread nationwide, dominating
the agricultural landscape of 69 out of the 82 provinces. The main island of Mindanao
supplies 60% of the total nut production in 2019 and has three regions among the top
four coconut producers, namely Davao, Northern Mindanao and Zamboanga Peninsula
with each region producing more than 1.5 B nuts (data from PSA, 2019).
In India, coconut production is concentrated in the southern peninsular region composed
of the four states of Kerala, Tamil Nadu, Karnataka, and Andhra Pradesh. This region
accounts for 89% of the coconut area of 2.1 M ha and 91% of the country’s production
(Deepthi N, 2017).

2 0 8 D E P A R T M E N T O F A G R I C U L T U R E P H I L I P P I N E C O C O N U T A U T H O R I T Y
The benchmark in terms of productivity is Brazil, ranked 6th in the world in terms of
area (187,000 ha), 5th in volume of nut production (2.3MT) but run-away first in terms
of productivity per hectare at over 12.5 MT/ha (data from FAOStat, 2019). Its modern,
technology-based agro-industrial plantations supply coconuts directly to processors.
This backward integration is also desired by oil mill processors in the Philippines but the
coconut farms are small and fragmented, thus difficult for them to consolidate. There are
VCO processors who practice this backward integration to a limited extent, maintaining
their own plantations and leasing other farms, but generally, not at a large scale. The
leap in tree productivity and production per hectare in Brazil was attributed to planting
of suitable dwarf variety and technologically advanced irrigation and fertigation systems
(ACA Ltd, 2019). Vietnam is also small-farmer focused but is the benchmark in Asia in
terms of tree productivity and production at 10.5 MT, a close second to Brazil (data from
FAOStat, 2019). Mekong Delta accounts for over 75% of coconut hectarage, so water is
probably not a constraint. Ben Tre, coconut capital of Vietnam, has increased its coconut
area by 25,000 ha in less than 10 years (up 68%) and accounted for 45% of coconut in
the country with corresponding yield increase (https://coconutvietnam.com.vn/). There
is much to learn from how these two countries have achieved such high yields. The
Agronomy Capital Advisors Ltd (ACAL, Jan. 2019) is a good reference for comprehensive
analysis of the coconut producer sector focused on the operational and sectoral
differences between Brazil and the top producing countries, Indonesia, the Philippines,
and India.
Reliance of supply in wide areas or concentration in fewer areas both have their
advantages and disadvantages, and strategic interventions for sustainable growth of the
coconut industry could differ. Calamities, strong typhoon, drought, conflict, disruption
in transport system, pest and disease outbreaks in a major supply grid would impact
the whole industry, whereas a wider spread of supply can buffer the supply chain under
such circumstances while waiting for the affected areas to recover. On the other hand,
spreading the supply too widely across the country, particularly in archipelagic Philippines,
poses challenges in collection and transport of feedstock to processors. This gave the
opportunity for the prevalence of multi-layered marketing system, which marginalized
the small growers from participating (and benefiting) in the higher levels of the coconut
value chains. Provision of programs and support system (improving farmers’ welfare and

2 0 9P H I L I P P I N E C O C O N U T I N D U S T R Y R O A D M A P 2 0 2 1 - 2 0 4 0
income, monitoring and enhancing crop health) to geographically dispersed and small
farms, could stretch thinly the resources of the government, thus diluting their impacts.
Focusing the same amount of resources and support to concentrated areas should make
a huge impact on coconut productivity and welfare of farmers.
The national programs of the top three coconut-producing countries have similarities—
but different approaches—in addressing similar problems of low productivity, low farmers’
income, poor management of coconut farms, pests and diseases, high and increasing
senility of trees. These programs include production and distribution of quality planting
materials, planting and rejuvenation/rehabilitation of old senile and diseased trees,
promoting integrated good agricultural, scientific practices to increase yield and income
of farmers. Noteworthy programs include (1) expansion to potential nontraditional
coconut areas following specialized schemes with financial and technical support to follow
scientific methods, and (2) community- based approach in effectively controlling and
managing pests and diseases in India. Indonesia and the Philippines have programs to
develop protocols for tissue culture (and embryo culture for Indonesia) and establishment
of coconut seed gardens in several major coconut-producing provinces. Plantation
Industries Minister Naveen Disanaya said that Sri Lanka will venture in a massive
expansion program to establish the second coconut triangle base in the North and East
aimed at doubling the coconut production in 10 years, with an allocation of Rs 200 M
for the coconut project. The first coconut triangle, which covers 66% of the total coconut
hectarage in Sri Lanka, is located in the districts of Kurunegala, Puttlam and Colombo
(www.news.lk/news)
The Philippines, because of its geographical location, is recurrently exposed to tropical
cyclones that are predicted to be more frequent and intense due to climate change.
The Philippines ranked 4th in the long- term climate risk index for 2000–2019 (annual
averages), with 317 devastating events, the highest among the top ten countries most
impacted by extreme weather events. The experience with super typhoons Bopha in 2012
Haiyan in 2013 and Mangkuk in 2018 brought devastation to the country (Germanwatch,
2021). Major coconut-producing areas were so devastated and are still unable to
recover. Disaster risk reduction and management should be factored in the development
programs of PCA and building resilience in the coconut production sector is a key
2 1 0 D E P A R T M E N T O F A G R I C U L T U R E P H I L I P P I N E C O C O N U T A U T H O R I T Y
strategy. Research on coconut phenology and how the crop responds to changes in the
environment need to be prioritized. Similarly, India needs to build climate resilience in the
coconut- producing regions. It ranked 5th in 2018 and 7th in 2019 climate risk index due
to the severe effects of seasonal monsoons that caused massive flooding, and due to six
out of ei gh t intense to very severe cyclones that caused death and $8.1 B in damages.
In Ben Tre, Vietnam, the worst drought elevated saltwater levels in rivers (reaching
5,000mg/L) and caused the worst drought in the area that reduced nut size rendering
them unmarketable (Hoang Nam, 2020).
Local BenchmarkingAssurance of steady supply of good quality coconuts, the lifeblood of the various
coconut-based value chain industry clusters, is key to sustainable growth of the industry.
About 80% of the coconuts produced in the country are processed into copra, the
feedstock for coco oil mills. From 2009–2019, the estimated yearly utilization of the oil
mills ranged from 38% to 69% of the total crushing capacity of 3.4 M MT/year of 60 oil
mills (Tables 3.3, 3.4, 3.5 Chapter 3). Added to this is the increasing demand for other
coconut products coming from whole nuts and sap, and the magnitude of supply deficit
increases further.
For farmers dependent only on coconut, mostly copra for their source of livelihood,
the low yield of coconut in the country at 44 nuts/tree /year is just about 50% of the
potential yield of the local talls and less than 30% of the conservative estimate of yield of
hybrids. The dependence of price of nut and copra on the fluctuating price of the world
oil market results in low income of farmers from coconut. Many studies report on income
earned by farmers from coconut farming and all converge on the same conclusion—
farmers generally earn low income from coconut farming and coconut farming alone
cannot provide a decent income for a typical coconut farmer, no matter what product
from coconut he sells. Table 4.26 presents the range of income (from PHP <10,000 to
>100,000/year) of coconut farmers’ percentage of NCFRS-registered farmers by region.
Of the total 1.44 M farmers, only 5.6% earn more than PHP 102,000. A great majority
(83%) earn less than PHP 50,001, of which 46% earn PHP 10,000 (0.528 M) or less, the
other 37% earn between PHP 10,001– 50,001 (0.425 M) (NCFRS, 2018).
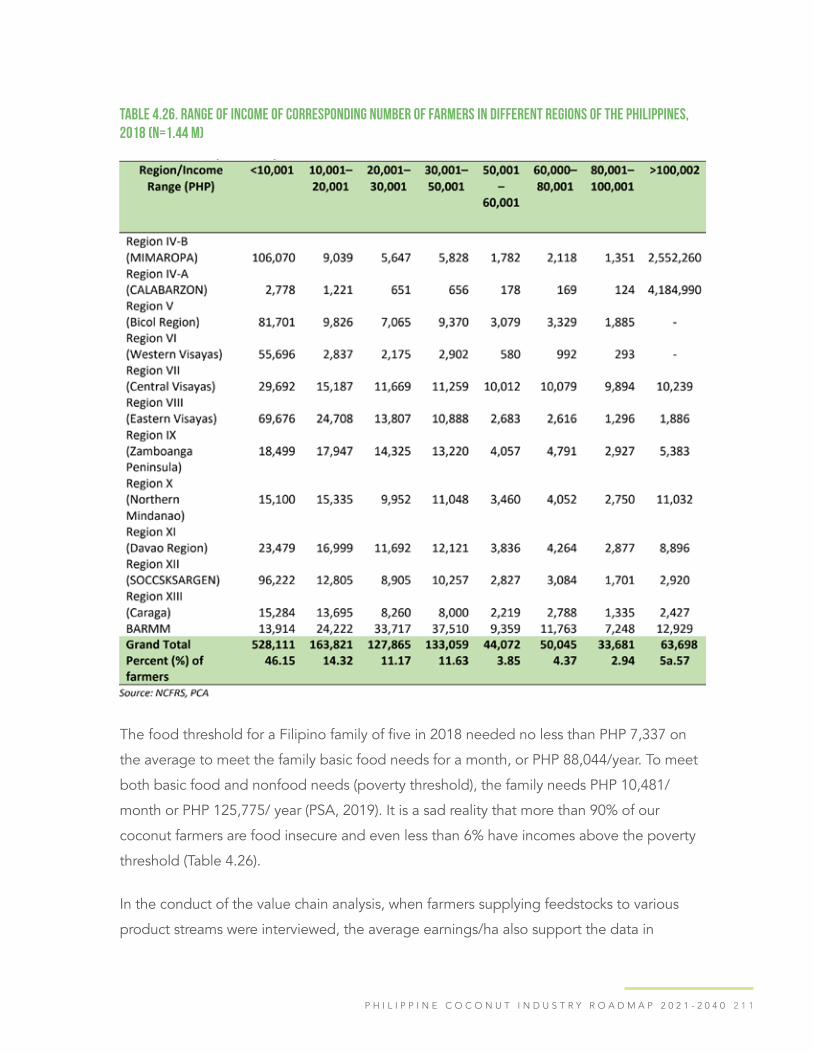
2 1 1P H I L I P P I N E C O C O N U T I N D U S T R Y R O A D M A P 2 0 2 1 - 2 0 4 0
Table 4.26. Range of income of corresponding number of farmers in different regions of the Philippines, 2018 (n=1.44 M)
The food threshold for a Filipino family of five in 2018 needed no less than PHP 7,337 on
the average to meet the family basic food needs for a month, or PHP 88,044/year. To meet
both basic food and nonfood needs (poverty threshold), the family needs PHP 10,481/
month or PHP 125,775/ year (PSA, 2019). It is a sad reality that more than 90% of our
coconut farmers are food insecure and even less than 6% have incomes above the poverty
threshold (Table 4.26).
In the conduct of the value chain analysis, when farmers supplying feedstocks to various
product streams were interviewed, the average earnings/ha also support the data in

2 1 2 D E P A R T M E N T O F A G R I C U L T U R E P H I L I P P I N E C O C O N U T A U T H O R I T Y
the NCFRS survey. But, from the limited survey data, there are farmers who could earn
much more than the typical farmer selling the same product, such as farmers selling
matured nuts and then performing value-adding to the sap, processing coco syrup/sugar
through a common service facility and participating in cooperative marketing system
(Alabat agro-hub). Generally, all farmer respondents have poor management of coconut
farms - rainfed, no fertilization (except for salt when PCA provides), no pest and disease
management, occasional weeding just to facilitate harvesting. While there are farms with
higher nut productivity per tree (more nuts/harvest), the income from copra and matured
nuts was more price dependent at the time of sale. Matured nut sellers to VCO processors
additionally get a price premium, particularly when the farm is certified organic.
Table 4.26.1. Net cash income of farmers selling specific products from coconut
In the 2019 NCFRS early registration, a random sample of 72 farmers from eight regions
validated the low income of coconut farmers with an average of PHP 26,145/ha. Income
from coconut ranged from PHP 10,675/ha to PHP 70,800/ha (Figure 4.16).

2 1 3P H I L I P P I N E C O C O N U T I N D U S T R Y R O A D M A P 2 0 2 1 - 2 0 4 0
Low income from coconut farming offers no incentive for the farmers to improve coconut
farm management. The coconut production sector remains an informal sector dominated
by small holders, landless tenants, and farm workers who have no social protection or
welfare benefits from the industry. Among the players in the numerous coconut value
chains, the farmer is the most marginalized and vulnerable, bearing the burden of low
and fluctuating prices of copra and even whole nuts that are dependent on the world
oil prices. All other players—the traders, consolidators, processors, brokers, exporters—
operate on margin; hence, whether the prices are high or low, they all earn profit,
unlike the coconut farmers who are paid based on the prevailing coconut oil price with
discounts for poor quality but generally without premium for good quality.
Addressing the Low Coconut Productivity and Declining Production in the Philippines
The causes of low productivity in the Philippines despite having the largest coconut
hectarage are many, such as the following: senility of trees; poor management practices,
recurrent extreme climate events typhoons and drought; rampant cutting even of
productive trees; and coconut land conversion to other uses, among others.
Figure 4.16. Income level of coconut registrants to the 2019 NCFRS

2 1 4 D E P A R T M E N T O F A G R I C U L T U R E P H I L I P P I N E C O C O N U T A U T H O R I T Y
There is much room for improving yield of coconuts in the country using already available
technologies. The traditional, still existing, practice of chronic under management of
coconuts—generally rainfed, no fertilization, no pest and disease monitoring, unmanaged
pests and diseases. Control, is initiated by the government (through PCA) only when
the infestation or infection is already serious and widespread such as the invasive pests
Brontispa or coconut leaf weevil (Brontispa longissima, Gestro) and coconut scale insect
(cocolisap, CSI Aspidiotus rigidus. Clearing of understory is done only during harvest (if
at all). This management system needs to change to increase nut productivity per tree
which averaged only 44 nuts/tree/year in 2019. However, the farmers have to be willing
to replant senile trees with good quality seedlings, adopt and sustain good agricultural
practices for new plantings and productive trees, including pest and disease monitoring
and management.
Table 4.27 presents the production practices of a typical coconut farmer against the best
practices (benchmark). It has been and will remain a challenge to make farmers continue
to plant/replant and shift toward good management practices, without an inclusive
program that will directly benefit them and their families. Thus, there is a need for farmers
to be incentivized and motivated to continue planting and sustainably manage their
coconut farms following the recommended good agricultural practices

2 1 5P H I L I P P I N E C O C O N U T I N D U S T R Y R O A D M A P 2 0 2 1 - 2 0 4 0
Tabl
e 4.
27. B
ench
mar
k an
d ty
pica
l pro
duct
ion
prac
tice
s

2 1 6 D E P A R T M E N T O F A G R I C U L T U R E P H I L I P P I N E C O C O N U T A U T H O R I T Y

2 1 7P H I L I P P I N E C O C O N U T I N D U S T R Y R O A D M A P 2 0 2 1 - 2 0 4 0

2 1 8 D E P A R T M E N T O F A G R I C U L T U R E P H I L I P P I N E C O C O N U T A U T H O R I T Y
Benchmark Analysis for Processing: Domestic and InternationalCoconut Oil
The Philippines is the largest producer and exporter of coconut oil in the world. The
benchmark coconut oil companies in the world are Cargill, Inc., Wilmar International
Limited, Granexport Manufacturing Corporation, and the Primex Group of Companies
based on the size of their coconut processing plants, use of modern machinery and
technology in coconut oil manufacturing, and wide distribution network in the domestic
and international market. All these companies comply with internationally recognized
GMP procedures. Wilmar Edible Oils Philippines, Granexport Manufacturing, and New
Davao Oil Mills of the Primex Group of Companies, which all manufacture refined coconut
oil, follow food safety standards related to the microbiological levels in food products.
The list of companies for all products are listed at the end of the chapter.
Desiccated Coconut
Philippine desiccated coconut is considered by foreign buyers as having the best quality
compared to those produced by the country’s closest competitors, namely Indonesia and
Sri Lanka. The benchmark desiccated coconut processing company in the Philippines and
in the world is Franklin Baker Co. because of its having the largest aggregate desiccated
coconut rated capacity, its adoption of best practices, use of modern equipment in
desiccated coconut processing, and its worldwide distribution network.
Coco Shell Charcoal-Based Activated Carbon
The benchmark coco shell charcoal-based activated carbon manufacturing plants in
the global market are Haycarb PLC, Jacobi Group, and Kuraray Co. Ltd. because of
their state-of-the-art coco shell charcoal-based activated carbon facilities, adoption of
strict quality assurance procedures, operation of several coconut-shell based charcoal
processing sites worldwide, and wide sales network in different countries. In the
2 1 9P H I L I P P I N E C O C O N U T I N D U S T R Y R O A D M A P 2 0 2 1 - 2 0 4 0
Philippines, the benchmark coco shell activated carbon manufacturing companies are
Jacobi Carbons Philippines and Cenapro Chemical Co.
Oleochemicals
The benchmark oleochemical companies in the Philippines are Chemrez Technologies,
Pilipinas Kao Philippines, Sakamoto Orient Chemicals Corporation, and Stephan
Philippines Quaternaries, Inc. These companies are currently engaged in new technology
and product development, expansion, and long-term contracts to maintain their
dominance in the Philippines and/or the global market.
Virgin Coconut Oil
Considering that the Philippines is the world’s top producer and exporter of virgin coconut
oil, the benchmark virgin coconut oil-producing companies in the world are therefore
operating in the country. These are Franklin Baker Co., Peter Paul Philippines, Prosource
International, and SC Global Coco Products, Inc. These companies produce virgin coconut
oil using state-of-the-art facilities/equipment and have established excellent distribution
network in international and Philippine markets. Another leading virgin coconut oil
processing company in the Philippines is Greenlife Coconut Products Philippines, Inc. Virgin
coconut oil produced by desiccated coconut manufacturing companies accounts for the
biggest portion of exported virgin coconut oil from the Philippines.
Coco Coir Products
India and Sri Lanka are the dominant players in the global coir market. The world’s
benchmark coir producing and exporting companies come from these countries. Some of
the world’s leading coir producer- exporters are Dutch Plantin Coir India Pvt. Ltd. (India),
Harish Coconut Products Pvt. Ltd. (India), Sivanthi Joe Coirs Pvt., Ltd. (India), and Hayleys
Fiber PLC (Sri Lanka). In the Philippines, Pilipinas Coir Fiber Co. is one of the leading coir
producing and exporting companies.

2 2 0 D E P A R T M E N T O F A G R I C U L T U R E P H I L I P P I N E C O C O N U T A U T H O R I T Y
Coco Sugar
The Philippines and Indonesia are the world’s leading producers and exporters of
coco sugar. The benchmark coco sugar processing companies in the world are Spythe
Global (Philippines), P.T. Coco Sugar (Indonesia), TREELIFE (Philippines), Big Tree Farms
(Indonesia), and Leo Integrated Farms because they produce high-quality organic and
non-GMO coco sugar and adopt Good Manufacturing Practices (GMP).
Coconut Water
The world’s benchmark coconut water processing companies are Peter Paul Philippines
Corporation, Axelum Resources, Inc., Century Pacific Foods, Inc., and Franklin Baker Co.
These Philippine companies are among the major suppliers of coconut water drink to
All Market, Inc., Pepsi Cola Co., and Costco that commercialize the popular brands of
coconut water drink in the international market, namely, Vita Coco, O.N.E. and Kirkland,
respectively. Other leading companies producing coconut water on a large scale in
the world are Celebes Coconut Corporation (Philippines), Cardinal Agri Products, Inc.
(Philippines), the Sambu Group of Companies (Indonesia), Silvermill Group of Companies
(Sri Lanka), and Universal PLC (Thailand).
Price Competitiveness of Coconut Oil as Cooking Oil
Local. Price competitiveness of refined bleached deodorized coconut oil as cooking oil
was assessed by comparing its retail price with that of palm oil, canola oil, soybean oil,
and corn oil. Coconut oil as cooking oil is not price competitive in the domestic market
as evident from its retail price being the highest in local supermarkets (Table 4.28). As
expected, palm oil’s retail price is the lowest among the different types of cooking oil
because the yield of oil palm is higher than that of coconut. Among the oil-producing
plants in the world, oil palm produces the highest oil content per hectare per year,
averaging between 3 and 7 MT/ha in commercial cultivations (Perera, 2013). According to
Magat (n.d.), the yield or productivity advantage of oil palm over the coconut is estimated
to be about 2.3 times at best achievable oil yields of the two tropical perennial crops.

2 2 1P H I L I P P I N E C O C O N U T I N D U S T R Y R O A D M A P 2 0 2 1 - 2 0 4 0
Table 4.28. Average retail prices of different types of cooking oil in supermarkets in Laguna, Philippines as of April 2021
International. The export parity price to domestic wholesale price ratio for coconut
oil was calculated to determine its price competitiveness in the export market. The
computed ratios are greater than one at 1.03 for coconut oil exported in flexi bag with
heat pad and 1.14 for coconut oil in closed steel drum. These calculated ratios indicate
that Philippine coconut oil is price competitive in the export market (Table 4.29).
Table 4.29. Price competitiveness of Philippine coconut oil under export trader scenario, Philippines, May2021

2 2 2 D E P A R T M E N T O F A G R I C U L T U R E P H I L I P P I N E C O C O N U T A U T H O R I T Y
International/Global Competitiveness of Philippine Coconut ProductsThis section presents two approaches used to measure global competitiveness of
exported coconut products, namely the Domestic Resource Cost Analysis (DRC) using
financial prices and the Revealed Comparative Advantage (RCA) approach.
DRC as a Measure of Competitive Advantage.
The COCOFIRM Market Research Team reviewed past studies that employed the DRC
analysis using financial prices and used their data to show the competitive advantage of
coconut oil in selected regions of the country. Competitive advantage is a good indicator
for intercountry comparison of competitiveness (Aragon, 2003). It indicates which
countries could better compete in international markets, under certain assumptions about
the existing marketing systems and government interventions.
Aragon (2003) reported that the resource cost ratio (RCR)—calculated by dividing DRC by
the prevailing official exchange rate—was 0.99 for the Bicol oil miller-exporters and 0.95
for the oil miller- exporters in Davao Region (Table 4.30). These RCR figures are less than
1.0 or unity and indicate competitive advantage in producing and exporting Philippine
crude coconut oil in both the Bicol and Davao regions. However, the Mindanao oil miller–
exporters were found to be more competitive in terms of crude coconut oil production
than the Bicol oil miller–exporters based on the DRC and RCR estimates in each region.
The average DRC (48.80) and RCR (0.96) representing the Philippines also indicate that
the country has a competitive advantage in the production and exportation of crude
coconut oil. This implies that it is more profitable to produce crude coconut oil in the
Philippines and export it to the international market rather than to import it. An RCR less
than unity further implies that the country is a foreign exchange earner of crude coconut
oil exports under existing sets of trade and exchange rate policies.

2 2 3P H I L I P P I N E C O C O N U T I N D U S T R Y R O A D M A P 2 0 2 1 - 2 0 4 0
Table 4.30. DRC and RCR estimates of competitive advantage in producing and exporting Philippine crude coconut oil, Philippines
In another study, Dampor (2004) estimated RCRs of 0.96 for Western Mindanao oil miller-
exporters, 0.97 for Davao Region oil miller-exporters, and 0.94 for Northern Mindanao oil
miller-exporters (Table 4.30). These RCR figures are less than 1.0 or unity, indicating the
competitive advantage of the Philippines in producing and exporting crude coconut oil.
These figures support Aragon’s previous findings. There are no available DRC estimates
for crude coconut oil produced by the country’s close competitors (i.e., Indonesia
and India) for comparative analysis to determine which country has more competitive
advantage in producing and exporting crude coconut oil.
RCA as a Measure of Global Competitiveness
Two coconut researchers and the COCOFIRM Research Team employed the RCA
methodology to measure and compare the global competitiveness of different coconut
products between the Philippines and its competitors. In the RCA approach, a positive
RCA index indicates that a country has a competitive edge in producing and exporting a
given commodity. The larger the RCA index, the higher is the level of competitiveness.
Comparing the global competitiveness of Philippine and Indonesian coconut oil during
the period 1995-2000, Aragon (2003) found that the mean RCA index of Philippine
coconut oil (124.53) was significantly much higher than the average RCA index of
Indonesian coconut oil (26.67). These RCA indices indicate that the level of export
competitiveness of Philippine coconut oil was greater than that of Indonesian coconut
oil (Table 4.31). The study pointed out that Indonesia posed a threat as evident from the

2 2 4 D E P A R T M E N T O F A G R I C U L T U R E P H I L I P P I N E C O C O N U T A U T H O R I T Y
increasing trend (52.92%/year) of the RCA index of Indonesian coconut oil while that of
Philippine coconut oil was declining (-8.83%/year).
Table 4.31. Comparison of the RCA indices of different coconut products among major coconut-producing countries, based on previous studies
Using the RCA methodology, Jayasekhar et al. (2016) analyzed the competitiveness in
the export of major coconut value-added products (i.e., coconut oil, desiccated coconut,
activated carbon, and virgin coconut oil) traded across the world by the Philippines, India,
Indonesia, Malaysia, and Thailand. The study revealed that the Philippines is the dominant
player with the highest RCA indices in all the coconut value- added product lines (Table
4.32. Further, the Philippines’ comparative advantage for all the aforementioned coconut
products is much higher than those of the four other major coconut exporting countries.
For Philippine coconut oil, the COCOFIRM Research Team estimated that the RCA indices
in 2017, 2018, and 2019 are 108.80, 120.85, and 107.81, respectively, which are relatively
much higher than the RCA indices estimated for crude coconut oil from Indonesia and
India (Table 4.32). These RCA estimates support the findings from previous studies that
the country has the highest comparative advantage in producing and exporting coconut
oil compared with its close competitors, Indonesia and India.

2 2 5P H I L I P P I N E C O C O N U T I N D U S T R Y R O A D M A P 2 0 2 1 - 2 0 4 0
Table 4.32. Comparison of the RCA indices of different coconut products among major coconut-producing and exporting countries, based on the COCOFIRM study
Sri Lanka and Indonesia are the country’s tight competitors in the global desiccated
coconut market. Although Sri Lanka is one of the Philippines’ closest competitors, high
production costs in Sri Lanka became the Philippines’ opportunity to have a significant
share in the global desiccated coconut market. As shown in Table 4.32, the Philippines’
RCA index for desiccated coconut (106.30 in 2019) was higher than that of Sri Lanka
(18.55) and Indonesia (19.35). In 2017 and 2018, the Philippines’ RCA indices for
desiccated coconut were also higher than that of Indonesia and Sri Lanka in the same
period. These RCA figures reveal that the Philippines has the highest comparative
advantage in producing and exporting desiccated coconut among the three leading
desiccated coconut producers and exporters.
Comparison of the RCA of the Philippines, India, Sri Lanka, and Indonesia shows that India
has the highest comparative advantage in producing and exporting activated carbon,
followed by the Philippines. As mentioned earlier under the trade performance section of
this report, India outranked the Philippines as the world’s top exporter of activated carbon

2 2 6 D E P A R T M E N T O F A G R I C U L T U R E P H I L I P P I N E C O C O N U T A U T H O R I T Y
since 2016. The COCOFIRM Research Team estimated that India’s RCA index of 34.25 for
activated carbon in 2017 was higher than the Philippines’ RCA index of 12.53.
Comparison of the RCA among the aforementioned global competitors in producing and
exporting activated carbon for 2018 and 2019 was not done due to lack of information on
the export values of the country’s competitors in these years.
Based on the COCOFIRM Research Team’s RCA estimates for virgin coconut oil and
coconut water, which are all greater than 1.0 during the period 2017-2019, the Philippines
has a comparative advantage in producing and exporting these non-traditional coconut
products (Table 4.32). The RCA indices for coconut water (7.47 to 12.36) are higher
compared to the RCA indices for virgin coconut oil (4.57 to 8.95). The high RCA indices
for coconut water are attributed to the higher export earnings generated from this
product. The companies that produce Vita Coco, O.N.E., and Kirkland (Costco) —the
popular brands of coconut water drink in the United States and/or Europe—source their
coconut water from the Philippines, among other countries.
In the Philippines, virgin coconut oil is produced on a large scale by desiccated coconut
processing companies using the expeller method. Virgin coconut oil produced by these
companies constitute a bigger portion of the country’s volume of virgin coconut oil
exports. Meanwhile, MSMEs produce a smaller volume of virgin coconut oil using the
wet process (i.e., fermentation and centrifuge). Moreover, some small- to medium-scale
processors also export their virgin coconut oil products to the international market.
Price competitiveness varies among virgin coconut oil producers in the country. Since
the desiccated coconut– virgin coconut oil processing companies have the capability to
mass-produce virgin coconut oil, they have economies of scale which makes their virgin
coconut oil products more price competitive compared with those produced by MSMEs
(Costales, 2019). Quality competitiveness also varies depending on the virgin coconut
oil processing method employed by the processors. Virgin coconut oil produced using
the fermentation process is less quality competitive compared with virgin coconut oil
produced either by the expeller or the centrifuge method. Costales (2019) reported that
the use of manual, non-measuring, and non- automated technology by virgin coconut
oil intermediate processors adopting the fermentation process caused product quality
2 2 7P H I L I P P I N E C O C O N U T I N D U S T R Y R O A D M A P 2 0 2 1 - 2 0 4 0
variability. There were also more rejects from using the fermentation process. In contrast,
centrifuge-processed virgin coconut oil is generally preferred by food manufacturers,
especially in the EU market, due to the consistency in the product’s quality and properties
such as taste and odor (Cristobal, 2019).
The Philippines and Indonesia compete in the global coconut sap sugar market. The
RCA indices for coconut sap sugar estimated by the COCOFIRM Research Team range
from 0.10 to 0.32 during the period 2017 to 2019. These indices indicate that the
Philippines has a very low comparative advantage in producing and exporting coconut
sap sugar (Table 4.32). These low RCA indices could be attributed to the low volume
of exports of Philippine coconut sap sugar. The RCA indices also exhibit a declining
trend from 2017 to 2018. Indonesia’s coconut sap sugar export data are not available
to facilitate comparative analysis of the competitiveness of coconut sap sugar between
the Philippines and Indonesia. Nevertheless, PCA sources reported that Philippine
coconut sap sugar is not price- and cost-competitive compared to Indonesia’s coconut
sap sugar which is being sold at a lower price due to the higher labor cost incurred in
tapping coconut sap in the country. Coconut sap is collected four (4) times a day at 4
hours interval in the Philippines while in Indonesia, coconut sap is collected only once a
day because their sap collectors use an anti-fermenting agent to retard the fermentation
process (Manohar, 2021). The quality of Philippine coconut sap sugar is at par with that
of Thailand while Indonesia’s coconut sap sugar is not as quality competitive with that
of the Philippines and Thailand. Philippine coconut sap sugar is globally recognized to
be of good quality because it is organically produced. However, a current threat to the
Philippine coconut sap sugar industry is adulteration which brings about trepidations
on product authenticity in the global market (Angulo, 2019). Some local coconut sugar
processor-exporters practice adulteration by mixing sugarcane with coconut sap sugar
and by mixing Philippine coconut sap sugar with low-quality and lower-priced coconut
sap sugar imported from Indonesia.
Based on the RCA estimates of the COCOFIRM Research Team, the Philippines has a
lower comparative advantage in producing and exporting coco coir products compared
to its close competitors, India and Sri Lanka. In 2019, India and Sri Lanka captured 94%
of the global coco coir market (FAOStat, 2020). The Philippines’ RCA index for coco coir

2 2 8 D E P A R T M E N T O F A G R I C U L T U R E P H I L I P P I N E C O C O N U T A U T H O R I T Y
in 2019 was only 12.74 compared to those of India (54.15) and Sri Lanka (23.50). The
same pattern could be observed in 2017 and 2018 with India having the highest RCA
index, followed by Sri Lanka. The Philippines had the lowest RCA index. There are several
reasons why the country’s coco coir is outcompeted in the export market. One of the
reasons is the small plant capacity of Philippine coir processing plants that constrain the
Filipino coir processor-exporters from meeting large orders abroad. Owing to inadequate
economies of scale, the country’s coir processing cost is higher (Costales, 2019). In
contrast, India has larger coir processing plants with economies of scale, and these are
fully mechanized. Coir exporters from India and Sri Lanka also incur lower transport cost
because of the proximity of these countries to China, the major coco coir importing
country. Coir products can be shipped by sea, air, or road from India to China and by
road and sea freight from Sri Lanka. Lower electricity cost in India (i.e., PHP 3.50-4.00/
kw) compared with the electricity cost in the Philippines (e.g., PHP 11-12/kw in Luzon and
PHP 8-9/kw in Davao/Mindanao) is another reason why India has a competitive edge over
the Philippines in terms of processing cost and price. Moreover, Philippine varieties have
bigger kernels and produce lesser fiber compared with India’s and Sri Lanka’s coconut
varieties (Costales, 2019). According to Mr. Reynaldo Go, the vice-president of the Coir
Association of the Philippines, coco coir products from India and Sri Lanka are slightly
more quality competitive than Philippine coco coir products because coir processors in
these countries practice retting (i.e., dipping the coconut husks in water for at least 3
days) which makes the coir fibers softer and of better quality.

2 2 9
MARKET TRENDS & PROSPECTS
This chapter presents the key drivers or the major demand factors (demand shifters) that
affect the demand for traditional and selected promising non-traditional coconut products
to provide a solid foundation in identifying the market prospects of these coconut
products in the future. The factors that negatively affected the demand for these products
were also tackled in this chapter. Future market trends and prospects (both local and
international) are also thoroughly discussed in this chapter to be able to anticipate the
country’s future coconut production and logistical needs.
Coconut OilKey Demand Drivers
• The key drivers in the global coconut oil market are as follows (Persistence Market Research,
2018; Market Research Future, 2019; and Industry Probe, 2020):
• Coconut oil market is driven by increasing application as an ingredient in the cosmetic
industry. Coconut oil is not only used as a cosmetic and an enhancement in beauty care but
also has nutritional and health benefits.
• Rise in demand for coconut oil as an ingredient in hair care and skin care products is leading to
the growth in the coconut oil market. Coconut oil acts as a natural moisturizer for the skin and
helps hydrate the skin and reduces water loss, especially in dry skin types. Coconut oil not only
moisturizes the skin but also helps to condition hair. For women opting for shampoos, hair oils,
conditioners, sunscreen, and serum, coconut oil has a solution for all these problems as proven
by dermatologists. Coconut oil has anti-microbial, anti-fungal, and anti-bacterial properties
that make it ideal for the manufacturing of various cosmetics.

2 3 0 D E P A R T M E N T O F A G R I C U L T U R E P H I L I P P I N E C O C O N U T A U T H O R I T Y
• Easy availability and low cost especially in tropical regions where coconuts are grown are also
boosting the demand for coconut oil in the global market.
• Increasing health benefits from coconut oil consumption are also driving the global coconut oil
market over the forecast period. It is emerging as a better option for cardiovascular patients
because of its saturated medium-chain fatty acid content, which lowers heart attack risk for
these patients. Medium- chain fatty acid behaves differently in the body compared to long-
chain fatty acids, which would make coconut oil more beneficial than other saturated fats.
Moreover, coconut oil also helps to reduce stress, curb appetite, strengthen the immune
system, control blood sugar, and increase good cholesterol. These factors are significantly
driving the growth of the global coconut oil market.
• Advancements in the field of dermatology have acted as a launchpad for the growth of the
global RBD coconut oil market. The ever-maturing skin and beauty treatment industry has
remained at the forefront of the market growth of RBD coconut oil. Moreover, the effectiveness
of RBD coconut oil in preventing acne, pimples, and red spots on the skin has also given
a thrust to market growth. Medical experts recommend the use of RBD coconut oil for the
purpose of frying. Experts in the field of chemistry have also given a seal of credibility to the
use of RBD coconut oil in cooking.
• The slow rancidification of coconut oil compared to olive and canola oil coupled with its health
benefits is likely to spur its market growth over the forecast period. Preference for cooking oil
which assists in the breakdown of fats is anticipated to push the coconut oil market volume to
reach 6,569.8 kilotons (KT) by 2025.
• The growing trend of using coconut oil as feedstock to produce biodiesel fuel as an alternative
to conventional diesel fuel is a recent driving factor in the growth of the global coconut oil
market. A flurry of innovations in this regard might act as an elixir boosting the prosperity of
the coconut oil market in the foreseeable future.
• The introduction of new innovative products made of coconut oil in the market such
as turmeric- infused coconut oil, Nature Wax Coconut 1, and Nature Wax Coconut 2 is
diversifying the coconut oil market.
However, health concerns regarding the unsaturated fat content of coconut oil by various
international organizations coupled with the downvote for its use will be a major factor
that can negatively affect the demand for coconut oil.

2 3 1P H I L I P P I N E C O C O N U T I N D U S T R Y R O A D M A P 2 0 2 1 - 2 0 4 0
Coconut Oil Domestic and Export Market Prospects
Domestic Market. The growth in the domestic consumption of RBD coconut oil as
cooking oil is projected to be slow due to the proliferation of lower-priced imported
palm oil, canola oil, corn oil, and other vegetable oils in retail stores and supermarkets
throughout the country. To increase domestic consumption of RBD coconut oil as
cooking oil, it is imperative that the government through the Department of Agriculture-
Agribusiness Market Assistance and Support Services (DA-AMAS), the Department of
Science and Technology-Food and Nutrition Research Institute (DOST-FNRI), and the
Department of Trade and Industry (DTI) should jointly launch intensified market promotion
activities using multi-media highlighting the health benefits that can be derived from
coconut oil consumption.
With the increase in the country’s population, it is projected that the domestic demand for
coconut oil as raw material for manufacturing margarine, shortening and other specialty
fats; as replacement for milk fat in reconstituted milk; and spray oils for crackers and
biscuits will further expand over time.
In the country’s non-food sector, coconut oil is used as feedstock in producing coco
methyl ester. Coconut biodiesel (coconut methyl ester or CME) has expanded the use of
coconut oil in the domestic market (Agustin, 2013). This is supported by Republic Act (RA)
9367 or the Philippine Biofuels Act of 2006 which remains in effect. From an admixture
of 1% biodiesel (Bl) in the diesel fuel blend since the law took effect in 2007, this was
increased to 2% (B2) in February 2009. Currently, the Philippine Coconut Authority has
submitted a proposal to Congress for approval to increase the CME blend from 2% (B2)
to 5% (B5) for the purpose of increasing local biodiesel utilization. If the proposal will be
approved by Congress, it is projected that the demand for crude coconut oil as feedstock
for CME production will increase from 0.273 M MT at 2% CME blend to 0.683 M MT at
5% CME blend in 2021 and will further expand from 0.350 M MT at 2% CME blend to
0.875 M MT at 5% CME blend in 2025 (PCA, 2021).

2 3 2 D E P A R T M E N T O F A G R I C U L T U R E P H I L I P P I N E C O C O N U T A U T H O R I T Y
Moreover, coconut oil is used as feedstock to locally manufacture other oleochemicals
or fatty-acid compounds to produce cosmetics, soaps, detergents, surfactants, paints,
varnishes, and lubricants. The local coconut oil market has lucrative potential in the
cosmetics and skincare industry. In view of the country’s growing female population, it
is expected that the demand for cosmetic products will show tremendous growth. The
cosmetic industry uses coconut oil for manufacturing numerous products such as bath
soaps, lipsticks, shampoos, conditioners, hair masks, and serums, among other beauty
and skincare products. Moreover, coconut oil is used as a skin-friendly foundation primer.
It is lightly dabbed all over the face prior to applying any foundation to make the makeup
last longer.
Currently, the Philippine Oleochemical Manufacturers Association is clamoring for the
revival of EO 259 which required all detergent manufacturers to use fatty alcohol in their
detergent formulation. The revival of this executive order will also increase domestic
demand for coconut oil in the detergent industry tremendously.
It is also projected that after the COVID-19 pandemic, the booming construction industry
in the country will continue to grow due to urbanization and this will subsequently
increase the demand for coconut oil for the manufacture of oleochemicals to be used in
the production of varnishes and paints.
Export Market. The global coconut oil market which was valued at US$ 4,110.8 M in
2020 is expected to reach US $ 5,537.9 M by the end of 2026, growing at a compounding
annual growth rate (CAGR) of 4.3% during the period 2021-2026 (Global Oil Market
Research Report, 2020). Increasing consumers’ awareness of the lauric acid content in
coconut oil coupled with its application in biofuels and cosmetics is predicted to drive the
market growth of coconut oil during the forecast period.
The United States and the Netherlands are the top importers of coconut oil, accounting
for 24.1% and 16.7% of the world coconut oil imports in 2019, respectively (FAOSTAT,
2020). These countries were also the country’s leading buyers of coconut oil. In 2019, the
United States’ market share of the country’s coconut oil exports was 26.0% while that of
the Netherlands was 17.1% (PSA 2020). However, Netherlands exhibited a faster growth
in imports of Philippine coconut oil at 20.4% per year than the United States (4.06%/year)
during the period 2009-2019.

2 3 3P H I L I P P I N E C O C O N U T I N D U S T R Y R O A D M A P 2 0 2 1 - 2 0 4 0
In the world market, coconut oil faces stiff competition with lower-priced palm oil as
cooking oil and palm kernel oil as feedstock in the manufacture of oleochemicals.
However, the growing negative advisory against the use of palm oil will likely increase
the demand for coconut oil in the European Union (EU) and the United States. The EU
initially banned palm kernel oil for use in biofuels out of concern that oil palm cultivation
accelerated deforestation, fires, and global warming. There have been claims that
forests are burned to clear areas for oil palm cultivation. Oil palm plantations, typically
monoculture crops, are therefore
under scrutiny for their effects on the environment, including loss of carbon-sequestering,
biodiverse forest land. There is also concern over displacement and disruption of human
and animal populations due to oil palm cultivation. By the end of 2014, EU labelling laws
changed so that products are now required to state if they contain palm oil. In January
2019, the European Parliament voted to ban the use of palm oil for biodiesel production
in the European Union by 2020 with the main objective to stop the deforestation of
rainforests in Malaysia and Indonesia (ISCC, 2019). Moreover, the United States indicated
that it banned shipments of palm oil from three of the world’s biggest producers in
Malaysia after finding indicators of forced labor and other human rights abuses in oil palm
plantations (Voa News, 2020).
As reported by Coca (2020), the growing awareness about the negative environmental
and social impacts of oil palm cultivation on the environment, biodiversity, and local
communities has led some consumers and brands in the United States and Europe to
switch to alternatives like coconut oil. Hence, palm oil imports for food consumption
are dropping in Europe and have stalled in the United States. In view of these recent
developments, it is expected that coconut oil’s position in the oil and fats trade in these
countries will improve.
However, to improve the Philippines’ competitive advantage over other coconut
oil-exporting countries like Indonesia, Filipino oil processor-exporters should give
importance to producing and exporting sustainable, ethical, traceable coconut oil.
Companies selling different brands of coconut oil products in Europe such as Lucy Bee
are now requiring complete traceability (i.e., from their shops down to coconut farms) in

2 3 4 D E P A R T M E N T O F A G R I C U L T U R E P H I L I P P I N E C O C O N U T A U T H O R I T Y
their purchases of coconut oil and are working with Fair Trade Sustainability Alliance (Fair
TSA) for certification to ensure that a large portion of their sales from coconut oil will go
directly to coconut farmers (Coca, 2020). Fairtrade certification promotes fair prices for
farmers, decent working and living conditions for workers, higher income of farmers by
bypassing unnecessary middlemen, promotes association of workers, and cooperatives
and advances sustainable agriculture. These EU companies do not want to be faced with
the same issues as what they experienced with palm oil whenever they import coconut
oil.
Desiccated CoconutKey demand drivers
• The development of the baking industry due to changes in lifestyle and food habits of
consumers has driven the growth of the desiccated coconut powder market. Desiccated
coconut is vastly used as toppings and as an ingredient in food industries such as bakery,
confectionery, culinary, and beverage. Most recently, there has been an increase in the interest
of consumers in desiccated coconut-based products such as kokosmakronen, breakfast
cereals, and many Asian dishes, which has driven the demand for desiccated coconut.
• Desiccated coconut is an important part of functional beverages – an outcome of strong
preference shown by the millennial populace that is demanding for variants that have health
blended with taste. Since desiccated coconut has health benefits, the demand for this coconut
product is exhibiting a rapid upward curve.
• An increase in disposable income coupled with stronger buying power and growth in the
e-commerce sector is bringing desiccated coconut to inaccessible locations. Desiccated
coconut is easily available in the market through retail stores, online, supermarkets, which has
fueled the growth in the global desiccated coconut market. Besides, as technology advances
and improves the shelf life of the ingredient, growth in demand is only anticipated to grow
further over the forecast period and beyond.
• There has been an increase in the sales and demand for organic desiccated coconut which has
a direct impact in driving the market growth of desiccated coconut.
• The new-age consumers are highly conscious of their feeding habits and as desiccated
coconut is considered gluten-free, high in dietary fiber, and rich in vitamins, and minerals,
it is showing high demand. Besides, this section of the population is also oriented towards
convenience and thus opts for the desiccated version due to its ease of use in various dishes.

2 3 5P H I L I P P I N E C O C O N U T I N D U S T R Y R O A D M A P 2 0 2 1 - 2 0 4 0
There are some factors that could negatively affect the demand for desiccated coconut.
Availability of several substitutes for desiccated coconut powder in the market such as
Brazil nuts and macadamia nuts that offer similar nutty flavor and texture like desiccated
coconut powder acts as a key restraint to the desiccated coconut market. Moreover, some
European consumers prefer value-added forms of products,
like coconut water and roasted coconut chips rather than desiccated coconut, as the
former products are more suitable for busy lifestyles.
Desiccated Coconut Domestic and Export Market Prospects
Domestic Market. In the domestic market, the major buyers of desiccated coconut
are institutional users such as hotels and pastry and bakery industries. The increase in the
number of hotels and bakeshops in the country due to rapid urbanization is expected to
expand further the local demand for desiccated coconut. However, household consumers’
demand for desiccated coconut is highly seasonal (i.e., family celebrations during
birthdays, Christmas and New Year holidays, weddings, etc.) and will be most likely
confined to consumers belonging to middle- and high-income households who can afford
to buy desiccated coconut and other baking ingredients for home baking and cooking.
Export Market. The European Union is the world’s largest importer of desiccated
coconut, accounting for more than 30% of global imports (IEG Vu 2019). In Western
Europe, Belgium is the major consumer of desiccated coconut followed by Germany,
the Netherlands, and the United Kingdom. Desiccated coconut is a key ingredient in
traditional bakery of many European countries such as kokosmakronen of the Netherlands
and coconut macaroons of the United Kingdom. Desiccated coconut is also widely used
as breakfast cereal. Sales of organic desiccated coconuts as well as fair-trade products
are also increasing in the Western European markets. Moreover, there is a shift in the
European market from traditional desiccated coconut towards value-added forms of
the product, such as roasted coconut chips, which consumers eat on the go to fit their
busy lifestyles. Desiccated coconuts are also being used in an increasing number of
applications such as snack bars, fruit desserts, and bread spreads.
2 3 6 D E P A R T M E N T O F A G R I C U L T U R E P H I L I P P I N E C O C O N U T A U T H O R I T Y
In the Asia-Pacific region India and Singapore are the major consumers of desiccated
coconut. It is extensively used in South Asian (i.e., Indian, Burmese, and Indonesian)
cuisines. In Asia, it is used as toppings in curries and other savory dishes as a substitute
for grated coconut and as an ingredient in cooked cereal and baked food (Globe
Newswire, 2020). In the North American region, the United States accounts for most
of desiccated coconut imports which are used as a staple ingredient in baking and
confectionery industries.
The Philippines, Sri Lanka, and Indonesia dominate the global production of desiccated
coconut. The largest share of imports of desiccated coconut to the European Union came
from the Philippines (54%), followed by Indonesia (30%) and Sri Lanka (8%) (IEG Vu, 2019).
Desiccated coconut from the Philippines, the leading world supplier, usually fetch higher
prices compared to desiccated coconut imported from Indonesia and Sri Lanka because
most European buyers consider Philippine desiccated coconut of premium quality. Hence,
the Philippines has the greatest ability to compete in the global desiccated coconut
market compared to its competitors, particularly in the European Union. In 2019, the
major export markets of the Philippines for desiccated coconut in the European Union
were the Netherlands, Germany, and Great Britain. In North America, the country’s export
markets for desiccated coconut were the United States and Canada.
In Europe, imports of desiccated coconuts are very dependent on the development of
the confectionery and bakery industries. As both industries have positive development
forecasts, it is anticipated that imports of desiccated coconut in the European Union will
expand tremendously in the long term (IEU
Vu, 2019). Being the largest exporter of premium quality desiccated coconut in Europe,
the Philippines will stand to benefit from the considerable growth in market demand for
desiccated coconut in the European market. About 35% of imported desiccated coconuts
are used by the food processing industry as an ingredient for final products in Europe (EU
Vu, 2019). The largest share of desiccated coconuts is used by the confectionery industry
as fillers inside chocolate bars, as an ingredient in biscuits, toffees, and chocolates.
Larger cuts are used as snacks sometimes sweetened and toasted. In the bakery industry,
desiccated coconuts are used as ingredients and for cake decorations.

2 3 7P H I L I P P I N E C O C O N U T I N D U S T R Y R O A D M A P 2 0 2 1 - 2 0 4 0
Coco Shell CharcoalKey Demand Drivers
Coconut shell charcoal may come in its raw or natural form, powdered and in briquettes.
The major key demand drivers in the global coco shell charcoal market are as follows
(Wiwimex, n.d.; Elvatara, n.d.; Lifegreen, 2019; Market Watch, 2021):
• The multiple uses of coconut shell charcoal serve as a major demand driver for coco shell
charcoal. Coconut shell charcoal is used widely as an efficient domestic and industrial fuel.
It is also used by foundries and goldsmiths. In the food industry, coconut charcoal is widely
used in barbecues as an alternative to wood charcoal due to its fast burning and food-grade
properties. The food industry is favoring it due to the pleasant flavor it emits when preparing
traditional foods and barbecues. It also has medical uses in devices for filtering blood like
dialysis units. Coco shell charcoal is also made into charcoal soap. Charcoal soap has the
amazing ability to control facial oil and draw away the impurities that build up in the pores. It
is also effective in the removal of dead cells, thus providing clean and flawless skin. It not only
aids the removal of toxins but also removes skin impurities thus helping in the treatment of
acne.
• The increasing demand for coconut shell-based products such as activated carbon, briquette,
and sisha has expanded the demand for coco shell charcoal. Aside from coal and wood,
coconut shell charcoal is also used as a raw material for the production of activated carbon.
• The newly found uses of coco shell charcoal in the construction of golf courses and as animal
feed are contributing to the growth in global coco shell charcoal market demand. Coconut
shell charcoal has been found to be a suitable material in the development of golf courses. In
golf courses, a layer of coconut shell charcoal is laid to a certain depth along with sand and
other biomass before planting grasses. Coconut shell charcoal is also used as feed for cattle,
pigs, and poultry. Some studies have shown that animals fed with coconut charcoal give more
milk. Similarly, for pigs and poultry, it is a suitable feed to increase weight and reduce the
chances of any disease occurring. Hence, this will lead to greater meat production.
High fluctuating prices of coconut shells due to small and fragmented coconut land
holdings may restrict the growth of the market for coco shell charcoal.

2 3 8 D E P A R T M E N T O F A G R I C U L T U R E P H I L I P P I N E C O C O N U T A U T H O R I T Y
Coco Shell Charcoal Domestic and Export Market Prospects
In the Philippines, coconut shell charcoal is widely used by rural and some urban
households as domestic fuel as a substitute to fuelwood and kerosene for cooking food.
Chefs in restaurants, small eateries, and hotels as well as urban households prefer to
use coco shell charcoal in preparing barbecue and grilling fish. The expansion of oil
mills and desiccated companies which utilize coco shell charcoal as fuel and activated
carbon processing plants which use coco shell charcoal as raw material in manufacturing
activated carbon is a significant factor to the growth of the coco shell charcoal market in
the Philippines.
Export Market. Coco shell charcoal has a great export market potential especially
in Japan and the Peoples Republic of China where Philippine coco charcoal is preferred
because of its good quality as raw material for the activated carbon industries in
these countries. In Japan, coconut shell charcoal is not only used for making activated
carbon, but the use of charcoal briquettes in the preparation of traditional foods such as
“sukiyaki” is also becoming more and more popular. In 2019, the Peoples Republic of
China was the Philippines’ biggest buyer of coco shell charcoal, accounting for 57% of
the total volume of coco shell charcoal, followed by Japan with 48% market share. The
Peoples Republic of China also registered much faster CAGR of 149%/year compared to
Japan’s 6.1%/year CAGR during the period 2009-2019.
The demand for coco shell charcoal is also growing due to the booming shisha market
all over the world. The biggest market is the Middle East since it is there where shisha
consumption started being popular. Charcoal briquettes are commonly used in Middle
Eastern countries to burn shisha and fragrances at home. Turkey, a Middle Eastern
country started to import charcoal briquette from the Philippines only in 2018 and posted
a remarkable CAGR of 245% from 2018 to 2019, thus becoming the country’s third largest
buyer of coco shell charcoal. Apart from Turkey, India and Sri Lanka were other foreign
buyers that used the imported coco shell charcoal from the Philippines for burning shisha.
The Republic of Korea is the country’s fourth largest export market for coco shell charcoal.
The Republic of Korea used coconut shell charcoal in the construction of golf courses of
international standards and for manufacturing activated carbon. From 2009 to 2019, the

2 3 9P H I L I P P I N E C O C O N U T I N D U S T R Y R O A D M A P 2 0 2 1 - 2 0 4 0
Republic of Korea exhibited a CAGR of 15% per year in its volume of imports of coco
shell charcoal from the Philippines.
In North America, the United States is the country’s export market for coco shell charcoal
while in Europe, Germany and Belgium are the main export markets for Philippine coco
shell charcoal. In America and Europe, charcoal briquettes are used to heat spas as well
as stoves for cooking. The use of coconut shell charcoal briquette for barbecue and
grilling purposes and in poultry raising is becoming popular in Europe also.
If the country’s major foreign buyers will further expand their utilization of coconut shell
charcoal in the next 5-10 years, this will raise their import demand for Philippine coco
shell charcoal significantly.
COCO SHELL CHARCOAL-BASED ACTIVATED CARBONKey Demand Drivers
The key trends that will drive the global activated carbon market include the following
(Transparency Market Research, 2018; Grandview Market Research, 2019; QYR Research,
2020):
• Increasing demand for water treatment and sewage and human waste treatment
applications as well as desulphurization, and purification of factory effluent gases
is expected to be a key growth driver. Among all end uses, it is widely used in
potable water purification and sewage treatment plants. Coconut activated carbon
is extensively used in water and sewage treatment owing to its ability to remove
particulate and chlorine as well as dissolve organic impurities in water. Growing
environmental concerns, stringent regulations, and standards as well as government
initiatives to safeguard the environment are expected to aid the market over the
forecast period. As a result, water treatment, air purification, and mercury absorption
are a few applications that are expected to witness brisk growth.
• The rising demand for the product in air purification applications from domestic as
well as commercial users is expected to offer ample growth opportunities in the
2 4 0 D E P A R T M E N T O F A G R I C U L T U R E P H I L I P P I N E C O C O N U T A U T H O R I T Y
forthcoming years. Activated carbon is used in greenhouses and manufacturing
industries for air purification and to remove toxic gases, odors, and harmful dust
particles. Consumption of activated carbon into the air conditioners and gas masks
has been increasing.
• Rapid urbanization and public and private investments in infrastructural developments
in emerging economies such as China, India, and Brazil have also fueled the demand
for wastewater management systems. This, in turn, is anticipated to drive the demand
for coconut activated carbon during the forecast period.
• Growing demand for processed foods and beverages is a major factor expected
to drive the market for activated carbon in the foreseeable future. In the food and
beverage sector, activated carbon is consumed in processes such as removal of
contaminants or impurities such as color and odor from sweeteners, food liquids,
syrups, beverages, glycerin, and amino and organic acids.
• Increasing population, disposable income, and health concerns are expected to
propel the demand for activated carbon over the forecast period. Activated carbon
is used for the purification of raw material compounds, kidney machine, nursing
supplies, and respirators. The demand for activated carbon in pharmaceutical and
medical applications is expected to further grow over time.
• Growing applications in automotive industries are projected to aid future market
growth of activated carbon. Applications in the automotive industry are expected to
witness a brisk growth over the forecast period and are presumed to assist the growth
over the next six years.
• One of the factors that could negatively affect the demand for activated carbon is
the presence of substitutes such as granulated rubber and coke breeze, but these
materials have not been used on a large scale.
Coco Shell Charcoal-based Activated Carbon Domestic and Export Market Prospects
Domestic Market. The domestic market prospect of coco shell charcoal-based
activated carbon is bright. In the Philippines, granular activated carbon from coconut
shells is heavily used in air treatment and municipal and city water treatment plants,

2 4 1P H I L I P P I N E C O C O N U T I N D U S T R Y R O A D M A P 2 0 2 1 - 2 0 4 0
especially in mercury and chlorine removal process. Activated carbon is also mainly used
in the food processing industry especially in soft drinks and sugar refining industries, the
monosodium glutamate manufacturing industry, and the coconut oil refining industry.
Local mining operations are also big users of activated carbon as it is used with cyanide
in extracting gold dust (Ordinario et al., 2019). Moreover, demand for food infused
with activated carbon has been also steadily growing in the domestic market such as
lemonade and frozen yogurts. At the consumer level, activated carbon is locally used for
health products such as toothpaste, toothbrush, and skincare products, including facial
masks and creams.
Export Market Prospect. World demand for activated carbon is expected to
strengthen in the next 10 years. The projected trend is based on the positive global
activated carbon market growth in the last decade. The global trade in activated carbon
in terms of US dollar value has been growing at a CAGR of 8.21%, which is projected
to hit a faster pace in the short-term to medium-term due to global environmental laws
encouraging the use of activated carbon for industries that cater to water filtration, air
purification, mining, and health care, among other uses (Ordinario et al., 2019).
In 2019, the world imports of activated carbon exceeded $1.92 B (TrendEconomy,
2021). USA and Japan are the largest importing countries of activated carbon in the
global market with 11.9% ($229 M) and 8.58% ($165 M) market shares, respectively
in 2019. Other major importers of activated carbon in the same year were Germany
(8.45% share or US$162 M), Peoples Republic of China (8.21% or US$ 157 M), Republic
of Korea (6.49% or US$ 124 M), and Belgium (4.86% or $93 M). These seven countries
absorbed 48.5% of the activated carbon product from the global market in 2019. The
growing demand from major importing countries of activated carbon such as Japan, USA,
Germany, China, and Korea have significantly contributed to the global market growth of
activated carbon.
The Philippines has favorable market prospects for coco shell charcoal-based activated
carbon exports to the world’s largest activated carbon importing countries. For the last
decade, the Philippines’ leading export markets for activated carbon were Japan, USA,
Germany, the People’s Republic of China, and the Republic of South Korea. Based on

2 4 2 D E P A R T M E N T O F A G R I C U L T U R E P H I L I P P I N E C O C O N U T A U T H O R I T Y
PSA data, these importing countries of coco shell charcoal-based activated carbon from
the Philippines exhibited high annual growth rates in terms of export volume from 2009
to 2019. In 2019, Japan was the top buyer of Philippine manufactured coco shell-based
activated carbon with 18%
market share, followed by USA with 12.3% market share. Germany slightly trailed behind
at 11.9%. The People’s Republic of China (7.9%) and the Republic of Korea trailed behind
(6.8%). Owing to rapid industrialization, the rising level of air and water pollution have
governments in these major importing countries of activated carbon impose strict air and
water pollution control and waste treatment norms. Owing to growing environmental
concerns, government regulatory agencies have recommended coconut activated carbon
as the best available material for use in air purification, mercury absorption, and water
treatment applications. The increasing applications of activated carbon in the food and
beverages industry and the pharmaceutical sectors have also contributed to demand
growth of activated carbon in these countries and are expected to increase further the
demand for coco shell-based activated carbon from the Philippines.
The Philippines’ close competitor in the global coco shell charcoal-based activated
carbon is India. In 2019, India outranked the Philippines in exporting activated carbon
because of the spike in the country’s exports of raw coco shell charcoal to China and
Japan where activated carbon manufacturers in these countries prefer Philippine coconut
shell charcoal as raw material for manufacturing activated carbon. Rising volume of
exports of raw coco shell charcoal has been depleting the supply of this raw material for
Filipino activated carbon manufacturers. In that year, India exported US$ 203 M worth of
activated carbon compared to the Philippines’ $129 M (TrendEconomy, 2021). Being the
second largest coconut producing country in the world where there is abundant supply
of coconut shells, there is a great possibility for the Philippines to outrank India as the
top world supplier of coconut shell charcoal-based activated carbon provided that the
country’s policy makers will regulate exports of raw coco shell charcoal by imposing an
export ban.

2 4 3P H I L I P P I N E C O C O N U T I N D U S T R Y R O A D M A P 2 0 2 1 - 2 0 4 0
OleochemicalsKey Demand Drivers
The key demand drivers in the global oleochemicals market are as follows (Allied Market
Research, 2020 and Factmr, 2021):
• The global market for oleochemicals is driven by high demand coming from consumer
markets. The demand for oleochemicals is increasing in the pharmaceutical and
personal care industry as consumers are becoming aware of the environmental
benefits and cost effectiveness offered by oleochemicals.
• Another key demand driver is easy availability of raw materials, and a growing market
for green chemicals. The Asia-Pacific region is estimated to be the fastest growing
region because of the easy availability of raw materials and development of newer
applications for the product.
• Growing environmental concerns have encouraged the growth of oleochemicals
applications across a range of industrial domains including food and beverage,
personal care and cosmetics, soaps and detergents, polymers, and pharmaceuticals,
among others. Oleochemicals have emerged as an ideal substitute for products
derived from petroleum due to its low levels of toxicity. Oleochemicals are viewed
as natural, green, organic, safe, renewable, and biodegradable by scientists and
consumers, thus considered to be environment friendly.
• The increase in demand for biodegradable products is driving the global market for
oleochemicals. Growing demand for bio-degradable products in food and beverage
industry is fueling the demand for oleochemicals globally.
• The increase in demand for various cosmetics and personal care products from
oleochemicals is projected to boost the demand for the global oleochemicals market.
• Population growth in the Americas, Europe, and Asia-Pacific will drive the demand
for oleochemicals across application segments such as personal care and cosmetics,
soaps and detergents, lubricants, food, and many others.
• The major factors that negatively affected the demand for oleochemicals using
coconut oil as feedstock are the influx of lower-priced palm oil imports and the
discontinued implementation of EO 259 which required all detergent manufacturers
to use fatty alcohol in their detergent formulation.

2 4 4 D E P A R T M E N T O F A G R I C U L T U R E P H I L I P P I N E C O C O N U T A U T H O R I T Y
Oleochemicals Domestic and Export Market Prospects
Domestic Market. Currently, the domestic market for oleochemicals is limited to coco
methyl ester for biodiesel production, but it will be favorable if EO 259 will be revived
to create domestic consumption of coconut oil and increase the country’s opportunity
to locally produce fatty alcohol again. Reviving this law will enable three oleochemical
companies manufacturing fatty alcohol to reopen. Pilipinas Kao, the only remaining
manufacturer of fatty alcohol, exports its fatty alcohol production for the export market.
There are many applications of fatty alcohol such as the production of detergents, shaving
creams, shampoos, face and body creams, and surfactants. They are components also of
cosmetics, foods, and as industrial solvents. They find use as co-emulsifiers, emollients
and thickeners in cosmetics and food industry. Other applications of fatty alcohol include
pharmaceutical and petroleum applications. With local production of fatty alcohol, the
Philippines can minimize importation of most of the country’s shampoo raw materials,
fabric softener, cleaning products, bar soaps, detergents, and soap noodles from Malaysia
and Indonesia.
At present, the local oleochemical industry is mostly composed of coco methyl ester
manufacturing companies. With the present CME blend of 2%, PCA estimated that the
CME requirement for biodiesel production is 252.86 M liters. If PCA’s proposal to increase
the CME blend from 2% to 5% under the Biofuels Act will be implemented, the projected
CME requirement will be 632.14 liters in 2021 and will further increase to 809.01 M liters
in 2025.
Export Market. The global oleochemicals market size is anticipated to reach USD
31.4 B by 2027 registering a CAGR of 5.8% (Research and Markets, 2020). Oleochemicals
are replacing many petroleum- based products as their properties help build a product
which is better for the environment and which can be manufactured from renewable
raw materials. Glycerol is estimated to be the fastest-growing product segment due
to increasing demand for technical-grade refined glycerin in the manufacturing of
metalworking fluids, adhesives & sealants, polyols, agrochemicals, oilfield chemicals,
and solvents. In 2019, Linoleic (C18:2) acid emerged as the largest fatty acid product
segment, both in terms of volume and revenue owing to the high product demand in

2 4 5P H I L I P P I N E C O C O N U T I N D U S T R Y R O A D M A P 2 0 2 1 - 2 0 4 0
the production of dietary supplements, paints, varnishes, food flavoring agents, and
surfactants. Soaps and detergents are projected to be the leading application segment,
both in terms of volume and revenue. The personal care and soaps and detergents
applications share more than 50.8% of the oleochemicals demand. The growth in this
segment can be attributed to increasing product demand from industrial and institutional
cleaning and textile sectors.
The Asia-Pacific Region takes the leading position in the global oleochemicals market
owing to the strong raw material base and expanding world scale plants. Palm oil, palm
kernel oil, and crude coconut oil are the feedstock used as raw materials in oleochemical
processing. Malaysia and Indonesia are the major producing and exporting countries of
palm oil and palm kernel oil. The Philippines is the largest exporter of crude coconut oil.
Palm kernel oil and crude coconut oil have a wide mix of all the fatty acids (Beroe, 2018).
This has positioned palm kernel oil and crude coconut oil as the preferred feedstock in
the oleochemical industry. However, palm kernel oil is the most traded commodity among
the oleochemical feedstock because of its lower price compared to crude coconut oil.
Coconut oil (CNO) competes head on with palm kernel oil (PKO). The first challenge
is improving reliability of supplies of CNO and bringing the price of CNO down to
be competitive with PKO. There are at least three ways to do this: 1) increase primary
production of coconut through fertilization and better agronomy (immediate) and
replanting with hybrids (long term), 2) conserve CNO by substitution of coconut cooking
oil with palm oil, and 3) granting of incentives and strong government support to the
domestic oleochemical processors of coconut oil (Javier, 2015).
In view of the European Union’s recent import ban on palm oil/palm kernel oil from
Indonesia and Malaysia for use in biofuels out of concern that oil palm cultivation
accelerated deforestation and global warming, it is projected that more oleochemicals
using coconut oil from the Philippines would be absorbed in the European market.
Similarly, the import ban on palm oil exports of three large Malaysian palm oil companies
by the United States will likely increase imports of Philippine coco methyl ester in this
country.

2 4 6 D E P A R T M E N T O F A G R I C U L T U R E P H I L I P P I N E C O C O N U T A U T H O R I T Y
VIRGIN COCONUT OILKey Demand Drivers
Important factors that stimulate the worldwide demand for virgin coconut oil are the
following (Juliano, 2007; VCO Market, 2010; Goldstein Market Intelligence, 2010; Infiniti
Research Limited 2017; ACA 2019; Costales, 2019; Verified Market Research, 2020; and
Gravitas, 2021):
• One of the key factors influencing the global demand for virgin coconut oil is its
health benefits. Several studies have shown the beneficial effects of virgin coconut
oil. With the rising number of health- conscious consumers aiming to maintain good
lifestyle and the growing perception that VCO is healthier than other oils, the market
for virgin coconut oil is expected to rise further in the near future.
• The wider application of virgin coconut oil to beauty, cosmetics, and personal care
products such as soaps, lotions, massage oils, beauty creams, lipsticks, and other hair
and skin care products is expected to stimulate further growth to the virgin coconut
oil market. More than 40% of consumers are using organic beauty products while 8%
more are interested to shift to organic beauty products. Technological advancements
in the field of dermatology, chemistry, and cosmetics have found ways to produce
better and more effective products to address the perceived demand of consumers
to look better and younger. Cosmetic and nutritional products, with some degree of
pharmaceutical activity are now called cosmeceuticals and nutraceuticals. Scientists
have considered the effectiveness and safety of traditional products from nature such
as virgin coconut oil.
• The increasing demand from the food industry is expected to propel growth in
the virgin coconut oil market. Greater consumer spending on functional food and
beverages favoring a nourishing lifestyle as well as growing interest on virgin coconut
oil over coconut oil are observed. More companies are also gearing towards catering
the market for culinary purposes.
•
• Virgin coconut oil plays an important role in the field of pharmaceuticals. It can serve

2 4 7P H I L I P P I N E C O C O N U T I N D U S T R Y R O A D M A P 2 0 2 1 - 2 0 4 0
as medicine to cure diabetes. Based on the World Health Organization (WHO), around
463 M people worldwide are living with diabetes in 2019. This poses a huge potential
for the virgin coconut oil market. Furthermore, an experiment conducted by the
Department of Science and Technology (DOST) showed that covid-19 patients who
were administered with virgin coconut oil experienced lesser symptoms and speedy
recovery than those who were not given virgin coconut oil. The Philippine Council for
Health Research and Development (PCHRD) study also reveals that the compounds
from virgin coconut oil decreased coronavirus count by 60-90% at low viral load. This
would entail an enormous market for virgin coconut oil.
• Virgin coconut oil is also used as food supplement. It can be taken orally by spoonful
or by capsule or applied externally for various ailments. As testimonials from more
satisfied users of virgin coconut oil are proliferating and as greater number of
consumers are preferring to increase their intake of omega fatty acid, a significant
growth in virgin coconut oil consumption is predicted in the future.
• Increase in population especially the aging population can trigger higher demand for
virgin coconut oil. Moreover, with modern access to online market and wide variety
of products at a discounted price, there would be a surge in the demand for virgin
coconut oil.
• Due to heightened environmental concerns, a rise in the demand specifically for
organic virgin coconut oil is seen in the future. The organic virgin coconut oil market
accounted for a bigger market share in 2019. This is due to rising demand for
healthier and nutritious food. The inadequacy of vitamins found in food because of
rapid climate change is the main driver for the organic virgin coconut oil market.
The factors that may impede the growth of virgin coconut oil demand are the introduction
of newer products, availability of substitutes such as extra virgin olive oil, sunflower seed
oil, grapeseed oil, almond oil, avocado oil, and neem oil (similar uses in the household,
cosmetics, and health sector), lack of awareness on the benefits of the virgin coconut
oil and lastly, the negative image, in general, of coconut oil due to its unsaturated fat
content.

2 4 8 D E P A R T M E N T O F A G R I C U L T U R E P H I L I P P I N E C O C O N U T A U T H O R I T Y
Virgin Coconut Oil Domestic and Export Market Prospects
Domestic Market. PCA reported the growing local consumption of virgin coconut oil
as manifested by the increase in the sales volume of virgin coconut oil producers (Juliano,
2007). Based on an interview with one of the major producers of virgin coconut oil in the
Philippines, there is still a lot of demand to fill in the country. The limiting factor is the
supply of high-quality raw materials appropriate for virgin coconut oil.
A surge in the local demand for virgin coconut oil is projected in the country in the
coming years. With the disclosure of the results of DOST’s experiment on the health
benefits from virgin coconut oil intake on covid-19 patients, a trajectory trend in its market
demand is anticipated. As more covid-19 cases are being reported daily, this would
create interest among covid-19 patients to purchase virgin coconut oil as an immune-
health supplement for faster recovery. Based in their sales data, Amway Philippines
observed an increase in demand for its health supplements (Manila Standard Lifestyle,
2020). This means that more Filipino consumers are getting more health conscious. As a
preventive measure against COVID-19, it is expected that the demand for virgin coconut
oil as food supplement will rise, not only for COVID-19 patients but for the entire Filipino
consumers. The future is bright for the virgin coconut oil industry not only locally but also
internationally.
The existence of multi-B food and cosmetics companies in the country would indicate that
domestic use of virgin coconut oil is present (Bello et al., 2020). Filipinos are also looking
for organic and natural beauty products. Several virgin coconut oil-based beauty soaps
and scrub are currently available in the market. This pattern of using natural products will
continue in the long run as the benefits of having a healthier lifestyle is being recognized.
Export Market Prospect. According to Verified Market Research (2020), the global
virgin coconut oil market was valued at US $ 1,280.6 M in 2019 and is expected to grow
at a CAGR of 10.04% over the forecast period of 2020 to 2027. It is projected to reach
US $ 2,874.9 M by 2027 (Verified Market Research, 2020). Based on Goldstein Research,
growth in global market demand for virgin coconut oil is expected to be driven by
growing consumer interest in natural beauty products (ACA, 2019).

2 4 9P H I L I P P I N E C O C O N U T I N D U S T R Y R O A D M A P 2 0 2 1 - 2 0 4 0
The global virgin coconut oil market is segmented by region classified as: Asia-Pacific
Region, European Region, Middle East, and African Region (MEA) and the Americas
Region. Asia Pacific comprises of countries like China, India, Sri Lanka, Singapore, Japan,
South Korea, Taiwan, Indonesia, Malaysia, Thailand, Vietnam, Australia, Fiji, Guam,
Hawaii, and Papua New Guinea. The European market, on the other hand, includes
Germany, France, Italy, Spain, United Kingdom and Russia while USA, Canada, and
Mexico fall in the Americas Region. The African Region covers African continent countries
and the Middle East countries of Abu Dhabi, Qatar, Kuwait, and the Kingdom of Saudi
Arabia (Costales, 2019).
Aside from occupying the biggest part in the global market, Asia Pacific is also the largest
producer and exporter of virgin coconut oil. This is due to easy access to coconuts in
the region (Costales, 2019). Japan, China, Singapore, South Korea and Australia are
among the top importers, while the three major exporters are also in this region like the
Philippines, Indonesia and Sri Lanka (Costales, 2019).
The regional market has an expected hike in the demand for virgin coconut oil for culinary
purposes (Market Research Future 2021). The use of virgin coconut oil for cooking
purposes in countries like China, India, and Japan is likely to increase the demand in this
region. Aside from this, Asia-Pacific has a notable presence of manufacturing companies
of virgin coconut oil such as Edward and Sons Trading Company, MaxCare, Greenville
Agro Corporation and others (Verified Market Research, 2020). With the pressing
demand for virgin coconut oil, the market players are finding it hard to meet the high
demand from consumers. The governments in this region are reaching out to provide
technological assistance to the players to enhance their production capabilities (Research
and Markets, 2019).
The demand for virgin coconut oil in the European Region is driven by an increasing
awareness of consumers towards healthy lifestyles and diets. There has been a rising
demand for organic beauty and health supplements (Goldstein Market Intelligence
2010). Having proven that virgin coconut oil reduces cholesterol levels, it produced
interest in the use of this product among consumers. It has transformed from a niche
market to a main stream market and currently has expanded its market outlets in large

2 5 0 D E P A R T M E N T O F A G R I C U L T U R E P H I L I P P I N E C O C O N U T A U T H O R I T Y
supermarkets. The rapid virgin coconut oil market growth in Europe is influenced by the
United Kingdom’s growing demand for virgin coconut oil. The Region imports from the
Philippines, Sri Lanka, Indonesia, India, Thailand, Malaysia, and Papua New Guinea. The
expanding volume of sales of virgin coconut oil and virgin coconut oil-based products on-
line, in supermarkets and special retail stores as food and beauty and cosmetics products
reveals its growing popularity among consumers (Costales, 2019).
In the Middle East and African Region, virgin coconut oil has gained popularity
particularly in Dubai and the United Arab Emirates (UAE). Virgin coconut oil was
introduced in UAE by Vita Coco, the leading coconut water producer and exporter in
the world. Based on market research, the African Region can reach a potential of about
US$10 B for its coconut product market. The growing market for virgin coconut oil has
motivated the entry of coconut processors in Africa. Specifically, the ROCAC Group from
Nairobi, Kenya started to export virgin coconut oil and coconut water to the UAE and
other countries (Costales, 2019).
In the Americas Region, greater awareness and nutritional benefits led to the popularity
of virgin coconut oil. The notion that virgin coconut oil aids in fighting obesity and
overweight related problems prevalent in the area also catalyzes the demand for this
product, specifically in the US market, the major virgin coconut oil importing country in
the region (Costales, 2019).
In the Philippines, the top importers are USA, Germany, Canada, United Kingdom, Brazil,
the Netherlands, and China. The North American market is still the biggest market
for virgin coconut oil from the Philippines, mainly provided by the desiccated coconut
producers that have branches in the United States (VCOP, 2019). In 2015, it acquired
more than 50% of the Philippines’ and 41% of Sri Lanka’s total virgin coconut oil exports
(Costales, 2019). Although the US market showed signs of slowing down as seen from
the country’s declining export of virgin coconut oil beginning in 2016 due to AHA’s
advisory on the negative effect of coconut oil on health, the slack in demand growth can
be boosted by venturing to the still untapped markets and by promoting virgin coconut
oil for industrial applications. Industry wise, the use of virgin coconut oil in food products
is not popular. Nevertheless, there are some manufacturers who have been using
2 5 1P H I L I P P I N E C O C O N U T I N D U S T R Y R O A D M A P 2 0 2 1 - 2 0 4 0
virgin coconut oil in the European market for their products like Get Fruity Bar (United
Kingdom), Bio Paranuss-Guarana Riegel (Germany) and Lifefood Coconut Bar (Germany/
Europe) (Costales, 2019).
Coconut WaterKey Demand Drivers
Coconut water is gaining popularity worldwide due to the following key demand drivers
(ACA 2019; Costales 2019; CBI Ministry of Foreign Affairs, 2020):
• The increasing popularity of coconut water as a healthy functional drink is one of the main drivers behind the growing interest in coconut water. The market will be growing fast as more consumers are becoming health conscious. Coconut water is marketed as a ‘health booster’ in several ways. It is considered as a ‘rehydrator’ or ‘anti-aging’ product, stressbuster, natural diuretic, digestive soother, detoxifier, stomach comforter, and cholesterol-lowering product.
• Due to its higher content of minerals and carbohydrates, coconut water can be classified as an isotonic beverage. In Europe, the market for sports drinks is forecasted to increase at an average yearly rate of more than 5% according to several sources.
• The competitive advantage of coconut water is that it is completely a natural drink. This makes it appealing to more buyers. While most other drinks are artificially created, coconut water has even less natural sugar. The sugar intake of most Europeans has gone down in the last few years, as consumers opted to live a healthier lifestyle. This change in consumption pattern has negatively affected the fruit juice and soft drinks industry. Greater demand for a natural drink is expected to be the trend.
• On one hand, since coconut water has low energy value and does not have sweetness flavor like fruit juices, it is often mixed with small quantities of fruit juices or purees to create more fragrant coconut water drinks and an improved nutritional value. With this, it is increasingly used as an ingredient in juice-based beverages that leads to projected increase in demand.
• Plant-based diets are also becoming increasingly popular. Coconut water is used as an ingredient in plant-based drinks. Coconut water is combined with ’no-added-sugar’ products to come out with the desired sweetness of the drink. Multiple plant-based
drink manufacturers have used coconut water in their products.

2 5 2 D E P A R T M E N T O F A G R I C U L T U R E P H I L I P P I N E C O C O N U T A U T H O R I T Y
Coconut Water Domestic and Export Market Prospects
Domestic Market. The domestic consumption of coconut water is relatively low
which implies the need for promotional efforts. Due to the abundant nature of coconut
trees in the country leading to greater access to coconut, local consumers prefer to drink
the water from fresh young nut rather than the packaged one. Aside from this, coconut
water from young buko has better taste and subjecting it to a certain process will lose
its refreshing, sweet taste. The challenge is to prolong the shelf life without changing its
taste. There is a great market potential for bottled pasteurized coconut water. The study
conducted by Hidalgo (2017) which targeted local consumers revealed that pasteurized
coconut water is widely accepted by general consumers and that 97% of the college
students are willing to buy and substitute coco water to their preferred beverages. For the
product test administered to three segments of the market under study such as those with
an active lifestyle (athletes/ sports enthusiasts), health-conscious individuals, and students,
the study showed that after tasting the 330-ml pasteurized coco water, 98% are willing to
replace their preferred beverage with coco water. This indicates that Filipino consumers
are continuously looking for a healthier option to soft drinks and other commercial
beverages. This reveals that given the market response, there is a great potential for
pasteurized coconut water to enter the Philippine beverage industry. The research on the
Philippines Food and Drinks Market: Emerging Opportunities showed that the health-
conscious segment of the society is dominant particularly among the young, affluent
population. The survey conducted by the Philips Index Health and Living also showed
that 54% of the Filipinos considered themselves as conscious about their health and
well-being which means they pay attention to the food they are eating. In another study
done by the Food and Nutrition Research Institute (FNRI), it was found out that 76.6%
of Filipino consumers are greatly influenced by nutrition facts when buying a product. In
another market survey, around 36% consider health benefits as their reason for buying a
beverage.
Export Market Prospect. According to a global research study conducted by ACA
(2019), the worldwide market for coconut water is predicted to grow at a CAGR of roughly
14.4% from 2017 to 2023. Thus, from US$ 6,150 M in 2017, this will reach at about US$
13,800 M in 2023.

2 5 3P H I L I P P I N E C O C O N U T I N D U S T R Y R O A D M A P 2 0 2 1 - 2 0 4 0
The global consumption of coconut water is approximately more than 600 M liters yearly.
This amount is based on coconut water retail sales, but the actual world consumption is
higher since the estimation excludes direct consumption from young coconuts, which is
also an important part in coconut production (CBI Ministry of Foreign Affairs, 2020).
Western Europe is a significant market for packaged coconut water while Australia
and New Zealand are also outlets for packaged coconut water. The European market
for coco water accounted for 10% of the total world sales. This is about 60-70 M liters
consumption in the European Union on an annual basis. The rate of increase in their
consumption ranges from 15-20% annually and the increase will persist but predicted to
be at a much lower rate of 10% per year. The physical import of coconut water in Europe
is smaller compared to its consumption since the imported concentrated coconut water is
further repacked with water or used as a beverage ingredient. In terms of import demand,
it is expected only to be roughly 30-40 M liters annually. The growth in the European
market for coconut water is influenced by an alternative way of living among consumers
such as their adherence to functional and plant-based drinks that led to an innovative and
healthier solution with coconut water (CBI Ministry of Foreign Affairs, 2020).
Specific countries in Europe like the United Kingdom, France, Spain, Germany, Italy, and
the Netherlands provide great opportunities for producers in developing countries. The
United Kingdom, being the main consumer of coconut water, the Netherlands as a trade
hub with numerous specialized traders, and Austria with several beverage processors,
all these countries in the region offer gainful opportunities for coconut water trade (CBI
Ministry of Foreign Affairs, 2020).
In France, coco water consumption has increased at least five times over for the last five
years. Currently, they are consuming around 12–14 M liters and are expected to be of
similar level with the United Kingdom. Their demand for coconut water is stimulated by
the healthy nature of coconut water as well as market promotional efforts of companies.
With lower fruit juice demand in the country, French processors of juice and soft drinks
offer less sugar content and even mix coco water with fruit juice (CBI Ministry of Foreign
Affairs, 2020).

2 5 4 D E P A R T M E N T O F A G R I C U L T U R E P H I L I P P I N E C O C O N U T A U T H O R I T Y
Germany was the first country where coconut water was introduced but the market did
not develop as rapidly as in the United Kingdom. However, the consumption rate is
currently rising and will likely be included in Europe’s top three largest coconut water-
consuming countries. Annual consumption of coconut water in Germany ranged from
6-8 M liters. Germany has the largest market for organic food and suppliers would have a
great deal of market for organic coconut water (CBI Ministry of Foreign Affairs, 2020).
The Italian consumption of coconut water lies between of 3 and 4 M liters yearly. New
product developments are prevalent in the country as well as the existence of a wide
variety of domestic and foreign brands. On the other hand, the Netherlands’ consumption
of coconut water is moving at a fast rate and many new brands are sprouting in the
market. Coconut water is also traded from the Netherlands by specialized juice ingredient
suppliers who have processing facilities in Brazil, Vietnam, Mexico, and Poland (CBI
Ministry of Foreign Affairs, 2020).
In Australia, the packaged coconut water market is also expected to grow at an enormous
rate. The demand is driven by Australian’s changing food habits and preferences,
especially the working population. Coconut water has greater appeal to the Australian
population due to its benefit of lowering blood pressure, maintaining blood glucose
levels, and rehydrating the body, among other benefits. This in turn is expected to
positively influence the market growth through 2025. The availability of coconut water
throughout the year due to its longer shelf life as well its accessibility in online shopping
also added to the increase in sales. The presence of cheaper substitutes and the high cost
of packaging are seen to be the blockage to market growth (ReportLinker, 2020).
COCONUT SUGARKey Demand Drivers
There are several key factors that could drive the global demand for coconut sugar. These
include the following (Transparency Research 2016; Technavio 2018; Grandview Research
2019; Gminsights 2020; IndustryARC 2020; CBIEU 2020; Marketresearch.biz, 2021):

2 5 5P H I L I P P I N E C O C O N U T I N D U S T R Y R O A D M A P 2 0 2 1 - 2 0 4 0
• More people are opting for healthier products. With the growing knowledge on the
health benefits of coconut sugar, while a considerable number of the population are
becoming aware of the ill- effects of processed white sugar, coconut sugar is likely to
gain a competitive advantage over mainstream products. The organic coconut sugar
has a low glycemic index compared to cane sugar and honey. Coconut sugar will
also be good for dairy substitutes. A rise in the number of lactose intolerant people
worldwide will also drive the market further in the projected period.
• The rising cases of diabetes, cardiovascular diseases, obesity rates, the change in
dietary patterns, and substandard healthcare conditions in developed and developing
countries may trigger an increase in the product demand. According to WHO, an
estimated of 1.6 M deaths in 2016 were directly caused by diabetes while 1.9 B adults
were overweight and around 650 M of these are obese. The cardio vascular disease is
the number one cause of death globally, with an estimated 17.9 M people who died
in 2016 due to this disease. Coconut sugar has features that do not spike insulin levels
quickly like regular sweeteners. It is rich in antioxidants and minerals and it has lauric
acid which is a good compound that destroys different varieties of host diseases such
as flu and viral infections. Coconut sugar also contains a fiber that reduces glucose
absorption. It is predicted that increasing levels of diabetes, cardiovascular disease,
and obesity will give rise to demand for coconut sugar as a healthier alternative.
• Coconut sugar has unlimited application to food and beverage ranging from snacks,
chocolate, breakfast cereals bakery products, confectionery, food seasoning to juices,
coffee, and tea. Based on the estimation of the Industry ARC’s analyst, the above uses
will have a CAGR of 5% to 6% in the sector.
• A more specific demand will be for organic food and drink products, particularly in
the European market. The primary concern of consumers is to do away with products
that made use of synthetic pesticides and related chemicals. A lot of food and drink
companies are increasingly using natural sweeteners. Organic coconut sugar is a
choice because of its nutritional qualities and ecological value. The reputation of
organic certification is also perceived to be a quality standard. With this, the demand
for organic coconut sugar will escalate in the European market. There is a great
potential for exporters of coconut sugar in developing countries to capitalize on this.
Since coconut sugar has a higher price than regular sugar, exporters can target the
2 5 6 D E P A R T M E N T O F A G R I C U L T U R E P H I L I P P I N E C O C O N U T A U T H O R I T Y
organic sector to justify the premium. It is anticipated that the demand for organic
products in Europe will continue to rise.
• The trend towards vegan food and drink products, especially in Europe is increasing.
This trend is expected to persist as companies are geared towards developing new
vegan products. Europe, which occupies more than one-third of the global vegan
product market, leads the way in terms of organic food innovations and will continue
to dominate in the coming years. According to Allied Market Research, the global
vegan industry is valued at US$ 14.2 B in 2018 and is expected to reach US$ 31.4 B
by 2026. With the vegan trend, the suppliers of coconut sugar in developing countries
can take advantage of the opportunity being set in the European market.
• An uptrend in the demand for healthier ingredients from the chocolate industry is
expected to take a portion in the market share. An increasing market demand for
coconut sugar-based vegan chocolates and the availability of coconut sugar-based
products in premium brands such as Lindt, Toblerone, Hershey are seen to have a
favorable gain in the penetration of the product. In Sweden, there was an over US$65
M sales turnover for organic chocolates, sugar, jam, and confectionary in 2017.
• The application of organic coconut sugar in producing skincare products like body
scrubs, shaving gels, facial and body creams as well as hair care products is also
contributing to the demand growth. These coconut sugar-based scrubs and face
packs are preferred because of their granular, lubricating, and antioxidant nature as
well as their ability to remove dead cells without harming the skin. With the worsening
air pollution level due to modern industrialization, these herbal cosmetic products in
Europe are projected to drive the demand for coconut sugar in the region.
• The increasing geriatric population and the number of middle-aged are prospective
customers of coconut sugar for skincare. Coconut sugar is a superior anti-aging
ingredient because of its production of collagen. Hence, people whose age ranges
from 40-50 years old would most probably use coconut sugar as a skincare product.
Most of the coconut sugar manufacturers are operating on a small scale and the quality
of coconut sugar produced by different processors varies. Since their coconut sugar
products differ in terms of appearance and texture, it would be difficult for them to
penetrate the export market.

2 5 7P H I L I P P I N E C O C O N U T I N D U S T R Y R O A D M A P 2 0 2 1 - 2 0 4 0
Some leading diabetes organizations in UK such as Diabetes UK viewed that although
coconut sugar is marketed as a better substitute to cane sugar, it is still a form of sugar
and it could still pose some risks to consumer health. Thus, they suggest consumers to
reduce all forms of sugar consumption. They provided advice on how to cut down on
sugar. This in turn would have a negative impact on coconut sugar demand.
Coconut Sugar Domestic and Export Market Prospects
Domestic Market. The local demand for coconut sugar has not been very well
documented because the use of the product is very minimal. Domestic consumers have
continued reliance on sugarcane-based sweeteners/additives (Angulo). As dictated by
the international market, the price of coconut sugar will remain high for some time as
demand (outside the country) will continue to outweigh the supply. The possible entrance
of big players would also have an impact on the future price. The degree of influence
on prices will depend on their production capacity and rate of supplying the market
(Costales, 2019).
The prevalence of diabetes among adults in the Philippines is 6.3%. Out of the total
63,265,700 adult population, there are 3,993,300 cases of diabetes in the country (IDF,
2020). The Philippines ranks fifth in the Western Pacific (behind China, Indonesia, Japan,
and Thailand) in terms of the number of diabetics. Based on the IDF Atlas 2017 Edition,
deaths related to diabetes in the Philippines were estimated to be 50,000 for ages 18
to 99 years old. The rate is expected to climb by 20% more in 2045 (Litonjua, 2018).
These records show that with the increasing number of diabetics, there could also be a
rising number of possible users of coconut sugar. With better promotion or information
dissemination, the projected market demand can largely increase.
Export Market. The analyst projected that the coconut sugar market will have a CAGR
of 5.86% from 2019 to 2024 and reach US$ 397.34 M by the end of 2024. The global
market for coconut sugar can be analyzed in four key regions, namely, North America,
Europe, Asia-Pacific, and the rest of the world. The North American coconut sugar market
covers the USA, Canada, and Mexico while the European coconut sugar market includes
the UK, Germany, France, Italy, Spain, and the rest of Europe. The coconut sugar market

2 5 8 D E P A R T M E N T O F A G R I C U L T U R E P H I L I P P I N E C O C O N U T A U T H O R I T Y
in Asia-Pacific is divided into China, India, Japan, Australia, New Zealand, and the rest of
Asia-Pacific. The rest of the world includes South America, the Middle East, and Africa
(Market Research Future, 2021).
Coconut sugar market demand in North America is led by the USA and Canada. A
significant growth is forecasted due to rising consumer awareness on health issues
pertaining to obesity and diabetes. A growing number of big restaurants across the USA
and Canada such as Starbucks, and Tim Hortons are serving coconut sugar alternative
food and beverages in their branches (Gminsights, 2020). Large food and beverage
manufacturers such as Tyson Foods, JBF, National Beef, and Pepsi Cola Co. are also
present in the USA and are expected to drive the demand for alternative sweeteners
(Grandview Research, 2019).
The demand for coconut sugar in the European market is growing. Greater demand
for natural and high-quality food products paved a way for coconut sugar suppliers
in developing countries to create a market (CBI EU, 2020). In Denmark, the stringent
government regulations on quality, awareness campaigns, and rising consumer inclination
towards high-quality products are expected to have a positive impact on coconut sugar
market demand. Furthermore, the Danish Agriculture and Food Council planned that 20%
of the Danish land area shall be used for organic farming by 2020 (Gminsights, 2020).
European consumers are also concerned with the nutritional values of their food and
beverages. Europeans prefer healthier products and natural sweeteners such as coconut
sugar are increasingly taking the place of sugar in food and beverage products. Based on
the results of a 2016 food consumption survey, out of 2,500 European consumers, 60% of
adults monitored how much sugar they consumed (CBI EU, 2020).
The increasing share of the population aged 65 years and above and the growing number
of them experiencing chronic diseases such as diabetes and heart diseases are expected
to propel the demand for alternative sweeteners such as coconut sugar. Moreover, the
growing interest for bio-based cosmetics in the region is forecasted to open a new door
for coconut sugar market growth over the next eight years (Grandview Research 2019).

2 5 9P H I L I P P I N E C O C O N U T I N D U S T R Y R O A D M A P 2 0 2 1 - 2 0 4 0
Consumers in countries in Europe like UK, Germany, France, and Italy have increasing
inclination towards organic chocolates, jams, honey, and confectionery items as brought
about by the rise in disposable income and their turning towards healthy and high-quality
products. Coconut sugar is widely used in manufacturing chocolates and jams due to its
organic nature and flavor-enhancing quality. This is anticipated to accelerate the future
market demand share for coconut sugar (Gminsights 2020).
The UK government implemented the so-called “sugar tax” on soft drinks in 2018. This
was done to fight childhood obesity. As a result, around 50% of soft drinks manufacturers
decreased their sugar content even before its implementation. This policy leads the way
to stimulate demand for alternative sweeteners such as coconut sugar (CBI EU, 2020).
In the Asia Pacific, the increase in disposable income and growing inclination for high-
quality and natural cosmetics may foster market growth for coconut sugar. Coconut
sugar is widely used in manufacturing face scrubs, peel-off masks, and moisturizers. It
has certain characteristics that prevent loss of moisture in the skin and is compatible with
other organic ingredients such as aloe vera, charcoal, and fruit extracts. The rapid growth
in the cosmetics industry in Korea, India, and China is expected to have a favorable
impact on the future trend of the coconut sugar market (Transparency Research, 2016).
Due to the rising geriatric population as well the increasing diabetic patients and obesity
cases, most consumers are on the lookout for alternatives like organic coconut sugar to
lower down their health risk (Transparency Research 2016). This would be an influencing
factor for the growth in demand for coconut sugar in Europe. In addition, the increasing
demand in the food and beverage sector is expected to support the growth in the target
coconut sugar market (Marketresearch.biz, 2021).
The Asia Pacific is also the largest producer of organic coconut sugar due to the
abundance of raw material (i.e., coconut sap) in the area. Coconut sugar prices are likely
to increase over the course of time due to the anticipated demand in the international
market. The cost of coconut sugar is much higher in the international market compared
with the domestic market. As a result, the manufacturers need to consider the prices to
gain a larger share in the global market (Grandview Research, 2019).

2 6 0 D E P A R T M E N T O F A G R I C U L T U R E P H I L I P P I N E C O C O N U T A U T H O R I T Y
To increase the export demand for Philippine coconut sugar, the DTI suggested that
there is a need to classify and promote Philippine coconut sugar as Philippine coconut
sweetener due to the sensitivity of the international market and health-conscious
consumers in the word “sugar”.
COCO COIRKey Demand Drivers
The versatility of coir fiber as a raw material for a range of uses such as floor coverings,
carpets, doormats, furniture padding, filling for mattresses, floor brushes, ropes, twines,
geotextiles, automobile seat, insulation and as packaging material had made it a much
sought-after product. Below are some of the catalysts for growth in the demand for coir
fiber and its value- added products (Entre Pinoys, 2017; ICC, 2018; and Persistence
Market Research, 2020):
• With the trend in the world going green, products that are sustainable and
environmentally friendly are also in demand. Coir and its products are the much
suitable eco-friendly products available in the market. It is 100% natural and organic
and does not cause any damage to the environment and is relatively cheaper.
• Application to horticulture, soil conditioning, gardening, and hydroponics are some
of the key market drivers for growth of coir products. Coir pith is one of the media
being used for hydroponics which is a water-based method of growing fruits and
vegetables. Hydroponics is gaining popularity among plant growers all over the
world. An increasing number of people are venturing into vegetable growing through
hydroponics system due to several advantages. This will likely lead to a spike in the
demand for coir pith. This medium has certain properties which allow the crop to
grow due to better air-to- water ratio.
• Geotextiles are applied to civil engineering, agriculture, and horticulture such as in
controlling soil erosion and firming soil build up. Synthetic polymers were previously
utilized in producing geotextiles, but coir has appeared to be nature-friendly and
more cost-effective. Coir geotextiles are more fitting for use as they absorb water and
control soil erosion. This eco-friendly property of coir geotextiles is boosting the coir
market. An increasing demand for geotextile products is therefore forecasted.

2 6 1P H I L I P P I N E C O C O N U T I N D U S T R Y R O A D M A P 2 0 2 1 - 2 0 4 0
Other innovations for coir use would create demand in the market as an alternative
environmentally friendly product. Coir ply from coir fiber as a substitute for wood,
rubberized coir mattresses for orthopedic beds and automobile seat cushions, garden
articles from coir fiber to replace plastic ones, converting coir pith into organic manure
or as a plant growth medium in nurseries and reforestation programs would all spur
growth as it creates its own market. However, these require market development, market
intelligence, and intensive promotional efforts.
Coco Coir Domestic and Export Market Prospects
Domestic Market. The local consumption of coir comes in the form of coco
geotextiles (geonets), stitched fiber for bed mattresses, plant liners, and other garden
products, doormats, and bio logs. The demand for these products used to be small
(DA, 2014). In 2012, the Philippine government, however, mandated the Department of
Public Works and Highways (DPWH) to patronize coconut bioengineering technology
such as coco nets, coco logs, coco twine, and coco peat in all its construction projects
if necessary. This agreement made by the Office of the Presidential Assistant for Food
Security and Agricultural Modernization (OPAFSAM) during the Aquino administration
with the National Irrigation Administration (NIA), DPWH, and PCA has expanded the
use of these materials (Costales, 2019). The DPWH needed up to 4 M square meters
of geonets for its road construction and irrigation projects, erosion control, and
embankment protection. In Bicol, the main market for coco geonets are government
agencies like DPWH, the Mines and Geosciences Bureau (MGB), as well as the different
LGUs. The utilization of coco nets has grown at a fast pace, averaging 273% in annual
growth rates from 2011 to 2014. Data showed that the demand for coco geonets for
DPWH projects in Bicol increased from 6,467 m2 in 2011 to 198,017 m2 in 2014, a
2,962% increase. This implies an increasing compliance with the circulars and directives to
use geonets for concrete and riprap (DA, 2014).
The mining sector also served as a big market for coco geonets. The coco geonets that
are applied for environmental rehabilitation are being adopted by the mining companies
to rehabilitate their mined areas, as part of their mandate to mitigate the environmental
effect of their activities (DA, 2014). The mining companies in Surigao del Norte and

2 6 2 D E P A R T M E N T O F A G R I C U L T U R E P H I L I P P I N E C O C O N U T A U T H O R I T Y
Surigao del Sur are also using geonets on sloping areas near communities and highways
to prevent landslides (Panganiban, 2014). In the Bicol Region, the total demand for coco
geonets was 1.45 M m2 in 2014, 86.4% of which comes from mining companies. This
total demand would require 1,928 MT of coir. The region would be able to satisfy the
demand if all decorticators are operating at full capacity and if they do not export or sell
the coir they produce, but instead process them into coco geonets. Filling this need will
create a huge impact in terms of employment in the countryside (DA, 2014).
Much of the demand are coming from the DPWH, NIA, other government agencies and
mining firms. There is also a demand from resorts like in Misamis Oriental and Bohol that
used geonets on slopes near the shoreline (Panganiban, 2014). This trend is expected
to persist in the future because apart from the high tensile strength of the material, it
is relatively abundant, making it cheaper compared to imported synthetic geotextiles.
Most importantly, it is eco-friendly, making it perfect for controlling soil erosion. Its
biodegradable nature promotes vegetation growth underneath, keeping its nutrients
intact. Widespread promotion and dissemination of its beneficial uses and effects would
fast track the growth of the industry. Aside from geonets, there is also an increasing
demand for horticultural purposes. Local markets are making available coco peat/dust
due to its high demand (Bello et al., 2020).
Another coir product that has a good market prospect is coco fiberboard, which is a
better substitute for lawanit, a low-cost panel board being imported in the country. The
total value of imported lawanit reaches US$ 64 M per year while the local yearly demand
for fiberboard is approximately 350,000 cubic meters which is equivalent to Php 5.4 B per
year. Coco fiberboard has superior quality and is more competitive than lawanit. It has
better material strength and can be used in interior and exterior walls as wood parquet,
roof tiles, furniture, and materials for housing construction. Moreover, the production of
coco fiberboards does not need a binder because coir has natural lignin, an adhesive
which is activated at a certain temperature and pressure. Hence, the processing of coco
fiberboards is simpler and cheaper than other particle fiber boards. The cost of producing
coco fiberboard is Php 150 which is less than P 100 compared to lawanit. Since lawanit is
made from timber, its costs may have gone up and its volume of production is less. Coco
fiberboards are now considered more sustainable (DA, 2014).

2 6 3P H I L I P P I N E C O C O N U T I N D U S T R Y R O A D M A P 2 0 2 1 - 2 0 4 0
Export Market Prospect. Previously, the global demand for coco coir and peat
has declined due to the slack in the Chinese economy and the switching of demand
to more value-added coco coir products. Despite this, the Coir Board of India remains
positive that it will revert to normal. The drivers of growth in the global arena would be
the eventual recovery of the Chinese economy, the expanded applications of coco coir
products in the industry and the intensified use of coco peat in horticulture to replace
peat moss in landscaping works and in potting medium. China is a major importer of
coco fiber, accounting for about 70- 75% of the total exports. It uses the raw material for
industrial applications with an estimated requirement of about 450,000 MT annually and
is expected to increase by 10% to 20% per year (Arancon, 2013) as cited by Costales in
2019. In South Korea, cocopeat is widely used in rice farming while in the Middle East,
such as Saudi Arabia, Kuwait, and Qatar, coco peat could substitute for peat moss as a
soil conditioner for ‘imported’ soil for landscaping and horticultural applications. There is
also a projection of an increase in demand from USA (Costales, 2019).
An extensive growth in the global coir market for the period 2020-2030 is anticipated
by the market analyst. The most contribution to market growth would emanate from
Europe and North America. Europe has a 29% share in the global coir market in 2019.
Hydroponics in Europe is becoming favorable to consumers and it is highly related to
the use of coir pith. The leading coir companies such as Fibre Dust LLC, Pelemix Ltd.,
Coco Argo, and others are devising ways to penetrate the hydroponics market. They
are also focusing on product diversification and product customization (as per customer
demand) and expanding the production capacity of coir products. American consumers,
on the other hand, are interested in the use of geotextiles, as the demand for eco-friendly
products is soaring high in the country (Persistence Market Research, 2020). Aside from
these regions, demand would also come from other sources such as Asia where there is a
strong demand for rubberized coir for mattresses use (ACA, 2019).
Sri Lanka is the top producer of coir while India is leaning towards the production of
value-added coir products such as mats, rugs, rope, and geotextiles (Entre Pinoys, 2017).
It is projected that exports from India will continue since the world market for coir and
its products is improving, particularly from China and the USA (ICC 2018). Sri Lanka and
India will continue to be a major supplier of coco coir products with coco peat as their

2 6 4 D E P A R T M E N T O F A G R I C U L T U R E P H I L I P P I N E C O C O N U T A U T H O R I T Y
dominant product. Other coir producers such as the Philippines, Indonesia, Malaysia,
Thailand, and Vietnam will have modest gains in their export of coir products as they
improve on their productivity. Raw coco coir and coco peat products will still be the
dominant export in terms of volume surpassing the other coco coir-based value-added
products except for tufted coco coir mats (Costales, 2019).
In terms of price, the trend will continue to be affected by the performance of China’s
economy and the exports of two major manufacturers and exporters in the world, Sri
Lanka and India. The combined exports volume of these two countries account for about
90% of the global exports for coir products (Costales, 2019).
The Philippines is one of the largest coconut-producing countries in the world, but its coir
production remains very low, and it has very limited participation in exportation in the
world market (Persistence Market Research 2020). This may be attributed to the priority
given to major products of coconut such as copra and desiccated coconut that generate
higher income than coir (Entre Pinoys, 2017). However, there is a very large market
demand and opportunities for coir products. The Philippines can venture into coco chips,
a new coir product which is a good medium for growing plants in greenhouses. Holland
has a Westland with 7,000 hectares of land for plant production under greenhouse
conditions using 1/3 cocopeat, 1/3 chip moist, and 1/3 rock wool, but the country is
slowly removing rock wool due to environmental issues. At present, only Europe and
Korea are using coco chips. These countries import 10,000 containers a year. Future
potential markets would be USA and China. Opportunities are present, but value-adding,
or technical know-how is needed to take advantage of the market demand.
The Philippines also has a potential market for coconut fiber in Switzerland. One of the
universities in Switzerland has developed an organic plywood that is made from coconut
husks which is as good as any wood but without chemicals and glue. Among other
products that Switzerland is eyeing from the Philippines are textile, food and processed
food, and other sustainable products like coconut husks. After the Philippines- European
Free Trade Agreement (EFTA) took effect, the trade between EFTA countries and the
Philippines increased by 9% in 2019. The agreement provides duty-free entry of local
exports to EFTA countries, which include Iceland, Liechtenstein, Norway, and Switzerland
(Business Mirror, 2020).

2 6 5P H I L I P P I N E C O C O N U T I N D U S T R Y R O A D M A P 2 0 2 1 - 2 0 4 0
Although there exist several export market opportunities for coco peat, coco chips for
hydroponics growing medium, coco boards for housing and furniture making, coco
coolers as alternative to styro boxes and coco pallets for shipping of products, the
Philippine coco coir industry would require further product and market development,
market intelligence, and intensive promotional efforts to realize the potential demand and
compete globally particularly with India and Sri Lanka.

2 6 6 D E P A R T M E N T O F A G R I C U L T U R E P H I L I P P I N E C O C O N U T A U T H O R I T Y

2 6 7
SWOT ANALYSIS OF THE COCONUT INDUSTRY
Figure 6.1. SWOT Matrix of the Philippine Coconut Industry, Farmers’ Welfare
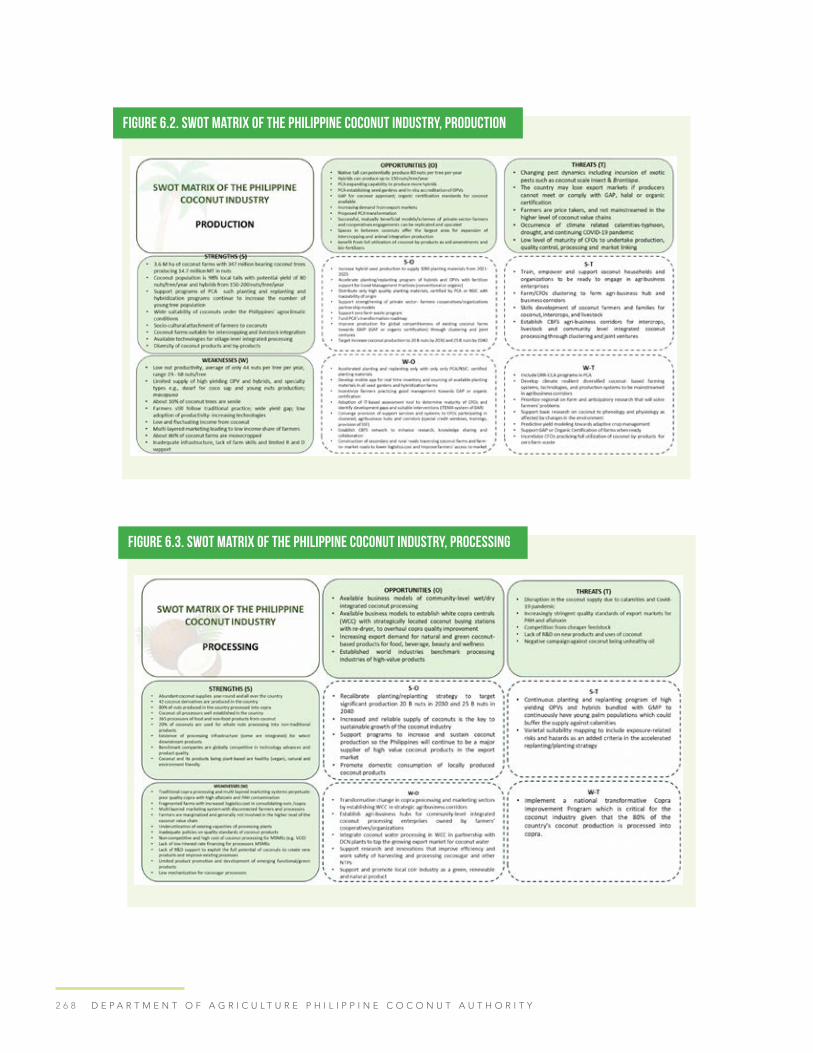
2 6 8 D E P A R T M E N T O F A G R I C U L T U R E P H I L I P P I N E C O C O N U T A U T H O R I T Y
Figure 6.2. SWOT Matrix of the Philippine Coconut Industry, Production
Figure 6.3. SWOT Matrix of the Philippine Coconut Industry, Processing

2 6 9P H I L I P P I N E C O C O N U T I N D U S T R Y R O A D M A P 2 0 2 1 - 2 0 4 0
Figure 6.4. SWOT Matrix of the Philippine Coconut Industry, Marketing
Figure 6.5. SWOT Matrix of the Philippine Coconut Industry, Institutional

2 7 0 D E P A R T M E N T O F A G R I C U L T U R E P H I L I P P I N E C O C O N U T A U T H O R I T Y

2 7 1
TARGET SETTING

2 7 2 D E P A R T M E N T O F A G R I C U L T U R E P H I L I P P I N E C O C O N U T A U T H O R I T Y
Tabl
e 7.
1. P
rogr
am/s
trat
egie
s p
hysi
cal t
arge
ts, r
espo
nsib
ilit
y m
atri
x, 2
021-
2025

2 7 3P H I L I P P I N E C O C O N U T I N D U S T R Y R O A D M A P 2 0 2 1 - 2 0 4 0

2 7 4 D E P A R T M E N T O F A G R I C U L T U R E P H I L I P P I N E C O C O N U T A U T H O R I T Y

2 7 5P H I L I P P I N E C O C O N U T I N D U S T R Y R O A D M A P 2 0 2 1 - 2 0 4 0

2 7 6 D E P A R T M E N T O F A G R I C U L T U R E P H I L I P P I N E C O C O N U T A U T H O R I T Y

2 7 7P H I L I P P I N E C O C O N U T I N D U S T R Y R O A D M A P 2 0 2 1 - 2 0 4 0

2 7 8 D E P A R T M E N T O F A G R I C U L T U R E P H I L I P P I N E C O C O N U T A U T H O R I T Y
Tabl
e 7.
2. P
rogr
am/s
trat
egie
s, fi
nanc
ial t
arge
ts, r
espo
nsib
ilit
y m
atri
x, 2
021-
2025

2 7 9P H I L I P P I N E C O C O N U T I N D U S T R Y R O A D M A P 2 0 2 1 - 2 0 4 0

2 8 0 D E P A R T M E N T O F A G R I C U L T U R E P H I L I P P I N E C O C O N U T A U T H O R I T Y

2 8 1P H I L I P P I N E C O C O N U T I N D U S T R Y R O A D M A P 2 0 2 1 - 2 0 4 0
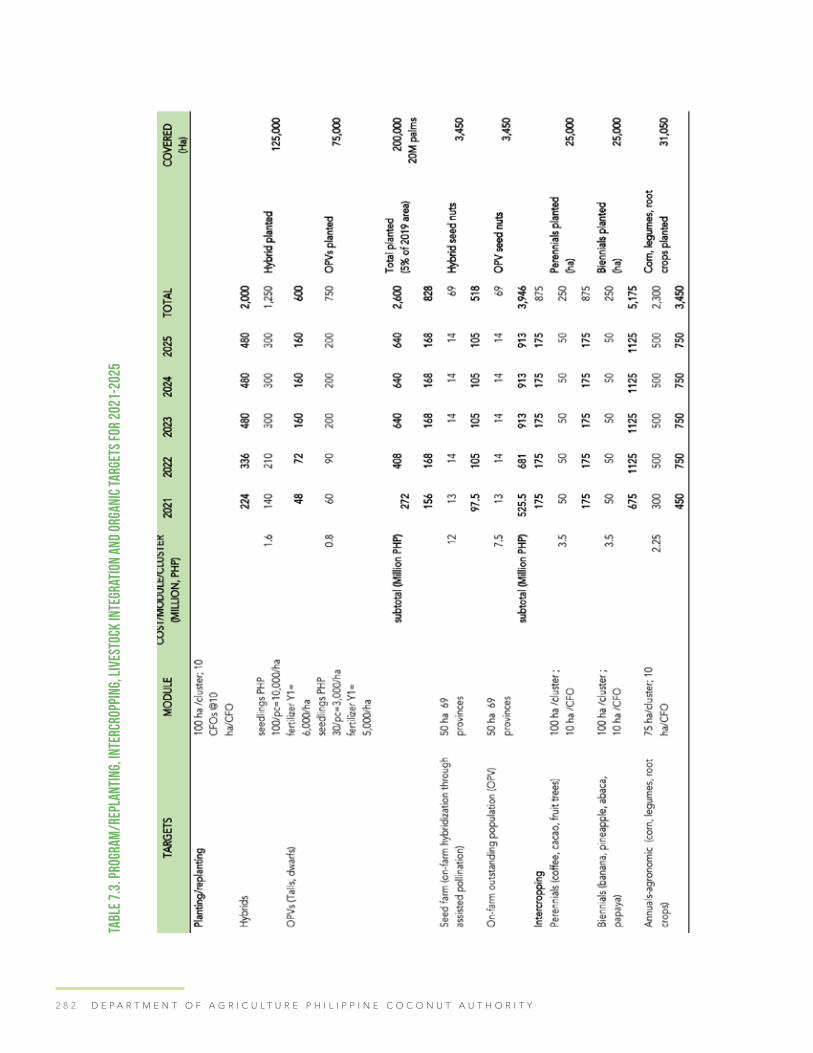
2 8 2 D E P A R T M E N T O F A G R I C U L T U R E P H I L I P P I N E C O C O N U T A U T H O R I T Y
Tabl
e 7.
3. P
rogr
am/r
epla
ntin
g, in
terc
ropp
ing,
live
stoc
k in
tegr
atio
n an
d or
gani
c ta
rget
s fo
r 20
21-2
025

2 8 3P H I L I P P I N E C O C O N U T I N D U S T R Y R O A D M A P 2 0 2 1 - 2 0 4 0

2 8 4 D E P A R T M E N T O F A G R I C U L T U R E P H I L I P P I N E C O C O N U T A U T H O R I T Y
Tabl
e 7.
4. P
rogr
am/s
trat
egie
s a
nd fi
nanc
ial t
arge
ts, r
espo
nsib
ilit
y m
atri
x, 2
021-
2025
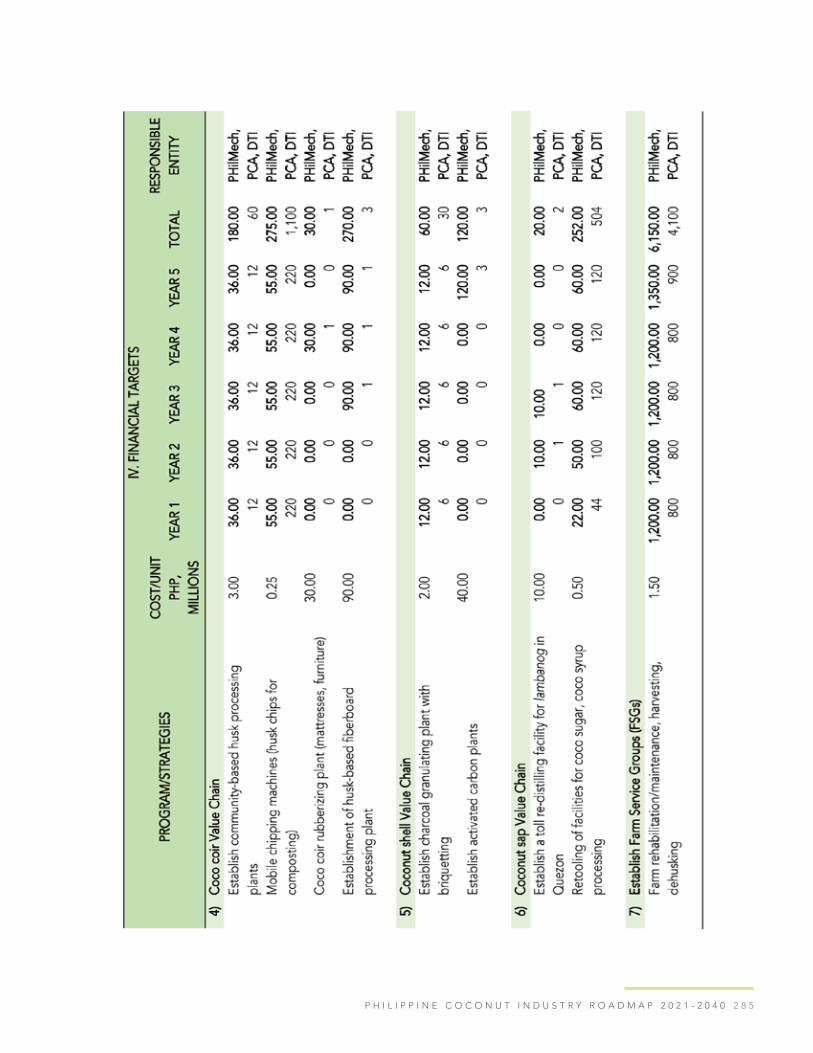
2 8 5P H I L I P P I N E C O C O N U T I N D U S T R Y R O A D M A P 2 0 2 1 - 2 0 4 0

2 8 6 D E P A R T M E N T O F A G R I C U L T U R E P H I L I P P I N E C O C O N U T A U T H O R I T Y

2 8 7P H I L I P P I N E C O C O N U T I N D U S T R Y R O A D M A P 2 0 2 1 - 2 0 4 0
For FY 2021 to 2025, PCA’s farm-level programs are focused on improving farmers’
productivity through the Accelerated Coconut Planting and Replanting Project (ACPRP),
Coconut Fertilization Project (CFP), and Coconut Seed Farm Development Project
(CSFDP). Aggregately, these three (3) programs had a lion’s share of 98% or PHP 38.8
billion of the total farm-level programs, projected to cover 280,000 hectares during the
period. Although strategic KAANIB Enterprise Development Project intercropping and
household-level coconut processing activities are needed to enhance farmers’ income
through diversification and value adding, these two programs had only a total share of
PHP 205 million for the five-year period (Table 5).
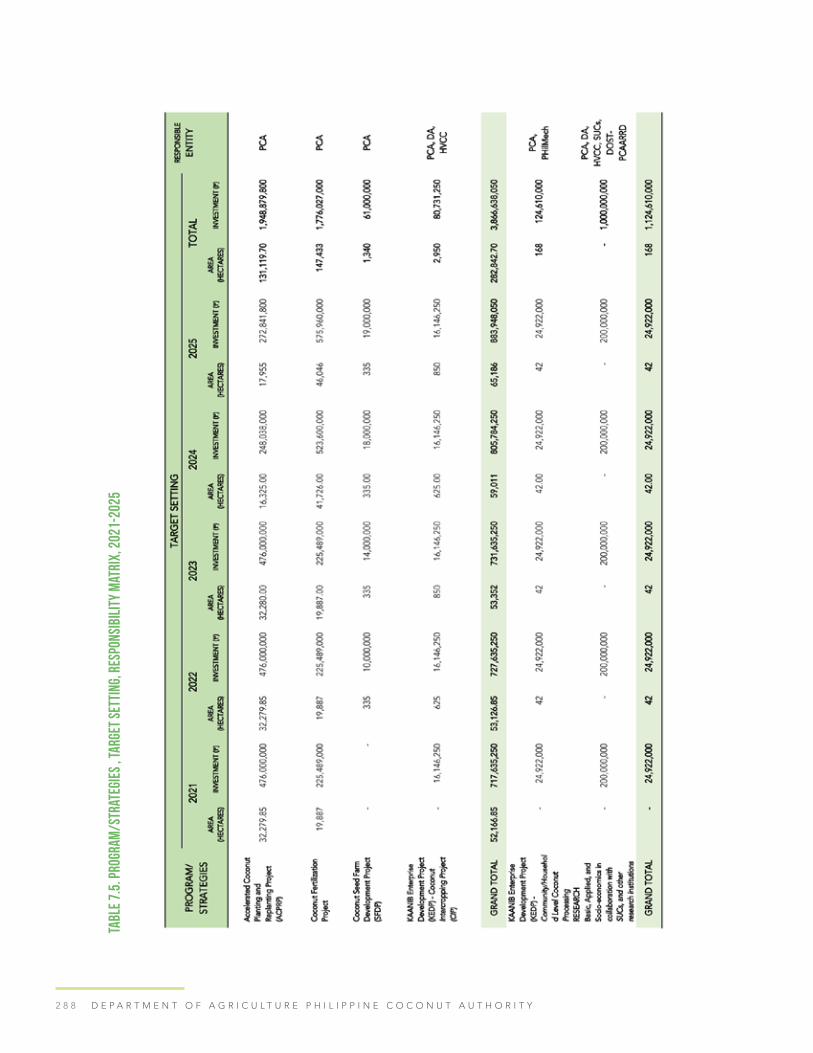
2 8 8 D E P A R T M E N T O F A G R I C U L T U R E P H I L I P P I N E C O C O N U T A U T H O R I T Y
Tabl
e 7.
5. P
rogr
am/s
trat
egie
s , t
arge
t set
ting
, res
pons
ibil
ity
mat
rix,
202
1-20
25

2 8 9
RECOMMENDATIONS FOR POLICIES,
STRATEGIES AND PROGRAMS

2 9 0 D E P A R T M E N T O F A G R I C U L T U R E P H I L I P P I N E C O C O N U T A U T H O R I T Y

2 9 1P H I L I P P I N E C O C O N U T I N D U S T R Y R O A D M A P 2 0 2 1 - 2 0 4 0

2 9 2 D E P A R T M E N T O F A G R I C U L T U R E P H I L I P P I N E C O C O N U T A U T H O R I T Y

2 9 3P H I L I P P I N E C O C O N U T I N D U S T R Y R O A D M A P 2 0 2 1 - 2 0 4 0

2 9 4 D E P A R T M E N T O F A G R I C U L T U R E P H I L I P P I N E C O C O N U T A U T H O R I T Y

2 9 5P H I L I P P I N E C O C O N U T I N D U S T R Y R O A D M A P 2 0 2 1 - 2 0 4 0
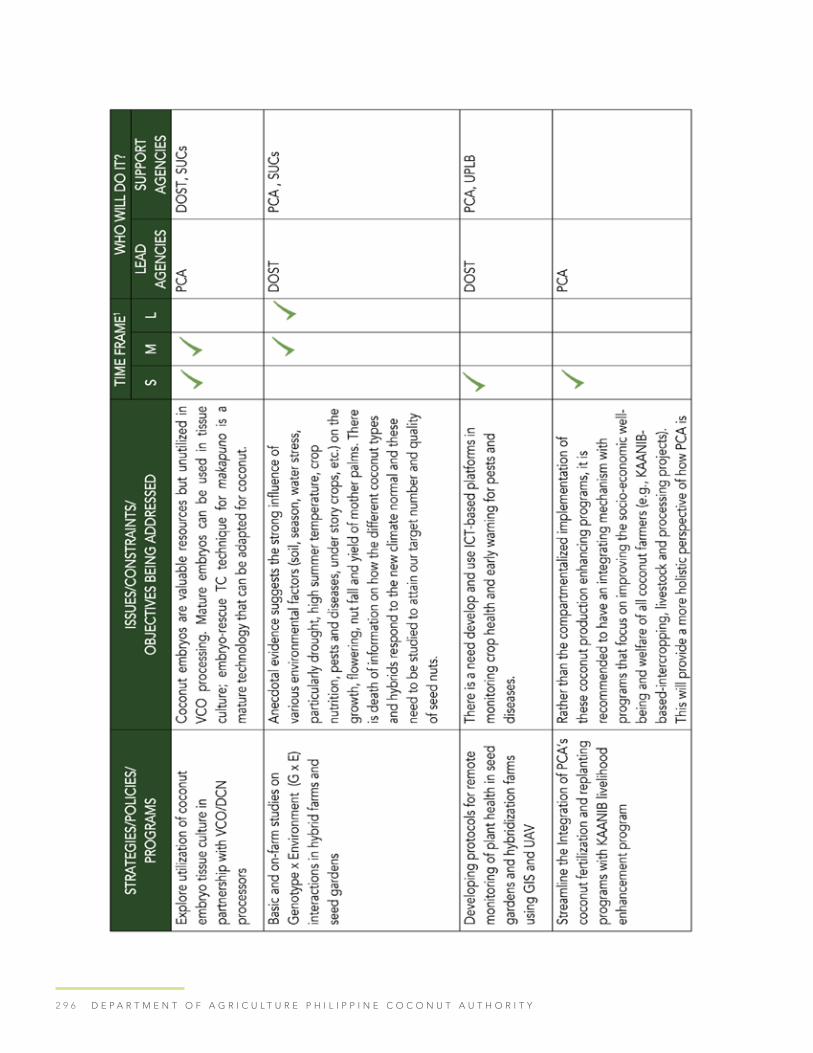
2 9 6 D E P A R T M E N T O F A G R I C U L T U R E P H I L I P P I N E C O C O N U T A U T H O R I T Y

2 9 7P H I L I P P I N E C O C O N U T I N D U S T R Y R O A D M A P 2 0 2 1 - 2 0 4 0

2 9 8 D E P A R T M E N T O F A G R I C U L T U R E P H I L I P P I N E C O C O N U T A U T H O R I T Y

2 9 9P H I L I P P I N E C O C O N U T I N D U S T R Y R O A D M A P 2 0 2 1 - 2 0 4 0

3 0 0 D E P A R T M E N T O F A G R I C U L T U R E P H I L I P P I N E C O C O N U T A U T H O R I T Y

3 0 1P H I L I P P I N E C O C O N U T I N D U S T R Y R O A D M A P 2 0 2 1 - 2 0 4 0

3 0 2 D E P A R T M E N T O F A G R I C U L T U R E P H I L I P P I N E C O C O N U T A U T H O R I T Y

3 0 3P H I L I P P I N E C O C O N U T I N D U S T R Y R O A D M A P 2 0 2 1 - 2 0 4 0
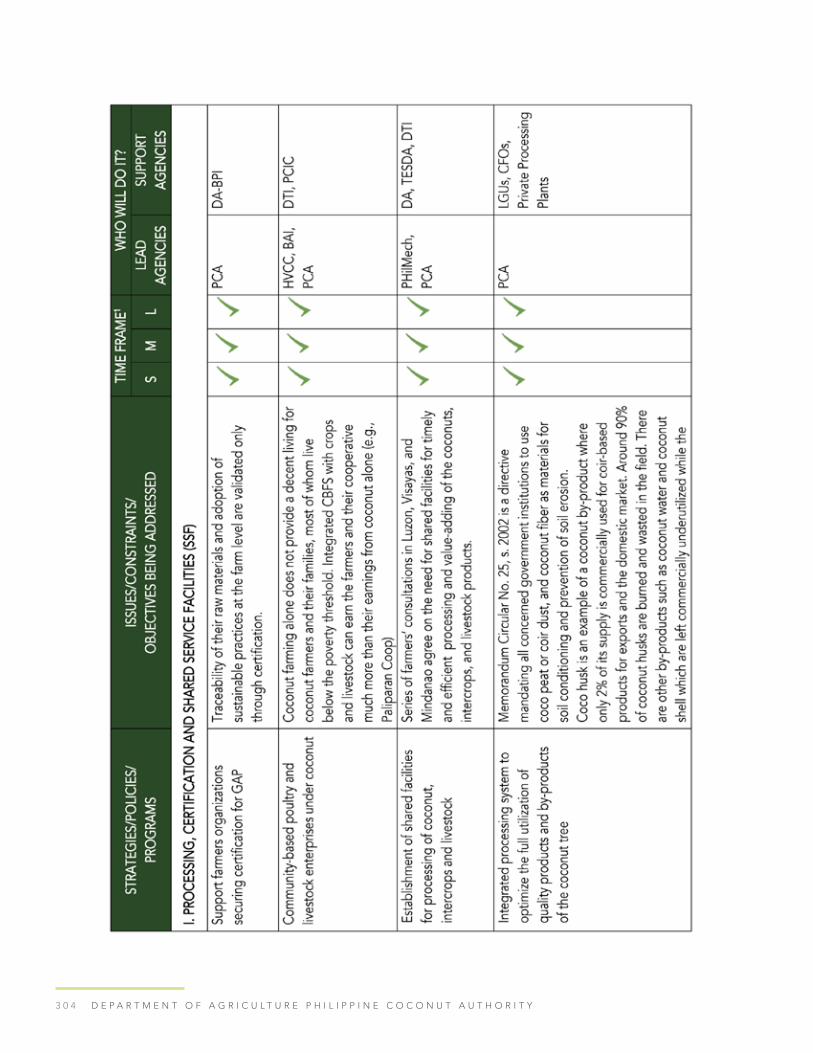
3 0 4 D E P A R T M E N T O F A G R I C U L T U R E P H I L I P P I N E C O C O N U T A U T H O R I T Y
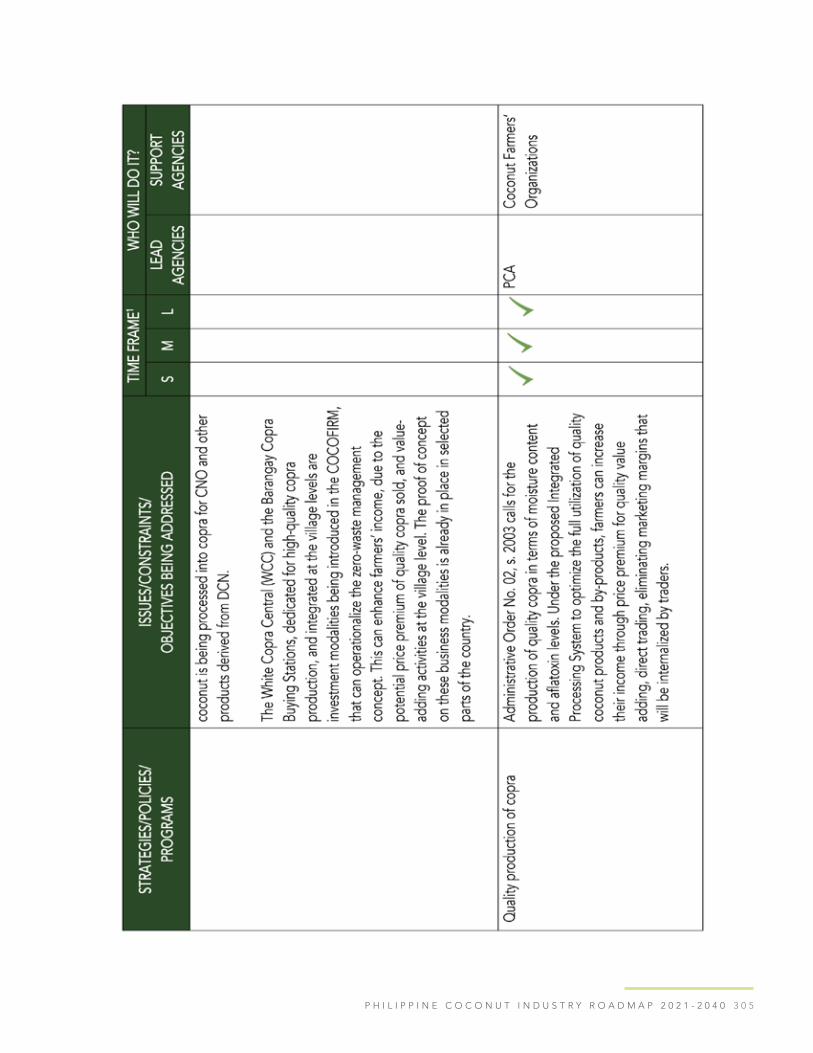
3 0 5P H I L I P P I N E C O C O N U T I N D U S T R Y R O A D M A P 2 0 2 1 - 2 0 4 0
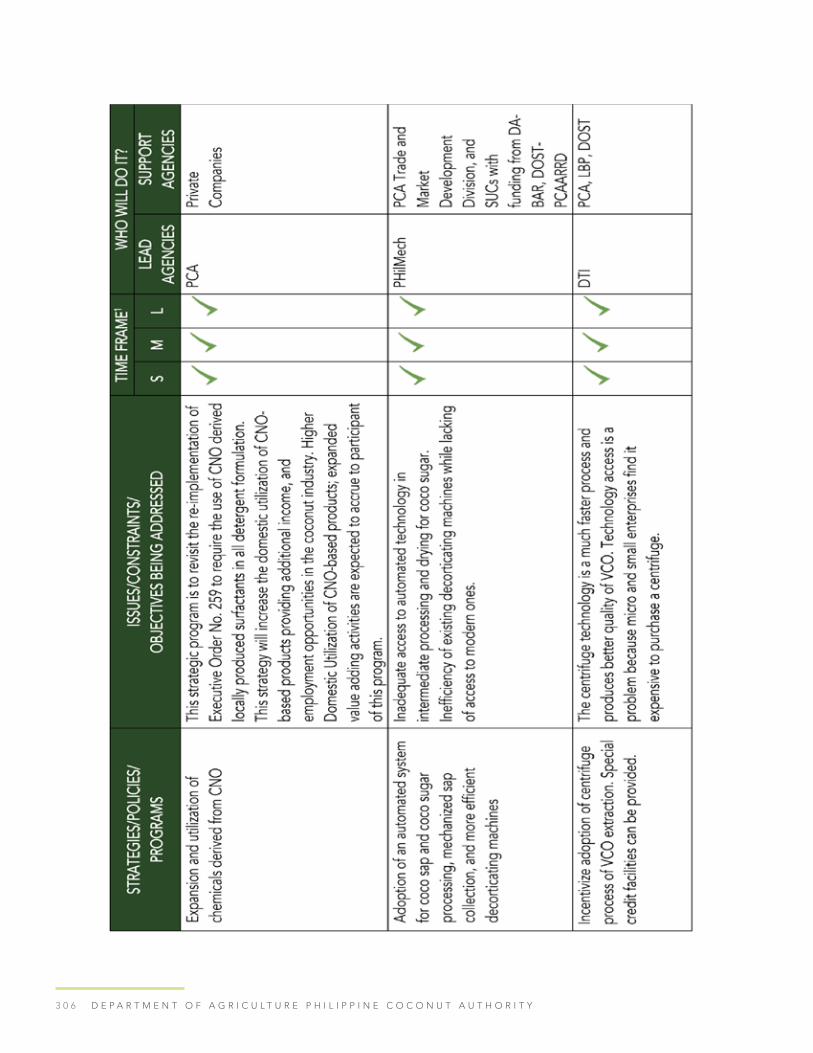
3 0 6 D E P A R T M E N T O F A G R I C U L T U R E P H I L I P P I N E C O C O N U T A U T H O R I T Y

3 0 7P H I L I P P I N E C O C O N U T I N D U S T R Y R O A D M A P 2 0 2 1 - 2 0 4 0

3 0 8 D E P A R T M E N T O F A G R I C U L T U R E P H I L I P P I N E C O C O N U T A U T H O R I T Y

3 0 9P H I L I P P I N E C O C O N U T I N D U S T R Y R O A D M A P 2 0 2 1 - 2 0 4 0
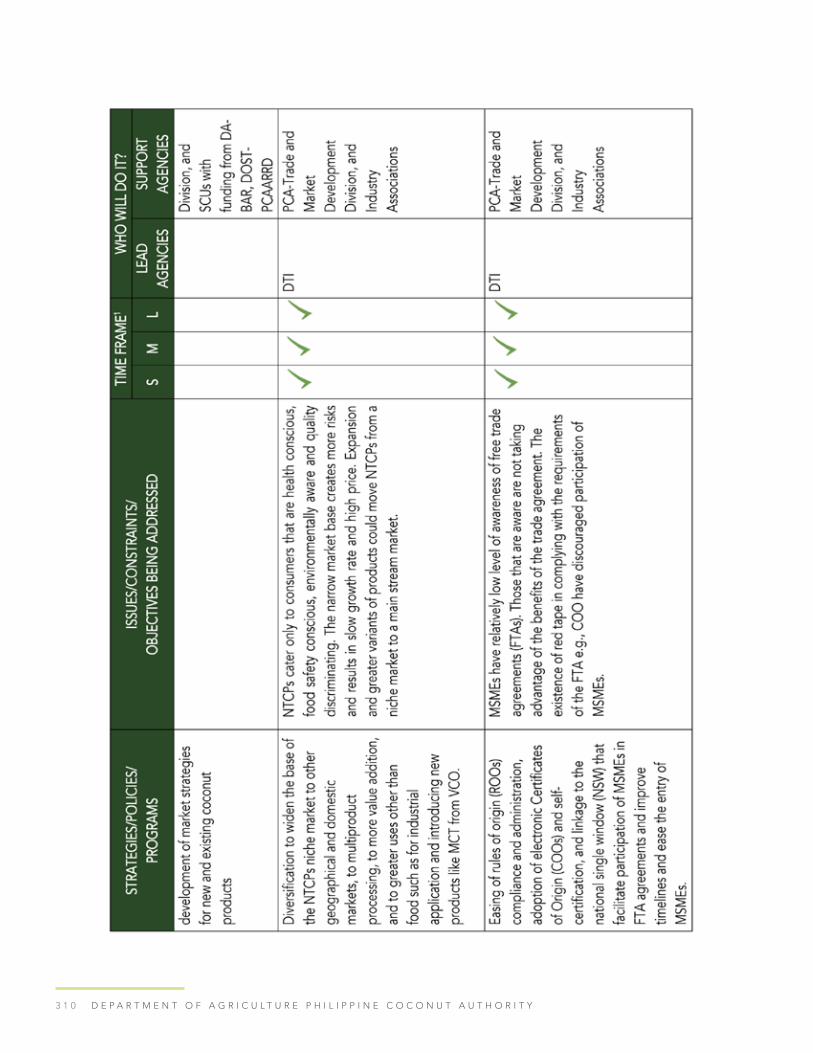
3 1 0 D E P A R T M E N T O F A G R I C U L T U R E P H I L I P P I N E C O C O N U T A U T H O R I T Y
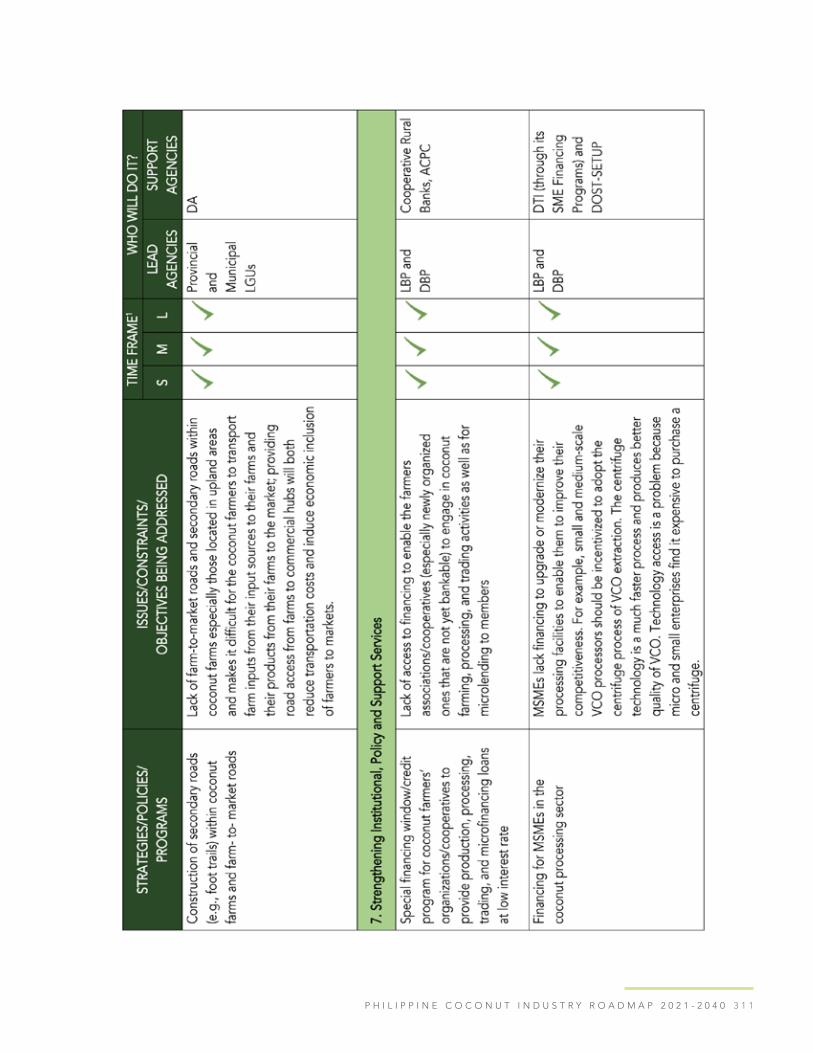
3 1 1P H I L I P P I N E C O C O N U T I N D U S T R Y R O A D M A P 2 0 2 1 - 2 0 4 0

3 1 2 D E P A R T M E N T O F A G R I C U L T U R E P H I L I P P I N E C O C O N U T A U T H O R I T Y

3 1 3P H I L I P P I N E C O C O N U T I N D U S T R Y R O A D M A P 2 0 2 1 - 2 0 4 0

3 1 4 D E P A R T M E N T O F A G R I C U L T U R E P H I L I P P I N E C O C O N U T A U T H O R I T Y

3 1 5P H I L I P P I N E C O C O N U T I N D U S T R Y R O A D M A P 2 0 2 1 - 2 0 4 0

3 1 6 D E P A R T M E N T O F A G R I C U L T U R E P H I L I P P I N E C O C O N U T A U T H O R I T Y

3 1 7P H I L I P P I N E C O C O N U T I N D U S T R Y R O A D M A P 2 0 2 1 - 2 0 4 0
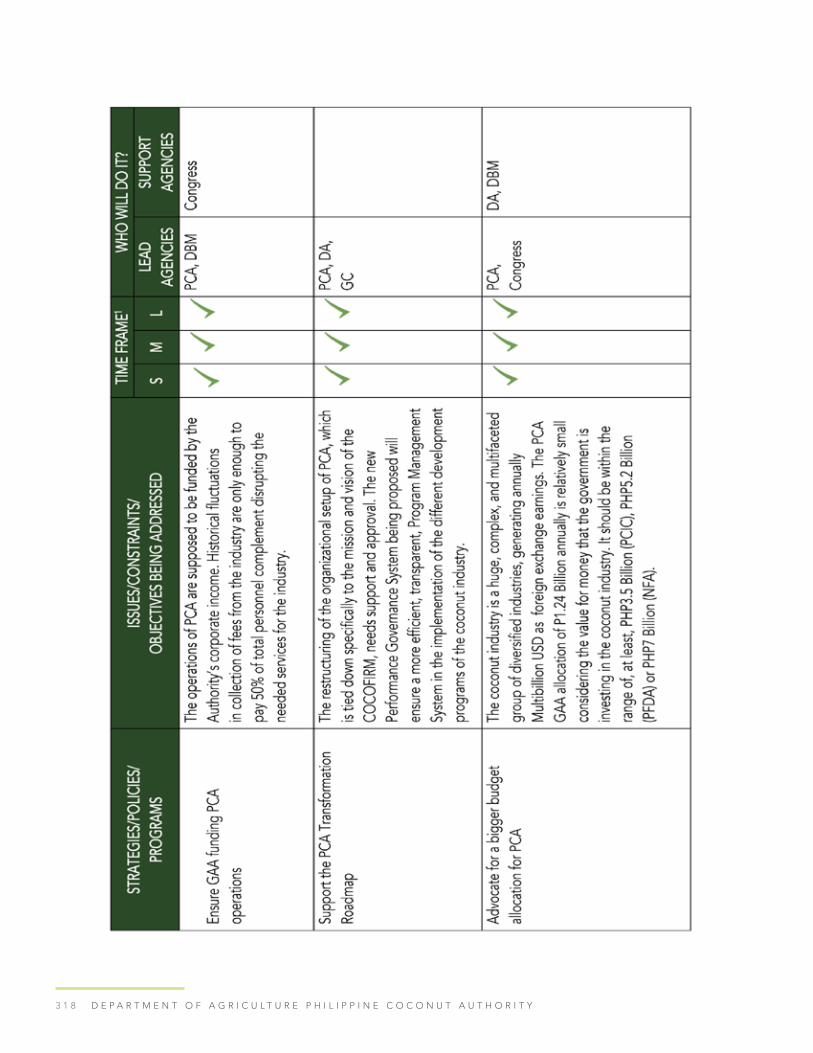
3 1 8 D E P A R T M E N T O F A G R I C U L T U R E P H I L I P P I N E C O C O N U T A U T H O R I T Y

3 1 9P H I L I P P I N E C O C O N U T I N D U S T R Y R O A D M A P 2 0 2 1 - 2 0 4 0

3 2 0 D E P A R T M E N T O F A G R I C U L T U R E P H I L I P P I N E C O C O N U T A U T H O R I T Y

3 2 1
INDUSTRY CLUSTER GOVERNANCE NETWORK

3 2 2 D E P A R T M E N T O F A G R I C U L T U R E P H I L I P P I N E C O C O N U T A U T H O R I T Y
Tabl
e 9.
1. in
dust
ry c
lust
er g
over
nanc
e ne
twor
k (im
plem
enta
tion
team
)

3 2 3P H I L I P P I N E C O C O N U T I N D U S T R Y R O A D M A P 2 0 2 1 - 2 0 4 0

3 2 4 D E P A R T M E N T O F A G R I C U L T U R E P H I L I P P I N E C O C O N U T A U T H O R I T Y

3 2 5P H I L I P P I N E C O C O N U T I N D U S T R Y R O A D M A P 2 0 2 1 - 2 0 4 0

3 2 6 D E P A R T M E N T O F A G R I C U L T U R E P H I L I P P I N E C O C O N U T A U T H O R I T Y

3 2 7P H I L I P P I N E C O C O N U T I N D U S T R Y R O A D M A P 2 0 2 1 - 2 0 4 0

3 2 8 D E P A R T M E N T O F A G R I C U L T U R E P H I L I P P I N E C O C O N U T A U T H O R I T Y

3 2 9P H I L I P P I N E C O C O N U T I N D U S T R Y R O A D M A P 2 0 2 1 - 2 0 4 0

3 3 0 D E P A R T M E N T O F A G R I C U L T U R E P H I L I P P I N E C O C O N U T A U T H O R I T Y

3 3 1P H I L I P P I N E C O C O N U T I N D U S T R Y R O A D M A P 2 0 2 1 - 2 0 4 0

3 3 2 D E P A R T M E N T O F A G R I C U L T U R E P H I L I P P I N E C O C O N U T A U T H O R I T Y
3 3 3
MONITORING EVALUATION & IMPACT ASSESSMENT
COCOFIRM forges strategic partnerships with the coconut industry stakeholders, DA-
PCA, other government agencies, and the private sector in achieving the coconut
industry’s vision, mission, and goals.
In Figure 10.1, the COCOFIRM will be implemented by the DA-PCA, in collaboration
with other government agencies or partnership with the private sector. In the new
organizational structure of the PCA, an Assessment and Monitoring Service (AMS) has
been created under the Office of the Administrator. A major function of this Service
Unit is to assess and monitor all development projects related to the coconut industry.
A participatory collaboration with other government agencies and active partnership
with the private sector is envisioned as central in the execution of the mandate of the
Assessment and Monitoring Service.
It is desirable for PCA/AMS to develop a National Coconut Industry Program Monitoring
Database (CIPMoD) to properly document projects and milestones and capture
relevant data through baseline questionnaires complementary to the NCFRS, post-
project assessments, and feedback mechanisms from various project stakeholders. A
collaborative project planning, implementation, monitoring and evaluation helps support
and understand communities better and encourage participation and project ownership
of beneficiaries. CIPMoD can be instrumental in capturing best practices that can be
scaled up or replicated as well as can document lessons learned to feed into better
development of other projects and programs. The implementation of CIPMoD requires
capacity building of national, regional, and provincial personnel to create and implement
a transparent monitoring system. Provincial and regional data can feed into one national
database.

3 3 4 D E P A R T M E N T O F A G R I C U L T U R E P H I L I P P I N E C O C O N U T A U T H O R I T Y
The COCOFIRM’s VISION is to have a resilient, secure, sustainable, and globally
competitive coconut industry with empowered and prosperous farmers. Its MISSION is to
develop agro-industrial growth corridors with synergistic and inclusive integration of all
stakeholders.
The mission and vision will be achieved through the transformation of seven (7) strategic
programs which are elucidated in Figure 10.2. The proposed systems framework to
monitor, evaluate, and assess the likely impacts of COCOFIRM is graphically illustrated
below. In Figure 10.2, these program categories are not stand-alone systems. They were
envisioned programs supporting and reinforcing each other. For example, given the
General Market demand-driven strategy for COCOFIRM, any processed coconut product
identified for the global and domestic markets will be communicated to the trade and
marketing program. It is also important to note that products produced under the CBFS,
like intercrops and livestock, are closely linked with Agri-business Hubs and Corridors.
Activities under each output are not mutually exclusive but are placed under an output
where the activity has a more significant contribution in the achievement of the output.
For example, activities under Output 5 (Improved Competitiveness of Traditional and
Non-Traditional Coconut Products in Local and Global Markets), such as the construction
Figure 10.1. Proposed National Coconut Industry Program Monitoring Database (CIPMoD) for COCOFIRM
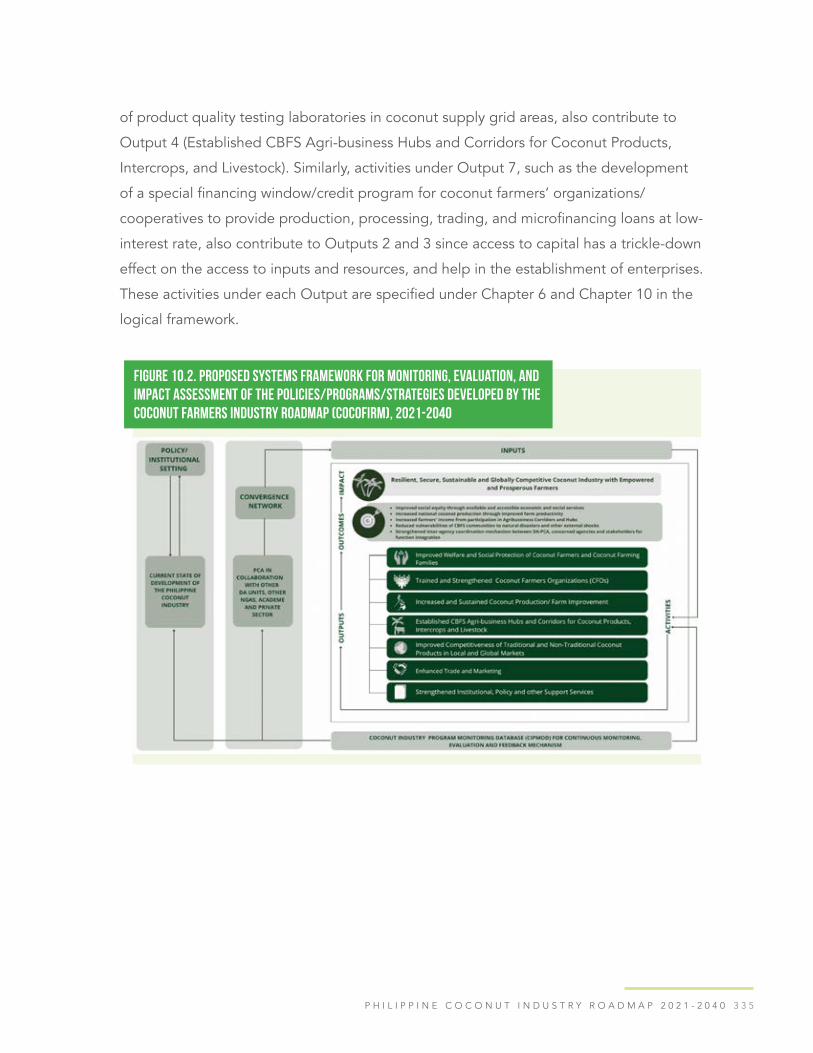
3 3 5P H I L I P P I N E C O C O N U T I N D U S T R Y R O A D M A P 2 0 2 1 - 2 0 4 0
of product quality testing laboratories in coconut supply grid areas, also contribute to
Output 4 (Established CBFS Agri-business Hubs and Corridors for Coconut Products,
Intercrops, and Livestock). Similarly, activities under Output 7, such as the development
of a special financing window/credit program for coconut farmers’ organizations/
cooperatives to provide production, processing, trading, and microfinancing loans at low-
interest rate, also contribute to Outputs 2 and 3 since access to capital has a trickle-down
effect on the access to inputs and resources, and help in the establishment of enterprises.
These activities under each Output are specified under Chapter 6 and Chapter 10 in the
logical framework.
Figure 10.2. Proposed Systems Framework for Monitoring, Evaluation, and Impact Assessment of the Policies/Programs/Strategies Developed by theCoconut Farmers Industry Roadmap (COCOFIRM), 2021-2040
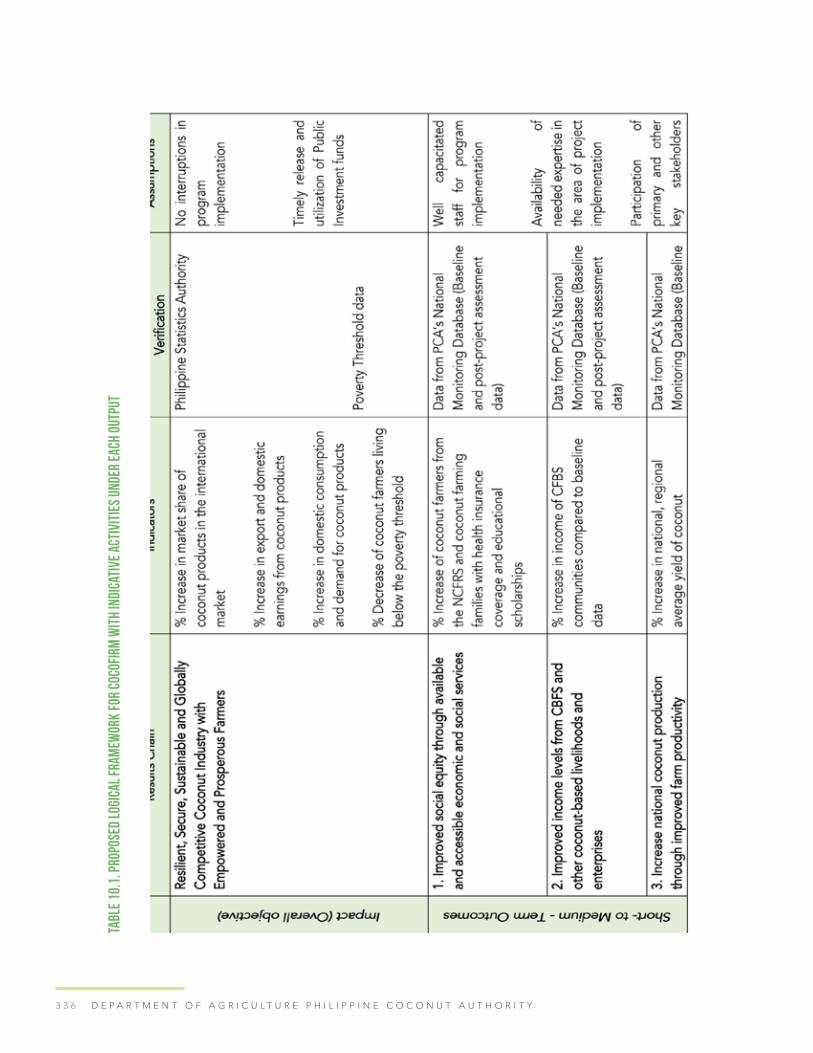
3 3 6 D E P A R T M E N T O F A G R I C U L T U R E P H I L I P P I N E C O C O N U T A U T H O R I T Y
Tabl
e 10
.1. P
ropo
sed
logi
cal f
ram
ewor
k fo
r CO
COFI
RM w
ith
indi
cati
ve a
ctiv
itie
s un
der
each
out
put
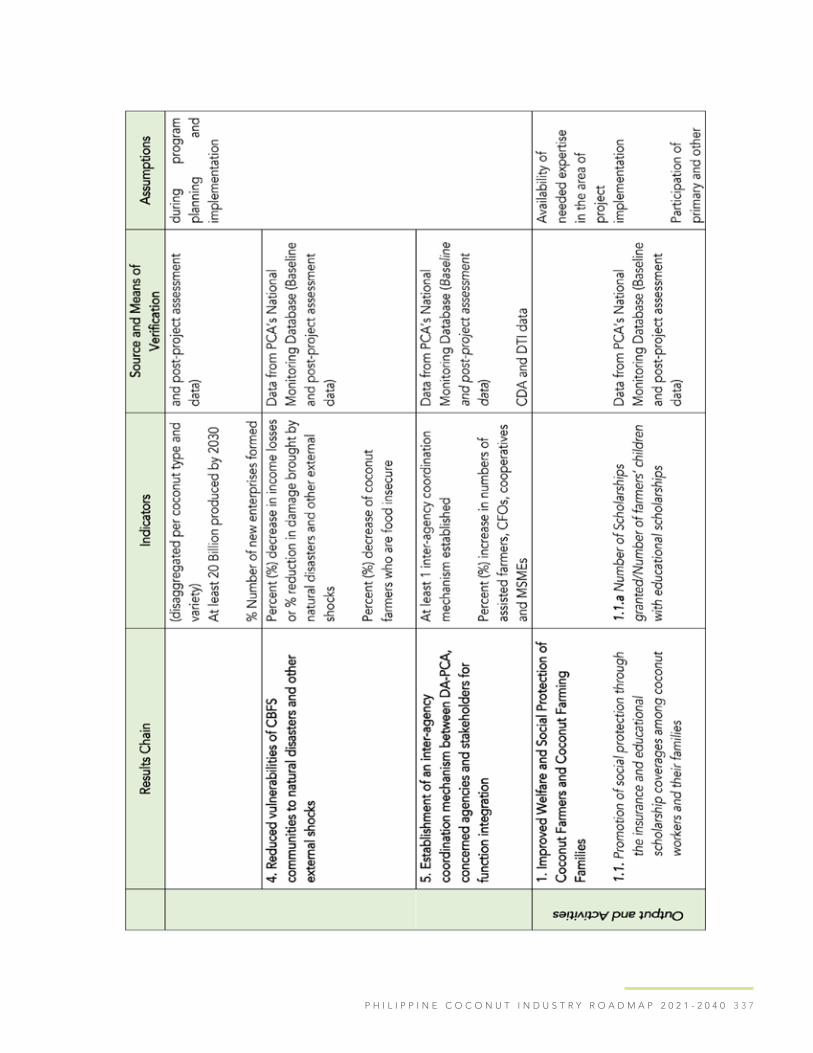
3 3 7P H I L I P P I N E C O C O N U T I N D U S T R Y R O A D M A P 2 0 2 1 - 2 0 4 0
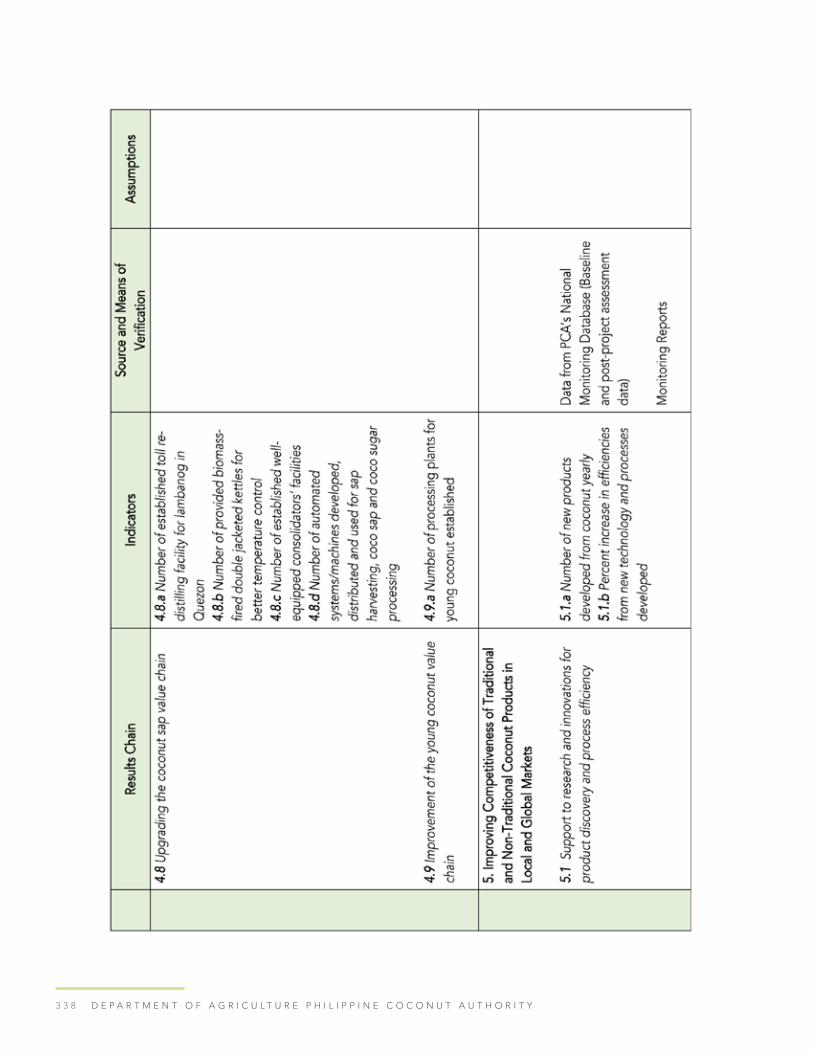
3 3 8 D E P A R T M E N T O F A G R I C U L T U R E P H I L I P P I N E C O C O N U T A U T H O R I T Y

3 3 9P H I L I P P I N E C O C O N U T I N D U S T R Y R O A D M A P 2 0 2 1 - 2 0 4 0

3 4 0 D E P A R T M E N T O F A G R I C U L T U R E P H I L I P P I N E C O C O N U T A U T H O R I T Y

3 4 1P H I L I P P I N E C O C O N U T I N D U S T R Y R O A D M A P 2 0 2 1 - 2 0 4 0

3 4 2 D E P A R T M E N T O F A G R I C U L T U R E P H I L I P P I N E C O C O N U T A U T H O R I T Y

3 4 3P H I L I P P I N E C O C O N U T I N D U S T R Y R O A D M A P 2 0 2 1 - 2 0 4 0

3 4 4 D E P A R T M E N T O F A G R I C U L T U R E P H I L I P P I N E C O C O N U T A U T H O R I T Y
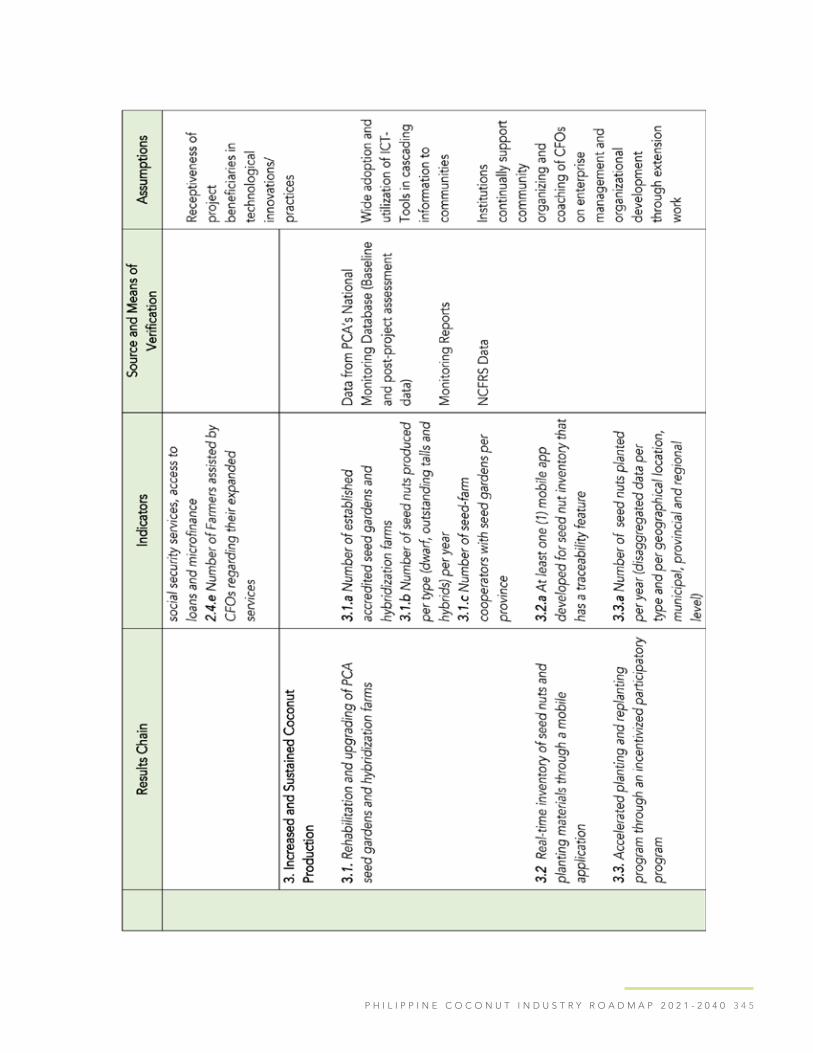
3 4 5P H I L I P P I N E C O C O N U T I N D U S T R Y R O A D M A P 2 0 2 1 - 2 0 4 0
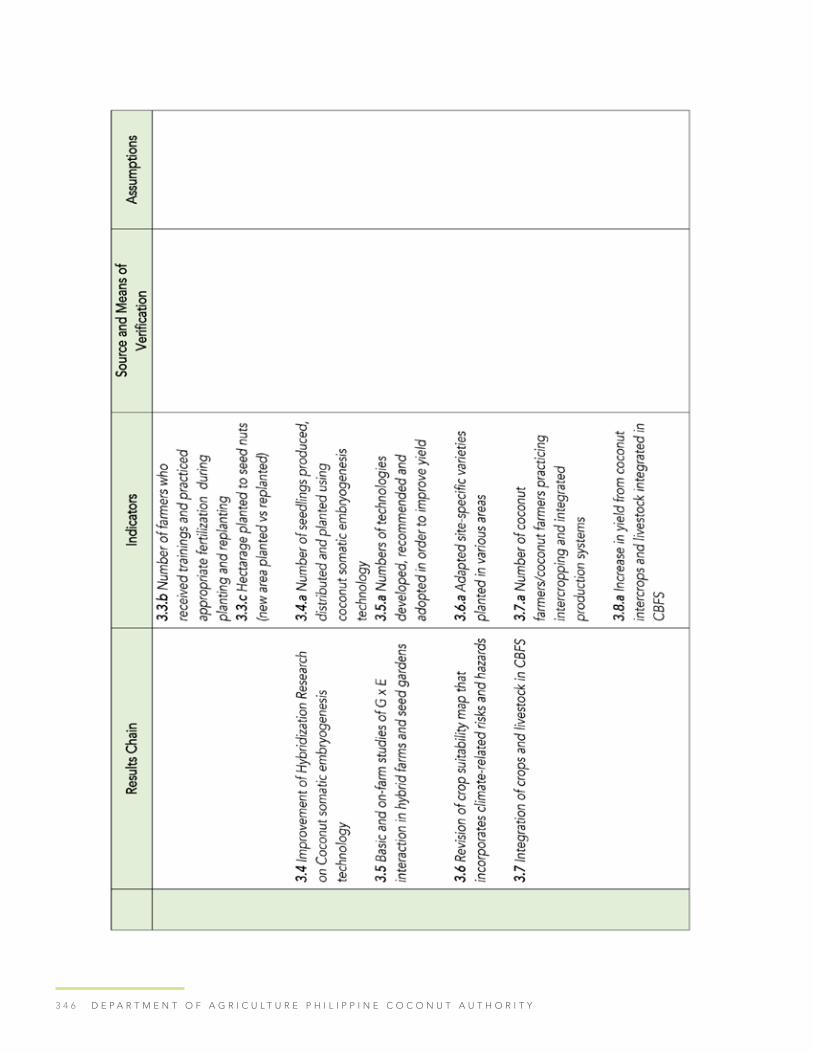
3 4 6 D E P A R T M E N T O F A G R I C U L T U R E P H I L I P P I N E C O C O N U T A U T H O R I T Y

3 4 7P H I L I P P I N E C O C O N U T I N D U S T R Y R O A D M A P 2 0 2 1 - 2 0 4 0

3 4 8 D E P A R T M E N T O F A G R I C U L T U R E P H I L I P P I N E C O C O N U T A U T H O R I T Y

3 4 9P H I L I P P I N E C O C O N U T I N D U S T R Y R O A D M A P 2 0 2 1 - 2 0 4 0

3 5 0 D E P A R T M E N T O F A G R I C U L T U R E P H I L I P P I N E C O C O N U T A U T H O R I T Y

3 5 1
ANNEXES

3 5 2 D E P A R T M E N T O F A G R I C U L T U R E P H I L I P P I N E C O C O N U T A U T H O R I T Y
Description and Uses of Traditional and Selected Nontraditional Coconut Products Included in the Coconut Farmers and Industry RoadmapCopra. Copra is the dried meat or kernel of the coconut. It is used as raw material in
processing coconut oil.
Coconut Oil. Coconut oil refers to the oil extracted from the edible part of a coconut,
which is known as the “kernel” of the coconut. The Philippines exports three types of
coconut oil, namely: crude coconut oil (CNO), refined bleached oil (RBO) or cochin oil,
and refined bleached deodorized oil (RBD) (Agustin, 2012 and CIIF, n.d.).
a. CNO refers to the oil extracted from copra after it has undergone pre-treatments,
such as reduction in size and heating. It is used as raw material in the manufacture of
cooking oil, specialty fats, oils, and oleochemicals.
b. Cochin oil or RBO is a refined but undeodorized coconut oil. It is derived by refining
crude coconut oil through neutralization and bleaching. Refined bleached oil is a
preferred raw material in the production of edible as well as non-edible products for
greater quality improvement.
c. RBD is a type of coconut oil that is “refined, bleached and deodorized”. It is mostly
used for home cooking, industrial and commercial food processing, and cosmetic and
pharmaceutical purposes. Since RBD coconut oil has a high level of lauric and caprylic
acid, it is an excellent choice for cooking. These fats are popular for fighting health
issues such as inflammation caused by polyunsaturated fatty acids.
Desiccated Coconut. Desiccated coconut (DCN) is a white, grated, dried, and
unsweetened fresh meat or kernel of a mature coconut, produced in many sizes and
textures from extra fine to coarse grades (Grenville, 2020). It is available in various
specialties or fancy-cuts like chips, threads, flakes, and slices. DCN is widely used in
the bakery and confectionery industries to enhance the texture, flavor, aroma, degree
of chewiness, and appearance of a wide variety of pastries and desserts, like nut bars

3 5 3P H I L I P P I N E C O C O N U T I N D U S T R Y R O A D M A P 2 0 2 1 - 2 0 4 0
cookies, biscuits, cakes, pies, and ice cream. It is used as toppings for cakes and pastries
as well as fillers in chocolate candy bars, among others. Having low cholesterol and
calories, yet high in fat, DCN is commonly consumed by those who pursue a low calorie-
high fat diet and a ketogenic diet. More than giving additional flavor, DCN became a go-
to-weight loss food or ingredient.
Copra Meal. Copra meal or copra cake is an important by-product of coconut oil milling or
oil extraction. It is an important animal feed ingredient because of its high protein and fat.
Coco Shell Charcoal. Coconut shell charcoal is the by-product resulting from the burning
of coconut shells of fully matured nuts with limited air supply and is carbonized (Coconut
Board, n.d.). Coconut shell charcoal is widely used as fuel for domestic and industrial use.
It has various uses for domestic, metallurgical, and chemical industries. It is used as the
chief raw material in the production of activated carbon. Coconut shell charcoal forms the
best raw material for producing granular activated carbon, an important product for many
industries.
Coco Shell-based Activated Carbon. Activated carbon made from coconut shells is a
form of carbon that has been processed by physicochemical activation method using
zinc chloride or calcium chloride to increase its porosity creating a larger surface area for
adsorption (CBTECH, 2018). Coconut shell carbon is the best material in eliminating taste
and odor compounds and superior for gas/vapor phase application. The density of micro-
pores is much higher in coconut than in other forms of activated carbon. It contains 50%
more micro-pores than bituminous coal making it better able to adsorb volatile organic
chemicals, which are otherwise difficult to remove from water. The most notable benefit is
that coconut shell-based activated carbon creates the cleanest water than any activated
carbon due to its porosity, total pore volume, and lack of leaching. Coconut shell-
activated carbon is known for its high hardness and low dust. It has a very high hardness
and is more abrasion-resistant than any other type of activated carbon. It is a totally
natural, environmentally friendly product, that has a very small carbon footprint since it is
derived from coconut shells.
Virgin Coconut Oil. Virgin coconut oil (VCO) is oil obtained from the fresh, mature kernel
of the coconut by mechanical or natural means with or without the use of heat, without

3 5 4 D E P A R T M E N T O F A G R I C U L T U R E P H I L I P P I N E C O C O N U T A U T H O R I T Y
undergoing chemical refining, bleaching, or deodorizing, and which does not lead to
the alteration of the nature of the oil (Cristobal, 2019). VCO is an oil that is suitable for
consumption without the need for further processing. It consists mainly of medium-chain
triglycerides, which are resistant to peroxidation. The saturated fatty acids in VCO are
distinct from animal fats, the latter consisting mainly of long-chain saturated fatty acids.
Some of the health benefits from VCO are lower cholesterol levels and reduced risk of
heart disease and diabetes (Dy, n.d.). Its lauric acid content also helps in weight loss,
healing wounds, and boosting the immune system. VCO is used as a food supplement,
body oil, massage oil, and as an ingredient in various personal care products (Arancon,
2010). It is also used in animal pets and racehorses.
Coco Water. Coconut water, less commonly known as coconut juice, is the clear liquid
inside coconuts (Dy, 2006). It is often extracted from young green coconuts. Domestically,
it is usually sold by small traders along the streets and in small eateries. It was used
intravenously during the war and in emergency situations. Nowadays, it is marketed as a
natural alternative to sports drinks due to its high electrolyte content. Used as a hydrating
drink, coconut water helps replenish fluids and minerals lost during prolonged physical
activity. Currently, a common practice among Filipino processor-exporters is to process
and export coconut water concentrate in a tetra pack. Concentrated coconut water is
produced through a process in which the coconut water is turned into a syrup by vacuum
evaporation and mostly concentrated to 60 degrees Brix, but it can be concentrated
to lower Brix values before it is packed (iTi Tropicals, 2014). Once the syrup has been
formed, water is added to it and then the water concentrate is packed. Coconut water
concentrate has the same taste, appearance, and nutritional content as single-strength
coconut water. Single-strength coconut water is the regular strength version of pure,
filtered coconut water extracted from fresh coconuts, and is a clear to slightly cloudy
liquid free from extraneous materials (Franklin Baker, n.d.). The characteristic of natural
coconut water is its refreshing, slightly sweet, and nutty natural taste.
Coco Coir Products. Coco coir products are natural fibers extracted from the husk, which
is the outer cover of the coconut fruit, with or without retting or soaking (Costales, 2019).
The husk either comes from green or immature coconut or from mature or brown nuts.
Coco coir consists of strands of coco fibers used in manufacturing value-added products

3 5 5P H I L I P P I N E C O C O N U T I N D U S T R Y R O A D M A P 2 0 2 1 - 2 0 4 0
such as organic ropes, twine, brooms, and brushes; doormats, rugs, cushion for car
seats, bed mattresses, and other upholstery, often in the form of rubberized coir pads;
geotextile nets for road construction; and bio-logs for erosion control, desertification, and
riverbank rehabilitation. Coconut peat consists of fine particles churned out in the process
of decorticating coconut husk to produce coco coir. Coir dust or coco peat is a byproduct
of making coco coir and has many horticultural and agricultural uses like soil conditioner
to substitute for peat moss and as a component of organic fertilizer and potting soil.
Coco Sap Products. Two new promising coco sap products covered in the roadmap
are coconut sugar and coconut aminos. Coconut sugar is a sweetener derived from the
sap of coconut trees (Dy, 2006). It is considered a healthy alternative to common table
sugar and artificial sweeteners. It has gained popularity as a natural sweetener safe for
diabetics because of its low glycemic index. It also contains a selection of amino acids
and vitamins which are beneficial to the human body. Coconut aminos is a dark-colored
salty, savory seasoning sauce made from the fermented sap of coconut trees and sea salt
(Miller, 2019). Coconut aminos act as a soy-free and gluten-free alternative to soy sauce
that provides a similar taste without the risk of allergic reactions or food sensitivities.
Coconut aminos has 73% less sodium than soy sauce. It is used to produce a variety of
food products.
Regional Production Trends and OutlookIn designing appropriate agri-business corridors and products for coconut and intercrops,
an analysis of the production trend and outlook at the regional level is important for
targeted planning. This chapter presents the status and outlook of regional coconut
production in the Philippines and supplements the information already provided by
regional roadmaps. The coconut statistics used are from PSA while the data on planting/
replanting, trees cut, farms applied for land conversion, and fertilization was obtained
from PCA.
Consistent with the changes in coconut hectarage, nut production in the country is
continuously fluctuating. The decline in production accompanied the yearly drop in area
planted to coconut from 2010 to 2014. Thereafter, there had also been a continuous

3 5 6 D E P A R T M E N T O F A G R I C U L T U R E P H I L I P P I N E C O C O N U T A U T H O R I T Y
increase in area planted to coconut, reaching 3.65 M ha- the highest in the past 11 years.
When managed well and risks from impending disasters are mitigated, this net increase
in coconut areas by almost 150,000 ha from 2014 to 2019 (PSA, 2019) could significantly
increase production in the coming years.
Despite the increased hectarage, the decline in yield started in 2012 and continued until
2016, followed by a slow recovery in nut production in 2017 which, by 2019, remained at
a level that was 1.1B short of the 2012 production (Figure 3.94). The key to full recovery
and sustainable growth of the production sector includes incentivizing farmers who
replant senile and damaged trees, plant in new areas with good quality seedlings, and
practice good, sustainable production management (whether producers opt for GAP
or organic production system). The production system for intercrops and livestock to
be integrated with coconuts should also follow the management system adopted for
coconuts. Thus, in the agribusiness corridor, there will be a sector for organic production
systems (which should be certified) to exploit the growing green niche market, and a
sector for the modern, high-input (including chemicals) production systems.
The COCOFIRM Program Team expects the PCA regional management—in consultation
with the coconut farmers’ organizations and other stakeholders—to use these production
trends and industry outlook as a supplement and complement to their regional
development plans, particularly to strategize the priorities and targets for improving
farmers’ welfare and to incentivize those who sustainably increase coconut production
and mainstream their participation at a higher level of the value chain, both in the
coconut and intercrops agri-business corridors.
The PCA’s coconut planting and replanting program from 2010/2011 to 2019 reported
102M trees planted in 962,134 ha, benefiting more than 608,000 farmers. This number
was less than 3% of the population of coconut-bearing trees in 2009 and only a net
increase of about 150,000 ha was reflected in 2019. Apparently, the majority of these
newly planted/replanted trees were replacement trees for those that were cut under RA
8048, for the senile trees, or for those damaged by typhoon, pests, and diseases.
Replanting and expansion replace more than 20% senile and largely unproductive trees.

3 5 7P H I L I P P I N E C O C O N U T I N D U S T R Y R O A D M A P 2 0 2 1 - 2 0 4 0
Mindanao produced more than half of the coconut production in the Philippines that
accounts for almost 60% in 2019, while Luzon and Visayas contributed only 26% and
14%, respectively. Table 60 details the contribution of each region in Mindanao where
Davao Region was the top regional nut producer of the country (13%), followed closely
by Northern Mindanao and Zamboanga Peninsula (12% each). All three regions have
more than 1.7B nut production over 300,000 ha planted to coconut with more than 32M
Figure 3.94. Area planted and volume of nut production in the Philippines, 2009–2019
Source: PSA, 2019
Figure 3.95. Number of bearing trees and number of seedlings planted/ replanted under the PCA program, 2009–2019
Source: PSA, 2019

3 5 8 D E P A R T M E N T O F A G R I C U L T U R E P H I L I P P I N E C O C O N U T A U T H O R I T Y
bearing trees. All regions of Mindanao, have a higher average yield per tree relative to
the national average except BARMM (39/nuts/tree/year).
The country’s coconut production had an average of 22% difference between the first
half of the year and the second half from 2015 to 2019. There were differences in trend
among regions, as follows: MIMAROPA, CALABARZON (>60%), Bicol Region, Eastern
Visayas, Central Visayas and Ilocos Region (30-45%), BARMM, Northern Mindanao, and
Central Visayas (10-20%), Western Visayas, Cagayan Valley and Caraga (<10%), and
Davao and SOCCSKSARGEN (<1%). Notably, Zamboanga Peninsula and CAR had higher
yields in the first half of the year compared with the second half, with 2.4% and 26.4%
differences, respectively.
Table 3.62. Yield difference among regions between the Jan - June and July - Dec, 2015-2019, Philippines
The regional and provincial production trends discussed in this section highlight the need
to consider production analysis at the provincial than the regional level. Within regions,
there were stark differences in coconut production trends across provinces where only
one, or at most three provinces, had significant contributions to coconut production. To
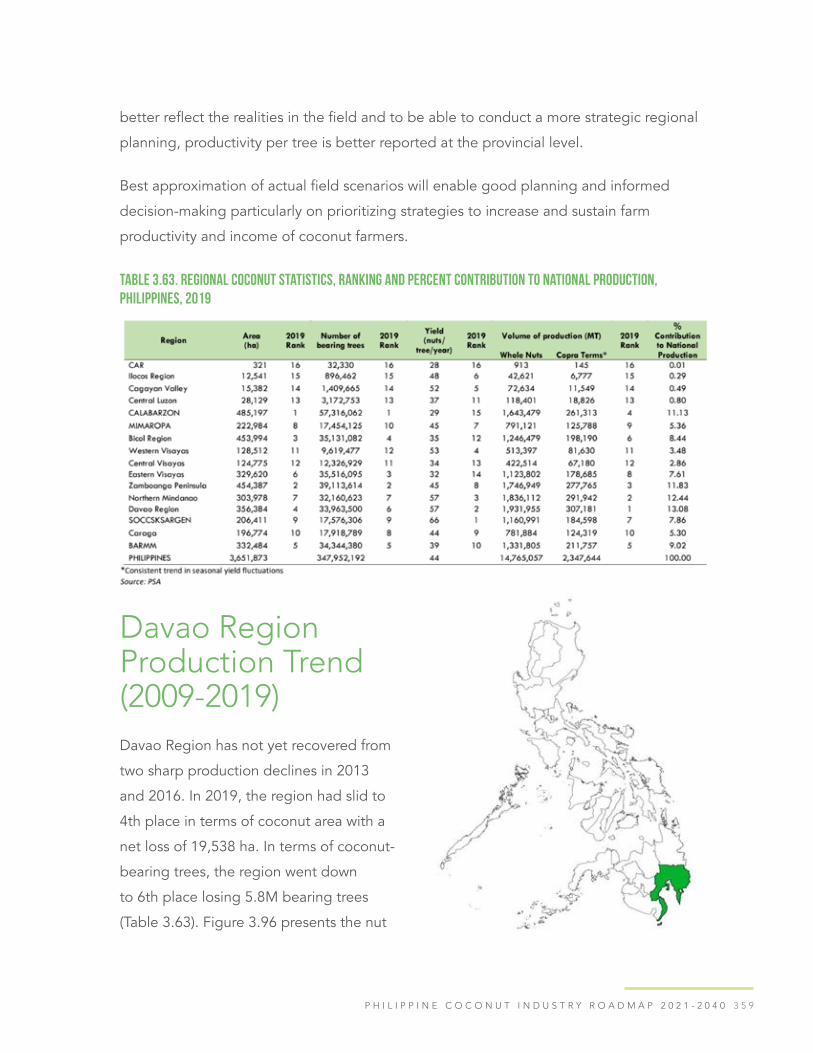
3 5 9P H I L I P P I N E C O C O N U T I N D U S T R Y R O A D M A P 2 0 2 1 - 2 0 4 0
better reflect the realities in the field and to be able to conduct a more strategic regional
planning, productivity per tree is better reported at the provincial level.
Best approximation of actual field scenarios will enable good planning and informed
decision-making particularly on prioritizing strategies to increase and sustain farm
productivity and income of coconut farmers.
Table 3.63. Regional coconut statistics, ranking and percent contribution to national production, Philippines, 2019
Davao Region Production Trend(2009-2019)Davao Region has not yet recovered from
two sharp production declines in 2013
and 2016. In 2019, the region had slid to
4th place in terms of coconut area with a
net loss of 19,538 ha. In terms of coconut-
bearing trees, the region went down
to 6th place losing 5.8M bearing trees
(Table 3.63). Figure 3.96 presents the nut

3 6 0 D E P A R T M E N T O F A G R I C U L T U R E P H I L I P P I N E C O C O N U T A U T H O R I T Y
production trend while Figure 3.97 presents the yearly growth trend in the provinces of
Davao Region.
With approximately 2.7B nuts, Davao Region still maintained its position as the top
coconut producer in 2019 despite significant losses in coconut area, number of bearing
trees, and productivity per tree (from 68 nuts/tree in 2009 to 57 nuts/tree in 2019).
Northern Mindanao trailed behind with 9.5M nuts. The semestral variation in yield was also
not pronounced in Davao Region, with less than 1% difference between the first half and
second half of the year (Table 3.62). Hence, supply was more predictable and reliable.
Figure 3.96. Volume of nut production and area planted to coconut in Davao Region, 2009–2019
Basic source of data: PSA
From 2009 to 2019, Davao Region suffered seven years of zero to negative growth in
nut production (i.e., 2010–2011, 2013, 2015–2017, and 2019). This situation is alarming
since Davao Region is the country’s top coconut producer. The overall production,
area planted, and yield per tree were on a downward trend during those years. If the
downward trend in production in Davao Region continues and the damaged areas are not
replanted or replaced, the national production will contract and semestral yield variation
will be more pronounced, threatening as well the reliability of supply. Continuing and
upscaled rehabilitation and replanting of coconut areas in high-producing provinces
of Davao Region are particularly critical for the long-term sustainability of coconut
production and the industries dependent on it.

3 6 1P H I L I P P I N E C O C O N U T I N D U S T R Y R O A D M A P 2 0 2 1 - 2 0 4 0
Table 3.64. Coconut regional and provincial statistics, Davao Region, 2019
Figure 3.97. Coconut production growth rate in Davao Region, 2009–2019
Basic source of data: PSA

3 6 2 D E P A R T M E N T O F A G R I C U L T U R E P H I L I P P I N E C O C O N U T A U T H O R I T Y
Category 5 Super Typhoon Bopha (Pablo) in 2012 was the strongest tropical cyclone
that hit Mindanao. The typhoon caused massive losses in many areas along its path,
specifically in Davao Region and Caraga Region where the most severe damages were
incurred. Davao Region lost almost 6M bearing trees particularly in Davao Oriental and
Compostela Valley. The province of Davao Oriental reported a 40% loss both in coconut
production and hectarage while Compostela Valley lost 33% and 52% of their coconut
production and areas, respectively (www.reliefweb.int). Both provinces have not recovered
from these losses until 2019 (Figure 3.98).
Davao Oriental, Davao del Sur, and Davao Occidental contributed about 65% to the
regional production of Davao Region (Figure 3.98 and Table 3.64). Davao Oriental
and Davao del Sur contributed 34% and 32%, respectively, while Davao Occidental
contributed 21% to the regional production in 2019.
Without further loss in area and number of trees, the decline in nut production in the
region persisted because of the severe and prolonged El Niño that lasted for 18 months
between February 2015 and July 2016. This phenomenon severely affected 16 of the
country’s 18 regions, with strongest impact in Mindanao that affected 27 provinces. (DA
Figure 3.98. Provincial nut production growth rate in Davao Region, 2009–2019
Note: Davao Occidental data before 2019 was included in Davao del SurBasic source of data: PSA
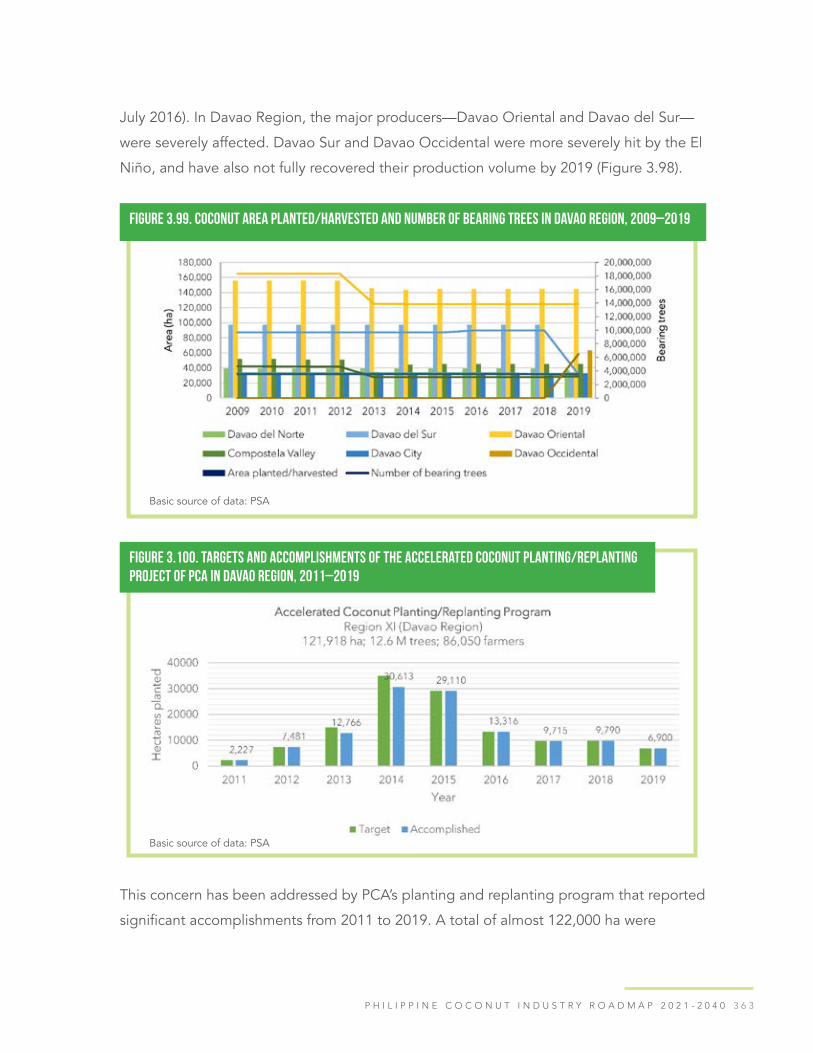
3 6 3P H I L I P P I N E C O C O N U T I N D U S T R Y R O A D M A P 2 0 2 1 - 2 0 4 0
July 2016). In Davao Region, the major producers—Davao Oriental and Davao del Sur—
were severely affected. Davao Sur and Davao Occidental were more severely hit by the El
Niño, and have also not fully recovered their production volume by 2019 (Figure 3.98).
Figure 3.99. Coconut area planted/harvested and number of bearing trees in Davao Region, 2009–2019
Basic source of data: PSA
Figure 3.100. Targets and accomplishments of the accelerated coconut planting/replanting project of PCA in Davao Region, 2011–2019
Basic source of data: PSA
This concern has been addressed by PCA’s planting and replanting program that reported
significant accomplishments from 2011 to 2019. A total of almost 122,000 ha were

3 6 4 D E P A R T M E N T O F A G R I C U L T U R E P H I L I P P I N E C O C O N U T A U T H O R I T Y
planted/replanted with 12.6M seedlings, benefiting 86,050 farmers in the region. This
figure is almost 32% of the total area in the region in 2009 (Figure 3.100).
Of the total accomplishments, 4.4M seedlings were planted in Davao Oriental, 2.5M in
Davao del Sur/Davao Occidental (2019), and 2.1M in Compostela Valley (Davao de Oro).
Assuming that survival rate is at 75%, the coconut trees planted should offset all losses in
coconut hectarage incurred by the region; however, this recovery was not reflected in the
2019 data of the PSA. According to the data, Davao Oriental is still short by 11,300 ha
from its hectarage in 2012 and Compostela Valley, by 6,200 ha.
Davao Region has a total land area of 473,223 has apportioned for coconut (Figure
3.101). There are only about 912 coconut-producing barangays in Davap. Although
this number appears to be small, it already represents 78% of the entire barangays in
the Region. Given the vast land allotted to coconut and a small number of barangays,
on average, the landholdings for coconut per barangay is roughly more than 500 has
compared with other regions that have an estimated 80 to 325 has of land. There are
263,825 coconut farmers that can be the source of the raw materials to the processors
via copra, matured nuts, and buko intermediaries. These farmers must be protected with
comprehensive insurance packages from the national government.
Predominant in the place are coco shell charcoal producers, desiccators, coco food
processors, oil millers, coir, and coco syrup companies. Around 70% of the goods
produced in the region are destined for export. The improvement in farm production is
crucial to the region as there are several competing uses from multitudes of processors.
Similar to Region X, expansion of farmlands is beneficial for Davao Region due to the
high suitability of the land for coconut plantation and its present high productivity rate.
Davao Region has a widespread growth in the coconut industry. Hence, every node in
the value chain must be carefully evaluated. Interventions laid out in Chapter VIII would
matter for every player in the value chain segment. To highlight a few, the proposed
Farmer-Owned White Copra Central (FWCC) and Farmer- Owned Copra Buying Station
(FCBS) would resolve the need to involve the farmers in the trading and processing
sectors. This intervention would also help stabilize the supply of nuts to large companies.
Some of the weaknesses of the industry, as pointed out in the roadmap, are lack of

3 6 5P H I L I P P I N E C O C O N U T I N D U S T R Y R O A D M A P 2 0 2 1 - 2 0 4 0
trainings or expertise on value- adding, low farm production and productivity due
to senility and poor agricultural practices, weak organizational capacities of farmers’
organizations, farmers limited access to financing, poor or inconsistent quality of copra,
among others (PCA Region XI, 2019). To address these weaknesses, the following
interventions are proposed: training on new value-adding technologies, expansion of
hybridization and fertilization program, provision of incentives for farmers in adopting
Good Agricultural Practices (GAP), support to farmer organizations securing certification
for GAP, capacity building of coconut farmers’ organizations, and special financing
window for farmers’ organizations.
The data reflected by the PSA is much lower than the PCA data: this discrepancy in
reporting calls for data reconciliation and harmonization. The PCA Regional Coconut
Statistics (2019) reported 2.38B nuts harvested from about 37M bearing trees.
Figure 3.101. Product flow map of the coconut industry in Davao Region, 2021
Source: PCA Region XI, 2019

3 6 6 D E P A R T M E N T O F A G R I C U L T U R E P H I L I P P I N E C O C O N U T A U T H O R I T Y
The COCOFIRM Program Team recommends the regular monitoring of the survival and
field performance of the new plantings. Assessment of the survival rate, particularly of those
planted the year before and during the severe El Niño of 2015–2016, would be harsh for
the seedlings planted in more than 50,000 ha at that time, as well as the 43,000 young
palms planted in the previous two years. Surviving palms planted from 2011 to 2014,
totaling 51,000 ha should start to be productive in 2019, and surviving palms that were
planted until 2019 are expected to be productive by 2024. Yield performance of these
young coconut populations would be important in projecting yield beyond 2024. Applying
GAP to already highly productive and suitable areas will further increase yield levels.
Prioritizing hybrid planting in owner-tiller farms (coconut ARCs) in Davao Region, with
additional criteria on climate hazards assessment and mitigation (e.g., identifying source
of supplemental irrigation), will significantly contribute to future-proofing the sustained
growth of the coconut industry.
Northern Mindanao Production Trend (2009-2019)Northern Mindanao contributed 12% to
the national coconut production. Three of
the five provinces namely, Lanao del Norte,
Misamis Oriental, and Misamis Occidental
equally contributed about 30% each to the
region’s total production.
From 2009 to 2019, the region increased
its coconut area by 3,400 ha (Figure
3.102). While production was reduced
by approximately 3% in 2016 and 2017,
presumably due to the impact of the 18 months of El Niño in 2014–2015, the upward trend
to recovery has already started but never reached the high level of production in 2015.

3 6 7P H I L I P P I N E C O C O N U T I N D U S T R Y R O A D M A P 2 0 2 1 - 2 0 4 0
From 2011 to 2019, the PCA reported planting/ replanting of 28,341.4 ha of coconut area
(with 3,273,177 seedlings) in the region. This area is equivalent to less than 2% of the
coconut hectarage in 2011. According to data provided in the regional roadmap, about
13% of the trees (4.8M) were senile. Although slow, consistent year- by-year planting/
replanting program can offset the reported 353,401 trees cut from 2011 to 2019, but still
inadequate in replacing senile trees. Nonetheless, at 75% survival of newly planted trees,
minus the losses from cutting and converted farms, there should be about 17,600 ha of
young coconut populations that are expected to be productive by the year 2024.
The total number of farmers expected to be given social protection is 153,050 (Figure
3.105). Farms covered 1,355 coconut-producing barangays or around 66% of the entire
scope of Region X. There are still areas for expansion as identified in the regional
roadmap although land-use conversion is recognized as a threat. Given that the land of
Northern Mindanao is classified as highly suitable for coconut plantation, it pays off to
plant and replace senile trees with hybrid varieties. The establishment of coconut seed
farms per province is envisioned in the future together with the identification of suitable
fertilizers location-wise (PCA Region X, 2019).
Figure 3.102. Volume of whole nut production and area planted to coconut in Northern Mindanao, 2009–2019
Note: The net change in area planted is not consistent with PCA’s report ofaccomplishment in their planting /replanting program
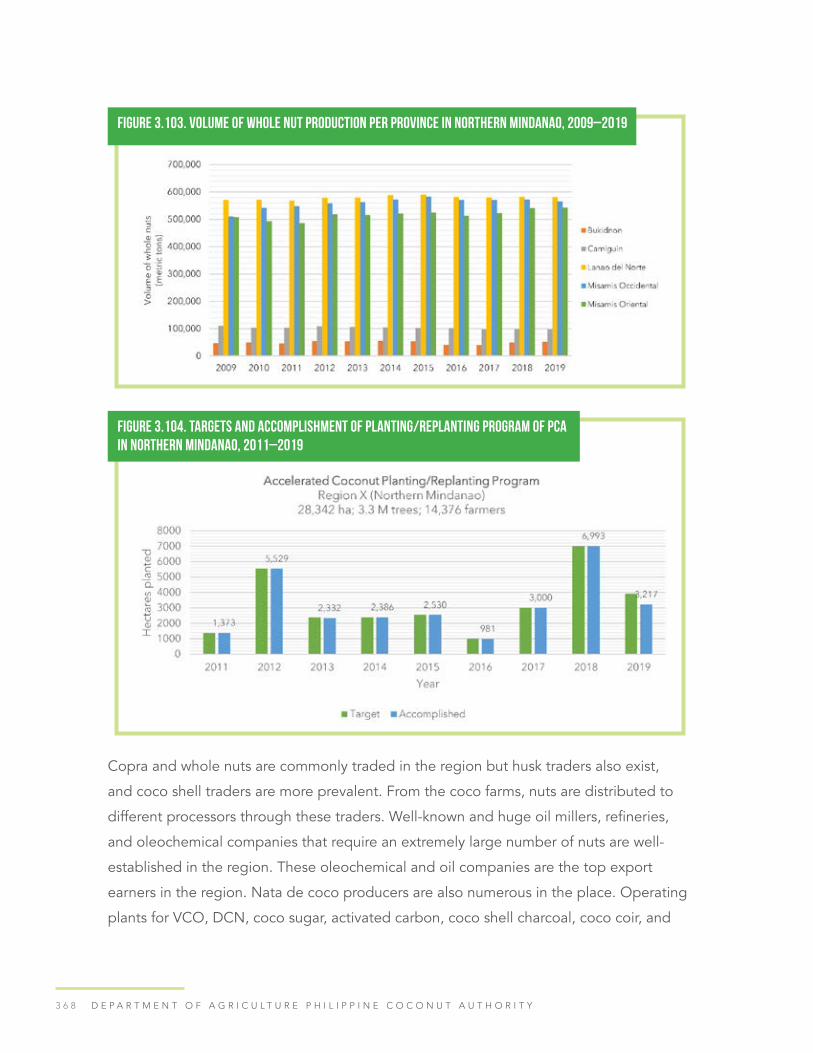
3 6 8 D E P A R T M E N T O F A G R I C U L T U R E P H I L I P P I N E C O C O N U T A U T H O R I T Y
Copra and whole nuts are commonly traded in the region but husk traders also exist,
and coco shell traders are more prevalent. From the coco farms, nuts are distributed to
different processors through these traders. Well-known and huge oil millers, refineries,
and oleochemical companies that require an extremely large number of nuts are well-
established in the region. These oleochemical and oil companies are the top export
earners in the region. Nata de coco producers are also numerous in the place. Operating
plants for VCO, DCN, coco sugar, activated carbon, coco shell charcoal, coco coir, and
Figure 3.103. Volume of whole nut production per province in Northern Mindanao, 2009–2019
Figure 3.104. Targets and accomplishment of Planting/Replanting Program of PCA in Northern Mindanao, 2011–2019
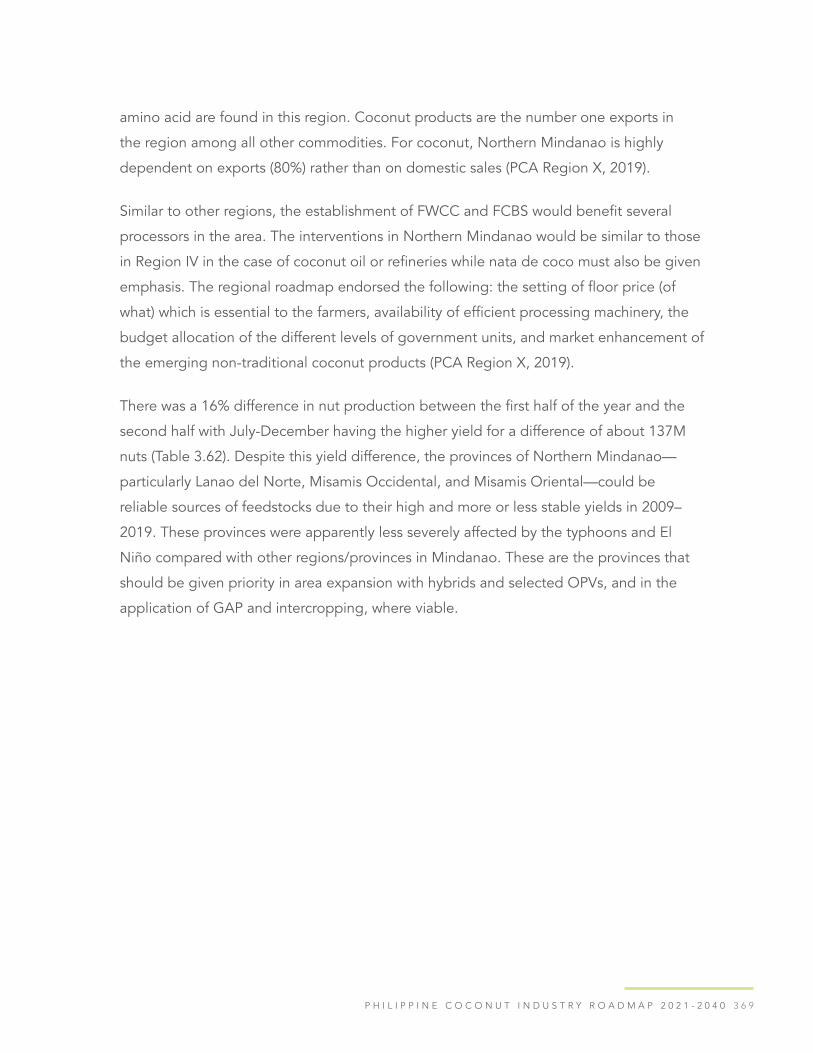
3 6 9P H I L I P P I N E C O C O N U T I N D U S T R Y R O A D M A P 2 0 2 1 - 2 0 4 0
amino acid are found in this region. Coconut products are the number one exports in
the region among all other commodities. For coconut, Northern Mindanao is highly
dependent on exports (80%) rather than on domestic sales (PCA Region X, 2019).
Similar to other regions, the establishment of FWCC and FCBS would benefit several
processors in the area. The interventions in Northern Mindanao would be similar to those
in Region IV in the case of coconut oil or refineries while nata de coco must also be given
emphasis. The regional roadmap endorsed the following: the setting of floor price (of
what) which is essential to the farmers, availability of efficient processing machinery, the
budget allocation of the different levels of government units, and market enhancement of
the emerging non-traditional coconut products (PCA Region X, 2019).
There was a 16% difference in nut production between the first half of the year and the
second half with July-December having the higher yield for a difference of about 137M
nuts (Table 3.62). Despite this yield difference, the provinces of Northern Mindanao—
particularly Lanao del Norte, Misamis Occidental, and Misamis Oriental—could be
reliable sources of feedstocks due to their high and more or less stable yields in 2009–
2019. These provinces were apparently less severely affected by the typhoons and El
Niño compared with other regions/provinces in Mindanao. These are the provinces that
should be given priority in area expansion with hybrids and selected OPVs, and in the
application of GAP and intercropping, where viable.
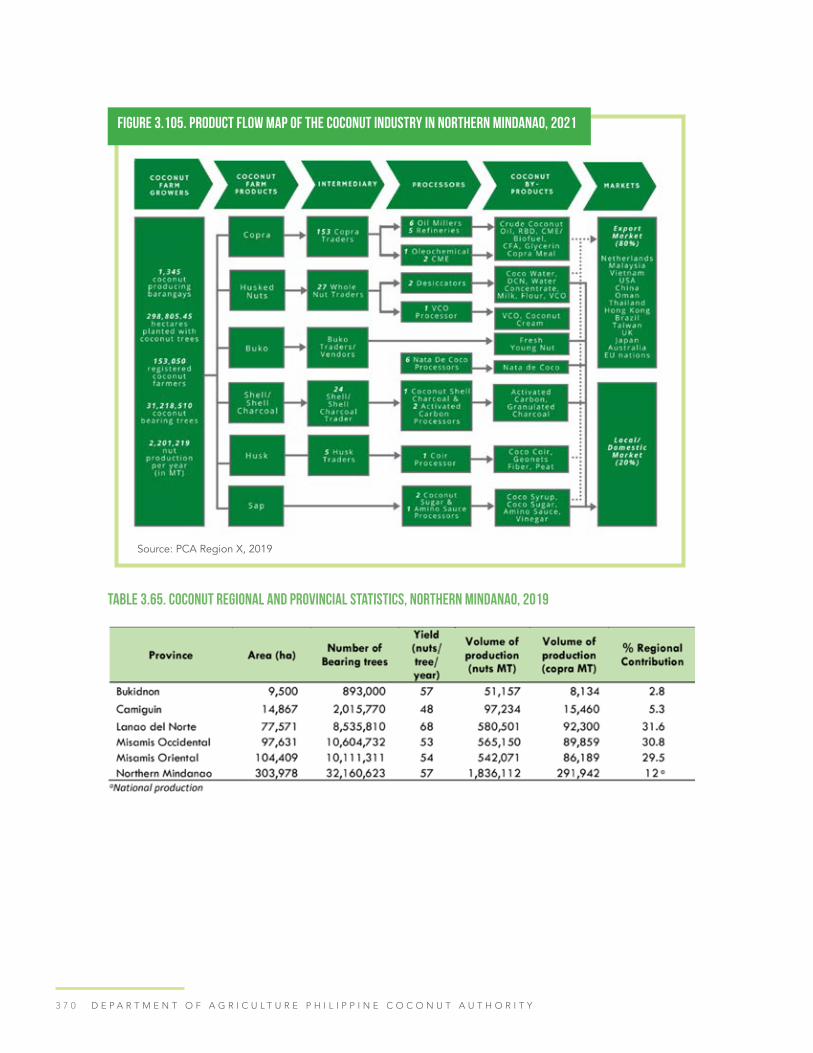
3 7 0 D E P A R T M E N T O F A G R I C U L T U R E P H I L I P P I N E C O C O N U T A U T H O R I T Y
Table 3.65. Coconut regional and provincial statistics, Northern Mindanao, 2019
Figure 3.105. Product flow map of the coconut industry in Northern Mindanao, 2021
Source: PCA Region X, 2019
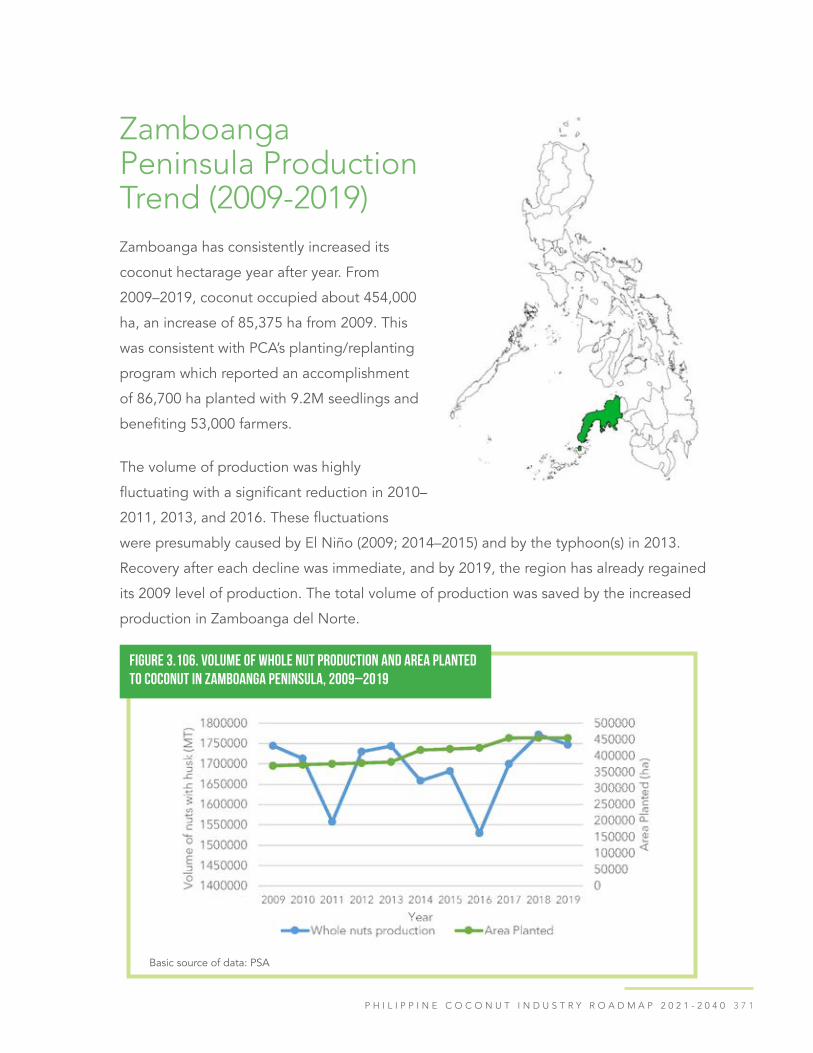
3 7 1P H I L I P P I N E C O C O N U T I N D U S T R Y R O A D M A P 2 0 2 1 - 2 0 4 0
Zamboanga Peninsula Production Trend (2009-2019)Zamboanga has consistently increased its
coconut hectarage year after year. From
2009–2019, coconut occupied about 454,000
ha, an increase of 85,375 ha from 2009. This
was consistent with PCA’s planting/replanting
program which reported an accomplishment
of 86,700 ha planted with 9.2M seedlings and
benefiting 53,000 farmers.
The volume of production was highly
fluctuating with a significant reduction in 2010–
2011, 2013, and 2016. These fluctuations
were presumably caused by El Niño (2009; 2014–2015) and by the typhoon(s) in 2013.
Recovery after each decline was immediate, and by 2019, the region has already regained
its 2009 level of production. The total volume of production was saved by the increased
production in Zamboanga del Norte.
Figure 3.106. Volume of whole nut production and area planted to coconut in Zamboanga Peninsula, 2009–2019
Basic source of data: PSA

3 7 2 D E P A R T M E N T O F A G R I C U L T U R E P H I L I P P I N E C O C O N U T A U T H O R I T Y
Two provinces, Zamboanga del Norte and Zamboanga del Sur, contributed 76% of the
regional production. Regional fluctuation was heavily affected by the changes in the
volume of production in these two provinces. Zamboanga del Norte, despite the external
shocks and risks, was even able to surpass its 2009 nut production by almost 103M MT,
reaching almost 840M MT. Zamboanga del Sur, on the other hand, had a net loss of 76M
MT. Zamboanga Sibugay’s production was fairly constant while Zamboanga City had a net
loss of 43.6M MT over the same period.
Figure 3.107. Targets and accomplishments of the accelerated coconut planting/replanting project of PCA in Zamboanga Peninsula, 2009–2019
Basic source of data: PSA
There was a small variation in yield in Zamboanga Peninsula between the first half of the
year and the second half, indicating a more reliable supply. Unlike in most other regions
(other than CAR), the yield during January–June was higher by about 2% compared with
the yield in July–December.
Ironically, Zamboanga del Norte and Zamboanga del Sur, the two provinces with the
highest coconut hectarage, had the lowest yield of 39 nuts per tree/year and 44 nuts per
tree/year, respectively. In contrast, the two minor coconut-producing provinces had above
average yields of 61 nuts per tree/year for Zamboanga Sibugay and 74 nuts per tree/year
for Zamboanga City.

3 7 3P H I L I P P I N E C O C O N U T I N D U S T R Y R O A D M A P 2 0 2 1 - 2 0 4 0
The portion of coconut farmers to the total employment in Zamboanga Peninsula is more
than a tenth (11%) of the region. These 240,225 farmers must be provided with social
protection. Barangays with coconut trees constitute 75% of the villages and an estimated
10% of the nation’s bearing coconut trees. The land of Zamboanga Peninsula is classified
Figure 3.108. Volume of whole nut production per province in Zamboanga Peninsula, 2009–2019
Basic source of data: PSA
Figure 3.109. Coconut area planted/harvested and number of bearing trees per province in Zamboanga Peninsula, 2009–2019
Basic source of data: PSA

3 7 4 D E P A R T M E N T O F A G R I C U L T U R E P H I L I P P I N E C O C O N U T A U T H O R I T Y
as highly suitable for coconut growing. Its coconut productivity is close to the national
average, that is, 45 nuts per year.
Coir processors are the most predominant in Zamboanga Peninsula followed by VCO
and oil millers. Coco sugar, activated carbon, and refineries are also present in the
area. Similar to Eastern Visayas, the establishment of community-based processing
plants, on-wheels coconut husks chipping machines, and coco coir rubberizing plant
is recommended for the coir industry to flourish. The concerns on value adding, high
operational cost, and limited capitalization in coir industry can be addressed through
skills development, upgrading of value-adding technologies, construction of secondary
roads, financial assistance in getting certifications, adoption of productivity and quality
enhancing technologies, installation of mechanical equipment, and provision of financing
program. Strategic planting can maximize the full benefits of planting and replanting in
the area. Due to the presence of oil millers and VCO plants in the area, a coconut variety
full of meat can be adopted, while a variety with thick husks can also be planted to
accommodate the coir processor’s needs.
In 2019, Zamboanga Peninsula contributed 12% to the national production, of which 48%
was supplied by Zamboanga del Norte with a below-average provincial yield. Zamboanga
del Sur supplied 28% with about half the hectarage and number of trees of Zamboanga
del Norte. Surviving trees planted from 2009–2014 should have started producing nuts
by 2019, and by 2024, the surviving trees of the 9.2M planted up to 2019 should all be
productive. These populations of young trees, 60% of which were planted in Zamboanga
del Norte and Zamboanga del Sur, should be managed using good and sustainable
agricultural practices to achieve high yields. Zamboanga Sibugay and Zamboanga City,
where suitable expansion areas are available, should be prioritized for planting, replanting
hybrids, selecting OPVs, and good and sustainable agricultural practices.

3 7 5P H I L I P P I N E C O C O N U T I N D U S T R Y R O A D M A P 2 0 2 1 - 2 0 4 0
Table 3.66. Coconut regional and provincial statistics, Zamboanga Peninsula, 2019
Figure 3.110. Product flow map of the coconut industry in Zamboanga Peninsula, 2019
Source: PCA Region IX, 2019

3 7 6 D E P A R T M E N T O F A G R I C U L T U R E P H I L I P P I N E C O C O N U T A U T H O R I T Y
BARMM (Bangsamoro Autonomous Region in Muslim Mindanao) Production Trend (2009–2019)BARMM is a promising area for coconut.
Production trend showed a consistent
increase in area planted with a net increase
of about 17,000 ha from 2009 to 2019. The
region produced 1.3B nuts in 333,000 ha in
2019. Maguindanao contributed 57% to the
total nut production in BARMM. There was
seasonality in the production trend with about 21% higher yield in the second half of the
year compared with the first half (January–June) (Table 3.62).
Maguindanao had the highest computed yield among the provinces in the country at 72
nuts/tree/year or about 57% of the total regional production (Table 3.67). With 10.5M
bearing trees, Maguindanao should be prioritized for promoting and incentivizing farmers
to practice GAP or organic production. Meanwhile, Sulu and Lanao del Sur are 2nd and
3rd to the highest regional contribution to production at 16% and 14%, respectively. The
production trends of the three BARMM provinces showed a continuous increase from
2009 to 2019. Maguindanao also has the highest yield among all provinces at 72 nuts/
tree/year, and with young bearing palms from the increased plantings from 2010 to 2019,
adoption of GAP will further increase the province’s volume of production.
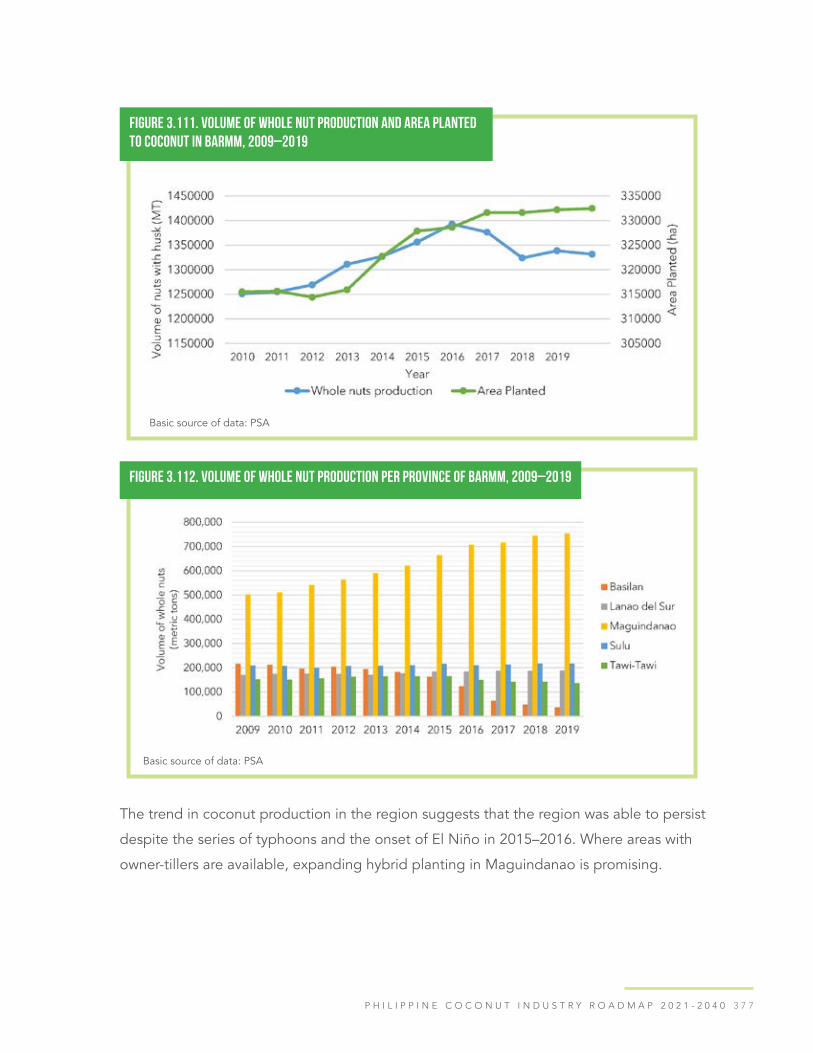
3 7 7P H I L I P P I N E C O C O N U T I N D U S T R Y R O A D M A P 2 0 2 1 - 2 0 4 0
The trend in coconut production in the region suggests that the region was able to persist
despite the series of typhoons and the onset of El Niño in 2015–2016. Where areas with
owner-tillers are available, expanding hybrid planting in Maguindanao is promising.
Figure 3.111. Volume of whole nut production and area planted to coconut in BARMM, 2009–2019
Basic source of data: PSA
Figure 3.112. Volume of whole nut production per province of BARMM, 2009–2019
Basic source of data: PSA

3 7 8 D E P A R T M E N T O F A G R I C U L T U R E P H I L I P P I N E C O C O N U T A U T H O R I T Y
Analysis at the provincial level provides a better insight into the variability of the
environment within the region, thus statistics at the regional level may not be reflective of
the realities therein.
The coconut resources in Bangsamoro region consist of 21 M coconut-bearing trees
planted in 283,018 has of land. These farms are being operated by 138,784 registered
farmers located in 1,202
barangays in five provinces of the region. These farmers are expected to receive social
protection from the Coco Levy Funds. The provinces in Bangsamoro are classified as
highly suitable for coconut planting. The COCOFIRM Program recommends that the
hybrid varieties be used for planting and replanting in this region to improve its average
yield of 39 nuts/tree/year, which is below the national average of 44 nuts/tree/year.
Coconut products are in the form of fresh young nuts and matured nuts that reach the
buyers in unprocessed form. There are several traders but there is only one processor
(VCO) in the region. These goods are transported both for domestic and foreign markets.
Since VCO is an emerging industry, a variety that is characterized by the thickness of
meat is an appropriate one for the farmers. Interventions that may be suitable aside from
enriching the production side would be entrepreneurship programs, market development,
Figure 3.113. Targets and accomplishments of the accelerated coconut planting/replanting project of PCA in BARMM, 2009–2019
Basic source of data: PSA
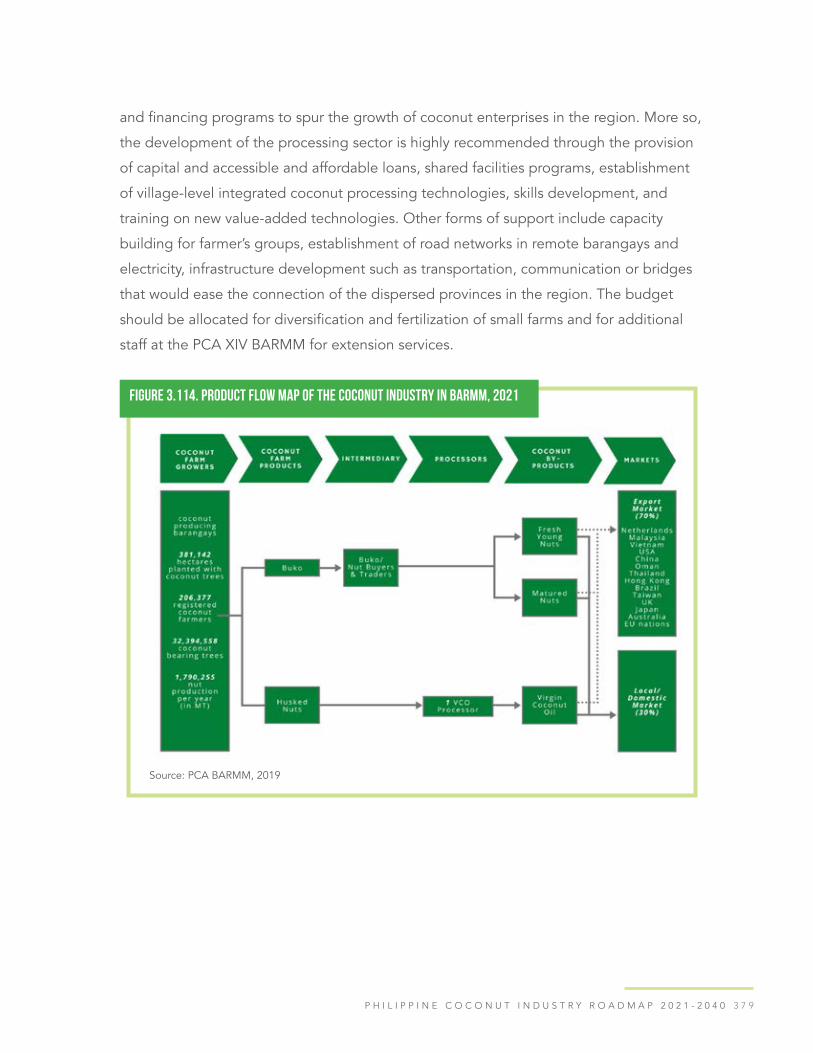
3 7 9P H I L I P P I N E C O C O N U T I N D U S T R Y R O A D M A P 2 0 2 1 - 2 0 4 0
and financing programs to spur the growth of coconut enterprises in the region. More so,
the development of the processing sector is highly recommended through the provision
of capital and accessible and affordable loans, shared facilities programs, establishment
of village-level integrated coconut processing technologies, skills development, and
training on new value-added technologies. Other forms of support include capacity
building for farmer’s groups, establishment of road networks in remote barangays and
electricity, infrastructure development such as transportation, communication or bridges
that would ease the connection of the dispersed provinces in the region. The budget
should be allocated for diversification and fertilization of small farms and for additional
staff at the PCA XIV BARMM for extension services.
Figure 3.114. Product flow map of the coconut industry in BARMM, 2021
Source: PCA BARMM, 2019

3 8 0 D E P A R T M E N T O F A G R I C U L T U R E P H I L I P P I N E C O C O N U T A U T H O R I T Y
Table 3.67. Coconut regional and provincial statistics, BARMM, 2019
PCA reported to have planted/replanted 71,572 ha in BARMM with 7.7M seedlings and
benefiting 22,168 farmers from 2009 to 2019; 40% of these seedlings were planted in
Maguindanao. About 391, 852 trees were reported cut under RA 8084, and no coconut
farm applied for conversion in 2009–2019. Nut production during the first half of the year
was consistently lower than in the second half by about 21% or 130,000 MT.
SOCCSKSARGEN Production Trend (2009–2019)Production trend showed a consistent
increase in area planted with a net
increase of about 37,000 ha from 2009
to 2019. The region produced 1.16B nuts
in 206,400 ha in 2019 (Figure 3.115).
SOCCSKSARGEN
contributed 8% to the national nut
production (Table 3.62). Unlike most
regions, SOCCSKSARGEN was a stable
supplier of nuts with less than 1%
difference in yield between the first and
second half of the year.
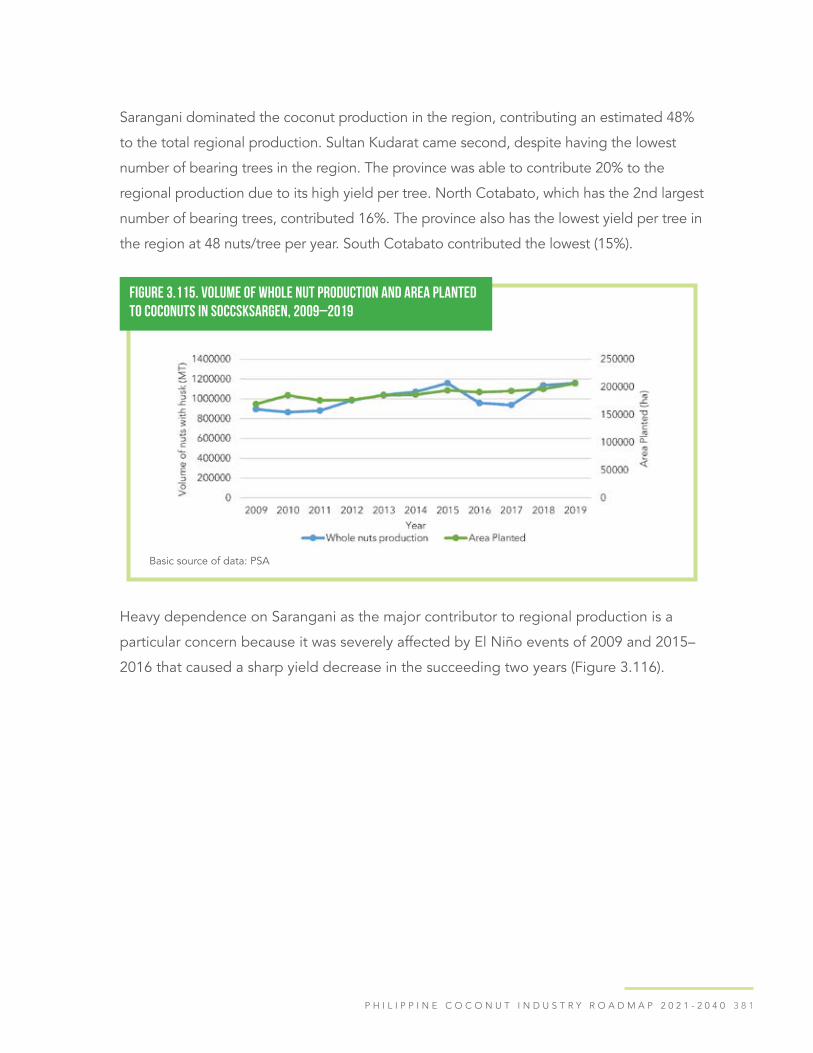
3 8 1P H I L I P P I N E C O C O N U T I N D U S T R Y R O A D M A P 2 0 2 1 - 2 0 4 0
Sarangani dominated the coconut production in the region, contributing an estimated 48%
to the total regional production. Sultan Kudarat came second, despite having the lowest
number of bearing trees in the region. The province was able to contribute 20% to the
regional production due to its high yield per tree. North Cotabato, which has the 2nd largest
number of bearing trees, contributed 16%. The province also has the lowest yield per tree in
the region at 48 nuts/tree per year. South Cotabato contributed the lowest (15%).
Figure 3.115. Volume of whole nut production and area planted to coconuts in SOCCSKSARGEN, 2009–2019
Basic source of data: PSA
Heavy dependence on Sarangani as the major contributor to regional production is a
particular concern because it was severely affected by El Niño events of 2009 and 2015–
2016 that caused a sharp yield decrease in the succeeding two years (Figure 3.116).
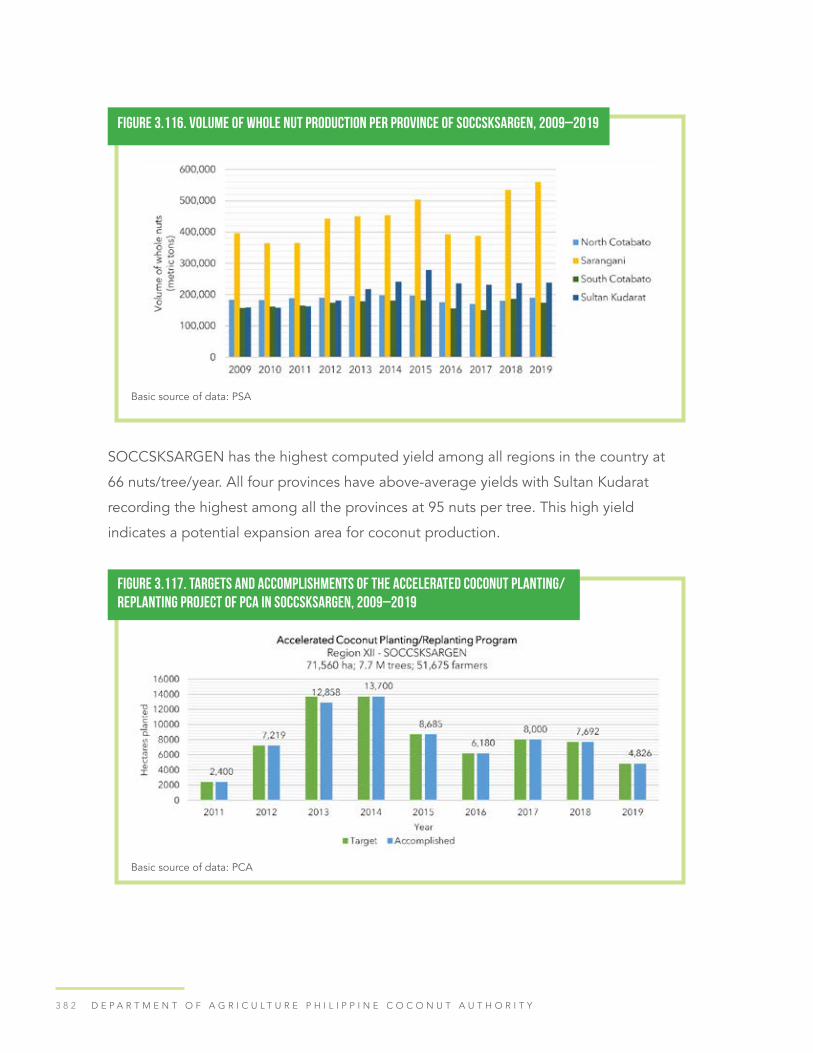
3 8 2 D E P A R T M E N T O F A G R I C U L T U R E P H I L I P P I N E C O C O N U T A U T H O R I T Y
SOCCSKSARGEN has the highest computed yield among all regions in the country at
66 nuts/tree/year. All four provinces have above-average yields with Sultan Kudarat
recording the highest among all the provinces at 95 nuts per tree. This high yield
indicates a potential expansion area for coconut production.
Figure 3.116. Volume of whole nut production per province of SOCCSKSARGEN, 2009–2019
Basic source of data: PSA
Figure 3.117. Targets and accomplishments of the accelerated coconut planting/replanting project of PCA in SOCCSKSARGEN, 2009–2019
Basic source of data: PCA

3 8 3P H I L I P P I N E C O C O N U T I N D U S T R Y R O A D M A P 2 0 2 1 - 2 0 4 0
PCA planted/replanted more than 71,500 ha with 7.7M seedlings from 2009–2019,
benefiting 51,675 farmers in SOCCSKSARGEN. These accomplishments covered more
than 137,000 trees that were cut under RA 8084 and the 240 ha that applied for land
conversion in 2009–2019. However, only about 50% of this accomplished planting/
replanting was reflected in the 2019 PSA statistics with a net increase of 31,000 ha.
The survival rate and field performance of these young plantings should be regularly
monitored, as the discrepancy in data suggested only about 50% survival rate.
Figure 3.118 illustrates the flow of coconut products in SOCCSKSARGEN. Its 967 barangays
in the four provinces that produce coconut, cover 277,523 has of coconut plantation with
20.8 M bearing trees. The 138,784 registered farmers can produce coco farm products
that are bought and sold by several intermediaries in the region. These farmers must be
included in the provision of social protection through the Coconut Levy Funds.
Figure 3.118. Product flow map of the coconut industry in SOCCSKSARGEN, 2021
Source: PSA and PCA Region XII, 2019

3 8 4 D E P A R T M E N T O F A G R I C U L T U R E P H I L I P P I N E C O C O N U T A U T H O R I T Y
The region has charcoal and husk traders that are not visibly present in other regions.
Well-known manufacturers of coconut products—such as coco sugar, coco coir, DCN,
coconut oil, VCO, coco water—are located in this region.. Seventy percent of the
products are traded internationally to various countries. Since there are many coco
sugar enterprises, the utilization of dwarf variety for planting would be appropriate to
those areas. For coco coir, the strategies would be similar to the ones enumerated in
Region VIII. Weaknesses of the coconut industry highlighted in the Region 12 roadmap
are: uncoordinated field operations that result in untimely harvesting and low-quality
product, lack of capital and mechanization, limited value-added operations in the farm
and production, limited support for processing, rising number of senile trees, inadequate
infrastructure for manufacture and transport, inadequate funds for smallholders, limited
program for the empowerment of small farm groups, lack of enthusiasm among the youth
to engage in coconut farming, and lack of social protection to the farmers. Strategies
to tackle these concerns are product standardization like support for certification,
financing program for the capital, infrastructure development program, planting and
replanting program of HYVs, capacity building of coconut farmers’ organizations, and
comprehensive social protection for farmers that include scholarships for their children.
Table 3.68. Coconut regional and provincial statistics, SOCCSKSARGEN, 2019
Surviving trees planted from 2009 to 2014 are projected to be productive by 2019 and
all surviving trees planted until 2019 should be productive by 2024. Hence, increase
in production is expected within the coming years due to the high yield potential of
the region coupled with good management. Further, to improve regional production,
supplemental irrigation sources, when viable, should be tapped specifically for suitable
sites in Sarangani province.

3 8 5P H I L I P P I N E C O C O N U T I N D U S T R Y R O A D M A P 2 0 2 1 - 2 0 4 0
CARAGA Region Production Trend (2009-2019)Caraga contributed 5% to the national
coconut production. Average yield per
tree was 44 nuts per year. The region has
been devastated by super typhoon Bopha
in 2012, and lost more than 24,000 ha
coconut plantations. Recovery was slow
until 2019 when the coconut hectarage
was still 18,500 ha short of the 2013
level (Figure 3.119). However, production
decline was not as steep as the reduction
in area, and this could be attributed to the
high contribution of Surigao del Sur (53%)
to the regional production. Moreover, the province was not affected by typhoon Bopha.
Production of Agusan del Norte, which contributed 22% to the region, was apparently
also not impacted by the typhoon. Meanwhile, the province of Surigao del Norte, which
contributed 18% to regional production in 2019, used to be a major production area.
From 2010, it had a declining trend in production that was aggravated by Typhoon Bopha
in 2012 and decreased the coconut production by 14,400 ha. The downward trend in
production continued until 2019, with a net decrease of 0.85 B nuts over the past 10
years. Part of the decline could be due to the separation of Agusan del Norte’s data from
that of the Dinagat islands, starting 2013.

3 8 6 D E P A R T M E N T O F A G R I C U L T U R E P H I L I P P I N E C O C O N U T A U T H O R I T Y
There was an average of 7.3% difference in production between the first half of the year
and the second half, with higher yield in the latter that amounted to about 17.6M nuts.
Figure 3.119. Volume of whole nut production (MT) and area planted to coconuts (ha) in Caraga, 2009–2019
Basic source of data: PSA
Figure 3.120. Volume of whole nut production per province, Caraga Region, 2009–2019
Basic source of data: PSA

3 8 7P H I L I P P I N E C O C O N U T I N D U S T R Y R O A D M A P 2 0 2 1 - 2 0 4 0
Figure 3.122 shows the product flow of coco farm products in Caraga. A total of 1,202
barangays out of 1,311 are engaged in coconut farming. With the Coconut Levy Act
recently signed by President Duterte, funds for social protection shall be made available
to a total of 206,377 farmers in Region XIII. The entire region is highly suitable for
coconut planting with a yield that is equal to the national average of 44 nuts/tree/year.
Copra buyers are spread across the provinces of Caraga, with Surigao del Sur having
the largest number while whole nut buyers are plenty in Agusan del Norte and none in
Dinagat Islands. A significant number of charcoal traders are found in the region and they
are highly concentrated in Surigao del Sur. These traders then supply the farm products
to existing manufacturers in the area. Refineries are evident in the place while at least one
processor for each coconut product was observed. Aside from refineries, VCO and coir
producers are prominent. Strategic planting of coconut variety with thick meat is advised
for their respective location. Products that are marketable in the region are coconet,
coconut coir-based organic fertilizer (CCBOF), VCO, desiccated, and coco-based pastry.
Interventions mentioned in Region VIII for coir production also apply to Caraga. For VCO-
related interventions, please refer to the discussion for Region VI.
Figure 3.121. Targets and accomplishments of the accelerated coconut planting/replanting project of PCA in Caraga, 2009–2019
Basic source of data: PCA

3 8 8 D E P A R T M E N T O F A G R I C U L T U R E P H I L I P P I N E C O C O N U T A U T H O R I T Y
Table 3.69. Coconut regional and provincial statistics, Caraga Region, 2019
Figure 3.122. Product flow map of the coconut industry in Caraga Region, 2021
Source: PCA Region XIII, 2019

3 8 9P H I L I P P I N E C O C O N U T I N D U S T R Y R O A D M A P 2 0 2 1 - 2 0 4 0
There were more than 89,000 ha planted/replanted with 9.5M seedlings that benefited
74,000 farmers in the region from 2009–2019. Thirty percent of the areas that were planted/
replanted can be found in Surigao del Sur. Coconut seedlings planted on or before 2014
are projected to start bearing by 2019, while all surviving plants planted up to 2019,
are projected to be productive by 2024. Yield fluctuations during El Niño events can be
mitigated by good production management and establishment of irrigation systems.
CALABARZON Production Trend (2009–2019)CALABARZON is the fourth top producer
of nuts at 1.6M MT in 2019, a net increase
of 0.2 M MT from 2009. CALABARZON also
contributed 56.5% to the total increase in
coconut area in the country. From 5th place
in 2009, the region ranked 1st in 2019 with
a coconut hectarage of 485,197 ha.
Coconut production in the region had a
net increase of 14.9% from 2009 to 2019
despite the decline in coconut production
in 2010–2011, 2014–2015, and 2019.
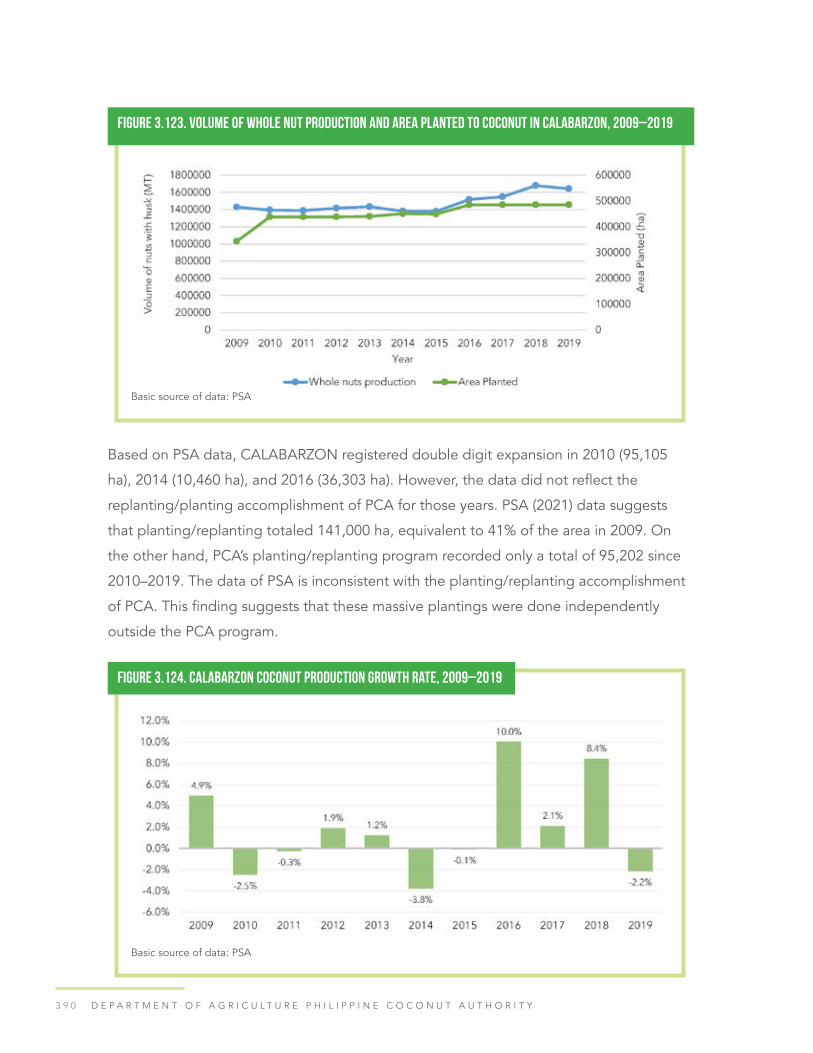
3 9 0 D E P A R T M E N T O F A G R I C U L T U R E P H I L I P P I N E C O C O N U T A U T H O R I T Y
Based on PSA data, CALABARZON registered double digit expansion in 2010 (95,105
ha), 2014 (10,460 ha), and 2016 (36,303 ha). However, the data did not reflect the
replanting/planting accomplishment of PCA for those years. PSA (2021) data suggests
that planting/replanting totaled 141,000 ha, equivalent to 41% of the area in 2009. On
the other hand, PCA’s planting/replanting program recorded only a total of 95,202 since
2010–2019. The data of PSA is inconsistent with the planting/replanting accomplishment
of PCA. This finding suggests that these massive plantings were done independently
outside the PCA program.
Figure 3.123. Volume of whole nut production and area planted to coconut in CALABARZON, 2009–2019
Basic source of data: PSA
Figure 3.124. CALABARZON coconut production growth rate, 2009–2019
Basic source of data: PSA
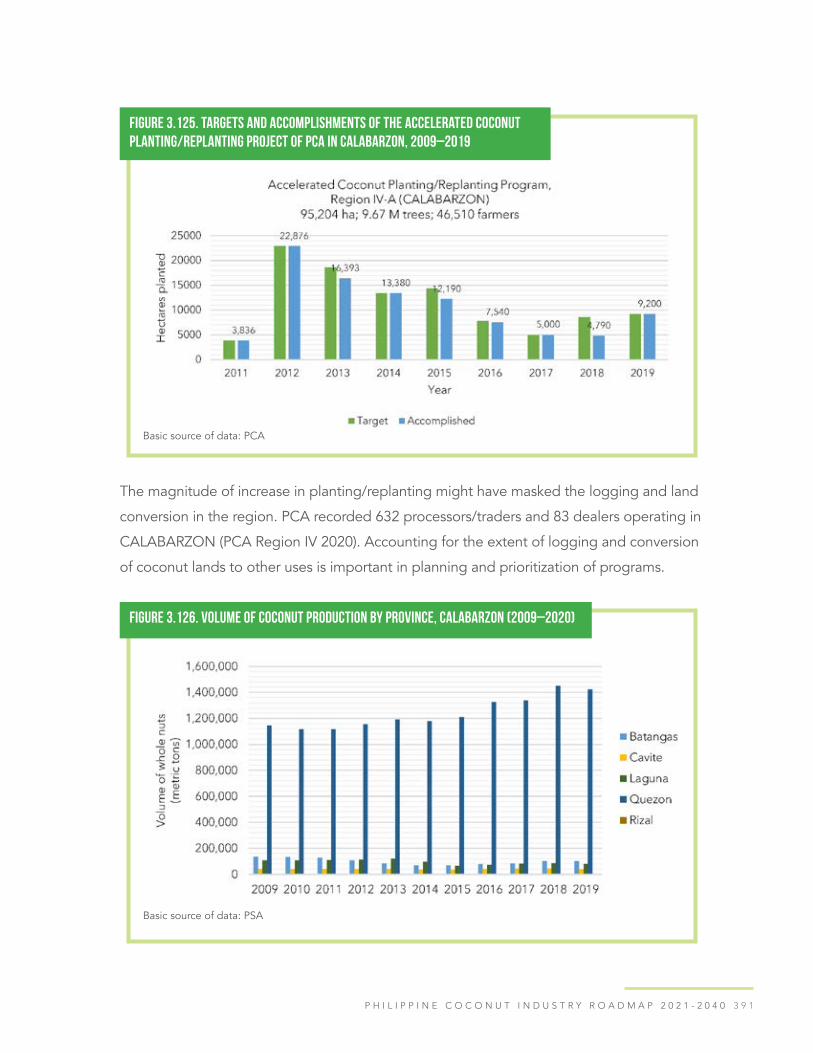
3 9 1P H I L I P P I N E C O C O N U T I N D U S T R Y R O A D M A P 2 0 2 1 - 2 0 4 0
The magnitude of increase in planting/replanting might have masked the logging and land
conversion in the region. PCA recorded 632 processors/traders and 83 dealers operating in
CALABARZON (PCA Region IV 2020). Accounting for the extent of logging and conversion
of coconut lands to other uses is important in planning and prioritization of programs.
Figure 3.125. Targets and accomplishments of the accelerated coconut planting/replanting project of PCA in CALABARZON, 2009–2019
Basic source of data: PCA
Figure 3.126. Volume of coconut production by province, CALABARZON (2009–2020)
Basic source of data: PSA
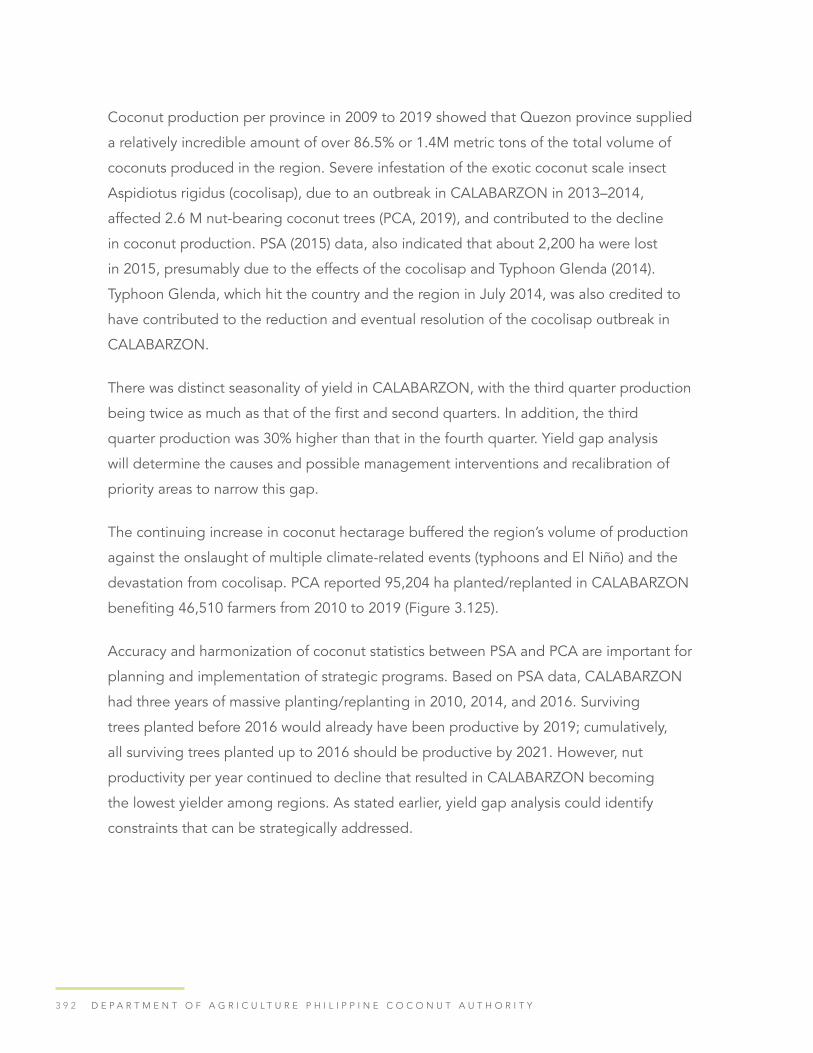
3 9 2 D E P A R T M E N T O F A G R I C U L T U R E P H I L I P P I N E C O C O N U T A U T H O R I T Y
Coconut production per province in 2009 to 2019 showed that Quezon province supplied
a relatively incredible amount of over 86.5% or 1.4M metric tons of the total volume of
coconuts produced in the region. Severe infestation of the exotic coconut scale insect
Aspidiotus rigidus (cocolisap), due to an outbreak in CALABARZON in 2013–2014,
affected 2.6 M nut-bearing coconut trees (PCA, 2019), and contributed to the decline
in coconut production. PSA (2015) data, also indicated that about 2,200 ha were lost
in 2015, presumably due to the effects of the cocolisap and Typhoon Glenda (2014).
Typhoon Glenda, which hit the country and the region in July 2014, was also credited to
have contributed to the reduction and eventual resolution of the cocolisap outbreak in
CALABARZON.
There was distinct seasonality of yield in CALABARZON, with the third quarter production
being twice as much as that of the first and second quarters. In addition, the third
quarter production was 30% higher than that in the fourth quarter. Yield gap analysis
will determine the causes and possible management interventions and recalibration of
priority areas to narrow this gap.
The continuing increase in coconut hectarage buffered the region’s volume of production
against the onslaught of multiple climate-related events (typhoons and El Niño) and the
devastation from cocolisap. PCA reported 95,204 ha planted/replanted in CALABARZON
benefiting 46,510 farmers from 2010 to 2019 (Figure 3.125).
Accuracy and harmonization of coconut statistics between PSA and PCA are important for
planning and implementation of strategic programs. Based on PSA data, CALABARZON
had three years of massive planting/replanting in 2010, 2014, and 2016. Surviving
trees planted before 2016 would already have been productive by 2019; cumulatively,
all surviving trees planted up to 2016 should be productive by 2021. However, nut
productivity per year continued to decline that resulted in CALABARZON becoming
the lowest yielder among regions. As stated earlier, yield gap analysis could identify
constraints that can be strategically addressed.
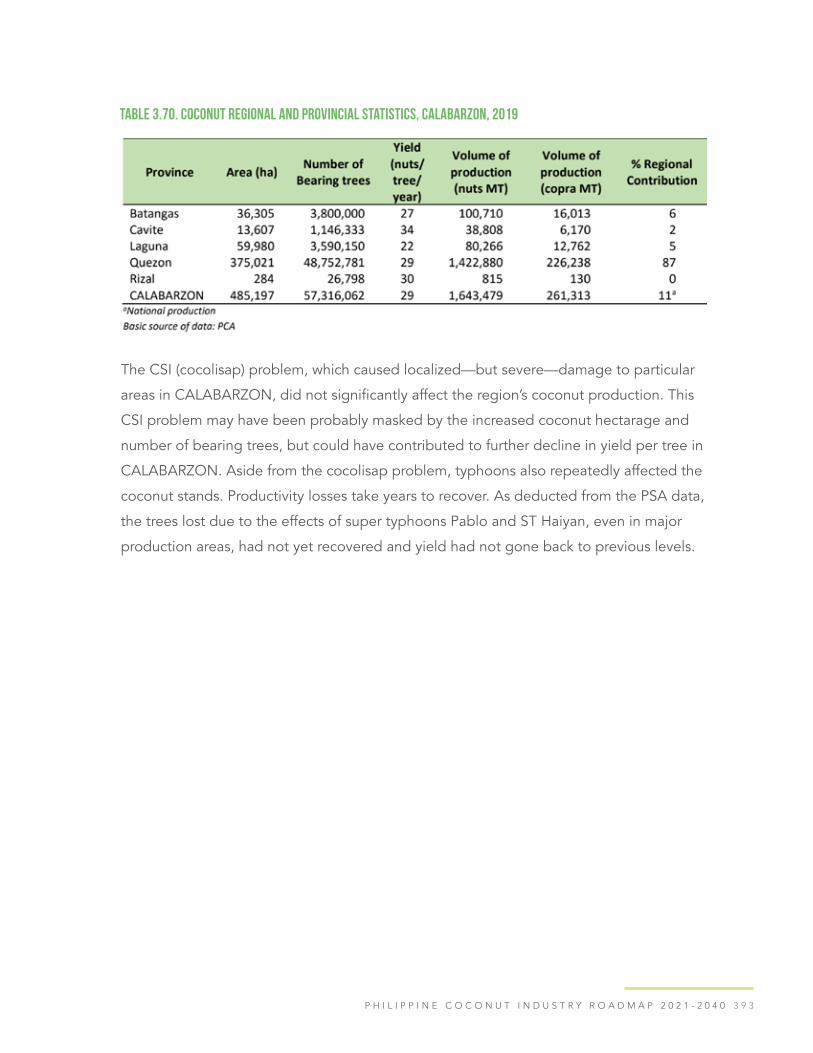
3 9 3P H I L I P P I N E C O C O N U T I N D U S T R Y R O A D M A P 2 0 2 1 - 2 0 4 0
Table 3.70. Coconut regional and provincial statistics, CALABARZON, 2019
The CSI (cocolisap) problem, which caused localized—but severe—damage to particular
areas in CALABARZON, did not significantly affect the region’s coconut production. This
CSI problem may have been probably masked by the increased coconut hectarage and
number of bearing trees, but could have contributed to further decline in yield per tree in
CALABARZON. Aside from the cocolisap problem, typhoons also repeatedly affected the
coconut stands. Productivity losses take years to recover. As deducted from the PSA data,
the trees lost due to the effects of super typhoons Pablo and ST Haiyan, even in major
production areas, had not yet recovered and yield had not gone back to previous levels.

3 9 4 D E P A R T M E N T O F A G R I C U L T U R E P H I L I P P I N E C O C O N U T A U T H O R I T Y
In future implementation of the planting/replanting program, the criteria for prioritizing
areas of high potential yield (i.e., high suitability and low risk) could be recalibrated to
identify areas for planting/replanting of hybrids and selected OPVs. The program should
also consider the commitment of farmers and organizations to apply sustainable coconut
management practices recommended by PCA.
With good management of the young population of trees planted/replanted, which
comprised about 28% of the coconut area in 2009, (and barring disasters that will severely
reduce yield per tree or worse, reduce the number of bearing trees) the productivity of
CALABARZON should pick up significantly and sustainably. The surviving palms in 56,000
ha that were planted from 2010 to 2014 should have started producing nuts in 2019;
cumulatively, the surviving palms planted until 2019, totaling 95,000 ha are projected
to be already productive by 2024. Monitoring the survival and field performance of
Figure 3.127. Product flow map of the coconut industry in CALABARZON & MIMAROPA, 2021
Source: PSA and PCA Region IV, 2019

3 9 5P H I L I P P I N E C O C O N U T I N D U S T R Y R O A D M A P 2 0 2 1 - 2 0 4 0
this young coconut population is an important input in projecting the future regional
production. Continuing planting and replanting programs could mitigate the effects of
frequent and extreme climate events.
Bicol Region Production Trend (2009–2019)From 2009 to 2019, the Bicol Region lost
its prominence as the leader in coconut
hectarage and has gone down to 6th place
in terms of volume of nut production. The
region has only contributed 8.4% to the
national coconut production. While the region
continued to slowly expand its production
area, its volume of production fluctuated and
declined considerably from 2013 to 2017 due
to various external shocks and risks such as strong typhoons and drought.
About 275,000 trees were cut in the region from 2009–2019. Bicol Region also has a
high number of senile/unproductive trees; hence, planting and replanting was needed
to sustain further increase in the region’s production capacity. From 2011 to 2019, about
83,000 ha has been planted to more than 8.8M trees, benefiting more than 477,000
farmers. Assuming 75% survival, these young plantations will comprise about 14% of the
total area planted to coconut in the Bicol region. By 2024, all surviving trees would have
been productive. Given good management, coconut production in the region is expected
to pick up further in the future.

3 9 6 D E P A R T M E N T O F A G R I C U L T U R E P H I L I P P I N E C O C O N U T A U T H O R I T Y
Camarines Sur, Masbate, and Camarines Norte were the three largest producers in the
Bicol Region, contributing almost 80% to the regional production. Camarines Sur, with
the largest area planted to coconut and the consistent top producer since 2009, lost its
top place to Masbate in 2019. Production of Sorsogon from 2011 has plummeted to
Figure 3.128. Volume of whole nut production and area planted to coconut in Bicol Region, 2009–2019
Basic source of data: PSA
Figure 3.129. Targets and accomplishments of the accelerated coconut planting/replanting project of PCA in Bicol Region, 2009–2019
Basic source of data: PCA

3 9 7P H I L I P P I N E C O C O N U T I N D U S T R Y R O A D M A P 2 0 2 1 - 2 0 4 0
only 53% of its productivity in 2009. Similarly, Albay ‘s production in 2019 was only 73%
of its production in 2013. Sorsogon and Masbate, starting 2017, and Camarines Norte
from 2014, have consistently increased their production up to 2019, despite having lesser
coconut hectarage than Camarines Sur. Camarines Sur had the greatest number of senile
trees, estimated to be around 35% (estimated from coconut area at 100 trees per ha and
number of bearing trees) in 2019. Despite this, Camarines Sur is the only province in Bicol
Region with an average productivity of 44 nuts per tree. All other provinces had below
average productivity per tree, ranging from 13-43 nuts per tree (Table 3.71).
The Bicol Region has a vast array of coconut plantations comprising 453,994 has, a total
of 301,268 farmers and over 35 M coconut bearing trees. The region is able to produce
several farm products like copra, husked nuts, buko, shell charcoal, and sap (Figure
3.132). This huge number of farmers should avail of the social protection from the Coco
Levy Funds. The productivity of coconut trees in Bicol Region is relatively lower at 35 nuts
per year. More hybrid varieties are needed for planting and replanting to raise yield. Land
in Bicol is classified as highly suitable for coconut, except for Camarines Sur and Masbate
which are categorized only as suitable.
Figure 3.130. Volume of whole nut production per province, Bicol Region, 2009–2019
Basic source of data: PSA

3 9 8 D E P A R T M E N T O F A G R I C U L T U R E P H I L I P P I N E C O C O N U T A U T H O R I T Y
Table 3.71. Coconut regional and provincial statistics, Bicol Region, 2019
Figure 3.131. Coconut area planted/harvested and number of bearing trees in Bicol Region, 2009–2019
Basic source of data: PSA
Hundreds of registered traders are found in the region such as copra traders and whole
nut buyers. A considerable number of charcoal traders is also present in Bicol Region.
Charcoal processing plants are the most prevalent: six charcoal processors , one for
activated carbon, and one for coco shell briquettes. There are only a handful of other
processors: four oil millers, one desiccator, and one activated carbon manufacturer.
The high number of charcoal processors are indicative of the growing demand for
the product and a thriving charcoal industry. Interventions and strategies pertaining
to charcoal industry may be given emphasis in Region V. Constraints identified in the
SWOT analysis for charcoal industry are: poor road network, small and widely dispersed
coconut farms that produce very small volume of coco shell charcoal, the involvement
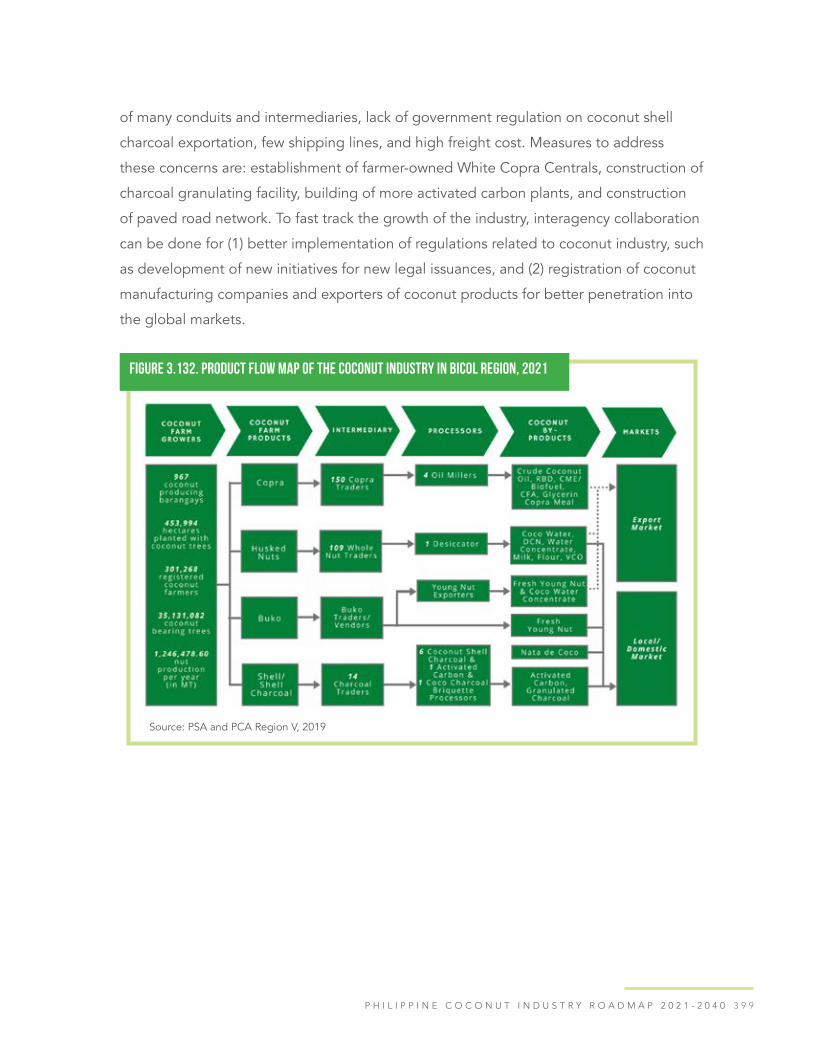
3 9 9P H I L I P P I N E C O C O N U T I N D U S T R Y R O A D M A P 2 0 2 1 - 2 0 4 0
of many conduits and intermediaries, lack of government regulation on coconut shell
charcoal exportation, few shipping lines, and high freight cost. Measures to address
these concerns are: establishment of farmer-owned White Copra Centrals, construction of
charcoal granulating facility, building of more activated carbon plants, and construction
of paved road network. To fast track the growth of the industry, interagency collaboration
can be done for (1) better implementation of regulations related to coconut industry, such
as development of new initiatives for new legal issuances, and (2) registration of coconut
manufacturing companies and exporters of coconut products for better penetration into
the global markets.
Figure 3.132. Product flow map of the coconut industry in Bicol Region, 2021
Source: PSA and PCA Region V, 2019

4 0 0 D E P A R T M E N T O F A G R I C U L T U R E P H I L I P P I N E C O C O N U T A U T H O R I T Y
MIMAROPA Production Trend (2009–2019)The islands of MIMAROPA contributed
only 5.5% to national coconut production
but recorded an increasing trend in both
planted areas and volume of production
from 2009 to 2019. Net increase in area
was 43,600 ha with a corresponding net
increase in production of 122M MT despite
the decline in 2016, presumably due to the
effect of severe El Niño (2015–2016).
Significant increase in regional coconut
production came from Palawan with a net
increase of 194M MT between 2009 and 2019, despite the decrease in 2016 from which
production has yet to fully recover.
Figure 3.133. Volume of whole nut production and area planted to coconut in MIMAROPA, 2009–2019
Basic source of data: PSA

4 0 1P H I L I P P I N E C O C O N U T I N D U S T R Y R O A D M A P 2 0 2 1 - 2 0 4 0
A total of 62,425 ha consisting of over 6.6 M trees were planted/replanted under the PCA
program from 2010 to 2019. These areas comprised about 28% of the coconut hectarage
in 2019. Assuming 75% survival rate, about 47,000 ha young coconut populations will all
be productive by 2024, further increasing the production volume of MIMAROPA.
Figure 3.134. Volume of whole nut production per province, MIMAROPA, 2009–2019
Basic source of data: PSA
Figure 3.135. Targets and accomplishments of the accelerated coconut planting/replanting project of PCA in MIMAROPA, 2009–2019
Basic source of data: PSA

4 0 2 D E P A R T M E N T O F A G R I C U L T U R E P H I L I P P I N E C O C O N U T A U T H O R I T Y
Coconut productivity in MIMAROPA was highly variable. Palawan and Occidental
Mindoro had a high productivity of 79 and 70 nuts/tree/year, respectively, while the rest of
the provinces had below average yields : Romblon (36 nuts/tree/year), Oriental Mindoro
(28 nuts/tree/year), and Marinduque (22 nuts/tree/year). Palawan accounted for 52% of
MIMAROPA’s coconut production while Romblon was far second contributing 27%. About
54% of the trees (over 3.5M) planted from 2010 to 2019 were in Palawan. Surviving trees
planted until 2014 will start to be productive by 2019 and all trees planted until 2019
will all be productive by 2024. Given good management, and pending any disaster that
could topple these trees in MIMAROPA, coconut production in the region is expected to
increase significantly.
Table 3.72. Coconut regional and provincial statistics, MIMAROPA, 2019
Eastern Visayas Production Trend (2009–2019)From 2009 to 2019, Eastern Visayas suffered
a net loss of 36.76% in production, equivalent
to 124.7M nuts or more than a third of its
production of 1.78B nuts in 2009. Throughout
the eleven-year period, Eastern Visayas lost
97,551 ha due to the historic super typhoon
Haiyan (Yolanda) in November 2013. Just a year
after, toward the end of 2014, Typhoon Ruby hit

4 0 3P H I L I P P I N E C O C O N U T I N D U S T R Y R O A D M A P 2 0 2 1 - 2 0 4 0
the region and damaged at least another 200,000 trees. Before ST Haiyan, the region was
the 2nd highest nut producer in the country with about 2 B nuts. Eastern Visayas dropped
from 2nd place in 2009 to 8th in 2019, with only about 55% production pre- Haiyan. In
terms of coconut hectarage, the region had recovered only 7,570 ha by 2019. With a total
coconut area of 329,620 ha, its ranking in coconut hectarage went down to 6th place in
2019. The provinces of Eastern Visayas, Leyte, and Eastern Samar were most severely
affected by Haiyan. Northern Samar’s production also contracted from 2016 which, like
the other two provinces, continued declining until 2018. This decline in production is
presumably compounded by the impact of severe drought in 2015–2016.
Figure 3.136. Volume of coconut production by province, Eastern Visayas, 2009–2019
Basic source of data: PSA
Eastern Visayas, like CALABARZON, also exhibited a consistent pattern of yield
seasonality with higher yield during the second half of the year compared with the first
half (January–June), with 36% difference amounting to 171M nuts (Figure 3.62).
From 2009 until 2016, Eastern Visayas had negative to zero annual growth rate (Figure
3.137). Although the region has planted 89,972 ha equivalent to 8.8M trees, and
benefiting about 44, 711 farmers in 2019, recovery was slow and the region was still
unable to recover the trees lost to ST Haiyan.
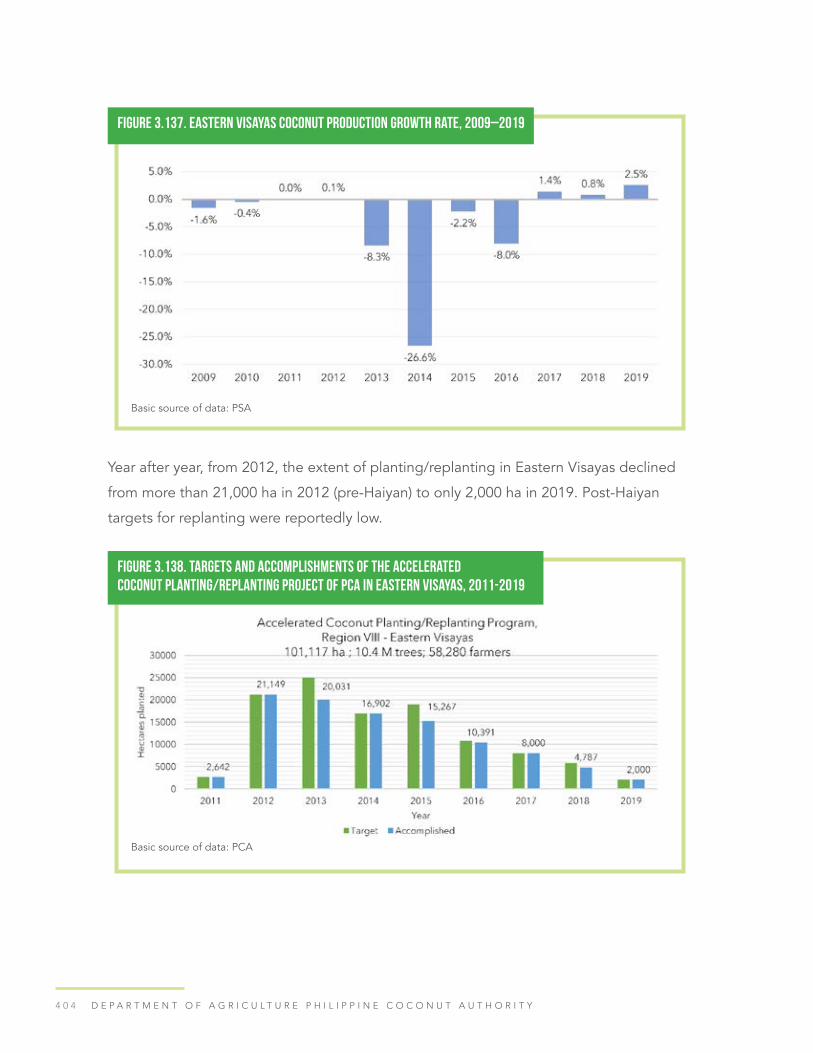
4 0 4 D E P A R T M E N T O F A G R I C U L T U R E P H I L I P P I N E C O C O N U T A U T H O R I T Y
Year after year, from 2012, the extent of planting/replanting in Eastern Visayas declined
from more than 21,000 ha in 2012 (pre-Haiyan) to only 2,000 ha in 2019. Post-Haiyan
targets for replanting were reportedly low.
Figure 3.137. Eastern Visayas coconut production growth rate, 2009–2019
Basic source of data: PSA
Figure 3.138. Targets and accomplishments of the accelerated coconut planting/replanting project of PCA in Eastern Visayas, 2011-2019
Basic source of data: PCA

4 0 5P H I L I P P I N E C O C O N U T I N D U S T R Y R O A D M A P 2 0 2 1 - 2 0 4 0
In 2019, Eastern Visayas contributed about 8% to the country’s total nut production.
Samar, Northern Samar, and Eastern Samar provinces contributed about 65% to the
region’s total production. Leyte contributed 20% to coconut production in the region,
while Southern Leyte and Biliran contributed 11% and 4%, respectively. Samar and
Southern Leyte had above average yields of 47 nuts/tree/year while the rest of the
provinces had below average yield, pulling down the regional average to only 32 nuts/
tree/year. Leyte, with the highest coconut hectarage and number of bearing trees, had
the lowest yield of only 21 nuts/tree/year. Recovery of trees from multiple stresses takes
time, but adopting good management practices, such as fertilization, has been proven to
increase yield a year later.
The coconut area in Eastern Visayas covered around 29% of the entire region, which is
classified as highly suitable for coconut planting. However, the yield of coconut trees in
the region is somewhat low at 32 nuts/tree/year. The low yield could be due to the series
of typhoons that beset the region but nonetheless, adoption of the appropriate hybrid
variety for replanting would be worthwhile.
The coconut plantations cover 84% of the barangays in the region. This number signifies
the importance of coconut to the community and the breadth of its awareness of the
commodity. The 3,666 registered coconut farmers represent 13% of the total number
of people employed in the region. This number is quite high considering that there are
several occupational categories. These farmers must be covered with social protection.
It can be gleaned from the diagram that there is a towering number of copra traders
(473), whole nut traders (131) and buko traders (50) present in Eastern Visayas.
Furthermore, the number of coir processors and coco charcoal plants in the region is
quite high. Interventions for these products are warranted. For charcoal producers, the
interventions mentioned for Region V can be applied to Region VIII. In the case of coir
production, the establishment of community-based integrated coconut husk processing
plants, the provision of on-wheels coconut husks chipping machines, and the building of
coco coir rubberizing plant for mattresses and hospital beds would all gear toward the
development of the coir industry.

4 0 6 D E P A R T M E N T O F A G R I C U L T U R E P H I L I P P I N E C O C O N U T A U T H O R I T Y
Table 3.73. Coconut regional and provincial statistics, Eastern Visayas, 2019
Figure 3.139. Product flow map of the coconut industry in Eastern Visayas, 2021
Source: PSA and PCA Region VIII, 2019

4 0 7P H I L I P P I N E C O C O N U T I N D U S T R Y R O A D M A P 2 0 2 1 - 2 0 4 0
Central Visayas Production Trend (2009–2019)Central Visayas contributed only 3% to national
coconut production (Table 63). The region was
also severely devastated by Super Typhoons
Haiyan (2013) and Ruby (2014), thus a net loss
in coconut hectarage of 3,900 ha or 6% of
its pre-Haiyan level by 2019. Volume of nut
production also declined by a total of 12%,
with reduction after each typhoon hit and even
a year thereafter. Recovery was short-lived as
production again declined steeply in 2019 (Figure 3.140).
Another 101,000 trees were reported cut from 2009 to 2018 under RA 8048. Central
Visayas had not yet fully recovered its lost coconut hectarage by 2019, posting a negative
growth rate average of –3.1% over the past 11 years. This data is not consistent with
the reported replanting/planting accomplishment of 49,594 ha, totaling 5.3M trees and
benefiting 39,477 farmers (Figure 3.141). The area and number of trees replanted should
have covered the losses 10 times over.

4 0 8 D E P A R T M E N T O F A G R I C U L T U R E P H I L I P P I N E C O C O N U T A U T H O R I T Y
The yield fluctuations in the region, which follow that of Bohol, were particularly striking
from 2014 to 2016 (25,000 MT) and in 2019 (20,000 MT).
Figure 3.140. Volume of whole nut production and area planted to coconut in Central Visayas, 2009–2019
Basic source of data: PSA
Figure 3.141. Targets and accomplishments of the accelerated coconut planting/replanting project of PCA
in Central Visayas, 2011–2019
Basic source of data: PCA

4 0 9P H I L I P P I N E C O C O N U T I N D U S T R Y R O A D M A P 2 0 2 1 - 2 0 4 0
Bohol and Negros Oriental contributed 36% each to regional nut production while
Cebu contributed another 26%. The island of Siquijor comprised only 2% of the regional
production. With more than 5,000 ha and 366,000 trees, this island province can be a good
site for an integrated coconut processing enterprise catering to the local market; However,
the island still needs to increase its productivity per tree which was only 24 nuts/tree/year
in 2019. It can be noted that the tree productivity in the region is below average, except
in Negros Oriental. Bohol, with 4.7M bearing trees, and Cebu, with almost 3.9M bearing
trees, have yields of only 32 nuts/tree/year and 29 nuts/tree/year, respectively.
Out of 3,003 total number of barangays in Central Visayas, 80% are engaged in coconut
farming. The 304,768 farmers involved are expected to be given social protection
from the Coco Levy Funds. These coconut farmers contribute around 6% to the total
employment in Central Visayas. The land area devoted for coconut in Region VII accounts
for 13% of the entire region. The region is generally categorized as suitable for coconut
growing; however, every year an estimated 5% of bearing trees are becoming senile (PCA
Region VII, 2019). Since the productivity in Central Visayas is low at 34 nuts per year,
replacing the senile trees with hybrid varieties would be beneficial (Figure 3.74).
Figure 3.142. Volume of whole nut production and area planted to coconut in Central Visayas, 2009-2019
Basic source of data: PSA

4 1 0 D E P A R T M E N T O F A G R I C U L T U R E P H I L I P P I N E C O C O N U T A U T H O R I T Y
One hundred eighty-two (182) copra traders are involved in the product flow, with 11
traders each for whole nuts and for buko (Figure 3.143). The movement of commodities
runs from the whole nut to several uses: the meat for CNO and VCO (on the side, flour is
also produced); the husk for dust and coir; the shell for fashion accessories and charcoal,
which is further used for activated carbon; and the sap for vinegar. These products reach
the retailers, industrial users, and household users locally or are exported to foreign
markets (PCA Region VII, 2019).
Oil millers and refineries that are operating in the area produce RBD, CME, biofuels,
CFA, glycerin, and copra meal. Similar to Western Visayas, the lead processors in this
region are those that produce VCO and coir (4), followed by coco sugar and refineries.
There is also an activated carbon plant but the charcoal from the region cannot meet the
company’s requirements (PCA Region VII . Establishment of farmer-owned White Copra
Centrals, charcoal granulating facility, and construction of paved road can be done to
address the region’s concerns. The regional roadmap also identified further strengthening
of the market for VCO, flour, coir, dust, and vinegar. Proposed strategies for market
and product development are: extensive market promotion program, expansion of the
utilization of geotextile in construction and erosion control projects, institutionalization
of the utilization of coco peat in fertilization, market facilitation, linkage and matching
to increase market access, capacity building on market negotiation, and participation of
SMEs in international trade fairs and exhibits.

4 1 1P H I L I P P I N E C O C O N U T I N D U S T R Y R O A D M A P 2 0 2 1 - 2 0 4 0
Table 3.74. Coconut regional and provincial statistics, Central Visayas, 2019
Figure 3.143. Product flow map of the coconut industry in Central Visayas, 2021
Source: PSA and PCA Region VII, 2019

4 1 2 D E P A R T M E N T O F A G R I C U L T U R E P H I L I P P I N E C O C O N U T A U T H O R I T Y
Western Visayas Production Trend (2009–2019)Western Visayas contributed 3.5% to
national coconut production. Similar to
other regions in the Visayas, coconut
hectarage and production were affected
by the Super Typhoons Haiyan and Ruby.
Recovery of production was immediate and
the increasing trend continued, surpassed
pre-Haiyan level by 2018, and further
rose in 2019. There was slow recovery of
lost hectarage until 2017 after which the
increase was significant and by 2019 already surpassed the pre-Haiyan area.
The region lost 18,413 ha of coconut plantations to Haiyan. Aklan and Capiz were the
most severely affected provinces which lost more than half of their respective coconut
areas in 2014. These provinces had not recovered until 2019 (Figure 3.145). Recovery
of production to pre-Haiyan level was reached in 2018 and can be attributed to Negros
Oriental which escaped the devastation of Haiyan and was able to consistently increase
its production until 2019. Dramatic recovery in Antique was also recorded, which by 2016
already surpassed its pre-Haiyan production. The province has recovered and increased
its coconut hectarage by 8,849 ha for a total of 128, 512 ha from 2009 to 2019, at an
average growth rate of 7.40%.

4 1 3P H I L I P P I N E C O C O N U T I N D U S T R Y R O A D M A P 2 0 2 1 - 2 0 4 0
The continuing planting/replanting program before ST Haiyan has already accomplished
about 19,000 ha. This accomplishment could have affected the fast recovery of the
provinces that were not as severely devastated by ST Haiyan.
Figure 3.144. Volume of whole nut production and area planted to coconut in Western Visayas, 2009-2019
Basic source of data: PSA
Figure 3.145. Volume of coconut production by province, Western Visayas, 2009–2019
Basic source of data: PSA

4 1 4 D E P A R T M E N T O F A G R I C U L T U R E P H I L I P P I N E C O C O N U T A U T H O R I T Y
Negros Occidental and Antique contributed 50% to the regional volume of production.
Meanwhile, Capiz, Iloilo, and Aklan produced another 40%, while 7% was produced on
the island of Guimaras, the least producer with 8,810 ha and more than 676,000 bearing
trees. Among the regions in Visayas, Western Visayas is the only region with above
average productivity per year at 53 nuts/tree/year, ranging from 52 nuts per tree to 62
nuts/tree/year in five provinces, except in Aklan whose yield per tree is only 38 nuts/tree/
year (Table 3.75).
Figure 3.147 presents the product flow map of Western Visayas. A total of 2,584
barangays are involved in coconut planting. This number represents 64% of the total
number of barangays, which means more than half of the communities in the locality
depend on coconut. A total of 237,393 farmers must be covered with social protection in
the area. Lands in Western Visayas are classified as suitable to highly suitable areas. The
productivity of coconuts in this region at 53 nuts/tree/year is comparatively higher than
the national average.
Traders in Western Visayas are not as numerous as in other regions. The major
players in the area are VCO producers and coir processors. Oil millers and coco sugar
manufacturers also exist in the area. Greater attention must be given to boost these non-
Figure 3.146. Targets and accomplishments of the accelerated coconut planting/replanting project of PCA in Western Visayas, 2011–2019
Basic source of data: PCA

4 1 5P H I L I P P I N E C O C O N U T I N D U S T R Y R O A D M A P 2 0 2 1 - 2 0 4 0
traditional products which are characterized by niche market, small scale operation, and
inefficiency of technology. Issues and problems in NTCPs can be addressed via market
facilitation and linkage, research and product diversification to widen the base to other
markets. Some to pump-prime the industry are: financial assistance in getting organic
certification, adoption of quality enhancing technologies, and provision of incentives
for adopting the use of centrifuge in VCO extraction. Provision of dwarf variety for coco
sugar is recommended. Strategic planting can also be implemented in areas as deemed
necessary and appropriate for different coconut products. More varieties that provide
meat are recommended for VCO producers in the area while varieties with thicker husks
are suggested for coir processors in respective places.
Figure 3.147. Product flow map of the coconut industry in Western Visayas, 2021
Source: PSA and PCA Region VI, 2019

4 1 6 D E P A R T M E N T O F A G R I C U L T U R E P H I L I P P I N E C O C O N U T A U T H O R I T Y
Table 3.75. Coconut regional and provincial statistics, Western Visayas, 2019
The quick recovery of Western Visayas compared with Central and Eastern Visayas is
recommended for further study.
CAR, Cagayan Valley, Ilocos Region, and Central Luzon Production Trend (2009–2019)Cagayan Valley, Cordillera Administrative
Region (CAR), Ilocos Region, and Central
Luzon are considered minor production
areas and were analyzed together since they
belong to one PCA region. Together, they
supplied only 1.6% to the national coconut
production. Nut production trends differed
in the four regions; Central Luzon, the largest
producer among them, had a net decrease of 81M MT from 2009 to 2019. The three
other regions had slight increases in production over the same period. The steep and
lingering decline starting 2015 was most likely due to the severe El Niño in 2015–2016
(Figure 3.148).

4 1 7P H I L I P P I N E C O C O N U T I N D U S T R Y R O A D M A P 2 0 2 1 - 2 0 4 0
Except in Central Luzon, the volume of nut production more or less followed the trend
in coconut hectarage. Additionally, despite the sharp increases in coconut areas, Central
Luzon’s production still contracted sharply (Figure 3.149).
Figure 3.148. Volume of nut produced in CAR, Cagayan Valley, Ilocos Region, and Central Luzon, 2009–2019
Basic source of data: PSA
Figure 3.149. Volume of whole nut production and area planted to coconut in CAR, Cagayan Valley, Ilocos Region, and Central Luzon, 2009–2019
Basic source of data: PSA

4 1 8 D E P A R T M E N T O F A G R I C U L T U R E P H I L I P P I N E C O C O N U T A U T H O R I T Y
From 2010 to 2019, about 16,000 ha were planted/replanted in Cagayan Valley, 15,100
ha in Central Luzon, and 13,000 ha in Ilocos Region. The planting/replanting program had
benefited over 6,800 farmers in Cagayan Valley, 8,500 in Central Luzon, and about 11,000
farmers in Ilocos Region. Lastly, CAR’s 2,080-ha farmlands were planted/replanted and
benefited almost 28,000 farmers.
The data of PCA and PSA need to be reconciled and harmonized , as the area reported
to have been replanted by PCA is more than six times the coconut hectarage in CAR in
2019, a little more than 100% of the coconut area in Cagayan Valley, Ilocos Region, and
almost twice that of Central Luzon.
The Ilocos Region has a total land area of 12,541 has devoted to coconut which is only
1% of the region’s total land area. Hence, there is still a large agricultural and potential
area for coconut land. Fifty- nine percent of the total coconut area is in Pangasinan. With
the remaining vast amount of land in Ilocos region, the development of new and existing
land can aid in supplying raw materials to cover the rising demand. Based on the regional
Figure 3.150. Area replanted/ planted by PCA program in CAR, Cagayan Valley, Ilocos Region, and Central Luzon from 2009 to 2019
Basic source of data: PCA

4 1 9P H I L I P P I N E C O C O N U T I N D U S T R Y R O A D M A P 2 0 2 1 - 2 0 4 0
roadmap of Ilocos Region, coconut production has to be increased five times more to
meet the demand. Strategic location of a centralized coconut plantation is recommended
in a rather dispersed nature of planted area in the region (PCA Regions I,II,III & CAR,
2019). The whole area of the Ilocos Region has suitable land for coconut farming. The
Accelerated and Strategic Planting and Replanting Program, bundled with fertilizer
support for two years, can be expanded. Though the magnitude of land per province
has been identified and projected, the limiting factor is the supply of good seedlings
for planting. One provincial nursery is already built in Pangasinan, but more seed farms
may be established for expansion. The average productivity of the nut is 49 nuts/tree/
year, which is greater than the national average of 44 nuts/tree/year (PCA Region I, II, III,
and CAR). Planting and replanting a hybrid variety of coconut would still be beneficial. A
total of 5,796 registered coconut farmers in Ilocos Region is expected to be given social
protection from the Coco Levy Funds.
Figure 3.151 shows that the nuts produced by the farmers are collected by the
consolidators who transfer them to the distributors and then to the retailers. A total of
69 consolidators and distributors are present in the area. There are nine producers of
bukayo. Calamay and “tupig” are some of the other coconut- based products produced
in the area. Ten percent of the population in the region consumes coconut but the
potential market can be enlarged to cater to tourists in the area. Since Ilocos Region is a
tourist destination, it pays off to engage in coconut enterprises, such as VCO, coco sugar
and coconut water, that are appealing to local and foreign tourists. The existing bukayo
industry can also be enriched through entrepreneurship and Upgrading Training and
other related programs for MSMEs.

4 2 0 D E P A R T M E N T O F A G R I C U L T U R E P H I L I P P I N E C O C O N U T A U T H O R I T Y
Similar to Ilocos Region, Cagayan Valley has minimal land allocated to coconut, i.e., 0.6%
of the entire region. Coconut productivity is 52 nuts/tree/year, which is higher compared
to other regions. There is a total of 7,781 farmers in the region. With the Coco Levy
Act, these farmers are expected to be given social protection by the government. Farm
products in this region are young and mature nuts but there are also two producers that
specialize in the production of buko pie and other confectioneries. Thirty-six coconut
traders are part of the product flow. The movement of products follows the same pattern
as that of Region I and the goods are being sold locally in nearby towns and provinces.
Strategies and interventions for Region II are similar to
Ilocos region, such as strategic planting or farm production expansion. This strategy is
fitting not only because of idle tracts of land that can be utilized for planting but also
because the land in Region II is classified as ‘suitable’ for coconut which implies high
productivity of the area. Provision of good quality seeds or more seed farm development
Figure 3.151. Product flow map of the coconut industry in Ilocos Region, 2019
Source: PSA and PCA Region I, 2019

4 2 1P H I L I P P I N E C O C O N U T I N D U S T R Y R O A D M A P 2 0 2 1 - 2 0 4 0
is warranted since only one seed farm was found. According to PCA Region II, the
region’s coconut production must increase by 72% to meet the market demand. A
proportionate increase in the budget allocated to coconut production in Cagayan Valley
must be realized.
Since coconut enterprises are scanty and at the nascent stage, the existing coconut-based
product business, e.g. buko pie and other confectioneries, can be boosted through skills
development program, training and capacity building, and entrepreneurship program and
promotion. Introduction of nontraditional products such as VCO, coco sugar, and coco
water in the region would also capture more market from local and foreign travelers.
Figure 3.152. Product flow map of the coconut industry in Cagayan Valley Region, 2021
Source: PSA and PCA Region II, 2019
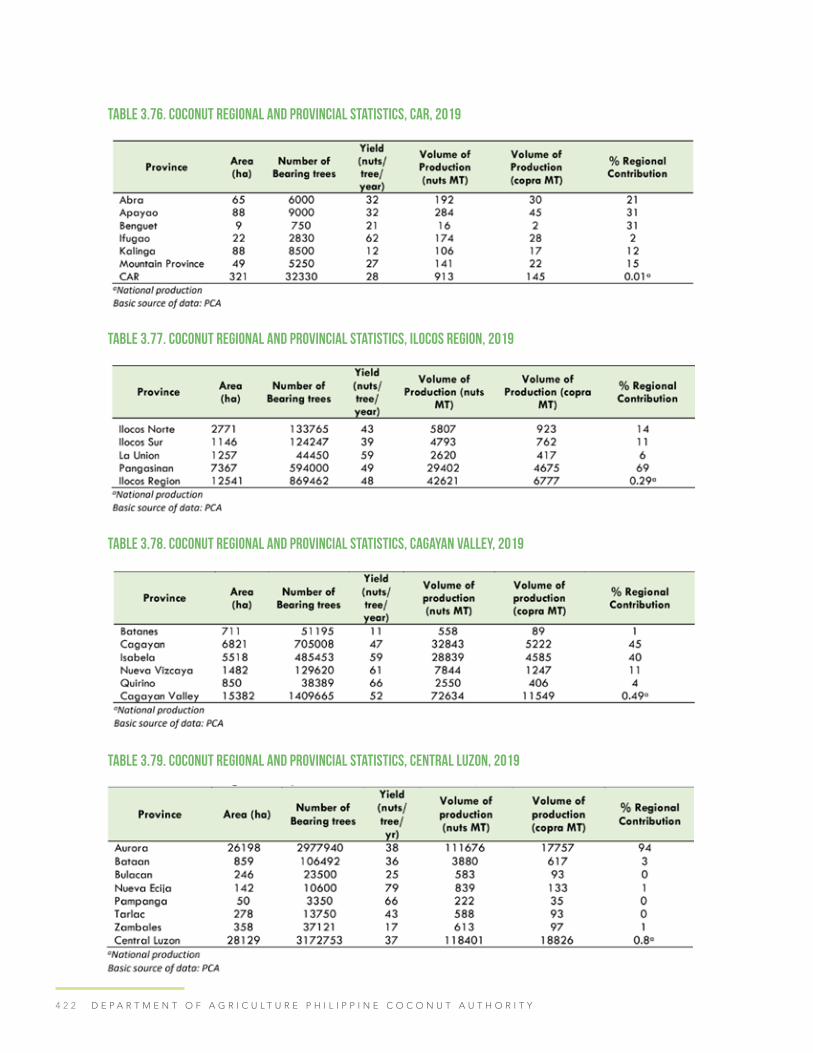
4 2 2 D E P A R T M E N T O F A G R I C U L T U R E P H I L I P P I N E C O C O N U T A U T H O R I T Y
Table 3.76. Coconut regional and provincial statistics, CAR, 2019
Table 3.77. Coconut regional and provincial statistics, Ilocos Region, 2019
Table 3.78. Coconut regional and provincial statistics, Cagayan Valley, 2019
Table 3.79. Coconut regional and provincial statistics, Central Luzon, 2019

4 2 3P H I L I P P I N E C O C O N U T I N D U S T R Y R O A D M A P 2 0 2 1 - 2 0 4 0
Only one province dominated coconut production in the Ilocos Region, with Pangasinan
contributing 69%, and Aurora in Central Luzon supplying 94%. In Cagayan Valley,
Cagayan (45%) and Isabela (40%) contributed 85% to the regional coconut production.
Coconut productivity differed across regions and within provinces in the region. Cagayan
Valley, except for Batanes, had above average productivity per tree in four provinces
ranging from 47 nuts/tree/year to 66 nuts/tree/year. In CAR, Ifugao had a computed
average of 62 nuts/tree/ year from only 2,800 bearing trees. In Ilocos Region, La Union
had 59 nuts/tree/year and Pangasinan, 49 nuts/tree/year. In Central Luzon, Nueva Ecija
produced 79 nuts/tree/year from only 10,600 bearing trees while Pampanga, with only
3,350 bearing trees, yielded 66 nuts/tree/year.
Analysis for Processing: Domestic and InternationalCoconut Oil• CARGILL, INC. Cargill, Inc. has two subsidiaries operating in Southeast Asia that are
manufacturing crude coconut oil, namely, Cargill Philippines and Cargill Indonesia
(https://www.cargill.ph). Cargill, Inc. started doing business in the Philippines in
1947 when the vegetable oil division started buying copra for export to the United
States. It was Cargill’s first office in Asia. Cargill Philippines now employs over 950
people throughout the country. The company’s primary offices are in Taguig City
(headquarters), Bulacan, Batangas, Laguna, and General Santos City, with several
satellite offices in strategic locations all over the Philippines. The company owns and
operates a copra crushing plant in General Santos City that produces crude coconut
oil and copra meal for domestic and export markets. Construction of the facility
was completed in January 1991 and its operation began in the same year to source
and process copra to produce crude coconut oil. Since then, the plant consistently
operates at one of the highest utilization rates in the Philippine coconut oil milling
industry (i.e., 171,000 MT/year) using the mechanical, full press oil extraction
technology. Cargill also operates several copra buying stations in the country to
supply its crushing capacity in General Santos City. The company’s copra buying
stations are in Puerto Princesa and Brooke’s Point, Palawan; Tagbilaran, Bohol; Sogod,
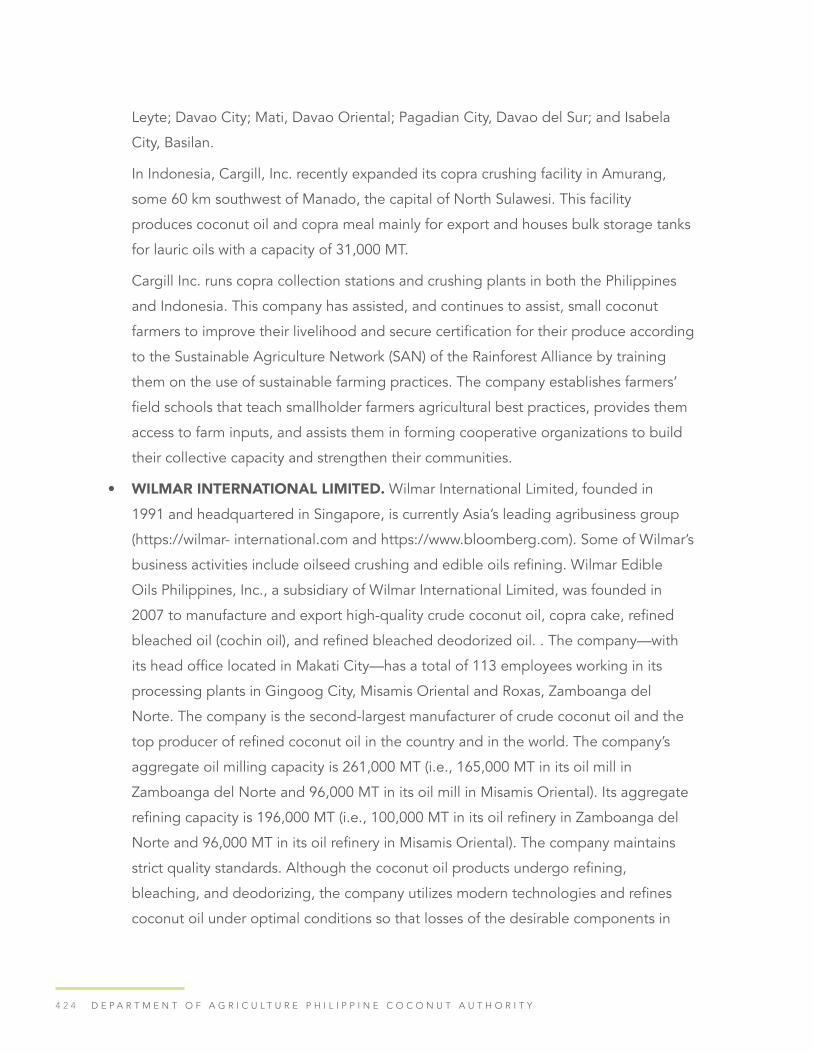
4 2 4 D E P A R T M E N T O F A G R I C U L T U R E P H I L I P P I N E C O C O N U T A U T H O R I T Y
Leyte; Davao City; Mati, Davao Oriental; Pagadian City, Davao del Sur; and Isabela
City, Basilan.
In Indonesia, Cargill, Inc. recently expanded its copra crushing facility in Amurang,
some 60 km southwest of Manado, the capital of North Sulawesi. This facility
produces coconut oil and copra meal mainly for export and houses bulk storage tanks
for lauric oils with a capacity of 31,000 MT.
Cargill Inc. runs copra collection stations and crushing plants in both the Philippines
and Indonesia. This company has assisted, and continues to assist, small coconut
farmers to improve their livelihood and secure certification for their produce according
to the Sustainable Agriculture Network (SAN) of the Rainforest Alliance by training
them on the use of sustainable farming practices. The company establishes farmers’
field schools that teach smallholder farmers agricultural best practices, provides them
access to farm inputs, and assists them in forming cooperative organizations to build
their collective capacity and strengthen their communities.
• WILMAR INTERNATIONAL LIMITED. Wilmar International Limited, founded in
1991 and headquartered in Singapore, is currently Asia’s leading agribusiness group
(https://wilmar- international.com and https://www.bloomberg.com). Some of Wilmar’s
business activities include oilseed crushing and edible oils refining. Wilmar Edible
Oils Philippines, Inc., a subsidiary of Wilmar International Limited, was founded in
2007 to manufacture and export high-quality crude coconut oil, copra cake, refined
bleached oil (cochin oil), and refined bleached deodorized oil. . The company—with
its head office located in Makati City—has a total of 113 employees working in its
processing plants in Gingoog City, Misamis Oriental and Roxas, Zamboanga del
Norte. The company is the second-largest manufacturer of crude coconut oil and the
top producer of refined coconut oil in the country and in the world. The company’s
aggregate oil milling capacity is 261,000 MT (i.e., 165,000 MT in its oil mill in
Zamboanga del Norte and 96,000 MT in its oil mill in Misamis Oriental). Its aggregate
refining capacity is 196,000 MT (i.e., 100,000 MT in its oil refinery in Zamboanga del
Norte and 96,000 MT in its oil refinery in Misamis Oriental). The company maintains
strict quality standards. Although the coconut oil products undergo refining,
bleaching, and deodorizing, the company utilizes modern technologies and refines
coconut oil under optimal conditions so that losses of the desirable components in

4 2 5P H I L I P P I N E C O C O N U T I N D U S T R Y R O A D M A P 2 0 2 1 - 2 0 4 0
RBD coconut oil are minimized. Wilmar International Limited secured the following
certifications: FSSC 22000, HACCP, Halal, ISO 14001, ISO 9001: 2018, Kosher, and
OHSAS 18001.
• GRANEXPORT MANUFACTURING CORPORATION. Granexport Manufacturing,
one of the Coconut Industry Investment Fund Oil Mills Group (CIIF OMG), is the
biggest single copra processing plant in the world. The company has the capacity to
crush 270,000 MT of copra per year (https://www.ciif.ph). Its 10-ha plant in Kiwalan,
Iligan City, Misamis Occidental was established in 1974. Its products include crude
coconut oil, copra pellets, cochin oil, and refined bleached deodorized oil. The plant
is equipped with a pier that accommodates vessels up to 65,000 deadweight tons
for loading finished products and unloading copra feedstock. On average, 80% of
the group’s produce are exported abroad while the balance is sold in the domestic
market. The company’s processing plant/coconut oil products are ISO 9001 (QAS
International), Halal, FDA, SK, ISPS and US FDA accredited.
• PRIMEX GROUP OF COMPANIES. Currently, with six factories manufacturing crude
coconut oil, the Primex Group of Companies has the largest total annual capacity
of 504,000,000 MT of crude coconut oil and 63,000 refined oil (https://primexcoco.
com). The Primex Group of Companies’ coconut oil mills are as follows: Primex Coco
Product in Candelaria, Quezon; Globe Coco Products Manufacturing Corp. in Legaspi,
Albay; Catarman Oil Mill in Northern Samar; Tacloban Oil Mills Inc. in Tolosa, Leyte;
Dipolog Oil Mills Inc. in Roxas, Zamboanga del Norte; and New Davao Oil Mills Inc. in
Panacan, Davao City. All the six coconut oil processing facilities of the Primex Group
of Companies are strategically located in areas where coconut trees are naturally
abundant. Situated in six different locations all over the Philippines, the Primex Group
of Companies is currently one of the largest users of coconut as raw material in the
world. The Primex Group of Companies secured the following certifications: USDA
Organic, Organico Brasil, EU Organic, Korea Organic, BRC, JAS EcoCert, Halal,
Kosher, Fair Trade, and Naturland.
Among its plants, the coconut processing plant of Prime Coconut Products, Inc. in
Candelaria, Quezon has the smallest rated capacity for crude coconut oil production
at 45,000 MT per year since the factory’s main product is desiccated coconut. The
factory also produces extra virgin coconut oil and coconut milk powder. The coconut

4 2 6 D E P A R T M E N T O F A G R I C U L T U R E P H I L I P P I N E C O C O N U T A U T H O R I T Y
milk powder production facility has an annual capacity of 3,000 MT. This factory
combines state-of-the-art equipment with high dairy standard and quality systems.
Operating since 1995, Globe Coco Products of Legazpi, Albay is one of the main
Primex processing centers for crude coconut oil. Its coconut oil processing plant
utilizes 14 expellers. The plant of the Globe Coco Products Manufacturing Corp.
produces 90,000 MT of crude coconut oil per year.
The Catarman Oil Mills Inc. in Northern Samar is the newest coconut oil processing
plant of the Primex Group of Companies. Utilizing 12 expellers, this plant can
produce 54,000 MT of crude coconut oil per year. Aside from its own private port, the
Catarman plant is also equipped with its own power generation system.
Located just 25 kilometers from the City of Tacloban, Leyte, the Tacloban Oil Mills Inc.
was established in 2006 with a plant capacity of 90,000 MT per year. Operations of
the plant consist mainly of processing crude coconut oil for export and for the local
market.
The coconut oil processing plant of Dipolog Oil Mills Inc. in Dipolog City, Zamboanga
del Norte has a rated capacity of 135,000 MT/year. Both the Tacloban Oil Mills Inc.
and Dipolog Oil Mills Inc. have their own private port and motor vessels to expedite
the transport of raw materials to the plant.
The New Davao Oil Mills Inc. was established in July 2001 to cater to the crude
coconut oil and refined coconut oil demand in the local and foreign markets. Utilizing
16 Anderson Super Duo expellers, this plant has the capacity to manufacture 90,000
MT of crude coconut oil and to refine 63,000 MT of coconut oil per year. The plant is
strategically located in Panacan, Davao and exports its finished products to the USA,
People’s Republic of China, and Europe.
Desiccated Coconut• FRANKLIN BAKER CO. Franklin Baker Co., a private company operating in the
Philippines, is the world’s leading supplier of desiccated coconut products (i.e.,
granulated and special cuts of desiccated coconuts, golden toasted and tender,
fresh, sweetened desiccated coconuts) (https://www.franklinbaker.com). Franklin
Baker’s three manufacturing plants—located in San Pablo City, Laguna and Sta. Cruz,
4 2 7P H I L I P P I N E C O C O N U T I N D U S T R Y R O A D M A P 2 0 2 1 - 2 0 4 0
Davao del Sur— are renowned for producing the highest quality desiccated coconut
products. Franklin Baker Co. has the largest aggregate desiccated coconut production
capacity at 61,000 MT. Its coconut processing plant in Sta. Cruz, Davao del Sur has
a rated capacity of 45,000 MT of desiccated coconut while its facility in San Pablo
City, Laguna has a lower rated capacity at 16,800 MT of desiccated coconut. The
company procures coconuts from different provinces in Mindanao. The company’s
desiccated coconut products are shipped to over 50 countries worldwide across the
United States, South America, Europe, Middle East, Africa, and Asia Pacific. Franklin
Baker Co. is the leading and preferred supplier of desiccated coconut to major food
manufacturers and confectionery/bakery producers in the United States—such as
Kraft Foods, Hershey’s, Kellogg’s, General Mills and Nestle—accounting for close to
50% share of the total Philippine coconut exports to the USA. The company has three
warehouse locations in the United States. It operates marketing offices in Memphis,
Texas, USA, and Northolt in the United Kingdom. The company’s retail brand is
“Baker’s Coconut”.
Franklin Baker Co. company focuses on quality attributes such as cut uniformity,
consistency, degree of whiteness, moisture levels, sulfite content, and the absence
of unwanted foreign materials. Above all else, the company’s compliance to
internationally recognized food safety standards related to microbiological levels in
food products and GMP procedures commands its utmost attention. In pursuit of
these exceptional standards, Franklin Baker employs several unique and industry
best practices in its manufacturing processes and the use of specialized equipment
to help ensure the high quality and safety of its desiccated coconut products. The
company practices steam pasteurization of all the nuts it processes. Its pasteurization
system offers significant benefits vs. the industry standard of using the thermal screw
system which gives a rotating exposure to steam that is not constant, cannot be
clearly monitored, and has the functional disadvantage of potential recontamination
due to the presence of “cold spots” resulting in incomplete kill. In addition, the
company’s desiccated coconut plants have the capability to produce their own
steam requirements and have backup generators to help prevent interruption in the
company’s manufacturing operations. Its high-care processing areas are supplied
with filtered air that helps prevent the desiccated coconut products from exposure

4 2 8 D E P A R T M E N T O F A G R I C U L T U R E P H I L I P P I N E C O C O N U T A U T H O R I T Y
to airborne physical and microbial contaminants. The company utilizes a continuous
blancher-dryer system to prevent post microbial contamination after pasteurization
(blanching). Moreover, the company implements an extensive sampling plan by taking
samples from each bag of product and combining these as a composite sample,
subject to extensive microbiological testing. This sampling plan was adopted based
on the US FDA & ICMSF (International Compendium of Microbiological Specifications
for Foods). Nonfood contact surface areas are subjected to regular swabbing for
pathogen testing, while food contact surface areas are sampled regularly and tested
rigorously for indicator organisms. Surface swabs (ATP & microbiological) are taken
before the start of operation on all food contact surface areas to validate compliance
to cleaning and sanitization procedures. Deep wells and all water at points of use are
sampled regularly for microbiological testing. Process and non-process water supplies
are regularly tested for chlorine levels. Microbiological testing includes aerobic plate
count, coliform group count, E. coli, molds, yeasts, Staphylococcus aureus, and
Salmonella. To ensure the accurate and timely detection of Salmonella, Franklin Baker
has adopted the use of rapid and highly sensitive PCR-based pathogen detection
systems since 2000. These detection equipment amplify the target organism’s DNA
and can detect the presence of Salmonella within 26 to 28 hours from the start of
analysis without the need for additional confirmation. The company also conducts
audit-level testing on lipolytic activity. The company’s standard operating procedure
requires that all products be automatically quarantined. No product is released for
shipment unless it receives documented and verified finished product clearance
from the Quality Assurance Department. The company also conducts inspections
of all container vans prior to use including their previous loads to ensure that each
container van is free from leaks, pests, and odor. As a further measure to protect its
products, the flooring of all container vans is lined with Kraft paper prior to product
loading. This procedure was adopted to help mitigate the risk of odor and moisture
migration inside the container van.
Owing to Franklin Baker’s compliance with internationally recognized food safety
standards related to microbiological levels in food products and GMP procedures
the company has extensive third party certifications and accreditations for all its
processing plants/products: USDA Organic, EU Organic, Non-GMO Project Verified,

4 2 9P H I L I P P I N E C O C O N U T I N D U S T R Y R O A D M A P 2 0 2 1 - 2 0 4 0
Fair Trade USA, British Retailers Consortium (BRC) Global Standard for Food Safety,
Japanese Agricultural Standard System (JAS), ISO 9001:2000, ISO 22000 Food Safety
Management System, HACCP (Hazard Analysis and Critical Control Points), FDA
Philippines, GMA-SAFE, AB PAO Accredited Testing Laboratory, Kosher certified
by OK Kosher Certification, and Halal certified by the Islamic Da’Wah Council of
the Philippines. The company received an Award of Excellence and the 2016-2018
American Master of Taste and Gold Medal Endorsement for Superior Taste. The
company’s microbiology laboratories are now accredited to the ISO 17025 Laboratory
Management System by the Philippine Accreditation Bureau. Franklin Baker Co. is a
member of SEDEX, the supplier of Ethical Data Exchange. SEDEX provides member
companies with a secure web-based platform for storing and sharing information on
four key pillars: Health and Safety, Labor Standards, Business Ethics and Environment.
Other leading players in the global desiccated coconut market are the Primex Group
of Companies, Superstar Coconut Products, Inc. (Philippines), Peter Paul Philippines
Corporation (Philippines), PT Global Coconut (Indonesia), and CBL Natural Foods (Sri
Lanka).
• PRIMEX GROUP OF COMPANIES. Primex is one of the leading desiccated coconut
brands in the world (Primex op. cit.). The two member companies of Primex that
produce high-grade quality desiccated coconut are Primex Coco Products, Inc.
and Primex Coco Davao, Inc. These two companies have an aggregate production
capacity of 50,000 MT per year. Primex Coco Products was established in 1991 in
Candelaria, Quezon and presently, the rated capacity of its factory is 24,000 MT per
year. The company now employs more than 1,500 employees. Primex Coco Products,
Inc. is ISO:22000 FSMS, JAS EcoCert, and BRC certified and is duly accredited by
most of the world’s major confectioneries.
Established in 2003 in Sta. Cruz, Davao del Sur, Primex Coco Davao started from a
rated annual capacity of 13,000 MT of desiccated coconut. In a short period of time,
the company’s capacity has doubled to 26,000 MT per year. Primex Coco Davao
Inc. is currently employing 1,800 employees. This makes Primex the fastest-growing
desiccated coconut manufacturer in the world. The industrial plant is uniquely and
specifically designed to meet international food standards, combining top-of-the-
line and efficient structures, heavy-duty equipment, and advanced quality monitoring

4 3 0 D E P A R T M E N T O F A G R I C U L T U R E P H I L I P P I N E C O C O N U T A U T H O R I T Y
system. The company produces multi-graded desiccated coconut. The company’s
factory/product is ISO 22000 certified and its desiccated coconut products are Halal,
Kosher, JAS EcoCert, BRC, USDA organic, EU organic, Korea organic, Organic Brasil,
Fair Trade, and Naturland certified.
All the desiccated coconut products produced by the Primex Group of companies
have a natural coconut flavor. They come in a variety of forms from chips, shredded,
flakes, granules, and macaroons. All the company’s desiccated coconut products
passed through the two companies’ meticulous quality checks which include metal
detection and microbiological analysis. The Primex companies produce different
variants of desiccated coconut—such as sweetened, toasted, and sweetened toasted;
and also various cuts such as extra-fine, fine, and medium.
• PETER PAUL PHILIPPINES CORPORATION. Peter Paul Philippines Corp. was
formerly a subsidiary of the US-based Peter Paul, Inc. of Naugatuck, Connecticut
when it began operations in Candelaria, Quezon becoming one of the pioneering
American companies in the country (https://www.peterpaul.com). It is now 100%
Filipino-owned and has expanded its operation due to the increased demand for
coconut products worldwide. Peter Paul Philippines Corp. is one of the largest
firms producing desiccated coconut in the Philippines and in the world. It has two
desiccated coconut factories with a total rated capacity of 44,000 MT per year. One
factory is in Candelaria, Quezon, which has a rated capacity of 22,000 MT per year,
mainly for export. The company’s factory in Quezon employs 1,700 workers. The
second factory is in Sorsogon, Sorsogon with a rated capacity of also 22,000 MT per
year. Since its inception, Peter Paul Philippines Corp. has achieved and maintained
its reputation for excellent quality coconut products. The company’s desiccated
coconut products are made from choice nuts and pass through stringent international
certified process. Peter Paul Philippines Corp.’s production of desiccated coconut is
an elaborate food processing system, with processes monitored at each control point
by inspection and testing of each product. The implementation of the company’s
stringent standards is evidenced by its HACCP, ISO 9001, ISO 22000, GMP, and
Organic certification (USDA and Europe) into its quality system. The company has also
Halal, Fair Trade, and Kosher certification.
Peter Paul Philippines Corp. is also a premier producer of other coconut-based

4 3 1P H I L I P P I N E C O C O N U T I N D U S T R Y R O A D M A P 2 0 2 1 - 2 0 4 0
products such as virgin coconut oil, coconut flour, coconut milk, coconut cream,
coconut water, creamed coconut, and toasted chips. The company is one of the
preferred global suppliers of coconut products. Peter Paul’s products are exported
to North and South America, Europe, other Asia countries, and the Middle East
where the company maintains a substantial share in each of these markets. Peter Paul
Philippines’ customers for desiccated coconut have established household name
brands in confectionery, cookie, and cereal industries. The company’s desiccated
coconut product line provides food manufacturers with an assorted array of different
cuts. The different variants of desiccated coconut produced by the company are
regular desiccated coconut, sweetened desiccated coconut, toasted desiccated
coconut, and toasted long chips.
• SUPERSTAR COCONUT PRODUCTS, INC. Superstar Coconut Products Co., Inc. is a
private manufacturer of coconut products based in the Philippines since 1992(https://
superstar.coconut.com). Family managed, Superstar Coconut Products Co., Inc.
operates two world-class desiccated coconut processing plants with an aggregate
rated capacity of 48,000 MT per year. Its desiccated coconut processing plant in
Candelaria, Quezon has a rated capacity of 22,000 MT per year while its desiccated
coconut processing facility in Davao City has a rated capacity of 26,000 MT. The
company has automated systems and top-notch machines and employs more than
2,000 skilled workers. Six different calibrated cuts of desiccated coconut are produced
by the company to suit the needs of customers.
The company has expanded its product line to include coconut milk powder, ,
coconut milk, coconut water, frozen coconut water concentrate, virgin coconut oil,
coconut flour, and creamed coconut. Coconut milk powder found a strong market
in Europe where fresh coconut milk is not readily available. The company’s coconut
products are BRC, USDA Organic, EU Organic, JAS, Halal, Kosher, and HACCP
certified. Superstar Coconut Products Co., Inc. is one of the major suppliers of
desiccated coconut to several companies all over the world.
• PT GLOBAL COCONUT. P T Global Coconut is a privately-owned company which
was established in 2012 and is one of the leading manufacturers of desiccated
coconut products (www.ptglobalcoconut.com). Its processing plant in North Sulawesi,
Indonesia is equipped with an ultra-modern and eco-friendly production facility with

4 3 2 D E P A R T M E N T O F A G R I C U L T U R E P H I L I P P I N E C O C O N U T A U T H O R I T Y
a peak operating capacity of 250,000 nuts per day (B2B supplies). It is also equipped
with the latest European food processing technologies from
Alfa Laval, aimed at producing the highest quality products for customers globally.
The company’s processing plant is Halal, ISO 22000, FSSC 22000, and KLBD Kosher
certified. The company exports desiccated coconut to the People’s Republic of China,
Thailand, Vietnam, and the United States.
• CBL NATURAL FOODS. CBL Natural Foods, which has been operating for over
20 years in Sri Lanka, produces organic, finely grated, and medium-sized grated
desiccated coconut with no added sugar, flavor, color, preservative, and additives
using modern technology (https://www.cblnaturalfoods.com). The company’s products
are organic certified by Control Union, Star-Kosher certified, IFS food safety and
quality standard certified by SGS International Certificate Services, JAS certified
by Control Union, and LK BIO-149 Certified for the EU. In addition, the company
has obtained ISO 22000 Quality Management System Certification awarded by the
International Organization for Standardization, HACCP certification from MOODY
International Holland, and Fair Trade certification. CBL Natural Foods’ conformity to
all international standards has enabled the company to export desiccated coconut to
45 countries.
Coco Shell Charcoal• JACOBI CARBONS PHILIPPINES. Jacobi Carbons Philippines, Inc., which
was established in Villanueva, Misamis Oriental in 2012, has the world’s
largest coconut shell charcoal processing plant at 252,974 MT/year (https://
qaphilippinescom>company). The company has modern rotary kilns and granulation
equipment and also highly efficient dust collector that captures all dust inside the
production area during processing. Jacobi Carbons Philippines, Inc. is engaged in
purchasing coconut shell charcoal from local farmers that the company granulates to
required sizes. The activated carbon facility of Jacobi Carbons Philippines uses bulk of
the granulated coconut shell charcoal produced at the company’s coco shell charcoal
processing plant as raw material. Moreover, the company prepares the granulated
coco shell charcoal for export to its affiliate companies in India, Vietnam, and Sri
Lanka after a thorough quality control process. At an average shipment volume of

4 3 3P H I L I P P I N E C O C O N U T I N D U S T R Y R O A D M A P 2 0 2 1 - 2 0 4 0
700–1000 MT weekly, these are being used to manufacture activated carbon of other
affiliate companies.
• BAKULAN NUSATRA. Bakulan Nusatra whose main office is in Solo, Central Java
is Indonesia’s largest supplier of high-quality food grade coconut shell charcoal and
coconut charcoal briquettes for shisha and barbeque (www.bakulan.nusantara.com
and https://www.zoominfo.com>bakulan-). The company’s capacity is 24,000 MT per
year and it has 21 employees. The company has several refinery factories that collect
thousands of tons of raw or burnt coconut shells directly from coconut farmers all over
the Indonesian archipelago. For both natural and granulated charcoal processing,
the company’s uniquely designed, continuous one-line process cleans and sorts the
coconut shell charcoal, removing any foreign materials or under burnt charcoal pieces.
Then the coconut shell charcoal pieces move to the next step for granulation via
conveyor belt. The company granulates coconut shell charcoal to any specification
suitable for all activated carbon processes. The company has rotary dryers to dry the
granulated coconut shell charcoal to put the moisture content down to the required
level. The company packs granulated coconut shell charcoal in 20-kg polypropylene
(PP) bags which are stacked on one-ton pellets and moved to a shipping container
for export. In manufacturing coconut shell charcoal briquette, high-grade granulated
coconut shell charcoal is turned into powder and molded into any shape or size
depending on the customers’ specifications. The company’s coconut shell powder is
fine as possible, less than 2mm, so all surfaces can ignite and burn evenly.
Granulated coconut shell charcoal is Bakulan Nusatra’s preferred form for coconut
charcoal export. The company’s main export destinations for granulated charcoal
are activated carbon plants in the People’s Republic of China and in Southeast Asian
countries. The company also exports charcoal briquette to over 10 different countries.
Each country has its own requirements for different characteristics of the charcoal
briquette.
Coco Shell Charcoal-based Activated Carbon• Haycarb PLC. Haycarb PLC is one of the world’s leading manufacturers and
marketers of coconut shell charcoal-based activated carbon (https://www.haycarb.
com). Accounting for over 16% of the global market share, the company has an

4 3 4 D E P A R T M E N T O F A G R I C U L T U R E P H I L I P P I N E C O C O N U T A U T H O R I T Y
annual capacity of over 50,000 MT of activated carbon. Haycarb PLC manufactures
a complete range of standard, washed and impregnated granular activated carbon,
powder activated carbon, and extruded pellet activated carbon for a full spectrum
of applications in water treatment, air treatment, gold recovery, food and beverage
industry, energy storage, and specialty applications. The company was established
in 1973 and operates six coco shell charcoal-based activated carbon manufacturing
locations in Sri Lanka, Thailand, and Indonesia. Haycarb PLC’s first coco shell charcoal-
based activated carbon processing plant, which was established in Madampe,
Sri Lanka, commenced its operation with 900 MT per annum. The facility has
now expanded to 10,500 MT per annum. The second coco shell charcoal-based
activated carbon production facility of Haycarb is located in Badalgama, Sri Lanka.
The facility expanded from 5,000 MT to 7,000 MT per annum. The company has set
up a coco shell charcoal-based activated carbon processing plant in Indonesia with
manufacturing capacity of over 6,500 MT per annum for the local market and another
facility with production capacity of 3,600 MT for export. The company acquired the
Shizuka plant in Thailand to further expand the Haycarb Group’s presence in the
country and to open new market segments in the region with enhanced capacity of
3,000 MT. Haycarb also put up a joint venture company called Carbokarn Co. Ltd.
In Thailand. Carbokarn’s extensive product range and technical services has enabled
it to capture around 80% of the coco shell charcoal-based activated carbon market
in Thailand across a wide range of applications. The company’s coco shell charcoal-
based activated plants supply a global sales network composed of marketing
subsidiaries in USA (i.e., Haycarb USA, Inc.), United Kingdom (i.e., Eurocarb Products
Limited), and Australia (Haycarb Holdings Australia). Haycarb Sri Lanka Head Office
acts as the central coordinating center for the Haycarb Group.
Haycarb PLC places vital importance on process and quality control in its production
systems. All Haycarb PLC’s coco shell charcoal-based activated carbon manufacturing
facilities situated in Sri Lanka, Thailand, and Indonesia are ISO 90001: 2008, National
Sanitation Foundation (NSF), Standard Global Services (SGS), United Kingdom
Accreditation Service (UKAS) Quality Management, Halal, and Kosher certified as
well as have EU’s Registration, Evaluation, Authorization and Restriction of Chemicals
(REACH) Compliance, Food Chemical Codex Compliance and Prop 65 Compliance
4 3 5P H I L I P P I N E C O C O N U T I N D U S T R Y R O A D M A P 2 0 2 1 - 2 0 4 0
certificates. Haycarb PLC is also an American Water Works Association (AWWA)
member and has won a silver award at the NCE (National Chamber of Exporters)
Export Award 2020. The company has adopted UN Global Compact Principles on
Sustainable Growth and its Sri Lankan operations are ISO 14001 certified.
Equipped with in-house R&D and engineering capabilities, the company also
offers total solutions suited to its customers from activated carbon testing and
product development, regeneration of spent activated carbon to designing and
implementation of activated carbon-based environmental engineering systems.
• JACOBI CARBONS GROUP. Founded in 2016, Jacobi Carbons Group is a wholly
owned subsidiary of Osaka Gas Chemicals Co. Ltd. and is a manufacturer of high-
quality activated carbon using raw materials based on coconut shell charcoal, wood,
and coal (www.jacobi.net>jacobi-history and https://www.jacobi.net>about). Jacobi
Carbons Group is now the world’s leading manufacturer of coco shell based-activated
carbon which is used in purification processes including drinking and process water
filtration, air and gas purification, recovery of precious metals and purification. The
Group has 19 global subsidiaries and 14 wholly owned production sites around
the world. Jacobi Carbons Group wholly owns and operates five (5) coconut shell
charcoal-based activated carbon facilities in China, India, Sri Lanka, Vietnam, and
the Philippines. Each Jacobi Carbons activated carbon facility operates modern,
efficient processing equipment. Jacobi Carbons is an accredited organization meeting
the rigid international standards (ISO 14001, ISO 45001, and ISO 9001) with local
accreditations in the production, distribution, and administration points. Jacobi
adopts strict quality assurance procedures to ensure that the company produces high
quality activated carbon products.
In 1987, Jacobi Carbons Group established its initial contacts in the People’s Republic
of China and rapidly developed the first major investment of any western company
in the activated carbon business. In 2005, Jacobi Carbons established a new state-
of-the-art, 100% wholly coconut shell charcoal-based activated carbon plant in Sri
Lanka. The 5000-MT per year plant is the first major “Greenfield” expansion in the
coconut shell charcoal-based activated carbon market in over 10 years. In 2008,
Jacobi Sri Lanka expanded its capacity to a total of 9,000 MT per year. In 2009, Jacobi
Carbons India opened what is to become the world’s largest coconut shell charcoal-

4 3 6 D E P A R T M E N T O F A G R I C U L T U R E P H I L I P P I N E C O C O N U T A U T H O R I T Y
based activated carbon in Coimbatore, India with an annual capacity of 16,000 MT
per year, propelling Jacobi to be in the top spot in the world coconut shell charcoal-
based activated carbon market. In 2011, Jacobi Carbons had put up a coconut shell-
based activated carbon plant in Vietnam which is exporting 400 loads of coconut
shell charcoal-based activated carbon per year. In 2015, Jacobi Carbons opened its
newest coco shell charcoal-based activated carbon production facility in Villanueva,
Misamis Oriental in the island of Mindanao, Philippines, adding an additional 20,000
MT of annual capacity. This facility is the world’s largest coconut shell charcoal-based
activated carbon plant with a new level of automation. This facility, with its size and
sophistication, represents the state-of-the-art in carbon activation technology. The
Jacobi Carbons Philippines facility includes a charcoal granulation plant, multiple
activation kilns with a nominal capacity exceeding 20,000 MT per year, grinding
and pulverizing capacity, specialty impregnation and water/acid washing. Jacobi
CARBONS PHILIPPINES, INC. is registered as an Ecozone Export Enterprise with the
Philippine Economic Zone Authority (PEZA). It operates within a total land area of 4.8-
has at PHIVIDEC Industrial Estate.
• KURARAY CO, LTD., CENAPRO CHEMICAL CORP., AND CALGON CARBON CORP. Kuraray Co. Ltd. Is one of the world’s leading manufacturers of activated
carbon (https://www.kuraray-c.co.jp> and https://www.kuraray.com>news). The
company started its activated carbon business in 1965 and expanded its production
bases to Japan and the Philippines as well as its marketing network to Japan,
Germany, USA, China, Korea, India, Singapore, and Vietnam. The company’s coconut
shell charcoal- based activated carbon is manufactured by Cenapro Chemical Corp.,
a joint venture in the Philippines. Kuraray Co. Ltd.’s activated carbon-based products
and manufactured goods, on the other hand, are processed and manufactured in its
processing plant in Japan.
Cenapro Chemical Corporation, a coco shell charcoal and activated carbon
manufacturing company established in Mandaue City, Cebu in 1975, is 35% owned
by Kuraray Co. Ltd. Cenapro Chemical Corporation has the capacity to produce 100
MT of granulated coconut shell charcoal per day and 20,000 MT of coconut shell
charcoal-based activated carbon per year, making the company one of the leading
manufacturers of coconut shell charcoal-based activated carbon in the Philippines

4 3 7P H I L I P P I N E C O C O N U T I N D U S T R Y R O A D M A P 2 0 2 1 - 2 0 4 0
(https://wwwcenapro.com>index.ph>our company). Cenapro Chemicals Corporation
employs 100 workers and has over 50,000 square meters of warehouses that provide
ample storage space for its raw charcoal, granulated charcoal, and activated carbon
products. The company exports its products to Japan, Korea, and Europe. The
company’s largest customer is Calgon Carbon Corporation.
In 2018, Kuraray Co. Ltd. acquired US-based Calgon Carbon Corp., a worldwide
leader in the manufacture of bituminous coal-based activated carbon only (https://
www.calgoncarbon>media>press-releases and https:www.calgoncarbon.com). At
present, Calgon Carbon Corp., a wholly owned subsidiary of Kuraray Co., Ltd., is now
a global leader in the manufacture and/or distribution of coal-, wood- and coconut-
based activated carbon products in granular, powdered, pelletized, and cloth form to
meet the most challenging purification demands of customers throughout the world.
Complemented by world class activated carbon and ultraviolet (UV) light purification
and disinfection equipment systems and service capabilities as well as diatomaceous
earth and perlites. Calgon Carbon Corp. provides purification solutions for more than
700 distinct applications, including drinking water, wastewater, pollution abatement,
and a variety of industrial and commercial manufacturing processes. Headquartered in
Pittsburg, Pennsylvania, Calgon Carbon Corp. employs approximately 1,300 people
and operates 20 manufacturing, reactivation, innovation and equipment fabrication
facilities in the U.S., Asia, and Europe where Calbon Carbon Corp. is known as
Chemviron.
Oleochemicals• CHEMREZ TECHNOLOGIES. In 2006, Chemrez Inc. was acquired by D & L subsidiary
Corro-Coat, Inc. to form what is now known as Chemrez Technologies, Inc. which
operates the Philippines’ first continuous-process biodiesel plant (https://chemrez.
com and http://chemrez.com>about us). The company acquired the following
certifications: ISO 9001, ISO 14001, Halal, HACCP, Kosher, Food Organic, and
OHSAS 18001 (International Standards for Occupational Health and Safety). Chemrez
Technologies is vertically integrated from coconut oil production to coconut-based
products development. The company produced coconut oil called CocoPure RBD
CNO.

4 3 8 D E P A R T M E N T O F A G R I C U L T U R E P H I L I P P I N E C O C O N U T A U T H O R I T Y
Chemrez Technologies, Inc. is a leading manufacturer of high-quality resins,
oleochemicals (especially coco methyl ester), surfactants, and specialty products that
are effective and cost-efficient without sacrificing ethical standards. The company
develops innovative coconut-based products and solutions through continuous
research and innovation with a focus on green chemistry. New technologies
developed by Chemrez Technologies, Inc. are regularly incorporated to improve
product performance and manufacturing processes. After years of dedicated
clinical development, Chemrez Technologies, Inc. successfully developed “Laurin
CocoMCT”, a premium all-natural MCT oil. Developed according to the principles
of green chemistry, the products developed by Chemrez Technologies, Inc. are
widely used in soaps, detergents, dishwashing liquids, shampoos, cosmetics, and
even in food applications. Some of the coconut-based products developed by the
company include the following: CocoPure SN80; 100% coconut-derived surfactants
with cleaning properties suitable for home and personal use; cold process soaps;
Cerin functional ingredients which are 100% coconut-derived solutions for enhancing
qualities and appearances; Salvonel, a sulfate-free, mild and gentle primary surfactant;
Fil-soft, a mild-foaming amphoteric surfactant that provides exceptional cleansing
performance and further enhances conditioning properties; Hi-Foam, a nitrosamine-
free, EO-free and DEA-free, mild liquid foam booster and stabilizer; Fil-Amide, a
non-ionic surfactant used as excellent foam booster stabilizer; Pearlizers/opacifiers,, a
cold-processable pearlizing agent for rinse-off products that are naturally-derived and
sustainable; thickeners such as Cocerin BGL and Cerin Rheotex 7000; emollients such
as Cerin CB 100; emulsifiers such as Cerin GMP, Cerin GMS, Cerin GMO and Cerin
GML; and fil-ester, a 100% coconut-derived intermediate raw material suitable and
exceptionally safe for a wide variety of industrial applications.
Chemrez Technologies, Inc. also produces biodiesel made from coconut. The
company collaborates with seasoned petroleum technologists and reputable testing
agencies to formulate a wide range of environment-friendly products. Some of
these products include: eco-friendly drilling chemicals with high lubricity and very
low toxicity; fuel enhancers and injector cleaners to improve combustion efficiency
and promote clean air, plant-based intermediate solvents and non-flammable
cleaners; LOVISC, a low-viscosity base fluid for use in drilling formulations for
4 3 9P H I L I P P I N E C O C O N U T I N D U S T R Y R O A D M A P 2 0 2 1 - 2 0 4 0
onshore and offshore applications; KLEENFIRE, organic injector cleaners that prevent
the build-up of fuel residue, optimized for various applications; BLACKSTARR, a
plant-based fuel oil treatment, combustion improver that provides lubricity to low-
sulfur fuel and reduces carbon soot and NOx emissions; BIOACTIV, fuel diesel
enhancers derived from natural raw materials; BIOSOLVE SPILL RX and SPILL- CARE,
concentrated type 2 and 3 oil spill dispersants and washing agents; DEGRIZ, a
premium fast- acting, waterless, hand cleaner for various adhesives and lubricants,
DISPERSA, and organic, plant- based and non-aromatic solvent used as an additive
in the formulation of demulsifiers, wax, paraffin, dispersants/inhibitors and poor
point depressants; SURFASOl, plant-derived low VOC solvents and cleaners for
intermediate formulations and industrial applications; BIOSOL, an oil system cleaner
formulated from esterified seed oil for optimum cleaning of engine lubrication system;
DUSTCON, a water-based dust suppressant used in mines, cement plants, logging,
etc.; engine coolant, a high quality monoethylene glycol based fluid incorporated with
rust and corrosion inhibitors; FMVSS 116 heavy-duty brake fluids that provide superior
braking efficiency and safety; Lubricote Wirerope Botube; and Chainkote Spray Oil.
• PILIPINAS KAO, INC. Pilipinas Kao, Inc. is a subsidiary of Kao Corporation, one of
Japan’s best- managed firms (https://chemical.kao.com). The company has been
in operation since 1979, supplying high quality, biodegradable chemical products
from coconut oil in both local and international markets. Pilipinas Kao operates an
oleochemical manufacturing complex in Jasaan, Misamis Oriental Ecozone where
the finest quality oleochemicals such as high purity single fatty alcohols, refined
glycerin, tertiary amines are produced using Kao’s sophisticated technology. The plant
in Misamis Oriental is the first cocochemical plant in the Philippines. Pilipinas Kao’s
environment-friendly oleochemicals are used for applications such as base materials
for the manufacture of cosmetics, shampoos, toothpaste, pharmaceuticals, industrial
and household detergents, food, emulsifiers, additives, and agricultural chemical
products. KALCOL, the fatty alcohol produced by Pilipinas Kao, Inc. comes in various
formulations and formats. It is widely used as an added ingredient or in compounds.
REFINED GLYCERIN, Pilipinas Kao’s refined gycerin brand, is widely used for the
formulations of pharmaceuticals, food additives, alkyd resins, soaps, toothpastes,
cosmetics, and as a humectant for cigarettes. FARMIN, Pilipinas Kao’s brand name

4 4 0 D E P A R T M E N T O F A G R I C U L T U R E P H I L I P P I N E C O C O N U T A U T H O R I T Y
for tertiary amines, is a starting material for various cationic/amphoteric surfactants,
germicides, bactericides, textile auxiliaries, word preservatives, oil recovery agent,
amine oxide, corrosion inhibitors and hair formulations.
In its early stage of operations, Pilipinas Kao manufactured fatty alcohols for
Kao Japan’s consumer products. After a series of expansions, most of the plant’s
oleochemical products are now exported to Asian neighbors, the USA, Europe, Africa,
and the Middle East. In recognition of its valuable contribution to the economy, the
Philippine government declared the whole plant site in Jasaan, Misamis Oriental
as an Economic Zone in 2001, and thus accorded Pilipinas Kao, Inc. with a host
of incentives. Backed by Kao Corporation’s 100-year experience in oleochemical
manufacturing, Pilipinas Kao steadily earned a reputation as one of the world’s
manufacturer of high-quality oleochemicals. In its continuing commitment to meet its
customers’ needs and exceed their expectations, Pilipinas Kao, Inc. has secured the
following certifications: ISO 9001, ISO 1400, OHSAS 18001, Kosher Certificate, and
Halal Certification.
• SAKAMOTO ORIENT CHEMICALS CORPORATION. Sakamoto Orient Chemicals
Corporation is the oleochemical production company of the Sakamoto Group
in Southeast Asia (https//sakamotokk.com.ph>about-us). The company was
established at the Cocochem Agro- Industrial Park in San Pascual, Batangas in 1988
to produce refined glycerin utilizing the raw material derived from coconut oil,
which is abundantly available in the Philippines. The current production capacity
for refined glycerin is 15,000 MT. The company started the production of diglycerin
and polyglycerol in 2000, and of brominated epoxy flame retardant in 2002. These
products of potential have been well accepted by customers throughout the world.
Sakamoto Orient Chemicals Corporation acquired the following certifications: ISO
9001, Kosher, Halal, and GMP for Food, GMP for Drugs, and RSPO Supply Chain
Certification Systems MB Model.
Having acquired pharmaceutical and food accreditation certificates, Sakamoto Orient
Chemicals Corporation is supplying high-quality products all around the world, with
the main destination being Japan.
• STEPAN PHILIPPINES QUATERNARIES, INC. Stepan Philippines Quaternaries,

4 4 1P H I L I P P I N E C O C O N U T I N D U S T R Y R O A D M A P 2 0 2 1 - 2 0 4 0
Inc. is an enterprise based in the Philippines and owned by Stepan Co (https://www.
bloomberg.com>profile>company). Its manufacturing plant, which is located at
the Cocochem Agro-Industrial Park in San Pascual, Batangas, is ISO 9001 certified,
indicating that the manufacturing facility is capable of safe, high- quality, service-
oriented, stable, and cost-effective operations and is mechanically reliable. Stepan
Philippines manufactures sulfonates, amides, and sulfates. All the products of the
company are Star Kosher certified. It has also Halal certification. The company has 51
employees.
In the international oleochemical market, among the leading companies that
manufacture high- quality oleochemicals using coconut oil as raw material are Kao
Group and Stepan Company. These companies are vertically integrated, have large
investments in R&D to produce high-value products, and have different production
sites and diverse markets worldwide.
• KAO GROUP. The Kao Group has bases handling all phases from research to
production and supply in the company’s locations in Japan, Asia, Europe, and North
America, which work together in various ways to provide quality products (https://
www.kao.com>global). In Japan, Kao’s plants in Wakayama, Kashima, Tochigi, and
Toyohashi are fully integrated with their research facilities to develop efficient, high-
quality production processes and produce many chemical products. Overseas, Kao’s
plants in the Philippines and Malaysia produce oleochemicals which are shipped to
customers and Kao Group companies around the globe. Other plants in Shanghai,
Indonesia, Thailand, Germany, Spain, the United States and Mexico produce
performance chemicals destined for various industrial sectors in those regions.
Kao Group’s chemical business is operated globally in the following three fields:
Oleochemicals, to ensure a stable supply of fats- and oils-based products; multi-
function Performance Chemicals based mainly on surfactants; and Specialty
Chemicals, high value-added products developed to meet customers’ needs.
Kao’s products are used in various industry sectors. Kao’s two major product groups
are fat and oil derivatives surfactants and function polymers aroma chemicals.
Under the fat and oil derivatives surfactants group are fatty acids, fatty alcohols,
fatty amines, esters, made waxes, glycerin, anionic surfactants, cationic surfactants,
amphoteric surfactants, non-ionic surfactants, and special surfactants. The function

4 4 2 D E P A R T M E N T O F A G R I C U L T U R E P H I L I P P I N E C O C O N U T A U T H O R I T Y
polymers aroma chemicals include natural polymer derivatives, functional oligomers,
polyacrylate polymers, polyamide resins, polyester resins, polyurethane resins, furan
resins, phenol resins, and synthetic aroma chemicals.
The Kao Group heavily invests in R&D. Kao Group now operates research facilities
in six Asian countries and four in North America and Europe. Research into product
development is carried out for Kao’s five of its field of business: Cosmetics, Skin
Care and Hair Care, Human Health Care, Fabric and Home Care and Chemical,
which develop a wide range of chemical products that meet the various needs of
the industry. Functions of fundamental research such as material science, biological
science, human science, and production technology are concentrated and
organizationally linked with Kao’s research laboratories outside Japan to continually
develop new products and technologies.
• STEPAN COMPANY. Stepan Co. is a manufacturer of specialty and intermediate
chemicals used in a broad range of industries since 1932 (https://www.stepan.
com). Although Stepan Company is classified with other specialty chemicals, it is
unique in the industry and does not have a competitor or competitors to precisely
match its business because its products have a specific focus. Its product lines are
surfactants, polymers, and specialty products. Stephan Co. is the leading merchant
producer of surfactants, which are key ingredients in consumer products such as
laundry detergents, hard surface cleaners, disinfectants, shampoos, and body wash
as well customized solutions for the agricultural oilfield and construction markets. The
company is also a leading supplier of polyurethane polyols used in thermal insulation
market. Moreover, Stephan Co. manufactures high purity esters, fats, and oils for the
pharmaceutical and dietary supplement industries. The company has produced more
than 650 commercial products and hundreds of custom formulated blends.
Stephan Co. utilizes a network of modern production facilities in North and South
America, Europe, China, Singapore, and the Philippines with 2,015 employees. The
plant locations are: Bauan, Batangas, Philippines; Jurong Island, Singapore; Nanjing,
Peoples Republic of China; Anaheim, California; Columbus and Winder, Georgia;
Fieldsboro and Maywood, New Jersey; Millsdale, Illinois; Ecatepec and Matamoros,
Mexico; Salto and Vespasiano, Brazil; Manizales, Colombia; Brzeg Dolny, Poland;
Stalybridge, United Kingdom; Voreppe, France; and Wesseling, Germany.

4 4 3P H I L I P P I N E C O C O N U T I N D U S T R Y R O A D M A P 2 0 2 1 - 2 0 4 0
Stephan Co.’s global R&D team is composed of 230 scientists in 13 R & D Centers
across 11 countries. The company has grown through a four-part strategy: (1) R&D
by developing a continuous stream of higher, value-added product applications,
improving existing processes, and developing new processes for known products;
(2) acquisitions in surfactants, polyols, and urethane systems; (3) globalization by
establishing manufacturing locations, sales offices, and product laboratories to supply
its customers in its global expansion; and (4) strategic alliances by leveraging its core
technologies in world markets with joint ventures where it adds know-how technology,
capital and customers to complement resources of local partners with raw material
supplies, plant sites, regional know-how and connections.
VIRGIN COCONUT OIL• PETER AND PAUL PHILIPPINES AND FRANKLIN BAKER CO. Both Peter Paul
Philippines and Franklin Baker Co. produce organic virgin coconut oil in their FDA-
accredited desiccated coconut factories using the expeller (or fresh, dry) method
without the use of heat with coconut flour and coconut water as by-products (Peter
Paul Philippines, op. cit. and Franklin Baker Co., op. cit.). These companies extract
organic virgin coconut oil from fresh matured organic coconut which they process
under strict hygienic conditions set by internationally accepted food safety and quality
standards (ISO 22000 and ISO 9001). State-of-the-art manufacturing equipment
are used to retain the product’s freshness and distinct coconut taste and scent. In
addition, no chemicals and preservatives are added.
Peter Paul’s 100% organic virgin coconut oil accreditations are USDA Organic,
Certification International Philippines, Kosher, Fair Trade USA, Halal, and Ecocert. In
the Philippines, Peter Paul sells its expeller-pressed organic virgin coconut oil online
through Lazada and Shoppe, in SM Supermarkets, Mercury Drugstores, the Landmark
Supermarkets, and other local supermarkets nationwide packed in PET bottles (250
ml, 473 ml, 500 ml, 828 ml, 1000 L), tote bag (1000 L), pail (10 L), and closed drum (20
L). The company exports organic virgin coconut oil in all major markets such as North
and South America, Europe, the Middle East, and other Asian countries.
Meanwhile, Franklin Baker’s organic virgin coconut oil accreditations include USDA
Organic, Halal, Kosher, Fair Trade USA, GMA-SAFE, and BRC. The company mostly
4 4 4 D E P A R T M E N T O F A G R I C U L T U R E P H I L I P P I N E C O C O N U T A U T H O R I T Y
exports its organic virgin coconut oil products to over 50 countries worldwide. The
North American market is the biggest market of both companies where they have
representative offices in the United States.
Prosource International. In 1995, Prosource International was established in the United
States to serve the needs of North American customers. However, the company
operates in the Philippines or out of its US Headquarters (https://shop.prosource.
coconut.com). In 2003, the company produced and commercialized organic virgin
coconut oil under the brand name, “ProSource Extra Virgin Coconut Oil”. The
“Prosource” brand is one of the top brands of virgin coconut oil in the Philippines.
Considered as one of the Philippines’ leading manufacturers of virgin coconut oil, the
company meticulously chooses the nuts and processes the nuts using the expeller
method without heat to preserve and maximize the beneficial nutrients of virgin
coconut oil. Made from fresh coconuts, Prosource International’s extra virgin oil is
100% organic, all-natural, and non-GMO. The company’s virgin coconut oil is also
USDA certified organic, Halal and Kosher certified, and manufactured under GMP
and HACCP systems. Prosource International, Inc. packaged extra virgin coconut oil
in 250-ml bottles and pioneered the sale of virgin coconut oil in Mercury drugstores.
Today, the company has expanded its export markets of extra virgin coconut oil in
North America, Australia, Europe, and Asian countries.
In addition to the Prosource Extra Virgin Coconut Oil being the company’s major
coconut product for trade, the company has diversified into a multi-product venture
offering other nontraditional products that will cater to the people’s growing concern
for health and wellness such as Prosource Extra Virgin Coconut Soap, Prosource
Cocogugo Shampoo, Prosource Extra Virgin Calming Oil, Nuco Organic Coconut
Wraps (Original), Nuco Organic Coconut Wraps (Moringa), Nuco Organic Wraps
(Turmeric), and Nuco Organic Coconut Wraps (Cinnamon).
Prosource takes a proactive role in supporting sustainable harvesting and agricultural
methods in coconut farming by partnering in sustainable agricultural projects to
generate social and economic benefits to the local coconut farming communities.
• SC GLOBAL COCO PRODUCTS, INC. Established in Brgy. Caridad, about 20
km north of Baybay City, Leyte in 2006, SC Global Coco Products, Inc. has been
producing organic virgin coconut oil using the expeller method in huge volume and

4 4 5P H I L I P P I N E C O C O N U T I N D U S T R Y R O A D M A P 2 0 2 1 - 2 0 4 0
exporting 6,000 MT of virgin coconut oil weekly, making the company one of the
biggest producers of virgin coconut oil in the world (http://scglobal.com.ph and
https://scglobal.food.com.ph). SC Global Coco Products, Inc. exports virgin coconut
oil to the United States, Europe, and other countries. All the coconut products of SC
Global Coco Products, Inc. are certified organic by Ecocert for USDA NOP and EU
and have Star Kosher, IDCP Halal, and SGS HACCP food safety certification.
• GREENLIFE COCONUT PRODUCTS PHILIPPINES, INC. Greenlife Coconut Products
Philippines, Inc. is a social enterprise company engaged in producing and exporting
high-value coconut products focusing on virgin coconut oil. Mr. Francisco Rubio,
the founder of the company, was the first innovator who introduced “Kakang Gata”,
a ready-made coconut milk in 1989 (https://www.greenlifecoco.ph.com). Owing to
his innovativeness, he was able to develop a virgin coconut oil process that uses
ANH (Absolute No Heat) method. In 2013, he introduced the VCO Standardization
Process for small virgin coconut oil processors to sustain the quality and food safety
of the product as well as to meet the standards established and set by the Philippine
National Standards for virgin coconut oil. In 2014, the company was incorporated.
Greenlife Coconut Products Philippines, Inc. has the capacity to produce 14,000 liters
per month of both conventional and organic virgin coconut oil (Costales 2019). It has
a central processing plant in Tayabas, Quezon that produces and standardizes variants
of virgin coconut oil. The company produces virgin coconut oil using the fermentation
and wet centrifuge process technology. In the latter technology, a tubular centrifuge
with a capacity of 300 liters/day at 8 hours of operation per day is used to purify virgin
coconut oil. This equipment enhances the purity by reducing moisture content in the
virgin coconut oil at the minimum level without the use of heat and at the same time
provides higher recovery.
Greenlife Coconut Products Philippines, Inc. was granted organic certification by
EU, JAS, and USDA- NOP in 2015 and was able to secure other compliances such
as Halal, Kosher, and Fair TSA. These certifications enabled the company to export
organic extra virgin coconut oil to Canada, USA, and Netherlands using its brand
name, “Greenlife” in the same year. Like the “Prosource” brand, “Greenlife” is one of
the top five Philippine VCO brands.
4 4 6 D E P A R T M E N T O F A G R I C U L T U R E P H I L I P P I N E C O C O N U T A U T H O R I T Y
Coco Coir Products• DUTCH PLANTIN COIR INDIA PVT LTD. Dutch Plantin Coir India Pvt., Ltd. is the
world’s producer of coir products, was established in 1984 (https://www.indiamart.
com and https://www.indiamart.com>aboutus). At present, the company has 14
coir production plants in Asia (i.e., 10 in India and 1 in Sr Lanka), Africa (1 in Ivory
Coast), and in Netherlands (1 in Helwood and 1 in Boekel). The company has two
headquarters: 1 in Boekel, Netherlands and 1 in Coimbatore, Tamil Nadu, India.
The distribution of the company’s production sites enables Dutch Plantin to produce
and supply coir products throughout the year, unaffected by weather. The company
adopts the same quality standards in all its coir production plants, whether they relate
to raw material packaging or hygiene. Each coir production site has its own research
laboratory with air-conditioned rooms, producing results that are representative and
reliable. Samples of coir products produced at the production sites are subjected to
a detailed analysis and inspected by ECAS (European Certification for the Sector),
an independent institute, which sees to it that the company’s coir products meet the
requirements of the RHP (Regeling Handelspotgronden or Potting Soil Regulation). By
using a variety of processing methods, Dutch Plantin produces three coir materials,
namely: coco peat, coco chips, and coco fiber. The company’s coir products are grow
bags, slabs and open to grow bags, coco peat block, coco block, and briquettes. The
company has both a central sales team and a separate logistics department located
among the production sites in India. Together they coordinate the organization of
sales and transport down to the smallest detail. The company exports its coir products
to over 50 countries.
In 2014, the Dutch Plantin was the recipient of the “Coir Pith Exporter of the Year”
award from the Government of India for being the largest exporter of coir pith
products with superior quality. Dutch Plantin holds the Dutch RHP quality mark as a
label for its coir pith products as well as the Swiss IMO- certificate which assures eco-
friendly, environmentally friendly, and socially responsible products. Dutch Plantin also
holds SA certification 8000 for social accountability and Fair Trade certification.
• HARISH COCONUT PRODUCTS PVT., LTD. Harish Coconut Products Pvt., Ltd.,
which commenced its operation in 1993, is one of the largest manufacturers and
exporters of coir products in India and in the world (https://www.harishcoconut.com).

4 4 7P H I L I P P I N E C O C O N U T I N D U S T R Y R O A D M A P 2 0 2 1 - 2 0 4 0
Its main headquarters is in Pollachi, India. Apart from Its coir manufacturing plant
in Tamil Nadu, India, Harish Coconut Products Pvt., Ltd. started its own subsidiary
company in Sri Lanka – Harish Tuff Lanka Pvt., Ltd., which commenced operations in
2006. The company’s manufacturing sites and warehouses combined with modern
machineries in production are spread across Southern India and Sri Lanka, enabling
the company to handle large orders at the shortest time possible. The company
acquired a dedicated yard for inhouse drying of coir fibers in 2008.
Harish Coconut Products Pvt., Ltd. manufactures rubberized coir products such as
mattresses, pillows, and cushions under the brand name, “COIR-ON”, which are
marketed overseas and domestically. The company also specializes in the production
of horticulture products (e.g., coir pots, coir pole, and mulch mats) and posting soil
and coir substrates such as coir pith (i.e., compressed blocks, grow bags, disc, and
pellet), husk chips, and custom substrates using modern technology for home and
garden markets as well as geo textile and biolog for erosion control. Moreover,
the company produces and exports coir fiber products such as sheet rope and
compressed bale.
The company exports its coir products to 18 countries. Coir fiber, twisted fiber, and
coco peat are exported to USA, European countries (e.g., Russia and the United
Kingdom), and China. About 80% of the total volume of coir fiber exports of the
company were shipped to China. The manufactured horticulture products, potting
soil and substrates are exported mainly to USA, China, Australia, and many other
European countries. China is the company’s major export market for geo textile.
In 2014, Harish Coconut Products Pvt. Ltd. was a recipient of the “Coir Industry
Award” for being the largest exporter in India in that year and the “Business Award”
in 2017-2018. Due to the company’s strict adherence to producing organic coir
products of high quality, the company obtained OMRI (Organic Materials Review
Institute) – USA, OMRI – Canada, and Sedex certifications in 2019.
• SIVANTHI JOE COIRS PVT., LTD. Sivanthi Joe Coirs Pvt., Ltd., which was founded
in 1993 in Tuticorin, India, is a manufacturer and exporter of high quality international
standard coco peat-based products (https://www.silvanthijoecoirs.com). The
company has the world’s largest state-of-art production coco peat factory in the port
city of Tuticorin and seven other manufacturing locations covering more than 200
4 4 8 D E P A R T M E N T O F A G R I C U L T U R E P H I L I P P I N E C O C O N U T A U T H O R I T Y
has (500 acres) in Tamil Nadu where coconuts are bountiful. The company’s plant
has a production capacity of 500,000 m3. The factory has 24-hours quality control
laboratory and well- equipped machineries and uses modern processing technology.
Sivanthi Joe Coirs Limited employs 2,000 workers and has one of the biggest network
of raw material suppliers in India.
The company produces coir peat-based products (e.g., briquettes, blocks, growbags,
quick fill bags, and naked planks), coco cut fiber, coco chips, coco crushed chips,
coco cubes, coco discs, and coco mixed blocks. The qualities of the company’s coir
products are: (1) buffered/treated in compliance with RHP Standards; (2) organic/
bio coco/green coco/eco coco in compliance with the procedures stipulated in the
National Program for Organic Production and the EEC Regulation N 2902/91 of
Switzerland’s IMO Control; (3) washed to low EC level; and (4) unwashed for both
horticulture and non-horticulture purposes.
Sivanthi Joe Coirs Pvt., Ltd. is the first company outside Netherlands to get
certification from the RHP certifying agency in the Netherlands, controlled by ECAS.
It is also the first coir company in the world to get the Certification for Organic
Coco Peat Production with compliance of procedures in the National Program for
Organic Production (NPOP) and the Regulation (EEC) N 2902/91 from IMO Control,
Switzerland. Moreover, it is the first company in the world to be awarded the RAL
quality mark “Substrate für Pflanzen” by GGS - Gütegemeinschaft Substrate für
Pflanzen e.V., Germany on the company’s coco peat/coco cut fiber/coco chips
products. The company has ISO 9001-2008 certification issued by the European
Certification for Agricultural Sector (MPS-ECAS), Netherlands and SA 8000-2008
certification issued by the British Standard Institution (BSI), United Kingdom. For
12 consecutive years (2000-2012), Sivanthi Joe Coirs Private Limited received the
prestigious award from the Government of India as the largest exporter of coco peat
-based products in that country.
• HAYLEYS FIBER PLC. Hayleys Fiber PLC, which was incorporated in 1878, is the
biggest and premier manufacturer and exporter of coconut fiber-based products in Sri
Lanka (https://markets.ft.com>data>equities>tearshett>pro). The company has five
(5) manufacturing plants in Sri Lanka and another plant in India with ample capacity
to serve its customers year-round with uninterrupted production. All the company’s

4 4 9P H I L I P P I N E C O C O N U T I N D U S T R Y R O A D M A P 2 0 2 1 - 2 0 4 0
coir manufacturing plants are equipped with modern technology and state-of-the-art
manufacturing facilities, thus ensuring a continuous supply of quality and eco-friendly
coir fiber-based products. The company’s erosion control products include geo
blankets, geo textiles, and geo logs. Its growing media products include grow bales,
grow blocks, and grow bags. The company’s horticulture products comprise of basket
liners, weed suppressors, bark guards, coco pots, and creeper guide. Its bedding
and upholstery products consist of bare block and finished mattresses, and flock and
needled felt. Its industrial fiber products include coir twine,
Its geo blankets consist of natural blanket, mulch cotton blanket, coir yarn blanket,
and coir twine blanket. Moreover, the company produces rubberized coir bare blocks,
interlocking coir bare blocks, and finished mattresses of varying densities. Sri Lanka is
renowned for the production of brown coir fiber and these in their raw form are used
extensively by numerous industries both locally and internationally. The company
supplies all the grades of coir fiber in bale form as well as in curled form (twisted fiber).
Hayleys Fiber PLC has secured BCSI, ISO 9001:2015, GMP and GOLS (Global Organic
Latex Standard) certifications. The company has marketing offices in USA, UK,
Netherlands, and Japan. It is exporting over 400 customized coir fiber-based products
around the world. The company’s customers include world renowned supermarket
chains, European automobile manufacturers, potting mix manufactures, and several
fortune 500 companies in more than 40 countries.
• PILIPINAS ECOFIBER CORPORATION. Pilipinas Ecofiber Corporation is one of
the leading manufacturers of processed coco fiber and coco peat in the Philippines.
It used to be called Soriano Multi-Purpose Fiber Corporation, but in September 2011,
its corporate name was changed with the approval of the Securities and Exchange
Commission (http://pilipinasecofiber.com). Pilipinas Ecofiber Corporation is a wholly
subsidiary of the Foundation for a Sustainable Society, Inc. (FSSI), which acquired
the company in June 2006. The company has operations in the provinces of Laguna,
Quezon, and Albay, processing fiber from coconut husks. The company’s processing
plant in San Pablo City, Laguna focuses on stitched coir and coco pot production while
the processing plant in Sariaya, Quezon produces coco fiber and coco peat. Meanwhile
the company’s processing plant in Malilipot, Albay is engaged in geotextile rope,
net and sack production. The company has established partnerships with the Fabrica

4 5 0 D E P A R T M E N T O F A G R I C U L T U R E P H I L I P P I N E C O C O N U T A U T H O R I T Y
Small Coconut Farmers Organization in San Vicente, Camarines Norte, the Coconut
Integrated Farmers Association in Labo, Camarines Norte, and the Cocobind Inc. in
Irosin, Sorsogon. The company’s main office is in San Pablo City, Laguna.
Pilipinas Ecofiber Corporation supplies coco mats made of stitched fiber to local
furniture and bed manufacturers and has both domestic and export market for various
products such as coco fiber, coco hips/coco mats, stitched coir pads, coco door mats,
plant liners in various shapes, coco nets, coco sacks, roll fiber or coir felt, biologs/
fascines, coco trays, coco pots, handmade coco ropes, coco biotray, and cocopeat.
The company exports its products to the United States, Canada, Japan, Republic of
Korea, People’s Republic of China, France, and Australia. It has a growing domestic
market for cocopeat among horticultural businesses, hog and poultry raisers, and
vegetable farmers. It has a solid domestic market for geotextiles, biologs, and the like
for soil erosion control.
Apart from manufacturing and trading coco coir products, the company is actively
involved in providing the following services: Installation of net, conduct of training
services, and equipment fabrication, and maintenance. The National Irrigation
Administration (NIA) has tapped Pilipinas Ecofiber Corporation to install geonets and
plant vetiber for erosion control in the agency’s river projects in different municipalities
of Laguna. In addition, the company installed geonets in the Petrowind Farm Project
in Nabas, Aklan and in the Antipolo Pumping Station.
As a social enterprise, Pilipinas Ecofiber trains mostly women from low-income
families on the art and skill of twining coco fiber into high quality ropes. Groups of
women in the Bicol Region and Manila have been trained for free by the company’s
experienced pool of twiners and weavers. The company also provides training on
weaving coco ropes into nets including training on quality standards and quality
control. Moreover, the company has extensive years of experience in the fabrication
of various machinery and equipment and/or equipment for coco fiber production and
equipment such as decorticating machine, cleaning machine, manual weaving loom,
motorized and manual twining machine, and ancillary equipment (e.g., conveyor
belts, carding machine, screening machine, etc.).

4 5 1P H I L I P P I N E C O C O N U T I N D U S T R Y R O A D M A P 2 0 2 1 - 2 0 4 0
Coco Sugar• SPYTHE GLOBAL. Spythe Global, a 100% Filipino-owned company based in
Balingasag, Misamis Oriental, was registered with the Department of Trade and
Industry in 2006 as a coconut sugar manufacturer (http://www.pca.da.gov.ph and
https://www.sunstar.com.ph). Spythe Global maintains its own coconut farm and
at the same time partners with other plantation owners who are willing to supply
the company with quality sap. The company employs more than 300 farm families
covering 30-38 has. Spythe Global employs at least 8 to 10 workers for every ha of
coconut plantation.
Spythe Global’s coconut sugar processing plant is an environment-friendly facility.
The company follows a no-waste production system. Raw materials not converted
to sugar and other commercial products are either donated or set aside for product
development. Used wastewater is collected to water plants or planting materials.
The coconut sugar processing factory of Spythe Global is BFAD-accredited. The
company’s certifications include Kosher, Halal, USDA Organic, OCCP, CERES EU, and
NOP. In the domestic market, Spythe Global sells its organic coconut sugar in malls
and other big stores in Cagayan de Oro City. The company also exports its organic
coconut sugar to the United States, Japan, Australia, Canada, Middle East, and
Europe. Due to the high demand for organic coconut sugar abroad, the company is
targeting at least 20 to 30 tons of finished products per month.
PT Coco Sugar. PT Coco Sugar, which was established in 1939, is one of the leading
producer- exporters of high-quality organic and non-GMO coconut sugar and nectar
in the world (https://cocosugar.com). The company is in Banyumas Regency, Central
Java, the center of coconut sugar production in Indonesia. PT Coco Sugar is the
first company in the world coconut sugar industry to get the FSSC 22000 Food
Safety System Certification which provides a framework for effectively managing
food safety responsibilities. FSSC 22000 is fully recognized by the Global Food
Safety Initiative (GFSI). The company has state-of-the art coconut sugar processing
facility that adheres to Good Manufacturing Practice standards. The company has
the following international product standard certifications: USDA, EU, JAS and Brazil
Organic Standard certification, Non-EU-Agriculture ID Bio-149 certification, US FDA
4 5 2 D E P A R T M E N T O F A G R I C U L T U R E P H I L I P P I N E C O C O N U T A U T H O R I T Y
registration, Halal Certification, Kosher Certification, Fair Trade Certification, Paleo
Certification, Non-GMO Project Verified Certification, and Vegan Verified Certification.
Through the brand name, “COCO SUGAR”, the company offers its coco sugar
products in the domestic and export market.
PT Coco Sugar directly works with its organic farmers to produce high quality organic
coconut sugar and nectar. The company conducts trainings for its farmer-cooperators
on organic farming practices, from how to organically fertilize the coconut trees
until processing the coconut sap according to international organic standards while
enabling them to have better income through fair trade.
• TREELIFE. TREELIFE is a company located in North Cotabato, Mindanao, Philippines
that was established in 2011 to produce and export high-quality organic coconut
sugar, coco aminos, and coco syrup (http://treelife.organic.com). The company
adopts organic and sustainable farm practices in its 50-ha farm to ensure that it
produces high grade, premium quality, organic products for its local and international
buyers. TREELIFE has the following product certifications: TUV SUD, USDA Organic,
FDA Philippines, JAS, Kosher, Katha Award, IT 00006 Italia. A TUV SUD certificate
represents a third- party endorsement by a globally renowned organization. It is a
mark of distinction that serves marketing tools, enhancing the value of the company’s
brand and inspiring greater confidence among its business partners and end-users.
The company sells its coco sugar in the domestic and export markets under the brand
name, “TREELIFE”.
TREELIFE’s aim is to provide a sustainable and reliable source of organic products,
at the same time helping to uplift local coconut farm households by offering them a
chance to work with a steady source of income, supporting the local, organic market
as well as a greener Philippines. The company is currently employing 800 coconut
farmers in surrounding coconut communities. The company provides standard training
to each employee in the production of world class organic coconut sugar, coco
aminos, and coco syrup.
• BIG TREE FARMS. Big Tree Farms is a sustainable organic foods company in Bali,
Indonesia (http://www.bigtreefarms.com). The company processes and manufactures
organic coco sugar, coco aminos, and coco nectar. Coco sugar produced by the
company has three flavors, namely, Brown, Golden and Vanilla while coco aminos has

4 5 3P H I L I P P I N E C O C O N U T I N D U S T R Y R O A D M A P 2 0 2 1 - 2 0 4 0
the following flavors: Original, Gingery Lime, Tangy BBQ, and Teriyaki. The company
has USFDA organic, Kosher, Fair Trade, Vegan, Paleo, and Non-GMO certification.
Hence, the company’s products are certified organic, fair trade, GMO-free, gluten-
free, and vegan.
Big Tree Farms works directly with over 14,000 small farmers to ensure fair and
transparent prices to its farmers for the coconut sap collected and to create
transparent, socially equitable relationships. The company launched a Farmers
Expansion Program to build an efficient and sustainable value chain for coco sugar
by connecting small farmers with lucrative export markets. Big Tree Farms’ inclusive
business model hinges on support with organic and Good Manufacturing Practice
(GAP) certification, the establishment of coconut sugar collection points to improve
the supply of processed sugar, and the provision of credit for processing equipment.
While this strategy enables farmers to secure a lucrative market for their produce, it
has also turned Big Tree Farms into the country’s largest organic food company with
Southeast Asia’s most extensive organic supply chain. The key to Big Tree Farms’
model is working through intermediaries—local traders who provide farmers with
microcredit and build producer groups’ capacity to assist their members with organic
certification. These intermediaries also help producer groups to develop coco sugar
collection points, establish efficient supply systems and pay farmers for their produce.
Since Big Tree Farms is committed to Fair Trade, it monitors intermediaries’ business
practices and allows farmers to switch traders if they do not receive reasonable prices.
With training and microfinancing support, this initiative has enabled small coconut
growers to increase their household incomes by up to 40%. To ensure that it maintains
a close connection with farmers, Big Tree Farms has begun constructing a new
facility closer to the area of coconut cultivation. This minimizes transport costs, which
translates into greater returns for the company and higher incomes for farmers.
Lao Integrated Farms. The coconut processing facility of Lao Integrated Farms, Inc.
is situated in Mr. Benjamin Lao’s diversified 5-ha coconut farm in Bansalan, Davao del
Sur where he practices organic farming (https://www.laointegratedfarms.com). Mr.
Lao, the owner of the Lao Integrated Farms, Inc. bagged his first national Gawad Saka
award as Outstanding Coconut Farmer that earned him a Php 120,000 cash prize,
which he invested in the construction of a mini-processing plant for coco sugar and

4 5 4 D E P A R T M E N T O F A G R I C U L T U R E P H I L I P P I N E C O C O N U T A U T H O R I T Y
coco syrup products. He was bestowed another Gawad Saka award as Outstanding
Organic Farmer with a cash prize of Php 100,000. Prior to its incorporation in
November 2009, the company employed 18 regular employees and had 30 suppliers
of coconut sap. Since February 2010, the company’s work force increased to 25 and
the number of his coconut sap suppliers rose to 55.
Lao Integrated Farms, Inc. has been known internationally as a major producer
and exporter of organic coconut syrup and coconut aminos seasoning to several
countries including USA, Canada, Germany, and Australia. The company was granted
the following certifications and accreditations by local and international certifying
agencies: FDA, HACCP, USDA Organic, Naturland, Stak K Kosher, Ecocert France,
and Halal which enabled the country to export coconut syrup and coconut aminos
seasoning abroad.
The brand name of the company’s coconut sap-based products is “Donnabelle”.
Donnabelle coco syrup sold in 320-ml, 500-ml, and 1000-ml bottles is used as
sweetener for other food products in restaurants and industrial and pharmaceutical
purposes, both locally and internationally. In the domestic market, the company sells
Donnabelle coco sugar in 250-g jars and 250-g packs to the Dragon Recipe Choice
and Prangels Snack Inn, both in Digos City, Davao del Sur. Donnabelle coconut sugar
and syrup are all 100% natural and 100% organic. Both coco sugar and syrup products
are consigned to the stores of the New City Commercial Corporation and Bios
Foundation in Davao City, and the major malls in Bohol and Samar in the Visayas. Two
hospitals in Cebu, the Mt. Blessings and Bio Integrated Health, are also patronizing
these products. These coconut sap-based products are also displayed in airports. The
company maintains an office in Manila to facilitate marketing and promotion as well as
to handle local orders and product orders from abroad.
Coconut Water• PETER PAUL PHILIPPINES CORPORATION. The international beverage firm, Pepsi
Cola, forged a joint venture agreement with Peter Paul Philippines Corporation
for the export of coconut water to the US market for its O.N.E brand of coconut
water drink (Peter Paul Philippines, op. cit.). Peter Paul Philippines Corporation is
now the largest and sole manufacturer of the U.S brand of coconut water drink. In

4 5 5P H I L I P P I N E C O C O N U T I N D U S T R Y R O A D M A P 2 0 2 1 - 2 0 4 0
manufacturing coconut water drink in its coconut processing plants in Candelaria,
Quezon and Sorsogon, Sorsogon, the company uses the latest sterilization and
packaging technology to ensure a fresh water drink with an eight-month shelf life. In
addition, the local Pepsi Cola also partnered with Peter Paul Philippines Corporation
to manufacture its Tropicana Coco water drink for local distribution. Owing to Peter
Paul’s stringent standards in processing coconut water and coconut water concentrate,
the company has been granted the following certifications: HACCP, ISO 9001, ISO
22000, GMP, and Organic certification (USDA and Europe), Halal, Fair Trade, and
Kosher.
Moreover, Peter Paul Philippines Corporation has a joint venture agreement with
Taiwan’s Chia Meei company to export concentrated and frozen coconut water
for final processing in Taiwan as a commercial drink. Before Peter Paul Philippines
Corporation entered into this joint venture with Chia Meei company, it was generating
80,000 liters a day of coconut water wastes from its desiccated coconut processing
plants. Peter Paul improved its handling of shelled and pared coconuts and installed
a breaker to facilitate collection of coconut water. The Chia Meei plant requires
40,000 liters a day of coconut water from Peter Paul Philippines Corporation.
After processing, the coconut water is shipped to Taiwan where it is produced as
a commercial drink. Coconut processing into a commercial juice drink involves
pasteurization and centrifugation to produce a clear, non-oily solution for packing in
sterile containers.
In 2021, Peter Paul Philippines Corporation will be establishing a new integrated
coconut processing facility in Plaridel, Misamis Occidental which would process
coconut into high-value coconut products such as coconut water, desiccated coconut,
and virgin coconut oil, among other coconut products.
• AXELUM RESOURCES CORP. Axelum Resources Corp., which was incorporated in
2010, is a fully integrated manufacturer and exporter of premium coconut products
such as coconut water, coconut water concentrate, desiccated coconut, virgin coconut
oil, coconut milk powder, coconut cream, coconut milk, reduced fat content, and
coconut oil. The company devotes a large portion of its production for export to the
world’s major continents (https:www.axelum.ph).
Coconut water accounts for 20-30% of the company’s revenues. The company packs
4 5 6 D E P A R T M E N T O F A G R I C U L T U R E P H I L I P P I N E C O C O N U T A U T H O R I T Y
its own coconut water (“Fiesta” label). It also packs coconut water for several other
brands and private labels. Axelum Resources Corp. sells the Fiesta Coconut Tropicale
brand on retail basis and the Fiesta Coconut Water brand for industries. Fiesta
Coconut Water and Fiesta Tropicale Coconut Water are processed using advanced
UHT technology to preserve the refreshing quality and flavor of natural coconut water.
Fiesta Tropicale Coconut Water comes in two variants: the Fiesta Tropicale Coconut
Water Natural and the Fiesta Tropicale Coconut Water Lychee Flavor, packed in 330-
ml Tetra Prisma in a carton of 12 bricks. It makes a delicious thirst-quenching drink
and can be used as a juice base for beverages when it is mixed with other fruit flavors.
Fresh Coconut Water is aseptically packed in 25-liter bags in a carton and 200-liter
bags in a drum to address the needs of beverage manufacturers.
Axelum Resources’ products undergo strict quality control and assurance in its modern
laboratory facilities (i.e., ISO 17025 accredited) that are fully equipped to conduct
all standard physical, chemical, and microbial tests for process control and release
of all finished goods. The company’s new state-of-the-art pressed coconut water
processing plant in Cagayan de Oro City, Misamis Oriental is a USDA- and EU-certified
organic plant and operates under strict GMP and HACCP programs. Its coconut water
processing plant, which was established within its 22-ha facility, is also BRC. Kosher,
Halal, SEDEX, Fair Trade and Unilever Sustainable Supplier certified. The company also
owns manufacturing and distribution facilities in the United States and Australia.
Axelum Resources, Inc. signed a supplier contract with All Market, Inc., the owner of
Vita Coco, the world’s largest coconut water brand, making the company the second
coconut supplier of coconut water to All Market, Inc. after a company in Brazil. The
coconut water processing plant produces a high-demand product variant for American
coconut juice, Vita Coco, an anchor client. Pressed coconut water offers a nuttier and
sweeter taste than traditional coconut water without additional sugar content. With
the commercial operation of its pressed coconut water line, Axelum Resources Co.
was able to meet its commitment to supply All Market, Inc. with 25 M liters of coconut
water in 2019. The coconut water is packaged using a Prisma Tetra packing machine,
the first of its kind in the Philippines. Vital Coco has a market volume of 120 M liters
per year supplied by eight to nine manufacturers including Axelum (20%) and Century
Pacific Food, Inc.
4 5 7P H I L I P P I N E C O C O N U T I N D U S T R Y R O A D M A P 2 0 2 1 - 2 0 4 0
The company’s coconut products are exported to 23 countries around the world. The
company has established an excellent distribution network covering USA, Canada,
South America, Australia, New Zealand, Europe including United Kingdom, Japan,
South Korea, Taiwan, and the Philippine market.
• CENTURY PACIFIC FOOD, INC. Century Pacific Food, Inc., which was incorporated
in 2013, is primarily engaged in manufacturing, processing, canning, buying, and
selling all kinds of food and food products (https://cenagricom>about-cpavi and
http://www.bloomberg.com>profile>company). Apart from its canned and processed
fish, canned meat, and dairy and mixes business segments, the company is engaged
in the coconut business segment. Century Pacific Food, Inc. is an integrated
manufacturer of coconut products and produces retail-packaged conventional and
organic coconut water, organic virgin coconut oil, desiccated coconut, coconut flour,
and coconut milk for the domestic and international markets. Century Pacific Food’s
coconut processing facility, which was acquired from Century Pacific Agricultural
Ventures, is in General Santos City, Mindanao. The company’s own coconut water
brand, “Aqua Coco Century Pacific” is geared toward the domestic market and is
currently sold through the company’s extensive distribution network in the Philippines.
Century Pacific Foods, Inc. sells coconut water to global brands and retailers. The
company has been one of the two suppliers of coconut water from the Philippines
to All Market, Inc. for Vita Coco, the world’s leading coconut water brand. In 2020,
Century Pacific Food, Inc. extended and expanded its long-term agreement to supply
packaged coconut water to All Market, Inc., the owner of Vita Coco, as it gears up for
a major expansion of its coconut processing business. The multi-year contract valued
at more than US$ 165 M reinforces the company’s position as one of the leading
coconut water exporters and one of the largest suppliers for Vita Coco globally. The
expanded deal between Century
Pacific Food, Inc. and Vita Coco is expected to benefit the many coconut farmers
of Mindanao, where the company’s coconut factory is located and sources its main
raw materials. In 2021, the company embarked on a major expansion of its coconut
business, increasing manufacturing capacity with an additional investment of Php 300
M to address the growing global demand for high-value coconut products.
The coconut product manufacturing facilities and quality systems of Century Pacific

4 5 8 D E P A R T M E N T O F A G R I C U L T U R E P H I L I P P I N E C O C O N U T A U T H O R I T Y
Food, Inc. are compliant and certified by leading and refutable local and international
agencies, including GMP, HACCP, BRC, Halal, and Kosher. It is also organic certified
for the U.S., EU, Korea, and Canada markets. Recently, the company was the first to
receive in the Philippines the United States FDA Food Safety Modernization Act and
Voluntary Qualified Importer Program for the export of its virgin coconut oil.
Century Pacific Food, Inc. went into a partnership with Vita Coco’s owner, All Market,
Inc. and the Founder of Hope to renovate old coconut plantations. Together, they
are developing a 20-ha coconut seedlings nursery. The plan is to distribute 130,000
seedlings yearly and to replace 90% of the senile trees in Mindanao over the next 25
years.
• FRANKLIN BAKER INC. In its two manufacturing facilities in San Pablo, Laguna and
Sta. Cruz, Davao del Sur, Franklin Baker Co. has a combined annual capacity of 4 M
liters of coconut water concentrate or 60 M liters of single strength coconut water
(Franklin Baker Co., op.cit.). In 2017, Franklin Baker Company opened a Php 2-B
coconut processing facility in a 15-ha plant site in Darong, Sta. Cruz, Davao del Sur
to produce 30 M liters of coconut water, 120 M pounds of desiccated coconut, 20 M
liters of virgin coconut oil, and 15 M liters of coconut milk. The establishment of this
new coconut processing plant has made the company one of the leading producers
and exporters of coconut water globally.
Coconut water and coconut water concentrate produced by Franklin Baker Co.
are packaged in tetra packs and exported to over 50 countries all over the world.
Coconut water exported by the company to the United States carries the brand
name, “Kirkland (Costco)”. In manufacturing its premium quality coconut water and
coconut water concentrate products, Franklin Baker, Inc. was granted the following
certifications and accreditations: USDA Organic, EU Organic, Non-GMO Project
Verified, Fair Trade USA, BRC, JAS, ISO 9001:2000, ISO 22000, HACCP, FDA, Kosher,
and Halal.
• CELEBES COCONUT CORPORATION. Celebes Coconut Corporation, which
started its operation in 1986 in Butuan City, Agusan del Norte, is one of the leading
fully integrated producers and exporters of organic and Fair Trade-certified coconut
products in the Philippines (https://www.celebes.com). The company transforms its
coconut water utilizing the most recent innovation to preserve the refreshing quality

4 5 9P H I L I P P I N E C O C O N U T I N D U S T R Y R O A D M A P 2 0 2 1 - 2 0 4 0
and flavor of natural coconut water.
Celebes Coconut Corporation manufactures both the Single Strength Coconut Water
and the Coconut Water Concentrate. These are available either as Conventional or as
Organic Coconut Water Concentrate. Frozen Coconut Water Concentrate 60 Brix is
produced by evaporation of the fresh coconut water. Coconut water is first collected,
filtered, then concentrated by evaporation, pasteurization, filling, and stored frozen.
The company’s coconut water products are 100% coconut water and are non-GMO
certified. Organic coconut juice or water is packed in cans or aseptic bulk packaging.
Meanwhile, organic coconut water is sold in cans. tetra pack, aseptic bulk packaging,
or sold frozen.
The company has the following certifications: USDA Organic, European Organic
Regulation, Fair Trade, JAS, BRC, Star – K Kosher, Halal, and Certified PAR Vin Bio-10
France. It was also granted certification by TUV SUD PS Philippines, Inc. for auditing,
testing and inspection services. The company also engages in continuous manpower
training in all aspects of the company’s operations. Presently, the company has over
2,000 employees and exports its coconut products to 49 countries worldwide.
• CARDINAL AGRI PRODUCTS, INC. Cardinal Agri Products, Inc. is a diversified
agribusiness enterprise based in the Philippines which established a world-class
coconut processing plant in 2015 at the Brooke’s Point Agro-Industrial Economic Zone
in Palawan (http://cardinalagri.com). The company has 500 employees and works with
over 3,000 farmers whose coconut farms and nut harvests have been inspected and
certified organic under USDA/NOP and EU regulations. The company can process
up to 300 MT of dehusked nuts per day to produce organic coconut water in 300-ml
Tetra Pak, organic virgin coconut oil, organic desiccated coconut, organic coconut
milk, organic coconut cream, organic coconut flour, white copra cake/meal, paring
oil, and paring cake. In manufacturing organic coconut water, Cardinal Agri Products,
Inc. uses fresh mature coconut. Once the nuts enter the factory, the coconut water
is drained after drilling and each batch is tested after collection but prior to UHT
pasteurization. The company uses exceptional UHT processing equipment to reduce
heat damage during processing while at the same time preserving flavor and texture.
Cardinal Agri Products Inc. implements strict end-to-end controls from sourcing to
shipping. The company is FDA accredited in the Philippines and its major export

4 6 0 D E P A R T M E N T O F A G R I C U L T U R E P H I L I P P I N E C O C O N U T A U T H O R I T Y
market is the United States. The company sells coconut water in bulk 200-kg drums or
330-ml Tetra Pak Prisma for select markets.
Other key players of the global coconut water industry from other countries include
the Sambu Group (Indonesia), Universal Food PLC (Thailand), and the Silvermill Group
(Sri Lanka).
• SAMBU GROUP OF COMPANIES. The Sambu Group of Companies is one of
the leading coconut water processors in Indonesia and one of the largest coconut
producers in the world (https://sambugroup.com). The company is headquartered
in Singapore, but it has facilities and plantations in Indonesia and the Philippines.
P.T. Kara Coco Nucifera Pratama was the first Sambu Group member company in
Indonesia to start processing coconut water in addition to other coconut products.
P.T. Kara Coco Nucifera Pratama is producing bulk coconut water (e.g., 20-kg bag
packaging; 200-kg drum packaging; and 1,000-kg flexbox packaging) but has also
launched its own brand, “Kara Coco”. Another company member of the Sambu
group, Pulau Sambu (Guntung) produces and commercializes coconut water in
different variants: Kara Coco 100% Coconut Water, Kara Coconut Water with Mango,
and Kara Coconut Water with Pink Guava. The Kara Coconut Water brands are
exported by the Sambu Group to Europe and Singapore.
• SILVERMILL GROUP OF COMPANIES. One of the most notable coconut water
processors in Sri Lanka is Silvermill Group of Companies which also packages coco
water in Tetra Pack machines for the Vita Coco brand, the market leader of packaged
coconut water in the world. Coconut water in 200-ml, 250-ml, 330-ml and 1-liter Tetra
Pack sizes are shipped to different countries. Surplus capacity of the Tetra lines is used
to provide contract packing service to well-known brands in Sri Lanka and abroad
(http://www.silvermillgroup.com>group-of-companies). The Silvermill Group of
Companies is also one of Sri Lanka’s largest manufacturers and exporters of coconut-
based products and has secured the following certifications: ISO, BRC, FSCC, Kosher,
Halal, NOP, and EU Organic.
• UNIVERSAL FOOD PLC. Universal Food PLC is one of the successful exporters of
coconut water from Thailand (https//www.bloomberg.com>company>UFC:TB). The
company produces a wide range of products in two factories in Lampang and Nakhon
Pathom province. The Universal Food PLC’s coconut water brand, “UFC Refresh”, has
4 6 1P H I L I P P I N E C O C O N U T I N D U S T R Y R O A D M A P 2 0 2 1 - 2 0 4 0
managed to be one of the recognized brands in Europe (i.e., Germany, Netherlands,
Russia, Switzerland), selling packed coconut water in several retail markets. The
company also exports “UFC Refresh” to Canada, Australia, New Zealand, Guam,
China, Hong Kong, India, Malaysia, Cambodia, Myanmar, Bahrain, Brunei, and Oman.
Thai coconut water is highly priced in the international market since it is produced
from the high-Brix, fragrant Nam Hom variety. The company secured the following
certifications and accreditations: SGS HACCP, SGS GMP, IFS, Halal, Non-GMO Project
Verified, Sedex, and Smeta. In 2020, the Universal Food PLC won the “Superior Taste
Award” for its coconut water brand, “Universal Refresh”, from the International Taste
Institute in Belgium.
THE COPRA-CNO PATHWAYThe farmers initiate the copra-CNO pathway by harvesting the coconuts, followed by
dehusking, and then drying of the nuts into copra using smoke kiln or tapahan, generally
in the farms by the farmers themselves. The tapahan is a very useful contraption that has
been used by farmers for over 120 years. The problem with the use of the tapahan is
the smoke which poses a health hazard to the users and which contaminates copra with
carcinogenic compounds called the PAHs. The drying time to make sufficiently dry copra
[8% moisture content (MC)] is about 24 to 30 hours. To save on time and effort, the farmer
stops drying after 12 to 16 hours, when the MC is still about 18 to 20%.
The traders buy copra even it is partially dried only. Copra at corriente grade (22% MC)
is tradable, but with penalty in prices based on a discount table provided by PCA. The
farmer sells his copra to a nearby barangay trader who will pay for the partially dried
copra at a discounted price. The barangay traders keep copra at the warehouse until
enough volume is accumulated to fit a jeepney for delivery to the town trader. (During
the time that the wet copra is in the barangay trader’s warehouse, the copra will become
infested with molds. On the other hand, the MC will decrease to about 15% due to the
natural phenomenon of moisture migration).
Similarly, the town trader will store the still-wet copra in the warehouse until there is
enough copra volume to fit a truck for delivery to a provincial trader. (Copra in the town

4 6 2 D E P A R T M E N T O F A G R I C U L T U R E P H I L I P P I N E C O C O N U T A U T H O R I T Y
trader’s warehouses will continue to be infested with molds. The MC will now decrease to
about 12%).
The provincial trader likewise will keep copra in his warehouse until it is ready for delivery to
the oil millers or to the miller’s copra consolidators. (Copra in the provincial trader’s and miller’s
warehouse will continue to be infested with molds. The MC will decrease to about 8%).
The time interval from the farmers to the oil mill is about one to three months.
Due to mold infestation (caused by MC while in the various warehouses), the FFA and
aflatoxin level in copra will be high.
The oil millers, upon receiving the copra, immediately measure the moisture content
using the Brown-Duvell Moisture Meter. The price of copra is based on the price of CNO
in the world market using a formula similar to that used by UNICOM (Coconut Industry
Yearbook, 1988). The oil mill consists of several standard industrial pieces of machinery,
including copra cutters, hammer mills, flakers, cookers, expellers, filters, among others.
The oil mills have reached the level of efficiencies where the crude oil recovery is 62.5%
(from copra feedstock with 64.5% fat content); and copra cake by-product with 8%
residual oil. The FFA in the crude oil will be in the range of 2-3% and will be high in PAHs.
Recent PCA data shows the aflatoxin level in copra cake is below the market upper limit
of 20 ppb.
The refiners purify the crude coconut oil through the following processes: a) neutralization
to reduce FFA to 0.01% using caustic soda and physical refining with steam under high
vacuum; and, b) de-colorization to remove the smoke contamination compounds, PAHs,
and color using activated carbon. After purification, the coconut oil is ready as feedstock
for industrial processes, such as in the manufacture of coco-chemicals. For making RBD
cooking oil, the purified oil is further deodorized by steam stripping.
The copra cake by-product is mainly used as an ingredient in animal feeds.
The oleochemicals processors convert the purified coconut oil into high-value products
such as fatty acids, fatty alcohols, methyl esters, surfactants. For food supplements and
cosmetics, organic certification is increasingly required.

4 6 3P H I L I P P I N E C O C O N U T I N D U S T R Y R O A D M A P 2 0 2 1 - 2 0 4 0
The downstream industries need better quality CNO to enable them to produce better
products at competitive costs.
ON MOISTURE CONTENT AND MOLDS
The most destructive mold that attacks copra is reported to be the yellow-brown
mold, Aspergillus flavus, which can grow on copra with 7-8% MC. The next most
pernicious is the black mold, Aspergillus niger, which can grow on copra when
MC is 18 to 20% (Banzon and Velasco, 1982). The green mold, Penicillium, is
reported to be not damaging, but it can grow on copra with only 5 to 6% MC.
Copra with an MC of 6% or less is not easily damaged by molds, insects, and
bacteria (Thampan, 1975). This is confirmed in a study by Villanueva (1989), where
it was found that below 6% copra is not infected with molds even after 2 months
in storage. Tuason and Madamba (1980) reported that at 8% and below, no
aflatoxin-producing molds will thrive on copra. The present table for MC discount
shows the reference MC is 6% and that price for copra with 5% MC and below.
Thus, the target MC 6% and must be dried fast enough to avoid mold growth.
Lozada (2020) found that moisture condensation on well-dried copra
will support mold growth. To prevent surface condensation in the
warehousing of well-dried copra, an aeration system should be provided.
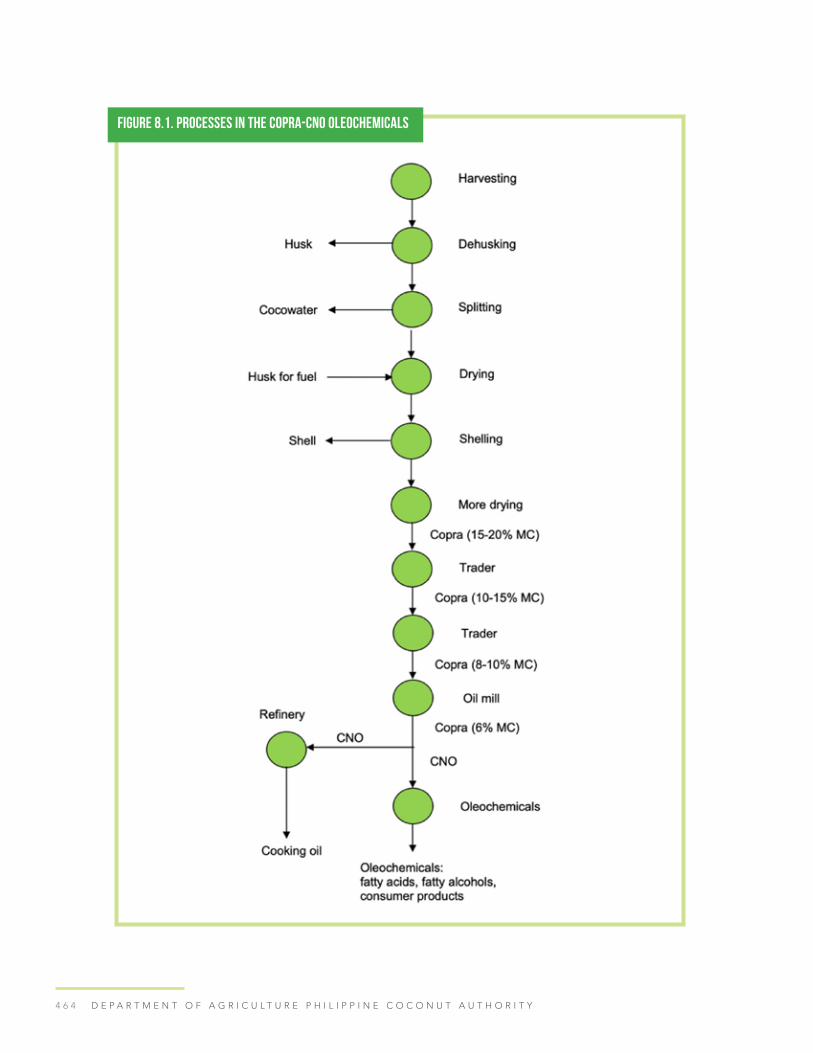
4 6 4 D E P A R T M E N T O F A G R I C U L T U R E P H I L I P P I N E C O C O N U T A U T H O R I T Y
Figure 8.1. Processes in the Copra-CNO Oleochemicals

4 6 5P H I L I P P I N E C O C O N U T I N D U S T R Y R O A D M A P 2 0 2 1 - 2 0 4 0
HARVESTING
There are three methods of harvesting
coconuts in the Philippines: (1) by allowing the
nut fall freely, (2) by climbing, and (3) by the
use of harvesting poles.
FREE-FALL
The nuts become fully ripe at end of the
12th month from the date of the opening
of the spates with maximum oil content and
maximum thickness of endosperm (Balleza
and Sierra, 1968, cited by Banzon and
Velasco, 1982). The 12-month old bunch is
characterized by having nuts that are brown
in color but are not fibrous. On the 13th
month, the nuts become very brown and
dry and they will fall to the ground one after
the other (Banzon and Velasco, 1982). This
is probably the easiest means of harvesting,
provided that the farms are clean and the
nuts can be located easily. When there is
thick underbrush, the nuts will only be found
when they have germinated into tall plants. At
this state, a portion of the meat would have
been consumed as food for the haustorium.
For tall coconut varieties, at the 12th and
Figure 8.2. Notches are cut on the tree trunk to step on
Figure 8.3. One of the climbing jigs
Figure 8.4. Another version of a climbing jig
13th months, the nuts would have the highest
oil content of 71.4% and 71.85% dry basis (or
68.79% and 69.23% wet basis at 3.64% moisture
(Balleza and Sierra, 1968, cited by Banzon et al,
1990).

4 6 6 D E P A R T M E N T O F A G R I C U L T U R E P H I L I P P I N E C O C O N U T A U T H O R I T Y
CLIMBING
It is a practice in the Visayan regions to climb each tree and cut whole bunches with a
tool called a halabas. This is a time- consuming and tiring way of harvesting coconuts.
A person climbs a tree with a circled rope on his feet to press around the tree trunk.
With this method, a harvester can do 25 trees per day. To make climbing easier, some
harvesters cut notches along the trunk to serve as steps. There were many attempts to
design climbing jigs but none have been widely used (Banzon and Velasco, 1982).
USE OF HARVESTING POLE
Harvesting with the use of bamboo poles with a halabas at the tip is much easier than
climbing. Very old trees that reach heights of up to 70 feet can still be easily reached with
several extensions of the poles. The bamboo poles in segments of 4-5m long are joined
end-to-end and secured by a peg. This operation is done by specialized and highly skilled
harvesting crews. Using the harvesting poles, about 100 trees can be harvested in one
day (Banzon and Velasco, 1982).
Since the manunungkit is paid by the number of nuts harvested, he harvests 3 bunches
each time he takes a tree to maximize the number of nuts at about the same effort.
The problem is: the first bunch is mature (mostly brown in color), the 2nd bunch is
half-mature(more green than brown), while the third bunch is immature (totally green).
Harvesting of immature nuts should be discouraged because the oil content of the
resulting copra would be lower, and it is much more difficult to dry. Ideally, only the
Figure 8.5. The skilled manunungkit shown with his motorcycle is responsible for a 50 ha -farm
mature nuts should be harvested because
they yield more copra and have high oil
content. When this is widely practiced, the
value of copra produced will be higher by
PHP 0.40-0.60 per kg.

4 6 7P H I L I P P I N E C O C O N U T I N D U S T R Y R O A D M A P 2 0 2 1 - 2 0 4 0
DEHUSKING
After harvesting, the nuts are gathered together into small piles, where they are then
dehusked. The tool that is being used by the taga-tapas in the Philippines for separating
the husks is a pointed metal or wooden spikes which are anchored firmly on the ground.
The husk is removed by impaling the nut against the spike, followed by a twisting action
of the wrist. A skilled taga-tapas can do 1,000 to 1,500 nuts per day. In remote areas, the
dehusked nuts are hauled using carabao-driven sleds or rattan baskets on horseback. The
husks are later collected for use as fuel in making copra, cooking, and sold to the fiber
mill. There are now a number of promising dehusking machines that can now be used to
mechanize this operation. Two of those are shown in the pictures (Figures 8.13 and 8.14).
Figure 8.7. Harvesting with extended bamboo poles
Figure 8.6. Harvesting pole
A C
B
Figure 8.8. Nut characteristics and recommended uses

4 6 8 D E P A R T M E N T O F A G R I C U L T U R E P H I L I P P I N E C O C O N U T A U T H O R I T Y
Figure 8.9. (left) Dehusking is done by impaling the husk on a pointed object followed by a twisting movement of the wrists
Figure 8.10. (right) Dehusking done in the middle of a coconut farm (Masbate)
Figure 8.11. (left) The husks are piled separately from dehusked nuts (Brooke’s Point, Palawan) Figure 8.12. (right) The horse can carry 4 times more dehusked nuts than whole nuts
Figure 8.13. (left) A promising model of manually operated dehusker
Figure 8.14. (right) A motorized coconut dehusking machine (Source: Newtech Industries, 2017)
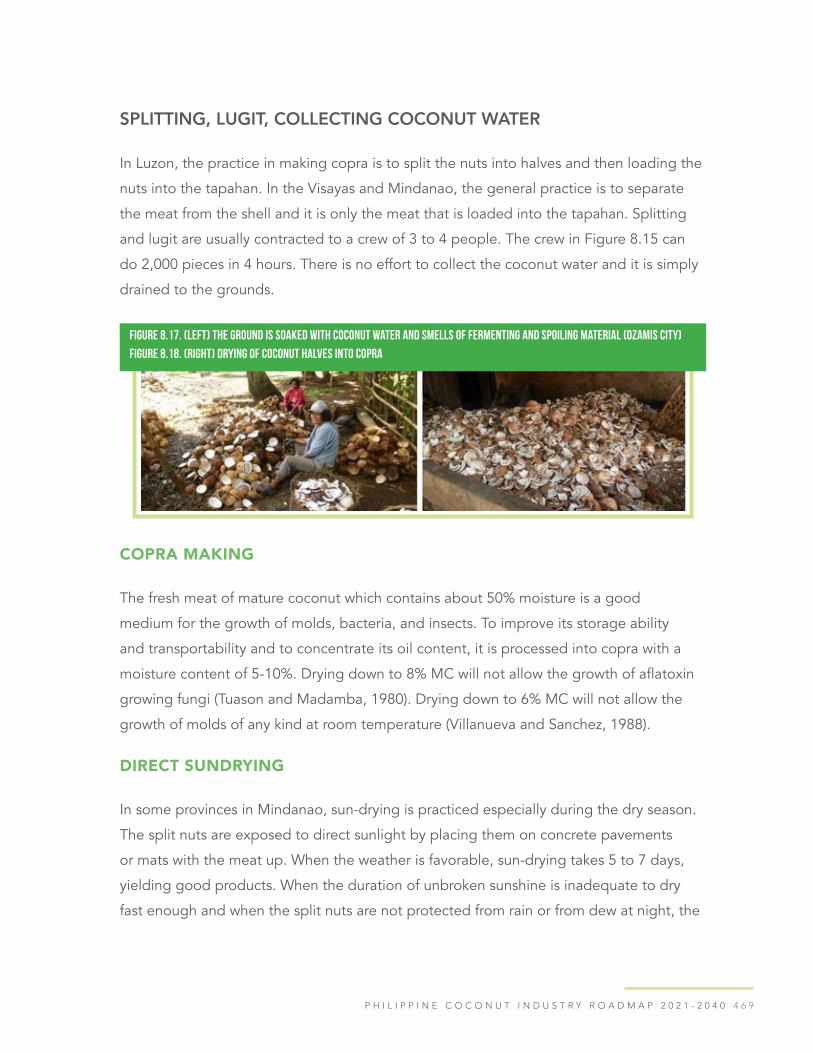
4 6 9P H I L I P P I N E C O C O N U T I N D U S T R Y R O A D M A P 2 0 2 1 - 2 0 4 0
SPLITTING, LUGIT, COLLECTING COCONUT WATER
In Luzon, the practice in making copra is to split the nuts into halves and then loading the
nuts into the tapahan. In the Visayas and Mindanao, the general practice is to separate
the meat from the shell and it is only the meat that is loaded into the tapahan. Splitting
and lugit are usually contracted to a crew of 3 to 4 people. The crew in Figure 8.15 can
do 2,000 pieces in 4 hours. There is no effort to collect the coconut water and it is simply
drained to the grounds.
Figure 8.17. (left) The ground is soaked with coconut water and smells of fermenting and spoiling material (Ozamis City)
Figure 8.18. (right) Drying of coconut halves into copra
COPRA MAKING
The fresh meat of mature coconut which contains about 50% moisture is a good
medium for the growth of molds, bacteria, and insects. To improve its storage ability
and transportability and to concentrate its oil content, it is processed into copra with a
moisture content of 5-10%. Drying down to 8% MC will not allow the growth of aflatoxin
growing fungi (Tuason and Madamba, 1980). Drying down to 6% MC will not allow the
growth of molds of any kind at room temperature (Villanueva and Sanchez, 1988).
DIRECT SUNDRYING
In some provinces in Mindanao, sun-drying is practiced especially during the dry season.
The split nuts are exposed to direct sunlight by placing them on concrete pavements
or mats with the meat up. When the weather is favorable, sun-drying takes 5 to 7 days,
yielding good products. When the duration of unbroken sunshine is inadequate to dry
fast enough and when the split nuts are not protected from rain or from dew at night, the

4 7 0 D E P A R T M E N T O F A G R I C U L T U R E P H I L I P P I N E C O C O N U T A U T H O R I T Y
resulting copra is moldy. Sundried copra by the roadside is susceptible to contamination
with dirt, soil or even animal waste.
In some installations in Sri Lanka, Indonesia, and quite rarely in the Philippines, the sun-
drying pavement is provided with roof on rails which can be moved over the drying area
at nightfall or in the event of rain.
TAPAHAN OR SMOKE KILN
The process of copra making starts by splitting the nut into halves with a single stroke
of an ax or a large knife. The coconut water is drained off into the ground as waste.
The coconut halves with the husks on are placed in the dryer and fired continuously for
about 12 hours until the meat shrinks and can be separated easily with a hand tool. Meat
separation takes about 0.75 man-days for 1000 nuts. After separating the meat they are
returned back to the dryer for further drying until the moisture content is about 10%
moisture content which takes about 12-18 hours more.
TYPES OF TAPAHAN
The kilns commonly used in the Philippines are of the direct-fired type where the products
of combustion come in contact with the product being dried. When coconut husk is used
for fuel, the resulting copra is heavily laden with smoke. Thus, the copra kilns are called
smoke kilns or “tapahan.” Five (5) general types of traditional direct-fired dryers have
been identified and have been used in the Philippines and Indonesia. These dryers are
shown in Figure 8.20a to 8.20e. They are low- cost, easy to build, and have served the oil
milling industry for many decades.
From the engineering point of view, however, it has the following technical deficiencies:
a) poor temperature control, b) poor temperature distribution; and c) low thermal
efficiency. These may be due to the incomplete combustion because of the absence of
a good furnace. Incomplete combustion also resulted to smoke contaminated products.
Furthermore, a slight breeze will carry away a good amount of hot gases.
It is shown that the copra-making system using the tapahan as practiced in the Philippines
is an appropriate one because of its affordability. Furthermore, it also provides excess

4 7 1P H I L I P P I N E C O C O N U T I N D U S T R Y R O A D M A P 2 0 2 1 - 2 0 4 0
husks or shells which are used as cooking fuel in the village households. Many farmers
share the use of the dryer with others, but the dryers are still generally under-utilized with
usage rates of as few as 12 to 48 times per year.
Despite the deficiencies of the tapahan engineering-wise, it is the most widely used
contraption for making copra and has served the coconut industry remarkably well
for over 120 years. In the absence of any census, it can be estimated that there could
be between 400,000 to 500,000 units of tapahan built with different dimensions,
configurations, and types of materials.
COPRA QUALITY
The quality of copra ultimately determines the quality of the oil and of the copra cake.
Good quality (clean, low moisture, mold-free and smoke- free) copra will yield oil that is
Figure 8.19. Copra is dark when the fuel used is coconut husks (A) while copra is lighter when the fuel mostly coconut shell (B)
edible and is characterized by low
FFA, pleasant smell, and water
white copra. The nutritive value of
the copra cake as ruminant feed
will be higher than that of poor
quality copra (Thampan, 1975).
There is no doubt that Philippine
copra is among the poorest in
quality, if not the worst in the
world. It is infested with molds and
insects, with contaminated smoke.
This poor copra quality is the result
of the practice of using immature
nuts, drying to high moisture
content at the farm level, non-
adoption of a grading standard,
and the use of trading practices
that do not discriminate against

4 7 2 D E P A R T M E N T O F A G R I C U L T U R E P H I L I P P I N E C O C O N U T A U T H O R I T Y
low quality. Furthermore, the warm and humid climate in the Philippines also helps mold
growth even at a relatively low moisture content of copra.
Figures 8.20 (a-e). A typical ‘tapahan’ dryers being used in the Philippines and Indonesia. Which are easy to construct and made of light materials. (sketches from WB 1987 report)

4 7 3P H I L I P P I N E C O C O N U T I N D U S T R Y R O A D M A P 2 0 2 1 - 2 0 4 0
Figures 8.21. Examples of smoke kilns or tapahan used in the Philippines
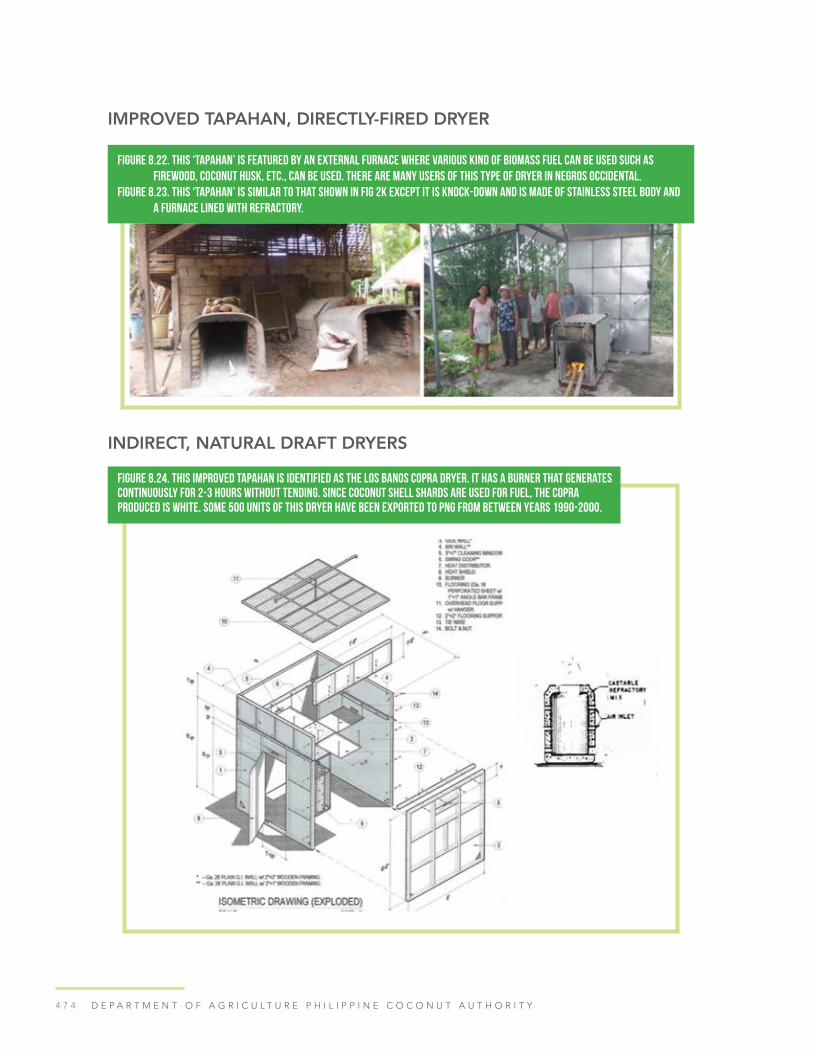
4 7 4 D E P A R T M E N T O F A G R I C U L T U R E P H I L I P P I N E C O C O N U T A U T H O R I T Y
IMPROVED TAPAHAN, DIRECTLY-FIRED DRYER
Figure 8.22. This ‘tapahan’ is featured by an external furnace where various kind of biomass fuel can be used such as firewood, coconut husk, etc., can be used. There are many users of this type of dryer in Negros Occidental.
Figure 8.23. This ‘tapahan’ is similar to that shown in Fig 2k except it is knock-down and is made of stainless steel body and a furnace lined with refractory.
INDIRECT, NATURAL DRAFT DRYERS
Figure 8.24. This improved tapahan is identified as the Los Banos Copra Dryer. It has a burner that generates continuously for 2-3 hours without tending. Since coconut shell shards are used for fuel, the copra produced is white. Some 500 units of this dryer have been exported to PNG from between years 1990-2000.

4 7 5P H I L I P P I N E C O C O N U T I N D U S T R Y R O A D M A P 2 0 2 1 - 2 0 4 0
COPRA TRADING AND WAREHOUSING
Generally, there are three to four layers of traders involved in the movement of copra
from the farmers to the millers. These are the following: barangay traders, town traders,
provincial traders, consolidators and finally, the millers. Each trading node has its costs
and margins. Since the mill gate price is pegged by world prices, all trading costs along
ways are deductions from the farm gate prices as shown in (Figure 8.27).
Figure 8.25. The Kukum Dryer (Kukum, PNG) and Cocopugon (Zamboanga, PCA) have heat exchangers where fuel is also burned inside and the hot products of combustion go out through the chimney. The heat exchanger of Kukum Dryer is made of metal drums while Cocopugon is made of bricks. When ambient gets in contact with hot surface of the heat exchangers, it becomes hot and would rise through the load of coconut meat by natural draft. The resulting product is white copra. The downside is that both dryers consume a lot of fuel because most of the heat goes out through the chimney. (Figures from: Dippon K. and Villaruel R. Copra Dryers and Copra Drying Technologies).
Figure 8.26. The LMC and the Newtech belong to the same copra dryer classification: indirectly heated and forced air dryers. The LMC has a heat exchanger heated with hot water from a boiler and the Newtech has a heat exchanger heat by hot gases from a furnace. Both dryers can have large capacities of practical loads up to 4000-6000 kg-nut and could be viable for use in copra centrals. The product is white copra.

4 7 6 D E P A R T M E N T O F A G R I C U L T U R E P H I L I P P I N E C O C O N U T A U T H O R I T Y
All the copra warehouses shown in the following pages (Figure 8.28) have the common
deficiency of not having an aeration system that would prevent temperature buildup and
would also dry copra some more.
Figure 8.27. The CNO – copra – Coconut value chain

4 7 7P H I L I P P I N E C O C O N U T I N D U S T R Y R O A D M A P 2 0 2 1 - 2 0 4 0
Figure 8.28. Images of copra transport, storage/warehouses, and other processes
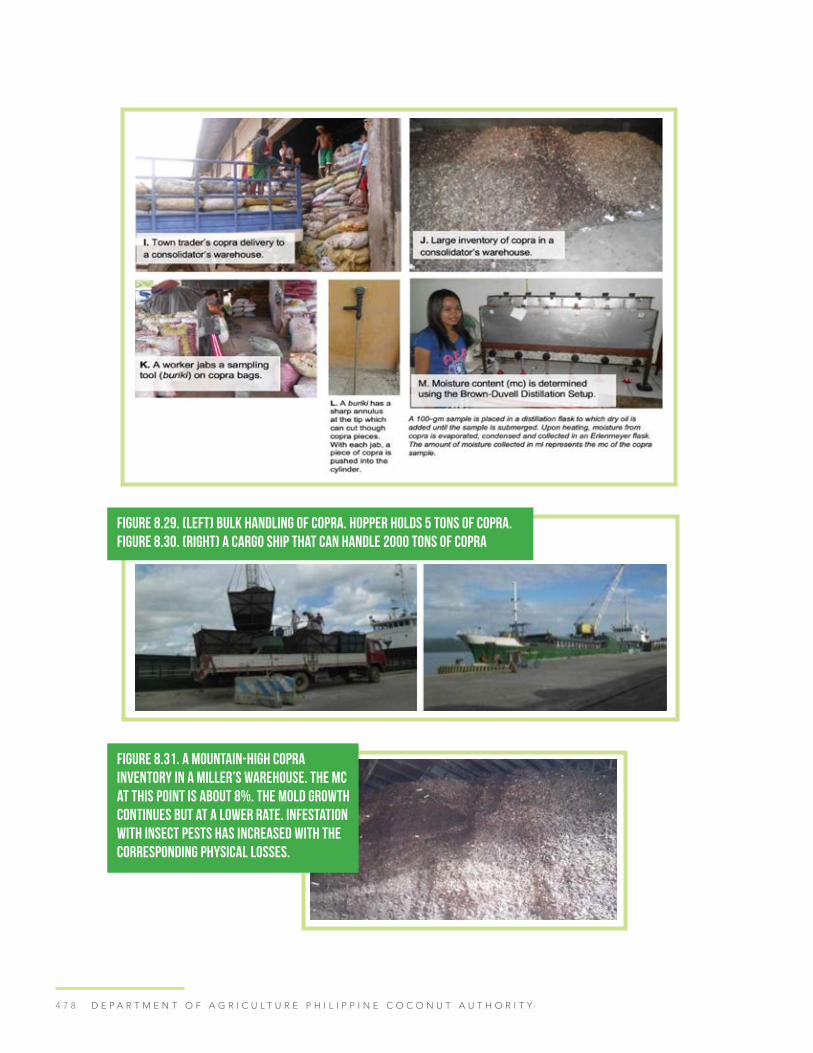
4 7 8 D E P A R T M E N T O F A G R I C U L T U R E P H I L I P P I N E C O C O N U T A U T H O R I T Y
Figure 8.29. (left) Bulk handling of copra. Hopper holds 5 tons of copra. Figure 8.30. (right) A cargo ship that can handle 2000 tons of copra
Figure 8.31. A mountain-high copra inventory in a miller’s warehouse. The mc at this point is about 8%. The mold growth continues but at a lower rate. Infestation with insect pests has increased with the corresponding physical losses.

4 7 9P H I L I P P I N E C O C O N U T I N D U S T R Y R O A D M A P 2 0 2 1 - 2 0 4 0
NOTES ON AFLATOXIN AND POLYCYCLIC AROMATIC HYDROCARBON (PAHs)
Aflatoxin
The stringent Sanitary and Phytosanitary (SPS) requirement of importing countries in the
European Union limiting the aflatoxin levels in feed ingredients and feeding stuff are due
to the harmful effects of aflatoxin on animals and human health. The SPS regulations
require that the aflatoxin level in copra cake should not exceed 20 ppb (PCA). The
aflatoxin levels in Philippine copra cake exceeds this level.
PAHs
Another major problem confronting the Philippines with regard to crude coconut oil
exportation is the stiffer quality requirement of the European Union, which imposes that
crude oil to be exported to Europe should have low polycyclic aromatic hydrocarbon
(PAH). PAH is derived from too much smoke when processing copra. Copra processed
using the traditional tapahan method has been reported at 79.8 ppb of benzo-A-pyrene,
one of the PAHs from smoke (Swetman, Head and Evans, 1999).
Competitiveness
In terms of price and quality, the country’s Philippine coconut oil is highly dependent
on the quality of copra. According to Boceta (1997), Philippine coconut oil sells at a
discount of 2 percent in the world market owing to its low quality. This situation had been
estimated to cost the country US $52million annually in terms of reduced export prices
and physical losses.
Complicated grading system
AO (1991) maintained the base price of copra at 12 percent moisture content as set by
AO 01(1991) but, in addition, the rejection level was reduced to 12 percent. However,
PCA-certified traders with drying facilities will be permitted to purchase tapahan-
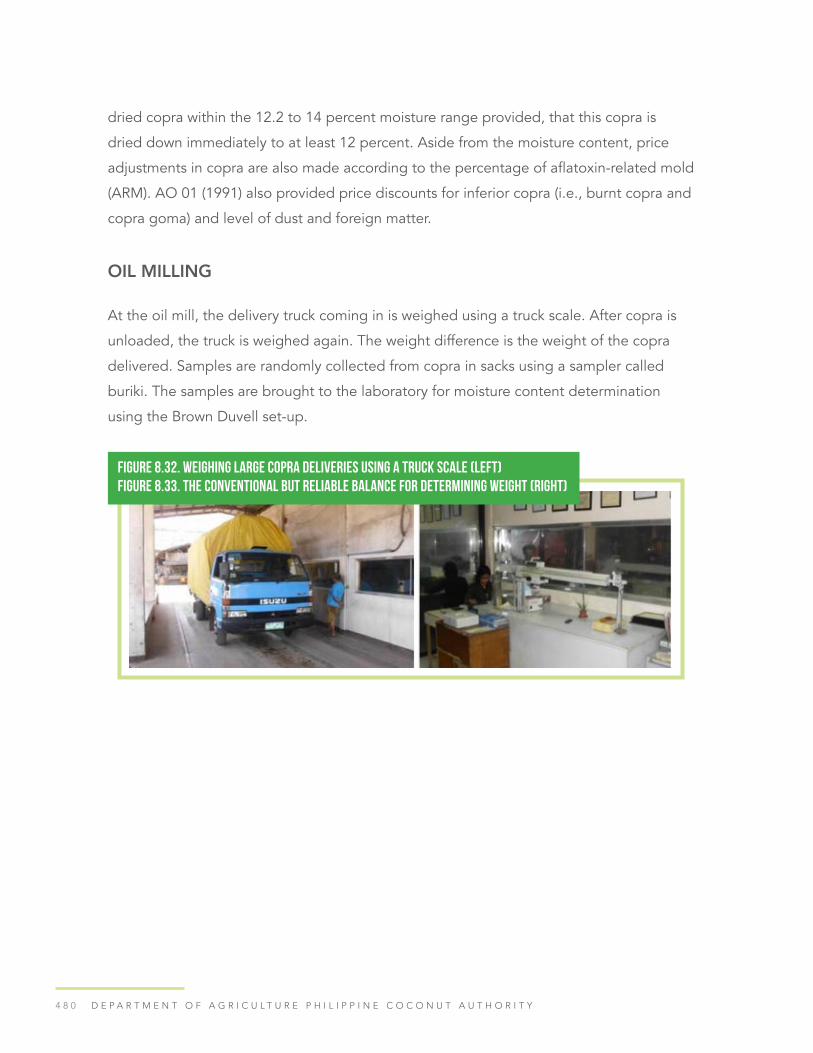
4 8 0 D E P A R T M E N T O F A G R I C U L T U R E P H I L I P P I N E C O C O N U T A U T H O R I T Y
dried copra within the 12.2 to 14 percent moisture range provided, that this copra is
dried down immediately to at least 12 percent. Aside from the moisture content, price
adjustments in copra are also made according to the percentage of aflatoxin-related mold
(ARM). AO 01 (1991) also provided price discounts for inferior copra (i.e., burnt copra and
copra goma) and level of dust and foreign matter.
OIL MILLING
At the oil mill, the delivery truck coming in is weighed using a truck scale. After copra is
unloaded, the truck is weighed again. The weight difference is the weight of the copra
delivered. Samples are randomly collected from copra in sacks using a sampler called
buriki. The samples are brought to the laboratory for moisture content determination
using the Brown Duvell set-up.
Figure 8.32. Weighing large copra deliveries using a truck scale (left)Figure 8.33. The conventional but reliable balance for determining weight (right)

4 8 1P H I L I P P I N E C O C O N U T I N D U S T R Y R O A D M A P 2 0 2 1 - 2 0 4 0
Figure 8.34. Copra in a miller’s warehouse. It appears that the first-in first-out movement is difficult to execute (left)Figure 8.35. Weighing large copra deliveries using a truck scale (right)
Figure 8.36. Computation Method of Copra Mill gate price (Coconut Industry Yearbook, 1998)

4 8 2 D E P A R T M E N T O F A G R I C U L T U R E P H I L I P P I N E C O C O N U T A U T H O R I T Y
Table 8.1. Discount table distributed by PCA
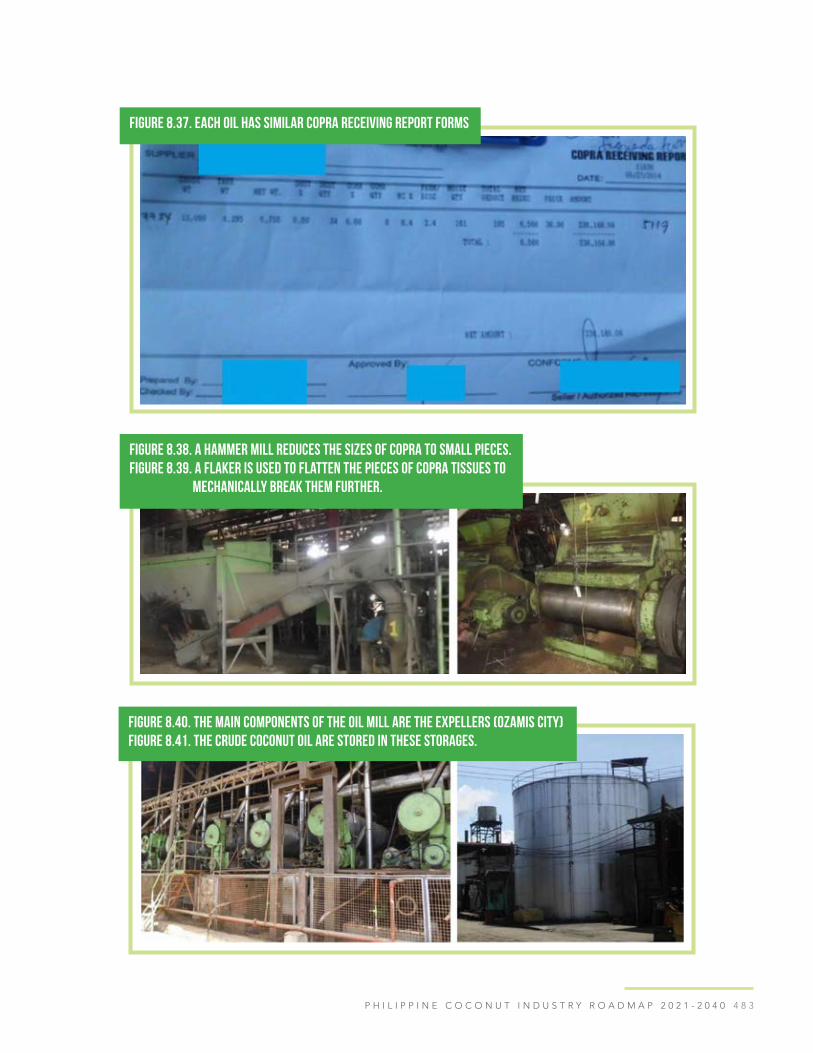
4 8 3P H I L I P P I N E C O C O N U T I N D U S T R Y R O A D M A P 2 0 2 1 - 2 0 4 0
Figure 8.38. A hammer mill reduces the sizes of copra to small pieces.Figure 8.39. A flaker is used to flatten the pieces of copra tissues to mechanically break them further.
Figure 8.37. Each oil has similar Copra Receiving Report forms
Figure 8.40. The main components of the oil mill are the expellers (Ozamis City)Figure 8.41. The crude coconut oil are stored in these storages.

4 8 4 D E P A R T M E N T O F A G R I C U L T U R E P H I L I P P I N E C O C O N U T A U T H O R I T Y
FWCCs and FCBSsFARMER-OWNED WHITE COPRA CENTRALS (FWCCs) & FARMER-OWNED COPRA BUYING STATIONS (FCBSs)
Business model for Farmers-Owned White Copra Centrals (FWCC)
The FWCC will buy mature, dehusked nuts directly from farmers and dry them into white
copra with a moisture content of not more than 6%. The dryers are indirectly heated
using a system of heat exchangers and heat source designed to recover charcoal. Before
drying, the coconut water will be extracted in a clean way so that it can be processed into
coconut water concentrate or made into plant growth enhancers. The white copra will
be sold directly to the oil millers or their consolidators. This business model, where by-
products are recovered and where at least 1 layer of trader is skipped, the FWCC will be
able to pay prices for de-husked nuts almost at par with that of the desiccators.
Capital Expenditures (CapEx) and financial viability for FWCC
The total investment for an FWCC with a capacity of 12,000 kg-nut per day is PHP 10M
(building PHP 3.5M, vehicles PHP 2.5M, equipment PHP 4.0M). The payback period is
2.00 years and the Financial Internal Rate of Return (FIRR) is 56.62%.
Business model for FCBS
The FCBS will buy partially dry copra from farmers, re-dry to lower MC, and then sell to oil
millers at a profit. One dryer can hold 4,000 kg of pasa copra at about 20% MC which is re-
dried into copra with 8% moisture content weighing about 1,125 kg. Re-drying time is about
5-6 hr. Fuel consumption is about 60kg of dry biomass fuel. (During the month of May 2019,
pasa copra was priced at PHP 13.00 and re-dried copra was priced at PHP 17.00/kg)
CAPEX and financial viability for Farmers-Owned Copra Buying Stations (FCBS)
The total investment for a FCBS is PHP 8.0M (building PHP 3.46M, vehicles PHP 2.5M,
equipment PHP 2.04M). The payback period is 2.25 years and FIRR is 61.89%.

4 8 5P H I L I P P I N E C O C O N U T I N D U S T R Y R O A D M A P 2 0 2 1 - 2 0 4 0
Figure 8.42. A modern cost-effective drying system at Ivisan, Capiz
Figure 8.43. Flowchart of the by-products we get from coconut

4 8 6 D E P A R T M E N T O F A G R I C U L T U R E P H I L I P P I N E C O C O N U T A U T H O R I T Y
The FWCC produces white copra with a moisture content no higher than 6%. The oil
extracted from this kind of copra has the following attributes: low in PAH, low in Free
Fatty Acids (FFA), and almost colorless. It satisfies the most stringent quality standards in
the world market. The main components of WCC are Copra Dryer with a heat exchanger
and a heat source that produces charcoal, at the same time generating process heat. The
technology for FWCC was developed using the vast experiences in the development and
promotion of UPLB Copra Dryer starting in 1979 (Figure 8.44).
Figure 8.44. Farmer-owned White Copra Center (FWCC)
*Each FWCC will need 26 factory workers, 13 harvesters and 10 dehuskers or a total of 49 people.

4 8 7P H I L I P P I N E C O C O N U T I N D U S T R Y R O A D M A P 2 0 2 1 - 2 0 4 0
Figure 8.45. Farmer-owned Copra Buying Stations (FCBS)
*Each FWCC will need 16 factory workers

4 8 8 D E P A R T M E N T O F A G R I C U L T U R E P H I L I P P I N E C O C O N U T A U T H O R I T Y
Implementation Scheme: Linking the farmers with industry
The FWCCs and FCBSs will supply high-quality copra to the oil mills in a coordinated
manner to ensure a “just-in-time” operation. In this manner, the time elapsed between
copra-making and oil milling will be dramatically shortened in order to reduce inventory
costs and post-harvest losses (in terms of quality loss and dry matter loss). Exports of
high-quality CNO and copra cake are very much welcomed by reputable CNO users like
Unilever and oleochemical companies. This innovative value chain with export orientation
will qualify for Philippine Economic Zone Authority (PEZA) accreditation.
Figure 8.46. Farmer-owned White Copra Central (FWCC)
*Each oil mill will be requested to set up a processing line using white copra as feedstock from 700 hectaresof coconut farm. Only 1 unit of 30-TPD expeller will be used for this purpose. Twelve (12) units of FWCC, 624workers will be needed. Area of farms from which coconuts will come from is 8,400 hectares cared of by4,200 farmers.
Farmers-owned Copra Buying Stations (FCBS). The remaining 4 expellers will need 120
tons copra per day (TPD) copra from 15 units of FCBS with 8 TPD capacity. The copra
supply will come from 35,000 hectares of coconut farms cared for by 17,500 farmers.
Each FCBS will need 16 factory workers; for 15 units of FCBS, the number of workers
needed is 240.
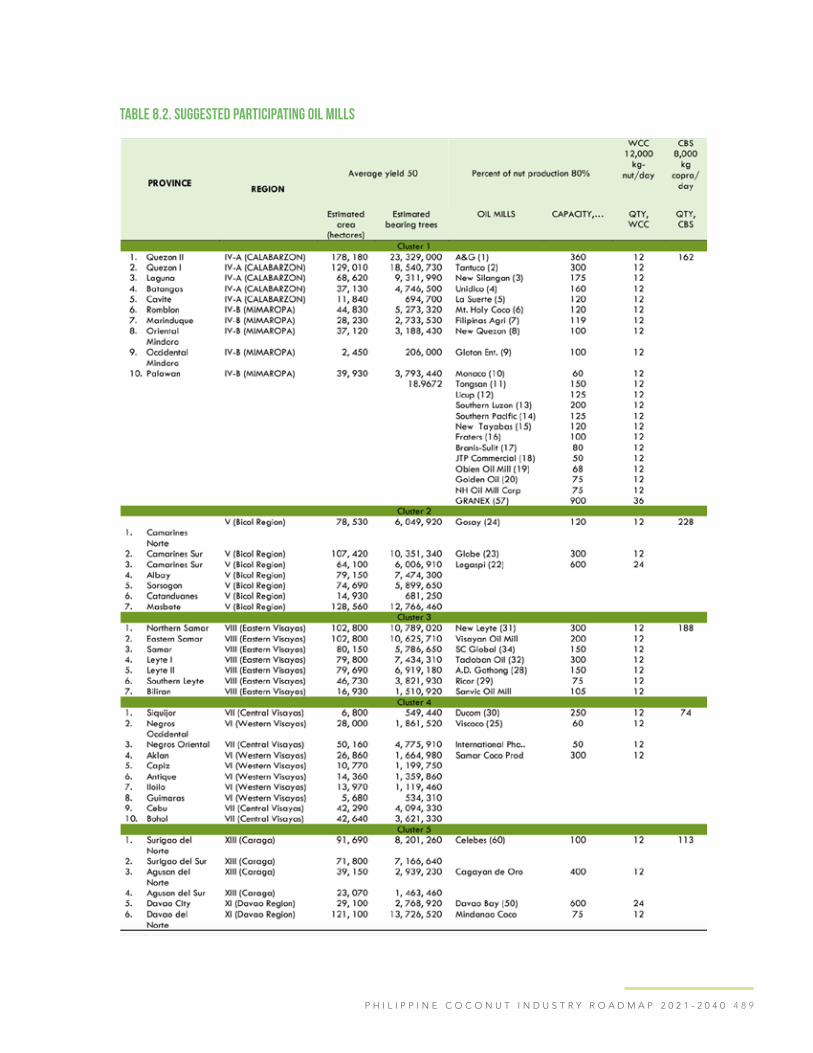
4 8 9P H I L I P P I N E C O C O N U T I N D U S T R Y R O A D M A P 2 0 2 1 - 2 0 4 0
Table 8.2. Suggested participating oil mills

4 9 0 D E P A R T M E N T O F A G R I C U L T U R E P H I L I P P I N E C O C O N U T A U T H O R I T Y
Table 8.3. Summary and Costs of WCC and CBS

4 9 1
Table 8.4. Special cluster/special projects by provinces
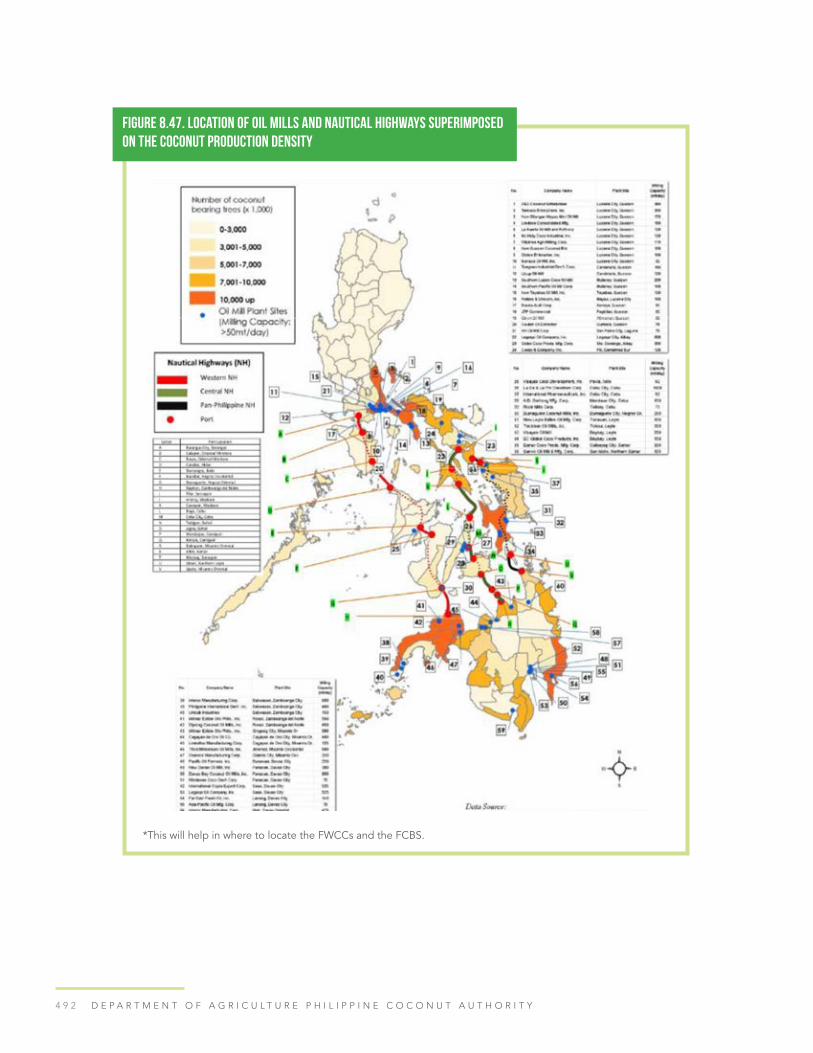
4 9 2 D E P A R T M E N T O F A G R I C U L T U R E P H I L I P P I N E C O C O N U T A U T H O R I T Y
Figure 8.47. Location of oil mills and nautical highways superimposed on the coconut production density
*This will help in where to locate the FWCCs and the FCBS.

4 9 3P H I L I P P I N E C O C O N U T I N D U S T R Y R O A D M A P 2 0 2 1 - 2 0 4 0
The transport and communication infrastructure in the Philippines has improved in the
last 20 years making copra trading more efficient by way of reduction in the layers of
trader and better awareness about copra and CNO prices. Another improvement needed
at the farm level is rural roads that would allow product movements under all-weather
conditions by tricycle.
BENEFITS FROM COPRA QUALITY IMPROVEMENT
4 9 4 D E P A R T M E N T O F A G R I C U L T U R E P H I L I P P I N E C O C O N U T A U T H O R I T Y
INTEGRATED COCONUT PROCESSING: VCO Based
The Integrated Coconut Processing Concept (ICPC) involves the production of multiple
products from coconut in one processing plant.
Large Scale (300,000-500,000 nuts per day)
The Desiccated Coconut (DCN) factories have capacities ranging from 300,000 to
500,000 nuts per day. Today, a typical DCN factory manufactures the following products:
DCN, coconut water concentrate, virgin coconut oil (VCO), coconut flour, and paring oil.
The VCO is produced by the dry method, where the oil is extracted from the DCN with
the use of expellers. The by-product in this operation is a cake that is pulverized into flour.
Paring oil, another specialty product, is derived from the hard brown testa covering of
coconut meat. The oil extracted from it contains oil with higher content of unsaturated
fatty acids than the regular CNO. The VCO production rate could go as high as 25 tons/
day. The products of DCN factories are exported. Figure 8.48 below is the typical process
flow chart used.
Quantum Diversified Coconut Products has the following product lines: Coconut milk
(canned and frozen), low-fat DCN, VCO 1 (wet process by centrifuge method), VCO 2
(expeller pressed), coconut protein (from skimmed milk), coconut water concentrate, and
vinegar. Canned coconut milk is exported but limited in volume. Frozen coconut milk in
5-kg pouches is marketed locally and is an ingredient in an ice-cream manufacture. The
capacity of Quantum is 10,000 kg-nuts/day and operating 2 days per week only (KII, Dario
Collo, Natural Quantum Diversified Products, Inc., March 2021).
Integrated coconut processing is also done at the village or micro-scale level, however,
the number of products is limited to what can be sold locally. In many instances, the
VCO is sold to a consolidator who does re-filtration and drying using a tubular centrifuge
before making it part of his inventory for export. The wet method is more extensively
used because of its lower equipment cost. In Sri Lanka, the dry method is used on the
micro-scale because the coconuts can be easily dried under the sun and small expellers
are available. Figure 8.50a and 8.50b show the flow charts for micro-scale processing.

4 9 5P H I L I P P I N E C O C O N U T I N D U S T R Y R O A D M A P 2 0 2 1 - 2 0 4 0
Figure 8.48. Process flow in DCN factory (Franklin Baker, Primex, etc.) Medium scale (10,000 nuts per day)

4 9 6 D E P A R T M E N T O F A G R I C U L T U R E P H I L I P P I N E C O C O N U T A U T H O R I T Y
Figure 8.49. Process flow used at Quantum Coconut Diversified ProductsMicro-scale (200-600 nuts per day)

4 9 7P H I L I P P I N E C O C O N U T I N D U S T R Y R O A D M A P 2 0 2 1 - 2 0 4 0
List of equipment for Integrated Coconut Processing: VCO-Based
DRY METHOD (MICRO-SCALE)
White copra route (600-1000 kg-nut/day) Indirect dryer (white copra)
Hammer mill (grind copra)
Expeller (extract oil, copra cake)
Figure 8.50a. Small-scale Integrated CoconutProcessing (Dry Process) 600-1000
Figure 8.50b. Integrated Coconut Processing (Wet Process). Micro-scale 200-600 kgnut/day VCO Processing

4 9 8 D E P A R T M E N T O F A G R I C U L T U R E P H I L I P P I N E C O C O N U T A U T H O R I T Y
Pressure filter (remove fine sediments)
Double jacketed kettle (dry the oil)
Village level DCN route (600-1000 kg-nut/day) De-shelling machine (remove the shell)
Paring tools (remove testa)
Coconut meat grinder (fine grinding)
Indirect cabinet dryer (drying DCN) Expeller (extraction of oil)
Pressure filter (remove fine sediments)
Double jacketed kettle (drying and pasteurizing of oil)
Pulverizer (cocoflour)
WET METHOD (MICRO-SCALE)
Fermentation method 600 kg-nut/day Graters
Coconut milk extractor
Fermentation cabinet
Fermentation vessels Pressure filter
Double jacketed kettle Vacuum dryer
Fermentation method (with tubular centrifuge) Graters
Coconut milk extractor
Fermentation cabinet
Fermentation vessel
Tubular centrifuge (remove fine sediments and last traces of moisture)
Double jacketed kettle (to pasteurize the oil)
DRY METHOD (LARGE SCALE)
The average industrial scale DCN processing line can process 300,000 kg-nut per 24
hours to produce some 40 tons of DCN. When this amount of DCN is pressed, about 24

4 9 9P H I L I P P I N E C O C O N U T I N D U S T R Y R O A D M A P 2 0 2 1 - 2 0 4 0
tons of VCO is obtained. The set of equipment needed to produce VCO from DCN are
the following:
• Conditioner
• Expeller
• Filter press
• Tubular centrifuge
COCONUT SAP VALUE CHAIN
Coconut sap is the unfermented, sweet, honey-colored sap tapped from the immature
inflorescence of coconut. It is collected as the raw material for tuba, coco-sugar and
syrup, lambanog, and vinegar. Coconut sap itself is a healthy drink and a rich source
of sugar, protein, minerals, anti- oxidant, and vitamins. It is considered one of the best
natural health drinks (it has served as an important source of nutrients for the people
of the isolated Pacific Island nations such as Kiribati since time immemorial). The most
significant characteristic of coconut sap is its low glycemic index (GI) of 35; GI is an
indicator of the extent of sugar absorbed into the blood (Manohar, 2007).
Tapping
Coconut sap is obtained by tapping the unopened spadix of the coconut palm. The
tapper cuts a thin slice off at the end of the efflorescence from which the sap drips
out. On average, a tree can yield 1-2 liters of coconut sap per day. The frequency of
tapping depends on the kind of products to make. It has been reported that a tapper
(climbing the palms) can tap 25 to 30 palms in a working day. Where the coconut trees
are connected by tree-top bamboo walkways, a tapper can tap about 75 to 90 trees. In
situations where the trees are still short or are of dwarf variety, tapping can be easy. To
ensure the freshness of the coconut sap, it must be collected every 5-6 hours. This is done
three to four times a day - two in the morning, two in the afternoon, and at night time.
The sap that has a pH of below 6 is made into vinegar and aminos. In an experiment with
tapping of 100 trees, a daily total of 1.38 litre per tree was obtained. When calculated
in 12 hour periods, during the daytime, the sap flow was 0.64 litre and during the night
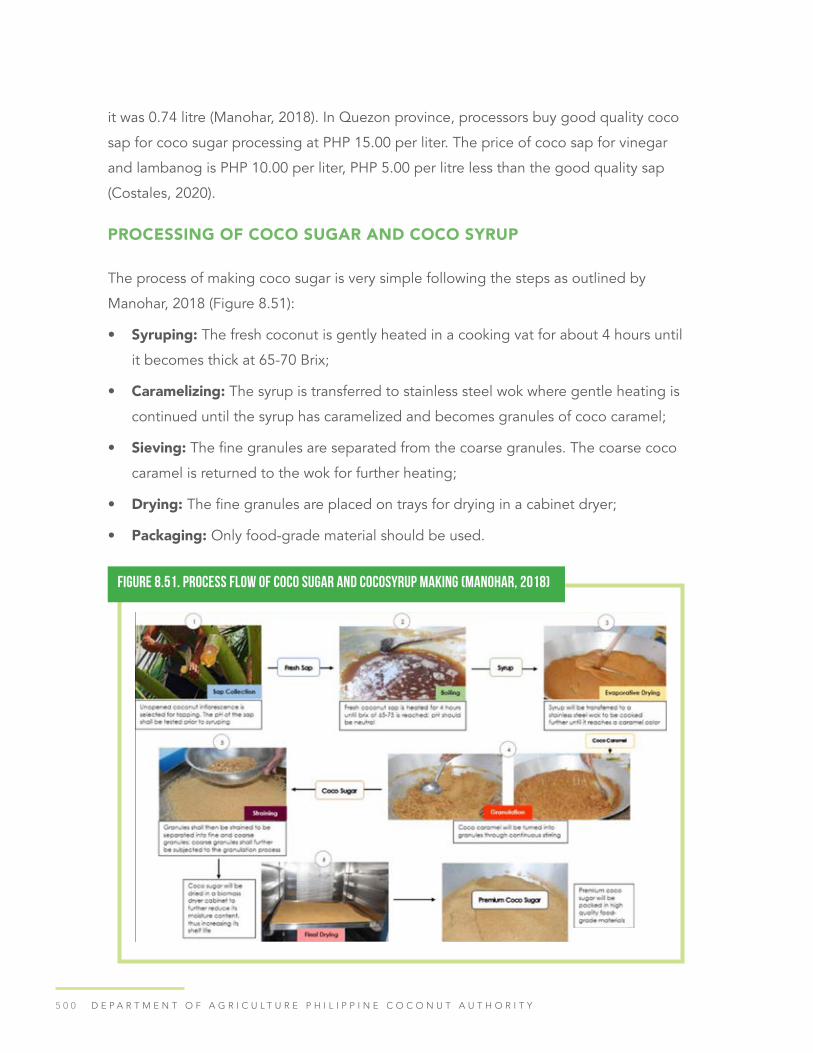
5 0 0 D E P A R T M E N T O F A G R I C U L T U R E P H I L I P P I N E C O C O N U T A U T H O R I T Y
it was 0.74 litre (Manohar, 2018). In Quezon province, processors buy good quality coco
sap for coco sugar processing at PHP 15.00 per liter. The price of coco sap for vinegar
and lambanog is PHP 10.00 per liter, PHP 5.00 per litre less than the good quality sap
(Costales, 2020).
PROCESSING OF COCO SUGAR AND COCO SYRUP
The process of making coco sugar is very simple following the steps as outlined by
Manohar, 2018 (Figure 8.51):
• Syruping: The fresh coconut is gently heated in a cooking vat for about 4 hours until
it becomes thick at 65-70 Brix;
• Caramelizing: The syrup is transferred to stainless steel wok where gentle heating is
continued until the syrup has caramelized and becomes granules of coco caramel;
• Sieving: The fine granules are separated from the coarse granules. The coarse coco
caramel is returned to the wok for further heating;
• Drying: The fine granules are placed on trays for drying in a cabinet dryer;
• Packaging: Only food-grade material should be used.
Figure 8.51. Process flow of coco sugar and cocosyrup making (Manohar, 2018)

5 0 1P H I L I P P I N E C O C O N U T I N D U S T R Y R O A D M A P 2 0 2 1 - 2 0 4 0
HIGHLIGHTS:
1.) The quality of raw material is an important determinant of coco sugar quality. The
metrics of quality is the level of sugar break. Philippine coco sap has a sugar break
of 12.5%, which is a slightly higher than Indonesia’s sugar breaks of 11% to 12%. The
quality of the coco sugar is much better when the sap is immediately processed and
when the sap’s pH level is neutral.
2.) Eight (8) kg of coconut sap will yield 1 kg coco sugar.
3.) Filipino tappers and processors do not use anti-fermenting agents such as limestone
and mangosteen bark to retard the fermentation, which is a practice in Indonesia
(Manohar, 2018).
4.) Variability in quality of the coco sugar is a common problem. This is attributed to the
use of solid fuel stoves and non-measuring stoves in the crystallization of the syrup.
The difficulty of controlling the heat from solid fuel combustion results to variability in
the finished products (Costales, 2020).
5.) Off-grade or fermented coconut sap are made into vinegar.
RECOMMENDATIONS FOR COCO SUGAR AND COCO SYRUP PROCESSING:
1.) Use of double jacketed kettle where there is temperature control feature (KII,
Norberto Ambagan, March 2021).
2.) Pre-process the sap into syrup in an intermediate processing point to stop
fermentation right away.
3.) In tapping of sap, the procedure of using a sterile food-grade tubing of conveying
coconut sap from a collecting receptacle (tied to the efflorescence) to the collecting
vessel on the ground, must be fully developed (Fabula, 2013).
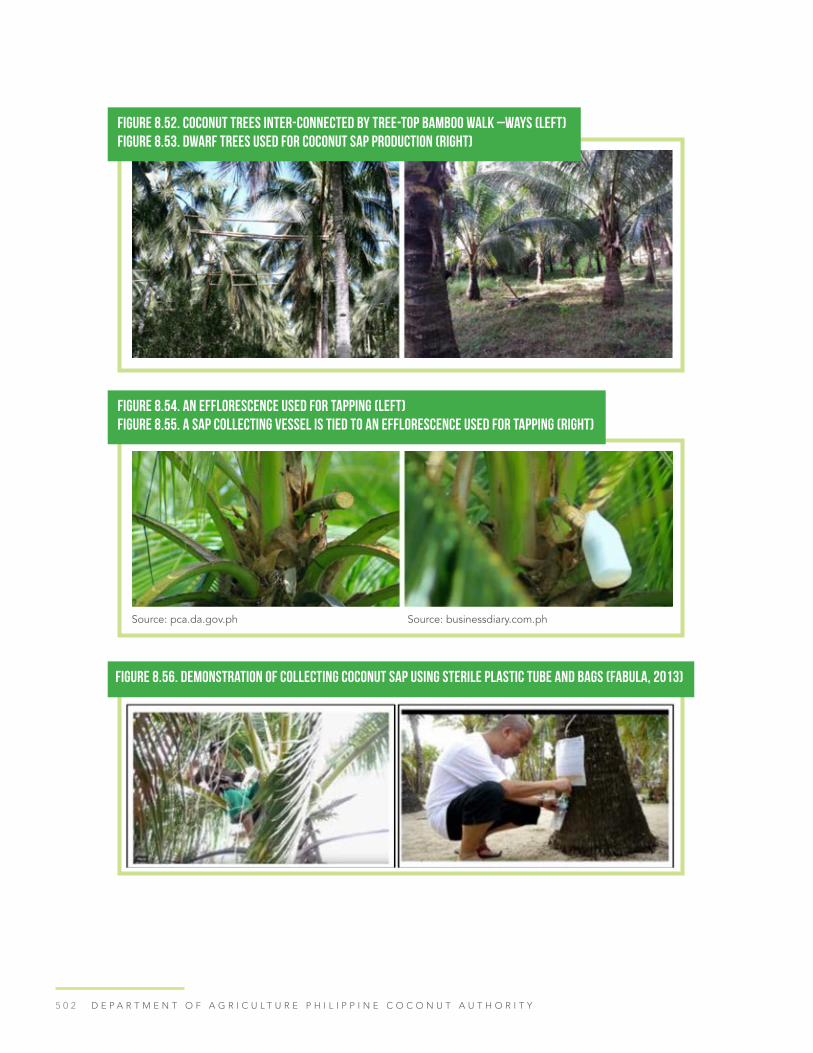
5 0 2 D E P A R T M E N T O F A G R I C U L T U R E P H I L I P P I N E C O C O N U T A U T H O R I T Y
Figure 8.52. Coconut trees inter-connected by tree-top bamboo walk –ways (LEFT)Figure 8.53. Dwarf trees used for coconut sap production (RIGHT)
Figure 8.54. An efflorescence used for tapping (left)Figure 8.55. A sap collecting vessel is tied to an efflorescence used for tapping (RIGHT)
Source: pca.da.gov.ph Source: businessdiary.com.ph
Figure 8.56. Demonstration of collecting coconut sap using sterile plastic tube and bags (Fabula, 2013)

5 0 3P H I L I P P I N E C O C O N U T I N D U S T R Y R O A D M A P 2 0 2 1 - 2 0 4 0
LAMBANOG PROCESSING
The process steps in the processing of lambanog are summarized below based on the
paper by Buenavista:
1. Receiving: Upon collection, the coconut sap should have a pearly white appearance
with a distinctive smell, and a pH of 7. Coconut sap packed in 20-L containers is
received at the production area and subsequently filtered.
2. Fermentation: At the fermenting vat, coconut sap is allowed to ferment in 200-L
food-grade plastic drums. Three to four days duration of fermentation results in an
alcohol content of approximately 7-8%.
Figure 8.57. Double jacketed kettle for better temperature control
Figure 8.58. Example packaging of coco sugars

5 0 4 D E P A R T M E N T O F A G R I C U L T U R E P H I L I P P I N E C O C O N U T A U T H O R I T Y
3. Distillation: The batch-type pot-still process using rice hull or wood as sources of
fuel is the traditional process of distillation used. Gently heating of the alcoholic
liquor is observed. The initial distillate (head or ‘bating’) of about 10 ounces contains
methanol. An alcohol meter (hydrometer) is utilized to measure the alcohol content,
which varies from 80 to 90 proof. The remaining liquor in the distillation vat (the tail)
is discarded. Distillation time takes around 6 to 8 hours. Rice hull, used bamboo,
fuelwood, and farm wastes are used as fuel for distillation. Temperature is controlled
by adjusting the feeding of fuel; too high a temperature can burn the coconut sap
which can produce a dark and unpleasant tasting distillate. It is a temperature-critical
process; over-boiling is avoided, and the longer the distillation time, the finer the
distillate. The yield of lambanog is based on the 17.51% recovery efficiency.
Figure 8.59. The sequence of making lambanog in pictures (Peralta, et al of Sanghaya Inc, 2015)
Note that it is a crystal clear product.
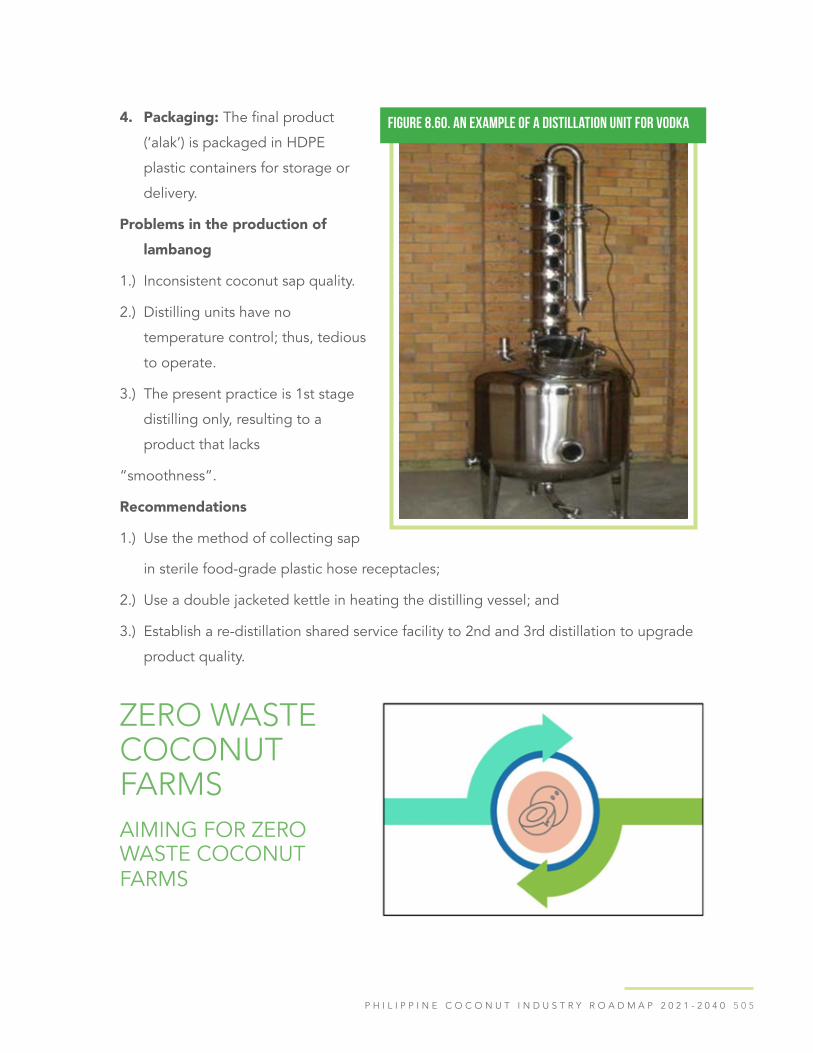
5 0 5P H I L I P P I N E C O C O N U T I N D U S T R Y R O A D M A P 2 0 2 1 - 2 0 4 0
4. Packaging: The final product
(‘alak’) is packaged in HDPE
plastic containers for storage or
delivery.
Problems in the production of lambanog
1.) Inconsistent coconut sap quality.
2.) Distilling units have no
temperature control; thus, tedious
to operate.
3.) The present practice is 1st stage
distilling only, resulting to a
product that lacks
“smoothness”.
Recommendations
1.) Use the method of collecting sap
Figure 8.60. An example of a distillation unit for vodka
in sterile food-grade plastic hose receptacles;
2.) Use a double jacketed kettle in heating the distilling vessel; and
3.) Establish a re-distillation shared service facility to 2nd and 3rd distillation to upgrade
product quality.
ZERO WASTE COCONUT FARMSAIMING FOR ZERO WASTE COCONUT FARMS
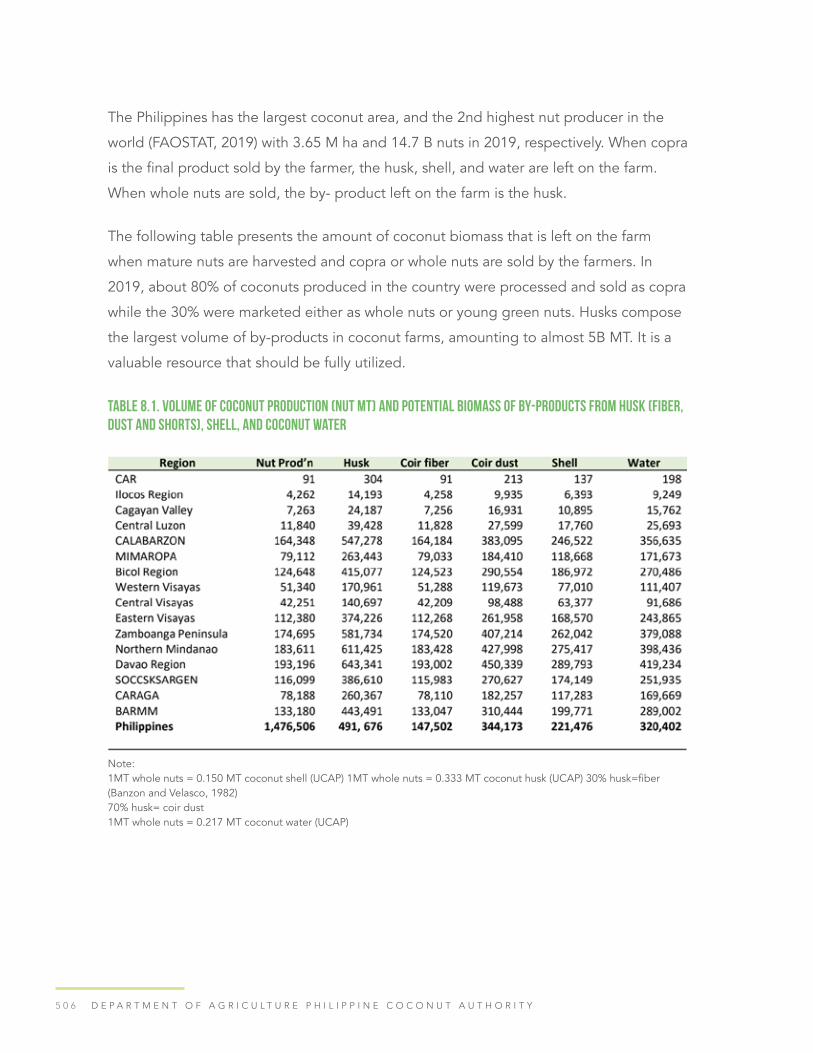
5 0 6 D E P A R T M E N T O F A G R I C U L T U R E P H I L I P P I N E C O C O N U T A U T H O R I T Y
The Philippines has the largest coconut area, and the 2nd highest nut producer in the
world (FAOSTAT, 2019) with 3.65 M ha and 14.7 B nuts in 2019, respectively. When copra
is the final product sold by the farmer, the husk, shell, and water are left on the farm.
When whole nuts are sold, the by- product left on the farm is the husk.
The following table presents the amount of coconut biomass that is left on the farm
when mature nuts are harvested and copra or whole nuts are sold by the farmers. In
2019, about 80% of coconuts produced in the country were processed and sold as copra
while the 30% were marketed either as whole nuts or young green nuts. Husks compose
the largest volume of by-products in coconut farms, amounting to almost 5B MT. It is a
valuable resource that should be fully utilized.
Table 8.1. Volume of coconut production (nut MT) and potential biomass of by-products from husk (fiber, dust and shorts), shell, and coconut water
Note:1MT whole nuts = 0.150 MT coconut shell (UCAP) 1MT whole nuts = 0.333 MT coconut husk (UCAP) 30% husk=fiber (Banzon and Velasco, 1982)70% husk= coir dust 1MT whole nuts = 0.217 MT coconut water (UCAP)

5 0 7P H I L I P P I N E C O C O N U T I N D U S T R Y R O A D M A P 2 0 2 1 - 2 0 4 0
COCONUT HUSK UTILIZATION
Pogoso et al. (2018) surveyed the husk
utilization by farmers in Luzon, Visayas, and
Mindanao (Figure 8.1). At most, only half
of the husk was utilized across the country,
as firewood while less than 5% is used for
handicrafts and as coco coir. With about 50% of the volume unutilized year after year,
about 150,000 MT of husks goes to waste.
Figure 8.1. Husk Utilization by farmers in Luzon, Visayas and Mindanao
Source: Pogoso, et. al., 2018
COCONUT HUSK AS FUEL
Coconut husks are usually used as fuel for copra processing or for cooking in the
household by direct combustion, otherwise, husks are left to rot in piles around the
tapahan. The husk (mesocarp, exocarp, and seedcoat) has a heating value of 17 MJ-kg-1,
but when burned as when it is used as fuel in copra making, it produces so much smoke
which irritates the eyes, nose, and throat, and odor may be nauseating (health.ny.gov). All
smoke contains carbon monoxide, carbon dioxide, and particulate matter (PM or soot).
Inhaling carbon monoxide Smoke inhalation damages the body due to lack of oxygen.

5 0 8 D E P A R T M E N T O F A G R I C U L T U R E P H I L I P P I N E C O C O N U T A U T H O R I T Y
The smoke itself can contain products that do not cause direct harm but takes up the
space needed by oxygen such as carbon dioxide (webmd.com). Long-term exposure or
frequent exposure to smoke for brief periods may cause long-term health effects.
COCONUT HUSK CHARCOAL
Husk cannot sustain a flame unless fanned
or mixed with other fuels. Processing of
husk to charcoal overcome this concern.
Husk charcoal, using the technology not
much different from charcoaling of wood or
coconut shell, has a heating value of 6320
kcal/kg and burns continuously without
smoke (Lozada, as cited by BAnzon and
Velasco 1982).
Husk yields 25% charcoal with 80% fixed
carbon, 11.6% ash, and a heat value of 5926 Kcal/kg (22.8 kg of coconut husk charcoal
produces the equivalent heat value of 12.5 kg LPG tank (13.5 x 10⁴ kcal)). Coconut husks
have a high amount of lignin and cellulose, and that is why it has a high
Photo source: https://www.lifegreencharcoal.com/coconut-shell-charcoal-briquette/
calorific value of 18.62MJ/kg. The chemical composition of coconut husks consists of
cellulose, lignin, pyroligneous acid, gas, charcoal, tar, tannin, and potassium. Every 10%
of the husk (50,000 MT) converted to charcoal yields 12,500 MT charcoal which is over
24,000 equivalent of 12.5 kg LPG tank
heating value.
COCONUT HUSK ASH
The coconut ash is rich in potassium in
the form of potassium oxide (Estudillo et
al., 1979, as cited by Banzon and Velasco,

5 0 9P H I L I P P I N E C O C O N U T I N D U S T R Y R O A D M A P 2 0 2 1 - 2 0 4 0
1982). Coconut husk ash has been demonstrated to be an excellent source of potassium
for immature coconut hybrids on developed peat performing as well as KCl at a ratio of
2.0-2.5:1. After 2 harvests, yield of control palms was 26 nuts/tree, KCl treated 93, and
husk at 105 (Bonneau, et al., 2010).
Mantiquilla et al. (1994), reported that the husk of coconut supplies 40.7% and 66.9% of
the Cl and
Photo source: melanatedmedia.com
K needs of the palm, respectively. Coconut husk ash has 17-35% K under average
conditions. According to Balce (1956), coconut husk ash contains 37.5% as K2O. In the
example above, 12,500 MT of charcoal (processed from only 10% or 50,000 MT husk
produced in 2019), would give about 2.0-4.6 MT of K2O raw coconut husk.
Table 8.2. Chemical composition of coconut husk (dry basis)

5 1 0 D E P A R T M E N T O F A G R I C U L T U R E P H I L I P P I N E C O C O N U T A U T H O R I T Y
Based on the table, 100 kg of mature husks will give 23 kg N, 4 kg P, 78 kg K, 8 kg Ca and
5 kg Mg. The husk is a significant source of K and of valuable mulch for the conservation
of moisture. Husk increases the water-holding capacity of the soil and enriches the
organic matter content.
Application of husk can either be piled at the base of the coconut trunk as mulch or
chopped and composted. A layer of husk with the convex side upward is placed 2m away
from the base around the tree to minimize the loss of moisture and heavy growth of weeds.
An ideal method is to bury the husks in trenches of 3 x 1.2 x 0.5m deep along coconut
rows. Each layer of husk is covered with a layer of earth. Mulched husk also improves the
physical condition of the surface soil by lowering its bulk density (Mantiquilla et al., 1994).
The following is another recommendation on the use of husk as mulching material.
RECYCLING HUSK• Husks have a high mineral content; 50 husks contain about 0.5 kg potash equal to
about 1kg muriate of potash. Husks may represent the equivalent of 200 to 300
kg KCl/ha per year. This should be taken into consideration when calculating the
profitability of alternative industrial uses of husks (fibers, energy).
• Husks can absorb and retain about six times their own dry weight of water.
• It takes about 3-4 years for husks to decompose.
• Dehusking the coconuts and leaving the husks in the field are generally recommended
practices.
• Husks can be placed around the palm as mulch, but they can also be buried. When
buried, they will improve soil conditions, and the soil’s water-holding capacity will be
increased. Husks should be placed with their convex side upwards, in circles around
the stem of palm.
• Inoculation with the cellulolytic fungus Trichoderma has been found to accelerate the
decomposition of husks. Two months after treated and untreated husks were buried
in the soil, distinct areas of decomposition in the treated husks were noted when
fibers were reduced to tiny pieces. The original soil K content was 190 ppm. After two
months, soil with untreated husks and soil with treated husks contained 517-593 ppm

5 1 1P H I L I P P I N E C O C O N U T I N D U S T R Y R O A D M A P 2 0 2 1 - 2 0 4 0
and 700-747 ppm extractable K, respectively.
• Leaving the husks in the field may attract termites.
Source: Liyanage, 1987; Nunez et al., 1991
The use of both husks and coir dust was found to be beneficial to coconut production
and partly attributed to their ability to retain moisture in the soil and the regeneration of
more roots per unit area (De et al., 2010). Coir dust appeared to be more effective than
husk in lateritic soil in terms of increasing copra yield. Husk in pits caused significant
improvement in nut and copra yield per palm, while coir dust placed in trenches had the
least effect. Furthermore, placing husk or coir dust in pits between two palms appeared
to be more effective and economical than in circular trenches around each palm. Based
on these results, the use of coir dust in pits is recommended as an effective
alternative to husk pits, for moisture conservation and in reducing the adverse effects on
the palm during the dry period.
COCONUT HUSK CHIPS
Photo source: httpps://amazon.com
Coconut husk is a popular growing medium in
the Horticulture industry, as 100% natural and
renewable resource. Coconut husk chips /cubes
are small pieces of husk and are recommended
for use in hydroponic systems due to their
excellent water retention and drainage properties. For gardening purposes, it is
promoted for use in flower beds and gardens for orchids, anthuriums, and other flowering
plants. Advantages of using husk chips include cut down fertilizer application by 25-20%,
neutral pH, and innate buffering capacity, resistance to fungal growth (greenmylife.in).
Fibredust.com markets coco chips in various sizes and combinations with coco coir in 5 kg
grow bags for hydroponics production of vegetables.
Coir husk chips are the fastest-growing coir exports products in the Philippines. Export
started in 2011 and by 2019, the average annual growth rate in export price (FOB US$/
MT) was 573.5%.

5 1 2 D E P A R T M E N T O F A G R I C U L T U R E P H I L I P P I N E C O C O N U T A U T H O R I T Y
COMPOSTED COCONUT HUSK
The coconut husks’ high Carbon Nitrogen ratio
(C/N) and its high lignin content resulting to low
biodegradability are some limitations for the
use of raw husk. It is not considered a good C
source for agriculture until it is decomposed.
Composting reduces the wide C/N ratio,
reduces the lignin and cellulose content,
reduces bulk, and converts plant nutrients to
forms available for plant uptake (Agritech portal: Organic farming agritech.tnau.ac.in).
Photo source: https://epigardening.com/coconut-coir/
Table 8.3. Nutritive value of coir dust is increased by composting (with the addition of poultry manure at a rate of 200 kg manure per 1 ton of coir dust) as follows:
On-farm production of coir dust compost is recommended with application rate of 5 kg/
established tree.
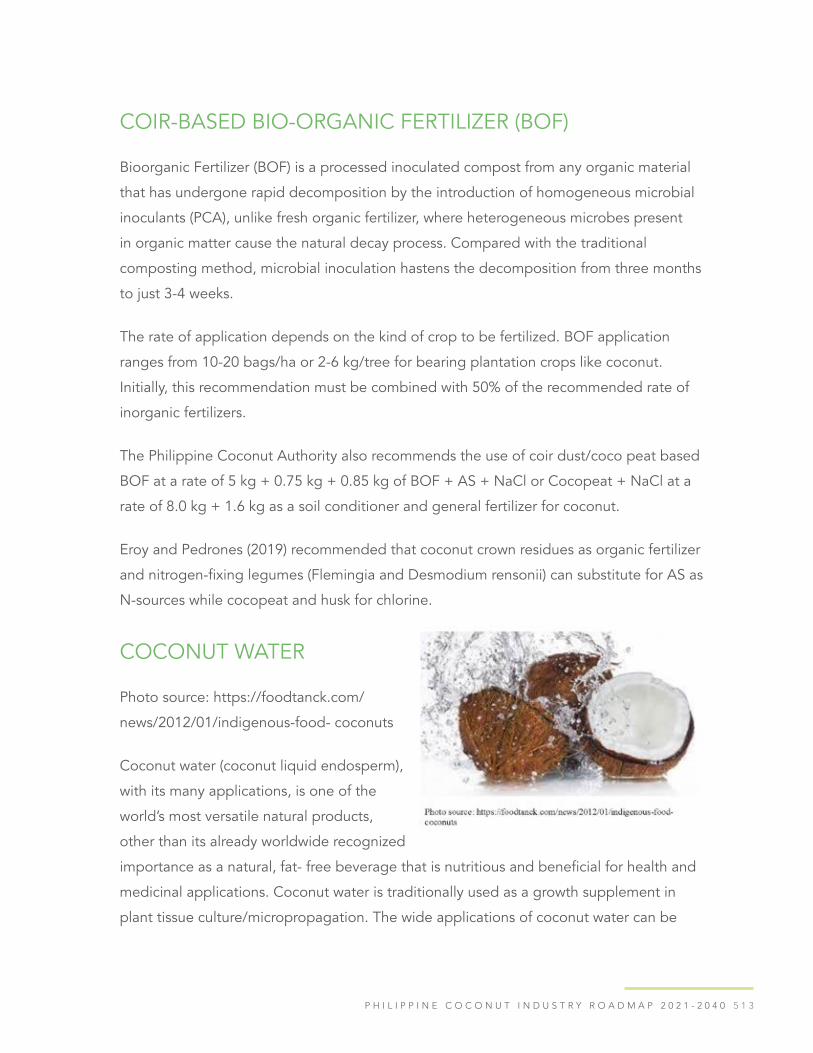
5 1 3P H I L I P P I N E C O C O N U T I N D U S T R Y R O A D M A P 2 0 2 1 - 2 0 4 0
COIR-BASED BIO-ORGANIC FERTILIZER (BOF)
Bioorganic Fertilizer (BOF) is a processed inoculated compost from any organic material
that has undergone rapid decomposition by the introduction of homogeneous microbial
inoculants (PCA), unlike fresh organic fertilizer, where heterogeneous microbes present
in organic matter cause the natural decay process. Compared with the traditional
composting method, microbial inoculation hastens the decomposition from three months
to just 3-4 weeks.
The rate of application depends on the kind of crop to be fertilized. BOF application
ranges from 10-20 bags/ha or 2-6 kg/tree for bearing plantation crops like coconut.
Initially, this recommendation must be combined with 50% of the recommended rate of
inorganic fertilizers.
The Philippine Coconut Authority also recommends the use of coir dust/coco peat based
BOF at a rate of 5 kg + 0.75 kg + 0.85 kg of BOF + AS + NaCl or Cocopeat + NaCl at a
rate of 8.0 kg + 1.6 kg as a soil conditioner and general fertilizer for coconut.
Eroy and Pedrones (2019) recommended that coconut crown residues as organic fertilizer
and nitrogen-fixing legumes (Flemingia and Desmodium rensonii) can substitute for AS as
N-sources while cocopeat and husk for chlorine.
COCONUT WATER
Photo source: https://foodtanck.com/
news/2012/01/indigenous-food- coconuts
Coconut water (coconut liquid endosperm),
with its many applications, is one of the
world’s most versatile natural products,
other than its already worldwide recognized
importance as a natural, fat- free beverage that is nutritious and beneficial for health and
medicinal applications. Coconut water is traditionally used as a growth supplement in
plant tissue culture/micropropagation. The wide applications of coconut water can be
5 1 4 D E P A R T M E N T O F A G R I C U L T U R E P H I L I P P I N E C O C O N U T A U T H O R I T Y
justified by its unique chemical composition of sugars, vitamins, minerals, amino acids,
and phytohormones.
Coconut water (CW) is a rich supplement that naturally contains sugar and minerals
including Potassium, Sodium, Magnesium, Calcium, and Iron. (https://coconuthandbook.
tetrapak.com/chapter/chemistry-coconut-water). Unopened, the coconut water is sterile
inside the shell, but once opened and the enzymes come in contact with oxygen, changes
occur and CW loses its nutrients and aroma. Minerals account only for 0.4% to 1% of the
liquid volume but contributes to CW’s isotonic properties. Potassium is the main element
of coconut water (Yong et. al., 2019).
With 1 MT whole nuts=0.217 MT coconut water (UCAP), the Philippines produced a
total of 320,000 MT of water. With 80% of the total nut production processed into copra,
about 70,000 MT of water is left of the farm, generally wasted year after year. There is
a great potential for this water to be collected by DCN factories which already have the
technology and market to add value to an otherwise wasted resource.
The proposed white copra central will be an ideal collection venue for this model. Else,
the copra central itself can process the water into concentrate. Coconut water that is not
further processed into concentrate should not be wasted. There are promising studies
on the use of coconut water in improving crop growth and yield. This should be pursued
further. There should be a means to bring the water back to the farm for irrigating
coconut and intercrops.
Coconut water contains plant growth regulators such as indole acetic acid (IAA).
A study by V.A. Agampodi and Æ Bimali Jayawardena (2009) evaluated the potential
of CW extracts containing natural IAA, on adventitious root development in vegetative
propagation of ornamental plant canes of D. purple compacta L. Steeping canes in 143-
lM IAA CW extract improved rooting in D. purple compacta L., and it was comparable
to the application of 143-lM authentic IAA. Exogenous application of IAA CW extract is
beneficial for induction and growth of adventitious roots in D. purple compacta L. canes
for vegetative propagation. The authors suggested that Reverse phase dialysis may be an
option for large-scale extraction of hormones from CW.

5 1 5P H I L I P P I N E C O C O N U T I N D U S T R Y R O A D M A P 2 0 2 1 - 2 0 4 0
Mature coconut water has been used for the mass propagation of different orchid
species like Dendrobium sp., Vanda sanderiana and Grandiflora sp. by tissue culture
techniques. (Rethinam and Kumar, 2001). While the growth promoters present in coconut
water (Marmaril et al., 1986) and milk (Pollard et al., 1961) have been identified, their
application to promote rooting has not been explored. Reverse phase dialysis may be an
option for large-scale extraction of hormones from CW.
The addition of fresh coco-water to hydroponically grown Lettuce (Lactuca sativa L.) at an
application rate of 50 ml, 100 ml and 150 ml for the 1st, 2nd, and 3rd week, respectively,
significantly increased the length and diameter of leaves; plant height; percent foliage N
and K content; length, fresh and oven-dry weight of roots; and yield compared to control
(coco-water addition) Application of coco-water as hydroponics nutrient solution and as
an additive to hydroponics solution was financially viable which has positive net present
value and a higher percentage of internal rate of return (IRR) Poliquit et al. (2019). Coco-
water as an additive for nutrients solution of hydroponics system is highly recommended
for lettuce production. The use of coco-water in hydroponics systems should be further
studied in other crops such as fruit vegetables by increasing its volume of application.
Coconut water (previously called “coco-nut milk”) has been shown to induce the division
of mature cells. For example, the growth of spinach tissue on a medium supplemented
with 10% to 15% (v/v) mature coconut water increased the weight of spinach callus after 5
weeks and accelerated shoot regeneration (4–5 weeks instead of 8– 12 weeks without).
The presence of both polyols and phytohormones could explain the growth-promoting
action of coconut water (Prades et al., 2012). Coconut water was highly sensitive to
fluctuations in potassium and sodium inputs and also sensitive to phosphorus, sulfur, and
chloride supplementation.

5 1 6
REFERENCESX. Bonneau, Irfan Haryanto, and Triyono Karsiwan, July 2010. Coconuthusk ash as
a fertilizer for coconut palms on Peat. Experimental Agriculture 46(03):401-414. DOI:10.1017/S))14479710000025.
Coconut Handbook. Retrieved from coconuthandbook.tetrapak.com
V. A. Agampodi and Bimali Jayawardena 2009. Effect of coconut (Cocos nucifera L.) water extracts on adventitious root development in vegetative propagation of Dracaena purplecompacta L. Acta Physiol Plant (2009) 31:279–284 DOI 10.1007/s11738-008-0230-y
Derby E. Poliquit, Jessie R. Sabijon, Lilibeth P. Perocho Lagrito Ebert B. Mante 2019. Additive Effects
of Coco-water on Fermented Plant Juice (FPJ) Extracts Influencing the Growth and Yield of Lettuce (Lactuca sativa L.) Grown under Hydroponics System
Asia Pacific Journal of Multidisciplinary Research Vol. 7 No.2, 1-9 May 2019 www.apjmr.com
1 1,2 3 2012.
Alexia PRADES *, Manuel DORNIER , Nafissatou DIOP , Jean-Pierre PAIN Coconut water
uses, composition and properties: a review Fruits, 2012, vol. 67, p. 87–107 http://www.fruits- journal.org or http://dx.doi.org/10.1051/fruits/2012002
Pogosa, J., V. Asio, M. Bande, S. Bianchi, J. Grenz and Pichelin. F. 2018. Productivity and Sustainability of Coconut Production and Husk Utilization in the Philippines: Coconut Husk Availability and Utilization IJERD – International Journal of Environmental and Rural Development (2018) 9-1 IJERD – International Journal of Environmental and Rural Development (2018) 9-1 Downoaded at https://www.researchgate.net/publication/332259191
J.A. Mantiquilla, L.H. Canja, R.Z. Margate, and S.S. Magat, 1994. The Use of Organic Fertilizer in Coconut (A Research Note) Philippine Journal of Coconut Studies 19(1): 8-13, June 1994
De, M. Liyanage, S. Jayasekara, K. Fernandopulle, M. (2010). Effects Of Application Of Coconut Husk and Coir Dust on The Yield of Coconut. Cocos. 9. 10.4038/cocos.v9i0.2125.

5 1 7P H I L I P P I N E C O C O N U T I N D U S T R Y R O A D M A P 2 0 2 1 - 2 0 4 0
Procedure and Sample Costs and Return in Coir-Based Bio-Organic Fertilizer (BOF) ProductionMATERIALSI. Raw materials: The amount depends on the desired quantity of heap and ratio of
plant residue and animal manures which could be 1:1, 2:1 or 1:2. For a 4 ton heap at
1:1 ratio you need:
a. Coir dust (2T)
b. Chicken manure (1T0
c. Swine Manure (1T)
d. Inoculant (1% of weight of raw material – 40kg)
II. Small tools and implement
a. Rakes
b. Shovel
c. Spading fork
d. Sprinklers or water hose
e. Plastic laminated sack as cover
f. Wheelbarrow
g. Weighing scale
h. Siever (wire mesh size of ¼ of an inch
i. Protective wear: gloves, mask, hats, boots
Note: Inoculants are commercially available in selected areas in the country but could be
easily accessed. Trichoderma harzianum, a single-celled fungus hastens the decomposition
of organic materials especially those high in lignin and cellulose like rice straw, coir dust,
bagasse and weeds. Commercial inoculants (i.e Greenmix, Mabijon composter) are
enriched with other beneficial microbes like the nitrogen-fixing bacteria, Azotobacter.
Leguminous plants could be part of the substrate to substitute part of the manure.

5 1 8 D E P A R T M E N T O F A G R I C U L T U R E P H I L I P P I N E C O C O N U T A U T H O R I T Y
How to Make Organic Fertilizer
I. Site selection:
The ideal composting site is shaded and well-drained and near a source of water.
However, open areas could be used. Four tons of agricultural waste can be composted in
a space measuring 4m x 6m.
II. Preparation of raw materials:
Collect the required amount of coir dust, chicken manure, and swine manure. Discard
stones, plastics, metals, and other non-biodegradable materials. Note their moisture
content and weights. Divide coir dust into three parts.
III. Piling of materials
Step 1. Spread 1/3 of coir dust as the first layer. Water to about 60% moisture content.
Press the sample in your palm and when the water does not fall freely, then it is almost
within the right water content. Apply the required amount of inoculant on top (0.5% of
the weight of the material in a layer.)
Step 2. Spread evenly the chicken manure on top, water and inoculate.
Step 3. Repeat steps 1 and 2 but use swine manure instead of chicken manure. Apply the
inoculant on top of the fourth layer combining the weight of materials in the fourth and
fifth layers.
Step 4. As the topmost layer, spread evenly coir dust but do not inoculate. This serves as
a buffer for odor.
Step 5. Cover the heap with laminated plastic sack to conserve moisture and prevent
rainwater from getting into the pile. Incubate for 4-7 days.
IV. Mixing and turning over
Step 6. After 4-7 days, turn and mix thoroughly the materials. Water if needed during
turning.Return the cover. Repeat step 6 at weekly interval.
5 1 9P H I L I P P I N E C O C O N U T I N D U S T R Y R O A D M A P 2 0 2 1 - 2 0 4 0
V. Harvesting, sieving and further processing
Step 7. After three or four weeks, harvest the material. Ripe compost has dark brown to
black color, no offensive smell, temperature is ambient and with 35% moisture content or
lower. Screen the organic fertilizer through manual sieve or mechanical sifter
Step 8. Inoculate the sifted material with 0.5% of the inoculant, store for three days under
shade.
Step 9. Put BOF in 50 kg plastic lined sack and seal. Do not pile directly on concrete
flooring but provide wooden platform and stack not more than10 sacks high. Store not
more than 6 months in an aerated but dry area.
QUALITY CONTROL MEASURES
For a good quality bioorganic fertilizer, observe these points:
1) Separate the dry materials from wet ones.
2) Monitor periodically the temperature of the heap. It must be within the right
temperature range. The heap must heat up to over 400C 24 hours after heaping.
Within the first week, the desired temperature is 40-500C. If this temperature is not
reached, check the wetness of the materials. Remove the cover, turn over the heap to
allow excess moisture to escape. Temperature must reach up to 620C.
3) For a product to be registered with the FPA as pure organic fertilizer, it must have
5-7% total NPK with at least 1.5% N and at least 10% carbon. The organic matter
must be 10% and above with a neutral to slightly alkaline pH.
PRODUCTION ECONOMICS:
Assumptions:
_ % recovery – 75 operation time – 30 days
_ 4 tons of raw material

5 2 0 D E P A R T M E N T O F A G R I C U L T U R E P H I L I P P I N E C O C O N U T A U T H O R I T Y
5 2 1P H I L I P P I N E C O C O N U T I N D U S T R Y R O A D M A P 2 0 2 1 - 2 0 4 0
LIVESTOCK INTEGRATIONSWINE PRODUCTION
The local pig industry contributes about USD5 B or 18.28% to the agricultural output
of the Philippines in 2015. The country is the tenth-largest consumer and the eighth-
top producer and seventh- largest importer of pork in the world. Due to the increasing
population and appetite for pork, consumption of pork per capita is expected to increase
from 15.96 in 2020 to 16.7 kg in 2025. Because of this continued rising demand, the
country becomes a major importer of pork according to the Philippine Statistics Authority.
Thus, to reduce importation, closed the gap, and become self-sufficient, local production
efficiency should be improved. The local industry is ripe for innovative techniques of
raising pigs such as venturing into raising native pigs.
Native pigs are raised in far-flung areas where housing structures or pens are not
provided. They multiply fast because they breed and give birth easily. An average of
5 – 8 piglets is produced per farrowing. The sows care for their young and have natural
antibodies against common diseases and parasites.
An advantage of pig farming is the low capital requirement. They are easy to raise and are
highly adaptable to local conditions. In addition, native pigs can survive by making use of
local feed sources and simple management practices. Their characteristic taste appeals to
consumers, which adds to their marketability.
In 2019, the gross value of hog production was PHP 247.48 B which was 10.8% lower
than the previous year’s PHP 277.53 B gross value (PSA, 2019). Despite the decrease,
swine remains to be the subsector with the highest gross value in the livestock and
poultry sectors mentioned. Like goat and cattle, the majority of the swine industry in the
country is dominated by backyard farm setting. Over 63% of the total 12.8M heads of
swine in 2019 are not raised commercially. The total swine inventory in the Philippines has
also declined by 7% in the last 10 years while production of pork on the other hand had
increased by 22% from 1.88 M to 2.3 M metric tons of pork (Figure 8.1 and 8.2).

5 2 2 D E P A R T M E N T O F A G R I C U L T U R E P H I L I P P I N E C O C O N U T A U T H O R I T Y
Community Based Native Pig Production (Dos por Cinco Scheme)
The scheme adopts the strategy of Native Swine Project (funded by DA-BAR and
implemented by the team of Dr. Bulatao of UPLB) that has worked well in Bondoc
Peninsula communities called the Dos por Cinco approach.
Figure 8.1. Swine inventory by backyard and commercial farm type, Philippines (PSA, 2009-2019)
Figure 8.2. Pork volume of production (metric tons), Philippines (PSA, 2009-2019)

5 2 3P H I L I P P I N E C O C O N U T I N D U S T R Y R O A D M A P 2 0 2 1 - 2 0 4 0
Each coconut farmer beneficiary will receive two ready-to-breed gilts (the Dos part) which
will give the farmers a sustainable annual supply of piglets. The piglets will be given by
the enterprise which could be sourced from reputable organizations.
Based on the project, a native sow gives birth to piglets two times in 14 months and
produces an average of seven piglets in a litter. Thus, a total of 28 piglets will be
produced in 28 months.
Additionally, the members will also be provided with five weanling or piglets (the Cinco
part) to farmers for immediate fattening. This will provide cash to the farmers in three to
four months while waiting for the gilts to give birth.
This initial animal loaned to the farmer will be debt-free and they need to pay it back
with the same number of piglets. They will then be re-loaned to new members enabling
the program to multiply its beneficiaries. For example, an initial 12 farmer members can
be multiplied into 45 beneficiaries (including the 12 original members) showing a 300%
growth in a span of 2 years.
Figure 8.3. Community based native pig production (Dos Por Cinco Scheme)
Note: New farmers will receive the same number of pigs after the prior batch returned the loaned pigs

5 2 4 D E P A R T M E N T O F A G R I C U L T U R E P H I L I P P I N E C O C O N U T A U T H O R I T Y
Farmers can opt to directly sell their pigs to the market to enjoy a higher margin or look
for a direct buyer. Another option is the enterprise will act as the middlemen and be in
charge of consolidating all available pigs for sale before selling this to the trucker which
will deliver them to processors. It is recommended to sell the piglets at the finishing
stage to enjoy higher income. The average farmgate price for a native pig with 24.5 kg
live weight is PHP 2,161. Thus, using the scheme a farmer can earn a potential of PHP
45,381.00 per two years from the piglets alone. This takes into the assumption that an
available local food source is used and the farmer can return back the five piglets and two
sows initially loaned.
DAIRY CATTLE PRODUCTION UNDER COCONUT PLANTATIONThe Philippines has more than three M hectares of land under coconut plantations.
The available area in between the widely spaced coconuts is suitable for other farming
activities such as growing crops and raising livestock to augment the limited income
from coconut. Integrating livestock production like dairy cattle farming under coconut
plantations maximizes the productivity and profitability of the given land.
A number of public-funded dairy projects were implemented in the past to utilize the area
under permanent crops like coconuts, rubber, and mango, among many others to provide
additional sources of income for farmers who fully depend on seasonal harvest to support
their families.
In the late ‘70s, the Dairy Trading and Research Institute implemented a dairy project
under an orchard setting mainly planted to coconut trees in Calauan, Laguna, in
collaboration with the local government. The project served as a demonstration farm to
test the suitability of integrating dairy cattle production under coconut plantations. The
project which ended in 1992 after the 15-year-contract for the use of property, showed
the suitability of raising dairy animals in the area (i.e. availability of pasture for rotational
grazing). Proper scheduling of cutting or grazing of pasture was necessary for efficient
recovery of harvested nuts. One drawback observed was the death of many coconut
trees, which was attributed to beetle infestation in the area. The patches of cattle dung

5 2 5P H I L I P P I N E C O C O N U T I N D U S T R Y R O A D M A P 2 0 2 1 - 2 0 4 0
served as breeding grounds for rhinoceros beetle that burrow and eat young coconuts.
Proper management of animal wastes such as the regular spreading of manure to the
pasture was recommended to prevent this problem.
More recently, the National Dairy Authority launched the Coco-Dairy Project, which aims
to convert underutilized coconut plantations in the country for dairy integration. The
project was part of their White Revolution program that aims to increase the number
of dairy animals through herd build-up and increase local milk production and reduce
dependence on dairy imports.
The prevailing condition in coconut plantations is very conducive for dairy farming;
integration of livestock production offers a viable option for coconut farmers to increase
their income and support the government’s call for increased production of milk from a
mere 1% to 10% of domestic demand.
To determine if it is logical or not to proceed with community-based dairy project, the
following factors should be considered:
• Food and feed security in an integrated-livestock production system
• Available labor – family and nearby communities
• Maximum land utilization for food and feed production
• Possible insect pests from dairy operation to coconuts
• Increase pasture competition between pasture and coconut trees
The approach of the National Dairy Authority’s (NDA) Palit-Baka program can be
adopted under coconut . A cluster of 10 to 20 farms located within the 20 km radius
(dairy zones) of the nearest milk processing plant will be formed and organized into a
dairy cooperative. The dairy coop transacts with the NDS, LGU, and other government
agencies on matters that concern dairy farming operation e.g. technical assistance,
animal loans (pregnant heifers and breeding bulls), marketing, etc.
The dairy cooperative may engage in a business of selling farm supplies like feed
concentrates, fertilizers, drugs, sanitizers, etc. to the farmer-members on a credit basis.
The accumulated costs of these supplies will be deducted from the proceeds of the sales

5 2 6 D E P A R T M E N T O F A G R I C U L T U R E P H I L I P P I N E C O C O N U T A U T H O R I T Y
of milk on a weekly or monthly basis. This scheme makes basic dairy farm supplies readily
available to the farmers at a regulated cost. The farmer-members would be receiving
some rebates from patronizing the coop at the end of the year.
Communal use of land in the community may also be pursued especially when some of
the members have problems with roughage supply. Farm machinery like tractors and land
preparation implements, forage chopper, clear may be purchased for communal use of all
farmer-members.
The cooperative will be assisted by the NDA-DA on aspects like training on dairy-cattle
production and management, animal health care, pasture production, feeds, and feeding
management among many others. Procurement of farm equipment i.e. milking machine,
forage chopper, milk drums, etc. can be coursed through the NDA to ensure getting the
required specifications and avail tax exemptions.
This approach can increase the number of milking cows from 2 milking cows in Year
1 to 12 milking cows in Year 10 daily milk production of 120 kg. The major source of
income comes from the sale of raw milk; raw milk is sold at the processing plant for PHP
33.00 per kg in Year 1. A 5% increase in the price of raw milk was used every year until
Y10. A yearling bull with an average weight of 120 kg will be sold at PHP 120/kg. Old,
unproductive cows with approx. bodyweight of 450 kg is sold also at the same price per
kg as that of the yearling bulls.
Other sources of income will come from the harvest of mature nuts. A mature coconut
tree in the Philippines produces an average of 45 nuts a year. A hectare of typical coconut
plantations with 10m x 10m spacing has about 100 trees. Mature nuts are sold at PHP
7.50 each. A yearly increase of PHP 0.50 can be used in the computation of the selling
price of the nuts.
The carrying capacity of improved pastures under coconut is reduced by about 30%;
under grazing management of pasture utilization, 2 to 3 A.U. o 2 to 3 mature cattle can
be raised in one hectare and 4 to 6 A.U. under the cut and carry system.
Improved forage species such as hybrid Napier, Mulato, and Mombasa grasses can be
planted in between coconut trees to occupy about 70% of the total land area. The 3

5 2 7P H I L I P P I N E C O C O N U T I N D U S T R Y R O A D M A P 2 0 2 1 - 2 0 4 0
hectares owned by the farmer is more than enough to support the feed requirement of
few animals at the start of the operation. Intercropping of corn and other cash crops/
short-term crops may be done. Residues from crop production will also augment
the geed requirement of the animals. The pasture will be established in phases; re-
establishment to be done after 5 years.
The three-hectare pasture under coconut can support the increasing number of animals
through the cut-and-carry system of utilization and with proper management, i.e.
fertilization, weed control, and by following the recommended cutting interval.
Legume supplements e.g. Centrosema, Kudzu, Kakawate, ipil-ipil, and fodder trees like
Malunggay, Indigofera, and Tricanthera are added to the daily roughage ration at about
30% of the requirement. Legume vines are mixed in the pasture; trees and shrubs are
planted along the perimeter fence of the farm. Mineral- salt mixture is provided as lick.
Water should be is available at all times.
Procurement of farm equipment i.e. milking machine, forage chopper, milk drums, etc.
can be coursed through the NDA to ensure getting the required specifications and avail
tax exemptions.
The financial analysis key performance indicator (i.e. ROI = 38.04%, IRR = 68%, and BCR
= 6.19) showed that the integration of dairy cattle production in a coconut plantation is a
profitable venture (Table 2). Starting with only two milking cows is very manageable for a
family with three hectares of land under mature coconut trees. The spaces under the trees
are very ideal for growing pasture crops to support roughage supply for an increasing
number of dairy animals until Y7 when there might be a need to outsource additional
roughage supply. With the application of intensive feed production in the 3 ha area, the
operation may subsist fully from on-farm roughage production. On the other hand, the
farmer may also opt to sell pregnant heifers to maintain the optimum number of milking
cows and avoid paying for additional labor. However, retaining the replacement heifers
until they are producing milk until Y10 and beyond would be more profitable compared
to selling them to other farms.
Although dairy farming is a 70-hour a week job, the income generated from it outweighs
5 2 8 D E P A R T M E N T O F A G R I C U L T U R E P H I L I P P I N E C O C O N U T A U T H O R I T Y
the investment and hard work to be spent by a coconut farmer. Integrating dairy farming
in permanent crops like coconut provides increased farm income and it also ensures daily
cash flow especially in the event that the main crop suffers from crop failure due to some
unforeseen events like the more recent coconut scale insect infestation and the destruction
brought about by Rhinoceros beetle and cadang-cadang disease to coconut trees in the past.

5 2 9P H I L I P P I N E C O C O N U T I N D U S T R Y R O A D M A P 2 0 2 1 - 2 0 4 0
Tabl
e 8.
2. H
erd
proj
ecti
on o
f dai
ry c
attl
e pr
oduc
tion
and
tota
l sal
es in
10
year
s

5 3 0 D E P A R T M E N T O F A G R I C U L T U R E P H I L I P P I N E C O C O N U T A U T H O R I T Y
Tabl
e 8.
3. E
xpen
ditu
res/
Capi
tal O
utla
y in
equ
ipm
ent a
nd s
uppl
y in
10
year
s

5 3 1P H I L I P P I N E C O C O N U T I N D U S T R Y R O A D M A P 2 0 2 1 - 2 0 4 0
Tabl
e 8.
4. Fe
eds
and
labo
r ex
pens
es in
10
year
s

5 3 2 D E P A R T M E N T O F A G R I C U L T U R E P H I L I P P I N E C O C O N U T A U T H O R I T Y
COMMUNITY-BASED POULTRY PRODUCTIONIntegrating poultry with coconut can be beneficial to the management of coconut farms
in terms of pest management, waste utilization, and improving soil fertility, and that the
combined income of the two is greater. The meat and eggs of native chicken are priced
higher compared to commercial poultry. Native chicken demand has significantly grown
in recent years due to its distinct taste as compared to broilers. Native chicken is known
for its adaptability to climate, hardiness, ability to utilize farm by-products, and resistance
to diseases. They also require minimal care and farm inputs.
The majority in the animal livestock and poultry sector is made up of small backyard
farmers. In 2019, the gross value of chicken production was PHP 173.94 B which was 1.9%
higher than the previous year’s PHP 170.72 B gross value (PSA, 2019). Chicken is second
only to the swine subsector that has the highest gross value of production.
Chicken is one of the popular types of meat for consumption along with swine/hog in the
Philippines as they are two of the most common and main ingredients for many Filipino
household meals. One million eight hundred twenty million metric tons (1.82 MMT) of
chicken meat was consumed in the Philippines in 2019, (statista.com, 2021). Based on PSA
data (2019), native chicken accounts for 44% of the total chicken inventory in the Philippines
with 82.3 M heads in 2019 followed by broiler chicken (35% of total) at 77.7 M heads
(Figure 8.4) with 1.93 M metric tons volume of chickens produced. Almost 40 M heads are
layer chickens with 583 thousand metric tons of chicken egg production (Figure 8.5).
Chicken production over the past 10 years grew in the Philippines by 48% while eggs
production grew by 58% (PSA data, 2009-2019).

5 3 3P H I L I P P I N E C O C O N U T I N D U S T R Y R O A D M A P 2 0 2 1 - 2 0 4 0
To attain the economies-of-scale and improved farm gate price deals, a community-based
livestock and poultry production business model is proposed. They are given chicks to
raise at the same age or productive layers to produce eggs. At harvest, all mature native
chicken or eggs will be sold at the same time.
The community-based model bring into perspective the benefits of public-private
partnership: resource sharing, risk reduction, and reward allocation.
Figure 8.4. Chicken inventory by broiler, layer, and native type, Philippines (2009-2019)
Figure 8.5. Poultry and eggs volume of production (metric tons), Philippines (2009-2019)
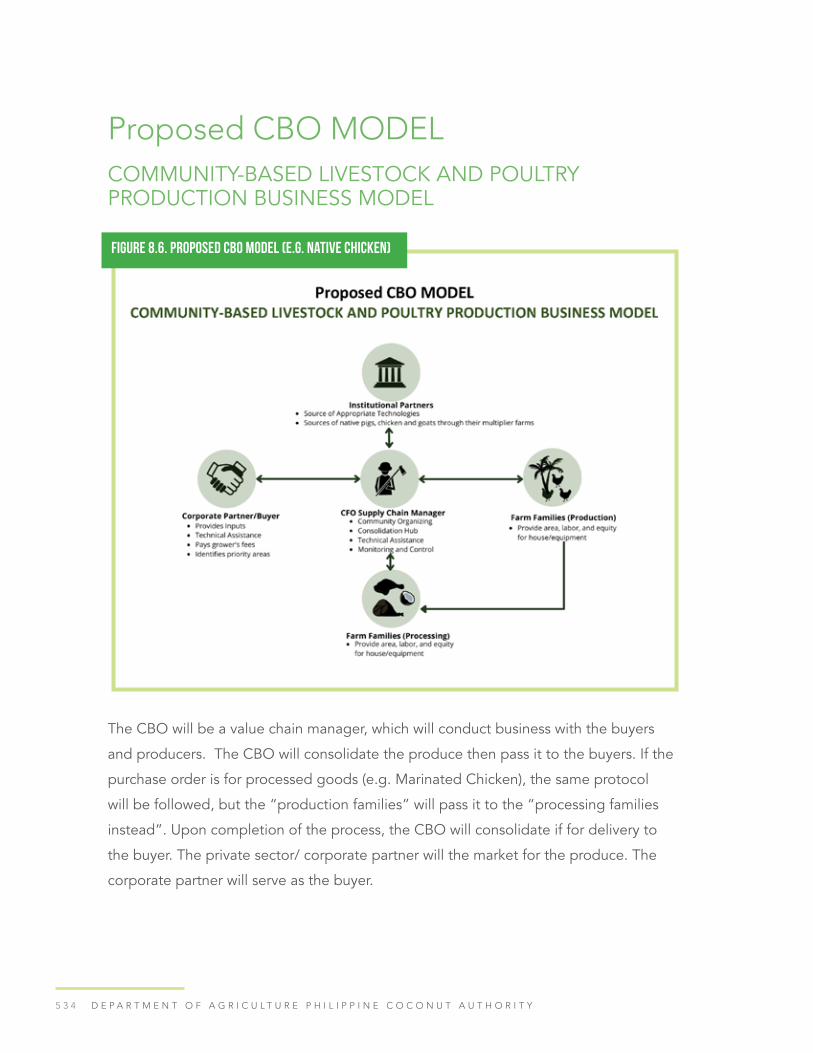
5 3 4 D E P A R T M E N T O F A G R I C U L T U R E P H I L I P P I N E C O C O N U T A U T H O R I T Y
Figure 8.6. Proposed CBO Model (e.g. Native Chicken)
Proposed CBO MODELCOMMUNITY-BASED LIVESTOCK AND POULTRY PRODUCTION BUSINESS MODEL
The CBO will be a value chain manager, which will conduct business with the buyers
and producers. The CBO will consolidate the produce then pass it to the buyers. If the
purchase order is for processed goods (e.g. Marinated Chicken), the same protocol
will be followed, but the “production families” will pass it to the “processing families
instead”. Upon completion of the process, the CBO will consolidate if for delivery to
the buyer. The private sector/ corporate partner will the market for the produce. The
corporate partner will serve as the buyer.

5 3 5P H I L I P P I N E C O C O N U T I N D U S T R Y R O A D M A P 2 0 2 1 - 2 0 4 0
Institutions such as State Universities, government agencies, and other concerned
organizations can be tapped to provide the necessary inputs, farming technologies, and
management to help the farmer in poultry production. Their local presence in the area
can immediately provide needed technical assistance such as managing pests or diseases
on the farm. Furthermore, this is to ensure that the production comply with the regulatory
system imposed by the government for quality.
Smallholder coconut farms can increase their income through this model with minor
inputs. A number of farmers will be contracted as a cluster to raise the chickens. Each
family will be given a certain number of chicks to raise depending on the size of their farm
and labor availability. Native chicken requires minimal space and attention, thus will not
be a major time-consuming activity for the farmer. Every family will be given chicks of the
same age and will harvest together to attain mass production of the same maturity which
will be consolidated by the supply chain manager and turn over to the corporate partner.
If the corporate buyer requires a certain processing activity before buying the matured
chicken, a group of the family will be contracted to do the job. They will be trained and
supervise by the supply chain manager in order to develop a standardized processing
procedure and produce the desired product with the same quality.
Management of Native Chicken under the CBO Model
Marketing of native chicken in urban areas is not a problem since the demand for the
product is increasing in recent years and is expected to grow in the coming years as
consumers shift towards organic products. Premium prices are paid for native chicken
because of their distinct taste and flavor. The CBO will consolidate all the chicken after 12
weeks and sell them to the corporate buyer in bulk or batch. It is a good strategy for the
enterprise to raise chicken in batches to ensure available chicken from time to time.

5 3 6 D E P A R T M E N T O F A G R I C U L T U R E P H I L I P P I N E C O C O N U T A U T H O R I T Y
EXAMPLES OF SUCCESSFUL BUSINESS MODELS THAT CAN BE ADAPTED FOR COCONUT INTERCROPPING
COFFEE
Coffee has a long history of cultivation in the country and it is a suitable intercrop for
coconut. There are about 34,000 smallholder coffee farmers in the country at present.
The local annual output of green coffee beans is estimated at 23,000 MT, with annual
requirements estimated at 64,000 MT (NESTLE 2017). The shortfall in requirements is
filled by imports. The average Filipino coffee farmer is 57 years old, owning 1.0 to 1.5
hectares. The average daily income from a one-hectare coffee farm is P168.00 (average of
gains from year 4 to year 10 of production divided by 365 calendar days) (NESTLE 2017).
Based on PSA 2015 estimates, Robusta accounted for 69% of total production, followed
by Arabica with 24%. Robusta coffee production and area has been on the decline,
despite the projects supporting its expansion.
Figure 8.7. Sample scheme for the native and egg production model
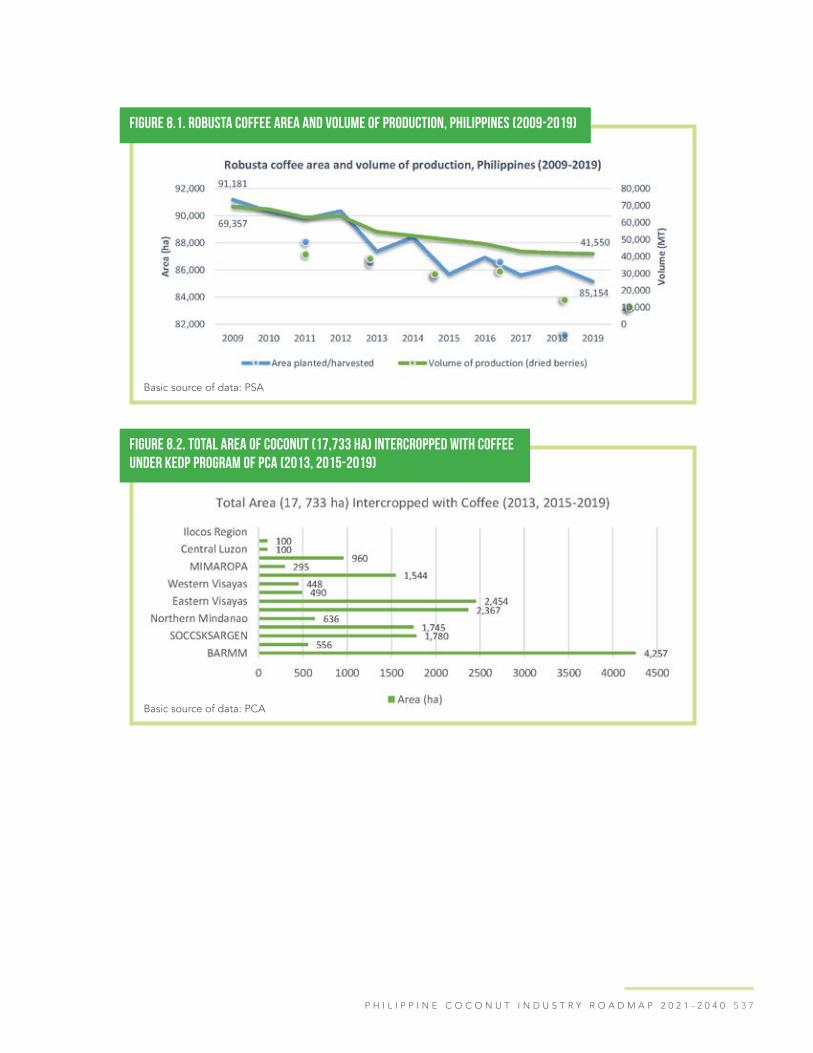
5 3 7P H I L I P P I N E C O C O N U T I N D U S T R Y R O A D M A P 2 0 2 1 - 2 0 4 0
Figure 8.1. Robusta coffee area and volume of production, Philippines (2009-2019)
Basic source of data: PSA
Figure 8.2. Total area of coconut (17,733 ha) intercropped with coffee under KEDP program of PCA (2013, 2015-2019)
Basic source of data: PCA

5 3 8 D E P A R T M E N T O F A G R I C U L T U R E P H I L I P P I N E C O C O N U T A U T H O R I T Y
Figure 8.3. Top coffee producing provinces (Coffee board)
The Coffee roadmap for 2017-2022 targets a total area of 140,552 ha in 2017 and
increase to 213,788 ha by 2022. Majority of the target areas for coffee production will be
in Mindanao particularly SOCCSKSARGEN and Davao. The KAANIB project has planted
almost 3,500 ha of coffee in these regions. KAANIBs in Zamboanga del Norte and North
Cotabato are reportedly already producing scion trees.
Additionally, KAANIB projects also planted significant hectarage in the areas where coffee
is already dominantly grown as presented in the Philippine coffee board map of coffee

5 3 9P H I L I P P I N E C O C O N U T I N D U S T R Y R O A D M A P 2 0 2 1 - 2 0 4 0
areas (Figure 8.3). Coffee plantings in the more successful CFOs and KAANIBs could
be further expanded and upscaled to form agri-corridors where support from various
government agencies and private sector can converge support towards a standardized
sustainable production practices (either GAP or organic) postharvest processing and
marketing of berries, the quality of which conforms to standards required by the market
to which they will be linked (by DTI).
COFFEE: A private- farmer/CBO partnership model (NESTLE Coffee + project)
A private-farmer/CBO partnership model that has gained support from coffee farmers in
Mindanao, is the NESTLE Coffee + project which reportedly supports farmers’ transition
from being subsistence farmers to agripreneur. The NESCAFÉ Plan aims to help coffee
farmers improve their livelihood by Creating Shared Value (CSV) through the promotion
of better farming practices to increase yields and farmers’ income. The project provides
training to farmers for free helping to sustain coffee bean standards-setting up satellite
buying stations near production areas; and propagating and selling at cost, high-quality
plantlets to the private sector and the government for distribution to farmers nationwide.
In 2018, a farmer productivity and income acceleration initiative involving 1,500 farmers in
Bukidnon and Sultan Kudarat was undertaken by NESTLE with GIZ, the German Agency
for International Cooperation. A representative sample of the participating farmers shows
that net farm income, on average, has increased from PHP 30,000 in 2018 to PHP 90,000
in 2019, with yield increase from 235 kg/ha to 477 kg/ha, as independently verified by the
Rainforest Alliance. Project Coffee+ farmers are adopting profitable and best- integrated
farming systems. Farmer groups and organizations of smallholder coffee farmers have
noted improvements in accessing services including financing and post-harvest support
for processing coffee cherries (https://www.nestle.com.ph/csv/local-initiatives/nescafe-
plan/leo-zambrano). NESCAFÉ Plan collaborates with government agencies and other
stakeholders i.e., Rural Agro-enterprise Partnership for Inclusive Development and
Growth (RAPID Growth) Project, for the coffee sector, DTI, funding partner International
Fund for Agricultural Development, and Nestlé have committed to support coffee
farmers in expanding production areas and improving productivity. Nestlé will provide a
ready market for Robusta beans from local farmers. Nestlé operates 10 satellite coffee

5 4 0 D E P A R T M E N T O F A G R I C U L T U R E P H I L I P P I N E C O C O N U T A U T H O R I T Y
buying stations in Silang in Cavite, Lipa City in Batangas, Tuguegarao City in Cagayan
Valley, Tagbina in Surigao del Sur, Cagayan de Oro City in Misamis Oriental, Tagum
City in Davao del Norte, General Santos City in South Cotabato, Maramag in Bukidnon,
Buenavista in Agusan del Norte and Iloilo City in Iloilo. Coffee buying stations enable
coffee farmers to sell their coffee harvest based on the prevailing market price (https://
www.philstar.com/ business/2015/03/02/1429015/nestle-opens-3-new-coffee-buying-
stations). Agri-corridors for coffee or “coffee towns” in areas already planted could
be enhanced (i.e., employment of standardized and sustainable production practices,
following a quality standard, collective processing, and marketing) and expanded by
active collaboration with such projects as NESTLEs’, which already proved successful
in increasing farmers’ productivity and income. This does not prevent KAANIB clusters
to further process their produce and market their own products for cupping. A detailed
feasibility study for these options is needed.

5 4 1P H I L I P P I N E C O C O N U T I N D U S T R Y R O A D M A P 2 0 2 1 - 2 0 4 0
Tabl
e 8.
1. C
osts
and
ret
urns
ana
lysi
s of
Rob
usta
cof
fee
prod
ucti
on in
one
(1) h
ecta
re a
rea
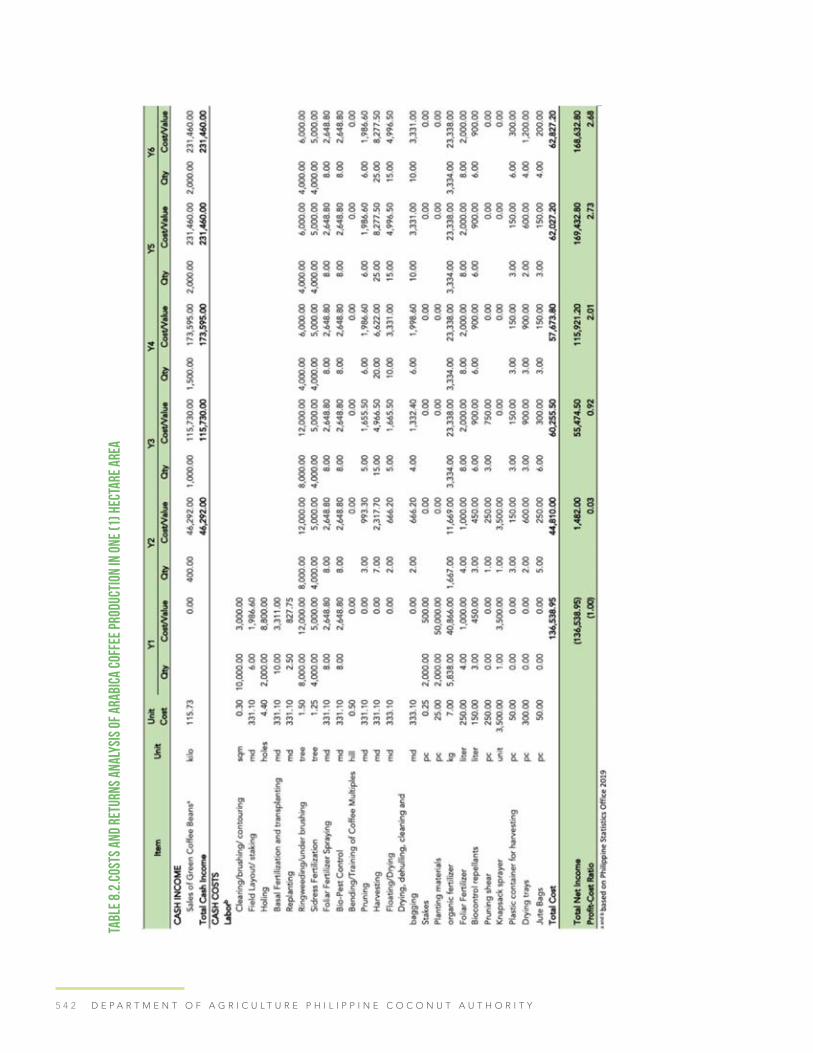
5 4 2 D E P A R T M E N T O F A G R I C U L T U R E P H I L I P P I N E C O C O N U T A U T H O R I T Y
Tabl
e 8.
2.Co
sts
and
retu
rns
anal
ysis
of A
rabi
ca c
offe
e pr
oduc
tion
in o
ne (1
) hec
tare
are
a

5 4 3P H I L I P P I N E C O C O N U T I N D U S T R Y R O A D M A P 2 0 2 1 - 2 0 4 0
CACAO
The Philippines is a net importer of cacao and the global supply shortfall is expected
to be at one million MT (MMT) by 2020. The grinding requirement of local chocolate
manufacturers is at 40,000 MT while production at present only stands at 10,000–12,000
MT from the 20,000–25,000 hectares (ha) of land (industry estimate). The said estimate is
higher compared with the 2015 Philippine Statistical Authority which was at 13,910 ha only
producing 6,020 MT. Figure 8.4 presents the area planted and volume of production of
cacao in the Philippines. The industry is dominated by Davao, occupying 64% of the area
planted and producing 80% of the country’s cacao volume of production (PSA, 2021).
Figure 8.4. Cacao area and volume of production, Philippines (2009-2019)
Basic source of data: PSA
Cacao is a suitable intercrop with coconut, as it requires shade during its vegetative growth.
The two (2) million (M) hectares of coconut farms ideal for cacao intercropping to narrow
the increasing supply- demand gap. The Philippine Cacao Industry Roadmap, anchored on
the Value Chain Approach and aligned with the 2022 Cacao Challenge targets to produce
100,000 MT of dried fermented beans by 2022. PCA KEDP in total contributed 10.6M,
(@17,733 ha , 600seedlings/ha; 2013; 2015-2019) (Figure 8.6). By 2016, DAHVCC also
has planted 21.7M (2015-2017) and DENR-NGP (13.3M, from 2011-2014). The KAANIB
sites planted to cacao, in Mindanao are also within the operating areas of the KENNEMER
bean sourcing program, and they hopefully would have benefitted and adopted the new
technologies and compliance to global quality standards.

5 4 4 D E P A R T M E N T O F A G R I C U L T U R E P H I L I P P I N E C O C O N U T A U T H O R I T Y
If proper trainings will be provided to beneficiaries and appropriate production protocols
will be observed, this will provide a big push for the industry. The genetic expression of
the existing varieties is at 3.5 kg per tree per year. Earnings from 1 ha cacao production
can lift the coconut farmers beyond the poverty threshold (Figure 8.5, 2017 prices).
Figure 8.5. Cost of production and return on investment in cacao production as monocrop and as intercrop
Source: Cacao roadmap, 2017-2022
Figure 8.6. Total area of coconut (18,740 ha; 9.37M seedlings) intercropped with cacao under KEDP program of PCA (2013, 2015-2019)
Basic source of data: PCA

5 4 5P H I L I P P I N E C O C O N U T I N D U S T R Y R O A D M A P 2 0 2 1 - 2 0 4 0
CACAO: A successful model for private company-led inclusive cacao sourcing project.
Kennemer Foods International Inc., an agribusiness company, through its inclusive
programs, established a cocoa sourcing network of 12,000 farmers. Kennemer customers
— global confectionaries and chocolate companies — are important partners to these
projects, both in cocoa-growing techniques and post- harvest technologies as well as in
the off-take of almost all of Kennemer’s cocoa bean production. In 2018, in partnership
with Agri-finance company (Agronomika Finance Corporation), the Dutch development
bank (FMO) and IDH, Kennemer’s program included an affordable package, targeting
Figure 8. 7. Regional commitments to the 2022 Cacao challenge

5 4 6 D E P A R T M E N T O F A G R I C U L T U R E P H I L I P P I N E C O C O N U T A U T H O R I T Y
30,000 smallholder coconut farmers, increasing their income to levels equivalent to the
Philippine average income per capita, which these farmers are currently estimated to
be 80% below. The program claimed that cacao can increase farmers’ income by 400%.
Farmers that are eligible to receive a loan will also participate in Kennemer’s Cocoa
Growership Program which enables farmers to gain access to the leading hybrid cocoa
varieties as seedlings, extensive agronomic training programs, rigorous farm monitoring
procedures, and tools, and centralized cocoa bean drying and fermenting facilities. This
combined support capacitates farmers to produce good quality cocoa beans at high-level
productivity and in a sustainable way. To qualify for the loan, farmers must be part of a
farmer cluster and pass assessments (by a loan officer and validated by a field technician)
on both the viability of the farm to grow cocoa and the farmer’s ability and desire to grow
cocoa. This combined technical support and access to finance will empower farmers,
transforming them into entrepreneurs with a positive operational, financial and profitable
track record. This will eventually increase the comfort of local and international financial
institutions to independently finance smallholder farmers and/or invest in these types of
high-impact programs. An important player in the model is the cacao doctor, a private
entrepreneur, put in charge of providing the technical and inputs needed by the 15
farmers in his/her cluster. The proigram targets expansion areas to have 40M cacao trees
of the KENNEMER program in 5 strategic zones , in Luzon, Visayas, and Mindanao. (as
cited by Sugeno et.al., 2016 Source: http://www.iadb.org),
From the gains of the KEDP, the HVCCP and PCA can collaborate with the program for
the KAANIBs access to their technical support and complement the common facilities
either as part of the growership program or as an open market to provide the KAANIBs
option to venture into a higher level of cacao processing, rather than just cooperative /
clustered processing and marketing.
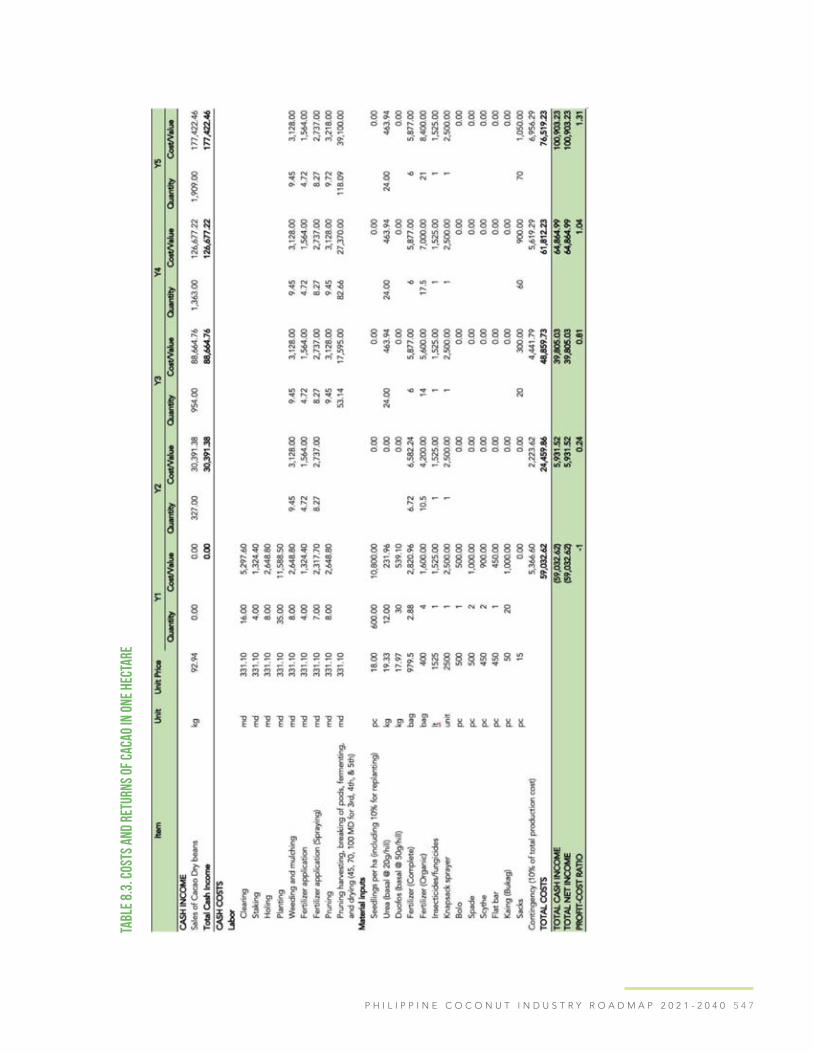
5 4 7P H I L I P P I N E C O C O N U T I N D U S T R Y R O A D M A P 2 0 2 1 - 2 0 4 0
Tabl
e 8.
3. C
osts
and
ret
urns
of c
acao
in o
ne h
ecta
re
5 4 8 D E P A R T M E N T O F A G R I C U L T U R E P H I L I P P I N E C O C O N U T A U T H O R I T Y
BANANA (SABA/CARBADA)
Banana is the most popular intercrop under coconuts in the Philippines either as sole
intercrop or a component in a multistorey cropping system. Land Equivalent Ratio (LER) of
coconut + banana intercropping suggests that production of a one-hectare intercropped farm
is equivalent to the production of a 2.13 ha of monocropped coconut (Aguilar, et al., 2016).
Banana is healthy, nutritious, and affordable. It is one of the few locally grown fruits
available year- round. Banana is the most popular fruit consumed by Filipinos contributing
75% of the total fruit intake. Cavendish is the export cultivar, and its production is
concentrated in Mindanao. Cardaba, is the cooking type of banana and its production has
gained importance as an export-oriented agro-industry in the country. Cardaba banana
has special qualities required for banana chips for export, with its texture and taste. The
market for banana chips is expanding. Demand for banana chips in US is actually much
bigger than its demand for fresh Cavendish Bananas (Antig S, PBGEA, 2021) Supplies
lag behind the growing demand. Vietnam’s imports have increased significantly, as it is
a trans-shipment point for Philippine banana chip exports to China. because it enjoys
preferential tariff rates with China due to long-standing bilateral agreements between the
two countries. (www.mindanews.com).
In 2014, there were 41 banana chip processors in the country, 6 in Metro Manila, 4 in
the Visayas (Metro Cebu), 2 in Cagayan de Oro, 1 in South Cotabato, 1 in Zamboanga
City, and the rest (27) are in Davao Region (Briones RM, 2014) generally, operating below
capacity due to supply limitations. Increase production around the processing plants
to bridge the supply-demand gap of 30-70% of the plant’s capacities. Saba/Cardaba
production is well distributed in the country, with the largest area in Davao occupying
13% of the area but contributing 20% to national production. Other and BARRM in
Mindanao, all regions in Visayas and Calabarzon, Cagayan Valley. Saba/Cardaba bananas
agri-business corridors engaging clustered farmers and CFOs could focus on these
already established markets, given equitable arrangements benefitting the farmers.
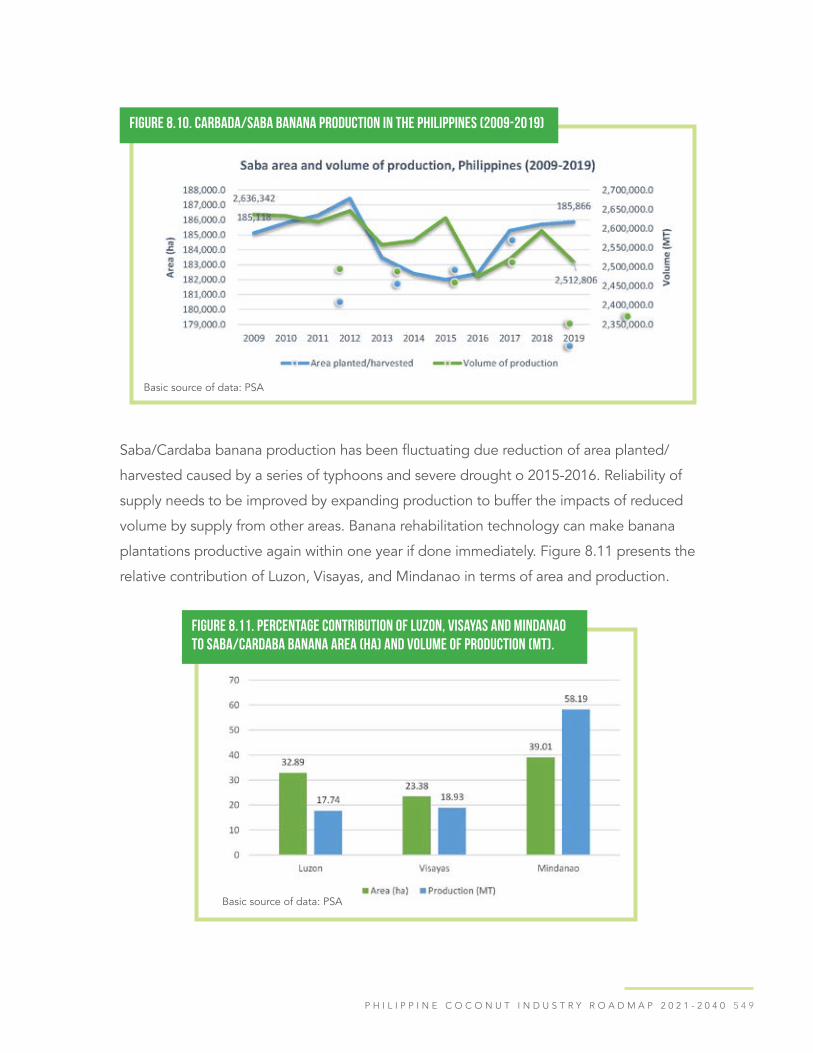
5 4 9P H I L I P P I N E C O C O N U T I N D U S T R Y R O A D M A P 2 0 2 1 - 2 0 4 0
Saba/Cardaba banana production has been fluctuating due reduction of area planted/
harvested caused by a series of typhoons and severe drought o 2015-2016. Reliability of
supply needs to be improved by expanding production to buffer the impacts of reduced
volume by supply from other areas. Banana rehabilitation technology can make banana
plantations productive again within one year if done immediately. Figure 8.11 presents the
relative contribution of Luzon, Visayas, and Mindanao in terms of area and production.
Figure 8.10. Carbada/Saba banana production in the Philippines (2009-2019)
Basic source of data: PSA
Figure 8.11. Percentage contribution of Luzon, Visayas and Mindanao to Saba/Cardaba banana area (ha) and volume of production (MT).
Basic source of data: PSA

5 5 0 D E P A R T M E N T O F A G R I C U L T U R E P H I L I P P I N E C O C O N U T A U T H O R I T Y
PCA intercropping program has contributed 8,882 ha of banana to from 2016-2020.
The banana varieties planted cannot be determined form the data made available to
COCOFIRM.
Figure 8.12. Total coconut area (8,882 ha ) intercropped with banana under the PCAintercropping programs CIP 2016-2020 and CDP1, CDP2 2020.
Basic source of data: PCA
Saba/Cardaba (ABB) Banana flow of materials is multi-layered and inefficient resulting in
significant postharvest losses. Major challenges for future market growth appear to be
associated with a coordinated approach to managing the field-to-market supply chain, for
both fresh and processed products (FAO, 2011).
The following section describes business models/approaches for clustering the produce
of small banana growers into successful enterprises.
1. “Good enough model “ -incremental changes in production practices Banana
Agrichain Competitiveness Enhancement (B-ACE) Program adopted SDCAsia’s “good
enough” approach to Good Agricultural Practices (GAP) in the banana chip value chain in
the Philippines—a choice to promote feasible upgrades and incremental improvements
in agricultural practices that resulted in the largest possible increases in yields and profits
(i.e., picking and choosing parts of GAP, rather than attempting to achieve full GAP
certification for all value chain participants) (Idrovo and Boquiren, 2009). The following
benefits to farmers were reported by the program: 1) Incremental improvements in

5 5 1P H I L I P P I N E C O C O N U T I N D U S T R Y R O A D M A P 2 0 2 1 - 2 0 4 0
agricultural practices—e.g., seed quality or variety, planting techniques, irrigation—
address issues of productivity, efficiency, and quality. 2) improve producers’ profit margins
and help banana chip processors promote a steady supply of quality inputs. However,
neither chip processors nor other buyers required certification; 3) Increase the incomes of
small-scale Cardaba banana producers and processors – targeted 30% over 3 years but
achieved nearly 80% increase over the control group.
For the export market, certification—for example, organic certification or HACCP is
important to at least some buyers and could have resulted in gains to producers.
2. Linking Agrarian Reform Beneficiaries to Corporate Supply Chain
DAR CRS Misamis Oriental Agroenterprise (Banana Cardava Marketing) 2014 - Linking
Agrarian Reform Beneficiaries to Corporate Supply Chain. The following eight steps in
the agro-enterprise clustering approach were implemented by the Catholic Relief Services
(CRS) to increase the production and income of ARBs and their household through
Agricultural Extension, Marketing Assistance, and Capacity-building, the project brought
together the CRS, DAR, LGUs ARBs: 1) Site selection partnership building and TWG
formation; 2) Product supply assessment and product selection; 3) Market chain study; 4)
Cluster formation;
5) Cluster plan formulation; 6) test marketing; 7) Scaling up and 8) cluster strengthening.
3. Linking farmers to banana chips processing
Another proposed model is a direct link between farmers and processors such as in
banana chips processing in Pagsanjan Laguna. This model expects that farmers are to
benefit greater by receiving higher prices and having an institutional buyer for their
product. The direct linkage between the enterprise and the farmers mean a more
transparent flow of information, easier access of farmers to resources, and an effective
relationship. Farmers need not to worry about where to sell their products as the time
is reduced in this model. The enterprise is also assured of fresh harvest which can be
processed into banana chips immediately. The enterprise can turn the raw banana into
chips in 24-hrs times which increases the quality of the chips and reduced harvest losses
due to quality deterioration.

5 5 2 D E P A R T M E N T O F A G R I C U L T U R E P H I L I P P I N E C O C O N U T A U T H O R I T Y
While the farmer will be in charged with managing their farms, the wife can work in chips
factory, increasing the family income. Jobs can range from quality checking the banana
fruits, cooking them into chips, and packaging them. This is one of the essences of the
social enterprise model. This further improves the relationship of the enterprise with the
farmer family.
The robust potential of the banana chip industry and its emerging market is a great
opportunity for establishing the model. Aside from the profit is the livelihood it will give
to families of farmers and improving the social and economic status of the farmers. A
premium price can be given to the harvested bananas of the farmer that meets the fruit
quality specifications.

5 5 3P H I L I P P I N E C O C O N U T I N D U S T R Y R O A D M A P 2 0 2 1 - 2 0 4 0
Tabl
e 8.
4. C
osts
and
ret
urns
ana
lysi
s of
Laka
tan
in o
ne (1
) hec
tare
are
a
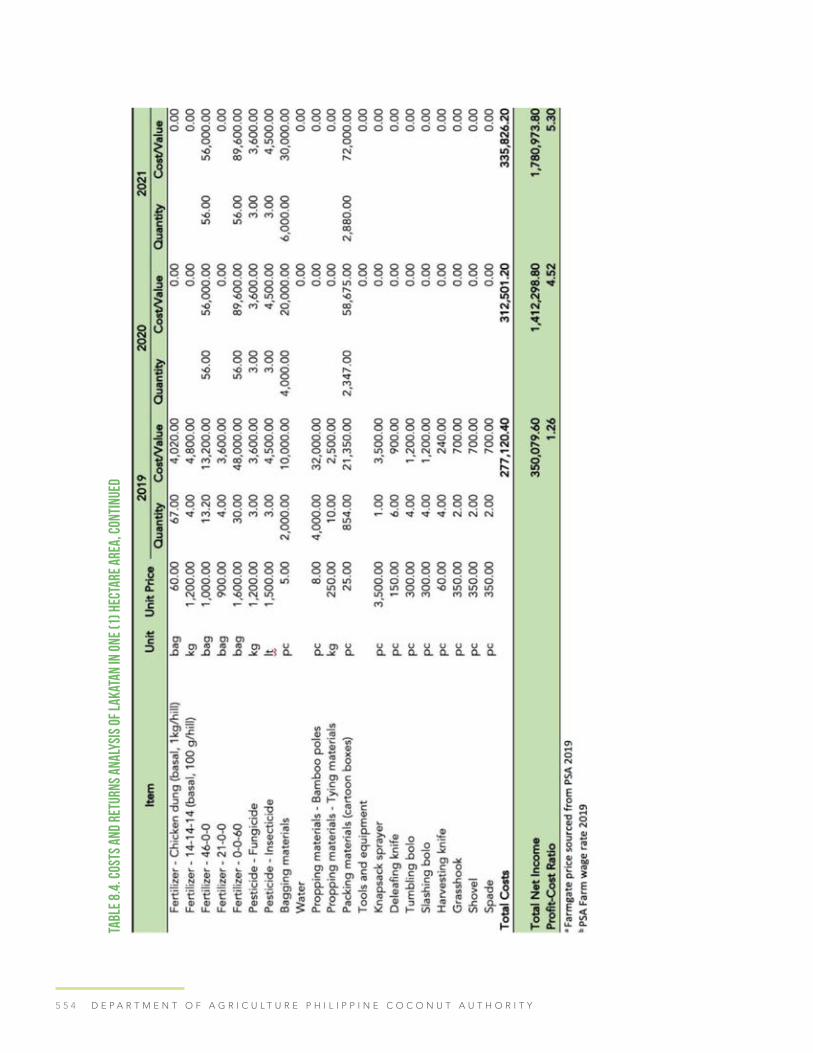
5 5 4 D E P A R T M E N T O F A G R I C U L T U R E P H I L I P P I N E C O C O N U T A U T H O R I T Y
Tabl
e 8.
4. C
osts
and
ret
urns
ana
lysi
s of
Laka
tan
in o
ne (1
) hec
tare
are
a, c
onti
nued

5 5 5P H I L I P P I N E C O C O N U T I N D U S T R Y R O A D M A P 2 0 2 1 - 2 0 4 0
Tabl
e 8.
5. C
osts
and
ret
urns
ana
lysi
s of
Sab
a in
one
(1) h
ecta
re a
rea

5 5 6 D E P A R T M E N T O F A G R I C U L T U R E P H I L I P P I N E C O C O N U T A U T H O R I T Y
FARM SERVICE CREW (FOR 115 HECTARES)Goals:
To professionalize coconut farm workers into a farm service crew, that will be provided
with decent income, and elevate their status as skilled workers qualified for SSS and other
social benefits
Services
• Harvesting, dehusking, and transport of nuts to roadside
• Regular farm maintenance services such as weeding and clearing of undergrowth,
fertilization/mulching, removal of dried/diseased fronds, land preparation for
intercrops
• Service 2 ½ hectares/day, harvesting about 2100 nuts per day
• Special skills - Harvesting at right maturity e.g., for copra and whole nuts for VCO or
DCN
Investments PHP 2.155 M (Orchard Tractor, truck, tools, carts, etc: PHP 1.815 M; shed
for tractor/truck PHP 0.30 M)
Financial Ratios: FIRR = 41%; NPV = 3,230; ROI = 34%
Daily Revenues
Crew to harvest at most 2 bunches per tree/ harvest, harvest 6x per year
Harvesting, dehusking, haul to roadside 2000 nuts @ P3.50/nut = PHP 7,000.00
Daily Expenses
(2 harvesters, 2 collectors, 2 dehuskers, 5 farm maintenance, 1 driver/foreman)
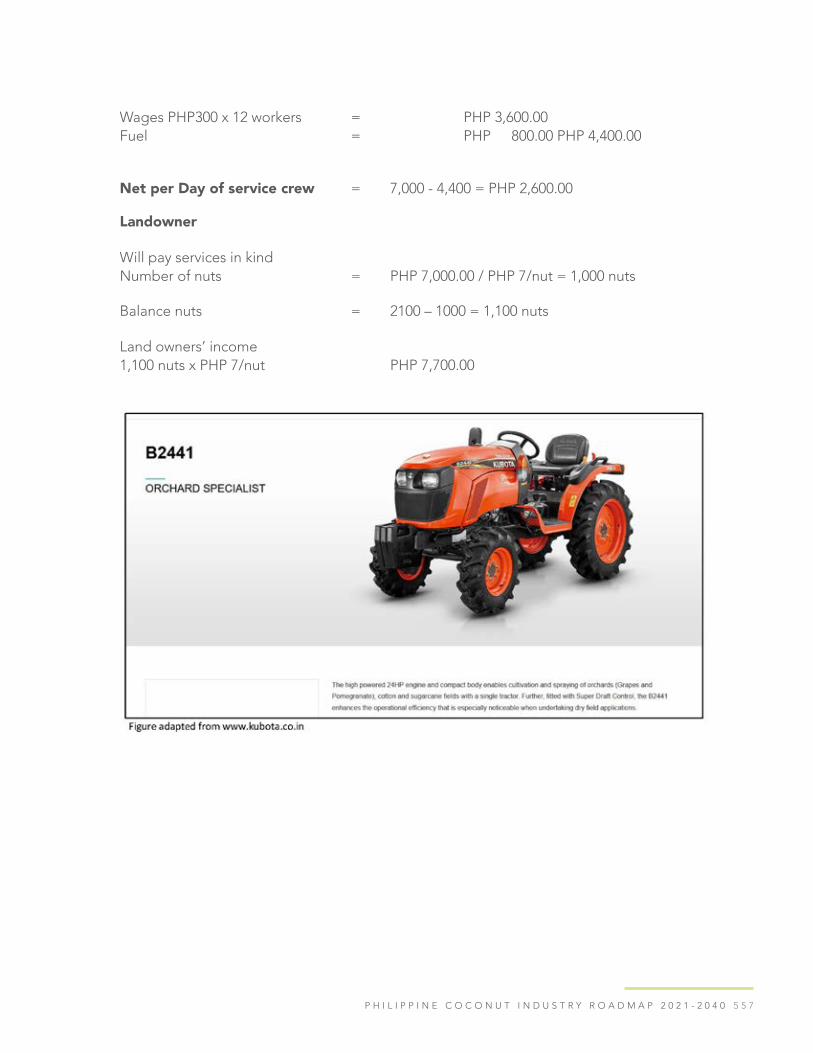
5 5 7P H I L I P P I N E C O C O N U T I N D U S T R Y R O A D M A P 2 0 2 1 - 2 0 4 0
Wages PHP300 x 12 workersFuel
==
PHP 3,600.00PHP 800.00 PHP 4,400.00
Net per Day of service crew =
7,000 - 4,400 = PHP 2,600.00
Landowner
Will pay services in kindNumber of nuts = PHP 7,000.00 / PHP 7/nut = 1,000 nuts
Balance nuts = 2100 – 1000 = 1,100 nuts
Land owners’ income1,100 nuts x PHP 7/nut PHP 7,700.00

5 5 8
REFERENCESAgustin, Yvonne. 2012a. The Supply Chain of Coconut Products in the Philippines in Support of
Global Sustainability of the Coconut Industry. UCAP.
Agustin, Yvonne. 2012a. Trade and Market Developments of Traditional and Emerging Non-
Traditional Coconut Products in the Philippines.
Allied Market Research. 2020. Oleochemicals Market Share Analysis. Retrieved from https://
alliedmarket research>oleochemicals.
Alouw, J & Wulandari, Sasqia. 2020. Present status and outlook of coconut development
in Indonesia. IOP Conference Series: Earth and Environmental Science. 418. 012035.
10.1088/1755-1315/418/1/012035.
Angulo, Cecilio. 2019. Coco Sap Sugar: Industry Status, Philippine Coconut Authority. Paper
presented om September 11, 2019, Lucena City, Quezon.
Aragon, Catherine. 2003. Determinants of Global Competitiveness of Philippine Coconut Oil
Industry. Unpublished M.S. Thesis. UPLB, Los Baños, Laguna.
Arancon Jr., Romulo. 2010. Global Coconut Industry Scenario: Trends and Opportunities. APCC.
Beroe. 2018. Oleochemicals Market Supplier, Risk and Competitive Intelligence. Retrieved from
https://www.beroeinc.com>Oleochemicals -market.
Boceta, Norheto. 1999. The Sun Is Still Rising on the Tree of Life. In: The Food and Agriculture
Centennial Book. University of Asia and Pacific.
CBTECH. 2018. Good Activated Carbon – China Leading Manufacturer. Retrieved from http://
www.activatedcarbon-zhuxi.com/activated/charcoal.
China Trade Institute. 2021. Global Desiccated Coconut Market, Size, Share, Outlook, and Growth
Opportunities, Forecast to 2026.
Cinco, M. (2015). Agency warns return of cocolisap. Retrieved from
http://www.pestnet.org/SummariesofMessages/Crops/Plantationcrops/Coconutoilpalm/I
nsects/Scaleoutbreak(cocolisap),Philippines.aspx.
CIIF. Nd. Commodities: CIIF Oil Mills. Retrieved from https://www.ciif.ph>index.ph>commodities
Coco, Nithin. 2020. Palm Oil Vs. Coconut Oil: What’s the More Sustainable Choice? Retrieved
fromhttps://www.triplepundit.com>story>palm-vs-coconut.
Costales, Cecilio. 2019. 3 NTP Value Chain Analysis and Development of VC Models. Excoll
Travera Enterprise Study.

5 5 9P H I L I P P I N E C O C O N U T I N D U S T R Y R O A D M A P 2 0 2 1 - 2 0 4 0
Cristobal, Agnes. 2019. VCO Industry in the Philippines. Presented at the Coordination Meeting –
1st TWG Meeting on the Anniversary of Organic Certification in the Coconut Oil Value Chain
on November 25, 2019, Makati City.
Dampor, Bon. 2004. Comparative Analysis of Asian Coconut oil Production and Trade and
Evaluation of the Competitiveness of the Philippine Coconut Oil Industry. Unpublished B.S.
Thesis. UPLB, Los Baños, Laguna.
Deepthi, Nair. 2017. Cocoinfo International: Replicable Models for Sustained Coconut
Development. Retrieved from Cocoinfo International Volume 24, No. 2, 2017.
Dar, William. 2017. “State of the PH coconut industry and what must be done.” Retrieved from
https://www.manilatimes.net/2017/08/25/business/columnists-business/state-ph- coconut-
industry-must-done/346624/.
Dar, William. 2019. “PH Coconut Industry a ‘Sleeping Giant’.” Philippine Coconut Authority.
Retrieved from https://pca.gov.ph/index.php/about-us/10-news/237-ph-coconut- industry-a-
sleeping-giant.
Department of Agriculture (DA), Philippine Coconut Authority. No more ‘cocolisap’ outbreak.
Retrieved from https://pca.gov.ph/10-news/49-no-more-cocolisap-outbreak.
Department of Agriculture (DA), Report on Damage Caused by El Niño, July 2016. Prasada Rao,
1986. Effect of drought on coconut production (India) Indian Coconut Journal 17 (8) pp11-
12. Abstract In Agris. FAO.org.
Department of Science and Technology - Food and Nutrition Research Institute. 2000. “This food
expenditure is estimated…” Chapter 3: page 6. Retrieved from fnri.dost.gov.ph.
Dodeja, Nisha. 2019. Great Demand for Desiccated Coconut Powder Market by Consumers
Globally.
Retrieved from: https://medium.com>.
Dy, Rolando and Senen Reyes 2006. The Philippine Coconut Industry Performance, Issues, and
Recommendations. EPRA and USAID.
Dy, Rolando. Undated. A Primer on PEF’s Priority Commodities: Industry Study on Coconut.
Eckstein D, Künzel V, Schäfer L. 2021. Global Climate Risk Index 2021: Who suffers most from
extreme weather events? Weather related loss events in 2019 and 2009-2019. Retrieved from
germanwatch.org.
Elvatara. Undated. 5 Amazing Uses of Coconut Shell Charcoal. Retrieved from https://elvatara.
com>.
Fact MR. 2021. Oleochemicals Market Forecast, Trend Analysis & Competition Tracking Global
Review to 2030. Retrieved from https://www.factmr.com>Chemicals & Materials.

5 6 0 D E P A R T M E N T O F A G R I C U L T U R E P H I L I P P I N E C O C O N U T A U T H O R I T Y
FAOSTAT. Area, production, and yield of leading coconut-producing countries. 2015-2019.
Retrieved from fao.org.
Globe Newswire.2020. Coconut Products by Type, Application and Form: Global Opportunity
Analysis and Industry Forecast 2019-2026. Retrieved from https://www.globenewswire.
com>2020/01/15>The-gl.
Grand View Research. 2019. Activated Carbon Market Size Share: Global Industry Report.
Retrieved from https://www.grandviewresearch.com>industry-analysis.
Grand View Research. 2020. Activated Carbon Market Information by Type (Powder Activated
Carbon, Granular Activated Crabon), Application (Water Purification, Air Purification, Food
& Beverage, Industrial Chemicals, Automotive, Metal Extractor)- Global Forecast to 2027.
Retrieved from https://www.market researchfuture.com>reports>activated.
Greenville. 2020. Philippines in the Desiccated Coconut Market. Retrieved from https://Greenville-
Agro.com/Blog/Philippines-in-the-dessicated-coconut-market/.
Heriyanto, Heriyanto, Detri Karya, and Asrol Asrol. 2019. Indonesian Competitiveness in
International Markets. International Journal of Recent Technology and Engineering (JRTE).
ISSN:2277-3878. Vol.8. Issue 25, July 2019.
Idrovo, I. 2006a. M. Boquiren, and J. Miguel. 2006. Value Chain Analysis: Coco Shell Charcoal. SD
Asia.
Idrovo, I. 2006b. M. Boquiren, and J. Miguel. 2006. Value Chain Analysis: Coconut Oil. SD Asia.
IEU Vu. 2019. Exporting Desiccated Coconuts to Europe. Retrieved from https://www.cbi.
eu>market-information>europe.
Industry Probe. 2020. The Global Coconut Oil Market to Grow Significantly from 2020-2028.
Retrieved from https//industry-probe.over-blog.com>2020/06>the-gl.
iTi Tropicals. 2014. Coconut Water Concentrate and Coconut Water Single Strength. Retrieved
from https://ititropicals.com>products>coconut-water-conc.
Jacob M, Amarmath CH, Kumar V, and Yusuf M. (1988). Variations in the yield of coconuts, as
influenced by the pattern of rainfall and duration of dry spell. Cord 4(02) pp34 journal.
coconutcommunity.org.
Javier, Emil. 2015. Modernizing Philippine Coconut Industry. NAST Bulletin No. 8.
Jayasekhar, S., K. Chandran, C. Thamban, D. Jaganathan, K. Muralidhanan. 2016. Analyzing the
Trade Competitiveness of Indian Coconut Sector in the Liberalization Regime. Retrieved from
https://doi.org/10.19071/jpc.2016.v44.i3.3163.
Life Green 2019. Coconut Chemical Ingredient Market Set for Rapid Growth and Trend by 2026.
Retrieved from https//www.lifegreen.charcoal.com>charcoal-ingredient.

5 6 1P H I L I P P I N E C O C O N U T I N D U S T R Y R O A D M A P 2 0 2 1 - 2 0 4 0
Magat, Severino. Undated. Understanding Right, the Productivity (Yield), of Coconut
from the Philippines’ Research and Field Experience: A Knowledge Tool for Industry
Development and Management (A Research Notes). Retrieved from http://pca.da.gov.
ph>coconutrde>images>yield.
Manohar, Erlene. 2021. Key Interest of BSAFE from the Value Chain Mapping of Coco Sugar.
Retrieved from http://pca.da.gov.ph>coconutrde>image>yield.
Mapa CS. (2019). “Proportion of Poor Filipinos was estimated at 16.6 Percent in 2018”. Poverty
Statistics. Philippine Statistics Authority. Retrieved from www.psa.gov.ph
Market Research Future. 2019. Coconut Oil Market Report Insights and Industry Analysis by
Type (Virgin Coconut Oil, Refined Coconut Oil), End-User (Industry, Food) and Region
Competitive Market Size, Share, Trends, and Forecast, 2018-2025. Retrieved from https://www.
globenewswire.com>2019/05/07>Coconut.
Market Watch. 2021. Coconut Shell Charcoal Research Report by Offering, by Technology, by
Implementation Methods, by Vertical, by Applications – Global Forecast to 2025. Retrieved
from www.marketwatch.com
Miraflor MB. 2020. “Coconut farmers are the poorest agri people.” Retrieved from https://
mb.com.ph/2020/10/25/coconut-farmers-are-poorest-agri-people/.
Miraflor MB. 2020. “Lands devoted to farming shrink to 13.32-M hectares.” Retrieved from https://
mb.com.ph/2020/08/04/lands-devoted-to-farming-shrink-to-13-32-m-hectares/.
Ordinario, Cai, Jasper Emmanuel Arcalas and Manuel Cayton. 2019. Activated Carbon: The New
Ember Warming Up PHL Economy. Retrieved from https://
businessmirror.ph/2019/05/02/activated-carbon-the-new-ember-warming-up-
phi-economy/.
PCA. 2021. Justifications for Increasing B2 to B5 Biodiesel Blend.
Perera, Chandrika. 2013. Oil Palm and Coconut. Retrieved from https://researchgate.
net>publication>28651848.
Persistence Market Research. 2018.Coconut Oil Market: Global Industry Trend Forecast 2017–
2025. Retrieved from https//www.persistencemarket research.com>coconut-o.
Philippine Statistics Authority. 2020. Agricultural Indicators System, Economic Growth: Agriculture.
Quezon City, Philippines. Retrieved from www.psa.gov.ph.
Philippine Statistic Authority. 2009-2019. Coconut Crop Statistics Database. Retrieved from
openstat.psa.com.ph
Philippine Statistic Authority. 2009-2019. Coconut Utilization Accounts (Year and Item). Retrieved
from openstat.psa.com.ph

5 6 2 D E P A R T M E N T O F A G R I C U L T U R E P H I L I P P I N E C O C O N U T A U T H O R I T Y
Philippine Statistics Authority. 2009 - 2020. Major Non-Food and Industrial Crops Quarterly
Bulletin: January – March, April – June, July – September, October – December, 2009-2020.
Quezon City, Philippines. Retrieved from www.psa.gov.ph
Philippine Statistics Authority. 2009 - 2020. Selected Statistics on Agriculture: 2009-2020. Quezon
City, Philippines. Retrieved from www.psa.gov.ph.
PR Newswire. 2020. Global Desiccated Coconut Market Report 2020-2026: A Look at the Top Five
Industry Players. Retrieved from https://prnewswire.com>news-releases>global-d.
PR Newswire. 2020. Oleochemicals Market Size, Share & Trends Analysis Report by Product,
by Region, and Segment Forecasts, 2020-2027. Retrieved from https://finance.yahoo.
com>news>global-34-89 billion.
QYR Research. 2020. Global Activated Carbon Canister Sales Market Trend. Retrieved from https://
www.qyr research.com>index>detail>global-a.
Rosales, Roel. 2020. Status, Challenges, and Opportunities of the Philippine Coconut Industry.
Philippine Coconut Authority.
Shahbandeh M. (2021). Global Leading Producers of Coconut 2019. Retrieved from https://www.
statista.com/statistics/1040499/world-coconut-production-by-leading- producers/
Sutton WR, Srivastava JP, Rosegrant M, Valmonte-Santos R, & Ashwill M. 2019. Striking a Balance
Managing El Niño and La Niña in Philippines’ Agriculture. Rep No. 132067. World Bank,
Washington, DC. License: Creative Commons Attribution CC BY 3.0 IGO
Tacio HD. (2019). “Coconut: Major Export Crop of Filipino Farmers.” Philippine Coconut Authority.
Retrieved from https://pca.gov.ph/index.php/10-news/234-coconut-major-export-crop- of-
filipino-farmers
Transparency Market Research. 2020. Activated Carbon Market: Global Industry Report, 2030.
Retrieved from https://www.transparencymarket research.com>activated.
Transparency Market Research. 2020. Desiccated Coconut Market – Global Industry
Analysis, Size, Share, Growth Trends, and Forecast 2021 -2025. Retrieved from https://
transparencymarketresearch.com>desiccated.
Trend Economy. 2021. Activated Carbon: Imports and Exports. Retrieved from: https://
trendeconomy.com>data>commodity-h2.
Voa News. 2020. US Bans Palm Oil from Malaysian Company Amid Labor Abuse Allegations.
Retrieved from https://www.voa.new.com>east-asia-pacifc>us-bans.
Wiwimex. 2018. Coconut Shell Charcoal and Its Uses. Retrieved from https://wiwimex.
com>coconut-shell-charcoal-and-its-uses.

5 6 3P H I L I P P I N E C O C O N U T I N D U S T R Y R O A D M A P 2 0 2 1 - 2 0 4 0
WEBSITES
https://www.cargill.ph
https://wilmar-international.com
https://www.ciif.ph
https://primexcoco.com
https://www.franklinbaker.com
https://www.peterpaul.com
https://superstar.coconut.com
https://www.ptglobalcoconut.com
https://www.jobstreet.com.ph>companies>5 05859-jacobi
https://qaphilippinescom>company
https://www.bakulan.nusantara.com
https://www.haycarb.com
https://www.jacobi.net>jacobi-history
https://www.kuraray.com>news
https://wwwcenapro.com>index.ph>our company
https:www.calgon carbon.com
https://chemrez.com
https://chemical.kao.com
https//sakamoto.com.ph>about-us
https://www.bloomberg.com>profile>company
https://www.kao.com>global
https://www.stepan.com
https://shop.prosource.coconut.com
https:www.philfarm.com>Organic Products
http://scglobal.com.ph

5 6 4 D E P A R T M E N T O F A G R I C U L T U R E P H I L I P P I N E C O C O N U T A U T H O R I T Y
https://www.greenlifecoco.ph.com
https:www.axelum.ph
https://cenagricom>about-cpavi
https://www.celebes.com
http://cardinalagri.com
https://sambugroup.com
http://www.silvermillgroup.com>group-of- companies
https//www.bloomberg.com>company>UFC:T B
http://www.pca.da.gov.ph
https://www.sunstar.com.ph
https://cocosugar.com
http://treelife.organic.com
http://www.bigtreefarms.com
https://www.laointegratedfarms.com
https://www.indiamart.com
https://www.harishcoconut.com
https://www.silvanthijoecoirs.com
https://markets.ft.com>data>equities>tearshett>pro
http://pilipinasecofiber.com

5 6 5P H I L I P P I N E C O C O N U T I N D U S T R Y R O A D M A P 2 0 2 1 - 2 0 4 0

5 6 6 D E P A R T M E N T O F A G R I C U L T U R E P H I L I P P I N E C O C O N U T A U T H O R I T Y

5 6 7P H I L I P P I N E C O C O N U T I N D U S T R Y R O A D M A P 2 0 2 1 - 2 0 4 0