IT Roadmap for ESCOM - CSTEP
88
IT Analysis and Roadmap for GESCOM Aug 4, 2009 Center for Study of Science, Technology and Policy (CSTEP) CAIR Building, Raj Bhavan Circle High Grounds, Bangalore 560001 www.cstep.in
-
Upload
khangminh22 -
Category
Documents
-
view
7 -
download
0
Transcript of IT Roadmap for ESCOM - CSTEP
IT Analysis and Roadmap for GESCOM
Aug 4, 2009
Center for Study of Science, Technology and Policy (CSTEP) CAIR Building, Raj Bhavan Circle High Grounds, Bangalore 560001
www.cstep.in
Center for Study of Science, Technology and Policy (CSTEP) is a private, non-profit (Section 25) research corporation. CSTEP’s mandate and vision is to undertake world-class research and analysis in chosen areas of science, technology and engineering and their intersection with policy and decision-making. CSTEP’s studies do not necessarily reflect the opinions of its sponsors.
Center for Study of Science, Technology and Policy (CSTEP)
CAIR Building, Raj Bhavan Circle High Grounds, Bangalore 560001
Telephone: + 91 80 22373311 Fax: + 91 80 22372619
www.cstep.in
1
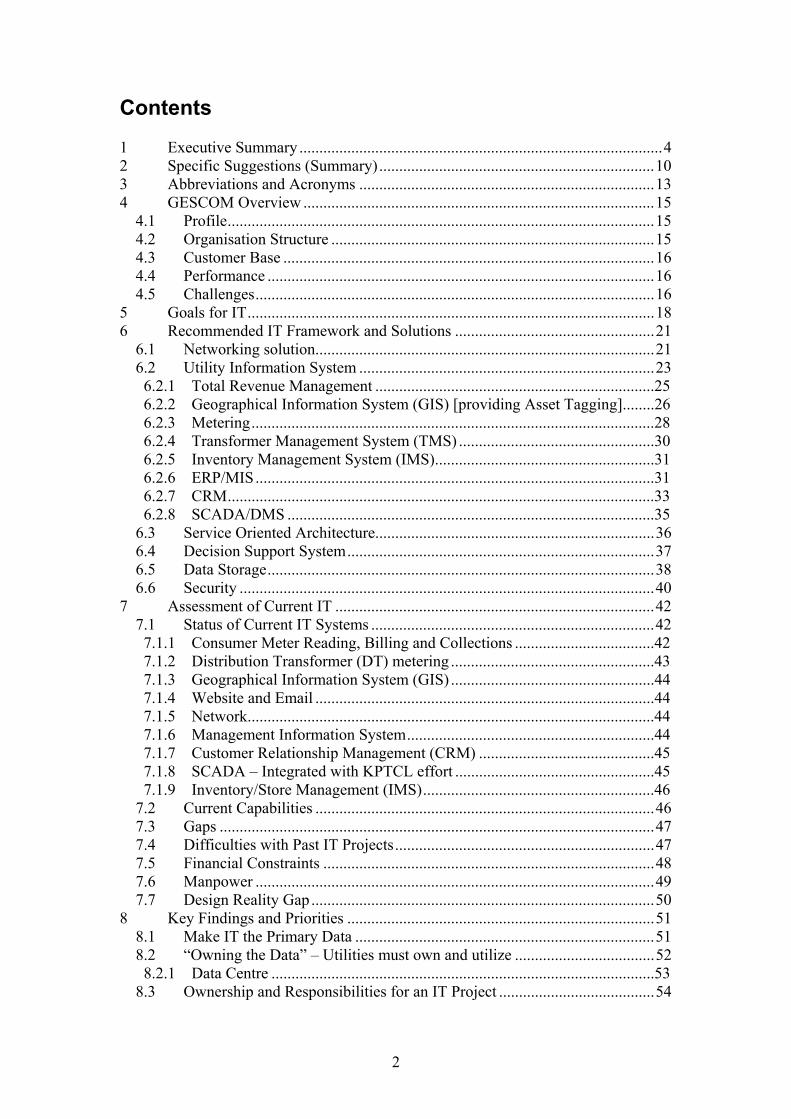
Contents 1 Executive Summary ...........................................................................................4 2 Specific Suggestions (Summary).....................................................................10 3 Abbreviations and Acronyms ..........................................................................13 4 GESCOM Overview ........................................................................................15
4.1 Profile...........................................................................................................15 4.2 Organisation Structure .................................................................................15 4.3 Customer Base .............................................................................................16 4.4 Performance .................................................................................................16 4.5 Challenges....................................................................................................16
5 Goals for IT......................................................................................................18 6 Recommended IT Framework and Solutions ..................................................21
6.1 Networking solution.....................................................................................21 6.2 Utility Information System ..........................................................................23 6.2.1 Total Revenue Management ......................................................................25 6.2.2 Geographical Information System (GIS) [providing Asset Tagging]........26 6.2.3 Metering.....................................................................................................28 6.2.4 Transformer Management System (TMS) .................................................30 6.2.5 Inventory Management System (IMS).......................................................31 6.2.6 ERP/MIS....................................................................................................31 6.2.7 CRM...........................................................................................................33 6.2.8 SCADA/DMS ............................................................................................35
6.3 Service Oriented Architecture......................................................................36 6.4 Decision Support System.............................................................................37 6.5 Data Storage.................................................................................................38 6.6 Security ........................................................................................................40
7 Assessment of Current IT ................................................................................42 7.1 Status of Current IT Systems .......................................................................42 7.1.1 Consumer Meter Reading, Billing and Collections ...................................42 7.1.2 Distribution Transformer (DT) metering ...................................................43 7.1.3 Geographical Information System (GIS) ...................................................44 7.1.4 Website and Email .....................................................................................44 7.1.5 Network......................................................................................................44 7.1.6 Management Information System..............................................................44 7.1.7 Customer Relationship Management (CRM) ............................................45 7.1.8 SCADA – Integrated with KPTCL effort ..................................................45 7.1.9 Inventory/Store Management (IMS)..........................................................46
7.2 Current Capabilities .....................................................................................46 7.3 Gaps .............................................................................................................47 7.4 Difficulties with Past IT Projects.................................................................47 7.5 Financial Constraints ...................................................................................48 7.6 Manpower ....................................................................................................49 7.7 Design Reality Gap......................................................................................50
8 Key Findings and Priorities .............................................................................51 8.1 Make IT the Primary Data ...........................................................................51 8.2 “Owning the Data” – Utilities must own and utilize ...................................52 8.2.1 Data Centre ................................................................................................53
8.3 Ownership and Responsibilities for an IT Project .......................................54
2
8.3.1 Manpower ..................................................................................................55 8.4 Ask Business Intelligence questions of the IT.............................................56 8.4.1 Data integration..........................................................................................56
8.5 Asset Tagging – Knowing what is where ....................................................57 8.5.1 Tagging System .........................................................................................58 8.5.2 Tagging Process .........................................................................................59
8.6 Starting the System versus Ongoing Use.....................................................60 8.7 Using the Data – Removing Location Limitations ......................................60 8.8 Share Best Practices and Technology Information across ESCOMs...........61
9 IT Design and Lifecycle...................................................................................63 9.1 Determine the end goals → Needs Assessment...........................................63 9.2 Stakeholder management .............................................................................63 9.2.1 Identification ..............................................................................................63 9.2.2 Responsibilities and interactions................................................................64 9.2.3 Recognition of capabilities, limitations and incentives .............................64
9.3 Design Details..............................................................................................64 9.3.1 Lifecycle planning and externality analysis...............................................64 9.3.2 Clarify the decision-making process..........................................................65 9.3.3 Make data available in the right time, place, format, etc. ..........................65 9.3.4 Simulation, prototyping, testing, etc. .........................................................65 9.3.5 Internalizing the solution is key – Using the solutions ..............................65 9.3.6 Improvements and Evolution – Post-analysis, feedback, and iteration .....66 9.3.7 Continuity and Scalability..........................................................................66 9.3.8 Improve the purchasing procedures – allow feedback, co-design, etc. .....66
10 Outside Drivers ................................................................................................69 10.1 R-APDRP.....................................................................................................69 10.2 Niranthara Jyothi..........................................................................................71 10.3 Intra-State ABT............................................................................................71
11 IT Implementation Roadmap ...........................................................................72 11.1 Roadmap Priorities.......................................................................................72 11.2 Roadmap Timeline.......................................................................................75 11.3 Smart Grid....................................................................................................76
12 Appendix: Indian Electricity Sector.................................................................78 12.1 Overview of Indian Electricity Sector .........................................................78 12.2 Challenges for the Indian Electricity Sector ................................................80 12.2.1 Power Shortage ..........................................................................................80 12.2.2 High T&D Losses ......................................................................................80 12.2.3 High Commercial Losses...........................................................................80 12.2.4 Lack of skilled workforce ..........................................................................81
12.3 Current State of IT in Indian Electricity Sector ...........................................81 12.4 IT Initiatives in Indian Electricity Distribution Companies ........................82
13 Report Preparation Background.......................................................................84 13.1 Author Bios..................................................................................................84 13.2 About CSTEP...............................................................................................85
14 Acknowledgements and Disclaimer ................................................................87
3
1 Executive Summary Information technology has become a powerful enabler of increased efficiency and control in various business processes in all facets of human activity. The power sector has been a relatively late entrant to utilizing the power of IT. In this report, we examine current and proposed IT initiatives being undertaken by GESCOM, and suggest changes in the technology design as well as a roadmap for IT initiatives. The focus is not on technology details but high-level design and integration of these into the business processes and institutional frameworks of the utility. This effort is mindful of and compatible with R-APDRP initiatives, including those by the Empanelled IT Consultants. Our aim is not to examine the R-APDRP Detailed Project Report, but to suggest selected options and systems level changes that can help all IT projects succeed. This broad mandate goes beyond what any R-APDRP consultant might be able to cover. Our overarching finding is one where IT is being deployed today in a relatively standalone or "islanded" fashion instead of towards an integrated plan which would provide vastly greater benefits to the utility. Stated another way, many of the present initiatives will produce enormous quantities of data, but as such without analysis functionality these will not necessarily provide the desired business intelligence required. We recommend a fundamental rethinking of the entire IT initiative lifecycle, covering all aspects such as needs assessment, stakeholder participation, design, acceptance procedures, and evolution. IT is not merely a product that can be dropped in by a professional agency or vendor; it is a process that requires full participation of all the layers of the utility hierarchy. Ownership, control, and utilization (i.e., analysis) of the data are fundamental issues for which we recommend GESCOM increase its role compared to existing projects and methodologies. 1) Real need: Integrated Utility Information System This is an integrated IT platform that brings together various ingredients that are standalone today, such as GIS, MIS, SCADA, TRM, etc. The components must work together through standards and interoperability (and open interfaces). This allows data to become information to knowledge to improved decision-making. 2) Utilities must plan and sequence for the process Given IT skills and manpower limitations, it is inevitable that outsiders (agencies/vendors) will be required for IT projects. That said, this doesn’t relieve utilities of their role in making the project a success. No outsider (neither vendor nor R-APDRP planners) can make external design decisions that will inherently be the best for the utility – they will make the best recommendations possible within the scope of their mandate, but utilities must make clarifications if they require anything different or additional. The first step of an IT project must be needs assessment. A base design for the system (e.g., centralized versus decentralized) must be planned before one can tender for such a system. While the details of the architecture are being designed, GESCOM must create the required underlying data and specify the functionality they require for
4
the vendor to implement. This includes asset tagging (identification) in a standardized, uniform, and universal manner. As the actual solution is being created, the end-users of any system must be involved in its design. If they don’t like it or they think they are unable to use it, it will not be used. There needs to be extensive prototyping and then field testing before a solution can be deployed in scale. 3) Utilize the IT systems – the real goal is Business Intelligence and Decision-
Making Data for data collection’s sake is not only meaningless, it is expensive. Data should lead to improved operations and financial viability, else it is of no value. Too many IT projects in the past have failed due to non-use. Even being “used” has usually meant just being operated instead of being integrated into business processes. E.g., a GIS system, if deployed, isn’t just a map made digital. It should be a starting point for load-flow analysis which then leads to faster new connections for consumers and for optimization of distribution grid for loss reduction. Given most field work and consumer interactions occur at the section and sub-division levels, these are the entities who must utilize the IT system for updating it with newer (transactional) data. First entering it into a ledger and then data entry into computers higher up (e.g., at a division) is not only costly, but it can lead to errors. IT should never become a burden on utility employees who are already overworked – it should be designed to be easy to use. 4) Connectivity becomes the glue for the IT applications Given that utilization of an IT solution at lower levels of GESCOM is mandatory for its success, we require interconnectivity for moving data between locations. This needs to be an appropriate minimum speed for the applications to run – the right speed is a function of availability, cost, and desired application. Applications like GIS (with visuals) take much longer to load over a network, especially if the bandwidth is low. The goal is anyone (with authorization) should be able to see any data, anywhere. This is a web access model, and a desired design goal. However, we recommend this not be interpreted as meaning thin clients only at remote locations. The main questions with a purely thin client design are (i) where are the data housed (data centre) and (ii) what happens if the network goes down? We suggest that the GESCOM own a copy of its data (especially financial!). This means it should be available with itself, instead of in a centralized (state level) data centre only, and also that it shouldn’t be left to the vendor. GESCOM should have its own data centre (it will have one anyways for LDC SCADA – that can be expanded at much lower cost than building one from scratch). We also suggest that the remote (field) locations have their respective data (pertaining to that section/sub-division) available on-site in a format mirrored from the central data centre. The field offices can also house their data as a backup (simply in ordinary computers), which then can get and send data updates from/to the data centre under normal modes of operation (when the network is available). 5) IT is not a silver bullet - Utilities face a number of challenges The financial challenges of all electricity utilities in India are well known. Even
5
manpower limitations are known. IT cannot fix all the problems on its own – it is just an enabler. Improved business practices are a key requirement, which includes checks and balances up and down the hierarchy. If these are there in the pre-IT design, they must be kept and enhanced in an IT-centric design. Utilities must also mandate that employees use the IT solution, and not avoid using it on personal (individual) grounds. Things like training and support can always be provided (and, in fact, should be part of any deployment tender.) 6) Utilities should rethink the entire IT process As stated before, IT is a long, continuous process, not a one-time fix. GESCOM should harness any funding and support available from R-APDRP, have a comprehensive plan and recognize its boundaries. R-APDRP’s focus is urban and semi-urban areas, which may not be where the utilities face the greatest challenges. The R-APDRP specifications are explicitly stated as just a template, and it would be difficult for any vendor (agency) to fully design an optimal solution in the accelerated timeframe envisaged. R-APDRP’s designs must also take advantage of Karnataka’s other initiatives such as KPTCL’s SCADA system or Nirantar Jyoti. Vendors, while critical in practice, will only do what is asked of them. Thus, the main challenge is designing what we want from the IT solution. Vendors then must be tasked with making their solution modular, scalable, web-enabled, etc. Vendors shouldn’t own the data, except for a brief period initially. This is important from both a strategic point of view but also for operational reasons. The goal of the utility should be business intelligence (information for decision-making). Unless the utility owns the data, the systems, etc., it cannot integrate these easily (if at all). Each vendor would simply point to the other vendors when asked questions or if its operations are examined, or if the utility tries to integrate applications and data with the aim of getting business intelligence. Given that all the ESCOMs in Karnataka have similar organizational structures, and for the most part, face similar issues, we strongly suggest that all the ESCOMs share data about IT projects – what works, what doesn’t, etc (best practices). They should even share vendor and equipment information. We feel this isn’t a commercial conflict since all the ESCOMs are owned by the same entity, the Government of Karnataka. We also suggest that a more participatory mechanism be devised for the design of the IT solution, even drawing in outside experts if required. 7) Vision for the future: Integration with workflows One of the challenges for an ESCOM when it comes to IT solutions is getting the staff to use the solution. This will happen only when IT is integrated into the existing business processes and workflows. IT should not act as an additional burden on top of the paper based systems. ESCOM staff will use an IT solution more readily if it simplifies their work rather than complicates it. Many of the problems of utilization occur when the IT deployment results in ‘paper and computer’ rather than ‘computer instead of paper’. Hence we look at the current information flows and workflows in GESCOM and present a vision for what they should aim for. Specific (detailed) suggestions and actionable items are listed in Section 2.
6
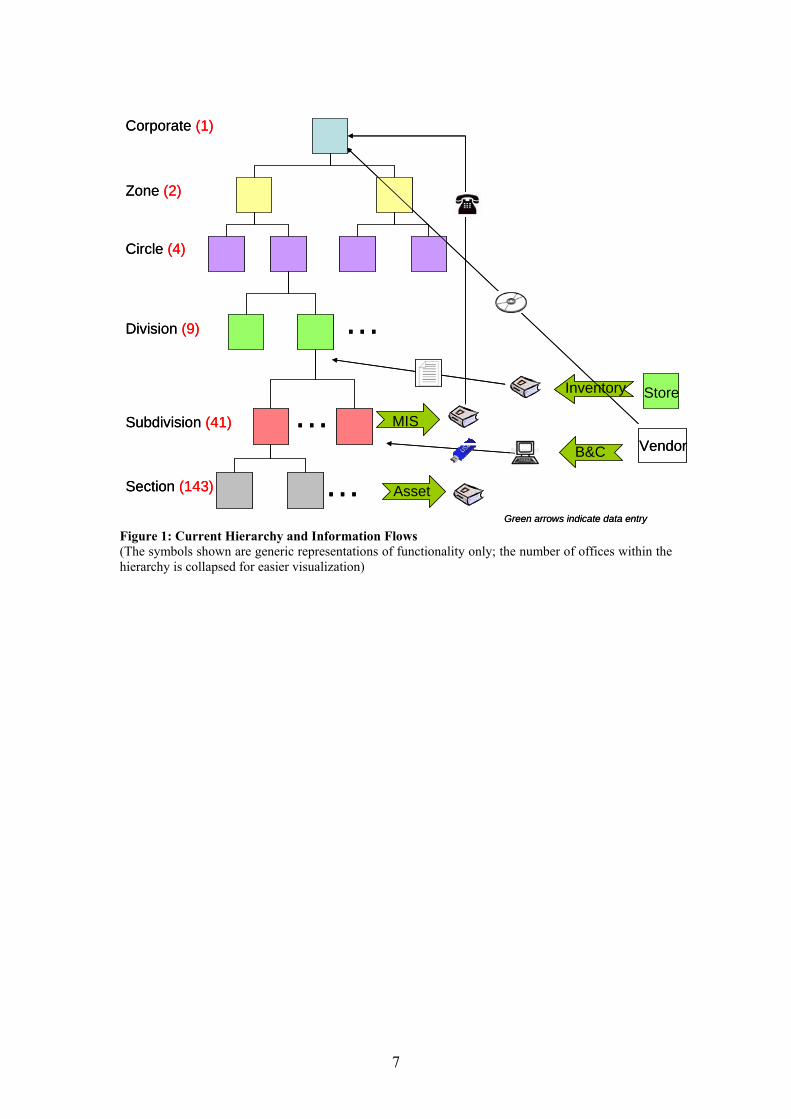
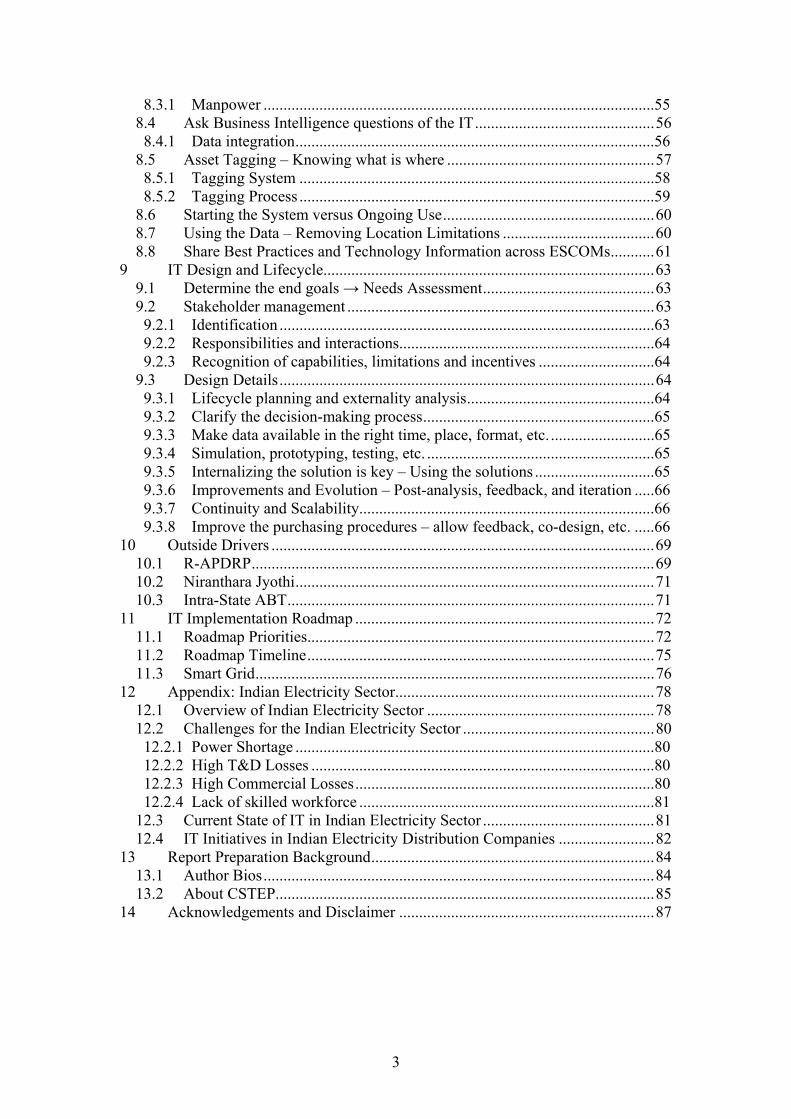
Figure 1: Current Hierarchy and Information Flows (The symbols shown are generic representations of functionality only; the number of offices within the hierarchy is collapsed for easier visualization)
Asset
7
MIS
B&C Vendor
Inventory Store
Corporate
Zone
Circle
Division
Subdivision
Section
(1)
(2)
(4)
(9)
(41)
(143)
Green arrows indicate data entry
…
…
… Asset
MIS
B&C Vendor
Inventory Store
Corporate
Zone
Circle
Division
Subdivision
Section
(1)
(2)
(4)
(9)
(41)
(143)
…
…
…Green arrows indicate data entry
8
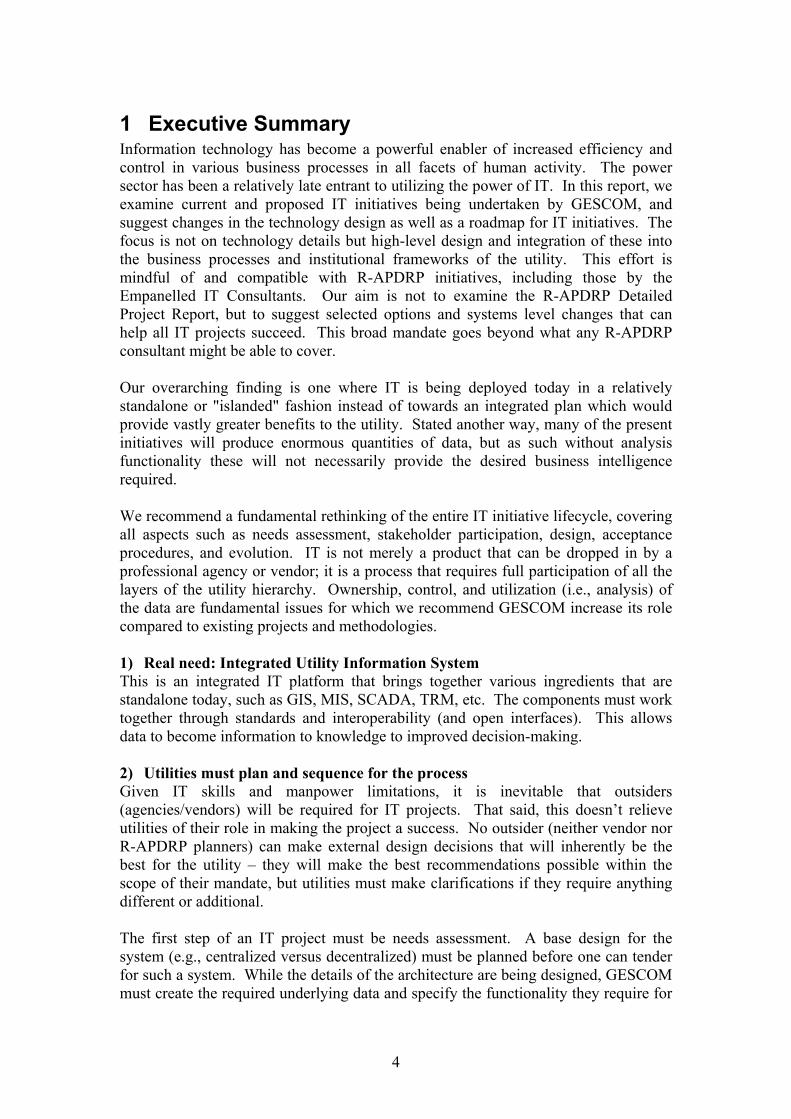
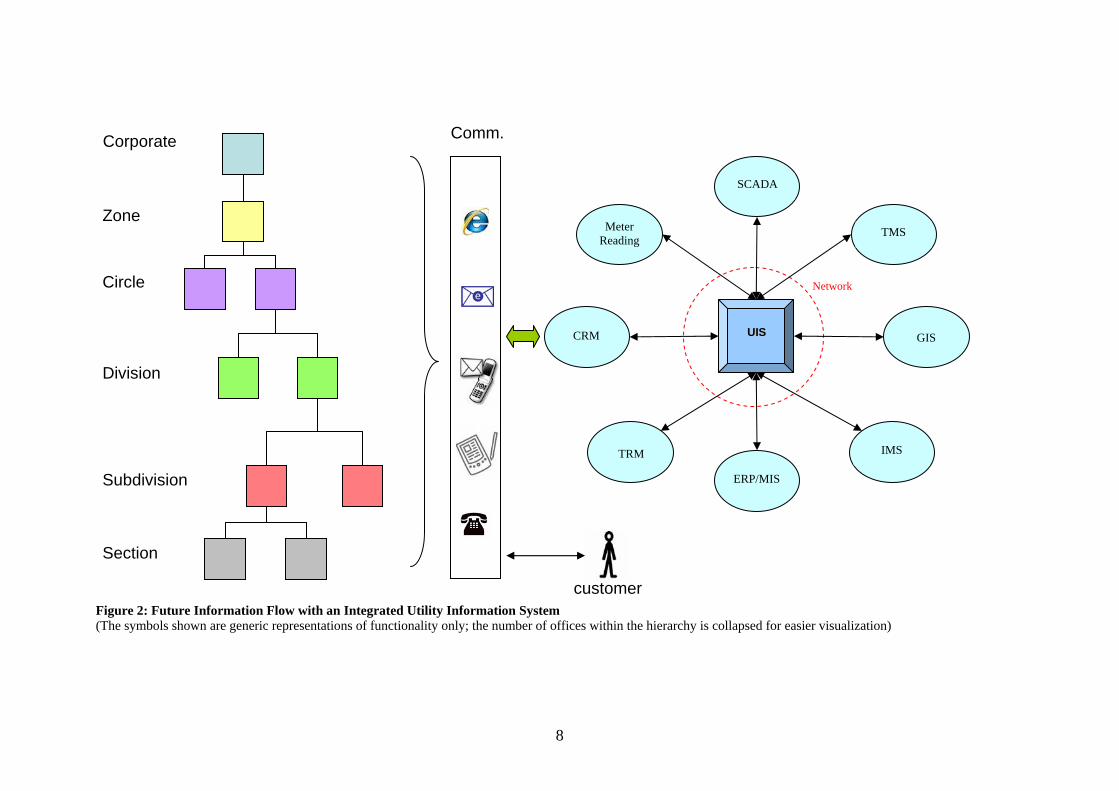
Figure 2: Future Information Flow with an Integrated Utility Information System (The symbols shown are generic representations of functionality only; the number of offices within the hierarchy is collapsed for easier visualization)
UUIISS
SCADA
TMS Meter Reading
ERP/MIS
GIS
CRM
IMS
Network
Corporate
Zone
Circle
Division
Subdivision
Section
Comm.
customer
TRM
IT projects cannot be perfect – there is always some learning involved. How does one measure the success of an IT initiative? Many measures are based on utilization rate, which is easy to measure but merely an input side metric. By that token, it is easy to recognize a failure of an initiative when the solution is not used or used insufficiently by the utility professionals. However, we posit that the success of an IT initiative must be tied to desired operational, business, and financial benefits. We believe, over the coming months and years, the role of IT can only become mission-critical. With this in mind, in this report we suggest a number of steps, both high level (strategic) and specific (operational) to help realize its potential.
9
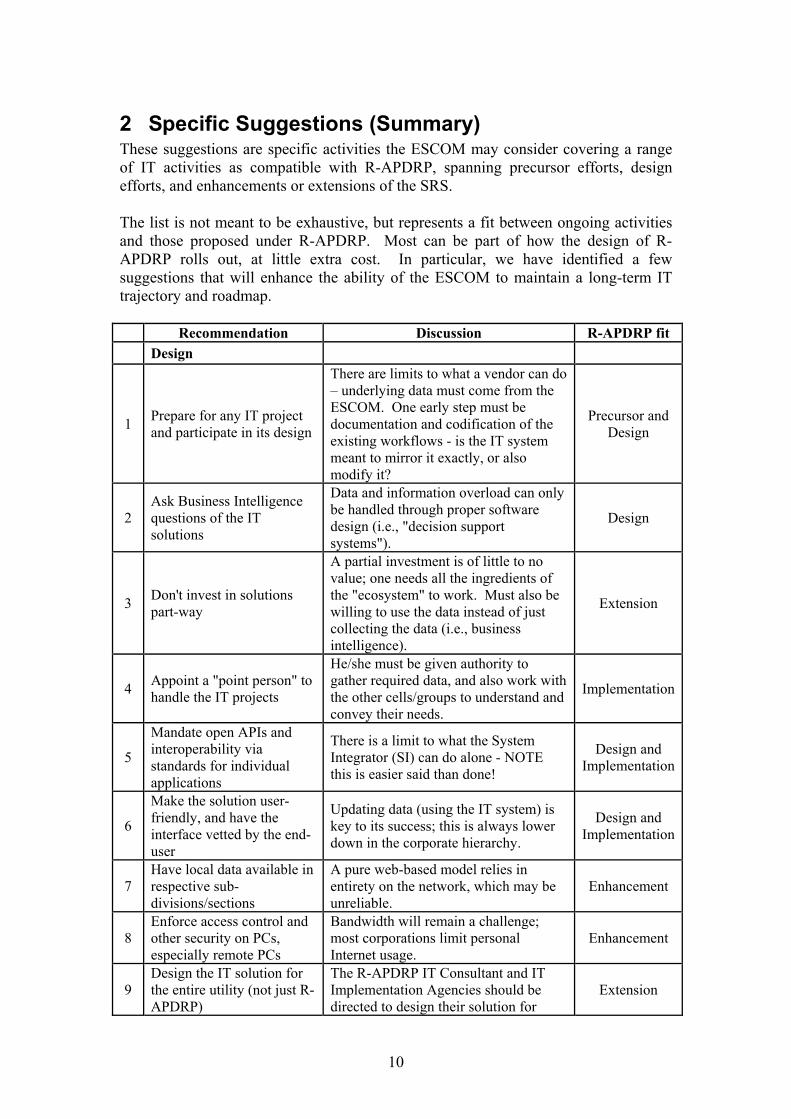
2 Specific Suggestions (Summary) These suggestions are specific activities the ESCOM may consider covering a range of IT activities as compatible with R-APDRP, spanning precursor efforts, design efforts, and enhancements or extensions of the SRS. The list is not meant to be exhaustive, but represents a fit between ongoing activities and those proposed under R-APDRP. Most can be part of how the design of R-APDRP rolls out, at little extra cost. In particular, we have identified a few suggestions that will enhance the ability of the ESCOM to maintain a long-term IT trajectory and roadmap.
Recommendation Discussion R-APDRP fit Design
1 Prepare for any IT project and participate in its design
There are limits to what a vendor can do – underlying data must come from the ESCOM. One early step must be documentation and codification of the existing workflows - is the IT system meant to mirror it exactly, or also modify it?
Precursor and Design
2 Ask Business Intelligence questions of the IT solutions
Data and information overload can only be handled through proper software design (i.e., "decision support systems").
Design
3 Don't invest in solutions part-way
A partial investment is of little to no value; one needs all the ingredients of the "ecosystem" to work. Must also be willing to use the data instead of just collecting the data (i.e., business intelligence).
Extension
4 Appoint a "point person" to handle the IT projects
He/she must be given authority to gather required data, and also work with the other cells/groups to understand and convey their needs.
Implementation
5
Mandate open APIs and interoperability via standards for individual applications
There is a limit to what the System Integrator (SI) can do alone - NOTE this is easier said than done!
Design and Implementation
6
Make the solution user-friendly, and have the interface vetted by the end-user
Updating data (using the IT system) is key to its success; this is always lower down in the corporate hierarchy.
Design and Implementation
7 Have local data available in respective sub-divisions/sections
A pure web-based model relies in entirety on the network, which may be unreliable.
Enhancement
8 Enforce access control and other security on PCs, especially remote PCs
Bandwidth will remain a challenge; most corporations limit personal Internet usage.
Enhancement
9 Design the IT solution for the entire utility (not just R-APDRP)
The R-APDRP IT Consultant and IT Implementation Agencies should be directed to design their solution for
Extension
10
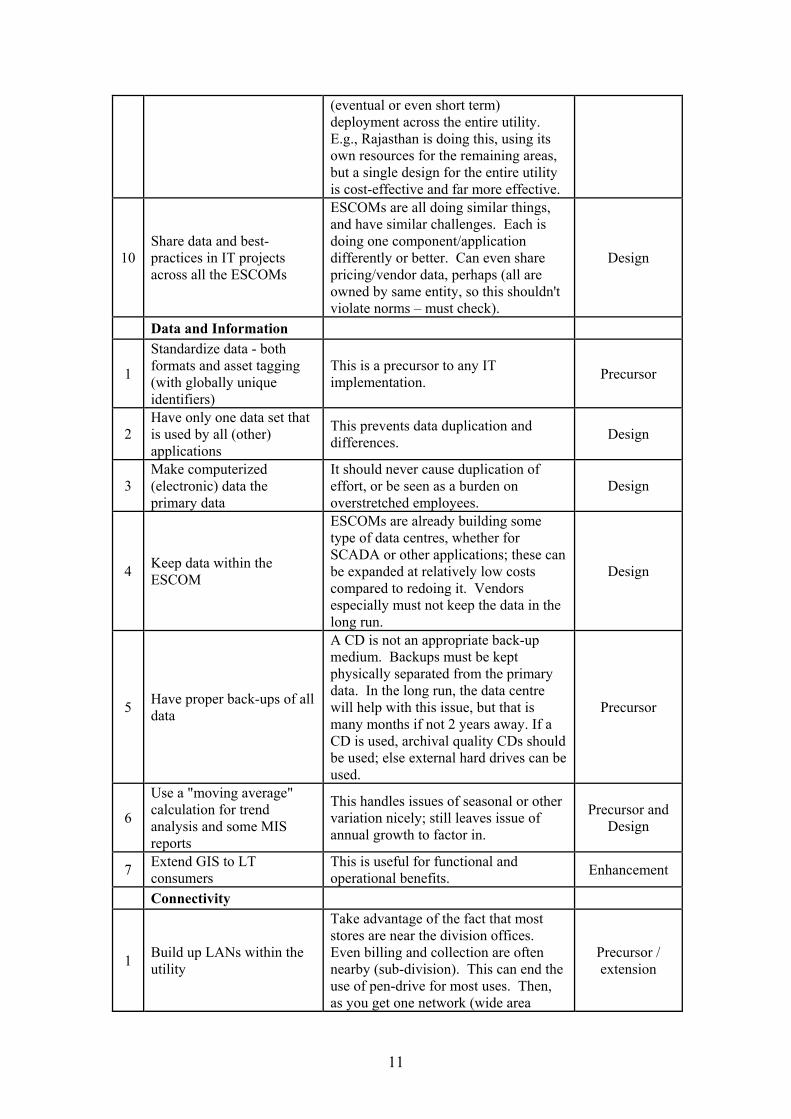
(eventual or even short term) deployment across the entire utility. E.g., Rajasthan is doing this, using its own resources for the remaining areas, but a single design for the entire utility is cost-effective and far more effective.
10 Share data and best-practices in IT projects across all the ESCOMs
ESCOMs are all doing similar things, and have similar challenges. Each is doing one component/application differently or better. Can even share pricing/vendor data, perhaps (all are owned by same entity, so this shouldn't violate norms – must check).
Design
Data and Information
1
Standardize data - both formats and asset tagging (with globally unique identifiers)
This is a precursor to any IT implementation. Precursor
2 Have only one data set that is used by all (other) applications
This prevents data duplication and differences. Design
3 Make computerized (electronic) data the primary data
It should never cause duplication of effort, or be seen as a burden on overstretched employees.
Design
4 Keep data within the ESCOM
ESCOMs are already building some type of data centres, whether for SCADA or other applications; these can be expanded at relatively low costs compared to redoing it. Vendors especially must not keep the data in the long run.
Design
5 Have proper back-ups of all data
A CD is not an appropriate back-up medium. Backups must be kept physically separated from the primary data. In the long run, the data centre will help with this issue, but that is many months if not 2 years away. If a CD is used, archival quality CDs should be used; else external hard drives can be used.
Precursor
6
Use a "moving average" calculation for trend analysis and some MIS reports
This handles issues of seasonal or other variation nicely; still leaves issue of annual growth to factor in.
Precursor and Design
7 Extend GIS to LT consumers
This is useful for functional and operational benefits. Enhancement
Connectivity
1 Build up LANs within the utility
Take advantage of the fact that most stores are near the division offices. Even billing and collection are often nearby (sub-division). This can end the use of pen-drive for most uses. Then, as you get one network (wide area
Precursor / extension
11
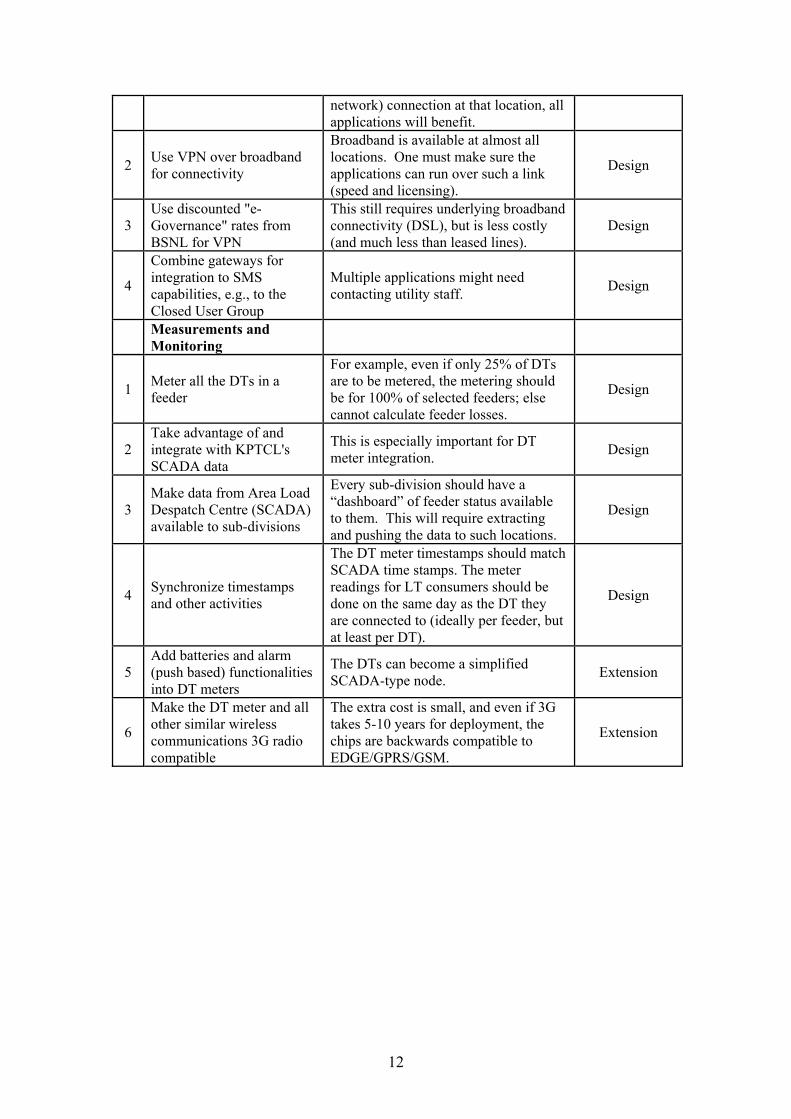
network) connection at that location, all applications will benefit.
2 Use VPN over broadband for connectivity
Broadband is available at almost all locations. One must make sure the applications can run over such a link (speed and licensing).
Design
3 Use discounted "e-Governance" rates from BSNL for VPN
This still requires underlying broadband connectivity (DSL), but is less costly (and much less than leased lines).
Design
4
Combine gateways for integration to SMS capabilities, e.g., to the Closed User Group
Multiple applications might need contacting utility staff. Design
Measurements and Monitoring
1 Meter all the DTs in a feeder
For example, even if only 25% of DTs are to be metered, the metering should be for 100% of selected feeders; else cannot calculate feeder losses.
Design
2 Take advantage of and integrate with KPTCL's SCADA data
This is especially important for DT meter integration. Design
3 Make data from Area Load Despatch Centre (SCADA) available to sub-divisions
Every sub-division should have a “dashboard” of feeder status available to them. This will require extracting and pushing the data to such locations.
Design
4 Synchronize timestamps and other activities
The DT meter timestamps should match SCADA time stamps. The meter readings for LT consumers should be done on the same day as the DT they are connected to (ideally per feeder, but at least per DT).
Design
5 Add batteries and alarm (push based) functionalities into DT meters
The DTs can become a simplified SCADA-type node. Extension
6
Make the DT meter and all other similar wireless communications 3G radio compatible
The extra cost is small, and even if 3G takes 5-10 years for deployment, the chips are backwards compatible to EDGE/GPRS/GSM.
Extension
12
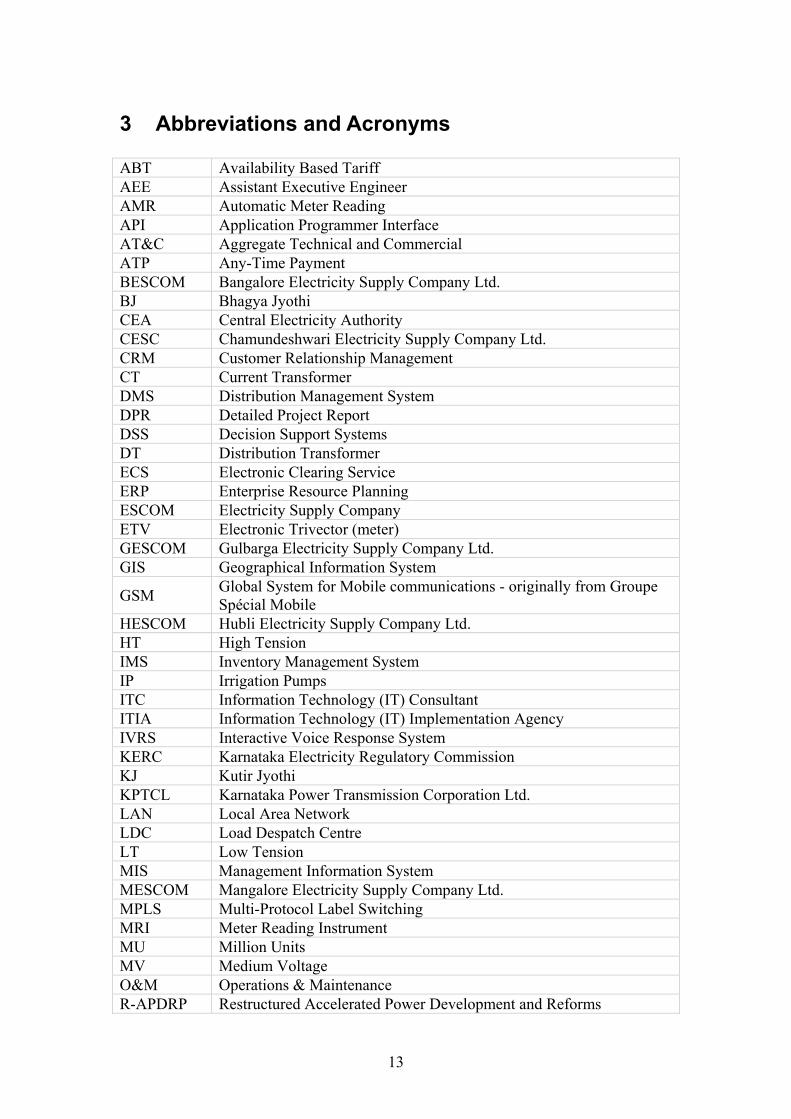
3 Abbreviations and Acronyms ABT Availability Based Tariff AEE Assistant Executive Engineer AMR Automatic Meter Reading API Application Programmer Interface AT&C Aggregate Technical and Commercial ATP Any-Time Payment BESCOM Bangalore Electricity Supply Company Ltd. BJ Bhagya Jyothi CEA Central Electricity Authority CESC Chamundeshwari Electricity Supply Company Ltd. CRM Customer Relationship Management CT Current Transformer DMS Distribution Management System DPR Detailed Project Report DSS Decision Support Systems DT Distribution Transformer ECS Electronic Clearing Service ERP Enterprise Resource Planning ESCOM Electricity Supply Company ETV Electronic Trivector (meter) GESCOM Gulbarga Electricity Supply Company Ltd. GIS Geographical Information System
GSM Global System for Mobile communications - originally from Groupe Spécial Mobile
HESCOM Hubli Electricity Supply Company Ltd. HT High Tension IMS Inventory Management System IP Irrigation Pumps ITC Information Technology (IT) Consultant ITIA Information Technology (IT) Implementation Agency IVRS Interactive Voice Response System KERC Karnataka Electricity Regulatory Commission KJ Kutir Jyothi KPTCL Karnataka Power Transmission Corporation Ltd. LAN Local Area Network LDC Load Despatch Centre LT Low Tension MIS Management Information System MESCOM Mangalore Electricity Supply Company Ltd. MPLS Multi-Protocol Label Switching MRI Meter Reading Instrument MU Million Units MV Medium Voltage O&M Operations & Maintenance R-APDRP Restructured Accelerated Power Development and Reforms
13
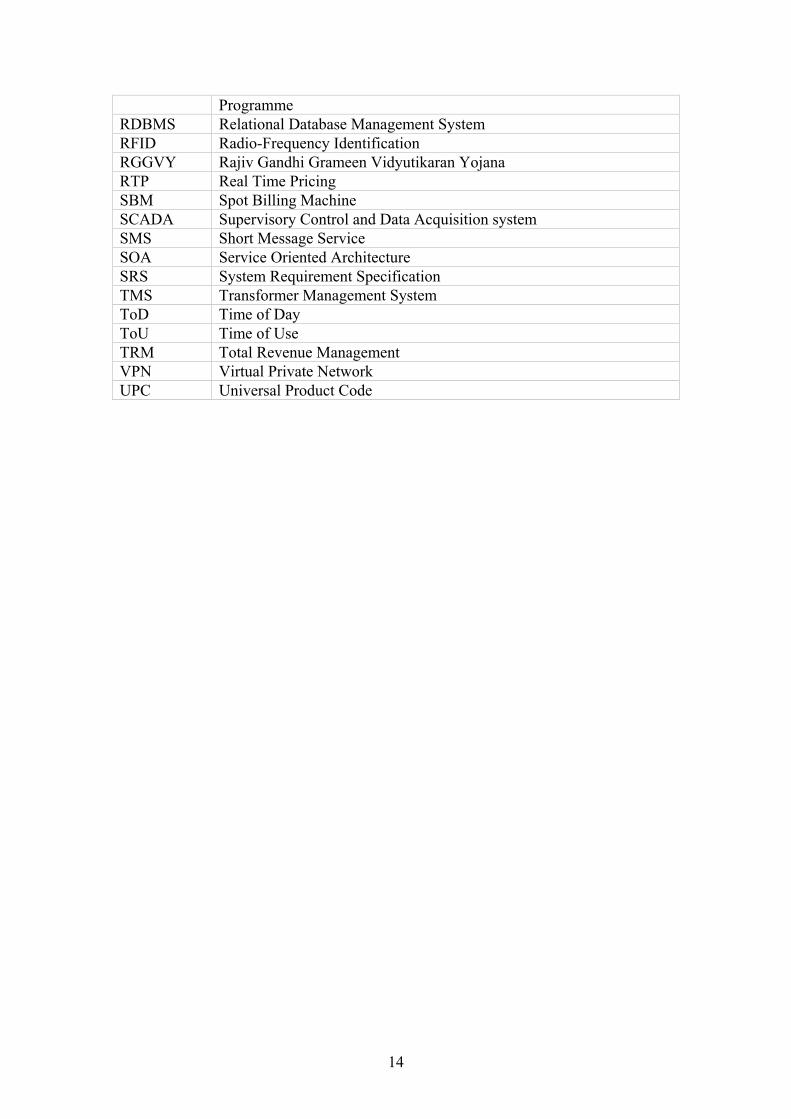
Programme RDBMS Relational Database Management System RFID Radio-Frequency Identification RGGVY Rajiv Gandhi Grameen Vidyutikaran Yojana RTP Real Time Pricing SBM Spot Billing Machine SCADA Supervisory Control and Data Acquisition system SMS Short Message Service SOA Service Oriented Architecture SRS System Requirement Specification TMS Transformer Management System ToD Time of Day ToU Time of Use TRM Total Revenue Management VPN Virtual Private Network UPC Universal Product Code
14
4 GESCOM Overview
4.1 Profile The government of Karnataka began reform of the state’s power sector detailed in a Policy Statement it put out in January 1997. The power sector was already split in 1970 between generation (through the Karnataka Power Corporation Ltd.) and transmission and distribution (controlled by the Karnataka Electricity Board). In 1999, the Karnataka Electricity Reforms Act was passed which mandated major restructuring of the Karnataka Electricity Board and its Corporatisation. As part of the Corporatisation, the Karnataka Electricity Board ceased to exist and the Karnataka Power Transmission Corporation Limited (KPTCL) was formed to look after Transmission and Distribution in the State. Also, as per this Act an independent regulatory commission known as Karnataka Electricity Regulatory Commission (KERC) was setup. Subsequently, the transmission and distribution activities carried out by KPTCL were unbundled and four power distribution companies were formed in June 2002.
• Bangalore Electricity Supply Company Ltd (BESCOM),
• Hubli Electricity Supply Company Ltd (HESCOM),
• Mangalore Electricity Supply Company Ltd (MESCOM),
• Gulbarga Electricity Supply Company Ltd (GESCOM).
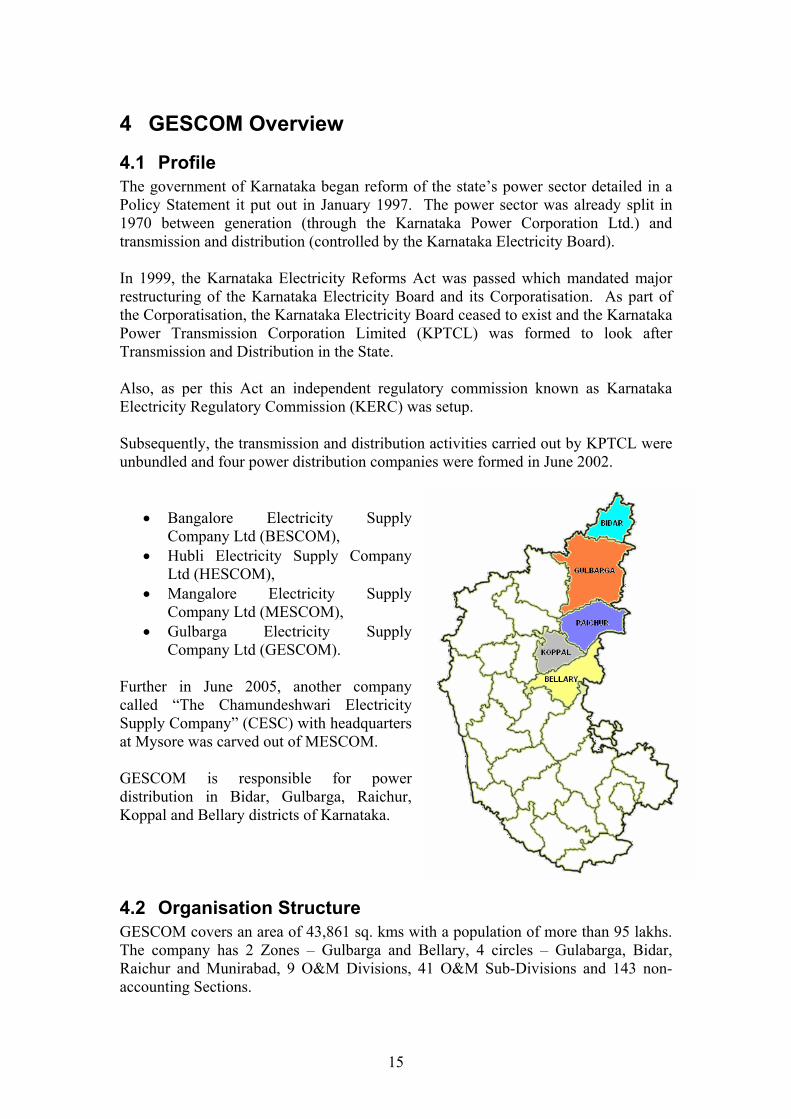
Further in June 2005, another company called “The Chamundeshwari Electricity Supply Company” (CESC) with headquarters at Mysore was carved out of MESCOM. GESCOM is responsible for power distribution in Bidar, Gulbarga, Raichur, Koppal and Bellary districts of Karnataka.
4.2 Organisation Structure GESCOM covers an area of 43,861 sq. kms with a population of more than 95 lakhs. The company has 2 Zones – Gulbarga and Bellary, 4 circles – Gulabarga, Bidar, Raichur and Munirabad, 9 O&M Divisions, 41 O&M Sub-Divisions and 143 non-accounting Sections.
15
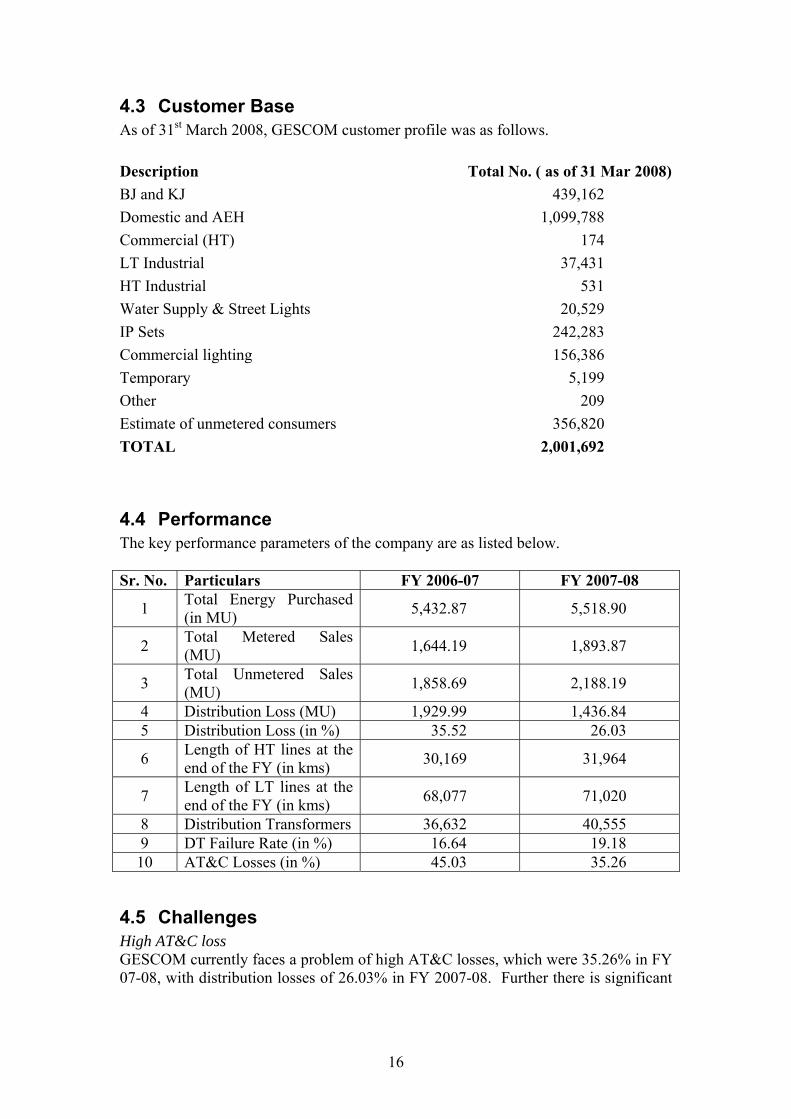
4.3 Customer Base As of 31st March 2008, GESCOM customer profile was as follows. Description Total No. ( as of 31 Mar 2008)BJ and KJ 439,162 Domestic and AEH 1,099,788 Commercial (HT) 174 LT Industrial 37,431 HT Industrial 531 Water Supply & Street Lights 20,529 IP Sets 242,283 Commercial lighting 156,386 Temporary 5,199 Other 209 Estimate of unmetered consumers 356,820 TOTAL 2,001,692
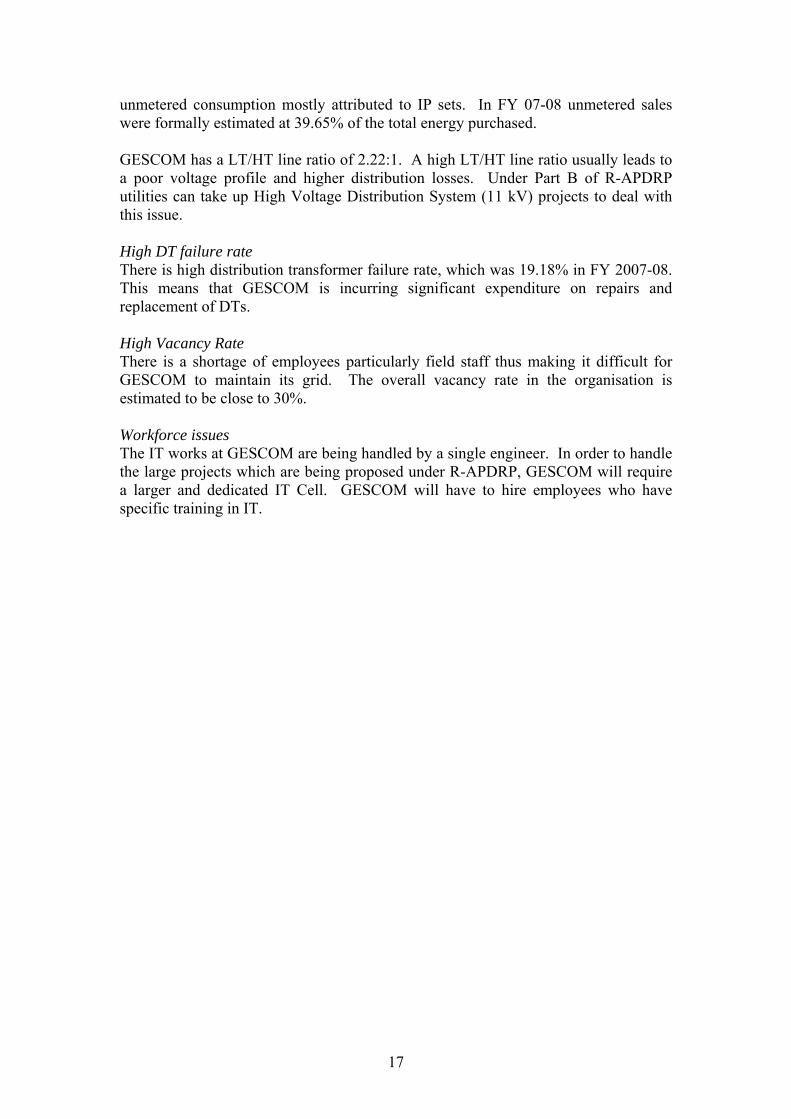
4.4 Performance The key performance parameters of the company are as listed below. Sr. No. Particulars FY 2006-07 FY 2007-08
1 Total Energy Purchased (in MU) 5,432.87 5,518.90
2 Total Metered Sales (MU) 1,644.19 1,893.87
3 Total Unmetered Sales (MU) 1,858.69 2,188.19
4 Distribution Loss (MU) 1,929.99 1,436.84 5 Distribution Loss (in %) 35.52 26.03
6 Length of HT lines at the end of the FY (in kms) 30,169 31,964
7 Length of LT lines at the end of the FY (in kms) 68,077 71,020
8 Distribution Transformers 36,632 40,555 9 DT Failure Rate (in %) 16.64 19.18 10 AT&C Losses (in %) 45.03 35.26
4.5 Challenges High AT&C loss GESCOM currently faces a problem of high AT&C losses, which were 35.26% in FY 07-08, with distribution losses of 26.03% in FY 2007-08. Further there is significant
16
unmetered consumption mostly attributed to IP sets. In FY 07-08 unmetered sales were formally estimated at 39.65% of the total energy purchased. GESCOM has a LT/HT line ratio of 2.22:1. A high LT/HT line ratio usually leads to a poor voltage profile and higher distribution losses. Under Part B of R-APDRP utilities can take up High Voltage Distribution System (11 kV) projects to deal with this issue. High DT failure rate There is high distribution transformer failure rate, which was 19.18% in FY 2007-08. This means that GESCOM is incurring significant expenditure on repairs and replacement of DTs. High Vacancy Rate There is a shortage of employees particularly field staff thus making it difficult for GESCOM to maintain its grid. The overall vacancy rate in the organisation is estimated to be close to 30%. Workforce issues The IT works at GESCOM are being handled by a single engineer. In order to handle the large projects which are being proposed under R-APDRP, GESCOM will require a larger and dedicated IT Cell. GESCOM will have to hire employees who have specific training in IT.
17
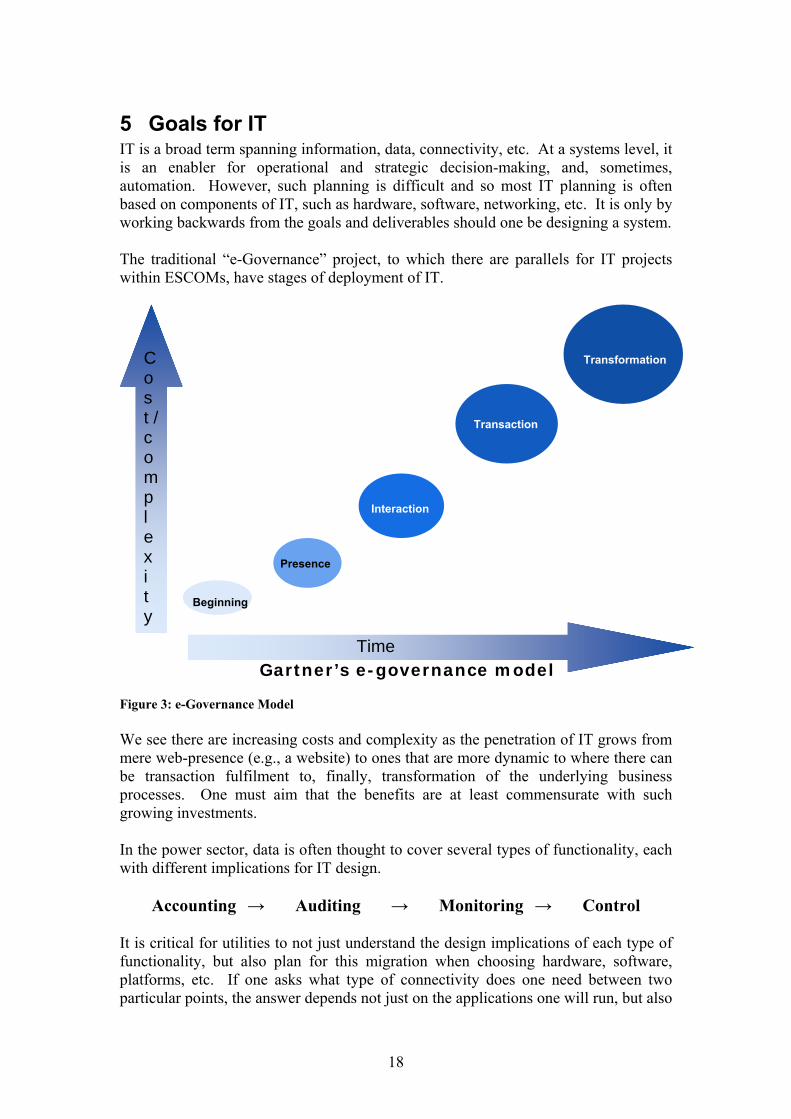
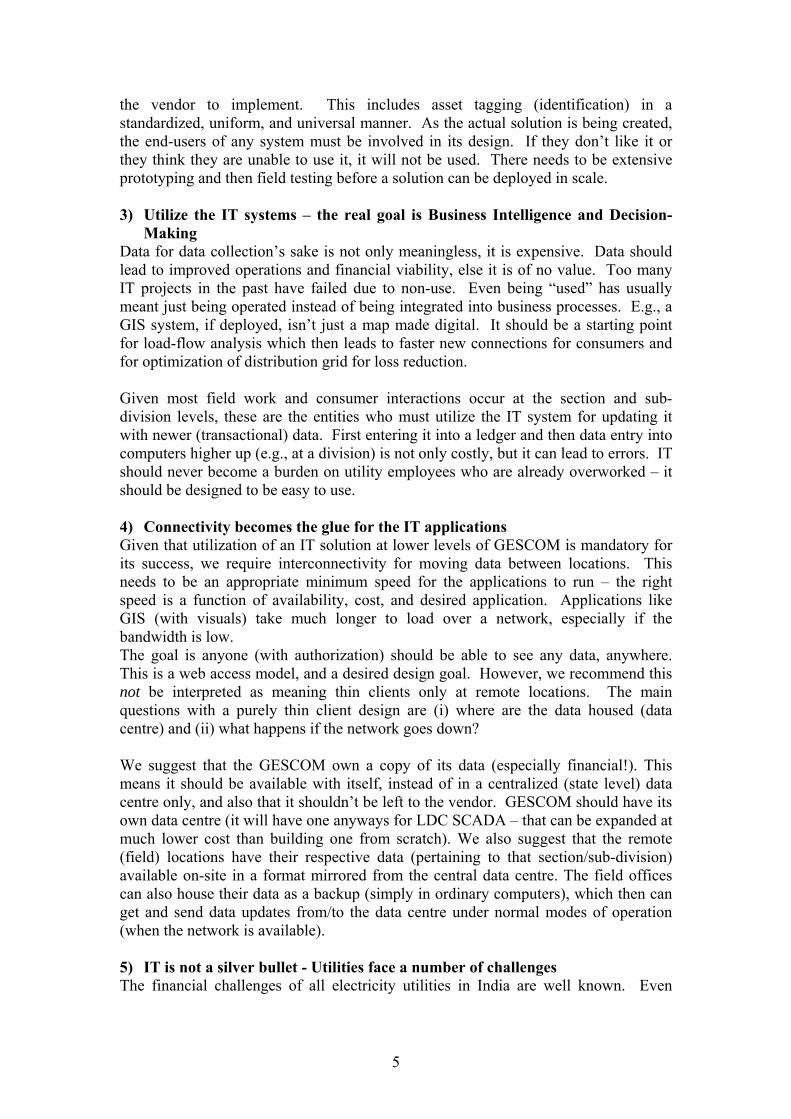
5 Goals for IT IT is a broad term spanning information, data, connectivity, etc. At a systems level, it is an enabler for operational and strategic decision-making, and, sometimes, automation. However, such planning is difficult and so most IT planning is often based on components of IT, such as hardware, software, networking, etc. It is only by working backwards from the goals and deliverables should one be designing a system. The traditional “e-Governance” project, to which there are parallels for IT projects within ESCOMs, have stages of deployment of IT.
Beginning
Gartner’s e-governance model
Transformation
Transaction
Interaction
Presence
Cos t / comp l e x i t y
Time
Figure 3: e-Governance Model We see there are increasing costs and complexity as the penetration of IT grows from mere web-presence (e.g., a website) to ones that are more dynamic to where there can be transaction fulfilment to, finally, transformation of the underlying business processes. One must aim that the benefits are at least commensurate with such growing investments. In the power sector, data is often thought to cover several types of functionality, each with different implications for IT design.
Accounting → Auditing → Monitoring → Control It is critical for utilities to not just understand the design implications of each type of functionality, but also plan for this migration when choosing hardware, software, platforms, etc. If one asks what type of connectivity does one need between two particular points, the answer depends not just on the applications one will run, but also
18
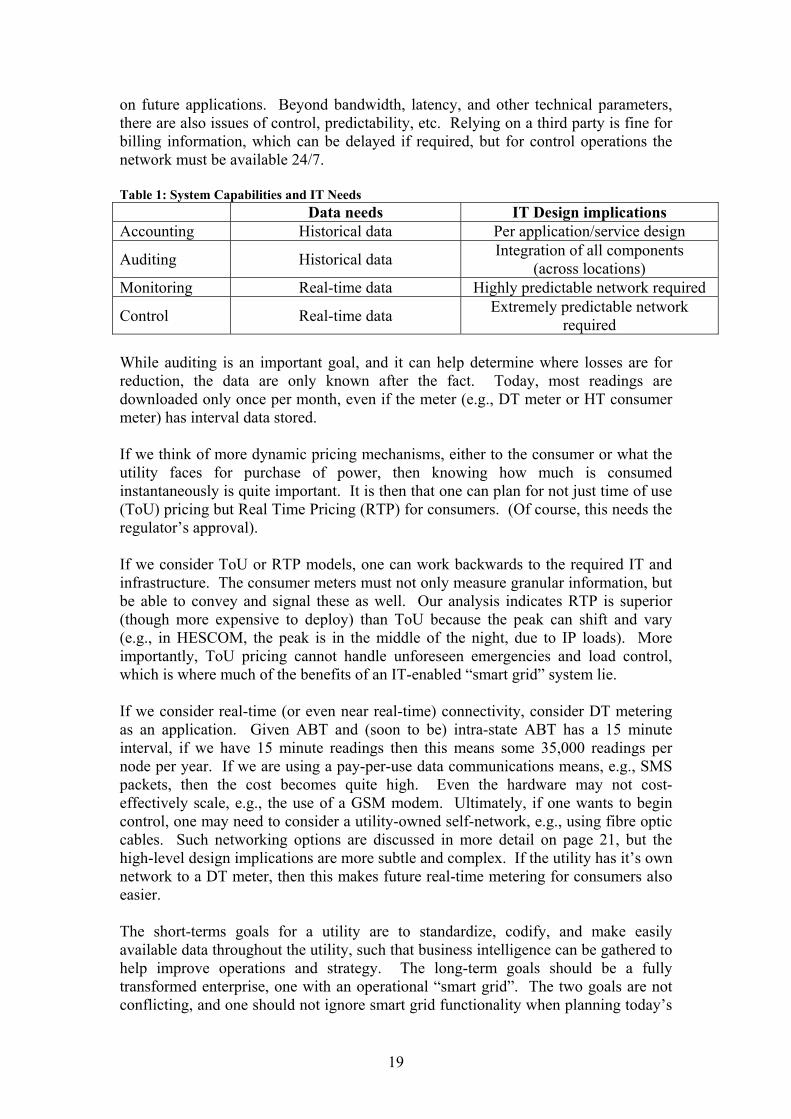
on future applications. Beyond bandwidth, latency, and other technical parameters, there are also issues of control, predictability, etc. Relying on a third party is fine for billing information, which can be delayed if required, but for control operations the network must be available 24/7. Table 1: System Capabilities and IT Needs Data needs IT Design implications Accounting Historical data Per application/service design
Auditing Historical data Integration of all components (across locations)
Monitoring Real-time data Highly predictable network required
Control Real-time data Extremely predictable network required
While auditing is an important goal, and it can help determine where losses are for reduction, the data are only known after the fact. Today, most readings are downloaded only once per month, even if the meter (e.g., DT meter or HT consumer meter) has interval data stored. If we think of more dynamic pricing mechanisms, either to the consumer or what the utility faces for purchase of power, then knowing how much is consumed instantaneously is quite important. It is then that one can plan for not just time of use (ToU) pricing but Real Time Pricing (RTP) for consumers. (Of course, this needs the regulator’s approval). If we consider ToU or RTP models, one can work backwards to the required IT and infrastructure. The consumer meters must not only measure granular information, but be able to convey and signal these as well. Our analysis indicates RTP is superior (though more expensive to deploy) than ToU because the peak can shift and vary (e.g., in HESCOM, the peak is in the middle of the night, due to IP loads). More importantly, ToU pricing cannot handle unforeseen emergencies and load control, which is where much of the benefits of an IT-enabled “smart grid” system lie. If we consider real-time (or even near real-time) connectivity, consider DT metering as an application. Given ABT and (soon to be) intra-state ABT has a 15 minute interval, if we have 15 minute readings then this means some 35,000 readings per node per year. If we are using a pay-per-use data communications means, e.g., SMS packets, then the cost becomes quite high. Even the hardware may not cost-effectively scale, e.g., the use of a GSM modem. Ultimately, if one wants to begin control, one may need to consider a utility-owned self-network, e.g., using fibre optic cables. Such networking options are discussed in more detail on page 21, but the high-level design implications are more subtle and complex. If the utility has it’s own network to a DT meter, then this makes future real-time metering for consumers also easier. The short-terms goals for a utility are to standardize, codify, and make easily available data throughout the utility, such that business intelligence can be gathered to help improve operations and strategy. The long-term goals should be a fully transformed enterprise, one with an operational “smart grid”. The two goals are not conflicting, and one should not ignore smart grid functionality when planning today’s
19
activities – there are synergies that can be exploited. We detail such a longer term vision in section 11.3.
20
6 Recommended IT Framework and Solutions We have considered some specific findings about GESCOM in Section 2. Here, we present a few general recommendations for an overall framework. These are mostly in order of importance, but, of course, a number of activities can and should be undertaken in parallel. This is because of their interdependence and impact on any overall solution.
6.1 Networking solution Connectivity is now the lifeblood of many organisations, and there are different technologies available to meet communications needs. Information, whether in a ledger or a PC, needs to be shared and also analyzed, and for this information sharing mechanisms are vital. With IT systems, any information can, in theory, be sent and used anywhere. For this, a networking solution is required. Trying to answer “how much speed do I need” (bandwidth) is a complex issue that is actually driven by the services and applications one wants to run (both today and in the future!), and also the architecture (which determines locations of where information is gathered, stored, and utilized). Other characteristics of different technology options beyond speed include latency (delay), predictability, security, and upgradeability. Focusing only on the data side of networking, most technologies are now geared towards IP (Internet Protocol) standards.1 How to get IP connectivity is partly a question of what physical layer is chosen (copper, optical fibre, wireless, etc.). The second question is whether one needs or wants a public Internet connection or a private network. Typically, a dedicated network is the most expensive solution when chosen from a service provider. This can be a point-to-point leased line, whose costs are based on capacity (speed) and distance. Instead, one can create an almost (virtually) private network over an open, public network, a Virtual Private Network (VPN). VPNs themselves are of two types: managed, where the service provider sets it up for you, or self-administered, where you simply take a public Internet connection across all your nodes, and use your solutions to set up the VPN. These can be hardware based or software based – the best solution depends on the scale, volume, availability of skilled manpower. If the latter is a challenge, this can also be outsourced to an agency instead of being given to BSNL or another network service provider. The question of which physical layer technology to be used is as much a supply issue as of demand. For the types of initiatives that GESCOM is considering, from what we understand, BSNL has a heavily discounted broadband VPN available for e-governance initiatives for a list price of Rs. 900/month per node, for 512 kbps connectivity; this is on top of base broadband charges which can be as low as a few hundred rupees per month for limited usage to some Rs. 1,600 per month for unlimited 256 kbps usage.2 This is
1 Note: The public Internet is built using IP standards, but is not the same thing. One can use IP standards in a private network such as a Local Area Network (LAN). 2 We have had personal discussions with BSNL officers regarding such options, even though the website(s) do not have all the information on available e-Governance schemes.
21
sufficient for most applications depending on the design. This can be further discounted through a minimum volume of purchase and time commitment (i.e., an annual contract). Within R-APDRP, there is a specification for 2 Mbps MPLS VPN links, which may not be available everywhere. A back-up link from a different provider is specified at 512 kbps from a different provider. It remains to be seen whether any two different providers respectively have enough coverage to provide such links across the ESCOM. Else, one would have to deal with multiple network service providers, increasing operational and management challenges. The last thing to consider is utilizing self-infrastructure (or building it). Worldwide, the power company often has the largest amount of telecommunications infrastructure, not just SCADA. They have the ‘right of way’ as they already have a distribution system – overhead on poles or underground. In the US, many communications links, especially in rural areas, are pole-based (aerial). This is very cost-effective. It saves labour charges since there is no digging involved and maintenance becomes easier. In fact, many poles are shared between the power company, the phone company, and the cable company. One suggestion for future power lines is to purchase conductors that ‘embed’ optical fibres within the conductor. This is available at very low incremental cost – and the labour charges are also not higher. Optical fibres are a very promising technology to keep in mind. While some think these are too costly, and no company needs so much bandwidth, the capacity is only part of the reason these are attractive. Optical fibres are immune to electromagnetic interference, and are non-conductors, so these are useful in electricity applications. Optical fibres are also not prone to theft, unlike copper. Lastly, and perhaps most importantly, for long-distance interconnections, an optical fibre link can operate many tens of kilometres (easily 70 km, or even 120 km in some configurations) on a point-to-point basis with no repeaters or amplifiers required. Virtually every other technology (copper, wireless, etc.) requires some additional equipment. One must ask what is the underlying technology being used. This is important to ensure that the solution can scale to future needs. E.g., as any real-time or large-data systems are put in place (or features such as conferencing), then the low-speed links will not be sufficient. It is worth emphasizing that with network connectivity, many of the so-called slower speeds are actually a subset of higher-speed links. For example, when one purchases a DSL connection of speed 256 kbps, the same line might actually be capable of much higher speeds, perhaps up to 2 Mbps or more. It is then an issue to negotiate with the provider, to get multiple times higher speeds without paying multiple times higher price. Given the lower bandwidth and data speed requirements at lower levels of the hierarchy of the ESCOM, it is likely that field and remote offices would have lower speed links, at the least 64 kbps but ideally higher. If the connections are used by more than one machine, and for general purpose connectivity, 64 kbps will not be sufficient. Additionally the bandwidth and speed requirements are closely linked to
22
the design of the web based solution. In case the ESCOM opts for what is known as a ‘thin client’ architecture (where at the lower level offices there is no data storage and all data is transmitted from a central location as and when requested by the client software) for its web-based IT solution, the speed and reliability of the network becomes much more important. Ensuring high reliability in this case might require redundancy of network connection, thereby increasing the costs. Given the varying speed availability and requirements by location, it is feasible to combine different technologies and even different carriers for some locations (using public Internet based technologies and then a VPN). One other issue that utilities need to plan for is access control to machines in a networked environment. Beyond the obvious issues of security (web-based access means any data could be seen if not edited anywhere with the right permissions), a user going online to the broader Internet might accidentally download some viruses, trojans, malware, etc. End-users may utilize a computer for personal use, and this also has bandwidth implications. Many corporations limit personal computer use, disallowing certain websites or types of applications (e.g., videos). In a design with a VPN, one possibility is where all traffic first travels on the corporate VPN to a central location, where a proxy server is used to monitor, separate, and control outbound (global Internet) traffic. All the remote PCs, servers, and machines must be manageable remotely, else this becomes an enormous operational and management headache.
6.2 Utility Information System Electricity distribution utilities are increasingly using IT tools in order to support their business processes, such as billing, maintenance, asset management and network extension planning. However, performing these business processes efficiently often requires access to information from different sources, departments and IT systems. This is where the concept of utility system integration comes in, where the aim is to provide seamless integration between operational systems such as SCADA/DMS/EMS, GIS and other information management systems. The UIS as envisioned is an enabling framework, given many functionalities are not within the scope of the SRS today. It states, “The creation of IT infrastructure under System requirement specification template will enable utilities to integrate other business processes such as ERP, SCADA etc., at a later date as per the requirement of the utility, which are presently not in the scope of the SRS document”3
3 Revised SRS Document, SRS Committee for Restructures APDRP under 11th Plan.
23
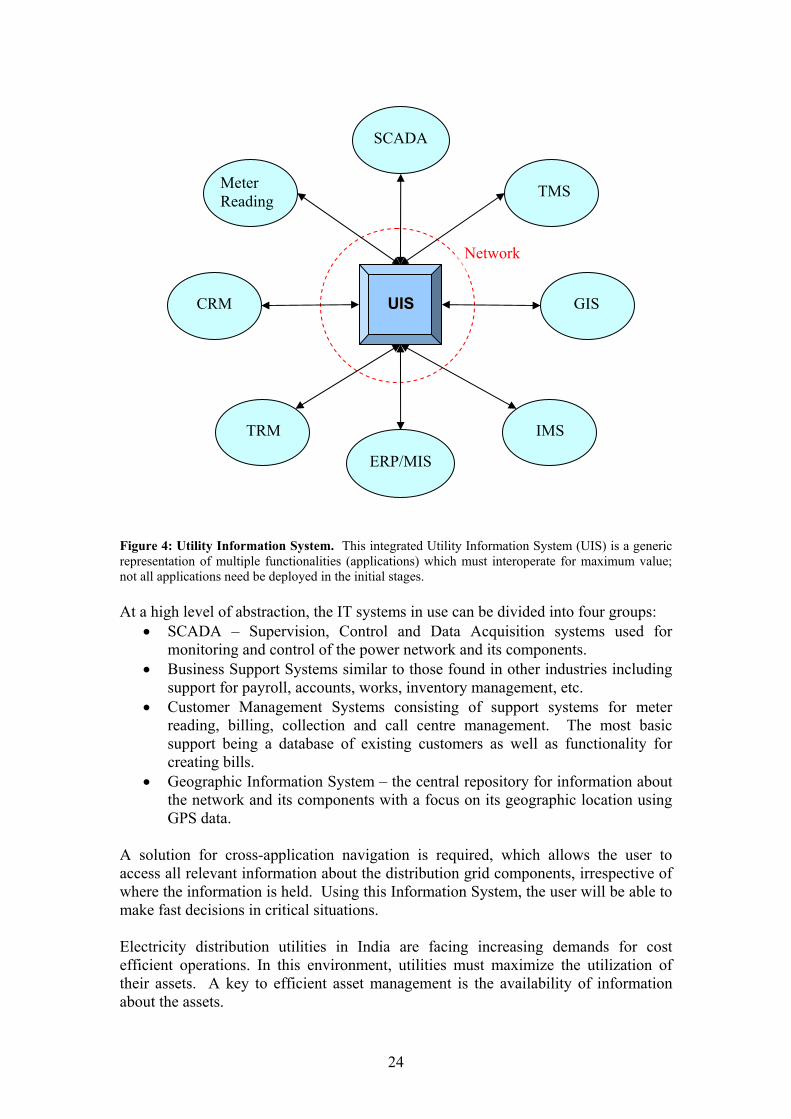
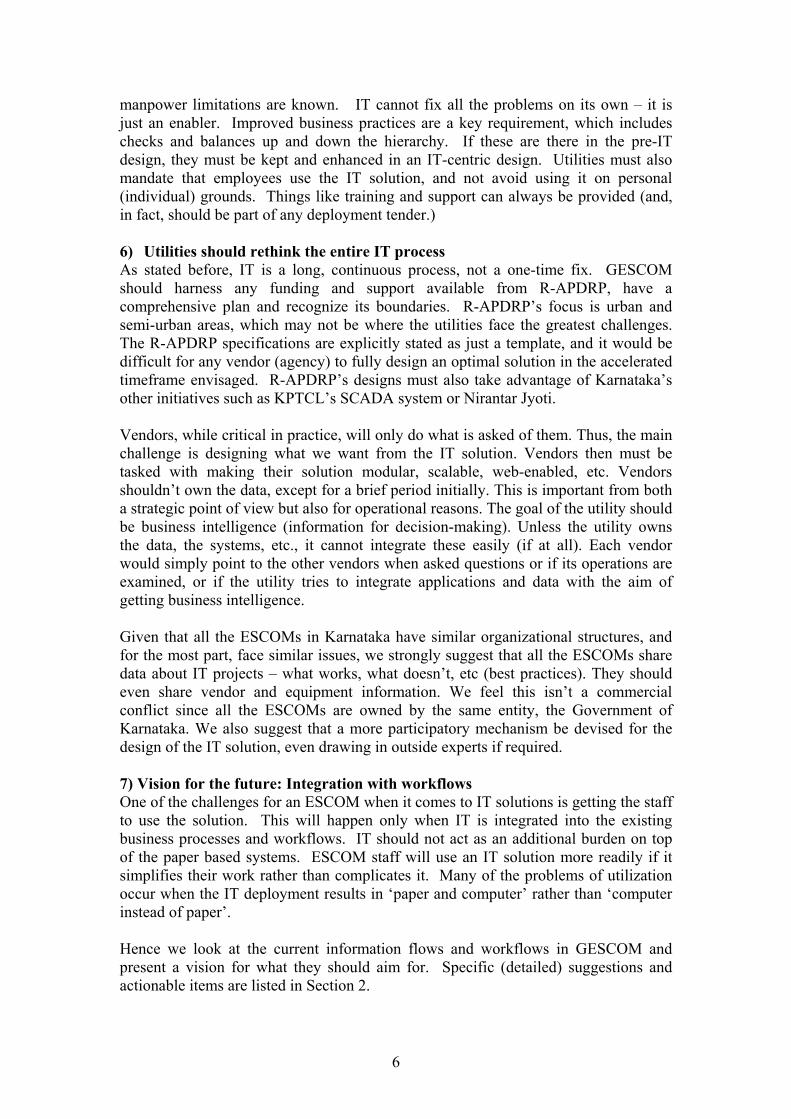
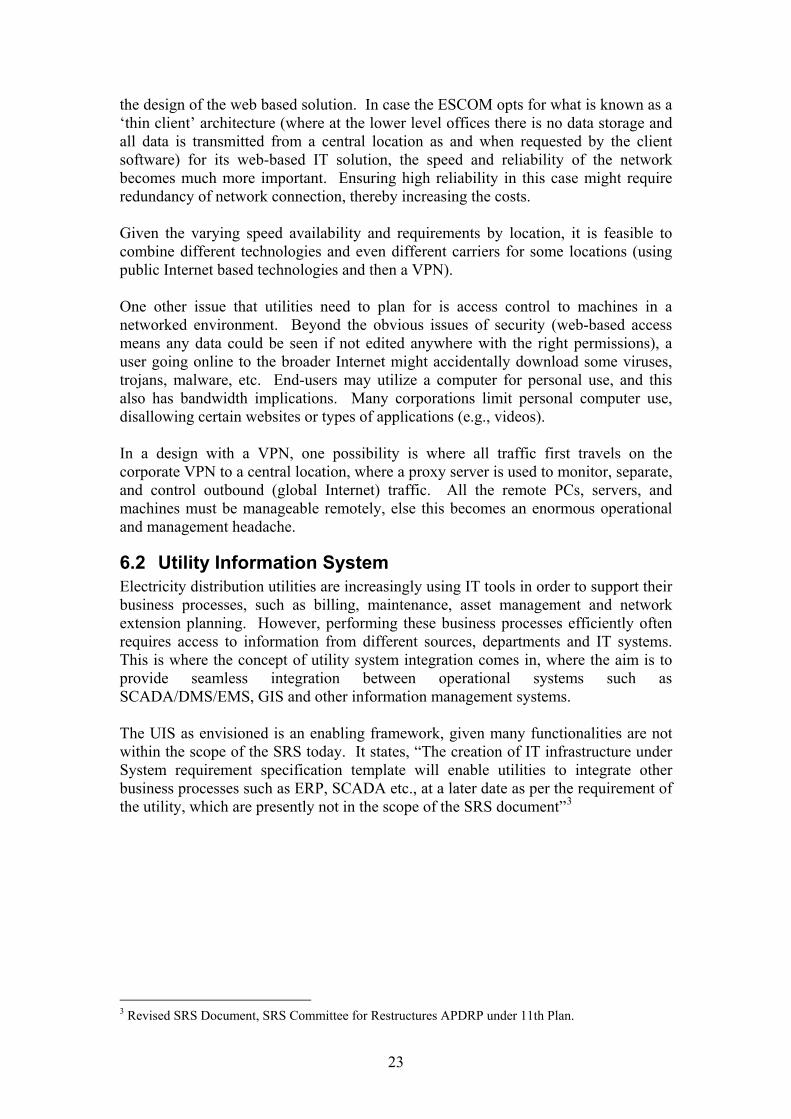
Figure 4: Utility Information System. This integrated Utility Information System (UIS) is a generic representation of multiple functionalities (applications) which must interoperate for maximum value; not all applications need be deployed in the initial stages. At a high level of abstraction, the IT systems in use can be divided into four groups:
• SCADA – Supervision, Control and Data Acquisition systems used for monitoring and control of the power network and its components.
• Business Support Systems similar to those found in other industries including support for payroll, accounts, works, inventory management, etc.
• Customer Management Systems consisting of support systems for meter reading, billing, collection and call centre management. The most basic support being a database of existing customers as well as functionality for creating bills.
• Geographic Information System – the central repository for information about the network and its components with a focus on its geographic location using GPS data.
A solution for cross-application navigation is required, which allows the user to access all relevant information about the distribution grid components, irrespective of where the information is held. Using this Information System, the user will be able to make fast decisions in critical situations. Electricity distribution utilities in India are facing increasing demands for cost efficient operations. In this environment, utilities must maximize the utilization of their assets. A key to efficient asset management is the availability of information about the assets.
ERP/MIS
UUIISS
TMS
Network
TRM IMS
CRM GIS
Meter Reading
SCADA
24
Electric utilities across India mostly have isolated IT systems, belonging to different departments, which have been developed over several years. The systems usually have different user interfaces and their own databases, and may be running on different operating systems. The utility’s engineers will increasingly need information from the different systems to be readily available at one location. However getting information from different systems is a cumbersome process. What is needed is a web-based solution, which can be used from any location, and integrates information from different databases and presents it to the user through a graphical user interface (GUI). Being “web-based” is not sufficient for ensuring easy back-end interoperability – a very high priority for ESCOMs. In section 6.3, we present some more suggestions for such an architecture. An integrated utility information system can be thought of as an e-governance initiative. By labelling it so, there is a discounted networking option available from BSNL; we expand on this in section 6.1.
6.2.1 Total Revenue Management A Total Revenue Management (TRM) for an electric utility can be defined as an integrated software solution that handles all the customer meter reading,4 billing, collection, and manages all revenue transactions. These are in many ways a succession to prior Billing and Collection (B&C) systems. Even within TRM, the bill generation and delivery mechanisms may be operated by different entities than the revenue collection. The latter is done by the utility or through selected third parties (agencies) using alternatives to collection counters which are at the sub-division level. Prior to computerization the process of billing, collection and accounting was done manually. This process was cumbersome, took a long time and was prone to errors. An integrated computerized system can simplify billing and collections, reduce paperwork and effort, and can improve revenue realization. A well designed web-based TRM solution could give the utility required scalability, greater flexibility, and desired features for a complete revenue management system combined with ease of integration with other IT systems. Having accurate information of all the consumers is very important for an electric utility. A utility needs to have in-depth knowledge of it’s customers, their exact locations on the grid, consumption patterns, trouble call pattern, associated network assets, etc. An integrated view of the customers and all their interactions with the utility will prove to be very useful. The current Billing and Collections system includes a Spot Billing Machine (SBM) into which the consumer data is loaded with facility to enter the current reading to print the spot bill. The meter readers punch in the reading into the SBM which prints the bill on the spot which is issued to the customer. At the end of the day the meter readers return to the office and upload the data to a computer usually through a serial connection.
4 Intelligent meters can also be integrated with SCADA systems, and are not the norm for consumer (LT) meters as of now.
25
The TRM system should generate bills for consumers who have not already received bills through the spot billing mechanism. The billing module should have functions for complex billing such as real-time pricing, time-of-day pricing or other modifications to the tariff that may be made in the future. If certain categories of consumers, e.g., HT consumers, are to be billed using alternative meters or mechanisms, these should still integrate into the broader TRM solution. The TRM software should also have features to allow adding new consumers, update of consumer information such as disconnection, meter replacement etc. The TRM solution should provide the software and support for the cash counters. The collections module should be able to integrate and reconcile information from various sources such as the cash counters, Any Time Payment kiosks, credit card, debit card, electronic clearing service through banks etc. The software should be able to generate reports containing statistics on collections, exception reports, daily and monthly DCB (Demand Collection Balance) reports and other user defined reports. With a web-based TRM solution the utility should be able to perform a range of automated, semi automated and manual tasks, such as
• Consumer billing on internet • Issuing payment reminders to customers • Sending bill alerts using e-mails or short message service (SMS) messages to
consumers [this requires a gateway functionality] • Triggering workflows and alerts for field staff • Disconnection orders
The TRM solution should also include features to support energy audit as well as revenue audit – for internal audit of all transactions as well as supporting documents for the external auditor. Finally the TRM system should have the capability to integrate with other IT systems such as GIS, TMS, MIS, CRM etc. For all of these, not only must the data labels (identifiers) be consistent, they should use the same data. That way a change in one system is reflected in other systems.
6.2.2 Geographical Information System (GIS) [providing Asset Tagging]
A Geographical Information System (GIS) is a system of hardware and software designed for capture, storage, retrieval, mapping and analysis of geographically referenced data and associated attributes. For an Electric Distribution Utility, GIS is a system of mapping the complete electrical distribution network including the low voltage system and customer supply points with latitude and longitude overlaid on maps. These map representations contain layers of information. The first layer could correspond to the distribution network coverage. The second layer could correspond to the land background containing roads, landmarks, buildings, rivers, railway crossings etc. The next
26
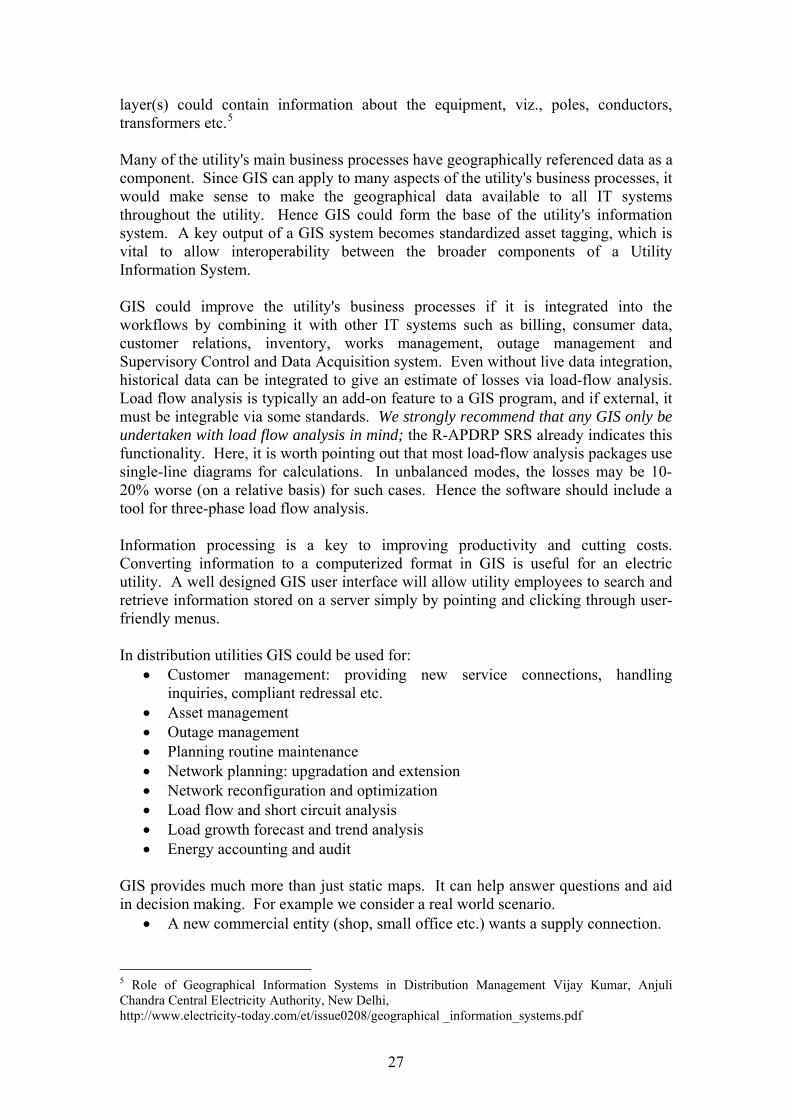
layer(s) could contain information about the equipment, viz., poles, conductors, transformers etc.5 Many of the utility's main business processes have geographically referenced data as a component. Since GIS can apply to many aspects of the utility's business processes, it would make sense to make the geographical data available to all IT systems throughout the utility. Hence GIS could form the base of the utility's information system. A key output of a GIS system becomes standardized asset tagging, which is vital to allow interoperability between the broader components of a Utility Information System. GIS could improve the utility's business processes if it is integrated into the workflows by combining it with other IT systems such as billing, consumer data, customer relations, inventory, works management, outage management and Supervisory Control and Data Acquisition system. Even without live data integration, historical data can be integrated to give an estimate of losses via load-flow analysis. Load flow analysis is typically an add-on feature to a GIS program, and if external, it must be integrable via some standards. We strongly recommend that any GIS only be undertaken with load flow analysis in mind; the R-APDRP SRS already indicates this functionality. Here, it is worth pointing out that most load-flow analysis packages use single-line diagrams for calculations. In unbalanced modes, the losses may be 10-20% worse (on a relative basis) for such cases. Hence the software should include a tool for three-phase load flow analysis. Information processing is a key to improving productivity and cutting costs. Converting information to a computerized format in GIS is useful for an electric utility. A well designed GIS user interface will allow utility employees to search and retrieve information stored on a server simply by pointing and clicking through user-friendly menus. In distribution utilities GIS could be used for:
• Customer management: providing new service connections, handling inquiries, compliant redressal etc.
• Asset management • Outage management • Planning routine maintenance • Network planning: upgradation and extension • Network reconfiguration and optimization • Load flow and short circuit analysis • Load growth forecast and trend analysis • Energy accounting and audit
GIS provides much more than just static maps. It can help answer questions and aid in decision making. For example we consider a real world scenario.
• A new commercial entity (shop, small office etc.) wants a supply connection.
5 Role of Geographical Information Systems in Distribution Management Vijay Kumar, Anjuli Chandra Central Electricity Authority, New Delhi, http://www.electricity-today.com/et/issue0208/geographical _information_systems.pdf
27
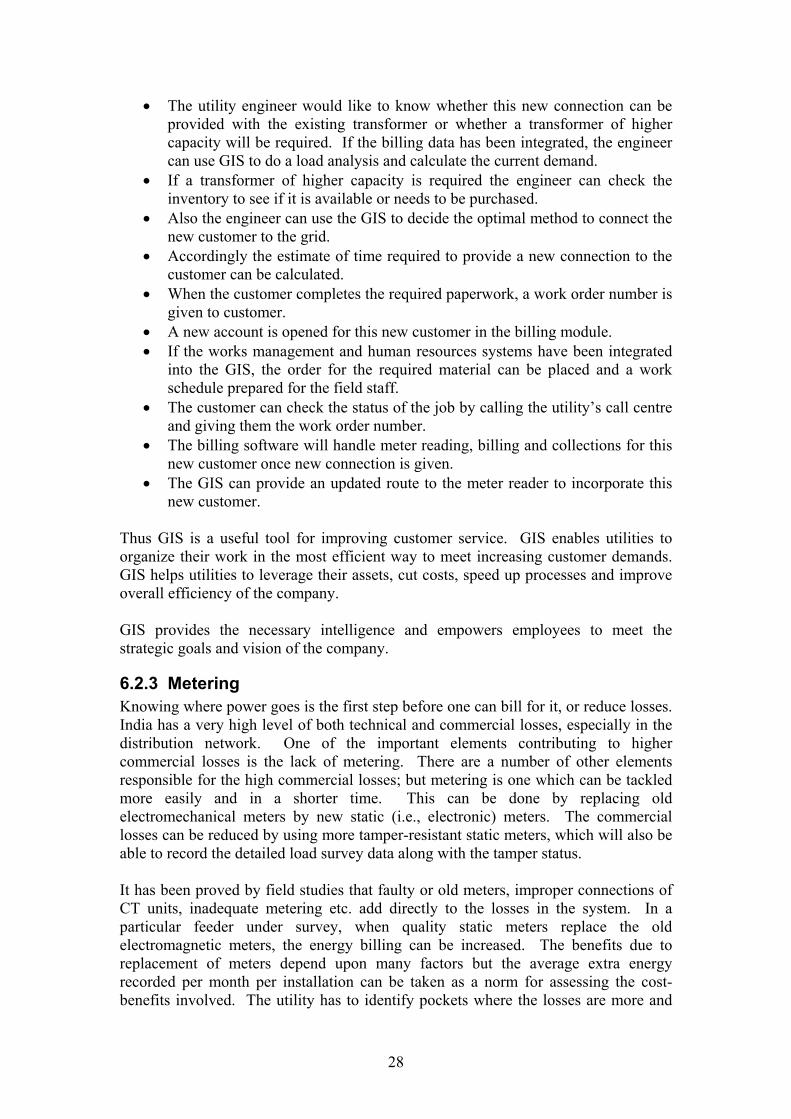
• The utility engineer would like to know whether this new connection can be provided with the existing transformer or whether a transformer of higher capacity will be required. If the billing data has been integrated, the engineer can use GIS to do a load analysis and calculate the current demand.
• If a transformer of higher capacity is required the engineer can check the inventory to see if it is available or needs to be purchased.
• Also the engineer can use the GIS to decide the optimal method to connect the new customer to the grid.
• Accordingly the estimate of time required to provide a new connection to the customer can be calculated.
• When the customer completes the required paperwork, a work order number is given to customer.
• A new account is opened for this new customer in the billing module. • If the works management and human resources systems have been integrated
into the GIS, the order for the required material can be placed and a work schedule prepared for the field staff.
• The customer can check the status of the job by calling the utility’s call centre and giving them the work order number.
• The billing software will handle meter reading, billing and collections for this new customer once new connection is given.
• The GIS can provide an updated route to the meter reader to incorporate this new customer.
Thus GIS is a useful tool for improving customer service. GIS enables utilities to organize their work in the most efficient way to meet increasing customer demands. GIS helps utilities to leverage their assets, cut costs, speed up processes and improve overall efficiency of the company. GIS provides the necessary intelligence and empowers employees to meet the strategic goals and vision of the company.
6.2.3 Metering Knowing where power goes is the first step before one can bill for it, or reduce losses. India has a very high level of both technical and commercial losses, especially in the distribution network. One of the important elements contributing to higher commercial losses is the lack of metering. There are a number of other elements responsible for the high commercial losses; but metering is one which can be tackled more easily and in a shorter time. This can be done by replacing old electromechanical meters by new static (i.e., electronic) meters. The commercial losses can be reduced by using more tamper-resistant static meters, which will also be able to record the detailed load survey data along with the tamper status. It has been proved by field studies that faulty or old meters, improper connections of CT units, inadequate metering etc. add directly to the losses in the system. In a particular feeder under survey, when quality static meters replace the old electromagnetic meters, the energy billing can be increased. The benefits due to replacement of meters depend upon many factors but the average extra energy recorded per month per installation can be taken as a norm for assessing the cost-benefits involved. The utility has to identify pockets where the losses are more and
28
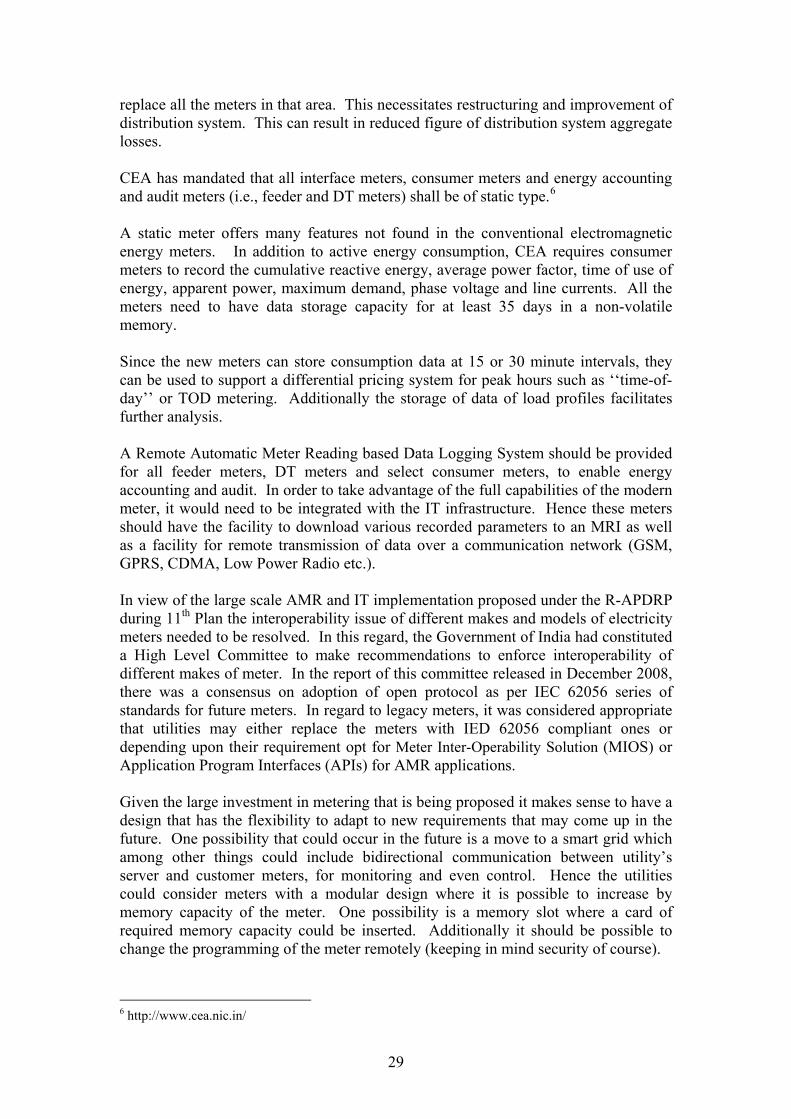
replace all the meters in that area. This necessitates restructuring and improvement of distribution system. This can result in reduced figure of distribution system aggregate losses. CEA has mandated that all interface meters, consumer meters and energy accounting and audit meters (i.e., feeder and DT meters) shall be of static type.6 A static meter offers many features not found in the conventional electromagnetic energy meters. In addition to active energy consumption, CEA requires consumer meters to record the cumulative reactive energy, average power factor, time of use of energy, apparent power, maximum demand, phase voltage and line currents. All the meters need to have data storage capacity for at least 35 days in a non-volatile memory. Since the new meters can store consumption data at 15 or 30 minute intervals, they can be used to support a differential pricing system for peak hours such as ‘‘time-of-day’’ or TOD metering. Additionally the storage of data of load profiles facilitates further analysis. A Remote Automatic Meter Reading based Data Logging System should be provided for all feeder meters, DT meters and select consumer meters, to enable energy accounting and audit. In order to take advantage of the full capabilities of the modern meter, it would need to be integrated with the IT infrastructure. Hence these meters should have the facility to download various recorded parameters to an MRI as well as a facility for remote transmission of data over a communication network (GSM, GPRS, CDMA, Low Power Radio etc.). In view of the large scale AMR and IT implementation proposed under the R-APDRP during 11th Plan the interoperability issue of different makes and models of electricity meters needed to be resolved. In this regard, the Government of India had constituted a High Level Committee to make recommendations to enforce interoperability of different makes of meter. In the report of this committee released in December 2008, there was a consensus on adoption of open protocol as per IEC 62056 series of standards for future meters. In regard to legacy meters, it was considered appropriate that utilities may either replace the meters with IED 62056 compliant ones or depending upon their requirement opt for Meter Inter-Operability Solution (MIOS) or Application Program Interfaces (APIs) for AMR applications. Given the large investment in metering that is being proposed it makes sense to have a design that has the flexibility to adapt to new requirements that may come up in the future. One possibility that could occur in the future is a move to a smart grid which among other things could include bidirectional communication between utility’s server and customer meters, for monitoring and even control. Hence the utilities could consider meters with a modular design where it is possible to increase by memory capacity of the meter. One possibility is a memory slot where a card of required memory capacity could be inserted. Additionally it should be possible to change the programming of the meter remotely (keeping in mind security of course).
6 http://www.cea.nic.in/
29
One idea that would give added functionality at low incremental price is what can be called as “poor man’s SCADA” – where a battery backup could be added to the DT meter so that it can continue working during outage events. This meter would include a ‘push’ function, i.e., initiate data transfer to the server under certain events such as outages, overloads, severe phase imbalance, transformer monitoring, and other utility defined critical activities or events. Alarms could be sent using SMS and/or email, or to the operator’s desktop application.
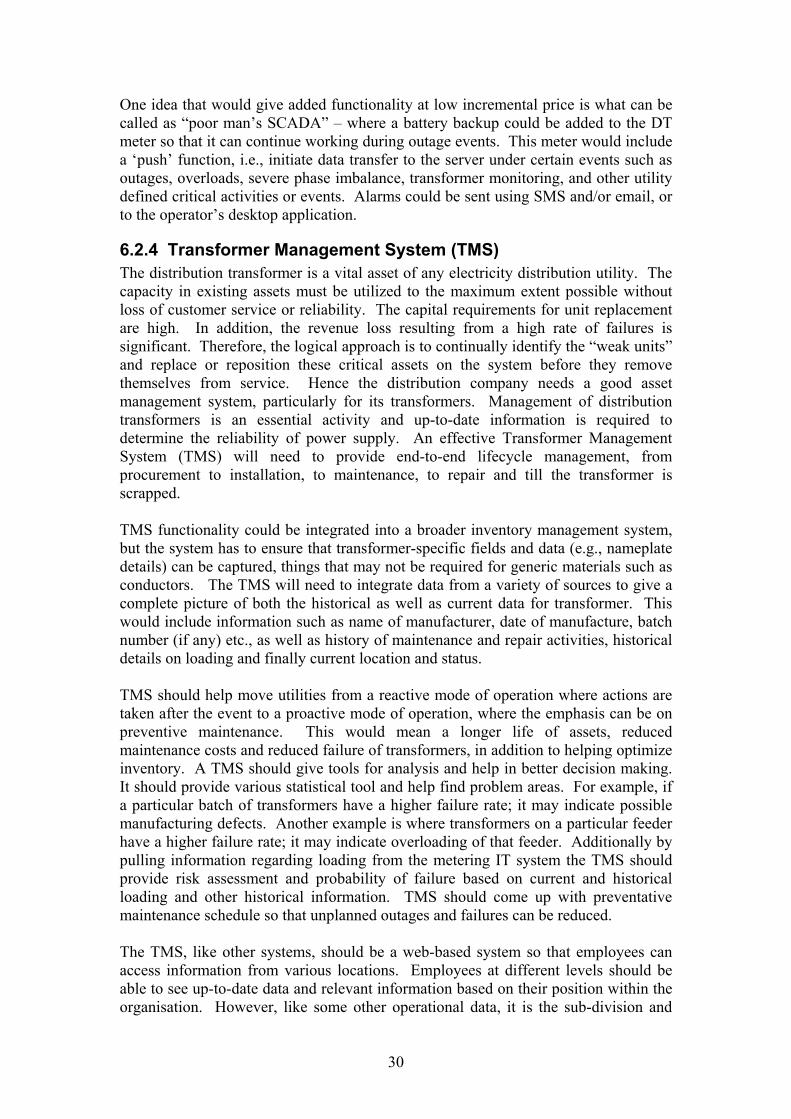
6.2.4 Transformer Management System (TMS) The distribution transformer is a vital asset of any electricity distribution utility. The capacity in existing assets must be utilized to the maximum extent possible without loss of customer service or reliability. The capital requirements for unit replacement are high. In addition, the revenue loss resulting from a high rate of failures is significant. Therefore, the logical approach is to continually identify the “weak units” and replace or reposition these critical assets on the system before they remove themselves from service. Hence the distribution company needs a good asset management system, particularly for its transformers. Management of distribution transformers is an essential activity and up-to-date information is required to determine the reliability of power supply. An effective Transformer Management System (TMS) will need to provide end-to-end lifecycle management, from procurement to installation, to maintenance, to repair and till the transformer is scrapped. TMS functionality could be integrated into a broader inventory management system, but the system has to ensure that transformer-specific fields and data (e.g., nameplate details) can be captured, things that may not be required for generic materials such as conductors. The TMS will need to integrate data from a variety of sources to give a complete picture of both the historical as well as current data for transformer. This would include information such as name of manufacturer, date of manufacture, batch number (if any) etc., as well as history of maintenance and repair activities, historical details on loading and finally current location and status. TMS should help move utilities from a reactive mode of operation where actions are taken after the event to a proactive mode of operation, where the emphasis can be on preventive maintenance. This would mean a longer life of assets, reduced maintenance costs and reduced failure of transformers, in addition to helping optimize inventory. A TMS should give tools for analysis and help in better decision making. It should provide various statistical tool and help find problem areas. For example, if a particular batch of transformers have a higher failure rate; it may indicate possible manufacturing defects. Another example is where transformers on a particular feeder have a higher failure rate; it may indicate overloading of that feeder. Additionally by pulling information regarding loading from the metering IT system the TMS should provide risk assessment and probability of failure based on current and historical loading and other historical information. TMS should come up with preventative maintenance schedule so that unplanned outages and failures can be reduced. The TMS, like other systems, should be a web-based system so that employees can access information from various locations. Employees at different levels should be able to see up-to-date data and relevant information based on their position within the organisation. However, like some other operational data, it is the sub-division and
30
field offices which truly require the detailed data, not the circle, zone, or corporate offices. In addition, it is these lower layer offices which must update the data through their day-to-day operations, since they are the ones responsible for the physical changes. Additionally TMS should integrate with other IT systems such as GIS, Inventory management etc. By integrating TMS with inventory and GIS, it will aid in maintenance and repair work, and also help to optimize placement of transformers in order to reduce overloading or improve utilization of transformers. Additionally by integrating TMS with customer & billing data from the TRM and DT and feeder metering data, it will aid in energy auditing. The TMS should be able to provide alerts or reminders to employees through email or SMS for various tasks, such as a reminder message for preventative maintenance.
6.2.5 Inventory Management System (IMS) TMS can be considered a specialized case of inventory management. Electricity distribution companies need to ensure equipment and supply inventories are available when and where needed, optimize costs and resources, maintain productivity to meet demand and service quality. A well designed Inventory Management System (IMS) could facilitate many business improvements, beyond improving transparency. The company could evaluate the cost of inventory, optimize inventory levels in terms of holding costs and availability, reduce excess inventory, and assess availability issues impacting project work performance, evaluate supplier performance and determine risks. An inventory management system should provide necessary information and analytical tools. It should evaluate historical inventory levels, turnover, and usage as well as forecast needs. It should be able to evaluate supplier performance metrics in terms of on-time delivery, quality of delivery, and costs. Improved vendor management will allow the GESCOM to choose vendors that can provide the products most quickly and most consistently and maintain quality. A very fundamental question about inventory management is the timescale of data updates. Online data is different from real-time, and these have different business drivers. Making data on-line is a component of a more sophisticated system that may be real-time, but captures many of the operational benefits described above. A computerized, on-line system, most importantly, should provide for the required approvals, checks, and balances that are today done through the ledgers and indents.
6.2.6 ERP/MIS Enterprise Resource Planning (ERP) is a process or an approach to aggregate and integrate all the company’s resources into one system. This one system is usually a large computerized system, where all kinds of data are standardized and systematically organized for improving the overall efficiency of the organisation. This system is not only used for getting all the organisation’s data and resources under one roof but it also helps in day to day functioning and future planning of the organisation’s activities. It reduces the dependency of one department over the other and helps in effective use of time and resources.
31
ERP software is multi-module application software that integrates activities across functional departments, such as finance, projects, human resources, supply chain and customer care. It helps schedule resources, which is a key issue for any entity facing manpower challenges. Long-term HR planning is a substantial task in and of itself, and some utilities may take steps towards HR software as a precursor to broader ERP solutions. It is important to recognise that in Karnataka, ESCOM employees actually have their appointments and files held by KPTCL – any ESCOM HR solution should ideally coordinate with KPTCL. Beyond internal ERP usage, ERP can also help manage operational activities and workflow. For an electric supply company, this could involve aggregating all the information on its assets and customers, from the planned usage to the under or overuse of their assets. This integration of all the forms of data would result in complete mapping of the organization and help in realizing the eventual goal of an IT roadmap. The current situation of not having an ERP system, results in compartmentalization of data into silos, making work flow a straight top to bottom flow, and limits the inter-department information flow in the organization. While the top-down approach is well established especially in India, as we move ahead it needs to change and become a matrix like structure where information flows across departments, and data sharing is based on business processes. The process would involve the recognition of all the resources, preparing the necessary templates followed by effective and secure data migration and finally managing mapping the enormous heterogeneous data to make it useful to everybody. ERP systems can have certain drawbacks (such as increasing complexity, intermingling of responsibilities, etc) but for a large organization with a single goal it can have more advantages than disadvantages. Eventually, it is up to the organization to make the value out of ERP and make the investment worthwhile as well as profitable. One challenge is that ERP’s benefits require a full-fledged implementation, integration into business processes, and even some changes in the current operation structures (a transformation as per Figure 3). Planning for any changes through an IT system (also known as “change management”) is a key challenge for any enterprise. Another important system is Management Information System (MIS). This can be defined as a planned system of “collecting, processing, storing and disseminating data in the form of information needed to carry out the functions of management”.7 This is clearly more than just report-generation, which is the main functionality of today’s rudimentary systems. MIS has also some differences with ERP as ERP incorporates elements that are not necessarily focused on decision support. A well integrated MIS can help provide critical data for regulatory agencies and the company’s corporate measurement system for both strategic and daily control. An MIS should provide reports with different format for different levels of employees. The particular reports will vary according to the individual needs and functional requirements. There are certain types of MIS reports, such as:
7 http://en.wikipedia.org/wiki/Management_Information_System
32
• Periodic scheduled reports: These are produced on a regular basis in a pre-specified basis on a weekly, monthly and/or yearly basis. They may include progress on various works and monthly or quarterly financial statements. Such reports are generally required by the regulator.
• Exception reports: These are produced only when certain events occur, for example if AT&C loss increases substantially in some area. These reports bring such exceptions to the attention of the management so that they may take action.
• Demand reports: These are produced whenever requested by some top official and allow the company to give quick responses to request for information.
• Push report: These are reports sent to employees that contain information that is likely to be of value but which is normally not known to that particular employee.
With an MIS the management can monitor implementation of projects and status changes. It should eliminate multiple entries into different systems and the dependence on offline reporting which consumes lot of time and is prone to errors. Staff would spend less time keying in data or otherwise duplicating work effort, hence reducing the administrative burden for the company.
6.2.7 CRM CRM can be defined as the strategic use of information, processes, technology and people to manage the customer's relationship with your company (marketing, sales, services, and support) across the whole customer life cycle.8 Customer Relationship Management (CRM) is an approach to organizing a company's interactions with customers that starts with a customer-centred point of view. It is not a single activity or technology but is a process that is used to understand the customer's needs and behaviours in order to develop a stronger relationship with them. In the future, as competition (especially for larger and more lucrative customers) emerges, CRM will become more and more important. Customer information is an asset that should be managed. It impacts operations. E.g., some companies use CRM to prioritize workflows to make sure their “best” customers are serviced first. In order for CRM to achieve its end goal data needs to be made available to those involved in implementing the CRM. Acquiring, storing, distributing and using customer data is critical to the performance of CRM.9 One way to think of CRM is in terms of the layers involved:
1. Database: The customer information database is the foundation for the execution of CRM strategy.
2. Interactions: Interactions with customers involve call centres (many utilities already have or are considering 24 hour call centre and toll-free line), service centres (where staff can provide direct service), online (through the internet), SMS (may include bill payment deadline alerts or other common information).
3. Medium: This includes the company staff/customer service representatives, who need to be trained to use the CRM software in order to respond to
8 Judith W. Kincaid, “Customer relationship management: getting it right”, Prentice Hall 2003 9 F. Buttle, "Customer relationship management: concepts and tools", Butterwoth-Heinemann, 2004
33
customer needs. The internet is becoming an important medium for interacting with customers. Customer can access the company’s web site for useful information. Some distribution companies put the customer’s bill information online and even have facility for online payment through credit card. Given that in some areas internet availability is low or customer technological awareness is low, mobile phones could be used. Considering the exponential growth of mobile phone penetration in semi-urban and even rural areas in India, SMS could be used since it is a simple and increasing widely used medium. Of course, such consumer friendly initiatives like bill intimation, payment reminders, etc. all have costs, but these may result in not just improved satisfaction but also revenues if payments become more forthcoming.
4. Tool: CRM software is not the focus but it is a tool that the company can use. To provide maximum benefit it should be part of the utility’s integrated information system. Call centre support is a crucial part of any CRM solution. The CRM software should enable the call centre operator to access both historical information as well as current status, to enable them to answer a customer’s query or facilitate grievance redressal. The software should integrate various interactions such as person to person, phone and email so as to have a complete history of customer interactions. One could even imagine proactive solutions in the future, where information on outages (scheduled and unscheduled) is intimated to the consumer in a “push” mechanism.
5. Result: CRM success can be judged on the basis of customer satisfaction. Increased customer satisfaction should be one of the company’s main goals. One of the ways that utilities can increase customer satisfaction is to increase the convenience of bill payment by allowing payment at more locations and through a variety of methods. Other than their cash collections centres, they may include Any-Time Payment (ATP) kiosks, Electronic Clearing Scheme (ECS) through banks and Post Offices. GESCOM should, in collaboration with the postal department, consider accepting bill payment in post offices; especially in rural areas since the postal department already has the infrastructure and cash handling facility. Utilities should also explore the possibility of collaborating with banks since they already have ATM machines in many locations and may want to build more. By such collaboration the capital costs for these kiosks could be split between the two businesses. GESCOM could also set up or utilize a common service centre similar to the MysoreOne or BangaloreOne project – a one stop interface with government, where citizen interactions with government departments will be under a single umbrella.10
Currently information usually sits at different locations (often on paper records) and there is a lack of a unified source of information regarding customers. A unified database containing data such as customer's name, address, details of meter, history of interactions etc that integrates all relevant information and stores it in digital form for authorized employees to easily access through the web, is essential. Customer databases generally serve two functions: operational and analytical. Hence there are at least two approaches to CRM which focus on different aspects. 11
10 http://www.bangaloreone.gov.in/ 11 http://en.wikipedia.org/wiki/Customer_relationship_management
34
Operational CRM: Its operational function is to help in everyday running of the business. For example at a call centre a Customer Service Representative needs access to a customer records in order to answer queries. Operational CRM provides support to "front office" business processes, e.g., to sales, marketing and service staff. Interactions with customers are generally stored in customers' contact histories, and staff can retrieve customer information as necessary. The contact history provides staff with immediate access to important information on the customer, eliminating the need to individually obtain this information directly from the customer. Analytical CRM: It analyzes customer data for a variety of purposes such as designing and executing targeted marketing campaigns, analyzing customer behaviour in order to make decisions relating to products and services, Management information system for financial forecasting etc. Analytical CRM generally makes use of data mining and other techniques to produce useful results for decision-making. Because of the company-wide size and scope of many CRM implementations, significant planning is essential for smooth roll-out. One of the primary functions of CRM software is to collect information about customers. When gathering data as part of a CRM solution, a company must consider the desire for customer privacy and data security.
6.2.8 SCADA/DMS A SCADA/DMS (Supervisory Control and Data Acquisition/Distribution Management System) enables supervision, control, optimization and better management of the distribution network.12 The system enables utilities to collect, store and analyze data from hundreds of data points in their networks and provides integrated, accurate and cost-effective management of distribution networks by providing control room operators with advanced computerized facilities allowing them to:
• Monitor the network connectivity • Analyze network and feeder load flows, both in real-time and in study modes • Carry out simulations of distribution power flow • Analyze all types of network faults and minimize down time • Define and test (in study mode) the results of switching sequences • Facilitating short-term and long-term network planning studies • Pinpoint faults and pre-empt outages
The system must be able to detect, display and log alarms and events. When there are problems, the SCADA system must notify operators to take corrective action. A Knowledge Based Systems (KBS) can be used to identify events and assists operators for the post-fault analysis. Alarms and events should be recorded so engineers or programmers can review the alarms to determine what caused the alarm and prevent them from happening again. Any SCADA/DMS should be integrated with other IT systems. In the short term, there will be feeder-level SCADA throughout Karnataka made available from 12 SCADA also operates independent of a DMS, across other segments of a power system.
35
KPTCL/LDC, and this needs integration into the utility’s IT system. In particular, the combination of DT metering and SCADA will allow real time monitoring of the network and actual calculation of Medium Voltage losses.13 It should draw in customer data and also communicate with the CRM to extract data such as trouble phone calls and feedback outage status information so that the call centre will have the necessary information to respond to customer enquiries. It should also interact with the asset management system and GIS to exchange data regarding network model and fault reports. Integration of SCADA data becomes easier if they follow OPC standardization; if that is not the case already, all the ESCOMs should request that from KPTCL. Eventually utilities should move towards a seamless integration between all operational systems such as SCADA/DMS and GIS and other information management systems. For example in an outage restoration process, the engineer can access maintenance information related to a specific fault directly from the SCADA system, location information from GIS and asset information from the asset management system, in order get complete information and hence speed up the restoration. Power utilities all around the world are increasingly adopting Substation Automation System for their grids and substations. Substation and Feeder Automation functions may include supervisory control and data acquisition from circuit breakers, tap changers, capacitor banks, line reclosers etc. Objectives may include improvement in efficiency, system reliability, power quality, and customer service. There are significant cost savings that can be achieved through the use of substation automation. However, the investments for these are large, and cannot be lumped into IT investments. Some of these projects can be funded under R-APDRP part B.
6.3 Service Oriented Architecture How does one achieve integration of the various components of IT systems? The information systems in utilities can be classified into three groups: (1) Asset oriented: Transformer Management System, Geographic Information System, and Enterprise Resource Planning (2) Operations oriented: SCADA and DMS; and (3) Customer oriented: Customer Relationship Management. Historically these systems have been built up over time as separate units without thought given to future integration. As a result the IT infrastructure is heterogeneous and spread across operating systems, applications, and software format. Utilities should be prepared to make quick changes by leveraging existing investments in IT infrastructure to address newer business requirements; instead of scrapping the existing system and starting from scratch. They should use an architecture that supports upgrading to newer methods of interaction with customers and vendors. Service Oriented Architecture (SOA) with its loosely coupled nature allows businesses to plug in new services or upgrade existing services in a granular fashion, to address the new business requirements.
13 This requires all the DTs in a feeder be metered.
36
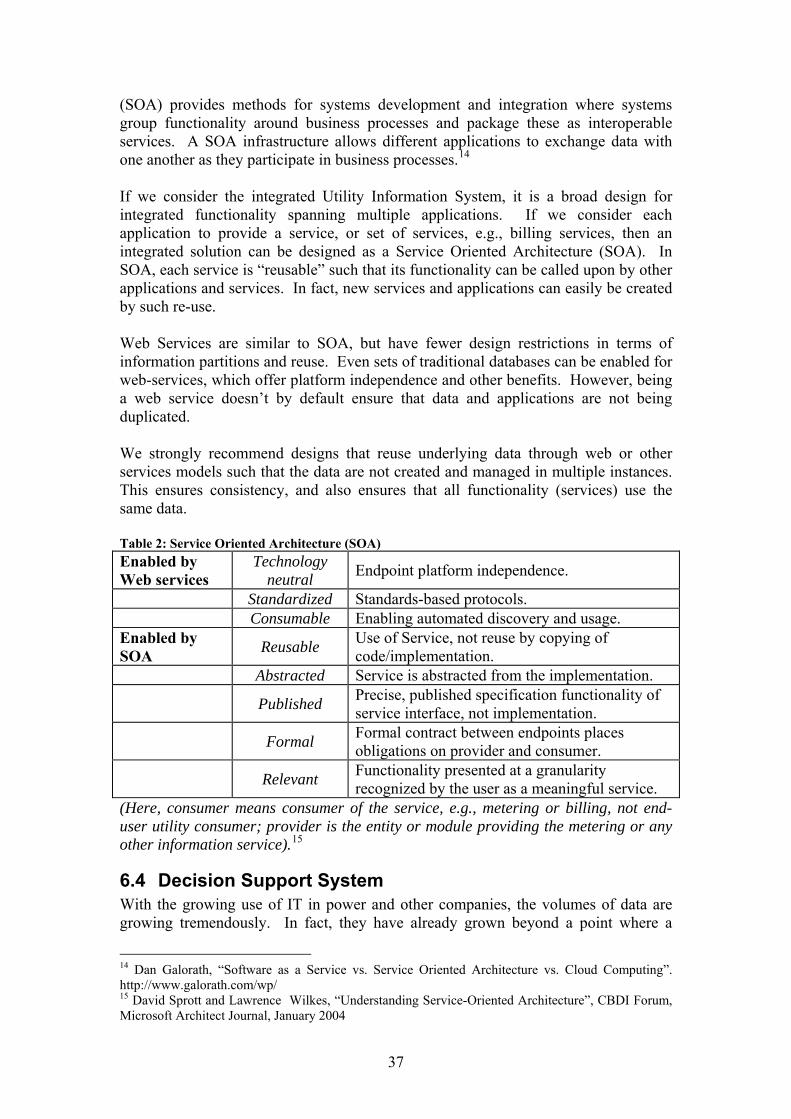
(SOA) provides methods for systems development and integration where systems group functionality around business processes and package these as interoperable services. A SOA infrastructure allows different applications to exchange data with one another as they participate in business processes.14 If we consider the integrated Utility Information System, it is a broad design for integrated functionality spanning multiple applications. If we consider each application to provide a service, or set of services, e.g., billing services, then an integrated solution can be designed as a Service Oriented Architecture (SOA). In SOA, each service is “reusable” such that its functionality can be called upon by other applications and services. In fact, new services and applications can easily be created by such re-use. Web Services are similar to SOA, but have fewer design restrictions in terms of information partitions and reuse. Even sets of traditional databases can be enabled for web-services, which offer platform independence and other benefits. However, being a web service doesn’t by default ensure that data and applications are not being duplicated. We strongly recommend designs that reuse underlying data through web or other services models such that the data are not created and managed in multiple instances. This ensures consistency, and also ensures that all functionality (services) use the same data. Table 2: Service Oriented Architecture (SOA) Enabled by Web services
Technology neutral Endpoint platform independence.
Standardized Standards-based protocols. Consumable Enabling automated discovery and usage. Enabled by SOA Reusable Use of Service, not reuse by copying of
code/implementation. Abstracted Service is abstracted from the implementation. Published Precise, published specification functionality of
service interface, not implementation. Formal Formal contract between endpoints places
obligations on provider and consumer. Relevant Functionality presented at a granularity
recognized by the user as a meaningful service. (Here, consumer means consumer of the service, e.g., metering or billing, not end-user utility consumer; provider is the entity or module providing the metering or any other information service).15
6.4 Decision Support System With the growing use of IT in power and other companies, the volumes of data are growing tremendously. In fact, they have already grown beyond a point where a
14 Dan Galorath, “Software as a Service vs. Service Oriented Architecture vs. Cloud Computing”. http://www.galorath.com/wp/ 15 David Sprott and Lawrence Wilkes, “Understanding Service-Oriented Architecture”, CBDI Forum, Microsoft Architect Journal, January 2004
37
person cannot make sense of them manually, and this will only get worse as we move towards on-line and then real-time systems.
Data → Information → Knowledge → Wisdom (Business Intelligence)
If we consider the above chain, data is just the first step in what we ask of IT. Decision Support Systems (DSS) are a specific class of computerized information systems that supports business and organizational decision-making activities.16 A DSS helps a manager or decision-maker retrieve, summarize and analyze decision relevant data.17 DSS helps managers answer questions relevant to a decision situation. The questions may be sophisticated and complex or simple. For example, a manager may query a database to find out the total collections situation for the past year and which areas had the maximum arrears. Other typical information that a decision support application might gather and present would be an inventory of all of your current assets or the consequences of different decision alternatives, given past experience in a context that is described. The three fundamental components of DSS architecture are:
1. the database, 2. the model (i.e., the decision context and user criteria), and 3. the user interface.
The DSS requires information support from a relational database management system (RDBMS). The database module provides several data management functions required to administer the DSS. The DSS database can be a distributed database with some components internal to the DSS and others external to it. External to the DSS are utility MIS databases that may be drawn upon to supply the utility information. The key to successful use of the DSS is the user interface. The user interface should be as simple as possible. Users should be able to make selections using easy-to-use menus, enter data in forms and visualize results in a variety of tables, plots and charts. Errors should be colour-highlighted to quickly point out problems. Benefits of DSS:
1. Improves personal efficiency 2. Expedites problem solving 3. Increases organizational control 4. Generates evidence in support of a decision
Helps automate the Managerial processes.
6.5 Data Storage Data Storage, as evident from the name, covers aspects of making all the data and information stored safely, securely, and in an accessible manner. We cover
16 http://en.wikipedia.org/wiki/Decision_support_system 17 This need not be high-up in the corporate hierarchy – even field staff make decisions on what activity to do when, where, how, etc.
38
GESCOM-specific architectural and ownership issues of data in section 8.2, and focus on general storage design and principles below. Effective data storing is not a straight forward task. It needs thorough understanding of the organization, planning and efficient implementation of modern storage techniques. For an existing electric supply company, the data can lie in ledgers as well as on the computer system. The different forms of data need to be collected, organized and eventually inputted in a common format. This requires choosing a common platform, creating the required and well planned data tables and eventually entering the huge amount of data collected over years into a database. Computer Data Storage not only requires additional hardware and relevant software, but also manpower to initialize the data storage and later to maintain the data efficiently and securely. The various roles involved in Data Storage could range from Data Storage Administrator to people responsible just for data entry. The task would require more effort in the beginning but once the setup is ready with the existing data, then in theory even current employees if given adequate training could continue to update the data. Data storage means not just entering data in electronic form, but also storing it securely, having multiple back-ups at multiple locations/servers and making data available easily, quickly and in the required manner when and where required (to the person having access rights ). Backing up data on a CD is not recommended for multiple reasons. Firstly, where will the CD be kept? Keeping CDs near the computer on whose hard-drive the original data is stored, is not recommended for disaster recovery reasons. More importantly, CDs have an unpredictable and short life, sometimes a few years at most. Back-ups should be online so as to be available as and when required, with off-line backups as well. At a data centre level, all the data should also be housed in a geographically diverse location, i.e., a disaster recovery centre. Data Storage is an important requirement in the modern digital world. It is basis for successful ERP and MIS implementations. Well organized data empowers the managers of an organization to make insightful decisions. It helps in tracking issues and preventing further problems. Secured Data storage provides good accountability and understandability of and for an organization. An important requirement for additional security and differentiability recommended in the R-APDRP System Requirement Specification (SRS) is that data for transaction processing should be stored separately from data for decision support. However, the architectural implications (e.g., which data is to be used when there is a conflict) is not fully spelled out). Even R-APDRP recommends some data be available in remote locations so as to not rely on the network. We recommend remote storage of “some” data be enhanced so that all required data can be mirrored at field locations, with only that small subset of data kept for local needs. The cost implications are small from a hardware perspective. What this will require is slight re-engineering of the applications to handle such semi-synchronous modes. There are also implications for licensing, but these should be investigated in more detail. Possible workarounds include virtualization and use of VPNs.
39
Licensing appears to drive some of the design of software as well as networking. This can lead to functional limitations or burdens on the type of network required. E.g., some instances have been seen where client licensing was limited to one or a few (“n”) users only on the same network (local area network). While the number of concurrent users is a commercial discussion, the *location* and type of network for such users should be left to GESCOM. The licensing should be ESCOM-wide, and should allow any IP address (with possible controls) to be used for client applications.
6.6 Security Electricity is a critical infrastructure, and thus its data is also critical. Billing and off-line data must be made available as and where required, but if data is used in operational (live) functionality, then it becomes absolutely critical to properly plan for data and IT security. It is worth emphasizing that the best security is by design, not as an add-on. Security is a multi-layer and multi-faceted process. One of the most basic is server/database level security. This basically asks the database administrator to have a secured server, with limited access to only the persons concerned. Along with that as data comes in and goes out across various domains, there needs to be control over the same, especially if a web service is employed. This means that
• Employees at various levels of the hierarchy should be able to access only specific data depending on the requirements
• Outsiders should not be able to hack into the system (especially if there is a VPN used to connect)
• There should be some restrictions on using external storage devices like pen drives (as it could result in theft of data)
• If there is a web service, then access control needs to be stronger to avoid hacking and virus attacks. This could mean that certain data can be accessed only on certain machines in the system.
• Customers should have access only to the required information about their account. Major changes (such as service shut down) should not be completely (remote) web enabled. Even when changes are made, there must be logging of all changes that are made.
The above list can go on with more and more complicated issues in data security arising everyday. It is important to not only follow guidelines from R-APDRP but add security functionality into all the solutions beyond those covered by R-APDRP. Some of the important guidelines include tracking key system accesses (generating log trails), time-stamp based auditing methods, exception reporting (trigger an alarm, if security audit fails), detailed system access tracking and maintaining audit trails in tamper proof environment along with disaster recovery. Other system integrity related guidelines include user process protection, versioning, version consistency checks. System maintenance and update, data input checks, integrity check for data passed over communication channels and data lock transfer (that is when one process like encryption or transfer is taking place, during that time
40
data cannot be updated or changed). Confidentiality, Networking and Data Transfer specifications include encryption of important documents, purchaser and customer specific information and well labelled data transfer across internal networks and encrypted for external networks. Other security measures include XML based security Web security schemes (XML digital signature and encryption, XKMS, SAML, etc.) and control over software change and updates. Besides that, as privatization and outsourcing is prevalent and the possible future of this industry, it makes data security all the more important. It is important that though the data maybe collected by an outsider it should be stored in the electric company’s sever, and the outsider should not have access to the data however insignificant it seems. Maintaining data security and a successful audit should be a primary concern when privatization or outsourcing takes place. This should also be done by following Information Systems Audit and Control Association (ISACA) standards, guidelines and procedures. ISACA has detailed information related to IT auditing which could also be important when it comes to maintaining security. All IT solutions, in the long run, should have their designs audited to prove security is part of the design, e.g., segregation of duties and roles, proper data and application separation, etc. Finally each employee needs to be given the required instructions and guidelines with respect to access and usage of information on the system and outside the system, to minimize risks and create the required awareness. Knowledge of vulnerabilities, enforcement of guidelines, and common sense are keys to data and IT security. Employees are especially critical since, contrary to what many people believe, most attacks or failures occur from within an organization, not outside, either through accident, negligence, or malicious actions.
41
7 Assessment of Current IT
7.1 Status of Current IT Systems
7.1.1 Consumer Meter Reading, Billing and Collections Computerization of billing has been implemented in all 41 sub-divisions of GESCOM. Computerized billing enables dispensing with manual ledgers and minimizing the chance of human error. The billing operation has been outsourced and meter readers carry out ‘spot billing’. Spot billing has been introduced in some locations. Spot billing is where the meter reader reads the energy consumed, provides the customer with a bill and sometimes even receives the payment. Meter readers are equipped with hand held devices, i.e., spot billing machines (SBMs), into which they enter the energy reading and which then print out bills. The SBM is loaded at the beginning of the day with a set of records / information based on which the meter data needs to be collected. This includes parameters pertaining to the installation and the previous reading. The meter reader follows a route to collect the required data and issues the bills. At the end of the day, the meter reader downloads the data into a computer, where the master data base gets updated. Meter readers come to the subdivision office to download consumer data for consumers on their route, and to upload the meter readings to the computer. Each reader reads approx 150 installations per day on average. In rural areas, each Panchayat selects a “Gram Vidyut Pratinidhi” (GVP) to carry out the various activities related to supply of electricity, such as meter reading, billing, collection and attending to consumer grievances. This concept was pioneered at HESCOM in 2003 and later extended to all ESCOMs in Karnataka. The compensation for GVPs is structured as follows - Rs. 2000 upto base line, 6% incentive on incremental collection and penalty of 2% on shortfall below base line collection. Also 20 paise per additional installation over 1200 installation per GP/per month is paid. The collection efficiency in urban areas is about 95% but is much lower in rural areas. Currently there are 4 different agencies (Ensoft, New Horizon, CSS Enterprises, and Bellary Computer Solutions) which have developed and implemented four different billing and collections software packages, called Total Revenue Management (TRM) packages. These software packages lack inter-operability. The front end is VB based whereas the back end is Oracle and SQL. There are some problems with SBMs such as breakdown of the machines. Also GESCOM meter readers did not receive adequate training to use the machines. The original contract for operating the TRM system was for 1 year, but agencies have been given extensions for past 5 years, since GESCOM has been unable to develop in-house capability.
42
The TRM solution (software and hardware) costs Rs. 2.4 per customer per month (billing cycle). In each subdivision the customer data is stored on the hard-drive of the computer. This data is backed up by burning it onto ordinary Compact Discs at the end of every month. These CDs are sent to the vendor’s head office by post or courier. After error checking and processing the vendor sends a report to the subdivision. This monthly billing report is then sent by each subdivision to the GESCOM corporate office. The vendor usually keeps a copy of the data but this arrangement may not last once the contract with GESCOM expires. The vendor also sends a copy of the raw consumer data on CDs to GESCOM’s corporate head-office by post. However the GESCOM corporate office does not have a copy of the proprietary software used by the agencies, and is, hence, unable to view the database. As per the contract for security the TRM databases can only be viewed by using the respective TRM software packages. Currently LT customers have electromagnetic energy meters while HT customers have ‘high-precision’ electronic meters. For customer meters GESCOM is in the process of replacing the old electromagnetic meters with static meters. This project is estimated to take 3 years. Customers can pay their bills at local cash counters. Electronic Clearing Service (ECS) facility for payment of bills does not exist. Additionally for bill payment there are 6 Any Time Payment (ATP) kiosks at GESCOM premises in various locations. The contract for maintenance has been given to Accel Transmatic Ltd. and the Annual Maintenance Contract costs GESCOM Rs. 46,000 per annum per ATP. An additional 4 ATPs are planned on a model similar to the ‘Bangalore One’ concept where different utilities, e.g., electric, water & municipal share the ATP kiosk.
7.1.2 Distribution Transformer (DT) metering An initiative for Remote Automatic Meter Reading (RAMR) of DTs has been taken up in GESCOM, in order to achieve accurate energy audit with minimum human intervention. Three agencies (Omni Agate, L&T, and Secure Meters) have been awarded contracts for this project. The target is to meter 100% of urban DTs and 25% of rural DTs. The total cost of the project is Rs. 58.94 Crores. Each of the three agencies has built their own database, their own interface and their own structure. The data from the 3 cannot be combined into a single database since the data formats are incompatible GSM is used for communicating with the meters. The agencies use a variety of service providers (BSNL, Airtel, Vodafone etc.) depending on their respective coverage area. The meters have memory capable of storing 35 days data. The data for an entire month is downloaded once each month. Monthly reports are being created using this data, which include the energy consumption, voltage profile and outage reports.
43

The DT metering has been completed in Gulbarga city. In rural areas out of the awarded number 6750, DT metering has been completed for 3026 DTs. Only DTs rated 63 kVA and above are being metered. The choice of which DTs are to be metered was based mainly on size and to ensure wide distribution – this means for any feeder, all the DTs are not metered.
7.1.3 Geographical Information System (GIS) GIS has not been implemented at GESCOM.
7.1.4 Website and Email GESCOM has a website www.gescom.in which has details of the services provided, tariff, contact details of employees etc. Customer can also send feedback email directly to the MD through the website. The website was designed and hosted by Dastur & Company. GESCOM does not have corporate email. A server was purchased for this purpose but is currently lying unutilized. The employees use Gmail, yahoo etc for email.
7.1.5 Network All offices down to the subdivision level have internet connectivity. The corporate office has a 256 kbps leased line (through BSNL) which costs approximately Rs. 2.2 lakh per annum; for internet access of all PCs at corporate office through a gateway (Two X-series 225 IBM servers). LAN has been established at corporate office (extended to O&M Zonal office at Gulbarga) using UTP-5 cable. The network does not extend to nearby offices such as the sub-division (billing and collection centre).
7.1.6 Management Information System The MIS system at GESCOM is in the form of reports, letters, and files. The data related to monthly Demand Collection Balance (DCB) statements, technical and financial parameters are maintained in Excel files or in hard copies. GESCOM does not have software application or an online MIS system for reporting. The responsibility for gathering data lies with the AEE of MIS department. Instead of following the hierarchy of the organization, the corporate office collects data directly from subdivision office and then feeds it back to the respective circle, zone and division offices. The data gathering is done manually over the phone or by emailing it. No MIS record keeping is being done at division level. The data received by corporate office often has lots of errors. At subdivision level the data which is in ledgers or paper-files is not entered into electronic form. There is a monthly multi-level review meeting at GESCOM where the progress on various initiatives detailed in the MIS reports is discussed. Records have to be sent to KPTCL and energy dept. regarding performance parameters of GESCOM before the end of the 1st week every month. Consolidated data is sent to KPTCL, which in turn collects reports from all ESCOMs and sends them to the state government. Additionally selected data is sent on quarterly and
44
monthly basis to KERC. Once a year report on accidents (no. of accidents, casualties, losses, compensation paid out etc.) is sent to CEA. Some data is not captured in reporting, e.g., currently if transformer is replaced (after failure or otherwise) with one with higher capacity then this information is not recorded in the data being gathered currently in the MIS report. This information is recorded in the paper ledger at the section offices.
7.1.7 Customer Relationship Management (CRM) GESCOM does not have any software solution for CRM. GESCOM has customer care centres called ‘Soujanaya Kendra’ at all division headquarters.
7.1.8 SCADA – Integrated with KPTCL effort Karnataka Power Transmission Corporation Ltd (KPTCL) is Karnataka's state power transmission utility. KPTCL has awarded ABB Ltd with a Rs 186 crore turnkey contract to implement an integrated 'Network Manager SCADA/ EMS / DMS (Supervisory control and data acquisition, energy management system, distribution management system) solution. The scope of the project includes design, engineering, supply, installation, testing and commissioning of the system. Network manager SCADA/DMS/EMS enables utilities to monitor and control their entire distribution network from a single control room and in real time. This solution incorporates energy and distribution management applications such as load-sharing technology and availability-based tariffs, which encourage users to keep to pre-arranged schedules. These features enable better planning and help to maintain a steady supply of power under normal conditions. They also facilitate quick restoration of power in case of outages, operational flexibility, archived data and reduction in losses caused by outages, besides bringing several operational efficiencies and commercial benefits. The system will enable monitoring and control of 830 main transmission and distribution substations spread across Karnataka. This initiative will significantly help management of the transmission and distribution network for KPTCL and the distribution utilities (i.e., ESCOMs), respectively. Both leased lines as well as VSAT Satellite communication are used for transferring data from substations. All substation related information as well as 11 kV feeder information are collected which need to be seamlessly integrated into ERP packages as planned in future. The SCADA project covers 86 out of GESCOM’s 101 Nos. 33/11 kV sub-stations amounting to Rs. 15.09 crores. The RTUs & Interface panels have been erected at 50 substations and work at balance 36 substations is under progress. According to the plan SCADA at all substations was to be operational by July 2009. The construction work of Distribution Control Centre (DCC) at corporate office in Gulbarga is under progress. It will have a VSAT connection as well as a 2 Mbps leased line from BSNL. There will be 2 servers and 2 workstations in the data centre.
45
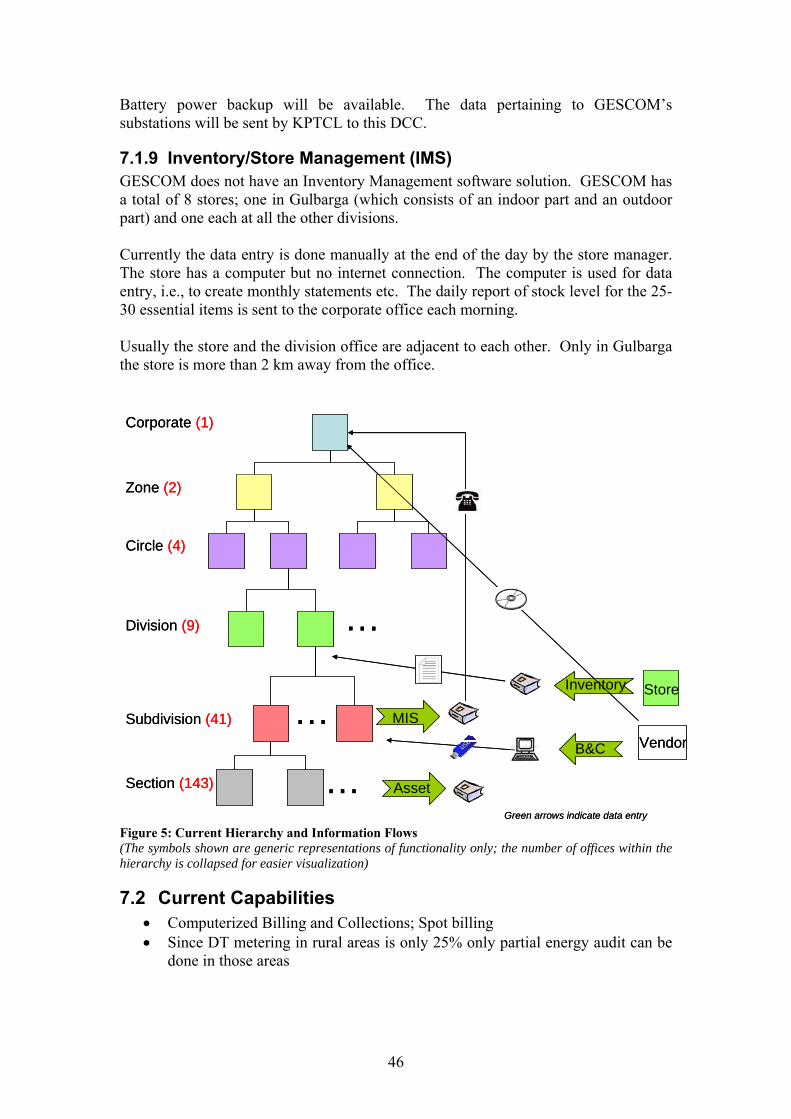
Battery power backup will be available. The data pertaining to GESCOM’s substations will be sent by KPTCL to this DCC.
7.1.9 Inventory/Store Management (IMS) GESCOM does not have an Inventory Management software solution. GESCOM has a total of 8 stores; one in Gulbarga (which consists of an indoor part and an outdoor part) and one each at all the other divisions. Currently the data entry is done manually at the end of the day by the store manager. The store has a computer but no internet connection. The computer is used for data entry, i.e., to create monthly statements etc. The daily report of stock level for the 25-30 essential items is sent to the corporate office each morning. Usually the store and the division office are adjacent to each other. Only in Gulbarga the store is more than 2 km away from the office.
Asset
MIS
B&C Vendor
Inventory Store
Corporate (1)
(2)
(4)
(9)
(41)
(143)
Zone
Circle
Division
Subdivision
Section
Green arrows indicate data entry
…
…
… Asset
MIS
B&C Vendor
Inventory Store
Corporate
Zone
Circle
Division
Subdivision
Section
(1)
(2)
(4)
(9)
(41)
(143)
…
…
… Green arrows indicate data entry
Figure 5: Current Hierarchy and Information Flows (The symbols shown are generic representations of functionality only; the number of offices within the hierarchy is collapsed for easier visualization)
7.2 Current Capabilities • Computerized Billing and Collections; Spot billing • Since DT metering in rural areas is only 25% only partial energy audit can be
done in those areas
46
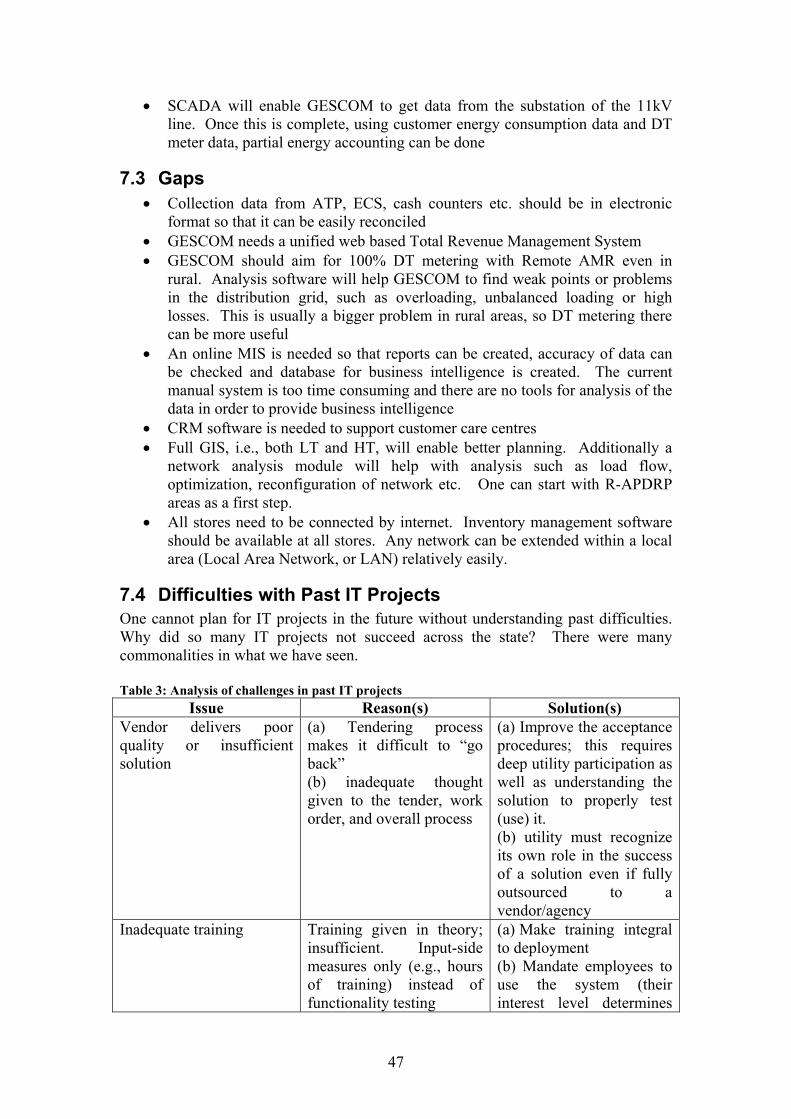
• SCADA will enable GESCOM to get data from the substation of the 11kV line. Once this is complete, using customer energy consumption data and DT meter data, partial energy accounting can be done
7.3 Gaps • Collection data from ATP, ECS, cash counters etc. should be in electronic
format so that it can be easily reconciled • GESCOM needs a unified web based Total Revenue Management System • GESCOM should aim for 100% DT metering with Remote AMR even in
rural. Analysis software will help GESCOM to find weak points or problems in the distribution grid, such as overloading, unbalanced loading or high losses. This is usually a bigger problem in rural areas, so DT metering there can be more useful
• An online MIS is needed so that reports can be created, accuracy of data can be checked and database for business intelligence is created. The current manual system is too time consuming and there are no tools for analysis of the data in order to provide business intelligence
• CRM software is needed to support customer care centres • Full GIS, i.e., both LT and HT, will enable better planning. Additionally a
network analysis module will help with analysis such as load flow, optimization, reconfiguration of network etc. One can start with R-APDRP areas as a first step.
• All stores need to be connected by internet. Inventory management software should be available at all stores. Any network can be extended within a local area (Local Area Network, or LAN) relatively easily.
7.4 Difficulties with Past IT Projects One cannot plan for IT projects in the future without understanding past difficulties. Why did so many IT projects not succeed across the state? There were many commonalities in what we have seen. Table 3: Analysis of challenges in past IT projects
Issue Reason(s) Solution(s) Vendor delivers poor quality or insufficient solution
(a) Tendering process makes it difficult to “go back” (b) inadequate thought given to the tender, work order, and overall process
(a) Improve the acceptance procedures; this requires deep utility participation as well as understanding the solution to properly test (use) it. (b) utility must recognize its own role in the success of a solution even if fully outsourced to a vendor/agency
Inadequate training Training given in theory; insufficient. Input-side measures only (e.g., hours of training) instead of functionality testing
(a) Make training integral to deployment (b) Mandate employees to use the system (their interest level determines
47
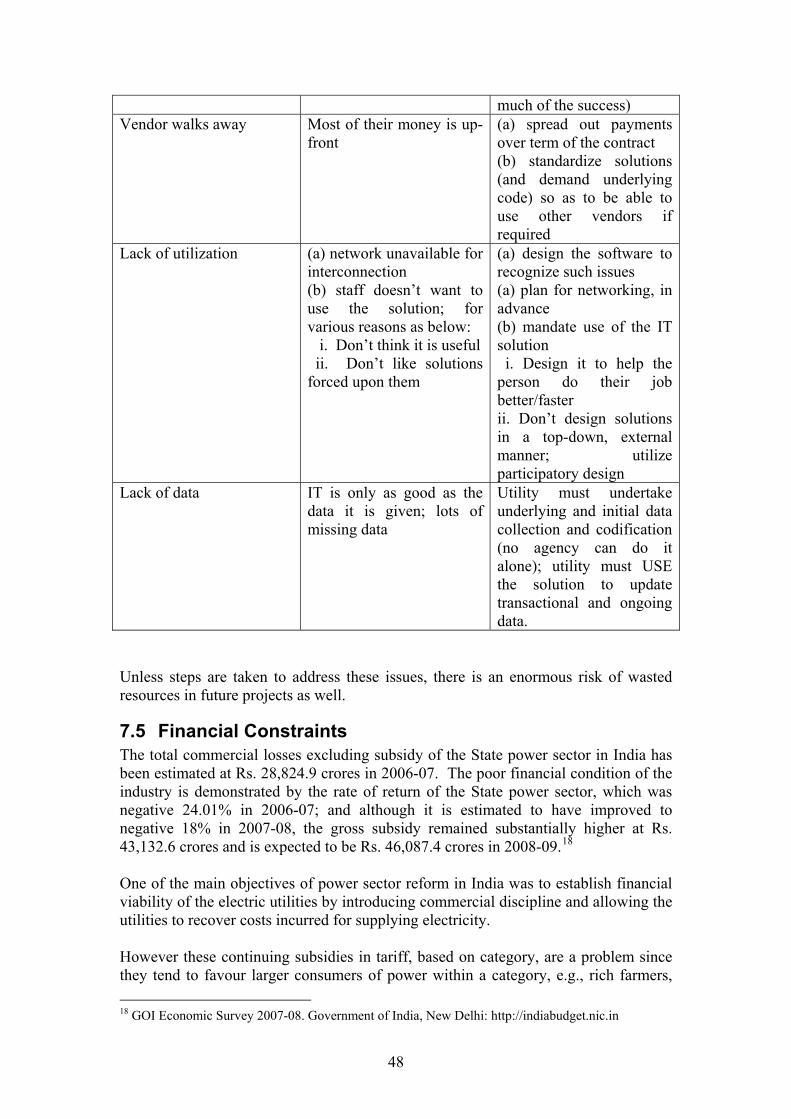
much of the success) Vendor walks away Most of their money is up-
front (a) spread out payments over term of the contract (b) standardize solutions (and demand underlying code) so as to be able to use other vendors if required
Lack of utilization (a) network unavailable for interconnection (b) staff doesn’t want to use the solution; for various reasons as below: i. Don’t think it is useful ii. Don’t like solutions forced upon them
(a) design the software to recognize such issues (a) plan for networking, in advance (b) mandate use of the IT solution i. Design it to help the person do their job better/faster ii. Don’t design solutions in a top-down, external manner; utilize participatory design
Lack of data IT is only as good as the data it is given; lots of missing data
Utility must undertake underlying and initial data collection and codification (no agency can do it alone); utility must USE the solution to update transactional and ongoing data.
Unless steps are taken to address these issues, there is an enormous risk of wasted resources in future projects as well.
7.5 Financial Constraints The total commercial losses excluding subsidy of the State power sector in India has been estimated at Rs. 28,824.9 crores in 2006-07. The poor financial condition of the industry is demonstrated by the rate of return of the State power sector, which was negative 24.01% in 2006-07; and although it is estimated to have improved to negative 18% in 2007-08, the gross subsidy remained substantially higher at Rs. 43,132.6 crores and is expected to be Rs. 46,087.4 crores in 2008-09.18 One of the main objectives of power sector reform in India was to establish financial viability of the electric utilities by introducing commercial discipline and allowing the utilities to recover costs incurred for supplying electricity. However these continuing subsidies in tariff, based on category, are a problem since they tend to favour larger consumers of power within a category, e.g., rich farmers, 18 GOI Economic Survey 2007-08. Government of India, New Delhi: http://indiabudget.nic.in
48
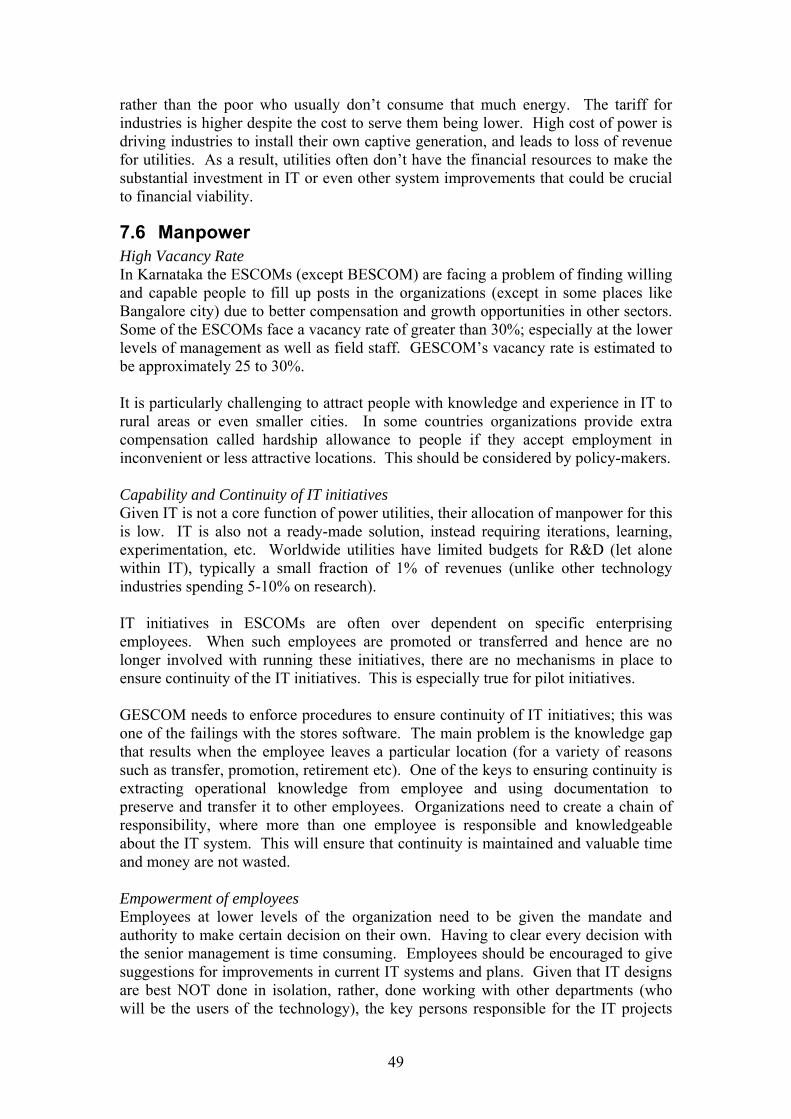
rather than the poor who usually don’t consume that much energy. The tariff for industries is higher despite the cost to serve them being lower. High cost of power is driving industries to install their own captive generation, and leads to loss of revenue for utilities. As a result, utilities often don’t have the financial resources to make the substantial investment in IT or even other system improvements that could be crucial to financial viability.
7.6 Manpower High Vacancy Rate In Karnataka the ESCOMs (except BESCOM) are facing a problem of finding willing and capable people to fill up posts in the organizations (except in some places like Bangalore city) due to better compensation and growth opportunities in other sectors. Some of the ESCOMs face a vacancy rate of greater than 30%; especially at the lower levels of management as well as field staff. GESCOM’s vacancy rate is estimated to be approximately 25 to 30%. It is particularly challenging to attract people with knowledge and experience in IT to rural areas or even smaller cities. In some countries organizations provide extra compensation called hardship allowance to people if they accept employment in inconvenient or less attractive locations. This should be considered by policy-makers. Capability and Continuity of IT initiatives Given IT is not a core function of power utilities, their allocation of manpower for this is low. IT is also not a ready-made solution, instead requiring iterations, learning, experimentation, etc. Worldwide utilities have limited budgets for R&D (let alone within IT), typically a small fraction of 1% of revenues (unlike other technology industries spending 5-10% on research). IT initiatives in ESCOMs are often over dependent on specific enterprising employees. When such employees are promoted or transferred and hence are no longer involved with running these initiatives, there are no mechanisms in place to ensure continuity of the IT initiatives. This is especially true for pilot initiatives. GESCOM needs to enforce procedures to ensure continuity of IT initiatives; this was one of the failings with the stores software. The main problem is the knowledge gap that results when the employee leaves a particular location (for a variety of reasons such as transfer, promotion, retirement etc). One of the keys to ensuring continuity is extracting operational knowledge from employee and using documentation to preserve and transfer it to other employees. Organizations need to create a chain of responsibility, where more than one employee is responsible and knowledgeable about the IT system. This will ensure that continuity is maintained and valuable time and money are not wasted. Empowerment of employees Employees at lower levels of the organization need to be given the mandate and authority to make certain decision on their own. Having to clear every decision with the senior management is time consuming. Employees should be encouraged to give suggestions for improvements in current IT systems and plans. Given that IT designs are best NOT done in isolation, rather, done working with other departments (who will be the users of the technology), the key persons responsible for the IT projects
49
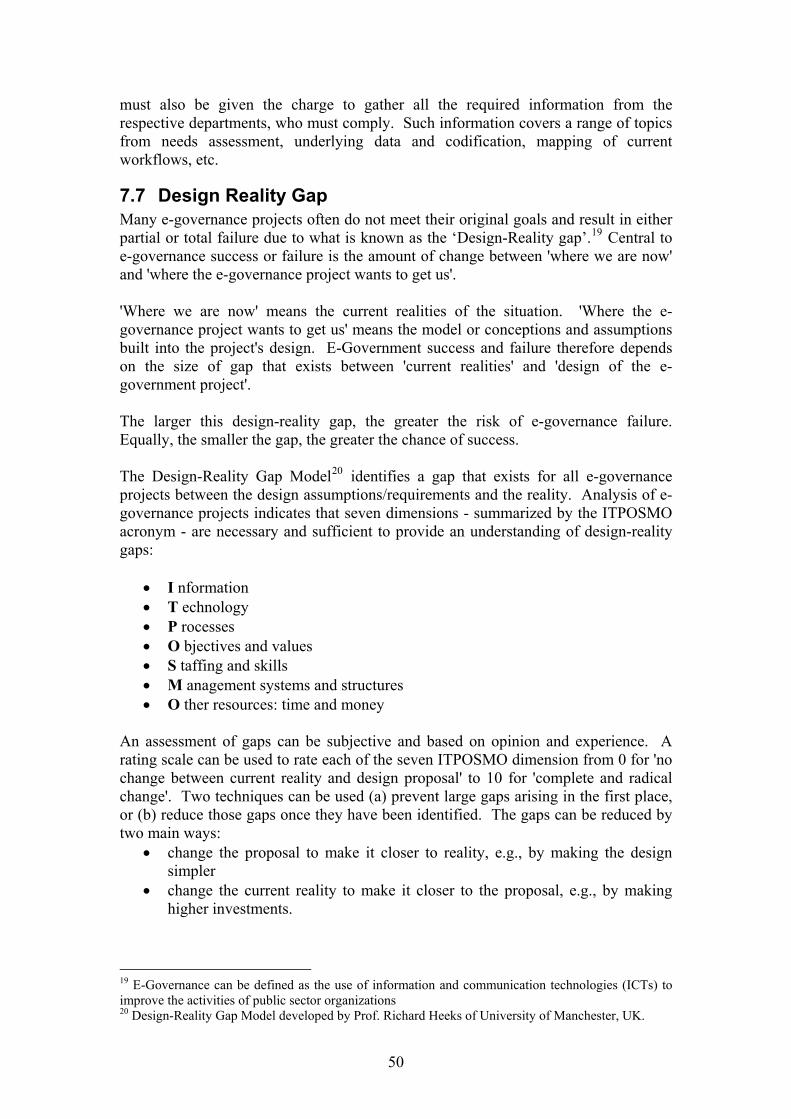
must also be given the charge to gather all the required information from the respective departments, who must comply. Such information covers a range of topics from needs assessment, underlying data and codification, mapping of current workflows, etc.
7.7 Design Reality Gap Many e-governance projects often do not meet their original goals and result in either partial or total failure due to what is known as the ‘Design-Reality gap’.19 Central to e-governance success or failure is the amount of change between 'where we are now' and 'where the e-governance project wants to get us'. 'Where we are now' means the current realities of the situation. 'Where the e-governance project wants to get us' means the model or conceptions and assumptions built into the project's design. E-Government success and failure therefore depends on the size of gap that exists between 'current realities' and 'design of the e-government project'. The larger this design-reality gap, the greater the risk of e-governance failure. Equally, the smaller the gap, the greater the chance of success. The Design-Reality Gap Model20 identifies a gap that exists for all e-governance projects between the design assumptions/requirements and the reality. Analysis of e-governance projects indicates that seven dimensions - summarized by the ITPOSMO acronym - are necessary and sufficient to provide an understanding of design-reality gaps:
• I nformation • T echnology • P rocesses • O bjectives and values • S taffing and skills • M anagement systems and structures • O ther resources: time and money
An assessment of gaps can be subjective and based on opinion and experience. A rating scale can be used to rate each of the seven ITPOSMO dimension from 0 for 'no change between current reality and design proposal' to 10 for 'complete and radical change'. Two techniques can be used (a) prevent large gaps arising in the first place, or (b) reduce those gaps once they have been identified. The gaps can be reduced by two main ways:
• change the proposal to make it closer to reality, e.g., by making the design simpler
• change the current reality to make it closer to the proposal, e.g., by making higher investments.
19 E-Governance can be defined as the use of information and communication technologies (ICTs) to improve the activities of public sector organizations 20 Design-Reality Gap Model developed by Prof. Richard Heeks of University of Manchester, UK.
50
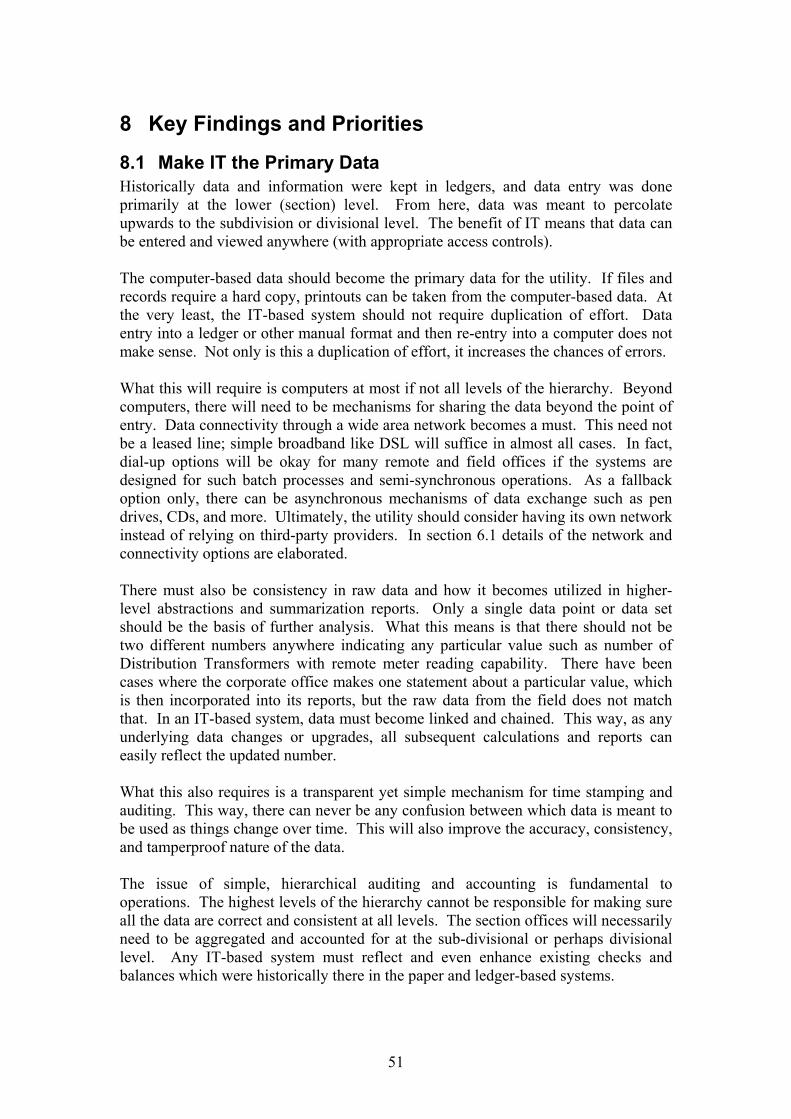
8 Key Findings and Priorities
8.1 Make IT the Primary Data Historically data and information were kept in ledgers, and data entry was done primarily at the lower (section) level. From here, data was meant to percolate upwards to the subdivision or divisional level. The benefit of IT means that data can be entered and viewed anywhere (with appropriate access controls). The computer-based data should become the primary data for the utility. If files and records require a hard copy, printouts can be taken from the computer-based data. At the very least, the IT-based system should not require duplication of effort. Data entry into a ledger or other manual format and then re-entry into a computer does not make sense. Not only is this a duplication of effort, it increases the chances of errors. What this will require is computers at most if not all levels of the hierarchy. Beyond computers, there will need to be mechanisms for sharing the data beyond the point of entry. Data connectivity through a wide area network becomes a must. This need not be a leased line; simple broadband like DSL will suffice in almost all cases. In fact, dial-up options will be okay for many remote and field offices if the systems are designed for such batch processes and semi-synchronous operations. As a fallback option only, there can be asynchronous mechanisms of data exchange such as pen drives, CDs, and more. Ultimately, the utility should consider having its own network instead of relying on third-party providers. In section 6.1 details of the network and connectivity options are elaborated. There must also be consistency in raw data and how it becomes utilized in higher-level abstractions and summarization reports. Only a single data point or data set should be the basis of further analysis. What this means is that there should not be two different numbers anywhere indicating any particular value such as number of Distribution Transformers with remote meter reading capability. There have been cases where the corporate office makes one statement about a particular value, which is then incorporated into its reports, but the raw data from the field does not match that. In an IT-based system, data must become linked and chained. This way, as any underlying data changes or upgrades, all subsequent calculations and reports can easily reflect the updated number. What this also requires is a transparent yet simple mechanism for time stamping and auditing. This way, there can never be any confusion between which data is meant to be used as things change over time. This will also improve the accuracy, consistency, and tamperproof nature of the data. The issue of simple, hierarchical auditing and accounting is fundamental to operations. The highest levels of the hierarchy cannot be responsible for making sure all the data are correct and consistent at all levels. The section offices will necessarily need to be aggregated and accounted for at the sub-divisional or perhaps divisional level. Any IT-based system must reflect and even enhance existing checks and balances which were historically there in the paper and ledger-based systems.
51
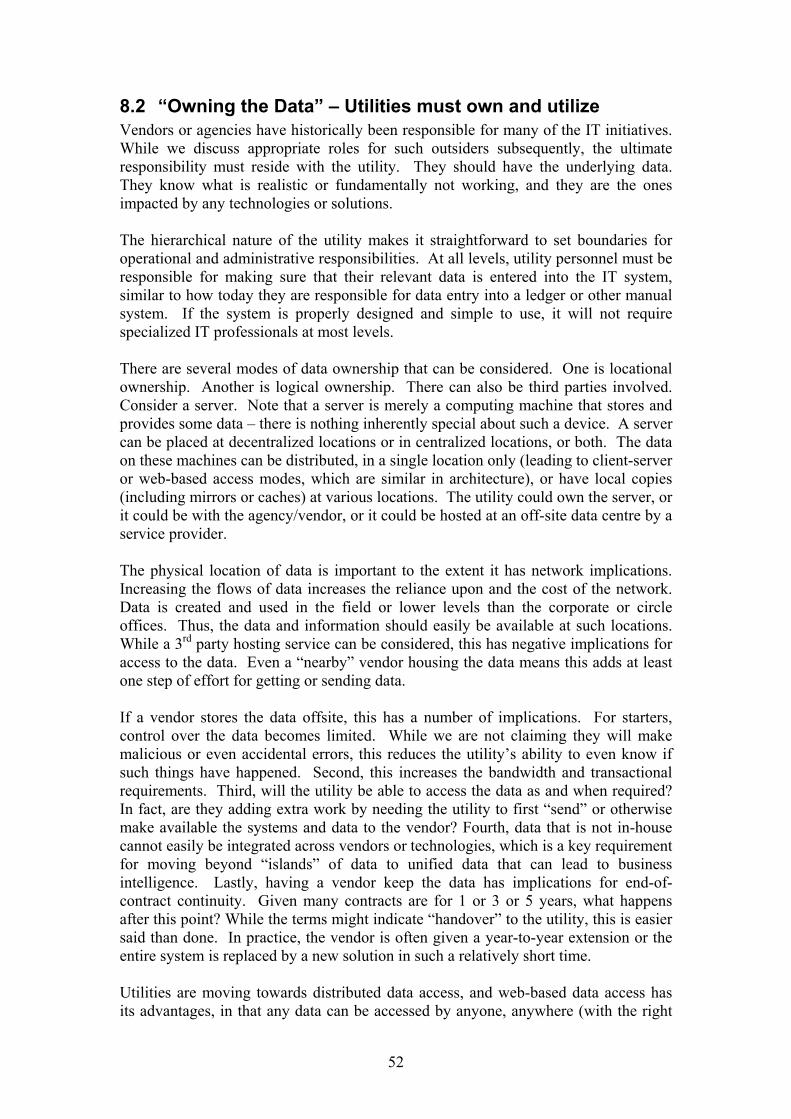
8.2 “Owning the Data” – Utilities must own and utilize Vendors or agencies have historically been responsible for many of the IT initiatives. While we discuss appropriate roles for such outsiders subsequently, the ultimate responsibility must reside with the utility. They should have the underlying data. They know what is realistic or fundamentally not working, and they are the ones impacted by any technologies or solutions. The hierarchical nature of the utility makes it straightforward to set boundaries for operational and administrative responsibilities. At all levels, utility personnel must be responsible for making sure that their relevant data is entered into the IT system, similar to how today they are responsible for data entry into a ledger or other manual system. If the system is properly designed and simple to use, it will not require specialized IT professionals at most levels. There are several modes of data ownership that can be considered. One is locational ownership. Another is logical ownership. There can also be third parties involved. Consider a server. Note that a server is merely a computing machine that stores and provides some data – there is nothing inherently special about such a device. A server can be placed at decentralized locations or in centralized locations, or both. The data on these machines can be distributed, in a single location only (leading to client-server or web-based access modes, which are similar in architecture), or have local copies (including mirrors or caches) at various locations. The utility could own the server, or it could be with the agency/vendor, or it could be hosted at an off-site data centre by a service provider. The physical location of data is important to the extent it has network implications. Increasing the flows of data increases the reliance upon and the cost of the network. Data is created and used in the field or lower levels than the corporate or circle offices. Thus, the data and information should easily be available at such locations. While a 3rd party hosting service can be considered, this has negative implications for access to the data. Even a “nearby” vendor housing the data means this adds at least one step of effort for getting or sending data. If a vendor stores the data offsite, this has a number of implications. For starters, control over the data becomes limited. While we are not claiming they will make malicious or even accidental errors, this reduces the utility’s ability to even know if such things have happened. Second, this increases the bandwidth and transactional requirements. Third, will the utility be able to access the data as and when required? In fact, are they adding extra work by needing the utility to first “send” or otherwise make available the systems and data to the vendor? Fourth, data that is not in-house cannot easily be integrated across vendors or technologies, which is a key requirement for moving beyond “islands” of data to unified data that can lead to business intelligence. Lastly, having a vendor keep the data has implications for end-of-contract continuity. Given many contracts are for 1 or 3 or 5 years, what happens after this point? While the terms might indicate “handover” to the utility, this is easier said than done. In practice, the vendor is often given a year-to-year extension or the entire system is replaced by a new solution in such a relatively short time. Utilities are moving towards distributed data access, and web-based data access has its advantages, in that any data can be accessed by anyone, anywhere (with the right
52
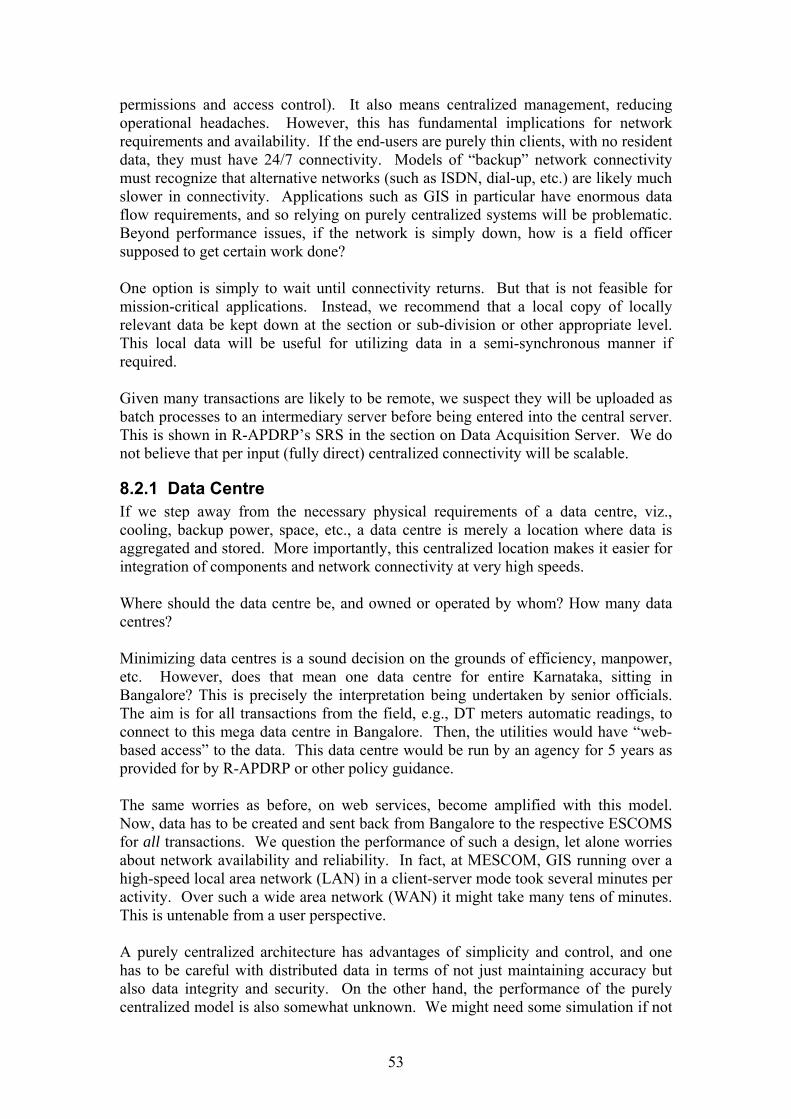
permissions and access control). It also means centralized management, reducing operational headaches. However, this has fundamental implications for network requirements and availability. If the end-users are purely thin clients, with no resident data, they must have 24/7 connectivity. Models of “backup” network connectivity must recognize that alternative networks (such as ISDN, dial-up, etc.) are likely much slower in connectivity. Applications such as GIS in particular have enormous data flow requirements, and so relying on purely centralized systems will be problematic. Beyond performance issues, if the network is simply down, how is a field officer supposed to get certain work done? One option is simply to wait until connectivity returns. But that is not feasible for mission-critical applications. Instead, we recommend that a local copy of locally relevant data be kept down at the section or sub-division or other appropriate level. This local data will be useful for utilizing data in a semi-synchronous manner if required. Given many transactions are likely to be remote, we suspect they will be uploaded as batch processes to an intermediary server before being entered into the central server. This is shown in R-APDRP’s SRS in the section on Data Acquisition Server. We do not believe that per input (fully direct) centralized connectivity will be scalable.
8.2.1 Data Centre If we step away from the necessary physical requirements of a data centre, viz., cooling, backup power, space, etc., a data centre is merely a location where data is aggregated and stored. More importantly, this centralized location makes it easier for integration of components and network connectivity at very high speeds. Where should the data centre be, and owned or operated by whom? How many data centres? Minimizing data centres is a sound decision on the grounds of efficiency, manpower, etc. However, does that mean one data centre for entire Karnataka, sitting in Bangalore? This is precisely the interpretation being undertaken by senior officials. The aim is for all transactions from the field, e.g., DT meters automatic readings, to connect to this mega data centre in Bangalore. Then, the utilities would have “web-based access” to the data. This data centre would be run by an agency for 5 years as provided for by R-APDRP or other policy guidance. The same worries as before, on web services, become amplified with this model. Now, data has to be created and sent back from Bangalore to the respective ESCOMS for all transactions. We question the performance of such a design, let alone worries about network availability and reliability. In fact, at MESCOM, GIS running over a high-speed local area network (LAN) in a client-server mode took several minutes per activity. Over such a wide area network (WAN) it might take many tens of minutes. This is untenable from a user perspective. A purely centralized architecture has advantages of simplicity and control, and one has to be careful with distributed data in terms of not just maintaining accuracy but also data integrity and security. On the other hand, the performance of the purely centralized model is also somewhat unknown. We might need some simulation if not
53
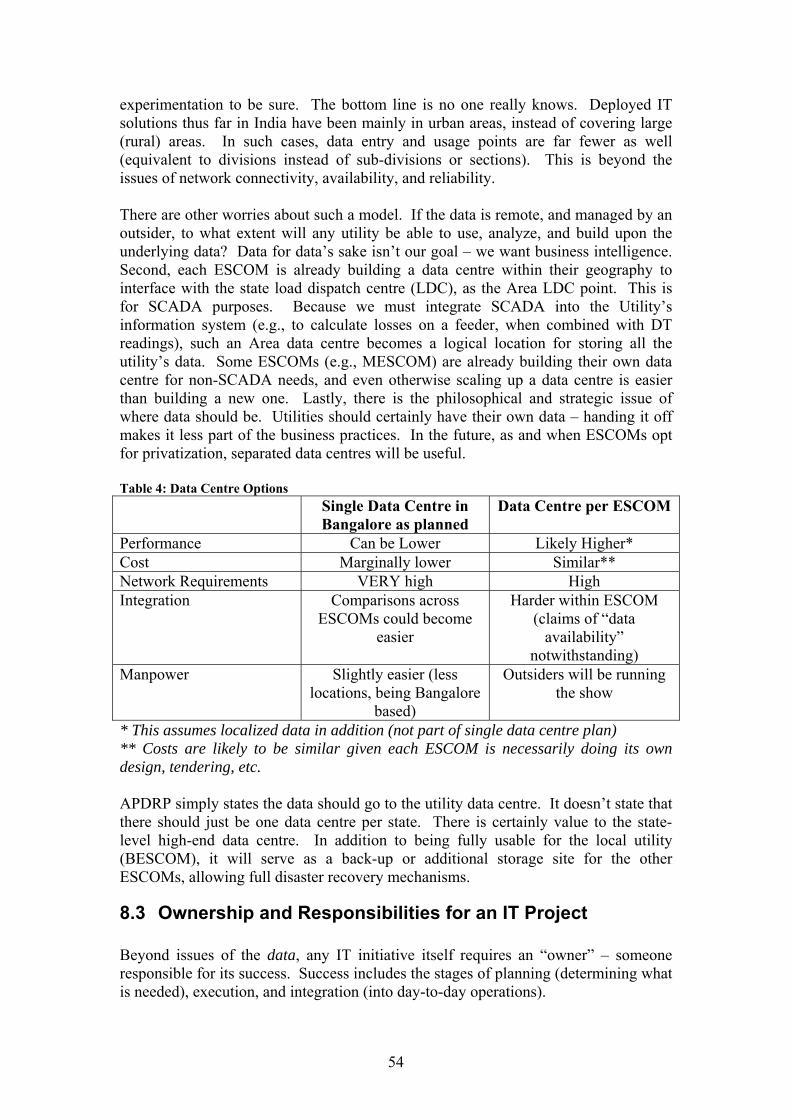
experimentation to be sure. The bottom line is no one really knows. Deployed IT solutions thus far in India have been mainly in urban areas, instead of covering large (rural) areas. In such cases, data entry and usage points are far fewer as well (equivalent to divisions instead of sub-divisions or sections). This is beyond the issues of network connectivity, availability, and reliability. There are other worries about such a model. If the data is remote, and managed by an outsider, to what extent will any utility be able to use, analyze, and build upon the underlying data? Data for data’s sake isn’t our goal – we want business intelligence. Second, each ESCOM is already building a data centre within their geography to interface with the state load dispatch centre (LDC), as the Area LDC point. This is for SCADA purposes. Because we must integrate SCADA into the Utility’s information system (e.g., to calculate losses on a feeder, when combined with DT readings), such an Area data centre becomes a logical location for storing all the utility’s data. Some ESCOMs (e.g., MESCOM) are already building their own data centre for non-SCADA needs, and even otherwise scaling up a data centre is easier than building a new one. Lastly, there is the philosophical and strategic issue of where data should be. Utilities should certainly have their own data – handing it off makes it less part of the business practices. In the future, as and when ESCOMs opt for privatization, separated data centres will be useful. Table 4: Data Centre Options Single Data Centre in
Bangalore as planned Data Centre per ESCOM
Performance Can be Lower Likely Higher* Cost Marginally lower Similar** Network Requirements VERY high High Integration Comparisons across
ESCOMs could become easier
Harder within ESCOM (claims of “data
availability” notwithstanding)
Manpower Slightly easier (less locations, being Bangalore
based)
Outsiders will be running the show
* This assumes localized data in addition (not part of single data centre plan) ** Costs are likely to be similar given each ESCOM is necessarily doing its own design, tendering, etc. APDRP simply states the data should go to the utility data centre. It doesn’t state that there should just be one data centre per state. There is certainly value to the state-level high-end data centre. In addition to being fully usable for the local utility (BESCOM), it will serve as a back-up or additional storage site for the other ESCOMs, allowing full disaster recovery mechanisms.
8.3 Ownership and Responsibilities for an IT Project Beyond issues of the data, any IT initiative itself requires an “owner” – someone responsible for its success. Success includes the stages of planning (determining what is needed), execution, and integration (into day-to-day operations).
54
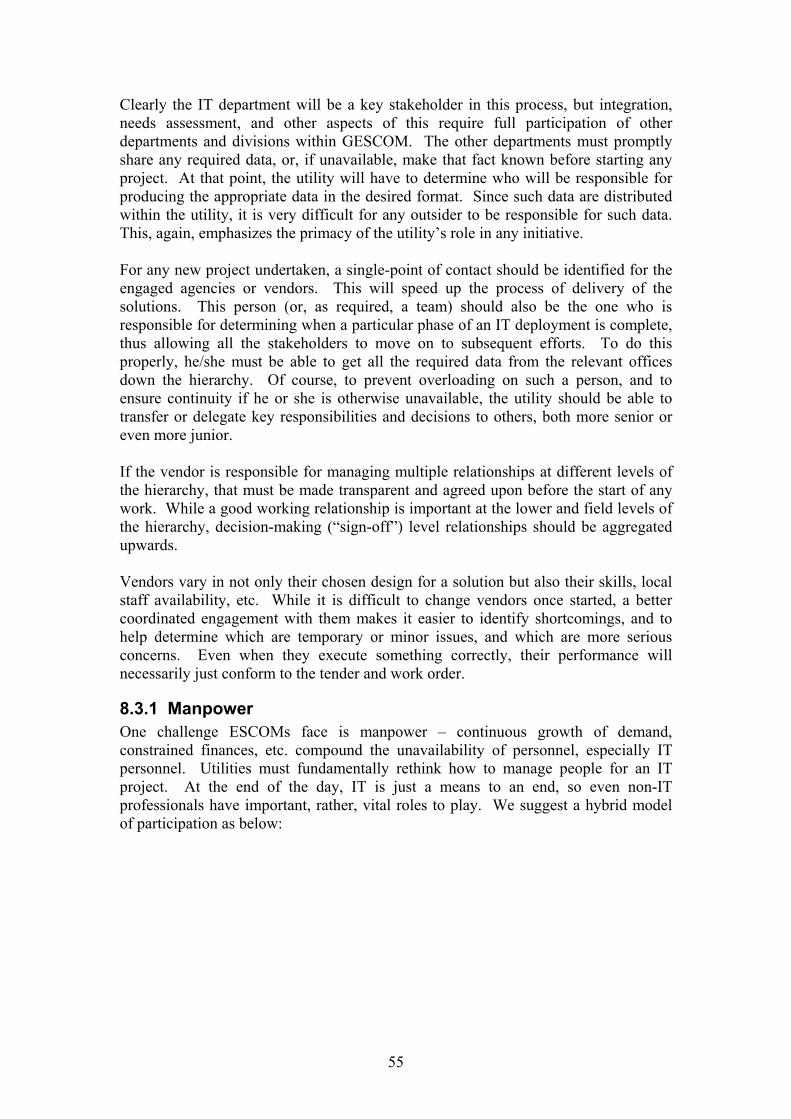
Clearly the IT department will be a key stakeholder in this process, but integration, needs assessment, and other aspects of this require full participation of other departments and divisions within GESCOM. The other departments must promptly share any required data, or, if unavailable, make that fact known before starting any project. At that point, the utility will have to determine who will be responsible for producing the appropriate data in the desired format. Since such data are distributed within the utility, it is very difficult for any outsider to be responsible for such data. This, again, emphasizes the primacy of the utility’s role in any initiative. For any new project undertaken, a single-point of contact should be identified for the engaged agencies or vendors. This will speed up the process of delivery of the solutions. This person (or, as required, a team) should also be the one who is responsible for determining when a particular phase of an IT deployment is complete, thus allowing all the stakeholders to move on to subsequent efforts. To do this properly, he/she must be able to get all the required data from the relevant offices down the hierarchy. Of course, to prevent overloading on such a person, and to ensure continuity if he or she is otherwise unavailable, the utility should be able to transfer or delegate key responsibilities and decisions to others, both more senior or even more junior. If the vendor is responsible for managing multiple relationships at different levels of the hierarchy, that must be made transparent and agreed upon before the start of any work. While a good working relationship is important at the lower and field levels of the hierarchy, decision-making (“sign-off”) level relationships should be aggregated upwards. Vendors vary in not only their chosen design for a solution but also their skills, local staff availability, etc. While it is difficult to change vendors once started, a better coordinated engagement with them makes it easier to identify shortcomings, and to help determine which are temporary or minor issues, and which are more serious concerns. Even when they execute something correctly, their performance will necessarily just conform to the tender and work order.
8.3.1 Manpower One challenge ESCOMs face is manpower – continuous growth of demand, constrained finances, etc. compound the unavailability of personnel, especially IT personnel. Utilities must fundamentally rethink how to manage people for an IT project. At the end of the day, IT is just a means to an end, so even non-IT professionals have important, rather, vital roles to play. We suggest a hybrid model of participation as below:
55
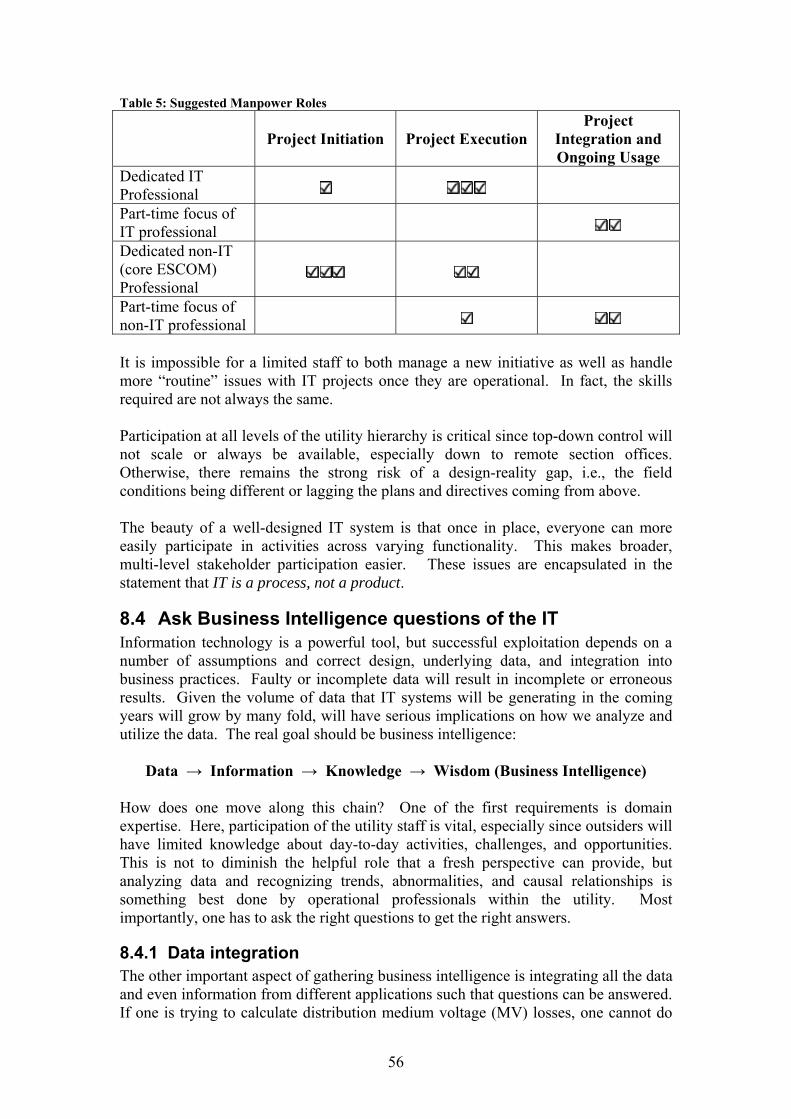
Table 5: Suggested Manpower Roles
Project Initiation Project Execution Project
Integration and Ongoing Usage
Dedicated IT Professional
Part-time focus of IT professional Dedicated non-IT (core ESCOM) Professional
Part-time focus of non-IT professional It is impossible for a limited staff to both manage a new initiative as well as handle more “routine” issues with IT projects once they are operational. In fact, the skills required are not always the same. Participation at all levels of the utility hierarchy is critical since top-down control will not scale or always be available, especially down to remote section offices. Otherwise, there remains the strong risk of a design-reality gap, i.e., the field conditions being different or lagging the plans and directives coming from above. The beauty of a well-designed IT system is that once in place, everyone can more easily participate in activities across varying functionality. This makes broader, multi-level stakeholder participation easier. These issues are encapsulated in the statement that IT is a process, not a product.
8.4 Ask Business Intelligence questions of the IT Information technology is a powerful tool, but successful exploitation depends on a number of assumptions and correct design, underlying data, and integration into business practices. Faulty or incomplete data will result in incomplete or erroneous results. Given the volume of data that IT systems will be generating in the coming years will grow by many fold, will have serious implications on how we analyze and utilize the data. The real goal should be business intelligence:
Data → Information → Knowledge → Wisdom (Business Intelligence) How does one move along this chain? One of the first requirements is domain expertise. Here, participation of the utility staff is vital, especially since outsiders will have limited knowledge about day-to-day activities, challenges, and opportunities. This is not to diminish the helpful role that a fresh perspective can provide, but analyzing data and recognizing trends, abnormalities, and causal relationships is something best done by operational professionals within the utility. Most importantly, one has to ask the right questions to get the right answers.
8.4.1 Data integration The other important aspect of gathering business intelligence is integrating all the data and even information from different applications such that questions can be answered. If one is trying to calculate distribution medium voltage (MV) losses, one cannot do
56
that by simply measuring the power across distribution transformers (DT metering). One also needs to know the input power at the feeder level. Such data will be coming from the KPTCL SCADA system. Similarly, one needs consumer data to know low voltage losses. If one is now trying to do system level optimization (perhaps reconductoring), then consumption patterns and data are required. GIS will help with routing for load flow analysis, etc. Today’s disparate or islanded IT projects must be designed for integration. This goes beyond just interoperability but using standards, standard fields, data structures, etc. Vendors must make their APIs (application programmer interfaces) lightweight and available to other applications and vendors. If we have two different vendors each doing some components of an overall IT system, one cannot accept finger-pointing for who is responsible for such integration (or the cause of problems). Instead of appointing yet a 3rd party for such a role, either one of the two vendors should be given such a role. For this, the other vendor will still have to provide information and support. Given the vast volumes of data that will be created by the IT solutions, it will be beyond the capabilities of a human being to fully analyze this data. Even for human examination the data needs to be standardized, sorted, presented properly, etc. Given a utility has lakhs of consumers, the volume of data is enormous even today. Real-time (or 15 minute interval) systems will only make things worse. One IT technology that can help is a Decision Support System (DSS). Decision Support Systems augment human decision makers and provide them with answers to questions (if properly framed). DSSes can be a standalone application or service, drawing data from all the components or services (applications) running, or DSS functionality can be a part of each IT component. E.g., a DT metering solution should be programmed to help identify the worse performers and make recommendations as to appropriate action. We have seen at one ESCOM where the AEEs were manually examining the data to look for deviations – such a computationally trivial task can be automated, freeing the AEE up for more strategic activities. Today, many IT systems simply produce monthly reports (often in .pdf format, and hence not easy to use further in calculations), instead of asking and answering business intelligence questions. One recommendation for how to achieve business intelligence is to ask the right questions before implementing any project. E.g., if one is trying to measure the MV losses, then one has to know all the inputs (from SCADA) and outputs (DT metering). Thus, one must meter all the DTs in a feeder. If the utility only has the budget or time to initially meter a fraction of the DTs, they should be chosen not for widest coverage or largest size, but to cover a feeder in its entirety; a fraction of feeders can be covered this way. This will allow loss calculations to be undertaken.
8.5 Asset Tagging – Knowing what is where A utility’s assets are not only expensive from a book value point of view, they are the means to deliver customers their much-needed power. The physical assets of a Distribution Company, i.e., Electricity Supply Company (ESCOM), include tens of thousands of kilometres of conductor (both medium voltage and low-voltage), tens of
57
thousands of distribution transformers, hundreds of thousands of poles, and on the order of a million end-user meters (depending on the size of the ESCOM). Beyond a small supply of assets in-house in the stores or the section offices, the vast majority of these assets are in use, in the field. Knowing what assets are where are important for ensuring proper utilization of assets and for improving the accountability of the system. More importantly, virtually every operational system (whether IT based or otherwise) needs some specific encoding or tagging. If we consider, say, a billing or total revenue management (TRM) system (even if ledger based), it must inherently link to a particular consumer, i.e., his/her meter. A transformer management system (TMS) captures data not merely on the transformer but also the pole or other location it is in use and also the feeder or section of feeder where it operates.21 The latter should ultimately link to which consumers are where in the supply chain. Standardized tagging is critical when different applications or IT projects are to be integrated. The ultimate example of asset tagging is a Geographic Information System (GIS). This is essentially a computerized mapping of the utility assets. Beyond what the assets are, it inherently includes the where asset is located (especially in-use). Proper asset tagging has several characteristics, the most important ones being consistency and universality. This tag must be unique per item, and could consist of a second portion that identifies its location. A correct system would be hierarchical in encoding, and have room to grow for many decades.
8.5.1 Tagging System As an example of a tagging system, a distribution transformer would have several pieces of information (if numeric).
Equipment: [TYPE identifier].[IDENTITY identifier].[LOCATION identifier]
A simplistic system would just have a few TYPE identifiers (meters, poles, etc.) but having additional data can help easily identify items for human operators. E.g., there can be different identifiers for 50 kVA versus 100 kVA versus 200 kVA distribution transformers. A large enough set of TYPE numbers (e.g., 0001-9999 or even 6 digits) leaves enough room to add additional items to the TYPE identifier, perhaps for the future when all parts/spares carry identifiers and, eventually, have embedded identifier chips (radio frequency ID, or RFID).
The IDENTITY identifier itself could be split into two segments, a physical number that is inviolate, and a human-assigned (“soft”) number that is based on existing accounting (ledger-based) norms. E.g., a consumer meter has an RR number (which is utility assigned), but will also have a manufacturer serial number. Both of these should match up to the same meter. An analogy is how a mobile phone has a phone number assigned by the carrier, e.g., 987-654-3210. This can change. But there is a handset number (EMEI) that cannot change. In the Internet, there is an IP address
21 Some asset management solutions talk of photographing the asset. While it can be helpful, it isn’t mandatory and it increases the data flow sizes (images are large files).
58
that the Internet Service Provider (ISP) assigns, but each device has a hardware address that doesn’t change (e.g., Ethernet address). The LOCATION identifier should precisely identify where the asset is. This should be hierarchical by zone, circle, division, sub-division, section, etc. E.g., 01 02 02 003 004 0009 0008 Zone, Circle, Division, subdivision, section, Other1, Other2. The exact details of how location is identified will need to be worked out by the ESCOM. This will inherently involve field personnel, who can identify the required granularity to identify specific locations. E.g., in a single (urban) location, there may be two or more feeders passing, with multiple transformers sharing several poles. It is recommended that for all such systems chosen, they should be planned a priori (in advance) such that the maximal length of any tag (LOCATION, IDENTITY, TYPE) is known in advance. This way the IT systems will not have to deal with additional lengths of strings. More importantly, one has to anticipate growth, changes, etc. such that one doesn’t need to redo the process every few years. Handing out 5 digit phone numbers and then 6 and then 7, etc. was an expensive process. Now, the nation has standardized on 10-digit total length phone numbers (including area code) which is a good system. Given that meter identifiers (such as RR – reading register) are not unique within the ESCOM, these can be made unique easily by prefixing unique sub-division identifiers. We also suggest that the entire state of Karnataka can standardize on such an encoding. This will make it easier (and less expensive) for IT solutions providers to design their systems, and will also make future reforms (privatization, purchases, demarcations, mergers, etc.) easier. To facilitate this, one could choose the first substring in the LOCATION be the utility identifier.
8.5.2 Tagging Process If there were no pre-existing data, a utility would be free to tag assets from scratch. Such a greenfield process will not be appropriate given assets today already have some encoding (using ledgers and equivalent systems). These data are typically at the section level through division. The first step must be determining where is the existing data, and in what format. Possible issues with existing data include missing data, erroneous data, etc. Any newer system should have error-checking mechanisms, but IT systems cannot replace human error-checking, which can only be done by those who know the existing system and data. Once the new (standardized) tagging system is created, someone will have to map the existing data to the new format. Such a responsibility will have to be very explicitly planned. If the utility itself is responsible for this activity (even through additional or temporary staff), this is additional work. If the IT vendor is responsible for this effort, it should be spelled out as a direct responsibility. Even with this task outsourced, no outsider can easily transcode the assets without full utility assistance and participation.
59
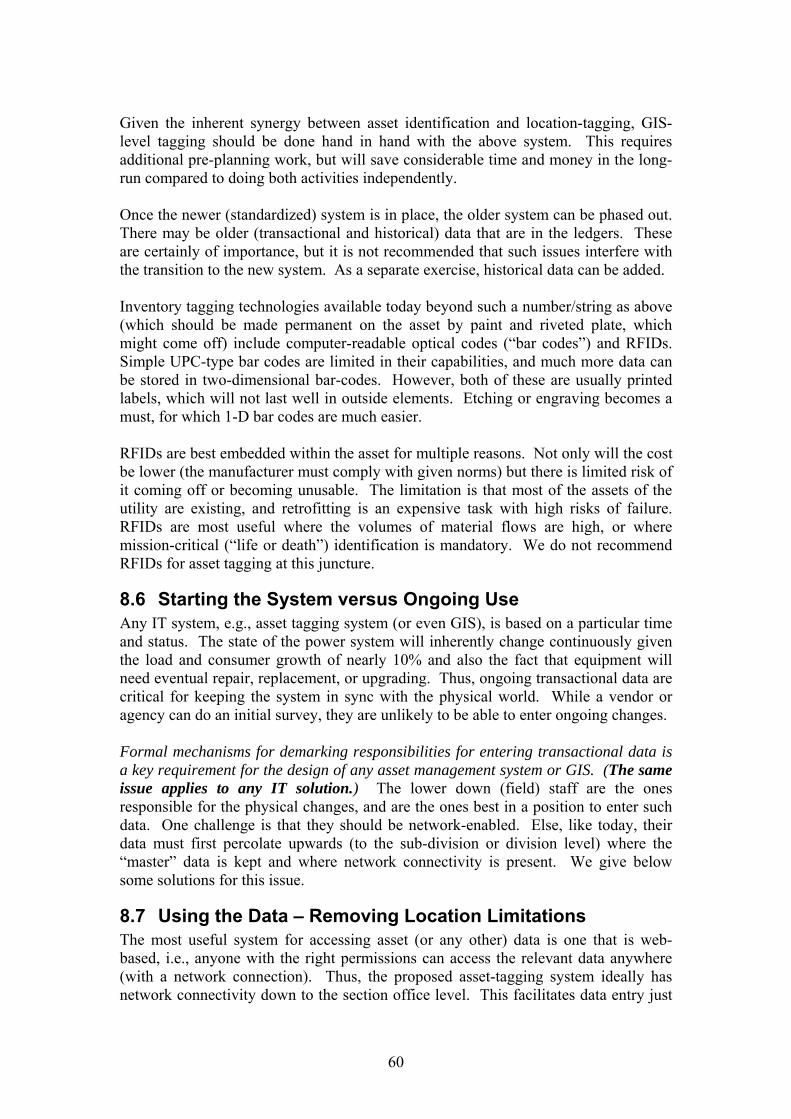
Given the inherent synergy between asset identification and location-tagging, GIS-level tagging should be done hand in hand with the above system. This requires additional pre-planning work, but will save considerable time and money in the long-run compared to doing both activities independently. Once the newer (standardized) system is in place, the older system can be phased out. There may be older (transactional and historical) data that are in the ledgers. These are certainly of importance, but it is not recommended that such issues interfere with the transition to the new system. As a separate exercise, historical data can be added. Inventory tagging technologies available today beyond such a number/string as above (which should be made permanent on the asset by paint and riveted plate, which might come off) include computer-readable optical codes (“bar codes”) and RFIDs. Simple UPC-type bar codes are limited in their capabilities, and much more data can be stored in two-dimensional bar-codes. However, both of these are usually printed labels, which will not last well in outside elements. Etching or engraving becomes a must, for which 1-D bar codes are much easier. RFIDs are best embedded within the asset for multiple reasons. Not only will the cost be lower (the manufacturer must comply with given norms) but there is limited risk of it coming off or becoming unusable. The limitation is that most of the assets of the utility are existing, and retrofitting is an expensive task with high risks of failure. RFIDs are most useful where the volumes of material flows are high, or where mission-critical (“life or death”) identification is mandatory. We do not recommend RFIDs for asset tagging at this juncture.
8.6 Starting the System versus Ongoing Use Any IT system, e.g., asset tagging system (or even GIS), is based on a particular time and status. The state of the power system will inherently change continuously given the load and consumer growth of nearly 10% and also the fact that equipment will need eventual repair, replacement, or upgrading. Thus, ongoing transactional data are critical for keeping the system in sync with the physical world. While a vendor or agency can do an initial survey, they are unlikely to be able to enter ongoing changes. Formal mechanisms for demarking responsibilities for entering transactional data is a key requirement for the design of any asset management system or GIS. (The same issue applies to any IT solution.) The lower down (field) staff are the ones responsible for the physical changes, and are the ones best in a position to enter such data. One challenge is that they should be network-enabled. Else, like today, their data must first percolate upwards (to the sub-division or division level) where the “master” data is kept and where network connectivity is present. We give below some solutions for this issue.
8.7 Using the Data – Removing Location Limitations The most useful system for accessing asset (or any other) data is one that is web-based, i.e., anyone with the right permissions can access the relevant data anywhere (with a network connection). Thus, the proposed asset-tagging system ideally has network connectivity down to the section office level. This facilitates data entry just
60
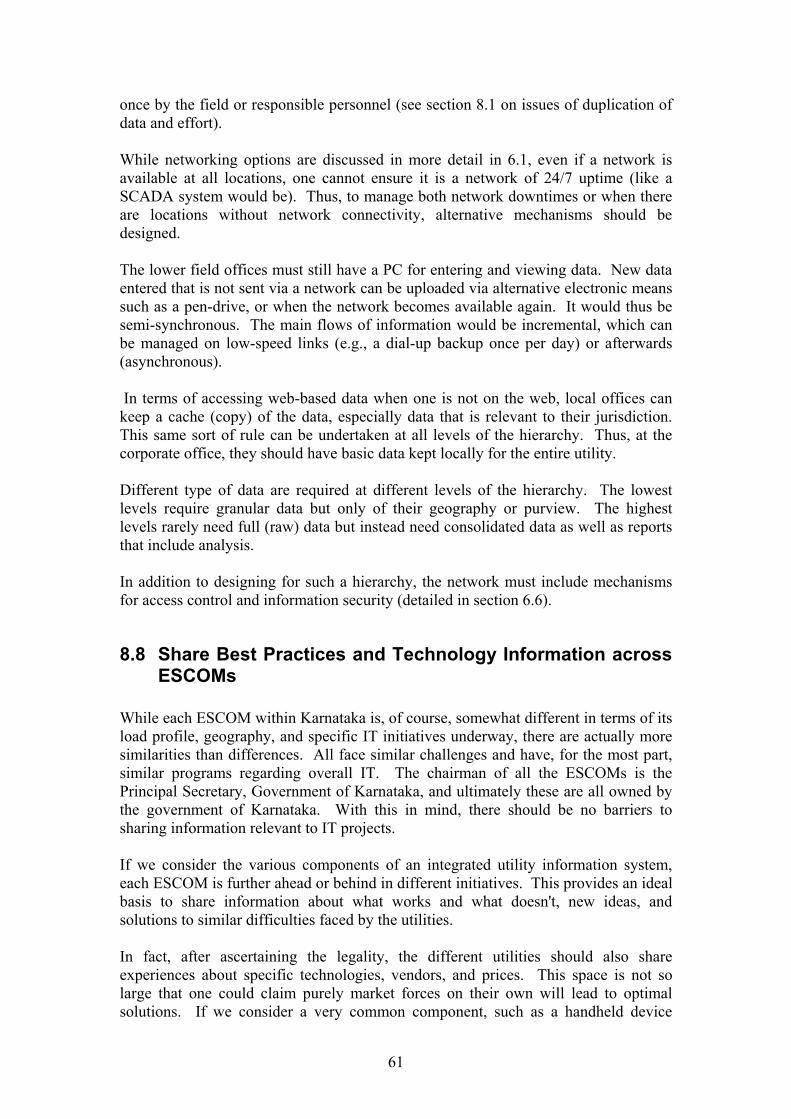
once by the field or responsible personnel (see section 8.1 on issues of duplication of data and effort). While networking options are discussed in more detail in 6.1, even if a network is available at all locations, one cannot ensure it is a network of 24/7 uptime (like a SCADA system would be). Thus, to manage both network downtimes or when there are locations without network connectivity, alternative mechanisms should be designed. The lower field offices must still have a PC for entering and viewing data. New data entered that is not sent via a network can be uploaded via alternative electronic means such as a pen-drive, or when the network becomes available again. It would thus be semi-synchronous. The main flows of information would be incremental, which can be managed on low-speed links (e.g., a dial-up backup once per day) or afterwards (asynchronous). In terms of accessing web-based data when one is not on the web, local offices can keep a cache (copy) of the data, especially data that is relevant to their jurisdiction. This same sort of rule can be undertaken at all levels of the hierarchy. Thus, at the corporate office, they should have basic data kept locally for the entire utility. Different type of data are required at different levels of the hierarchy. The lowest levels require granular data but only of their geography or purview. The highest levels rarely need full (raw) data but instead need consolidated data as well as reports that include analysis. In addition to designing for such a hierarchy, the network must include mechanisms for access control and information security (detailed in section 6.6).
8.8 Share Best Practices and Technology Information across ESCOMs
While each ESCOM within Karnataka is, of course, somewhat different in terms of its load profile, geography, and specific IT initiatives underway, there are actually more similarities than differences. All face similar challenges and have, for the most part, similar programs regarding overall IT. The chairman of all the ESCOMs is the Principal Secretary, Government of Karnataka, and ultimately these are all owned by the government of Karnataka. With this in mind, there should be no barriers to sharing information relevant to IT projects. If we consider the various components of an integrated utility information system, each ESCOM is further ahead or behind in different initiatives. This provides an ideal basis to share information about what works and what doesn't, new ideas, and solutions to similar difficulties faced by the utilities. In fact, after ascertaining the legality, the different utilities should also share experiences about specific technologies, vendors, and prices. This space is not so large that one could claim purely market forces on their own will lead to optimal solutions. If we consider a very common component, such as a handheld device
61
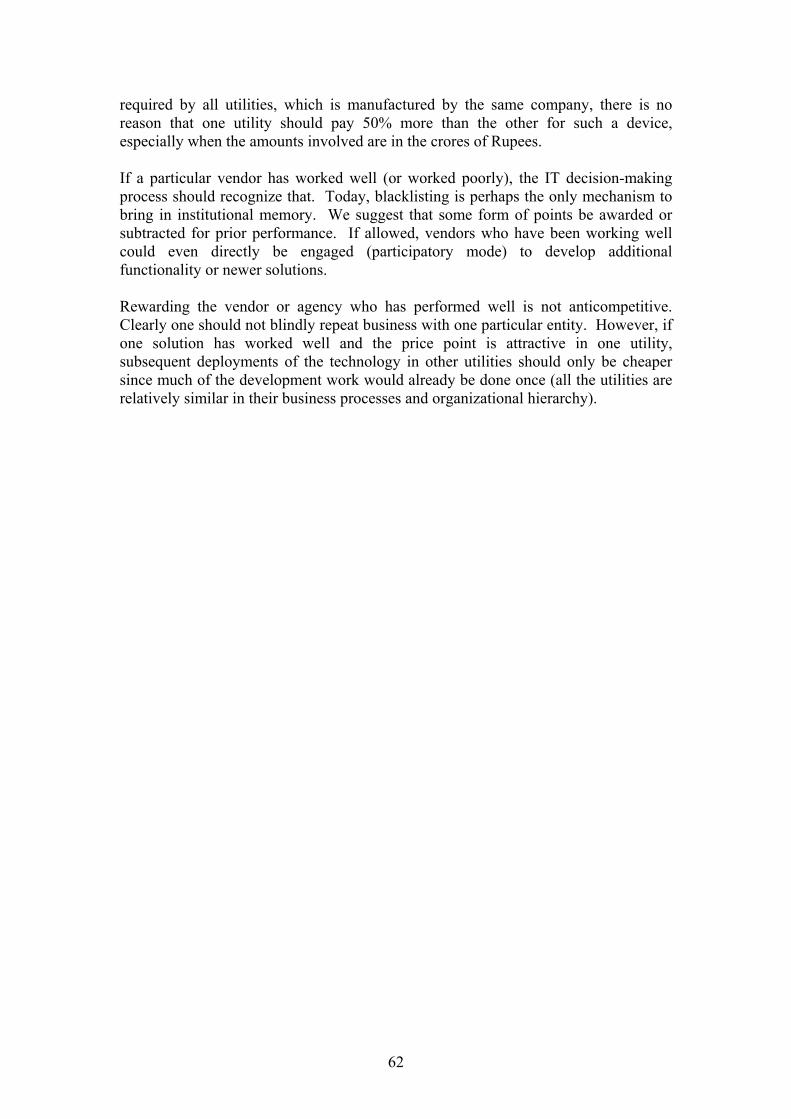
required by all utilities, which is manufactured by the same company, there is no reason that one utility should pay 50% more than the other for such a device, especially when the amounts involved are in the crores of Rupees. If a particular vendor has worked well (or worked poorly), the IT decision-making process should recognize that. Today, blacklisting is perhaps the only mechanism to bring in institutional memory. We suggest that some form of points be awarded or subtracted for prior performance. If allowed, vendors who have been working well could even directly be engaged (participatory mode) to develop additional functionality or newer solutions. Rewarding the vendor or agency who has performed well is not anticompetitive. Clearly one should not blindly repeat business with one particular entity. However, if one solution has worked well and the price point is attractive in one utility, subsequent deployments of the technology in other utilities should only be cheaper since much of the development work would already be done once (all the utilities are relatively similar in their business processes and organizational hierarchy).
62
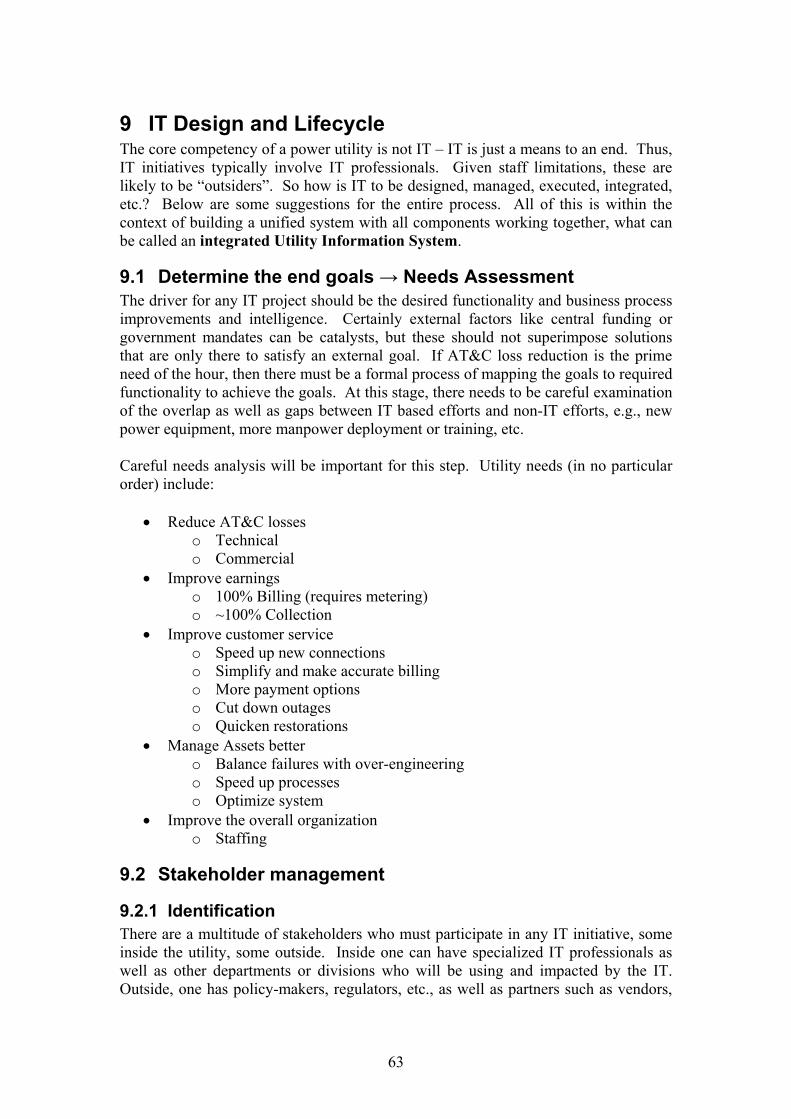
9 IT Design and Lifecycle The core competency of a power utility is not IT – IT is just a means to an end. Thus, IT initiatives typically involve IT professionals. Given staff limitations, these are likely to be “outsiders”. So how is IT to be designed, managed, executed, integrated, etc.? Below are some suggestions for the entire process. All of this is within the context of building a unified system with all components working together, what can be called an integrated Utility Information System.
9.1 Determine the end goals → Needs Assessment The driver for any IT project should be the desired functionality and business process improvements and intelligence. Certainly external factors like central funding or government mandates can be catalysts, but these should not superimpose solutions that are only there to satisfy an external goal. If AT&C loss reduction is the prime need of the hour, then there must be a formal process of mapping the goals to required functionality to achieve the goals. At this stage, there needs to be careful examination of the overlap as well as gaps between IT based efforts and non-IT efforts, e.g., new power equipment, more manpower deployment or training, etc. Careful needs analysis will be important for this step. Utility needs (in no particular order) include:
• Reduce AT&C losses o Technical o Commercial
• Improve earnings o 100% Billing (requires metering) o ~100% Collection
• Improve customer service o Speed up new connections o Simplify and make accurate billing o More payment options o Cut down outages o Quicken restorations
• Manage Assets better o Balance failures with over-engineering o Speed up processes o Optimize system
• Improve the overall organization o Staffing
9.2 Stakeholder management
9.2.1 Identification There are a multitude of stakeholders who must participate in any IT initiative, some inside the utility, some outside. Inside one can have specialized IT professionals as well as other departments or divisions who will be using and impacted by the IT. Outside, one has policy-makers, regulators, etc., as well as partners such as vendors,
63
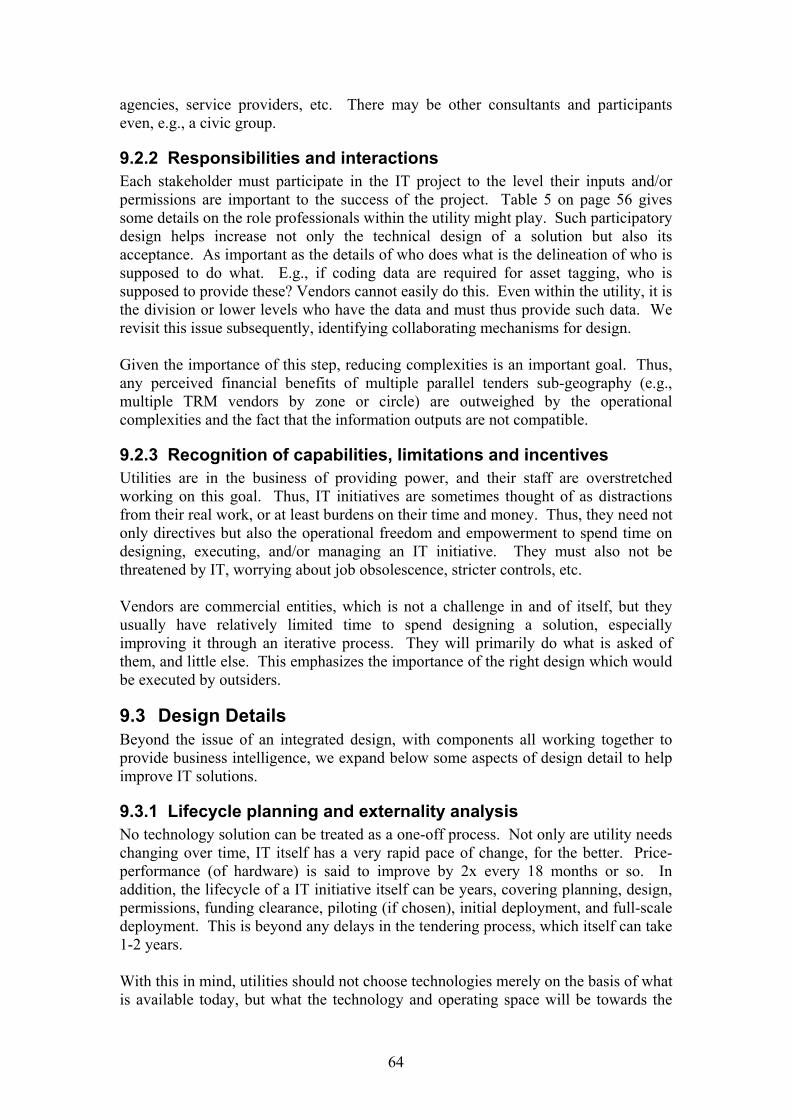
agencies, service providers, etc. There may be other consultants and participants even, e.g., a civic group.
9.2.2 Responsibilities and interactions Each stakeholder must participate in the IT project to the level their inputs and/or permissions are important to the success of the project. Table 5 on page 56 gives some details on the role professionals within the utility might play. Such participatory design helps increase not only the technical design of a solution but also its acceptance. As important as the details of who does what is the delineation of who is supposed to do what. E.g., if coding data are required for asset tagging, who is supposed to provide these? Vendors cannot easily do this. Even within the utility, it is the division or lower levels who have the data and must thus provide such data. We revisit this issue subsequently, identifying collaborating mechanisms for design. Given the importance of this step, reducing complexities is an important goal. Thus, any perceived financial benefits of multiple parallel tenders sub-geography (e.g., multiple TRM vendors by zone or circle) are outweighed by the operational complexities and the fact that the information outputs are not compatible.
9.2.3 Recognition of capabilities, limitations and incentives Utilities are in the business of providing power, and their staff are overstretched working on this goal. Thus, IT initiatives are sometimes thought of as distractions from their real work, or at least burdens on their time and money. Thus, they need not only directives but also the operational freedom and empowerment to spend time on designing, executing, and/or managing an IT initiative. They must also not be threatened by IT, worrying about job obsolescence, stricter controls, etc. Vendors are commercial entities, which is not a challenge in and of itself, but they usually have relatively limited time to spend designing a solution, especially improving it through an iterative process. They will primarily do what is asked of them, and little else. This emphasizes the importance of the right design which would be executed by outsiders.
9.3 Design Details Beyond the issue of an integrated design, with components all working together to provide business intelligence, we expand below some aspects of design detail to help improve IT solutions.
9.3.1 Lifecycle planning and externality analysis No technology solution can be treated as a one-off process. Not only are utility needs changing over time, IT itself has a very rapid pace of change, for the better. Price-performance (of hardware) is said to improve by 2x every 18 months or so. In addition, the lifecycle of a IT initiative itself can be years, covering planning, design, permissions, funding clearance, piloting (if chosen), initial deployment, and full-scale deployment. This is beyond any delays in the tendering process, which itself can take 1-2 years. With this in mind, utilities should not choose technologies merely on the basis of what is available today, but what the technology and operating space will be towards the
64
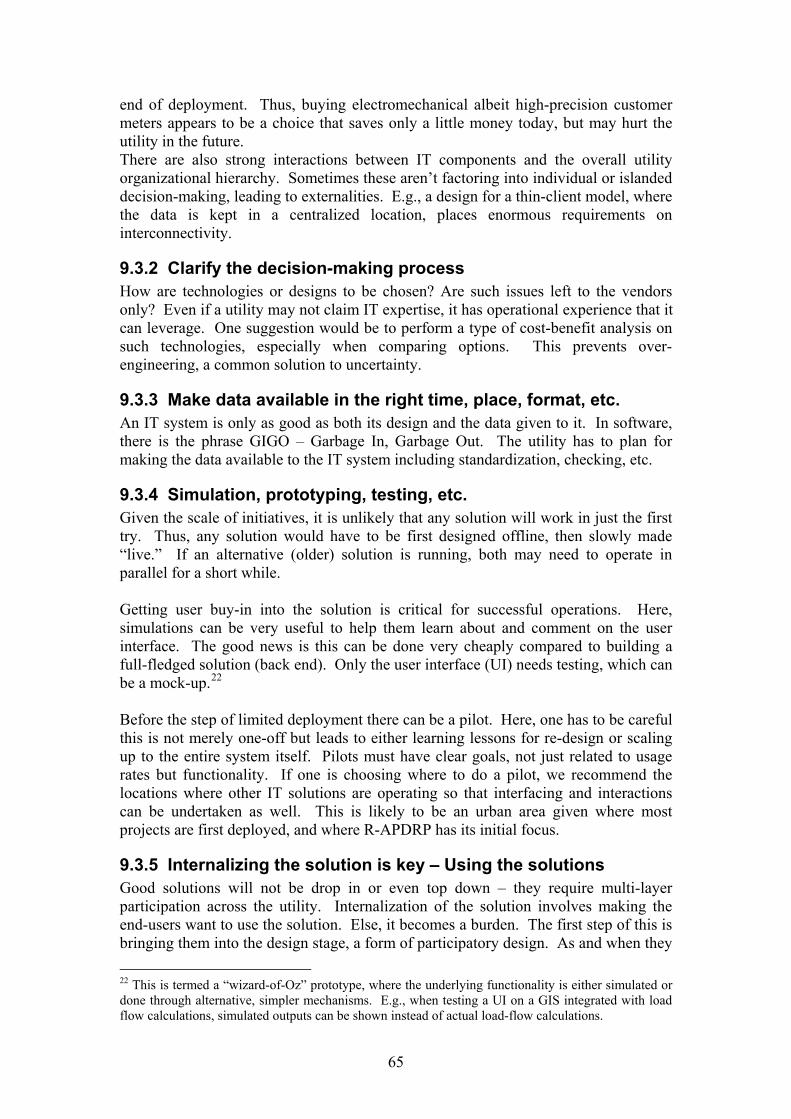
end of deployment. Thus, buying electromechanical albeit high-precision customer meters appears to be a choice that saves only a little money today, but may hurt the utility in the future. There are also strong interactions between IT components and the overall utility organizational hierarchy. Sometimes these aren’t factoring into individual or islanded decision-making, leading to externalities. E.g., a design for a thin-client model, where the data is kept in a centralized location, places enormous requirements on interconnectivity.
9.3.2 Clarify the decision-making process How are technologies or designs to be chosen? Are such issues left to the vendors only? Even if a utility may not claim IT expertise, it has operational experience that it can leverage. One suggestion would be to perform a type of cost-benefit analysis on such technologies, especially when comparing options. This prevents over-engineering, a common solution to uncertainty.
9.3.3 Make data available in the right time, place, format, etc. An IT system is only as good as both its design and the data given to it. In software, there is the phrase GIGO – Garbage In, Garbage Out. The utility has to plan for making the data available to the IT system including standardization, checking, etc.
9.3.4 Simulation, prototyping, testing, etc. Given the scale of initiatives, it is unlikely that any solution will work in just the first try. Thus, any solution would have to be first designed offline, then slowly made “live.” If an alternative (older) solution is running, both may need to operate in parallel for a short while. Getting user buy-in into the solution is critical for successful operations. Here, simulations can be very useful to help them learn about and comment on the user interface. The good news is this can be done very cheaply compared to building a full-fledged solution (back end). Only the user interface (UI) needs testing, which can be a mock-up.22 Before the step of limited deployment there can be a pilot. Here, one has to be careful this is not merely one-off but leads to either learning lessons for re-design or scaling up to the entire system itself. Pilots must have clear goals, not just related to usage rates but functionality. If one is choosing where to do a pilot, we recommend the locations where other IT solutions are operating so that interfacing and interactions can be undertaken as well. This is likely to be an urban area given where most projects are first deployed, and where R-APDRP has its initial focus.
9.3.5 Internalizing the solution is key – Using the solutions Good solutions will not be drop in or even top down – they require multi-layer participation across the utility. Internalization of the solution involves making the end-users want to use the solution. Else, it becomes a burden. The first step of this is bringing them into the design stage, a form of participatory design. As and when they 22 This is termed a “wizard-of-Oz” prototype, where the underlying functionality is either simulated or done through alternative, simpler mechanisms. E.g., when testing a UI on a GIS integrated with load flow calculations, simulated outputs can be shown instead of actual load-flow calculations.
65
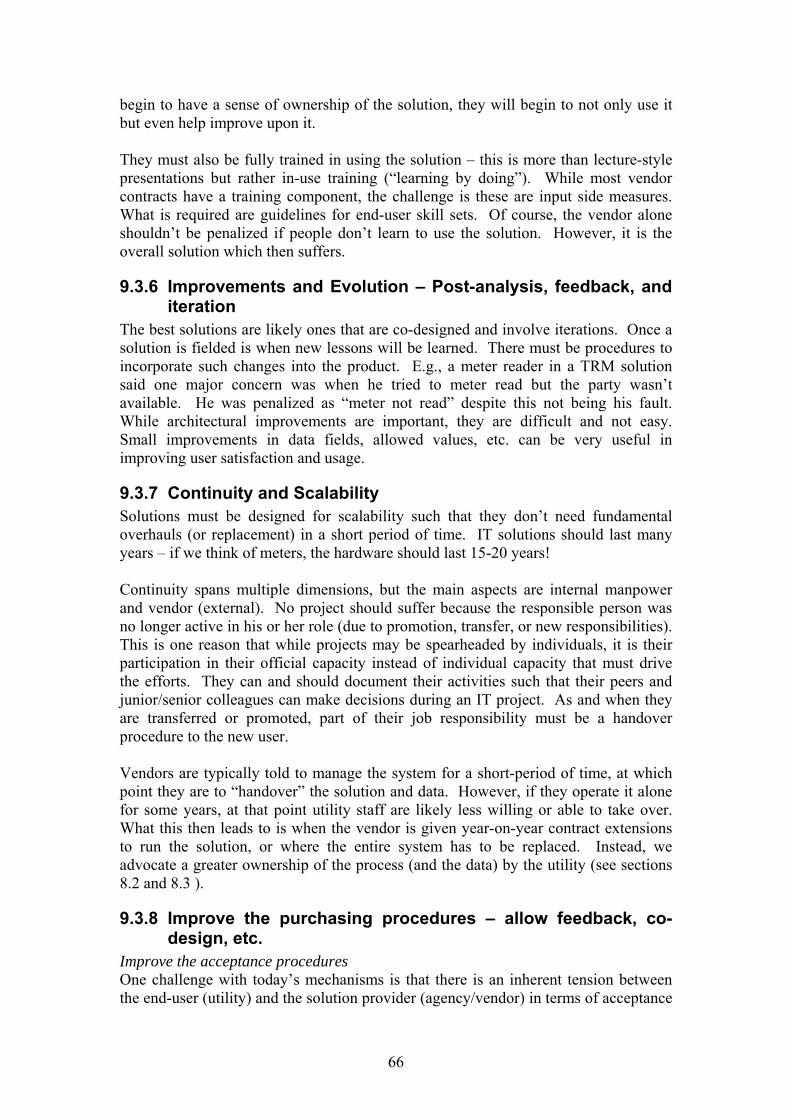
begin to have a sense of ownership of the solution, they will begin to not only use it but even help improve upon it. They must also be fully trained in using the solution – this is more than lecture-style presentations but rather in-use training (“learning by doing”). While most vendor contracts have a training component, the challenge is these are input side measures. What is required are guidelines for end-user skill sets. Of course, the vendor alone shouldn’t be penalized if people don’t learn to use the solution. However, it is the overall solution which then suffers.
9.3.6 Improvements and Evolution – Post-analysis, feedback, and iteration
The best solutions are likely ones that are co-designed and involve iterations. Once a solution is fielded is when new lessons will be learned. There must be procedures to incorporate such changes into the product. E.g., a meter reader in a TRM solution said one major concern was when he tried to meter read but the party wasn’t available. He was penalized as “meter not read” despite this not being his fault. While architectural improvements are important, they are difficult and not easy. Small improvements in data fields, allowed values, etc. can be very useful in improving user satisfaction and usage.
9.3.7 Continuity and Scalability Solutions must be designed for scalability such that they don’t need fundamental overhauls (or replacement) in a short period of time. IT solutions should last many years – if we think of meters, the hardware should last 15-20 years! Continuity spans multiple dimensions, but the main aspects are internal manpower and vendor (external). No project should suffer because the responsible person was no longer active in his or her role (due to promotion, transfer, or new responsibilities). This is one reason that while projects may be spearheaded by individuals, it is their participation in their official capacity instead of individual capacity that must drive the efforts. They can and should document their activities such that their peers and junior/senior colleagues can make decisions during an IT project. As and when they are transferred or promoted, part of their job responsibility must be a handover procedure to the new user. Vendors are typically told to manage the system for a short-period of time, at which point they are to “handover” the solution and data. However, if they operate it alone for some years, at that point utility staff are likely less willing or able to take over. What this then leads to is when the vendor is given year-on-year contract extensions to run the solution, or where the entire system has to be replaced. Instead, we advocate a greater ownership of the process (and the data) by the utility (see sections 8.2 and 8.3 ).
9.3.8 Improve the purchasing procedures – allow feedback, co-design, etc.
Improve the acceptance procedures One challenge with today’s mechanisms is that there is an inherent tension between the end-user (utility) and the solution provider (agency/vendor) in terms of acceptance
66
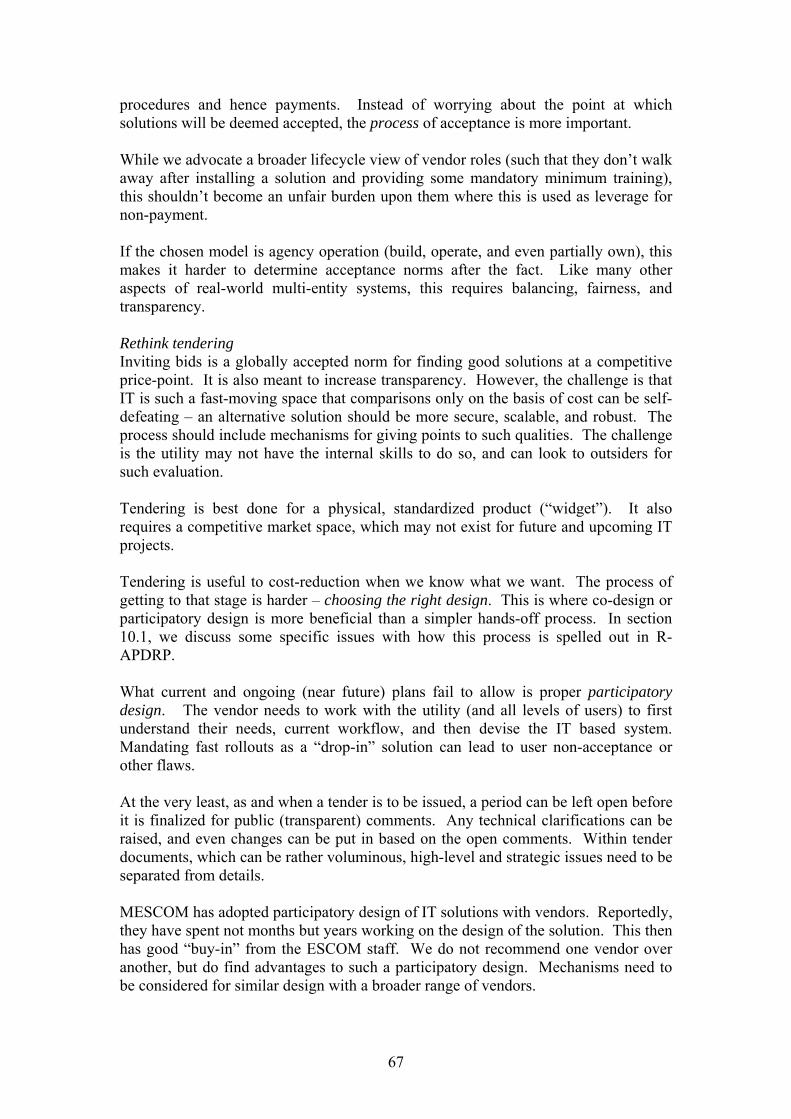
67
procedures and hence payments. Instead of worrying about the point at which solutions will be deemed accepted, the process of acceptance is more important. While we advocate a broader lifecycle view of vendor roles (such that they don’t walk away after installing a solution and providing some mandatory minimum training), this shouldn’t become an unfair burden upon them where this is used as leverage for non-payment. If the chosen model is agency operation (build, operate, and even partially own), this makes it harder to determine acceptance norms after the fact. Like many other aspects of real-world multi-entity systems, this requires balancing, fairness, and transparency. Rethink tendering Inviting bids is a globally accepted norm for finding good solutions at a competitive price-point. It is also meant to increase transparency. However, the challenge is that IT is such a fast-moving space that comparisons only on the basis of cost can be self-defeating – an alternative solution should be more secure, scalable, and robust. The process should include mechanisms for giving points to such qualities. The challenge is the utility may not have the internal skills to do so, and can look to outsiders for such evaluation. Tendering is best done for a physical, standardized product (“widget”). It also requires a competitive market space, which may not exist for future and upcoming IT projects. Tendering is useful to cost-reduction when we know what we want. The process of getting to that stage is harder – choosing the right design. This is where co-design or participatory design is more beneficial than a simpler hands-off process. In section 10.1, we discuss some specific issues with how this process is spelled out in R-APDRP. What current and ongoing (near future) plans fail to allow is proper participatory design. The vendor needs to work with the utility (and all levels of users) to first understand their needs, current workflow, and then devise the IT based system. Mandating fast rollouts as a “drop-in” solution can lead to user non-acceptance or other flaws. At the very least, as and when a tender is to be issued, a period can be left open before it is finalized for public (transparent) comments. Any technical clarifications can be raised, and even changes can be put in based on the open comments. Within tender documents, which can be rather voluminous, high-level and strategic issues need to be separated from details. MESCOM has adopted participatory design of IT solutions with vendors. Reportedly, they have spent not months but years working on the design of the solution. This then has good “buy-in” from the ESCOM staff. We do not recommend one vendor over another, but do find advantages to such a participatory design. Mechanisms need to be considered for similar design with a broader range of vendors.
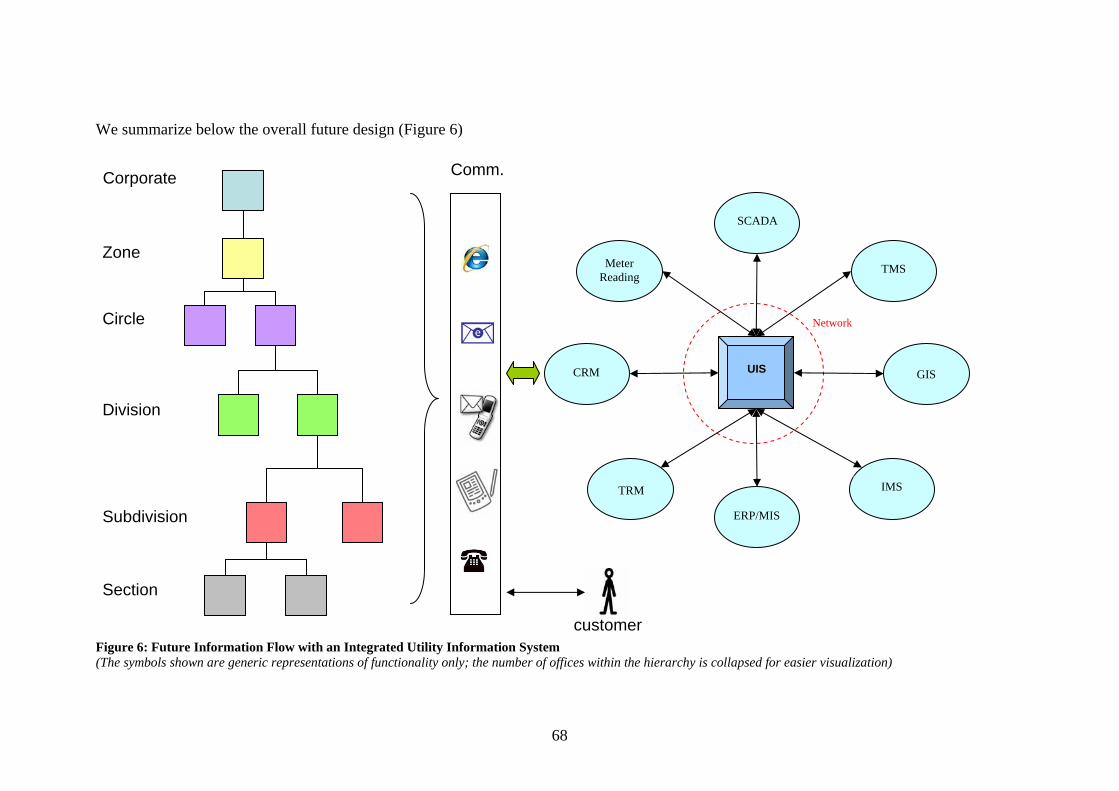
68
We summarize below the overall future design (Figure 6)
Figure 6: Future Information Flow with an Integrated Utility Information System (The symbols shown are generic representations of functionality only; the number of offices within the hierarchy is collapsed for easier visualization)
UUIISS
SCADA
TMS Meter Reading
ERP/MIS
GIS
CRM
IMS
Network
Corporate
Zone
Circle
Division
Subdivision
Section
Comm.
customer
TRM
10 Outside Drivers
10.1 R-APDRP R-APDRP is not the fundamental driver of IT within an ESCOM, but it is an important initiative that can be utilized to improve the operations of the utility. We give below a few observations about R-APDRP and offer suggestions on how the process can be enhanced. R-APDRP is the central government initiative to help improve operations in the power sector. The funding levels are tens of thousands of crores of rupees, with some 20% for IT initiatives. This provides a very useful funding mechanism and driver for initiatives within utilities. It is an extension of the earlier APDP and APDRP schemes, with a far greater focus on technology. However, it is important to recognize some limitations and possible implementation challenges in R-APDRP, and also some ideas for overcoming these. R-APDRP is a centralized initiative, where utilities are given financial support for undertaking actions to improve operations (where loans get converted to grants on successful completion of benchmarks or milestones). The goals and focus technologies are, for most utilities across India, significantly forward looking. It specifies the deployment of GIS, modern billing systems, etc. The specifications are spelled out, to be managed through the nodal agency (Power Finance Corporation). However, since the design is specified all-India, which helps bring all utilities up to modern designs, this also limits natural variations and experimentation with technologies which may be beneficial in a few cases. While it says the Systems Requirements Specifications (SRS) is only a template, there are indications that PFC requires strong reasoning for changes, which may take time, effort, and money. Regardless of the details of the design(s) chosen within R-APDRP, we recommend extensive participation of the utilities in the process of design of the solutions. We give below a few suggestions and other findings utilities may wish to consider. The first question is whether the output will lead to a unified Utility Information System. For the most part, that is the R-APDRP goal, but the details of the design (as opposed to the broader vision) are left to the IT implanting agency, in particular, the IT Systems Integrator. If we end up with multiple vendors covering even web-based services (as specified), interoperability and integration is not something we can just assume will happen – it will require effort at the design stage. R-APDRP also has an urban focus, on townships of 30,000 population and above (in Karnataka and other large states) chosen for deployment of solutions. Such a focus is understandable, but the difficulties GESCOM faces may be more critical outside such areas. R-APDRP also specifies that the detailed project reports (part A) be done in a very short time-frame (one month) with full business model calculations for every town above threshold size. One challenge is does any utility even have the required data for such calculations?
69
R-APDRP has two main Parts, A and B, where A is the IT, and B covers engineering improvements. Within Part A, there are two phases, with the preparation of Detailed Project Reports as the first phase (done by IT Consultants), and implementation as the second phase by the IT Implementation Agency (ITIA). These are through empanelled consultants, as specified by Min. of Power. One fundamental question is to what extent a design can be chosen without knowing full cost details (for which a tender is required). While any Part A IT consultant will certainly have some idea of costs, given the evolution and changes in IT, a more collaborative design can lead to lower overall system costs (spanning hardware, networking, datasets, manpower, software, customization, etc.). Review of the ITIA is not within the scope of the IT Consultant’s role, rather part of 3rd Party Evaluators as empanelled by PFC. One decision with R-APDRP and its SRS is that it is highly specific in many technical details, but does not get into design philosophies, trade-offs, and uncertainties (for example, identified above). It explicitly avoids getting into issues of governance, HR, etc., which may be critical to the success of IT projects as identified in this report. The SRS specifies many design details. It explicitly states these are a design template but utilities are wary of deviating from the SRS. The point is not to consider any specific issue as being right or wrong - such things require analysis. The question is what scope is there for doing any such analysis when the implications of any design change could be substantial money, if not impacting the overall success of a particular application. The SRS utilizes “best-of-breed” solutions in their parts, but without actually having a solution in place in India yet (especially in non-urban areas), it becomes difficult to examine the integrated solutions. E.g., a web-services model places enormous burdens on the network especially for applications like GIS. R-APDRP is a central solution, which has its plus points, but by its very nature is not able to leverage Karnataka initiatives that may be already operational or forthcoming, and which may provide complementary if not substitutive functionality. E.g., Karnataka already has e-tendering, and feeder data will be available on a real-time basis via KPTCL’s SCADA system. This is not a flaw in R-APDRP per se, but just something any design should recognize and integrate. We strongly advocate that R-APDRP be harnessed for its broader vision and funding, but the details of the design and solutions be modified as per utility needs. One is always free to do more or things slightly differently. E.g., in Rajasthan, the utility has asked the IT consultant to not only design the system for the specified (30,000+ population size) areas, but design, scale, and then build out solutions for the entire state. We have suggested this in our Recommendations and the Roadmap. Given R-APDRP’s focus on sometimes narrow technical specifications, we suggest a synergistic approach where Karnataka ESCOMs have their own roadmap(s) for IT. This is part of our suggestions in this report, and is compatible with R-APDRP. Utilities could then consider options for achieving the rest of the goals through minor enhancements or modifications to the DPRs as required or additional IT initiatives in some cases.
70
10.2 Niranthara Jyothi In order to improve the quality and reliability of power distribution in rural areas, the Karnataka State Government started the Niranthara Jyothi scheme in November 2008 on a pilot basis in Malur taluka. The goal of this scheme is to ensure 24 hours continuous 3-phase supply to non-agricultural consumers and 8 hours full three phase power supply for IP sets in rural areas. This scheme will be extended to other talukas in phases. This scheme is modelled on Gujarat’s Jyoti Gram project. Under this, separate feeders will be provided for irrigation pumpsets and for other loads in rural areas. This would ensure that power supply to non-agricultural consumers is not affected whenever there is interruption in the supply to IP sets. This system of bifurcating the supply network of IP sets from non-agricultural consumers should reduce energy losses. It is believed that this will help to take care of most of the additional power requirement for providing 24 hours non-irrigation supply to villages. While the government is paying for the capital investments, there are some uncertainties in the operational implications for the ESCOMs. From an IT perspective, can proper measurements be taken to help determine the exact impact of such policies? E.g., once rural consumers know for sure their power will not be cut, will pilferage or even sanctioned loads stabilize/decrease? Given the rural focus of Nirantar Jyoti, and R-APDRP’s urban/semi-urban focus, ESCOMs should request support for IT for such rural feeders.
10.3 Intra-State ABT Availability based tariff (ABT) is the scheme for charges for power drawn from Central Generation Stations, with charges being a function of both system frequency as well as deviations from a defined (day-ahead) schedule. The time block for ABT is 15 minutes. ABT charges for deviations can be as high as Rs. 10.4 per kWh. Today, ABT is a small fraction of total power drawn by Karnataka ESCOMs, and the entire costs are pooled together by an intermediary, PCKL, which buys the power and then distributes it to the 5 ESCOMs. What this does is shield the respective ESCOMs from their instantaneous burden on the supply-demand balance, averaging out some of the charges. As and when full KPTCL SCADA data becomes available across the state, likely within a few months or less than a year at most, there is a move to start Intra-state ABT. This will impact the utilities much more financially, and they will now need to know their loads with a 15 minute granularity to better predict how much they need to purchase from various suppliers. This increases the demand on more granular and (near) real-time metering, especially at the DT and the high volume consumer levels. If the ESCOM peak load coincides with the state peak and, more importantly, frequency fall, it would face greater financial burdens than today (where such issues today are only for a small fraction of CGS allocation).
71
11 IT Implementation Roadmap India seeks a revolution in its power sector through a variety of initiatives. The goals are to provide power to all, and improve reliability and quality of supply to facilitate growth of the country’s economy. However difficulties include the shortage of supply, rising energy costs and environmental concerns due to climate change. Consequently, initiatives have been pursued to improve energy efficiency, access to electricity and use of renewable energy. Government of India has set up the Bureau of Energy Efficiency (BEE) to accelerate adoption of energy efficiency in all sectors.23 To improve access particularly in rural areas, initiatives like RGGVY have been introduced. Government of India also has an entire ministry - Ministry of New and Renewable Energy (MNES) – to promote development of renewable energy sources.24 An additional problem is the poor financial condition of the public power sector, with many state electricity boards and distribution companies making losses. In order to produce a techno-commercial turnaround of the distribution system we have the R-APDRP scheme. Given these challenges, utilities need to adopt new technologies for improving efficiencies and customer service. Increasing convergence of operational technologies such as SCADA/DMS with IT will lead to smart grid technology, which will improve the reliability and efficiency of electric networks and allow users to monitor electric usage. This will help reduce power usage through price signals and by making energy efficiency simpler for customers.
11.1 Roadmap Priorities GESCOM should prioritize the various components of its IT system and follow a plan to reach the endpoint of having an integrated Utility Information System, and, ultimately, a Smart Grid (Section 11.3). The interdependencies between the individual components of technology solutions need to be well understood, especially given today the specifications have been written per application. In addition, the business value obtained from each component individually as well as the advantages of the complementary nature of certain components must be kept in mind when creating and executing an IT plan. There needs to be a logical sequence of activities or initiatives that align with the organization’s business strategy. There could be broadly three categories of IT initiatives:
1) Basic/Initial Focus: These are initiatives that are either needed for the core functions of the organization, or are essential before other IT components can be put in place. Many of these components may already be needed under Part A of R-APDRP for creating the baseline data; however there are known limitations of R-APDRP, viz., the compressed timeframe and the focus only certain geographies by size.
2) Building/Medium Focus: These are initiatives that build on the basic/essential IT initiatives in order to leverage the initial investment and as a result obtain
23 http://www.bee-india.nic.in/ 24 http://mnes.nic.in/
72
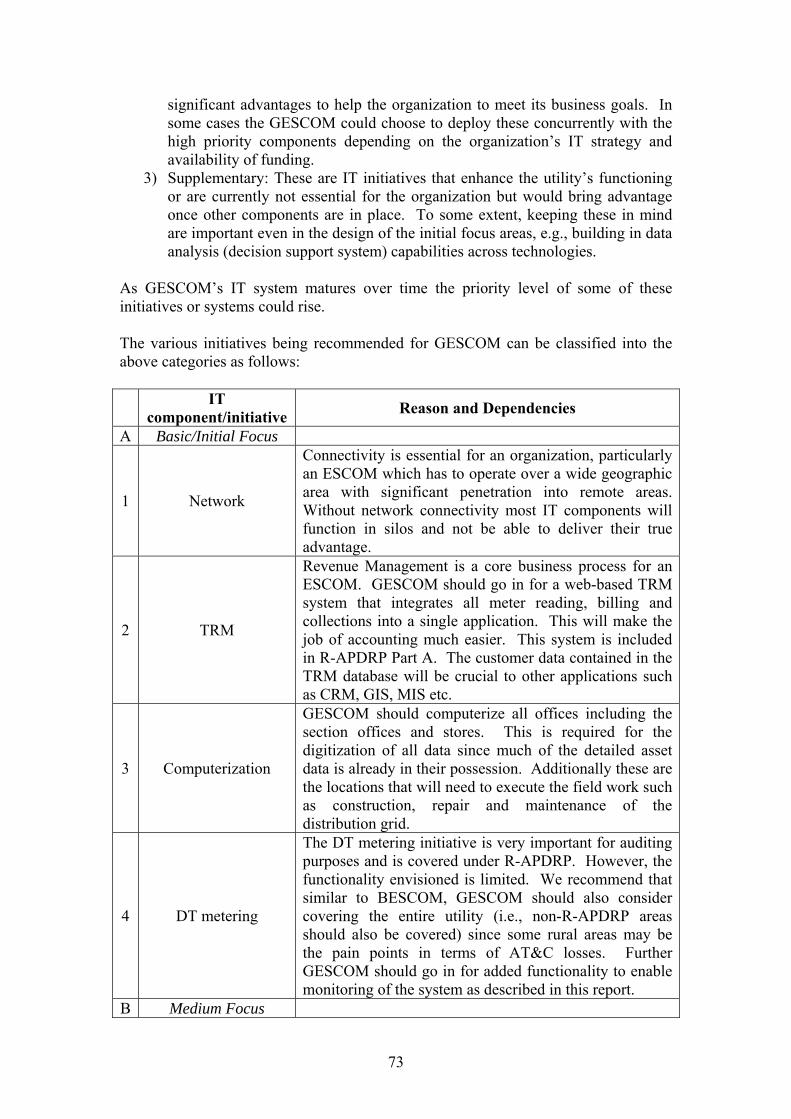
significant advantages to help the organization to meet its business goals. In some cases the GESCOM could choose to deploy these concurrently with the high priority components depending on the organization’s IT strategy and availability of funding.
3) Supplementary: These are IT initiatives that enhance the utility’s functioning or are currently not essential for the organization but would bring advantage once other components are in place. To some extent, keeping these in mind are important even in the design of the initial focus areas, e.g., building in data analysis (decision support system) capabilities across technologies.
As GESCOM’s IT system matures over time the priority level of some of these initiatives or systems could rise. The various initiatives being recommended for GESCOM can be classified into the above categories as follows:
IT component/initiative Reason and Dependencies
A Basic/Initial Focus
1 Network
Connectivity is essential for an organization, particularly an ESCOM which has to operate over a wide geographic area with significant penetration into remote areas. Without network connectivity most IT components will function in silos and not be able to deliver their true advantage.
2 TRM
Revenue Management is a core business process for an ESCOM. GESCOM should go in for a web-based TRM system that integrates all meter reading, billing and collections into a single application. This will make the job of accounting much easier. This system is included in R-APDRP Part A. The customer data contained in the TRM database will be crucial to other applications such as CRM, GIS, MIS etc.
3 Computerization
GESCOM should computerize all offices including the section offices and stores. This is required for the digitization of all data since much of the detailed asset data is already in their possession. Additionally these are the locations that will need to execute the field work such as construction, repair and maintenance of the distribution grid.
4 DT metering
The DT metering initiative is very important for auditing purposes and is covered under R-APDRP. However, the functionality envisioned is limited. We recommend that similar to BESCOM, GESCOM should also consider covering the entire utility (i.e., non-R-APDRP areas should also be covered) since some rural areas may be the pain points in terms of AT&C losses. Further GESCOM should go in for added functionality to enable monitoring of the system as described in this report.
B Medium Focus
73
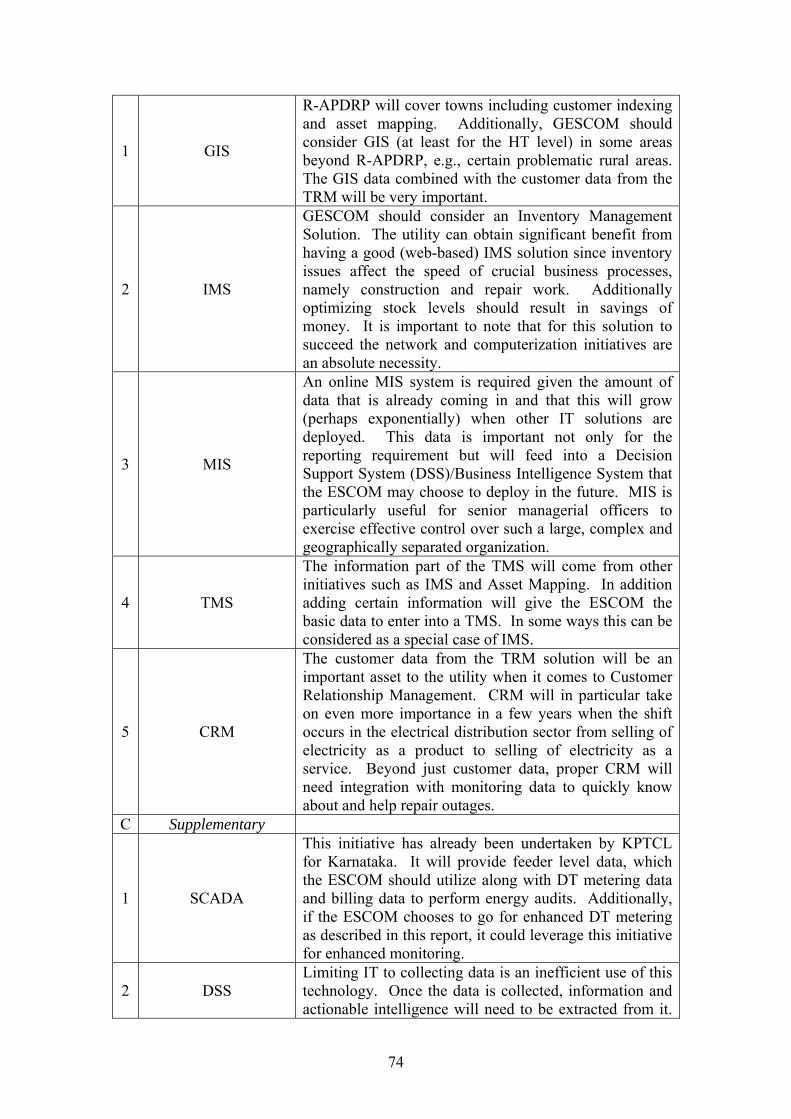
1 GIS
R-APDRP will cover towns including customer indexing and asset mapping. Additionally, GESCOM should consider GIS (at least for the HT level) in some areas beyond R-APDRP, e.g., certain problematic rural areas. The GIS data combined with the customer data from the TRM will be very important.
2 IMS
GESCOM should consider an Inventory Management Solution. The utility can obtain significant benefit from having a good (web-based) IMS solution since inventory issues affect the speed of crucial business processes, namely construction and repair work. Additionally optimizing stock levels should result in savings of money. It is important to note that for this solution to succeed the network and computerization initiatives are an absolute necessity.
3 MIS
An online MIS system is required given the amount of data that is already coming in and that this will grow (perhaps exponentially) when other IT solutions are deployed. This data is important not only for the reporting requirement but will feed into a Decision Support System (DSS)/Business Intelligence System that the ESCOM may choose to deploy in the future. MIS is particularly useful for senior managerial officers to exercise effective control over such a large, complex and geographically separated organization.
4 TMS
The information part of the TMS will come from other initiatives such as IMS and Asset Mapping. In addition adding certain information will give the ESCOM the basic data to enter into a TMS. In some ways this can be considered as a special case of IMS.
5 CRM
The customer data from the TRM solution will be an important asset to the utility when it comes to Customer Relationship Management. CRM will in particular take on even more importance in a few years when the shift occurs in the electrical distribution sector from selling of electricity as a product to selling of electricity as a service. Beyond just customer data, proper CRM will need integration with monitoring data to quickly know about and help repair outages.
C Supplementary
1 SCADA
This initiative has already been undertaken by KPTCL for Karnataka. It will provide feeder level data, which the ESCOM should utilize along with DT metering data and billing data to perform energy audits. Additionally, if the ESCOM chooses to go for enhanced DT metering as described in this report, it could leverage this initiative for enhanced monitoring.
2 DSS Limiting IT to collecting data is an inefficient use of this technology. Once the data is collected, information and actionable intelligence will need to be extracted from it.
74
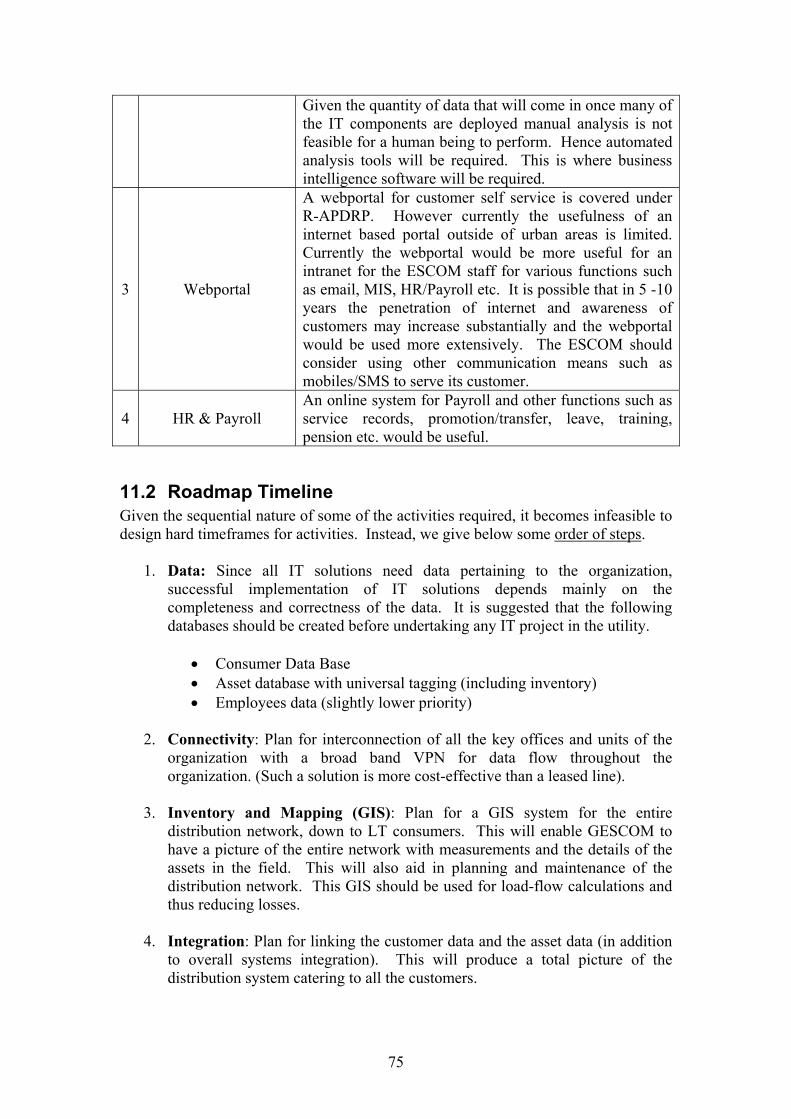
Given the quantity of data that will come in once many of the IT components are deployed manual analysis is not feasible for a human being to perform. Hence automated analysis tools will be required. This is where business intelligence software will be required.
3 Webportal
A webportal for customer self service is covered under R-APDRP. However currently the usefulness of an internet based portal outside of urban areas is limited. Currently the webportal would be more useful for an intranet for the ESCOM staff for various functions such as email, MIS, HR/Payroll etc. It is possible that in 5 -10 years the penetration of internet and awareness of customers may increase substantially and the webportal would be used more extensively. The ESCOM should consider using other communication means such as mobiles/SMS to serve its customer.
4 HR & Payroll An online system for Payroll and other functions such as service records, promotion/transfer, leave, training, pension etc. would be useful.
11.2 Roadmap Timeline Given the sequential nature of some of the activities required, it becomes infeasible to design hard timeframes for activities. Instead, we give below some order of steps.
1. Data: Since all IT solutions need data pertaining to the organization, successful implementation of IT solutions depends mainly on the completeness and correctness of the data. It is suggested that the following databases should be created before undertaking any IT project in the utility.
• Consumer Data Base • Asset database with universal tagging (including inventory) • Employees data (slightly lower priority)
2. Connectivity: Plan for interconnection of all the key offices and units of the
organization with a broad band VPN for data flow throughout the organization. (Such a solution is more cost-effective than a leased line).
3. Inventory and Mapping (GIS): Plan for a GIS system for the entire
distribution network, down to LT consumers. This will enable GESCOM to have a picture of the entire network with measurements and the details of the assets in the field. This will also aid in planning and maintenance of the distribution network. This GIS should be used for load-flow calculations and thus reducing losses.
4. Integration: Plan for linking the customer data and the asset data (in addition
to overall systems integration). This will produce a total picture of the distribution system catering to all the customers.
75
5. Revenue Auditing: Since the consumer database has been put in place plans for meter reading, spot billing, revenue collection accounting auditing can be made and the software solution can be planned and implemented across the entire organisation.
6. Improved DT Metering: Provide communicating ETV meters to all the DTs
synchronizing data with the SCADA server at the control centre. Establish the necessary communication system to remotely read the meter at least once in an hour and ideally ever 15 minutes from a designated centre (i.e., the control centre). This will go beyond audit to complete the monitoring system for the entire HT network. If this becomes unwieldy to manage more sub-control centres to cover restricted areas may be established.
7. Inventory Management: Use the data pertaining to the inventory and put in
place the hardware and software for an inventory management system and link this to the planning and procurement system.
8. MIS and Other Computing/ERP: The databases available now can enable
the implementation of other IT solutions like CRM, MIS, ERP. 9. HR Solutions: Since the employees’ data is available, a Human Resources
Management package can be implemented with all the necessary functionality. In every step above the ESCOM must ensure that the software packages are based on standards (where available) and have open interfaces for easy integration, modularity, and scalability. The goal should be web-based functionality (anytime, anywhere access with the right permissions).
11.3 Smart Grid The end vision for a utility should be the development of a smart grid. “Smart grid” implies adding monitoring, analysis, control, and communication capabilities to the national electrical delivery system, in order to optimize usage of the system while reducing energy consumption. The basic objective is to allow utilities and customers to manage electricity in every element of the distribution system and in households, as efficiently and economically as possible, by providing choice and flexibility. A smart grid will build on existing infrastructure, adding communication and control capabilities to optimize the operation of the entire electrical grid. From the utilities point of view the goal should be to move in the following direction over the next decade:
Accounting → Audit → Monitoring → Control
• Accounting: these are historical measurements done on an isolated basis (how much energy passes through a single point)
• Audit: Through the use of IT, the utilities should be able to pinpoint losses - both technical and commercial. Auditing goes beyond accounting by adding analysis to the measurements.
76
• Monitoring: The utility should be able to remotely monitor the condition of its equipment in the field, in order to anticipate and detect problems and either prevent them from disrupting supply or fix them quickly; this requires proper connectivity.
• Control: Ultimately, by combining automation and real-time or near real-time monitoring, the utility should be able to deliver power more efficiently to its customers
The key benefits of a smart grid as compared to traditional grid are:
• Self-healing: A smart grid can monitor, control, anticipate and immediately respond to system problems in order to mitigate outages or power quality problems
• Security from physical and cyber threats: Use of technology is expected to facilitate identification and response to man-made or natural disruptions
• Widespread use of distributed generation: Standardized power and communication interfaces will allow customers to interconnect fuel cells, renewable generation and other distributed generation on a simple ‘plug and play’ basis
• Enhancement of customer’s control on the appliances and equipments in their homes and businesses: Interconnection with energy management systems in smart buildings will enable customers to manage their energy use thereby reducing energy costs
Smart energy technologies can increase power system productivity, in the process of reducing costs. For instance, sensors in power lines could give grid operators real-time information on temperature of the lines and other parameters. These features help in understanding stress on the lines, making way for optimum utilization of the network. Furthermore, centralized information allows for efficiency, in terms of technical losses and labour usage and remedial action schemes to stabilize the grid during minor fluctuations. There are many drivers for optimizing usage of the infrastructure through management and monitoring of power generation, transmission and distribution with IT solutions. In US and Europe, digital technologies have emerged as feasible options, which can control end-user power demand and coordinate local and distributed generation with the grid. One of the major drivers for a smart grid is the need to manage peak loads. Not only is such power supply expensive, in India it is simply unavailable. A rule of thumb is that saving 5% peak load saves 25% of generation costs (US or European numbers). When digital technologies are infused into the power grid, end-user demand can be adjusted to available power supply, and local generation can take stress off the power lines. Thus power supply availability, quality and reliability can be improved. More details are available in a detailed report on such technologies produced by CSTEP and Infosys for the Ministry of Power in October 2008.25
25 CSTEP and Infosys, "Technology: Enabling the Transformation of Power Distribution: Roadmap and Reforms," Ministry of Power, October 2008.
77
12 Appendix: Indian Electricity Sector
12.1 Overview of Indian Electricity Sector India’s power sector is one of the largest in the world, and the transmission system is soon to operate as a single, synchronous grid. While the capacity is large, 148,265.41 MW as of April 30, 2009 (Ministry of Power official statistics, which exclude captive power), the demand is far higher.
In the past few years the government of India has taken steps to reform and restructure the power industry. The Electricity Act, 2003 was enacted to consolidate the laws relating to generation, transmission, distribution, trading and use of electricity, and to promote competition.26
The main provisions of this Act that relate to the distribution sector were:
• Provision for private participation in distribution • Provision of non-discriminatory ‘open-access’ made mandatory. Open-access
in distribution to be introduced in phases. • Provision for a cross-subsidy surcharge on direct sale to consumers until cross
subsidies are gradually phased out. • Mandatory metering of all electricity supplies. • Adoption of multi-year tariff principles
The Act allows entry of private companies in generation, transmission and distribution. However private participation in distribution is minimal and is limited to a few states such as Orissa, UP and Delhi – this excludes a handful of private distribution companies operating in cities like Ahmedabad, Kolkata and Mumbai, mostly from pre-independence days. The results of privatization in these states have been mixed. While Delhi has shown immense improvement in customer service, operational efficiencies and reduction of AT&C losses, Orissa has not made impressive progress.27
The Government of India identified Distribution Reforms as the key area to bring about efficiency & commercial viability into the power sector. The Government took various initiatives in this direction; one of these was the introduction of Accelerated Power Development Programme (APDP) in February, 2000. The main objective of this programme was to initiate a financial turnaround in the performance of the State owned power sector.28
In 2002-03 APDP was re-christened as Accelerated Power Development and Reforms Programme (APDRP). APDRP had now been given much wider scope than APDP. It was aimed at strengthening and up-gradation of the Sub-Transmission, and Distribution system in the country with the following objectives:
(i) Reducing Aggregate Technical and Commercial (AT&C) losses;
26 The Indian Electricity Act, 2003, http://www.powermin.nic.in/acts_notification/electricity_act2003/preliminary.htm 27 CSTEP and Infosys, "Technology: Enabling the Transformation of Power Distribution: Roadmap and Reforms," Ministry of Power, October 2008. 28 Ninth Report, Standing Committee on Energy (Fourteenth Lok Sabha), Implementation of Accelerated Power Development and Reforms Programme (APDRP), http://164.100.47.132/committeereports/Energy/9rep.pdf
78
(ii) Improving quality of supply of power; (iii) Increasing revenue collection; and (iv) Improving consumer satisfaction.
In 2008 APDRP was restructured and is now called Revised APDRP (R-APDRP). Under R-APDRP, states will be required to adopt reform to become eligible for APDRP funds and will have to achieve AT&C loss reduction targets. Utilities will have to take up commercial measures like energy accounting & auditing, managerial initiatives for making the employees more accountable, adoption of Information Technology for improving efficiency and enhance consumer satisfaction.29
RAPDRP will cover urban areas with population of more than 30,000 (10,000 in case of special category states). In addition, in certain high load density rural areas with significant loads, works of separation of agricultural feeders from domestic and industrial ones, and of High Voltage Distribution System (11kV) will also be taken up.
Another significant initiative is the Rajiv Gandhi Grameen Vidhyutikaran Yojana (RGGVY) which was introduced in April 2005 for achieving the objective of providing access to electricity to all rural households.30
Under this scheme 90% capital subsidy from Government of India will be provided for rural-electrification infrastructure through:
(i) Creation of Rural Electricity Distribution Backbone (REDB) with one 33/11 kV (or 66/11 kV) substation in every block where it does not exist.
(ii) Creation of Village Electricity Infrastructure (VEI) for electrification of all un-electrified villages/habitations and provision of distribution transformer (s) of appropriate capacity in every village/habitation.
(iii) Decentralized Distributed Generation (DDG) and supply system from conventional sources for villages/habitations where grid supply is not cost effective and where Ministry of Non-Conventional Energy Sources would not be providing electricity through their programmes.
Balance 10% will be loan assistance on soft terms by Rural Electrification Corporation. The scheme also provides for funding of electrification of all un-electrified Below Poverty Line (BPL) households with 100% capital subsidy. The scheme’s aim is electrifying all un-electrified villages over a period of four years, and providing access to electricity to all rural households.
The Government of India had launched the Kutir Jyoti (KJ) Programme in 1998-99 for extending single-point light connections to the households of BPL rural families. Now KJ Programme has been subsumed under RGGVY. In Karnataka, Bhagya Jyoti (BJ) is a scheme sponsored by the State Government for providing electricity to the economically weaker sections of society. In this scheme only one bulb is allowed to be used by the consumer. The BJ scheme is similar to the KJ scheme, except that it includes both the rural and the urban poor.
29 http://www.powermin.nic.in/distribution/apdrp/projects/pdf/Order_for_Restructured__APDRP_During_ 11th_Plan.pdf 30 http://rggvy.gov.in/
79

12.2 Challenges for the Indian Electricity Sector
12.2.1 Power Shortage India faces a large demand-supply gap, which together with high technical & commercial losses leads to a situation where there are frequent load shedding events. According to the Ministry of Power, as of Mar 2009 India faced an energy shortage of 10.9% and a peak power shortage of 11.6%. During the year 2008-09, Karnataka faced an energy deficit of 6% and a peak power deficit of 4.78%.31 Our estimates for the losses are higher than the official numbers; regardless of the actual amount, these are significant and disruptive to consumers and the economy.
12.2.2 High T&D Losses One of the main challenges facing the Indian power sector is the large Transmission & Distribution (T&D) loss. Additionally, there are serious problems such as a haphazardly planned distribution network and old or worn-out equipment leading to frequent outages. The LT/HT line ratio in distribution networks in India is high. Ideally this ratio should be 1:1 whereas in many states it is greater than 2:1. Longer LT lines lead to higher energy losses in the distribution system and greater voltage drops. A better voltage profile at the customer’s end means that efficiency of appliances will be higher. Also there is higher incidence of Distribution Transformer (DT) failures due to LT fault currents.
12.2.3 High Commercial Losses The Aggregate Technical and Commercial (AT&C) losses in various states are in the range of 18%-62% with an average national-level figure estimated at around 33.07% (2006-07).32 AT&C is a unified measure spanning technical losses, billing, and collection. There are many instances of unmetered supply and outright theft. The tariff structure is skewed such that the most profitable customers (viz., commercial and industries) are charged the highest tariff. There is a cross subsidy given to Irrigation Pump-sets (IP) which are usually charged a flat rate based on their declared rating and in many cases are unmetered.33 Unreliable supply in rural areas leads to farmers keeping their IP sets on all night hoping to make use of them during the few hours of supply. This includes an unknown number of unauthorized sets which leads to overloading of DTs and lines. Overloaded DTs and lines increase distribution losses. Overloading also results in high failure rate of DTs, which means a lot of money is spent of repair and replacement of transformers in the distribution system. Beyond loading, power rostering to rural areas to control pumpset loads leads to both non-supply of power to rural areas (if they share a feeder) or highly unbalanced loading when single-phase supply is given. This is being address by the Niranthara Jyothi scheme, which aims to segregate IP and other rural loads.
31 Load Generation Balance Report 2009-10, http://www.cea.nic.in/god/gmd/lgbr_report.pdf 32 Central Electricity Authority http://www.cea.nic.in/ 33 MESCOM is unique in the state with approximately 93% of IP sets metered.
80
Additionally there is a lack of energy accounting at the distribution level since many DTs do not have energy meters, making it difficult to determine losses or detect theft.
12.2.4 Lack of skilled workforce Due to better work culture, compensation and growth opportunities available in other industries, utilities are finding it difficult to attract and retain fresh talent; this is especially the case outside larger cities, especially Bangalore or Mysore. There is a lack of expertise that is required to handle modern tools and technologies in the field as well as in office. The productivity of employees (employees per kWh delivered) is low by global standards. The lack of training can be cited as a reason for low productivity. Specialized training under programmes such as Distribution Reform, Upgrades and Management (DRUM) funded by United States Agency for International Development (USAID) are trying to bridge this gap and are showing good results, but most of these programmes are aimed at executive-level employees.34
12.3 Current State of IT in Indian Electricity Sector In 2002, the Ministry of Power formed the IT Task Force for Power Sector. It made several recommendations to use IT for improving the commercial and operational performance in distribution and its implementation. The Task Force also defined the role of IT in profitability, improvement of quality of service, and provided a roadmap of three to five years with both short-term and long-term IT initiatives. However, an update to this report done in 2008 shows that only a few Distribution Companies have been able to adopt the recommendations of the Task Force. Moreover, the technology adoption has been piecemeal.35 Most utilities have been limited to computerization of offices along with internet connectivity. In some cases the billing and collections have been computerized. Utilities started pilot IT initiatives in limited geographical areas but many of these projects were abandoned due to lack of a coherent strategy and utility employees limited IT knowledge. Due to this lack of knowledge utilities often have limited or no control over their IT systems and crucial IT operations and data are in the hands of vendors. Utilities have limited IT expertise and experience and hence are highly dependent on vendors. There is either limited or no integration of applications with other IT systems. IT systems to date have mostly been standalone and they have a limited coverage area. There is often no standard architecture and IT systems lack interoperability. There exists significant duplication of work where most of the primary records are still on paper and computers are either used as secondary storage or not at all. IT systems have not been integrated into the workflow and processes. Indian electricity distribution companies face many challenges with regards to governance issues. Some companies have tried to implement Management
34 http://www.drumindia.org/ 35 CSTEP and Infosys, "Technology: Enabling the Transformation of Power Distribution: Roadmap and Reforms," Ministry of Power, October 2008.
81
Information Systems (MIS) but with limited success. Most of the reporting is manual, which gives ample space for errors, accidental or otherwise. In the Revised APDRP (R-APDRP) under the 11th Plan there is an emphasis on IT in the power sector. It is believed that accelerated reform in the power sector is required to achieve commercial viability and high efficiency for distribution companies. A robust power sector will provide the base for India’s target of economic growth. IT will play a key role in improving efficiency and enhancing customer satisfaction.
12.4 IT Initiatives in Indian Electricity Distribution Companies Indian power distribution is in the hands of various entities, some private but mostly public; a few are government bodies but most have been corporatized at the least as part of reforms begun in the late 1990s. Like other differences in the profiles and operations of these bodies, there is wide variance in the adoption of IT amongst Indian power distribution companies. Mumbai and Delhi (privately operated) are some of the leaders in use of IT, but aspects are in place in pockets around the country. Some companies in India have adopted IT solutions geared towards improving their financial performance, speeding up processes and increasing customer satisfaction. On the whole, Indian companies, even leading companies, are behind some Western utilities in their use of IT, where IT has been fully integrated into all internal operations, and even provides real-time monitoring of their system for both billing and operational purposes in some cases. North Delhi Power Limited (NDPL)
• Adopted AMRDA (Automated Meter Reading and Data Analysis) system that remotely downloads data from high-value meters to a central location. It helps in billing and detecting tampering and theft
• Introduced SMS-based Fault Management system using GSM which ensures that the ‘no supply’ complaints lodged by a consumer get addressed quickly
• Introduced centralized call centre for all complaints and enquires • Introduced consumer portal for providing online usage and billing data along
with online payment facility and complaint/request registration • Implemented advanced distribution SCADA system, GIS, ERP for operational
efficiency Andhra Pradesh: Southern Power Distribution Company Ltd (APSPDCL)
• Implemented CAT (Consumer Analysis Tool) software to integrate billing and collection data from Private Accounting Agencies (PAA) and consumers. This software reveals exceptions to be followed up by the field officers. It also generates reports on meter irregularities, collection irregularities and First Information Report (FIR) for theft cases
• Implemented Common Billing Software (CBS) to ensure that all PAAs are on a common platform and generate uniform data for superior quality of data maintenance
• Adopted the Transformer Information Management System (TIMS) to manage distribution transformers and track transformers through their life cycle. It helps in vendor analysis on transformer performance
82
• Improved customer service through Customer Service Centres, Call Centre, Computerized Collection Centre, Spot Billing and e-Seva
Reliance Energy Ltd. (REL) – Mumbai
• Installed a state of the art SCADA system for its T&D network. • Has laid down 200 kms of ADSS Optical Fibre Cable connecting 54 Nos. of
33/22/11 kV receiving stations and 3 Nos. of 220 kV bulk receiving stations. These are used as communication media for the Transmission and Distribution system.
• Integration of SCADA with Geographical Information System (GIS) and Outage Management System (OMS) is planned in the coming years
• Introduced variety of payment options such as Electronic Clearing Service (ECS), online payment through net-banking and credit cards, cash card on Reliance India Mobile or cash at collection centres, banks and customer care centres.
• Fully computerized customer care centres, 24 hour toll free helpline and interactive website.
83
13 Report Preparation Background
13.1 Author Bios 1. Dr. Rahul Tongia – Team Leader Dr. Rahul Tongia is Program Director at CSTEP, and prior to this was on the faculty at Carnegie Mellon University in the Program on Computation, Organisations, and Society (School of Computer Science) and the Dept. of Engineering and Public Policy for a dozen years. His research covers interdisciplinary issues of infrastructure, especially in energy and telecom. He has been on the Technology Advisory Board for leading US utilities’ projects on Smart Metering, and was previously Vice-Chair of the United Nations ICT Task Force Working Group on Enabling Environment (formerly, Low-cost Connectivity Access). His prior work on the energy sector in India includes a definitive study on the Political Economy of Reform of the power sector (book published by Cambridge University Press, UK), as well as a study (Energy Policy Journal, 1998) that helped improve India’s power sector tariffs. He has had a number of seminal publications in both the IT and the power space, especially for India. Recently, he was the Carnegie Mellon lead for executive level training for the Korean Power Company (KEPCO) for a semester long special course. The focus was on technology, innovation, IT, and business management. He has a BS (Electrical Engineering) from Brown University and a Ph.D. (Engineering and Public Policy) from Carnegie Mellon University. 2. Mr. H.S. Ramakrishna Mr. Ramakrishna was Executive Engineer Telecommunication in Karnataka Power Transmission Corporation Ltd (KPTCL) from 1997 to 2000. He was responsible for maintenance of the communication system in the entire state of Karnataka. While at KPTCL he planned and executed a VSAT network for voice and data communication for the Load dispatch operation facility. He also planned and executed the computerization of the load dispatch facility for the management of the state’s generation and transmission facility. Recently he worked as consultant for a period of one year with M/S Datagen in carrying out an Energy Audit for BESCOM in Bangalore city, Ramanagaram, and Tumkur. Also he worked as advisor to 3EC for a period of 6 months for re-designing of the distribution system to reduce the distribution losses and to improve the system reliability and preparation of project reports for CDM projects. He has a BE in Electrical Engineering from Bangalore University.
84
3. Mr. Anupam Thatte Anupam Thatte is a Research Engineer at CSTEP. He has a BE (Electrical Engineering) from Pune University and an MS (Electrical and Computer Engineering) from Carnegie Mellon University. He has previously worked for Concurrent Technologies Corporation (CTC), Pittsburgh, Pennsylvania, USA. While at CTC he was the Co-Principle Investigator for ‘Distribution Systems Fault Analysis’ - a U.S. Department of Energy (DOE) supported project. The aim of the project was to create an analysis software/tool that would determine the location of faults in distribution systems based on data gathered at substations. His prior work also includes research on Flexible AC Transmission System (FACTS) devices. His research interests lie in the areas of power systems and control. 4. Mr. Vivek B. Rao Vivek. B. Rao is a Software and IT Lead at CSTEP. He has a B.E (Electrical Engineering) from Bangalore University. He has 15 years of comprehensive large scale experience in Real Time/Embedded IT Systems, Telecom and Networking technologies. He has a strong background in program development and quality assurance in managing projects from initial conception through development to implementation, and presently leads the software development activities at CSTEP. He has extensive experience in designing technical infrastructure including Networking, Power, High Availability Networking with Server Clusters, Storage and Backup Networks, Bandwidth. and Communication and Computing Clusters. Prior to joining CSTEP he has worked as a consultant with DRDO (Real-Time-Embedded Avionics Sub Systems), Motorola (ISDN-Data Adapters), Novell (Netware NFS), CGI (Application Test Planning & CMMi QA) and Oracle India (Database Porting & QE).
13.2 About CSTEP
The Center for Study of Science Technology and Policy (CSTEP), Bangalore is a private, not-for-profit Research Corporation (known as Section 25 Company in Indian Company Laws) established in July 2005. Founded by some of the leading scientists and researchers in India, its vision is to pursue scholarly, quantitatively rigorous and objective research on issues interfacing science, technology and policy in subjects such as national security, energy, information, communications and infrastructure. India has few such institutions for inter-disciplinary studies and thus CSTEP is uniquely positioned to undertake technology and policy analyses.
CSTEP maintains academic rigor and neutrality in its analysis, and to this end is selective in receiving grants so as not to compromise the objectivity of the research findings. CSTEP has raised several endowments from industry here in India – notably the SSN Educational and Charitable Trust and the Sir Dorabji Tata Trust. CSTEP also has received government grants for specific projects. Recently, CSTEP
85
was invited to give a presentation to the Prime Minister and several Cabinet Ministers on issues in science and technology. CSTEP was also invited to participate in the Prime Minister’s National Solar Mission. CSTEP completed a major study of India’s nuclear power prospects and also contributed newspaper articles during the Parliament debate on the recent international nuclear agreement. The Ministry of Power appointed CSTEP and Infosys to look at the role of information technologies in power distribution; the report was released in October 2008.
Members of CSTEP regularly publish op-ed pieces in India’s leading and global newspapers and magazines. Their opinions are sought frequently by the Press and other agencies. A list of such publications is given in CSTEP’s home page (www.cstep.in).
CSTEP’s Chairman, Dr. V. S. Arunachalam, was former Scientific Advisor to the Defence and Prime Ministers of India, and CSTEP’s Board has a number of distinguished scientists, management specialists and the Chairman of a leading industry. Prof. M. G. K. Menon was the Scientific Advisor to the Prime Minister, Chairman of the Science Advisory Committee to the Cabinet and Minister for Science & Technology, Government of India. Dr. P. Rama Rao was Secretary, Department of Science and Technology, and Chairman, Atomic Energy Regulatory Board, and Member of the Atomic Energy Commission. CSTEP’s Scientific Advisory committee is headed by Dr. M. Vijayan, President of Indian National Science Academy (INSA) and also includes Dr. Kirit Parikh, Member in charge of Energy and interstate cooperation, Planning Commission, Government of India. Please see the CSTEP web site (www.cstep.in) for further information.
86
14 Acknowledgements and Disclaimer
We would like to thank GESCOM and the Govt. of Karnataka for the opportunity to work on this project. In particular, the officers of the ESCOM have been very generous with their time, suggestions, data, and hospitality. We have learned a great deal during these past few months, and hope this report is of value.
All facts and figures are based on best available information, in many cases provided by ESCOM professionals and their publications such as annual report and website. The recommendations and suggestions made are those by CSTEP alone, and do not necessarily represent the views of any sponsors, partners, or other entities. We are responsible for any errors or omissions.
87