
LCPDP-2020-2040.pdf - Decoalonize
248
0 REPUBLIC OF KENYA
-
Upload
khangminh22 -
Category
Documents
-
view
1 -
download
0
Transcript of LCPDP-2020-2040.pdf - Decoalonize

0
REPUBLIC OF KENYA

1
Table of contents
LIST OF ACRONYMS ............................................................................................................... 8
ACKNOWLEDGEMENTS ....................................................................................................... 11
EXECUTIVE SUMMARY .......................................................................................................... 12
1. INTRODUCTION ............................................................................................... 16
1.1. Objectives of the report ............................................................................... 18
1.1. The updating methodology ......................................................................... 18
2. STATUS OF THE POWER SECTOR IN KENYA .................................................. 20
2.1. Background .................................................................................................... 20
2.2. Sector Institutional Structure ......................................................................... 20
2.3. Reforms in the Power Sector ........................................................................ 22
2.4. Regional Integration ..................................................................................... 23
2.5. Electricity supply ............................................................................................ 23
2.6. Energy Sources in Kenya .............................................................................. 24
2.7. Transmission and Distribution ........................................................................ 27
2.8. Electricity Consumption ................................................................................ 29
2.9. Retail electricity tariffs ................................................................................... 31
2.10. Pass through adjustment mechanisms ....................................................... 32
2.11. Electricity demand ........................................................................................ 32
3. ELECTRICITY DEMAND FORECAST ................................................................ 34
3.1. Introduction .................................................................................................... 34
3.2. Objectives of the forecast ........................................................................... 34
3.3. Overview of the Domestic Economy .......................................................... 35
3.4. Performance of the Power Sector .............................................................. 35
3.5. Future Economic Outlook: The Vision 2030 and The Big Four Agenda .. 37
3.6. Demand Forecasting Methodology ........................................................... 39
3.6.1. General approach ........................................................................................ 39
3.6.2. Energy demand structure ............................................................................ 40
3.6.3. Planning steps ................................................................................................ 40
3.6.4. Main drivers of the projected demand ...................................................... 43
3.7. Definition of the Scenarios ........................................................................... 44
3.7.1. Reference Scenario ...................................................................................... 44
3.7.2. Vision Scenario ............................................................................................... 44
3.7.3. Low Scenario .................................................................................................. 44
3.8. Forecast Assumptions.................................................................................... 44
3.8.1. Suppressed Demand .................................................................................... 44
3.8.2. Domestic consumption ................................................................................. 45
3.8.3. Small commercial consumption assumption ............................................ 47
3.8.4. Large Commercial and Industrial consumption ....................................... 48
3.8.5. Street lighting ................................................................................................. 49
3.8.6. Target Loss Levels ........................................................................................... 49
3.8.7. Vision 2030 Flagship Projects ........................................................................ 50
3.9. Results of the forecast ................................................................................... 51
3.9.1. Electricity consumption and peak load ..................................................... 51
3.9.2. Losses ............................................................................................................... 54
3.9.3. Comparison of the demand forecast results . ........................................... 55
3.9.4. Demand Forecasting Conclussion and Reccomendation. .................... 55
4. ASSESSMENT OF NATURAL ENERGY RESOURCES IN KENYA ....................... 57
4.1. Current and Future Energy Sources ............................................................ 57
4.2. Fossil energy sources ..................................................................................... 57

2
4.3. Crude oil and liquid petroleum products .................................................. 57
4.3.1. Crude oil ......................................................................................................... 57
4.3.2. Heavy fuel oil .................................................................................................. 58
4.3.3. Gasoil and kerosene ..................................................................................... 59
4.3.4. Natural gas ..................................................................................................... 59
4.3.5. Liquefied natural gas (LNG) ......................................................................... 60
4.4. Solid fuels ........................................................................................................ 61
4.4.1. Coal ................................................................................................................. 61
4.5. Renewable energy sources ......................................................................... 62
4.5.1. Geothermal energy ...................................................................................... 62
4.5.2. Hydropower .................................................................................................... 65
4.5.2.1. Conventional Hydropower .......................................................................... 65
4.5.2.2. Pumped Storage Hydropower .................................................................... 67
4.5.3. Wind energy ................................................................................................... 68
4.5.4. Solar Energy Resources ................................................................................. 70
4.5.4.1. Photovoltaic (PV) ........................................................................................... 70
4.5.4.2. Concentrated solar power (CSP) ................................................................ 74
4.5.5. Biomass, biogas and waste-to-energy ....................................................... 76
4.6. Other energy sources ................................................................................... 77
4.6.1. Battery Storage .............................................................................................. 77
4.6.2. Nuclear Power ............................................................................................... 78
4.6.3. Interconnections with neighboring countries ............................................ 79
4.6.3.1. Eastern African Power Pool .......................................................................... 79
4.6.3.2. Interconnection with Ethiopia ..................................................................... 80
4.6.3.3. Interconnection with Uganda ..................................................................... 80
4.6.3.4. Interconnection with Tanzania .................................................................... 81
5. EVALUATION OF POWER GENERATION EXPANSION PROJECTS ............... 82
5.1. Objective ........................................................................................................ 82
5.2. Technical parameters of hydro power plants/hydrological modelling 82
5.3. Fuel cost forecast .......................................................................................... 82
5.3.1. Coal ................................................................................................................. 83
5.3.2. Crude Oil ......................................................................................................... 83
5.3.3. Nuclear ........................................................................................................... 84
5.3.4. Natural Gas .................................................................................................... 85
5.4. Assumptions on transport costs ................................................................... 86
5.5. Domestic Shipping cost assumptions.......................................................... 86
5.6. Fuel Forecast Results ..................................................................................... 87
5.7. Screening curve analysis .............................................................................. 88
5.8. Results of the Screening Analysis ................................................................. 91
5.9. Sensitivity Analysis .......................................................................................... 92
6. GENERATION EXPANSION PLANNING ......................................................... 93
6.1. Generation expansion planning approach .............................................. 93
6.1. Generation expansion planning approach ............................................. 93
6.2. Existing and Committed Generation Plants.............................................. 93
6.2.1 Existing Generation Plants ........................................................................... 93
6.2.2. Committed Generation Projects ................................................................ 94
6.3. Planning Criteria and Modelling assumptions ......................................... 100
6.3.1. Plant availability and energy generation ................................................ 100
6.3.2. Reserve requirements ................................................................................. 100
6.3.3. Loss of load probability (LOLP) .................................................................. 101
6.3.4. Spinning Reserves Requirement ................................................................ 101

3
6.3.5. Operational Reserves for Wind and Solar Balancing ............................. 101
6.3.6 Expansion Planning Reserve Margins ........................................................ 101
6.3.7. Hydrology forecast ...................................................................................... 102
6.4. Generation Expansion Simulations using LIPS-OP/XP .............................. 102
6.5. Results for Generation Expansion Scenarios Simulations ....................... 102
6.5.1. Optimised Case – Reference demand .................................................... 103
6.5.2. Fixed System Case ....................................................................................... 111
6.5.2.1. Fixed System Case- reference demand scenario .................................. 111
6.5.2.2. Fixed System case - low demand Scenario ............................................. 113
6.5.2.3. Fixed System Case - vision demand scenario ......................................... 114
6.6. Conclussions and Recommendations ...................................................... 115
7. INVESTMENT COSTS OF THE INTERCONNECTED SYSTEM AND THE
EVOLUTION OF TARIFFS IN THE MEDIUM TERM. ............................................................... 117
7.1. Introduction .................................................................................................. 117
7.2. Optimized Case – Reference Demand Scenario ................................... 117
7.3. Fixed system case – Reference Scenario ................................................. 119
7.4. Comparison of the Retail tariff scenarios ................................................. 122
8. TRANSMISSION PLANNNING ....................................................................... 124
8.1. Objectives of transmission planning ......................................................... 124
8.2. Methodology ............................................................................................... 124
8.3. Target Network concept ............................................................................ 125
8.4. Planning assumptions and criteria ............................................................ 127
8.4.1 Planning assumptions .................................................................................. 127
8.4.2. Planning criteria ........................................................................................... 128
8.4.2.1. System Voltage ............................................................................................ 128
8.4.2.2. Equipment loading ...................................................................................... 128
8.4.2.3. Voltage selection ........................................................................................ 128
8.4.2.4. Reliability criteria .......................................................................................... 128
8.4.2.5. Fault levels .................................................................................................... 129
8.4.2.6. Power losses .................................................................................................. 129
8.4.2.7. Catalogue of equipment and materials.................................................. 129
8.5. Generation and load data ........................................................................ 132
8.6. Generation data 2020 – 2040. ................................................................... 133
8.7. Load data. .................................................................................................... 133
8.8. Distributed load forecast 2020 -2040 ........................................................ 133
8.9. Development of Target network candidates ......................................... 133
8.9.1. Overview of the developed target network ........................................... 134
8.10. Developing Models for Target Networks Options ................................... 137
8.11. System Studies and Analysis ....................................................................... 137
8.12. Load flow studies ......................................................................................... 137
8.13. Contingency studies ................................................................................... 138
8.14. Fault Level studies ........................................................................................ 138
8.15. Simulation Results ......................................................................................... 138
8.16. Simulations Key Findings ............................................................................. 139
8.17. Recommendations – (short to medium term). ........................................ 141
8.17.1. Transmission Capacity ................................................................................ 141
8.17.2. Network Reliability ....................................................................................... 143
8.17.3. Optimization and Improvement of network performance ................... 143
8.17.4. System voltage control ............................................................................... 143
8.18. Recommendations – (Long term 2030 - 2040)......................................... 144
8.18.1. Transmission Capacity and System Voltage Control ............................. 144

4
8.18.2. Optimization of wayleaves ........................................................................ 145
8.18.3. Network Reliability ....................................................................................... 145
8.18.4. Optimization and Improvement of network performance ................... 145
8.19. Optimizing the future Transmission Network. ........................................... 145
8.19.1. Methodology ............................................................................................... 146
8.19.2. Development of sequence of investments ............................................. 146
8.19.3. Comparison of investment strategies ....................................................... 147
8.19.4. Investment Sequence ................................................................................. 147
8.19.4.1. Transmission lines and substations ............................................................. 147
8.19.5. Reactive Compensation Sequence ......................................................... 160
9. CONCLUSIONS AND RECOMMENDATIONS .............................................. 163
9.1. Conclusions .................................................................................................. 163
9.1.1. Demand Forecast ....................................................................................... 163
9.1.2. Generation Expansion planning ................................................................ 164
9.1.3. Ancillary Services Requirements ................................................................ 164
9.2. Summary of recommendations ................................................................. 165

5
ANNEXURES
ANNEX 1 Existing generation Plants .................................................................................................... 167
ANNEX 2 Average Hydrology forecast .............................................................................................. 171
ANNEX 3 Dry Hydrology forecast......................................................................................................... 171
ANNEX 4 IPP Projects with PPA considered Under Fixed System case ......................................... 172
ANNEX 5 IPP Projects without PPA consdered under Fixed system case .................................... 175
ANNEX 6 Technology capacity factors - Fixed system case Reference demand .................... 183
ANNEX 7 Installed Capacity vs Load - Fixed System Reference ................................................... 184
ANNEX 8 Frim capacity vs Peak Load - Fixed system case Refernce scenario ......................... 185
ANNEX 9 Levelised cost of energy - Fixed case with candidates - Reference scenario ........ 186
ANNEX 10 Demand Supply balance - Fixed System Low Demand.............................................. 186
ANNEX 11 Installed capacity vs Load - Fixed system Low demand ............................................. 189
ANNEX 12 Firm capacity vs peak load - Fixed system Low demand scenario .......................... 190
ANNEX 13 Annual generaion - Fixed System Low demand scenario .......................................... 191
ANNEX 14 Levelised cost of energy - Fixed case with candidates - low scenario .................... 192
ANNEX 15 Demand Supply balance - Fixed system Vision scenario ............................................ 193
ANNEX 16 Installed capacity vs Laod - Fixed System vision scenario .......................................... 194
ANNEX 17 Firm Capacity vs Peak Load - Fixed system vision scenario ....................................... 195
ANNEX 18 Annual generation - Fixed System vision scenario ........................................................ 196
ANNEX 19Levelised cost of Energy - fixed case with candidates - vision scenario ................... 197
ANNEX 20 Technology capacity factors - Optimised case Reference demand ...................... 198
ANNEX 21 Installed Capacity vs Peak Load- Optimised Reference case .................................. 200
ANNEX 22 Firm vs Peak load - Optimised Reference scenario ..................................................... 201
ANNEX 23 System LEC - Optimised Case - Reference scenario .................................................... 202
ANNEX 24 Electricty Generation costs - Optimised case ............................................................... 203
ANNEX 25 Electricity generation costs - Fixed Case system .......................................................... 205
ANNEX 26 Tranmisssion investment Analysis ...................................................................................... 207
ANNEX 27 Three phase Short circuit current ..................................................................................... 210
ANNEX 28 Three phase short circuit current without 400KV Year 2025 ........................................ 214
ANNEX 29 Three phase short circuit current with 400kv Year 400kV ............................................ 219
ANNEX 30 Three phase short circuit current 2030 ............................................................................ 224
ANNEX 31 Three phase short circuit current Year 2035 ................................................................... 231
ANNEX 32 Three phase short circuit current Year 2040 ................................................................... 238
ANNEX 33 System Losses ....................................................................................................................... 245
ANNEX 34 System Summary (generation, Load and Losses) ......................................................... 246

6
List of tables
Table 1:Installed and Effective Capacity ............................................................................................ 24
Table 2:Energy Purchased in GWh........................................................................................................ 25
Table 3:Transmission and Distribution Line Lengths between FY 2014/15-2019/20 ...................... 27
Table 4: Transformers in Service,total installed capacity in MVA as at 30th June,2020 ............... 29
Table 5: Consumption in GWh among various categories 2014/15-2019/20 ............................... 29
Table 6:Consumption in GWh by Region ............................................................................................ 30
Table 7:Retail Electricity Tariff Effective Date 1st Novermber 2018 .................................................. 31
Table 8:Time of Use Schedule ................................................................................................................ 32
Table 9: Consumption patterns, consumer trends and customer growth 2014/15 – 2019/20FY
..................................................................................................................................................................... 37
Table 10:Domestic Consumption Assumptions .................................................................................. 45
Table 11:Small Commercial Assumptions ............................................................................................ 47
Table 12: Large Commercial and Industrial Assumptions ................................................................ 48
Table 13:Street Lighting Assumptions .................................................................................................... 49
Table 14:Target Loss Levels ..................................................................................................................... 50
Table 15:Flagship Projects and their assumptions .............................................................................. 50
Table 16:Energy Demand Forecast 2020-2040 ................................................................................... 52
Table 17:Peak Demand Forecast 2020-2040....................................................................................... 54
Table 18:Comparison of current demand forecast with previous forecast ................................. 55
Table 19:Hydropower potential ............................................................................................................. 65
Table 20 Forecast assumptions .............................................................................................................. 85
Table 21:International shipping cost assumptions ............................................................................. 86
Table 22:List of screened candidates .................................................................................................. 88
Table 23 Techno-economic Data for screend projects ................................................................... 90
Table 24 Committed Projects................................................................................................................. 94
Table 25 Candidate Projects ................................................................................................................. 96
Table 26 Demand- Supply balance ................................................................................................... 103
Table 27 Optimised Case Reference scenario expansion – generation expansion overview105
Table 28 Demand Supply Balance - Fixed System case reference demand scenario ........... 111 Table 29 Year 2040 regional power balances (MW) ..................................................................................... 126
Table 30 Year 2040 Regional Power Interchange ....................................................................................... 126
Table 31 Power transformers ....................................................................................................................... 130
Table 32 Other line equipment ..................................................................................................................... 131
Table 33 Catalogue & Unit Cost of Equipment-Transmission Lines Cost (MUSD/km) ................................. 132
Table 34 Cost of RAP, Land (Way Leaves) .................................................................................................. 132
Table 35 Peak Load Distribution in Regions ................................................................................................ 133
Table 36 Transmission Projects from the 2019-2039 plan ................................................................. 135 Table 37 Target Network elements .............................................................................................................. 135
Table 38 Selected Options for Further Analyses Included .............................................................. 136 Table 39 Simulated network losses for the four target networks .................................................................... 138
Table 40 Summary of cost of investment of the three alternatives in USD .................................................... 147
Table 41 Ongoing Projects........................................................................................................................... 147
Table 42 Planned Projects ............................................................................................................................ 152
Table 43 Reactive Compensation Investment Sequence ................................................................................ 160 Table 44 Reactive Power equipment included as part of transmission lines cost in the transmission lines cost.
................................................................................................................................................................... 161

7
List of figures
Figure 1 Power Sector Institutional Structure ....................................................................................... 20
Figure 2 Generation Mix .......................................................................................................................... 24
Figure 3 Power Plants location in Kenya .............................................................................................. 26
Figure 4 Transmission Network in Kenya 2019/20 ................................................................................ 28
Figure 5 Electricity demand Vs Capacity ............................................................................................ 33
Figure 6 Kenya GDP Growth .................................................................................................................. 35
Figure 7 Peak Demand and energy consumption 2013/14 to 2019/20 ........................................ 36
Figure 8 Monthly Actual Peak Demand for 2020 ............................................................................... 37
Figure 9 Forecasted Electricity consumption ...................................................................................... 52
Figure 10 Forecasted Peak Load .......................................................................................................... 53
Figure 11 Trend Losses .............................................................................................................................. 55
Figure 12 Exploration Activities in Kenya .............................................................................................. 58
Figure 13 Location of geothermal projects within Kenya Rift valley .............................................. 64
Figure 14 Major rivers of the catchment areas and location of existing large hydropower
plants .......................................................................................................................................................... 66
Figure 15 Wind Energy Capcity ............................................................................................................. 69
Figure 16 global horinzatal irradiation .................................................................................................. 72
Figure 17 Photovoltaic power potential .............................................................................................. 73
Figure 18 Direct normal irradiation in Kenya ....................................................................................... 75
Figure 20 Fuel Price forcast for selected products ............................................................................. 87
Figure 21 Results of screening analysis ................................................................................................. 91
Figure 22 Associated Energy costs at different plant utilization level ............................................ 92
Figure 22 Optimised Case- Annual generation balance ............................................................... 104
Figure 23 Annual generation balance - Fixed System Reference demand scenario .............. 113
Figure 24 Annual Generation balance - Fixed system low demand scenario .......................... 114
Figure 25 Annual generation Balance - Fixed system Vision demand scenario ........................ 115
Figure 26 Investments costs for various techniologies. .................................................................... 117
Figure 27 Levelised costs under the optimised case reference scenario. .................................. 118
Figure 28 Tariff evolution - Optimised Reference case ................................................................... 119
Figure 29 Annual investme t costs for various technologies in the fixed case - Reference
scenario .................................................................................................................................................... 120
Figure 30 Annual Systems cost ............................................................................................................. 120
Figure 31 Levelised electricity cost - Fixed case Reference scenario .......................................... 121
Figure 32 Tariff evolution - Fixed System case ................................................................................... 122
Figure 33 Retail tariff Comparison ....................................................................................................... 123

8
LIST OF ACRONYMS
AGC Automatic Generator Control
CAIDI Customer Average Interruption Duration Index
CCGT Combined Cycle Gas Turbine
COD Commercial Operation Date
CSP Concentrated Solar Power
DNI Direct Normal Irradiation
DGE Deemed Generated Energy
EAPP East Africa Power Pool
EECA Energy Efficiency and Conservation Agency
EPRA Energy and Petroleum Regulatory Authority
EEPCO Ethiopian Electric Power Corporation
ENS (UE) Energy Not Served (Unserved Energy)
FEC Fuel Energy Cost
GDC Geothermal Development Company
GDP Gross Domestic Product
GHG Green House Gas
GHI Global Horizontal Irradiation
GoK Government of Kenya
GT Gas Turbine
GWh Giga Watt hours
HFO Heavy Fuel Oil
HPP Hydro Power Project
HSD High Speed Diesel
HVDC High Voltage Direct Current
IDC Interest During Construction
IAEA International Atomic Energy Agency
IEA International Energy Agency
INEP Integrated National Energy Plan
IPP Independent Power Producer
ISO Independent System Operator

9
TSO Transmission System Operator
KEEP Kenya Energy Expansion Program
KEMP Kenya Energy Modernization Project
KenGen Kenya Electricity Generating Company Limited
KEPSA Kenya Private Sector Alliance
KETRACO Kenya Electricity Transmission Company
KNBS Kenya National Bureau of Statistics
KNEB Kenya National Electricity Board (KNEB)
KPLC Kenya Power & Lighting Company Limited
KWh Kilo Watt hour
LCPDP Least Cost Power Development Plan
LIPS OP/XP Lahmeyer International Short term optimization & long term
Expansion
LEC Levelized Energy Cost
LNG Liquefied Natural Gas
LOLE Loss of Load Expectation
LOLP Loss of Load Probability
LRMC Long Run Marginal Cost
LTA Long Term Average
LV Low Voltage
MAED Model for Analysis of Demand
MOE Ministry of Energy
MORDA Ministry of Regional Development and Authority
MSD Medium Speed Diesel
MSW Municipal Solid Waste
MTCO2e Metric Tonnes of Carbon Dioxide
MTP Medium Term Plan
MW Mega Watt(s)
MWh Megawatt Hour(s)
NDC National Determined Contribution
NHIF National Hospital Insurance Fund

10
NPP Nuclear Power Plant
PSSE Power System Simulation for Engineers
PPA Power Purchase Agreement
PV Photo Voltaic
O & M Operation and Maintenance
FOM Fixed operations and maintenance costs
PPA Power Purchase Agreement
REREC Rural Electrification Renewable Energy Corporation
SAIFI System Average Interruption Frequency Index
SME Small Medium Enterprises
SWERA Solar and Wind Energy Resource Assessment
SAPP Southern African Power Pool
SPV Special Purpose Vehicle
UN United Nations
UNFCCC United Nations Framework Convention on Climate Change
VOM Variable Operation and Maintenance Costs
WARMA Water Resource Management

11
ACKNOWLEDGEMENTS
This report is a product of joint effort between all sector utilities within the
Kenyan power sector. Oversight and quality assurance is provided by a
Committee chaired by the Director General, Energy and Petroleum Regulatory
Authority (EPRA) as well as senior management of sector utilities. To enrich
and provide a broader input to the report, relevant public institutions namely
the Vision 2030 secretariat and Kenya National Bureau of Statistics (KNBS) as
well as the Kenya private sector Aliance KEPSA provide input at oversight
level.
The technical team of the LCPDP undertakes all relevant simulations, analysis
and draft the report for consideration by the Oversight committee. Special
acknowledgements to their efforts and dedication to duty that made the
preparation of the report possible and to the highest technical standards.
The Ministry of Energy (MOE) continues to provide policy guidance that
informed and steered the technical team towards the Government intended
focus on provision of adequate, reliable and affordable power in the country.
Accordingly, it is hoped that this report provides the required signals to
investors to participate in the power supply value chain in the country. The
Management of EPRA continues to provide regulatory and secretariat services
during the report preparation.
All sector utilities’ Chief Executive officers supported the process by facilitating
technical teams to participate in the various working sessions and also
providing oversight inpus and are appreciated.

12
EXECUTIVE SUMMARY In accordance with Part 2 section 4-8 of the Energy Act of 2019, the Cabinet Secretary, in collaboration with other stakeholders is mandated to develop an Integrated National Energy Plan (INEP) in respect of coal, renewable energy and electricity so as to ensure delivery of reliable energy services at least cost. In the 2019/20 Financial year, the sector embarked on updating the 2017-2037 LCPDP Long term plan as a transitional process to INEP. The update was finalised and the reveised 2019-2039 LCPDP Long term plan was presented to the Oversignt committee for consideration. The committee however adviced that the report would not be truly reflective of circumstances in the sector owing to the emergence of Covid 19 pandemic that affected the economy and other factors that influence power demand and supply in the country. Accordingly, this report is an update of the the report presented then but also integrated reccomendations from the following sector reports: i. Revised IPP/PPA taskforce report 2020 ii. Sustainability report for KPLC by joint EPRA/KPLC/Treasury team iii. Post Covid 19 sector report iv. Revised planting sequence of generation projects arising from Force Majeure reccomendations by sector players v. Views from Mott Macdonald on areas of improvement to the plan The report which initially intended to be an input to the proposed INEP has taken the traditional format as the Ministry completes both the INEP framework and the enabling regulation that are at an advanced stage of development. It covers the period 2020-2040.
Current Situation of in the Power Sector
As at December 2020, Kenya had a total installed generation capacity of 2,753MW. The peak demand has grown from 1,512MW recorded in FY 2014/15 to 1,976MW recorded in December 2020. Energy purchased declined to 11,462GWh in the FY 2019/20 from 11,493GWh in the previous financial year. Actual sales increased by 0.05% from 8,769 GWh in FY 2018/19 to 8,773GWh in FY 2019/20. Network losses remain a significant issue within the sector as they stood at 23.5% as at June 2020.
Demand Forecast
Demand forecast was modelled under three scenarios namely reference; low and vision. Each scenario was based on specific assumptions of the evolution of the related demand drivers.

13
Energy demand is forecasted to grow at an average of 5.28% while the peak load is forecasted to grow at an average of 5.38% in the reference scenario; 8.20% and 8.35% in the vision scenario and 4.78% and 4.89% in the low scenario respectively. Peak demand is forecasted to grow at an average of 5.3% from 1,972MW in the base year to 5,526MW at the end of the planning period under the Reference scenario. Similarly, under the Vision scenario peak demand increases to 9,635MW in 2040 growing at an average rate of 8.35%. The Low scenario peak demand increases to 5,028MW in 2040 at an average rate of 4.89%. Generation Expansion Planning criteria and results
Simulations were done on selected cases based on various assumptions. The cases included; Fixed system with candidates and the Optimized case. The reference case demand forecast scenario reflects the most likely development path hence its use in deriving the long term expansion plan under the Fixed case with candidates and optimized case generation expansion scenarios. Under the fixed case with candidates reference demand scenario, the total interconnected capacity grows from the current total interconnected capacity of 2,654 MW in 2020 to 8,371 MW in 2040. The reserve margin as percenatage of peak load averages 19% over the planning period, peaking at 27% in 2027 and low of 12% in 2023. The LEC increases from US Cents 8.31/kWh in 2020 to peak at US Cents 12.68/kWh in 2027, before decreasing to an average of US Cents 11.06 /kWh in the period from 2028 onwards. Under the Optimised case reference demand scenario, the total interconnected
capacity grows from the current 2,654 MW in 2020 to 8,186 MW in 2040. The
average annual excess energy as share of generation in the period 2020-2030 is
1%, but increases thereafter to an average of 4%. However, the level of vented
steam remains high at an average of 18% of the possible maximum geothermal
generation over the planning period. The LEC, rises from US Cents 8.31/KWh
in 2020 to peak at US Cents 10.23/KWh in 2033, before decreasing to an average
of US Cents 9.82 /KWh in the period 2034-2040.
Optimised Reference Expansion Plan-Generation Capacity Summary Table
Generation Type
Installed Capacity (MW)
2020 2025 2030 2040
Units % Units % Units % Units %
Hydro 829 30% 848.8 24.05% 1499.5 29.11% 1813.9 22.16%
Geothermal 783 28% 976.6 27.67% 1411.6 27.4% 2586.8 31.60%
Solar 53 2% 250.3 7.09% 454.3 9% 404 4.93%

14
Generation Type
Installed Capacity (MW)
2020 2025 2030 2040
Units % Units % Units % Units %
Wind 336 12% 475.5 13.47% 771.4 20% 731 8.93%
Cogeneration 2 0% 71.44 2.02% 197.4 3.83% 239.8 2.93%
Thermal 749 27% 506.4 14.35% 417.8 8.11% - -
Biogas - - - - - - -
Biomass - - - - - - -
Imports - - 200 5.67% 200 3.88% 200 2.44%
Gas Turbines (LNG) - - 200 5.67% 200 3.88% 480 5.86%
Coal - - - - - - 981.0 11.98%
Natural Gas - - - - - - 750.0 9.16%
Nuclear - - - - - - - -
Total 2,752 100 3,529 100 5,152 100 8,186.5 100
Tariff evolution
From the simulations, the total cost implication for planned projects under the optimized case is KShs. 692,302,518,693. The average base retail tariff is projected to increase from KSh20.85/kWh in 2020 to KShs. 24.48/kWh in 2025. The generation cost in the rises from Kshs.9.82/kWh in 2020 to KSh. 11.68/kWh in 2025. The fixed case with candidates in the period 2020-2025 is KShs 723,806,943,976. The average base retail tariff is projected to increase from the KShs 20.85/kWh to KShs 25.98/kWh. Over the same period, the generation unit cost is estimated to rise from Kshs 9.82/kWh in 2020 to 13.00/kWh in 2025. Summary of Recommendations
The following recommendations are made;
I. Acceleration of implementation of the Vision 2030 flagship projects and
Big Four agenda to spur demand and enhance implementation of demand creation initiatives and promote development of demand creation strategies by various utilities in the sector.
II. Improved system management, automation and innovation to enhance supply reliability, efficiency and reduce system losses, and Provide incentives that promote conducive environment for growth of industrial customers and their associated energy consumption
III. Adoption of optimised case as the national long term generation expansion plan for the 2020-2040 period.

15
IV. For Solar and Wind projects that do not have PPAs, it is recommended that they are migrated to Renewable Energy Auctions.
V. Peaking capacity power plants and Battery storage should be developed immediately to avert peak capacity shortfalls, absorb excess energy presented as vented steam during off-peak hours, provide system reserves and prevent load shedding in Western Kenya in the short term as transmission projects are being implemented. In the long term the recommended projects for the same purpose are LNG gas turbines, Pumped Hydro Storage and peaking hydro plants.
VI. Demand side management relating to load shifting is recommended to enable optimal utilization of the excess energy in the system during off-peak hours. This includes initiatives like strengthening the time of use tariff, electrification of the transport sector among others.
VII. Negotiate for firm 200MW Ethiopia imports for at least 5 years to allow for development of local firm capacity in the medium term.
VIII. Renegotiate CODs and tariffs for projects that have PPAs but are yet to commence construction, to be integrated according to the dates given in the optimal plan. Respective contingent liabilities for the committed projects should be determined to inform proposals and negotiations.
IX. Carry out a comprehensive study on ancillary services requirements for the system, including battery storage, pumped storage and reactive power compensation, with the increasing levels of intermittent renewable energy sources.

16
1. INTRODUCTION
Over the years, the Government through the Ministry responsible for Energy has been
involved in planning for power supply in the country through a series of regular
reports. These reports are guided by the existing policy framework as well as the
supporting legislation and are intended to guide stakeholders on Government
intentions and plans over a period of time. The mandate for coordination of sector
plans has in recent times been housed in the Energy and Petroleum Regulatory
Authority (EPRA) formerly ERC. The regulator established an electricity sub-sector
Planning Committee comprising of all sector utlities. The Energy Act No 1 of 2019
vested this mandate to the Ministry of Energy going forward as articulated in part II
section 5 of the act.
Section 4-8 of the Act provides for the development of an Energy Policy to be updated
every 5 years and regular development of Integrated National Energy Plans (INEP)
consisting of coal, Geothermal and electricity sub-plans in addition to County Energy
Plans. This report is intended to transition the electric power sub-sector to the new
dispensation as the Ministry prepares to take up the mandate after approval of the
INEP framework and draft regulation.
The plan integrates changes in planned generation sequencing largely from the Feed-
In-Tariff Policy approvals and also from new Government approved projects expected
in the medium to long term. In particular it attempts to restructure the generation
sequence of power plants in a manner that matches the demand forecast closely. This
is to ensure that the demand-supply balance is not skewed too heavily towards supply
as to leave the sector with stranded generation investments and the attendant high
system costs. In addition, the plan focuses on system requirements for integration of
renewable energy technologies namely solar and wind and provides guidance on
possible extra investment costs neccesary to ensure long term system stability and
affordable end-user tariffs. This Plan is categorised into five key areas;
(a) Load forecast – The section analyses power demand drivers in the country and
based on the power requirements for each of them, estimates long term by
aggregating them to arrive at consumption in Gigawatt hour (GWh). It also
aggregates all capacity requirements to arrive at peak load in Megawatts (MW).
The demand forecast is developed in three scenarios; low, reference and vision.
The forecast is prepared using a custom made excel based tool that uses Model
for Analysis of Demand (MAED) principles and assumptions.
(b) Generation Plan– The section considers the current levels of approvals of
generation projects in the power sector and applies short term and long term
plan simulations by utilizing an inhouse software Lahmeyer International

17
Power System operation Planning (LIPs OP) and Lahmeyer International Power
System Expansion Planning (LIPs XP) respectively to arrive at an optimal
generation sequence. The simulation tools take into consideration plant types
by technology, system constraints as well as relevant costs. Through a
comprehensive screening process, a least cost optimal solution is developed for
the period under review.
(c) Transmission Plan – The transmission plan has taken into consideration system
requirements, reliability based on an N-1 criteria as well as expected expansion
to meet the adequacy requirement. Power System Simulation for Engineers
(PSSE) has been utilized in system simulations to arrive at the ideal network
expansion plan. The development of the network requirements is informed by
the load forecast and its distribution, existing commitments and proposed
generation projects over the plan period.
(d) Ancillary service requirements - The technical team also attempted to analyse
system requirements over the period. This involved identifying investment
requirements that could make the system stable and reliable including the
provision of sufficient primary response to maintain power system frequency
in the event of network or generation outages.
(e) Tariff evolution - This section of the report provides an analysis of the impact of the plan on the end-user tariffs based on current tariff structure in the country. Since the report is a long term one, the technical team focuses on the period when the tariffs are fairly predictable namely the first 5 years of the plan. This is because in the long term, the level of unpredictability cannot allow for a meaningful forecast on tariffs. Evolution of tariffs was computed using an excel based model developed internally by the technical team.
(f) Environmental considerations - The report has also analysed the impact of the planned system on the environment and in particular the level of carbon emissions. This is important in meeting the country’s obligations on the international convention on climate change to which Kenya is a signatory. LIPS
XP/OP model was updated in 2019 to incorporate GHG emissions estimation. These model has been used in the preparation of the planting sequence and estimating the carbon emissions.
Following the completion of the Transitional LCPDP 2019-2039, the sector was adversley impacted by the outbreal of Covid-19. Electricity demand reduced significantly following implementation of health guidelines meant to curb the spread of the virus. There was unanimous decision by the sector on the need to review the finalised report and present a more accurate one having taken into account the impact of Covid-19. The revision of the LCPDP 2019-2039 involved revision of the demand forecast, re-simulation of generation and transmission plans and in addition, incorporation of recommendations of the following reports;
i. Revised IPP/PPA taskforce report 2020
ii. Sustainability report for KPLC by joint EPRA/KPLC/Treasury team

18
iii. Post Covid 19 sector report
iv. Revised planting sequence of generation projects arising from sector Force Majeure events
v. Views from Mott Macdonald on areas of improvement to the plan
1.1. Objectives of the report
The main objective of this update is to take into account new assumptions based on
the impact of Covid-19, reccomednations of sector reports, as market dynamics that
may influence future power expansion plan and accommodate new Government
policy guidance on renewable energy expansion in the short to long term. In addition,
the report is intended to provide a transition framework towards the power sector
component of the INEP
The specific objectives are to:
Update the load forecast taking into account the performance of the economy in the wake of Covid-19 and factor in reccomendations from various sectoral reports.
Update historical data, literature, committed and candidate projects;
Simulate generation sequence of proposed power plants;
Prepare a Transmission System expansion plan in line with the generation plan which incorporates ancillary service requirements;
Assess the evolution of tariffs based on the estimated expansion costs; and,
Present Transisitonial LCPDP 2020-2040 plan to guide policy and investment decisions in the country.
1.1. The updating methodology
The update was undertaken by the Least Cost Technical Planning Committee
comprising of officers from: Ministry of Energy (MoE); Kenya Electricity Generating
Company (KenGen); Kenya Power and Lighting Company (KPLC); Geothermal
Development Company (GDC); Rural Electrification and Renewable Energy
Corporation (REREC); Kenya Electricity Transmission Company Limited
(KETRACO); and the Nuclear Power and Energy Agency (NuPEA). The Energy and
Petroleum Regulatory Authority (EPRA) provided secretariat services and
coordinated the process. Senior management from the institutions above, in addition
to the Kenya National Bureau of Statistics (KNBS); Kenya Investment Authority (Ken
Invest) and the Kenya Private Sector Alliance (KEPSA) provided oversight and policy
guidance.

19
The methodology applied in preparing the report was utilization of forecasting and
simulation tools namely a MAED based customized tool for load forecasting, LIPs-
OP/XP for short/long term term system optimization and PSSE for transmission
planning and simulations

20
2. STATUS OF THE POWER SECTOR IN KENYA
2.1. Background
Kenya’s power sector has advanced in electricity generation, transmission,
distribution and access arising from implementation of various reforms, notably the
Electric Power Act 1997, Sessional Paper no. 4 of 2004, Energy Act 2006 and the
recently enacted Energy Act 2019. The Energy Act 2019 has introduced significant
changes to the mandate of the various sector institutions to align them to the
requirements and provisions of the Constitution of Kenya 2010. These reforms are
discussed in Section 2.3 of this report.
2.2. Sector Institutional Structure
After the enactment of the Energy Act in March 2019, there was reorganization of
the institutional structure of the power sector. The redulting institutional structure
is as represented in figure 1
Steam
development
Issue Policies and
Regulations
Recommend
policy
direction
Issue and
enforce
license
requirements
Consumer and
investor
protection
PPA and
network
contracts
Review
and
Approvals
Retail
Tariff
Approval
Dispute resolution in
the sector
REG
ULA
TION
DEV
ELO
PM
EN
T, IMP
LEM
EN
TATIO
N A
ND
EN
FO
RC
EM
EN
T
REREC KPLC PRIVATE DISCOs
RETAIL TO CONSUMERS
MINIGRIDS
KPLC EXPORT TO UGANDA AND
TANZANIA
MINIGRIDS
KETRACO
MINISTRY OF ENERGY ENERGY AND PETROLEUM
REGULATORY AUTHORITY
NuPEA
IPPs GDC IMPORT
FROM
(TANESCO,
UETCL &
EEU)
Energy and
petroleum Tribunal
KenGen
Figure 1 Power Sector Institutional Structure

21
a) The Ministry of Energy (MOE) is responsible for policy formulation and
monitoring of policy implementation to enable an environment conducive for
efficient operation and growth of the sector. It sets the strategic direction for the
growth of the sector and provides a long term vision for all sector players.
b) The Energy and Petroleum Regulatory Authority(EPRA) is responsible for
economic and technical regulation of the energy sector. Functions include
Licensing of power sector facilities and technicians, Energy audit, tariff setting
and sector oversight, regulations development and implementation including
compliance and enforcement among others.
c) Energy & Petroleum Tribunal is an independent legal entity whose main
purpose is hearing and determining disputes and appeals in accordance with the
Constitution of Kenya 2010, Energy Act 2019 and any other relevant law.
d) Rural Electrification and Renewable Energy Corporation(REREC) is mandated
by Energy Act 2019 to be the lead agency for development of renewable energy
resources other than geothermal and large hydropower, in addition to its
previous mandate of rural electrification.
e) The Kenya Electricity Generating Company (KenGen) is the main power
generation entity in the country. It is also a repository of significant technical
expertise in geothermal technology development
f) Kenya Electricity Transmission Company (KETRACO) has the mandate to
plan, design, construct, own, operate and maintain new high voltage (132kV and
above) electricity transmission lines that will form the backbone of the National
Transmission Grid & regional inter-connections. It is expected that this will also
facilitate evolution of an open- access- system in the country.
g) Nuclear Power and Energy Agency(NuPEA) is the nuclear energy programme
implementing organization responsible for promoting the development of
nuclear electricity generation in Kenya and carrying out research, development
and dissemination activities of energy related research findings . It is also
expected to facilitate and coordinate capacity building activities in the energy
sector.
Source: Ministry of Energy

22
h) The Kenya Power and Lighting Company (KPLC) is the system operator and
the main off-taker in the power market buying bulk power from all power
generators on the basis of negotiated Power Purchase Agreements (PPAs) for
onward supply to consumers. It also owns and operates part of the existing
transmission infrastructure and the entire interconnected distribution
network
i) Geothermal Development Company (GDC) is a fully owned Government
Special Purpose Vehicle (SPV) undertaking surface exploration of geothermal
fields, exploratory, appraisal and production drilling and managing proven
steam fields. It also enters into steam sales agreements with investors in the
power sector.
j) Independent Power Producers (IPPs) are private investors in the power sector
involved in generation either on a large scale or for the development of
renewable energy under the Feed-in -Tariff Policy.
k) Mini-grids are a set of electricity generators and energy storage systems
interconnected to a distribution network that supplies electricity to a localized
group of customers not covered by the national power grid as approved by
EPRA.
l) Solar home systems companies supply the solar home systems for households
far away from the grid and will play a significant role in ensuring universal
access to electrification.
2.3. Reforms in the Power Sector
The enactment of the Energy Act No. 1 of 2019, that came into effect in March 2019
introduced a set of reforms as follows:
i. Establishment of an inter-ministerial Renewable Energy Resources Advisory
Committee (RERAC).
ii. Transformation of the Kenya Nuclear Electricity Board(KNEB) into the Nuclear
Power and Energy Agency (NuPEA) with expanded mandate to promote and
implement a nuclear electricity generation program and implement a capacity
building programme for the power sector.
iii. Introduction of an Integrated National Energy Plan consisting of a coal,
electricity and renewable energy plan that incorporates County Energy Plans.
iv. Providing for open access to the transmission and distribution networks, with
EPRA mandated to designate a System Operator and encourage regional
interconnections to enhance regional electricity trade.

23
v. Establishment of the Energy Efficiency and Conservation Agency (EECA) as a
fully-fledged national public entity to promote energy efficiency and
conservation.
vi. Provision for county government to set aside suitable land for development of
energy infrastructure including but not limited to projects recommended in the
Integrated National Energy Plans
vii. Provision for national government to facilitate the development of a
Resettlement Action Plan Framework for energy related projects; including
livelihood restoration in the event of physical displacement of communities
viii. Provision for development of a framework on the functional devolution of roles
between the National government and County governments in consultation
with all stakeholders to avoid overlap of functions.
ix. Provision for viable financing options from local and international sources for
cost effective utilization of all its energy resources, ensuring maintenance of a
competitive fiscal investment climate in the country.
2.4. Regional Integration
The Kenya-Ethiopia 500kV HVDC bipolar line is expected to be completed in 2020
while both the Isinya-Singida 220kV and the Lessos - Tororo 220kV interconnectors
are at advanced stages of construction. The intention is to facilitate regional trading
and in the long run and ensure that power exchange between the countries in the
region is facilitated. This will enhance grid stability and allow for introduction of more
renewable technologies even where they are intermittent.
2.5. Electricity supply
The installed generation capacity has increased considerably over the past five years,
rising from 2,299MW in FY 2014/15 to 2,712MW in FY 2018/19, representing an
annual average growth rate of 4.52%. As at FY 2019/20, the installed capacity stood
at 2,753 MW inclusive of off grid power. The peak demand also grew from 1,512MW
recorded in FY 2014/15 to 1,882MW recorded in FY 2018/19, an annual average
growth of 4.89%. A peak demand of 1,976MW was recorded in December 2020.
KenGen, which is the largest power generator in the country currently, accounts for
62.97% of the industry’s effective generation capacity. The Independent Power
Producers (IPPs) accounts for 35.95%while Isolated grid generation under the Rural
Electrification Programme (REP), implemented by REREC, accounted for about
1.07%.

24
The effective capacity mix comprises of 30.2% of hydro, 24.7% thermal(MSD),2.1%
Thermal (GT), 28.8% geothermal, 12.2% from wind and 1.96% from solar. Kenya’s
current effective installed (grid and off-grid) electricity capacity is 2,668 MW as
depicted in Table 1.
Table 1:Installed and Effective Capacity
Capacity as at June 2020
Installed MW
% Installed Capacity (MW)
Effective*/Contracted MW % (effective)
Hydro 833.90 29.94% 805.10 30.18%
Geothermal 811.14 29.12% 767.56 28.77%
Thermal (MSD) 689.53 24.76% 659.48 24.72%
Thermal ( GT) 60.00 2.15% 56.00 2.10%
Biomass 2.00 0.07% 2.00 0.07%
Solar 52.51 1.89% 52.18 1.96%
Wind 336.05 12.07% 325.50 12.20%
Imports - 0.00% - 0.00%
2,785 100% 2,668 100%
Source: Kenya Power
2.6. Energy Sources in Kenya
The power generation mix comprises of 45.6% of geothermal, 36.2% hydro, 6.7% fossil
fuels, 9.6% wind and 0.8% from solar for the financial year ending June 2020. Figure
2 shows the evolution of the generation mix from 2017/18 to 2019/20.
Figure 2 Generation Mix
0.00%
5.00%
10.00%
15.00%
20.00%
25.00%
30.00%
35.00%
40.00%
45.00%
50.00%
2017 2018 2019 2020
Year
Generation Mix
HYDRO THERMAL WIND GEOTHERMAL BAGASSE/BIOGAS IMPORTS SOLAR
Source: Kenya Power

25
The FiT policy acceptance by IPPs and deliberate government policy to advance
renewable energy generation has led to continous decline in energy purchased from
Thermal generation. Energy purchased from thermals reduced from 1,298GWh in FY
2018/19 to 882 GWh in FY 2019/20. Energy purchases from Wind and Solar increased
in FY 2019/20 with 1,284GWh and 91GWh of energy purchased respectively. This is
as summarized in table 2
Table 2:Energy Purchased in GWh
Energy Purchased GWh
2014/15 2015/16 2016/17 2017/18 2018/19 2019/20
Hydro 3,310 3,787 3,341 3,224 3,741 3,693
Geothermal 4,060 4,609 4,451 5,053 5,033 5,352
Thermal 1,715 1,246 2,164 2,202 1,298 882
Cogeneration 14 0 1 4 0 0
Solar 1 1 1 0 60 91
Wind 38 57 63 47 1,192 1,284
Imports 79 67 184 171 170 161
Total 9,217 9,767 10,204 10,702 11,493 11,462
The location of power plants in the country are as depicted in figure 3, The figure
shows that most plants in the country are located in the geothermal-rich Olkaria belt
in rift valley with hydro plants largely located in the tana cascade. In recent years,
other technologies are emerging with wind having the best prospects, Wind plants are
already developed in Corner baridi in Rift valley as well as the prominent Lake
Turkana wind in Marsabit

26
Figure 3 Power Plants location in Kenya

27
2.7. Transmission and Distribution
The total length of the Transmission and distribution network was 243,207 kilometers
for all voltage levels in 2019/20 from 59,322 kilometers in 2014/15. This growth has been
greatly influenced by Kenya Electricity Transmission Company (KETRACO), who have
accelerated the development of transmission infrastructure within their mandate,
consisting of 132kV, 220kV and 400kV. Table 3 provides transmission and distribution
line lengths between FY 2014/15 and 2019/20.
Table 3:Transmission and Distribution Line Lengths between FY 2014/15-2019/20
VOLTAGE 2014/15 2015/16 2016/17 2017/18 2018/19 2019/20
400 kV 96.8 1,244.4 2,116.4 2,116.4
220 kV 1,352 1,452 1,555 1,686 1,686 1,686
132 kV 2,824 3,087 3,208 3,322 3,372 3,372
66 kV 952 977 1,000 1,168 1,187 1,187
33 kV 21,370 27,497 30,846 34,508 35,177 35,703
11 kV 32,823 35,383 37,234 38,968 39,797 40,616
Total HV and MV 59,322 68,396 73,940 80,897 83,335 84,681
415/240V or 433/250V 110,778 139,642 143,331 152,799 158,527
TOTAL 59,322 179,174 213,582 224,228 236,134 243,207
% INCREASE P.A. 15.3% 19.2% 5% 5% 3%
Source; Kenya Power
The total transmission network (400kV, 220kV, 132kV) stood at 7,174.35 kms by June
2020. The entire national interconnected electricity distribution network is under KPLC
and stood at 243,207 in 2019/20. The distribution network consists of 66 kV feeder lines
and 33kV and 11kV medium-voltage lines and 415/240V LV lines distributed across the
country. There are plans to construct additional distribution lines and establish new
substations to extend power supply in rural areas. The end goal is to attain universal
access by 2022. Projects and programs are also being implemented to reduce system
losses and improve system reliability.

28
Figure 4 Transmission Network in Kenya 2019/20
Source KETRACO

29
Generation sub stations expansion was significant for the review period, rising from
3,025MVA in 2015 to 3,878MVA in 2020. During the same period, transmission
substation capacity expanded from 3,144MVA to 4,942MVA while distribution sub-
stations increased from 3,572MVA in 2014/15 to 4,563MVA in 2019/20 FY. Distribution
transformer capacity significantly increased during the same period from 6,384MVA to
8,174MVA. Table 4 represents the transmission and distribution substations capacities
For the period under review
Table 4: Transformers in Service,total installed capacity in MVA as at 30th June,2020
2014/15 2015/16 2016/17 2017/18 2018/19 2019/20
Generation Substations TOTAL 3025 3145 3205 3370 3720 3878
Transmission Substations TOTAL 3144 3704 4376 4866 4942 4942
Distribution Substations Total 3572 3848 4056 4372 4480 4563
11/0.415 kV & 33/0.415 kV Distribution
Transformers
6,384 7,088 7,276 7,606 7,844 8174
Source; Kenya Power
2.8. Electricity Consumption
The demand for electricity has shown an upward trend in the last 5 years. While the
demand was 7,655 GWh in the 2014/15 financial year, it increased to 8,773 GWh in the
2019/20 financial year. This is largely attributed to the increased efforts in attaining
universal access to electricity by 2022. A summary of trends in consumption among
various customer categories, and consumption by region during the last 5 years is shown
in Tables 5 and 6 respectively.
Table 5: Consumption in GWh among various categories 2014/15-2019/20
tariff types of customers covered by this tariff
sales in GWh
2014/15 2015/16 2016/17 2017/18 2018/19 2019/20
DC Domestic 1,866 2,007 2,138 2,335 2366 2,508
SC Small Commercial 1,143 1,153 1,201 1,222 1250 1,262
CI Commercial and Industrial
4,030 4,104 4,266 4,225 4462 4,308
IT Off-peak 15 26 41 33 N/A N/A
SL Street lighting 35 40 55 66 68 76

30
REP System (DC(*((DC,SC,SL)
525 537 549 554 595 602
Export to Uganda 38 43 20 22 27 18
Export to Tanesco 2 2 2 1 0.01 0
TOTAL 7,655 7,912 8,272 8,459 8,769 8,773
% INCREASE P.A. 5.70% 3.40% 4.50% 2.30% 3.70% 0.0%
Source: Kenya Power
Table 6:Consumption in GWh by Region
REGION 2014/15 2015/16 2016/17 2017/18 2018/19 2019/20
Nairobi North 1,032 1,187 1,301 1,204 1,219 1,209
Nairobi South 1,667 1,696 1,759 1,728 1,719 1,733
Nairobi West 1,059 808 853 898 958 960
Coast 1,312 1,338 1,389 1,435 1,477 1,464
Central Rift 456 569 596 650 689 680
North Rift 269 280 269 303 288 302
South Nyanza 0 48 86 88 104 123
West Kenya 525 320 313 361 376 376
Mt Kenya 309 413 431 437 456 439
North Eastern 461 671 704 776 862 869
KPLC Sales 7,090 7,330 7,701 7,881 8,147 8,154
R.E.P. Schemes 525 537 549 554 595 602
Export Sales 40 45 22 23 27 18
TOTAL 7,655 7,912 8,272 8,459 8,769 8,773
%INCREASE P.A. 5.7% 3.4% 4.5% 2.3% 3.7% 0.0%
Source: Kenya Power

31
Generally, the medium term commercial sales growth will be driven by the expansion of
the economy and other factors which include: A growing population; urbanization;
intensive electrification programs; and continued growth in the manufacturing,
agricultural and other sectors of the economy that drive GDP growth.
2.9. Retail electricity tariffs
EPRA is mandated to set, review and adjust tariffs and tariff structures and the terms of
electrical supply in the country from both the interconnected and the Off-Grid Systems.
Retail electricity tariffs are set as per customer category as illustrated in table 7.
Table 7:Retail Electricity Tariff Effective Date 1st Novermber 2018
Customer Category Energy Limit
(kWh/Month)
Charge Rate
(KES/kWh)
Demand Charge
(KES/kVA)
DC- Lifeline 0-100 10.00 -
DC-Ordinary >100-1500 15.80 -
Small Commercial SC-1 0-100 10.00 -
Small Commercial SC-2 >100-15000 15.60 -
Commercial and Industrial CI 1 No limit 12.00 800
Commercial and Industrial CI 2 No limit 10.90 520
Commercial and Industrial CI 3 No limit 10.50 270
Commercial and Industrial CI 4 No limit 10.30 220
Commercial and Industrial CI 5 No limit 10.10 220
Street Lighting No Limit 7.50 -
Source: EPRA
Additionally, for CI1-CI5 customers operating at 100% production capacity during peak
and off-peak periods and consume more than their average threshold, they enjoy a 5%
discount on the applicable Energy Rate in respect of the Schedule of Tariffs - 2018 for the
off-peak consumption. This is upon satisfactory confirmation by KPLC that their
production is 100%. CI1-CI5 customers are required to meet their monthly Energy
Consumption Threshold upon which any units over and above that threshold is billed at
the 50% discounted Time of Use (TOU) Tariff. This discounted Time of Use Tariffs are
applicable during off-peak period as shown in Table 8.

32
Table 8:Time of Use Schedule
Day Start (Hrs.) End (Hrs.)
Weekdays 00:00 06:00
22:00 00:00
Saturday/Holidays 00:00 08:00
14:00 00:00
Sunday 00:00 00:00
Source; EPRA
2.10. Pass through adjustment mechanisms
Fuel Energy Charge (FEC)- This is the added cost or rebates to the consumers as
a result of fluctuations in world prices as well as fluctuations in the quantity of oil
consumed by electricity generation.
Water Resource Management Authority Levy (WARMA Levy)- Is the fee paid to the
Water Resource Management Authority for water used by the hydro power plants in the
generation of electricity. This levy is charged on energy purchased from hydropower
plants above 1MW.
Inflation Adjustment- This is the amount charged as a result of the effect of domestic
and international inflation on the supply of Electricity. It is adjusted on a semi-annual
basis.
Foreign Exchange Rate Fluctuation Adjustment (FERFA)- These are adjustments made
to cushion utilities from the effects of foreign exchange rate fluctuations, which has an
impact on costs. These adjustments pass on this risk to the consumers thereby keeping
the price signals to consumers at efficient levels.
2.11. Electricity demand
The nation has seen an upward trend in demand for electricity over the past decade. The
peak demand increased from 1,512MW in FY 2014/15 to 1,926MW in FY 2019/20. A new
peak of 1976MW was realized in the month of December 2020. Trend in peak demand
for the period 2014/15-2019/20 is shown in Figure 5.

33
Figure 5 Electricity demand Vs Capacity
Source: Kenya Power
The rise in peak demand is associated with the increased number of consumers connected
over the same period. The country has experienced a significant increase in the number
of customers connected to the grid, from 3,611,904 recorded in financial year 2014/15 to
7,576,145recorded in financial year 2019/20, of which rural connections were 1,502,943,
accounting for 20% of total connections. This is an annual average growth rate of 19.14%
and is a result of the accelerated electrification programs across the country.
0
500
1000
1500
2000
2500
3000
2014/15 2015/16 2016/17 2017/18 2018/19 2019/20
MW
Year
Demand Vs Capacity
System Peak Demand Installed capacity

34
3. ELECTRICITY DEMAND FORECAST
3.1. Introduction
Electricity is considered an enabler to the world’s economic growth and development. To
this end, preparation of an optimal power system expansion plan begins with credible
assessment and projection of the future electricity demand. Such an assessment is carried
out based on historical load data, current energy demand and economic parameters such
as national Gross Domestic Product (GDP), sectoral growth and end-use consumer
behaviour. The aim is to arrive at a realistic forecast applicable to the entire power sector
expansion programme. A demand forecast provides an insight into the sector’s capital
investment and expansion decisions. It indicates future capacity (in MW) and energy (in
GWh) requirements to enable the planning of generation and transmission investments.
A realistic electricity demand forecast is critical to ensure an optimal power system
expansion plan. A high load forecast may lead to over-investment in redundant
capacities, while a low demand forecast may result in capacity shortfalls that would slow
down economic development. The demand projection process calls for use of a proven
methodology, appropriate assumptions and accurate input data.
This section of the report provides the national electricity demand forecast for the period
2020 to 2040. It is a revision of the 2019-2039 forecast to factor in the impacts of COVID-
19 pandemic and recommendations from various sectoral reports.
3.2. Objectives of the forecast
The main objective of this demand forecast is to develop an acceptable and accurate
assessment of the future electricity demand for purposes of an optimal expansion plan
for the period 2020-2040. The specific objectives include:
(i) Review the economic environment in relation to electricity demand;
(ii) Review the key demand driving factors identified in previous plans;
(iii) Update assumptions used in the previous forecasts;
(iv) Update the status of the flagship projects;
(v) Factor in the impacts of COVID-19 pandemic and recommendations from
various sectoral reports.
(vi) Present demand forecast results for the period 2020-2040.

35
3.3. Overview of the Domestic Economy
The Gross Domestic Product (GDP) for the year 2019 expanded by an average of 5.4%,
which was lower than 6.3% growth registered in 2018 as shown in figure 6.
Figure 6 Kenya GDP Growth1
Source: KNBS
In 2019, a number of sectors posted impressive performances but the overall growth was
curtailed mostly by a slowdown in agriculture, manufacturing and transportation
subsectors. The Macroeconomic environment remained largely conducive for growth
throughout the year.
The provisional estimate for GDP growth in 2020 is 2.6% mainly due to COVID-19
containment measures that have led to a disruption on livelihoods and businesses. This
slowed down economic activities in the country and negatively impacted the
performance of various sectors and in particular demand for power in the country
3.4. Performance of the Power Sector
Electricity peak demand has been growing gradually over the last 6yrs with an annual
growth of approximately 4.6% per annum. The energy consumption increased from
9,280GWh in 2014/15 to 11,462GWh in 2019/20 representing an average growth of 4.5%
over the last six years as shown in figure 7.
1 2020* GDP based on Draft BROP 2020
5.9%
5.3%5.7% 5.8%
4.9%
6.3%
5.4%
2.6%
0.0%
1.0%
2.0%
3.0%
4.0%
5.0%
6.0%
7.0%
2013 2014 2015 2016 2017 2018 2019 2020*
GD
P G
row
th r
ates

36
Figure 7 Peak Demand and energy consumption 2013/14 to 2019/20
In 2019/20, energy consumption decreased to 11,462GWh compared to 11,493GWh in the
previous year. The overall energy consumption in the financial year recorded marginal
growth of 0.05% compared to the previous year 3.7%, while energy purchased contracted
by 0.3% from a growth of 7.4% the previous year. On the other hand, peak demand grew
to 1,926MW in 2019/20 FY from 1,882MW the previous FY.
The onset of COVID-19 pandemic in the second half of the 2019/20 financial year and
subsequent government containment measures created economic shocks, adversely
affecting the energy sector. During this period, peak electricity demand declined from
1,926MW in February 2020 to 1,765MW in April 2020, a decline of 9.1% as shown in figure
8.
-
2,000
4,000
6,000
8,000
10,000
12,000
14,000
0
500
1000
1500
2000
2500
2013/14 2014/15 2015/16 2016/17 2017/18 2018/19 2019/20
Ene
rgy
Pu
rch
ase
d (
GW
h)
Pe
ak D
em
and
(M
W)
Peak Demand Vs. Energy Purchased
Energy Purchased (GWh) Peak demand (MW)

37
Figure 8 Monthly Actual Peak Demand for 2020
The steep decline was followed by a gradual recovery as the government eased the
containment measures enabling resumption of various economic activities. Peak
electricity demand improved continually and attained the pre-COVID level in October
2020.
The specific consumption has also shown a decline over the last five years due to
increased connections of low consuming customers and use of energy and equipment
efficiency. Table 9 summarizes the consumption patterns, consumer trends and customer
growth for the last 6yrs
Table 9: Consumption patterns, consumer trends and customer growth 2014/15 – 2019/20FY
2014/15 2015/16 2016/17 2017/18 2018/19 2019/20
Annual
Consumption
(GWh) 7,615 7,867 8,250 8,435 8,742 8,755
No. of Customers
3,611,904
4,890,373
6,182,282
6,761,090
7,067,861 7,726,188
Specific
Consumption
(kWh)
2,108.40
1,608.65
1,334.46
1,247.59
1,236.87 1,133.2
3.5. Future Economic Outlook: The Vision 2030 and The Big Four Agenda
1,911
1,926
1,907
1,765
1,802
1,835
1,882 1,887
1,923 1,938
1,760
1,780
1,800
1,820
1,840
1,860
1,880
1,900
1,920
1,940
1,960
Jan-20 Feb-20 Mar-20 Apr-20 May-20 Jun-20 Jul-20 Aug-20 Sep-20 Oct-20
Pea
k D
eman
d (
MW
)

38
The Vision 2030 and the Big 4 Agenda identify energy as one of the enablers for sustained
economic growth and a key foundation for Kenya’s envisaged national transformation.
The Vision 2030, the country’s economic blue print, aims to transform Kenya from a low
income, agrarian economy into a newly industrialized middle-income country by the
year 2030, with an average GDP growth rate of 10% per annum.
In 2017, the Government conceptualized a development agenda, dubbed “Big 4 Agenda”,
based on the Vision 2030. The pillars of the agenda are enhancing manufacturing,
affordable housing, universal health coverage and food security and nutrition.
Manufacturing: The Government’s aim is to expand the manufacturing sector’s
contribution to GDP to 20% by 2022 through promoting key projects in the textiles and
leather industry; blue economy; and agro-processing. The overall enablers for growth
being: Small and Medium Enterprises (SMEs); Ease of doing business rank to 50th
globally; industrial parks/zones; and market access and standards. Various Special
Economic zones (SEZ) have been earmarked for electricity supply including Dongo
Kundu, Kedong Industrial Park, Konza Technopolis, and Africa Economic Zones. As at
2019, manufacturing sector contributed 8.2%2 as a share of GDP. Various SEZ are under
construction and are expected to commence electricity consumption towards the end of
the medium term.
Affordable Housing: Increasing access to affordable and decent shelter by facilitating
mass house production of at least five hundred thousand (500,000) housing units by 2022
across the country. This target will be achieved by working in partnership with financial
institutions, private developers, manufacturers of building materials and cooperatives to
deliver homes faster and reduce the cost of construction by at least 50%.
The Energy sector is in the process of supplying power to a number of already developed
housing projects in Nairobi and Naivasha. The following projects have been approved
for the financial year 2020/2021: Kisima Park in Lukenya Mavoko, Habitat Heights in
Lukenya Mavoko, Moke Gardens in Lukenya Mavoko, Jewel Heights in Juja Kiambu,
Benvar Estate in Juja Kiambu, Kenlek Ventures in Ruiru Kiambu, Rea Vipingo in
Mombasa and Muselele Estate in Athi River.
Universal Health Care: The target under this pillar are to achieve 100% universal health
care by reducing the cost and ensuring universal access to quality healthcare by 2022.
This will be achieved by scaling up NHIF uptake, launching multi-tier insurance plan
2 KNBS Economic Survey 2020 exclusive of Taxes

39
and commissioning of key equipment in hospitals. The sector plans to supply electricity
to all level 3 and 4 hospitals in the country.
A total of 635 health facilities were identified to be within the threshold of 15km from the
grid. These facilities will be connected by extension of the national grid. A total of 354
health facilities have been identified to be above the threshold of 15km from the grid.
These health facilities would therefore require to be supplied using a solar stand-alone
system.
Enhancing food security and nutrition: The Government aims at achieving 100% food
security and nutrition by 2022. This will be achieved through enhanced large-scale
production; increased smallholder productivity and agro-processing; and reduced cost
of food. The Sector is focusing on electrification of food processing facilities across the
country, irrigation and livestock holding grounds.
3.6. Demand Forecasting Methodology
3.6.1. General approach
Electricity demand growth is mainly a consequence of economic activities and household
needs. These sources make electricity demand forecasting a complex exercise, due to
unavailability of the individual consumers’ data thereby necessitating use of aggregated
data for system load forecasting.
To forecast the electricity demand, both parametric methods that integrate main variables
and non-parametric methods such as pattern recognition, have been used. The Lahmeyer
International Excel based Demand Forecast Model was used for energy demand
forecasting. This Model was developed specifically for demand forecat in the Kenyan
context and aligned with the requirements of generation expansion planning and
transmission simulations. It is based on MAED principles and previous sector LCPDPs.
The following steps were taken in the development of the forecast:
i. Trend-projection was used for correlation analysis of the different factors affecting
electricity demand growth in the country.
ii. A bottom-up approach was adopted for calculation of demand for domestic and
industrial consumers; street lighting; and flagship projects as identified in the
Vision 2030.
iii. Sensitivity was carried out using three scenarios; vision, reference, and low.

40
3.6.2. Energy demand structure
The forecasting approach followed the existing tariff categories and consumption levels:
i. Domestic consumption: this includes KPLC and REREC domestic consumers
connected at 250-415 volts
ii. Small commercial consumption: this includes KPLC and REREC consumers also
connected at 250-415 Volts.
iii. Commercial and Industrial consumption: this represents large power consumers
in tariff categories CI1 to CI5.
iv. Street lighting consumption: These are the number of lamps installed in urban
areas for lighting and are considered to grow at 85% of domestic consumer
growth.
Losses were dis-aggregated based on the following voltage levels:
i. Low Voltage level (415/220 V or 433/250V)
ii. Medium Voltage level (11 and 33 kV)
iii. High Voltage level (66, 132 and 220 kV)
3.6.3. Planning steps
The procedure for forecasting is as follows:
Step 1: Data input and assessment of assumptions on population growth and
urbanization, electrification/connectivity, consumption trends, GDP and flagship
projects.
Step 2: Calculation of electricity consumption by tariff groups (domestic, street lighting,
small commercial, large commercial / industrial) for four different geographic areas
(power system areas: Nairobi, Coast, Mt Kenya, Western); applying the formulas for each
year of the study period as indicated below:
For tariff groups: domestic, street lighting, small commercial,
𝐶𝐵,𝑇𝐺,𝑃𝑆𝐴 (𝑦) = {𝑆𝐶𝑇𝐺,𝑃𝑆𝐴(𝑦) + 𝑆𝐷𝑇𝐺,𝑃𝑆𝐴 (𝑦)} × #𝑐𝑇𝐺,𝑃𝑆𝐴(𝑦)
For tariff groups: large commercial / industrial
𝐶𝐵,𝐺,𝑃𝑆𝐴 (𝑦) = 𝐺𝐷𝑃𝐾𝐸 (𝑦) × 𝑎𝑃𝑆𝐴 + 𝑏𝑃𝑆𝐴
Where:
#c Number of connections
a, b Coefficients of (past) linear correlation between consumption and GDP in
absolute figures

41
(𝐶 = 𝑎 × 𝐺𝐷𝑃 + 𝑏), by power system area
CB Consumption billed (net) in GWh
GDPKE Gross Domestic Product of Kenya in KES
PSA Power system area
SC Specific consumption in kWh/year
SD Suppressed demand (which can be served in this particular year) in kWh/year
TG Tariff group
y Year
This has been replicated for each power system area and for the entire country where:
𝑃𝑆𝐴 𝑐𝑜𝑛𝑠𝑢𝑚𝑝𝑡𝑖𝑜𝑛 = (∑ 𝑇𝑎𝑟𝑖𝑓𝑓 𝑔𝑟𝑜𝑢𝑝 𝑐𝑜𝑛𝑠𝑢𝑚𝑝𝑡𝑖𝑜𝑛 ) + 𝑓𝑙𝑎𝑔𝑠ℎ𝑖𝑝 𝑝𝑟𝑜𝑗𝑒𝑐𝑡𝑠 𝑙𝑜𝑎𝑑
𝑇𝑜𝑡𝑎𝑙 𝑐𝑜𝑛𝑠𝑢𝑚𝑝𝑡𝑖𝑜𝑛 (𝐾𝑒𝑛𝑦𝑎) = ∑ 𝑃𝑆𝐴 𝑐𝑜𝑛𝑠𝑢𝑚𝑝𝑡𝑖𝑜𝑛
Step 3: Demand from future flagship projects load is added to the existing consumer
structure, assessed based on expected peak load and load (utilisations) factors. This is
computed for the reference and high scenarios (low case assumes that all flagship projects
will not happen):
𝐶𝐵,𝐹𝑃𝑆,𝑃𝑆𝐴(𝑦) = ∑ [𝑃𝐹𝑃(𝑦) × 𝐿𝐹𝐹𝑃(𝑦)]
𝑥
𝐹𝑃=1
Where:
CB Consumption billed (net)
FP Flagship project
LF Load factor of tariff group / flagship project in %
P Peak load in MW
PSA Power system area
y Year
Step 4: Total Losses for respective voltage levels are added (LV, MV, HV) to arrive at the
total losses for each PSA and the overall national loss level.

42
The gross consumption (power plant and transmission network sent-out) is arrived at by
a summation of the total consumption billed plus total losses. This has also been
computed for each PSA:
𝐶𝑃𝑃(𝑦) =𝐶𝐵(𝑦)
(1 − 𝐿𝐻𝑉,𝑀𝑉,𝐿𝑉)
𝐶𝑃𝑃,𝑃𝑆𝐴(𝑦) =𝐶𝑇𝑁,𝑃𝑆𝐴(𝑦)
(1 − 𝐿𝐻𝑉)
Where:
CB; CPP; CTN are Consumption billed (net); power plant sent-out (gross);
transmission network sent-out (substation, incl. distribution losses) in GWh respectively
HV High voltage
L Losses (share of corresponding voltage level) in %
LV Low voltage
MV Medium voltage
PSA Power system area
y Year
It is assumed that losses as percentage of the units purchased will be decreasing based on
the KPLC annual loss reduction trajectory over the planning period.
Step 5: System peak load is derived by adding the total losses to the product of total
consumption billed, load factor, responsibility factor and simultaneous peak factor.
Where:
CPP Consumption power plant sent-out (gross) in GWh
FP Flagship project
LF Load factor of tariff group / flagship project in %
P Peak load in MW
PSA Power system area
RF Responsibility factor (share of peak load contributing to system peak) of tariff
group / flagship project in %

43
SF Simultaneous peak factor (of peak load power system area) = peak load system /
sum peak loads power system areas in %
TG Tariff group
y Year
Hy Hours in a year.
3.6.4. Main drivers of the projected demand
Key driving factors of demand considered are:
i. Demography of Kenya: This includes population growth and urbanization. It has
an explicit effect on domestic consumption and connectivity level. It also has a
direct effect on economic activity that is easily quantifiable.
ii. GDP growth: Directly impacts on household’s income and activity of the
productive sector translated into electricity consumption of commercial and
industrial customers. Three scenarios of GDP growth are envisaged: High scenario
of attaining 6.3% GDP growth by 2022, 2020 Draft Budget Review Outlook Paper
Projections and the 10yr historical GDP growth average. All the scenarios assume
that the overall GDP grows from 2.6% in 2020. This is an estimate based on the
Draft Budget Review Outlook Paper Projection.
iii. Vision 2030 Flagship projects: These projects have an impact on GDP growth
under the reference and high scenarios, and contribute to demand growth based
on their specific load requirements. The plan considers projects that are expected
to be realised within the medium and long term periods. The projects are also
assumed to have gradual increase in the load. A 2% load impact on demand has
been factored in based on the assumed year of initial load and year of full load per
project.

44
3.7. Definition of the Scenarios
The forecast considers three scenarios for the LTP period 2020 -2040 with 2020 as the base
year.
3.7.1. Reference Scenario
This is the base case scenario with projection based on historical data trends.
3.7.2. Vision Scenario
This scenario is based on the development patterns highly driven by Vision 2030 growth
projections and implementation of flagship projects.
3.7.3. Low Scenario
The Scenario represents a low growth trajectory where most of the government plans are
not implemented as planned. It is assumed that in this scenario economic development
will be at the existing rate with no expected increase during the planning period.
3.8. Forecast Assumptions
3.8.1. Suppressed Demand
In the forecast, a suppressed demand of 4.61% has been assumed for the base year. In the
projections the demand is added to the existing maximum demand to account for power
not supplied due to;
System load outages at the time the peak demand occurred
Loads switched off by industrial customers at peak to avoid running their plants
under poor voltages
Customers disconnected from the system for various reasons. Accordingly:
SD= (O+LS)/CBK
O= C X S X P
Where
SD Suppressed demand
O Outages in GWh for the base financial year
LS Load shed in GWh for the base financial year
CBK Consumption billed/sales KPLC in the base financial year
P Peak load in MW for the base financial year
C Customer Average Interruption Duration Index (CAIDI) in hours for the base
financial year

45
S System Average Interruption Frequency Index (SAIFI) for the base financial year.
3.8.2. Domestic consumption
Future growth in electricity demand across the domestic consumers in Kenya will be
strongly influenced by population growth, urbanisation and the number of customers
connected. Table 10 indicates the assumptions made for domestic demand:
Table 10:Domestic Consumption Assumptions
Category Data sources Assumptions, parameters
Demography KNBS Census 2019 (county
level)
2019 Census of 47.56Million, grown
by 1.55% to get 48.3 million as the
base figure across the scenarios.
Population growth UN High fertility scenario
forecast
UN medium fertility
scenario forecast
UN low fertility scenario
forecast
Low: 2020: 48.3 million, grown by
average growth 2.26%/year
Reference: 2020: 48.3 Million: average
growth 1.97%/year
Vision: 2020: 48.3 Million: average
growth 1.67%/year
Household size KNBS 2019 Census 2019: 3.92 persons / household
Share of total urban
population
Average Annual
Urban growth rate
World Urbanization
Prospects: The 2018
Revision-Annual Rate of
Change of the urban
population.
Kenya Household
Integrated Budget Survey
2015/2016
Share of urban population 2020
estimated based on KHIBS data
2015/16 (28.2%) and projected based
on UN Average Annual Urban
growth rate of 3.79%
Electrification
targets (connectivity
level), connection
rate
KPLC Annual statistics
2019/20
Generation and
Transmission masterplan
2015
Vision: 99% connectivity by 2030
Reference: 611,251 no. of new
customers connected based on
average last 10 years, with a
reduction of 0.5% every year

46
Low: 464,621 no. of new customers
based on 3 year average from 2017/18
to 2019/20 with a reduction of 0.5%
every year
Annual
consumption per
connection (specific
consumption) in
kWh
KPLC annual reports
2019/20
Generation and
Transmission Masterplan
2015
Reference:
2020: urban: 327.96
(Urban connected customers Specific
Consumption). Computed based on
81% urban share (KPLC DC) of total
domestic customers for all scenarios.
Rural: 78.39
(Rural connected customers Specific
Consumption). Computed based on
19% Rural share (REREC DC) of total
domestic customers for all scenarios.
Annual increase in specific
consumption: 4%
Low:
2020: urban: 277.24 Rural: 58.91,
Annual increase in specific
consumption: 4%
Vision:
2020: urban: 554.47, Rural: 117.81,
Annual increase in specific
consumption: 6%
Suppressed demand Outages (Forced & Planned)
Base year 4.61% (Based on
CAIDI=4.32, SAIFI=48.6)
Target

47
Reference: 0% in 2030
Vision: 0% in 2025
Low: 0.5% in 2040
Curtailed Demand
Base year 4.61% (Sum of outages &
Load shedding, divided by Sales)
3.8.3. Small commercial consumption assumption
Small Commercial electricity sales account for about 16% of total retail sales in Kenya and
are dependent on changes in population and urbanisation. Demand from this category
has grown over the past 10 years at an average growth rate of 5.1% due to theemergence
of small market centres.
Table 11:Small Commercial Assumptions
Category Data sources Assumptions, parameters
Electrification / connections 2019/20 KPLC Annual
accounts All scenarios: growth new
connections 44% of growth in
new domestic connections
(historic correlation 2009/10 –
2019/20)
Annual consumption per
connection (specific
consumption, SC)
2019/20 KPLC Annual
accounts
Increase in specific consumption
Reference: annual increase: 1.5%;
(based on an average growth in SC
over the 5yrs)
Low: annual increase: 0.6%
(assumed from actual growth
recorded in 2019/20)
Vision: annual increase: 2.2%
(assumed from average last five
years pre-COVID-19)
Suppressed demand See domestic consumption assumption Table 10

48
3.8.4. Large Commercial and Industrial consumption
For industrial and commercial consumption, the driving factor considered is the
correlation of consumption to GDP growth.
Table 12 shows assumptions made in the development of Large Commercial and
Industrial forecast:
Table 12: Large Commercial and Industrial Assumptions
Determined by Data sources Assumptions, parameters
Connections &
consumption through
GDP growth
Draft 2019/20 KPLC Annual
accounts transferred to
calendar years
Draft Budget Review Outlook
Paper 2020
KIPPRA Kenya Economic
Report 2020
GDP Growth of 2.6% assumed
for the base year across the three
scenarios.
Reference:
GDP growth: Draft BROP 2020-
2025, and retained the growth
rate of 2025 (5.9%) for the
remainder of the planning
period.
Low: Average historic GDP
growth for past 10yrs (2010-
2019) at 5.3%
Low:
Average historic GDP growth
for past 10yrs (2010-2019) at
5.4%
Vision:
GDP growth based on KIPPRA
Economic Report
2021 (5.3%), 2022 (6.3%) and
Maintained 2022 growth rate for
the rest of the planning period.
Average injection of GDP by
Flagship projects is 2%.
Suppressed demand See domestic consumption assumption Table 10

49
3.8.5. Street lighting
The driving factors for street lighting demand are:
i. Number of poles indexed to the number of customers
ii. The specific consumption of the lamps
For the purpose of this forecast, each customer as per the KPLC street-lighting category
was assumed to represent a meter, which in turn represents 10 lamps/pole each 130 watts
operating from 6:00pm to 6:00am.
Table 13:Street Lighting Assumptions
Category Data sources Assumptions, parameters
Street Lighting Coverage KPLC Street Lighting
Division.
National street lighting
coverage of 52.6%
4.1% street lights not in
operation in the base year (out
of 151,000 lamps, 6,200 are not
in operation.)
Electrification / connections Draft 2019/20 KPLC Annual
accounts.
All scenarios: growth in new
connections = 85% of growth
in new domestic connections
(2009/10 – 2017/18 historic
correlation)
Annual consumption per
connection (specific cons.)
KPLC Street Lighting
Division
Specific consumption: 5,694
kWh/a -
((130*10*12*365)/1000) (10
lamps each 130 Watt on 6pm
to 6am)
Suppressed demand KPLC Street Lighting
Division
All scenarios: see domestic
consumption assumption
Table 10
3.8.6. Target Loss Levels
The target loss levels are assumed to be the same towards the end of the medium and
long period across all scenarios. The base year losses are apportioned at 12.7% (LV), 6.4%
(MV) and 4.4% (HV) respectively. This is as indicated in table 14.

50
Table 14:Target Loss Levels
VOLTAGE LEVEL BASE YEAR END OF MTP END OF LTP
LV 12.7% 11.5% 11.5%
MV 6.4% 5.5% 5.5%
HV 4.4% 3.5% 3.5%
3.8.7. Vision 2030 Flagship Projects
Vision 2030 recognizes energy as one of the enablers of sustained economic growth and
a key foundation of Kenya’s envisaged national transformation. The vision identifies
projects that have a significant bearing on future GDP growth as well but are significant
power consumers. The forecast factors various flagship projects as identified under the
Vision 2030 and shown in table 15.
Table 15:Flagship Projects and their assumptions
Project Reference High
First year
of
operation
Initial
load
[MW]
Year
of
total
load
Total
load
[MW]
First year
of
operatio
n
Initial
load
[MW]
Year of
total
load
Total
load
[MW]
ELECTRIFIED MASS RAPID
TRANSIT SYSTEM FOR
NAIROBI
2030 15 2038 50
ELECTRIFIED STANDARD
GAUGE RAILWAY MOMBASA -
NAIROBI
2030 98 2039 130
SPECIAL ECONOMIC
ZONES(TATU CITY, ATHI
RIVER,ELDORET)
2024 15 2038 60
SPECIAL ECONOMIC
ZONES(KEDONG,DONGO
KUNDU,KONZA)
2022 10 2040 60 2022 15 2038 60
SPECIAL ECONOMIC
ZONES(KENGEN)
2023 15 2030 50

51
SPECIAL ECONOMIC
ZONES(TILISI,LAMU)
2025 10 2040 40
SPECIAL ECONOMIC
ZONES(GDC,EGERTON,INFINI
TY,OSERIAN,VIKINGS)
2026 15 2041 60
SPECIAL ECONOMIC
ZONES(MUMIAS,SONDU,HOM
ABAY,KISUMU)
2030 20 2045 80
3.9. Results of the forecast
3.9.1. Electricity consumption and peak load - reference, vision, low scenarios
The annual forecasted electricity demand and peak load respectively are expected to
grow for all scenarios over the planning period. Energy demand is forecasted to grow at
an average of 5.28% while the peak load is forecasted to grow at an average of 5.38% in
the reference scenario; 8.20% and 8.35% in the vision scenario and 4.78% and 4.89% in the
low scenario respectively as shown in figure 9. The vision scenario increases at a higher
rate due to an assumed higher GDP growth and early impact of flagship projects.

52
Figure 9 Forecasted Electricity consumption
Electricity consumption is expected to rise over the planning period in all scenarios. Energy demand in the reference scenario grows at an average of 5.28% to reach 14,320GWh in 2025 and 32,914GWh by the end of the planning period as shown in figure 9. Under the Vision scenario energy demand increases at an average of 8.20% to 16,958GWh by 2025 from 11,760GWh in the base year. Consumption is forecasted to reach 56,845GWh by 2040 under this scenario. The Low scenario expands moderately at an average of 4.78% to reach 29,906GWh by the end of the planning period as shown in Table 16.
Table 16:Energy Demand Forecast 2020-2040
Reference Vision Low
Year GWh Growth GWh Growth GWh Growth
2020 11,760 11,760 11,760
2021 12,344 4.97% 12,817 8.99% 12,235 4.04%
2022 12,831 3.95% 13,866 8.19% 12,556 2.62%
2023 13,299 3.65% 14,775 6.55% 12,883 2.60%
2024 13,787 3.67% 15,837 7.19% 13,227 2.67%
2025 14,320 3.87% 16,958 7.08% 13,607 2.87%
2026 15,152 5.81% 18,294 7.88% 14,270 4.87%
2027 16,182 6.80% 19,742 7.92% 14,988 5.03%
2028 17,106 5.71% 21,408 8.44% 15,760 5.15%
2029 18,095 5.78% 23,216 8.45% 16,598 5.32%
2030 19,177 5.98% 25,444 9.59% 17,637 6.26%
0
10,000
20,000
30,000
40,000
50,000
60,000
2020 2021 2022 2023 2024 2025 2026 2027 2028 2029 2030 2031 2032 2033 2034 2035 2036 2037 2038 2039 2040
GW
h
Year
Consumption Sent Out
Reference GWh Vision GWh Low GWh

53
Reference Vision Low
Year GWh Growth GWh Growth GWh Growth
2031 20,259 5.64% 27,665 8.73% 18,558 5.22%
2032 21,369 5.48% 30,089 8.76% 19,540 5.29%
2033 22,551 5.53% 32,473 7.92% 20,586 5.36%
2034 23,811 5.59% 35,122 8.16% 21,703 5.42%
2035 25,131 5.54% 38,007 8.21% 22,875 5.40%
2036 26,461 5.29% 41,340 8.77% 24,096 5.34%
2037 27,976 5.73% 44,795 8.36% 25,443 5.59%
2038 29,547 5.62% 48,601 8.50% 26,842 5.50%
2039 31,206 5.61% 52,616 8.26% 28,327 5.53%
2040 32,914 5.47% 56,845 8.04% 29,906 5.57%
Average Growth 5.28% 8.20% 4.78%
Figure 10 Forecasted Peak Load
Peak demand is forecasted to grow at an average of 5.3% from 1,972MW in the base year
to 5,526MW at the end of the planning period under the Reference scenario. Similarly,
under the Vision scenario peak demand increases to 9,635MW in 2040 growing at an
3,184
9,635
2,307
5,028
1,972
2,613
5,526
0
1,000
2,000
3,000
4,000
5,000
6,000
7,000
8,000
9,000
10,000
MW
Peak Demand
Vision Low Reference

54
average rate of 8.35%. The Low scenario peak demand increases to 5,028MW in 2040 at
an average rate of 4.89% as shown in table 17.
Table 17:Peak Demand Forecast 2020-2040
Reference Vision
Low
MW Growth MW Growth MW Growth
2020 1976 1976 1976
2021 2029 2.64% 2108 6.6% 2010 1.7%
2022 2110 4.04% 2281 8.2% 2065 2.7%
2023 2190 3.76% 2435 6.7% 2121 2.7%
2024 2272 3.78% 2610 7.2% 2180 2.8%
2025 2363 3.97% 2799 7.2% 2245 3.0%
2026 2503 5.93% 3024 8.0% 2357 5.0%
2027 2677 6.94% 3269 8.1% 2478 5.2%
2028 2833 5.83% 3550 8.6% 2609 5.3%
2029 3000 5.90% 3859 8.7% 2751 5.4%
2030 3183 6.10% 4251 10.2% 2928 6.4%
2031 3368 5.82% 4627 8.8% 3084 5.3%
2032 3556 5.58% 5037 8.9% 3251 5.4%
2033 3757 5.64% 5441 8.0% 3429 5.5%
2034 3971 5.70% 5891 8.3% 3620 5.6%
2035 4195 5.65% 6382 8.3% 3820 5.5%
2036 4421 5.40% 6951 8.9% 4031 5.5%
2037 4680 5.84% 7542 8.5% 4261 5.7%
2038 4948 5.73% 8194 8.6% 4501 5.6%
2039 5232 5.75% 8892 8.5% 4757 5.7%
2040 5526 5.62% 9635 8.4% 5028 5.7%
Average Growth 5.3% 8.2% 4.8%
3.9.2. Losses
Under all scenarios, losses reduce from the initial 23.5% in 2020 to 16.7% at the end of the
planning period.

55
Figure 11 Trend Losses
3.9.3. Comparison of the demand forecast results with the previous forecast.
A comparison of the current forecast results in all scenarios indicate a reduction from the
previous forecast. The energy consumption shows a 0.02%, 0.44% and 0.58% reduction in
the low, reference and vision scenarios respectively. The peak demand shows a reduced
growth of 0.02%, 0.52% and 0.58% in low, reference and vision scenarios respectively as
indicated in table 18
Table 18:Comparison of current demand forecast with previous forecast
Plan Period DESCRIPTION Energy Peak Energy Peak Energy Peak
Low Reference Vision
2020-2040 Current Growth rate
4.78% 4.89% 5.28% 5.38% 8.20% 8.35%
2019-2039 Previous Growth rate
4.76% 4.91% 5.72% 5.90% 8.78% 8.93%
CHANGE -0.02% -0.02% -0.44% -0.52% -0.58% -0.58%
3.9.4. Demand Forecasting Conclussion and Reccomendation.
The review of the demand forecast incorporating the impact of the COVID-19 pandemic
and the recommendations of various sectoral reports indicates a slower demand growth
rate compared to the pre-COVID forecast. This is due to the decline in consumption by
commercial consumers adhering to government containment measures. However, this is
a temporary position that is likely to recover in the short to medium term, In addition, it
0.0%
5.0%
10.0%
15.0%
20.0%
25.0%
Loss
rat
eLoss rates

56
has been noted over time that flagship projects are not being implemented within the
timelines as envisaged, therefore slowing down both the economic and demand growth.
It has also been noted that specific consumption has declined due to low consumption by
newly connected customers.
The following are the recommendations:
i. Acceleration of implementation of the Vision 2030 flagship projects and Big Four
agenda to spur demand
ii. Enhance implementation of demand creation initiatives and promote
development of demand creation strategies by various utilities in the sector
iii. Allocate sufficient budget to implement the demand creation initiatives such as
new customer connections and grid enhancement
iv. Enhance coordination between various State departments, Agencies and County
governments to promote productive use of electricity
v. Improve system management, automation and innovation to enhance supply
reliability, efficiency and to reduce system losses
vi. Provide incentives that promote conducive environment for growth of industrial
customers and their associated energy consumption

57
4. ASSESSMENT OF NATURAL ENERGY RESOURCES IN KENYA 4.1. Current and Future Energy Sources
This chapter discusses the energy sources utilized for electric power generation as well
as the planned and potential energy sources for future electricity generation in Kenya. It
evaluates the characteristics of fossil fuels considering infrastructure and future
developments, overview of the available renewable energy sources and nuclear power as
potential future energy source. The regional power interconnections with neighbouring
countries as electricity supply options have also been discussed.
Currently, national primary energy consumption is dominated by biomass (charcoal and
wood fuel) accounting for 69%. This was followed by petroleum products (22%),
electricity (9%, about a third based on the fossil fuels heavy fuel oil (HFO) and gasoil
products, the remaining based on renewable energy sources), and coal (1%). Demand for
petroleum products has been increasing steadily by approximately 10% annually.
4.2. Fossil energy sources
Fossil energy sources are defined as hydrocarbon deposits formed in the geological past
from the remains of living organisms. In this report they are differentiated by their texture
and aggregate state, i.e. liquid, solid and gaseous energy sources.
At present, crude oil and coal are the only domestic fossil energy resources available for
extraction and potential use in power generation. Exploration activities on natural gas
deposits are underway.
4.3. Crude oil and liquid petroleum products
4.3.1. Crude oil
Crude oil is a liquid fossil fuel consisting of a complex mixture of hydrocarbons found in
and extracted from geological formations beneath the Earth’s surface. It is the basis for a
wide range of liquid, gaseous and solid petroleum products produced in refineries.
During the past 50 years, crude oil has been the major energy source in the world
measured by energy content, being nearly 10% ahead of the second placed coal, which
can be attributed to its dominance in the transport sector. Some petroleum products such
as gasoil and HFO are used for electricity generation.
Kenya has 46 onshore and offshore exploration blocks across the country and off the coast
and a total of 43 exploratory wells which have been drilled in four basins (Lamu,

58
Mandera, Anza, Tertiary Rift) by 20153. A corresponding number of 41 licences have been
awarded to international oil firms (exploration and production companies) to carry out
exploratory activities. Figure 12 provides an overview of ongoing exploration activities
in Kenya as from July 2015.
Figure 12 Exploration Activities in Kenya
Domestic crude oil deposits have been located in Turkana, the northern most
county of Kenya bordering Uganda and South Sudan. Extraction in Turkana is
ongoing with the crude oil transported by trucks to Mombasa for export. Plans are
underway to construct a pipeline from Turkana to Lamu for export.
About 25% of the installed power generating capacity of Kenya’s electricity sector
relies on imported petroleum products. The dependence on petroleum products
has been declining over time. This is due to the increase in the installed capacity
from renewable energy sources such as geothermal, wind and solar.
4.3.2. Heavy fuel oil
Heavy fuel oil (HFO) or residual oil is a fraction at the lower end of the fractioning
column obtained during the distillation process in the crude oil refinery. As a
residual product, it is of low quality compared to most petroleum products. High
viscosities require pre-heating for transport. HFO also includes a high share of
impurities, such as water, soil and sulphur depending on the crude oil. It is mostly
3 Ministry of Energy and Petroleum, Draft National Energy and Petroleum Policy (2015)

59
used as a relatively cheap but still liquid fuel for power generation and shipping.
Its use causes higher environmental pollution compared to other fuels. For every
fraction, various kinds of HFO exist distinguished by their viscosity and net
calorific value.
HFO is mainly used in diesel power plants, such as in the Kipevu Power Station
in Mombasa while the remaining proportion is used for industrial production. At
present all HFO is imported through Mombasa port and thereafter transported by
road to the power plant locations. It is currently not recommended as suitable fuel
option due to its negative environmental impact.
4.3.3. Gasoil and kerosene
Gasoil and kerosene are fractions at the middle of the fractioning column of the
distillation process. Various kinds of gasoil are also distinguished by their
viscosity and net calorific value. Gasoil and kerosene are at the upper end of the
cost range of generation fuels. Kerosene is used in households (e.g. for lighting
and generators), it powers jet engines of aircrafts, but also gas turbines in power
stations.
The transport sector accounts for the largest share of the total gasoil consumption
in Kenya. The remaining share of gasoil consumption is typically used for power
generation in large isolated grids. For power generation in Kenya, kerosene is used
in gas turbines such as for the Muhoroni Power Station. Gasoil and kerosene are
recommended fuel options for backup and peaking capacity plants.
4.3.4. Natural gas
Natural gas is a gaseous fossil fuel consisting of a mixture of hydrocarbons,
primarily methane found in and extracted from geological formations beneath the
earth’s surface. It can be distinguished by its composition and by the extraction
technology required by the geological formation. Beside the natural gas extracted
from gas fields, there is also associated gas or flare gas. This gas is produced during
the crude oil extraction process and is often flared. It generally shows a different
composition than free gas. As relatively new gas types, unconventional gas
resources are currently being developed such as shale gas or coal-bed methane
trapped within shale and coal formations.

60
Natural gas has been the third important energy source in the world measured by
energy content, behind crude oil and coal4. Its share has continuously been
increasing. Besides technical advances in the extraction and transport of natural
gas as well as achieving a lower price than crude oil, the increased consumption is
also due to its rather environmental friendly characteristics having virtually no
sulphur content and low carbon dioxide emissions. This makes its importance for
electricity generation to grow even further. However, the means of transport of
natural gas are limited to gaseous form in pipelines or liquefied natural gas (LNG)
in ships or trucks. These limitations restrict the use of natural gas to the vicinity of
gas fields and an existing pipeline network with idle capacity or it requires
relatively high investment costs for constructing new pipelines or the transport in
form of LNG.
Due to the early stage of exploration, it is assumed that domestic natural gas will
not be a potential energy source for power generation. If it were available in the
long term, it would make economic sense in comparison to other energy sources,
particularly replacing environmentally more harmful fossil fuels. However, power
generation based on domestic natural gas would have to compete (in terms of
finite resources and price) with other consumers such as industries and
households (e.g. for cooking).
4.3.5. Liquefied natural gas (LNG)
The supply of natural gas is mainly restricted by the available transport
infrastructure. The use of liquefied natural gas (LNG) is relatively a new option
for large-scale power generation. This is natural gas liquefied at the country of
origin, transported by special LNG ships to the port of destination, re-gasified in
LNG terminals and then transported to the consumer through pipelines. The
logistic facilities make up a considerable part of the overall LNG costs.
Due to the vast resources of natural gas worldwide, the potential for LNG is large
in theory. It is restricted by required liquefaction and regasification facilities as
well as competing demand on the world market. For Kenya, the prospects of
4 BP Statistical Review of World Energy June 2017

61
discovering natural gas deposits has resulted in the government exploring
opportunities for developing the domestic resource instead of importing.
LNG is recommended as an alternative fuel option to allow for the diversification
of fuels used in power generation and its environmental advantage compared to
more harmful fossil fuels. The use of LNG would also provide economic benefits
for other consumers, such as industries, households and transport sector.
4.4. Solid fuels
4.4.1. Coal
Coal is a solid fossil fuel consisting mostly of carbon with variable amounts of
other elements mainly hydrogen, sulphur, oxygen, and nitrogen. Coal is formed
when dead plant matter decays into peat and is converted into coal by the heat
and pressure of deep burial over millions of years. It is found in and extracted
from geological formations beneath the earth’s surface. For utilization in power
plants, coal can be distinguished by the heating value and its composition ranging
from lignite with a relatively low heating value to sub-bituminous coal. Coal has
been the second most important fossil energy source in the world measured by
energy content behind crude oil5. It is the most important fuel for power
generation worldwide due to its abundant reserves, which are relatively
distributed among many countries. However, the use of coal is accompanied by
strong environmental impacts, such as high emissions of sulphur dioxide, heavy
metals and harmful greenhouse gases.
In Kenya local coal reserves can be found in the Mui Basin which runs across the
Kitui county 200 km east of Nairobi. The coal basin stretches across an area of 500
square kilometers and is divided into four blocks: A (Zombe – Kabati), B (Itiku –
Mutitu), C (Yoonye – Kateiko) and D (Isekele – Karunga). Coal of substantial depth
of up to 27 meters was discovered in the said basin. 400 million tons of coal
reserves were confirmed in Block C109. The Government of Kenya has awarded
the contract for mining of coal in Blocks C and D. Coal mining, in particular open
pit as planned for Mui basin, has strong environmental and social impacts. The
5 BP Statistical Review of World Energy June 2017

62
mining will require large scale resettlement plans. Further, mining will produce
considerable pollution.
Due to its widespread deposits, production experience as well as relatively low
costs, coal is an important fuel option for expansion planning but the negative
environmental impacts has to be factored in. The planned coal power plant in
Lamu would be the first in Kenya. More coal power plants in future, utilizing
domestic coal, could be developed directly near the Mui Basin in Kitui County.
4.5. Renewable energy sources
Kenya has promising potential for power generation from renewable energy
sources. Availability of solar, hydro, wind, biomass and geothermal resources has
necessitated the government to seek expansion of renewable energy generation in
the country. Through least cost approach, the government has prioritized the
development of geothermal, wind and solar energy plants as well as solar-fed
mini-grids for rural electrification.
4.5.1. Geothermal energy
Kenya’s geothermal resource is located within the Rift Valley area, with recent
estimates putting the resource potential at about 10,000MW spread over 14 sites
as shown in figure 13. Currently, geothermal capacity provides nearly 50% of total
power generation with an installed capacity of 828 MW. The KenGen power plants
are equipped with single flash steam technology while the remaining capacity
owned and operated by independent power producers (IPP) use binary steam
cycle technology. Due to the low short-run marginal costs, geo-thermal power
plants generally run as base load.
At present, geothermal power is only being harnessed in the Olkaria, Menegai and
Eburru fields. In the medium and long term new geothermal reservoirs are being
explored in Suswa, Longonot, Akiira and Baringo Silali. Other potential
geothermal sites within the Kenya Rift that have not been studied in great depth
include Emuruangogolak, Arus, Badlands, Namarunu, Chepchuk, Magadi and
Barrier.
The actual applicable medium and long term potential has been derived based on
the current development status of the geothermal power plant pipeline. It is
expected that an overall capacity of 603 MW of geothermal power could be

63
implemented during the medium-term period since they are already at advanced
stage of construction or planning.
It is expected that geothermal power will play an essential role in the future
Kenyan power system. Good knowledge and expertise in geothermal exploration,
drilling, power plant implementation and operation is already present in the
country. However, drilling risks, high upfront costs and a rather long
implementation period have to be taken into account in the planning stage.
Geothermal, which is considered as “conventional" renewable energy source is
already well developed in Kenya and can compete with other sources. The
expansion planning is done through the fully identified candidates selected
through generation planning and optimization simulations according to their
costs and plant characteristics.
Geothermal power provides reliable base load power at low operating cost. Single
flash technology mainly used in Kenya today is technically unable to provide
flexible power. On the other hand, Binary systems are able to be operated in a
flexible way. With regard to future geothermal expansion and considering the
power system needs (load following, regulation control), it is recommended that
the opportunity to use binary technology is explored and deployed.

64
Figure 13 Location of geothermal projects within Kenya Rift valley
Oo
2oS
38oE36oE
North Island
L. Turkana
Central Island
South Island
Barrier Volcano
Emuruangogolak
Silale
Paka KKKKKK EEEEEENNNNNN YYYYYYAAAAAA
Nyambeni
Mt. Kenya
Mozambiquemetamorphic
belt
Longonot
Nairobi
Olorgesaille
Shombole
ChyuluOl'Doinyo Lengai
0 50 100 150
Kilometers
Basalt-Trachyte-Rhyolite centers
Nephelinitic centers
Alkaline centers
Lakes
Rift Faults
Kilimanjaro
TANZANIA
Cenozoicvolcanics
Mesozoicsediments
Suswa
Olkaria
Eburru
Menengai
Ol'Esakut
UGANDA
Huri
Korosi
Kisumu
ETHIO PIA4oN
38oE
Mt. Elgon
L. Magadi
Homa Hills
Geothermal Prospects
Geothermal Fields
L. Naivasha
Arus-Bogoria
L. Baringo
Namarunu
Rift Region Potential (MW)
Central Rift
Menengai 1,600MW
Eburru 250MW
1,850MW
South Rift
Olkaria 2,000MW
Longonot 750MW
Suswa 600MW
Lake Magadi 100MW
3,450MW
North Rift
Lake Baringo 200MW
Korosi 450MW
Paka 500MW
Silali 1,200MW
Emuruangogolak 650MW
Namarunu 400MW
Barrier 450MW
Arus Bogoria 400MW
4,250MW
Nyanza
Homa hills 100MW
Akira 350MW
450MW
Total Potential 10,000MW

65
4.5.2. Hydropower
4.5.2.1. Conventional Hydropower
Kenya has a considerable hydropower potential estimated in the range of 3,000-
6,000 MW. Over 800MW is already exploited, mainly in large installations owned
by the national power generation utility, KenGen. The existing hydropower plants
contribute about 30% of national annual electricity generation. There are eight (8)
power stations with capacity of more than 10MW each that have reservoirs. At
least half of the overall potential originates from smaller rivers that are key for
small-hydro resource. With the introduction of the feed-in-tariff policy in 2008,
small-scale candidate sites are already being developed across the country with
the majority being implemented by Kenya Tea Development Authority (KTDA).
The undeveloped hydroelectric power potential of economic significance is
estimated at 1,484 MW, out of which 1,249 MW is for projects of 30MW and above.
This hydropower potential is located in five geographical regions, mainly in
Kenya’s major drainage basins as shown in table 19. These include Lake Victoria
basin (329MW), Rift Valley basin (305MW), Athi River basin (60MW) and Tana
River basin (790MW).
Table 19:Hydropower potential
Catchment area Area (Km2) Identified Hydropower
potential (MW)
Lake Victoria North 18,374 151
Lake Victoria South 31,734 178
Rift Valley 130,452 305
Tana 126,026 790
Athi 58,639 60
Ewaso Ngiro North 210,226 0
TOTAL 575,451 1,484

66
Figure 14 Major rivers of the catchment areas and location of existing large hydropower plants
There is a growing consciousness of the possibilities that small hydropower might
offer vast generation options. Several studies and investigations have been carried
out and only a few small hydro schemes have been realized, either as part of the
national grid supply as shown in figure 14 or as stand-alone systems for agro-
industrial establishments or missionary facilities.

67
The economic risk in hydropower projects can be enormous, because they are
capital intensive. There is uncertainty with regard to power prices in the future,
and the costs of building and producing hydropower vary strongly from power
plant to power plant with some of the main variables being the size and location
of the plant. A small plant requires approximately as many people to operate as a
large one. Larger hydro power plants normally have a lower cost per kilowatt.
A hydropower-dominated system is vulnerable to large variations in hydrological
conditions. This has proved to be a big challenge in the recent past with the failure
of adequate rainfall resulting in power and energy shortfalls. Normally, it is a big
challenge for a hydro project in case people have to be relocated and this has been
the main reason why the Magwagwa hydro project on River Sondu has not been
implemented due to high population density that requires relocation.
Beyond the existing schemes, Kenya still has substantial hydropower potential.
This is evident by current plans to develop large hydro projects in Karura (90MW)
and High Grand Falls (500MW) in the Tana catchment area, Nandi Forest (50MW)
in the Lake Victoria North catchment area, Magwagwa (115MW) in the Lake
Victoria South catchment area, and Arror (80MW) in the Rift Valley area. This
development could lead to additional hydropower capacity of over 800 MW in the
long term.
There is a large pipeline of small hydropower projects under the FiT scheme whose
feasibility studies are still ongoing while other are under implementation.
4.5.2.2. Pumped Storage Hydropower
There is potential for pumped storage hydropower. Pumped storage is a type of
hydroelectric power generation that stores energy in the form of water in an upper
reservoir, pumped from a second reservoir at a lower elevation. During periods of
high electricity demand, the stored water is released through turbines in the same
manner as a conventional hydro station. Excess energy is used to recharge the
reservoir by pumping the water back to the upper reservoir. The system operates
as both a pump and a turbine.
Pumped storage stations differ from conventional hydro stations in that they are
a net consumer of electricity. In reality, pumped storage plants can be considered
as transmission facilities. They can be economical from an overall system

68
operation perspective due to peak/off-peak price differentials and, more
importantly, the provision of ancillary grid services. It is the largest-capacity and
most cost-effective form of grid energy storage currently available. Pumped
storage stations also provide ancillary electrical grid services such as network
frequency control and critical system reserves. This is due to the ability of pumped
storage plants, like other hydroelectric plants, to respond to load changes within
seconds.
Pumped storage is currently being utilized to stabilize the variability of
intermittent renewable power sources such as wind and solar. It is capable of
absorbing excess generation (or negative load) at times of high output and low
demand. It also releases the stored energy during peak demand periods, proving
to be an enabling technology for wind and solar power growing penetration into
the national energy supply system.
In response to the growing need for storage and the exceptional synergy between
pumped storage and variable renewable energy sources such as wind and solar,
the hydro industry is proposing to accelerate the development of pumped storage
capacity in the near future.
Preliminary studies indicate that suitable sites for pumped storage hydropower
projects are located in the north western, western and south western parts of
Kenya. Some of the sites include Lake Turkana west, Samburu, Kapenguria,
Kipcherere, Lomut, Sondu and Homabay south among others.
4.5.3. Wind energy
Wind power is among the most mature technologies of all renewable energy
sources in terms of commercial development. The development costs have
decreased dramatically in recent years and still coming down. Potential for
development is huge, and the world’s capacity is far larger than the world’s total
energy consumption.
Awareness and interest in wind power generation in Kenya is steadily growing.
The most recent investment in wind energy in Kenya is KenGen’s 25.5MW farm
in Ngong comprising thirty (30) 850kW turbines and Lake Turkana Wind Power
(LTWP)’s 310MW farm in Loiyangalani comprising 365 turbines of 850kW each.

69
In the short term, several wind power projects are planned and are in various
stages of implementation and more proposals pending approvals.
The Best wind sites in Kenya are located in Marsabit, Samburu, Laikipia, Meru,
Nyeri, Nyandarua and Kajiado counties. Other areas of interest are Lamu, off
shore Malindi, Loitokitok at the foot of Kilimanjaro and Narok plateau. On
average, the country has an area of close to 90,000 square kilometers with excellent
wind speeds of 6m/s and above.
Figure 15 Wind Energy Capcity

70
However, wind turbines generate electricity intermittently in correlation to the
underlying fluctuations of the wind speeds. Because wind turbines do not produce
power constantly and at their rated power (which is only achieved at higher wind
speeds), capacity factors are typically between 20 and 55%. One of the principal
areas of concerns of wind energy is its variable power output, accommodation of
which can be a challenge for the power network as the share of intermittent
generation on the grid rises.
A remote Solar and Wind Energy Resource Assessment (SWERA) mapping
exercise for Kenya was completed and published in 2008. This provides general
information on the areas with the highest wind potential as shown on figure 15. A
wind energy data analysis and development programme conducted in 2013 by
Wind Force Management Services Pvt. Ltd indicates a total technical potential of
4,600 MW.
4.5.4. Solar Energy Resources
Kenya has high insolation rates, with an average of 5-7 peak sunshine hours and
average daily insolation of 4-6 kWh/m2 due to its strategic location near the
equator. 10-14% of this energy can be converted into electricity due to the
dispersion and conversion efficiency of PV modules. Solar power is largely seen
as an option for rural electrification and decentralised applications.
With the enhanced state support and continuous decrease in development costs,
it is estimated that the rate of market penetration is set to improve considerably.
With the diversification of rural electrification strategies, it is expected that the
number of installed solar home systems will grow substantially. This can be
harnessed for water heating, electricity generation for households and
telecommunications facilities in isolated locations.
4.5.4.1. Photovoltaic (PV)
Kenya is endowed with very high solar resources, among the highest of Sub-
Saharan African countries. In favourable regions, the global horizontal irradiation
(GHI) is up to 2,400 kWh/m²/year. The average GHI received and photovoltaic
power potential in Kenya are shown in figure 16 and 17 respectively. Global
Horizontal Irradiance is the total amount of shortwave radiation received from
above by a horizontal surface. It is of particular interest to photovoltaic

71
installations and includes both Direct Normal Irradiance (DNI) and Diffuse
Horizontal Irradiance (DIF).
Photovoltaics (PV) devices convert solar energy directly into electrical energy. The
amount of energy that can be produced is proportional to the amount of solar
energy available on a specific site. PV has a seasonal variation in electricity
production, with the peaks generally following months with the highest solar
irradiation. Due to the stable climate, PV systems operating along the equator
typically have a fairly consistent exploitable solar potential throughout the year.
Electricity production varies on a daily basis, with no generation at night. Short
term fluctuations of weather conditions, including clouds and rainfall, impact the
hourly amount of electricity that is produced.

72
Figure 16 global horinzatal irradiation
.

73
Figure 17 Photovoltaic power potential

74
4.5.4.2. Concentrated solar power (CSP)
Concentrated Solar Power (CSP) plants are thermal power plants that collect solar
energy by using mirrors to concentrate direct sunlight onto a receiver. The receiver
collects and transfers the solar thermal energy to a heat transfer fluid used to
generate electricity in a steam turbine. CSP plants typically include a thermal
energy storage system, which allows for dispatchable electricity generation,
including possible generation during night time and periods with passing clouds.
Compared to PV, one of the reasons for the slower development of CSP is its high
levelised electricity cost. In general, the costs of CSP have dropped in recent years,
but not as significant as those of PV. CSP deployment is expected to increase
rapidly when it becomes competitive with peak production costs.
CSP generation requires direct normal irradiation (DNI) to operate. Direct Normal
Irradiance is the amount of solar radiation received per unit area by a surface that
is always perpendicular (or normal) to the rays that come in a straight line from
the direction of the sun at its current position in the sky. Typically, the amount of
irradiance received can be maximized annually by keeping the surface normal to
incoming radiation. This concept is of particular interest to concentrating solar
thermal installations and installations that track the position of the sun. DNI
received is approximately 2,300 kWh/m²/year in favourable regions as shown in
figure 18. However, there are presently no operational CSP plants in Kenya.

75
Figure 18 Direct normal irradiation in Kenya

76
4.5.5. Biomass, biogas and waste-to-energy
Biomass energy usually means renewable energy coming from sources such as
wood and wood residues, agricultural crops and residues, animal and human
wastes. The conversion technology depends on the biomass itself and is influenced
by demand side requirements. The final result of the conversion process is direct
heat and electricity or a solid, liquid or gaseous fuel. This flexibility is one of the
advantages of biomass compared to other renewable energy sources. There are
numerous commercially available technologies for the conversion process and the
utilisation of the resulting energy for heating or for power generation. Co-
generation incorporates the simultaneous utilisation for both heating and electric
power generation.
Solid biomass, rich in lignin, is used in an incinerator where the produced flue gas
provides heat and electricity or in a gasification process to provide a syngas for
further use. Solid/liquid biomass, which is poor in lignin, is commonly used in
fermenters and with the produced biogas also heat and electricity can be produced
for further use.
Biogas is a mixture of methane and carbon dioxide with small amounts of other
gases and needs a further cleaning step before it is usable. Biogas is similar to
landfill gas, which is produced by anaerobic decomposition of organic material in
landfill sites.
Municipal Solid Waste (MSW) constitutes a potential source of material and
energy as well. Because of its heterogeneous components, it is necessary to pre-
treat this waste (or collect it separated by source) before it can be used. The
objective is to re-cycle as much as possible and use the remaining material with a
high calorific value in an incinerator or gasification process to provide heat,
electricity or syngas. The wet material is used in a fermentation process to produce
biogas.
Agricultural and agro-industrial residues and wastes have the potential to
generate heat and/or power. The best example in several countries is power
generation from bagasse. Presently, its use for power generation into the national
electricity grid is being explored. Besides the sugar bagasse, there could be some
potential in the tea industry as well, which could co-generate about 1 MW in the
100 factories using their own wood plantations for drying.

77
A study conducted by GTZ in 2010 shows a biogas energy potential mainly for
heat production and a rather small potential for electric power production.
Currently, some biogas power projects have been submitted for implementation
under the FiT policy.
Biomass appears modest potential at present, but could increase significantly with
the agro industrial development and mainly through revamping sugar mills and
future concentration of other agro industries. A specific survey of agro residues in
the medium and long term, combined with the load centre and planned network
could suggest lower investments in the power sector than conventional power
supply and transmission.
4.6. Other energy sources
Other than the indigenous energy resources as a basis for power generation, there
is energy imported from neighbouring countries through inter-connections (which
could be based on various types of energy sources) which might reduce the need
for energy generation. The country is also exploring the use of nuclear energy for
power generation.
4.6.1. Battery Storage
The expected excess energy off peak hours and increased intermittent capacity in
the national grid during present opportunity for introduction of battery storage to
balance demand and supply in the system. This will assist in addressing the
following in the grid:
(i) Frequency regulation reserves especially due to the relatively large
proportion of variable renewable energy in the system.
(ii) Voltage instability in the system in some parts of the country.
(iii) Management of geothermal resources through reduction of steam
venting.
(iv) Increased penetration of variable renewable energy (VRE) generation.
(v) Provide system security by supplying energy during the shortage in
electricity generation.
(vi) Enable transmission and distribution replacement and deferrals as
they reduce loading on the lines during peak times.

78
Given that costs are on the decline, it is notable that even within the African context
where financing costs are sometimes higher, battery storage may compete with
fossil thermal power especially where the storage facility derives multiple network
services such as frequency regulation, load shifting and network reliability
concurrently.
A comprehensive analysis is required for the Kenyan system followed by a
comptetitive procurement process to obtain least cost prices for energy storage.
4.6.2. Nuclear Power
Nuclear power is an important contributor to the World electricity generation
accounting for 2563 TWhs in 2018 (~12% of total electricity production). The
growing awareness of benefits of nuclear power such as climate change mitigation
and energy security, has resulted in increased interest in nuclear power for
electricity production in several countries around the world including Kenya.
The total identified resource recoverable of uranium reserves worldwide are
estimated at 6.14 million tonnes6 in 2017. At current consumption levels, these
reserves would last more than 130 years7. Growing or diminishing future demand
should affect the time taken for complete depletion of the resource. Nuclear energy
is not a renewable energy. Currently, only low levels of uranium oxide have been
discovered in Kenya. However, exploration of uranium is still on-going8.
Conventional nuclear power production technology entails neutrons bombarding
heavy elements such as uranium (“nuclear fuel”) to disintegrate (“nuclear fission”)
which results in huge amounts of heat helping to produce steam and power
through steam turbine operation and harmful radio-active material. Uranium ore
is the raw material used in the production of nuclear power. Front end fuel cycle
refers to the necessary processing of such raw material to prepare nuclear fuel.
Yellow cake as an intermediate product is to be enriched to prepare the finished
nuclear fuel product of Uranium oxide. Uranium oxide is formed into pellets
6 World Nuclear Association
7 OECD Nuclear Energy Agency, International Atomic Energy Agency: Uranium 2018: Resources,
Production and Demand
8 Power Generation and Transmission Master Plan, Kenya, 2016

79
which are inserted into cylindrical rods, also referred to as zircaloy tubes, which
are bundled together. A great number of such bundles (approx. 100-200) are then
included in and constitute a reactor core. Back end fuel cycle refers to the
reprocessing and temporary or long-term storage of radioactive spent fuel or
waste. The radioactive waste is to be contained, handled and safely stored for a
long-term resulting in to very high long-term costs. Various options for
management of radioactive waste and spent fuel are available.
Compared to fossil fuels, the technology and investment costs required to build
and operate a nuclear power plant (NPP) are significant in the evaluation of
nuclear power as an expansion candidate. However, the relatively low costs for
fuel as well as the considerably lower amounts of fuel to be replaced, stored and
transported are advantages of nuclear power in terms of supply dependency and
fluctuation of fuel cost.
4.6.3. Interconnections with neighboring countries
Interconnections with neighbouring countries provide mutual benefits. This may
include additional sources of energy and power, the provision of axillary services
(e.g. reactive power, black start power) and an overall higher security of supply as
well as lower costs from sharing of generation back-up capacity or combining
complementary generation systems (e.g. hydro versus thermal based generation).
Currently, the Kenyan national grid is interconnected with Uganda via 132 kV
transmission line and the other neighbouring countries via distribution lines. The
purpose of these interconnections is to mutually support system stability (with
Uganda) and to supply isolated areas in the border (with Tanzania and Ethiopia).
With the objectives to increase transfer capacities, flexibility of grid operation and
to improve sustainable electricity supply in Kenya, various interconnection
projects are in the planning and implementation stages.
4.6.3.1. Eastern African Power Pool
The Eastern African Power Pool (EAPP) is an intergovernmental organisation
established in 2005 with the objective to provide an efficient framework for
pooling electricity resources and to promote power exchanges in Eastern Africa.
So far, ten countries have joined EAPP, namely Burundi, Democratic Republic of

80
Congo, Egypt, Ethiopia, Kenya, Libya, Rwanda, Sudan, Tanzania and Uganda. As
part of the “Regional Power System Master Plan and Grid Code Study” published
in 2011, major interconnection projects have been identified as well as planning
criteria to support inter-regional power exchange and a phased interconnection
plan for the EAPP countries has been developed. Additionally, a regional master
plan study for the EAPP region has been carried out.
Interconnections with neighbouring countries provide mutual benefits such as
purchasing energy from neighbouring countries at a lower price and receiving
additional security of supply. In this regard, it is recommended to further extend
interconnections with neighbouring countries in the long-term. Three
interconnection projects between Kenya and neighbouring countries are already
under implementation and more projects are in the planning stage. The actual
status of implementation and planning of interconnections is described below.
4.6.3.2. Interconnection with Ethiopia
The construction of a high voltage direct current (HVDC) overhead transmission
line between Ethiopia and Kenya is already under development and will be
completed in April 2020. The 500 KV line is constructed from Welayta Sodo in
Ethiopia to Suswa in Kenya resulting in a total length of approximately 1,045 km
(433 km in Ethiopia and 612 km in Kenya). The line is a bipolar configuration and
will be able to transfer 2 GW of electricity.
The Ethiopian Electric Power (successor of the restructured Ethiopian Electric
Power Corporation (EEPCo) will own the interconnection assets in Ethiopia. The
interconnection assets on the Kenya site will be owned by Kenya Electricity
Transmission Co. Ltd.
4.6.3.3. Interconnection with Uganda
It is planned to interconnect Kenya, Uganda and Rwanda on 400 kV level with the
objective of enabling regional power trade. The interconnector between Kenya and
Uganda is under construction.
The project involves the construction of a 400 kV double circuit overhead line
between Lessos in Kenya and Tororo in Uganda. The transmission line is designed
for a capacity of 1,700 MW. The objective of this line is to support the market for
power exchange within the EAPP.

81
4.6.3.4. Interconnection with Tanzania
A 400 kV double circuit transmission line with a total length of 507.5 km between
Tanzania and Kenya is in under implementation. 93 km of the line will be located
in Kenya and 415 km in Tanzania. The overhead line originates from Isinya
substation in Kenya, pass Namanga and Arusha and terminate at Singida
substation in Tanzania. The interconnector is designed for a capacity of 1,700 MW.
On the Kenyan side, this project also includes the extension of the existing Isinya
substation. The objective of this line is to support the market for power exchange
within the EAPP as well as the interconnection with the Southern Africa Power
Pool through Zambia.
An additional interconnection from Rongai through Kilgoris to complete the Lake
Victoria Ring (through Tanzania to Rwanda) is under investigations.

82
5. EVALUATION OF POWER GENERATION EXPANSION PROJECTS 5.1. Objective
The objective of this chapter is to assess candidate power generation projects to be
considered in the expansion planning process designed to meet projected demand
over the planning period. Preliminary economic assessment of the available and
potential energy sources was performed using the screening curves methodology.
The projects evaluated included several committed projects expected to be
commissioned in the short to medium term. Analyzing these approved projects
was necessary, considering that it may be prudent to reschedule some depending
on the system load growth.
5.2. Technical parameters of hydro power plants/hydrological modelling
The actual available capacity and the annual generation of hydropower plants
depend on the present hydrology. Long Term Average (LTA) hydrology
conditions are considered for modelling the operational dispatch in the main
expansion scenarios. This study considered long-term monthly major hydropower
plants production for a period of the 10 years preceding the simulations. The
period and data is considered representative as it covers all the upgrades that had
been carried out in various hydropower plants such as Tana, Masinga, Gitaru,
Kindaruma and Kiambere and includes some drought periods in 2008/09,
2011/12 and 2016/17 financial years.
In the low hydrology case, 66% of the LTA hydrological conditions, which is
equivalent to the worst-case scenario observed in previous ten years are
considered in analyzing the operational dispatch of the detected expansion plan
of the reference expansion scenario. However, for the design of the power system,
sufficient back-up capacity is provided for which isadequate to compensate
shortfalls in hydropower capacity during drought periods. For this reason, the
generation expansion modelling considers the firm capacity of hydropower plants
for dimensioning the power system. The firm capacity of hydropower plants is
defined as the P90 exceedance probability value determined based on historic half
hourly production data.
5.3. Fuel cost forecast
According to the International Energy Outlook 2019, global energy consumption
is expected to increase almost 50% by 2050. Consumption is expected to skyrocket
in India and China because of the high energy requirements by their intensive

83
manufacturing sectors. Renewable energy (including wind, solar, and
hydropower) is projected to be the world’s fastest-growing form of energy over
the next several decades (growing at a rate of over 3.1% per year). Despite that,
fossil fuels are expected to meet most of the world’s energy demand. Liquid fuels
are expected to remain the primary energy source for transportation, but electric-
powered transport, particularly for personal electric vehicles, is expected to grow
in popularity. Below is an overview of some of the fuels forecasted in this chapter.
5.3.1. Coal
According to International Energy Agency, Coal remains a major fuel in global
energy systems, accounting for almost 40% of electricity generation and more than
40% of energy-related carbon dioxide emissions. This is despite the growing
prominence of renewable energy sources. Global coal demand increased by
approximately 1.1% in 2019, continuing the rebound that began in 2017 after three
years of decline. The main driver was coal power generation, which rose almost
2% in 2019 to reach an all-time high. It is however expected that demand for coal
will remain under pressure due to strong uptake of renewables-based capacity
and, in the United States, the availability of inexpensive natural gas.
One of the most important coal markets is China, due to its large share in both
global coal demand and production. Any significant shifts in Chinese coal usage
or output has an immediate effect on other world’s markets. Although China’s
coal demand increased marginally since the rebound in 2017, the country is
increasing its efforts to reduce coal’s share in its energy mix. A large amount of
coal-fired capacity was taken offline in 2017 in order to reduce local pollution.
Many of those plants were smaller, old and inefficient coal-fired units, using
mostly low-quality coal, thus, contributing significantly to local air pollution. This
is part of a broader plan to cap coal-fired capacity at 1,100 gigawatts (GW) by 2020.
Furthermore, the Chinese government has decided to stop or delay more than 100
GW of previously planned and under construction coal power projects by 2020.
This is in line with the series of medium to long-term actions that the government
is taking to achieve its 13th Five Year Plan (FYP) climate related goals.
5.3.2. Crude Oil
Oil markets are going through a period of extraordinary change as the United
States is increasingly leading the expansion of global oil supplies, and demand is

84
shifting from developed economies and transportation fuels to Asia and
petrochemicals.
Fundamentally, oil demand depends on the strength of the global economy - in
particular the expansion of developing economies such as China and India. At the
same time, around the world, increasing consumer demand means more plastic,
which in turn means more petrochemicals. Despite efforts to curb plastics use and
encourage recycling, demand for plastics and petrochemicals is growing strongly.
Another major growth sector is aviation. In recent years, the air travel industry has
witnessed a spectacular expansion thanks to rising passenger numbers.
The rise of electric vehicles and improvements in battery pack technology is
believed to expose global oil demand under an imminent threat. About a third of
global oil demand is from cars, and 40 percent of the growth since the year 2000
has come from cars. Electric Vehicles are expected to be 30% of new car sales by
2040 from 1% in 2019. In 2017, there were 2.8 million electric cars on the road
compared to 1.5 billion oil fueled vehicles, and they could reach 36 million by 2025.
5.3.3. Nuclear
Uranium has the advantage of being highly concentrated source of energy which
is cheap and easy to transport. A kilogram of natural uranium will yield
approximately 20,000 as much energy as the same amount of coal.
Uranium is also available in abundance. The contribution of fuel to the overall cost
of electricity generated from nuclear power plants is relatively small. Low fuel
costs give nuclear energy an edge over other fossil fired plants. Uranium, however,
has to be processed, enriched and fabricated into fuel elements. This constitutes
half the total fuel cost.
The world’s power reactors with a combined capacity of approximately 400GWe
require 65,000 tons of uranium each year. The uranium fuel requirement is
increasing but the factors increasing fuel demand are offset by the trend for higher
burnup of fuel and other efficiencies, so demand is steady.
The World Nuclear Association (as of March 2017) cites prices of about US$1390
per kilogram of uranium as UO2 reactor fuel which works out to a fuel cost of US$
0.00429 /kWh. A reference fuel price of $4.983Mkcal ($1.191/GJ) was computed
for nuclear based on reference data. The fuel's contribution to the overall cost of
the electricity produced is relatively small, so even a large fuel price escalation will
have relatively little effect.

85
5.3.4. Natural Gas
Natural gas is a naturally occurring hydrocarbon gas mixture consisting primarily
of methane (CH4). It is the cleanest fossil fuel. Natural gas prices consist of two
main components which include various taxes and fees:
Commodity cost – The cost of the natural gas itself, either as produced natural gas
or as natural gas purchased at a market trading hub or under a contract by
marketers and utilities.
Transmission and distribution costs – The costs to move the natural gas by tankers
and pipeline from where it is produced or stored to local natural gas distribution
utilities and the cost to deliver it to consumers.
Table 20 Forecast assumptions
Product Data sources Assumptions & parameters
Crude oil EPRA Historical data on Murban crude prices WTI Crude Price forecast: https://www.barchart.com/futures/quotes/CL*0/futures-prices
Historical correlation exists between EPRA and WTI Crude prices Adopted WTI crude forecast between 2020 & 2030 Adopted average growth of 0.67% to forecast for period between 2031 & 2040 0.67% growth is derived from the average growth rate between 2020 & 2030
Coal ICE Richards Bay Coal Prices FOB South Africa https://www.barchart.com/futures/quotes/LVY00/futures-prices
Adopted ICE Richards Bay Coal Price projects for period between 2020 & 2025. Average growth rate of -3.47% has been used to forecast the period between 2025 & 2040 -3.47% is based on a 5yr average growth rate between 2019 and 2025
Gasoline 2015-2035 Electricity Masterplan by Lahmeyer International
A historical high correlation (99%) between gasoline and crude prices has been observed. Therefore the price of gasoline is assumed to be 135% of the crude price
HFO 2015-2035 Electricity Masterplan by Lahmeyer International
A historical high correlation (98%) between gasoline and crude prices has been observed. Therefore the price of gasoline is assumed to be 75% of the crude price
Natural Gas BP Statistics Review World Energy 2019,
Adopted historical Average German Import Price at FOB for the period 1988 to 2018 Adopted a 15yr average growth rate of 6% between 2004 & 2018.
LNG BP Statistics Review World Energy 2019,
Adopted historical LNG Japan Price at CIF for the period 1988 to 2018 Adopted a 10yr average growth rate of 1.5% between 2009 & 2019.

86
Uranium https://atb.nrel.gov/electricity/2019/index.html?t=cc www.eia.gov/analysis/studies/powerplants/capitalcost/pdf/capcost_assumption.pdf www.world-nuclear.org/information-library/economic-aspects/economics-of-nuclear-power.aspx http://euanmearns.com/how-long-does-it-take-to-build-a-nuclear-power-plant/
The fuel cost ($) per GJ ($/GJ) was computed to $1.08/GJ. This price was adopted over the planning period (2019 - 2039). The fixed and variable OM costs for the 600MWand 1000MW used were the same.
5.4. Assumptions on transport costs
International and national transport costs have to be considered in order to
calculate the actual fuel costs at the respective power plants. On top of the
international fuel prices (FOB), corresponding transport prices, have to be
considered to reflect the import prices applicable at Kenya’s border. Similarly,
domestic transport costs have been considered to reflect the fuel prices at the major
towns.
Table 21:International shipping cost assumptions
Fuel Assumption Data Source
Crude oil 5% mark-up on FOB 2015-2035 Masterplan Assumptions by Lahmeyer International
HFO 13% mark-up on FOB
Gasoil 4% mark-up on FOB
Coal 7 USD/ton
5.5. Domestic Shipping cost assumptions
KPC has had four pipeline tariff adjustments since 1994. The first review was in
2009 when the tariff was increased by 47% from Kshs 3.40/M3/km through a
phased adjustment to Kshs 4.50/M3/km effective April 2009 and Kshs
5.00/M3/km effective April 2010. The third adjustment was in April 2016 when
the Energy and Petroleum Regulatory Authority advised the Minister to approve
a 4.4% increase to Kshs 5.22/M3/km effective June 2016 for a three-year period.
The current tariff averages at Kshs 3.93/M3/km and will run through to 2020.
The pipeline tariff forecast has adopted the historical average growth of 2%
between the tariff control periods since 1994. Similarly, a constant trucking cost of
USD 49/ton has been adopted over the planning period. The distances considered

87
between Mombasa and Nairobi is 487 km and a distance of 798 km from Mombasa
to Eldoret. These distances are based on the current pricing formula used by EPRA
in computation of maximum petroleum pump prices.
5.6. Fuel Forecast Results
WTI Crude and LNG prices are expected to rise in 2020 then gradually dip to a
minimum in 2023. From 2023, the prices are expected to rise gradually through
2039 at a rate of 0.67%. This behavior is attributable to increased oil and gas
demand due to global economic growth and industrial production. See figure 20
Figure 19 Fuel Price forcast for selected products
Nuclear fuel, Uranium, has a very high calorific value, and improved technology
has led to fuel burn up increase by over 50%. This means that less fuel is required
to get an equivalent amount of power.
The cost of uranium is assumed to remain relatively constant at $1.08/GJ because
it is supplied under long term contracts since the demand is much more
predictable. Uranium is also abundant hence the stable prices.
0.00
2.00
4.00
6.00
8.00
10.00
12.00
US
D/G
J
Fuel Price forecast results for selected products
WTI Crude LNG COAL URANIUM

88
Coal sold for electric power generation is sold through long term contracts and
supplemented with spot purchases. The spot prices are more vulnerable to short
term market conditions.
In addition to electricity generation, coal is also used to produce coke which is
used in smelting iron ore to make steel. Coal prices have been changing at an
average rate of -3.57%. This change is attributable to the fact that coal is mainly
used for power generation and there is a global shift from coal power generation
to renewable and cleaner sources of electricity generation like wind, solar,
geothermal, nuclear etc.
5.7. Screening curve analysis
Screening curves were constructed for selected Thermals, Nuclear, Coal,
Geothermal, Imports and Hydro Candidate plants. The screening curve technique
is an approximate method that captures major tradeoffs between capital costs,
operating costs and utilization levels for various types of generating capacity in
the system. The screening curve method expresses the total annualized electricity
production cost for a generating unit, including all capital and operating expenses,
as a function of the unit capacity factor. This approach is especially useful for quick
comparative analyses of relative costs of different electricity generation
technologies.
Also assumed in the screening model is a discount factor of 10% and an exchange
rate of Ksh/$ 101. However, a sensitivity analysis at a discount rate of 8% was
carried out. The results of the sensitivity analysis are discussed under screening
results.
Table 22:List of screened candidates
Candidate Technology Capacity (MW)
KenGen Olkaria Geothermal 140
GDC-Silali Geothermal 140
Generic Coal Coal 300
Lamu Coal Coal 981
Kitui Coal Coal 960
Nuclear Unit 1 Nuclear 600
Nuclear Unit 2 Nuclear 1000
High Grand Falls Hydro 495
Karura Hydro 90

89
Ethiopia HVDC Import 200
Wajir CCGT Natural Gas 375
KenGen LNG LNG 200
Medium Speed Diesel Thermal 80

90
Table 23 Techno-economic Data for screend projects
Geothermal-Olkaria KenGen
Geothermal-Silali
Nuclear 1 Nuclear 2 Coal
Kitui Coal
Lamu Coal
GT- LNG KenGen
Wajir CCGT MSD Import Karura HGFalls
Configuration (n x MW) 1 x 140 1 x 140 (1 X 600) (1 X 1000) 2 X 150 3 X 320 3 X 327 2 x 100 3 x 125 1 x 80 200 2 X 45 5 X 99
Total Capacity (MW) 140 140 600 1000 300 960 981 200 375 80 200 90 495
Economic Life 25 25 60 60 30 30 30 25 20 20 25 40 40
Construction Period (yrs) 7 7 8 8 5 5 5 3 3 3 Complete 5 7
Maintenance schedule 2.0 2.0 2.9 2.9 4.3 4.3 4.3 3.6 3.6 2.0 0 4.3 4.2
Fixed Cost
Capital ( $ x 106) 511 481 3900 5900 828 2331 2504 137 506 132 342 1891
Capital ($/kW) 3650 3439 6500 5900 2760 2428 2553 686 1349 1650 3798 3820
Annuity Factor (or C.R.F.) 0.1102 0.1102 0.1003 0.1003 0.1061 0.1061 0.1061 0.1102 0.1175 0.1175 0.1023 0.1023
Interim Replacement 1.22% 1.22% 1.22% 1.22% 1.22% 1.22% 1.22% 0.35% 0.35% 0.35% 1.05% 1.05%
Fixed Annual Capital ($/kW/yr) 542.5 511.1 1052.3 955.2 412.8 363.1 381.7 85.1 179.7 221.9 539.3 566.6
Fixed O&M Costs ($/kW/yr) 151.9 151.9 66.3 66.3 51 69 68 20.9 18.0 7.1 15.3 16.0
Total Fixed Annual Cost ($/kW/yr) 694 663 1119 1021 464 432 450 106 198 229 555 583
Total Outage Rate 0.0585 0.0585 0.1049 0.1049 0.1324 0.1324 0.1324 0.0987 0.0987 0.0785 0.1024 0.1024
Annual Fixed Cost ($/kW/yr) 737 704 1250 1141 534 498 519 118 219 248 521 618 649
Annual Fixed Cost ($/kWh) 0.0842 0.0804 0.1427 0.1303 0.0610 0.0569 0.0592 0.0134 0.0250 0.0284 0.0595 0.0705 0.0741
Variable Cost
Fuel Price ($/GJ) - -
1.08
1.08 3.109 3.109 3.109 11.29 6.33 8.63 - - -
Heat Rate (kJ/kWh) 10,700.00 10,700.00
9,231.30
9,231.30 10,159 10,159 9,338 12,740 12,740 12,653 - - -
Fuel Cost ($/kWh) 0.00 0.00 0.01 0.01 0.03 0.03 0.03 0.14 0.08 0.11 0.00 0.00 0.00
Variable O&M ($/kWh) 0.00000 0.00000 0.000 0.000 0.0050 0.0046 0.0046 0.0036 0.0036 0.0060 - 0.0005 0.0005
Total Variable ($/kWh) 0.00000 0.00000 0.0105 0.0105 0.0366 0.0362 0.0336 0.1474 0.0843 0.1153 0.0000 0.0005 0.0005
Total Variable ($/kW/yr) 0 0 92 92 320 317 295 1292 738 1010 0 4 4

91
5.8. Results of the Screening Analysis
The results of the screening curves indicated Gas Turbines running on LNG and MSD
Plants are cheaper when run at very low capacity factors. This means that they are more
suitable to serve as peaking plants. At very high plant utilization levels, these plants are
more expensive due to associated higher variable costs. See figure 21 & 22
Figure 20 Results of screening analysis
0
200
400
600
800
1,000
1,200
1,400
1,600
1,800
2,000
0% 5% 10% 15% 20% 25% 30% 35% 40% 45% 50% 55% 60% 65% 70% 75% 80% 85% 90% 95% 100%
Un
it C
ost
s ($
/kW
/yr)
Plant Utilization
Screening curves for Representative Technologies
MSD 1 x 80 Geothermal-Olkaria Kengen 1 x 140 Nuclear 1 (1 X 600)Coal 2 X 150 GT- LNG KenGen 2 x 100 Nuclear 2 (1 X 1000)Geothermal-Silali 1 x 140 Wajir CCGT 3 x 125 Karura 2 X 45HGFalls 5 X 99 Import 200 Kitui Coal 3 X 320Lamu Coal 3 X 327

92
Figure 21 Associated Energy costs at different plant utilization level
On the other hand, Nuclear Power Plants, are very expensive when run at very low
capacity factors. As the plants are run at higher and higher utilization levels, the cost of
running them is relatively constant due to low fuel costs and associated variable costs.
It would therefore make no economic sense to run these plants at low capacity factors
while they can comfortably serve as base loads.
Geothermal and hydro plants also serve as base load plants and are relatively cheaper
compared to nuclear plants and thus rank higher in the merit order. It is therefore
advisable to run these technologies exhaustively before turning to Nuclear Plants.
5.9. Sensitivity Analysis
If concessional funding is available for public utilities, the cost of financing will be lower.
Then, the unit cost for various technologies would considerably come down. The model
adopted a lower discount factor of 8% which brings down the energy costs across the
technologies by more than 50%.
0.00
0.30
0.60
0.90
1.20
1.50
1.80
2.10
2.40
2.70
3.00
3.30
5% 15% 25% 35% 45% 55% 65% 75% 85% 95%
US$
/kW
h
Plant Utilization
Associated Energy Costs at different Utilization factors
MSD 1 x 80
Nuclear 1 (1 X 600)
Coal 2 X 150
Geothermal-Olkaria Kengen 1 x 140
GT- LNG KenGen 2 x 100
Karura 2 X 45
HGFalls 5 X 99
Kitui Coal 3 X 320
Lamu Coal 3 X 327
Nuclear 2 (1 X 1000)
Geothermal-Silali 1 x 140
Wajir CCGT 3 x 125
Import 200

93
6. GENERATION EXPANSION PLANNING
This chapter provides an overview of the generation expansion planning approach, the
expansion scenarios modelled and the results obtained from the various simulations
carried out. It also presents the recommended national generation expansion plan for
the period 2020-2040. The expansion plan adopted as the least cost plan forms the basis
for preparation of a power transmission plan
6.1. Generation expansion planning approach
6.1. Generation expansion planning approach
The LIPS-XP/OP tool was used to model the power system. Respective input data for
power plants, hourly electricity demand forecasts and planning criteria were updated.
Key modelling parameters include capital investment costs for each power plant, fuel
cost, fixed and variable operations and maintenance costs, economic life and planned
commissioning and decommissioning dates for the power plants. Simulations were
done on the cases assembled based on various assumptions. The modelling assumptions
and inputs are further discussed below.
6.2. Existing and Committed Generation Plants
6.2.1 Existing Generation Plants
The interconnected system effective generation capacity was 2,654MW as at December
2020, against a peak demand of 1,976MW. KenGen, the largest power generator in the
country, accounted for 1,742 MW of the industry’s installed generation capacity, and the
Independent Power Producers (IPPs) 946MW. Annex 1 shows the existing plants with
their commissioning and planned decommissioning dates.

94
6.2.2. Committed Generation Projects
Committed projects are defined as those with PPAs and for KenGen as approved
by EPRA. These projects are listed in table 24. From the list, projects that are
advanced in development and have commenced construction were identified as
indicated in table 25. The total capacity of committed projects was 2,839 MW for
the optimised and fixed cases respectively.
Table 24 Committed Projects
Project Company Capacity
(MW) Technology
PPA DATE
Optimised Case COD
Fixed case COD
1 Kleen Energy Limited 6 Hydro Dec-20 2022 2022
2 Hydro Project Service Peters Kianthumbi 0.51 Hydro Apr-21 2021 2021
3 KTDA - Nyambunde, Nyakwana 0.5 Hydro Jun-21 2022 2022
4 KTDA Ltd, South Maara (Greater Meru Power Co.) 1.5 Hydro Dec-21 2022 2022
5 KTDA Ltd, Lower Nyamindi 0.8 Hydro Dec-21 2022 2022
6 KTDA Ltd, Iraru 1 Hydro Dec-21 2022 2022
7 Power Technologies (Gatiki Small Hydro Plant) 9.6 Hydro Jun-22 2022 2022
8 Mt Kenya Community Based Organisation 0.6 Hydro Dec-22 2023 2023
9 Tindinyo Falls Resort 1.5 Hydro Jun-23 2023 2023
10
Frontier Investment Management/ Nithi Hydro 5.6 Hydro Dec-24 2025 2025
11 KTDA, Kipsonoi (Settet Power Co.) 0.6 Hydro Feb-25 2025 2025
12 Global Sustainable-Kaptis 14.7 Hydro Dec-25 2026 2026
13 Global Sustainable Ltd-Buchangu 4.5 Hydro Dec-25 2026 2026
Total Hydro 47MW
14 Cummins Cogeneration Kenya Limited 10 Biomass Jun-20 2023 2023
15 REA Vipingo Plantations Ltd (DWA Estates Ltd) 1.44 Biomass Dec-20 2022 2022
16 Kwale Int. Sugar Co. Ltd 10 Biomass Dec-21 2023 2023

95
17 Thika Way Investments (Homa Bay Biogas One) 8 Biogas Jun-23 2023 2023
18 Roadtech Solutions Ltd 10 Biomass Dec-24 2025 2025
Total Biomass/Biogas 39MW
19 Kipeto Energy Limited 100 Wind Jul-21 2021 2021
20 Chania Green 50 Wind May-
22 2024 2024
21 Aperture Green Power Ltd / Limuru Wind 50 Wind Dec-22 2026 2023
22 Bahari Winds (Electrawinds Kenya) 50 Wind Dec-24 2028 2025
23 Bahari Winds (Electrawinds Kenya) 40 Wind Dec-25 2029 2026
24 Prunus Energy 50 Wind Dec-25 2029 2026
Total Wind 340MW
25 Marco Borero Co Ltd. 1.5 Solar Jun-20 2022 2022
26 Alten Kenya Limited 40 Solar May-
21 2024 2022
27 Selenkei (Radiant) 40 Solar Dec-21 2022 2022
28 Eldosol (Cedate) 40 Solar Dec-21 2023 2022
29 Hannan Arya Energy (K) Ltd 10 Solar Dec-21 2027 2023
30
Vateki International Holdings /Malindi Solar Limited 40 Solar Jan-22 2023 2022
31 Kenergy Renewables Ltd-Rumuruti 40 Solar Dec-22 2028 2023
32 Kopere Solar Park Limited 40 Solar Jun-23 2024 2023
33 Dafre Holdings Company Ltd /Makindu solar ltd 30 Solar Dec-23 2029 2024
34 Seven Forks Solar Power Plant 42.5 Solar Jun-24 2026 2024
35 Greenmillenia Energy Limited 40 Solar Dec-25 2030 2026
36 Sun Power Kenya Limited (Kibwezi) 40 Solar Jun-26 2030 2026
Total Solar 404MW
36 Olkaria I Unit 6 83 Geothermal Jul-21 2021 2021
38 Sosian-Menengai Geothermal Power Ltd 35 Geothermal Dec-21 2023 2023
39
Quantum/QPEA GT Menengai Limited (Menengai) 35 Geothermal Jan-22 2023 2023
40 Orpower 22 (Menengai) 32.5 Geothermal Jun-22 2023 2023

96
41 Olkaria I AU/IV Uprating Unit 4 10 Geothermal Jul-22 2025 2023
42 Olkaria I AU/IV Uprating Unit 5 10 Geothermal Jun-23 2025 2023
43 Olkaria I AU/IV Uprating Unit 1 10 Geothermal Sep-22 2026 2023
44 Olkaria I AU/IV Uprating Unit 2 10 Geothermal Jul-23 2026 2023
45 Olkaria I Rehab unit 1 16.9 Geothermal May-
23 2026 2023
46 Olkaria I Rehab unit 2 16.9 Geothermal Dec-23 2027 2024
47 Olkaria I Rehab unit 3 16.9 Geothermal Apr-24 2027 2024
48 Olkaria VI(PPP) 140 Geothermal Jun-24 2029 2024
49
Akiira Geothermal Ltd & Marine Power Generation Company Ltd 70 Geothermal Jun-25 2031 2025
50
Africa Geothermal International (Kenya) Ltd - AGIL 140 Geothermal Jun-25 2029-39
2026-29
Total Geothermal 626MW
51 Amu Coal 981.5 Coal Dec-26 2037 2027
52 Ethiopia HVDC phase 1 200 import Jul-21 2021 2021
53 Ethiopia HVDC phase 2 200 import Jul-24
Total 2839MW
Table 25 Candidate Projects
No Project Company Capacity (MW)
Technology Aproved
COD Optimised case COD
Fixed Case COD
1 Hydel 5 Hydro Dec-20 2027 2027
2 Mutunguru Hydroelectric Company Ltd
7.8 Hydro Dec-20 2027 2027
3 Ventus Energy Ltd 7.67 Hydro Dec-21 2028 2028
4 Mwikhupo-Mwibale Hydro Power Kenya
7 Hydro Dec-22 2029 2029
5 Raising Masinga 0 Hydro Jun-23 2023 2023
6 Njega/Rukenya Hydro Power Limited (Rights transfer)
3.5 Hydro Dec-23 2030 2030
7 Greenlight Holdings/ Rianjue/Gichuki Ventures
1.5 Hydro Dec-23 2030 2030
8 Virunga Power Holdings Ltd, R. Sossio, Kaptama
4.5 Hydro Dec-23 2030 2030

97
No Project Company Capacity (MW)
Technology Aproved
COD Optimised case COD
Fixed Case COD
9 Karuga Gitugi Electrification Project
2.7 Hydro Dec-24 2032 2032
10 Kibisi Kinetic Energy Limited/Virunga Power Holdings
6.5 Hydro Jan-24 2031 2031
11 Rareh Nyamindi Hydro Ltd
5.2 Hydro Jan-24 2031 2031
12 Rareh Nyamindi Hydro Ltd
9.4 Hydro Jan-24 2031 2031
13 Rareh Nyamindi Hydro Ltd
6 Hydro Jan-24 2031 2031
14 VSHydro Kenya Ltd 9.1 Hydro Jan-24 2031 2031
15 Kirogori Electrification Project
7 Hydro Jun-24 2031 2031
16 KTDA R. Chemosit, Chemosit
2.5 Hydro Jun-24 2031 2031
17 KTDA Chemosit, Kiptiget 3.3 Hydro Dec-24 2032 2032
18 KTDA Ltd, Yurith, Chemosit
0.9 Hydro Dec-24 2032 2032
19 KTDA R. Rupingazi, Rutune
1.8 Hydro Dec-24 2032 2032
20 KTDA, R. Itare, Chemosit 1.3 Hydro Dec-24 2032 2032
21 KTDA, R. Yala, Taunet 2.77 Hydro Dec-24 2032 2032
22 Tridax Limited 4.2 Hydro Dec-24 2032 2032
23 Truck city ltd 5.28 Hydro Dec-24 2032 2032
24 Karura Hydro Power Plant 90 Hydro Dec-24 2026 2026
25 Gogo upgrade 12 Hydro Dec-24 2025 2025
26 Khalala Hydro Power Kenya Limited (Coastal Energy Ltd, Navakholo)
20 Hydro Dec-25 2033 2033
27 Dominion Farms 1 Hydro Dec-25 2033 2033
28 Chevron Africa Limited 7.8 Hydro Dec-25 2033 2033
29 Njumbi Hydropower Plant Ltd (Hydroneo)
9.6 Hydro Dec-25 2033 2033
30 High Grand Falls Multipurpose Project
693 Hydro Dec-25 2037
Total Hydro 938MW
31 Sukari Industries Ltd 22 Biomass Dec-19 2026 2026
32 VR Holding AB-Local Trade Ltd
3 Biomass Dec-21 2027 2027
33 Tana Biomass Generation Limited (Biogas-Solar Hybrid)
20 Biogas Jun-22 2028 2028
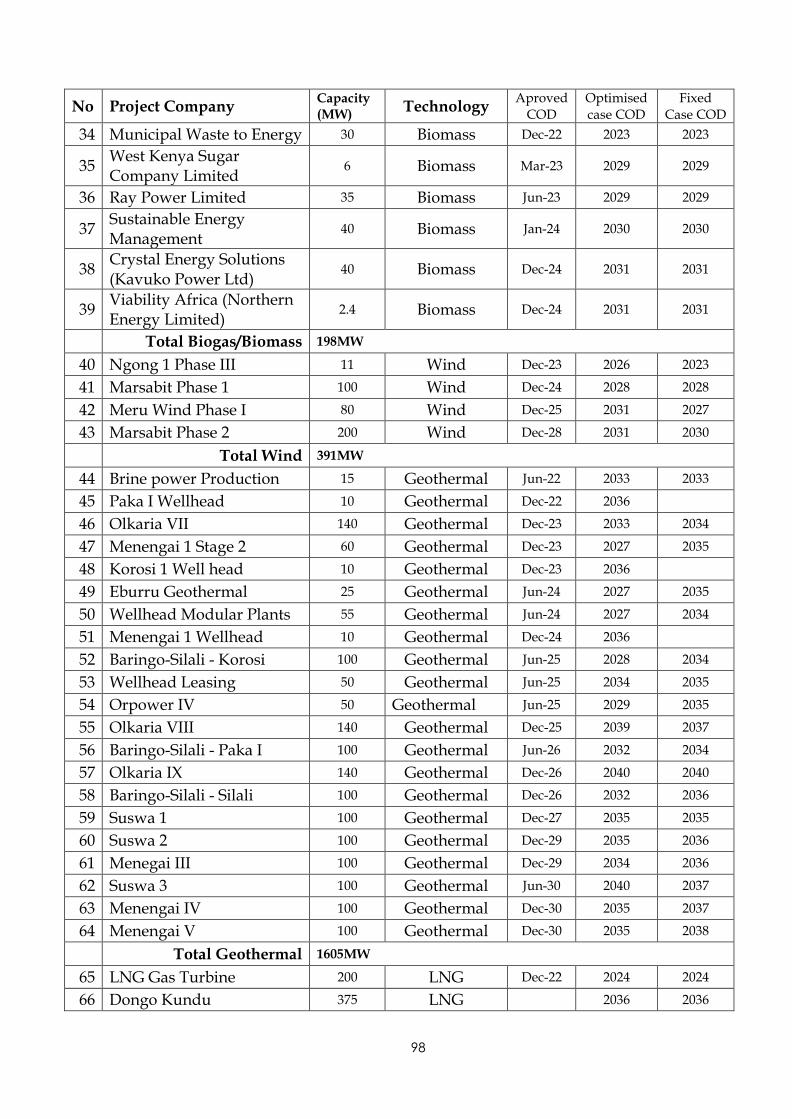
98
No Project Company Capacity (MW)
Technology Aproved
COD Optimised case COD
Fixed Case COD
34 Municipal Waste to Energy 30 Biomass Dec-22 2023 2023
35 West Kenya Sugar Company Limited
6 Biomass Mar-23 2029 2029
36 Ray Power Limited 35 Biomass Jun-23 2029 2029
37 Sustainable Energy Management
40 Biomass Jan-24 2030 2030
38 Crystal Energy Solutions (Kavuko Power Ltd)
40 Biomass Dec-24 2031 2031
39 Viability Africa (Northern Energy Limited)
2.4 Biomass Dec-24 2031 2031
Total Biogas/Biomass 198MW
40 Ngong 1 Phase III 11 Wind Dec-23 2026 2023
41 Marsabit Phase 1 100 Wind Dec-24 2028 2028
42 Meru Wind Phase I 80 Wind Dec-25 2031 2027
43 Marsabit Phase 2 200 Wind Dec-28 2031 2030
Total Wind 391MW
44 Brine power Production 15 Geothermal Jun-22 2033 2033
45 Paka I Wellhead 10 Geothermal Dec-22 2036
46 Olkaria VII 140 Geothermal Dec-23 2033 2034
47 Menengai 1 Stage 2 60 Geothermal Dec-23 2027 2035
48 Korosi 1 Well head 10 Geothermal Dec-23 2036
49 Eburru Geothermal 25 Geothermal Jun-24 2027 2035
50 Wellhead Modular Plants 55 Geothermal Jun-24 2027 2034
51 Menengai 1 Wellhead 10 Geothermal Dec-24 2036
52 Baringo-Silali - Korosi 100 Geothermal Jun-25 2028 2034
53 Wellhead Leasing 50 Geothermal Jun-25 2034 2035
54 Orpower IV 50 Geothermal Jun-25 2029 2035
55 Olkaria VIII 140 Geothermal Dec-25 2039 2037
56 Baringo-Silali - Paka I 100 Geothermal Jun-26 2032 2034
57 Olkaria IX 140 Geothermal Dec-26 2040 2040
58 Baringo-Silali - Silali 100 Geothermal Dec-26 2032 2036
59 Suswa 1 100 Geothermal Dec-27 2035 2035
60 Suswa 2 100 Geothermal Dec-29 2035 2036
61 Menegai III 100 Geothermal Dec-29 2034 2036
62 Suswa 3 100 Geothermal Jun-30 2040 2037
63 Menengai IV 100 Geothermal Dec-30 2035 2037
64 Menengai V 100 Geothermal Dec-30 2035 2038
Total Geothermal 1605MW
65 LNG Gas Turbine 200 LNG Dec-22 2024 2024
66 Dongo Kundu 375 LNG 2036 2036

99
No Project Company Capacity (MW)
Technology Aproved
COD Optimised case COD
Fixed Case COD
67 Dongo Kundu 375 LNG 2038 2038
Total LNG 950MW
68 Nuclear Power Generation 600 Nuclear 2035 0 2039
69 Battery Storage South Nyanza
50 Storage 2022 2022
70 Pumped Hydro Storage 300 Hydro Dec-25 2024 2024
Grand Total 5,033MW

100
6.3. Planning Criteria and Modelling assumptions
The key planning assumptions and criteria applied relate to plant availability and
generation, planning reserves, intermittent energy balancing and hydrological
forecasts
6.3.1. Plant availability and energy generation
Large Hydropower: P90 exceedance probability value of monthly maximum
output based on historical half hourly dispatch data.
Small hydropower: 25% of the available net small hydropower capacity reflecting
minimum of monthly average available capacity considering low hydrology.
Wind: 50% in 2020-2021 to cater for generation from Lake Turkana Wind Park
(LTWP), 45% in 2022-2023 and 35% thereafter considering that diverse fields
complement each other to support a quarter of the net capacity throughout.
Solar PV: 0% since solar is not available during peak.
Biomass: 50% of the available net capacity.
Load curve characteristics: The 2019 annual load curve was developed and
retained throughout the study plan as no major assumption was made to vary the
profiles.
6.3.2. Reserve requirements
In LIPS-XP planning tool, a lower level of detail for the reserve margin is
required for expansion planning purposes in comparison to operational
purposes. The power generation system is dimensioned in relation to the
forecasted peak demand while considering a reserve margin which is composed
of the following parts:
The reserve margin to cover the loss of the largest unit in the system.
Cold reserves for balancing occasional unavailability of power plants due
to planned maintenance and forced outages

101
6.3.3. Loss of load probability (LOLP)
Loss-of-Load Probability (LOLP) is a reliability indicator used to determine the
adequacy of a power system to meet generation requirements. The LOLP is the
ratio of total hours’ demand is not likely to be served, called Loss of Load
Expectation (LOLE), and the total hours in a year. It determines the probability of
not meeting demand over a given period. In this update, the LOLP was calculated
for the total 8,760 hours in each year of the considered period. In Kenya, the
adopted LOLE is 24 hours in a year which gives a LOLP of 0.274% of the time
which is used in generation modelling.
6.3.4. Spinning Reserves Requirement
Spinning reserves provide system stability through load-following, wind/solar balancing, and generating power in case of an outage. For operational considerations, reserve requirements are typically divided into two categories according to the delay acceptable in their availability:
1) Primary reserve allows for urgent measures to maintain system frequency by fast actions of committed units (within a few seconds).
2) Secondary reserve is needed for covering deviations from the scheduled load demand with a delay of a couple of minutes in order to allow for the ramp-up of not yet committed units.
6.3.5. Operational Reserves for Wind and Solar Balancing
The spinning reserves requirement for all the intermittent renewables was
estimated at 15% based on previous studies. However, when the intermittent
renewable plants are geographically dispersed then the variability tends to reduce.
The variability of the largest wind farm and solar farms are considered in this
analysis to arrive at the operational spinning reserve requirements.
6.3.6 Expansion Planning Reserve Margins

102
The spinning reserves requirement for all the intermittent renewables was
estimated at 15% based on previous studies. However, when the intermittent
renewable plants are geographically dispersed then the variability tends to reduce.
The variability of the largest wind farm and solar farms are considered in this
analysis to arrive at the operational spinning reserve requirements.
6.3.7. Hydrology forecast
This study considered long-term monthly major hydropower plants production
for a period of 10 years, 2010-2019. The firm capacity of hydropower plants is
defined as the P90 exceedance probability value determined based on historic half
hourly production data shown in annex 2.
6.4. Generation Expansion Simulations using LIPS-OP/XP
The generation expansion was simulated based on Optimised case and Fixed
system case, each with a base discount rate of 12% and assuming average
hydrology.
a) Optimised case- adopted as the basis for the least cost expansion plan,
considering only projects under construction within the medium term (2020-
2025) as committed, all other projects with PPAs, KenGen’s approved
projects, and small hydro and cogeneration projects with CODs were
optimised for the rest of the planning period. The Optimised case was based
on Reference demand growth.
b) Fixed system case – adopted committed projects as projects with PPAs, and
KenGen projects as approved by EPRA. All the projects were simulated
based on respective PPA date and status of development. Projects with
CODs but without PPAs were modelled as candidates and optimised
beyond the medium term. The Fixed case considered the Reference, Vision
and Low demand growth scenarios
6.5. Results for Generation Expansion Scenarios Simulations

103
This section presents the results of the optimised case and the fixed system case
considered in the generation expansion scenarios.
6.5.1. Optimised Case – Reference demand
The demand-supply output for the optimised expansion plan presented in Table
28, indicates that the total interconnected capacity grows from 2,654 MW in 2020
to 3,529MW and 8,186 MW in 2025 and 2040 respectively. The average annual
excess energy as share of generation in the period 2020-2030 is 1%, but increases
thereafter to an average of 4%. The level of vented steam grows over the years with
vented steam growing from 166Gwh in 2020 to over 2000GWh from 2030. An
average of 18% vented steam of the possible maximum geothermal generation
over the planning period is observed.
The excess generation and the vented steam are due to the increase in planting of
the baseload plants which also provide firm capacity during peak hours. Ideally,
optimisation should allow introduction of suitable capacity options other than the
projects with COD that were presented as candidates over the planning period.
Table 26 Demand- Supply balance
2020 2021 2022 2023 2024 2025 2030 2035 2040
Peak load MW 1,972 2,078 2,158 2,233 2,315 2,404 3,220 4,220 5,526
Peak load + reserve
margin
MW 2,255 2,350 2,429 2,503 2,620 2,711 3,596 4,662 6,461
Reserve margin % of peak
load
14% 13% 13% 12% 13% 13% 12% 10% 17%
Installed system
capacity
MW 2,654 2,907 2,968 3,151 3,481 3,529 5,152 6,395 8,186
Firm system capacity MW 2,260 2,463 2,448 2,520 2,695 2,724 3,717 4,682 6,679
Supply - demand gap MW 4 114 18 17 75 14 121 21 217
Electricity consumption versus
generation
2020 2021 2022 2023 2024 2025 2030 2035 2040
Electricity
consumption
GWh 12,072 12,720 13,207 13,670 14,171 14,718 19,710 25,830 33,830
Electricity generation GWh 12,078 12,866 13,283 13,930 14,393 14,844 20,412 27,994 33,871

104
2020 2021 2022 2023 2024 2025 2030 2035 2040
Excess energy GWh 6 146 76 261 222 125 702 2,161 41
Excess energy -
share on generation
% 0% 1% 1% 2% 2% 1% 3% 8% 0%
Vented GEO steam
(assuming single-flash
technology)
GWh 166 1,357 1,159 1,640 1,558 1,443 2,691 4,595 1,402
Vented GEO steam -
share on potential
max. GEO generation
% 3% 19% 16% 21% 20% 18% 23% 24% 7%
Figure 22 shows the annual generation balance
Figure 22 Optimised Case- Annual generation balance
The excess generation between 2029 and 2037 is due to the baseload capacity
developed to complement the intermittent plants. Table 27 shows the optimised
system expansion plan.

105
Table 27 Optimised Case Reference scenario expansion – generation expansion overview
Year
considered
for system
integration
Plant name Type Net
capacity
[MW]
Installed
Effective
[MW]
Firm
(MW)
Peak
load
(MW)
Reserve
(MW)
Surplus/
Deficit
(MW)
Reserve
Margin
(%)
End of 2020 2,653.6 2,260.0 1,972.1
283.4
4.5
14%
2021 HVDC Ethiopia Import
200.0
200.0
2021 Olkaria 1 - Unit 6 Geothermal
83.3
83.3
2021 Kipeto - Phase I Wind
50.0
25.0
2021 Kipeto - Phase II Wind
50.0
25.0
2021 KTDA -
Nyambunde,
Nyakwana
Small Hydro
0.5
0.1
2021 Muhoroni GT 1 Gas turbines
(gasoil)
(28.0)
(28.0)
2021 Muhoroni GT 2 Gas turbines
(gasoil)
(28.0)
(28.0)
2021 Tsavo Diesel
engines
(74.0)
(74.0)
End of 2021
253.8
2,907.4 2,463.4 2,078.0
271.8
113.6 13%
2022 Selenkei
(Radiant)
PV
40.0
-
2022 Hydro Project
Service Peters
Kianthumbi
Small Hydro
0.5
0.1
2022 KTDA Ltd, South
Maara (Greater
Meru Power Co.)
Small Hydro
1.5
0.4
2022 KTDA Ltd, Lower
Nyamindi
Small Hydro
0.8
0.2
2022 KTDA Ltd, Iraru Small Hydro
1.0
0.3
2022 Power
Technologies
(Gatiki Small
Hydro Plant)
Small Hydro
9.6
2.4
2022 Kleen Energy
Limited
Small Hydro
6.0
1.5
2022 REA Vipingo
Plantations Ltd
(DWA Estates
Ltd)
Cogeneration
1.4
0.7
End of 2022
60.9
2,968.2 2,447.7 2,157.6
271.8
18.4
13%
2023 Menengai 1
Phase I - Stage 1
Geothermal
102.5
102.5
2023 Mt Kenya
Community
Based
Organisation
Small Hydro
0.6
0.2
2023 Tindinyo Falls
Resort
Small Hydro
1.5
0.4
2023 Malindi Solar
Limited
PV
40.0
-
2023 Eldosol (Cedate) PV
40.0
-
2023 Cummins
Cogeneration
Kenya Limited
Cogeneration
10.0
5.0
2023 Kwale Int. Sugar
Co. Ltd
Cogeneration
10.0
5.0
2023 Thika Way
Investments
(Homa Bay
Biogas One)
Cogeneration
8.0
4.0

106
Year
considered
for system
integration
Plant name Type Net
capacity
[MW]
Installed
Effective
[MW]
Firm
(MW)
Peak
load
(MW)
Reserve
(MW)
Surplus/
Deficit
(MW)
Reserve
Margin
(%)
2023 Municipal Waste
to Energy
Cogeneration
30.0
15.0
2023 Kipevu 1 Diesel
engines
(60.0)
(60.0)
End of 2023
182.6
3,150.8 2,519.7 2,233.0
269.8
16.9
12%
2024 LNG Gas Turbine Gas turbines
(LNG)
200.0
200.0
2024 Chania Green Wind
50.0
17.5
2024 Alten Kenya
Limited
PV
40.0
-
2024 Kopere Solar
Park Limited
PV
40.0
-
s
330.0
3,480.8 2,694.7 2,314.9
304.7
75.0
13%
2025 Olkaria I Uprating
(Topping)
Geothermal
20.0
20.0
2025 Frontier
Investment
Management/
Nithi Hydro
Small Hydro
5.6
1.4
2025 KTDA, Kipsonoi
(Settet Power
Co.)
Small Hydro
0.6
0.2
2025 Gogo upgrade Small Hydro
12.0
3.0
2025 RoadTech
Solutions
Cogeneration
10.0
5.0
End of 2025
48.2
3,529.0 2,724.2 2,404.4
306.2
13.6
13%
2026 Olkaria IV
Uprating
(Topping)
Geothermal
20.0
20.0
2026 Olkaria 1 - Unit 1
Rehabilitation
Geothermal
17.0
17.0
2026 Karura Hydropower
90.0
70.7
2026 Aperture Wind
50.0
17.5
2026 Ngong 1 - Phase
III
Wind
11.0
3.9
2026 Marco Borero Co
Ltd.
PV
1.5
-
2026 Seven Forks Solar
Power Plant
PV
42.5
-
2026 Global
Sustainable-
Kaptis
Small Hydro
14.7
3.7
2026 Global
Sustainable Ltd-
Buchangu
Small Hydro
4.5
1.1
2026 Sukari Industries Cogeneration
22.0
11.0
End of 2026
273.2
3,802.2 2,869.1 2,544.2
316.2
8.8
12%
2027 Eburru 2 Geothermal
25.0
25.0
2027 Menengai I -
Stage 2
Geothermal
60.0
60.0
2027 Olkaria Modular Geothermal
55.0
55.0
2027 Olkaria 1 - Unit 2
Rehabilitation
Geothermal
17.0
17.0

107
Year
considered
for system
integration
Plant name Type Net
capacity
[MW]
Installed
Effective
[MW]
Firm
(MW)
Peak
load
(MW)
Reserve
(MW)
Surplus/
Deficit
(MW)
Reserve
Margin
(%)
2027 Olkaria 1 - Unit 3
Rehabilitation
Geothermal
17.0
17.0
2027 Hannan Arya
Energy (K) Ltd
PV
10.0
-
2027 Hydel Small Hydro
5.0
1.3
2027 Mutunguru
Hydroelectric
Company Ltd
Small Hydro
7.8
2.0
2027 VR Holding AB-
Local Trade Ltd
Cogeneration
3.0
1.5
End of 2027
199.8
4,002.0 3,047.8 2,717.1
328.8
1.9
12%
2028 Baringo Silali -
Korosi I
Geothermal
100.0
100.0
2028 Electrawinds
Bahari
Wind
50.0
17.5
2028 Marsabit Phase I
- KenGen
Wind
100.0
35.0
2028 Kenergy
Renewables Ltd-
Rumuruti
PV
40.0
-
2028 Ventus Energy
Ltd
Small Hydro
7.7
1.9
2028 Tana Biomass
Generation
Limited (Biogas-
Solar Hybrid)
Cogeneration
20.0
10.0
2028 Ngong 1, Phase I Wind
(5.1)
(1.8)
End of 2028
312.6
4,314.6 3,210.5 2,872.2
336.0
2.2
12%
2029 Olkaria 6 PPP Geothermal
140.0
140.0
2029 AGIL Longonot
Stage 1
Geothermal
35.0
35.0
2029 OrPower4 Plant 4
Additional
Geothermal
50.0
50.0
2029 Prunus Wind
50.0
17.5
2029 Electrawinds
Bahari Phase 2
Wind
40.0
14.0
2029 Makindu solar ltd PV
30.0
-
2029 Mwikhupo-
Mwibale Hydro
Power Kenya
Small Hydro
7.0
1.8
2029 Ray Power Ltd Cogeneration
35.0
17.5
2029 West Kenya
Sugar Company
Limited
Cogeneration
6.0
3.0
2029 Olkaria 2 Geothermal
(101.0)
(101.0)
End of 2029
292.0
4,606.6 3,388.2 3,038.2
345.0
5.0
11%
2030 High Grand Falls
Stage 1
Hydropower
495.0
392.7
2030 Greenmillenia
Energy Limited
PV
40.0
-
2030 Sun Power Kenya
Limited (Kibwezi)
PV
40.0
-
2030 Gem Gen Power
Company
Limited
Small Hydro
9.5
2.4

108
Year
considered
for system
integration
Plant name Type Net
capacity
[MW]
Installed
Effective
[MW]
Firm
(MW)
Peak
load
(MW)
Reserve
(MW)
Surplus/
Deficit
(MW)
Reserve
Margin
(%)
2030 Greenlight
Holdings /
rianjue/Gichuki
Ventures
Small Hydro
1.5
0.4
2030 Njega/Rukenya
Hydro power
ltd(rights transfer)
Small Hydro
3.5
0.9
2030 Virunga Power
Holdings, R
Sossio, Kaptama
Small Hydro
4.5
1.1
2030 Sustainable
Energy
Management
Solutions
Cogeneration
40.0
20.0
2030 Rabai Diesel
(CC-ICE)
Diesel
engines
(88.6)
(88.6)
End of 2030
545.4
5,152.0 3,717.0 3,219.8
376.3
120.9 12%
2031 Marine Power
Akiira Stage 1
Geothermal
70.0
70.0
2031 Meru Phase I Wind
80.0
28.0
2031 Marsabit Phase II
- KenGen
Wind
200.0
70.0
2031 Kibisi Kinetic
Energy
Limited/Virunga
Power Holdings
Small Hydro
6.5
1.6
2031 Kirogori
Electrification
Project
Small Hydro
7.0
1.8
2031 KTDA R.
Chemosit,
Chemosit
Small Hydro
2.5
0.6
2031 Rareh Nyamindi
Hydro Ltd
Small Hydro
5.2
1.3
2031 Rareh Nyamindi
Hydro Ltd
Small Hydro
9.4
2.4
2031 Rareh Nyamindi
Hydro Ltd
Small Hydro
6.0
1.5
2031 VSHydro Kenya
Ltd
Small Hydro
9.1
2.3
2031 Crystal Energy
Solutions (Kavuko
Power )
Cogeneration
40.0
20.0
2031 Viability Africa -
Northern Energy
Limited
Cogeneration
2.4
1.2
2031 Kipevu 3 Diesel
engines
(115.0)
(115.0)
2031 KenGen Olkaria
Wellheads II
Geothermal
(28.0)
(28.0)
End of 2031
295.1
5,447.1 3,774.6 3,401.5
367.4
5.8
11%
2032 Baringo Silali -
Paka I
Geothermal
100.0
100.0
2032 Baringo Silali -
Silali I
Geothermal
100.0
100.0
2032 Karuga Gitugi
Electrification
Project
Small Hydro
2.7
0.7
2032 KTDA Chemosit,
Kiptiget
Small Hydro
3.3
0.8
2032 KTDA Ltd, Yurith,
Chemosit
Small Hydro
0.9
0.2
2032 KTDA R.
Rupingazi,
Rutune
Small Hydro
1.8
0.5
2032 KTDA, R. Itare,
Chemosit
Small Hydro
1.3
0.3
2032 KTDA, R. Yala,
Taunet
Small Hydro
2.8
0.7

109
Year
considered
for system
integration
Plant name Type Net
capacity
[MW]
Installed
Effective
[MW]
Firm
(MW)
Peak
load
(MW)
Reserve
(MW)
Surplus/
Deficit
(MW)
Reserve
Margin
(%)
2032 Tridax Limited Small Hydro
4.2
1.1
2032 Truck city ltd Small Hydro
5.3
1.3
End of 2032
222.3
5,669.4 3,980.2 3,587.9
381.9
10.5
11%
2033 Olkaria 7 Geothermal
140.0
140.0
2033 AGIL Longonot
Stage 2
Geothermal
35.0
35.0
2033 Olkaria Brine
Power Plant
Geothermal
15.0
15.0
2033 Chevron Africa
Limited
Small Hydro
7.8
2.0
2033 Dominion Farms Small Hydro
1.0
0.3
2033 Khalala Hydro
Power Kenya
Limited (Coastal
Energy Ltd,
Navakholo)
Small Hydro
20.0
5.0
2033 Njumbi
Hydropower
Plant Ltd
(Hydroneo)
Small Hydro
9.6
2.4
2033 Western Hydro Small Hydro
10.0
2.5
End of 2033
238.4
5,907.8 4,182.3 3,786.4
395.6
0.3
10%
2034 Menengai III Geothermal
100.0
100.0
2034 Wellhead leasing Geothermal
50.0
50.0
2034 AGIL Longonot
Stage 3
Geothermal
35.0
35.0
2034 LNG Gas Turbine
2
Geothermal
280.0
280.0
2034 Iberafrica 2 Diesel
engines
(52.5)
(52.5)
2034 Thika (CC-ICE) Diesel
engines
(87.0)
(87.0)
2034 Athi River Gulf Diesel
engines
(80.3)
(80.3)
End of 2034
245.2
6,152.9 4,427.5 3,998.0
425.9
3.6
11%
2035 Menengai IV Geothermal
100.0
100.0
2035 Menengai V Geothermal
100.0
100.0
2035 Suswa I Geothermal
100.0
100.0
2035 Suswa II Geothermal
100.0
100.0
2035 KenGen Olkaria
Wellheads I &
Eburru
Geothermal
(54.8)
(54.8)
2035 Triumph
(Kitengela)
Diesel
engines
(83.0)
(83.0)
2035 Ngong 1, Phase II Wind
(20.4)
(7.1)
End of 2035
241.8
6,394.7 4,682.5 4,219.5
442.2
20.8
10%
2036 Dongo Kundu
CCGT - small 1
Natural gas
375.0
375.0

110
Year
considered
for system
integration
Plant name Type Net
capacity
[MW]
Installed
Effective
[MW]
Firm
(MW)
Peak
load
(MW)
Reserve
(MW)
Surplus/
Deficit
(MW)
Reserve
Margin
(%)
End of 2036
375.0
6,769.7 5,057.5 4,442.9
501.4
113.2 11%
2037 Lamu Unit 1 Coal
327.0
327.0
2037 High Grand Falls
Stage 1+2
Hydropower
693.0
549.7
2037 High Grand Falls
Stage 1
Hydropower
(495.0)
(392.7)
End of 2037
525.0
7,294.7 5,541.6 4,697.4
774.8
69.4
16%
2038 Dongo Kundu
CCGT - small 2
Natural gas
375.0
375.0
2038 Lake Turkana -
Phase I, Stage 1
Wind
(100.0)
(35.0)
2038 Lake Turkana -
Phase I, Stage 2
Wind
(100.0)
(35.0)
2038 Lake Turkana -
Phase I, Stage 3
Wind
(100.0)
(35.0)
2038 REA Garissa PV
(50.0)
-
2038 Strathmore PV
(0.3)
-
End of 2038
24.8
7,319.5 5,811.6 4,961.1
809.0
41.5
16%
2039 Lamu Unit 2 Coal
327.0
327.0
2039 Olkaria 8 Geothermal
140.0
140.0
2039 Olsuswa 70MW
unit 1
Geothermal
70.0
70.0
2039 AGIL Longonot
Stage 4
Geothermal
35.0
35.0
2039 Olsuswa 70MW
unit II
Geothermal
70.0
70.0
2039 Olkaria 4 Geothermal
(140.0)
(140.0)
2039 OrPower4 Plant
2&3 (Olkaria 3 -
Unit 7-9)
Geothermal
(62.0)
(62.0)
2039 Olkaria 1 - Unit 4-
5
Geothermal
(140.0)
(140.0)
End of 2039
300.0
7,619.5 6,111.6 5,239.6
862.2
9.8
16%
2040 Lamu Unit 3 Coal
327.0
327.0
2040 Olkaria 9 Geothermal
140.0
140.0
2040 Suswa III Geothermal
100.0
100.0
End of 2040
567.0
8,186.5 6,678.6 5,526.5
934.8
217.3 17%

111
6.5.2. Fixed System Case
The modelled case consists of the existing plants, committed KenGen and GDC
projects and IPP projects with PPAs over the planning period. This case was
simulated under the three demand forecast scenarios developed -Reference, Vision
and Low. This case results are summaried below;
6.5.2.1. Fixed System Case- reference demand scenario
The total interconnected capacity grew from 2,654 MW in 2020 to 8,371 MW in
2040, with system reserve margins averaging 19% over the planning period. Table
28 summarises the demand – supply balance for the fixed system case reference
scenario. With the high percentage of intermittent capacity, the system required
peaking capacity from 2024. Subsequently, an LNG plant, Karura and High Grand
Falls hydropower plants were picked in 2024, 2026 and 2030, respectively, to
provide firm and peaking capacity.
Table 28 Demand Supply Balance - Fixed System case reference demand scenario
2020 2021 2022 2023 2024 2025 2030 2035 2040
Peak load MW 1,972 2,078 2,158 2,233 2,315 2,404 3,220 4,220 5,526
Peak load +
reserve margin
MW 2,255 2,350 2,429 2,507 2,636 2,731 3,980 4,987 6,783
Reserve margin % of
peak
load
14% 13% 13% 12% 14% 14% 24% 18% 23%
Installed system
capacity
MW 2,654 2,907 3,090 3,400 3,897 4,045 6,298 6,716 8,371
Firm system
capacity
MW 2,260 2,463 2,448 2,604 2,947 3,044 4,681 5,003 6,864
Supply - demand
gap
MW 4 114 18 97 311 313 701 16 80

112
2020 2021 2022 2023 2024 2025 2030 2035 2040
Electricity consumption
versus generation
2020 2021 2022 2023 2024 2025 2030 2035 2040
Electricity
consumption
GWh
12,072 12,720 13,207 13,670 14,171 14,718 19,710 25,830 33,830
Electricity
generation
GWh
12,078 12,866 13,307 14,479 15,714 16,402 20,878 26,482 33,866
Excess energy GWh 6 146 99 810 1,543 1,684 1,166 653 36
Excess energy -
share on
generation
%
0% 1% 1% 6% 10% 10% 6% 2% 0%
Vented GEO
steam
GWh
166 1,357 1,279 1,873 2,264 2,402 2,394 3,357 1,581
Vented GEO
steam - share on
potential max.
GEO flash steam
generation
%
3% 19% 18% 22% 23% 23% 22% 20% 8%
From 2024 to 3031, the excess capacity in the system ranged between 300-800 MW
largely due to the Lamu coal plant, and the average annual excess energy as share
of generation in the period 2020-2030 at 6%. The level of vented steam was 1,200
GWh from 2021 to the end of the planning period. The average vented steam was
18% of the possible maximum geothermal generation, with a high of 23% in 2024-
2026. The excess energy and vented steam was mainly due to the high amounts of
solar, wind and geothermal baseload capacity in the system, as well as imports
from Ethiopia.
Capacity factors for the coal plant was significantly low at an average of 7% over
the planning period. Geothermal plants’ capacity factors declined beginning 2021
to an average of 77.5% over the planning period.

113
Figure 23 Annual generation balance - Fixed System Reference demand scenario
6.5.2.2. Fixed System case - low demand Scenario
The capacity requirement for this scenario is lower due to the low demand forecast,
growing from 2,654 MW in 2020 to 7,421 MW in 2040. However, excess capacity
was higher, ranging from 400 MW to 900MW, due to the large number of
committed plants. The steam vented over the planning period averaged 19% or
2,100 GWh of the possible maximum geothermal annual generation. The annual
generation mix over the period is shown in Figure 29.

114
Figure 24 Annual Generation balance - Fixed system low demand scenario
6.5.2.3. Fixed System Case - vision demand scenario
With the higher demand in this scenario, the interconnected system capacity was
higher growing from 2,654 MW in 2020 to 17,175 MW in 2040. This accommodated
all the committed projects and the excess capacity decreased compared to the other
scenarios, to an average of 96MW over the planning period. The excess energy was
also lower averaging 3% over the period. The Vented steam was also lower with
an average of 18%, and dispatch of plants more optimal with capacity factors of
83.6% for Geothermal and 28.2% for coal. The annual generation is illustrated in
figure 25.

115
Figure 25 Annual generation Balance - Fixed system Vision demand scenario
6.6. Conclussions and Recommendations
a) The optimised case to be adopted as the national long term generation expansion
plan for the 2020-2040 period.
b) The proposed solar and wind projects which are likely to deliver higher
intermittent capacity in the system than required should be spread to minimise
energy curtailment.
c) For Solar and Wind projects that do not have PPAs, it is reccomended that they are
migrated to renewable energy auctions.
d) Peaking capacity power plants and Battery storage should be developed
immediately to avert peak capacity shortfalls, absorb excess energy presented as
vented steam during off-peak hours, provide system reserves and prevent load
shedding in Western Kenya in the short term as transmission projects are being
implemented. In the long term the recommended projects for the same purpose
are LNG gas turbines, Pumped Hydro Storage and peaking hydro plants.
e) Demand side management relating to load shifting is recommended to enable
optimal utilisation of the excess energy in the system during off-peak hours. This
includes initiatives like strengthening the time of use tariff, electrification of the
transport sector among others.
f) Demand creation efforts to be enhanced to support optimal use of the existing
generation capacity and projects under implementation.

116
g) Negotiate for firm 200MW Ethiopia imports for at least 5 years to allow for
development of local firm capacity in the medium term.
h) In the period between 2022 and 2024, there is a risk of firm capacity shortfalls if
Ethiopia imports and the KenGen Olkaria I unit 6 plant are not realised as planned.
This may necessitate extension of the plants scheduled for retirement.
i) Renegotiate CODs and tariffs for projects that have PPAs but are yet to commence
construction, to be integrated according to the dates given in the optimal plan.
Respective contingent liabilities for the committed projects should be determined
to inform proposals and negotiations.
j) Carry out a comprehensive study on ancillary services requirements for the
system, including battery storage, pumped storage and reactive power
compensation, with the increasing levels of intermittent renewable energy sources.
k) The Automatic Generation Control (AGC) to be implemented as a matter of
urgency to improve the management of secondary reserves to ensure smoother
system frequency control.
l) Focus on sustainable technology for geothermal expansion that will minimize
steam venting and enhance flexibility

117
7. INVESTMENT COSTS OF THE INTERCONNECTED SYSTEM AND THE
EVOLUTION OF TARIFFS IN THE MEDIUM TERM.
7.1. Introduction
This chapter covers generation costs for the period 2020-2040 as simulated in the chapter
6, and the evolution of tariffs for the medium term period 2020-2025 where the projects
are committed and fixed. In the simulations for tariffs, only two cases were considered;
the Optimised Case Reference demand scenario and fixed Case Reference demand
scenario. This is primarily based on the fact the two cases provide a more realistic forecast
for policy formulation and implementation.
7.2. Optimized Case – Reference Demand Scenario
The implementation of an additional capacity of 8,186.5MW will require a capital
cost of USD 2.4725 billion. Figure 26 shows the total capital requirement for the
generation expansion plan and specific requirements for different technologies for
the period 2020 – 2040.
Figure 26 Investments costs for various techniologies.
0.0
500.0
1,000.0
1,500.0
2,000.0
2,500.0
3,000.0
202
0
2021
2022
2023
2024
2025
2026
2027
2028
2029
2030
203
1
2032
2033
2034
2035
2036
2037
2038
2039
2040
An
nu
al C
AP
EX [
MU
SD]
PV
Wind
Generic back-up capacityCogeneration
Import
Gas turbines(gasoil)Diesel engines
Natural gas
Nuclear
Coal
Hydropower

118
Figure 27 shows the Levelised cost of electricity of the system from 2020-2040. It
indicates that the LEC will increase from 8.31 USDCents/kWh in 2020 to
9.69USDCents/KWh in 2040, with the highest LEC cost recorded in 2033, 10.23
USDCents/KWh.
Figure 27 Levelised costs under the optimised case reference scenario.
From the simulations, the total cost implication for planned projects under the
optimized case is KShs. 692,302,518,693. Figure 28 illustrats the average base retail
tariff is projected to increase from KSh20.85/kWh in 2020 to KShs. 24.48/kWh in
2025. The generation cost in the rises from Kshs.9.82/kWh in 2020 to KSh.
11.68/kWh in 2025. The costs summary is attached herein as annex 8
0.00
2.00
4.00
6.00
8.00
10.00
12.00
20
20
20
21
20
22
20
23
20
24
20
25
20
26
20
27
20
28
20
29
20
30
20
31
20
32
20
33
20
34
20
35
20
36
203
7
20
38
20
39
20
40
Syst
em L
EC [
USD
cen
t/kW
h]
System LEC

119
Figure 28 Tariff evolution - Optimised Reference case
7.3. Fixed system case – Reference Scenario
The implementation of the additional capacity of 8,371.5MW will require a capital
cost of USD 10,055.1 billion. Figure 29 shows the total investment requirement for
the generation expansion plan and specific requirements for different technologies
for the period 2020-2040. Figure 30 shows the annual system cost for the period
2020-2040. The results indicate Geothermal shall require a larger share of the
Capital requirement.
20.85 21.73 22.30
23.83 24.22 24.48
9.82 10.36 10.61 11.69 11.75 11.68
0.0
2.0
4.0
6.0
8.0
10.0
12.0
14.0
16.0
18.0
20.0
22.0
24.0
26.0
2020 2021 2022 2023 2024 2025
Un
it C
ost
Ksh
/kW
hUnit Cost in KSh/kWh
Retail Tariffper unit soldKSh/kWhincl of Taxes& Levies
GenerationUnit CostKSh/kWhinlc fuel andlosses

120
Figure 29 Annual investme t costs for various technologies in the fixed case - Reference scenario
Figure 30 Annual Systems cost
Figure 31 shows the Levelised costs for the planned fixed system case. The cost
ranges from 8.31 USDCents/kWh in 2020, to 11.12 USDCents/kWh in 2040. The
highest Levelised cost of 12.68USDCent/kWh, is realized in 2027. The spike is
attributable to commissioning of the Lamu Coal power plant.
0.0
500.0
1,000.0
1,500.0
2,000.0
2,500.0
3,000.0
3,500.0
20
20
20
21
20
22
20
23
20
24
20
25
20
26
20
27
20
28
20
29
20
30
20
31
20
32
20
33
20
34
20
35
20
36
20
37
20
38
20
39
20
40
An
nu
al C
AP
EX [
MU
SD]
PV
Wind
Generic back-upcapacityCogeneration
Import
Gas turbines (gasoil)
Diesel engines
Natural gas
Nuclear
Coal
Hydropower
0
500
1,000
1,500
2,000
2,500
3,000
3,500
4,000
20
20
20
21
20
22
20
23
20
24
20
25
20
26
20
27
20
28
20
29
20
30
20
31
20
32
20
33
20
34
20
35
20
36
20
37
20
38
20
39
20
40
Co
st [
MU
SD]
System cost
Cost forunservedenergy
Carbonemissioncost
Fuel cost

121
Figure 31 Levelised electricity cost - Fixed case Reference scenario
The total cost implication for planned projects in the period 2020-2025 is KShs
734,215,403,304 . The total cost is the sum of capacity payment obligations, Energy
Costs, Fuel Energy Costs and Deemed generated costs. Table 37 shows the costs
and tariff evolution under the fixed system case for the period 2020-2025.
The cost implication in fixed system case, in the period 2020-2025 is KShs
723,806,943,976. The total cost breakdown is attache in annex 9. Figure 32
illustrates the average base retail tariff is projected to increase from the KShs
20.85/kWh to KShs 25.98/kWh. Over the same period, the generation unit cost is
estimated to rise from Kshs 9.82/kWh in 2020 to 13.00/kWh in 2025.
0.00
2.00
4.00
6.00
8.00
10.00
12.00
14.00
20
20
20
21
20
22
20
23
20
24
20
25
20
26
20
27
20
28
20
29
20
30
20
31
20
32
20
33
20
34
20
35
20
36
20
37
20
38
Syst
em L
EC [
USD
cen
t/kW
h]
System LEC

122
Figure 32 Tariff evolution - Fixed System case
7.4. Comparison of the Retail tariff scenarios
The tariffs are expected to rise over the planning period in the Fixed Case and
optimised case scenarios considered. The fixed case system reference scenario
however, has higher tariffs compared to the optimized reference scenario. This is
primarily attributed to the fixed scheduling of projects in the fixed case system.
20.85 21.63
22.54
24.24 25.38 25.98
9.82 10.27 10.83 12.05
12.77 13.00
5.0
7.0
9.0
11.0
13.0
15.0
17.0
19.0
21.0
23.0
25.0
27.0
29.0
2020 2021 2022 2023 2024 2025
Un
it C
ost
Ksh
/kW
hUnit Cost in KSh/kWh
Retail Tariffper unit soldKSh/kWh inclof Taxes &Levies
GenerationCost per unitsold KSh/kWh

123
Figure 33 Retail tariff Comparison
20.85 21.73 22.3023.83 24.22 24.4820.85 21.63
22.5424.24
25.38 25.98
0.00
5.00
10.00
15.00
20.00
25.00
30.00
2020 2021 2022 2023 2024 2025
Ksh
/kW
h
Year
Retail Tariff Comparison
Optimised case Fixed System Case

124
8. TRANSMISSION PLANNNING Transmission plan can be classified into: - Long term, medium-term and short term
transmission planning. This planning is vital for the development of the electricity
grid in the country. Long term transmission planning determines the long-term
strategic development of the transmission system. It highlights the transmission
system investments required to meet the long term plan for all generators and
loads, and achieve steady system stability while meeting the requirements of the
grid code. Short and Medium-term transmission planning are used for preliminary
evaluation of the alternatives/options proposed for improved system
performance and requirements for with the generation evacuation and,
reinforcement of power distribution.
8.1. Objectives of transmission planning
The main objectives of the transmission planning component are:
a) To ensure efficient and reliable supply of planned power generation to
demand centers economically
b) To minimize the expected energy not served and investment cost subject to
power flow and grid security constraints
c) To determine an optimal long term transmission system expansion
investment plan
d) To develop cost estimates for the planned investments.
8.2. Methodology The transmission network expansion planning involved:
Analysis of committed medium term (5 year) transmission plan through detailed technical studies
Development of a set of transmission network solutions for the planning horizon (year 2040) to be considered in selection of a target network on which the transmission expansion plan shall be based.

125
Preparation of detailed alternative long term transmission development sequences for comparison and determination of the least cost option.
Optimization of the alternative transmission development sequences through detailed technical studies
Development of cost estimates for the alternative sequences of planned investments.
Economic analysis and comparative evaluation of alternative investment plans to arrive at the least cost option.
8.3. Target Network concept Target network concept aims at solving the network expansion planning problem
anti chronologically. Planning starts with developing a network solution for the
horizon planning year and then working backwards to identify network solutions
required for previous years at defined time intervals. This ensures that any
network investment in the short term is used in the long term, and therefore is
useful in the long term, contrarily to the chronological approach where network
investments identified in the shorter term may not be required and have to be
modified or discarded in future. The process therefore ensures a coordinated
development of an efficient and economical transmission system. However, in
both approaches the minimization of the costs is to be carried out by comparing
development sequence variants.
The process of developing the target network candidates begins with development
of the short term (year 2025) committed transmission system model and then
building alternative functional network models for the planning horizon (year
2040) having taken into consideration the demand forecast and planned generation
plants for the years up to 2040.
The process of developing a target network thus involves;
i. Determining the location of future generation facilities; the future plant
locations were selected considering the nature of each generation plant and its
basic requirements, its existing resource development plans and its established
policies.
ii. Splitting the power network into several regions, determining the regional
power balances and estimating future potential flows between regions. For
instance, table 29 below estimates regional power balance expected for the year

126
2040 as per the assumed dispatch, while table 30 presents potential regional
exchange between regions in that year.
Table 29 Year 2040 regional power balances (MW)
Region Generation Demand Surplus/ Deficit (As per
assumed dispatch)
NAIROBI 109.3 2346.1 -2236.8
COAST 1027.9 956 71.9
MT KENYA 1543.3 522.8 1020.5
C RIFT 1750.1 418.5 1331.6
W REGION 150.2 730.8 -580.6
N RIFT 545.2 266.4 278.8
ETHIOPIA(Imports) 600.7 - -
EKT(Exports) - 200 -
Totals 5726.7 5440.6
Source: KETRACO
Table 30 Year 2040 Regional Power Interchange
REGION NAIROBI COAST MT
KENYA
C
CRIFT
W
KENYA
N RIFT UGANDA ETHIOPIA TANZANIA
NAIROBI MW - -60 -1260 -102 0 -568 - -590 200
MVAr - 249 108 -200 0 -36 - 266 -65
COAST MW 60 - -4 - - 45 - - -
MVAr -249 - -20 - - 19 - - -
MT KENYA MW 1260 4 -395 - 111 - - -
MVAr -108 20 -17 - -5 - - -
C CRIFT MW 102 - 395 111 693 - - -
MVAr 200 - 17 192 -82 - - -
W KENYA MW 0 - - -111 - -493 0 - -
MVAr 0 - - -192 - -34 0 - -
N RIFT MW 568 -45 -111 -693 493 - 0 - -
MVAr 36 -19 5 82 34 - -29 - -
UGANDA MW - - - - 0 0 - - -
MVAr - - - - 0 29 - - -
ETHIOPIA MW 590 - - - - - - - -
MVAr -266 - - - - - - - -
TANZANIA MW -200 - - - - - - - -
MVAr 65 - - - - - - - -

127
Source: KETRACO
iii. Estimating the number of transmission lines to plan between regions; In
estimating the number of transmission lines between regions 220kV and 400 kV
is adopted as the backbone transmission voltage in conformity with the current
regional standards, transmission distances and level of system demand. In
determining the number of transmission lines between regions, the transfer
capacity, limited by both the thermal rating and the surge impedance loading
(for long EHV lines), are considered.
8.4. Planning assumptions and criteria
8.4.1 Planning assumptions
In preparation of the transmission development plan the following basic
assumptions were made:
● Future thermal generation (coal and gas turbines) will be developed mainly in Coast area to reduce the cost of fuel transportation and consequent environmental impact.
● Future geothermal generation will follow the established geothermal development plan developed and provided by KenGen and GDC.
● Firm power imports will be available only from Ethiopia. However surplus power exchange and trans-border wheeling within the region are envisaged hence regional interconnections with Uganda and Tanzania are considered in the transmission development plan, the following is assumed:
- Kenya will import 200 MW from Ethiopia from 2021 and another 200 MW from 2023.
- 200MW will be exported from Ethiopia to Tanzania through Kenya from the year 2022.
● Due to anticipated right of way challenges and demand growth, major transmission lines will be designed as double circuits (and at higher system voltages) for higher transmission capacity, with a possibility of initial operation at lower voltage levels to reflect existing system strength and limit requirements for other line equipment

128
8.4.2. Planning criteria As guided by the Kenya National Transmission Grid Code, the following gives the
major aspects that were considered during the planning exercise;
8.4.2.1. System Voltage Under normal conditions all system voltages from 132 kV and above (i.e. 132kV,
220kV, and 400kV) should be within ± 5% of the nominal value and should not
exceed ±10% at steady state following a single contingency for 132 and 220kV. For
400kV should not exceed ± 5%. In order to maintain a satisfactory voltage profile
both static and fast acting dynamic reactive power compensation will be deployed
as required and noted for consideration as new investments.
8.4.2.2. Equipment loading
Under normal conditions and at steady state following single contingencies all
transmission equipment should not exceed 100% of the continuous rating. During
contingency conditions loading will be allowed to increase to 120%, which is a
threshold justified by the fact that the equipment can stand this level for a short
duration of time, the time that the operator applies remedial actions for bringing
the system back to a normal situation.
8.4.2.3. Voltage selection
Transmission development during the planning horizon will be based on 132, 220
and 400 kV. To enhance system operation and optimize way leaves cost all future
inter region transmission lines and regional interconnections shall be designed as
400 kV but may be initially operated at 220 kV. In determining voltage levels for
new power evacuation lines, consideration for all power plants to be developed in
any given location shall be taken into account to optimize overall transmission
cost.
8.4.2.4. Reliability criteria
The future transmission system is planned to operate satisfactorily under the
condition of a single element contingency, N-1 for transmission lines and
transformers. However, in assessing system reliability a double circuit line will be
considered as two separate circuits.

129
8.4.2.5. Fault levels
To allow for system growth, maximum fault levels should not exceed 80% of the
rated fault interrupting capacity of the circuit breakers. This criterion may lead
either to replacement of some breakers (i.e. upgrade) or to identification of
mitigation actions for limiting the fault levels.
8.4.2.6. Power losses The transmission system is planned to operate efficiently with power losses likely
not to exceed 5% at system peak, the economic comparison of variants will take
the cost of losses into account and identify the least (global) cost variant. For
economic comparison of alternative transmission development plans peak power
losses are converted to corresponding energy losses and costed at the LRMC of
energy (15 US cents/kWh).
8.4.2.7. Catalogue of equipment and materials Standard equipment and materials (e.g. transformers, conductors, capacitors,
substation diameters and bays e.t.c) are recommended for electricity transmission
grid infrastructural development for reasons that:
● They offer economic and monetary value due to bulk purchase.
● These equipment and materials are easily stocked for replacement in cases
of failure and redundancy: standardization allows reduction of the amount
of spare parts.
● It offers ease in operation and maintenance owing to its uniformity and
commonality.
● It makes it easier for the utility to train its technical staff on the standard
equipment
● It makes it easier to up rate certain equipment by substituting them with
others that may be recovered.
The catalogue of equipment and materials used in development of the
transmission plan and their estimated unit cost is summarized table 31 to table
33. Table 34 gives the cost estimates for wayleaves and substation land. The
tables were compiled using KETRACO estimated costs.

130
Table 31 Power transformers
POWER TRANSFORMERS
MAXIMUM
CAPACITY/RATING
VOLTAGE RATIO - kV (Costs in MUSD)
132/33 220/33 220/66 220/132 400/132 400/220 500/400
23MVA 0.5 0.62 0.7 - - - -
45/60MVA 0.75 0.8 0.9
90MVA - - - 0.98 1.5 - -
150MVA - - - 1.15 2 - -
200MVA (3-ph units for 220/66
rest 1-ph) - - 1.5 - 1.8 2.2 -
400MVA (1-ph unitsX3) - - - - 3 4.11
REACTOR BANKS
MAXIMUM
CAPACITY/RATING
VOLTAGE RATING- kV & UNIT COST in MUSD
33 66 132 220 400
7.5 MVAr 0.25 0. 0.3 0.370 -
10-15MVAr 0.38 0. 0.508 0.685 -
50 MVAr - - - - 0.75
100 MVAr - - - - 1.4
CAPACITOR BANKS
MAXIMUM
CAPACITY/RATING
VOLTAGE RATING- kV & UNIT COST in MUSD
33 66 132 220 400
7.5 MVAr - - - -
10-15 MVAr 0.54 0.75 -
50 MVAr - - - 0.85 8.7
100 MVAr - - - 1.3 1.4
STATCOMS
CAPACITY/RATING
VOLTAGE RATING- kV & UNIT COST in MUSD
33 66 132 220 400
– 50Mvar inductive and
50Mvar capacitive 1x-
/+50Mvar.
- - 18.5 - -

131
POWER TRANSFORMERS
MAXIMUM
CAPACITY/RATING
VOLTAGE RATIO - kV (Costs in MUSD)
132/33 220/33 220/66 220/132 400/132 400/220 500/400
–100Mvar Inductive and
50Mvar capacitive (-
/+1x50Mvar DRPC and 1x-
50Mvar MSR)
- - - 22.0 -
–200Mvar Inductive and
100Mvar capacitive (-
/+2x50Mvar DRPC and 2x-
50Mvar MSR)
- - - - 37.0
Source: KETRACO
Table 32 Other line equipment
PARTICULARS EQUIPMENT COST (MUSD) & VOLTAGE CLASS (kV)
33 66 132 220 400 500DC
Line Terminal Equipment 0.02 0.045 0.1 0.23 0.34 15.13 (per pole)
Transformer Terminal
Equipment
0.02 0.045 0.1 0.24 0.36
Diameter/Bay 0.1 0.13 0.22 1 1.7 inc
Partial Diameter - - - 0.5 0.85 -
Bus Coupler 0.025 0.05 0.22 0.34 - -
Power Transformer (see table
above)
- - - - - -
Reactor/Capacitor banks (see
table above)
- - - - - -
Bus Bars inc inc inc inc inc
Protection & Control inc inc inc inc inc
Telecom inc inc inc inc inc
Control Room building 0.9 1 1.2 2
SS Extension 0.2 0.35 0.4 -
Civil Structural Works 35% of cost of equipment
Design & Installation 27% of cost of equipment and civil-structural works
PM and Supervision 5% of total EPC cost
Contingency 15% of Total EPC + Supervision
Source: KETRACO

132
Table 33 Catalogue & Unit Cost of Equipment-Transmission Lines Cost (MUSD/km)
LINE VOLTAGE (KV)
EPC+PM EPC+PM EPC+PM EPC+PM
OHL DC OHL SC Mono Pole DC UG CABLE DC
132kV 0.156 0.1 0.244 1
220kV 0.3124 0.20 0.488 2
400kV 0.456 0.292 0.713 2.5
Source: KETRACO
Table 34 Cost of RAP, Land (Way Leaves)
SUBSTATION LAND COSTS
PRIMARY
VOLTAGE
(kV)
SIZE
(ACRES)
COST (M
KES)
COST (MUSD)
132 5 12.5 0.120192
220 10 25 0.240385
400 15 37.5 0.360577
WAYLEAVE COSTS
LINE
VOLTAGE SIZE (m)
SIZE
Sqm/KM
SIZE
ACRES/KM COST (M KES)/KM COST/KM (MUSD)
132 30 30000 7.413 18.533 0.178
220 40 40000 9.884 24.711 0.238
400 60 60000 14.826 37.066 0.356
Source: KETRACO
The costs will be expanded and revised in future to include equipment that has
been installed in the system and that which becomes available in the market. This
will be used for defining the many scenarios whose comparison provides the Least
Cost Scenarios. The cost for wayleaves assumes highly populated and built up
area, this represents the worst case scenario.
8.5. Generation and load data

133
8.6. Generation data 2020 – 2040.
The future generation plants considered in this plan are provided in section 6.2.
8.7. Load data. In disaggregating the national load forecast to individual substations in the
regions, the following assumptions are made:
● Uniform load growth rate in individual KPLC regions as per the demand
forecast.
● The Big 4 Agenda among other flagship projects as indicated in table 15
were assumed.
8.8. Distributed load forecast 2020 -2040 The forecast for the peak load distributed per region is as follows. In developing
the distributed forecast, it is assumed that peak demand occurs simultaneously in
all regions.
Table 35 Peak Load Distribution in Regions
2021 2025 2030 2035 2040 Region MW MVAr MW MVAr MW MVAr MW MVAr MW MVAr
Nairobi 941.02 309.30 1151.18 378.37 1337.5 439.6 1767.7 582.8 2311.7 762.2
Coast 279.23 91.78 338.44 111.24 595.2 202.4 757.4 255.8 962.6 323.2
Mt. Kenya 227.83 74.88 273.43 89.87 303.1 99.7 400.6 130.7 523.8 170.9
C Rift 119.73 39.35 153.09 50.32 260.8 85.7 338 117.8 435.6 152
N Rift 75.51 24.82 94.38 31.02 431.8 141.9 571 193.4 747.1 253
Western 218.58 71.84 268.27 88.18 152.6 50.2 201.8 65.7 264 85.9
Grand Total 1861.89 611.97 2278.78 749.00 3081 1019.5 4036.5 1346.2 5244.8 1747.2
Source: KETRACO
8.9. Development of Target network candidates
The target transmission network candidates for the previous horizon planning
year (2019 - 2039) were revisited. Alternative transmission system was then
developed considering the regional power balance as shown in table 36. which was

134
prepared by disaggregating the national load forecast into regional demands at the
local existing and potential substations and locating the generation plants on the
basis of assumptions outlined in section 8.4.
Based on the demand/supply assessment in all regions, inter regional supply lines
and voltages to meet the required transmission capacities were approximated in
consideration of the distances involved. In so doing these line loading limit
guidelines were adopted:
● 0- 80 km (short lines) – thermal limits
● 80 – 499 km (medium length) – transient stability and surge impedance
loading limit of 1.5x SIL
● Long lines 500 km and above –Voltage drop and surge impedance
loading limits of 1xSIL
In view of the existing network and the regional standards, 220kV and 400 kV lines
were considered as the main inter regional and regional transmission system
voltages.
8.9.1. Overview of the developed target network In the previous planning exercise, a combination of projects (in addition to the
committed network) were selected so as to address the following network
issues/challenges:
i. Provision of alternative source of supply for Lessos for improved reliability of supply for larger West Kenya
ii. Extending transmission lines to cater for new point loads and generation. iii. Reinforcing southern parts of West Kenya (Chemosit and South Nyanza). iv. Grid extension to off-grid areas currently supplied by diesel generator sets
(Wajir, Moyale and Mandera). v. Revamping and increasing evacuation capacity for transmission system
from Olkaria geo complex hence reducing reliance to Suswa substation. vi. Reinforcing 132kV and existing transmission network in Coast region -
Mombasa town, Bamburi and environs. The following projects were selected and included in the Transmission Plan

135
Table 36 Transmission Projects from the 2019-2039 plan
S/n PROJECT Length (km) Cost (USD)
1 400kV Maralal/Loosuk- Baringo-Lessos 179 202
2
220kV Keringet - Chemosit (cost includes inter tie with
132kV system at Chemosit)This is included as part of
Rongai-Keringet
73 72.05
3 220kV Mariakani- Bamburi Cement-Kilifi 81 92.86
4 Gilgil/Thika LILO - Longonot - Thika and 400 kV
Longonot Suswa 12 47.46
5 220kV Wajir-Mandera 250 161.1
6 220kV Marsabit-Moyale 180 119.94
TOTALS 775 695.41
Source: KETRACO
In the current planning period the only issue required to be addressed by network
expansion was supply to proposed ship recycling and steel making factory at
Shimoni/Kibuyuni in Kwale County. The developer has already applied for
supply to meet an estimated demand of 80MVA by 2023. The two options were
proposed to supply the proposed developments transmission projects as given in
Table 37.
Table 37 Target Network elements
Cluster A Length
Km
Cost/Modelling Details/Remarks YEAR COST
MUSD Segment 1: Power Supply to
Shimoni/Kibuyuni
A1
Opt
1
Mariakani –
Kibuyuni 220kV line
120 220kV transmission line, new
220/132/33kV substation at
Shimoni/Kibuyuni
2023 96

136
A2 Opt
2
LILO on
Mariakani/Dongo
Kundu to Kibuyuni
70 220kV LILO on both circuits of
Mariakani-Dongo Kundu, 220kV
Switch station at Kwale and 220kV
double circuit transmission line from
the Switch station to Kibuyuni, new
220/132/33kV substation at Kibuyuni.
2023 85
Source: KETRACO
Two target networks given below were considered in the further analysis: -
Preliminary analysis and observation (cost and grid code’s reliability requirement)
was done/considered to disregard the other combinations.
Table 38 Selected Options for Further Analyses Included
Segment TN 1 TN 2
1 A1 A2
Source: KETRACO
The following describes the two networks elements that were added/modelled
into the target network considered in the previous planning period to develop the
two target networks options:
Network Element 1
Project A1: This option considers development of approximately 120km of 220kV line from Mariakani to Kibuyuni, establishment of 220kV bay extension at Mariakani and construction of a new 220/132/33kV substation at Shimoni/Kibuyuni area.
Network Element 2 Project A2: This option considers cutting in and out of both circuits of the 220kV Mariakani-Dongo Kundu Transmission line, construction of a 220kV Switch Station at Bang’a in Kwale, approximately 2 sets of 10km 220kV double circuit transmission lines between the LILO and the switch station, new 220/132/33kV at Shimoni/Kibuyuni and approximately 70km of 220kV double circuit transmission line between the switch station at Bang’a and new substation at Shimoni/Kibuyuni.

137
The link to the 132kV system considered to be terminating at Kwale Sugar so as reinforce the existing 132kV system from Rabai was included in both of the networks above.
8.10. Developing Models for Target Networks Options
Initially the committed projects for 2020-2025 were modelled as expected in the
network for each year. System simulation were carried out to verify their adequacy
and highlight on any network constraints. Need to address these constraints
informed on additional investments required in the medium term and in a way
respond to the updated demand forecast and generation plan. The network models
for horizon year (2040) was developed and included the planned generation
plants, planned loads and all the transmission lines expected by 2040 as per the
previous planning period
Upon modelling targeted network, additional system reinforcements using the
standard network equipment tabulated in section 8.6 were identified and
modelled to create a converging model over the planning period. Reactive power
compensation devices were modelled at various nodes to provide variable reactive
power. Optimal sizes and ranges of reactive compensation equipment were
determined for optimised target network.
The network elements (options to supply Shimoni) were at different instances
included in the horizon network model. Since the supply to Shimoni is required
by 2023, the network elements were included for models from the year 2023. Two
target network options were then developed. Network analysis was carried out for
2020, 2025, 2030 2035 and 2040 as detailed in the next section. This compared the
performance of the target two network options.
8.11. System Studies and Analysis Each of the planning horizon networks developed has to comply with the
transmission system criteria applied. To optimize the networks, a series of studies
were conducted in PSS/E modelling and analysis tool as follows
8.12. Load flow studies

138
Load flow studies were carried out iteratively with further network reinforcements
to ensure that all system buses meet the +/- 5% voltage criteria and no system
equipment are overloaded at steady state. A load flow study forms the basis for all
other network studies. The system losses and the impact of target network
elements on system losses was determined from load flows.
8.13. Contingency studies
Contingency studies are an extension of load flow studies carried out to ensure the
target network meets the loading and voltage criteria following a defined
contingency, and to identify the required further network reinforcements to meet
the redundancy criteria. n-1 criterion was investigated in the development of the
target networks.
8.14. Fault Level studies Fault level computations were carried out to ensure that network circuit breakers
capacities are not exceeded within 20% margin at the planning horizon. If
exceeded corrective network designs will be required; such as reinforcement of
switchboards and replacement of breakers, reconfiguration of transmission lines
and specification of open substation bus couplers.
8.15. Simulation Results
The simulation results that are characterized by loss performance for each of the
target networks were analysed and used to rank the best target network
alternatives. The table 39 gives the simulated network losses for the four target
networks.
Table 39 Simulated network losses for the four target networks
YEAR NETWORK LOSSES IN MW
TN 1 TN 2
2025 85.41 85.49

139
2030 137.6 137.6
2035 184.5 186.3
2040 287.6 284.0
The network losses for the five networks compare closely, target networks with
slightly higher losses over the period included target networks 1, 4 and 5. In 2040
and beyond, target network 5 recorded lower losses hence more efficient. The cost
of the projects and these formed the basis for target network selection and hence
assisted in providing the transmission investment sequences that best met the set
technical criteria. PSS/E load flow models for the four target networks are attached
in the Appendices. Cost estimates for network elements in each target network
was determined and used in the economic analysis.
8.16. Simulations Key Findings Network constraints in the short term (2020-2025):
The following network constraints were identified in the existing and committed
network 2020-2025 and recommendations made for their resolutions;
i. Over loading due to inadequate transmission and transformation capacity
in West Kenya, Central Rift and Coast regions.
ii. System sub-optimal performance in Nairobi region due to;
● Delayed Nairobi 220 kV Ring projects (Kimuka, Athi River, Thika road
(66 kV feedouts pending) and Malaa 220kV substations)
● Malaa substation location being very far from the load centre (inner
Nairobi Region).
iii. System over-voltages at Garissa, Rabai and the other regions. The situation
is worse after commissioning of proposed 400kV networks and
commissioning of HVDC converter stations and especially during off peak
period.
iv. System under voltages at various substations in Nairobi, Coast, Mt Kenya
and West regions during peak periods.

140
v. Reliability criteria (N-1) not met for the following major transmission
corridors.
● Olkaria complex - Suswa
● Suswa - Nairobi North - Dandora
● Dandora – Juja road - Ruaraka
vi. Relatively high transmission losses (4.7% in 2020) in the short term due to
delayed commissioning of various committed projects, attributed to
wayleaves problems, vandalism and non-performance of contractors.
Network constraints in the short term (2030-2040):
The following network constraints were identified in the proposed networks 2030-
2040 and recommendations made for their resolution;
2030 constraints are as follows:
Over loading due to inadequate transmission and transformation capacity
in
Mt Kenya – Nairobi regional link, (132kV New Thika -Mangu-Juja Rd)
West Kenya Region (Chemosit 132/33kV transformers;
Coast regions (Bamburi 132/33kV transformers.
Over voltages at Off peak due to inadequate reactive power compensation
at low loading periods:
Mt Kenya Region and Coast Region (220kV Garissa-Bura-Hola-
Garsen System)
400kV system in the North Rift region (Lessos Hub).
2035 Constraints are as follows:
Over loading due to inadequate transmission and transformation capacity
in
Mt Kenya Region (132/33kV transformer at Githambo, Kiganjo,
Kutus and Garissa)
West Kenya Region (Kisii 132/33kV transformers;
Central Rift Region (Lanet 132/33kV transformers); and
North Rift region (Kabarnet 132/33kV transformers).

141
Over voltages at Off peak due to inadequate reactive power compensation
at low loading periods:
Mt Kenya Region (220kV Garissa-Habaswein-Wajir, Garissa-
Garbatula, Isiolo System)
400kV system in the Mt. Kenya region (Thika Hub).
2040 constraints are as follows:
Over loading due to inadequate transmission and transformation capacity
in
Mt Kenya – Nairobi regional link, (132kV New Thika -Mangu-Juja Rd,
Juja Rd 132/66kV transformers, 220/66kV transformers at Nairobi
North, City Centre and Embakasi)
West Kenya Region (Kisumu/Mamboleo 132/33kV transformers);
North Rift Region (Lessos 132/33kV transformers);
Central Rift Region (Soilo 132/33kV transformers); and
Coast regions (Bamburi 132/33kV transformers).
8.17. Recommendations – (short to medium term).
8.17.1. Transmission Capacity
Address inadequate transmission capacity in West Kenya, Central Rift and Coast
in the short term by fast tracking the following on going and committed
transmission projects.;
a) West Kenya Region
i. Fast track completion of Olkaria-Lessos-Kisumu 400kV/ 220
kV transmission line. This will offload Olkaria – Naivasha 132
kV line, Naivasha – Lanet- Lessos and Lessos – Muhoroni –
Kisumu lines.
ii. Fast track completion of Olkaria – Narok and Narok – Bomet
132 kV line sections. This will off-load Muhoroni – Chemosit
and improve voltages in South Nyanza sub-region

142
iii. Fast track completion of Sondu-Ndhiwa 132kV transmission
line. This will de-load Chemosit - Muhoroni and Sotik –Kisii
lines and improve system voltages in West Kenya.
b) Central Rift Region
i. Implement the second LILO to Soilo (Lanet-Makutano) – This
will de- load the lines to Makutano once Menengai generation
is commissioned
ii. Uprate transformers at Soilo Substation from 2x23MVA to
2x45MVA
iii. Fast track completion of 132kV Olkaria-Narok. This will
alleviate overloading of the 132kV Olkaria Naivasha 132kV
line.
iv. Installation of fast acting reactive power compensation at
Suswa 400/200kV substation on the 400kV bus.
c) Coast Region
i. Fastrack completion of Rabai –Kilifi 132kV line upgrade to
double circuit construction and steel tower construction.
ii. Implement Malindi – Kilifi 220 kV line and new Kilifi
220/132/33 kV substation. This alleviate over loading on the
132kV circuits from Rabai and improve system voltages
iii. Implement Kipevu – Mbaraki 132 kV line and 132/33 kV
substation. This will alleviate the overloading Bamburi-Kilifi.
iv. Installation of fast acting dynamic reactive power
compensation at strategic locations in Galu and Kilifi.
d) Mt Kenya Region
i. Complete Nanyuki - Isiolo and Nanyuki-Rumuruti
transmission lines. These will alleviate overloading on the
Kiganjo-Nanyuki line and improve the system voltages in the
Region.
e) Nairobi Region
i. Fast track commissioning of the Nairobi 220kV ring substations
and associated 66kV feedouts.

143
8.17.2. Network Reliability Reinforce committed transmission network to improve supply reliability
(compliance with n-1 redundancy criteria)
(a) Construct Olkaria 1AU – Olkaria V 220 kV double circuit line. This will
improve power evacuation reliability between Olkaria complex and Suswa
substation with the commissioning of Olkaria V power plant.
(b) Re-conductoring of Dandora-Nairobi North-Suswa and Dandora-Juja
transmission lines using high capacity high temperature low sag
conductors. This will additionally improve the reliability of Suswa –
Nairobi North and Dandora – Juja –Ruaraka corridors.
8.17.3. Optimization and Improvement of network performance Optimize and improve supply system in Nairobi by fast tracking construction of
Nairobi 220 kV ring project including Kimuka, Athi River, and Malaa 220/66 kV
substations along with their feeder outlets. Additionally, to optimize network
losses it is recommended that ongoing other transmission line projects be fast
tracked including connection of Suswa-Isinya- Mariakani and Isinya- Athi River-
Embakasi 220 kV lines to operate as double circuits as constructed.
8.17.4. System voltage control Operate sections of committed 400 kV system at 220 kV initially to limit system
voltages and need for extensive voltage control equipment deployment. It is
recommended that lightly loaded sections of 400kV network (outer ring) be
operated at 220kV to address system over voltages, for instance simulation
indicated/confirmed that Malaa-Thika-Gilgil-Lessos section of the 400kV can be
operated at 220kV up to 2030. Additionally, reactive power compensation
equipment should be employed to ensure effective system operation and voltage
stability in the event of a fault.
It is recommended that a complete system reactive compensation study over the
medium term be carried out with a view to addressing the high voltages expected
in the 220/400 kV system as well as the under voltages observed in Nairobi, Mt.

144
Kenya, Coast and West Kenya at peak periods. The study should consider and
optimize deployment of fast acting dynamic reactive compensation equipment e.g.
STATCOMs having simulated and estimated the interactions with already
installed power electronic based grid-based devices (DRPCs and HVDC converter
stations).
8.18. Recommendations – (Long term 2030 - 2040).
8.18.1. Transmission Capacity and System Voltage Control
Address inadequate transmission capacity in West Kenya, Central Rift and Coast
in the short term by fast tracking the following on going and committed
transmission projects.;
a) 2030
i. Uprating 132/33kV to 2x45MVA at Chemosit from 2030.
ii. Load transfers from New Bamburi to Bomani 132/33kV
substation from 2030
iii. New Thika -Mangu 132kV line - second line added (or
effecting LILO on the Mangu/Gatundu 132kV line to
terminate in New Thika)
iv. Installation of 100MVAr reactor at Lessos.
b) 2035
i. Installation of second 132/33kV transformer at Githambo,
Othaya and Kabarnet.
ii. Effecting load transfer from Kiganjo to Othaya and from Kilifi
to Bomani.
iii. Uprate/Replace all 18/23MVA transformers at Kisii/Kegati ,
Kutus to 45/60MVA,
iv. Uprate/Replace all 7.5MVA transformers at Garissa to 23MVA,
v. Installation of 100MVAr reactor at Thika and uprating the
9MVAr reactor to 30MVAr.
c) 2040

145
i. Reconductoring 132kV Mangu -Juja, New Thika-Mangu using
High Temp Low Sag (HTLS) Conductors
ii. Introduction of 2x200MVA 220/66kV step down at Dandora
and transferring about 200MW from Juja Rd to Dandora.
iii. Uprate/Replace two (2) of the 220/66kV 90MVA transformers
at Nairobi North with 200MVA 220/66kV transformer.
iv. Effecting load transfer from Embakasi to Athi River substation.
v. Installation of third 220/66kV transformer at City Centre.
vi. Installation of new 45MVA 132/33kV transformer at New
Bamburi.
vii. Uprate/Replace the 132/33kV 45MVA transformers at Kisumu
with 90MVA 132/33kV transformers.
viii. Uprate/Replace the 132/33kV 23MVA transformers at Lessos
with 45MVA 132/33kV transformers.
8.18.2. Optimization of wayleaves
It is recommended that all wayleaves for transmission system required in the
medium and long term in fashion that will guarantee timely completion of
project. The size secured must be able to accommodate double circuit
construction for all transmission circuits. 400kV construction be considered for
all regional (country – country or power pool - power pool) and inter region
(regions within the country). These may be initially operated at 220 kV.
8.18.3. Network Reliability 220 and 400kV elements critical in the transmission system to comply to with N-1
reliability criteria. Maintaining a sizable number of standard transformers for
possible deployment in the event one of the transformers put out of service.
8.18.4. Optimization and Improvement of network performance Optimize and improve supply system by maintaining normally open (NO) in some
interconnected 132kV lines and 220kV lines to avoid unnecessary overloading and
hence reduce transmission losses
8.19. Optimizing the future Transmission Network.

146
8.19.1. Methodology This entails finding acceptable sequence of investment starting from the 2020-2025
committed transmission networks and ending up to the developed target network.
The investment sequence for the target network was established by creating and
optimizing network models at 5 year intervals between 2025 and 2040, with the
investment conforming to the selected 2040 target network requirements. This is
done by starting with the 2040 target network and developing 2035, 2030 and 2025
network models in reverse sequence by switching generators and loads as per the
generation development plan and load forecast, and equipment not required as a
result.
Network models for each of the snapshot years are once again optimized through
load flow, contingency and short circuit studies to ensure transmission system
criteria is complied with at every stage. This is covered and the
findings/recommendations discussed in the previous section. The simulation
results are attached in the Appendices.
8.19.2. Development of sequence of investments
The alternative investment strategies were developed each from the initially
identified target network alternatives by application of the above methodology.
For each snapshot year in addition to transmission lines and substations
reinforcement requirements, reactive compensation requirements were also
determined and transmission losses evaluated.
For the purpose of comparison of different strategies, transmission losses cost at
the LRMC of energy were considered as a cost and added to the cost of
investments. To arrive at the least cost transmission plan, the annual costs of each
sequence of investment were discounted to the base year (2020) at the rate of 12%.
A summation of the present values of annual investments gives the PV of cost for
each investment strategy. The investment strategy with the least PV of cost is
determined as the least cost transmission expansion plan.
In addition to transmission lines and substations reinforcement requirements for
each snapshot year, reactive compensation requirements were also determined
and transmission losses evaluated.

147
8.19.3. Comparison of investment strategies
Table 40 represents a summary of investment cost streams and analysis of the three alternative investment strategies. Summary of investment cost of three alternatives in US Dollar.
Table 40 Summary of cost of investment of the three alternatives in USD
TARGET NETWORK 1 2
Total Cost (EPC_RAP+O&M + Losses)
9,498 9,492
Total PV Cost 4,640 4,631
From the above analysis, Target Network 2 results to lower NPV, this makes it the least cost development plan compared to Target Network 1, Target Network 2 is thus recommended for implementation. The present value of investments for this option is estimated at MUSD 4,631.00. Detailed investment analysis for the two option is tabulated in the annex 10.
8.19.4. Investment Sequence
8.19.4.1. Transmission lines and substations
The transmission lines and substations expected in the 2020-2040 planning period are listed in table 41 and 42
Table 41 Ongoing Projects

148
S/n
TRANSMISSION LINES SUBSTATIONS Projected
Commissioning Date9
Estimated Project
Cost
TL Name Length
(KM) S/n SS Name MVA
1
Nairobi Ring substations
(Isinya, Athi River, Kimuka,
Malaa)
- 1 Athi River 220/66kV
2x200MVA 400 Nov-21
243.50
2
Kimuka 220/66
2x200MVA 400 Nov-21
3 Malia 220/66
2x200MVA 400 Nov-21
2 System Reinforcement
(Isinya 400/220kV
Substation)
- 4 Isinya 400/220
4x200MVA 800 Dec-21
624.78 3 Eastern Electricity
Highway Project 500kV
(EEHP)
612 5 Suswa 500/400kV
4x350MVA 1400 Jun-21
4 Mwingi – Kitui 132kV 46 6
Kitui 132/33
1x23MVA 23 Mar-21
105.38
5 Kitui – Wote 132kV 66
Mar-21
6 Lessos – Kabarnet 132kV 65 7
Kabarnet 132/33
1x23MVA 23 Dec-21
7 Olkaria – Narok 132kV 68 8
Narok 132/33
1x23MVA 23 Dec-21
9 The dates are as projected in Dec 2020.Some dates are to be revised subject to the prevailing site condition, progress in acquisition of wayleaves and approval of
the existing contract time extensions applications. For simulation purposes it was assumed that the projects were commissioned in the year following the year
indicated in this table.

149
S/n
TRANSMISSION LINES SUBSTATIONS Projected
Commissioning Date9
Estimated Project
Cost
TL Name Length
(KM) S/n SS Name MVA
8
Olkaria – Lessos – Kisumu
(Kibos) 400/220/132kV 279
9 Kibos 220/132
1x150MVA 150 Feb-21
178.48 10
Kibos 132/33
1x45MVA 45 Feb-21
9
Isinya (Kajiado) –
Namanga 132kV 80
11 Namanga 132/33 23
MVA 23 Jun-21
42.57 12 Isinya 132/33 23MVA 23 Jun-21
13 Isinya 220/132
110MVA 110 Jun-21
10 Turkwel – Ortum – Kitale
220kV 135 14
Ortum 220/33
23MVA 23 Nov-21
45.07
11 Olkaria II additional
transformer (90MVA) - - - 90 Jun-21 -
12 Nanyuki – Rumuruti 132kV 79 15
Rumuruti 132/33
23MVA 23 Dec-21
Cost incl. (item
6,7,8)
13 Nanyuki – Isiolo 132kV 70 - - Dec-21
54.78
14 Nanyuki – Rumuruti 132kV
14.5 km UG cable 14.5 - - Dec-21 10
15 Nanyuki – Isiolo 132kV 5
km UG cable 5 - - Dec-21

150
S/n
TRANSMISSION LINES SUBSTATIONS Projected
Commissioning Date9
Estimated Project
Cost
TL Name Length
(KM) S/n SS Name MVA
16 Mariakani 400/220kV
substation - 16
Mariakani 400/220
4x200MVA 800 Dec-21 29.02
17
Garsen -Bura-Hola –
Garissa 220kV 240
17 Bura 220/33
1x23MVA 23 Dec-21
102.11
18 Hola 220/33
1x23MVA 23 Dec-21
2021 TOTAL
1759.5
1333.00
1,435.69
18 Sultan Hamud – Meruesh
i- Loitoktok 132kV 120
19 Loitoktok 132/33
23MVA 23 Jun-22
129.69
20 Merueshi 132/33
23MVA 23 Jun-22
19 Awendo- Isebania 50 21 Isebania 132/33 1x23 23 Jun-22
20 Isinya-Konza 400KV 45 - Konza 400/132
2x150MVA 300 Jun-22
21 Rabai-Bomani-Kilifi 132kV 67 22 Bomani 132/33
2x45MVA 90 Mar-22
32.41
2022 TOTAL 282
459
162.1
22 Lessos – Tororo 400kV 132 - - - Dec-23
86.36
23 Kamburu-Embu-Thika
220KV 150
- 23
Embu 220/132
2x90MVA 180 Dec-23
140.77

151
S/n
TRANSMISSION LINES SUBSTATIONS Projected
Commissioning Date9
Estimated Project
Cost
TL Name Length
(KM) S/n SS Name MVA
24 Thika 220/132
2x90MVA 180 Dec-23
24 Uplands (Limuru)
substation 25
Uplands132/66
2x60MVA 120 Dec-23
2023 TOTAL 282
480
227.13
25
Sondu (Thurdibuoro) –
Ongeng (Homa
Bay/Ndhiwa) 132kV
69 26 Thurdibuoro
1x23MVA 23 Jun-25
31.09
2025 TOTAL 69 23 31.09
Total Length (KM) 2392.5 Total SS Capacity
Added 2295
TOTAL COST (MUSD) 1,856.01

152
Table 42 Planned Projects
TRANSMISSION LINES SUBSTATIONS
Year
Expected in
the System
Estimated
Cost (MUSD)
Implementing
Agency
S/n Project Name Length (KM) S/n SS Name MVA
YEAR 2021
1 Second Circuit LiLo Nakuru West –
Lanet 132KV 1.5 - 2021 3.54 Kenya Power/
2021 TOTALS 1.5 - 0 0 3.54
YEAR 2022
1 Rongai Substation 132/33kV 1.5 1 Rongai 132/33 2x45MVA 90 2022 12.83 Kenya Power
2
Fast acting reacting power and
voltage control devices at various
regions for improved power quality
(Coast, Nairobi).
- 4x -200MVAr , +150MVAr
STATCOM/DRPC)
-200 and
+150
MVAr
2022 74 KETRACO
2022 TOTALS 1.5 1 90 86.83
YEAR 2023
1 Olkaria 1 AU-Olkaria IV /V 220KV 8 - - 2023 14.76 Generation
KenGen
2 Kimuka Substation 0 1 Kimuka 400/220
2x400MVA 800 2023 28.59 KETRACO
3
Substation Extensions works for
improved reliability and increased
power quality (Garsen, Kitale,
Kibos, Olkaria IAU)
-
- Garsen 220/33 23MVA 23 2023 40.64 KETRACO
- Kitale 220/132 110MVA 110 2023
- Kibos 220/132 150MVA 150 2023
- Kibos 132/33 45MVA 45 2023
- Olkaria IAU 220/132
90MVA 90 2023

153
4
Substation Extensions works for
improved reliability and increased
power quality (Garsen, Kitale,
Kibos, Olkaria IAU)
-
- Kyeni 132/33 23MVA 23 2023
35
KETRACO
- Mwingi 132/33 23MVA 23 2023
- Wote 132/33 23MVA 23 2023
- Kitui 132/33 23MVA 23 2023
- Narok 132/33 23MVA 23 2023
- Bomet 132/33 23 MVA 23 2023
5 Narok – Bomet 132kV 88 - - 2023 34.62 Kenya Power
6 Weru – Kilifi 220kV 48.5 2 Kilifi 220/132 2x150MVA 300 2023 52.89 KETRACO
7 Malindi -Weru (Circuit II) 220kV 22 - Malindi 220/33 45MVA 45 2023 27.13 KETRACO
8 Gilgil – Thika – Malaa– Konza
400kV 205 3 Thika 400/220 2x400MVA 800 2023 227
KETRACO –
some sections to
be operated t
220kV.
9 Mariakani – Dongo Kundu 220kV
Line 55 4 Dongo Kundu 2x75MVA 150 2023 56.5
KETRACO –
Required urgently
considering
Wasini Maritime
Ltd load expected
in 2023
10 Juja-Ruaraka 132KV 6.5 - - - 2023 1.71 KETRACO/KPLC
11 Musaga-Webuye 132KV 18 - - - 2023 2.79 KETRACO/KPLC
12
Kwale LILO (Mariakani/Dongo
Kundu) -Kibuyuni (including
switch station at Bang'a)
6 Kwale Sugar 220/132
2x90MVA 180 2023 84.9 KETRACO
13 Kipevu - Mbaraki 132kV 6.5 7 Mbaraki 132/33 2x45MVA 90 2023 14.44 KENYA POWER
2023 TOTALS 457.5 7 2921 620.97
YEAR 2024
1 Rongai 400/220 1 Rongai 400/220 2x200 400 2023 34.05 KETRACO

154
2 Rongai 220/132 2 Rongai 220/132 2x150 300 2023 18.85 KETRACO
3 Makindu substation - 3 Makindu 400/132 2x150 300 2024 32.05 KETRACO
4 National System Control Centre - 2024 50 KETRACO
5 400kV Gilgil and Lessos
substations - 4 Gilgil 400/220 2x400MVA 800 2024 48.73 KETRACO
5 Lessos 400/220 2x400MVA 800 2024 32.16 KETRACO
6 Menengai - Olkalou – Rumuruti
132kV 70 6 Olkalou 132/33 2x60MVA 120 2024
34.34 KETRACO
- Rumuruti Tx 2 1x23MVA 23 2024 KETRACO
7 Sotik – Kilgoris 132kV 50 7 Kilgoris 132/33 2x23MVA 46 2024 22 KETRACO
8 Rumuruti – Kabarnet 132kV 111 - Rumuruti Tx 2 1x23MVA 23 2024
79.45
KETRACO
9 Kisumu (Kibos) - Kakamega –
Musaga 220kV 73 8 Kakamega 220/33 23 2024 KETRACO/PPP
10 Lessos-Loosuk (Through Baringo)
400kV 179 - - - 2024 202 KETRACO/PPP
11 Meru –Maua 132kV 35 9 Maua 132/33 1x23MVA 23 2024 25.63 KETRACO
12 Rumuruti – Maralal/Loosuk 132kV 148 10 Loosuk 132/33 1x23MVA 23 2024 48.84 KETRACO
2024 TOTALS 666 10 2881 628.1
YEAR 2025
1 Machakos – Mwala – Sarara (T-off
of Kindaruma – Juja line) 132kV 80 1 Mwala 1x23MVA 23 2025 51.74 KETRACO
2 Voi –Taveta 132kV 110 2 New Voi 132 132/33 1x23 23 2025
40.96 KETRACO
3 Taveta 132/33 1x23MVA 23 2025 KETRACO
3 Kilgoris – (Isebania/Kehancha)
132kV 40 4
Isebania/Kehancha 132/33
1x23MVA 23 2025 29.2 KETRACO
4 Supply to Samburu SEZ from
Mariakani 30 5
Samburu 220/132kV
2x60MVA 90 2025 41.57
KETRACO –
Subject to
customer
scheduling of the
project

155
5 Rangala - Bondo – Ndigwa 132kV
57 6 Bondo 132/33 1x23MVA 23 2025 33.85
KETRACO
7 Ndwiga 132/33 1x23MVA 23 2025 KETRACO
6 Kitui - Mutomo – Kibwezi 132kV
132 8 Mutomo 132/33 1x23MVA 23 2025 59.35
KETRACO
9 Kibwezi 132/33 1x23MVA 23 2025 KETRACO
7 220kV Rongai – Keringet-Chemosit
-
96 10 Keringet 220/33 2x60MVA 120 2025
100
KETRACO/PPP
11 Chemosit 220/132kV
2x90MVA 180 2025 KETRACO/PPP
8 Kiambere - Maua – Isiolo 220kV
-
145 12 Maua 220/132 1x90MVA 90 2025 120.94
KETRACO
13 Isiolo 220/132 1x90MVA 90 2025 KETRACO
9 Githambo - Othaya-Kiganjo 132kV 72 14 Othaya 132/33 1x23MVA 23 2025 34.9 KETRACO
2025 TOTALS 762 14 777 512.51
YEAR 2026
1 Kiambere-Karura 220KV 20 - - 2026 22.92 Generation
KenGen
2 Awendo – Gogo – Magunga/
(Karungu Bay/Sindo) Bay 132Kv 48 - - 2026 25
Generation -
KenGen at Gogo
3 Reconductoring 220kV Suswa-NN
with HTLS (39km 2 cts) 39 - - 2026 9.8 KETRACO/KPLC
2026 TOTALS 107 0 0 57.72
YEAR 2027
1 Loiyangalani – Marsabit 400kV 136 1 Marsabit 400/220
2x200MVA 400 2027 139
KETRACO +
Generation
2 Kisumu(Kibos) – Bondo 132kV 61 - 2027 33 KETRACO/PPP
3 Kieni – Chogoria 132kV 23 2 Chogoria 132/33 1x23MVA 23 2027 18 KETRACO
4 Webuye - Kimilili – Kitale 132kV 73 3 Kimilili 132/33 1x23MVA 23 2027 35 KETRACO
5 Rangala – Busia 132kV 34 - - 2027 15.1 KETRACO
6 Isiolo – Marsabit 220kV 240 - - 2027 140 KETRACO+Gene
ration

156
2027 TOTALS 567 3 0 446 380.1
YEAR 2028
1
Isiolo – Garba Tula – Garissa
220kV
-
320
-
1 Garba Tulla 220/33
2x60MVA 120 2028
168.78 KETRACO
Garissa 220/132 1x110MVA 110 2028 KETRACO
2
Garissa – Habaswein – Wajir
220kV 330 2 Habaswein 220/33 23MVA - 2028
176.7 KETRACO
- - 3 Wajir 220/33 23MVA - 2028 KETRACO
3 Uprating reactors at Garissa
(from9MVAR to 30MVAr) 5 - - 2028 0.85 KETRACO/KPLC
4 Myanga – Busia 132kV 27 4 Busia 132/33 2x23MVA 46 2028 23.91 KETRACO
5
Turkwel – Lokichar – Lodwar
220kV
-
120
5 Lokichar 220/66 1x60MVA 60 2028 100
KETRACO
6 Lodwar 220/33 1x60MVA 60 2028 KETRACO
6 Baringo/Silali/Silale – Lokichar
220kV 245 - 2028 151
KETRACO+Gene
ration GDC
7 Ndhiwa (Ongeng)- Magunga
(Karungu Bay/Sindo) 132kV 50 7 Magunga 132/33 1x23MVA 23 2028 26.6 KETRACO
8 Uprating Chemosit SS (replace
23MVA with 45MVA TX) -
Chemosit 132/33kV
2x45MVA 90 2028 3.16
9 Baringo/Silali/Silale/Paka - Loosuk
400kV SS (LILO) - 8 2x400MVA 400/220 800 2028 35.24
KETRACO +
Generation - GDC
10 Suswa - Longonot –Olkaria VII
220KV 30 - - 2028 24.92
Generation -
KenGen/Agil
2028 TOTALS 1127 8 0 1309 711.16
YEAR 2030
1 Lodwar – Lokichoggio 220kV 190 1 Lokichoggio 220/33 1x23
MVA 23 2030 120 KETRACO
2 Isiolo – Loosuk (Maralal) 132kV 150 - 2030 121 KETRACO
3 Thika/Gilgil LILO - Longonot
400/220kV Substation. 12 2
Longonot 400/220
2x400MVA 800 2030 47.46
GENERATION/K
ETRACO

157
Reliability for
Suswa Substation
4 Malaa – Thika Road 220kV 30 - 2030 24.5 KETRACO+
Reinforcement
5 Kolwa Substation (Sondu-Kisumu
LILO) 2 3 Kolwa 132/33 2x45MVA 90 2030 10.4
KETRACO _
Expansion
6 Reinforcement of 132kV MNTL
(Voi 400/132kV SS) - 4 Voi 400/132 2x150MVA 300 2030 27.5 KETRACO
7
Fast acting reacting power and
voltage control devices at various
regions for improved power quality
(West Kenya, N Rift & Mt. Kenya)
4x -200MVAr , +150MVAr
STATCOM/DRPC)
-200 and
+150
MVAr
2030 111 KETRACO
8 220kV Kilifi-Bamburi/Bomani-
Mariakani 81 5
Bamburi 220/132
2x110MVA 220 2030 92.86 KETRACO
9 220kV Wajir-Mandera 250 6 Mandera 220/33 1x23MVA 23 2030 161.1 KETRACO
10 220kV Marsabit-Moyale 180 7 Moyale 220/33 1x23 23 2030 119.94 KETRACO
11 Thika/Malaa – HG Falls 400kV 200 7 - - 2030 180.34 Generation HG
Falls
2030 TOTALS 1095 7 1479 1016.1
YEAR 2034
1 Menengai – Rongai 400kV 45 1 Menengai 400/132 2x150 300 2034 76.08 KETRACO +
Generation GDC
2034 TOTALS 45 1 300 76.08
YEAR 2035
1 Ngong (Kimuka) – Magadi 220kV 88 1 Magadi 220/66 1x60MVA 60 2035 74.12 KETRACO
2
Substation Extensions works for
improved reliability and increased
transformation capaicty (Othaya,
Githambo,Kabarnet)
-
Othaya 132/33 23MVA 23 2023 1.15 KETRACO
Githambo 132/33 23MVA 23 2023 1.15 KETRACO
Kabarnet 132/33 23MVA 23 2023 1.15 KETRACO
3
Uprating/Replace all 23MVA
transformers with 45/60MVA
-
Kisii/Kegati 132/33
2x45MVA 45 2023 3.16
KETRACO
/KPLC

158
transformers for improved
reliability and increased
transformation capaicty
(Kisii/Kegati and Kutus)
Kutus 132/33 2x45MVA 45 2023 3.16 KETRACO/KPLC
4
Uprating/Replace all 7.5 MVA
transformers with 18/23MVA
transformers for improved
reliability and increased
transformation capaicty (Garissa)
Garissa 132/33 23MVA 23 2023 1.15 KETRACO
Garissa 132/11 23MVA 23 2023 1.15 KETRACO
5 Dandora –Juja Rd 132kV(cct 3) 5 - - 2035 12.14
Reinforcement
Kenya Power/
KETRACO
6 Kimuka (Ngong)- Matasia 220kV 10 2 Matasia 220/66 2x60MVA 120 2035 25 KETRACO
2035 TOTALS 103 2 385 123.33
YEAR 2037
1 Lamu –Lamu Coal 220KV 20 - 2037 20.37 KETRACO+Gene
ration
2 Malaa-Lamu 400KV 520 1 Lamu 400/220 2x200MVA 400 2037 487.65 KETRACO+Gene
ration
3 Malindi-Garsen 220kV( line II) 104 - 2037 29 KETRACO +
Generation
4 Garsen-Lamu 220kV ( line II ) 96 - 2037 27.3 KETRACO +
Generation
2037 TOTALS 740 1 - 400 564.32
YEAR 2038
1 Longonot –Olkaria VIII 220KV 20 - - 2038 22.92 Generation -
KenGen/Agil
2 Loiyangalani – Lodwar 220kV 180 1 Loiyangalani 400/220
2x150MVA 300 2038 115.7 KETRACO
3 Substation Extensions works to
accommodate additional
transformer for improved reliability
and increased transformation
-
City Centre 220/66
200MVA 200 2023 5.25 KETRACO

159
capaicty (City Centre, New
Bamburi,)
New Bamburi 132/33
45MVA 45 2023 1.79 KETRACO
4 Uprating/Replace 90MVA
transformers with 200VA
transformers for improved
reliability and increased
transformation capacity (Nairobi
North, Kisumu-Mamboleo, Lessos)
-
Nairobi North 220/66
2x200MVA 400 2023 7.3 KETRACO
Kisumu (Mambo Leo)
132/33 2x90MVA 180 2023 5.06 KETRACO
Lessos 132/33 2x45MVA 45 2023 3.16 KETRACO
5 Dandora 220/66kV SS - 2 Dandora 220/66 2x200MVA 400 2038 16.9 KETRACO
6 Reconductoring 132kV Mangu-Juja
with HTLS (46km 2 cts) 46 - - 2038 5.76 KETRACO
7 Reconductoring 132kV New Thika-
Mangu HTLS (9km 2 ccts) 9 - - 2038 1.134 KETRACO
2038 TOTALS 255 2 1570 184.974
YEAR 2040
1 Longonot –Olkaria IX 220KV 20 - - 2040 22.92 Generation -
KenGen/Agil
2 Weru-Galana 220kV 51 1 Galana 220/66 2x60MVA 120 2040 38.5
Subject to Volume
of operation at
Galana
3 Suswa-NIP 18 2 NIP 220/66kV 2x45MVA 90 2040 33.58
Subject to Volume
of operation at
NIP
4 Rongai - Kilgoris (Part of Lake
Victoria Ring) 400kV 235 3
Kilgoris 400/132
2x150MVA 300 2040 219 KETRACO
2040 TOTALS 324 3 510 314
89 GRAND TOTAL 6252.5 59 13068 5279.734

160
8.19.5. Reactive Compensation Sequence The Reactive Compensation10 Investment Sequence is as shown in table 43.
Table 43 Reactive Compensation Investment Sequence
NEW INVESTMENT IN REACTIVE POWER COMPENSATION REMARKS
YEAR BUS NAME VOLTAGE (kV) MVAr COST
(MUSD)
2020 ISINYA 400 2x-100 -
To be relocated from
Embakasi currently
operated at 220kV
2020 LOIYANGALANI 400 2x-100 - Currently being
operated at 220kV
2023 ORTUM 220 2x-15 0.87
2021 RANGALA 132 18 0.4
2022 MERU 132 -7.5 0.25
2022 BONDO 132 18 0.4
2022 GARSEN 220 -10 0.4
2022 GARISSA 220 -15 0.45
2022 KIPEVU 132 27.5 0.7
2024 KILGORIS 132 -30 0.7
2024 OTHAYA 132 20 0.46
2020 KILIFI 132 15 0.4
2025 ONGENG 132 25 0.46
10 Variable reactive power equipment to be considered in place for the traditional fixed shunt reactors
Fast acting reactive power to be considered in the short term. These are as per system requirements resulting from
the simulations. Additional studies are necessary to determine the best technology, minimum step size and
confirm/determine the most strategic location for effectiveness.
Reactive power requirements for distribution network not included as these as well require additional analysis and
accurate load data for the various substations.

161
TOTALS 5.49
Table 44 Reactive Power equipment included as part of transmission lines cost in the transmission
lines cost.
REACTIVE POWER COMPENSATION
INCLUDED IN TL COST TABLE
REMARKS
BUS NAME Base kV MVAr
GILGIL 400 -100 To be considered under fast acting q and v devices
GILGIL 400 -100 To be considered under fast acting q and v devices
KIMUKA 400 -100 To be considered under fast acting q and v devices
KIMUKA 400 -100 To be considered under fast acting q and v devices
ISIOLO 220 -30
MAKINDU 400 -100
VOI 400 -100
RONGAI 400 -100
RONGAI 400 -100
KILGORIS 400 -100
KILGORIS 400 -100
SUSWA 400 -100 To be considered under fast acting q and v devices
SUSWA 400 -100 To be considered under fast acting q and v devices
LESSOS 400 -100 To be considered under fast acting q and v devices
LESSOS 400 -100 To be considered under fast acting q and v devices
MALAA 400 -100 To be considered under fast acting q and v devices
THIKA 400 -100 To be considered under fast acting q and v devices

162
MALAA 400 -100 To be considered under fast acting q and v devices
GARISSA 220 -15
WAJIR 220 -45
GARBA TULLA 220 -30
HABASWEIN 220 -35
LOKICHOGIO 220 -25
LODWAR 220 -25
MANDERA 220.00 220 -25
MOYALE 220.00 220 -20
MOYALE 220.00 220 -20
KISUMU EAST
(KOLWA)
132 25 To be considered under fast acting q and v devices
KISUMU EAST
(KOLWA)
132 25 To be considered under fast acting q and v devices
KILGORIS 132 -25

163
9. CONCLUSIONS AND RECOMMENDATIONS
This report is a revision of the finalised transitional report 2019-2039. The report
takes into account changes in demand due to the adverse impact of the global
pandemic covid-19. The report undertook a review of committed power
generation and transmission projects and updated the power system simulation
data including plant types, system constraints and costs. The report is an
improvement over its predecessor in that it fully utilizes recent data by taking into
account the findings of the 2019 census report. It further provides energy
requirements for the proposed industrial/Special economic zones, updates
emission data from the proposed planting sequences and also provides ancillary
service requirements analysed by projects, providing general system requirements
for integration of intermittent renewable technologies going forward.
The report is aligned to the Energy Act 2019 which provides for development of an
Integrated National Energy Plans (INEP) consisting of coal, geothermal and
electricity sub-plans in addition to County Energy Plans. The plan is intended to
transition the electric power sub-sector to the new dispensation as the Ministry
prepares to take up the full mandate of preparing the Integrated National Energy
Plans going forward.
9.1. Conclusions
9.1.1. Demand Forecast The review of the demand forecast incorporating the impact of the COVID-19
pandemic and the recommendations of various sectoral reports indicates a slower
demand growth rate compared to the pre-COVID forecast. This is due to the
decline in consumption by commercial consumers adhering to government
containment measures. In addition, it has been noted over time that flagship
projects are not being implemented within the timelines as envisaged, therefore
slowing down both the economic and demand growth. It has also been noted that

164
specific consumption has declined due to low consumption by newly connected
customers
9.1.2. Generation Expansion planning Simulations were done on the cases assembled based on various assumptions as
discussed in chapter 6. Simulations were run based on three demand growth
scenarios namely; Reference, Vision and Low. The “Fixed Case Reference Scenario
and optimized case reference scenario” encapsulated the most likely development
path hence it was used in deriving the long term expansion plan.
Annual generation analysis indicates progressive addition of intermittent capacity
(solar and wind) in the planning period necessitates the selection of High Grand falls
hydro plant, Dongo Kundu CCGT and Back up diesel generation for system support.
Addition of 981MW Lamu coal generation in year 2027 to the system results in huge
surpluses over and above peak and reserve requirements.
9.1.3. Ancillary Services Requirements Preparation of this report comes at a time when the level of intermittent wind and
solar energy is expected to rise rapidly in the Kenyan system, due to commitment
by the Offtaker. This calls for the need to consistently evaluate the capability of
the system to accommodate these technologies and hence extra investment in
ancillary services. Critical ancillary services required include frequency control,
voltage control, congestion management and black start capability.
Commissioning of large intermittent renewable plants such as Lake Turkana
300MW wind and the 50MW Garissa Solar, has led to additional requirements of
ancillary services, especially primary reserves for system balancing to ensure
frequency stability. Currently, only hydro units are being used to stabilize the grid
in response to loss of generation, load variation and variability of wind and solar
generation.
Required contingency reserves are generally considered to be at least equal to the
size of the largest single generator connected to the power system. The largest unit
in the current system is 82 MW (Kiambere 2 x 82MW units). No generator larger

165
than Kiambere units is expected to be connected to the grid between now and 2023
except the Ethiopia import whose minimum with the two poles in operation is
expected to be 200MW. Therefore, loss of one pole constitutes the largest system
contingency which is 100MW.It is estimated that operational reserve for load
9.2. Summary of recommendations i. Acceleration of implementation of the Vision 2030 flagship projects and Big
Four agenda to spur demand and enhance implementation of demand
creation initiatives and promote development of demand creation strategies
by various utilities in the sector.
ii. Improved system management, automation and innovation to enhance
supply reliability, efficiency and reduce system losses, and Provide
incentives that promote conducive environment for growth of industrial
customers and their associated energy consumption.
iii. The optimised case to be adopted as the national long term generation expansion
plan for the 2020-2040 period.
iv. The proposed solar and wind projects which are likely to deliver higher
intermittent capacity in the system than required should be spread to minimise
energy curtailment.
v. For Solar and Wind projects that do not have PPAs, it is reccomended that they are
migrated to renewable energy auctions.
vi. Peaking capacity power plants and Battery storage should be developed
immediately to avert peak capacity shortfalls, absorb excess energy presented as
vented steam during off-peak hours, provide system reserves and prevent load
shedding in Western Kenya in the short term as transmission projects are being
implemented. In the long term the recommended projects for the same purpose
are LNG gas turbines, Pumped Hydro Storage and peaking hydro plants.
vii. Demand side management relating to load shifting is recommended to enable
optimal utilisation of the excess energy in the system during off-peak hours. This
includes initiatives like strengthening the time of use tariff, electrification of the
transport sector among others.

166
viii. Demand creation efforts to be enhanced to support optimal use of the existing
generation capacity and projects under implementation.
ix. Negotiate for firm 200MW Ethiopia imports for at least 5 years to allow for
development of local firm capacity in the medium term.
x. In the period between 2022 and 2024, there is a risk of firm capacity shortfalls if
Ethiopia imports and the KenGen Olkaria I unit 6 plant are not realised as planned.
This may necessitate extension of the plants scheduled for retirement.
xi. Renegotiate CODs and tariffs for projects that have PPAs but are yet to commence
construction, to be integrated according to the dates given in the optimal plan.
Respective contingent liabilities for the committed projects should be determined
to inform proposals and negotiations.
xii. Carry out a comprehensive study on ancillary services requirements for the
system, including battery storage, pumped storage and reactive power
compensation, with the increasing levels of intermittent renewable energy sources.
xiii. The Automatic Generation Control (AGC) to be implemented as a matter of
urgency to improve the management of secondary reserves to ensure smoother
system frequency control.
xiv. Focus on sustainable technology for geothermal expansion that will minimize
steam venting and enhance flexibility

167
ANNEXURES
ANNEX 1 Existing generation Plants
PPA Plants in the PPA Technology Contracted Capacity
(MW)
Installed Capacity
(MW)
Term of PPA
(years)
Payment Terms (Firm/
Non-Firm)
COD/ DCD/ OPS
Expiry Date
KENGEN (Major Hydros) 8
Masinga
Hydro
40 41.2
20 Firm 01-Jul-08 Jul-28
Kamburu 90 94.2
Kindaruma (Redeveloped)
70.5 72
Gitaru 216 225
Kiambere 164 168
Tana (Redeveloped) 20 25.7
Sondu Miriu 60 60.7
Turkwel 105 106
KENGEN (Small Hydros and Wind)
6
Wanjii
Hydro
7.4 7.4
15 Non-firm Jul-09 Jul-24
Gogo 1.6 2
Sosian 0.4 0.4
Sagana 1.5 1.5
Mesco 0.4 0.4
Ngong I Phase I Wind 5.1 5.1 Jan-35

168
PPA Plants in the PPA Technology Contracted Capacity
(MW)
Installed Capacity
(MW)
Term of PPA
(years)
Payment Terms (Firm/
Non-Firm)
COD/ DCD/ OPS
Expiry Date
Olkaria II 1 Geothermal 101 105 20 Firm Jul-08 Jul-28
Olkaria IV 1 Geothermal 140 149.8 25 Firm Sep-14 Sep-39
Olkaria I (Unit 4&5) 1 Geothermal 140 150.5 25 Firm Dec-14 Dec-39
Olkaria V 2 Geothermal 158 172.3 25 Firm Nov-19 Nov-44
Kipevu Diesel Power I 1 Thermal 60 73.5 15 Firm Jul-08 Jul-23
Kipevu Diesel Power III 1 Thermal 115 120 20 Firm Mar-11 Mar-31
Muhoroni Gas Turbine 1 Thermal 56 60 2 Firm Apr-19 Apr-21
Well Heads 8
Well head 37
Geothermal
5 5.5
15 Non-firm May-12 Apr-33
Well head 37 kwg 12 5 5
Well head 37 kwg 13 5 5
Well head 39 5 5
Well head 43 12.8 12.8
Well head 905 5 5
Well head 914 & 915 37.8 37.8
Well head 919 5 5
Eburru 1 Geothermal 2.44 2.44 20 Non-firm Feb-12 Feb-32
Sang'oro 1 Hydro 20 21.2 25 Non-firm Aug-12 Aug-37

169
PPA Plants in the PPA Technology Contracted Capacity
(MW)
Installed Capacity
(MW)
Term of PPA
(years)
Payment Terms (Firm/
Non-Firm)
COD/ DCD/ OPS
Expiry Date
Ngong 1 Phase II and Ngong 2 1 Ngong 1 Phase II
Wind 6.8 6.8 20
Non-firm Jan-15 Jan-35 Ngong 2 13.6 13.6
UETCL (Export & Import) - - 3 Non-firm Jun-20 Jun-21
REA Garissa 1 Solar 50 50 20 Non-firm FCOD not achieved
2038
Iberafrica Power Company Plant2 Thermal 52.5 52.5 25 Firm Oct-09 Oct-34
Tsavo Power Company Ltd. 1 Thermal 74 74 20 Firm Sep-01 Sep-21
Rabai Power 1 Thermal 88.6 90 20 Firm May-10 May-30
Orpower 4 Inc. 4
Expanded Plant1 Geothermal 63.8 63.8
25 Firm
Jun-18 Jan-43
Plant2 Geothermal 39.6 39.6 Apr-13 Apr-38
Plant3 Geothermal 17.6 17.6 Jan-14 Jan-39
Plant 4 Geothermal 29 29 Jan-16 Jan-41
Imenti Tea Factory Ltd. 1 Hydro 0.283 0.283 15 Non-firm Sep-09 Sep-24
Gikira Small Hydro 1 Hydro 0.514 0.514 20 Non-Firm May-14 May-34
Thika Power (Melec) 1 Thermal 87 87 20 Firm Mar-14 Mar-34

170
PPA Plants in the PPA Technology Contracted Capacity
(MW)
Installed Capacity
(MW)
Term of PPA
(years)
Payment Terms (Firm/
Non-Firm)
COD/ DCD/ OPS
Expiry Date
Gulf Power 1 Thermal 80.32 80.32 20 Firm Dec-14 Dec-34
Triumph Power 1 Thermal 83 83 20 Firm Jul-15 Feb-35
Biojoule Kenya 1 Biogas 2 2 20 Non-Firm Jan-16 Jan-36
GenPro-Teremi Falls 1 Hydro 5 5 20 Non-firm Jun-17 Jun-37
Chania Power Co- KTDA 1 Hydro 0.5 0.5 20 Non-firm FCOD not achieved
May-37
Gura KTDA 1 Hydro 2 2 20 Non-firm Jun-19 Jun-39
Strathmore Solar 1 Solar 0.25 0.25 20 Non-firm Sep-19 Sep-39
Lake Turkana Wind Power 1 Wind 300 310 20 Non-firm Mar-19 Mar-39
KTDA Metumi (North Mathioya) 1 Hydro 3.6 3.6 20 Non-firm FCOD not achieved
Jul-40
2,676 2,757

171
ANNEX 2 Average Hydrology forecast
Average Hydrology MWh per day
Jan Feb Mar Apr May Jun Jul Aug Sep Oct Nov Dec
Tana 215 126 129 208 303 348 254 205 174 190 307 303
Masinga 394 521 508 318 214 331 466 568 525 439 329 412
Kamburu 1073 1037 1032 1063 1095 1109 1063 1120 1103 1035 1151 1043
Gitaru 2199 2043 2044 2138 2251 2314 2254 2225 2197 2050 2274 2011
Kindaruma 486 479 488 501 557 619 537 524 502 469 555 483
Kiambere 2418 2409 2342 2273 2573 2579 2555 2509 2519 2442 2394 2432
Turkwel 1461 1545 1593 1287 1079 1069 1216 1360 1418 1384 1343 1283
Sondu 720 424 432 823 1171 1317 1239 1290 1292 1169 1120 961
Sang'oro 201 121 115 259 357 431 380 404 431 385 370 300
Karura 607 599 610 626 696 774 671 655 628 586 693 604
ANNEX 3 Dry Hydrology forecast
Dry Hydrology MWh per day
Jan Feb Mar Apr May Jun Jul Aug Sep Oct Nov Dec
Tana 142 83 85 137 200 230 168 136 115 126 202 200
Masinga 260 344 335 210 141 218 308 375 346 290 217 272
Kamburu 708 684 681 702 723 732 702 739 728 683 760 688
Gitaru 1451 1348 1349 1411 1486 1527 1488 1468 1450 1353 1501 1327
Kindaruma 321 316 322 331 368 408 354 346 332 309 366 319
Kiambere 1596 1590 1546 1500 1698 1702 1686 1656 1663 1612 1580 1605
Turkwel 964 1020 1051 850 712 705 802 898 936 913 886 847
Sondu 475 280 285 543 773 869 817 851 853 771 739 634
Sang'oro 132 80 76 171 236 285 251 266 284 254 245 198
Karura 401 395 403 413 459 511 443 432 414 387 458 399

172
ANNEX 4 IPP Projects with PPA considered Under Fixed System case
Project Company Capacity(MW) Technology PPA DATE Fixed case
COD
Optimised Case
COD
1 Alten Kenya Limited 40 Solar May-21 2022 2024
2 Aperture Green Power Ltd / Limuru Wind 50 Wind Dec-22 2023 2026
3 Cummins Cogeneration Kenya Limited 10 Biomas Jun-20 2023 2023
4 Dafre Holdings Company Ltd /Makindu solar ltd 30 Solar Dec-23 2024 2029
5 Frontier Investment Management/ Nithi Hydro 5.6 Hydro Dec-24 2025 2025
6 Global Sustainable-Kaptis 14.7 Hydro Dec-25 2026 2026
7 Global Sustainable Ltd-Buchangu 4.5 Hydro Dec-25 2026 2026
8 Greenmillenia Energy Limited 40 Solar Dec-25 2026 2030
9 Hydro Project Service Peters Kianthumbi 0.51 Hydro Apr-21 2021 2021
10 Kenergy Renewables Ltd-Rumuruti 40 Solar Dec-22 2023 2028
11 Kipeto Energy Limited 100 Wind Jul-21 2021 2021
12 KTDA, Kipsonoi (Settet Power Co.) 0.6 Hydro Feb-25 2025 2025
13 KTDA Ltd, South Maara (Greater Meru Power Co.) 1.5 Hydro Dec-21 2022 2022
14 KTDA Ltd, Lower Nyamindi 0.8 Hydro Dec-21 2022 2022
15 KTDA Ltd, Iraru 1 Hydro Dec-21 2022 2022

173
Project Company Capacity(MW) Technology PPA DATE Fixed case
COD
Optimised Case
COD
16 Kwale Int. Sugar Co. Ltd 10 Biomas Dec-21 2023 2023
17 Marco Borero Co Ltd. 1.5 Solar Jun-20 2022 2022
18 Mt Kenya Community Based Organisation 0.6 Hydro Dec-22 2023 2023
19 Power Technologies (Gatiki Small Hydro Plant) 9.6 Hydro Jun-22 2022 2022
20 REA Vipingo Plantations Ltd (DWA Estates Ltd) 1.44 Biomas Dec-20 2022 2022
21 Sun Power Kenya Limited (Kibwezi) 40 Solar Jun-26 2026 2030
22 Thika Way Investments (Homa Bay Biogas One) 8 Biogas Jun-23 2023 2023
23 Tindinyo Falls Resort 1.5 Hydro Jun-23 2023 2023
24 Vateki International Holdings /Malindi Solar Limited 40 Solar Jan-22 2022 2023
25 Kopere Solar Park Limited 40 Solar Jun-23 2023 2024
26 Quantum/QPEA GT Menengai Limited (Menengai) 35 Geothermal Jan-22 2023 2023
27 Sosian-Menengai Geothermal Power Ltd 35 Geothermal Dec-21 2023 2023
28 Orpower 22 (Menengai) 32.5 Geothermal Jun-22 2023 2023
29 Akiira Geothermal Ltd & Marine Power Generation
Company Ltd
70 Geothermal Jun-25 2025 2031
30 Kleen Energy Limited 6 Hydro Dec-20 2022 2022
31 Selenkei (Radiant) 40 Solar Dec-21 2022 2022

174
Project Company Capacity(MW) Technology PPA DATE Fixed case
COD
Optimised Case
COD
32 Eldosol (Cedate) 40 Solar Dec-21 2022 2023
33 Chania Green 50 Wind May-22 2024 2024
34 Roadtech Solutions Ltd 10 Biomas Dec-24 2025 2025
35 Hannan Arya Energy (K) Ltd 10 Solar Dec-21 2023 2027
36 Bahari Winds (Electrawinds Kenya) 50 Wind Dec-24 2025 2028
37 Bahari Winds (Electrawinds Kenya) 40 Wind Dec-25 2026 2029
38 Prunus Energy 50 Wind Dec-25 2026 2029
39 KTDA - Nyambunde, Nyakwana 0.5 Hydro Jun-21 2022 2022
40 Africa Geothermal International (Kenya) Ltd - AGIL 35 Geothermal Jun-25 2026 2029
41 Africa Geothermal International (Kenya) Ltd - AGIL 35 Geothermal 2027 2033
42 Africa Geothermal International (Kenya) Ltd - AGIL 35 Geothermal 2028 2034
43 Africa Geothermal International (Kenya) Ltd - AGIL 35 Geothermal 2029 2039
44 Amu Coal 981.5 Coal Dec-26 2027 2037
45 Ethiopia HVDC phase 1 200 import Jul-21 2021 2021
46 Ethiopia HVDC phase 2 200 import Jul-24

175
ANNEX 5 IPP Projects without PPA consdered under Fixed system case
Project Company Capacity(MW) Technology Expected COD Fixed Case COD Optimised case
COD
1 APGL Investments Kenya Limited 40 Solar Aug-21 Not Selected - Does not meet
Peak load requirments
Not
Optimised
2 Asachi powertech limited 30.6 Solar Dec-21 Not Selected - Does not meet
Peak load requirments
Not
Optimised
3 Azania Power Limited 40 Solar Dec-22 Not Selected - Does not meet
Peak load requirments
Not
Optimised
4 Biogas Holdings Ltd 0.25 Biogas Not set
5 BLA Machakos Solar Park /BELGEN 40 Solar Dec-26 Not Selected - Does not meet
Peak load requirments
Not
Optimised
6 Blue Sea Energy Ltd 50 Wind Dec-24 Not Selected - Does not meet
Peak load requirments
Not
Optimised
7 Chemelil Green Energy 40 Solar Dec-22 Not Selected - Does not meet
Peak load requirments
Not
Optimised
8 Chevron Africa Limited 7.8 Hydro Dec-25 2033 2033
9 Crystal Energy Solutions (Kavuko Power Ltd) 40 Biomas Dec-24 2031 2031
10 Dominion Farms 1 Hydro Dec-25 2033 2033

176
Project Company Capacity(MW) Technology Expected COD Fixed Case COD Optimised case
COD
11 Ergon Solair 10 Nov-21 Not Selected - Does not meet
Peak load requirments
30 Solar Nov-22 Not Selected - Does not meet
Peak load requirments
Not
Optimised
12 Escalate Group Limited 40 Solar Dec-23 Not Selected - Does not meet
Peak load requirments
Not
Optimised
13 Frontier Investment Management Africa Ltd &
Craftskills Wind Energy International Ltd
50 Wind Dec-25 Not Selected - Does not meet
Peak load requirments
Not
Optimised
14 Gem Gen Power Company Limited 9.5 Hydro Dec-23 2030 2030
15 Gigawatt Global Cooperatief U.A 10 Solar Dec-24 Not Selected - Does not meet
Peak load requirments
Not
Optimised
16 Gigawatt Global Cooperatief U.A 10 Solar Dec-24 Not Selected - Does not meet
Peak load requirments
Not
Optimised
17 Glevantas Ltd 2 Solar Dec-25 Not Selected - Does not meet
Peak load requirments
Not
Optimised
18 Greenlight Holdings/ Rianjue/Gichuki Ventures 1.5 Hydro Dec-23 2030 2030
19 Greenwood Power 40 Solar Jan-23 Not Selected - Does not meet
Peak load requirments
Not
Optimised
20 Hydel 5 Hydro Dec-20 2027 2027
21 Innowind Kenya Ltd 30.5 Solar Dec-24 Not Selected - Does not meet
Peak load requirments
Not
Optimised

177
Project Company Capacity(MW) Technology Expected COD Fixed Case COD Optimised case
COD
22 Kajire Energy Ltd (Rights transferred from Sagalla) 10 Solar Dec-23 Not Selected - Does not meet
Peak load requirments
Not
Optimised
23 Kamukuru Energy Limited 20 Solar Dec-25 Not Selected - Does not meet
Peak load requirments
Not
Optimised
24 Karuga Gitugi Electrification Project 2.7 Hydro Dec-24 2032 2032
26 Kengreen Energy Ltd 10 Solar Dec-26 Not Selected - Does not meet
Peak load requirments
Not
Optimised
27 Kenya Light Project Ltd 10 Solar Dec-24 Not Selected - Does not meet
Peak load requirments
Not
Optimised
28 Kenya Solar Energy Ltd (Kensen) 40 Solar Jun-22 Not Selected - Does not meet
Peak load requirments
Not
Optimised
29 Khalala Hydro Power Kenya Limited (Coastal Energy
Ltd, Navakholo)
20 Hydro Dec-25 2033 2033
30 Kiamariga Solar Energy Ltd 40 Solar Jun-25 Not Selected - Does not meet
Peak load requirments
Not
Optimised
31 Kibisi Kinetic Energy Limited/Virunga Power
Holdings
6.5 Hydro Jan-24 2031 2031
33 Kingdom Cell Lighting Company (Adenium Energy
Ltd/Mwingi One Solar Project)
10 Solar Dec-25 Not Selected - Does not meet
Peak load requirments
Not
Optimised
34 Kirogori Electrification Project 7 Hydro Jun-24 2031 2031
35 KTDA Chemosit, Kiptiget 3.3 Hydro Dec-24 2032 2032

178
Project Company Capacity(MW) Technology Expected COD Fixed Case COD Optimised case
COD
36 KTDA Ltd, Yurith, Chemosit 0.9 Hydro Dec-24 2032 2032
37 KTDA R. Chemosit, Chemosit 2.5 Hydro Jun-24 2031 2031
38 KTDA R. Rupingazi, Rutune 1.8 Hydro Dec-24 2032 2032
39 KTDA, R. Itare, Chemosit 1.3 Hydro Dec-24 2032 2032
40 KTDA, R. Yala, Taunet 2.77 Hydro Dec-24 2032 2032
41 Lakini Energy East Africa Ltd (Adenium Energy
Ltd/Gogar 1 Solar Park)
10 Solar Dec-25 Not Selected - Does not meet
Peak load requirments
Not
Optimised
42 Midlands Solar Energy Limited 50 Wind Dec-25 Not Selected - Does not meet
Peak load requirments
Not
Optimised
43 Midlands Solar Energy Limited 40 Solar Dec-26 Not Selected - Does not meet
Peak load requirments
Not
Optimised
44 Multilink Investments Group Ltd (Maingi Solar Project
Ltd)
40 Solar Dec-25 Not Selected - Does not meet
Peak load requirments
Not
Optimised
45 Mutunguru Hydroelectric Company Ltd 7.8 Hydro Dec-20 2027 2027
46 Mwikhupo-Mwibale Hydro Power Kenya 7 Hydro Dec-22 2029 2029
47 Naanovo Kenya Limited 30 Solar Dec-22 Not Selected - Does not meet
Peak load requirments
Not
Optimised
48 Nelios (Orion SARL) Solarion Investments Ltd 10 Solar Jan-23 2023 2023

179
Project Company Capacity(MW) Technology Expected COD Fixed Case COD Optimised case
COD
49 Njega/Rukenya Hydro Power Limited (Rights transfer) 3.5 Hydro Dec-23 2030 2030
50 Njumbi Hydropower Plant Ltd (Hydroneo) 9.6 Hydro Dec-25 2033 2033
51 Northern Power Ltd/Maralal Energy Ltd 50 Wind Jun-25 Not Selected - Does not meet
Peak load requirments
Not
Optimised
52 Pearl Zone KE Ltd 40 Solar Jun-21 Not Selected - Does not meet
Peak load requirments
Not
Optimised
53 Quaint Energy Kenya Limited 40 Solar Jul-21 Not Selected - Does not meet
Peak load requirments
Not
Optimised
54 Range Technologies Kenya Limited 60.8 Wind Dec-21 Not Selected - Does not meet
Peak load requirments
Not
Optimised
55 Rareh Nyamindi Hydro Ltd 5.2 Hydro Jan-24 2031 2031
56 Rareh Nyamindi Hydro Ltd 9.4 Hydro Jan-24 2031 2031
57 Rareh Nyamindi Hydro Ltd 6 Hydro Jan-24 2031 2031
58 Ray Power Limited 35 Biomas Jun-23 2029 2029
10 Solar Jun-23 2023 2023
10 Solar Dec-23 2023 2023
10 Solar Jun-24 2024 2024

180
Project Company Capacity(MW) Technology Expected COD Fixed Case COD Optimised case
COD
59 Sayor Energy Ltd 10 Solar Dec-20 Not Selected - Does not meet
Peak load requirments
Not
Optimised
60 Solar Century E.A Ltd (Sergoit Plant) 10 Solar Dec-24 Not Selected - Does not meet
Peak load requirments
Not
Optimised
61 Solar Stream Corporation 40 Solar Dec-24 Not Selected - Does not meet
Peak load requirments
Not
Optimised
62 Solarcentury East Africa Ltd (Lewa Borana Plant) 10 Solar Dec-24 Not Selected - Does not meet
Peak load requirments
Not
Optimised
63 Solargen Energy Corporation 40 Solar Jun-22 Not Selected - Does not meet
Peak load requirments
Not
Optimised
64 Solarjoule Ltd 10 Solar Dec-23 Not Selected - Does not meet
Peak load requirments
Not
Optimised
65 Sosian Astonfield 10 Solar Dec-20 Not Selected - Does not meet
Peak load requirments
Not
Optimised
20 Solar Dec-22 Not Selected - Does not meet
Peak load requirments
Not
Optimised
10 Solar Dec-23 Not Selected - Does not meet
Peak load requirments
Not
Optimised
66 Soy Solar Ltd 40 Solar Dec-23 Not Selected - Does not meet
Peak load requirments
Not
Optimised

181
Project Company Capacity(MW) Technology Expected COD Fixed Case COD Optimised case
COD
67 Sukari Industries Ltd 22 Biomas Dec-19 2026 2026
68 Sustainable Energy Management 40 Biomas Jan-24 2030 2030
69 Tana Biomass Generation Limited (Biogas-Solar
Hybrid)
20 Biogas Jun-22 2028 2028
70 Tarita Green Energy Company Limited (Cherab) 40 Solar Dec-24 Not Selected - Does not meet
Peak load requirments
Not
Optimised
71 Tarita Green Energy Company Limited(Kaptagat) 40 Solar Dec-23 Not Selected - Does not meet
Peak load requirments
Not
Optimised
72 Tellux Africa Limited 10 Solar Dec-24 Not Selected - Does not meet
Peak load requirments
Not
Optimised
73 Tellux Africa Limited 10 Solar Dec-24 Not Selected - Does not meet
Peak load requirments
Not
Optimised
74 Tenwek Hospital 0.25 Hydro Jun-19 Expired Expired
75 Tridax Limited 4.2 Hydro Dec-24 2032 2032
76 Truck city ltd 5.28 Hydro Dec-24 2032 2032
77 Turaco Energy Ltd 10 Solar Dec-25 Not Selected - Does not meet
Peak load requirments
Not
Optimised
78 Unilever Tea Kenya Ltd 2.85 Hydro Not set Not simulated Not
simulated
79 Ventus Energy Ltd 7.67 Hydro Dec-21 2028 2028

182
Project Company Capacity(MW) Technology Expected COD Fixed Case COD Optimised case
COD
80 Viability Africa (Northern Energy Limited) 2.4 Biomas Dec-24 2031 2031
81 Virunga Power Holdings Ltd, R. Sossio, Kaptama 4.5 Hydro Dec-23 2030 2030
82 VR Holding AB-Local Trade Ltd 3 Biomas Dec-21 2027 2027
83 VSHydro Kenya Ltd 9.1 Hydro Jan-24 2031 2031
84 West Kenya Sugar Company Limited 6 Biomas Mar-23 2029 2029
85 Xago Africa Limited 40 Solar Dec-21 Not Selected - Does not meet
Peak load requirments
Not
Optimised
86 Western Hydro 10 Hydro Dec-25 2033 2033
87 High Grand Falls Multipurpose Project 693 Hydro Dec-25 2037
88 Dongo Kundu 375 LNG 2036 2036
89 Dongo Kundu 375 LNG 2038 2038
91 Orpower IV 50 Geothermal Jun-25 2030 2030

183
ANNEX 6 Technology capacity factors - Fixed system case Reference demand
Capacity factor [%] 2021 2022 2023 2024 2025 2030 2035 2040
Geothermal 76.4% 77.5% 73.5% 72.8% 72.7% 73.5% 75.3% 87.4%
Hydropower 49.6% 49.6% 49.6% 49.6% 49.6% 41.3% 41.9% 37.7%
Coal 2.8% 4.6% 14.4%
Nuclear 30.9%
Natural gas 1.5%
Diesel engines 2.1% 3.2% 1.8% 0.9% 0.8% 0.0%
Import 86.6% 85.6% 85.3% 85.3% 85.0% 85.0% 85.2%
Cogeneration 50.0% 50.0% 50.0% 50.0% 50.0% 50.0% 50.0% 50.0%
Wind 51.7% 51.7% 48.6% 47.8% 46.2% 42.3% 42.5% 37.3%
PV 19.6% 15.9% 16.4% 14.8% 14.8% 15.6% 15.6% 15.2%
Gas turbines (LNG) 0.0% 0.0% 0.0% 0.1% 0.2%

184
ANNEX 7 Installed Capacity vs Load - Fixed System Reference

185
ANNEX 8 Frim capacity vs Peak Load - Fixed system case Refernce scenario

186
ANNEX 9 Levelised cost of energy - Fixed case with candidates - Reference scenario
ANNEX 10 Demand Supply balance - Fixed System Low Demand
2020 2021 2022 2023 2024 2025 2030 2035 2040
Peak load MW 1,972 2,060 2,111 2,163 2,221 2,285 2,962 3,841 5,028

187
2020 2021 2022 2023 2024 2025 2030 2035 2040
Peak load +
reserve
margin
MW
2,255 2,332 2,383 2,437 2,543 2,612 3,722 4,578 5,901
Reserve
margin
% of
peak
load 14% 13% 13% 13% 14% 14% 26% 19% 17%
Installed
system
capacity
MW
2,654 2,907 3,090 3,400 3,897 4,045 6,298 6,291 7,421
Firm system
capacity
MW
2,260 2,463 2,448 2,604 2,947 3,044 4,681 4,578 5,914
Supply -
demand gap
MW
4 131 64 167 404 433 959 0 13
Electricity
consumption versus
generation 2020 2021 2022 2023 2024 2025 2030 2035 2040
Electricity
consumption
GWh
12,072 12,612 12,925 13,243 13,598 13,988 18,131 23,515 30,743
Electricity
generation
GWh
12,078 12,805 13,127 14,395 15,621 16,288 20,542 23,943 30,775
Unserved
energy
GWh 0 0 0 0 0 0 0 0 563
Unserved
energy -
% 0% 0% 0% 0% 0% 0% 0% 0% 2%

188
2020 2021 2022 2023 2024 2025 2030 2035 2040
share on
consumption
Excess energy GWh 6 192 202 1,152 2,023 2,301 2,412 428 32
Excess
energy -
share on
generation
%
0% 2% 2% 8% 13% 14% 12% 2% 0%
Vented GEO
steam
GWh
166 1,405 1,417 1,919 2,330 2,486 2,590 2,514 1,238
Vented
GEO steam -
share on
potential
max. GEO
flash steam
generation
%
3% 20% 20% 23% 24% 24% 24% 19% 7%

189
ANNEX 11 Installed capacity vs Load - Fixed system Low demand

190
ANNEX 12 Firm capacity vs peak load - Fixed system Low demand scenario

191
ANNEX 13 Annual generaion - Fixed System Low demand scenario

192
ANNEX 14 Levelised cost of energy - Fixed case with candidates - low scenario

193
ANNEX 15 Demand Supply balance - Fixed system Vision scenario
2020 2021 2022 2023 2024 2025 2030 2035 2040
Peak load MW 1,972 2,155 2,331 2,478 2,656 2,844 4,268 6,382 9,635
Peak load + reserve
margin
MW
2,255 2,427 2,602 2,752 2,978 3,171 5,061 7,468 11,659
Reserve margin % of peak
load 14% 13% 12% 11% 12% 11% 19% 17% 21%
Installed system capacity MW 2,654 2,987 3,350 3,840 4,517 4,845 8,173 11,459 17,394
Firm system capacity MW 2,260 2,463 2,493 2,694 3,052 3,184 5,171 7,636 13,052
Supply - demand gap MW 4 36 -110 -58 74 13 110 169 1,393
Electricity consumption versus generation 2020 2021 2022 2023 2024 2025 2030 2035 2040
Electricity consumption GWh 12,072 13,194 14,267 15,170 16,261 17,412 26,125 39,025 58,367
Electricity generation GWh 12,078 13,266 14,336 15,917 17,718 19,031 26,827 39,114 58,372
Unserved energy GWh 0 0 2 2 0 1 1 3 0
Unserved energy - share
on consumption
%
0% 0% 0% 0% 0% 0% 0% 0% 0%
Excess energy GWh 6 73 71 749 1,457 1,620 702 92 5
Excess energy - share on
generation
%
0% 1% 0% 5% 8% 9% 3% 0% 0%
Vented GEO steam GWh 166 1,163 1,041 1,714 2,055 2,127 1,595 659 428

194
2020 2021 2022 2023 2024 2025 2030 2035 2040
Vented GEO steam -
share on potential max.
GEO flash steam
generation
%
3% 16% 15% 20% 21% 20% 16% 5% 2%
ANNEX 16 Installed capacity vs Laod - Fixed System vision scenario

195
ANNEX 17 Firm Capacity vs Peak Load - Fixed system vision scenario

196
ANNEX 18 Annual generation - Fixed System vision scenario

197
ANNEX 19Levelised cost of Energy - fixed case with candidates - vision scenario

198
ANNEX 20 Technology capacity factors - Optimised case Reference demand
Capacity factor [%] 2020 2021 2022 2023 2024 2025 2030 2031 2035 2040
Geothermal 92.1% 76.4% 79.1% 75.0% 76.0% 77.7% 72.8% 72.9% 72.3% 88.3%
Hydropower 49.6% 49.6% 49.6% 49.6% 49.6% 49.6% 41.3% 41.5% 41.9% 37.7%
Coal 26.2%
Natural gas 2.3%
Diesel engines 13.0% 2.1% 3.2% 2.6% 4.0% 5.0% 0.9% 2.0%
Gas turbines (gasoil) 0.1%
Import 86.6% 85.8% 86.1% 86.4% 85.5% 85.6% 85.2% 85.6%
Cogeneration 50.0% 50.0% 50.0% 50.0% 50.0% 50.0% 50.0% 50.0% 50.0% 50.0%
Wind 53.4% 51.7% 51.7% 51.7% 50.4% 50.4% 44.0% 42.3% 42.5% 37.3%
PV 19.6% 19.6% 15.0% 16.5% 16.5% 15.6% 15.6% 15.6% 15.2%

199

200
ANNEX 21 Installed Capacity vs Peak Load- Optimised Reference case

201
ANNEX 22 Firm vs Peak load - Optimised Reference scenario

202
ANNEX 23 System LEC - Optimised Case - Reference scenario

203
ANNEX 24 Electricty Generation costs - Optimised case
Year 2020 2021 2022 2023 2024 2025
Energy Purchased (kWh)
11,759,896,671
12,344,223,163
12,831,379,780
13,299,480,505
13,787,072,192
14,320,066,159
Deemed Energy (kWh)
-
613,200,000
611,740,000
1,224,940,000
1,224,940,000
1,224,940,000
Energy Cost Amount Ksh
25,210,836,063
31,416,774,634
40,936,038,134
51,511,003,654
55,807,163,408
58,954,203,016
Fuel Cost Amount in KSh
14,209,780,391
9,124,842,717
6,796,188,614
7,151,970,618
7,371,888,578
7,651,135,478
Capacity Charge Amount in KSh
53,104,411,678
57,283,151,503
55,968,359,720
55,729,294,553
56,557,238,803
57,433,819,083
Deemed Energy Cost Amount in KSh
-
4,635,792,000
5,323,603,665
10,087,952,637
10,072,347,526
9,964,722,219
Total Cost (KSh)
92,525,028,132
102,460,560,854
109,024,190,134
124,480,221,462
129,808,638,315
134,003,879,796
Generation Unit Cost KSh/kWh (without fuel
cost)
6.66
7.56
7.97
8.82
8.88
8.82
Fuel Cost Charge KSh/kWh
1.51
0.92
0.66
0.67
0.67
0.67
Generation Unit Cost KSh/kWh inlc fuel
and losses
9.82
10.36
10.61
11.69
11.75
11.68

204
Year 2020 2021 2022 2023 2024 2025
Generation Unit Cost US¢/kWh incl fuel and
losses
9.02
9.51
9.74
10.73
10.79
10.72
Forex Charge (est.) KSh/kWh
0.55
0.55
0.55
0.55
0.55
0.55
Levies and inflation (est.) KSh/kWh
1.21
1.21
1.21
1.21
1.21
1.21
T&D costs (est.) KSh/kWh
3.92
4.16
4.41
4.67
4.95
5.25
Capital related revenue requirement
Ksh/kWh
3.00
3.00
3.00
3.00
3.00
3.00
Retail Tariff per unit sold KSh/kWh excl of
Taxes & Levies
16.75
17.52
18.02
19.36
19.71
19.93
Retail Tariff per unit sold KSh/kWh incl of
Taxes & Levies
20.85
21.73
22.30
23.83
24.22
24.48
Retail Tariff US¢/kWh
19.13
19.95
20.46
21.87
22.23
22.47
Loss Factor
0.199
0.199
0.199
0.199
0.199
0.199

205
ANNEX 25 Electricity generation costs - Fixed Case system
Year 2020 2021 2022 2023 2024 2025
Energy Purchased (kWh) 11,759,896,671
12,344,223,163
12,831,379,780
13,299,480,505
13,787,072,192
14,320,066,159
Deemed Energy (kWh) -
613,200,000
611,740,000
1,224,940,000
1,224,940,000
1,224,940,000
Energy Cost Amount Ksh 25,210,836,063
31,416,774,634
40,936,038,134
51,511,003,654
55,807,163,408
58,954,203,016
Fuel Cost Amount in KSh 14,209,780,391
9,124,842,717
6,796,188,614
7,151,970,618
7,371,888,578
7,651,135,478
Capacity Charge Amount in KSh 53,104,411,678
57,283,151,503
55,968,359,720
55,729,294,553
56,557,238,803
57,433,819,083
Deemed Energy Cost Amount in KSh -
4,635,792,000
5,323,603,665
10,087,952,637
10,072,347,526
9,964,722,219
Total Cost (KSh) 92,525,028,132
102,460,560,854
109,024,190,134
124,480,221,462
129,808,638,315
134,003,879,796
Generation Unit Cost KSh/kWh (without fuel cost)
6.66
7.56
7.97
8.82
8.88
8.82
Fuel Cost Charge KSh/kWh 1.51
0.92
0.66
0.67
0.67
0.67
Generation Unit Cost KSh/kWh inlc fuel and losses
9.82
10.36
10.61
11.69
11.75
11.68
Generation Unit Cost US¢/kWh incl fuel and losses
9.02
9.51
9.74
10.73
10.79
10.72
Forex Charge (est.) KSh/kWh 0.55
0.55
0.55
0.55
0.55
0.55
Levies and inflation (est.) KSh/kWh 1.21
1.21
1.21
1.21
1.21
1.21
T&D costs (est.) KSh/kWh 3.92
4.16
4.41
4.67
4.95
5.25

206
Year 2020 2021 2022 2023 2024 2025
Capital related revenue requirement Ksh/kWh
3.00
3.00
3.00
3.00
3.00
3.00
Retail Tariff per unit sold KSh/kWh excl of Taxes & Levies
16.75
17.52
18.02
19.36
19.71
19.93
Retail Tariff per unit sold KSh/kWh incl of Taxes & Levies
20.85
21.73
22.30
23.83
24.22
24.48
Retail Tariff US¢/kWh 19.13
19.95
20.46
21.87
22.23
22.47
Loss Factor
0.199
0.199
0.199
0.199
0.199
0.199

207
ANNEX 26 Tranmisssion investment Analysis
1. COST OF LOSSES
Year
TN1 TN 2
Losses
(MW)
Losses
(GWh)
Cost of
Losses
(MUSD)
Losses
(MW)
Losses
(GWh)
Cost of Losses
(MUSD)
2021 85.41 409 61 85.5 409 61
2022 85.41 408 61 85.5 408 61
2023 85.41 407 61 85.5 408 61
2024 85.41 407 61 85.5 407 61
2025 85.41 406 61 85.5 406 61
2026 137.6 653 98 137.6 653 98
2027 137.6 651 98 137.6 651 98
2028 137.6 650 98 137.6 650 98
2029 137.6 649 97 137.6 649 97
2030 137.6 648 97 137.6 648 97
2031 184.5 866 130 186.3 874 131
2032 184.5 865 130 186.3 873 131
2033 184.5 863 129 186.3 872 131
2034 184.5 862 129 186.3 870 131
2035 184.5 860 129 186.3 869 130
2036 287.6 1339 201 284.0 1322 198
2037 287.6 1336 200 284.0 1320 198
2038 287.6 1334 200 284.0 1317 198
2039 287.6 1331 200 284.0 1314 197
2040 287.6 1328 199 284.0 1312 197

208
2. DISCOUNTING FACTORS (DF)
3. TARGET NETWORK 1 ANALYSIS
RATE 0.12
YEAR 2021 2022 2023 2024 2025 2026 2027 2028 2029 2030 2031 2032 2033 2034 2035 2036 2037 2038 2039 2040
YEAR NO 1 2 3 4 5 6 7 8 9 10 11 12 13 14 15 16 17 18 19 20
DF 0.892857 0.797194 0.71178 0.635518 0.567427 0.506631 0.452349 0.403883 0.36061 0.321973 0.287476 0.256675 0.229174 0.20462 0.182696 0.163122 0.145644 0.13004 0.116107 0.103667
Assumptions
Discount Rate 12%
Cost of Losses 0.15 USD/kWh
O&M Cost 2.5% of investment Cost
Year 2021 2022 2023 2024 2025 2026 2027 2028 2029 2030 2031 2032 2033 2034 2035 2036 2037 2038 2039 2040
Investment Cost (MUSD) 1439.23 313.96 859.27 628.1 543.6 57.72 380.1 711.16 0 1016.1 0 0 76.08 123.33 0 564.32 184.974 0 314
O & M Cost (MUSD) 35.98075 7.849 21.48175 15.7025 13.59 1.443 9.5025 17.779 0 25.4025 0 0 0 1.902 3.08325 0 14.108 4.62435 0 7.85
Cost of Losses (MUSD) 92 72 81 76 88 99 98 98 97 97 88 88 88 88 87 142 142 141 141 203
Total Cost (MUSD) 1,567 394 962 720 645 158 488 827 97 1,139 88 88 88 166 214 142 720 331 141 524
PV of Costs (MUSD) 1,399 314 685 457 366 80 221 334 35 367 25 23 20 34 39 23 105 43 16 54
Total PV of Costs (MUSD) 4,640

209
4. TARGET NETWORK 2 ANALYSIS
Assumptions
Discount Rate 12%
Cost of Losses 0.15 USD/kWh
O&M Cost 2.5% of investment Cost
Year 2021 2022 2023 2024 2025 2026 2027 2028 2029 2030 2031 2032 2033 2034 2035 2036 2037 2038 2039 2040
Investment Cost (MUSD) 1439.23 313.96 848.1 628.1 543.6 57.72 380.1 711.16 0 1016.1 0 0 0 76.08 123.33 0 564.32 184.974 0 314
O & M Cost (MUSD) 35.98075 7.849 21.2025 15.7025 13.59 1.443 9.5025 17.779 0 25.4025 0 0 0 1.902 3.08325 0 14.108 4.62435 0 7.85
Cost of Losses (MUSD) 92 72 81 76 88 91 98 98 97 97 89 89 89 89 88 144 144 143 143 202
Total Cost (MUSD) 1,567 394 951 720 645 150 488 827 97 1,139 89 89 89 167 215 144 722 333 143 524
PV of Costs (MUSD) 1,399 314 677 457 366 76 221 334 35 367 26 23 20 34 39 24 105 43 17 54
Total PV of Costs (MUSD) 4,631

210
ANNEX 27 Three phase Short circuit current
YEAR 2020 THREE PHASE SHORT CIRCUIT CURRENT
Bus Name Voltage Level
(kV) Maximum Fault
Current (kA) Breaker
Capacity (kA)
% of Breaker Capacity
[K_KAMBURU11 132.00] 132 12.075 31.5 38.33
[K_KAMBTRF11 132.00] 132 12.02 31.5 38.16
[K_DANDORA11 132.00] 132 11.199 31.5 35.55
[K_JUJA RD11 132.00] 132 11.026 31.5 35.00
[K_LOIY1 220.00] 220 10.607 31.5 33.67
[K_LOIY2 220.00] 220 10.607 31.5 33.67
[K_SUSWA21 220.00] 220 10.607 31.5 33.67
[K_GITARU11 132.00] 132 10.416 31.5 33.07
[K_OLKARIAIAU220.00] 220 9.889 31.5 31.39
[K_OLKARIA II220.00] 220 9.867 31.5 31.32
[K_RUARAK TE1132.00] 132 9.747 31.5 30.94
[K_RUARAKAT12132.00] 132 9.747 31.5 30.94
[K_RUARAKA11 132.00] 132 9.657 31.5 30.66
[K_DANDORA21 220.00] 220 9.15 31.5 29.05
[K_OLKARIA IV220.00] 220 9.031 31.5 28.67
[K_NBNORTH21 220.00] 220 8.901 31.5 28.26
[K_THIKA RD21220.00] 220 8.76 31.5 27.81
[KOLKARIAIII2220.00] 220 8.373 31.5 26.58
[K_RABAI11 132.00] 132 8.167 31.5 25.93
[K_KIPEVU11 132.00] 132 8.103 31.5 25.72
[K_KAMBURU21 220.00] 220 8.07 31.5 25.62
[K_KIPEVUDII1132.00] 132 8.067 31.5 25.61
[K_RABAITRF11132.00] 132 7.937 31.5 25.20
[K_RABTRF12 132.00] 132 7.937 31.5 25.20
[K_RABAITR 13132.00] 132 7.937 31.5 25.20
[K_EMBAKASI21220.00] 220 7.819 31.5 24.82
[K_OLKARIAIAU132.00] 132 7.661 31.5 24.32
[K_OLKARIA1 1132.00] 132 7.586 31.5 24.08
[K_CABLE-OHL2220.00] 220 7.56 31.5 24.00
[K_CBD 220.00] 220 7.475 31.5 23.73
[K_CABLE-OHL 220.00] 220 7.407 31.5 23.51
[K_OLKARIA II132.00] 132 7.305 31.5 23.19
[K_TEE OFF 132.00] 132 7.266 31.5 23.07
[K_KINDARUMA1132.00] 132 7.263 31.5 23.06
[K_JOMVU 132.00] 132 7.252 31.5 23.02
[K_NAIVASHA11132.00] 132 7.073 31.5 22.45

211
YEAR 2020 THREE PHASE SHORT CIRCUIT CURRENT
Bus Name Voltage Level
(kV) Maximum Fault
Current (kA) Breaker
Capacity (kA)
% of Breaker Capacity
[K_GITARU21 220.00] 220 6.923 31.5 21.98
[K_WELLHED37-132.00] 132 6.813 31.5 21.63
[K_KOKOTONI11132.00] 132 6.799 31.5 21.58
[K_ATHI RIVER220.00] 220 6.626 31.5 21.03
[K_KIAMBERE21220.00] 220 6.246 31.5 19.83
[K_MASINGA11 132.00] 132 6.13 31.5 19.46
[K_ISINYA 220.00] 220 5.884 31.5 18.68
[K_BAMBURI11 132.00] 132 5.406 31.5 17.16
[K_MARIAKANI1132.00] 132 4.79 31.5 15.21
[K_THIKA11 132.00] 132 4.773 31.5 15.15
[K_THIKA12 132.00] 220 4.747 31.5 15.07
[K_SUS1 220.00] 220 4.336 31.5 13.77
[K_SUS2 220.00] 220 4.336 31.5 13.77
[K_LOYAN 220.00] 220 4.336 31.5 13.77
[K_LANET11 132.00] 132 4.305 31.5 13.67
[K_ISHIARA11 132.00] 132 4.278 31.5 13.58
[K_LESSOS11 132.00] 132 4.258 31.5 13.52
[K_LESSTRF11 132.00] 132 4.258 31.5 13.52
[K_TOP STEEL 132.00] 132 4.242 31.5 13.47
[K_RABAI21 220.00] 220 4.208 31.5 13.36
[K_ISINYA 220.00] 220 4.114 31.5 13.06
[K_BAMB TEE 132.00] 132 3.864 31.5 12.27
[K_MUHORONI11132.00] 132 3.783 31.5 12.01
[K_SOILO11 132.00] 132 3.566 31.5 11.32
[K_MARIAKANI 220.00] 220 3.434 31.5 10.90
[K_KYENI11 132.00] 132 3.215 31.5 10.21
[K_RONGAI_NC 132.00] 132 3.191 31.5 10.13
[K_GATUNDU11 132.00] 132 3.181 31.5 10.10
[K_MWINGI11 132.00] 132 3.178 31.5 10.09
[K_VIPINGO31 132.00] 132 3.022 31.5 9.59
[K_SAMBURU11 132.00] 132 2.979 31.5 9.46
[K_MAKUTANO11132.00] 132 2.903 31.5 9.22
[K_MAKUTEE12 132.00] 132 2.871 31.5 9.11
[K_OLKARIA V 220.00] 220 2.805 31.5 8.90
[K_KISUMU 132132.00] 132 2.759 31.5 8.76
[K_MSCEMTEE31132.00] 132 2.661 31.5 8.45
[K_GALU11 132.00] 132 2.645 31.5 8.40
[K_SONDU11 132.00] 132 2.571 31.5 8.16

212
YEAR 2020 THREE PHASE SHORT CIRCUIT CURRENT
Bus Name Voltage Level
(kV) Maximum Fault
Current (kA) Breaker
Capacity (kA)
% of Breaker Capacity
[K_ELDORET11 132.00] 132 2.493 31.5 7.91
[K_MSACEM31 132.00] 132 2.491 31.5 7.91
[K_KAPSABET11132.00] 132 2.476 31.5 7.86
[K_SANGORO11 132.00] 132 2.443 31.5 7.76
[K_KONZA 132.00] 132 2.411 31.5 7.65
[K_CHEMOSIT11132.00] 132 2.401 31.5 7.62
[K_MSACEMTEE3132.00] 132 2.346 31.5 7.45
[K_ULU11 132.00] 132 2.316 31.5 7.35
[K_MUSAGA11 132.00] 132 2.27 31.5 7.21
[K_GITHAMBO11132.00] 132 2.231 31.5 7.08
[K_TITANIUM11132.00] 132 2.197 31.5 6.97
[K_KUTUSTEE2 132.00] 132 2.178 31.5 6.91
[K_TESTBUS 220.00] 220 2.135 31.5 6.78
[K_KITUI11 132.00] 132 2.085 31.5 6.62
[K_MUSAGATEE 132.00] 132 2.084 31.5 6.62
[K_LESSOS21 220.00] 220 2.083 31.5 6.61
[K_NEWMAUNGU 132.00] 132 2.049 31.5 6.50
[U_TORO11 132.00] 132 2.011 31.5 6.38
[K_MAUNGU11 132.00] 132 1.93 31.5 6.13
[K_KILIFI11 132.00] 132 1.903 31.5 6.04
[K_MACHAKOS11132.00] 132 1.901 31.5 6.03
[K_WEBUYE11 132.00] 132 1.862 31.5 5.91
[K_MALINDI21 220.00] 220 1.848 31.5 5.87
[K_NEW SULTAN132.00] 132 1.835 31.5 5.83
[K_SULTAN HA1132.00] 132 1.809 31.5 5.74
[K_TURKWEL21 220.00] 220 1.78 31.5 5.65
[K_SOTIK 132.00] 132 1.775 31.5 5.63
[K_KAINUK21 220.00] 220 1.775 31.5 5.63
[K_EMBU11 132.00] 132 1.733 31.5 5.50
[K_MUMIAS11 132.00] 132 1.704 31.5 5.41
[K_VOI11 132.00] 132 1.677 31.5 5.32
[K_KIBOKO11 132.00] 132 1.568 31.5 4.98
[K_MANYANI11 132.00] 132 1.504 31.5 4.77
[K_MAKINDU 132.00] 132 1.492 31.5 4.74
[K_MERU11 132.00] 132 1.481 31.5 4.70
[K_KUTUSTEE1 132.00] 132 1.437 31.5 4.56
[K_KITALE11 132.00] 132 1.435 31.5 4.56
[K_KISII11 132.00] 132 1.411 31.5 4.48

213
YEAR 2020 THREE PHASE SHORT CIRCUIT CURRENT
Bus Name Voltage Level
(kV) Maximum Fault
Current (kA) Breaker
Capacity (kA)
% of Breaker Capacity
[K_MTITO AND1132.00] 132 1.409 31.5 4.47
[K_BOMET11 132.00] 132 1.37 31.5 4.35
[K_WOTE11 132.00] 132 1.368 31.5 4.34
[K_RANGALA11 132.00] 132 1.337 31.5 4.24
[K_ISIOLO11 132.00] 132 1.222 31.5 3.88
[K_KIGANJO11 132.00] 132 1.109 31.5 3.52
[K_GARSEN21 220.00] 220 1.091 31.5 3.46
[K_AWENDO11 132.00] 132 1.09 31.5 3.46
[K_OLKIVWELLH220.00] 220 0.928 31.5 2.95
[K_NDHIWA11 132.00] 132 0.92 31.5 2.92
[K_NANYUKI11 132.00] 132 0.846 31.5 2.69
[K_LAMU21 220.00] 220 0.797 31.5 2.53
[K_GARISSA11 132.00] 132 0.725 31.5 2.30
[K_GARISA PV1132.00] 132 0.705 31.5 2.24

214
ANNEX 28 Three phase short circuit current without 400KV Year 2025
YEAR 2025 THREE PHASE SHORT CIRCUIT CURRENT WITHOUT 400KV
Bus Name Voltage Level
(kV) Maximum Fault
Current (kA) Breaker
Capacity (kA)
% of Breaker Capacity
[K_KAMBURU11 132.00] 132 13.3403 31.5 42.35
[K_SUSWA21 220.00] 220 13.3118 31.5 42.26
[K_LOIY2 220.00] 220 13.3118 31.5 42.26
[K_LOIY1 220.00] 220 13.3118 31.5 42.26
[K_KAMBTRF11 132.00] 132 13.3085 31.5 42.25
[K_OLKARIAIAU220.00] 220 13.2155 31.5 41.95
[K_OLKARIA II220.00] 220 13.1691 31.5 41.81
[K_DANDORA11 132.00] 132 12.9109 31.5 40.99
[K_JUJA RD11 132.00] 132 12.7128 31.5 40.36
[K_GITARU11 132.00] 132 11.2606 31.5 35.75
[K_RUARAKAT12132.00] 132 11.0732 31.5 35.15
[K_RUARAK TE1132.00] 132 11.0732 31.5 35.15
[K_DANDORA21 220.00] 220 11.0069 31.5 34.94
[K_RUARAKA11 132.00] 132 10.9704 31.5 34.83
[K_OLKARIA1 1132.00] 132 10.9607 31.5 34.80
[E_WOLAYTA 400.00] 400 13.8878 40 34.72
[K_A_DC1 400.00] 400 13.8878 40 34.72
[K_A_DC2 400.00] 400 13.8878 40 34.72
[K_SIDE_A 400.00] 400 13.8878 40 34.72
[K_OLKARIAIAU132.00] 132 10.8766 31.5 34.53
[K_OLKARIA II132.00] 132 10.8259 31.5 34.37
[K_OLKARIA V 220.00] 220 10.7981 31.5 34.28
[K_OLKARIAIII220.00] 220 10.648 31.5 33.80
[K_OLKARIA IV220.00] 220 10.3973 31.5 33.01
[K_NBNORTH21 220.00] 220 10.1201 31.5 32.13
[K_EMBAKASI21220.00] 220 10.0949 31.5 32.05
[K_THIKA RD21220.00] 220 10.0829 31.5 32.01
[K_ISINYA 220.00] 220 9.7867 31.5 31.07
[K_CABLE-OHL 220.00] 220 9.7064 31.5 30.81
[K_CABLE-OHL2220.00] 220 9.7064 31.5 30.81
[K_ATHI RIVER220.00] 220 9.6986 31.5 30.79
[K_CBD 220.00] 220 9.5365 31.5 30.27
[K_WELLHED37-132.00] 132 9.3681 31.5 29.74
[K_KAMBURU21 220.00] 220 8.8539 31.5 28.11
[K_KIMUKA 220220.00] 220 8.4911 31.5 26.96
[K_NAIVASHA11132.00] 132 8.448 31.5 26.82
[K_KINDARUMA1132.00] 132 8.1594 31.5 25.90

215
YEAR 2025 THREE PHASE SHORT CIRCUIT CURRENT WITHOUT 400KV
Bus Name Voltage Level
(kV) Maximum Fault
Current (kA) Breaker
Capacity (kA)
% of Breaker Capacity
[K_RABAI11 132.00] 132 7.9327 31.5 25.18
[K_KIPETO 220220.00] 220 7.7976 31.5 24.75
[K_RABAITR 13132.00] 132 7.7763 31.5 24.69
[K_RABTRF12 132.00] 132 7.7763 31.5 24.69
[K_RABAITRF11132.00] 132 7.7763 31.5 24.69
[K_GITARU21 220.00] 220 7.4604 31.5 23.68
[K_KIPEVU11 132.00] 132 7.4511 31.5 23.65
[K_KIPEVUDII1132.00] 132 7.3872 31.5 23.45
[K_KIAMBERE21220.00] 220 7.0329 31.5 22.33
[K_MASINGA11 132.00] 132 6.9001 31.5 21.91
[K_JOMVU 132.00] 132 6.8447 31.5 21.73
[K_TEE OFF 132.00] 132 6.7043 31.5 21.28
[K_KOKOTONI11132.00] 132 6.6304 31.5 21.05
[K_BAMBURI11 132.00] 132 6.1723 31.5 19.59
[K_THIKA11 132.00] 132 5.8476 31.5 18.56
[K_THIKA12 132.00] 132 5.8095 31.5 18.44
[K_BOMANI 132.00] 132 5.7751 31.5 18.33
[K_MALAA 220.00] 220 5.6855 31.5 18.05
[K_LESSTRF11 132.00] 132 5.5114 31.5 17.50
[K_LESSOS11 132.00] 132 5.5114 31.5 17.50
[K_VIPINGO31 132.00] 132 5.4779 31.5 17.39
[K_LANET11 132.00] 132 5.3936 31.5 17.12
[K_SOILO11 132.00] 132 5.3495 31.5 16.98
[K_SOILO TEE 132.00] 132 5.3026 31.5 16.83
[K_KIBOS 132 132.00] 132 5.2273 31.5 16.59
[K_KISUMU 132132.00] 132 5.1799 31.5 16.44
[K_BAMB TEE 132.00] 132 5.0927 31.5 16.17
[K_ISHIARA11 132.00] 132 5.0902 31.5 16.16
[K_MSCEMTEE31132.00] 132 4.9082 31.5 15.58
[K_RABAI21 220.00] 220 4.7656 31.5 15.13
[MWALA 132.00] 132 4.7571 31.5 15.10
[K_KILIFI11 132.00] 132 4.7323 31.5 15.02
[K_MSACEM31 132.00] 132 4.726 31.5 15.00
[K_MARIAKANI1132.00] 132 4.7047 31.5 14.94
[K_MSACEMTEE3132.00] 132 4.6021 31.5 14.61
[K_MAUA11 132.00] 132 4.5059 31.5 14.30
[K_MARIAKANI2220.00] 220 4.4967 31.5 14.28
[K_ISIOLO11 132.00] 132 4.4208 31.5 14.03

216
YEAR 2025 THREE PHASE SHORT CIRCUIT CURRENT WITHOUT 400KV
Bus Name Voltage Level
(kV) Maximum Fault
Current (kA) Breaker
Capacity (kA)
% of Breaker Capacity
[K_MUSAGA11 132.00] 132 4.3962 31.5 13.96
[K_MENENGAI11132.00] 132 4.3921 31.5 13.94
[K_MUHORONI11132.00] 132 4.2859 31.5 13.61
[K_RONGAI_NC 132.00] 132 4.2358 31.5 13.45
[K_KOPERE 132.00] 132 4.2074 31.5 13.36
[K_SIDE_B 400.00] 400 5.3044 40 13.26
[K_B_DC1 400.00] 400 5.3044 40 13.26
[K_B_DC2 400.00] 400 5.3044 40 13.26
[K_TOP STEEL 132.00] 132 4.1646 31.5 13.22
[K_KIBOS 220 220.00] 220 4.0629 31.5 12.90
[K_MERU11 132.00] 132 4.0292 31.5 12.79
[K_SONDU11 132.00] 132 3.9319 31.5 12.48
[K_LOYAN 220.00] 220 3.6872 31.5 11.71
[K_SUS2 220.00] 220 3.6872 31.5 11.71
[K_SUS1 220.00] 220 3.6872 31.5 11.71
[K_NANYUKI11 132.00] 132 3.6703 31.5 11.65
[K_MWINGI11 132.00] 132 3.663 31.5 11.63
[K_ISINYA 132.00] 132 3.657 31.5 11.61
[K_KYENI11 132.00] 132 3.6101 31.5 11.46
[K_SANGORO11 132.00] 132 3.6047 31.5 11.44
[K_KIGANJO11 132.00] 132 3.5695 31.5 11.33
[K_GATUNDU11 132.00] 132 3.5646 31.5 11.32
[K_LESSOS TEE220.00] 220 3.5376 31.5 11.23
[K_LESSOS TEE220.00] 220 3.5376 31.5 11.23
[K_MAKUTANO11132.00] 132 3.5351 31.5 11.22
[K_WALE TEE 220.00] 220 3.53 31.5 11.21
[K_OLKALOU132132.00] 132 3.501 31.5 11.11
[K_GITHAMBO11132.00] 132 3.4684 31.5 11.01
[K_KONZA 132.00] 132 3.4519 31.5 10.96
[K_MAKUTEE12 132.00] 132 3.4511 31.5 10.96
[K_CHEMOSIT11132.00] 132 3.3327 31.5 10.58
[K_ELDORET11 132.00] 132 3.332 31.5 10.58
[K_KUTUSTEE2 132.00] 132 3.3013 31.5 10.48
[K_DONGO_KU 220.00] 220 3.2718 31.5 10.39
[K_ULU11 132.00] 132 3.2201 31.5 10.22
[K_MACHAKOS11132.00] 132 3.1618 31.5 10.04
[K_RUMURUTI11132.00] 132 3.1522 31.5 10.01
[K_OTHAYA 132.00] 132 3.1433 31.5 9.98

217
YEAR 2025 THREE PHASE SHORT CIRCUIT CURRENT WITHOUT 400KV
Bus Name Voltage Level
(kV) Maximum Fault
Current (kA) Breaker
Capacity (kA)
% of Breaker Capacity
[K_SOTIK 132.00] 132 3.1386 31.5 9.96
[K_EMBU11 132.00] 132 3.0985 31.5 9.84
[K_MAUA 220 220.00] 220 3.082 31.5 9.78
[K_WEBUYE11 132.00] 132 3.0585 31.5 9.71
[K_KAKMEGA220220.00] 220 3.0472 31.5 9.67
[K_KUTUSTEE1 132.00] 132 3.0348 31.5 9.63
[K_NAROK11 132.00] 132 2.9376 31.5 9.33
[K_SAMBURU11 132.00] 132 2.9208 31.5 9.27
[K_KAPSABET11132.00] 132 2.8535 31.5 9.06
[K_MUSAGA220 220.00] 220 2.8456 31.5 9.03
[K_WERU 220.00] 220 2.8295 31.5 8.98
[K_MUMIAS11 132.00] 132 2.6878 31.5 8.53
[K_ISIOLO 220220.00] 220 2.6845 31.5 8.52
[K_BOMET11 132.00] 132 2.6392 31.5 8.38
[U_TORO11 132.00] 132 2.6361 31.5 8.37
[K_KILIFI 220220.00] 220 2.6335 31.5 8.36
[K_GALU11 132.00] 132 2.5688 31.5 8.15
[K_KISII11 132.00] 132 2.5463 31.5 8.08
[K_MUSAGATEE 132.00] 132 2.5082 31.5 7.96
[K_AWENDO11 132.00] 132 2.5025 31.5 7.94
[K_NDHIWA11 132.00] 132 2.4799 31.5 7.87
[K_KITALE11 132.00] 132 2.4326 31.5 7.72
[K_MALINDI21 220.00] 220 2.4117 31.5 7.66
[K_KILGORS132132.00] 132 2.4071 31.5 7.64
[K_LESSOS21 220.00] 220 2.2991 31.5 7.30
[K_KITUI11 132.00] 132 2.2819 31.5 7.24
[K_NEW SULTAN132.00] 132 2.235 31.5 7.10
[K_SULTAN HA1132.00] 132 2.1881 31.5 6.95
[K_TESTBUS 220.00] 220 2.1826 31.5 6.93
[K_TITANIUM11132.00] 132 2.1552 31.5 6.84
[K_TEE 220.00] 220 2.1307 31.5 6.76
[K_SELENKEI 220.00] 220 2.1159 31.5 6.72
[K_TURKWEL21 220.00] 220 2.0679 31.5 6.56
[K_KAINUK21 220.00] 220 2.0635 31.5 6.55
[K_ISIBENIA11132.00] 132 2.0362 31.5 6.46
[K_NEWMAUNGU 132.00] 132 1.9952 31.5 6.33
[K_KABARNET11132.00] 132 1.9735 31.5 6.27
[K_MAUNGU11 132.00] 132 1.8926 31.5 6.01

218
YEAR 2025 THREE PHASE SHORT CIRCUIT CURRENT WITHOUT 400KV
Bus Name Voltage Level
(kV) Maximum Fault
Current (kA) Breaker
Capacity (kA)
% of Breaker Capacity
[K_RANGALA11 132.00] 132 1.8707 31.5 5.94
[K_KIBOKO11 132.00] 132 1.7777 31.5 5.64
[K_K0RTUM21 220.00] 220 1.7741 31.5 5.63
[K_VOI11 132.00] 132 1.6743 31.5 5.32
[K_MAKINDU 132.00] 132 1.6517 31.5 5.24
[K_KITALE 220.00] 220 1.6039 31.5 5.09
[K_WOTE11 132.00] 132 1.5884 31.5 5.04
[K_MANYANI11 132.00] 132 1.53 31.5 4.86
[K_GARISSA11 132.00] 132 1.5238 31.5 4.84
[K_MTITO AND1132.00] 132 1.4774 31.5 4.69
[K_GARISA PV1132.00] 132 1.4378 31.5 4.56
[K_BONDO 132.00] 132 1.4201 31.5 4.51
[K_GARSEN21 220.00] 220 1.405 31.5 4.46
[K_NAMANGA 132.00] 132 1.3951 31.5 4.43
[K_MERUWESHI 132.00] 132 1.2681 31.5 4.03
[K_MUTOMO 132.00] 132 1.2141 31.5 3.85
[K_NDIGWA 132.00] 132 1.1679 31.5 3.71
[K_HOLA 220.00] 220 1.156 31.5 3.67
[K_BURA 220.00] 220 1.0699 31.5 3.40
[K_OLKIVWELLH220.00] 220 0.9569 31.5 3.04
[K_LAMU21 220.00] 220 0.9519 31.5 3.02
[K_TAVETA11 132.00] 132 0.9119 31.5 2.89
[K_GARISSA 220.00] 220 0.8906 31.5 2.83
[K_LOITOKTOK 132.00] 132 0.8892 31.5 2.82
[K_MARALAL11 132.00] 132 0.8694 31.5 2.76
[K_KIBWEZI 132.00] 132 0.8522 31.5 2.71

219
ANNEX 29 Three phase short circuit current with 400kv Year 400kV
YEAR 2025 THREE PHASE SHORT CIRCUIT CURRENT WITH 400kV
Bus Name Base Voltage (kV)
Maximum Fault Current (kA)
Breaker Capacity (kA)
%Breaker Capacity
[K_SUSWA21 220.00] 220 13.6105 31.5 43.21
[K_OLKARIAIAU220.00] 220 13.2484 31.5 42.06
[K_OLKARIA II220.00] 220 13.1955 31.5 41.89
[K_KAMBURU11 132.00] 132 13.0164 31.5 41.32
[K_KAMBTRF11 132.00] 132 12.9872 31.5 41.23
[K_DANDORA11 132.00] 132 12.1567 31.5 38.59
[K_JUJA RD11 132.00] 132 11.9876 31.5 38.06
[K_SIDE_A 400.00] 400 14.1255 40 35.31
[E_WOLAYTA 400.00] 400 14.1255 40 35.31
[K_GITARU11 132.00] 132 11.0671 31.5 35.13
[K_OLKARIA V 220.00] 220 10.7836 31.5 34.23
[K_OLKARIA1 1132.00] 132 10.6897 31.5 33.94
[K_OLKARIAIII220.00] 220 10.6235 31.5 33.73
[K_OLKARIAIAU132.00] 132 10.601 31.5 33.65
[K_OLKARIA II132.00] 132 10.5667 31.5 33.55
[K_DANDORA21 220.00] 220 10.5506 31.5 33.49
[K_RUARAK TE1132.00] 132 10.5121 31.5 33.37
[K_RUARAKAT12132.00] 132 10.5121 31.5 33.37
[K_OLKARIA IV220.00] 220 10.4981 31.5 33.33
[K_RUARAKA11 132.00] 132 10.4032 31.5 33.03
[K_ISINYA 220.00] 220 10.2789 31.5 32.63
[K_ISINYA21 220.00] 220 10.2789 31.5 32.63
[K_EMBAKASI21220.00] 220 9.8805 31.5 31.37
[K_NBNORTH21 220.00] 220 9.8326 31.5 31.21
[K_THIKA RD21220.00] 220 9.6862 31.5 30.75
[K_ATHI RIVER220.00] 220 9.6463 31.5 30.62
[K_RABAI11 132.00] 132 9.537 31.5 30.28
[K_CABLE-OHL2220.00] 220 9.5127 31.5 30.20
[K_CABLE-OHL 220.00] 220 9.5127 31.5 30.20
[K_RABAITRF11132.00] 132 9.3915 31.5 29.81
[K_RABTRF12 132.00] 132 9.3915 31.5 29.81
[K_RABAITR 13132.00] 132 9.3915 31.5 29.81
[K_CBD 220.00] 220 9.2895 31.5 29.49
[K_WELLHED37-132.00] 132 9.1972 31.5 29.20
[K_MAKINDU 132.00] 132 8.9967 31.5 28.56
[K_KONZA 132.00] 132 8.8357 31.5 28.05
[K_KIPEVU11 132.00] 132 8.6909 31.5 27.59

220
YEAR 2025 THREE PHASE SHORT CIRCUIT CURRENT WITH 400kV
Bus Name Base Voltage (kV)
Maximum Fault Current (kA)
Breaker Capacity (kA)
%Breaker Capacity
[K_KAMBURU21 220.00] 220 8.6371 31.5 27.42
[K_KIPEVUDII1132.00] 132 8.6087 31.5 27.33
[K_NAIVASHA11132.00] 132 8.2356 31.5 26.14
[K_KINDARUMA1132.00] 132 8.2034 31.5 26.04
[K_LESSOS11 132.00] 132 8.0794 31.5 25.65
[K_LESSTRF11 132.00] 132 8.0794 31.5 25.65
[K_KIPETO 220220.00] 220 8.0651 31.5 25.60
[K_JOMVU 132.00] 132 7.8718 31.5 24.99
[K_KIMUKA 220220.00] 220 7.8483 31.5 24.92
[K_TEE OFF 132.00] 132 7.7717 31.5 24.67
[K_KOKOTONI11132.00] 132 7.7101 31.5 24.48
[K_ULU11 132.00] 132 7.5177 31.5 23.87
[K_GILGIL 220220.00] 220 7.3144 31.5 23.22
[K_GITARU21 220.00] 220 7.291 31.5 23.15
[K_BAMBURI11 132.00] 132 7.0313 31.5 22.32
[K_RONGAI220 220.00] 220 6.9697 31.5 22.13
[K_KIAMBERE21220.00] 220 6.947 31.5 22.05
[K_LESSOS21 220.00] 220 6.8954 31.5 21.89
[K_MASINGA11 132.00] 132 6.7547 31.5 21.44
[K_BOMANI 132.00] 132 6.5238 31.5 20.71
[K_MARIAKANI2220.00] 220 6.5048 31.5 20.65
[K_RABAI21 220.00] 220 6.3641 31.5 20.20
[K_VIPINGO31 132.00] 132 6.1543 31.5 19.54
[K_SIDE_B 400.00] 400 7.2532 40 18.13
[K_BAMB TEE 132.00] 132 5.7087 31.5 18.12
[K_THIKA11 132.00] 132 5.6715 31.5 18.00
[K_THIKA12 132.00] 132 5.6357 31.5 17.89
[K_KIBOKO11 132.00] 132 5.5804 31.5 17.72
[K_KIBOS 132 132.00] 132 5.5148 31.5 17.51
[K_MALAA 220.00] 220 5.4999 31.5 17.46
[K_KISUMU 132132.00] 132 5.4921 31.5 17.44
[K_LANET11 132.00] 132 5.4499 31.5 17.30
[K_SOILO11 132.00] 132 5.4486 31.5 17.30
[K_MSCEMTEE31132.00] 132 5.4272 31.5 17.23
[K_SOILO TEE 132.00] 132 5.4049 31.5 17.16
[K_MACHAKOS11132.00] 132 5.4001 31.5 17.14
[K_KIMUKA 400.00] 400 6.7678 40 16.92
[K_RONGAI 132132.00] 132 5.323 31.5 16.90
[K_MUHORONI11132.00] 132 5.314 31.5 16.87

221
YEAR 2025 THREE PHASE SHORT CIRCUIT CURRENT WITH 400kV
Bus Name Base Voltage (kV)
Maximum Fault Current (kA)
Breaker Capacity (kA)
%Breaker Capacity
[K_MARIAKANI1132.00] 132 5.2401 31.5 16.64
[K_KILIFI11 132.00] 132 5.2195 31.5 16.57
[K_KOPERE 132.00] 132 5.1985 31.5 16.50
[K_MSACEM31 132.00] 132 5.1914 31.5 16.48
[K_ISINYA41 400.00] 400 6.5189 40 16.30
[MWALA 132.00] 132 5.1301 31.5 16.29
[K_MSACEMTEE3132.00] 132 5.0511 31.5 16.04
[K_CHEMOSIT11132.00] 132 5.0176 31.5 15.93
[K_ISHIARA11 132.00] 132 4.9892 31.5 15.84
[K_TEE 220.00] 220 4.939 31.5 15.68
[K_GILGIL 400.00] 400 6.2166 40 15.54
[K_SELENKEI 220.00] 220 4.8601 31.5 15.43
[K_MUSAGA11 132.00] 132 4.7043 31.5 14.93
[K_WALE TEE 220.00] 220 4.6539 31.5 14.77
[K_TOP STEEL 132.00] 132 4.6041 31.5 14.62
[K_NEW SULTAN132.00] 132 4.5909 31.5 14.57
[K_SULTAN HA1132.00] 132 4.5509 31.5 14.45
[K_MENENGAI11132.00] 132 4.4439 31.5 14.11
[K_MAUA11 132.00] 132 4.4428 31.5 14.10
[K_KERINGET20220.00] 220 4.4393 31.5 14.09
[K_RONGAI_NC 132.00] 132 4.3653 31.5 13.86
[K_ISIOLO11 132.00] 132 4.3635 31.5 13.85
[K_RONGAI 400400.00] 400 5.4314 40 13.58
[K_KIBOS 220 220.00] 220 4.229 31.5 13.43
[K_DONGO_KU 220.00] 220 4.2108 31.5 13.37
[K_MAKINDU400400.00] 400 5.2577 40 13.14
[K_SONDU11 132.00] 132 4.1251 31.5 13.10
[K_ELDORET11 132.00] 132 3.9727 31.5 12.61
[K_MERU11 132.00] 132 3.9642 31.5 12.58
[K_CHEMOSIT 2220.00] 220 3.9437 31.5 12.52
[K_SOTIK 132.00] 132 3.8754 31.5 12.30
[K_MAKUTEE12 132.00] 132 3.7855 31.5 12.02
[K_MAKUTANO11132.00] 132 3.7852 31.5 12.02
[K_SANGORO11 132.00] 132 3.767 31.5 11.96
[K_MWINGI11 132.00] 132 3.7038 31.5 11.76
[K_LESSOS 400400.00] 400 4.6769 40 11.69
[K_ISINYA 132.00] 132 3.673 31.5 11.66
[K_NANYUKI11 132.00] 132 3.6435 31.5 11.57
[K_LESSOS TEE220.00] 220 3.6111 31.5 11.46

222
YEAR 2025 THREE PHASE SHORT CIRCUIT CURRENT WITH 400kV
Bus Name Base Voltage (kV)
Maximum Fault Current (kA)
Breaker Capacity (kA)
%Breaker Capacity
[K_LESSOS TEE220.00] 220 3.6111 31.5 11.46
[K_THIKA 400 400.00] 400 4.546 40 11.37
[K_KYENI11 132.00] 132 3.5414 31.5 11.24
[K_OLKALOU132132.00] 132 3.5188 31.5 11.17
[K_GATUNDU11 132.00] 132 3.4847 31.5 11.06
[K_KIGANJO11 132.00] 132 3.4452 31.5 10.94
[K_KAPSABET11132.00] 132 3.4446 31.5 10.94
[K_GITHAMBO11132.00] 132 3.3381 31.5 10.60
[K_MALAA 400 400.00] 400 4.1499 40 10.37
[K_WERU 220.00] 220 3.2464 31.5 10.31
[K_SAMBURU11 132.00] 132 3.2216 31.5 10.23
[K_WEBUYE11 132.00] 132 3.2041 31.5 10.17
[K_KUTUSTEE2 132.00] 132 3.1767 31.5 10.08
[K_KAKMEGA220220.00] 220 3.1729 31.5 10.07
[K_RUMURUTI11132.00] 132 3.1584 31.5 10.03
[K_ONZA 400.00] 400 3.9271 40 9.82
[K_MARIAKANI4400.00] 400 3.8869 40 9.72
[K_MAUA 220 220.00] 220 3.0438 31.5 9.66
[K_OTHAYA 132.00] 132 3.0353 31.5 9.64
[K_NAROK11 132.00] 132 3.0154 31.5 9.57
[K_BOMET11 132.00] 132 2.982 31.5 9.47
[K_MUSAGA220 220.00] 220 2.9772 31.5 9.45
[K_EMBU11 132.00] 132 2.9302 31.5 9.30
[K_KILIFI 220220.00] 220 2.9265 31.5 9.29
[K_KUTUSTEE1 132.00] 132 2.9081 31.5 9.23
[K_KISII11 132.00] 132 2.8885 31.5 9.17
[U_TORO11 132.00] 132 2.8464 31.5 9.04
[K_MUSAGATEE 132.00] 132 2.8162 31.5 8.94
[K_LOYAN 400 400.00] 400 3.5724 40 8.93
[K_KILGORS132132.00] 132 2.7867 31.5 8.85
[K_MUMIAS11 132.00] 132 2.7721 31.5 8.80
[K_KITALE11 132.00] 132 2.7702 31.5 8.79
[K_AWENDO11 132.00] 132 2.7506 31.5 8.73
[K_MALINDI21 220.00] 220 2.7125 31.5 8.61
[K_NDHIWA11 132.00] 132 2.6517 31.5 8.42
[K_ISIOLO 220220.00] 220 2.6497 31.5 8.41
[K_MTITO AND1132.00] 132 2.6447 31.5 8.40
[K_TURKWEL21 220.00] 220 2.6398 31.5 8.38
[K_KAINUK21 220.00] 220 2.6325 31.5 8.36

223
YEAR 2025 THREE PHASE SHORT CIRCUIT CURRENT WITH 400kV
Bus Name Base Voltage (kV)
Maximum Fault Current (kA)
Breaker Capacity (kA)
%Breaker Capacity
[K_GALU11 132.00] 132 2.6036 31.5 8.27
[K_WOTE11 132.00] 132 2.4636 31.5 7.82
[K_TESTBUS 220.00] 220 2.3278 31.5 7.39
[K_NEWMAUNGU 132.00] 132 2.2974 31.5 7.29
[K_KITUI11 132.00] 132 2.2936 31.5 7.28
[K_ISIBENIA11132.00] 132 2.2464 31.5 7.13
[K_MAUNGU11 132.00] 132 2.2128 31.5 7.02
[K_KABARNET11132.00] 132 2.1952 31.5 6.97
[K_TITANIUM11132.00] 132 2.1617 31.5 6.86
[K_K0RTUM21 220.00] 220 2.1613 31.5 6.86
[K_MANYANI11 132.00] 132 2.1064 31.5 6.69
[K_VOI11 132.00] 132 2.0787 31.5 6.60
[K_KITALE 220.00] 220 1.8957 31.5 6.02
[K_RANGALA11 132.00] 132 1.8767 31.5 5.96
[K_MERUWESHI 132.00] 132 1.8044 31.5 5.73
[K_GARISSA11 132.00] 132 1.7145 31.5 5.44
[K_GARISA PV1132.00] 132 1.6073 31.5 5.10
[K_GARSEN21 220.00] 220 1.5306 31.5 4.86
[K_BONDO 132.00] 132 1.4284 31.5 4.53
[K_NAMANGA 132.00] 132 1.4061 31.5 4.46
[K_HOLA 220.00] 220 1.2497 31.5 3.97
[K_MUTOMO 132.00] 132 1.2146 31.5 3.86
[K_NDIGWA 132.00] 132 1.1751 31.5 3.73
[K_BURA 220.00] 220 1.1508 31.5 3.65
[K_LOITOKTOK 132.00] 132 1.1224 31.5 3.56
[K_TAVETA11 132.00] 132 1.0211 31.5 3.24
[K_LAMU21 220.00] 220 1.0052 31.5 3.19
[K_OLKIVWELLH220.00] 220 0.9583 31.5 3.04
[K_GARISSA 220.00] 220 0.926 31.5 2.94
[K_MARALAL11 132.00] 132 0.8805 31.5 2.80
[K_KIBWEZI 132.00] 132 0.8496 31.5 2.70
2030

224
ANNEX 30 Three phase short circuit current 2030
YEAR 2030 THREE PHASE SHORT CIRCUIT CURRENT
Bus Name Voltage Level (kV)
Maximum Fault Current (kA)
Breaker Capacity(kA)
% of Breaker Capacity
[K_JUJA RD11 132 18.28 31.5 58.03
[K_DANDORA11 132 18.28 31.5 58.03
[K_RUARAK TE1 132 18.24 31.5 57.90
[K_RUARAKAT12 132 18.24 31.5 57.90
[TEE 2 132 18.08 31.5 57.40
[K_THIKA11 132 18.09 31.5 57.43
[K_THIKA12 132 17.73 31.5 56.29
[K_RUARAKA11 132 17.01 31.5 54.00
[K_KAMBURU11 132 16.81 31.5 53.37
[K_KAMBTRF11 132 16.81 31.5 53.37
[K_THIKA NEW 132 15.05 31.5 47.78
[K_SUSWA21 220 19.36 40 48.40
[K_LESSOS11 132 14.67 31.5 46.57
[K_LESSTRF11 132 14.67 31.5 46.57
[K_NIP CC 220 18.58 40 46.45
[K_NIP CC 220 18.58 40 46.45
[K_OLKARIAIAU 220 18.14 40 45.35
[K_NIP 220 220 17.91 40 44.78
[K_GITARU11 132 13.81 31.5 43.84
[K_OLK V 220 17.4 40 43.50
[K_OLKARIA II 220 17.55 40 43.88
[K_OLKARIA IV 220 17.32 40 43.30
[K_KONZANEW 132 12.79 31.5 40.60
[K_UPLANDS 132 12.49 31.5 39.65
[K_SOILO11 132 12.67 31.5 40.22
[K_RONGAI 132 132 12.58 31.5 39.94
[K_MENE_NEW 132 12.58 31.5 39.94
[K_MENENGAI11 132 12.41 31.5 39.40
[K_KONZA 132 11.82 31.5 37.52
[K_ULU11 132 11.81 31.5 37.49
[K_MACHAKOS11 132 11.75 31.5 37.30
[K_DANDORA21 220 14.81 40 37.03
[K_MALAA220 220 14.69 40 36.73
[K_THIKA RD21 220 14.86 40 37.15

225
YEAR 2030 THREE PHASE SHORT CIRCUIT CURRENT
Bus Name Voltage Level (kV)
Maximum Fault Current (kA)
Breaker Capacity(kA)
% of Breaker Capacity
[K_EMBU13 132 11.11 31.5 35.27
[K_ISINYA21 220 14.17 40 35.43
[K_KUTUS11 132 10.58 31.5 33.59
[K_EMBA DUMMY 220 13.59 40 33.98
[K_EMBA-DUMMY 220 13.59 40 33.98
[K_NRB NORTH 220 13.6 40 34.00
[K_EMBAKASI21 220 13.59 40 33.98
[K_MAKINDU 132 10.5 31.5 33.33
[K_OLKARIA II 132 10.34 31.5 32.83
[K_KIMUKA 220 220 13.08 40 32.70
[K_OLKARIA1 1 132 10.08 31.5 32.00
[K_CABLE-OHL2 220 12.87 40 32.18
[K_ATHI RIVER 220 13 40 32.50
[K_CABLE-OHL 220 12.87 40 32.18
[K_KINDARUMA1 132 9.68 31.5 30.73
[K_OLKARIAIAU 132 9.83 31.5 31.21
[K_CBD 220 12.56 40 31.40
[K_GILGIL 220 220 12.39 40 30.98
[TEE 1 132 9.47 31.5 30.06
[K_GATUNDU11 132 9.35 31.5 29.68
[K_LANET11 132 9.5 31.5 30.16
[K_KILGORS132 132 9.6 31.5 30.48
[K_KAMBURU21 220 11.88 40 29.70
[K_LONGONOT 220 11.96 40 29.90
[K_WELLHED37- 132 8.67 31.5 27.52
[K_RONGAI_NC 132 8.92 31.5 28.32
[K_LESSOS 220 11.06 40 27.65
[K_LESSOS TEE 220 11.06 40 27.65
[K_LESSOS TEE 220 11.06 40 27.65
[K_B_DC2 400 11.08 40 27.70
[K_B_DC1 400 11.08 40 27.70
[K_SUSWA 400 11.08 40 27.70
[K_GILGIL 400 11.19 40 27.98
[K_NEW_VOI 132 8.61 31.5 27.33
[K_KIBOS 132 132 8.59 31.5 27.27

226
YEAR 2030 THREE PHASE SHORT CIRCUIT CURRENT
Bus Name Voltage Level (kV)
Maximum Fault Current (kA)
Breaker Capacity(kA)
% of Breaker Capacity
[K_RONGAI220 220 10.87 40 27.18
[K_THIKA 400 400 10.75 40 26.88
[K_KISUMU 132 132 8.23 31.5 26.13
[K_KIPETO 220 220 10.43 40 26.08
[K_KIMUKA 400 10.23 40 25.58
[K_MALAA 400 400 10.53 40 26.33
[K_LONGONOT 400 10.5 40 26.25
[K_MASINGA11 132 7.96 31.5 25.27
[K_CHEMOSIT11 132 7.73 31.5 24.54
[K_BARINGO21 220 10.1 40 25.25
[K_ISINYA41 400 9.98 40 24.95
[K_KONZA4 400 10.02 40 25.05
[TEE 1 132 7.68 31.5 24.38
[TEE2 132 7.72 31.5 24.51
[K_SOTIK 132 7.59 31.5 24.10
[K_MATASIA BS 220 9.44 40 23.60
[K_EMBU 220 9.54 40 23.85
[K_RONGAI 400 400 9.59 40 23.98
[K_ISIOLO11 132 7.36 31.5 23.37
[K_KIAMBERE21 220 9.31 40 23.28
[K_GITARU21 220 9.33 40 23.33
[K_OLKALOU132 132 6.81 31.5 21.62
[K_MUHORONI11 132 6.86 31.5 21.78
[K_KOLWA 132 6.89 31.5 21.87
[K_LOYAN 220 8.82 40 22.05
[K_MENENGAI40 400 8.78 40 21.95
[K_RABAI11 132 6.69 31.5 21.24
[K_RABAITRF11 132 6.63 31.5 21.05
[K_RABTRF12 132 6.63 31.5 21.05
[K_RABAITR 13 132 6.63 31.5 21.05
[K_MWALA 132 6.49 31.5 20.60
[K_NAIVASHA11 132 6.67 31.5 21.17
[K_KOPERE 132 6.54 31.5 20.76
[K_HG FALL 40 400 8.21 40 20.53
[K_MARAL/LOOS 400 8.31 40 20.78

227
YEAR 2030 THREE PHASE SHORT CIRCUIT CURRENT
Bus Name Voltage Level (kV)
Maximum Fault Current (kA)
Breaker Capacity(kA)
% of Breaker Capacity
[K_LESSOS 400 400 8.49 40 21.23
[K_KIBOKO11 132 6.38 31.5 20.25
[K_MAUA11 132 6.28 31.5 19.94
[K_BARINGO 400 8.1 40 20.25
[K_SULTAN HA1 132 5.95 31.5 18.89
[K_NEW SULTAN 132 6.14 31.5 19.49
[K_MERUWESHI 132 6.06 31.5 19.24
[K_LOITOKTOK 132 5.99 31.5 19.02
[K_KOKOTONI11 132 5.92 31.5 18.79
[K_BAMBURI11 132 5.89 31.5 18.70
[K_TEE OFF 132 5.99 31.5 19.02
[K_BOMANI 132 5.83 31.5 18.51
[K_KUTUSTEE1 132 5.94 31.5 18.86
[K_TEE 2 132 6.12 31.5 19.43
[K_RUMURUTI11 132 5.85 31.5 18.57
[K_MUSAGA11 132 5.98 31.5 18.98
[K_MYANGA 132 5.93 31.5 18.83
[MYANGA TEE1 132 5.93 31.5 18.83
[MYANGA TEE2 132 5.93 31.5 18.83
[K_THIKA 220 220 7.78 40 19.45
[K_OLKA VIII 220 7.53 40 18.83
[K_KIPEVU11 132 5.71 31.5 18.13
[K_JOMVU 132 5.58 31.5 17.71
[K_ISHIARA11 132 5.65 31.5 17.94
[K_MAUNGU11 132 5.32 31.5 16.89
[K_VIPINGO31 132 5.33 31.5 16.92
[K_MERU11 132 5.45 31.5 17.30
[K_ELDORET11 132 5.36 31.5 17.02
[U_TORO11 132 5.21 31.5 16.54
[K_OLKA VII 220 6.99 40 17.48
[K_TEE 220 6.65 40 16.63
[K_NAMANGA 400 6.63 40 16.58
[K_MAKINDU400 400 6.67 40 16.68
[K_KILIFI11 132 5 31.5 15.87
[K_VOI11 132 5.17 31.5 16.41

228
YEAR 2030 THREE PHASE SHORT CIRCUIT CURRENT
Bus Name Voltage Level (kV)
Maximum Fault Current (kA)
Breaker Capacity(kA)
% of Breaker Capacity
[K_KIGANJO11 132 5.05 31.5 16.03
[K_MWINGI11 132 5 31.5 15.87
[K_MAKUTANO11 132 5.19 31.5 16.48
[K_OLK IX 220 6.36 40 15.90
[K_AKIRA 220 220 6.5 40 16.25
[K_AGIL 220 220 6.5 40 16.25
[K_SELENKEI 220 6.51 40 16.28
[K_LOYAN 400 400 6.37 40 15.93
[K_MARIAKANI1 132 4.74 31.5 15.05
[K_MSCEMTEE31 132 4.81 31.5 15.27
[K_MSACEM31 132 4.66 31.5 14.79
[K_MSACEMTEE3 132 4.58 31.5 14.54
[K_BAMB TEE 132 4.8 31.5 15.24
[K_NEWMAUNGU 132 4.59 31.5 14.57
[K_NANYUKI11 132 4.84 31.5 15.37
[K_GITHAMBO11 132 4.73 31.5 15.02
[K_NAROK11 132 4.62 31.5 14.67
[K_SONDU11 132 4.75 31.5 15.08
[K_KITALE11 132 4.79 31.5 15.21
[K_KARURA 220 6 40 15.00
[K_KERINGET20 220 5.87 40 14.68
[K_KIBOS 220 220 6.17 40 15.43
[K_TOP STEEL 132 4.41 31.5 14.00
[K_WEBUYE11 132 4.53 31.5 14.38
[K_MUMIAS11 132 4.29 31.5 13.62
[K_SANGORO11 132 4.26 31.5 13.52
[K_BOMET11 132 4.34 31.5 13.78
[K_KISII11 132 4.51 31.5 14.32
[K_RANGALA11 132 4.47 31.5 14.19
[K_MUSAGATEE 132 4.36 31.5 13.84
[K_MARIAKANI2 220 5.75 40 14.38
[K_ISINYA 132 4.03 31.5 12.79
[K_KIPEVUDII1 132 4.08 31.5 12.95
[K_OTHAYA 132 4.01 31.5 12.73
[K_AWENDO11 132 4.11 31.5 13.05

229
YEAR 2030 THREE PHASE SHORT CIRCUIT CURRENT
Bus Name Voltage Level (kV)
Maximum Fault Current (kA)
Breaker Capacity(kA)
% of Breaker Capacity
[K_BUSIA 132 4.25 31.5 13.49
[K_KAPSABET11 132 4.24 31.5 13.46
[K_RABAI21 220 5.13 40 12.83
[K_CHEMOSIT 2 220 5.19 40 12.98
[K_LOKICHAR 220 5.18 40 12.95
[K_MARSABIT 220 5.08 40 12.70
[K_LODWAR 220 5.17 40 12.93
[K_SAMBURU11 132 3.78 31.5 12.00
[K_KIBUYUNI 132 3.88 31.5 12.32
[K_KYENI11 132 3.88 31.5 12.32
[K_WOTE 132 3.9 31.5 12.38
[K_KITUI11 132 3.71 31.5 11.78
[K_KABARNET11 132 3.88 31.5 12.32
[K_ISIBENIA11 132 3.69 31.5 11.71
[K_BONDO 132 3.91 31.5 12.41
[K_KIMILILI 132 3.86 31.5 12.25
[K_ISIOLO 220 220 4.88 40 12.20
[K_TURKWEL21 220 4.79 40 11.98
[K_KAINUK21 220 4.8 40 12.00
[K_VOI 400 400 4.9 40 12.25
[K_KILGORIS 400 4.93 40 12.33
[T_TARUSHA41 400 4.79 40 11.98
[K_MANYANI11 132 3.38 31.5 10.73
[K_NDHIWA 132 3.55 31.5 11.27
[K_SAMBURU 22 220 4.4 40 11.00
[K_KWALE TEE 220 4.39 40 10.98
[K_MAUA 220 220 4.56 40 11.40
[K_MTITO AND1 132 3.2 31.5 10.16
[K_GALU11 132 3.28 31.5 10.41
[K_KWALE SC 132 3.11 31.5 9.87
[K_TITANIUM11 132 3.11 31.5 9.87
[K_GOGO 132 3.08 31.5 9.78
[K_DONGO_KU 220 4 40 10.00
[K_KAKMEGA220 220 4.14 40 10.35
[K_MARIAKANI4 400 4.09 40 10.23

230
YEAR 2030 THREE PHASE SHORT CIRCUIT CURRENT
Bus Name Voltage Level (kV)
Maximum Fault Current (kA)
Breaker Capacity(kA)
% of Breaker Capacity
[K_GARISSA11 132 2.76 31.5 8.76
[K_MAGUNGA 132 2.74 31.5 8.70
[K_WERU 220 3.5 40 8.75
[K_KILIFI 220 3.5 40 8.75
[K_BAMBUR CE2 220 3.49 40 8.73
[K_MUSAGA220 220 3.61 40 9.03
[K_KORTUM21 220 3.45 40 8.63
[K_GARISA PV1 132 2.49 31.5 7.90
[K_NDIGWA 132 2.47 31.5 7.84
[K_MALINDI21 220 3.22 40 8.05
[K_KIBUYUNI2 220 3.23 40 8.08
[U_TORORO21 220 3.32 40 8.30
[K_CHOGORIA 132 2.34 31.5 7.43
[K_MAGADI 220 2.78 40 6.95
[K_GARBATULA 220 2.85 40 7.13
[K_KITALE 220 2.95 40 7.38
[K_MARALAL11 132 1.93 31.5 6.13
[K_GARSEN21 220 2.4 40 6.00
[K_GARISSA 220 2.49 40 6.23
[K_NAMANGA 132 1.44 31.5 4.57
[K_TAVETA11 132 1.64 31.5 5.21
[K_MUTOMO 132 1.52 31.5 4.83
[K_HOLA 220 2.06 40 5.15
[K_BURA 220 2 40 5.00
[K_LOKICHOGIO 220 2.05 40 5.13
[K_LAMU21 220 1.7 40 4.25
[K_KIBWEZI 132 0.99 31.5 3.14
[K_MOYALE 220 1.32 40 3.30
[K_WAJIR 220 0.69 40 1.73
[K_HABASWEIN 220 0.92 40 2.30

231
ANNEX 31 Three phase short circuit current Year 2035
YEAR 2035 THREE PHASE SHORT CIRCUIT CURRENT
Bus Name Voltage Level (kV)
Maximum Fault Current (kA)
Breaker Capacity(kA)
% of Breaker Capacity
[K_JUJA RD11 132 20.98 31.5 66.60
[K_DANDORA11 132 20.98 31.5 66.60
[K_RUARAK TE1 132 20.92 31.5 66.41
[K_RUARAKAT12 132 20.92 31.5 66.41
[TEE 2 132 20.7 31.5 65.71
[K_THIKA11 132 20.71 31.5 65.75
[K_THIKA12 132 20.24 31.5 64.25
[K_RUARAKA11 132 19.34 31.5 61.40
[K_SUSWA21 220 24.06 40 60.15
[K_NIP CC 220 22.85 40 57.13
[K_NIP CC 220 22.85 40 57.13
[K_KAMBURU11 132 17.66 31.5 56.06
[K_KAMBTRF11 132 17.65 31.5 56.03
[K_OLKARIAIAU 220 21.98 40 54.95
[K_NIP 220 220 21.85 40 54.63
[K_THIKA NEW 132 16.7 31.5 53.02
[K_OLKARIA II 220 21.32 40 53.30
[K_LESSOS11 132 16.45 31.5 52.22
[K_LESSTRF11 132 16.45 31.5 52.22
[K_OLK V 220 20.7 40 51.75
[K_OLKARIA IV 220 20.58 40 51.45
[K_GITARU11 132 14.32 31.5 45.46
[K_SOILO11 132 14.2 31.5 45.08
[K_RONGAI 132 132 14.11 31.5 44.79
[K_MENE_NEW 132 14.15 31.5 44.92
[K_KONZANEW 132 13.9 31.5 44.13
[K_MENENGAI11 132 13.88 31.5 44.06
[K_DANDORA21 220 17.61 40 44.03
[K_MALAA220 220 17.5 40 43.75
[K_THIKA RD21 220 17.64 40 44.10
[K_UPLANDS 132 13.69 31.5 43.46
[K_ISINYA21 220 16.88 40 42.20
[K_KONZA 132 12.78 31.5 40.57
[K_EMBA DUMMY 220 16.3 40 40.75

232
YEAR 2035 THREE PHASE SHORT CIRCUIT CURRENT
Bus Name Voltage Level (kV)
Maximum Fault Current (kA)
Breaker Capacity(kA)
% of Breaker Capacity
[K_EMBA-DUMMY 220 16.3 40 40.75
[K_EMBAKASI21 220 16.3 40 40.75
[K_ULU11 132 12.76 31.5 40.51
[K_MACHAKOS11 132 12.69 31.5 40.29
[K_NRB NORTH 220 15.83 40 39.58
[K_ATHI RIVER 220 15.47 40 38.68
[K_GILGIL 400 15.57 40 38.93
[K_CABLE-OHL2 220 15.27 40 38.18
[K_KIMUKA 220 220 15.34 40 38.35
[K_CABLE-OHL 220 15.27 40 38.18
[K_OLK III 220 15.39 40 38.48
[K_EMBU13 132 11.65 31.5 36.98
[K_CBD 220 14.86 40 37.15
[K_GILGIL 220 220 14.85 40 37.13
[K_MAKINDU 132 11.42 31.5 36.25
[K_LONGONOT 220 14.55 40 36.38
[K_BARINGO21 220 14.21 40 35.53
[K_B_DC2 400 14.56 40 36.40
[K_B_DC1 400 14.56 40 36.40
[K_SUSWA 400 14.56 40 36.40
[K_KUTUS11 132 11.08 31.5 35.17
[K_THIKA 400 400 13.84 40 34.60
[K_RONGAI 400 400 13.81 40 34.53
[K_OLKARIA II 132 10.85 31.5 34.44
[K_LONGONOT 400 13.74 40 34.35
[K_OLKARIA1 1 132 10.55 31.5 33.49
[K_OLKARIAIAU 132 10.27 31.5 32.60
[K_LANET11 132 10.25 31.5 32.54
[K_RONGAI220 220 13.24 40 33.10
[K_LESSOS 220 13.1 40 32.75
[K_LESSOS TEE 220 13.1 40 32.75
[K_LESSOS TEE 220 13.1 40 32.75
[K_KIMUKA 400 13.08 40 32.70
[K_MALAA 400 400 13.27 40 33.18
[K_RABAI11 132 9.97 31.5 31.65

233
YEAR 2035 THREE PHASE SHORT CIRCUIT CURRENT
Bus Name Voltage Level (kV)
Maximum Fault Current (kA)
Breaker Capacity(kA)
% of Breaker Capacity
[K_KINDARUMA1 132 9.98 31.5 31.68
[TEE 1 132 10.11 31.5 32.10
[K_GATUNDU11 132 9.97 31.5 31.65
[K_KAMBURU21 220 12.87 40 32.18
[K_ISINYA41 400 12.69 40 31.73
[K_MENENGAI40 400 12.75 40 31.88
[K_RABAITRF11 132 9.73 31.5 30.89
[K_RABTRF12 132 9.73 31.5 30.89
[K_RABAITR 13 132 9.73 31.5 30.89
[K_RONGAI_NC 132 9.67 31.5 30.70
[K_KONZA4 400 12.58 40 31.45
[K_NEW_VOI 132 9.55 31.5 30.32
[K_WELLHED37- 132 9.01 31.5 28.60
[K_KIBOS 132 132 9.03 31.5 28.67
[K_KIPETO 220 220 11.74 40 29.35
[K_LESSOS 400 400 11.39 40 28.48
[K_KIPEVU11 132 8.58 31.5 27.24
[K_TEE OFF 132 8.35 31.5 26.51
[TEE 1 132 8.42 31.5 26.73
[TEE2 132 8.5 31.5 26.98
[K_KISUMU 132 132 8.59 31.5 27.27
[K_BARINGO 400 10.85 40 27.13
[K_MARAL/LOOS 400 10.8 40 27.00
[K_KOKOTONI11 132 8.21 31.5 26.06
[K_JOMVU 132 8.05 31.5 25.56
[K_MASINGA11 132 8.15 31.5 25.87
[K_MATASIA BS 220 10.57 40 26.43
[K_EMBU 220 10.23 40 25.58
[K_HG FALL 40 400 10.42 40 26.05
[K_BAMBURI11 132 8.01 31.5 25.43
[K_BOMANI 132 7.79 31.5 24.73
[K_KIAMBERE21 220 9.9 40 24.75
[K_GITARU21 220 9.89 40 24.73
[K_ISIOLO11 132 7.62 31.5 24.19
[K_SUSWA GEN 220 9.51 40 23.78

234
YEAR 2035 THREE PHASE SHORT CIRCUIT CURRENT
Bus Name Voltage Level (kV)
Maximum Fault Current (kA)
Breaker Capacity(kA)
% of Breaker Capacity
[K_OLKALOU132 132 7.26 31.5 23.05
[K_CHEMOSIT11 132 7.19 31.5 22.83
[K_KOLWA 132 7.13 31.5 22.63
[K_LOYAN 220 9.28 40 23.20
[K_VIPINGO31 132 6.93 31.5 22.00
[K_NAIVASHA11 132 7.01 31.5 22.25
[K_MUHORONI11 132 6.97 31.5 22.13
[K_KOPERE 132 6.81 31.5 21.62
[K_KIBOKO11 132 6.7 31.5 21.27
[K_MAUA11 132 6.46 31.5 20.51
[K_MWALA 132 6.72 31.5 21.33
[K_THIKA 220 220 8.38 40 20.95
[K_SULTAN HA1 132 6.21 31.5 19.71
[K_NEW SULTAN 132 6.41 31.5 20.35
[K_MERUWESHI 132 6.33 31.5 20.10
[K_LOITOKTOK 132 6.25 31.5 19.84
[K_TEE 2 132 6.27 31.5 19.90
[K_RUMURUTI11 132 6.17 31.5 19.59
[K_MUSAGA11 132 6.23 31.5 19.78
[K_MAKINDU400 400 7.99 40 19.98
[K_KILIFI11 132 6.12 31.5 19.43
[K_MARIAKANI1 132 5.9 31.5 18.73
[K_MSCEMTEE31 132 6.02 31.5 19.11
[K_BAMB TEE 132 6.14 31.5 19.49
[K_KUTUSTEE1 132 6.11 31.5 19.40
[K_MYANGA 132 6.1 31.5 19.37
[MYANGA TEE1 132 6.1 31.5 19.37
[MYANGA TEE2 132 6.1 31.5 19.37
[K_OLKA VII 220 7.7 40 19.25
[K_NAMANGA 400 7.71 40 19.28
[K_MAUNGU11 132 5.79 31.5 18.38
[K_MSACEM31 132 5.77 31.5 18.32
[K_MSACEMTEE3 132 5.61 31.5 17.81
[K_ISHIARA11 132 5.76 31.5 18.29
[K_MERU11 132 5.61 31.5 17.81

235
YEAR 2035 THREE PHASE SHORT CIRCUIT CURRENT
Bus Name Voltage Level (kV)
Maximum Fault Current (kA)
Breaker Capacity(kA)
% of Breaker Capacity
[K_ELDORET11 132 5.59 31.5 17.75
[K_MARIAKANI2 220 7.14 40 17.85
[K_AKIRA 220 220 7.32 40 18.30
[K_AGIL 220 220 7.18 40 17.95
[K_TEE 220 7.29 40 18.23
[K_SELENKEI 220 7.12 40 17.80
[K_LOYAN 400 400 7.09 40 17.73
[K_VOI11 132 5.5 31.5 17.46
[K_TOP STEEL 132 5.33 31.5 16.92
[K_MAKUTANO11 132 5.43 31.5 17.24
[U_TORO11 132 5.3 31.5 16.83
[K_KIBOS 220 220 6.7 40 16.75
[K_KIPEVUDII1 132 5.11 31.5 16.22
[K_NEWMAUNGU 132 4.98 31.5 15.81
[K_NANYUKI11 132 4.93 31.5 15.65
[K_GITHAMBO11 132 4.89 31.5 15.52
[K_KIGANJO11 132 5.18 31.5 16.44
[K_MWINGI11 132 5.12 31.5 16.25
[K_SOTIK 132 4.97 31.5 15.78
[K_KITALE11 132 4.9 31.5 15.56
[K_RABAI21 220 6.48 40 16.20
[K_KARURA 220 6.23 40 15.58
[K_KERINGET20 220 6.36 40 15.90
[K_NAROK11 132 4.62 31.5 14.67
[K_WEBUYE11 132 4.67 31.5 14.83
[K_SONDU11 132 4.65 31.5 14.76
[K_RANGALA11 132 4.63 31.5 14.70
[K_VOI 400 400 5.8 40 14.50
[K_SAMBURU11 132 4.27 31.5 13.56
[K_KIBUYUNI 132 4.27 31.5 13.56
[K_MUMIAS11 132 4.43 31.5 14.06
[K_MUSAGATEE 132 4.46 31.5 14.16
[K_BUSIA 132 4.36 31.5 13.84
[K_KAPSABET11 132 4.38 31.5 13.90
[K_CHEMOSIT 2 220 5.49 40 13.73

236
YEAR 2035 THREE PHASE SHORT CIRCUIT CURRENT
Bus Name Voltage Level (kV)
Maximum Fault Current (kA)
Breaker Capacity(kA)
% of Breaker Capacity
[K_ISINYA 132 4.13 31.5 13.11
[K_KYENI11 132 3.95 31.5 12.54
[K_WOTE 132 4.01 31.5 12.73
[K_OTHAYA 132 4.14 31.5 13.14
[K_KABARNET11 132 4.03 31.5 12.79
[K_SANGORO11 132 4.19 31.5 13.30
[K_BONDO 132 4.03 31.5 12.79
[K_KIMILILI 132 3.94 31.5 12.51
[K_SAMBURU 22 220 5.15 40 12.88
[K_KWALE TEE 220 5.17 40 12.93
[K_ISIOLO 220 220 5.06 40 12.65
[K_MARSABIT 220 5.23 40 13.08
[T_TARUSHA41 400 5.31 40 13.28
[K_GALU11 132 3.77 31.5 11.97
[K_KITUI11 132 3.79 31.5 12.03
[K_BOMET11 132 3.63 31.5 11.52
[K_DONGO_KU 220 4.63 40 11.58
[K_MAUA 220 220 4.71 40 11.78
[K_TURKWEL21 220 4.7 40 11.75
[K_LOKICHAR 220 4.63 40 11.58
[K_KAINUK21 220 4.71 40 11.78
[K_LODWAR 220 4.62 40 11.55
[K_MARIAKANI4 400 4.83 40 12.08
[K_MTITO AND1 132 3.31 31.5 10.51
[K_MANYANI11 132 3.51 31.5 11.14
[K_KWALE SC 132 3.43 31.5 10.89
[K_TITANIUM11 132 3.51 31.5 11.14
[K_KISII11 132 3.51 31.5 11.14
[K_KILGORS132 132 3.31 31.5 10.51
[K_KILIFI 220 4.28 40 10.70
[K_BAMBUR CE2 220 4.31 40 10.78
[K_KAKMEGA220 220 4.4 40 11.00
[K_AWENDO11 132 3.28 31.5 10.41
[K_NDHIWA 132 3.1 31.5 9.84
[K_WERU 220 4.19 40 10.48

237
YEAR 2035 THREE PHASE SHORT CIRCUIT CURRENT
Bus Name Voltage Level (kV)
Maximum Fault Current (kA)
Breaker Capacity(kA)
% of Breaker Capacity
[K_MUSAGA220 220 3.81 40 9.53
[K_MALINDI21 220 3.78 40 9.45
[K_KIBUYUNI2 220 3.64 40 9.10
[K_KORTUM21 220 3.44 40 8.60
[U_TORORO21 220 3.48 40 8.70
[K_GARISSA11 132 2.6 31.5 8.25
[K_GARISA PV1 132 2.37 31.5 7.52
[K_ISIBENIA11 132 2.58 31.5 8.19
[K_NDIGWA 132 2.52 31.5 8.00
[K_MAGUNGA 132 2.41 31.5 7.65
[K_GOGO 132 2.64 31.5 8.38
[K_CHOGORIA 132 2.36 31.5 7.49
[K_MAGADI 220 2.87 40 7.18
[K_GARSEN21 220 2.64 40 6.60
[K_GARBATULA 220 2.91 40 7.28
[K_KITALE 220 2.98 40 7.45
[K_MARALAL11 132 1.96 31.5 6.22
[TEST BUS 220 2.35 40 5.88
[K_GARISSA 220 2.52 40 6.30
[K_NAMANGA 132 1.46 31.5 4.63
[K_TAVETA11 132 1.69 31.5 5.37
[K_MUTOMO 132 1.54 31.5 4.89
[K_LAMU21 220 1.81 40 4.53
[K_HOLA 220 2.18 40 5.45
[K_BURA 220 2.1 40 5.25
[K_LOKICHOGIO 220 1.92 40 4.80
[K_KIBWEZI 132 1 31.5 3.17
[K_MOYALE 220 1.33 40 3.33
[K_WAJIR 220 0.71 40 1.78
[K_HABASWEIN 220 0.95 40 2.38
[K_MANDERA 220 0.45 40 1.13
2040

238
ANNEX 32 Three phase short circuit current Year 2040
YEAR 2040 THREE PHASE SHORT CIRCUIT CURRENT
Bus Name Voltage Level (kV)
Maximum Fault Current (kA)
Breaker Capacity (kA)
% of Breaker Capacity
[K_JUJA 132 22.66 31.5 71.94
[K_DANDORA11 132 22.66 31.5 71.94
[K_RUARAK 132 22.59 31.5 71.71
[K_RUARAKAT 132 22.59 31.5 71.71
[TEE 132 22.29 31.5 70.76
[K_THIKA11 132 22.32 31.5 70.86
[K_THIKA12 132 21.77 31.5 69.11
[K_RUARAKA11 132 20.77 31.5 65.94
[K_SUSWA21 220 25.95 40 64.88
[K_NIP 220 24.54 40 61.35
[K_NIP 220 24.54 40 61.35
[K_KAMBURU11 132 18.21 31.5 57.81
[K_KAMBTRF11 132 18.19 31.5 57.75
[K_NIP 220 23.39 40 58.48
[K_OLKARIAIAU 220 22.94 40 57.35
[K_LESSOS11 132 17.31 31.5 54.95
[K_LESSTRF11 132 17.31 31.5 54.95
[K_OLKARIA 220 22.11 40 55.28
[K_OLK 220 21.77 40 54.43
[K_OLKARIA 220 21.64 40 54.10
[K_THIKA 132 16.76 31.5 53.21
[K_DANDORA 220 19.61 40 49.03
[K_MALAA220 220 19.72 40 49.30
[K_THIKA 220 19.62 40 49.05
[K_THIKA 132 15.03 31.5 47.71
[K_KONZANEW 132 14.71 31.5 46.70
[K_SOILO11 132 14.85 31.5 47.14
[K_RONGAI 132 14.7 31.5 46.67
[K_MENE_NEW 132 14.68 31.5 46.60
[K_ISINYA21 220 18.88 40 47.20
[K_UPLANDS 132 14.35 31.5 45.56
[K_GITARU11 132 14.64 31.5 46.48
[K_MENENGAI 132 14.41 31.5 45.75
[K_EMBA 220 18.26 40 45.65

239
YEAR 2040 THREE PHASE SHORT CIRCUIT CURRENT
Bus Name Voltage Level (kV)
Maximum Fault Current (kA)
Breaker Capacity (kA)
% of Breaker Capacity
[K_EMBA-DUMMY 220 18.26 40 45.65
[K_EMBAKASI 220 18.26 40 45.65
[K_HG 132 14.04 31.5 44.57
[K_GILGIL 400 17.72 40 44.30
[K_ULU11 132 13.44 31.5 42.67
[K_KONZA 132 13.46 31.5 42.73
[K_NRB 220 17.28 40 43.20
[K_ATHI 220 17.22 40 43.05
[K_MACHAKOS 132 13.37 31.5 42.44
[K_CABLE-OHL22 220 16.97 40 42.43
[K_CABLE-OHL 220 16.97 40 42.43
[K_LAMU 220 16.95 40 42.38
[K_KIMUKA 220 16.31 40 40.78
[K_CBD 220 16.5 40 41.25
[K_B_DC2 400 16.42 40 41.05
[K_B_DC1 400 16.42 40 41.05
[K_SUSWA 400 16.42 40 41.05
[K_MALAA 400 16.39 40 40.98
[K_GILGIL 220 15.83 40 39.58
[K_LONGONOT 220 15.88 40 39.70
[K_BARINGO21 220 16.14 40 40.35
[K_LONGONOT 400 15.98 40 39.95
[K_OLK 220 15.55 40 38.88
[K_MAKINDU 132 11.92 31.5 37.84
[K_RABAI11 132 12.12 31.5 38.48
[K_KONZA4 400 15.07 40 37.68
[K_RONGAI 400 15.23 40 38.08
[K_RABAITRF 132 11.76 31.5 37.33
[K_RABTRF12 132 11.76 31.5 37.33
[K_RABAITR 132 11.76 31.5 37.33
[K_ISINYA41 400 14.99 40 37.48
[K_KIMUKA 400 14.83 40 37.08
[K_OLKARIA 132 11.03 31.5 35.02
[K_RONGAI220 220 13.92 40 34.80
[K_LESSOS 220 13.95 40 34.88

240
YEAR 2040 THREE PHASE SHORT CIRCUIT CURRENT
Bus Name Voltage Level (kV)
Maximum Fault Current (kA)
Breaker Capacity (kA)
% of Breaker Capacity
[K_LESSOS 220 13.95 40 34.88
[K_LESSOS 220 13.95 40 34.88
[K_MENENGAI 400 13.86 40 34.65
[K_OLKARIA1 132 10.73 31.5 34.06
[K_LANET11 132 10.67 31.5 33.87
[K_KILGORS 132 10.83 31.5 34.38
[K_KAMBURU21 220 13.44 40 33.60
[K_NEW_VOI 132 10.37 31.5 32.92
[K_OLKARIAIAU 132 10.45 31.5 33.17
[K_KIPEVU11 132 10 31.5 31.75
[K_KINDARUMA 132 10.21 31.5 32.41
[K_RONGAI_NC 132 9.94 31.5 31.56
[K_KIPETO 220 12.64 40 31.60
[K_TEE 132 9.91 31.5 31.46
[K_KIBOS 132 9.82 31.5 31.17
[K_LESSOS 400 12.42 40 31.05
[K_KOKOTONI 132 9.57 31.5 30.38
[K_BAMBURI11 132 9.59 31.5 30.44
[K_JOMVU 132 9.32 31.5 29.59
[K_BOMANI 132 9.34 31.5 29.65
[K_EMBU13 132 9.49 31.5 30.13
[TEE 132 9.48 31.5 30.10
[K_GATUNDU11 132 9.36 31.5 29.71
[K_KISUMU 132 9.39 31.5 29.81
[K_LAMU21 220 12.09 40 30.23
[K_BARINGO 400 11.98 40 29.95
[K_MARAL/LOOS 400 11.87 40 29.68
[TEE 132 9.06 31.5 28.76
[TEE2 132 9.17 31.5 29.11
[K_KUTUS11 132 9.23 31.5 29.30
[K_WELLHED37 132 9.15 31.5 29.05
[K_CHEMOSIT 132 8.59 31.5 27.27
[K_SOTIK 132 8.39 31.5 26.63
[K_MATASIA 220 10.87 40 27.18
[K_VIPINGO31 132 8.17 31.5 25.94

241
YEAR 2040 THREE PHASE SHORT CIRCUIT CURRENT
Bus Name Voltage Level (kV)
Maximum Fault Current (kA)
Breaker Capacity (kA)
% of Breaker Capacity
[K_MASINGA11 132 8.22 31.5 26.10
[K_KIAMBERE 220 10.32 40 25.80
[K_GITARU21 220 10.2 40 25.50
[K_EMBU 220 10.47 40 26.18
[K_OLK 220 10.26 40 25.65
[K_ISIOLO 132 7.8 31.5 24.76
[K_SUSWA 220 9.87 40 24.68
[K_LOYAN 220 10 40 25.00
[K_KILIFI11 132 7.43 31.5 23.59
[K_ISIOLO11 132 7.48 31.5 23.75
[K_OLKALOU 132 7.44 31.5 23.62
[K_MUHORONI 132 7.52 31.5 23.87
[K_KOLWA 132 7.69 31.5 24.41
[K_MARIAKANI 220 9.56 40 23.90
[K_NAIVASHA 132 7.18 31.5 22.79
[K_MAKINDU 400 9.09 40 22.73
[K_KIBOKO11 132 6.9 31.5 21.90
[K_MSCEMTEE3 132 7.02 31.5 22.29
[K_BAMB 132 7.02 31.5 22.29
[K_MWALA 132 6.86 31.5 21.78
[K_KOPERE 132 7.06 31.5 22.41
[K_NEW 132 6.61 31.5 20.98
[K_MERUWESHI 132 6.53 31.5 20.73
[K_MARIAKANI 132 6.52 31.5 20.70
[K_MSACEM31 132 6.72 31.5 21.33
[K_MSACEMTEE 132 6.54 31.5 20.76
[K_MAUA11 132 6.66 31.5 21.14
[K_RABAI21 220 8.48 40 21.20
[K_NAMANGA 400 8.5 40 21.25
[K_SULTAN 132 6.4 31.5 20.32
[K_LOITOKTOK 132 6.45 31.5 20.48
[K_RUMURUTI 132 6.29 31.5 19.97
[K_MUSAGA11 132 6.4 31.5 20.32
[K_MYANGA 132 6.22 31.5 19.75
[MYANGA 132 6.22 31.5 19.75

242
YEAR 2040 THREE PHASE SHORT CIRCUIT CURRENT
Bus Name Voltage Level (kV)
Maximum Fault Current (kA)
Breaker Capacity (kA)
% of Breaker Capacity
[MYANGA 132 6.22 31.5 19.75
[K_THIKA 220 8.07 40 20.18
[K_OLKA 220 8.02 40 20.05
[K_MAUNGU11 132 6.13 31.5 19.46
[K_ISHIARA11 132 5.85 31.5 18.57
[K_TEE 132 5.91 31.5 18.76
[K_AKIRA 220 7.63 40 19.08
[K_AGIL 220 7.63 40 19.08
[K_TEE 220 7.55 40 18.88
[K_LOYAN 400 7.65 40 19.13
[K_KIPEVUDII 132 5.62 31.5 17.84
[K_VOI11 132 5.77 31.5 18.32
[K_TOP 132 5.81 31.5 18.44
[K_MERU11 132 5.71 31.5 18.13
[K_KUTUSTEE1 132 5.76 31.5 18.29
[K_MAKUTANO 132 5.53 31.5 17.56
[K_ELDORET11 132 5.73 31.5 18.19
[K_KWALE 220 7.16 40 17.90
[K_OLK 220 7.33 40 18.33
[K_KIBOS 220 7.09 40 17.73
[K_SELENKEI 220 7.37 40 18.43
[K_NEWMAUNGU 132 5.25 31.5 16.67
[K_KIGANJO11 132 5.24 31.5 16.63
[K_MWINGI11 132 5.25 31.5 16.67
[U_TORO11 132 5.36 31.5 17.02
[K_KERINGET 220 6.66 40 16.65
[K_VOI 400 6.76 40 16.90
[K_LAMU 400 6.98 40 17.45
[K_NANYUKI11 132 5 31.5 15.87
[K_GITHAMBO 132 5.02 31.5 15.94
[K_SONDU11 132 4.96 31.5 15.75
[K_KISII11 132 4.89 31.5 15.52
[K_KITALE11 132 5.05 31.5 16.03
[K_GARSEN21 220 6.42 40 16.05
[K_SAMBURU 220 6.3 40 15.75

243
YEAR 2040 THREE PHASE SHORT CIRCUIT CURRENT
Bus Name Voltage Level (kV)
Maximum Fault Current (kA)
Breaker Capacity (kA)
% of Breaker Capacity
[K_WERU 220 6.21 40 15.53
[K_DONGO_KU 220 6.55 40 16.38
[K_KARURA 220 6.39 40 15.98
[K_KIBUYUNI 132 4.83 31.5 15.33
[K_NAROK11 132 4.81 31.5 15.27
[K_WEBUYE11 132 4.78 31.5 15.17
[K_RANGALA11 132 4.77 31.5 15.14
[K_MALINDI21 220 5.9 40 14.75
[K_CHEMOSIT 220 5.81 40 14.53
[K_MARIAKANI 400 5.82 40 14.55
[K_KILGORIS 400 6.02 40 15.05
[K_SAMBURU 132 4.54 31.5 14.41
[K_MUMIAS11 132 4.54 31.5 14.41
[K_SANGORO11 132 4.43 31.5 14.06
[K_BOMET11 132 4.56 31.5 14.48
[K_AWENDO11 132 4.37 31.5 13.87
[K_MUSAGATEE 132 4.52 31.5 14.35
[K_BUSIA 132 4.45 31.5 14.13
[K_KAPSABET 132 4.44 31.5 14.10
[K_KILIFI 220 5.77 40 14.43
[K_LOKICHAR 220 5.48 40 13.70
[K_LODWAR 220 5.47 40 13.68
[T_TARUSHA41 400 5.67 40 14.18
[K_ISINYA 132 4.19 31.5 13.30
[K_GALU11 132 4.13 31.5 13.11
[K_KYENI11 132 4 31.5 12.70
[K_WOTE 132 4.1 31.5 13.02
[K_OTHAYA 132 4.19 31.5 13.30
[K_KABARNET 132 4.15 31.5 13.17
[K_BONDO 132 4.15 31.5 13.17
[K_KIMILILI 132 4.02 31.5 12.76
[K_BAMBUR 220 5.37 40 13.43
[K_ISIOLO 220 5.26 40 13.15
[K_TURKWEL21 220 5.07 40 12.68
[K_KAINUK21 220 5.08 40 12.70

244
YEAR 2040 THREE PHASE SHORT CIRCUIT CURRENT
Bus Name Voltage Level (kV)
Maximum Fault Current (kA)
Breaker Capacity (kA)
% of Breaker Capacity
[K_MARSABIT 220 5.37 40 13.43
[K_KWALE 132 3.76 31.5 11.94
[K_TITANIUM 132 3.83 31.5 12.16
[K_KITUI11 132 3.88 31.5 12.32
[K_NDHIWA 132 3.73 31.5 11.84
[K_ISIBENIA 132 3.88 31.5 12.32
[K_MAUA 220 4.88 40 12.20
[K_MTITO 132 3.38 31.5 10.73
[K_MANYANI 132 3.61 31.5 11.46
[K_KIBUYUNI2 220 4.44 40 11.10
[K_KAKMEGA 220 4.55 40 11.38
[K_GOGO 132 3.22 31.5 10.22
[K_MUSAGA220 220 3.92 40 9.80
[K_OLSUSWA 220 4.06 40 10.15
[K_GARISSA11 132 2.75 31.5 8.73
[K_MAGUNGA 132 2.85 31.5 9.05
[K_KORTUM21 220 3.61 40 9.03
[U_TORORO21 220 3.54 40 8.85
[K_CHOGORIA 132 2.38 31.5 7.56
[K_GARISA 132 2.48 31.5 7.87
[K_NDIGWA 132 2.57 31.5 8.16
[K_HOLA 220 3.34 40 8.35
[K_GARBATULA 220 3.12 40 7.80
[K_KITALE 220 3.09 40 7.73
[K_MAGADI 220 2.9 40 7.25
[K_BURA 220 2.87 40 7.18
[K_GARISSA 220 2.82 40 7.05
[K_MARALAL11 132 1.98 31.5 6.29
[K_MUTOMO 220 2.44 40 6.10
[K_TEE 220 2.44 40 6.10
[K_NAMANGA 132 1.47 31.5 4.67
[K_TAVETA11 132 1.72 31.5 5.46
[K_MUTOMO 132 1.56 31.5 4.95
[K_LOKICHOGIO 220 2.1 40 5.25
[K_KIBWEZI 132 1.01 31.5 3.21

245
YEAR 2040 THREE PHASE SHORT CIRCUIT CURRENT
Bus Name Voltage Level (kV)
Maximum Fault Current (kA)
Breaker Capacity (kA)
% of Breaker Capacity
[K_MOYALE 220 1.34 40 3.35
[K_WAJIR 220 0.72 40 1.80
[K_HABASWEIN 220 0.98 40 2.45
[K_MANDERA 220 0.46 40 1.15
ANNEX 33 System Losses
1. Losses without 400kV Network
1.
VOLTAGE LEVEL (kV) 2020 2021 2022 2023 2024 2025
MW MW MW MW MW MW
DC 0 0.01 0.01 0.01 0.01 0.01
400 0 0 0 0 0 0
220 48.16 45.56 47.17 26.87 27.68 26.87
132 35.67 30.4 33.78 33.22 29.54 30
TOTAL 83.83 75.97 80.96 60.1 57.23 56.88
% POWER LOSSES 4.26 3.70 3.79 2.76 2.57 2.43
2) Losses with 400kV Network
VOLTAGE LEVEL (kV)
2021 2022 2023 2024 2025 2030 2035 2040
MW MW MW MW MW MW MW MW
DC 1.2 1.2 1.2 1.2 1.2 10.77 10.77 10.77
400 2.56 3.58 3.52 5.48 5.93 22.69 28.57 28.29
220 39.71 40.2 16.09 17.53 18.33 34.22 52.68 71.37
132 30.58 34.24 32.62 29.13 25.64 30.1 41.63 66.42
TOTAL 74.05 79.22 53.43 53.34 51.1 97.78 133.65 176.85
%POWER LOSS 3.56 3.56 2.5 2.29 2.27 3.3 3.53 3.48

246
ANNEX 34 System Summary (generation, Load and Losses)
1. Medium Term
ZONE 2020 2025
Generation Load Losses Generation Load Losses
ETHIOPIA 0 0 0 200.1 0 2.9
0 0 0 -113.3 0 143.5
NAIROBI 103.8 1017.4 31 180.2 1219.3 30.8
75.4 334.4 234.3 38.9 400.8 281.3
UGANDA 61.2 0 0 50 0 0
20.9 0 0 -19 0 0.5
COAST 288.9 290.9 10.3 300 325.5 6.4
13.2 95.6 77.9 -65.7 107.4 54
MT KENYA 651.9 132.1 13.7 569.1 194.1 14.5
50.2 43.4 93.5 -4.6 63.4 92.4
C RIFT 636 112.5 46.5 811.2 166.7 20.3
142.6 37 339.4 -12 54.8 207.2
W REGION 86.4 213.7 14.3 85.2 258.2 8.8
28.5 70.8 52.2 -13.5 84.9 43.3
N RIFT 139.1 64 19.4 145.1 86.2 5.5
24.4 21 77.5 9.9 28.3 52.3
Active Power (MW) 1967.3 1830.6 135.2 2340.9 2250 89.2
Reactive Power (MVAr) 355.2 602.3 874.7 -179.4 739.6 874.7

247
2. Long Term
ZONE 2030 2035 2040
Generation Load Losses Generation Load Losses Generation Load Losses
NAIROBI 45.5 1337.5 41.3 109.3 1767.7 71.6 109.9 2311.3 114.8
9.7 439.6 419.6 176.1 582.8 701.4 49.4 762 1143.6
COAST 0 595.8 20.2 198.6 757.4 19 880.4 962.6 26
0 202.9 158.5 268.8 254.9 189.6 8 323.2 223.6
MT KENYA 1090 298.2 24.3 1053.5 400.6 26 1543.3 523.8 43.3
-194.2 98.8 203.3 -226.8 130.7 189.5 -235.3 170.9 314.4
C RIFT 1192.5 260.8 19.6 1587.6 338 33.5 1700.1 435.6 40
-98.9 85.7 236 -190.5 117.8 356.6 -53.9 152 399.2
W REGION 92.2 431.8 10.1 92.2 571 15.3 150.2 747.1 24.2
-13.7 141.9 62.2 46.5 190.4 107.2 28.5 253 184.5
N RIFT 545 152.6 10.4 745.1 201.8 22.5 695.2 264 23.6
-31.7 50.2 129.6 -281.4 65.7 235.3 -60.3 85.9 252.9
Active Power (MW)
2965 3076.7 126.5 3786.2 4036.5 187.9 5078.5 5244.4 273.3
Reactive Power (MVAr)
-328.8 1019.2 1209.1 -207.4 1342.2 1779.7 -292.9 1747.1 2518.9