Scenarios for biodegradable solid waste management and ...
70
TVM4930 - Industrial Ecology, Master Thesis Scenarios for biodegradable solid waste management and energy recovery in the 'A' Ward in Mumbai, India by Lars Gunnar Furelid Tellnes Supervised by Daniel Mueller and Venkatesh Govindarajan Norwegian University of Science and Technology Faculty of Engineering Science and Technology Department of Hydraulic and Environmental Engineering Trondheim June 15 th , 2010
-
Upload
khangminh22 -
Category
Documents
-
view
4 -
download
0
Transcript of Scenarios for biodegradable solid waste management and ...

TVM4930 - Industrial Ecology, Master Thesis
Scenarios for biodegradable solid waste management and energy recovery in the 'A' Ward in Mumbai, India
by
Lars Gunnar Furelid Tellnes
Supervised by
Daniel Mueller and Venkatesh Govindarajan
Norwegian University of Science and TechnologyFaculty of Engineering Science and Technology
Department of Hydraulic and Environmental Engineering
Trondheim June 15th, 2010

ii

AbstractIntroduction. Mumbai is one of the most highly-populated cities in the world and the commercial capital of India. Every day, about 6500 tons of municipal solid waste (MSW) and 2500 tons of construction and demolition waste are generated. The collection efficiency in Mumbai is relatively high for an Indian city, but there is a paucity of space for landfilling.. With the introduction of the Municipal Solid Waste (Management & Handling) Rules, 2000, biodegradable wastes could not be landfilled without prior processing.. To find a solution to this, the Municipal Corporation of Greater Mumbai (MCGM) entrusted a consultancy with the task of determining solutions to the city's waste treatment challenges in the short-, medium-, and long-term. The report, which was readied in year-2006 recommended the capping of the currently-operating landfills accompanied by landfill-gas (methane) capture, financed through the clean development mechanism. Further, it advised the MCGM to compost 6000 tons of mixed MSW and subject 500 tons of separately-collected market and restaurant wastes to biomethanation daily. The latter solution originates from the MSW rules which state that this fraction should be separately collected and used. This solution would also incur the lowest tipping fees.. Thus, centralised solutions can be beneficial and also more economical. The reaction to there recommendation has been from many that the civil societies role in waste handling have been rejected and that decentralised solutions are more beneficiary and cheaper.
Objectives. This study has therefore focused on decentralised and on-site treatment solutions of biodegradable solid wastes, in preference to the conventional, in-vogue centralised solution. The peninsular tip of the city which is an affluent area of Mumbai – the A ward – was selected as the study area. If treatment of waste could be commercially viable, was the driver behind the study.
Methods. Material flow analysis of the flow of biodegradable waste has been applied as a basis for this study. Material flow cost accounting has also been carried out. A stakeholder analysis has been performed in order to understand how the system would be influenced by differing perceptions and interests of the stakeholders associated with it. Scenario for treating all the waste of 'A' ward on-site, decentralised and centralised was compared to the current situation.
Results. Commercial and institutions were the largest generators in the 'A' ward, and was closely followed by the residences. The generators of waste were the primary stakeholders and the waste managers were the secondary. If all the waste were to be treated on-site of generation, the net cost of SWM services would almost be eliminated. Decentralised and centralised solution had almost the same net cost. On-site or decentralised treatment would require 0.3% of the total area of 'A' ward.
Conclusion. The MSW rules which came into force in year-2000 address the health, hygiene and environmental goals quite satisfactorily and degree of compliance to these rules is a good proxy for the level of hygiene and environmental upkeep. In a low-income country, cost-efficiency of SWM services is crucial. Were labour is cheap, costs could also serve as indicator of resource conservation. It should also be mentioned that resource recovery also has several economic, environmental and social side-benefits as well. Tools of industrial ecology like material flow analysis are important for decision support regarding this, however in depth study of the objectives and context of the study should be conducted before deciding on the method.
iii

Table of Contents1 Introduction......................................................................................................................................1
1.1 Objectives of the study.............................................................................................................21.2 Research questions....................................................................................................................2
2 Literature review..............................................................................................................................32.1 Solid waste management..........................................................................................................3
2.1.1 The goals of SWM.............................................................................................................42.1.2 Decision-making in ISWM................................................................................................5
2.2 Solid waste management in developing countries....................................................................62.3 Solid waste management in India.............................................................................................8
2.3.1 Legal aspects of SWM in India........................................................................................102.3.2 Treatment options used in India.......................................................................................11
2.4 Solid waste management in Mumbai......................................................................................122.4.1 Generation and Storage....................................................................................................152.4.2 Collection and transport...................................................................................................162.4.3 Treatment and disposal.....................................................................................................16
2.5 Solid waste management in 'A' ward......................................................................................183 Methods..........................................................................................................................................22
3.1 Industrial Ecology...................................................................................................................223.2 Material flow analysis.............................................................................................................233.3 System definition and processes of solid biodegradable waste..............................................25
3.3.1 Generation and storage.....................................................................................................263.3.2 Collection and transport...................................................................................................273.3.3 Decentralised biomethanation..........................................................................................273.3.4 Decentralised vermicomposting.......................................................................................273.3.5 Burning & dumping.........................................................................................................283.3.6 On-site vermicomposting.................................................................................................283.3.7 On-site biomethanation....................................................................................................29
3.4 System definition and process of material flow cost accounting............................................303.4.1 Generation and storage.....................................................................................................323.4.2 Collection and transport...................................................................................................323.4.3 Decentralised biomethanation..........................................................................................333.4.4 Decentralised vermicomposting.......................................................................................333.4.5 Burning & dumping.........................................................................................................333.4.6 On-site vermicomposting.................................................................................................333.4.7 On-site biomethanation....................................................................................................33
3.5 Evaluation of status quo indicators.........................................................................................343.5.1 Health and hygiene - processing according to MSW rules 2000.....................................353.5.2 Net municipal gross costs to total gross costs..................................................................353.5.3 Unit cost of SWM service................................................................................................353.5.4 Land use...........................................................................................................................35
3.6 Scenario analysis.....................................................................................................................363.7 Stakeholder identification.......................................................................................................363.8 Data collection........................................................................................................................37
4 Results............................................................................................................................................394.1.1 Material flow analysis of biodegradable solid waste.......................................................39
iv

4.1.2 Material flow cost accounting of biodegradable solid waste...........................................404.2 Evaluation of the status quo....................................................................................................414.3 Scenario analysis.....................................................................................................................414.4 Stakeholder analysis...............................................................................................................41
5 Discussion.......................................................................................................................................445.1 Discussion of results...............................................................................................................445.2 Discussion of methods............................................................................................................45
6 Conclusion, recommendation and limitations................................................................................486.1 Conclusion..............................................................................................................................486.2 Recommendation....................................................................................................................486.3 Limitations..............................................................................................................................49
7 List of literature..............................................................................................................................508 List of interviewees........................................................................................................................61
Index of TablesTable 1: Facts about the Republic of India (CIA, 2010)......................................................................9Table 2: India rank on the 2009 Legatum Prosperity Index (Legatum, 2010).....................................9Table 3: Facts about Greater Mumbai (MCGM, 2010)......................................................................13Table 4: Expenditure on various activities of SWM (SWM CELL, AIILSG (2003))........................14Table 5: Waste quantity and characteristics of Mumbai (CPCB).......................................................15Table 6: Waste transportation vehicles in Mumbai (MCGM, n.d.b)..................................................16Table 7: Facts about 'A' ward..............................................................................................................18Table 8: Waste collection vehicles used in 'A' ward ('A' ward office, 2009)......................................19Table 9: Parameters for the biodegradable waste material flow analysis...........................................30Table 10: Parameters used for the biodegradable waste material flow cost accounting....................34Table 11: Symbol, name, description and parameter values of the different scenarios......................36Table 12: Evaluation indicators for the current situation...................................................................41Table 13: Indicator values of the different scenarios..........................................................................41Table 14: Primary stakeholders of SWM in 'A' Ward, Mumbai, India...............................................42Table 15: Secondary stakeholders of SWM in 'A' Ward, Mumbai, India...........................................43Table 16: External stakeholders of SWM in 'A' Ward, Mumbai, India..............................................43
Illustration Index
v

Illustration 1: Functional elements of the SWM in Mumbai (MCGM, n.d.b)...................................15Illustration 2: Dumping grounds and transfer stations in Mumbai (MCGM, n.d.a)..........................17Illustration 3: Map of SWM facilities in 'A' ward. 1: Biomethanation at Tata Institute of Fundamental Research. 2: Biomethanation at INS Kunjali. 3: Vermicomposting at Colaba Pumping Station. 4: Dry waste sorting centre. 5: 'A' Ward Office (Map: Google Maps)..................................20Illustration 4: A triangle approach to eco-industrial design (Van Koppen, 2004:29).........................23Illustration 5: System definition of solid biodegradable waste flow system 'A' Ward, Mumbai.......25Illustration 6: System definition of the biodegradable waste flow cost accounting system 'A' Ward, Mumbai...............................................................................................................................................31Illustration 7: Biodegradable solid waste flow 'A' Ward, Mumbai, India..........................................39Illustration 8: Biodegradable solid waste flow cost accounting 'A' Ward, Mumbai, India................40
vi

PrefaceThe idea of this project comes from an interaction between Daniel Mueller, my supervisor, and an acquaintance of an entrepreneur in Mumbai. The entrepreneur, Prahlad Deora, is interested in the potential of utilising energy from solid waste in Mumbai. Venkatesh Govindarajan, my co-supervisor, visited Mumbai in the winter of 2008/2009 and met Deora and other potential stakeholders in the city. This served as the background for the objectives of my work that has culminated in this thesis. The thesis has been written as a part of a two-year masters programme in Industrial Ecology, a multi-disciplinary programme at the Norwegian University of Science and Technology. The thesis weight is 30 ECTS-credits and from the course description, the content of TVM4930 - Industrial Ecology, Master Thesis is:
The master thesis is carried out in the field of industrial ecology, i.e. the study of material and energy metabolism of given technical systems, their environmental and cost impacts, as well as factors influencing these issues. Examples of such technical systems are society's infrastructure (water, sewage, waste, energy), buildings and built environment stocks, and the material cycles for metals, biomass and nutrients (NTNU, n.d.).
From this, the metabolism in the society's infrastructure of waste flow has been studied. Different scenarios have been analysed to evaluate environmental and cost impacts. Factors that influence this have been analysed by using stakeholder analysis. In this work, I have ensured that the sources and methods are transparent and useful.
The work started in the spring of 2009, with a group project that was conducted in the course TVM4150 - Solid Waste Management. In this report, incineration and anaerobic digestion technologies were compared with each other for appropriateness for use in developing countries. Special emphasis was given to the factors which ought to be considered for practical decision-making. Following this, in the Fall of 2009, a report was prepared for TVM5175 - Industrial Ecology, Project, focusing on only the carbon flow in the biodegradable fraction of the waste in 'A' Ward in Mumbai India. The results from this was the energy potential associated with the same, if the wastes would be used for biogas generation. In the Fall of 2009, I attended a seminar on biological treatment by Waste Management Norway, the Sardinia Symposium 2009 and visited the Research Center of Waste and Resource Management at the Vienna University of Technology. These visits served as bases for my literature review. This was followed by a three-week field trip to Mumbai. In Mumbai, I conducted interviews, made field-surveys and gathered documentations that served both as literature sources and data for my project and thesis. In the thesis assignment, I was suppose to expand my analysis based on the carbon cycle system I made in my project. Even tough I raised the question frequently, I could not understand how the carbon cycle could be used to reach the objectives of my study. This resulted in that I used most of the thesis time for literature review and trivial analyses. From this, I could not find any scientific or practical grounds for the given approach and I changed the design of the system 10 days before the deadline.
vii

AcknowledgementsThe supervisors Daniel Mueller and Venkatesh Govindarajan for the fruitful discussions. The Department of Hydraulic and Environmental Engineering for sponsoring my field work to India. Mr. Prahlad Deora, Mr. Ravindra Jamenis and personnel at Graham Blowpack Pvt. Ltd., for their guidance and help during the field trip. Jakob Lederer and others at the Group of Waste and Resource Management at the Vienna University of Technology for help with the literature review and preparations for my field trip. Shanta Chatterji of the Clean Air Island and Vijaya Srinivasan from the Stree Mukti Sanghatana for their time and for sharing information about the solutions of civil societies to waste management and social issues in Mumbai. Dr. Amiya Kumar Sahu at the National Solid Waste Association of India for providing comprehensive information about MSWM in Mumbai. My visits to the Taj President, the Mumbai World Trade Centre and the 'A' ward office has provided me with useful insight. Thanks and best wishes to Rayson Ho, who wrote a similar thesis for Rio de Janeiro, for his cooperation and useful discussions. Joakim Auflem Eriksen and Kamilla Asplin for the group work on a project in the course Solid Waste Management, which served as a prequel to the project and the thesis. Tobin Rist and Venkatesh Govindarajan for the proofreading finally.
AcronymsAD Anaerobic DigestionAIILSG All India Institute of Local Self GovernmentBMC Brihanmumbai Municipal CorporationCA Cost AccountingCBA Cost Benefit AnalysisCDM Clean Development MechanismCPCB Central Pollution Control BoardGDP Gross Domestic ProductGHG Greenhouse GasesGNP Gross National ProductIE Industrial EcologyIPCC Intergovernmental Panel on Climate ChangeLCA Life Cycle AssessmentLPG Liquefied Petroleum GasMCDM Multi Criteria Decision MakingMCGM Municipal Corporation of Greater MumbaiMMRDA Mumbai Metropolitan Region Development AuthorityMPCB Maharashtra Pollution Control BoardMFA Material Flow AnalysisMSW Municipal Solid WasteMT Metric TonNGO Non-Governmental OrganisationNSWAI National Solid Waste Association of IndiaPPP Public Private PartnershipRCUES Regional Centre for Urban & Environmental StudiesSWM Solid Waste ManagementTIFF Tata Institute of Fundamental ResearchTPD Ton Per DayWTE Waste-To-Energy
viii

Currency Equivalents
1 USD = 46 Rupees (Rs.)
1 EUR = 57 Rupees (Rs.)
1 NOK = 7 Rupees (Rs.)
Approximate exchange rates from Bank of India 15.6.2010
ix

1 Introduction 1
1 IntroductionMumbai is the commercial capital of India and one of the most populous and densely populated cities in the world. The city and suburbs generate around 9000 MT (metric tons) of waste every day and in addition to stress on land resources by land-filling, the city is plagued by a host of health and environmental problems. The city also faces social challenges, as the prospects of earning a better livelihood impels more than 5000 people to move to the city daily. There are therefore many people living in slums and earning their bread as rag-pickers. This has provided an efficient and effective solution to the plastic, paper, metal and glass fractions of solid waste generated in the city. The two remaining large fractions are inert and biodegradable waste from food and gardens. The inert fraction has little impact on the environment if landfilled, but there are several issues with dumping of the food and garden waste. Because of this, the SWM handling rules forbid land-filling of untreated biodegradable waste. One can think of emissions to the air, leaching of undesirables from wetlands in which landfills are located, into water bodies. The biodegradable waste sent to landfills contain resources and with the right SWM system, these can be utilised. The carbon in the waste serves as a source for energy. The nitrogen, phosphorus and other elements are important nutrients. The potential for recovery, reuse and substitution of alternatives sourced from other sectors makes the prospects for energy and fertiliser production from solid waste attractive.
The goal of this paper is to evaluate the potential for handling the wastes at ward level, thereby reducing the amount of waste to be transported to central treatment and disposal. If this waste is used for energy and nutrient recovery, the decentralisation could also become commercially viable. The 'A' ward has been chosen as it is the furthest away from the landfills and is also one of the wealthiest regions of the city where waste collection coverage is complete and the awareness of sanitation issues higher.
In this study, biodegradable fraction of the Municipal Solid Waste is defined as food and garden and park related biological wastes. Food waste is what stems from food processing, distribution, leftovers etc. Garden-related wastes are generated in gardens, lawns and parks. The common phrase for such wastes in India is biodegradable waste, however in EU parlance it is simply called bio-waste.
In both the academic and political world, one of the debates or dilemmas in solid waste management in developing countries, is if the emphasis should be a large-scale centralised solution or smaller-scale decentralised solutions. The Municipal Corporation of Greater Mumbai (MCGM) is responsible for the waste-handling operations in Mumbai. There are plans to introduce composting and anaerobic digestion for treating biodegradable waste at the landfill-sites through public private partnerships. Also on the anvil are plans for upgrading the sewage treatment facilities with energy utilisation by anaerobic digestion. It is however to be determined if decentralised solutions are socially acceptable, economically viable, and environment-friendlier.
Lars Gunnar Furelid Tellnes

2 1.1 Objectives of the study
1.1 Objectives of the study1. Find the potential for recovering energy from waste in Mumbai.
2. Understand why this is of importance.
3. Find out how this idea can be commercially applied in practice.
1.2 Research questions1. How can the existing food-related organic waste management system in the A-ward be
evaluated according to the following criteria: Hygiene and health, environmental impacts, resource (energy and materials) recovery, employment generation and capital/operational costs?
2. Who are the stakeholders who have a say, influence and/or are impacted by changes in the way food waste is handled in the region? How can their interests be understood?
3. What are the possibilities (scenarios) for the A-ward to improve the performance according to the criteria listed above?
4. What are the possible business ideas which can emerge if entrepreneurs would be keen to participate in an 'overhauling' process? What is the scope for governmental intervention in order to play a role in utilizing the energy recovery potential of the food wastes in the region?
The Norwegian University of Science and Technology
2 Literature review 3
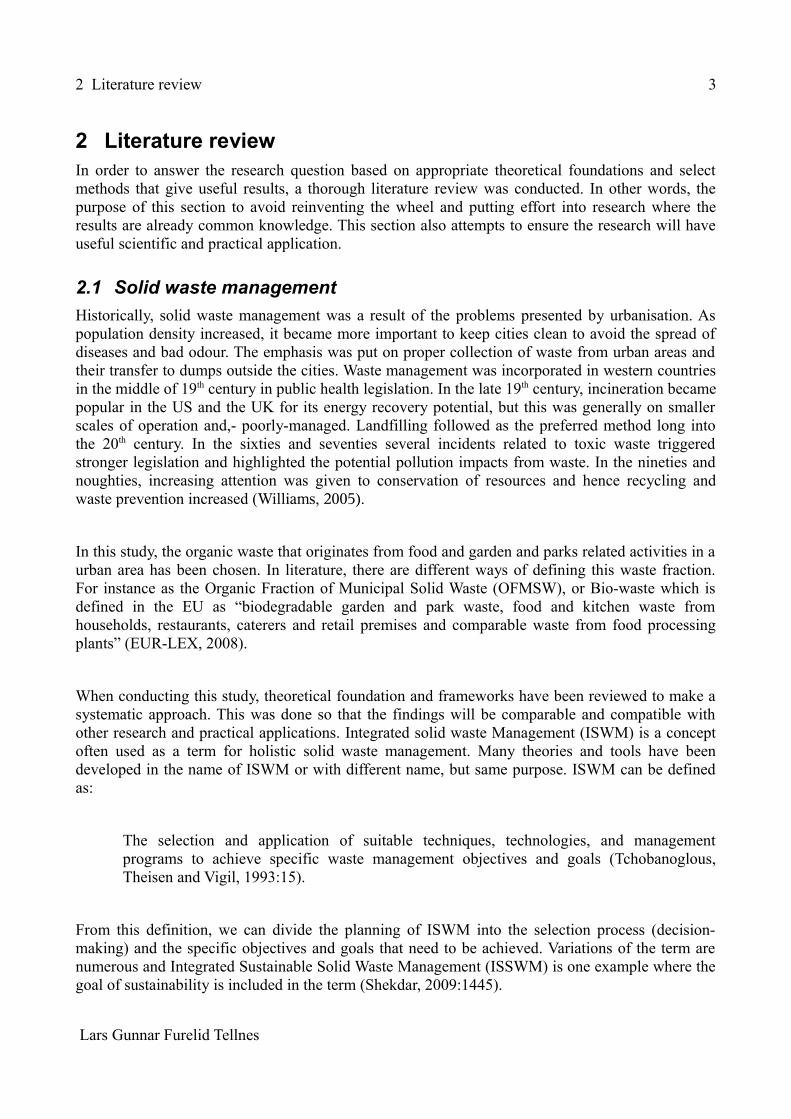
2 Literature reviewIn order to answer the research question based on appropriate theoretical foundations and select methods that give useful results, a thorough literature review was conducted. In other words, the purpose of this section to avoid reinventing the wheel and putting effort into research where the results are already common knowledge. This section also attempts to ensure the research will have useful scientific and practical application.
2.1 Solid waste managementHistorically, solid waste management was a result of the problems presented by urbanisation. As population density increased, it became more important to keep cities clean to avoid the spread of diseases and bad odour. The emphasis was put on proper collection of waste from urban areas and their transfer to dumps outside the cities. Waste management was incorporated in western countries in the middle of 19th century in public health legislation. In the late 19th century, incineration became popular in the US and the UK for its energy recovery potential, but this was generally on smaller scales of operation and,- poorly-managed. Landfilling followed as the preferred method long into the 20th century. In the sixties and seventies several incidents related to toxic waste triggered stronger legislation and highlighted the potential pollution impacts from waste. In the nineties and noughties, increasing attention was given to conservation of resources and hence recycling and waste prevention increased (Williams, 2005).
In this study, the organic waste that originates from food and garden and parks related activities in a urban area has been chosen. In literature, there are different ways of defining this waste fraction. For instance as the Organic Fraction of Municipal Solid Waste (OFMSW), or Bio-waste which is defined in the EU as “biodegradable garden and park waste, food and kitchen waste from households, restaurants, caterers and retail premises and comparable waste from food processing plants” (EUR-LEX, 2008).
When conducting this study, theoretical foundation and frameworks have been reviewed to make a systematic approach. This was done so that the findings will be comparable and compatible with other research and practical applications. Integrated solid waste Management (ISWM) is a concept often used as a term for holistic solid waste management. Many theories and tools have been developed in the name of ISWM or with different name, but same purpose. ISWM can be defined as:
The selection and application of suitable techniques, technologies, and management programs to achieve specific waste management objectives and goals (Tchobanoglous, Theisen and Vigil, 1993:15).
From this definition, we can divide the planning of ISWM into the selection process (decision-making) and the specific objectives and goals that need to be achieved. Variations of the term are numerous and Integrated Sustainable Solid Waste Management (ISSWM) is one example where the goal of sustainability is included in the term (Shekdar, 2009:1445).
Lars Gunnar Furelid Tellnes

4 2.1 Solid waste management
2.1.1 The goals of SWMISWM is from the definition about achieving specific goals, which are usually defined in national and local legislation. These have changed over the course of development different issues have arisen. The goals of modern waste management are however in general to:
• Protect human health and the environment
• Conserve resources such as materials, energy, and space
• Treat wastes before disposal so that they do not need aftercare when finally stored in landfills (Brunner and Rechberger, 2004).
These goals are familiar with the historical development of SWM, where the hygienic conditions of cities was one of the first main issues. For example, hygiene as the overall objective of public collection of solid waste was stated in the Norwegian Public Health law from 1860. Recycling and economic efficiency was also viewed as important to society, but only as sub-targets (Torstenson, 2006). Hygiene as a concept can be defined as “the science about the preventive (disease prevention) and the constructive (health promotion) medicine (Natvig, 1973:1). The term hygiene in everyday speech is more used as a term for cleanliness, but from the definition we can see that cleanliness is just a part of the term. Waste management is however considered a part of hygiene known as environmental hygiene. The environment is here all the extrinsic factors that can influence human life and health. The factors can be put into three sub-groups: the physical-chemical, the biological and the social (Natvig, 1973:60). Hanks,- (1967), argues that when it comes to direct contact with waste, occupations causing the worker to be direct exposed is of greatest concern. This would suggest that focusing on occupational health for workers in contact with waste is an important aspect. Böhm (2004) has assessed how hygienic safety of composted products treated by biological aerobic or anaerobic processes can be secured for the application in agriculture or horticulture. A three step control system conducting of process validation, process supervision and product supervision is recommended.
The environmental impacts of handling wastes have been of great concern in many studies. Mata-Alvarez, Macé, and Llabrés (2000) have reviewed the research on anaerobic digestion of organic wastes with a special attention paid to advantages in limiting the emissions of greenhouse gases. Jakrawatana, MacGill and Moore (2007) have studied the biomass waste from organic fraction of municipal solid waste and food manufacturing using MFA for energy and nutrient recovery, and for cadmium contamination control and GHG emissions. They have developed an analytical tool for management of biomass waste on a regional scale which follow five main steps.
In regard to resource conservation and waste management, the 'waste hierarchy' is used as the general concept and have been implemented in several legislations. Waste management is often modelled as a sub-system of the resource conservation system. In resource conservation, both the production and consumption sides are usually included, and often on a regional scale. The goal is to minimise the inflow and outflows to the environment and by this creating a closed loop system. Specific substances can be chosen of interest, like carbon that is an important carrier of energy. Bratland (2009) has studied the carbon cycle in Norway and the potential to recover energy with anaerobic digestion. Churkina (2008) has reviewed the state-of-the-art of modelling urban carbon
The Norwegian University of Science and Technology

2 Literature review 5
cycles. The findings show that for a comprehensive assessment of urban system's impact on global carbon cycle, the model should also include the human component of an urban system. Among others, food, respiration of live creatures and decomposition of waste are listed as pools and fluxes related to human activities where formal modelling framework does not exist. Svirejeva-Hopkins and Schellnhuber (2006) have estimated the contribution of urban territories and the process of urbanisation on the carbon cycle. This work include the rate of carbon sequestration per square kilometres in urban green areas in the different regions of the world.
The re-treatment of waste to avoid chemical leaching, the last goal of SWM has largely been addressed by Belevi and Baccini (1989) with a model predicting the long-term behaviour of MSW landfills. It was found that after the intensive period of landfill gas generation, the leachate will continue to be released for centuries. This means that using landfills for MSW and especially the organic fraction, disposal will impose a burden on several generations to come.
2.1.2 Decision-making in ISWMAs in the selection of suitable techniques, technologies and management programs, ISWM is often used to describe the framework or tool for decision making. Morrissey and Browne (2004) have reviewed different types of models that are being used for municipal waste management. These models are generally divided into three categories – based on cost benefit analysis (CBA), life cycle assessment (LCA) and multicriteria decision making (MCDM). Optimisation modelling is also a common approach and has been used by Fiorucci, Minciardi, Robba and Sacile (2003) and also by Costi, Minciardi, Robba, Rovatti and Sacile (2004). Other approaches have chosen to use material flow analysis. Mastellone, Brunner and Arena (2009) used substance flow analysis in assessing six different scenarios for waste management in the Campania region in Italy.
Several tools for including environmental system analysis in ISWM have been developed. Hokkanen and Salminen (1997) used the ELECTRE III decision-aid for SWM in Oulu region Finland. The method was proved useful, and especially for environmental problems with many decision-makers. Hanandeh and El-Zein (2009) also used the ELECTRE III, but for specifically biodegradable fraction of municipal solid waste. They develop a new procedure called ELECTRE-SS to account for uncertainty in criteria weightings and threshold values. Their results of the application on the biodegradable fraction of MSW in Sydney show that it is better for the environment to recycle paper than use anaerobic digestion (AD) and composting. The findings are also that AD is likely to out-perform incineration where there is no market for heat. At last, it was found that landfilling can be a sound alternative when conditions of uncertainty and overall performance are considered. Eriksson et al (2002) presents the ORWARE (ORganic WAste REcycling) which is a tool used for environmental system analysis of waste management systems. It is based on industrial ecology tools such as material flow analysis and life cycle assessment. The model has been used by scientist for 8 years and its aim has been to evaluate waste management plans and to optimise energy recovery from waste. The model has been developed by four research institutes in Sweden. EASEWASTE is another model for life cycle assessment for waste management. It has been developed at the Technical University of Denmark. The model has been used in several cases including full-scale assessment of WM in Danish municipalities (Christensen et al., 2007).
Lars Gunnar Furelid Tellnes

6 2.1 Solid waste management
These approaches mainly focus on technical, economic and environmental factors in the decision making framework. Many practitioners have emphasised that human and social issues should also be part of the decision-making process. Hung, Ma and Yang (2007) identifies that there are two ways of incorporating this. The first is to incorporate social factors into decision-making, the second is to include public participation into decision-making processes. From this, it was developed a sustainable decision making model for MSWM by combining multicriteria decision-making (MCDM) and consensus analysis model (CAM). The CAM is used to find the degree of consensus between stakeholders for particular alternatives.
Lang et al. (2006) argues that a system analysis including material flows, agent analysis and regulatory mechanisms is a prerequisite for understanding the impact of actions in the optimisation of waste management systems. Binder (2007a) has reviewed the social sciences modelling approaches that have been used with material flow analysis. Many of the approaches stem form economics, as it has a similar modelling structure. However it has been shown that these measures might not lead to expected improvements of the material system, since they lack important aspects of human decision-making. Binder (2007b) proposes a way of solving this with a newly developed method called structural agent analysis (SAA). The method is based on Giddens structuration theory and it provides a base for managing material flow based on understanding social structures. The advantage of SAA is that it considers interactions and dynamics of social structure and human agency, which means that the role of culture can be included. It also gives a cross-level approach, thus allowing for study the interference between different agent groups.
The different methods presented all deal with the selection process. The different approaches could however lead to different conclusions. As in the definition of ISWM presented, the selection is for achieving specific SWM objectives and goals. Therefore, there is a need for consensus on the goals and the reason for behind them.
2.2 Solid waste management in developing countriesThe theoretical approach and analytical tools in ISWM have been applied for cases in developing countries. Based on the goals for solid waste management, Lederer (2008) has compared the waste management in Vienna, Austria and Banda Aceh, Indonesia. Three different scenarios for improvement of the system in Banda Aceh were assessed and they included composting, incineration and full collection with sanitary landfilling. It was found that the full collection and sanitary landfilling would be the best strategy when trying to fulfil the goals of solid waste management. In Brunner and Fellner (2007) it has been studied whether the waste management systems that are presently applied in affluent countries are appropriate solutions in less developed regions. The following indicators for evaluating a SWM system where used:
• The rate of overall expenses for solid waste management to the GDP of the region.
• The percentage of the population having direct contact with waste (scavengers and inhabitants of residential areas without a waste collection service).
• Greenhouse gas emissions (expressed as CO2-equivalents).
• Nitrogen emissions to the hydrosphere.
The Norwegian University of Science and Technology

2 Literature review 7
• The rate of material recycling.
• The rate of waste landfilled.
• The required space (volume) for waste disposal.
• The long-term emissions from landfills or disposal sites (final storage quality).
The finding was that for cities in regions that spend less that 10 € per person on SWM, the 'waste hierarchy' is not a appropriate strategy. In these cases, more cost-effective methods should be used for complete collection and upgrading to sanitary landfilling. It is interesting here to note that Shimura, Yokota and Nitta (2001) found in a study on MSW flows in developing nations, that there is no correlation in waste generation growth in proportion to GNP. However, instead there is a correlation between GNP and collection rate. As the cost-effectiveness of SWM is crucial, Drescher et al. (2003) combines material flow analysis (MFA) with cost accounting (CA) for evaluation of decentralised composting compare to centralised composting in low- and middle income countries. The findings of the case study on Asmara, the capitol of Eritrea, is that decentralised significantly reduces transportation costs so that in partly compensate the investments and operation costs of the decentralised composting system.
The common decision-making models and tools have also been applied in less developed countries. Zhao, Wang, Lu, Damgaard and Christensen (2009) applied the EASEWASTE model to assess the environmental impacts and benefits of the current MSWM system and two modified systems in Hangzhou, China. In the current situation CH4 from landfills was the primary pollutant leading to GHG emissions and acidification was mostly caused by HCI and NH3 emissions from incineration. They found that the system could be relatively better if the waste was transported to the nearest incinerator, thus decrease of pollution from landfill of waste and increased energy production substituting traditional power plants. A scenario with a ban of free plastic shopping bags showed to reduce most environmental impacts, due to saved oil reserves and other materials used in production. The conclusion is that EASEWASTE is a very suitable method for evaluating the overall environmental consequences of SWM systems in developing countries such as China.
Material flow analysis has also been used for modelling resource recovery in developing countries. Montangero and Belevi (2008) present an approach for using material flow analysis in developing countries allowing for limited access to reliable data. The procedure is to first use parameters based on literature and expert judgement. If the outputs of the model are not reasonable, then the sensitive input parameters should be further assessed more accurate. The approach has been applied for impact of environmental sanitation system on phosphorus discharged into surface water in Hanoi. Belevi (2002) has used material flow analysis on phosphorus and nitrogen in organic material and waste flows in City of Kumasi, Ghana. The findings are that 30 % of urban and semi-urban agricultural demand for nitrogen and phosphorus can be covered by co-composting of faecal sludge with solid waste. Bingh (2004) has used MFA to study the flows of agricultural biomass residues and municipal solid waste in Uganda to find potential for energy utilisation. The results show that the higher potential of energy utilisation in the agricultural biomass residues than in the municipal solid waste.
Lars Gunnar Furelid Tellnes

8 2.2 Solid waste management in developingcountries
Stakeholders have also been included in Khan and Faisal (2008), which presents a hierarchical network decision structure as a tool that a local civic body can use to prioritize and select appropriate MSW disposal methods. An analytical network process super matrix approach has been used for this with value judgement from different stakeholders as inputs. Snel and Ali (1999) have studied stakeholders' participation in SWM in South Asia. They have found that there are many informal and formal stakeholders, and that their interrelation may be complex and therefore it is important of thorough analysis in project preparations. The right institutional framework is also important. According to UNEP (2005) guidelines for integrated solid waste management, the role of national government is three-fold:
1. To develop and enact legislation and policies that promotes and ensures protection of the environment.
2. To establish an agency or department to implement these programs
3. To perform pertinent research and development.
However, these institutional frameworks are often not strong enough, but there are other international arrangements that can have positive effects on SWM. Clean development mechanism (CDM) is a part of the Kyoto Protocol in which countries under a cap and trade regime can reduced emissions in countries outside the cap and trade regime and count it as their own reductions. The aim is that emissions can be reduced at the lowest cost and enable clean technology transfer from affluent to low income countries. Plöchl, Wetzer and Ragoßnig (2008) has studied the incentives of applying CDM to waste management projects. The findings are that CDM has led to an increase in the development of sustainable waste management projects, and that this have had a special positive effect in countries where such projects do not have a legal framework. Lybæk and Jacobsen (2009) have explored how principles of industrial ecology can be used in the design and development of CDM projects. Specifically, it is questioned whether the current practice of using CDM of a case-by-case approach in which different projects are implemented without coordinating a plan for achieving a long term solution. Instead, it is argued that IE principles can be used for a transformative plan for making system solutions in where resources are used in cycles instead of the linear approach. Yedla and Park (2009) presents a concept of co-benefits between implementing climate change concerns with national development goals in relation to solid waste management. The obstacles for this are lack of awareness, lack of capacity to quantify co-benefits and differences in priorities/interest of the sector.
2.3 Solid waste management in IndiaIndia is the second most populous country in the world and the world's largest democracy. It is a highly diverse country with respect to languages and religions. There is a vast rural population, but urbanisation is quickly increasing. Some basic facts are listed in Table 1.
The Norwegian University of Science and Technology

2 Literature review 9
Table 1: Facts about the Republic of India (CIA, 2010)
Parameter Value
Population 1,156,897,766 (July 2009 est.)
Urban population 29 % of total population (2008)
Life expectancy at birth 66.09 years
Capital New Dehli
Government type Federal republic
GDP (PPP) USD 3.56 trillion (2009 est.)
GDP (official exchange rate) USD 1.095 trillion (2009 est.)
Human development index 0.612 (2007)
After the rank on the human development index, India is categorised as developing country with a medium human development. An alternative is the Legatum Prosperity Index, which ranks 104 countries according to factors that are the fundamentals for prosperity.
Table 2: India rank on the 2009 Legatum Prosperity Index (Legatum, 2010)
Overall rank
Economic fundamentals
Entrepreneurship & Innovation
Democratic Institutions
Education Health Safety & Security
Governance Personal Freedom
Social Capital
45 43 55 36 86 88 87 41 47 5
What is special that can be observed in Table 2, is the high ranking for Social Capital. The reason for this is the high membership rate and dedication to civil society. This is also reflected in the practice of SWM, where many non-governmental organisations (NGO) and community-based organisations (CBO) are involved. However, the prosperity for SWM in India is not that good, some estimates are that India will surpass China in population in 2025, hence this will be a threatening driver for total waste generation. There are estimates that solid waste generation in India will peak at 150 million MT/year in 2025. Out of this 50-60% will be biodegradable organic, like food and garden waste (Visvanathan, 2010). Kumar et al. (2008) has studied the current situation of MSWM in 59 Indian cities. Shortcomings have been found in the existing practice of MSW. An indicative action plan for improvement of solid waste management in India cities have been made so that municipalities can use it to prepare specific plans. It has also been found that there is a need to strengthen existing monitoring mechanisms of implementation of the MSW rules 2000. Unnikrshnan and Singh (2009) have reviewed the clean development mechanism (CDM) for MSWM in India and compared it with other countries. In this, management problems, regulatory framework and opportunities have been looked at and it has been found that out of a total 119 CDM projects related to SWM, 16 are in India. Worldwide there is a high proportion of CDM used for methane capture and electricity generation at landfills, but in India there is high proportion of CDM for RDF projects. The reason for this could be that India is lacking sanitary landfills.
Lars Gunnar Furelid Tellnes
10 2.3 Solid waste management in India
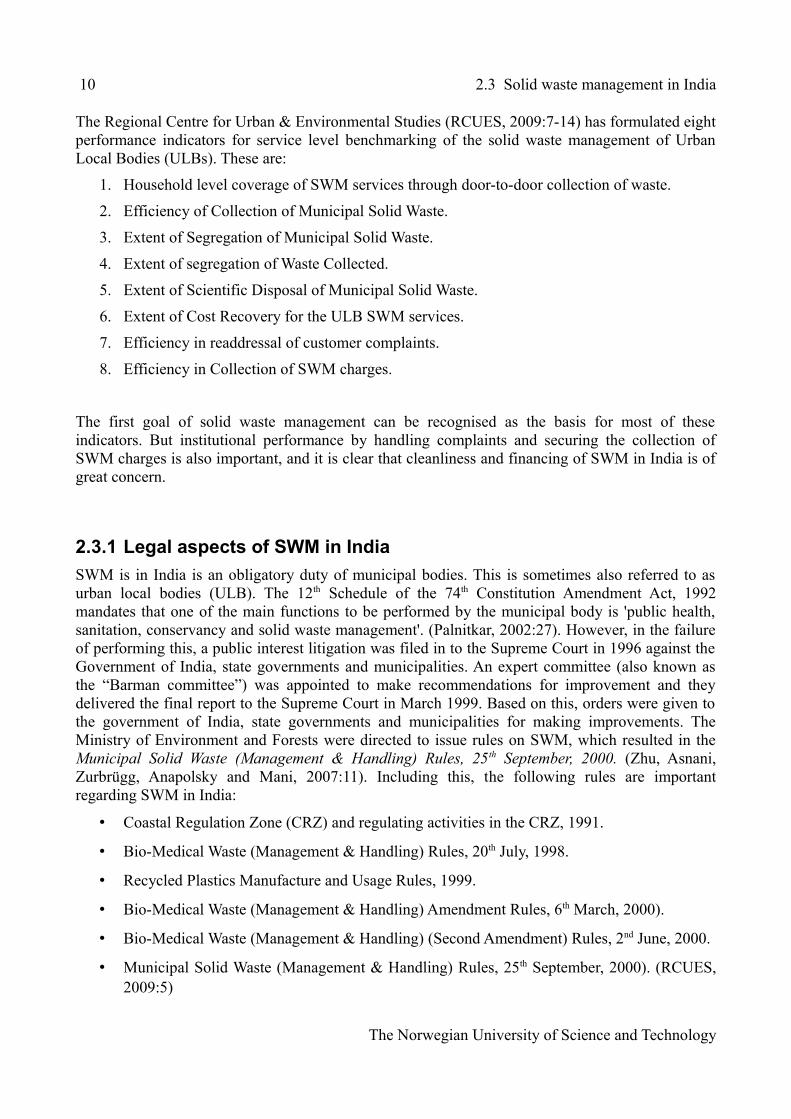
The Regional Centre for Urban & Environmental Studies (RCUES, 2009:7-14) has formulated eight performance indicators for service level benchmarking of the solid waste management of Urban Local Bodies (ULBs). These are:
1. Household level coverage of SWM services through door-to-door collection of waste.
2. Efficiency of Collection of Municipal Solid Waste.
3. Extent of Segregation of Municipal Solid Waste.
4. Extent of segregation of Waste Collected.
5. Extent of Scientific Disposal of Municipal Solid Waste.
6. Extent of Cost Recovery for the ULB SWM services.
7. Efficiency in readdressal of customer complaints.
8. Efficiency in Collection of SWM charges.
The first goal of solid waste management can be recognised as the basis for most of these indicators. But institutional performance by handling complaints and securing the collection of SWM charges is also important, and it is clear that cleanliness and financing of SWM in India is of great concern.
2.3.1 Legal aspects of SWM in IndiaSWM is in India is an obligatory duty of municipal bodies. This is sometimes also referred to as urban local bodies (ULB). The 12th Schedule of the 74th Constitution Amendment Act, 1992 mandates that one of the main functions to be performed by the municipal body is 'public health, sanitation, conservancy and solid waste management'. (Palnitkar, 2002:27). However, in the failure of performing this, a public interest litigation was filed in to the Supreme Court in 1996 against the Government of India, state governments and municipalities. An expert committee (also known as the “Barman committee”) was appointed to make recommendations for improvement and they delivered the final report to the Supreme Court in March 1999. Based on this, orders were given to the government of India, state governments and municipalities for making improvements. The Ministry of Environment and Forests were directed to issue rules on SWM, which resulted in the Municipal Solid Waste (Management & Handling) Rules, 25th September, 2000. (Zhu, Asnani, Zurbrügg, Anapolsky and Mani, 2007:11). Including this, the following rules are important regarding SWM in India:
• Coastal Regulation Zone (CRZ) and regulating activities in the CRZ, 1991.
• Bio-Medical Waste (Management & Handling) Rules, 20th July, 1998.
• Recycled Plastics Manufacture and Usage Rules, 1999.
• Bio-Medical Waste (Management & Handling) Amendment Rules, 6th March, 2000).
• Bio-Medical Waste (Management & Handling) (Second Amendment) Rules, 2nd June, 2000.
• Municipal Solid Waste (Management & Handling) Rules, 25th September, 2000). (RCUES, 2009:5)
The Norwegian University of Science and Technology

2 Literature review 11
It is the responsibility of the Central Pollution Control Board (CPCB) to monitor the implementation of these rules. Municipalities are required to submit annual reports regarding MSW in their area to the CPCB (Sharholy, Ahmad, Mahmood and Trivedi, 2008:446). Violations of these rules fall under the penal provision of the Environment (Protection) Act 1986 (29 of 1986) (RCUES, 2009:2). However, in a review from Sharholy et al. (2008), the conclusion is that there is a large gap between policy and implementation of solid waste management in Indian cities. It is also concluded that the main barriers for MSWM is lack of resources such as financing, infrastructure, suitable planning and data, and leadership.
The Municipal Solid Wastes (Management & Handling) Rules, 2000 lay down the most relevant rules for handling food and garden & park related wastes. Some specially related aspects form these rules are that in the lists of definitions “biodegradable substance means a substance that can be degraded by micro-organisms”.
In Schedule II Management of Municipal Solid Wastes, section number 1 collection of municipal solid wastes:
(iii) wastes from slaughter houses, meat and fish markets, fruits and vegetable markets, which are biodegradable in nature, shall be managed to make use of such wastes.
And in section number 5 processing of municipal solid waste(i) The biodegradable wastes shall be processed by composting, vermicomposting,
anaerobic digestion or any other appropriate biological processing for stabilization of wastes. It shall be ensured that compost or any other end product shall comply with standard as specified in Schedule-IV
It also says that incineration with or without energy recovery and pelletisation can be used in specific cases. In Section number 6 disposal of municipal solid waste, “Land filling shall be restricted to non-biodegradable, inter waste and other waste that are not suitable for recycling or for biological processing...”. In Schedule IV Standards for Composting, Treated Leachates and Incineration, it is listed up limiting concentration for final compost for use on food crops, for other use there are no regulations.
2.3.2 Treatment options used in IndiaThe Central Public Health and Environmental Engineering Organization (CPHEEO) collected information to identify proven technologies for processing and disposal of waste in urban India. They found that composting was a viable technology (CPHEEO, 2005). Ambulkar and Shekdar (2003) has studied the technical feasibility, operational stability and commercial viability of biomethanation technology in the Indian context. The result is a development plan that includes recommendations for national policy and development of appropriate technology. The Ministry of Urban Development (2005) constituted an inter-Ministerial task group on “Integrated Plant Nutrient Management Using City Compost”. The results was a comprehensive 400-page report on this issue, with technical and operational details. Narayana (2008) has argued that because of the high
Lars Gunnar Furelid Tellnes

12 2.3 Solid waste management in India
degradable fraction in municipal solid waste, composting is the best possible option to deal it with. However, the reason that many such attempts have failed, is that the waste is mixed and plastics in the compost makes the quality very low. Saha, Panwar and Singh (2009) conducted a study on municipal solid waste compost produced in 29 cities in India. The physio-chemical properties, fertilizer potential and heavy metal pollution potential was investigated. In an attempt to make it easy for stakeholders to judge the compost, a scheme for categorization of the compost into different marketable classes and restricted use classes was proposed.
Using Waste to Energy technologies in India has been used in some cases for RDF and biomethanation. Where three projects for RDF have been set up at Hyderabad, Vijayawada and Lucknow with an aggregate capacity of 17.6 MW. Biomethanation, the common word used for anaerobic digestion technology for biogas production in India. Biomethanation has been used for mixed urban waste in Vijayawada and for vegetable market waste in Chennai (NSWAI, 20063-5). Small scale plants have been used in millions in the rural areas as an alternative source of energy.
There are also many cases of small scale on-site and decentralised located SWM treatment options used in India. Zurbrügg, Drescher, Patel and Sharatchandra (2004) has assessed 17 decentralised composting initiatives in India. They say that the potential to launch and sustain these are dependent on the provision of space by the municipality. Heeb (2009) has studied the use of decentralised anaerobic digestion for market waste in a case study in India. The findings are that the technology is very suitable for treatment of market waste, but the most important task is to improve the economic attractiveness. This could be done by reducing the investments costs, selling effluent as fertilizer or achieving CDM credits. Yadav, Tare and Ahammed (2009) has studied the potential for using vermicomposting of source-separated human faeces with the aim of nutrient recycling. The reason is the high nutrient level in human faeces and the results indicates that there is a potential of vermicomposting for processing this. Drescher and Zurbrügg (2006) discuss the link between decentralised composting and achieving the Millennium Development Goals. The links are found to be that decentralised composting is providing sanitary conditions (Targets 10 and 11), providing job opportunities for the poor (Target 1), with use of compost to treat depleted soils and provide fertiliser will increase crop yields (Target 2) and avoiding methane emissions from landfills (Target 9).
2.4 Solid waste management in MumbaiMumbai was previously named Bombay and is the commercial capital of India. It is located on the west coast of India and is a important and a natural deep port. It is geographically divided into three major parts. The city, western suburbs and eastern suburbs. Some basic facts about Mumbai are listed in Table 3.
The Norwegian University of Science and Technology

2 Literature review 13
Table 3: Facts about Greater Mumbai (MCGM, 2010).
Parameter Value
Population 11,978,450 (2001)
Slum population 6,475,440 (2001)
Area 437.71 sq km
Population density 27,366 person per sq km
Per capita income 57,536.4 Rs. (2001)
Human development index 0.56 HDI
Solid waste management in Mumbai is under the responsibility of the Municipal Government of Greater Mumbai (MCGM). The waste management in Mumbai is regulated by the Greater Mumbai Cleanliness and Sanitation Bye-laws, 2006. In these laws, biodegradable waste is defined as “the waste of plant and animal origin e.g. kitchen waste, food & flower waste, leaf litter, garden waste, animal dung, fish/meat and any other material that gets decomposed by the action of living organism”. The laws also impose source segregation, with biodegradable (wet) waste as one of the categories. However, it is up to the Municipal Commissioner to notify the stages of implementation of these rules taking into account the level of awareness among generators of waste and availability of infrastructure support. It is also stated that local composting shall be promoted in order to minimise transportation of waste. If the waste is not composted, it should be stored by generators within their premise and its delivery shall be ensured to biodegradable waste collection vehicle provided for specified commercial generators of bulk boo waste. In Schedule II of the laws, there is a list of what should be considered as biodegradable waste. The rules also include prohibition of littering and specific fines for non-compliance with the law (MCGM, 2007). It is the responsibility of the Maharashtra Pollution Control Board to control the SWM in Mumbai.
Infrastructure Leasing and Financial Services Limited (IL&FS) conducted a consultancy assignment for SWM in Mumbai for the MCGM. This included how to improve the current practice of the waste disposal sites and how a long term SWM processing and disposal system for Mumbai should be in order to meet the requirements of the MSW rules, 2000. Technologies for treating MSW in Mumbai where identified and screened for the following considerations:
• If the technology was suitable for the characteristics of Mumbai MSW
• If the technology meets the requirements of the MSW rules and is social acceptable and have minimum impacts on environment and citizens.
• If it is economically and commercially viable.
Based on this, only composting was found to be viable for treatment of mixed MSW in Mumbai. However, RDF and incineration could be used if auxiliary fuel is used. Biomethanation was viable for market, restaurant and hotel waste and required lower tipping fees than composting. Refuse derived fuel (RDF) is possible for special waste with high calorific value such as coconut shells, paper and plastics. RDF is also found to be commercially viable in this case. Mass burn incineration was found not to be suited for treating mixed MSW in Mumbai, due to the high moisture content and hence low calorific value. Treating the special fraction of the waste with high calorific value is
Lars Gunnar Furelid Tellnes

14 2.4 Solid waste management in Mumbai
possible, but is at a much high cost than RDF and requires high tipping fees. With the use of a linear programming (optimisation) method for decision-making, it was found that 500 TPD of market and restaurant waste should be treated with biomethanation and 6000 TPD of mixed MSW should be treated by composting. This was done based on capacity constraints of the biomethanation plant and minimising costs. Land constraints were also included, however land availability was higher than demand and therefore did not effect the result. When the land availability at the different landfills was considered, the optimal location was found to be 500 TPD biomethanation at Mulund and composting of 1500 TPD at Deonar and 4500 TPD at Kanjur Village. Under this scheme, it was assumed a sale of 80% of the compost and when adding the inert fraction, which will require 1500 TPD to be deposited at sanitary landfill (IL&FS, 2006).
Table 4: Expenditure on various activities of SWM (SWM CELL, AIILSG (2003)).
Sweeping Collection Processing Disposal
INR 801,700,000 INR 1,196,938,000 INR 113,825,000 INR 2,112,463,000
As seen in Table 4, the MCGM has large expenditures on performing their SWM services. Yedla and Kansal (2003) has made an comprehensive cost-benefit analysis of the SWM system in Mumbai. Hidden and implicit costs and benefits are included and the results shows that the value of recyclables and land is neglected in the current waste management. The recommendations are that other solutions than open dumping should be introduced and private sector should be included. Rathi (2005) has studied the cost of alternative approaches for solid waste management in Mumbai. The cost of public private partnership (PPP) and community participation have been estimated and compared to only MCGM. It was found that community participation is the cheapest alternative and utilising only MCGM is the most expensive. Rathi (2007) has used a linear programming model for optimisation of the integrated solid waste management in Mumbai and included different solutions and stakeholders. Various economic and environmental costs that are relevant for SWM are considered in the model and the study finds it interesting if further studies would focus on optimal waste management strategies for each ward of Mumbai. Bhada (2007) has studied the feasibility of waste-to-energy (WTE) as a part of integrated solid waste management in Mumbai. It was found that the heating value of MSW in Mumbai is presently 9 MJ/kg and hence much higher than other studies that have reported approximately 4 MJ/kg, as seen in Table 5. This is then above the 7 MJ/kg threshold for when an incinerator can operate without additional fuel. In addition, the study found that a WTE facility would reduce the volume of MSW by 96.74 %.
The Norwegian University of Science and Technology

2 Literature review 15
Illustration 1: Functional elements of the SWM in Mumbai (MCGM, n.d.b)
The framework shown in Illustration 1 is used to present the elements of the SWM system in Mumbai. Note here that only recyclables from collection and transport are being identified as useful end products. Other end products that normally are included in SWM systems are coming from the treatment and disposal element and includes biogas, compost, refuse derived fuel and energy (Heie, 1997:3).
2.4.1 Generation and StorageSolid waste generated in Mumbai amounts to 9500 MT per day of which 3800 MT is biodegradable waste, 1700 MT is recyclable waste, 1000 MT of inert material and 3000 MT of construction debris and silt (MCGM, 2010). A study by the Central Pollution Control Board and the National Environmental Engineering Research Institute has characterised the wastes in Mumbai, as shown in Table 5.
Table 5: Waste quantity and characteristics of Mumbai (CPCB)
Waste quantity [TPD]
Waste generation
rate [kg/c/day]
Compostable [%]
Recyclables [%]
C/N ratio HCV [Kcal/kg]
Moisture [%]
5320 0.45 62.44 16.66 39.04 1786 54
The per capita waste generation is about 629.5 grams per person per day and is the highest of all Class I cities of Maharashtra.
Lars Gunnar Furelid Tellnes
16 2.4 Solid waste management in Mumbai
2.4.2 Collection and transportThe collection and transport of waste in Mumbai is dominated by the use of community containers, which are collected by dumper placers to transfer stations. At the transfer stations, the waste is been moved on to larger trucks and transported to dump sites. Many street sweepers have been deployed by the municipality for cleaning the streets and dispose of the waste into the community containers. However, the system is gradually changing with use of compactor vehicles and house-to-house collection. Some places this also include source segregation.
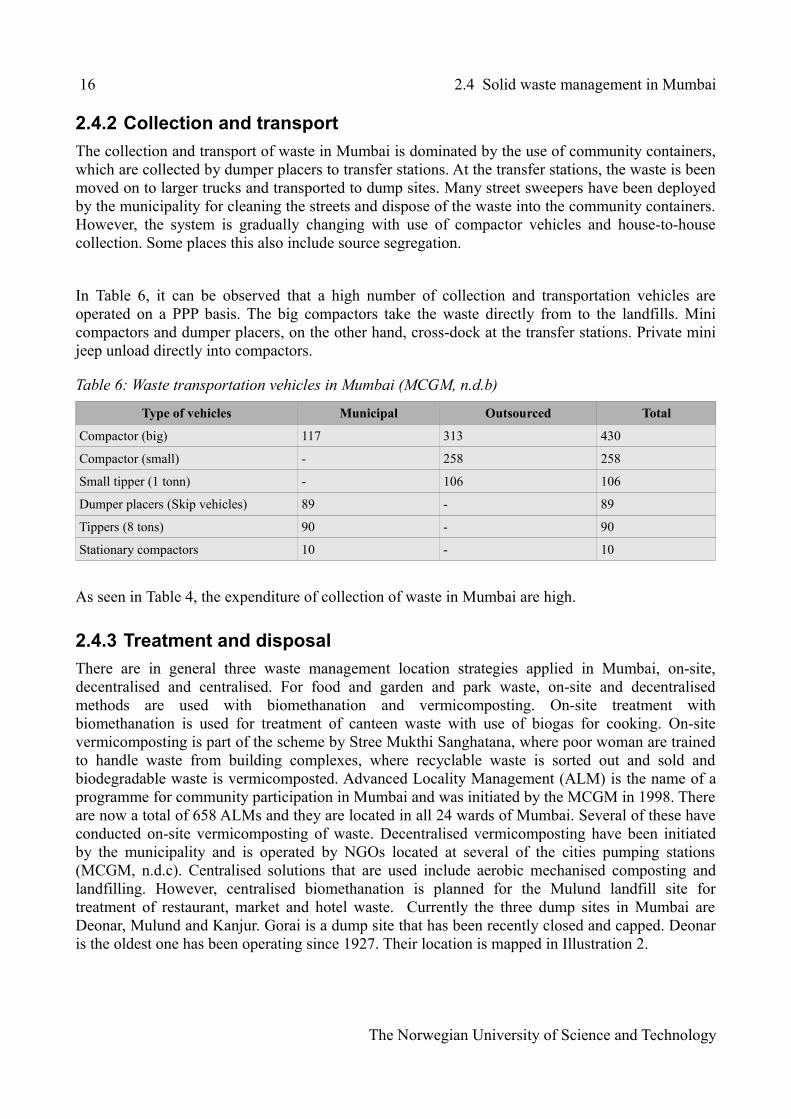
In Table 6, it can be observed that a high number of collection and transportation vehicles are operated on a PPP basis. The big compactors take the waste directly from to the landfills. Mini compactors and dumper placers, on the other hand, cross-dock at the transfer stations. Private mini jeep unload directly into compactors.
Table 6: Waste transportation vehicles in Mumbai (MCGM, n.d.b)
Type of vehicles Municipal Outsourced Total
Compactor (big) 117 313 430
Compactor (small) - 258 258
Small tipper (1 tonn) - 106 106
Dumper placers (Skip vehicles) 89 - 89
Tippers (8 tons) 90 - 90
Stationary compactors 10 - 10
As seen in Table 4, the expenditure of collection of waste in Mumbai are high.
2.4.3 Treatment and disposalThere are in general three waste management location strategies applied in Mumbai, on-site, decentralised and centralised. For food and garden and park waste, on-site and decentralised methods are used with biomethanation and vermicomposting. On-site treatment with biomethanation is used for treatment of canteen waste with use of biogas for cooking. On-site vermicomposting is part of the scheme by Stree Mukthi Sanghatana, where poor woman are trained to handle waste from building complexes, where recyclable waste is sorted out and sold and biodegradable waste is vermicomposted. Advanced Locality Management (ALM) is the name of a programme for community participation in Mumbai and was initiated by the MCGM in 1998. There are now a total of 658 ALMs and they are located in all 24 wards of Mumbai. Several of these have conducted on-site vermicomposting of waste. Decentralised vermicomposting have been initiated by the municipality and is operated by NGOs located at several of the cities pumping stations (MCGM, n.d.c). Centralised solutions that are used include aerobic mechanised composting and landfilling. However, centralised biomethanation is planned for the Mulund landfill site for treatment of restaurant, market and hotel waste. Currently the three dump sites in Mumbai are Deonar, Mulund and Kanjur. Gorai is a dump site that has been recently closed and capped. Deonar is the oldest one has been operating since 1927. Their location is mapped in Illustration 2.
The Norwegian University of Science and Technology

2 Literature review 17
The amount of waste composted at the landfill sites varies from source to source. The highest amount reported in Sinha and Heart (2002) that composting of mixed waste at the dump site has been done for 500 TPD in Mumbai. But, the MPCB only report that 100 TPD of waste is processed by vermicomposting in Mumbai. It is estimated that the methane emissions from the landfills in Mumbai amount to 90.75 Gg per year (NSWAI, 2006a:10). This is equivalent to approx 1.9 megatons of CO2-equivalent in global warming potential when a 100-year time-frame is used with methane having 21 times greater effect than carbon dioxide. At the recently closed Gorai landfill, landfill gas is collected. This has been conducted through a public private partnership (PPP) with MCGM as recommended by IL&FS Ecosmart. The project has applied for emission reduction credits (ERC) through the CDM. The landfill gas capture project is estimated to avoid 1,240,289 tons equivalents of carbon dioxide emissions over a 10-year period (UNFCC, n.d.) The Maharashtra Pollution Control Board (2006) points out that the MSW disposal sites are located in the thickly populated area of city and have been fully utilized and exhausted. The leachates from the dumping sites are not collected and it is directly finding its way into the creek and sea. The MCGM failed to implement treatment of MSW after the schedule laid down in the MSW rules. Dr. Sahu from the National Solid Waste Association of India (NSWAI) has argued that regional landfills should be developed for handling the waste from Mumbai. The current dump sites in Mumbai are located on wetlands with mangrove forests and this has direct impacts on the ecosystems. Aggarwal (2009) has in a letter to Justice Chandrachud at Bombay High Court expressed concerns with the MCGM practices on Deonar. It is pointed out that decentralised solutions like vermicomposting and biomethanation have been given little priority by the MCGM. An alternative method called “Bio-Remediation” has also been tested at Gorai. With this method, the landfilled waste is sprayed with
Lars Gunnar Furelid Tellnes
Illustration 2: Dumping grounds and transfer stations in Mumbai (MCGM, n.d.a)

18 2.4 Solid waste management in Mumbai
composting bio-cultures and then formed into conventional aerobic wind-rows on-site.
2.5 Solid waste management in 'A' wardThe 'A' ward is the southernmost ward in Mumbai and incorporates a naval area in Colaba, a business area in Nariman Point and many ports. Many governmental institutions are located here and there are also several landmarks and touristic spots, such as the Gateway of India and the Taj Mahal hotel. An other hotel, the Taj President is located at Cuffe Parade in the 'A' ward. It has been rated among the top three hotels in Mumbai, among the top 500 in the world by Travel and Leisure Magazine (Verma, 2010), and hotel is also benchmarked for environmental performance. The hotel has reduced waste sent to landfill by segregating wet and dry fraction, where the dry waste is recycled and wet waste is collected by the municipality. From the benchmarking of the use of energy, large amounts of GHG emission are produced because the electric poser generation in Mumbai is largely based on black coal thermal power (Earthcheck, 2009). Some basic facts are listed in Table 7.
Table 7: Facts about 'A' ward
Symbol Parameter Value Source
PR+PS Population 210 926 MCGM, n.d.a.
L Area 12.5 km2 MCGM, n.d.a
PF Floating population 4 000 000 Mumbai Prepared
PS Slum population 60893 MCGM, 2010
PE Work places 563840
HDI Human development index 0.58 MCGM, 2010
The responsibility of SWM in 'A' ward is of the 'A' Ward office. According to the 'A' ward office (2009), the challenges faced in the collection and segregation of garbage are:
1) No awareness of public cleanliness.
2) No segregation of dry and wet garbage at source.
3) Lack of civic sense in common people in this regard.
The collection of garbage from households, commercial firms and institutions is approximately 441.4 TPD. From restaurants and markets, its amounts to 21 TPD. These are calculated based on collection capacities ('A' Ward office). Other sources say 399 TPD of refuse and 47 TPD of silt/debris (MCGM, 2010) and 400 TPD of refuse, 4 TPD of silt and 20 TPD of debris (MCGM, n.d.a). The numbers for collected wastes sent to landfills, reported by the 'A' Ward office are different from those reported by the MCGM, both have calculated by capacity. Using trial and error, the potential difference is found to be associated with the truck dumper placers. If one considers 55 trips, instead as 69 trips, this will give a total of 399 TPD collected waste. About 99 % of the waste generated in 'A' ward is collected according to the 'A' ward office. The reason for this high collection rate is the requirement by the stakeholders in the ward. The list of the different vehicles
The Norwegian University of Science and Technology

2 Literature review 19
used for collection is presented in Table 8.
Table 8: Waste collection vehicles used in 'A' ward ('A' ward office, 2009)
Type of vehicles Number of vehicles Total trips Vehicle capacity [t/trip]
Waste collected [t/day]
Private big compactor 22 22 6 132
Private mini compactor
4 8 2.5 20
Private mini jeep 7 21 1 21
MCGM big compactor
13 13 6 78
Hyva 2 2 16 32
Dumper placer 18 69 2.6 179.4
Total 462.4
Recyclable waste is transported and stored in a municipal area surrounded by slums collectively known as the Fishermen Village, just north of Cuffe Parade, as shown in Illustration 3. The area is of approximately 50x60 meters and serves as a space for metal scrap, portable toilets on trailers for use during events and exhibitions and festive occasions. Here, women employed by an NGO sort recyclable wastes for sale to traders in the city. The municipality collects 6 TPD of dry garbage at source and transports it to this place. In addition, local rag pickers collect about 4% to 5% of garbage at source.
Lars Gunnar Furelid Tellnes

20 2.5 Solid waste management in 'A' ward
The largest part of the waste collected in the 'A' ward is disposed at the centralised landfills, and where 292 TPD are disposed at Deonar and 107 TPD is disposed at Mulund (MCGM, 2010). However, there is biological treatment of waste by vermicomposting and by biomethanation. There are two Nisargruna biomethanation plants in the 'A' ward, both of which are located in the naval area. They treat one ton per day made up of both canteen waste from INS Kunjali and Tata Institute of Fundamental Research (TIFR) (MPCB, 2009). From the treatment of waste in the biomethanation plants, the gas is used for substituting LPG use in canteens on site. A one-ton-per-day biomethanation plant can substitute approximately a maximum of two 19 kg cylinders of LPG each day (BARC, n.d.) Since 2000 there has been vermicomposting at the Colaba Pumping Station and 4-5 tons were treated per day, but currently only one ton per day is treated here. Electric vehicles have been used by the Clean Air Island for transport of waste to the vermicomposting facility at the Colaba Pumping Station. The motivation for using electric vehicles is to avoid
The Norwegian University of Science and Technology
Illustration 3: Map of SWM facilities in 'A' ward. 1: Biomethanation at Tata Institute of Fundamental Research. 2: Biomethanation at INS Kunjali. 3: Vermicomposting at Colaba Pumping Station. 4: Dry waste sorting centre. 5: 'A' Ward Office (Map: Google Maps)

2 Literature review 21
emissions. The current situation is that the vehicles are not operational. Use of electric vehicles is motivated by reducing air pollution. Electricity in Mumbai is largely based on coal power, and there are large air emissions related to this. The organic fertiliser from the vermicomposting is for garden and parks, however it does not seem as though there is an established market for this (Drescher, 2002). The area of Colaba Pumping station is owned by the municipality and includes a waste water treatment plant. The technology used is oxidation ditches, but the municipality is planning to upgrade this in order to recover energy through anaerobic digestion of the sludge. This is part of the Mumbai Sewage Disposal Project, were the municipal authorities are planing to treat sludge with energy recovery and water recycling for non-potable purposes on all the waste water treatment plants in Mumbai (Mhaske, P., 2010).
Lars Gunnar Furelid Tellnes

22 3 Methods
3 MethodsThe methods used here are based on the principles of industrial ecology. This includes a study of the metabolism of a system by it main flows and stocks, assessment of alternative techniques for improvement and analysis of the different actors and stakeholders involved. The metabolism is analysed in terms of total flow of biodegradable waste and by the cost accounted to the flows. The systems are then evaluated according to indicators dependent on these flows. In order to understand which issues are behind these flows, the stakeholders have been identified. Scenarios for improvement have been developed to assess the advantages and constrains of the different scenarios. These scenarios are on-site treatment, decentralised treatment and centralised treatment.
3.1 Industrial EcologyIndustrial Ecology (IE) is a multidisciplinary field that adopts a holistic approach to the study of human-environment interactions. It bases itself on the idea that industrial and anthropogenic systems can and should be designed to operate in the way natural ecosystems function. One of the outcomes of this would be that wastes generated in one anthropogenic sub-system would be the resource for another.
From the IE literature, the ecosystem approach to industrial systems has three major aspects:
(1) An industrial system itself can be described to as particular distribution of materials, energy and information flows, in analogy to an ecosystem.
(2) For its sustenance, an industrial system relies on resources and services provided by ecosystems.
(3) For the design of flows and technologies, the analogy with biological or ecological systems can serve a source of inspiration (Van Koppen, 2004:25).
In order to improve a system's environmental performance, there are different methods that can be lumped together into the framework of environmental design. There are many approaches from literature, but they contain three main elements:
• Analysing flows
• Identifying and assessing improvement options.
• Establishing and motivating a team (Van Koppen, 2004:28)
For IE, the approach for design is shown in Illustration 4.
The Norwegian University of Science and Technology
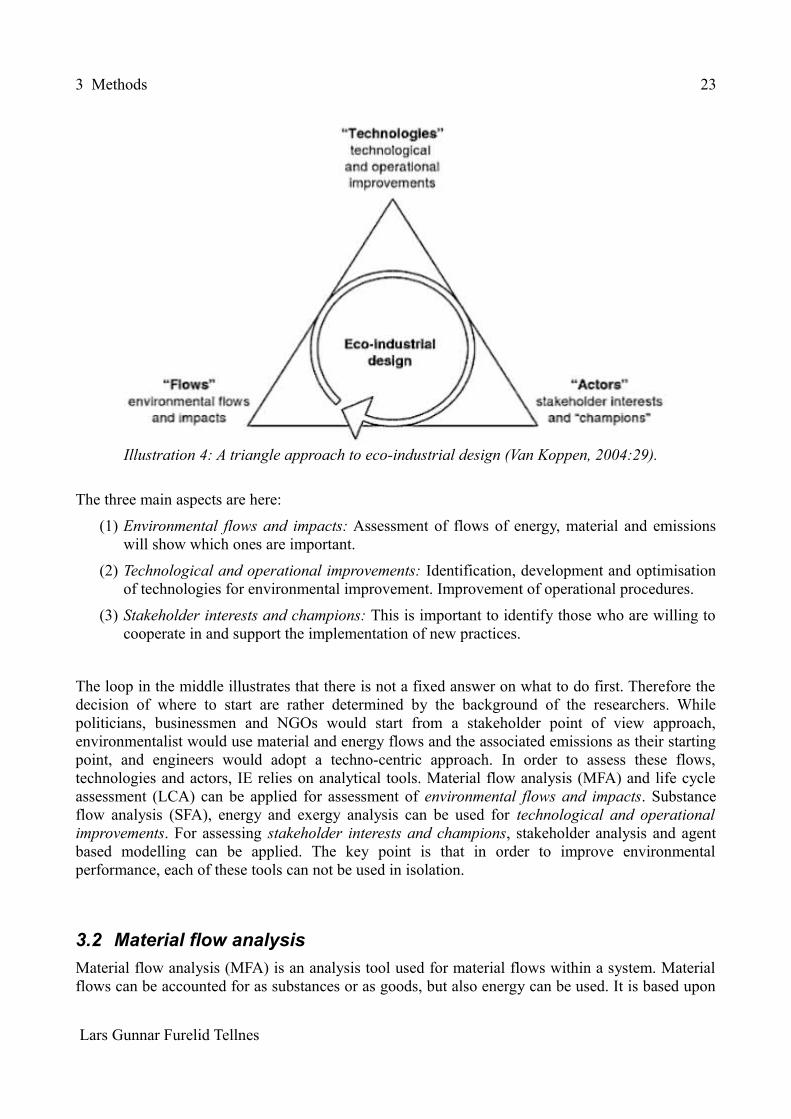
3 Methods 23
The three main aspects are here:
(1) Environmental flows and impacts: Assessment of flows of energy, material and emissions will show which ones are important.
(2) Technological and operational improvements: Identification, development and optimisation of technologies for environmental improvement. Improvement of operational procedures.
(3) Stakeholder interests and champions: This is important to identify those who are willing to cooperate in and support the implementation of new practices.
The loop in the middle illustrates that there is not a fixed answer on what to do first. Therefore the decision of where to start are rather determined by the background of the researchers. While politicians, businessmen and NGOs would start from a stakeholder point of view approach, environmentalist would use material and energy flows and the associated emissions as their starting point, and engineers would adopt a techno-centric approach. In order to assess these flows, technologies and actors, IE relies on analytical tools. Material flow analysis (MFA) and life cycle assessment (LCA) can be applied for assessment of environmental flows and impacts. Substance flow analysis (SFA), energy and exergy analysis can be used for technological and operational improvements. For assessing stakeholder interests and champions, stakeholder analysis and agent based modelling can be applied. The key point is that in order to improve environmental performance, each of these tools can not be used in isolation.
3.2 Material flow analysisMaterial flow analysis (MFA) is an analysis tool used for material flows within a system. Material flows can be accounted for as substances or as goods, but also energy can be used. It is based upon
Lars Gunnar Furelid Tellnes
Illustration 4: A triangle approach to eco-industrial design (Van Koppen, 2004:29).

24 3.2 Material flow analysis
the principles of the law of conservation of mass and has found use in several disciplines, without having a formal common procedure.
A common definition of Material flow analysis is:
Material flow analysis (MFA) is a systematic assessment of the flows and stocks of materials within a system defined in space and time (Brunner and Rechberger, 2004).
MFA can be used of process, factories, companies and regions. When applying MFA to studying the metabolism of a region, there are four main activities:
1. To Nourish; comprises all processes and goods to produce solid and liquid food for man.
2. To Clean; comprises all processes to maintain human health and to provide environmental protection from pollution.
3. To Reside and Work; comprises all processes which are set up to build and maintain residential units, working and recreational facilities.
4. To Transport and Communicate; comprises all processes which have developed to transport persons and materials and to exchange information. (Baccini and Brunner, 1991: 89-79).
The law of conservation of mass, allows one to use balance equations for each process in MFA.
input=outputstock change (3.2.1)
Hence, the inflows of a process minus the outflows are equal to stock change. Material flow analysis can be used for total flows, or for specific content of flows. Substance flow analysis (SFA), is when a chemical element or compound composed of uniform units are used as a indicator element (Brunner and Rechberger, 2004). In this case material flow analysis were used for the flow of food and garden waste as total flows. Substance flow analysis were used for the carbon content of the food and garden related flow. Carbon is the main carrier of energy, thus the carbon flow is a good indicator of the potential energy in the waste flows.
For computing flows and parameters, OpenOffice.org spreadsheet was use. In conducting a Multiple regression analysis, MS-Office Excel was used. The STAN 2 (SubSTance flow Analysis) computer software was used to compute stocks and system total inputs and outputs, and illustrate the system of material flow analysis. One advantage of using this software is that flows can be presented in Stankey-style, which means that the width of the flow arrows are in proportion of their values (IWA, n.d.).
In the analysis, there are two different systems used. One for the mass flow of biodegradable waste and one for analysing the costs of the flows, by adding net cost as an layer. Notation wise, it is common from Brunner and Rechberger (2004), that each process has a number and flows notation are for instance, A1-2, for a flow from process 1 to 2. Here, the flow have been given a more practical
The Norwegian University of Science and Technology

3 Methods 25
notation. For instance will WGS-CT, the total mass flow of food and garden & park waste, W, from generation & storage, GS, to collection & transport, CT. For the net cost flow C is used as notation.
3.3 System definition and processes of solid biodegradable wasteThe SWM system of biodegradable waste total flows in 2009 in 'A' Ward in Mumbai, India is shown in Illustration 5. This is based on the functional elements of the SWM system of Mumbai as shown in Illustration 1 and the SWM system in Heie (1997:3).
Lars Gunnar Furelid Tellnes
Illustration 5: System definition of solid biodegradable waste flow system 'A' Ward, Mumbai

26 3.3 System definition and processes of solidbiodegradable waste
3.3.1 Generation and storageThe total generation of food and garden & park waste in 'A' Ward is the sum of all the input flows
W 0−GS=W R−GSW S−GSW CI−GSW MR−GSW GP−GS (3.3.1.1)
Waste generation by population living in residences is calculated by
W R−GS=PR∗kg /P R/day∗ 3651000 (3.3.1.2)
Where, PR is the residence population in the 'A' Ward and kg/ PR/day is the average daily waste generation by the residences population. The distribution generation between waste coming from residences, slums and commercial & institutions where not available. This was solved by assuming that waste from slums is dependent on the slum population, waste form residents is dependent on non-slum population and waste from commercial and institutions is dependent on employment in the 'A' ward. The amount of waste generated per day for the different groups were estimated using multiple regression analysis with ward wise data on waste generation, slum population, non-slum population and employment. The data was obtained from Rathi (2007), MCGM (2010) and Pendharkar (2003).The other flows where calculated from the food or garden waste content of collected waste reported by the municipality and waste data on on-site and decentralised treatment.
Waste generation from slum population is calculated by
W S−GS=PS∗kg /P s /day∗ 3651000 (3.3.1.3)
Where, PSS is the slum population in the 'A' Ward and kg/ PS/day is the average daily waste generation by the residences population.
Waste generation from commercial and restaurants are calculated by
W CI−GS=PE∗kg /PE /day∗ 3651000 (3.3.1.4)
Where, PCI is the commercial employees in the 'A' Ward and kg/ PCI/day is the average daily waste generation by the residences population.
Waste from the markets and restaurants are calculated based on the collection. Hence, waste from markets and restaurants not collected separately is included in the generation from commercial and restaurants.
W MR−GS=365∗TPDMR (3.3.1.5)
Garden and park waste is calculated based on fraction of daily waste collected:
The Norwegian University of Science and Technology

3 Methods 27
W GP−GS=365∗TPDw−TPD MR∗ f gp (3.3.1.6)
Waste that is collected by municipal and private vehicles are calculated based on mass balance:
W GS−CT=W R−GSW S−GSW CI−GSW MR−GSW GP−GS−W GS−BD−W GS− IV−W IB−GS (3.3.1.7)
3.3.2 Collection and transportWaste transported to Deonar is calculated by
W CT−DL=W GS−CT−W CT−DB−W DV ∗k x−CT−DL (3.3.2.1)
Where, kx-CT-DL is the fraction collected waste that is transported to Deonar.
Waste transported to Mulund is calculated byW CT−ML=W GS−CT−W CT−DB−W CT−DV−W CT−DL (3.3.2.2)
Where, kx-CT-ML is the fraction collected waste that is transported to Deonar.
3.3.3 Decentralised biomethanationThe waste that is treated in decentralised biomethanation is calculated by:
W CT−DB=TPDDB∗365 (3.3.3.1)
Where, TPDDB is the capacity of treating waste per day at a decentralised biomethanation plant.
The biogas produced from biomethanation is calculated by:W DB−B=W CT−DB∗k DB−B (3.3.3.2)
Here, kDB-B is the weight fraction of the waste inputs to biomethanation that ends up as biogas.
Digestate from biomethanation is calculated by:W DB−D=W CT−DB∗k DB−D (3.3.3.3)
Here, kDB-D is the weight fraction of the waste inputs to biomethanation that ends up as digestate.
The off-gas and waste water is calculated by mass balance:W DB−OW=W CT−DB−W DB−B−W DB−D (3.3.3.4)
3.3.4 Decentralised vermicompostingThe waste treated at decentralised vermicomposting is calculated by
W CT−DV=TPDDV∗365 (3.3.4.1)
Lars Gunnar Furelid Tellnes

28 3.3 System definition and processes of solidbiodegradable waste
Where, TPDDV is the capacity of treating waste per day at a decentralised biomethanation plant.
The compost produced is calculated by.
W DV−C=W CT−DV∗k DV−C (3.3.4.2)
Here, kDV-C is the weight fraction of the waste inputs to vermicomposting that ends up as compost.
The off-gas and waste water from decentralised composting is calculated by mass balance:W DV−OW=W CT −DV−W DV−C (3.3.4.3)
3.3.5 Burning & dumpingThe burning & dumping of is calculated by:
W GS−BD=W R−GSW S−GSW CI−GSW MR−GSW GP−GS ∗k x−BD (3.3.5.1)
Here, kx-BD is the weight fraction of the waste inputs to storage & generation that ends up as either being bur& dumped.
The off-gas and waste water from burning & dumping is calculated by mass balance:W BD−OW=W GS−BD (3.3.5.2)
3.3.6 On-site vermicompostingThe food and garden & park waste treated by vermicomposting is calculated based on the treatment of the facilities:
W GS−IV=TPD IV∗365 (3.3.6.1)
Where, TPDIV is the capacity of treating waste per day at a on-site vermicomposting.
The compost from vermicomposting is calculated by
W IV−C=W GS− IV∗kGS−C (3.3.6.2)
The by-products of vermicomposting as off-gas and waste water is calculated by mass balance
W IV−OW=W GS−IV−W IV−C (3.3.6.3)
The Norwegian University of Science and Technology

3 Methods 29
3.3.7 On-site biomethanationThe waste treated by biomethanation is calculated based on the capacity of the plants
W GS−IB=TPD IB∗365 (3.3.7.1)
Where, TPDIB is the capacity of treating waste per day at a on-site biomethanation plant.
The biogas mass conversion from biomethanation is
W IB−B=W GS−IB∗k IB−B (3.3.7.2)
Here, kIB-B is the weight fraction of the waste inputs to biomethanation that ends up as biogas.
The organic fertiliser like product of biomethanation are digestate are are calculated by
W IB−D=W GS−IB∗k IB−D (3.3.7.3)
Here, kIB-D is the weight fraction of the waste inputs to biomethanation that ends up as digestate.
The by-products of biomethanation are off-gas and waster water and are calculated based on mass balance:
W IB−OW−W GS− IB−W GS− I (3.3.7.4)
The values for the parameters for the waste material flow analysis are listed in Table 9.
Lars Gunnar Furelid Tellnes

30 3.3 System definition and processes of solidbiodegradable waste
Table 9: Parameters for the biodegradable waste material flow analysis
Symbol Parameters Value Unit Reference
kg/PR/day Residents waste generation multiplier 0.6 kg/day Appendix
kg/PS/day Slum dwellers waste generation 0.3 kg/day Appendix
kg/PCI/day Employee waste generation multiplier 0.2 kg/day Appendix
TPDIB On-site biomethanation 2 t/day MPCB (n.d.)
TPDDB Decentralised biomethanation 0 t/day Assumption
TPDIV On-site vermicomposting 0 t/day Assumption
TPDDV Decentralised vermicomposting 1 t/day Clean Air Island
food Fraction food waste 0.54 IL&FS (2006)
fgp Fraction garden & park waste 0.1 IL&FS (2006)
kx-CT-DL Fraction Deonar 0.73 MCGM (2010)
kx-CT-ML Fraction Mulund 0.27 MCGM (2010)
kx-C Fraction waste to compost 0.25 Rathi (2006)
kx-B Fraction waste to biogas 0.1 Veeken (2005)
kx-D Fraction waste to digestate 0.1 Veeken (2005)
kx-BD Fraction uncollected waste 0.02 'A' Ward office
3.4 System definition and process of material flow cost accountingMaterial flow cost accounting (MFCA) is a relatively new method being developed. It is a tool for measuring flows and stocks of materials in both physical and monetary units (Jasch, 2009). There is also being developed an standard called ISO/DIS 14051 Environmental Management – Material flow cost accounting – General framework. However, due to the limitations of this report, the previous developed procedures are loosely followed.
The way cost are accounted is that they accumulate from end use and back to the generation. It can therefore be used for calculating tipping fees or collection fees of waste, since they will include all the cost that will follow. The generation cost that is calculated, is the total price of the SWM system and when divided by the total waste generated, a measure of average unit cost of SWM management. The system design is devoting from the procedures of MFA in Brunner and Rechberger (2004) in one vital aspects, the variable inside a process, for example in collection & transport CCT, this value is there used to show the net cost of the process. Which entails operation and maintenance and annualised capital costs.
The Norwegian University of Science and Technology

3 Methods 31
Land costs are not included. This is due to the assumption that land area in 'A' Ward is to expensive to be used mainly for solid waste treatment. However, where land inside the 'A' Ward is available and are not valued on the open marked, it can be located here. For example a garden or park surrounding a institution.
Lars Gunnar Furelid Tellnes
Illustration 6: System definition of the biodegradable waste flow cost accounting system 'A' Ward, Mumbai

32 3.4 System definition and process of materialflow cost accounting
Unit costs are in general calculated by
c x=AxO & M x
t W (3.4.1)
Annualised costs of invested capital is taken from Rathi (2006):
A= I∗r1−1r −n (3.4.2)
I investment, n lifetime of investment and r is discount rate.
Cost of landfill/open dumping has in Yedla only included cost of land and cost of operation. Costs of closure has not been included. Operational and maintenance costs. For the treatment options, this is taken from the waste mass flows.
The total cost of SWM in 'A' wardC=C ctC tC d (3.4.3)
3.4.1 Generation and storageTotal net cost of SWM in 'A' Ward
CGS−A=CR−CTCS−CTC CI−CTCMR−CTCGP−CT (3.4.1.1)
3.4.2 Collection and transportFrom Rathi (2007) the length from 'A' ward to Mulund is 32 km and to Deonar 24 km. The transport cost is per ton per km is 9 INR. The cost of maintenance of landfill and land of landfill was derived also from Rathi (2007). Costs of transporting to and tipping of waste at Deonar landfill is
CCT−DL=W CT −DL∗cCT−DLcTLcLL (3.4.2.1)
Where, cCT-D, is the unit transport cost from 'A' Ward to Deonar, cTL is the unit cost of operation of the landfill and cLL is the cost of landfill land.
Costs of transport to and tipping of waste at Mulund landfill:
CCT−ML=W CT−ML∗cCT−MLcTLcLL (3.4.2.2)
Where, cCT-D, is the unit transportt cost from 'A' Ward to Mulund landfill, cTL is the unit cost of operation of landfill and cLL is the cost of landfill land. Costs of tipping is here meant as equal to what a tipping fee which is a common procedure of charging for waste treatment. There is no
The Norwegian University of Science and Technology

3 Methods 33
information indicating that such a tipping fee is used in practice in Mumbai. The cost of tipping include treatment (operation & maintenance and investment costs), land costs and closure costs.
3.4.3 Decentralised biomethanationThe net costs of treating waste by decentralised vermicomposting are
CCT−DB=W CT−DB∗cCTC DB−BC DB−DC DB−OW (3.4.3.1)
3.4.4 Decentralised vermicompostingThe net costs of treating waste at decentralised vermicomposting are
CCT−DV=W CT−DB∗cCTC DV−CC DV−OW (3.4.4.1)
3.4.5 Burning & dumpingThe net costs of burning and dumping are calculated by
CSG−BD=W SG−BD∗cBDC BD−OW (3.4.5.1)
Where cSG-BD is the unit cost of burning and dumping of waste in the 'A' Ward.
3.4.6 On-site vermicompostingThe cost of treatment on-site vermicomposting is
CSG−V=W SG−V∗cTVcLV (3.4.6.1)
The cost of treatment in vermicompostingCGP−V=W GP−V∗cTVc LV (3.4.6.2)
The net cost (revenue) from compost from vermicomposting are
CV−C=W V−C∗cC (3.4.6.3)
3.4.7 On-site biomethanationThe cost of treating waste by biomethanation is given by
CCI−B=W CI−B∗cTBc LB (3.4.7.1)
Where cTB is the treatment cost of biomethanation
The net cost (revenue) from biogas income from biomethanation is given by
Lars Gunnar Furelid Tellnes

34 3.4 System definition and process of materialflow cost accounting
C B−BG=W CI−B∗c BG−LPG (3.4.7.2)
The net cost (revenue) from digestate and off-gas
C B−DO=W B−DO∗cDO (3.4.7.3)
The parameters of the flow cost accounting are listed in Table 10.
Table 10: Parameters used for the biodegradable waste material flow cost accounting
Symbol Cost parameters Value Unit Reference
cCT Unit cost of collection and transport 950 INR/t Yedla and Kansal (2003)
cCT-D Unit cost transport to Deonar 336 INR/t Rathi (2007)
cCT-M Unit cost transport to Mulund 448 INR/t Rathi (2007)
cDV Unit cost on-site biomethanation 444 INR/t Veeken (2005)
cDB Unit costs decentralised biomethanation 376 INR/t Veeken (2005)
cDV Unit cost decentralised vermicomposting 1400 INR/t Rathi (2007)
cIV Unit costs on-site vermicomposting 1450 INR/t Drecher (2002)
- Land cost biological treatment 1000 INR/t Assumption after Rathi (2007)
- Net costs electricity biomethanation -800 INR/t Veeken (2005), IL&FS (2006)
- Net cost digestate 0 INR/t Assumption
- Net cost compost product decentralised -3000 INR/t Drecher (2002)
- Net cost biogas substitution LPG -2000 INR/t Veeken (2005), Indiane (2010)
- Treatment cost landfill 328 INR/t Rathi (2007)
- Land cost landfill 380 INR/t Rathi (2007)
- Tipping fee centralised biomethanation 90 INR/t IL&FS (2006)
- Tipping fee centralised biomethanation with land costs 120 INR/t IL&FS (2006)
- Tipping fee centralised composting 150 INR/t IL&FS (2006)
- Tipping fee centralised with land costs 200 INR/t IL&FS (2006)
3.5 Evaluation of status quo indicatorsThe indicators were used for evaluation of the current system and the scenarios. An Indicator can be defined as:
An indicator is an elementary datum or a simple combination of data capable of measuring an observed phenomenon. (Fatta and Moll, 2003:48)
The observed phenomenon that the indicators were based on are the meeting the requirements of the MSW rules 2000, use of scarce availability of land and delivering SWM service at the lowest costs. They have been developed based on the literature, so that they can be used to compare with common practice in India and other studies.
The Norwegian University of Science and Technology

3 Methods 35
3.5.1 Health and hygiene - processing according to MSW rules 2000As health, environment and cleanliness are part of the overall objective in the Indian legislation, compliance with this rules are used as a indicator for performance to health, environment and hygiene. This is measured by the amount of waste treated according to the MSW rules 2000. The flows of the waste system are used for this.
waste treated [t W/a]waste generation [t W/a]
=W CT−DBW CT−DVW GS−IBW GS− IB
W R−GSW S−GSW CI−GSW MR−GS W GP−GS∗100 (3.5.1.1)
3.5.2 Net municipal gross costs to total gross costsThe cost for the municipality for delivering the SWM service to the 'A' Ward as percent of the total cost of SWM in 'A' ward is calculated by
CMCGM=CCTCCT−DLCT ML
CCT−DBCCT−DVCGS− IBCGS−DB (3.5.2.1)
3.5.3 Unit cost of SWM serviceThis is the average cost of SWM service in per ton of waste managed for the generators. If the generators were to be charged after the polluter pay principle, the charge will be in average equal to this. As the model is made so that the unit cost is equally distributed among the waste generators, calculating it can be done by dividing the net cost flow to any generator by the waste they generate:
Ct W=
C R−GS
W R−GS (3.5.3.1)
This indicator was chosen based on that “cost of SWM services per MT of waste” is the indicator used by the AIILSG in comparison between cities (AIILSG, 2003).
3.5.4 Land useAs mentioned earlier, Mumbai is one of the most populous cities in the world. The density of population is very high and thereby the pressure on land resources as well. In this backdrop, land use becomes a very important criterion when waste management options and alternatives are chosen. Land use details for vermicomposting and biomethanation are derived from literature.
Land use as percent of 'A' Ward area=L IBL IVLDBLDV
125000∗100 (3.5.4.1)
Where LIB, LIV, LDB and LDV is the total land use of respectively on-site biomethanation, on-site vermicomposting, decentralised biomethanation and decentralised vermicomposting.
Lars Gunnar Furelid Tellnes

36 3.5 Evaluation of status quo indicators
Each are calculated based on their waste treatment capacities and related land use, on-site vermicomposting is here used as an example:
L IB=TPD IB∗l IB (3.5.4.2)
Where lIB, is the land use of a on-site vermicomposting plant per ton of day treatment capacity.
3.6 Scenario analysis These potential is discovered in the scenarios that are listed in Table 11.
Table 11: Symbol, name, description and parameter values of the different scenarios
Symbol Scenario name Description Parameter values
SC0 Current scenario TPDIB=2
TPDDB=0
TPDIV=0
TPDDV=1
SC1 On-site treatment Biomethanation TPDIB=130
TPDDB=0
Vermicomposting TPDIV=150
No collection and transport is needed TPDDV=0
SC2 Decentralised treatment
Collection is needed TPDIB=0
Biomethanation TPDDB=130
TPDIV=0
Vermicomposting TPDDV=150
SC3 Centralised treatment
Waste to Deonar is treated with aerobic composting TPDIB=0
At Mulund it is treated with Biomethanation TPDDB=0
Collection and transport is needed TPDIV=0
TPDDV=0
This scenario will be based on the proposed solution from the consultancy report with the related tipping fees (IL&FS, 2006:33)
cLD=90
cLM=150
3.7 Stakeholder identificationThe stakeholders of organic waste management in 'A' ward were identified through interviews and literature review. The stakeholders were then grouped into categories of type of stakeholder, which institution/organisation they represented, their role and possible risks. The approach has mainly based on the method used in Snel and Ali (1999).
The Norwegian University of Science and Technology

3 Methods 37
The stakeholder identification is the first step of a stakeholder analysis. A stakeholder analysis can be defined as:
Stakeholder analysis is the identification of a project's key stakeholders, an assessment of their interests, and the ways in which these interests affect project riskiness and viability. ODA (1995).
When a stakeholder analysis is performed, there are from ODA (1995) three steps to be undertaken:
• draw up a 'stakeholder table';
• do an assessment of each stakeholder's importance to project success and their relative power/influence;
• identify risks and assumptions which will affect project design and success.
In this report, only the first step has been undertaken, the 'stakeholder table'. From ODA (1995), the 'stakeholder table' should be made by the following steps:
• identify and lists all potential stakeholders.
• Identify their interests (overt and hidden) in relation to the problems being addresses by a project and its objectives. Note that each stakeholder may have several interests.
• Briefly assess the likely impact of the project on each of these interests (positive, negative, or unknown).
• Indicate the relative priority which the project should give to each stakeholder in meeting their interests. ODA (1995).
The stakeholders are grouped into three categories found in Snel and Ali (1999:6-7):
• primary stakeholders are directly affected, either positively or negatively, by the implementation of a solid waste management project and include householders and citizens receiving waste management services;
• secondary stakeholders play intermediary role and may have an important effect on the project/programme outcome. These include urban government (municipalities) and their employees, other national/state government departments, NGOs, CBOs & Area Based Organisations, donor/lending agencies, waste pickers, private sweepers, small entrepreneurs and contractors working on area-based waste collection;
• external stakeholders are not directly involved but may nevertheless be affected by a specific project. In solid waste management this is an important group and there are many potential actors. For example: residents of nearby communities; itinerant waste buyers; middle-men in the waste recycling trade; waste reprocessors.
Lars Gunnar Furelid Tellnes

38 3.8 Data collection
3.8 Data collectionData were collected from both primary and secondary sources. The primary data were collected during a three-week study trip to Mumbai from October 17 until November 5 2009. During this trip, semi-structured interviews and observations were used to collect data. Semi-structured interviews were chosen as one to the components of the field work as the system definition of the material flow analysis was not completely known. 'Semi-structured' here implies gathering information by resorting to open questions around the issues which are of interest to the interviewer. In this approach, on question leads to another, triggered by the answers which the interviewees give. The interviewees are then able to share their own knowledge and understanding about the issue (Denscombe, 2007:176). Snowballing sampling was also used to find unknown stakeholders and informants. This was done by starting with a few people were the interviews was planned before the study trip started. During these interviews, the informants were asked to nominate other people they think are relevant for the research (Ibid.:17-18). During the interviews in Mumbai, many published and unpublished reports, articles, etc. were also gathered. Both before and after the study trip, several Internet searches were conducted.
The Norwegian University of Science and Technology

4 Results 39
4 Results
4.1.1 Material flow analysis of biodegradable solid wasteThe results of the biodegradable solid waste cycle is presented in Illustration 7. Key points are that commercials and institutions are the largest waste generators, but are closely followed by residences. Also it shows that most of the waste is transported to the landfills.
Lars Gunnar Furelid Tellnes
Illustration 7: Biodegradable solid waste flow 'A' Ward, Mumbai, India

40 4 Results
4.1.2 Material flow cost accounting of biodegradable solid wasteThe result of the material flow cost accounting of the biodegradable solid waste is presented in Illustration 8. From the costs of SWM services, it is clear that landfilling is the biggest cause, followed by collection and transport. Both vermicomposting and biomethanation have incomes from their products, but it is only for biomethanation that incomes surpasses the treatment costs.
The Norwegian University of Science and Technology
Illustration 8: Biodegradable solid waste flow cost accounting 'A' Ward, Mumbai, India
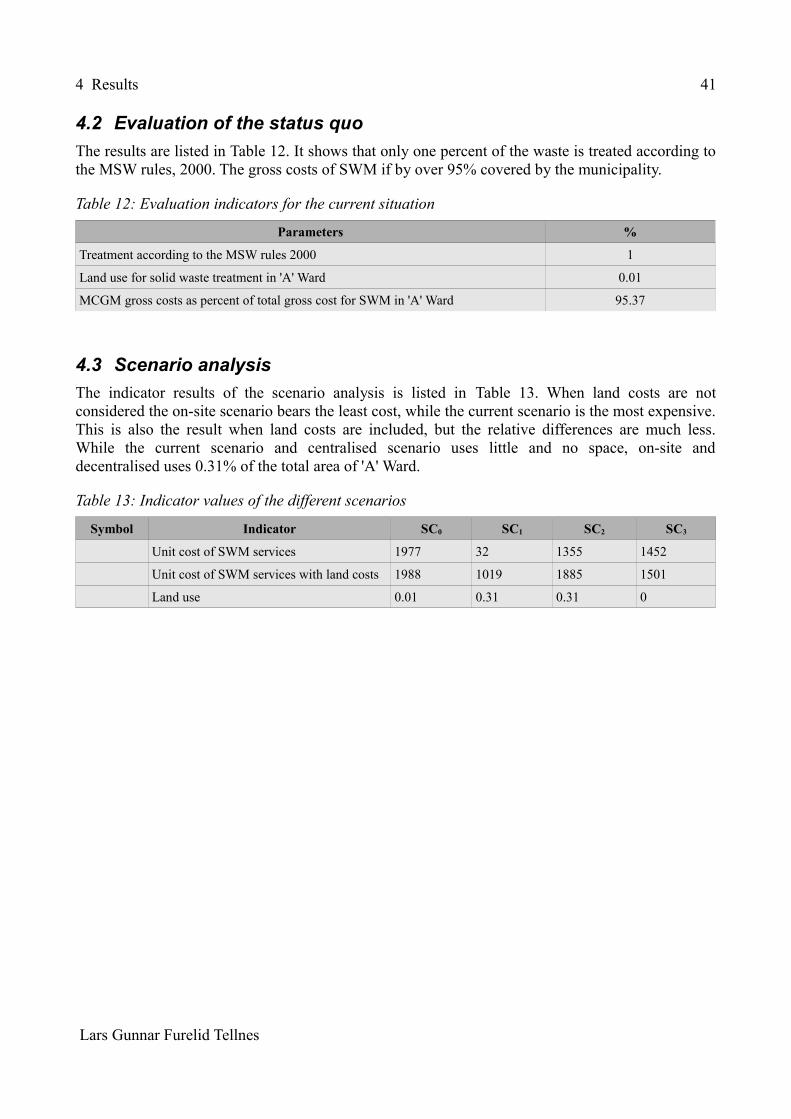
4 Results 41
4.2 Evaluation of the status quoThe results are listed in Table 12. It shows that only one percent of the waste is treated according to the MSW rules, 2000. The gross costs of SWM if by over 95% covered by the municipality.
Table 12: Evaluation indicators for the current situation
Parameters %
Treatment according to the MSW rules 2000 1
Land use for solid waste treatment in 'A' Ward 0.01
MCGM gross costs as percent of total gross cost for SWM in 'A' Ward 95.37
4.3 Scenario analysisThe indicator results of the scenario analysis is listed in Table 13. When land costs are not considered the on-site scenario bears the least cost, while the current scenario is the most expensive. This is also the result when land costs are included, but the relative differences are much less. While the current scenario and centralised scenario uses little and no space, on-site and decentralised uses 0.31% of the total area of 'A' Ward.
Table 13: Indicator values of the different scenarios
Symbol Indicator SC0 SC1 SC2 SC3
Unit cost of SWM services 1977 32 1355 1452
Unit cost of SWM services with land costs 1988 1019 1885 1501
Land use 0.01 0.31 0.31 0
Lars Gunnar Furelid Tellnes

42 4.4 Stakeholder analysis
4.4 Stakeholder analysisThe results of the stakeholder identification is listed in Table 14, Table 15 and Table 16. It shows that the generators of waste are the primary stakeholders. The secondary stakeholders are the ones who are managing the waste, either by collection and transport or by treatment. External stakeholder are many, and include research, governmental and state bodies, private enterprises and non-governmental institutions.
Table 14: Primary stakeholders of SWM in 'A' Ward, Mumbai, India
Primary Stakeholder
group
Parameters with direct
relation
Role Issues/risks to parameters
Identified Institution/organisations
Residence population
Not charged for waste collection.
Poor source segregationCould dispose waste in streets if charged for collection
Cuffe Parade Resident's Association (CPRA)
PR Land reclamation can lead to higher population
kg/PR/day Waste generation in food preparations etc
Higher living standards can lead to higher waste in food preparations
Slum population PS
kg/PS/day
Commercial & Institutions
Waste collection is charge in relation to license fee.
No incentive to reduce wastes (TPDIB,TPDIV)
Taj President and World Trade Centre
PCI
kg/PCI/day
Market & restaurants
Restaurants charges as commercial.Source segregated waste is collected
Shivaji market
Garden & parks Private and public operated
Burning of garden & park waste is cost free and convenient
HSBC, Taj President, CPRA
The Norwegian University of Science and Technology

4 Results 43
Table 15: Secondary stakeholders of SWM in 'A' Ward, Mumbai, India
Secondary Stakeholder
group
Parameters with direct
relation
Role Issues/risks to parameters
Identified Institution/organisati
ons
Urban local body/ Municipality
Responsible for SWMCollection of waste.Coordinating with NGOs and CBOs
MCGM, 'A' Ward office
NGO TPDDV Treats 1 TPD of waste by vermicomposting at Colaba Pumping station
Clean Air Island
Community based organisation (CBO)
TPDIV Have organised composting on-site many places in Mumbai. Unsure of extent of this practice in 'A' Ward.
Advanced location management (ALM)
CBO TPDIV Collect waste from slums and get fund from MCGM
Could introduce vermicomposting
Dattak Vasti Yojana
Private contractor Private collection and transport of waste in Mumbai
Ramky Group
Table 16: External stakeholders of SWM in 'A' Ward, Mumbai, India
External Stakeholder group
Role Identified Institution/organisations
State governance Support initiatives within solid waste management.
Mumbai Metropolitan Region Development Authority (MMRDA)
Environment control agencies
Responsible for environmental control
Maharashtra Pollution Control Board (MPCB), Central Pollution Control Board (CPCB)
Government of India Framework policymakers, Ministry of Urban Development, Ministry of Environment and Forests (MoEF), Ministry of New and Renewable Energy
Non-governmental organisations
Support of weaker groups of society
Stree Mukti Sanghatana (SMS)National Solid Waste Association of India (NSWAI).
Private Supporting public and private management decisions. IL&FS Ecosmart
Research Policy and management research with a SWM Cell.
All India Institute of Local Self GovernmentNational Environmental Engineering Research Institute (NEERI), Indian Institute of Technology, IIT, Bombay, Indira Gandhi Institute of Development Research (IGIDR) Bhabha Atomic Research Centre (BARC)
Lars Gunnar Furelid Tellnes

44 5 Discussion
5 Discussion
5.1 Discussion of resultsFrom the analysis of the flows of biodegradable waste, commercial and institutions are the largest. This reflects the fact that 'A' constitutes of many offices and the large floating population. In the current situation, 99% of the waste is landfilled under conditions not up to standards of hygiene set by legislation. Minor amounts of waste are currently treated inside the 'A' Ward by biomethanation and vermicomposting. Both are earning incomes, but biomethanation are is the only where the income is higher than the costs. Some waste is also dumped and burned illegally, but this is relatively low compared to the rest of the city and other cities in India. In the current scenario, only 1% of the waste is treated according to the MSW rules, 2000. As compliance with this rules is of much importance for secure hygiene conditions for human health, rising this value is of high importance. This can be achieved by treating the waste, either on-site of generation, decentralised inside 'A' ward or upgrading to treatment at the centralised landfills. The landfilling of the waste have direct impacts on human health, but this will not directly affect the people of 'A' ward.
From the stakeholder analysis, we can see that primary stakeholders are those who generated the waste and will be affected by lack of management of this. The secondary stakeholders are those who perform the management of waste. The external stakeholders are those who are not generating or managing the waste, but who are in relationship with those who do in relation to waste. The civil society is related to both generation and management of waste from residences and slums. If one should reduce the amount of waste sent to landfills, the waste from residences and slums could be treated on-site. The waste is not normally source segregated and there are no large demand for gas a single buyer. LPG gas for domestic use are in addition subsidised, so there are less incentives. Vermicomposting favours therefore for treatment and residences colonies in general have land space available, so this could be allocated for treatment. CBOs could operate and the unsegregated waste gives also an extra income with recovering of recyclables. Commercial and institutions which have large kitchens, have the potential to utilise the biogas from biomethanation to substitute LPG. Since these places are charge a fee for the handling of waste by the municipality, arrangements for reducing this, should be used as an extra incentives. An obstacle are land, since 'A' Ward is an affluent area and high land prices for commercial allocation. The double environmental benefits of substituting fossil fuels and avoiding landfilling of waste, should be used as a recognition of awareness by users and a green certificate could be developed.
How can the organic waste management be improved in the 'A' ward? Summing up the problems and solution. Institutions and hotels of small size and available green area can have vermicomposting. Domestic and slum waste is problematic due to poor segregation at source. Municipal collection to centralised treatment and disposal or on-site segregation and vermicomposting through schemes such as the Parisar Vikas programme are possible. The potential that are left to be discovered are market and restaurant waste and wet waste from larger institutions and hotels. The market and restaurant waste is thought to have a potential for its high levels of biodegradable waste, but since there is little available space on-site and assumed little potential for utilisation of energy, this should be collected at treated at a common place. Hotels and institutions with canteens usually have surrounding gardens and a large need for energy in food cooking, on-site
The Norwegian University of Science and Technology

5 Discussion 45
biogas plants could be used. From the scenarios, one can see that treating waste on-site would reduce the SWM cost to almost zero, when land cost is not considered.
For treating waste decentralised treatment, this as little relative difference to centralised, mainly due to the high collection costs. If this should be developed by a public private partnership, this would be possible if the municipalities paid a tipping fee. In utilisation of the products from treatment waste to organic fertiliser, this could be used to substitute artificial fertiliser, but this require the use on crops and are under stricter legislation. On-site treatment would in generally lead to small amounts of compost and would just be used in gardens on site. Same with decentralised. Centralised composting provides large amounts at the same location, but if the quality is good enough is not sure.
5.2 Discussion of methodsThe method here used are based on the principles of industrial ecology, where reducing environmental impacts by loop closing is the basic idea. From this a substance flow analysis was first used on the carbon cycle of the 'A' ward to identify the energy potentials as in developed in Tellnes (2010). Based on this, the system of SWM were to be evaluated and scenarios for improvement where to be conducted taking stakeholders into account. This system was developed based on the theoretical foundations of resource conservation, with the possibility of carbon utilisation. For assessment of the research question raised in this study, there were not possible to find literature linking this to the carbon cycle. Without literature findings, the results could not be compared with any similar studies in the same context, it was not possible to find out what we could learn from such a metabolism. Only on a country wide analysis in Bratland (2009), carbon cycle seems to have a function as a top-down approach. Here aggregate statistical data can be applied and the results can be inputs for strategic national planning and policy making. Realising that the carbon cycle could not be applied to answer the research questions, the system design was changed.
The new system was based on the way the municipality in Mumbai have structure their SWM system, as in Illustration 1, and how the SWM system was commonly structured in academic literature (Heie, 1997:3; Tchobanoglous, 1993:12; Shekdar, 2009:1444). The carbon flow was replaced by total flow of biodegradable waste and also the net cost accounting with this. Which is similar to the approach applied in Brunner and Fellner (2007) and Drescher et al. (2003).
The use of material flow analysis is here used as a tool for decision-making, as in several other studies. One obstacle that has been troubling is that who the decision is to be taken by has not been clearly defined, and not either their goals. In a system where the choice of treatment is based on both the municipality and private hands, finding a framework which entails both interests are troublesome. Specially when stakeholder are to be identified, this showed to be difficult since it is commonly used from one stakeholder like a company or organisation perspective and not for a region. What is the interest and preferences of a region? The top-down approach was therefore difficult to apply into practical solutions.
Lars Gunnar Furelid Tellnes

46 5.2 Discussion of methods
Proper generation calculation for market & restaurant waste is missing due to lack of data. This is making the uncertainty of the estimates large. For the case of Taj President, is was found that wet waste generation per employee was about 1 kg per day. Hence, it is about five times of a general worker where 0.2 kg per day is used. In order to improve the generation there is a need for ward wise data on employees in the market & restaurant establishments in Mumbai. Market and Restaurant waste generation WMR-CT are just calculated based on the collection of this waste fraction due to lack of data on employees in this sector. More precise waste generation multipliers should be developed. The selection of the different waste generating groups were based on the available data. The drawback of this is that it makes comparison difficult. AIILSG (2003) divides the waste generator groups into domestic, commercial, industrial, market area and hotel & restaurant.
Evaluations of a SWM system can be done more systematically by using models like ORWARE. However, challenges would arise, when an LCA has to be performed, as there is no database on upstream process. EASEWASTE was shown to be useful in studying waste management in Hangzhou in China, and so, it can be deemed to be appropriate for a developing country setting like Mumbai's. In the Hangzhou case, some of the data which were of less importance or lacking under Chinese conditions were taken from the EASEWASTE default database. From the theory of ISWM and eco-industrial design, these models would cover two of three aspects. The analysis of stakeholders would however be lacking.
The industrial ecology approach differs to economic approach represented by Rathi (2007). In industrial ecology all process inputs and outputs are counted, but in the economic analysis, only those with economic value are accounted for. For instance this relates to the composting process, where economic approach only takes into account the outputs of compost that accounts to 25 % of the inputs. In material flow analysis the rest 75 % of outputs are also considered. By this way, it is possible to identify possible process improvements and utilisation of resources.
Per day versus per year flows. In Western world waste management planning, it is common to count waste treatment capacities of facilities annual amounts. This is also the common practice in material flow analysis, so from this annual flows where also used here. But, in the Indian literature and practice, flows are usually counted as tons per day (TPD). One first implication of this is that numbers can not be directly compared by first sight. The reason behind using TPD could also be that waste is handled on a more day to day basis in India. Where in most places, it is collected every day and this is required by the rules. Seasonal variations in waste generation, might also lead to a greater importance in knowing the TPD capacities of treatment facilities. Technologies as biomethanation should have a stable inflow of waste and under feeding could therefore be a issue. Hence, taking into account the waste that is needed on a day to day basis in these plants are more important than the annual capacities.
Calculating the amount of waste dumped or burned could be improved by adding coefficients to collection of each waste generator. So that the difference between generation from each group and the collection from each group would be determined by this coefficient. This would be useful for evaluating different collection system like house-to-house collection and community bins systems. In the case like Mumbai, this is useful for evaluating collection systems like the Slum Adoption Programme and the overall change from community bin system to house-to-house collection with
The Norwegian University of Science and Technology

5 Discussion 47
segregation between between wet and dry garbage. In the case of segregated collection, the amount of waste generated going to the right bin is of high importance, hence this could also be an important parameter.
From the source of the transport cost, it was unsure if the cost included just one way to the landfill by the distance or if return driving was included. Comparing to average transport costs by ton weight of waste, it was clear that just one way was included and the distance multiplied with transport costs per ton per kilometre had to be doubled to include return driving. Other data issues are that the weakness of much of the waste data, is that flows are calculated based on capacity of collection and treatment, rather than actual collection and treatment.
Lars Gunnar Furelid Tellnes

48 6 Conclusion, recommendation and limitations
6 Conclusion, recommendation and limitations
6.1 ConclusionThe current system of SWM can be evaluated according to performance on health and hygiene with the compliance rate to the Mumbai Cleanliness By-laws and the MSW rules, 2000. For the 'A' Ward the municipality have a collection rate of 99%, but only 1% of the waste is treated according to the rules. For evaluating capital/operational cost a SWM system on the system level, MFCA is a practical way of achieving a overall holistic view and can also be used for benchmarking of SWM services per ton. This method also make possible for evaluating to which extent the waste handling are charged to the generators of waste (following a polluter pay principle). Employment generation can be applied to the level of CBOs and NGOs implemented in SWM as with the slum adoption programme
Stakeholders to a SWM system is primary those who generate the wastes and pay taxes for service . The waste handling actors are the secondary stakeholders. There is a third category of stakeholders who influence the system indirectly – NGOs, research institutes, legislating bodies, media units etc.
Scenarios for compliance with the MSW rules was on-site, centralised and decentralised solutions have to analysed according to land use and SWM service cost. On-site was the scenario with lowest cost, mainly due to no collection cost. Decentralised and centralised treatment had relative little differences in costs.
Business ideas for energy recovery are most likely to be successful with commercial food producers like restaurants and hotels, the reason being that they have strong incentives to resort to captive energy consumption, when one considers that they are charged more for the energy than they consume, vis-a-vis households. On-site biomethanation is a commercially-viable option, as this can substitute LPG in the kitchens of hotels and canteens in commercial complexes. Restaurants and hotels could, for instance, procure certificates testifying their environment-friendliness. A private company could provide this as a service at a monthly fee on par with the LPG and SWM charges. The role of the government here, is to provide financial incentives by reducing the SWM charges for actors who treat their own wastes.
6.2 RecommendationFor each part of the SWM system, there are some important issues that should be analysed in greater detail. Development of waste generation multipliers should be conducted for different generators, so that the difference between waste generation and waste collection can be more precisely estimated for every ward. The collection, transport and transfer system of Mumbai should be studied in greater detail to find out how the polluter-pays-principle could be enforced without the risk of increasing open-dumping or burning.
The Norwegian University of Science and Technology
6 Conclusion, recommendation and limitations 49
6.3 LimitationsIn terms of research design, data, time and scope there are several limitation to this study and other ways it could be conducted. In the start of the research design process, common objectives of the study was not formalised. This followed that the methods like the carbon cycle was selected without a theoretical foundation that could explain how these results should be used. During the research, this lead to that the focused was on overcome issues with applying this method, without consideration if the method solved the objectives of the study. In terms of data, this framed the analysis of this thesis. Local and field data from the study area was already collected for the need of the carbon cycle and additional was difficult to obtain later without being physically present. In addition, the most informative document source on the research area, IL&FS (2006), was not discovered until the final stages of the work. With regard to time, lack of clear objectives resulted in that much times was used to find trivial and random results which meaningful application and are therefore not included in this report. As a direct consequence of the time limitation, assessment of the uncertainty of the flows was not conducted. Time also limited the use of proper procedures for the material flow cost accounting. Lack of theoretical foundation also leaded to inconsistent and random use of terms and concept, which lead to a long clean up process.
Further research should be based on the based on the eco-design approach. For assessment of flows and the different technologies, environmental system analysis like ORWARE and EASEWASTE could be used. EASEWASTE has proved to be viable for similar case in Hangzhou, China and ORWARE are also including economic costs. The results from this could be used for setting SWM goals after compliance with the MSW rules 2000. In other words, there models could be applied so that long term planing could include goals of environment and resource conservation improvements, after the goal of hygiene is obtained.
Lars Gunnar Furelid Tellnes

50 7 List of literature
7 List of literatureAggarwal, R. (2009). Letter from concerned citizens on crucial aspects of solid waste
management in Mumbai. Retrieved June 6, 2010, from http://mumbaiswm.files.wordpress.com/2009/07/letter-to-justice-chandrachud.pdf
Ambulkar, A. R. and Shekdar, A. V. (2003). Prospects of biomethanation technology in the Indian context: a pragmatic approach. Resources, Conservation and Recycling, 40(2), 111-128.
Amlinger, F. (2009). Drivers for the management of organic waste – Trends and perspectives in an European context. Downloaded December 31, 2009, from http://www.avfallnorge.no/content/download/61057/518464/file/Amlinger_Biological%20waste%20treatment%20under%20European%20Regulation%20-%20Avfall%20Norge%20seminar%20-%20Stavanger%2021%20sep%2009.pdf.
'A' Ward Office (2009). Information Regarding Garbage Collection in 'A' ward. Respond letter to questions asked in the interview November 29, 2009.
Baccini, P. and Brunner, P. H. (1991). Metabolism of the Anthroposphere. New York: Springer.
BARC (2005). Nisargruna Plant at INS Kunjali Inaugurated. Retrieved January 5, 2010, from http://www.barc.ernet.in/publications/nl/2005/200502-6.pdf.
Beigl, P., Lebersorger, S. and Salhofer, S. (2008). Modelling municipal solid waste generation: A review. Waste Management, 28(1), 200-214.
Belevi, H. and Baccini, P. (1989). Long-Term Behavior of Municipal Solid Waste Landfills. Waste Management & Research, 7(1), 43-56.
Belevi, H. (2002, May). Material flow analysis as a strategic planning tool for regional waste water and solid waste management. Paper presented at 12th Europäisches Wasser-, Abwasser und Abfall-Symposium, IFAT 2002, Munich.
Bhada, P. (2007). Feasibility Analysis of Waste-to-Energy as a Key Component of Integrated Solid Waste Management in Mumbai, India. Unpublished Master thesis, Department of Earth and Environmental Engineering, Fu Foundation School of Engineering and applied Science, Columbia University, New York.
The Norwegian University of Science and Technology
7 List of literature 51
Binder, C. R. (2007a). From material flow analysis to material flow management Part I: social sciences modelling approaches coupled to MFA. Journal of Cleaner Production 15(17), 1596-1604.
Binder, C. R. (2007b). From material flow analysis to material flow management Part II: the role of structural agent analysis. Journal of Cleaner Production 15(17), 1605-1617.
Bingh, L. P. (2004). Opportunities for Utilizing Waste Biomass for Energy in Uganda. Unpublished Master thesis, Department of Energy and Process Engineering, Norwegian University of Science and Technology, Trondheim.
Borah, M. C., Mahanta, P., Kakoty, S. K., Saha, U. K. and Sahasrabudhe, A. D. (2007). Study of quality parameters in vermicomposting. Indian Journal of Biotechnology, 6, 410-413.
Böhm, R. (2004). Hygienic safety in organic waste management. In P. Lens, B. Hamelers, H. Hoitink and W. Bidlingmaier (Editors). Resource Recovery and Reuse in Organic Solid Waste Management. London: IWA Publishing.
Bratland, H. S. (2009). Food-related biomass management in Norway – potentials and limits for energy recovery. Unpublished Master's thesis, Department of Hydraulic and Environmental Engineering, Norwegian University of Science and Technology, Trondheim.
Brunner, P. H. and Fellner, J. (2007). Setting priorities for waste management strategies in developing countries. Waste Management and Research, 25, 234.
Brunner, P. H. and Rechberger, H. (2004). Practical Handbook of Material Flow Analysis. New York: Lewis.
CIA (2010). The World Factbook. Retrieved May 5, 2010, from https://www.cia.gov/library/publications/the-world-factbook/index.html
Costi, P., Minciardi, R., Robba, M., Rovatti, M. and Sacile, R. (2004). An environmentally sustainable decision model for urban solid waste management. Waste Management, 24(3), 277-295.
Churkina, G. (2008). Modeling the carbon cycle of urban systems. Ecological Modelling, 216(2), 107-113.
CPHEEO (2005). Report of the technology advisory group on solid waste management. New
Lars Gunnar Furelid Tellnes

52 7 List of literature
Dehli: Ministry of Urban Development.
Denscombe, M. (2007). The Good Research Guide. Berkshire: Open University Press.
Drescher, S. (2002). Decentralised composting. Fact Sheets from 5 Cities in Southern India. Retrieved May 4, 2010, from http://www.eawag.ch/organisation/abteilungen/sandec/publikationen/publications_swm/downloads_swm/factsheets-india.pdf
Drescher, S., Müller, C., Kubrom, T., Mehari, S., Zurbrügg, C. and Kytzia, S. (2003). Decentralised Composting – Assessment of Viability through Combined Material Flow Analysis and Cost Accounting. Retrieved May 4, 2010, from http://www.eawag.ch/organisation/abteilungen/sandec/publikationen/publications_swm/downloads_swm/drescher_MFA-PCA_ORBIT.pdf
Earthcheck (2009). Benchmarking assessment report: Taj President Hotel Mumbai, India.
EUR-Lex (2008). Directive 2008/98/EC of the European Parliament and of the Council of 19 November 2008 on waste and repealing certain Directives. Retrieved February 17, 2010, from http://eur-lex.europa.eu/LexUriServ/LexUriServ.do?uri=CELEX:32008L0098:EN:NOT
Eriksson, O., Frostell, B., Björklund, A., Assefa, G., Sundqvist, J.-O., Granath, J., Carlsson, M. Baky, A. and Thyselius, L. (2002). ORWARE – a simulation tool for waste management. Resources, Conservation and Recycling, 36(4), 287-307.
Fatta, D. and Moll, S. (2003). Assessment of information related to waste and material flows. A catalogue of methods and tools. Technical report No 96. Copenhagen: European Environment Agency.
Feachem, R. G., Bradley, D. J., Garelick, H. and Mara, D. D. (1983). Sanitation and Disease: Health Aspects of Excreta and Wastewater Management. Chichester: Wiley.
Fiorucci, P., Minciardi, R., Robba, M. and Sacile, R. (2003). Solid waste management in urban areas: Development and application of a decision support system. Resources, Conservation and Recycling, 37(4), 301-328.
Gerhardt, T., Cenni, R., Siegle, V., Spliethoff, H. and Hein, K. R. G. (1998). Retrieved May 21, 2010 from http://www.anl.gov/PCS/acsfuel/preprint%20archive/Files/43_1_DALLAS_03-98_0197.pdf.
The Norwegian University of Science and Technology

7 List of literature 53
Giusti, L. (2009). A review of waste management practices and their impact of human health. Waste Management, 29(8), 2227-2239.
Hanks, T. G. (1967). Solid Waste/Disease Relationships – a literature survey. Cincinnati: U.S Department of Health, Education and Welfare, Solid Waste Program, Publication SW-1c.
Hanandeh, A. E. and El-Zein, A. (2009). The development and application of multi-criteria decision-making tool with consideration of uncertainty: The selection of a management strategy for the bio-degradable fraction in the municipal solid waste. Bioresource Technology, 101, 555-561.
Heeb, F. (2009). Decentralised anaerobic digestion of market waste, Case study in Thiruvananthapuram, India. Swiss Federal Institute of Aquatic Science and Technology (Eawag), Dübendorf, Switzerland.
Heie, A. (1997) Kommunal miljøteknologi: en innføring i avfallshåndtering. Department of Hydraulic and Environmental Engineering. Norwegian University of Science and Technology, Trondheim.
Hokkanen, J. and Salminen, P. (1997). Choosing a solid waste management system using multicriteria decision analysis. European Journal of Operational Research, 98, 19-36.
Hung, M-L, Ma, H-w and Yang, W-F. (2007). A novel sustainable decision making model for municipal solid waste management. Waste Management, 27(2), 209-219.
Infrastructure Leasing & Financial Services Limited (IF&LS) (2006). Report on Selection of Waste Processing Technology and Scientific Management of Landfills for Collection of Solid Waste Data, Waste Procesing Technology and Scientific Management of Existing Dumping Grounds, MCGM. Retrieved June 4, 2010, from http://www.karmayog.com/cleanliness/ilfsreport.htm.
Indian Oil Corporation (2010). Indane Gas. Retrieved April 6, 2010, from http://www.iocl.com/Products/Indanegas.aspx.
IPCC (2006). 2006 IPCC Guidelines for National Greenhouse Gas Inventories, Prepared by the National Greenhouse Gas Inventories Programme, Eggleston H.S., Buendia L., Miwa K., Ngara T. and Tanabe K. (eds). Published: IGES, Japan.
Lars Gunnar Furelid Tellnes
54 7 List of literature
IWA (n.d.) STAN – Software for Substance Flow Analysis. Retrieved January 10, 2010, from http://www.iwa.tuwien.ac.at/iwa226_english/stan.html
Jasch, C. M. (2009). Environmental and Material Flow Cost Accounting: Principles and Procedures. In the series A. Tukker (Editor), Eco-Efficiency in Industry and Science, 25. Dordrecht: Springer.
Jakrawatana, N., MacGill, I. and Moore, S. (2007). A Decision Support Tool for Regional Biomass Waste Management and its Application in Regional Australia. Paper presented at ISWA/NVRD World Congress 2007 Amsterdam, Netherlands.
Joardar, S. (2000). Urban Residential Solid Waste Management in India. Issues Related to Institutional Arrangements. Public Works Management & Policy, 4(4), 319-330.
Johnson, Eric. (2008). Disagreement over carbon footprints: A comparison of electric and LPG forklifts. Energy Policy, 36(4), 1569-1573.
Joseph, K. (2006). Stakeholder participation for sustainable waste management. Habitat International, 30(4), 863-871.
Khan, S. and Faisal, M.N. (2008). An analytical network process model for municipal solid waste disposal options. Waste Management, 28(9), 1500-1508.
Kumar, S., Bhattacharyya, J. K., Vaidya, A. N., Chakrabarti, T., Devotta, S. and Akolkar, A. B. (2008). Assessment of the status of municipal solid waste management in metro cities, state capitals, class I cities and class II towns in India: An insight. Waste Management, 29(2), 883-895.
Kumar, S., Gaikwad, S. A., Shekdar, A. V., Kshirsagar, P. S. and Singh, R. N. (2004). Estimation method for national methane emission from solid waste landfills. Atmospheric Environment, 38(21), 3481-3487).
Lang, D. J., Binder, C. R., Scholz, R. W. Schleiss, K. and Stäubli, B. (2006). Impact factors and regulatory mechanism for material flow management: Integrating stakeholder and scientific perspectives: The case of bio-waste delivery. Resources, Conservation and Recycling, 47(2), 101-132.
Lederer, J. (2008). A goal-oriented assessment of solid waste management strategies in high and lower income countries. Unpublished Masters' thesis, Institute for Water Quality, Resources and Waste Management, Vienna University of Technology, Vienna.
The Norwegian University of Science and Technology

7 List of literature 55
Lybæk, R. and Jacobsen, N. B. (2009). The clean development mechanism and the principles of industrial ecology – exploring the interconnections and mutual opportunities. Progress in Industrial Ecology – An International Journal, 6(1), 11-28.
Mara, D. (2004). Domestic Wastewater Treatment in Developing Countries. London: Earthscan.
Mastellone, M. L., Brunner, P. H. and Arena U. (2009). Scenarios of Waste Management for a Waste Emergency Area. Journal of Industrial Ecology, 13(5), 735-757.
Mata-Alvarez, J., Macé, S. and Llabrés, P. (2000). Anaerobic digestion of organic solid wastes. An overview of research achievements and perspectives. Bioresource Technology, 74(1), 3-16.
MCGM (2007). Greater Mumbai Cleanliness &Sanitation Byelaws 2006. Retrieved October 1, 2009 from http://www.cleanupmumbaicity.org/cleanup/eng.pdf.
MCGM (2010). Mumbai Human Development Report 2009. New Delhi: Oxford University Press.
MCGM (n.d.a). 'A' Ward at a Glance. Retrieved December 25, 2009, from http://www.mcgm.gov.in/irj/portal/anonymous/qlwarda.
MCGM (n.d.b) Solid Waste Management MCGM Initiative. Retrieved April 9, 2010, from http://www.mcgm.gov.in/irj/portal/anonymous/qlcleanover.
MCGM (n.d.c). Efforts for Community Participation. Retrieved April 9, 2010, from http://www.cleanupmumbaicity.org/cleanup/peoplepart.php.
Mhaske, P. (2010). BMC will tap sludge for power worth Rs77 cr. DNA India. Retrieved May 19, 2010 from http://www.dnaindia.com/mumbai/report_bmc-will-tap-sludge-for-power-worth-rs77-cr_1360730.
Mitchell, R. K., Agle, B. R. and Wood, D. J. (1997). Toward a theory of stakeholder identification and salience: defining the principle of who and what really counts. Academy of Management Review, 22(4), 853-886.
MPCB (2009). Annual Report on Implimentation of MSW (management & handling) Rules, 2000. For the State of Maharashtra. (2007-08). Maharashtra Pollution Control Board,
Lars Gunnar Furelid Tellnes

56 7 List of literature
Mumbai.
Ministry of Environment and Forests (2000). Municipal Solid Wastes (Management and Handling) Rules, 2000. Retrieved February 17, 2010, from http://envfor.nic.in/legis/hsm/mswmhr.html.
Ministry of Urban Development (2005). Report of Inter-Ministerial Task Force on Integrated Plant Nutrient Management Using City Compost. Retrieved May 2, 2010, from http://urbanindia.nic.in/programme/uwss/imtf_pnm.pdf.
Montangero, A. and Belevi, H. (2008). An approach to optimise nutrient management in environmental sanitation systems despite limited data. Journal of Environmental Management, 88(4), 1538-1551.
Morrissey, A.J. And Browne, J. (2004). Waste management models and their application to sustainable waste management. Waste Management, 24(3), 297-308.
Mumbai Prepared (n.d.). A Ward Plan. Retrieved December 25, 2009, from http://www.mumbaiprepared.com/a-ward-plan.html.
Müller, C. (2007). Anaerobic Digestion of Biodegradable Solid Waste in Low- and Middle-Income Countries: Overview over existing technologies and relevant case studies. Retrieved April 24, 2010, from http://www.eawag.ch/organisation/abteilungen/sandec/publikationen/publications_swm/downloads_swm/Anaerobic_Digestion_high_resolution.pdf.
Narayana, T. (2008). Municipal solid waste management in India: From waste disposal to recovery of resources? Waste Management, 29(3), 1163-1166.
Natvig, H. (1973). Lærebok i Hygiene (Textbook in Hygiene) (3. utgave). Oslo: Liv og Helse Forlag. In Norwegian.
NSWAI (2006a). Climate Change: Methane Emissions in India. Urban Municipal Solid Waste Management, 5, 7-11.
NSWAI (2006b). Waste to Energy and its importance in Solid Waste Management in India. Urban Municipal Solid Waste Management, 5, 7-11.
NTNU (n.d.) TVM4930 - Industrial Ecology, Master Thesis. Retrieved May 5, 2010, from
The Norwegian University of Science and Technology

7 List of literature 57
http://www.ntnu.no/portal/page/portal/ntnuen/subject_area_courses?selectedItemId=31012&rootItemId=29569&emnekode=TVM4930&year=2009.
ODA (1995). Guidance Note on How to do Stakeholder analysis of Aid Projects and Programmes, Social Development Department. London: Overseas Development Administration.
Palnitkar, S. (2002). Training Module on Solid Waste Management. Mumbai: All India Institute of Local Self Government.
Patel, A. H. (2007). Bio-Remediation of Old Landfills. Proceedings of the International Conference on Sustainable Solid Waste Management, 5 - 7 September 2007. Chennai, India. 304-311.
Pendharkar, S. P. (2003). Population and Employment Profile of Mumbai Metropolitan Region. Retrieved December 25, 2009, from http://www.mmrdamumbai.org/docs/Population%20and%20Employment%20profile%20of%20MMR.pdf.
Plöchl, C., Wetzer, W. and Ragoßnig, A. (2008). Clean development mechanism: an incentive for waste management projects? Waste Management & Research, 26(1), 104-110.
Rathi, S. (2005). Alternative approaches for better municipal solid waste management in Mumbai, India. Waste Management, 26(10), 1192-1200.
Rathi, S. (2007). Optimization model for integrated municipal solid waste management in Mumbai, India. Environment and Development Economics, (12), 115-121.
RCUES (2009). Solid Waste Management and Service Level Benchmarks. Urban Environ Vision, 3(10-11), 2-15.
Saha, J. K., Panwar, N. and Singh, M. V. (2009). An assessment of municipal solid waste compost quality produced in different cities of India in the perspective of developing quality control indices. Waste Management, 30(2), 192-201.
Seadi, T. A. (2002). Good practice in quality management of AD residues from biogas production. IEA Bioenergy, Task 24 – Energy from Biological Conversion of Organic Waste.
Sharholy, M., Ahmad, K., Mahmood, G. and Trivedi, R.C. (2008). Municipal solid waste management in Indian cities – A review. Waste Management, 28(2), 459-467.
Lars Gunnar Furelid Tellnes
58 7 List of literature
Shastri, S. C. (2008). Solid Waste Management – An India Leagal Profile. Retrieved April 2, 2010, from http://www.nlsenlaw.org/waste-management/articles/solid-waste-management2014an-indian-legal-profile/.
Sinha, R. K. and Herat, S. (2002). A cost-effective microbial slurry technology for rapid composting of municipal solid wastes in waste dump sites in India and its feasibility for use in Australia. The Environmentalist, 22, 9-12.
Sinha, R. K., Herat, S., Agarwal, S., Asadi, R. and Carretero, E. (2002). Vermiculture and waste management: study of action of earthworms Elsinia foetida, Eudrilus euginae and Perionyx excavatus on biodegradation of some community wastes in India and Australia. The Envrionmentalist, 22, 261-268.
Snel, M. and Ali, M. (1999). Stakeholder analysis in local solid waste management schemes. WELL Study, Task No. 69. London School of Hygiene & Tropical Medicine, UK, Loughborough University, UK.
Shekdar, A. V. (2009). Sustainable solid waste management: An integrated approach for countries. Waste Management, 29(4), 1438-1448.
Shimura, S., Yokota, I. and Nitta, Y. (2001). Research for MSW flow analysis in developing nations. Journal of Material Cycles and Waste Management, 3(1), 48-59.
Svirejeva-Hopkins, A. and Schellnhuber, H-J. (2006). Modelling carbon dynamics from urban land conversion: fundamental model of city in relation to a local carbon cycle. Carbon Balance and Management, 1(8). Retrieved January 2, 2010, from http://www.cbmjournal.com/content/1/1/8.
SWM CELL, AIILSG (2003). Solid Waste Management in Class 1 Cities of Maharashtra. Mumbai: All India Institute of Local Self Government.
Tellnes, L. G. F. (2010). Analyse of the food and garden waste-related biomass cycle and identification of energy recovery potentials in the 'A' ward region in Mumbai, India. Unpublished project paper. Department of Hydraulic and Environmental Engineering, Norwegian University of Science and Technology, Trondheim.
Tchobanoglous, G., Theisen, H. and Vigil, S. A. (1993). Integrated Solid Waste Management: Engineering Principles and Management Issues. New York: McGraw-Hill.
The Norwegian University of Science and Technology

7 List of literature 59
Thorstenson, I. (2006). Ute av øye – ute av sinn?: En historie om avfall og gjenvinning. Oslo: Avfall Norge.
UNEP (2005). Integrated Waste Management Scoreboard: A Tool to Measure Performance in Municipal Solid Waste Management. Retrieved March 16, 2010, from http://www.unep.or.jp/Ietc/Publications/spc/IWM_scoreboard-binder.pdf.
UNFCC (n.d.) Gorai Landfill Closure and Gas Capture Project, Mumbai, India – project design document. Retrieved January 10, 2009, from http://cdm.unfccc.int/UserManagement/FileStorage/24VZJ7PYI0L53OX8QTAUGN6BK1F9DS.
Unnikrshnan, S. and Singh, A. (2009). Energy recovery in solid waste management through CDM in India and other countries. Resources, Conservancy and Recycling, Article in Press.
Van Koppen, C. S. A. (2004). Eco-industrial design of biomass cycles: flows, technologies, and actors. In P. Lens, B. Hamelers, H. Hoitink and W. Bidlingmaier (Editors). Resource Recovery and Reuse in Organic Solid Waste Management. London: IWA Publishing.
Veeken, A. (2005). Digestion and composting of domestic and market biodegradable waste in Kotte MC, Sri Lanka – Consultancy Report Dec 2005. UE Group, Wageningen University, The Netherlands.
Verma, M. (2010). Email correspondence, April 14, 2010.
Visvanathan C. (2010). A Glance at the World. Composting of municipal solid waste: Indian experience. Waste Management, 30(1), 162-164.
Wan, B. (2004). Energy Density of Methane. In G. Elert (Ed.), The Physics Factbook. Retrieved May 25, 2010, from http://hypertextbook.com/facts/2004/BillyWan.shtml.
Williams, P. T. (2005). Waste treatment and disposal (2nd edition). Chichester: John Wiley & Sons.
Yadav, K. D., Tare, V. and Ahammed, M. M. (2009). Vermicomposting of source-separated human faeces for nutrient recycling. Waste Management, 30(1), 50-56.
Yedla, S. and S. Kansal (2003). Economic insight into municipal solid waste management in Mumbai: a critical analysis. International Journal of Environment and Pollution, 19(5), 516–
Lars Gunnar Furelid Tellnes

60 7 List of literature
527.
Yedla, S. and Park, H.-S. (2009). Co-benefit as an approach to align climate change concerns with national development objectives: solid waste management. Journal of Material Cycles and Waste Management, 11(2), 123-129.
Zhao, Y., Wang, H.-T., Lu, W.-J., Damgaard, A. and Christensen, T. H. (2009). Life-cycle assessment of the municipal solid waste management system in Hangzhou, China (EASEWASTE). Waste Management & Research, 27, 399-406.
Zhu, D., Asnani, P.U., Zurbrügg, C., Anapolsky, S. and Mani, S. (2007). Improving municipal solid waste management in India: a sourcebook for policymakers and practitioners. New York: World Bank.
Zurbrügg, C., Drescher, S., Patel, A. and Sharatchandra, H. C. (2004). Decentralised composting of urban waste – an overview of community and private initiatives in Indian cities. Waste Management, 24(7), 655-662.
The Norwegian University of Science and Technology

8 List of interviewees 61
8 List of intervieweesThe table under list up the different informants interviewed during the field trip in Mumbai lasting from October 17 to November 5, 2009.
Date Interviewee Position Organisation
19/10/10 Dr. Amiya Kumar Sahu President National Solid Waste Association of India
21/10/10 Mr. Mahendra Verma and Premsing Sawant
Chief Engineer/Dy Chef Engineer
Taj President
21/10/10 - Officer in charge Colaba Pumping Station
23/01/10 Vijaja Srinivasan Stree Mukti Sangathana
26/10/10 Mr. Nipurte Mathernan Municipal Corporation
28/10/10 Dr. (Mrs) Sneha Palnitkar Director All India Institute of Local Self Government
28/10/10 Shanta Chatterji Convenor Clean Air Island
29/10/10 Shri Phalare Assistant Engineer (SWM)
'A' Ward Office
02/11/10 Dr. Anurag Garg Assistant Professor Centre for Environmental Science & Engineering at India Institute of Technology Bombay
03/11/10 Dinesh Sharma and J.P. Gate Joint Director – Engineering/ Director
World Trade Centre Mumbai
Lars Gunnar Furelid Tellnes